UNITED STATES
SECURITIES AND EXCHANGE COMMISSION
Washington, D.C. 20549
FORM N-CSR
CERTIFIED SHAREHOLDER REPORT OF REGISTERED
MANAGEMENT INVESTMENT COMPANIES
| | | | |
Investment Company Act file number | | 811-05426 |
| | |
|
| AIM Investment Funds (Invesco Investment Funds) |
| (Exact name of registrant as specified in charter) |
|
| 11 Greenway Plaza, Suite 1000 Houston, Texas 77046 |
| (Address of principal executive offices) (Zip code) |
|
| Sheri Morris 11 Greenway Plaza, Suite 1000 Houston, Texas 77046 |
| (Name and address of agent for service) |
| | | | |
| |
Registrant’s telephone number, including area code: | | (713) 626-1919 |
| | |
| |
Date of fiscal year end: 10/31 | | |
| |
Date of reporting period: 10/31/18 | | |
Item 1. Report to Stockholders.
| | | | | | |
| | | | |

| | Annual Report to Shareholders | | October 31, 2018 | | |
| | | | |
| | Invesco All Cap Market Neutral Fund | | |
| | Nasdaq: | | |
| | A: CPNAX ∎ C: CPNCX ∎ R: CPNRX ∎ Y: CPNYX ∎ R5: CPNFX ∎ R6: CPNSX | | |

Letters to Shareholders
| | |

Philip Taylor | | Dear Shareholders: This annual report includes information about your Fund, including performance data and a complete list of its investments as of the close of the reporting period. Inside is a discussion of how your Fund was managed and the factors that affected its performance during the reporting period. Throughout the reporting period, US economic data remained positive. Robust corporate profits, strong retail sales and unemployment rates near generational lows helped drive US markets to new all-time records multiple times during the reporting period. Against this backdrop, the US Federal Reserve raised the federal funds rate four times during the reporting period. Market volatility, largely non-existent in 2017, returned in 2018. Markets sold off first in February and again sharply in October, amid rising interest rates, concerns about potential trade wars and heightened geopolitical tensions. Despite the volatility, US equity markets were largely positive |
for the reporting period and fared better than international markets. Emerging markets were particularly hard hit due to a strong US dollar. During the October sell-off, investors retreated to more defensive areas of the market and to US Treasuries. The broader bond market declined during the reporting period due to the increase in US Treasury yields and widening credit spreads. As the year progresses, we’ll see how the interplay of economic data, interest rates, geopolitics and a host of other factors affect US and overseas equity and fixed income markets.
Short-term market volatility can prompt some investors to abandon their investment plans – and can cause others to settle for whatever returns the market has to offer. The investment professionals at Invesco, in contrast, invest with high conviction. This means that, no matter the asset class or the strategy, each investment team has a passion to exceed. We want to help investors achieve better outcomes, such as seeking higher returns, helping mitigate risk and generating income. Of course, investing with high conviction can’t guarantee a profit or ensure success; no investment strategy can. To learn more about how we invest with high conviction, visit invesco.com/HighConviction.
You, too, can invest with high conviction by maintaining a long-term investment perspective and by working with your financial adviser on a regular basis. During periods of short-term market volatility or uncertainty, your financial adviser can keep you focused on your long-term investment goals – a new home, a child’s college education or a secure retirement. He or she also can share research about the economy, the markets and individual investment options.
Visit our website for more information on your investments
Our website, invesco.com/us, offers a wide range of market insights and investment perspectives. On the website, you’ll find detailed information about our funds, including performance, holdings and portfolio manager commentaries. You can access information about your account by completing a simple, secure online registration. To do so, select “Log In” on the right side of the homepage, and then select “Register for Individual Account Access.”
In addition to the resources accessible on our website and through our mobile app, you can obtain timely updates to help you stay informed about the markets and the economy by connecting with Invesco on Twitter, LinkedIn or Facebook. You can access our blog at blog.invesco.us.com. Our goal is to provide you the information you want, when and where you want it.
Finally, I’m pleased to share with you Invesco’s commitment to both the Principles for Responsible Investment and to considering environmental, social and governance issues in our robust investment process. I invite you to learn more at invesco.com/esg.
Have questions?
For questions about your account, contact an Invesco client services representative at 800 959 4246. For Invesco-related questions or comments, please email me directly at phil@invesco.com.
All of us at Invesco look forward to serving your investment management needs. Thank you for investing with us.
Sincerely,

Philip Taylor
Senior Managing Director, Invesco Ltd.
| | |
| 2 | | Invesco All Cap Market Neutral Fund |
| | | | |

Bruce Crockett | | Dear Fellow Shareholders: Among the many important lessons I’ve learned in more than 40 years in a variety of business endeavors is the value of a trusted advocate. As independent chair of the Invesco Funds Board, I can assure you that the members of the Board are strong advocates for the interests of investors in Invesco’s mutual funds. We work hard to represent your interests through oversight of the quality of the investment management services your funds receive and other matters important to your investment, including but not limited to: |
| | ∎ | | Ensuring that Invesco offers a diverse lineup of mutual funds that your financial adviser can use to strive to meet your financial needs as your investment goals change over time. |
| | ∎ | | Monitoring how the portfolio management teams of the Invesco funds are performing in light of changing economic and market conditions. |
| ∎ | | Assessing each portfolio management team’s investment performance within the context of the investment strategy described in the fund’s prospectus. |
| ∎ | | Monitoring for potential conflicts of interests that may impact the nature of the services that your funds receive. |
We believe one of the most important services we provide our fund shareholders is the annual review of the funds’ advisory and sub-advisory contracts with Invesco Advisers and its affiliates. This review is required by the Investment Company Act of 1940 and focuses on the nature and quality of the services Invesco provides as the adviser to the Invesco funds and the reasonableness of the fees that it charges for those services. Each year, we spend months carefully reviewing information received from Invesco and a variety of independent sources, such as performance and fee data prepared by Lipper, Inc. (a subsidiary of Broadridge Financial Solutions, Inc.), an independent, third-party firm widely recognized as a leader in its field. We also meet with our independent legal counsel and other independent advisers to review and help us assess the information that we have received. Our goal is to assure that you receive quality investment management services for a reasonable fee.
I trust the measures outlined above provide assurance that you have a worthy advocate when it comes to choosing the Invesco Funds.
As always, please contact me at bruce@brucecrockett.com with any questions or concerns you may have. On behalf of the Board, we look forward to continuing to represent your interests and serving your needs.
Sincerely,

Bruce L. Crockett
Independent Chair
Invesco Funds Board of Trustees
| | |
| 3 | | Invesco All Cap Market Neutral Fund |
Management’s Discussion of Fund Performance
| | | | |
Performance summary For the fiscal year ended October 31, 2018, Class A shares of Invesco All Cap Market Neutral Fund (the Fund), at net asset value (NAV), underperformed the FTSE US 3-Month Treasury Bill Index, the Fund’s broad market/style-specific benchmark. Your Fund’s long-term performance appears later in this report. | |
Fund vs. Indexes | | | | |
Total returns, 10/31/17 to 10/31/18, at net asset value (NAV). Performance shown does not include applicable contingent deferred sales charges (CDSC) or front-end sales charges, which would have reduced performance. | |
| |
Class A Shares | | | -1.65% | |
Class C Shares | | | -2.37 | |
Class R Shares | | | -1.87 | |
Class Y Shares | | | -1.30 | |
Class R5 Shares | | | -1.29 | |
Class R6 Shares | | | -1.29 | |
FTSE US 3-Month Treasury Bill Indexq (Broad Market/Style-Specific Index) | | | 1.67 | |
Lipper Alternative Equity Market Neutral Funds Index⬛ (Peer Group Index) | | | -0.84 | |
Source(s): qFactSet Research Systems Inc., ⬛Lipper Inc. | | | | |
Market conditions and your Fund
The fiscal year proved to be an increasingly volatile time for US equities. The fiscal year began in the final months of 2017 with several major US stock market indexes repeatedly reaching new highs amid strong corporate profits, the prospect of tax reform legislation and exceedingly low stock market volatility.
Stock market euphoria continued in January 2018 as US equity markets steadily moved higher. Investors remained enthused about the passage of the Tax Cuts and Jobs Act signed into law in late December 2017, which significantly cut
corporate tax rates. However, in February 2018, volatility returned to the US stock and bond markets. Worries about how rising interest rates might affect economic growth, concerns about a potential trade war and heightened geopolitical tensions, caused the US stock markets to pull back and volatility to increase.
US equity markets generally recovered in the second quarter of 2018 as strong US retail sales and low unemployment buoyed markets. Throughout the summer, US equities moved higher as corporate profits surged. Several US equity indexes reached new highs despite potential headwinds including trade tensions,
| | | | | | | | | | | | | | | | |
Portfolio Composition | | | | | | | | | | | | | | | | |
By sector, based on total net assets | | | | | | | | | | | | | | | | |
| | | Equity Securities | | | | | | | | | |
| | | | Long1 | | | | Short2 | | | | Gross Exposure3 | | | | Net Exposure4 | |
Health Care | | | 26.4% | | | | 24.6% | | | | 51.0% | | | | 1.8% | |
Consumer Discretionary | | | 18.9 | | | | 19.6 | | | | 38.5 | | | | -0.7 | |
Information Technology | | | 12.5 | | | | 12.4 | | | | 24.9 | | | | 0.1 | |
Energy | | | 11.9 | | | | 11.2 | | | | 23.1 | | | | 0.7 | |
Industrials | | | 6.9 | | | | 7.6 | | | | 14.5 | | | | -0.7 | |
Communication Services | | | 5.4 | | | | 4.5 | | | | 9.9 | | | | 0.9 | |
Materials | | | 5.1 | | | | 4.0 | | | | 9.1 | | | | 1.1 | |
Financials | | | 2.5 | | | | 3.5 | | | | 6.0 | | | | -1.0 | |
Consumer Staples | | | 2.2 | | | | 2.2 | | | | 4.4 | | | | 0.0 | |
Real Estate | | | 1.6 | | | | 1.1 | | | | 2.7 | | | | 0.5 | |
Utilities | | | – | | | | 0.1 | | | | 0.1 | | | | -0.1 | |
| Money Market Funds Plus Other Assets Less Liabilities | | | 6.6 | | | | – | | | | 6.6 | | | | 6.6 | |
Total | | | 100.0 | | | | 90.8 | | | | 190.8 | | | | 9.2 | |
1 Represents the value of the equity securities in the portfolio.
2 Represents the value of the equity securities underlying the Fund’s equity short portfolio swap.
3 Represents the cumulative exposure of the Fund’s long and short positions.
4 Represents the net exposure of the Fund’s long and short positions.
tariff announcements and contagion concerns over a Turkish currency crisis. After a relatively quiet summer, market volatility markedly rose in the final month of the fiscal year. US equity markets suffered a sharp sell-off in October 2018 amid rising interest rates and concerns that higher inflation could mean a more restrictive monetary policy. In this environment, investors fled to more defensive areas of the market and to US Treasuries.
Given signs of a strong economy, the US Federal Reserve raised interest rates four times during the fiscal year: in December 2017 and in March, June and September 2018.1 In contrast, the European Central Bank and central banks in several other countries maintained extraordinarily accommodative monetary policies.
The Fund follows a market neutral strategy, which is intended to produce a portfolio that experiences minimal influence from the return patterns of the general US stock market. The Fund seeks neutral positioning in terms of beta (market exposure) by seeking to maintain neutral sector and industry exposures. The Fund uses a systematic model that evaluates fundamental and behavioral factors to forecast individual security returns and risks and ranks these securities based on their attractiveness relative to industry peers. Implementation occurs by establishing a portfolio with long positions in highly ranked stocks and shorting those
| | |
| Total Net Assets | | $97.9 million |
Data presented here are as of October 31, 2018.
| | |
| 4 | | Invesco All Cap Market Neutral Fund |
that are poorly ranked. As such, the goal is to provide absolute risk-adjusted returns over a full market cycle, regardless of the directions of equity markets.
Pursuant to the Fund’s market neutral construct, a positive spread between the top- and bottom-ranked stocks (long and short candidates for the portfolio) is intended to result in the Fund’s outperformance relative to the FTSE US 3-Month Treasury Bill Index. During the fiscal year, the Fund benefited the most from a positive long/short spread in six of the 11 market sectors, led by the energy, materials and information technology (IT) sectors. However, the long/short spread in the consumer discretionary, industrials and health care sectors partially offset those gains and detracted from the Fund’s returns during the fiscal year.
During the fiscal year, the strongest contributors to the Fund’s absolute performance were holdings in the energy sector. Specifically, the long and short holdings in the oil and gas, and consumable fuels industries performed well. In the materials sector, both long and short holdings contributed to the Fund’s returns. The Fund’s short holdings in the metals and mining industry, and the long holdings in the paper and forest products industry, performed as expected and were additive to the Fund’s returns. Within the IT sector, the long holdings in IT services delivered solid performance and contributed to the Fund’s returns. The key detractor for the fiscal year was the Fund’s short holdings in select industries. Short holdings rallied in the internet and direct marketing retail, health care equipment and supplies, electrical equipment and commercial services and supplies industries, and consequently, hampered the Fund’s absolute performance.
From a factor perspective, the Fund benefited from exposures to Momentum (both Earnings and Price) while our Quality signals were flat over the course of the fiscal year, despite showing signs of strength during heightened periods of volatility. Our Value signals detracted from overall model strength. We have observed that in this most recent period of yield curve flattening and rising yields, stocks with growth characteristics have outperformed those with value attributes. Perhaps the most observable example of this is that the Russell 3000 Growth Index outperformed the Russell 3000 Value Index by 7.4% during the fiscal year.2 We believe that having a balance of factors that have small, and in the case of Value versus Momentum,
negative correlations will smooth out the investment experience relative to relying on more concentrated factor exposures.
Please note that the Fund may utilize derivative instruments that include equity-related total return swaps and futures contracts. During the fiscal year, the Fund utilized equity-related total return swaps to efficiently implement its strategy and gain long and/or short exposure to the various sectors/industries described above, but did not use futures contracts. The implementation impact of using equity-related total return swaps is a component of transaction costs. Certain derivatives may amplify traditional investment risks through the creation of leverage and may be less liquid than traditional securities.
Thank you for your investment in Invesco All Cap Market Neutral Fund.
1 Source: US Federal Reserve
2 Source: FactSet Research Systems Inc.
The views and opinions expressed in management’s discussion of Fund performance are those of Invesco Advisers, Inc. These views and opinions are subject to change at any time based on factors such as market and economic conditions. These views and opinions may not be relied upon as investment advice or recommendations, or as an offer for a particular security. The information is not a complete analysis of every aspect of any market, country, industry, security or the Fund. Statements of fact are from sources considered reliable, but Invesco Advisers, Inc. makes no representation or warranty as to their completeness or accuracy. Although historical performance is no guarantee of future results, these insights may help you understand our investment management philosophy.
See important Fund and, if applicable, index disclosures later in this report.
| | |
 | | Michael Abata Chartered Financial Analyst, Portfolio Manager, is manager of Invesco All Cap Market |
| Neutral Fund. He joined Invesco in 2011. Mr. Abata earned a BA in economics from Binghamton University. |
| |
 | | Anthony Munchak Chartered Financial Analyst, Portfolio Manager, is manager of Invesco All Cap Market |
| Neutral Fund. He joined Invesco in 2000. Mr. Munchak earned a BS and an MS in finance from Boston College and an MBA from Bentley College. |
| | |
 | | Glen Murphy Chartered Financial Analyst, Portfolio Manager, is manager of Invesco All Cap Market |
| Neutral Fund. He joined Invesco in 1995. Mr. Murphy earned a BA from the University of Massachusetts at Amherst and an MS in finance from Boston College. |
| |
 | | Francis Orlando Chartered Financial Analyst, Portfolio Manager, is manager of Invesco All Cap Market |
| Neutral Fund. He joined Invesco in 1987. Mr. Orlando earned a BA in business administration from Merrimack College and an MBA from Boston University. |
5 Invesco All Cap Market Neutral Fund
Your Fund’s Long-Term Performance
Results of a $10,000 Investment – Oldest Share Class(es) since Inception
Fund and index data from 12/17/13
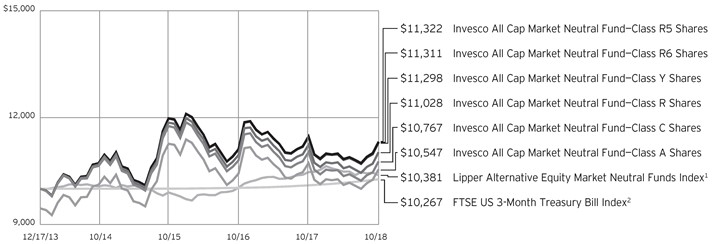
1 Source: Lipper Inc.
2 Source: FactSet Research Systems Inc.
Past performance cannot guarantee comparable future results.
The data shown in the chart include reinvested distributions, applicable sales charges and Fund expenses including
management fees. Index results include reinvested dividends, but they do not reflect sales charges. Performance of the peer group, if applicable, reflects fund expenses and management fees; performance
of a market index does not. Performance shown in the chart and table(s) does not reflect deduction of taxes a shareholder would pay on Fund distributions or sale of Fund shares.
continued from page 8
| | Fund’s short positions will cause the Fund to underperform the overall market and its peers that do not engage in shorting. If the Fund holds both long and short positions, and both positions decline simultaneously, the short positions will not provide any buffer (hedge) from declines in value of the Fund’s long positions. Certain types of short positions involve leverage, which may exaggerate any losses, potentially more than the actual cost of the investment, and will increase the volatility of the Fund’s returns. |
| ∎ | | Small- and mid-capitalization companies risks. Small- and mid-capitalization companies tend to be more vulnerable to changing market conditions, may have little or no operating history or track record of success, and may have more limited product lines and markets, less experienced management and fewer financial resources than larger companies. These companies’ securities may be more volatile and less liquid than those of more established companies, and their returns may vary, sometimes significantly, from the overall securities market. |
About indexes used in this report
| ∎ | | The FTSE US 3-Month Treasury Bill Index is an unmanaged index representative of three-month US Treasury bills. |
| ∎ | | The Lipper Alternative Equity Market Neutral Funds Index is an unmanaged index considered representative of alternative equity market neutral funds tracked by Lipper. |
| ∎ | | The Russell 3000® Growth Index is an unmanaged index considered representative of US growth stocks. The Russell 3000 Growth Index is a trademark/service mark of the Frank Russell Co. Russell® is a trademark of the Frank Russell Co. |
| ∎ | | The Russell 3000® Value Index is an unmanaged index considered representative of US value stocks. The Russell 3000 Value Index is a trademark/service mark of the Frank Russell Co. Russell® is a trademark of the Frank Russell Co. |
| ∎ | | The Fund is not managed to track the performance of any particular index, including the index(es) described here, and consequently, the performance of the Fund may deviate significantly from the performance of the index(es). |
| ∎ | | A direct investment cannot be made in an index. Unless otherwise indicated, index results include reinvested dividends, and they do not reflect sales charges. Performance of the peer group, if applicable, reflects fund expenses; performance of a market index does not. |
Other information
| ∎ | | The returns shown in management’s discussion of Fund performance are based on net asset values (NAVs) calculated for shareholder transactions. Generally accepted accounting principles require adjustments to be made to the net assets of the Fund at period end for financial reporting purposes, and as such, the NAVs for shareholder transactions and the returns based on those NAVs may differ from the NAVs and returns reported in the Financial Highlights. |
| ∎ | | Industry classifications used in this report are generally according to the Global Industry Classification Standard, which was developed by and is the exclusive property and a service mark of MSCI Inc. and Standard & Poor’s. |
| | |
| 6 | | Invesco All Cap Market Neutral Fund |
| | | | |
| |
Average Annual Total Returns | |
As of 10/31/18, including maximum applicable sales charges | |
| |
Class A Shares | | | | |
Inception (12/17/13) | | | 1.10 | % |
1 Year | | | -7.09 | |
| |
Class C Shares | | | | |
Inception (12/17/13) | | | 1.53 | % |
1 Year | | | -3.22 | |
| |
Class R Shares | | | | |
Inception (12/17/13) | | | 2.03 | % |
1 Year | | | -1.87 | |
| |
Class Y Shares | | | | |
Inception (12/17/13) | | | 2.54 | % |
1 Year | | | -1.30 | |
| |
Class R5 Shares | | | | |
Inception (12/17/13) | | | 2.58 | % |
1 Year | | | -1.29 | |
| |
Class R6 Shares | | | | |
Inception (12/17/13) | | | 2.56 | % |
1 Year | | | -1.29 | |
The performance data quoted represent past performance and cannot guarantee comparable future results; current performance may be lower or higher. Please visit invesco.com/performance for the most recent month-end performance. Performance figures reflect reinvested distributions, changes in net asset value and the effect of the maximum sales charge unless otherwise stated. Investment return and principal value will fluctuate so that you may have a gain or loss when you sell shares.
The net annual Fund operating expense ratio set forth in the most recent Fund prospectus as of the date of this report for Class A, Class C, Class R, Class Y, Class R5 and Class R6 shares was 1.41%, 2.16%, 1.66%, 1.16%, 1.04% and 1.04%, respectively.1 The total annual Fund operating expense ratio set forth in the most recent Fund prospectus as of the date of this report for Class A, Class C, Class R, Class Y, Class R5 and Class R6 shares was 1.42%, 2.17%, 1.67%, 1.17%, 1.05% and 1.05%, respectively. The expense ratios presented above may vary from the expense ratios presented in other sections of this report that are based on expenses incurred during the period covered by this report.
| | | | |
| |
Average Annual Total Returns | |
As of 9/30/18, the most recent calendar quarter end, including maximum applicable sales charges | |
| |
Class A Shares | | | | |
Inception (12/17/13) | | | 0.53 | % |
1 Year | | | -7.40 | |
| |
Class C Shares | | | | |
Inception (12/17/13) | | | 0.94 | % |
1 Year | | | -3.74 | |
| |
Class R Shares | | | | |
Inception (12/17/13) | | | 1.44 | % |
1 Year | | | -2.38 | |
| |
Class Y Shares | | | | |
Inception (12/17/13) | | | 1.94 | % |
1 Year | | | -1.90 | |
| |
Class R5 Shares | | | | |
Inception (12/17/13) | | | 2.01 | % |
1 Year | | | -1.67 | |
| |
Class R6 Shares | | | | |
Inception (12/17/13) | | | 1.99 | % |
1 Year | | | -1.67 | |
Class A share performance reflects the maximum 5.50% sales charge, and Class C share performance reflects the applicable contingent deferred sales charge (CDSC) for the period involved. The CDSC on Class C shares is 1% for the first year after purchase. Class R, Class Y, Class R5 and Class R6 class shares do not have a front-end sales charge or a CDSC; therefore, performance is at net asset value.
The performance of the Fund’s share classes will differ primarily due to different sales charge structures and class expenses.
Fund performance reflects any applicable fee waivers and/or expense reimbursements. Had the adviser not waived fees and/or reimbursed expenses currently or in the past, returns would have been lower. See current prospectus for more information.
| 1 | Total annual Fund operating expenses after any contractual fee waivers and/or expense reimbursements by the adviser in effect through at least June 30, 2020. See current prospectus for more information. |
7 Invesco All Cap Market Neutral Fund
Invesco All Cap Market Neutral Fund’s investment objective seeks to provide a positive return over a full market cycle from a broadly diversified portfolio of stocks while seeking to limit exposure to the general risks associated with stock market investing.
| ∎ | | Unless otherwise stated, information presented in this report is as of October 31, 2018, and is based on total net assets. |
| ∎ | | Unless otherwise noted, all data provided by Invesco. |
| ∎ | | To access your Fund’s reports/prospectus, visit invesco.com/fundreports. |
About share classes
| ∎ | | Class R shares are generally available only to employer sponsored retirement and benefit plans. Please see the prospectus for more information. |
| ∎ | | Class Y shares are available only to certain investors. Please see the prospectus for more information. |
| ∎ | | Class R5 shares and Class R6 shares are available for use by retirement plans that meet certain standards and for institutional investors. Class R6 shares are also available through intermediaries that have established an agreement with Invesco Distributors, Inc. to make such shares available for use in retail omnibus accounts. Please see the prospectus for more information. |
Principal risks of investing in the Fund
| ∎ | | Active trading risk. Active trading of portfolio securities may result in added expenses, a lower return and increased tax liability. |
| ∎ | | Derivatives risk. The value of a derivative instrument depends largely on (and is derived from) the value of an underlying security, currency, commodity, interest rate, index or other asset (each referred to as an underlying asset). In addition to risks relating to the underlying assets, the use of derivatives may include other, possibly greater, risks, including counterparty, leverage and liquidity risks. Counterparty risk is the risk that the counterparty to the derivative contract will default on its obligation to pay the Fund the amount owed or otherwise perform under the derivative contract. Derivatives create leverage risk because they do not require payment up front equal to the economic exposure created by holding a position in the derivative. As a result, an adverse change in the value of the underlying asset could result in the Fund sustaining a loss that is |
| | | substantially greater than the amount invested in the derivative or the anticipated value of the underlying asset, which may make the Fund’s returns more volatile and increase the risk of loss. Derivative instruments may also be less liquid than more traditional investments and the Fund may be unable to sell or close out its derivative positions at a desirable time or price. This risk may be more acute under adverse market conditions, during which the Fund may be most in need of liquidating its derivative positions. Derivatives may also be harder to value, less tax efficient and subject to changing government regulation that could impact the Fund’s ability to use certain derivatives or their cost. The SEC has proposed new regulations related to the use of derivatives and related instruments by registered investment companies. If adopted as proposed, these regulations would limit the Fund’s ability to engage in derivatives transactions and may result in increased costs or require the Fund to modify its investment strategies or to liquidate. Derivatives strategies may not always be successful. For example, derivatives used for hedging or to gain or limit exposure to a particular market segment may not provide the expected benefits, particularly during adverse market conditions. These risks are greater for the Fund than most other mutual funds because the Fund will implement its investment strategy primarily through derivative instruments rather than direct investments in stocks/bonds. |
| ∎ | | Management risk. The Fund is actively managed and depends heavily on the Adviser’s judgment about markets, interest rates or the attractiveness, relative values, liquidity, or potential appreciation of particular investments made for the Fund’s portfolio. The Fund could experience losses if these judgments prove to be incorrect. Additionally, legislative, regulatory, or tax developments |
This report must be accompanied or preceded by a currently effective Fund prospectus, which contains more complete information, including sales charges and expenses. Investors should read it carefully before investing.
NOT FDIC INSURED | MAY LOSE VALUE | NO BANK GUARANTEE
| | may adversely affect management of the Fund and, therefore, the ability of the Fund to achieve its investment objective. In particular, there is no guarantee that the portfolio manager’s stock selection process will produce a market neutral portfolio that reduces or eliminates the Fund’s exposure to general US stock market risk, sector or industry-specific risk or market capitalization risk. In addition, the Fund’s market neutral investment strategy will likely cause the Fund to underperform the broader US equity market during market rallies. Such underperformance could be significant during sudden or significant market rallies. |
| ∎ | | Market risk. The market values of the Fund’s investments, and therefore the value of the Fund’s shares, will go up and down, sometimes rapidly or unpredictably. Market risk may affect a single issuer, industry or section of the economy, or it may affect the market as a whole. Individual stock prices tend to go up and down more dramatically than those of certain other types of investments, such as bonds. During a general downturn in the financial markets, multiple asset classes may decline in value. When markets perform well, there can be no assurance that specific invest- ments held by the Fund will rise in value. |
| ∎ | | Sector focus risk. The Fund may from time to time invest a significant amount of its assets (i.e. over 25%) in one market sector or group of related industries. In this event, the Fund’s performance will depend to a greater extent on the overall condition of the sector or group of industries and there is increased risk that the Fund will lose significant value if conditions adversely affect that sector or group of industries. |
| ∎ | | Short position risk. Because the Fund’s potential loss on a short position arises from increases in the value of the asset sold short, the Fund will incur a loss on a short position, which is theoretically unlimited, if the price of the asset sold short increases from the short sale price. The counterparty to a short position or other market factors may prevent the Fund from closing out a short position at a desirable time or price and may reduce or eliminate any gain or result in a loss. In a rising market, the |
| | | | | | |
| 8 | | Invesco All Cap Market Neutral Fund | | | | continued on page 6 |
Schedule of Investments(a)
October 31, 2018
| | | | | | | | |
| | | Shares | | | Value | |
Common Stocks & Other Equity Interests–93.36% | |
| Advertising–1.05% | |
National CineMedia, Inc. | | | 74,200 | | | $ | 664,090 | |
TechTarget, Inc.(b) | | | 17,750 | | | | 360,680 | |
| | | | | | | | 1,024,770 | |
|
| Aerospace & Defense–0.16% | |
Axon Enterprise, Inc.(b) | | | 2,600 | | | | 160,472 | |
|
| Alternative Carriers–1.24% | |
Intelsat S.A.(b) | | | 37,850 | | | | 986,371 | |
Vonage Holdings Corp.(b) | | | 16,900 | | | | 224,094 | |
| | | | | | | | 1,210,465 | |
|
| Apparel Retail–3.16% | |
Abercrombie & Fitch Co.–Class A | | | 58,550 | | | | 1,153,435 | |
Cato Corp. (The)–Class A | | | 4,550 | | | | 87,724 | |
Foot Locker, Inc. | | | 24,950 | | | | 1,176,143 | |
Tilly’s Inc.–Class A | | | 38,240 | | | | 678,378 | |
| | | | | | | | 3,095,680 | |
|
| Apparel, Accessories & Luxury Goods–1.30% | |
Fossil Group, Inc.(b) | | | 55,450 | | | | 1,203,819 | |
Vera Bradley, Inc.(b) | | | 5,500 | | | | 72,545 | |
| | | | | | | | 1,276,364 | |
|
| Application Software–0.11% | |
Datawatch Corp.(b) | | | 11,600 | | | | 108,228 | |
|
| Asset Management & Custody Banks–0.35% | |
Blucora, Inc.(b) | | | 11,900 | | | | 344,148 | |
|
| Auto Parts & Equipment–0.70% | |
Delphi Technologies PLC | | | 3,000 | | | | 64,320 | |
Shiloh Industries, Inc.(b) | | | 15,750 | | | | 143,168 | |
Stoneridge, Inc.(b) | | | 15,550 | | | | 395,125 | |
Tower International Inc. | | | 2,900 | | | | 86,101 | |
| | | | | | | | 688,714 | |
|
| Biotechnology–9.55% | |
AMAG Pharmaceuticals, Inc.(b) | | | 11,400 | | | | 245,100 | |
ArQule Inc.(b) | | | 126,700 | | | | 490,329 | |
BioSpecifics Technologies Corp.(b) | | | 3,250 | | | | 199,127 | |
CareDx, Inc.(b) | | | 42,850 | | | | 1,118,813 | |
ChemoCentryx, Inc.(b) | | | 54,400 | | | | 588,608 | |
Concert Pharmaceuticals, Inc.(b) | | | 9,350 | | | | 139,502 | |
CytomX Therapeutics, Inc.(b) | | | 23,550 | | | | 335,823 | |
Eagle Pharmaceuticals, Inc.(b) | | | 7,100 | | | | 349,604 | |
Emergent Biosolutions, Inc.(b) | | | 450 | | | | 27,536 | |
Enanta Pharmaceuticals, Inc.(b) | | | 14,300 | | | | 1,103,388 | |
Genomic Health, Inc.(b) | | | 19,050 | | | | 1,366,075 | |
KalVista Pharmaceuticals, Inc.(b) | | | 18,750 | | | | 354,375 | |
Mirati Therapeutics, Inc.(b) | | | 3,300 | | | | 123,321 | |
Myriad Genetics, Inc.(b) | | | 27,900 | | | | 1,256,337 | |
| | | | | | | | |
| | | Shares | | | Value | |
| Biotechnology–(continued) | |
Pfenex Inc.(b) | | | 37,750 | | | $ | 149,868 | |
REGENXBIO Inc.(b) | | | 17,900 | | | | 1,193,393 | |
Vericel Corp.(b) | | | 12,400 | | | | 138,260 | |
Voyager Therapeutics, Inc.(b) | | | 3,500 | | | | 47,495 | |
XOMA Corp.(b) | | | 9,850 | | | | 121,254 | |
| | | | | | | | 9,348,208 | |
|
| Broadcasting–0.07% | |
Beasley Broadcast Group, Inc.–Class A | | | 10,850 | | | | 72,370 | |
|
| Cable & Satellite–0.11% | |
MSG Networks, Inc.–Class A(b) | | | 4,100 | | | | 104,755 | |
|
| Coal & Consumable Fuels–1.72% | |
Arch Coal, Inc.–Class A | | | 3,900 | | | | 374,010 | |
Hallador Energy Co. | | | 46,600 | | | | 305,696 | |
NACCO Industries, Inc.–Class A | | | 8,450 | | | | 291,863 | |
Peabody Energy Corp. | | | 20,150 | | | | 714,317 | |
| | | | | | | | 1,685,886 | |
|
| Commercial Printing–0.82% | |
Cimpress N.V. (Netherlands)(b) | | | 3,700 | | | | 462,463 | |
Ennis, Inc. | | | 9,300 | | | | 180,048 | |
Quad/Graphics, Inc. | | | 10,500 | | | | 162,015 | |
| | | | | | | | 804,526 | |
|
| Commodity Chemicals–0.51% | |
Methanex Corp. (Canada) | | | 7,650 | | | | 495,185 | |
|
| Communications Equipment–1.01% | |
Comtech Telecommunications Corp. | | | 30,000 | | | | 837,600 | |
NETGEAR, Inc.(b) | | | 900 | | | | 49,932 | |
PC-Tel, Inc.(b) | | | 23,950 | | | | 105,859 | |
| | | | | | | | 993,391 | |
|
| Construction Machinery & Heavy Trucks–0.46% | |
Commercial Vehicle Group, Inc.(b) | | | 23,050 | | | | 154,205 | |
Manitex International Inc.(b) | | | 3,800 | | | | 32,452 | |
Meritor, Inc.(b) | | | 15,250 | | | | 259,097 | |
| | | | | | | | 445,754 | |
|
| Consumer Electronics–0.73% | |
Turtle Beach Corp.(b) | | | 16,600 | | | | 294,650 | |
ZAGG, Inc.(b) | | | 34,450 | | | | 417,190 | |
| | | | | | | | 711,840 | |
|
| Consumer Finance–0.26% | |
Navient Corp. | | | 13,250 | | | | 153,435 | |
Nelnet, Inc.–Class A | | | 1,800 | | | | 101,322 | |
| | | | | | | | 254,757 | |
|
| Copper–0.60% | |
Freeport-McMoRan Inc. | | | 50,100 | | | | 583,665 | |
See accompanying Notes to Financial Statements which are an integral part of the financial statements.
9 Invesco All Cap Market Neutral Fund
| | | | | | | | |
| | | Shares | | | Value | |
| Data Processing & Outsourced Services–1.58% | |
Alliance Data Systems Corp. | | | 450 | | | $ | 92,781 | |
Cardtronics PLC–Class A(b) | | | 48,900 | | | | 1,328,124 | |
Everi Holdings Inc.(b) | | | 17,450 | | | | 125,640 | |
| | | | | | | | 1,546,545 | |
|
| Department Stores–1.75% | |
Kohl’s Corp. | | | 4,300 | | | | 325,639 | |
Macy’s, Inc. | | | 40,550 | | | | 1,390,459 | |
| | | | | | | | 1,716,098 | |
|
| Diversified Chemicals–0.43% | |
Huntsman Corp. | | | 19,050 | | | | 416,814 | |
|
| Diversified Metals & Mining–0.19% | |
Teck Resources Ltd.–Class B (Canada) | | | 9,150 | | | | 189,131 | |
|
| Education Services–0.63% | |
Cambium Learning Group Inc.(b) | | | 42,952 | | | | 617,650 | |
|
| Electrical Components & Equipment–0.58% | |
Atkore International Group, Inc.(b) | | | 6,850 | | | | 131,931 | |
Enphase Energy Inc.(b) | | | 95,150 | | | | 431,981 | |
| | | | | | | | 563,912 | |
|
| Electronic Components–0.12% | |
Bel Fuse, Inc.–Class B | | | 5,450 | | | | 119,900 | |
|
| Electronic Equipment & Instruments–2.65% | |
Control4 Corp.(b) | | | 32,060 | | | | 895,115 | |
Electro Scientific Industries, Inc.(b) | | | 38,600 | | | | 1,119,400 | |
Mesa Laboratories, Inc. | | | 500 | | | | 91,345 | |
Napco Security Technologies, Inc.(b) | | | 3,150 | | | | 44,321 | |
Zebra Technologies Corp.–Class A(b) | | | 2,650 | | | | 440,695 | |
| | | | | | | | 2,590,876 | |
|
| Fertilizers & Agricultural Chemicals–0.96% | |
CF Industries Holdings, Inc. | | | 19,600 | | | | 941,388 | |
|
| Food Distributors–0.06% | |
Chefs Warehouse, Inc. (The)(b) | | | 1,700 | | | | 57,171 | |
|
| Food Retail–0.40% | |
Natural Grocers by Vitamin Cottage, Inc.(b) | | | 21,800 | | | | 395,016 | |
|
| Footwear–1.95% | |
Crocs, Inc.(b) | | | 17,100 | | | | 351,234 | |
Deckers Outdoor Corp.(b) | | | 10,550 | | | | 1,341,643 | |
Rocky Brands, Inc. | | | 7,350 | | | | 211,092 | |
| | | | | | | | 1,903,969 | |
|
| Forest Products–0.18% | |
Norbord Inc. (Canada) | | | 6,800 | | | | 172,924 | |
|
| Gold–0.47% | |
Kirkland Lake Gold Ltd. (Canada) | | | 23,350 | | | | 456,726 | |
|
| Health Care Equipment–2.94% | |
Accuray Inc.(b) | | | 42,800 | | | | 192,172 | |
| | | | | | | | |
| | | Shares | | | Value | |
| Health Care Equipment–(continued) | |
FONAR Corp.(b) | | | 6,924 | | | $ | 171,300 | |
Glaukos Corp.(b) | | | 4,650 | | | | 269,421 | |
IntriCon Corp.(b) | | | 9,950 | | | | 416,706 | |
iRadimed Corp.(b) | | | 12,300 | | | | 307,008 | |
Novocure Ltd.(b) | | | 14,750 | | | | 488,815 | |
SurModics, Inc.(b) | | | 4,900 | | | | 310,807 | |
Tandem Diabetes Care, Inc.(b) | | | 19,200 | | | | 722,112 | |
| | | | | | | | 2,878,341 | |
|
| Health Care Facilities–1.22% | |
AAC Holdings, Inc.(b) | | | 16,550 | | | | 91,190 | |
Quorum Health Corp.(b) | | | 35,750 | | | | 142,285 | |
Tenet Healthcare Corp.(b) | | | 37,200 | | | | 957,156 | |
| | | | | | | | 1,190,631 | |
|
| Health Care Services–1.25% | |
American Renal Associates Holdings, Inc.(b) | | | 16,600 | | | | 320,214 | |
Psychemedics Corp. | | | 8,700 | | | | 152,250 | |
RadNet, Inc.(b) | | | 50,678 | | | | 750,034 | |
| | | | | | | | 1,222,498 | |
|
| Health Care Supplies–2.36% | |
BioLife Solutions, Inc.(b) | | | 18,350 | | | | 233,412 | |
Haemonetics Corp.(b) | | | 3,700 | | | | 386,539 | |
Lantheus Holdings, Inc.(b) | | | 21,050 | | | | 294,069 | |
STAAR Surgical Co.(b) | | | 34,850 | | | | 1,397,833 | |
| | | | | | | | 2,311,853 | |
|
| Health Care Technology–1.09% | |
Simulations Plus, Inc. | | | 4,500 | | | | 90,945 | |
Tabula Rasa Healthcare, Inc.(b) | | | 13,250 | | | | 978,910 | |
| | | | | | | | 1,069,855 | |
|
| Homebuilding–0.36% | |
KB Home | | | 17,550 | | | | 350,474 | |
|
| Homefurnishing Retail–0.92% | |
Aaron’s, Inc. | | | 4,700 | | | | 221,511 | |
RH(b) | | | 5,850 | | | | 676,903 | |
| | | | | | | | 898,414 | |
|
| Industrial Machinery–2.11% | |
DMC Global, Inc. | | | 12,850 | | | | 495,368 | |
Harsco Corp.(b) | | | 48,950 | | | | 1,344,656 | |
LB Foster Co.–Class A(b) | | | 12,490 | | | | 227,068 | |
| | | | | | | | 2,067,092 | |
|
| Interactive Home Entertainment–0.40% | |
Glu Mobile Inc.(b) | | | 55,850 | | | | 393,743 | |
|
| Interactive Media & Services–2.57% | |
Care.com, Inc.(b) | | | 30,700 | | | | 540,320 | |
Match Group, Inc.(b) | | | 4,300 | | | | 222,396 | |
Meet Group, Inc. (The)(b) | | | 76,250 | | | | 336,262 | |
QuinStreet, Inc.(b) | | | 52,400 | | | | 833,160 | |
TripAdvisor, Inc.(b) | | | 11,200 | | | | 583,968 | |
| | | | | | | | 2,516,106 | |
See accompanying Notes to Financial Statements which are an integral part of the financial statements.
10 Invesco All Cap Market Neutral Fund
| | | | | | | | |
| | | Shares | | | Value | |
| Internet & Direct Marketing Retail–2.51% | |
Etsy, Inc.(b) | | | 31,250 | | | $ | 1,328,750 | |
GrubHub, Inc.(b) | | | 400 | | | | 37,096 | |
Lands’ End, Inc.(b) | | | 11,500 | | | | 187,565 | |
Leaf Group Ltd.(b) | | | 4,800 | | | | 42,000 | |
Nutrisystem, Inc. | | | 7,900 | | | | 280,924 | |
Qurate Retail, Inc.(b) | | | 5,950 | | | | 130,543 | |
Stamps.com, Inc.(b) | | | 2,200 | | | | 444,774 | |
| | | | | | | | 2,451,652 | |
|
| Internet Services & Infrastructure–0.72% | |
Akamai Technologies, Inc.(b) | | | 3,000 | | | | 216,750 | |
Endurance International Group Holdings, Inc.(b) | | | 49,850 | | | | 492,020 | |
| | | | | | | | 708,770 | |
|
| IT Consulting & Other Services–1.35% | |
Perspecta Inc. | | | 6,700 | | | | 164,083 | |
Teradata Corp.(b) | | | 3,650 | | | | 132,860 | |
Unisys Corp.(b) | | | 55,650 | | | | 1,024,516 | |
| | | | | | | | 1,321,459 | |
|
| Leisure Facilities–0.51% | |
SeaWorld Entertainment, Inc.(b) | | | 7,300 | | | | 190,676 | |
Town Sports International Holdings, Inc.(b) | | | 39,800 | | | | 305,664 | |
| | | | | | | | 496,340 | |
|
| Leisure Products–0.23% | |
Johnson Outdoors Inc.–Class A | | | 2,250 | | | | 169,448 | |
MCBC Holdings, Inc.(b) | | | 1,850 | | | | 54,908 | |
| | | | | | | | 224,356 | |
|
| Life Sciences Tools & Services–1.60% | |
Champions Oncology, Inc.(b) | | | 12,950 | | | | 160,321 | |
Codexis, Inc.(b) | | | 26,800 | | | | 417,276 | |
Fluidigm Corp.(b) | | | 47,300 | | | | 340,560 | |
Medpace Holdings, Inc.(b) | | | 12,450 | | | | 648,645 | |
| | | | | | | | 1,566,802 | |
|
| Managed Health Care–0.09% | |
Triple-S Management Corp.–Class B
(Puerto Rico)(b) | | | 5,000 | | | | 85,800 | |
|
| Marine–0.08% | |
Genco Shipping & Trading Ltd.(b) | | | 7,000 | | | | 77,140 | |
|
| Metal & Glass Containers–0.08% | |
Myers Industries, Inc. | | | 4,700 | | | | 74,542 | |
|
| Motorcycle Manufacturers–0.39% | |
Harley-Davidson, Inc. | | | 9,950 | | | | 380,289 | |
|
| Oil & Gas Drilling–0.94% | |
Diamond Offshore Drilling, Inc.(b) | | | 32,800 | | | | 465,104 | |
Noble Corp. PLC(b) | | | 89,800 | | | | 450,796 | |
| | | | | | | | 915,900 | |
| | | | | | | | |
| | | Shares | | | Value | |
| Oil & Gas Equipment & Services–0.49% | |
Apergy Corp.(b) | | | 3,600 | | | $ | 140,364 | |
ION Geophysical Corp.(b) | | | 16,100 | | | | 190,141 | |
KLX Energy Services Holdings, Inc.(b) | | | 4,000 | | | | 115,560 | |
Mammoth Energy Services, Inc. | | | 1,550 | | | | 38,688 | |
| | | | | | | | 484,753 | |
|
| Oil & Gas Exploration & Production–6.31% | |
Bonanza Creek Energy, Inc.(b) | | | 5,800 | | | | 149,350 | |
California Resources Corp.(b) | | | 31,700 | | | | 993,478 | |
Chesapeake Energy Corp.(b) | | | 94,900 | | | | 333,099 | |
CNX Resources, Corp.(b) | | | 41,850 | | | | 654,953 | |
Comstock Resources, Inc.(b) | | | 19,100 | | | | 138,475 | |
Denbury Resources Inc.(b) | | | 303,650 | | | | 1,047,592 | |
Evolution Petroleum Corp. | | | 44,800 | | | | 461,440 | |
Panhandle Oil & Gas, Inc.–Class A | | | 9,100 | | | | 161,889 | |
W&T Offshore, Inc.(b) | | | 174,300 | | | | 1,174,782 | |
Whiting Petroleum Corp.(b) | | | 28,300 | | | | 1,055,590 | |
| | | | | | | | 6,170,648 | |
|
| Oil & Gas Refining & Marketing–2.27% | |
Adams Resources & Energy, Inc. | | | 3,600 | | | | 145,980 | |
HollyFrontier Corp. | | | 10,450 | | | | 704,748 | |
Renewable Energy Group Inc.(b) | | | 44,000 | | | | 1,367,520 | |
| | | | | | | | 2,218,248 | |
|
| Oil & Gas Storage & Transportation–0.15% | |
Overseas Shipholding Group, Inc.–Class A(b) | | | 47,200 | | | | 148,208 | |
|
| Packaged Foods & Meats–0.39% | |
Freshpet, Inc.(b) | | | 10,000 | | | | 381,000 | |
|
| Paper Products–0.32% | |
Resolute Forest Products Inc(b) | | | 15,750 | | | | 177,503 | |
Verso Corp.–Class A(b) | | | 5,000 | | | | 140,550 | |
| | | | | | | | 318,053 | |
|
| Personal Products–1.02% | |
Herbalife Nutrition Ltd.(b) | | | 9,750 | | | | 519,285 | |
Medifast, Inc. | | | 2,250 | | | | 476,280 | |
| | | | | | | | 995,565 | |
|
| Pharmaceuticals–6.24% | |
Assertio Therapeutics, Inc.(b) | | | 34,700 | | | | 168,469 | |
Cerecor, Inc.(b) | | | 31,800 | | | | 130,380 | |
Corcept Therapeutics Inc.(b) | | | 32,150 | | | | 377,763 | |
Endo International PLC(b) | | | 79,100 | | | | 1,339,954 | |
Horizon Pharma PLC(b) | | | 21,550 | | | | 392,425 | |
Innoviva, Inc.(b) | | | 83,650 | | | | 1,167,754 | |
Nektar Therapeutics(b) | | | 16,050 | | | | 620,814 | |
Pacira Pharmaceuticals, Inc.(b) | | | 21,750 | | | | 1,063,357 | |
Supernus Pharmaceuticals Inc.(b) | | | 850 | | | | 40,426 | |
WaVe Life Sciences Ltd.(b) | | | 17,250 | | | | 805,402 | |
| | | | | | | | 6,106,744 | |
See accompanying Notes to Financial Statements which are an integral part of the financial statements.
11 Invesco All Cap Market Neutral Fund
| | | | | | | | |
| | | Shares | | | Value | |
| Property & Casualty Insurance–0.47% | |
Ambac Financial Group, Inc.(b) | | | 22,400 | | | $ | 460,992 | |
|
| Real Estate Development–0.13% | |
Maui Land & Pineapple Co., Inc.(b) | | | 11,600 | | | | 130,732 | |
|
| Real Estate Services–0.29% | |
Altisource Portfolio Solutions S.A.(b) | | | 11,350 | | | | 286,361 | |
|
| Regional Banks–0.96% | |
First Financial Northwest, Inc. | | | 6,700 | | | | 101,237 | |
OFG Bancorp (Puerto Rico) | | | 49,300 | | | | 842,537 | |
| | | | | | | | 943,774 | |
|
| Residential REITs–0.21% | |
BRT Apartments Corp. | | | 17,500 | | | | 203,525 | |
|
| Restaurants–0.59% | |
Noodles & Co.(b) | | | 61,250 | | | | 577,588 | |
|
| Semiconductor Equipment–1.91% | |
Nanometrics Inc.(b) | | | 26,800 | | | | 859,208 | |
SolarEdge Technologies, Inc.(b) | | | 26,100 | | | | 1,010,853 | |
| | | | | | | | 1,870,061 | |
|
| Semiconductors–1.80% | |
Advanced Micro Devices, Inc.(b) | | | 3,750 | | | | 68,287 | |
Lattice Semiconductor Corp.(b) | | | 5,700 | | | | 34,257 | |
Micron Technology, Inc.(b) | | | 35,850 | | | | 1,352,262 | |
Pixelworks, Inc.(b) | | | 40,900 | | | | 170,962 | |
SMART Global Holdings, Inc.(b) | | | 4,700 | | | | 131,647 | |
| | | | | | | | 1,757,415 | |
|
| Specialized Consumer Services–0.38% | |
Liberty Tax, Inc. | | | 4,950 | | | | 53,460 | |
Weight Watchers International, Inc.(b) | | | 4,800 | | | | 317,280 | |
| | | | | | | | 370,740 | |
|
| Specialized REITs–0.94% | |
CoreCivic, Inc. | | | 32,800 | | | | 736,688 | |
SBA Communications Corp.(b) | | | 1,150 | | | | 186,495 | |
| | | | | | | | 923,183 | |
|
| Specialty Stores–2.80% | |
Dick’s Sporting Goods, Inc. | | | 32,650 | | | | 1,154,830 | |
Hibbett Sports, Inc.(b) | | | 22,750 | | | | 397,443 | |
Signet Jewelers Ltd. | | | 17,250 | | | | 966,862 | |
Vitamin Shoppe, Inc.(b) | | | 28,100 | | | | 218,337 | |
| | | | | | | | 2,737,472 | |
|
| Steel–1.35% | |
Warrior Met Coal, Inc. | | | 47,050 | | | | 1,317,400 | |
|
| Systems Software–0.93% | |
Dell Technologies Inc.–Class V(b) | | | 6,200 | | | | 560,418 | |
Fortinet, Inc.(b) | | | 2,250 | | | | 184,905 | |
Varonis Systems, Inc.(b) | | | 2,650 | | | | 161,835 | |
| | | | | | | | 907,158 | |
| | | | | | | | |
| | | Shares | | | Value | |
| Technology Hardware, Storage & Peripherals–0.32% | |
Avid Technology, Inc.(b) | | | 25,150 | | | $ | 133,295 | |
NetApp, Inc. | | | 1,250 | | | | 98,112 | |
Western Digital Corp. | | | 1,950 | | | | 83,987 | |
| | | | | | | | 315,394 | |
|
| Thrifts & Mortgage Finance–0.48% | |
Federal Agricultural Mortgage Corp.–Class C | | | 4,400 | | | | 307,296 | |
FS Bancorp, Inc. | | | 2,300 | | | | 103,822 | |
LendingTree, Inc.(b) | | | 280 | | | | 56,473 | |
| | | | | | | | 467,591 | |
|
| Tobacco–0.33% | |
Turning Point Brands, Inc. | | | 7,800 | | | | 320,580 | |
|
| Trading Companies & Distributors–2.51% | |
General Finance Corp.(b) | | | 23,000 | | | | 299,000 | |
H&E Equipment Services, Inc. | | | 9,400 | | | | 226,446 | |
Systemax, Inc. | | | 23,950 | | | | 773,824 | |
Titan Machinery, Inc.(b) | | | 6,750 | | | | 96,188 | |
Transcat, Inc.(b) | | | 4,600 | | | | 95,266 | |
Veritiv Corp.(b) | | | 13,850 | | | | 461,759 | |
W.W. Grainger, Inc. | | | 1,780 | | | | 505,467 | |
| | | | | | | | 2,457,950 | |
|
| Trucking–0.19% | |
USA Truck, Inc.(b) | | | 9,400 | | | | 184,898 | |
Total Common Stocks & Other Equity Interests
(Cost $84,810,359) | | | | 91,355,388 | |
|
Money Market Funds–6.97% | |
Invesco Government & Agency Portfolio–
Institutional Class, 2.08%(c) | | | 2,387,246 | | | | 2,387,246 | |
Invesco Liquid Assets Portfolio–Institutional Class, 2.27%(c) | | | 1,704,571 | | | | 1,704,912 | |
Invesco Treasury Portfolio–Institutional Class, 2.09%(c) | | | 2,728,281 | | | | 2,728,281 | |
Total Money Market Funds
(Cost $6,820,186) | | | | 6,820,439 | |
TOTAL INVESTMENTS IN SECURITIES–100.33%
(Cost $91,630,545) | | | | 98,175,827 | |
OTHER ASSETS LESS LIABILITIES–(0.33)% | | | | (324,373 | ) |
NET ASSETS–100.00% | | | $ | 97,851,454 | |
Investment Abbreviations:
| | |
| REIT | | – Real Estate Investment Trust |
See accompanying Notes to Financial Statements which are an integral part of the financial statements.
12 Invesco All Cap Market Neutral Fund
Notes to Schedule of Investments:
| (a) | Industry and/or sector classifications used in this report are generally according to the Global Industry Classification Standard, which was developed by and is the exclusive property and a service mark of MSCI Inc. and Standard & Poor’s. |
| (b) | Non-income producing security. |
| (c) | The money market fund and the Fund are affiliated by having the same investment adviser. The rate shown is the 7-day SEC standardized yield as of October 31, 2018. |
| | | | | | | | | | | | | | | | | | | | | | | | | | | | | | |
| Open Over-The-Counter Total Return Swap Agreements — Equity Risk | |
| Reference Entity | | Counterparty | | Maturity
Date | | | Floating Rate Index(1) | | Payment Frequency | | Notional Amount | | | Upfront Payments Paid (Received) | | | Value | | | Unrealized Appreciation | | | Net Value of Reference Entities | |
Equity Securities — Short | | Morgan Stanley & Co. LLC | | | 04/24/2019 | | | Federal Funds floating rate | | Monthly | | $ | (91,357,856 | ) | | $ | — | | | $ | 2,504,104 | (2)(3) | | $ | 2,504,104 | (2)(3) | | $ | (88,845,611 | ) |
| (1) | The Fund receives or pays the total return on the long and short positions underlying the total return swap and pays or receives a specific Federal Funds floating rate. |
| (2) | Amount includes $(8,141) of dividends payable and financing fees related to the reference entities. |
| (3) | Swaps are collateralized by $128,408 cash held with Morgan Stanley & Co. LLC, the Counterparty. |
The following table represents the individual short positions and related values of equity securities underlying the total return swap with Morgan Stanley & Co. LLC, as of October 31, 2018.
| | | | | | | | | | | | |
| | | Shares | | | Value | | | Percentage
of Reference
Entities | |
Equity Securities — Short | | | | | |
| Advertising | | | | | |
Boston Omaha Corp.–Class A | | | (3,100 | ) | | $ | (85,808 | ) | | | 0.09 | |
| |
| Aerospace & Defense | | | | | |
KeyW Holding Corp. (The) | | | (50,950 | ) | | | (398,939 | ) | | | 0.47 | |
Kratos Defense & Security Solutions, Inc. | | | (29,550 | ) | | | (370,261 | ) | | | 0.43 | |
| | | | | | | | (769,200 | ) | | | | |
| |
| Air Freight & Logistics | | | | | |
Radiant Logistics, Inc. | | | (35,950 | ) | | | (195,568 | ) | | | 0.21 | |
| |
| Airlines | | | | | |
Allegiant Travel Co. | | | (1,800 | ) | | | (205,452 | ) | | | 0.24 | |
| |
| Alternative Carriers | | | | | |
Iridium Communications Inc. | | | (20,200 | ) | | | (400,162 | ) | | | 0.44 | |
| |
| Apparel Retail | | | | | |
L Brands, Inc. | | | (26,950 | ) | | | (873,719 | ) | | | 0.88 | |
| |
| Apparel, Accessories & Luxury Goods | | | | | |
Hanesbrands, Inc. | | | (4,550 | ) | | | (78,078 | ) | | | 0.08 | |
Under Armour, Inc.–Class C | | | (30,050 | ) | | | (595,891 | ) | | | 0.56 | |
| | | | | | | | (673,969 | ) | | | | |
| |
| Application Software | | | | | |
Asure Software, Inc. | | | (16,000 | ) | | | (178,240 | ) | | | 0.20 | |
Benefitfocus, Inc. | | | (4,650 | ) | | | (165,215 | ) | | | 0.17 | |
Digimarc Corp. | | | (12,150 | ) | | | (305,330 | ) | | | 0.35 | |
Ellie Mae. Inc. | | | (3,000 | ) | | | (198,840 | ) | | | 0.27 | |
MINDBODY, Inc.–Class A | | | (28,750 | ) | | | (915,400 | ) | | | 1.01 | |
Nutanix, Inc.–Class A | | | (1,300 | ) | | | (53,963 | ) | | | 0.05 | |
Park City Group, Inc. | | | (10,250 | ) | | | (88,457 | ) | | | 0.09 | |
PROS Holdings, Inc. | | | (4,150 | ) | | | (136,618 | ) | | | 0.14 | |
SITO Mobile Ltd. | | | (23,950 | ) | | | (32,332 | ) | | | 0.04 | |
Veritone, Inc. | | | (18,750 | ) | | | (129,375 | ) | | | 0.16 | |
| | | | | | | | (2,203,770 | ) | | | | |
| | | | | | | | | | | | |
| | | Shares | | | Value | | | Percentage
of Reference
Entities | |
| Asset Management & Custody Banks | | | | | |
Safeguard Scientifics, Inc. | | | (6,900 | ) | | $ | (58,995 | ) | | | 0.07 | |
WisdomTree Investments, Inc. | | | (14,950 | ) | | | (116,161 | ) | | | 0.11 | |
| | | | | | | | (175,156 | ) | | | | |
| |
| Auto Parts & Equipment | | | | | |
Horizon Global Corp. | | | (25,250 | ) | | | (141,652 | ) | | | 0.17 | |
Kandi Technologies Group Inc. (China) | | | (58,150 | ) | | | (279,702 | ) | | | 0.26 | |
LCI Industries | | | (8,150 | ) | | | (565,203 | ) | | | 0.66 | |
| | | | | | | | (986,557 | ) | | | | |
| |
| Automobile Manufacturers | | | | | |
Tesla, Inc. | | | (2,580 | ) | | | (870,286 | ) | | | 0.74 | |
| |
| Automotive Retail | | | | | |
Camping World Holdings, Inc.–
Class A | | | (26,650 | ) | | | (457,048 | ) | | | 0.62 | |
CarMax, Inc. | | | (13,550 | ) | | | (920,181 | ) | | | 1.01 | |
Carvana Co | | | (6,550 | ) | | | (253,812 | ) | | | 0.30 | |
Lithia Motors, Inc.–Class A | | | (7,800 | ) | | | (694,824 | ) | | | 0.64 | |
Monro, Inc. | | | (5,850 | ) | | | (435,240 | ) | | | 0.43 | |
| | | | | | | | (2,761,105 | ) | | | | |
| |
| Biotechnology | | | | | |
Abeona Therapeutics, Inc. | | | (43,650 | ) | | | (375,390 | ) | | | 0.42 | |
ACADIA Pharmaceuticals Inc. | | | (45,700 | ) | | | (890,236 | ) | | | 1.09 | |
ADMA Biologics, Inc. | | | (29,950 | ) | | | (160,831 | ) | | | 0.18 | |
Advaxis, Inc. | | | (48,550 | ) | | | (27,237 | ) | | | 0.03 | |
Alnylam Pharmaceuticals Inc. | | | (8,450 | ) | | | (679,634 | ) | | | 0.71 | |
Bluebird Bio, Inc. | | | (1,650 | ) | | | (189,255 | ) | | | 0.21 | |
Calithera Biosciences, Inc. | | | (18,250 | ) | | | (86,140 | ) | | | 0.11 | |
Clovis Oncology Inc. | | | (18,800 | ) | | | (218,644 | ) | | | 0.43 | |
Corbus Pharmaceuticals Holdings, Inc. | | | (52,700 | ) | | | (350,982 | ) | | | 0.42 | |
Dynavax Technologies Corp. | | | (23,400 | ) | | | (231,426 | ) | | | 0.31 | |
Exact Sciences Corp. | | | (17,500 | ) | | | (1,243,375 | ) | | | 1.20 | |
Flexion Therapeutics, Inc. | | | (20,850 | ) | | | (282,309 | ) | | | 0.39 | |
Immunomedics, Inc. | | | (19,850 | ) | | | (447,221 | ) | | | 0.51 | |
See accompanying Notes to Financial Statements which are an integral part of the financial statements.
13 Invesco All Cap Market Neutral Fund
| | | | | | | | | | | | |
| | | Shares | | | Value | | | Percentage
of Reference
Entities | |
| Biotechnology–(continued) | | | | | |
Intrexon Corp. | | | (29,750 | ) | | $ | (343,910 | ) | | | 0.44 | |
Invitae Corp. | | | (3,700 | ) | | | (52,503 | ) | | | 0.05 | |
La Jolla Pharmaceutical Co. | | | (29,800 | ) | | | (485,740 | ) | | | 0.52 | |
PolarityTE, Inc. | | | (22,700 | ) | | | (345,948 | ) | | | 0.31 | |
Portola Pharmaceuticals Inc | | | (22,250 | ) | | | (438,103 | ) | | | 0.51 | |
Proteostasis Therapeutics, Inc. | | | (35,350 | ) | | | (219,523 | ) | | | 0.21 | |
Radius Health, Inc. | | | (20,350 | ) | | | (322,140 | ) | | | 0.41 | |
TESARO, Inc. | | | (20,350 | ) | | | (587,708 | ) | | | 0.81 | |
Tyme Technologies, Inc. | | | (79,252 | ) | | | (177,524 | ) | | | 0.20 | |
Ultragenyx Pharmaceutical Inc. | | | (12,300 | ) | | | (595,935 | ) | | | 0.83 | |
| | | | | | | | (8,751,714 | ) | | | | |
| |
| Building Products | | | | | |
Caesarstone Ltd. | | | (38,900 | ) | | | (614,231 | ) | | | 0.71 | |
| |
| Casinos & Gaming | | | | | |
Century Casinos, Inc. | | | (11,150 | ) | | | (69,576 | ) | | | 0.08 | |
Empire Resorts, Inc. | | | (6,550 | ) | | | (42,051 | ) | | | 0.06 | |
Scientific Games Corp. | | | (20,250 | ) | | | (450,765 | ) | | | 0.48 | |
Wynn Resorts Ltd. | | | (3,400 | ) | | | (342,040 | ) | | | 0.38 | |
| | | | | | | | (904,432 | ) | | | | |
| |
| Commodity Chemicals | | | | | |
Core Molding Technologies, Inc. | | | (5,600 | ) | | | (38,136 | ) | | | 0.04 | |
Loop Industries, Inc. (Canada) | | | (16,200 | ) | | | (148,878 | ) | | | 0.17 | |
Trecora Resources | | | (13,677 | ) | | | (147,712 | ) | | | 0.18 | |
| | | | | | | | (334,726 | ) | | | | |
| |
| Communications Equipment | | | | | |
Applied Optoelectronics, Inc. | | | (11,950 | ) | | | (234,579 | ) | | | 0.29 | |
EMCORE Corp. | | | (24,550 | ) | | | (121,031 | ) | | | 0.13 | |
ViaSat, Inc. | | | (10,050 | ) | | | (640,788 | ) | | | 0.68 | |
| | | | | | | | (996,398 | ) | | | | |
| |
| Construction & Engineering | | | | | |
Argan, Inc. | | | (16,600 | ) | | | (730,732 | ) | | | 0.78 | |
Granite Construction, Inc. | | | (8,750 | ) | | | (400,050 | ) | | | 0.39 | |
| | | | | | | | (1,130,782 | ) | | | | |
| |
| Construction Materials | | | | | |
Forterra, Inc. | | | (47,250 | ) | | | (213,097 | ) | | | 0.25 | |
Martin Marietta Materials, Inc. | | | (250 | ) | | | (42,820 | ) | | | 0.04 | |
Summit Materials, Inc.–Class A | | | (16,800 | ) | | | (226,800 | ) | | | 0.24 | |
U.S. Concrete, Inc. | | | (5,050 | ) | | | (164,832 | ) | | | 0.17 | |
Vulcan Materials Co. | | | (800 | ) | | | (80,912 | ) | | | 0.08 | |
| | | | | | | | (728,461 | ) | | | | |
| |
| Consumer Electronics | | | | | |
Universal Electronics, Inc. | | | (15,150 | ) | | | (473,740 | ) | | | 0.57 | |
Vuzix Corp. | | | (30,350 | ) | | | (184,528 | ) | | | 0.20 | |
| | | | | | | | (658,268 | ) | | | | |
| | | | | | | | | | | | |
| | | Shares | | | Value | | | Percentage
of Reference
Entities | |
| Data Processing & Outsourced Services | | | | | |
Square, Inc.–Class A | | | (4,800 | ) | | $ | (352,560 | ) | | | 0.39 | |
| |
| Distributors | | | | | |
Core-Mark Holding Co., Inc. | | | (20,900 | ) | | | (802,769 | ) | | | 0.87 | |
LKQ Corp. | | | (6,100 | ) | | | (166,347 | ) | | | 0.18 | |
Pool Corp. | | | (700 | ) | | | (102,025 | ) | | | 0.11 | |
| | | | | | | | (1,071,141 | ) | | | | |
| |
| Diversified Chemicals | | | | | |
LSB Industries, Inc. | | | (31,850 | ) | | | (242,060 | ) | | | 0.31 | |
| |
| Diversified Metals & Mining | | | | | |
Compass Minerals International, Inc. | | | (10,300 | ) | | | (499,653 | ) | | | 0.77 | |
| |
| Diversified Support Services | | | | | |
Healthcare Services Group, Inc. | | | (4,100 | ) | | | (166,419 | ) | | | 0.19 | |
Ritchie Bros. Auctioneers Inc. (Canada) | | | (13,650 | ) | | | (458,776 | ) | | | 0.49 | |
| | | | | | | | (625,195 | ) | | | | |
| |
| Electrical Components & Equipment | | | | | |
American Superconductor Corp. | | | (22,850 | ) | | | (136,872 | ) | | | 0.16 | |
Revolution Lighting Technologies, Inc. | | | (23,350 | ) | | | (35,959 | ) | | | 0.04 | |
Sunrun, Inc. | | | (92,750 | ) | | | (1,137,115 | ) | | | 1.30 | |
Vivint Solar, Inc. | | | (38,300 | ) | | | (198,777 | ) | | | 0.21 | |
| | | | | | | | (1,508,723 | ) | | | | |
| |
| Electronic Components | | | | | |
Akoustis Technologies, Inc. | | | (23,300 | ) | | | (94,831 | ) | | | 0.11 | |
II-VI Inc. | | | (18,150 | ) | | | (675,724 | ) | | | 0.76 | |
| | | | | | | | (770,555 | ) | | | | |
| |
| Electronic Equipment & Instruments | | | | | |
Coherent, Inc. | | | (8,000 | ) | | | (985,120 | ) | | | 1.08 | |
Iteris, Inc. | | | (35,664 | ) | | | (154,068 | ) | | | 0.16 | |
| | | | | | | | (1,139,188 | ) | | | | |
| |
| Electronic Manufacturing Services | | | | | |
IPG Photonics Corp. | | | (2,550 | ) | | | (340,552 | ) | | | 0.37 | |
Maxwell Technologies, Inc. | | | (42,503 | ) | | | (124,959 | ) | | | 0.15 | |
| | | | | | | | (465,511 | ) | | | | |
| |
| Environmental & Facilities Services | | | | | |
Team, Inc. | | | (26,750 | ) | | | (532,325 | ) | | | 0.56 | |
| |
| Fertilizers & Agricultural Chemicals | | | | | |
Scotts Miracle-Gro Co. (The) | | | (600 | ) | | | (40,044 | ) | | | 0.05 | |
| |
| Food Retail | | | | | |
Casey’s General Stores, Inc. | | | (750 | ) | | | (94,582 | ) | | | 0.10 | |
| |
| Footwear | | | | | |
Skechers U.S.A., Inc.–Class A | | | (6,050 | ) | | | (172,848 | ) | | | 0.19 | |
See accompanying Notes to Financial Statements which are an integral part of the financial statements.
14 Invesco All Cap Market Neutral Fund
| | | | | | | | | | | | |
| | | Shares | | | Value | | | Percentage
of Reference
Entities | |
| General Merchandise Stores | | | | | |
Big Lots, Inc. | | | (13,000 | ) | | $ | (539,760 | ) | | | 0.59 | |
Dollar Tree, Inc. | | | (9,700 | ) | | | (817,710 | ) | | | 0.89 | |
| | | | | | | | (1,357,470 | ) | | | | |
| |
| Gold | | | | | |
Tahoe Resources, Inc. | | | (50,000 | ) | | | (118,500 | ) | | | 0.15 | |
| |
| Health Care Equipment | | | | | |
Apollo Endosurgery, Inc. | | | (15,550 | ) | | | (88,324 | ) | | | 0.10 | |
Cantel Medical Corp. | | | (5,800 | ) | | | (459,070 | ) | | | 0.51 | |
Conformis, Inc. | | | (42,000 | ) | | | (35,864 | ) | | | 0.04 | |
CryoPort, Inc. | | | (31,400 | ) | | | (348,540 | ) | | | 0.38 | |
GenMark Diagnostics Inc. | | | (61,650 | ) | | | (328,594 | ) | | | 0.40 | |
Helius Medical Technologies, Inc. | | | (13,700 | ) | | | (140,288 | ) | | | 0.15 | |
Invacare Corp. | | | (33,908 | ) | | | (438,091 | ) | | | 0.52 | |
Nevro Corp. | | | (10,050 | ) | | | (490,038 | ) | | | 0.54 | |
NuVasive, Inc. | | | (14,850 | ) | | | (834,125 | ) | | | 1.03 | |
Oxford Immunotec Global PLC | | | (26,000 | ) | | | (400,660 | ) | | | 0.46 | |
Penumbra, Inc. | | | (4,300 | ) | | | (584,800 | ) | | | 0.64 | |
Pulse Biosciences, Inc. | | | (16,200 | ) | | | (207,522 | ) | | | 0.16 | |
SeaSpine Holdings Corp. | | | (4,750 | ) | | | (81,557 | ) | | | 0.09 | |
ViewRay, Inc. | | | (105,650 | ) | | | (913,873 | ) | | | 0.99 | |
Viveve Medical, Inc. | | | (26,000 | ) | | | (78,780 | ) | | | 0.10 | |
Wright Medical Group N.V. | | | (41,400 | ) | | | (1,116,972 | ) | | | 1.25 | |
| | | | | | | | (6,547,098 | ) | | | | |
| |
| Health Care Supplies | | | | | |
DENTSPLY SIRONA Inc. | | | (13,300 | ) | | | (460,579 | ) | | | 0.52 | |
Quotient Ltd. | | | (50,700 | ) | | | (324,987 | ) | | | 0.35 | |
Senseonics Holdings, Inc. | | | (90,300 | ) | | | (335,013 | ) | | | 0.34 | |
Sientra, Inc. | | | (31,650 | ) | | | (651,674 | ) | | | 0.77 | |
| | | | | | | | (1,772,253 | ) | | | | |
| |
| Health Care Technology | | | | | |
Medidata Solutions, Inc. | | | (5,500 | ) | | | (386,650 | ) | | | 0.42 | |
| |
| Home Furnishings | | | | | |
Mohawk Industries, Inc. | | | (1,050 | ) | | | (130,966 | ) | | | 0.17 | |
Tempur Sealy International, Inc. | | | (7,050 | ) | | | (325,781 | ) | | | 0.37 | |
| | | | | | | | (456,747 | ) | | | | |
| |
| Home Improvement Retail | | | | | |
Floor & Decor Holdings, Inc.– Class A | | | (31,800 | ) | | | (813,444 | ) | | | 0.91 | |
Tile Shop Holdings, Inc. (The) | | | (56,750 | ) | | | (368,875 | ) | | | 0.40 | |
| | | | | | | | (1,182,319 | ) | | | | |
| |
| Homebuilding | | | | | |
New Home Co. Inc. (The) | | | (15,050 | ) | | | (107,306 | ) | | | 0.12 | |
| |
| Homefurnishing Retail | | | | | |
Kirkland’s, Inc. | | | (15,100 | ) | | | (152,661 | ) | | | 0.16 | |
| | | | | | | | | | | | |
| | | Shares | | | Value | | | Percentage
of Reference
Entities | |
| Household Appliances | | | | | |
Whirlpool Corp. | | | (1,100 | ) | | $ | (120,736 | ) | | | 0.13 | |
| |
| Housewares & Specialties | | | | | |
Newell Brands, Inc. | | | (51,900 | ) | | | (824,172 | ) | | | 0.93 | |
| |
| Hypermarkets & Super Centers | | | | | |
PriceSmart Inc | | | (1,950 | ) | | | (136,792 | ) | | | 0.17 | |
| |
| Industrial Machinery | | | | | |
CIRCOR International, Inc. | | | (9,850 | ) | | | (320,223 | ) | | | 0.38 | |
Energy Recovery, Inc. | | | (8,500 | ) | | | (63,750 | ) | | | 0.07 | |
ExOne Co. (The) | | | (16,300 | ) | | | (107,580 | ) | | | 0.15 | |
| | | | | | | | (491,553 | ) | | | | |
| |
| Interactive Media & Services | | | | | |
Facebook, Inc.–Class A | | | (3,000 | ) | | | (455,370 | ) | | | 0.49 | |
Snap Inc.–Class A | | | (198,200 | ) | | | (1,310,102 | ) | | | 1.49 | |
Zillow Group, Inc.–Class C | | | (20,200 | ) | | | (813,252 | ) | | | 0.91 | |
| | | | | | | | (2,578,724 | ) | | | | |
| |
| Integrated Telecommunication Services | | | | | |
IDT Corp.–Class B | | | (23,950 | ) | | | (168,608 | ) | | | 0.20 | |
| |
| Internet & Direct Marketing Retail | | | | | |
Duluth Holdings, Inc.–Class B | | | (20,100 | ) | | | (617,673 | ) | | | 0.66 | |
Liquidity Services Inc. | | | (31,300 | ) | | | (185,922 | ) | | | 0.19 | |
MercadoLibre Inc. (Argentina) | | | (3,420 | ) | | | (1,109,790 | ) | | | 1.17 | |
Wayfair Inc.–Class A | | | (8,950 | ) | | | (987,096 | ) | | | 1.22 | |
| | | | | | | | (2,900,481 | ) | | | | |
| |
| Internet Services & Infrastructure | | | | | |
Shopify, Inc.–Class A (Canada) | | | (6,000 | ) | | | (828,900 | ) | | | 0.88 | |
| |
| Investment Banking & Brokerage | | | | | |
Virtu Financial, Inc.–Class A | | | (37,650 | ) | | | (893,058 | ) | | | 0.92 | |
| |
| Leisure Products | | | | | |
Mattel, Inc. | | | (67,700 | ) | | | (919,366 | ) | | | 1.04 | |
| |
| Life & Health Insurance | | | | | |
Trupanion, Inc. | | | (6,200 | ) | | | (156,612 | ) | | | 0.19 | |
| |
| Life Sciences Tools & Services | | | | | |
Accelerate Diagnostics, Inc. | | | (43,550 | ) | | | (650,637 | ) | | | 0.73 | |
Enzo Biochem, Inc. | | | (42,100 | ) | | | (139,772 | ) | | | 0.17 | |
NanoString Technologies, Inc. | | | (15,450 | ) | | | (238,084 | ) | | | 0.26 | |
Pacific Biosciences of California Inc. | | | (87,150 | ) | | | (387,818 | ) | | | 0.41 | |
| | | | | | | | (1,416,311 | ) | | | | |
| |
| Marine | | | | | |
Matson, Inc. | | | (9,200 | ) | | | (322,736 | ) | | | 0.37 | |
| |
| Movies & Entertainment | | | | | |
Live Nation Entertainment, Inc. | | | (7,750 | ) | | | (405,325 | ) | | | 0.45 | |
See accompanying Notes to Financial Statements which are an integral part of the financial statements.
15 Invesco All Cap Market Neutral Fund
| | | | | | | | | | | | |
| | | Shares | | | Value | | | Percentage
of Reference
Entities | |
| Multi-Utilities | | | | | |
Algonquin Power & Utilities Corp. (Canada) | | | (5,200 | ) | | $ | (51,896 | ) | | | 0.06 | |
| |
| Oil & Gas Equipment & Services | | | | | |
Bristow Group, Inc. | | | (33,700 | ) | | | (371,037 | ) | | | 0.43 | |
Forum Energy Technologies, Inc. | | | (29,000 | ) | | | (259,840 | ) | | | 0.29 | |
Franks International N.V. | | | (32,350 | ) | | | (229,685 | ) | | | 0.27 | |
Geospace Technologies Corp. | | | (13,650 | ) | | | (173,765 | ) | | | 0.18 | |
Gulf Island Fabrication, Inc. | | | (13,950 | ) | | | (118,575 | ) | | | 0.13 | |
Natural Gas Services Group, Inc. | | | (3,850 | ) | | | (74,305 | ) | | | 0.08 | |
Smart Sand, Inc. | | | (39,050 | ) | | | (108,168 | ) | | | 0.13 | |
| | | | | | | | (1,335,375 | ) | | | | |
| |
| Oil & Gas Exploration & Production | | | | | |
Callon Petroleum Co. | | | (58,800 | ) | | | (586,236 | ) | | | 0.74 | |
Centennial Resource Development, Inc.–Class A | | | (23,700 | ) | | | (454,092 | ) | | | 0.53 | |
EQT Corp. | | | (15,300 | ) | | | (519,741 | ) | | | 0.74 | |
Extraction Oil & Gas, Inc. | | | (36,400 | ) | | | (290,836 | ) | | | 0.34 | |
Jagged Peak Energy, Inc. | | | (53,750 | ) | | | (662,200 | ) | | | 0.79 | |
Lilis Energy, Inc. | | | (64,000 | ) | | | (172,800 | ) | | | 0.22 | |
Matador Resources Co. | | | (10,200 | ) | | | (294,168 | ) | | | 0.35 | |
Parsley Energy, Inc.–Class A | | | (24,600 | ) | | | (576,132 | ) | | | 0.75 | |
PDC Energy, Inc. | | | (2,300 | ) | | | (97,635 | ) | | | 0.11 | |
Resolute Energy Corp. | | | (26,100 | ) | | | (726,363 | ) | | | 0.82 | |
Ring Energy Inc. | | | (64,350 | ) | | | (458,816 | ) | | | 0.56 | |
Tellurian, Inc. | | | (153,650 | ) | | | (1,229,200 | ) | | | 1.50 | |
| | | | | | | | (6,068,219 | ) | | | | |
| |
| Oil & Gas Refining & Marketing | | | | | |
Green Plains Inc. | | | (41,050 | ) | | | (699,492 | ) | | | 0.77 | |
World Fuel Services Corp. | | | (21,400 | ) | | | (684,800 | ) | | | 0.65 | |
| | | | | | | | (1,384,292 | ) | | | | |
| |
| Oil & Gas Storage & Transportation | | | | | |
Enbridge Inc. (Canada) | | | (32,450 | ) | | | (1,009,519 | ) | | | 1.14 | |
Frontline Ltd.. (Norway) | | | (100,578 | ) | | | (719,133 | ) | | | 0.71 | |
Targa Resources Corp. | | | (5,600 | ) | | | (289,352 | ) | | | 0.34 | |
TransCanada Corp. (Canada) | | | (3,750 | ) | | | (141,450 | ) | | | 0.17 | |
| | | | | | | | (2,159,454 | ) | | | | |
| |
| Packaged Foods & Meats | | | | | |
Sanderson Farms, Inc. | | | (6,950 | ) | | | (683,810 | ) | | | 0.75 | |
| |
| Paper Products | | | | | |
P. H. Glatfelter Co. | | | (2,650 | ) | | | (47,435 | ) | | | 0.05 | |
| |
| Personal Products | | | | | |
Coty Inc.–Class A | | | (57,050 | ) | | | (601,878 | ) | | | 0.66 | |
Revlon, Inc.–Class A | | | (12,655 | ) | | | (265,755 | ) | | | 0.34 | |
| | | | | | | | (867,633 | ) | | | | |
| | | | | | | | | | | | |
| | | Shares | | | Value | | | Percentage
of Reference
Entities | |
| Pharmaceuticals | | | | | |
Aclaris Therapeutics, Inc. | | | (45,150 | ) | | $ | (536,834 | ) | | | 0.62 | |
Aerie Pharmaceuticals, Inc. | | | (13,800 | ) | | | (733,884 | ) | | | 0.88 | |
Akorn, Inc. | | | (38,300 | ) | | | (255,461 | ) | | | 0.28 | |
Axsome Therapeutics, Inc. | | | (23,550 | ) | | | (91,138 | ) | | | 0.10 | |
Catalent, Inc. | | | (7,400 | ) | | | (298,516 | ) | | | 0.33 | |
Clearside Biomedical, Inc. | | | (34,650 | ) | | | (187,803 | ) | | | 0.20 | |
Collegium Pharmaceutical, Inc. | | | (5,950 | ) | | | (95,497 | ) | | | 0.11 | |
Medicines Co. (The) | | | (24,400 | ) | | | (567,544 | ) | | | 0.71 | |
Ocular Therapeutix, Inc. | | | (41,750 | ) | | | (207,080 | ) | | | 0.27 | |
Paratek Pharmaceuticals, Inc. | | | (35,800 | ) | | | (266,710 | ) | | | 0.35 | |
Prestige Brands Holdings, Inc. | | | (11,450 | ) | | | (414,032 | ) | | | 0.47 | |
Reata Pharmaceuticals, Inc.–
Class A | | | (13,150 | ) | | | (774,930 | ) | | | 0.85 | |
TherapeuticsMD, Inc. | | | (98,100 | ) | | | (479,709 | ) | | | 0.58 | |
Theravance Biopharma, Inc. | | | (4,000 | ) | | | (97,080 | ) | | | 0.12 | |
Zogenix, Inc. | | | (2,300 | ) | | | (96,048 | ) | | | 0.11 | |
Zynerba Pharmaceuticals, Inc. | | | (17,850 | ) | | | (93,891 | ) | | | 0.12 | |
| | | | | | | | (5,196,157 | ) | | | | |
| |
| Property & Casualty Insurance | | | | | |
MBIA Inc. | | | (14,950 | ) | | | (148,005 | ) | | | 0.16 | |
| |
| Publishing | | | | | |
New York Times Co. (The)–Class A | | | (9,300 | ) | | | (245,520 | ) | | | 0.26 | |
| |
| Real Estate Operating Companies | | | | | |
Transcontinental Realty Investors, Inc. | | | (1,300 | ) | | | (44,317 | ) | | | 0.04 | |
Trinity Place Holdings, Inc. | | | (5,500 | ) | | | (29,370 | ) | | | 0.03 | |
| | | | | | | | (73,687 | ) | | | | |
| |
| Regional Banks | | | | | |
Banc of California, Inc. | | | (3,850 | ) | | | (61,407 | ) | | | 0.07 | |
Howard Bancorp, Inc. | | | (19,150 | ) | | | (304,677 | ) | | | 0.31 | |
Mid Penn Bancorp., Inc. | | | (1,750 | ) | | | (46,830 | ) | | | 0.05 | |
MidSouth Bancorp, Inc. | | | (16,718 | ) | | | (222,015 | ) | | | 0.25 | |
Republic First Bancorp., Inc. | | | (38,200 | ) | | | (257,850 | ) | | | 0.28 | |
| | | | | | | | (892,779 | ) | | | | |
| |
| Reinsurance | | | | | |
Greenlight Capital Re Ltd.–Class A | | | (18,000 | ) | | | (208,620 | ) | | | 0.22 | |
Maiden Holdings Ltd. | | | (24,600 | ) | | | (86,346 | ) | | | 0.09 | |
| | | | | | | | (294,966 | ) | | | | |
| |
| Research & Consulting Services | | | | | |
Willdan Group, Inc. | | | (9,257 | ) | | | (279,561 | ) | | | 0.32 | |
| |
| Restaurants | | | | | |
Del Friscos Restaurant Group, Inc. | | | (35,500 | ) | | | (239,625 | ) | | | 0.27 | |
Fiesta Restaurant Group, Inc. | | | (12,500 | ) | | | (322,625 | ) | | | 0.39 | |
Habit Restaurants, Inc. (The)–
Class A | | | (28,300 | ) | | | (359,410 | ) | | | 0.46 | |
See accompanying Notes to Financial Statements which are an integral part of the financial statements.
16 Invesco All Cap Market Neutral Fund
| | | | | | | | | | | | |
| | | Shares | | | Value | | | Percentage
of Reference
Entities | |
| Restaurants–(continued) | | | | | |
Shake Shack Inc.–Class A | | | (1,350 | ) | | $ | (71,402 | ) | | | 0.08 | |
| | | | | | | | (993,062 | ) | | | | |
| |
| Retail REITs | | | | | |
CBL & Associates Properties, Inc. | | | (151,800 | ) | | | (500,940 | ) | | | 0.56 | |
Pennsylvania Real Estate Investment Trust | | | (60,550 | ) | | | (541,923 | ) | | | 0.60 | |
| | | | | | | | (1,042,863 | ) | | | | |
| |
| Semiconductor Equipment | | | | | |
AXT, Inc. | | | (43,950 | ) | | | (289,631 | ) | | | 0.31 | |
PDF Solutions, Inc. | | | (34,273 | ) | | | (274,184 | ) | | | 0.31 | |
Ultra Clean Holdings, Inc. | | | (43,050 | ) | | | (452,886 | ) | | | 0.48 | |
| | | | | | | | (1,016,701 | ) | | | | |
| |
| Semiconductors | | | | | |
Alpha & Omega Semiconductor Ltd. | | | (8,600 | ) | | | (79,722 | ) | | | 0.09 | |
Cree, Inc. | | | (1,600 | ) | | | (62,112 | ) | | | 0.07 | |
Everspin Technologies, Inc. | | | (13,950 | ) | | | (98,068 | ) | | | 0.11 | |
GSI Technology, Inc. | | | (8,850 | ) | | | (52,303 | ) | | | 0.06 | |
Impinj, Inc. | | | (30,150 | ) | | | (590,940 | ) | | | 0.65 | |
MACOM Technology Solutions Holdings, Inc. | | | (22,450 | ) | | | (315,872 | ) | | | 0.36 | |
NeoPhotonics Corp. | | | (48,200 | ) | | | (385,600 | ) | | | 0.45 | |
Universal Display Corp. | | | (13,050 | ) | | | (1,605,281 | ) | | | 1.57 | |
| | | | | | | | (3,189,898 | ) | | | | |
| |
| Soft Drinks | | | | | |
Celsius Holdings, Inc. | | | (14,400 | ) | | | (57,456 | ) | | | 0.06 | |
| |
| Specialized Finance | | | | | |
On Deck Capital, Inc. | | | (6,400 | ) | | | (44,160 | ) | | | 0.05 | |
| |
| Specialty Chemicals | | | | | |
Advanced Emissions Solutions, Inc. | | | (21,215 | ) | | | (210,029 | ) | | | 0.24 | |
Albemarle Corp. | | | (3,600 | ) | | | (357,192 | ) | | | 0.38 | |
Flotek Industries, Inc. | | | (51,900 | ) | | | (93,939 | ) | | | 0.11 | |
Northern Technologies International Corp. | | | (1,900 | ) | | | (61,465 | ) | | | 0.07 | |
Sherwin-Williams Co. (The) | | | (400 | ) | | | (157,388 | ) | | | 0.18 | |
| | | | | | | | (880,013 | ) | | | | |
| |
| Specialty Stores | | | | | |
Big 5 Sporting Goods Corp. | | | (22,250 | ) | | | (78,098 | ) | | | 0.13 | |
MarineMax, Inc. | | | (6,150 | ) | | | (139,974 | ) | | | 0.14 | |
Ulta Beauty, Inc. | | | (3,700 | ) | | | (1,015,724 | ) | | | 1.11 | |
| | | | | | | | (1,233,796 | ) | | | | |
| |
| Steel | | | | | |
AK Steel Holding Corp. | | | (32,850 | ) | | | (121,545 | ) | | | 0.16 | |
Allegheny Technologies, Inc. | | | (3,100 | ) | | | (80,259 | ) | | | 0.09 | |
Ampco-Pittsburgh Corp. | | | (12,550 | ) | | | (46,560 | ) | | | 0.06 | |
| | | | | | | | | | | | |
| | | Shares | | | Value | | | Percentage
of Reference
Entities | |
| Steel–(continued) | | | | | |
Haynes International, Inc. | | | (1,650 | ) | | $ | (47,784 | ) | | | 0.05 | |
Ramaco Resources, Inc. | | | (45,500 | ) | | | (338,975 | ) | | | 0.39 | |
United States Steel Corp. | | | (10,150 | ) | | | (269,280 | ) | | | 0.30 | |
Worthington Industries, Inc. | | | (2,550 | ) | | | (106,794 | ) | | | 0.12 | |
| | | | | | | | (1,011,197 | ) | | | | |
| |
| Systems Software | | | | | |
FireEye, Inc. | | | (15,000 | ) | | | (277,350 | ) | | | 0.28 | |
SecureWorks Corp.–Class A | | | (27,891 | ) | | | (459,923 | ) | | | 0.47 | |
| | | | | | | | (737,273 | ) | | | | |
| |
| Technology Hardware, Storage & Peripherals | | | | | |
3D Systems Corp. | | | (18,450 | ) | | | (222,876 | ) | | | 0.34 | |
Diebold Nixdorf, Inc. | | | (18,800 | ) | | | (73,320 | ) | | | 0.08 | |
Intevac, Inc. | | | (22,300 | ) | | | (107,040 | ) | | | 0.11 | |
| | | | | | | | (403,236 | ) | | | | |
| |
| Thrifts & Mortgage Finance | | | | | |
Impac Mortgage Holdings, Inc. | | | (10,750 | ) | | | (55,792 | ) | | | 0.07 | |
Meta Financial Group, Inc. | | | (29,019 | ) | | | (732,440 | ) | | | 0.76 | |
| | | | | | | | (788,232 | ) | | | | |
| |
| Tobacco | | | | | |
Pyxus International, Inc. | | | (11,650 | ) | | | (276,571 | ) | | | 0.35 | |
| |
| Trading Companies & Distributors | | | | | |
EnviroStar, Inc. | | | (5,350 | ) | | | (222,293 | ) | | | 0.24 | |
Huttig Building Products, Inc. | | | (21,200 | ) | | | (79,076 | ) | | | 0.08 | |
NOW Inc. | | | (37,550 | ) | | | (482,142 | ) | | | 0.62 | |
| | | | | | | | (783,511 | ) | | | | |
| |
| Wireless Telecommunication Services | | | | | |
NII Holdings, Inc. | | | (93,300 | ) | | | (580,326 | ) | | | 0.60 | |
Total Equity Securities — Short | | | $ | (88,845,611 | ) | | | | |
See accompanying Notes to Financial Statements which are an integral part of the financial statements.
17 Invesco All Cap Market Neutral Fund
Statement of Assets and Liabilities
October 31, 2018
| | | | |
Assets: | | | | |
Investments in securities, at value (Cost $84,810,359) | | $ | 91,355,388 | |
Investments in affiliated money market funds, at value
(Cost $6,820,186) | | | 6,820,439 | |
Other investments: | | | | |
Unrealized appreciation on swap agreements — OTC | | | 2,504,104 | |
Foreign currencies, at value (Cost $378) | | | 362 | |
Deposits with brokers: | | | | |
Cash collateral — OTC derivatives | | | 128,408 | |
Receivable for: | | | | |
Investments sold | | | 8,625 | |
Fund shares sold | | | 44,156 | |
Dividends and interest | | | 43,454 | |
Investment for trustee deferred compensation and retirement plans | | | 10,225 | |
Other assets | | | 59,482 | |
Total assets | | | 100,974,643 | |
| |
Liabilities: | | | | |
Payable for: | | | | |
Fund shares reacquired | | | 16,029 | |
Amount due custodian | | | 3,000,610 | |
Accrued fees to affiliates | | | 21,325 | |
Accrued trustees’ and officers’ fees and benefits | | | 1,894 | |
Accrued other operating expenses | | | 73,106 | |
Trustee deferred compensation and retirement plans | | | 10,225 | |
Total liabilities | | | 3,123,189 | |
Net assets applicable to shares outstanding | | $ | 97,851,454 | |
| |
Net assets consist of: | | | | |
Shares of beneficial interest | | $ | 82,537,244 | |
Distributable earnings | | | 15,314,210 | |
| | | $ | 97,851,454 | |
| | | | |
Net Assets: | |
Class A | | $ | 9,363,732 | |
Class C | | $ | 2,682,951 | |
Class R | | $ | 86,657 | |
Class Y | | $ | 24,669,231 | |
Class R5 | | $ | 8,988 | |
Class R6 | | $ | 61,039,895 | |
|
Shares outstanding, no par value,
with an unlimited number of shares authorized: | |
Class A | | | 1,075,817 | |
Class C | | | 320,610 | |
Class R | | | 10,091 | |
Class Y | | | 2,801,503 | |
Class R5 | | | 1,018 | |
Class R6 | | | 6,919,846 | |
Class A: | | | | |
Net asset value per share | | $ | 8.70 | |
Maximum offering price per share | | | | |
(Net asset value of $8.70 ¸ 94.50%) | | $ | 9.21 | |
Class C: | | | | |
Net asset value and offering price per share | | $ | 8.37 | |
Class R: | | | | |
Net asset value and offering price per share | | $ | 8.59 | |
Class Y: | | | | |
Net asset value and offering price per share | | $ | 8.81 | |
Class R5: | | | | |
Net asset value and offering price per share | | $ | 8.83 | |
Class R6: | | | | |
Net asset value and offering price per share | | $ | 8.82 | |
See accompanying Notes to Financial Statements which are an integral part of the financial statements.
18 Invesco All Cap Market Neutral Fund
Statement of Operations
For the year ended October 31, 2018
| | | | |
Investment income: | | | | |
Dividends (net of foreign withholding taxes of $4,793) | | $ | 742,191 | |
Dividends from affiliated money market funds | | | 165,555 | |
Total investment income | | | 907,746 | |
| |
Expenses: | | | | |
Advisory fees | | | 948,050 | |
Administrative services fees | | | 50,000 | |
Custodian fees | | | 11,644 | |
Distribution fees: | | | | |
Class A | | | 26,274 | |
Class C | | | 32,761 | |
Class R | | | 499 | |
Transfer agent fees — A, C, R and Y | | | 57,993 | |
Transfer agent fees — R6 | | | 299 | |
Trustees’ and officers’ fees and benefits | | | 22,113 | |
Registration and filing fees | | | 84,326 | |
Reports to shareholders | | | 26,400 | |
Professional services fees | | | 83,543 | |
Other | | | 27,396 | |
Total expenses | | | 1,371,298 | |
Less: Fees waived, expenses reimbursed and expense offset arrangement(s) | | | (13,093 | ) |
Net expenses | | | 1,358,205 | |
Net investment income (loss) | | | (450,459 | ) |
| |
Realized and unrealized gain (loss) from: | | | | |
Net realized gain (loss) from: | | | | |
Investment securities | | | 18,371,237 | |
Swap agreements | | | (16,431,189 | ) |
| | | | 1,940,048 | |
Change in net unrealized appreciation (depreciation) of: | | | | |
Investment securities | | | (5,946,136 | ) |
Foreign currencies | | | (17 | ) |
Swap agreements | | | 1,647,805 | |
| | | | (4,298,348 | ) |
Net realized and unrealized gain (loss) | | | (2,358,300 | ) |
Net increase (decrease) in net assets resulting from operations | | $ | (2,808,759 | ) |
See accompanying Notes to Financial Statements which are an integral part of the financial statements.
19 Invesco All Cap Market Neutral Fund
Statement of Changes in Net Assets
For the years ended October 31, 2018 and 2017
| | | | | | | | |
| | | 2018 | | | 2017 | |
Operations: | | | | | | | | |
Net investment income (loss) | | $ | (450,459 | ) | | $ | (460,525 | ) |
Net realized gain | | | 1,940,048 | | | | 8,680,730 | |
Change in net unrealized appreciation (depreciation) | | | (4,298,348 | ) | | | (3,456,205 | ) |
Net increase (decrease) in net assets resulting from operations | | | (2,808,759 | ) | | | 4,764,000 | |
| | |
Distributions to shareholders from distributable earnings(1): | | | | | | | | |
Class A | | | (1,336,998 | ) | | | (23,299 | ) |
Class C | | | (538,114 | ) | | | (5,884 | ) |
Class R | | | (12,967 | ) | | | (63 | ) |
Class Y | | | (4,735,077 | ) | | | (23,998 | ) |
Class R5 | | | (1,189 | ) | | | (290 | ) |
Class R6 | | | (8,552,565 | ) | | | (40,229 | ) |
Total distributions from distributable earnings | | | (15,176,910 | ) | | | (93,763 | ) |
| | |
Share transactions–net: | | | | | | | | |
Class A | | | (82,857 | ) | | | (32,641,294 | ) |
Class C | | | (1,463,076 | ) | | | (5,491,479 | ) |
Class R | | | (6,467 | ) | | | 3,532 | |
Class Y | | | (10,331,816 | ) | | | (1,328,111 | ) |
Class R5 | | | — | | | | (484,975 | ) |
Class R6 | | | (988,459 | ) | | | (4,100,374 | ) |
Net increase (decrease) in net assets resulting from share transactions | | | (12,872,675 | ) | | | (44,042,701 | ) |
Net increase (decrease) in net assets | | | (30,858,344 | ) | | | (39,372,464 | ) |
| | |
Net assets: | | | | | | | | |
Beginning of year | | | 128,709,798 | | | | 168,082,262 | |
End of year | | $ | 97,851,454 | | | $ | 128,709,798 | |
| (1) | The Securities and Exchange Commission eliminated the requirement to disclose distribution components separately, except for tax return of capital. For the year ended October 31, 2017, distributions to shareholders from distributable earnings consisted of distributions from net realized gains. |
Notes to Financial Statements
October 31, 2018
NOTE 1—Significant Accounting Policies
Invesco All Cap Market Neutral Fund (the “Fund”) is a series portfolio of AIM Investment Funds (Invesco Investment Funds) (the “Trust”). The Trust is organized as a Delaware statutory trust and is registered under the Investment Company Act of 1940, as amended (the “1940 Act”), as an open-end series management investment company authorized to issue an unlimited number of shares of beneficial interest. Information presented in these financial statements pertains only to the Fund. Matters affecting the Fund or each class will be voted on exclusively by the shareholders of the Fund or each class.
The Fund’s investment objective is to provide a positive return over a full market cycle from a broadly diversified portfolio of stocks while seeking to limit exposure to the general risks associated with stock market investing.
The Fund currently consists of six different classes of shares: Class A, Class C, Class R, Class Y, Class R5 and Class R6. Class Y shares are available only to certain investors. Class A shares are sold with a front-end sales charge unless certain waiver criteria are met. Under certain circumstances, load waived shares may be subject to contingent deferred sales charges (“CDSC”). Class C shares are sold with a CDSC. Class R, Class Y, Class R5 and Class R6 shares are sold at net asset value.
The Fund is an investment company and accordingly follows the investment company accounting and reporting guidance in accordance with Financial Accounting Standards Board Accounting Standards Codification Topic 946, Financial Services — Investment Companies.
The following is a summary of the significant accounting policies followed by the Fund in the preparation of its financial statements.
| A. | Security Valuations — Securities, including restricted securities, are valued according to the following policy. |
A security listed or traded on an exchange (except convertible securities) is valued at its last sales price or official closing price as of the close of the customary trading session on the exchange where the security is principally traded, or lacking any sales or official closing price on a particular day, the security may be valued at the closing bid price on that day. Securities traded in the over-the-counter market are valued based on prices furnished by independent pricing services or market makers. When such securities are valued by an independent pricing service they may be considered fair valued. Futures contracts are valued at the final settlement price set by an exchange on which they are principally traded.
20 Invesco All Cap Market Neutral Fund
Listed options are valued at the mean between the last bid and asked prices from the exchange on which they are principally traded. Options not listed on an exchange are valued by an independent source at the mean between the last bid and asked prices. For purposes of determining net asset value (“NAV”) per share, futures and option contracts generally are valued 15 minutes after the close of the customary trading session of the New York Stock Exchange (“NYSE”).
Investments in open-end and closed-end registered investment companies that do not trade on an exchange are valued at the end-of-day net asset value per share. Investments in open-end and closed-end registered investment companies that trade on an exchange are valued at the last sales price or official closing price as of the close of the customary trading session on the exchange where the security is principally traded.
Debt obligations (including convertible securities) and unlisted equities are fair valued using an evaluated quote provided by an independent pricing service. Evaluated quotes provided by the pricing service may be determined without exclusive reliance on quoted prices, and may reflect appropriate factors such as institution-size trading in similar groups of securities, developments related to specific securities, dividend rate (for unlisted equities), yield (for debt obligations), quality, type of issue, coupon rate (for debt obligations), maturity (for debt obligations), individual trading characteristics and other market data. Pricing services generally value debt obligations assuming orderly transactions of institutional round lot size, but a fund may hold or transact in the same securities in smaller, odd lot sizes. Odd lots often trade at lower prices than institutional round lots. Debt obligations are subject to interest rate and credit risks. In addition, all debt obligations involve some risk of default with respect to interest and/or principal payments.
Foreign securities’ (including foreign exchange contracts) prices are converted into U.S. dollar amounts using the applicable exchange rates as of the close of the NYSE. If market quotations are available and reliable for foreign exchange-traded equity securities, the securities will be valued at the market quotations. Because trading hours for certain foreign securities end before the close of the NYSE, closing market quotations may become unreliable. If between the time trading ends on a particular security and the close of the customary trading session on the NYSE, events occur that the investment adviser determines are significant and make the closing price unreliable, the Fund may fair value the security. If the event is likely to have affected the closing price of the security, the security will be valued at fair value in good faith using procedures approved by the Board of Trustees. Adjustments to closing prices to reflect fair value may also be based on a screening process of an independent pricing service to indicate the degree of certainty, based on historical data, that the closing price in the principal market where a foreign security trades is not the current value as of the close of the NYSE. Foreign securities’ prices meeting the approved degree of certainty that the price is not reflective of current value will be priced at the indication of fair value from the independent pricing service. Multiple factors may be considered by the independent pricing service in determining adjustments to reflect fair value and may include information relating to sector indices, American Depositary Receipts and domestic and foreign index futures. Foreign securities may have additional risks including exchange rate changes, potential for sharply devalued currencies and high inflation, political and economic upheaval, the relative lack of issuer information, relatively low market liquidity and the potential lack of strict financial and accounting controls and standards.
Securities for which market prices are not provided by any of the above methods may be valued based upon quotes furnished by independent sources. The last bid price may be used to value equity securities. The mean between the last bid and asked prices is used to value debt obligations, including corporate loans.
Securities for which market quotations are not readily available or became unreliable are valued at fair value as determined in good faith by or under the supervision of the Trust’s officers following procedures approved by the Board of Trustees. Issuer specific events, market trends, bid/asked quotes of brokers and information providers and other market data may be reviewed in the course of making a good faith determination of a security’s fair value.
The Fund may invest in securities that are subject to interest rate risk, meaning the risk that the prices will generally fall as interest rates rise and, conversely, the prices will generally rise as interest rates fall. Specific securities differ in their sensitivity to changes in interest rates depending on their individual characteristics. Changes in interest rates may result in increased market volatility, which may affect the value and/or liquidity of certain Fund investments.
Valuations change in response to many factors including the historical and prospective earnings of the issuer, the value of the issuer’s assets, general economic conditions, interest rates, investor perceptions and market liquidity. Because of the inherent uncertainties of valuation, the values reflected in the financial statements may materially differ from the value received upon actual sale of those investments.
| B. | Securities Transactions and Investment Income — Securities transactions are accounted for on a trade date basis. Realized gains or losses on sales are computed on the basis of specific identification of the securities sold. Interest income (net of withholding tax, if any) is recorded on the accrual basis from settlement date. Bond premiums and discounts are amortized and/or accreted over the lives of the respective securities. Pay-in-kind interest income and non-cash dividend income received in the form of securities in-lieu of cash are recorded at the fair value of the securities received. Dividend income and dividend expense on short sales are recorded on the ex-dividend date. |
The Fund may periodically participate in litigation related to Fund investments. As such, the Fund may receive proceeds from litigation settlements. Any proceeds received are included in the Statement of Operations as realized gain (loss) for investments no longer held and as unrealized gain (loss) for investments still held.
Brokerage commissions and mark ups are considered transaction costs and are recorded as an increase to the cost basis of securities purchased and/or a reduction of proceeds on a sale of securities. Such transaction costs are included in the determination of net realized and unrealized gain (loss) from investment securities reported in the Statement of Operations and the Statement of Changes in Net Assets and the net realized and unrealized gains (losses) on securities per share in the Financial Highlights. Transaction costs are included in the calculation of the Fund’s net asset value and, accordingly, they reduce the Fund’s total returns. These transaction costs are not considered operating expenses and are not reflected in net investment income reported in the Statement of Operations and the Statement of Changes in Net Assets, or the net investment income per share and the ratios of expenses and net investment income reported in the Financial Highlights, nor are they limited by any expense limitation arrangements between the Fund and the investment adviser.
The Fund allocates income and realized and unrealized capital gains and losses to a class based on the relative net assets of each class.
| C. | Country Determination — For the purposes of making investment selection decisions and presentation in the Schedule of Investments, the investment adviser may determine the country in which an issuer is located and/or credit risk exposure based on various factors. These factors include the laws of the country under which the issuer is organized, where the issuer maintains a principal office, the country in which the issuer derives 50% or more of its total revenues and the country that has the primary market for the issuer’s securities, as well as other criteria. Among |
21 Invesco All Cap Market Neutral Fund
| | the other criteria that may be evaluated for making this determination are the country in which the issuer maintains 50% or more of its assets, the type of security, financial guarantees and enhancements, the nature of the collateral and the sponsor organization. Country of issuer and/or credit risk exposure has been determined to be the United States of America, unless otherwise noted. |
| D. | Distributions — Distributions from net investment income and net realized capital gain, if any, are generally declared and paid annually and recorded on the ex-dividend date. The Fund may elect to treat a portion of the proceeds from redemptions as distributions for federal income tax purposes. |
| E. | Federal Income Taxes — The Fund intends to comply with the requirements of Subchapter M of the Internal Revenue Code of 1986, as amended (the “Internal Revenue Code”), necessary to qualify as a regulated investment company and to distribute substantially all of the Fund’s taxable earnings to shareholders. As such, the Fund will not be subject to federal income taxes on otherwise taxable income (including net realized capital gain) that is distributed to shareholders. Therefore, no provision for federal income taxes is recorded in the financial statements. |
The Fund recognizes the tax benefits of uncertain tax positions only when the position is more likely than not to be sustained. Management has analyzed the Fund’s uncertain tax positions and concluded that no liability for unrecognized tax benefits should be recorded related to uncertain tax positions. Management is not aware of any tax positions for which it is reasonably possible that the total amounts of unrecognized tax benefits will change materially in the next 12 months.
The Fund files tax returns in the U.S. Federal jurisdiction and certain other jurisdictions. Generally, the Fund is subject to examinations by such taxing authorities for up to three years after the filing of the return for the tax period.
| F. | Expenses — Fees provided for under the Rule 12b-1 plan of a particular class of the Fund are charged to the operations of such class. Transfer agency fees and expenses and other shareholder recordkeeping fees and expenses attributable to Class R5 and Class R6 are allocated to each share class based on relative net assets. Sub-accounting fees attributable to Class R5 are charged to the operations of the class. Transfer agency fees and expenses and other shareholder recordkeeping fees and expenses relating to all other classes are allocated among those classes based on relative net assets. All other expenses are allocated among the classes based on relative net assets. |
| G. | Accounting Estimates — The preparation of financial statements in conformity with accounting principles generally accepted in the United States of America (“GAAP”) requires management to make estimates and assumptions that affect the reported amounts of assets and liabilities at the date of the financial statements and the reported amounts of revenues and expenses during the reporting period including estimates and assumptions related to taxation. Actual results could differ from those estimates by a significant amount. In addition, the Fund monitors for material events or transactions that may occur or become known after the period-end date and before the date the financial statements are released to print. |
| H. | Indemnifications — Under the Trust’s organizational documents, each Trustee, officer, employee or other agent of the Trust is indemnified against certain liabilities that may arise out of the performance of their duties to the Fund. Additionally, in the normal course of business, the Fund enters into contracts, including the Fund’s servicing agreements, that contain a variety of indemnification clauses. The Fund’s maximum exposure under these arrangements is unknown as this would involve future claims that may be made against the Fund that have not yet occurred. The risk of material loss as a result of such indemnification claims is considered remote. |
| I. | Foreign Currency Translations — Foreign currency is valued at the close of the NYSE based on quotations posted by banks and major currency dealers. Portfolio securities and other assets and liabilities denominated in foreign currencies are translated into U.S. dollar amounts at the date of valuation. Purchases and sales of portfolio securities (net of foreign taxes withheld on disposition) and income items denominated in foreign currencies are translated into U.S. dollar amounts on the respective dates of such transactions. The Fund does not separately account for the portion of the results of operations resulting from changes in foreign exchange rates on investments and the fluctuations arising from changes in market prices of securities held. The combined results of changes in foreign exchange rates and the fluctuation of market prices on investments (net of estimated foreign tax withholding) are included with the net realized and unrealized gain or loss from investments in the Statement of Operations. Reported net realized foreign currency gains or losses arise from (1) sales of foreign currencies, (2) currency gains or losses realized between the trade and settlement dates on securities transactions, and (3) the difference between the amounts of dividends, interest, and foreign withholding taxes recorded on the Fund’s books and the U.S. dollar equivalent of the amounts actually received or paid. Net unrealized foreign currency gains and losses arise from changes in the fair values of assets and liabilities, other than investments in securities at fiscal period end, resulting from changes in exchange rates. |
The Fund may invest in foreign securities, which may be subject to foreign taxes on income, gains on investments or currency repatriation, a portion of which may be recoverable. Foreign taxes, if any, are recorded based on the tax regulations and rates that exist in the foreign markets in which the Fund invests and are shown in the Statement of Operations.
| J. | Forward Foreign Currency Contracts — The Fund may engage in foreign currency transactions either on a spot (i.e. for prompt delivery and settlement) basis, or through forward foreign currency contracts, to manage or minimize currency or exchange rate risk. |
The Fund may also enter into forward foreign currency contracts for the purchase or sale of a security denominated in a foreign currency in order to “lock in” the U.S. dollar price of that security, or the Fund may also enter into forward foreign currency contracts that do not provide for physical settlement of the two currencies, but instead are settled by a single cash payment calculated as the difference between the agreed upon exchange rate and the spot rate at settlement based upon an agreed upon notional amount (non-deliverable forwards). The Fund will set aside liquid assets in an amount equal to the daily mark-to-market obligation for forward foreign currency contracts.
A forward foreign currency contract is an obligation between two parties (“Counterparties”) to purchase or sell a specific currency for an agreed-upon price at a future date. The use of forward foreign currency contracts does not eliminate fluctuations in the price of the underlying securities the Fund owns or intends to acquire but establishes a rate of exchange in advance. Fluctuations in the value of these contracts are measured by the difference in the contract date and reporting date exchange rates and are recorded as unrealized appreciation (depreciation) until the contracts are closed. When the contracts are closed, realized gains (losses) are recorded. Realized and unrealized gains (losses) on the contracts are included in the Statement of Operations. The primary risks associated with forward foreign currency contracts include failure of the Counterparty to meet the terms of the contract and the value of the foreign currency changing unfavorably. These risks may be in excess of the amounts reflected in the Statement of Assets and Liabilities.
| K. | Swap Agreements — The Fund may enter into various swap transactions, including interest rate, total return, volatility, variance, index, currency and credit default swap contracts (“CDS”) for investment purposes or to manage interest rate, equity, currency or credit risk. Such |
22 Invesco All Cap Market Neutral Fund
| | transactions are agreements between Counterparties. These agreements may contain among other conditions, events of default and termination events, and various covenants and representations such as provisions that require the Fund to maintain a pre-determined level of net assets, and/or provide limits regarding the decline of the Fund’s NAV over specific periods of time. If the Fund were to trigger such provisions and have open derivative positions at that time, the Counterparty may be able to terminate such agreement and request immediate payment in an amount equal to the net liability positions, if any. |
Interest rate, total return, volatility, variance, index, and currency swap agreements are two-party contracts entered into primarily to exchange the returns (or differentials in rates of returns) earned or realized on particular predetermined investments or instruments. The gross returns to be exchanged or “swapped” between the parties are calculated with respect to a notional amount, i.e., the return on or increase in value of a particular dollar amount invested at a particular interest rate or return of an underlying asset, in a particular foreign currency, or in a “basket” of securities representing a particular index.
A total return swap is an agreement in which one party makes payments based on a set rate, either fixed or variable, while the other party makes payments based on the return of an underlying asset, which includes both the income generated and capital gains, if any. The unrealized appreciation (depreciation) on total return swaps includes dividends on the underlying equity securities and financing rate payable from the Counterparty. At the maturity date, a net cash flow is exchanged where the total return is equivalent to the return of the underlying reference less a financing rate, if any. As a receiver, the Fund would receive payments based on any positive total return and would owe payments in the event of a negative total return. As the payer, the Fund would owe payments on any net positive total return, and would receive payment in the event of a negative total return.
Changes in the value of swap agreements are recognized as unrealized gains (losses) in the Statement of Operations by “marking to market” on a daily basis to reflect the value of the swap agreement at the end of each trading day. Payments received or paid at the beginning of the agreement are reflected as such on the Statement of Assets and Liabilities and may be referred to as upfront payments. The Fund accrues for the fixed payment stream and amortizes upfront payments, if any, on swap agreements on a daily basis with the net amount, recorded as a component of realized gain (loss) on the Statement of Operations. A liquidation payment received or made at the termination of a swap agreement is recorded as realized gain (loss) on the Statement of Operations. The Fund segregates cash or liquid securities having a value at least equal to the amount of the potential obligation of a Fund under any swap transaction. Cash held as collateral is recorded as deposits with brokers on the Statement of Assets and Liabilities. Entering into these agreements involves, to varying degrees, lack of liquidity and elements of credit, market, and Counterparty risk in excess of amounts recognized on the Statement of Assets and Liabilities. Such risks involve the possibility that a swap is difficult to sell or liquidate; the Counterparty does not honor its obligations under the agreement and unfavorable interest rates and market fluctuations. It is possible that developments in the swaps market, including potential government regulation, could adversely affect the Fund’s ability to terminate existing swap agreements or to realize amounts to be received under such agreements. A short position in a security poses more risk than holding the same security long. As there is no limit on how much the price of the security can increase, the Fund’s exposure is unlimited.
| L. | Leverage Risk — Leverage exists when the Fund can lose more than it originally invests because it purchases or sells an instrument or enters into a transaction without investing an amount equal to the full economic exposure of the instrument or transaction. |
| M. | Collateral — To the extent the Fund has designated or segregated a security as collateral and that security is subsequently sold, it is the Fund’s practice to replace such collateral no later than the next business day. |
NOTE 2—Advisory Fees and Other Fees Paid to Affiliates
The Trust has entered into a master investment advisory agreement with Invesco Advisers, Inc. (the “Adviser” or “Invesco”). Under the terms of the investment advisory agreement, the Fund accrues daily and pays monthly an advisory fee to the Adviser based on the annual rate of the Fund’s average daily net assets as follows:
| | | | |
| Average Daily Net Assets | | Rate | |
First $250 million | | | 0.85% | |
Next $250 million | | | 0.82% | |
Next $500 million | | | 0.80% | |
Next $1.5 billion | | | 0.77% | |
Next $2.5 billion | | | 0.75% | |
Next $2.5 billion | | | 0.72% | |
Next $2.5 billion | | | 0.70% | |
Over $10 billion | | | 0.67% | |
For the year ended October 31, 2018, the effective advisory fees incurred by the Fund was 0.85%.
Under the terms of a master sub-advisory agreement between the Adviser and each of Invesco Asset Management Deutschland GmbH, Invesco Asset Management Limited, Invesco Asset Management (Japan) Limited, Invesco Hong Kong Limited, Invesco Senior Secured Management, Inc. and Invesco Canada Ltd. and separate sub-advisory agreements with Invesco Capital Management LLC, formerly Invesco PowerShares Capital Management LLC, and Invesco Asset Management (India) Private Limited (collectively, the “Affiliated Sub-Advisers”) the Adviser, not the Fund, will pay 40% of the fees paid to the Adviser to any such Affiliated Sub-Adviser(s) that provide(s) discretionary investment management services to the Fund based on the percentage of assets allocated to such Affiliated Sub-Adviser(s).
The Adviser has contractually agreed, through at least February 29, 2020, to waive advisory fees and/or reimburse expenses to the extent necessary to limit total annual fund operating expenses after fee waiver and/or expense reimbursement (excluding certain items discussed below) of Class A, Class C, Class R, Class Y, Class R5 and Class R6 shares to 1.50%, 2.25%, 1.75%, 1.25%, 1.25% and 1.25%, respectively, of the Fund’s average daily net assets (the “expense limits”). In determining the Adviser’s obligation to waive advisory fees and/or reimburse expenses, the following expenses are not taken into account, and could cause the total annual fund operating expenses after fee waiver and/or expense reimbursement to exceed the numbers reflected above: (1) interest; (2) taxes; (3) dividend expense on short sales; (4) extraordinary or non-routine
23 Invesco All Cap Market Neutral Fund
items, including litigation expenses; and (5) expenses that the Fund has incurred but did not actually pay because of an expense offset arrangement. Unless Invesco continues the fee waiver agreement, it will terminate on February 29, 2020. During its term, the fee waiver agreement cannot be terminated or amended to increase the expense limits or reduce the advisory fee waiver without approval of the Board of Trustees. The Adviser did not waive fees and/or reimburse expenses during the period under these expense limits.
Further, the Adviser has contractually agreed, through at least June 30, 2020, to waive the advisory fee payable by the Fund in an amount equal to 100% of the net advisory fees the Adviser receives from the affiliated money market funds on investments by the Fund of uninvested cash in such affiliated money market funds.
For the year ended October 31, 2018, the Adviser waived advisory fees of $11,774 and reimbursed class level expenses of $211, $66, $2 and $616 of Class A, Class C, Class R and Class Y shares, respectively.
The Trust has entered into a master administrative services agreement with Invesco pursuant to which the Fund has agreed to pay Invesco for certain administrative costs incurred in providing accounting services to the Fund. For the year ended October 31, 2018, expenses incurred under the agreement are shown in the Statement of Operations as Administrative services fees.
The Trust has entered into a transfer agency and service agreement with Invesco Investment Services, Inc. (“IIS”) pursuant to which the Fund has agreed to pay IIS a fee for providing transfer agency and shareholder services to the Fund and reimburse IIS for certain expenses incurred by IIS in the course of providing such services. IIS may make payments to intermediaries that provide omnibus account services, sub-accounting services and/or networking services. All fees payable by IIS to intermediaries that provide omnibus account services or sub-accounting services are charged back to the Fund, subject to certain limitations approved by the Trust’s Board of Trustees. For the year ended October 31, 2018, expenses incurred under the agreement are shown in the Statement of Operations as Transfer agent fees.
The Trust has entered into master distribution agreements with Invesco Distributors, Inc. (“IDI”) to serve as the distributor for the Class A, Class C, Class R, Class Y, Class R5 and Class R6 shares of the Fund. The Trust has adopted plans pursuant to Rule 12b-1 under the 1940 Act with respect to the Fund’s Class A, Class C and Class R shares (collectively the “Plans”). The Fund, pursuant to the Plans, pays IDI compensation at the annual rate of 0.25% of the Fund’s average daily net assets of Class A shares, 1.00% of the average daily net assets of Class C shares and 0.50% of the average daily net assets of Class R shares. The fees are accrued daily and paid monthly. Of the Plan payments, up to 0.25% of the average daily net assets of each class of shares may be paid to furnish continuing personal shareholder services to customers who purchase and own shares of such classes. Any amounts not paid as a service fee under the Plans would constitute an asset-based sales charge. Rules of the Financial Industry Regulatory Authority (“FINRA”) impose a cap on the total sales charges, including asset-based sales charges, that may be paid by any class of shares of the Fund. For the year ended October 31, 2018, expenses incurred under the Plans are shown in the Statement of Operations as Distribution fees.
Front-end sales commissions and CDSC (collectively, the “sales charges”) are not recorded as expenses of the Fund. Front-end sales commissions are deducted from proceeds from the sales of Fund shares prior to investment in Class A shares of the Fund. CDSC are deducted from redemption proceeds prior to remittance to the shareholder. During the year ended October 31, 2018, IDI advised the Fund that IDI retained $1,829 in front-end sales commissions from the sale of Class A shares and $298 and $216 from Class A and Class C shares, respectively, for CDSC imposed upon redemptions by shareholders.
Certain officers and trustees of the Trust are officers and directors of the Adviser, IIS and/or IDI.
NOTE 3—Additional Valuation Information
GAAP defines fair value as the price that would be received to sell an asset or paid to transfer a liability in an orderly transaction between market participants at the measurement date, under current market conditions. GAAP establishes a hierarchy that prioritizes the inputs to valuation methods, giving the highest priority to readily available unadjusted quoted prices in an active market for identical assets (Level 1) and the lowest priority to significant unobservable inputs (Level 3), generally when market prices are not readily available or are unreliable. Based on the valuation inputs, the securities or other investments are tiered into one of three levels. Changes in valuation methods may result in transfers in or out of an investment’s assigned level:
| | Level 1 — | Prices are determined using quoted prices in an active market for identical assets. |
| | Level 2 — | Prices are determined using other significant observable inputs. Observable inputs are inputs that other market participants may use in pricing a security. These may include quoted prices for similar securities, interest rates, prepayment speeds, credit risk, yield curves, loss severities, default rates, discount rates, volatilities and others. |
| | Level 3 — | Prices are determined using significant unobservable inputs. In situations where quoted prices or observable inputs are unavailable (for example, when there is little or no market activity for an investment at the end of the period), unobservable inputs may be used. Unobservable inputs reflect the Fund’s own assumptions about the factors market participants would use in determining fair value of the securities or instruments and would be based on the best available information. |
The following is a summary of the tiered valuation input levels, as of October 31, 2018. The level assigned to the securities valuations may not be an indication of the risk or liquidity associated with investing in those securities. Because of the inherent uncertainties of valuation, the values reflected in the financial statements may materially differ from the value received upon actual sale of those investments.
| | | | | | | | | | | | | | | | |
| | | Level 1 | | | Level 2 | | | Level 3 | | | Total | |
Investments in Securities | | | | | | | | | | | | | | | | |
Common Stocks & Other Equity Interests | | $ | 91,355,388 | | | $ | — | | | $ | — | | | $ | 91,355,388 | |
Money Market Funds | | | 6,820,439 | | | | — | | | | — | | | | 6,820,439 | |
Total Investments in Securities | | | 98,175,827 | | | | — | | | | — | | | | 98,175,827 | |
Other Investments — Assets* | | | | | | | | | | | | | | | | |
Swap Agreements | | | — | | | | 2,504,104 | | | | — | | | | 2,504,104 | |
Total Investments | | $ | 98,175,827 | | | $ | 2,504,104 | | | $ | — | | | $ | 100,679,931 | |
| * | Unrealized appreciation. |
24 Invesco All Cap Market Neutral Fund
NOTE 4—Derivative Investments
The Fund may enter into an International Swaps and Derivatives Association Master Agreement (“ISDA Master Agreement”) under which a fund may trade OTC derivatives. An OTC transaction entered into under an ISDA Master Agreement typically involves a collateral posting arrangement, payment netting provisions and close-out netting provisions. These netting provisions allow for reduction of credit risk through netting of contractual obligations. The enforceability of the netting provisions of the ISDA Master Agreement depends on the governing law of the ISDA Master Agreement, among other factors.
For financial reporting purposes, the Fund does not offset OTC derivative assets or liabilities that are subject to ISDA Master Agreements in the Statement of Assets and Liabilities.
Value of Derivative Investments at Period-End
The table below summarizes the value of the Fund’s derivative investments, detailed by primary risk exposure, held as of October 31, 2018:
| | | | |
| | | Value | |
| Derivative Assets | | Equity
Risk | |
Unrealized appreciation on swap agreements — OTC | | $ | 2,504,104 | |
Derivatives not subject to master netting agreements | | | — | |
Total Derivative Assets subject to master netting agreements | | $ | 2,504,104 | |
Offsetting Assets and Liabilities
The table below reflects the Fund’s exposure to Counterparties subject to either an ISDA Master Agreement or other agreement for OTC derivative transactions as of October 31, 2018.
| | | | | | | | | | | | | | | | |
| | | Financial
Derivative
Assets | | | Collateral
(Received)/Pledged | | | Net
Amount | |
| Counterparty | | Swap
Agreements | | | Non-Cash | | | Cash | |
Morgan Stanley & Co. LLC | | $ | 2,504,104 | | | $ | — | | | $ | — | | | $ | 2,504,104 | |
Effect of Derivative Investments for the year ended October 31, 2018
The table below summarizes the gains (losses) on derivative investments, detailed by primary risk exposure, recognized in earnings during the period:
| | | | |
| | | Location of Gain (Loss) on
Statement of Operations | |
| | | Equity
Risk | |
Realized Gain (Loss): | | | | |
Swap agreements | | $ | (16,431,189 | ) |
Change in Net Unrealized Appreciation: | | | | |
Swap agreements | | | 1,647,805 | |
Total | | $ | (14,783,384 | ) |
The table below summarizes the average notional value of swap agreements outstanding during the period.
| | | | |
| | | Swap
Agreements | |
Average notional value | | $ | 100,558,690 | |
NOTE 5—Expense Offset Arrangement(s)
The expense offset arrangement is comprised of transfer agency credits which result from balances in demand deposit accounts used by the transfer agent for clearing shareholder transactions. For the year ended October 31, 2018, the Fund received credits from this arrangement, which resulted in the reduction of the Fund’s total expenses of $424.
NOTE 6—Trustees’ and Officers’ Fees and Benefits
Trustees’ and Officers’ Fees and Benefits include amounts accrued by the Fund to pay remuneration to certain Trustees and Officers of the Fund. Trustees have the option to defer compensation payable by the Fund, and Trustees’ and Officers’ Fees and Benefits also include amounts accrued by the Fund to fund such deferred compensation amounts. Those Trustees who defer compensation have the option to select various Invesco Funds in which their deferral accounts shall be deemed to be invested. Obligations under the deferred compensation plan represent unsecured claims against the general assets of the Fund.
25 Invesco All Cap Market Neutral Fund
NOTE 7—Cash Balances
The Fund is permitted to temporarily carry a negative or overdrawn balance in its account with State Street Bank and Trust Company, the custodian bank. Such balances, if any at period-end, are shown in the Statement of Assets and Liabilities under the payable caption Amount due custodian. To compensate the custodian bank for such overdrafts, the overdrawn Fund may either (1) leave funds as a compensating balance in the account so the custodian bank can be compensated by earning the additional interest; or (2) compensate by paying the custodian bank at a rate agreed upon by the custodian bank and Invesco, not to exceed the contractually agreed upon rate.
NOTE 8—Distributions to Shareholders and Tax Components of Net Assets
Tax Character of Distributions to Shareholders Paid During the Fiscal Years Ended October 31, 2018 and 2017:
| | | | | | | | |
| | | 2018 | | | 2017 | |
Long-term capital gain | | $ | 15,176,910 | | | $ | 93,763 | |
Tax Components of Net Assets at Period-End:
| | | | |
| | | 2018 | |
Undistributed long-term gain | | $ | 9,020,207 | |
Net unrealized appreciation — investments | | | 6,461,387 | |
Net unrealized appreciation (depreciation) — foreign currencies | | | (15 | ) |
Temporary book/tax differences | | | (9,077 | ) |
Late-Year ordinary loss deferral | | | (158,292 | ) |
Shares of beneficial interest | | | 82,537,244 | |
Total net assets | | $ | 97,851,454 | |
The difference between book-basis and tax-basis unrealized appreciation (depreciation) is due to differences in the timing of recognition of gains and losses on investments for tax and book purposes. The Fund’s net unrealized appreciation difference is attributable primarily to wash sales and swap agreements.
The temporary book/tax differences are a result of timing differences between book and tax recognition of income and/or expenses. The Fund’s temporary book/tax differences are the result of the trustee deferral of compensation.
Capital loss carryforward is calculated and reported as of a specific date. Results of transactions and other activity after that date may affect the amount of capital loss carryforward actually available for the Fund to utilize. Capital losses generated in years beginning after December 22, 2010 can be carried forward for an unlimited period, whereas previous losses expire in eight tax years. Capital losses with an expiration period may not be used to offset capital gains until all net capital losses without an expiration date have been utilized. Capital loss carryforwards with no expiration date will retain their character as either short-term or long-term capital losses instead of as short-term capital losses as under prior law. The ability to utilize capital loss carryforwards in the future may be limited under the Internal Revenue Code and related regulations based on the results of future transactions.
The Fund does not have a capital loss carryforward as of October 31, 2018.
NOTE 9—Investment Transactions
The aggregate amount of investment securities (other than short-term securities, U.S. Treasury obligations and money market funds, if any) purchased and sold by the Fund during the year ended October 31, 2018 was $126,684,410 and $164,302,768, respectively. Cost of investments, including any derivatives, on a tax basis includes the adjustments for financial reporting purposes as of the most recently completed federal income tax reporting period-end.
| | | | |
| Unrealized Appreciation (Depreciation) of Investments on a Tax Basis | |
Aggregate unrealized appreciation of investments | | $ | 10,363,437 | |
Aggregate unrealized (depreciation) of investments | | | (3,902,050 | ) |
Net unrealized appreciation of investments | | $ | 6,461,387 | |
Cost of investments for tax purposes is $94,218,544.
NOTE 10—Reclassification of Permanent Differences
Primarily as a result of differing book/tax treatment of net operating losses and swap agreements income, on October 31, 2018, undistributed net investment income (loss) was decreased by $1,358,073, undistributed net realized gain was increased by $7,245,920 and shares of beneficial interest was decreased by $5,887,847. This reclassification had no effect on the net assets of the Fund.
26 Invesco All Cap Market Neutral Fund
NOTE 11—Share Information
| | | | | | | | | | | | | | | | |
| | | Summary of Share Activity | |
| | | Years ended October 31, | |
| | | 2018(a) | | | 2017 | |
| | | Shares | | | Amount | | | Shares | | | Amount | |
Sold: | | | | | | | | | | | | | | | | |
Class A | | | 524,639 | | | $ | 4,575,171 | | | | 450,565 | | | $ | 4,530,754 | |
Class C | | | 21,237 | | | | 175,852 | | | | 58,328 | | | | 578,322 | |
Class R | | | 2,743 | | | | 22,967 | | | | 3,876 | | | | 38,742 | |
Class Y | | | 971,026 | | | | 8,552,867 | | | | 3,880,773 | | | | 39,331,445 | |
Class R6 | | | 1,177,387 | | | | 10,296,649 | | | | 941,211 | | | | 9,425,954 | |
| | | | |
Issued as reinvestment of dividends: | | | | | | | | | | | | | | | | |
Class A | | | 158,231 | | | | 1,335,466 | | | | 1,971 | | | | 20,639 | |
Class C | | | 65,856 | | | | 537,385 | | | | 573 | | | | 5,875 | |
Class R | | | 1,414 | | | | 11,798 | | | | 6 | | | | 57 | |
Class Y | | | 555,587 | | | | 4,733,602 | | | | 2,159 | | | | 22,736 | |
Class R6 | | | 1,003,683 | | | | 8,551,375 | | | | 3,792 | | | | 39,939 | |
| | | | |
Reacquired: | | | | | | | | | | | | | | | | |
Class A | | | (707,531 | ) | | | (5,993,494 | ) | | | (3,693,539 | ) | | | (37,192,687 | ) |
Class C | | | (262,116 | ) | | | (2,176,313 | ) | | | (618,543 | ) | | | (6,075,676 | ) |
Class R | | | (5,029 | ) | | | (41,232 | ) | | | (3,557 | ) | | | (35,267 | ) |
Class Y | | | (2,750,700 | ) | | | (23,618,285 | ) | | | (4,055,298 | ) | | | (40,682,292 | ) |
Class R5 | | | — | | | | — | | | | (48,983 | ) | | | (484,975 | ) |
Class R6 | | | (2,326,599 | ) | | | (19,836,483 | ) | | | (1,336,039 | ) | | | (13,566,267 | ) |
Net increase (decrease) in share activity | | | (1,570,172 | ) | | $ | (12,872,675 | ) | | | (4,412,705 | ) | | $ | (44,042,701 | ) |
| (a) | There is an entity that is a record owner of more than 5% of the outstanding shares of the Fund and owns 17% of the outstanding shares of the Fund. IDI has an agreement with this entity to sell Fund shares. The Fund, Invesco and/or Invesco affiliates may make payments to this entity, which is considered to be related to the Fund, for providing services to the Fund, Invesco and/or Invesco affiliates including but not limited to services such as, securities brokerage, distribution, third party record keeping and account servicing. The Fund has no knowledge as to whether all or any portion of the shares owned of record by this entity is also owned beneficially. |
| | In addition, 62% of the outstanding shares of the Fund are owned by the Adviser or an affiliate of the Adviser. |
27 Invesco All Cap Market Neutral Fund
NOTE 12—Financial Highlights
The following schedule presents financial highlights for a share of the Fund outstanding throughout the periods indicated.
| | | | | | | | | | | | | | | | | | | | | | | | | | | | | | | | | | | | | | | | | | | | | | | | | | | | | | | | | | | | | | | | |
| | | Net asset
value,
beginning
of period | | | Net
investment
income
(loss) (a) | | | Net gains
(losses)
on securities
(both
realized and
unrealized) | | | Total from
investment
operations | | | Dividends
from net
investment
income | | | Distributions
from net
realized
gains | | | Total
distributions | | | Net asset
value, end
of period | | | Total
return(b) | | | Net assets,
end of period
(000’s omitted) | | | Ratio of
expenses
to average
net assets
(including
interest
expense and
dividends on
short sales
expense)
with fee
waivers
and/or expenses
absorbed | | | Ratio of
expenses
to average
net assets
(including
interest
expense and dividends on
short sales
expense)
without fee
waivers
and/or expenses
absorbed | | | Ratio of
expenses
to average
net assets
(excluding
interest
expense and
dividends on
short sales
expense)
with fee
waivers
and/or expenses
absorbed | | | Ratio of
expenses
to average
net assets
(excluding
interest
expense and
dividends on
short sales
expense)
without fee
waivers
and/or expenses
absorbed | | | Ratio of net
investment
income (loss)
to average
net assets
| | | Portfolio
turnover(c) | |
Class A | | | | | | | | | | | | | | | | | | | | | | | | | | | | | | | | | | | | | | | | | | | | | | | | | | | | | | | | | | | | | | | | |
Year ended 10/31/18 | | $ | 10.07 | | | $ | (0.06 | ) | | $ | (0.14 | ) | | $ | (0.20 | ) | | $ | — | | | $ | (1.17 | ) | | $ | (1.17 | ) | | $ | 8.70 | | | | (1.65 | )% | | $ | 9,364 | | | | 1.49 | %(d) | | | 1.50 | %(d) | | | 1.49 | %(d) | | | 1.50 | %(d) | | | (0.68 | )%(d) | | | 125 | % |
Year ended 10/31/17 | | | 9.80 | | | | (0.05 | ) | | | 0.33 | | | | 0.28 | | | | — | | | | (0.01 | ) | | | (0.01 | ) | | | 10.07 | | | | 2.81 | | | | 11,085 | | | | 1.43 | | | | 1.48 | | | | 1.43 | | | | 1.48 | | | | (0.50 | ) | | | 162 | |
Year ended 10/31/16 | | | 11.92 | | | | (0.03 | ) | | | (0.76 | ) | | | (0.79 | ) | | | (1.33 | ) | | | — | | | | (1.33 | ) | | | 9.80 | | | | (7.42 | ) | | | 42,539 | | | | 1.61 | | | | 1.85 | | | | 1.61 | | | | 1.85 | | | | (0.26 | ) | | | 168 | |
Year ended 10/31/15 | | | 10.70 | | | | (0.20 | ) | | | 1.42 | | | | 1.22 | | | | — | | | | — | | | | — | | | | 11.92 | | | | 11.40 | | | | 12,812 | | | | 3.69 | (e) | | | 4.62 | (e) | | | 1.60 | | | | 2.53 | | | | (1.85 | ) | | | 175 | |
Year ended 10/31/14(f) | | | 10.00 | | | | (0.27 | ) | | | 0.97 | | | | 0.70 | | | | — | | | | — | | | | — | | | | 10.70 | | | | 7.00 | | | | 9,742 | | | | 4.53 | (e)(g) | | | 7.28 | (e)(g) | | | 1.60 | (g) | | | 4.35 | (g) | | | (3.03 | )(g) | | | 105 | |
Class C | | | | | | | | | | | | | | | | | | | | | | | | | | | | | | | | | | | | | | | | | | | | | | | | | | | | | | | | | | | | | | | | |
Year ended 10/31/18 | | | 9.80 | | | | (0.12 | ) | | | (0.14 | ) | | | (0.26 | ) | | | — | | | | (1.17 | ) | | | (1.17 | ) | | | 8.37 | | | | (2.37 | ) | | | 2,683 | | | | 2.24 | (d) | | | 2.25 | (d) | | | 2.24 | (d) | | | 2.25 | (d) | | | (1.43 | )(d) | | | 125 | |
Year ended 10/31/17 | | | 9.60 | | | | (0.12 | ) | | | 0.33 | | | | 0.21 | | | | — | | | | (0.01 | ) | | | (0.01 | ) | | | 9.80 | | | | 2.14 | | | | 4,856 | | | | 2.18 | | | | 2.23 | | | | 2.18 | | | | 2.23 | | | | (1.25 | ) | | | 162 | |
Year ended 10/31/16 | | | 11.76 | | | | (0.10 | ) | | | (0.76 | ) | | | (0.86 | ) | | | (1.30 | ) | | | — | | | | (1.30 | ) | | | 9.60 | | | | (8.19 | ) | | | 10,136 | | | | 2.36 | | | | 2.60 | | | | 2.36 | | | | 2.60 | | | | (1.01 | ) | | | 168 | |
Year ended 10/31/15 | | | 10.63 | | | | (0.28 | ) | | | 1.41 | | | | 1.13 | | | | — | | | | — | | | | — | | | | 11.76 | | | | 10.63 | | | | 1,772 | | | | 4.44 | (e) | | | 5.37 | (e) | | | 2.35 | | | | 3.28 | | | | (2.60 | ) | | | 175 | |
Year ended 10/31/14(f) | | | 10.00 | | | | (0.34 | ) | | | 0.97 | | | | 0.63 | | | | — | | | | — | | | | — | | | | 10.63 | | | | 6.30 | | | | 857 | | | | 5.28 | (e)(g) | | | 8.03 | (e)(g) | | | 2.35 | (g) | | | 5.10 | (g) | | | (3.78 | )(g) | | | 105 | |
Class R | | | | | | | | | | | | | | | | | | | | | | | | | | | | | | | | | | | | | | | | | | | | | | | | | | | | | | | | | | | | | | | | |
Year ended 10/31/18 | | | 9.98 | | | | (0.08 | ) | | | (0.14 | ) | | | (0.22 | ) | | | — | | | | (1.17 | ) | | | (1.17 | ) | | | 8.59 | | | | (1.87 | ) | | | 87 | | | | 1.74 | (d) | | | 1.75 | (d) | | | 1.74 | (d) | | | 1.75 | (d) | | | (0.93 | )(d) | | | 125 | |
Year ended 10/31/17 | | | 9.73 | | | | (0.07 | ) | | | 0.33 | | | | 0.26 | | | | — | | | | (0.01 | ) | | | (0.01 | ) | | | 9.98 | | | | 2.63 | | | | 109 | | | | 1.68 | | | | 1.73 | | | | 1.68 | | | | 1.73 | | | | (0.75 | ) | | | 162 | |
Year ended 10/31/16 | | | 11.86 | | | | (0.05 | ) | | | (0.76 | ) | | | (0.81 | ) | | | (1.32 | ) | | | — | | | | (1.32 | ) | | | 9.73 | | | | (7.66 | ) | | | 104 | | | | 1.86 | | | | 2.10 | | | | 1.86 | | | | 2.10 | | | | (0.51 | ) | | | 168 | |
Year ended 10/31/15 | | | 10.68 | | | | (0.22 | ) | | | 1.40 | | | | 1.18 | | | | — | | | | — | | | | — | | | | 11.86 | | | | 11.05 | | | | 23 | | | | 3.94 | (e) | | | 4.87 | (e) | | | 1.85 | | | | 2.78 | | | | (2.10 | ) | | | 175 | |
Year ended 10/31/14(f) | | | 10.00 | | | | (0.29 | ) | | | 0.97 | | | | 0.68 | | | | — | | | | — | | | | — | | | | 10.68 | | | | 6.80 | | | | 40 | | | | 4.78 | (e)(g) | | | 7.53 | (e)(g) | | | 1.85 | (g) | | | 4.60 | (g) | | | (3.28 | )(g) | | | 105 | |
Class Y | | | | | | | | | | | | | | | | | | | | | | | | | | | | | | | | | | | | | | | | | | | | | | | | | | | | | | | | | | | | | | | | |
Year ended 10/31/18 | | | 10.15 | | | | (0.04 | ) | | | (0.13 | ) | | | (0.17 | ) | | | — | | | | (1.17 | ) | | | (1.17 | ) | | | 8.81 | | | | (1.30 | ) | | | 24,669 | | | | 1.24 | (d) | | | 1.25 | (d) | | | 1.24 | (d) | | | 1.25 | (d) | | | (0.43 | )(d) | | | 125 | |
Year ended 10/31/17 | | | 9.85 | | | | (0.03 | ) | | | 0.34 | | | | 0.31 | | | | — | | | | (0.01 | ) | | | (0.01 | ) | | | 10.15 | | | | 3.10 | | | | 40,875 | | | | 1.18 | | | | 1.23 | | | | 1.18 | | | | 1.23 | | | | (0.25 | ) | | | 162 | |
Year ended 10/31/16 | | | 11.97 | | | | (0.00 | ) | | | (0.77 | ) | | | (0.77 | ) | | | (1.35 | ) | | | — | | | | (1.35 | ) | | | 9.85 | | | | (7.24 | ) | | | 41,369 | | | | 1.36 | | | | 1.60 | | | | 1.36 | | | | 1.60 | | | | (0.01 | ) | | | 168 | |
Year ended 10/31/15 | | | 10.72 | | | | (0.17 | ) | | | 1.42 | | | | 1.25 | | | | — | | | | — | | | | — | | | | 11.97 | | | | 11.66 | | | | 16,907 | | | | 3.44 | (e) | | | 4.37 | (e) | | | 1.35 | | | | 2.28 | | | | (1.60 | ) | | | 175 | |
Year ended 10/31/14(f) | | | 10.00 | | | | (0.25 | ) | | | 0.97 | | | | 0.72 | | | | — | | | | — | | | | — | | | | 10.72 | | | | 7.20 | | | | 14,651 | | | | 4.28 | (e)(g) | | | 7.03 | (e)(g) | | | 1.35 | (g) | | | 4.10 | (g) | | | (2.78 | )(g) | | | 105 | |
Class R5 | | | | | | | | | | | | | | | | | | | | | | | | | | | | | | | | | | | | | | | | | | | | | | | | | | | | | | | | | | | | | | | | |
Year ended 10/31/18 | | | 10.18 | | | | (0.02 | ) | | | (0.16 | ) | | | (0.18 | ) | | | — | | | | (1.17 | ) | | | (1.17 | ) | | | 8.83 | | | | (1.38 | ) | | | 9 | | | | 1.11 | (d) | | | 1.12 | (d) | | | 1.11 | (d) | | | 1.12 | (d) | | | (0.30 | )(d) | | | 125 | |
Year ended 10/31/17 | | | 9.86 | | | | (0.02 | ) | | | 0.35 | | | | 0.33 | | | | — | | | | (0.01 | ) | | | (0.01 | ) | | | 10.18 | | | | 3.30 | | | | 10 | | | | 1.10 | | | | 1.12 | | | | 1.10 | | | | 1.12 | | | | (0.17 | ) | | | 162 | |
Year ended 10/31/16 | | | 11.97 | | | | (0.00 | ) | | | (0.76 | ) | | | (0.76 | ) | | | (1.35 | ) | | | — | | | | (1.35 | ) | | | 9.86 | | | | (7.15 | ) | | | 493 | | | | 1.36 | | | | 1.45 | | | | 1.36 | | | | 1.45 | | | | (0.01 | ) | | | 168 | |
Year ended 10/31/15 | | | 10.72 | | | | (0.17 | ) | | | 1.42 | | | | 1.25 | | | | — | | | | — | | | | — | | | | 11.97 | | | | 11.66 | | | | 599 | | | | 3.44 | (e) | | | 4.28 | (e) | | | 1.35 | | | | 2.19 | | | | (1.60 | ) | | | 175 | |
Year ended 10/31/14(f) | | | 10.00 | | | | (0.25 | ) | | | 0.97 | | | | 0.72 | | | | — | | | | — | | | | — | | | | 10.72 | | | | 7.20 | | | | 648 | | | | 4.28 | (e)(g) | | | 7.00 | (e)(g) | | | 1.35 | (g) | | | 4.07 | (g) | | | (2.78 | )(g) | | | 105 | |
Class R6 | | | | | | | | | | | | | | | | | | | | | | | | | | | | | | | | | | | | | | | | | | | | | | | | | | | | | | | | | | | | | | | | |
Year ended 10/31/18 | | | 10.16 | | | | (0.03 | ) | | | (0.14 | ) | | | (0.17 | ) | | | — | | | | (1.17 | ) | | | (1.17 | ) | | | 8.82 | | | | (1.29 | ) | | | 61,040 | | | | 1.11 | (d) | | | 1.12 | (d) | | | 1.11 | (d) | | | 1.12 | (d) | | | (0.30 | )(d) | | | 125 | |
Year ended 10/31/17 | | | 9.85 | | | | (0.02 | ) | | | 0.34 | | | | 0.32 | | | | — | | | | (0.01 | ) | | | (0.01 | ) | | | 10.16 | | | | 3.20 | | | | 71,774 | | | | 1.10 | | | | 1.12 | | | | 1.10 | | | | 1.12 | | | | (0.17 | ) | | | 162 | |
Year ended 10/31/16 | | | 11.97 | | | | (0.00 | ) | | | (0.77 | ) | | | (0.77 | ) | | | (1.35 | ) | | | — | | | | (1.35 | ) | | | 9.85 | | | | (7.24 | ) | | | 73,442 | | | | 1.36 | | | | 1.44 | | | | 1.36 | | | | 1.44 | | | | (0.01 | ) | | | 168 | |
Year ended 10/31/15 | | | 10.72 | | | | (0.17 | ) | | | 1.42 | | | | 1.25 | | | | — | | | | — | | | | — | | | | 11.97 | | | | 11.66 | | | | 745 | | | | 3.44 | (e) | | | 4.28 | (e) | | | 1.35 | | | | 2.19 | | | | (1.60 | ) | | | 175 | |
Year ended 10/31/14(f) | | | 10.00 | | | | (0.25 | ) | | | 0.97 | | | | 0.72 | | | | — | | | | — | | | | — | | | | 10.72 | | | | 7.20 | | | | 584 | | | | 4.28 | (e)(g) | | | 6.99 | (e)(g) | | | 1.35 | (g) | | | 4.06 | (g) | | | (2.78 | )(g) | | | 105 | |
| (a) | Calculated using average shares outstanding. |
| (b) | Includes adjustments in accordance with accounting principles generally accepted in the United States of America and as such, the net asset value for financial reporting purposes and the returns based upon those net asset values may differ from the net asset value and returns for shareholder transactions. Does not include sales charges and is not annualized for periods less than one year, if applicable. |
| (c) | Portfolio turnover is calculated at the fund level and is not annualized for periods less than one year, if applicable. |
| (d) | Ratios are based on average daily net assets (000’s omitted) of $10,509, $3,276, $100, $30,613, $9 and $67,028 for Class A, Class C, Class R, Class Y, Class R5 and Class R6 shares, respectively. |
| (e) | Ratio of interest expense and dividends on short sales to average net assets for the years ended October 31, 2015 and October 31, 2014 were 2.09% and 2.93%, respectively. |
| (f) | Commencement date of December 17, 2013. |
28 Invesco All Cap Market Neutral Fund
Report of Independent Registered Public Accounting Firm
To the Board of Trustees of AIM Investment Funds (Invesco Investment Funds)
and Shareholders of Invesco All Cap Market Neutral Fund:
Opinion on the Financial Statements
We have audited the accompanying statement of assets and liabilities, including the schedule of investments, of Invesco All Cap Market Neutral Fund (one of the funds constituting AIM Investment Funds (Invesco Investment Funds), hereafter referred to as the “Fund”) as of October 31, 2018, the related statement of operations for the year ended October 31, 2018, the statement of changes in net assets for each of the two years in the period ended October 31, 2018, including the related notes, and the financial highlights for each of the periods indicated therein (collectively referred to as the financial statements). In our opinion, the financial statements present fairly, in all material respects, the financial position of the Fund as of October 31, 2018, the results of its operations for the year then ended, the changes in its net assets for each of the two years in the period ended October 31, 2018 and the financial highlights for each of the periods indicated therein in conformity with accounting principles generally accepted in the United States of America.
Basis for Opinion
These financial statements are the responsibility of the Fund’s management. Our responsibility is to express an opinion on the Fund’s financial statements based on our audits. We are a public accounting firm registered with the Public Company Accounting Oversight Board (United States) (PCAOB) and are required to be independent with respect to the Fund in accordance with the U.S. federal securities laws and the applicable rules and regulations of the Securities and Exchange Commission and the PCAOB.
We conducted our audits of these financial statements in accordance with the standards of the PCAOB. Those standards require that we plan and perform the audit to obtain reasonable assurance about whether the financial statements are free of material misstatement, whether due to error or fraud.
Our audits included performing procedures to assess the risks of material misstatement of the financial statements, whether due to error or fraud, and performing procedures that respond to those risks. Such procedures included examining, on a test basis, evidence regarding the amounts and disclosures in the financial statements. Our audits also included evaluating the accounting principles used and significant estimates made by management, as well as evaluating the overall presentation of the financial statements. Our procedures included confirmation of securities owned as of October 31, 2018 by correspondence with the custodian, transfer agent and brokers; when replies were not received from brokers, we performed other auditing procedures. We believe that our audits provide a reasonable basis for our opinion.
PricewaterhouseCoopers LLP
Houston, TX
December 28, 2018
We have served as the auditor of one or more of the investment companies in the Invesco group of investment companies since at least 1995. We have not been able to determine the specific year we began serving as auditor.
29 Invesco All Cap Market Neutral Fund
Calculating your ongoing Fund expenses
Example
As a shareholder of the Fund, you incur two types of costs: (1) transaction costs, which may include sales charges (loads) on purchase payments or contingent deferred sales charges on redemptions, if any; and (2) ongoing costs, including management fees, distribution and/or service (12b-1) fees, and other Fund expenses. This example is intended to help you understand your ongoing costs (in dollars) of investing in the Fund and to compare these costs with ongoing costs of investing in other mutual funds. The example is based on an investment of $1,000 invested at the beginning of the period and held for the entire period May 1, 2018 through October 31, 2018.
Actual expenses
The table below provides information about actual account values and actual expenses. You may use the information in this table, together with the amount you invested, to estimate the expenses that you paid over the period. Simply divide your account value by $1,000 (for example, an $8,600 account value divided by $1,000 = 8.6), then multiply the result by the number in the table under the heading entitled “Actual Expenses Paid During Period” to estimate the expenses you paid on your account during this period.
Hypothetical example for comparison purposes
The table below also provides information about hypothetical account values and hypothetical expenses based on the Fund’s actual expense ratio and an assumed rate of return of 5% per year before expenses, which is not the Fund’s actual return.
The hypothetical account values and expenses may not be used to estimate the actual ending account balance or expenses you paid for the period. You may use this information to compare the ongoing costs of investing in the Fund and other funds. To do so, compare this 5% hypothetical example with the 5% hypothetical examples that appear in the shareholder reports of the other funds.
Please note that the expenses shown in the table are meant to highlight your ongoing costs only and do not reflect any transaction costs, such as sales charges (loads) on purchase payments or contingent deferred sales charges on redemptions, if any. Therefore, the hypothetical information is useful in comparing ongoing costs only, and will not help you determine the relative total costs of owning different funds. In addition, if these transaction costs were included, your costs would have been higher.
| | | | | | | | | | | | | | | | | | | | | | | | |
Class | | Beginning
Account Value
(05/01/18) | | | ACTUAL | | | HYPOTHETICAL
(5% annual return before
expenses) | | | Annualized
Expense Ratio | |
| | Ending
Account Value
(10/31/18)1 | | | Expenses
Paid During
Period2 | | | Ending
Account Value
(10/31/18) | | | Expenses
Paid During
Period2 | |
| A | | $ | 1,000.00 | | | $ | 1,043.20 | | | $ | 7.67 | | | $ | 1,017.69 | | | $ | 7.58 | | | | 1.49 | % |
| C | | | 1,000.00 | | | | 1,039.80 | | | | 11.52 | | | | 1,013.91 | | | | 11.37 | | | | 2.24 | |
| R | | | 1,000.00 | | | | 1,042.50 | | | | 8.96 | | | | 1,016.43 | | | | 8.84 | | | | 1.74 | |
| Y | | | 1,000.00 | | | | 1,045.10 | | | | 6.39 | | | | 1,018.95 | | | | 6.31 | | | | 1.24 | |
| R5 | | | 1,000.00 | | | | 1,045.00 | | | | 5.88 | | | | 1,019.46 | | | | 5.80 | | | | 1.14 | |
| R6 | | | 1,000.00 | | | | 1,045.00 | | | | 5.88 | | | | 1,019.46 | | | | 5.80 | | | | 1.14 | |
| 1 | The actual ending account value is based on the actual total return of the Fund for the period May 1, 2018 through October 31, 2018, after actual expenses and will differ from the hypothetical ending account value which is based on the Fund’s expense ratio and a hypothetical annual return of 5% before expenses. |
| 2 | Expenses are equal to the Fund’s annualized expense ratio as indicated above multiplied by the average account value over the period, multiplied by 184/365 to reflect the most recent fiscal half year. |
30 Invesco All Cap Market Neutral Fund
Approval of Investment Advisory and Sub-Advisory Contracts
At meetings held on June 5-6, 2018, the Board of Trustees (the Board or the Trustees) of AIM Investment Funds (Invesco Investment Funds) as a whole, and the independent Trustees, who comprise over 75% of the Board, voting separately, approved the continuance of the Invesco All Cap Market Neutral Fund’s (the Fund) Master Investment Advisory Agreement with Invesco Advisers, Inc. (Invesco Advisers and the investment advisory agreement) and the Master Intergroup Sub-Advisory Contract for Mutual Funds with Invesco Asset Management Deutschland GmbH, Invesco Asset Management Limited, Invesco Asset Management (Japan) Limited, Invesco Hong Kong Limited, Invesco Senior Secured Management, Inc., Invesco Canada Ltd. and separate Sub-Advisory Contracts with Invesco Capital Management LLC and Invesco Asset Management (India) Private Limited (collectively, the Affiliated Sub-Advisers and the sub-advisory contracts) for another year, effective July 1, 2018. After evaluating the factors discussed below, among others, the Board approved the renewal of the Fund’s investment advisory agreement and the sub-advisory contracts and determined that the compensation payable by the Fund to Invesco Advisers and by Invesco Advisers to the Affiliated Sub-Advisers is fair and reasonable.
The Board’s Evaluation Process
The Board’s Investments Committee has established three Sub-Committees, which meet throughout the year to review the performance of funds advised by Invesco Advisers (the Invesco Funds). Over the course of each year, the Sub-Committees meet with portfolio managers for their assigned Invesco Funds and other members of management to review detailed information about investment performance and portfolio attributes of these funds. The Board took into account evaluations and reports that it received from the Investments Committee and Sub-Committees, as well as the information provided to such committees and the Board throughout the year, in considering whether to approve each Invesco Fund’s investment advisory agreement and sub-advisory contracts.
As part of the contract renewal process, the Board reviews and considers information provided in response to detailed requests for information submitted to management by the independent Trustees with assistance from legal counsel to the independent Trustees. The Board receives comparative investment performance and fee data regarding the Invesco Funds prepared by Invesco Advisers and Broadridge Financial Solutions, Inc. (Broadridge), an independent mutual fund data provider. The Board also receives an independent written evaluation from the Senior Officer, an officer of the Invesco Funds who reports directly to the independent Trustees. The Senior Officer’s
evaluation is prepared as part of his responsibility to manage the process by which the Invesco Funds’ proposed management fees are negotiated during the annual contract renewal process to ensure they are negotiated in a manner that is at arms’ length and reasonable. In addition to meetings with Invesco Advisers and fund counsel throughout the year, the independent Trustees also discuss the continuance of the investment advisory agreement and sub-advisory contracts in separate sessions with the Senior Officer and with independent legal counsel.
The discussion below is a summary of the Senior Officer’s independent written evaluation with respect to the Fund’s investment advisory agreement, as well as a discussion of the material factors and related conclusions that formed the basis for the Board’s approval of the Fund’s investment advisory agreement and sub-advisory contracts. The Trustees’ review and conclusions are based on the comprehensive consideration of all information presented to them during the course of the year and in prior years and are not the result of any single determinative factor. Moreover, one Trustee may have weighed a particular piece of information or factor differently than another Trustee. This information is current as of June 6, 2018.
Factors and Conclusions and Summary of Independent Written Fee Evaluation
| A. | Nature, Extent and Quality of Services Provided by Invesco Advisers and the Affiliated Sub-Advisers |
The Board reviewed the nature, extent and quality of the advisory services provided to the Fund by Invesco Advisers under the Fund’s investment advisory agreement, and the credentials and experience of the officers and employees of Invesco Advisers who provide these services, including the Fund’s portfolio manager(s). The Board’s review included consideration of Invesco Advisers’ investment process oversight and structure, credit analysis and investment risk management. The Board also considered non-advisory services that Invesco Advisers and its affiliates provide to the Invesco Funds such as various back office support functions, third party oversight, internal audit, valuation, portfolio trading and legal and compliance. The Board also reviewed and considered the benefits to shareholders of investing in a fund that is part of the Invesco family of funds under the umbrella of Invesco Ltd., Invesco Advisers’ parent company, and noted Invesco Ltd.’s depth and experience in conducting an investment management business, as well as its commitment of financial and other resources to such business. The Board concluded that the nature, extent and quality of the services provided to the Fund by Invesco Advisers are appropriate and satisfactory.
The Board reviewed the services that may be provided by the Affiliated Sub-Advisers under the sub-advisory contracts and the credentials and experience of the officers and employees of the Affiliated Sub-Advisers who provide these services. The Board noted the Affiliated Sub-Advisers’ expertise with respect to certain asset classes and that the Affiliated Sub-Advisers have offices and personnel that are located in financial centers around the world. As a result, the Board noted that the Affiliated Sub-Advisers can provide research and investment analysis on the markets and economies of various countries in which the Fund may invest, make recommendations regarding securities and assist with security trades. The Board concluded that the sub-advisory contracts may benefit the Fund and its shareholders by permitting Invesco Advisers to use the resources and talents of the Affiliated Sub-Advisers in managing the Fund. The Board concluded that the nature, extent and quality of the services that may be provided by the Affiliated Sub-Advisers are appropriate and satisfactory.
| B. | Fund Investment Performance |
The Board considered Fund investment performance as a relevant factor in considering whether to approve the investment advisory agreement. The Board did not view Fund investment performance as a relevant factor in considering whether to approve the sub-advisory contracts for the Fund, as no Affiliated Sub-Adviser currently manages assets of the Fund.
The Board compared the Fund’s investment performance over multiple time periods ending December 31, 2017 to the performance of funds in the Broadridge performance universe and against the Lipper Alternative Equity Market Neutral Funds Index. The Board noted that the Fund only had four years of performance history and compared the Fund’s investment performance during the past one and three calendar years to the performance of funds in the Broadridge performance universe and against the Index. The Board noted that performance of Class A shares of the Fund was in the fifth quintile of its performance universe for the one year period and the fourth quintile for the three year period (the first quintile being the best performing funds and the fifth quintile being the worst performing funds). The Board noted that performance of Class A shares of the Fund was below the performance of the Index for the one and three year periods. The Board noted that stock selection in certain sectors and capitalization sizes detracted from Fund performance. The Trustees also reviewed more recent Fund performance and this review did not change their conclusions.
31 Invesco All Cap Market Neutral Fund
| C. | Advisory and Sub-Advisory Fees and Fund Expenses |
The Board compared the Fund’s contractual management fee rate to the contractual management fee rates of funds in the Fund’s Broadridge expense group. The Board noted that the contractual management fee rate for Class A shares of the Fund was below the median contractual management fee rate of funds in its expense group. The Board noted that the term “contractual management fee” for funds in the expense group may include both advisory and certain non-portfolio management administrative services fees, but that Broadridge does not provide information on a fund by fund basis as to what is included. The Board also reviewed the methodology used by Broadridge in providing expense group information, which includes using each fund’s contractual management fee schedule (including any applicable breakpoints) as reported in the most recent prospectus or statement of additional information for each fund in the expense group. The Board also considered comparative information regarding the Fund’s total expense ratio and its various components. The Board noted that there were only five funds (including the Fund) in the expense group.
The Board noted that Invesco Advisers has contractually agreed to waive fees and/or limit expenses of the Fund in an amount necessary to limit total annual operating expenses to a specified percentage of average daily net assets for each class of the Fund.
The Board also considered the fees charged by Invesco Advisers and the Affiliated Sub-Advisers to other similarly managed client accounts. The Board noted that Invesco Advisers or the Affiliated Sub-Advisers may charge lower fees to large institutional clients. Invesco Advisers reviewed with the Board differences in the scope of services it provides to the Invesco Funds relative to certain other types of client accounts, including management of cash flows as a result of redemptions and purchases, necessary infrastructure such as officers, office space, technology, legal and distribution, oversight of service providers, costs and business risks associated with launching new funds and sponsoring and maintaining the product line, preparation of annual registration statement updates and financial information and compliance with federal and state laws and regulations.
The Board also compared the Fund’s effective advisory fee rate (the advisory fee rate after advisory fee waivers and before other expense limitations/waivers) to the effective advisory fee rates of other similarly managed third-party mutual funds advised or sub-advised by Invesco Advisers and its affiliates, based on asset balances as of December 31, 2017.
The Board also considered the services that may be provided by the Affiliated Sub-Advisers pursuant to the sub-advisory contracts, as well as the fees payable by Invesco Advisers to the Affiliated Sub-Advisers pursuant to the sub-advisory contracts.
| D. | Economies of Scale and Breakpoints |
The Board considered the extent to which there may be economies of scale in the provision of advisory services to the Fund. The Board also considered that the Fund may benefit from economies of scale through contractual breakpoints in the Fund’s advisory fee schedule, which generally operate to reduce the Fund’s expense ratio as it grows in size. The Board noted that the Fund shares directly in economies of scale through lower fees charged by third party service providers based on the combined size of the Invesco Funds. The Board noted that the Fund may also benefit from economies of scale through initial fee setting, fee waivers and expense reimbursements.
| E. | Profitability and Financial Resources |
The Board reviewed information from Invesco Advisers concerning the costs of the advisory and other services that Invesco Advisers and its affiliates provide to the Fund and the Invesco Funds and the profitability of Invesco Advisers and its affiliates in providing these services. The Board considered the methodology used for calculating profitability and noted the periodic review of such methodology by an independent consultant. The Board noted that Invesco Advisers continues to operate at a net profit from services Invesco Advisers and its affiliates provide to the Invesco Funds and the Fund. The Board did not deem the level of profits realized by Invesco Advisers and its affiliates from providing services to the Fund to be excessive given the nature, extent and quality of the services provided. The Board received information from Invesco Advisers demonstrating that Invesco Advisers and the Affiliated Sub-Advisers are financially sound and have the resources necessary to perform their obligations under the investment advisory agreement and sub-advisory contracts.
| F. | Collateral Benefits to Invesco Advisers and its Affiliates |
The Board considered various other benefits received by Invesco Advisers and its affiliates from the relationship with the Fund, including the fees received for providing administrative, transfer agency and distribution services to the Fund. The Board considered comparative information regarding fees charged for these services, including information provided by Broadridge and other independent sources. The Board considered the performance of Invesco Advisers and its affiliates in providing these services and the organizational structure employed to provide these services. The Board also considered that these services are provided to the Fund pursuant to written contracts that are reviewed and approved on an annual basis by the Board; and that the services are required for the operation of the Fund.
The Board considered the benefits realized by Invesco Advisers and the Affiliated Sub-Advisers as a result of portfolio brokerage transactions executed through “soft dollar” arrangements. The Board noted that soft dollar arrangements may result in the Fund bearing costs to
purchase research that may be used by Invesco Advisers or the Affiliated Sub-Advisers with other clients and may reduce Invesco Advisers’ or the Affiliated Sub-Advisers’ expenses. The Board also considered that it receives periodic reports from Invesco representing that these arrangements are consistent with regulatory requirements. The Board did not deem the soft dollar arrangements to be inappropriate.
The Board considered that the Fund’s uninvested cash and cash collateral from any securities lending arrangements may be invested in money market funds advised by Invesco Advisers pursuant to procedures approved by the Board. The Board noted that Invesco Advisers receives advisory fees from these affiliated money market funds attributable to such investments, although Invesco Advisers has contractually agreed to waive through varying periods the advisory fees payable by the Invesco Funds with respect to certain investments in the affiliated money market funds. The waiver is in an amount equal to 100% of the net advisory fee Invesco Advisers receives from the affiliated money market funds with respect to the Fund’s investment in the affiliated money market funds of uninvested cash, but not cash collateral. The Board concluded that the amount of advisory fees received by Invesco Advisers from the Fund’s investment of cash collateral from any securities lending arrangements in the affiliated money market funds is fair and reasonable.
The Board also considered that an affiliated broker may receive commissions for executing certain trades for the Fund. Invesco Advisers and the Affiliated Sub-Advisers may use the affiliated broker to, among other things, control order routing and minimize information leakage, and the Board was advised that such trades are executed in compliance with rules under the federal securities laws and consistent with best execution obligations.
32 Invesco All Cap Market Neutral Fund
Tax Information
Form 1099-DIV, Form 1042-S and other year–end tax information provide shareholders with actual calendar year amounts that should be included in their tax returns. Shareholders should consult their tax advisors.
The following distribution information is being provided as required by the Internal Revenue Code or to meet a specific state’s requirement.
The Fund designates the following amounts or, if subsequently determined to be different, the maximum amount allowable for its fiscal year ended October 31, 2018:
| | | | |
Federal and State Income Tax | |
Long-Term Capital Gain Distributions | | $ | 15,176,910 | |
Qualified Dividend Income* | | | 0.00 | % |
Corporate Dividends Received Deduction* | | | 0.00 | % |
U.S. Treasury Obligations* | | | 0.00 | % |
| | * | The above percentages are based on ordinary income dividends paid to shareholders during the Fund’s fiscal year. |
33 Invesco All Cap Market Neutral Fund
Trustees and Officers
The address of each trustee and officer is AIM Investment Funds (Invesco Investment Funds) (the “Trust”), 11 Greenway Plaza, Suite 1000, Houston, Texas 77046-1173. The trustees serve for the life of the Trust, subject to their earlier death, incapacitation, resignation, retirement or removal as more specifically provided in the Trust’s organizational documents. Each officer serves for a one year term or until their successors are elected and qualified. Column two below includes length of time served with predecessor entities, if any.
| | | | | | | | |
Name, Year of Birth and
Position(s) Held with the Trust | | Trustee and/
or Officer Since | | Principal Occupation(s)
During Past 5 Years | | Number of
Funds in Fund
Complex
Overseen by
Trustee | | Other Directorship(s)
Held by Trustee During
Past 5 Years |
| Interested Persons | | | | | | | | |
| Martin L. Flanagan1 — 1960 Trustee | | 2007 | | Executive Director, Chief Executive Officer and President, Invesco Ltd. (ultimate parent of Invesco and a global investment management firm); Trustee, The Invesco Funds; Vice Chair, Investment Company Institute; and Member of Executive Board, SMU Cox School of Business Formerly: Advisor to the Board, Invesco Advisers, Inc. (formerly known as Invesco Institutional (N.A.), Inc.); Chairman and Chief Executive Officer, Invesco Advisers, Inc. (registered investment adviser); Director, Chairman, Chief Executive Officer and President, Invesco Holding Company (US), Inc. (formerly IVZ Inc.) (holding company), Invesco Group Services, Inc. (service provider) and Invesco North American Holdings, Inc. (holding company); Director, Chief Executive Officer and President, Invesco Holding Company Limited (parent of Invesco and a global investment management firm); Director, Invesco Ltd.; Chairman, Investment Company Institute and President, Co-Chief Executive Officer, Co-President, Chief Operating Officer and Chief Financial Officer, Franklin Resources, Inc. (global investment management organization) | | 158 | | None |
Philip A. Taylor2 — 1954 Trustee and Senior Vice President | | 2006 | | Head of the Americas and Senior Managing Director, Invesco Ltd.; Director, Invesco Advisers, Inc. (formerly known as Invesco Institutional (N.A.), Inc.) (registered investment adviser); Director and Chairman, Invesco Investment Services, Inc. (formerly known as Invesco AIM Investment Services, Inc.) (registered transfer agent); Chief Executive Officer, Invesco Corporate Class Inc. (corporate mutual fund company); Director, Chairman and Chief Executive Officer, Invesco Canada Ltd. (formerly known as Invesco Trimark Ltd./Invesco Trimark Ltèe) (registered investment adviser and registered transfer agent); Trustee and Senior Vice President, The Invesco Funds; Director, Invesco Investment Advisers LLC (formerly known as Van Kampen Asset Management) Formerly: Director, Chairman, Chief Executive Officer and President, Invesco Management Group, Inc. (formerly known as Invesco AIM Management Group, Inc.) (financial services holding company); Co-Chairman, Co-President and Co-Chief Executive Officer, Invesco Advisers, Inc. (formerly known as Invesco Institutional (N.A.), Inc.) (registered investment adviser); Director, Chief Executive Officer and President, Van Kampen Exchange Corp; President and Principal Executive Officer, The Invesco Funds (other than AIM Treasurer’s Series Trust (Invesco Treasurer’s Series Trust), Short-Term Investments Trust and Invesco Management Trust); Executive Vice President, The Invesco Funds (AIM Treasurer’s Series Trust (Invesco Treasurer’s Series Trust), Short-Term Investments Trust and Invesco Management Trust only); Director and President, INVESCO Funds Group, Inc. (registered investment adviser and registered transfer agent); Director and Chairman, IVZ Distributors, Inc. (formerly known as INVESCO Distributors, Inc.) (registered broker dealer); Director, President and Chairman, Invesco Inc. (holding company), Invesco Canada Holdings Inc. (holding company), Trimark Investments Ltd./Placements Trimark Ltèe and Invesco Financial Services Ltd/Services Financiers Invesco Ltèe; Chief Executive Officer, Invesco Canada Fund Inc. (corporate mutual fund company); Director and Chairman, Van Kampen Investor Services Inc.; Director, Chief Executive Officer and President, 1371 Preferred Inc. (holding company) and Van Kampen Investments Inc.; Director and President, AIM GP Canada Inc. (general partner for limited partnerships) and Van Kampen Advisors, Inc.; Director and Chief Executive Officer, Invesco Trimark Dealer Inc. (registered broker dealer); Director, Invesco Distributors, Inc. (formerly known as Invesco AIM Distributors, Inc.) (registered broker dealer); Manager, Invesco Capital Management LLC; Director, Chief Executive Officer and President, Invesco Advisers, Inc.; Director, Chairman, Chief Executive Officer and President, Invesco AIM Capital Management, Inc.; President, Invesco Trimark Dealer Inc. and Invesco Trimark Ltd./Invesco Trimark Ltèe; Director and President, AIM Trimark Corporate Class Inc. and AIM Trimark Canada Fund Inc.; Senior Managing Director, Invesco Holding Company Limited; Director and Chairman, Fund Management Company (former registered broker dealer); President and Principal Executive Officer, The Invesco Funds (AIM Treasurer’s Series Trust (Invesco Treasurer’s Series Trust), and Short-Term Investments Trust only); President, AIM Trimark Global Fund Inc. and AIM Trimark Canada Fund Inc. | | 158 | | None |
| 1 | Mr. Flanagan is considered an interested person (within the meaning of Section 2(a)(19) of the 1940 Act) of the Trust because he is an officer of the Adviser to the Trust, and an officer and a director of Invesco Ltd., ultimate parent of the Adviser. |
| 2 | Mr. Taylor is considered an interested person (within the meaning of Section 2(a)(19) of the 1940 Act) of the Trust because he is an officer and a director of the Adviser. |
T-1 Invesco All Cap Market Neutral Fund
Trustees and Officers—(continued)
| | | | | | | | |
Name, Year of Birth and
Position(s) Held with the Trust | | Trustee and/
or Officer Since | | Principal Occupation(s)
During Past 5 Years | | Number of
Funds in Fund
Complex
Overseen by
Trustee | | Other Directorship(s)
Held by Trustee During
Past 5 Years |
| Independent Trustees | | | | | | | | |
Bruce L. Crockett — 1944 Trustee and Chair | | 2001 | | Chairman, Crockett Technologies Associates (technology consulting company) Formerly: Director, Captaris (unified messaging provider); Director, President and Chief Executive Officer, COMSAT Corporation; Chairman, Board of Governors of INTELSAT (international communications company); ACE Limited (insurance company); Independent Directors Council and Investment Company Institute: Member of the Audit Committee, Investment Company Institute; Member of the Executive Committee and Chair of the Governance Committee, Independent Directors Council | | 158 | | Director and Chairman of the Audit Committee, ALPS (Attorneys Liability Protection Society) (insurance company); Director and Member of the Audit Committee and Compensation Committee, Ferroglobe PLC (metallurgical company) |
David C. Arch — 1945 Trustee | | 2010 | | Chairman of Blistex Inc. (consumer health care products manufacturer); Member, World Presidents’ Organization | | 158 | | Board member of the Illinois Manufacturers’ Association |
Jack M. Fields — 1952 Trustee | | 2001 | | Chief Executive Officer, Twenty First Century Group, Inc. (government affairs company); and Chairman, Discovery Learning Alliance (non-profit) Formerly: Owner and Chief Executive Officer, Dos Angeles Ranch L.P. (cattle, hunting, corporate entertainment); Director, Insperity, Inc. (formerly known as Administaff) (human resources provider); Chief Executive Officer, Texana Timber LP (sustainable forestry company); Director of Cross Timbers Quail Research Ranch (non-profit); and member of the U.S. House of Representatives | | 158 | | None |
Cynthia Hostetler — 1962 Trustee | | 2017 | | Non-Executive Director and Trustee of a number of public and private business corporations Formerly: Director, Aberdeen Investment Funds (4 portfolios); Head of Investment Funds and Private Equity, Overseas Private Investment Corporation; President, First Manhattan Bancorporation, Inc.; Attorney, Simpson Thacher & Bartlett LLP | | 158 | | Vulcan Materials Company (construction materials company); Trilinc Global Impact Fund; Artio Global Investment LLC (mutual fund complex); Edgen Group, Inc. (specialized energy and infrastructure products distributor) |
Eli Jones — 1961 Trustee | | 2016 | | Professor and Dean, Mays Business School — Texas A&M University Formerly: Professor and Dean, Walton College of Business, University of Arkansas and E.J. Ourso College of Business, Louisiana State University; Director, Arvest Bank | | 158 | | Insperity, Inc. (formerly known as Administaff) (human resources provider) |
Prema Mathai-Davis — 1950 Trustee | | 2001 | | Retired | | 158 | | None |
Teresa M. Ressel — 1962 Trustee | | 2017 | | Non-executive director and trustee of a number of public and private business corporations Formerly: Chief Financial Officer, Olayan America, The Olayan Group (international investor/commercial/industrial); Chief Executive Officer, UBS Securities LLC; Group Chief Operating Officer, Americas, UBS AG; Assistant Secretary for Management & Budget and CFO, US Department of the Treasury | | 158 | | Atlantic Power Corporation (power generation company); ON Semiconductor Corp. (semiconductor supplier) |
Ann Barnett Stern — 1957 Trustee | | 2017 | | President and Chief Executive Officer, Houston Endowment Inc. (private philanthropic institution) Formerly: Executive Vice President and General Counsel, Texas Children’s Hospital; Attorney, Beck, Redden and Secrest, LLP; Business Law Instructor, University of St. Thomas; Attorney, Andrews & Kurth LLP | | 158 | | Federal Reserve Bank of Dallas |
Raymond Stickel, Jr. — 1944 Trustee | | 2005 | | Retired Formerly: Director, Mainstay VP Series Funds, Inc. (25 portfolios); Partner, Deloitte & Touche | | 158 | | None |
Robert C. Troccoli — 1949 Trustee | | 2016 | | Adjunct Professor, University of Denver — Daniels College of Business Formerly: Senior Partner, KPMG LLP | | 158 | | None |
Christopher L. Wilson — 1957 Trustee | | 2017 | | Non-executive director and trustee of a number of public and private business corporations Formerly: Director, TD Asset Management USA Inc. (mutual fund complex) (22 portfolios); Managing Partner, CT2, LLC (investing and consulting firm); President/Chief Executive Officer, Columbia Funds, Bank of America Corporation; President/Chief Executive Officer, CDC IXIS Asset Management Services, Inc.; Principal & Director of Operations, Scudder Funds, Scudder, Stevens & Clark, Inc.; Assistant Vice President, Fidelity Investments | | 158 | | ISO New England, Inc. (non-profit organization managing regional electricity market) |
T-2 Invesco All Cap Market Neutral Fund
Trustees and Officers—(continued)
| | | | | | | | |
Name, Year of Birth and
Position(s) Held with the Trust | | Trustee and/
or Officer Since | | Principal Occupation(s)
During Past 5 Years | | Number of
Funds in Fund
Complex
Overseen by
Trustee | | Other Directorship(s)
Held by Trustee During
Past 5 Years |
| Other Officers | | | | | | | | |
Sheri Morris — 1964 President, Principal Executive Officer and Treasurer | | 1999 | | President, Principal Executive Officer and Treasurer, The Invesco Funds; Vice President, Invesco Advisers, Inc. (formerly known as Invesco Institutional (N.A.), Inc.) (registered investment adviser); and Vice President, Invesco Exchange-Traded Fund Trust, Invesco Exchange-Traded Fund Trust II, Invesco India Exchange-Traded Fund Trust, Invesco Actively Managed Exchange-Traded Fund Trust, Invesco Actively Managed Exchange-Traded Commodity Fund Trust and Invesco Exchange-Traded Self-Indexed Fund Trust Formerly: Vice President and Principal Financial Officer, The Invesco Funds; Vice President, Invesco AIM Advisers, Inc., Invesco AIM Capital Management, Inc. and Invesco AIM Private Asset Management, Inc.; Assistant Vice President and Assistant Treasurer, The Invesco Funds and Assistant Vice President, Invesco Advisers, Inc., Invesco AIM Capital Management, Inc. and Invesco AIM Private Asset Management, Inc.; and Treasurer, Invesco Exchange-Traded Fund Trust, Invesco Exchange-Traded Fund Trust II, Invesco India Exchange-Traded Fund Trust and Invesco Actively Managed Exchange-Traded Fund Trust | | N/A | | N/A |
Russell C. Burk — 1958 Senior Vice President and Senior Officer | | 2005 | | Senior Vice President and Senior Officer, The Invesco Funds | | N/A | | N/A |
Jeffrey H. Kupor — 1968 Senior Vice President, Chief Legal Officer and Secretary | | 2018 | | Senior Vice President and Secretary, Invesco Advisers, Inc. (formerly known as Invesco Institutional (N.A.), Inc.) (registered investment adviser); Senior Vice President and Secretary, Invesco Distributors, Inc. (formerly known as Invesco AIM Distributors, Inc.); Vice President and Secretary, Invesco Investment Services, Inc. (formerly known as Invesco AIM Investment Services, Inc.) Senior Vice President, Chief Legal Officer and Secretary, The Invesco Funds; Secretary and General Counsel, Invesco Investment Advisers LLC (formerly known as Van Kampen Asset Management); Secretary and General Counsel, Invesco Capital Markets, Inc. (formerly known as Van Kampen Funds Inc.) and Chief Legal Officer, Invesco Exchange-Traded Fund Trust, Invesco Exchange-Traded Fund Trust II, Invesco India Exchange-Traded Fund Trust, Invesco Actively Managed Exchange-Traded Fund Trust, Invesco Actively Managed Exchange-Traded Commodity Fund Trust and Invesco Exchange-Traded Self-Indexed Fund Trust; Secretary, Invesco Indexing LLC; Secretary and General Counsel, INVESCO Private Capital Investments, Inc.; Secretary, W.L. Ross & Co., LLC; Secretary and Vice President, Jemstep, Inc. Formerly: Senior Vice President, Secretary and General Counsel, Invesco Management Group, Inc. (formerly known as Invesco AIM Management Group, Inc.); Assistant Secretary, INVESCO Asset Management (Bermuda) Ltd.; Secretary and General Counsel, Invesco Private Capital, Inc.; Assistant Secretary and General Counsel, INVESCO Realty, Inc.; Secretary and General Counsel, Invesco Senior Secured Management, Inc.; and Secretary, Sovereign G./P. Holdings Inc. | | N/A | | N/A |
John M. Zerr — 1962 Senior Vice President | | 2006 | | Chief Operating Officer of the Americas; Senior Vice President, Invesco Advisers, Inc. (formerly known as Invesco Institutional (N.A.), Inc.) (registered investment adviser); Senior Vice President, Invesco Distributors, Inc. (formerly known as Invesco AIM Distributors, Inc.); Director and Vice President, Invesco Investment Services, Inc. (formerly known as Invesco AIM Investment Services, Inc.) Senior Vice President, The Invesco Funds; Managing Director, Invesco Capital Management LLC; Director, Invesco Investment Advisers LLC (formerly known as Van Kampen Asset Management); Senior Vice President, Invesco Capital Markets, Inc. (formerly known as Van Kampen Funds Inc.); Manager, Invesco Indexing LLC Formerly: Director and Senior Vice President, Invesco Management Group, Inc. (formerly known as Invesco AIM Management Group, Inc.); Secretary and General Counsel, Invesco Management Group, Inc. (formerly known as Invesco AIM Management Group, Inc.); Secretary, Invesco Investment Services, Inc. (formerly known as Invesco AIM Investment Services, Inc.); Chief Legal Officer and Secretary, The Invesco Funds; Secretary and General Counsel, Invesco Investment Advisers LLC (formerly known as Van Kampen Asset Management); Secretary and General Counsel, Invesco Capital Markets, Inc. (formerly known as Van Kampen Funds Inc.); Chief Legal Officer, Invesco Exchange-Traded Fund Trust, Invesco Exchange-Traded Fund Trust II, Invesco India Exchange-Traded Fund Trust, Invesco Actively Managed Exchange-Traded Fund Trust, Invesco Actively Managed Exchange-Traded Commodity Fund Trust and Invesco Exchange-Traded Self-Indexed Fund Trust; Secretary, Invesco Indexing LLC; Director, Secretary, General Counsel and Senior Vice President, Van Kampen Exchange Corp.; Director, Vice President and Secretary, IVZ Distributors, Inc. (formerly known as INVESCO Distributors, Inc.); Director and Vice President, INVESCO Funds Group, Inc.; Director and Vice President, Van Kampen Advisors Inc.; Director, Vice President, Secretary and General Counsel, Van Kampen Investor Services Inc.; Director and Secretary, Invesco Distributors, Inc. (formerly known as Invesco AIM Distributors, Inc.); Director, Senior Vice President, General Counsel and Secretary, Invesco AIM Advisers, Inc. and Van Kampen Investments Inc.; Director, Vice President and Secretary, Fund Management Company; Director, Senior Vice President, Secretary, General Counsel and Vice President, Invesco AIM Capital Management, Inc.; Chief Operating Officer and General Counsel, Liberty Ridge Capital, Inc. (an investment adviser) | | N/A | | N/A |
T-3 Invesco All Cap Market Neutral Fund
Trustees and Officers—(continued)
| | | | | | | | |
Name, Year of Birth and
Position(s) Held with the Trust | | Trustee and/
or Officer Since | | Principal Occupation(s)
During Past 5 Years | | Number of
Funds in Fund
Complex
Overseen by
Trustee | | Other Directorship(s)
Held by Trustee During
Past 5 Years |
| Other Officers—(continued) | | | | | | | | |
Gregory G. McGreevey — 1962 Senior Vice President | | 2012 | | Senior Managing Director, Invesco Ltd.; Director, Chairman, President, and Chief Executive Officer, Invesco Advisers, Inc. (formerly known as Invesco Institutional (N.A.), Inc.) (registered investment adviser); Director, Invesco Mortgage Capital, Inc. and Invesco Senior Secured Management, Inc.; and Senior Vice President, The Invesco Funds Formerly: Senior Vice President, Invesco Management Group, Inc. and Invesco Advisers, Inc.; Assistant Vice President, The Invesco Funds | | N/A | | N/A |
Kelli Gallegos — 1970 Vice President, Principal Financial Officer and Assistant Treasurer | | 2008 | | Vice President and Treasurer, Invesco Exchange-Traded Fund Trust, Invesco Exchange-Traded Fund Trust II, Invesco India Exchange-Traded Fund Trust, Invesco Actively Managed Exchange-Traded Fund Trust, Invesco Actively Managed Exchange-Traded Commodity Fund Trust and Invesco Exchange-Traded Self-Indexed Fund Trust; Vice President, Principal Financial Officer and Assistant Treasurer, The Invesco Funds; Principal Financial and Accounting Officer — Pooled Investments, Invesco Capital Management LLC Formerly: Assistant Treasurer, Invesco Exchange-Traded Fund Trust, Invesco Exchange-Traded Fund Trust II, Invesco India Exchange-Traded Fund Trust, Invesco Actively Managed Exchange-Traded Fund Trust, Invesco Actively Managed Exchange-Traded Commodity Fund Trust and Invesco Exchange-Traded Self-Indexed Fund Trust; Assistant Treasurer, Invesco Capital Management LLC; Assistant Vice President, The Invesco Funds | | N/A | | N/A |
Tracy Sullivan — 1962 Vice President, Chief Tax Officer and Assistant Treasurer | | 2008 | | Vice President, Chief Tax Officer and Assistant Treasurer, The Invesco Funds; Assistant Treasurer, Invesco Capital Management LLC, Invesco Exchange-Traded Fund Trust, Invesco Exchange-Traded Fund Trust II, Invesco India Exchange-Traded Fund Trust, Invesco Actively Managed Exchange-Traded Fund Trust, Invesco Actively Managed Exchange-Traded Commodity Fund Trust and Invesco Exchange-Traded Self-Indexed Fund Trust Formerly: Assistant Vice President, The Invesco Funds | | N/A | | N/A |
Crissie M. Wisdom — 1969 Anti-Money Laundering Compliance Officer | | 2013 | | Anti-Money Laundering Compliance Officer, Invesco Advisers, Inc. (formerly known as Invesco Institutional (N.A.), Inc.) (registered investment adviser), Invesco Capital Markets, Inc. (formerly known as Van Kampen Funds Inc.), Invesco Distributors, Inc., Invesco Investment Services, Inc., The Invesco Funds, and Invesco Exchange-Traded Fund Trust, Invesco Exchange-Traded Fund Trust II, Invesco India Exchange-Traded Fund Trust, Invesco Actively Managed Exchange-Traded Fund Trust, Invesco Actively Managed Exchange-Traded Commodity Fund Trust and Invesco Exchange-Traded Self-Indexed Fund Trust; Anti-Money Laundering Compliance Officer and Bank Secrecy Act Officer, INVESCO National Trust Company and Invesco Trust Company; and Fraud Prevention Manager and Controls and Risk Analysis Manager for Invesco Investment Services, Inc. Formerly: Anti-Money Laundering Compliance Officer, Van Kampen Exchange Corp. and Invesco Management Group, Inc. | | N/A | | N/A |
Robert R. Leveille — 1969 Chief Compliance Officer | | 2016 | | Chief Compliance Officer, Invesco Advisers, Inc. (registered investment adviser); and Chief Compliance Officer, The Invesco Funds Formerly: Chief Compliance Officer, Putnam Investments and the Putnam Funds | | N/A | | N/A |
The Statement of Additional Information of the Trust includes additional information about the Fund’s Trustees and is available upon request, without charge, by calling 1.800.959.4246. Please refer to the Fund’s Statement of Additional Information for information on the Fund’s sub-advisers.
| | | | | | |
Office of the Fund 11 Greenway Plaza, Suite 1000 Houston, TX 77046-1173 | | Investment Adviser Invesco Advisers, Inc. 1555 Peachtree Street, N.E. Atlanta, GA 30309 | | Distributor Invesco Distributors, Inc. 11 Greenway Plaza, Suite 1000 Houston, TX 77046-1173 | | Auditors PricewaterhouseCoopers LLP 1000 Louisiana Street, Suite 5800 Houston, TX 77002-5021 |
| | | |
| | | | | | |
Counsel to the Fund Stradley Ronon Stevens & Young, LLP 2005 Market Street, Suite 2600 Philadelphia, PA 19103-7018 | | Counsel to the Independent Trustees Goodwin Procter LLP 901 New York Avenue, N.W. Washington, D.C. 20001 | | Transfer Agent Invesco Investment Services, Inc. 11 Greenway Plaza, Suite 1000 Houston, TX 77046-1173 | | Custodian State Street Bank and Trust Company 225 Franklin Street Boston, MA 02110-2801 |
T-4 Invesco All Cap Market Neutral Fund
Explore High-Conviction Investing with Invesco

Go paperless with eDelivery
Visit invesco.com/edelivery to enjoy the convenience and security of anytime electronic access to your investment documents.
With eDelivery, you can elect to have any or all of the following materials delivered straight to your inbox to download, save and print from your own computer:
∎ Fund reports and prospectuses
∎ Quarterly statements
∎ Daily confirmations
∎ Tax forms
Invesco mailing information
Send general correspondence to Invesco Investment Services, Inc., P.O. Box 219078, Kansas City, MO 64121-9078.
Important notice regarding delivery of security holder documents
To reduce Fund expenses, only one copy of most shareholder documents may be mailed to shareholders with multiple accounts at the same address (Householding). Mailing of your shareholder documents may be householded indefinitely unless you instruct us otherwise. If you do not want the mailing of these documents to be combined with those for other members of your household, please contact Invesco Investment Services, Inc. at 800 959 4246 or contact your financial institution. We will begin sending you individual copies for each account within 30 days after receiving your request.
Fund holdings and proxy voting information
The Fund provides a complete list of its holdings four times in each fiscal year, at the quarter ends. For the second and fourth quarters, the lists appear in the Fund’s semiannual and annual reports to shareholders. For the first and third quarters, the Fund files the lists with the Securities and Exchange Commission (SEC) on Form N-Q (or any successor Form). The most recent list of portfolio holdings is available at invesco.com/completeqtrholdings. Shareholders can also look up the Fund’s Forms N-Q (or any successor Form) on the SEC website at sec.gov. The SEC file numbers for the Fund are shown below.
A description of the policies and procedures that the Fund uses to determine how to vote proxies relating to portfolio securities is available without charge, upon request, from our Client Services department at 800 959 4246 or at invesco.com/proxyguidelines. The information is also available on the SEC website, sec.gov.
| | |
| Information regarding how the Fund voted proxies related to its portfolio securities during the most recent 12-month period ended June 30 is available at invesco.com/proxysearch. The information is also available on the SEC website, sec.gov. | |  |
| Invesco Advisers, Inc. is an investment adviser; it provides investment advisory services to individual and institutional clients and does not sell securities. Invesco Distributors, Inc. is the US distributor for Invesco Ltd.’s retail mutual funds, exchange-traded funds and institutional money market funds. Both are wholly owned, indirect subsidiaries of Invesco Ltd. |
| | | | | | | | |
| SEC file numbers: 811-05426 and 033-19338 | | Invesco Distributors, Inc. | | ACMN-AR-1 | | 12212018 | | 1157 |
| | | | | | |
| | | | |
 | | Annual Report to Shareholders | | October 31, 2018 | | |
| | | | |
| | Invesco Balanced-Risk Allocation Fund | | |
| | Nasdaq: | | |
| | A: ABRZX ∎ C: ABRCX ∎ R: ABRRX ∎ Y: ABRYX ∎ R5: ABRIX ∎ R6: ALLFX | | |

Letters to Shareholders
| | |

Philip Taylor | | Dear Shareholders: This annual report includes information about your Fund, including performance data and a complete list of its investments as of the close of the reporting period. Inside is a discussion of how your Fund was managed and the factors that affected its performance during the reporting period. Throughout the reporting period, US economic data remained positive. Robust corporate profits, strong retail sales and unemployment rates near generational lows helped drive US markets to new all-time records multiple times during the reporting period. Against this backdrop, the US Federal Reserve raised the federal funds rate four times during the reporting period. Market volatility, largely non-existent in 2017, returned in 2018. Markets sold off first in February and again sharply in October, amid rising interest rates, concerns about potential trade wars and |
heightened geopolitical tensions. Despite the volatility, US equity markets were largely positive for the reporting period and fared better than international markets. Emerging markets were particularly hard hit due to a strong US dollar. During the October sell-off, investors retreated to more defensive areas of the market and to US Treasuries. The broader bond market declined during the reporting period due to the increase in US Treasury yields and widening credit spreads. As the year progresses, we’ll see how the interplay of economic data, interest rates, geopolitics and a host of other factors affect US and overseas equity and fixed income markets.
Short-term market volatility can prompt some investors to abandon their investment plans – and can cause others to settle for whatever returns the market has to offer. The investment professionals at Invesco, in contrast, invest with high conviction. This means that, no matter the asset class or the strategy, each investment team has a passion to exceed. We want to help investors achieve better outcomes, such as seeking higher returns, helping mitigate risk and generating income. Of course, investing with high conviction can’t guarantee a profit or ensure success; no investment strategy can. To learn more about how we invest with high conviction, visit invesco.com/HighConviction.
You, too, can invest with high conviction by maintaining a long-term investment perspective and by working with your financial adviser on a regular basis. During periods of short-term market volatility or uncertainty, your financial adviser can keep you focused on your long-term investment goals – a new home, a child’s college education or a secure retirement. He or she also can share research about the economy, the markets and individual investment options.
Visit our website for more information on your investments
Our website, invesco.com/us, offers a wide range of market insights and investment perspectives. On the website, you’ll find detailed information about our funds, including performance, holdings and portfolio manager commentaries. You can access information about your account by completing a simple, secure online registration. To do so, select “Log In” on the right side of the homepage, and then select “Register for Individual Account Access.”
In addition to the resources accessible on our website and through our mobile app, you can obtain timely updates to help you stay informed about the markets and the economy by connecting with Invesco on Twitter, LinkedIn or Facebook. You can access our blog at blog.invesco.us.com. Our goal is to provide you the information you want, when and where you want it.
Finally, I’m pleased to share with you Invesco’s commitment to both the Principles for Responsible Investment and to considering environmental, social and governance issues in our robust investment process. I invite you to learn more at invesco.com/esg.
Have questions?
For questions about your account, contact an Invesco client services representative at 800 959 4246. For Invesco-related questions or comments, please email me directly at phil@invesco.com.
All of us at Invesco look forward to serving your investment management needs. Thank you for investing with us.
Sincerely,

Philip Taylor
Senior Managing Director, Invesco Ltd.
| | |
| 2 | | Invesco Balanced-Risk Allocation Fund |
| | | | |

Bruce Crockett | | Dear Fellow Shareholders: Among the many important lessons I’ve learned in more than 40 years in a variety of business endeavors is the value of a trusted advocate. As independent chair of the Invesco Funds Board, I can assure you that the members of the Board are strong advocates for the interests of investors in Invesco’s mutual funds. We work hard to represent your interests through oversight of the quality of the investment management services your funds receive and other matters important to your investment, including but not limited to: |
| | ∎ | | Ensuring that Invesco offers a diverse lineup of mutual funds that your financial adviser can use to strive to meet your financial needs as your investment goals change over time. |
| | ∎ | | Monitoring how the portfolio management teams of the Invesco funds are performing in light of changing economic and market conditions. |
| ∎ | | Assessing each portfolio management team’s investment performance within the context of the investment strategy described in the fund’s prospectus. |
| ∎ | | Monitoring for potential conflicts of interests that may impact the nature of the services that your funds receive. |
We believe one of the most important services we provide our fund shareholders is the annual review of the funds’ advisory and sub-advisory contracts with Invesco Advisers and its affiliates. This review is required by the Investment Company Act of 1940 and focuses on the nature and quality of the services Invesco provides as the adviser to the Invesco funds and the reasonableness of the fees that it charges for those services. Each year, we spend months carefully reviewing information received from Invesco and a variety of independent sources, such as performance and fee data prepared by Lipper, Inc. (a subsidiary of Broadridge Financial Solutions, Inc.), an independent, third-party firm widely recognized as a leader in its field. We also meet with our independent legal counsel and other independent advisers to review and help us assess the information that we have received. Our goal is to assure that you receive quality investment management services for a reasonable fee.
I trust the measures outlined above provide assurance that you have a worthy advocate when it comes to choosing the Invesco Funds.
As always, please contact me at bruce@brucecrockett.com with any questions or concerns you may have. On behalf of the Board, we look forward to continuing to represent your interests and serving your needs.
Sincerely,

Bruce L. Crockett
Independent Chair
Invesco Funds Board of Trustees
| | |
| 3 | | Invesco Balanced-Risk Allocation Fund |
Management’s Discussion of Fund Performance
| | | | |
| |
Performance summary For the fiscal year ended October 31, 2018, Class A shares of Invesco Balanced-Risk Allocation Fund (the Fund), at net asset value (NAV), underperformed the Fund’s custom style-specific benchmark, the Custom Invesco Balanced-Risk Allocation Style Index. Your Fund’s long-term performance appears later in this report. | |
Fund vs. Indexes | | | | |
Total returns, 10/31/17 to 10/31/18, at net asset value (NAV). Performance shown does not include applicable contingent deferred sales charges (CDSC) or front-end sales charges, which would have reduced performance. | |
| |
Class A Shares | | | -3.48 | % |
Class C Shares | | | -4.23 | |
Class R Shares | | | -3.82 | |
Class Y Shares | | | -3.34 | |
Class R5 Shares | | | -3.34 | |
Class R6 Shares | | | -3.16 | |
S&P 500 Indexq (Broad Market Index) | | | 7.35 | |
Custom Invesco Balanced-Risk Allocation Style Index⬛ (Style-Specific Index) | | | 0.03 | |
Lipper Alternative Global Macro Funds Indext (Peer Group Index) | | | -2.34 | |
| | |
Source(s): qFactSet Research Systems Inc.; ⬛Invesco, FactSet Research Systems Inc., RIMES Technologies Corp.; tLipper Inc. | | | | |
Market conditions and your Fund
For the fiscal year, the Fund at NAV reported negative absolute performance as all three of the major asset classes in which the Fund invests (stocks, bonds and commodities) detracted from Fund performance. The Fund invests in derivatives, such as swaps and futures, which are expected to correspond to the performance of US and international fixed income, equity and commodity markets. The strategic allocation portion of the investment process involves first selecting representative assets for each asset class from a universe of more than 50 assets. Next, we seek to construct the portfolio so that an approximately equal amount of risk comes from our equity, fixed income and commodity allocations. Tactical adjustments to the Fund’s portfolio are then made on a monthly basis to try and take advantage of short-term market dynamics.
The Fund’s strategic exposure to equities, obtained through the use of swaps and futures, detracted from results for
the fiscal year with five of the six markets in which the Fund invests posting negative returns. US large cap equities were the sole contributor as they shrugged off concerns about the global trade conflicts as tax cuts and stronger US economic growth supported earnings. US small cap equities could not hold gains, despite benefiting from less direct export exposure, as global stock markets sold off late in the fiscal year. Asian and European equities were the largest detractors. The Hong Kong market languished as it tends to trade in sympathy with China, where markets fell in response to the ongoing trade conflict, as well as weakening economic data. Similarly, the Japanese market was also pressured by trade battles and fears of slowing global growth. Europe’s performance was affected by a sluggish economy, a stronger euro versus major trading partners’ currencies and the transition to a less accommodative monetary policy from the European Central Bank (ECB) due to cuts in bond purchases. The UK market was not immune
to the volatility in global equities as it had to also deal with the ongoing challenge to leave the European Union (Brexit). Tactical positioning in equities, obtained through the use of swaps and futures, detracted from Fund results during the fiscal year as overweight exposures to all six markets did not prove timely, with the exception of US large caps.
The Fund’s strategic exposure to global government bonds, obtained through the use of swaps and futures, also detracted from Fund results for the fiscal year as losses in US, UK and Canadian government bonds outweighed gains from Australian and German government bonds.
German government bonds were the top contributor to Fund performance after having started the fiscal year off on weak footing as the ECB was signaling that it would begin to reduce asset purchases later in 2018. Prices then rose later in the fiscal year after Italy elected a new government – sparking fears of fracture across the European Union – and as the ECB reassured markets that policy would continue to be accommodative and data driven. Given Australia’s natural resource-based economy, Australian bond’s benefited from escalating trade war concerns, which drove investors to safe-have securities. Australian bonds also benefited from China’s slowing economic growth.
Canadian and US bonds were the largest detractors from the Fund’s performance during the fiscal year as the US Federal Reserve continued to raise interest rates as economic growth accelerated. Canadian bonds declined as inflation data surprised to the upside. Meanwhile, UK bond prices fell as interest rates increased as guidance from the Bank of England suggested that future policy tightening is likely. Tactical positioning to government bonds detracted from the Fund’s results during the fiscal year as losses in Australia, Germany, the UK and Canada were not fully offset by gains in the US.
| | | | | | |
Target Risk Allocation and Notional Asset Weights as of 10/31/18 |
| By asset class |
| Asset Class | |
| Target Risk
Allocation* |
| | Notional Asset
Weights** |
| | | | | | | | |
Equities | | | 49.90 | % | | | 43.74 | % |
Fixed Income | | | 22.47 | | | | 66.25 | |
Commodities | | | 27.63 | | | | 29.09 | |
Total | | | 100.00 | | | | 139.08 | |
| | |
* | | Reflects the risk that each asset class is expected to contribute to the overall risk of the Fund as measured by standard deviation and estimates of risk based on historical data. Standard deviation measures the annualized fluctuations (volatility) of monthly returns. |
** | | Proprietary models determine the Notional Asset Weights necessary to achieve the Target Risk Allocations. Total Notional Asset Weight greater than 100% is achieved through derivatives and other instruments that create leverage. |
| | | | |
Total Net Assets | | $ | 3.9 billion | |
| | |
| 4 | | Invesco Balanced-Risk Allocation Fund |
The Fund’s exposure to commodities, obtained through the use of swaps, futures and commodity-linked notes, also detracted from Fund performance for the fiscal year as gains in energy were outweighed by losses in agriculture, industrial metals and precious metals. Energy was the top contributor to the Fund’s results as supply fears lifted prices after the Trump administration re-imposed sanctions on Iran and Venezuelan output continued to decline as the country is engulfed in political turmoil.
Agriculture experienced the largest decline during the fiscal year due to the trade conflict and oversupplied markets. Within agriculture, soybeans and sugar were the top detractors from the the Fund’s performance. Sugar suffered as bumper crops in India and Thailand continued to add to the global supply glut. Additionally, depreciating currencies in emerging markets, against a stronger US dollar, caused emerging market producers to lower prices in response to consumer demand. Soybeans also declined as they were caught in the crosshairs of the trade battle with China while the US harvest produced high crop yields.
Industrial metals also detracted from the the Fund’s performance during the fiscal year due to the strengthening US dollar and a softening Chinese economy. Precious metals declined as higher interest rates in the US provided support for the US dollar and decreased demand for gold and silver. Silver declined more than gold as it traded in sympathy with its crossover use as an industrial metal. Tactical positioning in commodities contributed to the Fund’s performance during the fiscal year due to an overweight allocation to energy and underweight allocations to agriculture and precious metals.
Please note that our strategy is principally implemented with derivative instruments that include futures, commodity-linked notes and total return swaps. Therefore, all or most of the performance of the strategy, both positive and negative, can be attributed to these instruments. Derivatives can be a cost-effective way to gain exposure to asset classes. However, derivatives may amplify traditional investment risks through the creation of leverage and may be less liquid than traditional securities.
Thank you for your continued investment in Invesco Balanced-Risk Allocation Fund.
The views and opinions expressed in management’s discussion of Fund performance are those of Invesco Advisers, Inc. These views and opinions are subject to change at any time based on factors such as market and economic conditions. These views and opinions may not be relied upon as investment advice or recommendations, or as an offer for a particular security. The information is not a complete analysis of every aspect of any market, country, industry, security or the Fund. Statements of fact are from sources considered reliable, but Invesco Advisers, Inc. makes no representation or warranty as to their completeness or accuracy. Although historical performance is no guarantee of future results, these insights may help you understand our investment management philosophy.
See important Fund and, if applicable, index disclosures later in this report.
| | |
 | | Mark Ahnrud Chartered Financial Analyst, Portfolio Manager, is manager of Invesco Balanced-Risk Allocation Fund. He joined Invesco in |
| 2000. Mr. Ahnrud earned a BS in finance and investments from Babson College and an MBA from Duke University Fuqua School of Business. |
| | |
 | | Chris Devine Chartered Financial Analyst, Portfolio Manager, is manager of Invesco Balanced-Risk Allocation Fund. He joined Invesco in |
| 1998. Mr. Devine earned a BA in economics from Wake Forest University and an MBA from the University of Georgia. |
| | |
 | | Scott Hixon Chartered Financial Analyst, Portfolio Manager, is manager of Invesco Balanced-Risk Allocation Fund. He joined Invesco in |
| 1994. Mr. Hixon earned a BBA in finance from Georgia Southern University and an MBA in finance from Georgia State University. |
| | |
 | | Christian Ulrich Chartered Financial Analyst, Portfolio Manager, is manager of Invesco Balanced-Risk Allocation Fund. He joined Invesco in 2000. |
| Mr. Ulrich earned the equivalent of a BBA from the KV Zurich Business School in Zurich, Switzerland. |
| | |
 | | Scott Wolle Chartered Financial Analyst, Portfolio Manager, is manager of Invesco Balanced-Risk Allocation Fund. He joined Invesco in |
| 1999. Mr. Wolle earned a BS in finance from Virginia Polytechnic Institute and State University and an MBA from Duke University Fuqua School of Business. |
Assisted by Invesco’s Global Asset Allocation Team
5 Invesco Balanced-Risk Allocation Fund
Your Fund’s Long-Term Performance
Results of a $10,000 Investment – Oldest Share Class(es) since Inception
Fund and index data from 6/2/09
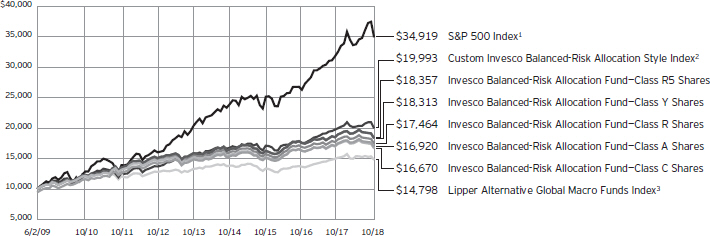
1 Source: FactSet Research Systems Inc.
2 Source(s): Invesco, FactSet Research Systems Inc., RIMES Technologies Corp.
3 Source: Lipper Inc.
Past performance cannot guarantee comparable future results.
The data shown in the chart include reinvested distributions, applicable sales charges and Fund expenses including management fees. Index results include reinvested dividends, but they do not reflect sales charges. Performance of the
peer group, if applicable, reflects fund expenses and management fees; performance of a market index does not. Performance shown in the chart and table(s) does not reflect deduction of taxes a shareholder would pay on Fund distributions or sale of Fund shares.
| | |
| 6 | | Invesco Balanced-Risk Allocation Fund |
| | | | |
| |
Average Annual Total Returns | |
As of 10/31/18, including maximum applicable sales charges | |
Class A Shares | | | | |
Inception (6/2/09) | | | 5.75 | % |
5 Years | | | 1.47 | |
1 Year | | | -8.82 | |
| |
Class C Shares | | | | |
Inception (6/2/09) | | | 5.58 | % |
5 Years | | | 1.87 | |
1 Year | | | -5.12 | |
| |
Class R Shares | | | | |
Inception (6/2/09) | | | 6.10 | % |
5 Years | | | 2.37 | |
1 Year | | | -3.82 | |
| |
Class Y Shares | | | | |
Inception (6/2/09) | | | 6.64 | % |
5 Years | | | 2.87 | |
1 Year | | | -3.34 | |
| |
Class R5 Shares | | | | |
Inception (6/2/09) | | | 6.67 | % |
5 Years | | | 2.91 | |
1 Year | | | -3.34 | |
| |
Class R6 Shares | | | | |
Inception | | | 6.63 | % |
5 Years | | | 3.01 | |
1 Year | | | -3.16 | |
| | | | |
| |
Average Annual Total Returns | |
As of 9/30/18, the most recent calendar quarter end, including maximum applicable sales charges | |
| |
Class A Shares | | | | |
Inception (6/2/09) | | | 6.29 | % |
5 Years | | | 2.70 | |
1 Year | | | -2.43 | |
| |
Class C Shares | | | | |
Inception (6/2/09) | | | 6.12 | % |
5 Years | | | 3.08 | |
1 Year | | | 1.43 | |
| |
Class R Shares | | | | |
Inception (6/2/09) | | | 6.65 | % |
5 Years | | | 3.60 | |
1 Year | | | 2.91 | |
| |
Class Y Shares | | | | |
Inception (6/2/09) | | | 7.20 | % |
5 Years | | | 4.14 | |
1 Year | | | 3.39 | |
| |
Class R5 Shares | | | | |
Inception (6/2/09) | | | 7.21 | % |
5 Years | | | 4.16 | |
1 Year | | | 3.39 | |
| |
Class R6 Shares | | | | |
Inception | | | 7.18 | % |
5 Years | | | 4.25 | |
1 Year | | | 3.48 | |
Class R6 shares incepted on September 24, 2012. Performance shown prior to that date is that of Class A shares and includes the 12b-1 fees applicable to Class A shares.
The performance data quoted represent past performance and cannot guarantee comparable future results; current performance may be lower or higher. Please visit invesco.com/performance for the most recent month-end performance. Performance figures reflect reinvested distributions, changes in net asset value and the effect of the maximum sales charge unless otherwise stated. Investment return and principal value will fluctuate so that you may have a gain or loss when you sell shares.
The net annual Fund operating expense ratio set forth in the most recent Fund prospectus as of the date of this report for Class A, Class C, Class R, Class Y, Class R5 and Class R6 shares was 1.31%, 2.06%, 1.56%, 1.06%, 1.01% and 0.94%, respectively.1 The total annual Fund operating expense ratio set forth in the most recent Fund prospectus as of the date of this report for Class A, Class C, Class R, Class Y,
Class R5 and Class R6 shares was 1.37%, 2.12%, 1.62%, 1.12%, 1.07% and 1.00%, respectively. The expense ratios presented above may vary from the expense ratios presented in other sections of this report that are based on expenses incurred during the period covered by this report.
Class A share performance reflects the maximum 5.50% sales charge, and Class C share performance reflects the applicable contingent deferred sales charge (CDSC) for the period involved. The CDSC on Class C shares is 1% for the first year after purchase. Class R, Class Y, Class R5 and Class R6 shares do not have a front-end sales charge or a CDSC; therefore, performance is at net asset value.
The performance of the Fund’s share classes will differ primarily due to different sales charge structures and class expenses.
Fund performance reflects any applicable fee waivers and/or expense reimbursements. Had the adviser not waived fees and/or reimbursed expenses currently or in the past, returns would have been lower. See current prospectus for more information.
| 1 | Total annual Fund operating expenses after any contractual fee waivers and/or expense reimbursements by the adviser in effect through at least June 30, 2020. See current prospectus for more information. |
7 Invesco Balanced-Risk Allocation Fund
Invesco Balanced-Risk Allocation Fund’s investment objective is to provide total return with a low to moderate correlation to traditional financial market indices.
| ∎ | | Unless otherwise stated, information presented in this report is as of October 31, 2018, and is based on total net assets. |
| ∎ | | Unless otherwise noted, all data provided by Invesco. |
| ∎ | | To access your Fund’s reports/prospectus, visit invesco.com/fundreports. |
About share classes
| ∎ | | Class R shares are generally available only to employer sponsored retirement and benefit plans. Please see the prospectus for more information. |
| ∎ | | Class Y shares are available only to certain investors. Please see the prospectus for more information. |
| ∎ | | Class R5 shares and Class R6 shares are available for use by retirement plans that meet certain standards and for institutional investors. Class R6 shares are also available through intermediaries that have established an agreement with Invesco Distributors, Inc. to make such shares available for use in retail omnibus accounts. Please see the prospectus for more information. |
Principal risks of investing in the Fund
| ∎ | | Changing fixed income market conditions risk. The current low interest rate environment was created in part by the Federal Reserve Board (FRB) and certain foreign central banks keeping the federal funds and equivalent foreign rates near, at or below zero. Increases in the federal funds and equivalent foreign rates may expose fixed income markets to heightened volatility and reduced liquidity for certain fixed income investments, particularly those with longer maturities. In addition, decreases in fixed income dealer market-making capacity may also potentially lead to heightened volatility and reduced liquidity in the fixed income markets. As a result, the value of the Fund’s investments and share price may decline. Changes in central bank policies could also result in higher than normal shareholder redemptions, which could potentially increase portfolio turnover and the Fund’s transaction costs. |
| ∎ | | Commodities tax risk. The tax treatment of commodity-linked derivative instruments may be adversely affected by changes in legislation, regulations or other legally binding authority. If, as a result |
| | of any such adverse action, the income of the Fund from certain commodity-linked derivatives was treated as non-qualifying income, the Fund might fail to qualify as a regulated investment company and be subject to federal income tax at the Fund level. As a result of a recent announcement by the Internal Revenue Service, the Fund intends to invest in commodity-linked notes: (a) directly, relying on an opinion of counsel confirming that income from such investments should be qualifying income because such commodity-linked notes constitute securities under section 2(a)(36) of the 1940 Act or (b) indirectly through the Subsidiary. Should the Internal Revenue Service issue further guidance, or Congress enact legislation, that adversely affects the tax treatment of the Fund’s use of commodity-linked notes or the Subsidiary (which guidance might be applied to the Fund retroactively), it could, among other consequences, limit the Fund’s ability to pursue its investment strategy. |
| ∎ | | Commodity-linked notes risk. In addition to risks associated with the underlying commodities, investments in commodity-linked notes may be subject to additional risks, such as non-payment of interest and loss of principal, counterparty risk, lack of a secondary market and risk of greater volatility than traditional equity and debt securities. The value of the commodity-linked notes the Fund buys may fluctuate significantly because the values of the underlying investments to which they are linked are themselves volatile. Additionally, certain commodity-linked notes employ “economic” leverage by requiring payment by the issuer of an amount that is a multiple of the price increase or decrease of the underlying commodity, commodity index, or other economic variable. Such economic leverage will increase the volatility of the value of these commodity-linked notes and the Fund to the extent it invests in such notes. |
This report must be accompanied or preceded by a currently effective Fund prospectus, which contains more complete information, including sales charges and expenses. Investors should read it carefully before investing.
NOT FDIC INSURED | MAY LOSE VALUE | NO BANK GUARANTEE
| ∎ | | Commodity risk. The Fund may have investment exposure to the commodities markets and/or a particular sector of the commodities markets, which may subject the Fund to greater volatility than investments in traditional securities, such as stocks and bonds. Volatility in the commodities markets may be caused by changes in overall market movements, domestic and foreign political and economic events and policies, war, acts of terrorism, changes in domestic or foreign interest rates and/or investor expectations concerning interest rates, domestic and foreign inflation rates, investment and trading activities of mutual funds, hedge funds and commodities funds, and factors such as drought, floods, weather, livestock disease, embargoes, tariffs and other regulatory developments or supply and demand disruptions. Because the Fund’s performance may be linked to the performance of volatile commodities, investors should be willing to assume the risks of potentially significant fluctuations in the value of the Fund’s shares. |
| ∎ | | Correlation risk. Because the Fund’s investment strategy seeks to balance risk across three asset classes and, within each asset class, across different countries and investments, to the extent either the asset classes or the selected countries and investments become correlated in a way not anticipated by the Adviser, the Fund’s risk allocation process may result in magnified risks and loss instead of balancing (reducing) the risk of loss. |
| ∎ | | Debt securities risk. The prices of debt securities held by the Fund will be affected by changes in interest rates, the creditworthiness of the issuer and other factors. An increase in prevailing interest rates typically causes the value of existing debt securities to fall and often has a greater impact on longer-duration debt securities and higher quality debt securities. Falling interest rates will cause the Fund to reinvest the proceeds of debt securities that have been repaid by the issuer at lower interest rates. Falling interest rates may also reduce the Fund’s distributable income because interest payments on floating rate debt instruments held by the Fund will decline. The Fund could lose money on investments in debt securities if the issuer or |
| | |
| 8 | | Invesco Balanced-Risk Allocation Fund |
| | borrower fails to meet its obligations to make interest payments and/or to repay principal in a timely manner. Changes in an issuer’s financial strength, the market’s perception of such strength or in the credit rating of the issuer or the security may affect the value of debt securities. The Adviser’s credit analysis may fail to anticipate such changes, which could result in buying a debt security at an inopportune time or failing to sell a debt security in advance of a price decline or other credit event. |
| ∎ | | Derivatives risk. The value of a derivative instrument depends largely on (and is derived from) the value of an underlying security, currency, commodity, interest rate, index or other asset (each referred to as an underlying asset). In addition to risks relating to the underlying assets, the use of derivatives may include other, possibly greater, risks, including counterparty, leverage and liquidity risks. Counterparty risk is the risk that the counterparty to the derivative contract will default on its obligation to pay the Fund the amount owed or otherwise perform under the derivative contract. Derivatives create leverage risk because they do not require payment up front equal to the economic exposure created by owning the derivative. As a result, an adverse change in the value of the underlying asset could result in the Fund sustaining a loss that is substantially greater than the amount invested in the derivative, which may make the Fund’s returns more volatile and increase the risk of loss. Derivative instruments may also be less liquid than more traditional investments and the Fund may be unable to sell or close out its derivative positions at a desirable time or price. This risk may be more acute under adverse market conditions, during which the Fund may be most in need of liquidating its derivative positions. Derivatives may also be harder to value, less tax efficient and subject to changing government regulation that could impact the Fund’s ability to use certain derivatives or their cost. The SEC has proposed new regulations related to the use of derivatives and related instruments by registered investment companies. If adopted as proposed, these regulations would limit the Fund’s ability to engage in derivatives |
| | transactions and may result in increased costs or require the Fund to modify its investment strategies or to liquidate. Also, derivatives used for hedging or to gain or limit exposure to a particular market segment may not provide the expected benefits, particularly during adverse market conditions. These risks are greater for the Fund than most other mutual funds because the Fund will implement its investment strategy primarily through derivative instruments rather than direct investments in stocks/bonds. |
| ∎ | | Exchange-traded funds risk. In addition to the risks associated with the underlying assets held by the exchange-traded fund, investments in exchange-traded funds are subject to the following additional risks: (1) an exchange-traded fund’s shares may trade above or below its net asset value; (2) an active trading market for the exchange-traded fund’s shares may not develop or be maintained; (3) trading an exchange-traded fund’s shares may be halted by the listing exchange; (4) a passively managed exchange-traded fund may not track the performance of the reference asset; and (5) a passively managed exchange-traded fund may hold troubled securities. Investment in exchange-traded funds may involve duplication of management fees and certain other expenses, as the Fund indirectly bears its proportionate share of any expenses paid by the exchange-traded funds in which it invests. Further, certain exchange-traded funds in which the Fund may invest are leveraged, which may result in economic leverage, permitting the Fund to gain exposure that is greater than would be the case in an unlevered instrument and potentially resulting in greater volatility. |
| ∎ | | Exchange-traded notes risk. Exchange-traded notes are subject to credit risk, counterparty risk, and the risk that the value of the exchange-traded note may drop due to a downgrade in the issuer’s credit rating. The value of an exchange-traded note may also be influenced by time to maturity, level of supply and demand for the exchange-traded note, volatility and lack of liquidity in the underlying market, changes in the applicable interest rates, and economic, legal, political, or geographic events that affect |
| | the referenced underlying market or assets. The Fund will bear its proportionate share of any fees and expenses borne by an exchange-traded note in which it invests. For certain exchange-traded notes, there may be restrictions on the Fund’s right to redeem its investment, which is meant to be held until maturity. |
| ∎ | | Foreign government debt risk. Investments in foreign government debt securities (sometimes referred to as sovereign debt securities) involve certain risks in addition to those relating to foreign securities or debt securities generally. The issuer of the debt or the governmental authorities that control the repayment of the debt may be unable or unwilling to repay principal or interest when due in accordance with the terms of such debt, and the Fund may have limited recourse in the event of a default against the defaulting government. Without the approval of debt holders, some governmental debtors have in the past been able to reschedule or restructure their debt payments or declare moratoria on payments. |
| ∎ | | Foreign securities risk. The Fund’s foreign investments may be adversely affected by political and social instability, changes in economic or taxation policies, difficulty in enforcing obligations, decreased liquidity or increased volatility. Foreign investments also involve the risk of the possible seizure, nationalization or expropriation of the issuer or foreign deposits (in which the Fund could lose its entire investments in a certain market) and the possible adoption of foreign governmental restrictions such as exchange controls. Unless the Fund has hedged its foreign securities risk, foreign securities risk also involves the risk of negative foreign currency rate fluctuations, which may cause the value of securities denominated in such foreign currency (or other instruments through which the Fund has exposure to foreign currencies) to decline in value. Currency exchange rates may fluctuate significantly over short periods of time. Currency hedging strategies, if used, are not always successful. |
| ∎ | | Management risk. The Fund is actively managed and depends heavily on the Adviser’s judgment about markets, interest rates or the attractiveness, relative |
| | | | |
| 9 | | Invesco Balanced-Risk Allocation Fund | | |
continued from page 9
| | values, liquidity, or potential appreciation of particular investments made for the Fund’s portfolio. The Fund could experience losses if these judgments prove to be incorrect. Because the Fund’s investment process relies heavily on its asset allocation process, market movements that are counter to the portfolio managers’ expectations may have a significant adverse effect on the Fund’s net asset value. Additionally, legislative, regulatory, or tax developments may adversely affect management of the Fund and, therefore, the ability of the Fund to achieve its investment objective. |
| ∎ | | Market risk. The market values of the Fund’s investments, and therefore the value of the Fund’s shares, will go up and down, sometimes rapidly or unpredictably. Market risk may affect a single issuer, industry or section of the economy, or it may affect the market as a whole. Individual stock prices tend to go up and down more dramatically than those of certain other types of investments, such as bonds. During a general downturn in the financial markets, multiple asset classes may decline in value. When markets perform well, there can be no assurance that specific investments held by the Fund will rise in value. |
| ∎ | | Short position risk. Because the Fund’s potential loss on a short position arises from increases in the value of the asset sold short, the Fund will incur a loss on a short position, which is theoretically unlimited, if the price of the asset sold short increases from the short sale price. The counterparty to a short position or other market factors may prevent the Fund from closing out a short position at a desirable time or price and may reduce or eliminate any gain or result in a loss. In a rising market, the Fund’s short positions will cause the Fund to underperform the overall market and its peers that do not engage in shorting. If the Fund holds both long and short positions, and both positions decline simultaneously, the short positions will not provide any buffer (hedge) from declines in value of the Fund’s long positions. Certain types of short positions involve leverage, which may exaggerate any losses, potentially more than the actual cost of the investment, and will increase the volatility of the Fund’s returns. |
| ∎ | | Subsidiary risk. By investing in the Subsidiary, the Fund is indirectly exposed to risks associated with the Subsidiary’s investments. The Subsidiary is not registered under the Investment Company Act of 1940, as amended (1940 Act), and, except as otherwise noted in this |
| | prospectus, is not subject to the investor protections of the 1940 Act. Changes in the laws of the United States and/or the Cayman Islands, under which the Fund and the Subsidiary, respectively, are organized, could result in the inability of the Fund and/or the Subsidiary to operate as described in this prospectus and the SAI, and could negatively affect the Fund and its shareholders. |
| ∎ | | US government obligations risk. Obligations of US government agencies and authorities receive varying levels of support and may not be backed by the full faith and credit of the US government, which could affect the Fund’s ability to recover should they default. No assurance can be given that the US government will provide financial support to its agencies and authorities if it is not obligated by law to do so. |
| ∎ | | Volatility risk. Although the Fund’s investment strategy targets a specific volatility level, certain of the Fund’s investments may appreciate or decrease significantly in value over short periods of time. This may cause the Fund’s net asset value per share to experience significant increases or declines in value over short periods of time. |
About indexes used in this report
| ∎ | | The S&P 500® Index is an unmanaged index considered representative of the US stock market. |
| ∎ | | The Custom Invesco Balanced-Risk Allocation Style Index is composed of 60% MSCI World Index and 40% Bloomberg Barclays U.S. Aggregate Bond Index. Effective December 1, 2009, the fixed income component of the Custom Balanced-Risk Allocation Style Index changed from the JP Morgan Global (Traded) Index to the Bloomberg Barclays U.S. Aggregate Bond Index. |
| ∎ | | The Lipper Alternative Global Macro Funds Index is an unmanaged index considered representative of alternative global macro funds tracked by Lipper. |
| ∎ | | The MSCI World IndexSM is an unmanaged index considered representative of stocks of developed countries. The index return is computed using the net return, which withholds applicable taxes for non-resident investors. |
| ∎ | | The Bloomberg Barclays U.S. Aggregate Bond Index is an unmanaged index considered representative of the US investment grade, fixed-rate bond market. The index return is computed using the net return, which withholds applicable taxes for non-resident investors. |
| ∎ | | The JP Morgan Global (Traded) Index is considered representative of fixed-rate debt of developed government bond markets. |
| ∎ | | The Fund is not managed to track the performance of any particular index, including the index(es) described here, and consequently, the performance of the Fund may deviate significantly from the performance of the index(es). |
| ∎ | | A direct investment cannot be made in an index. Unless otherwise indicated, index results include reinvested dividends, and they do not reflect sales charges. Performance of the peer group, if applicable, reflects fund expenses; performance of a market index does not. |
Other information
| ∎ | | The returns shown in management’s discussion of Fund performance are based on net asset values (NAVs) calculated for shareholder transactions. Generally accepted accounting principles require adjustments to be made to the net assets of the Fund at period end for financial reporting purposes, and as such, the NAVs for shareholder transactions and the returns based on those NAVs may differ from the NAVs and returns reported in the Financial Highlights. |
| | |
| 10 | | Invesco Balanced-Risk Allocation Fund |
Consolidated Schedule of Investments
October 31, 2018
| | | | | | | | | | | | | | | | |
| | | Interest
Rate | | | Maturity
Date | | | Principal
Amount | | | Value | |
U.S. Treasury Securities–38.41% | | | | | | | | | | | | | | | | |
| U.S. Treasury Bills–15.10%(a) | | | | | | | | | | | | | | | | |
U.S. Treasury Bills | | | 0.47 | % | | | 12/13/2018 | | | $ | 260,000,000 | | | $ | 259,381,200 | |
U.S. Treasury Bills | | | 0.66 | % | | | 12/27/2018 | | | | 134,000,000 | | | | 133,570,605 | |
U.S. Treasury Bills | | | 1.31 | % | | | 01/24/2019 | | | | 203,000,000 | | | | 201,930,526 | |
| | | | | | | | | | | | | | | | 594,882,331 | |
| | | | |
| U.S. Treasury Notes–23.31% | | | | | | | | | | | | | | | | |
U.S. Treasury Floating Rate Notes (3 mo. U.S. Treasury Bill Money Market Yield Rate)(b) | | | 2.31 | % | | | 01/31/2020 | | | | 334,000,000 | | | | 334,068,514 | |
U.S. Treasury Floating Rate Notes (3 mo. U.S. Treasury Bill Money Market Yield Rate + 0.03%)(b) | | | 2.35 | % | | | 04/30/2020 | | | | 346,240,000 | | | | 346,381,401 | |
U.S. Treasury Floating Rate Notes (3 mo. U.S. Treasury Bill Money Market Yield Rate + 0.04%)(b) | | | 2.36 | % | | | 07/31/2020 | | | | 237,520,000 | | | | 237,612,452 | |
| | | | | | | | | | | | | | | | 918,062,367 | |
Total U.S. Treasury Securities (Cost $1,512,674,474) | | | | | | | | | | | | | | | 1,512,944,698 | |
| | | | |
| | | | | | Expiration
Date | | | | | | | |
Commodity-Linked Securities–3.85% | | | | | | | | | | | | | | | | |
Canadian Imperial Bank of Commerce EMTN, U.S. Federal Funds Effective Rate minus 0.03% (linked to the Canadian Imperial Bank of Commerce Custom 7 Agriculture Commodity Index, multiplied by 2) (Canada)(c)(*) | | | | | | | 08/23/2019 | | | | 68,200,000 | | | | 65,343,386 | |
RBC Capital Markets, LLC, Commodity-Linked Notes, U.S. Federal Funds Effective Rate minus 0.04% (linked to the RBC Enhanced Agricultural Basket 07 Excess Return Index)(c)(*) | | | | | | | 08/30/2019 | | | | 88,700,000 | | | | 86,151,162 | |
Total Commodity-Linked Securities (Cost $156,900,000) | | | | | | | | | | | | | | | 151,494,548 | |
| | | | |
| | | | | | | | | Shares | | | | |
Money Market Funds–52.16% | | | | | | | | | | | | | | | | |
Invesco Government & Agency Portfolio–Institutional Class, 2.08%(d) | | | | | | | | | | | 717,570,356 | | | | 717,570,356 | |
Invesco Liquid Assets Portfolio–Institutional Class, 2.27%(d) | | | | | | | | | | | 103,606,193 | | | | 103,626,914 | |
Invesco STIC (Global Series) PLC–U.S. Dollar Liquidity Portfolio (Ireland)–Institutional Class, 2.26%(d) | | | | | | | | | | | 67,723,716 | | | | 67,723,716 | |
Invesco Treasury Obligations Portfolio–Institutional Class, 2.04%(d) | | | | | | | | | | | 1,000,000,000 | | | | 1,000,000,000 | |
Invesco Treasury Portfolio–Institutional Class, 2.09%(d) | | | | | | | | | | | 165,707,836 | | | | 165,707,836 | |
Total Money Market Funds (Cost $2,054,616,315) | | | | | | | | | | | | | | | 2,054,628,822 | |
TOTAL INVESTMENTS IN SECURITIES–94.42% (Cost $3,724,190,789) | | | | | | | | | | | | | | | 3,719,068,068 | |
OTHER ASSETS LESS LIABILITIES–5.58% | | | | | | | | | | | | | | | 219,929,352 | |
NET ASSETS–100.00% | | | | | | | | | | | | | | $ | 3,938,997,420 | |
| | | | | | | | | | | | | | | | | | | | |
| Open Futures Contracts(e) | |
| Long Futures Contracts | | Number of
Contracts | | | Expiration Month | | | Notional Value | | | Value | | | Unrealized
Appreciation
(Depreciation) | |
Brent Crude | | | 1,020 | | | | March-2019 | | | $ | 76,551,000 | | | $ | (2,135,532 | ) | | $ | (2,135,532 | ) |
Gasoline Reformulated Blendstock Oxygenate Blending | | | 1,353 | | | | November-2018 | | | | 99,525,057 | | | | (6,201,247 | ) | | | (6,201,247 | ) |
Natural Gas | | | 490 | | | | November-2018 | | | | 15,978,900 | | | | 480,538 | | | | 480,538 | |
New York Harbor Ultra-Low Sulfur Diesel | | | 393 | | | | February-2019 | | | | 36,877,705 | | | | (2,571,754 | ) | | | (2,571,754 | ) |
Silver | | | 653 | | | | December-2018 | | | | 46,630,730 | | | | (1,930,559 | ) | | | (1,930,559 | ) |
WTI Crude | | | 788 | | | | March-2019 | | | | 51,913,440 | | | | (6,249,528 | ) | | | (6,249,528 | ) |
Subtotal — Commodity Risk | | | | | | | | | | | | | | $ | (18,608,082 | ) | | $ | (18,608,082 | ) |
See accompanying Notes to Consolidated Financial Statements which are an integral part of the financial statements.
11 Invesco Balanced-Risk Allocation Fund
| | | | | | | | | | | | | | | | | | | | |
| Open Futures Contracts(e)—(continued) | |
| Long Futures Contracts | | Number of
Contracts | | | Expiration Month | | | Notional Value | | | Value | | | Unrealized
Appreciation
(Depreciation) | |
E-Mini Russell 2000 Index | | | 3,030 | | | | December-2018 | | | $ | 229,052,850 | | | $ | (31,491,914 | ) | | $ | (31,491,914 | ) |
E-Mini S&P 500 Index | | | 1,840 | | | | December-2018 | | | | 249,421,200 | | | | (17,183,468 | ) | | | (17,183,468 | ) |
EURO STOXX 50 Index | | | 6,800 | | | | December-2018 | | | | 246,002,594 | | | | (10,620,475 | ) | | | (10,620,475 | ) |
FTSE 100 Index | | | 3,340 | | | | December-2018 | | | | 303,582,029 | | | | (6,762,468 | ) | | | (6,762,468 | ) |
Hang Seng Index | | | 1,435 | | | | November-2018 | | | | 227,923,444 | | | | 1,269,726 | | | | 1,269,726 | |
Tokyo Stock Price Index | | | 2,775 | | | | December-2018 | | | | 403,578,234 | | | | (8,995,037 | ) | | | (8,995,037 | ) |
Subtotal — Equity Risk | | | | | | | | | | | | | | | (73,783,636 | ) | | | (73,783,636 | ) |
10 Year Mini Japanese Government Bonds | | | 44 | | | | December-2018 | | | | 58,738,157 | | | | 189,344 | | | | 189,344 | |
Australia 10 Year Bonds | | | 9,030 | | | | December-2018 | | | | 827,541,728 | | | | (2,722,358 | ) | | | (2,722,358 | ) |
Canada 10 Year Bonds | | | 6,630 | | | | December-2018 | | | | 665,543,317 | | | | (11,503,720 | ) | | | (11,503,720 | ) |
Euro Bund | | | 3,195 | | | | December-2018 | | | | 579,951,749 | | | | 581,812 | | | | 581,812 | |
Long Gilt | | | 2,085 | | | | December-2018 | | | | 326,228,478 | | | | 441,047 | | | | 441,047 | |
U.S. Treasury Long Bonds | | | 2,190 | | | | December-2018 | | | | 302,493,750 | | | | (14,409,519 | ) | | | (14,409,519 | ) |
Subtotal — Interest Rate Risk | | | | | | | | | | | | | | | (27,423,394 | ) | | | (27,423,394 | ) |
Total Futures Contracts | | | | | | | | | | | | | | $ | (119,815,112 | ) | | $ | (119,815,112 | ) |
| | | | | | | | | | | | | | | | | | | | | | | | | | | | | | | | | | | | | | | | |
| Open Over-The-Counter Total Return Swap Agreements(f)(g) | |
| Counterparty | | Pay/ Receive | | | Reference Entity(*) | | | Fixed
Rate | | | Payment Frequency | | | Number of Contracts | | | Maturity Date | | | Notional Value | | | Upfront Payments Paid (Received) | | | Value | | | Unrealized
Appreciation
(Depreciation) | |
Cargill, Inc. | | | Receive | | |
| Monthly Rebalance Commodity
Excess Return Index |
| | | 0.47 | % | | | Monthly | | | | 139,500 | | | | July-2019 | | | $ | 103,178,901 | | | $ | — | | | $ | 0 | | | $ | 0 | |
JPMorgan Chase Bank, N.A. | | | Receive | | |
| J.P. Morgan Contag Beta Gas
Oil Excess Return Index |
| | | 0.25 | | | | Monthly | | | | 145,500 | | | | April-2019 | | | | 44,157,359 | | | | — | | | | 0 | | | | 0 | |
Merrill Lynch International | | | Receive | | |
| Merrill Lynch Gold Excess
Return Index |
| | | 0.14 | | | | Monthly | | | | 132,000 | | | | June-2019 | | | | 19,960,142 | | | | — | | | | 0 | | | | 0 | |
Merrill Lynch International | | | Receive | | |
| MLCX Dynamic Enhanced
Copper Excess Return Index |
| | | 0.25 | | | | Monthly | | | | 83,500 | | | | September-2019 | | | | 47,696,536 | | | | — | | | | 0 | | | | 0 | |
Merrill Lynch International | | | Receive | | |
| MLCX Natural Gas Annual
Excess Return Index |
| | | 0.25 | | | | Monthly | | | | 1,360,000 | | | | November-2018 | | | | 63,192,373 | | | | — | | | | 0 | | | | 0 | |
Subtotal — Commodity Risk | | | | | | | | | | | | | | | | | | | | | | | | — | | | | 0 | | | | 0 | |
Goldman Sachs International | | | Receive | | | | Hang Seng Index Futures | | | | — | | | | Monthly | | | | 195 | | | | November-2018 | | | | 30,813,516 | | | | — | | | | 165,295 | | | | 165,295 | |
Subtotal — Equity Risk | | | | | | | | | | | | | | | | | | | | | | | | | | | | — | | | | 165,295 | | | | 165,295 | |
Subtotal — Appreciation | | | | | | | | | | | | | | | | | | | | | | | | | | | | — | | | | 165,295 | | | | 165,295 | |
Barclays Bank PLC | | | Receive | | |
| Barclays Commodity Strategy
1452 Excess Return Index |
| | | 0.33 | | | | Monthly | | | | 99,000 | | | | October-2019 | | | $ | 49,241,283 | | | | — | | | | (1,614,769 | ) | | | (1,614,769 | ) |
Canadian Imperial Bank of Commerce | | | Receive | | |
| Canadian Imperial Bank of
Commerce Dynamic Roll LME
Copper Excess Return Index 2 |
| | | 0.30 | | | | Monthly | | | | 827,000 | | | | April-2019 | | | | 64,438,351 | | | | — | | | | (2,511,020 | ) | | | (2,511,020 | ) |
Goldman Sachs International | | | Receive | | |
| Goldman Sachs Commodity
Strategy 1072 |
| | | 0.40 | | | | Monthly | | | | 283,000 | | | | July-2019 | | | | 21,978,765 | | | | — | | | | (297,197 | ) | | | (297,197 | ) |
JPMorgan Chase Bank, N.A. | | | Receive | | |
| J.P. Morgan Contag Beta
Copper Excess Return Index |
| | | 0.25 | | | | Monthly | | | | 70,500 | | | | June-2019 | | | | 26,832,385 | | | | — | | | | (1,064,952 | ) | | | (1,064,952 | ) |
JPMorgan Chase Bank, N.A. | | | Receive | | |
| S&P GSCI Gold Index Excess
Return |
| | | 0.09 | | | | Monthly | | | | 628,000 | | | | October-2019 | | | | 61,071,932 | | | | — | | | | (478,787 | ) | | | (478,787 | ) |
Macquarie Bank Ltd. | | | Receive | | |
| Macquarie Aluminum Dynamic
Selection Index |
| | | 0.30 | | | | Monthly | | | | 350,000 | | | | December-2018 | | | | 18,242,875 | | | | — | | | | (380,415 | ) | | | (380,415 | ) |
Morgan Stanley Capital Services LLC | | | Receive | | |
| S&P GSCI Aluminum Dynamic
Roll Index Excess Return |
| | | 0.38 | | | | Monthly | | | | 571,000 | | | | October-2019 | | | | 58,644,955 | | | | — | | | | (2,187,598 | ) | | | (2,187,598 | ) |
Subtotal — Commodity Risk | | | | | | | | | | | | | | | | | | | | | | | | — | | | | (8,534,738 | ) | | | (8,534,738 | ) |
Subtotal — Depreciation | | | | | | | | | | | | | | | | | | | | | | | | | | | | — | | | | (8,534,738 | ) | | | (8,534,738 | ) |
Total — Total Return Swap Agreements | | | | | | | | | | | | | | | | | | | $ | — | | | $ | (8,369,443 | ) | | $ | (8,369,443 | ) |
See accompanying Notes to Consolidated Financial Statements which are an integral part of the financial statements.
12 Invesco Balanced-Risk Allocation Fund
Investment Abbreviations:
| | |
| EMTN | | – European Medium Term Notes |
Notes to Consolidated Schedule of Investments:
| (a) | Securities traded on a discount basis. The interest rate shown represents the discount rate at the time of purchase by the Fund. |
| (b) | Interest or dividend rate is redetermined periodically. Rate shown is the rate in effect on October 31, 2018. |
| (c) | Security purchased or received in a transaction exempt from registration under the Securities Act of 1933, as amended (the “1933 Act”). The security may be resold pursuant to an exemption from registration under the 1933 Act, typically to qualified institutional buyers. The aggregate value of these securities at October 31, 2018 was $151,494,548, which represented 3.85% of the Fund’s Net Assets. |
| (d) | The money market fund and the Fund are affiliated by having the same investment adviser. The rate shown is the 7-day SEC standardized yield as of October 31, 2018. |
| (e) | Futures contracts collateralized by $186,220,000 cash held with Bank of America Merrill Lynch, the futures commission merchant. |
| (f) | The Fund receives or pays payments based on any positive or negative return on the Reference Entity, respectively. |
| (g) | Open Over-The-Counter total return swap agreements are collateralized by cash held with Counterparties in the amount of $37,245,501. |
| (*) | The table below includes additional information regarding the underlying components of certain reference entities that are not publicly available. |
| | | | | | |
| Reference Entity Components | |
| Reference Entity | | Underlying Components | | Percentage | |
Canadian Imperial Bank of Commerce Custom 7 Agriculture Commodity Index | |
| | |
| | Long Futures Contracts | | | | |
| | Coffee ‘C’ | | | 4.39 | % |
| | Corn | | | 5.04 | |
| | Cotton No. 2 | | | 20.55 | |
| | Lean Hogs | | | 0.51 | |
| | Live Cattle | | | 1.75 | |
| | Soybean Meal | | | 19.44 | |
| | Soybean Oil | | | 4.39 | |
| | Soybeans | | | 19.15 | |
| | Sugar No. 11 | | | 19.96 | |
| | Wheat | | | 4.82 | |
| | Total | | | 100.00 | % |
|
RBC Enhanced Agricultural Basket 07 Excess Return Index | |
| | |
| | Long Futures Contracts | | | | |
| | Coffee ‘C’ | | | 4.39 | % |
| | Corn | | | 5.04 | |
| | Cotton No. 2 | | | 20.55 | |
| | Lean Hogs | | | 0.51 | |
| | Live Cattle | | | 1.75 | |
| | Soybean Meal | | | 19.44 | |
| | Soybean Oil | | | 4.39 | |
| | Soybeans | | | 19.15 | |
| | Sugar No. 11 | | | 19.96 | |
| | Wheat | | | 4.82 | |
| | Total | | | 100.00 | % |
|
Monthly Rebalance Commodity Excess Return Index | |
| | |
| | Long Futures Contracts | | | | |
| | Coffee ‘C’ | | | 4.39 | % |
| | Corn | | | 5.04 | |
| | Cotton No. 2 | | | 20.55 | |
| | Lean Hogs | | | 0.51 | |
| | Live Cattle | | | 1.75 | |
| | Soybean Meal | | | 19.44 | |
| | Soybean Oil | | | 4.39 | |
| | Soybeans | | | 19.15 | |
| | Sugar No. 11 | | | 19.96 | |
| | Wheat | | | 4.82 | |
| | Total | | | 100.00 | % |
See accompanying Notes to Consolidated Financial Statements which are an integral part of the financial statements.
13 Invesco Balanced-Risk Allocation Fund
| | | | | | |
| Reference Entity Components—(continued) | |
| Reference Entity | | Underlying Components | | Percentage | |
J.P. Morgan Contag Beta Gas Oil Excess Return Index | |
| | |
| | Long Futures Contracts | | | | |
| | Gas Oil | | | 100.00 | % |
|
Merrill Lynch Gold Excess Return Index | |
| | Long Futures Contracts | | | | |
| | Gold | | | 100.00 | % |
|
MLCX Dynamic Enhanced Copper Excess Return Index | |
| | Long Futures Contracts | | | | |
| | Copper | | | 100.00 | % |
|
MLCX Natural Gas Annual Excess Return Index | |
| | Long Futures Contracts | | | | |
| | Natural Gas | | | 100.00 | % |
|
Barclays Commodity Strategy 1452 Excess Return Index | |
| | Long Futures Contracts | | | | |
| | Copper | | | 100.00 | % |
|
Canadian Imperial Bank of Commerce Dynamic Roll LME Copper Excess Return Index 2 | |
| | Long Futures Contracts | | | | |
| | Copper | | | 100.00 | % |
|
Goldman Sachs Commodity Strategy 1072 | |
| | Long Futures Contracts | | | | |
| | Coffee ‘C’ | | | 4.39 | % |
| | Corn | | | 5.04 | |
| | Cotton No. 2 | | | 20.55 | |
| | Lean Hogs | | | 0.51 | |
| | Live Cattle | | | 1.75 | |
| | Soybean Meal | | | 19.44 | |
| | Soybean Oil | | | 4.39 | |
| | Soybeans | | | 19.15 | |
| | Sugar No. 11 | | | 19.96 | |
| | Wheat | | | 4.82 | |
| | Total | | | 100.00 | % |
|
J.P. Morgan Contag Beta Copper Excess Return Index | |
| | Long Futures Contracts | | | | |
| | Copper | | | 100.00 | % |
|
S&P GSCI Gold Index Excess Return | |
| | Long Futures Contracts | | | | |
| | Gold | | | 100.00 | % |
|
Macquarie Aluminum Dynamic Selection Index | |
| | Long Futures Contracts | | | | |
| | Aluminum | | | 100.00 | % |
|
S&P GSCI Aluminum Dynamic Roll Index Excess Return | |
| | Long Futures Contracts | | | | |
| | Aluminum | | | 100.00 | % |
See accompanying Notes to Consolidated Financial Statements which are an integral part of the financial statements.
14 Invesco Balanced-Risk Allocation Fund
Consolidated Statement of Assets and Liabilities
October 31, 2018
| | | | |
Assets: | | | | |
Investments in securities, at value (Cost $1,669,574,474) | | $ | 1,664,439,246 | |
Investments in affiliated money market funds, at value (Cost $2,054,616,315) | | | 2,054,628,822 | |
Other investments: | | | | |
Variation margin receivable — futures contracts | | | 6,267,890 | |
Swaps receivable — OTC | | | 7,430,874 | |
Unrealized appreciation on swap agreements — OTC | | | 165,295 | |
Deposits with brokers: | | | | |
Cash collateral — exchange-traded futures contracts | | | 186,220,000 | |
Cash collateral — OTC derivatives | | | 37,245,501 | |
Receivable for: | | | | |
Dividends and interest | | | 4,305,921 | |
Fund shares sold | | | 2,703,325 | |
Investment for trustee deferred compensation and retirement plans | | | 588,996 | |
Other assets | | | 73,328 | |
Total assets | | | 3,964,069,198 | |
| |
Liabilities: | | | | |
Other investments: | | | | |
Unrealized depreciation on swap agreements — OTC | | | 8,534,738 | |
Swaps payable — OTC | | | 5,768,928 | |
Payable for: | | | | |
Amount due to custodian | | | 130,731 | |
Fund shares reacquired | | | 7,898,012 | |
Accrued fees to affiliates | | | 1,884,727 | |
Accrued trustees’ and officers’ fees and benefits | | | 6,534 | |
Accrued other operating expenses | | | 172,215 | |
Trustee deferred compensation and retirement plans | | | 675,893 | |
Total liabilities | | | 25,071,778 | |
Net assets applicable to shares outstanding | | $ | 3,938,997,420 | |
| |
Net assets consist of: | | | | |
Shares of beneficial interest | | $ | 3,997,518,613 | |
Distributable earnings | | | (58,521,193 | ) |
| | | $ | 3,938,997,420 | |
| | | | |
Net Assets: | | | | |
Class A | | $ | 1,016,131,454 | |
Class C | | $ | 735,307,985 | |
Class R | | $ | 19,988,596 | |
Class Y | | $ | 1,718,472,729 | |
Class R5 | | $ | 50,690,997 | |
Class R6 | | $ | 398,405,659 | |
|
Shares outstanding, no par value,
with an unlimited number of shares authorized: | |
Class A | | | 99,556,564 | |
Class C | | | 75,820,998 | |
Class R | | | 1,994,837 | |
Class Y | | | 165,649,764 | |
Class R5 | | | 4,883,795 | |
Class R6 | | | 38,313,709 | |
Class A: | | | | |
Net asset value per share | | $ | 10.21 | |
Maximum offering price per share | | | | |
(Net asset value of $10.21 ¸ 94.50%) | | $ | 10.80 | |
Class C: | | | | |
Net asset value and offering price per share | | $ | 9.70 | |
Class R: | | | | |
Net asset value and offering price per share | | $ | 10.02 | |
Class Y: | | | | |
Net asset value and offering price per share | | $ | 10.37 | |
Class R5: | | | | |
Net asset value and offering price per share | | $ | 10.38 | |
Class R6: | | | | |
Net asset value and offering price per share | | $ | 10.40 | |
See accompanying Notes to Consolidated Financial Statements which are an integral part of the financial statements.
15 Invesco Balanced-Risk Allocation Fund
Consolidated Statement of Operations
For the year ended October 31, 2018
| | | | |
Investment income: | | | | |
Interest | | $ | 29,593,431 | |
Dividends from affiliated money market funds | | | 40,867,555 | |
Total investment income | | | 70,460,986 | |
| |
Expenses: | | | | |
Advisory fees | | | 40,453,781 | |
Administrative services fees | | | 615,220 | |
Custodian fees | | | 100,583 | |
Distribution fees: | | | | |
Class A | | | 3,024,754 | |
Class B | | | 10,835 | |
Class C | | | 9,115,128 | |
Class R | | | 111,935 | |
Transfer agent fees — A, B, C, R and Y | | | 4,839,417 | |
Transfer agent fees — R5 | | | 79,884 | |
Transfer agent fees — R6 | | | 45,242 | |
Trustees’ and officers’ fees and benefits | | | 83,948 | |
Registration and filing fees | | | 202,364 | |
Reports to shareholders | | | 297,246 | |
Professional services fees | | | 166,574 | |
Other | | | 92,619 | |
Total expenses | | | 59,239,530 | |
Less: Fees waived and expense offset arrangement(s) | | | (2,830,040 | ) |
Net expenses | | | 56,409,490 | |
Net investment income | | | 14,051,496 | |
| |
Realized and unrealized gain (loss) from: | | | | |
Net realized gain (loss) from: | | | | |
Investment securities | | | (19,678,825 | ) |
Foreign currencies | | | (588,795 | ) |
Futures contracts | | | 142,277,034 | |
Swap agreements | | | (48,079,890 | ) |
| | | | 73,929,524 | |
Change in net unrealized appreciation (depreciation) of: | | | | |
Investment securities | | | (4,564,941 | ) |
Foreign currencies | | | (762,166 | ) |
Futures contracts | | | (217,200,507 | ) |
Swap agreements | | | (8,641,754 | ) |
| | | | (231,169,368 | ) |
Net realized and unrealized gain (loss) | | | (157,239,844 | ) |
Net increase (decrease) in net assets resulting from operations | | $ | (143,188,348 | ) |
See accompanying Notes to Consolidated Financial Statements which are an integral part of the financial statements.
16 Invesco Balanced-Risk Allocation Fund
Consolidated Statement of Changes in Net Assets
For the years ended October 31, 2018 and 2017
| | | | | | | | |
| | | 2018 | | | 2017 | |
Operations: | | | | | | | | |
Net investment income (loss) | | $ | 14,051,496 | | | $ | (27,225,221 | ) |
Net realized gain | | | 73,929,524 | | | | 214,440,934 | |
Change in net unrealized appreciation (depreciation) | | | (231,169,368 | ) | | | 194,728,338 | |
Net increase (decrease) in net assets resulting from operations | | | (143,188,348 | ) | | | 381,944,051 | |
| | |
Distributions to shareholders from distributable earnings(1): | | | | | | | | |
Class A | | | (80,624,333 | ) | | | (140,880,172 | ) |
Class B | | | (290,393 | ) | | | (580,186 | ) |
Class C | | | (65,247,506 | ) | | | (89,846,617 | ) |
Class R | | | (1,429,504 | ) | | | (2,041,777 | ) |
Class Y | | | (128,170,205 | ) | | | (137,254,087 | ) |
Class R5 | | | (7,249,597 | ) | | | (11,449,339 | ) |
Class R6 | | | (19,300,763 | ) | | | (22,976,759 | ) |
Total distributions from distributable earnings | | | (302,312,301 | ) | | | (405,028,937 | ) |
| | |
Share transactions–net: | | | | | | | | |
Class A | | | (205,218,146 | ) | | | (502,289,546 | ) |
Class B | | | (4,780,164 | ) | | | (3,444,466 | ) |
Class C | | | (218,982,102 | ) | | | (214,072,180 | ) |
Class R | | | (1,326,655 | ) | | | (3,615,578 | ) |
Class Y | | | (241,935,544 | ) | | | 376,209,099 | |
Class R5 | | | (60,343,625 | ) | | | (24,107,384 | ) |
Class R6 | | | 113,427,949 | | | | 32,561,955 | |
Net increase (decrease) in net assets resulting from share transactions | | | (619,158,287 | ) | | | (338,758,100 | ) |
Net increase (decrease) in net assets | | | (1,064,658,936 | ) | | | (361,842,986 | ) |
| | |
Net assets: | | | | | | | | |
Beginning of year | | | 5,003,656,356 | | | | 5,365,499,342 | |
End of year | | $ | 3,938,997,420 | | | $ | 5,003,656,356 | |
| (1) | For the year ended October 31, 2017, distributions to shareholders from distributable earnings consisted of distributions from net investment income and distributions from net realized gains. The Securities and Exchange Commission eliminated the requirement to disclose the distribution components separately, except for tax return of capital. For the year ended October 30, 2017, distributions from net investment income were $66,255,742, $237,993, $36,855,169, $922,264, $66,982,783, $5,634,379 and $11,414,824 and distributions from net realized gains were $74,624,430, $342,193, $52,991,448, $1,119,513, $70,271,304, $5,814,960, $11,561,935 for Class A, Class B, Class C, Class R, Class Y, Class R5 and Class R6 shares, respectively. |
Notes to Consolidated Financial Statements
October 31, 2018
NOTE 1—Significant Accounting Policies
Invesco Balanced-Risk Allocation Fund (the “Fund”) is a series portfolio of AIM Investment Funds (Invesco Investment Funds) (the “Trust”). The Trust is organized as a Delaware statutory trust and is registered under the Investment Company Act of 1940, as amended (the “1940 Act”), as an open-end series management investment company authorized to issue an unlimited number of shares of beneficial interest. Information presented in these consolidated financial statements pertains only to the Fund. Matters affecting the Fund or each class will be voted on exclusively by the shareholders of the Fund or each class.
The Fund will seek to gain exposure to the commodity markets primarily through investments in the Invesco Cayman Commodity Fund I Ltd. (the “Subsidiary”), a wholly-owned subsidiary of the Fund organized under the laws of the Cayman Islands. The Subsidiary was organized by the Fund to invest in commodity-linked derivatives and other securities that may provide leveraged and non-leveraged exposure to commodities. The Fund may invest up to 25% of its total assets in the Subsidiary.
The Fund’s investment objective is to provide total return with a low to moderate correlation to traditional financial market indices.
The Fund currently consists of six different classes of shares: Class A, Class C, Class R, Class Y, Class R5 and Class R6. Class Y shares are available only to certain investors. Class A shares are sold with a front-end sales charge unless certain waiver criteria are met. Under certain circumstances, load waived shares may be subject to contingent deferred sales charges (“CDSC”). Class C shares are sold with a CDSC. Class R, Class Y, Class R5 and Class R6 shares are sold at net asset value. Effective November 30, 2010, new or additional investments in Class B shares are no longer permitted. Existing shareholders of Class B shares were permitted to continue to reinvest dividends and capital gains distributions in Class B shares until their
17 Invesco Balanced-Risk Allocation Fund
conversion to Class A shares. Also, shareholders in Class B shares were able to exchange those shares for Class B shares of other Invesco Funds offering such shares until they converted to Class A shares. Generally, Class B shares automatically converted to Class A shares on or about the month-end, which was at least eight years after the date of purchase. Redemptions of Class B shares prior to the conversion date were subject to a CDSC. Effective January 26, 2018, all of the Fund’s outstanding Class B shares were converted to Class A shares, in advance of their normally scheduled conversion. No CDSC was paid in connection with this early conversion.
The Fund is an investment company and accordingly follows the investment company accounting and reporting guidance in accordance with Financial Accounting Standards Board Accounting Standards Codification Topic 946, Financial Services — Investment Companies.
The following is a summary of the significant accounting policies followed by the Fund in the preparation of its consolidated financial statements.
| A. | Security Valuations — Securities, including restricted securities, are valued according to the following policy. |
Debt obligations (including convertible securities) and unlisted equities are fair valued using an evaluated quote provided by an independent pricing service. Evaluated quotes provided by the pricing service may be determined without exclusive reliance on quoted prices, and may reflect appropriate factors such as institution-size trading in similar groups of securities, developments related to specific securities, dividend rate (for unlisted equities), yield (for debt obligations), quality, type of issue, coupon rate (for debt obligations), maturity (for debt obligations), individual trading characteristics and other market data. Pricing services generally value debt obligations assuming orderly transactions of institutional round lot size, but a fund may hold or transact in the same securities in smaller, odd lot sizes. Odd lots often trade at lower prices than institutional round lots. Debt obligations are subject to interest rate and credit risks. In addition, all debt obligations involve some risk of default with respect to interest and/or principal payments.
A security listed or traded on an exchange (except convertible securities) is valued at its last sales price or official closing price as of the close of the customary trading session on the exchange where the security is principally traded, or lacking any sales or official closing price on a particular day, the security may be valued at the closing bid price on that day. Securities traded in the over-the-counter market are valued based on prices furnished by independent pricing services or market makers. When such securities are valued by an independent pricing service they may be considered fair valued. Futures contracts are valued at the final settlement price set by an exchange on which they are principally traded. Listed options are valued at the mean between the last bid and asked prices from the exchange on which they are principally traded. Options not listed on an exchange are valued by an independent source at the mean between the last bid and asked prices. For purposes of determining net asset value (“NAV”) per share, futures and option contracts generally are valued 15 minutes after the close of the customary trading session of the New York Stock Exchange (“NYSE”).
Investments in open-end and closed-end registered investment companies that do not trade on an exchange are valued at the end-of-day net asset value per share. Investments in open-end and closed-end registered investment companies that trade on an exchange are valued at the last sales price or official closing price as of the close of the customary trading session on the exchange where the security is principally traded.
Swap agreements are fair valued using an evaluated quote, if available, provided by an independent pricing service. Evaluated quotes provided by the pricing service are valued based on a model which may include end-of-day net present values, spreads, ratings, industry, company performance and returns of referenced assets. Centrally cleared swap agreements are valued at the daily settlement price determined by the relevant exchange or clearinghouse.
Foreign securities’ (including foreign exchange contracts) prices are converted into U.S. dollar amounts using the applicable exchange rates as of the close of the NYSE. If market quotations are available and reliable for foreign exchange-traded equity securities, the securities will be valued at the market quotations. Because trading hours for certain foreign securities end before the close of the NYSE, closing market quotations may become unreliable. If between the time trading ends on a particular security and the close of the customary trading session on the NYSE, events occur that the investment adviser determines are significant and make the closing price unreliable, the Fund may fair value the security. If the event is likely to have affected the closing price of the security, the security will be valued at fair value in good faith using procedures approved by the Board of Trustees. Adjustments to closing prices to reflect fair value may also be based on a screening process of an independent pricing service to indicate the degree of certainty, based on historical data, that the closing price in the principal market where a foreign security trades is not the current value as of the close of the NYSE. Foreign securities’ prices meeting the approved degree of certainty that the price is not reflective of current value will be priced at the indication of fair value from the independent pricing service. Multiple factors may be considered by the independent pricing service in determining adjustments to reflect fair value and may include information relating to sector indices, American Depositary Receipts and domestic and foreign index futures. Foreign securities may have additional risks including exchange rate changes, potential for sharply devalued currencies and high inflation, political and economic upheaval, the relative lack of issuer information, relatively low market liquidity and the potential lack of strict financial and accounting controls and standards.
Securities for which market prices are not provided by any of the above methods may be valued based upon quotes furnished by independent sources. The last bid price may be used to value equity securities. The mean between the last bid and asked prices is used to value debt obligations, including corporate loans.
Securities for which market quotations are not readily available or became unreliable are valued at fair value as determined in good faith by or under the supervision of the Trust’s officers following procedures approved by the Board of Trustees. Issuer specific events, market trends, bid/asked quotes of brokers and information providers and other market data may be reviewed in the course of making a good faith determination of a security’s fair value.
The Fund may invest in securities that are subject to interest rate risk, meaning the risk that the prices will generally fall as interest rates rise and, conversely, the prices will generally rise as interest rates fall. Specific securities differ in their sensitivity to changes in interest rates depending on their individual characteristics. Changes in interest rates may result in increased market volatility, which may affect the value and/or liquidity of certain Fund investments.
Valuations change in response to many factors including the historical and prospective earnings of the issuer, the value of the issuer’s assets, general economic conditions, interest rates, investor perceptions and market liquidity. Because of the inherent uncertainties of valuation, the values reflected in the consolidated financial statements may materially differ from the value received upon actual sale of those investments.
| B. | Securities Transactions and Investment Income — Securities transactions are accounted for on a trade date basis. Realized gains or losses on sales are computed on the basis of specific identification of the securities sold. Interest income (net of withholding tax, if any) is recorded on the accrual basis from settlement date. Bond premiums and discounts are amortized and/or accreted over the lives of the respective |
18 Invesco Balanced-Risk Allocation Fund
| | securities. Pay-in-kind interest income and non-cash dividend income received in the form of securities in-lieu of cash are recorded at the fair value of the securities received. Dividend income (net of withholding tax, if any) is recorded on the ex-dividend date. |
The Fund may periodically participate in litigation related to Fund investments. As such, the Fund may receive proceeds from litigation settlements. Any proceeds received are included in the Consolidated Statement of Operations as realized gain (loss) for investments no longer held and as unrealized gain (loss) for investments still held.
Brokerage commissions and mark ups are considered transaction costs and are recorded as an increase to the cost basis of securities purchased and/or a reduction of proceeds on a sale of securities. Such transaction costs are included in the determination of net realized and unrealized gain (loss) from investment securities reported in the Consolidated Statement of Operations and the Consolidated Statement of Changes in Net Assets and the net realized and unrealized gains (losses) on securities per share in the Financial Highlights. Transaction costs are included in the calculation of the Fund’s net asset value and, accordingly, they reduce the Fund’s total returns. These transaction costs are not considered operating expenses and are not reflected in net investment income reported in the Consolidated Statement of Operations and the Consolidated Statement of Changes in Net Assets, or the net investment income per share and the ratios of expenses and net investment income reported in the Financial Highlights, nor are they limited by any expense limitation arrangements between the Fund and the investment adviser.
The Fund allocates income and realized and unrealized capital gains and losses to a class based on the relative net assets of each class.
| C. | Country Determination — For the purposes of making investment selection decisions and presentation in the Consolidated Schedule of Investments, the investment adviser may determine the country in which an issuer is located and/or credit risk exposure based on various factors. These factors include the laws of the country under which the issuer is organized, where the issuer maintains a principal office, the country in which the issuer derives 50% or more of its total revenues and the country that has the primary market for the issuer’s securities, as well as other criteria. Among the other criteria that may be evaluated for making this determination are the country in which the issuer maintains 50% or more of its assets, the type of security, financial guarantees and enhancements, the nature of the collateral and the sponsor organization. Country of issuer and/or credit risk exposure has been determined to be the United States of America, unless otherwise noted. |
| D. | Distributions — Distributions from net investment income and net realized capital gain, if any, are generally declared and paid annually and recorded on the ex-dividend date. The Fund may elect to treat a portion of the proceeds from redemptions as distributions for federal income tax purposes. |
| E. | Federal Income Taxes — The Fund intends to comply with the requirements of Subchapter M of the Internal Revenue Code of 1986, as amended (the “Internal Revenue Code”), necessary to qualify as a regulated investment company and to distribute substantially all of the Fund’s taxable earnings to shareholders. As such, the Fund will not be subject to federal income taxes on otherwise taxable income (including net realized capital gain) that is distributed to shareholders. Therefore, no provision for federal income taxes is recorded in the consolidated financial statements. |
The Fund recognizes the tax benefits of uncertain tax positions only when the position is more likely than not to be sustained. Management has analyzed the Fund’s uncertain tax positions and concluded that no liability for unrecognized tax benefits should be recorded related to uncertain tax positions. Management is not aware of any tax positions for which it is reasonably possible that the total amounts of unrecognized tax benefits will change materially in the next 12 months.
The Subsidiary is classified as a controlled foreign corporation under Subchapter N of the Internal Revenue Code. Therefore, the Fund is required to increase its taxable income by its share of the Subsidiary’s income. Net investment losses of the Subsidiary cannot be deducted by the Fund in the current period nor carried forward to offset taxable income in future periods.
The Fund files tax returns in the U.S. Federal jurisdiction and certain other jurisdictions. Generally the Fund is subject to examinations by such taxing authorities for up to three years after the filing of the return for the tax period.
| F. | Expenses — Fees provided for under the Rule 12b-1 plan of a particular class of the Fund are charged to the operations of such class. Transfer agency fees and expenses and other shareholder recordkeeping fees and expenses attributable to Class R5 and Class R6 are allocated to each share class based on relative net assets. Sub-accounting fees attributable to Class R5 are charged to the operations of the class. Transfer agency fees and expenses and other shareholder recordkeeping fees and expenses relating to all other classes are allocated among those classes based on relative net assets. All other expenses are allocated among the classes based on relative net assets. |
| G. | Accounting Estimates — The financial statements are prepared on a consolidated basis in conformity with accounting principles generally accepted in the United States of America (“GAAP”), which requires management to make estimates and assumptions that affect the reported amounts of assets and liabilities at the date of the financial statements and the reported amounts of revenues and expenses during the reporting period including estimates and assumptions related to taxation. Actual results could differ from those estimates by a significant amount. The accompanying financial statements reflect the financial position of the Fund and its Subsidiary and the results of operations on a consolidated basis. All inter-company accounts and transactions have been eliminated in consolidation. |
In addition, the Fund monitors for material events or transactions that may occur or become known after the period-end date and before the date the consolidated financial statements are released to print.
| H. | Indemnifications — Under the Trust’s organizational documents, each Trustee, officer, employee or other agent of the Trust, and under the Subsidiary’s organizational documents, the directors and officers of the Subsidiary, are indemnified against certain liabilities that may arise out of the performance of their duties to the Fund and/or the Subsidiary, respectively. Additionally, in the normal course of business, the Fund enters into contracts, including the Fund’s servicing agreements, that contain a variety of indemnification clauses. The Fund’s maximum exposure under these arrangements is unknown as this would involve future claims that may be made against the Fund that have not yet occurred. The risk of material loss as a result of such indemnification claims is considered remote. |
| I. | Structured Securities — The Fund may invest in structured securities. Structured securities are a type of derivative security whose value is determined by reference to changes in the value of underlying securities, currencies, interest rates, commodities, indices or other financial indicators (“reference instruments”). Most structured securities are fixed-income securities that have maturities of three years or less. Structured securities may be positively or negatively indexed (i.e., their principal value or interest rates may increase or decrease if the underlying reference instrument appreciates) and may have return characteristics similar to direct investments in the underlying reference instrument. |
Structured securities may entail a greater degree of market risk than other types of debt securities because the investor bears the risk of the reference instruments. In addition to the credit risk of structured securities and the normal risks of price changes in response to changes in
19 Invesco Balanced-Risk Allocation Fund
interest rates, the principal amount of structured notes or indexed securities may decrease as a result of changes in the value of the underlying reference instruments. Changes in the daily value of structured securities are recorded as unrealized gains (losses) in the Consolidated Statement of Operations. When the structured securities mature or are sold, the Fund recognizes a realized gain (loss) on the Consolidated Statement of Operations.
| J. | Foreign Currency Translations — Foreign currency is valued at the close of the NYSE based on quotations posted by banks and major currency dealers. Portfolio securities and other assets and liabilities denominated in foreign currencies are translated into U.S. dollar amounts at the date of valuation. Purchases and sales of portfolio securities (net of foreign taxes withheld on disposition) and income items denominated in foreign currencies are translated into U.S. dollar amounts on the respective dates of such transactions. The Fund does not separately account for the portion of the results of operations resulting from changes in foreign exchange rates on investments and the fluctuations arising from changes in market prices of securities held. The combined results of changes in foreign exchange rates and the fluctuation of market prices on investments (net of estimated foreign tax withholding) are included with the net realized and unrealized gain or loss from investments in the Consolidated Statement of Operations. Reported net realized foreign currency gains or losses arise from (1) sales of foreign currencies, (2) currency gains or losses realized between the trade and settlement dates on securities transactions, and (3) the difference between the amounts of dividends, interest, and foreign withholding taxes recorded on the Fund’s books and the U.S. dollar equivalent of the amounts actually received or paid. Net unrealized foreign currency gains and losses arise from changes in the fair values of assets and liabilities, other than investments in securities at fiscal period end, resulting from changes in exchange rates. |
The Fund may invest in foreign securities, which may be subject to foreign taxes on income, gains on investments or currency repatriation, a portion of which may be recoverable. Foreign taxes, if any, are recorded based on the tax regulations and rates that exist in the foreign markets in which the Fund invests and are shown in the Consolidated Statement of Operations.
| K. | Forward Foreign Currency Contracts — The Fund may engage in foreign currency transactions either on a spot (i.e. for prompt delivery and settlement) basis, or through forward foreign currency contracts, to manage or minimize currency or exchange rate risk. |
The Fund may also enter into forward foreign currency contracts for the purchase or sale of a security denominated in a foreign currency in order to “lock in” the U.S. dollar price of that security, or the Fund may also enter into forward foreign currency contracts that do not provide for physical settlement of the two currencies, but instead are settled by a single cash payment calculated as the difference between the agreed upon exchange rate and the spot rate at settlement based upon an agreed upon notional amount (non-deliverable forwards). The Fund will set aside liquid assets in an amount equal to the daily mark-to-market obligation for forward foreign currency contracts.
A forward foreign currency contract is an obligation between two parties (“Counterparties”) to purchase or sell a specific currency for an agreed-upon price at a future date. The use of forward foreign currency contracts does not eliminate fluctuations in the price of the underlying securities the Fund owns or intends to acquire but establishes a rate of exchange in advance. Fluctuations in the value of these contracts are measured by the difference in the contract date and reporting date exchange rates and are recorded as unrealized appreciation (depreciation) until the contracts are closed. When the contracts are closed, realized gains (losses) are recorded. Realized and unrealized gains (losses) on the contracts are included in the Consolidated Statement of Operations. The primary risks associated with forward foreign currency contracts include failure of the Counterparty to meet the terms of the contract and the value of the foreign currency changing unfavorably. These risks may be in excess of the amounts reflected in the Consolidated Statement of Assets and Liabilities.
| L. | Futures Contracts — The Fund may enter into futures contracts to equitize the Fund’s cash holdings or to manage exposure to interest rate, equity, commodity and market price movements and/or currency risks. A futures contract is an agreement between Counterparties to purchase or sell a specified underlying security, currency or commodity (or delivery of a cash settlement price, in the case of an index future) for a fixed price at a future date. The Fund currently invests only in exchange-traded futures and they are standardized as to maturity date and underlying financial instrument. Initial margin deposits required upon entering into futures contracts are satisfied by the segregation of specific securities or cash as collateral at the futures commission merchant (broker). During the period the futures contracts are open, changes in the value of the contracts are recognized as unrealized gains or losses by recalculating the value of the contracts on a daily basis. Subsequent or variation margin payments are received or made depending upon whether unrealized gains or losses are incurred. These amounts are reflected as receivables or payables on the Consolidated Statement of Assets and Liabilities. When the contracts are closed or expire, the Fund recognizes a realized gain or loss equal to the difference between the proceeds from, or cost of, the closing transaction and the Fund’s basis in the contract. The net realized gain (loss) and the change in unrealized gain (loss) on futures contracts held during the period is included on the Consolidated Statement of Operations. The primary risks associated with futures contracts are market risk and the absence of a liquid secondary market. If the Fund were unable to liquidate a futures contract and/or enter into an offsetting closing transaction, the Fund would continue to be subject to market risk with respect to the value of the contracts and continue to be required to maintain the margin deposits on the futures contracts. Futures contracts have minimal Counterparty risk since the exchange’s clearinghouse, as Counterparty to all exchange-traded futures, guarantees the futures against default. Risks may exceed amounts recognized in the Consolidated Statement of Assets and Liabilities. |
| M. | Swap Agreements — The Fund may enter into various swap transactions, including interest rate, total return, index, currency and credit default swap contracts (“CDS”) for investment purposes or to manage interest rate, currency, commodity or credit risk. Such transactions are agreements between Counterparties. These agreements may contain among other conditions, events of default and termination events, and various covenants and representations such as provisions that require the Fund to maintain a pre-determined level of net assets, and/or provide limits regarding the decline of the Fund’s NAV over specific periods of time. If the Fund were to trigger such provisions and have open derivative positions at that time, the Counterparty may be able to terminate such agreement and request immediate payment in an amount equal to the net liability positions, if any. |
Interest rate, total return, index, and currency swap agreements are two-party contracts entered into primarily to exchange the returns (or differentials in rates of returns) earned or realized on particular predetermined investments or instruments. The gross returns to be exchanged or “swapped” between the parties are calculated with respect to a notional amount, i.e., the return on or increase in value of a particular dollar amount invested at a particular interest rate or return of an underlying asset, in a particular foreign currency, or in a “basket” of securities representing a particular index. At the maturity date, a net cash flow is exchanged where the total return is equivalent to the return of the underlying reference less a financing rate, if any. As a receiver, the Fund would receive payments based on any positive total return and would
20 Invesco Balanced-Risk Allocation Fund
owe payments in the event of a negative total return. As the payer, the Fund would owe payments on any net positive total return, and would receive payment in the event of a negative total return.
Changes in the value of swap agreements are recognized as unrealized gains (losses) in the Consolidated Statement of Operations by “marking to market” on a daily basis to reflect the value of the swap agreement at the end of each trading day. Payments received or paid at the beginning of the agreement are reflected as such on the Consolidated Statement of Assets and Liabilities and may be referred to as upfront payments. The Fund accrues for the fixed payment stream and amortizes upfront payments, if any, on swap agreements on a daily basis with the net amount, recorded as a component of realized gain (loss) on the Consolidated Statement of Operations. A liquidation payment received or made at the termination of a swap agreement is recorded as realized gain (loss) on the Consolidated Statement of Operations. The Fund segregates cash or liquid securities having a value at least equal to the amount of the potential obligation of a Fund under any swap transaction. Cash held as collateral is recorded as deposits with brokers on the Consolidated Statement of Assets and Liabilities. Entering into these agreements involves, to varying degrees, lack of liquidity and elements of credit, market, and Counterparty risk in excess of amounts recognized on the Consolidated Statement of Assets and Liabilities. Such risks involve the possibility that a swap is difficult to sell or liquidate; the Counterparty does not honor its obligations under the agreement and unfavorable interest rates and market fluctuations. It is possible that developments in the swaps market, including potential government regulation, could adversely affect the Fund’s ability to terminate existing swap agreements or to realize amounts to be received under such agreements. A short position in a security poses more risk than holding the same security long. As there is no limit on how much the price of the security can increase, the Fund’s exposure is unlimited.
| N. | Other Risks — The Fund will seek to gain exposure to commodity markets primarily through an investment in the Subsidiary and through investments in exchange-traded funds and commodity-linked derivatives. The Subsidiary, unlike the Fund, may invest without limitation in commodities, commodity-linked derivatives and other securities, such as exchange-traded and commodity-linked notes, that may provide leveraged and non-leveraged exposure to commodity markets. The Fund is indirectly exposed to the risks associated with the Subsidiary’s investments. |
| O. | Leverage Risk — Leverage exists when the Fund can lose more than it originally invests because it purchases or sells an instrument or enters into a transaction without investing an amount equal to the full economic exposure of the instrument or transaction. |
| P. | Collateral — To the extent the Fund has designated or segregated a security as collateral and that security is subsequently sold, it is the Fund’s practice to replace such collateral no later than the next business day. |
NOTE 2—Advisory Fees and Other Fees Paid to Affiliates
The Trust has entered into a master investment advisory agreement with Invesco Advisers, Inc. (the “Adviser” or “Invesco”). Under the terms of the investment advisory agreement, the Fund accrues daily and pays monthly an advisory fee to the Adviser less the amount paid by the Subsidiary to the Adviser based on the annual rate of the Fund’s average daily net assets as follows:
| | | | |
| Average Daily Net Assets | | Rate | |
First $250 million | | | 0.95% | |
Next $250 million | | | 0.925% | |
Next $500 million | | | 0.90% | |
Next $1.5 billion | | | 0.875% | |
Next $2.5 billion | | | 0.85% | |
Next $2.5 billion | | | 0.825% | |
Next $2.5 billion | | | 0.80% | |
Over $10 billion | | | 0.775% | |
For the year ended October 31, 2018, the effective advisory fees incurred by the Fund was 0.87%.
The Subsidiary has entered into a separate contract with the Adviser whereby the Adviser provides investment advisory and other services to the Subsidiary. In consideration of these services, the Subsidiary pays an advisory fee to the Adviser based on the annual rate of the Subsidiary’s average daily net assets as set forth in the table above.
Under the terms of a master sub-advisory agreement between the Adviser and each of Invesco Asset Management Deutschland GmbH, Invesco Asset Management Limited, Invesco Asset Management (Japan) Limited, Invesco Hong Kong Limited, Invesco Senior Secured Management, Inc. and Invesco Canada Ltd. and separate sub-advisory agreements with Invesco Capital Management LLC, formerly Invesco PowerShares Capital Management LLC, and Invesco Asset Management (India) Private Limited (collectively, the “Affiliated Sub-Advisers”) the Adviser, not the Fund, will pay 40% of the fees paid to the Adviser to any such Affiliated Sub-Adviser(s) that provide(s) discretionary investment management services to the Fund based on the percentage of assets allocated to such Affiliated Sub-Adviser(s).
The Adviser has contractually agreed, through at least June 30, 2019, to waive advisory fees and/or reimburse expenses to the extent necessary to limit total annual fund operating expenses after fee waiver and/or expense reimbursement (excluding certain items discussed below) of Class A, Class C, Class R, Class Y, Class R5 and Class R6 shares to 2.00%, 2.75%, 2.25%, 1.75%, 1.75% and 1.75%, respectively, of the Fund’s average daily net assets (the “expense limits”). Prior to their conversion to Class A shares, the expense limit for Class B shares was 2.75% of average daily net assets. In determining the Adviser’s obligation to waive advisory fees and/or reimburse expenses, the following expenses are not taken into account, and could cause the total annual fund operating expenses after fee waiver and/or expense reimbursement to exceed the numbers reflected above: (1) interest; (2) taxes; (3) dividend expense on short sales; (4) extraordinary or non-routine items, including litigation expenses; and (5) expenses that the Fund has incurred but did not actually pay because of an expense offset arrangement. Acquired Fund Fees and Expenses are not operating expenses of the Fund directly, but are fees and expenses, including management fees of the investment companies in which the Fund invests. As a result, the total annual fund operating expenses after expense reimbursement may exceed the expense limits above. Unless Invesco continues the fee waiver agreement, it will terminate on June 30, 2019. During its term, the fee waiver agreement cannot be terminated or amended to increase the expense limits or reduce the advisory fee waiver without approval of the Board of Trustees. The Adviser did not waive fees and/or reimburse expenses during the period under these expense limits.
21 Invesco Balanced-Risk Allocation Fund
Further, the Adviser has contractually agreed, through at least June 30, 2020, to waive the advisory fee payable by the Fund in an amount equal to 100% of the net advisory fees the Adviser receives from the affiliated money market funds on investments by the Fund of uninvested cash in such affiliated money market funds.
For the year ended October 31, 2018, the Adviser waived advisory fees of $2,807,668.
The Trust has entered into a master administrative services agreement with Invesco pursuant to which the Fund has agreed to pay Invesco for certain administrative costs incurred in providing accounting services to the Fund. For the year ended October 31, 2018, expenses incurred under the agreement are shown in the Consolidated Statement of Operations as Administrative services fees.
The Trust has entered into a transfer agency and service agreement with Invesco Investment Services, Inc. (“IIS”) pursuant to which the Fund has agreed to pay IIS a fee for providing transfer agency and shareholder services to the Fund and reimburse IIS for certain expenses incurred by IIS in the course of providing such services. IIS may make payments to intermediaries that provide omnibus account services, sub-accounting services and/or networking services. All fees payable by IIS to intermediaries that provide omnibus account services or sub-accounting services are charged back to the Fund, subject to certain limitations approved by the Trust’s Board of Trustees. For the year ended October 31, 2018, expenses incurred under the agreement are shown in the Consolidated Statement of Operations as Transfer agent fees.
The Trust has entered into master distribution agreements with Invesco Distributors, Inc. (“IDI”) to serve as the distributor for the Class A, Class C, Class R, Class Y, Class R5 and Class R6 shares of the Fund. The Trust has adopted plans pursuant to Rule 12b-1 under the 1940 Act with respect to the Fund’s Class A, Class C and Class R shares (collectively, the “Plans”). The Fund, pursuant to the Plans, pays IDI compensation at the annual rate of 0.25% of the Fund’s average daily net assets of Class A shares, 1.00% of the average daily net assets of Class C shares and 0.50% of the average daily net assets of Class R shares. Prior to their conversion to Class A shares, the Fund paid an annual rate of 1.00% of the average daily net assets of Class B shares. The fees are accrued daily and paid monthly. Of the Plan payments, up to 0.25% of the average daily net assets of each class of shares may be paid to furnish continuing personal shareholder services to customers who purchase and own shares of such classes. Any amounts not paid as a service fee under the Plans would constitute an asset-based sales charge. Rules of the Financial Industry Regulatory Authority (“FINRA”) impose a cap on the total sales charges, including asset-based sales charges, that may be paid by any class of shares of the Fund. For the year ended October 31, 2018, expenses incurred under the Plans are shown in the Consolidated Statement of Operations as Distribution fees.
Front-end sales commissions and CDSC (collectively, the “sales charges”) are not recorded as expenses of the Fund. Front-end sales commissions are deducted from proceeds from the sales of Fund shares prior to investment in Class A shares of the Fund. CDSC are deducted from redemption proceeds prior to remittance to the shareholder. During the year ended October 31, 2018, IDI advised the Fund that IDI retained $165,811 in front-end sales commissions from the sale of Class A shares and $4,193 and $54,184 from Class A and Class C shares, respectively, for CDSC imposed on redemptions by shareholders.
Certain officers and trustees of the Trust are officers and directors of the Adviser, IIS and/or IDI.
NOTE 3—Additional Valuation Information
GAAP defines fair value as the price that would be received to sell an asset or paid to transfer a liability in an orderly transaction between market participants at the measurement date, under current market conditions. GAAP establishes a hierarchy that prioritizes the inputs to valuation methods, giving the highest priority to readily available unadjusted quoted prices in an active market for identical assets (Level 1) and the lowest priority to significant unobservable inputs (Level 3), generally when market prices are not readily available or are unreliable. Based on the valuation inputs, the securities or other investments are tiered into one of three levels. Changes in valuation methods may result in transfers in or out of an investment’s assigned level:
| | Level 1 — | Prices are determined using quoted prices in an active market for identical assets. |
| | Level 2 — | Prices are determined using other significant observable inputs. Observable inputs are inputs that other market participants may use in pricing a security. These may include quoted prices for similar securities, interest rates, prepayment speeds, credit risk, yield curves, loss severities, default rates, discount rates, volatilities and others. |
| | Level 3 — | Prices are determined using significant unobservable inputs. In situations where quoted prices or observable inputs are unavailable (for example, when there is little or no market activity for an investment at the end of the period), unobservable inputs may be used. Unobservable inputs reflect the Fund’s own assumptions about the factors market participants would use in determining fair value of the securities or instruments and would be based on the best available information. |
22 Invesco Balanced-Risk Allocation Fund
The following is a summary of the tiered valuation input levels, as of October 31, 2018. The level assigned to the securities valuations may not be an indication of the risk or liquidity associated with investing in those securities. Because of the inherent uncertainties of valuation, the values reflected in the consolidated financial statements may materially differ from the value received upon actual sale of those investments.
| | | | | | | | | | | | | | | | |
| | | Level 1 | | | Level 2 | | | Level 3 | | | Total | |
Investments in Securities | | | | | | | | | | | | | | | | |
U.S. Treasury Securities | | $ | — | | | $ | 1,512,944,698 | | | $ | — | | | $ | 1,512,944,698 | |
Commodity-Linked Securities | | | — | | | | 151,494,548 | | | | — | | | | 151,494,548 | |
Money Market Funds | | | 2,054,628,822 | | | | — | | | | — | | | | 2,054,628,822 | |
Total Investments in Securities | | | 2,054,628,822 | | | | 1,664,439,246 | | | | — | | | | 3,719,068,068 | |
Other Investments — Assets* | | | | | | | | | | | | | | | | |
Futures Contracts | | | 2,962,467 | | | | — | | | | — | | | | 2,962,467 | |
Swap Agreements | | | — | | | | 165,295 | | | | — | | | | 165,295 | |
| | | | 2,962,467 | | | | 165,295 | | | | — | | | | 3,127,762 | |
Other Investments — Liabilities* | | | | | | | | | | | | | | | | |
Futures Contracts | | | (122,777,579 | ) | | | — | | | | — | | | | (122,777,579 | ) |
Swap Agreements | | | — | | | | (8,534,738 | ) | | | — | | | | (8,534,738 | ) |
| | | | (122,777,579 | ) | | | (8,534,738 | ) | | | — | | | | (131,312,317 | ) |
Total Other Investments | | | (119,815,112 | ) | | | (8,369,443 | ) | | | — | | | | (128,184,555 | ) |
Total Investments | | $ | 1,934,813,710 | | | $ | 1,656,069,803 | | | $ | — | | | $ | 3,590,883,513 | |
| * | Unrealized appreciation (depreciation). |
NOTE 4—Derivative Investments
The Fund may enter into an International Swaps and Derivatives Association Master Agreement (“ISDA Master Agreement”) under which a fund may trade OTC derivatives. An OTC transaction entered into under an ISDA Master Agreement typically involves a collateral posting arrangement, payment netting provisions and close-out netting provisions. These netting provisions allow for reduction of credit risk through netting of contractual obligations. The enforceability of the netting provisions of the ISDA Master Agreement depends on the governing law of the ISDA Master Agreement, among other factors.
For financial reporting purposes, the Fund does not offset OTC derivative assets or liabilities that are subject to ISDA Master Agreements in the Consolidated Statement of Assets and Liabilities.
Value of Derivative Investments at Period-End
The table below summarizes the value of the Fund’s derivative investments, detailed by primary risk exposure, held as of October 31, 2018:
| | | | | | | | | | | | | | | | |
| | | Value | |
| Derivative Assets | | Commodity
Risk | | | Equity
Risk | | | Interest Rate
Risk | | | Total | |
Unrealized appreciation on futures contracts — Exchange-Traded(a) | | $ | 480,538 | | | $ | 1,269,726 | | | $ | 1,212,203 | | | $ | 2,962,467 | |
Unrealized appreciation on swap agreements — OTC | | | — | | | | 165,295 | | | | — | | | | 165,295 | |
Total Derivative Assets | | | 480,538 | | | | 1,435,021 | | | | 1,212,203 | | | | 3,127,762 | |
Derivatives not subject to master netting agreements | | | (480,538 | ) | | | (1,269,726 | ) | | | (1,212,203 | ) | | | (2,962,467 | ) |
Total Derivative Assets subject to master netting agreements | | $ | — | | | $ | 165,295 | | | $ | — | | | $ | 165,295 | |
| | | | |
| | | | | | | | | | | | | | | | |
| | | Value | |
| Derivative Liabilities | | Commodity
Risk | | | Equity
Risk | | | Interest Rate
Risk | | | Total | |
Unrealized depreciation on futures contracts — Exchange-Traded(a) | | $ | (19,088,620 | ) | | $ | (75,053,362 | ) | | $ | (28,635,597 | ) | | $ | (122,777,579 | ) |
Unrealized depreciation on swap agreements — OTC | | | (8,534,738 | ) | | | — | | | | — | | | | (8,534,738 | ) |
Total Derivative Liabilities | | | (27,623,358 | ) | | | (75,053,362 | ) | | | (28,635,597 | ) | | | (131,312,317 | ) |
Derivatives not subject to master netting agreements | | | 19,088,620 | | | | 75,053,362 | | | | 28,635,597 | | | | 122,777,579 | |
Total Derivative Liabilities subject to master netting agreements | | $ | (8,534,738 | ) | | $ | — | | | $ | — | | | $ | (8,534,738 | ) |
| (a) | The daily variation margin receivable at period-end is recorded in the Consolidated Statement of Assets and Liabilities. |
23 Invesco Balanced-Risk Allocation Fund
Offsetting Assets and Liabilities
The table below reflects the Fund’s exposure to Counterparties subject to either an ISDA Master Agreement or other agreement for OTC derivative transactions as of October 31, 2018.
| | | | | | | | | | | | | | | | | | | | | | | | |
| | | Financial
Derivative
Assets | | | Financial
Derivative
Liabilities | | | | | | Collateral (Received)/Pledged | | | | |
| Counterparty | | Swap
Agreements | | | Swap
Agreements | | | Net Value of
Derivatives | | | Non-Cash | | | Cash | | | Net Amount(a) | |
Parent | | | | | | | | | | | | | | | | | |
Goldman Sachs International | | $ | 165,295 | | | $ | (3,546,879 | ) | | $ | (3,381,584 | ) | | $ | — | | | $ | 2,830,000 | | | $ | (551,584 | ) |
| | | | | | |
Subsidiary | | | | | | | | | | | | | | | | | | | | | | | | |
Barclays Bank PLC | | | 3,619 | | | | (1,618,700 | ) | | | (1,615,081 | ) | | | — | | | | 1,615,081 | | | | — | |
Canadian Imperial Bank of Commerce | | | — | | | | (2,521,933 | ) | | | (2,521,933 | ) | | | — | | | | 2,521,933 | | | | — | |
Cargill, Inc. | | | 3,601,318 | | | | (43,614 | ) | | | 3,557,704 | | | | — | | | | (3,557,704 | ) | | | — | |
Goldman Sachs International | | | — | | | | (303,302 | ) | | | (303,302 | ) | | | — | | | | 303,302 | | | | — | |
JPMorgan Chase Bank, N.A. | | | — | | | | (1,549,992 | ) | | | (1,549,992 | ) | | | — | | | | 1,549,992 | | | | — | |
Macquarie Bank Ltd. | | | — | | | | (381,445 | ) | | | (381,445 | ) | | | — | | | | 381,445 | | | | — | |
Merrill Lynch International | | | 3,825,937 | | | | (2,122,907 | ) | | | 1,703,030 | | | | — | | | | — | | | | 1,703,030 | |
Morgan Stanley Capital Services LLC | | | — | | | | (2,214,894 | ) | | | (2,214,894 | ) | | | — | | | | 1,820,000 | | | | (394,894 | ) |
Subtotal — Subsidiary | | | 7,430,874 | | | | (10,756,787 | ) | | | (3,325,913 | ) | | | — | | | | 4,634,049 | | | | 1,308,136 | |
Total | | $ | 7,596,169 | | | $ | (14,303,666 | ) | | $ | (6,707,497 | ) | | $ | — | | | $ | 7,464,049 | | | $ | 756,552 | |
| (a) | The Fund and the Subsidiary are recognized as separate legal entities and as such are subject to separate netting arrangements with the Counterparty. |
Effect of Derivative Investments for the year ended October 31, 2018
The table below summarizes the gains (losses) on derivative investments, detailed by primary risk exposure, recognized in earnings during the period:
| | | | | | | | | | | | | | | | |
| | | Location of Gain (Loss) on
Consolidated Statement of Operations | |
| | | Commodity
Risk | | | Equity
Risk | | | Interest Rate
Risk | | | Total | |
Realized Gain (Loss): | | | | | | | | | | | | | | | | |
Futures contracts | | $ | 78,708,968 | | | $ | 101,129,395 | | | $ | (37,561,329 | ) | | $ | 142,277,034 | |
Swap agreements | | | (45,260,085 | ) | | | (1,692,318 | ) | | | (1,127,487 | ) | | | (48,079,890 | ) |
Change in Net Unrealized Appreciation (Depreciation): | | | | | | | | | | | | | | | | |
Futures contracts | | | (42,460,788 | ) | | | (168,283,685 | ) | | | (6,456,034 | ) | | | (217,200,507 | ) |
Swap agreements | | | (8,909,008 | ) | | | 267,254 | | | | — | | | | (8,641,754 | ) |
Total | | $ | (17,920,913 | ) | | $ | (68,579,354 | ) | | $ | (45,144,850 | ) | | $ | (131,645,117 | ) |
The table below summarizes the average notional value of futures contracts and swap agreements outstanding during the period.
| | | | | | | | |
| | | Futures Contracts | | | Swap Agreements | |
Average notional value | | $ | 5,519,189,210 | | | $ | 876,078,685 | |
NOTE 5—Expense Offset Arrangement(s)
The expense offset arrangement is comprised of transfer agency credits which result from balances in demand deposit accounts used by the transfer agent for clearing shareholder transactions. For the year ended October 31, 2018, the Fund received credits from this arrangement, which resulted in the reduction of the Fund’s total expenses of $22,372.
NOTE 6—Trustees’ and Officers’ Fees and Benefits
Trustees’ and Officers’ Fees and Benefits include amounts accrued by the Fund to pay remuneration to certain Trustees and Officers of the Fund. Trustees have the option to defer compensation payable by the Fund, and Trustees’ and Officers’ Fees and Benefits also include amounts accrued by the Fund to fund such deferred compensation amounts. Those Trustees who defer compensation have the option to select various Invesco Funds in which their deferral accounts shall be deemed to be invested. Finally, certain current Trustees were eligible to participate in a retirement plan that provided for benefits to be paid upon retirement to Trustees over a period of time based on the number of years of service. The Fund may have certain former Trustees who also participate in a retirement plan and receive benefits under such plan. Trustees’ and Officers’ Fees and Benefits include amounts accrued by the Fund to fund such retirement benefits. Obligations under the deferred compensation and retirement plans represent unsecured claims against the general assets of the Fund.
24 Invesco Balanced-Risk Allocation Fund
NOTE 7—Cash Balances
The Fund is permitted to temporarily carry a negative or overdrawn balance in its account with State Street Bank and Trust Company, the custodian bank. Such balances, if any at period-end, are shown in the Consolidated Statement of Assets and Liabilities under the payable caption Amount due custodian. To compensate the custodian bank for such overdrafts, the overdrawn Fund may either (1) leave funds as a compensating balance in the account so the custodian bank can be compensated by earning the additional interest; or (2) compensate by paying the custodian bank at a rate agreed upon by the custodian bank and Invesco, not to exceed the contractually agreed upon rate.
NOTE 8—Distributions to Shareholders and Tax Components of Net Assets
Tax Character of Distributions to Shareholders Paid During the Fiscal Years Ended October 31, 2018 and 2017:
| | | | | | | | |
| | | 2018 | | | 2017 | |
Ordinary income | | $ | 150,506,185 | | | $ | 276,778,756 | |
Long-term capital gain | | | 151,806,116 | | | | 128,250,181 | |
Total distributions | | $ | 302,312,301 | | | $ | 405,028,937 | |
Tax Components of Net Assets at Period-End:
| | | | |
| | | 2018 | |
Net unrealized appreciation (depreciation) — investments | | $ | (26,890,204 | ) |
Net unrealized appreciation (depreciation) — foreign currencies | | | (762,167 | ) |
Temporary book/tax differences | | | (646,206 | ) |
Capital loss carryforward | | | (30,222,616 | ) |
Shares of beneficial interest | | | 3,997,518,613 | |
Total net assets | | $ | 3,938,997,420 | |
The difference between book-basis and tax-basis unrealized appreciation (depreciation) is due to differences in the timing of recognition of gains and losses on investments for tax and book purposes. The Fund’s net unrealized appreciation (depreciation) difference is attributable primarily to futures contracts and swap agreements.
The temporary book/tax differences are a result of timing differences between book and tax recognition of income and/or expenses. The Fund’s temporary book/tax differences are the result of the trustee deferral of compensation and retirement plan benefits.
Capital loss carryforward is calculated and reported as of a specific date. Results of transactions and other activity after that date may affect the amount of capital loss carryforward actually available for the Fund to utilize. Capital losses generated in years beginning after December 22, 2010 can be carried forward for an unlimited period, whereas previous losses expire in eight tax years. Capital losses with an expiration period may not be used to offset capital gains until all net capital losses without an expiration date have been utilized. Capital loss carryforwards with no expiration date will retain their character as either short-term or long-term capital losses instead of as short-term capital losses as under prior law. The ability to utilize capital loss carryforwards in the future may be limited under the Internal Revenue Code and related regulations based on the results of future transactions.
The Fund has a capital loss carryforward as of October 31, 2018 as follows:
| | | | | | | | | | | | |
| Capital Loss Carryforward* | |
| Expiration | | Short-Term | | | Long-Term | | | Total | |
Not subject to expiration | | $ | 8,439,747 | | | $ | 21,782,869 | | | $ | 30,222,616 | |
* Capital loss carryforward as of the date listed above is reduced for limitations, if any, to the extent required by the Internal Revenue Code and may be further limited depending upon a variety of factors, including the realization of net unrealized gains or losses as of the date of any reorganization.
NOTE 9—Investment Transactions
The aggregate amount of investment securities (other than short-term securities, U.S. Treasury obligations and money market funds, if any) purchased and sold by the Fund during the year ended October 31, 2018 was $331,100,000 and $322,216,289, respectively. During the same period, purchases and sales of U.S. Treasury obligations were $973,760,000 and $1,053,106,542, respectively. Cost of investments, including any derivatives, on a tax basis includes the adjustments for financial reporting purposes as of the most recently completed federal income tax reporting period-end.
| | | | |
| Unrealized Appreciation (Depreciation) of Investments on a Tax Basis | |
Aggregate unrealized appreciation of investments | | $ | 3,443,649 | |
Aggregate unrealized (depreciation) of investments | | | (30,333,853 | ) |
Net unrealized appreciation (depreciation) of investments | | $ | (26,890,204 | ) |
Cost of investments for tax purposes is $3,617,773,717.
NOTE 10—Reclassification of Permanent Differences
Primarily as a result of differing book/tax treatment of income and distributions from the subsidiary, foreign currency transactions, net operating losses, futures contracts and swap agreements income, on October 31, 2018, undistributed net investment income was decreased by $5,277,367, undistributed net realized gain was increased by $53,830,405 and shares of beneficial interest was decreased by $48,553,038. This reclassification had no effect on the net assets of the Fund.
25 Invesco Balanced-Risk Allocation Fund
NOTE 11—Share Information
| | | | | | | | | | | | | | | | |
| | | Summary of Share Activity | |
| | | Years ended October 31, | |
| | | 2018(a) | | | 2017 | |
| | | Shares | | | Amount | | | Shares | | | Amount | |
Sold: | | | | | | | | | | | | | | | | |
Class A | | | 9,872,233 | | | $ | 106,846,923 | | | | 18,344,979 | | | $ | 199,052,527 | |
Class B(b) | | | 1,847 | | | | 19,646 | | | | 17,226 | | | | 180,479 | |
Class C | | | 3,832,309 | | | | 39,477,858 | | | | 7,991,905 | | | | 83,300,692 | |
Class R | | | 562,025 | | | | 5,940,987 | | | | 613,374 | | | | 6,597,183 | |
Class Y | | | 43,842,985 | | | | 480,152,084 | | | | 91,480,150 | | | | 1,002,638,508 | |
Class R5 | | | 1,599,242 | | | | 17,705,659 | | | | 367,417 | | | | 4,048,073 | |
Class R6 | | | 16,621,185 | | | | 182,521,790 | | | | 5,656,103 | | | | 62,767,897 | |
| | | | |
Issued as reinvestment of dividends: | | | | | | | | | | | | | | | | |
Class A | | | 7,313,079 | | | | 77,957,396 | | | | 12,977,593 | | | | 136,394,509 | |
Class B(b) | | | 28,468 | | | | 290,375 | | | | 57,085 | | | | 579,412 | |
Class C | | | 5,839,115 | | | | 59,558,974 | | | | 7,791,943 | | | | 79,088,220 | |
Class R | | | 118,620 | | | | 1,244,328 | | | | 164,218 | | | | 1,702,944 | |
Class Y | | | 9,951,049 | | | | 107,570,841 | | | | 10,355,586 | | | | 109,976,321 | |
Class R5 | | | 667,562 | | | | 7,223,017 | | | | 1,071,434 | | | | 11,378,630 | |
Class R6 | | | 1,782,157 | | | | 19,300,763 | | | | 2,159,386 | | | | 22,932,683 | |
| | | | |
Conversion of Class B shares to Class A shares:(c) | | | | | | | | | | | | | | | | |
Class A | | | 393,583 | | | | 4,329,415 | | | | 254,966 | | | | 2,780,044 | |
Class B | | | (411,272 | ) | | | (4,329,415 | ) | | | (264,857 | ) | | | (2,780,044 | ) |
| | | | |
Reacquired: | | | | | | | | | | | | | | | | |
Class A | | | (36,587,811 | ) | | | (394,351,880 | ) | | | (77,488,915 | ) | | | (840,516,626 | ) |
Class B(b) | | | (71,742 | ) | | | (760,770 | ) | | | (135,528 | ) | | | (1,424,313 | ) |
Class C | | | (30,903,065 | ) | | | (318,018,934 | ) | | | (35,969,659 | ) | | | (376,461,092 | ) |
Class R | | | (801,950 | ) | | | (8,511,970 | ) | | | (1,109,646 | ) | | | (11,915,705 | ) |
Class Y | | | (76,062,071 | ) | | | (829,658,469 | ) | | | (66,911,066 | ) | | | (736,405,730 | ) |
Class R5 | | | (7,801,543 | ) | | | (85,272,301 | ) | | | (3,647,987 | ) | | | (39,534,087 | ) |
Class R6 | | | (8,064,923 | ) | | | (88,394,604 | ) | | | (4,816,169 | ) | | | (53,138,625 | ) |
Net increase (decrease) in share activity | | | (58,278,918 | ) | | $ | (619,158,287 | ) | | | (31,040,462 | ) | | $ | (338,758,100 | ) |
| (a) | There are entities that are record owners of more than 5% of the outstanding shares of the Fund and in the aggregate own 41% of the outstanding shares of the Fund. IDI has an agreement with these entities to sell Fund shares. The Fund, Invesco and/or Invesco affiliates may make payments to these entities, which are considered to be related to the Fund, for providing services to the Fund, Invesco and/or Invesco affiliates including but not limited to services such as securities brokerage, distribution, third party record keeping and account servicing. The Fund has no knowledge as to whether all or any portion of the shares owned of record by these entities are also owned beneficially. |
| (b) | Reflects activity for the period November 1, 2017 through January 26, 2018 (date of conversion). |
| (c) | Effective as of the close of business January 26, 2018, all outstanding Class B shares were converted to Class A shares. |
26 Invesco Balanced-Risk Allocation Fund
NOTE 12—Financial Highlights
The following schedule presents financial highlights for a share of the Fund outstanding throughout the periods indicated.
| | | | | | | | | | | | | | | | | | | | | | | | | | | | | | | | | | | | | | | | | | | | | | | | | | | | | | | | |
| | | Net asset
value,
beginning
of period | | | Net
investment
income
(loss)(a) | | | Net gains
(losses)
on securities
(both
realized and
unrealized) | | | Total from
investment
operations | | | Dividends
from net
investment
income | | | Distributions
from net
realized
gains | | | Total
distributions | | | Net asset
value, end
of period | | | Total
return(b) | | | Net assets,
end of period
(000’s omitted) | | | Ratio of
expenses
to average
net assets
with fee waivers
and/or expenses
absorbed | | | Ratio of
expenses
to average net
assets without
fee waivers
and/or expenses
absorbed | | | Ratio of net
investment
income (loss)
to average
net assets | | | Portfolio
turnover(c) | |
Class A | | | | | | | | | | | | | | | | | | | | | | | | | | | | | | | | | | | | | | | | | | | | | | | | | | | | | | | | |
Year ended 10/31/18 | | $ | 11.28 | | | $ | 0.03 | | | $ | (0.40 | ) | | $ | (0.37 | ) | | $ | — | | | $ | (0.70 | ) | | $ | (0.70 | ) | | $ | 10.21 | | | | (3.57 | )% | | $ | 1,016,131 | | | | 1.21 | %(d) | | | 1.27 | %(d) | | | 0.32 | %(d) | | | 116 | % |
Year ended 10/31/17 | | | 11.34 | | | | (0.05 | ) | | | 0.87 | | | | 0.82 | | | | (0.41 | ) | | | (0.47 | ) | | | (0.88 | ) | | | 11.28 | | | | 7.76 | | | | 1,337,537 | | | | 1.22 | | | | 1.28 | | | | (0.49 | ) | | | 12 | |
Year ended 10/31/16 | | | 11.27 | | | | (0.10 | ) | | | 0.88 | | | | 0.78 | | | | (0.29 | ) | | | (0.42 | ) | | | (0.71 | ) | | | 11.34 | | | | 7.59 | | | | 1,864,271 | | | | 1.20 | | | | 1.27 | | | | (0.89 | ) | | | 96 | |
Year ended 10/31/15 | | | 12.36 | | | | (0.14 | ) | | | (0.05 | ) | | | (0.19 | ) | | | (0.24 | ) | | | (0.66 | ) | | | (0.90 | ) | | | 11.27 | | | | (1.64 | ) | | | 2,371,657 | | | | 1.21 | | | | 1.26 | | | | (1.16 | ) | | | 10 | |
Year ended 10/31/14 | | | 12.88 | | | | (0.14 | ) | | | 0.53 | | | | 0.39 | | | | — | | | | (0.91 | ) | | | (0.91 | ) | | | 12.36 | | | | 3.52 | | | | 2,938,957 | | | | 1.20 | | | | 1.24 | | | | (1.16 | ) | | | 72 | |
Class B | | | | | | | | | | | | | | | | | | | | | | | | | | | | | | | | | | | | | | | | | | | | | | | | | | | | | | | | |
Year ended 10/31/18(e) | | | 10.83 | | | | (0.01 | ) | | | 0.40 | | | | 0.39 | | | | — | | | | (0.70 | ) | | | (0.70 | ) | | | 10.52 | | | | 3.78 | | | | — | | | | 1.96 | (d)(f) | | | 2.02 | (d)(f) | | | (0.43 | )(d)(f) | | | 116 | |
Year ended 10/31/17 | | | 10.90 | | | | (0.12 | ) | | | 0.84 | | | | 0.72 | | | | (0.32 | ) | | | (0.47 | ) | | | (0.79 | ) | | | 10.83 | | | | 7.05 | | | | 4,903 | | | | 1.97 | | | | 2.03 | | | | (1.24 | ) | | | 12 | |
Year ended 10/31/16 | | | 10.85 | | | | (0.17 | ) | | | 0.83 | | | | 0.66 | | | | (0.19 | ) | | | (0.42 | ) | | | (0.61 | ) | | | 10.90 | | | | 6.67 | | | | 8,491 | | | | 1.95 | | | | 2.02 | | | | (1.64 | ) | | | 96 | |
Year ended 10/31/15 | | | 11.92 | | | | (0.22 | ) | | | (0.05 | ) | | | (0.27 | ) | | | (0.14 | ) | | | (0.66 | ) | | | (0.80 | ) | | | 10.85 | | | | (2.40 | ) | | | 13,242 | | | | 1.96 | | | | 2.01 | | | | (1.91 | ) | | | 10 | |
Year ended 10/31/14 | | | 12.53 | | | | (0.23 | ) | | | 0.53 | | | | 0.30 | | | | — | | | | (0.91 | ) | | | (0.91 | ) | | | 11.92 | | | | 2.85 | | | | 20,853 | | | | 1.95 | | | | 1.99 | | | | (1.91 | ) | | | 72 | |
Class C | | | | | | | | | | | | | | | | | | | | | | | | | | | | | | | | | | | | | | | | | | | | | | | | | | | | | | | | |
Year ended 10/31/18 | | | 10.83 | | | | (0.04 | ) | | | (0.39 | ) | | | (0.43 | ) | | | — | | | | (0.70 | ) | | | (0.70 | ) | | | 9.70 | | | | (4.31 | ) | | | 735,308 | | | | 1.96 | (d) | | | 2.02 | (d) | | | (0.43 | )(d) | | | 116 | |
Year ended 10/31/17 | | | 10.90 | | | | (0.12 | ) | | | 0.84 | | | | 0.72 | | | | (0.32 | ) | | | (0.47 | ) | | | (0.79 | ) | | | 10.83 | | | | 7.05 | | | | 1,051,038 | | | | 1.97 | | | | 2.03 | | | | (1.24 | ) | | | 12 | |
Year ended 10/31/16 | | | 10.85 | | | | (0.17 | ) | | | 0.83 | | | | 0.66 | | | | (0.19 | ) | | | (0.42 | ) | | | (0.61 | ) | | | 10.90 | | | | 6.67 | | | | 1,278,218 | | | | 1.95 | | | | 2.02 | | | | (1.64 | ) | | | 96 | |
Year ended 10/31/15 | | | 11.91 | | | | (0.22 | ) | | | (0.04 | ) | | | (0.26 | ) | | | (0.14 | ) | | | (0.66 | ) | | | (0.80 | ) | | | 10.85 | | | | (2.32 | ) | | | 1,584,982 | | | | 1.96 | | | | 2.01 | | | | (1.91 | ) | | | 10 | |
Year ended 10/31/14 | | | 12.53 | | | | (0.23 | ) | | | 0.52 | | | | 0.29 | | | | — | | | | (0.91 | ) | | | (0.91 | ) | | | 11.91 | | | | 2.77 | | | | 1,930,318 | | | | 1.95 | | | | 1.99 | | | | (1.91 | ) | | | 72 | |
Class R | | | | | | | | | | | | | | | | | | | | | | | | | | | | | | | | | | | | | | | | | | | | | | | | | | | | | | | | |
Year ended 10/31/18 | | | 11.11 | | | | 0.01 | | | | (0.40 | ) | | | (0.39 | ) | | | — | | | | (0.70 | ) | | | (0.70 | ) | | | 10.02 | | | | (3.82 | ) | | | 19,989 | | | | 1.46 | (d) | | | 1.52 | (d) | | | 0.07 | (d) | | | 116 | |
Year ended 10/31/17 | | | 11.18 | | | | (0.07 | ) | | | 0.85 | | | | 0.78 | | | | (0.38 | ) | | | (0.47 | ) | | | (0.85 | ) | | | 11.11 | | | | 7.48 | | | | 23,518 | | | | 1.47 | | | | 1.53 | | | | (0.74 | ) | | | 12 | |
Year ended 10/31/16 | | | 11.12 | | | | (0.12 | ) | | | 0.86 | | | | 0.74 | | | | (0.26 | ) | | | (0.42 | ) | | | (0.68 | ) | | | 11.18 | | | | 7.26 | | | | 27,359 | | | | 1.45 | | | | 1.52 | | | | (1.14 | ) | | | 96 | |
Year ended 10/31/15 | | | 12.20 | | | | (0.16 | ) | | | (0.05 | ) | | | (0.21 | ) | | | (0.21 | ) | | | (0.66 | ) | | | (0.87 | ) | | | 11.12 | | | | (1.86 | ) | | | 25,690 | | | | 1.46 | | | | 1.51 | | | | (1.41 | ) | | | 10 | |
Year ended 10/31/14 | | | 12.75 | | | | (0.17 | ) | | | 0.53 | | | | 0.36 | | | | — | | | | (0.91 | ) | | | (0.91 | ) | | | 12.20 | | | | 3.30 | | | | 28,166 | | | | 1.45 | | | | 1.49 | | | | (1.41 | ) | | | 72 | |
Class Y | | | | | | | | | | | | | | | | | | | | | | | | | | | | | | | | | | | | | | | | | | | | | | | | | | | | | | | | |
Year ended 10/31/18 | | | 11.43 | | | | 0.06 | | | | (0.42 | ) | | | (0.36 | ) | | | — | | | | (0.70 | ) | | | (0.70 | ) | | | 10.37 | | | | (3.42 | ) | | | 1,718,473 | | | | 0.96 | (d) | | | 1.02 | (d) | | | 0.57 | (d) | | | 116 | |
Year ended 10/31/17 | | | 11.47 | | | | (0.02 | ) | | | 0.88 | | | | 0.86 | | | | (0.43 | ) | | | (0.47 | ) | | | (0.90 | ) | | | 11.43 | | | | 8.15 | | | | 2,147,497 | | | | 0.97 | | | | 1.03 | | | | (0.24 | ) | | | 12 | |
Year ended 10/31/16 | | | 11.41 | | | | (0.07 | ) | | | 0.87 | | | | 0.80 | | | | (0.32 | ) | | | (0.42 | ) | | | (0.74 | ) | | | 11.47 | | | | 7.75 | | | | 1,755,257 | | | | 0.95 | | | | 1.02 | | | | (0.64 | ) | | | 96 | |
Year ended 10/31/15 | | | 12.51 | | | | (0.11 | ) | | | (0.05 | ) | | | (0.16 | ) | | | (0.28 | ) | | | (0.66 | ) | | | (0.94 | ) | | | 11.41 | | | | (1.40 | ) | | | 2,600,015 | | | | 0.96 | | | | 1.01 | | | | (0.91 | ) | | | 10 | |
Year ended 10/31/14 | | | 12.99 | | | | (0.11 | ) | | | 0.54 | | | | 0.43 | | | | — | | | | (0.91 | ) | | | (0.91 | ) | | | 12.51 | | | | 3.81 | | | | 3,699,738 | | | | 0.95 | | | | 0.99 | | | | (0.91 | ) | | | 72 | |
Class R5 | | | | | | | | | | | | | | | | | | | | | | | | | | | | | | | | | | | | | | | | | | | | | | | | | | | | | | | | |
Year ended 10/31/18 | | | 11.43 | | | | 0.07 | | | | (0.42 | ) | | | (0.35 | ) | | | — | | | | (0.70 | ) | | | (0.70 | ) | | | 10.38 | | | | (3.34 | ) | | | 50,691 | | | | 0.92 | (d) | | | 0.98 | (d) | | | 0.61 | (d) | | | 116 | |
Year ended 10/31/17 | | | 11.48 | | | | (0.01 | ) | | | 0.87 | | | | 0.86 | | | | (0.44 | ) | | | (0.47 | ) | | | (0.91 | ) | | | 11.43 | | | | 8.12 | | | | 119,103 | | | | 0.92 | | | | 0.98 | | | | (0.19 | ) | | | 12 | |
Year ended 10/31/16 | | | 11.41 | | | | (0.06 | ) | | | 0.88 | | | | 0.82 | | | | (0.33 | ) | | | (0.42 | ) | | | (0.75 | ) | | | 11.48 | | | | 7.88 | | | | 144,960 | | | | 0.89 | | | | 0.96 | | | | (0.58 | ) | | | 96 | |
Year ended 10/31/15 | | | 12.51 | | | | (0.10 | ) | | | (0.06 | ) | | | (0.16 | ) | | | (0.28 | ) | | | (0.66 | ) | | | (0.94 | ) | | | 11.41 | | | | (1.39 | ) | | | 158,826 | | | | 0.93 | | | | 0.98 | | | | (0.88 | ) | | | 10 | |
Year ended 10/31/14 | | | 12.99 | | | | (0.11 | ) | | | 0.54 | | | | 0.43 | | | | — | | | | (0.91 | ) | | | (0.91 | ) | | | 12.51 | | | | 3.81 | | | | 186,943 | | | | 0.93 | | | | 0.97 | | | | (0.89 | ) | | | 72 | |
Class R6 | | | | | | | | | | | | | | | | | | | | | | | | | | | | | | | | | | | | | | | | | | | | | | | | | | | | | | | | |
Year ended 10/31/18 | | | 11.44 | | | | 0.07 | | | | (0.41 | ) | | | (0.34 | ) | | | — | | | | (0.70 | ) | | | (0.70 | ) | | | 10.40 | | | | (3.24 | ) | | | 398,406 | | | | 0.86 | (d) | | | 0.92 | (d) | | | 0.67 | (d) | | | 116 | |
Year ended 10/31/17 | | | 11.49 | | | | (0.00 | ) | | | 0.87 | | | | 0.87 | | | | (0.45 | ) | | | (0.47 | ) | | | (0.92 | ) | | | 11.44 | | | | 8.20 | | | | 320,060 | | | | 0.85 | | | | 0.91 | | | | (0.12 | ) | | | 12 | |
Year ended 10/31/16 | | | 11.43 | | | | (0.06 | ) | | | 0.88 | | | | 0.82 | | | | (0.34 | ) | | | (0.42 | ) | | | (0.76 | ) | | | 11.49 | | | | 7.93 | | | | 286,944 | | | | 0.82 | | | | 0.89 | | | | (0.51 | ) | | | 96 | |
Year ended 10/31/15 | | | 12.53 | | | | (0.09 | ) | | | (0.05 | ) | | | (0.14 | ) | | | (0.30 | ) | | | (0.66 | ) | | | (0.96 | ) | | | 11.43 | | | | (1.27 | ) | | | 418,615 | | | | 0.83 | | | | 0.88 | | | | (0.78 | ) | | | 10 | |
Year ended 10/31/14 | | | 12.99 | | | | (0.10 | ) | | | 0.55 | | | | 0.45 | | | | — | | | | (0.91 | ) | | | (0.91 | ) | | | 12.53 | | | | 3.97 | | | | 480,626 | | | | 0.83 | | | | 0.87 | | | | (0.79 | ) | | | 72 | |
| (a) | Calculated using average shares outstanding. |
| (b) | Includes adjustments in accordance with accounting principles generally accepted in the United States of America and as such, the net asset value for financial reporting purposes and the returns based upon those net asset values may differ from the net asset value and returns for shareholder transactions. Does not include sales charges and is not annualized for periods less than one year, if applicable. |
| (c) | Portfolio turnover is calculated at the fund level and is not annualized for periods less than one year, if applicable. |
| (d) | Ratios are based on average daily net assets (000’s omitted) of $1,209,897, $4,550, $911,513, $22,387, $1,988,581, $102,443 and $398,362 for Class A, Class B, Class C, Class R, Class Y, Class R5 and Class R6 shares, respectively. |
| (e) | Reflects activity for the period November 1, 2017 through January 26, 2018 (date of conversion). |
27 Invesco Balanced-Risk Allocation Fund
Report of Independent Registered Public Accounting Firm
To the Board of Trustees of AIM Investment Funds (Invesco Investment Funds)
and Shareholders of Invesco Balanced-Risk Allocation Fund:
Opinion on the Financial Statements
We have audited the accompanying consolidated statement of assets and liabilities, including the consolidated schedule of investments, of Invesco Balanced-Risk Allocation Fund and its subsidiary (one of the funds constituting AIM Investment Funds (Invesco Investment Funds), hereafter referred to as the “Fund”) as of October 31, 2018, the related consolidated statement of operations for the year ended October 31, 2018, the consolidated statement of changes in net assets for each of the two years in the period ended October 31, 2018, including the related notes, and the financial highlights for each of the periods indicated therein (collectively referred to as the financial statements). In our opinion, the financial statements present fairly, in all material respects, the financial position of the Fund as of October 31, 2018, the results of its operations for the year then ended, the changes in its net assets for each of the two years in the period ended October 31, 2018 and the financial highlights for each of the periods indicated therein in conformity with accounting principles generally accepted in the United States of America.
Basis for Opinion
These financial statements are the responsibility of the Fund’s management. Our responsibility is to express an opinion on the Fund’s financial statements based on our audits. We are a public accounting firm registered with the Public Company Accounting Oversight Board (United States) (PCAOB) and are required to be independent with respect to the Fund in accordance with the U.S. federal securities laws and the applicable rules and regulations of the Securities and Exchange Commission and the PCAOB.
We conducted our audits of these financial statements in accordance with the standards of the PCAOB. Those standards require that we plan and perform the audit to obtain reasonable assurance about whether the financial statements are free of material misstatement, whether due to error or fraud.
Our audits included performing procedures to assess the risks of material misstatement of the financial statements, whether due to error or fraud, and performing procedures that respond to those risks. Such procedures included examining, on a test basis, evidence regarding the amounts and disclosures in the financial statements. Our audits also included evaluating the accounting principles used and significant estimates made by management, as well as evaluating the overall presentation of the financial statements. Our procedures included confirmation of securities owned as of October 31, 2018 by correspondence with the custodian, transfer agent and brokers; when replies were not received from brokers, we performed other auditing procedures. We believe that our audits provide a reasonable basis for our opinion.
PricewaterhouseCoopers LLP
Houston, TX
December 28, 2018
We have served as the auditor of one or more of the investment companies in the Invesco group of investment companies since at least 1995. We have not been able to determine the specific year we began serving as auditor.
28 Invesco Balanced-Risk Allocation Fund
Calculating your ongoing Fund expenses
Example
As a shareholder of the Fund, you incur two types of costs: (1) transaction costs, which may include sales charges (loads) on purchase payments or contingent deferred sales charges on redemptions, if any; and (2) ongoing costs, including distribution and/or service (12b-1) fees, and other Fund expenses. This example is intended to help you understand your ongoing costs (in dollars) of investing in the Fund and to compare these costs with ongoing costs of investing in other mutual funds. The example is based on an investment of $1,000 invested at the beginning of the period and held for the entire period May 1, 2018, through October 31, 2018.
In addition to the fees and expenses which the Fund bears directly, the Fund indirectly bears a pro rata share of the fees and expenses of the underlying funds in which the Fund invests. The amount of fees and expenses incurred indirectly by the Fund will vary because the underlying funds have varied expenses and fee levels and the Fund may own different proportions of the underlying funds at different times. Estimated underlying fund expenses are not expenses that are incurred directly by the Fund. They are expenses that are incurred directly by the underlying funds and are deducted from the value of the underlying funds the Fund invests in. The effect of the estimated underlying fund expenses that the Fund bears indirectly are included in the Fund’s total return.
Actual expenses
The table below provides information about actual account values and actual expenses. You may use the information in this table, together with the amount you invested, to estimate the expenses that you paid over the period. Simply divide your account value by $1,000 (for example, an $8,600 account value divided by $1,000 = 8.6), then multiply the result by the number in the table under the heading entitled “Actual Expenses Paid During Period” to estimate the expenses you paid on your account during this period.
Hypothetical example for comparison purposes
The table below also provides information about hypothetical account values and hypothetical expenses based on the Fund’s actual expense ratio and an assumed rate of return of 5% per year before expenses, which is not the Fund’s actual return.
The hypothetical account values and expenses may not be used to estimate the actual ending account balance or expenses you paid for the period. You may use this information to compare the ongoing costs of investing in the Fund and other funds. To do so, compare this 5% hypothetical example with the 5% hypothetical examples that appear in the shareholder reports of the other funds.
Please note that the expenses shown in the table are meant to highlight your ongoing costs only and do not reflect any transaction costs, such as sales charges (loads) on purchase payments or contingent deferred sales charges on redemptions, if any. Therefore, the hypothetical information is useful in comparing ongoing costs only, and will not help you determine the relative total costs of owning different funds. In addition, expenses shown in the table do not include the expenses of the underlying funds, which are borne indirectly by the Fund. If transaction costs and indirect expenses were included, your costs would have been higher.
| | | | | | | | | | | | | | | | | | | | | | | | |
| | | | | | ACTUAL | | | HYPOTHETICAL (5% annual return before
expenses) | | | Annualized
Expense Ratio | |
| Class | | Beginning
Account Value
(05/01/18) | | | Ending
Account Value
(10/31/18)1 | | | Expenses
Paid During
Period2 | | | Ending
Account Value
(10/31/18) | | | Expenses
Paid During
Period2 | |
| A | | $ | 1,000.00 | | | $ | 944.50 | | | $ | 5.93 | | | $ | 1,019.11 | | | $ | 6.16 | | | | 1.21 | % |
| C | | | 1,000.00 | | | | 940.80 | | | | 9.59 | | | | 1,015.32 | | | | 9.96 | | | | 1.96 | |
| R | | | 1,000.00 | | | | 943.50 | | | | 7.15 | | | | 1,017.85 | | | | 7.43 | | | | 1.46 | |
| Y | | | 1,000.00 | | | | 945.30 | | | | 4.71 | | | | 1,020.37 | | | | 4.89 | | | | 0.96 | |
| R5 | | | 1,000.00 | | | | 945.40 | | | | 4.46 | | | | 1,020.62 | | | | 4.63 | | | | 0.91 | |
| R6 | | | 1,000.00 | | | | 946.30 | | | | 4.22 | | | | 1,020.87 | | | | 4.38 | | | | 0.86 | |
| 1 | The actual ending account value is based on the actual total return of the Fund for the period May 1, 2018 through October 31, 2018, after actual expenses and will differ from the hypothetical ending account value which is based on the Fund’s expense ratio and a hypothetical annual return of 5% before expenses. |
| 2 | Expenses are equal to the Fund’s annualized expense ratio as indicated above multiplied by the average account value over the period, multiplied by 184/365 to reflect the most recent fiscal half year. |
29 Invesco Balanced-Risk Allocation Fund
Approval of Investment Advisory and Sub-Advisory Contracts
At meetings held on June 5-6, 2018, the Board of Trustees (the Board or the Trustees) of AIM Investment Funds (Invesco Investment Funds) Series as a whole, and the independent Trustees, who comprise over 75% of the Board, voting separately, approved the continuance of the Invesco Balanced-Risk Allocation Fund’s (the Fund) Master Investment Advisory Agreement with Invesco Advisers, Inc. (Invesco Advisers and the investment advisory agreement) and the Master Intergroup Sub-Advisory Contract for Mutual Funds with Invesco Asset Management Deutschland GmbH, Invesco Asset Management Limited, Invesco Asset Management (Japan) Limited, Invesco Hong Kong Limited, Invesco Senior Secured Management, Inc., Invesco Canada Ltd. and separate Sub-Advisory Contracts with Invesco Capital Management LLC and Invesco Asset Management (India) Private Limited (collectively, the Affiliated Sub-Advisers and the sub-advisory contracts) for another year, effective July 1, 2018. After evaluating the factors discussed below, among others, the Board approved the renewal of the Fund’s investment advisory agreement and the sub-advisory contracts and determined that the compensation payable by the Fund to Invesco Advisers and by Invesco Advisers to the Affiliated Sub-Advisers is fair and reasonable.
The Board’s Evaluation Process
The Board’s Investments Committee has established three Sub-Committees, which meet throughout the year to review the performance of funds advised by Invesco Advisers (the Invesco Funds). Over the course of each year, the Sub-Committees meet with portfolio managers for their assigned Invesco Funds and other members of management to review detailed information about investment performance and portfolio attributes of these funds. The Board took into account evaluations and reports that it received from the Investments Committee and Sub-Committees, as well as the information provided to such committees and the Board throughout the year, in considering whether to approve each Invesco Fund’s investment advisory agreement and sub-advisory contracts.
As part of the contract renewal process, the Board reviews and considers information provided in response to detailed requests for information submitted to management by the independent Trustees with assistance from legal counsel to the independent Trustees. The Board receives comparative investment performance and fee data regarding the Invesco Funds prepared by Invesco Advisers and Broadridge Financial Solutions, Inc. (Broadridge), an independent mutual fund data provider. The Board also receives an independent written evaluation from the Senior Officer, an officer of the Invesco Funds who reports directly to the independent Trustees. The Senior Officer’s
evaluation is prepared as part of his responsibility to manage the process by which the Invesco Funds’ proposed management fees are negotiated during the annual contract renewal process to ensure they are negotiated in a manner that is at arms’ length and reasonable. In addition to meetings with Invesco Advisers and fund counsel throughout the year, the independent Trustees also discuss the continuance of the investment advisory agreement and sub-advisory contracts in separate sessions with the Senior Officer and with independent legal counsel.
The discussion below is a summary of the Senior Officer’s independent written evaluation with respect to the Fund’s investment advisory agreement, as well as a discussion of the material factors and related conclusions that formed the basis for the Board’s approval of the Fund’s investment advisory agreement and sub-advisory contracts. The Trustees’ review and conclusions are based on the comprehensive consideration of all information presented to them during the course of the year and in prior years and are not the result of any single determinative factor. Moreover, one Trustee may have weighed a particular piece of information or factor differently than another Trustee. This information is current as of June 6, 2018.
Factors and Conclusions and Summary of Independent Written Fee Evaluation
| A. | Nature, Extent and Quality of Services Provided by Invesco Advisers and the Affiliated Sub-Advisers |
The Board reviewed the nature, extent and quality of the advisory services provided to the Fund by Invesco Advisers under the Fund’s investment advisory agreement, and the credentials and experience of the officers and employees of Invesco Advisers who provide these services, including the Fund’s portfolio manager(s). The Board’s review included consideration of Invesco Advisers’ investment process oversight and structure, credit analysis and investment risk management. The Board also considered non-advisory services that Invesco Advisers and its affiliates provide to the Invesco Funds such as various back office support functions, third party oversight, internal audit, valuation, portfolio trading and legal and compliance. The Board also reviewed and considered the benefits to shareholders of investing in a fund that is part of the Invesco family of funds under the umbrella of Invesco Ltd., Invesco Advisers’ parent company, and noted Invesco Ltd.’s depth and experience in conducting an investment management business, as well as its commitment of financial and other resources to such business. The Board concluded that the nature, extent and quality of the services provided to the Fund by Invesco Advisers are appropriate and satisfactory.
The Board reviewed the services that may be provided by the Affiliated Sub-Advisers under the sub-advisory contracts and the credentials and experience of the officers and employees of the Affiliated Sub-Advisers who provide these services. The Board noted the Affiliated Sub-Advisers’ expertise with respect to certain asset classes and that the Affiliated Sub-Advisers have offices and personnel that are located in financial centers around the world. As a result, the Board noted that the Affiliated Sub-Advisers can provide research and investment analysis on the markets and economies of various countries in which the Fund may invest, make recommendations regarding securities and assist with security trades. The Board concluded that the sub-advisory contracts may benefit the Fund and its shareholders by permitting Invesco Advisers to use the resources and talents of the Affiliated Sub-Advisers in managing the Fund. The Board concluded that the nature, extent and quality of the services that may be provided by the Affiliated Sub-Advisers are appropriate and satisfactory.
| B. | Fund Investment Performance |
The Board considered Fund investment performance as a relevant factor in considering whether to approve the investment advisory agreement. The Board did not view Fund investment performance as a relevant factor in considering whether to approve the sub-advisory contracts for the Fund, as no Affiliated Sub-Adviser currently manages assets of the Fund.
The Board compared the Fund’s investment performance over multiple time periods ending December 31, 2017 to the performance of funds in the Broadridge performance universe and against the Lipper Alternative Global Macro Funds Index. The Board noted that performance of Class A shares of the Fund was in the third quintile of its performance universe for the one year period and the second quintile for the three and five year periods (the first quintile being the best performing funds and the fifth quintile being the worst performing funds). The Board noted that performance of Class A shares of the Fund was below the performance of the Index for the one year period and above the performance of the Index for the three and five year periods. The Trustees also reviewed more recent Fund performance and this review did not change their conclusions.
| C. | Advisory and Sub-Advisory Fees and Fund Expenses |
The Board compared the Fund’s contractual management fee rate to the contractual management fee rates of funds in the Fund’s Broadridge expense group. The Board noted that the contractual management fee rate for Class A shares of the Fund was above the median contractual management fee rate of funds in its expense group. The Board noted
30 Invesco Balanced-Risk Allocation Fund
that the term “contractual management fee” for funds in the expense group may include both advisory and certain non-portfolio management administrative services fees, but that Broadridge does not provide information on a fund by fund basis as to what is included. The Board also reviewed the methodology used by Broadridge in providing expense group information, which includes using each fund’s contractual management fee schedule (including any applicable breakpoints) as reported in the most recent prospectus or statement of additional information for each fund in the expense group. The Board also considered comparative information regarding the Fund’s total expense ratio and its various components. The Board noted that the Fund’s actual and contractual management fees were in the fourth quintile of its expense group and discussed with management reasons for such relative actual and contractual management fees.
The Board noted that Invesco Advisers has contractually agreed to waive fees and/or limit expenses of the Fund in an amount necessary to limit total annual operating expenses to a specified percentage of average daily net assets for each class of the Fund.
The Board considered the fees charged by Invesco Advisers and the Affiliated Sub-Advisers to other similarly managed client accounts. The Board noted that Invesco Advisers or the Affiliated Sub-Advisers may charge lower fees to large institutional clients. Invesco Advisers reviewed with the Board differences in the scope of services it provides to the Invesco Funds relative to certain other types of client accounts, including management of cash flows as a result of redemptions and purchases, officers and office space, oversight of service providers, preparation of annual registration statement updates and financial information and compliance with federal and state laws and regulations.
The Board also compared the Fund’s effective advisory fee rate (the advisory fee rate after advisory fee waivers and before other expense limitations/waivers) to the effective advisory fee rates of other similarly managed third-party mutual funds advised or sub-advised by Invesco Advisers and its affiliates, based on asset balances as of December 31, 2017.
The Board also considered the services that may be provided by the Affiliated Sub-Advisers pursuant to the sub-advisory contracts, as well as the fees payable by Invesco Advisers to the Affiliated Sub-Advisers pursuant to the sub-advisory contracts.
| D. | Economies of Scale and Breakpoints |
The Board considered the extent to which there may be economies of scale in the provision of advisory services to the Fund. The Board also considered that the Fund benefits from economies of scale through contractual breakpoints in the Fund’s advisory fee schedule, which generally operate to reduce the Fund’s expense ratio as it grows in size. The Board noted that the Fund shares directly in
economies of scale through lower fees charged by third party service providers based on the combined size of the Invesco Funds. The Board noted that the Fund may also benefit from economies of scale through initial fee setting, fee waivers and expense reimbursements.
| E. | Profitability and Financial Resources |
The Board reviewed information from Invesco Advisers concerning the costs of the advisory and other services that Invesco Advisers and its affiliates provide to the Fund and the Invesco Funds and the profitability of Invesco Advisers and its affiliates in providing these services. The Board considered the methodology used for calculating profitability and noted the periodic review of such methodology by an independent consultant. The Board noted that Invesco Advisers continues to operate at a net profit from services Invesco Advisers and its affiliates provide to the Invesco Funds and the Fund. The Board did not deem the level of profits realized by Invesco Advisers and its affiliates from providing services to the Fund to be excessive given the nature, extent and quality of the services provided. The Board received information from Invesco Advisers demonstrating that Invesco Advisers and the Affiliated Sub-Advisers are financially sound and have the resources necessary to perform their obligations under the investment advisory agreement and sub-advisory contracts.
| F. | Collateral Benefits to Invesco Advisers and its Affiliates |
The Board considered various other benefits received by Invesco Advisers and its affiliates from the relationship with the Fund, including the fees received for providing administrative, transfer agency and distribution services to the Fund. The Board considered comparative information regarding fees charged for these services, including information provided by Broadridge and other independent sources. The Board considered the performance of Invesco Advisers and its affiliates in providing these services and the organizational structure employed to provide these services. The Board also considered that these services are provided to the Fund pursuant to written contracts that are reviewed and approved on an annual basis by the Board; and that the services are required for the operation of the Fund.
31 Invesco Balanced-Risk Allocation Fund
Tax Information
Form 1099-DIV, Form 1042-S and other year-end tax information provide shareholders with actual calendar year amounts that should be included in their tax returns. Shareholders should consult their tax advisors.
The following distribution information is being provided as required by the Internal Revenue Code or to meet a specific state’s requirement.
The Fund designates the following amounts or, if subsequently determined to be different, the maximum amount allowable for its fiscal year ended October 31, 2018:
| | | | |
Federal and State Income Tax | |
Long-Term Capital Gain Distributions | | $ | 151,806,116 | |
Qualified Dividend Income* | | | 0.00 | % |
Corporate Dividends Received Deduction* | | | 0.00 | % |
U.S. Treasury Obligations* | | | 38.28 | % |
| | * | The above percentages are based on ordinary income dividends paid to shareholders during the Fund’s fiscal year. |
| | | | |
Non-Resident Alien Shareholders | |
Qualified Short-Term Gains | | $ | 150,506,186 | |
32 Invesco Balanced-Risk Allocation Fund
Trustees and Officers
The address of each trustee and officer is AIM Investment Funds (Invesco Investment Funds) (the “Trust”), 11 Greenway Plaza, Suite 1000, Houston, Texas 77046-1173. The trustees serve for the life of the Trust, subject to their earlier death, incapacitation, resignation, retirement or removal as more specifically provided in the Trust’s organizational documents. Each officer serves for a one year term or until their successors are elected and qualified. Column two below includes length of time served with predecessor entities, if any.
| | | | | | | | |
Name, Year of Birth and
Position(s) Held with the Trust | | Trustee and/
or Officer Since | | Principal Occupation(s)
During Past 5 Years | | Number of
Funds in Fund
Complex
Overseen by
Trustee | | Other Directorship(s)
Held by Trustee During
Past 5 Years |
| Interested Persons | | | | | | | | |
| Martin L. Flanagan1 — 1960 Trustee | | 2007 | | Executive Director, Chief Executive Officer and President, Invesco Ltd. (ultimate parent of Invesco and a global investment management firm); Trustee, The Invesco Funds; Vice Chair, Investment Company Institute; and Member of Executive Board, SMU Cox School of Business Formerly: Advisor to the Board, Invesco Advisers, Inc. (formerly known as Invesco Institutional (N.A.), Inc.); Chairman and Chief Executive Officer, Invesco Advisers, Inc. (registered investment adviser); Director, Chairman, Chief Executive Officer and President, Invesco Holding Company (US), Inc. (formerly IVZ Inc.) (holding company), Invesco Group Services, Inc. (service provider) and Invesco North American Holdings, Inc. (holding company); Director, Chief Executive Officer and President, Invesco Holding Company Limited (parent of Invesco and a global investment management firm); Director, Invesco Ltd.; Chairman, Investment Company Institute and President, Co-Chief Executive Officer, Co-President, Chief Operating Officer and Chief Financial Officer, Franklin Resources, Inc. (global investment management organization) | | 158 | | None |
Philip A. Taylor2 — 1954 Trustee and Senior Vice President | | 2006 | | Head of the Americas and Senior Managing Director, Invesco Ltd.; Director, Invesco Advisers, Inc. (formerly known as Invesco Institutional (N.A.), Inc.) (registered investment adviser); Director and Chairman, Invesco Investment Services, Inc. (formerly known as Invesco AIM Investment Services, Inc.) (registered transfer agent); Chief Executive Officer, Invesco Corporate Class Inc. (corporate mutual fund company); Director, Chairman and Chief Executive Officer, Invesco Canada Ltd. (formerly known as Invesco Trimark Ltd./Invesco Trimark Ltèe) (registered investment adviser and registered transfer agent); Trustee and Senior Vice President, The Invesco Funds; Director, Invesco Investment Advisers LLC (formerly known as Van Kampen Asset Management) Formerly: Director, Chairman, Chief Executive Officer and President, Invesco Management Group, Inc. (formerly known as Invesco AIM Management Group, Inc.) (financial services holding company); Co-Chairman, Co-President and Co-Chief Executive Officer, Invesco Advisers, Inc. (formerly known as Invesco Institutional (N.A.), Inc.) (registered investment adviser); Director, Chief Executive Officer and President, Van Kampen Exchange Corp; President and Principal Executive Officer, The Invesco Funds (other than AIM Treasurer’s Series Trust (Invesco Treasurer’s Series Trust), Short-Term Investments Trust and Invesco Management Trust); Executive Vice President, The Invesco Funds (AIM Treasurer’s Series Trust (Invesco Treasurer’s Series Trust), Short-Term Investments Trust and Invesco Management Trust only); Director and President, INVESCO Funds Group, Inc. (registered investment adviser and registered transfer agent); Director and Chairman, IVZ Distributors, Inc. (formerly known as INVESCO Distributors, Inc.) (registered broker dealer); Director, President and Chairman, Invesco Inc. (holding company), Invesco Canada Holdings Inc. (holding company), Trimark Investments Ltd./Placements Trimark Ltèe and Invesco Financial Services Ltd/Services Financiers Invesco Ltèe; Chief Executive Officer, Invesco Canada Fund Inc. (corporate mutual fund company); Director and Chairman, Van Kampen Investor Services Inc.; Director, Chief Executive Officer and President, 1371 Preferred Inc. (holding company) and Van Kampen Investments Inc.; Director and President, AIM GP Canada Inc. (general partner for limited partnerships) and Van Kampen Advisors, Inc.; Director and Chief Executive Officer, Invesco Trimark Dealer Inc. (registered broker dealer); Director, Invesco Distributors, Inc. (formerly known as Invesco AIM Distributors, Inc.) (registered broker dealer); Manager, Invesco Capital Management LLC; Director, Chief Executive Officer and President, Invesco Advisers, Inc.; Director, Chairman, Chief Executive Officer and President, Invesco AIM Capital Management, Inc.; President, Invesco Trimark Dealer Inc. and Invesco Trimark Ltd./Invesco Trimark Ltèe; Director and President, AIM Trimark Corporate Class Inc. and AIM Trimark Canada Fund Inc.; Senior Managing Director, Invesco Holding Company Limited; Director and Chairman, Fund Management Company (former registered broker dealer); President and Principal Executive Officer, The Invesco Funds (AIM Treasurer’s Series Trust (Invesco Treasurer’s Series Trust), and Short-Term Investments Trust only); President, AIM Trimark Global Fund Inc. and AIM Trimark Canada Fund Inc. | | 158 | | None |
| 1 | Mr. Flanagan is considered an interested person (within the meaning of Section 2(a)(19) of the 1940 Act) of the Trust because he is an officer of the Adviser to the Trust, and an officer and a director of Invesco Ltd., ultimate parent of the Adviser. |
| 2 | Mr. Taylor is considered an interested person (within the meaning of Section 2(a)(19) of the 1940 Act) of the Trust because he is an officer and a director of the Adviser. |
T-1 Invesco Balanced-Risk Allocation Fund
Trustees and Officers—(continued)
| | | | | | | | |
Name, Year of Birth and
Position(s) Held with the Trust | | Trustee and/
or Officer Since | | Principal Occupation(s)
During Past 5 Years | | Number of
Funds in Fund
Complex
Overseen by
Trustee | | Other Directorship(s)
Held by Trustee During
Past 5 Years |
| Independent Trustees | | | | | | | | |
Bruce L. Crockett — 1944 Trustee and Chair | | 2001 | | Chairman, Crockett Technologies Associates (technology consulting company) Formerly: Director, Captaris (unified messaging provider); Director, President and Chief Executive Officer, COMSAT Corporation; Chairman, Board of Governors of INTELSAT (international communications company); ACE Limited (insurance company); Independent Directors Council and Investment Company Institute: Member of the Audit Committee, Investment Company Institute; Member of the Executive Committee and Chair of the Governance Committee, Independent Directors Council | | 158 | | Director and Chairman of the Audit Committee, ALPS (Attorneys Liability Protection Society) (insurance company); Director and Member of the Audit Committee and Compensation Committee, Ferroglobe PLC (metallurgical company) |
David C. Arch — 1945 Trustee | | 2010 | | Chairman of Blistex Inc. (consumer health care products manufacturer); Member, World Presidents’ Organization | | 158 | | Board member of the Illinois Manufacturers’ Association |
Jack M. Fields — 1952 Trustee | | 2001 | | Chief Executive Officer, Twenty First Century Group, Inc. (government affairs company); and Chairman, Discovery Learning Alliance (non-profit) Formerly: Owner and Chief Executive Officer, Dos Angeles Ranch L.P. (cattle, hunting, corporate entertainment); Director, Insperity, Inc. (formerly known as Administaff) (human resources provider); Chief Executive Officer, Texana Timber LP (sustainable forestry company); Director of Cross Timbers Quail Research Ranch (non-profit); and member of the U.S. House of Representatives | | 158 | | None |
Cynthia Hostetler — 1962 Trustee | | 2017 | | Non-Executive Director and Trustee of a number of public and private business corporations Formerly: Director, Aberdeen Investment Funds (4 portfolios); Head of Investment Funds and Private Equity, Overseas Private Investment Corporation; President, First Manhattan Bancorporation, Inc.; Attorney, Simpson Thacher & Bartlett LLP | | 158 | | Vulcan Materials Company (construction materials company); Trilinc Global Impact Fund; Artio Global Investment LLC (mutual fund complex); Edgen Group, Inc. (specialized energy and infrastructure products distributor) |
Eli Jones — 1961 Trustee | | 2016 | | Professor and Dean, Mays Business School — Texas A&M University Formerly: Professor and Dean, Walton College of Business, University of Arkansas and E.J. Ourso College of Business, Louisiana State University; Director, Arvest Bank | | 158 | | Insperity, Inc. (formerly known as Administaff) (human resources provider) |
Prema Mathai-Davis — 1950 Trustee | | 2001 | | Retired | | 158 | | None |
Teresa M. Ressel — 1962 Trustee | | 2017 | | Non-executive director and trustee of a number of public and private business corporations Formerly: Chief Financial Officer, Olayan America, The Olayan Group (international investor/commercial/industrial); Chief Executive Officer, UBS Securities LLC; Group Chief Operating Officer, Americas, UBS AG; Assistant Secretary for Management & Budget and CFO, US Department of the Treasury | | 158 | | Atlantic Power Corporation (power generation company); ON Semiconductor Corp. (semiconductor supplier) |
Ann Barnett Stern — 1957 Trustee | | 2017 | | President and Chief Executive Officer, Houston Endowment Inc. (private philanthropic institution) Formerly: Executive Vice President and General Counsel, Texas Children’s Hospital; Attorney, Beck, Redden and Secrest, LLP; Business Law Instructor, University of St. Thomas; Attorney, Andrews & Kurth LLP | | 158 | | Federal Reserve Bank of Dallas |
Raymond Stickel, Jr. — 1944 Trustee | | 2005 | | Retired Formerly: Director, Mainstay VP Series Funds, Inc. (25 portfolios); Partner, Deloitte & Touche | | 158 | | None |
Robert C. Troccoli — 1949 Trustee | | 2016 | | Adjunct Professor, University of Denver — Daniels College of Business Formerly: Senior Partner, KPMG LLP | | 158 | | None |
Christopher L. Wilson — 1957 Trustee | | 2017 | | Non-executive director and trustee of a number of public and private business corporations Formerly: Director, TD Asset Management USA Inc. (mutual fund complex) (22 portfolios); Managing Partner, CT2, LLC (investing and consulting firm); President/Chief Executive Officer, Columbia Funds, Bank of America Corporation; President/Chief Executive Officer, CDC IXIS Asset Management Services, Inc.; Principal & Director of Operations, Scudder Funds, Scudder, Stevens & Clark, Inc.; Assistant Vice President, Fidelity Investments | | 158 | | ISO New England, Inc. (non-profit organization managing regional electricity market) |
T-2 Invesco Balanced-Risk Allocation Fund
Trustees and Officers—(continued)
| | | | | | | | |
Name, Year of Birth and
Position(s) Held with the Trust | | Trustee and/
or Officer Since | | Principal Occupation(s)
During Past 5 Years | | Number of
Funds in Fund
Complex
Overseen by
Trustee | | Other Directorship(s)
Held by Trustee During
Past 5 Years |
| Other Officers | | | | | | | | |
Sheri Morris — 1964 President, Principal Executive Officer and Treasurer | | 1999 | | President, Principal Executive Officer and Treasurer, The Invesco Funds; Vice President, Invesco Advisers, Inc. (formerly known as Invesco Institutional (N.A.), Inc.) (registered investment adviser); and Vice President, Invesco Exchange-Traded Fund Trust, Invesco Exchange-Traded Fund Trust II, Invesco India Exchange-Traded Fund Trust, Invesco Actively Managed Exchange-Traded Fund Trust, Invesco Actively Managed Exchange-Traded Commodity Fund Trust and Invesco Exchange-Traded Self-Indexed Fund Trust Formerly: Vice President and Principal Financial Officer, The Invesco Funds; Vice President, Invesco AIM Advisers, Inc., Invesco AIM Capital Management, Inc. and Invesco AIM Private Asset Management, Inc.; Assistant Vice President and Assistant Treasurer, The Invesco Funds and Assistant Vice President, Invesco Advisers, Inc., Invesco AIM Capital Management, Inc. and Invesco AIM Private Asset Management, Inc.; and Treasurer, Invesco Exchange-Traded Fund Trust, Invesco Exchange-Traded Fund Trust II, Invesco India Exchange-Traded Fund Trust and Invesco Actively Managed Exchange-Traded Fund Trust | | N/A | | N/A |
Russell C. Burk — 1958 Senior Vice President and Senior Officer | | 2005 | | Senior Vice President and Senior Officer, The Invesco Funds | | N/A | | N/A |
Jeffrey H. Kupor — 1968 Senior Vice President, Chief Legal Officer and Secretary | | 2018 | | Senior Vice President and Secretary, Invesco Advisers, Inc. (formerly known as Invesco Institutional (N.A.), Inc.) (registered investment adviser); Senior Vice President and Secretary, Invesco Distributors, Inc. (formerly known as Invesco AIM Distributors, Inc.); Vice President and Secretary, Invesco Investment Services, Inc. (formerly known as Invesco AIM Investment Services, Inc.) Senior Vice President, Chief Legal Officer and Secretary, The Invesco Funds; Secretary and General Counsel, Invesco Investment Advisers LLC (formerly known as Van Kampen Asset Management); Secretary and General Counsel, Invesco Capital Markets, Inc. (formerly known as Van Kampen Funds Inc.) and Chief Legal Officer, Invesco Exchange-Traded Fund Trust, Invesco Exchange-Traded Fund Trust II, Invesco India Exchange-Traded Fund Trust, Invesco Actively Managed Exchange-Traded Fund Trust, Invesco Actively Managed Exchange-Traded Commodity Fund Trust and Invesco Exchange-Traded Self-Indexed Fund Trust; Secretary, Invesco Indexing LLC; Secretary and General Counsel, INVESCO Private Capital Investments, Inc.; Secretary, W.L. Ross & Co., LLC; Secretary and Vice President, Jemstep, Inc. Formerly: Senior Vice President, Secretary and General Counsel, Invesco Management Group, Inc. (formerly known as Invesco AIM Management Group, Inc.); Assistant Secretary, INVESCO Asset Management (Bermuda) Ltd.; Secretary and General Counsel, Invesco Private Capital, Inc.; Assistant Secretary and General Counsel, INVESCO Realty, Inc.; Secretary and General Counsel, Invesco Senior Secured Management, Inc.; and Secretary, Sovereign G./P. Holdings Inc. | | N/A | | N/A |
John M. Zerr — 1962 Senior Vice President | | 2006 | | Chief Operating Officer of the Americas; Senior Vice President, Invesco Advisers, Inc. (formerly known as Invesco Institutional (N.A.), Inc.) (registered investment adviser); Senior Vice President, Invesco Distributors, Inc. (formerly known as Invesco AIM Distributors, Inc.); Director and Vice President, Invesco Investment Services, Inc. (formerly known as Invesco AIM Investment Services, Inc.) Senior Vice President, The Invesco Funds; Managing Director, Invesco Capital Management LLC; Director, Invesco Investment Advisers LLC (formerly known as Van Kampen Asset Management); Senior Vice President, Invesco Capital Markets, Inc. (formerly known as Van Kampen Funds Inc.); Manager, Invesco Indexing LLC Formerly: Director and Senior Vice President, Invesco Management Group, Inc. (formerly known as Invesco AIM Management Group, Inc.); Secretary and General Counsel, Invesco Management Group, Inc. (formerly known as Invesco AIM Management Group, Inc.); Secretary, Invesco Investment Services, Inc. (formerly known as Invesco AIM Investment Services, Inc.); Chief Legal Officer and Secretary, The Invesco Funds; Secretary and General Counsel, Invesco Investment Advisers LLC (formerly known as Van Kampen Asset Management); Secretary and General Counsel, Invesco Capital Markets, Inc. (formerly known as Van Kampen Funds Inc.); Chief Legal Officer, Invesco Exchange-Traded Fund Trust, Invesco Exchange-Traded Fund Trust II, Invesco India Exchange-Traded Fund Trust, Invesco Actively Managed Exchange-Traded Fund Trust, Invesco Actively Managed Exchange-Traded Commodity Fund Trust and Invesco Exchange-Traded Self-Indexed Fund Trust; Secretary, Invesco Indexing LLC; Director, Secretary, General Counsel and Senior Vice President, Van Kampen Exchange Corp.; Director, Vice President and Secretary, IVZ Distributors, Inc. (formerly known as INVESCO Distributors, Inc.); Director and Vice President, INVESCO Funds Group, Inc.; Director and Vice President, Van Kampen Advisors Inc.; Director, Vice President, Secretary and General Counsel, Van Kampen Investor Services Inc.; Director and Secretary, Invesco Distributors, Inc. (formerly known as Invesco AIM Distributors, Inc.); Director, Senior Vice President, General Counsel and Secretary, Invesco AIM Advisers, Inc. and Van Kampen Investments Inc.; Director, Vice President and Secretary, Fund Management Company; Director, Senior Vice President, Secretary, General Counsel and Vice President, Invesco AIM Capital Management, Inc.; Chief Operating Officer and General Counsel, Liberty Ridge Capital, Inc. (an investment adviser) | | N/A | | N/A |
T-3 Invesco Balanced-Risk Allocation Fund
Trustees and Officers—(continued)
| | | | | | | | |
Name, Year of Birth and
Position(s) Held with the Trust | | Trustee and/
or Officer Since | | Principal Occupation(s)
During Past 5 Years | | Number of
Funds in Fund
Complex
Overseen by
Trustee | | Other Directorship(s)
Held by Trustee During
Past 5 Years |
| Other Officers—(continued) | | | | | | | | |
Gregory G. McGreevey — 1962 Senior Vice President | | 2012 | | Senior Managing Director, Invesco Ltd.; Director, Chairman, President, and Chief Executive Officer, Invesco Advisers, Inc. (formerly known as Invesco Institutional (N.A.), Inc.) (registered investment adviser); Director, Invesco Mortgage Capital, Inc. and Invesco Senior Secured Management, Inc.; and Senior Vice President, The Invesco Funds Formerly: Senior Vice President, Invesco Management Group, Inc. and Invesco Advisers, Inc.; Assistant Vice President, The Invesco Funds | | N/A | | N/A |
Kelli Gallegos — 1970 Vice President, Principal Financial Officer and Assistant Treasurer | | 2008 | | Vice President and Treasurer, Invesco Exchange-Traded Fund Trust, Invesco Exchange-Traded Fund Trust II, Invesco India Exchange-Traded Fund Trust, Invesco Actively Managed Exchange-Traded Fund Trust, Invesco Actively Managed Exchange-Traded Commodity Fund Trust and Invesco Exchange-Traded Self-Indexed Fund Trust; Vice President, Principal Financial Officer and Assistant Treasurer, The Invesco Funds; Principal Financial and Accounting Officer — Pooled Investments, Invesco Capital Management LLC Formerly: Assistant Treasurer, Invesco Exchange-Traded Fund Trust, Invesco Exchange-Traded Fund Trust II, Invesco India Exchange-Traded Fund Trust, Invesco Actively Managed Exchange-Traded Fund Trust, Invesco Actively Managed Exchange-Traded Commodity Fund Trust and Invesco Exchange-Traded Self-Indexed Fund Trust; Assistant Treasurer, Invesco Capital Management LLC; Assistant Vice President, The Invesco Funds | | N/A | | N/A |
Tracy Sullivan — 1962 Vice President, Chief Tax Officer and Assistant Treasurer | | 2008 | | Vice President, Chief Tax Officer and Assistant Treasurer, The Invesco Funds; Assistant Treasurer, Invesco Capital Management LLC, Invesco Exchange-Traded Fund Trust, Invesco Exchange-Traded Fund Trust II, Invesco India Exchange-Traded Fund Trust, Invesco Actively Managed Exchange-Traded Fund Trust, Invesco Actively Managed Exchange-Traded Commodity Fund Trust and Invesco Exchange-Traded Self-Indexed Fund Trust Formerly: Assistant Vice President, The Invesco Funds | | N/A | | N/A |
Crissie M. Wisdom — 1969 Anti-Money Laundering Compliance Officer | | 2013 | | Anti-Money Laundering Compliance Officer, Invesco Advisers, Inc. (formerly known as Invesco Institutional (N.A.), Inc.) (registered investment adviser), Invesco Capital Markets, Inc. (formerly known as Van Kampen Funds Inc.), Invesco Distributors, Inc., Invesco Investment Services, Inc., The Invesco Funds, and Invesco Exchange-Traded Fund Trust, Invesco Exchange-Traded Fund Trust II, Invesco India Exchange-Traded Fund Trust, Invesco Actively Managed Exchange-Traded Fund Trust, Invesco Actively Managed Exchange-Traded Commodity Fund Trust and Invesco Exchange-Traded Self-Indexed Fund Trust; Anti-Money Laundering Compliance Officer and Bank Secrecy Act Officer, INVESCO National Trust Company and Invesco Trust Company; and Fraud Prevention Manager and Controls and Risk Analysis Manager for Invesco Investment Services, Inc. Formerly: Anti-Money Laundering Compliance Officer, Van Kampen Exchange Corp. and Invesco Management Group, Inc. | | N/A | | N/A |
Robert R. Leveille — 1969 Chief Compliance Officer | | 2016 | | Chief Compliance Officer, Invesco Advisers, Inc. (registered investment adviser); and Chief Compliance Officer, The Invesco Funds Formerly: Chief Compliance Officer, Putnam Investments and the Putnam Funds | | N/A | | N/A |
The Statement of Additional Information of the Trust includes additional information about the Fund’s Trustees and is available upon request, without charge, by calling 1.800.959.4246. Please refer to the Fund’s Statement of Additional Information for information on the Fund’s sub-advisers.
| | | | | | |
Office of the Fund 11 Greenway Plaza, Suite 1000 Houston, TX 77046-1173 | | Investment Adviser Invesco Advisers, Inc. 1555 Peachtree Street, N.E. Atlanta, GA 30309 | | Distributor Invesco Distributors, Inc. 11 Greenway Plaza, Suite 1000 Houston, TX 77046-1173 | | Auditors PricewaterhouseCoopers LLP 1000 Louisiana Street, Suite 5800 Houston, TX 77002-5021 |
| | | |
| | | | | | |
Counsel to the Fund Stradley Ronon Stevens & Young, LLP 2005 Market Street, Suite 2600 Philadelphia, PA 19103-7018 | | Counsel to the Independent Trustees Goodwin Procter LLP 901 New York Avenue, N.W. Washington, D.C. 20001 | | Transfer Agent Invesco Investment Services, Inc. 11 Greenway Plaza, Suite 1000 Houston, TX 77046-1173 | | Custodian State Street Bank and Trust Company 225 Franklin Street Boston, MA 02110-2801 |
T-4 Invesco Balanced-Risk Allocation Fund
Explore High-Conviction Investing with Invesco

Go paperless with eDelivery
Visit invesco.com/edelivery to enjoy the convenience and security of anytime electronic access to your investment documents.
With eDelivery, you can elect to have any or all of the following materials delivered straight to your inbox to download, save and print from your own computer:
∎ Fund reports and prospectuses
∎ Quarterly statements
∎ Daily confirmations
∎ Tax forms
Invesco mailing information
Send general correspondence to Invesco Investment Services, Inc., P.O. Box 219078, Kansas City, MO 64121-9078.
Important notice regarding delivery of security holder documents
To reduce Fund expenses, only one copy of most shareholder documents may be mailed to shareholders with multiple accounts at the same address (Householding). Mailing of your shareholder documents may be householded indefinitely unless you instruct us otherwise. If you do not want the mailing of these documents to be combined with those for other members of your household, please contact Invesco Investment Services, Inc. at 800 959 4246 or contact your financial institution. We will begin sending you individual copies for each account within 30 days after receiving your request.
Fund holdings and proxy voting information
The Fund provides a complete list of its holdings four times in each fiscal year, at the quarter ends. For the second and fourth quarters, the lists appear in the Fund’s semiannual and annual reports to shareholders. For the first and third quarters, the Fund files the lists with the Securities and Exchange Commission (SEC) on Form N-Q (or any successor Form). The most recent list of portfolio holdings is available at invesco.com/completeqtrholdings. Shareholders can also look up the Fund’s Forms N-Q (or any successor Form) on the SEC website at sec.gov. The SEC file numbers for the Fund are shown below.
A description of the policies and procedures that the Fund uses to determine how to vote proxies relating to portfolio securities is available without charge, upon request, from our Client Services department at 800 959 4246 or at invesco.com/proxyguidelines. The information is also available on the SEC website, sec.gov.
| | |
Information regarding how the Fund voted proxies related to its portfolio securities during the most recent 12-month period ended June 30 is available at invesco.com/proxysearch. The information is also available on the SEC website, sec.gov. Invesco Advisers, Inc. is an investment adviser; it provides investment advisory services to individual and institutional clients and does not sell securities. Invesco Distributors, Inc. is the US distributor for Invesco Ltd.’s retail mutual funds, exchange-traded funds and institutional money market funds. Both are wholly owned, indirect subsidiaries of Invesco Ltd. | |  |
| | | | | | | | |
| SEC file numbers: 811-05426 and 033-19338 | | Invesco Distributors, Inc. | | IBRA-AR-1 | | 12272018 | | 1033 |
| | | | | | |
| | | | |
 | | Annual Report to Shareholders | | October 31, 2018 | | |
| | | | |
| | Invesco Balanced-Risk Commodity Strategy Fund | | |
| | Nasdaq: | | |
| | A: BRCAX ∎ C: BRCCX ∎ R: BRCRX ∎ Y: BRCYX ∎ R5: BRCNX ∎ R6: IBRFX | | |

Letters to Shareholders
| | |

Philip Taylor | | Dear Shareholders: This annual report includes information about your Fund, including performance data and a complete list of its investments as of the close of the reporting period. Inside is a discussion of how your Fund was managed and the factors that affected its performance during the reporting period. Throughout the reporting period, US economic data remained positive. Robust corporate profits, strong retail sales and unemployment rates near generational lows helped drive US markets to new all-time records multiple times during the reporting period. Against this backdrop, the US Federal Reserve raised the federal funds rate four times during the reporting period. Market volatility, largely non-existent in 2017, returned in 2018. Markets sold off first in |
February and again sharply in October, amid rising interest rates, concerns about potential trade wars and heightened geopolitical tensions. Despite the volatility, US equity markets were largely positive for the reporting period and fared better than international markets. Emerging markets were particularly hard hit due to a strong US dollar. During the October sell-off, investors retreated to more defensive areas of the market and to US Treasuries. The broader bond market declined during the reporting period due to the increase in US Treasury yields and widening credit spreads. As the year progresses, we’ll see how the interplay of economic data, interest rates, geopolitics and a host of other factors affect US and overseas equity and fixed income markets.
Short-term market volatility can prompt some investors to abandon their investment plans – and can cause others to settle for whatever returns the market has to offer. The investment professionals at Invesco, in contrast, invest with high conviction. This means that, no matter the asset class or the strategy, each investment team has a passion to exceed. We want to help investors achieve better outcomes, such as seeking higher returns, helping mitigate risk and generating income. Of course, investing with high conviction can’t guarantee a profit or ensure success; no investment strategy can. To learn more about how we invest with high conviction, visit invesco.com/HighConviction.
You, too, can invest with high conviction by maintaining a long-term investment perspective and by working with your financial adviser on a regular basis. During periods of short-term market volatility or uncertainty, your financial adviser can keep you focused on your long-term investment goals – a new home, a child’s college education or a secure retirement. He or she also can share research about the economy, the markets and individual investment options.
Visit our website for more information on your investments
Our website, invesco.com/us, offers a wide range of market insights and investment perspectives. On the website, you’ll find detailed information about our funds, including performance, holdings and portfolio manager commentaries. You can access information about your account by completing a simple, secure online registration. To do so, select “Log In” on the right side of the homepage, and then select “Register for Individual Account Access.”
In addition to the resources accessible on our website and through our mobile app, you can obtain timely updates to help you stay informed about the markets and the economy by connecting with Invesco on Twitter, LinkedIn or Facebook. You can access our blog at blog.invesco.us.com. Our goal is to provide you the information you want, when and where you want it.
Finally, I’m pleased to share with you Invesco’s commitment to both the Principles for Responsible Investment and to considering environmental, social and governance issues in our robust investment process. I invite you to learn more at invesco.com/esg.
Have questions?
For questions about your account, contact an Invesco client services representative at 800 959 4246. For Invesco-related questions or comments, please email me directly at phil@invesco.com.
All of us at Invesco look forward to serving your investment management needs. Thank you for investing with us.
Sincerely,

Philip Taylor
Senior Managing Director, Invesco Ltd.
| | |
| 2 | | Invesco Balanced-Risk Commodity Strategy Fund |
| | | | |

Bruce Crockett | | Dear Fellow Shareholders: Among the many important lessons I’ve learned in more than 40 years in a variety of business endeavors is the value of a trusted advocate. As independent chair of the Invesco Funds Board, I can assure you that the members of the Board are strong advocates for the interests of investors in Invesco’s mutual funds. We work hard to represent your interests through oversight of the quality of the investment management services your funds receive and other matters important to your investment, including but not limited to: |
| | ∎ | | Ensuring that Invesco offers a diverse lineup of mutual funds that your financial adviser can use to strive to meet your financial needs as your investment goals change over time. |
| | ∎ | | Monitoring how the portfolio management teams of the Invesco funds are performing in light of changing economic and market conditions. |
| ∎ | | Assessing each portfolio management team’s investment performance within the context of the investment strategy described in the fund’s prospectus. |
| ∎ | | Monitoring for potential conflicts of interests that may impact the nature of the services that your funds receive. |
We believe one of the most important services we provide our fund shareholders is the annual review of the funds’ advisory and sub-advisory contracts with Invesco Advisers and its affiliates. This review is required by the Investment Company Act of 1940 and focuses on the nature and quality of the services Invesco provides as the adviser to the Invesco funds and the reasonableness of the fees that it charges for those services. Each year, we spend months carefully reviewing information received from Invesco and a variety of independent sources, such as performance and fee data prepared by Lipper, Inc. (a subsidiary of Broadridge Financial Solutions, Inc.), an independent, third-party firm widely recognized as a leader in its field. We also meet with our independent legal counsel and other independent advisers to review and help us assess the information that we have received. Our goal is to assure that you receive quality investment management services for a reasonable fee.
I trust the measures outlined above provide assurance that you have a worthy advocate when it comes to choosing the Invesco Funds.
As always, please contact me at bruce@brucecrockett.com with any questions or concerns you may have. On behalf of the Board, we look forward to continuing to represent your interests and serving your needs.
Sincerely,

Bruce L. Crockett
Independent Chair
Invesco Funds Board of Trustees
| | |
| 3 | | Invesco Balanced-Risk Commodity Strategy Fund |
Management’s Discussion of Fund Performance
| | | | |
| |
Performance summary For the fiscal year ended October 31, 2018, Class A shares of Invesco Balanced-Risk Commodity Strategy Fund (the Fund), at net asset value (NAV), underperformed the Bloomberg Commodity Index, the Fund’s broad market/style-specific benchmark. Your Fund’s long-term performance appears later in this report. | |
| |
Fund vs. Indexes | |
Total returns, 10/31/17 to 10/31/18, at net asset value (NAV). Performance shown does not include applicable contingent deferred sales charges (CDSC) or front-end sales charges, which would have reduced performance. | |
| |
Class A Shares | | | -2.98 | % |
Class C Shares | | | -3.75 | |
Class R Shares | | | -3.32 | |
Class Y Shares | | | -2.77 | |
Class R5 Shares | | | -2.74 | |
Class R6 Shares | | | -2.72 | |
Bloomberg Commodity Indexq (Broad Market/Style-Specific Index) | | | -1.73 | |
Source(s): qBloomberg L.P. | | | | |
Market conditions and your Fund
The fiscal year ended October 31, 2018, was a challenging environment for commodities as the impact of US trade and monetary policy weighed on the asset class. Agriculture experienced the largest losses followed by industrial metals and precious metals. Energy commodities were able to counter the downtrend with gains. The Fund’s ability to tactically adjust its exposure to assets had a positive impact on the Fund’s performance, due to gains from overweighting positions in energy and select underweight positions in industrial metals, precious metals and agriculture. The Fund invests with a long bias in four commodity complexes – agriculture, energy, industrial metals and precious metals – and makes tactical adjustments on a monthly basis to try and take advantage of short-term market dynamics.
The Fund’s strategic positioning within agriculture was the main detractor from the Fund’s performance during the fiscal year as losses were experienced across grains, soft commodities and livestock. Sugar was the largest detractor in agriculture and amongst the largest in the broader strategy. Global sugar supplies
reached excess levels as a bumper crop in India set the stage for India to become the world’s largest producer, surpassing Brazil. Moreover, a weaker Brazilian economy and currency caused exporters to reduce prices of both sugar and coffee. Grain prices also declined due to robust global production and a stronger US dollar. Soybeans and soymeal were two other major detractors in agriculture as the US enacted tariffs on Chinese goods and the Chinese retaliated by placing tariffs on US-grown soybeans. Prices of livestock, including live cattle and lean hogs, also declined as markets remained well supplied and feed costs were favorable due to falling grain prices. However, the Fund’s tactical exposure to agriculture, obtained through the use of swaps, futures and commodity-linked notes, contributed to the Fund’s performance due to underweight positions in sugar, soybeans, soybean oil, coffee and corn.
Strategic positioning in industrial metals was another detractor from the Fund’s performance during the fiscal year as prices of copper and aluminum declined as a result of US trade policy and signs of slowing Chinese economic growth. Declines in aluminum and copper were
triggered by President Trump’s follow-through on a campaign promise to aggressively renegotiate trade deals. One of the president’s first actions was to impose tariffs on Chinese steel and aluminum, which stoked fears of a trade war and a global economic slowdown. As the fiscal year progressed, Chinese manufacturing data continued to show signs of decline and raised concerns about future demand. Copper was the largest single detractor in industrial metals and across the broader strategy. The Fund’s tactical exposure to industrial metals, obtained through the use of swaps, futures and commodity-linked notes, contributed to the Fund’s performance during the fiscal year as an underweight allocation to copper and a tactical short position in nickel were favorable.
During the fiscal year, the Fund’s strategic positioning in precious metals detracted from the Fund’s performance as both gold and silver declined in price, with silver being the larger net detractor since it traded in sympathy with its crossover use as an industrial metal. Despite many geopolitical concerns including tensions with North Korea, Iran and China, gold failed to gain its traditional bid as a safe-haven asset. The primary reason this did not occur can be attributed to the US Federal Reserve continuing to increase interest rates during the fiscal year, which helped the dollar to rise and push down the price of gold. The rising dollar not only makes gold less attractive, but it also negatively impacts prices of broader commodities because the dollar is the base currency that most raw materials use to establish their global price level. The Fund’s tactical positioning within precious metals, obtained through the use of swaps, futures and commodity-linked notes, was favorable to the Fund’s performance during the fiscal year due to an underweight position in both gold and silver.
Strategic positioning in energy contributed to the Fund’s performance due to gains in oil and distillates during the fiscal year. Oil was the largest contributor to
| | | | | | | | |
| |
Target Risk Allocation and Notional Asset Weights as of 10/31/18 | |
By asset class | | | | | | | | |
Asset Class | |
| Target Risk
Allocation* |
| |
| Notional Asset
Weights** |
|
Agriculture | | | 30.20% | | | | 28.24% | |
Energy | | | 44.60 | | | | 29.97 | |
Industrial Metals | | | 20.45 | | | | 19.39 | |
Precious Metals | | | 4.75 | | | | 6.60 | |
Total | | | 100.00 | | | | 84.20 | |
| * | Reflects the risk that each asset class is expected to contribute to the overall risk of the Fund as measured by standard deviation and estimates of risk based on historical data. Standard deviation measures the annualized fluctuations (volatility) of monthly returns. |
| ** | Proprietary models determine the Notional Asset Weights necessary to achieve the Target Risk Allocations. Total Notional Asset Weight greater than 100% is achieved through derivatives and other instruments that create leverage. |
| | | | |
| | |
Total Net Assets | | $ | 1.6 billion | |
| | |
| 4 | | Invesco Balanced-Risk Commodity Strategy Fund |
Fund performance due to gains in Brent crude oil and West Texas Intermediate (WTI) crude oil. Supply fears propelled prices higher as President Trump reimposed sanctions on Iran making it more difficult for the country to sell its oil production on world markets. Additionally, the ongoing demise of the Venezuelan economy has led to a drastic cut in oil production, which also drove oil prices higher. Distillate prices responded in kind with gasoil and heating being the primary beneficiaries. Contributions from unleaded gasoline were capped by rising oil production in the US along with higher gasoline inventories. Natural gas also provided modest contributions as production remains high despite tighter inventories. The Fund’s tactical exposure to energy, obtained through the use of swaps, futures and commodity-linked notes, contributed to performance due to an overweight position in Brent crude oil, heating oil, WTI crude oil, gasoil, natural gas and unleaded gasoline.
Please note that our strategy is principally implemented with derivative instruments that include futures, total return swaps and commodity-linked notes. Therefore, all or most of the performance of the strategy, both positive and negative, can be attributed to these instruments. Derivatives can be a cost-effective way to gain exposure to asset classes. However, derivatives may amplify traditional investment risks through the creation of leverage and may be less liquid than traditional securities.
Thank you for your continued investment in Invesco Balanced-Risk Commodity Strategy Fund.
The views and opinions expressed in management’s discussion of Fund performance are those of Invesco Advisers, Inc. These views and opinions are subject to change at any time based on factors such as market and economic conditions. These views and opinions may not be relied upon as investment advice or recommendations, or as an offer for a particular security. The information is not a complete analysis of every aspect of any market, country, industry, security or the Fund. Statements of fact are from sources considered reliable, but Invesco Advisers, Inc. makes no representation or warranty as to their completeness or accuracy. Although historical performance is no guarantee of future results, these insights may help you understand our investment management philosophy.
See important Fund and, if applicable, index disclosures later in this report.
| | |
 | | Mark Ahnrud Chartered Financial Analyst, Portfolio Manager, is manager of Invesco Balanced-Risk Commodity Strategy |
| Fund. He joined Invesco in 2000. Mr. Ahnrud earned a BS in finance and investments from Babson College and an MBA from Duke University Fuqua School of Business. |
| | |
 | | Chris Devine Chartered Financial Analyst, Portfolio Manager, is manager of Invesco Balanced-Risk Commodity Strategy |
| Fund. He joined Invesco in 1998. Mr. Devine earned a BA in economics from Wake Forest University and an MBA from the University of Georgia. |
| | |
 | | Scott Hixon Chartered Financial Analyst, Portfolio Manager, is manager of Invesco Balanced-Risk Commodity Strategy |
| Fund. He joined Invesco in 1994. Mr. Hixon earned a BBA in finance from Georgia Southern University and an MBA in finance from Georgia State University. |
| | |
 | | Christian Ulrich Chartered Financial Analyst, Portfolio Manager, is manager of Invesco Balanced-Risk Commodity Strategy |
| Fund. He joined Invesco in 2000. Mr. Ulrich earned the equivalent of a BBA from the KV Zurich Business School in Zurich, Switzerland. |
| | |
 | | Scott Wolle Chartered Financial Analyst, Portfolio Manager, is manager of Invesco Balanced-Risk Commodity Strategy |
| Fund. He joined Invesco in 1999. Mr. Wolle earned a BS in finance from Virginia Polytechnic Institute and State University and an MBA from Duke University Fuqua School of Business |
Assisted by Invesco’s Global Asset Allocation Team
5 Invesco Balanced-Risk Commodity Strategy Fund
Your Fund’s Long-Term Performance
Results of a $10,000 Investment – Oldest Share Class(es) since Inception
Fund and index data from 11/30/10
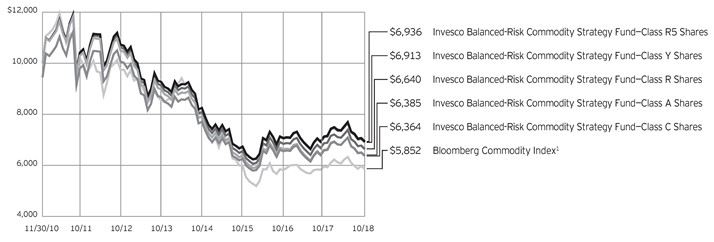
1 Source: Bloomberg L.P.
Past performance cannot guarantee comparable future results.
The data shown in the chart
include reinvested distributions, applicable sales charges and Fund expenses including
management fees. Index results include reinvested dividends, but they do not reflect sales charges. Performance of the peer group, if applicable, reflects fund expenses and management fees; perfor-
mance of a market index does not. Performance shown in the chart and table(s) does not reflect deduction of taxes a shareholder would pay on Fund distributions or sale of Fund shares.
continued from page 9
| | tered under the Investment Company Act of 1940, as amended (1940 Act), and, except as otherwise noted in this prospectus, is not subject to the investor protections of the 1940 Act. Changes in the laws of the United States and/ or the Cayman Islands, under which the Fund and the Subsidiary, respectively, are organized, could result in the inability of the Fund and/or the Subsidiary to operate as described in this prospectus and the SAI, and could negatively affect the Fund and its shareholders. |
| ∎ | | US government obligations risk. Obligations of US government agencies and authorities receive varying levels of support and may not be backed by the full faith and credit of the US government, which could affect the Fund’s ability to recover should they default. No assurance can be given that the US government will provide financial support to its agencies and authorities if it is not obligated by law to do so. |
About indexes used in this report
| ∎ | | The Bloomberg Commodity Index is an unmanaged index designed to be a highly liquid and diversified benchmark for the commodity futures market. |
| ∎ | | The Fund is not managed to track the performance of any particular index, including the index(es) described here, and consequently, the performance of the Fund may deviate significantly from the performance of the index(es). |
| ∎ | | A direct investment cannot be made in an index. Unless otherwise indicated, index results include reinvested dividends, and they do not reflect sales charges. Performance of the peer group, if applicable, reflects fund expenses; performance of a market index does not. |
Other information
| ∎ | | The returns shown in management’s discussion of Fund performance are based on net asset values (NAVs) calculated for shareholder transactions. Generally accepted accounting principles require adjustments to be made to the net assets of the Fund at period end for financial reporting purposes, and as such, the NAVs for shareholder transactions and the returns based on those NAVs may differ from the NAVs and returns reported in the Financial Highlights. |
| | |
| 6 | | Invesco Balanced-Risk Commodity Strategy Fund |
| | | | |
| |
Average Annual Total Returns | |
As of 10/31/18, including maximum applicable sales charges | |
| |
Class A Shares | | | | |
Inception (11/30/10) | | | -5.51 | % |
5 Years | | | -6.99 | |
1 Year | | | -8.32 | |
| |
Class C Shares | | | | |
Inception (11/30/10) | | | -5.55 | % |
5 Years | | | -6.65 | |
1 Year | | | -4.71 | |
| |
Class R Shares | | | | |
Inception (11/30/10) | | | -5.04 | % |
5 Years | | | -6.18 | |
1 Year | | | -3.32 | |
| |
Class Y Shares | | | | |
Inception (11/30/10) | | | -4.56 | % |
5 Years | | | -5.69 | |
1 Year | | | -2.77 | |
| |
Class R5 Shares | | | | |
Inception (11/30/10) | | | -4.52 | % |
5 Years | | | -5.63 | |
1 Year | | | -2.74 | |
| |
Class R6 Shares | | | | |
Inception | | | -4.56 | % |
5 Years | | | -5.55 | |
1 Year | | | -2.72 | |
Class R6 shares incepted on September 24, 2012. Performance shown prior to that date is that of Class A shares and includes the 12b-1 fees applicable to Class A shares.
The performance data quoted represent past performance and cannot guarantee comparable future results; current performance may be lower or higher. Please visit invesco.com/performance for the most recent month-end performance. Performance figures reflect reinvested distributions, changes in net asset value and the effect of the maximum sales charge unless otherwise stated. Investment return and principal value will fluctuate so that you may have a gain or loss when you sell shares.
The net annual Fund operating expense ratio set forth in the most recent Fund prospectus as of the date of this report for Class A, Class C, Class R, Class Y, Class R5 and Class R6 shares was 1.40%, 2.15%, 1.65%, 1.15%, 1.15% and 1.15%, respectively.1,2 The total annual Fund operating expense ratio set forth in the most recent Fund prospectus as of the date of this report for Class A, Class C, Class R, Class Y,
| | | | |
| |
Average Annual Total Returns | |
As of 9/30/18, the most recent calendar quarter end, including maximum applicable sales charges | |
| |
Class A Shares | | | | |
Inception (11/30/10) | | | -5.35 | % |
5 Years | | | -6.75 | |
1 Year | | | -3.92 | |
| |
Class C Shares | | | | |
Inception (11/30/10) | | | -5.35 | % |
5 Years | | | -6.39 | |
1 Year | | | -0.04 | |
| |
Class R Shares | | | | |
Inception (11/30/10) | | | -4.85 | % |
5 Years | | | -5.92 | |
1 Year | | | 1.40 | |
| |
Class Y Shares | | | | |
Inception (11/30/10) | | | -4.39 | % |
5 Years | | | -5.45 | |
1 Year | | | 1.83 | |
| |
Class R5 Shares | | | | |
Inception (11/30/10) | | | -4.33 | % |
5 Years | | | -5.36 | |
1 Year | | | 1.99 | |
| |
Class R6 Shares | | | | |
Inception | | | -4.37 | % |
5 Years | | | -5.29 | |
1 Year | | | 2.15 | |
Class R5 and Class R6 shares was 1.65%, 2.40%, 1.90%, 1.40%, 1.32% and 1.24%, respectively. The expense ratios presented above may vary from the expense ratios presented in other sections of this report that are based on expenses incurred during the period covered by this report.
Class A share performance reflects the maximum 5.50% sales charge, and Class C share performance reflects the applicable contingent deferred sales charge (CDSC) for the period involved. The CDSC on Class C shares is 1% for the first year after purchase. Class R, Class Y, Class R5 and Class R6 shares do not have a front-end sales charge or a CDSC; therefore, performance is at net asset value.
The performance of the Fund’s share classes will differ primarily due to different sales charge structures and class expenses.
Fund performance reflects any applicable fee waivers and/or expense reimbursements. Had the adviser not waived fees and/or reimbursed expenses currently or in the past, returns would have been lower. See current prospectus for more information.
| 1 | Total annual Fund operating expenses after any contractual fee waivers and/or expense reimbursements by the adviser in effect through at least February 29, 2020. See current prospectus for more information. |
| 2 | Total annual Fund operating expenses after any contractual fee waivers and/or expense reimbursements by the adviser in effect through at least June 30, 2020. See current prospectus for more information. |
7 Invesco Balanced-Risk Commodity Strategy Fund
Invesco Balanced-Risk Commodity Strategy Fund’s investment objective is to provide total return.
| ∎ | | Unless otherwise stated, information presented in this report is as of October 31, 2018, and is based on total net assets. |
| ∎ | | Unless otherwise noted, all data provided by Invesco. |
| ∎ | | To access your Fund’s reports/prospectus, visit invesco.com/fundreports. |
About share classes
| ∎ | | Class R shares are generally available only to employer sponsored retirement and benefit plans. Please see the prospectus for more information. |
| ∎ | | Class Y shares are available only to certain investors. Please see the prospectus for more information. |
| ∎ | | Class R5 shares and Class R6 shares are available for use by retirement plans that meet certain standards and for institutional investors. Class R6 shares are also available through intermediaries that have established an agreement with Invesco Distributors, Inc. to make such shares available for use in retail omnibus accounts. Please see the prospectus for more information. |
Principal risks of investing in the Fund
∎ Commodities tax risk. The tax treatment of commodity-linked derivative instruments may be adversely affected by changes in legislation, regulations or other legally binding authority. If, as a result of any such adverse action, the income of the Fund from certain commodity-linked derivatives was treated as non-qualifying income, the Fund might fail to qualify as a regulated investment company and be subject to federal income tax at the Fund level. As a result of a recent announcement by the Internal Revenue Service, the Fund intends to invest in commodity-linked notes: (a) directly, relying on an opinion of counsel confirming that income from such investments should be qualifying income because such commodity-linked notes constitute securities under section 2(a)(36) of the 1940 Act or (b) indirectly through the Subsidiary. Should the Internal Revenue Service issue further guidance, or Congress enact legislation, that adversely affects the tax treatment of the Fund’s use of commodity-linked notes or the Subsidiary (which guidance might be applied to the Fund retroactively), it could,
| | among other consequences, limit the Fund’s ability to pursue its investment strategy. |
| ∎ | | Commodity-linked notes risk. In addition to risks associated with the underlying commodities, investments in commodity-linked notes may be subject to additional risks, such as non-payment of interest and loss of principal, counterparty risk, lack of a secondary market and risk of greater volatility than traditional equity and debt securities. The value of the commodity-linked notes the Fund buys may fluctuate significantly because the values of the underlying investments to which they are linked are themselves volatile. Additionally, certain commodity-linked notes employ “economic” leverage by requiring payment by the issuer of an amount that is a multiple of the price increase or decrease of the underlying commodity, commodity index, or other economic variable. Such economic leverage will increase the volatility of the value of these commodity-linked notes and the Fund to the extent it invests in such notes. |
∎ Commodity risk. The Fund will concentrate its investments in commodities markets and will therefore have investment exposure to the commodities markets and one or more sectors of the commodities markets, which may subject the Fund to greater volatility than investments in traditional securities, such as stocks and bonds. Volatility in the commodities markets may be caused by changes in overall market movements, domestic and foreign political and economic events and policies, war, acts of terrorism, changes in domestic or foreign interest rates and/or investor expectations concerning interest rates, domestic and foreign inflation rates, investment and trading activities of mutual funds, hedge funds and commodities funds, and factors such as drought, floods, weather, livestock disease, embargoes, tariffs and other regulatory developments, or supply and demand disruptions. Because the
This report must be accompanied or preceded by a currently effective Fund prospectus, which contains more complete information, including sales charges and expenses. Investors should read it carefully before investing.
NOT FDIC INSURED | MAY LOSE VALUE | NO BANK GUARANTEE
| | Fund’s performance is linked to the performance of volatile commodities, investors should be willing to assume the risks of potentially significant fluctuations in the value of the Fund’s shares. |
| ∎ | | Correlation risk. Because the Fund’s investment strategy seeks to balance risk across the four sectors of the commodities market and, within each commodity sector, across different commodities, to the extent either the sectors of the commodities markets or the selected commodities become correlated in a way not anticipated by the Adviser, the Fund’s risk allocation process may result in magnified risks and loss instead of balancing (reducing) the risk of loss. |
∎ Debt securities risk. The prices of debt securities held by the Fund will be affected by changes in interest rates, the creditworthiness of the issuer and other factors. An increase in prevailing interest rates typically causes the value of existing debt securities to fall and often has a greater impact on longer-duration debt securities and higher quality debt securities. Falling interest rates will cause the Fund to reinvest the proceeds of debt securities that have been repaid by the issuer at lower interest rates. Falling interest rates may also reduce the Fund’s distributable income because interest payments on floating rate debt instruments held by the Fund will decline. The Fund could lose money on investments in debt securities if the issuer or borrower fails to meet its obligations to make interest payments and/or to repay principal in a timely manner. Changes in an issuer’s financial strength, the market’s perception of such strength or in the credit rating of the issuer or the security may affect the value of debt securities. The Adviser’s credit analysis may fail to anticipate such changes, which could result in buying a debt security at an inopportune time or failing to sell a debt security in advance of a price decline or other credit event.
∎ Derivatives risk. The value of a derivative instrument depends largely on (and is derived from) the value of an underlying security, currency, commodity, interest rate, index or other asset (each referred to as an underlying asset). In addition to risks relating to the underlying assets, the use of derivatives may include other, possibly greater, risks, including counterparty,
| | |
| 8 | | Invesco Balanced-Risk Commodity Strategy Fund |
| | leverage and liquidity risks. Counterparty risk is the risk that the counterparty to the derivative contract will default on its obligation to pay the Fund the amount owed or otherwise perform under the derivative contract. Derivatives create leverage risk because they do not require payment up front equal to the economic exposure created by holding a position in the derivative. As a result, an adverse change in the value of the underlying asset could result in the Fund sustaining a loss that is substantially greater than the amount invested in the derivative or the anticipated value of the underlying asset, which may make the Fund’s returns more volatile and increase the risk of loss. Derivative instruments may also be less liquid than more traditional investments and the Fund may be unable to sell or close out its derivative positions at a desirable time or price. This risk may be more acute under adverse market conditions, during which the Fund may be most in need of liquidating its derivative positions. Derivatives may also be harder to value, less tax efficient and subject to changing government regulation that could impact the Fund’s ability to use certain derivatives or their cost. The SEC has proposed new regulations related to the use of derivatives and related instruments by registered investment companies. If adopted as proposed, these regulations would limit the Fund’s ability to engage in derivatives transactions and may result in increased costs or require the Fund to modify its investment strategies or to liquidate. Derivative strategies may not always be successful. For example, derivatives used for hedging or to gain or limit exposure to a particular market segment may not provide the expected benefits, particularly during adverse market conditions. These risks are greater for the Fund than most other mutual funds because the Fund will implement its investment strategy primarily through derivative instruments rather than direct investments in stocks/bonds. |
| ∎ | | Exchange-traded funds risk. In addition to the risks associated with the underlying assets held by the exchange-traded fund, investments in exchange-traded funds are subject to the following |
| | additional risks: (1) an exchange-traded fund’s shares may trade above or below its net asset value; (2) an active trading market for the exchange-traded fund’s shares may not develop or be maintained; (3) trading an exchange-traded fund’s shares may be halted by the listing exchange; (4) a passively managed exchange-traded fund may not track the performance of the reference asset; and (5) a passively managed exchange-traded fund may hold troubled securities. Investment in exchange-traded funds may involve duplication of management fees and certain other expenses, as the Fund indirectly bears its proportionate share of any expenses paid by the exchange-traded funds in which it invests. Further, certain exchange-traded funds in which the Fund may invest are leveraged, which may result in economic leverage, permitting the Fund to gain exposure that is greater than would be the case in an unlevered instrument and potentially resulting in greater volatility. |
| ∎ | | Exchange-traded notes risk. Exchange-traded notes are subject to credit risk, counterparty risk, and the risk that the value of the exchange-traded note may drop due to a downgrade in the issuer’s credit rating. The value of an exchange-traded note may also be influenced by time to maturity, level of supply and demand for the exchange-traded note, volatility and lack of liquidity in the underlying market, changes in the applicable interest rates, and economic, legal, political, or geographic events that affect the referenced underlying market or assets. The Fund will bear its proportionate share of any fees and expenses borne by an exchange-traded note in which it invests. For certain exchange-traded notes, there may be restrictions on the Fund’s right to redeem its investment, which is meant to be held until maturity. |
| ∎ | | Management risk. The Fund is actively managed and depends heavily on the Adviser’s judgment about markets, interest rates or the attractiveness, relative values, liquidity, or potential appreciation of particular investments made for the Fund’s portfolio. The Fund could experience losses if these judgments prove to be incorrect. Because the Fund’s investment process relies heavily |
| | on its asset allocation process, market movements that are counter to the portfolio managers’ expectations may have a significant adverse effect on the Fund’s net asset value. Additionally, legislative, regulatory, or tax developments may adversely affect management of the Fund and, therefore, the ability of the Fund to achieve its investment objective. |
| ∎ | | Market risk. The market values of the Fund’s investments, and therefore the value of the Fund’s shares, will go up and down, sometimes rapidly or unpredictably. Market risk may affect a single issuer, industry or section of the economy, or it may affect the market as a whole. Individual stock prices tend to go up and down more dramatically than those of certain other types of investments, such as bonds. During a general downturn in the financial markets, multiple asset classes may decline in value. When markets perform well, there can be no assurance that specific investments held by the Fund will rise in value. |
| ∎ | | Short position risk. Because the Fund’s potential loss on a short position arises from increases in the value of the asset sold short, the Fund will incur a loss on a short position, which is theoretically unlimited, if the price of the asset sold short increases from the short sale price. The counterparty to a short position or other market factors may prevent the Fund from closing out a short position at a desirable time or price and may reduce or eliminate any gain or result in a loss. In a rising market, the Fund’s short positions will cause the Fund to underperform the overall market and its peers that do not engage in shorting. If the Fund holds both long and short positions, and both positions decline simultaneously, the short positions will not provide any buffer (hedge) from declines in value of the Fund’s long positions. Certain types of short positions involve leverage, which may exaggerate any losses, potentially more than the actual cost of the investment, and will increase the volatility of the Fund’s returns. |
| ∎ | | Subsidiary risk. By investing in the Subsidiary, the Fund is indirectly exposed to risks associated with the Subsidiary’s investments. The Subsidiary is not regis- |
continued on page 6
9 Invesco Balanced-Risk Commodity Strategy Fund
Consolidated Schedule of Investments
October 31, 2018
| | | | | | | | | | | | | | | | |
| | | Interest
Rate | | | Maturity
Date | | | Principal
Amount | | | Value | |
U.S. Treasury Securities–25.01% | | | | | | | | | | | | | | | | |
| U.S. Treasury Bills–12.13%(a) | | | | | | | | | | | | | | | | |
U.S. Treasury Bills | | | 0.47 | % | | | 12/13/2018 | | | $ | 43,000,000 | | | $ | 42,897,660 | |
U.S. Treasury Bills(b) | | | 1.17-1.73 | % | | | 12/27/2018 | | | | 45,650,000 | | | | 45,500,575 | |
U.S. Treasury Bills(b) | | | 0.66-1.42 | % | | | 02/07/2019 | | | | 101,600,000 | | | | 100,965,946 | |
| | | | | | | | | | | | | | | | 189,364,181 | |
| | | | |
| U.S. Treasury Notes–12.88%(c) | | | | | | | | | | | | | | | | |
U.S. Treasury Floating Rate Notes (3 mo. U.S. Treasury Bill Money Market Yield Rate) | | | 2.31 | % | | | 01/31/2020 | | | | 62,880,000 | | | | 62,892,898 | |
U.S. Treasury Floating Rate Notes (3 mo. U.S. Treasury Bill Money Market Yield
Rate + 0.03%) | | | 2.35 | % | | | 04/30/2020 | | | | 64,000,000 | | | | 64,026,137 | |
U.S. Treasury Floating Rate Notes (3 mo. U.S. Treasury Bill Money Market Yield
Rate + 0.04%) | | | 2.36 | % | | | 07/31/2020 | | | | 74,000,000 | | | | 74,028,804 | |
| | | | | | | | | | | | | | | | 200,947,839 | |
Total U.S. Treasury Securities (Cost $390,273,716) | | | | | | | | | | | | | | | 390,312,020 | |
| | | | |
| | | | | | Expiration
Date | | | | | | | |
Commodity-Linked Securities–4.11% | | | | | | | | | | | | | | | | |
Barclays Bank PLC, U.S. Federal Funds (Effective) rate minus 0.06% (linked to the Barclays Diversified Energy-Metals Total Return Index, multiplied by 3) (United Kingdom)(d) | | | | | | | 08/19/2019 | | | | 26,800,000 | | | | 25,001,895 | |
Barclays Bank PLC, U.S. Federal Funds (Effective) rate minus 0.06% (linked to the Barclays Diversified Energy-Metals Total Return Index, multiplied by 3) (United Kingdom)(d) | | | | | | | 11/25/2019 | | | | 13,300,000 | | | | 12,013,059 | |
International Bank for Reconstruction and Development, 3 month USD LIBOR rate minus 0.78% (linked to the Barclays Diversified Energy-Metals Total Return Index, multiplied by 2) (Supranational) | | | | | | | 01/30/2020 | | | | 30,000,000 | | | | 27,172,842 | |
Total Commodity-Linked Securities (Cost $70,100,000) | | | | | | | | | | | | | | | 64,187,796 | |
| | | | |
| | | | | | | | | Shares | | | | |
Money Market Funds–67.61% | | | | | | | | | | | | | | | | |
Invesco Government & Agency Portfolio–Institutional Class, 2.08%(e) | | | | | | | | | | | 328,121,612 | | | | 328,121,612 | |
Invesco Liquid Assets Portfolio–Institutional Class, 2.27%(e) | | | | | | | | | | | 214,238,468 | | | | 214,281,315 | |
Invesco Treasury Portfolio–Institutional Class, 2.09%(e) | | | | | | | | | | | 342,821,271 | | | | 342,821,271 | |
STIC (Global Series) PLC–U.S. Dollar Liquidity Portfolio (Ireland)–Institutional Class, 2.26%(e) | | | | | | | | | | | 169,816,138 | | | | 169,816,138 | |
Total Money Market Funds (Cost $1,055,045,067) | | | | | | | | | | | | | | | 1,055,040,336 | |
TOTAL INVESTMENTS IN SECURITIES–96.73% (Cost $1,515,418,783) | | | | | | | | | | | | | | | 1,509,540,152 | |
OTHER ASSETS LESS LIABILITIES–3.27% | | | | | | | | | | | | | | | 51,063,353 | |
NET ASSETS–100.00% | | | | | | | | | | | | | | $ | 1,560,603,505 | |
See accompanying Notes to Consolidated Financial Statements which are an integral part of the financial statements.
10 Invesco Balanced-Risk Commodity Strategy Fund
| | | | | | | | | | | | | | | | | | | | |
| Open Futures Contracts | |
| Long Futures Contracts | | Number of
Contracts | | | Expiration
Month | | | Notional
Value | | | Value | | | Unrealized
Appreciation
(Depreciation) | |
Coffee “C” | | | 172 | | | | December-2018 | | | $ | 7,269,150 | | | $ | 846,710 | | | $ | 846,710 | |
Corn | | | 955 | | | | December-2018 | | | | 17,345,188 | | | | (841,188 | ) | | | (841,188 | ) |
Cotton No. 2 | | | 2,383 | | | | December-2018 | | | | 91,578,690 | | | | (649,611 | ) | | | (649,611 | ) |
Gasoline Reformulated Blendstock Oxygenate Blending | | | 1,215 | | | | November-2018 | | | | 89,373,942 | | | | (5,567,263 | ) | | | (5,567,263 | ) |
Natural Gas | | | 1,070 | | | | November-2018 | | | | 34,892,700 | | | | 1,952,080 | | | | 1,952,080 | |
LME Zinc | | | 266 | | | | December-2018 | | | | 16,723,088 | | | | (819,772 | ) | | | (819,772 | ) |
Soybean | | | 2,202 | | | | July-2019 | | | | 98,126,625 | | | | (2,609,474 | ) | | | (2,609,474 | ) |
Wheat | | | 765 | | | | December-2018 | | | | 19,144,125 | | | | (2,199,918 | ) | | | (2,199,918 | ) |
Subtotal — Long | | | | | | | | | | | | | | | (9,888,436 | ) | | | (9,888,436 | ) |
| | | | | |
| | | | | | | | | | | | | | | | | | | | |
| Short Futures Contracts | | | | | | | | | | | | | | | |
Cocoa | | | 1,268 | | | | March-2019 | | | | (28,568,040 | ) | | | (1,984,729 | ) | | | (1,984,729 | ) |
Lean Hogs | | | 430 | | | | December-2018 | | | | (10,053,400 | ) | | | (275,504 | ) | | | (275,504 | ) |
LME Nickel | | | 142 | | | | December-2018 | | | | (9,769,458 | ) | | | 938,281 | | | | 938,281 | |
LME Zinc | | | 266 | | | | December-2018 | | | | (16,723,088 | ) | | | (728,350 | ) | | | (728,350 | ) |
Subtotal — Short | | | | | | | | | | | | | | | (2,050,302 | ) | | | (2,050,302 | ) |
Total Futures Contracts — Commodity Risk | | | | | | | | | | | | | | $ | (11,938,738 | ) | | $ | (11,938,738 | ) |
| | | | | | | | | | | | | | | | | | | | | | | | | | | | | | | | | | | | | | |
| Open Over-The-Counter Total Return Swap Agreements(f)(g) | |
| Counterparty | | Pay/
Receive | | | Reference Entity(h) | | Fixed
Rate | | | Payment
Frequency | | | Number of
Contracts | | | Maturity
Date | | | Notional
Value | | | Upfront
Payments
Paid
(Received) | | | Value | | | Unrealized
Appreciation
(Depreciation) | |
Goldman Sachs International | | | Receive | | | S&P GSCI Sugar Excess
Return Index | | | 0.37 | % | | | Monthly | | | | 503,500 | | | | March-2019 | | | $ | 83,729,935 | | | $ | — | | | $ | 1,617,645 | | | $ | 1,617,645 | |
JPMorgan Chase Bank, N.A. | | | Receive | | | J.P. Morgan Contag Beta Gas
Oil Excess Return Index | | | 0.25 | | | | Monthly | | | | 87,300 | | | | April-2019 | | | | 26,494,415 | | | | — | | | | 0 | | | | 0 | |
Merrill Lynch International | | | Receive | | | MLCXLXAE Excess Return Index | | | 0.25 | | | | Monthly | | | | 59,800 | | | | March-2019 | | | | 13,282,609 | | | | — | | | | 0 | | | | 0 | |
Merrill Lynch International | | | Receive | | | MLCX Dynamic Enhanced
Copper Excess Return Index | | | 0.25 | | | | Monthly | | | | 122,500 | | | | September-2019 | | | | 69,973,960 | | | | — | | | | 0 | | | | 0 | |
Merrill Lynch International | | | Receive | | | MLCX Natural Gas Annual
Excess Return Index | | | 0.25 | | | | Monthly | | | | 1,239,000 | | | | November-2018 | | | | 57,570,110 | | | | — | | | | 0 | | | | 0 | |
Royal Bank of Canada | | | Receive | | | RBC Enhanced Brent Crude Oil
01 Excess Return Index | | | 0.35 | | | | Monthly | | | | 182,100 | | | | March-2019 | | | | 66,476,388 | | | | — | | | | 0 | | | | 0 | |
Royal Bank of Canada | | | Receive | | | RBC Enhanced Copper LME 01
Excess Return Index | | | 0.28 | | | | Monthly | | | | 60,700 | | | | May-2019 | | | | 32,565,198 | | | | — | | | | 0 | | | | 0 | |
Subtotal — Appreciation | | | | | | | | | | | | | | | | | | | | | | | | | | | | | — | | | | 1,617,645 | | | | 1,617,645 | |
Barclays Bank PLC | | | Receive | | | Barclays Heating Oil Roll Yield
Excess Return Index | | | 0.37 | | | | Monthly | | | | 136,500 | | | | January-2019 | | | | 41,555,203 | | | | — | | | | (1,584,438 | ) | | | (1,584,438 | ) |
Barclays Bank PLC | | | Receive | | | Barclays Live Cattle Roll Yield
Excess Return Index | | | 0.47 | | | | Monthly | | | | 19,500 | | | | January-2019 | | | | 2,467,152 | | | | — | | | | (3,200 | ) | | | (3,200 | ) |
Barclays Bank PLC | | | Receive | | | Barclays WTI Crude Roll Yield
Excess Return Index | | | 0.35 | | | | Monthly | | | | 120,600 | | | | March-2019 | | | | 40,238,757 | | | | — | | | | (2,762,741 | ) | | | (2,762,741 | ) |
Canadian Imperial Bank of Commerce | | | Receive | | | CIBC Dynamic Roll LME Copper
Excess Return Index 2 | | | 0.30 | | | | Monthly | | | | 927,000 | | | | April-2019 | | | | 72,230,171 | | | | — | | | | (2,814,650 | ) | | | (2,814,650 | ) |
Goldman Sachs International | | | Receive | | | S&P GSCI Cotton Excess
Return Index | | | 0.45 | | | | Monthly | | | | 405,000 | | | | September-2019 | | | | 18,181,714 | | | | — | | | | (44,011 | ) | | | (44,011 | ) |
Goldman Sachs International | | | Receive | | | S&P GSCI Soybean Meal Excess
Return Index | | | 0.30 | | | | Monthly | | | | 110,350 | | | | June-2019 | | | | 115,406,237 | | | | — | | | | (4,384,426 | ) | | | (4,384,426 | ) |
JPMorgan Chase Bank, N.A. | | | Receive | | | S&P GSCI Gold Index
Excess Return | | | 0.09 | | | | Monthly | | | | 337,500 | | | | October-2019 | | | | 32,821,301 | | | | — | | | | (257,310 | ) | | | (257,310 | ) |
Macquarie Bank Ltd. | | | Receive | | | Macquarie Aluminum Dynamic
Selection Index | | | 0.30 | | | | Monthly | | | | 1,785,000 | | | | December-2018 | | | | 93,038,663 | | | | — | | | | (1,940,116 | ) | | | (1,940,116 | ) |
Macquarie Bank Ltd. | | | Receive | | | Macquarie Single Commodity
Silver type A Excess
Return Index | | | 0.16 | | | | Monthly | | | | 126,500 | | | | December-2018 | | | | 20,987,463 | | | | — | | | | (499,220 | ) | | | (499,220 | ) |
See accompanying Notes to Consolidated Financial Statements which are an integral part of the financial statements.
11 Invesco Balanced-Risk Commodity Strategy Fund
| | | | | | | | | | | | | | | | | | | | | | | | | | | | | | | | | | | | | | |
| Open Over-The-Counter Total Return Swap Agreements—(continued)(f)(g) | |
| Counterparty | | Pay/
Receive | | | Reference Entity(h) | | Fixed
Rate | | | Payment
Frequency | | | Number of
Contracts | | | Maturity
Date | | | Notional
Value | | | Upfront
Payments
Paid
(Received) | | | Value | | | Unrealized
Appreciation
(Depreciation) | |
Macquarie Bank Ltd. | | | Receive | | | Modified Macquarie Single
Commodity Sugar type A
Excess Return Index | | | 0.34 | % | | | Monthly | | | | 219,500 | | | | January-2019 | | | $ | 36,242,413 | | | $ | — | | | $ | (2,023,549 | ) | | $ | (2,023,549 | ) |
Morgan Stanley Capital Services LLC | | | Receive | | | MS Soybean Oil Dynamic
Roll Index | | | 0.30 | | | | Monthly | | | | 40,000 | | | | April-2019 | | | | 5,346,104 | | | | — | | | | (285,784 | ) | | | (285,784 | ) |
Subtotal — Depreciation | | | | | | | | — | | | | (16,599,445 | ) | | | (16,599,445 | ) |
Total Open Over-The-Counter Total Return Swap Agreements — Commodity Risk | | | | | | | $ | — | | | $ | (14,981,800 | ) | | $ | (14,981,800 | ) |
Investment Abbreviations:
| | |
| Barclays Diversified Energy-Metals Total Return Index | | – a basket of indices that provide exposure to various components of the energy and metals markets. The underlying commodities comprising the indices are: Brent Crude Oil, Copper, Gasoil, Gold, Silver, Unleaded Gasoline, and WTI Crude Oil. |
| LIBOR | | – London Interbank Offered Rate |
| USD | | – U.S. Dollar |
Notes to Consolidated Schedule of Investments:
| (a) | Security traded on a discount basis. The interest rate shown represents the discount rate at the time of purchase by the Fund. |
| (b) | All or a portion of the value was pledged as collateral to cover margin requirements for open futures contracts. See Note 1J. |
| (c) | Interest or dividend rate is redetermined periodically. Rate shown is the rate in effect on October 31, 2018. |
| (d) | Security purchased or received in a transaction exempt from registration under the Securities Act of 1933, as amended (the “1933 Act”). The security may be resold pursuant to an exemption from registration under the 1933 Act, typically to qualified institutional buyers. The aggregate value of these securities at October 31, 2018 was $37,014,954, which represented 2.37% of the Fund’s Net Assets. |
| (e) | The money market fund and the Fund are affiliated by having the same investment adviser. The rate shown is the 7-day SEC standardized yield as of October 31, 2018. |
| (f) | The Fund receives or pays payments based on any positive or negative return on the Reference Entity, respectively. |
| (g) | Open Over-The-Counter Total Return swap agreements are collateralized by cash held with Counterparties in the amount of $74,916,776. |
| (h) | The table below includes additional information regarding the underlying components of certain reference entities that are not publicly available. |
| | | | | | | | |
| Reference Entity Components | |
| Reference Entity | | Underlying Components | | | Percentage | |
S&P GSCI Sugar Excess Return Index | | | | | | | | |
| | | Long Futures Contracts | | | | | |
| | | Sugar | | | | 100 | % |
J.P. Morgan Contag Beta Gas Oil Excess Return Index | | | | | | | | |
| | | Long Futures Contracts | | | | | |
| | | Gas Oil | | | | 100 | % |
MLCXLXAE Excess Return Index | | | | | | | | |
| | | Long Futures Contracts | | | | | |
| | | Zinc | | | | 100 | % |
MLCX Dynamic Enhanced Copper Excess Return Index | | | | | | | | |
| | | Long Futures Contracts | | | | | |
| | | Copper | | | | 100 | % |
MLCX Natural Gas Annual Excess Return Index | | | | | | | | |
| | | Long Futures Contracts | | | | | |
| | | Natural Gas | | | | 100 | % |
RBC Enhanced Brent Crude Oil 01 Excess Return Index | | | | | | | | |
| | | Long Futures Contracts | | | | | |
| | | Brent Crude | | | | 100 | % |
RBC Enhanced Copper LME 01 Excess Return Index | | | | | | | | |
| | | Long Futures Contracts | | | | | |
| | | Copper | | | | 100 | % |
Barclays Heating Oil Roll Yield Excess Return Index | | | | | | | | |
| | | Long Futures Contracts | | | | | |
| | | Heating Oil | | | | 100 | % |
Barclays Live Cattle Roll Yield Excess Return Index | | | | | | | | |
| | | Long Futures Contracts | | | | | |
| | | Live Cattle | | | | 100 | % |
See accompanying Notes to Consolidated Financial Statements which are an integral part of the financial statements.
12 Invesco Balanced-Risk Commodity Strategy Fund
| | | | | | |
| Reference Entity Components—(continued) | |
| Reference Entity | | Underlying Components | | Percentage | |
Barclays WTI Crude Roll Yield Excess Return Index | | | | | | |
| | Long Futures Contracts | | | | |
| | WTI Crude | | | 100 | % |
CIBC Dynamic Roll LME Copper Excess Return Index 2 | | | | | | |
| | Long Futures Contracts | | | | |
| | Copper | | | 100 | % |
S&P GSCI Cotton Excess Return Index | | | | | | |
| | Long Futures Contracts | | | | |
| | Cotton No.2 | | | 100 | % |
S&P GSCI Soybean Meal Excess Return Index | | | | | | |
| | Long Futures Contracts | | | | |
| | Soybean Meal | | | 100 | % |
S&P GSCI Gold Index Excess Return | | | | | | |
| | Long Futures Contracts | | | | |
| | Gold | | | 100 | % |
Macquarie Aluminum Dynamic Selection Index | | | | | | |
| | Long Futures Contracts | | | | |
| | Aluminum | | | 100 | % |
Macquarie Single Commodity Silver type A Excess Return Index | | | | | | |
| | Long Futures Contracts | | | | |
| | Silver | | | 100 | % |
Modified Macquarie Single Commodity Sugar type A Excess Return Index | | | | | | |
| | Long Futures Contracts | | | | |
| | Sugar | | | 100 | % |
MS Soybean Oil Dynamic Roll Index | | | | | | |
| | Long Futures Contracts | | | | |
| | Soybean Oil | | | 100 | % |
See accompanying Notes to Consolidated Financial Statements which are an integral part of the financial statements.
13 Invesco Balanced-Risk Commodity Strategy Fund
Consolidated Statement of Assets and Liabilities
October 31, 2018
| | | | |
Assets: | | | | |
Investments in securities, at value (Cost $460,373,716) | | $ | 454,499,816 | |
Investments in affiliated money market funds, at value (Cost $1,055,045,067) | | | 1,055,040,336 | |
Other investments: | | | | |
Unrealized appreciation on LME futures contracts | | | 938,281 | |
Swaps receivable — OTC | | | 3,204,178 | |
Unrealized appreciation on swap agreements — OTC | | | 1,617,645 | |
Deposits with brokers: | | | | |
Cash collateral — OTC derivatives | | | 74,916,776 | |
Cash | | | 1,671 | |
Receivable for: | | | | |
Fund shares sold | | | 4,440,872 | |
Dividends | | | 1,961,716 | |
Fund expenses absorbed | | | 43,628 | |
Investment for trustee deferred compensation and retirement plans | | | 72,227 | |
Other assets | | | 155,924 | |
Total assets | | | 1,596,893,070 | |
| |
Liabilities: | | | | |
Other investments: | | | | |
Variation margin payable — futures contracts | | | 1,449,500 | |
LME futures contracts payable | | | 1,548,122 | |
Swaps payable — OTC | | | 12,051,437 | |
Unrealized depreciation on swap agreements — OTC | | | 16,599,445 | |
Payable for: | | | | |
Fund shares repurchased | | | 4,032,185 | |
Accrued fees to affiliates | | | 391,659 | |
Accrued trustees’ and officers’ fees and benefits | | | 2,714 | |
Accrued other operating expenses | | | 85,639 | |
Trustee deferred compensation and retirement plans | | | 128,864 | |
Total liabilities | | | 36,289,565 | |
Net assets applicable to shares outstanding | | $ | 1,560,603,505 | |
| |
Net assets consist of: | | | | |
Shares of beneficial interest | | $ | 1,588,669,340 | |
Distributable earnings | | | (28,065,835 | ) |
| | | $ | 1,560,603,505 | |
| | | | |
Net Assets: | | | | |
Class A | | $ | 34,543,198 | |
Class C | | $ | 9,555,073 | |
Class R | | $ | 1,622,359 | |
Class Y | | $ | 1,327,952,305 | |
Class R5 | | $ | 167,686,767 | |
Class R6 | | $ | 19,243,803 | |
|
Shares outstanding, no par value,
with an unlimited number of shares authorized: | |
Class A | | | 5,315,995 | |
Class C | | | 1,549,950 | |
Class R | | | 253,298 | |
Class Y | | | 200,393,783 | |
Class R5 | | | 25,197,645 | |
Class R6 | | | 2,883,101 | |
Class A: | | | | |
Net asset value per share | | $ | 6.50 | |
Maximum offering price per share | | | | |
(Net asset value of $6.50 ¸ 94.50%) | | $ | 6.88 | |
Class C: | | | | |
Net asset value and offering price per share | | $ | 6.16 | |
Class R: | | | | |
Net asset value and offering price per share | | $ | 6.40 | |
Class Y: | | | | |
Net asset value and offering price per share | | $ | 6.63 | |
Class R5: | | | | |
Net asset value and offering price per share | | $ | 6.65 | |
Class R6: | | | | |
Net asset value and offering price per share | | $ | 6.67 | |
See accompanying Notes to Consolidated Financial Statements which are an integral part of the financial statements.
14 Invesco Balanced-Risk Commodity Strategy Fund
Consolidated Statement of Operations
For the year ended October 31, 2018
| | | | |
Investment income: | | | | |
Dividends from affiliates | | $ | 11,213,523 | |
Interest | | | 5,992,390 | |
Total investment income | | | 17,205,913 | |
| |
Expenses: | | | | |
Advisory fees | | | 11,172,844 | |
Administrative services fees | | | 279,436 | |
Custodian fees | | | 17,628 | |
Distribution fees: | | | | |
Class A | | | 105,483 | |
Class B | | | 146 | |
Class C | | | 91,076 | |
Class R | | | 9,136 | |
Transfer agent fees — A, B, C, R and Y | | | 1,518,859 | |
Transfer agent fees — R5 | | | 195,453 | |
Transfer agent fees — R6 | | | 495 | |
Trustees’ and officers’ fees and benefits | | | 35,041 | |
Registration and filing fees | | | 145,129 | |
Reports to shareholders | | | 270,067 | |
Professional services fees | | | 74,247 | |
Other | | | 25,116 | |
Total expenses | | | 13,940,156 | |
Less: Fees waived, expenses reimbursed and expense offset arrangement(s) | | | (956,930 | ) |
Net expenses | | | 12,983,226 | |
Net investment income | | | 4,222,687 | |
| |
Realized and unrealized gain (loss): | | | | |
Net realized gain from (loss): | | | | |
Investment securities | | | 19,159,328 | |
Futures contracts | | | (11,255,095 | ) |
Swap agreements | | | (16,904,244 | ) |
| | | | (9,000,011 | ) |
Change in net unrealized appreciation (depreciation) of: | | | | |
Investment securities | | | (14,921,513 | ) |
Futures contracts | | | (10,558,145 | ) |
Swap agreements | | | (18,979,558 | ) |
| | | | (44,459,216 | ) |
Net realized and unrealized gain (loss) | | | (53,459,227 | ) |
Net increase (decrease) in net assets resulting from operations | | $ | (49,236,540 | ) |
See accompanying Notes to Consolidated Financial Statements which are an integral part of the financial statements.
15 Invesco Balanced-Risk Commodity Strategy Fund
Consolidated Statement of Changes in Net Assets
For the years ended October 31, 2018 and 2017
| | | | | | | | |
| | | 2018 | | | 2017 | |
Operations: | | | | | | | | |
Net investment income (loss) | | $ | 4,222,687 | | | $ | (4,538,717 | ) |
Net realized gain (loss) | | | (9,000,011 | ) | | | (9,638,258 | ) |
Change in net unrealized appreciation (depreciation) | | | (44,459,216 | ) | | | 16,822,397 | |
Net increase (decrease) in net assets resulting from operations | | | (49,236,540 | ) | | | 2,645,422 | |
| | |
Distributions to shareholders from distributable earnings(1): | | | | | | | | |
Class A | | | — | | | | (1,091,128 | ) |
Class B | | | — | | | | (3,367 | ) |
Class C | | | — | | | | (160,205 | ) |
Class R | | | — | | | | (18,396 | ) |
Class Y | | | (89,361 | ) | | | (16,712,187 | ) |
Class R5 | | | (66,877 | ) | | | (5,253,994 | ) |
Class R6 | | | (5,557 | ) | | | (56,525 | ) |
Total distributions from distributable earnings | | | (161,795 | ) | | | (23,295,802 | ) |
| | |
Share transactions–net: | | | | | | | | |
Class A | | | (20,804,780 | ) | | | 16,448,650 | |
Class B | | | (65,998 | ) | | | (85,660 | ) |
Class C | | | 2,992,241 | | | | 1,425,627 | |
Class R | | | 6,455 | | | | 892,561 | |
Class Y | | | 793,450,503 | | | | 19,012,305 | |
Class R5 | | | (33,782,869 | ) | | | 12,788,459 | |
Class R6 | | | 7,744,011 | | | | 10,313,107 | |
Net increase in net assets resulting from share transactions | | | 749,539,563 | | | | 60,795,049 | |
Net increase in net assets | | | 700,141,228 | | | | 40,144,669 | |
| | |
Net assets: | | | | | | | | |
Beginning of year | | | 860,462,277 | | | | 820,317,608 | |
End of year | | $ | 1,560,603,505 | | | $ | 860,462,277 | |
| (1) | The Securities and Exchange Commission eliminated the requirement to disclose distribution components separately, except for tax return of capital. For the year ended October 31, 2017, distributions to shareholders from distributable earnings consisted of distributions from net investment income. |
Notes to Consolidated Financial Statements
October 31, 2018
NOTE 1—Significant Accounting Policies
Invesco Balanced-Risk Commodity Strategy Fund (the “Fund”) is a series portfolio of AIM Investment Funds (Invesco Investment Funds) (the “Trust”). The Trust is organized as a Delaware statutory trust and is registered under the Investment Company Act of 1940, as amended (the “1940 Act”), as an open-end series management investment company authorized to issue an unlimited number of shares of beneficial interest. Information presented in these consolidated financial statements pertains only to the Fund. Matters affecting the Fund or each class will be voted on exclusively by the shareholders of the Fund or each class.
The Fund will seek to gain exposure to the commodity markets primarily through investments in the Invesco Cayman Commodity Fund III Ltd. (the “Subsidiary”), a wholly-owned subsidiary of the Fund organized under the laws of the Cayman Islands. The Subsidiary was organized by the Fund to invest in commodity-linked derivatives and other securities that may provide leveraged and non-leveraged exposure to commodities. The Fund may invest up to 25% of its total assets in the Subsidiary.
The Fund’s investment objective is to provide total return.
The Fund currently consists of six different classes of shares: Class A, Class C, Class R, Class Y, Class R5 and Class R6. Class Y shares are available only to certain investors. Class A shares are sold with a front-end sales charge unless certain waiver criteria are met. Under certain circumstances, load waived shares may be subject to contingent deferred sales charges (“CDSC”). Class C shares are sold with a CDSC. Class R, Class Y, Class R5 and Class R6 shares are sold at net asset value. Effective November 30, 2010, new or additional investments in Class B shares are no longer permitted. Existing shareholders of Class B shares were permitted to continue to reinvest dividends and capital gains distributions in Class B shares until their conversion to Class A shares. Also, shareholders in Class B shares were able to exchange those shares for Class B shares of other Invesco Funds offering such shares until they converted to Class A shares. Generally, Class B shares automatically converted to Class A shares on or about the month-end, which was at least eight years after the date of purchase. Redemptions of Class B shares prior to the conversion date were subject to a
16 Invesco Balanced-Risk Commodity Strategy Fund
CDSC. Effective January 26, 2018, all of the Fund’s outstanding Class B shares were converted to Class A shares, in advance of their normally scheduled conversion. No CDSC was paid in connection with this early conversion.
The Fund is an investment company and accordingly follows the investment company accounting and reporting guidance in accordance with Financial Accounting Standards Board Accounting Standards Codification Topic 946, Financial Services — Investment Companies.
The following is a summary of the significant accounting policies followed by the Fund in the preparation of its consolidated financial statements.
| A. | Security Valuations — Securities, including restricted securities, are valued according to the following policy. |
Debt obligations (including convertible securities) and unlisted equities are fair valued using an evaluated quote provided by an independent pricing service. Evaluated quotes provided by the pricing service may be determined without exclusive reliance on quoted prices, and may reflect appropriate factors such as institution-size trading in similar groups of securities, developments related to specific securities, dividend rate (for unlisted equities), yield (for debt obligations), quality, type of issue, coupon rate (for debt obligations), maturity (for debt obligations), individual trading characteristics and other market data. Pricing services generally value debt obligations assuming orderly transactions of institutional round lot size, but a fund may hold or transact in the same securities in smaller, odd lot sizes. Odd lots often trade at lower prices than institutional round lots. Debt obligations are subject to interest rate and credit risks. In addition, all debt obligations involve some risk of default with respect to interest and/or principal payments.
A security listed or traded on an exchange (except convertible securities) is valued at its last sales price or official closing price as of the close of the customary trading session on the exchange where the security is principally traded, or lacking any sales or official closing price on a particular day, the security may be valued at the closing bid price on that day. Securities traded in the over-the-counter market are valued based on prices furnished by independent pricing services or market makers. When such securities are valued by an independent pricing service they may be considered fair valued. Futures contracts are valued at the final settlement price set by an exchange on which they are principally traded. Listed options are valued at the mean between the last bid and asked prices from the exchange on which they are principally traded. Options not listed on an exchange are valued by an independent source at the mean between the last bid and asked prices. For purposes of determining net asset value (“NAV”) per share, futures and option contracts generally are valued 15 minutes after the close of the customary trading session of the New York Stock Exchange (“NYSE”).
Investments in open-end and closed-end registered investment companies that do not trade on an exchange are valued at the end-of-day net asset value per share. Investments in open-end and closed-end registered investment companies that trade on an exchange are valued at the last sales price or official closing price as of the close of the customary trading session on the exchange where the security is principally traded.
Swap agreements are fair valued using an evaluated quote, if available, provided by an independent pricing service. Evaluated quotes provided by the pricing service are valued based on a model which may include end-of-day net present values, spreads, ratings, industry, company performance and returns of referenced assets. Centrally cleared swap agreements are valued at the daily settlement price determined by the relevant exchange or clearinghouse.
Foreign securities’ (including foreign exchange contracts) prices are converted into U.S. dollar amounts using the applicable exchange rates as of the close of the NYSE. If market quotations are available and reliable for foreign exchange-traded equity securities, the securities will be valued at the market quotations. Because trading hours for certain foreign securities end before the close of the NYSE, closing market quotations may become unreliable. If between the time trading ends on a particular security and the close of the customary trading session on the NYSE, events occur that the investment adviser determines are significant and make the closing price unreliable, the Fund may fair value the security. If the event is likely to have affected the closing price of the security, the security will be valued at fair value in good faith using procedures approved by the Board of Trustees. Adjustments to closing prices to reflect fair value may also be based on a screening process of an independent pricing service to indicate the degree of certainty, based on historical data, that the closing price in the principal market where a foreign security trades is not the current value as of the close of the NYSE. Foreign securities’ prices meeting the approved degree of certainty that the price is not reflective of current value will be priced at the indication of fair value from the independent pricing service. Multiple factors may be considered by the independent pricing service in determining adjustments to reflect fair value and may include information relating to sector indices, American Depositary Receipts and domestic and foreign index futures. Foreign securities may have additional risks including exchange rate changes, potential for sharply devalued currencies and high inflation, political and economic upheaval, the relative lack of issuer information, relatively low market liquidity and the potential lack of strict financial and accounting controls and standards.
Securities for which market prices are not provided by any of the above methods may be valued based upon quotes furnished by independent sources. The last bid price may be used to value equity securities. The mean between the last bid and asked prices is used to value debt obligations, including corporate loans.
Securities for which market quotations are not readily available or became unreliable are valued at fair value as determined in good faith by or under the supervision of the Trust’s officers following procedures approved by the Board of Trustees. Issuer specific events, market trends, bid/asked quotes of brokers and information providers and other market data may be reviewed in the course of making a good faith determination of a security’s fair value.
The Fund may invest in securities that are subject to interest rate risk, meaning the risk that the prices will generally fall as interest rates rise and, conversely, the prices will generally rise as interest rates fall. Specific securities differ in their sensitivity to changes in interest rates depending on their individual characteristics. Changes in interest rates may result in increased market volatility, which may affect the value and/or liquidity of certain Fund investments.
Valuations change in response to many factors including the historical and prospective earnings of the issuer, the value of the issuer’s assets, general economic conditions, interest rates, investor perceptions and market liquidity. Because of the inherent uncertainties of valuation, the values reflected in the consolidated financial statements may materially differ from the value received upon actual sale of those investments.
| B. | Securities Transactions and Investment Income — Securities transactions are accounted for on a trade date basis. Realized gains or losses on sales are computed on the basis of specific identification of the securities sold. Interest income (net of withholding tax, if any) is recorded on the accrual basis from settlement date. Bond premiums and discounts are amortized and/or accreted over the lives of the respective securities. Pay-in-kind interest income and non-cash dividend income received in the form of securities in-lieu of cash are recorded at the fair value of the securities received. Dividend income (net of withholding tax, if any) is recorded on the ex-dividend date. |
17 Invesco Balanced-Risk Commodity Strategy Fund
The Fund may periodically participate in litigation related to Fund investments. As such, the Fund may receive proceeds from litigation settlements. Any proceeds received are included in the Consolidated Statement of Operations as realized gain (loss) for investments no longer held and as unrealized gain (loss) for investments still held.
Brokerage commissions and mark ups are considered transaction costs and are recorded as an increase to the cost basis of securities purchased and/or a reduction of proceeds on a sale of securities. Such transaction costs are included in the determination of net realized and unrealized gain (loss) from investment securities reported in the Consolidated Statement of Operations and the Consolidated Statement of Changes in Net Assets and the net realized and unrealized gains (losses) on securities per share in the Financial Highlights. Transaction costs are included in the calculation of the Fund’s net asset value and, accordingly, they reduce the Fund’s total returns. These transaction costs are not considered operating expenses and are not reflected in net investment income reported in the Consolidated Statement of Operations and the Consolidated Statement of Changes in Net Assets, or the net investment income per share and the ratios of expenses and net investment income reported in the Financial Highlights, nor are they limited by any expense limitation arrangements between the Fund and the investment adviser.
The Fund allocates income and realized and unrealized capital gains and losses to a class based on the relative net assets of each class.
| C. | Country Determination — For the purposes of making investment selection decisions and presentation in the Consolidated Schedule of Investments, the investment adviser may determine the country in which an issuer is located and/or credit risk exposure based on various factors. These factors include the laws of the country under which the issuer is organized, where the issuer maintains a principal office, the country in which the issuer derives 50% or more of its total revenues and the country that has the primary market for the issuer’s securities, as well as other criteria. Among the other criteria that may be evaluated for making this determination are the country in which the issuer maintains 50% or more of its assets, the type of security, financial guarantees and enhancements, the nature of the collateral and the sponsor organization. Country of issuer and/or credit risk exposure has been determined to be the United States of America, unless otherwise noted. |
| D. | Distributions — Distributions from net investment income and net realized capital gain, if any, are generally declared and paid annually and recorded on the ex-dividend date. The Fund may elect to treat a portion of the proceeds from redemptions as distributions for federal income tax purposes. |
| E. | Federal Income Taxes — The Fund intends to comply with the requirements of Subchapter M of the Internal Revenue Code of 1986, as amended (the “Internal Revenue Code”), necessary to qualify as a regulated investment company and to distribute substantially all of the Fund’s taxable earnings to shareholders. As such, the Fund will not be subject to federal income taxes on otherwise taxable income (including net realized capital gain) that is distributed to shareholders. Therefore, no provision for federal income taxes is recorded in the consolidated financial statements. |
The Fund recognizes the tax benefits of uncertain tax positions only when the position is more likely than not to be sustained. Management has analyzed the Fund’s uncertain tax positions and concluded that no liability for unrecognized tax benefits should be recorded related to uncertain tax positions. Management is not aware of any tax positions for which it is reasonably possible that the total amounts of unrecognized tax benefits will change materially in the next 12 months.
The Subsidiary is classified as a controlled foreign corporation under Subchapter N of the Internal Revenue Code. Therefore, the Fund is required to increase its taxable income by its share of the Subsidiary’s income. Net investment losses of the Subsidiary cannot be deducted by the Fund in the current period nor carried forward to offset taxable income in future periods.
The Fund files tax returns in the U.S. Federal jurisdiction and certain other jurisdictions. Generally the Fund is subject to examinations by such taxing authorities for up to three years after the filing of the return for the tax period.
| F. | Expenses — Fees provided for under the Rule 12b-1 plan of a particular class of the Fund are charged to the operations of such class. Transfer agency fees and expenses and other shareholder recordkeeping fees and expenses attributable to Class R5 and Class R6 are allocated to each share class based on relative net assets. Sub-accounting fees attributable to Class R5 are charged to the operations of the class. Transfer agency fees and expenses and other shareholder recordkeeping fees and expenses relating to all other classes are allocated among those classes based on relative net assets. All other expenses are allocated among the classes based on relative net assets. |
| G. | Accounting Estimates — The financial statements are prepared on a consolidated basis in conformity with accounting principles generally accepted in the United States of America (“GAAP”), which requires management to make estimates and assumptions that affect the reported amounts of assets and liabilities at the date of the financial statements and the reported amounts of revenues and expenses during the reporting period including estimates and assumptions related to taxation. Actual results could differ from those estimates by a significant amount. The accompanying financial statements reflect the financial position of the Fund and its Subsidiary and the results of operations on a consolidated basis. All inter-company accounts and transactions have been eliminated in consolidation. |
In addition, the Fund monitors for material events or transactions that may occur or become known after the period-end date and before the date the consolidated financial statements are released to print.
| H. | Indemnifications — Under the Trust’s organizational documents, each Trustee, officer, employee or other agent of the Trust, and under the Subsidiary’s organizational documents, the directors and officers of the Subsidiary, are indemnified against certain liabilities that may arise out of the performance of their duties to the Fund and/or the Subsidiary, respectively. Additionally, in the normal course of business, the Fund enters into contracts, including the Fund’s servicing agreements, that contain a variety of indemnification clauses. The Fund’s maximum exposure under these arrangements is unknown as this would involve future claims that may be made against the Fund that have not yet occurred. The risk of material loss as a result of such indemnification claims is considered remote. |
| I. | Structured Securities — The Fund may invest in structured securities. Structured securities are a type of derivative security whose value is determined by reference to changes in the value of underlying securities, currencies, interest rates, commodities, indices or other financial indicators (“reference instruments”). Most structured securities are fixed-income securities that have maturities of three years or less. Structured securities may be positively or negatively indexed (i.e., their principal value or interest rates may increase or decrease if the underlying reference instrument appreciates) and may have return characteristics similar to direct investments in the underlying reference instrument. |
Structured securities may entail a greater degree of market risk than other types of debt securities because the investor bears the risk of the reference instruments. In addition to the credit risk of structured securities and the normal risks of price changes in response to changes in interest rates, the principal amount of structured notes or indexed securities may decrease as a result of changes in the value of the underlying reference instruments. Changes in the daily value of structured securities are recorded as unrealized gains (losses) in the Consolidated Statement
18 Invesco Balanced-Risk Commodity Strategy Fund
of Operations. When the structured securities mature or are sold, the Fund recognizes a realized gain (loss) on the Consolidated Statement of Operations.
| J. | Futures Contracts — The Fund may enter into futures contracts to equitize the Fund’s cash holdings or to manage exposure to interest rate, equity and market price movements and/or currency risks. A futures contract is an agreement between two parties (“Counterparties”) to purchase or sell a specified underlying security, currency or commodity (or delivery of a cash settlement price, in the case of an index future) for a fixed price at a future date. The Fund currently invests only in exchange-traded futures and they are standardized as to maturity date and underlying financial instrument. Initial margin deposits required upon entering into futures contracts are satisfied by the segregation of specific securities or cash as collateral at the futures commission merchant (broker). During the period the futures contracts are open, changes in the value of the contracts are recognized as unrealized gains or losses by recalculating the value of the contracts on a daily basis. Subsequent or variation margin payments are received or made on non-LME futures contracts depending upon whether unrealized gains or losses are incurred. These amounts are reflected as receivables or payables on the Consolidated Statement of Assets and Liabilities. For LME contracts, subsequent or variation margin payments are not made and the value of the contracts is presented as unrealized appreciation or depreciation on the Statement of Assets and Liabilities. When LME or non-LME contracts are closed or expire, the Fund recognizes a realized gain or loss equal to the difference between the proceeds from, or cost of, the closing transaction and the Fund’s basis in the contract. The net realized gain (loss) and the change in unrealized gain (loss) on futures contracts held during the period is included on the Consolidated Statement of Operations. The primary risks associated with futures contracts are market risk and the absence of a liquid secondary market. If the Fund were unable to liquidate a futures contract and/or enter into an offsetting closing transaction, the Fund would continue to be subject to market risk with respect to the value of the contracts and continue to be required to maintain the margin deposits on the futures contracts. Futures contracts have minimal Counterparty risk since the exchange’s clearinghouse, as Counterparty to all exchange-traded futures, guarantees the futures against default. Risks may exceed amounts recognized in the Consolidated Statement of Assets and Liabilities. |
| K. | Swap Agreements — The Fund may enter into various swap transactions, including interest rate, total return, index, currency and credit default swap contracts (“CDS”) for investment purposes or to manage interest rate, currency, commodity or credit risk. Such transactions are agreements between Counterparties. These agreements may contain among other conditions, events of default and termination events, and various covenants and representations such as provisions that require the Fund to maintain a pre-determined level of net assets, and/or provide limits regarding the decline of the Fund’s NAV over specific periods of time. If the Fund were to trigger such provisions and have open derivative positions at that time, the Counterparty may be able to terminate such agreement and request immediate payment in an amount equal to the net liability positions, if any. |
Interest rate, total return, index, and currency swap agreements are two-party contracts entered into primarily to exchange the returns (or differentials in rates of returns) earned or realized on particular predetermined investments or instruments. The gross returns to be exchanged or “swapped” between the parties are calculated with respect to a notional amount, i.e., the return on or increase in value of a particular dollar amount invested at a particular interest rate or return of an underlying asset, in a particular foreign currency, or in a “basket” of securities representing a particular index. At the maturity date, a net cash flow is exchanged where the total return is equivalent to the return of the underlying reference less a financing rate, if any. As a receiver, the Fund would receive payments based on any positive total return and would owe payments in the event of a negative total return. As the payer, the Fund would owe payments on any net positive total return, and would receive payment in the event of a negative total return.
Changes in the value of swap agreements are recognized as unrealized gains (losses) in the Consolidated Statement of Operations by “marking to market” on a daily basis to reflect the value of the swap agreement at the end of each trading day. Payments received or paid at the beginning of the agreement are reflected as such on the Consolidated Statement of Assets and Liabilities and may be referred to as upfront payments. The Fund accrues for the fixed payment stream and amortizes upfront payments, if any, on swap agreements on a daily basis with the net amount, recorded as a component of realized gain (loss) on the Consolidated Statement of Operations. A liquidation payment received or made at the termination of a swap agreement is recorded as realized gain (loss) on the Consolidated Statement of Operations. The Fund segregates cash or liquid securities having a value at least equal to the amount of the potential obligation of a Fund under any swap transaction. Cash held as collateral is recorded as deposits with brokers on the Consolidated Statement of Assets and Liabilities. Entering into these agreements involves, to varying degrees, lack of liquidity and elements of credit, market, and Counterparty risk in excess of amounts recognized on the Consolidated Statement of Assets and Liabilities. Such risks involve the possibility that a swap is difficult to sell or liquidate; the Counterparty does not honor its obligations under the agreement and unfavorable interest rates and market fluctuations. It is possible that developments in the swaps market, including potential government regulation, could adversely affect the Fund’s ability to terminate existing swap agreements or to realize amounts to be received under such agreements. A short position in a security poses more risk than holding the same security long. As there is no limit on how much the price of the security can increase, the Fund’s exposure is unlimited.
| L. | Other Risks — The Fund will seek to gain exposure to commodity markets primarily through an investment in the Subsidiary and through investments in exchange-traded funds and commodity-linked derivatives. The Subsidiary, unlike the Fund, may invest without limitation in commodities, commodity-linked derivatives and other securities, such as exchange-traded and commodity-linked notes, that may provide leveraged and non-leveraged exposure to commodity markets. The Fund is indirectly exposed to the risks associated with the Subsidiary’s investments. |
| M. | Leverage Risk — Leverage exists when the Fund can lose more than it originally invests because it purchases or sells an instrument or enters into a transaction without investing an amount equal to the full economic exposure of the instrument or transaction. |
| N. | Collateral — To the extent the Fund has designated or segregated a security as collateral and that security is subsequently sold, it is the Fund’s practice to replace such collateral no later than the next business day. |
19 Invesco Balanced-Risk Commodity Strategy Fund
NOTE 2—Advisory Fees and Other Fees Paid to Affiliates
The Trust has entered into a master investment advisory agreement with Invesco Advisers, Inc. (the “Adviser” or “Invesco”). Under the terms of the investment advisory agreement, the Fund accrues daily and pays monthly an advisory fee to the Adviser less the amount paid by the Subsidiary to the Adviser based on the annual rate of the Fund’s average daily net assets as follows:
| | | | | | | | |
| Average Daily Net Assets | | Rate | |
First $250 million | | | 1 | .05% | | | | |
Next $250 million | | | 1 | .025% | | | | |
Next $500 million | | | 1 | .00% | | | | |
Next $1.5 billion | | | 0 | .975% | | | | |
Next $2.5 billion | | | 0 | .95% | | | | |
Next $2.5 billion | | | 0 | .925% | | | | |
Next $2.5 billion | | | 0 | .90% | | | | |
Over $10 billion | | | 0 | .875% | | | | |
For the year ended October 31, 2018, the effective advisory fees incurred by the Fund was 1.01%.
The Subsidiary has entered into a separate contract with the Adviser whereby the Adviser provides investment advisory and other services to the Subsidiary. In consideration of these services, the Subsidiary pays an advisory fee to the Adviser based on the annual rate of the Subsidiary’s average daily net assets as set forth in the table above.
Under the terms of a master sub-advisory agreement between the Adviser and each of Invesco Asset Management Deutschland GmbH, Invesco Asset Management Limited, Invesco Asset Management (Japan) Limited, Invesco Hong Kong Limited, Invesco Senior Secured Management, Inc. and Invesco Canada Ltd. and separate sub-advisory agreements with Invesco Capital Management LLC, formerly Invesco PowerShares Capital Management LLC, and Invesco Asset Management (India) Private Limited (collectively, the “Affiliated Sub-Advisers”) the Adviser, not the Fund, will pay 40% of the fees paid to the Adviser to any such Affiliated Sub-Adviser(s) that provide(s) discretionary investment management services to the Fund based on the percentage of assets allocated to such Affiliated Sub-Adviser(s).
Effective September 20, 2018, the Adviser has contractually agreed, through at least February 29, 2020, to waive advisory fees and/or reimburse expenses to the extent necessary to limit total annual fund operating expenses after fee waivers and/or reimbursements (excluding certain items discussed below) of Class A, Class C, Class R, Class Y, Class R5 and Class R6 shares to 1.40%, 2.15%, 1.65%, 1.15%, 1.15% and 1.15%, respectively, of the Fund’s average daily net assets (the “expense limits”). Prior to September 20, 2018, the Adviser had contractually agreed to waive advisory fees and/or reimburse expenses of all shares to the extent necessary to limit annual fund operating expenses after fee waiver and/or expense reimbursement (excluding certain items discussed below) of Class A, Class C, Class R, Class Y, Class R5 and Class R6 shares to 2.00%, 2.75%, 2.25%, 1.75%, 1.75% and 1.75%, respectively, of the Fund’s average daily net assets. Prior to their conversion to Class A shares, the expense limit for Class B shares was 2.75% of average daily net assets. In determining the Adviser’s obligation to waive advisory fees and/or reimburse expenses, the following expenses are not taken into account, and could cause the total annual fund operating expenses after fee waiver and/or expense reimbursement to exceed the numbers reflected above: (1) interest; (2) taxes; (3) dividend expense on short sales; (4) extraordinary or non-routine items, including litigation expenses; and (5) expenses that the Fund has incurred but did not actually pay because of an expense offset arrangement. Acquired Fund Fees and Expenses are not operating expenses of the Fund directly, but are fees and expenses, including management fees, of the investment companies in which the Fund invests. As a result, the total annual fund operating expenses after expense reimbursement may exceed the expense limits above. Unless Invesco continues the fee waiver agreement, it will terminate on February 29, 2020. During its term, the fee waiver agreement cannot be terminated or amended to increase the expense limits or reduce the advisory fee waiver without approval of the Board of Trustees.
Further, the Adviser has contractually agreed, through at least June 30, 2020, to waive the advisory fee payable by the Fund in an amount equal to 100% of the net advisory fees the Adviser receives on the Fund’s investments in certain affiliated funds.
For the year ended October 31, 2018, the Adviser waived advisory fees of $851,326 and reimbursed class level expenses of $4,347, $1, $938, $188, $86,092 and $12,918 of Class A, Class B, Class C, Class R, Class Y and Class R5 shares, respectively.
The Trust has entered into a master administrative services agreement with Invesco pursuant to which the Fund has agreed to pay Invesco for certain administrative costs incurred in providing accounting services to the Fund. For the year ended October 31, 2018, expenses incurred under the agreement are shown in the Consolidated Statement of Operations as Administrative services fees.
The Trust has entered into a transfer agency and service agreement with Invesco Investment Services, Inc. (“IIS”) pursuant to which the Fund has agreed to pay IIS a fee for providing transfer agency and shareholder services to the Fund and reimburse IIS for certain expenses incurred by IIS in the course of providing such services. IIS may make payments to intermediaries that provide omnibus account services, sub-accounting services and/or networking services. All fees payable by IIS to intermediaries that provide omnibus account services or sub-accounting services are charged back to the Fund, subject to certain limitations approved by the Trust’s Board of Trustees. For the year ended October 31, 2018, expenses incurred under the agreement are shown in the Consolidated Statement of Operations as Transfer agent fees.
The Trust has entered into master distribution agreements with Invesco Distributors, Inc. (“IDI”) to serve as the distributor for the Class A, Class C, Class R, Class Y, Class R5 and Class R6 shares of the Fund. The Trust has adopted plans pursuant to Rule 12b-1 under the 1940 Act with respect to the Fund’s Class A, Class C and Class R shares (collectively, the “Plans”). The Fund, pursuant to the Plans, pays IDI compensation at the annual rate of 0.25% of the Fund’s average daily net assets of Class A shares, 1.00% of the average daily net assets of Class C shares and 0.50% of the average daily net assets of Class R shares. Prior to their conversion to Class A shares, the Fund paid an annual rate of 1.00% of the average daily net assets of Class B shares. The fees are accrued daily and paid monthly. Of the Plan payments, up to 0.25% of the average daily net assets of each class of shares may be paid to furnish continuing personal shareholder services to customers who purchase and own shares of such classes. Any amounts not paid as a service fee under the Plans would constitute an asset-based sales charge. Rules of the Financial Industry Regulatory Authority (“FINRA”) impose a cap on the total sales charges, including asset-based sales charges, that may be paid by any class of shares of the Fund. For the year ended October 31, 2018, expenses incurred under the Plans are shown in the Consolidated Statement of Operations as Distribution fees.
20 Invesco Balanced-Risk Commodity Strategy Fund
Front-end sales commissions and CDSC (collectively, the “sales charges”) are not recorded as expenses of the Fund. Front-end sales commissions are deducted from proceeds from the sales of Fund shares prior to investment in Class A shares of the Fund. CDSC are deducted from redemption proceeds prior to remittance to the shareholder. During the year ended October 31, 2018, IDI advised the Fund that IDI retained $28,253 in front-end sales commissions from the sale of Class A shares and $1,260 from Class C shares for CDSC imposed on redemptions by shareholders.
Certain officers and trustees of the Trust are officers and directors of the Adviser, IIS and/or IDI.
NOTE 3—Additional Valuation Information
GAAP defines fair value as the price that would be received to sell an asset or paid to transfer a liability in an orderly transaction between market participants at the measurement date, under current market conditions. GAAP establishes a hierarchy that prioritizes the inputs to valuation methods, giving the highest priority to readily available unadjusted quoted prices in an active market for identical assets (Level 1) and the lowest priority to significant unobservable inputs (Level 3), generally when market prices are not readily available or are unreliable. Based on the valuation inputs, the securities or other investments are tiered into one of three levels. Changes in valuation methods may result in transfers in or out of an investment’s assigned level:
| | Level 1 — | Prices are determined using quoted prices in an active market for identical assets. |
| | Level 2 — | Prices are determined using other significant observable inputs. Observable inputs are inputs that other market participants may use in pricing a security. These may include quoted prices for similar securities, interest rates, prepayment speeds, credit risk, yield curves, loss severities, default rates, discount rates, volatilities and others. |
| | Level 3 — | Prices are determined using significant unobservable inputs. In situations where quoted prices or observable inputs are unavailable (for example, when there is little or no market activity for an investment at the end of the period), unobservable inputs may be used. Unobservable inputs reflect the Fund’s own assumptions about the factors market participants would use in determining fair value of the securities or instruments and would be based on the best available information. |
The following is a summary of the tiered valuation input levels, as of October 31, 2018. The level assigned to the securities valuations may not be an indication of the risk or liquidity associated with investing in those securities. Because of the inherent uncertainties of valuation, the values reflected in the financial statements may materially differ from the value received upon actual sale of those investments.
| | | | | | | | | | | | | | | | |
| | | Level 1 | | | Level 2 | | | Level 3 | | | Total | |
Investments in Securities | | | | | | | | | | | | | | | | |
U.S. Treasury Securities | | $ | — | | | $ | 390,312,020 | | | $ | — | | | $ | 390,312,020 | |
Commodity-Linked Securities | | | — | | | | 64,187,796 | | | | — | | | | 64,187,796 | |
Money Market Funds | | | 1,055,040,336 | | | | — | | | | — | | | | 1,055,040,336 | |
Total Investments in Securities | | | 1,055,040,336 | | | | 454,499,816 | | | | — | | | | 1,509,540,152 | |
Other Investments — Assets* | | | | | | | | | | | | | | | | |
Futures Contracts | | | 3,737,071 | | | | — | | | | — | | | | 3,737,071 | |
Swap Agreements | | | — | | | | 1,617,645 | | | | — | | | | 1,617,645 | |
| | | | 3,737,071 | | | | 1,617,645 | | | | — | | | | 5,354,716 | |
Other Investments — Liabilities* | | | | | | | | | | | | | | | | |
Futures Contracts | | | (15,675,809 | ) | | | — | | | | — | | | | (15,675,809 | ) |
Swap Agreements | | | — | | | | (16,599,445 | ) | | | — | | | | (16,599,445 | ) |
| | | | (15,675,809 | ) | | | (16,599,445 | ) | | | — | | | | (32,275,254 | ) |
Total Other Investments | | | (11,938,738 | ) | | | (14,981,800 | ) | | | — | | | | (26,920,538 | ) |
Total Investments | | $ | 1,043,101,598 | | | $ | 439,518,016 | | | $ | — | | | $ | 1,482,619,614 | |
| * | Unrealized appreciation (depreciation). |
NOTE 4—Derivative Investments
The Fund may enter into an International Swaps and Derivatives Association Master Agreement (“ISDA Master Agreement”) under which a fund may trade OTC derivatives. An OTC transaction entered into under an ISDA Master Agreement typically involves a collateral posting arrangement, payment netting provisions and close-out netting provisions. These netting provisions allow for reduction of credit risk through netting of contractual obligations. The enforceability of the netting provisions of the ISDA Master Agreement depends on the governing law of the ISDA Master Agreement, among other factors.
For financial reporting purposes, the Fund does not offset OTC derivative assets or liabilities that are subject to ISDA Master Agreements in the Consolidated Statement of Assets and Liabilities.
21 Invesco Balanced-Risk Commodity Strategy Fund
Value of Derivative Investments at Period-End
The table below summarizes the value of the Fund’s derivative investments, detailed by primary risk exposure, held as of October 31, 2018:
| | | | |
| | | Value | |
| Derivative Assets | | Commodity Risk | |
Unrealized appreciation on futures contracts — Exchange-Traded(a) | | $ | 3,737,071 | |
Unrealized appreciation on swap agreements — OTC | | | 1,617,645 | |
Total Derivative Assets | | | 5,354,716 | |
Derivatives not subject to master netting agreements | | | (3,737,071 | ) |
Total Derivative Assets subject to master netting agreements | | $ | 1,617,645 | |
| | | | |
| | | Value | |
| Derivative Liabilities | | Commodity
Risk | |
Unrealized depreciation on futures contracts — Exchange-Traded(a) | | $ | (15,675,809 | ) |
Unrealized depreciation on swap agreements — OTC | | | (16,599,445 | ) |
Total Derivative Liabilities | | | (32,275,254 | ) |
Derivatives not subject to master netting agreements | | | 15,675,809 | |
Total Derivative Liabilities subject to master netting agreements | | $ | (16,599,445 | ) |
| (a) | The daily variation margin receivable (payable) at period-end is recorded in the Consolidated Statement of Assets and Liabilities. |
Offsetting Assets and Liabilities
The table below reflects the Fund’s exposure to Counterparties subject to either an ISDA Master Agreement or other agreement for OTC derivative transactions as of October 31, 2018.
| | | | | | | | | | | | | | | | | | | | | | | | |
| | | Financial
Derivative
Assets | | | Financial
Derivative
Liabilities | | | | | | | | | | |
| | | Swap | | | Swap | | | Net Value of | | | Collateral (Received)/Pledged | | | Net | |
| Counterparty | | Agreements | | | Agreements | | | Derivatives | | | Non-Cash | | | Cash | | | Amount | |
Subsidiary | | | | | | | | | | | | | | | | | | | | | | | | |
Barclays Bank PLC | | $ | — | | | $ | (4,363,579 | ) | | $ | (4,363,579 | ) | | $ | — | | | $ | 4,363,579 | | | $ | — | |
Canadian Imperial Bank of Commerce | | | — | | | | (2,826,883 | ) | | | (2,826,883 | ) | | | — | | | | 2,826,883 | | | | — | |
Goldman Sachs International | | | 1,617,645 | | | | (4,477,803 | ) | | | (2,860,158 | ) | | | — | | | | 2,860,158 | | | | — | |
JPMorgan Chase Bank, N.A. | | | — | | | | (259,887 | ) | | | (259,887 | ) | | | — | | | | 259,887 | | | | — | |
Macquarie Bank Ltd. | | | — | | | | (4,471,087 | ) | | | (4,471,087 | ) | | | — | | | | 4,471,087 | | | | — | |
Merrill Lynch International | | | 3,204,178 | | | | (4,040,844 | ) | | | (836,666 | ) | | | — | | | | 836,666 | | | | — | |
Morgan Stanley Capital Services LLC | | | — | | | | (286,474 | ) | | | (286,474 | ) | | | — | | | | 260,000 | | | | (26,474 | ) |
Royal Bank of Canada | | | — | | | | (7,924,325 | ) | | | (7,924,325 | ) | | | — | | | | 7,040,000 | | | | (884,325 | ) |
Total | | $ | 4,821,823 | | | $ | (28,650,882 | ) | | $ | (23,829,059 | ) | | $ | — | | | $ | 22,918,260 | | | $ | (910,799 | ) |
Effect of Derivative Investments for the year ended October 31, 2018
The table below summarizes the gains (losses) on derivative investments, detailed by primary risk exposure, recognized in earnings during the period:
| | | | |
| | | Location of Gain (Loss) on
Consolidated Statement
of Operations | |
| | | Commodity
Risk | |
Realized Gain (Loss): | | | | |
Futures contracts | | $ | (11,255,095 | ) |
Swap agreements | | | (16,904,244 | ) |
Change in Net Unrealized Appreciation (Depreciation): | | | | |
Futures contracts | | | (10,558,145 | ) |
Swap agreements | | | (18,979,558 | ) |
Total | | $ | (57,697,042 | ) |
The table below summarizes the average notional value of futures contracts and swap agreements outstanding during the period.
| | | | | | | | |
| | | Futures
Contracts | | | Swap
Agreements | |
Average notional value | | $ | 312,164,466 | | | $ | 722,638,108 | |
22 Invesco Balanced-Risk Commodity Strategy Fund
NOTE 5—Investments in Affiliates
The Fund’s Adviser and the adviser for Invesco DB Gold Fund are subsidiaries of Invesco Ltd. and therefore, Invesco DB Gold Fund is considered to be affiliated with the Fund. The following is a summary of the transactions in, and earnings from, investments in Invesco DB Gold Fund for the year ended October 31, 2018.
| | | | | | | | | | | | | | | | | | | | | | | | | | | | |
| | | Value 10/31/17 | | | Purchases
at Cost | | | Proceeds
from Sales | | | Change in
Unrealized
Appreciation | | | Realized
Gain (Loss) | | | Value 10/31/18 | | | Dividend
Income | |
Invesco DB Gold Fund | | $ | 8,284,050 | | | $ | 3,364,950 | | | $ | (10,891,709 | ) | | $ | 3,390,782 | | | $ | (4,148,073 | ) | | $ | — | | | $ | 8,614 | |
NOTE 6—Expense Offset Arrangement(s)
The expense offset arrangement is comprised of transfer agency credits which result from balances in demand deposit accounts used by the transfer agent for clearing shareholder transactions. For the year ended October 31, 2018, the Fund received credits from this arrangement, which resulted in the reduction of the Fund’s total expenses of $1,120.
NOTE 7—Trustees’ and Officers’ Fees and Benefits
Trustees’ and Officers’ Fees and Benefits include amounts accrued by the Fund to pay remuneration to certain Trustees and Officers of the Fund. Trustees have the option to defer compensation payable by the Fund, and Trustees’ and Officers’ Fees and Benefits also include amounts accrued by the Fund to fund such deferred compensation amounts. Those Trustees who defer compensation have the option to select various Invesco Funds in which their deferral accounts shall be deemed to be invested. Finally, certain current Trustees were eligible to participate in a retirement plan that provided for benefits to be paid upon retirement to Trustees over a period of time based on the number of years of service. The Fund may have certain former Trustees who also participate in a retirement plan and receive benefits under such plan. Trustees’ and Officers’ Fees and Benefits include amounts accrued by the Fund to fund such retirement benefits. Obligations under the deferred compensation and retirement plans represent unsecured claims against the general assets of the Fund.
NOTE 8—Cash Balances
The Fund is permitted to temporarily carry a negative or overdrawn balance in its account with State Street Bank and Trust Company, the custodian bank. Such balances, if any at period-end, are shown in the Consolidated Statement of Assets and Liabilities under the payable caption Amount due custodian. To compensate the custodian bank for such overdrafts, the overdrawn Fund may either (1) leave funds as a compensating balance in the account so the custodian bank can be compensated by earning the additional interest; or (2) compensate by paying the custodian bank at a rate agreed upon by the custodian bank and Invesco, not to exceed the contractually agreed upon rate.
NOTE 9—Distributions to Shareholders and Tax Components of Net Assets
Tax Character of Distributions to Shareholders Paid During the Fiscal Years Ended October 31, 2018 and 2017:
| | | | | | | | |
| | | 2018 | | | 2017 | |
Ordinary income | | $ | 161,795 | | | $ | 23,295,802 | |
Tax Components of Net Assets at Period-End:
| | | | |
| | | 2018 | |
Undistributed ordinary income | | $ | 260,482 | |
Net unrealized appreciation (depreciation) — investments | | | (6,489,266 | ) |
Temporary book/tax differences | | | (122,480 | ) |
Capital loss carryforward | | | (21,714,571 | ) |
Shares of beneficial interest | | | 1,588,669,340 | |
Total net assets | | $ | 1,560,603,505 | |
The difference between book-basis and tax-basis unrealized appreciation (depreciation) is due to differences in the timing of recognition of gains and losses on investments for tax and book purposes. The Fund’s net unrealized appreciation (depreciation) difference is attributable primarily to futures contracts and swap agreements.
The temporary book/tax differences are a result of timing differences between book and tax recognition of income and/or expenses. The Fund’s temporary book/tax differences are the result of the trustee deferral of compensation and retirement plan benefits.
Capital loss carryforward is calculated and reported as of a specific date. Results of transactions and other activity after that date may affect the amount of capital loss carryforward actually available for the Fund to utilize. Capital losses generated in years beginning after December 22, 2010 can be carried forward for an unlimited period, whereas previous losses expire in eight tax years. Capital losses with an expiration period may not be used to offset capital gains until all net capital losses without an expiration date have been utilized. Capital loss carryforwards with no expiration date will retain their character as either short-term or long-term capital losses instead of as short-term capital losses as under prior law. The ability to utilize capital loss carryforwards in the future may be limited under the Internal Revenue Code and related regulations based on the results of future transactions.
23 Invesco Balanced-Risk Commodity Strategy Fund
The Fund has a capital loss carryforward as of October 31, 2018, as follows:
| | | | | | | | | | | | |
| Capital Loss Carryforward* | |
| Expiration | | Short-Term | | | Long-Term | | | Total | |
Not subject to expiration | | $ | 21,714,571 | | | $ | — | | | $ | 21,714,571 | |
| * | Capital loss carryforward as of the date listed above is reduced for limitations, if any, to the extent required by the Internal Revenue Code and may be further limited depending upon a variety of factors, including the realization of net unrealized gains or losses as of the date of any reorganization. |
NOTE 10—Investment Transactions
The aggregate amount of investment securities (other than short-term securities, U.S. Treasury obligations and money market funds, if any) purchased and sold by the Fund during the year ended October 31, 2018 was $73,464,950 and $76,390,888, respectively. During the same period, purchases and sales of U.S. Treasury obligations were $200,880,000 and $159,800,000, respectively. Cost of investments, including any derivatives, on a tax basis includes the adjustments for financial reporting purposes as of the most recently completed federal income tax reporting period-end.
| | | | |
| Unrealized Appreciation (Depreciation) of Investments on a Tax Basis | |
Aggregate unrealized appreciation of investments | | $ | 86,205,674 | |
Aggregate unrealized (depreciation) of investments | | | (92,694,940 | ) |
Net unrealized appreciation (depreciation) of investments | | $ | (6,489,266 | ) |
Cost of investments for tax purposes is $1,489,108,880.
NOTE 11—Reclassification of Permanent Differences
Primarily as a result of differing book/tax treatment of subsidiary suspended passive losses, swap agreement income and partnership adjustments, on October 31, 2018, undistributed net investment income was increased by $14,444,313, undistributed net realized gain (loss) was increased by $42,411,257 and shares of beneficial interest was decreased by $56,855,570. This reclassification had no effect on the net assets of the Fund.
24 Invesco Balanced-Risk Commodity Strategy Fund
NOTE 12—Share Information
| | | | | | | | | | | | | | | | |
| | | Summary of Share Activity | |
| | | Years ended October 31, | |
| | 2018(a) | | | 2017 | |
| | | Shares | | | Amount | | | Shares | | | Amount | |
Sold: | | | | | | | | | | | | | | | | |
Class A | | | 3,169,241 | | | $ | 21,780,368 | | | | 4,563,865 | | | $ | 30,361,277 | |
Class C | | | 810,035 | | | | 5,371,717 | | | | 632,764 | | | | 4,089,805 | |
Class R | | | 106,098 | | | | 722,955 | | | | 210,342 | | | | 1,356,759 | |
Class Y | | | 158,005,872 | | | | 1,087,459,862 | | | | 67,828,430 | | | | 461,730,692 | |
Class R5 | | | 1,200,171 | | | | 8,268,870 | | | | 2,861,151 | | | | 18,947,101 | |
Class R6 | | | 1,550,041 | | | | 10,982,304 | | | | 2,043,846 | | | | 13,792,890 | |
| | | | |
Issued as reinvestment of dividends: | | | | | | | | | | | | | | | | |
Class A | | | — | | | | — | | | | 149,749 | | | | 1,006,312 | |
Class B(b) | | | — | | | | — | | | | 396 | | | | 2,565 | |
Class C | | | — | | | | — | | | | 22,851 | | | | 147,620 | |
Class R | | | — | | | | — | | | | 2,740 | | | | 18,221 | |
Class Y | | | 8,118 | | | | 54,310 | | | | 1,163,388 | | | | 7,934,306 | |
Class R5 | | | 9,913 | | | | 66,518 | | | | 763,850 | | | | 5,224,733 | |
Class R6 | | | 825 | | | | 5,556 | | | | 8,252 | | | | 56,525 | |
| | | | |
Conversion of Class B shares to Class A shares:(c) | | | | | | | | | | | | | | | | |
Class A | | | 8,756 | | | | 62,252 | | | | 7,534 | | | | 49,496 | |
Class B | | | (9,155 | ) | | | (62,252 | ) | | | (7,837 | ) | | | (49,496 | ) |
| | | | |
Reacquired: | | | | | | | | | | | | | | | | |
Class A | | | (6,299,545 | ) | | | (42,647,400 | ) | | | (2,258,911 | ) | | | (14,968,435 | ) |
Class B(b) | | | (568 | ) | | | (3,746 | ) | | | (5,968 | ) | | | (38,729 | ) |
Class C | | | (366,650 | ) | | | (2,379,476 | ) | | | (449,948 | ) | | | (2,811,798 | ) |
Class R | | | (107,098 | ) | | | (716,500 | ) | | | (74,400 | ) | | | (482,419 | ) |
Class Y | | | (42,291,714 | ) | | | (294,063,669 | ) | | | (67,046,653 | ) | | | (450,652,693 | ) |
Class R5 | | | (6,060,828 | ) | | | (42,118,257 | ) | | | (1,674,504 | ) | | | (11,383,375 | ) |
Class R6 | | | (461,003 | ) | | | (3,243,849 | ) | | | (541,057 | ) | | | (3,536,308 | ) |
Net increase in share activity | | | 109,272,509 | | | $ | 749,539,563 | | | | 8,199,880 | | | $ | 60,795,049 | |
| (a) | There are entities that are record owners of more than 5% of the outstanding shares of the Fund and in the aggregate own 85% of the outstanding shares of the Fund. IDI has an agreement with these entities to sell Fund shares. The Fund, Invesco and/or Invesco affiliates may make payments to these entities, which are considered to be related to the Fund, for providing services to the Fund, Invesco and/or Invesco affiliates including but not limited to services such as securities brokerage, distribution, third party record keeping and account servicing. The Fund has no knowledge as to whether all or any portion of the shares owned of record by these entities are also owned beneficially. |
| (b) | Reflects activity for the period November 1, 2017 through January 26, 2018 (date of conversion). |
| (c) | Effective as of the close of business on January 26, 2018, all outstanding Class B shares were converted to Class A shares. |
25 Invesco Balanced-Risk Commodity Strategy Fund
NOTE 13—Financial Highlights
The following schedule presents financial highlights for a share of the Fund outstanding throughout the periods indicated.
| | | | | | | | | | | | | | | | | | | | | | | | | | | | | | | | | | | | | | | | | | | | | | | | |
| | | Net asset
value,
beginning
of period | | | Net
investment
income
(loss)(a) | | | Net gains
(losses)
on securities
(both
realized and
unrealized) | | | Total from
investment
operations | | | Dividends
from net
investment
income | | | Net asset
value, end
of period | | | Total
return(b) | | | Net assets,
end of period
(000’s omitted) | | | Ratio of
expenses
to average
net assets
with fee waivers
and/or expenses
absorbed | | | Ratio of
expenses
to average net
assets without
fee waivers
and/or expenses
absorbed | | | Ratio of net
investment
income (loss)
to average
net assets | | | Portfolio
turnover(c) | |
Class A | | | | | | | | | | | | | | | | | | | | | | | | | | | | | | | | | | | | | | | | | | | | | | | | |
Year ended 10/31/18 | | $ | 6.70 | | | $ | 0.01 | | | $ | (0.21 | ) | | $ | (0.20 | ) | | $ | — | | | $ | 6.50 | | | | (2.98 | )% | | $ | 34,543 | | | | 1.42 | %(d) | | | 1.51 | %(d) | | | 0.14 | %(d) | | | 96 | % |
Year ended 10/31/17 | | | 6.84 | | | | (0.05 | ) | | | 0.08 | | | | 0.03 | | | | (0.17 | ) | | | 6.70 | | | | 0.47 | | | | 56,532 | | | | 1.49 | | | | 1.56 | | | | (0.78 | ) | | | 10 | |
Year ended 10/31/16 | | | 6.54 | | | | (0.07 | ) | | | 0.37 | | | | 0.30 | | | | — | | | | 6.84 | | | | 4.59 | | | | 40,844 | | | | 1.47 | | | | 1.56 | | | | (1.11 | ) | | | 98 | |
Year ended 10/31/15 | | | 8.04 | | | | (0.10 | ) | | | (1.40 | ) | | | (1.50 | ) | | | — | | | | 6.54 | | | | (18.66 | ) | | | 34,892 | | | | 1.55 | | | | 1.59 | | | | (1.47 | ) | | | 17 | |
Year ended 10/31/14 | | | 9.05 | | | | (0.11 | ) | | | (0.90 | ) | | | (1.01 | ) | | | — | | | | 8.04 | | | | (11.16 | ) | | | 47,339 | | | | 1.30 | | | | 1.57 | | | | (1.25 | ) | | | 21 | |
Class B | | | | | | | | | | | | | | | | | | | | | | | | | | | | | | | | | | | | | | | | | | | | | | | | |
Year ended 10/31/18(e) | | | 6.42 | | | | (0.01 | ) | | | 0.39 | | | | 0.38 | | | | — | | | | 6.80 | | | | 5.92 | | | | — | | | | 2.17 | (d)(f) | | | 2.26 | (d)(f) | | | (0.61 | )(d)(f) | | | 96 | |
Year ended 10/31/17 | | | 6.58 | | | | (0.10 | ) | | | 0.09 | | | | (0.01 | ) | | | (0.15 | ) | | | 6.42 | | | | (0.19 | ) | | | 62 | | | | 2.24 | | | | 2.31 | | | | (1.53 | ) | | | 10 | |
Year ended 10/31/16 | | | 6.34 | | | | (0.12 | ) | | | 0.36 | | | | 0.24 | | | | — | | | | 6.58 | | | | 3.79 | | | | 152 | | | | 2.22 | | | | 2.31 | | | | (1.86 | ) | | | 98 | |
Year ended 10/31/15 | | | 7.85 | | | | (0.16 | ) | | | (1.35 | ) | | | (1.51 | ) | | | — | | | | 6.34 | | | | (19.24 | ) | | | 258 | | | | 2.30 | | | | 2.34 | | | | (2.22 | ) | | | 17 | |
Year ended 10/31/14 | | | 8.91 | | | | (0.17 | ) | | | (0.89 | ) | | | (1.06 | ) | | | — | | | | 7.85 | | | | (11.90 | ) | | | 514 | | | | 2.05 | | | | 2.32 | | | | (2.00 | ) | | | 21 | |
Class C | | | | | | | | | | | | | | | | | | | | | | | | | | | | | | | | | | | | | | | | | | | | | | | | |
Year ended 10/31/18 | | | 6.40 | | | | (0.04 | ) | | | (0.20 | ) | | | (0.24 | ) | | | — | | | | 6.16 | | | | (3.75 | ) | | | 9,555 | | | | 2.17 | (d) | | | 2.26 | (d) | | | (0.61 | )(d) | | | 96 | |
Year ended 10/31/17 | | | 6.57 | | | | (0.10 | ) | | | 0.08 | | | | (0.02 | ) | | | (0.15 | ) | | | 6.40 | | | | (0.34 | ) | | | 7,086 | | | | 2.24 | | | | 2.31 | | | | (1.53 | ) | | | 10 | |
Year ended 10/31/16 | | | 6.33 | | | | (0.12 | ) | | | 0.36 | | | | 0.24 | | | | — | | | | 6.57 | | | | 3.79 | | | | 5,915 | | | | 2.22 | | | | 2.31 | | | | (1.86 | ) | | | 98 | |
Year ended 10/31/15 | | | 7.84 | | | | (0.15 | ) | | | (1.36 | ) | | | (1.51 | ) | | | — | | | | 6.33 | | | | (19.26 | ) | | | 2,544 | | | | 2.30 | | | | 2.34 | | | | (2.22 | ) | | | 17 | |
Year ended 10/31/14 | | | 8.89 | | | | (0.17 | ) | | | (0.88 | ) | | | (1.05 | ) | | | — | | | | 7.84 | | | | (11.81 | ) | | | 3,612 | | | | 2.05 | | | | 2.32 | | | | (2.00 | ) | | | 21 | |
Class R | | | | | | | | | | | | | | | | | | | | | | | | | | | | | | | | | | | | | | | | | | | | | | | | |
Year ended 10/31/18 | | | 6.62 | | | | (0.01 | ) | | | (0.21 | ) | | | (0.22 | ) | | | — | | | | 6.40 | | | | (3.32 | ) | | | 1,622 | | | | 1.67 | (d) | | | 1.76 | (d) | | | (0.11 | )(d) | | | 96 | |
Year ended 10/31/17 | | | 6.76 | | | | (0.07 | ) | | | 0.09 | | | | 0.02 | | | | (0.16 | ) | | | 6.62 | | | | 0.35 | | | | 1,683 | | | | 1.74 | | | | 1.81 | | | | (1.03 | ) | | | 10 | |
Year ended 10/31/16 | | | 6.48 | | | | (0.09 | ) | | | 0.37 | | | | 0.28 | | | | — | | | | 6.76 | | | | 4.32 | | | | 782 | | | | 1.72 | | | | 1.81 | | | | (1.36 | ) | | | 98 | |
Year ended 10/31/15 | | | 7.99 | | | | (0.12 | ) | | | (1.39 | ) | | | (1.51 | ) | | | — | | | | 6.48 | | | | (18.90 | ) | | | 363 | | | | 1.80 | | | | 1.84 | | | | (1.72 | ) | | | 17 | |
Year ended 10/31/14 | | | 9.02 | | | | (0.13 | ) | | | (0.90 | ) | | | (1.03 | ) | | | — | | | | 7.99 | | | | (11.42 | ) | | | 371 | | | | 1.55 | | | | 1.82 | | | | (1.50 | ) | | | 21 | |
Class Y | | | | | | | | | | | | | | | | | | | | | | | | | | | | | | | | | | | | | | | | | | | | | | | | |
Year ended 10/31/18 | | | 6.82 | | | | 0.03 | | | | (0.22 | ) | | | (0.19 | ) | | | (0.00 | ) | | | 6.63 | | | | (2.77 | ) | | | 1,327,952 | | | | 1.17 | (d) | | | 1.26 | (d) | | | 0.39 | (d) | | | 96 | |
Year ended 10/31/17 | | | 6.95 | | | | (0.04 | ) | | | 0.10 | | | | 0.06 | | | | (0.19 | ) | | | 6.82 | | | | 0.80 | | | | 577,236 | | | | 1.24 | | | | 1.31 | | | | (0.53 | ) | | | 10 | |
Year ended 10/31/16 | | | 6.63 | | | | (0.06 | ) | | | 0.38 | | | | 0.32 | | | | — | | | | 6.95 | | | | 4.83 | | | | 574,878 | | | | 1.22 | | | | 1.31 | | | | (0.86 | ) | | | 98 | |
Year ended 10/31/15 | | | 8.13 | | | | (0.09 | ) | | | (1.41 | ) | | | (1.50 | ) | | | — | | | | 6.63 | | | | (18.45 | ) | | | 217,528 | | | | 1.30 | | | | 1.34 | | | | (1.22 | ) | | | 17 | |
Year ended 10/31/14 | | | 9.13 | | | | (0.09 | ) | | | (0.91 | ) | | | (1.00 | ) | | | — | | | | 8.13 | | | | (10.95 | ) | | | 268,106 | | | | 1.05 | | | | 1.32 | | | | (1.00 | ) | | | 21 | |
Class R5 | | | | | | | | | | | | | | | | | | | | | | | | | | | | | | | | | | | | | | | | | | | | | | | | |
Year ended 10/31/18 | | | 6.84 | | | | 0.03 | | | | (0.22 | ) | | | (0.19 | ) | | | (0.00 | ) | | | 6.65 | | | | (2.74 | ) | | | 167,687 | | | | 1.11 | (d) | | | 1.19 | (d) | | | 0.45 | (d) | | | 96 | |
Year ended 10/31/17 | | | 6.97 | | | | (0.03 | ) | | | 0.09 | | | | 0.06 | | | | (0.19 | ) | | | 6.84 | | | | 0.83 | | | | 205,568 | | | | 1.16 | | | | 1.23 | | | | (0.45 | ) | | | 10 | |
Year ended 10/31/16 | | | 6.64 | | | | (0.05 | ) | | | 0.38 | | | | 0.33 | | | | — | | | | 6.97 | | | | 4.97 | | | | 195,777 | | | | 1.13 | | | | 1.22 | | | | (0.77 | ) | | | 98 | |
Year ended 10/31/15 | | | 8.13 | | | | (0.08 | ) | | | (1.41 | ) | | | (1.49 | ) | | | — | | | | 6.64 | | | | (18.33 | ) | | | 259,674 | | | | 1.15 | | | | 1.19 | | | | (1.07 | ) | | | 17 | |
Year ended 10/31/14 | | | 9.13 | | | | (0.09 | ) | | | (0.91 | ) | | | (1.00 | ) | | | — | | | | 8.13 | | | | (10.95 | ) | | | 269,490 | | | | 1.02 | | | | 1.19 | | | | (0.97 | ) | | | 21 | |
Class R6 | | | | | | | | | | | | | | | | | | | | | | | | | | | | | | | | | | | | | | | | | | | | | | | | |
Year ended 10/31/18 | | | 6.86 | | | | 0.04 | | | | (0.23 | ) | | | (0.19 | ) | | | (0.00 | ) | | | 6.67 | | | | (2.72 | ) | | | 19,244 | | | | 1.01 | (d) | | | 1.09 | (d) | | | 0.55 | (d) | | | 96 | |
Year ended 10/31/17 | | | 6.98 | | | | (0.02 | ) | | | 0.09 | | | | 0.07 | | | | (0.19 | ) | | | 6.86 | | | | 1.04 | | | | 12,293 | | | | 1.08 | | | | 1.15 | | | | (0.37 | ) | | | 10 | |
Year ended 10/31/16 | | | 6.65 | | | | (0.04 | ) | | | 0.37 | | | | 0.33 | | | | — | | | | 6.98 | | | | 4.96 | | | | 1,971 | | | | 1.03 | | | | 1.12 | | | | (0.67 | ) | | | 98 | |
Year ended 10/31/15 | | | 8.13 | | | | (0.07 | ) | | | (1.41 | ) | | | (1.48 | ) | | | — | | | | 6.65 | | | | (18.20 | ) | | | 117,504 | | | | 1.05 | | | | 1.09 | | | | (0.97 | ) | | | 17 | |
Year ended 10/31/14 | | | 9.13 | | | | (0.08 | ) | | | (0.92 | ) | | | (1.00 | ) | | | — | | | | 8.13 | | | | (10.95 | ) | | | 131,076 | | | | 0.99 | | | | 1.10 | | | | (0.94 | ) | | | 21 | |
| (a) | Calculated using average shares outstanding. |
| (b) | Includes adjustments in accordance with accounting principles generally accepted in the United States of America and as such, the net asset value for financial reporting purposes and the returns based upon those net asset values may differ from the net asset value and returns for shareholder transactions. Does not include sales charges and is not annualized for periods less than one year, if applicable. |
| (c) | Portfolio turnover is calculated at the fund level and is not annualized for periods less than one year, if applicable. |
| (d) | Ratios are based on average daily net assets (000’s omitted) of $42,193, $61, $9,108, $1,827, $835,709, $195,455 and $16,754 for Class A, Class B, Class C, Class R, Class Y, Class R5 and Class R6 shares, respectively. |
| (e) | Reflects activity for the period November 1, 2017 through January 26, 2018 (date of conversion). |
26 Invesco Balanced-Risk Commodity Strategy Fund
Report of Independent Registered Public Accounting Firm
To the Board of Trustees of AIM Investment Funds (Invesco Investment Funds)
and Shareholders of Invesco Balanced-Risk Commodity Strategy Fund:
Opinion on the Financial Statements
We have audited the accompanying consolidated statement of assets and liabilities, including the consolidated schedule of investments, of Invesco Balanced-Risk Commodity Strategy Fund and its subsidiary (one of the funds constituting AIM Investment Funds (Invesco Investment Funds), hereafter referred to as the “Fund”) as of October 31, 2018, the related consolidated statement of operations for the year ended October 31, 2018, the consolidated statement of changes in net assets for each of the two years in the period ended October 31, 2018, including the related notes, and the financial highlights for each of the periods indicated therein (collectively referred to as the financial statements). In our opinion, the financial statements present fairly, in all material respects, the financial position of the Fund as of October 31, 2018, the results of its operations for the year then ended, the changes in its net assets for each of the two years in the period ended October 31, 2018 and the financial highlights for each of the periods indicated therein in conformity with accounting principles generally accepted in the United States of America.
Basis for Opinion
These financial statements are the responsibility of the Fund’s management. Our responsibility is to express an opinion on the Fund’s financial statements based on our audits. We are a public accounting firm registered with the Public Company Accounting Oversight Board (United States) (PCAOB) and are required to be independent with respect to the Fund in accordance with the U.S. federal securities laws and the applicable rules and regulations of the Securities and Exchange Commission and the PCAOB.
We conducted our audits of these financial statements in accordance with the standards of the PCAOB. Those standards require that we plan and perform the audit to obtain reasonable assurance about whether the financial statements are free of material misstatement, whether due to error or fraud.
Our audits included performing procedures to assess the risks of material misstatement of the financial statements, whether due to error or fraud, and performing procedures that respond to those risks. Such procedures included examining, on a test basis, evidence regarding the amounts and disclosures in the financial statements. Our audits also included evaluating the accounting principles used and significant estimates made by management, as well as evaluating the overall presentation of the financial statements. Our procedures included confirmation of securities owned as of October 31, 2018 by correspondence with the custodian, transfer agent and brokers; when replies were not received from brokers, we performed other auditing procedures. We believe that our audits provide a reasonable basis for our opinion.
PricewaterhouseCoopers LLP
Houston, TX
December 28, 2018
We have served as the auditor of one or more of the investment companies in the Invesco group of investment companies since at least 1995. We have not been able to determine the specific year we began serving as auditor.
27 Invesco Balanced-Risk Commodity Strategy Fund
Calculating your ongoing Fund expenses
Example
As a shareholder of the Fund, you incur two types of costs: (1) transaction costs, which may include sales charges (loads) on purchase payments or contingent deferred sales charges on redemptions, if any; and (2) ongoing costs, including distribution and/or service (12b-1) fees, and other Fund expenses. This example is intended to help you understand your ongoing costs (in dollars) of investing in the Fund and to compare these costs with ongoing costs of investing in other mutual funds. The example is based on an investment of $1,000 invested at the beginning of the period and held for the entire period May 1, 2018, through October 31, 2018.
In addition to the fees and expenses which the Fund bears directly, the Fund indirectly bears a pro rata share of the fees and expenses of the underlying funds in which the Fund invests. The amount of fees and expenses incurred indirectly by the Fund will vary because the underlying funds have varied expenses and fee levels and the Fund may own different proportions of the underlying funds at different times. Estimated underlying fund expenses are not expenses that are incurred directly by the Fund. They are expenses that are incurred directly by the underlying funds and are deducted from the value of the underlying funds the Fund invests in. The effect of the estimated underlying fund expenses that the Fund bears indirectly are included in the Fund’s total return.
Actual expenses
The table below provides information about actual account values and actual expenses. You may use the information in this table, together with the amount you invested, to estimate the expenses that you paid over the period. Simply divide your account value by $1,000 (for example, an $8,600 account value divided by $1,000 = 8.6), then multiply the result by the number in the table under the heading entitled “Actual Expenses Paid During Period” to estimate the expenses you paid on your account during this period.
Hypothetical example for comparison purposes
The table below also provides information about hypothetical account values and hypothetical expenses based on the Fund’s actual expense ratio and an assumed rate of return of 5% per year before expenses, which is not the Fund’s actual return.
The hypothetical account values and expenses may not be used to estimate the actual ending account balance or expenses you paid for the period. You may use this information to compare the ongoing costs of investing in the Fund and other funds. To do so, compare this 5% hypothetical example with the 5% hypothetical examples that appear in the shareholder reports of the other funds.
Please note that the expenses shown in the table are meant to highlight your ongoing costs only and do not reflect any transaction costs, such as sales charges (loads) on purchase payments or contingent deferred sales charges on redemptions, if any. Therefore, the hypothetical information is useful in comparing ongoing costs only, and will not help you determine the relative total costs of owning different funds. In addition, expenses shown in the table do not include the expenses of the underlying funds, which are borne indirectly by the Fund. If transaction costs and indirect expenses were included, your costs would have been higher.
| | | | | | | | | | | | | | | | | | | | | | | | |
| Class | | Beginning
Account Value
(05/01/18) | | | ACTUAL | | | HYPOTHETICAL (5% annual return before
expenses) | | | Annualized
Expense
Ratio2 | |
| | Ending
Account Value
(10/31/18)1 | | | Expenses
Paid During
Period2,3 | | | Ending
Account Value
(10/31/18) | | | Expenses
Paid During
Period2,4 | |
| A | | $ | 1,000.00 | | | $ | 919.40 | | | $ | 6.77 | | | $ | 1,018.15 | | | $ | 7.12 | | | | 1.40 | % |
| C | | | 1,000.00 | | | | 915.30 | | | | 10.38 | | | | 1,014.37 | | | | 10.92 | | | | 2.15 | |
| R | | | 1,000.00 | | | | 918.20 | | | | 7.98 | | | | 1,016.89 | | | | 8.39 | | | | 1.65 | |
| Y | | | 1,000.00 | | | | 920.80 | | | | 5.57 | | | | 1,019.41 | | | | 5.85 | | | | 1.15 | |
| R5 | | | 1,000.00 | | | | 919.80 | | | | 5.27 | | | | 1,019.71 | | | | 5.55 | | | | 1.09 | |
| R6 | | | 1,000.00 | | | | 921.30 | | | | 4.84 | | | | 1,020.16 | | | | 5.09 | | | | 1.00 | |
| 1 | The actual ending account value is based on the actual total return of the Fund for the period May 1, 2018 through October 31, 2018, after actual expenses and will differ from the hypothetical ending account value which is based on the Fund’s expense ratio and a hypothetical annual return of 5% before expenses. |
| 2 | Expenses are equal to the Fund’s annualized expense ratio as indicated above multiplied by the average account value over the period, multiplied by 184/365 to reflect the most recent fiscal half year. Effective September 20, 2018, the Fund’s adviser has contractually agreed to waive advisory fees and/or reimburse expenses to the extent necessary to limit total annual fund operating expense of Class A, Class C, Class R, Class Y, Class R5 and Class R6 shares to 1.40%, 2.15%, 1.65%, 1.15%, 1.15% and 1.15% of average daily net assets, respectively. The annualized expense ratios restated as if these agreements had been in effect throughout the entire most recent fiscal half year are 1.30%, 2.05%, 1.55%, 1.05%, 1.05% and 1.00% for Class A, Class C, Class R, Class Y, Class R5 and Class R6 shares, respectively. |
| 3 | The actual expenses paid restated as if the changes discussed above had been in effect throughout the entire most recent fiscal half year are $6.29, $9.90, $7.49, $5.08, $5.08 and $4.84 for Class A, Class C, Class R, Class Y, Class R5 and Class R6shares, respectively. |
| 4 | The hypothetical expenses paid restated as if the changes discussed above had been in effect throughout the entire most recent fiscal half year are $6.61, $10.41, $7.88, $5.35, $5.35 and $5.09 for Class A, Class C, Class R, Class Y, Class R5 and Class R6shares, respectively. |
28 Invesco Balanced-Risk Commodity Strategy Fund
Approval of Investment Advisory and Sub-Advisory Contracts
At meetings held on June 5-6, 2018, the Board of Trustees (the Board or the Trustees) of AIM Investment Funds (Invesco Investment Funds) as a whole, and the independent Trustees, who comprise over 75% of the Board, voting separately, approved the continuance of the Invesco Balanced-Risk Commodity Strategy Fund’s (the Fund) Master Investment Advisory Agreement with Invesco Advisers, Inc. (Invesco Advisers and the investment advisory agreement) and the Master Intergroup Sub-Advisory Contract for Mutual Funds with Invesco Asset Management Deutschland GmbH, Invesco Asset Management Limited, Invesco Asset Management (Japan) Limited, Invesco Hong Kong Limited, Invesco Senior Secured Management, Inc., Invesco Canada Ltd. and separate Sub-Advisory Contracts with Invesco Capital Management LLC and Invesco Asset Management (India) Private Limited (collectively, the Affiliated Sub-Advisers and the sub-advisory contracts) for another year, effective July 1, 2018. After evaluating the factors discussed below, among others, the Board approved the renewal of the Fund’s investment advisory agreement and the sub-advisory contracts and determined that the compensation payable by the Fund to Invesco Advisers and by Invesco Advisers to the Affiliated Sub-Advisers is fair and reasonable.
The Board’s Evaluation Process
The Board’s Investments Committee has established three Sub-Committees, which meet throughout the year to review the performance of funds advised by Invesco Advisers (the Invesco Funds). Over the course of each year, the Sub-Committees meet with portfolio managers for their assigned Invesco Funds and other members of management to review detailed information about investment performance and portfolio attributes of these funds. The Board took into account evaluations and reports that it received from the Investments Committee and Sub-Committees, as well as the information provided to such committees and the Board throughout the year, in considering whether to approve each Invesco Fund’s investment advisory agreement and sub-advisory contracts.
As part of the contract renewal process, the Board reviews and considers information provided in response to detailed requests for information submitted to management by the independent Trustees with assistance from legal counsel to the independent Trustees. The Board receives comparative investment performance and fee data regarding the Invesco Funds prepared by Invesco Advisers and Broadridge Financial Solutions, Inc. (Broadridge), an independent mutual fund data provider. The Board also receives an independent written evaluation from the Senior Officer, an officer of the Invesco Funds who reports directly to the
independent Trustees. The Senior Officer’s evaluation is prepared as part of his responsibility to manage the process by which the Invesco Funds’ proposed management fees are negotiated during the annual contract renewal process to ensure they are negotiated in a manner that is at arms’ length and reasonable. In addition to meetings with Invesco Advisers and fund counsel throughout the year, the independent Trustees also discuss the continuance of the investment advisory agreement and sub-advisory contracts in separate sessions with the Senior Officer and with independent legal counsel.
The discussion below is a summary of the Senior Officer’s independent written evaluation with respect to the Fund’s investment advisory agreement, as well as a discussion of the material factors and related conclusions that formed the basis for the Board’s approval of the Fund’s investment advisory agreement and sub-advisory contracts. The Trustees’ review and conclusions are based on the comprehensive consideration of all information presented to them during the course of the year and in prior years and are not the result of any single determinative factor. Moreover, one Trustee may have weighed a particular piece of information or factor differently than another Trustee. This information is current as of June 6, 2018.
Factors and Conclusions and Summary of Independent Written Fee Evaluation
| A. | Nature, Extent and Quality of Services Provided by Invesco Advisers and the Affiliated Sub-Advisers |
The Board reviewed the nature, extent and quality of the advisory services provided to the Fund by Invesco Advisers under the Fund’s investment advisory agreement, and the credentials and experience of the officers and employees of Invesco Advisers who provide these services, including the Fund’s portfolio manager(s). The Board’s review included consideration of Invesco Advisers’ investment process oversight and structure, credit analysis and investment risk management. The Board also considered non-advisory services that Invesco Advisers and its affiliates provide to the Invesco Funds such as various back office support functions, third party oversight, internal audit, valuation, portfolio trading and legal and compliance. The Board also reviewed and considered the benefits to shareholders of investing in a fund that is part of the Invesco family of funds under the umbrella of Invesco Ltd., Invesco Advisers’ parent company, and noted Invesco Ltd.’s depth and experience in conducting an investment management business, as well as its commitment of financial and other resources to such business. The Board concluded that the nature, extent and quality of the services provided to the Fund by
Invesco Advisers are appropriate and satisfactory.
The Board reviewed the services that may be provided by the Affiliated Sub-Advisers under the sub-advisory contracts and the credentials and experience of the officers and employees of the Affiliated Sub-Advisers who provide these services. The Board noted the Affiliated Sub-Advisers’ expertise with respect to certain asset classes and that the Affiliated Sub-Advisers have offices and personnel that are located in financial centers around the world. As a result, the Board noted that the Affiliated Sub-Advisers can provide research and investment analysis on the markets and economies of various countries in which the Fund may invest, make recommendations regarding securities and assist with security trades. The Board concluded that the sub-advisory contracts may benefit the Fund and its shareholders by permitting Invesco Advisers to use the resources and talents of the Affiliated Sub-Advisers in managing the Fund. The Board concluded that the nature, extent and quality of the services that may be provided by the Affiliated Sub-Advisers are appropriate and satisfactory.
| B. | Fund Investment Performance |
The Board considered Fund investment performance as a relevant factor in considering whether to approve the investment advisory agreement. The Board did not view Fund investment performance as a relevant factor in considering whether to approve the sub-advisory contracts for the Fund, as no Affiliated Sub-Adviser currently manages assets of the Fund.
The Board compared the Fund’s investment performance over multiple time periods ending December 31, 2017 to the performance of funds in the Broadridge performance universe and against the Lipper Commodities General Funds Index. The Board noted that performance of Class A shares of the Fund was in the second quintile of its performance universe for the one and five year periods and the first quintile for the three year period (the first quintile being the best performing funds and the fifth quintile being the worst performing funds). The Board noted that performance of Class A shares of the Fund was above the performance of the Index for the one and three year periods and reasonably comparable to the performance of the Index for the five year period. The Trustees also reviewed more recent Fund performance and this review did not change their conclusions.
| C. | Advisory and Sub-Advisory Fees and Fund Expenses |
The Board compared the Fund’s contractual management fee rate to the contractual management fee rates of funds in the Fund’s Broadridge expense group. The Board noted that the contractual management fee rate for Class A shares of the Fund was above the
29 Invesco Balanced-Risk Commodity Strategy Fund
median contractual management fee rate of funds in its expense group. The Board noted that the term “contractual management fee” for funds in the expense group may include both advisory and certain non-portfolio management administrative services fees, but that Broadridge does not provide information on a fund by fund basis as to what is included. The Board also reviewed the methodology used by Broadridge in providing expense group information, which includes using each fund’s contractual management fee schedule (including any applicable breakpoints) as reported in the most recent prospectus or statement of additional information for each fund in the expense group. The Board also considered comparative information regarding the Fund’s total expense ratio and its various components. The Board noted that the Fund’s actual and contractual management fees were in the fourth quintile and its total expense ratio was in the fifth quintile of its expense group and discussed with management reasons for such relative actual and contractual management fees and total expenses.
The Board noted that Invesco Advisers has contractually agreed to waive fees and/or limit expenses of the Fund in an amount necessary to limit total annual operating expenses to a specified percentage of average daily net assets for each class of the Fund.
The Board also considered the fees charged by Invesco Advisers and the Affiliated Sub-Advisers to other similarly managed client accounts. The Board noted that Invesco Advisers or the Affiliated Sub-Advisers may charge lower fees to large institutional clients. Invesco Advisers reviewed with the Board differences in the scope of services it provides to the Invesco Funds relative to certain other types of client accounts, including management of cash flows as a result of redemptions and purchases, necessary infrastructure such as officers, office space, technology, legal and distribution, oversight of service providers, costs and business risks associated with launching new funds and sponsoring and maintaining the product line, preparation of annual registration statement updates and financial information and compliance with federal and state laws and regulations.
The Board also considered the services that may be provided by the Affiliated Sub-Advisers pursuant to the sub-advisory contracts, as well as the fees payable by Invesco Advisers to the Affiliated Sub-Advisers pursuant to the sub-advisory contracts.
| D. | Economies of Scale and Breakpoints |
The Board considered the extent to which there may be economies of scale in the provision of advisory services to the Fund. The Board also considered that the Fund benefits from economies of scale through contractual breakpoints in the Fund’s advisory fee schedule, which generally operate to reduce the Fund’s expense ratio as it grows in size. The Board noted that the Fund shares directly in economies of scale through lower fees charged
by third party service providers based on the combined size of the Invesco Funds. The Board noted that the Fund may also benefit from economies of scale through initial fee setting, fee waivers and expense reimbursements.
| E. | Profitability and Financial Resources |
The Board reviewed information from Invesco Advisers concerning the costs of the advisory and other services that Invesco Advisers and its affiliates provide to the Fund and the Invesco Funds and the profitability of Invesco Advisers and its affiliates in providing these services. The Board considered the methodology used for calculating profitability and noted the periodic review of such methodology by an independent consultant. The Board noted that Invesco Advisers continues to operate at a net profit from services Invesco Advisers and its affiliates provide to the Invesco Funds and the Fund. The Board did not deem the level of profits realized by Invesco Advisers and its affiliates from providing services to the Fund to be excessive given the nature, extent and quality of the services provided. The Board received information from Invesco Advisers demonstrating that Invesco Advisers and the Affiliated Sub-Advisers are financially sound and have the resources necessary to perform their obligations under the investment advisory agreement and sub-advisory contracts.
| F. | Collateral Benefits to Invesco Advisers and its Affiliates |
The Board considered various other benefits received by Invesco Advisers and its affiliates from the relationship with the Fund, including the fees received for providing administrative, transfer agency and distribution services to the Fund. The Board considered comparative information regarding fees charged for these services, including information provided by Broadridge and other independent sources. The Board considered the performance of Invesco Advisers and its affiliates in providing these services and the organizational structure employed to provide these services. The Board also considered that these services are provided to the Fund pursuant to written contracts that are reviewed and approved on an annual basis by the Board; and that the services are required for the operation of the Fund.
30 Invesco Balanced-Risk Commodity Strategy Fund
Tax Information
Form 1099-DIV, Form 1042-S and other year-end tax information provide shareholders with actual calendar year amounts that should be included in their tax returns. Shareholders should consult their tax advisors.
The following distribution information is being provided as required by the Internal Revenue Code or to meet a specific state’s requirement.
The Fund designates the following amounts or, if subsequently determined to be different, the maximum amount allowable for its fiscal year ended October 31, 2018:
| | | | |
Federal and State Income Tax | |
Qualified Dividend Income* | | | 0.00 | % |
Corporate Dividends Received Deduction* | | | 0.00 | % |
U.S. Treasury Obligations* | | | 28.07 | % |
| | * | The above percentages are based on ordinary income dividends paid to shareholders during the Fund’s fiscal year. |
31 Invesco Balanced-Risk Commodity Strategy Fund
Trustees and Officers
The address of each trustee and officer is AIM Investment Funds (Invesco Investment Funds) (the “Trust”), 11 Greenway Plaza, Suite 1000, Houston, Texas 77046-1173. The trustees serve for the life of the Trust, subject to their earlier death, incapacitation, resignation, retirement or removal as more specifically provided in the Trust’s organizational documents. Each officer serves for a one year term or until their successors are elected and qualified. Column two below includes length of time served with predecessor entities, if any.
| | | | | | | | |
Name, Year of Birth and
Position(s) Held with the Trust | | Trustee and/
or Officer Since | | Principal Occupation(s)
During Past 5 Years | | Number of
Funds in Fund
Complex
Overseen by
Trustee | | Other Directorship(s)
Held by Trustee During
Past 5 Years |
| Interested Persons | | | | | | | | |
| Martin L. Flanagan1 — 1960 Trustee | | 2007 | | Executive Director, Chief Executive Officer and President, Invesco Ltd. (ultimate parent of Invesco and a global investment management firm); Trustee, The Invesco Funds; Vice Chair, Investment Company Institute; and Member of Executive Board, SMU Cox School of Business Formerly: Advisor to the Board, Invesco Advisers, Inc. (formerly known as Invesco Institutional (N.A.), Inc.); Chairman and Chief Executive Officer, Invesco Advisers, Inc. (registered investment adviser); Director, Chairman, Chief Executive Officer and President, Invesco Holding Company (US), Inc. (formerly IVZ Inc.) (holding company), Invesco Group Services, Inc. (service provider) and Invesco North American Holdings, Inc. (holding company); Director, Chief Executive Officer and President, Invesco Holding Company Limited (parent of Invesco and a global investment management firm); Director, Invesco Ltd.; Chairman, Investment Company Institute and President, Co-Chief Executive Officer, Co-President, Chief Operating Officer and Chief Financial Officer, Franklin Resources, Inc. (global investment management organization) | | 158 | | None |
Philip A. Taylor2 — 1954 Trustee and Senior Vice President | | 2006 | | Head of the Americas and Senior Managing Director, Invesco Ltd.; Director, Invesco Advisers, Inc. (formerly known as Invesco Institutional (N.A.), Inc.) (registered investment adviser); Director and Chairman, Invesco Investment Services, Inc. (formerly known as Invesco AIM Investment Services, Inc.) (registered transfer agent); Chief Executive Officer, Invesco Corporate Class Inc. (corporate mutual fund company); Director, Chairman and Chief Executive Officer, Invesco Canada Ltd. (formerly known as Invesco Trimark Ltd./Invesco Trimark Ltèe) (registered investment adviser and registered transfer agent); Trustee and Senior Vice President, The Invesco Funds; Director, Invesco Investment Advisers LLC (formerly known as Van Kampen Asset Management) Formerly: Director, Chairman, Chief Executive Officer and President, Invesco Management Group, Inc. (formerly known as Invesco AIM Management Group, Inc.) (financial services holding company); Co-Chairman, Co-President and Co-Chief Executive Officer, Invesco Advisers, Inc. (formerly known as Invesco Institutional (N.A.), Inc.) (registered investment adviser); Director, Chief Executive Officer and President, Van Kampen Exchange Corp; President and Principal Executive Officer, The Invesco Funds (other than AIM Treasurer’s Series Trust (Invesco Treasurer’s Series Trust), Short-Term Investments Trust and Invesco Management Trust); Executive Vice President, The Invesco Funds (AIM Treasurer’s Series Trust (Invesco Treasurer’s Series Trust), Short-Term Investments Trust and Invesco Management Trust only); Director and President, INVESCO Funds Group, Inc. (registered investment adviser and registered transfer agent); Director and Chairman, IVZ Distributors, Inc. (formerly known as INVESCO Distributors, Inc.) (registered broker dealer); Director, President and Chairman, Invesco Inc. (holding company), Invesco Canada Holdings Inc. (holding company), Trimark Investments Ltd./Placements Trimark Ltèe and Invesco Financial Services Ltd/Services Financiers Invesco Ltèe; Chief Executive Officer, Invesco Canada Fund Inc. (corporate mutual fund company); Director and Chairman, Van Kampen Investor Services Inc.; Director, Chief Executive Officer and President, 1371 Preferred Inc. (holding company) and Van Kampen Investments Inc.; Director and President, AIM GP Canada Inc. (general partner for limited partnerships) and Van Kampen Advisors, Inc.; Director and Chief Executive Officer, Invesco Trimark Dealer Inc. (registered broker dealer); Director, Invesco Distributors, Inc. (formerly known as Invesco AIM Distributors, Inc.) (registered broker dealer); Manager, Invesco Capital Management LLC; Director, Chief Executive Officer and President, Invesco Advisers, Inc.; Director, Chairman, Chief Executive Officer and President, Invesco AIM Capital Management, Inc.; President, Invesco Trimark Dealer Inc. and Invesco Trimark Ltd./Invesco Trimark Ltèe; Director and President, AIM Trimark Corporate Class Inc. and AIM Trimark Canada Fund Inc.; Senior Managing Director, Invesco Holding Company Limited; Director and Chairman, Fund Management Company (former registered broker dealer); President and Principal Executive Officer, The Invesco Funds (AIM Treasurer’s Series Trust (Invesco Treasurer’s Series Trust), and Short-Term Investments Trust only); President, AIM Trimark Global Fund Inc. and AIM Trimark Canada Fund Inc. | | 158 | | None |
| 1 | Mr. Flanagan is considered an interested person (within the meaning of Section 2(a)(19) of the 1940 Act) of the Trust because he is an officer of the Adviser to the Trust, and an officer and a director of Invesco Ltd., ultimate parent of the Adviser. |
| 2 | Mr. Taylor is considered an interested person (within the meaning of Section 2(a)(19) of the 1940 Act) of the Trust because he is an officer and a director of the Adviser. |
T-1 Invesco Balanced-Risk Commodity Strategy Fund
Trustees and Officers—(continued)
| | | | | | | | |
Name, Year of Birth and
Position(s) Held with the Trust | | Trustee and/
or Officer Since | | Principal Occupation(s)
During Past 5 Years | | Number of
Funds in Fund
Complex
Overseen by
Trustee | | Other Directorship(s)
Held by Trustee During
Past 5 Years |
| Independent Trustees | | | | | | | | |
Bruce L. Crockett — 1944 Trustee and Chair | | 2001 | | Chairman, Crockett Technologies Associates (technology consulting company) Formerly: Director, Captaris (unified messaging provider); Director, President and Chief Executive Officer, COMSAT Corporation; Chairman, Board of Governors of INTELSAT (international communications company); ACE Limited (insurance company); Independent Directors Council and Investment Company Institute: Member of the Audit Committee, Investment Company Institute; Member of the Executive Committee and Chair of the Governance Committee, Independent Directors Council | | 158 | | Director and Chairman of the Audit Committee, ALPS (Attorneys Liability Protection Society) (insurance company); Director and Member of the Audit Committee and Compensation Committee, Ferroglobe PLC (metallurgical company) |
David C. Arch — 1945 Trustee | | 2010 | | Chairman of Blistex Inc. (consumer health care products manufacturer); Member, World Presidents’ Organization | | 158 | | Board member of the Illinois Manufacturers’ Association |
Jack M. Fields — 1952 Trustee | | 2001 | | Chief Executive Officer, Twenty First Century Group, Inc. (government affairs company); and Chairman, Discovery Learning Alliance (non-profit) Formerly: Owner and Chief Executive Officer, Dos Angeles Ranch L.P. (cattle, hunting, corporate entertainment); Director, Insperity, Inc. (formerly known as Administaff) (human resources provider); Chief Executive Officer, Texana Timber LP (sustainable forestry company); Director of Cross Timbers Quail Research Ranch (non-profit); and member of the U.S. House of Representatives | | 158 | | None |
Cynthia Hostetler — 1962 Trustee | | 2017 | | Non-Executive Director and Trustee of a number of public and private business corporations Formerly: Director, Aberdeen Investment Funds (4 portfolios); Head of Investment Funds and Private Equity, Overseas Private Investment Corporation; President, First Manhattan Bancorporation, Inc.; Attorney, Simpson Thacher & Bartlett LLP | | 158 | | Vulcan Materials Company (construction materials company); Trilinc Global Impact Fund; Artio Global Investment LLC (mutual fund complex); Edgen Group, Inc. (specialized energy and infrastructure products distributor) |
Eli Jones — 1961 Trustee | | 2016 | | Professor and Dean, Mays Business School — Texas A&M University Formerly: Professor and Dean, Walton College of Business, University of Arkansas and E.J. Ourso College of Business, Louisiana State University; Director, Arvest Bank | | 158 | | Insperity, Inc. (formerly known as Administaff) (human resources provider) |
Prema Mathai-Davis — 1950 Trustee | | 2001 | | Retired | | 158 | | None |
Teresa M. Ressel — 1962 Trustee | | 2017 | | Non-executive director and trustee of a number of public and private business corporations Formerly: Chief Financial Officer, Olayan America, The Olayan Group (international investor/commercial/industrial); Chief Executive Officer, UBS Securities LLC; Group Chief Operating Officer, Americas, UBS AG; Assistant Secretary for Management & Budget and CFO, US Department of the Treasury | | 158 | | Atlantic Power Corporation (power generation company); ON Semiconductor Corp. (semiconductor supplier) |
Ann Barnett Stern — 1957 Trustee | | 2017 | | President and Chief Executive Officer, Houston Endowment Inc. (private philanthropic institution) Formerly: Executive Vice President and General Counsel, Texas Children’s Hospital; Attorney, Beck, Redden and Secrest, LLP; Business Law Instructor, University of St. Thomas; Attorney, Andrews & Kurth LLP | | 158 | | Federal Reserve Bank of Dallas |
Raymond Stickel, Jr. — 1944 Trustee | | 2005 | | Retired Formerly: Director, Mainstay VP Series Funds, Inc. (25 portfolios); Partner, Deloitte & Touche | | 158 | | None |
Robert C. Troccoli — 1949 Trustee | | 2016 | | Adjunct Professor, University of Denver — Daniels College of Business Formerly: Senior Partner, KPMG LLP | | 158 | | None |
Christopher L. Wilson — 1957 Trustee | | 2017 | | Non-executive director and trustee of a number of public and private business corporations Formerly: Director, TD Asset Management USA Inc. (mutual fund complex) (22 portfolios); Managing Partner, CT2, LLC (investing and consulting firm); President/Chief Executive Officer, Columbia Funds, Bank of America Corporation; President/Chief Executive Officer, CDC IXIS Asset Management Services, Inc.; Principal & Director of Operations, Scudder Funds, Scudder, Stevens & Clark, Inc.; Assistant Vice President, Fidelity Investments | | 158 | | ISO New England, Inc. (non-profit organization managing regional electricity market) |
T-2 Invesco Balanced-Risk Commodity Strategy Fund
Trustees and Officers—(continued)
| | | | | | | | |
Name, Year of Birth and
Position(s) Held with the Trust | | Trustee and/
or Officer Since | | Principal Occupation(s)
During Past 5 Years | | Number of
Funds in Fund
Complex
Overseen by
Trustee | | Other Directorship(s)
Held by Trustee During
Past 5 Years |
| Other Officers | | | | | | | | |
Sheri Morris — 1964 President, Principal Executive Officer and Treasurer | | 1999 | | President, Principal Executive Officer and Treasurer, The Invesco Funds; Vice President, Invesco Advisers, Inc. (formerly known as Invesco Institutional (N.A.), Inc.) (registered investment adviser); and Vice President, Invesco Exchange-Traded Fund Trust, Invesco Exchange-Traded Fund Trust II, Invesco India Exchange-Traded Fund Trust, Invesco Actively Managed Exchange-Traded Fund Trust, Invesco Actively Managed Exchange-Traded Commodity Fund Trust and Invesco Exchange-Traded Self-Indexed Fund Trust Formerly: Vice President and Principal Financial Officer, The Invesco Funds; Vice President, Invesco AIM Advisers, Inc., Invesco AIM Capital Management, Inc. and Invesco AIM Private Asset Management, Inc.; Assistant Vice President and Assistant Treasurer, The Invesco Funds and Assistant Vice President, Invesco Advisers, Inc., Invesco AIM Capital Management, Inc. and Invesco AIM Private Asset Management, Inc.; and Treasurer, Invesco Exchange-Traded Fund Trust, Invesco Exchange-Traded Fund Trust II, Invesco India Exchange-Traded Fund Trust and Invesco Actively Managed Exchange-Traded Fund Trust | | N/A | | N/A |
Russell C. Burk — 1958 Senior Vice President and Senior Officer | | 2005 | | Senior Vice President and Senior Officer, The Invesco Funds | | N/A | | N/A |
Jeffrey H. Kupor — 1968 Senior Vice President, Chief Legal Officer and Secretary | | 2018 | | Senior Vice President and Secretary, Invesco Advisers, Inc. (formerly known as Invesco Institutional (N.A.), Inc.) (registered investment adviser); Senior Vice President and Secretary, Invesco Distributors, Inc. (formerly known as Invesco AIM Distributors, Inc.); Vice President and Secretary, Invesco Investment Services, Inc. (formerly known as Invesco AIM Investment Services, Inc.) Senior Vice President, Chief Legal Officer and Secretary, The Invesco Funds; Secretary and General Counsel, Invesco Investment Advisers LLC (formerly known as Van Kampen Asset Management); Secretary and General Counsel, Invesco Capital Markets, Inc. (formerly known as Van Kampen Funds Inc.) and Chief Legal Officer, Invesco Exchange-Traded Fund Trust, Invesco Exchange-Traded Fund Trust II, Invesco India Exchange-Traded Fund Trust, Invesco Actively Managed Exchange-Traded Fund Trust, Invesco Actively Managed Exchange-Traded Commodity Fund Trust and Invesco Exchange-Traded Self-Indexed Fund Trust; Secretary, Invesco Indexing LLC; Secretary and General Counsel, INVESCO Private Capital Investments, Inc.; Secretary, W.L. Ross & Co., LLC; Secretary and Vice President, Jemstep, Inc. Formerly: Senior Vice President, Secretary and General Counsel, Invesco Management Group, Inc. (formerly known as Invesco AIM Management Group, Inc.); Assistant Secretary, INVESCO Asset Management (Bermuda) Ltd.; Secretary and General Counsel, Invesco Private Capital, Inc.; Assistant Secretary and General Counsel, INVESCO Realty, Inc.; Secretary and General Counsel, Invesco Senior Secured Management, Inc.; and Secretary, Sovereign G./P. Holdings Inc. | | N/A | | N/A |
John M. Zerr — 1962 Senior Vice President | | 2006 | | Chief Operating Officer of the Americas; Senior Vice President, Invesco Advisers, Inc. (formerly known as Invesco Institutional (N.A.), Inc.) (registered investment adviser); Senior Vice President, Invesco Distributors, Inc. (formerly known as Invesco AIM Distributors, Inc.); Director and Vice President, Invesco Investment Services, Inc. (formerly known as Invesco AIM Investment Services, Inc.) Senior Vice President, The Invesco Funds; Managing Director, Invesco Capital Management LLC; Director, Invesco Investment Advisers LLC (formerly known as Van Kampen Asset Management); Senior Vice President, Invesco Capital Markets, Inc. (formerly known as Van Kampen Funds Inc.); Manager, Invesco Indexing LLC Formerly: Director and Senior Vice President, Invesco Management Group, Inc. (formerly known as Invesco AIM Management Group, Inc.); Secretary and General Counsel, Invesco Management Group, Inc. (formerly known as Invesco AIM Management Group, Inc.); Secretary, Invesco Investment Services, Inc. (formerly known as Invesco AIM Investment Services, Inc.); Chief Legal Officer and Secretary, The Invesco Funds; Secretary and General Counsel, Invesco Investment Advisers LLC (formerly known as Van Kampen Asset Management); Secretary and General Counsel, Invesco Capital Markets, Inc. (formerly known as Van Kampen Funds Inc.); Chief Legal Officer, Invesco Exchange-Traded Fund Trust, Invesco Exchange-Traded Fund Trust II, Invesco India Exchange-Traded Fund Trust, Invesco Actively Managed Exchange-Traded Fund Trust, Invesco Actively Managed Exchange-Traded Commodity Fund Trust and Invesco Exchange-Traded Self-Indexed Fund Trust; Secretary, Invesco Indexing LLC; Director, Secretary, General Counsel and Senior Vice President, Van Kampen Exchange Corp.; Director, Vice President and Secretary, IVZ Distributors, Inc. (formerly known as INVESCO Distributors, Inc.); Director and Vice President, INVESCO Funds Group, Inc.; Director and Vice President, Van Kampen Advisors Inc.; Director, Vice President, Secretary and General Counsel, Van Kampen Investor Services Inc.; Director and Secretary, Invesco Distributors, Inc. (formerly known as Invesco AIM Distributors, Inc.); Director, Senior Vice President, General Counsel and Secretary, Invesco AIM Advisers, Inc. and Van Kampen Investments Inc.; Director, Vice President and Secretary, Fund Management Company; Director, Senior Vice President, Secretary, General Counsel and Vice President, Invesco AIM Capital Management, Inc.; Chief Operating Officer and General Counsel, Liberty Ridge Capital, Inc. (an investment adviser) | | N/A | | N/A |
T-3 Invesco Balanced-Risk Commodity Strategy Fund
Trustees and Officers—(continued)
| | | | | | | | |
Name, Year of Birth and
Position(s) Held with the Trust | | Trustee and/
or Officer Since | | Principal Occupation(s)
During Past 5 Years | | Number of
Funds in Fund
Complex
Overseen by
Trustee | | Other Directorship(s)
Held by Trustee During
Past 5 Years |
| Other Officers—(continued) | | | | | | | | |
Gregory G. McGreevey — 1962 Senior Vice President | | 2012 | | Senior Managing Director, Invesco Ltd.; Director, Chairman, President, and Chief Executive Officer, Invesco Advisers, Inc. (formerly known as Invesco Institutional (N.A.), Inc.) (registered investment adviser); Director, Invesco Mortgage Capital, Inc. and Invesco Senior Secured Management, Inc.; and Senior Vice President, The Invesco Funds Formerly: Senior Vice President, Invesco Management Group, Inc. and Invesco Advisers, Inc.; Assistant Vice President, The Invesco Funds | | N/A | | N/A |
Kelli Gallegos — 1970 Vice President, Principal Financial Officer and Assistant Treasurer | | 2008 | | Vice President and Treasurer, Invesco Exchange-Traded Fund Trust, Invesco Exchange-Traded Fund Trust II, Invesco India Exchange-Traded Fund Trust, Invesco Actively Managed Exchange-Traded Fund Trust, Invesco Actively Managed Exchange-Traded Commodity Fund Trust and Invesco Exchange-Traded Self-Indexed Fund Trust; Vice President, Principal Financial Officer and Assistant Treasurer, The Invesco Funds; Principal Financial and Accounting Officer — Pooled Investments, Invesco Capital Management LLC Formerly: Assistant Treasurer, Invesco Exchange-Traded Fund Trust, Invesco Exchange-Traded Fund Trust II, Invesco India Exchange-Traded Fund Trust, Invesco Actively Managed Exchange-Traded Fund Trust, Invesco Actively Managed Exchange-Traded Commodity Fund Trust and Invesco Exchange-Traded Self-Indexed Fund Trust; Assistant Treasurer, Invesco Capital Management LLC; Assistant Vice President, The Invesco Funds | | N/A | | N/A |
Tracy Sullivan — 1962 Vice President, Chief Tax Officer and Assistant Treasurer | | 2008 | | Vice President, Chief Tax Officer and Assistant Treasurer, The Invesco Funds; Assistant Treasurer, Invesco Capital Management LLC, Invesco Exchange-Traded Fund Trust, Invesco Exchange-Traded Fund Trust II, Invesco India Exchange-Traded Fund Trust, Invesco Actively Managed Exchange-Traded Fund Trust, Invesco Actively Managed Exchange-Traded Commodity Fund Trust and Invesco Exchange-Traded Self-Indexed Fund Trust Formerly: Assistant Vice President, The Invesco Funds | | N/A | | N/A |
Crissie M. Wisdom — 1969 Anti-Money Laundering Compliance Officer | | 2013 | | Anti-Money Laundering Compliance Officer, Invesco Advisers, Inc. (formerly known as Invesco Institutional (N.A.), Inc.) (registered investment adviser), Invesco Capital Markets, Inc. (formerly known as Van Kampen Funds Inc.), Invesco Distributors, Inc., Invesco Investment Services, Inc., The Invesco Funds, and Invesco Exchange-Traded Fund Trust, Invesco Exchange-Traded Fund Trust II, Invesco India Exchange-Traded Fund Trust, Invesco Actively Managed Exchange-Traded Fund Trust, Invesco Actively Managed Exchange-Traded Commodity Fund Trust and Invesco Exchange-Traded Self-Indexed Fund Trust; Anti-Money Laundering Compliance Officer and Bank Secrecy Act Officer, INVESCO National Trust Company and Invesco Trust Company; and Fraud Prevention Manager and Controls and Risk Analysis Manager for Invesco Investment Services, Inc. Formerly: Anti-Money Laundering Compliance Officer, Van Kampen Exchange Corp. and Invesco Management Group, Inc. | | N/A | | N/A |
Robert R. Leveille — 1969 Chief Compliance Officer | | 2016 | | Chief Compliance Officer, Invesco Advisers, Inc. (registered investment adviser); and Chief Compliance Officer, The Invesco Funds Formerly: Chief Compliance Officer, Putnam Investments and the Putnam Funds | | N/A | | N/A |
The Statement of Additional Information of the Trust includes additional information about the Fund’s Trustees and is available upon request, without charge, by calling 1.800.959.4246. Please refer to the Fund’s Statement of Additional Information for information on the Fund’s sub-advisers.
| | | | | | |
Office of the Fund 11 Greenway Plaza, Suite 1000 Houston, TX 77046-1173 | | Investment Adviser Invesco Advisers, Inc. 1555 Peachtree Street, N.E. Atlanta, GA 30309 | | Distributor Invesco Distributors, Inc. 11 Greenway Plaza, Suite 1000 Houston, TX 77046-1173 | | Auditors PricewaterhouseCoopers LLP 1000 Louisiana Street, Suite 5800 Houston, TX 77002-5021 |
| | | |
| | | | | | |
Counsel to the Fund Stradley Ronon Stevens & Young, LLP 2005 Market Street, Suite 2600 Philadelphia, PA 19103-7018 | | Counsel to the Independent Trustees Goodwin Procter LLP 901 New York Avenue, N.W. Washington, D.C. 20001 | | Transfer Agent Invesco Investment Services, Inc. 11 Greenway Plaza, Suite 1000 Houston, TX 77046-1173 | | Custodian State Street Bank and Trust Company 225 Franklin Street Boston, MA 02110-2801 |
T-4 Invesco Balanced-Risk Commodity Strategy Fund
Explore High-Conviction Investing with Invesco

Go paperless with eDelivery
Visit invesco.com/edelivery to enjoy the convenience and security of anytime electronic access to your investment documents.
With eDelivery, you can elect to have any or all of the following materials delivered straight to your inbox to download, save and print from your own computer:
| ∎ | | Fund reports and prospectuses |
Invesco mailing information
Send general correspondence to Invesco Investment Services, Inc., P.O. Box 219078, Kansas City, MO 64121-9078.
Important notice regarding delivery of security holder documents
To reduce Fund expenses, only one copy of most shareholder documents may be mailed to shareholders with multiple accounts at the same address (Householding). Mailing of your shareholder documents may be householded indefinitely unless you instruct us otherwise. If you do not want the mailing of these documents to be combined with those for other members of your household, please contact Invesco Investment Services, Inc. at 800 959 4246 or contact your financial institution. We will begin sending you individual copies for each account within 30 days after receiving your request.
Fund holdings and proxy voting information
The Fund provides a complete list of its holdings four times in each fiscal year, at the quarter ends. For the second and fourth quarters, the lists appear in the Fund’s semiannual and annual reports to shareholders. For the first and third quarters, the Fund files the lists with the Securities and Exchange Commission (SEC) on Form N-Q (or any successor Form). The most recent list of portfolio holdings is available at invesco.com/completeqtrholdings. Shareholders can also look up the Fund’s Forms N-Q (or any successor Form) on the SEC website at sec.gov. The SEC file numbers for the Fund are shown below.
A description of the policies and procedures that the Fund uses to determine how to vote proxies relating to portfolio securities is available without charge, upon request, from our Client Services department at 800 959 4246 or at invesco.com/proxyguidelines. The information is also available on the SEC website, sec.gov.
| | |
Information regarding how the Fund voted proxies related to its portfolio securities during the most recent 12-month period ended June 30 is available at invesco.com/proxysearch. The information is also available on the SEC website, sec.gov. Invesco Advisers, Inc. is an investment adviser; it provides investment advisory services to individual and institutional clients and does not sell securities. Invesco Distributors, Inc. is the US distributor for Invesco Ltd.’s retail mutual funds, exchange-traded funds and institutional money market funds. Both are wholly owned, indirect subsidiaries of Invesco Ltd. | |  |
| | | | | | | | | | | | |
SEC file numbers: 811-05426 and 033-19338 | | Invesco Distributors, Inc. | | BRCS-AR-1 | | | 12262018 | | | | 1221 | |
| | | | | | |
| | | | |
 | | Annual Report to Shareholders | | October 31, 2018 | | |
| | | | |
| | Invesco Developing Markets Fund | | |
| | Nasdaq: | | |
| | A: GTDDX ∎ C: GTDCX ∎ Y: GTDYX ∎ R5: GTDIX ∎ R6: GTDFX | | |

Letters to Shareholders
| | |

Philip Taylor | | Dear Shareholders: This annual report includes information about your Fund, including performance data and a complete list of its investments as of the close of the reporting period. Inside is a discussion of how your Fund was managed and the factors that affected its performance during the reporting period. Throughout the reporting period, US economic data remained positive. Robust corporate profits, strong retail sales and unemployment rates near generational lows helped drive US markets to new all-time records multiple times during the reporting period. Against this backdrop, the US Federal Reserve raised the federal funds rate four times during the reporting period. Market volatility, largely non-existent in 2017, returned in 2018. Markets sold off first in February |
and again sharply in October, amid rising interest rates, concerns about potential trade wars and heightened geopolitical tensions. Despite the volatility, US equity markets were largely positive for the reporting period and fared better than international markets. Emerging markets were particularly hard hit due to a strong US dollar. During the October sell-off, investors retreated to more defensive areas of the market and to US Treasuries. The broader bond market declined during the reporting period due to the increase in US Treasury yields and widening credit spreads. As the year progresses, we’ll see how the interplay of economic data, interest rates, geopolitics and a host of other factors affect US and overseas equity and fixed income markets.
Short-term market volatility can prompt some investors to abandon their investment plans – and can cause others to settle for whatever returns the market has to offer. The investment professionals at Invesco, in contrast, invest with high conviction. This means that, no matter the asset class or the strategy, each investment team has a passion to exceed. We want to help investors achieve better outcomes, such as seeking higher returns, helping mitigate risk and generating income. Of course, investing with high conviction can’t guarantee a profit or ensure success; no investment strategy can. To learn more about how we invest with high conviction, visit invesco.com/HighConviction.
You, too, can invest with high conviction by maintaining a long-term investment perspective and by working with your financial adviser on a regular basis. During periods of short-term market volatility or uncertainty, your financial adviser can keep you focused on your long-term investment goals – a new home, a child’s college education or a secure retirement. He or she also can share research about the economy, the markets and individual investment options.
Visit our website for more information on your investments
Our website, invesco.com/us, offers a wide range of market insights and investment perspectives. On the website, you’ll find detailed information about our funds, including performance, holdings and portfolio manager commentaries. You can access information about your account by completing a simple, secure online registration. To do so, select “Log In” on the right side of the homepage, and then select “Register for Individual Account Access.”
In addition to the resources accessible on our website and through our mobile app, you can obtain timely updates to help you stay informed about the markets and the economy by connecting with Invesco on Twitter, LinkedIn or Facebook. You can access our blog at blog.invesco.us.com. Our goal is to provide you the information you want, when and where you want it.
Finally, I’m pleased to share with you Invesco’s commitment to both the Principles for Responsible Investment and to considering environmental, social and governance issues in our robust investment process. I invite you to learn more at invesco.com/esg.
Have questions?
For questions about your account, contact an Invesco client services representative at 800 959 4246. For Invesco-related questions or comments, please email me directly at phil@invesco.com.
All of us at Invesco look forward to serving your investment management needs. Thank you for investing with us.
Sincerely,

Philip Taylor
Senior Managing Director, Invesco Ltd.
| | |
| 2 | | Invesco Developing Markets Fund |
| | | | |

Bruce Crockett | | Dear Fellow Shareholders: Among the many important lessons I’ve learned in more than 40 years in a variety of business endeavors is the value of a trusted advocate. As independent chair of the Invesco Funds Board, I can assure you that the members of the Board are strong advocates for the interests of investors in Invesco’s mutual funds. We work hard to represent your interests through oversight of the quality of the investment management services your funds receive and other matters important to your investment, including but not limited to: |
| | ∎ | | Ensuring that Invesco offers a diverse lineup of mutual funds that your financial adviser can use to strive to meet your financial needs as your investment goals change over time. |
| �� | ∎ | | Monitoring how the portfolio management teams of the Invesco funds are performing in light of changing economic and market conditions. |
| ∎ | | Assessing each portfolio management team’s investment performance within the context of the investment strategy described in the fund’s prospectus. |
| ∎ | | Monitoring for potential conflicts of interests that may impact the nature of the services that your funds receive. |
We believe one of the most important services we provide our fund shareholders is the annual review of the funds’ advisory and sub-advisory contracts with Invesco Advisers and its affiliates. This review is required by the Investment Company Act of 1940 and focuses on the nature and quality of the services Invesco provides as the adviser to the Invesco funds and the reasonableness of the fees that it charges for those services. Each year, we spend months carefully reviewing information received from Invesco and a variety of independent sources, such as performance and fee data prepared by Lipper, Inc. (a subsidiary of Broadridge Financial Solutions, Inc.), an independent, third-party firm widely recognized as a leader in its field. We also meet with our independent legal counsel and other independent advisers to review and help us assess the information that we have received. Our goal is to assure that you receive quality investment management services for a reasonable fee.
I trust the measures outlined above provide assurance that you have a worthy advocate when it comes to choosing the Invesco Funds.
As always, please contact me at bruce@brucecrockett.com with any questions or concerns you may have. On behalf of the Board, we look forward to continuing to represent your interests and serving your needs.
Sincerely,

Bruce L. Crockett
Independent Chair
Invesco Funds Board of Trustees
| | |
| 3 | | Invesco Developing Markets Fund |
Management’s Discussion of Fund Performance
| | | | |
| | |
Performance summary | | | | |
For the fiscal year ended October 31, 2018, Class A shares of Invesco Developing Markets Fund (the Fund), at net asset value (NAV), underperformed the MSCI Emerging Markets Index, the Fund’s broad market/style-specific benchmark. | |
Your Fund’s long-term performance appears later in this report. | | | | |
| | |
Fund vs. Indexes | | | | |
Total returns, 10/31/17 to 10/31/18, at net asset value (NAV). Performance shown does not include applicable contingent deferred sales charges (CDSC) or front-end sales charges, which would have reduced performance. | |
| |
Class A Shares | | | -16.14 | % |
Class C Shares | | | -16.77 | |
Class Y Shares | | | -15.92 | |
Class R5 Shares | | | -15.82 | |
Class R6 Shares | | | -15.79 | |
MSCI Emerging Markets Indexq (Broad Market/Style-Specific Index) | | | -12.52 | |
Lipper Emerging Market Funds Index⬛ (Peer Group Index) | | | -13.05 | |
Source(s): qRIMES Technologies Corp.; ⬛Lipper Inc. | | | | |
Market conditions and your Fund
The fiscal year proved to be an increasingly volatile time for global equities. The fiscal year began in the final months of 2017 with several US stock market indexes repeatedly reaching new highs amid strong corporate profits, the prospect of tax reform legislation and exceedingly low stock market volatility. Despite a sharp uptick in volatility, particularly in October 2018, US markets, in general, still produced positive returns for the fiscal year. International markets, however, were meaningfully less robust, many experiencing flat to negative results for the fiscal year.
At the beginning of 2018, markets saw significant turbulence in late January and early February, when stocks were whipsawed – first by concerns about accelerated US Federal Reserve (the Fed) tightening and then, later in the year, by fears of brewing trade wars and geopolitical tensions. After a relatively quiet summer, market volatility markedly rose
again in the final month of the fiscal year. Global equity markets (particularly the US) suffered a sharp sell-off in October 2018 amid rising interest rates and concerns that higher inflation could result in a more restrictive monetary policy.
Global economic growth, in general, was solid despite weakness in emerging markets. During the fiscal year, emerging markets were impacted by both country-specific issues, as well as, more generalized pressure resulting from the Fed’s tightening policy. In this environment, economic growth unsurprisingly slowed in emerging markets. Within the eurozone, economic growth accelerated, although there was divergence among countries. In Japan, economic growth improved over the latter part of the fiscal year. The US experienced strong growth during the fiscal year due to robust consumer and business spending. In addition, unemployment rates remained low, job creation was strong and inflation remained relatively controlled.
At the close of the fiscal year, equity
valuations in developed and emerging markets appeared relatively full in absolute terms, but overseas equity markets were trading at a material discount to those of the US.
Regardless of the macroeconomic environment, we remain focused on our bottom-up investment approach of identifying attractive companies that fit our earnings, quality and valuation (EQV) process.
On a geographic basis, the Fund’s holdings in Brazil, Turkey and Hong Kong – markets significantly impacted by macro and geopolitical concerns over the fiscal year – underperformed the MSCI Emerging Markets Index and were key detractors from both the Fund’s absolute and relative performance. Turkey-based Haci Omer Sabanci was one of the Fund’s largest individual detractors from Fund results during the fiscal year. The Turkish holding company suffered from negative investor sentiment toward the Turkish market. Additionally, Turkey’s consumer inflation continued to accelerate, driven by currency weakness that resulted in another interest rate hike. Despite this backdrop, we continue to believe that Sabanci’s strategic assets are highly attractive, it is conservatively managed, has a strong balance sheet and trades at a deep discount.
In contrast, the Fund’s holdings in Mexico outperformed those of the MSCI Emerging Markets Index for the fiscal year and contributed favorably to the Fund’s relative performance. In a weak market, the Fund’s cash exposure (which averaged around 9% during the fiscal year), benefited the Fund’s performance relative to the style-specific benchmark.
From a sector perspective, the Fund’s holdings in the energy, consumer staples and health care sectors underperformed those of the MSCI Emerging Markets
| | | | |
| | |
Portfolio Composition | | | | |
By sector % of total net assets | |
| |
Financials | | | 33.7% | |
Consumer Staples | | | 16.3 | |
Communication Services | | | 10.7 | |
Information Technology | | | 8.2 | |
Industrials | | | 6.5 | |
Consumer Discretionary | | | 6.4 | |
Health Care | | | 5.5 | |
Real Estate | | | 4.0 | |
Energy | | | 3.0 | |
Materials | | | 1.8 | |
Money Market Funds Plus Other Assets Less Liabilities | | | 3.9 | |
| | |
| |
Top 10 Equity Holdings* |
| % of total net assets |
| |
1. B3 S.A.-Brasil, Bolsa, Balcão | | 4.6% |
2. Sberbank of Russia PJSC- Preference Shares | | 3.7 |
3. Samsung Electronics Co., Ltd. | | 3.4 |
4. Yandex N.V.-Class A | | 3.3 |
5. Public Bank Bhd. | | 3.3 |
6. Richter Gedeon Nyrt | | 3.2 |
7. PT Bank Central Asia Tbk | | 3.2 |
8. Taiwan Semiconductor Manufacturing Co., Ltd. | | 3.0 |
9. Fomento Economico Mexicano, S.A.B. de C.V.-ADR | | 3.0 |
10. Kasikornbank PCL | | 2.8 |
| | | | |
| | |
Total Net Assets | | $ | 2.2 billion | |
| |
Total Number of Holdings* | | | 55 | |
The Fund’s holdings are subject to change, and there is no assurance that the Fund will continue to hold any particular security.
*Excluding money market fund holdings.
Data presented here are as of October 31, 2018.
4 Invesco Developing Markets Fund
Index and detracted from both relative and absolute returns during the fiscal year. Underweight exposure to the energy sector, the fiscal year’s strongest performing sector, was a drag on relative returns. In contrast, stock selection in and underweight exposure to the communication services sector favored the Fund’s relative performance.
For much of the fiscal year, the Fund’s more conservative quality-growth approach, with a focus on valuation, was out of favor with a market that has been narrowly focused on momentum growth names without regard for quality and valuation. During late 2017, stretched valuations kept us from owning strong communication services and consumer discretionary performers such as Tencent Holdings and Alibaba Group in China and Naspers in South Africa. Lack of exposure to these names was a drag on the Fund’s performance versus the MSCI Emerging Markets Index. In the latter part of the fiscal year, market sentiment shifted, with investors becoming much more focused on risk, fundamentals and valuation. Evidence of this shift included very weak and volatile performance from those same previously strong-performing momentum growth stocks – Tencent, Alibaba and Naspers. This trend, and not having any exposure to these names, later benefited the Fund’s relative performance. The change in investor sentiment continued into October 2018, as the market sold off fairly dramatically. We were encouraged by the prospect that the third quarter could mark the beginning of a more sustained shift in regime away from the narrow/momentum orientation that dominated in calendar year 2017 and the first half of 2018, toward a market that is more focused on fundamentals and valuation.
During the fiscal year, we continued to look for opportunities to improve the growth potential and quality of the Fund’s portfolio by adding companies based on our EQV outlook for each company. We took advantage of market volatility during the fiscal year to put some cash to work at more attractive valuation levels. We added several new holdings, including China-based social media platform Weibo, fast food restaurant company Yum China and packaged food manufacturer China Mengniu Dairy. We trimmed or sold several of the Fund’s holdings with EQV characteristics that were no longer as compelling as when we first initiated positions in them, including WH Group, NetEase, Cielo and Stella International.
As always, regardless of the macroeconomic environment, we remain focused on a bottom-up investment approach of identifying attractive companies that fit our EQV-focused investment process. We continue to look for high-quality growth companies that exhibit the following characteristics: strong organic revenue growth; high returns on capital; pricing power; strong balance sheets; cash generation; effective capital allocation and reasonable valuations. In addition, we continue to favor companies that are resilient in weak economic environments. Our balanced EQV-focused approach aligns with our goal of delivering attractive returns over the long term.
We thank you for your continued investment in Invesco Developing Markets Fund.
The views and opinions expressed in management’s discussion of Fund performance are those of Invesco Advisers, Inc. These views and opinions are subject to change at any time based on factors such as market and economic conditions. These views and opinions may not be relied upon as investment advice or recommendations, or as an offer for a particular security. The information is not a complete analysis of every aspect of any market, country, industry, security or the Fund. Statements of fact are from sources considered reliable, but Invesco Advisers, Inc. makes no representation or warranty as to their completeness or accuracy. Although historical performance is no guarantee of future results, these insights may help you understand our investment management philosophy.
See important Fund and, if applicable, index disclosures later in this report.
| | |
 | | Shuxin (Steve) Cao Chartered Financial Analyst, Portfolio Manager, is lead manager of Invesco Developing Markets Fund. He joined Invesco in 1997. |
Mr. Cao earned a BA in English from the Tianjin Foreign Language Institute and an MBA from Texas A&M University. He is also a Certified Public Accountant. |

| | Borge Endresen Chartered Financial Analyst, Portfolio Manager, is lead manager of Invesco Developing Markets Fund. He joined Invesco in 1999. |
Mr. Endresen earned a BS in finance from the University of Oregon and an MBA from The University of Texas at Austin. |

| | Brent Bates Chartered Financial Analyst, Portfolio Manager, is manager of Invesco Developing Markets Fund.He joined Invesco in |
1996. Mr. Bates earned a BBA from Texas A&M University and is a Certified Public Accountant. |

| | Mark Jason Chartered Financial Analyst, Portfolio Manager, is manager of Invesco Developing Markets Fund. He joined Invesco in 2001. |
| Mr. Jason earned a BS in finance and a BS in real estate from California State University, Northridge. |
5 Invesco Developing Markets Fund
Your Fund’s Long-Term Performance
Results of a $10,000 Investment – Oldest Share Class(es)
Fund and index data from 10/31/08
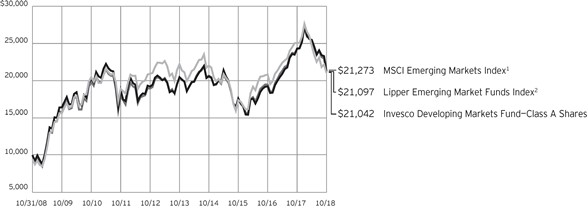
1 Source: RIMES Technologies Corp.
2 Source: Lipper Inc.
Past performance cannot guarantee comparable future results.
The data shown in the chart include reinvested distributions, applicable sales charges and Fund expenses including management fees. Index results include reinvested dividends, but they do not reflect sales charges. Performance of the
peer group, if applicable, reflects fund expenses and management fees; performance of a market index does not. Performance shown in the chart and table(s) does not reflect deduction of taxes a shareholder would pay on Fund distributions or sale of Fund shares.
6 Invesco Developing Markets Fund
| | | | |
| |
Average Annual Total Returns | |
As of 10/31/18, including maximum applicable sales charges | |
| |
Class A Shares | | | | |
Inception (1/11/94) | | | 4.53 | % |
10 Years | | | 7.72 | |
5 Years | | | -2.18 | |
1 Year | | | -20.74 | |
| |
Class C Shares | | | | |
Inception (3/1/99) | | | 8.02 | % |
10 Years | | | 7.53 | |
5 Years | | | -1.80 | |
1 Year | | | -17.60 | |
| |
Class Y Shares | | | | |
Inception (10/3/08) | | | 6.01 | % |
10 Years | | | 8.60 | |
5 Years | | | -0.82 | |
1 Year | | | -15.92 | |
| |
Class R5 Shares | | | | |
Inception (10/25/05) | | | 7.07 | % |
10 Years | | | 8.77 | |
5 Years | | | -0.69 | |
1 Year | | | -15.82 | |
| |
Class R6 Shares | | | | |
10 Years | | | 8.62 | % |
5 Years | | | -0.64 | |
1 Year | | | -15.79 | |
Class Y shares incepted on October 3, 2008. Performance shown prior to that date is that of Class A shares and includes the 12b-1 fees applicable to Class A shares.
Class R6 shares incepted on September 24, 2012. Performance shown prior to that date is that of Class A shares and includes the 12b-1 fees applicable to Class A shares.
The performance data quoted represent past performance and cannot guarantee comparable future results; current performance may be lower or higher. Please visit invesco.com/performance for the most recent month-end performance. Performance figures reflect reinvested distributions, changes in net asset value and the effect of the maximum sales charge unless otherwise stated. Investment return and principal value will fluctuate so that you may have a gain or loss when you sell shares.
The net annual Fund operating expense ratio set forth in the most recent Fund prospectus as of the date of this report for Class A, Class C, Class Y, Class R5 and Class R6 shares was
| | | | |
| |
Average Annual Total Returns | |
As of 9/30/18, the most recent calendar quarter end, including maximum applicable sales charges | |
| |
Class A Shares | | | | |
Inception (1/11/94) | | | 4.77 | % |
10 Years | | | 4.88 | |
5 Years | | | -0.44 | |
1 Year | | | -16.32 | |
| |
Class C Shares | | | | |
Inception (3/1/99) | | | 8.35 | % |
10 Years | | | 4.69 | |
5 Years | | | -0.07 | |
1 Year | | | -12.98 | |
| |
Class Y Shares | | | | |
10 Years | | | 5.74 | % |
5 Years | | | 0.94 | |
1 Year | | | -11.22 | |
| |
Class R5 Shares | | | | |
Inception (10/25/05) | | | 7.54 | % |
10 Years | | | 5.90 | |
5 Years | | | 1.07 | |
1 Year | | | -11.12 | |
| |
Class R6 Shares | | | | |
10 Years | | | 5.75 | % |
5 Years | | | 1.11 | |
1 Year | | | -11.08 | |
1.43%, 2.18%, 1.18%, 1.06% and 1.02%, respectively.1 The total annual Fund operating expense ratio set forth in the most recent Fund prospectus as of the date of this report for Class A, Class C, Class Y, Class R5 and Class R6 shares was 1.45%, 2.20%, 1.20%, 1.08% and 1.04%, respectively. The expense ratios presented above may vary from the expense ratios presented in other sections of this report that are based on expenses incurred during the period covered by this report.
Class A share performance reflects the maximum 5.50% sales charge, and Class C share performance reflects the applicable contingent deferred sales charge (CDSC) for the period involved. The CDSC on Class C shares is 1% for the first year after purchase. Class Y, Class R5 and Class R6 shares do not have a front-end sales charge or a CDSC; therefore, performance is at net asset value.
The performance of the Fund’s share classes will differ primarily due to different sales charge structures and class expenses.
Fund performance reflects any applicable fee waivers and/or expense reimbursements. Had the adviser not waived fees and/or reimbursed expenses currently or in the past, returns would have been lower. See current prospectus for more information.
| 1 | Total annual Fund operating expenses after any contractual fee waivers and/or expense reimbursements by the adviser in effect through at least June 30, 2020. See current prospectus for more information. |
7 Invesco Developing Markets Fund
Invesco Developing Markets Fund’s investment objective is long-term growth of capital.
| ∎ | | Unless otherwise stated, information presented in this report is as of October 31, 2018, and is based on total net assets. |
| ∎ | | Unless otherwise noted, all data provided by Invesco. |
| ∎ | | To access your Fund’s reports/prospectus, visit invesco.com/fundreports. |
About share classes
| ∎ | | Class Y shares are available to only certain investors. Please see the prospectus for more information. |
| ∎ | | Class R5 shares and Class R6 shares are available for use by retirement plans that meet certain standards and for institutional investors. Class R6 shares are also available through intermediaries that have established an agreement with Invesco Distributors, Inc. to make such shares available for use in retail omnibus accounts. Please see the prospectus for more information. |
Principal risks of investing in the Fund
| ∎ | | Depositary receipts risk. Investing in depositary receipts involves the same risks as direct investments in foreign securities. In addition, the underlying issuers of certain depositary receipts are under no obligation to distribute shareholder communications or pass through any voting rights with respect to the deposited securities to the holders of such receipts. The Fund may therefore receive less timely information or have less control than if it invested directly in the foreign issuer. |
∎ Derivatives risk. The value of a derivative instrument depends largely on (and is derived from) the value of an underlying security, currency, commodity, interest rate, index or other asset (each referred to as an underlying asset). In addition to risks relating to the underlying assets, the use of derivatives may include other, possibly greater, risks, including counterparty, leverage and liquidity risks. Counter-party risk is the risk that the counter-party to the derivative contract will default on its obligation to pay the Fund the amount owed or otherwise perform under the derivative contract. Derivatives create leverage risk because they do not require payment up front equal to the economic exposure created by owning the derivative. As a result, an adverse change in the value of the underlying
asset could result in the Fund sustaining a loss that is substantially greater than the amount invested in the derivative, which may make the Fund’s returns more volatile and increase the risk of loss. Derivative instruments may also be less liquid than more traditional investments and the Fund may be unable to sell or close out its derivative positions at a desirable time or price. This risk may be more acute under adverse market conditions, during which the Fund may be most in need of liquidating its derivative positions. Derivatives may also be harder to value, less tax efficient and subject to changing government regulation that could impact the Fund’s ability to use certain derivatives or their cost. Also, derivatives used for hedging or to gain or limit exposure to a particular market segment may not provide the expected benefits, particularly during adverse market conditions.
∎ Emerging markets securities risk. Emerging markets (also referred to as developing markets) are generally subject to greater market volatility, political, social and economic instability, uncertain trading markets and more governmental limitations on foreign investment than more developed markets. In addition, companies operating in emerging markets may be subject to lower trading volume and greater price fluctuations than companies in more developed markets. Securities law and the enforcement of systems of taxation in many emerging market countries may change quickly and unpredictably. The Fund’s investments in China A-shares are subject to trading restrictions, quota limitations and clearing and settlement risks. In addition, investments in emerging markets securities may also be subject to additional transaction costs, delays in settlement procedures, and lack of timely information.
∎ Foreign securities risk. The Fund’s foreign investments may be adversely affected by political and social instability,
This report must be accompanied or preceded by a currently effective Fund prospectus, which contains more complete information, including sales charges and expenses. Investors should read it carefully before investing.
NOT FDIC INSURED | MAY LOSE VALUE | NO BANK GUARANTEE
changes in economic or taxation policies, difficulty in enforcing obligations, decreased liquidity or increased volatility. Foreign investments also involve the risk of the possible seizure, nationalization or expropriation of the issuer or foreign deposits (in which the Fund could lose its entire investments in a certain market) and the possible adoption of foreign governmental restrictions such as exchange controls. Unless the Fund has hedged its foreign securities risk, foreign securities risk also involves the risk of negative foreign currency rate fluctuations, which may cause the value of securities denominated in such foreign currency (or other instruments through which the Fund has exposure to foreign currencies) to decline in value. Currency exchange rates may fluctuate significantly over short periods of time. Currency hedging strategies, if used, are not always successful.
∎ Geographic focus risk. The Fund may from time to time invest a substantial amount of its assets in securities of issuers located in a single country or a limited number of countries. Adverse economic, political or social conditions in those countries may therefore have a significant negative impact on the Fund’s investment performance.
∎ Growth investing risk. Growth stocks tend to be more expensive relative to the issuing company’s earnings or assets compared with other types of stock. As a result, they tend to be more sensitive to changes in, or investors’ expectations of, the issuing company’s earnings and can be more volatile.
∎ Management risk. The Fund is actively managed and depends heavily on the Adviser’s judgment about markets, interest rates or the attractiveness, relative values, liquidity, or potential appreciation of particular investments made for the Fund’s portfolio. The Fund could experience losses if these judgments prove to be incorrect. Additionally, legislative, regulatory, or tax developments may adversely affect management of the Fund and, therefore, the ability of the Fund to achieve its investment objective.
| | |
| 8 | | Invesco Developing Markets Fund |
| ∎ | | Market risk. The market values of the Fund’s investments, and therefore the value of the Fund’s shares, will go up and down, sometimes rapidly or unpredictably. Market risk may affect a single issuer, industry or section of the economy, or it may affect the market as a whole. Individual stock prices tend to go up and down more dramatically than those of certain other types of investments, such as bonds. During a general downturn in the financial markets, multiple asset classes may decline in value. When markets perform well, there can be no assurance that specific investments held by the Fund will rise in value. |
| ∎ | | Preferred securities risk. Preferred securities are subject to issuer-specific and market risks applicable generally to equity securities. Preferred securities also may be subordinated to bonds or other debt instruments, subjecting them to a greater risk of non-payment, may be less liquid than many other securities, such as common stocks, and generally offer no voting rights with respect to the issuer. |
∎ Sector focus risk. The Fund may from time to time invest a significant amount of its assets (i.e. over 25%) in one market sector or group of related industries. In this event, the Fund’s performance will depend to a greater extent on the overall condition of the sector or group of industries and there is increased risk that the Fund will lose significant value if conditions adversely affect that sector or group of industries.
∎ Small- and mid-capitalization companies risks. Small- and mid-capitalization companies tend to be more vulnerable to changing market conditions, may have little or no operating history or track record of success, and may have more limited product lines and markets, less experienced management and fewer financial resources than larger companies. These companies’ securities may be more volatile and less liquid than those of more established companies, and their returns may vary, sometimes significantly, from the overall securities market.
About indexes used in this report
| ∎ | | The MSCI Emerging Markets IndexSM is an unmanaged index considered representative of stocks of developing countries. The index is computed using the net return, which withholds applicable taxes for non-resident investors. |
| ∎ | | The Lipper Emerging Market Funds Index is an unmanaged index considered representative of emerging market funds tracked by Lipper. |
| ∎ | | The Fund is not managed to track the performance of any particular index, including the index(es) described here, and consequently, the performance of the Fund may deviate significantly from the performance of the index(es). |
| ∎ | | A direct investment cannot be made in an index. Unless otherwise indicated, index results include reinvested dividends, and they do not reflect sales charges. Performance of the peer group, if applicable, reflects fund expenses; performance of a market index does not. |
Other information
| ∎ | | CPA® and Certified Public Accountant® are trademarks owned by the American Institute of Certified Public Accountants. |
| ∎ | | The returns shown in management’s discussion of Fund performance are based on net asset values (NAVs) calculated for shareholder transactions. Generally accepted accounting principles require adjustments to be made to the net assets of the Fund at period end for financial reporting purposes, and as such, the NAVs for shareholder transactions and the returns based on those NAVs may differ from the NAVs and returns reported in the Financial Highlights. |
| ∎ | | Industry classifications used in this report are generally according to the Global Industry Classification Standard, which was developed by and is the exclusive property and a service mark of MSCI Inc. and Standard & Poor’s. |
9 Invesco Developing Markets Fund
Schedule of Investments
October 31, 2018
| | | | | | | | |
| | | Shares | | | Value | |
Common Stocks & Other Equity Interests–96.10% | |
| Brazil–17.05% | |
Ambev S.A.–ADR | | | 13,112,238 | | | $ | 56,775,991 | |
Arcos Dorados Holdings, Inc.–Class A | | | 5,721,029 | | | | 41,248,619 | |
B3 S.A. — Brasil, Bolsa, Balcão | | | 14,274,820 | | | | 102,376,715 | |
Banco Bradesco S.A.–ADR | | | 6,804,900 | | | | 62,400,933 | |
Fleury S.A. | | | 8,997,500 | | | | 50,505,918 | |
Kroton Educacional S.A. | | | 6,607,289 | | | | 20,239,983 | |
Multiplan Empreendimentos Imobiliarios S.A. | | | 3,463,029 | | | | 21,430,487 | |
Raia Drogasil S.A. | | | 1,039,300 | | | | 17,574,405 | |
TOTVS S.A. | | | 1,387,900 | | | | 9,360,820 | |
| | | | | | | | 381,913,871 | |
|
| China–15.48% | |
Baidu, Inc.–ADR | | | 98,098 | | | | 18,644,506 | |
China Mengniu Dairy Co. Ltd. | | | 15,291,000 | | | | 45,042,636 | |
China Mobile Ltd. | | | 2,332,500 | | | | 21,802,262 | |
Henan Shuanghui Investment & Development Co., Ltd.–Class A | | | 16,148,083 | | | | 52,189,930 | |
Industrial & Commercial Bank of China Ltd.–Class H | | | 39,374,000 | | | | 26,539,847 | |
Kweichow Moutai Co., Ltd.–Class A | | | 437,356 | | | | 34,589,648 | |
New Oriental Education & Technology Group, Inc.–ADR(a) | | | 225,561 | | | | 13,197,574 | |
Sunny Optical Technology Group Co., Ltd. | | | 3,305,700 | | | | 28,928,474 | |
Want Want China Holdings Ltd. | | | 24,950,000 | | | | 17,816,997 | |
Weibo Corp.–ADR(a) | | | 387,343 | | | | 22,857,110 | |
Wuliangye Yibin Co., Ltd.–Class A | | | 5,234,912 | | | | 36,142,443 | |
Yum China Holdings, Inc. | | | 801,196 | | | | 28,907,152 | |
| | | | | | | | 346,658,579 | |
|
| Egypt–0.57% | |
EFG-Hermes Holding Co.(a) | | | 16,152,502 | | | | 12,790,402 | |
|
| France–1.57% | |
Bollore S.A. | | | 8,290,471 | | | | 35,065,016 | |
|
| Hong Kong–2.61% | |
Galaxy Entertainment Group Ltd. | | | 7,431,000 | | | | 39,954,436 | |
Lee & Man Paper Manufacturing Ltd. | | | 21,593,000 | | | | 18,476,148 | |
| | | | | | | | 58,430,584 | |
|
| Hungary–3.20% | |
Richter Gedeon Nyrt | | | 3,854,462 | | | | 71,670,068 | |
|
| Indonesia–8.18% | |
PT Bank Central Asia Tbk | | | 46,011,600 | | | | 71,578,644 | |
PT Bank Mandiri Persero Tbk | | | 123,459,800 | | | | 55,742,022 | |
PT Telekomunikasi Indonesia Persero Tbk | | | 221,321,600 | | | | 55,948,493 | |
| | | | | | | | 183,269,159 | |
|
| Israel–1.00% | |
Israel Chemicals Ltd. | | | 3,907,788 | | | | 22,465,611 | |
| | | | | | | | |
| | | Shares | | | Value | |
| Malaysia–3.25% | |
Public Bank Bhd. | | | 12,379,000 | | | $ | 72,829,741 | |
|
| Mexico–9.66% | |
Bolsa Mexicana de Valores, S.A.B. de C.V. | | | 20,598,400 | | | | 31,049,832 | |
Fomento Economico Mexicano, S.A.B. de C.V.–ADR | | | 793,433 | | | | 67,497,345 | |
GMexico Transportes, S.A.B. de C.V.(b) | | | 26,168,230 | | | | 35,748,508 | |
Grupo Aeroportuario del Centro Norte, S.A.B. de C.V. | | | 3,478,298 | | | | 18,217,475 | |
Grupo Aeroportuario del Pacífico, S.A.B. de C.V.–Class B | | | 4,969,897 | | | | 41,333,337 | |
Kimberly-Clark de Mexico, S.A.B. de C.V.–Class A | | | 15,567,001 | | | | 22,430,981 | |
| | | | | | | | 216,277,478 | |
|
| Nigeria–1.46% | |
Zenith Bank PLC | | | 504,865,834 | | | | 32,684,152 | |
|
| Peru–2.21% | |
Credicorp Ltd. | | | 218,960 | | | | 49,421,462 | |
|
| Philippines–1.85% | |
SM Investments Corp. | | | 964,330 | | | | 16,246,471 | |
SM Prime Holdings Inc. | | | 39,697,200 | | | | 25,077,383 | |
| | | | | | | | 41,323,854 | |
|
| Russia–10.59% | |
Gazprom PJSC–ADR | | | 4,732,713 | | | | 22,390,763 | |
Mobile TeleSystems PJSC–ADR | | | 2,786,494 | | | | 22,319,817 | |
Sberbank of Russia PJSC | | | 12,827,144 | | | | 36,958,452 | |
Sberbank of Russia PJSC–Preference Shares | | | 33,146,390 | | | | 82,169,371 | |
Yandex N.V.–Class A(a) | | | 2,436,126 | | | | 73,400,476 | |
| | | | | | | | 237,238,879 | |
|
| South Korea–4.59% | |
NAVER Corp. | | | 254,120 | | | | 25,646,138 | |
Samsung Electronics Co., Ltd. | | | 2,060,950 | | | | 77,078,755 | |
| | | | | | | | 102,724,893 | |
|
| Taiwan–3.03% | |
Taiwan Semiconductor Manufacturing Co., Ltd. | | | 9,145,000 | | | | 67,944,005 | |
|
| Thailand–2.83% | |
Kasikornbank PCL | | | 10,511,700 | | | | 63,370,151 | |
|
| Turkey–5.04% | |
Anadolu Efes Biracilik Ve Malt Sanayii A.S. | | | 3,181,985 | | | | 10,696,561 | |
EIS Eczacibasi Ilac ve, Sinai ve Finansal Yatirimlar Sanayi ve Ticaret A.S. | | | 7,584,745 | | | | 4,045,300 | |
Haci Omer Sabanci Holding A.S. | | | 42,519,576 | | | | 54,357,896 | |
Tupras-Turkiye Petrol Rafinerileri A.S. | | | 1,857,272 | | | | 43,817,784 | |
| | | | | | | | 112,917,541 | |
See accompanying Notes to Financial Statements which are an integral part of the financial statements.
10 Invesco Developing Markets Fund
| | | | | | | | |
| | | Shares | | | Value | |
| United Arab Emirates–1.93% | |
Emaar Properties PJSC | | | 31,048,100 | | | $ | 43,174,597 | |
Total Common Stocks & Other Equity Interests
(Cost $2,063,977,860) | | | | 2,152,170,043 | |
|
Money Market Funds–3.97% | |
Invesco Government & Agency Portfolio–Institutional Class, 2.08%(c) | | | 31,071,374 | | | | 31,071,374 | |
Invesco Liquid Assets Portfolio–Institutional Class, 2.27%(c) | | | 22,190,291 | | | | 22,194,729 | |
Invesco Treasury Portfolio–Institutional Class, 2.09%(c) | | | 35,510,142 | | | | 35,510,142 | |
Total Money Market Funds
(Cost $88,776,245) | | | | 88,776,245 | |
TOTAL INVESTMENTS IN SECURITIES–100.07%
(Cost $2,152,754,105) | | | | 2,240,946,288 | |
OTHER ASSETS LESS LIABILITIES–(0.07)% | | | | (1,487,710 | ) |
NET ASSETS–100.00% | | | $ | 2,239,458,578 | |
Investment Abbreviations:
| | |
| ADR | | – American Depositary Receipt |
Notes to Schedule of Investments:
| (a) | Non-income producing security. |
| (b) | Security purchased or received in transaction exempt from registration under the Securities Act of 1933, as amended (the “1933 Act”). The security may be resold pursuant to an exemption from registration under the 1933 Act, typically to qualified institutional buyers. The value of this security at October 31, 2018 represented 1.60% of the Fund’s Net Assets. |
| (c) | The money market fund and the Fund are affiliated by having the same investment adviser. The rate shown is the 7-day SEC standardized yield as of October 31, 2018. |
See accompanying Notes to Financial Statements which are an integral part of the financial statements.
11 Invesco Developing Markets Fund
Statement of Assets and Liabilities
October 31, 2018
| | | | |
Assets: | | | | |
Investments in securities, at value (Cost $2,063,977,860) | | $ | 2,152,170,043 | |
Investments in affiliated money market funds, at value and cost | | | 88,776,245 | |
Foreign currencies, at value (Cost $1,229,907) | | | 1,078,784 | |
Receivable for: | | | | |
Investments sold | | | 18,398,550 | |
Dividends and interest | | | 1,244,812 | |
Fund shares sold | | | 1,487,464 | |
Fund expenses absorbed | | | 7,722 | |
Investment for trustee deferred compensation and retirement plans | | | 338,226 | |
Other assets | | | 77,301 | |
Total assets | | | 2,263,579,147 | |
| |
Liabilities: | | | | |
Payable for: | | | | |
Fund shares repurchased | | | 17,357,099 | |
Accrued foreign taxes | | | 4,823,674 | |
Accrued fees to affiliates | | | 873,645 | |
Accrued trustees’ and officers’ fees and benefits | | | 4,996 | |
Accrued other operating expenses | | | 679,254 | |
Trustee deferred compensation and retirement plans | | | 381,901 | |
Total liabilities | | | 24,120,569 | |
Net assets applicable to shares outstanding | | $ | 2,239,458,578 | |
| |
Net assets consist of: | | | | |
Shares of beneficial interest | | $ | 2,160,820,483 | |
Distributable earnings | | | 78,638,095 | |
| | | $ | 2,239,458,578 | |
| | | | |
Net Assets: | | | | |
Class A | | $ | 544,574,436 | |
Class C | | $ | 55,823,371 | |
Class Y | | $ | 986,549,683 | |
Class R5 | | $ | 287,511,482 | |
Class R6 | | $ | 364,999,606 | |
|
Shares outstanding, no par value,
with an unlimited number of shares authorized: | |
Class A | | | 17,832,952 | |
Class C | | | 1,883,361 | |
Class Y | | | 32,240,567 | |
Class R5 | | | 9,412,321 | |
Class R6 | | | 11,949,509 | |
Class A: | | | | |
Net asset value per share | | $ | 30.54 | |
Maximum offering price per share | | | | |
(Net asset value of $30.54 ¸ 94.50%) | | $ | 32.32 | |
Class C: | | | | |
Net asset value and offering price per share | | $ | 29.64 | |
Class Y: | | | | |
Net asset value and offering price per share | | $ | 30.60 | |
Class R5: | | | | |
Net asset value and offering price per share | | $ | 30.55 | |
Class R6: | | | | |
Net asset value and offering price per share | | $ | 30.55 | |
See accompanying Notes to Financial Statements which are an integral part of the financial statements.
12 Invesco Developing Markets Fund
Statement of Operations
For the year ended October 31, 2018
| | | | |
Investment income: | | | | |
Dividends (net of foreign withholding taxes of $9,026,642) | | $ | 76,160,013 | |
Interest and dividends from affiliates | | | 4,752,204 | |
Total investment income | | | 80,912,217 | |
| |
Expenses: | | | | |
Advisory fees | | | 26,890,493 | |
Administrative services fees | | | 563,987 | |
Custodian fees | | | 2,215,960 | |
Distribution fees: | | | | |
Class A | | | 1,766,969 | |
Class B | | | 11,437 | |
Class C | | | 770,545 | |
Transfer agent fees — A, B, C and Y | | | 3,618,665 | |
Transfer agent fees — R5 | | | 257,485 | |
Transfer agent fees — R6 | | | 54,638 | |
Trustees’ and officers’ fees and benefits | | | 65,496 | |
Registration and filing fees | | | 183,432 | |
Reports to shareholders | | | 369,255 | |
Professional services fees | | | 113,518 | |
Other | | | 58,001 | |
Total expenses | | | 36,939,881 | |
Less: Fees waived and expense offset arrangement(s) | | | (383,606 | ) |
Net expenses | | | 36,556,275 | |
Net investment income | | | 44,355,942 | |
| |
Realized and unrealized gain (loss) from: | | | | |
Net realized gain (loss) from: | | | | |
Investment securities (net of foreign taxes of $2,383,225) | | | 55,508,516 | |
Foreign currencies | | | (2,104,193 | ) |
| | | | 53,404,323 | |
Change in net unrealized appreciation (depreciation) of: | | | | |
Investment securities (net of foreign taxes of $5,082,911) | | | (580,222,535 | ) |
Foreign currencies | | | (105,546 | ) |
| | | | (580,328,081 | ) |
Net realized and unrealized gain (loss) | | | (526,923,758 | ) |
Net increase (decrease) in net assets resulting from operations | | $ | (482,567,816 | ) |
See accompanying Notes to Financial Statements which are an integral part of the financial statements.
13 Invesco Developing Markets Fund
Statement of Changes in Net Assets
For the years ended October 31, 2018 and 2017
| | | | | | | | |
| | | 2018 | | | 2017 | |
Operations: | | | | | | | | |
Net investment income | | $ | 44,355,942 | | | $ | 30,782,524 | |
Net realized gain | | | 53,404,323 | | | | 119,640,254 | |
Change in net unrealized appreciation (depreciation) | | | (580,328,081 | ) | | | 435,366,557 | |
Net increase (decrease) in net assets resulting from operations | | | (482,567,816 | ) | | | 585,789,335 | |
| | |
Distributions to shareholders from distributable earnings(1): | | | | | | | | |
Class A | | | (5,600,298 | ) | | | (6,465,840 | ) |
Class B | | | (237 | ) | | | (9,114 | ) |
Class C | | | (4,392 | ) | | | (88,315 | ) |
Class Y | | | (16,530,978 | ) | | | (11,463,530 | ) |
Class R5 | | | (5,045,947 | ) | | | (3,838,802 | ) |
Class R6 | | | (4,921,857 | ) | | | (2,041,422 | ) |
Total distributions to shareholders from distributable earnings | | | (32,103,709 | ) | | | (23,907,023 | ) |
| | |
Share transactions–net: | | | | | | | | |
Class A | | | (217,263,166 | ) | | | (91,568,138 | ) |
Class B | | | (5,577,356 | ) | | | (4,910,609 | ) |
Class C | | | (19,884,658 | ) | | | (9,310,384 | ) |
Class Y | | | (350,973,354 | ) | | | 244,683,793 | |
Class R5 | | | (116,212,674 | ) | | | 64,225,172 | |
Class R6 | | | 18,721,617 | | | | 217,227,291 | |
Net increase (decrease) in net assets resulting from share transactions | | | (691,189,591 | ) | | | 420,347,125 | |
Net increase (decrease) in net assets | | | (1,205,861,116 | ) | | | 982,229,437 | |
| | |
Net assets: | | | | | | | | |
Beginning of year | | | 3,445,319,694 | | | | 2,463,090,257 | |
End of year | | $ | 2,239,458,578 | | | $ | 3,445,319,694 | |
| (1) | The Securities and Exchange Commission eliminated the requirement to disclose distribution components separately, except for tax return of capital. For the year ended October 31, 2017, distributions to shareholders from distributable earnings consisted of distributions from net investment income. |
Notes to Financial Statements
October 31, 2018
NOTE 1—Significant Accounting Policies
Invesco Developing Markets Fund (the “Fund”) is a series portfolio of AIM Investment Funds (Invesco Investment Funds) (the “Trust”). The Trust is organized as a Delaware statutory trust and is registered under the Investment Company Act of 1940, as amended (the “1940 Act”), as an open-end series management investment company authorized to issue an unlimited number of shares of beneficial interest. Information presented in these financial statements pertains only to the Fund. Matters affecting the Fund or each class will be voted on exclusively by the shareholders of the Fund or each class.
The Fund’s investment objective is long-term growth of capital.
As of the open of business on June 8, 2017, the Fund has closed public sales of its shares to new investors.
The Fund currently consists of five different classes of shares: Class A, Class C, Class Y, Class R5 and Class R6. Class Y shares are available only to certain investors. Class A shares are sold with a front-end sales charge unless certain waiver criteria are met. Under certain circumstances, load waived shares may be subject to contingent deferred sales charges (“CDSC”). Class C shares are sold with a CDSC. Class Y, Class R5 and Class R6 shares are sold at net asset value. Effective November 30, 2010, new or additional investments in Class B shares are no longer permitted. Existing shareholders of Class B shares were permitted to continue to reinvest dividends and capital gains distributions in Class B shares until their conversion to Class A shares. Also, shareholders in Class B shares were able to exchange those shares for Class B shares of other Invesco Funds offering such shares until they converted to Class A shares. Generally, Class B shares automatically converted to Class A shares on or about the month-end, which was at least eight years after the date of purchase. Redemptions of Class B shares prior to the conversion date were subject to a CDSC. Effective January 26, 2018, all of the Fund’s outstanding Class B shares were converted to Class A shares, in advance of their normally scheduled conversion. No CDSC was paid in connection with this early conversion.
The Fund is an investment company and accordingly follows the investment company accounting and reporting guidance in accordance with Financial Accounting Standards Board Accounting Standards Codification Topic 946, Financial Services — Investment Companies.
14 Invesco Developing Markets Fund
The following is a summary of the significant accounting policies followed by the Fund in the preparation of its financial statements.
| A. | Security Valuations — Securities, including restricted securities, are valued according to the following policy. |
A security listed or traded on an exchange (except convertible securities) is valued at its last sales price or official closing price as of the close of the customary trading session on the exchange where the security is principally traded, or lacking any sales or official closing price on a particular day, the security may be valued at the closing bid price on that day. Securities traded in the over-the-counter market are valued based on prices furnished by independent pricing services or market makers. When such securities are valued by an independent pricing service they may be considered fair valued. Futures contracts are valued at the final settlement price set by an exchange on which they are principally traded. Listed options are valued at the mean between the last bid and asked prices from the exchange on which they are principally traded. Options not listed on an exchange are valued by an independent source at the mean between the last bid and asked prices. For purposes of determining net asset value (“NAV”) per share, futures and option contracts generally are valued 15 minutes after the close of the customary trading session of the New York Stock Exchange (“NYSE”).
Investments in open-end and closed-end registered investment companies that do not trade on an exchange are valued at the end-of-day net asset value per share. Investments in open-end and closed-end registered investment companies that trade on an exchange are valued at the last sales price or official closing price as of the close of the customary trading session on the exchange where the security is principally traded.
Debt obligations (including convertible securities) and unlisted equities are fair valued using an evaluated quote provided by an independent pricing service. Evaluated quotes provided by the pricing service may be determined without exclusive reliance on quoted prices, and may reflect appropriate factors such as institution-size trading in similar groups of securities, developments related to specific securities, dividend rate (for unlisted equities), yield (for debt obligations), quality, type of issue, coupon rate (for debt obligations), maturity (for debt obligations), individual trading characteristics and other market data. Pricing services generally value debt obligations assuming orderly transactions of institutional round lot size, but a fund may hold or transact in the same securities in smaller, odd lot sizes. Odd lots often trade at lower prices than institutional round lots. Debt obligations are subject to interest rate and credit risks. In addition, all debt obligations involve some risk of default with respect to interest and/or principal payments.
Foreign securities’ (including foreign exchange contracts) prices are converted into U.S. dollar amounts using the applicable exchange rates as of the close of the NYSE. If market quotations are available and reliable for foreign exchange-traded equity securities, the securities will be valued at the market quotations. Because trading hours for certain foreign securities end before the close of the NYSE, closing market quotations may become unreliable. If between the time trading ends on a particular security and the close of the customary trading session on the NYSE, events occur that the investment adviser determines are significant and make the closing price unreliable, the Fund may fair value the security. If the event is likely to have affected the closing price of the security, the security will be valued at fair value in good faith using procedures approved by the Board of Trustees. Adjustments to closing prices to reflect fair value may also be based on a screening process of an independent pricing service to indicate the degree of certainty, based on historical data, that the closing price in the principal market where a foreign security trades is not the current value as of the close of the NYSE. Foreign securities’ prices meeting the approved degree of certainty that the price is not reflective of current value will be priced at the indication of fair value from the independent pricing service. Multiple factors may be considered by the independent pricing service in determining adjustments to reflect fair value and may include information relating to sector indices, American Depositary Receipts and domestic and foreign index futures. Foreign securities may have additional risks including exchange rate changes, potential for sharply devalued currencies and high inflation, political and economic upheaval, the relative lack of issuer information, relatively low market liquidity and the potential lack of strict financial and accounting controls and standards.
Securities for which market prices are not provided by any of the above methods may be valued based upon quotes furnished by independent sources. The last bid price may be used to value equity securities. The mean between the last bid and asked prices is used to value debt obligations, including corporate loans.
Securities for which market quotations are not readily available or became unreliable are valued at fair value as determined in good faith by or under the supervision of the Trust’s officers following procedures approved by the Board of Trustees. Issuer specific events, market trends, bid/asked quotes of brokers and information providers and other market data may be reviewed in the course of making a good faith determination of a security’s fair value.
The Fund may invest in securities that are subject to interest rate risk, meaning the risk that the prices will generally fall as interest rates rise and, conversely, the prices will generally rise as interest rates fall. Specific securities differ in their sensitivity to changes in interest rates depending on their individual characteristics. Changes in interest rates may result in increased market volatility, which may affect the value and/or liquidity of certain Fund investments.
Valuations change in response to many factors including the historical and prospective earnings of the issuer, the value of the issuer’s assets, general economic conditions, interest rates, investor perceptions and market liquidity. Because of the inherent uncertainties of valuation, the values reflected in the financial statements may materially differ from the value received upon actual sale of those investments.
| B. | Securities Transactions and Investment Income — Securities transactions are accounted for on a trade date basis. Realized gains or losses on sales are computed on the basis of specific identification of the securities sold. Interest income (net of withholding tax, if any) is recorded on the accrual basis from settlement date. Dividend income (net of withholding tax, if any) is recorded on the ex-dividend date. |
The Fund may periodically participate in litigation related to Fund investments. As such, the Fund may receive proceeds from litigation settlements. Any proceeds received are included in the Statement of Operations as realized gain (loss) for investments no longer held and as unrealized gain (loss) for investments still held.
Brokerage commissions and mark ups are considered transaction costs and are recorded as an increase to the cost basis of securities purchased and/or a reduction of proceeds on a sale of securities. Such transaction costs are included in the determination of net realized and unrealized gain (loss) from investment securities reported in the Statement of Operations and the Statement of Changes in Net Assets and the net realized and unrealized gains (losses) on securities per share in the Financial Highlights. Transaction costs are included in the calculation of the Fund’s net asset value and, accordingly, they reduce the Fund’s total returns. These transaction costs are not considered operating expenses and are not reflected in net investment income reported in the Statement of Operations and the Statement of Changes in Net Assets, or the net investment income per share and the ratios of expenses and net investment income reported in the Financial Highlights, nor are they limited by any expense limitation arrangements between the Fund and the investment adviser.
15 Invesco Developing Markets Fund
The Fund allocates income and realized and unrealized capital gains and losses to a class based on the relative net assets of each class.
| C. | Country Determination — For the purposes of making investment selection decisions and presentation in the Schedule of Investments, the investment adviser may determine the country in which an issuer is located and/or credit risk exposure based on various factors. These factors include the laws of the country under which the issuer is organized, where the issuer maintains a principal office, the country in which the issuer derives 50% or more of its total revenues and the country that has the primary market for the issuer’s securities, as well as other criteria. Among the other criteria that may be evaluated for making this determination are the country in which the issuer maintains 50% or more of its assets, the type of security, financial guarantees and enhancements, the nature of the collateral and the sponsor organization. Country of issuer and/or credit risk exposure has been determined to be the United States of America, unless otherwise noted. |
| D. | Distributions — Distributions from net investment income and net realized capital gain, if any, are generally declared and paid annually and recorded on the ex-dividend date. The Fund may elect to treat a portion of the proceeds from redemptions as distributions for federal income tax purposes. |
| E. | Federal Income Taxes — The Fund intends to comply with the requirements of Subchapter M of the Internal Revenue Code of 1986, as amended (the “Internal Revenue Code”), necessary to qualify as a regulated investment company and to distribute substantially all of the Fund’s taxable earnings to shareholders. As such, the Fund will not be subject to federal income taxes on otherwise taxable income (including net realized capital gain) that is distributed to shareholders. Therefore, no provision for federal income taxes is recorded in the financial statements. |
The Fund recognizes the tax benefits of uncertain tax positions only when the position is more likely than not to be sustained. Management has analyzed the Fund’s uncertain tax positions and concluded that no liability for unrecognized tax benefits should be recorded related to uncertain tax positions. Management is not aware of any tax positions for which it is reasonably possible that the total amounts of unrecognized tax benefits will change materially in the next 12 months.
The Fund files tax returns in the U.S. Federal jurisdiction and certain other jurisdictions. Generally, the Fund is subject to examinations by such taxing authorities for up to three years after the filing of the return for the tax period.
| F. | Expenses — Fees provided for under the Rule 12b-1 plan of a particular class of the Fund are charged to the operations of such class. Transfer agency fees and expenses and other shareholder recordkeeping fees and expenses attributable to Class R5 and Class R6 are allocated to each share class based on relative net assets. Sub-accounting fees attributable to Class R5 are charged to the operations of the class. Transfer agency fees and expenses and other shareholder recordkeeping fees and expenses relating to all other classes are allocated among those classes based on relative net assets. All other expenses are allocated among the classes based on relative net assets. |
| G. | Accounting Estimates — The preparation of financial statements in conformity with accounting principles generally accepted in the United States of America (“GAAP”) requires management to make estimates and assumptions that affect the reported amounts of assets and liabilities at the date of the financial statements and the reported amounts of revenues and expenses during the reporting period including estimates and assumptions related to taxation. Actual results could differ from those estimates by a significant amount. In addition, the Fund monitors for material events or transactions that may occur or become known after the period-end date and before the date the financial statements are released to print. |
| H. | Indemnifications — Under the Trust’s organizational documents, each Trustee, officer, employee or other agent of the Trust is indemnified against certain liabilities that may arise out of the performance of their duties to the Fund. Additionally, in the normal course of business, the Fund enters into contracts, including the Fund’s servicing agreements, that contain a variety of indemnification clauses. The Fund’s maximum exposure under these arrangements is unknown as this would involve future claims that may be made against the Fund that have not yet occurred. The risk of material loss as a result of such indemnification claims is considered remote. |
| I. | Foreign Currency Translations — Foreign currency is valued at the close of the NYSE based on quotations posted by banks and major currency dealers. Portfolio securities and other assets and liabilities denominated in foreign currencies are translated into U.S. dollar amounts at the date of valuation. Purchases and sales of portfolio securities (net of foreign taxes withheld on disposition) and income items denominated in foreign currencies are translated into U.S. dollar amounts on the respective dates of such transactions. The Fund does not separately account for the portion of the results of operations resulting from changes in foreign exchange rates on investments and the fluctuations arising from changes in market prices of securities held. The combined results of changes in foreign exchange rates and the fluctuation of market prices on investments (net of estimated foreign tax withholding) are included with the net realized and unrealized gain or loss from investments in the Statement of Operations. Reported net realized foreign currency gains or losses arise from (1) sales of foreign currencies, (2) currency gains or losses realized between the trade and settlement dates on securities transactions, and (3) the difference between the amounts of dividends, interest, and foreign withholding taxes recorded on the Fund’s books and the U.S. dollar equivalent of the amounts actually received or paid. Net unrealized foreign currency gains and losses arise from changes in the fair values of assets and liabilities, other than investments in securities at fiscal period end, resulting from changes in exchange rates. |
The Fund may invest in foreign securities, which may be subject to foreign taxes on income, gains on investments or currency repatriation, a portion of which may be recoverable. Foreign taxes, if any, are recorded based on the tax regulations and rates that exist in the foreign markets in which the Fund invests and are shown in the Statement of Operations.
| J. | Forward Foreign Currency Contracts — The Fund may engage in foreign currency transactions either on a spot (i.e. for prompt delivery and settlement) basis, or through forward foreign currency contracts, to manage or minimize currency or exchange rate risk. |
The Fund may also enter into forward foreign currency contracts for the purchase or sale of a security denominated in a foreign currency in order to “lock in” the U.S. dollar price of that security, or the Fund may also enter into forward foreign currency contracts that do not provide for physical settlement of the two currencies, but instead are settled by a single cash payment calculated as the difference between the agreed upon exchange rate and the spot rate at settlement based upon an agreed upon notional amount (non-deliverable forwards). The Fund will set aside liquid assets in an amount equal to the daily mark-to-market obligation for forward foreign currency contracts.
A forward foreign currency contract is an obligation between two parties (“Counterparties”) to purchase or sell a specific currency for an agreed-upon price at a future date. The use of forward foreign currency contracts does not eliminate fluctuations in the price of the underlying securities the Fund owns or intends to acquire but establishes a rate of exchange in advance. Fluctuations in the value of these contracts are measured by the difference in the contract date and reporting date exchange rates and are recorded as unrealized appreciation (depreciation) until the contracts are closed. When the contracts are closed, realized gains (losses) are recorded. Realized and unrealized gains (losses) on the
16 Invesco Developing Markets Fund
contracts are included in the Statement of Operations. The primary risks associated with forward foreign currency contracts include failure of the Counterparty to meet the terms of the contract and the value of the foreign currency changing unfavorably. These risks may be in excess of the amounts reflected in the Statement of Assets and Liabilities.
NOTE 2—Advisory Fees and Other Fees Paid to Affiliates
The Trust has entered into a master investment advisory agreement with Invesco Advisers, Inc. (the “Adviser” or “Invesco”). Under the terms of the investment advisory agreement, the Fund accrues daily and pays monthly an advisory fee to the Adviser based on the annual rate of the Fund’s average daily net assets as follows:
| | | | | | | | |
| Average Daily Net Assets | | Rate | |
First $250 million | | | 0 | .935% | | | | |
Next $250 million | | | 0 | .91% | | | | |
Next $500 million | | | 0 | .885% | | | | |
Next $1.5 billion | | | 0 | .86% | | | | |
Next $2.5 billion | | | 0 | .835% | | | | |
Next $2.5 billion | | | 0 | .81% | | | | |
Next $2.5 billion | | | 0 | .785% | | | | |
Over $10 billion | | | 0 | .76% | | | | |
For the year ended October 31, 2018, the effective advisory fees incurred by the Fund was 0.87%.
Under the terms of a master sub-advisory agreement between the Adviser and each of Invesco Asset Management Deutschland GmbH, Invesco Asset Management Limited, Invesco Asset Management (Japan) Limited, Invesco Hong Kong Limited, Invesco Senior Secured Management, Inc. and Invesco Canada Ltd. and separate sub-advisory agreements with Invesco Capital Management LLC, formerly Invesco PowerShares Capital Management LLC, and Invesco Asset Management (India) Private Limited (collectively, the “Affiliated Sub-Advisers”) the Adviser, not the Fund, will pay 40% of the fees paid to the Adviser to any such Affiliated Sub-Adviser(s) that provide(s) discretionary investment management services to the Fund based on the percentage of assets allocated to such Affiliated Sub-Adviser(s).
The Adviser has contractually agreed, through at least June 30, 2019, to waive advisory fees and/or reimburse expenses to the extent necessary to limit total annual fund operating expenses after fee waivers and/or reimbursements (excluding certain items discussed below) of Class A, Class C, Class Y, Class R5 and Class R6 shares to 2.25%, 3.00%, 2.00%, 2.00% and 2.00%, respectively, of the Fund’s average daily net assets (the “expense limits”). Prior to their conversion to Class A shares, the expense limit for Class B was 3.00% of average daily net assets. In determining the Adviser’s obligation to waive advisory fees and/or reimburse expenses, the following expenses are not taken into account, and could cause the total annual fund operating expenses after fee waiver and/or expense reimbursement to exceed the numbers reflected above: (1) interest; (2) taxes; (3) dividend expense on short sales; (4) extraordinary or non-routine items, including litigation expenses; and (5) expenses that the Fund has incurred but did not actually pay because of an expense offset arrangement. Unless Invesco continues the fee waiver agreement, it will terminate on June 30, 2019. During its term, the fee waiver agreement cannot be terminated or amended to increase the expense limits or reduce the advisory fee waiver without approval of the Board of Trustees. The Adviser did not waive fees and/or reimburse expenses during the period under these expense limits.
Further, the Adviser has contractually agreed, through at least June 30, 2020, to waive the advisory fee payable by the Fund in an amount equal to 100% of the net advisory fees the Adviser receives from the affiliated money market funds on investments by the Fund of uninvested cash in such affiliated money market funds.
For the year ended October 31, 2018, the Adviser waived advisory fees of $368,990.
The Trust has entered into a master administrative services agreement with Invesco pursuant to which the Fund has agreed to pay Invesco for certain administrative costs incurred in providing accounting services to the Fund. For the year ended October 31, 2018, expenses incurred under the agreement are shown in the Statement of Operations as Administrative services fees.
The Trust has entered into a transfer agency and service agreement with Invesco Investment Services, Inc. (“IIS”) pursuant to which the Fund has agreed to pay IIS a fee for providing transfer agency and shareholder services to the Fund and reimburse IIS for certain expenses incurred by IIS in the course of providing such services. IIS may make payments to intermediaries that provide omnibus account services, sub-accounting services and/or networking services. All fees payable by IIS to intermediaries that provide omnibus account services or sub-accounting services are charged back to the Fund, subject to certain limitations approved by the Trust’s Board of Trustees. For the year ended October 31, 2018, expenses incurred under the agreement are shown in the Statement of Operations as Transfer agent fees.
The Trust has entered into master distribution agreements with Invesco Distributors, Inc. (“IDI”) to serve as the distributor for the Class A, Class C, Class Y, Class R5 and Class R6 shares of the Fund. The Trust has adopted plans pursuant to Rule 12b-1 under the 1940 Act with respect to the Fund’s Class A and Class C shares (collectively, the “Plans”). The Fund, pursuant to the Plans, pays IDI compensation at the annual rate of 0.25% of the Fund’s average daily net assets of Class A shares and 1.00% of the average daily net assets of Class C shares. Prior to their conversion to Class A shares, the Fund paid an annual rate of 1.00% of the average daily net assets of Class B shares. The fees are accrued daily and paid monthly. Of the Plan payments, up to 0.25% of the average daily net assets of each class of shares may be paid to furnish continuing personal shareholder services to customers who purchase and own shares of such classes. Any amounts not paid as a service fee under the Plans would constitute an asset-based sales charge. Rules of the Financial Industry Regulatory Authority (“FINRA”) impose a cap on the total sales charges, including asset-based sales charges, that may be paid by any class of shares of the Fund. For the year ended October 31, 2018, expenses incurred under the Plans are shown in the Statement of Operations as Distribution fees.
Front-end sales commissions and CDSC (collectively, the “sales charges”) are not recorded as expenses of the Fund. Front-end sales commissions are deducted from proceeds from the sales of Fund shares prior to investment in Class A shares of the Fund. CDSC are deducted from redemption proceeds prior to remittance to the shareholder. During the year ended October 31, 2018, IDI advised the Fund that IDI retained $28,547 in front-end sales commissions from the sale of Class A shares and $4,842 and $3,901 from Class A and Class C shares, respectively, for CDSC imposed on redemptions by shareholders.
17 Invesco Developing Markets Fund
Certain officers and trustees of the Trust are officers and directors of the Adviser, IIS and/or IDI.
NOTE 3—Additional Valuation Information
GAAP defines fair value as the price that would be received to sell an asset or paid to transfer a liability in an orderly transaction between market participants at the measurement date, under current market conditions. GAAP establishes a hierarchy that prioritizes the inputs to valuation methods, giving the highest priority to readily available unadjusted quoted prices in an active market for identical assets (Level 1) and the lowest priority to significant unobservable inputs (Level 3), generally when market prices are not readily available or are unreliable. Based on the valuation inputs, the securities or other investments are tiered into one of three levels. Changes in valuation methods may result in transfers in or out of an investment’s assigned level:
| | Level 1 — | Prices are determined using quoted prices in an active market for identical assets. |
| | Level 2 — | Prices are determined using other significant observable inputs. Observable inputs are inputs that other market participants may use in pricing a security. These may include quoted prices for similar securities, interest rates, prepayment speeds, credit risk, yield curves, loss severities, default rates, discount rates, volatilities and others. |
| | Level 3 — | Prices are determined using significant unobservable inputs. In situations where quoted prices or observable inputs are unavailable (for example, when there is little or no market activity for an investment at the end of the period), unobservable inputs may be used. Unobservable inputs reflect the Fund’s own assumptions about the factors market participants would use in determining fair value of the securities or instruments and would be based on the best available information. |
The following is a summary of the tiered valuation input levels, as of October 31, 2018. The level assigned to the securities valuations may not be an indication of the risk or liquidity associated with investing in those securities. Because of the inherent uncertainties of valuation, the values reflected in the financial statements may materially differ from the value received upon actual sale of those investments.
| | | | | | | | | | | | | | | | |
| | | Level 1 | | | Level 2 | | | Level 3 | | | Total | |
Investments in Securities | | | | | | | | | | | | | | | | |
Brazil | | $ | 381,913,871 | | | $ | — | | | $ | — | | | $ | 381,913,871 | |
China | | | 256,600,610 | | | | 90,057,969 | | | | — | | | | 346,658,579 | |
Egypt | | | 12,790,402 | | | | — | | | | — | | | | 12,790,402 | |
France | | | — | | | | 35,065,016 | | | | — | | | | 35,065,016 | |
Hong Kong | | | 18,476,148 | | | | 39,954,436 | | | | — | | | | 58,430,584 | |
Hungary | | | 71,670,068 | | | | — | | | | — | | | | 71,670,068 | |
Indonesia | | | 71,578,644 | | | | 111,690,515 | | | | — | | | | 183,269,159 | |
Israel | | | — | | | | 22,465,611 | | | | — | | | | 22,465,611 | |
Malaysia | | | — | | | | 72,829,741 | | | | — | | | | 72,829,741 | |
Mexico | | | 216,277,478 | | | | — | | | | — | | | | 216,277,478 | |
Nigeria | | | 32,684,152 | | | | — | | | | — | | | | 32,684,152 | |
Peru | | | 49,421,462 | | | | — | | | | — | | | | 49,421,462 | |
Philippines | | | 25,077,383 | | | | 16,246,471 | | | | — | | | | 41,323,854 | |
Russia | | | 95,720,293 | | | | 141,518,586 | | | | — | | | | 237,238,879 | |
South Korea | | | — | | | | 102,724,893 | | | | — | | | | 102,724,893 | |
Taiwan | | | — | | | | 67,944,005 | | | | — | | | | 67,944,005 | |
Thailand | | | — | | | | 63,370,151 | | | | — | | | | 63,370,151 | |
Turkey | | | 10,696,561 | | | | 102,220,980 | | | | — | | | | 112,917,541 | |
United Arab Emirates | | | — | | | | 43,174,597 | | | | — | | | | 43,174,597 | |
Money Market Funds | | | 88,776,245 | | | | — | | | | — | | | | 88,776,245 | |
Total Investments | | $ | 1,331,683,317 | | | $ | 909,262,971 | | | $ | — | | | $ | 2,240,946,288 | |
NOTE 4—Investments in Other Affiliates
The 1940 Act defines an “affiliated person” as an issuance in which a fund holds 5% or more of the outstanding voting securities. The Fund has not owned enough of the outstanding voting securities of the issuer to have control (as defined in the 1940 Act) of that issuer. The following is a summary of the investments in other affiliates (excluding affiliated money market funds) for the six months ended October 31, 2018.
| | | | | | | | | | | | | | | | | | | | | | | | | | | | |
| | | Value
10/31/17 | | | Purchases
at Cost | | | Proceeds
from Sales | | | Change in
Unrealized
Appreciation
(Depreciation) | | | Realized
Gain (Loss) | | | Value
10/31/18 | | | Dividend
Income | |
Arcos Dorados Holdings, Inc. — Class A(a) | | $ | 90,686,940 | | | $ | — | | | $ | (25,687,730 | ) | | $ | (60,950,160 | ) | | $ | (4,049,050 | ) | | $ | — | | | $ | 362,424 | |
| (a) | As of October 31, 2018, this security is no longer considered as an affiliate of the fund. |
18 Invesco Developing Markets Fund
NOTE 5—Expense Offset Arrangement(s)
The expense offset arrangement is comprised of transfer agency credits which result from balances in demand deposit accounts used by the transfer agent for clearing shareholder transactions. For the year ended October 31, 2018, the Fund received credits from this arrangement, which resulted in the reduction of the Fund’s total expenses of $14,616.
NOTE 6—Trustees’ and Officers’ Fees and Benefits
Trustees’ and Officers’ Fees and Benefits include amounts accrued by the Fund to pay remuneration to certain Trustees and Officers of the Fund. Trustees have the option to defer compensation payable by the Fund, and Trustees’ and Officers’ Fees and Benefits also include amounts accrued by the Fund to fund such deferred compensation amounts. Those Trustees who defer compensation have the option to select various Invesco Funds in which their deferral accounts shall be deemed to be invested. Finally, certain current Trustees were eligible to participate in a retirement plan that provided for benefits to be paid upon retirement to Trustees over a period of time based on the number of years of service. The Fund may have certain former Trustees who also participate in a retirement plan and receive benefits under such plan. Trustees’ and Officers’ Fees and Benefits include amounts accrued by the Fund to fund such retirement benefits. Obligations under the deferred compensation and retirement plans represent unsecured claims against the general assets of the Fund.
NOTE 7—Cash Balances
The Fund is permitted to temporarily carry a negative or overdrawn balance in its account with State Street Bank and Trust Company, the custodian bank. Such balances, if any at period-end, are shown in the Statement of Assets and Liabilities under the payable caption Amount due custodian. To compensate the custodian bank for such overdrafts, the overdrawn Fund may either (1) leave funds as a compensating balance in the account so the custodian bank can be compensated by earning the additional interest; or (2) compensate by paying the custodian bank at a rate agreed upon by the custodian bank and Invesco, not to exceed the contractually agreed upon rate.
NOTE 8—Distributions to Shareholders and Tax Components of Net Assets
Tax Character of Distributions to Shareholders Paid During the Fiscal Years Ended October 31, 2018 and 2017:
| | | | | | | | |
| | | 2018 | | | 2017 | |
Ordinary income | | $ | 32,103,709 | | | $ | 23,907,023 | |
Tax Components of Net Assets at Period-End:
| | | | |
| | | 2018 | |
Undistributed ordinary income | | $ | 37,610,496 | |
Net unrealized appreciation — investments | | | 86,330,021 | |
Net unrealized appreciation (depreciation) — foreign currencies | | | (266,991 | ) |
Temporary book/tax differences | | | (362,805 | ) |
Capital loss carryforward | | | (44,672,626 | ) |
Shares of beneficial interest | | | 2,160,820,483 | |
Total net assets | | $ | 2,239,458,578 | |
The difference between book-basis and tax-basis unrealized appreciation (depreciation) is due to differences in the timing of recognition of gains and losses on investments for tax and book purposes. The Fund’s net unrealized appreciation difference is attributable primarily to wash sales.
The temporary book/tax differences are a result of timing differences between book and tax recognition of income and/or expenses. The Fund’s temporary book/tax differences are the result of the trustee deferral of compensation and retirement plan benefits.
Capital loss carryforward is calculated and reported as of a specific date. Results of transactions and other activity after that date may affect the amount of capital loss carryforward actually available for the Fund to utilize. Capital losses generated in years beginning after December 22, 2010 can be carried forward for an unlimited period, whereas previous losses expire in eight tax years. Capital losses with an expiration period may not be used to offset capital gains until all net capital losses without an expiration date have been utilized. Capital loss carryforwards with no expiration date will retain their character as either short-term or long-term capital losses instead of as short-term capital losses as under prior law. The ability to utilize capital loss carryforwards in the future may be limited under the Internal Revenue Code and related regulations based on the results of future transactions.
The Fund has a capital loss carryforward as of October 31, 2018, as follows:
| | | | | | | | | | | | |
| Capital Loss Carryforward* | |
| Expiration | | Short-Term | | | Long-Term | | | Total | |
Not subject to expiration | | $ | — | | | $ | 44,672,626 | | | $ | 44,672,626 | |
| * | Capital loss carryforward as of the date listed above is reduced for limitations, if any, to the extent required by the Internal Revenue Code and may be further limited depending upon a variety of factors, including the realization of net unrealized gains or losses as of the date of any reorganization. |
NOTE 9—Investment Transactions
The aggregate amount of investment securities (other than short-term securities, U.S. Treasury obligations and money market funds, if any) purchased and sold by the Fund during the year ended October 31, 2018 was $570,963,814 and $834,885,441, respectively. Cost of
19 Invesco Developing Markets Fund
investments, including any derivatives, on a tax basis includes the adjustments for financial reporting purposes as of the most recently completed federal income tax reporting period-end.
| | | | |
| Unrealized Appreciation (Depreciation) of Investments on a Tax Basis | |
Aggregate unrealized appreciation of investments | | $ | 408,481,175 | |
Aggregate unrealized (depreciation) of investments | | | (322,151,154 | ) |
Net unrealized appreciation of investments | | $ | 86,330,021 | |
Cost of investments for tax purposes is $2,154,616,267.
NOTE 10—Reclassification of Permanent Differences
Primarily as a result of differing book/tax treatment of foreign currency transactions, on October 31, 2018, undistributed net investment income was decreased by $4,487,417 and undistributed net realized gain(loss) was increased by $4,487,417. This reclassification had no effect on the net assets or the distributable earnings of the Fund.
NOTE 11—Share Information
| | | | | | | | | | | | | | | | |
| | | Summary of Share Activity | |
| | | Years ended October 31, | |
| | | 2018(a) | | | 2017 | |
| | | Shares | | | Amount | | | Shares | | | Amount | |
Sold: | | | | | | | | | | | | | | | | |
Class A | | | 2,110,745 | | | $ | 75,597,388 | | | | 5,580,960 | | | $ | 179,300,415 | |
Class B(b) | | | 966 | | | | 35,601 | | | | 3,460 | | | | 107,898 | |
Class C | | | 74,017 | | | | 2,594,775 | | | | 421,647 | | | | 13,192,183 | |
Class Y | | | 13,040,787 | | | | 464,395,701 | | | | 23,586,261 | | | | 742,795,060 | |
Class R5 | | | 2,789,818 | | | | 98,466,621 | | | | 5,214,837 | | | | 169,419,983 | |
Class R6 | | | 4,463,920 | | | | 160,267,505 | | | | 7,776,259 | | | | 262,410,342 | |
| | | | |
Issued as reinvestment of dividends: | | | | | | | | | | | | | | | | |
Class A | | | 140,820 | | | | 5,158,251 | | | | 204,009 | | | | 5,975,421 | |
Class B(b) | | | 5 | | | | 189 | | | | 270 | | | | 7,751 | |
Class C | | | 112 | | | | 4,025 | | | | 2,815 | | | | 80,594 | |
Class Y | | | 272,609 | | | | 9,985,678 | | | | 224,203 | | | | 6,566,919 | |
Class R5 | | | 114,412 | | | | 4,179,476 | | | | 124,103 | | | | 3,625,047 | |
Class R6 | | | 104,419 | | | | 3,812,321 | | | | 69,519 | | | | 2,029,942 | |
| | | | |
Conversion of Class B shares to Class A shares:(c) | | | | | | | | | | | | | | | | |
Class A | | | 119,310 | | | | 4,815,368 | | | | 111,089 | | | | 3,668,845 | |
Class B | | | (122,363 | ) | | | (4,815,368 | ) | | | (113,940 | ) | | | (3,668,845 | ) |
| | | | |
Reacquired: | | | | | | | | | | | | | | | | |
Class A | | | (8,514,057 | ) | | | (302,834,173 | ) | | | (8,807,768 | ) | | | (280,512,819 | ) |
Class B(b) | | | (21,675 | ) | | | (797,778 | ) | | | (43,418 | ) | | | (1,357,413 | ) |
Class C | | | (669,772 | ) | | | (22,483,458 | ) | | | (715,863 | ) | | | (22,583,161 | ) |
Class Y | | | (23,957,809 | ) | | | (825,354,733 | ) | | | (15,253,958 | ) | | | (504,678,186 | ) |
Class R5 | | | (6,318,851 | ) | | | (218,858,771 | ) | | | (3,301,481 | ) | | | (108,819,858 | ) |
Class R6 | | | (4,270,373 | ) | | | (145,358,209 | ) | | | (1,435,306 | ) | | | (47,212,993 | ) |
Net increase (decrease) in share activity | | | (20,642,960 | ) | | $ | (691,189,591 | ) | | | 13,647,698 | | | $ | 420,347,125 | |
| (a) | There are entities that are record owners of more than 5% of the outstanding shares of the Fund and own 42% of the outstanding shares of the Fund. IDI has an agreement with this entity to sell Fund shares. The Fund, Invesco and/or Invesco affiliates may make payments to these entities, which are considered to be related to the Fund, for providing services to the Fund, Invesco and/or Invesco affiliates including but not limited to services such as, securities brokerage, distribution, third party record keeping and account servicing. The Fund has no knowledge as to whether all or any portion of the shares owned of record by these entities are also owned beneficially. |
| (b) | Class B shares activity for the period November 1, 2017 through January 26, 2018 (date of conversion). |
| (c) | Effective as of the close of business January 26, 2018, all outstanding Class B shares were converted to Class A shares. |
20 Invesco Developing Markets Fund
NOTE 12—Financial Highlights
The following schedule presents financial highlights for a share of the Fund outstanding throughout the periods indicated.
| | | | | | | | | | | | | | | | | | | | | | | | | | | | | | | | | | | | | | | | | | | | | | | | | | | | | | | | |
| | | Net asset
value,
beginning
of period | | | Net
investment
income(a) | | | Net gains
(losses)
on securities
(both
realized and
unrealized) | | | Total from
investment
operations | | | Dividends
from net
investment
income | | | Distributions
from net
realized
gains | | | Total
distributions | | | Net asset
value, end
of period | | | Total
return(b) | | | Net assets,
end of period
(000’s omitted) | | | Ratio of
expenses
to average
net assets
with fee waivers
and/or expenses
absorbed | | | Ratio of
expenses
to average net
assets without
fee waivers
and/or expenses
absorbed | | | Ratio of net
investment
income
to average
net assets | | | Portfolio
turnover(c) | |
Class A | | | | | | | | | | | | | | | | | | | | | | | | | | | | | | | | | | | | | | | | | | | | | | | | | | | | | | | | |
Year ended 10/31/18 | | $ | 36.66 | | | $ | 0.44 | | | $ | (6.29 | ) | | $ | (5.85 | ) | | $ | (0.27 | ) | | $ | — | | | $ | (0.27 | ) | | $ | 30.54 | | | | (16.09 | )% | | $ | 544,574 | | | | 1.39 | %(d) | | | 1.40 | %(d) | | | 1.23 | %(d) | | | 20 | % |
Year ended 10/31/17 | | | 30.67 | | | | 0.28 | | | | 5.96 | | | | 6.24 | | | | (0.25 | ) | | | — | | | | (0.25 | ) | | | 36.66 | | | | 20.55 | | | | 878,910 | | | | 1.41 | | | | 1.43 | | | | 0.86 | | | | 16 | |
Year ended 10/31/16 | | | 25.84 | | | | 0.27 | | | | 4.80 | | | | 5.07 | | | | (0.24 | ) | | | — | | | | (0.24 | ) | | | 30.67 | | | | 19.88 | | | | 824,702 | | | | 1.40 | | | | 1.41 | | | | 1.01 | | | | 3 | |
Year ended 10/31/15 | | | 33.77 | | | | 0.28 | | | | (7.32 | ) | | | (7.04 | ) | | | (0.33 | ) | | | (0.56 | ) | | | (0.89 | ) | | | 25.84 | | | | (21.20 | ) | | | 795,042 | | | | 1.43 | | | | 1.44 | | | | 0.96 | | | | 9 | |
Year ended 10/31/14 | | | 34.42 | | | | 0.38 | | | | (0.65 | ) | | | (0.27 | ) | | | (0.28 | ) | | | (0.10 | ) | | | (0.38 | ) | | | 33.77 | | | | (0.73 | ) | | | 1,251,018 | | | | 1.39 | | | | 1.41 | | | | 1.13 | | | | 13 | |
Class B | | | | | | | | | | | | | | | | | | | | | | | | | | | | | | | | | | | | | | | | | | | | | | | | | | | | | | | | |
Year ended 10/31/18(e) | | | 35.64 | | | | 0.04 | | | | 3.77 | | | | 3.81 | | | | (0.00 | ) | | | — | | | | (0.00 | ) | | | 39.45 | | | | 10.69 | | | | — | | | | 2.14 | (d)(f) | | | 2.15 | (d)(f) | | | 0.49 | (d)(f) | | | 20 | |
Year ended 10/31/17 | | | 29.82 | | | | 0.03 | | | | 5.82 | | | | 5.85 | | | | (0.03 | ) | | | — | | | | (0.03 | ) | | | 35.64 | | | | 19.65 | | | | 5,098 | | | | 2.16 | | | | 2.18 | | | | 0.11 | | | | 16 | |
Year ended 10/31/16 | | | 25.06 | | | | 0.07 | | | | 4.69 | | | | 4.76 | | | | — | | | | — | | | | — | | | | 29.82 | | | | 18.99 | | | | 8,848 | | | | 2.15 | | | | 2.16 | | | | 0.26 | | | | 3 | |
Year ended 10/31/15 | | | 32.72 | | | | 0.06 | | | | (7.11 | ) | | | (7.05 | ) | | | (0.05 | ) | | | (0.56 | ) | | | (0.61 | ) | | | 25.06 | | | | (21.80 | ) | | | 12,710 | | | | 2.18 | | | | 2.19 | | | | 0.21 | | | | 9 | |
Year ended 10/31/14 | | | 33.31 | | | | 0.12 | | | | (0.61 | ) | | | (0.49 | ) | | | (0.00 | ) | | | (0.10 | ) | | | (0.10 | ) | | | 32.72 | | | | (1.46 | ) | | | 28,314 | | | | 2.14 | | | | 2.16 | | | | 0.38 | | | | 13 | |
Class C | | | | | | | | | | | | | | | | | | | | | | | | | | | | | | | | | | | | | | | | | | | | | | | | | | | | | | | | |
Year ended 10/31/18 | | | 35.59 | | | | 0.17 | | | | (6.12 | ) | | | (5.95 | ) | | | (0.00 | ) | | | — | | | | (0.00 | ) | | | 29.64 | | | | (16.71 | ) | | | 55,823 | | | | 2.14 | (d) | | | 2.15 | (d) | | | 0.48 | (d) | | | 20 | |
Year ended 10/31/17 | | | 29.78 | | | | 0.03 | | | | 5.81 | | | | 5.84 | | | | (0.03 | ) | | | — | | | | (0.03 | ) | | | 35.59 | | | | 19.65 | | | | 88,231 | | | | 2.16 | | | | 2.18 | | | | 0.11 | | | | 16 | |
Year ended 10/31/16 | | | 25.03 | | | | 0.07 | | | | 4.68 | | | | 4.75 | | | | — | | | | — | | | | — | | | | 29.78 | | | | 18.98 | | | | 82,513 | | | | 2.15 | | | | 2.16 | | | | 0.26 | | | | 3 | |
Year ended 10/31/15 | | | 32.68 | | | | 0.06 | | | | (7.10 | ) | | | (7.04 | ) | | | (0.05 | ) | | | (0.56 | ) | | | (0.61 | ) | | | 25.03 | | | | (21.80 | ) | | | 82,395 | | | | 2.18 | | | | 2.19 | | | | 0.21 | | | | 9 | |
Year ended 10/31/14 | | | 33.27 | | | | 0.12 | | | | (0.61 | ) | | | (0.49 | ) | | | (0.00 | ) | | | (0.10 | ) | | | (0.10 | ) | | | 32.68 | | | | (1.47 | ) | | | 137,867 | | | | 2.14 | | | | 2.16 | | | | 0.38 | | | | 13 | |
Class Y | | | | | | | | | | | | | | | | | | | | | | | | | | | | | | | | | | | | | | | | | | | | | | | | | | | | | | | | |
Year ended 10/31/18 | | | 36.74 | | | | 0.53 | | | | (6.31 | ) | | | (5.78 | ) | | | (0.36 | ) | | | — | | | | (0.36 | ) | | | 30.60 | | | | (15.89 | ) | | | 986,550 | | | | 1.14 | (d) | | | 1.15 | (d) | | | 1.48 | (d) | | | 20 | |
Year ended 10/31/17 | | | 30.74 | | | | 0.37 | | | | 5.95 | | | | 6.32 | | | | (0.32 | ) | | | — | | | | (0.32 | ) | | | 36.74 | | | | 20.84 | | | | 1,575,401 | | | | 1.16 | | | | 1.18 | | | | 1.11 | | | | 16 | |
Year ended 10/31/16 | | | 25.92 | | | | 0.35 | | | | 4.79 | | | | 5.14 | | | | (0.32 | ) | | | — | | | | (0.32 | ) | | | 30.74 | | | | 20.18 | | | | 1,055,132 | | | | 1.15 | | | | 1.16 | | | | 1.26 | | | | 3 | |
Year ended 10/31/15 | | | 33.90 | | | | 0.36 | | | | (7.35 | ) | | | (6.99 | ) | | | (0.43 | ) | | | (0.56 | ) | | | (0.99 | ) | | | 25.92 | | | | (21.00 | ) | | | 1,016,382 | | | | 1.18 | | | | 1.19 | | | | 1.21 | | | | 9 | |
Year ended 10/31/14 | | | 34.55 | | | | 0.46 | | | | (0.64 | ) | | | (0.18 | ) | | | (0.37 | ) | | | (0.10 | ) | | | (0.47 | ) | | | 33.90 | | | | (0.47 | ) | | | 1,463,586 | | | | 1.14 | | | | 1.16 | | | | 1.38 | | | | 13 | |
Class R5 | | | | | | | | | | | | | | | | | | | | | | | | | | | | | | | | | | | | | | | | | | | | | | | | | | | | | | | | |
Year ended 10/31/18 | | | 36.68 | | | | 0.56 | | | | (6.29 | ) | | | (5.73 | ) | | | (0.40 | ) | | | — | | | | (0.40 | ) | | | 30.55 | | | | (15.80 | ) | | | 287,511 | | | | 1.04 | (d) | | | 1.05 | (d) | | | 1.58 | (d) | | | 20 | |
Year ended 10/31/17 | | | 30.69 | | | | 0.41 | | | | 5.94 | | | | 6.35 | | | | (0.36 | ) | | | — | | | | (0.36 | ) | | | 36.68 | | | | 20.97 | | | | 470,436 | | | | 1.04 | | | | 1.06 | | | | 1.23 | | | | 16 | |
Year ended 10/31/16 | | | 25.90 | | | | 0.38 | | | | 4.79 | | | | 5.17 | | | | (0.38 | ) | | | — | | | | (0.38 | ) | | | 30.69 | | | | 20.33 | | | | 331,079 | | | | 1.03 | | | | 1.04 | | | | 1.38 | | | | 3 | |
Year ended 10/31/15 | | | 33.87 | | | | 0.40 | | | | (7.33 | ) | | | (6.93 | ) | | | (0.48 | ) | | | (0.56 | ) | | | (1.04 | ) | | | 25.90 | | | | (20.87 | ) | | | 352,779 | | | | 1.03 | | | | 1.04 | | | | 1.36 | | | | 9 | |
Year ended 10/31/14 | | | 34.52 | | | | 0.51 | | | | (0.66 | ) | | | (0.15 | ) | | | (0.40 | ) | | | (0.10 | ) | | | (0.50 | ) | | | 33.87 | | | | (0.35 | ) | | | 686,180 | | | | 0.99 | | | | 1.01 | | | | 1.53 | | | | 13 | |
Class R6 | | | | | | | | | | | | | | | | | | | | | | | | | | | | | | | | | | | | | | | | | | | | | | | | | | | | | | | | |
Year ended 10/31/18 | | | 36.67 | | | | 0.57 | | | | (6.27 | ) | | | (5.70 | ) | | | (0.42 | ) | | | — | | | | (0.42 | ) | | | 30.55 | | | | (15.74 | ) | | | 365,000 | | | | 0.99 | (d) | | | 1.00 | (d) | | | 1.63 | (d) | | | 20 | |
Year ended 10/31/17 | | | 30.68 | | | | 0.42 | | | | 5.94 | | | | 6.36 | | | | (0.37 | ) | | | — | | | | (0.37 | ) | | | 36.67 | | | | 21.04 | | | | 427,243 | | | | 1.00 | | | | 1.02 | | | | 1.27 | | | | 16 | |
Year ended 10/31/16 | | | 25.90 | | | | 0.39 | | | | 4.78 | | | | 5.17 | | | | (0.39 | ) | | | — | | | | (0.39 | ) | | | 30.68 | | | | 20.35 | | | | 160,816 | | | | 0.98 | | | | 0.99 | | | | 1.43 | | | | 3 | |
Year ended 10/31/15 | | | 33.87 | | | | 0.41 | | | | (7.33 | ) | | | (6.92 | ) | | | (0.49 | ) | | | (0.56 | ) | | | (1.05 | ) | | | 25.90 | | | | (20.84 | ) | | | 180,773 | | | | 1.00 | | | | 1.01 | | | | 1.39 | | | | 9 | |
Year ended 10/31/14 | | | 34.52 | | | | 0.52 | | | | (0.65 | ) | | | (0.13 | ) | | | (0.42 | ) | | | (0.10 | ) | | | (0.52 | ) | | | 33.87 | | | | (0.31 | ) | | | 179,467 | | | | 0.97 | | | | 0.99 | | | | 1.55 | | | | 13 | |
| (a) | Calculated using average shares outstanding. |
| (b) | Includes adjustments in accordance with accounting principles generally accepted in the United States of America and as such, the net asset value for financial reporting purposes and the returns based upon those net asset values may differ from the net asset value and returns for shareholder transactions. Does not include sales charges and is not annualized for periods less than one year, if applicable. |
| (c) | Portfolio turnover is calculated at the fund level and is not annualized for periods less than one year, if applicable. |
| (d) | Ratios are based on average daily net assets (000’s omitted) of $706,782, $4,803, $77,055, $1,458,845, $409,080 and $440,266 for Class A, Class B, Class C, Class Y, Class R5 and Class R6 shares, respectively. |
| (e) | Reflects activity for the period November 1, 2017 through January 26, 2018 (date of conversion). |
21 Invesco Developing Markets Fund
Report of Independent Registered Public Accounting Firm
To the Board of Trustees of AIM Investment Funds (Invesco Investment Funds)
and Shareholders of Invesco Developing Markets Fund:
Opinion on the Financial Statements
We have audited the accompanying statement of assets and liabilities, including the schedule of investments, of Invesco Developing Markets Fund (one of the funds constituting AIM Investment Funds (Invesco Investment Funds), hereafter referred to as the “Fund”) as of October 31, 2018, the related statement of operations for the year ended October 31, 2018, the statement of changes in net assets for each of the two years in the period ended October 31, 2018, including the related notes, and the financial highlights for each of the periods indicated therein (collectively referred to as the financial statements). In our opinion, the financial statements present fairly, in all material respects, the financial position of the Fund as of October 31, 2018, the results of its operations for the year then ended, the changes in its net assets for each of the two years in the period ended October 31, 2018 and the financial highlights for each of the periods indicated therein in conformity with accounting principles generally accepted in the United States of America.
Basis for Opinion
These financial statements are the responsibility of the Fund’s management. Our responsibility is to express an opinion on the Fund’s financial statements based on our audits. We are a public accounting firm registered with the Public Company Accounting Oversight Board (United States) (PCAOB) and are required to be independent with respect to the Fund in accordance with the U.S. federal securities laws and the applicable rules and regulations of the Securities and Exchange Commission and the PCAOB.
We conducted our audits of these financial statements in accordance with the standards of the PCAOB. Those standards require that we plan and perform the audit to obtain reasonable assurance about whether the financial statements are free of material misstatement, whether due to error or fraud.
Our audits included performing procedures to assess the risks of material misstatement of the financial statements, whether due to error or fraud, and performing procedures that respond to those risks. Such procedures included examining, on a test basis, evidence regarding the amounts and disclosures in the financial statements. Our audits also included evaluating the accounting principles used and significant estimates made by management, as well as evaluating the overall presentation of the financial statements. Our procedures included confirmation of securities owned as of October 31, 2018 by correspondence with the custodian and transfer agent. We believe that our audits provide a reasonable basis for our opinion.
PricewaterhouseCoopers LLP
Houston, TX
December 28, 2018
We have served as the auditor of one or more of the investment companies in the Invesco group of investment companies since at least 1995. We have not been able to determine the specific year we began serving as auditor.
22 Invesco Developing Markets Fund
Calculating your ongoing Fund expenses
Example
As a shareholder of the Fund, you incur two types of costs: (1) transaction costs, which may include sales charges (loads) on purchase payments or contingent deferred sales charges on redemptions, if any; and (2) ongoing costs, including management fees, distribution and/or service (12b-1) fees, and other Fund expenses. This example is intended to help you understand your ongoing costs (in dollars) of investing in the Fund and to compare these costs with ongoing costs of investing in other mutual funds. The example is based on an investment of $1,000 invested at the beginning of the period and held for the entire period May 1, 2018 through October 31, 2018.
Actual expenses
The table below provides information about actual account values and actual expenses. You may use the information in this table, together with the amount you invested, to estimate the expenses that you paid over the period. Simply divide your account value by $1,000 (for example, an $8,600 account value divided by $1,000 = 8.6), then multiply the result by the number in the table under the heading entitled “Actual Expenses Paid During Period” to estimate the expenses you paid on your account during this period.
Hypothetical example for comparison purposes
The table below also provides information about hypothetical account values and hypothetical expenses based on the Fund’s actual expense ratio and an assumed rate of return of 5% per year before expenses, which is not the Fund’s actual return.
The hypothetical account values and expenses may not be used to estimate the actual ending account balance or expenses you paid for the period. You may use this information to compare the ongoing costs of investing in the Fund and other funds. To do so, compare this 5% hypothetical example with the 5% hypothetical examples that appear in the shareholder reports of the other funds.
Please note that the expenses shown in the table are meant to highlight your ongoing costs only and do not reflect any transaction costs, such as sales charges (loads) on purchase payments or contingent deferred sales charges on redemptions, if any. Therefore, the hypothetical information is useful in comparing ongoing costs only, and will not help you determine the relative total costs of owning different funds. In addition, if these transaction costs were included, your costs would have been higher.
| | | | | | | | | | | | | | | | | | | | | | | | |
Class | | Beginning
Account Value
(05/01/18) | | | ACTUAL | | | HYPOTHETICAL
(5% annual return before
expenses) | | | Annualized
Expense Ratio | |
| | Ending
Account Value
(10/31/18)1 | | | Expenses
Paid During
Period2 | | | Ending
Account Value
(10/31/18) | | | Expenses
Paid During
Period2 | |
| A | | $ | 1,000.00 | | | $ | 852.30 | | | $ | 6.40 | | | $ | 1,018.30 | | | $ | 6.97 | | | | 1.37 | % |
| C | | | 1,000.00 | | | | 849.00 | | | | 9.88 | | | | 1,014.52 | | | | 10.76 | | | | 2.12 | |
| Y | | | 1,000.00 | | | | 853.30 | | | | 5.23 | | | | 1,019.56 | | | | 5.70 | | | | 1.12 | |
| R5 | | | 1,000.00 | | | | 853.80 | | | | 4.81 | | | | 1,020.01 | | | | 5.24 | | | | 1.03 | |
| R6 | | | 1,000.00 | | | | 854.00 | | | | 4.53 | | | | 1,020.32 | | | | 4.94 | | | | 0.97 | |
| 1 | The actual ending account value is based on the actual total return of the Fund for the period May 1, 2018 through October 31, 2018, after actual expenses and will differ from the hypothetical ending account value which is based on the Fund’s expense ratio and a hypothetical annual return of 5% before expenses. |
| 2 | Expenses are equal to the Fund’s annualized expense ratio as indicated above multiplied by the average account value over the period, multiplied by 184/365 to reflect the most recent fiscal half year. |
23 Invesco Developing Markets Fund
Approval of Investment Advisory and Sub-Advisory Contracts
At meetings held on June 5-6, 2018, the Board of Trustees (the Board or the Trustees) of AIM Investment Funds (Invesco Investment Funds) as a whole, and the independent Trustees, who comprise over 75% of the Board, voting separately, approved the continuance of the Invesco Developing Markets Fund’s (the Fund) Master Investment Advisory Agreement with Invesco Advisers, Inc. (Invesco Advisers and the investment advisory agreement) and the Master Intergroup Sub-Advisory Contract for Mutual Funds with Invesco Asset Management Deutschland GmbH, Invesco Asset Management Limited, Invesco Asset Management (Japan) Limited, Invesco Hong Kong Limited, Invesco Senior Secured Management, Inc., Invesco Canada Ltd. and separate Sub-Advisory Contracts with Invesco Capital Management LLC and Invesco Asset Management (India) Private Limited (collectively, the Affiliated Sub-Advisers and the sub-advisory contracts) for another year, effective July 1, 2018. After evaluating the factors discussed below, among others, the Board approved the renewal of the Fund’s investment advisory agreement and the sub-advisory contracts and determined that the compensation payable by the Fund to Invesco Advisers and by Invesco Advisers to the Affiliated Sub-Advisers is fair and reasonable.
The Board’s Evaluation Process
The Board’s Investments Committee has established three Sub-Committees, which meet throughout the year to review the performance of funds advised by Invesco Advisers (the Invesco Funds). Over the course of each year, the Sub-Committees meet with portfolio managers for their assigned Invesco Funds and other members of management to review detailed information about investment performance and portfolio attributes of these funds. The Board took into account evaluations and reports that it received from the Investments Committee and Sub-Committees, as well as the information provided to such committees and the Board throughout the year, in considering whether to approve each Invesco Fund’s investment advisory agreement and sub-advisory contracts.
As part of the contract renewal process, the Board reviews and considers information provided in response to detailed requests for information submitted to management by the independent Trustees with assistance from legal counsel to the independent Trustees. The Board receives comparative investment performance and fee data regarding the Invesco Funds prepared by Invesco Advisers and Broadridge Financial Solutions, Inc. (Broadridge), an independent mutual fund data provider. The Board also receives an independent written evaluation from the Senior Officer, an officer of the Invesco Funds who reports directly to the
independent Trustees. The Senior Officer’s evaluation is prepared as part of his responsibility to manage the process by which the Invesco Funds’ proposed management fees are negotiated during the annual contract renewal process to ensure they are negotiated in a manner that is at arms’ length and reasonable. In addition to meetings with Invesco Advisers and fund counsel throughout the year, the independent Trustees also discuss the continuance of the investment advisory agreement and sub-advisory contracts in separate sessions with the Senior Officer and with independent legal counsel.
The discussion below is a summary of the Senior Officer’s independent written evaluation with respect to the Fund’s investment advisory agreement, as well as a discussion of the material factors and related conclusions that formed the basis for the Board’s approval of the Fund’s investment advisory agreement and sub-advisory contracts. The Trustees’ review and conclusions are based on the comprehensive consideration of all information presented to them during the course of the year and in prior years and are not the result of any single determinative factor. Moreover, one Trustee may have weighed a particular piece of information or factor differently than another Trustee. This information is current as of June 6, 2018.
Factors and Conclusions and Summary of Independent Written Fee Evaluation
| A. | Nature, Extent and Quality of Services Provided by Invesco Advisers and the Affiliated Sub-Advisers |
The Board reviewed the nature, extent and quality of the advisory services provided to the Fund by Invesco Advisers under the Fund’s investment advisory agreement, and the credentials and experience of the officers and employees of Invesco Advisers who provide these services, including the Fund’s portfolio manager(s). The Board’s review included consideration of Invesco Advisers’ investment process oversight and structure, credit analysis and investment risk management. The Board also considered non-advisory services that Invesco Advisers and its affiliates provide to the Invesco Funds such as various back office support functions, third party oversight, internal audit, valuation, portfolio trading and legal and compliance. The Board also reviewed and considered the benefits to shareholders of investing in a fund that is part of the Invesco family of funds under the umbrella of Invesco Ltd., Invesco Advisers’ parent company, and noted Invesco Ltd.’s depth and experience in conducting an investment management business, as well as its commitment of financial and other resources to such business. The Board concluded that the nature, extent and quality of the services provided to the Fund by
Invesco Advisers are appropriate and satisfactory.
The Board reviewed the services that may be provided by the Affiliated Sub-Advisers under the sub-advisory contracts and the credentials and experience of the officers and employees of the Affiliated Sub-Advisers who provide these services. The Board noted the Affiliated Sub-Advisers’ expertise with respect to certain asset classes and that the Affiliated Sub-Advisers have offices and personnel that are located in financial centers around the world. As a result, the Board noted that the Affiliated Sub-Advisers can provide research and investment analysis on the markets and economies of various countries in which the Fund may invest, make recommendations regarding securities and assist with security trades. The Board concluded that the sub-advisory contracts may benefit the Fund and its shareholders by permitting Invesco Advisers to use the resources and talents of the Affiliated Sub-Advisers in managing the Fund. The Board concluded that the nature, extent and quality of the services that may be provided by the Affiliated Sub-Advisers are appropriate and satisfactory.
| B. | Fund Investment Performance |
The Board considered Fund investment performance as a relevant factor in considering whether to approve the investment advisory agreement. The Board did not view Fund investment performance as a relevant factor in considering whether to approve the sub-advisory contracts for the Fund, as no Affiliated Sub-Adviser currently manages assets of the Fund.
The Board compared the Fund’s investment performance over multiple time periods ending December 31, 2017 to the performance of funds in the Broadridge performance universe and against the Lipper Emerging Market Funds Index. The Board noted that performance of Class A shares of the Fund was in the fourth quintile of its performance universe for the one and five year periods and the third quintile for the three year period (the first quintile being the best performing funds and the fifth quintile being the worst performing funds). The Board noted that performance of Class A shares of the Fund was below the performance of the Index for the one and five year periods, and reasonably comparable to the performance of the Index for the three year period. The Board noted that the valuation component of the Fund’s investment process was the primary headwind to relative performance, as it resulted in the Fund’s lack of exposure to certain outperforming names as well as the Fund’s cash position, both detractors to Fund performance. The Trustees also reviewed more recent Fund performance and this review did not change their conclusions.
24 Invesco Developing Markets Fund
| C. | Advisory and Sub-Advisory Fees and Fund Expenses |
The Board compared the Fund’s contractual management fee rate to the contractual management fee rates of funds in the Fund’s Broadridge expense group. The Board noted that the contractual management fee rate for Class A shares of the Fund was below the median contractual management fee rate of funds in its expense group. The Board noted that the term “contractual management fee” for funds in the expense group may include both advisory and certain non-portfolio management administrative services fees, but that Broadridge does not provide information on a fund by fund basis as to what is included. The Board also reviewed the methodology used by Broadridge in providing expense group information, which includes using each fund’s contractual management fee schedule (including any applicable breakpoints) as reported in the most recent prospectus or statement of additional information for each fund in the expense group. The Board also considered comparative information regarding the Fund’s total expense ratio and its various components.
The Board noted that Invesco Advisers has contractually agreed to waive fees and/or limit expenses of the Fund in an amount necessary to limit total annual operating expenses to a specified percentage of average daily net assets for each class of the Fund.
The Board also considered the fees charged by Invesco Advisers and the Affiliated Sub-Advisers to other similarly managed client accounts. The Board noted that Invesco Advisers or the Affiliated Sub-Advisers may charge lower fees to large institutional clients. Invesco Advisers reviewed with the Board differences in the scope of services it provides to the Invesco Funds relative to certain other types of client accounts, including management of cash flows as a result of redemptions and purchases, necessary infrastructure such as officers, office space, technology, legal and distribution, oversight of service providers, costs and business risks associated with launching new funds and sponsoring and maintaining the product line, preparation of annual registration statement updates and financial information and compliance with federal and state laws and regulations.
The Board also considered the services that may be provided by the Affiliated Sub-Advisers pursuant to the sub-advisory contracts, as well as the fees payable by Invesco Advisers to the Affiliated Sub-Advisers pursuant to the sub-advisory contracts.
| D. | Economies of Scale and Breakpoints |
The Board considered the extent to which there may be economies of scale in the provision of advisory services to the Fund. The Board also considered that the Fund benefits from economies of scale through contractual breakpoints in the Fund’s advisory fee schedule, which generally operate to reduce the Fund’s expense ratio as it grows in size. The Board
noted that the Fund shares directly in economies of scale through lower fees charged by third party service providers based on the combined size of the Invesco Funds. The Board noted that the Fund may also benefit from economies of scale through initial fee setting, fee waivers and expense reimbursements.
| E. | Profitability and Financial Resources |
The Board reviewed information from Invesco Advisers concerning the costs of the advisory and other services that Invesco Advisers and its affiliates provide to the Fund and the Invesco Funds and the profitability of Invesco Advisers and its affiliates in providing these services. The Board considered the methodology used for calculating profitability and noted the periodic review of such methodology by an independent consultant. The Board noted that Invesco Advisers continues to operate at a net profit from services Invesco Advisers and its affiliates provide to the Invesco Funds and the Fund. The Board did not deem the level of profits realized by Invesco Advisers and its affiliates from providing services to the Fund to be excessive given the nature, extent and quality of the services provided. The Board received information from Invesco Advisers demonstrating that Invesco Advisers and the Affiliated Sub-Advisers are financially sound and have the resources necessary to perform their obligations under the investment advisory agreement and sub-advisory contracts.
| F. | Collateral Benefits to Invesco Advisers and its Affiliates |
The Board considered various other benefits received by Invesco Advisers and its affiliates from the relationship with the Fund, including the fees received for providing administrative, transfer agency and distribution services to the Fund. The Board considered comparative information regarding fees charged for these services, including information provided by Broadridge and other independent sources. The Board considered the performance of Invesco Advisers and its affiliates in providing these services and the organizational structure employed to provide these services. The Board also considered that these services are provided to the Fund pursuant to written contracts that are reviewed and approved on an annual basis by the Board; and that the services are required for the operation of the Fund.
The Board considered the benefits realized by Invesco Advisers and the Affiliated Sub-Advisers as a result of portfolio brokerage transactions executed through “soft dollar” arrangements. The Board noted that soft dollar arrangements may result in the Fund bearing costs to purchase research that may be used by Invesco Advisers or the Affiliated Sub-Advisers with other clients and may reduce Invesco Advisers’ or the Affiliated Sub-Advisers’ expenses. The Board also considered that it receives periodic reports from Invesco representing that these arrangements are consistent with regulatory requirements. The Board did not deem the soft dollar arrangements to be inappropriate.
The Board considered that the Fund’s uninvested cash and cash collateral from any securities lending arrangements may be invested in money market funds advised by Invesco Advisers pursuant to procedures approved by the Board. The Board noted that Invesco Advisers receives advisory fees from these affiliated money market funds attributable to such investments, although Invesco Advisers has contractually agreed to waive through varying periods the advisory fees payable by the Invesco Funds with respect to certain investments in the affiliated money market funds. The waiver is in an amount equal to 100% of the net advisory fee Invesco Advisers receives from the affiliated money market funds with respect to the Fund’s investment in the affiliated money market funds of uninvested cash, but not cash collateral. The Board concluded that the amount of advisory fees received by Invesco Advisers from the Fund’s investment of cash collateral from any securities lending arrangements in the affiliated money market funds is fair and reasonable.
The Board also considered that an affiliated broker may receive commissions for executing certain trades for the Fund. Invesco Advisers and the Affiliated Sub-Advisers may use the affiliated broker to, among other things, control order routing and minimize information leakage, and the Board was advised that such trades are executed in compliance with rules under the federal securities laws and consistent with best execution obligations.
25 Invesco Developing Markets Fund
Tax Information
Form 1099-DIV, Form 1042-S and other year-end tax information provide shareholders with actual calendar year amounts that should be included in their tax returns. Shareholders should consult their tax advisors.
The following distribution information is being provided as required by the Internal Revenue Code or to meet a specific state’s requirement.
The Fund designates the following amounts or, if subsequently determined to be different, the maximum amount allowable for its fiscal year ended October 31, 2018:
| | | | |
Federal and State Income Tax | |
Qualified Dividend Income* | | | 100 | % |
Corporate Dividends Received Deduction* | | | 0.00 | % |
U.S. Treasury Obligations* | | | 0.00 | % |
Foreign Taxes | | $ | 0.1280 | per share |
Foreign Source Income | | $ | 1.2332 | per share |
| | * | The above percentages are based on ordinary income dividends paid to shareholders during the Fund’s fiscal year. |
26 Invesco Developing Markets Fund
Trustees and Officers
The address of each trustee and officer is AIM Investment Funds (Invesco Investment Funds) (the “Trust”), 11 Greenway Plaza, Suite 1000, Houston, Texas 77046-1173. The trustees serve for the life of the Trust, subject to their earlier death, incapacitation, resignation, retirement or removal as more specifically provided in the Trust’s organizational documents. Each officer serves for a one year term or until their successors are elected and qualified. Column two below includes length of time served with predecessor entities, if any.
| | | | | | | | |
Name, Year of Birth and
Position(s) Held with the Trust | | Trustee and/
or Officer Since | | Principal Occupation(s)
During Past 5 Years | | Number of
Funds in Fund
Complex
Overseen by
Trustee | | Other Directorship(s)
Held by Trustee During
Past 5 Years |
| Interested Persons | | | | | | | | |
| Martin L. Flanagan1 — 1960 Trustee | | 2007 | | Executive Director, Chief Executive Officer and President, Invesco Ltd. (ultimate parent of Invesco and a global investment management firm); Trustee, The Invesco Funds; Vice Chair, Investment Company Institute; and Member of Executive Board, SMU Cox School of Business Formerly: Advisor to the Board, Invesco Advisers, Inc. (formerly known as Invesco Institutional (N.A.), Inc.); Chairman and Chief Executive Officer, Invesco Advisers, Inc. (registered investment adviser); Director, Chairman, Chief Executive Officer and President, Invesco Holding Company (US), Inc. (formerly IVZ Inc.) (holding company), Invesco Group Services, Inc. (service provider) and Invesco North American Holdings, Inc. (holding company); Director, Chief Executive Officer and President, Invesco Holding Company Limited (parent of Invesco and a global investment management firm); Director, Invesco Ltd.; Chairman, Investment Company Institute and President, Co-Chief Executive Officer, Co-President, Chief Operating Officer and Chief Financial Officer, Franklin Resources, Inc. (global investment management organization) | | 158 | | None |
Philip A. Taylor2 — 1954 Trustee and Senior Vice President | | 2006 | | Head of the Americas and Senior Managing Director, Invesco Ltd.; Director, Invesco Advisers, Inc. (formerly known as Invesco Institutional (N.A.), Inc.) (registered investment adviser); Director and Chairman, Invesco Investment Services, Inc. (formerly known as Invesco AIM Investment Services, Inc.) (registered transfer agent); Chief Executive Officer, Invesco Corporate Class Inc. (corporate mutual fund company); Director, Chairman and Chief Executive Officer, Invesco Canada Ltd. (formerly known as Invesco Trimark Ltd./Invesco Trimark Ltèe) (registered investment adviser and registered transfer agent); Trustee and Senior Vice President, The Invesco Funds; Director, Invesco Investment Advisers LLC (formerly known as Van Kampen Asset Management) Formerly: Director, Chairman, Chief Executive Officer and President, Invesco Management Group, Inc. (formerly known as Invesco AIM Management Group, Inc.) (financial services holding company); Co-Chairman, Co-President and Co-Chief Executive Officer, Invesco Advisers, Inc. (formerly known as Invesco Institutional (N.A.), Inc.) (registered investment adviser); Director, Chief Executive Officer and President, Van Kampen Exchange Corp; President and Principal Executive Officer, The Invesco Funds (other than AIM Treasurer’s Series Trust (Invesco Treasurer’s Series Trust), Short-Term Investments Trust and Invesco Management Trust); Executive Vice President, The Invesco Funds (AIM Treasurer’s Series Trust (Invesco Treasurer’s Series Trust), Short-Term Investments Trust and Invesco Management Trust only); Director and President, INVESCO Funds Group, Inc. (registered investment adviser and registered transfer agent); Director and Chairman, IVZ Distributors, Inc. (formerly known as INVESCO Distributors, Inc.) (registered broker dealer); Director, President and Chairman, Invesco Inc. (holding company), Invesco Canada Holdings Inc. (holding company), Trimark Investments Ltd./Placements Trimark Ltèe and Invesco Financial Services Ltd/Services Financiers Invesco Ltèe; Chief Executive Officer, Invesco Canada Fund Inc. (corporate mutual fund company); Director and Chairman, Van Kampen Investor Services Inc.; Director, Chief Executive Officer and President, 1371 Preferred Inc. (holding company) and Van Kampen Investments Inc.; Director and President, AIM GP Canada Inc. (general partner for limited partnerships) and Van Kampen Advisors, Inc.; Director and Chief Executive Officer, Invesco Trimark Dealer Inc. (registered broker dealer); Director, Invesco Distributors, Inc. (formerly known as Invesco AIM Distributors, Inc.) (registered broker dealer); Manager, Invesco Capital Management LLC; Director, Chief Executive Officer and President, Invesco Advisers, Inc.; Director, Chairman, Chief Executive Officer and President, Invesco AIM Capital Management, Inc.; President, Invesco Trimark Dealer Inc. and Invesco Trimark Ltd./Invesco Trimark Ltèe; Director and President, AIM Trimark Corporate Class Inc. and AIM Trimark Canada Fund Inc.; Senior Managing Director, Invesco Holding Company Limited; Director and Chairman, Fund Management Company (former registered broker dealer); President and Principal Executive Officer, The Invesco Funds (AIM Treasurer’s Series Trust (Invesco Treasurer’s Series Trust), and Short-Term Investments Trust only); President, AIM Trimark Global Fund Inc. and AIM Trimark Canada Fund Inc. | | 158 | | None |
| 1 | Mr. Flanagan is considered an interested person (within the meaning of Section 2(a)(19) of the 1940 Act) of the Trust because he is an officer of the Adviser to the Trust, and an officer and a director of Invesco Ltd., ultimate parent of the Adviser. |
| 2 | Mr. Taylor is considered an interested person (within the meaning of Section 2(a)(19) of the 1940 Act) of the Trust because he is an officer and a director of the Adviser. |
T-1 Invesco Developing Markets Fund
Trustees and Officers—(continued)
| | | | | | | | |
Name, Year of Birth and
Position(s) Held with the Trust | | Trustee and/
or Officer Since | | Principal Occupation(s)
During Past 5 Years | | Number of
Funds in Fund
Complex
Overseen by
Trustee | | Other Directorship(s)
Held by Trustee During
Past 5 Years |
| Independent Trustees | | | | | | | | |
Bruce L. Crockett — 1944 Trustee and Chair | | 2001 | | Chairman, Crockett Technologies Associates (technology consulting company) Formerly: Director, Captaris (unified messaging provider); Director, President and Chief Executive Officer, COMSAT Corporation; Chairman, Board of Governors of INTELSAT (international communications company); ACE Limited (insurance company); Independent Directors Council and Investment Company Institute: Member of the Audit Committee, Investment Company Institute; Member of the Executive Committee and Chair of the Governance Committee, Independent Directors Council | | 158 | | Director and Chairman of the Audit Committee, ALPS (Attorneys Liability Protection Society) (insurance company); Director and Member of the Audit Committee and Compensation Committee, Ferroglobe PLC (metallurgical company) |
David C. Arch — 1945 Trustee | | 2010 | | Chairman of Blistex Inc. (consumer health care products manufacturer); Member, World Presidents’ Organization | | 158 | | Board member of the Illinois Manufacturers’ Association |
Jack M. Fields — 1952 Trustee | | 2001 | | Chief Executive Officer, Twenty First Century Group, Inc. (government affairs company); and Chairman, Discovery Learning Alliance (non-profit) Formerly: Owner and Chief Executive Officer, Dos Angeles Ranch L.P. (cattle, hunting, corporate entertainment); Director, Insperity, Inc. (formerly known as Administaff) (human resources provider); Chief Executive Officer, Texana Timber LP (sustainable forestry company); Director of Cross Timbers Quail Research Ranch (non-profit); and member of the U.S. House of Representatives | | 158 | | None |
Cynthia Hostetler — 1962 Trustee | | 2017 | | Non-Executive Director and Trustee of a number of public and private business corporations Formerly: Director, Aberdeen Investment Funds (4 portfolios); Head of Investment Funds and Private Equity, Overseas Private Investment Corporation; President, First Manhattan Bancorporation, Inc.; Attorney, Simpson Thacher & Bartlett LLP | | 158 | | Vulcan Materials Company (construction materials company); Trilinc Global Impact Fund; Artio Global Investment LLC (mutual fund complex); Edgen Group, Inc. (specialized energy and infrastructure products distributor) |
Eli Jones — 1961 Trustee | | 2016 | | Professor and Dean, Mays Business School — Texas A&M University Formerly: Professor and Dean, Walton College of Business, University of Arkansas and E.J. Ourso College of Business, Louisiana State University; Director, Arvest Bank | | 158 | | Insperity, Inc. (formerly known as Administaff) (human resources provider) |
Prema Mathai-Davis — 1950 Trustee | | 2001 | | Retired | | 158 | | None |
Teresa M. Ressel — 1962 Trustee | | 2017 | | Non-executive director and trustee of a number of public and private business corporations Formerly: Chief Financial Officer, Olayan America, The Olayan Group (international investor/commercial/industrial); Chief Executive Officer, UBS Securities LLC; Group Chief Operating Officer, Americas, UBS AG; Assistant Secretary for Management & Budget and CFO, US Department of the Treasury | | 158 | | Atlantic Power Corporation (power generation company); ON Semiconductor Corp. (semiconductor supplier) |
Ann Barnett Stern — 1957 Trustee | | 2017 | | President and Chief Executive Officer, Houston Endowment Inc. (private philanthropic institution) Formerly: Executive Vice President and General Counsel, Texas Children’s Hospital; Attorney, Beck, Redden and Secrest, LLP; Business Law Instructor, University of St. Thomas; Attorney, Andrews & Kurth LLP | | 158 | | Federal Reserve Bank of Dallas |
Raymond Stickel, Jr. — 1944 Trustee | | 2005 | | Retired Formerly: Director, Mainstay VP Series Funds, Inc. (25 portfolios); Partner, Deloitte & Touche | | 158 | | None |
Robert C. Troccoli — 1949 Trustee | | 2016 | | Adjunct Professor, University of Denver — Daniels College of Business Formerly: Senior Partner, KPMG LLP | | 158 | | None |
Christopher L. Wilson — 1957 Trustee | | 2017 | | Non-executive director and trustee of a number of public and private business corporations Formerly: Director, TD Asset Management USA Inc. (mutual fund complex) (22 portfolios); Managing Partner, CT2, LLC (investing and consulting firm); President/Chief Executive Officer, Columbia Funds, Bank of America Corporation; President/Chief Executive Officer, CDC IXIS Asset Management Services, Inc.; Principal & Director of Operations, Scudder Funds, Scudder, Stevens & Clark, Inc.; Assistant Vice President, Fidelity Investments | | 158 | | ISO New England, Inc. (non-profit organization managing regional electricity market) |
T-2 Invesco Developing Markets Fund
Trustees and Officers—(continued)
| | | | | | | | |
Name, Year of Birth and
Position(s) Held with the Trust | | Trustee and/
or Officer Since | | Principal Occupation(s)
During Past 5 Years | | Number of
Funds in Fund
Complex
Overseen by
Trustee | | Other Directorship(s)
Held by Trustee During
Past 5 Years |
| Other Officers | | | | | | | | |
Sheri Morris — 1964 President, Principal Executive Officer and Treasurer | | 1999 | | President, Principal Executive Officer and Treasurer, The Invesco Funds; Vice President, Invesco Advisers, Inc. (formerly known as Invesco Institutional (N.A.), Inc.) (registered investment adviser); and Vice President, Invesco Exchange-Traded Fund Trust, Invesco Exchange-Traded Fund Trust II, Invesco India Exchange-Traded Fund Trust, Invesco Actively Managed Exchange-Traded Fund Trust, Invesco Actively Managed Exchange-Traded Commodity Fund Trust and Invesco Exchange-Traded Self-Indexed Fund Trust Formerly: Vice President and Principal Financial Officer, The Invesco Funds; Vice President, Invesco AIM Advisers, Inc., Invesco AIM Capital Management, Inc. and Invesco AIM Private Asset Management, Inc.; Assistant Vice President and Assistant Treasurer, The Invesco Funds and Assistant Vice President, Invesco Advisers, Inc., Invesco AIM Capital Management, Inc. and Invesco AIM Private Asset Management, Inc.; and Treasurer, Invesco Exchange-Traded Fund Trust, Invesco Exchange-Traded Fund Trust II, Invesco India Exchange-Traded Fund Trust and Invesco Actively Managed Exchange-Traded Fund Trust | | N/A | | N/A |
Russell C. Burk — 1958 Senior Vice President and Senior Officer | | 2005 | | Senior Vice President and Senior Officer, The Invesco Funds | | N/A | | N/A |
Jeffrey H. Kupor — 1968 Senior Vice President, Chief Legal Officer and Secretary | | 2018 | | Senior Vice President and Secretary, Invesco Advisers, Inc. (formerly known as Invesco Institutional (N.A.), Inc.) (registered investment adviser); Senior Vice President and Secretary, Invesco Distributors, Inc. (formerly known as Invesco AIM Distributors, Inc.); Vice President and Secretary, Invesco Investment Services, Inc. (formerly known as Invesco AIM Investment Services, Inc.) Senior Vice President, Chief Legal Officer and Secretary, The Invesco Funds; Secretary and General Counsel, Invesco Investment Advisers LLC (formerly known as Van Kampen Asset Management); Secretary and General Counsel, Invesco Capital Markets, Inc. (formerly known as Van Kampen Funds Inc.) and Chief Legal Officer, Invesco Exchange-Traded Fund Trust, Invesco Exchange-Traded Fund Trust II, Invesco India Exchange-Traded Fund Trust, Invesco Actively Managed Exchange-Traded Fund Trust, Invesco Actively Managed Exchange-Traded Commodity Fund Trust and Invesco Exchange-Traded Self-Indexed Fund Trust; Secretary, Invesco Indexing LLC; Secretary and General Counsel, INVESCO Private Capital Investments, Inc.; Secretary, W.L. Ross & Co., LLC; Secretary and Vice President, Jemstep, Inc. Formerly: Senior Vice President, Secretary and General Counsel, Invesco Management Group, Inc. (formerly known as Invesco AIM Management Group, Inc.); Assistant Secretary, INVESCO Asset Management (Bermuda) Ltd.; Secretary and General Counsel, Invesco Private Capital, Inc.; Assistant Secretary and General Counsel, INVESCO Realty, Inc.; Secretary and General Counsel, Invesco Senior Secured Management, Inc.; and Secretary, Sovereign G./P. Holdings Inc. | | N/A | | N/A |
John M. Zerr — 1962 Senior Vice President | | 2006 | | Chief Operating Officer of the Americas; Senior Vice President, Invesco Advisers, Inc. (formerly known as Invesco Institutional (N.A.), Inc.) (registered investment adviser); Senior Vice President, Invesco Distributors, Inc. (formerly known as Invesco AIM Distributors, Inc.); Director and Vice President, Invesco Investment Services, Inc. (formerly known as Invesco AIM Investment Services, Inc.) Senior Vice President, The Invesco Funds; Managing Director, Invesco Capital Management LLC; Director, Invesco Investment Advisers LLC (formerly known as Van Kampen Asset Management); Senior Vice President, Invesco Capital Markets, Inc. (formerly known as Van Kampen Funds Inc.); Manager, Invesco Indexing LLC Formerly: Director and Senior Vice President, Invesco Management Group, Inc. (formerly known as Invesco AIM Management Group, Inc.); Secretary and General Counsel, Invesco Management Group, Inc. (formerly known as Invesco AIM Management Group, Inc.); Secretary, Invesco Investment Services, Inc. (formerly known as Invesco AIM Investment Services, Inc.); Chief Legal Officer and Secretary, The Invesco Funds; Secretary and General Counsel, Invesco Investment Advisers LLC (formerly known as Van Kampen Asset Management); Secretary and General Counsel, Invesco Capital Markets, Inc. (formerly known as Van Kampen Funds Inc.); Chief Legal Officer, Invesco Exchange-Traded Fund Trust, Invesco Exchange-Traded Fund Trust II, Invesco India Exchange-Traded Fund Trust, Invesco Actively Managed Exchange-Traded Fund Trust, Invesco Actively Managed Exchange-Traded Commodity Fund Trust and Invesco Exchange-Traded Self-Indexed Fund Trust; Secretary, Invesco Indexing LLC; Director, Secretary, General Counsel and Senior Vice President, Van Kampen Exchange Corp.; Director, Vice President and Secretary, IVZ Distributors, Inc. (formerly known as INVESCO Distributors, Inc.); Director and Vice President, INVESCO Funds Group, Inc.; Director and Vice President, Van Kampen Advisors Inc.; Director, Vice President, Secretary and General Counsel, Van Kampen Investor Services Inc.; Director and Secretary, Invesco Distributors, Inc. (formerly known as Invesco AIM Distributors, Inc.); Director, Senior Vice President, General Counsel and Secretary, Invesco AIM Advisers, Inc. and Van Kampen Investments Inc.; Director, Vice President and Secretary, Fund Management Company; Director, Senior Vice President, Secretary, General Counsel and Vice President, Invesco AIM Capital Management, Inc.; Chief Operating Officer and General Counsel, Liberty Ridge Capital, Inc. (an investment adviser) | | N/A | | N/A |
T-3 Invesco Developing Markets Fund
Trustees and Officers—(continued)
| | | | | | | | |
Name, Year of Birth and
Position(s) Held with the Trust | | Trustee and/
or Officer Since | | Principal Occupation(s)
During Past 5 Years | | Number of
Funds in Fund
Complex
Overseen by
Trustee | | Other Directorship(s)
Held by Trustee During
Past 5 Years |
| Other Officers—(continued) | | | | | | | | |
Gregory G. McGreevey — 1962 Senior Vice President | | 2012 | | Senior Managing Director, Invesco Ltd.; Director, Chairman, President, and Chief Executive Officer, Invesco Advisers, Inc. (formerly known as Invesco Institutional (N.A.), Inc.) (registered investment adviser); Director, Invesco Mortgage Capital, Inc. and Invesco Senior Secured Management, Inc.; and Senior Vice President, The Invesco Funds Formerly: Senior Vice President, Invesco Management Group, Inc. and Invesco Advisers, Inc.; Assistant Vice President, The Invesco Funds | | N/A | | N/A |
Kelli Gallegos — 1970 Vice President, Principal Financial Officer and Assistant Treasurer | | 2008 | | Vice President and Treasurer, Invesco Exchange-Traded Fund Trust, Invesco Exchange-Traded Fund Trust II, Invesco India Exchange-Traded Fund Trust, Invesco Actively Managed Exchange-Traded Fund Trust, Invesco Actively Managed Exchange-Traded Commodity Fund Trust and Invesco Exchange-Traded Self-Indexed Fund Trust; Vice President, Principal Financial Officer and Assistant Treasurer, The Invesco Funds; Principal Financial and Accounting Officer — Pooled Investments, Invesco Capital Management LLC Formerly: Assistant Treasurer, Invesco Exchange-Traded Fund Trust, Invesco Exchange-Traded Fund Trust II, Invesco India Exchange-Traded Fund Trust, Invesco Actively Managed Exchange-Traded Fund Trust, Invesco Actively Managed Exchange-Traded Commodity Fund Trust and Invesco Exchange-Traded Self-Indexed Fund Trust; Assistant Treasurer, Invesco Capital Management LLC; Assistant Vice President, The Invesco Funds | | N/A | | N/A |
Tracy Sullivan — 1962 Vice President, Chief Tax Officer and Assistant Treasurer | | 2008 | | Vice President, Chief Tax Officer and Assistant Treasurer, The Invesco Funds; Assistant Treasurer, Invesco Capital Management LLC, Invesco Exchange-Traded Fund Trust, Invesco Exchange-Traded Fund Trust II, Invesco India Exchange-Traded Fund Trust, Invesco Actively Managed Exchange-Traded Fund Trust, Invesco Actively Managed Exchange-Traded Commodity Fund Trust and Invesco Exchange-Traded Self-Indexed Fund Trust Formerly: Assistant Vice President, The Invesco Funds | | N/A | | N/A |
Crissie M. Wisdom — 1969 Anti-Money Laundering Compliance Officer | | 2013 | | Anti-Money Laundering Compliance Officer, Invesco Advisers, Inc. (formerly known as Invesco Institutional (N.A.), Inc.) (registered investment adviser), Invesco Capital Markets, Inc. (formerly known as Van Kampen Funds Inc.), Invesco Distributors, Inc., Invesco Investment Services, Inc., The Invesco Funds, and Invesco Exchange-Traded Fund Trust, Invesco Exchange-Traded Fund Trust II, Invesco India Exchange-Traded Fund Trust, Invesco Actively Managed Exchange-Traded Fund Trust, Invesco Actively Managed Exchange-Traded Commodity Fund Trust and Invesco Exchange-Traded Self-Indexed Fund Trust; Anti-Money Laundering Compliance Officer and Bank Secrecy Act Officer, INVESCO National Trust Company and Invesco Trust Company; and Fraud Prevention Manager and Controls and Risk Analysis Manager for Invesco Investment Services, Inc. Formerly: Anti-Money Laundering Compliance Officer, Van Kampen Exchange Corp. and Invesco Management Group, Inc. | | N/A | | N/A |
Robert R. Leveille — 1969 Chief Compliance Officer | | 2016 | | Chief Compliance Officer, Invesco Advisers, Inc. (registered investment adviser); and Chief Compliance Officer, The Invesco Funds Formerly: Chief Compliance Officer, Putnam Investments and the Putnam Funds | | N/A | | N/A |
The Statement of Additional Information of the Trust includes additional information about the Fund’s Trustees and is available upon request, without charge, by calling 1.800.959.4246. Please refer to the Fund’s Statement of Additional Information for information on the Fund’s sub-advisers.
| | | | | | |
Office of the Fund 11 Greenway Plaza, Suite 1000 Houston, TX 77046-1173 | | Investment Adviser Invesco Advisers, Inc. 1555 Peachtree Street, N.E. Atlanta, GA 30309 | | Distributor Invesco Distributors, Inc. 11 Greenway Plaza, Suite 1000 Houston, TX 77046-1173 | | Auditors PricewaterhouseCoopers LLP 1000 Louisiana Street, Suite 5800 Houston, TX 77002-5021 |
| | | |
| | | | | | |
Counsel to the Fund Stradley Ronon Stevens & Young, LLP 2005 Market Street, Suite 2600 Philadelphia, PA 19103-7018 | | Counsel to the Independent Trustees Goodwin Procter LLP 901 New York Avenue, N.W. Washington, D.C. 20001 | | Transfer Agent Invesco Investment Services, Inc. 11 Greenway Plaza, Suite 1000 Houston, TX 77046-1173 | | Custodian State Street Bank and Trust Company 225 Franklin Street Boston, MA 02110-2801 |
T-4 Invesco Developing Markets Fund
Explore High-Conviction Investing with Invesco

Go paperless with eDelivery
Visit invesco.com/edelivery to enjoy the convenience and security of anytime electronic access to your investment documents.
With eDelivery, you can elect to have any or all of the following materials delivered straight to your inbox to download, save and print from your own computer:
∎ Fund reports and prospectuses
∎ Quarterly statements
∎ Daily confirmations
∎ Tax forms
Invesco mailing information
Send general correspondence to Invesco Investment Services, Inc., P.O. Box 219078, Kansas City, MO 64121-9078.
Important notice regarding delivery of security holder documents
To reduce Fund expenses, only one copy of most shareholder documents may be mailed to shareholders with multiple accounts at the same address (Householding). Mailing of your shareholder documents may be householded indefinitely unless you instruct us otherwise. If you do not want the mailing of these documents to be combined with those for other members of your household, please contact Invesco Investment Services, Inc. at 800 959 4246 or contact your financial institution. We will begin sending you individual copies for each account within 30 days after receiving your request.
Fund holdings and proxy voting information
The Fund provides a complete list of its holdings four times in each fiscal year, at the quarter ends. For the second and fourth quarters, the lists appear in the Fund’s semiannual and annual reports to shareholders. For the first and third quarters, the Fund files the lists with the Securities and Exchange Commission (SEC) on Form N-Q (or any successor Form). The most recent list of portfolio holdings is available at invesco.com/completeqtrholdings. Shareholders can also look up the Fund’s Forms N-Q (or any successor Form) on the SEC website at sec.gov. The SEC file numbers for the Fund are shown below.
A description of the policies and procedures that the Fund uses to determine how to vote proxies relating to portfolio securities is available without charge, upon request, from our Client Services department at 800 959 4246 or at invesco.com/proxyguidelines. The information is also available on the SEC website, sec.gov.
| | |
Information regarding how the Fund voted proxies related to its portfolio securities during the most recent 12-month period ended June 30 is available at invesco.com/proxysearch. The information is also available on the SEC website, sec.gov. Invesco Advisers, Inc. is an investment adviser; it provides investment advisory services to individual and institutional clients and does not sell securities. Invesco Distributors, Inc. is the US distributor for Invesco Ltd.’s retail mutual funds, exchange-traded funds and institutional money market funds. Both are wholly owned, indirect subsidiaries of Invesco Ltd. | | 
|
| | | | | | | | |
| SEC file numbers: 811-05426 and 033-19338 | | Invesco Distributors, Inc. | | DVM-AR-1 | | 12172018 | | 1452 |
| | | | | | |
| | | | |
 | | Annual Report to Shareholders | | October 31, 2018 | | |
| | | | |
| | Invesco Emerging Markets Equity Fund | | |
| | Effective November 1, 2018, after the close of the fiscal year, Invesco Emerging Markets Equity Fund was renamed Invesco Emerging Markets Select Equity Fund. | | |
| | Nasdaq: | | |
| | A: IEMAX ∎ C: IEMCX ∎ R: IEMRX ∎ Y: IEMYX ∎ R5: IEMIX ∎ R6: EMEFX | | |

Letters to Shareholders
| | |

Philip Taylor | | Dear Shareholders: This annual report includes information about your Fund, including performance data and a complete list of its investments as of the close of the reporting period. Inside is a discussion of how your Fund was managed and the factors that affected its performance during the reporting period. Throughout the reporting period, US economic data remained positive. Robust corporate profits, strong retail sales and unemployment rates near generational lows helped drive US markets to new all-time records multiple times during the reporting period. Against this backdrop, the US Federal Reserve raised the federal funds rate four times during the reporting period. Market volatility, largely non-existent in 2017, returned in 2018. Markets sold off first in February and again sharply in October, amid rising interest rates, concerns about potential trade wars and |
heightened geopolitical tensions. Despite the volatility, US equity markets were largely positive for the reporting period and fared better than international markets. Emerging markets were particularly hard hit due to a strong US dollar. During the October sell-off, investors retreated to more defensive areas of the market and to US Treasuries. The broader bond market declined during the reporting period due to the increase in US Treasury yields and widening credit spreads. As the year progresses, we’ll see how the interplay of economic data, interest rates, geopolitics and a host of other factors affect US and overseas equity and fixed income markets.
Short-term market volatility can prompt some investors to abandon their investment plans – and can cause others to settle for whatever returns the market has to offer. The investment professionals at Invesco, in contrast, invest with high conviction. This means that, no matter the asset class or the strategy, each investment team has a passion to exceed. We want to help investors achieve better outcomes, such as seeking higher returns, helping mitigate risk and generating income. Of course, investing with high conviction can’t guarantee a profit or ensure success; no investment strategy can. To learn more about how we invest with high conviction, visit invesco.com/HighConviction.
You, too, can invest with high conviction by maintaining a long-term investment perspective and by working with your financial adviser on a regular basis. During periods of short-term market volatility or uncertainty, your financial adviser can keep you focused on your long-term investment goals – a new home, a child’s college education or a secure retirement. He or she also can share research about the economy, the markets and individual investment options.
Visit our website for more information on your investments
Our website, invesco.com/us, offers a wide range of market insights and investment perspectives. On the website, you’ll find detailed information about our funds, including performance, holdings and portfolio manager commentaries. You can access information about your account by completing a simple, secure online registration. To do so, select “Log In” on the right side of the homepage, and then select “Register for Individual Account Access.”
In addition to the resources accessible on our website and through our mobile app, you can obtain timely updates to help you stay informed about the markets and the economy by connecting with Invesco on Twitter, LinkedIn or Facebook. You can access our blog at blog.invesco.us.com. Our goal is to provide you the information you want, when and where you want it.
Finally, I’m pleased to share with you Invesco’s commitment to both the Principles for Responsible Investment and to considering environmental, social and governance issues in our robust investment process. I invite you to learn more at invesco.com/esg.
Have questions?
For questions about your account, contact an Invesco client services representative at 800 959 4246. For Invesco-related questions or comments, please email me directly at phil@invesco.com.
All of us at Invesco look forward to serving your investment management needs. Thank you for investing with us.
Sincerely,

Philip Taylor
Senior Managing Director, Invesco Ltd.
| | |
| 2 | | Invesco Emerging Markets Equity Fund |
| | | | |

Bruce Crockett | | Dear Fellow Shareholders: Among the many important lessons I’ve learned in more than 40 years in a variety of business endeavors is the value of a trusted advocate. As independent chair of the Invesco Funds Board, I can assure you that the members of the Board are strong advocates for the interests of investors in Invesco’s mutual funds. We work hard to represent your interests through oversight of the quality of the investment management services your funds receive and other matters important to your investment, including but not limited to: |
| | ∎ | | Ensuring that Invesco offers a diverse lineup of mutual funds that your financial adviser can use to strive to meet your financial needs as your investment goals change over time. |
| | ∎ | | Monitoring how the portfolio management teams of the Invesco funds are performing in light of changing economic and market conditions. |
| ∎ | | Assessing each portfolio management team’s investment performance within the context of the investment strategy described in the fund’s prospectus. |
| ∎ | | Monitoring for potential conflicts of interests that may impact the nature of the services that your funds receive. |
We believe one of the most important services we provide our fund shareholders is the annual review of the funds’ advisory and sub-advisory contracts with Invesco Advisers and its affiliates. This review is required by the Investment Company Act of 1940 and focuses on the nature and quality of the services Invesco provides as the adviser to the Invesco funds and the reasonableness of the fees that it charges for those services. Each year, we spend months carefully reviewing information received from Invesco and a variety of independent sources, such as performance and fee data prepared by Lipper, Inc. (a subsidiary of Broadridge Financial Solutions, Inc.), an independent, third-party firm widely recognized as a leader in its field. We also meet with our independent legal counsel and other independent advisers to review and help us assess the information that we have received. Our goal is to assure that you receive quality investment management services for a reasonable fee.
I trust the measures outlined above provide assurance that you have a worthy advocate when it comes to choosing the Invesco Funds.
As always, please contact me at bruce@brucecrockett.com with any questions or concerns you may have. On behalf of the Board, we look forward to continuing to represent your interests and serving your needs.
Sincerely,

Bruce L. Crockett
Independent Chair
Invesco Funds Board of Trustees
| | |
| 3 | | Invesco Emerging Markets Equity Fund |
Management’s Discussion of Fund Performance
| | | | |
| |
Performance summary For the fiscal year ended October 31, 2018, Class A shares of Invesco Emerging Markets Equity Fund (the Fund), at net asset value (NAV), underperformed the MSCI Emerging Markets Index, the Fund’s style-specific benchmark. Your Fund’s long-term performance appears later in this report. | |
| |
Fund vs. Indexes | |
Total returns, 10/31/17 to 10/31/18, at net asset value (NAV). Performance shown does not include applicable contingent deferred sales charges (CDSC) or front-end sales charges, which would have reduced performance. | | | | |
| |
Class A Shares | | | -17.45 | % |
Class C Shares | | | -17.94 | |
Class R Shares | | | -17.59 | |
Class Y Shares | | | -17.17 | |
Class R5 Shares | | | -17.16 | |
Class R6 Shares | | | -17.18 | |
MSCI EAFE Indexq (Broad Market Index) | | | -6.85 | |
MSCI Emerging Markets Indexq (Style-Specific Index) | | | -12.52 | |
Lipper Emerging Market Funds Index⬛ (Peer Group Index) | | | -13.05 | |
Source(s): qRIMES Technologies Corp.; ⬛Lipper Inc. | | | | |
Market conditions and your Fund
The fiscal year proved to be an increasingly volatile time for global equities. The fiscal year began in the final months of 2017 with several US stock market indexes repeatedly reaching new highs amid strong corporate profits, the prospect of tax reform legislation and exceedingly low stock market volatility. Despite a sharp uptick in volatility, particularly in October 2018, US markets, in general, still produced positive returns for the fiscal year. International markets, however, were meaningfully less robust, many experiencing flat to negative results for the fiscal year. This divergence between the US and other markets could be attributed to the strength of the US economy and the widely-held belief that the US could win trade wars with other countries.
At the beginning of 2018, markets saw significant turbulence in late January and early February, when stocks were
whipsawed – first by concerns about accelerated US Federal Reserve (the Fed) tightening and then, later in the year, by fears of brewing trade wars and geopolitical tensions. After a relatively quiet summer, market volatility markedly rose again in the final month of the fiscal year. Global equity markets (particularly the US) suffered a sharp sell-off in October 2018 amid rising interest rates and concerns that higher inflation could result in a more restrictive monetary policy.
Global economic growth, in general, was solid despite weakness in emerging markets. During the fiscal year, emerging markets were impacted by both country-specific issues, as well as, more generalized pressure resulting from the Fed’s tightening policy. In this environment, economic growth unsurprisingly slowed in emerging markets. Within the eurozone, economic growth accelerated, although there was divergence among
countries. In Japan, economic growth improved over the latter part of the fiscal year. The US experienced strong growth during the fiscal year due to robust consumer and business spending. In addition, unemployment rates remained low, job creation was strong and inflation remained relatively controlled.
At the close of the fiscal year, equity valuations in developed and emerging markets appeared relatively full in absolute terms, but overseas equity markets were trading at a material discount to those of the US. In sum, while valuations were not cheap, recent earnings growth and upward earnings revisions improved in many non-US developed markets.
Before we discuss the Fund’s results during the fiscal year, it is helpful to briefly explain how we manage the Fund for shareholders. We view ourselves as business people buying businesses, and we consider the purchase of a stock as an ownership interest in a business. We strive to develop a proprietary view of a business through in-depth, fundamental research that includes careful financial statement analysis and meetings with company management. We then seek to purchase businesses whose stock prices are below what we have calculated to be the true value of the company based on an estimate of its future free cash flows.
Our investment approach focuses on individual businesses rather than market sectors. Therefore, the Fund shares little in common with sector weightings of various market indexes. However, if we were to broadly categorize businesses with which we had the most success during the fiscal year, select materials and energy stocks were the strongest contributors to the Fund’s absolute performance.
| | | | | | |
| | |
Portfolio Composition | | | |
By sector % of total net assets | | | |
| | |
Consumer Staples | | | 22.3% | | | |
Communication Services | | | 21.1 | | | |
Financials | | | 19.2 | | | |
Information Technology | | | 15.9 | | | |
Consumer Discretionary | | | 11.8 | | | |
Health Care | | | 4.3 | | | |
Industrials | | | 2.9 | | | |
Money Market Funds Plus Other Assets Less Liabilities | | | 2.5 | | | |
| | |
| |
Top 10 Equity Holdings* |
| % of total net assets |
| |
1. Cielo S.A. | | 5.9% |
2. Liberty Latin America Ltd.-Class C | | 5.8 |
3. Alibaba Group Holding Ltd.-ADR | | 4.9 |
4. Ping An Insurance (Group) Co. of China Ltd.-Class H | | 4.2 |
5. Naspers Ltd.-Class N | | 4.2 |
6. Taiwan Semiconductor Manufacturing Co., Ltd. | | 4.1 |
7. Kweichow Moutai Co., Ltd.-Class A | | 4.0 |
8. Samsung Electronics Co., Ltd.-Preference Shares | | 4.0 |
9. Tencent Holdings Ltd. | | 3.2 |
10. Housing Development Finance Corp. Ltd. | | 2.9 |
| | | | |
| | |
Total Net Assets | | $ | 55.5 million | |
| |
Total Number of Holdings* | | | 51 | |
The Fund’s holdings are subject to change, and there is no assurance that the Fund will continue to hold any particular security.
*Excluding money market fund holdings.
Data presented here are as of October 31, 2018.
| | |
| 4 | | Invesco Emerging Markets Equity Fund |
Relative to the Fund’s style-specific benchmark, security selection in the health care sector contributed to the Fund’s performance during the fiscal year. Additionally, underweight exposure to the real estate sector also helped the Fund’s relative performance.
On a regional basis, the Fund’s holdings in India, Hong Kong and Chile benefited the Fund’s relative performance during the fiscal year.
The top contributors to the Fund’s performance relative to the style-specific benchmark over the fiscal year included Tal Education Group and Shenzhou International Group. Tal Education Group is an educational services provider based in China that provides tutoring services to students covering core academic subjects. During the fiscal year, shares of the company appreciated due to strong enrollment growth and margin expansion. Shenzhou International Group is a Chinese clothing manufacturer. The company’s share price increased after company management reported strong revenue growth, in particular from apparel brands, Nike and Puma. We exited our positions in both Tal Education Group and Shenzhou International Group before the close of the fiscal year.
Conversely, holdings in the financials sector detracted from the Fund’s performance relative to the style-specific benchmark during the fiscal year. Additionally, the Fund’s reduced exposure to the energy sector – the strongest-performing sector in the style-specific benchmark – detracted from its relative performance.
Regionally, the Fund’s holdings in Brazil, Thailand and China detracted from relative performance during the fiscal year. The top detractors from the Fund’s relative performance over the fiscal year included Vipshop Holdings and Cielo.
Vipshop is one of China’s largest online retailers of discounted branded goods. The company’s share price fell after it reported disappointing operating results. Additionally, a potential merger between the company and JD.com (not a Fund holding) was dampened due to the personal scandal facing JD.com’s founder. Despite these concerns, we continued to believe the company’s valuation is less than the value of its fixed assets and, as such, maintain our position in the business.
Cielo is Brazil’s largest credit and debit card payment processor and has a dominant position in processing Visa transactions. During the fiscal year, Cielo faced regulatory and competitive pressures in
the debit market causing margin compression. The company was also affected by higher-than-expected marketing expenses related to the launch of its Stelo POS brand. We remain confident in the business and added to our position based on share price weakness.
During the fiscal year, we continued to focus on finding quality businesses we believed were trading at attractive values relative to their long-term prospects. In contrast, the market is often driven by short-term events or outlooks in both good times and bad. Market volatility allows us to take advantage of investment opportunities we believe may benefit the Fund in the long term. While we can never predict future Fund performance, we pledge that we will adhere to our discipline and continually strive to upgrade the quality of the Fund’s portfolio.
As always, we thank you for your investment in Invesco Emerging Markets Equity Fund and for sharing our long-term investment perspective.
The views and opinions expressed in management’s discussion of Fund performance are those of Invesco Advisers, Inc. These views and opinions are subject to change at any time based on factors such as market and economic conditions. These views and opinions may not be relied upon as investment advice or recommendations, or as an offer for a particular security. The information is not a complete analysis of every aspect of any market, country, industry, security or the Fund. Statements of fact are from sources considered reliable, but Invesco Advisers, Inc. makes no representation or warranty as to their completeness or accuracy. Although historical performance is no guarantee of future results, these insights may help you understand our investment management philosophy.
See important Fund and, if applicable, index disclosures later in this report.
| | |
 | | Ingrid Baker Chartered Financial Analyst, Portfolio Manager, is manager of Invesco Emerging Markets Equity Fund. She joined |
| Invesco in 1999. Ms. Baker earned a BA in international politics from Oberlin College and an MBA from the IESE Business School in Barcelona, Spain. |
| | |
 | | Jeff Feng Chartered Financial Analyst, Portfolio Manager, is manager of Invesco Emerging Markets Equity Fund. Effective |
| November 1, 2018, after the close of the fiscal year, Mr. Feng joined the management team. He joined Invesco in 2009. Mr. Feng earned a BA in finance from Xiamen University in China and an MBA from the Richard Ivey School of Business at the University of Western Ontario. |
| | |
Assisted by Invesco’s Global Core Equity Team |
5 Invesco Emerging Markets Equity Fund
Your Fund’s Long-Term Performance
Results of a $10,000 Investment – Oldest Share Class(es) since Inception
Fund and index data from 5/31/11
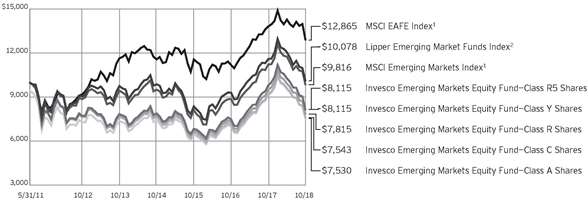
1 Source: RIMES Technologies Corp.
2 Source: Lipper Inc.
Past performance cannot guarantee comparable future results.
The data shown in the chart include reinvested distributions, applicable sales charges and Fund expenses including
management fees. Index results include reinvested dividends, but they do not reflect sales charges. Performance of the peer group, if applicable, reflects fund expenses and management fees; performance
of a market index does not. Performance shown in the chart and table(s) does not reflect deduction of taxes a shareholder would pay on Fund distributions or sale of Fund shares.
| | |
| 6 | | Invesco Emerging Markets Equity Fund |
| | | | |
| |
Average Annual Total Returns | |
As of 10/31/18, including maximum applicable sales charges | |
| |
Class A Shares | | | | |
Inception (5/31/11) | | | -3.75 | % |
5 Years | | | -0.67 | |
1 Year | | | -21.98 | |
| |
Class C Shares | | | | |
Inception (5/31/11) | | | -3.73 | % |
5 Years | | | -0.29 | |
1 Year | | | -18.76 | |
| |
Class R Shares | | | | |
Inception (5/31/11) | | | -3.27 | % |
5 Years | | | 0.19 | |
1 Year | | | -17.59 | |
| |
Class Y Shares | | | | |
Inception (5/31/11) | | | -2.78 | % |
5 Years | | | 0.71 | |
1 Year | | | -17.17 | |
| |
Class R5 Shares | | | | |
Inception (5/31/11) | | | -2.78 | % |
5 Years | | | 0.71 | |
1 Year | | | -17.16 | |
| |
Class R6 Shares | | | | |
Inception | | | -2.84 | % |
5 Years | | | 0.69 | |
1 Year | | | -17.18 | |
Class R6 shares incepted on September 24, 2012. Performance shown prior to that date is that of Class A shares and includes the 12b-1 fees applicable to Class A shares.
The performance data quoted represent past performance and cannot guarantee comparable future results; current performance may be lower or higher. Please visit invesco.com/performance for the most recent month-end performance. Performance figures reflect reinvested distributions, changes in net asset value and the effect of the maximum sales charge unless otherwise stated. Investment return and principal value will fluctuate so that you may have a gain or loss when you sell shares.
The net annual Fund operating expense ratio set forth in the most recent Fund prospectus as of the date of this report for Class A, Class C, Class R, Class Y, Class R5 and Class R6 shares was 1.34%, 2.09%, 1.59%, 1.09%, 1.09% and 1.09%, respectively.1 The total annual Fund operating expense ratio set forth in the most recent Fund prospectus as of the date of this report for Class A, Class C, Class R, Class Y, Class R5 and Class R6 shares was
| | | | |
| |
Average Annual Total Returns | |
As of 9/30/18, the most recent calendar quarter end, including maximum applicable sales charges | |
| |
Class A Shares | | | | |
Inception (5/31/11) | | | -2.34 | % |
5 Years | | | 2.29 | |
1 Year | | | -9.14 | |
| |
Class C Shares | | | | |
Inception (5/31/11) | | | -2.32 | % |
5 Years | | | 2.69 | |
1 Year | | | -5.57 | |
| |
Class R Shares | | | | |
Inception (5/31/11) | | | -1.86 | % |
5 Years | | | 3.16 | |
1 Year | | | -4.19 | |
| |
Class Y Shares | | | | |
Inception (5/31/11) | | | -1.37 | % |
5 Years | | | 3.71 | |
1 Year | | | -3.69 | |
| |
Class R5 Shares | | | | |
Inception (5/31/11) | | | -1.37 | % |
5 Years | | | 3.72 | |
1 Year | | | -3.68 | |
| |
Class R6 Shares | | | | |
Inception | | | -1.41 | % |
5 Years | | | 3.69 | |
1 Year | | | -3.57 | |
2.46%, 3.21%, 2.71%, 2.21%, 1.92% and 1.92%, respectively. The expense ratios presented above may vary from the expense ratios presented in other sections of this report that are based on expenses incurred during the period covered by this report.
Class A share performance reflects the maximum 5.50% sales charge, and Class C share performance reflects the applicable contingent deferred sales charge (CDSC) for the period involved. The CDSC on Class C shares is 1% for the first year after purchase. Class R, Class Y, Class R5 and Class R6 shares do not have a front-end sales charge or a CDSC; therefore, performance is at net asset value.
The performance of the Fund’s share classes will differ primarily due to different sales charge structures and class expenses.
Fund performance reflects any applicable fee waivers and/or expense reimbursements. Had the adviser not waived fees and/or reimbursed expenses currently or in the past, returns would have been lower. See current prospectus for more information.
| 1 | Total annual Fund operating expenses after any contractual fee waivers and/or expense reimbursements by the adviser in effect through at least February 29, 2020. See current prospectus for more information. |
7 Invesco Emerging Markets Equity Fund
Invesco Emerging Markets Equity Fund’s investment objective is long-term growth of capital.
| ∎ | | Unless otherwise stated, information presented in this report is as of October 31, 2018, and is based on total net assets. |
| ∎ | | Unless otherwise noted, all data provided by Invesco. |
| ∎ | | To access your Fund’s reports/prospectus, visit invesco.com/fundreports. |
About share classes
| ∎ | | Class R shares are generally available only to employer sponsored retirement and benefit plans. Please see the prospectus for more information. |
| ∎ | | Class Y shares are available only to certain investors. Please see the prospectus for more information. |
| ∎ | | Class R5 shares and Class R6 shares are available for use by retirement plans that meet certain standards and for institutional investors. Class R6 shares are also available through intermediaries that have established an agreement with Invesco Distributors, Inc. to make such shares available for use in retail omnibus accounts. Please see the prospectus for more information. |
Principal risks of investing in the Fund
| ∎ | | Active trading risk. Active trading of portfolio securities may result in added expenses, a lower return and increased tax liability. |
| ∎ | | Depositary receipts risk. Investing in depositary receipts involves the same risks as direct investments in foreign securities. In addition, the underlying issuers of certain depositary receipts are under no obligation to distribute shareholder communications or pass through any voting rights with respect to the deposited securities to the holders of such receipts. The Fund may therefore receive less timely information or have less control than if it invested directly in the foreign issuer. |
∎ Emerging markets securities risk. Emerging markets (also referred to as developing markets) are generally subject to greater market volatility, political, social and economic instability, uncertain trading markets and more governmental limitations on foreign investment than more developed markets. In addition, companies operating in emerging markets may be subject to lower trading volume and greater price fluctuations than companies in more developed markets. Securities law and
| | the enforcement of systems of taxation in many emerging market countries may change quickly and unpredictably. The Fund’s investments in China A- shares are subject to trading restrictions, quota limitations and clearing and settlement risks. In addition, investments in emerging markets securities may also be subject to additional transaction costs, delays in settlement procedures, and lack of timely information. |
| ∎ | | Foreign securities risk. The Fund’s foreign investments may be adversely affected by political and social instability, changes in economic or taxation policies, difficulty in enforcing obligations, decreased liquidity or increased volatility. Foreign investments also involve the risk of the possible seizure, nationalization or expropriation of the issuer or foreign deposits (in which the Fund could lose its entire investments in a certain market) and the possible adoption of foreign governmental restrictions such as exchange controls. Unless the Fund has hedged its foreign securities risk, foreign securities risk also involves the risk of negative foreign currency rate fluctuations, which may cause the value of securities denominated in such foreign currency (or other instruments through which the Fund has exposure to foreign currencies) to decline in value. Currency exchange rates may fluctuate significantly over short periods of time. Currency hedging strategies, if used, are not always successful. |
| ∎ | | Geographic focus risk. The Fund may from time to time invest a substantial amount of its assets in securities of issuers located in a single country or a limited number of countries. Adverse economic, political or social conditions in those countries may therefore have a significant negative impact on the Fund’s investment performance. |
∎ Management risk. The Fund is actively managed and depends heavily on the Adviser’s judgment about markets, interest rates or the attractiveness, relative
This report must be accompanied or preceded by a currently effective Fund prospectus, which contains more complete information, including sales charges and expenses. Investors should read it carefully before investing.
NOT FDIC INSURED | MAY LOSE VALUE | NO BANK GUARANTEE
| | values, liquidity, or potential appreciation of particular investments made for the Fund’s portfolio. The Fund could experience losses if these judgments prove to be incorrect. Additionally, legislative, regulatory, or tax developments may adversely affect management of the Fund and, therefore, the ability of the Fund to achieve its investment objective. |
| ∎ | | Market risk. The market values of the Fund’s investments, and therefore the value of the Fund’s shares, will go up and down, sometimes rapidly or unpredictably. Market risk may affect a single issuer, industry or section of the economy, or it may affect the market as a whole. Individual stock prices tend to go up and down more dramatically than those of certain other types of investments, such as bonds. During a general downturn in the financial markets, multiple asset classes may decline in value. When markets perform well, there can be no assurance that specific investments held by the Fund will rise in value. |
| ∎ | | Preferred securities risk. Preferred securities are subject to issuer-specific and market risks applicable generally to equity securities. Preferred securities also may be subordinated to bonds or other debt instruments, subjecting them to a greater risk of non-payment, may be less liquid than many other securities, such as common stocks, and generally offer no voting rights with respect to the issuer. |
∎ Sector focus risk. The Fund may from time to time invest a significant amount of its assets (i.e. over 25%) in one market sector or group of related industries. In this event, the Fund’s performance will depend to a greater extent on the overall condition of the sector or group of industries and there is increased risk that the Fund will lose significant value if conditions adversely affect that sector or group of industries.
∎ Small- and mid-capitalization companies risks. Small- and mid-capitalization companies tend to be more vulnerable to changing market conditions, may have little or no operating history or track record of success, and may have more limited product lines and markets, less experienced management
| | |
| 8 | | Invesco Emerging Markets Equity Fund |
| | and fewer financial resources than larger companies. These companies’ securities may be more volatile and less liquid than those of more established companies, and their returns may vary, sometimes significantly, from the overall securities market. |
| ∎ | | Value investing style risk. A value investing style subjects the Fund to the risk that the valuations never improve or that the returns on value equity securities are less than returns on other styles of investing or the overall stock market. |
About indexes used in this report
| ∎ | | The MSCI EAFE® Index is an unmanaged index considered representative of stocks of Europe, Australasia and the Far East. The index is computed using the net return, which withholds applicable taxes for non-resident investors. |
| ∎ | | The MSCI Emerging Markets IndexSM is an unmanaged index considered representative of stocks of developing countries. The index is computed using the net return, which withholds applicable taxes for non-resident investors. |
| ∎ | | The Lipper Emerging Market Funds Index is an unmanaged index considered representative of emerging market funds tracked by Lipper. |
| ∎ | | The Fund is not managed to track the performance of any particular index, including the index(es) described here, and consequently, the performance of the Fund may deviate significantly from the performance of the index(es). | |
| ∎ | | A direct investment cannot be made in an index. Unless otherwise indicated, |
| | | index results include reinvested dividends, and they do not reflect sales charges. Performance of the peer group, if applicable, reflects fund expenses; performance of a market index does not. |
Other information
| ∎ | | The returns shown in management’s discussion of Fund performance are based on net asset values (NAVs) calculated for shareholder transactions. Generally accepted accounting principles require adjustments to be made to the net assets of the Fund at period end for financial reporting purposes, and as such, the NAVs for shareholder transactions and the returns based on those NAVs may differ from the NAVs and returns reported in the Financial Highlights. |
| ∎ | | Industry classifications used in this report are generally according to the Global Industry Classification Standard, which was developed by and is the exclusive property and a service mark of MSCI Inc. and Standard & Poor’s. |
9 Invesco Emerging Markets Equity Fund
Schedule of Investments
October 31, 2018
| | | | | | | | |
| | | Shares | | | Value | |
Common Stocks & Other Equity Interests–97.45% | |
| Argentina–1.79% | |
MercadoLibre Inc. | | | 3,063 | | | $ | 993,943 | |
|
| Brazil–10.90% | |
Cielo S.A. | | | 917,100 | | | | 3,260,307 | |
Itau Unibanco Holding S.A.–Preference Shares | | | 87,900 | | | | 1,160,663 | |
Multiplus S.A. | | | 129,300 | | | | 870,686 | |
Natura Cosmeticos S.A. | | | 87,500 | | | | 760,144 | |
| | | | | | | | 6,051,800 | |
|
| Chile–5.75% | |
Liberty Latin America Ltd.–Class C(a) | | | 177,153 | | | | 3,190,525 | |
|
| China–29.03% | |
Alibaba Group Holding Ltd.–ADR(a) | | | 19,280 | | | | 2,743,158 | |
China Isotope & Radiation Corp.(a) | | | 513,400 | | | | 853,708 | |
Focus Media Information Technology Co., Ltd.–Class A | | | 1,205,718 | | | | 1,043,323 | |
Inner Mongolia Yili Industrial Group Co., Ltd.–Class A | | | 332,757 | | | | 1,058,278 | |
Kweichow Moutai Co., Ltd.–Class A | | | 28,173 | | | | 2,228,149 | |
Midea Group Co., Ltd.–Class A | | | 181,100 | | | | 961,836 | |
NetEase, Inc.–ADR | | | 716 | | | | 148,821 | |
New Oriental Education & Technology Group, Inc.–ADR(a) | | | 7,142 | | | | 417,878 | |
Ping An Insurance (Group) Co. of China Ltd.–Class H | | | 245,500 | | | | 2,323,403 | |
Shandong Weigao Group Medical Polymer Co. Ltd.–Class H | | | 1,060,000 | | | | 947,545 | |
Sinopharm Group Co. Ltd.–Class H | | | 124,400 | | | | 602,628 | |
Tencent Holdings Ltd. | | | 51,500 | | | | 1,745,595 | |
Vipshop Holdings Ltd.–ADR(a) | | | 213,281 | | | | 1,036,546 | |
| | | | | | | | 16,110,868 | |
|
| Egypt–1.92% | |
Eastern Tobacco | | | 1,184,405 | | | | 1,063,453 | |
|
| India–3.81% | |
Housing Development Finance Corp. Ltd. | | | 66,214 | | | | 1,587,491 | |
Zee Entertainment Enterprises Ltd. | | | 85,694 | | | | 524,258 | |
| | | | | | | | 2,111,749 | |
|
| Indonesia–2.85% | |
PT Bank Central Asia Tbk | | | 191,700 | | | | 298,221 | |
PT Bank Rakyat Indonesia (Persero) Tbk | | | 2,324,100 | | | | 482,496 | |
PT Media Nusantara Citra Tbk | | | 15,608,700 | | | | 802,378 | |
| | | | | | | | 1,583,095 | |
|
| Kenya–1.56% | |
East African Breweries Ltd. | | | 509,200 | | | | 867,785 | |
| | | | | | | | |
| | | Shares | | | Value | |
| Malaysia–0.74% | |
Genting Malaysia Bhd. | | | 297,900 | | | $ | 320,108 | |
Public Bank Bhd. | | | 15,000 | | | | 88,250 | |
| | | | | | | | 408,358 | |
|
| Mexico–3.21% | |
Arca Continental S.A.B. de C.V. | | | 198,300 | | | | 995,734 | |
Fomento Economico Mexicano, S.A.B. de C.V.–ADR | | | 9,208 | | | | 783,325 | |
| | | | | | | | 1,779,059 | |
|
| Nigeria–1.61% | |
Nigerian Breweries PLC | | | 3,926,492 | | | | 891,303 | |
|
| Philippines–1.24% | |
Bank of the Philippine Islands | | | 448,740 | | | | 689,793 | |
|
| Poland–1.53% | |
Benefit Systems S.A.(a) | | | 3,727 | | | | 848,911 | |
|
| Russia–7.14% | |
Moscow Exchange MICEX-RTS PJSC | | | 963,872 | | | | 1,286,163 | |
Sberbank of Russia PJSC–ADR | | | 51,219 | | | | 598,750 | |
Sberbank of Russia PJSC–ADR | | | 102,211 | | | | 1,201,422 | |
Yandex N.V.–Class A(a) | | | 29,118 | | | | 877,325 | |
| | | | | | | | 3,963,660 | |
|
| South Africa–5.11% | |
AVI Ltd. | | | 12,710 | | | | 86,155 | |
Clicks Group Ltd. | | | 34,567 | | | | 440,508 | |
Naspers Ltd.–Class N | | | 13,188 | | | | 2,309,948 | |
| | | | | | | | 2,836,611 | |
|
| South Korea–8.42% | |
Amorepacific Corp.–Preference Shares | | | 10,345 | | | | 814,892 | |
CJ ENM Co., Ltd. | | | 420 | | | | 83,523 | |
Muhak Co., Ltd. | | | 78,443 | | | | 803,644 | |
NAVER Corp. | | | 7,478 | | | | 754,690 | |
Samsung Electronics Co., Ltd.–Preference Shares | | | 70,390 | | | | 2,218,131 | |
| | | | | | | | 4,674,880 | |
|
| Taiwan–5.46% | |
King Slide Works Co., Ltd. | | | 72,000 | | | | 751,901 | |
Taiwan Semiconductor Manufacturing Co., Ltd. | | | 307,000 | | | | 2,280,898 | |
| | | | | | | | 3,032,799 | |
|
| Thailand–4.27% | |
Kasikornbank PCL | | | 155,800 | | | | 939,246 | |
Sea Ltd.–ADR(a) | | | 35,910 | | | | 468,626 | |
Thai Beverage PCL | | | 2,130,900 | | | | 963,639 | |
| | | | | | | | 2,371,511 | |
See accompanying Notes to Financial Statements which are an integral part of the financial statements.
10 Invesco Emerging Markets Equity Fund
| | | | | | | | |
| | | Shares | | | Value | |
| Turkey–1.11% | |
Ulker Biskuvi Sanayi A.S. | | | 231,607 | | | $ | 614,494 | |
Total Common Stocks & Other Equity Interests
(Cost $65,332,222) | | | | 54,084,597 | |
|
Money Market Funds–1.31% | |
Invesco Government & Agency Portfolio–Institutional Class, 2.08%(b) | | | 254,709 | | | | 254,709 | |
Invesco Liquid Assets Portfolio–Institutional Class, 2.27%(b) | | | 181,847 | | | | 181,883 | |
Invesco Treasury Portfolio–Institutional Class, 2.09%(b) | | | 291,096 | | | | 291,096 | |
Total Money Market Funds
(Cost $727,718) | | | | 727,688 | |
TOTAL INVESTMENTS IN SECURITIES–98.76% (Cost $66,059,940) | | | | | | | 54,812,285 | |
OTHER ASSETS LESS LIABILITIES–1.24% | | | | 687,238 | |
NET ASSETS–100.00% | | | $ | 55,499,523 | |
Investment Abbreviations:
| | |
| ADR | | – American Depositary Receipt |
Notes to Schedule of Investments:
| (a) | Non-income producing security. |
| (b) | The money market fund and the Fund are affiliated by having the same investment adviser. The rate shown is the 7-day SEC standardized yield as of October 31, 2018. |
See accompanying Notes to Financial Statements which are an integral part of the financial statements.
11 Invesco Emerging Markets Equity Fund
Statement of Assets and Liabilities
October 31, 2018
| | | | |
Assets: | | | | |
Investments in securities, at value (Cost $65,332,222) | | $ | 54,084,597 | |
Investments in affiliated money market funds, at value (Cost $727,718) | | | 727,688 | |
Cash | | | 41,973 | |
Foreign currencies, at value (Cost $110,302) | | | 109,747 | |
Receivable for: | | | | |
Investments sold | | | 721,214 | |
Fund shares sold | | | 81,714 | |
Dividends | | | 59,402 | |
Investment for trustee deferred compensation and retirement plans | | | 20,766 | |
Other assets | | | 39,374 | |
Total assets | | | 55,886,475 | |
|
Liabilities: | |
Payable for: | | | | |
Investments purchased | | | 101,210 | |
Fund shares reacquired | | | 153,676 | |
Accrued fees to affiliates | | | 36,567 | |
Accrued trustees’ and officers’ fees and benefits | | | 1,697 | |
Accrued other operating expenses | | | 72,223 | |
Trustee deferred compensation and retirement plans | | | 21,579 | |
Total liabilities | | | 386,952 | |
Net assets applicable to shares outstanding | | $ | 55,499,523 | |
|
Net assets consist of: | |
Shares of beneficial interest | | $ | 63,985,576 | |
Distributable earnings | | | (8,486,053 | ) |
| | | $ | 55,499,523 | |
| | | | |
Net Assets: | |
Class A | | $ | 27,579,656 | |
Class C | | $ | 7,295,846 | |
Class R | | $ | 2,077,358 | |
Class Y | | $ | 16,696,640 | |
Class R5 | | $ | 1,623,189 | |
Class R6 | | $ | 226,834 | |
|
Shares outstanding, no par value,
with an unlimited number of shares authorized: | |
Class A | | | 3,593,997 | |
Class C | | | 984,883 | |
Class R | | | 273,719 | |
Class Y | | | 2,166,071 | |
Class R5 | | | 210,574 | |
Class R6 | | | 29,454 | |
Class A: | | | | |
Net asset value per share | | $ | 7.67 | |
Maximum offering price per share | | | | |
(Net asset value of $7.67 ¸ 94.50%) | | $ | 8.12 | |
Class C: | | | | |
Net asset value and offering price per share | | $ | 7.41 | |
Class R: | | | | |
Net asset value and offering price per share | | $ | 7.59 | |
Class Y: | | | | |
Net asset value and offering price per share | | $ | 7.71 | |
Class R5: | | | | |
Net asset value and offering price per share | | $ | 7.71 | |
Class R6: | | | | |
Net asset value and offering price per share | | $ | 7.70 | |
See accompanying Notes to Financial Statements which are an integral part of the financial statements.
12 Invesco Emerging Markets Equity Fund
Statement of Operations
For the year ended October 31, 2018
| | | | |
Investment income: | | | | |
Dividends (net of foreign withholding taxes of $121,571) | | $ | 1,235,452 | |
Dividends from affiliated money market funds | | | 23,687 | |
Total investment income | | | 1,259,139 | |
| |
Expenses: | | | | |
Advisory fees | | | 572,218 | |
Administrative services fees | | | 50,000 | |
Custodian fees | | | 66,671 | |
Distribution fees: | | | | |
Class A | | | 85,456 | |
Class C | | | 91,242 | |
Class R | | | 12,557 | |
Transfer agent fees — A, C, R and Y | | | 139,394 | |
Transfer agent fees — R5 | | | 125 | |
Transfer agent fees — R6 | | | 11 | |
Trustees’ and officers’ fees and benefits | | | 21,384 | |
Registration and filing fees | | | 94,967 | |
Reports to shareholders | | | 19,138 | |
Professional services fees | | | 100,105 | |
Other | | | 19,701 | |
Total expenses | | | 1,272,969 | |
Less: Fees waived, expenses reimbursed and expense offset arrangement(s) | | | (423,914 | ) |
Net expenses | | | 849,055 | |
Net investment income | | | 410,084 | |
| |
Realized and unrealized gain (loss) from: | | | | |
Net realized gain (loss) from: | | | | |
Investment securities (net of foreign taxes of $145,996) | | | 6,551,484 | |
Foreign currencies | | | (74,357 | ) |
| | | | 6,477,127 | |
Change in net unrealized appreciation (depreciation) of: | | | | |
Investment securities | | | (20,187,295 | ) |
Foreign currencies | | | (155 | ) |
| | | | (20,187,450 | ) |
Net realized and unrealized gain (loss) | | | (13,710,323 | ) |
Net increase (decrease) in net assets resulting from operations | | $ | (13,300,239 | ) |
See accompanying Notes to Financial Statements which are an integral part of the financial statements.
13 Invesco Emerging Markets Equity Fund
Statement of Changes in Net Assets
For the years ended October 31, 2018 and 2017
| | | | | | | | |
| | | 2018 | | | 2017 | |
Operations: | | | | | | | | |
Net investment income | | $ | 410,084 | | | $ | 84,389 | |
Net realized gain | | | 6,477,127 | | | | 1,767,893 | |
Change in net unrealized appreciation (depreciation) | | | (20,187,450 | ) | | | 6,895,427 | |
Net increase (decrease) in net assets resulting from operations | | | (13,300,239 | ) | | | 8,747,709 | |
| | |
Distributions to shareholders from distributable earnings:(1) | | | | | | | | |
Class A | | | (26,509 | ) | | | (11,076 | ) |
Class Y | | | (20,895 | ) | | | (17,401 | ) |
Class R5 | | | (4,874 | ) | | | (4,962 | ) |
Class R6 | | | (30 | ) | | | (22,501 | ) |
Total distributions from distributable earnings | | | (52,308 | ) | | | (55,940 | ) |
| | |
Share transactions–net: | | | | | | | | |
Class A | | | 10,481,220 | | | | 8,005,020 | |
Class C | | | 2,454,337 | | | | 2,423,355 | |
Class R | | | 375,244 | | | | 449,330 | |
Class Y | | | 12,898,628 | | | | 758,252 | |
Class R5 | | | 4,821 | | | | 4,962 | |
Class R6 | | | 275,011 | | | | (7,195,831 | ) |
Net increase in net assets resulting from share transactions | | | 26,489,261 | | | | 4,445,088 | |
Net increase in net assets | | | 13,136,714 | | | | 13,136,857 | |
| | |
Net assets: | | | | | | | | |
Beginning of year | | | 42,362,809 | | | | 29,225,952 | |
End of year | | $ | 55,499,523 | | | $ | 42,362,809 | |
| (1) | The Securities and Exchange Commission eliminated the requirement to disclose distribution components separately, except for tax return of capital. For the year ended October 31, 2017, distributions to shareholders from distributable earnings consisted of distributions from net investment income. |
Notes to Financial Statements
October 31, 2018
NOTE 1—Significant Accounting Policies
Invesco Emerging Markets Equity Fund (the “Fund”) is a series portfolio of AIM Investment Funds (Invesco Investment Funds) (the “Trust”). The Trust is organized as a Delaware statutory trust and is registered under the Investment Company Act of 1940, as amended (the “1940 Act”), as an open-end series management investment company authorized to issue an unlimited number of shares of beneficial interest. Information presented in these financial statements pertains only to the Fund. Matters affecting the Fund or each class will be voted on exclusively by the shareholders of the Fund or each class.
The Fund’s investment objective is long-term growth of capital.
The Fund currently consists of six different classes of shares: Class A, Class C, Class R, Class Y, Class R5 and Class R6. Class Y shares are available only to certain investors. Class A shares are sold with a front-end sales charge unless certain waiver criteria are met. Under certain circumstances, load waived shares may be subject to contingent deferred sales charges (“CDSC”). Class C shares are sold with a CDSC. Class R, Class Y, Class R5 and Class R6 shares are sold at net asset value.
The Fund is an investment company and accordingly follows the investment company accounting and reporting guidance in accordance with Financial Accounting Standards Board Accounting Standards Codification Topic 946, Financial Services — Investment Companies.
The following is a summary of the significant accounting policies followed by the Fund in the preparation of its financial statements.
| A. | Security Valuations — Securities, including restricted securities, are valued according to the following policy. |
A security listed or traded on an exchange (except convertible securities) is valued at its last sales price or official closing price as of the close of the customary trading session on the exchange where the security is principally traded, or lacking any sales or official closing price on a particular day, the security may be valued at the closing bid price on that day. Securities traded in the over-the-counter market are valued based on prices furnished by independent pricing services or market makers. When such securities are valued by an independent pricing service they may be considered fair valued. Futures contracts are valued at the final settlement price set by an exchange on which they are principally traded. Listed options are valued at the mean between the last bid and asked prices from the exchange on which they are principally traded. Options not listed on an exchange are valued by an independent source at the mean between the last bid and asked prices. For purposes of determining net asset value (“NAV”) per share, futures and option contracts generally are valued 15 minutes after the close of the customary trading session of the New York Stock Exchange (“NYSE”).
14 Invesco Emerging Markets Equity Fund
Investments in open-end and closed-end registered investment companies that do not trade on an exchange are valued at the end-of-day net asset value per share. Investments in open-end and closed-end registered investment companies that trade on an exchange are valued at the last sales price or official closing price as of the close of the customary trading session on the exchange where the security is principally traded.
Debt obligations (including convertible securities) and unlisted equities are fair valued using an evaluated quote provided by an independent pricing service. Evaluated quotes provided by the pricing service may be determined without exclusive reliance on quoted prices, and may reflect appropriate factors such as institution-size trading in similar groups of securities, developments related to specific securities, dividend rate (for unlisted equities), yield (for debt obligations), quality, type of issue, coupon rate (for debt obligations), maturity (for debt obligations), individual trading characteristics and other market data. Pricing services generally value debt obligations assuming orderly transactions of institutional round lot size, but a fund may hold or transact in the same securities in smaller, odd lot sizes. Odd lots often trade at lower prices than institutional round lots. Debt obligations are subject to interest rate and credit risks. In addition, all debt obligations involve some risk of default with respect to interest and/or principal payments.
Foreign securities’ (including foreign exchange contracts) prices are converted into U.S. dollar amounts using the applicable exchange rates as of the close of the NYSE. If market quotations are available and reliable for foreign exchange-traded equity securities, the securities will be valued at the market quotations. Because trading hours for certain foreign securities end before the close of the NYSE, closing market quotations may become unreliable. If between the time trading ends on a particular security and the close of the customary trading session on the NYSE, events occur that the investment adviser determines are significant and make the closing price unreliable, the Fund may fair value the security. If the event is likely to have affected the closing price of the security, the security will be valued at fair value in good faith using procedures approved by the Board of Trustees. Adjustments to closing prices to reflect fair value may also be based on a screening process of an independent pricing service to indicate the degree of certainty, based on historical data, that the closing price in the principal market where a foreign security trades is not the current value as of the close of the NYSE. Foreign securities’ prices meeting the approved degree of certainty that the price is not reflective of current value will be priced at the indication of fair value from the independent pricing service. Multiple factors may be considered by the independent pricing service in determining adjustments to reflect fair value and may include information relating to sector indices, American Depositary Receipts and domestic and foreign index futures. Foreign securities may have additional risks including exchange rate changes, potential for sharply devalued currencies and high inflation, political and economic upheaval, the relative lack of issuer information, relatively low market liquidity and the potential lack of strict financial and accounting controls and standards.
Securities for which market prices are not provided by any of the above methods may be valued based upon quotes furnished by independent sources. The last bid price may be used to value equity securities. The mean between the last bid and asked prices is used to value debt obligations, including corporate loans.
Securities for which market quotations are not readily available or became unreliable are valued at fair value as determined in good faith by or under the supervision of the Trust’s officers following procedures approved by the Board of Trustees. Issuer specific events, market trends, bid/asked quotes of brokers and information providers and other market data may be reviewed in the course of making a good faith determination of a security’s fair value.
The Fund may invest in securities that are subject to interest rate risk, meaning the risk that the prices will generally fall as interest rates rise and, conversely, the prices will generally rise as interest rates fall. Specific securities differ in their sensitivity to changes in interest rates depending on their individual characteristics. Changes in interest rates may result in increased market volatility, which may affect the value and/or liquidity of certain Fund investments.
Valuations change in response to many factors including the historical and prospective earnings of the issuer, the value of the issuer’s assets, general economic conditions, interest rates, investor perceptions and market liquidity. Because of the inherent uncertainties of valuation, the values reflected in the financial statements may materially differ from the value received upon actual sale of those investments.
| B. | Securities Transactions and Investment Income — Securities transactions are accounted for on a trade date basis. Realized gains or losses on sales are computed on the basis of specific identification of the securities sold. Interest income (net of withholding tax, if any) is recorded on the accrual basis from settlement date. Dividend income (net of withholding tax, if any) is recorded on the ex-dividend date. |
The Fund may periodically participate in litigation related to Fund investments. As such, the Fund may receive proceeds from litigation settlements. Any proceeds received are included in the Statement of Operations as realized gain (loss) for investments no longer held and as unrealized gain (loss) for investments still held.
Brokerage commissions and mark ups are considered transaction costs and are recorded as an increase to the cost basis of securities purchased and/or a reduction of proceeds on a sale of securities. Such transaction costs are included in the determination of net realized and unrealized gain (loss) from investment securities reported in the Statement of Operations and the Statement of Changes in Net Assets and the net realized and unrealized gains (losses) on securities per share in the Financial Highlights. Transaction costs are included in the calculation of the Fund’s net asset value and, accordingly, they reduce the Fund’s total returns. These transaction costs are not considered operating expenses and are not reflected in net investment income reported in the Statement of Operations and the Statement of Changes in Net Assets, or the net investment income per share and the ratios of expenses and net investment income reported in the Financial Highlights, nor are they limited by any expense limitation arrangements between the Fund and the investment adviser.
The Fund allocates income and realized and unrealized capital gains and losses to a class based on the relative net assets of each class.
| C. | Country Determination — For the purposes of making investment selection decisions and presentation in the Schedule of Investments, the investment adviser may determine the country in which an issuer is located and/or credit risk exposure based on various factors. These factors include the laws of the country under which the issuer is organized, where the issuer maintains a principal office, the country in which the issuer derives 50% or more of its total revenues and the country that has the primary market for the issuer’s securities, as well as other criteria. Among the other criteria that may be evaluated for making this determination are the country in which the issuer maintains 50% or more of its assets, the type of security, financial guarantees and enhancements, the nature of the collateral and the sponsor organization. Country of issuer and/or credit risk exposure has been determined to be the United States of America, unless otherwise noted. |
| D. | Distributions — Distributions from net investment income and net realized capital gain, if any, are generally declared and paid annually and recorded on the ex-dividend date. The Fund may elect to treat a portion of the proceeds from redemptions as distributions for federal income tax purposes. |
15 Invesco Emerging Markets Equity Fund
| E. | Federal Income Taxes — The Fund intends to comply with the requirements of Subchapter M of the Internal Revenue Code of 1986, as amended (the “Internal Revenue Code”), necessary to qualify as a regulated investment company and to distribute substantially all of the Fund’s taxable earnings to shareholders. As such, the Fund will not be subject to federal income taxes on otherwise taxable income (including net realized capital gain) that is distributed to shareholders. Therefore, no provision for federal income taxes is recorded in the financial statements. |
The Fund recognizes the tax benefits of uncertain tax positions only when the position is more likely than not to be sustained. Management has analyzed the Fund’s uncertain tax positions and concluded that no liability for unrecognized tax benefits should be recorded related to uncertain tax positions. Management is not aware of any tax positions for which it is reasonably possible that the total amounts of unrecognized tax benefits will change materially in the next 12 months.
The Fund files tax returns in the U.S. Federal jurisdiction and certain other jurisdictions. Generally, the Fund is subject to examinations by such taxing authorities for up to three years after the filing of the return for the tax period.
| F. | Expenses — Fees provided for under the Rule 12b-1 plan of a particular class of the Fund are charged to the operations of such class. Transfer agency fees and expenses and other shareholder recordkeeping fees and expenses attributable to Class R5 and Class R6 are allocated to each share class based on relative net assets. Sub-accounting fees attributable to Class R5 are charged to the operations of the class. Transfer agency fees and expenses and other shareholder recordkeeping fees and expenses relating to all other classes are allocated among those classes based on relative net assets. All other expenses are allocated among the classes based on relative net assets. |
| G. | Accounting Estimates — The preparation of financial statements in conformity with accounting principles generally accepted in the United States of America (“GAAP”) requires management to make estimates and assumptions that affect the reported amounts of assets and liabilities at the date of the financial statements and the reported amounts of revenues and expenses during the reporting period including estimates and assumptions related to taxation. Actual results could differ from those estimates by a significant amount. In addition, the Fund monitors for material events or transactions that may occur or become known after the period-end date and before the date the financial statements are released to print. |
| H. | Indemnifications — Under the Trust’s organizational documents, each Trustee, officer, employee or other agent of the Trust is indemnified against certain liabilities that may arise out of the performance of their duties to the Fund. Additionally, in the normal course of business, the Fund enters into contracts, including the Fund’s servicing agreements, that contain a variety of indemnification clauses. The Fund’s maximum exposure under these arrangements is unknown as this would involve future claims that may be made against the Fund that have not yet occurred. The risk of material loss as a result of such indemnification claims is considered remote. |
| I. | Foreign Currency Translations — Foreign currency is valued at the close of the NYSE based on quotations posted by banks and major currency dealers. Portfolio securities and other assets and liabilities denominated in foreign currencies are translated into U.S. dollar amounts at the date of valuation. Purchases and sales of portfolio securities (net of foreign taxes withheld on disposition) and income items denominated in foreign currencies are translated into U.S. dollar amounts on the respective dates of such transactions. The Fund does not separately account for the portion of the results of operations resulting from changes in foreign exchange rates on investments and the fluctuations arising from changes in market prices of securities held. The combined results of changes in foreign exchange rates and the fluctuation of market prices on investments (net of estimated foreign tax withholding) are included with the net realized and unrealized gain or loss from investments in the Statement of Operations. Reported net realized foreign currency gains or losses arise from (1) sales of foreign currencies, (2) currency gains or losses realized between the trade and settlement dates on securities transactions, and (3) the difference between the amounts of dividends, interest, and foreign withholding taxes recorded on the Fund’s books and the U.S. dollar equivalent of the amounts actually received or paid. Net unrealized foreign currency gains and losses arise from changes in the fair values of assets and liabilities, other than investments in securities at fiscal period end, resulting from changes in exchange rates. |
The Fund may invest in foreign securities, which may be subject to foreign taxes on income, gains on investments or currency repatriation, a portion of which may be recoverable. Foreign taxes, if any, are recorded based on the tax regulations and rates that exist in the foreign markets in which the Fund invests and are shown in the Statement of Operations.
| J. | Forward Foreign Currency Contracts — The Fund may engage in foreign currency transactions either on a spot (i.e. for prompt delivery and settlement) basis, or through forward foreign currency contracts, to manage or minimize currency or exchange rate risk. |
The Fund may also enter into forward foreign currency contracts for the purchase or sale of a security denominated in a foreign currency in order to “lock in” the U.S. dollar price of that security, or the Fund may also enter into forward foreign currency contracts that do not provide for physical settlement of the two currencies, but instead are settled by a single cash payment calculated as the difference between the agreed upon exchange rate and the spot rate at settlement based upon an agreed upon notional amount (non-deliverable forwards). The Fund will set aside liquid assets in an amount equal to the daily mark-to-market obligation for forward foreign currency contracts.
A forward foreign currency contract is an obligation between two parties (“Counterparties”) to purchase or sell a specific currency for an agreed-upon price at a future date. The use of forward foreign currency contracts does not eliminate fluctuations in the price of the underlying securities the Fund owns or intends to acquire but establishes a rate of exchange in advance. Fluctuations in the value of these contracts are measured by the difference in the contract date and reporting date exchange rates and are recorded as unrealized appreciation (depreciation) until the contracts are closed. When the contracts are closed, realized gains (losses) are recorded. Realized and unrealized gains (losses) on the contracts are included in the Statement of Operations. The primary risks associated with forward foreign currency contracts include failure of the Counterparty to meet the terms of the contract and the value of the foreign currency changing unfavorably. These risks may be in excess of the amounts reflected in the Statement of Assets and Liabilities.
16 Invesco Emerging Markets Equity Fund
NOTE 2—Advisory Fees and Other Fees Paid to Affiliates
The Trust has entered into a master investment advisory agreement with Invesco Advisers, Inc. (the “Adviser” or “Invesco”). Under the terms of the investment advisory agreement, the Fund accrues daily and pays monthly an advisory fee to the Adviser based on the annual rate of the Fund’s average daily net assets as follows:
| | | | | | | | |
| Average Daily Net Assets | | Rate | |
First $250 million | | | 0 | .935% | | | | |
Next $250 million | | | 0 | .91% | | | | |
Next $500 million | | | 0 | .885% | | | | |
Next $1.5 billion | | | 0 | .86% | | | | |
Next $2.5 billion | | | 0 | .835% | | | | |
Next $2.5 billion | | | 0 | .81% | | | | |
Next $2.5 billion | | | 0 | .785 | | | | |
Over $10 billion | | | 0 | .76% | | | | |
For the year ended October 31, 2018, the effective advisory fees incurred by the Fund was 0.935%.
Under the terms of a master sub-advisory agreement between the Adviser and each of Invesco Asset Management Deutschland GmbH, Invesco Asset Management Limited, Invesco Asset Management (Japan) Limited, Invesco Hong Kong Limited, Invesco Senior Secured Management, Inc. and Invesco Canada Ltd. and separate sub-advisory agreements with Invesco Capital Management LLC, formerly Invesco PowerShares Capital Management LLC, and Invesco Asset Management (India) Private Limited (collectively, the “Affiliated Sub-Advisers”) the Adviser, not the Fund, will pay 40% of the fees paid to the Adviser to any such Affiliated Sub-Adviser(s) that provide(s) discretionary investment management services to the Fund based on the percentage of assets allocated to such Affiliated Sub-Adviser(s).
The Adviser has contractually agreed, through at least February 29, 2020, to waive advisory fees and/or reimburse expenses to the extent necessary to limit total annual fund operating expenses after fee waiver and/or expense reimbursement (excluding certain items discussed below) of Class A, Class C, Class R, Class Y, Class R5 and Class R6 shares to 1.33%, 2.08%, 1.58%, 1.08%, 1.08% and 1.08%, respectively, of the Fund’s average daily net assets (the “expense limits”). In determining the Adviser’s obligation to waive advisory fees and/or reimburse expenses, the following expenses are not taken into account, and could cause the total annual fund operating expenses after fee waiver and/or expense reimbursement to exceed the numbers reflected above: (1) interest; (2) taxes; (3) dividend expense on short sales; (4) extraordinary or non-routine items, including litigation expenses; and (5) expenses that the Fund has incurred but did not actually pay because of an expense offset arrangement. Unless Invesco continues the fee waiver agreement, it will terminate on February 29, 2020. During its term, the fee waiver agreement cannot be terminated or amended to increase the expense limits or reduce the advisory fee waiver without approval of the Board of Trustees.
Further, the Adviser has contractually agreed, through at least June 30, 2020, to waive the advisory fee payable by the Fund in an amount equal to 100% of the net advisory fees the Adviser receives from the affiliated money market funds on investments by the Fund of uninvested cash in such affiliated money market funds.
For the year ended October 31, 2018, the Adviser waived advisory fees of $284,384 and reimbursed class level expenses of $79,469, $21,212, $5,839, $30,726, $125 and $11 of Class A, Class C, Class R, Class Y, Class R5 and Class R6 shares, respectively.
The Trust has entered into a master administrative services agreement with Invesco pursuant to which the Fund has agreed to pay Invesco for certain administrative costs incurred in providing accounting services to the Fund. For the year ended October 31, 2018, expenses incurred under the agreement are shown in the Statement of Operations as Administrative services fees.
The Trust has entered into a transfer agency and service agreement with Invesco Investment Services, Inc. (“IIS”) pursuant to which the Fund has agreed to pay IIS a fee for providing transfer agency and shareholder services to the Fund and reimburse IIS for certain expenses incurred by IIS in the course of providing such services. IIS may make payments to intermediaries that provide omnibus account services, sub-accounting services and/or networking services. All fees payable by IIS to intermediaries that provide omnibus account services or sub-accounting services are charged back to the Fund, subject to certain limitations approved by the Trust’s Board of Trustees. For the year ended October 31, 2018, expenses incurred under the agreement are shown in the Statement of Operations as Transfer agent fees.
The Trust has entered into master distribution agreements with Invesco Distributors, Inc. (“IDI”) to serve as the distributor for the Class A, Class C, Class R, Class Y, Class R5 and Class R6 shares of the Fund. The Trust has adopted plans pursuant to Rule 12b-1 under the 1940 Act with respect to the Fund’s Class A, Class C and Class R shares (collectively the “Plans”). The Fund, pursuant to the Plans, pays IDI compensation at the annual rate of 0.25% of the Fund’s average daily net assets of Class A shares, 1.00% of the average daily net assets of Class C shares and 0.50% of the average daily net assets of Class R shares. The fees are accrued daily and paid monthly. Of the Plan payments, up to 0.25% of the average daily net assets of each class of shares may be paid to furnish continuing personal shareholder services to customers who purchase and own shares of such classes. Any amounts not paid as a service fee under the Plans would constitute an asset-based sales charge. Rules of the Financial Industry Regulatory Authority (“FINRA”) impose a cap on the total sales charges, including asset-based sales charges, that may be paid by any class of shares of the Fund. For the year ended October 31, 2018, expenses incurred under the Plans are shown in the Statement of Operations as Distribution fees.
Front-end sales commissions and CDSC (collectively, the “sales charges”) are not recorded as expenses of the Fund. Front-end sales commissions are deducted from proceeds from the sales of Fund shares prior to investment in Class A shares of the Fund. CDSC are deducted from redemption proceeds prior to remittance to the shareholder. During the year ended October 31, 2018, IDI advised the Fund that IDI retained $26,674 in front-end sales commissions from the sale of Class A shares and $788 and $1,426 from Class A and Class C shares, respectively, for CDSC imposed upon redemptions by shareholders.
Certain officers and trustees of the Trust are officers and directors of the Adviser, IIS and/or IDI.
17 Invesco Emerging Markets Equity Fund
NOTE 3—Additional Valuation Information
GAAP defines fair value as the price that would be received to sell an asset or paid to transfer a liability in an orderly transaction between market participants at the measurement date, under current market conditions. GAAP establishes a hierarchy that prioritizes the inputs to valuation methods, giving the highest priority to readily available unadjusted quoted prices in an active market for identical assets (Level 1) and the lowest priority to significant unobservable inputs (Level 3), generally when market prices are not readily available or are unreliable. Based on the valuation inputs, the securities or other investments are tiered into one of three levels. Changes in valuation methods may result in transfers in or out of an investment’s assigned level:
| | Level 1 — | Prices are determined using quoted prices in an active market for identical assets. |
| | Level 2 — | Prices are determined using other significant observable inputs. Observable inputs are inputs that other market participants may use in pricing a security. These may include quoted prices for similar securities, interest rates, prepayment speeds, credit risk, yield curves, loss severities, default rates, discount rates, volatilities and others. |
| | Level 3 — | Prices are determined using significant unobservable inputs. In situations where quoted prices or observable inputs are unavailable (for example, when there is little or no market activity for an investment at the end of the period), unobservable inputs may be used. Unobservable inputs reflect the Fund’s own assumptions about the factors market participants would use in determining fair value of the securities or instruments and would be based on the best available information. |
The following is a summary of the tiered valuation input levels, as of October 31, 2018. The level assigned to the securities valuations may not be an indication of the risk or liquidity associated with investing in those securities. Because of the inherent uncertainties of valuation, the values reflected in the financial statements may materially differ from the value received upon actual sale of those investments.
| | | | | | | | | | | | | | | | |
| | | Level 1 | | | Level 2 | | | Level 3 | | | Total | |
Investments in Securities | | | | | | | | | | | | | | | | |
Argentina | | $ | 993,943 | | | $ | — | | | $ | — | | | $ | 993,943 | |
Brazil | | | 6,051,800 | | | | — | | | | — | | | | 6,051,800 | |
Chile | | | 3,190,525 | | | | — | | | | — | | | | 3,190,525 | |
China | | | 7,109,492 | | | | 9,001,376 | | | | — | | | | 16,110,868 | |
Egypt | | | 1,063,453 | | | | — | | | | — | | | | 1,063,453 | |
India | | | — | | | | 2,111,749 | | | | — | | | | 2,111,749 | |
Indonesia | | | 298,221 | | | | 1,284,874 | | | | — | | | | 1,583,095 | |
Kenya | | | 867,785 | | | | — | | | | — | | | | 867,785 | |
Malaysia | | | — | | | | 408,358 | | | | — | | | | 408,358 | |
Mexico | | | 1,779,059 | | | | — | | | | — | | | | 1,779,059 | |
Nigeria | | | 891,303 | | | | — | | | | — | | | | 891,303 | |
Philippines | | | — | | | | 689,793 | | | | — | | | | 689,793 | |
Poland | | | 848,911 | | | | — | | | | — | | | | 848,911 | |
Russia | | | 1,476,075 | | | | 2,487,585 | | | | — | | | | 3,963,660 | |
South Africa | | | 526,663 | | | | 2,309,948 | | | | — | | | | 2,836,611 | |
South Korea | | | — | | | | 4,674,880 | | | | — | | | | 4,674,880 | |
Taiwan | | | — | | | | 3,032,799 | | | | — | | | | 3,032,799 | |
Thailand | | | 468,626 | | | | 1,902,885 | | | | — | | | | 2,371,511 | |
Turkey | | | — | | | | 614,494 | | | | — | | | | 614,494 | |
Money Market Funds | | | 727,688 | | | | — | | | | — | | | | 727,688 | |
Total Investments | | $ | 26,293,544 | | | $ | 28,518,741 | | | $ | — | | | $ | 54,812,285 | |
NOTE 4—Expense Offset Arrangement(s)
The expense offset arrangement is comprised of transfer agency credits which result from balances in demand deposit accounts used by the transfer agent for clearing shareholder transactions. For the year ended October 31, 2018, the Fund received credits from this arrangement, which resulted in the reduction of the Fund’s total expenses of $2,148.
NOTE 5—Trustees’ and Officers’ Fees and Benefits
Trustees’ and Officers’ Fees and Benefits include amounts accrued by the Fund to pay remuneration to certain Trustees and Officers of the Fund. Trustees have the option to defer compensation payable by the Fund, and Trustees’ and Officers’ Fees and Benefits also include amounts accrued by the Fund to fund such deferred compensation amounts. Those Trustees who defer compensation have the option to select various Invesco Funds in which their deferral accounts shall be deemed to be invested. Finally, certain current Trustees were eligible to participate in a retirement plan that provided for benefits to be paid upon retirement to Trustees over a period of time based on the number of years of service. The Fund may have certain former Trustees who also participate in a retirement plan and receive benefits under such plan. Trustees’ and Officers’ Fees and Benefits include amounts accrued by the Fund to fund such retirement benefits. Obligations under the deferred compensation and retirement plans represent unsecured claims against the general assets of the Fund.
18 Invesco Emerging Markets Equity Fund
NOTE 6—Cash Balances
The Fund is permitted to temporarily carry a negative or overdrawn balance in its account with State Street Bank and Trust Company, the custodian bank. Such balances, if any at period-end, are shown in the Statement of Assets and Liabilities under the payable caption Amount due custodian. To compensate the custodian bank for such overdrafts, the overdrawn Fund may either (1) leave funds as a compensating balance in the account so the custodian bank can be compensated by earning the additional interest; or (2) compensate by paying the custodian bank at a rate agreed upon by the custodian bank and Invesco, not to exceed the contractually agreed upon rate.
NOTE 7—Distributions to Shareholders and Tax Components of Net Assets
Tax Character of Distributions to Shareholders Paid During the Fiscal Years Ended October 31, 2018 and 2017:
| | | | | | | | |
| | | 2018 | | | 2017 | |
Ordinary income | | $ | 52,308 | | | $ | 55,940 | |
Tax Components of Net Assets at Period-End:
| | | | |
| | | 2018 | |
Undistributed ordinary income | | $ | 182,127 | |
Undistributed long-term gain | | | 2,625,048 | |
Net unrealized appreciation (depreciation) — investments | | | (11,273,170 | ) |
Net unrealized appreciation (depreciation) — foreign currencies | | | (810 | ) |
Temporary book/tax differences | | | (19,248 | ) |
Shares of beneficial interest | | | 63,985,576 | |
Total net assets | | $ | 55,499,523 | |
The difference between book-basis and tax-basis unrealized appreciation (depreciation) is due to differences in the timing of recognition of gains and losses on investments for tax and book purposes. The Fund’s net unrealized appreciation (depreciation) difference is attributable primarily to wash sales .
The temporary book/tax differences are a result of timing differences between book and tax recognition of income and/or expenses. The Fund’s temporary book/tax differences are the result of the trustee deferral of compensation and retirement plan benefits.
Capital loss carryforward is calculated and reported as of a specific date. Results of transactions and other activity after that date may affect the amount of capital loss carryforward actually available for the Fund to utilize. Capital losses generated in years beginning after December 22, 2010 can be carried forward for an unlimited period, whereas previous losses expire in eight tax years. Capital losses with an expiration period may not be used to offset capital gains until all net capital losses without an expiration date have been utilized. Capital loss carryforwards with no expiration date will retain their character as either short-term or long-term capital losses instead of as short-term capital losses as under prior law. The ability to utilize capital loss carryforwards in the future may be limited under the Internal Revenue Code and related regulations based on the results of future transactions.
The Fund does not have a capital loss carryforward as of October 31, 2018.
NOTE 8—Investment Transactions
The aggregate amount of investment securities (other than short-term securities, U.S. Treasury obligations and money market funds, if any) purchased and sold by the Fund during the year ended October 31, 2018 was $87,496,902 and $61,188,825, respectively. Cost of investments, including any derivatives, on a tax basis includes the adjustments for financial reporting purposes as of the most recently completed federal income tax reporting period-end.
| | | | |
| Unrealized Appreciation (Depreciation) of Investments on a Tax Basis | |
Aggregate unrealized appreciation of investments | | $ | 709,456 | |
Aggregate unrealized (depreciation) of investments | | | (11,982,626 | ) |
Net unrealized appreciation (depreciation) of investments | | $ | (11,273,170 | ) |
Cost of investments for tax purposes is $66,085,455.
19 Invesco Emerging Markets Equity Fund
NOTE 9—Reclassification of Permanent Differences
Primarily as a result of differing book/tax treatment of foreign taxes and foreign currency transactions, on October 31, 2018, undistributed net investment income was decreased by $220,353 and undistributed net realized gain was increased by $220,353. This reclassification had no effect on the net assets or the distributable earnings of the Fund.
NOTE 10—Share Information
| | | | | | | | | | | | | | | | |
| | | Summary of Share Activity | |
| | | Years ended October 31, | |
| | | 2018(a) | | | 2017 | |
| | | Shares | | | Amount | | | Shares | | | Amount | |
Sold: | | | | | | | | | | | | | | | | |
Class A | | | 2,894,364 | | | $ | 28,256,246 | | | | 1,833,147 | | | $ | 14,913,268 | |
Class C | | | 648,178 | | | | 6,195,402 | | | | 439,256 | | | | 3,483,436 | |
Class R | | | 153,410 | | | | 1,471,972 | | | | 110,874 | | | | 878,616 | |
Class Y | | | 2,160,435 | | | | 19,944,351 | | | | 709,532 | | | | 5,538,744 | |
Class R6 | | | 32,019 | | | | 310,085 | | | | 51,683 | | | | 344,289 | |
| | | | |
Issued as reinvestment of dividends: | | | | | | | | | | | | | | | | |
Class A | | | 2,661 | | | | 25,488 | | | | 1,567 | | | | 10,624 | |
Class Y | | | 2,036 | | | | 19,542 | | | | 2,442 | | | | 16,585 | |
Class R5 | | | 501 | | | | 4,821 | | | | 723 | | | | 4,962 | |
Class R6 | | | — | | | | — | | | | 3,309 | | | | 22,501 | |
| | | | |
Reacquired: | | | | | | | | | | | | | | | | |
Class A | | | (1,916,105 | ) | | | (17,800,514 | ) | | | (885,522 | ) | | | (6,918,872 | ) |
Class C | | | (415,101 | ) | | | (3,741,065 | ) | | | (139,344 | ) | | | (1,060,081 | ) |
Class R | | | (117,506 | ) | | | (1,096,728 | ) | | | (51,809 | ) | | | (429,286 | ) |
Class Y | | | (758,662 | ) | | | (7,065,265 | ) | | | (629,373 | ) | | | (4,797,077 | ) |
Class R6(b) | | | (3,855 | ) | | | (35,074 | ) | | | (976,786 | ) | | | (7,562,621 | ) |
Net increase in share activity | | | 2,682,375 | | | $ | 26,489,261 | | | | 469,699 | | | $ | 4,445,088 | |
| (a) | There are entities that are record owners of more than 5% of the outstanding shares of the Fund and in the aggregate own 43% of the outstanding shares of the Fund. IDI has an agreement with these entities to sell Fund shares. The Fund, Invesco and/or Invesco affiliates may make payments to these entities, which are considered to be related to the Fund, for providing services to the Fund, Invesco and/or Invesco affiliates including but not limited to services such as securities brokerage, distribution, third party record keeping and account servicing. The Fund has no knowledge as to whether all or any portion of the shares owned of record by these entities are also owned beneficially. |
| (b) | On May 1, 2017, 850,367 Class R6 shares valued at $6,658,374 were redeemed by affiliated mutual funds. |
20 Invesco Emerging Markets Equity Fund
NOTE 11—Financial Highlights
The following schedule presents financial highlights for a share of the Fund outstanding throughout the periods indicated.
| | | | | | | | | | | | | | | | | | | | | | | | | | | | | | | | | | | | | | | | | | | | | | | | |
| | | Net asset
value,
beginning
of period | | | Net
investment
income
(loss)(a) | | | Net gains
(losses)
on securities
(both
realized and
unrealized) | | | Total from
investment
operations | | | Dividends
from net
investment
income | | | Net asset
value, end
of period | | | Total
return(b) | | | Net assets,
end of period
(000’s omitted) | | | Ratio of
expenses
to average
net assets
with fee waivers
and/or expenses
absorbed | | | Ratio of
expenses
to average net
assets without
fee waivers
and/or expenses
absorbed | | | Ratio of net
investment
income (loss)
to average
net assets | | | Portfolio
turnover(c) | |
Class A | | | | | | | | | | | | | | | | | | | | | | | | | | | | | | | | | | | | | | | | | | | | | | | | |
Year ended 10/31/18 | | $ | 9.30 | | | $ | 0.07 | | | $ | (1.69 | ) | | $ | (1.62 | ) | | $ | (0.01 | ) | | $ | 7.67 | | | | (17.45 | )% | | $ | 27,580 | | | | 1.33 | %(d) | | | 2.03 | %(d) | | | 0.73 | %(d) | | | 104 | % |
Year ended 10/31/17 | | | 7.13 | | | | 0.03 | | | | 2.15 | | | | 2.18 | | | | (0.01 | ) | | | 9.30 | | | | 30.57 | | | | 24,297 | | | | 1.36 | | | | 2.45 | | | | 0.30 | | | | 57 | |
Year ended 10/31/16 | | | 6.53 | | | | 0.02 | | | | 0.58 | | | | 0.60 | | | | — | | | | 7.13 | | | | 9.19 | | | | 11,855 | | | | 1.66 | | | | 2.59 | | | | 0.33 | | | | 47 | |
Year ended 10/31/15 | | | 7.58 | | | | 0.02 | | | | (1.04 | ) | | | (1.02 | ) | | | (0.03 | ) | | | 6.53 | | | | (13.45 | ) | | | 10,516 | | | | 1.85 | | | | 2.58 | | | | 0.23 | | | | 97 | |
Year ended 10/31/14 | | | 7.61 | | | | 0.06 | | | | (0.03 | ) | | | 0.03 | | | | (0.06 | ) | | | 7.58 | | | | 0.44 | | | | 10,654 | | | | 1.85 | | | | 2.57 | | | | 0.74 | | | | 94 | |
Class C | | | | | | | | | | | | | | | | | | | | | | | | | | | | | | | | | | | | | | | | | | | | | | | | |
Year ended 10/31/18 | | | 9.04 | | | | (0.00 | ) | | | (1.63 | ) | | | (1.63 | ) | | | — | | | | 7.41 | | | | (18.03 | ) | | | 7,296 | | | | 2.08 | (d) | | | 2.78 | (d) | | | (0.02 | )(d) | | | 104 | |
Year ended 10/31/17 | | | 6.97 | | | | (0.03 | ) | | | 2.10 | | | | 2.07 | | | | — | | | | 9.04 | | | | 29.70 | | | | 6,793 | | | | 2.11 | | | | 3.20 | | | | (0.45 | ) | | | 57 | |
Year ended 10/31/16 | | | 6.43 | | | | (0.03 | ) | | | 0.57 | | | | 0.54 | | | | — | | | | 6.97 | | | | 8.40 | | | | 3,149 | | | | 2.41 | | | | 3.34 | | | | (0.42 | ) | | | 47 | |
Year ended 10/31/15 | | | 7.49 | | | | (0.04 | ) | | | (1.02 | ) | | | (1.06 | ) | | | — | | | | 6.43 | | | | (14.15 | ) | | | 2,572 | | | | 2.60 | | | | 3.33 | | | | (0.52 | ) | | | 97 | |
Year ended 10/31/14 | | | 7.55 | | | | (0.00 | ) | | | (0.03 | ) | | | (0.03 | ) | | | (0.03 | ) | | | 7.49 | | | | (0.40 | ) | | | 2,825 | | | | 2.60 | | | | 3.32 | | | | (0.01 | ) | | | 94 | |
Class R | | | | | | | | | | | | | | | | | | | | | | | | | | | | | | | | | | | | | | | | | | | | | | | | |
Year ended 10/31/18 | | | 9.21 | | | | 0.05 | | | | (1.67 | ) | | | (1.62 | ) | | | — | | | | 7.59 | | | | (17.59 | ) | | | 2,077 | | | | 1.58 | (d) | | | 2.28 | (d) | | | 0.48 | (d) | | | 104 | |
Year ended 10/31/17 | | | 7.07 | | | | 0.00 | | | | 2.14 | | | | 2.14 | | | | — | | | | 9.21 | | | | 30.27 | | | | 2,190 | | | | 1.61 | | | | 2.70 | | | | 0.05 | | | | 57 | |
Year ended 10/31/16 | | | 6.50 | | | | 0.01 | | | | 0.56 | | | | 0.57 | | | | — | | | | 7.07 | | | | 8.77 | | | | 1,263 | | | | 1.91 | | | | 2.84 | | | | 0.08 | | | | 47 | |
Year ended 10/31/15 | | | 7.55 | | | | (0.00 | ) | | | (1.03 | ) | | | (1.03 | ) | | | (0.02 | ) | | | 6.50 | | | | (13.71 | ) | | | 1,188 | | | | 2.10 | | | | 2.83 | | | | (0.02 | ) | | | 97 | |
Year ended 10/31/14 | | | 7.59 | | | | 0.04 | | | | (0.03 | ) | | | 0.01 | | | | (0.05 | ) | | | 7.55 | | | | 0.17 | | | | 1,341 | | | | 2.10 | | | | 2.82 | | | | 0.49 | | | | 94 | |
Class Y | | | | | | | | | | | | | | | | | | | | | | | | | | | | | | | | | | | | | | | | | | | | | | | | |
Year ended 10/31/18 | | | 9.33 | | | | 0.09 | | | | (1.69 | ) | | | (1.60 | ) | | | (0.02 | ) | | | 7.71 | | | | (17.17 | ) | | | 16,697 | | | | 1.08 | (d) | | | 1.78 | (d) | | | 0.98 | (d) | | | 104 | |
Year ended 10/31/17 | | | 7.15 | | | | 0.04 | | | | 2.16 | | | | 2.20 | | | | (0.02 | ) | | | 9.33 | | | | 30.94 | | | | 7,111 | | | | 1.11 | | | | 2.20 | | | | 0.55 | | | | 57 | |
Year ended 10/31/16 | | | 6.53 | | | | 0.04 | | | | 0.58 | | | | 0.62 | | | | — | | | | 7.15 | | | | 9.49 | | | | 4,858 | | | | 1.41 | | | | 2.34 | | | | 0.58 | | | | 47 | |
Year ended 10/31/15 | | | 7.59 | | | | 0.03 | | | | (1.04 | ) | | | (1.01 | ) | | | (0.05 | ) | | | 6.53 | | | | (13.28 | ) | | | 3,607 | | | | 1.60 | | | | 2.33 | | | | 0.48 | | | | 97 | |
Year ended 10/31/14 | | | 7.62 | | | | 0.08 | | | | (0.04 | ) | | | 0.04 | | | | (0.07 | ) | | | 7.59 | | | | 0.60 | | | | 3,295 | | | | 1.60 | | | | 2.32 | | | | 0.99 | | | | 94 | |
Class R5 | | | | | | | | | | | | | | | | | | | | | | | | | | | | | | | | | | | | | | | | | | | | | | | | |
Year ended 10/31/18 | | | 9.33 | | | | 0.09 | | | | (1.69 | ) | | | (1.60 | ) | | | (0.02 | ) | | | 7.71 | | | | (17.16 | ) | | | 1,623 | | | | 1.08 | (d) | | | 1.55 | (d) | | | 0.98 | (d) | | | 104 | |
Year ended 10/31/17 | | | 7.15 | | | | 0.04 | | | | 2.16 | | | | 2.20 | | | | (0.02 | ) | | | 9.33 | | | | 30.94 | | | | 1,960 | | | | 1.10 | | | | 1.91 | | | | 0.56 | | | | 57 | |
Year ended 10/31/16 | | | 6.53 | | | | 0.04 | | | | 0.58 | | | | 0.62 | | | | — | | | | 7.15 | | | | 9.49 | | | | 1,497 | | | | 1.41 | | | | 1.99 | | | | 0.58 | | | | 47 | |
Year ended 10/31/15 | | | 7.60 | | | | 0.03 | | | | (1.05 | ) | | | (1.02 | ) | | | (0.05 | ) | | | 6.53 | | | | (13.40 | ) | | | 885 | | | | 1.60 | | | | 1.98 | | | | 0.48 | | | | 97 | |
Year ended 10/31/14 | | | 7.62 | | | | 0.07 | | | | (0.02 | ) | | | 0.05 | | | | (0.07 | ) | | | 7.60 | | | | 0.74 | | | | 896 | | | | 1.60 | | | | 2.02 | | | | 0.99 | | | | 94 | |
Class R6 | | | | | | | | | | | | | | | | | | | | | | | | | | | | | | | | | | | | | | | | | | | | | | | | |
Year ended 10/31/18 | | | 9.32 | | | | 0.09 | | | | (1.69 | ) | | | (1.60 | ) | | | (0.02 | ) | | | 7.70 | | | | (17.18 | ) | | | 227 | | | | 1.08 | (d) | | | 1.55 | (d) | | | 0.98 | (d) | | | 104 | |
Year ended 10/31/17 | | | 7.15 | | | | 0.04 | | | | 2.15 | | | | 2.19 | | | | (0.02 | ) | | | 9.32 | | | | 30.80 | | | | 12 | | | | 1.10 | | | | 1.91 | | | | 0.56 | | | | 57 | |
Year ended 10/31/16 | | | 6.54 | | | | 0.04 | | | | 0.57 | | | | 0.61 | | | | — | | | | 7.15 | | | | 9.33 | | | | 6,604 | | | | 1.41 | | | | 1.99 | | | | 0.58 | | | | 47 | |
Year ended 10/31/15 | | | 7.60 | | | | 0.03 | | | | (1.04 | ) | | | (1.01 | ) | | | (0.05 | ) | | | 6.54 | | | | (13.26 | ) | | | 7,171 | | | | 1.60 | | | | 1.98 | | | | 0.48 | | | | 97 | |
Year ended 10/31/14 | | | 7.62 | | | | 0.07 | | | | (0.02 | ) | | | 0.05 | | | | (0.07 | ) | | | 7.60 | | | | 0.73 | | | | 8,116 | | | | 1.60 | | | | 2.00 | | | | 0.99 | | | | 94 | |
| (a) | Calculated using average shares outstanding. |
| (b) | Includes adjustments in accordance with accounting principles generally accepted in the United States of America and as such, the net asset value for financial reporting purposes and the returns based upon those net asset values may differ from the net asset value and returns for shareholder transactions. Does not include sales charges and is not annualized for periods less than one year, if applicable. |
| (c) | Portfolio turnover is calculated at the fund level and is not annualized for periods less than one year, if applicable. |
| (d) | Ratios are based on average daily net assets (000’s omitted) of $34,182, $9,124, $2,511, $13,216, $1,990 and $175 for Class A, Class C, Class R, Class Y, Class R5 and Class R6 shares, respectively. |
NOTE 12—Subsequent Event
Effective on or about November 1, 2018, the Board of Trustees of the Trust approved changes to the Fund’s name to Invesco Emerging Markets Select Equity Fund, principal investment strategies and portfolio managers.
21 Invesco Emerging Markets Equity Fund
Report of Independent Registered Public Accounting Firm
To the Board of Trustees of AIM Investment Funds (Invesco Investment Funds)
and Shareholders of Invesco Emerging Markets Equity Fund:
Opinion on the Financial Statements
We have audited the accompanying statement of assets and liabilities, including the schedule of investments, of Invesco Emerging Markets Equity Fund (one of the funds constituting AIM Investment Funds (Invesco Investment Funds), hereafter referred to as the “Fund”) as of October 31, 2018, the related statement of operations for the year ended October 31, 2018, the statement of changes in net assets for each of the two years in the period ended October 31, 2018, including the related notes, and the financial highlights for each of the five years in the period ended October 31, 2018 (collectively referred to as the financial statements). In our opinion, the financial statements present fairly, in all material respects, the financial position of the Fund as of October 31, 2018, the results of its operations for the year then ended, the changes in its net assets for each of the two years in the period ended October 31, 2018 and the financial highlights for each of the five years in the period ended October 31, 2018 in conformity with accounting principles generally accepted in the United States of America.
Basis for Opinion
These financial statements are the responsibility of the Fund’s management. Our responsibility is to express an opinion on the Fund’s financial statements based on our audits. We are a public accounting firm registered with the Public Company Accounting Oversight Board (United States) (PCAOB) and are required to be independent with respect to the Fund in accordance with the U.S. federal securities laws and the applicable rules and regulations of the Securities and Exchange Commission and the PCAOB.
We conducted our audits of these financial statements in accordance with the standards of the PCAOB. Those standards require that we plan and perform the audit to obtain reasonable assurance about whether the financial statements are free of material misstatement, whether due to error or fraud.
Our audits included performing procedures to assess the risks of material misstatement of the financial statements, whether due to error or fraud, and performing procedures that respond to those risks. Such procedures included examining, on a test basis, evidence regarding the amounts and disclosures in the financial statements. Our audits also included evaluating the accounting principles used and significant estimates made by management, as well as evaluating the overall presentation of the financial statements. Our procedures included confirmation of securities owned as of October 31, 2018 by correspondence with the custodian, transfer agent and brokers; when replies were not received from brokers, we performed other auditing procedures. We believe that our audits provide a reasonable basis for our opinion.
PricewaterhouseCoopers LLP
Houston, TX
December 28, 2018
We have served as the auditor of one or more of the investment companies in the Invesco group of investment companies since at least 1995. We have not been able to determine the specific year we began serving as auditor.
22 Invesco Emerging Markets Equity Fund
Calculating your ongoing Fund expenses
Example
As a shareholder of the Fund, you incur two types of costs: (1) transaction costs, which may include sales charges (loads) on purchase payments or contingent deferred sales charges on redemptions, if any; and (2) ongoing costs, including management fees, distribution and/or service (12b-1) fees, and other Fund expenses. This example is intended to help you understand your ongoing costs (in dollars) of investing in the Fund and to compare these costs with ongoing costs of investing in other mutual funds. The example is based on an investment of $1,000 invested at the beginning of the period and held for the entire period May 1, 2018 through October 31, 2018.
Actual expenses
The table below provides information about actual account values and actual expenses. You may use the information in this table, together with the amount you invested, to estimate the expenses that you paid over the period. Simply divide your account value by $1,000 (for example, an $8,600 account value divided by $1,000 = 8.6), then multiply the result by the number in the table under the heading entitled “Actual Expenses Paid During Period” to estimate the expenses you paid on your account during this period.
Hypothetical example for comparison purposes
The table below also provides information about hypothetical account values and hypothetical expenses based on the Fund’s actual expense ratio and an assumed rate of return of 5% per year before expenses, which is not the Fund’s actual return.
The hypothetical account values and expenses may not be used to estimate the actual ending account balance or expenses you paid for the period. You may use this information to compare the ongoing costs of investing in the Fund and other funds. To do so, compare this 5% hypothetical example with the 5% hypothetical examples that appear in the shareholder reports of the other funds.
Please note that the expenses shown in the table are meant to highlight your ongoing costs only and do not reflect any transaction costs, such as sales charges (loads) on purchase payments or contingent deferred sales charges on redemptions, if any. Therefore, the hypothetical information is useful in comparing ongoing costs only, and will not help you determine the relative total costs of owning different funds. In addition, if these transaction costs were included, your costs would have been higher.
| | | | | | | | | | | | | | | | | | | | | | | | |
Class | | Beginning
Account Value
(05/01/18) | | | ACTUAL | | | HYPOTHETICAL (5% annual return before
expenses) | | | Annualized
Expense
Ratio | |
| | Ending
Account Value
(10/31/18)1 | | | Expenses
Paid During
Period2 | | | Ending
Account Value
(10/31/18) | | | Expenses
Paid During
Period2 | |
| A | | $ | 1,000.00 | | | $ | 788.30 | | | $ | 5.99 | | | $ | 1,018.50 | | | $ | 6.77 | | | | 1.33 | % |
| C | | | 1,000.00 | | | | 785.80 | | | | 9.36 | | | | 1,014.72 | | | | 10.56 | | | | 2.08 | |
| R | | | 1,000.00 | | | | 788.20 | | | | 7.12 | | | | 1,017.24 | | | | 8.03 | | | | 1.58 | |
| Y | | | 1,000.00 | | | | 790.00 | | | | 4.87 | | | | 1,019.76 | | | | 5.50 | | | | 1.08 | |
| R5 | | | 1,000.00 | | | | 790.00 | | | | 4.87 | | | | 1,019.76 | | | | 5.50 | | | | 1.08 | |
| R6 | | | 1,000.00 | | | | 789.70 | | | | 4.87 | | | | 1,019.76 | | | | 5.50 | | | | 1.08 | |
| 1 | The actual ending account value is based on the actual total return of the Fund for the period May 1, 2018 through October 31, 2018, after actual expenses and will differ from the hypothetical ending account value which is based on the Fund’s expense ratio and a hypothetical annual return of 5% before expenses. |
| 2 | Expenses are equal to the Fund’s annualized expense ratio as indicated above multiplied by the average account value over the period, multiplied by 184/365 to reflect the most recent fiscal half year. |
23 Invesco Emerging Markets Equity Fund
Approval of Investment Advisory and Sub-Advisory Contracts
At meetings held on June 5-6, 2018, the Board of Trustees (the Board or the Trustees) of AIM Investment Funds (Invesco Investment Funds) as a whole, and the independent Trustees, who comprise over 75% of the Board, voting separately, approved the continuance of the Invesco Emerging Markets Select Equity Fund formerly known as Invesco Emerging Markets Equity Fund’s (the Fund) Master Investment Advisory Agreement with Invesco Advisers, Inc. (Invesco Advisers and the investment advisory agreement) and the Master Intergroup Sub-Advisory Contract for Mutual Funds with Invesco Asset Management Deutschland GmbH, Invesco Asset Management Limited, Invesco Asset Management (Japan) Limited, Invesco Hong Kong Limited, Invesco Senior Secured Management, Inc., Invesco Canada Ltd. and separate Sub-Advisory Contracts with Invesco Capital Management LLC and Invesco Asset Management (India) Private Limited (collectively, the Affiliated Sub-Advisers and the sub-advisory contracts) for another year, effective July 1, 2018. After evaluating the factors discussed below, among others, the Board approved the renewal of the Fund’s investment advisory agreement and the sub-advisory contracts and determined that the compensation payable by the Fund to Invesco Advisers and by Invesco Advisers to the Affiliated Sub-Advisers is fair and reasonable.
The Board’s Evaluation Process
The Board’s Investments Committee has established three Sub-Committees, which meet throughout the year to review the performance of funds advised by Invesco Advisers (the Invesco Funds). Over the course of each year, the Sub-Committees meet with portfolio managers for their assigned Invesco Funds and other members of management to review detailed information about investment performance and portfolio attributes of these funds. The Board took into account evaluations and reports that it received from the Investments Committee and Sub-Committees, as well as the information provided to such committees and the Board throughout the year, in considering whether to approve each Invesco Fund’s investment advisory agreement and sub-advisory contracts.
As part of the contract renewal process, the Board reviews and considers information provided in response to detailed requests for information submitted to management by the independent Trustees with assistance from legal counsel to the independent Trustees. The Board receives comparative investment performance and fee data regarding the Invesco Funds prepared by Invesco Advisers and Broadridge Financial Solutions, Inc. (Broadridge), an independent mutual fund data provider. The Board also receives an independent written evaluation from the Senior Officer, an officer of
the Invesco Funds who reports directly to the independent Trustees. The Senior Officer’s evaluation is prepared as part of his responsibility to manage the process by which the Invesco Funds’ proposed management fees are negotiated during the annual contract renewal process to ensure they are negotiated in a manner that is at arms’ length and reasonable. In addition to meetings with Invesco Advisers and fund counsel throughout the year, the independent Trustees also discuss the continuance of the investment advisory agreement and sub-advisory contracts in separate sessions with the Senior Officer and with independent legal counsel.
The discussion below is a summary of the Senior Officer’s independent written evaluation with respect to the Fund’s investment advisory agreement, as well as a discussion of the material factors and related conclusions that formed the basis for the Board’s approval of the Fund’s investment advisory agreement and sub-advisory contracts. The Trustees’ review and conclusions are based on the comprehensive consideration of all information presented to them during the course of the year and in prior years and are not the result of any single determinative factor. Moreover, one Trustee may have weighed a particular piece of information or factor differently than another Trustee. This information is current as of June 6, 2018.
Factors and Conclusions and Summary of Independent Written Fee Evaluation
| A. | Nature, Extent and Quality of Services Provided by Invesco Advisers and the Affiliated Sub-Advisers |
The Board reviewed the nature, extent and quality of the advisory services provided to the Fund by Invesco Advisers under the Fund’s investment advisory agreement, and the credentials and experience of the officers and employees of Invesco Advisers who provide these services, including the Fund’s portfolio manager(s). The Board’s review included consideration of Invesco Advisers’ investment process oversight and structure, credit analysis and investment risk management. The Board also considered non-advisory services that Invesco Advisers and its affiliates provide to the Invesco Funds such as various back office support functions, third party oversight, internal audit, valuation, portfolio trading and legal and compliance. The Board also reviewed and considered the benefits to shareholders of investing in a fund that is part of the Invesco family of funds under the umbrella of Invesco Ltd., Invesco Advisers’ parent company, and noted Invesco Ltd.’s depth and experience in conducting an investment management business, as well as its commitment of financial and other resources to such business. The Board concluded that the nature, extent and
quality of the services provided to the Fund by Invesco Advisers are appropriate and satisfactory.
The Board reviewed the services that may be provided by the Affiliated Sub-Advisers under the sub-advisory contracts and the credentials and experience of the officers and employees of the Affiliated Sub-Advisers who provide these services. The Board noted the Affiliated Sub-Advisers’ expertise with respect to certain asset classes and that the Affiliated Sub-Advisers have offices and personnel that are located in financial centers around the world. As a result, the Board noted that the Affiliated Sub-Advisers can provide research and investment analysis on the markets and economies of various countries in which the Fund may invest, make recommendations regarding securities and assist with security trades. The Board concluded that the sub-advisory contracts may benefit the Fund and its shareholders by permitting Invesco Advisers to use the resources and talents of the Affiliated Sub-Advisers in managing the Fund. The Board concluded that the nature, extent and quality of the services that may be provided by the Affiliated Sub-Advisers are appropriate and satisfactory.
| B. | Fund Investment Performance |
The Board considered Fund investment performance as a relevant factor in considering whether to approve the investment advisory agreement. The Board did not view Fund investment performance as a relevant factor in considering whether to approve the sub-advisory contracts for the Fund, as no Affiliated Sub-Adviser currently manages assets of the Fund.
The Board compared the Fund’s investment performance over multiple time periods ending December 31, 2017 to the performance of funds in the Broadridge performance universe and against the Lipper Emerging Markets Funds Index. The Board noted that the Fund’s performance of Class A shares of the Fund was in the first quintile of its performance universe for the one and three year periods and the third quintile for the five year period (the first quintile being the best performing funds and the fifth quintile being the worst performing funds). The Board noted that performance of Class A shares of the Fund was above the performance of the Index for the one and three year periods and reasonably comparable to the performance of the Index for the five year period. The Trustees also reviewed more recent Fund performance and this review did not change their conclusions.
| C. | Advisory and Sub-Advisory Fees and Fund Expenses |
The Board compared the Fund’s contractual management fee rate to the contractual management fee rates of funds in the Fund’s Broadridge expense group. The Board noted that the contractual management fee rate for
24 Invesco Emerging Markets Equity Fund
Class A shares of the Fund was below the median contractual management fee rate of funds in its expense group. The Board noted that the term “contractual management fee” for funds in the expense group may include both advisory and certain non-portfolio management administrative services fees, but that Broadridge does not provide information on a fund by fund basis as to what is included. The Board also reviewed the methodology used by Broadridge in providing expense group information, which includes using each fund’s contractual management fee schedule (including any applicable breakpoints) as reported in the most recent prospectus or statement of additional information for each fund in the expense group. The Board also considered comparative information regarding the Fund’s total expense ratio and its various components.
The Board noted that Invesco Advisers has contractually agreed to waive fees and/or limit expenses of the Fund in an amount necessary to limit total annual operating expenses to a specified percentage of average daily net assets for each class of the Fund.
The Board also considered the fees charged by Invesco Advisers and the Affiliated Sub-Advisers to other similarly managed client accounts. The Board noted that Invesco Advisers or the Affiliated Sub-Advisers may charge lower fees to large institutional clients. Invesco Advisers reviewed with the Board differences in the scope of services it provides to the Invesco Funds relative to certain other types of client accounts, including management of cash flows as a result of redemptions and purchases, necessary infrastructure such as officers, office space, technology, legal and distribution, oversight of service providers, costs and business risks associated with launching new funds and sponsoring and maintaining the product line, preparation of annual registration statement updates and financial information and compliance with federal and state laws and regulations.
The Board also considered the services that may be provided by the Affiliated Sub-Advisers pursuant to the sub-advisory contracts, as well as the fees payable by Invesco Advisers to the Affiliated Sub-Advisers pursuant to the sub-advisory contracts.
| D. | Economies of Scale and Breakpoints |
The Board considered the extent to which there may be economies of scale in the provision of advisory services to the Fund. The Board also considered that the Fund may benefit from economies of scale through contractual breakpoints in the Fund’s advisory fee schedule, which generally operate to reduce the Fund’s expense ratio as it grows in size. The Board noted that the Fund shares directly in economies of scale through lower fees charged by third party service providers based on the combined size of the Invesco Funds. The Board noted that the Fund may also benefit from economies of scale through initial fee setting, fee waivers and expense reimbursements.
| E. | Profitability and Financial Resources |
The Board reviewed information from Invesco Advisers concerning the costs of the advisory and other services that Invesco Advisers and its affiliates provide to the Fund and the Invesco Funds and the profitability of Invesco Advisers and its affiliates in providing these services. The Board considered the methodology used for calculating profitability and noted the periodic review of such methodology by an independent consultant. The Board noted that Invesco Advisers continues to operate at a net profit from services Invesco Advisers and its affiliates provide to the Invesco Funds. The Board received information from Invesco Advisers demonstrating that Invesco Advisers and the Affiliated Sub-Advisers are financially sound and have the resources necessary to perform their obligations under the investment advisory agreement and sub-advisory contracts.
| F. | Collateral Benefits to Invesco Advisers and its Affiliates |
The Board considered various other benefits received by Invesco Advisers and its affiliates from the relationship with the Fund, including the fees received for providing administrative, transfer agency and distribution services to the Fund. The Board considered comparative information regarding fees charged for these services, including information provided by Broadridge and other independent sources. The Board considered the performance of Invesco Advisers and its affiliates in providing these services and the organizational structure employed to provide these services. The Board also considered that these services are provided to the Fund pursuant to written contracts that are reviewed and approved on an annual basis by the Board; and that the services are required for the operation of the Fund.
The Board considered the benefits realized by Invesco Advisers and the Affiliated Sub-Advisers as a result of portfolio brokerage transactions executed through “soft dollar” arrangements. The Board noted that soft dollar arrangements may result in the Fund bearing costs to purchase research that may be used by Invesco Advisers or the Affiliated Sub-Advisers with other clients and may reduce Invesco Advisers’ or the Affiliated Sub-Advisers’ expenses. The Board also considered that it receives periodic reports from Invesco representing that these arrangements are consistent with regulatory requirements. The Board did not deem the soft dollar arrangements to be inappropriate.
The Board considered that the Fund’s uninvested cash and cash collateral from any securities lending arrangements may be invested in money market funds advised by Invesco Advisers pursuant to procedures approved by the Board. The Board noted that Invesco Advisers receives advisory fees from these affiliated money market funds attributable to such investments, although Invesco Advisers has contractually agreed to waive through varying periods the advisory fees payable by the Invesco Funds with respect to certain investments in the affiliated money
market funds. The waiver is in an amount equal to 100% of the net advisory fee Invesco Advisers receives from the affiliated money market funds with respect to the Fund’s investment in the affiliated money market funds of uninvested cash, but not cash collateral. The Board concluded that the amount of advisory fees received by Invesco Advisers from the Fund’s investment of cash collateral from any securities lending arrangements in the affiliated money market funds is fair and reasonable.
The Board also considered that an affiliated broker may receive commissions for executing certain trades for the Fund. Invesco Advisers and the Affiliated Sub-Advisers may use the affiliated broker to, among other things, control order routing and minimize information leakage, and the Board was advised that such trades are executed in compliance with rules under the federal securities laws and consistent with best execution obligations.
25 Invesco Emerging Markets Equity Fund
Tax Information
Form 1099-DIV, Form 1042-S and other year-end tax information provide shareholders with actual calendar year amounts that should be included in their tax returns. Shareholders should consult their tax advisors.
The following distribution information is being provided as required by the Internal Revenue Code or to meet a specific state’s requirement.
The Fund designates the following amounts or, if subsequently determined to be different, the maximum amount allowable for its fiscal year ended October 31, 2018:
| | | | |
Federal and State Income Tax | |
Qualified Dividend Income* | | | 100.00 | % |
Corporate Dividends Received Deduction* | | | 0.47 | % |
U.S. Treasury Obligations* | | | 0.00 | % |
| | * | The above percentages are based on ordinary income dividends paid to shareholders during the Fund’s fiscal year. |
26 Invesco Emerging Markets Equity Fund
Trustees and Officers
The address of each trustee and officer is AIM Investment Funds (Invesco Investment Funds) (the “Trust”), 11 Greenway Plaza, Suite 1000, Houston, Texas 77046-1173. The trustees serve for the life of the Trust, subject to their earlier death, incapacitation, resignation, retirement or removal as more specifically provided in the Trust’s organizational documents. Each officer serves for a one year term or until their successors are elected and qualified. Column two below includes length of time served with predecessor entities, if any.
| | | | | | | | |
Name, Year of Birth and
Position(s) Held with the Trust | | Trustee and/
or Officer Since | | Principal Occupation(s)
During Past 5 Years | | Number of
Funds in Fund
Complex
Overseen by
Trustee | | Other Directorship(s)
Held by Trustee During
Past 5 Years |
| Interested Persons | | | | | | | | |
| Martin L. Flanagan1 — 1960 Trustee | | 2007 | | Executive Director, Chief Executive Officer and President, Invesco Ltd. (ultimate parent of Invesco and a global investment management firm); Trustee, The Invesco Funds; Vice Chair, Investment Company Institute; and Member of Executive Board, SMU Cox School of Business Formerly: Advisor to the Board, Invesco Advisers, Inc. (formerly known as Invesco Institutional (N.A.), Inc.); Chairman and Chief Executive Officer, Invesco Advisers, Inc. (registered investment adviser); Director, Chairman, Chief Executive Officer and President, Invesco Holding Company (US), Inc. (formerly IVZ Inc.) (holding company), Invesco Group Services, Inc. (service provider) and Invesco North American Holdings, Inc. (holding company); Director, Chief Executive Officer and President, Invesco Holding Company Limited (parent of Invesco and a global investment management firm); Director, Invesco Ltd.; Chairman, Investment Company Institute and President, Co-Chief Executive Officer, Co-President, Chief Operating Officer and Chief Financial Officer, Franklin Resources, Inc. (global investment management organization) | | 158 | | None |
Philip A. Taylor2 — 1954 Trustee and Senior Vice President | | 2006 | | Head of the Americas and Senior Managing Director, Invesco Ltd.; Director, Invesco Advisers, Inc. (formerly known as Invesco Institutional (N.A.), Inc.) (registered investment adviser); Director and Chairman, Invesco Investment Services, Inc. (formerly known as Invesco AIM Investment Services, Inc.) (registered transfer agent); Chief Executive Officer, Invesco Corporate Class Inc. (corporate mutual fund company); Director, Chairman and Chief Executive Officer, Invesco Canada Ltd. (formerly known as Invesco Trimark Ltd./Invesco Trimark Ltèe) (registered investment adviser and registered transfer agent); Trustee and Senior Vice President, The Invesco Funds; Director, Invesco Investment Advisers LLC (formerly known as Van Kampen Asset Management) Formerly: Director, Chairman, Chief Executive Officer and President, Invesco Management Group, Inc. (formerly known as Invesco AIM Management Group, Inc.) (financial services holding company); Co-Chairman, Co-President and Co-Chief Executive Officer, Invesco Advisers, Inc. (formerly known as Invesco Institutional (N.A.), Inc.) (registered investment adviser); Director, Chief Executive Officer and President, Van Kampen Exchange Corp; President and Principal Executive Officer, The Invesco Funds (other than AIM Treasurer’s Series Trust (Invesco Treasurer’s Series Trust), Short-Term Investments Trust and Invesco Management Trust); Executive Vice President, The Invesco Funds (AIM Treasurer’s Series Trust (Invesco Treasurer’s Series Trust), Short-Term Investments Trust and Invesco Management Trust only); Director and President, INVESCO Funds Group, Inc. (registered investment adviser and registered transfer agent); Director and Chairman, IVZ Distributors, Inc. (formerly known as INVESCO Distributors, Inc.) (registered broker dealer); Director, President and Chairman, Invesco Inc. (holding company), Invesco Canada Holdings Inc. (holding company), Trimark Investments Ltd./Placements Trimark Ltèe and Invesco Financial Services Ltd/Services Financiers Invesco Ltèe; Chief Executive Officer, Invesco Canada Fund Inc. (corporate mutual fund company); Director and Chairman, Van Kampen Investor Services Inc.; Director, Chief Executive Officer and President, 1371 Preferred Inc. (holding company) and Van Kampen Investments Inc.; Director and President, AIM GP Canada Inc. (general partner for limited partnerships) and Van Kampen Advisors, Inc.; Director and Chief Executive Officer, Invesco Trimark Dealer Inc. (registered broker dealer); Director, Invesco Distributors, Inc. (formerly known as Invesco AIM Distributors, Inc.) (registered broker dealer); Manager, Invesco Capital Management LLC; Director, Chief Executive Officer and President, Invesco Advisers, Inc.; Director, Chairman, Chief Executive Officer and President, Invesco AIM Capital Management, Inc.; President, Invesco Trimark Dealer Inc. and Invesco Trimark Ltd./Invesco Trimark Ltèe; Director and President, AIM Trimark Corporate Class Inc. and AIM Trimark Canada Fund Inc.; Senior Managing Director, Invesco Holding Company Limited; Director and Chairman, Fund Management Company (former registered broker dealer); President and Principal Executive Officer, The Invesco Funds (AIM Treasurer’s Series Trust (Invesco Treasurer’s Series Trust), and Short-Term Investments Trust only); President, AIM Trimark Global Fund Inc. and AIM Trimark Canada Fund Inc. | | 158 | | None |
| 1 | Mr. Flanagan is considered an interested person (within the meaning of Section 2(a)(19) of the 1940 Act) of the Trust because he is an officer of the Adviser to the Trust, and an officer and a director of Invesco Ltd., ultimate parent of the Adviser. |
| 2 | Mr. Taylor is considered an interested person (within the meaning of Section 2(a)(19) of the 1940 Act) of the Trust because he is an officer and a director of the Adviser. |
T-1 Invesco Emerging Markets Equity Fund
Trustees and Officers—(continued)
| | | | | | | | |
Name, Year of Birth and
Position(s) Held with the Trust | | Trustee and/
or Officer Since | | Principal Occupation(s)
During Past 5 Years | | Number of
Funds in Fund
Complex
Overseen by
Trustee | | Other Directorship(s)
Held by Trustee During
Past 5 Years |
| Independent Trustees | | | | | | | | |
Bruce L. Crockett — 1944 Trustee and Chair | | 2001 | | Chairman, Crockett Technologies Associates (technology consulting company) Formerly: Director, Captaris (unified messaging provider); Director, President and Chief Executive Officer, COMSAT Corporation; Chairman, Board of Governors of INTELSAT (international communications company); ACE Limited (insurance company); Independent Directors Council and Investment Company Institute: Member of the Audit Committee, Investment Company Institute; Member of the Executive Committee and Chair of the Governance Committee, Independent Directors Council | | 158 | | Director and Chairman of the Audit Committee, ALPS (Attorneys Liability Protection Society) (insurance company); Director and Member of the Audit Committee and Compensation Committee, Ferroglobe PLC (metallurgical company) |
David C. Arch — 1945 Trustee | | 2010 | | Chairman of Blistex Inc. (consumer health care products manufacturer); Member, World Presidents’ Organization | | 158 | | Board member of the Illinois Manufacturers’ Association |
Jack M. Fields — 1952 Trustee | | 2001 | | Chief Executive Officer, Twenty First Century Group, Inc. (government affairs company); and Chairman, Discovery Learning Alliance (non-profit) Formerly: Owner and Chief Executive Officer, Dos Angeles Ranch L.P. (cattle, hunting, corporate entertainment); Director, Insperity, Inc. (formerly known as Administaff) (human resources provider); Chief Executive Officer, Texana Timber LP (sustainable forestry company); Director of Cross Timbers Quail Research Ranch (non-profit); and member of the U.S. House of Representatives | | 158 | | None |
Cynthia Hostetler — 1962 Trustee | | 2017 | | Non-Executive Director and Trustee of a number of public and private business corporations Formerly: Director, Aberdeen Investment Funds (4 portfolios); Head of Investment Funds and Private Equity, Overseas Private Investment Corporation; President, First Manhattan Bancorporation, Inc.; Attorney, Simpson Thacher & Bartlett LLP | | 158 | | Vulcan Materials Company (construction materials company); Trilinc Global Impact Fund; Artio Global Investment LLC (mutual fund complex); Edgen Group, Inc. (specialized energy and infrastructure products distributor) |
Eli Jones — 1961 Trustee | | 2016 | | Professor and Dean, Mays Business School — Texas A&M University Formerly: Professor and Dean, Walton College of Business, University of Arkansas and E.J. Ourso College of Business, Louisiana State University; Director, Arvest Bank | | 158 | | Insperity, Inc. (formerly known as Administaff) (human resources provider) |
Prema Mathai-Davis — 1950 Trustee | | 2001 | | Retired | | 158 | | None |
Teresa M. Ressel — 1962 Trustee | | 2017 | | Non-executive director and trustee of a number of public and private business corporations Formerly: Chief Financial Officer, Olayan America, The Olayan Group (international investor/commercial/industrial); Chief Executive Officer, UBS Securities LLC; Group Chief Operating Officer, Americas, UBS AG; Assistant Secretary for Management & Budget and CFO, US Department of the Treasury | | 158 | | Atlantic Power Corporation (power generation company); ON Semiconductor Corp. (semiconductor supplier) |
Ann Barnett Stern — 1957 Trustee | | 2017 | | President and Chief Executive Officer, Houston Endowment Inc. (private philanthropic institution) Formerly: Executive Vice President and General Counsel, Texas Children’s Hospital; Attorney, Beck, Redden and Secrest, LLP; Business Law Instructor, University of St. Thomas; Attorney, Andrews & Kurth LLP | | 158 | | Federal Reserve Bank of Dallas |
Raymond Stickel, Jr. — 1944 Trustee | | 2005 | | Retired Formerly: Director, Mainstay VP Series Funds, Inc. (25 portfolios); Partner, Deloitte & Touche | | 158 | | None |
Robert C. Troccoli — 1949 Trustee | | 2016 | | Adjunct Professor, University of Denver — Daniels College of Business Formerly: Senior Partner, KPMG LLP | | 158 | | None |
Christopher L. Wilson — 1957 Trustee | | 2017 | | Non-executive director and trustee of a number of public and private business corporations Formerly: Director, TD Asset Management USA Inc. (mutual fund complex) (22 portfolios); Managing Partner, CT2, LLC (investing and consulting firm); President/Chief Executive Officer, Columbia Funds, Bank of America Corporation; President/Chief Executive Officer, CDC IXIS Asset Management Services, Inc.; Principal & Director of Operations, Scudder Funds, Scudder, Stevens & Clark, Inc.; Assistant Vice President, Fidelity Investments | | 158 | | ISO New England, Inc. (non-profit organization managing regional electricity market) |
T-2 Invesco Emerging Markets Equity Fund
Trustees and Officers—(continued)
| | | | | | | | |
Name, Year of Birth and
Position(s) Held with the Trust | | Trustee and/
or Officer Since | | Principal Occupation(s)
During Past 5 Years | | Number of
Funds in Fund
Complex
Overseen by
Trustee | | Other Directorship(s)
Held by Trustee During
Past 5 Years |
| Other Officers | | | | | | | | |
Sheri Morris — 1964 President, Principal Executive Officer and Treasurer | | 1999 | | President, Principal Executive Officer and Treasurer, The Invesco Funds; Vice President, Invesco Advisers, Inc. (formerly known as Invesco Institutional (N.A.), Inc.) (registered investment adviser); and Vice President, Invesco Exchange-Traded Fund Trust, Invesco Exchange-Traded Fund Trust II, Invesco India Exchange-Traded Fund Trust, Invesco Actively Managed Exchange-Traded Fund Trust, Invesco Actively Managed Exchange-Traded Commodity Fund Trust and Invesco Exchange-Traded Self-Indexed Fund Trust Formerly: Vice President and Principal Financial Officer, The Invesco Funds; Vice President, Invesco AIM Advisers, Inc., Invesco AIM Capital Management, Inc. and Invesco AIM Private Asset Management, Inc.; Assistant Vice President and Assistant Treasurer, The Invesco Funds and Assistant Vice President, Invesco Advisers, Inc., Invesco AIM Capital Management, Inc. and Invesco AIM Private Asset Management, Inc.; and Treasurer, Invesco Exchange-Traded Fund Trust, Invesco Exchange-Traded Fund Trust II, Invesco India Exchange-Traded Fund Trust and Invesco Actively Managed Exchange-Traded Fund Trust | | N/A | | N/A |
Russell C. Burk — 1958 Senior Vice President and Senior Officer | | 2005 | | Senior Vice President and Senior Officer, The Invesco Funds | | N/A | | N/A |
Jeffrey H. Kupor — 1968 Senior Vice President, Chief Legal Officer and Secretary | | 2018 | | Senior Vice President and Secretary, Invesco Advisers, Inc. (formerly known as Invesco Institutional (N.A.), Inc.) (registered investment adviser); Senior Vice President and Secretary, Invesco Distributors, Inc. (formerly known as Invesco AIM Distributors, Inc.); Vice President and Secretary, Invesco Investment Services, Inc. (formerly known as Invesco AIM Investment Services, Inc.) Senior Vice President, Chief Legal Officer and Secretary, The Invesco Funds; Secretary and General Counsel, Invesco Investment Advisers LLC (formerly known as Van Kampen Asset Management); Secretary and General Counsel, Invesco Capital Markets, Inc. (formerly known as Van Kampen Funds Inc.) and Chief Legal Officer, Invesco Exchange-Traded Fund Trust, Invesco Exchange-Traded Fund Trust II, Invesco India Exchange-Traded Fund Trust, Invesco Actively Managed Exchange-Traded Fund Trust, Invesco Actively Managed Exchange-Traded Commodity Fund Trust and Invesco Exchange-Traded Self-Indexed Fund Trust; Secretary, Invesco Indexing LLC; Secretary and General Counsel, INVESCO Private Capital Investments, Inc.; Secretary, W.L. Ross & Co., LLC; Secretary and Vice President, Jemstep, Inc. Formerly: Senior Vice President, Secretary and General Counsel, Invesco Management Group, Inc. (formerly known as Invesco AIM Management Group, Inc.); Assistant Secretary, INVESCO Asset Management (Bermuda) Ltd.; Secretary and General Counsel, Invesco Private Capital, Inc.; Assistant Secretary and General Counsel, INVESCO Realty, Inc.; Secretary and General Counsel, Invesco Senior Secured Management, Inc.; and Secretary, Sovereign G./P. Holdings Inc. | | N/A | | N/A |
John M. Zerr — 1962 Senior Vice President | | 2006 | | Chief Operating Officer of the Americas; Senior Vice President, Invesco Advisers, Inc. (formerly known as Invesco Institutional (N.A.), Inc.) (registered investment adviser); Senior Vice President, Invesco Distributors, Inc. (formerly known as Invesco AIM Distributors, Inc.); Director and Vice President, Invesco Investment Services, Inc. (formerly known as Invesco AIM Investment Services, Inc.) Senior Vice President, The Invesco Funds; Managing Director, Invesco Capital Management LLC; Director, Invesco Investment Advisers LLC (formerly known as Van Kampen Asset Management); Senior Vice President, Invesco Capital Markets, Inc. (formerly known as Van Kampen Funds Inc.); Manager, Invesco Indexing LLC Formerly: Director and Senior Vice President, Invesco Management Group, Inc. (formerly known as Invesco AIM Management Group, Inc.); Secretary and General Counsel, Invesco Management Group, Inc. (formerly known as Invesco AIM Management Group, Inc.); Secretary, Invesco Investment Services, Inc. (formerly known as Invesco AIM Investment Services, Inc.); Chief Legal Officer and Secretary, The Invesco Funds; Secretary and General Counsel, Invesco Investment Advisers LLC (formerly known as Van Kampen Asset Management); Secretary and General Counsel, Invesco Capital Markets, Inc. (formerly known as Van Kampen Funds Inc.); Chief Legal Officer, Invesco Exchange-Traded Fund Trust, Invesco Exchange-Traded Fund Trust II, Invesco India Exchange-Traded Fund Trust, Invesco Actively Managed Exchange-Traded Fund Trust, Invesco Actively Managed Exchange-Traded Commodity Fund Trust and Invesco Exchange-Traded Self-Indexed Fund Trust; Secretary, Invesco Indexing LLC; Director, Secretary, General Counsel and Senior Vice President, Van Kampen Exchange Corp.; Director, Vice President and Secretary, IVZ Distributors, Inc. (formerly known as INVESCO Distributors, Inc.); Director and Vice President, INVESCO Funds Group, Inc.; Director and Vice President, Van Kampen Advisors Inc.; Director, Vice President, Secretary and General Counsel, Van Kampen Investor Services Inc.; Director and Secretary, Invesco Distributors, Inc. (formerly known as Invesco AIM Distributors, Inc.); Director, Senior Vice President, General Counsel and Secretary, Invesco AIM Advisers, Inc. and Van Kampen Investments Inc.; Director, Vice President and Secretary, Fund Management Company; Director, Senior Vice President, Secretary, General Counsel and Vice President, Invesco AIM Capital Management, Inc.; Chief Operating Officer and General Counsel, Liberty Ridge Capital, Inc. (an investment adviser) | | N/A | | N/A |
T-3 Invesco Emerging Markets Equity Fund
Trustees and Officers—(continued)
| | | | | | | | |
Name, Year of Birth and
Position(s) Held with the Trust | | Trustee and/
or Officer Since | | Principal Occupation(s)
During Past 5 Years | | Number of
Funds in Fund
Complex
Overseen by
Trustee | | Other Directorship(s)
Held by Trustee During
Past 5 Years |
| Other Officers—(continued) | | | | | | | | |
Gregory G. McGreevey — 1962 Senior Vice President | | 2012 | | Senior Managing Director, Invesco Ltd.; Director, Chairman, President, and Chief Executive Officer, Invesco Advisers, Inc. (formerly known as Invesco Institutional (N.A.), Inc.) (registered investment adviser); Director, Invesco Mortgage Capital, Inc. and Invesco Senior Secured Management, Inc.; and Senior Vice President, The Invesco Funds Formerly: Senior Vice President, Invesco Management Group, Inc. and Invesco Advisers, Inc.; Assistant Vice President, The Invesco Funds | | N/A | | N/A |
Kelli Gallegos — 1970 Vice President, Principal Financial Officer and Assistant Treasurer | | 2008 | | Vice President and Treasurer, Invesco Exchange-Traded Fund Trust, Invesco Exchange-Traded Fund Trust II, Invesco India Exchange-Traded Fund Trust, Invesco Actively Managed Exchange-Traded Fund Trust, Invesco Actively Managed Exchange-Traded Commodity Fund Trust and Invesco Exchange-Traded Self-Indexed Fund Trust; Vice President, Principal Financial Officer and Assistant Treasurer, The Invesco Funds; Principal Financial and Accounting Officer — Pooled Investments, Invesco Capital Management LLC Formerly: Assistant Treasurer, Invesco Exchange-Traded Fund Trust, Invesco Exchange-Traded Fund Trust II, Invesco India Exchange-Traded Fund Trust, Invesco Actively Managed Exchange-Traded Fund Trust, Invesco Actively Managed Exchange-Traded Commodity Fund Trust and Invesco Exchange-Traded Self-Indexed Fund Trust; Assistant Treasurer, Invesco Capital Management LLC; Assistant Vice President, The Invesco Funds | | N/A | | N/A |
Tracy Sullivan — 1962 Vice President, Chief Tax Officer and Assistant Treasurer | | 2008 | | Vice President, Chief Tax Officer and Assistant Treasurer, The Invesco Funds; Assistant Treasurer, Invesco Capital Management LLC, Invesco Exchange-Traded Fund Trust, Invesco Exchange-Traded Fund Trust II, Invesco India Exchange-Traded Fund Trust, Invesco Actively Managed Exchange-Traded Fund Trust, Invesco Actively Managed Exchange-Traded Commodity Fund Trust and Invesco Exchange-Traded Self-Indexed Fund Trust Formerly: Assistant Vice President, The Invesco Funds | | N/A | | N/A |
Crissie M. Wisdom — 1969 Anti-Money Laundering Compliance Officer | | 2013 | | Anti-Money Laundering Compliance Officer, Invesco Advisers, Inc. (formerly known as Invesco Institutional (N.A.), Inc.) (registered investment adviser), Invesco Capital Markets, Inc. (formerly known as Van Kampen Funds Inc.), Invesco Distributors, Inc., Invesco Investment Services, Inc., The Invesco Funds, and Invesco Exchange-Traded Fund Trust, Invesco Exchange-Traded Fund Trust II, Invesco India Exchange-Traded Fund Trust, Invesco Actively Managed Exchange-Traded Fund Trust, Invesco Actively Managed Exchange-Traded Commodity Fund Trust and Invesco Exchange-Traded Self-Indexed Fund Trust; Anti-Money Laundering Compliance Officer and Bank Secrecy Act Officer, INVESCO National Trust Company and Invesco Trust Company; and Fraud Prevention Manager and Controls and Risk Analysis Manager for Invesco Investment Services, Inc. Formerly: Anti-Money Laundering Compliance Officer, Van Kampen Exchange Corp. and Invesco Management Group, Inc. | | N/A | | N/A |
Robert R. Leveille — 1969 Chief Compliance Officer | | 2016 | | Chief Compliance Officer, Invesco Advisers, Inc. (registered investment adviser); and Chief Compliance Officer, The Invesco Funds Formerly: Chief Compliance Officer, Putnam Investments and the Putnam Funds | | N/A | | N/A |
The Statement of Additional Information of the Trust includes additional information about the Fund’s Trustees and is available upon request, without charge, by calling 1.800.959.4246. Please refer to the Fund’s Statement of Additional Information for information on the Fund’s sub-advisers.
| | | | | | |
Office of the Fund 11 Greenway Plaza, Suite 1000 Houston, TX 77046-1173 | | Investment Adviser Invesco Advisers, Inc. 1555 Peachtree Street, N.E. Atlanta, GA 30309 | | Distributor Invesco Distributors, Inc. 11 Greenway Plaza, Suite 1000 Houston, TX 77046-1173 | | Auditors PricewaterhouseCoopers LLP 1000 Louisiana Street, Suite 5800 Houston, TX 77002-5021 |
| | | |
| | | | | | |
Counsel to the Fund Stradley Ronon Stevens & Young, LLP 2005 Market Street, Suite 2600 Philadelphia, PA 19103-7018 | | Counsel to the Independent Trustees Goodwin Procter LLP 901 New York Avenue, N.W. Washington, D.C. 20001 | | Transfer Agent Invesco Investment Services, Inc. 11 Greenway Plaza, Suite 1000 Houston, TX 77046-1173 | | Custodian State Street Bank and Trust Company 225 Franklin Street Boston, MA 02110-2801 |
T-4 Invesco Emerging Markets Equity Fund
Explore High-Conviction Investing with Invesco

Go paperless with eDelivery
Visit invesco.com/edelivery to enjoy the convenience and security of anytime electronic access to your investment documents.
With eDelivery, you can elect to have any or all of the following materials delivered straight to your inbox to download, save and print from your own computer:
| ∎ | | Fund reports and prospectuses |
Invesco mailing information
Send general correspondence to Invesco Investment Services, Inc., P.O. Box 219078, Kansas City, MO 64121-9078.
Important notice regarding delivery of security holder documents
To reduce Fund expenses, only one copy of most shareholder documents may be mailed to shareholders with multiple accounts at the same address (Householding). Mailing of your shareholder documents may be householded indefinitely unless you instruct us otherwise. If you do not want the mailing of these documents to be combined with those for other members of your household, please contact Invesco Investment Services, Inc. at 800 959 4246 or contact your financial institution. We will begin sending you individual copies for each account within 30 days after receiving your request.
Fund holdings and proxy voting information
The Fund provides a complete list of its holdings four times in each fiscal year, at the quarter ends. For the second and fourth quarters, the lists appear in the Fund’s semiannual and annual reports to shareholders. For the first and third quarters, the Fund files the lists with the Securities and Exchange Commission (SEC) on Form N-Q (or any successor Form). The most recent list of portfolio holdings is available at invesco.com/completeqtrholdings. Shareholders can also look up the Fund’s Forms N-Q (or any successor Form) on the SEC website at sec.gov. The SEC file numbers for the Fund are shown below.
A description of the policies and procedures that the Fund uses to determine how to vote proxies relating to portfolio securities is available without charge, upon request, from our Client Services department at 800 959 4246 or at invesco.com/proxyguidelines. The information is also available on the SEC website, sec.gov.
| | |
Information regarding how the Fund voted proxies related to its portfolio securities during the most recent 12-month period ended June 30 is available at invesco.com/proxysearch. The information is also available on the SEC website, sec.gov. Invesco Advisers, Inc. is an investment adviser; it provides investment advisory services to individual and institutional clients and does not sell securities. Invesco Distributors, Inc. is the US distributor for Invesco Ltd.’s retail mutual funds, exchange-traded funds and institutional money market funds. Both are wholly owned, indirect subsidiaries of Invesco Ltd. | |  |
| | | | | | | | |
| SEC file numbers: 811-05426 and 033-19338 | | Invesco Distributors, Inc. | | EME-AR-1 | | 12202018 | | 1233 |
| | | | | | |
| | | | |

| | | | Annual Report to Shareholders | | October 31, 2018 |
| | |
| | Invesco Emerging Markets Flexible Bond Fund |
| | | | Nasdaq: |
| | | | A: IAEMX ∎ C: ICEMX ∎ R: IREMX ∎ Y: IYEMX ∎ R5: IIEMX ∎ R6: IFEMX |

Letters to Shareholders
| | |

Philip Taylor | | Dear Shareholders: This annual report includes information about your Fund, including performance data and a complete list of its investments as of the close of the reporting period. Inside is a discussion of how your Fund was managed and the factors that affected its performance during the reporting period. Throughout the reporting period, US economic data remained positive. Robust corporate profits, strong retail sales and unemployment rates near generational lows helped drive US markets to new all-time records multiple times during the reporting period. Against this backdrop, the US Federal Reserve raised the federal funds rate four times during the reporting period. Market volatility, largely non-existent in 2017, returned in 2018. Markets sold off first in February and again sharply in October, amid rising interest rates, concerns about potential trade wars and heightened geopolitical tensions. Despite the volatility, US equity markets were largely positive |
for the reporting period and fared better than international markets. Emerging markets were particularly hard hit due to a strong US dollar. During the October sell-off, investors retreated to more defensive areas of the market and to US Treasuries. The broader bond market declined during the reporting period due to the increase in US Treasury yields and widening credit spreads. As the year progresses, we’ll see how the interplay of economic data, interest rates, geopolitics and a host of other factors affect US and overseas equity and fixed income markets.
Short-term market volatility can prompt some investors to abandon their investment plans – and can cause others to settle for whatever returns the market has to offer. The investment professionals at Invesco, in contrast, invest with high conviction. This means that, no matter the asset class or the strategy, each investment team has a passion to exceed. We want to help investors achieve better outcomes, such as seeking higher returns, helping mitigate risk and generating income. Of course, investing with high conviction can’t guarantee a profit or ensure success; no investment strategy can. To learn more about how we invest with high conviction, visit invesco.com/HighConviction.
You, too, can invest with high conviction by maintaining a long-term investment perspective and by working with your financial adviser on a regular basis. During periods of short-term market volatility or uncertainty, your financial adviser can keep you focused on your long-term investment goals – a new home, a child’s college education or a secure retirement. He or she also can share research about the economy, the markets and individual investment options.
Visit our website for more information on your investments
Our website, invesco.com/us, offers a wide range of market insights and investment perspectives. On the website, you’ll find detailed information about our funds, including performance, holdings and portfolio manager commentaries. You can access information about your account by completing a simple, secure online registration. To do so, select “Log In” on the right side of the homepage, and then select “Register for Individual Account Access.”
In addition to the resources accessible on our website and through our mobile app, you can obtain timely updates to help you stay informed about the markets and the economy by connecting with Invesco on Twitter, LinkedIn or Facebook. You can access our blog at blog.invesco.us.com. Our goal is to provide you the information you want, when and where you want it.
Finally, I’m pleased to share with you Invesco’s commitment to both the Principles for Responsible Investment and to considering environmental, social and governance issues in our robust investment process. I invite you to learn more at invesco.com/esg.
Have questions?
For questions about your account, contact an Invesco client services representative at 800 959 4246. For Invesco-related questions or comments, please email me directly at phil@invesco.com.
All of us at Invesco look forward to serving your investment management needs. Thank you for investing with us.
Sincerely,

Philip Taylor
Senior Managing Director, Invesco Ltd.
| | |
| 2 | | Invesco Emerging Markets Flexible Bond Fund |
| | | | |

Bruce Crockett | | Dear Fellow Shareholders: Among the many important lessons I’ve learned in more than 40 years in a variety of business endeavors is the value of a trusted advocate. As independent chair of the Invesco Funds Board, I can assure you that the members of the Board are strong advocates for the interests of investors in Invesco’s mutual funds. We work hard to represent your interests through oversight of the quality of the investment management services your funds receive and other matters important to your investment, including but not limited to: |
| | ∎ | | Ensuring that Invesco offers a diverse lineup of mutual funds that your financial adviser can use to strive to meet your financial needs as your investment goals change over time. |
| | ∎ | | Monitoring how the portfolio management teams of the Invesco funds are performing in light of changing economic and market conditions. |
| ∎ | | Assessing each portfolio management team’s investment performance within the context of the investment strategy described in the fund’s prospectus. |
| ∎ | | Monitoring for potential conflicts of interests that may impact the nature of the services that your funds receive. |
We believe one of the most important services we provide our fund shareholders is the annual review of the funds’ advisory and sub-advisory contracts with Invesco Advisers and its affiliates. This review is required by the Investment Company Act of 1940 and focuses on the nature and quality of the services Invesco provides as the adviser to the Invesco funds and the reasonableness of the fees that it charges for those services. Each year, we spend months carefully reviewing information received from Invesco and a variety of independent sources, such as performance and fee data prepared by Lipper, Inc. (a subsidiary of Broadridge Financial Solutions, Inc.), an independent, third-party firm widely recognized as a leader in its field. We also meet with our independent legal counsel and other independent advisers to review and help us assess the information that we have received. Our goal is to assure that you receive quality investment management services for a reasonable fee.
I trust the measures outlined above provide assurance that you have a worthy advocate when it comes to choosing the Invesco Funds.
As always, please contact me at bruce@brucecrockett.com with any questions or concerns you may have. On behalf of the Board, we look forward to continuing to represent your interests and serving your needs.
Sincerely,

Bruce L. Crockett
Independent Chair
Invesco Funds Board of Trustees
| | |
| 3 | | Invesco Emerging Markets Flexible Bond Fund |
Management’s Discussion of Fund Performance
| | | | |
| |
Performance summary For the fiscal year ended October 31, 2018, Class A shares of Invesco Emerging Markets Flexible Bond Fund (the Fund), at net asset value (NAV), underperformed the 3-Month USD LIBOR Index, the Fund’s style-specific index. Your Fund’s long-term performance appears later in this report. | |
| | |
Fund vs. Indexes | | | | |
Total returns, 10/31/17 to 10/31/18, at net asset value (NAV). Performance shown does not include applicable contingent deferred sales charges (CDSC) or front-end sales charges, which would have reduced performance. | |
| |
Class A Shares | | | -10.09 | % |
Class C Shares | | | -10.77 | |
Class R Shares | | | -10.33 | |
Class Y Shares | | | -9.85 | |
Class R5 Shares | | | -9.85 | |
Class R6 Shares | | | -9.88 | |
JP Morgan EMBI Global Diversified Indexq (Broad Market Index) | | | -4.39 | |
3-Month USD LIBOR Index⬛ (Style-Specific Index) | | | 2.11 | |
Lipper Emerging Markets Hard Currency Debt Funds Index◆ (Peer Group Index) | | | -5.69 | |
| | |
Source(s): qFactSet Research Systems Inc.; ⬛Bloomberg L.P.; ◆Lipper Inc. | | | | |
Market conditions and your Fund
Following two years of strong performance, emerging markets debt posted negative returns over the fiscal year. Hard currency sovereign debt returned -4.39%, corporate debt was down -1.86% and local currency debt returned -6.58%.1 For both credit asset classes, returns were driven in part by credit spread widening. However, the primary driver of negative returns was an increase in US interest rates. The 10-year US treasury yield ended at 3.15% – 77 bps higher than the beginning of the fiscal year.2 High yield rated bonds under-
| | | | | | | | |
Portfolio Composition | |
By industry | | | % of total net assets | |
| |
Sovereign Debt | | | | 45.6% | |
Other Diversified Financial Services | | | | 7.7 | |
Diversified Banks | | | | 6.2 | |
Wireless Telecommunication Services | | | | 4.3 | |
Real Estate Development | | | | 3.9 | |
Oil & Gas Exploration & Production | | | | 3.9 | |
Integrated Oil & Gas | | | | 2.6 | |
Electric Utilities | | | | | | | 2.4 | |
Diversified Chemicals | | | | 2.2 | |
Independent Power Producers & Energy Traders | | | | 2.1 | |
Diversified Metals & Mining | | | | 1.9 | |
Marine Ports & Services | | | | 1.4 | |
Consumer Finance | | | | 1.4 | |
IT Consulting & Other Services | | | | 1.0 | |
Industry Type Each Less Than 1% of Portfolio | | | | 6.0 | |
Money Market Funds Plus Other Assets Less Liabilities | | | | 7.4 | |
performed the investment grade segment of the market for sovereign and corporate debt. For local currency debt, the primary driver of negative returns was the US dollar’s appreciation versus emerging markets currencies.
Heading into the fiscal year, emerging markets had experienced abnormally low volatility and strong inflows into the asset class driven by a global hunt for yield. Retail fund flows continued through January 2018 until a period of broad market volatility and rising US rates sparked a sell-off from emerging markets debt. During spring 2018, widening growth differentials between the US and other
| | | | | | |
| | |
Top Five Debt Issuers* | | | | |
| | % of total net assets | |
| | |
1. | | Mexican Bonos | | | 4.8% | |
2. | | Argentine Republic Government International Bond | | | 4.6 | |
3. | | Indonesia Treasury Bond | | | 3.3 | |
4. | | Bonos de la Tesoreria de la Republica en pesos | | | 3.0 | |
5. | | Romania Government Bond | | | 2.7 | |
| | | | |
| | |
Total Net Assets | | $ | 37.3 million | |
| |
Total Number of Holdings* | | | 104 | |
The Fund’s holdings are subject to change, and there is no assurance that the Fund will continue to hold any particular security.
*Excluding money market fund holdings.
Data presented here are as of October 31, 2018.
developed market economies drove the US dollar and US rates higher, tightening financial conditions for emerging markets in the process. A knock-on effect of higher US rates and a stronger US dollar increased hedging costs for non-US based investors who did not wish to take US dollar currency risk. As many emerging markets investors fell into this category, the asset class suffered further as investors continued to withdraw funds. Moving into the summer, monetary policy missteps in Argentina and Turkey led to significant pressure on currency and credit markets in those countries as well as fears over broader contagion within emerging markets. Additional concerns were alighted by US trade tensions with Mexico and China, sanctions risk in Russia and Turkey, and a heavy political calendar in Latin America.
For the fiscal year, the Fund under-performed its style-specific benchmark. Local currency debt was the biggest detractor from relative Fund performance at the asset class level. On a country basis, Brazil, Argentina, Indonesia and Mexico were the laggards and detracted from relative Fund returns for the fiscal year.
At the close of the fiscal year, we believed the sell-off resulted in value creation in segments of the market. Our belief is that some countries were unjustifiably impacted by concerns over the tightening in US dollar-funding conditions. Therefore, we saw an opportunity to add exposure to these select markets. In our view, stability in Argentina and Turkey alone should give way to an emerging markets asset-price recovery. Additionally, we believe the recent market-friendly election result in Brazil at the close of the fiscal year should have the same effect if we see a move towards pension and fiscal reform. At the same time, we acknowledged uncertainties related to policy orientation during the recent emerging markets election cycle, which we believe will continue with elections in Argentina, Indonesia and South Africa in focus. Our opinion is that policy easing efforts in China during the fiscal year, stability in the renminbi, along with indications of broader stability in the US dollar (and US funding conditions), could provide much needed support to emerging markets fixed income. In our view, the importance of these macroeconomic drivers cannot be overstated for broad emerging markets performance.
| | |
| 4 | | Invesco Emerging Markets Flexible Bond Fund |
Please note that our strategy is implemented with derivative instruments. Therefore, some of the performance of the strategy, both positive and negative, can be attributed to these instruments. Derivatives can be a cost-effective way to gain exposure to asset classes. However, derivatives may amplify traditional investment risks through the creation of leverage and may be less liquid than traditional securities.
We wish to remind you that the Fund is subject to interest rate risk, meaning when interest rates rise, the value of fixed income securities tends to fall. The risk may be greater in the current market environment because US interest rates are near historic lows. The degree to which the value of fixed income securities may decline due to rising interest rates may vary depending on the speed and magnitude of the increase in interest rates, as well as individual security characteristics such as price, maturity, duration and coupon and market forces such as supply and demand for similar securities. We are monitoring interest rates, and the market, economic and geopolitical factors that may impact the direction, speed and magnitude of changes to interest rates across the maturity spectrum, including the potential impact of monetary policy changes by the Fed and certain foreign central banks. If interest rates rise, markets may experience increased volatility, which may affect the value and/or liquidity of certain of the Fund’s investments.
Thank you for your investment in Invesco Emerging Markets Flexible Bond Fund.
| 2 | Source: US Department of the Treasury |
The views and opinions expressed in management’s discussion of Fund performance are those of Invesco Advisers, Inc. These views and opinions are subject to change at any time based on factors such as market and economic conditions. These views and opinions may not be relied upon as investment advice or recommendations, or as an offer for a particular security. The information is not a complete analysis of every aspect of any market, country, industry, security or the Fund. Statements of fact are from sources considered reliable, but Invesco Advisers, Inc. makes no representation or warranty as to their completeness or accuracy. Although historical performance is no guarantee of future results, these insights may help you understand our investment management philosophy.
See important Fund and, if applicable, index disclosures later in this report.
| | |

| | Rashique Rahman Portfolio Manager, is lead manager of Invesco Emerging Markets Flexible Bond Fund. Mr. Rahman is the Head |
| of Emerging Markets for Invesco Fixed Income. He joined Invesco in 2014. Mr. Rahman did undergraduate work at the University of California, Los Angeles, and earned an MA and an MBA from Columbia University. |
| |
 | | Michael Hyman Portfolio Manager, is manager of Invesco Emerging Markets Flexible Bond Fund. He joined Invesco in 2013. |
| Mr. Hyman earned a BSE in finance from Pennsylvania State University and an MBA from the Stern School of Business at New York University. |
| |
 | | Rob Turner Portfolio Manager, is manager of Invesco Emerging Markets Flexible Bond Fund. He joined Invesco in 2017. |
| Mr. Turner earned a BA with a focus in political science from the University of Arizona and an MBA from Georgia State University. |
5 Invesco Emerging Markets Flexible Bond Fund
Your Fund’s Long-Term Performance
Results of a $10,000 Investment – Oldest Share Class(es) since Inception
Fund and index data from 6/16/10
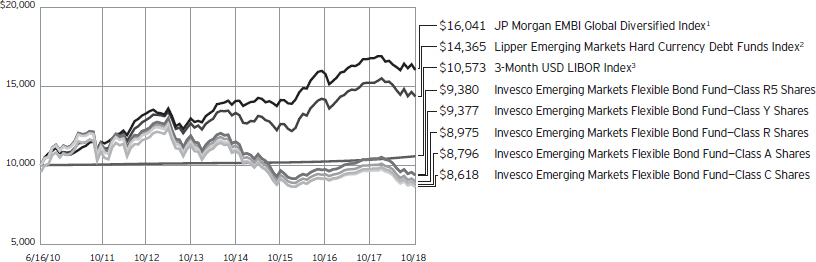
1 Source: FactSet Research Systems Inc.
2 Source: Lipper Inc.
3 Source: Bloomberg L.P.
Past performance cannot guarantee comparable future results.
The data shown in the chart include reinvested distributions, applicable sales charges and Fund expenses including management fees. Index results include reinvested dividends, but they do not reflect sales charges. Performance of the
peer group, if applicable, reflects fund expenses and management fees; performance of a market index does not. Performance shown in the chart and table(s) does not reflect deduction of taxes a shareholder would pay on Fund distributions or sale of Fund shares.
| | |
| 6 | | Invesco Emerging Markets Flexible Bond Fund |
| | | | |
| |
Average Annual Total Returns | |
As of 10/31/18, including maximum applicable sales charges | |
| |
Class A Shares | | | | |
Inception (6/16/10) | | | -1.52 | % |
5 Years | | | -5.69 | |
1 Year | | | -13.93 | |
| |
Class C Shares | | | | |
Inception (6/16/10) | | | -1.76 | % |
5 Years | | | -5.59 | |
1 Year | | | -11.63 | |
| |
Class R Shares | | | | |
Inception (6/16/10) | | | -1.28 | % |
5 Years | | | -5.12 | |
1 Year | | | -10.33 | |
| |
Class Y Shares | | | | |
Inception (6/16/10) | | | -0.77 | % |
5 Years | | | -4.62 | |
1 Year | | | -9.85 | |
| |
Class R5 Shares | | | | |
Inception (6/16/10) | | | -0.76 | % |
5 Years | | | -4.60 | |
1 Year | | | -9.85 | |
| |
Class R6 Shares | | | | |
Inception | | | -0.85 | % |
5 Years | | | -4.63 | |
1 Year | | | -9.88 | |
Class R6 shares incepted on September 24, 2012. Performance shown prior to that date is that of Class A shares and includes the 12b-1 fees applicable to Class A shares.
The performance data quoted represent past performance and cannot guarantee comparable future results; current performance may be lower or higher. Please visit invesco.com/performance for the most recent month-end performance. Performance figures reflect reinvested distributions, changes in net asset value and the effect of the maximum sales charge unless otherwise stated. Investment return and principal value will fluctuate so that you may have a gain or loss when you sell shares.
The net annual Fund operating expense ratio set forth in the most recent Fund prospectus as of the date of this report for Class A, Class C, Class R, Class Y, Class R5 and Class R6 shares was 1.25%, 2.00%, 1.50%, 1.00%, 1.00% and 1.00%, respectively.1,2 The total annual Fund operating expense ratio set forth in the most recent Fund prospectus as of the date of this report for Class A, Class C, Class R, Class Y,
| | | | |
| |
Average Annual Total Returns | |
As of 9/30/18, the most recent calendar quarter end, including maximum applicable sales charges | |
| |
Class A Shares | | | | |
Inception (6/16/10) | | | -1.29 | % |
5 Years | | | -4.86 | |
1 Year | | | -11.90 | |
| |
Class C Shares | | | | |
Inception (6/16/10) | | | -1.54 | % |
5 Years | | | -4.78 | |
1 Year | | | -9.66 | |
| |
Class R Shares | | | | |
Inception (6/16/10) | | | -1.05 | % |
5 Years | | | -4.31 | |
1 Year | | | -8.20 | |
| |
Class Y Shares | | | | |
Inception (6/16/10) | | | -0.55 | % |
5 Years | | | -3.82 | |
1 Year | | | -7.73 | |
| |
Class R5 Shares | | | | |
Inception (6/16/10) | | | -0.54 | % |
5 Years | | | -3.79 | |
1 Year | | | -7.73 | |
| |
Class R6 Shares | | | | |
Inception | | | -0.61 | % |
5 Years | | | -3.79 | |
1 Year | | | -7.73 | |
Class R5 and Class R6 shares was 1.93%, 2.68%, 2.18%, 1.68%, 1.33% and 1.33%, respectively. The expense ratios presented above may vary from the expense ratios presented in other sections of this report that are based on expenses incurred during the period covered by this report.
Class A share performance reflects the maximum 4.25% sales charge, and Class C share performance reflects the applicable contingent deferred sales charge (CDSC) for the period involved. The CDSC on Class C shares is 1% for the first year after purchase. Class R, Class Y, Class R5 and Class R6 shares do not have a front-end sales charge or a CDSC; therefore, performance is at net asset value.
The performance of the Fund’s share classes will differ primarily due to different sales charge structures and class expenses.
Fund performance reflects any applicable fee waivers and/or expense reimbursements. Had the adviser not waived fees and/or reimbursed expenses currently or in the past, returns would have been lower. See current prospectus for more information.
| 1 | Total annual Fund operating expenses after any contractual fee waivers and/or expense reimbursements by the adviser in effect through at least February 29, 2020. See current prospectus for more information. |
| 2 | Total annual Fund operating expenses after any contractual fee waivers and/or expense reimbursements by the adviser in effect through at least June 30, 2020. See current prospectus for more information. |
7 Invesco Emerging Markets Flexible Bond Fund
Invesco Emerging Markets Flexible Bond Fund’s investment objective is total return through growth of capital and current income.
| ∎ | | Unless otherwise stated, information presented in this report is as of October 31, 2018, and is based on total net assets. |
| ∎ | | Unless otherwise noted, all data provided by Invesco. |
| ∎ | | To access your Fund’s reports/prospectus, visit invesco.com/fundreports. |
About share classes
| ∎ | | Class R shares are generally available only to employer sponsored retirement and benefit plans. Please see the prospectus for more information. |
| ∎ | | Class Y shares are available only to certain investors. Please see the prospectus for more information. |
| ∎ | | Class R5 shares and Class R6 shares are available for use by retirement plans that meet certain standards and for institutional investors. Class R6 shares are also available through intermediaries that have established an agreement with Invesco Distributors, Inc. to make such shares available for use in retail omnibus accounts. Please see the prospectus for more information. |
Principal risks of investing in the Fund
| ∎ | | Active trading risk. Active trading of portfolio securities may result in added expenses, a lower return and increased tax liability. |
| ∎ | | Changing fixed income market conditions risk. The current low interest rate environment was created in part by the Federal Reserve Board (FRB) and certain foreign central banks keeping the federal funds and equivalent foreign rates near, at or below zero. Increases in the federal funds and equivalent foreign rates may expose fixed income markets to heightened volatility and reduced liquidity for certain fixed income investments, particularly those with longer maturities. In addition, decreases in fixed income dealer market-making capacity may also potentially lead to heightened volatility and reduced liquidity in the fixed income markets. As a result, the value of the Fund’s investments and share price may decline. Changes in central bank policies could also result in higher than normal shareholder redemptions, which could potentially increase portfolio turnover and the Fund’s transaction costs. |
| ∎ | | Commodities tax risk. The tax treatment |
| | of commodity-linked derivative instruments may be adversely affected by changes in legislation, regulations or other legally binding authority. If, as a result of any such adverse action, the income of the Fund from certain commodity-linked derivatives was treated as non-qualifying income, the Fund might fail to qualify as a regulated investment company and be subject to federal income tax at the Fund level. As a result of a recent announcement by the Internal Revenue Service, the Fund intends to invest in commodity-linked notes: (a) directly, relying on an opinion of counsel confirming that income from such investments should be qualifying income because such commodity-linked notes constitute securities under section 2(a)(36) of the 1940 Act or (b) indirectly through the Subsidiary. Should the Internal Revenue Service issue further guidance, or Congress enact legislation, that adversely affects the tax treatment of the Fund’s use of commodity-linked notes or the Subsidiary (which guidance might be applied to the Fund retroactively), it could, among other consequences, limit the Fund’s ability to pursue its investment strategy. |
| ∎ | | Commodity risk. The Fund may have investment exposure to the commodities markets and/or a particular sector of the commodities markets, which may subject the Fund to greater volatility than investments in traditional securities, such as stocks and bonds. Volatility in the commodities markets may be caused by changes in overall market movements, domestic and foreign political and economic events and policies, war, acts of terrorism, changes in domestic or foreign interest rates and/ or investor expectations concerning interest rates, domestic and foreign inflation rates, investment and trading activities of mutual funds, hedge funds and commodities funds, and factors such as drought, floods, weather, livestock disease, embargoes, tariffs and |
This report must be accompanied or preceded by a currently effective Fund prospectus, which contains more complete information, including sales charges and expenses. Investors should read it carefully before investing.
NOT FDIC INSURED | MAY LOSE VALUE | NO BANK GUARANTEE
| | other regulatory developments or supply and demand disruptions. Because the Fund’s performance may be linked to the performance of volatile commodities, investors should be willing to assume the risks of potentially significant fluctuations in the value of the Fund’s shares. |
| ∎ | | Credit linked notes risk. Risks of credit linked notes include those risks associated with the underlying reference obligation including but not limited to market risk, interest rate risk, credit risk, default risk and, in some cases, foreign currency risk. An investor in a credit linked note bears counterparty risk or the risk that the issuer of the credit linked note will default or become bankrupt and not make timely payment of principal and interest of the structured security. Credit linked notes may be less liquid than other investments and therefore harder to dispose of at the desired time and price. In addition, credit linked notes may be leveraged and, as a result, small changes in the value of the underlying reference obligation may produce disproportionate losses to the Fund. |
| ∎ | | Debt securities risk. The prices of debt securities held by the Fund will be affected by changes in interest rates, the creditworthiness of the issuer and other factors. An increase in prevailing interest rates typically causes the value of existing debt securities to fall and often has a greater impact on longer-duration debt securities and higher quality debt securities. Falling interest rates will cause the Fund to reinvest the proceeds of debt securities that have been repaid by the issuer at lower interest rates. Falling interest rates may also reduce the Fund’s distributable income because interest payments on floating rate debt instruments held by the Fund will decline. The Fund could lose money on investments in debt securities if the issuer or borrower fails to meet its obligations to make interest payments and/or to repay principal in a timely manner. Changes in an issuer’s financial strength, the market’s perception of such strength or in the credit rating of the issuer or the security may affect the value of debt securities. The Adviser’s credit analysis may fail to anticipate such changes, which could result in buying a debt security at an inopportune |
| | |
| 8 | | Invesco Emerging Markets Flexible Bond Fund |
| | time or failing to sell a debt security in advance of a price decline or other credit event. |
| ∎ | | Derivatives risk. The value of a derivative instrument depends largely on (and is derived from) the value of an underlying security, currency, commodity, interest rate, index or other asset (each referred to as an underlying asset). In addition to risks relating to the underlying assets, the use of derivatives may include other, possibly greater, risks, including counterparty, leverage and liquidity risks. Counterparty risk is the risk that the counterparty to the derivative contract will default on its obligation to pay the Fund the amount owed or otherwise perform under the derivative contract. Derivatives create leverage risk because they do not require payment up front equal to the economic exposure created by owning the derivative. As a result, an adverse change in the value of the underlying asset could result in the Fund sustaining a loss that is substantially greater than the amount invested in the derivative, which may make the Fund’s returns more volatile and increase the risk of loss. Derivative instruments may also be less liquid than more traditional investments and the Fund may be unable to sell or close out its derivative positions at a desirable time or price. This risk may be more acute under adverse market conditions, during which the Fund may be most in need of liquidating its derivative positions. Derivatives may also be harder to value, less tax efficient and subject to changing government regulation that could impact the Fund’s ability to use certain derivatives or their cost. Also, derivatives used for hedging or to gain or limit exposure to a particular market segment may not provide the expected benefits, particularly during adverse market conditions. These risks are greater for the Fund than mutual funds that do not use derivative instruments or that use derivative instruments to a lesser extent than the Fund to implement their investment strategies. |
| ∎ | | Emerging markets securities risk. Emerging markets (also referred to as developing markets) are generally subject to greater market volatility, political, social and economic instability, uncertain |
| | trading markets and more governmental limitations on foreign investment than more developed markets. In addition, companies operating in emerging markets may be subject to lower trading volume and greater price fluctuations than companies in more developed markets. Securities law and the enforcement of systems of taxation in many emerging market countries may change quickly and unpredictably. In addition, investments in emerging markets securities may also be subject to additional transaction costs, delays in settlement procedures, and lack of timely information. |
| ∎ | | Foreign currency tax risk. If the US Treasury Department were to exercise its authority to issue regulations that exclude from the definition of “qualifying income” foreign currency gains not directly related to the Fund’s business of investing in securities, the Fund may be unable to qualify as a regulated investment company for one or more years. In this event, the Fund’s Board of Trustees may authorize a significant change in investment strategy or other action. |
| ∎ | | Foreign government debt risk. Investments in foreign government debt securities (sometimes referred to as sovereign debt securities) involve certain risks in addition to those relating to foreign securities or debt securities generally. The issuer of the debt or the governmental authorities that control the repayment of the debt may be unable or unwilling to repay principal or interest when due in accordance with the terms of such debt, and the Fund may have limited recourse in the event of a default against the defaulting government. Without the approval of debt holders, some governmental debtors have in the past been able to reschedule or restructure their debt payments or declare moratoria on payments. |
| ∎ | | Foreign securities risk. The Fund’s foreign investments may be adversely affected by political and social instability, changes in economic or taxation policies, difficulty in enforcing obligations, decreased liquidity or increased volatility. Foreign investments also involve the risk of the possible seizure, nationalization or expropriation of the issuer or foreign deposits (in which the Fund could lose its entire investments in a |
| | certain market) and the possible adoption of foreign governmental restrictions such as exchange controls. Unless the Fund has hedged its foreign securities risk, foreign securities risk also involves the risk of negative foreign currency rate fluctuations, which may cause the value of securities denominated in such foreign currency (or other instruments through which the Fund has exposure to foreign currencies) to decline in value. Currency exchange rates may fluctuate significantly over short periods of time. Currency hedging strategies, if used, are not always successful. |
| ∎ | | Geographic focus risk. The Fund may from time to time invest a substantial amount of its assets in securities of issuers located in a single country or a limited number of countries. Adverse economic, political or social conditions in those countries may therefore have a significant negative impact on the Fund’s investment performance. |
| ∎ | | High yield debt securities (junk bond) risk. Investments in high yield debt securities (“junk bonds”) and other lower-rated securities will subject the Fund to substantial risk of loss. These securities are considered to be speculative with respect to the issuer’s ability to pay interest and principal when due, are more susceptible to default or decline in market value and are less liquid than investment grade debt securities. Prices of high yield debt securities tend to be very volatile. |
| ∎ | | Liquidity risk. The Fund may be unable to sell illiquid investments at the time or price it desires and, as a result, could lose its entire investment in such investments. Liquid securities can become illiquid during periods of market stress. If a significant amount of the Fund’s securities become illiquid, the Fund may not be able to timely pay redemption proceeds and may need to sell securities at significantly reduced prices. |
| ∎ | | Management risk. The Fund is actively managed and depends heavily on the Adviser’s judgment about markets, interest rates or the attractiveness, relative values, liquidity, or potential appreciation of particular investments made for the Fund’s portfolio. The Fund could experience losses if these judgments |
continued on page 10
| | |
| 9 | | Invesco Emerging Markets Flexible Bond Fund |
continued from page 9
| | prove to be incorrect. Additionally, legislative, regulatory, or tax developments may adversely affect management of the Fund and, therefore, the ability of the Fund to achieve its investment objective. |
| ∎ | | Market risk. The market values of the Fund’s investments, and therefore the value of the Fund’s shares, will go up and down, sometimes rapidly or unpredictably. Market risk may affect a single issuer, industry or section of the economy, or it may affect the market as a whole. Individual stock prices tend to go up and down more dramatically than those of certain other types of investments, such as bonds. During a general downturn in the financial markets, multiple asset classes may decline in value. When markets perform well, there can be no assurance that specific investments held by the Fund will rise in value. |
| ∎ | | Non-diversification risk. The Fund is non-diversified and can invest a greater portion of its assets in the obligations or securities of a small number of issuers or any single issuer than a diversified fund can. A change in the value of one or a few issuers’ securities will therefore affect the value of the Fund more than if it was a diversified fund. |
| ∎ | | Short position risk. Because the Fund’s potential loss on a short position arises from increases in the value of the asset sold short, the Fund will incur a loss on a short position, which is theoretically unlimited, if the price of the asset sold short increases from the short sale price. The counterparty to a short position or other market factors may prevent the Fund from closing out a short position at a desirable time or price and may reduce or eliminate any gain or result in a loss. In a rising market, the Fund’s short positions will cause the Fund to underperform the overall market and its peers that do not engage in shorting. If the Fund holds both long and short positions, and both positions decline simultaneously, the short positions will not provide any buffer (hedge) from declines in value of the Fund’s long positions. Certain types of short positions involve leverage, which may exaggerate any losses, potentially more than the actual cost of the investment, and will increase the volatility of the Fund’s returns. |
| ∎ | | Subsidiary risk. By investing in the Subsidiary, the Fund is indirectly exposed to risks associated with the Subsidiary’s investments. The Subsidiary is not registered under the Investment Company |
| | Act of 1940, as amended (1940 Act), and, except as otherwise noted in this prospectus, is not subject to the investor protections of the 1940 Act. Changes in the laws of the United States and/ or the Cayman Islands, under which the Fund and the Subsidiary, respectively, are organized, could result in the inability of the Fund and/or the Subsidiary to operate as described in this prospectus and the SAI, and could negatively affect the Fund and its shareholders. |
About indexes used in this report
| ∎ | | The JP Morgan EMBI Global Diversified Index is an unmanaged index that tracks the traded market for US-dollar-denominated Brady bonds, Eurobonds, traded loans and local market debt instruments issued by sovereign and quasi-sovereign entities. |
| ∎ | | The 3-Month USD LIBOR Index is unmanaged index considered representative of the average interest rate at which a selection of banks in London are prepared to lend to one another in American dollars with a maturity of three months. |
| ∎ | | The Lipper Emerging Markets Hard Currency Debt Funds Index is an unmanaged index considered representative of emerging market debt funds tracked by Lipper. |
| ∎ | | The Fund is not managed to track the performance of any particular index, including the index(es) described here, and consequently, the performance of the Fund may deviate significantly from the performance of the index(es). |
| ∎ | | A direct investment cannot be made in an index. Unless otherwise indicated, index results include reinvested dividends, and they do not reflect sales charges. Performance of the peer group, if applicable, reflects fund expenses; performance of a market index does not. |
Other information
| ∎ | | The returns shown in management’s discussion of Fund performance are based on net asset values (NAVs) calculated for shareholder transactions. Generally accepted accounting principles require adjustments to be made to the net assets of the Fund at period end for financial reporting purposes, and as such, the NAVs for shareholder transactions and the returns based on those NAVs may differ from the NAVs and returns reported in the Financial Highlights. |
| | |
| 10 | | Invesco Emerging Markets Flexible Bond Fund |
Consolidated Schedule of Investments
October 31, 2018
| | | | | | | | |
| | | Principal
Amount | | | Value | |
U.S. Dollar Denominated Bonds & Notes–72.99% | |
| Angola–1.35% | |
Angolan Government International Bond, REGS, Sr. Unsec. Euro Notes, 9.38%, 05/08/2048(a) | | $ | 500,000 | | | $ | 504,013 | |
|
| Argentina–4.57% | |
Argentine Republic Government International Bond, Sr. Unsec. Global Bonds,
6.63%, 07/06/2028 | | | 1,050,000 | | | | 841,836 | |
6.88%, 01/26/2027 | | | 450,000 | | | | 377,831 | |
7.50%, 04/22/2026 | | | 550,000 | | | | 484,275 | |
| | | | | | | | 1,703,942 | |
|
| Brazil–3.62% | |
Banco BTG Pactual S.A.,
Sr. Unsec. Notes,
5.50%, 01/31/2023(a) | | | 271,000 | | | | 262,703 | |
Brazilian Government International Bond, Sr. Unsec. Global Notes,
4.63%, 01/13/2028 | | | 419,000 | | | | 394,384 | |
Petrobras Global Finance B.V., Sr. Unsec. Gtd. Global Notes, 5.75%, 02/01/2029 | | | 330,000 | | | | 306,075 | |
7.25%, 03/17/2044 | | | 400,000 | | | | 387,250 | |
| | | | | | | | 1,350,412 | |
|
| Canada–1.03% | |
Gran Tierra Energy International Holdings Ltd., Sr. Unsec. Gtd. Notes, 6.25%, 02/15/2025(a) | | | 400,000 | | | | 384,000 | |
|
| Chile–0.74% | |
Empresa Nacional del Petroleo, Sr. Unsec. Notes, 5.25%, 11/06/2029(a) | | | 276,000 | | | | 275,138 | |
|
| China–6.12% | |
Alibaba Group Holding Ltd., Sr. Unsec. Global Notes, 4.20%, 12/06/2047 | | | 350,000 | | | | 303,539 | |
Country Garden Holdings Co. Ltd., REGS, Sr. Sec. Gtd. First Lien Euro Bonds, 5.13%, 01/17/2025(a) | | | 250,000 | | | | 196,858 | |
Envision Energy Overseas Capital Co. Ltd., REGS, Sr. Unsec. Gtd. Euro Bonds, 7.50%, 04/26/2021(a) | | | 200,000 | | | | 156,473 | |
Franshion Brilliant Ltd., REGS, Unsec. Sub. Gtd. Euro Bonds, 4.88%(a)(b) | | | 350,000 | | | | 295,769 | |
| | | | | | | | |
| | | Principal
Amount | | | Value | |
| China–(continued) | |
Longfor Group Holdings Ltd., REGS, Sr. Unsec.
Euro Bonds, 4.50%, 01/16/2028(a) | | $ | 350,000 | | | $ | 296,547 | |
Minmetals Bounteous Finance (BVI) Ltd., REGS, Sr. Unsec. Gtd. Euro Bonds, 3.50%, 07/30/2020(a) | | | 400,000 | | | | 396,729 | |
Ronshine China Holdings Ltd., REGS, Sr. Sec. Gtd. First Lien Euro Bonds, 6.95%, 12/08/2018(a)(c) | | | 300,000 | | | | 298,798 | |
Shimao Property Holdings Ltd., REGS, Sr. Unsec. Gtd. Euro Bonds, 5.20%, 01/30/2025(a) | | | 400,000 | | | | 339,331 | |
| | | | | | | | 2,284,044 | |
|
| Colombia–2.12% | |
Colombia Government International Bond, Sr. Unsec. Global Notes, 3.88%, 04/25/2027 | | | 200,000 | | | | 190,850 | |
Ecopetrol S.A., Sr. Unsec. Global Notes, 5.38%, 06/26/2026 | | | 200,000 | | | | 202,440 | |
GeoPark Ltd., REGS, Sr. Sec. First Lien Euro Notes, 6.50%, 09/21/2024(a) | | | 400,000 | | | | 399,500 | |
| | | | | | | | 792,790 | |
|
| Costa Rica–0.38% | |
Instituto Costarricense de Electricidad, REGS, Sr. Unsec. Euro Notes, 6.38%, 05/15/2043(a) | | | 200,000 | | | | 142,750 | |
|
| Dominican Republic–1.60% | |
Dominican Republic International Bond, Sr. Unsec. Notes, 6.00%, 07/19/2028(a) | | | 600,000 | | | | 596,250 | |
|
| El Salvador–1.09% | |
El Salvador Government International Bond, Sr. Unsec. Notes, 8.63%, 02/28/2029(a) | | | 127,000 | | | | 129,540 | |
REGS, Sr. Unsec. Euro Notes, 7.65%, 06/15/2035(a) | | | 300,000 | | | | 276,375 | |
| | | | | | | | 405,915 | |
|
| Guatemala–0.52% | |
Industrial Senior Trust, REGS, Sr. Unsec. Gtd. Euro Notes, 5.50%, 11/01/2022(a) | | | 200,000 | | | | 195,750 | |
See accompanying Notes to Consolidated Financial Statements which are an integral part of the financial statements.
11 Invesco Emerging Markets Flexible Bond Fund
| | | | | | | | |
| | | Principal
Amount | | | Value | |
| India–1.95% | |
Vedanta Resources PLC, Sr. Unsec. Notes, 6.13%, 08/09/2024(a) | | $ | 269,000 | | | $ | 238,696 | |
REGS, Sr. Unsec. Euro Notes, 6.13%, 08/09/2024(a) | | | 550,000 | | | | 488,039 | |
| | | | | | | | 726,735 | |
|
| Indonesia–1.08% | |
Indika Energy Capital III Pte. Ltd., REGS, Sr. Sec. Gtd. First Lien Euro Notes, 5.88%, 11/09/2024(a) | | | 250,000 | | | | 224,208 | |
Perusahaan Listrik Negara PT, REGS, Sr. Unsec. Medium-Term Euro Notes, 4.13%, 05/15/2027(a) | | | 200,000 | | | | 180,506 | |
| | | | | | | | 404,714 | |
|
| Israel–0.21% | |
Teva Pharmaceutical Finance Netherlands III B.V., Sr. Unsec. Gtd. Global Notes, 6.00%, 04/15/2024 | | | 77,000 | | | | 76,716 | |
|
| Jamaica–2.41% | |
Jamaica Government International Bond, Sr. Unsec. Global Notes, 6.75%, 04/28/2028 | | | 505,000 | | | | 549,819 | |
7.88%, 07/28/2045 | | | 300,000 | | | | 350,250 | |
| | | | | | | | 900,069 | |
|
| Jordan–0.85% | |
Jordan Government International Bond, Sr. Unsec. Bonds, 7.38%, 10/10/2047(a) | | | 350,000 | | | | 317,867 | |
|
| Kazakhstan–1.09% | |
KazMunayGas National Co. JSC, REGS, Sr. Unsec. Euro Notes, 6.38%, 10/24/2048(a) | | | 400,000 | | | | 407,279 | |
|
| Kenya–0.76% | |
Kenya Government International Bond, REGS, Sr. Unsec. Euro Notes, 7.25%, 02/28/2028(a) | | | 300,000 | | | | 283,698 | |
|
| Lebanon–2.29% | |
Lebanon Government International Bond,
Sr. Unsec. Medium-Term Euro Notes, 6.40%, 05/26/2023 | | | 300,000 | | | | 261,024 | |
Sr. Unsec. Medium-Term Global Notes, 5.50%, 04/23/2019 | | | 400,000 | | | | 395,766 | |
REGS, Sr. Unsec. Medium-Term Global Euro Notes,
6.00%, 05/20/2019(a) | | | 200,000 | | | | 197,840 | |
| | | | | | | | 854,630 | |
| | | | | | | | |
| | | Principal
Amount | | | Value | |
| Mexico–9.24% | |
América Móvil, S.A.B. de C.V., Sr. Unsec. Gtd. Global Notes, 5.00%, 10/16/2019 | | $ | 200,000 | | | $ | 203,094 | |
Banco Santander Mexico S.A. Institucion de Banca Multiple Grupo Financiero Santander, Unsec. Sub. Notes, 5.95%, 10/01/2028(a) | | | 200,000 | | | | 200,646 | |
Cometa Energia, S.A. de C.V., REGS, Sr. Sec. Gtd. Euro Notes, 6.38%, 04/24/2035(a) | | | 246,750 | | | | 239,298 | |
Sr. Sec. Gtd. Notes, 6.38%, 04/24/2035(a) | | | 222,075 | | | | 215,368 | |
Comisión Federal de Electricidad,
REGS, Sr. Unsec. Euro Notes, 5.75%, 02/14/2042(a) | | | 200,000 | | | | 186,802 | |
6.13%, 06/16/2045(a) | | | 200,000 | | | | 195,852 | |
Controladora Mabe, S.A. de C.V., Sr. Unsec. Gtd. Notes, 5.60%, 10/23/2028(a) | | | 300,000 | | | | 288,750 | |
Mexico City Airport Trust, REGS, Sr. Sec. Euro Bonds, 5.50%, 07/31/2047(a) | | | 350,000 | | | | 277,375 | |
Petróleos Mexicanos, Sr. Unsec. Gtd. Global Notes, 6.75%, 09/21/2047 | | | 410,000 | | | | 354,199 | |
Sr. Unsec. Gtd. Notes, 5.35%, 02/12/2028(a) | | | 104,000 | | | | 92,914 | |
6.50%, 01/23/2029(a) | | | 116,000 | | | | 111,041 | |
SixSigma Networks México, S.A. de C.V.,
Sr. Unsec. Gtd. Notes, 7.50%, 05/02/2025(a) | | | 200,000 | | | | 189,750 | |
REGS, Sr. Unsec. Gtd. Euro Notes, 7.50%, 05/02/2025(a) | | | 400,000 | | | | 379,500 | |
Unifin Financiera, S.A.B. de C.V., SOFOM, E.N.R.,
Sr. Unsec. Gtd. Bonds, 7.25%, 09/27/2023(a) | | | 250,000 | | | | 242,563 | |
Sr. Unsec. Notes, 7.38%, 02/12/2026(a) | | | 290,000 | | | | 271,513 | |
| | | | | | | | 3,448,665 | |
|
| Namibia–0.48% | |
Namibia International Bonds, REGS, Sr. Unsec. Euro Notes, 5.25%, 10/29/2025(a) | | | 200,000 | | | | 180,830 | |
|
| Oman–3.34% | |
Oman Government International Bond, REGS, Sr. Unsec. Euro Notes, 4.75%, 06/15/2026(a) | | | 350,000 | | | | 323,118 | |
OmGrid Funding Ltd., Sr. Unsec. Gtd. Bonds, 5.20%, 05/16/2027(a) | | | 200,000 | | | | 182,114 | |
Oztel Holdings SPC Ltd., Sr. Sec. Gtd. Bonds, 6.63%, 04/24/2028(a) | | | 384,000 | | | | 377,444 | |
5.63%, 10/24/2023(a) | | | 361,000 | | | | 361,731 | |
| | | | | | | | 1,244,407 | |
See accompanying Notes to Consolidated Financial Statements which are an integral part of the financial statements.
12 Invesco Emerging Markets Flexible Bond Fund
| | | | | | | | |
| | | Principal
Amount | | | Value | |
| Papua New Guinea–0.53% | |
Papua New Guinea Governement International Bond, Sr. Unsec. Notes, 8.38%, 10/04/2028(a) | | $ | 200,000 | | | $ | 198,750 | |
|
| Paraguay–0.52% | |
Paraguay Government International Bond, Sr. Unsec. Notes, 5.60%, 03/13/2048(a) | | | 200,000 | | | | 192,250 | |
|
| Peru–3.08% | |
Corp. Financiera de Desarrollo S.A., Sr. Unsec. Bonds, 3.25%, 07/15/2019(a) | | | 600,000 | | | | 600,239 | |
Inkia Energy Ltd., REGS, Sr. Unsec. Euro Notes, 5.88%, 11/09/2027(a) | | | 350,000 | | | | 331,979 | |
Peru Enhanced Pass-Through Finance Ltd., REGS, Class A-2, Sr. Sec. First Lien Pass Through. Ctfs., 0.00%, 06/02/2025(a)(d) | | | 250,000 | | | | 217,188 | |
| | | | | | | | 1,149,406 | |
|
| Qatar–2.82% | |
Qatar Government International Bond, Sr. Unsec. Notes, 4.50%, 04/23/2028(a) | | | 254,000 | | | | 259,715 | |
5.10%, 04/23/2048(a) | | | 389,000 | | | | 395,834 | |
QNB Finance Ltd., REGS, Sr. Unsec. Gtd. Euro Notes, 2.88%, 04/29/2020(a) | | | 400,000 | | | | 395,720 | |
| | | | | | | | 1,051,269 | |
|
| Saudi Arabia–0.88% | |
Dar Al-Arkan Sukuk Co. Ltd., REGS, Sr. Unsec. Gtd. Euro Bonds, 6.88%, 03/21/2023(a) | | | 350,000 | | | | 327,919 | |
|
| Senegal–0.58% | |
Senegal Government International Bond, Unsec. Notes, 6.25%, 05/23/2033(a) | | | 250,000 | | | | 216,884 | |
|
| Singapore–0.67% | |
Puma International Financing S.A., Sr. Unsec. Gtd. Notes, 5.00%, 01/24/2026(a) | | | 300,000 | | | | 249,117 | |
|
| South Africa–4.60% | |
MTN (Mauritius) Investments Ltd., REGS, Sr. Unsec. Gtd. Euro Notes, 5.37%, 02/13/2022(a) | | | 300,000 | | | | 289,673 | |
| | | | | | | | |
| | | Principal
Amount | | | Value | |
| South Africa–(continued) | |
Petra Diamonds US Treasury PLC, REGS, Sec. Gtd. Second Lien Euro Notes, 7.25%, 05/01/2022(a) | | $ | 300,000 | | | $ | 288,750 | |
Sec. Gtd. Second Lien Notes, 7.25%, 05/01/2022(a) | | | 340,000 | | | | 327,250 | |
Sasol Financing USA LLC, Sr. Unsec. Gtd. Global Notes, 5.88%, 03/27/2024 | | | 279,000 | | | | 281,410 | |
6.50%, 09/27/2028 | | | 521,000 | | | | 528,287 | |
| | | | | | | | 1,715,370 | |
|
| Sri Lanka–0.85% | |
Sri Lanka Government International Bond, REGS, Sr. Unsec. Euro Notes, 5.75%, 04/18/2023(a) | | | 350,000 | | | | 315,465 | |
|
| Supranational–1.62% | |
African Export-Import Bank (The), REGS, Sr. Unsec. Medium-Term Euro Notes, 4.75%, 07/29/2019(a) | | | 600,000 | | | | 604,146 | |
|
| Turkey–6.64% | |
Akbank T.A.S., REGS, Unsec. Sub. Medium-Term Euro Notes, 7.20%, 03/16/2027(a) | | | 350,000 | | | | 298,094 | |
Turkcell Iletisim Hizmetleri A.S., Sr. Unsec. Notes, 5.80%, 04/11/2028(a) | | | 200,000 | | | | 173,703 | |
Turkey Government International Bond,
Sr. Unsec. Global Bonds, 6.13%, 10/24/2028 | | | 200,000 | | | | 178,822 | |
Sr. Unsec. Global Notes, 7.25%, 12/23/2023 | | | 225,000 | | | | 223,661 | |
Turkiye Is Bankasi A.S., REGS, Unsec. Sub. Euro Notes, 7.85%, 12/10/2023(a) | | | 230,000 | | | | 195,023 | |
7.00%, 06/29/2028(a) | | | 270,000 | | | | 201,566 | |
6.00%, 10/24/2022(a) | | | 500,000 | | | | 411,638 | |
Turkiye Vakiflar Bankasi T.A.O., REGS, Sr. Unsec. Global Notes, 5.50%, 10/27/2021(a) | | | 450,000 | | | | 405,787 | |
Sr. Unsec. Notes, 5.75%, 01/30/2023(a) | | | 450,000 | | | | 389,591 | |
| | | | | | | | 2,477,885 | |
|
| Ukraine–2.33% | |
Kernel Holding S.A., Sr. Unsec. Gtd. Notes, 8.75%, 01/31/2022(a) | | | 343,000 | | | | 345,523 | |
Ukraine Government International Bond, Sr. Unsec. Notes, 8.99%, 02/01/2024(a) | | | 200,000 | | | | 198,625 | |
9.75%, 11/01/2028(a) | | | 329,000 | | | | 325,471 | |
| | | | | | | | 869,619 | |
See accompanying Notes to Consolidated Financial Statements which are an integral part of the financial statements.
13 Invesco Emerging Markets Flexible Bond Fund
| | | | | | | | |
| | | Principal
Amount | | | Value | |
| United Arab Emirates–1.03% | |
DP World Crescent Ltd., Sr. Unsec. Notes, 4.85%, 09/26/2028(a) | | $ | 200,000 | | | $ | 195,825 | |
DP World Ltd., Sr. Unsec. Notes, 5.63%, 09/25/2048(a) | | | 200,000 | | | | 189,710 | |
| | | | | | | | 385,535 | |
Total U.S. Dollar Denominated Bonds & Notes (Cost $28,049,275) | | | | 27,234,229 | |
|
Non-U.S. Dollar Denominated Bonds & Notes–19.59%(e) | |
| Brazil–1.53% | | | | | | | | |
Brazil Notas do Tesouro Nacional, Series F, Unsec. Notes, 10.00%, 01/01/2025 | | BRL | 2,030,000 | | | | 572,074 | |
|
| Chile–3.02% | |
Bonos de la Tesorería General de la Republica en pesos, Sr. Unsec. Bonds, 5.00%, 03/01/2035 | | CLP | 300,000,000 | | | | 437,001 | |
Unsec. Bonds, 4.50%, 03/01/2026 | | CLP | 475,000,000 | | | | 688,438 | |
| | | | | | | | 1,125,439 | |
|
| Colombia–1.57% | |
Colombian Titulos De Tesoreria, Series B, Sr. Unsec. Bonds, 10.00%, 07/24/2024 | | COP | 1,620,000,000 | | | | 587,056 | |
|
| Czech Republic–0.41% | |
Czech Republic Government Bond, Series 94, REGS, Unsec. Bonds, 0.95%, 05/15/2030(a) | | CZK | 4,000,000 | | | | 151,964 | |
| | | | | | | | |
| | | Principal
Amount | | | Value | |
| Indonesia–3.30% | |
Indonesia Treasury Bond, Series FR63, Sr. Unsec. Bonds, 5.63%, 05/15/2023 | | IDR | 8,375,000,000 | | | $ | 495,531 | |
Series FR64, Sr. Unsec. Bonds, 6.13%, 05/15/2028 | | IDR | 13,240,000,000 | | | | 735,265 | |
| | | | | | | | 1,230,796 | |
|
| Mexico–6.73% | |
Mexican Bonos, Series M, Sr. Unsec. Bonds, 6.50%, 06/09/2022 | | MXN | 25,000,000 | | | | 1,150,234 | |
7.50%, 06/03/2027 | | MXN | 13,800,000 | | | | 625,615 | |
Mexico CETES, Sr. Unsec. Bills, 0.00%, 11/22/2018(d) | | MXN | 150,000,000 | | | | 735,098 | |
| | | | | | | | 2,510,947 | |
|
| Romania–2.67% | |
Romania Government Bond, Unsec. Bonds, 4.25%, 06/28/2023 | | RON | 3,300,000 | | | | 788,458 | |
5.80%, 07/26/2027 | | RON | 800,000 | | | | 206,423 | |
| | | | | | | | 994,881 | |
|
| United Arab Emirates–0.36% | |
DP World Ltd., Sr. Unsec. Notes, 2.38%, 09/25/2026(a) | | EUR | 120,000 | | | | 135,429 | |
Total Non U.S. Dollar Denominated Bonds & Notes (Cost $7,786,946) | | | | 7,308,586 | |
|
Options Purchased–0.01% | |
(Cost $3,774)(f) | | | | | | | 4,934 | |
TOTAL INVESTMENTS IN SECURITIES–92.59%
(Cost $35,839,995) | | | | 34,547,749 | |
OTHER ASSETS LESS LIABILITIES–7.41% | | | | 2,763,335 | |
NET ASSETS–100.00% | | | $ | 37,311,084 | |
Investment Abbreviations:
| | |
| BRL | | – Brazilian Real |
| CLP | | – Chilean Peso |
| COP | | – Colombian Peso |
| Ctfs. | | – Certificates |
| | |
| CZK | | – Czech Koruna |
| EUR | | – Euro |
| Gtd. | | – Guaranteed |
| IDR | | – Indonesian Rupiah |
| | |
| MXN | | – Mexican Peso |
| REGS | | – Regulation S |
| RON | | – Romanian Leu |
| Sec. | | – Secured |
| | |
| Sr. | | – Senior |
| Sub. | | – Subordinated |
| Unsec. | | – Unsecured |
Notes to Consolidated Schedule of Investments:
| (a) | Security purchased or received in a transaction exempt from registration under the Securities Act of 1933, as amended (the “1933 Act”). The security may be resold pursuant to an exemption from registration under the 1933 Act, typically to qualified institutional buyers. The aggregate value of these securities at October 31, 2018 was $20,630,094, which represented 55.29% of the Fund’s Net Assets. |
| (b) | Perpetual bond with no specified maturity date. |
| (c) | Security has an irrevocable call by the issuer or mandatory put by the holder. Maturity date reflects such call or put. |
| (d) | Zero coupon bond issued at a discount. The interest rate shown represents the yield to maturity at issue. |
| (e) | Foreign denominated security. Principal amount is denominated in the currency indicated. |
| (f) | The table below details options purchased. See Notes 1M. |
| | | | | | | | | | | | | | | | | | | | | | | | | | | | | | |
| Open Over-The-Counter Foreign Currency Options Purchased — Currency Risk | |
| Description | | Type of
Contract | | | Counterparty | | Expiration
Date | | | Exercise
Price | | | Notional
Value | | | Value | |
USD versus THB | | | Put | | | Citibank, N.A. | | | 01/14/2019 | | | | THB | | | | 33.400 | | | | USD | | | | 695,000 | | | $ | 4,934 | |
Total Foreign Currency Options Purchased (Cost $3,774) | | | | | | | $ | 4,934 | |
See accompanying Notes to Consolidated Financial Statements which are an integral part of the financial statements.
14 Invesco Emerging Markets Flexible Bond Fund
| | | | | | | | | | | | | | | | | | | | | | |
| Open Forward Foreign Currency Contracts | |
Settlement Date | | Counterparty | | Contract to | | | Unrealized
Appreciation
(Depreciation) | |
| | Deliver | | | Receive | |
11/05/2018 | | Citibank, N.A. | | | BRL | | | | 1,580,000 | | | | USD | | | | 425,539 | | | $ | 979 | |
11/05/2018 | | Citibank, N.A. | | | USD | | | | 422,609 | | | | BRL | | | | 1,580,000 | | | | 1,951 | |
11/05/2018 | | Goldman Sachs International | | | BRL | | | | 5,308,197 | | | | USD | | | | 1,433,127 | | | | 6,767 | |
11/05/2018 | | Goldman Sachs International | | | USD | | | | 1,385,581 | | | | BRL | | | | 5,308,197 | | | | 40,778 | |
11/30/2018 | | Bank of America, N.A. | | | CZK | | | | 17,074,000 | | | | USD | | | | 777,419 | | | | 31,364 | |
11/30/2018 | | Bank of America, N.A. | | | IDR | | | | 4,375,336,000 | | | | USD | | | | 290,720 | | | | 3,910 | |
11/30/2018 | | Bank of America, N.A. | | | USD | | | | 123,444 | | | | TRY | | | | 770,000 | | | | 11,938 | |
11/30/2018 | | Barclays Bank PLC | | | THB | | | | 13,500,000 | | | | USD | | | | 415,346 | | | | 7,848 | |
11/30/2018 | | Barclays Bank PLC | | | USD | | | | 727,842 | | | | IDR | | | | 11,165,000,000 | | | | 4,041 | |
11/30/2018 | | Barclays Bank PLC | | | USD | | | | 338,583 | | | | RUB | | | | 23,088,000 | | | | 10,671 | |
11/30/2018 | | Citibank, N.A. | | | COP | | | | 1,210,800,000 | | | | USD | | | | 392,098 | | | | 16,502 | |
11/30/2018 | | Citibank, N.A. | | | EUR | | | | 200,000 | | | | USD | | | | 236,202 | | | | 9,182 | |
11/30/2018 | | Citibank, N.A. | | | MXN | | | | 56,400,000 | | | | USD | | | | 2,970,214 | | | | 205,207 | |
11/30/2018 | | Citibank, N.A. | | | PEN | | | | 1,381,000 | | | | USD | | | | 414,715 | | | | 5,509 | |
11/30/2018 | | Citibank, N.A. | | | PLN | | | | 410,000 | | | | USD | | | | 111,370 | | | | 4,466 | |
11/30/2018 | | Citibank, N.A. | | | TRY | | | | 2,000,000 | | | | USD | | | | 357,357 | | | | 5,715 | |
11/30/2018 | | Citibank, N.A. | | | ZAR | | | | 6,330,000 | | | | USD | | | | 440,436 | | | | 12,817 | |
11/30/2018 | | Citibank, N.A. | | | USD | | | | 94,293 | | | | ARS | | | | 3,800,000 | | | | 7,955 | |
11/30/2018 | | Citibank, N.A. | | | USD | | | | 38,249 | | | | IDR | | | | 584,250,000 | | | | 50 | |
11/30/2018 | | Citibank, N.A. | | | USD | | | | 506,605 | | | | TRY | | | | 3,125,452 | | | | 42,914 | |
11/30/2018 | | Deutsche Bank AG | | | USD | | | | 188,032 | | | | TRY | | | | 1,100,000 | | | | 5,371 | |
11/30/2018 | | Goldman Sachs International | | | CLP | | | | 45,000,000 | | | | USD | | | | 68,393 | | | | 3,720 | |
11/30/2018 | | Goldman Sachs International | | | IDR | | | | 28,106,800,000 | | | | USD | | | | 1,871,609 | | | | 29,166 | |
11/30/2018 | | Goldman Sachs International | | | USD | | | | 248,403 | | | | ARS | | | | 9,917,500 | | | | 18,451 | |
11/30/2018 | | Goldman Sachs International | | | USD | | | | 407,959 | | | | ZAR | | | | 6,200,000 | | | | 10,877 | |
11/30/2018 | | Goldman Sachs International | | | ZAR | | | | 6,700,000 | | | | USD | | | | 460,482 | | | | 7,869 | |
11/30/2018 | | J.P. Morgan Chase Bank, N.A. | | | CLP | | | | 495,138,000 | | | | USD | | | | 737,032 | | | | 25,434 | |
11/30/2018 | | J.P. Morgan Chase Bank, N.A. | | | HUF | | | | 46,000,000 | | | | USD | | | | 166,659 | | | | 5,932 | |
11/30/2018 | | Morgan Stanley Bank, N.A. | | | PEN | | | | 2,250,000 | | | | USD | | | | 679,491 | | | | 12,791 | |
11/30/2018 | | Morgan Stanley Bank, N.A. | | | ZAR | | | | 8,650,000 | | | | USD | | | | 596,733 | | | | 12,388 | |
12/03/2018 | | Citibank, N.A. | | | RON | | | | 1,520,000 | | | | USD | | | | 380,619 | | | | 11,794 | |
12/03/2018 | | Goldman Sachs International | | | RON | | | | 5,989,950 | | | | USD | | | | 1,503,518 | | | | 50,070 | |
07/24/2019 | | Bank of America, N.A. | | | CNY | | | | 1,350,000 | | | | USD | | | | 197,123 | | | | 3,423 | |
Subtotal — Appreciation | | | | 627,850 | |
11/05/2018 | | Barclays Bank PLC | | | BRL | | | | 5,430,000 | | | | USD | | | | 1,327,417 | | | | (131,672 | ) |
11/05/2018 | | Barclays Bank PLC | | | USD | | | | 1,460,580 | | | | BRL | | | | 5,430,000 | | | | (1,491 | ) |
11/30/2018 | | Bank of America, N.A. | | | USD | | | | 167,200 | | | | HUF | | | | 46,000,000 | | | | (6,473 | ) |
11/30/2018 | | Bank of America, N.A. | | | USD | | | | 278,766 | | | | ZAR | | | | 4,033,000 | | | | (6,320 | ) |
11/30/2018 | | Barclays Bank PLC | | | TRY | | | | 325,200 | | | | USD | | | | 49,668 | | | | (7,509 | ) |
11/30/2018 | | Barclays Bank PLC | | | USD | | | | 416,590 | | | | THB | | | | 13,500,000 | | | | (9,091 | ) |
11/30/2018 | | Citibank, N.A. | | | ARS | | | | 14,600,000 | | | | USD | | | | 391,079 | | | | (1,769 | ) |
11/30/2018 | | Citibank, N.A. | | | IDR | | | | 12,180,000,000 | | | | USD | | | | 788,070 | | | | (10,347 | ) |
11/30/2018 | | Citibank, N.A. | | | USD | | | | 149,846 | | | | COP | | | | 440,000,000 | | | | (13,356 | ) |
11/30/2018 | | Citibank, N.A. | | | USD | | | | 620,552 | | | | CZK | | | | 13,600,000 | | | | (26,295 | ) |
11/30/2018 | | Citibank, N.A. | | | USD | | | | 502,694 | | | | MXN | | | | 9,590,000 | | | | (32,545 | ) |
11/30/2018 | | Citibank, N.A. | | | USD | | | | 359,879 | | | | PEN | | | | 1,193,000 | | | | (6,380 | ) |
11/30/2018 | | Citibank, N.A. | | | USD | | | | 112,495 | | | | PLN | | | | 410,000 | | | | (5,591 | ) |
11/30/2018 | | Citibank, N.A. | | | USD | | | | 573,923 | | | | ZAR | | | | 8,337,000 | | | | (10,723 | ) |
11/30/2018 | | Goldman Sachs International | | | RUB | | | | 23,088,000 | | | | USD | | | | 339,092 | | | | (10,162 | ) |
11/30/2018 | | Goldman Sachs International | | | TRY | | | | 2,670,251 | | | | USD | | | | 466,129 | | | | (3,357 | ) |
11/30/2018 | | Goldman Sachs International | | | USD | | | | 715,250 | | | | IDR | | | | 10,600,000,000 | | | | (20,404 | ) |
See accompanying Notes to Consolidated Financial Statements which are an integral part of the financial statements.
15 Invesco Emerging Markets Flexible Bond Fund
| | | | | | | | | | | | | | | | | | | | | | |
| Open Forward Foreign Currency Contracts–(continued) | |
Settlement Date | | Counterparty | | Contract to | | | Unrealized
Appreciation
(Depreciation) | |
| | Deliver | | | Receive | |
11/30/2018 | | Goldman Sachs International | | | USD | | | | 206,910 | | | | MXN | | | | 3,880,000 | | | $ | (16,694 | ) |
11/30/2018 | | J.P. Morgan Chase Bank, N.A. | | | USD | | | | 234,535 | | | | CLP | | | | 160,000,000 | | | | (4,588 | ) |
11/30/2018 | | Morgan Stanley Bank, N.A. | | | USD | | | | 206,014 | | | | COP | | | | 620,000,000 | | | | (13,687 | ) |
11/30/2018 | | Morgan Stanley Bank, N.A. | | | USD | | | | 736,741 | | | | PEN | | | | 2,438,000 | | | | (14,334 | ) |
12/03/2018 | | Citibank, N.A. | | | USD | | | | 730,815 | | | | RON | | | | 2,975,000 | | | | (8,937 | ) |
12/03/2018 | | Goldman Sachs International | | | USD | | | | 82,631 | | | | RON | | | | 337,000 | | | | (858 | ) |
12/04/2018 | | Citibank, N.A. | | | BRL | | | | 2,160,197 | | | | USD | | | | 578,676 | | | | (107 | ) |
12/04/2018 | | Citibank, N.A. | | | USD | | | | 187,054 | | | | BRL | | | | 695,000 | | | | (842 | ) |
07/24/2019 | | Bank of America, N.A. | | | USD | | | | 196,736 | | | | CNY | | | | 1,350,000 | | | | (3,035 | ) |
10/31/2019 | | Goldman Sachs International | | | CNY | | | | 1,365,234 | | | | USD | | | | 195,000 | | | | (980 | ) |
Subtotal — Depreciation | | | | | | | | | | | | | | | | | | | (367,547 | ) |
Total Foreign Currency Contracts — Currency Risk | | | | | | | | | | | | | | | | | | $ | 260,303 | |
Currency Abbreviations:
| | |
| ARS | | – Argentine Peso |
| BRL | | – Brazilian Real |
| CLP | | – Chilean Peso |
| CNY | | – Chinese Yuan |
| COP | | – Colombian Peso |
| CZK | | – Czech Koruna |
| EUR | | – Euro |
| HUF | | – Hungarian Forint |
| IDR | | – Indonesian Rupiah |
| MXN | | – Mexican Peso |
| PEN | | – Peruvian Sol |
| PLN | | – Poland Zloty |
| RON | | – Romanian Leu |
| RUB | | – Russian Ruble |
| THB | | – Thailand Baht |
| TRY | | – Turkish Lira |
| USD | | – U.S. Dollar |
| ZAR | | – South African Rand |
See accompanying Notes to Consolidated Financial Statements which are an integral part of the financial statements.
16 Invesco Emerging Markets Flexible Bond Fund
Consolidated Statement of Assets and Liabilities
October 31, 2018
| | | | |
Assets: | | | | |
Investments in securities, at value (Cost $35,839,995) | | $ | 34,547,749 | |
Other investments: | | | | |
Unrealized appreciation on forward foreign currency contracts outstanding | | | 627,850 | |
Cash | | | 467,504 | |
Foreign currencies, at value (Cost $976,845) | | | 993,247 | |
Receivable for: | | | | |
Investments sold | | | 1,419,808 | |
Dividends and interest | | | 500,905 | |
Fund shares sold | | | 200 | |
Fund expenses absorbed | | | 6,871 | |
Investment for trustee deferred compensation and retirement plans | | | 27,279 | |
Other assets | | | 38,412 | |
Total assets | | | 38,629,825 | |
| |
Liabilities: | | | | |
Other investments: | | | | |
Unrealized depreciation on forward foreign currency contracts outstanding | | | 367,547 | |
Payable for: | | | | |
Investments purchased | | | 804,765 | |
Fund shares repurchased | | | 11,248 | |
Accrued fees to affiliates | | | 6,470 | |
Accrued trustees’ and officers’ fees and benefits | | | 1,687 | |
Accrued other operating expenses | | | 98,618 | |
Trustee deferred compensation and retirement plans | | | 28,406 | |
Total liabilities | | | 1,318,741 | |
Net assets applicable to shares outstanding | | $ | 37,311,084 | |
| |
Net assets applicable consist of: | | | | |
Shares of beneficial interest | | $ | 43,291,904 | |
Distributable earnings | | | (5,980,820 | ) |
| | | $ | 37,311,084 | |
| | | | |
Net Assets: | | | | |
Class A | | $ | 3,434,411 | |
Class C | | $ | 946,072 | |
Class R | | $ | 90,345 | |
Class Y | | $ | 1,116,334 | |
Class R5 | | $ | 5,919 | |
Class R6 | | $ | 31,718,003 | |
|
Shares outstanding, no par value,
with an unlimited number of shares authorized: | |
Class A | | | 593,375 | |
Class C | | | 163,379 | |
Class R | | | 15,627 | |
Class Y | | | 192,889 | |
Class R5 | | | 1,023 | |
Class R6 | | | 5,487,396 | |
Class A: | | | | |
Net asset value per share | | $ | 5.79 | |
Maximum offering price per share | | | | |
(Net asset value of $5.79 ¸ 95.75%) | | $ | 6.05 | |
Class C: | | | | |
Net asset value and offering price per share | | $ | 5.79 | |
Class R: | | | | |
Net asset value and offering price per share | | $ | 5.78 | |
Class Y: | | | | |
Net asset value and offering price per share | | $ | 5.79 | |
Class R5: | | | | |
Net asset value and offering price per share | | $ | 5.79 | |
Class R6: | | | | |
Net asset value and offering price per share | | $ | 5.78 | |
See accompanying Notes to Consolidated Financial Statements which are an integral part of the financial statements.
17 Invesco Emerging Markets Flexible Bond Fund
Consolidated Statement of Operations
For the year ended October 31, 2018
| | | | |
Investment income: | | | | |
Interest (net of foreign withholding taxes of $29,087) | | $ | 2,913,247 | |
Dividends from affiliated money market funds | | | 55,485 | |
Total investment income | | | 2,968,732 | |
| |
Expenses: | | | | |
Advisory fees | | | 366,554 | |
Administrative services fees | | | 50,000 | |
Custodian fees | | | 44,316 | |
Distribution fees: | | | | |
Class A | | | 10,466 | |
Class B | | | 155 | |
Class C | | | 12,569 | |
Class R | | | 763 | |
Transfer agent fees — A, B, C, R & Y | | | 23,088 | |
Transfer agent fees — R6 | | | 149 | |
Trustees’ and officers’ fees and benefits | | | 20,884 | |
Registration and filing fees | | | 87,764 | |
Reports to shareholders | | | 19,226 | |
Professional services fees | | | 81,347 | |
Other | | | 44,159 | |
Total expenses | | | 761,440 | |
Less: Fees waived, expenses reimbursed and expense offset arrangement(s) | | | (254,245 | ) |
Net expenses | | | 507,195 | |
Net investment income | | | 2,461,537 | |
| |
Realized and unrealized gain (loss) from: | | | | |
Net realized gain (loss) from: | | | | |
Investment securities | | | (3,799,322 | ) |
Foreign currencies | | | (53,577 | ) |
Forward foreign currency contracts | | | (446,354 | ) |
Futures contracts | | | (22,482 | ) |
Option contracts written | | | 28,112 | |
Swap agreements | | | (228,494 | ) |
| | | | (4,522,117 | ) |
Change in net unrealized appreciation (depreciation) of: | | | | |
Investment securities | | | (2,721,684 | ) |
Foreign currencies | | | 21,796 | |
Forward foreign currency contracts | | | (45,517 | ) |
Futures contracts | | | 42,905 | |
Option contracts written | | | (958 | ) |
Swap agreements | | | 111,508 | |
| | | | (2,591,950 | ) |
Net realized and unrealized gain (loss) | | | (7,114,067 | ) |
Net increase (decrease) in net assets resulting from operations | | $ | (4,652,530 | ) |
See accompanying Notes to Consolidated Financial Statements which are an integral part of the financial statements.
18 Invesco Emerging Markets Flexible Bond Fund
Consolidated Statement of Changes in Net Assets
For the years ended October 31, 2018 and 2017
| | | | | | | | |
| | | 2018 | | | 2017 | |
Operations: | | | | | | | | |
Net investment income | | $ | 2,461,537 | | | $ | 3,383,259 | |
Net realized gain (loss) | | | (4,522,117 | ) | | | (374,815 | ) |
Change in net unrealized appreciation (depreciation) | | | (2,591,950 | ) | | | 1,078,584 | |
Net increase (decrease) in net assets resulting from operations | | | (4,652,530 | ) | | | 4,087,028 | |
| | |
Distributions to shareholders from distributable earnings(1): | | | | | | | | |
Class A | | | (130,497 | ) | | | (163,006 | ) |
Class B | | | — | | | | (2,408 | ) |
Class C | | | (29,725 | ) | | | (34,538 | ) |
Class R | | | (4,149 | ) | | | (9,158 | ) |
Class Y | | | (70,981 | ) | | | (46,029 | ) |
Class R5 | | | (219 | ) | | | (266 | ) |
Class R6 | | | (1,376,683 | ) | | | (2,155,646 | ) |
Total distributions from distributable earnings | | | (1,612,254 | ) | | | (2,411,051 | ) |
| | |
Return on capital: | | | | | | | | |
Class A | | | (39,740 | ) | | | — | |
Class C | | | (11,932 | ) | | | — | |
Class R | | | (1,449 | ) | | | — | |
Class Y | | | (19,145 | ) | | | — | |
Class R5 | | | (61 | ) | | | — | |
Class R6 | | | (391,475 | ) | | | — | |
Total return of capital | | | (463,802 | ) | | | — | |
| | |
Share transactions-net: | | | | | | | | |
Class A | | | (803,791 | ) | | | (467,124 | ) |
Class B | | | (68,467 | ) | | | (54,285 | ) |
Class C | | | (95,207 | ) | | | (4,002 | ) |
Class R | | | (176,276 | ) | | | 11,179 | |
Class Y | | | (553,789 | ) | | | 1,593,643 | |
Class R6 | | | (12,148,670 | ) | | | (12,694,404 | ) |
Net increase (decrease) in net assets resulting from share transactions | | | (13,846,200 | ) | | | (11,614,993 | ) |
Net increase (decrease) in net assets | | | (20,574,786 | ) | | | (9,939,016 | ) |
| | |
Net assets: | | | | | | | | |
Beginning of year | | | 57,885,870 | | | | 67,824,886 | |
End of year | | $ | 37,311,084 | | | $ | 57,885,870 | |
| (1) | The Securities and Exchange Commission eliminated the requirement to disclose distribution components separately, except for tax return of capital. For the year ended October 31, 2017, distributions to shareholders from distributable earnings consisted of distributions from net investment income. |
Notes to Consolidated Financial Statements
October 31, 2018
NOTE 1—Significant Accounting Policies
Invesco Emerging Markets Flexible Bond Fund (the “Fund”) is a series portfolio of AIM Investment Funds (Invesco Investment Funds) (the “Trust”). The Trust is organized as a Delaware statutory trust and is registered under the Investment Company Act of 1940, as amended (the “1940 Act”), as an open-end series management investment company authorized to issue an unlimited number of shares of beneficial interest. Information presented in these consolidated financial statements pertains only to the Fund. Matters affecting the Fund or each class will be voted on exclusively by the shareholders of the Fund or each class.
The Fund will seek to gain exposure to the commodity markets primarily through investments in the Invesco Emerging Markets Flexible Bond Cayman Ltd. (the “Subsidiary”), a wholly-owned subsidiary of the Fund organized under the laws of the Cayman Islands. The Subsidiary was organized
19 Invesco Emerging Markets Flexible Bond Fund
by the Fund to invest in commodity-linked derivatives and other securities that may provide leveraged and non-leveraged exposure to commodities. The Fund may invest up to 25% of its total assets in the Subsidiary.
The Fund’s investment objective is total return through growth of capital and current income.
The Fund currently consists of six different classes of shares: Class A, Class C, Class R, Class Y, Class R5 and Class R6. Class Y shares are available only to certain investors. Class A shares are sold with a front-end sales charge unless certain waiver criteria are met. Under certain circumstances, load waived shares may be subject to contingent deferred sales charges (“CDSC”). Class C shares are sold with a CDSC. Class R, Class Y, Class R5 and Class R6 shares are sold at net asset value. Effective November 30, 2010, new or additional investments in Class B shares are no longer permitted. Existing shareholders of Class B shares were permitted to continue to reinvest dividends and capital gains distributions in Class B shares until their conversion to Class A shares. Also, shareholders in Class B shares were able to exchange those shares for Class B shares of other Invesco Funds offering such shares until they converted to Class A shares. Generally, Class B shares automatically converted to Class A shares on or about the month-end, which was at least eight years after the date of purchase. Redemptions of Class B shares prior to the conversion date were subject to a CDSC. Effective January 26, 2018, all of the Fund’s outstanding Class B shares were converted to Class A shares, in advance of their normally scheduled conversion. No CDSC was paid in connection with this early conversion.
The Fund is an investment company and accordingly follows the investment company accounting and reporting guidance in accordance with Financial Accounting Standards Board Accounting Standards Codification Topic 946, Financial Services — Investment Companies.
The following is a summary of the significant accounting policies followed by the Fund in the preparation of its consolidated financial statements.
| A. | Security Valuations — Securities, including restricted securities, are valued according to the following policy. |
Debt obligations (including convertible securities) and unlisted equities are fair valued using an evaluated quote provided by an independent pricing service. Evaluated quotes provided by the pricing service may be determined without exclusive reliance on quoted prices, and may reflect appropriate factors such as institution-size trading in similar groups of securities, developments related to specific securities, dividend rate (for unlisted equities), yield (for debt obligations), quality, type of issue, coupon rate (for debt obligations), maturity (for debt obligations), individual trading characteristics and other market data. Pricing services generally value debt obligations assuming orderly transactions of institutional round lot size, but a fund may hold or transact in the same securities in smaller, odd lot sizes. Odd lots often trade at lower prices than institutional round lots. Debt obligations are subject to interest rate and credit risks. In addition, all debt obligations involve some risk of default with respect to interest and/or principal payments.
A security listed or traded on an exchange (except convertible securities) is valued at its last sales price or official closing price as of the close of the customary trading session on the exchange where the security is principally traded, or lacking any sales or official closing price on a particular day, the security may be valued at the closing bid price on that day. Securities traded in the over-the-counter market are valued based on prices furnished by independent pricing services or market makers. When such securities are valued by an independent pricing service they may be considered fair valued. Futures contracts are valued at the final settlement price set by an exchange on which they are principally traded. Listed options are valued at the mean between the last bid and asked prices from the exchange on which they are principally traded. Options not listed on an exchange are valued by an independent source at the mean between the last bid and asked prices. For purposes of determining net asset value (“NAV”) per share, futures and option contracts generally are valued 15 minutes after the close of the customary trading session of the New York Stock Exchange (“NYSE”).
Investments in open-end and closed-end registered investment companies that do not trade on an exchange are valued at the end-of-day net asset value per share. Investments in open-end and closed-end registered investment companies that trade on an exchange are valued at the last sales price or official closing price as of the close of the customary trading session on the exchange where the security is principally traded.
Swap agreements are fair valued using an evaluated quote, if available, provided by an independent pricing service. Evaluated quotes provided by the pricing service are valued based on a model which may include end-of-day net present values, spreads, ratings, industry, company performance and returns of referenced assets. Centrally cleared swap agreements are valued at the daily settlement price determined by the relevant exchange or clearinghouse.
Foreign securities’ (including foreign exchange contracts) prices are converted into U.S. dollar amounts using the applicable exchange rates as of the close of the NYSE. If market quotations are available and reliable for foreign exchange-traded equity securities, the securities will be valued at the market quotations. Because trading hours for certain foreign securities end before the close of the NYSE, closing market quotations may become unreliable. If between the time trading ends on a particular security and the close of the customary trading session on the NYSE, events occur that the investment adviser determines are significant and make the closing price unreliable, the Fund may fair value the security. If the event is likely to have affected the closing price of the security, the security will be valued at fair value in good faith using procedures approved by the Board of Trustees. Adjustments to closing prices to reflect fair value may also be based on a screening process of an independent pricing service to indicate the degree of certainty, based on historical data, that the closing price in the principal market where a foreign security trades is not the current value as of the close of the NYSE. Foreign securities’ prices meeting the approved degree of certainty that the price is not reflective of current value will be priced at the indication of fair value from the independent pricing service. Multiple factors may be considered by the independent pricing service in determining adjustments to reflect fair value and may include information relating to sector indices, American Depositary Receipts and domestic and foreign index futures. Foreign securities may have additional risks including exchange rate changes, potential for sharply devalued currencies and high inflation, political and economic upheaval, the relative lack of issuer information, relatively low market liquidity and the potential lack of strict financial and accounting controls and standards.
Securities for which market prices are not provided by any of the above methods may be valued based upon quotes furnished by independent sources. The last bid price may be used to value equity securities. The mean between the last bid and asked prices is used to value debt obligations, including corporate loans.
Securities for which market quotations are not readily available or became unreliable are valued at fair value as determined in good faith by or under the supervision of the Trust’s officers following procedures approved by the Board of Trustees. Issuer specific events, market trends, bid/asked quotes of brokers and information providers and other market data may be reviewed in the course of making a good faith determination of a security’s fair value.
The Fund may invest in securities that are subject to interest rate risk, meaning the risk that the prices will generally fall as interest rates rise and, conversely, the prices will generally rise as interest rates fall. Specific securities differ in their sensitivity to changes in interest rates
20 Invesco Emerging Markets Flexible Bond Fund
depending on their individual characteristics. Changes in interest rates may result in increased market volatility, which may affect the value and/or liquidity of certain Fund investments.
Valuations change in response to many factors including the historical and prospective earnings of the issuer, the value of the issuer’s assets, general economic conditions, interest rates, investor perceptions and market liquidity. Because of the inherent uncertainties of valuation, the values reflected in the consolidated financial statements may materially differ from the value received upon actual sale of those investments.
| B. | Securities Transactions and Investment Income — Securities transactions are accounted for on a trade date basis. Realized gains or losses on sales are computed on the basis of specific identification of the securities sold. Interest income (net of withholding tax, if any) is recorded on the accrual basis from settlement date. Bond premiums and discounts are amortized and/or accreted over the lives of the respective securities. Pay-in-kind interest income and non-cash dividend income received in the form of securities in-lieu of cash are recorded at the fair value of the securities received. Dividend income (net of withholding tax, if any) is recorded on the ex-dividend date. |
The Fund may periodically participate in litigation related to Fund investments. As such, the Fund may receive proceeds from litigation settlements. Any proceeds received are included in the Consolidated Statement of Operations as realized gain (loss) for investments no longer held and as unrealized gain (loss) for investments still held.
Brokerage commissions and mark ups are considered transaction costs and are recorded as an increase to the cost basis of securities purchased and/or a reduction of proceeds on a sale of securities. Such transaction costs are included in the determination of net realized and unrealized gain (loss) from investment securities reported in the Consolidated Statement of Operations and the Consolidated Statement of Changes in Net Assets and the net realized and unrealized gains (losses) on securities per share in the Financial Highlights. Transaction costs are included in the calculation of the Fund’s net asset value and, accordingly, they reduce the Fund’s total returns. These transaction costs are not considered operating expenses and are not reflected in net investment income reported in the Consolidated Statement of Operations and the Consolidated Statement of Changes in Net Assets, or the net investment income per share and the ratios of expenses and net investment income reported in the Financial Highlights, nor are they limited by any expense limitation arrangements between the Fund and the investment adviser.
The Fund allocates income and realized and unrealized capital gains and losses to a class based on the relative net assets of each class.
| C. | Country Determination — For the purposes of making investment selection decisions and presentation in the Consolidated Schedule of Investments, the investment adviser may determine the country in which an issuer is located and/or credit risk exposure based on various factors. These factors include the laws of the country under which the issuer is organized, where the issuer maintains a principal office, the country in which the issuer derives 50% or more of its total revenues and the country that has the primary market for the issuer’s securities, as well as other criteria. Among the other criteria that may be evaluated for making this determination are the country in which the issuer maintains 50% or more of its assets, the type of security, financial guarantees and enhancements, the nature of the collateral and the sponsor organization. Country of issuer and/or credit risk exposure has been determined to be the United States of America, unless otherwise noted. |
| D. | Distributions — Distributions from net investment income, if any, are declared and paid quarterly and are recorded on the ex-dividend date. Distributions from net realized capital gain, if any, are generally declared and paid annually and recorded on the ex-dividend date. The Fund may elect to treat a portion of the proceeds from redemptions as distributions for federal income tax purposes. |
| E. | Federal Income Taxes — The Fund intends to comply with the requirements of Subchapter M of the Internal Revenue Code of 1986, as amended (the “Internal Revenue Code”), necessary to qualify as a regulated investment company and to distribute substantially all of the Fund’s taxable earnings to shareholders. As such, the Fund will not be subject to federal income taxes on otherwise taxable income (including net realized capital gain) that is distributed to shareholders. Therefore, no provision for federal income taxes is recorded in the consolidated financial statements. |
The Fund recognizes the tax benefits of uncertain tax positions only when the position is more likely than not to be sustained. Management has analyzed the Fund’s uncertain tax positions and concluded that no liability for unrecognized tax benefits should be recorded related to uncertain tax positions. Management is not aware of any tax positions for which it is reasonably possible that the total amounts of unrecognized tax benefits will change materially in the next 12 months.
The Subsidiary is classified as a controlled foreign corporation under Subchapter N of the Internal Revenue Code. Therefore, the Fund is required to increase its taxable income by its share of the Subsidiary’s income. Net investment losses of the Subsidiary cannot be deducted by the Fund in the current period nor carried forward to offset taxable income in future periods.
The Fund files tax returns in the U.S. Federal jurisdiction and certain other jurisdictions. Generally the Fund is subject to examinations by such taxing authorities for up to three years after the filing of the return for the tax period.
| F. | Expenses — Fees provided for under the Rule 12b-1 plan of a particular class of the Fund are charged to the operations of such class. Transfer agency fees and expenses and other shareholder recordkeeping fees and expenses attributable to Class R5 and Class R6 are allocated to each share class based on relative net assets. Sub-accounting fees attributable to Class R5 are charged to the operations of the class. Transfer agency fees and expenses and other shareholder recordkeeping fees and expenses relating to all other classes are allocated among those classes based on relative net assets. All other expenses are allocated among the classes based on relative net assets. |
| G. | Accounting Estimates — The financial statements are prepared on a consolidated basis in conformity with accounting principles generally accepted in the United States of America (“GAAP”), which requires management to make estimates and assumptions that affect the reported amounts of assets and liabilities at the date of the financial statements and the reported amounts of revenues and expenses during the reporting period including estimates and assumptions related to taxation. Actual results could differ from those estimates by a significant amount. The accompanying financial statements reflect the financial position of the Fund and its Subsidiary and the results of operations on a consolidated basis. All inter-company accounts and transactions have been eliminated in consolidation. |
In addition, the Fund monitors for material events or transactions that may occur or become known after the period-end date and before the date the consolidated financial statements are released to print.
| H. | Indemnifications — Under the Trust’s organizational documents, each Trustee, officer, employee or other agent of the Trust, and under the Subsidiary’s organizational documents, the directors and officers of the Subsidiary, are indemnified against certain liabilities that may arise out of the performance of their duties to the Fund and/or the Subsidiary, respectively. Additionally, in the normal course of business, the Fund enters into contracts, including the Fund’s servicing agreements, that contain a variety of indemnification clauses. The Fund’s maximum exposure under these arrangements is unknown as this would involve future claims that may be made against the Fund that have not yet occurred. The risk of material loss as a result of such indemnification claims is considered remote. |
21 Invesco Emerging Markets Flexible Bond Fund
| I. | Structured Securities — The Fund may invest in structured securities. Structured securities are a type of derivative security whose value is determined by reference to changes in the value of underlying securities, currencies, interest rates, commodities, indices or other financial indicators (“reference instruments”). Most structured securities are fixed-income securities that have maturities of three years or less. Structured securities may be positively or negatively indexed (i.e., their principal value or interest rates may increase or decrease if the underlying reference instrument appreciates) and may have return characteristics similar to direct investments in the underlying reference instrument. |
Structured securities may entail a greater degree of market risk than other types of debt securities because the investor bears the risk of the reference instruments. In addition to the credit risk of structured securities and the normal risks of price changes in response to changes in interest rates, the principal amount of structured notes or indexed securities may decrease as a result of changes in the value of the underlying reference instruments. Changes in the daily value of structured securities are recorded as unrealized gains (losses) in the Consolidated Statement of Operations. When the structured securities mature or are sold, the Fund recognizes a realized gain (loss) on the Consolidated Statement of Operations.
| J. | Foreign Currency Translations — Foreign currency is valued at the close of the NYSE based on quotations posted by banks and major currency dealers. Portfolio securities and other assets and liabilities denominated in foreign currencies are translated into U.S. dollar amounts at the date of valuation. Purchases and sales of portfolio securities (net of foreign taxes withheld on disposition) and income items denominated in foreign currencies are translated into U.S. dollar amounts on the respective dates of such transactions. The Fund does not separately account for the portion of the results of operations resulting from changes in foreign exchange rates on investments and the fluctuations arising from changes in market prices of securities held. The combined results of changes in foreign exchange rates and the fluctuation of market prices on investments (net of estimated foreign tax withholding) are included with the net realized and unrealized gain or loss from investments in the Consolidated Statement of Operations. Reported net realized foreign currency gains or losses arise from (1) sales of foreign currencies, (2) currency gains or losses realized between the trade and settlement dates on securities transactions, and (3) the difference between the amounts of dividends, interest, and foreign withholding taxes recorded on the Fund’s books and the U.S. dollar equivalent of the amounts actually received or paid. Net unrealized foreign currency gains and losses arise from changes in the fair values of assets and liabilities, other than investments in securities at fiscal period end, resulting from changes in exchange rates. |
The Fund may invest in foreign securities, which may be subject to foreign taxes on income, gains on investments or currency repatriation, a portion of which may be recoverable. Foreign taxes, if any, are recorded based on the tax regulations and rates that exist in the foreign markets in which the Fund invests and are shown in the Consolidated Statement of Operations.
| K. | Forward Foreign Currency Contracts — The Fund may engage in foreign currency transactions either on a spot (i.e. for prompt delivery and settlement) basis, or through forward foreign currency contracts, to manage or minimize currency or exchange rate risk. |
The Fund may also enter into forward foreign currency contracts for the purchase or sale of a security denominated in a foreign currency in order to “lock in” the U.S. dollar price of that security, or the Fund may also enter into forward foreign currency contracts that do not provide for physical settlement of the two currencies, but instead are settled by a single cash payment calculated as the difference between the agreed upon exchange rate and the spot rate at settlement based upon an agreed upon notional amount (non-deliverable forwards). The Fund will set aside liquid assets in an amount equal to the daily mark-to-market obligation for forward foreign currency contracts.
A forward foreign currency contract is an obligation between two parties (“Counterparties”) to purchase or sell a specific currency for an agreed-upon price at a future date. The use of forward foreign currency contracts does not eliminate fluctuations in the price of the underlying securities the Fund owns or intends to acquire but establishes a rate of exchange in advance. Fluctuations in the value of these contracts are measured by the difference in the contract date and reporting date exchange rates and are recorded as unrealized appreciation (depreciation) until the contracts are closed. When the contracts are closed, realized gains (losses) are recorded. Realized and unrealized gains (losses) on the contracts are included in the Consolidated Statement of Operations. The primary risks associated with forward foreign currency contracts include failure of the Counterparty to meet the terms of the contract and the value of the foreign currency changing unfavorably. These risks may be in excess of the amounts reflected in the Consolidated Statement of Assets and Liabilities.
| L. | Futures Contracts — The Fund may enter into futures contracts to equitize the Fund’s cash holdings or to manage exposure to interest rate, equity, commodity and market price movements and/or currency risks. A futures contract is an agreement between Counterparties to purchase or sell a specified underlying security, currency or commodity (or delivery of a cash settlement price, in the case of an index future) for a fixed price at a future date. The Fund currently invests only in exchange-traded futures and they are standardized as to maturity date and underlying financial instrument. Initial margin deposits required upon entering into futures contracts are satisfied by the segregation of specific securities or cash as collateral at the futures commission merchant (broker). During the period the futures contracts are open, changes in the value of the contracts are recognized as unrealized gains or losses by recalculating the value of the contracts on a daily basis. Subsequent or variation margin payments are received or made depending upon whether unrealized gains or losses are incurred. These amounts are reflected as receivables or payables on the Consolidated Statement of Assets and Liabilities. When the contracts are closed or expire, the Fund recognizes a realized gain or loss equal to the difference between the proceeds from, or cost of, the closing transaction and the Fund’s basis in the contract. The net realized gain (loss) and the change in unrealized gain (loss) on futures contracts held during the period is included on the Consolidated Statement of Operations. The primary risks associated with futures contracts are market risk and the absence of a liquid secondary market. If the Fund were unable to liquidate a futures contract and/or enter into an offsetting closing transaction, the Fund would continue to be subject to market risk with respect to the value of the contracts and continue to be required to maintain the margin deposits on the futures contracts. Futures contracts have minimal Counterparty risk since the exchange’s clearinghouse, as Counterparty to all exchange-traded futures, guarantees the futures against default. Risks may exceed amounts recognized in the Consolidated Statement of Assets and Liabilities. |
| M. | Put Options Purchased and Written — The Fund may purchase and write put options including options on securities indexes, or foreign currency and/or futures contracts. By purchasing a put option, the Fund obtains the right (but not the obligation) to sell the option’s underlying instrument at a fixed strike price. In return for this right, the Fund pays an option premium. The option’s underlying instrument may be a security, securities index, or a futures contract. Put options may be used by the Fund to hedge securities it owns by locking in a minimum price at which the Fund can sell. If security prices fall, the put option could be exercised to offset all or a portion of the Fund’s resulting losses. At the same time, because the maximum the Fund has at risk is the cost of the option, purchasing put options does not eliminate the potential for the Fund to profit from an increase in the value of the underlying portfolio securities. The Fund may write put options to earn additional income in the form of |
22 Invesco Emerging Markets Flexible Bond Fund
| | option premiums if it expects the price of the underlying instrument to remain stable or rise during the option period so that the option will not be exercised. The risk in this strategy is that the price of the underlying securities may decline by an amount greater than the premium received. Put options written are reported as a liability in the Consolidated Statement of Assets and Liabilities. Realized and unrealized gains and losses on put options purchased and put options written are included in the Consolidated Statement of Operations as Net realized gain (loss) from and Change in net unrealized appreciation (depreciation) of Investment securities and Option contracts written, respectively. A risk in buying an option is that the Fund pays a premium whether or not the option is exercised. In addition, there can be no assurance that a liquid secondary market will exist for any option purchased. |
| N. | Swap Agreements — The Fund may enter into various swap transactions, including interest rate, total return, index, currency and credit default swap contracts (“CDS”) for investment purposes or to manage interest rate, currency, commodity or credit risk. Such transactions are agreements between Counterparties. A swap agreement may be negotiated bilaterally and traded over-the-counter (“OTC”) between two parties (“uncleared/OTC”) or, in some instances, must be transacted through a future commission merchant (“FCM”) and cleared through a clearinghouse that serves as a central Counterparty (“centrally cleared swap”). These agreements may contain among other conditions, events of default and termination events, and various covenants and representations such as provisions that require the Fund to maintain a pre-determined level of net assets, and/or provide limits regarding the decline of the Fund’s NAV over specific periods of time. If the Fund were to trigger such provisions and have open derivative positions at that time, the Counterparty may be able to terminate such agreement and request immediate payment in an amount equal to the net liability positions, if any. |
Interest rate, total return, index, and currency swap agreements are two-party contracts entered into primarily to exchange the returns (or differentials in rates of returns) earned or realized on particular predetermined investments or instruments. The gross returns to be exchanged or “swapped” between the parties are calculated with respect to a notional amount, i.e., the return on or increase in value of a particular dollar amount invested at a particular interest rate or return of an underlying asset, in a particular foreign currency, or in a “basket” of securities representing a particular index.
In a centrally cleared swap, the Fund’s ultimate Counterparty is a central clearinghouse. The Fund initially will enter into centrally cleared swaps through an executing broker. When a fund enters into a centrally cleared swap, it must deliver to the central Counterparty (via the FCM) an amount referred to as “initial margin.” Initial margin requirements are determined by the central Counterparty, but an FCM may require additional initial margin above the amount required by the central Counterparty. Initial margin deposits required upon entering into centrally cleared swaps are satisfied by cash or securities as collateral at the FCM. Securities deposited as initial margin are designated on the Schedule of Investments and cash deposited is recorded on the Consolidated Statement of Assets and Liabilities. During the term of a cleared swap agreement, a “variation margin” amount may be required to be paid by the Fund or may be received by the Fund, based on the daily change in price of the underlying reference instrument subject to the swap agreement and is recorded as a receivable or payable for variation margin in the Consolidated Statement of Assets and Liabilities until the centrally cleared swap is terminated at which time a realized gain or loss is recorded.
A CDS is an agreement between Counterparties to exchange the credit risk of an issuer. A buyer of a CDS is said to buy protection by paying a fixed payment over the life of the agreement and in some situations an upfront payment to the seller of the CDS. If a defined credit event occurs (such as payment default or bankruptcy), the Fund as a protection buyer would cease paying its fixed payment, the Fund would deliver eligible bonds issued by the reference entity to the seller, and the seller would pay the full notional value, or the “par value”, of the referenced obligation to the Fund. A seller of a CDS is said to sell protection and thus would receive a fixed payment over the life of the agreement and an upfront payment, if applicable. If a credit event occurs, the Fund as a protection seller would cease to receive the fixed payment stream, the Fund would pay the buyer “par value” or the full notional value of the referenced obligation, and the Fund would receive the eligible bonds issued by the reference entity. In turn, these bonds may be sold in order to realize a recovery value. Alternatively, the seller of the CDS and its Counterparty may agree to net the notional amount and the market value of the bonds and make a cash payment equal to the difference to the buyer of protection. If no credit event occurs, the Fund receives the fixed payment over the life of the agreement. As the seller, the Fund would effectively add leverage to its portfolio because, in addition to its total net assets, the Fund would be subject to investment exposure on the notional amount of the CDS. In connection with these agreements, cash and securities may be identified as collateral in accordance with the terms of the respective swap agreements to provide assets of value and recourse in the event of default under the swap agreement or bankruptcy/insolvency of a party to the swap agreement. If a Counterparty becomes bankrupt or otherwise fails to perform its obligations due to financial difficulties, the Fund may experience significant delays in obtaining any recovery in a bankruptcy or other reorganization proceeding. The Fund may obtain only limited recovery or may obtain no recovery in such circumstances. The Fund’s maximum risk of loss from Counterparty risk, either as the protection seller or as the protection buyer, is the value of the contract. The risk may be mitigated by having a master netting arrangement between the Fund and the Counterparty and by the designation of collateral by the Counterparty to cover the Fund’s exposure to the Counterparty.
Implied credit spreads represent the current level at which protection could be bought or sold given the terms of the existing CDS contract and serve as an indicator of the current status of the payment/performance risk of the CDS. An implied spread that has widened or increased since entry into the initial contract may indicate a deteriorating credit profile and increased risk of default for the reference entity. A declining or narrowing spread may indicate an improving credit profile or decreased risk of default for the reference entity. Alternatively, credit spreads may increase or decrease reflecting the general tolerance for risk in the credit markets.
An interest rate swap is an agreement between Counterparties pursuant to which the parties exchange a floating rate payment for a fixed rate payment based on a specified notional amount.
A total return swap is an agreement in which one party makes payments based on a set rate, either fixed or variable, while the other party makes payments based on the return of an underlying asset, which includes both the income generated and capital gains, if any. The unrealized appreciation (depreciation) on total return swaps includes dividends on the underlying securities and financing rate payable from the Counterparty. At the maturity date, a net cash flow is exchanged where the total return is equivalent to the return of the underlying reference less a financing rate, if any. As a receiver, the Fund would receive payments based on any positive total return and would owe payments in the event of a negative total return. As the payer, the Fund would owe payments on any net positive total return, and would receive payment in the event of a negative total return.
23 Invesco Emerging Markets Flexible Bond Fund
Changes in the value of centrally cleared and OTC swap agreements are recognized as unrealized gains (losses) in the Consolidated Statement of Operations by “marking to market” on a daily basis to reflect the value of the swap agreement at the end of each trading day. Payments received or paid at the beginning of the agreement are reflected as such on the Consolidated Statement of Assets and Liabilities and may be referred to as upfront payments. The Fund accrues for the fixed payment stream and amortizes upfront payments, if any, on swap agreements on a daily basis with the net amount, recorded as a component of realized gain (loss) on the Consolidated Statement of Operations. A liquidation payment received or made at the termination of a swap agreement is recorded as realized gain (loss) on the Consolidated Statement of Operations. The Fund segregates cash or liquid securities having a value at least equal to the amount of the potential obligation of a Fund under any swap transaction. Cash held as collateral is recorded as deposits with brokers on the Consolidated Statement of Assets and Liabilities. Entering into these agreements involves, to varying degrees, lack of liquidity and elements of credit, market, and Counterparty risk in excess of amounts recognized on the Consolidated Statement of Assets and Liabilities. Such risks involve the possibility that a swap is difficult to sell or liquidate; the Counterparty does not honor its obligations under the agreement and unfavorable interest rates and market fluctuations. It is possible that developments in the swaps market, including potential government regulation, could adversely affect the Fund’s ability to terminate existing swap agreements or to realize amounts to be received under such agreements. A short position in a security poses more risk than holding the same security long. As there is no limit on how much the price of the security can increase, the Fund’s exposure is unlimited.
| O. | Other Risks — The Fund will seek to gain exposure to commodity markets primarily through an investment in the Subsidiary and through investments in exchange-traded funds and commodity-linked derivatives. The Subsidiary, unlike the Fund, may invest without limitation in commodities, commodity-linked derivatives and other securities, such as exchange-traded and commodity-linked notes, that may provide leveraged and non-leveraged exposure to commodity markets. The Fund is indirectly exposed to the risks associated with the Subsidiary’s investments. |
The Fund is non-diversified and may invest in securities of fewer issuers than if it were diversified. Thus, the value of the Fund’s shares may vary more widely and the Fund may be subject to greater market and credit risk than if the Fund invested more broadly.
| P. | Leverage Risk — Leverage exists when the Fund can lose more than it originally invests because it purchases or sells an instrument or enters into a transaction without investing an amount equal to the full economic exposure of the instrument or transaction. |
| Q. | Collateral — To the extent the Fund has designated or segregated a security as collateral and that security is subsequently sold, it is the Fund’s practice to replace such collateral no later than the next business day. |
NOTE 2—Advisory Fees and Other Fees Paid to Affiliates
The Trust has entered into a master investment advisory agreement with Invesco Advisers, Inc. (the “Adviser” or “Invesco”). Under the terms of the investment advisory agreement, the Fund accrues daily and pays monthly an advisory fee to the Adviser based on the annual rate of the Fund’s average daily net assets as follows:
| | | | |
| Average Daily Net Assets | | Rate | |
First $500 million | | | 0.75% | |
Next $500 million | | | 0.70% | |
Next $500 million | | | 0.67% | |
Over $1.5 billion | | | 0.65% | |
For the year ended October 31, 2018, the effective advisory fees incurred by the Fund was 0.75%.
The Subsidiary has entered into a separate contract with the Adviser whereby the Adviser provides investment advisory and other services to the Subsidiary. In consideration of these services, the Subsidiary pays an advisory fee to the Adviser based on the annual rate of the Subsidiary’s average daily net assets as set forth in the table above.
Under the terms of a master sub-advisory agreement between the Adviser and each of Invesco Asset Management Deutschland GmbH, Invesco Asset Management Limited, Invesco Asset Management (Japan) Limited, Invesco Hong Kong Limited, Invesco Senior Secured Management, Inc. and Invesco Canada Ltd. and separate sub-advisory agreements with Invesco Capital Management LLC, formerly Invesco PowerShares Capital Management LLC, and Invesco Asset Management (India) Private Limited (collectively, the “Affiliated Sub-Advisers”) the Adviser, not the Fund, will pay 40% of the fees paid to the Adviser to any such Affiliated Sub-Adviser(s) that provide(s) discretionary investment management services to the Fund based on the percentage of assets allocated to such Affiliated Sub-Adviser(s).
The Adviser has contractually agreed, through at least February 29, 2020, to waive advisory fees and/or reimburse expenses to the extent necessary to limit total annual fund operating expenses after fee waiver and/or expense reimbursement (excluding certain items discussed below) of Class A, Class C, Class R, Class Y, Class R5 and Class R6 shares to 1.24%, 1.99%, 1.49%, 0.99%, 0.99% and 0.99%, respectively, of the Fund’s average daily net assets (the “expense limits”). Prior to their conversion to Class A shares, the expense limit for Class B shares was 1.99% of average daily net assets. In determining the Adviser’s obligation to waive advisory fees and/or reimburse expenses, the following expenses are not taken into account, and could cause the total annual fund operating expenses after fee waiver and/or expense reimbursement to exceed the numbers reflected above: (1) interest; (2) taxes; (3) dividend expense on short sales; (4) extraordinary or non-routine items, including litigation expenses; and (5) expenses that the Fund has incurred but did not actually pay because of an expense offset arrangement. Acquired Fund Fees and Expenses are not operating expenses of the Fund directly, but are fees and expenses, including management fees, of the investment companies in which the Fund invests. As a result, the total annual fund operating expenses after expense reimbursement may exceed the expense limits above. Unless Invesco continues the fee waiver agreement, it will terminate on February 29, 2020. During its term, the fee waiver agreement cannot be terminated or amended to increase the expense limits or reduce the advisory fee waiver without approval of the Board of Trustees.
Further, the Adviser has contractually agreed, through at least June 30, 2020, to waive the advisory fee payable by the Fund in an amount equal to 100% of the net advisory fees the Adviser receives from the affiliated money market funds on investments by the Fund of uninvested cash in such affiliated money market funds.
For the year ended October 31, 2018, the Adviser waived advisory fees of $231,008 and reimbursed class level expenses of $12,463, $46, $3,742, $454, $6,004 and $149 of Class A, Class B, Class C, Class R, Class Y and Class R6 shares, respectively.
24 Invesco Emerging Markets Flexible Bond Fund
The Trust has entered into a master administrative services agreement with Invesco pursuant to which the Fund has agreed to pay Invesco for certain administrative costs incurred in providing accounting services to the Fund. For the year ended October 31, 2018, expenses incurred under the agreement are shown in the Consolidated Statement of Operations as Administrative services fees.
The Trust has entered into a transfer agency and service agreement with Invesco Investment Services, Inc. (“IIS”) pursuant to which the Fund has agreed to pay IIS a fee for providing transfer agency and shareholder services to the Fund and reimburse IIS for certain expenses incurred by IIS in the course of providing such services. IIS may make payments to intermediaries that provide omnibus account services, sub-accounting services and/or networking services. All fees payable by IIS to intermediaries that provide omnibus account services or sub-accounting services are charged back to the Fund, subject to certain limitations approved by the Trust’s Board of Trustees. For the year ended October 31, 2018, expenses incurred under the agreement are shown in the Consolidated Statement of Operations as Transfer agent fees.
The Trust has entered into master distribution agreements with Invesco Distributors, Inc. (“IDI”) to serve as the distributor for the Class A, Class C, Class R, Class Y, Class R5 and Class R6 shares of the Fund. The Trust has adopted plans pursuant to Rule 12b-1 under the 1940 Act with respect to the Fund’s Class A, Class C and Class R shares (collectively, the “Plans”). The Fund, pursuant to the Plans, pays IDI compensation at the annual rate of 0.25% of the Fund’s average daily net assets of Class A shares, 1.00% of the average daily net assets of Class C shares and 0.50% of the average daily net assets of Class R shares. Prior to their conversion to Class A shares, the Fund paid an annual rate of 1.00% of the average daily net assets of Class B shares. The fees are accrued daily and paid monthly. Of the Plan payments, up to 0.25% of the average daily net assets of each class of shares may be paid to furnish continuing personal shareholder services to customers who purchase and own shares of such classes. Any amounts not paid as a service fee under the Plans would constitute an asset-based sales charge. Rules of the Financial Industry Regulatory Authority (“FINRA”) impose a cap on the total sales charges, including asset-based sales charges, that may be paid by any class of shares of the Fund. For the year ended October 31, 2018, expenses incurred under the Plans are shown in the Consolidated Statement of Operations as Distribution fees.
Front-end sales commissions and CDSC (collectively, the “sales charges”) are not recorded as expenses of the Fund. Front-end sales commissions are deducted from proceeds from the sales of Fund shares prior to investment in Class A shares of the Fund. CDSC are deducted from redemption proceeds prior to remittance to the shareholder. During the year ended October 31, 2018, IDI advised the Fund that IDI retained $785 in front-end sales commissions from the sale of Class A shares and $345 and $90 from Class A and Class C shares, respectively, for CDSC imposed on redemptions by shareholders.
Certain officers and trustees of the Trust are officers and directors of the Adviser, IIS and/or IDI.
NOTE 3—Additional Valuation Information
GAAP defines fair value as the price that would be received to sell an asset or paid to transfer a liability in an orderly transaction between market participants at the measurement date, under current market conditions. GAAP establishes a hierarchy that prioritizes the inputs to valuation methods, giving the highest priority to readily available unadjusted quoted prices in an active market for identical assets (Level 1) and the lowest priority to significant unobservable inputs (Level 3), generally when market prices are not readily available or are unreliable. Based on the valuation inputs, the securities or other investments are tiered into one of three levels. Changes in valuation methods may result in transfers in or out of an investment’s assigned level:
| | Level 1 — | Prices are determined using quoted prices in an active market for identical assets. |
| | Level 2 — | Prices are determined using other significant observable inputs. Observable inputs are inputs that other market participants may use in pricing a security. These may include quoted prices for similar securities, interest rates, prepayment speeds, credit risk, yield curves, loss severities, default rates, discount rates, volatilities and others. |
| | Level 3 — | Prices are determined using significant unobservable inputs. In situations where quoted prices or observable inputs are unavailable (for example, when there is little or no market activity for an investment at the end of the period), unobservable inputs may be used. Unobservable inputs reflect the Fund’s own assumptions about the factors market participants would use in determining fair value of the securities or instruments and would be based on the best available information. |
The following is a summary of the tiered valuation input levels, as of October 31, 2018. The level assigned to the securities valuations may not be an indication of the risk or liquidity associated with investing in those securities. Because of the inherent uncertainties of valuation, the values reflected in the financial statements may materially differ from the value received upon actual sale of those investments.
| | | | | | | | | | | | | | | | |
| | | Level 1 | | | Level 2 | | | Level 3 | | | Total | |
Investments in Securities | | | | | | | | | | | | | | | | |
U.S. Dollar Denominated Bonds & Notes | | $ | — | | | $ | 27,234,229 | | | $ | — | | | $ | 27,234,229 | |
Non-U.S. Dollar Denominated Bonds & Notes | | | — | | | | 7,308,586 | | | | — | | | | 7,308,586 | |
Options Purchased | | | — | | | | 4,934 | | | | — | | | | 4,934 | |
Total Investments in Securities | | | — | | | | 34,547,749 | | | | — | | | | 34,547,749 | |
Other Investments — Assets* | | | | | | | | | | | | | | | | |
Forward Foreign Currency Contracts | | | — | | | | 627,850 | | | | — | | | | 627,850 | |
Other Investments — Liabilities* | | | | | | | | | | | | | | | | |
Forward Foreign Currency Contracts | | | — | | | | (367,547 | ) | | | — | | | | (367,547 | ) |
Total Other Investments | | | — | | | | 260,303 | | | | — | | | | 260,303 | |
Total Investments | | $ | — | | | $ | 34,808,052 | | | $ | — | | | $ | 34,808,052 | |
| * | Unrealized appreciation (depreciation). |
25 Invesco Emerging Markets Flexible Bond Fund
NOTE 4—Derivative Investments
The Fund may enter into an International Swaps and Derivatives Association Master Agreement (“ISDA Master Agreement”) under which a fund may trade OTC derivatives. An OTC transaction entered into under an ISDA Master Agreement typically involves a collateral posting arrangement, payment netting provisions and close-out netting provisions. These netting provisions allow for reduction of credit risk through netting of contractual obligations. The enforceability of the netting provisions of the ISDA Master Agreement depends on the governing law of the ISDA Master Agreement, among other factors.
For financial reporting purposes, the Fund does not offset OTC derivative assets or liabilities that are subject to ISDA Master Agreements in the Consolidated Statement of Assets and Liabilities.
Value of Derivative Investments at Period-End
The table below summarizes the value of the Fund’s derivative investments, detailed by primary risk exposure, held as of October 31, 2018:
| | | | |
| | | Value | |
| Derivative Assets | | Currency
Risk | |
Options purchased, at value — OTC(a) | | $ | 4,934 | |
Unrealized appreciation on forward foreign currency contracts outstanding | | | 627,850 | |
Total Derivative Assets | | | 632,784 | |
Derivatives not subject to master netting agreements | | | — | |
Total Derivative Assets subject to master netting agreements | | $ | 632,784 | |
| |
| | | Value | |
| Derivative Liabilities | | Currency
Risk | |
Unrealized depreciation on forward foreign currency contracts outstanding | | $ | (367,547 | ) |
Derivatives not subject to master netting agreements | | | — | |
Total Derivative Liabilities subject to master netting agreements | | $ | (367,547 | ) |
| (a) | Options purchased, at value, as reported in the Consolidated Schedule of Investments. |
Offsetting Assets and Liabilities
The table below reflects the Fund’s exposure to Counterparties subject to either an ISDA Master Agreement or other agreement for OTC derivative transactions as of October 31, 2018.
| | | | | | | | | | | | | | | | | | | | | | | | | | | | | | | | |
| | | Financial
Derivative
Assets | | | Financial
Derivative
Liabilities | | | Net Value of
Derivatives | | | Collateral (Received)/Pledged | | | Net
Amount | |
| Counterparty | | Forward
Foreign Currency
Contracts | | | Options
Purchased | | | Total
Assets | | | Forward
Foreign Currency
Contracts | | | Non-Cash | | | Cash | |
Parent | | | | | | | | | | | | | | | | | | | | | | | | | | | | | | | | |
Bank of America, N.A. | | $ | 50,635 | | | $ | — | | | $ | 50,635 | | | $ | (15,828 | ) | | $ | 34,807 | | | $ | — | | | $ | — | | | $ | 34,807 | |
Barclays Bank PLC | | | 22,560 | | | | — | | | | 22,560 | | | | (149,763 | ) | | | (127,203 | ) | | | — | | | | — | | | | (127,203 | ) |
Citibank, N.A. | | | 325,041 | | | | 4,934 | | | | 329,975 | | | | (116,892 | ) | | | 213,083 | | | | — | | | | — | | | | 213,083 | |
Deutsche Bank AG | | | 5,371 | | | | — | | | | 5,371 | | | | — | | | | 5,371 | | | | — | | | | — | | | | 5,371 | |
Goldman Sachs International | | | 167,698 | | | | — | | | | 167,698 | | | | (52,455 | ) | | | 115,243 | | | | — | | | | — | | | | 115,243 | |
J.P. Morgan Chase Bank N.A. | | | 31,366 | | | | — | | | | 31,366 | | | | (4,588 | ) | | | 26,778 | | | | — | | | | — | | | | 26,778 | |
Morgan Stanley Bank, N.A. | | | 25,179 | | | | — | | | | 25,179 | | | | (28,021 | ) | | | (2,842 | ) | | | — | | | | — | | | | (2,842 | ) |
Total | | $ | 627,850 | | | $ | 4,934 | | | $ | 632,784 | | | $ | (367,547 | ) | | $ | 265,237 | | | $ | — | | | $ | — | | | $ | 265,237 | |
26 Invesco Emerging Markets Flexible Bond Fund
Effect of Derivative Investments for the year ended October 31, 2018
The table below summarizes the gains (losses) on derivative investments, detailed by primary risk exposure, recognized in earnings during the period:
| | | | | | | | | | | | | | | | | | | | |
| | | Location of Gain (Loss) on Consolidated Statement of Operations | |
| | | Commodity
Risk | | | Credit Risk | | | Currency
Risk | | | Interest
Rate Risk | | | Total | |
Realized Gain (Loss): | | | | | | | | | | | | | | | | | | | | |
Forward foreign currency contracts | | $ | — | | | $ | — | | | $ | (446,354 | ) | | $ | — | | | $ | (446,354 | ) |
Futures contracts | | | (25,730 | ) | | | — | | | | — | | | | 3,248 | | | | (22,482 | ) |
Options purchased(a) | | | — | | | | — | | | | (89,605 | ) | | | 148,002 | | | | 58,397 | |
Options written | | | — | | | | — | | | | 28,112 | | | | — | | | | 28,112 | |
Swap agreements | | | — | | | | (15,600 | ) | | | — | | | | (212,894 | ) | | | (228,494 | ) |
Change in Net Unrealized Appreciation (Depreciation): | | | | | | | | | | | | | | | | | | | | |
Forward foreign currency contracts | | | — | | | | — | | | | (45,517 | ) | | | — | | | | (45,517 | ) |
Futures contracts | | | 528 | | | | — | | | | — | | | | 42,377 | | | | 42,905 | |
Options purchased(a) | | | — | | | | — | | | | 28,610 | | | | (17,340 | ) | | | 11,270 | |
Options written | | | — | | | | — | | | | (958 | ) | | | — | | | | (958 | ) |
Swap agreements | | | — | | | | (23,905 | ) | | | — | | | | 135,413 | | | | 111,508 | |
Total | | $ | (25,202 | ) | | $ | (39,505 | ) | | $ | (525,712 | ) | | $ | 98,806 | | | $ | (491,613 | ) |
| (a) | Options purchased are included in the net realized gain (loss) from investment securities and the change in net unrealized appreciation (depreciation) of investment securities. |
The table below summarizes the three month average notional value of futures contracts, twelve month average notional value of forward foreign currency contracts, ten month average notional value of options purchased and eight month average notional value of options written and swap agreements outstanding during the period.
| | | | | | | | | | | | | | | | | | | | |
| | | Forward
Foreign
Currency
Contracts | | | Futures
Contracts | | | Options
Purchased | | | Options
Written | | | Swap
Agreements | |
Average notional value | | $ | 45,699,284 | | | $ | 7,691,711 | | | $ | 3,108,691 | | | $ | 1,700,000 | | | $ | 10,344,319 | |
NOTE 5—Expense Offset Arrangement(s)
The expense offset arrangement is comprised of transfer agency credits which result from balances in demand deposit accounts used by the transfer agent for clearing shareholder transactions. For the year ended October 31, 2018, the Fund received credits from this arrangement, which resulted in the reduction of the Fund’s total expenses of $379.
NOTE 6—Trustees’ and Officers’ Fees and Benefits
Trustees’ and Officers’ Fees and Benefits include amounts accrued by the Fund to pay remuneration to certain Trustees and Officers of the Fund. Trustees have the option to defer compensation payable by the Fund, and Trustees’ and Officers’ Fees and Benefits also include amounts accrued by the Fund to fund such deferred compensation amounts. Those Trustees who defer compensation have the option to select various Invesco Funds in which their deferral accounts shall be deemed to be invested. Finally, certain current Trustees were eligible to participate in a retirement plan that provided for benefits to be paid upon retirement to Trustees over a period of time based on the number of years of service. The Fund may have certain former Trustees who also participate in a retirement plan and receive benefits under such plan. Trustees’ and Officers’ Fees and Benefits include amounts accrued by the Fund to fund such retirement benefits. Obligations under the deferred compensation and retirement plans represent unsecured claims against the general assets of the Fund.
NOTE 7—Cash Balances
The Fund is permitted to temporarily carry a negative or overdrawn balance in its account with State Street Bank and Trust Company, the custodian bank. Such balances, if any at period-end, are shown in the Consolidated Statement of Assets and Liabilities under the payable caption Amount due custodian. To compensate the custodian bank for such overdrafts, the overdrawn Fund may either (1) leave funds as a compensating balance in the account so the custodian bank can be compensated by earning the additional interest; or (2) compensate by paying the custodian bank at a rate agreed upon by the custodian bank and Invesco, not to exceed the contractually agreed upon rate.
27 Invesco Emerging Markets Flexible Bond Fund
NOTE 8—Distributions to Shareholders and Tax Components of Net Assets
Tax Character of Distributions to Shareholders Paid During the Fiscal Years Ended October 31, 2018 and 2017:
| | | | | | | | |
| | | 2018 | | | 2017 | |
Ordinary income | | $ | 1,612,254 | | | $ | 2,411,051 | |
Return of capital | | | 463,802 | | | | — | |
Total distributions | | $ | 2,076,056 | | | $ | 2,411,051 | |
Tax Components of Net Assets at Period-End:
| | | | |
| | | 2018 | |
Net unrealized appreciation (depreciation) — investments | | $ | (1,663,049 | ) |
Net unrealized appreciation — foreign currencies | | | 8,815 | |
Temporary book/tax differences | | | (25,634 | ) |
Capital loss carryforward | | | (4,300,952 | ) |
Shares of beneficial interest | | | 43,291,904 | |
Total net assets | | $ | 37,311,084 | |
The difference between book-basis and tax-basis unrealized appreciation (depreciation) is due to differences in the timing of recognition of gains and losses on investments for tax and book purposes. The Fund’s net unrealized appreciation (depreciation) difference is attributable primarily to wash sales, straddles and foreign currency contracts.
The temporary book/tax differences are a result of timing differences between book and tax recognition of income and/or expenses. The Fund’s temporary book/tax differences are the result of the trustee deferral of compensation and retirement plan benefits.
Capital loss carryforward is calculated and reported as of a specific date. Results of transactions and other activity after that date may affect the amount of capital loss carryforward actually available for the Fund to utilize. Capital losses generated in years beginning after December 22, 2010 can be carried forward for an unlimited period, whereas previous losses expire in eight tax years. Capital losses with an expiration period may not be used to offset capital gains until all net capital losses without an expiration date have been utilized. Capital loss carryforwards with no expiration date will retain their character as either short-term or long-term capital losses instead of as short-term capital losses as under prior law. The ability to utilize capital loss carryforwards in the future may be limited under the Internal Revenue Code and related regulations based on the results of future transactions.
The Fund has a capital loss carryforward as of October 31, 2018, as follows:
| | | | | | | | | | | | |
| Capital Loss Carryforward* | |
| Expiration | | Short-Term | | | Long-Term | | | Total | |
Not subject to expiration | | $ | 2,645,329 | | | $ | 1,655,623 | | | $ | 4,300,952 | |
| * | Capital loss carryforward as of the date listed above is reduced for limitations, if any, to the extent required by the Internal Revenue Code and may be further limited depending upon a variety of factors, including the realization of net unrealized gains or losses as of the date of any reorganization. |
NOTE 9—Investment Transactions
The aggregate amount of investment securities (other than short-term securities, U.S. Treasury obligations and money market funds, if any) purchased and sold by the Fund during the year ended October 31, 2018 was $111,733,170 and $122,517,659, respectively. Cost of investments, including any derivatives, on a tax basis includes the adjustments for financial reporting purposes as of the most recently completed federal income tax reporting period-end.
| | | | |
| Unrealized Appreciation (Depreciation) of Investments on a Tax Basis | |
Aggregate unrealized appreciation of investments | | $ | 804,451 | |
Aggregate unrealized (depreciation) of investments | | | (2,467,500 | ) |
Net unrealized appreciation (depreciation) of investments | | $ | (1,663,049 | ) |
Cost of investments for tax purposes is $36,471,101.
NOTE 10—Reclassification of Permanent Differences
Primarily as a result of differing book/tax treatment of foreign currency transactions and return of capital distributions, on October 31, 2018, undistributed net investment income was decreased by $1,206,694, undistributed net realized gain (loss) was increased by $1,706,070 and shares of beneficial interest was decreased by $499,376. This reclassification had no effect on the net assets of the Fund.
28 Invesco Emerging Markets Flexible Bond Fund
NOTE 11—Share Information
| | | | | | | | | | | | | | | | |
| | | Summary of Share Activity | |
| | | Years ended October 31, | |
| | | 2018(a) | | | 2017 | |
| | | Shares | | | Amount | | | Shares | | | Amount | |
Sold: | | | | | | | | | | | | | | | | |
Class A | | | 152,537 | | | $ | 990,105 | | | | 231,935 | | | $ | 1,537,198 | |
Class B(b) | | | — | | | | — | | | | 4,146 | | | | 27,896 | |
Class C | | | 85,800 | | | | 570,891 | | | | 57,250 | | | | 378,197 | |
Class R | | | 2,305 | | | | 14,868 | | | | 5,432 | | | | 35,646 | |
Class Y | | | 121,362 | | | | 779,423 | | | | 319,698 | | | | 2,114,044 | |
Class R6 | | | 486,839 | | | | 3,083,982 | | | | 2,029 | | | | 13,232 | |
| | | | |
Issued as reinvestment of dividends: | | | | | | | | | | | | | | | | |
Class A | | | 23,667 | | | | 147,792 | | | | 19,843 | | | | 130,341 | |
Class B(b) | | | 42 | | | | 280 | | | | 320 | | | | 2,095 | |
Class C | | | 4,371 | | | | 27,284 | | | | 4,072 | | | | 26,779 | |
Class R | | | 846 | | | | 5,353 | | | | 1,353 | | | | 8,886 | |
Class Y | | | 8,469 | | | | 52,556 | | | | 4,509 | | | | 29,792 | |
Class R6 | | | 282,356 | | | | 1,767,650 | | | | 329,038 | | | | 2,155,646 | |
| | | | |
Conversion of Class B shares to Class A shares:(c) | | | | | | | | | | | | | | | | |
Class A | | | 9,784 | | | | 65,942 | | | | 8,303 | | | | 54,831 | |
Class B | | | (9,790 | ) | | | (65,942 | ) | | | (8,306 | ) | | | (54,831 | ) |
| | | | |
Reacquired: | | | | | | | | | | | | | | | | |
Class A | | | (312,825 | ) | | | (2,007,630 | ) | | | (332,849 | ) | | | (2,189,494 | ) |
Class B(b) | | | (420 | ) | | | (2,805 | ) | | | (4,555 | ) | | | (29,445 | ) |
Class C | | | (108,717 | ) | | | (693,382 | ) | | | (62,177 | ) | | | (408,978 | ) |
Class R | | | (29,682 | ) | | | (196,497 | ) | | | (5,144 | ) | | | (33,353 | ) |
Class Y | | | (231,698 | ) | | | (1,385,768 | ) | | | (83,659 | ) | | | (550,193 | ) |
Class R6(d) | | | (2,666,822 | ) | | | (17,000,302 | ) | | | (2,245,209 | ) | | | (14,863,282 | ) |
Net increase (decrease) in share activity | | | (2,181,576 | ) | | $ | (13,846,200 | ) | | | (1,753,971 | ) | | $ | (11,614,993 | ) |
| (a) | 85% of the outstanding shares of the Fund are owned by the Adviser or an affiliate of the Adviser. |
| (b) | Class B shares activity for the period November 1, 2017 through January 26, 2018 (date of conversion). |
| (c) | Effective as of the close of business January 26, 2018, all outstanding Class B shares were converted to Class A shares. |
| (d) | On May 1, 2017, 1,545,008 Class R6 shares valued at $10,243,403 were redeemed by affiliated mutual funds. |
29 Invesco Emerging Markets Flexible Bond Fund
NOTE 12—Financial Highlights
The following schedule presents financial highlights for a share of the Fund outstanding throughout the periods indicated.
| | | | | | | | | | | | | | | | | | | | | | | | | | | | | | | | | | | | | | | | | | | | | | | | | | | | | | | | |
| | | Net asset
value,
beginning
of period | | | Net
investment
income(a) | | | Net gains
(losses)
on securities
(both
realized and
unrealized) | | | Total from
investment
operations | | | Dividends
from net
investment
income | | | Return of
capital | | | Total
distributions | | | Net asset
value, end
of period | | | Total
return(b) | | | Net assets,
end of period
(000’s omitted) | | | Ratio of
expenses
to average
net assets
with fee waivers
and/or expenses
absorbed | | | Ratio of
expenses
to average net
assets without
fee waivers
and/or expenses
absorbed | | | Ratio of net
investment
income to
average
net assets | | | Portfolio
turnover(c) | |
Class A | | | | | | | | | | | | | | | | | | | | | | | | | | | | | | | | | | | | | | | | | | | | | | | | | | | | | | | | |
Year ended 10/31/18 | | $ | 6.71 | | | $ | 0.30 | | | $ | (0.96 | ) | | $ | (0.66 | ) | | $ | (0.20 | ) | | $ | (0.06 | ) | | $ | (0.26 | ) | | $ | 5.79 | | | | (10.09 | )% | | $ | 3,434 | | | | 1.28 | %(d) | | | 2.06 | %(d) | | | 4.79 | %(d) | | | 260 | % |
Year ended 10/31/17 | | | 6.53 | | | | 0.35 | | | | 0.07 | | | | 0.42 | | | | (0.24 | ) | | | — | | | | (0.24 | ) | | | 6.71 | | | | 6.62 | | | | 4,832 | | | | 1.23 | | | | 1.91 | | | | 5.25 | | | | 245 | |
Year ended 10/31/16 | | | 6.77 | | | | 0.27 | | | | (0.25 | ) | | | 0.02 | | | | — | | | | (0.26 | ) | | | (0.26 | ) | | | 6.53 | | | | 0.45 | | | | 5,182 | | | | 1.23 | | | | 1.91 | | | | 4.16 | | | | 266 | |
Year ended 10/31/15 | | | 8.49 | | | | 0.41 | | | | (1.76 | ) | | | (1.35 | ) | | | — | | | | (0.37 | ) | | | (0.37 | ) | | | 6.77 | | | | (16.20 | ) | | | 6,282 | | | | 1.24 | | | | 1.89 | | | | 5.46 | | | | 50 | |
Year ended 10/31/14 | | | 9.17 | | | | 0.46 | | | | (0.77 | ) | | | (0.31 | ) | | | (0.06 | ) | | | (0.31 | ) | | | (0.37 | ) | | | 8.49 | | | | (3.44 | ) | | | 9,379 | | | | 1.24 | | | | 1.84 | | | | 5.29 | | | | 69 | |
Class B | | | | | | | | | | | | | | | | | | | | | | | | | | | | | | | | | | | | | | | | | | | | | | | | | | | | | | | | |
Year ended 10/31/18(e) | | | 6.71 | | | | 0.06 | | | | 0.02 | | | | 0.08 | | | | (0.05 | ) | | | — | | | | (0.05 | ) | | | 6.74 | | | | 1.23 | | | | — | | | | 2.03 | (d)(f) | | | 2.81 | (d)(f) | | | 4.04 | (d)(f) | | | 260 | |
Year ended 10/31/17 | | | 6.53 | | | | 0.30 | | | | 0.07 | | | | 0.37 | | | | (0.19 | ) | | | — | | | | (0.19 | ) | | | 6.71 | | | | 5.82 | | | | 68 | | | | 1.98 | | | | 2.66 | | | | 4.50 | | | | 245 | |
Year ended 10/31/16 | | | 6.77 | | | | 0.22 | | | | (0.25 | ) | | | (0.03 | ) | | | — | | | | (0.21 | ) | | | (0.21 | ) | | | 6.53 | | | | (0.37 | ) | | | 121 | | | | 1.98 | | | | 2.66 | | | | 3.41 | | | | 266 | |
Year ended 10/31/15 | | | 8.48 | | | | 0.35 | | | | (1.75 | ) | | | (1.40 | ) | | | — | | | | (0.31 | ) | | | (0.31 | ) | | | 6.77 | | | | (16.72 | ) | | | 296 | | | | 1.99 | | | | 2.64 | | | | 4.71 | | | | 50 | |
Year ended 10/31/14 | | | 9.16 | | | | 0.40 | | | | (0.78 | ) | | | (0.38 | ) | | | (0.05 | ) | | | (0.25 | ) | | | (0.30 | ) | | | 8.48 | | | | (4.17 | ) | | | 349 | | | | 1.99 | | | | 2.59 | | | | 4.54 | | | | 69 | |
Class C | | | | | | | | | | | | | | | | | | | | | | | | | | | | | | | | | | | | | | | | | | | | | | | | | | | | | | | | |
Year ended 10/31/18 | | | 6.71 | | | | 0.26 | | | | (0.97 | ) | | | (0.71 | ) | | | (0.16 | ) | | | (0.05 | ) | | | (0.21 | ) | | | 5.79 | | | | (10.77 | ) | | | 946 | | | | 2.03 | (d) | | | 2.81 | (d) | | | 4.04 | (d) | | | 260 | |
Year ended 10/31/17 | | | 6.54 | | | | 0.30 | | | | 0.06 | | | | 0.36 | | | | (0.19 | ) | | | — | | | | (0.19 | ) | | | 6.71 | | | | 5.66 | | | | 1,221 | | | | 1.98 | | | | 2.66 | | | | 4.50 | | | | 245 | |
Year ended 10/31/16 | | | 6.77 | | | | 0.22 | | | | (0.24 | ) | | | (0.02 | ) | | | — | | | | (0.21 | ) | | | (0.21 | ) | | | 6.54 | | | | (0.21 | ) | | | 1,195 | | | | 1.98 | | | | 2.66 | | | | 3.41 | | | | 266 | |
Year ended 10/31/15 | | | 8.49 | | | | 0.35 | | | | (1.75 | ) | | | (1.40 | ) | | | — | | | | (0.32 | ) | | | (0.32 | ) | | | 6.77 | | | | (16.82 | ) | | | 1,385 | | | | 1.99 | | | | 2.64 | | | | 4.71 | | | | 50 | |
Year ended 10/31/14 | | | 9.17 | | | | 0.40 | | | | (0.78 | ) | | | (0.38 | ) | | | (0.05 | ) | | | (0.25 | ) | | | (0.30 | ) | | | 8.49 | | | | (4.16 | ) | | | 2,244 | | | | 1.99 | | | | 2.59 | | | | 4.54 | | | | 69 | |
Class R | | | | | | | | | | | | | | | | | | | | | | | | | | | | | | | | | | | | | | | | | | | | | | | | | | | | | | | | |
Year ended 10/31/18 | | | 6.70 | | | | 0.29 | | | | (0.97 | ) | | | (0.68 | ) | | | (0.18 | ) | | | (0.06 | ) | | | (0.24 | ) | | | 5.78 | | | | (10.33 | ) | | | 90 | | | | 1.53 | (d) | | | 2.31 | (d) | | | 4.54 | (d) | | | 260 | |
Year ended 10/31/17 | | | 6.53 | | | | 0.33 | | | | 0.07 | | | | 0.40 | | | | (0.23 | ) | | | — | | | | (0.23 | ) | | | 6.70 | | | | 6.20 | | | | 283 | | | | 1.48 | | | | 2.16 | | | | 5.00 | | | | 245 | |
Year ended 10/31/16 | | | 6.76 | | | | 0.25 | | | | (0.24 | ) | | | 0.01 | | | | — | | | | (0.24 | ) | | | (0.24 | ) | | | 6.53 | | | | 0.33 | | | | 264 | | | | 1.48 | | | | 2.16 | | | | 3.91 | | | | 266 | |
Year ended 10/31/15 | | | 8.48 | | | | 0.39 | | | | (1.76 | ) | | | (1.37 | ) | | | — | | | | (0.35 | ) | | | (0.35 | ) | | | 6.76 | | | | (16.43 | ) | | | 363 | | | | 1.49 | | | | 2.14 | | | | 5.21 | | | | 50 | |
Year ended 10/31/14 | | | 9.17 | | | | 0.44 | | | | (0.78 | ) | | | (0.34 | ) | | | (0.06 | ) | | | (0.29 | ) | | | (0.35 | ) | | | 8.48 | | | | (3.79 | ) | | | 460 | | | | 1.49 | | | | 2.09 | | | | 5.04 | | | | 69 | |
Class Y | | | | | | | | | | | | | | | | | | | | | | | | | | | | | | | | | | | | | | | | | | | | | | | | | | | | | | | | |
Year ended 10/31/18 | | | 6.71 | | | | 0.32 | | | | (0.97 | ) | | | (0.65 | ) | | | (0.21 | ) | | | (0.06 | ) | | | (0.27 | ) | | | 5.79 | | | | (9.85 | ) | | | 1,116 | | | | 1.03 | (d) | | | 1.81 | (d) | | | 5.04 | (d) | | | 260 | |
Year ended 10/31/17 | | | 6.53 | | | | 0.36 | | | | 0.08 | | | | 0.44 | | | | (0.26 | ) | | | — | | | | (0.26 | ) | | | 6.71 | | | | 6.89 | | | | 1,977 | | | | 0.98 | | | | 1.66 | | | | 5.50 | | | | 245 | |
Year ended 10/31/16 | | | 6.77 | | | | 0.29 | | | | (0.25 | ) | | | 0.04 | | | | — | | | | (0.28 | ) | | | (0.28 | ) | | | 6.53 | | | | 0.72 | | | | 354 | | | | 0.98 | | | | 1.66 | | | | 4.41 | | | | 266 | |
Year ended 10/31/15 | | | 8.49 | | | | 0.45 | | | | (1.78 | ) | | | (1.33 | ) | | | — | | | | (0.39 | ) | | | (0.39 | ) | | | 6.77 | | | | (15.99 | ) | | | 304 | | | | 0.99 | | | | 1.64 | | | | 5.71 | | | | 50 | |
Year ended 10/31/14 | | | 9.17 | | | | 0.49 | | | | (0.78 | ) | | | (0.29 | ) | | | (0.06 | ) | | | (0.33 | ) | | | (0.39 | ) | | | 8.49 | | | | (3.20 | ) | | | 2,911 | | | | 0.99 | | | | 1.59 | | | | 5.54 | | | | 69 | |
Class R5 | | | | | | | | | | | | | | | | | | | | | | | | | | | | | | | | | | | | | | | | | | | | | | | | | | | | | | | | |
Year ended 10/31/18 | | | 6.71 | | | | 0.32 | | | | (0.97 | ) | | | (0.65 | ) | | | (0.21 | ) | | | (0.06 | ) | | | (0.27 | ) | | | 5.79 | | | | (9.85 | ) | | | 6 | | | | 0.98 | (d) | | | 1.45 | (d) | | | 5.09 | (d) | | | 260 | |
Year ended 10/31/17 | | | 6.53 | | | | 0.36 | | | | 0.08 | | | | 0.44 | | | | (0.26 | ) | | | — | | | | (0.26 | ) | | | 6.71 | | | | 6.89 | | | | 7 | | | | 0.98 | | | | 1.31 | | | | 5.50 | | | | 245 | |
Year ended 10/31/16 | | | 6.77 | | | | 0.29 | | | | (0.25 | ) | | | 0.04 | | | | — | | | | (0.28 | ) | | | (0.28 | ) | | | 6.53 | | | | 0.72 | | | | 7 | | | | 0.98 | | | | 1.28 | | | | 4.41 | | | | 266 | |
Year ended 10/31/15 | | | 8.48 | | | | 0.45 | | | | (1.77 | ) | | | (1.32 | ) | | | — | | | | (0.39 | ) | | | (0.39 | ) | | | 6.77 | | | | (15.89 | ) | | | 7 | | | | 0.99 | | | | 1.34 | | | | 5.71 | | | | 50 | |
Year ended 10/31/14 | | | 9.16 | | | | 0.49 | | | | (0.78 | ) | | | (0.29 | ) | | | (0.06 | ) | | | (0.33 | ) | | | (0.39 | ) | | | 8.48 | | | | (3.20 | ) | | | 186 | | | | 0.99 | | | | 1.31 | | | | 5.54 | | | | 69 | |
Class R6 | | | | | | | | | | | | | | | | | | | | | | | | | | | | | | | | | | | | | | | | | | | | | | | | | | | | | | | | |
Year ended 10/31/18 | | | 6.70 | | | | 0.33 | | | | (0.98 | ) | | | (0.65 | ) | | | (0.21 | ) | | | (0.06 | ) | | | (0.27 | ) | | | 5.78 | | | | (9.88 | ) | | | 31,718 | | | | 0.98 | (d) | | | 1.45 | (d) | | | 5.09 | (d) | | | 260 | |
Year ended 10/31/17 | | | 6.53 | | | | 0.36 | | | | 0.07 | | | | 0.43 | | | | (0.26 | ) | | | — | | | | (0.26 | ) | | | 6.70 | | | | 6.73 | | | | 49,498 | | | | 0.98 | | | | 1.31 | | | | 5.50 | | | | 245 | |
Year ended 10/31/16 | | | 6.77 | | | | 0.29 | | | | (0.25 | ) | | | 0.04 | | | | — | | | | (0.28 | ) | | | (0.28 | ) | | | 6.53 | | | | 0.73 | | | | 60,702 | | | | 0.98 | | | | 1.28 | | | | 4.41 | | | | 266 | |
Year ended 10/31/15 | | | 8.48 | | | | 0.43 | | | | (1.75 | ) | | | (1.32 | ) | | | — | | | | (0.39 | ) | | | (0.39 | ) | | | 6.77 | | | | (15.89 | ) | | | 37,373 | | | | 0.99 | | | | 1.33 | | | | 5.71 | | | | 50 | |
Year ended 10/31/14 | | | 9.16 | | | | 0.49 | | | | (0.78 | ) | | | (0.29 | ) | | | (0.06 | ) | | | (0.33 | ) | | | (0.39 | ) | | | 8.48 | | | | (3.21 | ) | | | 39,617 | | | | 0.99 | | | | 1.30 | | | | 5.54 | | | | 69 | |
| (a) | Calculated using average shares outstanding. |
| (b) | Includes adjustments in accordance with accounting principles generally accepted in the United States of America and as such, the net asset value for financial reporting purposes and the returns based upon those net asset values may differ from the net asset value and returns for shareholder transactions. Does not include sales charges and is not annualized for periods less than one year, if applicable. |
| (c) | Portfolio turnover is calculated at the fund level and is not annualized for periods less than one year, if applicable. |
| (d) | Ratios are based on average daily net assets (000’s omitted) of $4,186, $65, $1,257, $153, $2,017, $6 and $41,239 for Class A, Class B, Class C, Class R, Class Y, Class R5 and Class R6 shares, respectively. |
| (e) | Reflects activity for the period November 1, 2017 through January 26, 2018 (date of conversion). |
30 Invesco Emerging Markets Flexible Bond Fund
Report of Independent Registered Public Accounting Firm
To the Board of Trustees of AIM Investment Funds (Invesco Investment Funds)
and Shareholders of Invesco Emerging Markets Flexible Bond Fund:
Opinion on the Financial Statements
We have audited the accompanying consolidated statement of assets and liabilities, including the consolidated schedule of investments, of Invesco Emerging Markets Flexible Bond Fund and its subsidiary (one of the funds constituting AIM Investment Funds (Invesco Investment Funds), hereafter referred to as the “Fund”) as of October 31, 2018, the related consolidated statement of operations for the year ended October 31, 2018, the consolidated statement of changes in net assets for each of the two years in the period ended October 31, 2018, including the related notes, and the financial highlights for each of the periods indicated therein (collectively referred to as the financial statements). In our opinion, the financial statements present fairly, in all material respects, the financial position of the Fund as of October 31, 2018, the results of its operations for the year then ended, the changes in its net assets for each of the two years in the period ended October 31, 2018 and the financial highlights for each of the periods indicated therein in conformity with accounting principles generally accepted in the United States of America.
Basis for Opinion
These financial statements are the responsibility of the Fund’s management. Our responsibility is to express an opinion on the Fund’s financial statements based on our audits. We are a public accounting firm registered with the Public Company Accounting Oversight Board (United States) (PCAOB) and are required to be independent with respect to the Fund in accordance with the U.S. federal securities laws and the applicable rules and regulations of the Securities and Exchange Commission and the PCAOB.
We conducted our audits of these financial statements in accordance with the standards of the PCAOB. Those standards require that we plan and perform the audit to obtain reasonable assurance about whether the financial statements are free of material misstatement, whether due to error or fraud.
Our audits included performing procedures to assess the risks of material misstatement of the financial statements, whether due to error or fraud, and performing procedures that respond to those risks. Such procedures included examining, on a test basis, evidence regarding the amounts and disclosures in the financial statements. Our audits also included evaluating the accounting principles used and significant estimates made by management, as well as evaluating the overall presentation of the financial statements. Our procedures included confirmation of securities owned as of October 31, 2018 by correspondence with the custodian and brokers; when replies were not received from brokers, we performed other auditing procedures. We believe that our audits provide a reasonable basis for our opinion.
PricewaterhouseCoopers LLP
Houston, TX
December 28, 2018
We have served as the auditor of one or more of the investment companies in the Invesco group of investment companies since at least 1995. We have not been able to determine the specific year we began serving as auditor.
31 Invesco Emerging Markets Flexible Bond Fund
Calculating your ongoing Fund expenses
Example
As a shareholder of the Fund, you incur two types of costs: (1) transaction costs, which may include sales charges (loads) on purchase payments or contingent deferred sales charges on redemptions, if any; and (2) ongoing costs, including management fees, distribution and/or service (12b-1) fees, and other Fund expenses. This example is intended to help you understand your ongoing costs (in dollars) of investing in the Fund and to compare these costs with ongoing costs of investing in other mutual funds. The example is based on an investment of $1,000 invested at the beginning of the period and held for the entire period May 1, 2018 through October 31, 2018.
Actual expenses
The table below provides information about actual account values and actual expenses. You may use the information in this table, together with the amount you invested, to estimate the expenses that you paid over the period. Simply divide your account value by $1,000 (for example, an $8,600 account value divided by $1,000 = 8.6), then multiply the result by the number in the table under the heading entitled “Actual Expenses Paid During Period” to estimate the expenses you paid on your account during this period.
Hypothetical example for comparison purposes
The table below also provides information about hypothetical account values and hypothetical expenses based on the Fund’s actual expense ratio and an assumed rate of return of 5% per year before expenses, which is not the Fund’s actual return.
The hypothetical account values and expenses may not be used to estimate the actual ending account balance or expenses you paid for the period. You may use this information to compare the ongoing costs of investing in the Fund and other funds. To do so, compare this 5% hypothetical example with the 5% hypothetical examples that appear in the shareholder reports of the other funds.
Please note that the expenses shown in the table are meant to highlight your ongoing costs only and do not reflect any transaction costs, such as sales charges (loads) on purchase payments or contingent deferred sales charges on redemptions, if any. Therefore, the hypothetical information is useful in comparing ongoing costs only, and will not help you determine the relative total costs of owning different funds. In addition, if these transaction costs were included, your costs would have been higher.
| | | | | | | | | | | | | | | | | | | | | | | | |
| Class | | Beginning
Account Value
(05/01/18) | | | ACTUAL | | | HYPOTHETICAL (5% annual return before
expenses) | | | Annualized
Expense
Ratio | |
| | Ending
Account Value
(10/31/18)1 | | | Expenses
Paid During
Period2 | | | Ending
Account Value
(10/31/18) | | | Expenses
Paid During
Period2 | |
| A | | $ | 1,000.00 | | | $ | 924.50 | | | $ | 5.97 | | | $ | 1,019.00 | | | $ | 6.26 | | | | 1.23 | % |
| C | | | 1,000.00 | | | | 919.50 | | | | 9.58 | | | | 1,015.22 | | | | 10.06 | | | | 1.98 | |
| R | | | 1,000.00 | | | | 921.80 | | | | 7.17 | | | | 1,017.74 | | | | 7.53 | | | | 1.48 | |
| Y | | | 1,000.00 | | | | 925.70 | | | | 4.76 | | | | 1,020.27 | | | | 4.99 | | | | 0.98 | |
| R5 | | | 1,000.00 | | | | 925.70 | | | | 4.76 | | | | 1,020.27 | | | | 4.99 | | | | 0.98 | |
| R6 | | | 1,000.00 | | | | 924.10 | | | | 4.75 | | | | 1,020.27 | | | | 4.99 | | | | 0.98 | |
| 1 | The actual ending account value is based on the actual total return of the Fund for the period May 1, 2018 through October 31, 2018, after actual expenses and will differ from the hypothetical ending account value which is based on the Fund’s expense ratio and a hypothetical annual return of 5% before expenses. |
| 2 | Expenses are equal to the Fund’s annualized expense ratio as indicated above multiplied by the average account value over the period, multiplied by 184/365 to reflect the most recent fiscal half year. |
32 Invesco Emerging Markets Flexible Bond Fund
Approval of Investment Advisory and Sub-Advisory Contracts
At meetings held on June 5-6, 2018, the Board of Trustees (the Board or the Trustees) of AIM Investment Funds (Invesco Investment Funds) as a whole, and the independent Trustees, who comprise over 75% of the Board, voting separately, approved the continuance of the Invesco Emerging Markets Flexible Bond Fund’s (the Fund) Master Investment Advisory Agreement with Invesco Advisers, Inc. (Invesco Advisers and the investment advisory agreement) and the Master Intergroup Sub-Advisory Contract for Mutual Funds with Invesco Asset Management Deutschland GmbH, Invesco Asset Management Limited, Invesco Asset Management (Japan) Limited, Invesco Hong Kong Limited, Invesco Senior Secured Management, Inc., Invesco Canada Ltd. and separate Sub-Advisory Contracts with Invesco Capital Management LLC and Invesco Asset Management (India) Private Limited (collectively, the Affiliated Sub-Advisers and the sub-advisory contracts) for another year, effective July 1, 2018. After evaluating the factors discussed below, among others, the Board approved the renewal of the Fund’s investment advisory agreement and the sub-advisory contracts and determined that the compensation payable by the Fund to Invesco Advisers and by Invesco Advisers to the Affiliated Sub-Advisers is fair and reasonable.
The Board’s Evaluation Process
The Board’s Investments Committee has established three Sub-Committees, which meet throughout the year to review the performance of funds advised by Invesco Advisers (the Invesco Funds). Over the course of each year, the Sub-Committees meet with portfolio managers for their assigned Invesco Funds and other members of management to review detailed information about investment performance and portfolio attributes of these funds. The Board took into account evaluations and reports that it received from the Investments Committee and Sub-Committees, as well as the information provided to such committees and the Board throughout the year, in considering whether to approve each Invesco Fund���s investment advisory agreement and sub-advisory contracts.
As part of the contract renewal process, the Board reviews and considers information provided in response to detailed requests for information submitted to management by the independent Trustees with assistance from legal counsel to the independent Trustees. The Board receives comparative investment performance and fee data regarding the Invesco Funds prepared by Invesco Advisers and Broadridge Financial Solutions, Inc. (Broadridge), an independent mutual fund data provider. The Board also receives an independent written evaluation from the Senior Officer, an officer of the Invesco Funds who reports directly to the
independent Trustees. The Senior Officer’s evaluation is prepared as part of his responsibility to manage the process by which the Invesco Funds’ proposed management fees are negotiated during the annual contract renewal process to ensure they are negotiated in a manner that is at arms’ length and reasonable. In addition to meetings with Invesco Advisers and fund counsel throughout the year, the independent Trustees also discuss the continuance of the investment advisory agreement and sub-advisory contracts in separate sessions with the Senior Officer and with independent legal counsel.
The discussion below is a summary of the Senior Officer’s independent written evaluation with respect to the Fund’s investment advisory agreement, as well as a discussion of the material factors and related conclusions that formed the basis for the Board’s approval of the Fund’s investment advisory agreement and sub-advisory contracts. The Trustees’ review and conclusions are based on the comprehensive consideration of all information presented to them during the course of the year and in prior years and are not the result of any single determinative factor. Moreover, one Trustee may have weighed a particular piece of information or factor differently than another Trustee. This information is current as of June 6, 2018.
Factors and Conclusions and Summary of Independent Written Fee Evaluation
| A. | Nature, Extent and Quality of Services Provided by Invesco Advisers and the Affiliated Sub-Advisers |
The Board reviewed the nature, extent and quality of the advisory services provided to the Fund by Invesco Advisers under the Fund’s investment advisory agreement, and the credentials and experience of the officers and employees of Invesco Advisers who provide these services, including the Fund’s portfolio manager(s). The Board’s review included consideration of Invesco Advisers’ investment process oversight and structure, credit analysis and investment risk management. The Board also considered non-advisory services that Invesco Advisers and its affiliates provide to the Invesco Funds such as various back office support functions, third party oversight, internal audit, valuation, portfolio trading and legal and compliance. The Board also reviewed and considered the benefits to shareholders of investing in a fund that is part of the Invesco family of funds under the umbrella of Invesco Ltd., Invesco Advisers’ parent company, and noted Invesco Ltd.’s depth and experience in conducting an investment management business, as well as its commitment of financial and other resources to such business. The Board concluded that the nature, extent and quality of the services provided to the Fund by Invesco Advisers are appropriate and satisfactory.
The Board reviewed the services that may be provided by the Affiliated Sub-Advisers under the sub-advisory contracts and the credentials and experience of the officers and employees of the Affiliated Sub-Advisers who provide these services. The Board noted the Affiliated Sub-Advisers’ expertise with respect to certain asset classes and that the Affiliated Sub-Advisers have offices and personnel that are located in financial centers around the world. As a result, the Board noted that the Affiliated Sub-Advisers can provide research and investment analysis on the markets and economies of various countries in which the Fund may invest, make recommendations regarding securities and assist with security trades. The Board concluded that the sub-advisory contracts may benefit the Fund and its shareholders by permitting Invesco Advisers to use the resources and talents of the Affiliated Sub-Advisers in managing the Fund. The Board concluded that the nature, extent and quality of the services that may be provided by the Affiliated Sub-Advisers are appropriate and satisfactory.
| B. | Fund Investment Performance |
The Board considered Fund investment performance as a relevant factor in considering whether to approve the investment advisory agreement. The Board did not view Fund investment performance as a relevant factor in considering whether to approve the sub-advisory contracts for the Fund, as no Affiliated Sub-Adviser currently manages assets of the Fund.
The Board noted that the Fund had changed its name, investment strategy and index on February 26, 2016 and compared the Fund’s investment performance for the one year ended December 31, 2017 to the performance of funds in the Broadridge performance universe and against the Lipper Emerging Markets Hard Currency Debt Funds Index. The Board noted that performance of Class A shares of the Fund was in the fifth quintile of its performance universe for the one year period (the first quintile being the best performing funds and the fifth quintile being the worst performing funds). The Board noted that performance of Class A shares of the Fund was below the performance of the Index for the one year period. The Board noted that the Fund’s exposure to the US dollar detracted from Fund performance. The Trustees also reviewed more recent Fund performance and this review did not change their conclusions.
| C. | Advisory and Sub-Advisory Fees and Fund Expenses |
The Board compared the Fund’s contractual management fee rate to the contractual management fee rates of funds in the Fund’s Broadridge expense group. The Board noted that the contractual management fee rate for
33 Invesco Emerging Markets Flexible Bond Fund
Class A shares of the Fund was above the median contractual management fee rate of funds in its expense group. The Board noted that the term “contractual management fee” for funds in the expense group may include both advisory and certain non-portfolio management administrative services fees, but that Broadridge does not provide information on a fund by fund basis as to what is included. The Board also reviewed the methodology used by Broadridge in providing expense group information, which includes using each fund’s contractual management fee schedule (including any applicable breakpoints) as reported in the most recent prospectus or statement of additional information for each fund in the expense group. The Board also considered comparative information regarding the Fund’s total expense ratio and its various components. The Board noted that the Fund’s contractual management fees and total expense ratio were in the fourth and fifth quintiles of its expense group, respectively, and discussed with management reasons for such relative contractual management fees and total expenses.
The Board noted that Invesco Advisers has contractually agreed to waive fees and/or limit expenses of the Fund in an amount necessary to limit total annual operating expenses to a specified percentage of average daily net assets for each class of the Fund.
The Board also considered the fees charged by Invesco Advisers and the Affiliated Sub-Advisers to other similarly managed client accounts. The Board noted that Invesco Advisers or the Affiliated Sub-Advisers may charge lower fees to large institutional clients. Invesco Advisers reviewed with the Board differences in the scope of services it provides to the Invesco Funds relative to certain other types of client accounts, including management of cash flows as a result of redemptions and purchases, necessary infrastructure such as officers, office space, technology, legal and distribution, oversight of service providers, costs and business risks associated with launching new funds and sponsoring and maintaining the product line, preparation of annual registration statement updates and financial information and compliance with federal and state laws and regulations.
The Board also considered the services that may be provided by the Affiliated Sub-Advisers pursuant to the sub-advisory contracts, as well as the fees payable by Invesco Advisers to the Affiliated Sub-Advisers pursuant to the sub-advisory contracts.
| D. | Economies of Scale and Breakpoints |
The Board considered the extent to which there may be economies of scale in the provision of advisory services to the Fund. The Board also considered that the Fund may benefit from economies of scale through contractual breakpoints in the Fund’s advisory fee schedule, which generally operate to reduce the Fund’s expense ratio as it grows in size. The Board noted that the Fund shares directly in
economies of scale through lower fees charged by third party service providers based on the combined size of the Invesco Funds. The Board noted that the Fund may also benefit from economies of scale through initial fee setting, fee waivers and expense reimbursements.
| E. | Profitability and Financial Resources |
The Board reviewed information from Invesco Advisers concerning the costs of the advisory and other services that Invesco Advisers and its affiliates provide to the Fund and the Invesco Funds and the profitability of Invesco Advisers and its affiliates in providing these services. The Board considered the methodology used for calculating profitability and noted the periodic review of such methodology by an independent consultant. The Board noted that Invesco Advisers continues to operate at a net profit from services Invesco Advisers and its affiliates provide to the Invesco Funds. The Board received information from Invesco Advisers demonstrating that Invesco Advisers and the Affiliated Sub-Advisers are financially sound and have the resources necessary to perform their obligations under the investment advisory agreement and sub-advisory contracts.
| F. | Collateral Benefits to Invesco Advisers and its Affiliates |
The Board considered various other benefits received by Invesco Advisers and its affiliates from the relationship with the Fund, including the fees received for providing administrative, transfer agency and distribution services to the Fund. The Board considered comparative information regarding fees charged for these services, including information provided by Broadridge and other independent sources. The Board considered the performance of Invesco Advisers and its affiliates in providing these services and the organizational structure employed to provide these services. The Board also considered that these services are provided to the Fund pursuant to written contracts that are reviewed and approved on an annual basis by the Board; and that the services are required for the operation of the Fund.
The Board considered the benefits realized by Invesco Advisers and the Affiliated Sub-Advisers as a result of portfolio brokerage transactions executed through “soft dollar” arrangements. Invesco Advisers noted that the Fund does not execute brokerage transactions through “soft dollar” arrangements to any significant degree.
The Board considered that the Fund’s uninvested cash and cash collateral from any securities lending arrangements may be invested in money market funds advised by Invesco Advisers pursuant to procedures approved by the Board. The Board noted that Invesco Advisers receives advisory fees from these affiliated money market funds attributable to such investments, although Invesco Advisers has contractually agreed to waive through varying periods the advisory fees payable by the Invesco Funds with respect to certain investments in the affiliated money market funds. The waiver is in an amount equal
to 100% of the net advisory fee Invesco Advisers receives from the affiliated money market funds with respect to the Fund’s investment in the affiliated money market funds of uninvested cash, but not cash collateral. The Board concluded that the amount of advisory fees received by Invesco Advisers from the Fund’s investment of cash collateral from any securities lending arrangements in the affiliated money market funds is fair and reasonable.
34 Invesco Emerging Markets Flexible Bond Fund
Tax Information
Form 1099-DIV, Form 1042-S and other year-end tax information provide shareholders with actual calendar year amounts that should be included in their tax returns. Shareholders should consult their tax advisors.
The following distribution information is being provided as required by the Internal Revenue Code or to meet a specific state’s requirement.
The Fund designates the following amounts or, if subsequently determined to be different, the maximum amount allowable for its fiscal year ended October 31, 2018:
| | | | |
Federal and State Income Tax | |
Qualified Dividend Income* | | | 0.21 | % |
Corporate Dividends Received Deduction* | | | 0.00 | % |
U.S. Treasury Obligations* | | | 0.00 | % |
| | * | The above percentages are based on ordinary income dividends paid to shareholders during the Fund’s fiscal year. |
35 Invesco Emerging Markets Flexible Bond Fund
Trustees and Officers
The address of each trustee and officer is AIM Investment Funds (Invesco Investment Funds) (the “Trust”), 11 Greenway Plaza, Suite 1000, Houston, Texas 77046-1173. The trustees serve for the life of the Trust, subject to their earlier death, incapacitation, resignation, retirement or removal as more specifically provided in the Trust’s organizational documents. Each officer serves for a one year term or until their successors are elected and qualified. Column two below includes length of time served with predecessor entities, if any.
| | | | | | | | |
Name, Year of Birth and
Position(s) Held with the Trust | | Trustee and/
or Officer Since | | Principal Occupation(s)
During Past 5 Years | | Number of
Funds in Fund
Complex
Overseen by
Trustee | | Other Directorship(s)
Held by Trustee During
Past 5 Years |
| Interested Persons | | | | | | | | |
| Martin L. Flanagan1 — 1960 Trustee | | 2007 | | Executive Director, Chief Executive Officer and President, Invesco Ltd. (ultimate parent of Invesco and a global investment management firm); Trustee, The Invesco Funds; Vice Chair, Investment Company Institute; and Member of Executive Board, SMU Cox School of Business Formerly: Advisor to the Board, Invesco Advisers, Inc. (formerly known as Invesco Institutional (N.A.), Inc.); Chairman and Chief Executive Officer, Invesco Advisers, Inc. (registered investment adviser); Director, Chairman, Chief Executive Officer and President, Invesco Holding Company (US), Inc. (formerly IVZ Inc.) (holding company), Invesco Group Services, Inc. (service provider) and Invesco North American Holdings, Inc. (holding company); Director, Chief Executive Officer and President, Invesco Holding Company Limited (parent of Invesco and a global investment management firm); Director, Invesco Ltd.; Chairman, Investment Company Institute and President, Co-Chief Executive Officer, Co-President, Chief Operating Officer and Chief Financial Officer, Franklin Resources, Inc. (global investment management organization) | | 158 | | None |
Philip A. Taylor2 — 1954 Trustee and Senior Vice President | | 2006 | | Head of the Americas and Senior Managing Director, Invesco Ltd.; Director, Invesco Advisers, Inc. (formerly known as Invesco Institutional (N.A.), Inc.) (registered investment adviser); Director and Chairman, Invesco Investment Services, Inc. (formerly known as Invesco AIM Investment Services, Inc.) (registered transfer agent); Chief Executive Officer, Invesco Corporate Class Inc. (corporate mutual fund company); Director, Chairman and Chief Executive Officer, Invesco Canada Ltd. (formerly known as Invesco Trimark Ltd./Invesco Trimark Ltèe) (registered investment adviser and registered transfer agent); Trustee and Senior Vice President, The Invesco Funds; Director, Invesco Investment Advisers LLC (formerly known as Van Kampen Asset Management) Formerly: Director, Chairman, Chief Executive Officer and President, Invesco Management Group, Inc. (formerly known as Invesco AIM Management Group, Inc.) (financial services holding company); Co-Chairman, Co-President and Co-Chief Executive Officer, Invesco Advisers, Inc. (formerly known as Invesco Institutional (N.A.), Inc.) (registered investment adviser); Director, Chief Executive Officer and President, Van Kampen Exchange Corp; President and Principal Executive Officer, The Invesco Funds (other than AIM Treasurer’s Series Trust (Invesco Treasurer’s Series Trust), Short-Term Investments Trust and Invesco Management Trust); Executive Vice President, The Invesco Funds (AIM Treasurer’s Series Trust (Invesco Treasurer’s Series Trust), Short-Term Investments Trust and Invesco Management Trust only); Director and President, INVESCO Funds Group, Inc. (registered investment adviser and registered transfer agent); Director and Chairman, IVZ Distributors, Inc. (formerly known as INVESCO Distributors, Inc.) (registered broker dealer); Director, President and Chairman, Invesco Inc. (holding company), Invesco Canada Holdings Inc. (holding company), Trimark Investments Ltd./Placements Trimark Ltèe and Invesco Financial Services Ltd/Services Financiers Invesco Ltèe; Chief Executive Officer, Invesco Canada Fund Inc. (corporate mutual fund company); Director and Chairman, Van Kampen Investor Services Inc.; Director, Chief Executive Officer and President, 1371 Preferred Inc. (holding company) and Van Kampen Investments Inc.; Director and President, AIM GP Canada Inc. (general partner for limited partnerships) and Van Kampen Advisors, Inc.; Director and Chief Executive Officer, Invesco Trimark Dealer Inc. (registered broker dealer); Director, Invesco Distributors, Inc. (formerly known as Invesco AIM Distributors, Inc.) (registered broker dealer); Manager, Invesco Capital Management LLC; Director, Chief Executive Officer and President, Invesco Advisers, Inc.; Director, Chairman, Chief Executive Officer and President, Invesco AIM Capital Management, Inc.; President, Invesco Trimark Dealer Inc. and Invesco Trimark Ltd./Invesco Trimark Ltèe; Director and President, AIM Trimark Corporate Class Inc. and AIM Trimark Canada Fund Inc.; Senior Managing Director, Invesco Holding Company Limited; Director and Chairman, Fund Management Company (former registered broker dealer); President and Principal Executive Officer, The Invesco Funds (AIM Treasurer’s Series Trust (Invesco Treasurer’s Series Trust), and Short-Term Investments Trust only); President, AIM Trimark Global Fund Inc. and AIM Trimark Canada Fund Inc. | | 158 | | None |
| 1 | Mr. Flanagan is considered an interested person (within the meaning of Section 2(a)(19) of the 1940 Act) of the Trust because he is an officer of the Adviser to the Trust, and an officer and a director of Invesco Ltd., ultimate parent of the Adviser. |
| 2 | Mr. Taylor is considered an interested person (within the meaning of Section 2(a)(19) of the 1940 Act) of the Trust because he is an officer and a director of the Adviser. |
T-1 Invesco Emerging Markets Flexible Bond Fund
Trustees and Officers—(continued)
| | | | | | | | |
Name, Year of Birth and
Position(s) Held with the Trust | | Trustee and/
or Officer Since | | Principal Occupation(s)
During Past 5 Years | | Number of
Funds in Fund
Complex
Overseen by
Trustee | | Other Directorship(s)
Held by Trustee During
Past 5 Years |
| Independent Trustees | | | | | | | | |
Bruce L. Crockett — 1944 Trustee and Chair | | 2001 | | Chairman, Crockett Technologies Associates (technology consulting company) Formerly: Director, Captaris (unified messaging provider); Director, President and Chief Executive Officer, COMSAT Corporation; Chairman, Board of Governors of INTELSAT (international communications company); ACE Limited (insurance company); Independent Directors Council and Investment Company Institute: Member of the Audit Committee, Investment Company Institute; Member of the Executive Committee and Chair of the Governance Committee, Independent Directors Council | | 158 | | Director and Chairman of the Audit Committee, ALPS (Attorneys Liability Protection Society) (insurance company); Director and Member of the Audit Committee and Compensation Committee, Ferroglobe PLC (metallurgical company) |
David C. Arch — 1945 Trustee | | 2010 | | Chairman of Blistex Inc. (consumer health care products manufacturer); Member, World Presidents’ Organization | | 158 | | Board member of the Illinois Manufacturers’ Association |
Jack M. Fields — 1952 Trustee | | 2001 | | Chief Executive Officer, Twenty First Century Group, Inc. (government affairs company); and Chairman, Discovery Learning Alliance (non-profit) Formerly: Owner and Chief Executive Officer, Dos Angeles Ranch L.P. (cattle, hunting, corporate entertainment); Director, Insperity, Inc. (formerly known as Administaff) (human resources provider); Chief Executive Officer, Texana Timber LP (sustainable forestry company); Director of Cross Timbers Quail Research Ranch (non-profit); and member of the U.S. House of Representatives | | 158 | | None |
Cynthia Hostetler — 1962 Trustee | | 2017 | | Non-Executive Director and Trustee of a number of public and private business corporations Formerly: Director, Aberdeen Investment Funds (4 portfolios); Head of Investment Funds and Private Equity, Overseas Private Investment Corporation; President, First Manhattan Bancorporation, Inc.; Attorney, Simpson Thacher & Bartlett LLP | | 158 | | Vulcan Materials Company (construction materials company); Trilinc Global Impact Fund; Artio Global Investment LLC (mutual fund complex); Edgen Group, Inc. (specialized energy and infrastructure products distributor) |
Eli Jones — 1961 Trustee | | 2016 | | Professor and Dean, Mays Business School — Texas A&M University Formerly: Professor and Dean, Walton College of Business, University of Arkansas and E.J. Ourso College of Business, Louisiana State University; Director, Arvest Bank | | 158 | | Insperity, Inc. (formerly known as Administaff) (human resources provider) |
Prema Mathai-Davis — 1950 Trustee | | 2001 | | Retired | | 158 | | None |
Teresa M. Ressel — 1962 Trustee | | 2017 | | Non-executive director and trustee of a number of public and private business corporations Formerly: Chief Financial Officer, Olayan America, The Olayan Group (international investor/commercial/industrial); Chief Executive Officer, UBS Securities LLC; Group Chief Operating Officer, Americas, UBS AG; Assistant Secretary for Management & Budget and CFO, US Department of the Treasury | | 158 | | Atlantic Power Corporation (power generation company); ON Semiconductor Corp. (semiconductor supplier) |
Ann Barnett Stern — 1957 Trustee | | 2017 | | President and Chief Executive Officer, Houston Endowment Inc. (private philanthropic institution) Formerly: Executive Vice President and General Counsel, Texas Children’s Hospital; Attorney, Beck, Redden and Secrest, LLP; Business Law Instructor, University of St. Thomas; Attorney, Andrews & Kurth LLP | | 158 | | Federal Reserve Bank of Dallas |
Raymond Stickel, Jr. — 1944 Trustee | | 2005 | | Retired Formerly: Director, Mainstay VP Series Funds, Inc. (25 portfolios); Partner, Deloitte & Touche | | 158 | | None |
Robert C. Troccoli — 1949 Trustee | | 2016 | | Adjunct Professor, University of Denver — Daniels College of Business Formerly: Senior Partner, KPMG LLP | | 158 | | None |
Christopher L. Wilson — 1957 Trustee | | 2017 | | Non-executive director and trustee of a number of public and private business corporations Formerly: Director, TD Asset Management USA Inc. (mutual fund complex) (22 portfolios); Managing Partner, CT2, LLC (investing and consulting firm); President/Chief Executive Officer, Columbia Funds, Bank of America Corporation; President/Chief Executive Officer, CDC IXIS Asset Management Services, Inc.; Principal & Director of Operations, Scudder Funds, Scudder, Stevens & Clark, Inc.; Assistant Vice President, Fidelity Investments | | 158 | | ISO New England, Inc. (non-profit organization managing regional electricity market) |
T-2 Invesco Emerging Markets Flexible Bond Fund
Trustees and Officers—(continued)
| | | | | | | | |
Name, Year of Birth and
Position(s) Held with the Trust | | Trustee and/
or Officer Since | | Principal Occupation(s)
During Past 5 Years | | Number of
Funds in Fund
Complex
Overseen by
Trustee | | Other Directorship(s)
Held by Trustee During
Past 5 Years |
| Other Officers | | | | | | | | |
Sheri Morris — 1964 President, Principal Executive Officer and Treasurer | | 1999 | | President, Principal Executive Officer and Treasurer, The Invesco Funds; Vice President, Invesco Advisers, Inc. (formerly known as Invesco Institutional (N.A.), Inc.) (registered investment adviser); and Vice President, Invesco Exchange-Traded Fund Trust, Invesco Exchange-Traded Fund Trust II, Invesco India Exchange-Traded Fund Trust, Invesco Actively Managed Exchange-Traded Fund Trust, Invesco Actively Managed Exchange-Traded Commodity Fund Trust and Invesco Exchange-Traded Self-Indexed Fund Trust Formerly: Vice President and Principal Financial Officer, The Invesco Funds; Vice President, Invesco AIM Advisers, Inc., Invesco AIM Capital Management, Inc. and Invesco AIM Private Asset Management, Inc.; Assistant Vice President and Assistant Treasurer, The Invesco Funds and Assistant Vice President, Invesco Advisers, Inc., Invesco AIM Capital Management, Inc. and Invesco AIM Private Asset Management, Inc.; and Treasurer, Invesco Exchange-Traded Fund Trust, Invesco Exchange-Traded Fund Trust II, Invesco India Exchange-Traded Fund Trust and Invesco Actively Managed Exchange-Traded Fund Trust | | N/A | | N/A |
Russell C. Burk — 1958 Senior Vice President and Senior Officer | | 2005 | | Senior Vice President and Senior Officer, The Invesco Funds | | N/A | | N/A |
Jeffrey H. Kupor — 1968 Senior Vice President, Chief Legal Officer and Secretary | | 2018 | | Senior Vice President and Secretary, Invesco Advisers, Inc. (formerly known as Invesco Institutional (N.A.), Inc.) (registered investment adviser); Senior Vice President and Secretary, Invesco Distributors, Inc. (formerly known as Invesco AIM Distributors, Inc.); Vice President and Secretary, Invesco Investment Services, Inc. (formerly known as Invesco AIM Investment Services, Inc.) Senior Vice President, Chief Legal Officer and Secretary, The Invesco Funds; Secretary and General Counsel, Invesco Investment Advisers LLC (formerly known as Van Kampen Asset Management); Secretary and General Counsel, Invesco Capital Markets, Inc. (formerly known as Van Kampen Funds Inc.) and Chief Legal Officer, Invesco Exchange-Traded Fund Trust, Invesco Exchange-Traded Fund Trust II, Invesco India Exchange-Traded Fund Trust, Invesco Actively Managed Exchange-Traded Fund Trust, Invesco Actively Managed Exchange-Traded Commodity Fund Trust and Invesco Exchange-Traded Self-Indexed Fund Trust; Secretary, Invesco Indexing LLC; Secretary and General Counsel, INVESCO Private Capital Investments, Inc.; Secretary, W.L. Ross & Co., LLC; Secretary and Vice President, Jemstep, Inc. Formerly: Senior Vice President, Secretary and General Counsel, Invesco Management Group, Inc. (formerly known as Invesco AIM Management Group, Inc.); Assistant Secretary, INVESCO Asset Management (Bermuda) Ltd.; Secretary and General Counsel, Invesco Private Capital, Inc.; Assistant Secretary and General Counsel, INVESCO Realty, Inc.; Secretary and General Counsel, Invesco Senior Secured Management, Inc.; and Secretary, Sovereign G./P. Holdings Inc. | | N/A | | N/A |
John M. Zerr — 1962 Senior Vice President | | 2006 | | Chief Operating Officer of the Americas; Senior Vice President, Invesco Advisers, Inc. (formerly known as Invesco Institutional (N.A.), Inc.) (registered investment adviser); Senior Vice President, Invesco Distributors, Inc. (formerly known as Invesco AIM Distributors, Inc.); Director and Vice President, Invesco Investment Services, Inc. (formerly known as Invesco AIM Investment Services, Inc.) Senior Vice President, The Invesco Funds; Managing Director, Invesco Capital Management LLC; Director, Invesco Investment Advisers LLC (formerly known as Van Kampen Asset Management); Senior Vice President, Invesco Capital Markets, Inc. (formerly known as Van Kampen Funds Inc.); Manager, Invesco Indexing LLC Formerly: Director and Senior Vice President, Invesco Management Group, Inc. (formerly known as Invesco AIM Management Group, Inc.); Secretary and General Counsel, Invesco Management Group, Inc. (formerly known as Invesco AIM Management Group, Inc.); Secretary, Invesco Investment Services, Inc. (formerly known as Invesco AIM Investment Services, Inc.); Chief Legal Officer and Secretary, The Invesco Funds; Secretary and General Counsel, Invesco Investment Advisers LLC (formerly known as Van Kampen Asset Management); Secretary and General Counsel, Invesco Capital Markets, Inc. (formerly known as Van Kampen Funds Inc.); Chief Legal Officer, Invesco Exchange-Traded Fund Trust, Invesco Exchange-Traded Fund Trust II, Invesco India Exchange-Traded Fund Trust, Invesco Actively Managed Exchange-Traded Fund Trust, Invesco Actively Managed Exchange-Traded Commodity Fund Trust and Invesco Exchange-Traded Self-Indexed Fund Trust; Secretary, Invesco Indexing LLC; Director, Secretary, General Counsel and Senior Vice President, Van Kampen Exchange Corp.; Director, Vice President and Secretary, IVZ Distributors, Inc. (formerly known as INVESCO Distributors, Inc.); Director and Vice President, INVESCO Funds Group, Inc.; Director and Vice President, Van Kampen Advisors Inc.; Director, Vice President, Secretary and General Counsel, Van Kampen Investor Services Inc.; Director and Secretary, Invesco Distributors, Inc. (formerly known as Invesco AIM Distributors, Inc.); Director, Senior Vice President, General Counsel and Secretary, Invesco AIM Advisers, Inc. and Van Kampen Investments Inc.; Director, Vice President and Secretary, Fund Management Company; Director, Senior Vice President, Secretary, General Counsel and Vice President, Invesco AIM Capital Management, Inc.; Chief Operating Officer and General Counsel, Liberty Ridge Capital, Inc. (an investment adviser) | | N/A | | N/A |
T-3 Invesco Emerging Markets Flexible Bond Fund
Trustees and Officers—(continued)
| | | | | | | | |
Name, Year of Birth and
Position(s) Held with the Trust | | Trustee and/
or Officer Since | | Principal Occupation(s)
During Past 5 Years | | Number of
Funds in Fund
Complex
Overseen by
Trustee | | Other Directorship(s)
Held by Trustee During
Past 5 Years |
| Other Officers—(continued) | | | | | | | | |
Gregory G. McGreevey — 1962 Senior Vice President | | 2012 | | Senior Managing Director, Invesco Ltd.; Director, Chairman, President, and Chief Executive Officer, Invesco Advisers, Inc. (formerly known as Invesco Institutional (N.A.), Inc.) (registered investment adviser); Director, Invesco Mortgage Capital, Inc. and Invesco Senior Secured Management, Inc.; and Senior Vice President, The Invesco Funds Formerly: Senior Vice President, Invesco Management Group, Inc. and Invesco Advisers, Inc.; Assistant Vice President, The Invesco Funds | | N/A | | N/A |
Kelli Gallegos — 1970 Vice President, Principal Financial Officer and Assistant Treasurer | | 2008 | | Vice President and Treasurer, Invesco Exchange-Traded Fund Trust, Invesco Exchange-Traded Fund Trust II, Invesco India Exchange-Traded Fund Trust, Invesco Actively Managed Exchange-Traded Fund Trust, Invesco Actively Managed Exchange-Traded Commodity Fund Trust and Invesco Exchange-Traded Self-Indexed Fund Trust; Vice President, Principal Financial Officer and Assistant Treasurer, The Invesco Funds; Principal Financial and Accounting Officer — Pooled Investments, Invesco Capital Management LLC Formerly: Assistant Treasurer, Invesco Exchange-Traded Fund Trust, Invesco Exchange-Traded Fund Trust II, Invesco India Exchange-Traded Fund Trust, Invesco Actively Managed Exchange-Traded Fund Trust, Invesco Actively Managed Exchange-Traded Commodity Fund Trust and Invesco Exchange-Traded Self-Indexed Fund Trust; Assistant Treasurer, Invesco Capital Management LLC; Assistant Vice President, The Invesco Funds | | N/A | | N/A |
Tracy Sullivan — 1962 Vice President, Chief Tax Officer and Assistant Treasurer | | 2008 | | Vice President, Chief Tax Officer and Assistant Treasurer, The Invesco Funds; Assistant Treasurer, Invesco Capital Management LLC, Invesco Exchange-Traded Fund Trust, Invesco Exchange-Traded Fund Trust II, Invesco India Exchange-Traded Fund Trust, Invesco Actively Managed Exchange-Traded Fund Trust, Invesco Actively Managed Exchange-Traded Commodity Fund Trust and Invesco Exchange-Traded Self-Indexed Fund Trust Formerly: Assistant Vice President, The Invesco Funds | | N/A | | N/A |
Crissie M. Wisdom — 1969 Anti-Money Laundering Compliance Officer | | 2013 | | Anti-Money Laundering Compliance Officer, Invesco Advisers, Inc. (formerly known as Invesco Institutional (N.A.), Inc.) (registered investment adviser), Invesco Capital Markets, Inc. (formerly known as Van Kampen Funds Inc.), Invesco Distributors, Inc., Invesco Investment Services, Inc., The Invesco Funds, and Invesco Exchange-Traded Fund Trust, Invesco Exchange-Traded Fund Trust II, Invesco India Exchange-Traded Fund Trust, Invesco Actively Managed Exchange-Traded Fund Trust, Invesco Actively Managed Exchange-Traded Commodity Fund Trust and Invesco Exchange-Traded Self-Indexed Fund Trust; Anti-Money Laundering Compliance Officer and Bank Secrecy Act Officer, INVESCO National Trust Company and Invesco Trust Company; and Fraud Prevention Manager and Controls and Risk Analysis Manager for Invesco Investment Services, Inc. Formerly: Anti-Money Laundering Compliance Officer, Van Kampen Exchange Corp. and Invesco Management Group, Inc. | | N/A | | N/A |
Robert R. Leveille — 1969 Chief Compliance Officer | | 2016 | | Chief Compliance Officer, Invesco Advisers, Inc. (registered investment adviser); and Chief Compliance Officer, The Invesco Funds Formerly: Chief Compliance Officer, Putnam Investments and the Putnam Funds | | N/A | | N/A |
The Statement of Additional Information of the Trust includes additional information about the Fund’s Trustees and is available upon request, without charge, by calling 1.800.959.4246. Please refer to the Fund’s Statement of Additional Information for information on the Fund’s sub-advisers.
| | | | | | |
Office of the Fund 11 Greenway Plaza, Suite 1000 Houston, TX 77046-1173 | | Investment Adviser Invesco Advisers, Inc. 1555 Peachtree Street, N.E. Atlanta, GA 30309 | | Distributor Invesco Distributors, Inc. 11 Greenway Plaza, Suite 1000 Houston, TX 77046-1173 | | Auditors PricewaterhouseCoopers LLP 1000 Louisiana Street, Suite 5800 Houston, TX 77002-5021 |
| | | |
| | | | | | |
Counsel to the Fund Stradley Ronon Stevens & Young, LLP 2005 Market Street, Suite 2600 Philadelphia, PA 19103-7018 | | Counsel to the Independent Trustees Goodwin Procter LLP 901 New York Avenue, N.W. Washington, D.C. 20001 | | Transfer Agent Invesco Investment Services, Inc. 11 Greenway Plaza, Suite 1000 Houston, TX 77046-1173 | | Custodian State Street Bank and Trust Company 225 Franklin Street Boston, MA 02110-2801 |
T-4 Invesco Emerging Markets Flexible Bond Fund
Explore High-Conviction Investing with Invesco

Go paperless with eDelivery
Visit invesco.com/edelivery to enjoy the convenience and security of anytime electronic access to your investment documents.
With eDelivery, you can elect to have any or all of the following materials delivered straight to your inbox to download, save and print from your own computer:
∎ Fund reports and prospectuses
∎ Quarterly statements
∎ Daily confirmations
∎ Tax forms
Invesco mailing information
Send general correspondence to Invesco Investment Services, Inc., P.O. Box 219078, Kansas City, MO 64121-9078.
Important notice regarding delivery of security holder documents
To reduce Fund expenses, only one copy of most shareholder documents may be mailed to shareholders with multiple accounts at the same address (Householding). Mailing of your shareholder documents may be householded indefinitely unless you instruct us otherwise. If you do not want the mailing of these documents to be combined with those for other members of your household, please contact Invesco Investment Services, Inc. at 800 959 4246 or contact your financial institution. We will begin sending you individual copies for each account within 30 days after receiving your request.
Fund holdings and proxy voting information
The Fund provides a complete list of its holdings four times in each fiscal year, at the quarter ends. For the second and fourth quarters, the lists appear in the Fund’s semiannual and annual reports to shareholders. For the first and third quarters, the Fund files the lists with the Securities and Exchange Commission (SEC) on Form N-Q (or any successor Form). The most recent list of portfolio holdings is available at invesco.com/completeqtrholdings. Shareholders can also look up the Fund’s Forms N-Q (or any successor Form) on the SEC website at sec.gov. The SEC file numbers for the Fund are shown below.
A description of the policies and procedures that the Fund uses to determine how to vote proxies relating to portfolio securities is available without charge, upon request, from our Client Services department at 800 959 4246 or at invesco.com/proxyguidelines. The information is also available on the SEC website, sec.gov.
| | |
Information regarding how the Fund voted proxies related to its portfolio securities during the most recent 12-month period ended June 30 is available at invesco.com/proxysearch. The information is also available on the SEC website, sec.gov. Invesco Advisers, Inc. is an investment adviser; it provides investment advisory services to individual and institutional clients and does not sell securities. Invesco Distributors, Inc. is the US distributor for Invesco Ltd.’s retail mutual funds, exchange-traded funds and institutional money market funds. Both are wholly owned, indirect subsidiaries of Invesco Ltd. | | 
|
| | | | | | | | |
| SEC file numbers: 811-05426 and 033-19338 | | Invesco Distributors, Inc. | | EMFB-AR-1 | | 12262018 | | 1453 |
| | | | | | |
| | | | |
 | | Annual Report to Shareholders | | October 31, 2018 | | |
| | | | |
| | Invesco Endeavor Fund | | |
| | Nasdaq: | | |
| | A: ATDAX ∎ C: ATDCX ∎ R: ATDRX ∎ Y: ATDYX ∎ R5: ATDIX ∎ R6: ATDFX | | |

Letters to Shareholders
| | |

Philip Taylor | | Dear Shareholders: This annual report includes information about your Fund, including performance data and a complete list of its investments as of the close of the reporting period. Inside is a discussion of how your Fund was managed and the factors that affected its performance during the reporting period. Throughout the reporting period, US economic data remained positive. Robust corporate profits, strong retail sales and unemployment rates near generational lows helped drive US markets to new all-time records multiple times during the reporting period. Against this backdrop, the US Federal Reserve raised the federal funds rate four times during the reporting period. Market volatility, largely non-existent in 2017, returned in 2018. Markets sold off first in February and again sharply in October, amid rising interest rates, concerns about potential trade wars and |
heightened geopolitical tensions. Despite the volatility, US equity markets were largely positive for the reporting period and fared better than international markets. Emerging markets were particularly hard hit due to a strong US dollar. During the October sell-off, investors retreated to more defensive areas of the market and to US Treasuries. The broader bond market declined during the reporting period due to the increase in US Treasury yields and widening credit spreads. As the year progresses, we’ll see how the interplay of economic data, interest rates, geopolitics and a host of other factors affect US and overseas equity and fixed income markets.
Short-term market volatility can prompt some investors to abandon their investment plans – and can cause others to settle for whatever returns the market has to offer. The investment professionals at Invesco, in contrast, invest with high conviction. This means that, no matter the asset class or the strategy, each investment team has a passion to exceed. We want to help investors achieve better outcomes, such as seeking higher returns, helping mitigate risk and generating income. Of course, investing with high conviction can’t guarantee a profit or ensure success; no investment strategy can. To learn more about how we invest with high conviction, visit invesco.com/HighConviction.
You, too, can invest with high conviction by maintaining a long-term investment perspective and by working with your financial adviser on a regular basis. During periods of short-term market volatility or uncertainty, your financial adviser can keep you focused on your long-term investment goals – a new home, a child’s college education or a secure retirement. He or she also can share research about the economy, the markets and individual investment options.
Visit our website for more information on your investments
Our website, invesco.com/us, offers a wide range of market insights and investment perspectives. On the website, you’ll find detailed information about our funds, including performance, holdings and portfolio manager commentaries. You can access information about your account by completing a simple, secure online registration. To do so, select “Log In” on the right side of the homepage, and then select “Register for Individual Account Access.”
In addition to the resources accessible on our website and through our mobile app, you can obtain timely updates to help you stay informed about the markets and the economy by connecting with Invesco on Twitter, LinkedIn or Facebook. You can access our blog at blog.invesco.us.com. Our goal is to provide you the information you want, when and where you want it.
Finally, I’m pleased to share with you Invesco’s commitment to both the Principles for Responsible Investment and to considering environmental, social and governance issues in our robust investment process. I invite you to learn more at invesco.com/esg.
Have questions?
For questions about your account, contact an Invesco client services representative at 800 959 4246. For Invesco-related questions or comments, please email me directly at phil@invesco.com.
All of us at Invesco look forward to serving your investment management needs. Thank you for investing with us.
Sincerely,

Philip Taylor
Senior Managing Director, Invesco Ltd.
| | | | |

Bruce Crockett | | Dear Fellow Shareholders: Among the many important lessons I’ve learned in more than 40 years in a variety of business endeavors is the value of a trusted advocate. As independent chair of the Invesco Funds Board, I can assure you that the members of the Board are strong advocates for the interests of investors in Invesco’s mutual funds. We work hard to represent your interests through oversight of the quality of the investment management services your funds receive and other matters important to your investment, including but not limited to: |
| | ∎ | | Ensuring that Invesco offers a diverse lineup of mutual funds that your financial adviser can use to strive to meet your financial needs as your investment goals change over time. |
| | ∎ | | Monitoring how the portfolio management teams of the Invesco funds are performing in light of changing economic and market conditions. |
| ∎ | | Assessing each portfolio management team’s investment performance within the context of the investment strategy described in the fund’s prospectus. |
| ∎ | | Monitoring for potential conflicts of interests that may impact the nature of the services that your funds receive. |
We believe one of the most important services we provide our fund shareholders is the annual review of the funds’ advisory and sub-advisory contracts with Invesco Advisers and its affiliates. This review is required by the Investment Company Act of 1940 and focuses on the nature and quality of the services Invesco provides as the adviser to the Invesco funds and the reasonableness of the fees that it charges for those services. Each year, we spend months carefully reviewing information received from Invesco and a variety of independent sources, such as performance and fee data prepared by Lipper, Inc. (a subsidiary of Broadridge Financial Solutions, Inc.), an independent, third-party firm widely recognized as a leader in its field. We also meet with our independent legal counsel and other independent advisers to review and help us assess the information that we have received. Our goal is to assure that you receive quality investment management services for a reasonable fee.
I trust the measures outlined above provide assurance that you have a worthy advocate when it comes to choosing the Invesco Funds.
As always, please contact me at bruce@brucecrockett.com with any questions or concerns you may have. On behalf of the Board, we look forward to continuing to represent your interests and serving your needs.
Sincerely,

Bruce L. Crockett
Independent Chair
Invesco Funds Board of Trustees
Management’s Discussion of Fund Performance
| | | | | | | | |
| | |
Performance summary For the fiscal year ended October 31, 2018, Class A shares of Invesco Endeavor Fund (the Fund), at net asset value (NAV), underperformed the Russell Midcap Index, the Fund’s style-specific benchmark. Your Fund’s long-term performance appears later in this report. | | | | | |
| | |
Fund vs. Indexes | | | | | |
Total returns, 10/31/17 to 10/31/18, at net asset value (NAV). Performance shown does not include applicable contingent deferred sales charges (CDSC) or front-end sales charges, which would have reduced performance. | | | | | |
| | |
Class A Shares | | | -4.48 | % | | | | |
Class C Shares | | | -5.18 | | | | | |
Class R Shares | | | -4.72 | | | | | |
Class Y Shares | | | -4.25 | | | | | |
Class R5 Shares | | | -4.13 | | | | | |
Class R6 Shares | | | -4.06 | | | | | |
S&P 500 Indexq (Broad Market Index) | | | 7.35 | | | | | |
Russell Midcap Indexq (Style-Specific Index) | | | 2.79 | | | | | |
Lipper Mid-Cap Core Funds Index⬛ (Peer Group Index) | | | 0.72 | | | | | |
Source(s): qFactSet Research Systems Inc.; ⬛Lipper Inc. | | | | | | | | |
Market conditions and your Fund
The fiscal year proved to be an increasingly volatile time for US equities. The fiscal year began in the final months of 2017 with several major US stock market indexes repeatedly reaching new highs amid strong corporate profits, the prospect of tax reform legislation and exceedingly low stock market volatility.
Stock market euphoria continued in January 2018 as US equity markets steadily moved higher. Investors remained enthused about the passage of the Tax Cuts and Jobs Act signed into law in late December 2017, which significantly cut corporate tax rates. However, in February 2018, volatility returned to the US stock and bond markets. Worries about how rising interest rates might affect economic growth, concerns about a potential trade war and heightened geopolitical tensions, caused the US stock markets to pull back and volatility to increase.
US equity markets generally recovered in the second quarter of 2018 as strong US retail sales and low unemployment buoyed markets. Throughout the summer, US equities moved higher as corporate profits surged. Several US equity indexes reached new highs despite potential headwinds including trade tensions, tariff announcements and contagion concerns over a Turkish currency crisis. After a relatively quiet summer, market volatility markedly rose in the final month of the fiscal year. US equity markets suffered a sharp sell-off in October 2018 amid rising interest rates and concerns that higher inflation could mean a more restrictive monetary policy. In this environment, investors fled to more defensive areas of the market and to US Treasuries.
Given signs of a strong economy, the US Federal Reserve raised interest rates four times during the fiscal year: in December 2017 and in March, June and September 2018.1 In contrast, the
European Central Bank and central banks in several other countries maintained extraordinarily accommodative monetary policies.
Before we discuss the Fund’s results during the fiscal year, it is helpful to briefly explain how we manage the Fund for shareholders. We view ourselves as business people buying businesses, and we consider the purchase of a stock as an ownership interest in a business. We strive to develop a proprietary view of a business through in-depth, fundamental research that includes careful financial statement analysis and meetings with company management. We then seek to purchase businesses whose stock prices are below what we have calculated to be the true value of the company based on an estimate of its future free cash flows.
Our investment approach focuses on individual businesses rather than market sectors. Therefore, the Fund shares little in common with sector weightings of various market indexes. However, if we were to broadly categorize businesses with which we had the most success during the fiscal year, select holdings in the consumer discretionary sector were among the largest absolute contributors to the Fund’s performance. Conversely, select holdings in the financials sector were among the largest absolute detractors from the Fund’s performance.
Relative to the Fund’s style-specific benchmark, the same was true. Security selection in the consumer discretionary sector contributed most to the Fund’s relative performance during the fiscal year, while security selection in the financials sector hurt the Fund’s relative performance.
During the fiscal year, Ross Stores was the top contributor to the Fund’s performance relative to the style-specific benchmark. Shares of the off-price retailer rose over the fiscal year as the market reacted favorably to impressive
| | | | | | |
| | | Portfolio Composition | | | | |
| | By sector | | | % of total net assets | |
| | | | | | |
| | |
| | | Industrials | | | 26.8 | % |
| | | Information Technology | | | 16.9 | |
| | | Financials | | | 15.4 | |
| | | Health Care | | | 11.8 | |
| | | Consumer Discretionary | | | 10.0 | |
| | | Real Estate | | | 6.5 | |
| | | Energy | | | 2.5 | |
| | | Materials | | | 2.5 | |
| | | Money Market Funds Plus Other Assets Less Liabilities | | | 7.6 | |
| | | | | | |
| Top 10 Equity Holdings* | |
| | % of total net assets | |
| | |
1. | | Brookfield Property Partners L.P. | | | 6.6% | |
2. | | Check Point Software Technologies Ltd. | | | 4.8 | |
3. | | UnitedHealth Group Inc. | | | 4.8 | |
4. | | Affiliated Managers Group, Inc. | | | 4.5 | |
5. | | McKesson Corp. | | | 4.0 | |
6. | | Cognizant Technology Solutions Corp.-Class A | | | 3.9 | |
7. | | Titan Machinery, Inc. | | | 3.7 | |
8. | | DCC PLC | | | 3.5 | |
9. | | Ross Stores, Inc. | | | 3.5 | |
10. | | CarMax, Inc. | | | 3.5 | |
| | | | |
| Total Net Assets | | $ | 188.5 million | |
| |
| Total Number of Holdings* | | | 30 | |
The Fund’s holdings are subject to change, and there is no assurance that the Fund will continue to hold any particular security.
*Excluding money market fund holdings.
Data presented here are as of October 31, 2018.
operating results that beat expectations. We believe Ross Stores is less susceptible to the rise of internet retailing and that the firm’s ongoing strategy to deliver compelling discounted bargains to cost-conscious customers will continue to thrive in the current environment.
Another top contributor to the Fund’s relative performance during the fiscal year was Spirit Airlines. The company reported strong operating results and management offered better-than-expected earnings guidance, as the cost of air fares has recently risen. Based on market share, Spirit Airlines is the largest ultra-low-cost carrier in the US. It has enjoyed a significant cost advantage over both large legacy airlines and regular low-cost airlines, such as Southwest and Jet-Blue (not Fund holdings). Spirit Airlines was able to enter new routes and markets, taking market share from incumbents by offering very low, unbundled fares.
During the fiscal year, Encore Capital Group was the largest detractor from the Fund’s performance versus the style-specific benchmark. Encore Capital Group is a financial company that buys consumer receivables from major banks and credit unions, and works to collect as much of the outstanding debt as possible. Shares of the company declined over the fiscal year due to a variety of factors, including increased uncertainty around the continued growth in the supply of charged-off receivables. Investors may have additional concerns around increased inflation expectations as lenders/collectors bear the risk of getting repaid with weaker dollars.
Affiliated Managers Group was another relative detractor to the Fund’s performance during the fiscal year. Affiliated Managers Group is a top-tier wealth management firm with $824 billion in assets under management. The company has a unique business model that involves buying stakes in boutique asset management firms. With over 500 actively managed products, Affiliated Managers Group has an attractive menu of options for investors. The company’s share price weakened during the fiscal year due to general investor pessimism toward asset managers and active management, along with fears that the market may be near the top of its current cycle.
During the fiscal year, several new holdings that met our investment criteria were added to the portfolio, including DCC, Nielsen Holdings, Rev Group, Open Text, CDK Global and Axalta Coating Systems. We exited our positions in Capella Education, Cenovus
Energy, Newalta, Echo Global Logistics, FTI Consulting and Plantronics before the close of the fiscal year. Generally, holdings are sold if we believe full valuation is reached; if new, relatively more attractive investment opportunities exist; or if new information arises that changes our outlook regarding the future of a business.
In a market often driven by short-term factors, we continued to focus on finding quality businesses we believed were trading at attractive values relative to their long-term prospects. While we can never predict future Fund performance, we pledge to you that we will adhere to our discipline of being business people who buy businesses – and we will continually strive to upgrade the quality of the Fund’s portfolio.
As always, we thank you for your investment in Invesco Endeavor Fund and for sharing our long-term investment perspective.
1 Source: US Federal Reserve
The views and opinions expressed in management’s discussion of Fund performance are those of Invesco Advisers, Inc. These views and opinions are subject to change at any time based on factors such as market and economic conditions. These views and opinions may not be relied upon as investment advice or recommendations, or as an offer for a particular security. The information is not a complete analysis of every aspect of any market, country, industry, security or the Fund. Statements of fact are from sources considered reliable, but Invesco Advisers, Inc. makes no representation or warranty as to their completeness or accuracy. Although historical performance is no guarantee of future results, these insights may help you understand our investment management philosophy.
See important Fund and, if applicable, index disclosures later in this report.
| | |
 | | Mark Uptigrove Chartered Financial Analyst, Portfolio Manager, is lead manager of Invesco Endeavor Fund. He |
joined Invesco in 2005. Mr. Uptigrove earned a BA from the University of Western Ontario and an MBA from the Richard Ivey School of Business. |
 | | Clayton Zacharias Chartered Financial Analyst, Portfolio Manager, is manager of Invesco Endeavor Fund. |
| He joined Invesco in 2002. Mr. Zacharias earned a BBA from Simon Fraser University. |
5 Invesco Endeavor Fund
Your Fund’s Long-Term Performance
Results of a $10,000 Investment – Oldest Share Class(es)
Fund and index data from 10/31/08
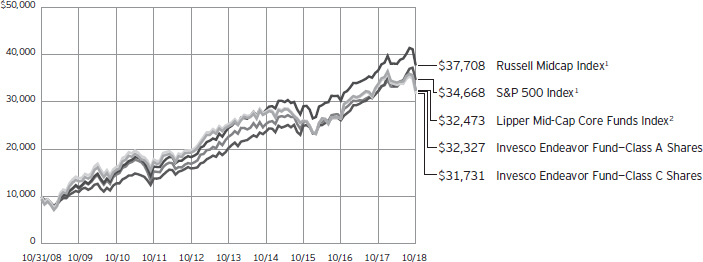
1 Source: FactSet Research Systems Inc.
2 Source: Lipper Inc.
Past performance cannot guarantee comparable future results.
The data shown in the chart include reinvested distributions, applicable sales charges and Fund expenses including
management fees. Index results include reinvested dividends, but they do not reflect sales charges. Performance of the peer group, if applicable, reflects fund expenses and management fees; performance
of a market index does not. Performance shown in the chart and table(s) does not reflect deduction of taxes a shareholder would pay on Fund distributions or sale of Fund shares.
continued from page 8
| ∎ | | Small- and mid-capitalization companies risks. Small- and mid-capitalization companies tend to be more vulnerable to changing market conditions, may have little or no operating history or track record of success, and may have more limited product lines and markets, less experienced management and fewer financial resources than larger companies. These companies’ securities may be more volatile and less liquid than those of more established companies, and their returns may vary, sometimes significantly, from the overall securities market. |
| ∎ | | US government obligations risk. Obligations of US government agencies and authorities receive varying levels of support and may not be backed by the full faith and credit of the US government, which could affect the Fund’s ability to recover should they default. No assurance can be given that the US government will provide financial support to its agencies and authorities if it is not obligated by law to do so. |
| ∎ | | Value investing style risk. A value investing style subjects the Fund to the risk that the valuations never improve |
| | | or that the returns on value equity securities are less than returns on other styles of investing or the overall stock market. |
About indexes used in this report
| ∎ | | The S&P 500® Index is an unmanaged index considered representative of the US stock market. |
| ∎ | | The Russell Midcap® Index is an unmanaged index considered representative of mid-cap stocks. The Russell Midcap Index is a trademark/service mark of the Frank Russell Co. Russell® is a trademark of the Frank Russell Co. |
| ∎ | | The Lipper Mid-Cap Core Funds Index is an unmanaged index considered representative of mid-cap core funds tracked by Lipper. |
| ∎ | | The Fund is not managed to track the performance of any particular index, including the index(es) described here, and consequently, the performance of the Fund may deviate significantly from the performance of the index(es). |
| ∎ | | A direct investment cannot be made in an index. Unless otherwise indicated, index results include reinvested dividends, and they do not reflect sales |
| | | charges. Performance of the peer group, if applicable, reflects fund expenses; performance of a market index does not. |
Other information
| ∎ | | The returns shown in management’s discussion of Fund performance are based on net asset values (NAVs) calculated for shareholder transactions. Generally accepted accounting principles require adjustments to be made to the net assets of the Fund at period end for financial reporting purposes, and as such, the NAVs for shareholder transactions and the returns based on those NAVs may differ from the NAVs and returns reported in the Financial Highlights. |
| ∎ | | Industry classifications used in this report are generally according to the Global Industry Classification Standard, which was developed by and is the exclusive property and a service mark of MSCI Inc. and Standard & Poor’s. |
| | | | |
Average Annual Total Returns | |
| As of 10/31/18, including maximum applicable sales charges | |
| | | | | |
| |
| Class A Shares | | | | |
| Inception (11/4/03) | | | 8.44 | % |
| 10 Years | | | 12.45 | |
| 5 Years | | | 4.22 | |
| 1 Year | | | -9.73 | |
| |
| Class C Shares | | | | |
| Inception (11/4/03) | | | 8.06 | % |
| 10 Years | | | 12.24 | |
| 5 Years | | | 4.61 | |
| 1 Year | | | -6.10 | |
| |
| Class R Shares | | | | |
| Inception (4/30/04) | | | 8.26 | % |
| 10 Years | | | 12.80 | |
| 5 Years | | | 5.14 | |
| 1 Year | | | -4.72 | |
| |
| Class Y Shares | | | | |
| Inception (10/3/08) | | | 10.85 | % |
| 10 Years | | | 13.37 | % |
| 5 Years | | | 5.66 | |
| 1 Year | | | -4.25 | |
| |
| Class R5 Shares | | | | |
| Inception (4/30/04) | | | 9.02 | % |
| 10 Years | | | 13.59 | |
| 5 Years | | | 5.79 | |
| 1 Year | | | -4.13 | |
| |
| Class R6 Shares | | | | |
| 10 Years | | | 13.40 | % |
| 5 Years | | | 5.89 | |
| 1 Year | | | -4.06 | |
Class Y shares incepted on October 3, 2008. Performance shown prior to that date is that of Class A shares and includes the 12b-1 fees applicable to Class A shares.
Class R6 shares incepted on September 24, 2012. Performance shown prior to that date is that of Class A shares and includes the 12b-1 fees applicable to Class A shares.
The performance data quoted represent past performance and cannot guarantee comparable future results; current performance may be lower or higher. Please visit invesco.com/performance for the most recent month-end performance. Performance figures reflect reinvested distributions, changes in net asset value and the effect of the maximum sales charge unless otherwise stated. Investment return and principal value will fluctuate so that you may have a gain or loss when you sell shares.
| | | | |
Average Annual Total Returns | |
| As of 9/30/18, the most recent calendar quarter end, including maximum applicable sales charges | |
| |
| Class A Shares | | | | |
| Inception (11/4/03) | | | 9.19 | % |
| 10 Years | | | 10.26 | |
| 5 Years | | | 6.52 | |
| 1 Year | | | 2.17 | |
| |
| Class C Shares | | | | |
| Inception (11/4/03) | | | 8.80 | % |
| 10 Years | | | 10.06 | |
| 5 Years | | | 6.93 | |
| 1 Year | | | 6.27 | |
| |
| Class R Shares | | | | |
| Inception (4/30/04) | | | 9.03 | % |
| 10 Years | | | 10.61 | |
| 5 Years | | | 7.46 | |
| 1 Year | | | 7.78 | |
| |
| Class Y Shares | | | | |
| 10 Years | | | 11.16 | % |
| 5 Years | | | 7.99 | |
| 1 Year | | | 8.34 | |
| |
| Class R5 Shares | | | | |
| Inception (4/30/04) | | | 9.79 | % |
| 10 Years | | | 11.38 | |
| 5 Years | | | 8.12 | |
| 1 Year | | | 8.39 | |
| |
| Class R6 Shares | | | | |
| 10 Years | | | 11.19 | % |
| 5 Years | | | 8.23 | |
| 1 Year | | | 8.55 | |
The net annual Fund operating expense ratio set forth in the most recent Fund prospectus as of the date of this report for Class A, Class C, Class R, Class Y, Class R5 and Class R6 shares was 1.37%, 2.12%, 1.62%, 1.12%, 0.99% and 0.91%, respectively.1 The total annual Fund operating expense ratio set forth in the most recent Fund prospectus as of the date of this report for Class A, Class C, Class R, Class Y, Class R5 and Class R6 shares was 1.39%, 2.14%, 1.64%, 1.14%, 1.01% and 0.93%, respectively. The expense ratios presented above may vary from the expense ratios presented in other sections of this report that are based on expenses incurred during the period covered by this report.
Class A share performance reflects the maximum 5.50% sales charge, and Class C share performance reflects the applicable contingent deferred sales charge (CDSC) for the period involved. The CDSC on Class C shares is 1% for
the first year after purchase. Class R, Class Y, Class R5 and Class R6 shares do not have a front-end sales charge or a CDSC; therefore, performance is at net asset value.
The performance of the Fund’s share classes will differ primarily due to different sales charge structures and class expenses.
Fund performance reflects any applicable fee waivers and/or expense reimbursements. Had the adviser not waived fees and/or reimbursed expenses currently or in the past, returns would have been lower. See current prospectus for more information.
| 1 | Total annual Fund operating expenses after any contractual fee waivers and/or expense reimbursements by the adviser in effect through at least June 30, 2020. See current prospectus for more information. |
Invesco Endeavor Fund’s investment objective is long-term growth of capital.
| ∎ | | Unless otherwise stated, information presented in this report is as of October 31, 2018, and is based on total net assets. |
| ∎ | | Unless otherwise noted, all data provided by Invesco. |
| ∎ | | To access your Fund’s reports/prospectus, visit invesco.com/fundreports. |
About share classes
| ∎ | | Class R shares are generally available only to employer sponsored retirement and benefit plans. Please see the prospectus for more information. |
| ∎ | | Class Y shares are available only to certain investors. Please see the prospectus for more information. |
| ∎ | | Class R5 shares and Class R6 shares are available for use by retirement plans that meet certain standards and for institutional investors. Class R6 shares are also available through intermediaries that have established an agreement with Invesco Distributors, Inc. to make such shares available for use in retail omnibus accounts. Please see the prospectus for more information. |
Principal risks of investing in the Fund
| ∎ | | Cash/cash equivalents risk. In rising markets, holding cash or cash equivalents will negatively affect the Fund’s performance relative to its benchmark. |
| ∎ | | Debt securities Risk. The prices of debt securities held by the Fund will be affected by changes in interest rates, the creditworthiness of the issuer and other factors. An increase in prevailing interest rates typically causes the value of existing debt securities to fall and often has a greater impact on longer-duration debt securities and higher quality debt securities. Falling interest rates will cause the Fund to reinvest the proceeds of debt securities that have been repaid by the issuer at lower interest rates. Falling interest rates may also reduce the Fund’s distributable income because interest payments on floating rate debt instruments held by the Fund will decline. The Fund could lose money on investments in debt securities if the issuer or borrower fails to meet its obligations to make interest payments and/or to repay principal in a timely manner. Changes in an issuer’s financial strength, the market’s perception of such strength or in the credit rating of the issuer or the security may affect the value of debt securities. The Adviser’s |
| | credit analysis may fail to anticipate such changes, which could result in buying a debt security at an inopportune time or failing to sell a debt security in advance of a price decline or other credit event. |
| ∎ | | Foreign securities risk. The Fund’s foreign investments may be adversely affected by political and social instability, changes in economic or taxation policies, difficulty in enforcing obligations, decreased liquidity or increased volatility. Foreign investments also involve the risk of the possible seizure, nationalization or expropriation of the issuer or foreign deposits (in which the Fund could lose its entire investments in a certain market) and the possible adoption of foreign governmental restrictions such as exchange controls. Unless the Fund has hedged its foreign securities risk, foreign securities risk also involves the risk of negative foreign currency rate fluctuations, which may cause the value of securities denominated in such foreign currency (or other instruments through which the Fund has exposure to foreign currencies) to decline in value. Currency exchange rates may fluctuate significantly over short periods of time. Currency hedging strategies, if used, are not always successful. |
| ∎ | | Limited number of holdings risk. The Fund holds a more limited number of securities than other funds with a similar investment strategy. As a result, each investment has a greater effect on the Fund’s overall performance and any change in the value of these securities could significantly affect the value of your investment in the Fund. |
| ∎ | | Management risk. The Fund is actively managed and depends heavily on the Adviser’s judgment about markets, interest rates or the attractiveness, relative values, liquidity, or potential appreciation of particular investments made for the Fund’s portfolio. The Fund could experience losses if these judgments prove to be incorrect. Additionally, legislative, regulatory, or tax developments |
This report must be accompanied or preceded by a currently effective Fund prospectus, which contains more complete information, including sales charges and expenses. Investors should read it carefully before investing.
NOT FDIC INSURED | MAY LOSE VALUE | NO BANK GUARANTEE
| | may adversely affect management of the Fund and, therefore, the ability of the Fund to achieve its investment objective. |
| ∎ | | Market risk. The market values of the Fund’s investments, and therefore the value of the Fund’s shares, will go up and down, sometimes rapidly or unpredictably. Market risk may affect a single issuer, industry or section of the economy, or it may affect the market as a whole. Individual stock prices tend to go up and down more dramatically than those of certain other types of investments, such as bonds. During a general downturn in the financial markets, multiple asset classes may decline in value. When markets perform well, there can be no assurance that specific investments held by the Fund will rise in value. |
| ∎ | | Money market fund risk. The share price of certain underlying money market funds may fluctuate and the Fund may lose money by investing in an underlying money market fund. The share price of money market funds can fall below the $1.00 share price. An underlying money market fund’s sponsor has no legal obligation to provide financial support to an underlying money market fund, and you should not rely on or expect that the sponsor will enter into support agreements or take other actions to provide financial support to an underlying money market fund or maintain an underlying money market fund’s $1.00 share price at any time. The credit quality of an underlying money market fund’s holdings can change rapidly in certain markets, and the default of a single holding could have an adverse impact on an underlying money market fund’s share price. An underlying money market fund’s share price can also be negatively affected during periods of high redemption pressures, illiquid markets, and/or significant market volatility. An underlying money market fund’s Board may elect to impose a fee upon the sale of the Fund’s shares or temporarily suspend the Fund’s ability to sell shares in the future if an underlying money market fund’s liquidity falls below required minimums because of market conditions or other factors. |
continued on page 6
Schedule of Investments(a)
October 31, 2018
| | | | | | | | |
| | | Shares | | | Value | |
Common Stocks & Other Equity Interests–92.44% | |
| Agricultural & Farm Machinery–2.76% | |
Deere & Co. | | | 38,381 | | | $ | 5,198,323 | |
|
| Airlines–6.05% | |
Ryanair Holdings PLC–ADR (Ireland)(b) | | | 72,892 | | | | 6,035,458 | |
Spirit Airlines, Inc.(b) | | | 103,466 | | | | 5,369,885 | |
| | | | | | | | 11,405,343 | |
|
| Apparel Retail–3.47% | |
Ross Stores, Inc. | | | 66,036 | | | | 6,537,564 | |
|
| Application Software–5.73% | |
CDK Global, Inc. | | | 95,927 | | | | 5,490,861 | |
Open Text Corp. (Canada) | | | 157,405 | | | | 5,320,289 | |
| | | | | | | | 10,811,150 | |
|
| Asset Management & Custody Banks–7.65% | |
Affiliated Managers Group, Inc. | | | 73,992 | | | | 8,409,931 | |
Oaktree Capital Group LLC | | | 143,794 | | | | 6,014,903 | |
| | | | | | | | 14,424,834 | |
|
| Automotive Retail–6.50% | |
AutoZone, Inc. | | | 7,832 | | | | 5,744,537 | |
CarMax, Inc.(b) | | | 95,823 | | | | 6,507,340 | |
| | | | | | | | 12,251,877 | |
|
| Construction & Engineering–0.99% | |
Orion Group Holdings, Inc.(b) | | | 395,746 | | | | 1,867,921 | |
|
| Construction Machinery & Heavy Trucks–2.27% | |
REV Group, Inc. | | | 392,211 | | | | 4,279,022 | |
|
| Consumer Finance–2.77% | |
Encore Capital Group, Inc.(b) | | | 205,368 | | | | 5,218,401 | |
|
| Data Processing & Outsourced Services–2.48% | |
Alliance Data Systems Corp. | | | 22,663 | | | | 4,672,657 | |
|
| Diversified Banks–2.46% | |
Bank of America Corp. | | | 168,936 | | | | 4,645,740 | |
|
| Environmental & Facilities Services–2.79% | |
Stericycle, Inc.(b) | | | 105,081 | | | | 5,250,898 | |
|
| Health Care Distributors–4.00% | |
McKesson Corp. | | | 60,467 | | | | 7,543,863 | |
|
| Health Care Equipment–2.98% | |
Zimmer Biomet Holdings, Inc. | | | 49,392 | | | | 5,610,437 | |
|
| Industrial Conglomerates–3.48% | |
DCC PLC (United Kingdom) | | | 76,492 | | | | 6,565,396 | |
| | | | | | | | |
| | | Shares | | | Value | |
| IT Consulting & Other Services–3.86% | |
Cognizant Technology Solutions Corp.–Class A | | | 105,461 | | | $ | 7,279,973 | |
|
| Life & Health Insurance–2.44% | |
Unum Group | | | 126,756 | | | | 4,596,173 | |
|
| Managed Health Care–4.78% | |
UnitedHealth Group Inc. | | | 34,446 | | | | 9,002,462 | |
|
| Multi-Line Insurance–0.09% | |
Vienna Insurance Group AG Wiener Versicherung Gruppe (Austria) | | | 6,530 | | | | 173,811 | |
|
| Oil & Gas Exploration & Production–2.52% | |
Devon Energy Corp. | | | 146,671 | | | | 4,752,140 | |
|
| Real Estate Operating Companies–6.55% | |
Brookfield Property Partners L.P. | | | 639,225 | | | | 12,343,434 | |
|
| Research & Consulting Services–3.40% | |
Nielsen Holdings PLC | | | 246,770 | | | | 6,411,085 | |
|
| Specialty Chemicals–2.49% | |
Axalta Coating Systems Ltd.(b) | | | 190,521 | | | | 4,702,058 | |
|
| Systems Software–4.79% | |
Check Point Software Technologies Ltd. (Israel)(b) | | | 81,350 | | | | 9,029,850 | |
|
| Trading Companies & Distributors–5.14% | |
Grafton Group PLC (United Kingdom)(c) | | | 284,937 | | | | 2,636,856 | |
Titan Machinery, Inc.(b) | | | 495,433 | | | | 7,059,920 | |
| | | | | | | | 9,696,776 | |
Total Common Stocks & Other Equity Interests
(Cost $145,188,177) | | | | 174,271,188 | |
|
Money Market Funds–7.44% | |
Invesco Government & Agency Portfolio–Institutional Class, 2.08%(d) | | | 4,909,668 | | | | 4,909,668 | |
Invesco Liquid Assets Portfolio–Institutional Class, 2.27%(d) | | | 3,506,123 | | | | 3,506,824 | |
Invesco Treasury Portfolio–Institutional Class, 2.09%(d) | | | 5,611,049 | | | | 5,611,049 | |
Total Money Market Funds
(Cost $14,027,148) | | | | 14,027,541 | |
TOTAL INVESTMENTS IN SECURITIES–99.88%
(Cost $159,215,325) | | | | 188,298,729 | |
OTHER ASSETS LESS LIABILITIES–0.12% | | | | 233,054 | |
NET ASSETS–100.00% | | | $ | 188,531,783 | |
Investment Abbreviations:
| | |
| ADR | | – American Depositary Receipt |
Notes to Schedule of Investments:
| (a) | Industry and/or sector classifications used in this report are generally according to the Global Industry Classification Standard, which was developed by and is the exclusive property and a service mark of MSCI Inc. and Standard & Poor’s. |
| (b) | Non-income producing security. |
| (c) | Each unit represents one ordinary share, seventeen Class A shares and one Class C share. |
| (d) | The money market fund and the Fund are affiliated by having the same investment adviser. The rate shown is the 7-day SEC standardized yield as of October 31, 2018. |
See accompanying Notes to Financial Statements which are an integral part of the financial statements.
9 Invesco Endeavor Fund
Statement of Assets and Liabilities
October 31, 2018
| | | | |
Assets: | | | | |
Investments in securities, at value (Cost $145,188,177) | | $ | 174,271,188 | |
Investments in affiliated money market funds, at value (Cost $14,027,148) | | | 14,027,541 | |
Receivable for: | | | | |
Investments sold | | | 286,638 | |
Dividends and interest | | | 162,824 | |
Fund shares sold | | | 176,127 | |
Investment for trustee deferred compensation and retirement plans | | | 66,461 | |
Other assets | | | 48,545 | |
Total assets | | | 189,039,324 | |
|
Liabilities: | |
Payable for: | | | | |
Fund shares repurchased | | | 229,434 | |
Accrued fees to affiliates | | | 140,505 | |
Accrued trustees’ and officers’ fees and benefits | | | 1,870 | |
Accrued other operating expenses | | | 60,707 | |
Trustee deferred compensation and retirement plans | | | 75,025 | |
Total liabilities | | | 507,541 | |
Net assets applicable to shares outstanding | | $ | 188,531,783 | |
|
Net assets consist of: | |
Shares of beneficial interest | | $ | 150,568,946 | |
Distributable earnings | | | 37,962,837 | |
| | | $ | 188,531,783 | |
| | | | |
Net Assets: | |
Class A | | $ | 116,080,172 | |
Class C | | $ | 23,489,620 | |
Class R | | $ | 10,069,896 | |
Class Y | | $ | 30,604,106 | |
Class R5 | | $ | 6,762,411 | |
Class R6 | | $ | 1,525,578 | |
|
Shares outstanding, no par value,
with an unlimited number of shares authorized: | |
Class A | | | 6,300,588 | |
Class C | | | 1,483,571 | |
Class R | | | 570,723 | |
Class Y | | | 1,607,894 | |
Class R5 | | | 344,523 | |
Class R6 | | | 77,238 | |
Class A: | | | | |
Net asset value per share | | $ | 18.42 | |
Maximum offering price per share | | | | |
(Net asset value of $18.42 ¸ 94.50%) | | $ | 19.49 | |
Class C: | | | | |
Net asset value and offering price per share | | $ | 15.83 | |
Class R: | | | | |
Net asset value and offering price per share | | $ | 17.64 | |
Class Y: | | | | |
Net asset value and offering price per share | | $ | 19.03 | |
Class R5: | | | | |
Net asset value and offering price per share | | $ | 19.63 | |
Class R6: | | | | |
Net asset value and offering price per share | | $ | 19.75 | |
See accompanying Notes to Financial Statements which are an integral part of the financial statements.
10 Invesco Endeavor Fund
Statement of Operations
For the year ended October 31, 2018
| | | | |
Investment income: | | | | |
Dividends (net of foreign withholding taxes of $36,766) | | $ | 2,948,055 | |
Dividends from affiliated money market funds | | | 486,585 | |
Total investment income | | | 3,434,640 | |
| |
Expenses: | | | | |
Advisory fees | | | 1,748,150 | |
Administrative services fees | | | 80,162 | |
Custodian fees | | | 8,991 | |
Distribution Fees: | | | | |
Class A | | | 333,977 | |
Class B | | | 1,399 | |
Class C | | | 290,734 | |
Class R | | | 63,550 | |
Transfer agent fees — A, B, C, R and Y | | | 440,688 | |
Transfer agent fees — R5 | | | 19,505 | |
Transfer agent fees — R6 | | | 588 | |
Trustees’ and officers’ fees and benefits | | | 23,349 | |
Registration and filing fees | | | 99,576 | |
Reports to shareholders | | | 35,351 | |
Professional services fees | | | 66,553 | |
Other | | | 19,654 | |
Total expenses | | | 3,232,227 | |
Less: Fees waived and expense offset arrangement(s) | | | (44,316 | ) |
Net expenses | | | 3,187,911 | |
Net investment income | | | 246,729 | |
| |
Realized and unrealized gain (loss): | | | | |
Net realized gain (loss) from: | | | | |
Investment securities | | | 10,241,231 | |
Foreign currencies | | | (30,757 | ) |
| | | | 10,210,474 | |
Change in net unrealized appreciation (depreciation) of: | | | | |
Investment securities | | | (17,531,737 | ) |
Foreign currencies | | | (2,093 | ) |
| | | | (17,533,830 | ) |
Net realized and unrealized gain (loss) | | | (7,323,356 | ) |
Net increase (decrease) in net assets resulting from operations | | $ | (7,076,627 | ) |
See accompanying Notes to Financial Statements which are an integral part of the financial statements.
11 Invesco Endeavor Fund
Statement of Changes in Net Assets
For the years ended October 31, 2018 and 2017
| | | | | | | | |
| | | 2018 | | | 2017 | |
Operations: | | | | | | | | |
Net investment income | | $ | 246,729 | | | $ | (361,707 | ) |
Net realized gain | | | 10,210,474 | | | | 26,040,264 | |
Change in net unrealized appreciation (depreciation) | | | (17,533,830 | ) | | | 37,845,677 | |
Net increase (decrease) in net assets resulting from operations | | | (7,076,627 | ) | | | 63,524,234 | |
| | |
Distributions to shareholders from distributable earnings(1): | | | | | | | | |
Class A | | | (3,714,684 | ) | | | (12,424,004 | ) |
Class B | | | (17,894 | ) | | | (112,920 | ) |
Class C | | | (970,910 | ) | | | (3,915,415 | ) |
Class R | | | (405,139 | ) | | | (1,786,325 | ) |
Class Y | | | (998,009 | ) | | | (2,904,478 | ) |
Class R5 | | | (569,252 | ) | | | (2,170,163 | ) |
Class R6 | | | (53,908 | ) | | | (4,593,195 | ) |
Total distributions from distributable earnings | | | (6,729,796 | ) | | | (27,906,500 | ) |
| | |
Share transactions-net: | | | | | | | | |
Class A | | | (7,883,151 | ) | | | (1,049,715 | ) |
Class B | | | (662,373 | ) | | | (628,934 | ) |
Class C | | | (5,977,107 | ) | | | (3,264,441 | ) |
Class R | | | (3,578,420 | ) | | | (5,371,596 | ) |
Class Y | | | (4,207,378 | ) | | | 13,558,855 | |
Class R5 | | | (15,459,641 | ) | | | (2,388,568 | ) |
Class R6 | | | (420,656 | ) | | | (52,762,339 | ) |
Net increase (decrease) in net assets resulting from share transactions | | | (38,188,726 | ) | | | (51,906,738 | ) |
Net increase (decrease) in net assets | | | (51,995,149 | ) | | | (16,289,004 | ) |
| | |
Net assets: | | | | | | | | |
Beginning of year | | | 240,526,932 | | | | 256,815,936 | |
End of year | | $ | 188,531,783 | | | $ | 240,526,932 | |
| (1) | The Securities and Exchange Commission eliminated the requirement to disclose distribution components separately, except for tax return of capital. For the year ended October 31, 2017, distributions to shareholders from distributable earnings consisted of distributions from net realized gains. |
Notes to Financial Statements
October 31, 2018
NOTE 1—Significant Accounting Policies
Invesco Endeavor Fund (the “Fund”) is a series portfolio of AIM Investment Funds (Invesco Investment Funds) (the “Trust”). The Trust is organized as a Delaware statutory trust and is registered under the Investment Company Act of 1940, as amended (the “1940 Act”), as an open-end series management investment company authorized to issue an unlimited number of shares of beneficial interest. Information presented in these financial statements pertains only to the Fund. Matters affecting the Fund or each class will be voted on exclusively by the shareholders of the Fund or each class.
The Fund’s investment objective is long-term growth of capital.
The Fund currently consists of six different classes of shares: Class A, Class C, Class R, Class Y, Class R5 and Class R6. Class Y shares are available only to certain investors. Class A shares are sold with a front-end sales charge unless certain waiver criteria are met. Under certain circumstances, load waived shares may be subject to contingent deferred sales charges (“CDSC”). Class C shares are sold with a CDSC. Class R, Class Y, Class R5 and Class R6 shares are sold at net asset value. Effective November 30, 2010, new or additional investments in Class B shares are no longer permitted. Existing shareholders of Class B shares were permitted to continue to reinvest dividends and capital gains distributions in Class B shares until their conversion to Class A shares. Also, shareholders in Class B shares were able to exchange those shares for Class B shares of other Invesco Funds offering such shares until they converted to Class A shares. Generally, Class B shares automatically converted to Class A shares on or about the month-end, which was at least eight years after the date of purchase. Redemptions of Class B shares prior to the conversion date were subject to a CDSC. Effective January 26, 2018, all of the Fund’s outstanding Class B shares were converted to Class A shares, in advance of their normally scheduled conversion. No CDSC was paid in connection with this early conversion.
The Fund is an investment company and accordingly follows the investment company accounting and reporting guidance in accordance with Financial Accounting Standards Board Accounting Standards Codification Topic 946, Financial Services — Investment Companies.
12 Invesco Endeavor Fund
The following is a summary of the significant accounting policies followed by the Fund in the preparation of its financial statements.
| A. | Security Valuations — Securities, including restricted securities, are valued according to the following policy. |
A security listed or traded on an exchange (except convertible securities) is valued at its last sales price or official closing price as of the close of the customary trading session on the exchange where the security is principally traded, or lacking any sales or official closing price on a particular day, the security may be valued at the closing bid price on that day. Securities traded in the over-the-counter market are valued based on prices furnished by independent pricing services or market makers. When such securities are valued by an independent pricing service they may be considered fair valued. Futures contracts are valued at the final settlement price set by an exchange on which they are principally traded. Listed options are valued at the mean between the last bid and asked prices from the exchange on which they are principally traded. Options not listed on an exchange are valued by an independent source at the mean between the last bid and asked prices. For purposes of determining net asset value (“NAV”) per share, futures and option contracts generally are valued 15 minutes after the close of the customary trading session of the New York Stock Exchange (“NYSE”).
Investments in open-end and closed-end registered investment companies that do not trade on an exchange are valued at the end-of-day net asset value per share. Investments in open-end and closed-end registered investment companies that trade on an exchange are valued at the last sales price or official closing price as of the close of the customary trading session on the exchange where the security is principally traded.
Debt obligations (including convertible securities) and unlisted equities are fair valued using an evaluated quote provided by an independent pricing service. Evaluated quotes provided by the pricing service may be determined without exclusive reliance on quoted prices, and may reflect appropriate factors such as institution-size trading in similar groups of securities, developments related to specific securities, dividend rate (for unlisted equities), yield (for debt obligations), quality, type of issue, coupon rate (for debt obligations), maturity (for debt obligations), individual trading characteristics and other market data. Pricing services generally value debt obligations assuming orderly transactions of institutional round lot size, but a fund may hold or transact in the same securities in smaller, odd lot sizes. Odd lots often trade at lower prices than institutional round lots. Debt obligations are subject to interest rate and credit risks. In addition, all debt obligations involve some risk of default with respect to interest and/or principal payments.
Foreign securities’ (including foreign exchange contracts) prices are converted into U.S. dollar amounts using the applicable exchange rates as of the close of the NYSE. If market quotations are available and reliable for foreign exchange-traded equity securities, the securities will be valued at the market quotations. Because trading hours for certain foreign securities end before the close of the NYSE, closing market quotations may become unreliable. If between the time trading ends on a particular security and the close of the customary trading session on the NYSE, events occur that the investment adviser determines are significant and make the closing price unreliable, the Fund may fair value the security. If the event is likely to have affected the closing price of the security, the security will be valued at fair value in good faith using procedures approved by the Board of Trustees. Adjustments to closing prices to reflect fair value may also be based on a screening process of an independent pricing service to indicate the degree of certainty, based on historical data, that the closing price in the principal market where a foreign security trades is not the current value as of the close of the NYSE. Foreign securities’ prices meeting the approved degree of certainty that the price is not reflective of current value will be priced at the indication of fair value from the independent pricing service. Multiple factors may be considered by the independent pricing service in determining adjustments to reflect fair value and may include information relating to sector indices, American Depositary Receipts and domestic and foreign index futures. Foreign securities may have additional risks including exchange rate changes, potential for sharply devalued currencies and high inflation, political and economic upheaval, the relative lack of issuer information, relatively low market liquidity and the potential lack of strict financial and accounting controls and standards.
Securities for which market prices are not provided by any of the above methods may be valued based upon quotes furnished by independent sources. The last bid price may be used to value equity securities. The mean between the last bid and asked prices is used to value debt obligations, including corporate loans.
Securities for which market quotations are not readily available or became unreliable are valued at fair value as determined in good faith by or under the supervision of the Trust’s officers following procedures approved by the Board of Trustees. Issuer specific events, market trends, bid/asked quotes of brokers and information providers and other market data may be reviewed in the course of making a good faith determination of a security’s fair value.
The Fund may invest in securities that are subject to interest rate risk, meaning the risk that the prices will generally fall as interest rates rise and, conversely, the prices will generally rise as interest rates fall. Specific securities differ in their sensitivity to changes in interest rates depending on their individual characteristics. Changes in interest rates may result in increased market volatility, which may affect the value and/or liquidity of certain Fund investments.
Valuations change in response to many factors including the historical and prospective earnings of the issuer, the value of the issuer’s assets, general economic conditions, interest rates, investor perceptions and market liquidity. Because of the inherent uncertainties of valuation, the values reflected in the financial statements may materially differ from the value received upon actual sale of those investments.
| B. | Securities Transactions and Investment Income — Securities transactions are accounted for on a trade date basis. Realized gains or losses on sales are computed on the basis of specific identification of the securities sold. Interest income (net of withholding tax, if any) is recorded on the accrual basis from settlement date. Dividend income (net of withholding tax, if any) is recorded on the ex-dividend date. |
The Fund may periodically participate in litigation related to Fund investments. As such, the Fund may receive proceeds from litigation settlements. Any proceeds received are included in the Statement of Operations as realized gain (loss) for investments no longer held and as unrealized gain (loss) for investments still held.
Brokerage commissions and mark ups are considered transaction costs and are recorded as an increase to the cost basis of securities purchased and/or a reduction of proceeds on a sale of securities. Such transaction costs are included in the determination of net realized and unrealized gain (loss) from investment securities reported in the Statement of Operations and the Statement of Changes in Net Assets and the net realized and unrealized gains (losses) on securities per share in the Financial Highlights. Transaction costs are included in the calculation of the Fund’s net asset value and, accordingly, they reduce the Fund’s total returns. These transaction costs are not considered operating expenses and are not reflected in net investment income reported in the Statement of Operations and the Statement of Changes in Net Assets, or the net investment income per share and the ratios of expenses and net investment income reported in the Financial Highlights, nor are they limited by any expense limitation arrangements between the Fund and the investment adviser.
13 Invesco Endeavor Fund
The Fund allocates income and realized and unrealized capital gains and losses to a class based on the relative net assets of each class.
| C. | Country Determination — For the purposes of making investment selection decisions and presentation in the Schedule of Investments, the investment adviser may determine the country in which an issuer is located and/or credit risk exposure based on various factors. These factors include the laws of the country under which the issuer is organized, where the issuer maintains a principal office, the country in which the issuer derives 50% or more of its total revenues and the country that has the primary market for the issuer’s securities, as well as other criteria. Among the other criteria that may be evaluated for making this determination are the country in which the issuer maintains 50% or more of its assets, the type of security, financial guarantees and enhancements, the nature of the collateral and the sponsor organization. Country of issuer and/or credit risk exposure has been determined to be the United States of America, unless otherwise noted. |
| D. | Distributions — Distributions from net investment income and net realized capital gain, if any, are generally declared and paid annually and recorded on the ex-dividend date. The Fund may elect to treat a portion of the proceeds from redemptions as distributions for federal income tax purposes. |
| E. | Federal Income Taxes — The Fund intends to comply with the requirements of Subchapter M of the Internal Revenue Code of 1986, as amended (the “Internal Revenue Code”), necessary to qualify as a regulated investment company and to distribute substantially all of the Fund’s taxable earnings to shareholders. As such, the Fund will not be subject to federal income taxes on otherwise taxable income (including net realized capital gain) that is distributed to shareholders. Therefore, no provision for federal income taxes is recorded in the financial statements. |
The Fund recognizes the tax benefits of uncertain tax positions only when the position is more likely than not to be sustained. Management has analyzed the Fund’s uncertain tax positions and concluded that no liability for unrecognized tax benefits should be recorded related to uncertain tax positions. Management is not aware of any tax positions for which it is reasonably possible that the total amounts of unrecognized tax benefits will change materially in the next 12 months.
The Fund files tax returns in the U.S. Federal jurisdiction and certain other jurisdictions. Generally, the Fund is subject to examinations by such taxing authorities for up to three years after the filing of the return for the tax period.
| F. | Expenses — Fees provided for under the Rule 12b-1 plan of a particular class of the Fund are charged to the operations of such class. Transfer agency fees and expenses and other shareholder recordkeeping fees and expenses attributable to Class R5 and Class R6 are allocated to each share class based on relative net assets. Sub-accounting fees attributable to Class R5 are charged to the operations of the class. Transfer agency fees and expenses and other shareholder recordkeeping fees and expenses relating to all other classes are allocated among those classes based on relative net assets. All other expenses are allocated among the classes based on relative net assets. |
| G. | Accounting Estimates — The preparation of financial statements in conformity with accounting principles generally accepted in the United States of America (“GAAP”) requires management to make estimates and assumptions that affect the reported amounts of assets and liabilities at the date of the financial statements and the reported amounts of revenues and expenses during the reporting period including estimates and assumptions related to taxation. Actual results could differ from those estimates by a significant amount. In addition, the Fund monitors for material events or transactions that may occur or become known after the period-end date and before the date the financial statements are released to print. |
| H. | Indemnifications — Under the Trust’s organizational documents, each Trustee, officer, employee or other agent of the Trust is indemnified against certain liabilities that may arise out of the performance of their duties to the Fund. Additionally, in the normal course of business, the Fund enters into contracts, including the Fund’s servicing agreements, that contain a variety of indemnification clauses. The Fund’s maximum exposure under these arrangements is unknown as this would involve future claims that may be made against the Fund that have not yet occurred. The risk of material loss as a result of such indemnification claims is considered remote. |
| I. | Foreign Currency Translations — Foreign currency is valued at the close of the NYSE based on quotations posted by banks and major currency dealers. Portfolio securities and other assets and liabilities denominated in foreign currencies are translated into U.S. dollar amounts at the date of valuation. Purchases and sales of portfolio securities (net of foreign taxes withheld on disposition) and income items denominated in foreign currencies are translated into U.S. dollar amounts on the respective dates of such transactions. The Fund does not separately account for the portion of the results of operations resulting from changes in foreign exchange rates on investments and the fluctuations arising from changes in market prices of securities held. The combined results of changes in foreign exchange rates and the fluctuation of market prices on investments (net of estimated foreign tax withholding) are included with the net realized and unrealized gain or loss from investments in the Statement of Operations. Reported net realized foreign currency gains or losses arise from (1) sales of foreign currencies, (2) currency gains or losses realized between the trade and settlement dates on securities transactions, and (3) the difference between the amounts of dividends, interest, and foreign withholding taxes recorded on the Fund’s books and the U.S. dollar equivalent of the amounts actually received or paid. Net unrealized foreign currency gains and losses arise from changes in the fair values of assets and liabilities, other than investments in securities at fiscal period end, resulting from changes in exchange rates. |
The Fund may invest in foreign securities, which may be subject to foreign taxes on income, gains on investments or currency repatriation, a portion of which may be recoverable. Foreign taxes, if any, are recorded based on the tax regulations and rates that exist in the foreign markets in which the Fund invests and are shown in the Statement of Operations.
| J. | Forward Foreign Currency Contracts — The Fund may engage in foreign currency transactions either on a spot (i.e. for prompt delivery and settlement) basis, or through forward foreign currency contracts, to manage or minimize currency or exchange rate risk. |
The Fund may also enter into forward foreign currency contracts for the purchase or sale of a security denominated in a foreign currency in order to “lock in” the U.S. dollar price of that security, or the Fund may also enter into forward foreign currency contracts that do not provide for physical settlement of the two currencies, but instead are settled by a single cash payment calculated as the difference between the agreed upon exchange rate and the spot rate at settlement based upon an agreed upon notional amount (non-deliverable forwards). The Fund will set aside liquid assets in an amount equal to the daily mark-to-market obligation for forward foreign currency contracts.
A forward foreign currency contract is an obligation between two parties (“Counterparties”) to purchase or sell a specific currency for an agreed-upon price at a future date. The use of forward foreign currency contracts does not eliminate fluctuations in the price of the underlying securities the Fund owns or intends to acquire but establishes a rate of exchange in advance. Fluctuations in the value of these contracts are measured by the difference in the contract date and reporting date exchange rates and are recorded as unrealized appreciation (depreciation) until the contracts are closed. When the contracts are closed, realized gains (losses) are recorded. Realized and unrealized gains (losses) on the
14 Invesco Endeavor Fund
contracts are included in the Statement of Operations. The primary risks associated with forward foreign currency contracts include failure of the Counterparty to meet the terms of the contract and the value of the foreign currency changing unfavorably. These risks may be in excess of the amounts reflected in the Statement of Assets and Liabilities.
NOTE 2—Advisory Fees and Other Fees Paid to Affiliates
The Trust has entered into a master investment advisory agreement with Invesco Advisers, Inc. (the “Adviser” or “Invesco”). Under the terms of the investment advisory agreement, the Fund accrues daily and pays monthly an advisory fee to the Adviser based on the annual rate of the Fund’s average daily net assets as follows:
| | | | |
| Average Daily Net Assets | | Rate | |
First $250 million | | | 0.745% | |
Next $250 million | | | 0.73% | |
Next $500 million | | | 0.715% | |
Next $1.5 billion | | | 0.70% | |
Next $2.5 billion | | | 0.685% | |
Next $2.5 billion | | | 0.67% | |
Next $2.5 billion | | | 0.655% | |
Over $10 billion | | | 0.64% | |
For the year ended October 31, 2018, the effective advisory fees incurred by the Fund was 0.745%.
Under the terms of a master sub-advisory agreement between the Adviser and each of Invesco Asset Management Deutschland GmbH, Invesco Asset Management Limited, Invesco Asset Management (Japan) Limited, Invesco Hong Kong Limited, Invesco Senior Secured Management, Inc. and Invesco Canada Ltd. (collectively, the “Affiliated Sub-Advisers”) the Adviser, not the Fund, will pay 40% of the fees paid to the Adviser to any such Affiliated Sub-Adviser(s) that provide(s) discretionary investment management services to the Fund based on the percentage of assets allocated to such Affiliated Sub-Adviser(s).
The Adviser has contractually agreed, through at least June 30, 2019, to waive advisory fees and/or reimburse expenses to the extent necessary to limit total annual fund operating expenses after fee waiver and/or expense reimbursement (excluding certain items discussed below) of Class A, Class C, Class R, Class Y, Class R5 and Class R6 shares to 2.00%, 2.75%, 2.25%, 1.75%, 1.75% and 1.75%, respectively, of the Fund’s average daily net assets (the “expense limits”). Prior to their conversion to Class A shares, the expense limit for Class B shares was 2.75% of average daily net assets. In determining the Adviser’s obligation to waive advisory fees and/or reimburse expenses, the following expenses are not taken into account, and could cause the total annual fund operating expenses after fee waiver and/or expense reimbursement to exceed the numbers reflected above: (1) interest; (2) taxes; (3) dividend expense on short sales; (4) extraordinary or non-routine items, including litigation expenses; and (5) expenses that the Fund has incurred but did not actually pay because of an expense offset arrangement. Unless Invesco continues the fee waiver agreement, it will terminate on June 30, 2019. During its term, the fee waiver agreement cannot be terminated or amended to increase the expense limits or reduce the advisory fee waiver without approval of the Board of Trustees. The Adviser did not waive fees and/or reimburse expenses during the period under these expense limits.
Further, the Adviser has contractually agreed, through at least June 30, 2020, to waive the advisory fee payable by the Fund in an amount equal to 100% of the net advisory fees the Adviser receives from the affiliated money market funds on investments by the Fund of uninvested cash in such affiliated money market funds.
For the year ended October 31, 2018, the Adviser waived advisory fees of $39,573.
The Trust has entered into a master administrative services agreement with Invesco pursuant to which the Fund has agreed to pay Invesco for certain administrative costs incurred in providing accounting services to the Fund. For the year ended October 31, 2018, expenses incurred under the agreement are shown in the Statement of Operations as Administrative services fees.
The Trust has entered into a transfer agency and service agreement with Invesco Investment Services, Inc. (“IIS”) pursuant to which the Fund has agreed to pay IIS a fee for providing transfer agency and shareholder services to the Fund and reimburse IIS for certain expenses incurred by IIS in the course of providing such services. IIS may make payments to intermediaries that provide omnibus account services, sub-accounting services and/or networking services. All fees payable by IIS to intermediaries that provide omnibus account services or sub-accounting services are charged back to the Fund, subject to certain limitations approved by the Trust’s Board of Trustees. For the year ended October 31, 2018, expenses incurred under the agreement are shown in the Statement of Operations as Transfer agent fees.
The Trust has entered into master distribution agreements with Invesco Distributors, Inc. (“IDI”) to serve as the distributor for the Class A, Class C, Class R, Class Y, Class R5 and Class R6 shares of the Fund. The Trust has adopted plans pursuant to Rule 12b-1 under the 1940 Act with respect to the Fund’s Class A, Class C and Class R shares (collectively, the “Plans”). The Fund, pursuant to the Plans, pays IDI compensation at the annual rate of 0.25% of the Fund’s average daily net assets of Class A shares, 1.00% of the average daily net assets of Class C shares and 0.50% of the average daily net assets of Class R shares. Prior to their conversion to Class A shares, the Fund paid an annual rate of 1.00% of the average daily net assets of Class B shares. The fees are accrued daily and paid monthly. Of the Plan payments, up to 0.25% of the average daily net assets of each class of shares may be paid to furnish continuing personal shareholder services to customers who purchase and own shares of such classes. Any amounts not paid as a service fee under the Plans would constitute an asset-based sales charge. Rules of the Financial Industry Regulatory Authority (“FINRA”) impose a cap on the total sales charges, including asset-based sales charges, that may be paid by any class of shares of the Fund. For the year ended October 31, 2018, expenses incurred under the Plans are shown in the Statement of Operations as Distribution fees.
Front-end sales commissions and CDSC (collectively, the “sales charges”) are not recorded as expenses of the Fund. Front-end sales commissions are deducted from proceeds from the sales of Fund shares prior to investment in Class A shares of the Fund. CDSC are deducted from redemption proceeds prior to remittance to the shareholder. During the year ended October 31, 2018, IDI advised the Fund that IDI retained $26,647 in front-end sales commissions from the sale of Class A shares and $332 and $1,574 from Class A and Class C shares, respectively, for CDSC imposed on redemptions by shareholders.
15 Invesco Endeavor Fund
Certain officers and trustees of the Trust are officers and directors of the Adviser, IIS and/or IDI.
NOTE 3—Additional Valuation Information
GAAP defines fair value as the price that would be received to sell an asset or paid to transfer a liability in an orderly transaction between market participants at the measurement date, under current market conditions. GAAP establishes a hierarchy that prioritizes the inputs to valuation methods, giving the highest priority to readily available unadjusted quoted prices in an active market for identical assets (Level 1) and the lowest priority to significant unobservable inputs (Level 3), generally when market prices are not readily available or are unreliable. Based on the valuation inputs, the securities or other investments are tiered into one of three levels. Changes in valuation methods may result in transfers in or out of an investment’s assigned level:
| | Level 1 — | Prices are determined using quoted prices in an active market for identical assets. |
| | Level 2 — | Prices are determined using other significant observable inputs. Observable inputs are inputs that other market participants may use in pricing a security. These may include quoted prices for similar securities, interest rates, prepayment speeds, credit risk, yield curves, loss severities, default rates, discount rates, volatilities and others. |
| | Level 3 — | Prices are determined using significant unobservable inputs. In situations where quoted prices or observable inputs are unavailable (for example, when there is little or no market activity for an investment at the end of the period), unobservable inputs may be used. Unobservable inputs reflect the Fund’s own assumptions about the factors market participants would use in determining fair value of the securities or instruments and would be based on the best available information. |
As of October 31, 2018, all of the securities in this Fund were valued based on Level 1 inputs (see the Schedule of Investments for security categories). The level assigned to the securities valuations may not be an indication of the risk or liquidity associated with investing in those securities. Because of the inherent uncertainties of valuation, the values reflected in the financial statements may materially differ from the value received upon actual sale of those investments.
NOTE 4—Expense Offset Arrangement(s)
The expense offset arrangement is comprised of transfer agency credits which result from balances in demand deposit accounts used by the transfer agent for clearing shareholder transactions. For the year ended October 31, 2018, the Fund received credits from this arrangement, which resulted in the reduction of the Fund’s total expenses of $4,743.
NOTE 5—Trustees’ and Officers’ Fees and Benefits
Trustees’ and Officers’ Fees and Benefits include amounts accrued by the Fund to pay remuneration to certain Trustees and Officers of the Fund. Trustees have the option to defer compensation payable by the Fund, and Trustees’ and Officers’ Fees and Benefits also include amounts accrued by the Fund to fund such deferred compensation amounts. Those Trustees who defer compensation have the option to select various Invesco Funds in which their deferral accounts shall be deemed to be invested. Finally, certain current Trustees were eligible to participate in a retirement plan that provided for benefits to be paid upon retirement to Trustees over a period of time based on the number of years of service. The Fund may have certain former Trustees who also participate in a retirement plan and receive benefits under such plan. Trustees’ and Officers’ Fees and Benefits include amounts accrued by the Fund to fund such retirement benefits. Obligations under the deferred compensation and retirement plans represent unsecured claims against the general assets of the Fund.
NOTE 6—Cash Balances
The Fund is permitted to temporarily carry a negative or overdrawn balance in its account with State Street Bank and Trust Company, the custodian bank. Such balances, if any at period-end, are shown in the Statement of Assets and Liabilities under the payable caption Amount due custodian. To compensate the custodian bank for such overdrafts, the overdrawn Fund may either (1) leave funds as a compensating balance in the account so the custodian bank can be compensated by earning the additional interest; or (2) compensate by paying the custodian bank at a rate agreed upon by the custodian bank and Invesco, not to exceed the contractually agreed upon rate.
NOTE 7—Distributions to Shareholders and Tax Components of Net Assets
Tax Character of Distributions to Shareholders Paid During the Fiscal Years Ended October 31, 2018 and 2017:
| | | | | | | | |
| | | 2018 | | | 2017 | |
Ordinary income | | $ | 1,152,794 | | | $ | 2,901,936 | |
Long-term capital gain | | | 5,577,002 | | | | 25,004,564 | |
Total distributions | | $ | 6,729,796 | | | $ | 27,906,500 | |
16 Invesco Endeavor Fund
Tax Components of Net Assets at Period-End:
| | | | |
| | | 2018 | |
Undistributed ordinary income | | $ | 2,260,699 | |
Undistributed long-term gain | | | 8,033,455 | |
Net unrealized appreciation — investments | | | 27,739,050 | |
Net unrealized appreciation (depreciation) — foreign currencies | | | (586 | ) |
Temporary book/tax differences | | | (69,781 | ) |
Shares of beneficial interest | | | 150,568,946 | |
Total net assets | | $ | 188,531,783 | |
The difference between book-basis and tax-basis unrealized appreciation (depreciation) is due to differences in the timing of recognition of gains and losses on investments for tax and book purposes. The Fund’s net unrealized appreciation difference is attributable primarily to wash sales and partnerships.
The temporary book/tax differences are a result of timing differences between book and tax recognition of income and/or expenses. The Fund’s temporary book/tax differences are the result of the trustee deferral of compensation and retirement plan benefits.
Capital loss carryforward is calculated and reported as of a specific date. Results of transactions and other activity after that date may affect the amount of capital loss carryforward actually available for the Fund to utilize. Capital losses generated in years beginning after December 22, 2010 can be carried forward for an unlimited period, whereas previous losses expire in eight tax years. Capital losses with an expiration period may not be used to offset capital gains until all net capital losses without an expiration date have been utilized. Capital loss carryforwards with no expiration date will retain their character as either short-term or long-term capital losses instead of as short-term capital losses as under prior law. The ability to utilize capital loss carryforwards in the future may be limited under the Internal Revenue Code and related regulations based on the results of future transactions.
The Fund does not have a capital loss carryforward as of October 31, 2018.
NOTE 8—Investment Transactions
The aggregate amount of investment securities (other than short-term securities, U.S. Treasury obligations and money market funds, if any) purchased and sold by the Fund during the year ended October 31, 2018 was $67,627,873 and $80,396,450, respectively. Cost of investments, including any derivatives, on a tax basis includes the adjustments for financial reporting purposes as of the most recently completed federal income tax reporting period-end.
| | | | |
| Unrealized Appreciation (Depreciation) of Investments on a Tax Basis | |
Aggregate unrealized appreciation of investments | | $ | 36,600,666 | |
Aggregate unrealized (depreciation) of investments | | | (8,861,616 | ) |
Net unrealized appreciation of investments | | $ | 27,739,050 | |
Cost of investments for tax purposes is $160,559,679.
NOTE 9—Reclassification of Permanent Differences
Primarily as a result of differing book/tax treatment of partnerships and net operating losses, on October 31, 2018, undistributed net investment income was decreased by $392,310 and undistributed net realized gain was increased by $392,310. This reclassification had no effect on the net assets or the distributable earnings of the Fund.
17 Invesco Endeavor Fund
NOTE 10—Share Information
| | | | | | | | | | | | | | | | |
| | | Summary of Share Activity | |
| | | Years ended October 31, | |
| | | 2018(a) | | | 2017 | |
| | | Shares | | | Amount | | | Shares | | | Amount | |
Sold: | | | | | | | | | | | | | | | | |
Class A | | | 981,490 | | | $ | 19,603,323 | | | | 1,807,365 | | | $ | 34,503,121 | |
Class B(b) | | | 225 | | | | 4,018 | | | | 6,048 | | | | 102,352 | |
Class C | | | 105,922 | | | | 1,841,025 | | | | 530,870 | | | | 8,932,756 | |
Class R | | | 118,043 | | | | 2,267,283 | | | | 245,467 | | | | 4,520,273 | |
Class Y | | | 457,325 | | | | 9,458,463 | | | | 1,335,758 | | | | 26,384,134 | |
Class R5 | | | 140,568 | | | | 2,995,624 | | | | 182,739 | | | | 3,694,560 | |
Class R6 | | | 64,077 | | | | 1,378,578 | | | | 92,237 | | | | 1,821,200 | |
| | | | |
Issued as reinvestment of dividends: | | | | | | | | | | | | | | | | |
Class A | | | 180,366 | | | | 3,600,097 | | | | 646,548 | | | | 12,001,370 | |
Class B(b) | | | 1,018 | | | | 17,563 | | | | 6,665 | | | | 108,737 | |
Class C | | | 53,635 | | | | 926,282 | | | | 230,746 | | | | 3,755,445 | |
Class R | | | 21,115 | | | | 404,560 | | | | 99,570 | | | | 1,782,309 | |
Class Y | | | 42,480 | | | | 874,239 | | | | 142,134 | | | | 2,700,939 | |
Class R5 | | | 26,729 | | | | 566,931 | | | | 110,165 | | | | 2,160,340 | |
Class R6 | | | 2,510 | | | | 53,507 | | | | 233,120 | | | | 4,593,195 | |
| | | | |
Conversion of Class B shares to Class A shares:(c) | | | | | | | | | | | | | | | | |
Class A | | | 29,185 | | | | 617,254 | | | | 28,063 | | | | 538,538 | |
Class B | | | (33,929 | ) | | | (617,254 | ) | | | (32,635 | ) | | | (538,538 | ) |
| | | | |
Reacquired: | | | | | | | | | | | | | | | | |
Class A | | | (1,587,752 | ) | | | (31,703,825 | ) | | | (2,510,541 | ) | | | (48,092,744 | ) |
Class B(b) | | | (3,851 | ) | | | (66,700 | ) | | | (17,410 | ) | | | (301,485 | ) |
Class C | | | (507,719 | ) | | | (8,744,414 | ) | | | (951,649 | ) | | | (15,952,642 | ) |
Class R | | | (327,321 | ) | | | (6,250,263 | ) | | | (637,158 | ) | | | (11,674,178 | ) |
Class Y | | | (707,471 | ) | | | (14,540,080 | ) | | | (794,777 | ) | | | (15,526,218 | ) |
Class R5 | | | (877,735 | ) | | | (19,022,196 | ) | | | (411,566 | ) | | | (8,243,468 | ) |
Class R6(d) | | | (85,901 | ) | | | (1,852,741 | ) | | | (3,022,821 | ) | | | (59,176,734 | ) |
Net increase (decrease) in share activity | | | (1,906,991 | ) | | $ | (38,188,726 | ) | | | (2,681,062 | ) | | $ | (51,906,738 | ) |
| (a) | There are entities that are record owners of more than 5% of the outstanding shares of the Fund and in the aggregate own 33% of the outstanding shares of the Fund. IDI has an agreement with these entities to sell Fund shares. The Fund, Invesco and/or Invesco affiliates may make payments to these entities, which are considered to be related to the Fund, for providing services to the Fund, Invesco and/or Invesco affiliates including but not limited to services such as securities brokerage, distribution, third party record keeping and account servicing. The Fund has no knowledge as to whether all or any portion of the shares owned of record by these entities are also owned beneficially. |
| (b) | Class B shares activity for the period November 1, 2017 through January 26, 2018 (date of conversion). |
| (c) | Effective as of the close of business January 26, 2018, all outstanding Class B shares were converted to Class A shares. |
| (d) | On May 5, 2017, 2,459,627 Class R6 shares valued at $47,864,341 were redeemed by affiliated mutual funds. |
18 Invesco Endeavor Fund
NOTE 11—Financial Highlights
The following schedule presents financial highlights for a share of the Fund outstanding throughout the periods indicated.
| | | | | | | | | | | | | | | | | | | | | | | | | | | | | | | | | | | | | | | | | | | | | | | | | | | | | | | | |
| | | Net asset
value,
beginning
of period | | | Net
investment
income
(loss)(a) | | | Net gains
(losses)
on securities
(both
realized and
unrealized) | | | Total from
investment
operations | | | Dividends
from net
investment
income | | | Distributions
from net
realized
gains | | | Total
distributions | | | Net asset
value, end
of period | | | Total
return(b) | | | Net assets,
end of period
(000’s omitted) | | | Ratio of
expenses
to average
net assets
with fee waivers
and/or expenses
absorbed | | | Ratio of
expenses
to average net
assets without
fee waivers
and/or expenses
absorbed | | | Ratio of net
investment
income (loss)
to average
net assets | | | Portfolio
turnover(c) | |
Class A | |
Year ended 10/31/18 | | $ | 19.81 | | | $ | 0.03 | | | $ | (0.88 | ) | | $ | (0.85 | ) | | $ | | | | $ | (0.54 | ) | | $ | (0.54 | ) | | $ | 18.42 | | | | (4.48 | )% | | $ | 116,080 | | | | 1.32 | %(d) | | | 1.34 | %(d) | | | 0.14 | %(d) | | | 34 | % |
Year ended 10/31/17 | | | 17.19 | | | | (0.03 | ) | | | 4.57 | | | | 4.54 | | | | — | | | | (1.92 | ) | | | (1.92 | ) | | | 19.81 | | | | 27.44 | | | | 132,670 | | | | 1.34 | | | | 1.36 | | | | (0.13 | ) | | | 19 | |
Year ended 10/31/16 | | | 19.30 | | | | (0.02 | ) | | | 0.21 | | | | 0.19 | | | | — | | | | (2.30 | ) | | | (2.30 | ) | | | 17.19 | | | | 2.08 | | | | 115,588 | | | | 1.34 | | | | 1.36 | | | | (0.12 | ) | | | 28 | |
Year ended 10/31/15 | | | 22.57 | | | | (0.01 | ) | | | (1.25 | ) | | | (1.26 | ) | | | — | | | | (2.01 | ) | | | (2.01 | ) | | | 19.30 | | | | (5.80 | ) | | | 147,504 | | | | 1.26 | | | | 1.29 | | | | (0.04 | ) | | | 27 | |
Year ended 10/31/14 | | | 21.18 | | | | (0.09 | ) | | | 2.35 | | | | 2.26 | | | | (0.01 | ) | | | (0.86 | ) | | | (0.87 | ) | | | 22.57 | | | | 11.13 | | | | 192,326 | | | | 1.26 | | | | 1.29 | | | | (0.43 | ) | | | 27 | |
Class B | | | | | | | | | | | | | | | | | | | | | | | | | | | | | | | | | | | | | | | | | | | | | | | | | | | | | | | | |
Year ended 10/31/18(e) | | | 17.21 | | | | (0.03 | ) | | | 1.63 | | | | 1.60 | | | | — | | | | (0.54 | ) | | | (0.54 | ) | | | 18.27 | | | | 9.50 | | | | — | | | | 2.07 | (d)(f) | | | 2.09 | (d)(f) | | | (0.61 | )(d)(f) | | | 34 | |
Year ended 10/31/17 | | | 15.25 | | | | (0.15 | ) | | | 4.03 | | | | 3.88 | | | | — | | | | (1.92 | ) | | | (1.92 | ) | | | 17.21 | | | | 26.54 | | | | 629 | | | | 2.09 | | | | 2.11 | | | | (0.88 | ) | | | 19 | |
Year ended 10/31/16 | | | 17.52 | | | | (0.13 | ) | | | 0.16 | | | | 0.03 | | | | — | | | | (2.30 | ) | | | (2.30 | ) | | | 15.25 | | | | 1.28 | | | | 1,127 | | | | 2.09 | | | | 2.11 | | | | (0.87 | ) | | | 28 | |
Year ended 10/31/15 | | | 20.82 | | | | (0.15 | ) | | | (1.14 | ) | | | (1.29 | ) | | | — | | | | (2.01 | ) | | | (2.01 | ) | | | 17.52 | | | | (6.50 | ) | | | 2,161 | | | | 2.01 | | | | 2.04 | | | | (0.79 | ) | | | 27 | |
Year ended 10/31/14 | | | 19.74 | | | | (0.24 | ) | | | 2.18 | | | | 1.94 | | | | — | | | | (0.86 | ) | | | (0.86 | ) | | | 20.82 | | | | 10.27 | | | | 4,855 | | | | 2.01 | | | | 2.04 | | | | (1.18 | ) | | | 27 | |
Class C | | | | | | | | | | | | | | | | | | | | | | | | | | | | | | | | | | | | | | | | | | | | | | | | | | | | | | | | |
Year ended 10/31/18 | | | 17.22 | | | | (0.11 | ) | | | (0.74 | ) | | | (0.85 | ) | | | — | | | | (0.54 | ) | | | (0.54 | ) | | | 15.83 | | | | (5.18 | ) | | | 23,490 | | | | 2.07 | (d) | | | 2.09 | (d) | | | (0.61 | )(d) | | | 34 | |
Year ended 10/31/17 | | | 15.26 | | | | (0.15 | ) | | | 4.03 | | | | 3.88 | | | | — | | | | (1.92 | ) | | | (1.92 | ) | | | 17.22 | | | | 26.52 | | | | 31,548 | | | | 2.09 | | | | 2.11 | | | | (0.88 | ) | | | 19 | |
Year ended 10/31/16 | | | 17.53 | | | | (0.13 | ) | | | 0.16 | | | | 0.03 | | | | — | | | | (2.30 | ) | | | (2.30 | ) | | | 15.26 | | | | 1.27 | | | | 30,857 | | | | 2.09 | | | | 2.11 | | | | (0.87 | ) | | | 28 | |
Year ended 10/31/15 | | | 20.83 | | | | (0.15 | ) | | | (1.14 | ) | | | (1.29 | ) | | | — | | | | (2.01 | ) | | | (2.01 | ) | | | 17.53 | | | | (6.49 | ) | | | 42,965 | | | | 2.01 | | | | 2.04 | | | | (0.79 | ) | | | 27 | |
Year ended 10/31/14 | | | 19.75 | | | | (0.24 | ) | | | 2.18 | | | | 1.94 | | | | — | | | | (0.86 | ) | | | (0.86 | ) | | | 20.83 | | | | 10.27 | | | | 53,542 | | | | 2.01 | | | | 2.04 | | | | (1.18 | ) | | | 27 | |
Class R | | | | | | | | | | | | | | | | | | | | | | | | | | | | | | | | | | | | | | | | | | | | | | | | | | | | | | | | |
Year ended 10/31/18 | | | 19.04 | | | | (0.02 | ) | | | (0.84 | ) | | | (0.86 | ) | | | — | | | | (0.54 | ) | | | (0.54 | ) | | | 17.64 | | | | (4.72 | ) | | | 10,070 | | | | 1.57 | (d) | | | 1.59 | (d) | | | (0.11 | )(d) | | | 34 | |
Year ended 10/31/17 | | | 16.62 | | | | (0.07 | ) | | | 4.41 | | | | 4.34 | | | | — | | | | (1.92 | ) | | | (1.92 | ) | | | 19.04 | | | | 27.16 | | | | 14,449 | | | | 1.59 | | | | 1.61 | | | | (0.38 | ) | | | 19 | |
Year ended 10/31/16 | | | 18.78 | | | | (0.06 | ) | | | 0.20 | | | | 0.14 | | | | — | | | | (2.30 | ) | | | (2.30 | ) | | | 16.62 | | | | 1.83 | | | | 17,469 | | | | 1.59 | | | | 1.61 | | | | (0.37 | ) | | | 28 | |
Year ended 10/31/15 | | | 22.08 | | | | (0.06 | ) | | | (1.23 | ) | | | (1.29 | ) | | | — | | | | (2.01 | ) | | | (2.01 | ) | | | 18.78 | | | | (6.09 | ) | | | 24,855 | | | | 1.51 | | | | 1.54 | | | | (0.29 | ) | | | 27 | |
Year ended 10/31/14 | | | 20.77 | | | | (0.14 | ) | | | 2.31 | | | | 2.17 | | | | — | | | | (0.86 | ) | | | (0.86 | ) | | | 22.08 | | | | 10.89 | | | | 34,634 | | | | 1.51 | | | | 1.54 | | | | (0.68 | ) | | | 27 | |
Class Y | | | | | | | | | | | | | | | | | | | | | | | | | | | | | | | | | | | | | | | | | | | | | | | | | | | | | | | | |
Year ended 10/31/18 | | | 20.40 | | | | 0.08 | | | | (0.91 | ) | | | (0.83 | ) | | | — | | | | (0.54 | ) | | | (0.54 | ) | | | 19.03 | | | | (4.25 | ) | | | 30,604 | | | | 1.07 | (d) | | | 1.09 | (d) | | | 0.39 | (d) | | | 34 | |
Year ended 10/31/17 | | | 17.61 | | | | 0.02 | | | | 4.69 | | | | 4.71 | | | | — | | | | (1.92 | ) | | | (1.92 | ) | | | 20.40 | | | | 27.77 | | | | 37,034 | | | | 1.09 | | | | 1.11 | | | | 0.12 | | | | 19 | |
Year ended 10/31/16 | | | 19.66 | | | | 0.02 | | | | 0.23 | | | | 0.25 | | | | — | | | | (2.30 | ) | | | (2.30 | ) | | | 17.61 | | | | 2.37 | | | | 19,938 | | | | 1.09 | | | | 1.11 | | | | 0.13 | | | | 28 | |
Year ended 10/31/15 | | | 22.91 | | | | 0.04 | | | | (1.28 | ) | | | (1.24 | ) | | | — | | | | (2.01 | ) | | | (2.01 | ) | | | 19.66 | | | | (5.61 | ) | | | 40,425 | | | | 1.01 | | | | 1.04 | | | | 0.21 | | | | 27 | |
Year ended 10/31/14 | | | 21.48 | | | | (0.04 | ) | | | 2.38 | | | | 2.34 | | | | (0.05 | ) | | | (0.86 | ) | | | (0.91 | ) | | | 22.91 | | | | 11.39 | | | | 71,898 | | | | 1.01 | | | | 1.04 | | | | (0.18 | ) | | | 27 | |
Class R5 | | | | | | | | | | | | | | | | | | | | | | | | | | | | | | | | | | | | | | | | | | | | | | | | | | | | | | | | |
Year ended 10/31/18 | | | 21.00 | | | | 0.10 | | | | (0.93 | ) | | | (0.83 | ) | | | — | | | | (0.54 | ) | | | (0.54 | ) | | | 19.63 | | | | (4.13 | ) | | | 6,762 | | | | 0.97 | (d) | | | 0.99 | (d) | | | 0.49 | (d) | | | 34 | |
Year ended 10/31/17 | | | 18.06 | | | | 0.05 | | | | 4.81 | | | | 4.86 | | | | — | | | | (1.92 | ) | | | (1.92 | ) | | | 21.00 | | | | 27.92 | | | | 22,158 | | | | 0.96 | | | | 0.98 | | | | 0.25 | | | | 19 | |
Year ended 10/31/16 | | | 20.08 | | | | 0.05 | | | | 0.23 | | | | 0.28 | | | | — | | | | (2.30 | ) | | | (2.30 | ) | | | 18.06 | | | | 2.49 | | | | 21,192 | | | | 0.94 | | | | 0.96 | | | | 0.28 | | | | 28 | |
Year ended 10/31/15 | | | 23.32 | | | | 0.07 | | | | (1.30 | ) | | | (1.23 | ) | | | — | | | | (2.01 | ) | | | (2.01 | ) | | | 20.08 | | | | (5.46 | ) | | | 33,854 | | | | 0.89 | | | | 0.92 | | | | 0.33 | | | | 27 | |
Year ended 10/31/14 | | | 21.84 | | | | (0.02 | ) | | | 2.43 | | | | 2.41 | | | | (0.07 | ) | | | (0.86 | ) | | | (0.93 | ) | | | 23.32 | | | | 11.51 | | | | 49,356 | | | | 0.90 | | | | 0.93 | | | | (0.07 | ) | | | 27 | |
Class R6 | | | | | | | | | | | | | | | | | | | | | | | | | | | | | | | | | | | | | | | | | | | | | | | | | | | | | | | | |
Year ended 10/31/18 | | | 21.11 | | | | 0.12 | | | | (0.94 | ) | | | (0.82 | ) | | | — | | | | (0.54 | ) | | | (0.54 | ) | | | 19.75 | | | | (4.06 | ) | | | 1,526 | | | | 0.89 | (d) | | | 0.91 | (d) | | | 0.57 | (d) | | | 34 | |
Year ended 10/31/17 | | | 18.13 | | | | 0.07 | | | | 4.83 | | | | 4.90 | | | | — | | | | (1.92 | ) | | | (1.92 | ) | | | 21.11 | | | | 28.04 | | | | 2,038 | | | | 0.88 | | | | 0.90 | | | | 0.33 | | | | 19 | |
Year ended 10/31/16 | | | 20.13 | | | | 0.06 | | | | 0.24 | | | | 0.30 | | | | — | | | | (2.30 | ) | | | (2.30 | ) | | | 18.13 | | | | 2.59 | | | | 50,645 | | | | 0.85 | | | | 0.87 | | | | 0.37 | | | | 28 | |
Year ended 10/31/15 | | | 23.35 | | | | 0.09 | | | | (1.30 | ) | | | (1.21 | ) | | | — | | | | (2.01 | ) | | | (2.01 | ) | | | 20.13 | | | | (5.36 | ) | | | 91,275 | | | | 0.80 | | | | 0.83 | | | | 0.42 | | | | 27 | |
Year ended 10/31/14 | | | 21.86 | | | | 0.01 | | | | 2.42 | | | | 2.43 | | | | (0.08 | ) | | | (0.86 | ) | | | (0.94 | ) | | | 23.35 | | | | 11.62 | | | | 100,410 | | | | 0.81 | | | | 0.84 | | | | 0.02 | | | | 27 | |
| (a) | Calculated using average shares outstanding. |
| (b) | Includes adjustments in accordance with accounting principles generally accepted in the United States of America and as such, the net asset value for financial reporting purposes and the returns based upon those net asset values may differ from the net asset value and returns for shareholder transactions. Does not include sales charges and is not annualized for periods less than one year, if applicable. |
| (c) | Portfolio turnover is calculated at the fund level and is not annualized for periods less than one year, if applicable. |
| (d) | Ratios are based on average daily net assets (000’s omitted) of $133,590, $588, $29,073, $12,710, $37,086, $19,580 and $2,471 for Class A, Class B, Class C, Class R, Class Y, Class R5 and Class R6 shares, respectively. |
| (e) | Reflects activity for the period November 1, 2017 through January 26, 2018 (date of conversion). |
19 Invesco Endeavor Fund
Report of Independent Registered Public Accounting Firm
To the Board of Trustees of AIM Investment Funds (Invesco Investment Funds)
and Shareholders of Invesco Endeavor Fund:
Opinion on the Financial Statements
We have audited the accompanying statement of assets and liabilities, including the schedule of investments, of Invesco Endeavor Fund (one of the funds constituting AIM Investment Funds (Invesco Investment Funds), hereafter referred to as the “Fund”) as of October 31, 2018, the related statement of operations for the year ended October 31, 2018, the statement of changes in net assets for each of the two years in the period ended October 31, 2018, including the related notes, and the financial highlights for each of the periods indicated therein (collectively referred to as the financial statements). In our opinion, the financial statements present fairly, in all material respects, the financial position of the Fund as of October 31, 2018, the results of its operations for the year then ended, the changes in its net assets for each of the two years in the period ended October 31, 2018 and the financial highlights for each of the periods indicated therein in conformity with accounting principles generally accepted in the United States of America.
Basis for Opinion
These financial statements are the responsibility of the Fund’s management. Our responsibility is to express an opinion on the Fund’s financial statements based on our audits. We are a public accounting firm registered with the Public Company Accounting Oversight Board (United States) (PCAOB) and are required to be independent with respect to the Fund in accordance with the U.S. federal securities laws and the applicable rules and regulations of the Securities and Exchange Commission and the PCAOB.
We conducted our audits of these financial statements in accordance with the standards of the PCAOB. Those standards require that we plan and perform the audit to obtain reasonable assurance about whether the financial statements are free of material misstatement, whether due to error or fraud.
Our audits included performing procedures to assess the risks of material misstatement of the financial statements, whether due to error or fraud, and performing procedures that respond to those risks. Such procedures included examining, on a test basis, evidence regarding the amounts and disclosures in the financial statements. Our audits also included evaluating the accounting principles used and significant estimates made by management, as well as evaluating the overall presentation of the financial statements. Our procedures included confirmation of securities owned as of October 31, 2018 by correspondence with the custodian and transfer agent. We believe that our audits provide a reasonable basis for our opinion.
PricewaterhouseCoopers LLP
Houston, TX
December 28, 2018
We have served as the auditor of one or more of the investment companies in the Invesco group of investment companies since at least 1995. We have not been able to determine the specific year we began serving as auditor.
20 Invesco Endeavor Fund
Calculating your ongoing Fund expenses
Example
As a shareholder of the Fund, you incur two types of costs: (1) transaction costs, which may include sales charges (loads) on purchase payments or contingent deferred sales charges on redemptions, if any; and (2) ongoing costs, including management fees, distribution and/or service (12b-1) fees, and other Fund expenses. This example is intended to help you understand your ongoing costs (in dollars) of investing in the Fund and to compare these costs with ongoing costs of investing in other mutual funds. The example is based on an investment of $1,000 invested at the beginning of the period and held for the entire period May 1, 2018 through October 31, 2018.
Actual expenses
The table below provides information about actual account values and actual expenses. You may use the information in this table, together with the amount you invested, to estimate the expenses that you paid over the period. Simply divide your account value by $1,000 (for example, an $8,600 account value divided by $1,000 = 8.6), then multiply the result by the number in the table under the heading entitled “Actual Expenses Paid During Period” to estimate the expenses you paid on your account during this period.
Hypothetical example for comparison purposes
The table below also provides information about hypothetical account values and hypothetical expenses based on the Fund’s actual expense ratio and an assumed rate of return of 5% per year before expenses, which is not the Fund’s actual return.
The hypothetical account values and expenses may not be used to estimate the actual ending account balance or expenses you paid for the period. You may use this information to compare the ongoing costs of investing in the Fund and other funds. To do so, compare this 5% hypothetical example with the 5% hypothetical examples that appear in the shareholder reports of the other funds.
Please note that the expenses shown in the table are meant to highlight your ongoing costs only and do not reflect any transaction costs, such as sales charges (loads) on purchase payments or contingent deferred sales charges on redemptions, if any. Therefore, the hypothetical information is useful in comparing ongoing costs only, and will not help you determine the relative total costs of owning different funds. In addition, if these transaction costs were included, your costs would have been higher.
| | | | | | | | | | | | | | | | | | | | | | | | |
Class | | Beginning
Account Value
(05/01/18) | | | ACTUAL | | | HYPOTHETICAL
(5% annual return before
expenses) | | | Annualized
Expense Ratio | |
| | Ending
Account Value
(10/31/18)1 | | | Expenses
Paid During
Period2 | | | Ending
Account Value
(10/31/18) | | | Expenses
Paid During
Period2 | |
| A | | $ | 1,000.00 | | | $ | 947.50 | | | $ | 6.53 | | | $ | 1,018.50 | | | $ | 6.77 | | | | 1.33 | % |
| C | | | 1,000.00 | | | | 943.90 | | | | 10.19 | | | | 1,014.72 | | | | 10.56 | | | | 2.08 | |
| R | | | 1,000.00 | | | | 946.40 | | | | 7.75 | | | | 1,017.24 | | | | 8.03 | | | | 1.58 | |
| Y | | | 1,000.00 | | | | 948.60 | | | | 5.30 | | | | 1,019.76 | | | | 5.50 | | | | 1.08 | |
| R5 | | | 1,000.00 | | | | 949.20 | | | | 4.77 | | | | 1,020.32 | | | | 4.94 | | | | 0.97 | |
| R6 | | | 1,000.00 | | | | 949.50 | | | | 4.42 | | | | 1,020.67 | | | | 4.58 | | | | 0.90 | |
| 1 | The actual ending account value is based on the actual total return of the Fund for the period May 1, 2018 through October 31, 2018, after actual expenses and will differ from the hypothetical ending account value which is based on the Fund’s expense ratio and a hypothetical annual return of 5% before expenses. |
| 2 | Expenses are equal to the Fund’s annualized expense ratio as indicated above multiplied by the average account value over the period, multiplied by 184/365 to reflect the most recent fiscal half year. |
21 Invesco Endeavor Fund
Approval of Investment Advisory and Sub-Advisory Contracts
At meetings held on June 5-6, 2018, the Board of Trustees (the Board or the Trustees) of AIM Investment Funds (Invesco Investment Funds) as a whole, and the independent Trustees, who comprise over 75% of the Board, voting separately, approved the continuance of the Invesco Endeavor Fund’s (the Fund) Master Investment Advisory Agreement with Invesco Advisers, Inc. (Invesco Advisers and the investment advisory agreement) and the Master Intergroup Sub-Advisory Contract for Mutual Funds with Invesco Asset Management Deutschland GmbH, Invesco Asset Management Limited, Invesco Asset Management (Japan) Limited, Invesco Hong Kong Limited, Invesco Senior Secured Management, Inc., Invesco Canada Ltd. and separate Sub-Advisory Contracts with Invesco Capital Management LLC and Invesco Asset Management (India) Private Limited (collectively, the Affiliated Sub-Advisers and the sub-advisory contracts) for another year, effective July 1, 2018. After evaluating the factors discussed below, among others, the Board approved the renewal of the Fund’s investment advisory agreement and the sub-advisory contracts and determined that the compensation payable by the Fund to Invesco Advisers and by Invesco Advisers to the Affiliated Sub-Advisers is fair and reasonable.
The Board’s Evaluation Process
The Board’s Investments Committee has established three Sub-Committees, which meet throughout the year to review the performance of funds advised by Invesco Advisers (the Invesco Funds). Over the course of each year, the Sub-Committees meet with portfolio managers for their assigned Invesco Funds and other members of management to review detailed information about investment performance and portfolio attributes of these funds. The Board took into account evaluations and reports that it received from the Investments Committee and Sub-Committees, as well as the information provided to such committees and the Board throughout the year, in considering whether to approve each Invesco Fund’s investment advisory agreement and sub-advisory contracts.
As part of the contract renewal process, the Board reviews and considers information provided in response to detailed requests for information submitted to management by the independent Trustees with assistance from legal counsel to the independent Trustees. The Board receives comparative investment performance and fee data regarding the Invesco Funds prepared by Invesco Advisers and Broadridge Financial Solutions, Inc. (Broadridge), an independent mutual fund data provider. The Board also receives an independent written evaluation from the Senior Officer, an officer of the Invesco Funds who reports directly to the independent Trustees. The Senior Officer’s
evaluation is prepared as part of his responsibility to manage the process by which the Invesco Funds’ proposed management fees are negotiated during the annual contract renewal process to ensure they are negotiated in a manner that is at arms’ length and reasonable. In addition to meetings with Invesco Advisers and fund counsel throughout the year, the independent Trustees also discuss the continuance of the investment advisory agreement and sub-advisory contracts in separate sessions with the Senior Officer and with independent legal counsel.
The discussion below is a summary of the Senior Officer’s independent written evaluation with respect to the Fund’s investment advisory agreement, as well as a discussion of the material factors and related conclusions that formed the basis for the Board’s approval of the Fund’s investment advisory agreement and sub-advisory contracts. The Trustees’ review and conclusions are based on the comprehensive consideration of all information presented to them during the course of the year and in prior years and are not the result of any single determinative factor. Moreover, one Trustee may have weighed a particular piece of information or factor differently than another Trustee. This information is current as of June 6, 2018.
Factors and Conclusions and Summary of Independent Written Fee Evaluation
| A. | Nature, Extent and Quality of Services Provided by Invesco Advisers and the Affiliated Sub-Advisers |
The Board reviewed the nature, extent and quality of the advisory services provided to the Fund by Invesco Advisers under the Fund’s investment advisory agreement, and the credentials and experience of the officers and employees of Invesco Advisers who provide these services, including the Fund’s portfolio manager(s). The Board’s review included consideration of Invesco Advisers’ investment process oversight and structure, credit analysis and investment risk management. The Board also considered non-advisory services that Invesco Advisers and its affiliates provide to the Invesco Funds such as various back office support functions, third party oversight, internal audit, valuation, portfolio trading and legal and compliance. The Board also reviewed and considered the benefits to shareholders of investing in a fund that is part of the Invesco family of funds under the umbrella of Invesco Ltd., Invesco Advisers’ parent company, and noted Invesco Ltd.’s depth and experience in conducting an investment management business, as well as its commitment of financial and other resources to such business. The Board concluded that the nature, extent and quality of the services provided to the Fund by
Invesco Advisers are appropriate and satisfactory.
The Board reviewed the services that may be provided by the Affiliated Sub-Advisers under the sub-advisory contracts and the credentials and experience of the officers and employees of the Affiliated Sub-Advisers who provide these services. The Board noted the Affiliated Sub-Advisers’ expertise with respect to certain asset classes and that the Affiliated Sub-Advisers have offices and personnel that are located in financial centers around the world. As a result, the Board noted that the Affiliated Sub-Advisers can provide research and investment analysis on the markets and economies of various countries in which the Fund may invest, make recommendations regarding securities and assist with security trades. The Board concluded that the sub-advisory contracts may benefit the Fund and its shareholders by permitting Invesco Advisers to use the resources and talents of the Affiliated Sub-Advisers in managing the Fund. The Board concluded that the nature, extent and quality of the services that may be provided by the Affiliated Sub-Advisers are appropriate and satisfactory.
| B. | Fund Investment Performance |
The Board considered Fund investment performance as a relevant factor in considering whether to approve the investment advisory agreement as well as the sub-advisory contracts for the Fund, as Invesco Canada Ltd. currently manages assets of the Fund.
The Board compared the Fund’s investment performance over multiple time periods ending December 31, 2017 to the performance of funds in the Broadridge performance universe and against the Lipper Mid-Cap Core Funds Index. The Board noted that performance of Class A shares of the Fund was in the second quintile of its performance universe for the one year period, the third quintile for the three year period and the fifth quintile for the five year period (the first quintile being the best performing funds and the fifth quintile being the worst performing funds). The Board noted that performance of Class A shares of the Fund was above the performance of the Index for the one year period, reasonably comparable to the performance of the Index for the three year period and below the performance of the Index for the five year period. The Board noted that the Fund’s cash position and overweight exposure to and security selection in certain sectors negatively impacted performance. The Trustees also reviewed more recent Fund performance and this review did not change their conclusions.
| C. | Advisory and Sub-Advisory Fees and Fund Expenses |
The Board compared the Fund’s contractual management fee rate to the contractual management fee rates of funds in the Fund’s
22 Invesco Endeavor Fund
Broadridge expense group. The Board noted that the contractual management fee rate for Class A shares of the Fund was below the median contractual management fee rate of funds in its expense group. The Board noted that the term “contractual management fee” for funds in the expense group may include both advisory and certain non-portfolio management administrative services fees, but that Broadridge does not provide information on a fund by fund basis as to what is included. The Board also reviewed the methodology used by Broadridge in providing expense group information, which includes using each fund’s contractual management fee schedule (including any applicable breakpoints) as reported in the most recent prospectus or statement of additional information for each fund in the expense group. The Board also considered comparative information regarding the Fund’s total expense ratio and its various components. The Board noted that the Fund’s total expense ratio was in the fourth quintile of its expense group and discussed with management reasons for such relative total expenses.
The Board noted that Invesco Advisers has contractually agreed to waive fees and/or limit expenses of the Fund in an amount necessary to limit total annual operating expenses to a specified percentage of average daily net assets for each class of the Fund.
The Board noted that Invesco Advisers and the Affiliated Sub-Advisers do not manage other funds or client accounts with investment strategies comparable to those of the Fund.
The Board also considered the services that may be provided by the Affiliated Sub-Advisers pursuant to the sub-advisory contracts, as well as the fees payable by Invesco Advisers to the Affiliated Sub-Advisers pursuant to the sub-advisory contracts. The Board noted that Invesco Advisers retains overall responsibility for, and provides services to, sub-advised Invesco Funds, including oversight of the Affiliated Sub-Advisers as well as the additional services described herein other than day-to-day portfolio management.
| D. | Economies of Scale and Breakpoints |
The Board considered the extent to which there may be economies of scale in the provision of advisory services to the Fund. The Board also considered that the Fund benefits from economies of scale through contractual breakpoints in the Fund’s advisory fee schedule, which generally operate to reduce the Fund’s expense ratio as it grows in size. The Board noted that the Fund shares directly in economies of scale through lower fees charged by third party service providers based on the combined size of the Invesco Funds. The Board noted that the Fund may also benefit from economies of scale through initial fee setting, fee waivers and expense reimbursements.
| E. | Profitability and Financial Resources |
The Board reviewed information from Invesco Advisers concerning the costs of the advisory and other services that Invesco Advisers and its
affiliates provide to the Fund and the Invesco Funds and the profitability of Invesco Advisers and its affiliates in providing these services. The Board considered the methodology used for calculating profitability and noted the periodic review of such methodology by an independent consultant. The Board noted that Invesco Advisers continues to operate at a net profit from services Invesco Advisers and its affiliates provide to the Invesco Funds and the Fund. The Board did not deem the level of profits realized by Invesco Advisers and its affiliates from providing services to the Fund to be excessive given the nature, extent and quality of the services provided. The Board received information from Invesco Advisers demonstrating that Invesco Advisers and the Affiliated Sub-Advisers are financially sound and have the resources necessary to perform their obligations under the investment advisory agreement and sub-advisory contracts.
| F. | Collateral Benefits to Invesco Advisers and its Affiliates |
The Board considered various other benefits received by Invesco Advisers and its affiliates from the relationship with the Fund, including the fees received for providing administrative, transfer agency and distribution services to the Fund. The Board considered comparative information regarding fees charged for these services, including information provided by Broadridge and other independent sources. The Board considered the performance of Invesco Advisers and its affiliates in providing these services and the organizational structure employed to provide these services. The Board also considered that these services are provided to the Fund pursuant to written contracts that are reviewed and approved on an annual basis by the Board; and that the services are required for the operation of the Fund.
The Board considered the benefits realized by Invesco Advisers and the Affiliated Sub-Advisers as a result of portfolio brokerage transactions executed through “soft dollar” arrangements. The Board noted that soft dollar arrangements may result in the Fund bearing costs to purchase research that may be used by Invesco Advisers or the Affiliated Sub-Advisers with other clients and may reduce Invesco Advisers’ or the Affiliated Sub-Advisers’ expenses. The Board also considered that it receives periodic reports from Invesco representing that these arrangements are consistent with regulatory requirements. The Board did not deem the soft dollar arrangements to be inappropriate.
The Board considered that the Fund’s uninvested cash and cash collateral from any securities lending arrangements may be invested in money market funds advised by Invesco Advisers pursuant to procedures approved by the Board. The Board noted that Invesco Advisers receives advisory fees from these affiliated money market funds attributable to such investments, although Invesco Advisers has contractually agreed to waive through varying periods the advisory fees payable by the Invesco Funds with respect to
certain investments in the affiliated money market funds. The waiver is in an amount equal to 100% of the net advisory fee Invesco Advisers receives from the affiliated money market funds with respect to the Fund’s investment in the affiliated money market funds of uninvested cash, but not cash collateral. The Board concluded that the amount of advisory fees received by Invesco Advisers from the Fund’s investment of cash collateral from any securities lending arrangements in the affiliated money market funds is fair and reasonable.
The Board also considered that an affiliated broker may receive commissions for executing certain trades for the Fund. Invesco Advisers and the Affiliated Sub-Advisers may use the affiliated broker to, among other things, control order routing and minimize information leakage, and the Board was advised that such trades are executed in compliance with rules under the federal securities laws and consistent with best execution obligations.
23 Invesco Endeavor Fund
Tax Information
Form 1099-DIV, Form 1042-S and other year–end tax information provide shareholders with actual calendar year amounts that should be included in their tax returns. Shareholders should consult their tax advisors.
The following distribution information is being provided as required by the Internal Revenue Code or to meet a specific state’s requirement.
The Fund designates the following amounts or, if subsequently determined to be different, the maximum amount allowable for its fiscal year ended October 31, 2018:
| | | | |
Federal and State Income Tax | |
Long-Term Capital Gain Distributions | | $ | 5,577,002 | |
Qualified Dividend Income* | | | 64.13 | % |
Corporate Dividends Received Deduction* | | | 55.22 | % |
U.S. Treasury Obligations* | | | 0 | % |
| | * | The above percentages are based on ordinary income dividends paid to shareholders during the Fund’s fiscal year. |
24 Invesco Endeavor Fund
Trustees and Officers
The address of each trustee and officer is AIM Investment Funds (Invesco Investment Funds) (the “Trust”), 11 Greenway Plaza, Suite 1000, Houston, Texas 77046-1173. The trustees serve for the life of the Trust, subject to their earlier death, incapacitation, resignation, retirement or removal as more specifically provided in the Trust’s organizational documents. Each officer serves for a one year term or until their successors are elected and qualified. Column two below includes length of time served with predecessor entities, if any.
| | | | | | | | |
Name, Year of Birth and
Position(s) Held with the Trust | | Trustee and/
or Officer Since | | Principal Occupation(s)
During Past 5 Years | | Number of
Funds in Fund
Complex
Overseen by
Trustee | | Other Directorship(s)
Held by Trustee During
Past 5 Years |
| Interested Persons | | | | | | | | |
| Martin L. Flanagan1 — 1960 Trustee | | 2007 | | Executive Director, Chief Executive Officer and President, Invesco Ltd. (ultimate parent of Invesco and a global investment management firm); Trustee, The Invesco Funds; Vice Chair, Investment Company Institute; and Member of Executive Board, SMU Cox School of Business Formerly: Advisor to the Board, Invesco Advisers, Inc. (formerly known as Invesco Institutional (N.A.), Inc.); Chairman and Chief Executive Officer, Invesco Advisers, Inc. (registered investment adviser); Director, Chairman, Chief Executive Officer and President, Invesco Holding Company (US), Inc. (formerly IVZ Inc.) (holding company), Invesco Group Services, Inc. (service provider) and Invesco North American Holdings, Inc. (holding company); Director, Chief Executive Officer and President, Invesco Holding Company Limited (parent of Invesco and a global investment management firm); Director, Invesco Ltd.; Chairman, Investment Company Institute and President, Co-Chief Executive Officer, Co-President, Chief Operating Officer and Chief Financial Officer, Franklin Resources, Inc. (global investment management organization) | | 158 | | None |
Philip A. Taylor2 — 1954 Trustee and Senior Vice President | | 2006 | | Head of the Americas and Senior Managing Director, Invesco Ltd.; Director, Invesco Advisers, Inc. (formerly known as Invesco Institutional (N.A.), Inc.) (registered investment adviser); Director and Chairman, Invesco Investment Services, Inc. (formerly known as Invesco AIM Investment Services, Inc.) (registered transfer agent); Chief Executive Officer, Invesco Corporate Class Inc. (corporate mutual fund company); Director, Chairman and Chief Executive Officer, Invesco Canada Ltd. (formerly known as Invesco Trimark Ltd./Invesco Trimark Ltèe) (registered investment adviser and registered transfer agent); Trustee and Senior Vice President, The Invesco Funds; Director, Invesco Investment Advisers LLC (formerly known as Van Kampen Asset Management) Formerly: Director, Chairman, Chief Executive Officer and President, Invesco Management Group, Inc. (formerly known as Invesco AIM Management Group, Inc.) (financial services holding company); Co-Chairman, Co-President and Co-Chief Executive Officer, Invesco Advisers, Inc. (formerly known as Invesco Institutional (N.A.), Inc.) (registered investment adviser); Director, Chief Executive Officer and President, Van Kampen Exchange Corp; President and Principal Executive Officer, The Invesco Funds (other than AIM Treasurer’s Series Trust (Invesco Treasurer’s Series Trust), Short-Term Investments Trust and Invesco Management Trust); Executive Vice President, The Invesco Funds (AIM Treasurer’s Series Trust (Invesco Treasurer’s Series Trust), Short-Term Investments Trust and Invesco Management Trust only); Director and President, INVESCO Funds Group, Inc. (registered investment adviser and registered transfer agent); Director and Chairman, IVZ Distributors, Inc. (formerly known as INVESCO Distributors, Inc.) (registered broker dealer); Director, President and Chairman, Invesco Inc. (holding company), Invesco Canada Holdings Inc. (holding company), Trimark Investments Ltd./Placements Trimark Ltèe and Invesco Financial Services Ltd/Services Financiers Invesco Ltèe; Chief Executive Officer, Invesco Canada Fund Inc. (corporate mutual fund company); Director and Chairman, Van Kampen Investor Services Inc.; Director, Chief Executive Officer and President, 1371 Preferred Inc. (holding company) and Van Kampen Investments Inc.; Director and President, AIM GP Canada Inc. (general partner for limited partnerships) and Van Kampen Advisors, Inc.; Director and Chief Executive Officer, Invesco Trimark Dealer Inc. (registered broker dealer); Director, Invesco Distributors, Inc. (formerly known as Invesco AIM Distributors, Inc.) (registered broker dealer); Manager, Invesco Capital Management LLC; Director, Chief Executive Officer and President, Invesco Advisers, Inc.; Director, Chairman, Chief Executive Officer and President, Invesco AIM Capital Management, Inc.; President, Invesco Trimark Dealer Inc. and Invesco Trimark Ltd./Invesco Trimark Ltèe; Director and President, AIM Trimark Corporate Class Inc. and AIM Trimark Canada Fund Inc.; Senior Managing Director, Invesco Holding Company Limited; Director and Chairman, Fund Management Company (former registered broker dealer); President and Principal Executive Officer, The Invesco Funds (AIM Treasurer’s Series Trust (Invesco Treasurer’s Series Trust), and Short-Term Investments Trust only); President, AIM Trimark Global Fund Inc. and AIM Trimark Canada Fund Inc. | | 158 | | None |
| 1 | Mr. Flanagan is considered an interested person (within the meaning of Section 2(a)(19) of the 1940 Act) of the Trust because he is an officer of the Adviser to the Trust, and an officer and a director of Invesco Ltd., ultimate parent of the Adviser. |
| 2 | Mr. Taylor is considered an interested person (within the meaning of Section 2(a)(19) of the 1940 Act) of the Trust because he is an officer and a director of the Adviser. |
T-1 Invesco Endeavor Fund
Trustees and Officers—(continued)
| | | | | | | | |
Name, Year of Birth and
Position(s) Held with the Trust | | Trustee and/
or Officer Since | | Principal Occupation(s)
During Past 5 Years | | Number of
Funds in Fund
Complex
Overseen by
Trustee | | Other Directorship(s)
Held by Trustee During
Past 5 Years |
| Independent Trustees | | | | | | �� | | |
Bruce L. Crockett — 1944 Trustee and Chair | | 2001 | | Chairman, Crockett Technologies Associates (technology consulting company) Formerly: Director, Captaris (unified messaging provider); Director, President and Chief Executive Officer, COMSAT Corporation; Chairman, Board of Governors of INTELSAT (international communications company); ACE Limited (insurance company); Independent Directors Council and Investment Company Institute: Member of the Audit Committee, Investment Company Institute; Member of the Executive Committee and Chair of the Governance Committee, Independent Directors Council | | 158 | | Director and Chairman of the Audit Committee, ALPS (Attorneys Liability Protection Society) (insurance company); Director and Member of the Audit Committee and Compensation Committee, Ferroglobe PLC (metallurgical company) |
David C. Arch — 1945 Trustee | | 2010 | | Chairman of Blistex Inc. (consumer health care products manufacturer); Member, World Presidents’ Organization | | 158 | | Board member of the Illinois Manufacturers’ Association |
Jack M. Fields — 1952 Trustee | | 2001 | | Chief Executive Officer, Twenty First Century Group, Inc. (government affairs company); and Chairman, Discovery Learning Alliance (non-profit) Formerly: Owner and Chief Executive Officer, Dos Angeles Ranch L.P. (cattle, hunting, corporate entertainment); Director, Insperity, Inc. (formerly known as Administaff) (human resources provider); Chief Executive Officer, Texana Timber LP (sustainable forestry company); Director of Cross Timbers Quail Research Ranch (non-profit); and member of the U.S. House of Representatives | | 158 | | None |
Cynthia Hostetler — 1962 Trustee | | 2017 | | Non-Executive Director and Trustee of a number of public and private business corporations Formerly: Director, Aberdeen Investment Funds (4 portfolios); Head of Investment Funds and Private Equity, Overseas Private Investment Corporation; President, First Manhattan Bancorporation, Inc.; Attorney, Simpson Thacher & Bartlett LLP | | 158 | | Vulcan Materials Company (construction materials company); Trilinc Global Impact Fund; Artio Global Investment LLC (mutual fund complex); Edgen Group, Inc. (specialized energy and infrastructure products distributor) |
Eli Jones — 1961 Trustee | | 2016 | | Professor and Dean, Mays Business School — Texas A&M University Formerly: Professor and Dean, Walton College of Business, University of Arkansas and E.J. Ourso College of Business, Louisiana State University; Director, Arvest Bank | | 158 | | Insperity, Inc. (formerly known as Administaff) (human resources provider) |
Prema Mathai-Davis — 1950 Trustee | | 2001 | | Retired | | 158 | | None |
Teresa M. Ressel — 1962 Trustee | | 2017 | | Non-executive director and trustee of a number of public and private business corporations Formerly: Chief Financial Officer, Olayan America, The Olayan Group (international investor/commercial/industrial); Chief Executive Officer, UBS Securities LLC; Group Chief Operating Officer, Americas, UBS AG; Assistant Secretary for Management & Budget and CFO, US Department of the Treasury | | 158 | | Atlantic Power Corporation (power generation company); ON Semiconductor Corp. (semiconductor supplier) |
Ann Barnett Stern — 1957 Trustee | | 2017 | | President and Chief Executive Officer, Houston Endowment Inc. (private philanthropic institution) Formerly: Executive Vice President and General Counsel, Texas Children’s Hospital; Attorney, Beck, Redden and Secrest, LLP; Business Law Instructor, University of St. Thomas; Attorney, Andrews & Kurth LLP | | 158 | | Federal Reserve Bank of Dallas |
Raymond Stickel, Jr. — 1944 Trustee | | 2005 | | Retired Formerly: Director, Mainstay VP Series Funds, Inc. (25 portfolios); Partner, Deloitte & Touche | | 158 | | None |
Robert C. Troccoli — 1949 Trustee | | 2016 | | Adjunct Professor, University of Denver — Daniels College of Business Formerly: Senior Partner, KPMG LLP | | 158 | | None |
Christopher L. Wilson — 1957 Trustee | | 2017 | | Non-executive director and trustee of a number of public and private business corporations Formerly: Director, TD Asset Management USA Inc. (mutual fund complex) (22 portfolios); Managing Partner, CT2, LLC (investing and consulting firm); President/Chief Executive Officer, Columbia Funds, Bank of America Corporation; President/Chief Executive Officer, CDC IXIS Asset Management Services, Inc.; Principal & Director of Operations, Scudder Funds, Scudder, Stevens & Clark, Inc.; Assistant Vice President, Fidelity Investments | | 158 | | ISO New England, Inc. (non-profit organization managing regional electricity market) |
T-2 Invesco Endeavor Fund
Trustees and Officers—(continued)
| | | | | | | | |
Name, Year of Birth and
Position(s) Held with the Trust | | Trustee and/
or Officer Since | | Principal Occupation(s)
During Past 5 Years | | Number of
Funds in Fund
Complex
Overseen by
Trustee | | Other Directorship(s)
Held by Trustee During
Past 5 Years |
| Other Officers | | | | | | | | |
Sheri Morris — 1964 President, Principal Executive Officer and Treasurer | | 1999 | | President, Principal Executive Officer and Treasurer, The Invesco Funds; Vice President, Invesco Advisers, Inc. (formerly known as Invesco Institutional (N.A.), Inc.) (registered investment adviser); and Vice President, Invesco Exchange-Traded Fund Trust, Invesco Exchange-Traded Fund Trust II, Invesco India Exchange-Traded Fund Trust, Invesco Actively Managed Exchange-Traded Fund Trust, Invesco Actively Managed Exchange-Traded Commodity Fund Trust and Invesco Exchange-Traded Self-Indexed Fund Trust Formerly: Vice President and Principal Financial Officer, The Invesco Funds; Vice President, Invesco AIM Advisers, Inc., Invesco AIM Capital Management, Inc. and Invesco AIM Private Asset Management, Inc.; Assistant Vice President and Assistant Treasurer, The Invesco Funds and Assistant Vice President, Invesco Advisers, Inc., Invesco AIM Capital Management, Inc. and Invesco AIM Private Asset Management, Inc.; and Treasurer, Invesco Exchange-Traded Fund Trust, Invesco Exchange-Traded Fund Trust II, Invesco India Exchange-Traded Fund Trust and Invesco Actively Managed Exchange-Traded Fund Trust | | N/A | | N/A |
Russell C. Burk — 1958 Senior Vice President and Senior Officer | | 2005 | | Senior Vice President and Senior Officer, The Invesco Funds | | N/A | | N/A |
Jeffrey H. Kupor — 1968 Senior Vice President, Chief Legal Officer and Secretary | | 2018 | | Senior Vice President and Secretary, Invesco Advisers, Inc. (formerly known as Invesco Institutional (N.A.), Inc.) (registered investment adviser); Senior Vice President and Secretary, Invesco Distributors, Inc. (formerly known as Invesco AIM Distributors, Inc.); Vice President and Secretary, Invesco Investment Services, Inc. (formerly known as Invesco AIM Investment Services, Inc.) Senior Vice President, Chief Legal Officer and Secretary, The Invesco Funds; Secretary and General Counsel, Invesco Investment Advisers LLC (formerly known as Van Kampen Asset Management); Secretary and General Counsel, Invesco Capital Markets, Inc. (formerly known as Van Kampen Funds Inc.) and Chief Legal Officer, Invesco Exchange-Traded Fund Trust, Invesco Exchange-Traded Fund Trust II, Invesco India Exchange-Traded Fund Trust, Invesco Actively Managed Exchange-Traded Fund Trust, Invesco Actively Managed Exchange-Traded Commodity Fund Trust and Invesco Exchange-Traded Self-Indexed Fund Trust; Secretary, Invesco Indexing LLC; Secretary and General Counsel, INVESCO Private Capital Investments, Inc.; Secretary, W.L. Ross & Co., LLC; Secretary and Vice President, Jemstep, Inc. Formerly: Senior Vice President, Secretary and General Counsel, Invesco Management Group, Inc. (formerly known as Invesco AIM Management Group, Inc.); Assistant Secretary, INVESCO Asset Management (Bermuda) Ltd.; Secretary and General Counsel, Invesco Private Capital, Inc.; Assistant Secretary and General Counsel, INVESCO Realty, Inc.; Secretary and General Counsel, Invesco Senior Secured Management, Inc.; and Secretary, Sovereign G./P. Holdings Inc. | | N/A | | N/A |
John M. Zerr — 1962 Senior Vice President | | 2006 | | Chief Operating Officer of the Americas; Senior Vice President, Invesco Advisers, Inc. (formerly known as Invesco Institutional (N.A.), Inc.) (registered investment adviser); Senior Vice President, Invesco Distributors, Inc. (formerly known as Invesco AIM Distributors, Inc.); Director and Vice President, Invesco Investment Services, Inc. (formerly known as Invesco AIM Investment Services, Inc.) Senior Vice President, The Invesco Funds; Managing Director, Invesco Capital Management LLC; Director, Invesco Investment Advisers LLC (formerly known as Van Kampen Asset Management); Senior Vice President, Invesco Capital Markets, Inc. (formerly known as Van Kampen Funds Inc.); Manager, Invesco Indexing LLC Formerly: Director and Senior Vice President, Invesco Management Group, Inc. (formerly known as Invesco AIM Management Group, Inc.); Secretary and General Counsel, Invesco Management Group, Inc. (formerly known as Invesco AIM Management Group, Inc.); Secretary, Invesco Investment Services, Inc. (formerly known as Invesco AIM Investment Services, Inc.); Chief Legal Officer and Secretary, The Invesco Funds; Secretary and General Counsel, Invesco Investment Advisers LLC (formerly known as Van Kampen Asset Management); Secretary and General Counsel, Invesco Capital Markets, Inc. (formerly known as Van Kampen Funds Inc.); Chief Legal Officer, Invesco Exchange-Traded Fund Trust, Invesco Exchange-Traded Fund Trust II, Invesco India Exchange-Traded Fund Trust, Invesco Actively Managed Exchange-Traded Fund Trust, Invesco Actively Managed Exchange-Traded Commodity Fund Trust and Invesco Exchange-Traded Self-Indexed Fund Trust; Secretary, Invesco Indexing LLC; Director, Secretary, General Counsel and Senior Vice President, Van Kampen Exchange Corp.; Director, Vice President and Secretary, IVZ Distributors, Inc. (formerly known as INVESCO Distributors, Inc.); Director and Vice President, INVESCO Funds Group, Inc.; Director and Vice President, Van Kampen Advisors Inc.; Director, Vice President, Secretary and General Counsel, Van Kampen Investor Services Inc.; Director and Secretary, Invesco Distributors, Inc. (formerly known as Invesco AIM Distributors, Inc.); Director, Senior Vice President, General Counsel and Secretary, Invesco AIM Advisers, Inc. and Van Kampen Investments Inc.; Director, Vice President and Secretary, Fund Management Company; Director, Senior Vice President, Secretary, General Counsel and Vice President, Invesco AIM Capital Management, Inc.; Chief Operating Officer and General Counsel, Liberty Ridge Capital, Inc. (an investment adviser) | | N/A | | N/A |
T-3 Invesco Endeavor Fund
Trustees and Officers—(continued)
| | | | | | | | |
Name, Year of Birth and
Position(s) Held with the Trust | | Trustee and/
or Officer Since | | Principal Occupation(s)
During Past 5 Years | | Number of
Funds in Fund
Complex
Overseen by
Trustee | | Other Directorship(s)
Held by Trustee During
Past 5 Years |
| Other Officers—(continued) | | | | | | | | |
Gregory G. McGreevey — 1962 Senior Vice President | | 2012 | | Senior Managing Director, Invesco Ltd.; Director, Chairman, President, and Chief Executive Officer, Invesco Advisers, Inc. (formerly known as Invesco Institutional (N.A.), Inc.) (registered investment adviser); Director, Invesco Mortgage Capital, Inc. and Invesco Senior Secured Management, Inc.; and Senior Vice President, The Invesco Funds Formerly: Senior Vice President, Invesco Management Group, Inc. and Invesco Advisers, Inc.; Assistant Vice President, The Invesco Funds | | N/A | | N/A |
Kelli Gallegos — 1970 Vice President, Principal Financial Officer and Assistant Treasurer | | 2008 | | Vice President and Treasurer, Invesco Exchange-Traded Fund Trust, Invesco Exchange-Traded Fund Trust II, Invesco India Exchange-Traded Fund Trust, Invesco Actively Managed Exchange-Traded Fund Trust, Invesco Actively Managed Exchange-Traded Commodity Fund Trust and Invesco Exchange-Traded Self-Indexed Fund Trust; Vice President, Principal Financial Officer and Assistant Treasurer, The Invesco Funds; Principal Financial and Accounting Officer — Pooled Investments, Invesco Capital Management LLC Formerly: Assistant Treasurer, Invesco Exchange-Traded Fund Trust, Invesco Exchange-Traded Fund Trust II, Invesco India Exchange-Traded Fund Trust, Invesco Actively Managed Exchange-Traded Fund Trust, Invesco Actively Managed Exchange-Traded Commodity Fund Trust and Invesco Exchange-Traded Self-Indexed Fund Trust; Assistant Treasurer, Invesco Capital Management LLC; Assistant Vice President, The Invesco Funds | | N/A | | N/A |
Tracy Sullivan — 1962 Vice President, Chief Tax Officer and Assistant Treasurer | | 2008 | | Vice President, Chief Tax Officer and Assistant Treasurer, The Invesco Funds; Assistant Treasurer, Invesco Capital Management LLC, Invesco Exchange-Traded Fund Trust, Invesco Exchange-Traded Fund Trust II, Invesco India Exchange-Traded Fund Trust, Invesco Actively Managed Exchange-Traded Fund Trust, Invesco Actively Managed Exchange-Traded Commodity Fund Trust and Invesco Exchange-Traded Self-Indexed Fund Trust Formerly: Assistant Vice President, The Invesco Funds | | N/A | | N/A |
Crissie M. Wisdom — 1969 Anti-Money Laundering Compliance Officer | | 2013 | | Anti-Money Laundering Compliance Officer, Invesco Advisers, Inc. (formerly known as Invesco Institutional (N.A.), Inc.) (registered investment adviser), Invesco Capital Markets, Inc. (formerly known as Van Kampen Funds Inc.), Invesco Distributors, Inc., Invesco Investment Services, Inc., The Invesco Funds, and Invesco Exchange-Traded Fund Trust, Invesco Exchange-Traded Fund Trust II, Invesco India Exchange-Traded Fund Trust, Invesco Actively Managed Exchange-Traded Fund Trust, Invesco Actively Managed Exchange-Traded Commodity Fund Trust and Invesco Exchange-Traded Self-Indexed Fund Trust; Anti-Money Laundering Compliance Officer and Bank Secrecy Act Officer, INVESCO National Trust Company and Invesco Trust Company; and Fraud Prevention Manager and Controls and Risk Analysis Manager for Invesco Investment Services, Inc. Formerly: Anti-Money Laundering Compliance Officer, Van Kampen Exchange Corp. and Invesco Management Group, Inc. | | N/A | | N/A |
Robert R. Leveille — 1969 Chief Compliance Officer | | 2016 | | Chief Compliance Officer, Invesco Advisers, Inc. (registered investment adviser); and Chief Compliance Officer, The Invesco Funds Formerly: Chief Compliance Officer, Putnam Investments and the Putnam Funds | | N/A | | N/A |
The Statement of Additional Information of the Trust includes additional information about the Fund’s Trustees and is available upon request, without charge, by calling 1.800.959.4246. Please refer to the Fund’s Statement of Additional Information for information on the Fund’s sub-advisers.
| | | | | | |
Office of the Fund 11 Greenway Plaza, Suite 1000 Houston, TX 77046-1173 | | Investment Adviser Invesco Advisers, Inc. 1555 Peachtree Street, N.E. Atlanta, GA 30309 | | Distributor Invesco Distributors, Inc. 11 Greenway Plaza, Suite 1000 Houston, TX 77046-1173 | | Auditors PricewaterhouseCoopers LLP 1000 Louisiana Street, Suite 5800 Houston, TX 77002-5021 |
| | | |
| | | | | | |
Counsel to the Fund Stradley Ronon Stevens & Young, LLP 2005 Market Street, Suite 2600 Philadelphia, PA 19103-7018 | | Counsel to the Independent Trustees Goodwin Procter LLP 901 New York Avenue, N.W. Washington, D.C. 20001 | | Transfer Agent Invesco Investment Services, Inc. 11 Greenway Plaza, Suite 1000 Houston, TX 77046-1173 | | Custodian State Street Bank and Trust Company 225 Franklin Street Boston, MA 02110-2801 |
T-4 Invesco Endeavor Fund
Explore High-Conviction Investing with Invesco

Go paperless with eDelivery
Visit invesco.com/edelivery to enjoy the convenience and security of anytime electronic access to your investment documents.
With eDelivery, you can elect to have any or all of the following materials delivered straight to your inbox to download, save and print from your own computer:
∎ Fund reports and prospectuses
∎ Quarterly statements
∎ Daily confirmations
∎ Tax forms
Invesco mailing information
Send general correspondence to Invesco Investment Services, Inc., P.O. Box 219078, Kansas City, MO 64121-9078.
Important notice regarding delivery of security holder documents
To reduce Fund expenses, only one copy of most shareholder documents may be mailed to shareholders with multiple accounts at the same address (Householding). Mailing of your shareholder documents may be householded indefinitely unless you instruct us otherwise. If you do not want the mailing of these documents to be combined with those for other members of your household, please contact Invesco Investment Services, Inc. at 800 959 4246 or contact your financial institution. We will begin sending you individual copies for each account within 30 days after receiving your request.
Fund holdings and proxy voting information
The Fund provides a complete list of its holdings four times in each fiscal year, at the quarter ends. For the second and fourth quarters, the lists appear in the Fund’s semiannual and annual reports to shareholders. For the first and third quarters, the Fund files the lists with the Securities and Exchange Commission (SEC) on Form N-Q (or any successor Form). The most recent list of portfolio holdings is available at invesco.com/completeqtrholdings. Shareholders can also look up the Fund’s Forms N-Q (or any successor Form) on the SEC website at sec.gov. The SEC file numbers for the Fund are shown below.
A description of the policies and procedures that the Fund uses to determine how to vote proxies relating to portfolio securities is available without charge, upon request, from our Client Services department at 800 959 4246 or at invesco.com/proxyguidelines. The information is also available on the SEC website, sec.gov.
| | |
Information regarding how the Fund voted proxies related to its portfolio securities during the most recent 12-month period ended June 30 is available at invesco.com/proxysearch. The information is also available on the SEC website, sec.gov. Invesco Advisers, Inc. is an investment adviser; it provides investment advisory services to individual and institutional clients and does not sell securities. Invesco Distributors, Inc. is the US distributor for Invesco Ltd.’s retail mutual funds, exchange-traded funds and institutional money market funds. Both are wholly owned, indirect subsidiaries of Invesco Ltd. | | 
|
| | | | | | | | |
| SEC file numbers: 811-05426 and 033-19338 | | Invesco Distributors, Inc. | | END-AR-1 | | 12142018 | | 1441 |
| | | | |
| | |
 | | Annual Report to Shareholders | | October 31, 2018 |
| | |
| | Invesco Global Infrastructure Fund |
| | Nasdaq: | | |
| | A: GIZAX ∎ C: GIZCX ∎ R: GIZRX ∎ Y: GIZYX ∎ R5: GIZFX ∎ R6: GIZSX |

Letters to Shareholders
| | |

Philip Taylor | | Dear Shareholders: This annual report includes information about your Fund, including performance data and a complete list of its investments as of the close of the reporting period. Inside is a discussion of how your Fund was managed and the factors that affected its performance during the reporting period. Throughout the reporting period, US economic data remained positive. Robust corporate profits, strong retail sales and unemployment rates near generational lows helped drive US markets to new all-time records multiple times during the reporting period. Against this backdrop, the US Federal Reserve raised the federal funds rate four times during the reporting period. Market volatility, largely non-existent in 2017, returned in 2018. Markets sold off first in February and again sharply in October, amid rising interest rates, concerns about potential trade wars and heightened geopolitical tensions. Despite the volatility, US equity markets were largely positive |
| for the reporting period and fared better than international markets. Emerging markets were particularly hard hit due to a strong US dollar. During the October sell-off, investors retreated to more defensive areas of the market and to US Treasuries. The broader bond market declined during the reporting period due to the increase in US Treasury yields and widening credit spreads. As the year progresses, we’ll see how the interplay of economic data, interest rates, geopolitics and a host of other factors affect US and overseas equity and fixed income markets. |
Short-term market volatility can prompt some investors to abandon their investment plans – and can cause others to settle for whatever returns the market has to offer. The investment professionals at Invesco, in contrast, invest with high conviction. This means that, no matter the asset class or the strategy, each investment team has a passion to exceed. We want to help investors achieve better outcomes, such as seeking higher returns, helping mitigate risk and generating income. Of course, investing with high conviction can’t guarantee a profit or ensure success; no investment strategy can. To learn more about how we invest with high conviction, visit invesco.com/HighConviction. |
You, too, can invest with high conviction by maintaining a long-term investment perspective and by working with your financial adviser on a regular basis. During periods of short-term market volatility or uncertainty, your financial adviser can keep you focused on your long-term investment goals – a new home, a child’s college education or a secure retirement. He or she also can share research about the economy, the markets and individual investment options. |
Visit our website for more information on your investments
Our website, invesco.com/us, offers a wide range of market insights and investment perspectives. On the website, you’ll find detailed information about our funds, including performance, holdings and portfolio manager commentaries. You can access information about your account by completing a simple, secure online registration. To do so, select “Log In” on the right side of the homepage, and then select “Register for Individual Account Access.”
In addition to the resources accessible on our website and through our mobile app, you can obtain timely updates to help you stay informed about the markets and the economy by connecting with Invesco on Twitter, LinkedIn or Facebook. You can access our blog at blog.invesco.us.com. Our goal is to provide you the information you want, when and where you want it.
Finally, I’m pleased to share with you Invesco’s commitment to both the Principles for Responsible Investment and to considering environmental, social and governance issues in our robust investment process. I invite you to learn more at invesco.com/esg.
Have questions?
For questions about your account, contact an Invesco client services representative at 800 959 4246. For Invesco-related
questions or comments, please email me directly at phil@invesco.com.
All of us at Invesco look forward to serving your investment management needs. Thank you for investing with us.
|
| Sincerely, |
 |
| Philip Taylor |
| Senior Managing Director, Invesco Ltd. |
| | |
| 2 | | Invesco Global Infrastructure Fund |
| | | | |

Bruce Crockett | | Dear Fellow Shareholders: Among the many important lessons I’ve learned in more than 40 years in a variety of business endeavors is the value of a trusted advocate. As independent chair of the Invesco Funds Board, I can assure you that the members of the Board are strong advocates for the interests of investors in Invesco’s mutual funds. We work hard to represent your interests through oversight of the quality of the investment management services your funds receive and other matters important to your investment, including but not limited to: |
| | ∎ | | Ensuring that Invesco offers a diverse lineup of mutual funds that your financial adviser can use to strive to meet your financial needs as your investment goals change over time. |
| | ∎ | | Monitoring how the portfolio management teams of the Invesco funds are performing in light of changing economic and market conditions. |
∎ Assessing each portfolio management team’s investment performance within the context of the investment strategy described in the fund’s prospectus. ∎ Monitoring for potential conflicts of interests that may impact the nature of the services that your funds receive. We believe one of the most important services we provide our fund shareholders is the annual review of the funds’ advisory and sub-advisory contracts with Invesco Advisers and its affiliates. This review is required by the Investment Company Act of 1940 and focuses on the nature and quality of the services Invesco provides as the adviser to the Invesco funds and the reasonableness of the fees that it charges for those services. Each year, we spend months carefully reviewing information received from Invesco and a variety of independent sources, such as performance and fee data prepared by Lipper, Inc. (a subsidiary of Broadridge Financial Solutions, Inc.), an independent, third-party firm widely recognized as a leader in its field. We also meet with our independent legal counsel and other independent advisers to review and help us assess the information that we have received. Our goal is to assure that you receive quality investment management services for a reasonable fee. I trust the measures outlined above provide assurance that you have a worthy advocate when it comes to choosing the Invesco Funds. As always, please contact me at bruce@brucecrockett.com with any questions or concerns you may have. On behalf of the Board, we look forward to continuing to represent your interests and serving your needs. |
|
| Sincerely, |
 |
| Bruce L. Crockett |
| Independent Chair |
| Invesco Funds Board of Trustees |
| | |
| 3 | | Invesco Global Infrastructure Fund |
Management’s Discussion of Fund Performance
| | | | |
| |
Performance summary For the fiscal year ended October 31, 2018, Class A shares of Invesco Global Infrastructure Fund (the Fund), at net asset value (NAV), outperformed the Fund’s style-specific benchmark, the Dow Jones Brookfield Global Infrastructure Index. Your Fund’s long-term performance appears later in this report. | |
| | |
Fund vs. Indexes | | | | |
Total returns, 10/31/17 to 10/31/18, at net asset value (NAV). Performance shown does not include applicable contingent deferred sales charges (CDSC) or front-end sales charges, which would have reduced performance. | |
| |
Class A Shares | | | -2.65 | % |
Class C Shares | | | -3.39 | |
Class R Shares | | | -2.80 | |
Class Y Shares | | | -2.31 | |
Class R5 Shares | | | -2.31 | |
Class R6 Shares | | | -2.31 | |
MSCI World Indexq(Broad Market Index) | | | 1.16 | |
Dow Jones Brookfield Global Infrastructure Index∎ (Style-Specific Index) | | | -3.99 | |
Lipper Global Infrastructure Funds Classification Average◆ (Peer Group) | | | -5.17 | |
Source(s): qRIMES Technologies Corp.; ∎FactSet Research Systems Inc.; ◆Lipper Inc. | | | | |
Market conditions and your Fund
The fiscal year proved to be an increasingly volatile time for global equities. The fiscal year began in the final months of 2017 with several US stock market indexes repeatedly reaching new highs amid strong corporate profits, the prospect of tax reform legislation and exceedingly low stock market volatility. Despite a sharp uptick in volatility, particularly in October 2018, US markets, in general, still produced positive returns for the fiscal year. International markets, however, were meaningfully less robust, many experiencing flat to negative results for the fiscal year. This divergence between the US and other markets could be attributed to the strength of the US economy and the widely-held belief that the US could win trade wars with other countries.
At the beginning of 2018, markets saw significant turbulence in late January and early February, when stocks were whipsawed – first by concerns about
accelerated US Federal Reserve (the Fed) tightening and then, later in the year, by fears of brewing trade wars and geopolitical tensions. After a relatively quiet summer, market volatility markedly rose again in the final month of the fiscal year. Global equity markets (particularly the US) suffered a sharp sell-off in October 2018 amid rising interest rates and concerns that higher inflation could result in a more restrictive monetary policy.
Global economic growth, in general, was solid despite weakness in emerging markets. During the fiscal year, emerging markets were impacted by both country-specific issues, as well as, more generalized pressure resulting from the Fed’s tightening policy. In this environment, economic growth unsurprisingly slowed in emerging markets. Within the eurozone, economic growth accelerated, although there was divergence among countries. In Japan, economic growth improved over the latter part of the fiscal
year. The US experienced strong growth during the fiscal year due to robust consumer and business spending. In addition, unemployment rates remained low, job creation was strong and inflation remained relatively controlled.
At the close of the fiscal year, equity valuations in developed and emerging markets appeared relatively full in absolute terms, but overseas equity markets were trading at a material discount to those of the US. In sum, while valuations were not cheap, earnings growth and upward earnings revisions improved in many non-US developed markets.
In general, global infrastructure stocks produced a loss and underperformed broad market equities, which were driven by the information technology, health care and consumer discretionary sectors during the fiscal year. The Fund also produced a loss for the fiscal year, but outperformed its style-specific benchmark, the Dow Jones Brookfield Global Infrastructure Index, due to a combination of security selection and market allocation.
Relative to the style-specific benchmark, both stock selection and market allocation contributed to the Fund’s returns during the fiscal year. Specifically, stock selection in midstream services was a key contributor to the Fund’s performance relative to the style-specific benchmark. A combination of security selection and overweight allocation in the electric utilities infrastructure sector, security selection and overweight allocation in the airports infrastructure sector, and overweight allocation to the rail infrastructure sector all benefited the Fund’s relative performance. Conversely, security selection in the gas distribution and water infrastructure sectors detracted from relative returns for the fiscal year.
Top individual contributors to the Fund’s absolute performance during the
| | | | |
| |
Portfolio Composition | |
By infrastructure sector | | | % of total net assets | |
| |
Midstream Services | | | 25.9% | |
Telecom | | | 19.5 | |
Gas Distribution | | | 14.6 | |
Electric Utilities | | | 12.2 | |
Diversified | | | 7.0 | |
Water | | | 6.2 | |
Tolls | | | 5.0 | |
Airports | | | 4.3 | |
Rail | | | 2.0 | |
Gas Utilities | | | 0.9 | |
Renewables | | | 0.7 | |
Money Market Funds Plus Other Assets Less Liabilities | | | 1.7 | |
| | | | | | |
| | |
Top 10 Equity Holdings* | | | | |
| | % of total net assets | |
| | |
1. | | American Tower Corp.-Class A | | | 7.8% | |
2. | | Crown Castle International Corp. | | | 4.8 | |
3. | | Pembina Pipeline Corp. | | | 4.4 | |
4. | | Vinci S.A. | | | 4.1 | |
5. | | ONEOK, Inc. | | | 3.9 | |
6. | | Cheniere Energy, Inc. | | | 3.9 | |
7. | | Consolidated Edison, Inc. | | | 3.6 | |
8. | | Enbridge Inc. | | | 3.3 | |
9. | | CenterPoint Energy, Inc. | | | 3.2 | |
10. | | PG&E Corp. | | | 3.2 | |
| | | | |
| | |
Total Net Assets | | $ | 20.0 million | |
| |
Total Number of Holdings* | | | 59 | |
The Fund’s holdings are subject to change, and there is no assurance that the Fund will continue to hold any particular security.
*Excluding money market fund holdings.
Data presented here are as of October 31, 2018.
| | |
| 4 | | Invesco Global Infrastructure Fund |
fiscal year included midstream service companies ONEOK and Cheniere Energy. Higher energy prices and increased US energy production helped energy infrastructure companies in general over the fiscal year. ONEOK’s common stock also benefited from strong earnings results and increases in its quarterly dividend, as well as plans for expansion in the Rocky Mountain Region and acquisition of the remaining interest in West Texas LPG Pipeline System.
Cheniere Energy completed its merger with Cheniere Energy Partners LP during the fiscal year. In March 2018, the Federal Energy Regulatory Commission (FERC) issued a surprise ruling on the Income Tax Allowance Policy for master limited partnerships (MLPs). This move prompted a handful of pipeline companies, like Cheniere Energy, to reorganize. The reorganization of Cheniere Energy was viewed favorably, even though FERC ended up reversing some of the adverse consequences for MLPs in its final ruling in July.
Atlantia, an Italian company that owns toll roads primarily connecting major urban centers in Italy, was the largest detractor from the Fund’s absolute performance for the fiscal year. Standard and Poor’s placed Atlantia and its subsidiaries on CreditWatch negative following the collapse of a Genoa bridge that is part of a toll road operated by an Atlantia subsidiary. The CreditWatch stemmed from the risk that the still-undetermined cause of the collapse could result in potential litigation, fines for damages and loss of concessions.
PG&E, whose primary subsidiary is Pacific Gas & Electric Company, was also among the top individual detractors from the Fund’s performance during the fiscal year. In December 2017, the company decided to suspend its quarterly dividend given the uncertainty of liabilities related to the Northern California wildfires. The company also announced an estimated $1.6 to $1.8 billion in after-tax costs associated with the wildfires in its second-quarter 2018 earnings release. We continued to hold both Atlantia and PG&E at the end of the fiscal year.
At the close of the fiscal year, the Fund held underweight allocations relative to the style-specific benchmark in the more regulated infrastructure sectors, mainly gas distribution and electric utilities. The Fund held overweight allocations in the more competitive and user pay sectors, such as towers, rail and tolls – where growth characteristics remain relatively attractive. The Fund was not invested in ports during the fiscal year given the continued uncertainty around global trade.
Diverging trends in the use of economic stimulus are shaping yield demand and leverage characteristics in individual countries. In general, the Fund remained focused on companies with above-average earnings growth characteristics, sound balance sheets and strategic infrastructure assets that provide a relatively more stable underlying earnings stream.
We thank you for your investment in Invesco Global Infrastructure Fund.
The views and opinions expressed in management’s discussion of Fund performance are those of Invesco Advisers, Inc. These views and opinions are subject to change at any time based on factors such as market and economic conditions. These views and opinions may not be relied upon as investment advice or recommendations, or as an offer for a particular security. The information is not a complete analysis of every aspect of any market, country, industry, security or the Fund. Statements of fact are from sources considered reliable, but Invesco Advisers, Inc. makes no representation or warranty as to their completeness or accuracy. Although historical performance is no guarantee of future results, these insights may help you understand our investment management philosophy.
See important Fund and, if applicable, index disclosures later in this report.
| | |
 | | Joe Rodriguez, Jr. Portfolio Manager, is lead manager of Invesco Global Infrastructure Fund. He is Head of Global |
| Securities with Invesco Real Estate, where he oversees all phases of the unit, including securities research and administration. Mr. Rodriguez joined Invesco in 1990. He earned a BBA in economics and finance and an MBA in finance from Baylor University. |
| |
 | | Darin Turner Portfolio Manager, is lead manager of Invesco Global Infrastructure Fund. He joined Invesco in 2005. |
| Mr. Turner earned a BBA in finance from Baylor University, an MS in real estate from The University of Texas at Arlington and an MBA specializing in investments from Southern Methodist University. |
| |
 | | Mark Blackburn Chartered Financial Analyst, Portfolio Manager, is manager of Invesco Global Infrastructure Fund. He |
| joined Invesco in 1998. Mr. Blackburn earned a BS in accounting from Louisiana State University and an MBA from Southern Methodist University. He is also a Certified Public Accountant. |
| | |
 | | James Cowen Portfolio Manager, is manager of Invesco Global Infrastructure Fund. He joined Invesco in 2000. Mr. Cowen earned a |
| Master of Town and Country Planning degree from the University of Manchester and a Master of Philosophy degree in land economy from Cambridge University. |
| |
 | | Paul Curbo Chartered Financial Analyst, Portfolio Manager, is manager of Invesco Global Infrastructure Fund. He |
| joined Invesco in 1998. Mr. Curbo earned a BBA in finance from The University of Texas at Austin. |
| |
 | | Ping-Ying Wang Chartered Financial Analyst, Portfolio Manager, is manager of Invesco Global Infrastructure Fund. She |
| joined Invesco in 1998. Ms. Wang earned a BS in international finance from the People’s University of China and a PhD in finance from The University of Texas at Dallas. |
| |
 | | Grant Jackson Chartered Financial Analyst, Portfolio Manager, is manager of Invesco Global Infrastructure Fund. He |
| joined Invesco in 2005. Mr. Jackson earned his BS degree in mechanical engineering from The University of Texas at Austin and his MBA from Southern Methodist University’s Cox School of Business. |
5 Invesco Global Infrastructure Fund
Your Fund’s Long-Term Performance
Results of a $10,000 Investment – Oldest Share Class(es) since Inception
Fund and index data from 5/2/14
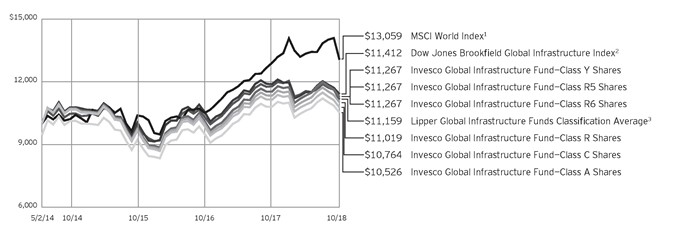
1 Source: RIMES Technologies Corp.
2 Source: Factset Research Systems Inc.
3 Source: Lipper Inc.
Past performance cannot guarantee comparable future results.
The data shown in the chart include reinvested distributions, applicable sales charges and Fund expenses including management fees. Index results include reinvested dividends, but they do not reflect sales charges. Performance of the
peer group, if applicable, reflects fund expenses and management fees; performance of a market index does not. Performance shown in the chart and table(s) does not reflect deduction of taxes a shareholder would pay on Fund distributions or sale of Fund shares.
| | |
| 6 | | Invesco Global Infrastructure Fund |
| | | | |
| |
Average Annual Total Returns | |
As of 10/31/18, including maximum applicable sales charges | |
| |
Class A Shares | | | | |
Inception (5/2/2014) | | | 1.15 | % |
1 Year | | | -8.05 | |
| |
Class C Shares | | | | |
Inception (5/2/2014) | | | 1.65 | % |
1 Year | | | -4.32 | |
| |
Class R Shares | | | | |
Inception (5/2/2014) | | | 2.18 | % |
1 Year | | | -2.80 | |
| |
Class Y Shares | | | | |
Inception (5/2/2014) | | | 2.69 | % |
1 Year | | | -2.31 | |
| |
Class R5 Shares | | | | |
Inception (5/2/2014) | | | 2.69 | % |
1 Year | | | -2.31 | |
| |
Class R6 Shares | | | | |
Inception (5/2/2014) | | | 2.69 | % |
1 Year | | | -2.31 | |
The performance data quoted represent past performance and cannot guarantee comparable future results; current performance may be lower or higher. Please visit invesco.com/performance for the most recent month-end performance. Performance figures reflect reinvested distributions, changes in net asset value and the effect of the maximum sales charge unless otherwise stated. Investment return and principal value will fluctuate so that you may have a gain or loss when you sell shares.
The net annual Fund operating expense ratio set forth in the most recent Fund prospectus as of the date of this report for Class A, Class C, Class R, Class Y, Class R5 and Class R6 shares was 1.28%, 2.03%, 1.53%, 1.03%, 1.03% and 1.03%, respectively.1 The total annual Fund operating expense ratio set forth in the most recent Fund prospectus as of the date of this report for Class A, Class C, Class R, Class Y, Class R5 and Class R6 shares was 2.87%, 3.62%, 3.12%, 2.62%, 2.54% and 2.54%, respectively. The expense ratios presented above may vary from the expense ratios presented in other sections of this report that are based on expenses incurred during the period covered by this report.
| | | | |
| |
Average Annual Total Returns | |
As of 9/30/18, the most recent calendar quarter end, including maximum applicable sales charges | |
| |
Class A Shares | | | | |
Inception (5/2/2014) | | | 1.89 | % |
1 Year | | | -5.11 | |
| |
Class C Shares | | | | |
Inception (5/2/2014) | | | 2.43 | % |
1 Year | | | -1.26 | |
| |
Class R Shares | | | | |
Inception (5/2/2014) | | | 2.95 | % |
1 Year | | | 0.21 | |
| |
Class Y Shares | | | | |
Inception (5/2/2014) | | | 3.45 | % |
1 Year | | | 0.71 | |
| |
Class R5 Shares | | | | |
Inception (5/2/2014) | | | 3.47 | % |
1 Year | | | 0.81 | |
| |
Class R6 Shares | | | | |
Inception (5/2/2014) | | | 3.45 | % |
1 Year | | | 0.71 | |
Class A share performance reflects the maximum 5.50% sales charge, and Class C share performance reflects the applicable contingent deferred sales charge (CDSC) for the period involved. The CDSC on Class C shares is 1% for the first year after purchase. Class R, Class Y, Class R5 and Class R6 class shares do not have a front-end sales charge or a CDSC; therefore, performance is at net asset value.
The performance of the Fund’s share classes will differ primarily due to different sales charge structures and class expenses.
Fund performance reflects any applicable fee waivers and/or expense reimbursements. Had the adviser not waived fees and/or reimbursed expenses currently or in the past, returns would have been lower. See current prospectus for more information.
1 Total annual Fund operating expenses after any contractual fee waivers and/or expense reimbursements by the adviser in effect through at least February 29, 2020. See current prospectus for more information.
7 Invesco Global Infrastructure Fund
Invesco Global Infrastructure Fund’s investment objective is total return through growth of capital and current income.
| ∎ | | Unless otherwise stated, information presented in this report is as of October 31, 2018, and is based on total net assets. |
| ∎ | | Unless otherwise noted, all data provided by Invesco. |
| ∎ | | To access your Fund’s reports/prospectus, visit invesco.com/fundreports. |
About share classes
| ∎ | | Class R shares are generally available only to employer sponsored retirement and benefit plans. Please see the prospectus for more information. |
| ∎ | | Class Y shares are available only to certain investors. Please see the prospectus for more information. |
| ∎ | | Class R5 shares and Class R6 shares are available for use by retirement plans that meet certain standards and for institutional investors. Class R6 shares are also available through intermediaries that have established an agreement with Invesco Distributors, Inc. to make such shares available for use in retail omnibus accounts. Please see the prospectus for more information. |
Principal risks of investing in the Fund
| ∎ | | Active trading risk. Active trading of portfolio securities may result in added expenses, a lower return and increased tax liability. |
| ∎ | | Depositary receipts risk. Investing in depositary receipts involves the same risks as direct investments in foreign securities. In addition, the underlying issuers of certain depositary receipts are under no obligation to distribute shareholder communications or pass through any voting rights with respect to the deposited securities to the holders of such receipts. The Fund may therefore receive less timely information or have less control than if it invested directly in the foreign issuer. |
| ∎ | | Derivatives risk. The value of a derivative instrument depends largely on (and is derived from) the value of an underlying security, currency, commodity, interest rate, index or other asset (each referred to as an underlying asset). In addition to risks relating to the underlying assets, the use of derivatives may include other, possibly greater, risks, including counterparty, leverage and liquidity risks. Counterparty risk is the risk that the counterparty |
| | | to the derivative contract will default on its obligation to pay the Fund the amount owed or otherwise perform under the derivative contract. Derivatives create leverage risk because they do not require payment up front equal to the economic exposure created by owning the derivative. As a result, an adverse change in the value of the underlying asset could result in the Fund sustaining a loss that is substantially greater than the amount invested in the derivative, which may make the Fund’s returns more volatile and increase the risk of loss. Derivative instruments may also be less liquid than more traditional investments and the Fund may be unable to sell or close out its derivative positions at a desirable time or price. This risk may be more acute under adverse market conditions, during which the Fund may be most in need of liquidating its derivative positions. Derivatives may also be harder to value, less tax efficient and subject to changing government regulation that could impact the Fund’s ability to use certain derivatives or their cost. Also, derivatives used for hedging or to gain or limit exposure to a particular market segment may not provide the expected benefits, particularly during adverse market conditions. |
| ∎ | | Emerging markets securities risk. Emerging markets (also referred to as developing markets) are generally subject to greater market volatility, political, social and economic instability, uncertain trading markets and more governmental limitations on foreign investment than more developed markets. In addition, companies operating in emerging markets may be subject to lower trading volume and greater price fluctuations than companies in more developed markets. Securities law and the enforcement of systems of taxation in many emerging market countries may change quickly and unpredictably. In addition, investments in emerging markets securities may also be subject |
This report must be accompanied or preceded by a currently effective Fund prospectus, which contains more complete information, including sales charges and expenses. Investors should read it carefully before investing.
NOT FDIC INSURED | MAY LOSE VALUE | NO BANK GUARANTEE
| | to additional transaction costs, delays in settlement procedures, and lack of timely information. |
| ∎ | | Foreign securities risk. The Fund’s foreign investments may be adversely affected by political and social instability, changes in economic or taxation policies, difficulty in enforcing obligations, decreased liquidity or increased volatility. Foreign investments also involve the risk of the possible seizure, nationalization or expropriation of the issuer or foreign deposits (in which the Fund could lose its entire investments in a certain market) and the possible adoption of foreign governmental restrictions such as exchange controls. Unless the Fund has hedged its foreign securities risk, foreign securities risk also involves the risk of negative foreign currency rate fluctuations, which may cause the value of securities denominated in such foreign currency (or other instruments through which the Fund has exposure to foreign currencies) to decline in value. Currency exchange rates may fluctuate significantly over short periods of time. Currency hedging strategies, if used, are not always successful. |
| ∎ | | Geographic focus risk. The Fund may from time to time invest a substantial amount of its assets in securities of issuers located in a single country or a limited number of countries. Adverse economic, political or social conditions in those countries may therefore have a significant negative impact on the Fund’s investment performance. |
| ∎ | | Infrastructure-related companies risk. The Fund will concentrate its investments in the infrastructure industry. Infrastructure-related companies are subject to a variety of risk factors, including costs associated with environmental, governmental and other regulations, high interest costs for capital construction programs, high leverage, the effects of economic slowdowns, surplus capacity, increased competition, fluctuations of fuel prices, the effects of energy conservation policies, unfavorable tax laws or accounting policies, environmental damage, difficulty in raising capital, increased susceptibility to terrorist acts or political actions, and general changes in market sentiment towards infrastructure assets. |
| | |
| 8 | | Invesco Global Infrastructure Fund |
| ∎ | | Management risk. The Fund is actively managed and depends heavily on the Adviser’s judgment about markets, interest rates or the attractiveness, relative values, liquidity, or potential appreciation of particular investments made for the Fund’s portfolio. The Fund could experience losses if these judgments prove to be incorrect. Additionally, legislative, regulatory, or tax developments may adversely affect management of the Fund and, therefore, the ability of the Fund to achieve its investment objective. |
| ∎ | | Market risk. The market values of the Fund’s investments, and therefore the value of the Fund’s shares, will go up and down, sometimes rapidly or unpredictably. Market risk may affect a single issuer, industry or section of the economy, or it may affect the market as a whole. Individual stock prices tend to go up and down more dramatically than those of certain other types of investments, such as bonds. During a general downturn in the financial markets, multiple asset classes may decline in value. When markets perform well, there can be no assurance that specific investments held by the Fund will rise in value. |
| ∎ | | MLP risk. The Fund invests in securities of MLPs, which are subject to the following risks: |
| | – | | Limited partner risk. An MLP is a public limited partnership or limited liability company taxed as a partnership under the Internal Revenue Code of 1986, as amended (the Code). Although the characteristics of MLPs closely resemble a traditional limited partnership, a major difference is that MLPs may trade on a public exchange or in the over-the-counter market. The risks of investing in an MLP are similar to those of investing in a partnership, including more flexible governance structures, which could result in less protection for investors than investments in a corporation. Investors in an MLP normally would not be liable for the debts of the MLP beyond the amount that the investor has contributed but investors may not be shielded to the same extent that a shareholder of a corporation would be. In certain circumstances, creditors of an MLP would have the right to seek return of capital distributed to a limited partner, which right would continue after an investor sold its investment in the MLP. In addition, MLP distributions may be reduced by fees and other expenses incurred by the MLP. |
| | – | | Liquidity risk. The ability to trade on a public exchange or in the over-the- counter market provides a certain amount of liquidity not found in many limited partnership investments. However, MLP interests may be less liquid than conventional publicly traded securities and, therefore, more difficult to trade at desirable times and/or prices. |
| | – | | Interest rate risk. MLPs generally are considered interest-rate sensitive investments. During periods of interest rate volatility, these investments may not provide attractive returns. |
| | – | | General partner risk. The holder of the general partner or managing member interest can be liable in certain circumstances for amounts greater than the amount of the holder’s investment in the general partner or managing member. |
| | Additionally, if the Fund were to invest more than 25% of its total assets in MLPs that are taxed as partnerships this could cause the Fund to lose its status as regulated investment company under Subchapter M of the Code. |
| ∎ | | MLP tax risk. MLPs taxed as partnerships do not pay US federal income tax at the partnership level. A change in current tax law, or a change in the underlying business mix of a given MLP, however, could result in an MLP being classified as a corporation for US federal income tax purposes, which would have the effect of reducing the amount of cash available for distribution by the MLP and, as a result, could result in a reduction of the value of the Fund’s investment, and consequently your investment in the Fund and lower income. Each year, the Fund will send you an annual tax statement (Form 1099) to assist you in completing your federal, state and local tax returns. If an MLP in which the Fund invests amends its partnership tax return, the Fund will, when necessary, send you a corrected Form 1099, which could, in turn, require you to amend your federal, state or local tax returns. |
| ∎ | | Non-diversification risk. The Fund is non-diversified and can invest a greater portion of its assets in the obligations or securities of a small number of issuers or any single issuer than a diversified fund can. A change in the value of one or a few issuers’ securities will therefore affect the value of the Fund more than if it was a diversified fund. |
| ∎ | | Small- and mid-capitalization companies risks. Small- and mid-capitalization companies tend to be more vulnerable to changing market conditions, may |
| | have little or no operating history or track record of success, and may have more limited product lines and markets, less experienced management and fewer financial resources than larger companies. These companies’ securities may be more volatile and less liquid than those of more established companies, and their returns may vary, sometimes significantly, from the overall securities market. |
About indexes used in this report
| ∎ | | The MSCI World IndexSM is an unmanaged index considered representative of stocks of developed countries. The index is computed using the net return, which withholds applicable taxes for non-resident investors. |
| ∎ | | The Dow Jones Brookfield Global Infrastructure Index is designed to measure the stock performance of infrastructure companies domiciled globally and covers all sectors of the infrastructure market. The index is computed using the net return, which withholds applicable taxes for non-resident investors. |
| ∎ | | The Lipper Global Infrastructure Funds Classification Average represents an average of all of the funds in the Lipper Global Infrastructure Funds classification. |
| ∎ | | The Fund is not managed to track the performance of any particular index, including the index(es) described here, and consequently, the performance of the Fund may deviate significantly from the performance of the index(es). |
| ∎ | | A direct investment cannot be made in an index. Unless otherwise indicated, index results include reinvested dividends, and they do not reflect sales charges. Performance of the peer group, if applicable, reflects fund expenses; performance of a market index does not. |
Other information
| ∎ | | CPA® and Certified Public Accountant® are trademarks owned by the American Institute of Certified Public Accountants. |
| ∎ | | The returns shown in management’s discussion of Fund performance are based on net asset values (NAVs) calculated for shareholder transactions. Generally accepted accounting principles require adjustments to be made to the net assets of the Fund at period end for financial reporting purposes, and as such, the NAVs for shareholder transactions and the returns based on those NAVs may differ from the NAVs and returns reported in the Financial Highlights. |
9 Invesco Global Infrastructure Fund
Schedule of Investments
October 31, 2018
| | | | | | | | |
| | | Shares | | | Value | |
Common Stocks & Other Equity Interests–98.29% | |
| Australia–3.53% | |
APA Group | | | 12,394 | | | $ | 84,388 | |
Atlas Arteria Ltd. | | | 49,895 | | | | 241,679 | |
Transurban Group | | | 47,418 | | | | 380,787 | |
| | | | | | | | 706,854 | |
|
| Brazil–0.29% | |
Cia de Saneamento Basico do Estado de Sao Paulo–ADR | | | 7,769 | | | | 57,646 | |
|
| Canada–12.00% | |
Enbridge Inc. | | | 21,491 | | | | 669,650 | |
Fortis, Inc. | | | 6,703 | | | | 221,490 | |
Pembina Pipeline Corp. | | | 26,982 | | | | 872,720 | |
TransCanada Corp. | | | 16,995 | | | | 640,838 | |
| | | | | | | | 2,404,698 | |
|
| China–1.66% | |
ENN Energy Holdings Ltd. | | | 19,100 | | | | 162,832 | |
Shenzhen Expressway Co. Ltd.–Class H | | | 140,000 | | | | 129,039 | |
Zhejiang Expressway Co., Ltd.–Class H | | | 48,000 | | | | 40,523 | |
| | | | | | | | 332,394 | |
|
| France–9.71% | |
Aéroports de Paris | | | 1,886 | | | | 394,734 | |
Eiffage S.A. | | | 3,831 | | | | 374,654 | |
Eutelsat Communications S.A. | | | 3,942 | | | | 80,098 | |
Getlink | | | 21,668 | | | | 272,787 | |
Vinci S.A. | | | 9,212 | | | | 823,032 | |
| | | | | | | | 1,945,305 | |
|
| Germany–0.32% | |
Fraport AG Frankfurt Airport Services Worldwide | | | 843 | | | | 65,215 | |
|
| Hong Kong–2.24% | |
China Gas Holdings Ltd. | | | 64,600 | | | | 204,930 | |
China Water Affairs Group Ltd. | | | 112,000 | | | | 101,186 | |
Hong Kong & China Gas Co., Ltd. (The) | | | 75,100 | | | | 143,069 | |
| | | | | | | | 449,185 | |
|
| Italy–3.50% | |
Atlantia S.p.A. | | | 10,030 | | | | 201,762 | |
Infrastrutture Wireless Italiane S.p.A.(a) | | | 24,887 | | | | 173,358 | |
Italgas S.p.A. | | | 15,466 | | | | 79,915 | |
Terna Rete Elettrica Nazionale S.p.A. | | | 47,648 | | | | 246,366 | |
| | | | | | | | 701,401 | |
|
| Japan–1.38% | |
Japan Airport Terminal Co., Ltd. | | | 5,500 | | | | 210,221 | |
Nippon Gas Co., Ltd. | | | 2,200 | | | | 66,328 | |
| | | | | | | | 276,549 | |
| | | | | | | | |
| | | Shares | | | Value | |
| Luxembourg–1.56% | |
SES S.A. | | | 14,575 | | | $ | 313,246 | |
|
| Mexico–0.75% | |
Grupo Aeroportuario del Pacifico S.A.B. de
C.V.–ADR | | | 1,812 | | | | 150,179 | |
|
| Netherlands–0.35% | |
InterXion Holding N.V.(b) | | | 1,201 | | | | 70,703 | |
|
| New Zealand–0.20% | |
Auckland International Airport Ltd. | | | 8,796 | | | | 40,121 | |
|
| Spain–3.18% | |
Atlantica Yield PLC | | | 6,649 | | | | 130,387 | |
Cellnex Telecom S.A.(a) | | | 5,672 | | | | 141,261 | |
Ferrovial, S.A. | | | 10,701 | | | | 214,236 | |
Red Electrica Corp. S.A. | | | 7,278 | | | | 150,735 | |
| | | | | | | | 636,619 | |
|
| United Kingdom–6.05% | |
National Grid PLC | | | 45,174 | | | | 478,792 | |
Pennon Group PLC | | | 21,860 | | | | 208,499 | |
Severn Trent PLC | | | 2,327 | | | | 55,413 | |
United Utilities Group PLC | | | 50,538 | | | | 469,367 | |
| | | | | | | | 1,212,071 | |
|
| United States–51.57% | |
American Tower Corp.–Class A | | | 10,018 | | | | 1,560,904 | |
American Water Works Co., Inc. | | | 3,875 | | | | 343,054 | |
Atmos Energy Corp. | | | 1,991 | | | | 185,322 | |
Avangrid, Inc. | | | 2,366 | | | | 111,226 | |
CenterPoint Energy, Inc. | | | 23,991 | | | | 647,997 | |
Cheniere Energy, Inc.(b) | | | 12,800 | | | | 773,248 | |
CMS Energy Corp. | | | 403 | | | | 19,957 | |
Consolidated Edison, Inc. | | | 9,594 | | | | 729,144 | |
Crown Castle International Corp. | | | 8,768 | | | | 953,432 | |
CSX Corp. | | | 1,804 | | | | 124,223 | |
Edison International | | | 6,279 | | | | 435,700 | |
Energy Transfer L.P. | | | 12,364 | | | | 192,137 | |
Kinder Morgan, Inc. | | | 22,541 | | | | 383,648 | |
NiSource Inc. | | | 5,963 | | | | 151,222 | |
ONEOK, Inc. | | | 11,816 | | | | 775,130 | |
PG&E Corp.(b) | | | 13,815 | | | | 646,680 | |
SBA Communications Corp.–Class A(b) | | | 3,837 | | | | 622,246 | |
Sempra Energy | | | 4,482 | | | | 493,558 | |
Southwest Gas Holdings, Inc. | | | 3,998 | | | | 308,925 | |
Targa Resources Corp. | | | 5,917 | | | | 305,731 | |
Williams Cos., Inc. (The) | | | 23,517 | | | | 572,169 | |
| | | | | | | | 10,335,653 | |
Total Common Stocks & Other Equity Interests
(Cost $19,027,862) | | | | 19,697,839 | |
See accompanying Notes to Financial Statements which are an integral part of the financial statements.
10 Invesco Global Infrastructure Fund
| | | | | | | | |
| | | Shares | | | Value | |
Money Market Funds–0.83% | | | | | | | | |
Invesco Government & Agency Portfolio–Institutional Class, 2.08%(c) | | | 55,436 | | | $ | 55,436 | |
Invesco Liquid Assets Portfolio–Institutional Class, 2.27%(c) | | | 47,764 | | | | 47,774 | |
Invesco Treasury Portfolio–Institutional Class, 2.09%(c) | | | 63,356 | | | | 63,356 | |
Total Money Market Funds
(Cost $166,563) | | | | 166,566 | |
TOTAL INVESTMENTS IN SECURITIES–99.12%
(Cost $19,194,425) | | | | 19,864,405 | |
OTHER ASSETS LESS LIABILITIES–0.88% | | | | 176,738 | |
NET ASSETS–100.00% | | | $ | 20,041,143 | |
Investment Abbreviations:
| | |
| ADR | | – American Depositary Receipt |
Notes to Schedule of Investments:
| (a) | Security purchased or received in a transaction exempt from registration under the Securities Act of 1933, as amended (the “1933 Act”). The security may be resold pursuant to an exemption from registration under the 1933 Act, typically to qualified institutional buyers. The aggregate value of these securities at October 31, 2018 was $314,619, which represented 1.57% of the Fund’s Net Assets. |
| (b) | Non-income producing security. |
| (c) | The money market fund and the Fund are affiliated by having the same investment adviser. The rate shown is the 7-day SEC standardized yield as of October 31, 2018. |
See accompanying Notes to Financial Statements which are an integral part of the financial statements.
11 Invesco Global Infrastructure Fund
Statement of Assets and Liabilities
October 31, 2018
| | | | |
Assets: | | | | |
Investments in securities, at value (Cost $19,027,862) | | $ | 19,697,839 | |
Investments in affiliated money market funds, at value (Cost $166,563) | | | 166,566 | |
Foreign currencies, at value (Cost $34,507) | | | 34,168 | |
Receivable for: | | | | |
Investments sold | | | 378,330 | |
Dividends | | | 17,944 | |
Fund shares sold | | | 14,143 | |
Fund expenses absorbed | | | 7,726 | |
Investment for trustee deferred compensation and retirement plans | | | 8,848 | |
Other assets | | | 31,378 | |
Total assets | | | 20,356,942 | |
| |
Liabilities: | | | | |
Payable for: | | | | |
Investments purchased | | | 221,076 | |
Fund shares reacquired | | | 3,313 | |
Accrued fees to affiliates | | | 9,636 | |
Accrued trustees’ and officers’ fees and benefits | | | 1,994 | |
Accrued other operating expenses | | | 70,932 | |
Trustee deferred compensation and retirement plans | | | 8,848 | |
Total liabilities | | | 315,799 | |
Net assets applicable to shares outstanding | | $ | 20,041,143 | |
| |
Net assets consist of: | | | | |
Shares of beneficial interest | | $ | 19,839,010 | |
Distributable earnings | | | 202,133 | |
| | | $ | 20,041,143 | |
| | | | |
Net Assets: | |
Class A | | $ | 8,097,774 | |
Class C | | $ | 1,579,009 | |
Class R | | $ | 350,604 | |
Class Y | | $ | 9,775,136 | |
Class R5 | | $ | 10,027 | |
Class R6 | | $ | 228,593 | |
|
Shares outstanding, no par value,
with an unlimited number of shares authorized: | |
Class A | | | 808,850 | |
Class C | | | 158,038 | |
Class R | | | 35,039 | |
Class Y | | | 976,022 | |
Class R5 | | | 1,001 | |
Class R6 | | | 22,825 | |
Class A: | | | | |
Net asset value per share | | $ | 10.01 | |
Maximum offering price per share | | | | |
(Net asset value of $10.01 ¸ 94.50%) | | $ | 10.60 | |
Class C: | | | | |
Net asset value and offering price per share | | $ | 9.99 | |
Class R: | | | | |
Net asset value and offering price per share | | $ | 10.01 | |
Class Y: | | | | |
Net asset value and offering price per share | | $ | 10.02 | |
Class R5: | | | | |
Net asset value and offering price per share | | $ | 10.02 | |
Class R6: | | | | |
Net asset value and offering price per share | | $ | 10.02 | |
See accompanying Notes to Financial Statements which are an integral part of the financial statements.
12 Invesco Global Infrastructure Fund
Statement of Operations
For the year ended October 31, 2018
| | | | |
Investment income: | | | | |
Dividends (net of foreign withholding taxes of $46,356) | | $ | 661,996 | |
Dividends from affiliated money market funds | | | 3,089 | |
Total investment income | | | 665,085 | |
| |
Expenses: | | | | |
Advisory fees | | | 184,004 | |
Administrative services fees | | | 50,000 | |
Custodian fees | | | 20,631 | |
Distribution fees: | | | | |
Class A | | | 22,759 | |
Class C | | | 18,375 | |
Class R | | | 1,718 | |
Transfer agent fees — A, C, R and Y | | | 40,167 | |
Transfer agent fees — R5 | | | 6 | |
Transfer agent fees — R6 | | | 132 | |
Trustees’ and officers’ fees and benefits | | | 20,974 | |
Registration and filing fees | | | 84,874 | |
Reports to shareholders | | | 17,439 | |
Professional services fees | | | 68,683 | |
Other | | | 19,164 | |
Total expenses | | | 548,926 | |
Less: Fees waived, expenses reimbursed and expense offset arrangement(s) | | | (280,632 | ) |
Net expenses | | | 268,294 | |
Net investment income | | | 396,791 | |
| |
Realized and unrealized gain (loss) from: | | | | |
Net realized gain (loss) from: | | | | |
Investment securities | | | 245,590 | |
Foreign currencies | | | (7,712 | ) |
| | | | 237,878 | |
Change in net unrealized appreciation (depreciation) of: | | | | |
Investment securities | | | (1,175,795 | ) |
Foreign currencies | | | 311 | |
| | | | (1,175,484 | ) |
Net realized and unrealized gain (loss) | | | (937,606 | ) |
Net increase (decrease) in net assets resulting from operations | | $ | (540,815 | ) |
See accompanying Notes to Financial Statements which are an integral part of the financial statements.
13 Invesco Global Infrastructure Fund
Statement of Changes in Net Assets
For the years ended October 31, 2018 and 2017
| | | | | | | | |
| | | 2018 | | | 2017 | |
Operations: | | | | | | | | |
Net investment income | | $ | 396,791 | | | $ | 429,571 | |
Net realized gain | | | 237,878 | | | | 711,655 | |
Change in net unrealized appreciation (depreciation) | | | (1,175,484 | ) | | | 1,300,196 | |
Net increase (decrease) in net assets resulting from operations | | | (540,815 | ) | | | 2,441,422 | |
| | |
Distributions to shareholders from distributable earnings:(1) | | | | | | | | |
Class A | | | (376,949 | ) | | | (133,550 | ) |
Class C | | | (68,541 | ) | | | (16,079 | ) |
Class R | | | (12,164 | ) | | | (3,225 | ) |
Class Y | | | (464,195 | ) | | | (179,756 | ) |
Class R5 | | | (471 | ) | | | (215 | ) |
Class R6 | | | (8,902 | ) | | | (3,330 | ) |
Total distributions from distributable earnings | | | (931,222 | ) | | | (336,155 | ) |
| | |
Return of capital: | | | | | | | | |
Class A | | | (14,744 | ) | | | — | |
Class C | | | (2,979 | ) | | | — | |
Class R | | | (557 | ) | | | — | |
Class Y | | | (16,823 | ) | | | — | |
Class R5 | | | (17 | ) | | | — | |
Class R6 | | | (345 | ) | | | — | |
Total return of capital | | | (35,465 | ) | | | — | |
| | |
Share transactions–net: | | | | | | | | |
Class A | | | (171,079 | ) | | | 3,866,129 | |
Class C | | | (301,339 | ) | | | 1,400,904 | |
Class R | | | 77,381 | | | | 202,316 | |
Class Y | | | (205,683 | ) | | | 4,473,703 | |
Class R6 | | | 48,757 | | | | 60,864 | |
Net increase (decrease) in net assets resulting from share transactions | | | (551,963 | ) | | | 10,003,916 | |
Net increase (decrease) in net assets | | | (2,059,465 | ) | | | 12,109,183 | |
| | |
Net assets: | | | | | | | | |
Beginning of year | | | 22,100,608 | | | | 9,991,425 | |
End of year | | $ | 20,041,143 | | | $ | 22,100,608 | |
| (1) | The Securities and Exchange Commission eliminated the requirement to disclose distribution components separately, except for tax return of capital. For the year ended October 31, 2017, distributions to shareholders from distributable earnings consisted of distributions from net investment income. |
Notes to Financial Statements
October 31, 2018
NOTE 1—Significant Accounting Policies
Invesco Global Infrastructure Fund (the “Fund”) is a series portfolio of AIM Investment Funds (Invesco Investment Funds) (the “Trust”). The Trust is organized as a Delaware statutory trust and is registered under the Investment Company Act of 1940, as amended (the “1940 Act”), as an open-end series management investment company authorized to issue an unlimited number of shares of beneficial interest. Information presented in these financial statements pertains only to the Fund. Matters affecting the Fund or each class will be voted on exclusively by the shareholders of the Fund or each class.
The Fund’s investment objective is total return through growth of capital and current income.
The Fund currently consists of six different classes of shares: Class A, Class C, Class R, Class Y, Class R5 and Class R6. Class Y shares are available only to certain investors. Class A shares are sold with a front-end sales charge unless certain waiver criteria are met. Under certain circumstances, load waived shares may be subject to contingent deferred sales charges (“CDSC”). Class C shares are sold with a CDSC. Class R, Class Y, Class R5 and Class R6 shares are sold at net asset value.
The Fund is an investment company and accordingly follows the investment company accounting and reporting guidance in accordance with Financial Accounting Standards Board Accounting Standards Codification Topic 946, Financial Services – Investment Companies.
14 Invesco Global Infrastructure Fund
The following is a summary of the significant accounting policies followed by the Fund in the preparation of its financial statements.
| A. | Security Valuations — Securities, including restricted securities, are valued according to the following policy. |
A security listed or traded on an exchange (except convertible securities) is valued at its last sales price or official closing price as of the close of the customary trading session on the exchange where the security is principally traded, or lacking any sales or official closing price on a particular day, the security may be valued at the closing bid price on that day. Securities traded in the over-the-counter market are valued based on prices furnished by independent pricing services or market makers. When such securities are valued by an independent pricing service they may be considered fair valued. Futures contracts are valued at the final settlement price set by an exchange on which they are principally traded. Listed options are valued at the mean between the last bid and asked prices from the exchange on which they are principally traded. Options not listed on an exchange are valued by an independent source at the mean between the last bid and asked prices. For purposes of determining net asset value (“NAV”) per share, futures and option contracts generally are valued 15 minutes after the close of the customary trading session of the New York Stock Exchange (“NYSE”).
Investments in open-end and closed-end registered investment companies that do not trade on an exchange are valued at the end-of-day net asset value per share. Investments in open-end and closed-end registered investment companies that trade on an exchange are valued at the last sales price or official closing price as of the close of the customary trading session on the exchange where the security is principally traded.
Debt obligations (including convertible securities) and unlisted equities are fair valued using an evaluated quote provided by an independent pricing service. Evaluated quotes provided by the pricing service may be determined without exclusive reliance on quoted prices, and may reflect appropriate factors such as institution-size trading in similar groups of securities, developments related to specific securities, dividend rate (for unlisted equities), yield (for debt obligations), quality, type of issue, coupon rate (for debt obligations), maturity (for debt obligations), individual trading characteristics and other market data. Pricing services generally value debt obligations assuming orderly transactions of institutional round lot size, but a fund may hold or transact in the same securities in smaller, odd lot sizes. Odd lots often trade at lower prices than institutional round lots. Debt obligations are subject to interest rate and credit risks. In addition, all debt obligations involve some risk of default with respect to interest and/or principal payments.
Foreign securities’ (including foreign exchange contracts) prices are converted into U.S. dollar amounts using the applicable exchange rates as of the close of the NYSE. If market quotations are available and reliable for foreign exchange-traded equity securities, the securities will be valued at the market quotations. Because trading hours for certain foreign securities end before the close of the NYSE, closing market quotations may become unreliable. If between the time trading ends on a particular security and the close of the customary trading session on the NYSE, events occur that the investment adviser determines are significant and make the closing price unreliable, the Fund may fair value the security. If the event is likely to have affected the closing price of the security, the security will be valued at fair value in good faith using procedures approved by the Board of Trustees. Adjustments to closing prices to reflect fair value may also be based on a screening process of an independent pricing service to indicate the degree of certainty, based on historical data, that the closing price in the principal market where a foreign security trades is not the current value as of the close of the NYSE. Foreign securities’ prices meeting the approved degree of certainty that the price is not reflective of current value will be priced at the indication of fair value from the independent pricing service. Multiple factors may be considered by the independent pricing service in determining adjustments to reflect fair value and may include information relating to sector indices, American Depositary Receipts and domestic and foreign index futures. Foreign securities may have additional risks including exchange rate changes, potential for sharply devalued currencies and high inflation, political and economic upheaval, the relative lack of issuer information, relatively low market liquidity and the potential lack of strict financial and accounting controls and standards.
Securities for which market prices are not provided by any of the above methods may be valued based upon quotes furnished by independent sources. The last bid price may be used to value equity securities. The mean between the last bid and asked prices is used to value debt obligations, including corporate loans.
Securities for which market quotations are not readily available or became unreliable are valued at fair value as determined in good faith by or under the supervision of the Trust’s officers following procedures approved by the Board of Trustees. Issuer specific events, market trends, bid/asked quotes of brokers and information providers and other market data may be reviewed in the course of making a good faith determination of a security’s fair value.
The Fund may invest in securities that are subject to interest rate risk, meaning the risk that the prices will generally fall as interest rates rise and, conversely, the prices will generally rise as interest rates fall. Specific securities differ in their sensitivity to changes in interest rates depending on their individual characteristics. Changes in interest rates may result in increased market volatility, which may affect the value and/or liquidity of certain Fund investments.
Valuations change in response to many factors including the historical and prospective earnings of the issuer, the value of the issuer’s assets, general economic conditions, interest rates, investor perceptions and market liquidity. Because of the inherent uncertainties of valuation, the values reflected in the financial statements may materially differ from the value received upon actual sale of those investments.
| B. | Securities Transactions and Investment Income — Securities transactions are accounted for on a trade date basis. Realized gains or losses on sales are computed on the basis of specific identification of the securities sold. Interest income (net of withholding tax, if any) is recorded on the accrual basis from settlement date. Dividend income (net of withholding tax, if any) is recorded on the ex-dividend date. |
The Fund may periodically participate in litigation related to Fund investments. As such, the Fund may receive proceeds from litigation settlements. Any proceeds received are included in the Statement of Operations as realized gain (loss) for investments no longer held and as unrealized gain (loss) for investments still held.
Brokerage commissions and mark ups are considered transaction costs and are recorded as an increase to the cost basis of securities purchased and/or a reduction of proceeds on a sale of securities. Such transaction costs are included in the determination of net realized and unrealized gain (loss) from investment securities reported in the Statement of Operations and the Statement of Changes in Net Assets and the net realized and unrealized gains (losses) on securities per share in the Financial Highlights. Transaction costs are included in the calculation of the Fund’s net asset value and, accordingly, they reduce the Fund’s total returns. These transaction costs are not considered operating expenses and are not reflected in net investment income reported in the Statement of Operations and the Statement of Changes in Net Assets, or the net investment income per share and the ratios of expenses and net investment income reported in the Financial Highlights, nor are they limited by any expense limitation arrangements between the Fund and the investment adviser.
The Fund allocates income and realized and unrealized capital gains and losses to a class based on the relative net assets of each class.
15 Invesco Global Infrastructure Fund
| C. | Country Determination — For the purposes of making investment selection decisions and presentation in the Schedule of Investments, the investment adviser may determine the country in which an issuer is located and/or credit risk exposure based on various factors. These factors include the laws of the country under which the issuer is organized, where the issuer maintains a principal office, the country in which the issuer derives 50% or more of its total revenues and the country that has the primary market for the issuer’s securities, as well as other criteria. Among the other criteria that may be evaluated for making this determination are the country in which the issuer maintains 50% or more of its assets, the type of security, financial guarantees and enhancements, the nature of the collateral and the sponsor organization. Country of issuer and/or credit risk exposure has been determined to be the United States of America, unless otherwise noted. |
| D. | Distributions — Distributions from net investment income, if any, are declared and paid quarterly and are recorded on the ex-dividend date. Distributions from net realized capital gain, if any, are generally declared and paid annually and recorded on the ex-dividend date. The Fund may elect to treat a portion of the proceeds from redemptions as distributions for federal income tax purposes. |
| E. | Master Limited Partnerships — The Fund invests in Master Limited Partnerships (“MLPs”). MLPs are publicly traded partnerships and limited liability companies taxed as partnerships under the Internal Revenue Code of 1986, as amended (the “Internal Revenue Code”). The Fund invests in MLPs engaged in, among other things, the transportation, storage, processing, refining, marketing, exploration, production and mining of minerals and natural resources. The Fund is a partner in each MLP; accordingly, the Fund is required to take into account the Fund’s allocable share of income, gains, losses, deductions, expenses, and tax credits recognized by each MLP. |
MLP’s may be less liquid and subject to more abrupt or erratic price movements than conventional publicly traded securities.
The Fund is non-diversified and will invest in securities of fewer issues than if it were diversified.
| F. | Return of Capital — Distributions received from the Fund’s investments in MLPs generally are comprised of income and return of capital. The Fund records investment income and return of capital based on estimates made at the time such distributions are received. The return of capital portion of the distribution is a reduction to investment income that results in an equivalent reduction in the cost basis of the associated investments and increases net realized gains (losses) and change in unrealized appreciation (depreciation). Such estimates are based on historical information available from each MLP and other industry sources. These estimates will subsequently be revised and may materially differ primarily based on information received from the MLPs after their tax reporting periods are concluded. |
| G. | Federal Income Taxes — The Fund intends to comply with the requirements of Subchapter M of the Internal Revenue Code of 1986, as amended (the “Internal Revenue Code”), necessary to qualify as a regulated investment company and to distribute substantially all of the Fund’s taxable earnings to shareholders. As such, the Fund will not be subject to federal income taxes on otherwise taxable income (including net realized capital gain) that is distributed to shareholders. Therefore, no provision for federal income taxes is recorded in the financial statements. |
The Fund recognizes the tax benefits of uncertain tax positions only when the position is more likely than not to be sustained. Management has analyzed the Fund’s uncertain tax positions and concluded that no liability for unrecognized tax benefits should be recorded related to uncertain tax positions. Management is not aware of any tax positions for which it is reasonably possible that the total amounts of unrecognized tax benefits will change materially in the next 12 months.
The Fund files tax returns in the U.S. Federal jurisdiction and certain other jurisdictions. Generally, the Fund is subject to examinations by such taxing authorities for up to three years after the filing of the return for the tax period.
| H. | Expenses — Fees provided for under the Rule 12b-1 plan of a particular class of the Fund are charged to the operations of such class. Transfer agency fees and expenses and other shareholder recordkeeping fees and expenses attributable to Class R5 and Class R6 are allocated to each share class based on relative net assets. Sub-accounting fees attributable to Class R5 are charged to the operations of the class. Transfer agency fees and expenses and other shareholder recordkeeping fees and expenses relating to all other classes are allocated among those classes based on relative net assets. All other expenses are allocated among the classes based on relative net assets. |
| I. | Accounting Estimates — The preparation of financial statements in conformity with accounting principles generally accepted in the United States of America (“GAAP”) requires management to make estimates and assumptions that affect the reported amounts of assets and liabilities at the date of the financial statements and the reported amounts of revenues and expenses during the reporting period including estimates and assumptions related to taxation. Actual results could differ from those estimates by a significant amount. In addition, the Fund monitors for material events or transactions that may occur or become known after the period-end date and before the date the financial statements are released to print. |
| J. | Indemnifications — Under the Trust’s organizational documents, each Trustee, officer, employee or other agent of the Trust is indemnified against certain liabilities that may arise out of the performance of their duties to the Fund. Additionally, in the normal course of business, the Fund enters into contracts, including the Fund’s servicing agreements, that contain a variety of indemnification clauses. The Fund’s maximum exposure under these arrangements is unknown as this would involve future claims that may be made against the Fund that have not yet occurred. The risk of material loss as a result of such indemnification claims is considered remote. |
| K. | Foreign Currency Translations — Foreign currency is valued at the close of the NYSE based on quotations posted by banks and major currency dealers. Portfolio securities and other assets and liabilities denominated in foreign currencies are translated into U.S. dollar amounts at the date of valuation. Purchases and sales of portfolio securities (net of foreign taxes withheld on disposition) and income items denominated in foreign currencies are translated into U.S. dollar amounts on the respective dates of such transactions. The Fund does not separately account for the portion of the results of operations resulting from changes in foreign exchange rates on investments and the fluctuations arising from changes in market prices of securities held. The combined results of changes in foreign exchange rates and the fluctuation of market prices on investments (net of estimated foreign tax withholding) are included with the net realized and unrealized gain or loss from investments in the Statement of Operations. Reported net realized foreign currency gains or losses arise from (1) sales of foreign currencies, (2) currency gains or losses realized between the trade and settlement dates on securities transactions, and (3) the difference between the amounts of dividends, interest, and foreign withholding taxes recorded on the Fund’s books and the U.S. dollar equivalent of the amounts actually received or paid. Net unrealized foreign currency gains and losses arise from changes in the fair values of assets and liabilities, other than investments in securities at fiscal period end, resulting from changes in exchange rates. |
The Fund may invest in foreign securities, which may be subject to foreign taxes on income, gains on investments or currency repatriation, a portion of which may be recoverable. Foreign taxes, if any, are recorded based on the tax regulations and rates that exist in the foreign markets in which the Fund invests and are shown in the Statement of Operations.
16 Invesco Global Infrastructure Fund
| L. | Forward Foreign Currency Contracts — The Fund may engage in foreign currency transactions either on a spot (i.e. for prompt delivery and settlement) basis, or through forward foreign currency contracts, to manage or minimize currency or exchange rate risk. |
The Fund may also enter into forward foreign currency contracts for the purchase or sale of a security denominated in a foreign currency in order to “lock in” the U.S. dollar price of that security, or the Fund may also enter into forward foreign currency contracts that do not provide for physical settlement of the two currencies, but instead are settled by a single cash payment calculated as the difference between the agreed upon exchange rate and the spot rate at settlement based upon an agreed upon notional amount (non-deliverable forwards). The Fund will set aside liquid assets in an amount equal to the daily mark-to-market obligation for forward foreign currency contracts.
A forward foreign currency contract is an obligation between two parties (“Counterparties”) to purchase or sell a specific currency for an agreed-upon price at a future date. The use of forward foreign currency contracts does not eliminate fluctuations in the price of the underlying securities the Fund owns or intends to acquire but establishes a rate of exchange in advance. Fluctuations in the value of these contracts are measured by the difference in the contract date and reporting date exchange rates and are recorded as unrealized appreciation (depreciation) until the contracts are closed. When the contracts are closed, realized gains (losses) are recorded. Realized and unrealized gains (losses) on the contracts are included in the Statement of Operations. The primary risks associated with forward foreign currency contracts include failure of the Counterparty to meet the terms of the contract and the value of the foreign currency changing unfavorably. These risks may be in excess of the amounts reflected in the Statement of Assets and Liabilities.
NOTE 2—Advisory Fees and Other Fees Paid to Affiliates
The Trust has entered into a master investment advisory agreement with Invesco Advisers, Inc. (the “Adviser” or “Invesco”). Under the terms of the investment advisory agreement, the Fund accrues daily and pays monthly an advisory fee to the Adviser based on the annual rate of the Fund’s average daily net assets as follows:
| | | | | | | | |
| Average Daily Net Assets | | Rate | |
First $2.5 billion | | | 0 | .84% | | | | |
Next $2 billion | | | 0 | .80% | | | | |
Next $3.5 billion | | | 0 | .785% | | | | |
Over $8 billion | | | 0 | .77% | | | | |
For the year ended October 31, 2018, the effective advisory fees incurred by the Fund was 0.84%.
Under the terms of a master sub-advisory agreement between the Adviser and each of Invesco Asset Management Deutschland GmbH, Invesco Asset Management Limited, Invesco Asset Management (Japan) Limited, Invesco Hong Kong Limited, Invesco Senior Secured Management, Inc. and Invesco Canada Ltd. and separate sub-advisory agreements with Invesco Capital Management LLC, formerly Invesco PowerShares Capital Management LLC, and Invesco Asset Management (India) Private Limited (collectively, the “Affiliated Sub-Advisers”) the Adviser, not the Fund, will pay 40% of the fees paid to the Adviser to any such Affiliated Sub-Adviser(s) that provide(s) discretionary investment management services to the Fund based on the percentage of assets allocated to such Affiliated Sub-Adviser(s).
The Adviser has contractually agreed, through at least February 29, 2020, to waive advisory fees and/or reimburse expenses of all shares to the extent necessary to limit total annual fund operating expenses after fee waiver and/or expense reimbursement (excluding certain items discussed below) of Class A, Class C, Class R, Class Y, Class R5 and Class R6 shares to 1.28%, 2.03%, 1.53%, 1.03%, 1.03% and 1.03%, respectively, of average daily net assets (the “expense limits”). In determining the Adviser’s obligation to waive advisory fees and/or reimburse expenses, the following expenses are not taken into account, and could cause the total annual fund operating expenses after fee waiver and/or expense reimbursement to exceed the numbers reflected above: (1) interest; (2) taxes; (3) dividend expense on short sales; (4) extraordinary or non-routine items, litigation expenses; and (5) expenses that the Fund has incurred but did not actually pay because of an expense offset arrangement. Unless Invesco continues the fee waiver agreement, it will terminate on February 29, 2020. During its term, the fee waiver agreement cannot be terminated or amended to increase the expense limits or reduce the advisory fee waiver without approval of the Board of Trustees.
Further, the Adviser has contractually agreed, through at least June 30, 2020, to waive the advisory fee payable by the Fund in an amount equal to 100% of the net advisory fees the Adviser receives from the affiliated money market funds on investments by the Fund of uninvested cash in such affiliated money market funds.
For the year ended October 31, 2018, the Adviser waived advisory fees and reimbursed fund level expenses of $240,327 and reimbursed class level expenses of $16,660, $3,363, $629, $19,028, $6 and $132 of Class A, Class C, Class R, Class Y, Class R5 and Class R6 shares, respectively.
The Trust has entered into a transfer agency and service agreement with Invesco Investment Services, Inc. (“IIS”) pursuant to which the Fund has agreed to pay IIS a fee for providing transfer agency and shareholder services to the Fund and reimburse IIS for certain expenses incurred by IIS in the course of providing such services. IIS may make payments to intermediaries that provide omnibus account services, sub-accounting services and/or networking services. All fees payable by IIS to intermediaries that provide omnibus account services or sub-accounting services are charged back to the Fund, subject to certain limitations approved by the Trust’s Board of Trustees. For the year ended October 31, 2018, expenses incurred under the agreement are shown in the Statement of Operations as Transfer agent fees.
The Trust has entered into a master administrative services agreement with Invesco pursuant to which the Fund has agreed to pay Invesco for certain administrative costs incurred in providing accounting services to the Fund. For the year ended October 31, 2018, expenses incurred under the agreement are shown in the Statement of Operations as Administrative services fees.
The Trust has entered into master distribution agreements with Invesco Distributors, Inc. (“IDI”) to serve as the distributor for the Class A, Class C, Class R, Class Y, Class R5 and Class R6 shares of the Fund. The Trust has adopted plans pursuant to Rule 12b-1 under the 1940 Act with respect to the Fund’s Class A, Class C and Class R shares (collectively, the “Plans”). The Fund, pursuant to the Plans, pays IDI compensation at the annual rate of 0.25% of the Fund’s average daily net assets of Class A shares, 1.00% of the average daily net assets of Class C shares and 0.50% of the average daily net assets of Class R shares. The fees are accrued daily and paid monthly. Of the Plan payments, up to 0.25% of the average daily net assets of each class of shares may be paid to furnish continuing personal shareholder services to customers who purchase and own shares of such classes. Any
17 Invesco Global Infrastructure Fund
amounts not paid as a service fee under the Plans would constitute an asset-based sales charge. Rules of the Financial Industry Regulatory Authority (“FINRA”) impose a cap on the total sales charges, including asset-based sales charges, that may be paid by any class of shares of the Fund. For the year ended October 31, 2018, expenses incurred under the Plans are shown in the Statement of Operations as Distribution fees.
Front-end sales commissions and CDSC (collectively, the “sales charges”) are not recorded as expenses of the Fund. Front-end sales commissions are deducted from proceeds from the sales of Fund shares prior to investment in Class A shares of the Fund. CDSC are deducted from redemption proceeds prior to remittance to the shareholder. During the year ended October 31, 2018, IDI advised the Fund that IDI retained $2,266 in front-end sales commissions from the sale of Class A shares and $205 from Class C shares, respectively, for CDSC imposed upon redemptions by shareholders.
Certain officers and trustees of the Trust are officers and directors of the Adviser, IIS and/or IDI.
NOTE 3—Additional Valuation Information
GAAP defines fair value as the price that would be received to sell an asset or paid to transfer a liability in an orderly transaction between market participants at the measurement date, under current market conditions. GAAP establishes a hierarchy that prioritizes the inputs to valuation methods, giving the highest priority to readily available unadjusted quoted prices in an active market for identical assets (Level 1) and the lowest priority to significant unobservable inputs (Level 3), generally when market prices are not readily available or are unreliable. Based on the valuation inputs, the securities or other investments are tiered into one of three levels. Changes in valuation methods may result in transfers in or out of an investment’s assigned level:
| | Level 1 — | Prices are determined using quoted prices in an active market for identical assets. |
| | Level 2 — | Prices are determined using other significant observable inputs. Observable inputs are inputs that other market participants may use in pricing a security. These may include quoted prices for similar securities, interest rates, prepayment speeds, credit risk, yield curves, loss severities, default rates, discount rates, volatilities and others. |
| | Level 3 — | Prices are determined using significant unobservable inputs. In situations where quoted prices or observable inputs are unavailable (for example, when there is little or no market activity for an investment at the end of the period), unobservable inputs may be used. Unobservable inputs reflect the Fund’s own assumptions about the factors market participants would use in determining fair value of the securities or instruments and would be based on the best available information. |
The following is a summary of the tiered valuation input levels, as of October 31, 2018. The level assigned to the securities valuations may not be an indication of the risk or liquidity associated with investing in those securities. Because of the inherent uncertainties of valuation, the values reflected in the financial statements may materially differ from the value received upon actual sale of those investments.
| | | | | | | | | | | | | | | | |
| | | Level 1 | | | Level 2 | | | Level 3 | | | Total | |
Investments in Securities | | | | | | | | | | | | | | | | |
Australia | | $ | 380,787 | | | $ | 326,067 | | | $ | — | | | $ | 706,854 | |
Brazil | | | 57,646 | | | | — | | | | — | | | | 57,646 | |
Canada | | | 2,404,698 | | | | — | | | | — | | | | 2,404,698 | |
China | | | — | | | | 332,394 | | | | — | | | | 332,394 | |
France | | | 1,095,819 | | | | 849,486 | | | | — | | | | 1,945,305 | |
Germany | | | 65,215 | | | | — | | | | — | | | | 65,215 | |
Hong Kong | | | — | | | | 449,185 | | | | — | | | | 449,185 | |
Italy | | | 701,401 | | | | — | | | | — | | | | 701,401 | |
Japan | | | — | | | | 276,549 | | | | — | | | | 276,549 | |
Luxembourg | | | 313,246 | | | | — | | | | — | | | | 313,246 | |
Mexico | | | 150,179 | | | | — | | | | — | | | | 150,179 | |
Netherlands | | | 70,703 | | | | — | | | | — | | | | 70,703 | |
New Zealand | | | 40,121 | | | | — | | | | — | | | | 40,121 | |
Spain | | | 130,387 | | | | 506,232 | | | | — | | | | 636,619 | |
United Kingdom | | | 1,212,071 | | | | — | | | | — | | | | 1,212,071 | |
United States | | | 10,335,653 | | | | — | | | | — | | | | 10,335,653 | |
Money Market Funds | | | 166,566 | | | | — | | | | — | | | | 166,566 | |
Total Investments | | $ | 17,124,492 | | | $ | 2,739,913 | | | $ | — | | | $ | 19,864,405 | |
NOTE 4—Expense Offset Arrangement(s)
The expense offset arrangement is comprised of transfer agency credits which result from balances in demand deposit accounts used by the transfer agent for clearing shareholder transactions. For the year ended October 31, 2018, the Fund received credits from this arrangement, which resulted in the reduction of the Fund’s total expenses of $487.
NOTE 5—Trustees’ and Officers’ Fees and Benefits
Trustees’ and Officers’ Fees and Benefits include amounts accrued by the Fund to pay remuneration to certain Trustees and Officers of the Fund. Trustees have the option to defer compensation payable by the Fund, and Trustees’ and Officers’ Fees and Benefits also include amounts accrued by the Fund to fund such deferred compensation amounts. Those Trustees who defer compensation have the option to select various Invesco Funds in which their deferral accounts shall be deemed to be invested. Obligations under the deferred compensation plan represent unsecured claims against the general assets of the Fund.
18 Invesco Global Infrastructure Fund
NOTE 6—Cash Balances
The Fund is permitted to temporarily carry a negative or overdrawn balance in its account with State Street Bank and Trust Company, the custodian bank. Such balances, if any at period-end, are shown in the Statement of Assets and Liabilities under the payable caption Amount due custodian. To compensate the custodian bank for such overdrafts, the overdrawn Fund may either (1) leave funds as a compensating balance in the account so the custodian bank can be compensated by earning the additional interest; or (2) compensate by paying the custodian bank at a rate agreed upon by the custodian bank and Invesco, not to exceed the contractually agreed upon rate.
NOTE 7—Distributions to Shareholders and Tax Components of Net Assets
Tax Character of Distributions to Shareholders Paid During the Fiscal Years Ended October 31, 2018 and 2017:
| | | | | | | | |
| | | 2018 | | | 2017 | |
Ordinary income | | $ | 580,607 | | | $ | 336,155 | |
Return of capital | | | 35,465 | | | | — | |
Long-term capital gain | | | 350,615 | | | | — | |
Total distributions | | $ | 966,687 | | | $ | 336,155 | |
Tax Components of Net Assets at Period-End:
| | | | |
| | | 2018 | |
Net unrealized appreciation — investments | | $ | 271,431 | |
Net unrealized appreciation (depreciation) — foreign currencies | | | (458 | ) |
Temporary book/tax differences | | | (7,856 | ) |
Capital loss carryforward | | | (60,984 | ) |
Shares of beneficial interest | | | 19,839,010 | |
Total net assets | | $ | 20,041,143 | |
The difference between book-basis and tax-basis unrealized appreciation (depreciation) is due to differences in the timing of recognition of gains and losses on investments for tax and book purposes. The Fund’s net unrealized appreciation difference is attributable primarily to wash sales.
The temporary book/tax differences are a result of timing differences between book and tax recognition of income and/or expenses. The Fund’s temporary book/tax differences are the result of the trustee deferral of compensation and retirement plan benefits.
Capital loss carryforward is calculated and reported as of a specific date. Results of transactions and other activity after that date may affect the amount of capital loss carryforward actually available for the Fund to utilize. The ability to utilize capital loss carryforwards in the future may be limited under the Internal Revenue Code and related regulations based on the results of future transactions.
The Fund has a capital loss carryforward as of October 31, 2018, as follows:
| | | | | | | | | | | | |
| Capital Loss Carryforward* | |
| Expiration | | Short-Term | | | Long-Term | | | Total | |
Not subject to expiration | | $ | 60,984 | | | $ | — | | | $ | 60,984 | |
| * | Capital loss carryforward as of the date listed above is reduced for limitations, if any, to the extent required by the Internal Revenue Code and may be further limited depending upon a variety of factors, including the realization of net unrealized gains or losses as of the date of any reorganization. |
NOTE 8—Investment Transactions
The aggregate amount of investment securities (other than short-term securities, U.S. Treasury obligations and money market funds, if any) purchased and sold by the Fund during the year ended October 31, 2018 was $24,639,056 and $25,889,700, respectively. Cost of investments, including any derivatives, on a tax basis includes the adjustments for financial reporting purposes as of the most recently completed federal income tax reporting period-end.
| | | | |
| Unrealized Appreciation (Depreciation) of Investments on a Tax Basis | |
Aggregate unrealized appreciation of investments | | $ | 954,389 | |
Aggregate unrealized (depreciation) of investments | | | (682,958 | ) |
Net unrealized appreciation of investments | | $ | 271,431 | |
Cost of investments for tax purposes is $19,592,974.
NOTE 9—Reclassification of Permanent Differences
Primarily as a result of differing book/tax treatment of distributions and foreign currency transactions, on October 31, 2018, undistributed net investment income was decreased by $47,837, undistributed net realized gain was increased by $83,805 and shares of beneficial interest was decreased by $35,968. This reclassification had no effect on the net assets of the Fund.
19 Invesco Global Infrastructure Fund
NOTE 10—Share Information
| | | | | | | | | | | | | | | | |
| | | Summary of Share Activity | |
| | | Years ended October 31, | |
| | | 2018(a) | | | 2017 | |
| | | Shares | | | Amount | | | Shares | | | Amount | |
Sold: | | | | | | | | | | | | | | | | |
Class A | | | 266,393 | | | $ | 2,810,371 | | | | 540,397 | | | $ | 5,370,212 | |
Class C | | | 30,397 | | | | 316,866 | | | | 167,142 | | | | 1,644,192 | |
Class R | | | 12,223 | | | | 126,337 | | | | 27,781 | | | | 281,761 | |
Class Y | | | 145,210 | | | | 1,492,854 | | | | 604,953 | | | | 5,980,042 | |
Class R6 | | | 7,840 | | | | 80,995 | | | | 9,889 | | | | 97,616 | |
| | | | |
Issued as reinvestment of dividends | | | | | | | | | | | | | | | | |
Class A | | | 29,484 | | | | 308,374 | | | | 10,009 | | | | 103,226 | |
Class C | | | 6,559 | | | | 68,810 | | | | 1,522 | | | | 15,805 | |
Class R | | | 1,175 | | | | 12,285 | | | | 292 | | | | 3,060 | |
Class Y | | | 29,951 | | | | 313,342 | | | | 13,517 | | | | 139,417 | |
Class R6 | | | 839 | | | | 8,759 | | | | 304 | | | | 3,114 | |
| | | | |
Reacquired: | | | | | | | | | | | | | | | | |
Class A | | | (315,829 | ) | | | (3,289,824 | ) | | | (157,736 | ) | | | (1,607,309 | ) |
Class C | | | (67,022 | ) | | | (687,015 | ) | | | (25,138 | ) | | | (259,093 | ) |
Class R | | | (5,921 | ) | | | (61,241 | ) | | | (7,704 | ) | | | (82,505 | ) |
Class Y | | | (193,987 | ) | | | (2,011,879 | ) | | | (161,852 | ) | | | (1,645,756 | ) |
Class R6 | | | (3,925 | ) | | | (40,997 | ) | | | (4,001 | ) | | | (39,866 | ) |
Net increase (decrease) in share activity | | | (56,613 | ) | | $ | (551,963 | ) | | | 1,019,375 | | | $ | 10,003,916 | |
| (a) | There are entities that are record owners of more than 5% of the outstanding shares of the Fund and in the aggregate own 42% of the outstanding shares of the Fund. IDI has an agreement with these entities to sell Fund shares. The Fund, Invesco and/or Invesco affiliates may make payments to these entities, which are considered to be related to the Fund, for providing services to the Fund, Invesco and/or Invesco affiliates including but not limited to services such as securities brokerage, distribution, third party record keeping and account servicing. The Fund has no knowledge as to whether all or any portion of the shares owned of record by these entities are also owned beneficially. |
| | In addition, 17% of the outstanding shares of the Fund are owned by the Adviser or an affiliate of the Adviser. |
20 Invesco Global Infrastructure Fund
NOTE 11—Financial Highlights
The following schedule presents financial highlights for a share of the Fund outstanding throughout the periods indicated.
| | | | | | | | | | | | | | | | | | | | | | | | | | | | | | | | | | | | | | | | | | | | | | | | | | | | | | | | | | | | |
| | | Net asset
value,
beginning
of period | | | Net
investment
income(a) | | | Net gains
(losses)
on securities
(both
realized and
unrealized) | | | Total from
investment
operations | | | Dividends
from net
investment
income | | | Return
of
capital | | | Distributions
from net
realized
gains | | | Total
distributions | | | Net asset
value, end
of period | | | Total
return(b) | | | Net assets,
end of period
(000’s omitted) | | | Ratio of
expenses
to average
net assets
with fee waivers
and/or expenses
absorbed | | | Ratio of
expenses
to average net
assets without
fee waivers
and/or expenses
absorbed | | | Ratio of net
investment
income
to average
net assets | | | Portfolio
turnover(c) | |
Class A | | | | | | | | | | | | | | | | | | | | | | | | | | | | | | | | | | | | | | | | | | | | | | | | | | | | | | | | | | | | |
Year ended 10/31/18 | | $ | 10.74 | | | $ | 0.18 | | | $ | (0.45 | ) | | $ | (0.27 | ) | | $ | (0.19 | ) | | $ | (0.02 | ) | | $ | (0.25 | ) | | $ | (0.46 | ) | | $ | 10.01 | | | | (2.65 | )% | | $ | 8,098 | | | | 1.28 | %(d) | | | 2.56 | %(d) | | | 1.76 | %(d) | | | 114 | % |
Year ended 10/31/17 | | | 9.62 | | | | 0.25 | (e) | | | 1.06 | | | | 1.31 | | | | (0.19 | ) | | | — | | | | — | | | | (0.19 | ) | | | 10.74 | | | | 13.74 | | | | 8,899 | | | | 1.29 | | | | 2.87 | | | | 2.40 | (e) | | | 99 | |
Year ended 10/31/16 | | | 9.50 | | | | 0.17 | | | | 0.11 | | | | 0.28 | | | | (0.16 | ) | | | — | | | | — | | | | (0.16 | ) | | | 9.62 | | | | 3.01 | | | | 4,194 | | | | 1.40 | | | | 4.29 | | | | 1.76 | | | | 85 | |
Year ended 10/31/15 | | | 10.66 | | | | 0.17 | | | | (1.11 | ) | | | (0.94 | ) | | | (0.21 | ) | | | — | | | | (0.01 | ) | | | (0.22 | ) | | | 9.50 | | | | (8.85 | ) | | | 3,262 | | | | 1.40 | | | | 6.36 | | | | 1.68 | | | | 84 | |
Year ended 10/31/14(f) | | | 10.00 | | | | 0.08 | | | | 0.63 | | | | 0.71 | | | | (0.05 | ) | | | — | | | | — | | | | (0.05 | ) | | | 10.66 | | | | 7.12 | | | | 2,497 | | | | 1.39 | (g) | | | 8.60 | (g) | | | 1.51 | (g) | | | 19 | |
Class C | | | | | | | | | | | | | | | | | | | | | | | | | | | | | | | | | | | | | | | | | | | | | | | | | | | | | | | | | | | | |
Year ended 10/31/18 | | | 10.72 | | | | 0.10 | | | | (0.44 | ) | | | (0.34 | ) | | | (0.13 | ) | | | (0.01 | ) | | | (0.25 | ) | | | (0.39 | ) | | | 9.99 | | | | (3.39 | ) | | | 1,579 | | | | 2.03 | (d) | | | 3.31 | (d) | | | 1.01 | (d) | | | 114 | |
Year ended 10/31/17 | | | 9.60 | | | | 0.17 | (e) | | | 1.06 | | | | 1.23 | | | | (0.11 | ) | | | — | | | | — | | | | (0.11 | ) | | | 10.72 | | | | 12.92 | | | | 2,016 | | | | 2.04 | | | | 3.62 | | | | 1.65 | (e) | | | 99 | |
Year ended 10/31/16 | | | 9.48 | | | | 0.10 | | | | 0.11 | | | | 0.21 | | | | (0.09 | ) | | | — | | | | — | | | | (0.09 | ) | | | 9.60 | | | | 2.24 | | | | 428 | | | | 2.15 | | | | 5.04 | | | | 1.01 | | | | 85 | |
Year ended 10/31/15 | | | 10.64 | | | | 0.09 | | | | (1.10 | ) | | | (1.01 | ) | | | (0.14 | ) | | | — | | | | (0.01 | ) | | | (0.15 | ) | | | 9.48 | | | | (9.56 | ) | | | 279 | | | | 2.15 | | | | 7.11 | | | | 0.93 | | | | 84 | |
Year ended 10/31/14(f) | | | 10.00 | | | | 0.04 | | | | 0.63 | | | | 0.67 | | | | (0.03 | ) | | | — | | | | — | | | | (0.03 | ) | | | 10.64 | | | | 6.71 | | | | 181 | | | | 2.14 | (g) | | | 9.35 | (g) | | | 0.76 | (g) | | | 19 | |
Class R | | | | | | | | | | | | | | | | | | | | | | | | | | | | | | | | | | | | | | | | | | | | | | | | | | | | | | | | | | | | |
Year ended 10/31/18 | | | 10.73 | | | | 0.16 | | | | (0.44 | ) | | | (0.28 | ) | | | (0.18 | ) | | | (0.01 | ) | | | (0.25 | ) | | | (0.44 | ) | | | 10.01 | | | | (2.80 | ) | | | 351 | | | | 1.53 | (d) | | | 2.81 | (d) | | | 1.51 | (d) | | | 114 | |
Year ended 10/31/17 | | | 9.61 | | | | 0.22 | (e) | | | 1.06 | | | | 1.28 | | | | (0.16 | ) | | | — | | | | — | | | | (0.16 | ) | | | 10.73 | | | | 13.47 | | | | 296 | | | | 1.54 | | | | 3.12 | | | | 2.15 | (e) | | | 99 | |
Year ended 10/31/16 | | | 9.49 | | | | 0.14 | | | | 0.11 | | | | 0.25 | | | | (0.13 | ) | | | — | | | | — | | | | (0.13 | ) | | | 9.61 | | | | 2.76 | | | | 69 | | | | 1.65 | | | | 4.54 | | | | 1.51 | | | | 85 | |
Year ended 10/31/15 | | | 10.66 | | | | 0.14 | | | | (1.11 | ) | | | (0.97 | ) | | | (0.19 | ) | | | — | | | | (0.01 | ) | | | (0.20 | ) | | | 9.49 | | | | (9.18 | ) | | | 27 | | | | 1.65 | | | | 6.61 | | | | 1.43 | | | | 84 | |
Year ended 10/31/14(f) | | | 10.00 | | | | 0.07 | | | | 0.64 | | | | 0.71 | | | | (0.05 | ) | | | — | | | | — | | | | (0.05 | ) | | | 10.66 | | | | 7.05 | | | | 13 | | | | 1.64 | (g) | | | 8.85 | (g) | | | 1.26 | (g) | | | 19 | |
Class Y | | | | | | | | | | | | | | | | | | | | | | | | | | | | | | | | | | | | | | | | | | | | | | | | | | | | | | | | | | | | |
Year ended 10/31/18 | | | 10.74 | | | | 0.21 | | | | (0.44 | ) | | | (0.23 | ) | | | (0.22 | ) | | | (0.02 | ) | | | (0.25 | ) | | | (0.49 | ) | | | 10.02 | | | | (2.31 | ) | | | 9,775 | | | | 1.03 | (d) | | | 2.31 | (d) | | | 2.01 | (d) | | | 114 | |
Year ended 10/31/17 | | | 9.62 | | | | 0.27 | (e) | | | 1.06 | | | | 1.33 | | | | (0.21 | ) | | | — | | | | — | | | | (0.21 | ) | | | 10.74 | | | | 14.02 | | | | 10,685 | | | | 1.04 | | | | 2.62 | | | | 2.65 | (e) | | | 99 | |
Year ended 10/31/16 | | | 9.50 | | | | 0.19 | | | | 0.11 | | | | 0.30 | | | | (0.18 | ) | | | — | | | | — | | | | (0.18 | ) | | | 9.62 | | | | 3.27 | | | | 5,177 | | | | 1.15 | | | | 4.04 | | | | 2.01 | | | | 85 | |
Year ended 10/31/15 | | | 10.67 | | | | 0.20 | | | | (1.12 | ) | | | (0.92 | ) | | | (0.24 | ) | | | — | | | | (0.01 | ) | | | (0.25 | ) | | | 9.50 | | | | (8.70 | ) | | | 4,223 | | | | 1.15 | | | | 6.11 | | | | 1.93 | | | | 84 | |
Year ended 10/31/14(f) | | | 10.00 | | | | 0.09 | | | | 0.64 | | | | 0.73 | | | | (0.06 | ) | | | — | | | | — | | | | (0.06 | ) | | | 10.67 | | | | 7.29 | | | | 2,287 | | | | 1.14 | (g) | | | 8.35 | (g) | | | 1.76 | (g) | | | 19 | |
Class R5 | | | | | | | | | | | | | | | | | | | | | | | | | | | | | | | | | | | | | | | | | | | | | | | | | | | | | | | | | | | | |
Year ended 10/31/18 | | | 10.74 | | | | 0.21 | | | | (0.44 | ) | | | (0.23 | ) | | | (0.22 | ) | | | (0.02 | ) | | | (0.25 | ) | | | (0.49 | ) | | | 10.02 | | | | (2.31 | ) | | | 10 | | | | 1.03 | (d) | | | 2.19 | (d) | | | 2.01 | (d) | | | 114 | |
Year ended 10/31/17 | | | 9.62 | | | | 0.27 | (e) | | | 1.06 | | | | 1.33 | | | | (0.21 | ) | | | — | | | | — | | | | (0.21 | ) | | | 10.74 | | | | 14.02 | | | | 11 | | | | 1.04 | | | | 2.54 | | | | 2.65 | (e) | | | 99 | |
Year ended 10/31/16 | | | 9.50 | | | | 0.19 | | | | 0.11 | | | | 0.30 | | | | (0.18 | ) | | | — | | | | — | | | | (0.18 | ) | | | 9.62 | | | | 3.27 | | | | 10 | | | | 1.15 | | | | 4.02 | | | | 2.01 | | | | 85 | |
Year ended 10/31/15 | | | 10.67 | | | | 0.20 | | | | (1.12 | ) | | | (0.92 | ) | | | (0.24 | ) | | | — | | | | (0.01 | ) | | | (0.25 | ) | | | 9.50 | | | | (8.70 | ) | | | 10 | | | | 1.15 | | | | 6.00 | | | | 1.93 | | | | 84 | |
Year ended 10/31/14(f) | | | 10.00 | | | | 0.09 | | | | 0.64 | | | | 0.73 | | | | (0.06 | ) | | | — | | | | — | | | | (0.06 | ) | | | 10.67 | | | | 7.29 | | | | 11 | | | | 1.14 | (g) | | | 8.34 | (g) | | | 1.76 | (g) | | | 19 | |
Class R6 | | | | | | | | | | | | | | | | | | | | | | | | | | | | | | | | | | | | | | | | | | | | | | | | | | | | | | | | | | | | |
Year ended 10/31/18 | | | 10.74 | | | | 0.21 | | | | (0.44 | ) | | | (0.23 | ) | | | (0.22 | ) | | | (0.02 | ) | | | (0.25 | ) | | | (0.49 | ) | | | 10.02 | | | | (2.31 | ) | | | 229 | | | | 1.03 | (d) | | | 2.19 | (d) | | | 2.01 | (d) | | | 114 | |
Year ended 10/31/17 | | | 9.62 | | | | 0.27 | (e) | | | 1.06 | | | | 1.33 | | | | (0.21 | ) | | | — | | | | — | | | | (0.21 | ) | | | 10.74 | | | | 14.02 | | | | 194 | | | | 1.04 | | | | 2.54 | | | | 2.65 | (e) | | | 99 | |
Year ended 10/31/16 | | | 9.50 | | | | 0.19 | | | | 0.11 | | | | 0.30 | | | | (0.18 | ) | | | — | | | | — | | | | (0.18 | ) | | | 9.62 | | | | 3.27 | | | | 114 | | | | 1.15 | | | | 4.02 | | | | 2.01 | | | | 85 | |
Year ended 10/31/15 | | | 10.67 | | | | 0.20 | | | | (1.12 | ) | | | (0.92 | ) | | | (0.24 | ) | | | — | | | | (0.01 | ) | | | (0.25 | ) | | | 9.50 | | | | (8.70 | ) | | | 69 | | | | 1.15 | | | | 6.00 | | | | 1.93 | | | | 84 | |
Year ended 10/31/14(f) | | | 10.00 | | | | 0.09 | | | | 0.64 | | | | 0.73 | | | | (0.06 | ) | | | — | | | | — | | | | (0.06 | ) | | | 10.67 | | | | 7.29 | | | | 38 | | | | 1.14 | (g) | | | 8.34 | (g) | | | 1.76 | (g) | | | 19 | |
| (a) | Calculated using average shares outstanding. |
| (b) | Includes adjustments in accordance with accounting principles generally accepted in the United States of America and as such, the net asset value for financial reporting purposes and the returns based upon those net asset values may differ from the net asset value and returns for shareholder transactions. Does not include sales charges and is not annualized for periods less than one year, if applicable. |
| (c) | Portfolio turnover is calculated at the fund level and is not annualized for periods less than one year, if applicable. |
| (d) | Ratios are based on average daily net assets (000’s omitted) of $9,103, $1,837, $344, $10,397, $10 and $213 for Class A, Class C, Class R, Class Y, Class R5 and Class R6 shares, respectively. |
| (e) | Net investment income per share and the ratio of net investment income to average net assets includes significant dividends received during the period. Net investment income per share and the ratio of net investment income to average net assets excluding the significant dividends are $0.20 and 1.88%, $0.12 and 1.13%, $0.17 and 1.63%, $0.22 and 2.13%, $0.22 and 2.13% and $0.22 and 2.13% for Class A, Class C, Class R, Class Y, Class R5 and Class R6 shares, respectively. |
| (f) | Commencement date of May 2, 2014. |
21 Invesco Global Infrastructure Fund
Report of Independent Registered Public Accounting Firm
To the Board of Trustees of AIM Investment Funds (Invesco Investment Funds)
and Shareholders of Invesco Global Infrastructure Fund:
Opinion on the Financial Statements
We have audited the accompanying statement of assets and liabilities, including the schedule of investments, of Invesco Global Infrastructure Fund (one of the funds constituting AIM Investment Funds (Invesco Investment Funds), hereafter referred to as the “Fund”) as of October 31, 2018, the related statement of operations for the year ended October 31, 2018, the statement of changes in net assets for each of the two years in the period ended October 31, 2018, including the related notes, and the financial highlights for each of the periods indicated therein (collectively referred to as the financial statements). In our opinion, the financial statements present fairly, in all material respects, the financial position of the Fund as of October 31, 2018, the results of its operations for the year then ended, the changes in its net assets for each of the two years in the period ended October 31, 2018 and the financial highlights for each of the periods indicated therein in conformity with accounting principles generally accepted in the United States of America.
Basis for Opinion
These financial statements are the responsibility of the Fund’s management. Our responsibility is to express an opinion on the Fund’s financial statements based on our audits. We are a public accounting firm registered with the Public Company Accounting Oversight Board (United States) (PCAOB) and are required to be independent with respect to the Fund in accordance with the U.S. federal securities laws and the applicable rules and regulations of the Securities and Exchange Commission and the PCAOB.
We conducted our audits of these financial statements in accordance with the standards of the PCAOB. Those standards require that we plan and perform the audit to obtain reasonable assurance about whether the financial statements are free of material misstatement, whether due to error or fraud.
Our audits included performing procedures to assess the risks of material misstatement of the financial statements, whether due to error or fraud, and performing procedures that respond to those risks. Such procedures included examining, on a test basis, evidence regarding the amounts and disclosures in the financial statements. Our audits also included evaluating the accounting principles used and significant estimates made by management, as well as evaluating the overall presentation of the financial statements. Our procedures included confirmation of securities owned as of October 31, 2018 by correspondence with the custodian, transfer agent and brokers; when replies were not received from brokers, we performed other auditing procedures. We believe that our audits provide a reasonable basis for our opinion.
PricewaterhouseCoopers LLP
Houston, TX
December 28, 2018
We have served as the auditor of one or more of the investment companies in the Invesco group of investment companies since at least 1995. We have not been able to determine the specific year we began serving as auditor.
22 Invesco Global Infrastructure Fund
Calculating your ongoing Fund expenses
Example
As a shareholder of the Fund, you incur two types of costs: (1) transaction costs, which may include sales charges (loads) on purchase payments or contingent deferred sales charges on redemptions, if any; and (2) ongoing costs, including management fees, distribution and/or service (12b-1) fees, and other Fund expenses. This example is intended to help you understand your ongoing costs (in dollars) of investing in the Fund and to compare these costs with ongoing costs of investing in other mutual funds. The example is based on an investment of $1,000 invested at the beginning of the period and held for the entire period May 1, 2018 through October 31, 2018.
Actual expenses
The table below provides information about actual account values and actual expenses. You may use the information in this table, together with the amount you invested, to estimate the expenses that you paid over the period. Simply divide your account value by $1,000 (for example, an $8,600 account value divided by $1,000 = 8.6), then multiply the result by the number in the table under the heading entitled “Actual Expenses Paid During Period” to estimate the expenses you paid on your account during this period.
Hypothetical example for comparison purposes
The table below also provides information about hypothetical account values and hypothetical expenses based on the Fund’s actual expense ratio and an assumed rate of return of 5% per year before expenses, which is not the Fund’s actual return.
The hypothetical account values and expenses may not be used to estimate the actual ending account balance or expenses you paid for the period. You may use this information to compare the ongoing costs of investing in the Fund and other funds. To do so, compare this 5% hypothetical example with the 5% hypothetical examples that appear in the shareholder reports of the other funds.
Please note that the expenses shown in the table are meant to highlight your ongoing costs only and do not reflect any transaction costs, such as sales charges (loads) on purchase payments or contingent deferred sales charges on redemptions, if any. Therefore, the hypothetical information is useful in comparing ongoing costs only, and will not help you determine the relative total costs of owning different funds. In addition, if these transaction costs were included, your costs would have been higher.
| | | | | | | | | | | | | | | | | | | | | | | | |
Class | | Beginning
Account Value
(05/01/18) | | | ACTUAL | | | HYPOTHETICAL
(5% annual return before
expenses) | | | Annualized
Expense Ratio | |
| | Ending
Account Value
(10/31/18)1 | | | Expenses
Paid During
Period2 | | | Ending
Account Value
(10/31/18) | | | Expenses
Paid During
Period2 | |
| A | | $ | 1,000.00 | | | $ | 991.10 | | | $ | 6.42 | | | $ | 1,018.75 | | | $ | 6.51 | | | | 1.28 | % |
| C | | | 1,000.00 | | | | 987.30 | | | | 10.17 | | | | 1,014.97 | | | | 10.31 | | | | 2.03 | |
| R | | | 1,000.00 | | | | 990.80 | | | | 7.68 | | | | 1,017.49 | | | | 7.78 | | | | 1.53 | |
| Y | | | 1,000.00 | | | | 993.30 | | | | 5.17 | | | | 1,020.01 | | | | 5.24 | | | | 1.03 | |
| R5 | | | 1,000.00 | | | | 993.30 | | | | 5.17 | | | | 1,020.01 | | | | 5.24 | | | | 1.03 | |
| R6 | | | 1,000.00 | | | | 993.30 | | | | 5.17 | | | | 1,020.01 | | | | 5.24 | | | | 1.03 | |
| 1 | The actual ending account value is based on the actual total return of the Fund for the period May 1, 2018 through October 31, 2018, after actual expenses and will differ from the hypothetical ending account value which is based on the Fund’s expense ratio and a hypothetical annual return of 5% before expenses. |
| 2 | Expenses are equal to the Fund’s annualized expense ratio as indicated above multiplied by the average account value over the period, multiplied by 184/365 to reflect the most recent fiscal half year. |
23 Invesco Global Infrastructure Fund
Approval of Investment Advisory and Sub-Advisory Contracts
At meetings held on June 5-6, 2018, the Board of Trustees (the Board or the Trustees) of AIM Investment Funds (Invesco Investment Funds) as a whole, and the independent Trustees, who comprise over 75% of the Board, voting separately, approved the continuance of the Invesco Global Infrastructure Fund’s (the Fund) Master Investment Advisory Agreement with Invesco Advisers, Inc. (Invesco Advisers and the investment advisory agreement) and the Master Intergroup Sub-Advisory Contract for Mutual Funds with Invesco Asset Management Deutschland GmbH, Invesco Asset Management Limited, Invesco Asset Management (Japan) Limited, Invesco Hong Kong Limited, Invesco Senior Secured Management, Inc., Invesco Canada Ltd. and separate Sub-Advisory Contracts with Invesco Capital Management LLC and Invesco Asset Management (India) Private Limited (collectively, the Affiliated Sub-Advisers and the sub-advisory contracts) for another year, effective July 1, 2018. After evaluating the factors discussed below, among others, the Board approved the renewal of the Fund’s investment advisory agreement and the sub-advisory contracts and determined that the compensation payable by the Fund to Invesco Advisers and by Invesco Advisers to the Affiliated Sub-Advisers is fair and reasonable.
The Board’s Evaluation Process
The Board’s Investments Committee has established three Sub-Committees, which meet throughout the year to review the performance of funds advised by Invesco Advisers (the Invesco Funds). Over the course of each year, the Sub-Committees meet with portfolio managers for their assigned Invesco Funds and other members of management to review detailed information about investment performance and portfolio attributes of these funds. The Board took into account evaluations and reports that it received from the Investments Committee and Sub-Committees, as well as the information provided to such committees and the Board throughout the year, in considering whether to approve each Invesco Fund’s investment advisory agreement and sub-advisory contracts.
As part of the contract renewal process, the Board reviews and considers information provided in response to detailed requests for information submitted to management by the independent Trustees with assistance from legal counsel to the independent Trustees. The Board receives comparative investment performance and fee data regarding the Invesco Funds prepared by Invesco Advisers and Broadridge Financial Solutions, Inc. (Broadridge), an independent mutual fund data provider. The Board also receives an independent written evaluation from the Senior Officer, an officer of the Invesco Funds who reports directly to the independent Trustees. The Senior Officer’s
evaluation is prepared as part of his responsibility to manage the process by which the Invesco Funds’ proposed management fees are negotiated during the annual contract renewal process to ensure they are negotiated in a manner that is at arms’ length and reasonable. In addition to meetings with Invesco Advisers and fund counsel throughout the year, the independent Trustees also discuss the continuance of the investment advisory agreement and sub-advisory contracts in separate sessions with the Senior Officer and with independent legal counsel.
The discussion below is a summary of the Senior Officer’s independent written evaluation with respect to the Fund’s investment advisory agreement, as well as a discussion of the material factors and related conclusions that formed the basis for the Board’s approval of the Fund’s investment advisory agreement and sub-advisory contracts. The Trustees’ review and conclusions are based on the comprehensive consideration of all information presented to them during the course of the year and in prior years and are not the result of any single determinative factor. Moreover, one Trustee may have weighed a particular piece of information or factor differently than another Trustee. This information is current as of June 6, 2018.
Factors and Conclusions and Summary of Independent Written Fee Evaluation
| A. | Nature, Extent and Quality of Services Provided by Invesco Advisers and the Affiliated Sub-Advisers |
The Board reviewed the nature, extent and quality of the advisory services provided to the Fund by Invesco Advisers under the Fund’s investment advisory agreement, and the credentials and experience of the officers and employees of Invesco Advisers who provide these services, including the Fund’s portfolio manager(s). The Board’s review included consideration of Invesco Advisers’ investment process oversight and structure, credit analysis and investment risk management. The Board also considered non-advisory services that Invesco Advisers and its affiliates provide to the Invesco Funds such as various back office support functions, third party oversight, internal audit, valuation, portfolio trading and legal and compliance. The Board also reviewed and considered the benefits to shareholders of investing in a fund that is part of the Invesco family of funds under the umbrella of Invesco Ltd., Invesco Advisers’ parent company, and noted Invesco Ltd.’s depth and experience in conducting an investment management business, as well as its commitment of financial and other resources to such business. The Board concluded that the nature, extent and quality of the services provided to the Fund by
Invesco Advisers are appropriate and satisfactory.
The Board reviewed the services that may be provided by the Affiliated Sub-Advisers under the sub-advisory contracts and the credentials and experience of the officers and employees of the Affiliated Sub-Advisers who provide these services. The Board noted the Affiliated Sub-Advisers’ expertise with respect to certain asset classes and that the Affiliated Sub-Advisers have offices and personnel that are located in financial centers around the world. As a result, the Board noted that the Affiliated Sub-Advisers can provide research and investment analysis on the markets and economies of various countries in which the Fund may invest, make recommendations regarding securities and assist with security trades. The Board concluded that the sub-advisory contracts may benefit the Fund and its shareholders by permitting Invesco Advisers to use the resources and talents of the Affiliated Sub-Advisers in managing the Fund. The Board concluded that the nature, extent and quality of the services that may be provided by the Affiliated Sub-Advisers are appropriate and satisfactory.
| B. | Fund Investment Performance |
The Board considered Fund investment performance as a relevant factor in considering whether to approve the investment advisory agreement as well as the sub-advisory contracts for the Fund, as Invesco Asset Management Limited currently manages assets of the Fund.
The Board compared the Fund’s investment performance over multiple time periods ending December 31, 2017 to the performance of funds in the Broadridge performance universe and against the Lipper Global Infrastructure Funds Index. The Board noted that performance of Class A shares of the Fund was in the third quintile of its performance universe for the one year period and the fourth quintile for the three year period (the first quintile being the best performing funds and the fifth quintile being the worst performing funds). The Board noted that performance of Class A shares of the Fund was reasonably comparable to the performance of the Index for the one year period, and below the performance of the Index for the three year period. The Board noted that underweight exposure to emerging markets and overweight exposure to certain sectors detracted from the Fund’s relative performance. The Trustees also reviewed more recent Fund performance and this review did not change their conclusions.
| C. | Advisory and Sub-Advisory Fees and Fund Expenses |
The Board compared the Fund’s contractual management fee rate to the contractual management fee rates of funds in the Fund’s Broadridge expense group. The Board noted that the contractual management fee rate for Class A shares of the Fund was below the median contractual management fee rate of
24 Invesco Global Infrastructure Fund
funds in its expense group. The Board noted that the term “contractual management fee” for funds in the expense group may include both advisory and certain non-portfolio management administrative services fees, but that Broadridge does not provide information on a fund by fund basis as to what is included. The Board also reviewed the methodology used by Broadridge in providing expense group information, which includes using each fund’s contractual management fee schedule (including any applicable breakpoints) as reported in the most recent prospectus or statement of additional information for each fund in the expense group. The Board also considered comparative information regarding the Fund’s total expense ratio and its various components.
The Board noted that Invesco Advisers has contractually agreed to waive fees and/or limit expenses of the Fund in an amount necessary to limit total annual operating expenses to a specified percentage of average daily net assets for each class of the Fund.
The Board noted that Invesco Advisers and the Affiliated Sub-Advisers do not manage other similarly managed mutual funds or client accounts.
The Board also considered the services that may be provided by the Affiliated Sub-Advisers pursuant to the sub-advisory contracts, as well as the fees payable by Invesco Advisers to the Affiliated Sub-Advisers pursuant to the sub-advisory contracts. The Board noted that Invesco Advisers retains overall responsibility for, and provides services to, sub-advised Invesco Funds, including oversight of the Affiliated Sub-Advisers as well as the additional services described herein other than day-to-day portfolio management.
| D. | Economies of Scale and Breakpoints |
The Board considered the extent to which there may be economies of scale in the provision of advisory services to the Fund. The Board also considered that the Fund may benefit from economies of scale through contractual breakpoints in the Fund’s advisory fee schedule, which generally operate to reduce the Fund’s expense ratio as it grows in size. The Board noted that the Fund shares directly in economies of scale through lower fees charged by third party service providers based on the combined size of the Invesco Funds. The Board noted that the Fund may also benefit from economies of scale through initial fee setting, fee waivers and expense reimbursements.
| E. | Profitability and Financial Resources |
The Board reviewed information from Invesco Advisers concerning the costs of the advisory and other services that Invesco Advisers and its affiliates provide to the Fund and the Invesco Funds and the profitability of Invesco Advisers and its affiliates in providing these services. The Board considered the methodology used for calculating profitability and noted the periodic review of such methodology by an independent consultant. The Board noted that Invesco Advisers continues to operate at a net profit
from services Invesco Advisers and its affiliates provide to the Invesco Funds. The Board received information from Invesco Advisers demonstrating that Invesco Advisers and the Affiliated Sub-Advisers are financially sound and have the resources necessary to perform their obligations under the investment advisory agreement and sub-advisory contracts.
| F. | Collateral Benefits to Invesco Advisers and its Affiliates |
The Board considered various other benefits received by Invesco Advisers and its affiliates from the relationship with the Fund, including the fees received for providing administrative, transfer agency and distribution services to the Fund. The Board considered comparative information regarding fees charged for these services, including information provided by Broadridge and other independent sources. The Board considered the performance of Invesco Advisers and its affiliates in providing these services and the organizational structure employed to provide these services. The Board also considered that these services are provided to the Fund pursuant to written contracts that are reviewed and approved on an annual basis by the Board; and that the services are required for the operation of the Fund.
The Board considered the benefits realized by Invesco Advisers and the Affiliated Sub-Advisers as a result of portfolio brokerage transactions executed through “soft dollar” arrangements. The Board noted that soft dollar arrangements may result in the Fund bearing costs to purchase research that may be used by Invesco Advisers or the Affiliated Sub-Advisers with other clients and may reduce Invesco Advisers’ or the Affiliated Sub-Advisers’ expenses. The Board also considered that it receives periodic reports from Invesco representing that these arrangements are consistent with regulatory requirements. The Board did not deem the soft dollar arrangements to be inappropriate.
The Board considered that the Fund’s uninvested cash and cash collateral from any securities lending arrangements may be invested in money market funds advised by Invesco Advisers pursuant to procedures approved by the Board. The Board noted that Invesco Advisers receives advisory fees from these affiliated money market funds attributable to such investments, although Invesco Advisers has contractually agreed to waive through varying periods the advisory fees payable by the Invesco Funds with respect to certain investments in the affiliated money market funds. The waiver is in an amount equal to 100% of the net advisory fee Invesco Advisers receives from the affiliated money market funds with respect to the Fund’s investment in the affiliated money market funds of uninvested cash, but not cash collateral. The Board concluded that the amount of advisory fees received by Invesco Advisers from the Fund’s investment of cash collateral from any securities lending arrangements in the affiliated money market funds is fair and reasonable.
The Board also considered that an affiliated broker may receive commissions for executing certain trades for the Fund. Invesco Advisers and the Affiliated Sub-Advisers may use the affiliated broker to, among other things, control order routing and minimize information leakage, and the Board was advised that such trades are executed in compliance with rules under the federal securities laws and consistent with best execution obligations.
25 Invesco Global Infrastructure Fund
Tax Information
Form 1099-DIV, Form 1042-S and other year–end tax information provide shareholders with actual calendar year amounts that should be included in their tax returns. Shareholders should consult their tax advisors.
The following distribution information is being provided as required by the Internal Revenue Code or to meet a specific state’s requirement.
The Fund designates the following amounts or, if subsequently determined to be different, the maximum amount allowable for its fiscal year ended October 31, 2018:
| | | | |
Federal and State Income Tax | |
Long-Term Capital Gain Distributions | | $ | 350,615 | |
Qualified Dividend Income* | | | 93.64 | % |
Corporate Dividends Received Deduction* | | | 38.88 | % |
U.S. Treasury Obligations* | | | 0 | % |
| | * | The above percentages are based on ordinary income dividends paid to shareholders during the Fund’s fiscal year. |
| | | | |
Non-Resident Alien Shareholders | |
Qualified Short-Term Gains | | $ | 147,465 | |
26 Invesco Global Infrastructure Fund
Trustees and Officers
The address of each trustee and officer is AIM Investment Funds (Invesco Investment Funds) (the “Trust”), 11 Greenway Plaza, Suite 1000, Houston, Texas 77046-1173. The trustees serve for the life of the Trust, subject to their earlier death, incapacitation, resignation, retirement or removal as more specifically provided in the Trust’s organizational documents. Each officer serves for a one year term or until their successors are elected and qualified. Column two below includes length of time served with predecessor entities, if any.
| | | | | | | | |
Name, Year of Birth and
Position(s) Held with the Trust | | Trustee and/
or Officer Since | | Principal Occupation(s)
During Past 5 Years | | Number of
Funds in Fund
Complex
Overseen by
Trustee | | Other Directorship(s)
Held by Trustee During
Past 5 Years |
| Interested Persons | | | | | | | | |
| Martin L. Flanagan1 — 1960 Trustee | | 2007 | | Executive Director, Chief Executive Officer and President, Invesco Ltd. (ultimate parent of Invesco and a global investment management firm); Trustee, The Invesco Funds; Vice Chair, Investment Company Institute; and Member of Executive Board, SMU Cox School of Business Formerly: Advisor to the Board, Invesco Advisers, Inc. (formerly known as Invesco Institutional (N.A.), Inc.); Chairman and Chief Executive Officer, Invesco Advisers, Inc. (registered investment adviser); Director, Chairman, Chief Executive Officer and President, Invesco Holding Company (US), Inc. (formerly IVZ Inc.) (holding company), Invesco Group Services, Inc. (service provider) and Invesco North American Holdings, Inc. (holding company); Director, Chief Executive Officer and President, Invesco Holding Company Limited (parent of Invesco and a global investment management firm); Director, Invesco Ltd.; Chairman, Investment Company Institute and President, Co-Chief Executive Officer, Co-President, Chief Operating Officer and Chief Financial Officer, Franklin Resources, Inc. (global investment management organization) | | 158 | | None |
Philip A. Taylor2 — 1954 Trustee and Senior Vice President | | 2006 | | Head of the Americas and Senior Managing Director, Invesco Ltd.; Director, Invesco Advisers, Inc. (formerly known as Invesco Institutional (N.A.), Inc.) (registered investment adviser); Director and Chairman, Invesco Investment Services, Inc. (formerly known as Invesco AIM Investment Services, Inc.) (registered transfer agent); Chief Executive Officer, Invesco Corporate Class Inc. (corporate mutual fund company); Director, Chairman and Chief Executive Officer, Invesco Canada Ltd. (formerly known as Invesco Trimark Ltd./Invesco Trimark Ltèe) (registered investment adviser and registered transfer agent); Trustee and Senior Vice President, The Invesco Funds; Director, Invesco Investment Advisers LLC (formerly known as Van Kampen Asset Management) Formerly: Director, Chairman, Chief Executive Officer and President, Invesco Management Group, Inc. (formerly known as Invesco AIM Management Group, Inc.) (financial services holding company); Co-Chairman, Co-President and Co-Chief Executive Officer, Invesco Advisers, Inc. (formerly known as Invesco Institutional (N.A.), Inc.) (registered investment adviser); Director, Chief Executive Officer and President, Van Kampen Exchange Corp; President and Principal Executive Officer, The Invesco Funds (other than AIM Treasurer’s Series Trust (Invesco Treasurer’s Series Trust), Short-Term Investments Trust and Invesco Management Trust); Executive Vice President, The Invesco Funds (AIM Treasurer’s Series Trust (Invesco Treasurer’s Series Trust), Short-Term Investments Trust and Invesco Management Trust only); Director and President, INVESCO Funds Group, Inc. (registered investment adviser and registered transfer agent); Director and Chairman, IVZ Distributors, Inc. (formerly known as INVESCO Distributors, Inc.) (registered broker dealer); Director, President and Chairman, Invesco Inc. (holding company), Invesco Canada Holdings Inc. (holding company), Trimark Investments Ltd./Placements Trimark Ltèe and Invesco Financial Services Ltd/Services Financiers Invesco Ltèe; Chief Executive Officer, Invesco Canada Fund Inc. (corporate mutual fund company); Director and Chairman, Van Kampen Investor Services Inc.; Director, Chief Executive Officer and President, 1371 Preferred Inc. (holding company) and Van Kampen Investments Inc.; Director and President, AIM GP Canada Inc. (general partner for limited partnerships) and Van Kampen Advisors, Inc.; Director and Chief Executive Officer, Invesco Trimark Dealer Inc. (registered broker dealer); Director, Invesco Distributors, Inc. (formerly known as Invesco AIM Distributors, Inc.) (registered broker dealer); Manager, Invesco Capital Management LLC; Director, Chief Executive Officer and President, Invesco Advisers, Inc.; Director, Chairman, Chief Executive Officer and President, Invesco AIM Capital Management, Inc.; President, Invesco Trimark Dealer Inc. and Invesco Trimark Ltd./Invesco Trimark Ltèe; Director and President, AIM Trimark Corporate Class Inc. and AIM Trimark Canada Fund Inc.; Senior Managing Director, Invesco Holding Company Limited; Director and Chairman, Fund Management Company (former registered broker dealer); President and Principal Executive Officer, The Invesco Funds (AIM Treasurer’s Series Trust (Invesco Treasurer’s Series Trust), and Short-Term Investments Trust only); President, AIM Trimark Global Fund Inc. and AIM Trimark Canada Fund Inc. | | 158 | | None |
| 1 | Mr. Flanagan is considered an interested person (within the meaning of Section 2(a)(19) of the 1940 Act) of the Trust because he is an officer of the Adviser to the Trust, and an officer and a director of Invesco Ltd., ultimate parent of the Adviser. |
| 2 | Mr. Taylor is considered an interested person (within the meaning of Section 2(a)(19) of the 1940 Act) of the Trust because he is an officer and a director of the Adviser. |
T-1 Invesco Global Infrastructure Fund
Trustees and Officers—(continued)
| | | | | | | | |
Name, Year of Birth and
Position(s) Held with the Trust | | Trustee and/
or Officer Since | | Principal Occupation(s)
During Past 5 Years | | Number of
Funds in Fund
Complex
Overseen by
Trustee | | Other Directorship(s)
Held by Trustee During
Past 5 Years |
| Independent Trustees | | | | | | | | |
Bruce L. Crockett — 1944 Trustee and Chair | | 2001 | | Chairman, Crockett Technologies Associates (technology consulting company) Formerly: Director, Captaris (unified messaging provider); Director, President and Chief Executive Officer, COMSAT Corporation; Chairman, Board of Governors of INTELSAT (international communications company); ACE Limited (insurance company); Independent Directors Council and Investment Company Institute: Member of the Audit Committee, Investment Company Institute; Member of the Executive Committee and Chair of the Governance Committee, Independent Directors Council | | 158 | | Director and Chairman of the Audit Committee, ALPS (Attorneys Liability Protection Society) (insurance company); Director and Member of the Audit Committee and Compensation Committee, Ferroglobe PLC (metallurgical company) |
David C. Arch — 1945 Trustee | | 2010 | | Chairman of Blistex Inc. (consumer health care products manufacturer); Member, World Presidents’ Organization | | 158 | | Board member of the Illinois Manufacturers’ Association |
Jack M. Fields — 1952 Trustee | | 2001 | | Chief Executive Officer, Twenty First Century Group, Inc. (government affairs company); and Chairman, Discovery Learning Alliance (non-profit) Formerly: Owner and Chief Executive Officer, Dos Angeles Ranch L.P. (cattle, hunting, corporate entertainment); Director, Insperity, Inc. (formerly known as Administaff) (human resources provider); Chief Executive Officer, Texana Timber LP (sustainable forestry company); Director of Cross Timbers Quail Research Ranch (non-profit); and member of the U.S. House of Representatives | | 158 | | None |
Cynthia Hostetler — 1962 Trustee | | 2017 | | Non-Executive Director and Trustee of a number of public and private business corporations Formerly: Director, Aberdeen Investment Funds (4 portfolios); Head of Investment Funds and Private Equity, Overseas Private Investment Corporation; President, First Manhattan Bancorporation, Inc.; Attorney, Simpson Thacher & Bartlett LLP | | 158 | | Vulcan Materials Company (construction materials company); Trilinc Global Impact Fund; Artio Global Investment LLC (mutual fund complex); Edgen Group, Inc. (specialized energy and infrastructure products distributor) |
Eli Jones — 1961 Trustee | | 2016 | | Professor and Dean, Mays Business School — Texas A&M University Formerly: Professor and Dean, Walton College of Business, University of Arkansas and E.J. Ourso College of Business, Louisiana State University; Director, Arvest Bank | | 158 | | Insperity, Inc. (formerly known as Administaff) (human resources provider) |
Prema Mathai-Davis — 1950 Trustee | | 2001 | | Retired | | 158 | | None |
Teresa M. Ressel — 1962 Trustee | | 2017 | | Non-executive director and trustee of a number of public and private business corporations Formerly: Chief Financial Officer, Olayan America, The Olayan Group (international investor/commercial/industrial); Chief Executive Officer, UBS Securities LLC; Group Chief Operating Officer, Americas, UBS AG; Assistant Secretary for Management & Budget and CFO, US Department of the Treasury | | 158 | | Atlantic Power Corporation (power generation company); ON Semiconductor Corp. (semiconductor supplier) |
Ann Barnett Stern — 1957 Trustee | | 2017 | | President and Chief Executive Officer, Houston Endowment Inc. (private philanthropic institution) Formerly: Executive Vice President and General Counsel, Texas Children’s Hospital; Attorney, Beck, Redden and Secrest, LLP; Business Law Instructor, University of St. Thomas; Attorney, Andrews & Kurth LLP | | 158 | | Federal Reserve Bank of Dallas |
Raymond Stickel, Jr. — 1944 Trustee | | 2005 | | Retired Formerly: Director, Mainstay VP Series Funds, Inc. (25 portfolios); Partner, Deloitte & Touche | | 158 | | None |
Robert C. Troccoli — 1949 Trustee | | 2016 | | Adjunct Professor, University of Denver — Daniels College of Business Formerly: Senior Partner, KPMG LLP | | 158 | | None |
Christopher L. Wilson — 1957 Trustee | | 2017 | | Non-executive director and trustee of a number of public and private business corporations Formerly: Director, TD Asset Management USA Inc. (mutual fund complex) (22 portfolios); Managing Partner, CT2, LLC (investing and consulting firm); President/Chief Executive Officer, Columbia Funds, Bank of America Corporation; President/Chief Executive Officer, CDC IXIS Asset Management Services, Inc.; Principal & Director of Operations, Scudder Funds, Scudder, Stevens & Clark, Inc.; Assistant Vice President, Fidelity Investments | | 158 | | ISO New England, Inc. (non-profit organization managing regional electricity market) |
T-2 Invesco Global Infrastructure Fund
Trustees and Officers—(continued)
| | | | | | | | |
Name, Year of Birth and
Position(s) Held with the Trust | | Trustee and/
or Officer Since | | Principal Occupation(s)
During Past 5 Years | | Number of
Funds in Fund
Complex
Overseen by
Trustee | | Other Directorship(s)
Held by Trustee During
Past 5 Years |
| Other Officers | | | | | | | | |
Sheri Morris — 1964 President, Principal Executive Officer and Treasurer | | 1999 | | President, Principal Executive Officer and Treasurer, The Invesco Funds; Vice President, Invesco Advisers, Inc. (formerly known as Invesco Institutional (N.A.), Inc.) (registered investment adviser); and Vice President, Invesco Exchange-Traded Fund Trust, Invesco Exchange-Traded Fund Trust II, Invesco India Exchange-Traded Fund Trust, Invesco Actively Managed Exchange-Traded Fund Trust, Invesco Actively Managed Exchange-Traded Commodity Fund Trust and Invesco Exchange-Traded Self-Indexed Fund Trust Formerly: Vice President and Principal Financial Officer, The Invesco Funds; Vice President, Invesco AIM Advisers, Inc., Invesco AIM Capital Management, Inc. and Invesco AIM Private Asset Management, Inc.; Assistant Vice President and Assistant Treasurer, The Invesco Funds and Assistant Vice President, Invesco Advisers, Inc., Invesco AIM Capital Management, Inc. and Invesco AIM Private Asset Management, Inc.; and Treasurer, Invesco Exchange-Traded Fund Trust, Invesco Exchange-Traded Fund Trust II, Invesco India Exchange-Traded Fund Trust and Invesco Actively Managed Exchange-Traded Fund Trust | | N/A | | N/A |
Russell C. Burk — 1958 Senior Vice President and Senior Officer | | 2005 | | Senior Vice President and Senior Officer, The Invesco Funds | | N/A | | N/A |
Jeffrey H. Kupor — 1968 Senior Vice President, Chief Legal Officer and Secretary | | 2018 | | Senior Vice President and Secretary, Invesco Advisers, Inc. (formerly known as Invesco Institutional (N.A.), Inc.) (registered investment adviser); Senior Vice President and Secretary, Invesco Distributors, Inc. (formerly known as Invesco AIM Distributors, Inc.); Vice President and Secretary, Invesco Investment Services, Inc. (formerly known as Invesco AIM Investment Services, Inc.) Senior Vice President, Chief Legal Officer and Secretary, The Invesco Funds; Secretary and General Counsel, Invesco Investment Advisers LLC (formerly known as Van Kampen Asset Management); Secretary and General Counsel, Invesco Capital Markets, Inc. (formerly known as Van Kampen Funds Inc.) and Chief Legal Officer, Invesco Exchange-Traded Fund Trust, Invesco Exchange-Traded Fund Trust II, Invesco India Exchange-Traded Fund Trust, Invesco Actively Managed Exchange-Traded Fund Trust, Invesco Actively Managed Exchange-Traded Commodity Fund Trust and Invesco Exchange-Traded Self-Indexed Fund Trust; Secretary, Invesco Indexing LLC; Secretary and General Counsel, INVESCO Private Capital Investments, Inc.; Secretary, W.L. Ross & Co., LLC; Secretary and Vice President, Jemstep, Inc. Formerly: Senior Vice President, Secretary and General Counsel, Invesco Management Group, Inc. (formerly known as Invesco AIM Management Group, Inc.); Assistant Secretary, INVESCO Asset Management (Bermuda) Ltd.; Secretary and General Counsel, Invesco Private Capital, Inc.; Assistant Secretary and General Counsel, INVESCO Realty, Inc.; Secretary and General Counsel, Invesco Senior Secured Management, Inc.; and Secretary, Sovereign G./P. Holdings Inc. | | N/A | | N/A |
John M. Zerr — 1962 Senior Vice President | | 2006 | | Chief Operating Officer of the Americas; Senior Vice President, Invesco Advisers, Inc. (formerly known as Invesco Institutional (N.A.), Inc.) (registered investment adviser); Senior Vice President, Invesco Distributors, Inc. (formerly known as Invesco AIM Distributors, Inc.); Director and Vice President, Invesco Investment Services, Inc. (formerly known as Invesco AIM Investment Services, Inc.) Senior Vice President, The Invesco Funds; Managing Director, Invesco Capital Management LLC; Director, Invesco Investment Advisers LLC (formerly known as Van Kampen Asset Management); Senior Vice President, Invesco Capital Markets, Inc. (formerly known as Van Kampen Funds Inc.); Manager, Invesco Indexing LLC Formerly: Director and Senior Vice President, Invesco Management Group, Inc. (formerly known as Invesco AIM Management Group, Inc.); Secretary and General Counsel, Invesco Management Group, Inc. (formerly known as Invesco AIM Management Group, Inc.); Secretary, Invesco Investment Services, Inc. (formerly known as Invesco AIM Investment Services, Inc.); Chief Legal Officer and Secretary, The Invesco Funds; Secretary and General Counsel, Invesco Investment Advisers LLC (formerly known as Van Kampen Asset Management); Secretary and General Counsel, Invesco Capital Markets, Inc. (formerly known as Van Kampen Funds Inc.); Chief Legal Officer, Invesco Exchange-Traded Fund Trust, Invesco Exchange-Traded Fund Trust II, Invesco India Exchange-Traded Fund Trust, Invesco Actively Managed Exchange-Traded Fund Trust, Invesco Actively Managed Exchange-Traded Commodity Fund Trust and Invesco Exchange-Traded Self-Indexed Fund Trust; Secretary, Invesco Indexing LLC; Director, Secretary, General Counsel and Senior Vice President, Van Kampen Exchange Corp.; Director, Vice President and Secretary, IVZ Distributors, Inc. (formerly known as INVESCO Distributors, Inc.); Director and Vice President, INVESCO Funds Group, Inc.; Director and Vice President, Van Kampen Advisors Inc.; Director, Vice President, Secretary and General Counsel, Van Kampen Investor Services Inc.; Director and Secretary, Invesco Distributors, Inc. (formerly known as Invesco AIM Distributors, Inc.); Director, Senior Vice President, General Counsel and Secretary, Invesco AIM Advisers, Inc. and Van Kampen Investments Inc.; Director, Vice President and Secretary, Fund Management Company; Director, Senior Vice President, Secretary, General Counsel and Vice President, Invesco AIM Capital Management, Inc.; Chief Operating Officer and General Counsel, Liberty Ridge Capital, Inc. (an investment adviser) | | N/A | | N/A |
T-3 Invesco Global Infrastructure Fund
Trustees and Officers—(continued)
| | | | | | | | |
Name, Year of Birth and
Position(s) Held with the Trust | | Trustee and/
or Officer Since | | Principal Occupation(s)
During Past 5 Years | | Number of
Funds in Fund
Complex
Overseen by
Trustee | | Other Directorship(s)
Held by Trustee During
Past 5 Years |
| Other Officers—(continued) | | | | | | | | |
Gregory G. McGreevey — 1962 Senior Vice President | | 2012 | | Senior Managing Director, Invesco Ltd.; Director, Chairman, President, and Chief Executive Officer, Invesco Advisers, Inc. (formerly known as Invesco Institutional (N.A.), Inc.) (registered investment adviser); Director, Invesco Mortgage Capital, Inc. and Invesco Senior Secured Management, Inc.; and Senior Vice President, The Invesco Funds Formerly: Senior Vice President, Invesco Management Group, Inc. and Invesco Advisers, Inc.; Assistant Vice President, The Invesco Funds | | N/A | | N/A |
Kelli Gallegos — 1970 Vice President, Principal Financial Officer and Assistant Treasurer | | 2008 | | Vice President and Treasurer, Invesco Exchange-Traded Fund Trust, Invesco Exchange-Traded Fund Trust II, Invesco India Exchange-Traded Fund Trust, Invesco Actively Managed Exchange-Traded Fund Trust, Invesco Actively Managed Exchange-Traded Commodity Fund Trust and Invesco Exchange-Traded Self-Indexed Fund Trust; Vice President, Principal Financial Officer and Assistant Treasurer, The Invesco Funds; Principal Financial and Accounting Officer — Pooled Investments, Invesco Capital Management LLC Formerly: Assistant Treasurer, Invesco Exchange-Traded Fund Trust, Invesco Exchange-Traded Fund Trust II, Invesco India Exchange-Traded Fund Trust, Invesco Actively Managed Exchange-Traded Fund Trust, Invesco Actively Managed Exchange-Traded Commodity Fund Trust and Invesco Exchange-Traded Self-Indexed Fund Trust; Assistant Treasurer, Invesco Capital Management LLC; Assistant Vice President, The Invesco Funds | | N/A | | N/A |
Tracy Sullivan — 1962 Vice President, Chief Tax Officer and Assistant Treasurer | | 2008 | | Vice President, Chief Tax Officer and Assistant Treasurer, The Invesco Funds; Assistant Treasurer, Invesco Capital Management LLC, Invesco Exchange-Traded Fund Trust, Invesco Exchange-Traded Fund Trust II, Invesco India Exchange-Traded Fund Trust, Invesco Actively Managed Exchange-Traded Fund Trust, Invesco Actively Managed Exchange-Traded Commodity Fund Trust and Invesco Exchange-Traded Self-Indexed Fund Trust Formerly: Assistant Vice President, The Invesco Funds | | N/A | | N/A |
Crissie M. Wisdom — 1969 Anti-Money Laundering Compliance Officer | | 2013 | | Anti-Money Laundering Compliance Officer, Invesco Advisers, Inc. (formerly known as Invesco Institutional (N.A.), Inc.) (registered investment adviser), Invesco Capital Markets, Inc. (formerly known as Van Kampen Funds Inc.), Invesco Distributors, Inc., Invesco Investment Services, Inc., The Invesco Funds, and Invesco Exchange-Traded Fund Trust, Invesco Exchange-Traded Fund Trust II, Invesco India Exchange-Traded Fund Trust, Invesco Actively Managed Exchange-Traded Fund Trust, Invesco Actively Managed Exchange-Traded Commodity Fund Trust and Invesco Exchange-Traded Self-Indexed Fund Trust; Anti-Money Laundering Compliance Officer and Bank Secrecy Act Officer, INVESCO National Trust Company and Invesco Trust Company; and Fraud Prevention Manager and Controls and Risk Analysis Manager for Invesco Investment Services, Inc. Formerly: Anti-Money Laundering Compliance Officer, Van Kampen Exchange Corp. and Invesco Management Group, Inc. | | N/A | | N/A |
Robert R. Leveille — 1969 Chief Compliance Officer | | 2016 | | Chief Compliance Officer, Invesco Advisers, Inc. (registered investment adviser); and Chief Compliance Officer, The Invesco Funds Formerly: Chief Compliance Officer, Putnam Investments and the Putnam Funds | | N/A | | N/A |
The Statement of Additional Information of the Trust includes additional information about the Fund’s Trustees and is available upon request, without charge, by calling 1.800.959.4246. Please refer to the Fund’s Statement of Additional Information for information on the Fund’s sub-advisers.
| | | | | | |
Office of the Fund 11 Greenway Plaza, Suite 1000 Houston, TX 77046-1173 | | Investment Adviser Invesco Advisers, Inc. 1555 Peachtree Street, N.E. Atlanta, GA 30309 | | Distributor Invesco Distributors, Inc. 11 Greenway Plaza, Suite 1000 Houston, TX 77046-1173 | | Auditors PricewaterhouseCoopers LLP 1000 Louisiana Street, Suite 5800 Houston, TX 77002-5021 |
| | | |
| | | | | | |
Counsel to the Fund Stradley Ronon Stevens & Young, LLP 2005 Market Street, Suite 2600 Philadelphia, PA 19103-7018 | | Counsel to the Independent Trustees Goodwin Procter LLP 901 New York Avenue, N.W. Washington, D.C. 20001 | | Transfer Agent Invesco Investment Services, Inc. 11 Greenway Plaza, Suite 1000 Houston, TX 77046-1173 | | Custodian State Street Bank and Trust Company 225 Franklin Street Boston, MA 02110-2801 |
T-4 Invesco Global Infrastructure Fund
Explore High-Conviction Investing with Invesco

Go paperless with eDelivery
Visit invesco.com/edelivery to enjoy the convenience and security of anytime electronic access to your investment documents.
With eDelivery, you can elect to have any or all of the following materials delivered straight to your inbox to download, save and print from your own computer:
| ∎ | | Fund reports and prospectuses |
Invesco mailing information
Send general correspondence to Invesco Investment Services, Inc., P.O. Box 219078, Kansas City, MO 64121-9078.
Important notice regarding delivery of security holder documents
To reduce Fund expenses, only one copy of most shareholder documents may be mailed to shareholders with multiple accounts at the same address (Householding). Mailing of your shareholder documents may be householded indefinitely unless you instruct us otherwise. If you do not want the mailing of these documents to be combined with those for other members of your house-hold, please contact Invesco Investment Services, Inc. at 800 959 4246 or contact your financial institution. We will begin sending you individual copies for each account within 30 days after receiving your request.
Fund holdings and proxy voting information
The Fund provides a complete list of its holdings four times in each fiscal year, at the quarter ends. For the second and fourth quarters, the lists appear in the Fund’s semiannual and annual reports to shareholders. For the first and third quarters, the Fund files the lists with the Securities and Exchange Commission (SEC) on Form N-Q (or any successor Form). The most recent list of portfolio holdings is available at invesco.com/completeqtrholdings. Shareholders can also look up the Fund’s Forms N-Q (or any successor Form) on the SEC website at sec.gov. The SEC file numbers for the Fund are shown below.
A description of the policies and procedures that the Fund uses to determine how to vote proxies relating to portfolio securities is available without charge, upon request, from our Client Services department at 800 959 4246 or at invesco.com/proxyguidelines. The information is also available on the SEC website, sec.gov.
| | |
Information regarding how the Fund voted proxies related to its portfolio securities during the most recent 12-month period ended June 30 is available at invesco.com/proxysearch. The information is also available on the SEC website, sec.gov. Invesco Advisers, Inc. is an investment adviser; it provides investment advisory services to individual and institutional clients and does not sell securities. Invesco Distributors, Inc. is the US distributor for Invesco Ltd.’s retail mutual funds, exchange-traded funds and institutional money market funds. Both are wholly owned, indirect subsidiaries of Invesco Ltd. | |  |
| | | | | | | | |
| SEC file numbers: 811-05426 and 033-19338 | | Invesco Distributors, Inc. | | GBLI-AR-1
| | 11152018 | | 1045 |
| | | | | | | | |
| | | | | |
 | | Annual Report to Shareholders | | | October 31, 2018 | | | |
| | | | | |
| | Invesco Global Market Neutral Fund | | | |
| | Nasdaq: | | | | | | |
| | A: MKNAX ∎ C: MKNCX ∎ R: MKNRX ∎ Y: MKNYX ∎ R5: MKNFX ∎ R6: MKNSX | | | |

Letters to Shareholders
| | |

Philip Taylor | | Dear Shareholders: This annual report includes information about your Fund, including performance data and a complete list of its investments as of the close of the reporting period. Inside is a discussion of how your Fund was managed and the factors that affected its performance during the reporting period. Throughout the reporting period, US economic data remained positive. Robust corporate profits, strong retail sales and unemployment rates near generational lows helped drive US markets to new all-time records multiple times during the reporting period. Against this backdrop, the US Federal Reserve raised the federal funds rate four times during the reporting period. Market volatility, largely non-existent in 2017, returned in 2018. Markets sold off first in February |
and again sharply in October, amid rising interest rates, concerns about potential trade wars and heightened geopolitical tensions. Despite the volatility, US equity markets were largely positive for the reporting period and fared better than international markets. Emerging markets were particularly hard hit due to a strong US dollar. During the October sell-off, investors retreated to more defensive areas of the market and to US Treasuries. The broader bond market declined during the reporting period due to the increase in US Treasury yields and widening credit spreads. As the year progresses, we’ll see how the interplay of economic data, interest rates, geopolitics and a host of other factors affect US and overseas equity and fixed income markets.
Short-term market volatility can prompt some investors to abandon their investment plans – and can cause others to settle for whatever returns the market has to offer. The investment professionals at Invesco, in contrast, invest with high conviction. This means that, no matter the asset class or the strategy, each investment team has a passion to exceed. We want to help investors achieve better outcomes, such as seeking higher returns, helping mitigate risk and generating income. Of course, investing with high conviction can’t guarantee a profit or ensure success; no investment strategy can. To learn more about how we invest with high conviction, visit invesco.com/HighConviction.
You, too, can invest with high conviction by maintaining a long-term investment perspective and by working with your financial adviser on a regular basis. During periods of short-term market volatility or uncertainty, your financial adviser can keep you focused on your long-term investment goals – a new home, a child’s college education or a secure retirement. He or she also can share research about the economy, the markets and individual investment options.
Visit our website for more information on your investments
Our website, invesco.com/us, offers a wide range of market insights and investment perspectives. On the website, you’ll find detailed information about our funds, including performance, holdings and portfolio manager commentaries. You can access information about your account by completing a simple, secure online registration. To do so, select “Log In” on the right side of the homepage, and then select “Register for Individual Account Access.”
In addition to the resources accessible on our website and through our mobile app, you can obtain timely updates to help you stay informed about the markets and the economy by connecting with Invesco on Twitter, LinkedIn or Facebook. You can access our blog at blog.invesco.us.com. Our goal is to provide you the information you want, when and where you want it.
Finally, I’m pleased to share with you Invesco’s commitment to both the Principles for Responsible Investment and to considering environmental, social and governance issues in our robust investment process. I invite you to learn more at invesco.com/esg.
Have questions?
For questions about your account, contact an Invesco client services representative at 800 959 4246. For Invesco-related questions or comments, please email me directly at phil@invesco.com.
All of us at Invesco look forward to serving your investment management needs. Thank you for investing with us.
Sincerely,

Philip Taylor
Senior Managing Director, Invesco Ltd.
| | |
| 2 | | Invesco Global Market Neutral Fund |
| | | | |

Bruce Crockett | | Dear Fellow Shareholders: Among the many important lessons I’ve learned in more than 40 years in a variety of business endeavors is the value of a trusted advocate. As independent chair of the Invesco Funds Board, I can assure you that the members of the Board are strong advocates for the interests of investors in Invesco’s mutual funds. We work hard to represent your interests through oversight of the quality of the investment management services your funds receive and other matters important to your investment, including but not limited to: |
| | ∎ | | Ensuring that Invesco offers a diverse lineup of mutual funds that your financial adviser can use to strive to meet your financial needs as your investment goals change over time. |
| | ∎ | | Monitoring how the portfolio management teams of the Invesco funds are performing in light of changing economic and market conditions. |
| ∎ | | Assessing each portfolio management team’s investment performance within the context of the investment strategy described in the fund’s prospectus. |
| ∎ | | Monitoring for potential conflicts of interests that may impact the nature of the services that your funds receive. |
We believe one of the most important services we provide our fund shareholders is the annual review of the funds’ advisory and sub-advisory contracts with Invesco Advisers and its affiliates. This review is required by the Investment Company Act of 1940 and focuses on the nature and quality of the services Invesco provides as the adviser to the Invesco funds and the reasonableness of the fees that it charges for those services. Each year, we spend months carefully reviewing information received from Invesco and a variety of independent sources, such as performance and fee data prepared by Lipper, Inc. (a subsidiary of Broadridge Financial Solutions, Inc.), an independent, third-party firm widely recognized as a leader in its field. We also meet with our independent legal counsel and other independent advisers to review and help us assess the information that we have received. Our goal is to assure that you receive quality investment management services for a reasonable fee.
I trust the measures outlined above provide assurance that you have a worthy advocate when it comes to choosing the Invesco Funds.
As always, please contact me at bruce@brucecrockett.com with any questions or concerns you may have. On behalf of the Board, we look forward to continuing to represent your interests and serving your needs.
Sincerely,

Bruce L. Crockett
Independent Chair
Invesco Funds Board of Trustees
| | |
| 3 | | Invesco Global Market Neutral Fund |
Management’s Discussion of Fund Performance
| | | | |
| |
Performance summary | |
|
For the fiscal year ended October 31, 2018, Class A shares of Invesco Global Market Neutral Fund (the Fund), at net asset value (NAV), underperformed the FTSE US 3-Month Treasury Bill Index, the Fund’s broad market/style-specific benchmark. Your Fund’s long-term performance appears later in this report. | |
Fund vs. Indexes | | | | |
Total returns, 10/31/17 to 10/31/18, at net asset value (NAV). Performance shown does not include applicable contingent deferred sales charges (CDSC) or front-end sales charges, which would have reduced performance. | |
| |
Class A Shares | | | -0.79 | % |
Class C Shares | | | -1.56 | |
Class R Shares | | | -1.11 | |
Class Y Shares | | | -0.56 | |
Class R5 Shares | | | -0.57 | |
Class R6 Shares | | | -0.57 | |
FTSE US 3-Month Treasury Bill Indexq (Broad Market/Style-Specific Index) | | | 1.67 | |
Lipper Alternative Equity Market Neutral Funds Index⬛ (Peer Group Index) | | | -0.84 | |
Source(s): qFactSet Research Systems Inc., ⬛Lipper Inc. | | | | |
Market conditions and your Fund
The fiscal year proved to be an increasingly volatile time for global equities. The fiscal year began in the final months of 2017 with several US stock market indexes repeatedly reaching new highs amid strong corporate profits, the prospect of tax reform legislation and exceedingly low stock market volatility. Despite a sharp uptick in volatility, particularly in October 2018, US markets, in general, still produced positive returns for the fis-cal year. International markets, however, were meaningfully less robust, many experiencing flat to negative results for the fiscal year. This divergence between
the US and other markets could be attributed to the strength of the US economy and the widely-held belief that the US could win trade wars with other countries.
At the beginning of 2018, markets saw significant turbulence in late January and early February, when stocks were whip-sawed – first by concerns about accelerated US Federal Reserve (the Fed) tightening and then, later in the year, by fears of brewing trade wars and geopolitical tensions. After a relatively quiet summer, market volatility markedly rose again in the final month of the fiscal year. Global equity markets (particularly the US) suffered a sharp sell-off in October 2018 amid rising interest rates and
| | | | | | | | | | | | | | | | |
| | | | | |
Portfolio Composition | | | | | | | | | | | | | | | | |
By sector, based on total net assets | | | | | | | | | | | | | | | | |
| | | Equity Securities | | | Gross | | | Net | |
| | | Long1 | | | Short2 | | | Exposure3 | | | Exposure4 | |
| | | | |
Industrials | | | 19.4 | % | | | 18.2 | | | | 37.6 | % | | | 1.2 | % |
Consumer Discretionary | | | 16.3 | | | | 15.4 | | | | 31.7 | | | | 0.9 | |
Materials | | | 13.6 | | | | 14.6 | | | | 28.2 | | | | -1.0 | |
Information Technology | | | 9.7 | | | | 9.2 | | | | 18.9 | | | | 0.5 | |
Health Care | | | 9.3 | | | | 8.5 | | | | 17.8 | | | | 0.8 | |
Energy | | | 5.4 | | | | 4.6 | | | | 10.0 | | | | 0.8 | |
Consumer Staples | | | 4.8 | | | | 3.7 | | | | 8.5 | | | | 1.1 | |
Communication Services | | | 3.6 | | | | 4.5 | | | | 8.1 | | | | -0.9 | |
Financials | | | 3.3 | | | | 2.6 | | | | 5.9 | | | | 0.7 | |
Real Estate | | | 2.4 | | | | 3.5 | | | | 5.9 | | | | -1.1 | |
Utilities | | | 1.3 | | | | 2.0 | | | | 3.3 | | | | -0.7 | |
Money Market Funds Plus Other Assets Less Liabilities | | | 10.9 | | | | – | | | | 10.9 | | | | 10.9 | |
Total | | | 100.0 | | | | 86.8 | | | | 186.8 | | | | 13.2 | |
| 1 | Represents the value of the equity securities in the portfolio. |
| 2 | Represents the value of the equity securities underlying the Fund’s equity short portfolio swaps. |
| 3 | Represents the cumulative exposure of the Fund’s long and short positions. |
| 4 | Represents the net exposure of the Fund’s long and short positions. |
concerns that higher inflation could result in a more restrictive monetary policy.
Global economic growth, in general, was solid despite weakness in emerging markets. During the fiscal year, emerging markets were impacted by both country-specific issues, as well as, more generalized pressure resulting from the Fed’s tightening policy. In this environment, economic growth unsurprisingly slowed in emerging markets. Within the eurozone, economic growth accelerated, although there was divergence among countries. In Japan, economic growth improved over the latter part of the fiscal year. The US experienced strong growth during the fiscal year due to robust consumer and business spending. In addition, unemployment rates remained low, job creation was strong and inflation remained relatively controlled.
At the close of the fiscal year, equity valuations in developed and emerging markets appeared relatively full in absolute terms, but overseas equity markets were trading at a material discount to those of the US. In sum, while valuations were not cheap, recent earnings growth and upward earnings revisions improved in many non-US developed markets.
The Fund follows a market neutral strategy, which is intended to produce a portfolio that experiences minimal influence from the return patterns of the general global stock market. The Fund seeks neutral positioning in terms of beta (market exposure) by seeking to maintain
| | | | |
Total Net Assets | | | $10.8 million | |
Data presented here are as of October 31, 2018.
| | |
| 4 | | Invesco Global Market Neutral Fund |
neutral country, sector and industry exposures. The Fund uses a systematic model that evaluates fundamental and behavioral factors to forecast individual security returns and risks and ranks these securities based on their attractiveness relative to industry peers. Implementation occurs by establishing a portfolio with long positions in highly ranked stocks and shorting those that are poorly ranked. As such, the goal is to provide absolute risk adjusted returns over a full market cycle, regardless of the direction of the equity markets.
Pursuant to the Fund’s market neutral construct, a positive spread between the top- and bottom-ranked stocks (long and short candidates for the portfolio) is intended to result in the Fund’s outperformance relative to the FTSE US 3-Month Treasury Bill Index. The largest contributors to the Fund’s relative performance for the fiscal year were holdings in the health care and consumer staples sectors. Conversely, holdings in the industrials and information technology (IT) sectors were key detractors from the Fund’s relative performance during the fiscal year.
In the health care sector, the short positions in the biotechnology industry performed as expected and aided the Fund’s absolute performance for the fiscal year. In the consumer staples sector, stock selection in both long and short holdings contributed to the Fund’s performance relative to the broad market/style-specific benchmark – primarily due to holdings in the food, beverage and tobacco industry. Finally, short holdings in the materials sector – specifically, the chemicals and the construction/containers/paper industries – also contributed to the Fund’s relative performance during the fiscal year.
During the fiscal year, holdings in the industrials sector detracted from the Fund’s performance relative to its broad market/style-specific benchmark. These included long holdings in the commercial and professional services and capital goods industries. Within the IT sector, long holdings in computers/electronics and semiconductors failed to perform as expected and detracted from the Fund’s relative results.
From a factor perspective, the Fund benefited from exposures to Momentum (both Earnings and Price) while our Quality signals were flat over the course of the fiscal year, despite showing signs of strength during heightened periods of volatility. Our Value signals detracted from overall model strength. We have
observed that in this most recent period of yield curve flattening and rising yields, stocks with growth characteristics have outperformed those with value attributes. Perhaps the most observable example of this is that the Russell 3000 Growth Index outperformed the Russell 3000 Value Index by 7.4% during the fiscal year.1 We believe that having a balance of factors that have small, and in the case of Value versus Momentum, negative correlations will smooth out the investment experience relative to relying on more concentrated factor exposures.
Please note that the Fund may utilize derivative instruments that include equity-related total return swaps and futures contracts. During the fiscal year, the Fund utilized equity-related total return swaps to efficiently implement its strategy and gain long and/or short exposure to the various sectors/industries described above, but did not use futures contracts. The implementation impact of using equity-related total return swaps is a component of transaction costs. Derivatives may amplify traditional investment risks through the creation of leverage and may be less liquid than traditional securities.
Thank you for your investment in Invesco Global Market Neutral Fund.
1 Source: FactSet Research Systems Inc.
The views and opinions expressed in management’s discussion of Fund performance are those of Invesco Advisers, Inc. These views and opinions are subject to change at any time based on factors such as market and economic conditions. These views and opinions may not be relied upon as investment advice or recommendations, or as an offer for a particular security. The information is not a complete analysis of every aspect of any market, country, industry, security or the Fund. Statements of fact are from sources considered reliable, but Invesco Advisers, Inc. makes no representation or warranty as to their completeness or accuracy. Although historical performance is no guarantee of future results, these insights may help you understand our investment management philosophy.
See important Fund and, if applicable, index disclosures later in this report.
| | |

| | Michael Abata |
| | Chartered Financial Analyst, Portfolio Manager, is manager of Invesco Global Market Neutral Fund. He joined |
| Invesco in 2011. Mr. Abata earned a BA in economics from Binghamton University. |
| | |

| | Nils Huter |
| | Chartered Financial Analyst, Portfolio Manager, is manager of Invesco Global Market Neutral Fund. He joined Invesco in 2007. |
| Mr. Huter earned a business administration degree, Diplom Kaufmann (FH), from the University of Applied Sciences and Arts in Hildesheim. |
| | |

| | Robert Nakouzi |
| | Portfolio Manager, is manager of Invesco Global |
| | Market Neutral Fund. He joined Invesco in 2004. |
| Mr. Nakouzi earned a Licence en Gestion de Entreprises from the University of Beirut in 1989 and a bachelor’s degree in finance and marketing from the University of Applied Sciences in Frank-furt, Germany. |
5 Invesco Global Market Neutral Fund
Your Fund’s Long-Term Performance
Results of a $10,000 Investment - Oldest Share Class(es) since Inception
Fund and index data from 12/19/13
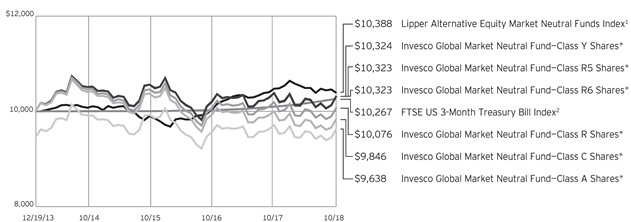
1 Source: Lipper Inc.
2 Source: FactSet Research Systems Inc.
*Includes the effect of the Adviser pay-in for an economic loss of $0.52 per share
Past performance cannot guarantee comparable future results.
The data shown in the chart include reinvested distributions, applicable sales charges and Fund expenses including
management fees. Index results include reinvested dividends, but they do not reflect sales charges. Performance of the peer group, if applicable, reflects fund expenses and management fees; perfor-
mance of a market index does not. Performance shown in the chart and table(s) does not reflect deduction of taxes a shareholder would pay on Fund distributions or sale of Fund shares.
| | |
| 6 | | Invesco Global Market Neutral Fund |
| | | | |
| |
Average Annual Total Returns | |
As of 10/31/18, including maximum applicable sales charges | |
| |
Class A Shares | | | | |
Inception (12/19/13) | | | -0.75 | %* |
1 Year | | | -6.28 | |
| |
Class C Shares | | | | |
Inception (12/19/13) | | | -0.32 | %* |
1 Year | | | -2.48 | |
| |
Class R Shares | | | | |
Inception (12/19/13) | | | 0.16 | %* |
1 Year | | | -1.11 | |
| |
Class Y Shares | | | | |
Inception (12/19/13) | | | 0.66 | %* |
1 Year | | | -0.56 | |
| |
Class R5 Shares | | | | |
Inception (12/19/13) | | | 0.66 | %* |
1 Year | | | -0.57 | |
| |
Class R6 Shares | | | | |
Inception (12/19/13) | | | 0.66 | %* |
1 Year | | | -0.57 | |
* Amount includes the effect of the Adviser pay-in for an economic loss of $0.41 per share for the fiscal period-end 2014 and $0.11 for fiscal period-end 2015. Had the pay-in not been made, average annual total returns were estimated at -1.92%, -1.53%, -1.04%, -0.52%, -0.52% and -0.52% for Class A, Class C, Class R, Class Y, Class R5 and Class R6 shares, respectively. | |
The performance data quoted represent past performance and cannot guarantee comparable future results; current performance may be lower or higher. Please visit invesco.com/performance for the most recent month-end performance. Performance figures reflect reinvested distributions, changes in net asset value and the effect of the maximum sales charge unless otherwise stated. Investment return and principal value will fluctuate so that you may have a gain or loss when you sell shares.
The net annual Fund operating expense ratio set forth in the most recent Fund prospectus as of the date of this report for Class A, Class C, Class R, Class Y, Class R5 and Class R6 shares was 1.50%, 2.25%, 1.75%, 1.25%, 1.25% and 1.25%, respectively.1,2 The total annual Fund operating expense ratio set forth in the most recent Fund prospectus as of the date of this report for Class A, Class C, Class R, Class Y, Class R5 and Class R6 shares was 2.88%, 3.63%, 3.13%, 2.63%, 2.55% and 2.55%, respectively. The expense ratios presented above may vary from the expense ratios presented in other
| | | | |
| |
Average Annual Total Returns | |
As of 9/30/18, the most recent calendar quarter end, including maximum applicable sales charges | |
| |
Class A Shares | | | | |
Inception (12/19/13) | | | -1.17 | %** |
1 Year | | | -7.23 | |
| |
Class C Shares | | | | |
Inception (12/19/13) | | | -0.72 | %** |
1 Year | | | -3.54 | |
| |
Class R Shares | | | | |
Inception (12/19/13) | | | -0.23 | %** |
1 Year | | | -2.06 | |
| |
Class Y Shares | | | | |
Inception (12/19/13) | | | 0.26 | %** |
1 Year | | | -1.50 | |
| |
Class R5 Shares | | | | |
Inception (12/19/13) | | | 0.26 | %** |
1 Year | | | -1.60 | |
| |
Class R6 Shares | | | | |
Inception (12/19/13) | | | 0.26 | %** |
1 Year | | | -1.60 | |
** Amount includes the effect of the Adviser pay-in for an economic loss of $0.41 per share for the fiscal period-end 2014 and $0.11 for fiscal period-end 2015. Had the pay-in not been made, average annual total returns were estimated at -2.38%, -1.98%, -1.46%, -0.95%, -0.95% and -0.95% for Class A, Class C, Class R, Class Y, Class R5 and Class R6 shares, respectively. | |
sections of this report that are based on expenses incurred during the period covered by this report.
Class A share performance reflects the maximum 5.50% sales charge, and Class C share performance reflects the applicable contingent deferred sales charge (CDSC) for the period involved. The CDSC on Class C shares is 1% for the first year after purchase. Class R, Class Y, Class R5 and Class R6 class shares do not have a front-end sales charge or a CDSC; therefore, performance is at net asset value.
The performance of the Fund’s share classes will differ primarily due to different sales charge structures and class expenses.
Fund performance reflects any applicable fee waivers and/or expense reimbursements. Had the adviser not waived fees and/or reimbursed expenses currently or in the past, returns would have been lower. See current prospectus for more information.
| 1 | Total annual Fund operating expenses after any contractual fee waivers and/or expense reimbursements by the adviser in effect through at least February 29, 2020. See current prospectus for more information. |
| 2 | Total annual Fund operating expenses after any contractual fee waivers and/or expense reimbursements by the adviser in effect through at least June 30, 2020. See current prospectus for more information. |
7 Invesco Global Market Neutral Fund
Invesco Global Market Neutral Fund’s investment objective is to seek to provide a positive return over a full market cycle from a broadly diversified portfolio of stocks while seeking to limit exposure to the general risks associated with the stock market investing.
| ∎ | | Unless otherwise stated, information presented in this report is as of October 31, 2018, and is based on total net assets. |
| ∎ | | Unless otherwise noted, all data provided by Invesco. |
| ∎ | | To access your Fund’s reports/prospectus, visit invesco.com/fundreports. |
About share classes
| ∎ | | Class R shares are generally available only to employer sponsored retirement and benefit plans. Please see the prospectus for more information. |
| ∎ | | Class Y shares are available only to certain investors. Please see the prospectus for more information. |
| ∎ | | Class R5 shares and Class R6 shares are available for use by retirement plans that meet certain standards and for institutional investors. Class R6 shares are also available through intermediaries that have established an agreement with Invesco Distributors, Inc. to make such shares available for use in retail omnibus accounts. Please see the prospectus for more information. |
Principal risks of investing in the Fund
| ∎ | | Derivatives risk. The value of a derivative instrument depends largely on (and is derived from) the value of an underlying security, currency, commodity, interest rate, index or other asset (each referred to as an underlying asset). In addition to risks relating to the underlying assets, the use of derivatives may include other, possibly greater, risks, including counterparty, leverage and liquidity risks. Counterparty risk is the risk that the counterparty to the derivative contract will default on its obligation to pay the Fund the amount owed or otherwise perform under the derivative contract. Derivatives create leverage risk because they do not require payment up front equal to the economic exposure created by holding a position in the derivative. As a result, an adverse change in the value of the underlying asset could result in the Fund sustaining a loss that is substantially greater than the amount invested in the derivative or the anticipated value of the underlying asset, which may make the Fund’s returns more volatile and increase the risk of |
| | loss. Derivative instruments may also be less liquid than more traditional investments and the Fund may be unable to sell or close out its derivative positions at a desirable time or price. This risk may be more acute under adverse market conditions, during which the Fund may be most in need of liquidating its derivative positions. Derivatives may also be harder to value, less tax efficient and subject to changing government regulation that could impact the Fund’s ability to use certain derivatives or their cost. The SEC has proposed new regulations related to the use of derivatives and related instruments by registered investment companies. If adopted as proposed, these regulations would limit the Fund’s ability to engage in derivatives transactions and may result in increased costs or require the Fund to modify its investment strategies or to liquidate. Derivatives strategies may not always be successful. For example, derivatives used for hedging or to gain or limit exposure to a particular market segment may not provide the expected benefits, particularly during adverse market conditions. These risks are greater for the Fund than most other mutual funds because the Fund will implement its investment strategy primarily through derivative instruments rather than direct investments in stocks/bonds. |
| ∎ | | Foreign securities risk. The Fund’s foreign investments may be adversely affected by political and social instability, changes in economic or taxation policies, difficulty in enforcing obligations, decreased liquidity or increased volatility. Foreign investments also involve the risk of the possible seizure, nationalization or expropriation of the issuer or foreign deposits (in which the Fund could lose its entire investments in a certain market) and the possible adoption of foreign governmental restrictions such as exchange controls. Unless the Fund has hedged its foreign |
This report must be accompanied or preceded by a currently effective Fund prospectus, which contains more complete information, including sales charges and expenses. Investors should read it carefully before investing.
NOT FDIC INSURED | MAY LOSE VALUE | NO BANK GUARANTEE
| | securities risk, foreign securities risk also involves the risk of negative foreign currency rate fluctuations, which may cause the value of securities denominated in such foreign currency (or other instruments through which the Fund has exposure to foreign currencies) to decline in value. Currency exchange rates may fluctuate significantly over short periods of time. Currency hedging strategies, if used, are not always successful. |
| ∎ | | Investing in the European Union risk. Investments in certain countries in the European Union are susceptible to high economic risks associated with high levels of debt, such as investments in sovereign debt of Greece, Italy and Spain. Efforts of the member states to further unify their economic and monetary policies may increase the potential for the downward movement of one member state’s market to cause a similar effect on other member states’ markets. Separately, the European Union faces issues involving its membership, structure, procedures and policies. The exit of one or more member states from the European Union, such as the United Kingdom (UK) which has announced its intention to exit, would place its currency and banking system in jeopardy. The exit by the UK or other member states will likely result in increased volatility, illiquidity and potentially lower economic growth in the affected markets, which will adversely affect the Fund’s investments. |
| ∎ | | Management risk. The Fund is actively managed and depends heavily on the Adviser’s judgment about markets, interest rates or the attractiveness, relative values, liquidity, or potential appreciation of particular investments made for the Fund’s portfolio. The Fund could experience losses if these judgments prove to be incorrect. Additionally, legislative, regulatory, or tax developments may adversely affect management of the Fund and, therefore, the ability of the Fund to achieve its investment objective. In particular, there is no guarantee that the portfolio manager’s stock selection process will produce a market neutral portfolio that reduces or eliminates the Fund’s exposure to general US stock market risk, sector or |
| | |
| 8 | | Invesco Global Market Neutral Fund |
| | industry-specific risk or market capitalization risk. In addition, the Fund’s market neutral investment strategy will likely cause the Fund to underperform the broader US equity market during market rallies. Such underperformance could be significant during sudden or significant market rallies. |
| ∎ | | Market risk. The market values of the Fund’s investments, and therefore the value of the Fund’s shares, will go up and down, sometimes rapidly or unpredictably. Market risk may affect a single issuer, industry or section of the economy, or it may affect the market as a whole. Individual stock prices tend to go up and down more dramatically than those of certain other types of investments, such as bonds. During a general downturn in the financial markets, multiple asset classes may decline in value. When markets perform well, there can be no assurance that specific investments held by the Fund will rise in value. |
| ∎ | | Preferred securities risk. Preferred securities are subject to issuer-specific and market risks applicable generally to equity securities. Preferred securities also may be subordinated to bonds or other debt instruments, subjecting them to a greater risk of nonpayment, may be less liquid than many other securities, such as common stocks, and generally offer no voting rights with respect to the issuer. |
| ∎ | | Short position risk. Because the Fund’s potential loss on a short position arises from increases in the value of the asset sold short, the Fund will incur a loss on a short position, which is theoretically unlimited, if the price of the asset sold short increases from the short sale price. The counterparty to a short position or other market factors may prevent the Fund from closing out a short position at a desirable time or price and may reduce or eliminate any gain or result in a loss. In a rising market, the Fund’s short positions will cause the Fund to underperform the overall market and its peers that do not engage in shorting. If the Fund holds both long and short positions, and both positions decline simultaneously, the short positions will not provide any buffer (hedge) from declines in value of the Fund’s long positions. Certain types of |
| | short positions involve leverage, which may exaggerate any losses, potentially more than the actual cost of the investment, and will increase the volatility of the Fund’s returns. |
| ∎ | | Small- and mid-capitalization companies risks. Small- and mid-capitalization companies tend to be more vulnerable to changing market conditions, may have little or no operating history or track record of success, and may have more limited product lines and markets, less experienced management and fewer financial resources than larger companies. These companies’ securities may be more volatile and less liquid than those of more established companies, and their returns may vary, sometimes significantly, from the overall securities market. |
About indexes used in this report
| ∎ | | The FTSE US 3-Month Treasury Bill Index is an unmanaged index representative of three-month US Treasury bills. |
| ∎ | | The Lipper Alternative Equity Market Neutral Funds Index is an unmanaged index considered representative of alternative equity market neutral funds tracked by Lipper. |
| ∎ | | The Russell 3000® Growth Index is an unmanaged index considered representative of US growth stocks. The Russell 3000 Growth Index is a trademark/service mark of the Frank Russell Co. Russell® is a trademark of the Frank Russell Co. |
| ∎ | | The Russell 3000® Value Index is an unmanaged index considered representative of US value stocks. The Russell 3000 Value Index is a trademark/service mark of the Frank Russell Co. Russell® is a trademark of the Frank Russell Co. |
| ∎ | | The Fund is not managed to track the performance of any particular index, including the index(es) described here, and consequently, the performance of the Fund may deviate significantly from the performance of the index(es). |
| ∎ | | A direct investment cannot be made in an index. Unless otherwise indicated, index results include reinvested dividends, and they do not reflect sales charges. Performance of the peer group, if applicable, reflects fund expenses; performance of a market index does not. |
Other information
| ∎ | | The returns shown in management’s discussion of Fund performance are based on net asset values (NAVs) calculated for shareholder transactions. Generally accepted accounting principles require adjustments to be made to the net assets of the Fund at period end for financial reporting purposes, and as such, the NAVs for shareholder transactions and the returns based on those NAVs may differ from the NAVs and returns reported in the Financial Highlights. |
| ∎ | | Industry classifications used in this report are generally according to the Global Industry Classification Standard, which was developed by and is the exclusive property and a service mark of MSCI Inc. and Standard & Poor’s. |
9 Invesco Global Market Neutral Fund
Schedule of Investments
October 31, 2018
| | | | | | | | |
| | | Shares | | | Value | |
Common Stocks & Other Equity Interests–89.14% | |
| Australia–2.12% | |
Altium Ltd. | | | 1,485 | | | $ | 22,997 | |
Beach Energy Ltd. | | | 14,679 | | | | 18,186 | |
BHP Billiton PLC | | | 6,042 | | | | 120,644 | |
BlueScope Steel Ltd. | | | 4,661 | | | | 47,765 | |
Santos Ltd. | | | 4,271 | | | | 20,081 | |
| | | | | | | | 229,673 | |
|
| Canada–3.86% | |
Canada Goose Holdings Inc.(a) | | | 558 | | | | 30,471 | |
Canadian Pacific Railway Ltd. | | | 224 | | | | 45,942 | |
Canfor Corp.(a) | | | 3,481 | | | | 50,008 | |
Enerplus Corp. | | | 5,583 | | | | 51,958 | |
Kirkland Lake Gold Ltd. | | | 1,075 | | | | 21,095 | |
Teck Resources Ltd.–Class B | | | 1,120 | | | | 23,152 | |
TFI International Inc. | | | 2,604 | | | | 86,668 | |
Transcontinental Inc.–Class A | | | 1,684 | | | | 27,723 | |
West Fraser Timber Co., Ltd. | | | 1,632 | | | | 82,003 | |
| | | | | | | | 419,020 | |
|
| China–1.14% | |
Yangzijiang Shipbuilding Holdings Ltd. | | | 137,800 | | | | 123,765 | |
|
| Denmark–1.58% | |
DFDS A/S | | | 709 | | | | 30,354 | |
GN Store Nord A/S | | | 535 | | | | 22,654 | |
Rockwool International A/S–Class B | | | 79 | | | | 26,976 | |
Royal Unibrew A/S | | | 1,285 | | | | 91,150 | |
| | | | | | | | 171,134 | |
|
| Finland–2.08% | |
Stora Enso Oyj–Class R | | | 3,026 | | | | 45,592 | |
UPM-Kymmene Oyj | | | 5,600 | | | | 180,160 | |
| | | | | | | | 225,752 | |
|
| France–2.47% | |
Faurecia S.A. | | | 466 | | | | 22,520 | |
Nexity S.A. | | | 1,019 | | | | 48,751 | |
Peugeot S.A. | | | 8,273 | | | | 196,227 | |
| | | | | | | | 267,498 | |
|
| Germany–3.66% | |
Covestro AG–REGS(b) | | | 1,393 | | | | 90,103 | |
Hochtief AG | | | 569 | | | | 84,408 | |
Schaeffler AG–Preference Shares | | | 16,192 | | | | 171,110 | |
Siltronic AG | | | 559 | | | | 51,324 | |
| | | | | | | | 396,945 | |
|
| Ireland–0.52% | |
AerCap Holdings N.V.(a) | | | 573 | | | | 28,696 | |
Smurfit Kappa Group PLC | | | 828 | | | | 27,153 | |
| | | | | | | | 55,849 | |
| | | | | | | | |
| | | Shares | | | Value | |
| Japan–17.75% | |
AEON Mall Co., Ltd. | | | 1,900 | | | $ | 35,165 | |
AGC Inc. | | | 5,000 | | | | 163,684 | |
Brother Industries, Ltd. | | | 3,100 | | | | 56,564 | |
Citizen Watch Co., Ltd. | | | 6,300 | | | | 36,081 | |
Dai Nippon Printing Co., Ltd. | | | 7,900 | | | | 176,979 | |
Daiwa House Industry Co., Ltd. | | | 2,500 | | | | 75,203 | |
Denka Co., Ltd. | | | 2,200 | | | | 71,325 | |
Electric Power Development Co., Ltd. | | | 1,300 | | | | 35,360 | |
Haseko Corp. | | | 2,000 | | | | 25,309 | |
Ibiden Co., Ltd. | | | 9,100 | | | | 111,807 | |
JTEKT Corp. | | | 4,800 | | | | 59,609 | |
K’s Holdings Corp. | | | 9,000 | | | | 113,446 | |
Marubeni Corp. | | | 12,600 | | | | 101,793 | |
Mitsubishi Corp. | | | 2,300 | | | | 64,538 | |
Mitsui & Co., Ltd. | | | 11,400 | | | | 191,519 | |
Nippon Express Co., Ltd. | | | 1,200 | | | | 75,709 | |
Nippon Telegraph & Telephone Corp. | | | 900 | | | | 37,786 | |
Nishimatsu Construction Co., Ltd. | | | 2,600 | | | | 60,889 | |
Ricoh Co., Ltd. | | | 3,100 | | | | 30,917 | |
Seino Holdings Co., Ltd. | | | 5,000 | | | | 68,894 | |
Sojitz Corp. | | | 28,900 | | | | 96,894 | |
Sumitomo Chemical Co., Ltd. | | | 9,000 | | | | 44,888 | |
Tokyo Gas Co., Ltd. | | | 4,300 | | | | 105,676 | |
Toppan Printing Co., Ltd. | | | 6,000 | | | | 84,698 | |
| | | | | | | | 1,924,733 | |
|
| Jordan–0.82% | |
Hikma Pharmaceuticals PLC | | | 3,673 | | | | 89,258 | |
|
| Luxembourg–0.17% | |
ArcelorMittal | | | 723 | | | | 18,045 | |
|
| Netherlands–1.02% | |
Koninklijke Ahold Delhaize N.V. | | | 4,811 | | | | 110,212 | |
|
| Norway–2.88% | |
Salmar ASA | | | 3,339 | | | | 175,790 | |
TGS NOPEC Geophysical Co. ASA | | | 4,115 | | | | 136,884 | |
| | | | | | | | 312,674 | |
|
| Puerto Rico–0.31% | |
Popular, Inc. | | | 637 | | | | 33,130 | |
|
| Russia–1.61% | |
Evraz PLC | | | 25,097 | | | | 174,162 | |
|
| Spain–0.66% | |
ACS, Actividades de Construccion y Servicios, S.A. | | | 514 | | | | 19,240 | |
Mediaset Espana Comunicacion S.A. | | | 7,751 | | | | 52,703 | |
| | | | | | | | 71,943 | |
|
| Sweden–2.67% | |
Loomis AB–Class B | | | 1,489 | | | | 45,999 | |
Sandvik AB | | | 7,353 | | | | 116,265 | |
See accompanying Notes to Financial Statements which are an integral part of the financial statements.
10 Invesco Global Market Neutral Fund
| | | | | | | | |
| | | Shares | | | Value | |
| Sweden–(continued) | |
Svenska Cellulosa AB SCA–Class B | | | 11,480 | | | $ | 108,643 | |
Swedish Match AB | | | 373 | | | | 19,003 | |
| | | | | | | | 289,910 | |
|
| Switzerland–0.42% | |
Georg Fischer AG | | | 31 | | | | 28,756 | |
SFS Group AG | | | 166 | | | | 16,243 | |
| | | | | | | | 44,999 | |
|
| United Kingdom–3.99% | |
Fiat Chrysler Automobiles N.V.(a) | | | 5,162 | | | | 78,251 | |
GlaxoSmithKline PLC | | | 3,108 | | | | 60,090 | |
Moneysupermarket.com Group PLC | | | 12,975 | | | | 48,635 | |
PageGroup PLC | | | 10,980 | | | | 70,443 | |
Pearson PLC | | | 8,447 | | | | 96,883 | |
Persimmon PLC | | | 2,686 | | | | 78,746 | |
| | | | | | | | 433,048 | |
|
| United States–39.41% | |
Aaron’s, Inc. | | | 1,351 | | | | 63,673 | |
AbbVie Inc. | | | 1,169 | | | | 91,007 | |
Akamai Technologies, Inc.(a) | | | 1,401 | | | | 101,222 | |
Allison Transmission Holdings, Inc. | | | 1,983 | | | | 87,411 | |
AMC Networks Inc.–Class A(a) | | | 459 | | | | 26,888 | |
American Eagle Outfitters, Inc. | | | 2,016 | | | | 46,489 | |
American Equity Investment Life Holding Co. | | | 998 | | | | 31,158 | |
Amgen Inc. | | | 366 | | | | 70,561 | |
Biogen Inc.(a) | | | 381 | | | | 115,927 | |
BRP Inc. | | | 4,709 | | | | 189,462 | |
CF Industries Holdings, Inc. | | | 901 | | | | 43,275 | |
Cisco Systems, Inc. | | | 3,389 | | | | 155,047 | |
ConocoPhillips | | | 1,147 | | | | 80,175 | |
CoreCivic, Inc. | | | 2,189 | | | | 49,165 | |
Deckers Outdoor Corp.(a) | | | 785 | | | | 99,828 | |
Dick’s Sporting Goods, Inc. | | | 2,188 | | | | 77,390 | |
Domtar Corp. | | | 401 | | | | 18,570 | |
Endo International PLC(a) | | | 2,452 | | | | 41,537 | |
Foot Locker, Inc. | | | 458 | | | | 21,590 | |
Fortinet, Inc.(a) | | | 1,216 | | | | 99,931 | |
Freeport-McMoRan Inc. | | | 2,413 | | | | 28,111 | |
Genworth Financial, Inc.–Class A(a) | | | 23,865 | | | | 102,142 | |
Gilead Sciences, Inc. | | | 1,616 | | | | 110,179 | |
Herbalife Nutrition Ltd.(a) | | | 1,594 | | | | 84,896 | |
HollyFrontier Corp. | | | 1,682 | | | | 113,434 | |
HP Inc. | | | 796 | | | | 19,215 | |
Huntsman Corp. | | | 6,022 | | | | 131,761 | |
Hyatt Hotels Corp.–Class A | | | 2,296 | | | | 158,883 | |
| | | | | | | | |
| | | Shares | | | Value | |
| United States–(continued) | |
InterDigital, Inc. | | | 882 | | | $ | 62,578 | |
Kohl’s Corp. | | | 1,174 | | | | 88,907 | |
Korn/Ferry International | | | 678 | | | | 30,605 | |
Kroger Co. (The) | | | 1,387 | | | | 41,277 | |
Lear Corp. | | | 330 | | | | 43,857 | |
Louisiana-Pacific Corp. | | | 1,209 | | | | 26,320 | |
LyondellBasell Industries N.V.–Class A | | | 579 | | | | 51,687 | |
Macy’s, Inc. | | | 3,957 | | | | 135,686 | |
Michael Kors Holdings Ltd.(a) | | | 1,378 | | | | 76,355 | |
Micron Technology, Inc.(a) | | | 2,055 | | | | 77,515 | |
Navient Corp. | | | 3,223 | | | | 37,322 | |
NetApp, Inc. | | | 1,607 | | | | 126,133 | |
Newmont Mining Corp. | | | 2,386 | | | | 73,775 | |
Park Hotels & Resorts Inc. | | | 1,952 | | | | 56,745 | |
Peabody Energy Corp. | | | 3,193 | | | | 113,192 | |
Santander Consumer USA Holdings Inc. | | | 2,194 | | | | 41,138 | |
Seagate Technology PLC | | | 1,943 | | | | 78,167 | |
Tenet Healthcare Corp.(a) | | | 2,792 | | | | 71,838 | |
United Continental Holdings Inc.(a) | | | 548 | | | | 46,859 | |
United Therapeutics Corp.(a) | | | 1,067 | | | | 118,288 | |
Vertex Pharmaceuticals Inc.(a) | | | 464 | | | | 78,629 | |
Viacom Inc.–Class B | | | 5,484 | | | | 175,378 | |
VMware, Inc.–Class A(a) | | | 128 | | | | 18,098 | |
Voya Financial, Inc. | | | 2,427 | | | | 106,206 | |
W.W. Grainger, Inc. | | | 150 | | | | 42,596 | |
WellCare Health Plans, Inc.(a) | | | 514 | | | | 141,859 | |
Whiting Petroleum Corp.(a) | | | 1,429 | | | | 53,302 | |
| | | | | | | | 4,273,239 | |
Total Common Stocks & Other Equity Interests
(Cost $9,487,978) | | | | 9,664,989 | |
|
Money Market Funds–7.86%(c) | |
Invesco Government & Agency Portfolio–Institutional Class, 2.08% | | | 298,126 | | | | 298,126 | |
Invesco Liquid Assets Portfolio–Institutional Class, 2.27% | | | 212,905 | | | | 212,947 | |
Invesco Treasury Portfolio–Institutional Class, 2.09% | | | 340,716 | | | | 340,716 | |
Total Money Market Funds
(Cost $851,789) | | | | 851,789 | |
TOTAL INVESTMENTS IN SECURITIES–97.00%
(Cost $10,339,767) | | | | 10,516,778 | |
OTHER ASSETS LESS LIABILITIES–3.00% | | | | 325,419 | |
NET ASSETS–100.00% | | | $ | 10,842,197 | |
Investment Abbreviations:
Notes to Schedule of Investments:
| (a) | Non-income producing security. |
| (b) | Security purchased or received in transaction exempt from registration under the Securities Act of 1933, as amended (the “1933 Act”). The security may be resold pursuant to an exemption from registration under the 1933 Act, typically to qualified institutional buyers. The value of this security at October 31, 2018 represented 0.83% of the Fund’s Net Assets. |
| (c) | The money market fund and the Fund are affiliated by having the same investment adviser. The rate shown is the 7-day SEC standardized yield as of October 31, 2018. |
See accompanying Notes to Financial Statements which are an integral part of the financial statements.
11 Invesco Global Market Neutral Fund
| | | | | | | | | | | | | | | | | | | | | | | | | | | | | | |
| Open Over–The–Counter Total Return Swap Agreements | |
| Reference Entity | | Counterparty | | Maturity
Date | | Floating
Rate Index(1) | | Payment
Frequency | | | Notional Value | | | Upfront
Payments
(Received) | | | Value(2)(3) | | | Unrealized
Appreciation
(Depreciation)(2)(3) | | | Net Value of
Reference
Entities | |
Australia Equity Securities-Short | | Morgan Stanley &
Co. LLC | | 01/23/2019 | | Federal Funds floating rate | | | Monthly | | | $ | (23,807 | ) | | $ | — | | | $ | 141 | | | $ | 141 | | | $ | (23,679 | ) |
Denmark Equity Securities-Short | | Morgan Stanley &
Co. LLC | | 01/23/2019 | | Federal Funds floating rate | | | Monthly | | | | (130,708 | ) | | | — | | | | 1,005 | | | | 1,005 | | | | (129,759 | ) |
Subtotal — Appreciation | | | | | | | | | | | | | — | | | | 1,146 | | | | 1,146 | | | | (153,438 | ) |
Canada Equity Securities-Short | | Morgan Stanley &
Co. LLC | | 01/23/2019 | | Federal Funds floating rate | | | Monthly | | | | (558,137 | ) | | | — | | | | (3,662 | ) | | | (3,662 | ) | | | (561,072 | ) |
Euro Area Equity Securities-Short | | Morgan Stanley &
Co. LLC | | 01/23/2019 | | Federal Funds floating rate | | | Monthly | | | | (1,226,901 | ) | | | — | | | | (19,620 | ) | | | (19,620 | ) | | | (1,247,069 | ) |
Hong Kong Equity Securities-Short | | Morgan Stanley &
Co. LLC | | 10/15/2020 | | Federal Funds floating rate | | | Monthly | | | | (75,924 | ) | | | — | | | | (1,973 | ) | | | (1,973 | ) | | | (77,961 | ) |
Japan Equity Securities-Short | | Morgan Stanley &
Co. LLC | | 01/28/2019 | | Federal Funds floating rate | | | Monthly | | | | (1,839,780 | ) | | | — | | | | (61,650 | ) | | | (61,650 | ) | | | (1,894,710 | ) |
New Zealand Equity Securities-Short | | Morgan Stanley &
Co. LLC | | 03/16/2020 | | Federal Funds floating rate | | | Monthly | | | | (94,912 | ) | | | — | | | | (1,564 | ) | | | (1,564 | ) | | | (96,526 | ) |
Norway Equity Securities-Short | | Morgan Stanley &
Co. LLC | | 01/23/2019 | | Federal Funds floating rate | | | Monthly | | | | (276,585 | ) | | | — | | | | (5,387 | ) | | | (5,387 | ) | | | (282,094 | ) |
Singapore Equity Securities-Short | | Morgan Stanley &
Co. LLC | | 01/23/2019 | | Federal Funds floating rate | | | Monthly | | | | (19,417 | ) | | | — | | | | (319 | ) | | | (319 | ) | | | (19,747 | ) |
Spain Equity Securities-Short | | Morgan Stanley &
Co. LLC | | 02/22/2019 | | Federal Funds floating rate | | | Monthly | | | | (85,919 | ) | | | — | | | | (1,378 | ) | | | (1,378 | ) | | | (87,334 | ) |
Sweden Equity Securities-Short | | Morgan Stanley &
Co. LLC | | 01/23/2019 | | Federal Funds floating rate | | | Monthly | | | | (216,934 | ) | | | — | | | | (1,525 | ) | | | (1,525 | ) | | | (218,549 | ) |
Switzerland Equity Securities-Short | | Morgan Stanley &
Co. LLC | | 01/23/2019 | | Federal Funds floating rate | | | Monthly | | | | (84,972 | ) | | | — | | | | (4,301 | ) | | | (4,301 | ) | | | (88,865 | ) |
United Kingdom Equity Securities-Short | | Morgan Stanley &
Co. LLC | | 01/23/2019 | | Federal Funds floating rate | | | Monthly | | | | (666,207 | ) | | | — | | | | (9,322 | ) | | | (9,322 | ) | | | (672,729 | ) |
United States Equity Securities-Short | | Morgan Stanley &
Co. LLC | | 12/23/2019 | | Federal Funds floating rate | | | Monthly | | | | (4,006,288 | ) | | | — | | | | (8,682 | ) | | | (8,682 | ) | | | (4,015,256 | ) |
Subtotal — Depreciation | | | | | | | | | | | | | — | | | | (119,383 | ) | | | (119,383 | ) | | | (9,261,912 | ) |
Total Return Swap Agreements — Equity Risk | | | | | | | | | | | | $ | — | | | $ | (118,237 | ) | | $ | (118,237 | ) | | $ | (9,415,350 | ) |
| (1) | The Fund receives or pays the total return on the short positions underlying the total return swap, and receives a specific Federal Funds floating rate. The total return swaps are settled in U.S. Dollars. |
| (2) | Amount includes $(9,378) of dividends payable and financing fees related to the reference entities. |
| (3) | Swap agreements collateralized by $51,661 cash held with Morgan Stanley & Co. LLC, the Counterparty. |
The following table represents the individual short positions and related values of equity securities underlying the total return swaps with Morgan Stanley & Co. LLC, as of October 31, 2018.
| | | | | | | | | | | | |
| | | Shares | | | Value | | | Percentage of
Reference Entities | |
Equity Securities — Short | | | | | |
| Australia | | | | | | | | | | | | |
Tabcorp Holdings Ltd. | | | (7,238 | ) | | $ | (23,679 | ) | | | 0.27 | |
|
| Canada | |
CCL Industries Inc.–Class B | | | (4,766 | ) | | | (200,517 | ) | | | 2.12 | |
Emera Inc. | | | (2,207 | ) | | | (68,106 | ) | | | 0.74 | |
SNC-Lavalin Group Inc. | | | (4,523 | ) | | | (161,499 | ) | | | 1.73 | |
Stella-Jones Inc. | | | (2,544 | ) | | | (81,482 | ) | | | 0.88 | |
Waste Connections, Inc. | | | (647 | ) | | | (49,468 | ) | | | 0.53 | |
| | | | | (561,072 | ) | | | | |
|
| Denmark | |
Chr. Hansen Holding A/S | | | (335 | ) | | | (33,861 | ) | | | 0.37 | |
Genmab A/S | | | (700 | ) | | | (95,898 | ) | | | 1.04 | |
| | | | | (129,759 | ) | | | | |
| | | | | | | | | | | | |
| | | Shares | | | Value | | | Percentage of
Reference Entities | |
| Euro Area | |
Anheuser-Busch InBev S.A./N.V. | | | (957 | ) | | $ | (70,592 | ) | | | 0.76 | |
Banco BPM S.p.A. | | | (10,664 | ) | | | (20,058 | ) | | | 0.22 | |
bpost S.A. | | | (1,295 | ) | | | (19,665 | ) | | | 0.21 | |
Cairn Homes PLC | | | (12,550 | ) | | | (20,152 | ) | | | 0.22 | |
Daimler AG | | | (3,168 | ) | | | (187,838 | ) | | | 2.02 | |
Evotec AG | | | (3,427 | ) | | | (67,719 | ) | | | 0.70 | |
GEA Group AG | | | (585 | ) | | | (17,794 | ) | | | 0.18 | |
Getlink | | | (5,916 | ) | | | (74,462 | ) | | | 0.80 | |
Huhtamaki OYJ | | | (4,762 | ) | | | (133,680 | ) | | | 1.35 | |
Koninklijke Vopak N.V. | | | (1,175 | ) | | | (53,223 | ) | | | 0.57 | |
Outokumpu OYJ | | | (9,111 | ) | | | (38,277 | ) | | | 0.40 | |
Renault S.A. | | | (902 | ) | | | (67,486 | ) | | | 0.73 | |
Rocket Internet SE | | | (765 | ) | | | (22,108 | ) | | | 0.23 | |
See accompanying Notes to Financial Statements which are an integral part of the financial statements.
12 Invesco Global Market Neutral Fund
| | | | | | | | | | | | |
| | | Shares | | | Value | | | Percentage of
Reference Entities | |
| Euro Area–(continued) | |
Rubis SCA | | | (1,412 | ) | | $ | (73,072 | ) | | | 0.77 | |
Snam S.p.A. | | | (25,140 | ) | | | (104,024 | ) | | | 1.13 | |
Takeaway.com N.V. | | | (618 | ) | | | (36,391 | ) | | | 0.38 | |
TechnipFMC PLC | | | (682 | ) | | | (18,195 | ) | | | 0.19 | |
thyssenkrupp AG | | | (8,618 | ) | | | (181,274 | ) | | | 1.91 | |
Valeo S.A. | | | (1,270 | ) | | | (41,059 | ) | | | 0.41 | |
| | | | | (1,247,069 | ) | | | | |
|
| Hong Kong | |
Yue Yuen Industrial Holdings Ltd. | | | (28,500 | ) | | | (77,961 | ) | | | 0.82 | |
|
| Japan | |
AIN HOLDINGS Inc. | | | (300 | ) | | | (23,496 | ) | | | 0.24 | |
Daifuku Co., Ltd. | | | (2,800 | ) | | | (120,563 | ) | | | 1.22 | |
Kansai Paint Co., Ltd. | | | (6,800 | ) | | | (100,672 | ) | | | 1.08 | |
Keihan Holdings Co., Ltd. | | | (600 | ) | | | (22,752 | ) | | | 0.24 | |
Keyence Corp. | | | (200 | ) | | | (97,989 | ) | | | 1.00 | |
Koito Manufacturing Co., Ltd. | | | (1,500 | ) | | | (71,498 | ) | | | 0.73 | |
Kyushu Electric Power Co., Inc. | | | (6,100 | ) | | | (71,014 | ) | | | 0.78 | |
M3, Inc. | | | (3,200 | ) | | | (51,543 | ) | | | 0.55 | |
Makita Corp. | | | (1,600 | ) | | | (55,356 | ) | | | 0.70 | |
Maruichi Steel Tube Ltd. | | | (1,400 | ) | | | (40,436 | ) | | | 0.43 | |
MISUMI Group Inc. | | | (8,800 | ) | | | (176,671 | ) | | | 1.75 | |
Monotaro Co., Ltd. | | | (4,900 | ) | | | (108,141 | ) | | | 1.09 | |
Nidec Corp. | | | (800 | ) | | | (102,702 | ) | | | 1.07 | |
Nifco Inc. | | | (3,900 | ) | | | (88,836 | ) | | | 0.94 | |
Nihon M&A Center Inc. | | | (3,700 | ) | | | (88,738 | ) | | | 0.91 | |
Nitori Holdings Co., Ltd. | | | (1,000 | ) | | | (130,548 | ) | | | 1.36 | |
Relo Group Inc. | | | (2,200 | ) | | | (51,964 | ) | | | 0.54 | |
Ryohin Keikaku Co., Ltd. | | | (200 | ) | | | (52,822 | ) | | | 0.55 | |
Seria Co., Ltd. | | | (700 | ) | | | (23,598 | ) | | | 0.24 | |
Seven Bank, Ltd. | | | (20,800 | ) | | | (65,052 | ) | | | 0.69 | |
Shimano Inc. | | | (600 | ) | | | (82,077 | ) | | | 0.88 | |
Toshiba Corp. | | | (6,500 | ) | | | (194,649 | ) | | | 1.99 | |
TOTO Ltd. | | | (600 | ) | | | (21,529 | ) | | | 0.23 | |
Toyo Tire & Rubber Co., Ltd. | | | (1,900 | ) | | | (31,815 | ) | | | 0.34 | |
YASKAWA Electric Corp. | | | (700 | ) | | | (20,249 | ) | | | 0.20 | |
| | | | | (1,894,710 | ) | | | | |
|
| New Zealand | |
Fletcher Building Ltd. | | | (24,496 | ) | | | (96,526 | ) | | | 1.02 | |
|
| Norway | |
Schibsted ASA–Class A | | | (925 | ) | | | (32,047 | ) | | | 0.34 | |
Schibsted ASA–Class B | | | (2,435 | ) | | | (77,112 | ) | | | 0.83 | |
Yara International ASA | | | (4,020 | ) | | | (172,935 | ) | | | 1.80 | |
| | | | | (282,094 | ) | | | | |
|
| Singapore | |
Sembcorp Industries Ltd. | | | (9,700 | ) | | | (19,747 | ) | | | 0.21 | |
|
| Spain | |
Cellnex Telecom S.A. | | | (3,504 | ) | | | (87,334 | ) | | | 0.92 | |
| | | | | | | | | | | | |
| | | Shares | | | Value | | | Percentage of
Reference Entities | |
| Sweden | |
Husqvarna AB–Class B | | | (6,505 | ) | | $ | (49,124 | ) | | | 0.51 | |
Modern Times Group MTG AB–Class B | | | (3,678 | ) | | | (135,902 | ) | | | 1.46 | |
Skanska AB–Class B | | | (2,130 | ) | | | (33,523 | ) | | | 0.36 | |
| | | | | (218,549 | ) | | | | |
|
| Switzerland | |
ams AG | | | (1,728 | ) | | | (67,213 | ) | | | 0.69 | |
dormakaba Holding AG | | | (30 | ) | | | (21,652 | ) | | | 0.23 | |
| | | | | (88,865 | ) | | | | |
|
| United Kingdom | |
BBA Aviation PLC | | | (15,764 | ) | | | (48,392 | ) | | | 0.51 | |
British American Tobacco PLC | | | (1,790 | ) | | | (77,630 | ) | | | 0.84 | |
Capital & Counties Properties PLC | | | (10,606 | ) | | | (33,927 | ) | | | 0.36 | |
Dechra Pharmaceuticals PLC | | | (816 | ) | | | (23,840 | ) | | | 0.25 | |
Fresnillo, PLC | | | (13,310 | ) | | | (144,348 | ) | | | 1.58 | |
John Wood Group PLC | | | (3,501 | ) | | | (31,955 | ) | | | 0.34 | |
Just Eat PLC | | | (2,733 | ) | | | (21,222 | ) | | | 0.22 | |
KAZ Minerals PLC | | | (8,544 | ) | | | (56,649 | ) | | | 0.59 | |
Paddy Power Betfair PLC | | | (350 | ) | | | (30,059 | ) | | | 0.32 | |
Serco Group PLC | | | (30,457 | ) | | | (37,406 | ) | | | 0.40 | |
Weir Group PLC/The | | | (8,254 | ) | | | (167,301 | ) | | | 1.75 | |
| | | | | (672,729 | ) | | | | |
|
| United States | |
ABM Industries Inc. | | | (947 | ) | | | (29,120 | ) | | | 0.32 | |
ACADIA Pharmaceuticals Inc. | | | (4,363 | ) | | | (84,991 | ) | | | 0.99 | |
Bank OZK | | | (864 | ) | | | (23,639 | ) | | | 0.24 | |
Big Lots, Inc. | | | (649 | ) | | | (26,947 | ) | | | 0.30 | |
Callon Petroleum Co. | | | (8,690 | ) | | | (86,639 | ) | | | 0.92 | |
Cantel Medical Corp. | | | (261 | ) | | | (20,658 | ) | | | 0.22 | |
Centennial Resource Development, Inc.–Class A | | | (1,375 | ) | | | (26,345 | ) | | | 0.28 | |
Clovis Oncology Inc. | | | (3,780 | ) | | | (43,961 | ) | | | 0.67 | |
Cognex Corp. | | | (3,711 | ) | | | (158,979 | ) | | | 1.67 | |
Coherent, Inc. | | | (625 | ) | | | (76,963 | ) | | | 0.83 | |
Compass Minerals International, Inc. | | | (512 | ) | | | (24,837 | ) | | | 0.26 | |
Coty Inc.–Class A | | | (6,160 | ) | | | (64,988 | ) | | | 0.67 | |
Dentsply Sirona Inc. | | | (1,433 | ) | | | (49,625 | ) | | | 0.54 | |
Diamondback Energy Inc. | | | (822 | ) | | | (92,360 | ) | | | 0.97 | |
Equinix, Inc. | | | (205 | ) | | | (77,642 | ) | | | 0.83 | |
Exact Sciences Corp. | | | (994 | ) | | | (70,624 | ) | | | 0.69 | |
FireEye, Inc. | | | (3,073 | ) | | | (56,820 | ) | | | 0.56 | |
Flex Ltd. | | | (6,090 | ) | | | (47,868 | ) | | | 0.50 | |
Floor & Decor Holdings, Inc.–Class A | | | (545 | ) | | | (13,941 | ) | | | 0.15 | |
Gartner, Inc. | | | (668 | ) | | | (98,543 | ) | | | 1.02 | |
Granite Construction, Inc. | | | (3,042 | ) | | | (139,080 | ) | | | 1.55 | |
Hasbro, Inc. | | | (437 | ) | | | (40,077 | ) | | | 0.43 | |
Healthcare Services Group, Inc. | | | (2,692 | ) | | | (109,268 | ) | | | 1.22 | |
Howard Hughes Corp. | | | (852 | ) | | | (95,015 | ) | | | 0.99 | |
See accompanying Notes to Financial Statements which are an integral part of the financial statements.
13 Invesco Global Market Neutral Fund
| | | | | | | | | | | | |
| | | Shares | | | Value | | | Percentage of
Reference Entities | |
| United States–(continued) | |
II-VI Inc. | | | (667 | ) | | $ | (24,832 | ) | | | 0.26 | |
Insulet Corp. | | | (705 | ) | | | (62,188 | ) | | | 0.65 | |
IPG Photonics Corp. | | | (278 | ) | | | (37,127 | ) | | | 0.42 | |
Iron Mountain Inc. | | | (803 | ) | | | (24,580 | ) | | | 0.27 | |
Kilroy Realty Corp. | | | (1,389 | ) | | | (95,674 | ) | | | 1.03 | |
Knight-Swift Transportation Holdings Inc. | | | (3,292 | ) | | | (105,344 | ) | | | 1.15 | |
LCI Industries | | | (1,257 | ) | | | (87,173 | ) | | | 0.94 | |
Liberty Broadband Corp.–Class A | | | (677 | ) | | | (56,049 | ) | | | 0.59 | |
Lithia Motors, Inc.–Class A | | | (871 | ) | | | (77,589 | ) | | | 0.85 | |
Live Nation Entertainment, Inc. | | | (1,226 | ) | | | (64,120 | ) | | | 0.66 | |
LKQ Corp. | | | (2,264 | ) | | | (61,739 | ) | | | 0.65 | |
Markel Corp. | | | (111 | ) | | | (121,350 | ) | | | 1.28 | |
Martin Marietta Materials, Inc. | | | (439 | ) | | | (75,192 | ) | | | 0.78 | |
Mattel, Inc. | | | (9,243 | ) | | | (125,520 | ) | | | 1.37 | |
Medicines Co. (The) | | | (2,397 | ) | | | (55,754 | ) | | | 0.61 | |
Medidata Solutions, Inc. | | | (1,193 | ) | | | (83,868 | ) | | | 0.90 | |
Mohawk Industries, Inc. | | | (120 | ) | | | (14,968 | ) | | | 0.16 | |
Monro, Inc. | | | (828 | ) | | | (61,603 | ) | | | 0.67 | |
Nevro Corp. | | | (1,107 | ) | | | (53,977 | ) | | | 0.58 | |
Newell Brands, Inc. | | | (3,584 | ) | | | (56,914 | ) | | | 0.61 | |
Portola Pharmaceuticals, Inc. | | | (2,662 | ) | | | (52,415 | ) | | | 0.54 | |
PriceSmart, Inc. | | | (886 | ) | | | (62,153 | ) | | | 0.65 | |
Sanderson Farms, Inc. | | | (1,053 | ) | | | (103,605 | ) | | | 1.17 | |
Scotts Miracle-Gro Co. (The) | | | (872 | ) | | | (58,197 | ) | | | 0.64 | |
Sensient Technologies Corp. | | | (1,462 | ) | | | (94,825 | ) | | | 1.03 | |
Sterling Bancorp | | | (1,597 | ) | | | (28,714 | ) | | | 0.31 | |
Summit Materials, Inc.–Class A | | | (1,654 | ) | | | (22,329 | ) | | | 0.23 | |
Targa Resources Corp. | | | (1,590 | ) | | | (82,155 | ) | | | 0.86 | |
Tesaro, Inc. | | | (2,595 | ) | | | (74,944 | ) | | | 0.87 | |
Ultragenyx Pharmaceutical Inc. | | | (631 | ) | | | (30,572 | ) | | | 0.34 | |
United Bankshares, Inc. | | | (759 | ) | | | (25,176 | ) | | | 0.27 | |
Universal Display Corp. | | | (934 | ) | | | (114,891 | ) | | | 1.09 | |
ViaSat, Inc. | | | (3,127 | ) | | | (199,378 | ) | | | 2.08 | |
Vulcan Materials Co. | | | (260 | ) | | | (26,296 | ) | | | 0.28 | |
Wayfair, Inc.–Class A | | | (445 | ) | | | (49,079 | ) | | | 0.51 | |
Welbilt, Inc. | | | (2,489 | ) | | | (46,594 | ) | | | 0.50 | |
Zayo Group Holdings, Inc. | | | (1,320 | ) | | | (39,442 | ) | | | 0.42 | |
| | | | | | | | (4,015,256 | ) | | | | |
Total Equity Securities — Short | | | $ | (9,415,350 | ) | | | | |
See accompanying Notes to Financial Statements which are an integral part of the financial statements.
14 Invesco Global Market Neutral Fund
Statement of Assets and Liabilities
October 31, 2018
| | | | |
Assets: | | | | |
Investments in securities, at value (Cost $9,487,978) | | $ | 9,664,989 | |
Investments in affiliated money market funds, at value and cost | | | 851,789 | |
Other investments: | | | | |
Swaps receivable — OTC | | | 432,709 | |
Unrealized appreciation on swap agreements — OTC | | | 1,146 | |
Deposits with brokers: | | | | |
Cash Collateral — OTC derivatives | | | 51,661 | |
Foreign currencies, at value (Cost $4,161) | | | 4,110 | |
Receivable for: | | | | |
Fund shares sold | | | 4,595 | |
Dividends | | | 33,356 | |
Fund expenses absorbed | | | 11,628 | |
Investment for trustee deferred compensation and retirement plans | | | 9,809 | |
Other assets | | | 56,959 | |
Total assets | | | 11,122,751 | |
| |
Liabilities: | | | | |
Other investments: | | | | |
Swaps payable — OTC | | | 5,222 | |
Unrealized depreciation on swap agreements — OTC | | | 119,383 | |
Payable for: | | | | |
Amount due custodian | | | 50,296 | |
Accrued fees to affiliates | | | 3,097 | |
Accrued trustees’ and officers’ fees and benefits | | | 1,644 | |
Accrued other operating expenses | | | 91,103 | |
Trustee deferred compensation and retirement plans | | | 9,809 | |
Total liabilities | | | 280,554 | |
Net assets applicable to shares outstanding | | $ | 10,842,197 | |
| |
Net assets consist of: | | | | |
Shares of beneficial interest | | $ | 7,805,516 | |
Distributable earnings | | | 3,036,681 | |
| | | $ | 10,842,197 | |
| | | | |
Net Assets: | | | | |
Class A | | $ | 4,592,076 | |
Class C | | $ | 123,489 | |
Class R | | $ | 39,390 | |
Class Y | | $ | 4,698,394 | |
Class R5 | | $ | 469,589 | |
Class R6 | | $ | 919,259 | |
|
Shares outstanding, no par value,
with an unlimited number of shares authorized: | |
Class A | | | 494,162 | |
Class C | | | 13,772 | |
Class R | | | 4,288 | |
Class Y | | | 500,345 | |
Class R5 | | | 50,001 | |
Class R6 | | | 97,858 | |
Class A: | | | | |
Net asset value per share | | $ | 9.29 | |
Maximum offering price per share | | | | |
(Net asset value of $9.29 ¸ 94.50%) | | $ | 9.83 | |
Class C: | | | | |
Net asset value and offering price per share | | $ | 8.97 | |
Class R: | | | | |
Net asset value and offering price per share | | $ | 9.19 | |
Class Y: | | | | |
Net asset value and offering price per share | | $ | 9.39 | |
Class R5: | | | | |
Net asset value and offering price per share | | $ | 9.39 | |
Class R6: | | | | |
Net asset value and offering price per share | | $ | 9.39 | |
See accompanying Notes to Financial Statements which are an integral part of the financial statements.
15 Invesco Global Market Neutral Fund
Statement of Operations
For the year ended October 31, 2018
| | | | |
Investment income: | | | | |
Dividends (net of foreign withholding taxes of $23,070) | | $ | 291,622 | |
Dividends from affiliated money market funds | | | 13,157 | |
Total investment income | | | 304,779 | |
| |
Expenses: | | | | |
Advisory fees | | | 133,511 | |
Administrative services fees | | | 50,000 | |
Custodian fees | | | 7,199 | |
Distribution fees: | | | | |
Class A | | | 15,764 | |
Class C | | | 1,980 | |
Class R | | | 205 | |
Transfer agent fees — A, C, R and Y | | | 9,048 | |
Transfer agent fees — R5 | | | 49 | |
Transfer agent fees — R6 | | | 96 | |
Trustees’ and officers’ fees and benefits | | | 20,826 | |
Registration and filing fees | | | 80,202 | |
Reports to shareholders | | | 15,131 | |
Professional services fees | | | 95,676 | |
Other | | | 27,928 | |
Total expenses | | | 457,615 | |
Less: Fees waived and expenses reimbursed | | | (265,206 | ) |
Net expenses | | | 192,409 | |
Net investment income | | | 112,370 | |
| |
Realized and unrealized gain (loss) from: | | | | |
Net realized gain (loss) from: | | | | |
Investment securities | | | 2,671,542 | |
Foreign currencies | | | (5,256 | ) |
Swap agreements | | | 320,656 | |
| | | | 2,986,942 | |
Change in net unrealized appreciation (depreciation) of: | | | | |
Investment securities | | | (3,243,194 | ) |
Foreign currencies | | | (110 | ) |
Swap agreements | | | (25,915 | ) |
| | | | (3,269,219 | ) |
Net realized and unrealized gain (loss) | | | (282,277 | ) |
Net increase (decrease) in net assets resulting from operations | | $ | (169,907 | ) |
See accompanying Notes to Financial Statements which are an integral part of the financial statements.
16 Invesco Global Market Neutral Fund
Statement of Changes in Net Assets
For the years ended October 31, 2018 and 2017
| | | | | | | | |
| | | 2018 | | | 2017 | |
Operations: | | | | | | | | |
Net investment income | | $ | 112,370 | | | $ | 117,392 | |
Net realized gain (loss) | | | 2,986,942 | | | | (1,415,189 | ) |
Change in net unrealized appreciation (depreciation) | | | (3,269,219 | ) | | | 1,626,538 | |
Net increase (decrease) in net assets resulting from operations | | | (169,907 | ) | | | 328,741 | |
| | |
Distributions to shareholders from distributable earnings: | | | | | | | | |
Class A | | | (523,417 | ) | | | — | |
Class C | | | (25,478 | ) | | | — | |
Class R | | | (2,226 | ) | | | — | |
Class Y | | | (505,288 | ) | | | — | |
Class R5 | | | (34,326 | ) | | | — | |
Class R6 | | | (65,827 | ) | | | — | |
Total distributions from distributable earnings | | | (1,156,562 | ) | | | — | |
| | |
Share transactions–net: | | | | | | | | |
Class A | | | (2,453,283 | ) | | | (190,910 | ) |
Class C | | | (224,102 | ) | | | (256,799 | ) |
Class R | | | 9,943 | | | | 8,513 | |
Class Y | | | (2,205,488 | ) | | | (4,966,606 | ) |
Class R6 | | | 24,608 | | | | 162,755 | |
Net increase (decrease) in net assets resulting from share transactions | | | (4,848,322 | ) | | | (5,243,047 | ) |
Net increase (decrease) in net assets | | | (6,174,791 | ) | | | (4,914,306 | ) |
| | |
Net assets: | | | | | | | | |
Beginning of year | | | 17,016,988 | | | | 21,931,294 | |
End of period | | $ | 10,842,197 | | | $ | 17,016,988 | |
Notes to Financial Statements
October 31, 2018
NOTE 1—Significant Accounting Policies
Invesco Global Market Neutral Fund (the “Fund”) is a series portfolio of AIM Investment Funds (Invesco Investment Funds) (the “Trust”). The Trust is organized as a Delaware statutory trust and is registered under the Investment Company Act of 1940, as amended (the “1940 Act”), as an open-end series management investment company authorized to issue an unlimited number of shares of beneficial interest. Information presented in these financial statements pertains only to the Fund. Matters affecting the Fund or each class will be voted on exclusively by the shareholders of the Fund or each class.
The Fund’s investment objective is to seek to provide a positive return over a full market cycle from a broadly diversified portfolio of stocks while seeking to limit exposure to the general risks associated with stock market investing.
The Fund currently consists of six different classes of shares: Class A, Class C, Class R, Class Y, Class R5 and Class R6. Class Y shares are available only to certain investors. Class A shares are sold with a front-end sales charge unless certain waiver criteria are met. Under certain circumstances, load waived shares may be subject to contingent deferred sales charges (“CDSC”). Class C shares are sold with a CDSC. Class R, Class Y, Class R5 and Class R6 shares are sold at net asset value.
The Fund is an investment company and accordingly follows the investment company accounting and reporting guidance in accordance with Financial Accounting Standards Board Accounting Standards Codification Topic 946, Financial Services — Investment Companies.
The following is a summary of the significant accounting policies followed by the Fund in the preparation of its financial statements.
| A. | Security Valuations — Securities, including restricted securities, are valued according to the following policy. |
A security listed or traded on an exchange (except convertible securities) is valued at its last sales price or official closing price as of the close of the customary trading session on the exchange where the security is principally traded, or lacking any sales or official closing price on a particular day, the security may be valued at the closing bid price on that day. Securities traded in the over-the-counter market are valued based on prices furnished by independent pricing services or market makers. When such securities are valued by an independent pricing service they may be considered fair valued. Futures contracts are valued at the final settlement price set by an exchange on which they are principally traded. Listed options are valued at the mean between the last bid and asked prices from the exchange on which they are principally traded. Options not listed on an exchange are valued by an independent source at the mean between the last bid and asked prices. For purposes of determining net
17 Invesco Global Market Neutral Fund
asset value (“NAV”) per share, futures and option contracts generally are valued 15 minutes after the close of the customary trading session of the New York Stock Exchange (“NYSE”).
Investments in open-end and closed-end registered investment companies that do not trade on an exchange are valued at the end-of-day net asset value per share. Investments in open-end and closed-end registered investment companies that trade on an exchange are valued at the last sales price or official closing price as of the close of the customary trading session on the exchange where the security is principally traded.
Swap agreements are fair valued using an evaluated quote, if available, provided by an independent pricing service. Evaluated quotes provided by the pricing service are valued based on a model which may include end-of-day net present values, spreads, ratings, industry, company performance and returns of referenced assets. Centrally cleared swap agreements are valued at the daily settlement price determined by the relevant exchange or clearinghouse.
Debt obligations (including convertible securities) and unlisted equities are fair valued using an evaluated quote provided by an independent pricing service. Evaluated quotes provided by the pricing service may be determined without exclusive reliance on quoted prices, and may reflect appropriate factors such as institution-size trading in similar groups of securities, developments related to specific securities, dividend rate (for unlisted equities), yield (for debt obligations), quality, type of issue, coupon rate (for debt obligations), maturity (for debt obligations), individual trading characteristics and other market data. Pricing services generally value debt obligations assuming orderly transactions of institutional round lot size, but a fund may hold or transact in the same securities in smaller, odd lot sizes. Odd lots often trade at lower prices than institutional round lots. Debt obligations are subject to interest rate and credit risks. In addition, all debt obligations involve some risk of default with respect to interest and/or principal payments.
Foreign securities’ (including foreign exchange contracts) prices are converted into U.S. dollar amounts using the applicable exchange rates as of the close of the NYSE. If market quotations are available and reliable for foreign exchange-traded equity securities, the securities will be valued at the market quotations. Because trading hours for certain foreign securities end before the close of the NYSE, closing market quotations may become unreliable. If between the time trading ends on a particular security and the close of the customary trading session on the NYSE, events occur that the investment adviser determines are significant and make the closing price unreliable, the Fund may fair value the security. If the event is likely to have affected the closing price of the security, the security will be valued at fair value in good faith using procedures approved by the Board of Trustees. Adjustments to closing prices to reflect fair value may also be based on a screening process of an independent pricing service to indicate the degree of certainty, based on historical data, that the closing price in the principal market where a foreign security trades is not the current value as of the close of the NYSE. Foreign securities’ prices meeting the approved degree of certainty that the price is not reflective of current value will be priced at the indication of fair value from the independent pricing service. Multiple factors may be considered by the independent pricing service in determining adjustments to reflect fair value and may include information relating to sector indices, American Depositary Receipts and domestic and foreign index futures. Foreign securities may have additional risks including exchange rate changes, potential for sharply devalued currencies and high inflation, political and economic upheaval, the relative lack of issuer information, relatively low market liquidity and the potential lack of strict financial and accounting controls and standards.
Securities for which market prices are not provided by any of the above methods may be valued based upon quotes furnished by independent sources. The last bid price may be used to value equity securities. The mean between the last bid and asked prices is used to value debt obligations, including corporate loans.
Securities for which market quotations are not readily available or became unreliable are valued at fair value as determined in good faith by or under the supervision of the Trust’s officers following procedures approved by the Board of Trustees. Issuer specific events, market trends, bid/asked quotes of brokers and information providers and other market data may be reviewed in the course of making a good faith determination of a security’s fair value.
The Fund may invest in securities that are subject to interest rate risk, meaning the risk that the prices will generally fall as interest rates rise and, conversely, the prices will generally rise as interest rates fall. Specific securities differ in their sensitivity to changes in interest rates depending on their individual characteristics. Changes in interest rates may result in increased market volatility, which may affect the value and/or liquidity of certain Fund investments.
Valuations change in response to many factors including the historical and prospective earnings of the issuer, the value of the issuer’s assets, general economic conditions, interest rates, investor perceptions and market liquidity. Because of the inherent uncertainties of valuation, the values reflected in the financial statements may materially differ from the value received upon actual sale of those investments.
| B. | Securities Transactions and Investment Income — Securities transactions are accounted for on a trade date basis. Realized gains or losses on sales are computed on the basis of specific identification of the securities sold. Interest income (net of withholding tax, if any) is recorded on the accrual basis from settlement date. Dividend income (net of withholding tax, if any) is recorded on the ex-dividend date. |
The Fund may periodically participate in litigation related to Fund investments. As such, the Fund may receive proceeds from litigation settlements. Any proceeds received are included in the Statement of Operations as realized gain (loss) for investments no longer held and as unrealized gain (loss) for investments still held.
Brokerage commissions and mark ups are considered transaction costs and are recorded as an increase to the cost basis of securities purchased and/or a reduction of proceeds on a sale of securities. Such transaction costs are included in the determination of net realized and unrealized gain (loss) from investment securities reported in the Statement of Operations and the Statement of Changes in Net Assets and the net realized and unrealized gains (losses) on securities per share in the Financial Highlights. Transaction costs are included in the calculation of the Fund’s net asset value and, accordingly, they reduce the Fund’s total returns. These transaction costs are not considered operating expenses and are not reflected in net investment income reported in the Statement of Operations and the Statement of Changes in Net Assets, or the net investment income per share and the ratios of expenses and net investment income reported in the Financial Highlights, nor are they limited by any expense limitation arrangements between the Fund and the investment adviser.
The Fund allocates income and realized and unrealized capital gains and losses to a class based on the relative net assets of each class.
| C. | Country Determination — For the purposes of making investment selection decisions and presentation in the Schedule of Investments, the investment adviser may determine the country in which an issuer is located and/or credit risk exposure based on various factors. These factors include the laws of the country under which the issuer is organized, where the issuer maintains a principal office, the country in which the issuer derives 50% or more of its total revenues and the country that has the primary market for the issuer’s securities, as well as other criteria. Among |
18 Invesco Global Market Neutral Fund
| | the other criteria that may be evaluated for making this determination are the country in which the issuer maintains 50% or more of its assets, the type of security, financial guarantees and enhancements, the nature of the collateral and the sponsor organization. Country of issuer and/or credit risk exposure has been determined to be the United States of America, unless otherwise noted. |
| D. | Distributions — Distributions from net investment income and net realized capital gain, if any, are generally declared and paid annually and recorded on the ex-dividend date. The Fund may elect to treat a portion of the proceeds from redemptions as distributions for federal income tax purposes. |
| E. | Federal Income Taxes — The Fund intends to comply with the requirements of Subchapter M of the Internal Revenue Code of 1986, as amended (the “Internal Revenue Code”), necessary to qualify as a regulated investment company and to distribute substantially all of the Fund’s taxable earnings to shareholders. As such, the Fund will not be subject to federal income taxes on otherwise taxable income (including net realized capital gain) that is distributed to shareholders. Therefore, no provision for federal income taxes is recorded in the financial statements. |
The Fund recognizes the tax benefits of uncertain tax positions only when the position is more likely than not to be sustained. Management has analyzed the Fund’s uncertain tax positions and concluded that no liability for unrecognized tax benefits should be recorded related to uncertain tax positions. Management is not aware of any tax positions for which it is reasonably possible that the total amounts of unrecognized tax benefits will change materially in the next 12 months.
The Fund files tax returns in the U.S. Federal jurisdiction and certain other jurisdictions. Generally, the Fund is subject to examinations by such taxing authorities for up to three years after the filing of the return for the tax period.
| F. | Expenses — Fees provided for under the Rule 12b-1 plan of a particular class of the Fund are charged to the operations of such class. Transfer agency fees and expenses and other shareholder recordkeeping fees and expenses attributable to Class R5 and Class R6 are allocated to each share class based on relative net assets. Sub-accounting fees attributable to Class R5 are charged to the operations of the class. Transfer agency fees and expenses and other shareholder recordkeeping fees and expenses relating to all other classes are allocated among those classes based on relative net assets. All other expenses are allocated among the classes based on relative net assets. |
| G. | Accounting Estimates — The preparation of financial statements in conformity with accounting principles generally accepted in the United States of America (“GAAP”) requires management to make estimates and assumptions that affect the reported amounts of assets and liabilities at the date of the financial statements and the reported amounts of revenues and expenses during the reporting period including estimates and assumptions related to taxation. Actual results could differ from those estimates by a significant amount. In addition, the Fund monitors for material events or transactions that may occur or become known after the period-end date and before the date the financial statements are released to print. |
| H. | Indemnifications — Under the Trust’s organizational documents, each Trustee, officer, employee or other agent of the Trust is indemnified against certain liabilities that may arise out of the performance of their duties to the Fund. Additionally, in the normal course of business, the Fund enters into contracts, including the Fund’s servicing agreements, that contain a variety of indemnification clauses. The Fund’s maximum exposure under these arrangements is unknown as this would involve future claims that may be made against the Fund that have not yet occurred. The risk of material loss as a result of such indemnification claims is considered remote. |
| I. | Foreign Currency Translations — Foreign currency is valued at the close of the NYSE based on quotations posted by banks and major currency dealers. Portfolio securities and other assets and liabilities denominated in foreign currencies are translated into U.S. dollar amounts at the date of valuation. Purchases and sales of portfolio securities (net of foreign taxes withheld on disposition) and income items denominated in foreign currencies are translated into U.S. dollar amounts on the respective dates of such transactions. The Fund does not separately account for the portion of the results of operations resulting from changes in foreign exchange rates on investments and the fluctuations arising from changes in market prices of securities held. The combined results of changes in foreign exchange rates and the fluctuation of market prices on investments (net of estimated foreign tax withholding) are included with the net realized and unrealized gain or loss from investments in the Statement of Operations. Reported net realized foreign currency gains or losses arise from (1) sales of foreign currencies, (2) currency gains or losses realized between the trade and settlement dates on securities transactions, and (3) the difference between the amounts of dividends, interest, and foreign withholding taxes recorded on the Fund’s books and the U.S. dollar equivalent of the amounts actually received or paid. Net unrealized foreign currency gains and losses arise from changes in the fair values of assets and liabilities, other than investments in securities at fiscal period end, resulting from changes in exchange rates. |
The Fund may invest in foreign securities, which may be subject to foreign taxes on income, gains on investments or currency repatriation, a portion of which may be recoverable. Foreign taxes, if any, are recorded based on the tax regulations and rates that exist in the foreign markets in which the Fund invests and are shown in the Statement of Operations.
| J. | Forward Foreign Currency Contracts — The Fund may engage in foreign currency transactions either on a spot (i.e. for prompt delivery and settlement) basis, or through forward foreign currency contracts, to manage or minimize currency or exchange rate risk. |
The Fund may also enter into forward foreign currency contracts for the purchase or sale of a security denominated in a foreign currency in order to “lock in” the U.S. dollar price of that security, or the Fund may also enter into forward foreign currency contracts that do not provide for physical settlement of the two currencies, but instead are settled by a single cash payment calculated as the difference between the agreed upon exchange rate and the spot rate at settlement based upon an agreed upon notional amount (non-deliverable forwards). The Fund will set aside liquid assets in an amount equal to the daily mark-to-market obligation for forward foreign currency contracts.
A forward foreign currency contract is an obligation between two parties (“Counterparties”) to purchase or sell a specific currency for an agreed-upon price at a future date. The use of forward foreign currency contracts does not eliminate fluctuations in the price of the underlying securities the Fund owns or intends to acquire but establishes a rate of exchange in advance. Fluctuations in the value of these contracts are measured by the difference in the contract date and reporting date exchange rates and are recorded as unrealized appreciation (depreciation) until the contracts are closed. When the contracts are closed, realized gains (losses) are recorded. Realized and unrealized gains (losses) on the contracts are included in the Statement of Operations. The primary risks associated with forward foreign currency contracts include failure of the Counterparty to meet the terms of the contract and the value of the foreign currency changing unfavorably. These risks may be in excess of the amounts reflected in the Statement of Assets and Liabilities.
| K. | Swap Agreements — The Fund may enter into various swap transactions, including interest rate, total return, volatility, variance, index, currency and credit default swap contracts (“CDS”) for investment purposes or to manage interest rate, equity, currency or credit risk. Such |
19 Invesco Global Market Neutral Fund
| | transactions are agreements between Counterparties. These agreements may contain among other conditions, events of default and termination events, and various covenants and representations such as provisions that require the Fund to maintain a pre-determined level of net assets, and/or provide limits regarding the decline of the Fund’s NAV over specific periods of time. If the Fund were to trigger such provisions and have open derivative positions at that time, the Counterparty may be able to terminate such agreement and request immediate payment in an amount equal to the net liability positions, if any. |
Interest rate, total return, volatility, variance, index, and currency swap agreements are two-party contracts entered into primarily to exchange the returns (or differentials in rates of returns) earned or realized on particular predetermined investments or instruments. The gross returns to be exchanged or “swapped” between the parties are calculated with respect to a notional amount, i.e., the return on or increase in value of a particular dollar amount invested at a particular interest rate or return of an underlying asset, in a particular foreign currency, or in a “basket” of securities representing a particular index.
A total return swap is an agreement in which one party makes payments based on a set rate, either fixed or variable, while the other party makes payments based on the return of an underlying asset, which includes both the income generated and capital gains, if any. The unrealized appreciation (depreciation) on total return swaps includes dividends on the underlying equity securities and financing rate payable from the Counterparty. At the maturity date, a net cash flow is exchanged where the total return is equivalent to the return of the underlying reference less a financing rate, if any. As a receiver, the Fund would receive payments based on any positive total return and would owe payments in the event of a negative total return. As the payer, the Fund would owe payments on any net positive total return, and would receive payment in the event of a negative total return.
Changes in the value of swap agreements are recognized as unrealized gains (losses) in the Statement of Operations by “marking to market” on a daily basis to reflect the value of the swap agreement at the end of each trading day. Payments received or paid at the beginning of the agreement are reflected as such on the Statement of Assets and Liabilities and may be referred to as upfront payments. The Fund accrues for the fixed payment stream and amortizes upfront payments, if any, on swap agreements on a daily basis with the net amount, recorded as a component of realized gain (loss) on the Statement of Operations. A liquidation payment received or made at the termination of a swap agreement is recorded as realized gain (loss) on the Statement of Operations. The Fund segregates cash or liquid securities having a value at least equal to the amount of the potential obligation of a Fund under any swap transaction. Cash held as collateral is recorded as deposits with brokers on the Statement of Assets and Liabilities. Entering into these agreements involves, to varying degrees, lack of liquidity and elements of credit, market, and Counterparty risk in excess of amounts recognized on the Statement of Assets and Liabilities. Such risks involve the possibility that a swap is difficult to sell or liquidate; the Counterparty does not honor its obligations under the agreement and unfavorable interest rates and market fluctuations. It is possible that developments in the swaps market, including potential government regulation, could adversely affect the Fund’s ability to terminate existing swap agreements or to realize amounts to be received under such agreements. A short position in a security poses more risk than holding the same security long. As there is no limit on how much the price of the security can increase, the Fund’s exposure is unlimited.
| L. | Leverage Risk — Leverage exists when the Fund can lose more than it originally invests because it purchases or sells an instrument or enters into a transaction without investing an amount equal to the full economic exposure of the instrument or transaction. |
| M. | Collateral — To the extent the Fund has designated or segregated a security as collateral and that security is subsequently sold, it is the Fund’s practice to replace such collateral no later than the next business day. |
NOTE 2—Advisory Fees and Other Fees Paid to Affiliates
The Trust has entered into a master investment advisory agreement with Invesco Advisers, Inc. (the “Adviser” or “Invesco”). Under the terms of the investment advisory agreement, the Fund accrues daily and pays monthly an advisory fee to the Adviser based on the annual rate of the Fund’s average daily net assets as follows:
| | | | |
| Average Daily Net Assets | | Rate | |
First $250 million | | | 0.95% | |
Next $250 million | | | 0.93% | |
Next $500 million | | | 0.91% | |
Next $1.5 billion | | | 0.89% | |
Next $2.5 billion | | | 0.87% | |
Next $2.5 billion | | | 0.85% | |
Next $2.5 billion | | | 0.83% | |
Over $10 billion | | | 0.81% | |
For the year ended October 31, 2018, the effective advisory fees incurred by the Fund was 0.95%.
Under the terms of a master sub-advisory agreement between the Adviser and each of Invesco Asset Management Deutschland GmbH, Invesco Asset Management Limited, Invesco Asset Management (Japan) Limited, Invesco Hong Kong Limited, Invesco Senior Secured Management, Inc. and Invesco Canada Ltd. and separate sub-advisory agreements with Invesco Capital Management LLC, formerly Invesco PowerShares Capital Management LLC, and Invesco Asset Management (India) Private Limited (collectively, the “Affiliated Sub-Advisers”) the Adviser, not the Fund, will pay 40% of the fees paid to the Adviser to any such Affiliated Sub-Adviser(s) that provide(s) discretionary investment management services to the Fund based on the percentage of assets allocated to such Affiliated Sub-Adviser(s).
The Adviser has contractually agreed, through at least February 29, 2020, to waive advisory fees and/or reimburse expenses to the extent necessary to limit total annual fund operating expenses after fee waiver and/or expense reimbursement (excluding certain items discussed below) of Class A, Class C, Class R, Class Y, Class R5 and Class R6 shares to 1.50%, 2.25%, 1.75%, 1.25%, 1.25% and 1.25% of average daily net assets (the “expense limits”), respectively. In determining the Adviser’s obligation to waive advisory fees and/or reimburse expenses, the following expenses are not taken into account, and could cause total annual fund operating expenses after fee waiver and/or expense reimbursement to exceed the
20 Invesco Global Market Neutral Fund
numbers reflected above: (1) interest; (2) taxes; (3) dividend expense on short sales; (4) extraordinary or non-routine items, including litigation expenses; and (5) expenses that the Fund has incurred but did not actually pay because of an expense offset arrangement. Unless Invesco continues the fee waiver agreement, it will terminate on February 29, 2020. During its term, the fee waiver agreement cannot be terminated or amended to increase the expense limits or reduce the advisory fee waiver without approval of the Board of Trustees.
Further, the Adviser has contractually agreed, through at least June 30, 2020, to waive the advisory fee payable by the Fund in an amount equal to 100% of the net advisory fees the Adviser receives from the affiliated money market funds on investments by the Fund of uninvested cash in such affiliated money market funds.
For the year ended October 31, 2018, the Adviser waived advisory fees of $256,013 and reimbursed class level expenses of $4,502, $141, $29, $4,376, $49 and $96 of Class A, Class C, Class R, Class Y, Class R5 and Class R6 shares, respectively.
The Trust has entered into a master administrative services agreement with Invesco pursuant to which the Fund has agreed to pay Invesco for certain administrative costs incurred in providing accounting services to the Fund. For the year ended October 31, 2018, expenses incurred under the agreement are shown in the Statement of Operations as Administrative services fees.
The Trust has entered into a transfer agency and service agreement with Invesco Investment Services, Inc. (“IIS”) pursuant to which the Fund has agreed to pay IIS a fee for providing transfer agency and shareholder services to the Fund and reimburse IIS for certain expenses incurred by IIS in the course of providing such services. IIS may make payments to intermediaries that provide omnibus account services, sub-accounting services and/or networking services. All fees payable by IIS to intermediaries that provide omnibus account services or sub-accounting services are charged back to the Fund, subject to certain limitations approved by the Trust’s Board of Trustees. For the year ended October 31, 2018, expenses incurred under the agreement are shown in the Statement of Operations as Transfer agent fees.
The Trust has entered into master distribution agreements with Invesco Distributors, Inc. (“IDI”) to serve as the distributor for the Class A, Class C, Class R, Class Y, Class R5 and Class R6 shares of the Fund. The Trust has adopted plans pursuant to Rule 12b-1 under the 1940 Act with respect to the Fund’s Class A, Class C and Class R shares (collectively the “Plans”). The Fund, pursuant to the Plans, pays IDI compensation at the annual rate of 0.25% of the Fund’s average daily net assets of Class A shares, 1.00% of the average daily net assets of Class C shares and 0.50% of the average daily net assets of Class R shares. The fees are accrued daily and paid monthly. Of the Plan payments, up to 0.25% of the average daily net assets of each class of shares may be paid to furnish continuing personal shareholder services to customers who purchase and own shares of such classes. Any amounts not paid as a service fee under the Plans would constitute an asset-based sales charge. Rules of the Financial Industry Regulatory Authority (“FINRA”) impose a cap on the total sales charges, including asset-based sales charges, that may be paid by any class of shares of the Fund. For the year ended October 31, 2018, expenses incurred under the Plans are shown in the Statement of Operations as Distribution fees.
Front-end sales commissions and CDSC (collectively, the “sales charges”) are not recorded as expenses of the Fund. Front-end sales commissions are deducted from proceeds from the sales of Fund shares prior to investment in Class A shares of the Fund. CDSC are deducted from redemption proceeds prior to remittance to the shareholder. During the year ended October 31, 2018, IDI advised the Fund that IDI retained $51 in front-end sales commissions from the sale of Class A shares and $32 from Class C shares, respectively, for CDSC imposed upon redemptions by shareholders.
Certain officers and trustees of the Trust are officers and directors of the Adviser, IIS and/or IDI.
NOTE 3—Additional Valuation Information
GAAP defines fair value as the price that would be received to sell an asset or paid to transfer a liability in an orderly transaction between market participants at the measurement date, under current market conditions. GAAP establishes a hierarchy that prioritizes the inputs to valuation methods, giving the highest priority to readily available unadjusted quoted prices in an active market for identical assets (Level 1) and the lowest priority to significant unobservable inputs (Level 3), generally when market prices are not readily available or are unreliable. Based on the valuation inputs, the securities or other investments are tiered into one of three levels. Changes in valuation methods may result in transfers in or out of an investment’s assigned level:
| | Level 1 — | Prices are determined using quoted prices in an active market for identical assets. |
| | Level 2 — | Prices are determined using other significant observable inputs. Observable inputs are inputs that other market participants may use in pricing a security. These may include quoted prices for similar securities, interest rates, prepayment speeds, credit risk, yield curves, loss severities, default rates, discount rates, volatilities and others. |
| | Level 3 — | Prices are determined using significant unobservable inputs. In situations where quoted prices or observable inputs are unavailable (for example, when there is little or no market activity for an investment at the end of the period), unobservable inputs may be used. Unobservable inputs reflect the Fund’s own assumptions about the factors market participants would use in determining fair value of the securities or instruments and would be based on the best available information. |
21 Invesco Global Market Neutral Fund
The following is a summary of the tiered valuation input levels, as of October 31, 2018. The level assigned to the securities valuations may not be an indication of the risk or liquidity associated with investing in those securities. Because of the inherent uncertainties of valuation, the values reflected in the financial statements may materially differ from the value received upon actual sale of those investments.
| | | | | | | | | | | | | | | | |
| | | Level 1 | | | Level 2 | | | Level 3 | | | Total | |
Investments in Securities | | | | | | | | | | | | | | | | |
Australia | | $ | 163,722 | | | $ | 65,951 | | | $ | — | | | $ | 229,673 | |
Canada | | | 419,020 | | | | — | | | | — | | | | 419,020 | |
China | | | — | | | | 123,765 | | | | — | | | | 123,765 | |
Denmark | | | 30,354 | | | | 140,780 | | | | — | | | | 171,134 | |
Finland | | | 225,752 | | | | — | | | | — | | | | 225,752 | |
France | | | — | | | | 267,498 | | | | — | | | | 267,498 | |
Germany | | | 396,945 | | | | — | | | | — | | | | 396,945 | |
Ireland | | | 55,849 | | | | — | | | | — | | | | 55,849 | |
Japan | | | 35,165 | | | | 1,889,568 | | | | — | | | | 1,924,733 | |
Jordan | | | 89,258 | | | | — | | | | — | | | | 89,258 | |
Luxembourg | | | 18,045 | | | | — | | | | — | | | | 18,045 | |
Netherlands | | | 110,212 | | | | — | | | | — | | | | 110,212 | |
Norway | | | — | | | | 312,674 | | | | — | | | | 312,674 | |
Puerto Rico | | | 33,130 | | | | — | | | | — | | | | 33,130 | |
Russia | | | 174,162 | | | | — | | | | — | | | | 174,162 | |
Spain | | | — | | | | 71,943 | | | | — | | | | 71,943 | |
Sweden | | | 127,646 | | | | 162,264 | | | | — | | | | 289,910 | |
Switzerland | | | — | | | | 44,999 | | | | — | | | | 44,999 | |
United Kingdom | | | 197,824 | | | | 235,224 | | | | — | | | | 433,048 | |
United States | | | 4,273,239 | | | | — | | | | — | | | | 4,273,239 | |
Money Market Funds | | | 851,789 | | | | — | | | | — | | | | 851,789 | |
Total Investments in Securities | | | 7,202,112 | | | | 3,314,666 | | | | — | | | | 10,516,778 | |
Other Investments – Assets* | | | | | | | | | | | | | | | | |
Swap Agreements | | | — | | | | 1,146 | | | | — | | | | 1,146 | |
Other Investments – Liabilities* | | | | | | | | | | | | | | | | |
Swap Agreements | | | — | | | | (119,383 | ) | | | — | | | | (119,383 | ) |
Total Other Investments | | | — | | | | (118,237 | ) | | | — | | | | (118,237 | ) |
Total Investments | | $ | 7,202,112 | | | $ | 3,196,429 | | | $ | — | | | $ | 10,398,541 | |
| * | Unrealized appreciation (depreciation). |
NOTE 4—Derivative Investments
The Fund may enter into an International Swaps and Derivatives Association Master Agreement (“ISDA Master Agreement”) under which a fund may trade OTC derivatives. An OTC transaction entered into under an ISDA Master Agreement typically involves a collateral posting arrangement, payment netting provisions and close-out netting provisions. These netting provisions allow for reduction of credit risk through netting of contractual obligations. The enforceability of the netting provisions of the ISDA Master Agreement depends on the governing law of the ISDA Master Agreement, among other factors.
For financial reporting purposes, the Fund does not offset OTC derivative assets or liabilities that are subject to ISDA Master Agreements in the Statement of Assets and Liabilities.
Value of Derivative Investments at Period-End
The table below summarizes the value of the Fund’s derivative investments, detailed by primary risk exposure, held as of October 31, 2018:
| | | | |
| | | Value | |
| Derivative Assets | | Equity Risk | |
Unrealized appreciation on swap agreements — OTC | | $ | 1,146 | |
Derivatives not subject to master netting agreements | | | — | |
Total Derivative Assets subject to master netting agreements | | $ | 1,146 | |
| |
| | | | |
| Derivative Liabilities | | Equity Risk | |
Unrealized depreciation on swap agreements — OTC | | $ | (119,383 | ) |
Derivatives not subject to master netting agreements | | | — | |
Total Derivative Liabilities subject to master netting agreements | | $ | (119,383 | ) |
22 Invesco Global Market Neutral Fund
Offsetting Assets and Liabilities
The table below reflects the Fund’s exposure to Counterparties subject to either an ISDA Master Agreement or other agreement for OTC derivative transactions as of October 31, 2018.
| | | | | | | | | | | | | | | | | | | | | | | | |
| | | Financial
Derivative
Assets | | | Financial
Derivative
Liabilities | | | | | | Collateral (Received)/Pledged | | | | |
| Counterparty | | Swap
Agreements | | | Swap
Agreements | | | Net Value of
Derivatives | | | Non-Cash | | | Cash | | | Net
Amount | |
| Morgan Stanley & Co. LLC | | $ | 1,146 | | | $ | (119,383 | ) | | $ | (118,237 | ) | | $ | — | | | $ | 51,661 | | | $ | (66,576 | ) |
Effect of Derivative Investments for the year ended October 31, 2018
The table below summarizes the gains (losses) on derivative investments, detailed by primary risk exposure, recognized in earnings during the period:
| | | | |
| | | Location of Gain (Loss) on
Statement of Operations | |
| | | Equity Risk | |
Realized Gain: | | | | |
Swap agreements | | $ | 320,656 | |
Change in Net Unrealized Appreciation (Depreciation): | | | | |
Swap agreements | | | (25,915 | ) |
Total | | $ | 294,741 | |
The table below summarizes the average notional value of swap agreements outstanding during the period.
| | | | |
| | | Swap
Agreements | |
Average notional value | | $ | 12,835,940 | |
NOTE 5—Trustees’ and Officers’ Fees and Benefits
Trustees’ and Officers’ Fees and Benefits include amounts accrued by the Fund to pay remuneration to certain Trustees and Officers of the Fund. Trustees have the option to defer compensation payable by the Fund, and Trustees’ and Officers’ Fees and Benefits also include amounts accrued by the Fund to fund such deferred compensation amounts. Those Trustees who defer compensation have the option to select various Invesco Funds in which their deferral accounts shall be deemed to be invested. Obligations under the deferred compensation plan represent unsecured claims against the general assets of the Fund.
NOTE 6—Cash Balances
The Fund is permitted to temporarily carry a negative or overdrawn balance in its account with State Street Bank and Trust Company, the custodian bank. Such balances, if any at period-end, are shown in the Statement of Assets and Liabilities under the payable caption Amount due custodian. To compensate the custodian bank for such overdrafts, the overdrawn Fund may either (1) leave funds as a compensating balance in the account so the custodian bank can be compensated by earning the additional interest; or (2) compensate by paying the custodian bank at a rate agreed upon by the custodian bank and Invesco, not to exceed the contractually agreed upon rate.
NOTE 7—Distributions to Shareholders and Tax Components of Net Assets
Tax Character of Distributions to Shareholders Paid During the Fiscal Years Ended October 31, 2018 and 2017:
| | | | | | | | |
| | | 2018 | | | 2017 | |
Long-term capital gain | | $ | 1,156,562 | | | $ | — | |
Tax Components of Net Assets at Period-End:
| | | | |
| | | 2018 | |
Undistributed ordinary income | | $ | 337,805 | |
Undistributed long-term gain | | | 2,609,668 | |
Net unrealized appreciation — investments | | | 98,137 | |
Net unrealized appreciation (depreciation) — foreign currencies | | | (220 | ) |
Temporary book/tax differences | | | (8,709 | ) |
Shares of beneficial interest | | | 7,805,516 | |
Total net assets | | $ | 10,842,197 | |
The difference between book-basis and tax-basis unrealized appreciation (depreciation) is due to differences in the timing of recognition of gains and losses on investments for tax and book purposes. The Fund’s net unrealized appreciation difference is attributable primarily to swap agreements, passive foreign investment companies and wash sales.
23 Invesco Global Market Neutral Fund
The temporary book/tax differences are a result of timing differences between book and tax recognition of income and/or expenses. The Fund’s temporary book/tax differences are the result of the trustee deferral of compensation and retirement plan benefits.
Capital loss carryforward is calculated and reported as of a specific date. Results of transactions and other activity after that date may affect the amount of capital loss carryforward actually available for the Fund to utilize. Capital losses generated in years beginning after December 22, 2010 can be carried forward for an unlimited period, whereas previous losses expire in eight tax years. Capital losses with an expiration period may not be used to offset capital gains until all net capital losses without an expiration date have been utilized. Capital loss carryforwards with no expiration date will retain their character as either short-term or long-term capital losses instead of as short-term capital losses as under prior law. The ability to utilize capital loss carryforwards in the future may be limited under the Internal Revenue Code and related regulations based on the results of future transactions.
The Fund does not have a capital loss carryforward as of October 31, 2018.
NOTE 8—Investment Transactions
The aggregate amount of investment securities (other than short-term securities, U.S. Treasury obligations and money market funds, if any) purchased and sold by the Fund during the year ended October 31, 2018 was $8,342,596 and $14,103,436, respectively. Cost of investments, including any derivatives, on a tax basis includes the adjustments for financial reporting purposes as of the most recently completed federal income tax reporting period-end.
| | | | |
| Unrealized Appreciation (Depreciation) of Investments on a Tax Basis | |
Aggregate unrealized appreciation of investments | | $ | 981,632 | |
Aggregate unrealized (depreciation) of investments | | | (883,495 | ) |
Net unrealized appreciation of investments | | $ | 98,137 | |
Cost of investments for tax purposes is $10,300,404.
NOTE 9—Reclassification of Permanent Differences
Primarily as a result of differing book/tax treatment of swap agreements, on October 31, 2018, undistributed net investment income was increased by $331,807 and undistributed net realized gain was decreased by $331,807. This reclassification had no effect on the net assets or the distributable earnings of the Fund.
NOTE 10—Share Information
| | | | | | | | | | | | | | | | |
| | | Summary of Share Activity | |
| | | Years ended October 31, | |
| | | 2018(a) | | | 2017 | |
| | | Shares | | | Amount | | | Shares | | | Amount | |
Sold: | | | | | | | | | | | | | | | | |
Class A | | | 37,928 | | | $ | 351,211 | | | | 50,956 | | | $ | 506,412 | |
Class C | | | 568 | | | | 5,059 | | | | 8,688 | | | | 84,771 | |
Class R | | | 1,601 | | | | 14,805 | | | | 863 | | | | 8,513 | |
Class Y | | | 5,880 | | | | 54,351 | | | | 87,656 | | | | 880,836 | |
Class R6 | | | 17,152 | | | | 159,607 | | | | 32,982 | | | | 330,711 | |
| | | | |
Issued as reinvestment of dividends: | | | | | | | | | | | | | | | | |
Class A | | | 23,313 | | | | 215,178 | | | | — | | | | — | |
Class C | | | 1,398 | | | | 12,539 | | | | — | | | | — | |
Class R | | | 168 | | | | 1,539 | | | | — | | | | — | |
Class Y | | | 21,188 | | | | 197,049 | | | | — | | | | — | |
Class R6 | | | 3,384 | | | | 31,502 | | | | — | | | | — | |
| | | | |
Reacquired: | | | | | | | | | | | | | | | | |
Class A | | | (327,811 | ) | | | (3,019,672 | ) | | | (69,912 | ) | | | (697,322 | ) |
Class C | | | (27,069 | ) | | | (241,700 | ) | | | (34,891 | ) | | | (341,570 | ) |
Class R | | | (712 | ) | | | (6,401 | ) | | | — | | | | — | |
Class Y | | | (264,209 | ) | | | (2,456,888 | ) | | | (581,028 | ) | | | (5,847,442 | ) |
Class R6 | | | (17,887 | ) | | | (166,501 | ) | | | (16,681 | ) | | | (167,956 | ) |
Net increase (decrease) in share activity | | | (525,108 | ) | | $ | (4,848,322 | ) | | | (521,367 | ) | | $ | (5,243,047 | ) |
| (a) | 91% of the outstanding shares of the Fund are owned by the Adviser or an affiliate of the Adviser. |
24 Invesco Global Market Neutral Fund
NOTE 11—Financial Highlights
The following schedule presents financial highlights for a share of the Fund outstanding throughout the periods indicated.
| | | | | | | | | | | | | | | | | | | | | | | | | | | | | | | | | | | | | | | | | | | | | | | | | | | | | | | | |
| | | Net asset
value,
beginning
of period | | | Net
investment
income
(loss)(a) | | | Net gains
(losses)
on securities
(both
realized and
unrealized) | | | Total from
investment
operations | | | Dividends
from net
investment
income | | | Distributions
from net
realized gains | | | Total
distributions | | | Net asset
value, end
of period | | | Total
return(b) | | | Net assets,
end of period
(000’s omitted) | | | Ratio of
expenses
to average
net assets
with fee waivers
and/or expenses
absorbed | | | Ratio of
expenses
to average net
assets without
fee waivers
and/or expenses
absorbed | | | Ratio of net
investment
income (loss)
to average
net assets | | | Portfolio
turnover(c) | |
Class A | | | | | | | | | | | | | | | | | | | | | | | | | | | | | | | | | | | | | | | | | | | | | | | | | | | | | | | | |
Year ended 10/31/18 | | $ | 10.06 | | | $ | 0.06 | | | $ | (0.14 | ) | | $ | (0.08 | ) | | $ | — | | | $ | (0.69 | ) | | $ | (0.69 | ) | | $ | 9.29 | | | | (0.79 | )% | | $ | 4,592 | | | | 1.49 | %(d) | | | 3.38 | %(d) | | | 0.68 | %(d) | | | 64 | % |
Year ended 10/31/17 | | | 9.91 | | | | 0.05 | | | | 0.10 | | | | 0.15 | | | | — | | | | — | | | | — | | | | 10.06 | | | | 1.51 | | | | 7,654 | | | | 1.52 | | | | 2.93 | | | | 0.51 | | | | 35 | |
Year ended 10/31/16 | | | 10.31 | | | | 0.10 | | | | (0.47 | ) | | | (0.37 | ) | | | — | | | | (0.03 | ) | | | (0.03 | ) | | | 9.91 | | | | (3.64 | ) | | | 7,729 | | | | 1.61 | | | | 2.89 | | | | 1.00 | | | | 79 | |
Year ended 10/31/15 | | | 10.49 | | | | 0.07 | | | | (0.06 | ) | | | 0.01 | | | | (0.18 | ) | | | (0.01 | ) | | | (0.19 | ) | | | 10.31 | | | | 0.16 | (e) | | | 5,716 | | | | 1.61 | | | | 3.28 | | | | 0.69 | | | | 77 | |
Year ended 10/31/14(f) | | | 10.00 | | | | 0.04 | | | | 0.45 | | | | 0.49 | | | | — | | | | — | | | | — | | | | 10.49 | | | | 4.90 | (g) | | | 5,197 | | | | 1.61 | (h) | | | 4.61 | (h) | | | 0.43 | (h) | | | 46 | |
Class C | | | | | | | | | | | | | | | | | | | | | | | | | | | | | | | | | | | | | | | | | | | | | | | | | | | | | | | | |
Year ended 10/31/18 | | | 9.81 | | | | (0.01 | ) | | | (0.14 | ) | | | (0.15 | ) | | | — | | | | (0.69 | ) | | | (0.69 | ) | | | 8.97 | | | | (1.56 | ) | | | 123 | | | | 2.24 | (d) | | | 4.13 | (d) | | | (0.07 | )(d) | | | 64 | |
Year ended 10/31/17 | | | 9.74 | | | | (0.02 | ) | | | 0.09 | | | | 0.07 | | | | — | | | | — | | | | — | | | | 9.81 | | | | 0.72 | | | | 381 | | | | 2.27 | | | | 3.68 | | | | (0.24 | ) | | | 35 | |
Year ended 10/31/16 | | | 10.20 | | | | 0.03 | | | | (0.46 | ) | | | (0.43 | ) | | | — | | | | (0.03 | ) | | | (0.03 | ) | | | 9.74 | | | | (4.27 | ) | | | 634 | | | | 2.36 | | | | 3.64 | | | | 0.25 | | | | 79 | |
Year ended 10/31/15 | | | 10.41 | | | | (0.01 | ) | | | (0.03 | ) | | | (0.04 | ) | | | (0.16 | ) | | | (0.01 | ) | | | (0.17 | ) | | | 10.20 | | | | (0.35 | )(e) | | | 603 | | | | 2.36 | | | | 4.03 | | | | (0.06 | ) | | | 77 | |
Year ended 10/31/14(f) | | | 10.00 | | | | (0.03 | ) | | | 0.44 | | | | 0.41 | | | | — | | | | — | | | | — | | | | 10.41 | | | | 4.10 | (g) | | | 123 | | | | 2.36 | (h) | | | 5.36 | (h) | | | (0.32 | )(h) | | | 46 | |
Class R | | | | | | | | | | | | | | | | | | | | | | | | | | | | | | | | | | | | | | | | | | | | | | | | | | | | | | | | |
Year ended 10/31/18 | | | 9.98 | | | | 0.04 | | | | (0.14 | ) | | | (0.10 | ) | | | — | | | | (0.69 | ) | | | (0.69 | ) | | | 9.19 | | | | (1.00 | ) | | | 39 | | | | 1.74 | (d) | | | 3.63 | (d) | | | 0.43 | (d) | | | 64 | |
Year ended 10/31/17 | | | 9.86 | | | | 0.03 | | | | 0.09 | | | | 0.12 | | | | — | | | | — | | | | — | | | | 9.98 | | | | 1.22 | | | | 32 | | | | 1.77 | | | | 3.18 | | | | 0.26 | | | | 35 | |
Year ended 10/31/16 | | | 10.27 | | | | 0.08 | | | | (0.46 | ) | | | (0.38 | ) | | | — | | | | (0.03 | ) | | | (0.03 | ) | | | 9.86 | | | | (3.75 | ) | | | 23 | | | | 1.86 | | | | 3.14 | | | | 0.75 | | | | 79 | |
Year ended 10/31/15 | | | 10.46 | | | | 0.05 | | | | (0.05 | ) | | | (0.00 | ) | | | (0.18 | ) | | | (0.01 | ) | | | (0.19 | ) | | | 10.27 | | | | (0.01 | )(e) | | | 17 | | | | 1.86 | | | | 3.53 | | | | 0.44 | | | | 77 | |
Year ended 10/31/14(f) | | | 10.00 | | | | 0.02 | | | | 0.44 | | | | 0.46 | | | | — | | | | — | | | | — | | | | 10.46 | | | | 4.60 | (g) | | | 14 | | | | 1.86 | (h) | | | 4.86 | (h) | | | 0.18 | (h) | | | 46 | |
Class Y | | | | | | | | | | | | | | | | | | | | | | | | | | | | | | | | | | | | | | | | | | | | | | | | | | | | | | | | |
Year ended 10/31/18 | | | 10.14 | | | | 0.09 | | | | (0.15 | ) | | | (0.06 | ) | | | — | | | | (0.69 | ) | | | (0.69 | ) | | | 9.39 | | | | (0.56 | ) | | | 4,698 | | | | 1.24 | (d) | | | 3.13 | (d) | | | 0.93 | (d) | | | 64 | |
Year ended 10/31/17 | | | 9.96 | | | | 0.08 | | | | 0.10 | | | | 0.18 | | | | — | | | | — | | | | — | | | | 10.14 | | | | 1.81 | | | | 7,476 | | | | 1.27 | | | | 2.68 | | | | 0.76 | | | | 35 | |
Year ended 10/31/16 | | | 10.34 | | | | 0.13 | | | | (0.48 | ) | | | (0.35 | ) | | | — | | | | (0.03 | ) | | | (0.03 | ) | | | 9.96 | | | | (3.43 | ) | | | 12,261 | | | | 1.36 | | | | 2.64 | | | | 1.25 | | | | 79 | |
Year ended 10/31/15 | | | 10.52 | | | | 0.10 | | | | (0.06 | ) | | | 0.04 | | | | (0.21 | ) | | | (0.01 | ) | | | (0.22 | ) | | | 10.34 | | | | 0.38 | (e) | | | 12,305 | | | | 1.36 | | | | 3.03 | | | | 0.94 | | | | 77 | |
Year ended 10/31/14(f) | | | 10.00 | | | | 0.06 | | | | 0.46 | | | | 0.52 | | | | — | | | | — | | | | — | | | | 10.52 | | | | 5.20 | (g) | | | 7,311 | | | | 1.36 | (h) | | | 4.36 | (h) | | | 0.68 | (h) | | | 46 | |
Class R5 | | | | | | | | | | | | | | | | | | | | | | | | | | | | | | | | | | | | | | | | | | | | | | | | | | | | | | | | |
Year ended 10/31/18 | | | 10.14 | | | | 0.09 | | | | (0.15 | ) | | | (0.06 | ) | | | — | | | | (0.69 | ) | | | (0.69 | ) | | | 9.39 | | | | (0.57 | ) | | | 470 | | | | 1.24 | (d) | | | 3.07 | (d) | | | 0.93 | (d) | | | 64 | |
Year ended 10/31/17 | | | 9.96 | | | | 0.08 | | | | 0.10 | | | | 0.18 | | | | — | | | | — | | | | — | | | | 10.14 | | | | 1.81 | | | | 507 | | | | 1.26 | | | | 2.60 | | | | 0.77 | | | | 35 | |
Year ended 10/31/16 | | | 10.34 | | | | 0.13 | | | | (0.48 | ) | | | (0.35 | ) | | | — | | | | (0.03 | ) | | | (0.03 | ) | | | 9.96 | | | | (3.43 | ) | | | 498 | | | | 1.36 | | | | 2.56 | | | | 1.25 | | | | 79 | |
Year ended 10/31/15 | | | 10.51 | | | | 0.10 | | | | (0.05 | ) | | | 0.05 | | | | (0.21 | ) | | | (0.01 | ) | | | (0.22 | ) | | | 10.34 | | | | 0.47 | (e) | | | 517 | | | | 1.36 | | | | 2.97 | | | | 0.94 | | | | 77 | |
Year ended 10/31/14(f) | | | 10.00 | | | | 0.06 | | | | 0.45 | | | | 0.51 | | | | — | | | | — | | | | — | | | | 10.51 | | | | 5.10 | (g) | | | 671 | | | | 1.36 | (h) | | | 4.33 | (h) | | | 0.68 | (h) | | | 46 | |
Class R6 | | | | | | | | | | | | | | | | | | | | | | | | | | | | | | | | | | | | | | | | | | | | | | | | | | | | | | | | |
Year ended 10/31/18 | | | 10.14 | | | | 0.09 | | | | (0.15 | ) | | | (0.06 | ) | | | — | | | | (0.69 | ) | | | (0.69 | ) | | | 9.39 | | | | (0.57 | ) | | | 919 | | | | 1.24 | (d) | | | 3.07 | (d) | | | 0.93 | (d) | | | 64 | |
Year ended 10/31/17 | | | 9.97 | | | | 0.08 | | | | 0.09 | | | | 0.17 | | | | — | | | | — | | | | — | | | | 10.14 | | | | 1.71 | | | | 966 | | | | 1.26 | | | | 2.60 | | | | 0.77 | | | | 35 | |
Year ended 10/31/16 | | | 10.34 | | | | 0.13 | | | | (0.47 | ) | | | (0.34 | ) | | | — | | | | (0.03 | ) | | | (0.03 | ) | | | 9.97 | | | | (3.33 | ) | | | 786 | | | | 1.36 | | | | 2.56 | | | | 1.25 | | | | 79 | |
Year ended 10/31/15 | | | 10.51 | | | | 0.10 | | | | (0.05 | ) | | | 0.05 | | | | (0.21 | ) | | | (0.01 | ) | | | (0.22 | ) | | | 10.34 | | | | 0.47 | (e) | | | 664 | | | | 1.36 | | | | 2.97 | | | | 0.94 | | | | 77 | |
Year ended 10/31/14(f) | | | 10.00 | | | | 0.06 | | | | 0.45 | | | | 0.51 | | | | — | | | | — | | | | — | | | | 10.51 | | | | 5.10 | (g) | | | 573 | | | | 1.36 | (h) | | | 4.33 | (h) | | | 0.68 | (h) | | | 46 | |
| (a) | Calculated using average shares outstanding. |
| (b) | Includes adjustments in accordance with accounting principles generally accepted in the United States of America and as such, the net asset value for financial reporting purposes and the returns based upon those net asset values may differ from the net asset value and returns for shareholder transactions. Does not include sales charges and is not annualized for periods less than one year, if applicable. |
| (c) | Portfolio turnover is calculated at the fund level and is not annualized for periods less than one year, if applicable. |
| (d) | Ratios are based on average daily net assets (000’s omitted) of $6,305, $198, $41, $6,130, $468 and $912 for Class A, Class C, Class R, Class Y, Class R5 and Class R6 shares, respectively. |
| (e) | Amount includes the effect of the Adviser pay-in for an economic loss of $0.11 per share. Had the pay-in not been made, the total return would have been (0.91)%, (1.42)%, (1.09)%, (0.69)%, (0.60)% and (0.60)% for Class A, Class C, Class R, Class Y, Class R5 and Class R6 shares, respectively. |
| (f) | Commencement December 19, 2013. |
| (g) | Amount includes the effect of the Adviser pay-in for the economic loss of $0.41 per share. Had the pay-in not been made, the total return would have been 0.80%, 0.10%, 0.60%, 1.00%, 1.00% and 1.00% for Class A, Class C, Class R, Class Y, Class R5 and Class R6 shares, respectively. |
25 Invesco Global Market Neutral Fund
Report of Independent Registered Public Accounting Firm
To the Board of Trustees of AIM Investment Funds (Invesco Investment Funds)
and Shareholders of Invesco Global Market Neutral Fund:
Opinion on the Financial Statements
We have audited the accompanying statement of assets and liabilities, including the schedule of investments, of Invesco Global Market Neutral Fund (one of the funds constituting AIM Investment Funds (Invesco Investment Funds), hereafter referred to as the “Fund”) as of October 31, 2018, the related statement of operations for the year ended October 31, 2018, the statement of changes in net assets for each of the two years in the period ended October 31, 2018, including the related notes, and the financial highlights for each of the periods indicated therein (collectively referred to as the financial statements). In our opinion, the financial statements present fairly, in all material respects, the financial position of the Fund as of October 31, 2018, the results of its operations for the year then ended, the changes in its net assets for each of the two years in the period ended October 31, 2018 and the financial highlights for each of the periods indicated therein in conformity with accounting principles generally accepted in the United States of America.
Basis for Opinion
These financial statements are the responsibility of the Fund’s management. Our responsibility is to express an opinion on the Fund’s financial statements based on our audits. We are a public accounting firm registered with the Public Company Accounting Oversight Board (United States) (PCAOB) and are required to be independent with respect to the Fund in accordance with the U.S. federal securities laws and the applicable rules and regulations of the Securities and Exchange Commission and the PCAOB.
We conducted our audits of these financial statements in accordance with the standards of the PCAOB. Those standards require that we plan and perform the audit to obtain reasonable assurance about whether the financial statements are free of material misstatement, whether due to error or fraud.
Our audits included performing procedures to assess the risks of material misstatement of the financial statements, whether due to error or fraud, and performing procedures that respond to those risks. Such procedures included examining, on a test basis, evidence regarding the amounts and disclosures in the financial statements. Our audits also included evaluating the accounting principles used and significant estimates made by management, as well as evaluating the overall presentation of the financial statements. Our procedures included confirmation of securities owned as of October 31, 2018 by correspondence with the custodian, transfer agent and brokers; when replies were not received from brokers, we performed other auditing procedures. We believe that our audits provide a reasonable basis for our opinion.
PricewaterhouseCoopers LLP
Houston, TX
December 28, 2018
We have served as the auditor of one or more of the investment companies in the Invesco group of investment companies since at least 1995. We have not been able to determine the specific year we began serving as auditor.
26 Invesco Global Market Neutral Fund
Calculating your ongoing Fund expenses
Example
As a shareholder of the Fund, you incur two types of costs: (1) transaction costs, which may include sales charges (loads) on purchase payments or contingent deferred sales charges on redemptions, if any; and (2) ongoing costs, including management fees, distribution and/or service (12b-1) fees, and other Fund expenses. This example is intended to help you understand your ongoing costs (in dollars) of investing in the Fund and to compare these costs with ongoing costs of investing in other mutual funds. The example is based on an investment of $1,000 invested at the beginning of the period and held for the entire period May 1, 2018 through October 31, 2018.
Actual expenses
The table below provides information about actual account values and actual expenses. You may use the information in this table, together with the amount you invested, to estimate the expenses that you paid over the period. Simply divide your account value by $1,000 (for example, an $8,600 account value divided by $1,000 = 8.6), then multiply the result by the number in the table under the heading entitled “Actual Expenses Paid During Period” to estimate the expenses you paid on your account during this period.
Hypothetical example for comparison purposes
The table below also provides information about hypothetical account values and hypothetical expenses based on the Fund’s actual expense ratio and an assumed rate of return of 5% per year before expenses, which is not the Fund’s actual return.
The hypothetical account values and expenses may not be used to estimate the actual ending account balance or expenses you paid for the period. You may use this information to compare the ongoing costs of investing in the Fund and other funds. To do so, compare this 5% hypothetical example with the 5% hypothetical examples that appear in the shareholder reports of the other funds.
Please note that the expenses shown in the table are meant to highlight your ongoing costs only and do not reflect any transaction costs, such as sales charges (loads) on purchase payments or contingent deferred sales charges on redemptions, if any. Therefore, the hypothetical information is useful in comparing ongoing costs only, and will not help you determine the relative total costs of owning different funds. In addition, if these transaction costs were included, your costs would have been higher.
| | | | | | | | | | | | | | | | | | | | | | | | |
| Class | | Beginning
Account Value
(05/01/18) | | | ACTUAL | | | HYPOTHETICAL (5% annual return before expenses) | | | Annualized
Expense Ratio | |
| | Ending
Account Value
(10/31/18)1 | | | Expenses
Paid During
Period2 | | | Ending
Account Value
(10/31/18) | | | Expenses
Paid During
Period2 | |
| A | | $ | 1,000.00 | | | $ | 1,005.40 | | | $ | 7.53 | | | $ | 1,017.69 | | | $ | 7.58 | | | | 1.49 | % |
| C | | | 1,000.00 | | | | 1,002.20 | | | | 11.30 | | | | 1,013.91 | | | | 11.37 | | | | 2.24 | |
| R | | | 1,000.00 | | | | 1,003.30 | | | | 8.79 | | | | 1,016.43 | | | | 8.84 | | | | 1.74 | |
| Y | | | 1,000.00 | | | | 1,006.40 | | | | 6.27 | | | | 1,018.95 | | | | 6.31 | | | | 1.24 | |
| R5 | | | 1,000.00 | | | | 1,005.30 | | | | 6.27 | | | | 1,018.95 | | | | 6.31 | | | | 1.24 | |
| R6 | | | 1,000.00 | | | | 1,006.40 | | | | 6.27 | | | | 1,018.95 | | | | 6.31 | | | | 1.24 | |
| 1 | The actual ending account value is based on the actual total return of the Fund for the period May 1, 2018 through October 31, 2018, after actual expenses and will differ from the hypothetical ending account value which is based on the Fund’s expense ratio and a hypothetical annual return of 5% before expenses. |
| 2 | Expenses are equal to the Fund’s annualized expense ratio as indicated above multiplied by the average account value over the period, multiplied by 184/365 to reflect the most recent fiscal half year. |
27 Invesco Global Market Neutral Fund
Approval of Investment Advisory and Sub-Advisory Contracts
At meetings held on June 5-6, 2018, the Board of Trustees (the Board or the Trustees) of AIM Investment Funds (Invesco Investment Funds) as a whole, and the independent Trustees, who comprise over 75% of the Board, voting separately, approved the continuance of the Invesco Global Market Neutral Fund’s (the Fund) Master Investment Advisory Agreement with Invesco Advisers, Inc. (Invesco Advisers and the investment advisory agreement) and the Master Intergroup Sub-Advisory Contract for Mutual Funds with Invesco Asset Management Deutschland GmbH, Invesco Asset Management Limited, Invesco Asset Management (Japan) Limited, Invesco Hong Kong Limited, Invesco Senior Secured Management, Inc., Invesco Canada Ltd. and separate Sub-Advisory Contracts with Invesco Capital Management LLC and Invesco Asset Management (India) Private Limited (collectively, the Affiliated Sub-Advisers and the sub-advisory contracts) for another year, effective July 1, 2018. After evaluating the factors discussed below, among others, the Board approved the renewal of the Fund’s investment advisory agreement and the sub-advisory contracts and determined that the compensation payable by the Fund to Invesco Advisers and by Invesco Advisers to the Affiliated Sub-Advisers is fair and reasonable.
The Board’s Evaluation Process
The Board’s Investments Committee has established three Sub-Committees, which meet throughout the year to review the performance of funds advised by Invesco Advisers (the Invesco Funds). Over the course of each year, the Sub-Committees meet with portfolio managers for their assigned Invesco Funds and other members of management to review detailed information about investment performance and portfolio attributes of these funds. The Board took into account evaluations and reports that it received from the Investments Committee and Sub-Committees, as well as the information provided to such committees and the Board throughout the year, in considering whether to approve each Invesco Fund’s investment advisory agreement and sub-advisory contracts.
As part of the contract renewal process, the Board reviews and considers information provided in response to detailed requests for information submitted to management by the independent Trustees with assistance from legal counsel to the independent Trustees. The Board receives comparative investment performance and fee data regarding the Invesco Funds prepared by Invesco Advisers and Broadridge Financial Solutions, Inc. (Broadridge), an independent mutual fund data provider. The Board also receives an independent written evaluation from the Senior Officer, an officer of the Invesco Funds who reports directly to the independent Trustees. The Senior Officer’s
evaluation is prepared as part of his responsibility to manage the process by which the Invesco Funds’ proposed management fees are negotiated during the annual contract renewal process to ensure they are negotiated in a manner that is at arms’ length and reasonable. In addition to meetings with Invesco Advisers and fund counsel throughout the year, the independent Trustees also discuss the continuance of the investment advisory agreement and sub-advisory contracts in separate sessions with the Senior Officer and with independent legal counsel.
The discussion below is a summary of the Senior Officer’s independent written evaluation with respect to the Fund’s investment advisory agreement, as well as a discussion of the material factors and related conclusions that formed the basis for the Board’s approval of the Fund’s investment advisory agreement and sub-advisory contracts. The Trustees’ review and conclusions are based on the comprehensive consideration of all information presented to them during the course of the year and in prior years and are not the result of any single determinative factor. Moreover, one Trustee may have weighed a particular piece of information or factor differently than another Trustee. This information is current as of June 6, 2018.
Factors and Conclusions and Summary of Independent Written Fee Evaluation
| A. | Nature, Extent and Quality of Services Provided by Invesco Advisers and the Affiliated Sub-Advisers |
The Board reviewed the nature, extent and quality of the advisory services provided to the Fund by Invesco Advisers under the Fund’s investment advisory agreement, and the credentials and experience of the officers and employees of Invesco Advisers who provide these services, including the Fund’s portfolio manager(s). The Board’s review included consideration of Invesco Advisers’ investment process oversight and structure, credit analysis and investment risk management. The Board also considered non-advisory services that Invesco Advisers and its affiliates provide to the Invesco Funds such as various back office support functions, third party oversight, internal audit, valuation, portfolio trading and legal and compliance. The Board also reviewed and considered the benefits to shareholders of investing in a fund that is part of the Invesco family of funds under the umbrella of Invesco Ltd., Invesco Advisers’ parent company, and noted Invesco Ltd.’s depth and experience in conducting an investment management business, as well as its commitment of financial and other resources to such business. The Board concluded that the nature, extent and quality of the services provided to the Fund by
Invesco Advisers are appropriate and satisfactory.
The Board reviewed the services that may be provided by the Affiliated Sub-Advisers under the sub-advisory contracts and the credentials and experience of the officers and employees of the Affiliated Sub-Advisers who provide these services. The Board noted the Affiliated Sub-Advisers’ expertise with respect to certain asset classes and that the Affiliated Sub-Advisers have offices and personnel that are located in financial centers around the world. As a result, the Board noted that the Affiliated Sub-Advisers can provide research and investment analysis on the markets and economies of various countries in which the Fund may invest, make recommendations regarding securities and assist with security trades. The Board concluded that the sub-advisory contracts may benefit the Fund and its shareholders by permitting Invesco Advisers to use the resources and talents of the Affiliated Sub-Advisers in managing the Fund. The Board concluded that the nature, extent and quality of the services that may be provided by the Affiliated Sub-Advisers are appropriate and satisfactory.
| B. | Fund Investment Performance |
The Board considered Fund investment performance as a relevant factor in considering whether to approve the investment advisory agreement as well as the sub-advisory contracts for the Fund, as Invesco Asset Management Deutschland GmbH currently manages assets of the Fund.
The Board compared the Fund’s investment performance over multiple time periods ending December 31, 2017 to the performance of funds in the Broadridge performance universe and against the Lipper Alternative Equity Market Neutral Funds Index. The Board noted that performance of Class A shares of the Fund was in the fourth quintile of its performance universe for the one year period and the fifth quintile for the three year period (the first quintile being the best performing funds and the fifth quintile being the worst performing funds). The Board noted that performance of Class A shares of the Fund was below the performance of the Index for the one and three year periods. The Board noted that stock selection in and underweight exposure to certain types of securities and regions detracted from the Fund’s performance. The Trustees also reviewed more recent Fund performance and this review did not change their conclusions.
| C. | Advisory and Sub-Advisory Fees and Fund Expenses |
The Board compared the Fund’s contractual management fee rate to the contractual management fee rates of funds in the Fund’s Broadridge expense group. The Board noted that the contractual management fee rate for Class A shares of the Fund was below the
28 Invesco Global Market Neutral Fund
median contractual management fee rate of funds in its expense group. The Board noted that the term “contractual management fee” for funds in the expense group may include both advisory and certain non-portfolio management administrative services fees, but that Broadridge does not provide information on a fund by fund basis as to what is included. The Board also reviewed the methodology used by Broadridge in providing expense group information, which includes using each fund’s contractual management fee schedule (including any applicable breakpoints) as reported in the most recent prospectus or statement of additional information for each fund in the expense group. The Board also considered comparative information regarding the Fund’s total expense ratio and its various components.
The Board noted that Invesco Advisers has contractually agreed to waive fees and/or limit expenses of the Fund in an amount necessary to limit total annual operating expenses to a specified percentage of average daily net assets for each class of the Fund.
The Board also considered the fees charged by Invesco Advisers and the Affiliated Sub-Advisers to other similarly managed client accounts. The Board noted that Invesco Advisers or the Affiliated Sub-Advisers may charge lower fees to large institutional clients. Invesco Advisers reviewed with the Board differences in the scope of services it provides to the Invesco Funds relative to certain other types of client accounts, including management of cash flows as a result of redemptions and purchases, necessary infrastructure such as officers, office space, technology, legal and distribution, oversight of service providers, costs and business risks associated with launching new funds and sponsoring and maintaining the product line, preparation of annual registration statement updates and financial information and compliance with federal and state laws and regulations.
The Board also considered the services that may be provided by the Affiliated Sub-Advisers pursuant to the sub-advisory contracts, as well as the fees payable by Invesco Advisers to the Affiliated Sub-Advisers pursuant to the sub-advisory contracts. The Board noted that Invesco Advisers retains overall responsibility for, and provides services to, sub-advised Invesco Funds, including oversight of the Affiliated Sub-Advisers as well as the additional services described herein other than day-to-day portfolio management.
| D. | Economies of Scale and Breakpoints |
The Board considered the extent to which there may be economies of scale in the provision of advisory services to the Fund. The Board also considered that the Fund may benefit from economies of scale through contractual breakpoints in the Fund’s advisory fee schedule, which generally operate to reduce the Fund’s expense ratio as it grows in size. The Board noted that the Fund shares directly in
economies of scale through lower fees charged by third party service providers based on the combined size of the Invesco Funds. The Board noted that the Fund may also benefit from economies of scale through initial fee setting, fee waivers and expense reimbursements.
| E. | Profitability and Financial Resources |
The Board reviewed information from Invesco Advisers concerning the costs of the advisory and other services that Invesco Advisers and its affiliates provide to the Fund and the Invesco Funds and the profitability of Invesco Advisers and its affiliates in providing these services. The Board considered the methodology used for calculating profitability and noted the periodic review of such methodology by an independent consultant. The Board noted that Invesco Advisers continues to operate at a net profit from services Invesco Advisers and its affiliates provide to the Invesco Funds. The Board received information from Invesco Advisers demonstrating that Invesco Advisers and the Affiliated Sub-Advisers are financially sound and have the resources necessary to perform their obligations under the investment advisory agreement and sub-advisory contracts.
| F. | Collateral Benefits to Invesco Advisers and its Affiliates |
The Board considered various other benefits received by Invesco Advisers and its affiliates from the relationship with the Fund, including the fees received for providing administrative, transfer agency and distribution services to the Fund. The Board considered comparative information regarding fees charged for these services, including information provided by Broadridge and other independent sources. The Board considered the performance of Invesco Advisers and its affiliates in providing these services and the organizational structure employed to provide these services. The Board also considered that these services are provided to the Fund pursuant to written contracts that are reviewed and approved on an annual basis by the Board; and that the services are required for the operation of the Fund.
The Board considered the benefits realized by Invesco Advisers and the Affiliated Sub-Advisers as a result of portfolio brokerage transactions executed through “soft dollar” arrangements. The Board noted that soft dollar arrangements may result in the Fund bearing costs to purchase research that may be used by Invesco Advisers or the Affiliated Sub-Advisers with other clients and may reduce Invesco Advisers’ or the Affiliated Sub-Advisers’ expenses. The Board also considered that it receives periodic reports from Invesco representing that these arrangements are consistent with regulatory requirements. The Board did not deem the soft dollar arrangements to be inappropriate.
The Board considered that the Fund’s uninvested cash and cash collateral from any securities lending arrangements may be invested in money market funds advised by Invesco Advisers pursuant to procedures approved by the Board. The Board noted that Invesco Advisers receives advisory fees from
these affiliated money market funds attributable to such investments, although Invesco Advisers has contractually agreed to waive through varying periods the advisory fees payable by the Invesco Funds with respect to certain investments in the affiliated money market funds. The waiver is in an amount equal to 100% of the net advisory fee Invesco Advisers receives from the affiliated money market funds with respect to the Fund’s investment in the affiliated money market funds of uninvested cash, but not cash collateral. The Board concluded that the amount of advisory fees received by Invesco Advisers from the Fund’s investment of cash collateral from any securities lending arrangements in the affiliated money market funds is fair and reasonable.
The Board also considered that an affiliated broker may receive commissions for executing certain trades for the Fund. Invesco Advisers and the Affiliated Sub-Advisers may use the affiliated broker to, among other things, control order routing and minimize information leakage, and the Board was advised that such trades are executed in compliance with rules under the federal securities laws and consistent with best execution obligations.
29 Invesco Global Market Neutral Fund
Tax Information
Form 1099-DIV, Form 1042-S and other year-end tax information provide shareholders with actual calendar year amounts that should be included in their tax returns. Shareholders should consult their tax advisors.
The following distribution information is being provided as required by the Internal Revenue Code or to meet a specific state’s requirement.
The Fund designates the following amounts or, if subsequently determined to be different, the maximum amount allowable for its fiscal year ended October 31, 2018:
| | | | |
Federal and State Income Tax | | | |
Long-Term Capital Gain Distributions | | $ | 1,156,562 | |
Qualified Dividend Income* | | | 0 | % |
Corporate Dividends Received Deduction* | | | 0 | % |
U.S. Treasury Obligations* | | | 0 | % |
| | * | The above percentages are based on ordinary income dividends paid to shareholders during the Fund’s fiscal year. |
30 Invesco Global Market Neutral Fund
Trustees and Officers
The address of each trustee and officer is AIM Investment Funds (Invesco Investment Funds) (the “Trust”), 11 Greenway Plaza, Suite 1000, Houston, Texas 77046-1173. The trustees serve for the life of the Trust, subject to their earlier death, incapacitation, resignation, retirement or removal as more specifically provided in the Trust’s organizational documents. Each officer serves for a one year term or until their successors are elected and qualified. Column two below includes length of time served with predecessor entities, if any.
| | | | | | | | |
Name, Year of Birth and
Position(s) Held with the Trust | | Trustee and/
or Officer Since | | Principal Occupation(s)
During Past 5 Years | | Number of
Funds in Fund
Complex
Overseen by
Trustee | | Other Directorship(s)
Held by Trustee During
Past 5 Years |
| Interested Persons | | | | | | | | |
| Martin L. Flanagan1 — 1960 Trustee | | 2007 | | Executive Director, Chief Executive Officer and President, Invesco Ltd. (ultimate parent of Invesco and a global investment management firm); Trustee, The Invesco Funds; Vice Chair, Investment Company Institute; and Member of Executive Board, SMU Cox School of Business Formerly: Advisor to the Board, Invesco Advisers, Inc. (formerly known as Invesco Institutional (N.A.), Inc.); Chairman and Chief Executive Officer, Invesco Advisers, Inc. (registered investment adviser); Director, Chairman, Chief Executive Officer and President, Invesco Holding Company (US), Inc. (formerly IVZ Inc.) (holding company), Invesco Group Services, Inc. (service provider) and Invesco North American Holdings, Inc. (holding company); Director, Chief Executive Officer and President, Invesco Holding Company Limited (parent of Invesco and a global investment management firm); Director, Invesco Ltd.; Chairman, Investment Company Institute and President, Co-Chief Executive Officer, Co-President, Chief Operating Officer and Chief Financial Officer, Franklin Resources, Inc. (global investment management organization) | | 158 | | None |
Philip A. Taylor2 — 1954 Trustee and Senior Vice President | | 2006 | | Head of the Americas and Senior Managing Director, Invesco Ltd.; Director, Invesco Advisers, Inc. (formerly known as Invesco Institutional (N.A.), Inc.) (registered investment adviser); Director and Chairman, Invesco Investment Services, Inc. (formerly known as Invesco AIM Investment Services, Inc.) (registered transfer agent); Chief Executive Officer, Invesco Corporate Class Inc. (corporate mutual fund company); Director, Chairman and Chief Executive Officer, Invesco Canada Ltd. (formerly known as Invesco Trimark Ltd./Invesco Trimark Ltèe) (registered investment adviser and registered transfer agent); Trustee and Senior Vice President, The Invesco Funds; Director, Invesco Investment Advisers LLC (formerly known as Van Kampen Asset Management) Formerly: Director, Chairman, Chief Executive Officer and President, Invesco Management Group, Inc. (formerly known as Invesco AIM Management Group, Inc.) (financial services holding company); Co-Chairman, Co-President and Co-Chief Executive Officer, Invesco Advisers, Inc. (formerly known as Invesco Institutional (N.A.), Inc.) (registered investment adviser); Director, Chief Executive Officer and President, Van Kampen Exchange Corp; President and Principal Executive Officer, The Invesco Funds (other than AIM Treasurer’s Series Trust (Invesco Treasurer’s Series Trust), Short-Term Investments Trust and Invesco Management Trust); Executive Vice President, The Invesco Funds (AIM Treasurer’s Series Trust (Invesco Treasurer’s Series Trust), Short-Term Investments Trust and Invesco Management Trust only); Director and President, INVESCO Funds Group, Inc. (registered investment adviser and registered transfer agent); Director and Chairman, IVZ Distributors, Inc. (formerly known as INVESCO Distributors, Inc.) (registered broker dealer); Director, President and Chairman, Invesco Inc. (holding company), Invesco Canada Holdings Inc. (holding company), Trimark Investments Ltd./Placements Trimark Ltèe and Invesco Financial Services Ltd/Services Financiers Invesco Ltèe; Chief Executive Officer, Invesco Canada Fund Inc. (corporate mutual fund company); Director and Chairman, Van Kampen Investor Services Inc.; Director, Chief Executive Officer and President, 1371 Preferred Inc. (holding company) and Van Kampen Investments Inc.; Director and President, AIM GP Canada Inc. (general partner for limited partnerships) and Van Kampen Advisors, Inc.; Director and Chief Executive Officer, Invesco Trimark Dealer Inc. (registered broker dealer); Director, Invesco Distributors, Inc. (formerly known as Invesco AIM Distributors, Inc.) (registered broker dealer); Manager, Invesco Capital Management LLC; Director, Chief Executive Officer and President, Invesco Advisers, Inc.; Director, Chairman, Chief Executive Officer and President, Invesco AIM Capital Management, Inc.; President, Invesco Trimark Dealer Inc. and Invesco Trimark Ltd./Invesco Trimark Ltèe; Director and President, AIM Trimark Corporate Class Inc. and AIM Trimark Canada Fund Inc.; Senior Managing Director, Invesco Holding Company Limited; Director and Chairman, Fund Management Company (former registered broker dealer); President and Principal Executive Officer, The Invesco Funds (AIM Treasurer’s Series Trust (Invesco Treasurer’s Series Trust), and Short-Term Investments Trust only); President, AIM Trimark Global Fund Inc. and AIM Trimark Canada Fund Inc. | | 158 | | None |
| 1 | Mr. Flanagan is considered an interested person (within the meaning of Section 2(a)(19) of the 1940 Act) of the Trust because he is an officer of the Adviser to the Trust, and an officer and a director of Invesco Ltd., ultimate parent of the Adviser. |
| 2 | Mr. Taylor is considered an interested person (within the meaning of Section 2(a)(19) of the 1940 Act) of the Trust because he is an officer and a director of the Adviser. |
T-1 Invesco Global Market Neutral Fund
Trustees and Officers—(continued)
| | | | | | | | |
Name, Year of Birth and
Position(s) Held with the Trust | | Trustee and/
or Officer Since | | Principal Occupation(s)
During Past 5 Years | | Number of
Funds in Fund
Complex
Overseen by
Trustee | | Other Directorship(s)
Held by Trustee During
Past 5 Years |
| Independent Trustees | | | | | | | | |
Bruce L. Crockett — 1944 Trustee and Chair | | 2001 | | Chairman, Crockett Technologies Associates (technology consulting company) Formerly: Director, Captaris (unified messaging provider); Director, President and Chief Executive Officer, COMSAT Corporation; Chairman, Board of Governors of INTELSAT (international communications company); ACE Limited (insurance company); Independent Directors Council and Investment Company Institute: Member of the Audit Committee, Investment Company Institute; Member of the Executive Committee and Chair of the Governance Committee, Independent Directors Council | | 158 | | Director and Chairman of the Audit Committee, ALPS (Attorneys Liability Protection Society) (insurance company); Director and Member of the Audit Committee and Compensation Committee, Ferroglobe PLC (metallurgical company) |
David C. Arch — 1945 Trustee | | 2010 | | Chairman of Blistex Inc. (consumer health care products manufacturer); Member, World Presidents’ Organization | | 158 | | Board member of the Illinois Manufacturers’ Association |
Jack M. Fields — 1952 Trustee | | 2001 | | Chief Executive Officer, Twenty First Century Group, Inc. (government affairs company); and Chairman, Discovery Learning Alliance (non-profit) Formerly: Owner and Chief Executive Officer, Dos Angeles Ranch L.P. (cattle, hunting, corporate entertainment); Director, Insperity, Inc. (formerly known as Administaff) (human resources provider); Chief Executive Officer, Texana Timber LP (sustainable forestry company); Director of Cross Timbers Quail Research Ranch (non-profit); and member of the U.S. House of Representatives | | 158 | | None |
Cynthia Hostetler — 1962 Trustee | | 2017 | | Non-Executive Director and Trustee of a number of public and private business corporations Formerly: Director, Aberdeen Investment Funds (4 portfolios); Head of Investment Funds and Private Equity, Overseas Private Investment Corporation; President, First Manhattan Bancorporation, Inc.; Attorney, Simpson Thacher & Bartlett LLP | | 158 | | Vulcan Materials Company (construction materials company); Trilinc Global Impact Fund; Artio Global Investment LLC (mutual fund complex); Edgen Group, Inc. (specialized energy and infrastructure products distributor) |
Eli Jones — 1961 Trustee | | 2016 | | Professor and Dean, Mays Business School — Texas A&M University Formerly: Professor and Dean, Walton College of Business, University of Arkansas and E.J. Ourso College of Business, Louisiana State University; Director, Arvest Bank | | 158 | | Insperity, Inc. (formerly known as Administaff) (human resources provider) |
Prema Mathai-Davis — 1950 Trustee | | 2001 | | Retired | | 158 | | None |
Teresa M. Ressel — 1962 Trustee | | 2017 | | Non-executive director and trustee of a number of public and private business corporations Formerly: Chief Financial Officer, Olayan America, The Olayan Group (international investor/commercial/industrial); Chief Executive Officer, UBS Securities LLC; Group Chief Operating Officer, Americas, UBS AG; Assistant Secretary for Management & Budget and CFO, US Department of the Treasury | | 158 | | Atlantic Power Corporation (power generation company); ON Semiconductor Corp. (semiconductor supplier) |
Ann Barnett Stern — 1957 Trustee | | 2017 | | President and Chief Executive Officer, Houston Endowment Inc. (private philanthropic institution) Formerly: Executive Vice President and General Counsel, Texas Children’s Hospital; Attorney, Beck, Redden and Secrest, LLP; Business Law Instructor, University of St. Thomas; Attorney, Andrews & Kurth LLP | | 158 | | Federal Reserve Bank of Dallas |
Raymond Stickel, Jr. — 1944 Trustee | | 2005 | | Retired Formerly: Director, Mainstay VP Series Funds, Inc. (25 portfolios); Partner, Deloitte & Touche | | 158 | | None |
Robert C. Troccoli — 1949 Trustee | | 2016 | | Adjunct Professor, University of Denver — Daniels College of Business Formerly: Senior Partner, KPMG LLP | | 158 | | None |
Christopher L. Wilson — 1957 Trustee | | 2017 | | Non-executive director and trustee of a number of public and private business corporations Formerly: Director, TD Asset Management USA Inc. (mutual fund complex) (22 portfolios); Managing Partner, CT2, LLC (investing and consulting firm); President/Chief Executive Officer, Columbia Funds, Bank of America Corporation; President/Chief Executive Officer, CDC IXIS Asset Management Services, Inc.; Principal & Director of Operations, Scudder Funds, Scudder, Stevens & Clark, Inc.; Assistant Vice President, Fidelity Investments | | 158 | | ISO New England, Inc. (non-profit organization managing regional electricity market) |
T-2 Invesco Global Market Neutral Fund
Trustees and Officers—(continued)
| | | | | | | | |
Name, Year of Birth and
Position(s) Held with the Trust | | Trustee and/
or Officer Since | | Principal Occupation(s)
During Past 5 Years | | Number of
Funds in Fund
Complex
Overseen by
Trustee | | Other Directorship(s)
Held by Trustee During
Past 5 Years |
| Other Officers | | | | | | | | |
Sheri Morris — 1964 President, Principal Executive Officer and Treasurer | | 1999 | | President, Principal Executive Officer and Treasurer, The Invesco Funds; Vice President, Invesco Advisers, Inc. (formerly known as Invesco Institutional (N.A.), Inc.) (registered investment adviser); and Vice President, Invesco Exchange-Traded Fund Trust, Invesco Exchange-Traded Fund Trust II, Invesco India Exchange-Traded Fund Trust, Invesco Actively Managed Exchange-Traded Fund Trust, Invesco Actively Managed Exchange-Traded Commodity Fund Trust and Invesco Exchange-Traded Self-Indexed Fund Trust Formerly: Vice President and Principal Financial Officer, The Invesco Funds; Vice President, Invesco AIM Advisers, Inc., Invesco AIM Capital Management, Inc. and Invesco AIM Private Asset Management, Inc.; Assistant Vice President and Assistant Treasurer, The Invesco Funds and Assistant Vice President, Invesco Advisers, Inc., Invesco AIM Capital Management, Inc. and Invesco AIM Private Asset Management, Inc.; and Treasurer, Invesco Exchange-Traded Fund Trust, Invesco Exchange-Traded Fund Trust II, Invesco India Exchange-Traded Fund Trust and Invesco Actively Managed Exchange-Traded Fund Trust | | N/A | | N/A |
Russell C. Burk — 1958 Senior Vice President and Senior Officer | | 2005 | | Senior Vice President and Senior Officer, The Invesco Funds | | N/A | | N/A |
Jeffrey H. Kupor — 1968 Senior Vice President, Chief Legal Officer and Secretary | | 2018 | | Senior Vice President and Secretary, Invesco Advisers, Inc. (formerly known as Invesco Institutional (N.A.), Inc.) (registered investment adviser); Senior Vice President and Secretary, Invesco Distributors, Inc. (formerly known as Invesco AIM Distributors, Inc.); Vice President and Secretary, Invesco Investment Services, Inc. (formerly known as Invesco AIM Investment Services, Inc.) Senior Vice President, Chief Legal Officer and Secretary, The Invesco Funds; Secretary and General Counsel, Invesco Investment Advisers LLC (formerly known as Van Kampen Asset Management); Secretary and General Counsel, Invesco Capital Markets, Inc. (formerly known as Van Kampen Funds Inc.) and Chief Legal Officer, Invesco Exchange-Traded Fund Trust, Invesco Exchange-Traded Fund Trust II, Invesco India Exchange-Traded Fund Trust, Invesco Actively Managed Exchange-Traded Fund Trust, Invesco Actively Managed Exchange-Traded Commodity Fund Trust and Invesco Exchange-Traded Self-Indexed Fund Trust; Secretary, Invesco Indexing LLC; Secretary and General Counsel, INVESCO Private Capital Investments, Inc.; Secretary, W.L. Ross & Co., LLC; Secretary and Vice President, Jemstep, Inc. Formerly: Senior Vice President, Secretary and General Counsel, Invesco Management Group, Inc. (formerly known as Invesco AIM Management Group, Inc.); Assistant Secretary, INVESCO Asset Management (Bermuda) Ltd.; Secretary and General Counsel, Invesco Private Capital, Inc.; Assistant Secretary and General Counsel, INVESCO Realty, Inc.; Secretary and General Counsel, Invesco Senior Secured Management, Inc.; and Secretary, Sovereign G./P. Holdings Inc. | | N/A | | N/A |
John M. Zerr — 1962 Senior Vice President | | 2006 | | Chief Operating Officer of the Americas; Senior Vice President, Invesco Advisers, Inc. (formerly known as Invesco Institutional (N.A.), Inc.) (registered investment adviser); Senior Vice President, Invesco Distributors, Inc. (formerly known as Invesco AIM Distributors, Inc.); Director and Vice President, Invesco Investment Services, Inc. (formerly known as Invesco AIM Investment Services, Inc.) Senior Vice President, The Invesco Funds; Managing Director, Invesco Capital Management LLC; Director, Invesco Investment Advisers LLC (formerly known as Van Kampen Asset Management); Senior Vice President, Invesco Capital Markets, Inc. (formerly known as Van Kampen Funds Inc.); Manager, Invesco Indexing LLC Formerly: Director and Senior Vice President, Invesco Management Group, Inc. (formerly known as Invesco AIM Management Group, Inc.); Secretary and General Counsel, Invesco Management Group, Inc. (formerly known as Invesco AIM Management Group, Inc.); Secretary, Invesco Investment Services, Inc. (formerly known as Invesco AIM Investment Services, Inc.); Chief Legal Officer and Secretary, The Invesco Funds; Secretary and General Counsel, Invesco Investment Advisers LLC (formerly known as Van Kampen Asset Management); Secretary and General Counsel, Invesco Capital Markets, Inc. (formerly known as Van Kampen Funds Inc.); Chief Legal Officer, Invesco Exchange-Traded Fund Trust, Invesco Exchange-Traded Fund Trust II, Invesco India Exchange-Traded Fund Trust, Invesco Actively Managed Exchange-Traded Fund Trust, Invesco Actively Managed Exchange-Traded Commodity Fund Trust and Invesco Exchange-Traded Self-Indexed Fund Trust; Secretary, Invesco Indexing LLC; Director, Secretary, General Counsel and Senior Vice President, Van Kampen Exchange Corp.; Director, Vice President and Secretary, IVZ Distributors, Inc. (formerly known as INVESCO Distributors, Inc.); Director and Vice President, INVESCO Funds Group, Inc.; Director and Vice President, Van Kampen Advisors Inc.; Director, Vice President, Secretary and General Counsel, Van Kampen Investor Services Inc.; Director and Secretary, Invesco Distributors, Inc. (formerly known as Invesco AIM Distributors, Inc.); Director, Senior Vice President, General Counsel and Secretary, Invesco AIM Advisers, Inc. and Van Kampen Investments Inc.; Director, Vice President and Secretary, Fund Management Company; Director, Senior Vice President, Secretary, General Counsel and Vice President, Invesco AIM Capital Management, Inc.; Chief Operating Officer and General Counsel, Liberty Ridge Capital, Inc. (an investment adviser) | | N/A | | N/A |
T-3 Invesco Global Market Neutral Fund
Trustees and Officers—(continued)
| | | | | | | | |
Name, Year of Birth and
Position(s) Held with the Trust | | Trustee and/
or Officer Since | | Principal Occupation(s)
During Past 5 Years | | Number of
Funds in Fund
Complex
Overseen by
Trustee | | Other Directorship(s)
Held by Trustee During
Past 5 Years |
| Other Officers—(continued) | | | | | | | | |
Gregory G. McGreevey — 1962 Senior Vice President | | 2012 | | Senior Managing Director, Invesco Ltd.; Director, Chairman, President, and Chief Executive Officer, Invesco Advisers, Inc. (formerly known as Invesco Institutional (N.A.), Inc.) (registered investment adviser); Director, Invesco Mortgage Capital, Inc. and Invesco Senior Secured Management, Inc.; and Senior Vice President, The Invesco Funds Formerly: Senior Vice President, Invesco Management Group, Inc. and Invesco Advisers, Inc.; Assistant Vice President, The Invesco Funds | | N/A | | N/A |
Kelli Gallegos — 1970 Vice President, Principal Financial Officer and Assistant Treasurer | | 2008 | | Vice President and Treasurer, Invesco Exchange-Traded Fund Trust, Invesco Exchange-Traded Fund Trust II, Invesco India Exchange-Traded Fund Trust, Invesco Actively Managed Exchange-Traded Fund Trust, Invesco Actively Managed Exchange-Traded Commodity Fund Trust and Invesco Exchange-Traded Self-Indexed Fund Trust; Vice President, Principal Financial Officer and Assistant Treasurer, The Invesco Funds; Principal Financial and Accounting Officer — Pooled Investments, Invesco Capital Management LLC Formerly: Assistant Treasurer, Invesco Exchange-Traded Fund Trust, Invesco Exchange-Traded Fund Trust II, Invesco India Exchange-Traded Fund Trust, Invesco Actively Managed Exchange-Traded Fund Trust, Invesco Actively Managed Exchange-Traded Commodity Fund Trust and Invesco Exchange-Traded Self-Indexed Fund Trust; Assistant Treasurer, Invesco Capital Management LLC; Assistant Vice President, The Invesco Funds | | N/A | | N/A |
Tracy Sullivan — 1962 Vice President, Chief Tax Officer and Assistant Treasurer | | 2008 | | Vice President, Chief Tax Officer and Assistant Treasurer, The Invesco Funds; Assistant Treasurer, Invesco Capital Management LLC, Invesco Exchange-Traded Fund Trust, Invesco Exchange-Traded Fund Trust II, Invesco India Exchange-Traded Fund Trust, Invesco Actively Managed Exchange-Traded Fund Trust, Invesco Actively Managed Exchange-Traded Commodity Fund Trust and Invesco Exchange-Traded Self-Indexed Fund Trust Formerly: Assistant Vice President, The Invesco Funds | | N/A | | N/A |
Crissie M. Wisdom — 1969 Anti-Money Laundering Compliance Officer | | 2013 | | Anti-Money Laundering Compliance Officer, Invesco Advisers, Inc. (formerly known as Invesco Institutional (N.A.), Inc.) (registered investment adviser), Invesco Capital Markets, Inc. (formerly known as Van Kampen Funds Inc.), Invesco Distributors, Inc., Invesco Investment Services, Inc., The Invesco Funds, and Invesco Exchange-Traded Fund Trust, Invesco Exchange-Traded Fund Trust II, Invesco India Exchange-Traded Fund Trust, Invesco Actively Managed Exchange-Traded Fund Trust, Invesco Actively Managed Exchange-Traded Commodity Fund Trust and Invesco Exchange-Traded Self-Indexed Fund Trust; Anti-Money Laundering Compliance Officer and Bank Secrecy Act Officer, INVESCO National Trust Company and Invesco Trust Company; and Fraud Prevention Manager and Controls and Risk Analysis Manager for Invesco Investment Services, Inc. Formerly: Anti-Money Laundering Compliance Officer, Van Kampen Exchange Corp. and Invesco Management Group, Inc. | | N/A | | N/A |
Robert R. Leveille — 1969 Chief Compliance Officer | | 2016 | | Chief Compliance Officer, Invesco Advisers, Inc. (registered investment adviser); and Chief Compliance Officer, The Invesco Funds Formerly: Chief Compliance Officer, Putnam Investments and the Putnam Funds | | N/A | | N/A |
The Statement of Additional Information of the Trust includes additional information about the Fund’s Trustees and is available upon request, without charge, by calling 1.800.959.4246. Please refer to the Fund’s Statement of Additional Information for information on the Fund’s sub-advisers.
| | | | | | |
Office of the Fund 11 Greenway Plaza, Suite 1000 Houston, TX 77046-1173 | | Investment Adviser Invesco Advisers, Inc. 1555 Peachtree Street, N.E. Atlanta, GA 30309 | | Distributor Invesco Distributors, Inc. 11 Greenway Plaza, Suite 1000 Houston, TX 77046-1173 | | Auditors PricewaterhouseCoopers LLP 1000 Louisiana Street, Suite 5800 Houston, TX 77002-5021 |
| | | |
| | | | | | |
Counsel to the Fund Stradley Ronon Stevens & Young, LLP 2005 Market Street, Suite 2600 Philadelphia, PA 19103-7018 | | Counsel to the Independent Trustees Goodwin Procter LLP 901 New York Avenue, N.W. Washington, D.C. 20001 | | Transfer Agent Invesco Investment Services, Inc. 11 Greenway Plaza, Suite 1000 Houston, TX 77046-1173 | | Custodian State Street Bank and Trust Company 225 Franklin Street Boston, MA 02110-2801 |
T-4 Invesco Global Market Neutral Fund
Explore High-Conviction Investing with Invesco

Go paperless with eDelivery
Visit invesco.com/edelivery to enjoy the convenience and security of anytime electronic access to your investment documents.
With eDelivery, you can elect to have any or all of the following materials delivered straight to your inbox to download, save and print from your own computer:
| ∎ | | Fund reports and prospectuses |
Invesco mailing information
Send general correspondence to Invesco Investment Services, Inc., P.O. Box 219078, Kansas City, MO 64121-9078.
Important notice regarding delivery of security holder documents
To reduce Fund expenses, only one copy of most shareholder documents may be mailed to shareholders with multiple accounts at the same address (Householding). Mailing of your shareholder documents may be householded indefinitely unless you instruct us otherwise. If you do not want the mailing of these documents to be combined with those for other members of your household, please contact Invesco Investment Services, Inc. at 800 959 4246 or contact your financial institution. We will begin sending you individual copies for each account within 30 days after receiving your request.
Fund holdings and proxy voting information
The Fund provides a complete list of its holdings four times in each fiscal year, at the quarter ends. For the second and fourth quarters, the lists appear in the Fund’s semiannual and annual reports to shareholders. For the first and third quarters, the Fund files the lists with the Securities and Exchange Commission (SEC) on Form N-Q (or any successor Form). The most recent list of portfolio holdings is available at invesco.com/completeqtrholdings. Shareholders can also look up the Fund’s Forms N-Q (or any successor Form) on the SEC website at sec.gov. The SEC file numbers for the Fund are shown below.
A description of the policies and procedures that the Fund uses to determine how to vote proxies relating to portfolio securities is available without charge, upon request, from our Client Services department at 800 959 4246 or at invesco.com/proxyguidelines. The information is also available on the SEC website, sec.gov.
| | |
| Information regarding how the Fund voted proxies related to its portfolio securities during the most recent 12-month period ended June 30 is available at invesco.com/proxysearch. The information is also available on the SEC website, sec.gov. | | 
|
| Invesco Advisers, Inc. is an investment adviser; it provides investment advisory services to individual and institutional clients and does not sell securities. Invesco Distributors, Inc. is the US distributor for Invesco Ltd.’s retail mutual funds, exchange-traded funds and institutional money market funds. Both are wholly owned, indirect subsidiaries of Invesco Ltd. |
| | | | | | | | |
| SEC file numbers: 811-05426 and 033-19338 | | Invesco Distributors, Inc. | | GMN-AR-1 | | 12212018 | | 1203 |
| | | | | | |
| | | | |
 | | Annual Report to Shareholders | | October 31, 2018 | | |
| | | | |
| | Invesco Global Targeted Returns Fund | | |
| | Nasdaq: | | |
| | A: GLTAX ∎ C: GLTCX ∎ R: GLTRX ∎ Y: GLTYX ∎ R5: GLTFX ∎ R6: GLTSX | | |

Letters to Shareholders
| | |

Philip Taylor | | Dear Shareholders: This annual report includes information about your Fund, including performance data and a complete list of its investments as of the close of the reporting period. Inside is a discussion of how your Fund was managed and the factors that affected its performance during the reporting period. Throughout the reporting period, US economic data remained positive. Robust corporate profits, strong retail sales and unemployment rates near generational lows helped drive US markets to new all-time records multiple times during the reporting period. Against this backdrop, the US Federal Reserve raised the federal funds rate four times during the reporting period. Market volatility, largely non-existent in 2017, returned in 2018. Markets sold off first in February and again sharply in October, amid rising interest rates, concerns about potential trade wars and |
heightened geopolitical tensions. Despite the volatility, US equity markets were largely positive for the reporting period and fared better than international markets. Emerging markets were particularly hard hit due to a strong US dollar. During the October sell-off, investors retreated to more defensive areas of the market and to US Treasuries. The broader bond market declined during the reporting period due to the increase in US Treasury yields and widening credit spreads. As the year progresses, we’ll see how the interplay of economic data, interest rates, geopolitics and a host of other factors affect US and overseas equity and fixed income markets.
Short-term market volatility can prompt some investors to abandon their investment plans – and can cause others to settle for whatever returns the market has to offer. The investment professionals at Invesco, in contrast, invest with high conviction. This means that, no matter the asset class or the strategy, each investment team has a passion to exceed. We want to help investors achieve better outcomes, such as seeking higher returns, helping mitigate risk and generating income. Of course, investing with high conviction can’t guarantee a profit or ensure success; no investment strategy can. To learn more about how we invest with high conviction, visit invesco.com/HighConviction.
You, too, can invest with high conviction by maintaining a long-term investment perspective and by working with your financial adviser on a regular basis. During periods of short-term market volatility or uncertainty, your financial adviser can keep you focused on your long-term investment goals – a new home, a child’s college education or a secure retirement. He or she also can share research about the economy, the markets and individual investment options.
Visit our website for more information on your investments
Our website, invesco.com/us, offers a wide range of market insights and investment perspectives. On the website, you’ll find detailed information about our funds, including performance, holdings and portfolio manager commentaries. You can access information about your account by completing a simple, secure online registration. To do so, select “Log In” on the right side of the homepage, and then select “Register for Individual Account Access.”
In addition to the resources accessible on our website and through our mobile app, you can obtain timely updates to help you stay informed about the markets and the economy by connecting with Invesco on Twitter, LinkedIn or Facebook. You can access our blog at blog.invesco.us.com. Our goal is to provide you the information you want, when and where you want it.
Finally, I’m pleased to share with you Invesco’s commitment to both the Principles for Responsible Investment and to considering environmental, social and governance issues in our robust investment process. I invite you to learn more at invesco.com/esg.
Have questions?
For questions about your account, contact an Invesco client services representative at 800 959 4246. For Invesco-related questions or comments, please email me directly at phil@invesco.com.
All of us at Invesco look forward to serving your investment management needs. Thank you for investing with us.
Sincerely,

Philip Taylor
Senior Managing Director, Invesco Ltd.
| | |
| 2 | | Invesco Global Targeted Returns Fund |
| | | | |

Bruce Crockett | | Dear Fellow Shareholders: Among the many important lessons I’ve learned in more than 40 years in a variety of business endeavors is the value of a trusted advocate. As independent chair of the Invesco Funds Board, I can assure you that the members of the Board are strong advocates for the interests of investors in Invesco’s mutual funds. We work hard to represent your interests through oversight of the quality of the investment management services your funds receive and other matters important to your investment, including but not limited to: |
| | ∎ | | Ensuring that Invesco offers a diverse lineup of mutual funds that your financial adviser can use to strive to meet your financial needs as your investment goals change over time. |
| | ∎ | | Monitoring how the portfolio management teams of the Invesco funds are performing in light of changing economic and market conditions. |
| ∎ | | Assessing each portfolio management team’s investment performance within the context of the investment strategy described in the fund’s prospectus. |
| ∎ | | Monitoring for potential conflicts of interests that may impact the nature of the services that your funds receive. |
We believe one of the most important services we provide our fund shareholders is the annual review of the funds’ advisory and sub-advisory contracts with Invesco Advisers and its affiliates. This review is required by the Investment Company Act of 1940 and focuses on the nature and quality of the services Invesco provides as the adviser to the Invesco funds and the reasonableness of the fees that it charges for those services. Each year, we spend months carefully reviewing information received from Invesco and a variety of independent sources, such as performance and fee data prepared by Lipper, Inc. (a subsidiary of Broadridge Financial Solutions, Inc.), an independent, third-party firm widely recognized as a leader in its field. We also meet with our independent legal counsel and other independent advisers to review and help us assess the information that we have received. Our goal is to assure that you receive quality investment management services for a reasonable fee.
I trust the measures outlined above provide assurance that you have a worthy advocate when it comes to choosing the Invesco Funds.
As always, please contact me at bruce@brucecrockett.com with any questions or concerns you may have. On behalf of the Board, we look forward to continuing to represent your interests and serving your needs.
Sincerely,

Bruce L. Crockett
Independent Chair
Invesco Funds Board of Trustees
| | |
| 3 | | Invesco Global Targeted Returns Fund |
Management’s Discussion of Fund Performance
| | | | |
| | |
Performance summary For the fiscal year ended October 31, 2018, Class A shares of Invesco Global Targeted Returns Fund (the Fund), at net asset value (NAV), underperformed the FTSE US 3-Month Treasury Bill Index, the Fund’s broad market/style-specific benchmark. Your Fund’s long-term performance appears later in this report. | | |
| | | | | | | | |
| | | |
Fund vs. Indexes | | | | | | | | |
Total returns, 10/31/17 to 10/31/18, at net asset value (NAV). Performance shown does not include applicable contingent deferred sales charges (CDSC) or front-end sales charges, which would have reduced performance. | | | | | |
| | |
Class A Shares | | | -3.60 | % | | | | |
Class C Shares | | | -4.29 | | | | | |
Class R Shares | | | -3.82 | | | | | |
Class Y Shares | | | -3.39 | | | | | |
Class R5 Shares | | | -3.38 | | | | | |
Class R6 Shares | | | -3.39 | | | | | |
FTSE US 3-Month Treasury Bill Indexq (Broad Market/Style-Specific Index) | | | 1.67 | | | | | |
Source(s): qFactSet Research Systems Inc. | | | | | | | | |
Market conditions and your Fund
The Fund’s investment objective is to seek a positive return over the long term in all market environments. The Fund targets an annual gross return of 5% above three-month US Treasury bills and aims to achieve this with less than half the volatility of global equities (as represented by the MSCI World 100% Hedged to USD Index), over a rolling three-year period. The Fund seeks to achieve these targets by investing in long-term investment ideas (typically 20-30 ideas) that are
combined through a risk-managed process into a single portfolio. There is no guarantee that the Fund will achieve either a positive return or its target return, and an investor may lose money by investing in the Fund. Each idea reflects a fundamental macroeconomic view with regard to asset classes, geographies, currencies or sectors globally that have the potential to deliver a positive return over a two- to three-year time horizon. This can include investments in a wide range of asset types, including derivative instruments and physical securities.
| | | | | | |
| Portfolio Composition | | | | | | |
| By asset type | | | | | | |
| | | Risk Allocation1 | | Notional Value as % of Total Net Assets2 | | Value as % of Total Net Assets3 |
| Commodity | | 7.99% | | 38.08% | | 0.20% |
| Credit | | 6.48 | | 32.11 | | 16.23 |
| Currency | | 31.43 | | 46.41 | | 2.14 |
| Equity | | 25.87 | | 729.76 | | 37.39 |
| Inflation | | 7.20 | | 166.84 | | 0.46 |
| Interest Rate | | 15.63 | | 350.18 | | 9.97 |
| Volatility4 | | 5.40 | | 0.83 | | -0.50 |
Money Market Funds Plus Other Assets Less Liabilities | | – | | – | | 34.11 |
The fiscal year proved to be an increasingly volatile time for global equities. The fiscal year began in the final months of 2017 with several US stock market indexes repeatedly reaching new highs amid strong corporate profits, the prospect of tax reform legislation and exceedingly low stock market volatility. Despite a sharp uptick in volatility, particularly in October 2018, US markets, in general, still produced positive returns for the fiscal year. International markets, however, were meaningfully less robust, many experiencing flat to negative results for the fiscal year. This divergence between the US and other markets could be attributed to the strength of the US economy and the widely-held belief that the US could win trade wars with other countries.
At the beginning of 2018, markets saw significant turbulence in late January and early February, when stocks were whip-sawed – first by concerns about accelerated US Federal Reserve (the Fed) tightening and then, later in the year, by fears of brewing trade wars and geopolitical tensions. After a relatively quiet summer, market volatility markedly rose again in the final month of the fiscal year. Global equity markets (particularly the US) suffered a sharp sell-off in October 2018 amid rising interest rates and concerns that higher inflation could result in a more restrictive monetary policy.
Emerging markets were impacted by both country-specific issues, as well as, more generalized pressure resulting from the Fed’s tightening policy. In this environment, economic growth unsurprisingly slowed in emerging markets. Within the eurozone, economic growth accelerated,
| | |
| Total Net Assets | | $100.1 million |
The Fund’s holdings are subject to change, and there is no assurance that the Fund will continue to hold any particular security.
Data presented here are as of October 31, 2018.
| 1 | The values in this column represent the Adviser’s proprietary measure of risk that each asset type contributes to the Fund. The risk associated with each asset type is calculated by aggregating the independent risk, as of the end of the fiscal period, of each of the Fund’s investment ideas that are included in that asset type. Independent risk is determined by measuring the historical price volatility of the assets or asset classes that comprise the investment idea using a statistical measurement called standard deviation. Standard deviation measures how much historical prices vary from their average over a certain period of time. The risk of each investment idea takes into account the Adviser’s evaluation of the risk dynamics and expected correlation of the components of the investment idea based on historical price movements. Historical price movements may not be representative of future price movements and, therefore, the actual risk of each asset type may be much greater or lower than the values shown. In addition, there are ways to measure risk other than standard deviation which, if used, may have resulted in a different risk allocation. |
| 2 | The values in this column represent the gross notional amount of the derivative instruments and other investments held by the Fund, including purchased and written options, futures, swaps and investment companies. The notional amount of a derivative is the nominal or face amount used to calculate payments made on the instrument. The gross notional amount does not reflect any offsetting or netting of long and short positions. The notional amounts of derivatives and other investments denominated in foreign currencies have been adjusted to the US dollar equivalent using spot exchange rates. See the Consolidated Schedule of Investments for a complete list of derivative instruments held by the Fund as of October 31, 2018. |
| 3 | The percentages in this column were calculated by adding the market value of purchased options, the net unrealized appreciation/depreciation of written options, futures, swaps and forwards, and the net asset value of affiliated money market funds held by the Fund. See the Consolidated Schedule of Investments for the complete list of derivative instruments held by the Fund as of October 31, 2018. |
| 4 | Includes the volatility and variance swaps held by the Fund, the gains and losses on which are driven by the volatility (i.e., the positive and negative changes in value over time) of a particular asset, such as stocks or currencies, and not by the asset itself. |
| | |
| 4 | | Invesco Global Targeted Returns Fund |
although there was divergence among countries. In Japan, growth improved over the latter part of the fiscal year.
One of the significant contributors to the Fund’s performance during the fiscal year was the Currency - US Dollar vs Taiwanese Dollar idea, which favored the US dollar. The Taiwanese dollar depreciated throughout the fiscal year as economic growth in the US outpaced growth in Taiwan, and the US dollar strengthened due to the Fed’s tightening policy. This idea was also bolstered by increasing concern over China moving away from importing Taiwanese goods to becoming a competitor. In the Currency - Chile and Mexico vs Australia and New Zealand idea, the Fund’s performance benefited from favoring the Chilean and Mexican pesos against both the Australian and New Zealand dollars. This idea performed well due to lagging economic growth in Australia and New Zealand, compared to that of the emerging economies of the pesos. Specifically, the Mexican peso improved following the country’s election and optimism around the United States-Mexico-Canada Agreement, while Australia and New Zealand struggled as their governments rebalanced following the end of the commodities supercycle. Our Equity - US Large Cap vs Small Cap idea also performed well during the fiscal year. Favoring US large-cap companies over US small-cap companies contributed to the Fund’s performance, primarily due to large-cap growth stocks, such as the FAANG (Facebook, Apple, Amazon, Netflix and Alphabet’s Google) stocks driving growth in US equity markets. Additionally, the rising interest rate environment of the US made small-cap stocks susceptible, since they were relatively more levered and there was increased hardship in borrowing during the fiscal year.
Among the most significant detractors from the Fund’s performance for the fiscal year was the Currency - Swedish Krona vs Euro idea, which favored the Swedish krona against the relatively more expensive euro. The krona depreciated throughout the fiscal year as Swedish economic growth failed to outpace the eurozone by a large margin. We still believe Sweden has better long-term country fundamentals than the eurozone, its biggest trading partner, and continued to hold this idea in the Fund at the close of the fiscal year. The Equity - Dispersion idea, which aims to capture the divergence between individual stocks and their relevant equity indexes, detracted from the Fund’s performance in late 2017 and early 2018. This occurred due to US stocks and their relevant indexes moving up together during
the melt-up in late 2017, and then subsequently falling together in early 2018. Additionally, our Equity - Selective Asia Exposure idea detracted from the Fund’s performance, especially in the latter half of the fiscal year. This idea seeks to benefit from our belief that Asian equities are relatively cheap with stabilizing fundamentals. However, we saw increased volatility and downside in Asian equities due, in part, to trade war threats from the Trump administration.
Over the next two to three years, we believe the global economy may have to contend with structural vulnerabilities as cyclical momentum slows. One example is the impact of the stronger US dollar and trade disruption in some emerging markets. In our view, both US economic momentum and Chinese policy are likely central to extending the current economic cycle. We believe inflation will likely be contained and, while positive wage growth could test policymakers’ resolve, we believe a lack of pricing power and the ongoing debt overhang will keep inflation low versus historical levels. “Price discovery” by central banks likely supports only a gradual change in policy and US and international policies will ultimately converge. Risk assets, impacted by regional drivers, appear to require an increasingly selective and nuanced approach, particularly in emerging markets. We believe volatility will reset at a higher average level and bouts of volatility are likely to be triggered by a broad range of sources, including central bank action and investor behavior.
Our investment ideas make significant use of derivative instruments. Therefore, the performance of the Fund, both positive and negative, can be attributed largely to these instruments. Derivatives can be a cost-effective way to gain exposure to asset classes. However, derivatives may amplify traditional investment risks through the creation of leverage and may be less liquid than traditional securities.
We thank you for your investment in Invesco Global Targeted Returns Fund.
The views and opinions expressed in management’s discussion of Fund performance are those of Invesco Advisers, Inc. These views and opinions are subject to change at any time based on factors such as market and economic conditions. These views and opinions may not be relied upon as investment advice or recommendations, or as an offer for a particular security. The information is not a complete analysis of every aspect of any market, country, industry, security or the Fund. Statements of fact are from sources considered reliable, but Invesco Advisers, Inc. makes no representation or warranty as to their completeness or accuracy. Although historical performance is no guarantee of future results, these insights may help you understand our investment management philosophy.
See important Fund and, if applicable, index disclosures later in this report.
| | |
 | | David Millar Portfolio Manager, is lead manager of Invesco Global Targeted Returns Fund. He joined |
| Invesco in 2013. Mr. Millar earned a BSc (Hons) degree in mathematical statistics from the University of Cape Town. He is a Fellow of the Institute and Faculty of Actuaries. |
| | |
 | | Richard Batty Portfolio Manager, is manager of Invesco Global Targeted Returns Fund. He joined Invesco |
| in 2013. Mr. Batty earned a PhD in financial economics from Brunel University. |
| | |
 | | Dave Jubb Portfolio Manager, is manager of Invesco Global Targeted Returns Fund. He joined Invesco |
| in 2013. Mr. Jubb earned a Bsc (Hons) in mathematics from St. Andrews University. He is a Fellow of the Institute and Faculty of Actuaries. |
| | |
 | | Gwilym Satchell Professional Risk Manager, Portfolio Manager, is manager of Invesco Global Targeted Returns |
| Fund. He joined Invesco in 2013. Mr. Satchell earned a degree in computer science from Warwick University and a master’s degree from the University of Edinburgh Business School. |
| | |
 | | Danielle Singer Chartered Financial Analyst, Portfolio Manager, is manager of Invesco Global Targeted Returns |
| Fund. She joined Invesco in 2014. Ms. Singer earned a BA degree from Middlebury College and an MBA from the University of Chicago with concentrations in analytic finance and econometrics. |
|
| 5 Invesco Global Targeted Returns Fund |
Your Fund’s Long-Term Performance
Results of a $10,000 Investment – Oldest Share Class(es) since Inception
Fund and index data from 12/19/13
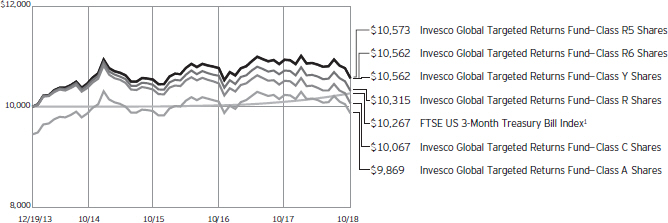
1 Source: FactSet Research Systems Inc.
Past performance cannot guarantee comparable future results.
The data shown in the chart include reinvested distributions, applicable sales charges and Fund expenses including management fees. Index results include reinvested dividends, but they do not reflect sales charges. Performance of the
peer group, if applicable, reflects fund expenses and management fees; performance of a market index does not. Performance shown in the chart and table(s) does not reflect deduction of taxes a shareholder would pay on Fund distributions or sale of Fund shares.
| | |
| 6 | | Invesco Global Targeted Returns Fund |
| | | | |
| |
Average Annual Total Returns | |
As of 10/31/18, including maximum applicable sales charges | |
| |
Class A Shares | | | | |
Inception (12/19/13) | | | -0.27 | % |
1 Year | | | -8.88 | |
| |
Class C Shares | | | | |
Inception (12/19/13) | | | 0.14 | % |
1 Year | | | -5.24 | |
| |
Class R Shares | | | | |
Inception (12/19/13) | | | 0.64 | % |
1 Year | | | -3.82 | |
| |
Class Y Shares | | | | |
Inception (12/19/13) | | | 1.13 | % |
1 Year | | | -3.39 | |
| |
Class R5 Shares | | | | |
Inception (12/19/13) | | | 1.15 | % |
1 Year | | | -3.38 | |
| |
Class R6 Shares | | | | |
Inception (12/19/13) | | | 1.13 | % |
1 Year | | | -3.39 | |
The performance data quoted represent past performance and cannot guarantee comparable future results; current performance may be lower or higher. Please visit invesco.com/performance for the most recent month-end performance. Performance figures reflect reinvested distributions, changes in net asset value and the effect of the maximum sales charge unless otherwise stated. Investment return and principal value will fluctuate so that you may have a gain or loss when you sell shares.
The net annual Fund operating expense ratio set forth in the most recent Fund prospectus as of the date of this report for Class A, Class C, Class R, Class Y, Class R5 and Class R6 shares was 1.44%, 2.19%, 1.69%, 1.19%, 1.19% and 1.19%, respectively.1,2 The total annual Fund operating expense ratio set forth in the most recent Fund prospectus as of the date of this report for Class A, Class C, Class R, Class Y, Class R5 and Class R6 shares was 2.11%, 2.86%, 2.36%, 1.86%, 1.82% and 1.76%, respectively. The expense ratios presented above may vary from the expense ratios presented in other sections of this report that are based on expenses incurred during the period covered by this report.
| | | | |
| |
Average Annual Total Returns | |
As of 9/30/18, the most recent calendar quarter end, including maximum applicable sales charges | |
| |
Class A Shares | | | | |
Inception (12/19/13) | | | 0.11 | % |
1 Year | | | -6.48 | |
| |
Class C Shares | | | | |
Inception (12/19/13) | | | 0.56 | % |
1 Year | | | -2.63 | |
| |
Class R Shares | | | | |
Inception (12/19/13) | | | 1.04 | % |
1 Year | | | -1.32 | |
| |
Class Y Shares | | | | |
Inception (12/19/13) | | | 1.56 | % |
1 Year | | | -0.70 | |
| |
Class R5 Shares | | | | |
Inception (12/19/13) | | | 1.56 | % |
1 Year | | | -0.80 | |
| |
Class R6 Shares | | | | |
Inception (12/19/13) | | | 1.56 | % |
1 Year | | | -0.70 | |
Class A share performance reflects the maximum 5.50% sales charge, and Class C share performance reflects the applicable contingent deferred sales charge (CDSC) for the period involved. The CDSC on Class C shares is 1% for the first year after purchase. Class R, Class Y, Class R5 and Class R6 class shares do not have a front-end sales charge or a CDSC; therefore, performance is at net asset value.
The performance of the Fund’s share classes will differ primarily due to different sales charge structures and class expenses.
Fund performance reflects any applicable fee waivers and/or expense reimbursements. Had the adviser not waived fees and/or reimbursed expenses currently or in the past, returns would have been lower. See current prospectus for more information.
| 1 | Total annual Fund operating expenses after any contractual fee waivers and/or expense reimbursements by the adviser in effect through at least February 29, 2020. See current prospectus for more information. |
| 2 | Total annual Fund operating expenses after any contractual fee waivers and/or expense reimbursements by the adviser in effect through at least June 30, 2020. See current prospectus for more information. |
| | |
| 7 | | Invesco Global Targeted Returns Fund |
Invesco Global Targeted Returns Fund’s investment objective is to seek a positive total return over the long term in all market environments.
| ∎ | | Unless otherwise stated, information presented in this report is as of October 31, 2018, and is based on total net assets. |
| ∎ | | Unless otherwise noted, all data provided by Invesco. |
| ∎ | | To access your Fund’s reports/prospectus, visit invesco.com/fundreports. |
| | |
About share classes ∎ Class R shares are generally available only to employer sponsored retirement and benefit plans. Please see the prospectus for more information. ∎ Class Y shares are available only to certain investors. Please see the prospectus for more information. ∎ Class R5 shares and Class R6 shares are available for use by retirement plans that meet certain standards and for institutional investors. Class R6 shares are also available through intermediaries that have established an agreement with Invesco Distributors, Inc. to make such shares available for use in retail omnibus accounts. Please see the prospectus for more information. Principal risks of investing in the Fund ∎ Changing fixed income market conditions risk. The current low interest rate environment was created in part by the Federal Reserve Board (FRB) and certain foreign central banks keeping the federal funds and equivalent foreign rates near, at or below zero. Increases in the federal funds and equivalent foreign rates may expose fixed income markets to heightened volatility and reduced liquidity for certain fixed income investments, particularly those with longer maturities. In addition, decreases in fixed income dealer market-making capacity may also potentially lead to heightened volatility and reduced liquidity in the fixed income markets. As a result, the value of the Fund’s investments and share price may decline. Changes in central bank policies could also result in higher than normal shareholder redemptions, which could potentially increase portfolio turnover and the Fund’s transaction costs. ∎ Commodities tax risk. The tax treatment of commodity-linked derivative instruments may be adversely affected by changes in legislation, regulations or other legally binding authority. If, as a result of any such adverse action, the income | | of the Fund from certain commodity-linked derivatives was treated as non-qualifying income, the Fund might fail to qualify as a regulated investment company and be subject to federal income tax at the Fund level. As a result of a recent announcement by the Internal Revenue Service, the Fund intends to invest in commodity-linked notes: (a) directly, relying on an opinion of counsel confirming that income from such investments should be qualifying income because such commodity-linked notes constitute securities under section 2(a) (36) of the 1940 Act or (b) indirectly through the Subsidiary. Should the Internal Revenue Service issue further guidance, or Congress enact legislation, that adversely affects the tax treatment of the Fund’s use of commodity-linked notes or the Subsidiary (which guidance might be applied to the Fund retroactively), it could, among other consequences, limit the Fund’s ability to pursue its investment strategy. ∎ Commodity risk. The Fund may have investment exposure to the commodities markets and/or a particular sector of the commodities markets, which may subject the Fund to greater volatility than investments in traditional securities, such as stocks and bonds. Volatility in the commodities markets may be caused by changes in overall market movements, domestic and foreign political and economic events and policies, war, acts of terrorism, changes in domestic or foreign interest rates and/ or investor expectations concerning interest rates, domestic and foreign inflation rates, investment and trading activities of mutual funds, hedge funds and commodities funds, and factors such as drought, floods, weather, livestock disease, embargoes, tariffs and other regulatory developments or supply and demand disruptions. Because the Fund’s performance may be linked to the performance of volatile commodities, investors should be willing to assume the risks of potentially significant |
This report must be accompanied or preceded by a currently effective Fund prospectus, which contains more complete information, including sales charges and expenses. Investors should read it carefully before investing.
NOT FDIC INSURED | MAY LOSE VALUE | NO BANK GUARANTEE
| | fluctuations in the value of the Fund’s shares. |
| ∎ | | Debt securities risk. The prices of debt securities held by the Fund will be affected by changes in interest rates, the creditworthiness of the issuer and other factors. An increase in prevailing interest rates typically causes the value of existing debt securities to fall and often has a greater impact on longer-duration debt securities and higher quality debt securities. Falling interest rates will cause the Fund to reinvest the proceeds of debt securities that have been repaid by the issuer at lower interest rates. Falling interest rates may also reduce the Fund’s distributable income because interest payments on floating rate debt instruments held by the Fund will decline. The Fund could lose money on investments in debt securities if the issuer or borrower fails to meet its obligations to make interest payments and/or to repay principal in a timely manner. Changes in an issuer’s financial strength, the market’s perception of such strength or in the credit rating of the issuer or the security may affect the value of debt securities. The Adviser’s credit analysis may fail to anticipate such changes, which could result in buying a debt security at an inopportune time or failing to sell a debt security in advance of a price decline or other credit event. |
| ∎ | | Derivatives risk. The value of a derivative instrument depends largely on (and is derived from) the value of an underlying security, currency, commodity, interest rate, index or other asset (each referred to as an underlying asset). In addition to risks relating to the underlying assets, the use of derivatives may include other, possibly greater, risks, including counterparty, leverage and liquidity risks. Counterparty risk is the risk that the counterparty to the derivative contract will default on its obligation to pay the Fund the amount owed or otherwise perform under the derivative contract. Derivatives create leverage risk because they do not require payment up front equal to the economic exposure created by owning the derivative. As a result, an adverse change in the value of the underlying asset could result in the Fund sustaining a loss that is substantially greater than the amount invested in |
| | |
| 8 | | Invesco Global Targeted Returns Fund |
| | the derivative, which may make the Fund’s returns more volatile and increase the risk of loss. Derivative instruments may also be less liquid than more traditional investments and the Fund may be unable to sell or close out its derivative positions at a desirable time or price. This risk may be more acute under adverse market conditions, during which the Fund may be most in need of liquidating its derivative positions. Derivatives may also be harder to value, less tax efficient and subject to changing government regulation that could impact the Fund’s ability to use certain derivatives or their cost. The SEC has proposed new regulations related to the use of derivatives and related instruments by registered investment companies. If adopted as proposed, these regulations would limit the Fund’s ability to engage in derivatives transactions and may result in increased costs or require the Fund to modify its investment strategies or to liquidate. Also, derivatives used for hedging or to gain or limit exposure to a particular market segment may not provide the expected benefits, particularly during adverse market conditions. These risks are greater for the Fund than most other mutual funds because the Fund will implement its investment strategy primarily through derivative instruments rather than direct investments in stocks/bonds. |
| ∎ | | Emerging markets securities risk. Emerging markets (also referred to as developing markets) are generally subject to greater market volatility, political, social and economic instability, uncertain trading markets and more governmental limitations on foreign investment than more developed markets. In addition, companies operating in emerging markets may be subject to lower trading volume and greater price fluctuations than companies in more developed markets. Securities law and the enforcement of systems of taxation in many emerging market countries may change quickly and unpredictably. In addition, investments in emerging markets securities may also be subject to additional transaction costs, delays in settlement procedures, and lack of timely information. |
| ∎ | | Exchange-traded funds risk. In addition to the risks associated with the underlying assets held by the exchange-traded fund, investments in exchange-traded funds are subject to the following additional risks: (1) an exchange-traded fund’s shares may trade above or below its net asset value; (2) an active |
| | | trading market for the exchange-traded fund’s shares may not develop or be maintained; (3) trading an exchange-traded fund’s shares may be halted by the listing exchange; (4) a passively managed exchange-traded fund may not track the performance of the reference asset; and (5) a passively managed exchange-traded fund may hold troubled securities. Investment in exchange-traded funds may involve duplication of management fees and certain other expenses, as the Fund indirectly bears its proportionate share of any expenses paid by the exchange-traded funds in which it invests. Further, certain exchange-traded funds in which the Fund may invest are leveraged, which may result in economic leverage, permitting the Fund to gain exposure that is greater than would be the case in an unlevered instrument and potentially resulting in greater volatility. |
| ∎ | | Foreign currency tax risk. If the US Treasury Department were to exercise its authority to issue regulations that exclude from the definition of “qualifying income” foreign currency gains not directly related to the Fund’s business of investing in securities, the Fund may be unable to qualify as a regulated investment company for one or more years. In this event, the Fund’s Board of Trustees may authorize a significant change in investment strategy or other action. |
| ∎ | | Foreign government debt risk. Investments in foreign government debt securities (sometimes referred to as sovereign debt securities) involve certain risks in addition to those relating to foreign securities or debt securities generally. The issuer of the debt or the governmental authorities that control the repayment of the debt may be unable or unwilling to repay principal or interest when due in accordance with the terms of such debt, and the Fund may have limited recourse in the event of a default against the defaulting government. Without the approval of debt holders, some governmental debtors have in the past been able to reschedule or restructure their debt payments or declare moratoria on payments. |
| ∎ | | Foreign securities risk. The Fund’s foreign investments may be adversely affected by political and social instability, changes in economic or taxation policies, difficulty in enforcing obligations, decreased liquidity or increased volatility. Foreign investments also involve the risk of the possible seizure, nationalization or expropriation of the issuer or foreign deposits (in which the Fund could lose its entire investments in a |
| | | certain market) and the possible adoption of foreign governmental restrictions such as exchange controls. Unless the Fund has hedged its foreign securities risk, foreign securities risk also involves the risk of negative foreign currency rate fluctuations, which may cause the value of securities denominated in such foreign currency (or other instruments through which the Fund has exposure to foreign currencies) to decline in value. Currency exchange rates may fluctuate significantly over short periods of time. Currency hedging strategies, if used, are not always successful. |
| ∎ | | High yield debt securities (junk bond) risk. Investments in high yield debt securities (“junk bonds”) and other lower-rated securities will subject the Fund to substantial risk of loss. These securities are considered to be speculative with respect to the issuer’s ability to pay interest and principal when due, are more susceptible to default or decline in market value and are less liquid than investment grade debt securities. Prices of high yield debt securities tend to be very volatile. |
| ∎ | | Inflation-indexed securities risk. The values of inflation-indexed securities generally fluctuate in response to changes in real interest rates, and the Fund’s income from its investments in these securities is likely to fluctuate considerably more than the income distributions of its investments in more traditional fixed-income securities. |
| ∎ | | Inflation-indexed securities tax risk. Any increase in the principal amount of an inflation-indexed security may be included for tax purposes in the Fund’s gross income, even though no cash attributable to such gross income has been received by the Fund. In such event, the Fund may be required to make annual distributions to shareholders that exceed the cash it has otherwise received. In order to pay such distributions, the Fund may be required to raise cash by selling portfolio investments. The sale of such investments could result in capital gains to the Fund and additional capital gain distributions to shareholders. In addition, adjustments during the taxable year for deflation to an inflation-indexed bond held by the Fund may cause amounts previously distributed to shareholders in the taxable year as income to be characterized as a return of capital. |
| ∎ | | Investing in the European Union risk. Investments in certain countries in the European Union are susceptible to high economic risks associated with high |
| | |
| 9 | | Invesco Global Targeted Returns Fund |
| | levels of debt, such as investments in sovereign debt of Greece, Italy and Spain. Efforts of the member states to further unify their economic and monetary policies may increase the potential for the downward movement of one member state’s market to cause a similar effect on other member states’ markets. Separately, the European Union faces issues involving its membership, structure, procedures and policies. The exit of one or more member states from the European Union, such as the United Kingdom (UK) which has announced its intention to exit, would place its currency and banking system in jeopardy. The exit by the UK or other member states will likely result in increased volatility, illiquidity and potentially lower economic growth in the affected markets, which will adversely affect the Fund’s investments. |
| ∎ | | Investment companies risk. Investing in other investment companies could result in the duplication of certain fees, including management and administrative fees, and may expose the Fund to the risks of owning the underlying investments that the other investment company holds. |
| ∎ | | Management risk. The Fund is actively managed and depends heavily on the Adviser’s judgment about markets, interest rates or the attractiveness, relative values, liquidity, or potential appreciation of particular investments made for the Fund’s portfolio. The Fund could experience losses if these judgments prove to be incorrect. Because the Fund’s investment process relies heavily on its asset allocation process, market movements that are counter to the portfolio managers’ expectations may have a significant adverse effect on the Fund’s net asset value. Additionally, legislative, regulatory, or tax developments may adversely affect management of the Fund and, therefore, the ability of the Fund to achieve its investment objective. |
| ∎ | | Market risk. The market values of the Fund’s investments, and therefore the value of the Fund’s shares, will go up and down, sometimes rapidly or unpredictably. Market risk may affect a single issuer, industry or section of the economy, or it may affect the market as a whole. Individual stock prices tend to go up and down more dramatically than those of certain other types of investments, such as bonds. During a general downturn in the financial markets, multiple asset classes may decline in value. When markets perform well, there can be no assurance that specific investments held by the Fund will rise in value. |
| ∎ | | REIT risk/real estate risk. Investments in real estate related instruments may be affected by economic, legal, cultural, environmental or technological factors that affect property values, rents or occupancies of real estate related to the Fund’s holdings. Shares of real estate related companies, which tend to be small- and mid-cap companies, may be more volatile and less liquid. |
| ∎ | | Short position risk. Because the Fund’s potential loss on a short position arises from increases in the value of the asset sold short, the Fund will incur a loss on a short position, which is theoretically unlimited, if the price of the asset sold short increases from the short sale price. The counterparty to a short position or other market factors may prevent the Fund from closing out a short position at a desirable time or price and may reduce or eliminate any gain or result in a loss. In a rising market, the Fund’s short positions will cause the Fund to underperform the overall market and its peers that do not engage in shorting. If the Fund holds both long and short positions, and both positions decline simultaneously, the short positions will not provide any buffer (hedge) from declines in value of the Fund’s long positions. Certain types of short positions involve leverage, which may exaggerate any losses, potentially more than the actual cost of the investment, and will increase the volatility of the Fund’s returns. |
| ∎ | | Small- and mid-capitalization companies risks. Small- and mid-capitalization companies tend to be more vulnerable to changing market conditions, may have little or no operating history or track record of success, and may have more limited product lines and markets, less experienced management and fewer financial resources than larger companies. These companies’ securities may be more volatile and less liquid than those of more established companies, and their returns may vary, sometimes significantly, from the overall securities market. |
| ∎ | | Subsidiary risk. By investing in the Subsidiary, the Fund is indirectly exposed to risks associated with the Subsidiary’s investments. The Subsidiary is not registered under the Investment Company Act of 1940, as amended (1940 Act), and, except as otherwise noted in this prospectus, is not subject to the investor protections of the 1940 Act. Changes in the laws of the United States and/ or the Cayman Islands, under which the Fund and the Subsidiary, respectively, are organized, could result in the inability |
| | | of the Fund and/or the Subsidiary to operate as described in this prospectus and the SAI, and could negatively affect the Fund and its shareholders. |
| ∎ | | US government obligations risk. Obligations of US government agencies and authorities receive varying levels of support and may not be backed by the full faith and credit of the US government, which could affect the Fund’s ability to recover should they default. No assurance can be given that the US government will provide financial support to its agencies and authorities if it is not obligated by law to do so. |
| ∎ | | Volatility risk. Although the Fund’s investment strategy targets a specific volatility level, certain of the Fund’s investments may appreciate or decrease significantly in value over short periods of time. This may cause the Fund’s net asset value per share to experience significant increases or declines in value over short periods of time. |
About indexes used in this report
| ∎ | | The FTSE US 3-Month Treasury Bill Index is an unmanaged index representative of three-month US Treasury bills. |
| ∎ | | The MSCI World 100% Hedged to USD IndexSM is an unmanaged index considered representative of stocks of developed countries. The index is 100% hedged to the US dollar. |
| ∎ | | The Fund is not managed to track the performance of any particular index, including the index(es) described here, and consequently, the performance of the Fund may deviate significantly from the performance of the index(es). |
| ∎ | | A direct investment cannot be made in an index. Unless otherwise indicated, index results include reinvested dividends, and they do not reflect sales charges. Performance of the peer group, if applicable, reflects fund expenses; performance of a market index does not. |
Other information
| ∎ | | The returns shown in management’s discussion of Fund performance are based on net asset values (NAVs) calculated for shareholder transactions. Generally accepted accounting principles require adjustments to be made to the net assets of the Fund at period end for financial reporting purposes, and as such, the NAVs for shareholder transactions and the returns based on those NAVs may differ from the NAVs and returns reported in the Financial Highlights. |
| | |
| 10 | | Invesco Global Targeted Returns Fund |
Consolidated Schedule of Investments
October 31, 2018
| | | | | | | | |
| | | Shares | | | Value | |
Common Stocks & Other Equity Interests–30.59% | |
| Australia–0.35% | |
Alumina Ltd. | | | 9,000 | | | $ | 16,251 | |
Amcor Ltd. | | | 6,425 | | | | 60,509 | |
BHP Billiton PLC | | | 3,931 | | | | 78,493 | |
Fairfax Media Ltd. | | | 21,402 | | | | 9,699 | |
Metcash Ltd. | | | 12,623 | | | | 24,636 | |
Newcrest Mining Ltd. | | | 2,037 | | | | 29,912 | |
Origin Energy Ltd.(a) | | | 3,633 | | | | 18,789 | |
QBE Insurance Group Ltd. | | | 5,747 | | | | 46,141 | |
Telstra Corp. Ltd. | | | 9,108 | | | | 19,918 | |
Woodside Petroleum Ltd. | | | 1,896 | | | | 46,883 | |
| | | | | | | | 351,231 | |
|
| Austria–0.03% | |
Verbund AG | | | 632 | | | | 25,440 | |
|
| Belgium–0.10% | |
Colruyt S.A. | | | 401 | | | | 23,304 | |
UCB S.A. | | | 903 | | | | 75,779 | |
| | | | | | | | 99,083 | |
|
| Brazil–0.19% | |
EZ Tec Empreendimentos e Participacoes S.A. | | | 11,335 | | | | 72,809 | |
Kroton Educacional S.A. | | | 6,200 | | | | 18,996 | |
Telefonica Brasil S.A.–Preference Shares | | | 8,887 | | | | 102,919 | |
| | | | | | | | 194,724 | |
|
| Canada–0.34% | |
Agnico Eagle Mines Ltd. | | | 1,698 | | | | 60,041 | |
Canadian Natural Resources Ltd. | | | 5,240 | | | | 143,789 | |
Goldcorp, Inc. | | | 5,311 | | | | 47,905 | |
Methanex Corp. | | | 670 | | | | 43,369 | |
PrairieSky Royalty Ltd. | | | 2,634 | | | | 40,021 | |
| | | | | | | | 335,125 | |
|
| China–2.15% | |
51job, Inc.–ADR(a) | | | 1,589 | | | | 97,581 | |
Alibaba Group Holding Ltd.–ADR(a) | | | 703 | | | | 100,023 | |
Baidu, Inc.–ADR(a) | | | 1,189 | | | | 225,981 | |
Bank of China Ltd.–Class H | | | 222,000 | | | | 94,365 | |
Bitauto Holdings Ltd.–ADR(a) | | | 2,720 | | | | 51,952 | |
Changyou.com Ltd.–ADR | | | 270 | | | | 3,613 | |
China Communications Services Corp. Ltd.–Class H | | | 32,000 | | | | 25,930 | |
China Conch Venture Holdings Ltd. | | | 25,500 | | | | 71,718 | |
China Mobile Ltd. | | | 24,000 | | | | 224,348 | |
China Oilfield Services Ltd.–Class H | | | 6,000 | | | | 5,650 | |
China Resources Power Holdings Co. Ltd. | | | 32,000 | | | | 56,235 | |
CNOOC Ltd. | | | 99,000 | | | | 167,725 | |
| | | | | | | | |
| | | Shares | | | Value | |
| China–(continued) | |
Dongfeng Motor Group Co. Ltd.–Class H | | | 62,000 | | | $ | 61,327 | |
ENN Energy Holdings Ltd. | | | 8,000 | | | | 68,207 | |
FIH Mobile Ltd.(a) | | | 8,000 | | | | 748 | |
Industrial & Commercial Bank of China Ltd.–Class H | | | 265,000 | | | | 178,634 | |
JD.com, Inc.–ADR(a) | | | 6,832 | | | | 160,689 | |
Minth Group Ltd. | | | 20,000 | | | | 65,141 | |
NetEase, Inc.–ADR | | | 766 | | | | 159,213 | |
Qingdao Port International Co., Ltd.–Class H–REGS(a)(b) | | | 86,000 | | | | 50,450 | |
Sohu.com Ltd.–ADR(a) | | | 280 | | | | 5,060 | |
Tencent Holdings Ltd. | | | 8,000 | | | | 271,179 | |
Zhejiang Expressway Co., Ltd.–Class H | | | 12,000 | | | | 10,131 | |
| | | | | | | | 2,155,900 | |
|
| Denmark–0.45% | |
A.P. Møller — Maersk A/S–Class B | | | 52 | | | | 66,028 | |
Carlsberg A/S–Class B | | | 713 | | | | 78,650 | |
Dfds A/S | | | 657 | | | | 28,127 | |
DSV A/S | | | 488 | | | | 39,236 | |
GN Store Nord A/S | | | 1,637 | | | | 69,317 | |
Novo Nordisk A/S–Class B | | | 1,401 | | | | 60,508 | |
Rockwool International A/S–Class B | | | 86 | | | | 29,366 | |
Royal Unibrew A/S | | | 770 | | | | 54,619 | |
Sydbank A/S | | | 391 | | | | 9,023 | |
William Demant Holding A/S(a) | | | 612 | | | | 20,143 | |
| | | | | | | | 455,017 | |
|
| Faroe Islands–0.05% | |
Bakkafrost P/F | | | 935 | | | | 52,499 | |
|
| Finland–0.47% | |
Nokia Oyj | | | 24,035 | | | | 135,430 | |
Stora Enso Oyj–Class R | | | 6,745 | | | | 101,624 | |
UPM-Kymmene Oyj | | | 7,107 | | | | 228,643 | |
| | | | | | | | 465,697 | |
|
| France–2.09% | |
Airbus S.E. | | | 351 | | | | 38,678 | |
Altran Technologies S.A. | | | 3,336 | | | | 33,130 | |
AXA S.A. | | | 2,007 | | | | 50,231 | |
BNP Paribas S.A. | | | 2,340 | | | | 121,991 | |
Capgemini S.E. | | | 1,251 | | | | 152,996 | |
Carrefour S.A. | | | 6,360 | | | | 123,515 | |
Cie Generale des Etablissements Michelin SCA | | | 1,406 | | | | 144,018 | |
Dassault Aviation S.A. | | | 31 | | | | 51,428 | |
Engie S.A. | | | 5,096 | | | | 67,950 | |
L’Oreal S.A. | | | 354 | | | | 79,733 | |
Nexity S.A. | | | 260 | | | | 12,439 | |
See accompanying Notes to Consolidated Financial Statements which are an integral part of the financial statements.
11 Invesco Global Targeted Returns Fund
| | | | | | | | |
| | | Shares | | | Value | |
| France–(continued) | |
Orange S.A. | | | 16,009 | | | $ | 250,205 | |
Peugeot S.A. | | | 3,243 | | | | 76,921 | |
Safran S.A. | | | 917 | | | | 118,094 | |
Sanofi | | | 609 | | | | 54,421 | |
Société Générale S.A. | | | 1,534 | | | | 56,336 | |
Teleperformance | | | 441 | | | | 72,658 | |
TOTAL S.A. | | | 9,981 | | | | 585,647 | |
| | | | | | | | 2,090,391 | |
|
| Germany–1.23% | |
Allianz S.E. | | | 308 | | | | 64,329 | |
Aurubis AG | | | 124 | | | | 7,538 | |
BASF S.E. | | | 1,743 | | | | 134,276 | |
Bayer AG | | | 5,417 | | | | 415,777 | |
Beiersdorf AG | | | 177 | | | | 18,320 | |
Covestro AG–REGS(b) | | | 257 | | | | 16,623 | |
Deutsche Post AG | | | 6,775 | | | | 214,433 | |
Deutsche Telekom AG | | | 4,782 | | | | 78,492 | |
Fraport AG Frankfurt Airport Services Worldwide | | | 174 | | | | 13,458 | |
Hochtief AG | | | 349 | | | | 51,772 | |
SAP S.E. | | | 689 | | | | 73,856 | |
TAG Immobilien AG | | | 1,078 | | | | 24,634 | |
TUI AG | | | 724 | | | | 12,019 | |
Volkswagen AG–Preference Shares | | | 635 | | | | 106,969 | |
| | | | | | | | 1,232,496 | |
|
| Hong Kong–0.68% | |
AIA Group Ltd. | | | 40,000 | | | | 304,262 | |
CK Asset Holdings Ltd. | | | 14,000 | | | | 90,652 | |
CK Hutchison Holdings Ltd. | | | 17,500 | | | | 175,836 | |
Pacific Basin Shipping Ltd. | | | 49,000 | | | | 10,710 | |
Standard Chartered PLC | | | 14,400 | | | | 100,660 | |
| | | | | | | | 682,120 | |
|
| India–0.80% | |
Adani Ports & Special Economic Zone Ltd. | | | 11,257 | | | | 48,655 | |
Godrej Consumer Products Ltd. | | | 3,998 | | | | 39,185 | |
HDFC Bank Ltd.–ADR | | | 2,491 | | | | 221,475 | |
Housing Development Finance Corp. Ltd. | | | 1,272 | | | | 30,492 | |
ICICI Bank Ltd.–ADR | | | 17,279 | | | | 163,980 | |
Infosys Ltd.–ADR | | | 13,184 | | | | 124,852 | |
UPL Ltd. | | | 12,665 | | | | 116,073 | |
Zee Entertainment Enterprises Ltd. | | | 8,443 | | | | 51,646 | |
| | | | | | | | 796,358 | |
|
| Indonesia–0.06% | |
PT Bank Negara Indonesia (Persero) Tbk | | | 132,000 | | | | 63,971 | |
|
| Ireland–0.16% | |
AerCap Holdings N.V.(a) | | | 506 | | | | 25,340 | |
CRH PLC | | | 1,405 | | | | 41,973 | |
| | | | | | | | |
| | | Shares | | | Value | |
| Ireland–(continued) | |
Kingspan Group PLC | | | 1,751 | | | $ | 76,141 | |
Smurfit Kappa Group PLC | | | 548 | | | | 17,971 | |
| | | | | | | | 161,425 | |
|
| Italy–0.46% | |
Banco BPM S.p.A.(a) | | | 33,440 | | | | 62,729 | |
Eni S.p.A. | | | 5,412 | | | | 96,255 | |
Intesa Sanpaolo S.p.A. | | | 81,098 | | | | 179,355 | |
Iren S.p.A. | | | 4,675 | | | | 10,127 | |
Telecom Italia S.p.A.(a) | | | 186,459 | | | | 109,803 | |
| | | | | | | | 458,269 | |
|
| Japan–0.27% | |
INPEX Corp. | | | 2,500 | | | | 28,783 | |
Mitsubishi Estate Co., Ltd. | | | 1,700 | | | | 27,115 | |
NEXON Co., Ltd.(a) | | | 800 | | | | 9,064 | |
Sumitomo Mitsui Financial Group, Inc. | | | 2,400 | | | | 93,209 | |
Toyota Motor Corp. | | | 1,900 | | | | 111,218 | |
| | | | | | | | 269,389 | |
|
| Jersey–0.07% | |
Randgold Resources Ltd. | | | 828 | | | | 65,078 | |
|
| Jordan–0.08% | |
Hikma Pharmaceuticals PLC | | | 3,084 | | | | 74,945 | |
|
| Luxembourg–0.01% | |
RTL Group S.A. | | | 226 | | | | 14,511 | |
|
| Malaysia–0.01% | |
British American Tobacco Malaysia Bhd. | | | 1,100 | | | | 8,176 | |
|
| Mexico–0.09% | |
Fibra Uno Administracion S.A. de C.V. | | | 87,500 | | | | 93,736 | |
|
| Netherlands–0.65% | |
ASM International N.V. | | | 670 | | | | 28,823 | |
Heineken Holding N.V. | | | 550 | | | | 47,646 | |
ING Groep N.V. | | | 14,898 | | | | 176,219 | |
Koninklijke Ahold Delhaize N.V. | | | 11,195 | | | | 256,460 | |
Koninklijke DSM N.V. | | | 296 | | | | 25,937 | |
SBM Offshore N.V. | | | 3,563 | | | | 61,651 | |
Wolters Kluwer N.V. | | | 995 | | | | 56,517 | |
| | | | | | | | 653,253 | |
|
| Norway–0.58% | |
Equinor ASA | | | 10,608 | | | | 273,278 | |
Leroy Seafood Group ASA | | | 2,431 | | | | 22,349 | |
Orkla ASA | | | 3,369 | | | | 29,032 | |
SalMar ASA | | | 1,599 | | | | 84,183 | |
Telenor ASA | | | 3,400 | | | | 62,261 | |
TGS NOPEC Geophysical Co. ASA | | | 2,065 | | | | 68,692 | |
Yara International ASA | | | 900 | | | | 38,627 | |
| | | | | | | | 578,422 | |
See accompanying Notes to Consolidated Financial Statements which are an integral part of the financial statements.
12 Invesco Global Targeted Returns Fund
| | | | | | | | |
| | | Shares | | | Value | |
| Philippines–0.02% | |
Robinsons Retail Holdings, Inc. | | | 16,620 | | | $ | 23,580 | |
|
| Russia–0.16% | |
Evraz PLC | | | 11,098 | | | | 77,015 | |
Sberbank of Russia PJSC–ADR | | | 6,760 | | | | 79,459 | |
| | | | | | | | 156,474 | |
|
| Singapore–0.20% | |
DBS Group Holdings Ltd. | | | 4,000 | | | | 67,869 | |
Parkway Life REIT | | | 3,200 | | | | 6,006 | |
United Overseas Bank Ltd. | | | 7,200 | | | | 126,999 | |
| | | | | | | | 200,874 | |
|
| South Africa–0.09% | |
Anglo American PLC | | | 2,507 | | | | 53,673 | |
Naspers Ltd.–Class N | | | 234 | | | | 40,984 | |
| | | | | | | | 94,657 | |
|
| South Korea–1.43% | |
E-MART Inc. | | | 108 | | | | 19,318 | |
Hyundai Motor Co. | | | 650 | | | | 60,888 | |
Hyundai Motor Co.–Preference Shares | | | 922 | | | | 57,414 | |
Hyundai Steel Co. | | | 531 | | | | 19,528 | |
Kangwon Land, Inc. | | | 898 | | | | 22,660 | |
KB Financial Group Inc. | | | 3,336 | | | | 138,729 | |
Korea Electric Power Corp. | | | 5,236 | | | | 124,794 | |
LG Chem Ltd. | | | 124 | | | | 37,918 | |
LG Corp. | | | 1,467 | | | | 85,597 | |
POSCO | | | 391 | | | | 88,188 | |
Samsung Electronics Co., Ltd. | | | 11,052 | | | | 413,243 | |
Samsung Electronics Co., Ltd.–Preference Shares | | | 6,505 | | | | 204,937 | |
Samsung Fire & Marine Insurance Co., Ltd. | | | 196 | | | | 47,890 | |
Shinhan Financial Group Co., Ltd. | | | 2,830 | | | | 105,157 | |
| | | | | | | | 1,426,261 | |
|
| Spain–0.52% | |
Atresmedia Corp. de Medios de Comunicación, S.A. | | | 3,502 | | | | 19,757 | |
Banco Bilbao Vizcaya Argentaria, S.A. | | | 9,662 | | | | 53,325 | |
Banco Santander S.A. | | | 20,921 | | | | 99,160 | |
Banco Santander S.A.–Rts.(a) | | | 20,921 | | | | 813 | |
Bankia S.A. | | | 18,606 | | | | 58,428 | |
CaixaBank, S.A. | | | 43,157 | | | | 174,657 | |
Industria de Diseno Textil, S.A. | | | 2,036 | | | | 57,411 | |
Mediaset Espana Comunicacion S.A. | | | 2,947 | | | | 20,038 | |
Merlin Properties SOCIMI, S.A. | | | 2,008 | | | | 25,170 | |
Neinor Homes, S.L.U.–REGS(a)(b) | | | 769 | | | | 12,366 | |
| | | | | | | | 521,125 | |
|
| Sweden–0.62% | |
Autoliv, Inc. | | | 1,183 | | | | 98,591 | |
Axfood AB | | | 2,237 | | | | 39,899 | |
Loomis AB–Class B | | | 906 | | | | 27,989 | |
| | | | | | | | |
| | | Shares | | | Value | |
| Sweden–(continued) | |
Sandvik AB | | | 4,757 | | | $ | 75,217 | |
Securitas AB–Class B | | | 4,950 | | | | 84,826 | |
SSAB AB–Class A | | | 2,763 | | | | 11,034 | |
SSAB AB–Class B | | | 10,083 | | | | 32,658 | |
Svenska Cellulosa AB SCA–Class B | | | 7,230 | | | | 68,422 | |
Swedish Match AB | | | 1,642 | | | | 83,653 | |
Swedish Orphan Biovitrum AB(a) | | | 1,106 | | | | 22,572 | |
Telia Co. AB | | | 17,666 | | | | 79,489 | |
| | | | | | | | 624,350 | |
|
| Switzerland–1.42% | |
Adecco Group AG | | | 814 | | | | 39,820 | |
Barry Callebaut AG | | | 13 | | | | 25,358 | |
Bucher Industries AG | | | 45 | | | | 12,384 | |
Coca-Cola HBC AG | | | 1,107 | | | | 32,681 | |
Flughafen Zürich AG | | | 107 | | | | 21,113 | |
Georg Fischer AG | | | 22 | | | | 20,407 | |
Glencore PLC | | | 38,286 | | | | 156,012 | |
Logitech International S.A. | | | 865 | | | | 32,005 | |
Novartis AG | | | 3,102 | | | | 270,846 | |
Roche Holding AG | | | 1,859 | | | | 451,016 | |
SGS S.A. | | | 29 | | | | 68,697 | |
Sunrise Communications Group AG–REGS(b) | | | 342 | | | | 30,082 | |
UBS Group AG | | | 7,335 | | | | 102,333 | |
Zurich Insurance Group AG | | | 507 | | | | 157,293 | |
| | | | | | | | 1,420,047 | |
|
| Taiwan–0.88% | |
Asustek Computer Inc. | | | 5,000 | | | | 36,843 | |
China Life Insurance Co., Ltd. | | | 16,380 | | | | 15,613 | |
Delta Electronics Inc. | | | 9,000 | | | | 38,055 | |
Gigabyte Technology Co., Ltd. | | | 11,000 | | | | 14,287 | |
Hon Hai Precision Industry Co., Ltd. | | | 29,400 | | | | 75,149 | |
MediaTek Inc. | | | 11,000 | | | | 81,552 | |
Taiwan Semiconductor Manufacturing Co. Ltd. | | | 25,000 | | | | 185,693 | |
Taiwan Semiconductor Manufacturing Co. Ltd.–ADR | | | 11,437 | | | | 435,750 | |
Yageo Corp. | | | 1 | | | | 7 | |
| | | | | | | | 882,949 | |
|
| Thailand–0.14% | |
Bangkok Bank PCL | | | 13,200 | | | | 84,685 | |
Bangkok Bank PCL–NVDR | | | 7,500 | | | | 46,991 | |
CPN Retail Growth Leasehold REIT | | | 14,800 | | | | 11,736 | |
| | | | | | | | 143,412 | |
|
| United Arab Emirates–0.00% | |
Borr Drilling Ltd.(a) | | | 106 | | | | 411 | |
|
| United Kingdom–10.57% | |
Aviva PLC | | | 60,183 | | | | 329,212 | |
Babcock International Group PLC | | | 16,188 | | | | 126,447 | |
See accompanying Notes to Consolidated Financial Statements which are an integral part of the financial statements.
13 Invesco Global Targeted Returns Fund
| | | | | | | | |
| | | Shares | | | Value | |
| United Kingdom–(continued) | |
BAE Systems PLC | | | 67,728 | | | $ | 455,113 | |
Balfour Beatty PLC | | | 17,561 | | | | 59,047 | |
Barclays PLC | | | 142,498 | | | | 313,390 | |
Barratt Developments PLC | | | 2,215 | | | | 14,529 | |
Beazley PLC | | | 18,545 | | | | 125,020 | |
BP PLC | | | 140,223 | | | | 1,015,549 | |
British American Tobacco PLC | | | 10,834 | | | | 469,869 | |
British Land Co. PLC (The) | | | 13,802 | | | | 104,351 | |
BT Group PLC | | | 107,265 | | | | 329,757 | |
BTG PLC(a) | | | 15,798 | | | | 111,448 | |
Bunzl PLC | | | 4,221 | | | | 124,563 | |
Capita PLC(a) | | | 44,398 | | | | 72,997 | |
Dairy Crest Group PLC | | | 8,465 | | | | 51,740 | |
Derwent London PLC | | | 3,336 | | | | 124,875 | |
Drax Group PLC | | | 4,026 | | | | 20,663 | |
easyJet PLC | | | 17,054 | | | | 261,540 | |
Electrocomponents PLC | | | 2,120 | | | | 16,771 | |
Essentra PLC | | | 14,395 | | | | 70,276 | |
G4S PLC | | | 80,466 | | | | 220,800 | |
GlaxoSmithKline PLC | | | 12,811 | | | | 247,687 | |
Grafton Group PLC(c) | | | 1,449 | | | | 13,407 | |
Hays PLC | | | 8,141 | | | | 17,034 | |
Hiscox Ltd. | | | 7,740 | | | | 161,037 | |
Howden Joinery Group PLC | | | 6,297 | | | | 37,751 | |
HSBC Holdings PLC | | | 6,800 | | | | 55,750 | |
Imperial Brands PLC | | | 5,112 | | | | 173,188 | |
Inchcape PLC | | | 2,287 | | | | 15,812 | |
InterContinental Hotels Group PLC | | | 898 | | | | 47,113 | |
International Consolidated Airlines Group, S.A. | | | 10,036 | | | | 77,401 | |
International Consolidated Airlines Group, S.A. | | | 12,353 | | | | 95,260 | |
Intertek Group PLC | | | 735 | | | | 44,036 | |
J Sainsbury PLC | | | 66,489 | | | | 264,436 | |
Lancashire Holdings Ltd. | | | 9,499 | | | | 71,552 | |
Legal & General Group PLC | | | 109,270 | | | | 350,911 | |
Marks & Spencer Group PLC | | | 64,058 | | | | 242,324 | |
N Brown Group PLC | | | 13,226 | | | | 22,903 | |
NewRiver REIT PLC | | | 42,349 | | | | 136,929 | |
Next PLC | | | 4,286 | | | | 285,050 | |
PageGroup PLC | | | 5,218 | | | | 33,476 | |
Pearson PLC | | | 7,178 | | | | 82,328 | |
Persimmon PLC | | | 2,802 | | | | 82,147 | |
Provident Financial PLC(a) | | | 11,398 | | | | 74,348 | |
RELX PLC | | | 12,065 | | | | 238,795 | |
Rentokil Initial PLC | | | 35,207 | | | | 142,273 | |
Rightmove PLC | | | 4,750 | | | | 27,448 | |
Rolls-Royce Holdings PLC | | | 43,498 | | | | 466,404 | |
Rolls-Royce Holdings PLC–Preference
Shares(a) | | | 1,963,970 | | | | 2,510 | |
Royal Bank of Scotland Group PLC (The) | | | 111,138 | | | | 335,769 | |
| | | | | | | | |
| | | Shares | | | Value | |
| United Kingdom–(continued) | |
Royal Dutch Shell PLC–Class A | | | 20,031 | | | $ | 640,118 | |
Royal Dutch Shell PLC–Class B | | | 4,145 | | | | 134,939 | |
Royal Dutch Shell PLC–Class A | | | 9,313 | | | | 295,596 | |
Royal Mail PLC | | | 9,803 | | | | 44,976 | |
RSA Insurance Group PLC | | | 18,251 | | | | 131,645 | |
Smith & Nephew PLC | | | 2,603 | | | | 42,326 | |
SSP Group PLC | | | 2,186 | | | | 18,651 | |
Stagecoach Group PLC | | | 29,677 | | | | 57,953 | |
Standard Chartered PLC | | | 4,516 | | | | 31,714 | |
TalkTalk Telecom Group PLC | | | 47,743 | | | | 73,219 | |
Tate & Lyle PLC | | | 9,529 | | | | 81,983 | |
Tesco PLC | | | 91,078 | | | | 248,276 | |
Thomas Cook Group PLC | | | 151,903 | | | | 87,592 | |
TP ICAP PLC | | | 11,059 | | | | 40,987 | |
Vectura Group PLC(a) | | | 24,035 | | | | 21,840 | |
Victrex PLC | | | 339 | | | | 11,490 | |
Vodafone Group PLC | | | 152,381 | | | | 287,869 | |
WH Smith PLC | | | 728 | | | | 18,074 | |
Whitbread PLC | | | 250 | | | | 14,058 | |
William Hill PLC | | | 9,007 | | | | 24,196 | |
Wm Morrison Supermarkets PLC | | | 4,423 | | | | 14,024 | |
| | | | | | | | 10,584,562 | |
|
| United States–3.13% | |
Allergan PLC | | | 378 | | | | 59,728 | |
Altria Group, Inc. | | | 3,576 | | | | 232,583 | |
American Express Co. | | | 825 | | | | 84,752 | |
Amgen Inc. | | | 364 | | | | 70,175 | |
Anthem, Inc. | | | 189 | | | | 52,083 | |
Aon PLC | | | 521 | | | | 81,370 | |
Apache Corp. | | | 1,273 | | | | 48,157 | |
Baker Hughes, a GE Co. | | | 4,577 | | | | 122,160 | |
Berkshire Hathaway Inc.–Class B(a) | | | 353 | | | | 72,464 | |
Biogen Inc.(a) | | | 141 | | | | 42,902 | |
Booking Holdings Inc.(a) | | | 20 | | | | 37,491 | |
Broadcom Inc. | | | 376 | | | | 84,032 | |
Chevron Corp. | | | 1,540 | | | | 171,941 | |
Citigroup Inc. | | | 3,434 | | | | 224,790 | |
eBay Inc.(a) | | | 1,024 | | | | 29,727 | |
First Republic Bank | | | 1,469 | | | | 133,664 | |
Gilead Sciences, Inc. | | | 1,638 | | | | 111,679 | |
JPMorgan Chase & Co. | | | 1,715 | | | | 186,969 | |
Las Vegas Sands Corp. | | | 2,626 | | | | 134,005 | |
Markel Corp.(a) | | | 57 | | | | 62,315 | |
Mastercard Inc.–Class A | | | 151 | | | | 29,848 | |
Microsoft Corp. | | | 654 | | | | 69,854 | |
Nasdaq, Inc. | | | 1,487 | | | | 128,938 | |
National Oilwell Varco Inc. | | | 2,763 | | | | 101,678 | |
Newmont Mining Corp. | | | 1,811 | | | | 55,996 | |
Pfizer Inc. | | | 3,568 | | | | 153,638 | |
Samsonite International S.A.(a)(b) | | | 11,700 | | | | 33,572 | |
See accompanying Notes to Consolidated Financial Statements which are an integral part of the financial statements.
14 Invesco Global Targeted Returns Fund
| | | | | | | | |
| | |
Shares | | | Value | |
| United States–(continued) | |
TE Connectivity Ltd. | | | 1,192 | | | $ | 89,901 | |
United Rentals, Inc.(a) | | | 232 | | | | 27,856 | |
United Technologies Corp. | | | 1,557 | | | | 193,395 | |
Wells Fargo & Co. | | | 2,690 | | | | 143,189 | |
Williams-Sonoma, Inc. | | | 984 | | | | 58,430 | |
| | | | | | | | 3,129,282 | |
|
| Zambia–0.04% | |
First Quantum Minerals Ltd. | | | 4,084 | | | | 40,769 | |
Total Common Stocks & Other Equity Interests
(Cost $31,558,709) | | | | 30,626,009 | |
| | |
| | | Principal Amount | | | | |
Non-U.S. Dollar Denominated Bonds & Notes–12.95%(d) | |
| Australia–0.12% | | | | | | | | |
Origin Energy Finance Ltd., REGS, Unsec. Sub. Gtd. Euro Bonds, 4.00%, 09/16/2074(b) | | EUR | 100,000 | | | | 115,724 | |
|
| Belgium–0.13% | |
Solvay Finance S.A., REGS, Jr. Unsec. Sub. Gtd. Euro Bonds, 5.87%(b)(e) | | EUR | 100,000 | | | | 127,638 | |
|
| Canada–0.03% | |
Parkland Fuel Corp., Sr. Unsec. Gtd. Notes, 5.63%, 05/09/2025 | | CAD | 40,000 | | | | 30,198 | |
|
| Denmark–0.12% | |
DKT Finance ApS, Sr. Sec. Gtd. First Lien Notes,
7.00%, 06/17/2023(b) | | EUR | 100,000 | | | | 121,764 | |
|
| France–0.72% | |
Burger King France S.A.S., Sr. Sec. Gtd. Floating Rate Bonds,
5.25% (3 mo. EURIBOR +
5.25%), 05/01/2023(b)(f) | | EUR | 100,000 | | | | 114,554 | |
La Financière ATALIAN S.A.S, Sr. Unsec. Gtd. Notes, 6.63%, 05/15/2025(b) | | GBP | 100,000 | | | | 117,895 | |
Orange S.A., REGS, Jr. Unsec. Sub. Euro Notes, 5.88%(b)(e) | | GBP | 100,000 | | | | 136,496 | |
Picard Groupe S.A.S., Sr. Sec. Gtd. Floating Rate First Lien Notes, 3.00% (3 mo. EURIBOR + 3.00%), 11/30/2023(b)(f) | | EUR | 100,000 | | | | 112,119 | |
TOTAL S.A., REGS, Jr. Unsec. Sub. Medium-Term Euro
Notes, 2.25%(b)(e) | | EUR | 100,000 | | | | 115,851 | |
Électricité de France S.A., REGS, Jr. Unsec. Sub. Medium-Term Euro Notes, 5.88%(b)(e) | | GBP | 100,000 | | | | 124,502 | |
| | | | | | | | 721,417 | |
|
| Germany–0.32% | |
CBR Fashion Finance B.V., Sr. Sec. Gtd. Bonds, 5.13%, 10/01/2022(b) | | EUR | 100,000 | | | | 92,888 | |
| | | | | | | | |
| | | Principal Amount | | | Value | |
| Germany–(continued) | |
Deutsche Bank AG, REGS, Jr. Unsec. Sub. Euro Notes, 7.13%(b)(e) | | GBP | 100,000 | | | $ | 116,695 | |
Unitymedia Hessen GmbH & Co. KG/Unitymedia NRW GmbH, REGS, Sr. Sec. Gtd. First Lien Euro Bonds, 4.63%, 02/15/2026(b) | | EUR | 90,000 | | | | 110,452 | |
| | | | | | | | 320,035 | |
|
| Israel–0.12% | |
Teva Pharmaceutical Finance Netherlands II B.V., Sr. Unsec. Gtd. Notes, 4.50%, 03/01/2025(b) | | EUR | 100,000 | | | | 119,782 | |
|
| Italy–0.29% | |
Italy Buoni Poliennali del Tesoro, | | | | | | | | |
Sr. Unsec. Euro Bonds, 0.35%, 06/15/2020 | | EUR | 20,000 | | | | 22,398 | |
REGS, Sr. Unsec. Euro Bonds, 1.25%, 12/01/2026(b) | | EUR | 55,000 | | | | 54,497 | |
Pro-Gest S.p.A., Sr. Unsec. Bonds, 3.25%, 12/15/2024(b) | | EUR | 100,000 | | | | 106,488 | |
Wind Tre S.p.A., Sr. Sec. Gtd. Floating Rate First Lien Notes, 2.75% (3 mo. EURIBOR + 2.75%), 01/20/2024(b)(f) | | EUR | 100,000 | | | | 105,092 | |
| | | | | | | | 288,475 | |
|
| Japan–0.11% | |
SoftBank Group Corp., REGS, Sr. Unsec. Gtd. Euro Notes, 3.13%, 09/19/2025(b) | | EUR | 100,000 | | | | 105,286 | |
|
| Mexico–3.37% | |
Mexican Bonos, Series M, Sr. Unsec. Bonds, | | | | | | | | |
6.50%, 06/09/2022 | | MXN | 35,100,000 | | | | 1,615,736 | |
7.50%, 06/03/2027 | | MXN | 1,500,000 | | | | 68,036 | |
8.00%, 12/07/2023 | | MXN | 33,700,000 | | | | 1,614,631 | |
Petróleos Mexicanos, REGS, Sr. Unsec. Gtd. Medium-Term Euro Notes, 8.25%, 06/02/2022(b) | | GBP | 50,000 | | | | 75,220 | |
| | | | | | | | 3,373,623 | |
|
| Netherlands–0.10% | |
HEMA Bondco I B.V., Sr. Sec. Gtd. Floating Rate First Lien Notes, 6.25% (3 mo. EURIBOR + 6.25%), 07/15/2022(b)(f) | | EUR | 100,000 | | | | 103,680 | |
|
| Poland–3.53% | |
Republic of Poland Government Bond, | | | | | | | | |
Series 0726, Unsec. Bonds, 2.50%, 07/25/2026 | | PLN | 13,008,000 | | | | 3,271,242 | |
Series 0727, Unsec. Bonds, 2.50%, 07/25/2027 | | PLN | 1,053,000 | | | | 261,483 | |
| | | | | | | | 3,532,725 | |
|
| Portugal–0.07% | |
Portugal Obrigações do Tesouro, REGS, Sr. Unsec. Euro Bonds, 2.88%, 10/15/2025(b) | | EUR | 60,000 | | | | 74,898 | |
See accompanying Notes to Consolidated Financial Statements which are an integral part of the financial statements.
15 Invesco Global Targeted Returns Fund
| | | | | | | | |
| | | Principal Amount | | | Value | |
| South Africa–0.16% | |
Republic of South Africa Government Bond, Series 2048, Unsec. Bonds, 8.75%, 02/28/2048 | | ZAR | 2,800,000 | | | $ | 163,389 | |
|
| Spain–0.59% | |
Caixabank S.A., REGS, Jr. Unsec. Sub. Euro Bonds, 6.75%(b)(e) | | EUR | 200,000 | | | | 238,500 | |
LHMC Finco S.a.r.l., Sr. Sec. Gtd. First Lien Notes, 6.25%, 12/20/2023(b) | | EUR | 100,000 | | | | 117,397 | |
Naviera Armas, S.A., Sr. Sec. Gtd. Floating Rate Bonds,
6.50% (3 mo. EURIBOR +
6.50%), 07/31/2023(b)(f) | | EUR | 100,000 | | | | 113,599 | |
Spain Government Bond, REGS, Sr. Unsec. Euro Bonds, 1.95%, 04/30/2026(b) | | EUR | 55,000 | | | | 65,783 | |
Spain Government Inflation Linked Bond, REGS, Sr. Unsec. Euro Bonds, 0.55%, 11/30/2019(b) | | EUR | 50,000 | | | | 60,191 | |
| | | | | | | | 595,470 | |
|
| Switzerland–0.25% | |
ELM B.V. for Swiss Reinsurance Co. Ltd., REGS, Jr. Unsec. Sub. Medium-Term Euro Notes, 6.30%(b)(e) | | GBP | 100,000 | | | | 129,276 | |
LafargeHolcim Sterling Finance (Netherlands) B.V., REGS, Sr. Unsec. Gtd. Medium-Term Euro Notes, 3.00%, 05/12/2032(b) | | GBP | 100,000 | | | | 116,058 | |
| | | | | | | | 245,334 | |
|
| United Kingdom–2.84% | |
Barclays Bank PLC, Series RCI, REGS, Jr. Unsec. Sub. Euro
Bonds, 14.00%(b)(e) | | GBP | 150,000 | | | | 205,549 | |
Boparan Finance PLC, REGS, Sr. Sec. Gtd. First Lien Euro Notes, 5.50%, 07/15/2021(b) | | GBP | 100,000 | | | | 112,671 | |
BP Capital Markets PLC, REGS, Sr. Unsec. Gtd. Medium-Term Euro Notes, 1.18%, 08/12/2023(b) | | GBP | 100,000 | | | | 125,227 | |
Centrica PLC, REGS, Jr. Unsec. Sub. Euro Bonds, 5.25%, 04/10/2075(b) | | GBP | 100,000 | | | | 132,113 | |
CYBG PLC, REGS, Unsec. Sub. Euro Bonds, 5.00%, 02/09/2026(b) | | GBP | 100,000 | | | | 130,519 | |
Ei Group PLC, Sr. Sec. First Mortgage Euro Bonds, 6.50%, 12/06/2018 | | GBP | 50,000 | | | | 64,348 | |
Fidelity International Ltd., REGS, Sr. Unsec. Medium-Term Euro Notes, 6.75%, 10/19/2020(b) | | GBP | 50,000 | | | | 69,774 | |
HBOS Capital Funding L.P., REGS, Jr. Unsec. Sub. Gtd. Euro Notes, 6.46%(b)(e) | | GBP | 100,000 | | | | 128,325 | |
InterContinental Hotels Group PLC, REGS, Sr. Unsec. Gtd. Medium-Term Euro Notes, 2.13%, 08/24/2026(b) | | GBP | 100,000 | | | | 120,324 | |
| | | | | | | | |
| | | Principal Amount | | | Value | |
| United Kingdom–(continued) | |
Lloyds Banking Group PLC, REGS, Jr. Unsec. Sub. Euro
Bonds, 7.88%(b)(e) | | GBP | 200,000 | | | $ | 285,716 | |
Marks & Spencer PLC, REGS, Sr. Unsec. Medium-Term Euro Notes, 4.75%, 06/12/2025(b) | | GBP | 100,000 | | | | 138,511 | |
Nationwide Building Society, REGS, Jr. Unsec. Sub. Notes, 10.25%(b)(e) | | GBP | 68,000 | | | | 128,183 | |
NatWest Markets PLC, Series 352, Jr. Unsec. Sub. Medium-Term Euro Notes, 6.20%(e) | | GBP | 13,000 | | | | 18,153 | |
Next PLC, REGS, Sr. Unsec. Euro Bonds, 3.63%, 05/18/2028(b) | | GBP | 100,000 | | | | 128,614 | |
RAC Bond Co. PLC, REGS, Sr. Sec. Gtd. First Lien Medium-Term Euro Notes, 4.87%, 05/06/2026(b) | | GBP | 100,000 | | | | 128,534 | |
RL Finance Bonds No. 3 PLC, REGS, Unsec. Gtd. Sub. Euro Bonds, 6.13%, 11/13/2028(b) | | GBP | 100,000 | | | | 136,591 | |
Tesco Property Finance 2 PLC, REGS, Sr. Sec. First Lien Mortgage-Backed Euro Bonds, 6.05%, 10/13/2039(b) | | GBP | 43,045 | | | | 66,189 | |
Thames Water Utilities Cayman Finance Ltd., REGS, Sr. Sec. Gtd. First Lien Medium-Term Euro Notes, 1.88%, 01/24/2024(b) | | GBP | 100,000 | | | | 124,617 | |
Travis Perkins PLC, REGS, Sr. Unsec. Gtd. Euro Bonds,
4.50%, 09/07/2023(b) | | GBP | 100,000 | | | | 125,441 | |
United Kingdom Gilt Inflation-Linked, REGS, Unsec. Bonds, 0.13%, 03/22/2026(b) | | GBP | 60,000 | | | | 97,587 | |
Virgin Media Secured Finance PLC, REGS, Sr. Sec. Gtd. First Lien Euro Notes, 6.25%, 03/28/2029(b) | | GBP | 100,000 | | | | 132,890 | |
Vodafone Group PLC, REGS, Sr. Unsec. Medium-Term Euro Notes, 3.38%, 08/08/2049(b) | | GBP | 100,000 | | | | 114,603 | |
Yorkshire Building Society (The), REGS, Sr. Unsec. Medium-Term Euro Notes, 3.50%, 04/21/2026(b) | | GBP | 100,000 | | | | 131,865 | |
| | | | | | | | 2,846,344 | |
|
| United States–0.08% | |
Johnson & Johnson, Sr. Unsec. Global Notes, 5.50%, 11/06/2024 | | GBP | 50,000 | | | | 78,139 | |
Total Non-U.S. Dollar Denominated Bonds & Notes (Cost $13,482,075) | | | | 12,963,921 | |
|
U.S. Dollar Denominated Bonds & Notes–10.59% | |
| Argentina–0.14% | | | | | | | | |
Transportadora de Gas del Sur S.A., Sr. Unsec. Notes,
6.75%, 05/02/2025(b) | | $ | 150,000 | | | | 141,376 | |
See accompanying Notes to Consolidated Financial Statements which are an integral part of the financial statements.
16 Invesco Global Targeted Returns Fund
| | | | | | | | |
| | | Principal Amount | | | Value | |
| Australia–0.02% | |
Nufarm Australia Ltd./Nufarm Americas Inc., Sr. Unsec. Gtd. Notes, 5.75%, 04/30/2026(b) | | $ | 16,000 | | | $ | 15,020 | |
|
| Belgium–0.10% | |
Anheuser-Busch InBev Finance, Inc., Sr. Unsec. Gtd. Global Notes, 3.70%, 02/01/2024 | | | 100,000 | | | | 98,133 | |
|
| Brazil–0.26% | |
MARB BondCo PLC, Sr. Unsec. Gtd. Notes, 7.00%, 03/15/2024(b) | | | 200,000 | | | | 192,200 | |
Petrobras Global Finance B.V., Sr. Unsec. Gtd. Global Notes, | | | | | | | | |
5.75%, 02/01/2029 | | | 39,000 | | | | 36,173 | |
8.75%, 05/23/2026 | | | 25,000 | | | | 28,021 | |
| | | | | | | | 256,394 | |
|
| Canada–0.37% | |
1011778 BC ULC/ New Red Finance, Inc., Sec. Gtd. Second Lien Notes, 5.00%, 10/15/2025(b) | | | 39,000 | | | | 36,660 | |
Air Canada, Sr. Unsec. Gtd. Notes, 7.75%, 04/15/2021(b) | | | 25,000 | | | | 26,872 | |
Bombardier Inc., Sr. Unsec. Notes, | | | | | | | | |
6.13%, 01/15/2023(b) | | | 25,000 | | | | 24,812 | |
7.50%, 03/15/2025(b) | | | 18,000 | | | | 18,085 | |
Cott Holdings Inc., Sr. Unsec. Gtd. Notes, 5.50%, 04/01/2025(b) | | | 50,000 | | | | 47,750 | |
Hudbay Minerals, Inc., Sr. Unsec. Gtd. Notes, 7.63%, 01/15/2025(b) | | | 31,000 | | | | 31,232 | |
Hulk Finance Corp., Sr. Unsec. Notes, 7.00%, 06/01/2026(b) | | | 64,000 | | | | 59,040 | |
Mercer International Inc., Sr. Unsec. Global Notes, | | | | | | | | |
5.50%, 01/15/2026 | | | 10,000 | | | | 9,722 | |
6.50%, 02/01/2024 | | | 15,000 | | | | 15,188 | |
Parkland Fuel Corp., Sr. Unsec. Notes, 6.00%, 04/01/2026(b) | | | 23,000 | | | | 22,540 | |
Precision Drilling Corp., Sr. Unsec. Gtd. Global Notes, | | | | | | | | |
5.25%, 11/15/2024 | | | 15,000 | | | | 13,988 | |
6.50%, 12/15/2021 | | | 8,788 | | | | 8,898 | |
Taseko Mines Ltd., Sr. Sec. Gtd. First Lien Notes, 8.75%, 06/15/2022(b) | | | 19,000 | | | | 18,763 | |
Teck Resources Ltd., Sr. Unsec. Notes, 6.13%, 10/01/2035 | | | 33,000 | | | | 33,577 | |
| | | | | | | | 367,127 | |
|
| China–0.15% | |
Eagle Intermediate Global Holding B.V./Ruyi US Finance LLC, Sr. Sec. Gtd. First Lien Bonds, 7.50%, 05/01/2025(b) | | | 150,000 | | | | 145,500 | |
|
| France–0.50% | |
AXA S.A., Series A, Jr. Unsec. Sub. Notes, 6.46%(b)(e) | | | 100,000 | | | | 100,250 | |
| | | | | | | | |
| | | Principal Amount | | | Value | |
| France–(continued) | |
BNP Paribas S.A., REGS, Jr. Unsec. Sub. Euro Notes, 7.38%(b)(e) | | $ | 200,000 | | | $ | 205,750 | |
Societe Generale S.A., Unsec. Sub. Notes, 4.25%, 04/14/2025(b) | | | 200,000 | | | | 190,905 | |
| | | | | | | | 496,905 | |
|
| Germany–0.16% | |
Allianz S.E., Series DIP, REGS, Jr. Unsec. Sub. Medium-Term Euro
Notes, 3.88%(b)(e) | | | 200,000 | | | | 163,453 | |
|
| Israel–0.04% | |
Teva Pharmaceutical Finance IV, B.V., Sr. Unsec. Gtd. Global Notes, 3.65%, 11/10/2021 | | | 25,000 | | | | 23,967 | |
Teva Pharmaceutical Finance Netherlands III B.V., Sr. Unsec. Gtd. Global Notes, 6.00%, 04/15/2024 | | | 19,000 | | | | 18,930 | |
| | | | | | | | 42,897 | |
|
| Italy–0.21% | |
Telecom Italia Capital S.A., Sr. Unsec. Gtd. Global Notes, | | | | | | | | |
6.38%, 11/15/2033 | | | 7,000 | | | | 6,440 | |
7.20%, 07/18/2036 | | | 16,000 | | | | 15,782 | |
Telecom Italia S.p.A., Sr. Unsec. Notes, 5.30%, 05/30/2024(b) | | | 200,000 | | | | 189,250 | |
| | | | | | | | 211,472 | |
|
| Luxembourg–0.30% | |
Altice Financing S.A., Sr. Sec. Gtd. First Lien Bonds, 7.50%, 05/15/2026(b) | | | 200,000 | | | | 188,500 | |
ArcelorMittal, Sr. Unsec. Global Notes, 7.00%, 10/15/2039 | | | 23,000 | | | | 25,518 | |
Intelsat Jackson Holdings S.A., | | | | | | | | |
Sr. Unsec. Gtd. Global Bonds, 5.50%, 08/01/2023 | | | 76,000 | | | | 68,210 | |
Sr. Unsec. Gtd. Notes, 8.50%, 10/15/2024(b) | | | 23,000 | | | | 22,626 | |
| | | | | | | | 304,854 | |
|
| Mexico–0.18% | |
Fomento Economico Mexicano S.A.B. de C.V., Sr. Unsec. Global Notes, 2.88%, 05/10/2023 | | | 150,000 | | | | 142,139 | |
Petróleos Mexicanos, | | | | | | | | |
Sr. Unsec. Gtd. Global Notes, 6.88%, 08/04/2026 | | | 11,000 | | | | 10,983 | |
Sr. Unsec. Gtd. Notes, 5.35%, 02/12/2028(b) | | | 29,000 | | | | 25,909 | |
| | | | | | | | 179,031 | |
|
| Spain–0.13% | |
Telefónica Emisiones, S.A.U., Sr. Unsec. Gtd. Global Notes, 4.90%, 03/06/2048 | | | 150,000 | | | | 134,045 | |
See accompanying Notes to Consolidated Financial Statements which are an integral part of the financial statements.
17 Invesco Global Targeted Returns Fund
| | | | | | | | |
| | | Principal Amount | | | Value | |
| Switzerland–0.20% | |
Cloverie PLC for Zurich Insurance Co. Ltd., REGS, Unsec. Sub. Medium-Term Euro Notes, 5.63%, 06/24/2046(b) | | $ | 200,000 | | | $ | 201,431 | |
|
| United Kingdom–0.48% | |
HSBC Holdings PLC, Jr. Unsec. Sub. Global Bonds, 6.00%(e) | | | 200,000 | | | | 184,500 | |
Royal Bank of Scotland Group PLC (The), | | | | | | | | |
Jr. Unsec. Sub. Bonds, 7.50%(e) | | | 200,000 | | | | 203,800 | |
Series U, Jr. Unsec. Sub. Variable Rate Global Notes, 4.71%
(3 mo. USD LIBOR + 2.32%)(e)(f) | | | 100,000 | | | | 93,750 | |
| | | | | | | | 482,050 | |
|
| United States–7.29% | |
Advanced Disposal Services, Inc., Sr. Unsec. Gtd. Notes, 5.63%, 11/15/2024(b) | | | 25,000 | | | | 24,438 | |
AES Corp. (The), Sr. Unsec. Notes, 5.50%, 04/15/2025 | | | 15,000 | | | | 15,113 | |
Albertsons Cos. LLC/ Safeway Inc./New Albertson’s L.P./Albertson’s LLC, Sr. Unsec. Gtd. Global Notes, 6.63%, 06/15/2024 | | | 47,000 | | | | 44,650 | |
Ally Financial Inc., Sr. Unsec. Gtd. Global Notes, 8.00%, 03/15/2020 | | | 30,000 | | | | 31,537 | |
AMC Entertainment Holdings, Inc., Sr. Unsec. Gtd. Sub. Global Notes, | | | | | | | | |
5.75%, 06/15/2025 | | | 40,000 | | | | 37,150 | |
5.88%, 11/15/2026 | | | 30,000 | | | | 27,600 | |
AMC Networks Inc., Sr. Unsec. Gtd. Global Notes, 5.00%, 04/01/2024 | | | 60,000 | | | | 57,537 | |
AmeriGas Partners, L.P./AmeriGas Finance Corp., Sr. Unsec. Global Notes, 5.88%, 08/20/2026 | | | 40,000 | | | | 38,000 | |
Apple Inc., Sr. Unsec. Global Notes, 3.45%, 02/09/2045 | | | 50,000 | | | | 43,021 | |
Archrock Partners, L.P./Archrock Partners Finance Corp., Sr. Unsec. Gtd. Global Notes, 6.00%, 10/01/2022 | | | 15,000 | | | | 14,925 | |
Ascent Resources Utica Holdings, LLC/ARU Finance Corp., Sr. Unsec. Notes, 10.00%, 04/01/2022(b) | | | 19,000 | | | | 21,019 | |
Ashton Woods USA LLC/Ashton Woods Finance Co., Sr. Unsec. Notes, 6.88%, 02/15/2021(b) | | | 36,000 | | | | 36,180 | |
Avis Budget Car Rental LLC/Avis Budget Finance Inc., Sr. Unsec. Gtd. Notes, 5.25%, 03/15/2025(b) | | | 38,000 | | | | 34,152 | |
B&G Foods, Inc., Sr. Unsec. Gtd. Notes, 5.25%, 04/01/2025 | | | 22,000 | | | | 21,038 | |
| | | | | | | | |
| | | Principal Amount | | | Value | |
| United States–(continued) | |
Bausch Health Cos. Inc., | | | | | | | | |
Sr. Sec. Gtd. First Lien Notes, 5.50%, 11/01/2025(b) | | $ | 21,000 | | | $ | 20,659 | |
Sr. Unsec. Gtd. Notes, | | | | | | | | |
6.13%, 04/15/2025(b) | | | 65,000 | | | | 59,943 | |
9.25%, 04/01/2026(b) | | | 14,000 | | | | 14,718 | |
BBA U.S. Holdings, Inc., Sr. Unsec. Notes, 5.38%, 05/01/2026(b) | | | 12,000 | | | | 11,895 | |
Beazer Homes USA, Inc., Sr. Unsec. Gtd. Global Notes, | | | | | | | | |
5.88%, 10/15/2027 | | | 6,000 | | | | 4,875 | |
6.75%, 03/15/2025 | | | 40,000 | | | | 35,250 | |
8.75%, 03/15/2022 | | | 25,000 | | | | 25,313 | |
BMC East, LLC, Sr. Sec. Gtd. First Lien Notes, 5.50%, 10/01/2024(b) | | | 50,000 | | | | 47,000 | |
Booking Holdings Inc., Sr. Unsec. Global Notes, 3.60%, 06/01/2026 | | | 100,000 | | | | 95,678 | |
Boyd Gaming Corp., Sr. Unsec. Gtd. Global Notes, | | | | | | | | |
6.00%, 08/15/2026 | | | 12,000 | | | | 11,640 | |
6.38%, 04/01/2026 | | | 40,000 | | | | 39,800 | |
Brink’s Co. (The), Sr. Unsec. Gtd. Notes, 4.63%, 10/15/2027(b) | | | 62,000 | | | | 57,195 | |
Callon Petroleum Co., Sr. Unsec. Gtd. Global Notes, 6.13%, 10/01/2024 | | | 60,000 | | | | 58,800 | |
Carrols Restaurant Group, Inc., Sec. Gtd. Second Lien Global Notes, 8.00%, 05/01/2022 | | | 13,000 | | | | 13,520 | |
CCO Holdings LLC/CCO Holdings Capital Corp., | | | | | | | | |
Sr. Unsec. Global Notes, 5.75%, 09/01/2023 | | | 20,000 | | | | 20,200 | |
Sr. Unsec. Notes, | | | | | | | | |
5.13%, 05/01/2027(b) | | | 100,000 | | | | 94,375 | |
5.75%, 02/15/2026(b) | | | 110,000 | | | | 109,175 | |
Centene Corp., Sr. Unsec. Notes, 5.38%, 06/01/2026(b) | | | 16,000 | | | | 16,280 | |
CenturyLink, Inc., | | | | | | | | |
Series S, Sr. Unsec. Notes, 6.45%, 06/15/2021 | | | 38,000 | | | | 38,997 | |
Series Y, Sr. Unsec. Global Notes, 7.50%, 04/01/2024 | | | 30,000 | | | | 31,575 | |
Charles River Laboratories International, Inc., Sr. Unsec. Gtd. Notes, 5.50%, 04/01/2026(b) | | | 9,000 | | | | 9,000 | |
Chemours Co. (The), Sr. Unsec. Gtd. Global Notes, 7.00%, 05/15/2025 | | | 20,000 | | | | 20,700 | |
Cincinnati Bell Inc., | | | | | | | | |
Sr. Unsec. Gtd. Notes, 7.00%, 07/15/2024(b) | | | 40,000 | | | | 36,200 | |
Sr. Unsec. Notes, 8.00%, 10/15/2025(b) | | | 6,000 | | | | 5,490 | |
CIT Group Inc., Unsec. Sub. Global Notes, 6.13%, 03/09/2028 | | | 6,000 | | | | 6,240 | |
See accompanying Notes to Consolidated Financial Statements which are an integral part of the financial statements.
18 Invesco Global Targeted Returns Fund
| | | | | | | | |
| | | Principal Amount | | | Value | |
| United States–(continued) | |
Clear Channel Worldwide Holdings, Inc., | | | | | | | | |
Series B, Sr. Unsec. Gtd. Global Notes, 6.50%, 11/15/2022 | | $ | 50,000 | | | $ | 51,010 | |
Sr. Unsec. Gtd. Sub. Global Notes, 7.63%, 03/15/2020 | | | 30,000 | | | | 30,075 | |
Cleaver-Brooks, Inc., Sr. Sec. Notes, 7.88%, 03/01/2023(b) | | | 52,000 | | | | 52,390 | |
Cleveland-Cliffs Inc., Sr. Unsec. Gtd. Global Notes, 5.75%, 03/01/2025 | | | 40,000 | | | | 37,950 | |
Community Health Systems, Inc., | | | | | | | | |
Sr. Sec. Gtd. First Lien Global Notes, 5.13%, 08/01/2021 | | | 40,000 | | | | 38,100 | |
Sr. Sec. Gtd. First Lien Notes, 6.25%, 03/31/2023 | | | 38,000 | | | | 35,091 | |
Core & Main LP, Sr. Unsec. Notes, 6.13%, 08/15/2025(b) | | | 40,000 | | | | 37,700 | |
Coty Inc., Sr. Unsec. Gtd. Notes, 6.50%, 04/15/2026(b) | | | 70,000 | | | | 65,450 | |
Crown Americas LLC/Crown Americas Capital Corp. V, Sr. Unsec. Gtd. Global Notes, 4.25%, 09/30/2026 | | | 20,000 | | | | 18,200 | |
CSC Holdings LLC, Sr. Unsec. Global Notes, 6.75%, 11/15/2021 | | | 121,000 | | | | 127,008 | |
Dana Inc., Sr. Unsec. Notes, 5.50%, 12/15/2024 | | | 60,000 | | | | 58,110 | |
DaVita Inc., Sr. Unsec. Gtd. Global Notes, 5.00%, 05/01/2025 | | | 10,000 | | | | 9,450 | |
Dell International LLC/ EMC Corp., Sr. Unsec. Gtd. Notes, 7.13%, 06/15/2024(b) | | | 68,000 | | | | 72,023 | |
Diamond Offshore Drilling, Inc., Sr. Unsec. Global Notes, 4.88%, 11/01/2043 | | | 12,000 | | | | 8,220 | |
Discover Financial Services, Inc., Series C, Jr. Unsec. Sub. Global Notes, 5.50%(e) | | | 21,000 | | | | 19,871 | |
DISH DBS Corp., Sr. Unsec. Gtd. Global Notes, | | | | | | | | |
5.88%, 11/15/2024 | | | 146,000 | | | | 124,647 | |
7.88%, 09/01/2019 | | | 25,000 | | | | 25,807 | |
Eagle Holding Co. II, LLC, Sr. Unsec. PIK Notes, 8.38% PIK Rate, 7.63% Cash Rate, 05/15/2022(b)(g) | | | 45,000 | | | | 45,337 | |
Encompass Health Corp., Sr. Unsec. Gtd. Global Notes, 5.75%, 09/15/2025 | | | 35,000 | | | | 34,825 | |
EnerSys, Sr. Unsec. Gtd. Notes, 5.00%, 04/30/2023(b) | | | 60,000 | | | | 59,550 | |
EnPro Industries, Inc., Sr. Unsec. Notes, 5.75%, 10/15/2026(b) | | | 15,000 | | | | 14,855 | |
Ensco PLC, Sr. Unsec. Global Notes, | | | | | | | | |
4.50%, 10/01/2024 | | | 3,000 | | | | 2,449 | |
7.75%, 02/01/2026 | | | 40,000 | | | | 37,450 | |
| | | | | | | | |
| | | Principal Amount | | | Value | |
| United States–(continued) | |
EP Energy LLC/Everest Acquisition Finance Inc., Sr. Sec. Gtd. First Lien Notes, 8.00%, 11/29/2024(b) | | $ | 60,000 | | | $ | 58,200 | |
Equinix Inc., Sr. Unsec. Notes, 5.88%, 01/15/2026 | | | 30,000 | | | | 30,525 | |
Ferrellgas L.P./Ferrellgas Finance Corp., | | | | | | | | |
Sr. Unsec. Global Notes, 6.50%, 05/01/2021 | | | 34,000 | | | | 30,600 | |
Sr. Unsec. Gtd. Global Notes, 6.75%, 06/15/2023 | | | 6,000 | | | | 5,205 | |
First Data Corp., Sr. Unsec. Gtd. Notes, 7.00%, 12/01/2023(b) | | | 81,000 | | | | 84,048 | |
Flex Acquisition Co., Inc., Sr. Unsec. Notes, 7.88%, 07/15/2026(b) | | | 28,000 | | | | 27,098 | |
Flexi-Van Leasing, Inc., Sec. Second Lien Notes, 10.00%, 02/15/2023(b) | | | 19,000 | | | | 15,865 | |
Freeport-McMoRan Inc., Sr. Unsec. Gtd. Global Notes, 5.40%, 11/14/2034 | | | 59,000 | | | | 51,920 | |
Frontier Communications Corp., Sr. Unsec. Global Notes, | | | | | | | | |
10.50%, 09/15/2022 | | | 51,000 | | | | 42,712 | |
11.00%, 09/15/2025 | | | 27,000 | | | | 19,913 | |
Gulfport Energy Corp., Sr. Unsec. Gtd. Global Notes, 6.00%, 10/15/2024 | | | 65,000 | | | | 61,262 | |
H&E Equipment Services, Inc., Sr. Unsec. Gtd. Global Notes, 5.63%, 09/01/2025 | | | 55,000 | | | | 52,525 | |
Hanesbrands Inc., Sr. Unsec. Gtd. Notes, 4.63%, 05/15/2024(b) | | | 100,000 | | | | 96,250 | |
HCA, Inc., | | | | | | | | |
Sr. Sec. Gtd. First Lien Notes, 5.25%, 04/15/2025 | | | 56,000 | | | | 57,330 | |
Sr. Unsec. Gtd. Notes, | | | | | | | | |
5.38%, 09/01/2026 | | | 10,000 | | | | 9,950 | |
5.88%, 02/15/2026 | | | 85,000 | | | | 87,125 | |
Heartland Dental, LLC, Sr. Unsec. Notes, 8.50%, 05/01/2026(b) | | | 33,000 | | | | 31,515 | |
Herc Rentals Inc., Sec. Gtd. Second Lien Notes, 7.75%, 06/01/2024(b) | | | 36,000 | | | | 38,160 | |
Hertz Corp. (The), Sec. Gtd. Second Lien Notes, 7.63%, 06/01/2022(b) | | | 12,000 | | | | 11,525 | |
Hewlett Packard Enterprise Co., Sr. Unsec. Global Notes, 4.90%, 10/15/2025 | | | 50,000 | | | | 50,843 | |
Hill-Rom Holdings, Inc., Sr. Unsec. Gtd. Notes, 5.00%, 02/15/2025(b) | | | 39,000 | | | | 37,830 | |
Hillman Group Inc. (The), Sr. Unsec. Gtd. Notes, 6.38%, 07/15/2022(b) | | | 53,000 | | | | 46,905 | |
HLF Financing S.a.r.l., LLC/ Herbalife International, Inc., Sr. Unsec. Gtd. Notes, 7.25%, 08/15/2026(b) | | | 21,000 | | | | 21,289 | |
See accompanying Notes to Consolidated Financial Statements which are an integral part of the financial statements.
19 Invesco Global Targeted Returns Fund
| | | | | | | | |
| | | Principal Amount | | | Value | |
| United States–(continued) | |
Hot Topic, Inc., Sr. Sec. Gtd. First Lien Notes, 9.25%, 06/15/2021(b) | | $ | 60,000 | | | $ | 59,550 | |
Hughes Satellite Systems Corp., Sr. Unsec. Gtd. Global Notes, 7.63%, 06/15/2021 | | | 50,000 | | | | 53,150 | |
Ingles Markets, Inc., Sr. Unsec. Global Notes, 5.75%, 06/15/2023 | | | 11,000 | | | | 11,000 | |
IRB Holding Corp., Sr. Unsec. Gtd. Notes, 6.75%, 02/15/2026(b) | | | 35,000 | | | | 33,600 | |
Iron Mountain US Holdings, Inc., Sr. Unsec. Gtd. Notes, 5.38%, 06/01/2026(b) | | | 35,000 | | | | 32,375 | |
Itron, Inc., Sr. Unsec. Gtd. Notes, 5.00%, 01/15/2026(b) | | | 27,000 | | | | 25,211 | |
J. C. Penney Corp., Inc., | | | | | | | | |
Sec. Gtd. Second Lien Notes, 8.63%, 03/15/2025(b) | | | 50,000 | | | | 32,750 | |
Sr. Unsec. Gtd. Deb., 7.40%, 04/01/2037 | | | 50,000 | | | | 20,250 | |
Sr. Unsec. Gtd. Notes, 6.38%, 10/15/2036 | | | 50,000 | | | | 19,375 | |
J.B. Poindexter & Co., Inc., Sr. Unsec. Bonds, 7.13%, 04/15/2026(b) | | | 58,000 | | | | 60,030 | |
Jagged Peak Energy LLC, Sr. Unsec. Gtd. Notes, 5.88%, 05/01/2026(b) | | | 39,000 | | | | 38,122 | |
JBS USA Lux S.A./JBS USA Finance, Inc., REGS, Sr. Unsec. Gtd. Euro Notes, 5.75%, 06/15/2025(b) | | | 45,000 | | | | 43,369 | |
KB Home, Sr. Unsec. Gtd. Notes, 7.50%, 09/15/2022 | | | 23,000 | | | | 24,380 | |
Kenan Advantage Group Inc. (The), Sr. Unsec. Notes, 7.88%, 07/31/2023(b) | | | 60,000 | | | | 60,600 | |
KFC Holding Co./Pizza Hut Holdings LLC/Taco Bell of America LLC, Sr. Unsec. Gtd. Notes, 4.75%, 06/01/2027(b) | | | 16,000 | | | | 15,080 | |
Koppers Inc., Sr. Unsec. Gtd. Notes, 6.00%, 02/15/2025(b) | | | 35,000 | | | | 33,698 | |
L Brands, Inc., Sr. Unsec. Gtd. Global Notes, 6.88%, 11/01/2035 | | | 30,000 | | | | 25,650 | |
Lennar Corp., Sr. Unsec. Gtd. Global Notes, | | | | | | | | |
4.75%, 11/15/2022 | | | 25,000 | | | | 24,818 | |
5.25%, 06/01/2026 | | | 23,000 | | | | 22,053 | |
Level 3 Financing, Inc., Sr. Unsec. Gtd. Global Notes, 5.25%, 03/15/2026 | | | 65,000 | | | | 62,562 | |
Lithia Motors, Inc., Sr. Unsec. Gtd. Notes, 5.25%, 08/01/2025(b) | | | 17,000 | | | | 16,065 | |
LPL Holdings Inc., Sr. Unsec. Gtd. Notes, 5.75%, 09/15/2025(b) | | | 32,000 | | | | 31,120 | |
| | | | | | | | |
| | | Principal Amount | | | Value | |
| United States–(continued) | |
Mattel, Inc., | | | | | | | | |
Sr. Unsec. Gtd. Notes, 6.75%, 12/31/2025(b) | | $ | 22,000 | | | $ | 21,058 | |
Sr. Unsec. Notes, 6.20%, 10/01/2040 | | | 7,000 | | | | 5,740 | |
Meredith Corp., Sr. Unsec. Gtd. Notes, 6.88%, 02/01/2026(b) | | | 59,000 | | | | 59,147 | |
Meritage Homes Corp., Sr. Unsec. Gtd. Global Notes, 6.00%, 06/01/2025 | | | 21,000 | | | | 20,528 | |
Meritor Inc., Sr. Unsec. Gtd. Notes, 6.25%, 02/15/2024 | | | 60,000 | | | | 59,400 | |
MGM Resorts International, Sr. Unsec. Gtd. Notes, 4.63%, 09/01/2026 | | | 60,000 | | | | 54,450 | |
Microsoft Corp., Sr. Unsec. Global Bonds, 2.40%, 08/08/2026 | | | 80,000 | | | | 73,050 | |
Molina Healthcare, Inc., Sr. Unsec. Gtd. Notes, 4.88%, 06/15/2025(b) | | | 24,000 | | | | 23,040 | |
MPH Acquisition Holdings LLC, Sr. Unsec. Gtd. Notes, 7.13%, 06/01/2024(b) | | | 13,000 | | | | 13,238 | |
MPT Operating Partnership L.P./MPT Finance Corp., Sr. Unsec. Gtd. Global Notes, 5.00%, 10/15/2027 | | | 50,000 | | | | 47,110 | |
MSCI Inc., Sr. Unsec. Gtd. Notes, 5.75%, 08/15/2025(b) | | | 20,000 | | | | 20,650 | |
Mueller Industries, Inc., Unsec. Sub. Deb., 6.00%, 03/01/2027 | | | 35,000 | | | | 33,687 | |
Mueller Water Products, Inc., Sr. Unsec. Gtd. Notes, 5.50%, 06/15/2026(b) | | | 8,000 | | | | 7,940 | |
Murphy Oil USA, Inc., Sr. Unsec. Gtd. Global Notes, 5.63%, 05/01/2027 | | | 52,000 | | | | 50,895 | |
Navient Corp., Sr. Unsec. Medium-Term Notes, | | | | | | | | |
7.25%, 01/25/2022 | | | 25,000 | | | | 26,094 | |
8.00%, 03/25/2020 | | | 45,000 | | | | 47,081 | |
Netflix, Inc., | | | | | | | | |
Sr. Unsec. Global Notes, 5.75%, 03/01/2024 | | | 33,000 | | | | 33,660 | |
Sr. Unsec. Notes, 5.88%, 11/15/2028(b) | | | 22,000 | | | | 21,725 | |
Noble Holding International Ltd., Sr. Unsec. Gtd. Global Notes, 7.75%, 01/15/2024 | | | 45,000 | | | | 42,244 | |
Novelis Corp., Sr. Unsec. Gtd. Notes, | |
5.88%, 09/30/2026(b) | | | 4,000 | | | | 3,780 | |
6.25%, 08/15/2024(b) | | | 50,000 | | | | 49,625 | |
NRG Energy, Inc., Sr. Unsec. Gtd. Global Notes, 6.63%, 01/15/2027 | | | 42,000 | | | | 43,627 | |
Oasis Petroleum Inc., Sr. Unsec. Gtd. Global Notes, 6.88%, 01/15/2023 | | | 60,000 | | | | 60,600 | |
See accompanying Notes to Consolidated Financial Statements which are an integral part of the financial statements.
20 Invesco Global Targeted Returns Fund
| | | | | | | | |
| | | Principal Amount | | | Value | |
| United States–(continued) | |
OI European Group B.V., Sr. Unsec. Gtd. Notes, 4.00%, 03/15/2023(b) | | $ | 9,000 | | | $ | 8,449 | |
Parsley Energy, LLC/Finance Corp., Sr. Unsec. Gtd. Notes, | | | | | | | | |
5.63%, 10/15/2027(b) | | | 15,000 | | | | 14,824 | |
6.25%, 06/01/2024(b) | | | 44,000 | | | | 45,320 | |
Penske Automotive Group Inc., Sr. Unsec. Sub. Gtd. Notes, 5.50%, 05/15/2026 | | | 43,000 | | | | 41,065 | |
Plains All American Pipeline, L.P., Series B, Jr. Unsec. Sub. Notes, 6.13%(e) | | | 25,000 | | | | 23,563 | |
Plastipak Holdings Inc., Sr. Unsec. Notes, 6.25%, 10/15/2025(b) | | | 34,000 | | | | 31,280 | |
Platform Specialty Products Corp., Sr. Unsec. Gtd. Notes, 5.88%, 12/01/2025(b) | | | 27,000 | | | | 25,718 | |
Prestige Brands, Inc., Sr. Unsec. Gtd. Notes, 6.38%, 03/01/2024(b) | | | 13,000 | | | | 12,903 | |
Prime Security Services Borrower, LLC/Prime Finance, Inc., Sec. Gtd. Second Lien Notes, 9.25%, 05/15/2023(b) | | | 74,000 | | | | 78,381 | |
QEP Resources, Inc., | | | | | | | | |
Sr. Unsec. Global Notes, 5.63%, 03/01/2026 | | | 13,000 | | | | 12,285 | |
Sr. Unsec. Notes, 6.88%, 03/01/2021 | | | 30,000 | | | | 31,350 | |
Rackspace Hosting, Inc., Sr. Unsec. Gtd. Notes, 8.63%, 11/15/2024(b) | | | 20,000 | | | | 18,850 | |
Range Resources Corp., Sr. Unsec. Gtd. Global Notes, | | | | | | | | |
4.88%, 05/15/2025 | | | 34,000 | | | | 31,620 | |
5.88%, 07/01/2022 | | | 29,000 | | | | 29,290 | |
Rayonier A.M. Products Inc., Sr. Unsec. Gtd. Notes, 5.50%, 06/01/2024(b) | | | 55,000 | | | | 51,700 | |
Reynolds Group Issuer Inc./LLC, Sr. Unsec. Gtd. Notes, 7.00%, 07/15/2024(b) | | | 60,000 | | | | 60,262 | |
SBA Communications Corp., Sr. Unsec. Global Notes, 4.88%, 09/01/2024 | | | 20,000 | | | | 19,375 | |
Schweitzer-Mauduit International, Inc., Sr. Unsec. Notes, 6.88%, 10/01/2026(b) | | | 22,000 | | | | 22,330 | |
Scientific Games International Inc., Sr. Unsec. Gtd. Global Notes, 10.00%, 12/01/2022 | | | 50,000 | | | | 52,437 | |
SemGroup Corp./ Rose Rock Finance Corp., Sr. Unsec. Gtd. Global Notes, 5.63%, 11/15/2023 | | | 30,000 | | | | 28,500 | |
ServiceMaster Co., LLC (The), Sr. Unsec. Gtd. Notes, 5.13%, 11/15/2024(b) | | | 40,000 | | | | 38,600 | |
Sirius XM Radio Inc., Sr. Unsec. Gtd. Notes, 5.38%, 07/15/2026(b) | | | 30,000 | | | | 29,415 | |
| | | | | | | | |
| | | Principal Amount | | | Value | |
| United States–(continued) | |
SM Energy Co., Sr. Unsec. Global Notes, | | | | | | | | |
6.13%, 11/15/2022 | | $ | 19,000 | | | $ | 19,333 | |
6.63%, 01/15/2027 | | | 5,000 | | | | 5,050 | |
Southwestern Energy Co., Sr. Unsec. Gtd. Global Notes, | | | | | | | | |
7.50%, 04/01/2026 | | | 22,000 | | | | 22,495 | |
7.75%, 10/01/2027 | | | 15,000 | | | | 15,375 | |
Spectrum Brands, Inc., Sr. Unsec. Gtd. Global Notes, 5.75%, 07/15/2025 | | | 60,000 | | | | 58,500 | |
Sprint Capital Corp., Sr. Unsec. Gtd. Global Notes, 8.75%, 03/15/2032 | | | 4,000 | | | | 4,360 | |
Sprint Communications Inc., Sr. Unsec. Global Notes, 11.50%, 11/15/2021 | | | 40,000 | | | | 47,100 | |
Sprint Corp., Sr. Unsec. Gtd. Global Notes, | | | | | | | | |
7.25%, 09/15/2021 | | | 35,000 | | | | 36,619 | |
7.63%, 02/15/2025 | | | 6,000 | | | | 6,248 | |
7.88%, 09/15/2023 | | | 110,000 | | | | 117,700 | |
SRS Distribution Inc., Sr. Unsec. Gtd. Notes, 8.25%, 07/01/2026(b) | | | 17,000 | | | | 15,980 | |
Standard Industries Inc., Sr. Unsec. Notes, 6.00%, 10/15/2025(b) | | | 57,000 | | | | 56,287 | |
Stevens Holding Co., Inc., Sr. Unsec. Gtd. Notes, 6.13%, 10/01/2026(b) | | | 10,000 | | | | 9,989 | |
Suburban Propane Partners, L.P./Suburban Energy Finance Corp., Sr. Unsec. Global Notes, 5.50%, 06/01/2024 | | | 29,000 | | | | 27,695 | |
SunCoke Energy Partners, L.P./ SunCoke Energy Partners Finance Corp., Sr. Unsec. Gtd. Notes, 7.50%, 06/15/2025(b) | | | 30,000 | | | | 30,600 | |
Sunoco LP/Sunoco Finance Corp., Sr. Unsec. Gtd. Notes, 4.88%, 01/15/2023(b) | | | 22,000 | | | | 21,258 | |
Surgery Center Holdings, Inc., Sr. Unsec. Gtd. Notes, | | | | | | | | |
6.75%, 07/01/2025(b) | | | 14,000 | | | | 13,195 | |
8.88%, 04/15/2021(b) | | | 25,000 | | | | 25,812 | |
T-Mobile USA, Inc., | | | | | | | | |
Sr. Unsec. Gtd. Global Bonds, 6.50%, 01/15/2026 | | | 64,000 | | | | 67,680 | |
Sr. Unsec. Gtd. Notes, 6.00%, 04/15/2024 | | | 50,000 | | | | 51,375 | |
Targa Resources Partners L.P./Targa Resources Partners Finance Corp., | | | | | | | | |
Sr. Unsec. Gtd. Global Bonds, 5.13%, 02/01/2025 | | | 34,000 | | | | 33,235 | |
Sr. Unsec. Gtd. Notes, 5.88%, 04/15/2026(b) | | | 15,000 | | | | 15,159 | |
Taylor Morrison Communities Inc./ Taylor Morrison Holdings II, Inc., Sr. Unsec. Gtd. Notes, 5.88%, 04/15/2023(b) | | | 30,000 | | | | 29,775 | |
See accompanying Notes to Consolidated Financial Statements which are an integral part of the financial statements.
21 Invesco Global Targeted Returns Fund
| | | | | | | | |
| | | Principal Amount | | | Value | |
| United States–(continued) | |
Tempo Acquisition, LLC/Finance Corp., Sr. Unsec. Notes, 6.75%, 06/01/2025(b) | | $ | 24,000 | | | $ | 22,913 | |
Tenet Healthcare Corp., Sr. Unsec. Global Notes, 6.75%, 06/15/2023 | | | 61,000 | | | | 61,058 | |
Terex Corp., Sr. Unsec. Gtd. Notes, 5.63%, 02/01/2025(b) | | | 25,000 | | | | 23,813 | |
Titan International, Inc., Sr. Sec. Gtd. First Lien Global Notes, 6.50%, 11/30/2023 | | | 57,000 | | | | 53,295 | |
TransDigm Inc., Sr. Unsec. Gtd. Sub. Global Notes, 6.50%, 05/15/2025 | | | 56,000 | | | | 55,930 | |
Transocean Inc., Sr. Unsec. Gtd. Global Notes, 7.50%, 04/15/2031 | | | 49,000 | | | | 45,570 | |
TreeHouse Foods, Inc., Sr. Unsec. Gtd. Notes, 6.00%, 02/15/2024(b) | | | 24,000 | | | | 24,060 | |
Trinseo Materials Operating S.C.A./Trinseo Materials Finance, Inc., Sr. Unsec. Gtd. Notes, 5.38%, 09/01/2025(b) | | | 18,000 | | | | 16,785 | |
Triumph Group, Inc., Sr. Unsec. Gtd. Global Notes, 7.75%, 08/15/2025 | | | 42,000 | | | | 39,585 | |
United Rentals North America, Inc., | | | | | | | | |
Sr. Unsec. Gtd. Global Notes, 5.50%, 07/15/2025 | | | 35,000 | | | | 34,234 | |
Sr. Unsec. Gtd. Notes, | | | | | | | | |
5.88%, 09/15/2026 | | | 12,000 | | | | 11,805 | |
6.50%, 12/15/2026 | | | 9,000 | | | | 9,124 | |
United States Steel Corp., Sr. Unsec. Global Notes, 6.88%, 08/15/2025 | | | 58,000 | | | | 57,130 | |
US Foods, Inc., Sr. Unsec. Gtd. Notes, 5.88%, 06/15/2024(b) | | | 30,000 | | | | 29,850 | |
Valvoline Inc., Sr. Unsec. Gtd. Global Notes, 5.50%, 07/15/2024 | | | 20,000 | | | | 19,925 | |
Verizon Communications Inc., Sr. Unsec. Global Notes, 4.40%, 11/01/2034 | | | 50,000 | | | | 47,363 | |
VFH Parent LLC/Orchestra Co-Issuer Inc., Sec. Gtd. Second Lien Notes, 6.75%, 06/15/2022(b) | | | 12,000 | | | | 12,270 | |
Walmart Inc., Sr. Unsec. Notes, 2.65%, 12/15/2024 | | | 100,000 | | | | 95,034 | |
Walt Disney Co. (The), Sr. Unsec. Global Notes, 3.00%, 02/13/2026 | | | 50,000 | | | | 47,625 | |
Waste Pro USA, Inc., Sr. Unsec. Notes, 5.50%, 02/15/2026(b) | | | 15,000 | | | | 14,250 | |
Weatherford International Ltd., Sr. Unsec. Gtd. Notes, 6.50%, 08/01/2036 | | | 45,000 | | | | 30,150 | |
WellCare Health Plans, Inc., Sr. Unsec. Notes, 5.25%, 04/01/2025 | | | 25,000 | | | | 25,000 | |
5.38%, 08/15/2026(b) | | | 15,000 | | | | 15,000 | |
| | | | | | | | |
| | | Principal Amount | | | Value | |
| United States–(continued) | |
Western Digital Corp., Sr. Unsec. Gtd. Notes, 4.75%, 02/15/2026 | | $ | 30,000 | | | $ | 27,750 | |
Whiting Petroleum Corp., Sr. Unsec. Gtd. Global Notes, 6.25%, 04/01/2023 | | | 25,000 | | | | 25,375 | |
WildHorse Resource Development Corp., Sr. Unsec. Gtd. Global Notes, 6.88%, 02/01/2025 | | | 47,000 | | | | 47,000 | |
William Lyon Homes, Inc., Sr. Unsec. Gtd. Global Notes, 6.00%, 09/01/2023 | | | 8,000 | | | | 7,340 | |
WPX Energy Inc., Sr. Unsec. Notes, 5.25%, 09/15/2024 | | | 65,000 | | | | 64,512 | |
Wrangler Buyer Corp., Sr. Unsec. Notes, 6.00%, 10/01/2025(b) | | | 8,000 | | | | 8,600 | |
Wynn Las Vegas LLC/Wynn Las Vegas Capital Corp., REGS, Sr. Unsec. Gtd. Euro Notes, 5.25%, 05/15/2027(b) | | | 25,000 | | | | 22,656 | |
| | | | | | | | 7,301,557 | |
|
| Zambia–0.06% | |
First Quantum Minerals Ltd., Sr. Unsec. Gtd. Notes, 7.00%, 02/15/2021(b) | | | 60,000 | | | | 58,800 | |
Total U.S. Dollar Denominated Bonds & Notes
(Cost $11,094,923) | | | | 10,600,045 | |
|
U.S. Treasury Securities–0.72% | |
| U.S. Treasury Notes–0.62% | | | | | | | | |
2.25%, 02/29/2020 | | | 630,000 | | | | 625,533 | |
|
| U.S. Treasury Inflation — Indexed Notes–0.10% | |
0.13%, 04/15/2021 | | | 99,790 | (h) | | | 97,263 | |
Total U.S. Treasury Securities
(Cost $726,068) | | | | 722,796 | |
| | |
| | | Shares | | | | |
Preferred Stocks–0.05% | |
| United States–0.05% | | | | | | | | |
CIT Group Inc., Series A, 5.80% Pfd. | | | 10,000 | | | | 9,860 | |
Wells Fargo & Co., Class A, Series L, $75.00 Conv. Pfd. | | | 30 | | | | 38,160 | |
Total Preferred Stocks
(Cost $48,100) | | | | 48,020 | |
|
Money Market Funds–31.51% | |
Invesco Government & Agency Portfolio–Institutional Class, 2.08%(i) | | | 9,555,346 | | | | 9,555,346 | |
Invesco Liquid Assets Portfolio–Institutional Class, 2.27%(i) | | | 7,253,269 | | | | 7,254,720 | |
Invesco Treasury Portfolio–Institutional Class, 2.09%(i) | | | 10,920,395 | | | | 10,920,395 | |
See accompanying Notes to Consolidated Financial Statements which are an integral part of the financial statements.
22 Invesco Global Targeted Returns Fund
| | | | | | | | |
| | | Shares | | | Value | |
Money Market Funds–(continued) | |
STIC (Global Series) PLC–U.S. Dollar Liquidity Portfolio (Ireland)–Institutional Class, 2.26%(i) | | | 3,816,442 | | | $ | 3,816,442 | |
Total Money Market Funds
(Cost $31,547,364) | | | | 31,546,903 | |
|
Options Purchased–7.93% | |
(Cost $11,060,147) | | | | | | | 7,946,652 | |
TOTAL INVESTMENTS IN SECURITIES–94.34%
(Cost $99,517,386) | | | | 94,454,346 | |
OTHER ASSETS LESS LIABILITIES–5.66% | | | | 5,669,244 | |
NET ASSETS–100.00% | | | $ | 100,123,590 | |
Investment Abbreviations:
| | |
| ADR | | – American Depositary Receipt |
| CAD | | – Canadian Dollar |
| Conv. | | – Convertible |
| Deb. | | – Debentures |
| DIP | | – Debtor-in-Possession |
| EUR | | – Euro |
| EURIBOR | | – Euro Interbank Offered Rate |
| GBP | | – British Pound Sterling |
| Gtd. | | – Guaranteed |
| Jr. | | – Junior |
| LIBOR | | – London Interbank Offered Rate |
| MXN | | – Mexican Peso |
| NVDR | | – Non-Voting Depositary Receipt |
| Pfd. | | – Preferred |
| PIK | | – Pay-in-Kind |
| PLN | | – Poland Zloty |
| REGS | | – Regulation S |
| REIT | | – Real Estate Investment Trust |
| Rts. | | – Rights |
| Sec. | | – Secured |
| Sr. | | – Senior |
| Sub. | | – Subordinated |
| Unsec. | | – Unsecured |
| USD | | – U.S. Dollar |
| ZAR | | – South African Rand |
Notes to Consolidated Schedule of Investments:
| (a) | Non-income producing security. |
| (b) | Security purchased or received in a transaction exempt from registration under the Securities Act of 1933, as amended (the “1933 Act”). The security may be resold pursuant to an exemption from registration under the 1933 Act, typically to qualified institutional buyers. The aggregate value of these securities at October 31, 2018 was $10,987,751, which represented 10.97% of the Fund’s Net Assets. |
| (c) | Each unit represents one ordinary share, seventeen Class A shares and one Class C share. |
| (d) | Foreign denominated security. Principal amount is denominated in the currency indicated. |
| (e) | Perpetual bond with no specified maturity date. |
| (f) | Interest or dividend rate is redetermined periodically. Rate shown is the rate in effect on October 31, 2018. |
| (g) | All or a portion of this security is Pay-in-Kind. Pay-in-Kind securities pay interest income in the form of securities. |
| (h) | Principal amount of security and interest payments are adjusted for inflation. See Note 1I. |
| (i) | The money market fund and the Fund are affiliated by having the same investment adviser. The rate shown is the 7-day SEC standardized yield as of October 31, 2018. |
See accompanying Notes to Consolidated Financial Statements which are an integral part of the financial statements.
23 Invesco Global Targeted Returns Fund
| | | | | | | | | | | | | | | | | | | | | | | | | | | | | | | | | | |
| Open Over-The-Counter Index Options Purchased* | |
| Description | | Type of
Contract | | | Counterparty | | Expiration
Date | | | Number of
Contracts | | | Exercise
Price | | | Notional
Value(j) | | | Value | |
Euro Stoxx 50 Index | | | Call | | | Goldman Sachs International | | | 12/20/2019 | | | | 41 | | | | EUR | | | | 3,400 | | | | EUR | | | | 1,394,000 | | | $ | 33,711 | |
Euro Stoxx 50 Index | | | Call | | | J.P. Morgan Chase Bank, N.A. | | | 12/20/2019 | | | | 103 | | | | EUR | | | | 3,350 | | | | EUR | | | | 3,450,500 | | | | 102,413 | |
Euro Stoxx 50 Index | | | Call | | | J.P. Morgan Chase Bank, N.A. | | | 12/20/2019 | | | | 144 | | | | EUR | | | | 3,400 | | | | EUR | | | | 4,896,000 | | | | 118,400 | |
Euro Stoxx 50 Index | | | Call | | | Societe Generale | | | 12/18/2020 | | | | 9 | | | | EUR | | | | 3,400 | | | | EUR | | | | 306,000 | | | | 11,217 | |
Euro Stoxx 50 Index | | | Call | | | UBS AG | | | 12/20/2019 | | | | 103 | | | | EUR | | | | 3,350 | | | | EUR | | | | 3,450,500 | | | | 102,413 | |
Euro Stoxx Banks Index | | | Call | | | Goldman Sachs International | | | 06/21/2019 | | | | 291 | | | | EUR | | | | 120 | | | | EUR | | | | 1,746,000 | | | | 7,352 | |
Euro Stoxx Banks Index | | | Call | | | Goldman Sachs International | | | 12/20/2019 | | | | 30 | | | | EUR | | | | 105 | | | | EUR | | | | 157,500 | | | | 6,212 | |
Euro Stoxx Banks Index | | | Call | | | J.P. Morgan Chase Bank, N.A. | | | 06/21/2019 | | | | 291 | | | | EUR | | | | 120 | | | | EUR | | | | 1,746,000 | | | | 7,352 | |
Euro Stoxx Banks Index | | | Call | | | J.P. Morgan Chase Bank, N.A. | | | 12/20/2019 | | | | 91 | | | | EUR | | | | 105 | | | | EUR | | | | 477,750 | | | | 18,844 | |
Euro Stoxx Banks Index | | | Call | | | J.P. Morgan Chase Bank, N.A. | | | 12/20/2019 | | | | 40 | | | | EUR | | | | 110 | | | | EUR | | | | 220,000 | | | | 5,604 | |
FTSE 100 Index | | | Call | | | Barclays Bank PLC | | | 03/15/2019 | | | | 174 | | | | GBP | | | | 7,250 | | | | GBP | | | | 12,615,000 | | | | 331,193 | |
FTSE 100 Index | | | Call | | | Barclays Bank PLC | | | 12/20/2019 | | | | 1 | | | | GBP | | | | 7,400 | | | | GBP | | | | 74,000 | | | | 2,458 | |
FTSE 100 Index | | | Call | | | J.P. Morgan Chase Bank, N.A. | | | 03/15/2019 | | | | 48 | | | | GBP | | | | 7,450 | | | | GBP | | | | 3,576,000 | | | | 48,651 | |
FTSE 100 Index | | | Call | | | J.P. Morgan Chase Bank, N.A. | | | 03/15/2019 | | | | 72 | | | | GBP | | | | 7,750 | | | | GBP | | | | 5,580,000 | | | | 22,945 | |
FTSE 100 Index | | | Call | | | Societe Generale | | | 03/15/2019 | | | | 348 | | | | GBP | | | | 7,600 | | | | GBP | | | | 26,448,000 | | | | 205,444 | |
FTSE 100 Index | | | Call | | | Societe Generale | | | 12/20/2019 | | | | 17 | | | | GBP | | | | 7,600 | | | | GBP | | | | 1,292,000 | | | | 29,709 | |
FTSE 100 Index | | | Call | | | UBS AG | | | 03/15/2019 | | | | 72 | | | | GBP | | | | 7,750 | | | | GBP | | | | 5,580,000 | | | | 22,946 | |
Hang Seng China Enterprise Index | | | Call | | | Societe Generale | | | 12/28/2018 | | | | 64 | | | | HKD | | | | 12,300 | | | | HKD | | | | 39,360,000 | | | | 3,164 | |
Nikkei 225 Index | | | Call | | | BNP Paribas S.A. | | | 12/14/2018 | | | | 2 | | | | JPY | | | | 21,750 | | | | JPY | | | | 43,500,000 | | | | 13,993 | |
Nikkei 225 Index | | | Call | | | Societe Generale | | | 12/14/2018 | | | | 7 | | | | JPY | | | | 25,000 | | | | JPY | | | | 175,000,000 | | | | 1,029 | |
Nikkei 225 Index | | | Call | | | UBS AG | | | 12/14/2018 | | | | 45 | | | | JPY | | | | 22,750 | | | | JPY | | | | 1,023,750,000 | | | | 126,238 | |
S&P 500 Index | | | Call | | | Citibank, N.A. | | | 02/15/2019 | | | | 35 | | | | USD | | | | 2,860 | | | | USD | | | | 10,010,000 | | | | 128,078 | |
S&P 500 Index | | | Call | | | Goldman Sachs International | | | 12/21/2018 | | | | 3 | | | | USD | | | | 2,700 | | | | USD | | | | 810,000 | | | | 24,246 | |
S&P 500 Index | | | Call | | | Goldman Sachs International | | | 12/21/2018 | | | | 8 | | | | USD | | | | 2,725 | | | | USD | | | | 2,180,000 | | | | 52,834 | |
S&P 500 Index | | | Call | | | Goldman Sachs International | | | 12/21/2018 | | | | 11 | | | | USD | | | | 2,750 | | | | USD | | | | 3,025,000 | | | | 58,027 | |
S&P 500 Index | | | Call | | | Goldman Sachs International | | | 12/21/2018 | | | | 6 | | | | USD | | | | 2,975 | | | | USD | | | | 1,785,000 | | | | 1,364 | |
S&P 500 Index | | | Call | | | Goldman Sachs International | | | 12/21/2018 | | | | 3 | | | | USD | | | | 3,200 | | | | USD | | | | 960,000 | | | | 19 | |
S&P 500 Index | | | Call | | | Goldman Sachs International | | | 12/21/2018 | | | | 7 | | | | USD | | | | 3,250 | | | | USD | | | | 2,275,000 | | | | 20 | |
S&P 500 Index | | | Call | | | Goldman Sachs International | | | 12/21/2018 | | | | 5 | | | | USD | | | | 3,300 | | | | USD | | | | 1,650,000 | | | | 7 | |
S&P 500 Index | | | Call | | | Goldman Sachs International | | | 12/21/2018 | | | | 5 | | | | USD | | | | 3,400 | | | | USD | | | | 1,700,000 | | | | 2 | |
S&P 500 Index | | | Call | | | Goldman Sachs International | | | 12/21/2018 | | | | 9 | | | | USD | | | | 3,500 | | | | USD | | | | 3,150,000 | | | | 1 | |
S&P 500 Index | | | Call | | | Goldman Sachs International | | | 12/21/2018 | | | | 2 | | | | USD | | | | 3,600 | | | | USD | | | | 720,000 | | | | 0 | |
S&P 500 Index | | | Call | | | Goldman Sachs International | | | 01/18/2019 | | | | 180 | | | | USD | | | | 2,885 | | | | USD | | | | 51,930,000 | | | | 353,428 | |
S&P 500 Index | | | Call | | | J.P. Morgan Chase Bank, N.A. | | | 12/21/2018 | | | | 3 | | | | USD | | | | 2,725 | | | | USD | | | | 817,500 | | | | 19,813 | |
S&P 500 Index | | | Call | | | J.P. Morgan Chase Bank, N.A. | | | 12/21/2018 | | | | 5 | | | | USD | | | | 2,750 | | | | USD | | | | 1,375,000 | | | | 26,376 | |
S&P 500 Index | | | Call | | | J.P. Morgan Chase Bank, N.A. | | | 12/21/2018 | | | | 2 | | | | USD | | | | 2,975 | | | | USD | | | | 595,000 | | | | 455 | |
S&P 500 Index | | | Call | | | J.P. Morgan Chase Bank, N.A. | | | 12/21/2018 | | | | 3 | | | | USD | | | | 3,250 | | | | USD | | | | 975,000 | | | | 9 | |
S&P 500 Index | | | Call | | | J.P. Morgan Chase Bank, N.A. | | | 12/21/2018 | | | | 2 | | | | USD | | | | 3,300 | | | | USD | | | | 660,000 | | | | 3 | |
S&P 500 Index | | | Call | | | J.P. Morgan Chase Bank, N.A. | | | 12/21/2018 | | | | 2 | | | | USD | | | | 3,400 | | | | USD | | | | 680,000 | | | | 1 | |
S&P 500 Index | | | Call | | | J.P. Morgan Chase Bank, N.A. | | | 12/21/2018 | | | | 4 | | | | USD | | | | 3,500 | | | | USD | | | | 1,400,000 | | | | 1 | |
S&P 500 Index | | | Call | | | Societe Generale | | | 12/21/2018 | | | | 4 | | | | USD | | | | 2,700 | | | | USD | | | | 1,080,000 | | | | 32,328 | |
S&P 500 Index | | | Call | | | Societe Generale | | | 12/21/2018 | | | | 6 | | | | USD | | | | 2,725 | | | | USD | | | | 1,635,000 | | | | 39,626 | |
S&P 500 Index | | | Call | | | Societe Generale | | | 12/21/2018 | | | | 8 | | | | USD | | | | 2,750 | | | | USD | | | | 2,200,000 | | | | 42,202 | |
S&P 500 Index | | | Call | | | Societe Generale | | | 12/21/2018 | | | | 4 | | | | USD | | | | 2,975 | | | | USD | | | | 1,190,000 | | | | 909 | |
S&P 500 Index | | | Call | | | Societe Generale | | | 12/21/2018 | | | | 2 | | | | USD | | | | 3,200 | | | | USD | | | | 640,000 | | | | 12 | |
S&P 500 Index | | | Call | | | Societe Generale | | | 12/21/2018 | | | | 5 | | | | USD | | | | 3,250 | | | | USD | | | | 1,625,000 | | | | 15 | |
S&P 500 Index | | | Call | | | Societe Generale | | | 12/21/2018 | | | | 4 | | | | USD | | | | 3,300 | | | | USD | | | | 1,320,000 | | | | 5 | |
S&P 500 Index | | | Call | | | Societe Generale | | | 12/21/2018 | | | | 4 | | | | USD | | | | 3,400 | | | | USD | | | | 1,360,000 | | | | 1 | |
S&P 500 Index | | | Call | | | Societe Generale | | | 12/21/2018 | | | | 8 | | | | USD | | | | 3,500 | | | | USD | | | | 2,800,000 | | | | 1 | |
S&P 500 Index | | | Call | | | Societe Generale | | | 12/21/2018 | | | | 2 | | | | USD | | | | 3,600 | | | | USD | | | | 720,000 | | | | 0 | |
See accompanying Notes to Consolidated Financial Statements which are an integral part of the financial statements.
24 Invesco Global Targeted Returns Fund
| | | | | | | | | | | | | | | | | | | | | | | | | | | | | | | | | | |
| Open Over-The-Counter Index Options Purchased*—(continued) | |
| Description | | Type of
Contract | | | Counterparty | | Expiration
Date | | | Number of
Contracts | | | Exercise
Price | | | Notional
Value(j) | | | Value | |
S&P 500 Index | | | Call | | | UBS AG | | | 12/21/2018 | | | | 3 | | | | USD | | | | 2,700 | | | | USD | | | | 810,000 | | | $ | 24,246 | |
S&P 500 Index | | | Call | | | UBS AG | | | 12/21/2018 | | | | 2 | | | | USD | | | | 3,200 | | | | USD | | | | 640,000 | | | | 12 | |
S&P 500 Index | | | Call | | | UBS AG | | | 12/21/2018 | | | | 2 | | | | USD | | | | 3,600 | | | | USD | | | | 720,000 | | | | 0 | |
S&P 500 Index | | | Call | | | UBS AG | | | 02/15/2019 | | | | 84 | | | | USD | | | | 2,815 | | | | USD | | | | 23,646,000 | | | | 448,060 | |
S&P 500 Index | | | Call | | | UBS AG | | | 02/15/2019 | | | | 84 | | | | USD | | | | 2,835 | | | | USD | | | | 23,814,000 | | | | 381,899 | |
Swiss Market Index | | | Call | | | J.P. Morgan Chase Bank, N.A. | | | 12/20/2019 | | | | 3 | | | | CHF | | | | 9,100 | | | | CHF | | | | 273,000 | | | | 10,093 | |
Swiss Market Index | | | Call | | | Societe Generale | | | 12/20/2019 | | | | 27 | | | | CHF | | | | 9,400 | | | | CHF | | | | 2,538,000 | | | | 60,960 | |
Subtotal — Index Call Options Purchased | | | | 2,540 | | | | | | | | | | | | | | | | | | | | 2,926,341 | |
Euro Stoxx Banks Index | | | Put | | | Goldman Sachs International | | | 06/21/2019 | | | | 268 | | | | EUR | | | | 105 | | | | EUR | | | | 1,407,000 | | | | 221,433 | |
Euro Stoxx Banks Index | | | Put | | | Goldman Sachs International | | | 12/20/2019 | | | | 30 | | | | EUR | | | | 95 | | | | EUR | | | | 142,500 | | | | 18,016 | |
Euro Stoxx Banks Index | | | Put | | | J.P. Morgan Chase Bank, N.A. | | | 06/21/2019 | | | | 268 | | | | EUR | | | | 105 | | | | EUR | | | | 1,407,000 | | | | 221,433 | |
Euro Stoxx Banks Index | | | Put | | | J.P. Morgan Chase Bank, N.A. | | | 12/20/2019 | | | | 82 | | | | EUR | | | | 95 | | | | EUR | | | | 389,500 | | | | 49,244 | |
Euro Stoxx Banks Index | | | Put | | | J.P. Morgan Chase Bank, N.A. | | | 12/20/2019 | | | | 39 | | | | EUR | | | | 100 | | | | EUR | | | | 195,000 | | | | 29,863 | |
Euro Stoxx Banks Index | | | Put | | | UBS AG | | | 06/21/2019 | | | | 212 | | | | EUR | | | | 95 | | | | EUR | | | | 1,007,000 | | | | 98,244 | |
FTSE 100 Index | | | Put | | | Barclays Bank PLC | | | 03/15/2019 | | | | 87 | | | | GBP | | | | 6,525 | | | | GBP | | | | 5,676,750 | | | | 120,969 | |
FTSE 100 Index | | | Put | | | Barclays Bank PLC | | | 12/20/2019 | | | | 1 | | | | GBP | | | | 6,700 | | | | GBP | | | | 67,000 | | | | 4,740 | |
FTSE 100 Index | | | Put | | | J.P. Morgan Chase Bank, N.A. | | | 03/15/2019 | | | | 16 | | | | GBP | | | | 7,100 | | | | GBP | | | | 1,136,000 | | | | 58,015 | |
FTSE 100 Index | | | Put | | | Societe Generale | | | 12/20/2019 | | | | 15 | | | | GBP | | | | 6,900 | | | | GBP | | | | 1,035,000 | | | | 86,846 | |
Hang Seng China Enterprise Index | | | Put | | | Societe Generale | | | 12/28/2018 | | | | 32 | | | | HKD | | | | 11,600 | | | | HKD | | | | 18,560,000 | | | | 297,988 | |
Hang Seng China Enterprise Index | | | Put | | | UBS AG | | | 12/28/2018 | | | | 46 | | | | HKD | | | | 10,100 | | | | HKD | | | | 23,230,000 | | | | 106,930 | |
Nikkei 225 Index | | | Put | | | Societe Generale | | | 12/14/2018 | | | | 7 | | | | JPY | | | | 21,000 | | | | JPY | | | | 147,000,000 | | | | 23,942 | |
S&P 500 Index | | | Put | | | Goldman Sachs International | | | 12/21/2018 | | | | 11 | | | | USD | | | | 1,300 | | | | USD | | | | 1,430,000 | | | | 74 | |
S&P 500 Index | | | Put | | | Goldman Sachs International | | | 12/21/2018 | | | | 20 | | | | USD | | | | 1,350 | | | | USD | | | | 2,700,000 | | | | 180 | |
S&P 500 Index | | | Put | | | Goldman Sachs International | | | 12/21/2018 | | | | 5 | | | | USD | | | | 1,525 | | | | USD | | | | 762,500 | | | | 117 | |
S&P 500 Index | | | Put | | | Goldman Sachs International | | | 12/21/2018 | | | | 6 | | | | USD | | | | 1,700 | | | | USD | | | | 1,020,000 | | | | 326 | |
S&P 500 Index | | | Put | | | Goldman Sachs International | | | 12/21/2018 | | | | 8 | | | | USD | | | | 1,725 | | | | USD | | | | 1,380,000 | | | | 486 | |
S&P 500 Index | | | Put | | | Goldman Sachs International | | | 12/21/2018 | | | | 12 | | | | USD | | | | 1,750 | | | | USD | | | | 2,100,000 | | | | 816 | |
S&P 500 Index | | | Put | | | Goldman Sachs International | | | 12/21/2018 | | | | 5 | | | | USD | | | | 1,925 | | | | USD | | | | 962,500 | | | | 714 | |
S&P 500 Index | | | Put | | | Goldman Sachs International | | | 12/21/2018 | | | | 4 | | | | USD | | | | 2,100 | | | | USD | | | | 840,000 | | | | 1,179 | |
S&P 500 Index | | | Put | | | Goldman Sachs International | | | 12/21/2018 | | | | 8 | | | | USD | | | | 2,125 | | | | USD | | | | 1,700,000 | | | | 2,636 | |
S&P 500 Index | | | Put | | | Goldman Sachs International | | | 12/21/2018 | | | | 12 | | | | USD | | | | 2,150 | | | | USD | | | | 2,580,000 | | | | 4,438 | |
S&P 500 Index | | | Put | | | Goldman Sachs International | | | 12/21/2018 | | | | 4 | | | | USD | | | | 2,425 | | | | USD | | | | 970,000 | | | | 5,832 | |
S&P 500 Index | | | Put | | | J.P. Morgan Chase Bank, N.A. | | | 12/21/2018 | | | | 8 | | | | USD | | | | 1,350 | | | | USD | | | | 1,080,000 | | | | 72 | |
S&P 500 Index | | | Put | | | J.P. Morgan Chase Bank, N.A. | | | 12/21/2018 | | | | 2 | | | | USD | | | | 1,525 | | | | USD | | | | 305,000 | | | | 47 | |
S&P 500 Index | | | Put | | | J.P. Morgan Chase Bank, N.A. | | | 12/21/2018 | | | | 3 | | | | USD | | | | 1,725 | | | | USD | | | | 517,500 | | | | 182 | |
S&P 500 Index | | | Put | | | J.P. Morgan Chase Bank, N.A. | | | 12/21/2018 | | | | 5 | | | | USD | | | | 1,750 | | | | USD | | | | 875,000 | | | | 340 | |
S&P 500 Index | | | Put | | | J.P. Morgan Chase Bank, N.A. | | | 12/21/2018 | | | | 2 | | | | USD | | | | 1,925 | | | | USD | | | | 385,000 | | | | 285 | |
S&P 500 Index | | | Put | | | J.P. Morgan Chase Bank, N.A. | | | 12/21/2018 | | | | 4 | | | | USD | | | | 2,125 | | | | USD | | | | 850,000 | | | | 1,318 | |
S&P 500 Index | | | Put | | | J.P. Morgan Chase Bank, N.A. | | | 12/21/2018 | | | | 5 | | | | USD | | | | 2,150 | | | | USD | | | | 1,075,000 | | | | 1,849 | |
S&P 500 Index | | | Put | | | J.P. Morgan Chase Bank, N.A. | | | 12/21/2018 | | | | 2 | | | | USD | | | | 2,425 | | | | USD | | | | 485,000 | | | | 2,916 | |
S&P 500 Index | | | Put | | | Societe Generale | | | 12/21/2018 | | | | 9 | | | | USD | | | | 1,300 | | | | USD | | | | 1,170,000 | | | | 60 | |
S&P 500 Index | | | Put | | | Societe Generale | | | 12/21/2018 | | | | 15 | | | | USD | | | | 1,350 | | | | USD | | | | 2,025,000 | | | | 135 | |
S&P 500 Index | | | Put | | | Societe Generale | | | 12/21/2018 | | | | 4 | | | | USD | | | | 1,525 | | | | USD | | | | 610,000 | | | | 93 | |
S&P 500 Index | | | Put | | | Societe Generale | | | 12/21/2018 | | | | 4 | | | | USD | | | | 1,700 | | | | USD | | | | 680,000 | | | | 217 | |
S&P 500 Index | | | Put | | | Societe Generale | | | 12/21/2018 | | | | 6 | | | | USD | | | | 1,725 | | | | USD | | | | 1,035,000 | | | | 365 | |
S&P 500 Index | | | Put | | | Societe Generale | | | 12/21/2018 | | | | 9 | | | | USD | | | | 1,750 | | | | USD | | | | 1,575,000 | | | | 612 | |
S&P 500 Index | | | Put | | | Societe Generale | | | 12/21/2018 | | | | 3 | | | | USD | | | | 1,925 | | | | USD | | | | 577,500 | | | | 428 | |
S&P 500 Index | | | Put | | | Societe Generale | | | 12/21/2018 | | | | 5 | | | | USD | | | | 2,100 | | | | USD | | | | 1,050,000 | | | | 1,473 | |
S&P 500 Index | | | Put | | | Societe Generale | | | 12/21/2018 | | | | 6 | | | | USD | | | | 2,125 | | | | USD | | | | 1,275,000 | | | | 1,977 | |
See accompanying Notes to Consolidated Financial Statements which are an integral part of the financial statements.
25 Invesco Global Targeted Returns Fund
| | | | | | | | | | | | | | | | | | | | | | | | | | | | | | | | | | |
| Open Over-The-Counter Index Options Purchased*—(continued) | |
| Description | | Type of
Contract | | | Counterparty | | Expiration
Date | | | Number of
Contracts | | | Exercise
Price | | | Notional
Value(j) | | | Value | |
S&P 500 Index | | | Put | | | Societe Generale | | | 12/21/2018 | | | | 10 | | | | USD | | | | 2,150 | | | | USD | | | | 2,150,000 | | | $ | 3,699 | |
S&P 500 Index | | | Put | | | Societe Generale | | | 12/21/2018 | | | | 2 | | | | USD | | | | 2,425 | | | | USD | | | | 485,000 | | | | 2,916 | |
S&P 500 Index | | | Put | | | UBS AG | | | 12/21/2018 | | | | 3 | | | | USD | | | | 1,300 | | | | USD | | | | 390,000 | | | | 20 | |
S&P 500 Index | | | Put | | | UBS AG | | | 12/21/2018 | | | | 6 | | | | USD | | | | 1,350 | | | | USD | | | | 810,000 | | | | 54 | |
S&P 500 Index | | | Put | | | UBS AG | | | 12/21/2018 | | | | 2 | | | | USD | | | | 1,525 | | | | USD | | | | 305,000 | | | | 47 | |
S&P 500 Index | | | Put | | | UBS AG | | | 12/21/2018 | | | | 3 | | | | USD | | | | 1,700 | | | | USD | | | | 510,000 | | | | 163 | |
S&P 500 Index | | | Put | | | UBS AG | | | 12/21/2018 | | | | 2 | | | | USD | | | | 1,725 | | | | USD | | | | 345,000 | | | | 122 | |
S&P 500 Index | | | Put | | | UBS AG | | | 12/21/2018 | | | | 3 | | | | USD | | | | 1,750 | | | | USD | | | | 525,000 | | | | 204 | |
S&P 500 Index | | | Put | | | UBS AG | | | 12/21/2018 | | | | 1 | | | | USD | | | | 1,925 | | | | USD | | | | 192,500 | | | | 143 | |
S&P 500 Index | | | Put | | | UBS AG | | | 12/21/2018 | | | | 4 | | | | USD | | | | 2,100 | | | | USD | | | | 840,000 | | | | 1,178 | |
S&P 500 Index | | | Put | | | UBS AG | | | 12/21/2018 | | | | 2 | | | | USD | | | | 2,125 | | | | USD | | | | 425,000 | | | | 659 | |
S&P 500 Index | | | Put | | | UBS AG | | | 12/21/2018 | | | | 4 | | | | USD | | | | 2,150 | | | | USD | | | | 860,000 | | | | 1,479 | |
S&P 500 Index | | | Put | | | UBS AG | | | 12/21/2018 | | | | 1 | | | | USD | | | | 2,425 | | | | USD | | | | 242,500 | | | | 1,458 | |
Swiss Market Index | | | Put | | | J.P. Morgan Chase Bank, N.A. | | | 12/20/2019 | | | | 3 | | | | CHF | | | | 8,200 | | | | CHF | | | | 246,000 | | | | 10,375 | |
Swiss Market Index | | | Put | | | Societe Generale | | | 12/20/2019 | | | | 23 | | | | CHF | | | | 8,500 | | | | CHF | | | | 1,955,000 | | | | 102,986 | |
Subtotal — Index Put Options Purchased | | | | 1,359 | | | | | | | | | | | | | | | | | | | | 1,492,333 | |
Total Index Options Purchased — Equity Risk | | | | 3,899 | | | | | | | | | | | | | | | | | | | $ | 4,418,674 | |
| (j) | Notional Value is calculated by multiplying the Number of Contracts by the Exercise Price by the multiplier. |
| | | | | | | | | | | | | | | | | | | | | | | | | | | | | | |
| Open Over-The-Counter Foreign Currency Options Purchased* | |
| Description | | Type of
Contract | | | Counterparty | | Expiration
Date | | | Exercise
Price | | | Notional
Value | | | Value | |
AUD versus USD | | | Call | | | Citibank, N.A. | | | 08/28/2019 | | | | USD | | | | 0.730 | | | | AUD | | | | 4,993,114 | | | $ | 78,174 | |
AUD versus USD | | | Call | | | Citibank, N.A. | | | 09/12/2019 | | | | USD | | | | 0.725 | | | | AUD | | | | 2,218,043 | | | | 40,870 | |
AUD versus USD | | | Call | | | J.P. Morgan Chase Bank, N.A. | | | 09/12/2019 | | | | USD | | | | 0.725 | | | | AUD | | | | 2,775,871 | | | | 51,148 | |
CHF versus JPY | | | Call | | | Goldman Sachs International | | | 11/06/2018 | | | | JPY | | | | 117.090 | | | | CHF | | | | 820,000 | | | | 0 | |
CHF versus JPY | | | Call | | | Goldman Sachs International | | | 11/06/2018 | | | | JPY | | | | 117.650 | | | | CHF | | | | 820,000 | | | | 0 | |
CHF versus JPY | | | Call | | | Goldman Sachs International | | | 11/06/2018 | | | | JPY | | | | 118.200 | | | | CHF | | | | 820,000 | | | | 0 | |
GBP versus USD | | | Call | | | Deutsche Bank AG | | | 04/29/2019 | | | | USD | | | | 1.380 | | | | GBP | | | | 100,000 | | | | 661 | |
USD versus BRL | | | Call | | | J.P. Morgan Chase Bank, N.A. | | | 01/17/2019 | | | | BRL | | | | 3.750 | | | | USD | | | | 728,000 | | | | 18,094 | |
USD versus BRL | | | Call | | | Morgan Stanley & Co. LLC | | | 01/17/2019 | | | | BRL | | | | 3.750 | | | | USD | | | | 1,922,000 | | | | 47,769 | |
USD versus BRL | | | Call | | | Morgan Stanley & Co. LLC | | | 08/19/2019 | | | | BRL | | | | 4.450 | | | | USD | | | | 2,148,000 | | | | 33,943 | |
USD versus CAD | | | Call | | | Bank of America, N.A. | | | 08/28/2019 | | | | CAD | | | | 1.310 | | | | USD | | | | 3,643,000 | | | | 97,658 | |
USD versus CAD | | | Call | | | Bank of America, N.A. | | | 09/12/2019 | | | | CAD | | | | 1.289 | | | | USD | | | | 3,639,977 | | | | 129,273 | |
Subtotal — Foreign Currency Call Options Purchased | | | | | | | | | | | | | | | | | | | | | | | 497,590 | |
AUD versus USD | | | Put | | | Citibank, N.A. | | | 08/28/2019 | | | | USD | | | | 0.730 | | | | AUD | | | | 4,993,114 | | | | 170,907 | |
AUD versus USD | | | Put | | | Citibank, N.A. | | | 09/12/2019 | | | | USD | | | | 0.725 | | | | AUD | | | | 2,218,043 | | | | 70,522 | |
AUD versus USD | | | Put | | | J.P. Morgan Chase Bank, N.A. | | | 09/12/2019 | | | | USD | | | | 0.725 | | | | AUD | | | | 2,775,871 | | | | 88,258 | |
CHF versus JPY | | | Put | | | Bank of America, N.A. | | | 11/06/2018 | | | | JPY | | | | 105.890 | | | | CHF | | | | 820,000 | | | | 1 | |
CHF versus JPY | | | Put | | | Bank of America, N.A. | | | 11/06/2018 | | | | JPY | | | | 106.440 | | | | CHF | | | | 716,698 | | | | 1 | |
CHF versus JPY | | | Put | | | Bank of America, N.A. | | | 11/06/2018 | | | | JPY | | | | 107.000 | | | | CHF | | | | 820,000 | | | | 2 | |
CHF versus JPY | | | Put | | | Goldman Sachs International | | | 11/06/2018 | | | | JPY | | | | 106.440 | | | | CHF | | | | 103,302 | | | | 0 | |
USD versus CAD | | | Put | | | Bank of America, N.A. | | | 08/28/2019 | | | | CAD | | | | 1.310 | | | | USD | | | | 3,643,000 | | | | 94,571 | |
USD versus CAD | | | Put | | | Bank of America, N.A. | | | 09/12/2019 | | | | CAD | | | | 1.289 | | | | USD | | | | 3,639,977 | | | | 69,807 | |
Subtotal — Foreign Currency Put Options Purchased | | | | | | | | | | | | | | | | | | | | 494,069 | |
Total Foreign Currency Options Purchased — Currency Risk | | | | | | | | | | | | | | | $ | 991,659 | |
See accompanying Notes to Consolidated Financial Statements which are an integral part of the financial statements.
26 Invesco Global Targeted Returns Fund
| | | | | | | | | | | | | | | | | | | | | | | | | | | | | | | | | | |
| Open Over-The-Counter Interest Rate Swaptions Purchased* | |
| Description | | Type of
Contract | | | Counterparty | | Exercise
Rate | | | Pay/
Receive
Exercise
Rate | | | Floating Rate Index | | | Payment
Frequency | | | Expiration
Date | | | Notional
Value | | | Value | |
10 Year Interest Rate Swap | | | Call | | | Bank of America, N.A. | | | 2.98 | % | | | Receive | | | | 3 Month USD LIBOR | | | | Quarterly | | | | 07/19/2028 | | | $ | 5,471,000 | | | $ | 227,307 | |
10 Year Interest Rate Swap | | | Call | | | Bank of America, N.A. | | | 2.99 | | | | Receive | | | | 3 Month USD LIBOR | | | | Quarterly | | | | 07/17/2028 | | | | 4,968,000 | | | | 207,311 | |
10 Year Interest Rate Swap | | | Call | | | Bank of America, N.A. | | | 3.00 | | | | Receive | | | | 3 Month USD LIBOR | | | | Quarterly | | | | 07/18/2028 | | | | 5,087,000 | | | | 212,886 | |
10 Year Interest Rate Swap | | | Call | | | Bank of America, N.A. | | | 3.06 | | | | Receive | | | | 3 Month USD LIBOR | | | | Quarterly | | | | 06/15/2028 | | | | 3,739,083 | | | | 162,426 | |
10 Year Interest Rate Swap | | | Call | | | Bank of America, N.A. | | | 3.06 | | | | Receive | | | | 3 Month USD LIBOR | | | | Quarterly | | | | 06/19/2028 | | | | 3,739,083 | | | | 162,951 | |
10 Year Interest Rate Swap | | | Call | | | Bank of America, N.A. | | | 3.36 | | | | Receive | | | | 3 Month USD LIBOR | | | | Quarterly | | | | 10/11/2028 | | | | 2,532,400 | | | | 133,269 | |
10 Year Interest Rate Swap | | | Call | | | Citibank, N.A. | | | 2.98 | | | | Receive | | | | 3 Month USD LIBOR | | | | Quarterly | | | | 07/11/2028 | | | | 2,100,000 | | | | 87,033 | |
10 Year Interest Rate Swap | | | Call | | | Citibank, N.A. | | | 2.99 | | | | Receive | | | | 3 Month USD LIBOR | | | | Quarterly | | | | 07/11/2028 | | | | 2,133,000 | | | | 88,961 | |
10 Year Interest Rate Swap | | | Call | | | Citibank, N.A. | | | 3.01 | | | | Receive | | | | 3 Month USD LIBOR | | | | Quarterly | | | | 07/10/2028 | | | | 2,100,000 | | | | 88,557 | |
10 Year Interest Rate Swap | | | Call | | | Citibank, N.A. | | | 3.07 | | | | Receive | | | | 3 Month USD LIBOR | | | | Quarterly | | | | 07/25/2028 | | | | 4,503,000 | | | | 197,352 | |
10 Year Interest Rate Swap | | | Call | | | Citibank, N.A. | | | 3.08 | | | | Receive | | | | 3 Month USD LIBOR | | | | Quarterly | | | | 07/24/2028 | | | | 4,165,000 | | | | 183,625 | |
10 Year Interest Rate Swap | | | Call | | | Citibank, N.A. | | | 3.32 | | | | Receive | | | | 3 Month USD LIBOR | | | | Quarterly | | | | 10/16/2028 | | | | 2,215,850 | | | | 113,691 | |
10 Year Interest Rate Swap | | | Call | | | Morgan Stanley Capital
Services LLC | | | 3.12 | | | | Receive | | | | 3 Month USD LIBOR | | | | Quarterly | | | | 09/13/2028 | | | | 2,960,000 | | | | 134,238 | |
10 Year Interest Rate Swap | | | Call | | | Morgan Stanley & Co. LLC | | | 3.32 | | | | Receive | | | | 3 Month USD LIBOR | | | | Quarterly | | | | 10/12/2028 | | | | 949,650 | | | | 48,740 | |
10 Year Interest Rate Swap | | | Call | | | Societe Generale | | | 3.10 | | | | Receive | | | | 3 Month USD LIBOR | | | | Quarterly | | | | 07/26/2028 | | | | 4,503,000 | | | | 200,914 | |
10 Year Interest Rate Swap | | | Call | | | Societe Generale | | | 3.11 | | | | Receive | | | | 3 Month USD LIBOR | | | | Quarterly | | | | 07/27/2028 | | | | 2,341,000 | | | | 105,145 | |
10 Year Interest Rate Swap | | | Call | | | Societe Generale | | | 3.39 | | | | Receive | | | | 3 Month USD LIBOR | | | | Quarterly | | | | 10/10/2028 | | | | 633,100 | | | | 33,783 | |
Subtotal — Interest Rate Call Swaptions Purchased | | | | 2,388,189 | |
5 Year Interest Rate Swap | | | Put | | | Barclays Bank PLC | | | 3.18 | | | | Pay | | | | 3 Month USD LIBOR | | | | Quarterly | | | | 02/13/2019 | | | | 9,549,955 | | | | 56,088 | |
5 Year Interest Rate Swap | | | Put | | | Barclays Bank PLC | | | 3.24 | | | | Pay | | | | 3 Month USD LIBOR | | | | Quarterly | | | | 02/11/2019 | | | | 9,801,045 | | | | 44,825 | |
5 Year Interest Rate Swap | | | Put | | | Citibank, N.A. | | | 3.29 | | | | Pay | | | | 3 Month USD LIBOR | | | | Quarterly | | | | 03/13/2019 | | | | 1,486,000 | | | | 7,022 | |
5 Year Interest Rate Swap | | | Put | | | Citibank, N.A. | | | 3.35 | | | | Pay | | | | 3 Month USD LIBOR | | | | Quarterly | | | | 04/26/2019 | | | | 1,443,980 | | | | 7,273 | |
5 Year Interest Rate Swap | | | Put | | | Citibank, N.A. | | | 3.38 | | | | Pay | | | | 3 Month USD LIBOR | | | | Quarterly | | | | 04/29/2019 | | | | 1,443,980 | | | | 6,755 | |
5 Year Interest Rate Swap | | | Put | | | Citibank, N.A. | | | 3.39 | | | | Pay | | | | 3 Month USD LIBOR | | | | Quarterly | | | | 04/30/2019 | | | | 1,436,518 | | | | 6,547 | |
5 Year Interest Rate Swap | | | Put | | | Citibank, N.A. | | | 3.41 | | | | Pay | | | | 3 Month USD LIBOR | | | | Quarterly | | | | 04/24/2019 | | | | 2,050,000 | | | | 8,419 | |
5 Year Interest Rate Swap | | | Put | | | Citibank, N.A. | | | 3.41 | | | | Pay | | | | 3 Month USD LIBOR | | | | Quarterly | | | | 04/25/2019 | | | | 1,453,457 | | | | 5,984 | |
5 Year Interest Rate Swap | | | Put | | | Citibank, N.A. | | | 3.43 | | | | Pay | | | | 3 Month USD LIBOR | | | | Quarterly | | | | 04/30/2019 | | | | 1,320,850 | | | | 5,217 | |
Subtotal — Interest Rate Put Swaptions Purchased | | | | 148,130 | |
Total Interest Rate Swaptions Purchased — Interest Rate Risk | | | | | | | | | | | | | | | | | | | $ | 2,536,319 | |
Total Options Purchased (Cost $11,060,147) | | | | | | | | | | | | | | | | | | | $ | 7,946,652 | |
| | | | | | | | | | | | | | | | | | | | | | | | | | | | | | | | | | | | | | | | | | |
| Open Over-The-Counter Index Options Written* | |
| Description | | Type of
Contract | | | Counterparty | | Expiration
Date | | | Number of
Contracts | | | Exercise
Price | | | Premiums
Received | | | Notional
Value(k) | | | Value | | | Unrealized
Appreciation
(Depreciation) | |
Euro Stoxx 50 Index | | | Call | | | Deutsche Bank AG | | | 12/20/2019 | | | | 22 | | | | EUR | | | | 3,400 | | | $ | (67,595 | ) | | | EUR | | | | 748,000 | | | $ | (18,089 | ) | | $ | 49,506 | |
Euro Stoxx 50 Index | | | Call | | | Goldman Sachs International | | | 12/20/2019 | | | | 21 | | | | EUR | | | | 3,400 | | | | (64,769 | ) | | | EUR | | | | 714,000 | | | | (17,267 | ) | | | 47,502 | |
Euro Stoxx 50 Index | | | Call | | | J.P. Morgan Chase Bank, N.A. | | | 12/20/2019 | | | | 62 | | | | EUR | | | | 3,350 | | | | (108,420 | ) | | | EUR | | | | 2,077,000 | | | | (61,647 | ) | | | 46,773 | |
Euro Stoxx 50 Index | | | Call | | | UBS AG | | | 12/20/2019 | | | | 61 | | | | EUR | | | | 3,350 | | | | (113,952 | ) | | | EUR | | | | 2,043,500 | | | | (60,652 | ) | | | 53,300 | |
Euro Stoxx 50 Index | | | Call | | | UBS AG | | | 12/20/2019 | | | | 58 | | | | EUR | | | | 3,400 | | | | (148,840 | ) | | | EUR | | | | 1,972,000 | | | | (47,689 | ) | | | 101,151 | |
FTSE 100 Index | | | Call | | | Barclays Bank PLC | | | 03/15/2019 | | | | 348 | | | | GBP | | | | 7,600 | | | | (122,049 | ) | | | GBP | | | | 26,448,000 | | | | (205,444 | ) | | | (83,395 | ) |
FTSE 100 Index | | | Call | | | J.P. Morgan Chase Bank, N.A. | | | 03/15/2019 | | | | 24 | | | | GBP | | | | 7,450 | | | | (55,087 | ) | | | GBP | | | | 1,788,000 | | | | (24,325 | ) | | | 30,762 | |
FTSE 100 Index | | | Call | | | J.P. Morgan Chase Bank, N.A. | | | 03/15/2019 | | | | 144 | | | | GBP | | | | 7,750 | | | | (27,151 | ) | | | GBP | | | | 11,160,000 | | | | (45,891 | ) | | | (18,740 | ) |
FTSE 100 Index | | | Call | | | Societe Generale | | | 03/15/2019 | | | | 174 | | | | GBP | | | | 7,250 | | | | (475,641 | ) | | | GBP | | | | 12,615,000 | | | | (331,193 | ) | | | 144,448 | |
FTSE 100 Index | | | Call | | | UBS AG | | | 03/15/2019 | | | | 24 | | | | GBP | | | | 7,450 | | | | (57,517 | ) | | | GBP | | | | 1,788,000 | | | | (24,325 | ) | | | 33,192 | |
See accompanying Notes to Consolidated Financial Statements which are an integral part of the financial statements.
27 Invesco Global Targeted Returns Fund
| | | | | | | | | | | | | | | | | | | | | | | | | | | | | | | | | | | | | | | | | | |
| Open Over-The-Counter Index Options Written*—(continued) | |
| Description | | Type of
Contract | | | Counterparty | | Expiration
Date | | | Number of
Contracts | | | Exercise
Price | | | Premiums
Received | | | Notional
Value(k) | | | Value | | | Unrealized
Appreciation
(Depreciation) | |
Hang Seng China Enterprise Index | | | Call | | | Societe Generale | | | 12/28/2018 | | | | 32 | | | | HKD | | | | 12,900 | | | $ | (82,605 | ) | | | HKD | | | | 20,640,000 | | | $ | (490 | ) | | $ | 82,115 | |
Nikkei 225 Index | | | Call | | | BNP Paribas S.A. | | | 12/14/2018 | | | | 2 | | | | JPY | | | | 24,000 | | | | (8,348 | ) | | | JPY | | | | 48,000,000 | | | | (1,184 | ) | | | 7,164 | |
Nikkei 225 Index | | | Call | | | Societe Generale | | | 12/14/2018 | | | | 7 | | | | JPY | | | | 22,750 | | | | (28,961 | ) | | | JPY | | | | 159,250,000 | | | | (19,637 | ) | | | 9,324 | |
Nikkei 225 Index | | | Call | | | UBS AG | | | 12/14/2018 | | | | 45 | | | | JPY | | | | 25,000 | | | | (257,216 | ) | | | JPY | | | | 1,125,000,000 | | | | (6,614 | ) | | | 250,602 | |
S&P 500 Index | | | Call | | | Citibank, N.A. | | | 02/15/2019 | | | | 53 | | | | USD | | | | 2,995 | | | | (59,386 | ) | | | USD | | | | 15,873,500 | | | | (46,954 | ) | | | 12,432 | |
S&P 500 Index | | | Call | | | Goldman Sachs International | | | 01/18/2019 | | | | 90 | | | | USD | | | | 2,775 | | | | (805,753 | ) | | | USD | | | | 24,975,000 | | | | (519,320 | ) | | | 286,433 | |
S&P 500 Index | | | Call | | | Goldman Sachs International | | | 12/20/2019 | | | | 1 | | | | USD | | | | 2,825 | | | | (18,901 | ) | | | USD | | | | 282,500 | | | | (15,146 | ) | | | 3,755 | |
S&P 500 Index | | | Call | | | Goldman Sachs International | | | 12/20/2019 | | | | 1 | | | | USD | | | | 3,075 | | | | (7,015 | ) | | | USD | | | | 307,500 | | | | (5,315 | ) | | | 1,700 | |
S&P 500 Index | | | Call | | | Goldman Sachs International | | | 12/20/2019 | | | | 1 | | | | USD | | | | 3,200 | | | | (5,751 | ) | | | USD | | | | 320,000 | | | | (2,739 | ) | | | 3,012 | |
S&P 500 Index | | | Call | | | Goldman Sachs International | | | 12/20/2019 | | | | 2 | | | | USD | | | | 3,250 | | | | (6,852 | ) | | | USD | | | | 650,000 | | | | (4,018 | ) | | | 2,834 | |
S&P 500 Index | | | Call | | | Goldman Sachs International | | | 12/20/2019 | | | | 1 | | | | USD | | | | 3,300 | | | | (3,143 | ) | | | USD | | | | 330,000 | | | | (1,440 | ) | | | 1,703 | |
S&P 500 Index | | | Call | | | Goldman Sachs International | | | 12/20/2019 | | | | 2 | | | | USD | | | | 3,400 | | | | (2,486 | ) | | | USD | | | | 680,000 | | | | (1,582 | ) | | | 904 | |
S&P 500 Index | | | Call | | | Goldman Sachs International | | | 12/20/2019 | | | | 1 | | | | USD | | | | 3,500 | | | | (824 | ) | | | USD | | | | 350,000 | | | | (471 | ) | | | 353 | |
S&P 500 Index | | | Call | | | Goldman Sachs International | | | 12/20/2019 | | | | 1 | | | | USD | | | | 3,600 | | | | (459 | ) | | | USD | | | | 360,000 | | | | (298 | ) | | | 161 | |
S&P 500 Index | | | Call | | | Goldman Sachs International | | | 12/20/2019 | | | | 1 | | | | USD | | | | 3,700 | | | | (286 | ) | | | USD | | | | 370,000 | | | | (198 | ) | | | 88 | |
S&P 500 Index | | | Call | | | J.P. Morgan Chase Bank, N.A. | | | 12/21/2018 | | | | 10 | | | | USD | | | | 2,700 | | | | (86,513 | ) | | | USD | | | | 2,700,000 | | | | (80,820 | ) | | | 5,693 | |
S&P 500 Index | | | Call | | | J.P. Morgan Chase Bank, N.A. | | | 12/21/2018 | | | | 7 | | | | USD | | | | 3,200 | | | | (874 | ) | | | USD | | | | 2,240,000 | | | | (45 | ) | | | 829 | |
S&P 500 Index | | | Call | | | J.P. Morgan Chase Bank, N.A. | | | 12/21/2018 | | | | 6 | | | | USD | | | | 3,600 | | | | (6 | ) | | | USD | | | | 2,160,000 | | | | — | | | | 6 | |
S&P 500 Index | | | Call | | | J.P. Morgan Chase Bank, N.A. | | | 12/20/2019 | | | | 1 | | | | USD | | | | 2,925 | | | | (19,206 | ) | | | USD | | | | 292,500 | | | | (10,469 | ) | | | 8,737 | |
S&P 500 Index | | | Call | | | J.P. Morgan Chase Bank, N.A. | | | 12/20/2019 | | | | 3 | | | | USD | | | | 2,950 | | | | (37,641 | ) | | | USD | | | | 885,000 | | | | (28,278 | ) | | | 9,363 | |
S&P 500 Index | | | Call | | | J.P. Morgan Chase Bank, N.A. | | | 12/20/2019 | | | | 1 | | | | USD | | | | 3,200 | | | | (5,787 | ) | | | USD | | | | 320,000 | | | | (2,739 | ) | | | 3,048 | |
S&P 500 Index | | | Call | | | J.P. Morgan Chase Bank, N.A. | | | 12/20/2019 | | | | 2 | | | | USD | | | | 3,300 | | | | (4,360 | ) | | | USD | | | | 660,000 | | | | (2,881 | ) | | | 1,479 | |
S&P 500 Index | | | Call | | | J.P. Morgan Chase Bank, N.A. | | | 12/20/2019 | | | | 1 | | | | USD | | | | 3,500 | | | | (864 | ) | | | USD | | | | 350,000 | | | | (471 | ) | | | 393 | |
S&P 500 Index | | | Call | | | J.P. Morgan Chase Bank, N.A. | | | 12/20/2019 | | | | 1 | | | | USD | | | | 3,600 | | | | (700 | ) | | | USD | | | | 360,000 | | | | (298 | ) | | | 402 | |
S&P 500 Index | | | Call | | | Societe Generale | | | 12/20/2019 | | | | 1 | | | | USD | | | | 3,200 | | | | (6,571 | ) | | | USD | | | | 320,000 | | | | (2,739 | ) | | | 3,832 | |
S&P 500 Index | | | Call | | | Societe Generale | | | 12/20/2019 | | | | 1 | | | | USD | | | | 3,250 | | | | (4,903 | ) | | | USD | | | | 325,000 | | | | (2,009 | ) | | | 2,894 | |
S&P 500 Index | | | Call | | | Societe Generale | | | 12/20/2019 | | | | 1 | | | | USD | | | | 3,300 | | | | (3,538 | ) | | | USD | | | | 330,000 | | | | (1,440 | ) | | | 2,098 | |
S&P 500 Index | | | Call | | | Societe Generale | | | 12/20/2019 | | | | 1 | | | | USD | | | �� | 3,500 | | | | (737 | ) | | | USD | | | | 350,000 | | | | (471 | ) | | | 266 | |
S&P 500 Index | | | Call | | | Societe Generale | | | 12/20/2019 | | | | 1 | | | | USD | | | | 3,600 | | | | (351 | ) | | | USD | | | | 360,000 | | | | (298 | ) | | | 53 | |
S&P 500 Index | | | Call | | | UBS AG | | | 12/21/2018 | | | | 17 | | | | USD | | | | 2,725 | | | | (195,895 | ) | | | USD | | | | 4,632,500 | | | | (112,272 | ) | | | 83,623 | |
S&P 500 Index | | | Call | | | UBS AG | | | 12/21/2018 | | | | 24 | | | | USD | | | | 2,750 | | | | (240,795 | ) | | | USD | | | | 6,600,000 | | | | (126,605 | ) | | | 114,190 | |
S&P 500 Index | | | Call | | | UBS AG | | | 12/21/2018 | | | | 12 | | | | USD | | | | 2,975 | | | | (16,125 | ) | | | USD | | | | 3,570,000 | | | | (2,727 | ) | | | 13,398 | |
S&P 500 Index | | | Call | | | UBS AG | | | 12/21/2018 | | | | 15 | | | | USD | | | | 3,250 | | | | (1,920 | ) | | | USD | | | | 4,875,000 | | | | (43 | ) | | | 1,877 | |
S&P 500 Index | | | Call | | | UBS AG | | | 12/21/2018 | | | | 11 | | | | USD | | | | 3,300 | | | | (1,168 | ) | | | USD | | | | 3,630,000 | | | | (15 | ) | | | 1,153 | |
S&P 500 Index | | | Call | | | UBS AG | | | 12/21/2018 | | | | 11 | | | | USD | | | | 3,400 | | | | (701 | ) | | | USD | | | | 3,740,000 | | | | (5 | ) | | | 696 | |
See accompanying Notes to Consolidated Financial Statements which are an integral part of the financial statements.
28 Invesco Global Targeted Returns Fund
| | | | | | | | | | | | | | | | | | | | | | | | | | | | | | | | | | | | | | | | | | |
| Open Over-The-Counter Index Options Written*—(continued) | |
| Description | | Type of
Contract | | | Counterparty | | Expiration
Date | | | Number of
Contracts | | | Exercise
Price | | | Premiums
Received | | | Notional
Value(k) | | | Value | | | Unrealized
Appreciation
(Depreciation) | |
S&P 500 Index | | | Call | | | UBS AG | | | 12/21/2018 | | | | 21 | | | | USD | | | | 3,500 | | | $ | (876 | ) | | | USD | | | | 7,350,000 | | | $ | (2 | ) | | $ | 874 | |
S&P 500 Index | | | Call | | | UBS AG | | | 02/15/2019 | | | | 42 | | | | USD | | | | 2,710 | | | | (508,186 | ) | | | USD | | | | 11,382,000 | | | | (456,640 | ) | | | 51,546 | |
S&P 500 Index | | | Call | | | UBS AG | | | 02/15/2019 | | | | 42 | | | | USD | | | | 2,730 | | | | (447,300 | ) | | | USD | | | | 11,466,000 | | | | (405,035 | ) | | | 42,265 | |
S&P 500 Index | | | Call | | | UBS AG | | | 12/20/2019 | | | | 3 | | | | USD | | | | 2,700 | | | | (69,591 | ) | | | USD | | | | 810,000 | | | | (66,324 | ) | | | 3,267 | |
S&P 500 Index | | | Call | | | UBS AG | | | 12/20/2019 | | | | 1 | | | | USD | | | | 2,825 | | | | (19,437 | ) | | | USD | | | | 282,500 | | | | (15,146 | ) | | | 4,291 | |
S&P 500 Index | | | Call | | | UBS AG | | | 12/20/2019 | | | | 1 | | | | USD | | | | 3,075 | | | | (7,657 | ) | | | USD | | | | 307,500 | | | | (5,315 | ) | | | 2,342 | |
S&P 500 Index | | | Call | | | UBS AG | | | 12/20/2019 | | | | 5 | | | | USD | | | | 3,200 | | | | (23,512 | ) | | | USD | | | | 1,600,000 | | | | (13,695 | ) | | | 9,817 | |
S&P 500 Index | | | Call | | | UBS AG | | | 12/20/2019 | | | | 2 | | | | USD | | | | 3,300 | | | | (5,895 | ) | | | USD | | | | 660,000 | | | | (2,880 | ) | | | 3,015 | |
S&P 500 Index | | | Call | | | UBS AG | | | 12/20/2019 | | | | 3 | | | | USD | | | | 3,400 | | | | (4,204 | ) | | | USD | | | | 1,020,000 | | | | (2,373 | ) | | | 1,831 | |
S&P 500 Index | | | Call | | | UBS AG | | | 12/20/2019 | | | | 5 | | | | USD | | | | 3,500 | | | | (2,650 | ) | | | USD | | | | 1,750,000 | | | | (2,355 | ) | | | 295 | |
S&P 500 Index | | | Call | | | UBS AG | | | 12/20/2019 | | | | 2 | | | | USD | | | | 3,600 | | | | (285 | ) | | | USD | | | | 720,000 | | | | (596 | ) | | | (311 | ) |
S&P 500 Index | | | Call | | | UBS AG | | | 12/20/2019 | | | | 2 | | | | USD | | | | 3,700 | | | | (66 | ) | | | USD | | | | 740,000 | | | | (396 | ) | | | (330 | ) |
Swiss Market Index | | | Call | | | J.P. Morgan Chase Bank, N.A. | | | 12/20/2019 | | | | 2 | | | | CHF | | | | 9,400 | | | | (2,602 | ) | | | CHF | | | | 188,000 | | | | (4,516 | ) | | | (1,914 | ) |
Subtotal — Index Call Options Written | | | | 1,436 | | | | | | | | | | | | (4,249,923 | ) | | | | | | | | | | | (2,811,826 | ) | | | 1,438,097 | |
FTSE 100 Index | | | Put | | | J.P. Morgan Chase Bank, N.A. | | | 03/15/2019 | | | | 8 | | | | GBP | | | | 7,100 | | | | (19,184 | ) | | | GBP | | | | 568,000 | | | | (29,007 | ) | | | (9,823 | ) |
FTSE 100 Index | | | Put | | | Societe Generale | | | 03/15/2019 | | | | 87 | | | | GBP | | | | 6,525 | | | | (121,175 | ) | | | GBP | | | | 5,676,750 | | | | (120,969 | ) | | | 206 | |
FTSE 100 Index | | | Put | | | UBS AG | | | 03/15/2019 | | | | 8 | | | | GBP | | | | 7,100 | | | | (16,883 | ) | | | GBP | | | | 568,000 | | | | (29,007 | ) | | | (12,124 | ) |
Hang Seng China Enterprise Index | | | Put | | | Societe Generale | | | 12/28/2018 | | | | 128 | | | | HKD | | | | 11,000 | | | | (199,829 | ) | | | HKD | | | | 70,400,000 | | | | (762,084 | ) | | | (562,255 | ) |
Nikkei 225 Index | | | Put | | | BNP Paribas S.A. | | | 12/14/2018 | | | | 2 | | | | JPY | | | | 20,000 | | | | (15,828 | ) | | | JPY | | | | 40,000,000 | | | | (3,540 | ) | | | 12,288 | |
Nikkei 225 Index | | | Put | | | UBS AG | | | 12/14/2018 | | | | 45 | | | | JPY | | | | 21,000 | | | | (414,597 | ) | | | JPY | | | | 945,000,000 | | | | (153,915 | ) | | | 260,682 | |
S&P 500 Index | | | Put | | | Goldman Sachs International | | | 12/21/2018 | | | | 45 | | | | USD | | | | 2,360 | | | | (61,336 | ) | | | USD | | | | 10,620,000 | | | | (45,545 | ) | | | 15,791 | |
S&P 500 Index | | | Put | | | Goldman Sachs International | | | 12/20/2019 | | | | 5 | | | | USD | | | | 1,300 | | | | (1,496 | ) | | | USD | | | | 650,000 | | | | (2,619 | ) | | | (1,123 | ) |
S&P 500 Index | | | Put | | | Goldman Sachs International | | | 12/20/2019 | | | | 5 | | | | USD | | | | 1,400 | | | | (2,217 | ) | | | USD | | | | 700,000 | | | | (3,669 | ) | | | (1,452 | ) |
S&P 500 Index | | | Put | | | Goldman Sachs International | | | 12/20/2019 | | | | 5 | | | | USD | | | | 1,500 | | | | (2,791 | ) | | | USD | | | | 750,000 | | | | (5,035 | ) | | | (2,244 | ) |
S&P 500 Index | | | Put | | | Goldman Sachs International | | | 12/20/2019 | | | | 6 | | | | USD | | | | 1,600 | | | | (5,595 | ) | | | USD | | | | 960,000 | | | | (8,134 | ) | | | (2,539 | ) |
S&P 500 Index | | | Put | | | Goldman Sachs International | | | 12/20/2019 | | | | 3 | | | | USD | | | | 1,700 | | | | (2,998 | ) | | | USD | | | | 510,000 | | | | (5,384 | ) | | | (2,386 | ) |
S&P 500 Index | | | Put | | | Goldman Sachs International | | | 12/20/2019 | | | | 4 | | | | USD | | | | 1,800 | | | | (6,446 | ) | | | USD | | | | 720,000 | | | | (9,368 | ) | | | (2,922 | ) |
S&P 500 Index | | | Put | | | Goldman Sachs International | | | 12/20/2019 | | | | 5 | | | | USD | | | | 1,900 | | | | (8,442 | ) | | | USD | | | | 950,000 | | | | (15,102 | ) | | | (6,660 | ) |
S&P 500 Index | | | Put | | | Goldman Sachs International | | | 12/20/2019 | | | | 6 | | | | USD | | | | 2,000 | | | | (16,008 | ) | | | USD | | | | 1,200,000 | | | | (23,134 | ) | | | (7,126 | ) |
S&P 500 Index | | | Put | | | Goldman Sachs International | | | 12/20/2019 | | | | 2 | | | | USD | | | | 2,100 | | | | (5,441 | ) | | | USD | | | | 420,000 | | | | (9,742 | ) | | | (4,301 | ) |
S&P 500 Index | | | Put | | | Goldman Sachs International | | | 12/20/2019 | | | | 3 | | | | USD | | | | 2,250 | | | | (15,007 | ) | | | USD | | | | 675,000 | | | | (20,505 | ) | | | (5,498 | ) |
S&P 500 Index | | | Put | | | Goldman Sachs International | | | 12/20/2019 | | | | 4 | | | | USD | | | | 2,400 | | | | (21,418 | ) | | | USD | | | | 960,000 | | | | (37,918 | ) | | | (16,500 | ) |
S&P 500 Index | | | Put | | | Goldman Sachs International | | | 12/20/2019 | | | | 3 | | | | USD | | | | 2,550 | | | | (25,401 | ) | | | USD | | | | 765,000 | | | | (39,095 | ) | | | (13,694 | ) |
S&P 500 Index | | | Put | | | J.P. Morgan Chase Bank, N.A. | | | 12/21/2018 | | | | 12 | | | | USD | | | | 1,300 | | | | (1,125 | ) | | | USD | | | | 1,560,000 | | | | (80 | ) | | | 1,045 | |
S&P 500 Index | | | Put | | | J.P. Morgan Chase Bank, N.A. | | | 12/21/2018 | | | | 13 | | | | USD | | | | 1,700 | | | | (8,196 | ) | | | USD | | | | 2,210,000 | | | | (705 | ) | | | 7,491 | |
See accompanying Notes to Consolidated Financial Statements which are an integral part of the financial statements.
29 Invesco Global Targeted Returns Fund
| | | | | | | | | | | | | | | | | | | | | | | | | | | | | | | | | | | | | | | | | | |
| Open Over-The-Counter Index Options Written*—(continued) | |
| Description | | Type of
Contract | | | Counterparty | | Expiration
Date | | | Number of
Contracts | | | Exercise
Price | | | Premiums
Received | | | Notional
Value(k) | | | Value | | | Unrealized
Appreciation
(Depreciation) | |
S&P 500 Index | | | Put | | | J.P. Morgan Chase Bank, N.A. | | | 12/21/2018 | | | | 13 | | | | USD | | | | 2,100 | | | $ | (31,705 | ) | | | USD | | | | 2,730,000 | | | $ | (3,831 | ) | | $ | 27,874 | |
S&P 500 Index | | | Put | | | J.P. Morgan Chase Bank, N.A. | | | 12/20/2019 | | | | 2 | | | | USD | | | | 1,300 | | | | (412 | ) | | | USD | | | | 260,000 | | | | (1,048 | ) | | | (636 | ) |
S&P 500 Index | | | Put | | | J.P. Morgan Chase Bank, N.A. | | | 12/20/2019 | | | | 1 | | | | USD | | | | 1,400 | | | | (335 | ) | | | USD | | | | 140,000 | | | | (734 | ) | | | (399 | ) |
S&P 500 Index | | | Put | | | J.P. Morgan Chase Bank, N.A. | | | 12/20/2019 | | | | 10 | | | | USD | | | | 1,500 | | | | (8,105 | ) | | | USD | | | | 1,500,000 | | | | (10,070 | ) | | | (1,965 | ) |
S&P 500 Index | | | Put | | | J.P. Morgan Chase Bank, N.A. | | | 12/20/2019 | | | | 2 | | | | USD | | | | 1,600 | | | | (1,494 | ) | | | USD | | | | 320,000 | | | | (2,712 | ) | | | (1,218 | ) |
S&P 500 Index | | | Put | | | J.P. Morgan Chase Bank, N.A. | | | 12/20/2019 | | | | 2 | | | | USD | | | | 1,700 | | | | (2,092 | ) | | | USD | | | | 340,000 | | | | (3,589 | ) | | | (1,497 | ) |
S&P 500 Index | | | Put | | | J.P. Morgan Chase Bank, N.A. | | | 12/20/2019 | | | | 1 | | | | USD | | | | 1,800 | | | | (1,420 | ) | | | USD | | | | 180,000 | | | | (2,342 | ) | | | (922 | ) |
S&P 500 Index | | | Put | | | J.P. Morgan Chase Bank, N.A. | | | 12/20/2019 | | | | 10 | | | | USD | | | | 1,900 | | | | (26,631 | ) | | | USD | | | | 1,900,000 | | | | (30,205 | ) | | | (3,574 | ) |
S&P 500 Index | | | Put | | | J.P. Morgan Chase Bank, N.A. | | | 12/20/2019 | | | | 1 | | | | USD | | | | 2,000 | | | | (2,431 | ) | | | USD | | | | 200,000 | | | | (3,856 | ) | | | (1,425 | ) |
S&P 500 Index | | | Put | | | J.P. Morgan Chase Bank, N.A. | | | 12/20/2019 | | | | 1 | | | | USD | | | | 2,100 | | | | (3,097 | ) | | | USD | | | | 210,000 | | | | (4,871 | ) | | | (1,774 | ) |
S&P 500 Index | | | Put | | | J.P. Morgan Chase Bank, N.A. | | | 12/20/2019 | | | | 6 | | | | USD | | | | 2,400 | | | | (39,232 | ) | | | USD | | | | 1,440,000 | | | | (56,877 | ) | | | (17,645 | ) |
S&P 500 Index | | | Put | | | J.P. Morgan Chase Bank, N.A. | | | 12/20/2019 | | | | 1 | | | | USD | | | | 2,550 | | | | (8,172 | ) | | | USD | | | | 255,000 | | | | (13,032 | ) | | | (4,860 | ) |
S&P 500 Index | | | Put | | | Societe Generale | | | 12/20/2019 | | | | 3 | | | | USD | | | | 1,300 | | | | (792 | ) | | | USD | | | | 390,000 | | | | (1,571 | ) | | | (779 | ) |
S&P 500 Index | | | Put | | | Societe Generale | | | 12/20/2019 | | | | 3 | | | | USD | | | | 1,400 | | | | (1,084 | ) | | | USD | | | | 420,000 | | | | (2,202 | ) | | | (1,118 | ) |
S&P 500 Index | | | Put | | | Societe Generale | | | 12/20/2019 | | | | 5 | | | | USD | | | | 1,500 | | | | (2,453 | ) | | | USD | | | | 750,000 | | | | (5,035 | ) | | | (2,582 | ) |
S&P 500 Index | | | Put | | | Societe Generale | | | 12/20/2019 | | | | 2 | | | | USD | | | | 1,600 | | | | (1,326 | ) | | | USD | | | | 320,000 | | | | (2,712 | ) | | | (1,386 | ) |
S&P 500 Index | | | Put | | | Societe Generale | | | 12/20/2019 | | | | 3 | | | | USD | | | | 1,700 | | | | (2,631 | ) | | | USD | | | | 510,000 | | | | (5,384 | ) | | | (2,753 | ) |
S&P 500 Index | | | Put | | | Societe Generale | | | 12/20/2019 | | | | 2 | | | | USD | | | | 1,800 | | | | (2,293 | ) | | | USD | | | | 360,000 | | | | (4,684 | ) | | | (2,391 | ) |
S&P 500 Index | | | Put | | | Societe Generale | | | 12/20/2019 | | | | 4 | | | | USD | | | | 1,900 | | | | (5,961 | ) | | | USD | | | | 760,000 | | | | (12,081 | ) | | | (6,120 | ) |
S&P 500 Index | | | Put | | | Societe Generale | | | 12/20/2019 | | | | 3 | | | | USD | | | | 2,000 | | | | (5,757 | ) | | | USD | | | | 600,000 | | | | (11,567 | ) | | | (5,810 | ) |
S&P 500 Index | | | Put | | | Societe Generale | | | 12/20/2019 | | | | 1 | | | | USD | | | | 2,100 | | | | (2,437 | ) | | | USD | | | | 210,000 | | | | (4,871 | ) | | | (2,434 | ) |
S&P 500 Index | | | Put | | | Societe Generale | | | 12/20/2019 | | | | 1 | | | | USD | | | | 2,250 | | | | (3,454 | ) | | | USD | | | | 225,000 | | | | (6,835 | ) | | | (3,381 | ) |
S&P 500 Index | | | Put | | | Societe Generale | | | 12/20/2019 | | | | 3 | | | | USD | | | | 2,400 | | | | (14,618 | ) | | | USD | | | | 720,000 | | | | (28,438 | ) | | | (13,820 | ) |
S&P 500 Index | | | Put | | | Societe Generale | | | 12/20/2019 | | | | 2 | | | | USD | | | | 2,550 | | | | (13,637 | ) | | | USD | | | | 510,000 | | | | (26,064 | ) | | | (12,427 | ) |
S&P 500 Index | | | Put | | | UBS AG | | | 12/21/2018 | | | | 11 | | | | USD | | | | 1,300 | | | | (1,230 | ) | | | USD | | | | 1,430,000 | | | | (75 | ) | | | 1,155 | |
S&P 500 Index | | | Put | | | UBS AG | | | 12/21/2018 | | | | 49 | | | | USD | | | | 1,350 | | | | (6,494 | ) | | | USD | | | | 6,615,000 | | | | (441 | ) | | | 6,053 | |
S&P 500 Index | | | Put | | | UBS AG | | | 12/21/2018 | | | | 13 | | | | USD | | | | 1,525 | | | | (2,895 | ) | | | USD | | | | 1,982,500 | | | | (302 | ) | | | 2,593 | |
S&P 500 Index | | | Put | | | UBS AG | | | 12/21/2018 | | | | 19 | | | | USD | | | | 1,725 | | | | (8,385 | ) | | | USD | | | | 3,277,500 | | | | (1,155 | ) | | | 7,230 | |
S&P 500 Index | | | Put | | | UBS AG | | | 12/21/2018 | | | | 29 | | | | USD | | | | 1,750 | | | | (13,705 | ) | | | USD | | | | 5,075,000 | | | | (1,972 | ) | | | 11,733 | |
S&P 500 Index | | | Put | | | UBS AG | | | 12/21/2018 | | | | 11 | | | | USD | | | | 1,925 | | | | (9,215 | ) | | | USD | | | | 2,117,500 | | | | (1,570 | ) | | | 7,645 | |
S&P 500 Index | | | Put | | | UBS AG | | | 12/21/2018 | | | | 20 | | | | USD | | | | 2,125 | | | | (32,080 | ) | | | USD | | | | 4,250,000 | | | | (6,591 | ) | | | 25,489 | |
S&P 500 Index | | | Put | | | UBS AG | | | 12/21/2018 | | | | 31 | | | | USD | | | | 2,150 | | | | (50,900 | ) | | | USD | | | | 6,665,000 | | | | (11,465 | ) | | | 39,435 | |
S&P 500 Index | | | Put | | | UBS AG | | | 12/21/2018 | | | | 9 | | | | USD | | | | 2,425 | | | | (36,840 | ) | | | USD | | | | 2,182,500 | | | | (13,121 | ) | | | 23,719 | |
S&P 500 Index | | | Put | | | UBS AG | | | 01/18/2019 | | | | 21 | | | | USD | | | | 2,440 | | | | (56,786 | ) | | | USD | | | | 5,124,000 | | | | (54,420 | ) | | | 2,366 | |
S&P 500 Index | | | Put | | | UBS AG | | | 01/18/2019 | | | | 21 | | | | USD | | | | 2,460 | | | | (64,741 | ) | | | USD | | | | 5,166,000 | | | | (59,460 | ) | | | 5,281 | |
S&P 500 Index | | | Put | | | UBS AG | | | 12/20/2019 | | | | 13 | | | | USD | | | | 1,300 | | | | (4,671 | ) | | | USD | | | | 1,690,000 | | | | (6,810 | ) | | | (2,139 | ) |
S&P 500 Index | | | Put | | | UBS AG | | | 12/20/2019 | | | | 5 | | | | USD | | | | 1,400 | | | | (1,823 | ) | | | USD | | | | 700,000 | | | | (3,670 | ) | | | (1,847 | ) |
S&P 500 Index | | | Put | | | UBS AG | | | 12/20/2019 | | | | 10 | | | | USD | | | | 1,500 | | | | (4,926 | ) | | | USD | | | | 1,500,000 | | | | (10,070 | ) | | | (5,144 | ) |
S&P 500 Index | | | Put | | | UBS AG | | | 12/20/2019 | | | | 9 | | | | USD | | | | 1,600 | | | | (7,037 | ) | | | USD | | | | 1,440,000 | | | | (12,203 | ) | | | (5,166 | ) |
S&P 500 Index | | | Put | | | UBS AG | | | 12/20/2019 | | | | 13 | | | | USD | | | | 1,700 | | | | (19,921 | ) | | | USD | | | | 2,210,000 | | | | (23,331 | ) | | | (3,410 | ) |
S&P 500 Index | | | Put | | | UBS AG | | | 12/20/2019 | | | | 5 | | | | USD | | | | 1,800 | | | | (6,974 | ) | | | USD | | | | 900,000 | | | | (11,710 | ) | | | (4,736 | ) |
S&P 500 Index | | | Put | | | UBS AG | | | 12/20/2019 | | | | 9 | | | | USD | | | | 1,900 | | | | (14,968 | ) | | | USD | | | | 1,710,000 | | | | (27,184 | ) | | | (12,216 | ) |
See accompanying Notes to Consolidated Financial Statements which are an integral part of the financial statements.
30 Invesco Global Targeted Returns Fund
| | | | | | | | | | | | | | | | | | | | | | | | | | | | | | | | | | | | | | | | | | |
| Open Over-The-Counter Index Options Written*—(continued) | |
| Description | | Type of
Contract | | | Counterparty | | Expiration
Date | | | Number of
Contracts | | | Exercise
Price | | | Premiums
Received | | | Notional
Value(k) | | | Value | | | Unrealized
Appreciation
(Depreciation) | |
S&P 500 Index | | | Put | | | UBS AG | | | 12/20/2019 | | | | 7 | | | | USD | | | | 2,000 | | | $ | (17,307 | ) | | | USD | | | | 1,400,000 | | | $ | (26,990 | ) | | $ | (9,683 | ) |
S&P 500 Index | | | Put | | | UBS AG | | | 12/20/2019 | | | | 8 | | | | USD | | | | 2,100 | | | | (36,823 | ) | | | USD | | | | 1,680,000 | | | | (38,967 | ) | | | (2,144 | ) |
S&P 500 Index | | | Put | | | UBS AG | | | 12/20/2019 | | | | 3 | | | | USD | | | | 2,250 | | | | (13,498 | ) | | | USD | | | | 675,000 | | | | (20,505 | ) | | | (7,007 | ) |
S&P 500 Index | | | Put | | | UBS AG | | | 12/20/2019 | | | | 5 | | | | USD | | | | 2,400 | | | | (26,530 | ) | | | USD | | | | 1,200,000 | | | | (47,396 | ) | | | (20,866 | ) |
S&P 500 Index | | | Put | | | UBS AG | | | 12/20/2019 | | | | 5 | | | | USD | | | | 2,550 | | | | (43,118 | ) | | | USD | | | | 1,275,000 | | | | (65,158 | ) | | | (22,040 | ) |
Swiss Market Index | | | Put | | | J.P. Morgan Chase Bank, N.A. | | | 12/20/2019 | | | | 2 | | | | CHF | | | | 8,500 | | | | (11,952 | ) | | | CHF | | | | 170,000 | | | | (8,955 | ) | | | 2,997 | |
Subtotal — Index Put Options Written | | | | 809 | | | | | | | | | | | | (1,645,801 | ) | | | | | | | | | | | (2,022,689 | ) | | | (376,888 | ) |
Total — Index Options Written — Equity Risk | | | | 2,245 | | | | | | | | | | | $ | (5,895,724 | ) | | | | | | | | | | $ | (4,834,515 | ) | | $ | 1,061,209 | |
| (k) | Notional Value is calculated by multiplying the Number of Contracts by the Exercise Price by the multiplier. |
| | | | | | | | | | | | | | | | | | | | | | | | | | | | | | | | | | | | | | |
| Open Over-The-Counter Foreign Currency Options Written* | |
| Description | | Type of
Contract | | | Counterparty | | Expiration
Date | | | Exercise
Price | | | Premiums
Received | | | Notional
Value | | | Value | | | Unrealized
Appreciation
(Depreciation) | |
CHF versus JPY | | | Call | | | Bank of America, N.A. | | | 11/06/2018 | | | | JPY | | | | 117.650 | | | $ | (3,151 | ) | | | CHF | | | | 716,698 | | | $ | — | | | $ | 3,151 | |
CHF versus JPY | | | Call | | | Bank of America, N.A. | | | 11/06/2018 | | | | JPY | | | | 118.200 | | | | (2,645 | ) | | | CHF | | | | 820,000 | | | | — | | | | 2,645 | |
CHF versus JPY | | | Call | | | Bank of America, N.A. | | | 11/06/2018 | | | | JPY | | | | 117.090 | | | | (3,863 | ) | | | CHF | | | | 820,000 | | | | — | | | | 3,863 | |
CHF versus JPY | | | Call | | | Goldman Sachs International | | | 11/06/2018 | | | | JPY | | | | 117.650 | | | | (99 | ) | | | CHF | | | | 103,302 | | | | — | | | | 99 | |
USD versus BRL | | | Call | | | Barclays Bank PLC | | | 08/14/2019 | | | | BRL | | | | 4.450 | | | | (9,852 | ) | | | USD | | | | 181,000 | | | | (2,786 | ) | | | 7,066 | |
USD versus BRL | | | Call | | | J.P. Morgan Chase Bank, N.A. | | | 01/17/2019 | | | | BRL | | | | 3.750 | | | | (3,510 | ) | | | USD | | | | 178,000 | | | | (4,424 | ) | | | (914 | ) |
USD versus BRL | | | Call | | | Morgan Stanley & Co. LLC | | | 01/17/2019 | | | | BRL | | | | 3.750 | | | | (191,715 | ) | | | USD | | | | 2,472,000 | | | | (61,439 | ) | | | 130,276 | |
USD versus BRL | | | Call | | | Morgan Stanley & Co. LLC | | | 08/14/2019 | | | | BRL | | | | 4.450 | | | | (1,631 | ) | | | USD | | | | 103,000 | | | | (1,586 | ) | | | 45 | |
Subtotal — Foreign Currency Call Options Written | | | | | | | | | | | | | | | (216,466 | ) | | | | | | | | | | | (70,235 | ) | | | 146,231 | |
CHF versus JPY | | | Put | | | Goldman Sachs International | | | 11/06/2018 | | | | JPY | | | | 105.890 | | | | (1,344 | ) | | | CHF | | | | 820,000 | | | | (1 | ) | | | 1,343 | |
CHF versus JPY | | | Put | | | Goldman Sachs International | | | 11/06/2018 | | | | JPY | | | | 106.440 | | | | (1,622 | ) | | | CHF | | | | 820,000 | | | | (1 | ) | | | 1,621 | |
CHF versus JPY | | | Put | | | Goldman Sachs International | | | 11/06/2018 | | | | JPY | | | | 107.000 | | | | (1,965 | ) | | | CHF | | | | 820,000 | | | | (2 | ) | | | 1,963 | |
GBP versus USD | | | Put | | | Deutsche Bank AG | | | 04/29/2019 | | | | USD | | | | 1.100 | | | | (353 | ) | | | GBP | | | | 100,000 | | | | (364 | ) | | | (11 | ) |
Subtotal — Foreign Currency Put Options Written | | | | | | | | | | | | | | | (5,284 | ) | | | | | | | | | | | (368 | ) | | | 4,916 | |
Total — Foreign Currency Options Written — Currency Risk | | | | | | | | | | | | | | $ | (221,750 | ) | | | | | | | | | | $ | (70,603 | ) | | $ | 151,147 | |
| | | | | | | | | | | | | | | | | | | | | | | | | | | | | | | | | | | | | | | | | | |
| Open Over-The-Counter Interest Rate Swaptions Written* | |
| Description | | Type of
Contract | | | Counterparty | | Exercise
Rate | | | Pay/
Receive
Exercise
Rate | | | Floating
Rate Index | | | Payment
Frequency | | | Expiration
Date | | | Premium
Received | | | Notional
Value | | | Value | | | Unrealized
Appreciation
(Depreciation) | |
10 Year Interest Rate Swap | | | Call | | | Bank of America, N.A. | | | 3.05 | % | | | Receive | | | | 3 Month USD LIBOR | | | | Quarterly | | | | 08/30/2028 | | | $ | (330,374 | ) | | $ | 5,837,000 | | | $ | (253,777 | ) | | $ | 76,597 | |
5 Year Interest Rate Swap | | | Call | | | Citibank, N.A. | | | 2.85 | | | | Receive | | | | 3 Month USD LIBOR | | | | Quarterly | | | | 04/26/2019 | | | | (6,209 | ) | | | 1,443,980 | | | | (4,627 | ) | | | 1,582 | |
5 Year Interest Rate Swap | | | Call | | | Citibank, N.A. | | | 2.88 | | | | Receive | | | | 3 Month USD LIBOR | | | | Quarterly | | | | 04/29/2019 | | | | (5,704 | ) | | | 1,443,980 | | | | (5,139 | ) | | | 565 | |
5 Year Interest Rate Swap | | | Call | | | Citibank, N.A. | | | 2.89 | | | | Receive | | | | 3 Month USD LIBOR | | | | Quarterly | | | | 04/30/2019 | | | | (6,105 | ) | | | 1,436,518 | | | | (5,300 | ) | | | 805 | |
5 Year Interest Rate Swap | | | Call | | | Citibank, N.A. | | | 2.91 | | | | Receive | | | | 3 Month USD LIBOR | | | | Quarterly | | | | 04/24/2019 | | | | (7,400 | ) | | | 2,050,000 | | | | (7,774 | ) | | | (374 | ) |
5 Year Interest Rate Swap | | | Call | | | Citibank, N.A. | | | 2.91 | | | | Receive | | | | 3 Month USD LIBOR | | | | Quarterly | | | | 04/25/2019 | | | | (5,378 | ) | | | 1,453,457 | | | | (5,568 | ) | | | (190 | ) |
5 Year Interest Rate Swap | | | Call | | | Citibank, N.A. | | | 2.93 | | | | Receive | | | | 3 Month USD LIBOR | | | | Quarterly | | | | 04/30/2019 | | | | (5,283 | ) | | | 1,320,850 | | | | (5,283 | ) | | | — | |
Subtotal — Interest Rate Call Swaptions Written | | | | (366,453 | ) | | | | | | | (287,468 | ) | | | 78,985 | |
5 Year Interest Rate Swap | | | Put | | | Morgan Stanley & Co. LLC | | | 3.20 | | | | Pay | | | | 3 Month USD LIBOR | | | | Quarterly | | | | 02/28/2019 | | | | (4,600 | ) | | | 1,268,000 | | | | (7,839 | ) | | | (3,239 | ) |
Subtotal — Interest Rate Put Swaptions Written | | | | (4,600 | ) | | | | | | | (7,839 | ) | | | (3,239 | ) |
Total — Interest Rate Swaptions Written — Interest Rate Risk | | | | (371,053 | ) | | | | | | | (295,307 | ) | | | 75,746 | |
Total Options Written | | | $ | (6,488,527 | ) | | | | | | $ | (5,200,425 | ) | | $ | 1,288,102 | |
See accompanying Notes to Consolidated Financial Statements which are an integral part of the financial statements.
31 Invesco Global Targeted Returns Fund
| | | | | | | | | | | | | | | | | | | | |
| Open Futures Contracts(l) | |
| Long Futures Contracts | | Number of
Contracts | | | Expiration Month | | | Notional Value | | | Value | | | Unrealized
Appreciation (Depreciation) | |
EURO STOXX Banks Index | | | 486 | | | | December-2018 | | | $ | 2,663,677 | | | $ | (144,798 | ) | | $ | (144,798 | ) |
MSCI Taiwan Index | | | 29 | | | | November-2018 | | | | 1,058,210 | | | | 32,086 | | | | 32,086 | |
Swiss Market Index | | | 4 | | | | December-2018 | | | | 357,073 | | | | 21,745 | | | | 21,745 | |
Subtotal — Equity Risk | | | | | | | | | | | | | | | (90,967 | ) | | | (90,967 | ) |
Euro Bund | | | 2 | | | | December-2018 | | | | 362,957 | | | | 4,397 | | | | 4,397 | |
Euro BTP Italian Government Bonds | | | 2 | | | | December-2018 | | | | 275,490 | | | | 883 | | | | 883 | |
Euro-Buxl 30 Year Bonds | | | 2 | | | | December-2018 | | | | 400,643 | | | | (596 | ) | | | (596 | ) |
U.S. Treasury Ultra Bonds | | | 1 | | | | December-2018 | | | | 149,219 | | | | (9,594 | ) | | | (9,594 | ) |
Subtotal — Interest Rate Risk | | | | | | | | | | | | | | | (4,910 | ) | | | (4,910 | ) |
Subtotal — Long Futures Contracts | | | | | | | | | | | | | | | (95,877 | ) | | | (95,877 | ) |
| | | | | |
| | | | | | | | | | | | | | | | | | | | |
Short Futures Contracts | | | | | | | | | | | | | | | | | | | | |
Bovespa Index | | | 40 | | | | December-2018 | | | | (944,808 | ) | | | (37,943 | ) | | | (37,943 | ) |
E-Mini Russell 2000 Index | | | 103 | | | | December-2018 | | | | (7,786,285 | ) | | | 790,103 | | | | 790,103 | |
E-Mini S&P 500 Index | | | 57 | | | | December-2018 | | | | (7,726,635 | ) | | | 227,507 | | | | 227,507 | |
EURO STOXX 50 Index | | | 179 | | | | December-2018 | | | | (6,474,225 | ) | | | 264,850 | | | | 264,850 | |
FTSE 100 Index | | | 83 | | | | December-2018 | | | | (7,542,922 | ) | | | 268,608 | | | | 268,608 | |
Hang Seng China Enterprise Index | | | 43 | | | | November-2018 | | | | (2,778,324 | ) | | | (11,521 | ) | | | (11,521 | ) |
Mexican Bolsa IPC Index | | | 20 | | | | December-2018 | | | | (434,397 | ) | | | 40,926 | | | | 40,926 | |
MSCI AC Asia ex Japan Index | | | 78 | | | | December-2018 | | | | (3,288,301 | ) | | | 303,094 | | | | 303,094 | |
Nikkei 225 Index | | | 13 | | | | December-2018 | | | | (1,257,442 | ) | | | 32,435 | | | | 32,435 | |
Russell UK Mid 150 Index | | | 43 | | | | December-2018 | | | | (1,996,886 | ) | | | 140,219 | | | | 140,219 | |
Subtotal — Equity Risk | | | | | | | | | | | | | | | 2,018,278 | | | | 2,018,278 | |
Long Gilt | | | 7 | | | | December-2018 | | | | (1,095,080 | ) | | | (131 | ) | | | (131 | ) |
U.S. Treasury 5 Year Notes | | | 3 | | | | December-2018 | | | | (337,148 | ) | | | 187 | | | | 187 | |
U.S. Treasury 10 Year Notes | | | 5 | | | | December-2018 | | | | (592,188 | ) | | | 6,719 | | | | 6,719 | |
Subtotal — Interest Rate Risk | | | | | | | | | | | | | | | 6,775 | | | | 6,775 | |
Subtotal — Short Futures Contracts | | | | | | | | | | | | | | | 2,025,053 | | | | 2,025,053 | |
Total — Futures Contracts | | | | | | | | | | | | | | $ | 1,929,176 | | | $ | 1,929,176 | |
| (l) | Futures contracts collateralized by $2,537,284 cash held with Bank of America Merrill Lynch, the futures commission merchant. |
| | | | | | | | | | | | | | | | | | | | | | | | | | | | | | | | | | | | | | | | |
| Open Centrally Cleared Credit Default Swap Agreements(m) | |
| Reference Entity | | Buy/Sell
Protection | | | (Pay)/
Receive
Fixed
Rate | | | Payment
Frequency | | | Maturity
Date | | | Implied
Credit
Spread(n) | | | Notional
Value | | | Upfront
Payments
Paid
(Received) | | | Value | | | Unrealized
Appreciation
(Depreciation)(o) | |
Markit CDX North America Investment Grade Index, Series 31, Version 1 | | | Buy | | | | (1.00 | )% | | | Quarterly | | | | 12/20/2023 | | | | 0.681 | % | | | USD | | | | 16,456,000 | | | $ | (285,923 | ) | | $ | (242,595 | ) | | $ | 43,328 | |
Markit iTraxx Europe Crossover Index,
Series 30, Version 1 | | | Buy | | | | (5.00 | ) | | | Quarterly | | | | 12/20/2023 | | | | 2.972 | | | | EUR | | | | 250,000 | | | | (31,727 | ) | | | (26,182 | ) | | | 5,545 | |
Markit iTraxx Europe Index,
Series 30, Version 1 | | | Buy | | | | (1.00 | ) | | | Quarterly | | | | 12/20/2023 | | | | 0.741 | | | | EUR | | | | 13,589,000 | | | | (211,685 | ) | | | (200,323 | ) | | | 11,362 | |
Subtotal Centrally Cleared Credit Default Swap Agreements — Credit Risk | | | | | | | | | | | | | | | $ | (529,335 | ) | | $ | (469,100 | ) | | $ | 60,235 | |
| (o) | The daily variation margin receivable (payable) at period end is recorded in the Consolidated Statement of Assets and Liabilities. |
| | | | | | | | | | | | | | | | | | | | | | | | | | | | | | | | | | | | | | | | |
| Open Over-The-Counter Credit Default Swap Agreements — Credit Risk* | |
| Counterparty | | Reference Entity | | Buy/Sell
Protection | | (Pay)/
Receive
Fixed
Rate | | | Payment
Frequency | | | Maturity
Date | | | Implied
Credit
Spread(n) | | | Notional
Value | | | Upfront
Payments
Paid
(Received) | | | Value | | | Unrealized
Appreciation | |
J.P. Morgan Chase Bank, N.A. | | Jaguar Land Rover Automotive PLC | | Sell | | | 5.00 | % | | | Quarterly | | | | 12/20/2023 | | | | 4.990 | % | | | EUR | | | | 20,000 | | | $ | — | | | $ | 10 | | | $ | 10 | |
Subtotal Over-The-Counter Credit Default Swap Agreements | | | | | | | | | | | | | | | | | | | | — | | | | 10 | | | | 10 | |
Total Credit Default Swap Agreements | | | | | | | | | | | | | | | | | | | $ | (529,335 | ) | | $ | (469,090 | ) | | $ | 60,245 | |
See accompanying Notes to Consolidated Financial Statements which are an integral part of the financial statements.
32 Invesco Global Targeted Returns Fund
| (n) | Implied credit spreads represent the current level as of October 31, 2018 at which protection could be bought or sold given the terms of the existing credit default swap contract and serve as an indicator of the current status of the payment/performance risk of the credit default swap contract. An implied credit spread that has widened or increased since entry into the initial contract may indicate a deteriorating credit profile and increased risk of default for the reference entity. A declining or narrowing spread may indicate an improving credit profile or decreased risk of default for the reference entity. Alternatively, credit spreads may increase or decrease reflecting the general tolerance for risk in the credit spread markets generally. |
| | | | | | | | | | | | | | | | | | | | | | | | | | | | | | | | | | |
| Open Centrally Cleared Interest Rate Swap Agreements(m) | |
Pay/Receive Floating Rate | | Floating Rate Index | | Payment
Frequency | | (Pay)/
Receive
Fixed
Rate | | | Payment
Frequency | | Maturity
Date | | | Notional
Value | | | Upfront
Payments
Paid
(Received) | | | Value | | | Unrealized
Appreciation
(Depreciation)(p) | |
Receive | | 3 Month CDOR | | Semi-Annually | | | (2.439 | )% | | Semi-Annually | | | 07/25/2021 | | | | CAD | | | | 2,602,000 | | | $ | — | | | $ | 15,233 | | | $ | 15,233 | |
Receive | | 3 Month CDOR | | Semi-Annually | | | (2.490 | ) | | Semi-Annually | | | 08/22/2021 | | | | CAD | | | | 1,516,000 | | | | — | | | | 6,557 | | | | 6,557 | |
Receive | | 3 Month CDOR | | Semi-Annually | | | (2.510 | ) | | Semi-Annually | | | 08/30/2021 | | | | CAD | | | | 1,437,000 | | | | — | | | | 5,675 | | | | 5,675 | |
Receive | | 3 Month USD LIBOR | | Quarterly | | | (2.655 | ) | | Semi-Annually | | | 03/18/2027 | | | | USD | | | | 2,005,530 | | | | — | | | | 73,797 | | | | 73,797 | |
Receive | | 3 Month USD LIBOR | | Quarterly | | | (2.661 | ) | | Semi-Annually | | | 03/18/2027 | | | | USD | | | | 4,228,055 | | | | — | | | | 154,071 | | | | 154,071 | |
Receive | | 3 Month USD LIBOR | | Quarterly | | | (2.665 | ) | | Semi-Annually | | | 03/18/2027 | | | | USD | | | | 3,971,347 | | | | — | | | | 143,724 | | | | 143,724 | |
Receive | | 3 Month USD LIBOR | | Quarterly | | | (2.672 | ) | | Semi-Annually | | | 03/18/2027 | | | | USD | | | | 4,003,118 | | | | — | | | | 143,203 | | | | 143,203 | |
Receive | | 3 Month USD LIBOR | | Quarterly | | | (2.676 | ) | | Semi-Annually | | | 03/18/2027 | | | | USD | | | | 4,034,889 | | | | — | | | | 143,360 | | | | 143,360 | |
Receive | | 3 Month USD LIBOR | | Quarterly | | | (2.678 | ) | | Semi-Annually | | | 03/18/2027 | | | | USD | | | | 4,011,061 | | | | — | | | | 142,027 | | | | 142,027 | |
Receive | | 3 Month USD LIBOR | | Quarterly | | | (2.909 | ) | | Semi-Annually | | | 03/18/2027 | | | | USD | | | | 2,264,000 | | | | — | | | | 48,404 | | | | 48,404 | |
Receive | | 3 Month USD LIBOR | | Quarterly | | | (2.942 | ) | | Semi-Annually | | | 09/16/2023 | | | | USD | | | | 2,361,000 | | | | — | | | | 15,007 | | | | 15,007 | |
Receive | | 3 Month USD LIBOR | | Quarterly | | | (3.043 | ) | | Semi-Annually | | | 09/16/2027 | | | | USD | | | | 1,041,500 | | | | — | | | | 12,370 | | | | 12,370 | |
Receive | | 3 Month USD LIBOR | | Quarterly | | | (3.044 | ) | | Semi-Annually | | | 09/16/2027 | | | | USD | | | | 1,041,500 | | | | — | | | | 12,276 | | | | 12,276 | |
Receive | | 3 Month USD LIBOR | | Quarterly | | | (3.164 | ) | | Semi-Annually | | | 12/16/2023 | | | | USD | | | | 2,389,000 | | | | — | | | | 513 | | | | 513 | |
Receive | | 6 Month EUR LIBOR | | Semi-Annually | | | (0.015 | ) | | Annually | | | 09/19/2021 | | | | EUR | | | | 2,201,000 | | | | — | | | | 177 | | | | 177 | |
Receive | | 6 Month EUR LIBOR | | Semi-Annually | | | (1.514 | ) | | Annually | | | 09/20/2028 | | | | EUR | | | | 1,156,592 | | | | — | | | | 3,681 | | | | 3,681 | |
Receive | | 6 Month EUR LIBOR | | Semi-Annually | | | (1.522 | ) | | Annually | | | 09/20/2028 | | | | EUR | | | | 2,313,183 | | | | — | | | | 6,425 | | | | 6,425 | |
Receive | | 6 Month EUR LIBOR | | Semi-Annually | | | (1.539 | ) | | Annually | | | 09/20/2028 | | | | EUR | | | | 1,156,591 | | | | — | | | | 2,119 | | | | 2,119 | |
Receive | | 6 Month GBP LIBOR | | Semi-Annually | | | (1.500 | ) | | Semi-Annually | | | 12/15/2047 | | | | GBP | | | | 304,000 | | | | — | | | | 10,556 | | | | 10,556 | |
Receive | | 6 Month GBP LIBOR | | Semi-Annually | | | (1.552 | ) | | Semi-Annually | | | 03/16/2048 | | | | GBP | | | | 1,792,964 | | | | — | | | | 47,797 | | | | 47,797 | |
Receive | | 6 Month GBP LIBOR | | Semi-Annually | | | (1.576 | ) | | Semi-Annually | | | 03/16/2048 | | | | GBP | | | | 896,482 | | | | — | | | | 20,923 | | | | 20,923 | |
Receive | | 6 Month GBP LIBOR | | Semi-Annually | | | (1.581 | ) | | Semi-Annually | | | 03/16/2048 | | | | GBP | | | | 621,229 | | | | — | | | | 14,021 | | | | 14,021 | |
Receive | | 6 Month GBP LIBOR | | Semi-Annually | | | (1.598 | ) | | Semi-Annually | | | 12/15/2047 | | | | GBP | | | | 570,000 | | | | — | | | | 9,577 | | | | 9,577 | |
Receive | | 6 Month GBP LIBOR | | Semi-Annually | | | (1.600 | ) | | Semi-Annually | | | 09/21/2048 | | | | GBP | | | | 395,701 | | | | — | | | | 7,239 | | | | 7,239 | |
Receive | | 6 Month GBP LIBOR | | Semi-Annually | | | (1.608 | ) | | Semi-Annually | | | 12/15/2047 | | | | GBP | | | | 571,000 | | | | — | | | | 11,194 | | | | 11,194 | |
Receive | | 6 Month GBP LIBOR | | Semi-Annually | | | (1.614 | ) | | Semi-Annually | | | 03/16/2048 | | | | GBP | | | | 1,361,325 | | | | — | | | | 24,542 | | | | 24,542 | |
Receive | | 6 Month GBP LIBOR | | Semi-Annually | | | (1.614 | ) | | Semi-Annually | | | 09/21/2048 | | | | GBP | | | | 395,700 | | | | — | | | | 6,471 | | | | 6,471 | |
Receive | | 6 Month GBP LIBOR | | Semi-Annually | | | (1.626 | ) | | Semi-Annually | | | 09/21/2048 | | | | GBP | | | | 395,701 | | | | — | | | | 5,785 | | | | 5,785 | |
Receive | | 6 Month GBP LIBOR | | Semi-Annually | | | (1.628 | ) | | Semi-Annually | | | 06/15/2048 | | | | GBP | | | | 116,000 | | | | — | | | | 1,769 | | | | 1,769 | |
Receive | | 6 Month GBP LIBOR | | Semi-Annually | | | (1.641 | ) | | Semi-Annually | | | 09/21/2048 | | | | GBP | | | | 272,000 | | | | — | | | | 3,429 | | | | 3,429 | |
Receive | | 6 Month GBP LIBOR | | Semi-Annually | | | (1.648 | ) | | Semi-Annually | | | 12/15/2047 | | | | GBP | | | | 586,000 | | | | — | | | | 6,801 | | | | 6,801 | |
Receive | | 6 Month GBP LIBOR | | Semi-Annually | | | (1.648 | ) | | Semi-Annually | | | 06/15/2048 | | | | GBP | | | | 116,000 | | | | — | | | | 1,446 | | | | 1,446 | |
Receive | | 6 Month GBP LIBOR | | Semi-Annually | | | (1.660 | ) | | Semi-Annually | | | 09/21/2048 | | | | GBP | | | | 395,701 | | | | — | | | | 3,946 | | | | 3,946 | |
Receive | | 6 Month GBP LIBOR | | Semi-Annually | | | (1.676 | ) | | Semi-Annually | | | 09/21/2048 | | | | GBP | | | | 248,235 | | | | — | | | | 1,687 | | | | 1,687 | |
Receive | | 6 Month GBP LIBOR | | Semi-Annually | | | (1.681 | ) | | Semi-Annually | | | 09/21/2048 | | | | GBP | | | | 244,530 | | | | — | | | | 1,509 | | | | 1,509 | |
Receive | | 6 Month GBP LIBOR | | Semi-Annually | | | (1.694 | ) | | Semi-Annually | | | 03/16/2048 | | | | GBP | | | | 300,300 | | | | — | | | | 2,048 | | | | 2,048 | |
Receive | | 6 Month GBP LIBOR | | Semi-Annually | | | (1.695 | ) | | Semi-Annually | | | 03/16/2048 | | | | GBP | | | | 300,300 | | | | — | | | | 1,985 | | | | 1,985 | |
Receive | | 6 Month GBP LIBOR | | Semi-Annually | | | (1.702 | ) | | Semi-Annually | | | 03/16/2048 | | | | GBP | | | | 309,400 | | | | — | | | | 1,742 | | | | 1,742 | |
Receive | | 6 Month GBP LIBOR | | Semi-Annually | | | (1.702 | ) | | Semi-Annually | | | 09/21/2048 | | | | GBP | | | | 248,235 | | | | — | | | | 798 | | | | 798 | |
Receive | | 6 Month GBP LIBOR | | Semi-Annually | | | (1.708 | ) | | Semi-Annually | | | 06/15/2048 | | | | GBP | | | | 442,000 | | | | — | | | | 1,786 | | | | 1,786 | |
Receive | | 6 Month GBP LIBOR | | Semi-Annually | | | (1.713 | ) | | Semi-Annually | | | 06/15/2048 | | | | GBP | | | | 442,000 | | | | — | | | | 1,479 | | | | 1,479 | |
Receive | | 6 Month GBP LIBOR | | Semi-Annually | | | (1.733 | ) | | Semi-Annually | | | 03/16/2048 | | | | GBP | | | | 267,000 | | | | — | | | | 347 | | | | 347 | |
Pay | | 3 Month AUD BBSW | | Quarterly | | | 2.347 | | | Quarterly | | | 09/16/2022 | | | | AUD | | | | 1,831,324 | | | | — | | | | 12 | | | | 12 | |
Pay | | 3 Month AUD BBSW | | Quarterly | | | 2.349 | | | Quarterly | | | 09/16/2022 | | | | AUD | | | | 3,206,352 | | | | — | | | | 107 | | | | 107 | |
Pay | | 3 Month AUD BBSW | | Quarterly | | | 2.490 | | | Quarterly | | | 06/17/2022 | | | | AUD | | | | 2,022,372 | | | | — | | | | 5,245 | | | | 5,245 | |
See accompanying Notes to Consolidated Financial Statements which are an integral part of the financial statements.
33 Invesco Global Targeted Returns Fund
| | | | | | | | | | | | | | | | | | | | | | | | | | | | | | | | | | | | | | |
| Open Centrally Cleared Interest Rate Swap Agreements(m)—(continued) | |
Pay/Receive Floating Rate | | Floating Rate Index | | Payment
Frequency | | | (Pay)/
Receive
Fixed
Rate | | | Payment
Frequency | | | Maturity
Date | | | Notional
Value | | | Upfront
Payments
Paid
(Received) | | | Value | | | Unrealized
Appreciation
(Depreciation)(p) | |
Pay | | 3 Month AUD BBSW | | | Quarterly | | | | 2.493 | % | | | Quarterly | | | | 06/17/2022 | | | | AUD | | | | 1,862,985 | | | $ | — | | | $ | 4,894 | | | $ | 4,894 | |
Pay | | 3 Month AUD BBSW | | | Quarterly | | | | 2.559 | | | | Quarterly | | | | 03/18/2022 | | | | AUD | | | | 2,969,629 | | | | — | | | | 12,449 | | | | 12,449 | |
Pay | | 3 Month AUD BBSW | | | Quarterly | | | | 2.560 | | | | Quarterly | | | | 03/18/2022 | | | | AUD | | | | 2,913,304 | | | | — | | | | 12,252 | | | | 12,252 | |
Pay | | 3 Month AUD BBSW | | | Quarterly | | | | 2.560 | | | | Quarterly | | | | 06/17/2022 | | | | AUD | | | | 2,064,896 | | | | — | | | | 7,288 | | | | 7,288 | |
Pay | | 3 Month AUD BBSW | | | Quarterly | | | | 2.564 | | | | Quarterly | | | | 03/18/2022 | | | | AUD | | | | 3,458,371 | | | | — | | | | 14,730 | | | | 14,730 | |
Pay | | 3 Month AUD BBSW | | | Quarterly | | | | 2.565 | | | | Quarterly | | | | 06/17/2022 | | | | AUD | | | | 4,167,854 | | | | — | | | | 14,990 | | | | 14,990 | |
Pay | | 3 Month AUD BBSW | | | Quarterly | | | | 2.570 | | | | Quarterly | | | | 06/17/2022 | | | | AUD | | | | 3,988,394 | | | | — | | | | 14,610 | | | | 14,610 | |
Pay | | 3 Month AUD BBSW | | | Quarterly | | | | 2.575 | | | | Quarterly | | | | 03/18/2022 | | | | AUD | | | | 3,120,098 | | | | — | | | | 13,751 | | | | 13,751 | |
Pay | | 3 Month AUD BBSW | | | Quarterly | | | | 2.583 | | | | Quarterly | | | | 03/18/2022 | | | | AUD | | | | 3,007,286 | | | | — | | | | 13,577 | | | | 13,577 | |
Pay | | 3 Month AUD BBSW | | | Quarterly | | | | 2.585 | | | | Quarterly | | | | 03/18/2022 | | | | AUD | | | | 3,458,371 | | | | — | | | | 15,707 | | | | 15,707 | |
Pay | | 3 Month AUD BBSW | | | Quarterly | | | | 2.597 | | | | Quarterly | | | | 03/18/2022 | | | | AUD | | | | 3,120,098 | | | | — | | | | 14,674 | | | | 14,674 | |
Pay | | 3 Month AUD BBSW | | | Quarterly | | | | 2.631 | | | | Quarterly | | | | 03/18/2022 | | | | AUD | | | | 3,767,034 | | | | — | | | | 19,439 | | | | 19,439 | |
Pay | | 3 Month AUD BBSW | | | Quarterly | | | | 2.636 | | | | Quarterly | | | | 06/17/2022 | | | | AUD | | | | 2,142,088 | | | | — | | | | 9,738 | | | | 9,738 | |
Pay | | 3 Month AUD BBSW | | | Quarterly | | | | 2.642 | | | | Quarterly | | | | 03/18/2022 | | | | AUD | | | | 3,458,372 | | | | — | | | | 18,358 | | | | 18,358 | |
Pay | | 3 Month AUD BBSW | | | Quarterly | | | | 2.653 | | | | Quarterly | | | | 06/17/2022 | | | | AUD | | | | 2,142,088 | | | | — | | | | 10,211 | | | | 10,211 | |
Pay | | 3 Month AUD BBSW | | | Quarterly | | | | 2.662 | | | | Quarterly | | | | 06/17/2022 | | | | AUD | | | | 3,496,472 | | | | — | | | | 17,111 | | | | 17,111 | |
Pay | | 3 Month AUD BBSW | | | Quarterly | | | | 2.663 | | | | Quarterly | | | | 06/17/2022 | | | | AUD | | | | 2,142,088 | | | | — | | | | 10,497 | | | | 10,497 | |
Pay | | 3 Month AUD BBSW | | | Quarterly | | | | 2.664 | | | | Quarterly | | | | 06/17/2022 | | | | AUD | | | | 2,142,088 | | | | — | | | | 10,540 | | | | 10,540 | |
Pay | | 3 Month AUD BBSW | | | Quarterly | | | | 2.665 | | | | Quarterly | | | | 06/17/2022 | | | | AUD | | | | 2,142,088 | | | | — | | | | 10,569 | | | | 10,569 | |
Pay | | 3 Month AUD BBSW | | | Quarterly | | | | 2.688 | | | | Quarterly | | | | 06/17/2022 | | | | AUD | | | | 2,142,088 | | | | — | | | | 11,228 | | | | 11,228 | |
Pay | | 3 Month USD LIBOR | | | Quarterly | | | | 3.309 | | | | Semi-Annually | | | | 12/16/2027 | | | | USD | | | | 628,000 | | | | — | | | | 2,337 | | | | 2,337 | |
Pay | | 6 Month EUR LIBOR | | | Semi-Annually | | | | 0.031 | | | | Annually | | | | 09/19/2021 | | | | EUR | | | | 1,160,000 | | | | — | | | | 508 | | | | 508 | |
Pay | | 6 Month EUR LIBOR | | | Semi-Annually | | | | 0.142 | | | | Annually | | | | 12/19/2021 | | | | EUR | | | | 853,000 | | | | — | | | | 2,035 | | | | 2,035 | |
Pay | | 6 Month EUR LIBOR | | | Semi-Annually | | | | 1.639 | | | | Annually | | | | 12/20/2028 | | | | EUR | | | | 609,000 | | | | — | | | | 748 | | | | 748 | |
Pay | | 6 Month GBP LIBOR | | | Semi-Annually | | | | 1.727 | | | | Semi-Annually | | | | 12/21/2048 | | | | GBP | | | | 565,000 | | | | — | | | | 523 | | | | 523 | |
Pay | | 6 Month GBP LIBOR | | | Semi-Annually | | | | 1.728 | | | | Semi-Annually | | | | 12/21/2048 | | | | GBP | | | | 282,500 | | | | — | | | | 291 | | | | 291 | |
Pay | | 6 Month GBP LIBOR | | | Semi-Annually | | | | 1.735 | | | | Semi-Annually | | | | 12/21/2048 | | | | GBP | | | | 282,500 | | | | — | | | | 565 | | | | 565 | |
Subtotal — Appreciation | | | | | | | | | | | | | | | | | | | | — | | | | 1,386,480 | | | | 1,386,480 | |
Receive | | 3 Month AUD BBSW | | | Quarterly | | | | (2.438 | ) | | | Quarterly | | | | 12/16/2022 | | | | AUD | | | | 3,086,000 | | | | — | | | | (1,604 | ) | | | (1,604 | ) |
Receive | | 3 Month CDOR | | | Semi-Annually | | | | (2.739 | ) | | | Semi-Annually | | | | 10/09/2021 | | | | CAD | | | | 574,000 | | | | — | | | | (276 | ) | | | (276 | ) |
Receive | | 3 Month USD LIBOR | | | Quarterly | | | | (3.268 | ) | | | Semi-Annually | | | | 12/16/2023 | | | | USD | | | | 2,109,000 | | | | — | | | | (5,437 | ) | | | (5,437 | ) |
Receive | | 6 Month EUR LIBOR | | | Semi-Annually | | | | (0.004 | ) | | | Annually | | | | 06/20/2021 | | | | EUR | | | | 529,000 | | | | — | | | | (417 | ) | | | (417 | ) |
Receive | | 6 Month EUR LIBOR | | | Semi-Annually | | | | (0.082 | ) | | | Annually | | | | 06/20/2021 | | | | EUR | | | | 2,507,500 | | | | — | | | | (7,876 | ) | | | (7,876 | ) |
Receive | | 6 Month EUR LIBOR | | | Semi-Annually | | | | (0.087 | ) | | | Annually | | | | 06/20/2021 | | | | EUR | | | | 5,015,000 | | | | — | | | | (16,550 | ) | | | (16,550 | ) |
Receive | | 6 Month EUR LIBOR | | | Semi-Annually | | | | (0.088 | ) | | | Annually | | | | 06/20/2021 | | | | EUR | | | | 7,522,500 | | | | — | | | | (25,095 | ) | | | (25,095 | ) |
Receive | | 6 Month EUR LIBOR | | | Semi-Annually | | | | (0.494 | ) | | | Annually | | | | 12/19/2023 | | | | EUR | | | | 791,750 | | | | — | | | | (4,839 | ) | | | (4,839 | ) |
Receive | | 6 Month EUR LIBOR | | | Semi-Annually | | | | (0.499 | ) | | | Annually | | | | 12/19/2023 | | | | EUR | | | | 791,750 | | | | — | | | | (5,076 | ) | | | (5,076 | ) |
Receive | | 6 Month EUR LIBOR | | | Semi-Annually | | | | (0.500 | ) | | | Annually | | | | 12/19/2023 | | | | EUR | | | | 791,750 | | | | — | | | | (5,121 | ) | | | (5,121 | ) |
Receive | | 6 Month EUR LIBOR | | | Semi-Annually | | | | (0.501 | ) | | | Annually | | | | 12/19/2023 | | | | EUR | | | | 791,750 | | | | — | | | | (5,152 | ) | | | (5,152 | ) |
Receive | | 6 Month EUR LIBOR | | | Semi-Annually | | | | (1.574 | ) | | | Annually | | | | 09/20/2028 | | | | EUR | | | | 1,156,591 | | | | — | | | | (50 | ) | | | (50 | ) |
Receive | | 6 Month EUR LIBOR | | | Semi-Annually | | | | (1.580 | ) | | | Annually | | | | 09/20/2028 | | | | EUR | | | | 1,156,591 | | | | — | | | | (412 | ) | | | (412 | ) |
Receive | | 6 Month EUR LIBOR | | | Semi-Annually | | | | (1.590 | ) | | | Annually | | | | 09/20/2028 | | | | EUR | | | | 2,313,183 | | | | — | | | | (2,136 | ) | | | (2,136 | ) |
Receive | | 6 Month EUR LIBOR | | | Semi-Annually | | | | (1.599 | ) | | | Annually | | | | 09/20/2028 | | | | EUR | | | | 1,156,591 | | | | — | | | | (1,631 | ) | | | (1,631 | ) |
Receive | | 6 Month EUR LIBOR | | | Semi-Annually | | | | (1.602 | ) | | | Annually | | | | 09/20/2028 | | | | EUR | | | | 1,155,678 | | | | — | | | | (1,845 | ) | | | (1,845 | ) |
Receive | | 6 Month EUR LIBOR | | | Semi-Annually | | | | (1.714 | ) | | | Annually | | | | 12/20/2028 | | | | EUR | | | | 499,500 | | | | — | | | | (2,641 | ) | | | (2,641 | ) |
Receive | | 6 Month EUR LIBOR | | | Semi-Annually | | | | (1.715 | ) | | | Annually | | | | 12/20/2028 | | | | EUR | | | | 499,500 | | | | — | | | | (2,654 | ) | | | (2,654 | ) |
Receive | | 6 Month EUR LIBOR | | | Semi-Annually | | | | (1.722 | ) | | | Annually | | | | 12/20/2028 | | | | EUR | | | | 499,500 | | | | — | | | | (2,842 | ) | | | (2,842 | ) |
Receive | | 6 Month EUR LIBOR | | | Semi-Annually | | | | (1.725 | ) | | | Annually | | | | 12/20/2028 | | | | EUR | | | | 499,500 | | | | — | | | | (2,937 | ) | | | (2,937 | ) |
Receive | | 6 Month EUR LIBOR | | | Semi-Annually | | | | (1.726 | ) | | | Annually | | | | 12/20/2028 | | | | EUR | | | | 499,500 | | | | — | | | | (2,963 | ) | | | (2,963 | ) |
See accompanying Notes to Consolidated Financial Statements which are an integral part of the financial statements.
34 Invesco Global Targeted Returns Fund
| | | | | | | | | | | | | | | | | | | | | | | | | | | | | | | | | | | | |
| Open Centrally Cleared Interest Rate Swap Agreements(m)—(continued) | |
Pay/Receive Floating Rate | | Floating Rate Index | | Payment
Frequency | | (Pay)/
Receive
Fixed
Rate | | | Payment
Frequency | | | Maturity
Date | | | Notional
Value | | | Upfront
Payments
Paid
(Received) | | | Value | | | Unrealized
Appreciation
(Depreciation)(p) | |
Receive | | 6 Month EUR LIBOR | | Semi-Annually | | | (1.727 | ) % | | | Annually | | | | 12/20/2028 | | | | EUR | | | | 499,500 | | | $ | — | | | $ | (2,977 | ) | | $ | (2,977 | ) |
Receive | | 6 Month EUR LIBOR | | Semi-Annually | | | (1.729 | ) | | | Annually | | | | 12/20/2028 | | | | EUR | | | | 499,500 | | | | — | | | | (3,031 | ) | | | (3,031 | ) |
Receive | | 6 Month EUR LIBOR | | Semi-Annually | | | (1.731 | ) | | | Annually | | | | 12/20/2028 | | | | EUR | | | | 499,500 | | | | — | | | | (3,098 | ) | | | (3,098 | ) |
Receive | | 6 Month EUR LIBOR | | Semi-Annually | | | (1.757 | ) | | | Annually | | | | 12/20/2028 | | | | EUR | | | | 999,000 | | | | — | | | | (7,594 | ) | | | (7,594 | ) |
Receive | | 6 Month GBP LIBOR | | Semi-Annually | | | (1.743 | ) | | | Semi-Annually | | | | 03/16/2048 | | | | GBP | | | | 267,000 | | | | — | | | | (26 | ) | | | (26 | ) |
Receive | | 6 Month GBP LIBOR | | Semi-Annually | | | (1.875 | ) | | | Semi-Annually | | | | 12/21/2048 | | | | GBP | | | | 239,491 | | | | — | | | | (5,129 | ) | | | (5,129 | ) |
Receive | | 6 Month GBP LIBOR | | Semi-Annually | | | (1.877 | ) | | | Semi-Annually | | | | 12/21/2048 | | | | GBP | | | | 465,286 | | | | — | | | | (10,086 | ) | | | (10,086 | ) |
Receive | | 6 Month GBP LIBOR | | Semi-Annually | | | (1.878 | ) | | | Semi-Annually | | | | 12/21/2048 | | | | GBP | | | | 227,688 | | | | — | | | | (4,964 | ) | | | (4,964 | ) |
Receive | | 6 Month GBP LIBOR | | Semi-Annually | | | (1.880 | ) | | | Semi-Annually | | | | 12/21/2048 | | | | GBP | | | | 165,591 | | | | — | | | | (3,656 | ) | | | (3,656 | ) |
Receive | | 6 Month GBP LIBOR | | Semi-Annually | | | (1.882 | ) | | | Semi-Annually | | | | 12/21/2048 | | | | GBP | | | | 238,037 | | | | — | | | | (5,321 | ) | | | (5,321 | ) |
Receive | | 6 Month GBP LIBOR | | Semi-Annually | | | (1.898 | ) | | | Semi-Annually | | | | 12/21/2048 | | | | GBP | | | | 239,300 | | | | — | | | | (5,869 | ) | | | (5,869 | ) |
Receive | | 6 Month GBP LIBOR | | Semi-Annually | | | (1.900 | ) | | | Semi-Annually | | | | 12/21/2048 | | | | GBP | | | | 341,532 | | | | — | | | | (8,485 | ) | | | (8,485 | ) |
Receive | | 6 Month GBP LIBOR | | Semi-Annually | | | (1.919 | ) | | | Semi-Annually | | | | 12/21/2048 | | | | GBP | | | | 476,075 | | | | — | | | | (13,095 | ) | | | (13,095 | ) |
Pay | | 28 Day MXN TIIE | | 28 Day | | | 6.925 | | | | 28 Day | | | | 06/16/2021 | | | | MXN | | | | 1,500,000 | | | | — | | | | (2,576 | ) | | | (2,576 | ) |
Pay | | 3 Month AUD BBSW | | Quarterly | | | 2.335 | | | | Quarterly | | | | 09/16/2022 | | | | AUD | | | | 1,831,324 | | | | — | | | | (280 | ) | | | (280 | ) |
Pay | | 3 Month CDOR | | Semi-Annually | | | 2.281 | | | | Semi-Annually | | | | 06/21/2021 | | | | CAD | | | | 2,437,000 | | | | — | | | | (18,958 | ) | | | (18,958 | ) |
Pay | | 3 Month CDOR | | Semi-Annually | | | 2.340 | | | | Semi-Annually | | | | 06/20/2021 | | | | CAD | | | | 3,377,816 | | | | — | | | | (22,458 | ) | | | (22,458 | ) |
Pay | | 3 Month CDOR | | Semi-Annually | | | 2.348 | | | | Semi-Annually | | | | 06/20/2021 | | | | CAD | | | | 3,377,816 | | | | — | | | | (21,967 | ) | | | (21,967 | ) |
Pay | | 3 Month CDOR | | Semi-Annually | | | 2.350 | | | | Semi-Annually | | | | 06/20/2021 | | | | CAD | | | | 3,377,816 | | | | — | | | | (21,803 | ) | | | (21,803 | ) |
Pay | | 3 Month CDOR | | Semi-Annually | | | 2.355 | | | | Semi-Annually | | | | 06/20/2021 | | | | CAD | | | | 3,377,816 | | | | — | | | | (21,476 | ) | | | (21,476 | ) |
Pay | | 3 Month CDOR | | Semi-Annually | | | 2.368 | | | | Semi-Annually | | | | 06/20/2021 | | | | CAD | | | | 3,377,816 | | | | — | | | | (20,658 | ) | | | (20,658 | ) |
Pay | | 3 Month CDOR | | Semi-Annually | | | 2.370 | | | | Semi-Annually | | | | 06/20/2021 | | | | CAD | | | | 3,377,816 | | | | — | | | | (20,494 | ) | | | (20,494 | ) |
Pay | | 3 Month CDOR | | Semi-Annually | | | 2.378 | | | | Semi-Annually | | | | 06/20/2021 | | | | CAD | | | | 3,377,816 | | | | — | | | | (20,004 | ) | | | (20,004 | ) |
Pay | | 3 Month CDOR | | Semi-Annually | | | 2.380 | | | | Semi-Annually | | | | 06/20/2021 | | | | CAD | | | | 3,377,816 | | | | — | | | | (19,840 | ) | | | (19,840 | ) |
Pay | | 3 Month CDOR | | Semi-Annually | | | 2.390 | | | | Semi-Annually | | | | 06/20/2021 | | | | CAD | | | | 3,685,472 | | | | — | | | | (20,933 | ) | | | (20,933 | ) |
Pay | | 3 Month CDOR | | Semi-Annually | | | 2.535 | | | | Semi-Annually | | | | 09/12/2021 | | | | CAD | | | | 2,668,000 | | | | — | | | | (9,413 | ) | | | (9,413 | ) |
Pay | | 3 Month CDOR | | Semi-Annually | | | 2.618 | | | | Semi-Annually | | | | 09/25/2021 | | | | CAD | | | | 2,115,000 | | | | — | | | | (4,004 | ) | | | (4,004 | ) |
Pay | | 3 Month USD LIBOR | | Quarterly | | | 2.535 | | | | Semi-Annually | | | | 03/18/2023 | | | | USD | | | | 4,293,033 | | | | — | | | | (79,540 | ) | | | (79,540 | ) |
Pay | | 3 Month USD LIBOR | | Quarterly | | | 2.538 | | | | Semi-Annually | | | | 03/18/2023 | | | | USD | | | | 9,079,468 | | | | — | | | | (167,624 | ) | | | (167,624 | ) |
Pay | | 3 Month USD LIBOR | | Quarterly | | | 2.547 | | | | Semi-Annually | | | | 03/18/2023 | | | | USD | | | | 8,578,125 | | | | — | | | | (156,215 | ) | | | (156,215 | ) |
Pay | | 3 Month USD LIBOR | | Quarterly | | | 2.549 | | | | Semi-Annually | | | | 03/18/2023 | | | | USD | | | | 8,578,125 | | | | — | | | | (155,768 | ) | | | (155,768 | ) |
Pay | | 3 Month USD LIBOR | | Quarterly | | | 2.553 | | | | Semi-Annually | | | | 03/18/2023 | | | | USD | | | | 17,156,249 | | | | — | | | | (309,646 | ) | | | (309,646 | ) |
Pay | | 3 Month USD LIBOR | | Quarterly | | | 2.832 | | | | Semi-Annually | | | | 03/18/2023 | | | | USD | | | | 7,064,000 | | | | — | | | | (73,180 | ) | | | (73,180 | ) |
Pay | | 3 Month USD LIBOR | | Quarterly | | | 2.964 | | | | Semi-Annually | | | | 09/16/2027 | | | | USD | | | | 937,000 | | | | — | | | | (15,558 | ) | | | (15,558 | ) |
Pay | | 3 Month USD LIBOR | | Quarterly | | | 3.031 | | | | Semi-Annually | | | | 09/16/2023 | | | | USD | | | | 2,287,000 | | | | — | | | | (9,005 | ) | | | (9,005 | ) |
Pay | | 3 Month USD LIBOR | | Quarterly | | | 3.033 | | | | Semi-Annually | | | | 09/16/2023 | | | | USD | | | | 2,287,000 | | | | — | | | | (8,912 | ) | | | (8,912 | ) |
Pay | | 3 Month USD LIBOR | | Quarterly | | | 3.222 | | | | Semi-Annually | | | | 12/16/2027 | | | | USD | | | | 1,205,000 | | | | — | | | | (1,779 | ) | | | (1,779 | ) |
Pay | | 6 Month EUR LIBOR | | Semi-Annually | | | 0.010 | | | | Annually | | | | 09/19/2021 | | | | EUR | | | | 1,024,000 | | | | — | | | | (238 | ) | | | (238 | ) |
Pay | | 6 Month EUR LIBOR | | Semi-Annually | | | 1.535 | | | | Annually | | | | 09/20/2028 | | | | EUR | | | | 781,000 | | | | — | | | | (1,608 | ) | | | (1,608 | ) |
Pay | | 6 Month GBP LIBOR | | Semi-Annually | | | 1.661 | | | | Semi-Annually | | | | 09/21/2048 | | | | GBP | | | | 1,132,000 | | | | — | | | | (11,037 | ) | | | (11,037 | ) |
Subtotal — Depreciation | | | | | | | | | | | | | | | | | | | | | | | — | | | | (1,385,859 | ) | | | (1,385,859 | ) |
Subtotal — Interest Rate Swap Agreements — Interest Rate Risk | | | | | | | | | | | $ | — | | | $ | 621 | | | $ | 621 | |
| (m) | Centrally cleared swap agreements collateralized by $1,585,932 cash held with Credit Suisse Securities (USA) LLC. |
| (p) | The daily variation margin receivable (payable) at period end is recorded in the Consolidated Statement of Assets and Liabilities. |
See accompanying Notes to Consolidated Financial Statements which are an integral part of the financial statements.
35 Invesco Global Targeted Returns Fund
| | | | | | | | | | | | | | | | | | | | | | | | | | | | | | | | | | | | | | | | |
| Open Over-The-Counter Inflation Swap Agreements* | |
| Counterparty | | Pay/Receive Floating Rate | | Floating Rate Index | | Payment
Frequency | | | Fixed
Rate | | | Payment
Frequency | | | Maturity
Date | | | Notional
Value | | | Upfront
Payments
Paid
(Received) | | | Value | | | Unrealized
Appreciation
(Depreciation) | |
Barclays Bank PLC | | Receive | | United States CPI Urban
Consumers NSA | | | At Maturity | | | | 1.955 | % | | | At Maturity | | | | 10/18/2026 | | | | USD | | | | 1,314,000 | | | $ | — | | | $ | 37,305 | | | $ | 37,305 | |
Barclays Bank PLC | | Receive | | United States CPI Urban
Consumers NSA | | | At Maturity | | | | 1.960 | | | | At Maturity | | | | 10/18/2026 | | | | USD | | | | 1,314,000 | | | | — | | | | 36,681 | | | | 36,681 | |
Barclays Bank PLC | | Receive | | United States CPI Urban
Consumers NSA | | | At Maturity | | | | 1.993 | | | | At Maturity | | | | 10/21/2026 | | | | USD | | | | 1,288,000 | | | | — | | | | 32,059 | | | | 32,059 | |
Barclays Bank PLC | | Receive | | United States CPI Urban
Consumers NSA | | | At Maturity | | | | 1.995 | | | | At Maturity | | | | 10/19/2026 | | | | USD | | | | 1,314,000 | | | | — | | | | 32,339 | | | | 32,339 | |
Barclays Bank PLC | | Receive | | United States CPI Urban
Consumers NSA | | | At Maturity | | | | 1.995 | | | | At Maturity | | | | 10/24/2026 | | | | USD | | | | 1,314,000 | | | | — | | | | 32,464 | | | | 32,464 | |
Barclays Bank PLC | | Receive | | United States CPI Urban
Consumers NSA | | | At Maturity | | | | 2.000 | | | | At Maturity | | | | 10/19/2026 | | | | USD | | | | 1,288,000 | | | | — | | | | 31,086 | | | | 31,086 | |
Barclays Bank PLC | | Receive | | United States CPI Urban
Consumers NSA | | | At Maturity | | | | 2.010 | | | | At Maturity | | | | 10/20/2026 | | | | USD | | | | 1,314,000 | | | | — | | | | 30,488 | | | | 30,488 | |
Barclays Bank PLC | | Receive | | United States CPI Urban
Consumers NSA | | | At Maturity | | | | 2.010 | | | | At Maturity | | | | 10/21/2026 | | | | USD | | | | 1,314,000 | | | | — | | | | 30,515 | | | | 30,515 | |
Barclays Bank PLC | | Receive | | United States CPI Urban
Consumers NSA | | | At Maturity | | | | 2.225 | | | | At Maturity | | | | 11/16/2026 | | | | USD | | | | 1,825,000 | | | | — | | | | 4,430 | | | | 4,430 | |
Goldman Sachs International | | Receive | | United States CPI Urban
Consumers NSA | | | At Maturity | | | | 2.040 | | | | At Maturity | | | | 11/01/2026 | | | | USD | | | | 1,320,000 | | | | — | | | | 27,181 | | | | 27,181 | |
Goldman Sachs International | | Receive | | United States CPI Urban
Consumers NSA | | | At Maturity | | | | 2.218 | | | | At Maturity | | | | 11/16/2026 | | | | USD | | | | 1,762,000 | | | | — | | | | 5,558 | | | | 5,558 | |
Morgan Stanley Capital Services LLC | | Receive | | United States CPI Urban
Consumers NSA | | | At Maturity | | | | 2.048 | | | | At Maturity | | | | 11/01/2026 | | | | USD | | | | 1,299,000 | | | | — | | | | 25,818 | | | | 25,818 | |
Morgan Stanley Capital Services LLC | | Receive | | United States CPI Urban
Consumers NSA | | | At Maturity | | | | 2.249 | | | | At Maturity | | | | 11/16/2026 | | | | USD | | | | 1,493,000 | | | | — | | | | 146 | | | | 146 | |
Subtotal — Appreciation | | | | | | | | | | | | | | | | | | | — | | | | 326,070 | | | | 326,070 | |
Barclays Bank PLC | | Receive | | United States CPI Urban
Consumers NSA | | | At Maturity | | | | 2.255 | | | | At Maturity | | | | 11/17/2026 | | | | USD | | | | 1,867,000 | | | | — | | | | (950 | ) | | | (950 | ) |
Morgan Stanley Capital Services LLC | | Receive | | United States CPI Urban
Consumers NSA | | | At Maturity | | | | 2.255 | | | | At Maturity | | | | 11/17/2026 | | | | USD | | | | 1,867,000 | | | | — | | | | (859 | ) | | | (859 | ) |
Morgan Stanley Capital Services LLC | | Receive | | United States CPI Urban
Consumers NSA | | | At Maturity | | | | 2.259 | | | | At Maturity | | | | 11/16/2026 | | | | USD | | | | 1,276,000 | | | | — | | | | (1,116 | ) | | | (1,116 | ) |
Morgan Stanley Capital Services LLC | | Receive | | United States CPI Urban
Consumers NSA | | | At Maturity | | | | 2.284 | | | | At Maturity | | | | 11/16/2026 | | | | USD | | | | 2,776,000 | | | | — | | | | (9,185 | ) | | | (9,185 | ) |
Barclays Bank PLC | | Pay | | United States CPI Urban
Consumers NSA | | | At Maturity | | | | 2.233 | | | | At Maturity | | | | 12/19/2026 | | | | USD | | | | 2,578,000 | | | | — | | | | (1,762 | ) | | | (1,762 | ) |
Goldman Sachs International | | Pay | | United Kingdom RPI | | | At Maturity | | | | 3.060 | | | | At Maturity | | | | 12/29/2025 | | | | GBP | | | | 3,450,000 | | | | — | | | | (195,748 | ) | | | (195,748 | ) |
Subtotal — Depreciation | | | | | | | | | | | | | | | | | | | | — | | | | (209,620 | ) | | | (209,620 | ) |
Subtotal — Over-The-Counter Inflation Swap Agreements | | | | | | | | | | | | | | | | | | | $ | — | | | $ | 116,450 | | | $ | 116,450 | |
| | | | | | | | | | | | | | | | | | | | | | | | | | | | | | | | | | | | |
| Centrally Cleared Inflation Swap Agreements(q) | |
| Pay/Receive | | Floating Rate Index | | Payment
Frequency | | Fixed
Rate | | | Payment
Frequency | | | Maturity
Date | | | Notional
Value | | | Upfront
Payments
Paid
(Received) | | | Value | | | Unrealized
Appreciation
(Depreciation)(r) | |
Receive | | Eurostat Eurozone HICP Ex Tobacco Unrevised Series NSA | | At Maturity | | | 1.176 | % | | | At Maturity | | | | 07/15/2022 | | | | EUR | | | | 2,754,047 | | | $ | — | | | $ | 50,146 | | | $ | 50,146 | |
Receive | | Eurostat Eurozone HICP Ex Tobacco Unrevised Series NSA | | At Maturity | | | 1.180 | | | | At Maturity | | | | 07/15/2022 | | | | EUR | | | | 2,666,152 | | | | — | | | | 47,913 | | | | 47,913 | |
Receive | | Eurostat Eurozone HICP Ex Tobacco Unrevised Series NSA | | At Maturity | | | 1.202 | | | | At Maturity | | | | 07/15/2022 | | | | EUR | | | | 3,984,578 | | | | — | | | | 66,489 | | | | 66,489 | |
See accompanying Notes to Consolidated Financial Statements which are an integral part of the financial statements.
36 Invesco Global Targeted Returns Fund
| | | | | | | | | | | | | | | | | | | | | | | | | | | | | | | | | | | | |
| Centrally Cleared Inflation Swap Agreements(q)—(continued) | |
| Pay/Receive | | Floating Rate Index | | Payment
Frequency | | Fixed
Rate | | | Payment
Frequency | | | Maturity
Date | | | Notional
Value | | | Upfront
Payments
Paid
(Received) | | | Value | | | Unrealized
Appreciation
(Depreciation)(r) | |
Receive | | Eurostat Eurozone HICP Ex Tobacco Unrevised Series NSA | | At Maturity | | | 1.222 | % | | | At Maturity | | | | 07/15/2022 | | | | EUR | | | | 3,999,227 | | | $ | — | | | $ | 61,799 | | | $ | 61,799 | |
Receive | | Eurostat Eurozone HICP Ex Tobacco Unrevised Series NSA | | At Maturity | | | 1.310 | | | | At Maturity | | | | 08/15/2022 | | | | EUR | | | | 6,650,145 | | | | — | | | | 82,440 | | | | 82,440 | |
Receive | | Eurostat Eurozone HICP Ex Tobacco Unrevised Series NSA | | At Maturity | | | 1.315 | | | | At Maturity | | | | 08/15/2022 | | | | EUR | | | | 2,996,344 | | | | — | | | | 36,213 | | | | 36,213 | |
Receive | | Eurostat Eurozone HICP Ex Tobacco Unrevised Series NSA | | At Maturity | | | 1.410 | | | | At Maturity | | | | 08/15/2023 | | | | EUR | | | | 1,073,549 | | | | — | | | | 2,926 | | | | 2,926 | |
Receive | | Eurostat Eurozone HICP Ex Tobacco Unrevised Series NSA | | At Maturity | | | 1.413 | | | | At Maturity | | | | 08/15/2023 | | | | EUR | | | | 2,147,097 | | | | — | | | | 5,534 | | | | 5,534 | |
Receive | | Eurostat Eurozone HICP Ex Tobacco Unrevised Series NSA | | At Maturity | | | 1.418 | | | | At Maturity | | | | 08/15/2023 | | | | EUR | | | | 1,073,549 | | | | — | | | | 2,448 | | | | 2,448 | |
Receive | | Eurostat Eurozone HICP Ex Tobacco Unrevised Series NSA | | At Maturity | | | 1.422 | | | | At Maturity | | | | 08/15/2023 | | | | EUR | | | | 1,061,060 | | | | — | | | | 2,136 | | | | 2,136 | |
Receive | | Eurostat Eurozone HICP Ex Tobacco Unrevised Series NSA | | At Maturity | | | 1.425 | | | | At Maturity | | | | 08/15/2023 | | | | EUR | | | | 2,147,098 | | | | — | | | | 3,940 | | | | 3,940 | |
Receive | | Eurostat Eurozone HICP Ex Tobacco Unrevised Series NSA | | At Maturity | | | 1.427 | | | | At Maturity | | | | 08/15/2023 | | | | EUR | | | | 2,147,098 | | | | — | | | | 3,684 | | | | 3,684 | |
Receive | | Eurostat Eurozone HICP Ex Tobacco Unrevised Series NSA | | At Maturity | | | 1.433 | | | | At Maturity | | | | 08/15/2023 | | | | EUR | | | | 1,073,549 | | | | — | | | | 1,491 | | | | 1,491 | |
Receive | | Eurostat Eurozone HICP Ex Tobacco Unrevised Series NSA | | At Maturity | | | 1.485 | | | | At Maturity | | | | 05/15/2023 | | | | EUR | | | | 1,410,000 | | | | — | | | | 3,673 | | | | 3,673 | |
Receive | | Eurostat Eurozone HICP Ex Tobacco Unrevised Series NSA | | At Maturity | | | 1.520 | | | | At Maturity | | | | 04/15/2028 | | | | EUR | | | | 1,201,000 | | | | — | | | | 6,103 | | | | 6,103 | |
Receive | | United Kingdom RPI | | At Maturity | | | 3.500 | | | | At Maturity | | | | 05/15/2027 | | | | GBP | | | | 327,724 | | | | — | | | | 2,202 | | | | 2,202 | |
Receive | | United Kingdom RPI | | At Maturity | | | 3.512 | | | | At Maturity | | | | 05/15/2027 | | | | GBP | | | | 327,724 | | | | — | | | | 1,667 | | | | 1,667 | |
Receive | | United Kingdom RPI | | At Maturity | | | 3.542 | | | | At Maturity | | | | 05/15/2027 | | | | GBP | | | | 327,723 | | | | — | | | | 326 | | | | 326 | |
Receive | | United Kingdom RPI | | At Maturity | | | 3.546 | | | | At Maturity | | | | 05/15/2027 | | | | GBP | | | | 327,724 | | | | — | | | | 147 | | | | 147 | |
Receive | | United States CPI Urban Consumers NSA | | At Maturity | | | 2.069 | | | | At Maturity | | | | 08/25/2027 | | | | USD | | | | 220,120 | | | | — | | | | 4,643 | | | | 4,643 | |
Receive | | United States CPI Urban Consumers NSA | | At Maturity | | | 2.074 | | | | At Maturity | | | | 08/23/2027 | | | | USD | | | | 436,000 | | | | — | | | | 8,989 | | | | 8,989 | |
Receive | | United States CPI Urban Consumers NSA | | At Maturity | | | 2.079 | | | | At Maturity | | | | 08/22/2027 | | | | USD | | | | 237,000 | | | | — | | | | 4,770 | | | | 4,770 | |
Receive | | United States CPI Urban Consumers NSA | | At Maturity | | | 2.082 | | | | At Maturity | | | | 08/24/2027 | | | | USD | | | | 436,000 | | | | — | | | | 8,655 | | | | 8,655 | |
Receive | | United States CPI Urban Consumers NSA | | At Maturity | | | 2.093 | | | | At Maturity | | | | 08/21/2027 | | | | USD | | | | 948,000 | | | | — | | | | 17,812 | | | | 17,812 | |
Receive | | United States CPI Urban Consumers NSA | | At Maturity | | | 2.123 | | | | At Maturity | | | | 10/19/2027 | | | | USD | | | | 617,000 | | | | — | | | | 10,616 | | | | 10,616 | |
Receive | | United States CPI Urban Consumers NSA | | At Maturity | | | 2.131 | | | | At Maturity | | | | 10/19/2027 | | | | USD | | | | 617,000 | | | | — | | | | 10,126 | | | | 10,126 | |
Receive | | United States CPI Urban Consumers NSA | | At Maturity | | | 2.131 | | | | At Maturity | | | | 10/23/2027 | | | | USD | | | | 308,000 | | | | — | | | | 4,987 | | | | 4,987 | |
See accompanying Notes to Consolidated Financial Statements which are an integral part of the financial statements.
37 Invesco Global Targeted Returns Fund
| | | | | | | | | | | | | | | | | | | | | | | | | | | | | | | | | | | | | | |
| Centrally Cleared Inflation Swap Agreements(q)—(continued) | |
| Pay/Receive | | Floating Rate Index | | Payment
Frequency | | | Fixed
Rate | | | Payment
Frequency | | | Maturity
Date | | | Notional
Value | | | Upfront
Payments
Paid
(Received) | | | Value | | | Unrealized
Appreciation
(Depreciation)(r) | |
Receive | | United States CPI Urban Consumers NSA | | | At Maturity | | | | 2.147 | % | | | At Maturity | | | | 04/25/2027 | | | | USD | | | | 198,000 | | | $ | — | | | $ | 1,381 | | | $ | 1,381 | |
Receive | | United States CPI Urban Consumers NSA | | | At Maturity | | | | 2.148 | | | | At Maturity | | | | 10/20/2027 | | | | USD | | | | 617,000 | | | | — | | | | 9,146 | | | | 9,146 | |
Receive | | United States CPI Urban Consumers NSA | | | At Maturity | | | | 2.150 | | | | At Maturity | | | | 10/20/2027 | | | | USD | | | | 308,000 | | | | — | | | | 4,493 | | | | 4,493 | |
Receive | | United States CPI Urban Consumers NSA | | | At Maturity | | | | 2.199 | | | | At Maturity | | | | 04/26/2027 | | | | USD | | | | 397,000 | | | | — | | | | 794 | | | | 794 | |
Pay | | Eurostat Eurozone HICP Ex Tobacco Unrevised Series NSA | | | At Maturity | | | | 1.550 | | | | At Maturity | | | | 07/15/2023 | | | | EUR | | | | 902,000 | | | | — | | | | 259 | | | | 259 | |
Pay | | Eurostat Eurozone HICP Ex Tobacco Unrevised Series NSA | | | At Maturity | | | | 1.558 | | | | At Maturity | | | | 08/15/2028 | | | | EUR | | | | 1,073,549 | | | | — | | | | 96 | | | | 96 | |
Pay | | Eurostat Eurozone HICP Ex Tobacco Unrevised Series NSA | | | At Maturity | | | | 1.560 | | | | At Maturity | | | | 08/15/2028 | | | | EUR | | | | 1,073,549 | | | | — | | | | 420 | | | | 420 | |
Pay | | Eurostat Eurozone HICP Ex Tobacco Unrevised Series NSA | | | At Maturity | | | | 1.563 | | | | At Maturity | | | | 08/15/2028 | | | | EUR | | | | 1,073,549 | | | | — | | | | 743 | | | | 743 | |
Pay | | Eurostat Eurozone HICP Ex Tobacco Unrevised Series NSA | | | At Maturity | | | | 1.563 | | | | At Maturity | | | | 10/15/2028 | | | | EUR | | | | 387,281 | | | | — | | | | 1,106 | | | | 1,106 | |
Pay | | Eurostat Eurozone HICP Ex Tobacco Unrevised Series NSA | | | At Maturity | | | | 1.565 | | | | At Maturity | | | | 08/15/2028 | | | | EUR | | | | 3,220,647 | | | | — | | | | 3,201 | | | | 3,201 | |
Pay | | Eurostat Eurozone HICP Ex Tobacco Unrevised Series NSA | | | At Maturity | | | | 1.565 | | | | At Maturity | | | | 10/15/2028 | | | | EUR | | | | 387,282 | | | | — | | | | 1,164 | | | | 1,164 | |
Pay | | Eurostat Eurozone HICP Ex Tobacco Unrevised Series NSA | | | At Maturity | | | | 1.568 | | | | At Maturity | | | | 08/15/2028 | | | | EUR | | | | 1,061,060 | | | | — | | | | 1,375 | | | | 1,375 | |
Pay | | Eurostat Eurozone HICP Ex Tobacco Unrevised Series NSA | | | At Maturity | | | | 1.575 | | | | At Maturity | | | | 10/15/2028 | | | | EUR | | | | 238,437 | | | | — | | | | 1,018 | | | | 1,018 | |
Pay | | United Kingdom RPI | | | At Maturity | | | | 3.630 | | | | At Maturity | | | | 01/15/2027 | | | | GBP | | | | 644,421 | | | | — | | | | 6,411 | | | | 6,411 | |
Pay | | United Kingdom RPI | | | At Maturity | | | | 3.633 | | | | At Maturity | | | | 01/15/2027 | | | | GBP | | | | 885,159 | | | | — | | | | 9,227 | | | | 9,227 | |
Pay | | United Kingdom RPI | | | At Maturity | | | | 3.635 | | | | At Maturity | | | | 01/15/2027 | | | | GBP | | | | 644,420 | | | | — | | | | 6,923 | | | | 6,923 | |
Pay | | United States CPI Urban Consumers NSA | | | At Maturity | | | | 2.254 | | | | At Maturity | | | | 10/02/2027 | | | | USD | | | | 944,821 | | | | — | | | | 799 | | | | 799 | |
Pay | | United States CPI Urban Consumers NSA | | | At Maturity | | | | 2.261 | | | | At Maturity | | | | 10/02/2027 | | | | USD | | | | 603,319 | | | | — | | | | 862 | | | | 862 | |
Pay | | United States CPI Urban Consumers NSA | | | At Maturity | | | | 2.281 | | | | At Maturity | | | | 03/01/2027 | | | | USD | | | | 919,000 | | | | — | | | | 4,087 | | | | 4,087 | |
Pay | | United States CPI Urban Consumers NSA | | | At Maturity | | | | 2.315 | | | | At Maturity | | | | 03/15/2028 | | | | USD | | | | 147,000 | | | | — | | | | 823 | | | | 823 | |
Pay | | United States CPI Urban Consumers NSA | | | At Maturity | | | | 2.342 | | | | At Maturity | | | | 04/16/2028 | | | | USD | | | | 439,000 | | | | — | | | | 4,056 | | | | 4,056 | |
Pay | | United States CPI Urban Consumers NSA | | | At Maturity | | | | 2.367 | | | | At Maturity | | | | 07/27/2028 | | | | USD | | | | 713,000 | | | | — | | | | 7,897 | | | | 7,897 | |
Pay | | United States CPI Urban Consumers NSA | | | At Maturity | | | | 2.394 | | | | At Maturity | | | | 07/11/2028 | | | | USD | | | | 382,000 | | | | — | | | | 4,903 | | | | 4,903 | |
Subtotal — Appreciation | | | | | | | | | | | | | | | | | | | | | | | | | | | — | | | | 523,059 | | | | 523,059 | |
Receive | | Eurostat Eurozone HICP Ex Tobacco Unrevised Series NSA | | | At Maturity | | | | 1.455 | | | | At Maturity | | | | 10/15/2023 | | | | EUR | | | | 1,591,534 | | | | — | | | | (4,209 | ) | | | (4,209 | ) |
See accompanying Notes to Consolidated Financial Statements which are an integral part of the financial statements.
38 Invesco Global Targeted Returns Fund
| | | | | | | | | | | | | | | | | | | | | | | | | | | | | | | | | | | | |
| Centrally Cleared Inflation Swap Agreements(q)—(continued) | |
| Pay/Receive | | Floating Rate Index | | Payment
Frequency | | Fixed
Rate | | | Payment
Frequency | | | Maturity
Date | | | Notional
Value | | | Upfront
Payments
Paid
(Received) | | | Value | | | Unrealized
Appreciation
(Depreciation)(r) | |
Receive | | Eurostat Eurozone HICP Ex Tobacco Unrevised Series NSA | | At Maturity | | | 1.458 | % | | | At Maturity | | | | 10/15/2023 | | | | EUR | | | | 1,591,534 | | | $ | — | | | $ | (4,446 | ) | | $ | (4,446 | ) |
Receive | | Eurostat Eurozone HICP Ex Tobacco Unrevised Series NSA | | At Maturity | | | 1.470 | | | | At Maturity | | | | 10/15/2023 | | | | EUR | | | | 1,470,932 | | | | — | | | | (5,202 | ) | | | (5,202 | ) |
Receive | | Eurostat Eurozone HICP Ex Tobacco Unrevised Series NSA | | At Maturity | | | 1.586 | | | | At Maturity | | | | 08/15/2028 | | | | EUR | | | | 2,612,000 | | | | — | | | | (9,298 | ) | | | (9,298 | ) |
Receive | | Eurostat Eurozone HICP Ex Tobacco Unrevised Series NSA | | At Maturity | | | 1.603 | | | | At Maturity | | | | 07/15/2028 | | | | EUR | | | | 1,585,000 | | | | — | | | | (683 | ) | | | (683 | ) |
Receive | | Eurostat Eurozone HICP Ex Tobacco Unrevised Series NSA | | At Maturity | | | 1.639 | | | | At Maturity | | | | 07/15/2028 | | | | EUR | | | | 924,000 | | | | — | | | | (4,466 | ) | | | (4,466 | ) |
Receive | | United Kingdom RPI | | At Maturity | | | 3.554 | | | | At Maturity | | | | 05/15/2027 | | | | GBP | | | | 327,724 | | | | — | | | | (211 | ) | | | (211 | ) |
Receive | | United Kingdom RPI | | At Maturity | | | 3.558 | | | | At Maturity | | | | 05/15/2027 | | | | GBP | | | | 327,724 | | | | — | | | | (390 | ) | | | (390 | ) |
Receive | | United Kingdom RPI | | At Maturity | | | 3.559 | | | | At Maturity | | | | 05/15/2027 | | | | GBP | | | | 327,723 | | | | — | | | | (435 | ) | | | (435 | ) |
Receive | | United Kingdom RPI | | At Maturity | | | 3.561 | | | | At Maturity | | | | 05/15/2027 | | | | GBP | | | | 327,723 | | | | — | | | | (525 | ) | | | (525 | ) |
Receive | | United States CPI Urban Consumers NSA | | At Maturity | | | 2.294 | | | | At Maturity | | | | 01/12/2027 | | | | USD | | | | 866,000 | | | | — | | | | (4,590 | ) | | | (4,590 | ) |
Receive | | United States CPI Urban Consumers NSA | | At Maturity | | | 2.300 | | | | At Maturity | | | | 01/12/2027 | | | | USD | | | | 866,000 | | | | — | | | | (5,095 | ) | | | (5,095 | ) |
Receive | | United States CPI Urban Consumers NSA | | At Maturity | | | 2.369 | | | | At Maturity | | | | 10/04/2028 | | | | USD | | | | 749,000 | | | | — | | | | (7,517 | ) | | | (7,517 | ) |
Pay | | Eurostat Eurozone HICP Ex Tobacco Unrevised Series NSA | | At Maturity | | | 1.334 | | | | At Maturity | | | | 06/15/2027 | | | | EUR | | | | 338,000 | | | | — | | | | (8,540 | ) | | | (8,540 | ) |
Pay | | Eurostat Eurozone HICP Ex Tobacco Unrevised Series NSA | | At Maturity | | | 1.370 | | | | At Maturity | | | | 04/15/2023 | | | | EUR | | | | 890,000 | | | | — | | | | (6,172 | ) | | | (6,172 | ) |
Pay | | Eurostat Eurozone HICP Ex Tobacco Unrevised Series NSA | | At Maturity | | | 1.375 | | | | At Maturity | | | | 07/15/2027 | | | | EUR | | | | 2,754,047 | | | | — | | | | (53,971 | ) | | | (53,971 | ) |
Pay | | Eurostat Eurozone HICP Ex Tobacco Unrevised Series NSA | | At Maturity | | | 1.380 | | | | At Maturity | | | | 07/15/2027 | | | | EUR | | | | 2,666,152 | | | | — | | | | (50,639 | ) | | | (50,639 | ) |
Pay | | Eurostat Eurozone HICP Ex Tobacco Unrevised Series NSA | | At Maturity | | | 1.388 | | | | At Maturity | | | | 07/15/2027 | | | | EUR | | | | 3,984,578 | | | | — | | | | (71,626 | ) | | | (71,626 | ) |
Pay | | Eurostat Eurozone HICP Ex Tobacco Unrevised Series NSA | | At Maturity | | | 1.406 | | | | At Maturity | | | | 07/15/2027 | | | | EUR | | | | 3,999,227 | | | | — | | | | (63,554 | ) | | | (63,554 | ) |
Pay | | Eurostat Eurozone HICP Ex Tobacco Unrevised Series NSA | | At Maturity | | | 1.453 | | | | At Maturity | | | | 08/15/2023 | | | | EUR | | | | 2,612,000 | | | | — | | | | (521 | ) | | | (521 | ) |
Pay | | Eurostat Eurozone HICP Ex Tobacco Unrevised Series NSA | | At Maturity | | | 1.462 | | | | At Maturity | | | | 08/15/2027 | | | | EUR | | | | 6,650,145 | | | | — | | | | (75,709 | ) | | | (75,709 | ) |
Pay | | Eurostat Eurozone HICP Ex Tobacco Unrevised Series NSA | | At Maturity | | | 1.465 | | | | At Maturity | | | | 08/15/2027 | | | | EUR | | | | 2,996,344 | | | | — | | | | (33,164 | ) | | | (33,164 | ) |
Pay | | Eurostat Eurozone HICP Ex Tobacco Unrevised Series NSA | | At Maturity | | | 1.493 | | | | At Maturity | | | | 07/15/2023 | | | | EUR | | | | 1,585,000 | | | | — | | | | (4,989 | ) | | | (4,989 | ) |
Pay | | Eurostat Eurozone HICP Ex Tobacco Unrevised Series NSA | | At Maturity | | | 1.545 | | | | At Maturity | | | | 08/15/2028 | | | | EUR | | | | 2,147,097 | | | | — | | | | (3,042 | ) | | | (3,042 | ) |
See accompanying Notes to Consolidated Financial Statements which are an integral part of the financial statements.
39 Invesco Global Targeted Returns Fund
| | | | | | | | | | | | | | | | | | | | | | | | | | | | | | | | | | | | | | |
| Centrally Cleared Inflation Swap Agreements(q)—(continued) | |
| Pay/Receive | | Floating Rate Index | | Payment
Frequency | | | Fixed
Rate | | | Payment
Frequency | | | Maturity
Date | | | Notional
Value | | | Upfront
Payments
Paid
(Received) | | | Value | | | Unrealized
Appreciation
(Depreciation)(r) | |
Pay | | Eurostat Eurozone HICP Ex Tobacco Unrevised Series NSA | | | At Maturity | | | | 1.550 | % | | | At Maturity | | | | 08/15/2028 | | | | EUR | | | | 1,073,549 | | | $ | — | | | $ | (874 | ) | | $ | (874 | ) |
Pay | | Eurostat Eurozone HICP Ex Tobacco Unrevised Series NSA | | | At Maturity | | | | 1.585 | | | | At Maturity | | | | 05/15/2028 | | | | EUR | | | | 1,410,000 | | | | — | | | | (283 | ) | | | (283 | ) |
Pay | | United Kingdom RPI | | | At Maturity | | | | 3.106 | | | | At Maturity | | | | 06/15/2026 | | | | GBP | | | | 1,196,950 | | | | — | | | | (82,337 | ) | | | (82,337 | ) |
Pay | | United Kingdom RPI | | | At Maturity | | | | 3.250 | | | | At Maturity | | | | 07/15/2025 | | | | GBP | | | | 381,299 | | | | — | | | | (9,347 | ) | | | (9,347 | ) |
Pay | | United Kingdom RPI | | | At Maturity | | | | 3.321 | | | | At Maturity | | | | 08/15/2027 | | | | GBP | | | | 334,383 | | | | — | | | | (11,664 | ) | | | (11,664 | ) |
Pay | | United Kingdom RPI | | | At Maturity | | | | 3.335 | | | | At Maturity | | | | 08/15/2027 | | | | GBP | | | | 839,930 | | | | — | | | | (27,492 | ) | | | (27,492 | ) |
Pay | | United Kingdom RPI | | | At Maturity | | | | 3.343 | | | | At Maturity | | | | 08/15/2027 | | | | GBP | | | | 852,071 | | | | — | | | | (26,908 | ) | | | (26,908 | ) |
Pay | | United Kingdom RPI | | | At Maturity | | | | 3.352 | | | | At Maturity | | | | 10/15/2027 | | | | GBP | | | | 38,845 | | | | — | | | | (906 | ) | | | (906 | ) |
Pay | | United Kingdom RPI | | | At Maturity | | | | 3.353 | | | | At Maturity | | | | 08/15/2027 | | | | GBP | | | | 426,036 | | | | — | | | | (12,799 | ) | | | (12,799 | ) |
Pay | | United Kingdom RPI | | | At Maturity | | | | 3.378 | | | | At Maturity | | | | 08/15/2027 | | | | GBP | | | | 972,670 | | | | — | | | | (25,476 | ) | | | (25,476 | ) |
Pay | | United Kingdom RPI | | | At Maturity | | | | 3.391 | | | | At Maturity | | | | 09/15/2028 | | | | GBP | | | | 594,773 | | | | — | | | | (15,271 | ) | | | (15,271 | ) |
Pay | | United Kingdom RPI | | | At Maturity | | | | 3.411 | | | | At Maturity | | | | 05/15/2027 | | | | GBP | | | | 1,022,000 | | | | — | | | | (18,749 | ) | | | (18,749 | ) |
Pay | | United States CPI Urban Consumers NSA | | | At Maturity | | | | 2.055 | | | | At Maturity | | | | 06/08/2027 | | | | USD | | | | 3,860,000 | | | | — | | | | (75,750 | ) | | | (75,750 | ) |
Pay | | United States CPI Urban Consumers NSA | | | At Maturity | | | | 2.081 | | | | At Maturity | | | | 05/18/2027 | | | | USD | | | | 3,154,000 | | | | — | | | | (48,383 | ) | | | (48,383 | ) |
Pay | | United States CPI Urban Consumers NSA | | | At Maturity | | | | 2.093 | | | | At Maturity | | | | 06/07/2027 | | | | USD | | | | 819,000 | | | | — | | | | (13,133 | ) | | | (13,133 | ) |
Pay | | United States CPI Urban Consumers NSA | | | At Maturity | | | | 2.120 | | | | At Maturity | | | | 05/12/2027 | | | | USD | | | | 3,231,000 | | | | — | | | | (35,306 | ) | | | (35,306 | ) |
Pay | | United States CPI Urban Consumers NSA | | | At Maturity | | | | 2.133 | | | | At Maturity | | | | 05/15/2027 | | | | USD | | | | 1,117,000 | | | | — | | | | (11,481 | ) | | | (11,481 | ) |
Pay | | United States CPI Urban Consumers NSA | | | At Maturity | | | | 2.135 | | | | At Maturity | | | | 05/11/2027 | | | | USD | | | | 890,000 | | | | — | | | | (8,354 | ) | | | (8,354 | ) |
Pay | | United States CPI Urban Consumers NSA | | | At Maturity | | | | 2.138 | | | | At Maturity | | | | 05/11/2027 | | | | USD | | | | 1,574,000 | | | | — | | | | (14,402 | ) | | | (14,402 | ) |
Pay | | United States CPI Urban Consumers NSA | | | At Maturity | | | | 2.144 | | | | At Maturity | | | | 05/11/2027 | | | | USD | | | | 1,574,000 | | | | — | | | | (13,432 | ) | | | (13,432 | ) |
Pay | | United States CPI Urban Consumers NSA | | | At Maturity | | | | 2.165 | | | | At Maturity | | | | 10/25/2027 | | | | USD | | | | 693,000 | | | | — | | | | (8,979 | ) | | | (8,979 | ) |
Pay | | United States CPI Urban Consumers NSA | | | At Maturity | | | | 2.170 | | | | At Maturity | | | | 09/18/2027 | | | | USD | | | | 437,000 | | | | — | | | | (5,584 | ) | | | (5,584 | ) |
Pay | | United States CPI Urban Consumers NSA | | | At Maturity | | | | 2.174 | | | | At Maturity | | | | 12/13/2027 | | | | USD | | | | 590,000 | | | | — | | | | (5,128 | ) | | | (5,128 | ) |
Pay | | United States CPI Urban Consumers NSA | | | At Maturity | | | | 2.223 | | | | At Maturity | | | | 10/02/2027 | | | | USD | | | | 472,411 | | | | — | | | | (820 | ) | | | (820 | ) |
Pay | | United States CPI Urban Consumers NSA | | | At Maturity | | | | 2.229 | | | | At Maturity | | | | 10/02/2027 | | | | USD | | | | 472,410 | | | | — | | | | (584 | ) | | | (584 | ) |
Pay | | United States CPI Urban Consumers NSA | | | At Maturity | | | | 2.230 | | | | At Maturity | | | | 10/30/2028 | | | | USD | | | | 944,821 | | | | — | | | | (3,375 | ) | | | (3,375 | ) |
Pay | | United States CPI Urban Consumers NSA | | | At Maturity | | | | 2.258 | | | | At Maturity | | | | 10/29/2028 | | | | USD | | | | 944,821 | | | | — | | | | (960 | ) | | | (960 | ) |
Pay | | United States CPI Urban Consumers NSA | | | At Maturity | | | | 2.263 | | | | At Maturity | | | | 10/31/2028 | | | | USD | | | | 944,821 | | | | — | | | | (594 | ) | | | (594 | ) |
Subtotal — Depreciation | | | | — | | | | (897,365 | ) | | | (897,365 | ) |
Subtotal — Centrally Cleared Inflation Swap Agreements | | | | — | | | | (374,306 | ) | | | (374,306 | ) |
Total — Interest Rate and Inflation Swap Agreements — Interest Rate Risk | | | $ | — | | | $ | (257,235 | ) | | $ | (257,235 | ) |
| (q) | Centrally Cleared Inflation swap agreements collateralized by $864,741 cash held with Credit Suisse Securities (USA) LLC. |
| (r) | The daily variation margin receivable (payable) at period end is recorded in the Consolidated Statement of Assets and Liabilities. |
See accompanying Notes to Consolidated Financial Statements which are an integral part of the financial statements.
40 Invesco Global Targeted Returns Fund
| | | | | | | | | | | | | | | | | | | | | | | | | | | | |
| Open Over-The-Counter Variance Swap Agreements* | |
| Counterparty | | Reference Entity | | Pay/
Receive
Variance | | Volatility
Strike Rate | | | Payment
Frequency | | | Maturity
Date | | | | | | Notional
Value | | | Unrealized
Appreciation
(Depreciation) | |
Goldman Sachs International | | Hang Seng China Enterprise Index | | Receive | | | 25.00 | % | | | At Maturity | | | | 12/30/2019 | | | | HKD | | | | 36,236 | | | $ | 1,611 | |
Goldman Sachs International | | Hang Seng China Enterprise Index | | Receive | | | 25.05 | | | | At Maturity | | | | 12/30/2019 | | | | HKD | | | | 85,129 | | | | 15,103 | |
Goldman Sachs International | | Hang Seng China Enterprise Index | | Receive | | | 25.20 | | | | At Maturity | | | | 12/30/2019 | | | | HKD | | | | 32,291 | | | | 1,506 | |
Goldman Sachs International | | Hang Seng Index | | Receive | | | 22.50 | | | | At Maturity | | | | 12/30/2019 | | | | HKD | | | | 10,300 | | | | 1,972 | |
Goldman Sachs International | | S&P/ASX 200 Index | | Receive | | | 15.90 | | | | At Maturity | | | | 12/19/2019 | | | | AUD | | | | 4,212 | | | | 2,931 | |
Goldman Sachs International | | S&P/ASX 200 Index | | Receive | | | 16.00 | | | | At Maturity | | | | 12/19/2019 | | | | AUD | | | | 2,968 | | | | 123 | |
J.P. Morgan Chase Bank, N.A. | | Hang Seng China Enterprise Index | | Receive | | | 24.94 | | | | At Maturity | | | | 12/30/2019 | | | | HKD | | | | 25,942 | | | | 4,845 | |
J.P. Morgan Chase Bank, N.A. | | Hang Seng China Enterprise Index | | Receive | | | 25.00 | | | | At Maturity | | | | 12/30/2019 | | | | HKD | | | | 74,208 | | | | 8,116 | |
J.P. Morgan Chase Bank, N.A. | | Hang Seng China Enterprise Index | | Receive | | | 25.10 | | | | At Maturity | | | | 12/30/2019 | | | | HKD | | | | 22,970 | | | | 4,389 | |
J.P. Morgan Chase Bank, N.A. | | Hang Seng Index | | Receive | | | 21.80 | | | | At Maturity | | | | 12/30/2019 | | | | HKD | | | | 52,590 | | | | 12,156 | |
J.P. Morgan Chase Bank, N.A. | | Hang Seng Index | | Receive | | | 22.64 | | | | At Maturity | | | | 12/30/2019 | | | | HKD | | | | 8,943 | | | | 2,406 | |
J.P. Morgan Chase Bank, N.A. | | S&P/ASX 200 Index | | Receive | | | 15.40 | | | | At Maturity | | | | 12/19/2019 | | | | AUD | | | | 2,337 | | | | 2,043 | |
J.P. Morgan Chase Bank, N.A. | | S&P/ASX 200 Index | | Receive | | | 15.73 | | | | At Maturity | | | | 12/19/2019 | | | | AUD | | | | 5,896 | | | | 4,646 | |
J.P. Morgan Chase Bank, N.A. | | S&P/ASX 200 Index | | Receive | | | 15.84 | | | | At Maturity | | | | 12/19/2019 | | | | AUD | | | | 1,412 | | | | 344 | |
Societe Generale | | Hang Seng China Enterprise Index | | Receive | | | 24.80 | | | | At Maturity | | | | 12/30/2019 | | | | HKD | | | | 36,236 | | | | 2,377 | |
Societe Generale | | Hang Seng China Enterprise Index | | Receive | | | 25.00 | | | | At Maturity | | | | 12/30/2019 | | | | HKD | | | | 53,022 | | | | 2,246 | |
Societe Generale | | Hang Seng China Enterprise Index | | Receive | | | 25.10 | | | | At Maturity | | | | 12/30/2019 | | | | HKD | | | | 20,410 | | | | 803 | |
Societe Generale | | Hang Seng China Enterprise Index | | Receive | | | 25.33 | | | | At Maturity | | | | 12/30/2019 | | | | HKD | | | | 35,247 | | | | 5,023 | |
Societe Generale | | Hang Seng Index | | Receive | | | 22.79 | | | | At Maturity | | | | 12/30/2019 | | | | HKD | | | | 9,599 | | | | 2,705 | |
Societe Generale | | KOSPI 200 Index | | Receive | | | 17.60 | | | | At Maturity | | | | 12/12/2019 | | | | KRW | | | | 8,425,923 | | | | 15,656 | |
Societe Generale | | KOSPI 200 Index | | Receive | | | 18.25 | | | | At Maturity | | | | 12/12/2019 | | | | KRW | | | | 2,001,759 | | | | 2,756 | |
Societe Generale | | S&P/ASX 200 Index | | Receive | | | 15.60 | | | | At Maturity | | | | 12/19/2019 | | | | AUD | | | | 5,901 | | | | 5,122 | |
Societe Generale | | S&P/ASX 200 Index | | Receive | | | 16.25 | | | | At Maturity | | | | 12/19/2019 | | | | AUD | | | | 4,925 | | | | 3,155 | |
UBS AG | | Hang Seng China Enterprise Index | | Receive | | | 22.80 | | | | At Maturity | | | | 12/28/2018 | | | | HKD | | | | 6,292 | | | | 157 | |
UBS AG | | Hang Seng China Enterprise Index | | Receive | | | 24.70 | | | | At Maturity | | | | 12/30/2019 | | | | HKD | | | | 36,236 | | | | 2,982 | |
UBS AG | | Hang Seng China Enterprise Index | | Receive | | | 24.80 | | | | At Maturity | | | | 12/30/2019 | | | | HKD | | | | 91,010 | | | | 18,081 | |
UBS AG | | Hang Seng China Enterprise Index | | Receive | | | 25.30 | | | | At Maturity | | | | 12/30/2019 | | | | HKD | | | | 32,292 | | | | 965 | |
UBS AG | | Hang Seng Index | | Receive | | | 22.40 | | | | At Maturity | | | | 12/30/2019 | | | | HKD | | | | 10,300 | | | | 2,063 | |
UBS AG | | Hang Seng Index | | Receive | | | 22.50 | | | | At Maturity | | | | 12/30/2019 | | | | HKD | | | | 152 | | | | 43 | |
UBS AG | | Hang Seng Index | | Receive | | | 22.77 | | | | At Maturity | | | | 12/30/2019 | | | | HKD | | | | 29,979 | | | | 2,009 | |
UBS AG | | KOSPI 200 Index | | Receive | | | 17.70 | | | | At Maturity | | | | 12/12/2019 | | | | KRW | | | | 5,376,546 | | | | 8,817 | |
UBS AG | | S&P/ASX 200 Index | | Receive | | | 15.60 | | | | At Maturity | | | | 12/19/2019 | | | | AUD | | | | 5,607 | | | | 5,361 | |
UBS AG | | S&P/ASX 200 Index | | Receive | | | 15.80 | | | | At Maturity | | | | 12/19/2019 | | | | AUD | | | | 2,969 | | | | 532 | |
UBS AG | | S&P/ASX 200 Index | | Receive | | | 15.85 | | | | At Maturity | | | | 12/19/2019 | | | | AUD | | | | 6,798 | | | | 4,520 | |
BNP Paribas S.A. | | S&P 500 Index | | Pay | | | 17.65 | | | | At Maturity | | | | 12/21/2018 | | | | USD | | | | 6,188 | | | | 21,640 | |
BNP Paribas S.A. | | S&P 500 Index | | Pay | | | 17.75 | | | | At Maturity | | | | 12/21/2018 | | | | USD | | | | 2,071 | | | | 7,286 | |
Citibank, N.A. | | S&P 500 Index | | Pay | | | 16.65 | | | | At Maturity | | | | 12/21/2018 | | | | USD | | | | 3,485 | | | | 8,600 | |
Citibank, N.A. | | S&P 500 Index | | Pay | | | 17.41 | | | | At Maturity | | | | 12/21/2018 | | | | USD | | | | 3,890 | | | | 12,492 | |
Citibank, N.A. | | S&P 500 Index | | Pay | | | 17.55 | | | | At Maturity | | | | 12/21/2018 | | | | USD | | | | 3,886 | | | | 14,422 | |
Goldman Sachs International | | S&P 500 Index | | Pay | | | 16.65 | | | | At Maturity | | | | 12/21/2018 | | | | USD | | | | 15,210 | | | | 15,009 | |
J.P. Morgan Chase Bank, N.A. | | S&P 500 Index | | Pay | | | 16.55 | | | | At Maturity | | | | 12/21/2018 | | | | USD | | | | 892 | | | | 1,119 | |
J.P. Morgan Chase Bank, N.A. | | S&P 500 Index | | Pay | | | 16.70 | | | | At Maturity | | | | 12/21/2018 | | | | USD | | | | 5,204 | | | | 7,972 | |
J.P. Morgan Chase Bank, N.A. | | S&P 500 Index | | Pay | | | 16.90 | | | | At Maturity | | | | 12/21/2018 | | | | USD | | | | 6,548 | | | | 13,060 | |
J.P. Morgan Chase Bank, N.A. | | S&P 500 Index | | Pay | | | 17.31 | | | | At Maturity | | | | 12/21/2018 | | | | USD | | | | 2,784 | | | | 6,802 | |
J.P. Morgan Chase Bank, N.A. | | S&P 500 Index | | Pay | | | 17.45 | | | | At Maturity | | | | 12/21/2018 | | | | USD | | | | 4,851 | | | | 13,137 | |
J.P. Morgan Chase Bank, N.A. | | S&P 500 Index | | Pay | | | 17.95 | | | | At Maturity | | | | 12/21/2018 | | | | USD | | | | 23,318 | | | | 94,841 | |
J.P. Morgan Chase Bank, N.A. | | S&P 500 Index | | Pay | | | 18.09 | | | | At Maturity | | | | 12/21/2018 | | | | USD | | | | 2,373 | | | | 7,674 | |
J.P. Morgan Chase Bank, N.A. | | S&P 500 Index | | Pay | | | 18.58 | | | | At Maturity | | | | 12/21/2018 | | | | USD | | | | 2,374 | | | | 8,540 | |
Societe Generale | | Hang Seng China Enterprise Index | | Pay | | | 25.95 | | | | At Maturity | | | | 12/30/2019 | | | | HKD | | | | 8,496 | | | | 334 | |
Societe Generale | | KOSPI 200 Index | | Pay | | | 20.00 | | | | At Maturity | | | | 12/13/2018 | | | | KRW | | | | 7,789,108 | | | | 29,823 | |
Societe Generale | | S&P 500 Index | | Pay | | | 15.95 | | | | At Maturity | | | | 12/21/2018 | | | | USD | | | | 5,448 | | | | 9,594 | |
See accompanying Notes to Consolidated Financial Statements which are an integral part of the financial statements.
41 Invesco Global Targeted Returns Fund
| | | | | | | | | | | | | | | | | | | | | | | | | | | | | | |
| Open Over-The-Counter Variance Swap Agreements*—(continued) | |
| Counterparty | | Reference Entity | | | Pay/
Receive
Variance | | Volatility
Strike Rate | | | Payment
Frequency | | | Maturity
Date | | | | | | Notional
Value | | | Unrealized
Appreciation
(Depreciation) | |
Societe Generale | | | S&P 500 Index | | | Pay | | | 16.41 | % | | | At Maturity | | | | 12/21/2018 | | | | USD | | | | 2,343 | | | $ | 1,078 | |
Societe Generale | | | S&P 500 Index | | | Pay | | | 16.85 | | | | At Maturity | | | | 12/21/2018 | | | | USD | | | | 4,362 | | | | 10,852 | |
Societe Generale | | | S&P 500 Index | | | Pay | | | 17.36 | | | | At Maturity | | | | 12/21/2018 | | | | USD | | | | 9,742 | | | | 24,372 | |
Societe Generale | | | S&P 500 Index | | | Pay | | | 17.70 | | | | At Maturity | | | | 12/21/2018 | | | | USD | | | | 23,318 | | | | 90,163 | |
Societe Generale | | | S&P 500 Index | | | Pay | | | 17.80 | | | | At Maturity | | | | 12/21/2018 | | | | USD | | | | 7,772 | | | | 30,362 | |
Societe Generale | | | S&P 500 Index | | | Pay | | | 18.15 | | | | At Maturity | | | | 12/21/2018 | | | | USD | | | | 2,666 | | | | 10,575 | |
UBS AG | | | KOSPI 200 Index | | | Pay | | | 19.00 | | | | At Maturity | | | | 12/13/2018 | | | | KRW | | | | 7,721,467 | | | | 23,950 | |
UBS AG | | | KOSPI 200 Index | | | Pay | | | 19.60 | | | | At Maturity | | | | 12/13/2018 | | | | KRW | | | | 7,712,584 | | | | 28,258 | |
UBS AG | | | KOSPI 200 Index | | | Pay | | | 19.70 | | | | At Maturity | | | | 12/13/2018 | | | | KRW | | | | 4,834,372 | | | | 18,045 | |
UBS AG | | | KOSPI 200 Index | | | Pay | | | 20.30 | | | | At Maturity | | | | 12/13/2018 | | | | KRW | | | | 13,155,600 | | | | 60,794 | |
UBS AG | | | S&P 500 Index | | | Pay | | | 16.96 | | | | At Maturity | | | | 12/21/2018 | | | | USD | | | | 4,501 | | | | 12,603 | |
UBS AG | | | S&P 500 Index | | | Pay | | | 17.20 | | | | At Maturity | | | | 12/21/2018 | | | | USD | | | | 9,701 | | | | 24,217 | |
UBS AG | | | S&P 500 Index | | | Pay | | | 17.40 | | | | At Maturity | | | | 12/21/2018 | | | | USD | | | | 3,742 | | | | 13,445 | |
UBS AG | | | S&P 500 Index | | | Pay | | | 17.60 | | | | At Maturity | | | | 12/21/2018 | | | | USD | | | | 3,887 | | | | 14,578 | |
UBS AG | | | S&P 500 Index | | | Pay | | | 17.75 | | | | At Maturity | | | | 12/21/2018 | | | | USD | | | | 6,906 | | | | 14,712 | |
UBS AG | | | S&P 500 Index | | | Pay | | | 18.00 | | | | At Maturity | | | | 12/21/2018 | | | | USD | | | | 24,915 | | | | 101,149 | |
UBS AG | | | S&P 500 Index | | | Pay | | | 18.05 | | | | At Maturity | | | | 12/21/2018 | | | | USD | | | | 1,629 | | | | 5,224 | |
Subtotal — Appreciation | | | | | | | | | | | | | | | | | | | | | | | | | | | | | 904,286 | |
BNP Paribas S.A. | | | KOSPI 200 Index | | | Receive | | | 19.89 | | | | At Maturity | | | | 12/13/2018 | | | | KRW | | | | 3,322,882 | | | | (14,087 | ) |
BNP Paribas S.A. | | | KOSPI 200 Index | | | Receive | | | 20.19 | | | | At Maturity | | | | 12/13/2018 | | | | KRW | | | | 3,470,917 | | | | (15,081 | ) |
BNP Paribas S.A. | | | S&P/ASX 200 Index | | | Receive | | | 15.75 | | | | At Maturity | | | | 12/20/2018 | | | | AUD | | | | 4,923 | | | | (11,954 | ) |
Citibank, N.A. | | | KOSPI 200 Index | | | Receive | | | 18.72 | | | | At Maturity | | | | 12/13/2018 | | | | KRW | | | | 1,008,074 | | | | (3,256 | ) |
Citibank, N.A. | | | KOSPI 200 Index | | | Receive | | | 19.59 | | | | At Maturity | | | | 12/13/2018 | | | | KRW | | | | 2,276,485 | | | | (8,934 | ) |
Citibank, N.A. | | | KOSPI 200 Index | | | Receive | | | 19.85 | | | | At Maturity | | | | 12/13/2018 | | | | KRW | | | | 4,414,436 | | | | (19,588 | ) |
Citibank, N.A. | | | S&P 500 Index | | | Receive | | | 17.62 | | | | At Maturity | | | | 12/21/2018 | | | | USD | | | | 14,398 | | | | (41,558 | ) |
Goldman Sachs International | | | Hang Seng China Enterprise Index | | | Receive | | | 23.20 | | | | At Maturity | | | | 12/28/2018 | | | | HKD | | | | 6,292 | | | | (87 | ) |
Goldman Sachs International | | | Hang Seng China Enterprise Index | | | Receive | | | 24.00 | | | | At Maturity | | | | 12/28/2018 | | | | HKD | | | | 36,236 | | | | (6,621 | ) |
J.P. Morgan Chase Bank, N.A. | | | Hang Seng China Enterprise Index | | | Receive | | | 24.75 | | | | At Maturity | | | | 12/28/2018 | | | | HKD | | | | 67,209 | | | | (24,701 | ) |
J.P. Morgan Chase Bank, N.A. | | | Hang Seng China Enterprise Index | | | Receive | | | 25.05 | | | | At Maturity | | | | 12/28/2018 | | | | HKD | | | | 67,209 | | | | (26,767 | ) |
J.P. Morgan Chase Bank, N.A. | | | Hang Seng China Enterprise Index | | | Receive | | | 25.59 | | | | At Maturity | | | | 12/28/2018 | | | | HKD | | | | 13,305 | | | | (5,472 | ) |
J.P. Morgan Chase Bank, N.A. | | | Hang Seng Index | | | Receive | | | 21.09 | | | | At Maturity | | | | 12/28/2018 | | | | HKD | | | | 13,915 | | | | (2,450 | ) |
J.P. Morgan Chase Bank, N.A. | | | Hang Seng Index | | | Receive | | | 21.29 | | | | At Maturity | | | | 12/28/2018 | | | | HKD | | | | 23,608 | | | | (2,906 | ) |
J.P. Morgan Chase Bank, N.A. | | | Hang Seng Index | | | Receive | | | 21.43 | | | | At Maturity | | | | 12/28/2018 | | | | HKD | | | | 34,156 | | | | (6,274 | ) |
J.P. Morgan Chase Bank, N.A. | | | Hang Seng Index | | | Receive | | | 21.50 | | | | At Maturity | | | | 12/28/2018 | | | | HKD | | | | 59,358 | | | | (13,332 | ) |
J.P. Morgan Chase Bank, N.A. | | | Hang Seng Index | | | Receive | | | 21.85 | | | | At Maturity | | | | 12/28/2018 | | | | HKD | | | | 25,293 | | | | (7,201 | ) |
J.P. Morgan Chase Bank, N.A. | | | Hang Seng Index | | | Receive | | | 22.39 | | | | At Maturity | | | | 12/28/2018 | | | | HKD | | | | 40,215 | | | | (15,684 | ) |
J.P. Morgan Chase Bank, N.A. | | | Hang Seng Index | | | Receive | | | 22.44 | | | | At Maturity | | | | 12/28/2018 | | | | HKD | | | | 11,809 | | | | (4,479 | ) |
J.P. Morgan Chase Bank, N.A. | | | KOSPI 200 Index | | | Receive | | | 18.79 | | | | At Maturity | | | | 12/13/2018 | | | | KRW | | | | 26,414,363 | | | | (96,162 | ) |
J.P. Morgan Chase Bank, N.A. | | | S&P/ASX 200 Index | | | Receive | | | 14.28 | | | | At Maturity | | | | 12/20/2018 | | | | AUD | | | | 4,715 | | | | (7,208 | ) |
J.P. Morgan Chase Bank, N.A. | | | S&P/ASX 200 Index | | | Receive | | | 14.50 | | | | At Maturity | | | | 12/20/2018 | | | | AUD | | | | 4,716 | | | | (7,746 | ) |
J.P. Morgan Chase Bank, N.A. | | | S&P/ASX 200 Index | | | Receive | | | 15.59 | | | | At Maturity | | | | 12/20/2018 | | | | AUD | | | | 4,403 | | | | (9,896 | ) |
Societe Generale | | | Hang Seng China Enterprise Index | | | Receive | | | 23.30 | | | | At Maturity | | | | 12/28/2018 | | | | HKD | | | | 20,410 | | | | (1,600 | ) |
Societe Generale | | | Hang Seng China Enterprise Index | | | Receive | | | 23.50 | | | | At Maturity | | | | 12/28/2018 | | | | HKD | | | | 56,646 | | | | (7,058 | ) |
Societe Generale | | | Hang Seng China Enterprise Index | | | Receive | | | 24.00 | | | | At Maturity | | | | 12/28/2018 | | | | HKD | | | | 32,612 | | | | (6,231 | ) |
Societe Generale | | | Hang Seng China Enterprise Index | | | Receive | | | 25.39 | | | | At Maturity | | | | 12/30/2019 | | | | HKD | | | | 31,377 | | | | (444 | ) |
Societe Generale | | | Hang Seng China Enterprise Index | | | Receive | | | 25.95 | | | | At Maturity | | | | 12/28/2018 | | | | HKD | | | | 25,936 | | | | (12,006 | ) |
Societe Generale | | | Hang Seng China Enterprise Index | | | Receive | | | 26.00 | | | | At Maturity | | | | 12/28/2018 | | | | HKD | | | | 25,936 | | | | (12,160 | ) |
Societe Generale | | | KOSPI 200 Index | | | Receive | | | 18.35 | | | | At Maturity | | | | 12/13/2018 | | | | KRW | | | | 3,878,625 | | | | (11,496 | ) |
Societe Generale | | | KOSPI 200 Index | | | Receive | | | 19.00 | | | | At Maturity | | | | 12/13/2018 | | | | KRW | | | | 17,608,798 | | | | (66,617 | ) |
Societe Generale | | | KOSPI 200 Index | | | Receive | | | 19.40 | | | | At Maturity | | | | 12/13/2018 | | | | KRW | | | | 8,794,672 | | | | (36,329 | ) |
Societe Generale | | | KOSPI 200 Index | | | Receive | | | 19.90 | | | | At Maturity | | | | 12/13/2018 | | | | KRW | | | | 8,824,892 | | | | (39,446 | ) |
See accompanying Notes to Consolidated Financial Statements which are an integral part of the financial statements.
42 Invesco Global Targeted Returns Fund
| | | | | | | | | | | | | | | | | | | | | | | | | | | | | | | | |
| Open Over-The-Counter Variance Swap Agreements*—(continued) | |
| Counterparty | | Reference Entity | | | Pay/
Receive
Variance | | | Volatility
Strike Rate | | | Payment
Frequency | | | Maturity
Date | | | | | | Notional
Value | | | Unrealized
Appreciation
(Depreciation) | |
Societe Generale | | | KOSPI 200 Index | | | | Receive | | | | 19.97 | % | | | At Maturity | | | | 12/13/2018 | | | | KRW | | | | 4,560,014 | | | $ | (19,914 | ) |
Societe Generale | | | KOSPI 200 Index | | | | Receive | | | | 20.28 | | | | At Maturity | | | | 12/13/2018 | | | | KRW | | | | 4,951,830 | | | | (21,231 | ) |
Societe Generale | | | S&P/ASX 200 Index | | | | Receive | | | | 15.99 | | | | At Maturity | | | | 12/19/2019 | | | | AUD | | | | 3,468 | | | | (442 | ) |
UBS AG | | | Hang Seng China Enterprise Index | | | | Receive | | | | 23.00 | | | | At Maturity | | | | 12/28/2018 | | | | HKD | | | | 36,236 | | | | (2,112 | ) |
UBS AG | | | Hang Seng China Enterprise Index | | | | Receive | | | | 25.00 | | | | At Maturity | | | | 12/28/2018 | | | | HKD | | | | 51,858 | | | | (17,722 | ) |
UBS AG | | | Hang Seng China Enterprise Index | | | | Receive | | | | 25.30 | | | | At Maturity | | | | 12/28/2019 | | | | HKD | | | | 51,871 | | | | (21,704 | ) |
UBS AG | | | Hang Seng China Enterprise Index | | | | Receive | | | | 25.70 | | | | At Maturity | | | | 12/30/2019 | | | | HKD | | | | 44,329 | | | | (4,008 | ) |
UBS AG | | | Hang Seng China Enterprise Index | | | | Receive | | | | 26.04 | | | | At Maturity | | | | 12/28/2018 | | | | HKD | | | | 103,115 | | | | (50,547 | ) |
UBS AG | | | Hang Seng Index | | | | Receive | | | | 21.48 | | | | At Maturity | | | | 12/28/2018 | | | | HKD | | | | 28,725 | | | | (5,601 | ) |
UBS AG | | | Hang Seng Index | | | | Receive | | | | 21.68 | | | | At Maturity | | | | 12/28/2018 | | | | HKD | | | | 28,721 | | | | (8,020 | ) |
UBS AG | | | Hang Seng Index | | | | Receive | | | | 21.79 | | | | At Maturity | | | | 12/28/2018 | | | | HKD | | | | 18,601 | | | | (6,189 | ) |
UBS AG | | | KOSPI 200 Index | | | | Receive | | | | 18.60 | | | | At Maturity | | | | 12/13/2018 | | | | KRW | | | | 17,588,568 | | | | (63,194 | ) |
UBS AG | | | KOSPI 200 Index | | | | Receive | | | | 19.30 | | | | At Maturity | | | | 12/13/2018 | | | | KRW | | | | 10,458,789 | | | | (42,427 | ) |
UBS AG | | | KOSPI 200 Index | | | | Receive | | | | 19.44 | | | | At Maturity | | | | 12/13/2018 | | | | KRW | | | | 1,758,023 | | | | (6,656 | ) |
UBS AG | | | KOSPI 200 Index | | | | Receive | | | | 19.80 | | | | At Maturity | | | | 12/13/2018 | | | | KRW | | | | 4,414,527 | | | | (19,445 | ) |
UBS AG | | | KOSPI 200 Index | | | | Receive | | | | 19.95 | | | | At Maturity | | | | 12/13/2018 | | | | KRW | | | | 5,617,288 | | | | (24,934 | ) |
UBS AG | | | S&P 500 Index | | | | Receive | | | | 16.48 | | | | At Maturity | | | | 12/21/2018 | | | | USD | | | | 13,621 | | | | (19,603 | ) |
UBS AG | | | S&P 500 Index | | | | Receive | | | | 16.64 | | | | At Maturity | | | | 12/21/2018 | | | | USD | | | | 13,621 | | | | (21,031 | ) |
UBS AG | | | S&P 500 Index | | | | Receive | | | | 17.00 | | | | At Maturity | | | | 12/21/2018 | | | | USD | | | | 13,621 | | | | (24,885 | ) |
UBS AG | | | S&P 500 Index | | | | Receive | | | | 17.05 | | | | At Maturity | | | | 12/21/2018 | | | | USD | | | | 13,881 | | | | (25,581 | ) |
UBS AG | | | S&P 500 Index | | | | Receive | | | | 17.08 | | | | At Maturity | | | | 12/21/2018 | | | | USD | | | | 13,882 | | | | (25,834 | ) |
UBS AG | | | S&P 500 Index | | | | Receive | | | | 17.50 | | | | At Maturity | | | | 12/21/2018 | | | | USD | | | | 13,881 | | | | (30,773 | ) |
UBS AG | | | S&P/ASX 200 Index | | | | Receive | | | | 14.38 | | | | At Maturity | | | | 12/20/2018 | | | | AUD | | | | 3,773 | | | | (5,900 | ) |
UBS AG | | | S&P/ASX 200 Index | | | | Receive | | | | 15.55 | | | | At Maturity | | | | 12/20/2018 | | | | AUD | | | | 11,600 | | | | (27,124 | ) |
UBS AG | | | S&P/ASX 200 Index | | | | Receive | | | | 15.65 | | | | At Maturity | | | | 12/20/2018 | | | | AUD | | | | 21,214 | | | | (51,024 | ) |
UBS AG | | | S&P/ASX 200 Index | | | | Receive | | | | 15.69 | | | | At Maturity | | | | 12/20/2018 | | | | AUD | | | | 4,922 | | | | (11,828 | ) |
UBS AG | | | S&P/ASX 200 Index | | | | Receive | | | | 15.75 | | | | At Maturity | | | | 12/19/2019 | | | | AUD | | | | 5,902 | | | | (1,457 | ) |
UBS AG | | | S&P/ASX 200 Index | | | | Receive | | | | 15.77 | | | | At Maturity | | | | 12/20/2018 | | | | AUD | | | | 4,922 | | | | (12,006 | ) |
UBS AG | | | S&P/ASX 200 Index | | | | Receive | | | | 15.84 | | | | At Maturity | | | | 12/19/2019 | | | | AUD | | | | 8,330 | | | | (890 | ) |
UBS AG | | | S&P/ASX 200 Index | | | | Receive | | | | 16.03 | | | | At Maturity | | | | 12/20/2018 | | | | AUD | | | | 6,961 | | | | (17,930 | ) |
Goldman Sachs International | | | Hang Seng China Enterprise Index | | | | Pay | | | | 22.35 | | | | At Maturity | | | | 12/28/2018 | | | | HKD | | | | 84,501 | | | | (40,348 | ) |
Goldman Sachs International | | | S&P/ASX 200 Index | | | | Pay | | | | 13.30 | | | | At Maturity | | | | 12/20/2018 | | | | AUD | | | | 4,468 | | | | (11,625 | ) |
J.P. Morgan Chase Bank, N.A. | | | Hang Seng Index | | | | Pay | | | | 20.80 | | | | At Maturity | | | | 12/28/2018 | | | | HKD | | | | 19,152 | | | | (9,467 | ) |
J.P. Morgan Chase Bank, N.A. | | | S&P/ASX 200 Index | | | | Pay | | | | 13.93 | | | | At Maturity | | | | 12/20/2018 | | | | AUD | | | | 6,254 | | | | (11,708 | ) |
Societe Generale | | | Hang Seng China Enterprise Index | | | | Pay | | | | 22.50 | | | | At Maturity | | | | 12/28/2018 | | | | HKD | | | | 34,987 | | | | (16,069 | ) |
Societe Generale | | | Hang Seng China Enterprise Index | | | | Pay | | | | 22.79 | | | | At Maturity | | | | 12/28/2018 | | | | HKD | | | | 8,496 | | | | (461 | ) |
Societe Generale | | | KOSPI 200 Index | | | | Pay | | | | 13.70 | | | | At Maturity | | | | 12/13/2018 | | | | KRW | | | | 10,636,497 | | | | (89,133 | ) |
Societe Generale | | | S&P/ASX 200 Index | | | | Pay | | | | 13.80 | | | | At Maturity | | | | 12/20/2018 | | | | AUD | | | | 5,901 | | | | (11,181 | ) |
UBS AG | | | Hang Seng China Enterprise Index | | | | Pay | | | | 22.75 | | | | At Maturity | | | | 12/28/2018 | | | | HKD | | | | 32,847 | | | | (6,641 | ) |
UBS AG | | | Hang Seng Index | | | | Pay | | | | 20.40 | | | | At Maturity | | | | 12/28/2018 | | | | HKD | | | | 62,677 | | | | (32,912 | ) |
UBS AG | | | S&P 500 Index | | | | Pay | | | | 15.25 | | | | At Maturity | | | | 12/21/2018 | | | | USD | | | | 3,810 | | | | (4,648 | ) |
UBS AG | | | S&P 500 Index | | | | Pay | | | | 15.35 | | | | At Maturity | | | | 12/21/2018 | | | | USD | | | | 10,698 | | | | (11,676 | ) |
UBS AG | | | S&P/ASX 200 Index | | | | Pay | | | | 12.60 | | | | At Maturity | | | | 12/20/2018 | | | | AUD | | | | 5,948 | | | | (20,692 | ) |
Subtotal — Depreciation | | | | | | | | | | | | | | | | | | | | | | | | | | | | | | | (1,401,404 | ) |
Total — Variance Swap Agreements — Equity Risk | | | | | | | | | | | | | | | | | | | | | | | $ | (497,118 | ) |
See accompanying Notes to Consolidated Financial Statements which are an integral part of the financial statements.
43 Invesco Global Targeted Returns Fund
| | | | | | | | | | | | | | | | | | | | | | | | | | | | | | | | | | | | |
| Open Over-The-Counter Total Return Swap Agreements(s)* | |
| Counterparty | | Pay/
Receive | | Reference Entity(t) | | Fixed
Rate | | | Payment
Frequency | | | Number of
Contracts | | | Maturity Date | | | Notional
Value | | | Upfront Payments Paid (Received) | | | Value | | | Unrealized
Appreciation (Depreciation) | |
Macquarie Bank Ltd. | | Pay | | Macquarie MQCP252 Index | | | 0.12 | % | | | Monthly | | | | 70,774 | | | | 02/21/2019 | | | USD | 7,790,767 | | | $ | — | | | $ | 321,399 | | | $ | 321,399 | |
Macquarie Bank Ltd. | | Pay | | Macquarie MQCP625E Index | | | 0.24 | | | | Monthly | | | | 8,246 | | | | 02/21/2019 | | | USD | 1,295,437 | | | | — | | | | 4,176 | | | | 4,176 | |
Macquarie Bank Ltd. | | Pay | | Macquarie MQCP626E Index | | | 0.29 | | | | Monthly | | | | 3,279 | | | | 02/21/2019 | | | USD | 729,343 | | | | — | | | | 329 | | | | 329 | |
BNP Paribas S.A. | | Receive | | BNP Paribas DR Alpha ex-Agriculture and Livestock Index | | | 0.15 | | | | Monthly | | | | 18,125 | | | | 06/25/2019 | | | USD | 5,331,282 | | | | — | | | | 18,529 | | | | 18,529 | |
Subtotal — Commodity Risk | | | | | | | | | | | | — | | | | 344,433 | | | | 344,433 | |
Goldman Sachs International | | Pay | | Bovespa Index | | | — | | | | Monthly | | | | 40 | | | | 12/13/2018 | | | BRL | 3,379,642 | | | | — | | | | 36,497 | | | | 36,497 | |
Morgan Stanley Capital Services LLC | | Pay | | Morgan Stanley Systematic 5-Month Dispersion Index | | | — | | | | Monthly | | | | 28,865 | | | | 04/09/2019 | | | USD | 5,543,494 | | | | — | | | | 11,768 | | | | 11,768 | |
Morgan Stanley Capital Services LLC | | Pay | | Morgan Stanley Systematic 5-Month Dispersion Index | | | 0.10 | | | | Monthly | | | | 1,160 | | | | 04/09/2019 | | | USD | 222,880 | | | | — | | | | 534 | | | | 534 | |
Morgan Stanley Capital Services LLC | | Receive | | Morgan Stanley Systematic 6-Month European Dispersion Index | | | — | | | | Monthly | | | | 5,659 | | | | 09/24/2019 | | | EUR | 927,963 | | | | — | | | | 769 | | | | 769 | |
Morgan Stanley Capital Services LLC | | Receive | | Morgan Stanley Systematic 6-Month European Dispersion (Wednesday) Index | | | — | | | | Monthly | | | | 5,613 | | | | 09/24/2019 | | | EUR | 928,110 | | | | — | | | | 636 | | | | 636 | |
Subtotal — Equity Risk | | | | | | | | | | | | — | | | | 50,204 | | | | 50,204 | |
Subtotal — Appreciation | | | | | | | | | | | | — | | | | 394,637 | | | | 394,637 | |
BNP Paribas S.A. | | Pay | | BNP Paribas DR Alpha ex-Agriculture and Livestock Index | | | 0.15 | | | | Monthly | | | | 3,747 | | | | 06/25/2019 | | | USD | 1,102,141 | | | | — | | | | (3,831 | ) | | | (3,831 | ) |
Macquarie Bank Ltd. | | Receive | | Macquarie MQCP252 Index | | | 0.12 | | | | Monthly | | | | 21,488 | | | | 02/21/2019 | | | USD | 2,365,388 | | | | — | | | | (97,581 | ) | | | (97,581 | ) |
Macquarie Bank Ltd. | | Receive | | Macquarie MQCP625E Index | | | 0.24 | | | | Monthly | | | | 82,767 | | | | 02/21/2019 | | | USD | 13,002,596 | | | | — | | | | (41,921 | ) | | | (41,921 | ) |
Macquarie Bank Ltd. | | Receive | | Macquarie MQCP626E Index | | | 0.29 | | | | Monthly | | | | 29,700 | | | | 02/21/2019 | | | USD | 6,606,124 | | | | — | | | | (2,979 | ) | | | (2,979 | ) |
Subtotal — Commodity Risk | | | | | | | | | | | | — | | | | (146,312 | ) | | | (146,312 | ) |
Goldman Sachs International | | Pay | | Mexican Bolsa Index | | | — | | | | Monthly | | | | 490 | | | | 12/24/2018 | | | MXN | 24,745,000 | | | | — | | | | (141,065 | ) | | | (141,065 | ) |
Morgan Stanley Capital Services LLC | | Receive | | Morgan Stanley Systematic 5-Month Dispersion Index | | | — | | | | Monthly | | | | 30,027 | | | | 04/09/2019 | | | USD | 5,767,886 | | | | — | | | | (13,812 | ) | | | (13,812 | ) |
Subtotal — Equity Risk | | | | | | | | | | | | — | | | | (154,877 | ) | | | (154,877 | ) |
Subtotal — Depreciation | | | | | | | | | | | | — | | | | (301,189 | ) | | | (301,189 | ) |
Total — Total Return Swap Agreements | | | | | | | | | | | $ | — | | | $ | 93,448 | | | $ | 93,448 | |
Index Information:
| | |
Morgan Stanley Systematic
5-Month Dispersion Index | | – An index comprising cash, equity securities, options on equity securities and stock market index futures. |
Morgan Stanley Systematic
6-Month European Dispersion
Index | | – An index comprising cash, equity securities, options on equity securities and stock market index futures. |
Morgan Stanley Systematic
6-Month European
Dispersion (Wednesday) Index | | – An index comprising cash, equity securities, options on equity securities and stock market index futures. |
| (s) | The Fund receives or pays payments based on any positive or negative return on the Reference Entity, respectively. |
See accompanying Notes to Consolidated Financial Statements which are an integral part of the financial statements.
44 Invesco Global Targeted Returns Fund
| (t) | The tables below include additional information regarding the underlying components of certain reference entities that are not publicly available. |
| | | | | | |
| Reference Entity Components | |
| Reference Entity | | Underlying Components | | Percentage | |
Macquarie MQCP252 Index | | | | | | |
| | | Long Futures Contracts | | | |
| | Aluminum | | | 13.76 | % |
| | Heating Oil | | | 8.57 | |
| | High Grade Copper | | | 19.16 | |
| | Natural Gas | | | 19.02 | |
| | Nickel | | | 6.75 | |
| | Unleaded Gasoline | | | 8.73 | |
| | WTI Crude | | | 16.18 | |
| | Zinc | | | 7.83 | |
| | |
| | | | | | |
| | | Short Futures Contracts | | | |
| | Aluminum | | | (13.76 | )% |
| | Heating Oil | | | (8.57 | ) |
| | High Grade Copper | | | (19.16 | ) |
| | Natural Gas | | | (19.02 | ) |
| | Nickel | | | (6.75 | ) |
| | Unleaded Gasoline | | | (8.73 | ) |
| | WTI Crude | | | (16.18 | ) |
| | Zinc | | | (7.83 | ) |
Macquarie MQCP625E Index | | | | | | |
| | | Long Futures Contracts | | | |
| | Aluminum | | | 13.76 | % |
| | Heating Oil | | | 8.57 | |
| | High Grade Copper | | | 19.16 | |
| | Natural Gas | | | 19.02 | |
| | Nickel | | | 6.75 | |
| | Unleaded Gasoline | | | 8.73 | |
| | WTI Crude | | | 16.18 | |
| | Zinc | | | 7.83 | |
| | |
| | | | | | |
| | | Short Futures Contracts | | | |
| | Aluminum | | | (13.76 | )% |
| | Heating Oil | | | (8.57 | ) |
| | High Grade Copper | | | (19.16 | ) |
| | Natural Gas | | | (19.02 | ) |
| | Nickel | | | (6.75 | ) |
| | Unleaded Gasoline | | | (8.73 | ) |
| | WTI Crude | | | (16.18 | ) |
| | Zinc | | | (7.83 | ) |
Macquarie MQCP626E Index | | | | | | |
| | | Long Futures Contracts | | | |
| | Aluminum | | | 13.76 | % |
| | Heating Oil | | | 8.57 | |
| | High Grade Copper | | | 19.16 | |
| | Natural Gas | | | 19.02 | |
| | Nickel | | | 6.75 | |
| | Unleaded Gasoline | | | 8.73 | |
| | WTI Crude | | | 16.18 | |
| | Zinc | | | 7.83 | |
| | |
| | | | | | |
| | | Short Futures Contracts | | | |
| | Aluminum | | | (13.76 | )% |
| | Heating Oil | | | (8.57 | ) |
| | High Grade Copper | | | (19.16 | ) |
| | Natural Gas | | | (19.02 | ) |
| | Nickel | | | (6.75 | ) |
| | Unleaded Gasoline | | | (8.73 | ) |
| | WTI Crude | | | (16.18 | ) |
| | Zinc | | | (7.83 | ) |
See accompanying Notes to Consolidated Financial Statements which are an integral part of the financial statements.
45 Invesco Global Targeted Returns Fund
| | | | | | | | | | | | | | | | |
| Reference Entity | |
Morgan Stanley Systematic 5-Month Dispersion Index | | | | | | | | | | | | | | | | |
| | | | | | | | | | | | | | | | |
| Top 50 Underlying Reference Entity Components | |
| Description | | | | | | | | | | | Percentage | |
| | | | |
| | | | | | | | | | | | | | | | |
Currencies | | | | | | | | | | | | | | | | |
U.S. Dollars | | | | | | | | | | | | | | | 61.62 | % |
| | | | |
| | | | | | | | | | | | | | | | |
| Long Futures Contracts | | | | | Expiration
Month | | | | | | | |
SPX Index | | | | | | | December–2018 | | | | | | | | 62.79 | % |
| | | | |
| | | | | | | | | | | | | | | | |
Short Equity Securities | | | | | | | | | | | | | | | | |
Abbott Laboratories | | | | | | | | | | | | | | | (1.66 | )% |
Altria Group Inc. | | | | | | | | | | | | | | | (1.54 | ) |
Apple Inc. | | | | | | | | | | | | | | | (10.17 | ) |
Berkshire Hathaway Inc. — Class B | | | | | | | | | | | | | | | (1.58 | ) |
Boeing Co. | | | | | | | | | | | | | | | (0.65 | ) |
Cisco Systems, Inc. | | | | | | | | | | | | | | | (0.82 | ) |
Coca-Cola Co. (The) | | | | | | | | | | | | | | | (2.70 | ) |
Comcast Corp. | | | | | | | | | | | | | | | (2.00 | ) |
Exxon Mobil Corp. | | | | | | | | | | | | | | | (0.28 | ) |
Intel Corp. | | | | | | | | | | | | | | | (0.43 | ) |
Johnson & Johnson | | | | | | | | | | | | | | | (4.49 | ) |
JPMorgan Chase & Co. | | | | | | | | | | | | | | | (0.30 | ) |
McDonald’s Corp. | | | | | | | | | | | | | | | (1.88 | ) |
Medtronic PLC | | | | | | | | | | | | | | | (0.36 | ) |
Merck & Co., Inc. | | | | | | | | | | | | | | | (1.82 | ) |
Microsoft Corp. | | | | | | | | | | | | | | | (1.46 | ) |
Oracle Corp. | | | | | | | | | | | | | | | (0.60 | ) |
PepsiCo., Inc. | | | | | | | | | | | | | | | (0.51 | ) |
Pfizer Inc. | | | | | | | | | | | | | | | (2.66 | ) |
Philip Morris International Inc. | | | | | | | | | | | | | | | (1.40 | ) |
Procter & Gamble Co. | | | | | | | | | | | | | | | (2.41 | ) |
UnitedHealth Group Inc. | | | | | | | | | | | | | | | (0.88 | ) |
Verizon Communications Inc. | | | | | | | | | | | | | | | (2.30 | ) |
Visa Inc. — Class A | | | | | | | | | | | | | | | (0.37 | ) |
Walmart Inc. | | | | | | | | | | | | | | | (1.81 | ) |
Walt Disney Co. | | | | | | | | | | | | | | | (0.74 | ) |
| | | | |
| Long Equity Securities | | | | | | | | | | | | |
3M Co. | | | | | | | | | | | | | | | 0.37 | % |
AbbVie Inc. | | | | | | | | | | | | | | | 0.64 | |
Alphabet Inc. — Class A | | | | | | | | | | | | | | | 0.69 | |
Alphabet Inc. — Class C | | | | | | | | | | | | | | | 0.74 | |
Amazon.com, Inc. | | | | | | | | | | | | | | | 2.40 | |
Bank of America Corp. | | | | | | | | | | | | | | | 0.80 | |
Chevron Corp. | | | | | | | | | | | | | | | 0.58 | |
Citigroup Inc. | | | | | | | | | | | | | | | 0.27 | |
Dow Dupont Inc. | | | | | | | | | | | | | | | 0.56 | |
Facebook, Inc. | | | | | | | | | | | | | | | 0.93 | |
General Electric Co. | | | | | | | | | | | | | | | 0.33 | |
Home Depot, Inc. (The) | | | | | | | | | | | | | | | 1.02 | |
IBM Corp. | | | | | | | | | | | | | | | 0.60 | |
Netflix, Inc. | | | | | | | | | | | | | | | 0.41 | |
Nvidia Corp. | | | | | | | | | | | | | | | 0.34 | |
Texas Instruments Inc. | | | | | | | | | | | | | | | 0.25 | |
See accompanying Notes to Consolidated Financial Statements which are an integral part of the financial statements.
46 Invesco Global Targeted Returns Fund
| | | | | | | | | | | | | | | | |
| Top 50 Underlying Reference Entity Components—(continued) | |
Options Written | |
| | | Type of
Contract | | | Expiration
Date | | | Exercise
Price | | | Percentage | |
SPX Index | | | Call | | | | 03/15/2019 | | | $ | 2,775 | | | | (0.61 | )% |
SPX Index | | | Call | | | | 03/15/2019 | | | | 2,875 | | | | (0.57 | ) |
Apple Inc. | | | Call | | | | 12/21/2018 | | | | 210 | | | | (0.29 | ) |
SPX Index | | | Call | | | | 03/15/2019 | | | | 2,975 | | | | (0.26 | ) |
SPX Index | | | Call | | | | 03/15/2019 | | | | 3,050 | | | | (0.24 | ) |
SPX Index | | | Call | | | | 03/15/2019 | | | | 3,000 | | | | (0.17 | ) |
| | | | | | | | | | | | | | | | | | | | | | | | | | | | | | | | | | | | | | |
| Open Over-The-Counter Total Return Swap Agreements(u)* | |
| Counterparty | | Pay/
Receive | | | Reference
Entity | | Floating
Rate
Index | | | Payment Frequency | | | Number of
Contracts | | | Maturity
Date | | | Notional
Value | | | Upfront Payments Paid (Received) | | | Value | | | Unrealized
Appreciation (Depreciation) | |
Societe Generale | | | Receive | | | SG Strong Balance Sheet 250 Index | | | 3 Month USD LIBOR + 0.300 | % | | | Monthly | | | | 828 | | | | 10/02/2019 | | | $ | 764,472 | | | $ | — | | | $ | 4,275 | | | $ | 4,275 | |
Societe Generale | | | Receive | | | SG Strong Balance Sheet 250 Index | | | 3 Month USD LIBOR + 0.300% | | | | Monthly | | | | 830 | | | | 10/04/2019 | | | | 770,177 | | | | — | | | | 428 | | | | 428 | |
Subtotal — Appreciation | | | | | | | | | | | | | | | | | | | | | | | — | | | | 4,703 | | | | 4,703 | |
J.P. Morgan Chase Bank, N.A. | | | Receive | | | MSCI World Energy Sector Total Return Index | | | 3 Month USD LIBOR – 0.300 | % | | | Monthly | | | | 97 | | | | 01/23/2019 | | | | 35,392 | | | | — | | | | (3,211 | ) | | | (3,211 | ) |
J.P. Morgan Chase Bank, N.A. | | | Receive | | | MSCI World Energy Sector Total Return Index | | | 3 Month USD LIBOR – 0.310 | % | | | Monthly | | | | 1,441 | | | | 01/23/2019 | | | | 522,230 | | | | — | | | | (47,387 | ) | | | (47,387 | ) |
J.P. Morgan Chase Bank, N.A. | | | Receive | | | MSCI World Energy Sector Total Return Index | | | 3 Month USD LIBOR – 0.340 | % | | | Monthly | | | | 2,000 | | | | 01/23/2019 | | | | 724,462 | | | | — | | | | (65,738 | ) | | | (65,738 | ) |
J.P. Morgan Chase Bank, N.A. | | | Receive | | | MSCI World Energy Sector Total Return Index | | | 3 Month USD LIBOR – 0.360 | % | | | Monthly | | | | 839 | | | | 01/23/2019 | | | | 304,038 | | | | — | | | | (27,589 | ) | | | (27,589 | ) |
UBS AG | | | Receive | | | MSCI World Energy Sector Total Return Index | | | 3 Month USD LIBOR – 0.300 | % | | | Monthly | | | | 1,846 | | | | 09/30/2019 | | | | 681,225 | | | | — | | | | (73,147 | ) | | | (73,147 | ) |
UBS AG | | | Receive | | | MSCI World Energy Sector Total Return Index | | | 3 Month USD LIBOR – 0.385% | | | | Monthly | | | | 8,800 | | | | 09/30/2019 | | | | 3,229,119 | | | | — | | | | (330,119 | ) | | | (330,119 | ) |
Subtotal — Depreciation | | | | | | | | | | | | | | | | | | | | | | | — | | | | (547,191 | ) | | | (547,191 | ) |
Total — Total Return Swap Agreements — Equity Risk | | | $ | — | | | $ | (542,488 | ) | | $ | (542,488 | ) |
| (u) | The Fund receives or pays payments based on any positive or negative return on the Reference Entity, respectively. |
| * | Over-The-Counter options purchased, options written and swap agreements are collateralized by cash held with Counterparties in the amount of $2,660,000. |
| | | | | | | | | | | | | | | | | | | | | | |
| Open Forward Foreign Currency Contracts | |
Settlement
Date | | Counterparty | | Contract to | | | Unrealized
Appreciation
(Depreciation) | |
| | | | | Deliver | | | | | | Receive | |
11/09/2018 | | Barclays Bank PLC | | | INR | | | | 760,000 | | | | USD | | | | 10,298 | | | $ | 39 | |
11/09/2018 | | Citibank, N.A. | | | USD | | | | 8,229 | | | | BRL | | | | 31,000 | | | | 100 | |
11/09/2018 | | Deutsche Bank AG | | | AUD | | | | 2,721,834 | | | | USD | | | | 2,160,517 | | | | 233,035 | |
11/09/2018 | | Goldman Sachs International | | | KRW | | | | 70,901,000 | | | | USD | | | | 62,564 | | | | 374 | |
11/09/2018 | | State Street Bank & Trust Co. | | | CAD | | | | 2,067,000 | | | | USD | | | | 1,595,838 | | | | 25,293 | |
11/09/2018 | | State Street Bank & Trust Co. | | | CHF | | | | 1,591,913 | | | | USD | | | | 1,606,116 | | | | 24,479 | |
11/09/2018 | | State Street Bank & Trust Co. | | | CNY | | | | 2,261,811 | | | | USD | | | | 326,083 | | | | 1,917 | |
11/09/2018 | | State Street Bank & Trust Co. | | | DKK | | | | 2,895,671 | | | | USD | | | | 447,382 | | | | 7,444 | |
11/09/2018 | | State Street Bank & Trust Co. | | | EUR | | | | 8,707,656 | | | | USD | | | | 10,037,870 | | | | 170,396 | |
11/09/2018 | | State Street Bank & Trust Co. | | | GBP | | | | 12,816,046 | | | | USD | | | | 16,745,338 | | | | 360,122 | |
11/09/2018 | | State Street Bank & Trust Co. | | | HKD | | | | 24,050,732 | | | | USD | | | | 3,070,696 | | | | 2,536 | |
11/09/2018 | | State Street Bank & Trust Co. | | | HUF | | | | 2,287,000 | | | | USD | | | | 8,107 | | | | 122 | |
11/09/2018 | | State Street Bank & Trust Co. | | | KRW | | | | 2,574,623,404 | | | | USD | | | | 2,275,097 | | | | 16,784 | |
11/09/2018 | | State Street Bank & Trust Co. | | | MXN | | | | 1,674,000 | | | | USD | | | | 87,467 | | | | 5,140 | |
11/09/2018 | | State Street Bank & Trust Co. | | | NOK | | | | 5,932,071 | | | | USD | | | | 717,896 | | | | 14,045 | |
11/09/2018 | | State Street Bank & Trust Co. | | | SEK | | | | 5,316,647 | | | | USD | | | | 586,897 | | | | 5,599 | |
11/09/2018 | | State Street Bank & Trust Co. | | | SGD | | | | 267,518 | | | | USD | | | | 193,645 | | | | 478 | |
See accompanying Notes to Consolidated Financial Statements which are an integral part of the financial statements.
47 Invesco Global Targeted Returns Fund
| | | | | | | | | | | | | | | | | | | | | | |
| Open Forward Foreign Currency Contracts—(continued) | |
Settlement
Date | | Counterparty | | Contract to | | | Unrealized
Appreciation
(Depreciation) | |
| | | | | Deliver | | | | | | Receive | |
11/09/2018 | | State Street Bank & Trust Co. | | | THB | | | | 4,411,000 | | | | USD | | | | 135,574 | | | $ | 2,331 | |
11/09/2018 | | State Street Bank & Trust Co. | | | TWD | | | | 21,282,602 | | | | USD | | | | 688,565 | | | | 439 | |
11/09/2018 | | State Street Bank & Trust Co. | | | USD | | | | 3,067,714 | | | | HKD | | | | 24,050,732 | | | | 446 | |
11/09/2018 | | State Street Bank & Trust Co. | | | USD | | | | 579,801 | | | | SEK | | | | 5,316,647 | | | | 1,498 | |
11/09/2018 | | State Street Bank & Trust Co. | | | USD | | | | 193,066 | | | | SGD | | | | 267,518 | | | | 101 | |
11/09/2018 | | State Street Bank & Trust Co. | | | USD | | | | 132,975 | | | | THB | | | | 4,411,000 | | | | 269 | |
11/09/2018 | | State Street Bank & Trust Co. | | | USD | | | | 653,591 | | | | TWD | | | | 20,238,602 | | | | 779 | |
11/13/2018 | | Barclays Bank PLC | | | AUD | | | | 300,739 | | | | USD | | | | 214,775 | | | | 1,798 | |
11/13/2018 | | Barclays Bank PLC | | | CAD | | | | 221,417 | | | | USD | | | | 171,227 | | | | 2,979 | |
11/13/2018 | | Barclays Bank PLC | | | CNY | | | | 27,427,631 | | | | USD | | | | 3,997,049 | | | | 66,491 | |
11/13/2018 | | Barclays Bank PLC | | | INR | | | | 34,824,200 | | | | USD | | | | 483,938 | | | | 14,230 | |
11/13/2018 | | Barclays Bank PLC | | | MXN | | | | 11,344,000 | | | | USD | | | | 593,212 | | | | 35,692 | |
11/13/2018 | | Citibank, N.A. | | | AUD | | | | 766,746 | | | | USD | | | | 545,408 | | | | 2,413 | |
11/13/2018 | | Citibank, N.A. | | | CAD | | | | 789,325 | | | | USD | | | | 606,415 | | | | 6,632 | |
11/13/2018 | | Deutsche Bank AG | | | AUD | | | | 3,021,578 | | | | USD | | | | 2,232,085 | | | | 92,263 | |
11/13/2018 | | Deutsche Bank AG | | | CAD | | | | 3,454,842 | | | | USD | | | | 2,674,591 | | | | 49,364 | |
11/13/2018 | | Deutsche Bank AG | | | TWD | | | | 111,785,928 | | | | USD | | | | 3,675,839 | | | | 60,310 | |
11/13/2018 | | Goldman Sachs International | | | AUD | | | | 408,829 | | | | USD | | | | 292,241 | | | | 2,717 | |
11/13/2018 | | Goldman Sachs International | | | CAD | | | | 394,088 | | | | USD | | | | 303,346 | | | | 3,891 | |
11/13/2018 | | Goldman Sachs International | | | CHF | | | | 5,940,769 | | | | JPY | | | | 335,784,020 | | | | 9,982 | |
11/13/2018 | | Goldman Sachs International | | | INR | | | | 23,169,000 | | | | USD | | | | 327,200 | | | | 14,696 | |
11/13/2018 | | Goldman Sachs International | | | KRW | | | | 838,977,859 | | | | USD | | | | 751,106 | | | | 15,272 | |
11/13/2018 | | Goldman Sachs International | | | MXN | | | | 4,466,000 | | | | USD | | | | 231,410 | | | | 11,921 | |
11/13/2018 | | Goldman Sachs International | | | NZD | | | | 2,693,333 | | | | USD | | | | 1,819,638 | | | | 62,270 | |
11/13/2018 | | Goldman Sachs International | | | USD | | | | 219,987 | | | | BRL | | | | 831,000 | | | | 3,081 | |
11/13/2018 | | J.P. Morgan Chase Bank, N.A. | | | AUD | | | | 174,299 | | | | USD | | | | 123,518 | | | | 83 | |
11/13/2018 | | J.P. Morgan Chase Bank, N.A. | | | EUR | | | | 3,155,291 | | | | USD | | | | 3,699,302 | | | | 122,626 | |
11/13/2018 | | J.P. Morgan Chase Bank, N.A. | | | INR | | | | 14,047,458 | | | | USD | | | | 194,026 | | | | 4,554 | |
11/13/2018 | | J.P. Morgan Chase Bank, N.A. | | | KRW | | | | 381,107,975 | | | | USD | | | | 338,268 | | | | 4,014 | |
11/13/2018 | | J.P. Morgan Chase Bank, N.A. | | | MXN | | | | 3,808,000 | | | | USD | | | | 199,491 | | | | 12,340 | |
11/13/2018 | | Merrill Lynch International | | | BRL | | | | 518,000 | | | | USD | | | | 140,780 | | | | 1,732 | |
11/13/2018 | | Merrill Lynch International | | | KRW | | | | 166,631,514 | | | | USD | | | | 148,420 | | | | 2,275 | |
11/13/2018 | | Morgan Stanley & Co. LLC | | | CAD | | | | 733,064 | | | | USD | | | | 564,527 | | | | 7,494 | |
11/13/2018 | | Morgan Stanley & Co. LLC | | | CLP | | | | 730,900,000 | | | | USD | | | | 1,109,975 | | | | 60,884 | |
11/13/2018 | | Morgan Stanley & Co. LLC | | | INR | | | | 10,718,160 | | | | USD | | | | 148,164 | | | | 3,597 | |
11/13/2018 | | Morgan Stanley & Co. LLC | | | KRW | | | | 167,802,160 | | | | USD | | | | 150,529 | | | | 3,356 | |
11/13/2018 | | Royal Bank of Scotland Securities Inc. | | | KRW | | | | 209,744,464 | | | | USD | | | | 187,758 | | | | 3,800 | |
11/13/2018 | | Standard Charted Bank PLC | | | INR | | | | 15,818,382 | | | | USD | | | | 217,847 | | | | 4,489 | |
11/13/2018 | | Standard Charted Bank PLC | | | KRW | | | | 333,263,028 | | | | USD | | | | 297,317 | | | | 5,026 | |
11/30/2018 | | Goldman Sachs International | | | CAD | | | | 38,866 | | | | USD | | | | 29,997 | | | | 455 | |
11/30/2018 | | Goldman Sachs International | | | EUR | | | | 1,100,000 | | | | USD | | | | 1,301,154 | | | | 52,598 | |
11/30/2018 | | Goldman Sachs International | | | GBP | | | | 2,268,000 | | | | USD | | | | 2,984,881 | | | | 82,655 | |
12/11/2018 | | State Street Bank & Trust Co. | | | BRL | | | | 606,000 | | | | USD | | | | 163,494 | | | | 1,215 | |
12/11/2018 | | State Street Bank & Trust Co. | | | CAD | | | | 851,000 | | | | USD | | | | 648,310 | | | | 1,283 | |
12/11/2018 | | State Street Bank & Trust Co. | | | CHF | | | | 1,525,913 | | | | USD | | | | 1,522,181 | | | | 1,113 | |
12/11/2018 | | State Street Bank & Trust Co. | | | DKK | | | | 2,626,671 | | | | USD | | | | 400,335 | | | | 19 | |
12/11/2018 | | State Street Bank & Trust Co. | | | EUR | | | | 6,574,656 | | | | USD | | | | 7,474,135 | | | | 2,103 | |
12/11/2018 | | State Street Bank & Trust Co. | | | IDR | | | | 978,193,000 | | | | USD | | | | 63,933 | | | | 106 | |
12/11/2018 | | State Street Bank & Trust Co. | | | INR | | | | 19,939,000 | | | | USD | | | | 268,238 | | | | 583 | |
12/11/2018 | | State Street Bank & Trust Co. | | | MXN | | | | 1,422,000 | | | | USD | | | | 70,225 | | | | 672 | |
See accompanying Notes to Consolidated Financial Statements which are an integral part of the financial statements.
48 Invesco Global Targeted Returns Fund
| | | | | | | | | | | | | | | | | | | | | | |
| Open Forward Foreign Currency Contracts—(continued) | |
Settlement
Date | | Counterparty | | Contract to | | | Unrealized
Appreciation
(Depreciation) | |
| | | | | Deliver | | | | | | Receive | |
12/11/2018 | | State Street Bank & Trust Co. | | | TWD | | | | 11,725,602 | | | | USD | | | | 380,109 | | | $ | 5 | |
12/11/2018 | | State Street Bank & Trust Co. | | | USD | | | | 320,182 | | | | HKD | | | | 2,509,000 | | | | 194 | |
12/11/2018 | | State Street Bank & Trust Co. | | | USD | | | | 272 | | | | IDR | | | | 4,163,000 | | | | 0 | |
12/11/2018 | | State Street Bank & Trust Co. | | | USD | | | | 35,560 | | | | JPY | | | | 4,012,000 | | | | 111 | |
12/11/2018 | | State Street Bank & Trust Co. | | | USD | | | | 418,439 | | | | KRW | | | | 477,154,761 | | | | 29 | |
12/11/2018 | | State Street Bank & Trust Co. | | | ZAR | | | | 644,000 | | | | USD | | | | 43,543 | | | | 117 | |
12/12/2018 | | Goldman Sachs International | | | EUR | | | | 558,771 | | | | GBP | | | | 531,247 | | | | 1,915 | |
12/12/2018 | | Goldman Sachs International | | | EUR | | | | 540,000 | | | | USD | | | | 634,580 | | | | 20,805 | |
12/12/2018 | | Goldman Sachs International | | | GBP | | | | 1,085,000 | | | | USD | | | | 1,427,092 | | | | 37,566 | |
12/13/2018 | | Barclays Bank PLC | | | AUD | | | | 498,000 | | | | USD | | | | 359,760 | | | | 6,980 | |
12/13/2018 | | Barclays Bank PLC | | | CNY | | | | 33,911,862 | | | | USD | | | | 4,941,259 | | | | 87,789 | |
12/13/2018 | | Barclays Bank PLC | | | MXN | | | | 4,093,000 | | | | USD | | | | 215,332 | | | | 15,205 | |
12/13/2018 | | Barclays Bank PLC | | | NZD | | | | 1,002,800 | | | | USD | | | | 657,157 | | | | 2,628 | |
12/13/2018 | | Deutsche Bank AG | | | AUD | | | | 1,504,462 | | | | USD | | | | 1,078,943 | | | | 13,193 | |
12/13/2018 | | Deutsche Bank AG | | | EUR | | | | 7,364,611 | | | | SEK | | | | 40,057,812 | | | | 79,512 | |
12/13/2018 | | Goldman Sachs International | | | CLP | | | | 51,500,000 | | | | USD | | | | 76,540 | | | | 2,589 | |
12/13/2018 | | Goldman Sachs International | | | EUR | | | | 1,752,912 | | | | USD | | | | 2,042,552 | | | | 49,926 | |
12/13/2018 | | Goldman Sachs International | | | KRW | | | | 8,415,813,862 | | | | USD | | | | 7,562,941 | | | | 181,743 | |
12/13/2018 | | Goldman Sachs International | | | MXN | | | | 1,500,000 | | | | USD | | | | 79,060 | | | | 5,717 | |
12/13/2018 | | Goldman Sachs International | | | USD | | | | 2,040,714 | | | | BRL | | | | 8,581,000 | | | | 256,819 | |
12/13/2018 | | J.P. Morgan Chase Bank, N.A. | | | CLP | | | | 69,900,000 | | | | USD | | | | 106,086 | | | | 5,714 | |
12/13/2018 | | J.P. Morgan Chase Bank, N.A. | | | EUR | | | | 2,441,333 | | | | USD | | | | 2,871,313 | | | | 96,123 | |
12/13/2018 | | J.P. Morgan Chase Bank, N.A. | | | TWD | | | | 22,633,755 | | | | USD | | | | 739,071 | | | | 5,244 | |
12/13/2018 | | Morgan Stanley & Co. LLC | | | MXN | | | | 2,739,000 | | | | USD | | | | 142,380 | | | | 8,456 | |
12/13/2018 | | Morgan Stanley & Co. LLC | | | NZD | | | | 265,000 | | | | USD | | | | 174,466 | | | | 1,500 | |
12/13/2018 | | Standard Charted Bank PLC | | | INR | | | | 44,613,906 | | | | USD | | | | 606,521 | | | | 7,804 | |
12/13/2018 | | Standard Charted Bank PLC | | | KRW | | | | 883,358,000 | | | | USD | | | | 787,751 | | | | 12,991 | |
12/13/2018 | | Standard Charted Bank PLC | | | TWD | | | | 118,528,431 | | | | USD | | | | 3,876,899 | | | | 33,992 | |
12/13/2018 | | State Street Bank & Trust Co. | | | EUR | | | | 263,812 | | | | USD | | | | 308,886 | | | | 8,997 | |
12/13/2018 | | State Street Bank & Trust Co. | | | INR | | | | 10,192,700 | | | | USD | | | | 138,459 | | | | 1,674 | |
12/13/2018 | | State Street Bank & Trust Co. | | | MXN | | | | 1,507,000 | | | | USD | | | | 78,280 | | | | 4,595 | |
12/13/2018 | | UBS AG | | | INR | | | | 37,199,594 | | | | USD | | | | 509,038 | | | | 9,821 | |
01/11/2019 | | Barclays Bank PLC | | | EUR | | | | 2,592,170 | | | | USD | | | | 3,004,133 | | | | 48,385 | |
01/11/2019 | | Barclays Bank PLC | | | MXN | | | | 5,584,000 | | | | USD | | | | 289,610 | | | | 17,920 | |
01/11/2019 | | Deutsche Bank AG | | | CNY | | | | 6,797,300 | | | | USD | | | | 980,109 | | | | 9,063 | |
01/11/2019 | | Goldman Sachs International | | | EUR | | | | 5,455,055 | | | | SEK | | | | 29,276,271 | | | | 7,524 | |
01/11/2019 | | Goldman Sachs International | | | EUR | | | | 310,000 | | | | USD | | | | 358,924 | | | | 5,443 | |
01/11/2019 | | Goldman Sachs International | | | GBP | | | | 537,000 | | | | USD | | | | 705,800 | | | | 16,805 | |
01/11/2019 | | Goldman Sachs International | | | TWD | | | | 54,449,009 | | | | USD | | | | 1,776,766 | | | | 6,925 | |
01/11/2019 | | Goldman Sachs International | | | USD | | | | 2,650,536 | | | | INR | | | | 198,493,307 | | | | 2,083 | |
01/18/2019 | | Goldman Sachs International | | | ZAR | | | | 1,070,000 | | | | USD | | | | 73,646 | | | | 1,862 | |
01/19/2019 | | Goldman Sachs International | | | EUR | | | | 64,210 | | | | GBP | | | | 60,906 | | | | 33 | |
01/23/2019 | | Goldman Sachs International | | | EUR | | | | 473,157 | | | | USD | | | | 544,310 | | | | 4,181 | |
01/23/2019 | | Goldman Sachs International | | | GBP | | | | 61,754 | | | | USD | | | | 80,000 | | | | 716 | |
Subtotal — Appreciation | | | | 2,789,534 | |
11/09/2018 | | Barclays Bank PLC | | | USD | | | | 350,529 | | | | AUD | | | | 465,884 | | | | (20,611 | ) |
11/09/2018 | | Citibank, N.A. | | | USD | | | | 384,111 | | | | AUD | | | | 507,392 | | | | (24,799 | ) |
11/09/2018 | | J.P. Morgan Chase Bank, N.A. | | | USD | | | | 582,050 | | | | AUD | | | | 774,057 | | | | (33,897 | ) |
11/09/2018 | | J.P. Morgan Chase Bank, N.A. | | | USD | | | | 2,586 | | | | INR | | | | 191,000 | | | | (8 | ) |
11/09/2018 | | J.P. Morgan Chase Bank, N.A. | | | USD | | | | 115,608 | | | | KRW | | | | 130,683,000 | | | | (980 | ) |
See accompanying Notes to Consolidated Financial Statements which are an integral part of the financial statements.
49 Invesco Global Targeted Returns Fund
| | | | | | | | | | | | | | | | | | | | | | |
| Open Forward Foreign Currency Contracts—(continued) | |
Settlement
Date | | Counterparty | | Contract to | | | Unrealized
Appreciation
(Depreciation) | |
| | | | | Deliver | | | | | | Receive | |
11/09/2018 | | J.P. Morgan Chase Bank, N.A. | | | USD | | | | 33,913 | | | | TWD | | | | 1,044,000 | | | $ | (157 | ) |
11/09/2018 | | State Street Bank & Trust Co. | | | AUD | | | | 1,260,646 | | | | USD | | | | 891,972 | | | | (762 | ) |
11/09/2018 | | State Street Bank & Trust Co. | | | BRL | | | | 735,000 | | | | USD | | | | 189,915 | | | | (7,457 | ) |
11/09/2018 | | State Street Bank & Trust Co. | | | IDR | | | | 1,019,729,000 | | | | USD | | | | 66,478 | | | | (476 | ) |
11/09/2018 | | State Street Bank & Trust Co. | | | INR | | | | 22,459,000 | | | | USD | | | | 300,956 | | | | (2,204 | ) |
11/09/2018 | | State Street Bank & Trust Co. | | | JPY | | | | 107,602,161 | | | | USD | | | | 948,747 | | | | (5,217 | ) |
11/09/2018 | | State Street Bank & Trust Co. | | | USD | | | | 893,269 | | | | AUD | | | | 1,260,646 | | | | (535 | ) |
11/09/2018 | | State Street Bank & Trust Co. | | | USD | | | | 190,003 | | | | BRL | | | | 704,000 | | | | (956 | ) |
11/09/2018 | | State Street Bank & Trust Co. | | | USD | | | | 1,578,332 | | | | CAD | | | | 2,067,000 | | | | (7,788 | ) |
11/09/2018 | | State Street Bank & Trust Co. | | | USD | | | | 1,584,715 | | | | CHF | | | | 1,591,913 | | | | (3,078 | ) |
11/09/2018 | | State Street Bank & Trust Co. | | | USD | | | | 324,193 | | | | CNY | | | | 2,261,811 | | | | (27 | ) |
11/09/2018 | | State Street Bank & Trust Co. | | | USD | | | | 440,733 | | | | DKK | | | | 2,895,671 | | | | (795 | ) |
11/09/2018 | | State Street Bank & Trust Co. | | | USD | | | | 9,915,151 | | | | EUR | | | | 8,707,656 | | | | (47,676 | ) |
11/09/2018 | | State Street Bank & Trust Co. | | | USD | | | | 16,525,788 | | | | GBP | | | | 12,877,046 | | | | (62,584 | ) |
11/09/2018 | | State Street Bank & Trust Co. | | | USD | | | | 7,991 | | | | HUF | | | | 2,287,000 | | | | (6 | ) |
11/09/2018 | | State Street Bank & Trust Co. | | | USD | | | | 67,040 | | | | IDR | | | | 1,019,729,000 | | | | (86 | ) |
11/09/2018 | | State Street Bank & Trust Co. | | | USD | | | | 311,096 | | | | INR | | | | 23,028,000 | | | | (256 | ) |
11/09/2018 | | State Street Bank & Trust Co. | | | USD | | | | 955,581 | | | | JPY | | | | 107,602,161 | | | | (1,617 | ) |
11/09/2018 | | State Street Bank & Trust Co. | | | USD | | | | 2,208,966 | | | | KRW | | | | 2,514,841,404 | | | | (3,090 | ) |
11/09/2018 | | State Street Bank & Trust Co. | | | USD | | | | 83,514 | | | | MXN | | | | 1,674,000 | | | | (1,188 | ) |
11/09/2018 | | State Street Bank & Trust Co. | | | USD | | | | 705,658 | | | | NOK | | | | 5,932,071 | | | | (1,807 | ) |
11/09/2018 | | State Street Bank & Trust Co. | | | USD | | | | 55,852 | | | | ZAR | | | | 820,000 | | | | (334 | ) |
11/09/2018 | | State Street Bank & Trust Co. | | | ZAR | | | | 820,000 | | | | USD | | | | 55,345 | | | | (173 | ) |
11/13/2018 | | Barclays Bank PLC | | | BRL | | | | 471,000 | | | | USD | | | | 120,642 | | | | (5,790 | ) |
11/13/2018 | | Barclays Bank PLC | | | EUR | | | | 9,743,617 | | | | SEK | | | | 51,756,955 | | | | (22,612 | ) |
11/13/2018 | | Barclays Bank PLC | | | USD | | | | 430,388 | | | | CAD | | | | 562,225 | | | | (3,171 | ) |
11/13/2018 | | Barclays Bank PLC | | | USD | | | | 496,908 | | | | CNY | | | | 3,406,500 | | | | (8,734 | ) |
11/13/2018 | | Barclays Bank PLC | | | USD | | | | 5,493,098 | | | | INR | | | | 382,428,107 | | | | (334,911 | ) |
11/13/2018 | | Barclays Bank PLC | | | USD | | | | 406,743 | | | | JPY | | | | 45,185,826 | | | | (6,023 | ) |
11/13/2018 | | Barclays Bank PLC | | | USD | | | | 208,702 | | | | NZD | | | | 316,800 | | | | (1,993 | ) |
11/13/2018 | | Barclays Bank PLC | | | USD | | | | 426,344 | | | | TWD | | | | 13,026,512 | | | | (5,023 | ) |
11/13/2018 | | Citibank, N.A. | | | USD | | | | 1,761,840 | | | | AUD | | | | 2,481,755 | | | | (4,311 | ) |
11/13/2018 | | Citibank, N.A. | | | USD | | | | 397,367 | | | | NZD | | | | 603,566 | | | | (3,547 | ) |
11/13/2018 | | Deutsche Bank AG | | | JPY | | | | 82,925,000 | | | | USD | | | | 727,278 | | | | (8,124 | ) |
11/13/2018 | | Deutsche Bank AG | | | USD | | | | 256,124 | | | | AUD | | | | 353,907 | | | | (5,494 | ) |
11/13/2018 | | Deutsche Bank AG | | | USD | | | | 192,536 | | | | CAD | | | | 250,300 | | | | (2,340 | ) |
11/13/2018 | | Deutsche Bank AG | | | USD | | | | 1,702,536 | | | | CLP | | | | 1,098,731,293 | | | | (125,481 | ) |
11/13/2018 | | Goldman Sachs International | | | JPY | | | | 39,866,033 | | | | CHF | | | | 706,767 | | | | (2,220 | ) |
11/13/2018 | | Goldman Sachs International | | | SEK | | | | 5,720,907 | | | | EUR | | | | 1,051,319 | | | | (14,596 | ) |
11/13/2018 | | Goldman Sachs International | | | USD | | | | 373,401 | | | | AUD | | | | 521,351 | | | | (4,191 | ) |
11/13/2018 | | Goldman Sachs International | | | USD | | | | 793,329 | | | | CAD | | | | 1,037,744 | | | | (4,780 | ) |
11/13/2018 | | Goldman Sachs International | | | USD | | | | 80,845 | | | | CLP | | | | 55,900,000 | | | | (609 | ) |
11/13/2018 | | Goldman Sachs International | | | USD | | | | 360,004 | | | | CNY | | | | 2,466,900 | | | | (6,481 | ) |
11/13/2018 | | Goldman Sachs International | | | USD | | | | 695,545 | | | | JPY | | | | 77,075,550 | | | | (12,017 | ) |
11/13/2018 | | Goldman Sachs International | | | USD | | | | 3,226,589 | | | | MXN | | | | 61,244,499 | | | | (216,624 | ) |
11/13/2018 | | Goldman Sachs International | | | USD | | | | 108,441 | | | | NZD | | | | 163,000 | | | | (2,085 | ) |
11/13/2018 | | Goldman Sachs International | | | USD | | | | 384,785 | | | | TWD | | | | 11,743,652 | | | | (4,957 | ) |
11/13/2018 | | J.P. Morgan Chase Bank, N.A. | | | JPY | | | | 100,199,191 | | | | CHF | | | | 1,733,800 | | | | (35,157 | ) |
11/13/2018 | | J.P. Morgan Chase Bank, N.A. | | | USD | | | | 1,407,856 | | | | CAD | | | | 1,835,124 | | | | (13,402 | ) |
11/13/2018 | | J.P. Morgan Chase Bank, N.A. | | | USD | | | | 309,289 | | | | EUR | | | | 263,886 | | | | (10,162 | ) |
See accompanying Notes to Consolidated Financial Statements which are an integral part of the financial statements.
50 Invesco Global Targeted Returns Fund
| | | | | | | | | | | | | | | | | | | | | | |
| Open Forward Foreign Currency Contracts—(continued) | |
Settlement
Date | | Counterparty | | Contract to | | | Unrealized
Appreciation
(Depreciation) | |
| | | | | Deliver | | | | | | Receive | |
11/13/2018 | | J.P. Morgan Chase Bank, N.A. | | | USD | | | | 607,331 | | | | JPY | | | | 67,778,740 | | | $ | (6,250 | ) |
11/13/2018 | | J.P. Morgan Chase Bank, N.A. | | | USD | | | | 410,269 | | | | KRW | | | | 462,948,000 | | | | (4,236 | ) |
11/13/2018 | | J.P. Morgan Chase Bank, N.A. | | | USD | | | | 208,757 | | | | NZD | | | | 316,768 | | | | (2,069 | ) |
11/13/2018 | | Merrill Lynch International | | | JPY | | | | 69,786,711 | | | | CHF | | | | 1,213,752 | | | | (20,734 | ) |
11/13/2018 | | Merrill Lynch International | | | USD | | | | 358,495 | | | | CAD | | | | 465,694 | | | | (4,629 | ) |
11/13/2018 | | Morgan Stanley & Co. LLC | | | AUD | | | | 586,852 | | | | USD | | | | 415,400 | | | | (197 | ) |
11/13/2018 | | Morgan Stanley & Co. LLC | | | JPY | | | | 49,183,951 | | | | CHF | | | | 854,988 | | | | (13,848 | ) |
11/13/2018 | | Morgan Stanley & Co. LLC | | | USD | | | | 351,004 | | | | AUD | | | | 494,012 | | | | (1,155 | ) |
11/13/2018 | | Morgan Stanley & Co. LLC | | | USD | | | | 1,792,128 | | | | CAD | | | | 2,323,966 | | | | (26,219 | ) |
11/13/2018 | | Morgan Stanley & Co. LLC | | | USD | | | | 162,405 | | | | JPY | | | | 17,948,942 | | | | (3,228 | ) |
11/13/2018 | | Standard Charted Bank PLC | | | USD | | | | 19,831 | | | | NZD | | | | 30,066 | | | | (213 | ) |
11/13/2018 | | UBS AG | | | JPY | | | | 87,170,950 | | | | CHF | | | | 1,511,350 | | | | (29,747 | ) |
11/13/2018 | | UBS AG | | | USD | | | | 161,657 | | | | JPY | | | | 17,948,942 | | | | (2,481 | ) |
11/30/2018 | | Goldman Sachs International | | | USD | | | | 696,396 | | | | EUR | | | | 590,000 | | | | (26,716 | ) |
11/30/2018 | | Goldman Sachs International | | | USD | | | | 449,207 | | | | GBP | | | | 340,000 | | | | (14,129 | ) |
12/11/2018 | | State Street Bank & Trust Co. | | | AUD | | | | 940,646 | | | | USD | | | | 666,322 | | | | (10 | ) |
12/11/2018 | | State Street Bank & Trust Co. | | | CNY | | | | 2,261,811 | | | | USD | | | | 323,636 | | | | (117 | ) |
12/11/2018 | | State Street Bank & Trust Co. | | | GBP | | | | 8,909,046 | | | | USD | | | | 11,364,406 | | | | (44,373 | ) |
12/11/2018 | | State Street Bank & Trust Co. | | | HKD | | | | 16,918,732 | | | | USD | | | | 2,159,060 | | | | (1,306 | ) |
12/11/2018 | | State Street Bank & Trust Co. | | | HUF | | | | 2,287,000 | | | | USD | | | | 8,007 | | | | (1 | ) |
12/11/2018 | | State Street Bank & Trust Co. | | | JPY | | | | 31,506,161 | | | | USD | | | | 279,248 | | | | (871 | ) |
12/11/2018 | | State Street Bank & Trust Co. | | | KRW | | | | 1,628,910,643 | | | | USD | | | | 1,428,468 | | | | (99 | ) |
12/11/2018 | | State Street Bank & Trust Co. | | | NOK | | | | 5,305,071 | | | | USD | | | | 630,240 | | | | (177 | ) |
12/11/2018 | | State Street Bank & Trust Co. | | | SEK | | | | 4,831,647 | | | | USD | | | | 527,671 | | | | (2,257 | ) |
12/11/2018 | | State Street Bank & Trust Co. | | | SGD | | | | 259,518 | | | | USD | | | | 187,389 | | | | (138 | ) |
12/11/2018 | | State Street Bank & Trust Co. | | | THB | | | | 4,411,000 | | | | USD | | | | 132,936 | | | | (314 | ) |
12/13/2018 | | Barclays Bank PLC | | | SEK | | | | 8,870,944 | | | | EUR | | | | 1,671,604 | | | | (368 | ) |
12/13/2018 | | Barclays Bank PLC | | | USD | | | | 2,865,589 | | | | INR | | | | 207,729,407 | | | | (77,870 | ) |
12/13/2018 | | Citibank, N.A. | | | USD | | | | 143,506 | | | | EUR | | | | 123,533 | | | | (3,080 | ) |
12/13/2018 | | Citibank, N.A. | | | USD | | | | 314,834 | | | | MXN | | | | 6,013,000 | | | | (20,829 | ) |
12/13/2018 | | Deutsche Bank AG | | | BRL | | | | 926,000 | | | | USD | | | | 235,996 | | | | (11,938 | ) |
12/13/2018 | | Deutsche Bank AG | | | USD | | | | 138,124 | | | | CLP | | | | 95,367,687 | | | | (1,182 | ) |
12/13/2018 | | Deutsche Bank AG | | | USD | | | | 3,481,306 | | | | MXN | | | | 68,411,499 | | | | (136,332 | ) |
12/13/2018 | | Goldman Sachs International | | | BRL | | | | 531,000 | | | | USD | | | | 127,859 | | | | (14,314 | ) |
12/13/2018 | | Goldman Sachs International | | | USD | | | | 440,772 | | | | CNY | | | | 3,070,200 | | | | (1,365 | ) |
12/13/2018 | | Goldman Sachs International | | | USD | | | | 7,832,485 | | | | JPY | | | | 866,838,312 | | | | (123,678 | ) |
12/13/2018 | | J.P. Morgan Chase Bank, N.A. | | | USD | | | | 90,112 | | | | CAD | | | | 118,339 | | | | (132 | ) |
12/13/2018 | | J.P. Morgan Chase Bank, N.A. | | | USD | | | | 188,820 | | | | CLP | | | | 128,700,000 | | | | (4,015 | ) |
12/13/2018 | | J.P. Morgan Chase Bank, N.A. | | | USD | | | | 417,693 | | | | TWD | | | | 12,745,906 | | | | (4,448 | ) |
12/13/2018 | | Morgan Stanley & Co. LLC | | | USD | | | | 193,056 | | | | AUD | | | | 272,123 | | | | (286 | ) |
12/13/2018 | | Morgan Stanley & Co. LLC | | | USD | | | | 787,890 | | | | JPY | | | | 87,271,000 | | | | (11,788 | ) |
12/13/2018 | | Standard Charted Bank PLC | | | USD | | | | 348,453 | | | | CNY | | | | 2,400,900 | | | | (4,836 | ) |
12/13/2018 | | State Street Bank & Trust Co. | | | USD | | | | 208,677 | | | | AUD | | | | 289,000 | | | | (3,951 | ) |
12/13/2018 | | State Street Bank & Trust Co. | | | USD | | | | 189,601 | | | | EUR | | | | 160,000 | | | | (7,721 | ) |
12/13/2018 | | State Street Bank & Trust Co. | | | USD | | | | 97,378 | | | | NZD | | | | 147,000 | | | | (1,431 | ) |
01/11/2019 | | Deutsche Bank AG | | | AUD | | | | 17,461 | | | | USD | | | | 12,364 | | | | (10 | ) |
01/11/2019 | | Goldman Sachs International | | | NZD | | | | 473,067 | | | | USD | | | | 307,386 | | | | (1,500 | ) |
01/11/2019 | | Goldman Sachs International | | | USD | | | | 1,068,106 | | | | CLP | | | | 715,001,021 | | | | (40,843 | ) |
01/11/2019 | | J.P. Morgan Chase Bank, N.A. | | | TWD | | | | 41,081,758 | | | | USD | | | | 1,322,871 | | | | (12,474 | ) |
01/11/2019 | | Standard Charted Bank PLC | | | KRW | | | | 443,886,000 | | | | USD | | | | 388,997 | | | | (774 | ) |
See accompanying Notes to Consolidated Financial Statements which are an integral part of the financial statements.
51 Invesco Global Targeted Returns Fund
| | | | | | | | | | | | | | | | | | | | | | |
| Open Forward Foreign Currency Contracts—(continued) | |
Settlement
Date | | Counterparty | | Contract to | | | Unrealized
Appreciation
(Depreciation) | |
| | | | | Deliver | | | | | | Receive | |
01/11/2019 | | Standard Charted Bank PLC | | | USD | | | | 346,875 | | | | JPY | | | | 38,655,000 | | | $ | (2,085 | ) |
01/18/2019 | | Goldman Sachs International | | | USD | | | | 28,931 | | | | EUR | | | | 25,000 | | | | (406 | ) |
01/18/2019 | | Goldman Sachs International | | | USD | | | | 18,267 | | | | GBP | | | | 14,000 | | | | (297 | ) |
01/23/2019 | | Goldman Sachs International | | | EUR | | | | 125,846 | | | | GBP | | | | 119,253 | | | | (109 | ) |
01/23/2019 | | Goldman Sachs International | | | USD | | | | 308,319 | | | | GBP | | | | 238,000 | | | | (2,759 | ) |
Subtotal — Depreciation | | | | (1,789,734 | ) |
Total Forward Foreign Currency Contracts — Currency Risk | | | $ | 999,800 | |
Investment Abbreviations:
| | |
| AUD | | – Australian Dollar |
| BBSW | | – Bank Bill Swap Rate |
| BRL | | – Brazilian Real |
| CAD | | – Canadian Dollar |
| CDOR | | – Canadian Dealer Offered Rate |
| CHF | | – Swiss Franc |
| CLP | | – Chilean Peso |
| CNY | | – Chinese Yuan |
| CPI | | – Consumer Price Index |
| DKK | | – Danish Krone |
| EUR | | – Euro |
| GBP | | – British Pound Sterling |
| HICP | | – Harmonised Index of Consumer Prices |
| HKD | | – Hong Kong Dollar |
| HUF | | – Hungarian Forint |
| IDR | | – Indonesian Rupiah |
| INR | | – Indian Rupee |
| JPY | | – Japanese Yen |
| KRW | | – South Korean Won |
| LIBOR | | – London Interbank Offered Rate |
| MXN | | – Mexican New Peso |
| NOK | | – Norwegian Krone |
| NSA | | – Non-Seasonally Adjusted |
| NZD | | – New Zealand Dollar |
| RPI | | – Retail Price Index |
| SEK | | – Swedish Krona |
| SGD | | – Singapore Dollar |
| THB | | – Thai Bat |
| TIIE | | – Interbank Equilibrium Interest Rate |
| TWD | | – New Taiwan Dollar |
| USD | | – U.S. Dollar |
| ZAR | | – South African Rand |
See accompanying Notes to Consolidated Financial Statements which are an integral part of the financial statements.
52 Invesco Global Targeted Returns Fund
Consolidated Statement of Assets and Liabilities
October 31, 2018
| | | | |
Assets: | | | | |
Investments in securities, at value (Cost $67,970,022) | | $ | 62,907,443 | |
Investments in affiliates, at value (Cost $31,547,364) | | | 31,546,903 | |
Other investments: | | | | |
Swaps receivable — OTC | | | 219,672 | |
Unrealized appreciation on forward foreign currency contracts outstanding | | | 2,789,534 | |
Unrealized appreciation on swap agreements — OTC | | | 1,629,706 | |
Deposits with brokers: | | | | |
Cash collateral — exchange-traded futures contracts | | | 2,537,284 | |
Cash collateral — centrally cleared swap agreements | | | 2,450,673 | |
Cash collateral — OTC Derivatives | | | 2,660,000 | |
Cash | | | 148,121 | |
Foreign currencies, at value (Cost $3,134,785) | | | 3,102,502 | |
Receivable for: | | | | |
Investments sold | | | 183,833 | |
Fund shares sold | | | 23,761 | |
Dividends and interest | | | 553,058 | |
Fund expenses absorbed | | | 347,683 | |
Investment for trustee deferred compensation and retirement plans | | | 10,421 | |
Other assets | | | 136,096 | |
Total assets | | | 111,246,690 | |
| |
Liabilities: | | | | |
Other investments: | | | | |
Options written, at value (premiums received $6,488,527) | | | 5,200,425 | |
Swaps payable — OTC | | | 7,000 | |
Variation margin payable — futures contracts | | | 307,484 | |
Variation margin payable — centrally cleared swap agreements | | | 46,662 | |
Unrealized depreciation on forward foreign currency contracts outstanding | | | 1,789,734 | |
Unrealized depreciation on swap agreements — OTC | | | 2,459,404 | |
Payable for: | | | | |
Investments purchased | | | 580,968 | |
Fund shares reacquired | | | 189,077 | |
Accrued foreign taxes | | | 2,346 | |
Accrued fees to affiliates | | | 33,563 | |
Accrued trustees’ and officers’ fees and benefits | | | 1,765 | |
Accrued other operating expenses | | | 494,251 | |
Trustee deferred compensation and retirement plans | | | 10,421 | |
Total liabilities | | | 11,123,100 | |
Net assets applicable to shares outstanding | | $ | 100,123,590 | |
| |
Net assets consist of: | | | | |
Shares of beneficial interest | | $ | 107,401,929 | |
Distributable earnings | | | (7,278,339 | ) |
| | | $ | 100,123,590 | |
| | | | |
Net Assets: | | | | |
Class A | | $ | 11,415,873 | |
Class C | | $ | 7,350,922 | |
Class R | | $ | 20,315 | |
Class Y | | $ | 70,487,891 | |
Class R5 | | $ | 9,707 | |
Class R6 | | $ | 10,838,882 | |
|
Shares outstanding, no par value,
with an unlimited number of shares authorized: | |
Class A | | | 1,184,604 | |
Class C | | | 783,869 | |
Class R | | | 2,126 | |
Class Y | | | 7,264,611 | |
Class R5 | | | 1,000 | |
Class R6 | | | 1,117,418 | |
Class A: | | | | |
Net asset value per share | | $ | 9.64 | |
Maximum offering price per share | | | | |
(Net asset value of $9.64 ¸ 94.50%) | | $ | 10.20 | |
Class C: | | | | |
Net asset value and offering price per share | | $ | 9.38 | |
Class R: | | | | |
Net asset value and offering price per share | | $ | 9.56 | |
Class Y: | | | | |
Net asset value and offering price per share | | $ | 9.70 | |
Class R5: | | | | |
Net asset value and offering price per share | | $ | 9.71 | |
Class R6: | | | | |
Net asset value and offering price per share | | $ | 9.70 | |
See accompanying Notes to Consolidated Financial Statements which are an integral part of the financial statements.
53 Invesco Global Targeted Returns Fund
Consolidated Statement of Operations
For the year ended October 31, 2018
| | | | |
Investment income: | | | | |
Dividends (net of foreign withholding taxes of $122,610) | | $ | 1,536,515 | |
Dividends from affiliated underlying funds | | | 555,444 | |
Interest (net of foreign withholding taxes of $2,937) | | | 1,444,581 | |
Total investment income | | | 3,536,540 | |
| |
Expenses: | | | | |
Advisory fees | | | 1,461,340 | |
Administrative services fees | | | 50,000 | |
Custodian fees | | | 248,076 | |
Distribution fees: | | | | |
Class A | | | 39,502 | |
Class C | | | 95,464 | |
Class R | | | 131 | |
Transfer agent fees — A, C, R and Y | | | 112,066 | |
Transfer agent fees — R6 | | | 322 | |
Trustees’ and officers’ fees and benefits | | | 21,904 | |
Registration and filing fees | | | 85,555 | |
Licensing Fees | | | 142,119 | |
Reports to shareholders | | | 28,366 | |
Professional services fees | | | 157,827 | |
Pricing fees | | | 895,841 | |
Other | | | 26,751 | |
Total expenses | | | 3,365,264 | |
Less: Fees waived, expenses reimbursed and expense offset arrangement(s) | | | (1,706,530 | ) |
Net expenses | | | 1,658,734 | |
Net investment income | | | 1,877,806 | |
| |
Realized and unrealized gain (loss) from: | | | | |
Net realized gain (loss) from: | | | | |
Investment securities (net of foreign taxes of $3,254) | | | (13,527,200 | ) |
Foreign currencies | | | (208,580 | ) |
Forward foreign currency contracts | | | (165,767 | ) |
Futures contracts | | | (1,290,408 | ) |
Option contracts written | | | 11,596,125 | |
Swap agreements | | | (2,292,201 | ) |
| | | | (5,888,031 | ) |
Change in net unrealized appreciation (depreciation) of: | | | | |
Investment securities (net of foreign taxes of $2,346) | | | (5,110,411 | ) |
Foreign currencies | | | (36,806 | ) |
Forward foreign currency contracts | | | 1,752,570 | |
Futures contracts | | | 3,768,252 | |
Option contracts written | | | (285,513 | ) |
Swap agreements | | | (193,795 | ) |
| | | | (105,703 | ) |
Net realized and unrealized gain (loss) | | | (5,993,734 | ) |
Net increase (decrease) in net assets resulting from operations | | $ | (4,115,928 | ) |
See accompanying Notes to Consolidated Financial Statements which are an integral part of the financial statements.
54 Invesco Global Targeted Returns Fund
Consolidated Statement of Changes in Net Assets
For the years ended October 31, 2018 and 2017
| | | | | | | | |
| | | 2018 | | | 2017 | |
Operations: | | | | | | | | |
Net investment income | | $ | 1,877,806 | | | $ | 2,485,856 | |
Net realized gain (loss) | | | (5,888,031 | ) | | | (4,483,613 | ) |
Change in net unrealized appreciation (depreciation) | | | (105,703 | ) | | | 4,018,356 | |
Net increase (decrease) in net assets resulting from operations | | | (4,115,928 | ) | | | 2,020,599 | |
| | |
Distributions to shareholders from distributable earnings(1): | | | | | | | | |
Class A | | | — | | | | (1,060,560 | ) |
Class C | | | — | | | | (586,742 | ) |
Class R | | | — | | | | (715 | ) |
Class Y | | | — | | | | (7,106,144 | ) |
Class R5 | | | — | | | | (2,838 | ) |
Class R6 | | | — | | | | (465 | ) |
Total distributions from distributable earnings | | | — | | | | (8,757,464 | ) |
| | |
Return of capital: | | | | | | | | |
Class A | | | — | | | | (11,454 | ) |
Class C | | | — | | | | (3,524 | ) |
Class R | | | — | | | | (7 | ) |
Class Y | | | — | | | | (87,296 | ) |
Class R5 | | | — | | | | (35 | ) |
Class R6 | | | — | | | | (6 | ) |
Total return of capital | | | — | | | | (102,322 | ) |
| | |
Share transactions–net: | | | | | | | | |
Class A | | | (7,472,627 | ) | | | (9,083,175 | ) |
Class C | | | (4,529,099 | ) | | | (3,618,751 | ) |
Class R | | | (4,720 | ) | | | 10,007 | |
Class Y | | | (34,676,616 | ) | | | (61,768,547 | ) |
Class R5 | | | — | | | | (51,152 | ) |
Class R6 | | | 2,569,725 | | | | 8,592,340 | |
Net increase (decrease) in net assets resulting from share transactions | | | (44,113,337 | ) | | | (65,919,278 | ) |
Net increase (decrease) in net assets | | | (48,229,265 | ) | | | (72,758,465 | ) |
| | |
Net assets: | | | | | | | | |
Beginning of year | | | 148,352,855 | | | | 221,111,320 | |
End of year | | $ | 100,123,590 | | | $ | 148,352,855 | |
| (1) | For the year ended October 31, 2017, distributions to shareholders from distributable earnings consisted of distributions from net investment income and distributions from net realized gains. The Securities and Exchange Commission eliminated the requirement to disclose the distribution components separately, except for tax return of capital. For the year ended October 31, 2017, distributions from net investment income were $302,695, $93,125, $177, $2,306,952, $921 and $151 and distributions from net realized gains were $757,865, $493,617, $538, $4,799,192, $1,917 and $314 for Class A, Class C, Class R, Class Y, Class R5 and Class R6 shares, respectively. |
Notes to Consolidated Financial Statements
October 31, 2018
NOTE 1—Significant Accounting Policies
Invesco Global Targeted Returns Fund (the “Fund”) is a series portfolio of AIM Investment Funds (Invesco Investment Funds) (the “Trust”). The Trust is organized as a Delaware statutory trust and is registered under the Investment Company Act of 1940, as amended (the “1940 Act”), as an open-end series management investment company authorized to issue an unlimited number of shares of beneficial interest. Information presented in these consolidated financial statements pertains only to the Fund. Matters affecting the Fund or each class will be voted on exclusively by the shareholders of the Fund or each class.
The Fund will seek to gain exposure to the commodity markets primarily through investments in the Invesco Cayman Commodity Fund VII Ltd. (the “Subsidiary”), a wholly-owned subsidiary of the Fund organized under the laws of the Cayman Islands. The Subsidiary was organized by the Fund to
55 Invesco Global Targeted Returns Fund
invest in commodity-linked derivatives and other securities that may provide leveraged and non-leveraged exposure to commodities. The Fund may invest up to 25% of its total assets in the Subsidiary.
The Fund’s investment objective is to seek a positive total return over the long term in all market environments.
The Fund currently consists of six different classes of shares: Class A, Class C, Class R, Class Y, Class R5 and Class R6. Class Y shares are available only to certain investors. Class A shares are sold with a front-end sales charge unless certain waiver criteria are met. Under certain circumstances, load waived shares may be subject to contingent deferred sales charges (“CDSC”). Class C shares are sold with a CDSC. Class R, Class Y, Class R5 and Class R6 shares are sold at net asset value.
The Fund is an investment company and accordingly follows the investment company accounting and reporting guidance in accordance with Financial Accounting Standards Board Accounting Standards Codification Topic 946, Financial Services — Investment Companies.
The following is a summary of the significant accounting policies followed by the Fund in the preparation of its consolidated financial statements.
| A. | Security Valuations — Securities, including restricted securities, are valued according to the following policy. |
A security listed or traded on an exchange (except convertible securities) is valued at its last sales price or official closing price as of the close of the customary trading session on the exchange where the security is principally traded, or lacking any sales or official closing price on a particular day, the security may be valued at the closing bid price on that day. Securities traded in the over-the-counter market are valued based on prices furnished by independent pricing services or market makers. When such securities are valued by an independent pricing service they may be considered fair valued. Futures contracts are valued at the final settlement price set by an exchange on which they are principally traded. Listed options are valued at the mean between the last bid and asked prices from the exchange on which they are principally traded. Options not listed on an exchange are valued by an independent source at the mean between the last bid and asked prices. For purposes of determining net asset value (“NAV”) per share, futures and option contracts generally are valued 15 minutes after the close of the customary trading session of the New York Stock Exchange (“NYSE”).
Investments in open-end and closed-end registered investment companies that do not trade on an exchange are valued at the end-of-day net asset value per share. Investments in open-end and closed-end registered investment companies that trade on an exchange are valued at the last sales price or official closing price as of the close of the customary trading session on the exchange where the security is principally traded.
Swap agreements are fair valued using an evaluated quote, if available, provided by an independent pricing service. Evaluated quotes provided by the pricing service are valued based on a model which may include end-of-day net present values, spreads, ratings, industry, company performance and returns of referenced assets. Centrally cleared swap agreements are valued at the daily settlement price determined by the relevant exchange or clearinghouse.
Debt obligations (including convertible securities) and unlisted equities are fair valued using an evaluated quote provided by an independent pricing service. Evaluated quotes provided by the pricing service may be determined without exclusive reliance on quoted prices, and may reflect appropriate factors such as institution-size trading in similar groups of securities, developments related to specific securities, dividend rate (for unlisted equities), yield (for debt obligations), quality, type of issue, coupon rate (for debt obligations), maturity (for debt obligations), individual trading characteristics and other market data. Pricing services generally value debt obligations assuming orderly transactions of institutional round lot size, but a fund may hold or transact in the same securities in smaller, odd lot sizes. Odd lots often trade at lower prices than institutional round lots. Debt obligations are subject to interest rate and credit risks. In addition, all debt obligations involve some risk of default with respect to interest and/or principal payments.
Foreign securities’ (including foreign exchange contracts) prices are converted into U.S. dollar amounts using the applicable exchange rates as of the close of the NYSE. If market quotations are available and reliable for foreign exchange-traded equity securities, the securities will be valued at the market quotations. Because trading hours for certain foreign securities end before the close of the NYSE, closing market quotations may become unreliable. If between the time trading ends on a particular security and the close of the customary trading session on the NYSE, events occur that the investment adviser determines are significant and make the closing price unreliable, the Fund may fair value the security. If the event is likely to have affected the closing price of the security, the security will be valued at fair value in good faith using procedures approved by the Board of Trustees. Adjustments to closing prices to reflect fair value may also be based on a screening process of an independent pricing service to indicate the degree of certainty, based on historical data, that the closing price in the principal market where a foreign security trades is not the current value as of the close of the NYSE. Foreign securities’ prices meeting the approved degree of certainty that the price is not reflective of current value will be priced at the indication of fair value from the independent pricing service. Multiple factors may be considered by the independent pricing service in determining adjustments to reflect fair value and may include information relating to sector indices, American Depositary Receipts and domestic and foreign index futures. Foreign securities may have additional risks including exchange rate changes, potential for sharply devalued currencies and high inflation, political and economic upheaval, the relative lack of issuer information, relatively low market liquidity and the potential lack of strict financial and accounting controls and standards.
Securities for which market prices are not provided by any of the above methods may be valued based upon quotes furnished by independent sources. The last bid price may be used to value equity securities. The mean between the last bid and asked prices is used to value debt obligations, including corporate loans.
Securities for which market quotations are not readily available or became unreliable are valued at fair value as determined in good faith by or under the supervision of the Trust’s officers following procedures approved by the Board of Trustees. Issuer specific events, market trends, bid/asked quotes of brokers and information providers and other market data may be reviewed in the course of making a good faith determination of a security’s fair value.
The Fund may invest in securities that are subject to interest rate risk, meaning the risk that the prices will generally fall as interest rates rise and, conversely, the prices will generally rise as interest rates fall. Specific securities differ in their sensitivity to changes in interest rates depending on their individual characteristics. Changes in interest rates may result in increased market volatility, which may affect the value and/or liquidity of certain Fund investments.
Valuations change in response to many factors including the historical and prospective earnings of the issuer, the value of the issuer’s assets, general economic conditions, interest rates, investor perceptions and market liquidity. Because of the inherent uncertainties of valuation, the values reflected in the consolidated financial statements may materially differ from the value received upon actual sale of those investments.
56 Invesco Global Targeted Returns Fund
| B. | Securities Transactions and Investment Income — Securities transactions are accounted for on a trade date basis. Realized gains or losses on sales are computed on the basis of specific identification of the securities sold. Interest income (net of withholding tax, if any) is recorded on the accrual basis from settlement date. Bond premiums and discounts are amortized and/or accreted over the lives of the respective securities. Pay-in-kind interest income and non-cash dividend income received in the form of securities in-lieu of cash are recorded at the fair value of the securities received. Dividend income (net of withholding tax, if any) is recorded on the ex-dividend date. |
The Fund may periodically participate in litigation related to Fund investments. As such, the Fund may receive proceeds from litigation settlements. Any proceeds received are included in the Consolidated Statement of Operations as realized gain (loss) for investments no longer held and as unrealized gain (loss) for investments still held.
Brokerage commissions and mark ups are considered transaction costs and are recorded as an increase to the cost basis of securities purchased and/or a reduction of proceeds on a sale of securities. Such transaction costs are included in the determination of net realized and unrealized gain (loss) from investment securities reported in the Consolidated Statement of Operations and the Consolidated Statement of Changes in Net Assets and the net realized and unrealized gains (losses) on securities per share in the Financial Highlights. Transaction costs are included in the calculation of the Fund’s net asset value and, accordingly, they reduce the Fund’s total returns. These transaction costs are not considered operating expenses and are not reflected in net investment income reported in the Consolidated Statement of Operations and the Consolidated Statement of Changes in Net Assets, or the net investment income per share and the ratios of expenses and net investment income reported in the Financial Highlights, nor are they limited by any expense limitation arrangements between the Fund and the investment adviser.
The Fund allocates income and realized and unrealized capital gains and losses to a class based on the relative net assets of each class.
| C. | Country Determination — For the purposes of making investment selection decisions and presentation in the Consolidated Schedule of Investments, the investment adviser may determine the country in which an issuer is located and/or credit risk exposure based on various factors. These factors include the laws of the country under which the issuer is organized, where the issuer maintains a principal office, the country in which the issuer derives 50% or more of its total revenues and the country that has the primary market for the issuer’s securities, as well as other criteria. Among the other criteria that may be evaluated for making this determination are the country in which the issuer maintains 50% or more of its assets, the type of security, financial guarantees and enhancements, the nature of the collateral and the sponsor organization. Country of issuer and/or credit risk exposure has been determined to be the United States of America, unless otherwise noted. |
| D. | Distributions — Distributions from net investment income and net realized capital gain, if any, are generally declared and paid annually and recorded on the ex-dividend date. The Fund may elect to treat a portion of the proceeds from redemptions as distributions for federal income tax purposes. |
| E. | Federal Income Taxes — The Fund intends to comply with the requirements of Subchapter M of the Internal Revenue Code of 1986, as amended (the “Internal Revenue Code”), necessary to qualify as a regulated investment company and to distribute substantially all of the Fund’s taxable earnings to shareholders. As such, the Fund will not be subject to federal income taxes on otherwise taxable income (including net realized capital gain) that is distributed to shareholders. Therefore, no provision for federal income taxes is recorded in the consolidated financial statements. |
The Fund recognizes the tax benefits of uncertain tax positions only when the position is more likely than not to be sustained. Management has analyzed the Fund’s uncertain tax positions and concluded that no liability for unrecognized tax benefits should be recorded related to uncertain tax positions. Management is not aware of any tax positions for which it is reasonably possible that the total amounts of unrecognized tax benefits will change materially in the next 12 months.
The Subsidiary is classified as a controlled foreign corporation under Subchapter N of the Internal Revenue Code. Therefore, the Fund is required to increase its taxable income by its share of the Subsidiary’s income. Net investment losses of the Subsidiary cannot be deducted by the Fund in the current period nor carried forward to offset taxable income in future periods.
The Fund files tax returns in the U.S. Federal jurisdiction and certain other jurisdictions. Generally the Fund is subject to examinations by such taxing authorities for up to three years after the filing of the return for the tax period.
| F. | Expenses — Fees provided for under the Rule 12b-1 plan of a particular class of the Fund are charged to the operations of such class. Transfer agency fees and expenses and other shareholder recordkeeping fees and expenses attributable to Class R5 and Class R6 are allocated to each share class based on relative net assets. Sub-accounting fees attributable to Class R5 are charged to the operations of the class. Transfer agency fees and expenses and other shareholder recordkeeping fees and expenses relating to all other classes are allocated among those classes based on relative net assets. All other expenses are allocated among the classes based on relative net assets. |
| G. | Accounting Estimates — The financial statements are prepared on a consolidated basis in conformity with accounting principles generally accepted in the United States of America (“GAAP”), which requires management to make estimates and assumptions that affect the reported amounts of assets and liabilities at the date of the financial statements and the reported amounts of revenues and expenses during the reporting period including estimates and assumptions related to taxation. Actual results could differ from those estimates by a significant amount. The accompanying financial statements reflect the financial position of the Fund and its Subsidiary and the results of operations on a consolidated basis. All inter-company accounts and transactions have been eliminated in consolidation. |
In addition, the Fund monitors for material events or transactions that may occur or become known after the period-end date and before the date the consolidated financial statements are released to print.
| H. | Indemnifications — Under the Trust’s organizational documents, each Trustee, officer, employee or other agent of the Trust, and under the Subsidiary’s organizational documents, the directors and officers of the Subsidiary, are indemnified against certain liabilities that may arise out of the performance of their duties to the Fund and/or the Subsidiary, respectively. Additionally, in the normal course of business, the Fund enters into contracts, including the Fund’s servicing agreements, that contain a variety of indemnification clauses. The Fund’s maximum exposure under these arrangements is unknown as this would involve future claims that may be made against the Fund that have not yet occurred. The risk of material loss as a result of such indemnification claims is considered remote. |
| I. | Treasury Inflation-Protected Securities — The Fund may invest in Treasury Inflation-Protected Securities (“TIPS”). TIPS are fixed income securities whose principal value is periodically adjusted to the rate of inflation. The principal value of TIPS will be adjusted upward or downward, and any increase or decrease in the principal amount of TIPS will be shown as Treasury Inflation - Protected Securities inflation adjustments in the Statement of Operations, even though investors do not receive their principal until maturity. |
57 Invesco Global Targeted Returns Fund
| J. | Structured Securities — The Fund may invest in structured securities. Structured securities are a type of derivative security whose value is determined by reference to changes in the value of underlying securities, currencies, interest rates, commodities, indices or other financial indicators (“reference instruments”). Most structured securities are fixed-income securities that have maturities of three years or less. Structured securities may be positively or negatively indexed (i.e., their principal value or interest rates may increase or decrease if the underlying reference instrument appreciates) and may have return characteristics similar to direct investments in the underlying reference instrument. |
Structured securities may entail a greater degree of market risk than other types of debt securities because the investor bears the risk of the reference instruments. In addition to the credit risk of structured securities and the normal risks of price changes in response to changes in interest rates, the principal amount of structured notes or indexed securities may decrease as a result of changes in the value of the underlying reference instruments. Changes in the daily value of structured securities are recorded as unrealized gains (losses) in the Consolidated Statement of Operations. When the structured securities mature or are sold, the Fund recognizes a realized gain (loss) on the Consolidated Statement of Operations.
| K. | Foreign Currency Translations — Foreign currency is valued at the close of the NYSE based on quotations posted by banks and major currency dealers. Portfolio securities and other assets and liabilities denominated in foreign currencies are translated into U.S. dollar amounts at the date of valuation. Purchases and sales of portfolio securities (net of foreign taxes withheld on disposition) and income items denominated in foreign currencies are translated into U.S. dollar amounts on the respective dates of such transactions. The Fund does not separately account for the portion of the results of operations resulting from changes in foreign exchange rates on investments and the fluctuations arising from changes in market prices of securities held. The combined results of changes in foreign exchange rates and the fluctuation of market prices on investments (net of estimated foreign tax withholding) are included with the net realized and unrealized gain or loss from investments in the Consolidated Statement of Operations. Reported net realized foreign currency gains or losses arise from (1) sales of foreign currencies, (2) currency gains or losses realized between the trade and settlement dates on securities transactions, and (3) the difference between the amounts of dividends, interest, and foreign withholding taxes recorded on the Fund’s books and the U.S. dollar equivalent of the amounts actually received or paid. Net unrealized foreign currency gains and losses arise from changes in the fair values of assets and liabilities, other than investments in securities at fiscal period end, resulting from changes in exchange rates. |
The Fund may invest in foreign securities, which may be subject to foreign taxes on income, gains on investments or currency repatriation, a portion of which may be recoverable. Foreign taxes, if any, are recorded based on the tax regulations and rates that exist in the foreign markets in which the Fund invests and are shown in the Consolidated Statement of Operations.
| L. | Forward Foreign Currency Contracts — The Fund may engage in foreign currency transactions either on a spot (i.e. for prompt delivery and settlement) basis, or through forward foreign currency contracts, to manage or minimize currency or exchange rate risk. |
The Fund may also enter into forward foreign currency contracts for the purchase or sale of a security denominated in a foreign currency in order to “lock in” the U.S. dollar price of that security, or the Fund may also enter into forward foreign currency contracts that do not provide for physical settlement of the two currencies, but instead are settled by a single cash payment calculated as the difference between the agreed upon exchange rate and the spot rate at settlement based upon an agreed upon notional amount (non-deliverable forwards). The Fund will set aside liquid assets in an amount equal to the daily mark-to-market obligation for forward foreign currency contracts.
A forward foreign currency contract is an obligation between two parties (“Counterparties”) to purchase or sell a specific currency for an agreed-upon price at a future date. The use of forward foreign currency contracts does not eliminate fluctuations in the price of the underlying securities the Fund owns or intends to acquire but establishes a rate of exchange in advance. Fluctuations in the value of these contracts are measured by the difference in the contract date and reporting date exchange rates and are recorded as unrealized appreciation (depreciation) until the contracts are closed. When the contracts are closed, realized gains (losses) are recorded. Realized and unrealized gains (losses) on the contracts are included in the Consolidated Statement of Operations. The primary risks associated with forward foreign currency contracts include failure of the Counterparty to meet the terms of the contract and the value of the foreign currency changing unfavorably. These risks may be in excess of the amounts reflected in the Consolidated Statement of Assets and Liabilities.
| M. | Futures Contracts — The Fund may enter into futures contracts to equitize the Fund’s cash holdings or to manage exposure to interest rate, equity, commodity and market price movements and/or currency risks. A futures contract is an agreement between Counterparties to purchase or sell a specified underlying security, currency or commodity (or delivery of a cash settlement price, in the case of an index future) for a fixed price at a future date. The Fund currently invests only in exchange-traded futures and they are standardized as to maturity date and underlying financial instrument. Initial margin deposits required upon entering into futures contracts are satisfied by the segregation of specific securities or cash as collateral at the futures commission merchant (broker). During the period the futures contracts are open, changes in the value of the contracts are recognized as unrealized gains or losses by recalculating the value of the contracts on a daily basis. Subsequent or variation margin payments are received or made depending upon whether unrealized gains or losses are incurred. These amounts are reflected as receivables or payables on the Consolidated Statement of Assets and Liabilities. When the contracts are closed or expire, the Fund recognizes a realized gain or loss equal to the difference between the proceeds from, or cost of, the closing transaction and the Fund’s basis in the contract. The net realized gain (loss) and the change in unrealized gain (loss) on futures contracts held during the period is included on the Consolidated Statement of Operations. The primary risks associated with futures contracts are market risk and the absence of a liquid secondary market. If the Fund were unable to liquidate a futures contract and/or enter into an offsetting closing transaction, the Fund would continue to be subject to market risk with respect to the value of the contracts and continue to be required to maintain the margin deposits on the futures contracts. Futures contracts have minimal Counterparty risk since the exchange’s clearinghouse, as Counterparty to all exchange-traded futures, guarantees the futures against default. Risks may exceed amounts recognized in the Consolidated Statement of Assets and Liabilities. |
| N. | Call Options Purchased and Written — The Fund may write covered call options and/or buy call options. A covered call option gives the purchaser of such option the right to buy, and the writer the obligation to sell, the underlying security or foreign currency at the stated exercise price during the option period. Options written by the Fund normally will have expiration dates between three and nine months from the date written. The exercise price of a call option may be below, equal to, or above the current market value of the underlying security at the time the option is written. |
Additionally, the Fund may enter into an option on a swap agreement, also called a “swaption”. A swaption is an option that gives the buyer the right, but not the obligation, to enter into a swap on a future date in exchange for paying a market-based premium. A receiver swaption gives the
58 Invesco Global Targeted Returns Fund
owner the right to receive the total return of a specified asset, reference rate or index. Swaptions also include options that allow an existing swap to be terminated or extended by one of the Counterparties.
When the Fund writes a covered call option, an amount equal to the premium received by the Fund is recorded as an asset and an equivalent liability in the Consolidated Statement of Assets and Liabilities. The amount of the liability is subsequently “marked-to-market” to reflect the current market value of the option written. If a written covered call option expires on the stipulated expiration date, or if the Fund enters into a closing purchase transaction, the Fund realizes a gain (or a loss if the closing purchase transaction exceeds the premium received when the option was written) without regard to any unrealized gain or loss on the underlying security, and the liability related to such option is extinguished. If a written covered call option is exercised, the Fund realizes a gain or a loss from the sale of the underlying security and the proceeds of the sale are increased by the premium originally received. Realized and unrealized gains and losses on call options written are included in the Consolidated Statement of Operations as Net realized gain (loss) from and Change in net unrealized appreciation (depreciation) of Option contracts written. A risk in writing a covered call option is that the Fund gives up the opportunity for profit if the market price of the security increases and the option is exercised.
When the Fund buys a call option, an amount equal to the premium paid by the Fund is recorded as an investment on the Consolidated Statement of Assets and Liabilities. The amount of the investment is subsequently “marked-to-market” to reflect the current value of the option purchased. Realized and unrealized gains and losses on call options purchased are included in the Consolidated Statement of Operations as Net realized gain (loss) from and Change in net unrealized appreciation (depreciation) of Investment securities. A risk in buying an option is that the Fund pays a premium whether or not the option is exercised. In addition, there can be no assurance that a liquid secondary market will exist for any option purchased.
| O. | Put Options Purchased and Written — The Fund may purchase and write put options including options on securities indexes, or foreign currency and/or futures contracts. By purchasing a put option, the Fund obtains the right (but not the obligation) to sell the option’s underlying instrument at a fixed strike price. In return for this right, the Fund pays an option premium. The option’s underlying instrument may be a security, securities index, or a futures contract. Put options may be used by the Fund to hedge securities it owns by locking in a minimum price at which the Fund can sell. If security prices fall, the put option could be exercised to offset all or a portion of the Fund’s resulting losses. At the same time, because the maximum the Fund has at risk is the cost of the option, purchasing put options does not eliminate the potential for the Fund to profit from an increase in the value of the underlying portfolio securities. The Fund may write put options to earn additional income in the form of option premiums if it expects the price of the underlying instrument to remain stable or rise during the option period so that the option will not be exercised. The risk in this strategy is that the price of the underlying securities may decline by an amount greater than the premium received. Put options written are reported as a liability in the Consolidated Statement of Assets and Liabilities. Realized and unrealized gains and losses on put options purchased and put options written are included in the Consolidated Statement of Operations as Net realized gain (loss) from and Change in net unrealized appreciation (depreciation) of Investment securities and Option contracts written, respectively. A risk in buying an option is that the Fund pays a premium whether or not the option is exercised. In addition, there can be no assurance that a liquid secondary market will exist for any option purchased. |
| P. | Swap Agreements — The Fund may enter into various swap transactions, including interest rate, total return, volatility, variance, index, currency and credit default swap contracts (“CDS”) for investment purposes or to manage interest rate, equity, currency, commodity or credit risk. Such transactions are agreements between Counterparties. A swap agreement may be negotiated bilaterally and traded over-the-counter (“OTC”) between two parties (“uncleared/OTC”) or, in some instances, must be transacted through a future commission merchant (“FCM”) and cleared through a clearinghouse that serves as a central Counterparty (“centrally cleared swap”). These agreements may contain among other conditions, events of default and termination events, and various covenants and representations such as provisions that require the Fund to maintain a pre-determined level of net assets, and/or provide limits regarding the decline of the Fund’s NAV over specific periods of time. If the Fund were to trigger such provisions and have open derivative positions at that time, the Counterparty may be able to terminate such agreement and request immediate payment in an amount equal to the net liability positions, if any. |
Interest rate, total return, volatility, variance, index and currency swap agreements are two-party contracts entered into primarily to exchange the returns (or differentials in rates of returns) earned or realized on particular predetermined investments or instruments. The gross returns to be exchanged or “swapped” between the parties are calculated with respect to a notional amount, i.e., the return on or increase in value of a particular dollar amount invested at a particular interest rate or return of an underlying asset, in a particular foreign currency, or in a “basket” of securities representing a particular index.
Inflation swap agreements are contracts in which one party agrees to pay the cumulative percentage increase in a price index, such as the Consumer Price Index, over the term of the swap, and the other party pays a compounded fixed rate.
In a centrally cleared swap, the Fund’s ultimate Counterparty is a central clearinghouse. The Fund will initially enter into centrally cleared swaps through an executing broker. When a fund enters into a centrally cleared swap, it must deliver to the central Counterparty (via the FCM) an amount referred to as “initial margin.” Initial margin requirements are determined by the central Counterparty, but an FCM may require additional initial margin above the amount required by the central Counterparty. Initial margin deposits required upon entering into centrally cleared swaps are satisfied by cash or securities as collateral at the FCM. Securities deposited as initial margin are designated on the Consolidated Schedule of Investments and cash deposited is recorded on the Consolidated Statement of Assets and Liabilities. During the term of a cleared swap agreement, a “variation margin” amount may be required to be paid by the Fund or may be received by the Fund, based on the daily change in price of the underlying reference instrument subject to the swap agreement and is recorded as a receivable or payable for variation margin in the Consolidated Statement of Assets and Liabilities until the centrally cleared swap is terminated, at which time a realized gain or loss is recorded.
A CDS is an agreement between Counterparties to exchange the credit risk of an issuer. A buyer of a CDS is said to buy protection by paying a fixed payment over the life of the agreement and in some situations an upfront payment to the seller of the CDS. If a defined credit event occurs (such as payment default or bankruptcy), the Fund as a protection buyer would cease paying its fixed payment, the Fund would deliver eligible bonds issued by the reference entity to the seller, and the seller would pay the full notional value, or the “par value”, of the referenced obligation to the Fund. A seller of a CDS is said to sell protection and thus would receive a fixed payment over the life of the agreement and an upfront payment, if applicable. If a credit event occurs, the Fund as a protection seller would cease to receive the fixed payment stream, the Fund would pay the buyer “par value” or the full notional value of the referenced obligation, and the Fund would receive the eligible bonds issued by the
59 Invesco Global Targeted Returns Fund
reference entity. In turn, these bonds may be sold in order to realize a recovery value. Alternatively, the seller of the CDS and its Counterparty may agree to net the notional amount and the market value of the bonds and make a cash payment equal to the difference to the buyer of protection. If no credit event occurs, the Fund receives the fixed payment over the life of the agreement. As the seller, the Fund would effectively add leverage to its portfolio because, in addition to its total net assets, the Fund would be subject to investment exposure on the notional amount of the CDS. In connection with these agreements, cash and securities may be identified as collateral in accordance with the terms of the respective swap agreements to provide assets of value and recourse in the event of default under the swap agreement or bankruptcy/insolvency of a party to the swap agreement. If a Counterparty becomes bankrupt or otherwise fails to perform its obligations due to financial difficulties, the Fund may experience significant delays in obtaining any recovery in a bankruptcy or other reorganization proceeding. The Fund may obtain only limited recovery or may obtain no recovery in such circumstances. The Fund’s maximum risk of loss from Counterparty risk, either as the protection seller or as the protection buyer, is the value of the contract. The risk may be mitigated by having a master netting arrangement between the Fund and the Counterparty and by the designation of collateral by the Counterparty to cover the Fund’s exposure to the Counterparty.
Implied credit spreads represent the current level at which protection could be bought or sold given the terms of the existing CDS contract and serve as an indicator of the current status of the payment/performance risk of the CDS. An implied spread that has widened or increased since entry into the initial contract may indicate a deteriorating credit profile and increased risk of default for the reference entity. A declining or narrowing spread may indicate an improving credit profile or decreased risk of default for the reference entity. Alternatively, credit spreads may increase or decrease reflecting the general tolerance for risk in the credit markets.
A volatility swap involves an exchange between the Fund and a Counterparty of periodic payments based on the measured volatility of an underlying security, currency, commodity, interest rate, index or other reference asset over a specified time frame. Depending on the structure of the swap, either the Fund’s or the Counterparty’s payment obligation will typically be based on the realized volatility of the reference asset as measured by changes in its price or level over a specified time period, while the other party’s payment obligation will be based on a specified rate representing expected volatility for the reference asset at the time the swap is executed, or the measured volatility of a different reference asset over a specified time period. The Fund will typically make or lose money on a volatility swap depending on the magnitude of the reference asset’s volatility, or size of the movements in its price, over a specified time period, rather than general increases or decreases in the price of the reference asset. Volatility swaps are often used to speculate on future volatility levels, to trade the spread between realized and expected volatility, or to decrease the volatility exposure of other investments held by the Fund. Variance swaps are similar to volatility swaps, except payments are based on the difference between the implied and measured volatility mathematically squared.
An interest rate swap is an agreement between Counterparties pursuant to which the parties exchange a floating rate payment for a fixed rate payment based on a specified notional amount.
Changes in the value of centrally cleared and OTC swap agreements are recognized as unrealized gains (losses) in the Consolidated Statement of Operations by “marking to market” on a daily basis to reflect the value of the swap agreement at the end of each trading day. Payments received or paid at the beginning of the agreement are reflected as such on the Consolidated Statement of Assets and Liabilities and may be referred to as upfront payments. The Fund accrues for the fixed payment stream and amortizes upfront payments, if any, on swap agreements on a daily basis with the net amount, recorded as a component of realized gain (loss) on the Consolidated Statement of Operations. A liquidation payment received or made at the termination of a swap agreement is recorded as realized gain (loss) on the Consolidated Statement of Operations. The Fund segregates cash or liquid securities having a value at least equal to the amount of the potential obligation of the Fund under any swap transaction. Cash held as collateral is recorded as deposits with brokers on the Consolidated Statement of Assets and Liabilities. Entering into these agreements involves, to varying degrees, lack of liquidity and elements of credit, market, and Counterparty risk in excess of amounts recognized on the Consolidated Statement of Assets and Liabilities. Such risks involve the possibility that a swap is difficult to sell or liquidate, the Counterparty does not honor its obligations under the agreement and unfavorable interest rates and market fluctuations. It is possible that developments in the swaps market, including potential government regulation, could adversely affect the Fund’s ability to terminate existing swap agreements or to realize amounts to be received under such agreements. A short position in a security poses more risk than holding the same security long. As there is no limit on how much the price of the security can increase, the Fund’s exposure is unlimited.
Notional amounts of each individual credit default swap agreement outstanding as of October 31, 2018 for which the Fund is the seller of protection are disclosed in the open swap agreements table. These potential amounts would be partially offset by any recovery values of the respective referenced obligations, upfront payments received upon entering into the agreement, or net amounts received from the settlement of buy protection credit default swap agreements entered into by the Fund for the same referenced entity or entities.
| Q. | Other Risks — The Fund will seek to gain exposure to commodity markets primarily through an investment in the Subsidiary and through investments in exchange-traded funds and commodity-linked derivatives. The Subsidiary, unlike the Fund, may invest without limitation in commodities, commodity-linked derivatives and other securities, such as exchange-traded and commodity-linked notes, that may provide leveraged and non-leveraged exposure to commodity markets. The Fund is indirectly exposed to the risks associated with the Subsidiary’s investments. |
| R. | Leverage Risk — Leverage exists when the Fund can lose more than it originally invests because it purchases or sells an instrument or enters into a transaction without investing an amount equal to the full economic exposure of the instrument or transaction. |
| S. | Collateral — To the extent the Fund has designated or segregated a security as collateral and that security is subsequently sold, it is the Fund’s practice to replace such collateral no later than the next business day. |
60 Invesco Global Targeted Returns Fund
NOTE 2—Advisory Fees and Other Fees Paid to Affiliates
The Trust has entered into a master investment advisory agreement with Invesco Advisers, Inc. (the “Adviser” or “Invesco”). Under the terms of the investment advisory agreement, the Fund accrues daily and pays monthly an advisory fee to the Adviser based on the annual rate of the Fund’s average daily net assets as follows:
| | | | |
| Average Daily Net Assets | | Rate | |
First $250 million | | | 1.10% | |
Next $250 million | | | 1.08% | |
Next $500 million | | | 1.05% | |
Next $1.5 billion | | | 1.03% | |
Next $2.5 billion | | | 1.00% | |
Next $2.5 billion | | | 0.98% | |
Next $2.5 billion | | | 0.95% | |
Over $10 billion | | | 0.93% | |
For the year ended October 31, 2018, the effective advisory fees incurred by the Fund was 1.10%.
The Subsidiary has entered into a separate contract with the Adviser whereby the Adviser provides investment advisory and other services to the Subsidiary. In consideration of these services, the Subsidiary pays an advisory fee to the Adviser based on the annual rate of the Subsidiary’s average daily net assets as set forth in the table above.
Under the terms of a master sub-advisory agreement between the Adviser and each of Invesco Asset Management Deutschland GmbH, Invesco Asset Management Limited, Invesco Asset Management (Japan) Limited, Invesco Hong Kong Limited, Invesco Senior Secured Management, Inc. and Invesco Canada Ltd. and separate sub-advisory agreements with Invesco Capital Management LLC, formerly Invesco PowerShares Capital Management LLC, and Invesco Asset Management (India) Private Limited (collectively, the “Affiliated Sub-Advisers”) the Adviser, not the Fund, will pay 40% of the fees paid to the Adviser to any such Affiliated Sub-Adviser(s) that provide(s) discretionary investment management services to the Fund based on the percentage of assets allocated to such Affiliated Sub-Adviser(s).
The Adviser has contractually agreed, through at least February 29, 2020, to waive advisory fees and/or reimburse expenses to the extent necessary to limit total annual fund operating expenses after fee waiver and/or expense reimbursement (excluding certain items discussed below) of Class A, Class C, Class R, Class Y, Class R5 and Class R6 shares to 1.44%, 2.19%, 1.69%, 1.19%, 1.19% and 1.19%, respectively, of average daily net assets (the “expense limits”). In determining the Adviser’s obligation to waive advisory fees and/or reimburse expenses, the following expenses are not taken into account, and could cause total annual fund operating expenses after fee waiver and/or expense reimbursement to exceed the numbers reflected above: (1) interest; (2) taxes; (3) dividend expense on short sales; (4) extraordinary or non-routine items, including litigation expenses; and (5) expenses that the Fund has incurred but did not actually pay because of an expense offset arrangement. Acquired Fund Fees and Expenses are not operating expenses of the Fund directly, but are fees and expenses, including management fees of the investment companies in which the Fund invests. As a result, the total annual fund operating expenses after expense reimbursement may exceed the expense limits above. Unless Invesco continues the fee waiver agreement, it will terminate on February 29, 2020. During its term, the fee waiver agreement cannot be terminated or amended to increase the expense limits or reduce the advisory fee waiver without approval of the Board of Trustees.
Further, the Adviser has contractually agreed, through at least June 30, 2020, to waive the advisory fee payable by the Fund in an amount equal to 100% of the net advisory fees the Adviser receives on the Fund’s investments in certain affiliated funds.
For the year ended October 31, 2018, the Adviser waived advisory fees of $1,594,142 and reimbursed class level expenses of $14,384, $8,691, $24, $88,765, $0 and $322 of Class A, Class C, Class R, Class Y, Class R5 and Class R6 shares, respectively.
The Trust has entered into a master administrative services agreement with Invesco pursuant to which the Fund has agreed to pay Invesco for certain administrative costs incurred in providing accounting services to the Fund. For the year ended October 31, 2018, expenses incurred under the agreement are shown in the Consolidated Statement of Operations as Administrative services fees.
The Trust has entered into a transfer agency and service agreement with Invesco Investment Services, Inc. (“IIS”) pursuant to which the Fund has agreed to pay IIS a fee for providing transfer agency and shareholder services to the Fund and reimburse IIS for certain expenses incurred by IIS in the course of providing such services. IIS may make payments to intermediaries that provide omnibus account services, sub-accounting services and/or networking services. All fees payable by IIS to intermediaries that provide omnibus account services or sub-accounting services are charged back to the Fund, subject to certain limitations approved by the Trust’s Board of Trustees. For the year ended October 31, 2018, expenses incurred under the agreement are shown in the Consolidated Statement of Operations as Transfer agent fees.
The Trust has entered into master distribution agreements with Invesco Distributors, Inc. (“IDI”) to serve as the distributor for the Class A, Class C, Class R, Class Y, Class R5 and Class R6 shares of the Fund. The Trust has adopted plans pursuant to Rule 12b-1 under the 1940 Act with respect to the Fund’s Class A, Class C and Class R shares (collectively, the “Plans”). The Fund, pursuant to the Plans, pays IDI compensation at the annual rate of 0.25% of the Fund’s average daily net assets of Class A shares, 1.00% of the average daily net assets of Class C shares and 0.50% of the average daily net assets of Class R shares. The fees are accrued daily and paid monthly. Of the Plan payments, up to 0.25% of the average daily net assets of each class of shares may be paid to furnish continuing personal shareholder services to customers who purchase and own shares of such classes. Any amounts not paid as a service fee under the Plans would constitute an asset-based sales charge. Rules of the Financial Industry Regulatory Authority (“FINRA”) impose a cap on the total sales charges, including asset-based sales charges, that may be paid by any class of shares of the Fund. For the year ended October 31, 2018, expenses incurred under the Plans are shown in the Consolidated Statement of Operations as Distribution fees.
Front-end sales commissions and CDSC (collectively, the “sales charges”) are not recorded as expenses of the Fund. Front-end sales commissions are deducted from proceeds from the sales of Fund shares prior to investment in Class A shares of the Fund. CDSC are deducted from redemption proceeds prior to remittance to the shareholder. During the year ended October 31, 2018, IDI advised the Fund that IDI retained $875 in front-end sales commissions from the sale of Class A shares and $9,606 and $182 from Class A and Class C shares, respectively, for CDSC imposed upon redemptions by shareholders.
Certain officers and trustees of the Trust are officers and directors of the Adviser, IIS and/or IDI.
61 Invesco Global Targeted Returns Fund
NOTE 3—Additional Valuation Information
GAAP defines fair value as the price that would be received to sell an asset or paid to transfer a liability in an orderly transaction between market participants at the measurement date, under current market conditions. GAAP establishes a hierarchy that prioritizes the inputs to valuation methods, giving the highest priority to readily available unadjusted quoted prices in an active market for identical assets (Level 1) and the lowest priority to significant unobservable inputs (Level 3), generally when market prices are not readily available or are unreliable. Based on the valuation inputs, the securities or other investments are tiered into one of three levels. Changes in valuation methods may result in transfers in or out of an investment’s assigned level:
| | Level 1 — | Prices are determined using quoted prices in an active market for identical assets. |
| | Level 2 — | Prices are determined using other significant observable inputs. Observable inputs are inputs that other market participants may use in pricing a security. These may include quoted prices for similar securities, interest rates, prepayment speeds, credit risk, yield curves, loss severities, default rates, discount rates, volatilities and others. |
| | Level 3 — | Prices are determined using significant unobservable inputs. In situations where quoted prices or observable inputs are unavailable (for example, when there is little or no market activity for an investment at the end of the period), unobservable inputs may be used. Unobservable inputs reflect the Fund’s own assumptions about the factors market participants would use in determining fair value of the securities or instruments and would be based on the best available information. |
The following is a summary of the tiered valuation input levels, as of October 31, 2018. The level assigned to the securities valuations may not be an indication of the risk or liquidity associated with investing in those securities. Because of the inherent uncertainties of valuation, the values reflected in the financial statements may materially differ from the value received upon actual sale of those investments.
| | | | | | | | | | | | | | | | |
| | | Level 1 | | | Level 2 | | | Level 3 | | | Total | |
Investments in Securities | | | | | | | | | | | | | | | | |
Common Stocks & Other Equity Interests | | $ | 17,061,328 | | | $ | 13,564,681 | | | $ | — | | | $ | 30,626,009 | |
Non-U.S. Dollar Denominated Bonds & Notes | | | — | | | | 12,963,921 | | | | — | | | | 12,963,921 | |
U.S. Dollar Denominated Bonds & Notes | | | — | | | | 10,600,045 | | | | — | | | | 10,600,045 | |
U.S. Treasury Securities | | | — | | | | 722,796 | | | | — | | | | 722,796 | |
Preferred Stocks | | | 38,160 | | | | 9,860 | | | | — | | | | 48,020 | |
Money Market Funds | | | 31,546,903 | | | | — | | | | — | | | | 31,546,903 | |
Options Purchased | | | — | | | | 7,946,652 | | | | — | | | | 7,946,652 | |
Total Investments in Securities | | | 48,646,391 | | | | 45,807,955 | | | | — | | | | 94,454,346 | |
Other Investments — Assets* | | | | | | | | | | | | | | | | |
Forward Foreign Currency Contracts | | | — | | | | 2,789,534 | | | | — | | | | 2,789,534 | |
Futures Contracts | | | 2,133,759 | | | | — | | | | — | | | | 2,133,759 | |
Swap Agreements | | | — | | | | 3,599,480 | | | | — | | | | 3,599,480 | |
| | | | 2,133,759 | | | | 6,389,014 | | | | — | | | | 8,522,773 | |
Other Investments — Liabilities* | | | | | | | | | | | | | | | | |
Forward Foreign Currency Contracts | | | — | | | | (1,789,734 | ) | | | — | | | | (1,789,734 | ) |
Futures Contracts | | | (204,583 | ) | | | — | | | | — | | | | (204,583 | ) |
Options Written | | | — | | | | (5,200,425 | ) | | | — | | | | (5,200,425 | ) |
Swap Agreements | | | — | | | | (4,742,628 | ) | | | — | | | | (4,742,628 | ) |
| | | | (204,583 | ) | | | (11,732,787 | ) | | | — | | | | (11,937,370 | ) |
Total Other Investments | | | 1,929,176 | | | | (5,343,773 | ) | | | — | | | | (3,414,597 | ) |
Total Investments | | $ | 50,575,567 | | | $ | 40,464,182 | | | $ | — | | | $ | 91,039,749 | |
| * | Forward foreign currency contracts, futures contracts and swap agreements are valued at unrealized appreciation (depreciation). Options written are shown at value. |
NOTE 4—Derivative Investments
The Fund may enter into an International Swaps and Derivatives Association Master Agreement (“ISDA Master Agreement”) under which a fund may trade OTC derivatives. An OTC transaction entered into under an ISDA Master Agreement typically involves a collateral posting arrangement, payment netting provisions and close-out netting provisions. These netting provisions allow for reduction of credit risk through netting of contractual obligations. The enforceability of the netting provisions of the ISDA Master Agreement depends on the governing law of the ISDA Master Agreement, among other factors.
For financial reporting purposes, the Fund does not offset OTC derivative assets or liabilities that are subject to ISDA Master Agreements in the Consolidated Statement of Assets and Liabilities.
62 Invesco Global Targeted Returns Fund
Value of Derivative Investments at Period-End
The table below summarizes the value of the Fund’s derivative investments, detailed by primary risk exposure, held as of October 31, 2018:
| | | | | | | | | | | | | | | | | | | | | | | | |
| | | Value | |
| Derivative Assets | | Commodity
Risk | | | Credit
Risk | | | Currency
Risk | | | Equity
Risk | | | Interest Rate
Risk | | | Total | |
Unrealized appreciation on futures contracts —Exchange-Traded(a) | | $ | — | | | $ | — | | | $ | — | | | $ | 2,121,573 | | | $ | 12,186 | | | $ | 2,133,759 | |
Unrealized appreciation on swap agreements — Centrally Cleared(a) | | | — | | | | 60,235 | | | | — | | | | — | | | | 1,909,539 | | | | 1,969,774 | |
Unrealized appreciation on swap agreements — OTC | | | 344,433 | | | | 10 | | | | — | | | | 959,193 | | | | 326,070 | | | | 1,629,706 | |
Options purchased, at value — OTC(b) | | | — | | | | — | | | | 991,659 | | | | 4,418,674 | | | | 2,536,319 | | | | 7,946,652 | |
Unrealized appreciation on forward foreign currency contracts outstanding | | | — | | | | — | | | | 2,789,534 | | | | — | | | | — | | | | 2,789,534 | |
Total Derivative Assets | | | 344,433 | | | | 60,245 | | | | 3,781,193 | | | | 7,499,440 | | | | 4,784,114 | | | | 16,469,425 | |
Derivatives not subject to master netting agreements | | | — | | | | (60,235 | ) | | | — | | | | (2,121,573 | ) | | | (1,921,725 | ) | | | (4,103,533 | ) |
Total Derivative Assets subject to master netting agreements | | $ | 344,433 | | | $ | 10 | | | $ | 3,781,193 | | | $ | 5,377,867 | | | $ | 2,862,389 | | | $ | 12,365,892 | |
| |
| | | Value | |
| Derivative Liabilities | | Commodity
Risk | | | Credit
Risk | | | Currency
Risk | | | Equity
Risk | | | Interest Rate
Risk | | | Total | |
Unrealized depreciation on futures contracts — Exchange-Traded(a) | | $ | — | | | $ | — | | | $ | — | | | $ | (194,262 | ) | | $ | (10,321 | ) | | $ | (204,583 | ) |
Unrealized depreciation on swap agreements — Centrally Cleared(a) | | | — | | | | — | | | | — | | | | — | | | | (2,283,224 | ) | | | (2,283,224 | ) |
Unrealized depreciation on swap agreements — OTC | | | (146,312 | ) | | | — | | | | — | | | | (2,103,472 | ) | | | (209,620 | ) | | | (2,459,404 | ) |
Options written, at value — OTC | | | — | | | | — | | | | (70,603 | ) | | | (4,834,515 | ) | | | (295,307 | ) | | | (5,200,425 | ) |
Unrealized depreciation on forward foreign currency contracts outstanding | | | — | | | | — | | | | (1,789,734 | ) | | | — | | | | — | | | | (1,789,734 | ) |
Total Derivative Liabilities | | | (146,312 | ) | | | — | | | | (1,860,337 | ) | | | (7,132,249 | ) | | | (2,798,472 | ) | | | (11,937,370 | ) |
Derivatives not subject to master netting agreements | | | — | | | | — | | | | — | | | | 194,262 | | | | 2,293,545 | | | | 2,487,807 | |
Total Derivative Liabilities subject to master netting agreements | | $ | (146,312 | ) | | $ | — | | | $ | (1,860,337 | ) | | $ | (6,937,987 | ) | | $ | (504,927 | ) | | $ | (9,449,563 | ) |
| (a) | The daily variation margin receivable (payable) at period-end is recorded in the Consolidated Statement of Assets and Liabilities. |
| (b) | Options purchased, at value as reported in the Consolidated Schedule of Investments. |
63 Invesco Global Targeted Returns Fund
Offsetting Assets and Liabilities
The table below reflects the Fund’s exposure to Counterparties subject to either an ISDA Master Agreement or other agreement for OTC derivative transactions as of October 31, 2018.
| | | | | | | | | | | | | | | | | | | | | | | | | | | | | | | | | | | | | | | | | | | | | | | | |
| | | Financial Derivative Assets | | | Financial Derivative Liabilities | | | Net Value of
Derivatives | | | Collateral
(Received)/Pledged | | | Net
Amount(a) | |
| | | Forward
Foreign
Currency
Contracts | | | Options
Purchased | | | Swap
Agreements | | | Total
Assets | | | Forward
Foreign
Currency
Contracts | | | Options
Written | | | Swap
Agreements | | | Total
Liabilities | | | | |
| Counterparty | | Non-Cash | | | Cash | |
Fund | | | | | | | | | | | | | | | | | | | | | | | | | | | | | | | | | | | | | | | | | | | | | | | | |
Bank of America, N.A. | | $ | — | | | $ | 1,497,463 | | | $ | — | | | $ | 1,497,463 | | | $ | — | | | $ | (253,777 | ) | | $ | — | | | $ | (253,777 | ) | | $ | 1,243,686 | | | $ | — | | | $ | (920,000 | ) | | $ | 323,686 | |
Barclays Bank PLC | | | 300,136 | | | | 560,273 | | | | — | | | | 860,409 | | | | (487,106 | ) | | | (208,230 | ) | | | — | | | | (695,336 | ) | | | 165,073 | | | | — | | | | (130,000 | ) | | | 35,073 | |
BNP Paribas S.A. | | | — | | | | 13,993 | | | | 28,926 | | | | 42,919 | | | | — | | | | (4,724 | ) | | | (41,122 | ) | | | (45,846 | ) | | | (2,927 | ) | | | — | | | | — | | | | (2,927 | ) |
Citibank, N.A. | | | 9,145 | | | | 1,294,987 | | | | 35,514 | | | | 1,339,646 | | | | (56,566 | ) | | | (80,645 | ) | | | (73,336 | ) | | | (210,547 | ) | | | 1,129,099 | | | | — | | | | (1,090,000 | ) | | | 39,099 | |
Deutsche Bank AG | | | 536,740 | | | | 661 | | | | — | | | | 537,401 | | | | (290,901 | ) | | | (18,453 | ) | | | — | | | | (309,354 | ) | | | 228,047 | | | | — | | | | — | | | | 228,047 | |
Goldman Sachs International | | | 862,564 | | | | 793,470 | | | | 74,752 | | | | 1,730,786 | | | | (494,676 | ) | | | (793,048 | ) | | | (199,746 | ) | | | (1,487,470 | ) | | | 243,316 | | | | — | | | | (243,316 | ) | | | — | |
J.P. Morgan Chase Bank, N.A. | | | 250,698 | | | | 914,399 | | | | 411,772 | | | | 1,576,869 | | | | (127,387 | ) | | | (438,718 | ) | | | (402,378 | ) | | | (968,483 | ) | | | 608,386 | | | | — | | | | (320,000 | ) | | | 288,386 | |
Merrill Lynch International | | | 4,007 | | | | — | | | | — | | | | 4,007 | | | | (25,363 | ) | | | — | | | | — | | | | (25,363 | ) | | | (21,356 | ) | | | — | | | | — | | | | (21,356 | ) |
Morgan Stanley & Co. LLC | | | 85,287 | | | | 130,452 | | | | — | | | | 215,739 | | | | (56,721 | ) | | | (70,864 | ) | | | — | | | | (127,585 | ) | | | 88,154 | | | | — | | | | (88,154 | ) | | | — | |
Morgan Stanley Capital Services LLC | | | — | | | | 134,238 | | | | — | | | | 134,238 | | | | — | | | | — | | | | — | | | | — | | | | 134,238 | | | | — | | | | — | | | | 134,238 | |
Royal Bank of Scotland Securities Inc. | | | 3,800 | | | | — | | | | — | | | | 3,800 | | | | — | | | | — | | | | — | | | | — | | | | 3,800 | | | | — | | | | — | | | | 3,800 | |
Societe Generale | | | — | | | | 1,290,201 | | | | 251,699 | | | | 1,541,900 | | | | — | | | | (1,352,774 | ) | | | (351,818 | ) | | | (1,704,592 | ) | | | (162,692 | ) | | | — | | | | 162,692 | | | | — | |
Standard Charted Bank PLC | | | 64,302 | | | | — | | | | — | | | | 64,302 | | | | (7,908 | ) | | | — | | | | — | | | | (7,908 | ) | | | 56,394 | | | | — | | | | — | | | | 56,394 | |
State Street Bank & Trust Co. | | | 618,058 | | | | — | | | | — | | | | 618,058 | | | | (180,483 | ) | | | — | | | | — | | | | (180,483 | ) | | | 437,575 | | | | — | | | | (430,000 | ) | | | 7,575 | |
UBS AG | | | 9,821 | | | | 1,316,515 | | | | 362,505 | | | | 1,688,841 | | | | (32,228 | ) | | | (1,979,192 | ) | | | (1,028,260 | ) | | | (3,039,680 | ) | | | (1,350,839 | ) | | | — | | | | 1,350,839 | | | | — | |
Subtotal — Fund | | | 2,744,558 | | | | 7,946,652 | | | | 1,165,168 | | | | 11,856,378 | | | | (1,759,339 | ) | | | (5,200,425 | ) | | | (2,096,660 | ) | | | (9,056,424 | ) | | | 2,799,954 | | | | — | | | | (1,707,939 | ) | | | 1,092,015 | |
| | | | | | | | | | | | |
Subsidiary | | | | | | | | | | | | | | | | | | | | | | | | | | | | | | | | | | | | | | | | | | | | | | | | |
Barclays Bank PLC | | | — | | | | — | | | | 267,367 | | | | 267,367 | | | | — | | | | — | | | | (2,712 | ) | | | (2,712 | ) | | | 264,655 | | | | — | | | | (264,655 | ) | | | — | |
BNP Paribas S.A. | | | ��� | | | | — | | | | 18,529 | | | | 18,529 | | | | — | | | | — | | | | (3,831 | ) | | | (3,831 | ) | | | 14,698 | | | | — | | | | — | | | | 14,698 | |
Goldman Sachs International | | | — | | | | — | | | | 32,739 | | | | 32,739 | | | | — | | | | — | | | | (195,748 | ) | | | (195,748 | ) | | | (163,009 | ) | | | — | | | | 163,009 | | | | — | |
Macquarie Bank Ltd. | | | — | | | | — | | | | 325,904 | | | | 325,904 | | | | — | | | | — | | | | (142,481 | ) | | | (142,481 | ) | | | 183,423 | | | | — | | | | — | | | | 183,423 | |
Morgan Stanley Capital Services LLC | | | — | | | | — | | | | 39,671 | | | | 39,671 | | | | — | | | | — | | | | (24,972 | ) | | | (24,972 | ) | | | 14,699 | | | | — | | | | — | | | | 14,699 | |
State Street Bank & Trust Co. | | | 44,976 | | | | — | | | | — | | | | 44,976 | | | | (30,395 | ) | | | — | | | | — | | | | (30,395 | ) | | | 14,581 | | | | — | | | | — | | | | 14,581 | |
Subtotal — Subsidiary | | $ | 44,976 | | | $ | — | | | $ | 684,210 | | | $ | 729,186 | | | $ | (30,395 | ) | | $ | — | | | $ | (369,744 | ) | | $ | (400,139 | ) | | $ | 329,047 | | | $ | — | | | $ | (101,646 | ) | | $ | 227,401 | |
Total | | $ | 2,789,534 | | | $ | 7,946,652 | | | $ | 1,849,378 | | | $ | 12,585,564 | | | $ | (1,789,734 | ) | | $ | (5,200,425 | ) | | $ | (2,466,404 | ) | | $ | (9,456,563 | ) | | $ | 3,129,001 | | | $ | — | | | $ | (1,809,585 | ) | | $ | 1,319,416 | |
| (a) | The Fund and the Subsidiary are recognized as separate legal entities and as such are subject to separate netting arrangements with the Counterparty. |
Effect of Derivative Investments for the year ended October 31, 2018
The table below summarizes the gains (losses) on derivative investments, detailed by primary risk exposure, recognized in earnings during the period:
| | | | | | | | | | | | | | | | | | | | | | | | |
| | | Commodity
Risk | | | Location of Gain (Loss) on Consolidated Statement of Operations | | | Total | |
| | | Credit
Risk | | | Currency
Risk | | | Equity
Risk | | | Interest Rate
Risk | |
Realized Gain (Loss): | | | | | | | | | | | | | | | | | | | | | | | | |
Forward foreign currency contracts | | $ | — | | | $ | — | | | $ | (165,767 | ) | | $ | — | | | $ | — | | | $ | (165,767 | ) |
Futures contracts | | | — | | | | — | | | | — | | | | (1,256,836 | ) | | | (33,572 | ) | | | (1,290,408 | ) |
Options purchased(a) | | | — | | | | — | | | | (3,035,163 | ) | | | (13,954,063 | ) | | | (11,214 | ) | | | (17,000,440 | ) |
Options written | | | — | | | | — | | | | 1,662,433 | | | | 9,871,404 | | | | 62,288 | | | | 11,596,125 | |
Swap agreements | | | (975,347 | ) | | | 312,627 | | | | — | | | | (475,170 | ) | | | (1,154,311 | ) | | | (2,292,201 | ) |
Change in Net Unrealized Appreciation (Depreciation): | | | | | | | | | | | | | | | | | | | | | | | | |
Forward foreign currency contracts | | | — | | | | — | | | | 1,752,570 | | | | — | | | | — | | | | 1,752,570 | |
Futures contracts | | | — | | | | — | | | | — | | | | 3,506,841 | | | | 261,411 | | | | 3,768,252 | |
Options purchased(a) | | | — | | | | — | | | | 1,891,173 | | | | 2,970,334 | | | | (609,763 | ) | | | 4,251,744 | |
Options written | | | — | | | | — | | | | (390,698 | ) | | | 29,439 | | | | 75,746 | | | | (285,513 | ) |
Swap agreements | | | 220,360 | | | | 423,093 | | | | — | | | | (640,545 | ) | | | (196,703 | ) | | | (193,795 | ) |
Total | | $ | (754,987 | ) | | $ | 735,720 | | | $ | 1,714,548 | | | $ | 51,404 | | | $ | (1,606,118 | ) | | $ | 140,567 | |
| (a) | Options purchased are included in the net realized gain (loss) from investment securities and the change in net unrealized appreciation (depreciation) of investment securities. |
64 Invesco Global Targeted Returns Fund
The table below summarizes the average notional value of forward foreign currency contracts, futures contracts, options purchased, options written and swap agreements outstanding during the period.
| | | | | | | | | | | | | | | | | | | | | | | | | | | | |
| | | Forward
Foreign Currency
Contracts | | | Futures
Contracts | | | Index
Options
Purchased | | | Index
Options
Written | | | Foreign
Currency
Options | | | Swaptions(a) | | | Swap
Agreements | |
Average notional value | | $ | 289,166,012 | | | $ | 72,724,762 | | | $ | 147,283,032 | | | $ | 87,937,026 | | | $ | 83,694,944 | | | $ | 67,969,140 | | | $ | 709,706,743 | |
Average contracts | | | — | | | | — | | | | 4,655 | | | | 1,764 | | | | — | | | | — | | | | — | |
| (a) | Summarizes the five month average notional value of swaptions outstanding during the period. |
NOTE 5—Expense Offset Arrangement(s)
The expense offset arrangement is comprised of transfer agency credits which result from balances in demand deposit accounts used by the transfer agent for clearing shareholder transactions. For the year ended October 31, 2018, the Fund received credits from this arrangement, which resulted in the reduction of the Fund’s total expenses of $202.
NOTE 6—Trustees’ and Officers’ Fees and Benefits
Trustees’ and Officers’ Fees and Benefits include amounts accrued by the Fund to pay remuneration to certain Trustees and Officers of the Fund. Trustees have the option to defer compensation payable by the Fund, and Trustees’ and Officers’ Fees and Benefits also include amounts accrued by the Fund to fund such deferred compensation amounts. Those Trustees who defer compensation have the option to select various Invesco Funds in which their deferral accounts shall be deemed to be invested. Obligations under the deferred compensation plan represent unsecured claims against the general assets of the Fund.
NOTE 7—Cash Balances
The Fund is permitted to temporarily carry a negative or overdrawn balance in its account with State Street Bank and Trust Company, the custodian bank. Such balances, if any at period-end, are shown in the Consolidated Statement of Assets and Liabilities under the payable caption Amount due custodian. To compensate the custodian bank for such overdrafts, the overdrawn Fund may either (1) leave funds as a compensating balance in the account so the custodian bank can be compensated by earning the additional interest; or (2) compensate by paying the custodian bank at a rate agreed upon by the custodian bank and Invesco, not to exceed the contractually agreed upon rate.
NOTE 8—Distributions to Shareholders and Tax Components of Net Assets
Tax Character of Distributions to Shareholders Paid During the Fiscal Years Ended October 31, 2018 and 2017:
| | | | | | | | |
| | | 2018 | | | 2017 | |
Ordinary income | | $ | — | | | $ | 4,586,711 | |
Return of capital | | | — | | | | 102,322 | |
Long-term capital gain | | | — | | | | 4,170,753 | |
Total distributions | | $ | — | | | $ | 8,859,786 | |
Tax Components of Net Assets at Period-End:
| | | | |
| | | 2018 | |
Undistributed ordinary income | | $ | 1,222,121 | |
Net unrealized appreciation (depreciation) — investments | | | (6,120,011 | ) |
Net unrealized appreciation (depreciation) — foreign currencies | | | (54,866 | ) |
Temporary book/tax differences | | | (9,252 | ) |
Capital loss carryforward | | | (2,316,331 | ) |
Shares of beneficial interest | | | 107,401,929 | |
Total net assets | | $ | 100,123,590 | |
The difference between book-basis and tax-basis unrealized appreciation (depreciation) is due to differences in the timing of recognition of gains and losses on investments for tax and book purposes. The Fund’s net unrealized appreciation (depreciation) difference is attributable primarily to derivative investments, straddles and wash sales.
The temporary book/tax differences are a result of timing differences between book and tax recognition of income and/or expenses. The Fund’s temporary book/tax differences are the result of the trustee deferral of compensation and retirement plan benefits.
Capital loss carryforward is calculated and reported as of a specific date. Results of transactions and other activity after that date may affect the amount of capital loss carryforward actually available for the Fund to utilize. Capital losses generated in years beginning after December 22, 2010 can be carried forward for an unlimited period, whereas previous losses expire in eight tax years. Capital losses with an expiration period may not be used to offset capital gains until all net capital losses without an expiration date have been utilized. Capital loss carryforwards with no expiration date will retain their character as either short-term or long-term capital losses instead of as short-term capital losses as under prior law. The ability to utilize capital loss carryforwards in the future may be limited under the Internal Revenue Code and related regulations based on the results of future transactions.
65 Invesco Global Targeted Returns Fund
The Fund has a capital loss carryforward as of October 31, 2018, as follows:
| | | | | | | | | | | | |
| Capital Loss Carryforward* | |
| Expiration | | Short-Term | | | Long-Term | | | Total | |
Not subject to expiration | | $ | — | | | $ | 2,316,331 | | | $ | 2,316,331 | |
| * | Capital loss carryforward as of the date listed above is reduced for limitations, if any, to the extent required by the Internal Revenue Code and may be further limited depending upon a variety of factors, including the realization of net unrealized gains or losses as of the date of any reorganization. |
NOTE 9—Investment Transactions
The aggregate amount of investment securities (other than short-term securities, U.S. Treasury obligations and money market funds, if any) purchased and sold by the Fund during the year ended October 31, 2018 was $50,458,022 and $88,288,164, respectively. During the same period, purchases and sales of U.S. Treasury obligations were $3,952,352 and $4,369,751, respectively. Cost of investments, including any derivatives, on a tax basis includes the adjustments for financial reporting purposes as of the most recently completed federal income tax reporting period-end.
| | | | |
| Unrealized Appreciation (Depreciation) of Investments on a Tax Basis | |
Aggregate unrealized appreciation of investments | | $ | 17,933,339 | |
Aggregate unrealized (depreciation) of investments | | | (24,053,350 | ) |
Net unrealized appreciation (depreciation) of investments | | $ | (6,120,011 | ) |
Cost of investments for tax purposes is $97,159,760.
NOTE 10—Reclassification of Permanent Differences
Primarily as a result of differing book/tax treatment of foreign currency transactions, net operating losses and income from swap agreements, on October 31, 2018, undistributed net investment income was decreased by $1,404,602, undistributed net realized gain (loss) was increased by $3,587,038 and shares of beneficial interest was decreased by $2,182,436. This reclassification had no effect on the net assets of the Fund.
NOTE 11—Share Information
| | | | | | | | | | | | | | | | |
| | | Summary of Share Activity | |
| | | Years ended October 31, | |
| | | 2018(a) | | | 2017 | |
| | | Shares | | | Amount | | | Shares | | | Amount | |
Sold: | | | | | | | | | | | | | | | | |
Class A | | | 242,971 | | | $ | 2,411,704 | | | | 432,607 | | | $ | 4,320,006 | |
Class C | | | 20,964 | | | | 203,906 | | | | 170,628 | | | | 1,667,723 | |
Class R | | | 168 | | | | 1,650 | | | | 981 | | | | 9,707 | |
Class Y | | | 2,738,953 | | | | 27,496,036 | | | | 5,299,391 | | | | 52,987,480 | |
Class R6 | | | 347,964 | | | | 3,462,293 | | | | 869,493 | | | | 8,703,963 | |
| | | | |
Issued as reinvestment of dividends: | | | | | | | | | | | | | | | | |
Class A | | | — | | | | — | | | | 109,618 | | | | 1,068,780 | |
Class C | | | — | | | | — | | | | 60,540 | | | | 582,399 | |
Class R | | | — | | | | — | | | | 31 | | | | 300 | |
Class Y | | | — | | | | — | | | | 736,278 | | | | 7,193,440 | |
Class R5 | | | — | | | | — | | | | 246 | | | | 2,402 | |
| | | | |
Reacquired: | | | | | | | | | | | | | | | | |
Class A | | | (994,972 | ) | | | (9,884,331 | ) | | | (1,444,640 | ) | | | (14,471,961 | ) |
Class C | | | (488,145 | ) | | | (4,733,005 | ) | | | (601,188 | ) | | | (5,868,873 | ) |
Class R | | | (661 | ) | | | (6,370 | ) | | | — | | | | — | |
Class Y | | | (6,237,453 | ) | | | (62,172,652 | ) | | | (12,178,368 | ) | | | (121,949,467 | ) |
Class R5 | | | — | | | | — | | | | (5,347 | ) | | | (53,554 | ) |
Class R6 | | | (89,972 | ) | | | (892,568 | ) | | | (11,067 | ) | | | (111,623 | ) |
Net increase (decrease) in share activity | | | (4,460,183 | ) | | $ | (44,113,337 | ) | | | (6,560,797 | ) | | $ | (65,919,278 | ) |
| (a) | There are entities that are record owners of more than 5% of the outstanding shares of the Fund and in the aggregate own 74% of the outstanding shares of the Fund. IDI has an agreement with these entities to sell Fund shares. The Fund, Invesco and/or Invesco affiliates may make payments to these entities, which are considered to be related to the Fund, for providing services to the Fund, Invesco and/or Invesco affiliates including but not limited to services such as securities brokerage, distribution, third party record keeping and account servicing. The Fund has no knowledge as to whether all or any portion of the shares owned of record by these entities are also owned beneficially. |
| | In addition, 11% of the outstanding shares of the Fund are owned by the Adviser or an affiliate of the Adviser. |
66 Invesco Global Targeted Returns Fund
NOTE 12—Financial Highlights
The following schedule presents financial highlights for a share of the Fund outstanding throughout the periods indicated.
| | | | | | | | | | | | | | | | | | | | | | | | | | | | | | | | | | | | | | | | | | | | | | | | | | | | | | | | | | | | |
| | | Net asset
value,
beginning
of period | | | Net
investment
income
(loss)(a) | | | Net gains
(losses)
on securities
(both
realized and
unrealized) | | | Total from
investment
operations | | | Dividends
from net
investment
income | | | Return of
capital | | | Distributions
from net
realized
gains | | | Total
distributions | | | Net asset
value, end
of period | | | Total
return(b) | | | Net assets,
end of period
(000’s omitted) | | | Ratio of
expenses
to average
net assets
with fee waivers
and/or expenses
absorbed | | | Ratio of
expenses
to average net
assets without
fee waivers
and/or expenses
absorbed | | | Ratio of net
investment
income (loss)
to average
net assets | | | Portfolio
turnover(c) | |
Class A | | | | | | | | | | | | | | | | | | | | | | | | | | | | | | | | | | | | | | | | | | | | | | | | | | | | | | | | | | | | |
Year ended 10/31/18 | | $ | 10.00 | | | $ | 0.13 | | | $ | (0.49 | ) | | $ | (0.36 | ) | | $ | — | | | $ | — | | | $ | — | | | $ | — | | | $ | 9.64 | | | | (3.60 | )% | | $ | 11,416 | | | | 1.40 | %(d) | | | 2.69 | %(d) | | | 1.26 | %(d) | | | 67 | % |
Year ended 10/31/17 | | | 10.32 | | | | 0.12 | | | | 0.00 | | | | 0.12 | | | | (0.12 | ) | | | (0.01 | ) | | | (0.31 | ) | | | (0.44 | ) | | | 10.00 | | | | 1.32 | | | | 19,360 | | | | 1.29 | | | | 2.16 | | | | 1.24 | | | | 121 | |
Year ended 10/31/16 | | | 10.33 | | | | 0.05 | | | | 0.14 | | | | 0.19 | | | | (0.06 | ) | | | — | | | | (0.14 | ) | | | (0.20 | ) | | | 10.32 | | | | 1.90 | | | | 29,309 | | | | 1.31 | (e) | | | 2.35 | | | | 0.51 | | | | 23 | |
Year ended 10/31/15 | | | 10.44 | | | | 0.01 | | | | 0.04 | | | | 0.05 | | | | (0.06 | ) | | | — | | | | (0.10 | ) | | | (0.16 | ) | | | 10.33 | | | | 0.49 | | | | 23,688 | | | | 1.33 | (e) | | | 2.38 | | | | 0.05 | | | | 79 | |
Year ended 10/31/14(f) | | | 10.00 | | | | (0.02 | ) | | | 0.46 | | | | 0.44 | | | | — | | | | — | | | | — | | | | — | | | | 10.44 | | | | 4.40 | | | | 13,504 | | | | 1.29 | (e)(g) | | | 3.16 | (g) | | | (0.18 | )(g) | | | 20 | |
Class C | | | | | | | | | | | | | | | | | | | | | | | | | | | | | | | | | | | | | | | | | | | | | | | | | | | | | | | | | | | | |
Year ended 10/31/18 | | | 9.80 | | | | 0.05 | | | | (0.47 | ) | | | (0.42 | ) | | | — | | | | — | | | | — | | | | — | | | | 9.38 | | | | (4.29 | ) | | | 7,351 | | | | 2.15 | (d) | | | 3.44 | (d) | | | 0.51 | (d) | | | 67 | |
Year ended 10/31/17 | | | 10.13 | | | | 0.05 | | | | (0.01 | ) | | | 0.04 | | | | (0.06 | ) | | | (0.00 | ) | | | (0.31 | ) | | | (0.37 | ) | | | 9.80 | | | | 0.52 | | | | 12,263 | | | | 2.04 | | | | 2.91 | | | | 0.49 | | | | 121 | |
Year ended 10/31/16 | | | 10.19 | | | | (0.02 | ) | | | 0.14 | | | | 0.12 | | | | (0.04 | ) | | | — | | | | (0.14 | ) | | | (0.18 | ) | | | 10.13 | | | | 1.17 | | | | 16,428 | | | | 2.06 | (e) | | | 3.10 | | | | (0.24 | ) | | | 23 | |
Year ended 10/31/15 | | | 10.37 | | | | (0.07 | ) | | | 0.04 | | | | (0.03 | ) | | | (0.05 | ) | | | — | | | | (0.10 | ) | | | (0.15 | ) | | | 10.19 | | | | (0.27 | ) | | | 11,524 | | | | 2.08 | (e) | | | 3.13 | | | | (0.70 | ) | | | 79 | |
Year ended 10/31/14(f) | | | 10.00 | | | | (0.08 | ) | | | 0.45 | | | | 0.37 | | | | — | | | | — | | | | — | | | | — | | | | 10.37 | | | | 3.70 | | | | 444 | | | | 2.04 | (e)(g) | | | 3.91 | (g) | | | (0.93 | )(g) | | | 20 | |
Class R | | | | | | | | | | | | | | | | | | | | | | | | | | | | | | | | | | | | | | | | | | | | | | | | | | | | | | | | | | | | |
Year ended 10/31/18 | | | 9.94 | | | | 0.10 | | | | (0.48 | ) | | | (0.38 | ) | | | — | | | | — | | | | — | | | | — | | | | 9.56 | | | | (3.82 | ) | | | 20 | | | | 1.65 | (d) | | | 2.94 | (d) | | | 1.01 | (d) | | | 67 | |
Year ended 10/31/17 | | | 10.27 | | | | 0.10 | | | | (0.01 | ) | | | 0.09 | | | | (0.10 | ) | | | (0.01 | ) | | | (0.31 | ) | | | (0.42 | ) | | | 9.94 | | | | 0.99 | | | | 26 | | | | 1.54 | | | | 2.41 | | | | 0.99 | | | | 121 | |
Year ended 10/31/16 | | | 10.29 | | | | 0.03 | | | | 0.14 | | | | 0.17 | | | | (0.05 | ) | | | — | | | | (0.14 | ) | | | (0.19 | ) | | | 10.27 | | | | 1.65 | | | | 17 | | | | 1.56 | (e) | | | 2.60 | | | | 0.26 | | | | 23 | |
Year ended 10/31/15 | | | 10.42 | | | | (0.02 | ) | | | 0.04 | | | | 0.02 | | | | (0.05 | ) | | | — | | | | (0.10 | ) | | | (0.15 | ) | | | 10.29 | | | | 0.27 | | | | 10 | | | | 1.58 | (e) | | | 2.63 | | | | (0.20 | ) | | | 79 | |
Year ended 10/31/14(f) | | | 10.00 | | | | (0.04 | ) | | | 0.46 | | | | 0.42 | | | | — | | | | — | | | | — | | | | — | | | | 10.42 | | | | 4.20 | | | | 10 | | | | 1.54 | (e)(g) | | | 3.41 | (g) | | | (0.43 | )(g) | | | 20 | |
Class Y | | | | | | | | | | | | | | | | | | | | | | | | | | | | | | | | | | | | | | | | | | | | | | | | | | | | | | | | | | | | |
Year ended 10/31/18 | | | 10.04 | | | | 0.15 | | | | (0.49 | ) | | | (0.34 | ) | | | — | | | | — | | | | — | | | | — | | | | 9.70 | | | | (3.39 | ) | | | 70,488 | | | | 1.15 | (d) | | | 2.44 | (d) | | | 1.51 | (d) | | | 67 | |
Year ended 10/31/17 | | | 10.37 | | | | 0.15 | | | | (0.01 | ) | | | 0.14 | | | | (0.15 | ) | | | (0.01 | ) | | | (0.31 | ) | | | (0.47 | ) | | | 10.04 | | | | 1.48 | | | | 108,068 | | | | 1.04 | | | | 1.91 | | | | 1.49 | | | | 121 | |
Year ended 10/31/16 | | | 10.37 | | | | 0.08 | | | | 0.15 | | | | 0.23 | | | | (0.09 | ) | | | — | | | | (0.14 | ) | | | (0.23 | ) | | | 10.37 | | | | 2.24 | | | | 175,284 | | | | 1.06 | (e) | | | 2.10 | | | | 0.76 | | | | 23 | |
Year ended 10/31/15 | | | 10.46 | | | | 0.03 | | | | 0.04 | | | | 0.07 | | | | (0.06 | ) | | | — | | | | (0.10 | ) | | | (0.16 | ) | | | 10.37 | | | | 0.72 | | | | 97,703 | | | | 1.08 | (e) | | | 2.13 | | | | 0.30 | | | | 79 | |
Year ended 10/31/14(f) | | | 10.00 | | | | 0.01 | | | | 0.45 | | | | 0.46 | | | | — | | | | — | | | | — | | | | — | | | | 10.46 | | | | 4.60 | | | | 16,352 | | | | 1.04 | (e)(g) | | | 2.91 | (g) | | | 0.07 | (g) | | | 20 | |
Class R5 | | | | | | | | | | | | | | | | | | | | | | | | | | | | | | | | | | | | | | | | | | | | | | | | | | | | | | | | | | | | |
Year ended 10/31/18 | | | 10.05 | | | | 0.15 | | | | (0.49 | ) | | | (0.34 | ) | | | — | | | | — | | | | — | | | | — | | | | 9.71 | | | | (3.38 | ) | | | 10 | | | | 1.15 | (d) | | | 2.35 | (d) | | | 1.51 | (d) | | | 67 | |
Year ended 10/31/17 | | | 10.37 | | | | 0.15 | | | | 0.00 | | | | 0.15 | | | | (0.15 | ) | | | (0.01 | ) | | | (0.31 | ) | | | (0.47 | ) | | | 10.05 | | | | 1.58 | | | | 10 | | | | 1.04 | | | | 1.87 | | | | 1.49 | | | | 121 | |
Year ended 10/31/16 | | | 10.38 | | | | 0.08 | | | | 0.14 | | | | 0.22 | | | | (0.09 | ) | | | — | | | | (0.14 | ) | | | (0.23 | ) | | | 10.37 | | | | 2.15 | | | | 63 | | | | 1.06 | (e) | | | 2.09 | | | | 0.76 | | | | 23 | |
Year ended 10/31/15 | | | 10.46 | | | | 0.03 | | | | 0.05 | | | | 0.08 | | | | (0.06 | ) | | | — | | | | (0.10 | ) | | | (0.16 | ) | | | 10.38 | | | | 0.82 | | | | 62 | | �� | | 1.08 | (e) | | | 2.07 | | | | 0.30 | | | | 79 | |
Year ended 10/31/14(f) | | | 10.00 | | | | 0.01 | | | | 0.45 | | | | 0.46 | | | | — | | | | — | | | | — | | | | — | | | | 10.46 | | | | 4.60 | | | | 2,724 | | | | 1.04 | (e)(g) | | | 2.87 | (g) | | | 0.07 | (g) | | | 20 | |
Class R6 | | | | | | | | | | | | | | | | | | | | | | | | | | | | | | | | | | | | | | | | | | | | | | | | | | | | | | | | | | | | |
Year ended 10/31/18 | | | 10.04 | | | | 0.15 | | | | (0.49 | ) | | | (0.34 | ) | | | — | | | | — | | | | — | | | | — | | | | 9.70 | | | | (3.39 | ) | | | 10,839 | | | | 1.15 | (d) | | | 2.35 | (d) | | | 1.51 | (d) | | | 67 | |
Year ended 10/31/17 | | | 10.36 | | | | 0.15 | | | | 0.00 | | | | 0.15 | | | | (0.15 | ) | | | (0.01 | ) | | | (0.31 | ) | | | (0.47 | ) | | | 10.04 | | | | 1.59 | | | | 8,626 | | | | 1.04 | | | | 1.81 | | | | 1.49 | | | | 121 | |
Year ended 10/31/16 | | | 10.37 | | | | 0.08 | | | | 0.14 | | | | 0.22 | | | | (0.09 | ) | | | — | | | | (0.14 | ) | | | (0.23 | ) | | | 10.36 | | | | 2.14 | | | | 10 | | | | 1.06 | (e) | | | 2.00 | | | | 0.76 | | | | 23 | |
Year ended 10/31/15 | | | 10.46 | | | | 0.03 | | | | 0.04 | | | | 0.07 | | | | (0.06 | ) | | | — | | | | (0.10 | ) | | | (0.16 | ) | | | 10.37 | | | | 0.73 | | | | 8,063 | | | | 1.08 | (e) | | | 2.07 | | | | 0.30 | | | | 79 | |
Year ended 10/31/14(f) | | | 10.00 | | | | 0.01 | | | | 0.45 | | | | 0.46 | | | | — | | | | — | | | | — | | | | — | | | | 10.46 | | | | 4.60 | | | | 9,298 | | | | 1.04 | (e)(g) | | | 2.87 | (g) | | | 0.07 | (g) | | | 20 | |
| (a) | Calculated using average shares outstanding. |
| (b) | Includes adjustments in accordance with accounting principles generally accepted in the United States of America and as such, the net asset value for financial reporting purposes and the returns based upon those net asset values may differ from the net asset value and returns for shareholder transactions. Does not include sales charges and is not annualized for periods less than one year, if applicable. |
| (c) | Portfolio turnover is calculated at the fund level and is not annualized for periods less than one year, if applicable. |
| (d) | Ratios are based on average daily net assets (000’s omitted) of $15,801, $9,546, $26, $97,505, $10 and $9,961 for Class A, Class C, Class R, Class Y, Class R5 and Class R6 shares, respectively. |
| (e) | In addition to the fees and expenses which the Fund bears directly; the Fund indirectly bears a pro rata share of the fees and expenses of the underlying funds in which the Fund invests. Because the underlying funds have varied expenses and fee levels and the Fund may own different proportions at different times, the amount of fees and expenses incurred indirectly by the Fund will vary. Estimated underlying fund expenses are not expenses that are incurred directly by your Fund. They are expenses that are incurred directly by the underlying funds and are deducted from the value of the funds your Fund invests in. The effect of the estimated underlying fund expenses that you bear indirectly is included in your Fund’s total return. Estimated acquired fund fees from underlying funds were 0.44%, 0.44% and 0.50% for the years ended October 31, 2016 and 2015 and the period ended October 31, 2014. |
| (f) | Commencement date of December 19, 2013. |
67 Invesco Global Targeted Returns Fund
Report of Independent Registered Public Accounting Firm
To the Board of Trustees of AIM Investment Funds (Invesco Investment Funds)
and Shareholders of Invesco Global Targeted Returns Fund:
Opinion on the Financial Statements
We have audited the accompanying consolidated statement of assets and liabilities, including the consolidated schedule of investments, of Invesco Global Targeted Returns Fund and its subsidiary (one of the funds constituting AIM Investment Funds (Invesco Investment Funds), hereafter referred to as the “Fund”) as of October 31, 2018, the related consolidated statement of operations for the year ended October 31, 2018, the consolidated statement of changes in net assets for each of the two years in the period ended October 31, 2018, including the related notes, and the financial highlights for each of the periods indicated therein (collectively referred to as the financial statements). In our opinion, the financial statements present fairly, in all material respects, the financial position of the Fund as of October 31, 2018, the results of its operations for the year then ended, the changes in its net assets for each of the two years in the period ended October 31, 2018 and the financial highlights for each of the periods indicated therein in conformity with accounting principles generally accepted in the United States of America.
Basis for Opinion
These financial statements are the responsibility of the Fund’s management. Our responsibility is to express an opinion on the Fund’s financial statements based on our audits. We are a public accounting firm registered with the Public Company Accounting Oversight Board (United States) (PCAOB) and are required to be independent with respect to the Fund in accordance with the U.S. federal securities laws and the applicable rules and regulations of the Securities and Exchange Commission and the PCAOB.
We conducted our audits of these financial statements in accordance with the standards of the PCAOB. Those standards require that we plan and perform the audit to obtain reasonable assurance about whether the financial statements are free of material misstatement, whether due to error or fraud.
Our audits included performing procedures to assess the risks of material misstatement of the financial statements, whether due to error or fraud, and performing procedures that respond to those risks. Such procedures included examining, on a test basis, evidence regarding the amounts and disclosures in the financial statements. Our audits also included evaluating the accounting principles used and significant estimates made by management, as well as evaluating the overall presentation of the financial statements. Our procedures included confirmation of securities owned as of October 31, 2018 by correspondence with the custodian, transfer agent and brokers; when replies were not received from brokers, we performed other auditing procedures. We believe that our audits provide a reasonable basis for our opinion.
PricewaterhouseCoopers LLP
Houston, TX
December 28, 2018
We have served as the auditor of one or more of the investment companies in the Invesco group of investment companies since at least 1995. We have not been able to determine the specific year we began serving as auditor.
68 Invesco Global Targeted Returns Fund
Calculating your ongoing Fund expenses
Example
As a shareholder of the Fund, you incur two types of costs: (1) transaction costs, which may include sales charges (loads) on purchase payments or contingent deferred sales charges on redemptions, if any; and (2) ongoing costs, including management fees, distribution and/or service (12b-1) fees, and other Fund expenses. This example is intended to help you understand your ongoing costs (in dollars) of investing in the Fund and to compare these costs with ongoing costs of investing in other mutual funds. The example is based on an investment of $1,000 invested at the beginning of the period and held for the entire period May 1, 2018 through October 31, 2018.
Actual expenses
The table below provides information about actual account values and actual expenses. You may use the information in this table, together with the amount you invested, to estimate the expenses that you paid over the period. Simply divide your account value by $1,000 (for example, an $8,600 account value divided by $1,000 = 8.6), then multiply the result by the number in the table under the heading entitled “Actual Expenses Paid During Period” to estimate the expenses you paid on your account during this period.
Hypothetical example for comparison purposes
The table below also provides information about hypothetical account values and hypothetical expenses based on the Fund’s actual expense ratio and an assumed rate of return of 5% per year before expenses, which is not the Fund’s actual return.
The hypothetical account values and expenses may not be used to estimate the actual ending account balance or expenses you paid for the period. You may use this information to compare the ongoing costs of investing in the Fund and other funds. To do so, compare this 5% hypothetical example with the 5% hypothetical examples that appear in the shareholder reports of the other funds.
Please note that the expenses shown in the table are meant to highlight your ongoing costs only and do not reflect any transaction costs, such as sales charges (loads) on purchase payments or contingent deferred sales charges on redemptions, if any. Therefore, the hypothetical information is useful in comparing ongoing costs only, and will not help you determine the relative total costs of owning different funds. In addition, if these transaction costs were included, your costs would have been higher.
| | | | | | | | | | | | | | | | | | | | | | | | |
| Class | | Beginning
Account Value
(05/01/18) | | | ACTUAL | | | HYPOTHETICAL
(5% annual return before
expenses) | | | Annualized
Expense Ratio | |
| | Ending
Account Value
(10/31/18)1 | | | Expenses
Paid During
Period2 | | | Ending
Account Value
(10/31/18) | | | Expenses
Paid During
Period2 | |
A | | $ | 1,000.00 | | | $ | 973.70 | | | $ | 6.96 | | | $ | 1,018.15 | | | $ | 7.12 | | | | 1.40 | % |
C | | | 1,000.00 | | | | 970.00 | | | | 10.68 | | | | 1,014.37 | | | | 10.92 | | | | 2.15 | |
R | | | 1,000.00 | | | | 972.50 | | | | 8.20 | | | | 1,016.89 | | | | 8.39 | | | | 1.65 | |
Y | | | 1,000.00 | | | | 974.90 | | | | 5.72 | | | | 1,019.41 | | | | 5.85 | | | | 1.15 | |
R5 | | | 1,000.00 | | | | 974.90 | | | | 5.72 | | | | 1,019.41 | | | | 5.85 | | | | 1.15 | |
R6 | | | 1,000.00 | | | | 974.90 | | | | 5.72 | | | | 1,019.41 | | | | 5.85 | | | | 1.15 | |
| 1 | The actual ending account value is based on the actual total return of the Fund for the period May 1, 2018 through October 31, 2018, after actual expenses and will differ from the hypothetical ending account value which is based on the Fund’s expense ratio and a hypothetical annual return of 5% before expenses. |
| 2 | Expenses are equal to the Fund’s annualized expense ratio as indicated above multiplied by the average account value over the period, multiplied by 184/365 to reflect the most recent fiscal half year. |
69 Invesco Global Targeted Returns Fund
Approval of Investment Advisory and Sub-Advisory Contracts
At meetings held on June 5-6, 2018, the Board of Trustees (the Board or the Trustees) of AIM Investment Funds (Invesco Investment Funds) as a whole, and the independent Trustees, who comprise over 75% of the Board, voting separately, approved the continuance of the Invesco Global Targeted Return Fund’s (the Fund) Master Investment Advisory Agreement with Invesco Advisers, Inc. (Invesco Advisers and the investment advisory agreement) and the Master Intergroup Sub-Advisory Contract for Mutual Funds with Invesco Asset Management Deutschland GmbH, Invesco Asset Management Limited, Invesco Asset Management (Japan) Limited, Invesco Hong Kong Limited, Invesco Senior Secured Management, Inc., Invesco Canada Ltd. and separate Sub-Advisory Contracts with Invesco Capital Management LLC and Invesco Asset Management (India) Private Limited (collectively, the Affiliated Sub-Advisers and the sub-advisory contracts) for another year, effective July 1, 2018. After evaluating the factors discussed below, among others, the Board approved the renewal of the Fund’s investment advisory agreement and the sub-advisory contracts and determined that the compensation payable by the Fund to Invesco Advisers and by Invesco Advisers to the Affiliated Sub-Advisers is fair and reasonable.
The Board’s Evaluation Process
The Board’s Investments Committee has established three Sub-Committees, which meet throughout the year to review the performance of funds advised by Invesco Advisers (the Invesco Funds). Over the course of each year, the Sub-Committees meet with portfolio managers for their assigned Invesco Funds and other members of management to review detailed information about investment performance and portfolio attributes of these funds. The Board took into account evaluations and reports that it received from the Investments Committee and Sub-Committees, as well as the information provided to such committees and the Board throughout the year, in considering whether to approve each Invesco Fund’s investment advisory agreement and sub-advisory contracts.
As part of the contract renewal process, the Board reviews and considers information provided in response to detailed requests for information submitted to management by the independent Trustees with assistance from legal counsel to the independent Trustees. The Board receives comparative investment performance and fee data regarding the Invesco Funds prepared by Invesco Advisers and Broadridge Financial Solutions, Inc. (Broadridge), an independent mutual fund data provider. The Board also receives an independent written evaluation from the Senior Officer, an officer of the Invesco Funds who reports directly to the independent Trustees. The Senior Officer’s
evaluation is prepared as part of his responsibility to manage the process by which the Invesco Funds’ proposed management fees are negotiated during the annual contract renewal process to ensure they are negotiated in a manner that is at arms’ length and reasonable. In addition to meetings with Invesco Advisers and fund counsel throughout the year, the independent Trustees also discuss the continuance of the investment advisory agreement and sub-advisory contracts in separate sessions with the Senior Officer and with independent legal counsel.
The discussion below is a summary of the Senior Officer’s independent written evaluation with respect to the Fund’s investment advisory agreement, as well as a discussion of the material factors and related conclusions that formed the basis for the Board’s approval of the Fund’s investment advisory agreement and sub-advisory contracts. The Trustees’ review and conclusions are based on the comprehensive consideration of all information presented to them during the course of the year and in prior years and are not the result of any single determinative factor. Moreover, one Trustee may have weighed a particular piece of information or factor differently than another Trustee. This information is current as of June 6, 2018.
Factors and Conclusions and Summary of Independent Written Fee Evaluation
| A. | Nature, Extent and Quality of Services Provided by Invesco Advisers and the Affiliated Sub-Advisers |
The Board reviewed the nature, extent and quality of the advisory services provided to the Fund by Invesco Advisers under the Fund’s investment advisory agreement, and the credentials and experience of the officers and employees of Invesco Advisers who provide these services, including the Fund’s portfolio manager(s). The Board’s review included consideration of Invesco Advisers’ investment process oversight and structure, credit analysis and investment risk management. The Board also considered non-advisory services that Invesco Advisers and its affiliates provide to the Invesco Funds such as various back office support functions, third party oversight, internal audit, valuation, portfolio trading and legal and compliance. The Board also reviewed and considered the benefits to shareholders of investing in a fund that is part of the Invesco family of funds under the umbrella of Invesco Ltd., Invesco Advisers’ parent company, and noted Invesco Ltd.’s depth and experience in conducting an investment management business, as well as its commitment of financial and other resources to such business. The Board concluded that the nature, extent and quality of the services provided to the Fund by
Invesco Advisers are appropriate and satisfactory.
The Board reviewed the services that may be provided by the Affiliated Sub-Advisers under the sub-advisory contracts and the credentials and experience of the officers and employees of the Affiliated Sub-Advisers who provide these services. The Board noted the Affiliated Sub-Advisers’ expertise with respect to certain asset classes and that the Affiliated Sub-Advisers have offices and personnel that are located in financial centers around the world. As a result, the Board noted that the Affiliated Sub-Advisers can provide research and investment analysis on the markets and economies of various countries in which the Fund may invest, make recommendations regarding securities and assist with security trades. The Board concluded that the sub-advisory contracts may benefit the Fund and its shareholders by permitting Invesco Advisers to use the resources and talents of the Affiliated Sub-Advisers in managing the Fund. The Board concluded that the nature, extent and quality of the services that may be provided by the Affiliated Sub-Advisers are appropriate and satisfactory.
| B. | Fund Investment Performance |
The Board considered Fund investment performance as a relevant factor in considering whether to approve the investment advisory agreement as well as the sub-advisory contracts for the Fund, as Invesco Asset Management Limited currently manages assets of the Fund.
The Board compared the Fund’s investment performance over multiple time periods ending December 31, 2017 to the performance of funds in the Broadridge performance universe and against the Lipper Absolute Return Funds Index. The Board noted that performance of Class A shares of the Fund was in the fifth quintile of its performance universe for the one year period and the fourth quintile for the three year period (the first quintile being the best performing funds and the fifth quintile being the worst performing funds). The Board noted that performance of Class A shares of the Fund was below the performance of the Index for the one and three year periods. The Board noted that the Fund’s equity exposure relative to its peers detracted from Fund performance. The Board further noted that the Fund’s Lipper classification is highly diverse and therefore relative rankings may provide limited insight into the portfolio manager’s investment skill. The Board also noted that the Fund had recently transitioned from investing primarily in underlying funds in a fund-of-funds structure to investing primarily in direct investments in a sleeved structure. The Trustees also reviewed more recent Fund performance and this review did not change their conclusions.
70 Invesco Global Targeted Returns Fund
| C. | Advisory and Sub-Advisory Fees and Fund Expenses |
The Board compared the Fund’s contractual management fee rate to the contractual management fee rates of funds in the Fund’s Broadridge expense group. The Board noted that the contractual management fee rate for Class A shares of the Fund was above the median contractual management fee rate of funds in its expense group. The Board noted that the term “contractual management fee” for funds in the expense group may include both advisory and certain non-portfolio management administrative services fees, but that Broadridge does not provide information on a fund by fund basis as to what is included. The Board also reviewed the methodology used by Broadridge in providing expense group information, which includes using each fund’s contractual management fee schedule (including any applicable breakpoints) as reported in the most recent prospectus or statement of additional information for each fund in the expense group. The Board also considered comparative information regarding the Fund’s total expense ratio and its various components. The Board noted that the Fund’s contractual management fees were in the fourth quintile of its expense group and discussed with management reasons for such relative contractual management fees.
The Board noted that Invesco Advisers has contractually agreed to waive fees and/or limit expenses of the Fund in an amount necessary to limit total annual operating expenses to a specified percentage of average daily net assets for each class of the Fund.
The Board also considered the fees charged by Invesco Advisers and the Affiliated Sub-Advisers to other similarly managed client accounts. The Board noted that Invesco Advisers or the Affiliated Sub-Advisers may charge lower fees to large institutional clients. Invesco Advisers reviewed with the Board differences in the scope of services it provides to the Invesco Funds relative to certain other types of client accounts, including management of cash flows as a result of redemptions and purchases, necessary infrastructure such as officers, office space, technology, legal and distribution, oversight of service providers, costs and business risks associated with launching new funds and sponsoring and maintaining the product line, preparation of annual registration statement updates and financial information and compliance with federal and state laws and regulations.
The Board also considered the services that may be provided by the Affiliated Sub-Advisers pursuant to the sub-advisory contracts, as well as the fees payable by Invesco Advisers to the Affiliated Sub-Advisers pursuant to the sub-advisory contracts. The Board noted that Invesco Advisers retains overall responsibility for, and provides services to, sub-advised Invesco Funds, including oversight of the Affiliated Sub-Advisers as well as the additional
services described herein other than day-to-day portfolio management.
| D. | Economies of Scale and Breakpoints |
The Board considered the extent to which there may be economies of scale in the provision of advisory services to the Fund. The Board also considered that the Fund may benefit from economies of scale through contractual breakpoints in the Fund’s advisory fee schedule, which generally operate to reduce the Fund’s expense ratio as it grows in size. The Board noted that the Fund shares directly in economies of scale through lower fees charged by third party service providers based on the combined size of the Invesco Funds. The Board noted that the Fund may also benefit from economies of scale through initial fee setting, fee waivers and expense reimbursements.
| E. | Profitability and Financial Resources |
The Board reviewed information from Invesco Advisers concerning the costs of the advisory and other services that Invesco Advisers and its affiliates provide to the Fund and the Invesco Funds and the profitability of Invesco Advisers and its affiliates in providing these services. The Board considered the methodology used for calculating profitability and noted the periodic review of such methodology by an independent consultant. The Board noted that Invesco Advisers continues to operate at a net profit from services Invesco Advisers and its affiliates provide to the Invesco Funds and the Fund. The Board did not deem the level of profits realized by Invesco Advisers and its affiliates from providing services to the Fund to be excessive given the nature, extent and quality of the services provided. The Board received information from Invesco Advisers demonstrating that Invesco Advisers and the Affiliated Sub-Advisers are financially sound and have the resources necessary to perform their obligations under the investment advisory agreement and sub-advisory contracts.
| F. | Collateral Benefits to Invesco Advisers and its Affiliates |
The Board considered various other benefits received by Invesco Advisers and its affiliates from the relationship with the Fund, including the fees received for providing administrative transfer agency and distribution services to the Fund. The Board considered comparative information regarding fees charged for these services, including information provided by Broadridge and other independent sources. The Board considered the performance of Invesco Advisers and its affiliates in providing these services and the organizational structure employed to provide these services. The Board also considered that these services are provided to the Fund pursuant to written contracts that are reviewed and approved on an annual basis by the Board; and that the services are required for the operation of the Fund.
The Board considered the benefits realized by Invesco Advisers and the Affiliated Sub-Advisers as a result of portfolio brokerage transactions executed through “soft dollar” arrangements. Invesco Advisers noted that the Fund does not
execute brokerage transactions through “soft dollar” arrangements to any significant degree.
The Board considered that the Fund’s uninvested cash and cash collateral from any securities lending arrangements may be invested in money market funds advised by Invesco Advisers pursuant to procedures approved by the Board. The Board noted that Invesco Advisers receives advisory fees from these affiliated money market funds attributable to such investments, although Invesco Advisers has contractually agreed to waive through varying periods the advisory fees payable by the Invesco Funds with respect to certain investments in the affiliated money market funds. The waiver is in an amount equal to 100% of the net advisory fee Invesco Advisers receives from the affiliated money market funds with respect to the Fund’s investment in the affiliated money market funds of uninvested cash, but not cash collateral. The Board concluded that the amount of advisory fees received by Invesco Advisers from the Fund’s investment of cash collateral from any securities lending arrangements in the affiliated money market funds is fair and reasonable.
71 Invesco Global Targeted Returns Fund
Tax Information
Form 1099-DIV, Form 1042–S and other year-end tax information provide shareholders with actual calendar year amounts that should be included in their tax returns. Shareholders should consult their tax advisors.
The following distribution information is being provided as required by the Internal Revenue Code or to meet a specific state’s requirement.
The Fund designates the following amounts or, if subsequently determined to be different, the maximum amount allowable for its fiscal year ended October 31, 2018:
| | | | |
Federal and State Income Tax | |
Qualified Dividend Income* | | | 0.00 | % |
Corporate Dividends Received Deduction* | | | 0.00 | % |
U.S. Treasury Obligations* | | | 0.46 | % |
| | * | The above percentages are based on ordinary income dividends paid to shareholders during the Fund’s fiscal year. |
72 Invesco Global Targeted Returns Fund
Trustees and Officers
The address of each trustee and officer is AIM Investment Funds (Invesco Investment Funds) (the “Trust”), 11 Greenway Plaza, Suite 1000, Houston, Texas 77046-1173. The trustees serve for the life of the Trust, subject to their earlier death, incapacitation, resignation, retirement or removal as more specifically provided in the Trust’s organizational documents. Each officer serves for a one year term or until their successors are elected and qualified. Column two below includes length of time served with predecessor entities, if any.
| | | | | | | | |
Name, Year of Birth and
Position(s) Held with the Trust | | Trustee and/
or Officer Since | | Principal Occupation(s)
During Past 5 Years | | Number of
Funds in Fund
Complex
Overseen by
Trustee | | Other Directorship(s)
Held by Trustee During
Past 5 Years |
| Interested Persons | | | | | | | | |
| Martin L. Flanagan1 — 1960 Trustee | | 2007 | | Executive Director, Chief Executive Officer and President, Invesco Ltd. (ultimate parent of Invesco and a global investment management firm); Trustee, The Invesco Funds; Vice Chair, Investment Company Institute; and Member of Executive Board, SMU Cox School of Business Formerly: Advisor to the Board, Invesco Advisers, Inc. (formerly known as Invesco Institutional (N.A.), Inc.); Chairman and Chief Executive Officer, Invesco Advisers, Inc. (registered investment adviser); Director, Chairman, Chief Executive Officer and President, Invesco Holding Company (US), Inc. (formerly IVZ Inc.) (holding company), Invesco Group Services, Inc. (service provider) and Invesco North American Holdings, Inc. (holding company); Director, Chief Executive Officer and President, Invesco Holding Company Limited (parent of Invesco and a global investment management firm); Director, Invesco Ltd.; Chairman, Investment Company Institute and President, Co-Chief Executive Officer, Co-President, Chief Operating Officer and Chief Financial Officer, Franklin Resources, Inc. (global investment management organization) | | 158 | | None |
Philip A. Taylor2 — 1954 Trustee and Senior Vice President | | 2006 | | Head of the Americas and Senior Managing Director, Invesco Ltd.; Director, Invesco Advisers, Inc. (formerly known as Invesco Institutional (N.A.), Inc.) (registered investment adviser); Director and Chairman, Invesco Investment Services, Inc. (formerly known as Invesco AIM Investment Services, Inc.) (registered transfer agent); Chief Executive Officer, Invesco Corporate Class Inc. (corporate mutual fund company); Director, Chairman and Chief Executive Officer, Invesco Canada Ltd. (formerly known as Invesco Trimark Ltd./Invesco Trimark Ltèe) (registered investment adviser and registered transfer agent); Trustee and Senior Vice President, The Invesco Funds; Director, Invesco Investment Advisers LLC (formerly known as Van Kampen Asset Management) Formerly: Director, Chairman, Chief Executive Officer and President, Invesco Management Group, Inc. (formerly known as Invesco AIM Management Group, Inc.) (financial services holding company); Co-Chairman, Co-President and Co-Chief Executive Officer, Invesco Advisers, Inc. (formerly known as Invesco Institutional (N.A.), Inc.) (registered investment adviser); Director, Chief Executive Officer and President, Van Kampen Exchange Corp; President and Principal Executive Officer, The Invesco Funds (other than AIM Treasurer’s Series Trust (Invesco Treasurer’s Series Trust), Short-Term Investments Trust and Invesco Management Trust); Executive Vice President, The Invesco Funds (AIM Treasurer’s Series Trust (Invesco Treasurer’s Series Trust), Short-Term Investments Trust and Invesco Management Trust only); Director and President, INVESCO Funds Group, Inc. (registered investment adviser and registered transfer agent); Director and Chairman, IVZ Distributors, Inc. (formerly known as INVESCO Distributors, Inc.) (registered broker dealer); Director, President and Chairman, Invesco Inc. (holding company), Invesco Canada Holdings Inc. (holding company), Trimark Investments Ltd./Placements Trimark Ltèe and Invesco Financial Services Ltd/Services Financiers Invesco Ltèe; Chief Executive Officer, Invesco Canada Fund Inc. (corporate mutual fund company); Director and Chairman, Van Kampen Investor Services Inc.; Director, Chief Executive Officer and President, 1371 Preferred Inc. (holding company) and Van Kampen Investments Inc.; Director and President, AIM GP Canada Inc. (general partner for limited partnerships) and Van Kampen Advisors, Inc.; Director and Chief Executive Officer, Invesco Trimark Dealer Inc. (registered broker dealer); Director, Invesco Distributors, Inc. (formerly known as Invesco AIM Distributors, Inc.) (registered broker dealer); Manager, Invesco Capital Management LLC; Director, Chief Executive Officer and President, Invesco Advisers, Inc.; Director, Chairman, Chief Executive Officer and President, Invesco AIM Capital Management, Inc.; President, Invesco Trimark Dealer Inc. and Invesco Trimark Ltd./Invesco Trimark Ltèe; Director and President, AIM Trimark Corporate Class Inc. and AIM Trimark Canada Fund Inc.; Senior Managing Director, Invesco Holding Company Limited; Director and Chairman, Fund Management Company (former registered broker dealer); President and Principal Executive Officer, The Invesco Funds (AIM Treasurer’s Series Trust (Invesco Treasurer’s Series Trust), and Short-Term Investments Trust only); President, AIM Trimark Global Fund Inc. and AIM Trimark Canada Fund Inc. | | 158 | | None |
| 1 | Mr. Flanagan is considered an interested person (within the meaning of Section 2(a)(19) of the 1940 Act) of the Trust because he is an officer of the Adviser to the Trust, and an officer and a director of Invesco Ltd., ultimate parent of the Adviser. |
| 2 | Mr. Taylor is considered an interested person (within the meaning of Section 2(a)(19) of the 1940 Act) of the Trust because he is an officer and a director of the Adviser. |
T-1 Invesco Global Targeted Returns Fund
Trustees and Officers—(continued)
| | | | | | | | |
Name, Year of Birth and
Position(s) Held with the Trust | | Trustee and/
or Officer Since | | Principal Occupation(s)
During Past 5 Years | | Number of
Funds in Fund
Complex
Overseen by
Trustee | | Other Directorship(s)
Held by Trustee During
Past 5 Years |
| Independent Trustees | | | | | | | | |
Bruce L. Crockett — 1944 Trustee and Chair | | 2001 | | Chairman, Crockett Technologies Associates (technology consulting company) Formerly: Director, Captaris (unified messaging provider); Director, President and Chief Executive Officer, COMSAT Corporation; Chairman, Board of Governors of INTELSAT (international communications company); ACE Limited (insurance company); Independent Directors Council and Investment Company Institute: Member of the Audit Committee, Investment Company Institute; Member of the Executive Committee and Chair of the Governance Committee, Independent Directors Council | | 158 | | Director and Chairman of the Audit Committee, ALPS (Attorneys Liability Protection Society) (insurance company); Director and Member of the Audit Committee and Compensation Committee, Ferroglobe PLC (metallurgical company) |
David C. Arch — 1945 Trustee | | 2010 | | Chairman of Blistex Inc. (consumer health care products manufacturer); Member, World Presidents’ Organization | | 158 | | Board member of the Illinois Manufacturers’ Association |
Jack M. Fields — 1952 Trustee | | 2001 | | Chief Executive Officer, Twenty First Century Group, Inc. (government affairs company); and Chairman, Discovery Learning Alliance (non-profit) Formerly: Owner and Chief Executive Officer, Dos Angeles Ranch L.P. (cattle, hunting, corporate entertainment); Director, Insperity, Inc. (formerly known as Administaff) (human resources provider); Chief Executive Officer, Texana Timber LP (sustainable forestry company); Director of Cross Timbers Quail Research Ranch (non-profit); and member of the U.S. House of Representatives | | 158 | | None |
Cynthia Hostetler — 1962 Trustee | | 2017 | | Non-Executive Director and Trustee of a number of public and private business corporations Formerly: Director, Aberdeen Investment Funds (4 portfolios); Head of Investment Funds and Private Equity, Overseas Private Investment Corporation; President, First Manhattan Bancorporation, Inc.; Attorney, Simpson Thacher & Bartlett LLP | | 158 | | Vulcan Materials Company (construction materials company); Trilinc Global Impact Fund; Artio Global Investment LLC (mutual fund complex); Edgen Group, Inc. (specialized energy and infrastructure products distributor) |
Eli Jones — 1961 Trustee | | 2016 | | Professor and Dean, Mays Business School — Texas A&M University Formerly: Professor and Dean, Walton College of Business, University of Arkansas and E.J. Ourso College of Business, Louisiana State University; Director, Arvest Bank | | 158 | | Insperity, Inc. (formerly known as Administaff) (human resources provider) |
Prema Mathai-Davis — 1950 Trustee | | 2001 | | Retired | | 158 | | None |
Teresa M. Ressel — 1962 Trustee | | 2017 | | Non-executive director and trustee of a number of public and private business corporations Formerly: Chief Financial Officer, Olayan America, The Olayan Group (international investor/commercial/industrial); Chief Executive Officer, UBS Securities LLC; Group Chief Operating Officer, Americas, UBS AG; Assistant Secretary for Management & Budget and CFO, US Department of the Treasury | | 158 | | Atlantic Power Corporation (power generation company); ON Semiconductor Corp. (semiconductor supplier) |
Ann Barnett Stern — 1957 Trustee | | 2017 | | President and Chief Executive Officer, Houston Endowment Inc. (private philanthropic institution) Formerly: Executive Vice President and General Counsel, Texas Children’s Hospital; Attorney, Beck, Redden and Secrest, LLP; Business Law Instructor, University of St. Thomas; Attorney, Andrews & Kurth LLP | | 158 | | Federal Reserve Bank of Dallas |
Raymond Stickel, Jr. — 1944 Trustee | | 2005 | | Retired Formerly: Director, Mainstay VP Series Funds, Inc. (25 portfolios); Partner, Deloitte & Touche | | 158 | | None |
Robert C. Troccoli — 1949 Trustee | | 2016 | | Adjunct Professor, University of Denver — Daniels College of Business Formerly: Senior Partner, KPMG LLP | | 158 | | None |
Christopher L. Wilson — 1957 Trustee | | 2017 | | Non-executive director and trustee of a number of public and private business corporations Formerly: Director, TD Asset Management USA Inc. (mutual fund complex) (22 portfolios); Managing Partner, CT2, LLC (investing and consulting firm); President/Chief Executive Officer, Columbia Funds, Bank of America Corporation; President/Chief Executive Officer, CDC IXIS Asset Management Services, Inc.; Principal & Director of Operations, Scudder Funds, Scudder, Stevens & Clark, Inc.; Assistant Vice President, Fidelity Investments | | 158 | | ISO New England, Inc. (non-profit organization managing regional electricity market) |
T-2 Invesco Global Targeted Returns Fund
Trustees and Officers—(continued)
| | | | | | | | |
Name, Year of Birth and
Position(s) Held with the Trust | | Trustee and/
or Officer Since | | Principal Occupation(s)
During Past 5 Years | | Number of
Funds in Fund
Complex
Overseen by
Trustee | | Other Directorship(s)
Held by Trustee During
Past 5 Years |
| Other Officers | | | | | | | | |
Sheri Morris — 1964 President, Principal Executive Officer and Treasurer | | 1999 | | President, Principal Executive Officer and Treasurer, The Invesco Funds; Vice President, Invesco Advisers, Inc. (formerly known as Invesco Institutional (N.A.), Inc.) (registered investment adviser); and Vice President, Invesco Exchange-Traded Fund Trust, Invesco Exchange-Traded Fund Trust II, Invesco India Exchange-Traded Fund Trust, Invesco Actively Managed Exchange-Traded Fund Trust, Invesco Actively Managed Exchange-Traded Commodity Fund Trust and Invesco Exchange-Traded Self-Indexed Fund Trust Formerly: Vice President and Principal Financial Officer, The Invesco Funds; Vice President, Invesco AIM Advisers, Inc., Invesco AIM Capital Management, Inc. and Invesco AIM Private Asset Management, Inc.; Assistant Vice President and Assistant Treasurer, The Invesco Funds and Assistant Vice President, Invesco Advisers, Inc., Invesco AIM Capital Management, Inc. and Invesco AIM Private Asset Management, Inc.; and Treasurer, Invesco Exchange-Traded Fund Trust, Invesco Exchange-Traded Fund Trust II, Invesco India Exchange-Traded Fund Trust and Invesco Actively Managed Exchange-Traded Fund Trust | | N/A | | N/A |
Russell C. Burk — 1958 Senior Vice President and Senior Officer | | 2005 | | Senior Vice President and Senior Officer, The Invesco Funds | | N/A | | N/A |
Jeffrey H. Kupor — 1968 Senior Vice President, Chief Legal Officer and Secretary | | 2018 | | Senior Vice President and Secretary, Invesco Advisers, Inc. (formerly known as Invesco Institutional (N.A.), Inc.) (registered investment adviser); Senior Vice President and Secretary, Invesco Distributors, Inc. (formerly known as Invesco AIM Distributors, Inc.); Vice President and Secretary, Invesco Investment Services, Inc. (formerly known as Invesco AIM Investment Services, Inc.) Senior Vice President, Chief Legal Officer and Secretary, The Invesco Funds; Secretary and General Counsel, Invesco Investment Advisers LLC (formerly known as Van Kampen Asset Management); Secretary and General Counsel, Invesco Capital Markets, Inc. (formerly known as Van Kampen Funds Inc.) and Chief Legal Officer, Invesco Exchange-Traded Fund Trust, Invesco Exchange-Traded Fund Trust II, Invesco India Exchange-Traded Fund Trust, Invesco Actively Managed Exchange-Traded Fund Trust, Invesco Actively Managed Exchange-Traded Commodity Fund Trust and Invesco Exchange-Traded Self-Indexed Fund Trust; Secretary, Invesco Indexing LLC; Secretary and General Counsel, INVESCO Private Capital Investments, Inc.; Secretary, W.L. Ross & Co., LLC; Secretary and Vice President, Jemstep, Inc. Formerly: Senior Vice President, Secretary and General Counsel, Invesco Management Group, Inc. (formerly known as Invesco AIM Management Group, Inc.); Assistant Secretary, INVESCO Asset Management (Bermuda) Ltd.; Secretary and General Counsel, Invesco Private Capital, Inc.; Assistant Secretary and General Counsel, INVESCO Realty, Inc.; Secretary and General Counsel, Invesco Senior Secured Management, Inc.; and Secretary, Sovereign G./P. Holdings Inc. | | N/A | | N/A |
John M. Zerr — 1962 Senior Vice President | | 2006 | | Chief Operating Officer of the Americas; Senior Vice President, Invesco Advisers, Inc. (formerly known as Invesco Institutional (N.A.), Inc.) (registered investment adviser); Senior Vice President, Invesco Distributors, Inc. (formerly known as Invesco AIM Distributors, Inc.); Director and Vice President, Invesco Investment Services, Inc. (formerly known as Invesco AIM Investment Services, Inc.) Senior Vice President, The Invesco Funds; Managing Director, Invesco Capital Management LLC; Director, Invesco Investment Advisers LLC (formerly known as Van Kampen Asset Management); Senior Vice President, Invesco Capital Markets, Inc. (formerly known as Van Kampen Funds Inc.); Manager, Invesco Indexing LLC Formerly: Director and Senior Vice President, Invesco Management Group, Inc. (formerly known as Invesco AIM Management Group, Inc.); Secretary and General Counsel, Invesco Management Group, Inc. (formerly known as Invesco AIM Management Group, Inc.); Secretary, Invesco Investment Services, Inc. (formerly known as Invesco AIM Investment Services, Inc.); Chief Legal Officer and Secretary, The Invesco Funds; Secretary and General Counsel, Invesco Investment Advisers LLC (formerly known as Van Kampen Asset Management); Secretary and General Counsel, Invesco Capital Markets, Inc. (formerly known as Van Kampen Funds Inc.); Chief Legal Officer, Invesco Exchange-Traded Fund Trust, Invesco Exchange-Traded Fund Trust II, Invesco India Exchange-Traded Fund Trust, Invesco Actively Managed Exchange-Traded Fund Trust, Invesco Actively Managed Exchange-Traded Commodity Fund Trust and Invesco Exchange-Traded Self-Indexed Fund Trust; Secretary, Invesco Indexing LLC; Director, Secretary, General Counsel and Senior Vice President, Van Kampen Exchange Corp.; Director, Vice President and Secretary, IVZ Distributors, Inc. (formerly known as INVESCO Distributors, Inc.); Director and Vice President, INVESCO Funds Group, Inc.; Director and Vice President, Van Kampen Advisors Inc.; Director, Vice President, Secretary and General Counsel, Van Kampen Investor Services Inc.; Director and Secretary, Invesco Distributors, Inc. (formerly known as Invesco AIM Distributors, Inc.); Director, Senior Vice President, General Counsel and Secretary, Invesco AIM Advisers, Inc. and Van Kampen Investments Inc.; Director, Vice President and Secretary, Fund Management Company; Director, Senior Vice President, Secretary, General Counsel and Vice President, Invesco AIM Capital Management, Inc.; Chief Operating Officer and General Counsel, Liberty Ridge Capital, Inc. (an investment adviser) | | N/A | | N/A |
T-3 Invesco Global Targeted Returns Fund
Trustees and Officers—(continued)
| | | | | | | | |
Name, Year of Birth and
Position(s) Held with the Trust | | Trustee and/
or Officer Since | | Principal Occupation(s)
During Past 5 Years | | Number of
Funds in Fund
Complex
Overseen by
Trustee | | Other Directorship(s)
Held by Trustee During
Past 5 Years |
| Other Officers—(continued) | | | | | | | | |
Gregory G. McGreevey — 1962 Senior Vice President | | 2012 | | Senior Managing Director, Invesco Ltd.; Director, Chairman, President, and Chief Executive Officer, Invesco Advisers, Inc. (formerly known as Invesco Institutional (N.A.), Inc.) (registered investment adviser); Director, Invesco Mortgage Capital, Inc. and Invesco Senior Secured Management, Inc.; and Senior Vice President, The Invesco Funds Formerly: Senior Vice President, Invesco Management Group, Inc. and Invesco Advisers, Inc.; Assistant Vice President, The Invesco Funds | | N/A | | N/A |
Kelli Gallegos — 1970 Vice President, Principal Financial Officer and Assistant Treasurer | | 2008 | | Vice President and Treasurer, Invesco Exchange-Traded Fund Trust, Invesco Exchange-Traded Fund Trust II, Invesco India Exchange-Traded Fund Trust, Invesco Actively Managed Exchange-Traded Fund Trust, Invesco Actively Managed Exchange-Traded Commodity Fund Trust and Invesco Exchange-Traded Self-Indexed Fund Trust; Vice President, Principal Financial Officer and Assistant Treasurer, The Invesco Funds; Principal Financial and Accounting Officer — Pooled Investments, Invesco Capital Management LLC Formerly: Assistant Treasurer, Invesco Exchange-Traded Fund Trust, Invesco Exchange-Traded Fund Trust II, Invesco India Exchange-Traded Fund Trust, Invesco Actively Managed Exchange-Traded Fund Trust, Invesco Actively Managed Exchange-Traded Commodity Fund Trust and Invesco Exchange-Traded Self-Indexed Fund Trust; Assistant Treasurer, Invesco Capital Management LLC; Assistant Vice President, The Invesco Funds | | N/A | | N/A |
Tracy Sullivan — 1962 Vice President, Chief Tax Officer and Assistant Treasurer | | 2008 | | Vice President, Chief Tax Officer and Assistant Treasurer, The Invesco Funds; Assistant Treasurer, Invesco Capital Management LLC, Invesco Exchange-Traded Fund Trust, Invesco Exchange-Traded Fund Trust II, Invesco India Exchange-Traded Fund Trust, Invesco Actively Managed Exchange-Traded Fund Trust, Invesco Actively Managed Exchange-Traded Commodity Fund Trust and Invesco Exchange-Traded Self-Indexed Fund Trust Formerly: Assistant Vice President, The Invesco Funds | | N/A | | N/A |
Crissie M. Wisdom — 1969 Anti-Money Laundering Compliance Officer | | 2013 | | Anti-Money Laundering Compliance Officer, Invesco Advisers, Inc. (formerly known as Invesco Institutional (N.A.), Inc.) (registered investment adviser), Invesco Capital Markets, Inc. (formerly known as Van Kampen Funds Inc.), Invesco Distributors, Inc., Invesco Investment Services, Inc., The Invesco Funds, and Invesco Exchange-Traded Fund Trust, Invesco Exchange-Traded Fund Trust II, Invesco India Exchange-Traded Fund Trust, Invesco Actively Managed Exchange-Traded Fund Trust, Invesco Actively Managed Exchange-Traded Commodity Fund Trust and Invesco Exchange-Traded Self-Indexed Fund Trust; Anti-Money Laundering Compliance Officer and Bank Secrecy Act Officer, INVESCO National Trust Company and Invesco Trust Company; and Fraud Prevention Manager and Controls and Risk Analysis Manager for Invesco Investment Services, Inc. Formerly: Anti-Money Laundering Compliance Officer, Van Kampen Exchange Corp. and Invesco Management Group, Inc. | | N/A | | N/A |
Robert R. Leveille — 1969 Chief Compliance Officer | | 2016 | | Chief Compliance Officer, Invesco Advisers, Inc. (registered investment adviser); and Chief Compliance Officer, The Invesco Funds Formerly: Chief Compliance Officer, Putnam Investments and the Putnam Funds | | N/A | | N/A |
The Statement of Additional Information of the Trust includes additional information about the Fund’s Trustees and is available upon request, without charge, by calling 1.800.959.4246. Please refer to the Fund’s Statement of Additional Information for information on the Fund’s sub-advisers.
| | | | | | |
Office of the Fund 11 Greenway Plaza, Suite 1000 Houston, TX 77046-1173 | | Investment Adviser Invesco Advisers, Inc. 1555 Peachtree Street, N.E. Atlanta, GA 30309 | | Distributor Invesco Distributors, Inc. 11 Greenway Plaza, Suite 1000 Houston, TX 77046-1173 | | Auditors PricewaterhouseCoopers LLP 1000 Louisiana Street, Suite 5800 Houston, TX 77002-5021 |
| | | |
| | | | | | |
Counsel to the Fund Stradley Ronon Stevens & Young, LLP 2005 Market Street, Suite 2600 Philadelphia, PA 19103-7018 | | Counsel to the Independent Trustees Goodwin Procter LLP 901 New York Avenue, N.W. Washington, D.C. 20001 | | Transfer Agent Invesco Investment Services, Inc. 11 Greenway Plaza, Suite 1000 Houston, TX 77046-1173 | | Custodian State Street Bank and Trust Company 225 Franklin Street Boston, MA 02110-2801 |
T-4 Invesco Global Targeted Returns Fund
Explore High-Conviction Investing with Invesco

Go paperless with eDelivery
Visit invesco.com/edelivery to enjoy the convenience and security of anytime electronic access to your investment documents.
With eDelivery, you can elect to have any or all of the following materials delivered straight to your inbox to download, save and print from your own computer:
∎ Fund reports and prospectuses
∎ Quarterly statements
∎ Daily confirmations
∎ Tax forms
Invesco mailing information
Send general correspondence to Invesco Investment Services, Inc., P.O. Box 219078, Kansas City, MO 64121-9078.
Important notice regarding delivery of security holder documents
To reduce Fund expenses, only one copy of most shareholder documents may be mailed to shareholders with multiple accounts at the same address (Householding). Mailing of your shareholder documents may be householded indefinitely unless you instruct us otherwise. If you do not want the mailing of these documents to be combined with those for other members of your household, please contact Invesco Investment Services, Inc. at 800 959 4246 or contact your financial institution. We will begin sending you individual copies for each account within 30 days after receiving your request.
Fund holdings and proxy voting information
The Fund provides a complete list of its holdings four times in each fiscal year, at the quarter ends. For the second and fourth quarters, the lists appear in the Fund’s semiannual and annual reports to shareholders. For the first and third quarters, the Fund files the lists with the Securities and Exchange Commission (SEC) on Form N-Q (or any successor Form). The most recent list of portfolio holdings is available at invesco.com/completeqtrholdings. Shareholders can also look up the Fund’s Forms N-Q (or any successor Form) on the SEC website at sec.gov. The SEC file numbers for the Fund are shown below.
A description of the policies and procedures that the Fund uses to determine how to vote proxies relating to portfolio securities is available without charge, upon request, from our Client Services department at 800 959 4246 or at invesco.com/proxyguidelines. The information is also available on the SEC website, sec.gov.
| | |
Information regarding how the Fund voted proxies related to its portfolio securities during the most recent 12-month period ended June 30 is available at invesco.com/proxysearch. The information is also available on the SEC website, sec.gov. Invesco Advisers, Inc. is an investment adviser; it provides investment advisory services to individual and institutional clients and does not sell securities. Invesco Distributors, Inc. is the US distributor for Invesco Ltd.’s retail mutual funds, exchange-traded funds and institutional money market funds. Both are wholly owned, indirect subsidiaries of Invesco Ltd. | |  |
| | | | | | | | |
| SEC file numbers: 811-05426 and 033-19338 | | Invesco Distributors, Inc. | | GTR-AR-1 | | 12262018 | | 1159 |
| | | | | | |
| | | | |
 | | Annual Report to Shareholders | | October 31, 2018 | | |
| | | | |
| | Invesco Greater China Fund | | |
| | Nasdaq: | | |
| | A: AACFX ∎ C: CACFX ∎ Y: AMCYX ∎ R5: IACFX ∎ R6: CACSX | | |
Letters to Shareholders
| | |

Philip Taylor | | Dear Shareholders: This annual report includes information about your Fund, including performance data and a complete list of its investments as of the close of the reporting period. Inside is a discussion of how your Fund was managed and the factors that affected its performance during the reporting period. Throughout the reporting period, US economic data remained positive. Robust corporate profits, strong retail sales and unemployment rates near generational lows helped drive US markets to new all-time records multiple times during the reporting period. Against this backdrop, the US Federal Reserve raised the federal funds rate four times during the reporting period. Market volatility, largely non-existent in 2017, returned in 2018. Markets sold off first in |
February and again sharply in October, amid rising interest rates, concerns about potential trade wars and heightened geopolitical tensions. Despite the volatility, US equity markets were largely positive for the reporting period and fared better than international markets. Emerging markets were particularly hard hit due to a strong US dollar. During the October sell-off, investors retreated to more defensive areas of the market and to US Treasuries. The broader bond market declined during the reporting period due to the increase in US Treasury yields and widening credit spreads. As the year progresses, we’ll see how the interplay of economic data, interest rates, geopolitics and a host of other factors affect US and overseas equity and fixed income markets.
Short-term market volatility can prompt some investors to abandon their investment plans – and can cause others to settle for whatever returns the market has to offer. The investment professionals at Invesco, in contrast, invest with high conviction. This means that, no matter the asset class or the strategy, each investment team has a passion to exceed. We want to help investors achieve better outcomes, such as seeking higher returns, helping mitigate risk and generating income. Of course, investing with high conviction can’t guarantee a profit or ensure success; no investment strategy can. To learn more about how we invest with high conviction, visit invesco.com/HighConviction.
You, too, can invest with high conviction by maintaining a long-term investment perspective and by working with your financial adviser on a regular basis. During periods of short-term market volatility or uncertainty, your financial adviser can keep you focused on your long-term investment goals – a new home, a child’s college education or a secure retirement. He or she also can share research about the economy, the markets and individual investment options.
Visit our website for more information on your investments
Our website, invesco.com/us, offers a wide range of market insights and investment perspectives. On the website, you’ll find detailed information about our funds, including performance, holdings and portfolio manager commentaries. You can access information about your account by completing a simple, secure online registration. To do so, select “Log In” on the right side of the homepage, and then select “Register for Individual Account Access.”
In addition to the resources accessible on our website and through our mobile app, you can obtain timely updates to help you stay informed about the markets and the economy by connecting with Invesco on Twitter, LinkedIn or Facebook. You can access our blog at blog.invesco.us.com. Our goal is to provide you the information you want, when and where you want it.
Finally, I’m pleased to share with you Invesco’s commitment to both the Principles for Responsible Investment and to considering environmental, social and governance issues in our robust investment process. I invite you to learn more at invesco.com/esg.
Have questions?
For questions about your account, contact an Invesco client services representative at 800 959 4246. For Invesco-related questions or comments, please email me directly at phil@invesco.com.
All of us at Invesco look forward to serving your investment management needs. Thank you for investing with us.
Sincerely,

Philip Taylor
Senior Managing Director, Invesco Ltd.
| | |
| 2 | | Invesco Greater China Fund |
| | | | |

Bruce Crockett | | Dear Fellow Shareholders: Among the many important lessons I’ve learned in more than 40 years in a variety of business endeavors is the value of a trusted advocate. As independent chair of the Invesco Funds Board, I can assure you that the members of the Board are strong advocates for the interests of investors in Invesco’s mutual funds. We work hard to represent your interests through oversight of the quality of the investment management services your funds receive and other matters important to your investment, including but not limited to: |
| | ∎ | | Ensuring that Invesco offers a diverse lineup of mutual funds that your financial adviser can use to strive to meet your financial needs as your investment goals change over time. |
| | ∎ | | Monitoring how the portfolio management teams of the Invesco funds are performing in light of changing economic and market conditions. |
| ∎ | | Assessing each portfolio management team’s investment performance within the context of the investment strategy described in the fund’s prospectus. |
| ∎ | | Monitoring for potential conflicts of interests that may impact the nature of the services that your funds receive. |
We believe one of the most important services we provide our fund shareholders is the annual review of the funds’ advisory and sub-advisory contracts with Invesco Advisers and its affiliates. This review is required by the Investment Company Act of 1940 and focuses on the nature and quality of the services Invesco provides as the adviser to the Invesco funds and the reasonableness of the fees that it charges for those services. Each year, we spend months carefully reviewing information received from Invesco and a variety of independent sources, such as performance and fee data prepared by Lipper, Inc. (a subsidiary of Broadridge Financial Solutions, Inc.), an independent, third-party firm widely recognized as a leader in its field. We also meet with our independent legal counsel and other independent advisers to review and help us assess the information that we have received. Our goal is to assure that you receive quality investment management services for a reasonable fee.
I trust the measures outlined above provide assurance that you have a worthy advocate when it comes to choosing the Invesco Funds.
As always, please contact me at bruce@brucecrockett.com with any questions or concerns you may have. On behalf of the Board, we look forward to continuing to represent your interests and serving your needs.
Sincerely,

Bruce L. Crockett
Independent Chair
Invesco Funds Board of Trustees
| | |
| 3 | | Invesco Greater China Fund |
Management’s Discussion of Fund Performance
| | | | |
| |
Performance summary For the fiscal year ended October 31, 2018, Class A shares of Invesco Greater China Fund (the Fund), at net asset value (NAV), outperformed the MSCI Golden Dragon Index, the Fund’s broad market/style-specific benchmark. Your Fund’s long-term performance appears later in this report. | |
| |
Fund vs. Indexes | |
Total returns, 10/31/17 to 10/31/18, at net asset value (NAV). Performance shown does not include applicable contingent deferred sales charges (CDSC) or front-end sales charges, which would have reduced performance. | |
| |
Class A Shares* | | | -12.71 | % |
Class C Shares* | | | -13.36 | |
Class Y Shares* | | | -12.48 | |
Class R5 Shares* | | | -12.38 | |
Class R6 Shares* | | | -12.36 | |
MSCI Golden Dragon Indexq (Broad Market/ Style-Specific Index) | | | -13.67 | |
Lipper China Region Funds Index⬛ (Peer Group Index) | | | -13.38 | |
Source(s): qRIMES Technologies Corp.; ⬛Lipper Inc. *Performance includes litigation proceeds. Had these proceeds not been received, total returns would have been lower. | |
Market conditions and your Fund
The fiscal year proved to be an increasingly volatile time for global equities, and Greater Chinese equities were not immune to broad market trends. The fiscal year began with China’s equity market rising on continued earnings upgrades and ongoing investment inflow. China’s economic growth accelerated for the first time in seven years thanks to strong growth in consumption and improving exports. Hong Kong and Taiwanese equities benefited from a spillover of positive sentiment from Chinese equities.
Greater Chinese equities experienced heightened volatility entering into 2018 over concerns about the trajectory of US monetary policy and rising US trade protectionism. Domestic conditions, on the other hand, remained stable, even though growth moderated as a result of the government’s efforts in deleveraging.
At the end of the fiscal year, ongoing concerns about trade tensions, fear of
weakness spreading from other emerging markets, and slower economic growth continued to weigh on Greater China equities. The Chinese government adopted more accommodative macroeconomic policies, such as reserve requirement ratio cuts and tax reductions, to help stabilize the economic outlook. On a sector basis, energy was the best-performing sector during the fiscal year on the back of rising oil prices. Less economically sensitive sectors, such as utilities, proved resilient too. In Hong Kong, sentiment remained weak given the negative spillover from China, while Taiwan equities showed resiliency, supported by robust economic growth and a solid trade balance.
For the fiscal year, stock selection and sector allocation had a positive impact on the Fund’s performance relative to the broad market/style-specific index. The Fund’s relative outperformance was driven by stock selection in and an overweight
allocation to the positive-performing health care sector. In particular, Shangdong Weigao Group Medical Polymer, a medical devices research, development and production company, was a notable contributor to the Fund’s relative performance during the fiscal year.
Overweight exposure to and stock selection in the consumer staples sector also supported Fund results relative to the broad market/style-specific index during the fiscal year. Taiwan-based convenience store operator President Chain Store was a top contributor within the sector.
Fund holdings in the materials sector outperformed those of the broad market/ style-specific index during the fiscal year and contributed to relative Fund returns. An overweight allocation to the sector added to relative performance as well. Asia Cement China Holdings was a key contributor in this sector for the fiscal year.
In contrast, the Fund’s holdings in the information technology (IT) sector underperformed those of the broad market/style-specific benchmark and detracted from relative performance during the fiscal year. Hon Hai Precision Industry (better known as Foxconn), a Taiwan-based multinational electronics contract manufacturing company that is a key Apple (not a Fund holding) supplier, was the leading detractor from the Fund’s relative performance. Foxconn shares have been under pressure due to ongoing concerns over the trade tension between the US and China, but it reported strong September revenue and a higher fourth-quarter outlook, which could help support its share price. Largan Precision, a Taiwan-listed supplier of camera lens modules for various devices, was another key detractor from the Fund’s relative performance within this sector.
An underweight allocation to the financials sector and having no exposure
| | | | |
| | |
Portfolio Composition | | | | |
By sector % of total net assets | |
| |
Consumer Discretionary | | | 26.4% | |
Information Technology | | | 18.9 | |
Communication Services | | | 13.9 | |
Consumer Staples | | | 12.2 | |
Health Care | | | 9.2 | |
Materials | | | 7.8 | |
Industrials | | | 7.4 | |
Utilities | | | 3.1 | |
Money Market Funds
Plus Other Assets Less Liabilities | | | 1.1 | |
| | |
| |
Top 10 Equity Holdings* |
| % of total net assets |
| |
1. Alibaba Group Holding Ltd.-ADR | | 9.5% |
2. Taiwan Semiconductor Manufacturing Co., Ltd. | | 4.6 |
3. China Mobile Ltd. | | 4.4 |
4. President Chain Store Corp. | | 4.0 |
5. Tencent Holdings Ltd. | | 3.9 |
6. Hon Hai Precision Industry Co., Ltd. | | 3.9 |
7. Shandong Weigao Group Medical Polymer Co. Ltd.
-Class H | | 3.8 |
8. Sun Art Retail Group Ltd. | | 3.2 |
9. Hengan International Group Co. Ltd. | | 3.0 |
10. Sinopharm Group Co. Ltd.
-Class H | | 2.9 |
| | | | |
| | |
Total Net Assets | | $ | 78.2 million | |
| |
Total Number of Holdings* | | | 51 | |
The Fund’s holdings are subject to change, and there is no assurance that the Fund will continue to hold any particular security.
*Excluding money market fund holdings.
Data presented here are as of October 31, 2018.
| | |
| 4 | | Invesco Greater China Fund |
to the energy sector hampered the Fund’s performance relative to the broad market/ style-specific index during the fiscal year.
Stock selection in the utilities sector detracted from the Fund’s absolute performance as well as the Fund’s relative performance versus the broad market/ style-specific index during the fiscal year. This was mainly due to the Fund’s holdings in Beijing Enterprises Holdings and natural gas company Towngas China.
Our investment strategy remains purely focused on bottom-up stock opportunities that we believe add the most value to the Fund. We adopt a selective approach, favoring companies with sustainable leadership and competitive advantages. This has led to the Fund having meaningful exposure in consumer-related sectors. We believe the Fund’s holdings are well positioned to gain from structural opportunities in China’s consumer sector.
At the close of the fiscal year, we believed all three markets within Greater China should remain on a solid path, benefiting from resilient consumption. In China, we viewed domestic consumption as becoming an increasingly important economic growth driver, with steady expansion thanks to rising income and accumulated wealth. We believe stronger consumption growth in China’s lower-tier cities could become a notable theme. In our view, these trends could spur further innovation in the consumer and IT sectors and help build up a dynamic ecosystem that promotes creativity. In Hong Kong and Taiwan, private consumption growth was strong during the fiscal year and we believe that a robust labor market and healthy wage growth will continue to support it.
Thank you for your continued investment in Invesco Greater China Fund.
The views and opinions expressed in management’s discussion of Fund performance are those of Invesco Advisers, Inc. These views and opinions are subject to change at any time based on factors such as market and economic conditions. These views and opinions may not be relied upon as investment advice or recommendations, or as an offer for a particular security. The information is not a complete analysis of every aspect of any market, country, industry, security or the Fund. Statements of fact are from sources considered reliable, but Invesco Advisers, Inc. makes no representation or warranty as to their completeness or accuracy. Although historical performance is no guarantee of future results, these insights may help you understand our investment management philosophy.
See important Fund and, if applicable, index disclosures later in this report.
| | |
 | | Mike Shiao |
| | Portfolio Manager and Chief Investment Officer of Invesco’s Greater China Equities Team, is manager of Invesco |
| Greater China Fund. He joined Invesco in 2002. Mr. Shiao earned a bachelor’s degree from National Chung Hsing University, Taiwan and an MS in finance from Drexel University. |
5 Invesco Greater China Fund
Your Fund’s Long-Term Performance
Results of a $10,000 Investment – Oldest Share Class(es)
Fund and index data from 10/31/08
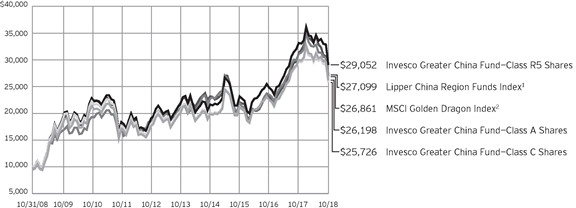
1 Source: Lipper Inc.
2 Source: RIMES Technologies Corp.
Past performance cannot guarantee comparable future results.
The data shown in the chart include reinvested distributions, applicable sales charges and Fund expenses including management fees. Index results include reinvested dividends, but they do not reflect sales charges. Performance of the
peer group, if applicable, reflects fund expenses and management fees; performance of a market index does not. Performance shown in the chart and table(s) does not reflect deduction of taxes a shareholder would pay on Fund distributions or sale of Fund shares.
| | |
| 6 | | Invesco Greater China Fund |
| | | | |
| |
Average Annual Total Returns | |
As of 10/31/18, including maximum applicable sales charges | |
| |
Class A Shares | | | | |
Inception (3/31/06) | | | 8.13 | % |
10 Years | | | 10.11 | |
5 Years | | | 4.29 | |
1 Year | | | -17.51 | |
| |
Class C Shares | | | | |
Inception (3/31/06) | | | 7.80 | % |
10 Years | | | 9.91 | |
5 Years | | | 4.69 | |
1 Year | | | -14.22 | |
| |
Class Y Shares | | | | |
Inception (10/3/08) | | | 8.72 | % |
10 Years | | | 11.01 | |
5 Years | | | 5.74 | |
1 Year | | | -12.48 | |
| |
Class R5 Shares | | | | |
Inception (3/31/06) | | | 9.11 | % |
10 Years | | | 11.25 | |
5 Years | | | 5.94 | |
1 Year | | | -12.38 | |
| |
Class R6 Shares | | | | |
10 Years | | | 10.80 | % |
5 Years | | | 5.61 | |
1 Year | | | -12.36 | |
|
Performance includes litigation proceeds. Had these proceeds not been received, total returns would have been lower. | |
Class Y shares incepted on October 3, 2008. Performance shown prior to that date is that of Class A shares and includes the 12b-1 fees applicable to Class A shares.
Class R6 shares incepted on April 4, 2017. Performance shown prior to that date is that of Class A shares and includes the 12b-1 fees applicable to Class A shares.
The performance data quoted represent past performance and cannot guarantee comparable future results; current performance may be lower or higher. Please visit invesco.com/performance for the most recent month-end performance. Performance figures reflect reinvested distributions, changes in net asset value and the effect of the maximum sales charge unless otherwise stated. Investment return and principal value will fluctuate so that you may have a gain or loss when you sell shares.
The total annual Fund operating expense ratio set forth in the most recent Fund prospectus as of the date of this report for Class A, Class C, Class Y,
| | | | |
| |
Average Annual Total Returns | |
As of 9/30/18, the most recent calendar quarter end, including maximum applicable sales charges | |
| |
Class A Shares | | | | |
Inception (3/31/06) | | | 9.26 | % |
10 Years | | | 8.79 | |
5 Years | | | 7.47 | |
1 Year | | | -3.32 | |
| |
Class C Shares | | | | |
Inception (3/31/06) | | | 8.93 | % |
10 Years | | | 8.59 | |
5 Years | | | 7.88 | |
1 Year | | | 0.49 | |
| |
Class Y Shares | | | | |
10 Years | | | 9.68 | % |
5 Years | | | 8.96 | |
1 Year | | | 2.54 | |
| |
Class R5 Shares | | | | |
Inception (3/31/06) | | | 10.26 | % |
10 Years | | | 9.94 | |
5 Years | | | 9.18 | |
1 Year | | | 2.72 | |
| |
Class R6 Shares | | | | |
10 Years | | | 9.48 | % |
5 Years | | | 8.82 | |
1 Year | | | 2.67 | |
|
Performance includes litigation proceeds. Had these proceeds not been received, total returns would have been lower. | |
Class R5 and Class R6 shares was 1.93%, 2.68%, 1.68%, 1.50% and 1.47%, respectively. The expense ratios presented above may vary from the expense ratios presented in other sections of this report that are based on expenses incurred during the period covered by this report.
Class A share performance reflects the maximum 5.50% sales charge, and Class C share performance reflects the applicable contingent deferred sales charge (CDSC) for the period involved. Class Y, Class R5 and Class R6 shares do not have a front-end sales charge or a CDSC; therefore, performance is at net asset value.
The performance of the Fund’s share classes will differ primarily due to different sales charge structures and class expenses.
Fund performance reflects any applicable fee waivers and/or expense reimbursements. Had the adviser not waived fees and/or reimbursed expenses currently or in the past, returns would have been lower. See current prospectus for more information.
7 Invesco Greater China Fund
Invesco Greater China Fund’s investment objective is long-term growth of capital.
| ∎ | | Unless otherwise stated, information presented in this report is as of October 31, 2018, and is based on total net assets. |
| ∎ | | Unless otherwise noted, all data provided by Invesco. |
| ∎ | | To access your Fund’s reports/prospectus, visit invesco.com/fundreports. |
About share classes
| ∎ | | Class Y shares are available to only certain investors. Please see the prospectus for more information. |
| ∎ | | Class R5 shares and Class R6 shares are available for use by retirement plans that meet certain standards and for institutional investors. Class R6 shares are also available through intermediaries that have established an agreement with Invesco Distributors, Inc. to make such shares available for use in retail omnibus accounts. Please see the prospectus for more information. |
Principal risks of investing in the Fund
| ∎ | | Convertible securities risk. The market values of convertible securities are affected by market interest rates, the risk of actual issuer default on interest or principal payments and the value of the underlying common stock into which the convertible security may be converted. Additionally, a convertible security is subject to the same types of market and issuer risks as apply to the underlying common stock. In addition, certain convertible securities are subject to involuntary conversions and may undergo principal write-downs upon the occurrence of certain triggering events, and, as a result, are subject to an increased risk of loss. Convertible securities may be rated below investment grade. |
| ∎ | | Debt securities risk. The prices of debt securities held by the Fund will be affected by changes in interest rates, the creditworthiness of the issuer and other factors. An increase in prevailing interest rates typically causes the value of existing debt securities to fall and often has a greater impact on longer-duration debt securities and higher quality debt securities. Falling interest rates will cause the Fund to reinvest the proceeds of debt securities that have been repaid by the issuer at lower interest rates. Falling interest rates may also reduce |
| | the Fund’s distributable income because interest payments on floating rate debt instruments held by the Fund will decline. The Fund could lose money on investments in debt securities if the issuer or borrower fails to meet its obligations to make interest payments and/or to repay principal in a timely manner. Changes in an issuer’s financial strength, the market’s perception of such strength or in the credit rating of the issuer or the security may affect the value of debt securities. The Adviser’s credit analysis may fail to anticipate such changes, which could result in buying a debt security at an inopportune time or failing to sell a debt security in advance of a price decline or other credit event. |
| ∎ | | Depositary receipts risk. Investing in depositary receipts involves the same risks as direct investments in foreign securities. In addition, the underlying issuers of certain depositary receipts are under no obligation to distribute shareholder communications or pass through any voting rights with respect to the deposited securities to the holders of such receipts. The Fund may therefore receive less timely information or have less control than if it invested directly in the foreign issuer. |
| ∎ | | Emerging markets securities risk. Emerging markets (also referred to as developing markets) are generally subject to greater market volatility, political, social and economic instability, uncertain trading markets and more governmental limitations on foreign investment than more developed markets. In addition, companies operating in emerging markets may be subject to lower trading volume and greater price fluctuations than companies in more developed markets. Securities law and the enforcement of systems of taxation in many emerging market countries may change quickly and unpredictably. In addition, investments in emerging markets securities may also be subject to additional transaction costs, delays |
This report must be accompanied or preceded by a currently effective Fund prospectus, which contains more complete information, including sales charges and expenses. Investors should read it carefully before investing.
NOT FDIC INSURED | MAY LOSE VALUE | NO BANK GUARANTEE
| | in settlement procedures, and lack of timely information. |
| ∎ | | Foreign government debt risk. Invest- ments in foreign government debt securities (sometimes referred to as sovereign debt securities) involve certain risks in addition to those relating to foreign securities or debt securities generally. The issuer of the debt or the governmental authorities that control the repayment of the debt may be unable or unwilling to repay principal or interest when due in accordance with the terms of such debt, and the Fund may have limited recourse in the event of a default against the defaulting government. Without the approval of debt holders, some governmental debtors have in the past been able to reschedule or restructure their debt payments or declare moratoria on payments. |
| ∎ | | Foreign securities risk. The Fund’s foreign investments may be adversely affected by political and social instability, changes in economic o taxation policies, difficulty in enforcing obligations, decreased liquidity or increased volatility. Foreign investments also involve the risk of the possible seizure, nationalization or expropriation of the issuer or foreign deposits (in which the Fund could lose its entire investments in a certain market) and the possible adoption of foreign governmental restrictions such as exchange controls. Unless the Fund has hedged its foreign securities risk, foreign securities risk also involves the risk of negative foreign currency rate fluctuations, which may cause the value of securities denominated in such foreign currency (or other instruments through which the Fund has exposure to foreign currencies) to decline in value. Currency exchange rates may fluctuate significant- ly over short periods of time. Currency hedging strategies, if used, are not always successful. |
| ∎ | | Geographic focus risk. The Fund may from time to time invest a substantial amount of its assets in securities of issuers located in a single country or a limited number of countries. Adverse economic, political or social conditions in those countries may therefore have a significant negative impact on the Fund’s investment performance. |
| | |
| 8 | | Invesco Greater China Fund |
| ∎ | | Management risk. The Fund is actively managed and depends heavily on the Adviser’s judgment about markets, interest rates or the attractiveness, relative values, liquidity, or potential appreciation of particular investments made for the Fund’s portfolio. The Fund could experience losses if these judgments prove to be incorrect. Additionally, legislative, regulatory, or tax developments may adversely affect management of the Fund and, therefore, the ability of the Fund to achieve its investment objective. |
| ∎ | | Market risk. The market values of the Fund’s investments, and therefore the value of the Fund’s shares, will go up and down, sometimes rapidly or unpredictably. Market risk may affect a single issuer, industry or section of the economy, or it may affect the market as a whole. Individual stock prices tend to go up and down more dramatically than those of certain other types of investments, such as bonds. During a general downturn in the financial markets, multiple asset classes may decline in value. When markets perform well, there can be no assurance that specific investments held by the Fund will rise in value. |
| ∎ | | Participation notes risk. Investments in participation notes involve the same risks associated with a direct investment in the underlying security, currency or market they seek to replicate, and, in addition, subject the Fund to the credit-worthiness of the bank or broker-dealer that issued the participation notes. |
| ∎ | | Preferred securities risk. Preferred securities are subject to issuer-specific and market risks applicable generally to equity securities. Preferred securities also may be subordinated to bonds or other debt instruments, subjecting them to a greater risk of non-payment, may be less liquid than many other securities, such as common stocks, and generally offer no voting rights with respect to the issuer. |
| ∎ | | Sector focus risk. The Fund may from time to time invest a significant amount of its assets (i.e. over 25%) in one market sector or group of related industries. In this event, the Fund’s performance will depend to a greater extent on the overall condition of the sector or group of industries and there is increased |
| | | risk that the Fund will lose significant value if conditions adversely affect that sector or group of industries. |
| ∎ | | Small- and mid-capitalization companies risks. Small- and mid-capitalization companies tend to be more vulnerable to changing market conditions, may have little or no operating history or track record of success, and may have more limited product lines and markets, less experienced management and fewer financial resources than larger companies. These companies’ securities may be more volatile and less liquid than those of more established companies, and their returns may vary, sometimes significantly, from the overall securities market. |
| ∎ | | Unique economic and political risks of investing in Greater China. Investments in companies located or operating in Greater China involve risks not associated with investments in Western nations, such as nationalization, expropriation, or confiscation of property; difficulty in obtaining and/or enforcing judgments; alteration or discontinuation of economic reforms; military conflicts, either internal or with other countries; inflation, currency fluctuations and fluctuations in inflation and interest rates that may have negative effects on the economy and securities markets of Greater China; and Greater China’s dependency on the economies of other Asian countries, many of which are developing countries. Events in any one country within Greater China may impact the other countries in the region or Greater China as a whole. Certain securities issued by companies located or operating in Greater China, such as China A- shares, are subject to trading restrictions, quota limitations and less market liquidity. Additionally, developing countries, such as those in Greater China, may subject the Fund’s investments to a number of tax rules, and the application of many of those rules may be uncertain. Moreover, China has implemented a number of tax reforms in recent years, and may amend or revise its existing tax laws and/or procedures in the future, possibly with retroactive effect. Changes inapplicable Chinese tax law could reduce the after-tax profits of the Fund, directly or indirectly, including |
| | | by reducing the after-tax profits of companies in China in which the Fund invests. Uncertainties in Chinese tax rules could result in unexpected tax liabilities for the Fund. |
About indexes used in this report
| ∎ | | The MSCI Golden Dragon Index captures the equity market performance of large- and mid-cap China securities and non-domestic China securities listed in Hong Kong and Taiwan. The index is computed using the net return, which withholds applicable taxes for non-residents. |
| ∎ | | The Lipper China Region Funds Index is an unmanaged index considered representative of China region funds tracked by Lipper. |
| ∎ | | The Fund is not managed to track the performance of any particular index, including the index(es) described here, and consequently, the performance of the Fund may deviate significantly from the performance of the index(es). |
| ∎ | | A direct investment cannot be made in an index. Unless otherwise indicated, index results include reinvested dividends, and they do not reflect sales charges. Performance of the peer group, if applicable, reflects fund expenses; performance of a market index does not. |
Other information
| ∎ | | The returns shown in management’s discussion of Fund performance are based on net asset values (NAVs) calculated for shareholder transactions. Generally accepted accounting principles require adjustments to be made to the net assets of the Fund at period end for financial reporting purposes, and as such, the NAVs for shareholder transactions and the returns based on those NAVs may differ from the NAVs and returns reported in the Financial Highlights. |
| ∎ | | Industry classifications used in this report are generally according to the Global Industry Classification Standard, which was developed by and is the exclusive property and a service mark of MSCI Inc. and Standard & Poor’s. |
9 Invesco Greater China Fund
Schedule of Investments(a)
October 31, 2018
| | | | | | | | |
| | | Shares | | | Value | |
Common Stocks & Other Equity Interests–98.88%(b) | |
| Apparel Retail–2.25% | |
Pou Sheng International (Holdings) Ltd. (Hong Kong) | | | 9,261,000 | | | $ | 1,762,812 | |
|
| Auto Parts & Equipment–4.31% | |
Hu Lane Associate Inc. (Taiwan) | | | 257,000 | | | | 652,159 | |
HUAYU Automotive Systems Co., Ltd.–Class A | | | 394,204 | | | | 989,034 | |
Minth Group Ltd. | | | 532,000 | | | | 1,732,641 | |
| | | | | | | | 3,373,834 | |
|
| Automobile Manufacturers–0.36% | |
Jiangling Motors Corp. Ltd.-Class B | | | 311,100 | | | | 279,286 | |
|
| Commodity Chemicals–4.17% | |
Formosa Chemicals & Fibre Corp. (Taiwan) | | | 457,000 | | | | 1,644,045 | |
Formosa Plastics Corp. (Taiwan) | | | 499,000 | | | | 1,618,784 | |
| | | | | | | | 3,262,829 | |
|
| Construction Materials–1.48% | |
Asia Cement China Holdings Corp. | | | 1,343,500 | | | | 1,157,567 | |
|
| Electrical Components & Equipment–1.22% | |
Voltronic Power Technology Corp. (Taiwan) | | | 59,150 | | | | 954,834 | |
|
| Electronic Components–3.28% | |
Chin-Poon Industrial Co., Ltd. (Taiwan) | | | 647,000 | | | | 717,702 | |
Largan Precision Co., Ltd. (Taiwan) | | | 17,000 | | | | 1,845,853 | |
| | | | | | | | 2,563,555 | |
|
| Electronic Equipment & Instruments–0.63% | |
Flytech Technology Co., Ltd. (Taiwan) | | | 220,000 | | | | 491,505 | |
|
| Electronic Manufacturing Services–3.94% | |
FIH Mobile Ltd.(c) | | | 877,000 | | | | 81,966 | |
Hon Hai Precision Industry Co., Ltd. (Taiwan) | | | 1,172,000 | | | | 2,996,524 | |
| | | | | | | | 3,078,490 | |
|
| Food Retail–3.99% | |
President Chain Store Corp. (Taiwan) | | | 276,000 | | | | 3,119,907 | |
| |
| Footwear–1.13% | | | | | |
Stella International Holdings Ltd. (Hong Kong) | | | 886,000 | | | | 886,909 | |
| |
| Gas Utilities–3.05% | | | | | |
ENN Energy Holdings Ltd. | | | 102,000 | | | | 869,573 | |
Towngas China Co. Ltd. | | | 2,082,000 | | | | 1,513,323 | |
| | | | | | | | 2,382,896 | |
|
| Health Care Distributors–2.86% | |
Sinopharm Group Co. Ltd.–Class H | | | 462,400 | | | | 2,239,994 | |
|
| Health Care Equipment–2.26% | |
Microport Scientific Corp. | | | 1,476,000 | | | | 1,768,566 | |
| | | | | | | | |
| | | Shares | | | Value | |
| Health Care Supplies–3.78% | |
Shandong Weigao Group Medical Polymer Co. Ltd.–Class H | | | 3,308,000 | | | $ | 2,957,055 | |
|
| Hotels, Resorts & Cruise Lines–1.90% | |
China International Travel Service Corp. Ltd.–Class A | | | 90,100 | | | | 700,665 | |
Shanghai Jinjiang International Hotels Development Co., Ltd.–Class B | | | 381,578 | | | | 783,055 | |
| | | | | | | | 1,483,720 | |
|
| Household Appliances–0.34% | |
Hangzhou Robam Appliances Co. Ltd.–Class A | | | 89,490 | | | | 269,467 | |
|
| Hypermarkets & Super Centers–3.21% | |
Sun Art Retail Group Ltd. (Hong Kong) | | | 2,288,500 | | | | 2,508,418 | |
|
| Industrial Conglomerates–1.28% | |
CK Hutchison Holdings Ltd. (Hong Kong) | | | 100,000 | | | | 1,004,705 | |
|
| Industrial Machinery–1.17% | |
CIMC Enric Holdings Ltd. | | | 1,190,000 | | | | 918,338 | |
|
| Interactive Home Entertainment–0.97% | |
Changyou.com Ltd.–ADR | | | 56,500 | | | | 755,970 | |
|
| Interactive Media & Services–7.69% | |
Autohome Inc.–ADR | | | 11,200 | | | | 810,656 | |
Tencent Holdings Ltd. | | | 89,800 | | | | 3,043,776 | |
YY Inc.–ADR(c) | | | 33,800 | | | | 2,159,820 | |
| | | | | | | | 6,014,252 | |
|
| Internet & Direct Marketing Retail–12.39% | |
Alibaba Group Holding Ltd.–ADR(c) | | | 51,536 | | | | 7,332,542 | |
Ctrip.com International, Ltd.–ADR(c) | | | 33,886 | | | | 1,127,726 | |
PChome Online Inc. (Taiwan)(c) | | | 268,305 | | | | 1,231,528 | |
| | | | | | | | 9,691,796 | |
|
| Leisure Products–1.09% | |
Goodbaby International Holdings Ltd. | | | 2,750,000 | | | | 855,486 | |
|
| Marine Ports & Services–1.17% | |
Qingdao Port International Co., Ltd.–Class H(c)(d) | | | 1,562,000 | | | | 916,252 | |
|
| Packaged Foods & Meats–2.07% | |
Qinqin Foodstuffs Group (Cayman) Co. Ltd.(c) | | | 55,600 | | | | 15,527 | |
Uni-President China Holdings Ltd. | | | 1,654,000 | | | | 1,600,966 | |
| | | | | | | | 1,616,493 | |
|
| Personal Products–2.95% | |
Hengan International Group Co. Ltd. | | | 289,500 | | | | 2,303,551 | |
|
| Pharmaceuticals–0.28% | |
Shanghai Fudan-Zhangjiang Bio-Pharmaceutical Co. Ltd.–Class H | | | 477,000 | | | | 218,976 | |
See accompanying Notes to Financial Statements which are an integral part of the financial statements.
10 Invesco Greater China Fund
| | | | | | | | |
| | | Shares | | | Value | |
| Research & Consulting Services–2.58% | |
Centre Testing International Group Co. Ltd.–Class A | | | 2,244,795 | | | $ | 2,021,733 | |
|
| Restaurants–2.63% | |
Ajisen (China) Holdings Ltd. (Hong Kong) | | | 3,195,000 | | | | 1,067,451 | |
Cafe de Coral Holdings Ltd. (Hong Kong) | | | 332,000 | | | | 720,787 | |
Xiabuxiabu Catering Management China Holdings Co. Ltd.(d) | | | 217,000 | | | | 270,218 | |
| | | | | | | | 2,058,456 | |
|
| Semiconductor Equipment–1.99% | |
ASM Pacific Technology Ltd. (Hong Kong) | | | 179,500 | | | | 1,554,693 | |
|
| Semiconductors–7.01% | |
MediaTek Inc. (Taiwan) | | | 261,000 | | | | 1,935,511 | |
Taiwan Semiconductor Manufacturing Co., Ltd. (Taiwan) | | | 477,000 | | | | 3,543,935 | |
| | | | | | | | 5,479,446 | |
|
| Steel–2.11% | |
Baoshan Iron & Steel Co., Ltd.–Class A | | | 1,506,409 | | | | 1,652,404 | |
|
| Technology Hardware, Storage & Peripherals–2.08% | |
Asustek Computer Inc. (Taiwan) | | | 221,000 | | | | 1,628,881 | |
| | | | | | | | |
| | | Shares | | | Value | |
| Wireless Telecommunication Services–5.26% | |
China Mobile Ltd. | | | 362,500 | | | $ | 3,388,347 | |
SmarTone Telecommunications Holdings Ltd. (Hong Kong) | | | 521,500 | | | | 723,534 | |
| | | | | | | | 4,111,881 | |
Total Common Stocks & Other Equity Interests
(Cost $83,254,280) | | | | 77,344,957 | |
|
Money Market Funds–0.21% | |
Invesco Government & Agency Portfolio–Institutional Class, 2.08%(e) | | | 58,963 | | | | 58,963 | |
Invesco Liquid Assets Portfolio–Institutional Class, 2.27%(e) | | | 42,108 | | | | 42,116 | |
Invesco Treasury Portfolio–Institutional Class, 2.09%(e) | | | 67,386 | | | | 67,386 | |
Total Money Market Funds
(Cost $168,465) | | | | 168,465 | |
TOTAL INVESTMENTS IN SECURITIES–99.09%
(Cost $83,422,745) | | | | 77,513,422 | |
OTHER ASSETS LESS LIABILITIES–0.91% | | | | 710,434 | |
NET ASSETS–100.00% | | | $ | 78,223,856 | |
Investment Abbreviations:
| | |
| ADR | | – American Depositary Receipt |
Notes to Schedule of Investments:
| (a) | Industry and/or sector classifications used in this report are generally according to the Global Industry Classification Standard, which was developed by and is the exclusive property and a service mark of MSCI Inc. and Standard & Poor’s. |
| (b) | Country of issuer and/or credit risk exposure listed in Common Stocks & Other Equity Interests has been determined to be China unless otherwise noted. |
| (c) | Non-income producing security. |
| (d) | Security purchased or received in a transaction exempt from registration under the Securities Act of 1933, as amended (the “1933 Act”). The security may be resold pursuant to an exemption from registration under the 1933 Act, typically to qualified institutional buyers. The aggregate value of these securities at October 31, 2018 was $1,186,470, which represented 1.52% of the Fund’s Net Assets. |
| (e) | The money market fund and the Fund are affiliated by having the same investment adviser. The rate shown is the 7-day SEC standardized yield as of October 31, 2018. |
See accompanying Notes to Financial Statements which are an integral part of the financial statements.
11 Invesco Greater China Fund
Statement of Assets and Liabilities
October 31, 2018
| | | | |
Assets: | | | | |
Investments in securities, at value (Cost $83,254,280) | | $ | 77,344,957 | |
Investments in affiliated money market funds, at value and cost | | | 168,465 | |
Foreign currencies, at value | | | 99,782 | |
Receivable for: | | | | |
Dividends | | | 12,217 | |
Fund shares sold | | | 780,681 | |
Investment for trustee deferred compensation and retirement plans | | | 51,775 | |
Total assets | | | 78,457,877 | |
|
Liabilities: | |
Payable for: | | | | |
Fund shares reacquired | | | 62,080 | |
Accrued fees to affiliates | | | 60,087 | |
Accrued trustees’ and officers’ fees and benefits | | | 1,732 | |
Accrued other operating expenses | | | 52,609 | |
Trustee deferred compensation and retirement plans | | | 57,513 | |
Total liabilities | | | 234,021 | |
Net assets applicable to shares outstanding | | $ | 78,223,856 | |
| |
Net assets consist of: | | | | |
Shares of beneficial interest | | $ | 71,381,438 | |
Distributable earnings | | | 6,842,418 | |
| | | $ | 78,223,856 | |
| | | | |
Net Assets: | |
Class A | | $ | 59,614,556 | |
Class C | | $ | 10,155,332 | |
Class Y | | $ | 7,800,955 | |
Class R5 | | $ | 24,504 | |
Class R6 | | $ | 628,509 | |
| |
Shares outstanding, no par value,
with an unlimited number of shares authorized: | | | | |
Class A | | | 2,335,789 | |
Class C | | | 411,977 | |
Class Y | | | 305,098 | |
Class R5 | | | 958 | |
Class R6 | | | 24,580 | |
Class A: | | | | |
Net asset value per share | | $ | 25.52 | |
Maximum offering price per share | | | | |
(Net asset value of $25.52 ¸ 94.50%) | | $ | 27.01 | |
Class C: | | | | |
Net asset value and offering price per share | | $ | 24.65 | |
Class Y: | | | | |
Net asset value and offering price per share | | $ | 25.57 | |
Class R5: | | | | |
Net asset value and offering price per share | | $ | 25.58 | |
Class R6: | | | | |
Net asset value and offering price per share | | $ | 25.57 | |
See accompanying Notes to Financial Statements which are an integral part of the financial statements.
12 Invesco Greater China Fund
Statement of Operations
For the year ended October 31, 2018
| | | | |
Investment income: | | | | |
Dividends (net of foreign withholding taxes of $303,019) | | $ | 2,836,407 | |
Dividends from affiliated money market funds | | | 16,409 | |
Total investment income | | | 2,852,816 | |
| |
Expenses: | | | | |
Advisory fees | | | 907,678 | |
Administrative services fees | | | 50,000 | |
Custodian fees | | | 76,003 | |
Distribution fees: | | | | |
Class A | | | 181,737 | |
Class B | | | 1,709 | |
Class C | | | 128,347 | |
Transfer agent fees — A, B, C and Y | | | 235,008 | |
Transfer agent fees — R5 | | | 57 | |
Transfer agent fees — R6 | | | 614 | |
Trustees’ and officers’ fees and benefits | | | 21,737 | |
Registration and filing fees | | | 82,535 | |
Reports to shareholders | | | 25,573 | |
Professional services fees | | | 82,623 | |
Other | | | 19,290 | |
Total expenses | | | 1,812,911 | |
Less: Fees waived and expense offset arrangement (s) | | | (7,109 | ) |
Net expenses | | | 1,805,802 | |
Net investment income | | | 1,047,014 | |
| |
Realized and unrealized gain (loss): | | | | |
Net realized gain (loss) from: | | | | |
Investment securities | | | 12,374,262 | |
Foreign currencies | | | (32,966 | ) |
| | | | 12,341,296 | |
Change in net unrealized appreciation (depreciation) of: | | | | |
Investment securities | | | (25,170,612 | ) |
Foreign currencies | | | 172 | |
| | | | (25,170,440 | ) |
Net realized and unrealized gain (loss) | | | (12,829,144 | ) |
Net increase (decrease) in net assets resulting from operations | | $ | (11,782,130 | ) |
See accompanying Notes to Financial Statements which are an integral part of the financial statements.
13 Invesco Greater China Fund
Statement of Changes in Net Assets
For the years ended October 31, 2018 and 2017
| | | | | | | | |
| | | 2018 | | | 2017 | |
Operations: | | | | | | | | |
Net investment income | | $ | 1,047,014 | | | $ | 86,056 | |
Net realized gain | | | 12,341,296 | | | | 3,508,172 | |
Change in net unrealized appreciation (depreciation) | | | (25,170,440 | ) | | | 18,738,674 | |
Net increase (decrease) in net assets resulting from operations | | | (11,782,130 | ) | | | 22,332,902 | |
| | |
Distributions to shareholders from distributable earnings(1): | | | | | | | | |
Class A | | | (385,286 | ) | | | (354,279 | ) |
Class B | | | — | | | | — | |
Class C | | | — | | | | — | |
Class Y | | | (84,412 | ) | | | (45,730 | ) |
Class R5 | | | (635 | ) | | | (619 | ) |
Class R6 | | | (996 | ) | | | — | |
Total distributions from distributable earnings | | | (471,329 | ) | | | (400,628 | ) |
| | |
Share transactions–net: | | | | | | | | |
Class A | | | (688,606 | ) | | | 1,136,916 | |
Class B | | | (834,194 | ) | | | (720,092 | ) |
Class C | | | (1,704,943 | ) | | | (1,792,194 | ) |
Class Y | | | (2,576,711 | ) | | | 4,144,381 | |
Class R5 | | | (43,420 | ) | | | 243 | |
Class R6 | | | 673,801 | | | | 104,144 | |
Net increase (decrease) change in net assets resulting from share transactions | | | (5,174,073 | ) | | | 2,873,398 | |
Net increase (decrease) in net assets | | | (17,427,532 | ) | | | 24,805,672 | |
| | |
Net assets: | | | | | | | | |
Beginning of year | | | 95,651,388 | | | | 70,845,716 | |
End of year | | $ | 78,223,856 | | | $ | 95,651,388 | |
| (1) | The Securities and Exchange Commission eliminated the requirement to disclose distribution components separately, except for tax return of capital. For the year ended October 31, 2017, distributions to shareholders from distributable earnings consisted of distributions from net investment income. |
Notes to Financial Statements
October 31, 2018
NOTE 1—Significant Accounting Policies
Invesco Greater China Fund (the “Fund”) is a series portfolio of AIM Investment Funds (Invesco Investment Funds) (the “Trust”). The Trust is organized as a Delaware statutory trust and is registered under the Investment Company Act of 1940, as amended (the “1940 Act”), as an open-end series management investment company authorized to issue an unlimited number of shares of beneficial interest. Information presented in these financial statements pertains only to the Fund. Matters affecting the Fund or each class will be voted on exclusively by the shareholders of the Fund or each class.
The Fund’s investment objective is long-term growth of capital.
The Fund currently consists of five different classes of shares: Class A, Class C, Class Y, Class R5 and Class R6. Class Y shares are available only to certain investors. Class A shares are sold with a front-end sales charge unless certain waiver criteria are met. Under certain circumstances, load waived shares may be subject to contingent deferred sales charges (“CDSC”). Class C shares are sold with a CDSC. Class Y, Class R5 and Class R6 shares are sold at net asset value. Effective November 30, 2010, new or additional investments in Class B shares are no longer permitted. Existing shareholders of Class B shares were permitted to continue to reinvest dividends and capital gains distributions in Class B shares until their conversion to Class A shares. Also, shareholders in Class B shares were able to exchange those shares for Class B shares of other Invesco Funds offering such shares until they converted to Class A shares. Generally, Class B shares automatically converted to Class A shares on or about the month-end, which was at least eight years after the date of purchase. Redemptions of Class B shares prior to the conversion date were subject to a CDSC. Effective January 26, 2018, all of the Fund’s outstanding Class B shares were converted to Class A shares, in advance of their normally scheduled conversion. No CDSC was paid in connection with this early conversion.
The Fund is an investment company and accordingly follows the investment company accounting and reporting guidance in accordance with Financial Accounting Standards Board Accounting Standards Codification Topic 946, Financial Services — Investment Companies.
14 Invesco Greater China Fund
The following is a summary of the significant accounting policies followed by the Fund in the preparation of its financial statements.
| A. | Security Valuations — Securities, including restricted securities, are valued according to the following policy. |
A security listed or traded on an exchange (except convertible securities) is valued at its last sales price or official closing price as of the close of the customary trading session on the exchange where the security is principally traded, or lacking any sales or official closing price on a particular day, the security may be valued at the closing bid price on that day. Securities traded in the over-the-counter market are valued based on prices furnished by independent pricing services or market makers. When such securities are valued by an independent pricing service they may be considered fair valued. Futures contracts are valued at the final settlement price set by an exchange on which they are principally traded. Listed options are valued at the mean between the last bid and asked prices from the exchange on which they are principally traded. Options not listed on an exchange are valued by an independent source at the mean between the last bid and asked prices. For purposes of determining net asset value (“NAV”) per share, futures and option contracts generally are valued 15 minutes after the close of the customary trading session of the New York Stock Exchange (“NYSE”).
Investments in open-end and closed-end registered investment companies that do not trade on an exchange are valued at the end-of-day net asset value per share. Investments in open-end and closed-end registered investment companies that trade on an exchange are valued at the last sales price or official closing price as of the close of the customary trading session on the exchange where the security is principally traded.
Debt obligations (including convertible securities) and unlisted equities are fair valued using an evaluated quote provided by an independent pricing service. Evaluated quotes provided by the pricing service may be determined without exclusive reliance on quoted prices, and may reflect appropriate factors such as institution-size trading in similar groups of securities, developments related to specific securities, dividend rate (for unlisted equities), yield (for debt obligations), quality, type of issue, coupon rate (for debt obligations), maturity (for debt obligations), individual trading characteristics and other market data. Pricing services generally value debt obligations assuming orderly transactions of institutional round lot size, but a fund may hold or transact in the same securities in smaller, odd lot sizes. Odd lots often trade at lower prices than institutional round lots. Debt obligations are subject to interest rate and credit risks. In addition, all debt obligations involve some risk of default with respect to interest and/or principal payments.
Foreign securities’ (including foreign exchange contracts) prices are converted into U.S. dollar amounts using the applicable exchange rates as of the close of the NYSE. If market quotations are available and reliable for foreign exchange-traded equity securities, the securities will be valued at the market quotations. Because trading hours for certain foreign securities end before the close of the NYSE, closing market quotations may become unreliable. If between the time trading ends on a particular security and the close of the customary trading session on the NYSE, events occur that the investment adviser determines are significant and make the closing price unreliable, the Fund may fair value the security. If the event is likely to have affected the closing price of the security, the security will be valued at fair value in good faith using procedures approved by the Board of Trustees. Adjustments to closing prices to reflect fair value may also be based on a screening process of an independent pricing service to indicate the degree of certainty, based on historical data, that the closing price in the principal market where a foreign security trades is not the current value as of the close of the NYSE. Foreign securities’ prices meeting the approved degree of certainty that the price is not reflective of current value will be priced at the indication of fair value from the independent pricing service. Multiple factors may be considered by the independent pricing service in determining adjustments to reflect fair value and may include information relating to sector indices, American Depositary Receipts and domestic and foreign index futures. Foreign securities may have additional risks including exchange rate changes, potential for sharply devalued currencies and high inflation, political and economic upheaval, the relative lack of issuer information, relatively low market liquidity and the potential lack of strict financial and accounting controls and standards.
Securities for which market prices are not provided by any of the above methods may be valued based upon quotes furnished by independent sources. The last bid price may be used to value equity securities. The mean between the last bid and asked prices is used to value debt obligations, including corporate loans.
Securities for which market quotations are not readily available or became unreliable are valued at fair value as determined in good faith by or under the supervision of the Fund’s officers following procedures approved by the Board of Trustees. Issuer specific events, market trends, bid/asked quotes of brokers and information providers and other market data may be reviewed in the course of making a good faith determination of a security’s fair value.
The Fund may invest in securities that are subject to interest rate risk, meaning the risk that the prices will generally fall as interest rates rise and, conversely, the prices will generally rise as interest rates fall. Specific securities differ in their sensitivity to changes in interest rates depending on their individual characteristics. Changes in interest rates may result in increased market volatility, which may affect the value and/or liquidity of certain Fund investments.
Valuations change in response to many factors including the historical and prospective earnings of the issuer, the value of the issuer’s assets, general economic conditions, interest rates, investor perceptions and market liquidity. Because of the inherent uncertainties of valuation, the values reflected in the financial statements may materially differ from the value received upon actual sale of those investments.
| B. | Securities Transactions and Investment Income — Securities transactions are accounted for on a trade date basis. Realized gains or losses on sales are computed on the basis of specific identification of the securities sold. Interest income (net of withholding tax, if any) is recorded on the accrual basis from settlement date. Dividend income (net of withholding tax, if any) is recorded on the ex-dividend date. |
The Fund may periodically participate in litigation related to Fund investments. As such, the Fund may receive proceeds from litigation settlements. Any proceeds received are included in the Statement of Operations as realized gain (loss) for investments no longer held and as unrealized gain (loss) for investments still held.
Brokerage commissions and mark ups are considered transaction costs and are recorded as an increase to the cost basis of securities purchased and/or a reduction of proceeds on a sale of securities. Such transaction costs are included in the determination of net realized and unrealized gain (loss) from investment securities reported in the Statement of Operations and the Statement of Changes in Net Assets and the net realized and unrealized gains (losses) on securities per share in the Financial Highlights. Transaction costs are included in the calculation of the Fund’s net asset value and, accordingly, they reduce the Fund’s total returns. These transaction costs are not considered operating expenses and are not reflected in net investment income reported in the Statement of Operations and the Statement of Changes in Net Assets, or the net investment income per share and the ratios of expenses and net investment income reported in the Financial Highlights, nor are they limited by any expense limitation arrangements between the Fund and the investment adviser.
15 Invesco Greater China Fund
The Fund allocates income and realized and unrealized capital gains and losses to a class based on the relative net assets of each class.
| C. | Country Determination — For the purposes of making investment selection decisions and presentation in the Schedule of Investments, the investment adviser may determine the country in which an issuer is located and/or credit risk exposure based on various factors. These factors include the laws of the country under which the issuer is organized, where the issuer maintains a principal office, the country in which the issuer derives 50% or more of its total revenues and the country that has the primary market for the issuer’s securities, as well as other criteria. Among the other criteria that may be evaluated for making this determination are the country in which the issuer maintains 50% or more of its assets, the type of security, financial guarantees and enhancements, the nature of the collateral and the sponsor organization. Country of issuer and/or credit risk exposure has been determined to be the United States of America, unless otherwise noted. |
| D. | Distributions — Distributions from net investment income and net realized capital gain, if any, are generally declared and paid annually and recorded on the ex-dividend date. The Fund may elect to treat a portion of the proceeds from redemptions as distributions for federal income tax purposes. |
| E. | Federal Income Taxes — The Fund intends to comply with the requirements of Subchapter M of the Internal Revenue Code of 1986, as amended (the “Internal Revenue Code”), necessary to qualify as a regulated investment company and to distribute substantially all of the Fund’s taxable earnings to shareholders. As such, the Fund will not be subject to federal income taxes on otherwise taxable income (including net realized capital gain) that is distributed to shareholders. Therefore, no provision for federal income taxes is recorded in the financial statements. |
The Fund recognizes the tax benefits of uncertain tax positions only when the position is more likely than not to be sustained. Management has analyzed the Fund’s uncertain tax positions and concluded that no liability for unrecognized tax benefits should be recorded related to uncertain tax positions. Management is not aware of any tax positions for which it is reasonably possible that the total amounts of unrecognized tax benefits will change materially in the next 12 months.
The Fund files tax returns in the U.S. Federal jurisdiction and certain other jurisdictions. Generally, the Fund is subject to examinations by such taxing authorities for up to three years after the filing of the return for the tax period.
| F. | Expenses — Fees provided for under the Rule 12b-1 plan of a particular class of the Fund are charged to the operations of such class. Transfer agency fees and expenses and other shareholder recordkeeping fees and expenses attributable to Class R5 and Class R6 are allocated to each share class based on relative net assets. Sub-accounting fees attributable to Class R5 are charged to the operations of the class. Transfer agency fees and expenses and other shareholder recordkeeping fees and expenses relating to all other classes are allocated among those classes based on relative net assets. All other expenses are allocated among the classes based on relative net assets. |
| G. | Accounting Estimates — The preparation of financial statements in conformity with accounting principles generally accepted in the United States of America (“GAAP”) requires management to make estimates and assumptions that affect the reported amounts of assets and liabilities at the date of the financial statements and the reported amounts of revenues and expenses during the reporting period including estimates and assumptions related to taxation. Actual results could differ from those estimates by a significant amount. In addition, the Fund monitors for material events or transactions that may occur or become known after the period-end date and before the date the financial statements are released to print. |
| H. | Indemnifications — Under the Trust’s organizational documents, each Trustee, officer, employee or other agent of the Trust is indemnified against certain liabilities that may arise out of the performance of their duties to the Fund. Additionally, in the normal course of business, the Fund enters into contracts, including the Fund’s servicing agreements, that contain a variety of indemnification clauses. The Fund’s maximum exposure under these arrangements is unknown as this would involve future claims that may be made against the Fund that have not yet occurred. The risk of material loss as a result of such indemnification claims is considered remote. |
| I. | Foreign Currency Translations — Foreign currency is valued at the close of the NYSE based on quotations posted by banks and major currency dealers. Portfolio securities and other assets and liabilities denominated in foreign currencies are translated into U.S. dollar amounts at the date of valuation. Purchases and sales of portfolio securities (net of foreign taxes withheld on disposition) and income items denominated in foreign currencies are translated into U.S. dollar amounts on the respective dates of such transactions. The Fund does not separately account for the portion of the results of operations resulting from changes in foreign exchange rates on investments and the fluctuations arising from changes in market prices of securities held. The combined results of changes in foreign exchange rates and the fluctuation of market prices on investments (net of estimated foreign tax withholding) are included with the net realized and unrealized gain or loss from investments in the Statement of Operations. Reported net realized foreign currency gains or losses arise from (1) sales of foreign currencies, (2) currency gains or losses realized between the trade and settlement dates on securities transactions, and (3) the difference between the amounts of dividends, interest, and foreign withholding taxes recorded on the Fund’s books and the U.S. dollar equivalent of the amounts actually received or paid. Net unrealized foreign currency gains and losses arise from changes in the fair values of assets and liabilities, other than investments in securities at fiscal period end, resulting from changes in exchange rates. |
The Fund may invest in foreign securities, which may be subject to foreign taxes on income, gains on investments or currency repatriation, a portion of which may be recoverable. Foreign taxes, if any, are recorded based on the tax regulations and rates that exist in the foreign markets in which the Fund invests and are shown in the Statement of Operations.
| J. | Forward Foreign Currency Contracts — The Fund may engage in foreign currency transactions either on a spot (i.e. for prompt delivery and settlement) basis, or through forward foreign currency contracts, to manage or minimize currency or exchange rate risk. |
The Fund may also enter into forward foreign currency contracts for the purchase or sale of a security denominated in a foreign currency in order to “lock in” the U.S. dollar price of that security, or the Fund may also enter into forward foreign currency contracts that do not provide for physical settlement of the two currencies, but instead are settled by a single cash payment calculated as the difference between the agreed upon exchange rate and the spot rate at settlement based upon an agreed upon notional amount (non-deliverable forwards). The Fund will set aside liquid assets in an amount equal to the daily mark-to-market obligation for forward foreign currency contracts.
A forward foreign currency contract is an obligation between two parties (“Counterparties”) to purchase or sell a specific currency for an agreed-upon price at a future date. The use of forward foreign currency contracts does not eliminate fluctuations in the price of the underlying securities the Fund owns or intends to acquire but establishes a rate of exchange in advance. Fluctuations in the value of these contracts are measured by the difference in the contract date and reporting date exchange rates and are recorded as unrealized appreciation (depreciation) until the contracts are closed. When the contracts are closed, realized gains (losses) are recorded. Realized and unrealized gains (losses) on the
16 Invesco Greater China Fund
contracts are included in the Statement of Operations. The primary risks associated with forward foreign currency contracts include failure of the Counterparty to meet the terms of the contract and the value of the foreign currency changing unfavorably. These risks may be in excess of the amounts reflected in the Statement of Assets and Liabilities.
| K. | Other Risks — Investing in a single-country mutual fund involves greater risk than investing in a more diversified fund due to lack of exposure to other countries. The political and economic conditions and changes in regulatory, tax or economic policy in a single country could significantly affect the market in that country and in surrounding or related countries. |
Investing in developing countries can add additional risk, such as high rates of inflation or sharply devalued currencies against the U.S. dollar.
Transaction costs are often higher and there may be delays in settlement procedures.
Certain securities issued by companies in China may be less liquid, harder to sell or more volatile than U.S. securities.
NOTE 2—Advisory Fees and Other Fees Paid to Affiliates
The Trust has entered into a master investment advisory agreement with Invesco Advisers, Inc. (the “Adviser” or “Invesco”). Under the terms of the investment advisory agreement, the Fund accrues daily and pays monthly an advisory fee to the Adviser based on the annual rate of the Fund’s average daily net assets as follows:
| | | | | | | | |
| Average Daily Net Assets | | Rate | |
First $250 million | | | 0 | .935% | | | | |
Next $250 million | | | 0 | .91% | | | | |
Next $500 million | | | 0 | .885% | | | | |
Next $1.5 billion | | | 0 | .86% | | | | |
Next $2.5 billion | | | 0 | .835% | | | | |
Next $2.5 billion | | | 0 | .81% | | | | |
Next $2.5 billion | | | 0 | .785% | | | | |
Over $10 billion | | | 0 | .76% | | | | |
For the year ended October 31, 2018, the effective advisory fees incurred by the Fund was 0.935%.
Under the terms of a master sub-advisory agreement between the Adviser and each of Invesco Asset Management Deutschland GmbH, Invesco Asset Management Limited, Invesco Asset Management (Japan) Limited, Invesco Hong Kong Limited, Invesco Senior Secured Management, Inc. and Invesco Canada Ltd. (collectively, the “Affiliated Sub-Advisers”) the Adviser, not the Fund, will pay 40% of the fees paid to the Adviser to any such Affiliated Sub-Adviser(s) that provide(s) discretionary investment management services to the Fund based on the percentage of assets allocated to such Affiliated Sub-Adviser(s).
The Adviser has contractually agreed, through at least June 30, 2019, to waive advisory fees and/or reimburse expenses to the extent necessary to limit total annual fund operating expenses after fee waiver and/or expense reimbursement (excluding certain items discussed below) of Class A, Class C, Class Y, Class R5 and Class R6 shares to 2.25%, 3.00%, 2.00%, 2.00% and 2.00%, respectively, of the Fund’s average daily net assets (the “expense limits”). Prior to their conversion to Class A shares, the expense limit for Class B shares was 3.00% of average daily net assets. In determining the Adviser’s obligation to waive advisory fees and/or reimburse expenses, the following expenses are not taken into account, and could cause the total annual fund operating expenses after fee waiver and/or reimbursement to exceed the numbers reflected above: (1) interest; (2) taxes; (3) dividend expense on short sales; (4) extraordinary or non-routine items, including litigation expenses; and (5) expenses that the Fund has incurred but did not actually pay because of an expense offset arrangement. Unless Invesco continues the fee waiver agreement, it will terminate on June 30, 2019. During its term, the fee waiver agreement cannot be terminated or amended to increase the expense limits or reduce the advisory fee waiver without approval of the Board of Trustees. The Adviser did not waive fees and/or reimburse expenses during the period under these expense limits.
Further, the Adviser has contractually agreed, through at least June 30, 2020, to waive the advisory fee payable by the Fund in an amount equal to 100% of the net advisory fees the Adviser receives from the affiliated money market funds on investments by the Fund of uninvested cash in such affiliated money market funds.
For the year ended October 31, 2018, the Adviser waived advisory fees of $1,508.
The Trust has entered into a master administrative services agreement with Invesco pursuant to which the Fund has agreed to pay Invesco for certain administrative costs incurred in providing accounting services to the Fund. For the year ended October 31, 2018, expenses incurred under the agreement are shown in the Statement of Operations as Administrative services fees.
The Trust has entered into a transfer agency and service agreement with Invesco Investment Services, Inc. (“IIS”) pursuant to which the Fund has agreed to pay IIS a fee for providing transfer agency and shareholder services to the Fund and reimburse IIS for certain expenses incurred by IIS in the course of providing such services. IIS may make payments to intermediaries that provide omnibus account services, sub-accounting services and/or networking services. All fees payable by IIS to intermediaries that provide omnibus account services or sub-accounting services are charged back to the Fund, subject to certain limitations approved by the Trust’s Board of Trustees. For the year ended October 31, 2018, expenses incurred under the agreement are shown in the Statement of Operations as Transfer agent fees.
The Trust has entered into master distribution agreements with Invesco Distributors, Inc. (“IDI”) to serve as the distributor for the Class A, Class C, Class Y, Class R5 and Class R6 shares of the Fund. The Trust has adopted plans pursuant to Rule 12b-1 under the 1940 Act with respect to the Fund’s Class A and Class C shares (collectively, the “Plans”). The Fund, pursuant to the Plans, pays IDI compensation at the annual rate of 0.25% of the Fund’s average daily net assets of Class A shares and 1.00% of the average daily net assets of Class C shares. Prior to their conversion to Class A shares, the Fund paid an annual rate of 1.00% of the average daily net assets of Class B shares. The fees are accrued daily and paid monthly. Of the Plan payments, up to 0.25% of the average daily net assets of each class of shares may be paid to furnish continuing personal shareholder services to customers who purchase and own shares of such classes. Any amounts not paid as a service fee under the Plans would constitute an asset-based sales charge. Rules of the Financial Industry Regulatory Authority (“FINRA”) impose a cap on the total sales charges, including asset-based sales
17 Invesco Greater China Fund
charges, that may be paid by any class of shares of the Fund. For the year ended October 31, 2018, expenses incurred under the Plans are shown in the Statement of Operations as Distribution fees.
Front-end sales commissions and CDSC (collectively, the “sales charges”) are not recorded as expenses of the Fund. Front-end sales commissions are deducted from proceeds from the sales of Fund shares prior to investment in Class A shares of the Fund. CDSC are deducted from redemption proceeds prior to remittance to the shareholder. During the year ended October 31, 2018, IDI advised the Fund that IDI retained $31,808 in front-end sales commissions from the sale of Class A shares and $35 and $1,881 from Class A and Class C shares, respectively, for CDSC imposed on redemptions by shareholders.
Certain officers and trustees of the Trust are officers and directors of the Adviser, IIS and/or IDI.
NOTE 3—Additional Valuation Information
GAAP defines fair value as the price that would be received to sell an asset or paid to transfer a liability in an orderly transaction between market participants at the measurement date, under current market conditions. GAAP establishes a hierarchy that prioritizes the inputs to valuation methods, giving the highest priority to readily available unadjusted quoted prices in an active market for identical assets (Level 1) and the lowest priority to significant unobservable inputs (Level 3), generally when market prices are not readily available or are unreliable. Based on the valuation inputs, the securities or other investments are tiered into one of three levels. Changes in valuation methods may result in transfers in or out of an investment’s assigned level:
| | Level 1 — | Prices are determined using quoted prices in an active market for identical assets. |
| | Level 2 — | Prices are determined using other significant observable inputs. Observable inputs are inputs that other market participants may use in pricing a security. These may include quoted prices for similar securities, interest rates, prepayment speeds, credit risk, yield curves, loss severities, default rates, discount rates, volatilities and others. |
| | Level 3 — | Prices are determined using significant unobservable inputs. In situations where quoted prices or observable inputs are unavailable (for example, when there is little or no market activity for an investment at the end of the period), unobservable inputs may be used. Unobservable inputs reflect the Fund’s own assumptions about the factors market participants would use in determining fair value of the securities or instruments and would be based on the best available information. |
The following is a summary of the tiered valuation input levels, as of October 31, 2018. The level assigned to the securities valuations may not be an indication of the risk or liquidity associated with investing in those securities. Because of the inherent uncertainties of valuation, the values reflected in the financial statements may materially differ from the value received upon actual sale of those investments.
| | | | | | | | | | | | | | | | |
| | | Level 1 | | | Level 2 | | | Level 3 | | | Total | |
Investments in Securities | | | | | | | | | | | | | | | | |
Common Stocks & Other Equity Interests | | $ | 27,030,079 | | | $ | 50,314,878 | | | $ | — | | | $ | 77,344,957 | |
Money Market Funds | | | 168,465 | | | | — | | | | — | | | | 168,465 | |
Total Investments | | $ | 27,198,544 | | | $ | 50,314,878 | | | $ | — | | | $ | 77,513,422 | |
NOTE 4—Expense Offset Arrangement(s)
The expense offset arrangement is comprised of transfer agency credits which result from balances in demand deposit accounts used by the transfer agent for clearing shareholder transactions. For the year ended October 31, 2018, the Fund received credits from this arrangement, which resulted in the reduction of the Fund’s total expenses of $5,601.
NOTE 5—Trustees’ and Officers’ Fees and Benefits
Trustees’ and Officers’ Fees and Benefits include amounts accrued by the Fund to pay remuneration to certain Trustees and Officers of the Fund. Trustees have the option to defer compensation payable by the Fund, and Trustees’ and Officers’ Fees and Benefits also include amounts accrued by the Fund to fund such deferred compensation amounts. Those Trustees who defer compensation have the option to select various Invesco Funds in which their deferral accounts shall be deemed to be invested. Finally, certain current Trustees were eligible to participate in a retirement plan that provided for benefits to be paid upon retirement to Trustees over a period of time based on the number of years of service. The Fund may have certain former Trustees who also participate in a retirement plan and receive benefits under such plan. Trustees’ and Officers’ Fees and Benefits include amounts accrued by the Fund to fund such retirement benefits. Obligations under the deferred compensation and retirement plans represent unsecured claims against the general assets of the Fund.
NOTE 6—Cash Balances
The Fund is permitted to temporarily carry a negative or overdrawn balance in its account with State Street Bank and Trust Company, the custodian bank. Such balances, if any at period-end, are shown in the Statement of Assets and Liabilities under the payable caption Amount due custodian. To compensate the custodian bank for such overdrafts, the overdrawn Fund may either (1) leave funds as a compensating balance in the account so the custodian bank can be compensated by earning the additional interest; or (2) compensate by paying the custodian bank at a rate agreed upon by the custodian bank and Invesco, not to exceed the contractually agreed upon rate.
18 Invesco Greater China Fund
NOTE 7—Distributions to Shareholders and Tax Components of Net Assets
Tax Character of Distributions to Shareholders Paid During the Fiscal Years Ended October 31, 2018 and 2017:
| | | | | | | | |
| | | 2018 | | | 2017 | |
Ordinary income | | $ | 471,329 | | | $ | 400,628 | |
Tax Components of Net Assets at Period-End:
| | | | |
| | | 2018 | |
Undistributed ordinary income | | $ | 4,137,874 | |
Undistributed long-term gain | | | 8,666,968 | |
Net unrealized appreciation (depreciation) — investments | | | (5,909,374 | ) |
Net unrealized appreciation — foreign currencies | | | 147 | |
Temporary book/tax differences | | | (53,197 | ) |
Shares of beneficial interest | | | 71,381,438 | |
Total net assets | | $ | 78,223,856 | |
The difference between book-basis and tax-basis unrealized appreciation (depreciation) is due to differences in the timing of recognition of gains and losses on investments for tax and book purposes. The Fund’s net unrealized appreciation (depreciation) difference is attributable primarily to wash sales.
The temporary book/tax differences are a result of timing differences between book and tax recognition of income and/or expenses. The Fund’s temporary book/tax differences are the result of the trustee deferral of compensation and retirement plan benefits.
Capital loss carryforward is calculated and reported as of a specific date. Results of transactions and other activity after that date may affect the amount of capital loss carryforward actually available for the Fund to utilize. Capital losses generated in years beginning after December 22, 2010 can be carried forward for an unlimited period, whereas previous losses expire in eight tax years. Capital losses with an expiration period may not be used to offset capital gains until all net capital losses without an expiration date have been utilized. Capital loss carryforwards with no expiration date will retain their character as either short-term or long-term capital losses instead of as short-term capital losses as under prior law. The ability to utilize capital loss carryforwards in the future may be limited under the Internal Revenue Code and related regulations based on the results of future transactions.
The Fund does not have a capital loss carryforward as of October 31, 2018.
NOTE 8—Investment Transactions
The aggregate amount of investment securities (other than short-term securities, U.S. Treasury obligations and money market funds, if any) purchased and sold by the Fund during the year ended October 31, 2018 was $43,294,073 and $48,520,316, respectively. Cost of investments, including any derivatives, on a tax basis includes the adjustments for financial reporting purposes as of the most recently completed federal income tax reporting period-end.
| | | | |
| Unrealized Appreciation (Depreciation) of Investments on a Tax Basis | |
Aggregate unrealized appreciation of investments | | $ | 10,216,820 | |
Aggregate unrealized (depreciation) of investments | | | (16,126,194 | ) |
Net unrealized appreciation (depreciation) of investments | | $ | (5,909,374 | ) |
Cost of investments for tax purposes is $83,422,796.
NOTE 9—Reclassification of Permanent Differences
Primarily as a result of differing book/tax treatment of foreign currency transactions, on October 31, 2018, undistributed net investment income was decreased by $32,966 and undistributed net realized gain was increased by $32,966. This reclassification had no effect on the net assets or the distributable earnings of the Fund.
19 Invesco Greater China Fund
NOTE 10—Share Information
| | | | | | | | | | | | | | | | |
| | | Summary of Share Activity | |
| | | Years ended October 31, | |
| | | 2018(a) | | | 2017 | |
| | | Shares | | | Amount | | | Shares | | | Amount | |
Sold: | | | | | | | | | | | | | | | | |
Class A | | | 537,510 | | | $ | 16,196,961 | | | | 569,913 | | | $ | 14,502,235 | |
Class B(b) | | | — | | | | — | | | | 1,033 | | | | 23,318 | |
Class C | | | 52,637 | | | | 1,540,837 | | | | 45,152 | | | | 1,130,270 | |
Class Y | | | 157,028 | | | | 4,532,706 | | | | 346,947 | | | | 8,827,823 | |
Class R6 | | | 35,950 | | | | 1,119,985 | | | | 3,633 | | | | 104,144 | |
| | | | |
Issued as reinvestment of dividends: | | | | | | | | | | | | | | | | |
Class A | | | 12,961 | | | | 372,496 | | | | 15,781 | | | | 339,129 | |
Class Y | | | 2,244 | | | | 64,471 | | | | 1,898 | | | | 40,746 | |
Class R5 | | | 15 | | | | 444 | | | | 20 | | | | 432 | |
Class R6 | | | 31 | | | | 881 | | | | — | | | | — | |
| | | | |
Conversion of Class B shares to Class A shares:(c) | | | | | | | | | | | | | | | | |
Class A | | | 22,686 | | | | 734,786 | | | | 21,353 | | | | 537,044 | |
Class B | | | (23,444 | ) | | | (734,786 | ) | | | (21,965 | ) | | | (537,044 | ) |
| | | | |
Reacquired: | | | | | | | | | | | | | | | | |
Class A | | | (613,067 | ) | | | (17,992,849 | ) | | | (592,344 | ) | | | (14,241,492 | ) |
Class B(b) | | | (3,360 | ) | | | (99,408 | ) | | | (8,760 | ) | | | (206,366 | ) |
Class C | | | (112,428 | ) | | | (3,245,780 | ) | | | (125,409 | ) | | | (2,922,464 | ) |
Class Y | | | (242,905 | ) | | | (7,173,888 | ) | | | (194,454 | ) | | | (4,724,188 | ) |
Class R5 | | | (1,492 | ) | | | (43,864 | ) | | | (8 | ) | | | (189 | ) |
Class R6 | | | (15,034 | ) | | | (447,065 | ) | | | — | | | | — | |
Net increase (decrease) in share activity | | | (190,668 | ) | | $ | (5,174,073 | ) | | | 62,790 | | | $ | 2,873,398 | |
| (a) | There are entities that are record owners of more than 5% of the outstanding shares of the Fund and in the aggregate own 27% of the outstanding shares of the Fund. IDI has an agreement with these entities to sell Fund shares. The Fund, Invesco and/or Invesco affiliates may make payments to these entities, which are considered to be related to the Fund, for providing services to the Fund, Invesco and/or Invesco affiliates including but not limited to services such as securities brokerage, distribution, third party record keeping and account servicing. The Fund has no knowledge as to whether all or any portion of the shares owned of record by these entities are also owned beneficially. |
| (b) | Class B shares activity for the period November 1, 2017 through January 26, 2018 (date of conversion). |
| (c) | Effective as of the close of business January 26, 2018, all outstanding Class B shares were converted to Class A shares. |
20 Invesco Greater China Fund
NOTE 11—Financial Highlights
The following schedule presents financial highlights for a share of the Fund outstanding throughout the periods indicated.
| | | | | | | | | | | | | | | | | | | | | | | | | | | | | | | | | | | | | | | | | | | | | | | | |
| | | Net asset
value,
beginning
of period | | | Net
investment
income
(loss)(a) | | | Net gains
(losses)
on securities
(both
realized and
unrealized) | | | Total from
investment
operations | | | Dividends
from net
investment
income | | | Net asset
value, end
of period | | | Total
return(b) | | | Net assets,
end of period
(000’s omitted) | | | Ratio of
expenses
to average
net assets
with fee waivers
and/or expenses
absorbed | | | Ratio of
expenses
to average net
assets without
fee waivers
and/or expenses
absorbed | | | Ratio of net
investment
income (loss)
to average
net assets | | | Portfolio
turnover(c) | |
Class A | |
Year ended 10/31/18 | | $ | 29.40 | | | $ | 0.34 | (d) | | $ | (4.06 | )(e) | | $ | (3.72 | ) | | $ | (0.16 | ) | | $ | 25.52 | | | | (12.71 | )%(e) | | $ | 59,615 | | | | 1.79 | %(f) | | | 1.80 | %(f) | | | 1.15 | %(d)(f) | | | 45 | % |
Year ended 10/31/17 | | | 22.23 | | | | 0.05 | | | | 7.27 | | | | 7.32 | | | | (0.15 | ) | | | 29.40 | | | | 33.19 | | | | 69,843 | | | | 1.93 | | | | 1.93 | | | | 0.22 | | | | 56 | |
Year ended 10/31/16 | | | 21.10 | | | | 0.15 | | | | 1.20 | | | | 1.35 | | | | (0.22 | ) | | | 22.23 | | | | 6.51 | | | | 52,479 | | | | 1.93 | | | | 1.93 | | | | 0.74 | | | | 52 | |
Year ended 10/31/15 | | | 19.93 | | | | 0.18 | | | | 1.08 | | | | 1.26 | | | | (0.09 | ) | | | 21.10 | | | | 6.36 | | | | 53,087 | | | | 1.88 | | | | 1.88 | | | | 0.85 | | | | 130 | |
Year ended 10/31/14 | | | 20.31 | | | | (0.03 | ) | | | (0.13 | ) | | | (0.16 | ) | | | (0.22 | ) | | | 19.93 | | | | (0.87 | ) | | | 62,957 | | | | 1.85 | | | | 1.85 | | | | (0.15 | ) | | | 124 | |
Class B | |
Year ended 10/31/18(g) | | | 28.50 | | | | 0.03 | | | | 2.99 | (e) | | | 3.02 | | | | — | | | | 31.52 | | | | 10.60 | (e) | | | — | | | | 2.54 | (f)(h) | | | 2.55 | (f)(h) | | | 0.40 | (f)(h) | | | 45 | |
Year ended 10/31/17 | | | 21.56 | | | | (0.13 | ) | | | 7.07 | | | | 6.94 | | | | — | | | | 28.50 | | | | 32.19 | | | | 764 | | | | 2.68 | | | | 2.68 | | | | (0.53 | ) | | | 56 | |
Year ended 10/31/16 | | | 20.43 | | | | (0.00 | ) | | | 1.16 | | | | 1.16 | | | | (0.03 | ) | | | 21.56 | | | | 5.72 | | | | 1,218 | | | | 2.68 | | | | 2.68 | | | | (0.01 | ) | | | 52 | |
Year ended 10/31/15 | | | 19.35 | | | | 0.02 | | | | 1.06 | | | | 1.08 | | | | — | | | | 20.43 | | | | 5.58 | | | | 2,600 | | | | 2.63 | | | | 2.63 | | | | 0.10 | | | | 130 | |
Year ended 10/31/14 | | | 19.71 | | | | (0.18 | ) | | | (0.14 | ) | | | (0.32 | ) | | | (0.04 | ) | | | 19.35 | | | | (1.61 | ) | | | 5,303 | | | | 2.60 | | | | 2.60 | | | | (0.90 | ) | | | 124 | |
Class C | |
Year ended 10/31/18 | | | 28.45 | | | | 0.11 | (d) | | | (3.91 | )(e) | | | (3.80 | ) | | | — | | | | 24.65 | | | | (13.36 | )(e) | | | 10,155 | | | | 2.54 | (f) | | | 2.55 | (f) | | | 0.40 | (d)(f) | | | 45 | |
Year ended 10/31/17 | | | 21.52 | | | | (0.13 | ) | | | 7.06 | | | | 6.93 | | | | — | | | | 28.45 | | | | 32.20 | | | | 13,422 | | | | 2.68 | | | | 2.68 | | | | (0.53 | ) | | | 56 | |
Year ended 10/31/16 | | | 20.39 | | | | (0.00 | ) | | | 1.16 | | | | 1.16 | | | | (0.03 | ) | | | 21.52 | | | | 5.73 | | | | 11,879 | | | | 2.68 | | | | 2.68 | | | | (0.01 | ) | | | 52 | |
Year ended 10/31/15 | | | 19.32 | | | | 0.02 | | | | 1.05 | | | | 1.07 | | | | — | | | | 20.39 | | | | 5.54 | | | | 13,922 | | | | 2.63 | | | | 2.63 | | | | 0.10 | | | | 130 | |
Year ended 10/31/14 | | | 19.68 | | | | (0.18 | ) | | | (0.14 | ) | | | (0.32 | ) | | | (0.04 | ) | | | 19.32 | | | | (1.62 | ) | | | 15,978 | | | | 2.60 | | | | 2.60 | | | | (0.90 | ) | | | 124 | |
Class Y | |
Year ended 10/31/18 | | | 29.44 | | | | 0.42 | (d) | | | (4.07 | )(e) | | | (3.65 | ) | | | (0.22 | ) | | | 25.57 | | | | (12.48 | )(e) | | | 7,801 | | | | 1.54 | (f) | | | 1.55 | (f) | | | 1.40 | (d)(f) | | | 45 | |
Year ended 10/31/17 | | | 22.26 | | | | 0.12 | | | | 7.27 | | | | 7.39 | | | | (0.21 | ) | | | 29.44 | | | | 33.53 | | | | 11,444 | | | | 1.68 | | | | 1.68 | | | | 0.47 | | | | 56 | |
Year ended 10/31/16 | | | 21.14 | | | | 0.21 | | | | 1.19 | | | | 1.40 | | | | (0.28 | ) | | | 22.26 | | | | 6.77 | | | | 5,216 | | | | 1.68 | | | | 1.68 | | | | 0.99 | | | | 52 | |
Year ended 10/31/15 | | | 19.98 | | | | 0.23 | | | | 1.08 | | | | 1.31 | | | | (0.15 | ) | | | 21.14 | | | | 6.62 | | | | 3,449 | | | | 1.63 | | | | 1.63 | | | | 1.10 | | | | 130 | |
Year ended 10/31/14 | | | 20.36 | | | | 0.02 | | | | (0.13 | ) | | | (0.11 | ) | | | (0.27 | ) | | | 19.98 | | | | (0.62 | ) | | | 4,494 | | | | 1.60 | | | | 1.60 | | | | 0.10 | | | | 124 | |
Class R5 | |
Year ended 10/31/18 | | | 29.46 | | | | 0.46 | (d) | | | (4.08 | )(e) | | | (3.62 | ) | | | (0.26 | ) | | | 25.58 | | | | (12.38 | )(e) | | | 25 | | | | 1.40 | (f) | | | 1.40 | (f) | | | 1.54 | (d)(f) | | | 45 | |
Year ended 10/31/17 | | | 22.28 | | | | 0.16 | | | | 7.28 | | | | 7.44 | | | | (0.26 | ) | | | 29.46 | | | | 33.80 | | | | 72 | | | | 1.50 | | | | 1.50 | | | | 0.65 | | | | 56 | |
Year ended 10/31/16 | | | 21.17 | | | | 0.25 | | | | 1.19 | | | | 1.44 | | | | (0.33 | ) | | | 22.28 | | | | 7.00 | | | | 54 | | | | 1.45 | | | | 1.45 | | | | 1.22 | | | | 52 | |
Year ended 10/31/15 | | | 20.01 | | | | 0.28 | | | | 1.08 | | | | 1.36 | | | | (0.20 | ) | | | 21.17 | | | | 6.88 | | | | 75 | | | | 1.41 | | | | 1.41 | | | | 1.32 | | | | 130 | |
Year ended 10/31/14 | | | 20.38 | | | | 0.06 | | | | (0.14 | ) | | | (0.08 | ) | | | (0.29 | ) | | | 20.01 | | | | (0.46 | ) | | | 104 | | | | 1.39 | | | | 1.39 | | | | 0.31 | | | | 124 | |
Class R6 | |
Year ended 10/31/18 | | | 29.45 | | | | 0.46 | (d) | | | (4.07 | )(e) | | | (3.61 | ) | | | (0.27 | ) | | | 25.57 | | | | (12.36 | )(e) | | | 629 | | | | 1.40 | (f) | | | 1.40 | (f) | | | 1.54 | (d)(f) | | | 45 | |
Year ended 10/31/17(i) | | | 23.28 | | | | 0.25 | | | | 5.92 | | | | 6.17 | | | | — | | | | 29.45 | | | | 26.50 | | | | 107 | | | | 1.47 | (h) | | | 1.47 | (h) | | | 0.68 | (h) | | | 56 | |
| (a) | Calculated using average shares outstanding. |
| (b) | Includes adjustments in accordance with accounting principles generally accepted in the United States of America and as such, the net asset value for financial reporting purposes and the returns based upon those net asset values may differ from the net asset value and returns for shareholder transactions. Does not include sales charges and is not annualized for periods less than one year, if applicable. |
| (c) | Portfolio turnover is calculated at the fund level and is not annualized for periods less than one year, if applicable. |
| (d) | Net investment income (loss) per share and the ratio of net investment income (loss) to average net assets includes significant dividends received during the year ended October 31, 2018. Net investment income (loss) per share and the ratio of net investment income (loss) to average net assets excluding the significant dividends are $0.18 and 0.60%, $(0.05) and (0.15)%, $0.26 and 0.85%, 0.30 and 0.99% and $0.30 and 0.99% for Class A, Class C, Class Y, Class R5 and Class R6 shares, respectively. |
| (e) | Includes litigation proceeds received during the year. Had these litigation proceeds not been received, Net gains (losses) on securities (both realized and unrealized) per share would have been $(4.16), $3.00, $(4.01), $(4.17), $(4.18) and $(4.17) for Class A, Class B, Class C, Class Y, Class R5, and Class R6 shares, respectively. Total returns would have been lower. |
| (f) | Ratios are based on average daily net assets (000’s omitted) of $72,686, $718, $12,835, $10,699, $58, and $628 for Class A, Class B, Class C, Class Y, Class R5 and Class R6 shares, respectively. |
| (g) | Reflects activity for the period November 1, 2017 through January 26, 2018 (date of conversion). |
| (i) | Commencement date of April 4, 2017 for Class R6 shares. |
21 Invesco Greater China Fund
Report of Independent Registered Public Accounting Firm
To the Board of Trustees of AIM Investment Funds (Invesco Investment Funds)
and Shareholders of Invesco Greater China Fund:
Opinion on the Financial Statements
We have audited the accompanying statement of assets and liabilities, including the schedule of investments, of Invesco Greater China Fund (one of the funds constituting AIM Investment Funds (Invesco Investment Funds), hereafter referred to as the “Fund”) as of October 31, 2018, the related statement of operations for the year ended October 31, 2018, the statement of changes in net assets for each of the two years in the period ended October 31, 2018, including the related notes, and the financial highlights for each of the periods indicated therein (collectively referred to as the financial statements). In our opinion, the financial statements present fairly, in all material respects, the financial position of the Fund as of October 31, 2018, the results of its operations for the year then ended, the changes in its net assets for each of the two years in the period ended October 31, 2018 and the financial highlights for each of the periods indicated therein in conformity with accounting principles generally accepted in the United States of America.
Basis for Opinion
These financial statements are the responsibility of the Fund’s management. Our responsibility is to express an opinion on the Fund’s financial statements based on our audits. We are a public accounting firm registered with the Public Company Accounting Oversight Board (United States) (PCAOB) and are required to be independent with respect to the Fund in accordance with the U.S. federal securities laws and the applicable rules and regulations of the Securities and Exchange Commission and the PCAOB.
We conducted our audits of these financial statements in accordance with the standards of the PCAOB. Those standards require that we plan and perform the audit to obtain reasonable assurance about whether the financial statements are free of material misstatement, whether due to error or fraud.
Our audits included performing procedures to assess the risks of material misstatement of the financial statements, whether due to error or fraud, and performing procedures that respond to those risks. Such procedures included examining, on a test basis, evidence regarding the amounts and disclosures in the financial statements. Our audits also included evaluating the accounting principles used and significant estimates made by management, as well as evaluating the overall presentation of the financial statements. Our procedures included confirmation of securities owned as of October 31, 2018 by correspondence with the custodian and transfer agent. We believe that our audits provide a reasonable basis for our opinion.
PricewaterhouseCoopers LLP
Houston, TX
December 28, 2018
We have served as the auditor of one or more of the investment companies in the Invesco group of investment companies since at least 1995. We have not been able to determine the specific year we began serving as auditor.
22 Invesco Greater China Fund
Calculating your ongoing Fund expenses
Example
As a shareholder of the Fund, you incur two types of costs: (1) transaction costs, which may include sales charges (loads) on purchase payments or contingent deferred sales charges on redemptions, if any; and (2) ongoing costs, including management fees, distribution and/or service (12b-1) fees, and other Fund expenses. This example is intended to help you understand your ongoing costs (in dollars) of investing in the Fund and to compare these costs with ongoing costs of investing in other mutual funds. The example is based on an investment of $1,000 invested at the beginning of the period and held for the entire period May 1, 2018 through October 31, 2018.
Actual expenses
The table below provides information about actual account values and actual expenses. You may use the information in this table, together with the amount you invested, to estimate the expenses that you paid over the period. Simply divide your account value by $1,000 (for example, an $8,600 account value divided by $1,000 = 8.6), then multiply the result by the number in the table under the heading entitled “Actual Expenses Paid During Period” to estimate the expenses you paid on your account during this period.
Hypothetical example for comparison purposes
The table below also provides information about hypothetical account values and hypothetical expenses based on the Fund’s actual expense ratio and an assumed rate of return of 5% per year before expenses, which is not the Fund’s actual return.
The hypothetical account values and expenses may not be used to estimate the actual ending account balance or expenses you paid for the period. You may use this information to compare the ongoing costs of investing in the Fund and other funds. To do so, compare this 5% hypothetical example with the 5% hypothetical examples that appear in the shareholder reports of the other funds.
Please note that the expenses shown in the table are meant to highlight your ongoing costs only and do not reflect any transaction costs, such as sales charges (loads) on purchase payments or contingent deferred sales charges on redemptions, if any. Therefore, the hypothetical information is useful in comparing ongoing costs only, and will not help you determine the relative total costs of owning different funds. In addition, if these transaction costs were included, your costs would have been higher.
| | | | | | | | | | | | | | | | | | | | | | | | |
| Class | | Beginning
Account Value
(05/01/18) | | | ACTUAL | | | HYPOTHETICAL (5% annual return before
expenses) | | | Annualized
Expense Ratio | |
| | Ending
Account Value
(10/31/18)1 | | | Expenses
Paid During
Period2 | | | Ending
Account Value
(10/31/18) | | | Expenses
Paid During
Period2 | |
| A | | $ | 1,000.00 | | | $ | 872.20 | | | $ | 8.35 | | | $ | 1,016.28 | | | $ | 9.00 | | | | 1.77 | % |
| C | | | 1,000.00 | | | | 868.90 | | | | 11.87 | | | | 1,012.50 | | | | 12.78 | | | | 2.52 | |
| Y | | | 1,000.00 | | | | 873.30 | | | | 7.18 | | | | 1,017.54 | | | | 7.73 | | | | 1.52 | |
| R5 | | | 1,000.00 | | | | 873.60 | | | | 6.52 | | | | 1,018.25 | | | | 7.02 | | | | 1.38 | |
| R6 | | | 1,000.00 | | | | 873.90 | | | | 6.52 | | | | 1,018.25 | | | | 7.02 | | | | 1.38 | |
| 1 | The actual ending account value is based on the actual total return of the Fund for the period May 1, 2018 through October 31, 2018, after actual expenses and will differ from the hypothetical ending account value which is based on the Fund’s expense ratio and a hypothetical annual return of 5% before expenses. |
| 2 | Expenses are equal to the Fund’s annualized expense ratio as indicated above multiplied by the average account value over the period, multiplied by 184/365 to reflect the most recent fiscal half year. |
23 Invesco Greater China Fund
Approval of Investment Advisory and Sub-Advisory Contracts
At meetings held on June 5-6, 2018, the Board of Trustees (the Board or the Trustees) of AIM Investment Funds (Invesco Investment Funds) as a whole, and the independent Trustees, who comprise over 75% of the Board, voting separately, approved the continuance of the Invesco Greater China Fund’s (the Fund) Master Investment Advisory Agreement with Invesco Advisers, Inc. (Invesco Advisers and the investment advisory agreement) and the Master Intergroup Sub-Advisory Contract for Mutual Funds with Invesco Asset Management Deutschland GmbH, Invesco Asset Management Limited, Invesco Asset Management (Japan) Limited, Invesco Hong Kong Limited, Invesco Senior Secured Management, Inc. and Invesco Canada Ltd. (collectively, the Affiliated Sub-Advisers and the sub-advisory contracts) for another year, effective July 1, 2018. After evaluating the factors discussed below, among others, the Board approved the renewal of the Fund’s investment advisory agreement and the sub-advisory contracts and determined that the compensation payable by the Fund to Invesco Advisers and by Invesco Advisers to the Affiliated Sub-Advisers is fair and reasonable.
The Board’s Evaluation Process
The Board’s Investments Committee has established three Sub-Committees, which meet throughout the year to review the performance of funds advised by Invesco Advisers (the Invesco Funds). Over the course of each year, the Sub-Committees meet with portfolio managers for their assigned Invesco Funds and other members of management to review detailed information about investment performance and portfolio attributes of these funds. The Board took into account evaluations and reports that it received from the Investments Committee and Sub-Committees, as well as the information provided to such committees and the Board throughout the year, in considering whether to approve each Invesco Fund’s investment advisory agreement and sub-advisory contracts.
As part of the contract renewal process, the Board reviews and considers information provided in response to detailed requests for information submitted to management by the independent Trustees with assistance from legal counsel to the independent Trustees. The Board receives comparative investment performance and fee data regarding the Invesco Funds prepared by Invesco Advisers and Broadridge Financial Solutions, Inc. (Broadridge), an independent mutual fund data provider. The Board also receives an independent written evaluation from the Senior Officer, an officer of the Invesco Funds who reports directly to the independent Trustees. The Senior Officer’s evaluation is prepared as part of his responsibility to manage the process by which the Invesco Funds’ proposed management fees
are negotiated during the annual contract renewal process to ensure they are negotiated in a manner that is at arms’ length and reasonable. In addition to meetings with Invesco Advisers and fund counsel throughout the year, the independent Trustees also discuss the continuance of the investment advisory agreement and sub-advisory contracts in separate sessions with the Senior Officer and with independent legal counsel.
The discussion below is a summary of the Senior Officer’s independent written evaluation with respect to the Fund’s investment advisory agreement, as well as a discussion of the material factors and related conclusions that formed the basis for the Board’s approval of the Fund’s investment advisory agreement and sub-advisory contracts. The Trustees’ review and conclusions are based on the comprehensive consideration of all information presented to them during the course of the year and in prior years and are not the result of any single determinative factor. Moreover, one Trustee may have weighed a particular piece of information or factor differently than another Trustee. This information is current as of June 6, 2018.
Factors and Conclusions and Summary of Independent Written Fee Evaluation
| A. | Nature, Extent and Quality of Services Provided by Invesco Advisers and the Affiliated Sub-Advisers |
The Board reviewed the nature, extent and quality of the advisory services provided to the Fund by Invesco Advisers under the Fund’s investment advisory agreement, and the credentials and experience of the officers and employees of Invesco Advisers who provide these services, including the Fund’s portfolio manager(s). The Board’s review included consideration of Invesco Advisers’ investment process oversight and structure, credit analysis and investment risk management. The Board also considered non-advisory services that Invesco Advisers and its affiliates provide to the Invesco Funds such as various back office support functions, third party oversight, internal audit, valuation, portfolio trading and legal and compliance. The Board also reviewed and considered the benefits to shareholders of investing in a fund that is part of the Invesco family of funds under the umbrella of Invesco Ltd., Invesco Advisers’ parent company, and noted Invesco Ltd.’s depth and experience in conducting an investment management business, as well as its commitment of financial and other resources to such business. The Board concluded that the nature, extent and quality of the services provided to the Fund by Invesco Advisers are appropriate and satisfactory.
The Board reviewed the services that may be provided by the Affiliated Sub-Advisers under
the sub-advisory contracts and the credentials and experience of the officers and employees of the Affiliated Sub-Advisers who provide these services. The Board noted the Affiliated Sub-Advisers’ expertise with respect to certain asset classes and that the Affiliated Sub-Advisers have offices and personnel that are located in financial centers around the world. As a result, the Board noted that the Affiliated Sub-Advisers can provide research and investment analysis on the markets and economies of various countries in which the Fund may invest, make recommendations regarding securities and assist with security trades. The Board concluded that the sub-advisory contracts may benefit the Fund and its shareholders by permitting Invesco Advisers to use the resources and talents of the Affiliated Sub-Advisers in managing the Fund. The Board concluded that the nature, extent and quality of the services that may be provided by the Affiliated Sub-Advisers are appropriate and satisfactory.
| B. | Fund Investment Performance |
The Board considered Fund investment performance as a relevant factor in considering whether to approve the investment advisory agreement as well as the sub-advisory contracts for the Fund, as Invesco Hong Kong Limited currently manages assets of the Fund.
The Board noted that the Fund was renamed reflecting broader China region exposure on June 15, 2015. The Board compared the Fund’s investment performance over multiple time periods ending December 31, 2017 to the performance of funds in the Broadridge performance universe and against the Lipper China Region Funds Index. The Board noted that performance of Class A shares of the Fund was in the third quintile of its performance universe for the one and five year periods and the first quintile for the three year period (the first quintile being the best performing funds and the fifth quintile being the worst performing funds). The Board noted that performance of Class A shares of the Fund was below the performance of the Index for the one year period, above the performance of the Index for the three year period, and reasonably comparable to the performance of the Index for the five year period. The Trustees also reviewed more recent Fund performance and this review did not change their conclusions.
| C. | Advisory and Sub-Advisory Fees and Fund Expenses |
The Board compared the Fund’s contractual management fee rate to the contractual management fee rates of funds in the Fund’s Broadridge expense group. The Board noted that the contractual management fee rate for Class A shares of the Fund was below the median contractual management fee rate of funds in its expense group. The Board noted that the term “contractual management fee” for
24 Invesco Greater China Fund
funds in the expense group may include both advisory and certain non-portfolio management administrative services fees, but that Broadridge does not provide information on a fund by fund basis as to what is included. The Board also reviewed the methodology used by Broadridge in providing expense group information, which includes using each fund’s contractual management fee schedule (including any applicable breakpoints) as reported in the most recent prospectus or statement of additional information for each fund in the expense group. The Board also considered comparative information regarding the Fund’s total expense ratio and its various components. The Board noted that the Fund’s total expense ratio was in the fourth quintile of its expense group and discussed with management reasons for such relative total expenses.
The Board noted that Invesco Advisers has contractually agreed to waive fees and/or limit expenses of the Fund in an amount necessary to limit total annual operating expenses to a specified percentage of average daily net assets for each class of the Fund.
The Board also considered the fees charged by Invesco Advisers and the Affiliated Sub-Advisers to other similarly managed client accounts. The Board noted that Invesco Advisers or the Affiliated Sub-Advisers may charge lower fees to large institutional clients. Invesco Advisers reviewed with the Board differences in the scope of services it provides to the Invesco Funds relative to certain other types of client accounts, including management of cash flows as a result of redemptions and purchases, necessary infrastructure such as officers, office space, technology, legal and distribution, oversight of service providers, costs and business risks associated with launching new funds and sponsoring and maintaining the product line, preparation of annual registration statement updates and financial information and compliance with federal and state laws and regulations.
The Board also compared the Fund’s effective advisory fee rate (the advisory fee rate after advisory fee waivers and before other expense limitations/waivers) to the effective advisory fee rates of other similarly managed third-party mutual funds advised or sub-advised by Invesco Advisers and its affiliates, based on asset balances as of December 31, 2017.
The Board also considered the services that may be provided by the Affiliated Sub-Advisers pursuant to the sub-advisory contracts, as well as the fees payable by Invesco Advisers to the Affiliated Sub-Advisers pursuant to the sub-advisory contracts. The Board noted that Invesco Advisers retains overall responsibility for, and provides services to, sub-advised Invesco Funds, including oversight of the Affiliated Sub-Advisers as well as the additional services described herein other than day-to-day portfolio management.
| D. | Economies of Scale and Breakpoints |
The Board considered the extent to which there may be economies of scale in the provision of advisory services to the Fund. The Board also considered that the Fund may benefit from economies of scale through contractual breakpoints in the Fund’s advisory fee schedule, which generally operate to reduce the Fund’s expense ratio as it grows in size. The Board noted that the Fund shares directly in economies of scale through lower fees charged by third party service providers based on the combined size of the Invesco Funds. The Board noted that the Fund may also benefit from economies of scale through initial fee setting, fee waivers and expense reimbursements.
| E. | Profitability and Financial Resources |
The Board reviewed information from Invesco Advisers concerning the costs of the advisory and other services that Invesco Advisers and its affiliates provide to the Fund and the Invesco Funds and the profitability of Invesco Advisers and its affiliates in providing these services. The Board considered the methodology used for calculating profitability and noted the periodic review of such methodology by an independent consultant. The Board noted that Invesco Advisers continues to operate at a net profit from services Invesco Advisers and its affiliates provide to the Invesco Funds and the Fund. The Board did not deem the level of profits realized by Invesco Advisers and its affiliates from providing services to the Fund to be excessive given the nature, extent and quality of the services provided. The Board received information from Invesco Advisers demonstrating that Invesco Advisers and the Affiliated Sub-Advisers are financially sound and have the resources necessary to perform their obligations under the investment advisory agreement and sub-advisory contracts.
| F. | Collateral Benefits to Invesco Advisers and its Affiliates |
The Board considered various other benefits received by Invesco Advisers and its affiliates from the relationship with the Fund, including the fees received for providing administrative, transfer agency and distribution services to the Fund. The Board considered comparative information regarding fees charged for these services, including information provided by Broadridge and other independent sources. The Board considered the performance of Invesco Advisers and its affiliates in providing these services and the organizational structure employed to provide these services. The Board also considered that these services are provided to the Fund pursuant to written contracts that are reviewed and approved on an annual basis by the Board; and that the services are required for the operation of the Fund.
The Board considered the benefits realized by Invesco Advisers and the Affiliated Sub-Advisers as a result of portfolio brokerage transactions executed through “soft dollar” arrangements. The Board noted that soft dollar arrangements may result in the Fund bearing costs to purchase research that may be used by Invesco
Advisers or the Affiliated Sub-Advisers with other clients and may reduce Invesco Advisers’ or the Affiliated Sub-Advisers’ expenses. The Board also considered that it receives periodic reports from Invesco representing that these arrangements are consistent with regulatory requirements. The Board did not deem the soft dollar arrangements to be inappropriate.
The Board considered that the Fund’s uninvested cash and cash collateral from any securities lending arrangements may be invested in money market funds advised by Invesco Advisers pursuant to procedures approved by the Board. The Board noted that Invesco Advisers receives advisory fees from these affiliated money market funds attributable to such investments, although Invesco Advisers has contractually agreed to waive through varying periods the advisory fees payable by the Invesco Funds with respect to certain investments in the affiliated money market funds. The waiver is in an amount equal to 100% of the net advisory fee Invesco Advisers receives from the affiliated money market funds with respect to the Fund’s investment in the affiliated money market funds of uninvested cash, but not cash collateral. The Board concluded that the amount of advisory fees received by Invesco Advisers from the Fund’s investment of cash collateral from any securities lending arrangements in the affiliated money market funds is fair and reasonable.
The Board also considered that an affiliated broker may receive commissions for executing certain trades for the Fund. Invesco Advisers and the Affiliated Sub-Advisers may use the affiliated broker to, among other things, control order routing and minimize information leakage, and the Board was advised that such trades are executed in compliance with rules under the federal securities laws and consistent with best execution obligations.
25 Invesco Greater China Fund
Tax Information
Form 1099-DIV, Form 1042-S and other year-end tax information provide shareholders with actual calendar year amounts that should be included in their tax returns. Shareholders should consult their tax advisors.
The following distribution information is being provided as required by the Internal Revenue Code or to meet a specific state’s requirement.
The Fund designates the following amounts or, if subsequently determined to be different, the maximum amount allowable for its fiscal year ended October 31, 2018:
| | | | |
Federal and State Income Tax | |
Qualified Dividend Income* | | | 6.68 | % |
Corporate Dividends Received Deduction* | | | 0.00 | % |
U.S. Treasury Obligations* | | | 0.00 | % |
Foreign Taxes | | $ | 0.0997 | per share |
Foreign Source Income | | $ | 1.0323 | per share |
| | * | The above percentages are based on ordinary income dividends paid to shareholders during the Fund’s fiscal year. |
26 Invesco Greater China Fund
Trustees and Officers
The address of each trustee and officer is AIM Investment Funds (Invesco Investment Funds) (the “Trust”), 11 Greenway Plaza, Suite 1000, Houston, Texas 77046-1173. The trustees serve for the life of the Trust, subject to their earlier death, incapacitation, resignation, retirement or removal as more specifically provided in the Trust’s organizational documents. Each officer serves for a one year term or until their successors are elected and qualified. Column two below includes length of time served with predecessor entities, if any.
| | | | | | | | |
Name, Year of Birth and
Position(s) Held with the Trust | | Trustee and/
or Officer Since | | Principal Occupation(s)
During Past 5 Years | | Number of
Funds in Fund
Complex
Overseen by
Trustee | | Other Directorship(s)
Held by Trustee During
Past 5 Years |
| Interested Persons | | | | | | | | |
| Martin L. Flanagan1 — 1960 Trustee | | 2007 | | Executive Director, Chief Executive Officer and President, Invesco Ltd. (ultimate parent of Invesco and a global investment management firm); Trustee, The Invesco Funds; Vice Chair, Investment Company Institute; and Member of Executive Board, SMU Cox School of Business Formerly: Advisor to the Board, Invesco Advisers, Inc. (formerly known as Invesco Institutional (N.A.), Inc.); Chairman and Chief Executive Officer, Invesco Advisers, Inc. (registered investment adviser); Director, Chairman, Chief Executive Officer and President, Invesco Holding Company (US), Inc. (formerly IVZ Inc.) (holding company), Invesco Group Services, Inc. (service provider) and Invesco North American Holdings, Inc. (holding company); Director, Chief Executive Officer and President, Invesco Holding Company Limited (parent of Invesco and a global investment management firm); Director, Invesco Ltd.; Chairman, Investment Company Institute and President, Co-Chief Executive Officer, Co-President, Chief Operating Officer and Chief Financial Officer, Franklin Resources, Inc. (global investment management organization) | | 158 | | None |
Philip A. Taylor2 — 1954 Trustee and Senior Vice President | | 2006 | | Head of the Americas and Senior Managing Director, Invesco Ltd.; Director, Invesco Advisers, Inc. (formerly known as Invesco Institutional (N.A.), Inc.) (registered investment adviser); Director and Chairman, Invesco Investment Services, Inc. (formerly known as Invesco AIM Investment Services, Inc.) (registered transfer agent); Chief Executive Officer, Invesco Corporate Class Inc. (corporate mutual fund company); Director, Chairman and Chief Executive Officer, Invesco Canada Ltd. (formerly known as Invesco Trimark Ltd./Invesco Trimark Ltèe) (registered investment adviser and registered transfer agent); Trustee and Senior Vice President, The Invesco Funds; Director, Invesco Investment Advisers LLC (formerly known as Van Kampen Asset Management) Formerly: Director, Chairman, Chief Executive Officer and President, Invesco Management Group, Inc. (formerly known as Invesco AIM Management Group, Inc.) (financial services holding company); Co-Chairman, Co-President and Co-Chief Executive Officer, Invesco Advisers, Inc. (formerly known as Invesco Institutional (N.A.), Inc.) (registered investment adviser); Director, Chief Executive Officer and President, Van Kampen Exchange Corp; President and Principal Executive Officer, The Invesco Funds (other than AIM Treasurer’s Series Trust (Invesco Treasurer’s Series Trust), Short-Term Investments Trust and Invesco Management Trust); Executive Vice President, The Invesco Funds (AIM Treasurer’s Series Trust (Invesco Treasurer’s Series Trust), Short-Term Investments Trust and Invesco Management Trust only); Director and President, INVESCO Funds Group, Inc. (registered investment adviser and registered transfer agent); Director and Chairman, IVZ Distributors, Inc. (formerly known as INVESCO Distributors, Inc.) (registered broker dealer); Director, President and Chairman, Invesco Inc. (holding company), Invesco Canada Holdings Inc. (holding company), Trimark Investments Ltd./Placements Trimark Ltèe and Invesco Financial Services Ltd/Services Financiers Invesco Ltèe; Chief Executive Officer, Invesco Canada Fund Inc. (corporate mutual fund company); Director and Chairman, Van Kampen Investor Services Inc.; Director, Chief Executive Officer and President, 1371 Preferred Inc. (holding company) and Van Kampen Investments Inc.; Director and President, AIM GP Canada Inc. (general partner for limited partnerships) and Van Kampen Advisors, Inc.; Director and Chief Executive Officer, Invesco Trimark Dealer Inc. (registered broker dealer); Director, Invesco Distributors, Inc. (formerly known as Invesco AIM Distributors, Inc.) (registered broker dealer); Manager, Invesco Capital Management LLC; Director, Chief Executive Officer and President, Invesco Advisers, Inc.; Director, Chairman, Chief Executive Officer and President, Invesco AIM Capital Management, Inc.; President, Invesco Trimark Dealer Inc. and Invesco Trimark Ltd./Invesco Trimark Ltèe; Director and President, AIM Trimark Corporate Class Inc. and AIM Trimark Canada Fund Inc.; Senior Managing Director, Invesco Holding Company Limited; Director and Chairman, Fund Management Company (former registered broker dealer); President and Principal Executive Officer, The Invesco Funds (AIM Treasurer’s Series Trust (Invesco Treasurer’s Series Trust), and Short-Term Investments Trust only); President, AIM Trimark Global Fund Inc. and AIM Trimark Canada Fund Inc. | | 158 | | None |
| 1 | Mr. Flanagan is considered an interested person (within the meaning of Section 2(a)(19) of the 1940 Act) of the Trust because he is an officer of the Adviser to the Trust, and an officer and a director of Invesco Ltd., ultimate parent of the Adviser. |
| 2 | Mr. Taylor is considered an interested person (within the meaning of Section 2(a)(19) of the 1940 Act) of the Trust because he is an officer and a director of the Adviser. |
T-1 Invesco Greater China Fund
Trustees and Officers—(continued)
| | | | | | | | |
Name, Year of Birth and
Position(s) Held with the Trust | | Trustee and/
or Officer Since | | Principal Occupation(s)
During Past 5 Years | | Number of
Funds in Fund
Complex
Overseen by
Trustee | | Other Directorship(s)
Held by Trustee During
Past 5 Years |
| Independent Trustees | | | | | | | | |
Bruce L. Crockett — 1944 Trustee and Chair | | 2001 | | Chairman, Crockett Technologies Associates (technology consulting company) Formerly: Director, Captaris (unified messaging provider); Director, President and Chief Executive Officer, COMSAT Corporation; Chairman, Board of Governors of INTELSAT (international communications company); ACE Limited (insurance company); Independent Directors Council and Investment Company Institute: Member of the Audit Committee, Investment Company Institute; Member of the Executive Committee and Chair of the Governance Committee, Independent Directors Council | | 158 | | Director and Chairman of the Audit Committee, ALPS (Attorneys Liability Protection Society) (insurance company); Director and Member of the Audit Committee and Compensation Committee, Ferroglobe PLC (metallurgical company) |
David C. Arch — 1945 Trustee | | 2010 | | Chairman of Blistex Inc. (consumer health care products manufacturer); Member, World Presidents’ Organization | | 158 | | Board member of the Illinois Manufacturers’ Association |
Jack M. Fields — 1952 Trustee | | 2001 | | Chief Executive Officer, Twenty First Century Group, Inc. (government affairs company); and Chairman, Discovery Learning Alliance (non-profit) Formerly: Owner and Chief Executive Officer, Dos Angeles Ranch L.P. (cattle, hunting, corporate entertainment); Director, Insperity, Inc. (formerly known as Administaff) (human resources provider); Chief Executive Officer, Texana Timber LP (sustainable forestry company); Director of Cross Timbers Quail Research Ranch (non-profit); and member of the U.S. House of Representatives | | 158 | | None |
Cynthia Hostetler — 1962 Trustee | | 2017 | | Non-Executive Director and Trustee of a number of public and private business corporations Formerly: Director, Aberdeen Investment Funds (4 portfolios); Head of Investment Funds and Private Equity, Overseas Private Investment Corporation; President, First Manhattan Bancorporation, Inc.; Attorney, Simpson Thacher & Bartlett LLP | | 158 | | Vulcan Materials Company (construction materials company); Trilinc Global Impact Fund; Artio Global Investment LLC (mutual fund complex); Edgen Group, Inc. (specialized energy and infrastructure products distributor) |
Eli Jones — 1961 Trustee | | 2016 | | Professor and Dean, Mays Business School — Texas A&M University Formerly: Professor and Dean, Walton College of Business, University of Arkansas and E.J. Ourso College of Business, Louisiana State University; Director, Arvest Bank | | 158 | | Insperity, Inc. (formerly known as Administaff) (human resources provider) |
Prema Mathai-Davis — 1950 Trustee | | 2001 | | Retired | | 158 | | None |
Teresa M. Ressel — 1962 Trustee | | 2017 | | Non-executive director and trustee of a number of public and private business corporations Formerly: Chief Financial Officer, Olayan America, The Olayan Group (international investor/commercial/industrial); Chief Executive Officer, UBS Securities LLC; Group Chief Operating Officer, Americas, UBS AG; Assistant Secretary for Management & Budget and CFO, US Department of the Treasury | | 158 | | Atlantic Power Corporation (power generation company); ON Semiconductor Corp. (semiconductor supplier) |
Ann Barnett Stern — 1957 Trustee | | 2017 | | President and Chief Executive Officer, Houston Endowment Inc. (private philanthropic institution) Formerly: Executive Vice President and General Counsel, Texas Children’s Hospital; Attorney, Beck, Redden and Secrest, LLP; Business Law Instructor, University of St. Thomas; Attorney, Andrews & Kurth LLP | | 158 | | Federal Reserve Bank of Dallas |
Raymond Stickel, Jr. — 1944 Trustee | | 2005 | | Retired Formerly: Director, Mainstay VP Series Funds, Inc. (25 portfolios); Partner, Deloitte & Touche | | 158 | | None |
Robert C. Troccoli — 1949 Trustee | | 2016 | | Adjunct Professor, University of Denver — Daniels College of Business Formerly: Senior Partner, KPMG LLP | | 158 | | None |
Christopher L. Wilson — 1957 Trustee | | 2017 | | Non-executive director and trustee of a number of public and private business corporations Formerly: Director, TD Asset Management USA Inc. (mutual fund complex) (22 portfolios); Managing Partner, CT2, LLC (investing and consulting firm); President/Chief Executive Officer, Columbia Funds, Bank of America Corporation; President/Chief Executive Officer, CDC IXIS Asset Management Services, Inc.; Principal & Director of Operations, Scudder Funds, Scudder, Stevens & Clark, Inc.; Assistant Vice President, Fidelity Investments | | 158 | | ISO New England, Inc. (non-profit organization managing regional electricity market) |
T-2 Invesco Greater China Fund
Trustees and Officers—(continued)
| | | | | | | | |
Name, Year of Birth and
Position(s) Held with the Trust | | Trustee and/
or Officer Since | | Principal Occupation(s)
During Past 5 Years | | Number of
Funds in Fund
Complex
Overseen by
Trustee | | Other Directorship(s)
Held by Trustee During
Past 5 Years |
| Other Officers | | | | | | | | |
Sheri Morris — 1964 President, Principal Executive Officer and Treasurer | | 1999 | | President, Principal Executive Officer and Treasurer, The Invesco Funds; Vice President, Invesco Advisers, Inc. (formerly known as Invesco Institutional (N.A.), Inc.) (registered investment adviser); and Vice President, Invesco Exchange-Traded Fund Trust, Invesco Exchange-Traded Fund Trust II, Invesco India Exchange-Traded Fund Trust, Invesco Actively Managed Exchange-Traded Fund Trust, Invesco Actively Managed Exchange-Traded Commodity Fund Trust and Invesco Exchange-Traded Self-Indexed Fund Trust Formerly: Vice President and Principal Financial Officer, The Invesco Funds; Vice President, Invesco AIM Advisers, Inc., Invesco AIM Capital Management, Inc. and Invesco AIM Private Asset Management, Inc.; Assistant Vice President and Assistant Treasurer, The Invesco Funds and Assistant Vice President, Invesco Advisers, Inc., Invesco AIM Capital Management, Inc. and Invesco AIM Private Asset Management, Inc.; and Treasurer, Invesco Exchange-Traded Fund Trust, Invesco Exchange-Traded Fund Trust II, Invesco India Exchange-Traded Fund Trust and Invesco Actively Managed Exchange-Traded Fund Trust | | N/A | | N/A |
Russell C. Burk — 1958 Senior Vice President and Senior Officer | | 2005 | | Senior Vice President and Senior Officer, The Invesco Funds | | N/A | | N/A |
Jeffrey H. Kupor — 1968 Senior Vice President, Chief Legal Officer and Secretary | | 2018 | | Senior Vice President and Secretary, Invesco Advisers, Inc. (formerly known as Invesco Institutional (N.A.), Inc.) (registered investment adviser); Senior Vice President and Secretary, Invesco Distributors, Inc. (formerly known as Invesco AIM Distributors, Inc.); Vice President and Secretary, Invesco Investment Services, Inc. (formerly known as Invesco AIM Investment Services, Inc.) Senior Vice President, Chief Legal Officer and Secretary, The Invesco Funds; Secretary and General Counsel, Invesco Investment Advisers LLC (formerly known as Van Kampen Asset Management); Secretary and General Counsel, Invesco Capital Markets, Inc. (formerly known as Van Kampen Funds Inc.) and Chief Legal Officer, Invesco Exchange-Traded Fund Trust, Invesco Exchange-Traded Fund Trust II, Invesco India Exchange-Traded Fund Trust, Invesco Actively Managed Exchange-Traded Fund Trust, Invesco Actively Managed Exchange-Traded Commodity Fund Trust and Invesco Exchange-Traded Self-Indexed Fund Trust; Secretary, Invesco Indexing LLC; Secretary and General Counsel, INVESCO Private Capital Investments, Inc.; Secretary, W.L. Ross & Co., LLC; Secretary and Vice President, Jemstep, Inc. Formerly: Senior Vice President, Secretary and General Counsel, Invesco Management Group, Inc. (formerly known as Invesco AIM Management Group, Inc.); Assistant Secretary, INVESCO Asset Management (Bermuda) Ltd.; Secretary and General Counsel, Invesco Private Capital, Inc.; Assistant Secretary and General Counsel, INVESCO Realty, Inc.; Secretary and General Counsel, Invesco Senior Secured Management, Inc.; and Secretary, Sovereign G./P. Holdings Inc. | | N/A | | N/A |
John M. Zerr — 1962 Senior Vice President | | 2006 | | Chief Operating Officer of the Americas; Senior Vice President, Invesco Advisers, Inc. (formerly known as Invesco Institutional (N.A.), Inc.) (registered investment adviser); Senior Vice President, Invesco Distributors, Inc. (formerly known as Invesco AIM Distributors, Inc.); Director and Vice President, Invesco Investment Services, Inc. (formerly known as Invesco AIM Investment Services, Inc.) Senior Vice President, The Invesco Funds; Managing Director, Invesco Capital Management LLC; Director, Invesco Investment Advisers LLC (formerly known as Van Kampen Asset Management); Senior Vice President, Invesco Capital Markets, Inc. (formerly known as Van Kampen Funds Inc.); Manager, Invesco Indexing LLC Formerly: Director and Senior Vice President, Invesco Management Group, Inc. (formerly known as Invesco AIM Management Group, Inc.); Secretary and General Counsel, Invesco Management Group, Inc. (formerly known as Invesco AIM Management Group, Inc.); Secretary, Invesco Investment Services, Inc. (formerly known as Invesco AIM Investment Services, Inc.); Chief Legal Officer and Secretary, The Invesco Funds; Secretary and General Counsel, Invesco Investment Advisers LLC (formerly known as Van Kampen Asset Management); Secretary and General Counsel, Invesco Capital Markets, Inc. (formerly known as Van Kampen Funds Inc.); Chief Legal Officer, Invesco Exchange-Traded Fund Trust, Invesco Exchange-Traded Fund Trust II, Invesco India Exchange-Traded Fund Trust, Invesco Actively Managed Exchange-Traded Fund Trust, Invesco Actively Managed Exchange-Traded Commodity Fund Trust and Invesco Exchange-Traded Self-Indexed Fund Trust; Secretary, Invesco Indexing LLC; Director, Secretary, General Counsel and Senior Vice President, Van Kampen Exchange Corp.; Director, Vice President and Secretary, IVZ Distributors, Inc. (formerly known as INVESCO Distributors, Inc.); Director and Vice President, INVESCO Funds Group, Inc.; Director and Vice President, Van Kampen Advisors Inc.; Director, Vice President, Secretary and General Counsel, Van Kampen Investor Services Inc.; Director and Secretary, Invesco Distributors, Inc. (formerly known as Invesco AIM Distributors, Inc.); Director, Senior Vice President, General Counsel and Secretary, Invesco AIM Advisers, Inc. and Van Kampen Investments Inc.; Director, Vice President and Secretary, Fund Management Company; Director, Senior Vice President, Secretary, General Counsel and Vice President, Invesco AIM Capital Management, Inc.; Chief Operating Officer and General Counsel, Liberty Ridge Capital, Inc. (an investment adviser) | | N/A | | N/A |
T-3 Invesco Greater China Fund
Trustees and Officers—(continued)
| | | | | | | | |
Name, Year of Birth and
Position(s) Held with the Trust | | Trustee and/
or Officer Since | | Principal Occupation(s)
During Past 5 Years | | Number of
Funds in Fund
Complex
Overseen by
Trustee | | Other Directorship(s)
Held by Trustee During
Past 5 Years |
| Other Officers—(continued) | | | | | | | | |
Gregory G. McGreevey — 1962 Senior Vice President | | 2012 | | Senior Managing Director, Invesco Ltd.; Director, Chairman, President, and Chief Executive Officer, Invesco Advisers, Inc. (formerly known as Invesco Institutional (N.A.), Inc.) (registered investment adviser); Director, Invesco Mortgage Capital, Inc. and Invesco Senior Secured Management, Inc.; and Senior Vice President, The Invesco Funds Formerly: Senior Vice President, Invesco Management Group, Inc. and Invesco Advisers, Inc.; Assistant Vice President, The Invesco Funds | | N/A | | N/A |
Kelli Gallegos — 1970 Vice President, Principal Financial Officer and Assistant Treasurer | | 2008 | | Vice President and Treasurer, Invesco Exchange-Traded Fund Trust, Invesco Exchange-Traded Fund Trust II, Invesco India Exchange-Traded Fund Trust, Invesco Actively Managed Exchange-Traded Fund Trust, Invesco Actively Managed Exchange-Traded Commodity Fund Trust and Invesco Exchange-Traded Self-Indexed Fund Trust; Vice President, Principal Financial Officer and Assistant Treasurer, The Invesco Funds; Principal Financial and Accounting Officer — Pooled Investments, Invesco Capital Management LLC Formerly: Assistant Treasurer, Invesco Exchange-Traded Fund Trust, Invesco Exchange-Traded Fund Trust II, Invesco India Exchange-Traded Fund Trust, Invesco Actively Managed Exchange-Traded Fund Trust, Invesco Actively Managed Exchange-Traded Commodity Fund Trust and Invesco Exchange-Traded Self-Indexed Fund Trust; Assistant Treasurer, Invesco Capital Management LLC; Assistant Vice President, The Invesco Funds | | N/A | | N/A |
Tracy Sullivan — 1962 Vice President, Chief Tax Officer and Assistant Treasurer | | 2008 | | Vice President, Chief Tax Officer and Assistant Treasurer, The Invesco Funds; Assistant Treasurer, Invesco Capital Management LLC, Invesco Exchange-Traded Fund Trust, Invesco Exchange-Traded Fund Trust II, Invesco India Exchange-Traded Fund Trust, Invesco Actively Managed Exchange-Traded Fund Trust, Invesco Actively Managed Exchange-Traded Commodity Fund Trust and Invesco Exchange-Traded Self-Indexed Fund Trust Formerly: Assistant Vice President, The Invesco Funds | | N/A | | N/A |
Crissie M. Wisdom — 1969 Anti-Money Laundering Compliance Officer | | 2013 | | Anti-Money Laundering Compliance Officer, Invesco Advisers, Inc. (formerly known as Invesco Institutional (N.A.), Inc.) (registered investment adviser), Invesco Capital Markets, Inc. (formerly known as Van Kampen Funds Inc.), Invesco Distributors, Inc., Invesco Investment Services, Inc., The Invesco Funds, and Invesco Exchange-Traded Fund Trust, Invesco Exchange-Traded Fund Trust II, Invesco India Exchange-Traded Fund Trust, Invesco Actively Managed Exchange-Traded Fund Trust, Invesco Actively Managed Exchange-Traded Commodity Fund Trust and Invesco Exchange-Traded Self-Indexed Fund Trust; Anti-Money Laundering Compliance Officer and Bank Secrecy Act Officer, INVESCO National Trust Company and Invesco Trust Company; and Fraud Prevention Manager and Controls and Risk Analysis Manager for Invesco Investment Services, Inc. Formerly: Anti-Money Laundering Compliance Officer, Van Kampen Exchange Corp. and Invesco Management Group, Inc. | | N/A | | N/A |
Robert R. Leveille — 1969 Chief Compliance Officer | | 2016 | | Chief Compliance Officer, Invesco Advisers, Inc. (registered investment adviser); and Chief Compliance Officer, The Invesco Funds Formerly: Chief Compliance Officer, Putnam Investments and the Putnam Funds | | N/A | | N/A |
The Statement of Additional Information of the Trust includes additional information about the Fund’s Trustees and is available upon request, without charge, by calling 1.800.959.4246. Please refer to the Fund’s Statement of Additional Information for information on the Fund’s sub-advisers.
| | | | | | |
Office of the Fund 11 Greenway Plaza, Suite 1000 Houston, TX 77046-1173 | | Investment Adviser Invesco Advisers, Inc. 1555 Peachtree Street, N.E. Atlanta, GA 30309 | | Distributor Invesco Distributors, Inc. 11 Greenway Plaza, Suite 1000 Houston, TX 77046-1173 | | Auditors PricewaterhouseCoopers LLP 1000 Louisiana Street, Suite 5800 Houston, TX 77002-5021 |
| | | |
| | | | | | |
Counsel to the Fund Stradley Ronon Stevens & Young, LLP 2005 Market Street, Suite 2600 Philadelphia, PA 19103-7018 | | Counsel to the Independent Trustees Goodwin Procter LLP 901 New York Avenue, N.W. Washington, D.C. 20001 | | Transfer Agent Invesco Investment Services, Inc. 11 Greenway Plaza, Suite 1000 Houston, TX 77046-1173 | | Custodian State Street Bank and Trust Company 225 Franklin Street Boston, MA 02110-2801 |
T-4 Invesco Greater China Fund
Explore High-Conviction Investing with Invesco

Go paperless with eDelivery
Visit invesco.com/edelivery to enjoy the convenience and security of anytime electronic access to your investment documents.
With eDelivery, you can elect to have any or all of the following materials delivered straight to your inbox to download, save and print from your own computer:
| ∎ | | Fund reports and prospectuses |
Invesco mailing information
Send general correspondence to Invesco Investment Services, Inc., P.O. Box 219078, Kansas City, MO 64121-9078.
Important notice regarding delivery of security holder documents
To reduce Fund expenses, only one copy of most shareholder documents may be mailed to shareholders with multiple accounts at the same address (Householding). Mailing of your shareholder documents may be householded indefinitely unless you instruct us otherwise. If you do not want the mailing of these documents to be combined with those for other members of your household, please contact Invesco Investment Services, Inc. at 800 959 4246 or contact your financial institution. We will begin sending you individual copies for each account within 30 days after receiving your request.
Fund holdings and proxy voting information
The Fund provides a complete list of its holdings four times in each fiscal year, at the quarter ends. For the second and fourth quarters, the lists appear in the Fund’s semiannual and annual reports to shareholders. For the first and third quarters, the Fund files the lists with the Securities and Exchange Commission (SEC) on Form N-Q (or any successor Form). The most recent list of portfolio holdings is available at invesco.com/completeqtrholdings. Shareholders can also look up the Fund’s Forms N-Q (or any successor Form) on the SEC website at sec.gov. The SEC file numbers for the Fund are shown below.
A description of the policies and procedures that the Fund uses to determine how to vote proxies relating to portfolio securities is available without charge, upon request, from our Client Services department at 800 959 4246 or at invesco.com/proxyguidelines. The information is also available on the SEC website, sec.gov.
| | |
| Information regarding how the Fund voted proxies related to its portfolio securities during the most recent 12-month period ended June 30 is available at invesco.com/proxysearch. The information is also available on the SEC website, sec.gov. | |  |
| Invesco Advisers, Inc. is an investment adviser; it provides investment advisory services to individual and institutional clients and does not sell securities. Invesco Distributors, Inc. is the US distributor for Invesco Ltd.’s retail mutual funds, exchange-traded funds and institutional money market funds. Both are wholly owned, indirect subsidiaries of Invesco Ltd. |
| | | | | | | | |
| SEC file numbers: 811-05426 and 033-19338 | | Invesco Distributors, Inc. | | CHI-AR-1 | | 12262018 | | 1357 |
| | | | | | |
| | | | |
 | | Annual Report to Shareholders | | October 31, 2018 | | |
| | | | |
| | Invesco Health Care Fund | | |
| | Nasdaq: | | |
| | A: GGHCX ∎ C: GTHCX ∎ Y: GGHYX ∎ Investor: GTHIX ∎ R6: GGHSX | | |

Letters to Shareholders
| | |

Philip Taylor | | Dear Shareholders: This annual report includes information about your Fund, including performance data and a complete list of its investments as of the close of the reporting period. Inside is a discussion of how your Fund was managed and the factors that affected its performance during the reporting period. Throughout the reporting period, US economic data remained positive. Robust corporate profits, strong retail sales and unemployment rates near generational lows helped drive US markets to new all-time records multiple times during the reporting period. Against this backdrop, the US Federal Reserve raised the federal funds rate four times during the reporting period. Market volatility, largely non-existent in 2017, returned in 2018. Markets sold off first in February and again sharply in October, amid rising interest rates, concerns about potential trade wars and |
heightened geopolitical tensions. Despite the volatility, US equity markets were largely positive for the reporting period and fared better than international markets. Emerging markets were particularly hard hit due to a strong US dollar. During the October sell-off, investors retreated to more defensive areas of the market and to US Treasuries. The broader bond market declined during the reporting period due to the increase in US Treasury yields and widening credit spreads. As the year progresses, we’ll see how the interplay of economic data, interest rates, geopolitics and a host of other factors affect US and overseas equity and fixed income markets.
Short-term market volatility can prompt some investors to abandon their investment plans – and can cause others to settle for whatever returns the market has to offer. The investment professionals at Invesco, in contrast, invest with high conviction. This means that, no matter the asset class or the strategy, each investment team has a passion to exceed. We want to help investors achieve better outcomes, such as seeking higher returns, helping mitigate risk and generating income. Of course, investing with high conviction can’t guarantee a profit or ensure success; no investment strategy can. To learn more about how we invest with high conviction, visit invesco.com/HighConviction.
You, too, can invest with high conviction by maintaining a long-term investment perspective and by working with your financial adviser on a regular basis. During periods of short-term market volatility or uncertainty, your financial adviser can keep you focused on your long-term investment goals – a new home, a child’s college education or a secure retirement. He or she also can share research about the economy, the markets and individual investment options.
Visit our website for more information on your investments
Our website, invesco.com/us, offers a wide range of market insights and investment perspectives. On the website, you’ll find detailed information about our funds, including performance, holdings and portfolio manager commentaries. You can access information about your account by completing a simple, secure online registration. To do so, select “Log In” on the right side of the homepage, and then select “Register for Individual Account Access.”
In addition to the resources accessible on our website and through our mobile app, you can obtain timely updates to help you stay informed about the markets and the economy by connecting with Invesco on Twitter, LinkedIn or Facebook. You can access our blog at blog.invesco.us.com. Our goal is to provide you the information you want, when and where you want it.
Finally, I’m pleased to share with you Invesco’s commitment to both the Principles for Responsible Investment and to considering environmental, social and governance issues in our robust investment process. I invite you to learn more at invesco.com/esg.
Have questions?
For questions about your account, contact an Invesco client services representative at 800 959 4246. For Invesco-related questions or comments, please email me directly at phil@invesco.com.
All of us at Invesco look forward to serving your investment management needs. Thank you for investing with us.
Sincerely,

Philip Taylor
Senior Managing Director, Invesco Ltd.
| | |
| 2 | | Invesco Health Care Fund |
| | | | |

Bruce Crockett | | Dear Fellow Shareholders: Among the many important lessons I’ve learned in more than 40 years in a variety of business endeavors is the value of a trusted advocate. As independent chair of the Invesco Funds Board, I can assure you that the members of the Board are strong advocates for the interests of investors in Invesco’s mutual funds. We work hard to represent your interests through oversight of the quality of the investment management services your funds receive and other matters important to your investment, including but not limited to: |
| | ∎ | | Ensuring that Invesco offers a diverse lineup of mutual funds that your financial adviser can use to strive to meet your financial needs as your investment goals change over time. |
| | ∎ | | Monitoring how the portfolio management teams of the Invesco funds are performing in light of changing economic and market conditions. |
| ∎ | | Assessing each portfolio management team’s investment performance within the context of the investment strategy described in the fund’s prospectus. |
| ∎ | | Monitoring for potential conflicts of interests that may impact the nature of the services that your funds receive. |
We believe one of the most important services we provide our fund shareholders is the annual review of the funds’ advisory and sub-advisory contracts with Invesco Advisers and its affiliates. This review is required by the Investment Company Act of 1940 and focuses on the nature and quality of the services Invesco provides as the adviser to the Invesco funds and the reasonableness of the fees that it charges for those services. Each year, we spend months carefully reviewing information received from Invesco and a variety of independent sources, such as performance and fee data prepared by Lipper, Inc. (a subsidiary of Broadridge Financial Solutions, Inc.), an independent, third-party firm widely recognized as a leader in its field. We also meet with our independent legal counsel and other independent advisers to review and help us assess the information that we have received. Our goal is to assure that you receive quality investment management services for a reasonable fee.
I trust the measures outlined above provide assurance that you have a worthy advocate when it comes to choosing the Invesco Funds.
As always, please contact me at bruce@brucecrockett.com with any questions or concerns you may have. On behalf of the Board, we look forward to continuing to represent your interests and serving your needs.
Sincerely,

Bruce L. Crockett
Independent Chair
Invesco Funds Board of Trustees
| | |
| 3 | | Invesco Health Care Fund |
Management’s Discussion of Fund Performance
| | | | |
| |
Performance summary For the fiscal year ended October 31, 2018, Class A shares of Invesco Health Care Fund (the Fund), underperformed the MSCI World Health Care Index, the Fund’s style-specific benchmark. Your Fund’s long-term performance appears later in this report. | |
| | |
Fund vs. Indexes | | | | |
Total returns, 10/31/17 to 10/31/18, at net asset value (NAV). Performance shown does not include applicable contingent deferred sales charges (CDSC) or front-end sales charges, which would have reduced performance. | |
| |
Class A Shares | | | 7.03 | % |
Class C Shares | | | 6.24 | |
Class Y Shares | | | 7.32 | |
Investor Class Shares | | | 7.03 | |
Class R6 Shares | | | 7.37 | |
MSCI World Indexq (Broad Market Index) | | | 1.16 | |
MSCI World Health Care Indexq (Style-Specific Index) | | | 8.07 | |
Lipper Global Health/Biotechnology Funds Index⬛ (Peer Group Index) | | | 7.53 | |
Source(s): qRIMES Technologies Corp.; ⬛Lipper Inc. | | | | |
Market conditions and your Fund
The fiscal year proved to be an increasingly volatile time for global equities. The fiscal year began in the final months of 2017 with several US stock market indexes repeatedly reaching new highs amid strong corporate profits, the prospect of tax reform legislation and exceedingly low stock market volatility. Despite a sharp uptick in volatility, particularly in October 2018, US markets, in general, still produced positive returns for the fiscal year. International markets, however, were meaningfully less robust, many experiencing flat to negative results for the fiscal year. This divergence between the US and other markets could be attributed to the strength of the US economy and the widely-held belief that the US could win trade wars with other countries.
At the beginning of 2018, markets saw significant turbulence in late January and early February, when stocks were whipsawed – first by concerns about accelerated US Federal Reserve (the Fed)
tightening and then, later in the year, by fears of brewing trade wars and geopolitical tensions. After a relatively quiet summer, market volatility markedly rose again in the final month of the fiscal year. Global equity markets (particularly the US) suffered a sharp sell-off in October 2018 amid rising interest rates and concerns that higher inflation could result in a more restrictive monetary policy.
Global economic growth, in general, was solid despite weakness in emerging markets. During the fiscal year, emerging markets were impacted by both country-specific issues, as well as, more generalized pressure resulting from the Fed’s tightening policy. In this environment, economic growth unsurprisingly slowed in emerging markets. Within the eurozone, economic growth accelerated, although there was divergence among countries. In Japan, economic growth improved over the latter part of the fiscal year. The US experienced strong growth during the fiscal year due to robust consumer and business spending. In
addition, unemployment rates remained low, job creation was strong and inflation remained relatively controlled.
At the close of the fiscal year, equity valuations in developed and emerging markets appeared relatively full in absolute terms, but overseas equity markets were trading at a material discount to those of the US. In sum, while valuations were not cheap, recent earnings growth and upward earnings revisions improved in many non-US developed markets.
In this environment, the MSCI World Index, the Fund’s broad market index, returned 1.16% and health care stocks, as represented by the MSCI World Health Care Index, the Fund’s style-specific index, returned 8.07% for the fiscal year.
Relative to the style-specific index, stock selection in the health care providers and services industry was the largest contributor to the Fund’s return for the fiscal year. The Fund’s stock selection in the biotechnology and health care technology industries, as well as stock selection in and overweight allocation to the life science tools and services industry, also aided relative performance.
A top contributor to the Fund’s relative performance for the fiscal year was UnitedHealth Group. UnitedHealth is the dominant health systems company in the US with a differentiated business model that is compelling to its customers and far ahead of its competitors. The company delivered solid earnings per share that exceeded consensus expectations and raised its guidance for future earnings.
Pharmaceutical company Sarepta Therapeutics was also a significant contributor to the Fund’s relative performance during the fiscal year. The company announced positive data for its gene therapy treatment for Duchenne Muscular Dystrophy, a life-threatening illness affecting young boys.
| | | | |
Portfolio Composition | |
| By sector | | | % of total net assets | |
| | | | |
| |
Health Care | | | 95.3 | % |
Consumer Staples | | | 0.4 | |
Money Market Funds Plus Other Assets Less Liabilities | | | 4.3 | |
| | | | | | |
Top 10 Equity Holdings* | |
| | | | | % of total net assets | |
| | | | | | |
| | |
| 1. | | UnitedHealth Group Inc. | | | 4.8% | |
| 2. | | Johnson & Johnson | | | 4.5 | |
| 3. | | Thermo Fisher Scientific, Inc. | | | 4.3 | |
| 4. | | Medtronic PLC | | | 4.1 | |
| 5. | | AstraZeneca PLC | | | 3.9 | |
| 6. | | Eli Lilly and Co. | | | 3.4 | |
| 7. | | Merck & Co., Inc. | | | 3.3 | |
| 8. | | Zimmer Biomet Holdings, Inc. | | | 3.1 | |
| 9. | | Sanofi-ADR | | | 2.8 | |
| 10. | | BioMarin Pharmaceutical Inc. | | | 2.6 | |
| | | | |
Total Net Assets | | $ | 1.4 billion | |
| |
| Total Number of Holdings* | | | 71 | |
The Fund’s holdings are subject to change, and there is no assurance that the Fund will continue to hold any particular security.
*Excluding money market fund holdings.
Data presented here are as of October 31, 2018.
| | |
| 4 | | Invesco Health Care Fund |
Security selection in the pharmaceutical industry was the primary driver of the Fund’s underperformance relative to the style-specific index during the fiscal year. The Fund’s stock selection in the health care equipment and supplies industry also detracted from its relative returns.
During the fiscal year, the largest detractor from the Fund’s relative performance was Clovis Oncology. The company disappointed investors as optimism decreased regarding the company’s key drug, Rubraca. Another key detractor from relative performance was Dentsply Sirona. The dental equipment maker underperformed after delivering lower-than-expected synergies in several key segments and experiencing a series of leadership changes. We exited our position in the company before the close of the fiscal year. Bayer also detracted from the Fund’s relative performance as it was hit hard following the announcement of a $289 million lawsuit verdict against Monsanto (not a Fund holding), a company that Bayer recently acquired.
We believe health care should benefit from several secular trends, including improved innovation, favorable M&A environment, aging populations in developed countries, higher per capita spending on health care in emerging markets and increased access to health care globally. Given this backdrop, we continued to emphasize investments in companies that could benefit from some or many of these themes. From a market capitalization perspective, the Fund maintained overweight exposure to mid-cap and small-cap companies at the close of the fiscal year. The Fund’s largest industry exposures were in biotechnology and managed care at the close of the fiscal year.
As always, thank you for your continued investment in Invesco Health Care Fund.
The views and opinions expressed in management’s discussion of Fund performance are those of Invesco Advisers, Inc. These views and opinions are subject to change at any time based on factors such as market and economic conditions. These views and opinions may not be relied upon as investment advice or recommendations, or as an offer for a particular security. The information is not a complete analysis of every aspect of any market, country, industry, security or the Fund. Statements of fact are from sources considered reliable, but Invesco Advisers, Inc. makes no representation or warranty as to their completeness or accuracy. Although historical performance is no guarantee of future results, these insights may help you understand our investment management philosophy.
See important Fund and, if applicable, index disclosures later in this report.
| | |
 | | Henry Wu Portfolio Manager, is manager of Invesco Global Health Care Fund. He joined Invesco in 2014. Mr. Wu earned |
| a BS degree, with honors, in biological sciences and an MS degree in engineering-economic systems and operations research from Stanford University. He also earned an MBA from Harvard University. |
Effective November 9, 2018, after the close of the fiscal year, Derek Taner left the management team.
5 Invesco Health Care Fund
Your Fund’s Long-Term Performance
Results of a $10,000 Investment – Oldest Share Class(es)
Fund and index data from 10/31/08
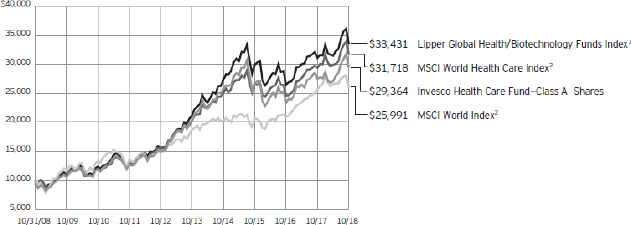
1 Source: Lipper Inc.
2 Source: RIMES Technologies Corp.
Past performance cannot guarantee comparable future results.
The data shown in the chart include reinvested distributions, applicable sales charges and Fund expenses including management fees. Index results include reinvested dividends but they do not reflect sales charges. Performance of the
peer group, if applicable, reflects fund expenses and management fees; performance of a market index does not. Performance shown in the chart and table(s) does not reflect deduction of taxes a shareholder would pay on Fund distributions or sale of Fund shares.
| | |
| 6 | | Invesco Health Care Fund |
| | | | |
| |
Average Annual Total Returns | |
As of 10/31/18, including maximum applicable sales charges | |
| |
Class A Shares | | | | |
Inception (8/7/89) | | | 10.35 | % |
10 Years | | | 11.37 | |
5 Years | | | 6.45 | |
1 Year | | | 1.15 | |
| |
Class C Shares | | | | |
Inception (3/1/99) | | | 7.85 | % |
10 Years | | | 11.17 | |
5 Years | | | 6.86 | |
1 Year | | | 5.28 | |
| |
Class Y Shares | | | | |
Inception (10/3/08) | | | 10.72 | % |
10 Years | | | 12.29 | |
5 Years | | | 7.93 | |
1 Year | | | 7.32 | |
| |
Investor Class Shares | | | | |
Inception (7/15/05) | | | 8.24 | % |
10 Years | | | 12.01 | |
5 Years | | | 7.66 | |
1 Year | | | 7.03 | |
| |
Class R6 Shares | | | | |
10 Years | | | 12.06 | % |
5 Years | | | 7.77 | |
1 Year | | | 7.37 | |
Class Y shares incepted on October 3, 2008. Performance shown prior to that date is that of Class A shares and includes the 12b-1 fees applicable to Class A shares.
Class R6 shares incepted on April 4, 2017. Performance shown prior to that date is that of Class A shares and includes the 12b-1 fees applicable to Class A shares.
The performance data quoted represent past performance and cannot guarantee comparable future results; current performance may be lower or higher. Please visit invesco.com/performance for the most recent month-end performance. Performance figures reflect reinvested distributions, changes in net asset value and the effect of the maximum sales charge unless otherwise stated. Investment return and principal value will fluctuate so that you may have a gain or loss when you sell shares.
The total annual Fund operating expense ratio set forth in the most recent Fund prospectus as of the date of this report for Class A, Class C, Class Y, Investor Class and Class R6 shares was
| | | | |
| |
Average Annual Total Returns | |
As of 9/30/18, the most recent calendar quarter end, including maximum applicable sales charges | |
| |
Class A Shares | | | | |
Inception (8/7/89) | | | 10.69 | % |
10 Years | | | 10.39 | |
5 Years | | | 8.63 | |
1 Year | | | 5.37 | |
| |
Class C Shares | | | | |
Inception (3/1/99) | | | 8.32 | % |
10 Years | | | 10.19 | |
5 Years | | | 9.04 | |
1 Year | | | 9.64 | |
| |
Class Y Shares | | | | |
10 Years | | | 11.29 | % |
5 Years | | | 10.14 | |
1 Year | | | 11.78 | |
| |
Investor Class Shares | | | | |
Inception (7/15/05) | | | 8.95 | % |
10 Years | | | 11.01 | |
5 Years | | | 9.85 | |
1 Year | | | 11.48 | |
| |
Class R6 Shares | | | | |
10 Years | | | 11.07 | % |
5 Years | | | 9.96 | |
1 Year | | | 11.83 | |
1.12%, 1.87%, 0.87%, 1.12% and 0.80%, respectively. The expense ratios presented above may vary from the expense ratios presented in other sections of this report that are based on expenses incurred during the period covered by this report.
Class A share performance reflects the maximum 5.50% sales charge, and Class C share performance reflects the applicable contingent deferred sales charge (CDSC) for the period involved. The CDSC on Class C shares is 1% for the first year after purchase. Class Y shares, Investor Class shares and Class R6 shares do not have a front-end sales charge or a CDSC; therefore, performance is at net asset value.
The performance of the Fund’s share classes will differ primarily due to different sales charge structures and class expenses.
Fund performance reflects any applicable fee waivers and/or expense reimbursements. Had the adviser not waived fees and/or reimbursed expenses currently or in the past, returns would have been lower. See current prospectus for more information.
7 Invesco Health Care Fund
Invesco Global Health Care Fund’s investment objective is long-term growth of capital.
| ∎ | | Unless otherwise stated, information presented in this report is as of October 31, 2018, and is based on total net assets. |
| ∎ | | Unless otherwise noted, all data provided by Invesco. |
| ∎ | | To access your Fund’s reports/prospectus, visit invesco.com/fundreports. |
About share classes
| ∎ | | Class Y shares and Investor Class shares are available only to certain investors. Please see the prospectus for more information. |
| ∎ | | Class R6 shares are available for use by retirement plans that meet certain standards and for institutional investors. Class R6 shares are also available through intermediaries that have established an agreement with Invesco Distributors, Inc. to make such shares availale for use in retail omnibus accounts. Please see the prospectus for more information. |
Principal risks of investing in the Fund
| ∎ | | Convertible securities risk. The market values of convertible securities are affected by market interest rates, the risk of actual issuer default on interest or principal payments and the value of the underlying common stock into which the convertible security may be converted. Additionally, a convertible security is subject to the same types of market and issuer risks as apply to the underlying common stock. In addition, certain convertible securities are subject to involuntary conversions and may undergo principal write-downs upon the occurrence of certain triggering events, and, as a result, are subject to an increased risk of loss. Convertible securities may be rated below investment grade. |
| ∎ | | Depositary receipts risk. Investing in depositary receipts involves the same risks as direct investments in foreign securities. In addition, the underlying issuers of certain depositary receipts are under no obligation to distribute shareholder communications or pass through any voting rights with respect to the deposited securities to the holders of such receipts. The Fund may therefore receive less timely information or have less control than if it invested directly in the foreign issuer. |
| ∎ | | Derivatives risk. The value of a derivative instrument depends largely on (and is derived from) the value of an underlying security, currency, commodity, interest rate, index or other asset (each referred to as an underlying asset). In addition to risks relating to the underlying assets, the use of derivatives may include other, possibly greater, risks, including counterparty, leverage and liquidity risks. Counterparty risk is the risk that the counterparty to the derivative contract will default on its obligation to pay the Fund the amount owed or otherwise perform under the derivative contract. Derivatives create leverage risk because they do not require payment up front equal to the economic exposure created by owning the derivative. As a result, an adverse change in the value of the underlying asset could result in the Fund sustaining a loss that is substantially greater than the amount invested in the derivative, which may make the Fund’s returns more volatile and increase the risk of loss. Derivative instruments may also be less liquid than more traditional investments and the Fund may be unable to sell or close out its derivative positions at a desirable time or price. This risk may be more acute under adverse market conditions, during which the Fund may be most in need of liquidating its derivative positions. Derivatives may also be harder to value, less tax efficient and subject to changing government regulation that could impact the Fund’s ability to use certain derivatives or their cost. Also, derivatives used for hedging or to gain or limit exposure to a particular market segment may not provide the expected benefits, particularly during adverse market conditions. |
| ∎ | | Emerging markets securities risk. Emerging markets (also referred to as developing markets) are generally subject to greater market volatility, political, social and economic instability, uncertain trading markets and more |
This report must be accompanied or preceded by a currently effective Fund prospectus, which contains more complete information, including sales charges and expenses. Investors should read it carefully before investing.
NOT FDIC INSURED | MAY LOSE VALUE | NO BANK GUARANTEE
| | governmental limitations on foreign investment than more developed markets. In addition, companies operating in emerging markets may be subject to lower trading volume and greater price fluctuations than companies in more developed markets. Securities law and the enforcement of systems of taxation in many emerging market countries may change quickly and unpredictably. In addition, investments in emerging markets securities may also be subject to additional transaction costs, delays in settlement procedures, and lack of timely information. |
| ∎ | | Foreign securities risk. The Fund’s foreign investments may be adversely affected by political and social instability, changes in economic or taxation policies, difficulty in enforcing obligations, decreased liquidity or increased volatility. Foreign investments also involve the risk of the possible seizure, nationalization or expropriation of the issuer or foreign deposits (in which the Fund could lose its entire investments in a certain market) and the possible adoption of foreign governmental restrictions such as exchange controls. Unless the Fund has hedged its foreign securities risk, foreign securities risk also involves the risk of negative foreign currency rate fluctuations, which may cause the value of securities denominated in such foreign currency (or other instruments through which the Fund has exposure to foreign currencies) to decline in value. Currency exchange rates may fluctuate significantly over short periods of time. Currency hedging strategies, if used, are not always successful. |
| ∎ | | Geographic focus risk. The Fund may from time to time invest a substantial amount of its assets in securities of issuers located in a single country or a limited number of countries. Adverse economic, political or social conditions in those countries may therefore have a significant negative impact on the Fund’s investment performance. |
| | |
| 8 | | Invesco Health Care Fund |
| ∎ | | Health care sector risk. The Fund will concentrate its investments in the securities of domestic and foreign issuers in the health care sector. The health care sector is subject to significant government regulations, increases or decreases in the cost of medical products and services, and competitive forces that could negatively impact a health care company’s profitability. The health care sector may also be affected by government health care programs. |
| ∎ | | Management risk. The Fund is actively managed and depends heavily on the Adviser’s judgment about markets, interest rates or the attractiveness, relative values, liquidity, or potential appreciation of particular investments made for the Fund’s portfolio. The Fund could experience losses if these judgments prove to be incorrect. Additionally, legislative, regulatory, or tax developments may adversely affect management of the Fund and, therefore, the ability of the Fund to achieve its investment objective. |
| ∎ | | Market risk. The market values of the Fund’s investments, and therefore the value of the Fund’s shares, will go up and down, sometimes rapidly or unpredictably. Market risk may affect a single issuer, industry or section of the economy, or it may affect the market as a whole. Individual stock prices tend to go up and down more dramatically than those of certain other types of investments, such as bonds. During a general downturn in the financial markets, multiple asset classes may decline in value. When markets perform well, there can be no assurance that specific investments held by the Fund will rise in value. |
| ∎ | | Preferred securities risk. Preferred securities are subject to issuer-specific and market risks applicable generally to equity securities. Preferred securities also may be subordinated to bonds or other debt instruments, subjecting them to a greater risk of non-payment, may be less liquid than many other securities, such as common stocks, and generally offer no voting rights with respect to the issuer. |
| ∎ | | Small- and mid-capitalization companies risks. Small- and mid-capitalization companies tend to be more vulnerable to changing market conditions, may have little or no operating history or track record of success, and may have more limited product lines and markets, less experienced management and fewer financial resources than larger companies. These companies’ securities may be more volatile and less liquid than those of more established companies, and their returns may vary, sometimes significantly, from the overall securities market. |
About indexes used in this report
| ∎ | | The MSCI World IndexSM is an unmanaged index considered representative of stocks of developed countries. The index is computed using the net return, which withholds applicable taxes for non-resident investors. |
| ∎ | | The MSCI World Health Care Index is an unmanaged index considered representative of health care stocks of developed countries. The index is computed using the net return, which withholds applicable taxes for non-resident investors. |
| ∎ | | The Lipper Global Health/ Biotechnology Funds Index is an unmanaged index considered representative of global health/biotechnology funds tracked by Lipper. |
| ∎ | | The Fund is not managed to track the performance of any particular index, including the index(es) described here, and consequently, the performance of the Fund may deviate significantly from the performance of the index(es). |
| ∎ | | A direct investment cannot be made in an index. Unless otherwise indicated, index results include reinvested dividends, and they do not reflect sales charges. Performance of the peer group, if applicable, reflects fund expenses; performance of a market index does not. |
Other information
| ∎ | | The returns shown in management’s discussion of Fund performance are based on net asset values (NAVs) calculated for shareholder transactions. Generally accepted accounting principles require adjustments to be made to the net assets of the Fund at period end for financial reporting purposes, and as such, the NAVs for shareholder transactions and the returns based on those NAVs may differ from the NAVs and returns reported in the Financial Highlights. |
| ∎ | | Industry classifications used in this report are generally according to the Global Industry Classification Standard, which was developed by and is the exclusive property and a service mark of MSCI Inc. and Standard & Poor’s. |
| | |
| 9 | | Invesco Health Care Fund |
Schedule of Investments(a)
October 31, 2018
| | | | | | | | |
| | | Shares | | | Value | |
Common Stocks & Other Equity Interests–95.72% | |
| Biotechnology–20.33% | |
ACADIA Pharmaceuticals Inc.(b) | | | 347,241 | | | $ | 6,764,255 | |
Alexion Pharmaceuticals, Inc.(b) | | | 227,193 | | | | 25,461,519 | |
Amarin Corp, PLC–ADR (Ireland) | | | 403,082 | | | | 8,396,198 | |
Amicus Therapeutics, Inc.(b) | | | 440,071 | | | | 4,919,994 | |
Array BioPharma Inc.(b) | | | 788,549 | | | | 12,774,494 | |
Ascendis Pharma A/S–ADR (Denmark)(b) | | | 104,103 | | | | 6,692,782 | |
Avrobio, Inc.(b) | | | 103,816 | | | | 3,120,709 | |
BioCryst Pharmaceuticals, Inc.(b) | | | 639,339 | | | | 4,679,961 | |
Biogen Inc.(b) | | | 106,364 | | | | 32,363,374 | |
BioMarin Pharmaceutical Inc.(b) | | | 284,970 | | | | 26,265,685 | |
bluebird Bio, Inc.(b) | | | 58,211 | | | | 6,676,802 | |
Celgene Corp.(b) | | | 227,179 | | | | 16,266,016 | |
Clovis Oncology Inc.(b) | | | 234,518 | | | | 2,727,444 | |
DBV Technologies S.A.–ADR (France)(b) | | | 578,614 | | | | 10,669,642 | |
Exact Sciences Corp.(b) | | | 229,234 | | | | 16,287,076 | |
Heron Therapeutics, Inc.(b) | | | 209,431 | | | | 5,813,805 | |
Incyte Corp.(b) | | | 220,921 | | | | 14,320,099 | |
Loxo Oncology, Inc.(b) | | | 40,962 | | | | 6,253,259 | |
Neurocrine Biosciences, Inc.(b) | | | 101,800 | | | | 10,907,870 | |
REGENXBIO Inc.(b) | | | 100,622 | | | | 6,708,469 | |
Rocket Pharmaceuticals, Inc.(b) | | | 317,861 | | | | 5,034,918 | |
Rubius Therapeutics, Inc.(b) | | | 275,076 | | | | 4,519,499 | |
Sarepta Therapeutics, Inc.(b) | | | 76,875 | | | | 10,282,800 | |
Vertex Pharmaceuticals Inc.(b) | | | 160,932 | | | | 27,271,537 | |
| | | | | | | | 275,178,207 | |
|
| Drug Retail–0.41% | |
Raia Drogasil S.A. (Brazil) | | | 331,578 | | | | 5,606,934 | |
|
| Health Care Equipment–17.43% | |
Abbott Laboratories(b) | | | 446,542 | | | | 30,784,606 | |
Baxter International Inc. | | | 275,653 | | | | 17,231,069 | |
Boston Scientific Corp.(b) | | | 831,578 | | | | 30,053,229 | |
Edwards Lifesciences Corp.(b) | | | 97,380 | | | | 14,373,288 | |
Koninklijke Philips N.V. (Netherlands) | | | 549,002 | | | | 20,470,555 | |
Medtronic PLC | | | 585,317 | | | | 52,573,173 | |
Olympus Corp. (Japan) | | | 356,600 | | | | 11,865,173 | |
Wright Medical Group N.V.(b) | | | 787,696 | | | | 21,252,038 | |
Zimmer Biomet Holdings, Inc. | | | 327,847 | | | | 37,240,141 | |
| | | | | | | | 235,843,272 | |
|
| Health Care Facilities–1.62% | |
HCA Healthcare, Inc. | | | 164,633 | | | | 21,983,444 | |
|
| Health Care Supplies–0.74% | |
Align Technology, Inc.(b) | | | 45,256 | | | | 10,010,627 | |
|
| Health Care Technology–0.97% | |
HMS Holdings Corp.(b) | | | 215,816 | | | | 6,219,817 | |
Inspire Medical Systems, Inc.(b) | | | 172,063 | | | | 6,896,285 | |
| | | | | | | | 13,116,102 | |
| | | | | | | | |
| | | Shares | | | Value | |
| Life Sciences Tools & Services–6.75% | |
Agilent Technologies, Inc. | | | 110,427 | | | $ | 7,154,565 | |
Eurofins Scientific S.E. (Luxembourg) | | | 25,957 | | | | 13,124,252 | |
Illumina, Inc.(b) | | | 50,010 | | | | 15,560,611 | |
Thermo Fisher Scientific, Inc. | | | 237,483 | | | | 55,487,903 | |
| | | | | | | | 91,327,331 | |
|
| Managed Health Care–14.89% | |
Anthem, Inc. | | | 110,623 | | | | 30,484,380 | |
Centene Corp.(b) | | | 203,348 | | | | 26,500,311 | |
Cigna Corp. | | | 113,530 | | | | 24,273,849 | |
Hapvida Participacoes e Investimentos S.A. (Brazil)(b)(c) | | | 1,026,700 | | | | 7,057,097 | |
HealthEquity, Inc.(b) | | | 77,279 | | | | 7,094,212 | |
Humana Inc. | | | 107,718 | | | | 34,513,925 | |
Notre Dame Intermedica Participacoes S.A. (Brazil)(b) | | | 1,026,461 | | | | 6,622,418 | |
UnitedHealth Group Inc. | | | 248,448 | | | | 64,931,885 | |
| | | | | | | | 201,478,077 | |
|
| Pharmaceuticals–32.58% | |
Aclaris Therapeutics, Inc.(b) | | | 391,396 | | | | 4,653,698 | |
Aerie Pharmaceuticals, Inc.(b) | | | 125,574 | | | | 6,678,025 | |
Allergan PLC | | | 73,566 | | | | 11,624,164 | |
AstraZeneca PLC–ADR (United Kingdom) | | | 1,196,873 | | | | 46,414,735 | |
Bristol-Myers Squibb Co. | | | 251,391 | | | | 12,705,301 | |
Elanco Animal Health Inc. | | | 200,845 | | | | 6,121,756 | |
Eli Lilly and Co. | | | 414,341 | | | | 44,931,138 | |
Indivior PLC (United Kingdom)(b) | | | 2,065,447 | | | | 4,972,544 | |
Jazz Pharmaceuticals PLC(b) | | | 65,531 | | | | 10,407,633 | |
Johnson & Johnson | | | 420,518 | | | | 58,868,315 | |
Merck & Co., Inc. | | | 561,618 | | | | 41,340,701 | |
Nippon Shinyaku Co., Ltd. (Japan) | | | 199,000 | | | | 11,436,329 | |
Novartis AG–ADR (Switzerland) | | | 688,804 | | | | 60,242,798 | |
Novo Nordisk A/S–Class B (Denmark) | | | 483,201 | | | | 20,869,229 | |
Odonate Therapeutics, Inc.(b) | | | 280,651 | | | | 4,069,439 | |
Pfizer Inc. | | | 616,358 | | | | 26,540,375 | |
Roche Holding AG (Switzerland) | | | 86,253 | | | | 20,929,131 | |
Sanofi–ADR (France) | | | 787,572 | | | | 35,220,220 | |
Supernus Pharmaceuticals Inc.(b) | | | 127,837 | | | | 6,079,928 | |
Zogenix, Inc.(b) | | | 164,347 | | | | 6,863,131 | |
| | | | | | | | 440,968,590 | |
Total Common Stocks & Other Equity Interests
(Cost $902,468,727) | | | | 1,295,512,584 | |
|
Preferred Stocks–0.00% | |
| Health Care Equipment–0.00% | | | | | | | | |
Intact Medical Corp., Series C, Pfd.(Acquired 03/26/2001;
Cost $2,000,001)(c)(d)(e) | | | 2,439,026 | | | | 2 | |
See accompanying Notes to Financial Statements which are an integral part of the financial statements.
10 Invesco Health Care Fund
| | | | | | | | |
| | | Shares | | | Value | |
Money Market Funds–4.39% | |
Invesco Government & Agency
Portfolio–Institutional Class, 2.08%(f) | | | 20,756,712 | | | $ | 20,756,712 | |
Invesco Liquid Assets Portfolio–Institutional Class, 2.27%(f) | | | 14,982,228 | | | | 14,985,225 | |
Invesco Treasury Portfolio–Institutional Class, 2.09%(f) | | | 23,721,957 | | | | 23,721,957 | |
Total Money Market Funds
(Cost $59,462,114) | | | | 59,463,894 | |
TOTAL INVESTMENTS IN SECURITIES–100.11%
(Cost $963,930,842) | | | | 1,354,976,480 | |
OTHER ASSETS LESS LIABILITIES–(0.11)% | | | | (1,527,435 | ) |
NET ASSETS–100.00% | | | $ | 1,353,449,045 | |
Investment Abbreviations:
| | |
| ADR | | – American Depositary Receipt |
| Pfd. | | – Preferred |
Notes to Schedule of Investments:
| (a) | Industry and/or sector classifications used in this report are generally according to the Global Industry Classification Standard, which was developed by and is the exclusive property and a service mark of MSCI Inc. and Standard & Poor’s. |
| (b) | Non-income producing security. |
| (c) | Security purchased or received in a transaction exempt from registration under the Securities Act of 1933, as amended (the “1933 Act”). The security may be resold pursuant to an exemption from registration under the 1933 Act, typically to qualified institutional buyers. The value of the security at October 31, 2018 represented less than 1% of the Fund’s Net Assets. |
| (d) | Security is considered venture capital. See Note 1K. |
| (e) | Security valued using significant unobservable inputs (Level 3). See Note 3. |
| (f) | The money market fund and the Fund are affiliated by having the same investment adviser. The rate shown is the 7-day SEC standardized yield as of October 31, 2018. |
See accompanying Notes to Financial Statements which are an integral part of the financial statements.
11 Invesco Health Care Fund
Statement of Assets and Liabilities
October 31, 2018
| | | | |
Assets: | | | | |
Investments in securities, at value (Cost $904,468,728) | | $ | 1,295,512,586 | |
Investments in affiliated money market funds, at value and (Cost $59,462,114) | | | 59,463,894 | |
Cash | | | 11,923,493 | |
Foreign currencies, at value (Cost $5,120,611) | | | 5,120,616 | |
Receivable for: | | | | |
Dividends | | | 1,589,742 | |
Fund shares sold | | | 248,545 | |
Investment for trustee deferred compensation and retirement plans | | | 253,065 | |
Other assets | | | 37,259 | |
Total assets | | | 1,374,149,200 | |
| |
Liabilities: | | | | |
Payable for: | | | | |
Investments purchased | | | 18,453,475 | |
Fund shares reacquired | | | 1,120,106 | |
Accrued fees to affiliates | | | 679,209 | |
Accrued trustees’ and officers’ fees and benefits | | | 2,980 | |
Accrued other operating expenses | | | 111,586 | |
Trustee deferred compensation and retirement plans | | | 332,799 | |
Total liabilities | | | 20,700,155 | |
Net assets applicable to shares outstanding | | $ | 1,353,449,045 | |
| |
Net assets consist of: | | | | |
Shares of beneficial interest | | $ | 858,617,768 | |
Distributable earnings | | | 494,831,277 | |
| | | $ | 1,353,449,045 | |
| | | | |
Net Assets: | | | | |
Class A | | $ | 687,513,343 | |
Class C | | $ | 45,895,405 | |
Class Y | | $ | 36,930,015 | |
Investor Class | | $ | 583,068,983 | |
Class R6 | | $ | 41,299 | |
|
Shares outstanding, no par value,
with an unlimited number of shares authorized: | |
Class A | | | 18,142,861 | |
Class C | | | 1,751,817 | |
Class Y | | | 955,064 | |
Investor Class | | | 15,383,955 | |
Class R6 | | | 1,067 | |
Class A: | | | | |
Net asset value per share | | $ | 37.89 | |
Maximum offering price per share | | | | |
(Net asset value of $37.89 ¸ 94.50%) | | $ | 40.10 | |
Class C: | | | | |
Net asset value and offering price per share | | $ | 26.20 | |
Class Y: | | | | |
Net asset value and offering price per share | | $ | 38.67 | |
Investor Class: | | | | |
Net asset value and offering price per share | | $ | 37.90 | |
Class R6: | | | | |
Net asset value and offering price per share | | $ | 38.71 | |
See accompanying Notes to Financial Statements which are an integral part of the financial statements.
12 Invesco Health Care Fund
Statement of Operations
For the year ended October 31, 2018
| | | | |
Investment income: | | | | |
Dividends (net of foreign withholding taxes of $774,485) | | $ | 13,323,074 | |
Dividends from affiliated money market funds | | | 797,116 | |
Total investment income | | | 14,120,190 | |
| |
Expenses: | | | | |
Advisory fees | | | 8,620,247 | |
Administrative services fees | | | 337,766 | |
Custodian fees | | | 89,107 | |
Distribution fees: | | | | |
Class A | | | 1,750,793 | |
Class B | | | 4,559 | |
Class C | | | 507,743 | |
Investor Class | | | 1,474,438 | |
Transfer agent fees — A, B, C, Y and Investor | | | 2,118,654 | |
Transfer agent fees — R6 | | | 33 | |
Trustees’ and officers’ fees and benefits | | | 41,567 | |
Registration and filing fees | | | 102,274 | |
Reports to shareholders | | | 142,452 | |
Professional services fees | | | 108,363 | |
Other | | | 40,323 | |
Total expenses | | | 15,338,319 | |
Less: Fees waived and expense offset arrangement(s) | | | (86,549 | ) |
Net expenses | | | 15,251,770 | |
Net investment income (loss) | | | (1,131,580 | ) |
| |
Realized and unrealized gain (loss) from: | | | | |
Net realized gain (loss) from: | | | | |
Investment securities | | | 107,840,381 | |
Foreign currencies | | | 40,168 | |
| | | | 107,880,549 | |
Change in net unrealized appreciation (depreciation) of: | | | | |
Investment securities | | | (13,843,598 | ) |
Foreign currencies | | | 27,061 | |
| | | | (13,816,537 | ) |
Net realized and unrealized gain | | | 94,064,012 | |
Net increase in net assets resulting from operations | | $ | 92,932,432 | |
See accompanying Notes to Financial Statements which are an integral part of the financial statements.
13 Invesco Health Care Fund
Statement of Changes in Net Assets
For the years ended October 31, 2018 and 2017
| | | | | | | | |
| | | 2018 | | | 2017 | |
Operations: | | | | | | | | |
Net investment income (loss) | | $ | (1,131,580 | ) | | $ | (2,102,543 | ) |
Net realized gain | | | 107,880,549 | | | | 91,355,823 | |
Change in net unrealized appreciation (depreciation) | | | (13,816,537 | ) | | | 141,437,481 | |
Net increase in net assets resulting from operations | | | 92,932,432 | | | | 230,690,761 | |
| | |
Distributions to shareholders from distributable earnings(1): | | | | | | | | |
Class A | | | (45,906,721 | ) | | | (17,431,100 | ) |
Class B | | | (174,565 | ) | | | (135,902 | ) |
Class C | | | (4,951,203 | ) | | | (1,930,498 | ) |
Class Y | | | (2,282,309 | ) | | | (626,191 | ) |
Investor Class | | | (38,238,241 | ) | | | (13,616,687 | ) |
Class R6 | | | (872 | ) | | | — | |
Total distributions from distributable earnings | | | (91,553,911 | ) | | | (33,740,378 | ) |
| | |
Share transactions–net: | | | | | | | | |
Class A | | | (36,463,447 | ) | | | (105,311,767 | ) |
Class B | | | (2,032,988 | ) | | | (3,051,588 | ) |
Class C | | | (8,958,431 | ) | | | (17,796,792 | ) |
Class Y | | | 1,002,253 | | | | 9,660,440 | |
Investor Class | | | (14,702,435 | ) | | | (49,623,544 | ) |
Class R6 | | | 25,083 | | | | 13,272 | |
Net increase (decrease) in net assets resulting from share transactions | | | (61,129,965 | ) | | | (166,109,979 | ) |
Net increase (decrease) in net assets | | | (59,751,444 | ) | | | 30,840,404 | |
| | |
Net assets: | | | | | | | | |
Beginning of year | | | 1,413,200,489 | | | | 1,382,360,085 | |
End of year | | $ | 1,353,449,045 | | | $ | 1,413,200,489 | |
| (1) | For the year ended October 31, 2017, distributions to shareholders from distributable earnings consisted of distributions from net investment income and net realized gains. The Securities and Exchange Commission eliminated the requirement to disclose the distribution components separately, except for tax return of capital. For the year ended October 31, 2017, distributions from net investment income were $1,607,275, $118,323 and $1,255,558 for Class A, Class Y and Investor Class, respectively, and distributions from net realized gains were $15,823,825, $135,902, $1,930,498, $507,868 and $12,361,129 for Class A, Class B, Class C, Class Y and Investor Class, respectively. |
Notes to Financial Statements
October 31, 2018
NOTE 1—Significant Accounting Policies
Invesco Health Care Fund, formerly Invesco Global Health Care Fund, (the “Fund”) is a series portfolio of AIM Investment Funds (Invesco Investment Funds) (the “Trust”). The Trust is organized as a Delaware statutory trust and is registered under the Investment Company Act of 1940, as amended (the “1940 Act”), as an open-end series management investment company authorized to issue an unlimited number of shares of beneficial interest. Information presented in these financial statements pertains only to the Fund. Matters affecting the Fund or each class will be voted on exclusively by the shareholders of the Fund or each class.
The Fund’s investment objective is long-term growth of capital.
The Fund currently consists of five different classes of shares: Class A, Class C, Class Y, Investor Class and Class R6. Class Y and Investor Class shares are available only to certain investors. Class A shares are sold with a front-end sales charge unless certain waiver criteria are met. Under certain circumstances, load waived shares may be subject to contingent deferred sales charges (“CDSC”). Class C shares are sold with a CDSC. Class Y, Investor Class and Class R6 shares are sold at net asset value. Effective November 30, 2010, new or additional investments in Class B shares are no longer permitted. Existing shareholders of Class B shares were permitted to continue to reinvest dividends and capital gains distributions in Class B shares until their conversion to Class A shares. Also, shareholders in Class B shares were able to exchange those shares for Class B shares of other Invesco Funds offering such shares until they converted to Class A shares. Generally, Class B shares automatically converted to Class A shares on or about the month-end, which was at least eight years after the date of purchase. Redemptions of Class B shares prior to the conversion date were subject to a CDSC. Effective January 26, 2018, all of the Fund’s outstanding Class B shares were converted to Class A shares, in advance of their normally scheduled conversion. No CDSC was paid in connection with this early conversion.
14 Invesco Health Care Fund
The Fund is an investment company and accordingly follows the investment company accounting and reporting guidance in accordance with Financial Accounting Standards Board Accounting Standards Codification Topic 946, Financial Services — Investment Companies.
The following is a summary of the significant accounting policies followed by the Fund in the preparation of its financial statements.
| A. | Security Valuations — Securities, including restricted securities, are valued according to the following policy. |
A security listed or traded on an exchange (except convertible securities) is valued at its last sales price or official closing price as of the close of the customary trading session on the exchange where the security is principally traded, or lacking any sales or official closing price on a particular day, the security may be valued at the closing bid price on that day. Securities traded in the over-the-counter market are valued based on prices furnished by independent pricing services or market makers. When such securities are valued by an independent pricing service they may be considered fair valued. Futures contracts are valued at the final settlement price set by an exchange on which they are principally traded. Listed options are valued at the mean between the last bid and asked prices from the exchange on which they are principally traded. Options not listed on an exchange are valued by an independent source at the mean between the last bid and asked prices. For purposes of determining net asset value (“NAV”) per share, futures and option contracts generally are valued 15 minutes after the close of the customary trading session of the New York Stock Exchange (“NYSE”).
Investments in open-end and closed-end registered investment companies that do not trade on an exchange are valued at the end-of-day net asset value per share. Investments in open-end and closed-end registered investment companies that trade on an exchange are valued at the last sales price or official closing price as of the close of the customary trading session on the exchange where the security is principally traded.
Debt obligations (including convertible securities) and unlisted equities are fair valued using an evaluated quote provided by an independent pricing service. Evaluated quotes provided by the pricing service may be determined without exclusive reliance on quoted prices, and may reflect appropriate factors such as institution-size trading in similar groups of securities, developments related to specific securities, dividend rate (for unlisted equities), yield (for debt obligations), quality, type of issue, coupon rate (for debt obligations), maturity (for debt obligations), individual trading characteristics and other market data. Pricing services generally value debt obligations assuming orderly transactions of institutional round lot size, but a fund may hold or transact in the same securities in smaller, odd lot sizes. Odd lots often trade at lower prices than institutional round lots. Debt obligations are subject to interest rate and credit risks. In addition, all debt obligations involve some risk of default with respect to interest and/or principal payments.
Foreign securities’ (including foreign exchange contracts) prices are converted into U.S. dollar amounts using the applicable exchange rates as of the close of the NYSE. If market quotations are available and reliable for foreign exchange-traded equity securities, the securities will be valued at the market quotations. Because trading hours for certain foreign securities end before the close of the NYSE, closing market quotations may become unreliable. If between the time trading ends on a particular security and the close of the customary trading session on the NYSE, events occur that the investment adviser determines are significant and make the closing price unreliable, the Fund may fair value the security. If the event is likely to have affected the closing price of the security, the security will be valued at fair value in good faith using procedures approved by the Board of Trustees. Adjustments to closing prices to reflect fair value may also be based on a screening process of an independent pricing service to indicate the degree of certainty, based on historical data, that the closing price in the principal market where a foreign security trades is not the current value as of the close of the NYSE. Foreign securities’ prices meeting the approved degree of certainty that the price is not reflective of current value will be priced at the indication of fair value from the independent pricing service. Multiple factors may be considered by the independent pricing service in determining adjustments to reflect fair value and may include information relating to sector indices, American Depositary Receipts and domestic and foreign index futures. Foreign securities may have additional risks including exchange rate changes, potential for sharply devalued currencies and high inflation, political and economic upheaval, the relative lack of issuer information, relatively low market liquidity and the potential lack of strict financial and accounting controls and standards.
Securities for which market prices are not provided by any of the above methods may be valued based upon quotes furnished by independent sources. The last bid price may be used to value equity securities. The mean between the last bid and asked prices is used to value debt obligations, including corporate loans.
Securities for which market quotations are not readily available or became unreliable are valued at fair value as determined in good faith by or under the supervision of the Trust’s officers following procedures approved by the Board of Trustees. Issuer specific events, market trends, bid/asked quotes of brokers and information providers and other market data may be reviewed in the course of making a good faith determination of a security’s fair value.
The Fund may invest in securities that are subject to interest rate risk, meaning the risk that the prices will generally fall as interest rates rise and, conversely, the prices will generally rise as interest rates fall. Specific securities differ in their sensitivity to changes in interest rates depending on their individual characteristics. Changes in interest rates may result in increased market volatility, which may affect the value and/or liquidity of certain Fund investments.
Valuations change in response to many factors including the historical and prospective earnings of the issuer, the value of the issuer’s assets, general economic conditions, interest rates, investor perceptions and market liquidity. Because of the inherent uncertainties of valuation, the values reflected in the financial statements may materially differ from the value received upon actual sale of those investments.
| B. | Securities Transactions and Investment Income — Securities transactions are accounted for on a trade date basis. Realized gains or losses on sales are computed on the basis of specific identification of the securities sold. Interest income (net of withholding tax, if any) is recorded on the accrual basis from settlement date. Dividend income (net of withholding tax, if any) is recorded on the ex-dividend date. |
The Fund may periodically participate in litigation related to Fund investments. As such, the Fund may receive proceeds from litigation settlements. Any proceeds received are included in the Statement of Operations as realized gain (loss) for investments no longer held and as unrealized gain (loss) for investments still held.
Brokerage commissions and mark ups are considered transaction costs and are recorded as an increase to the cost basis of securities purchased and/or a reduction of proceeds on a sale of securities. Such transaction costs are included in the determination of net realized and unrealized gain (loss) from investment securities reported in the Statement of Operations and the Statement of Changes in Net Assets and the net realized and unrealized gains (losses) on securities per share in the Financial Highlights. Transaction costs are included in the calculation of the Fund’s net asset value and, accordingly, they reduce the Fund’s total returns. These transaction costs are not considered operating expenses and are not reflected in net investment income reported in the Statement of Operations and the Statement of Changes in Net Assets, or the net
15 Invesco Health Care Fund
investment income per share and the ratios of expenses and net investment income reported in the Financial Highlights, nor are they limited by any expense limitation arrangements between the Fund and the investment adviser.
The Fund allocates income and realized and unrealized capital gains and losses to a class based on the relative net assets of each class.
| C. | Country Determination — For the purposes of making investment selection decisions and presentation in the Schedule of Investments, the investment adviser may determine the country in which an issuer is located and/or credit risk exposure based on various factors. These factors include the laws of the country under which the issuer is organized, where the issuer maintains a principal office, the country in which the issuer derives 50% or more of its total revenues and the country that has the primary market for the issuer’s securities, as well as other criteria. Among the other criteria that may be evaluated for making this determination are the country in which the issuer maintains 50% or more of its assets, the type of security, financial guarantees and enhancements, the nature of the collateral and the sponsor organization. Country of issuer and/or credit risk exposure has been determined to be the United States of America, unless otherwise noted. |
| D. | Distributions — Distributions from net investment income and net realized capital gain, if any, are generally declared and paid annually and recorded on the ex-dividend date. The Fund may elect to treat a portion of the proceeds from redemptions as distributions for federal income tax purposes. |
| E. | Federal Income Taxes — The Fund intends to comply with the requirements of Subchapter M of the Internal Revenue Code of 1986, as amended (the “Internal Revenue Code”), necessary to qualify as a regulated investment company and to distribute substantially all of the Fund’s taxable earnings to shareholders. As such, the Fund will not be subject to federal income taxes on otherwise taxable income (including net realized capital gain) that is distributed to shareholders. Therefore, no provision for federal income taxes is recorded in the financial statements. |
The Fund recognizes the tax benefits of uncertain tax positions only when the position is more likely than not to be sustained. Management has analyzed the Fund’s uncertain tax positions and concluded that no liability for unrecognized tax benefits should be recorded related to uncertain tax positions. Management is not aware of any tax positions for which it is reasonably possible that the total amounts of unrecognized tax benefits will change materially in the next 12 months.
The Fund files tax returns in the U.S. Federal jurisdiction and certain other jurisdictions. Generally, the Fund is subject to examinations by such taxing authorities for up to three years after the filing of the return for the tax period.
| F. | Expenses — Fees provided for under the Rule 12b-1 plan of a particular class of the Fund are charged to the operations of such class. Transfer agency fees and expenses and other shareholder recordkeeping fees and expenses attributable to Class R6 are charged to such class. Transfer agency fees and expenses and other shareholder recordkeeping fees and expenses relating to all other classes are allocated among those classes based on relative net assets. All other expenses are allocated among the classes based on relative net assets. |
| G. | Accounting Estimates — The preparation of financial statements in conformity with accounting principles generally accepted in the United States of America (“GAAP”) requires management to make estimates and assumptions that affect the reported amounts of assets and liabilities at the date of the financial statements and the reported amounts of revenues and expenses during the reporting period including estimates and assumptions related to taxation. Actual results could differ from those estimates by a significant amount. In addition, the Fund monitors for material events or transactions that may occur or become known after the period-end date and before the date the financial statements are released to print. |
| H. | Indemnifications — Under the Trust’s organizational documents, each Trustee, officer, employee or other agent of the Trust is indemnified against certain liabilities that may arise out of the performance of their duties to the Fund. Additionally, in the normal course of business, the Fund enters into contracts, including the Fund’s servicing agreements, that contain a variety of indemnification clauses. The Fund’s maximum exposure under these arrangements is unknown as this would involve future claims that may be made against the Fund that have not yet occurred. The risk of material loss as a result of such indemnification claims is considered remote. |
| I. | Foreign Currency Translations — Foreign currency is valued at the close of the NYSE based on quotations posted by banks and major currency dealers. Portfolio securities and other assets and liabilities denominated in foreign currencies are translated into U.S. dollar amounts at the date of valuation. Purchases and sales of portfolio securities (net of foreign taxes withheld on disposition) and income items denominated in foreign currencies are translated into U.S. dollar amounts on the respective dates of such transactions. The Fund does not separately account for the portion of the results of operations resulting from changes in foreign exchange rates on investments and the fluctuations arising from changes in market prices of securities held. The combined results of changes in foreign exchange rates and the fluctuation of market prices on investments (net of estimated foreign tax withholding) are included with the net realized and unrealized gain or loss from investments in the Statement of Operations. Reported net realized foreign currency gains or losses arise from (1) sales of foreign currencies, (2) currency gains or losses realized between the trade and settlement dates on securities transactions, and (3) the difference between the amounts of dividends, interest, and foreign withholding taxes recorded on the Fund’s books and the U.S. dollar equivalent of the amounts actually received or paid. Net unrealized foreign currency gains and losses arise from changes in the fair values of assets and liabilities, other than investments in securities at fiscal period end, resulting from changes in exchange rates. |
The Fund may invest in foreign securities, which may be subject to foreign taxes on income, gains on investments or currency repatriation, a portion of which may be recoverable. Foreign taxes, if any, are recorded based on the tax regulations and rates that exist in the foreign markets in which the Fund invests and are shown in the Statement of Operations.
| J. | Forward Foreign Currency Contracts — The Fund may engage in foreign currency transactions either on a spot (i.e. for prompt delivery and settlement) basis, or through forward foreign currency contracts, to manage or minimize currency or exchange rate risk. |
The Fund may also enter into forward foreign currency contracts for the purchase or sale of a security denominated in a foreign currency in order to “lock in��� the U.S. dollar price of that security, or the Fund may also enter into forward foreign currency contracts that do not provide for physical settlement of the two currencies, but instead are settled by a single cash payment calculated as the difference between the agreed upon exchange rate and the spot rate at settlement based upon an agreed upon notional amount (non-deliverable forwards). The Fund will set aside liquid assets in an amount equal to the daily mark-to-market obligation for forward foreign currency contracts.
A forward foreign currency contract is an obligation between two parties (“Counterparties”) to purchase or sell a specific currency for an agreed-upon price at a future date. The use of forward foreign currency contracts does not eliminate fluctuations in the price of the underlying securities the Fund owns or intends to acquire but establishes a rate of exchange in advance. Fluctuations in the value of these contracts are measured by the difference in the contract date and reporting date exchange rates and are recorded as unrealized appreciation (depreciation)
16 Invesco Health Care Fund
until the contracts are closed. When the contracts are closed, realized gains (losses) are recorded. Realized and unrealized gains (losses) on the contracts are included in the Statement of Operations. The primary risks associated with forward foreign currency contracts include failure of the Counterparty to meet the terms of the contract and the value of the foreign currency changing unfavorably. These risks may be in excess of the amounts reflected in the Statement of Assets and Liabilities.
| K. | Other Risks — The Fund’s performance is vulnerable to factors affecting the health care industry, including government regulation, obsolescence caused by scientific advances and technological innovations. |
The Fund has invested in non-publicly traded companies, some of which are in the startup or development stages. These investments are inherently risky, as the market for the technologies or products these companies are developing are typically in the early stages and may never materialize. The Fund could lose its entire investment in these companies. These investments are valued at fair value as determined in good faith in accordance with procedures approved by the Board of Trustees. Investments in privately held venture capital securities are illiquid.
NOTE 2—Advisory Fees and Other Fees Paid to Affiliates
The Trust has entered into a master investment advisory agreement with Invesco Advisers, Inc. (the “Adviser” or “Invesco”). Under the terms of the investment advisory agreement, the Fund accrues daily and pays monthly an advisory fee to the Adviser based on the annual rate of the Fund’s average daily net assets as follows:
| | | | | | | | |
| Average Daily Net Assets | | Rate | |
First $350 million | | | 0 | .75% | | | | |
Next $350 million | | | 0 | .65% | | | | |
Next $1.3 billion | | | 0 | .55% | | | | |
Next $2 billion | | | 0 | .45% | | | | |
Next $2 billion | | | 0 | .40% | | | | |
Next $2 billion | | | 0 | .375% | | | | |
Over $8 billion | | | 0 | .35% | | | | |
For the year ended October 31, 2018, the effective advisory fees incurred by the Fund was 0.63%.
Under the terms of a master sub-advisory agreement between the Adviser and each of Invesco Asset Management Deutschland GmbH, Invesco Asset Management Limited, Invesco Asset Management (Japan) Limited, Invesco Hong Kong Limited, Invesco Senior Secured Management, Inc. and Invesco Canada Ltd. (collectively, the “Affiliated Sub-Advisers”) the Adviser, not the Fund, will pay 40% of the fees paid to the Adviser to any such Affiliated Sub-Adviser(s) that provide(s) discretionary investment management services to the Fund based on the percentage of assets allocated to such Affiliated Sub-Adviser(s).
The Adviser has contractually agreed, through at least June 30, 2019, to waive advisory fees and/or reimburse expenses to the extent necessary to limit total annual fund operating expenses after fee waiver and/or expense reimbursement (excluding certain items discussed below) of Class A, Class C, Class Y, Investor Class and Class R6 shares to 2.00%, 2.75%, 1.75%, 2.00% and 1.75% of average daily net assets (the “expense limits”), respectively. Prior to their conversion to Class A shares, the expense limit for Class B shares was 2.75% of average daily net assets. In determining the Adviser’s obligation to waive advisory fees and/or reimburse expenses, the following expenses are not taken into account, and could cause total annual fund operating expenses after fee waiver and/or expense reimbursement to exceed the numbers reflected above: (1) interest; (2) taxes; (3) dividend expense on short sales; (4) extraordinary or non-routine items, including litigation expenses; and (5) expenses that the Fund has incurred but did not actually pay because of an expense offset arrangement. Unless Invesco continues the fee waiver agreement, it will terminate on June 30, 2019. During its term, the fee waiver agreement cannot be terminated or amended to increase the expense limits or reduce the advisory fee waiver without approval of the Board of Trustees. The Adviser did not waive fees and/or reimburse expenses during the period under these expense limits.
Further, the Adviser has contractually agreed, through at least June 30, 2020, to waive the advisory fee payable by the Fund in an amount equal to 100% of the net advisory fees the Adviser receives from the affiliated money market funds on investments by the Fund of uninvested cash in such affiliated money market funds.
For the year ended October 31, 2018, the Adviser waived advisory fees of $54,601.
The Trust has entered into a master administrative services agreement with Invesco pursuant to which the Fund has agreed to pay Invesco for certain administrative costs incurred in providing accounting services to the Fund. For the year ended October 31, 2018, expenses incurred under the agreement are shown in the Statement of Operations as Administrative services fees.
The Trust has entered into a transfer agency and service agreement with Invesco Investment Services, Inc. (“IIS”) pursuant to which the Fund has agreed to pay IIS a fee for providing transfer agency and shareholder services to the Fund and reimburse IIS for certain expenses incurred by IIS in the course of providing such services. IIS may make payments to intermediaries that provide omnibus account services, sub-accounting services and/or networking services. All fees payable by IIS to intermediaries that provide omnibus account services or sub-accounting services are charged back to the Fund, subject to certain limitations approved by the Trust’s Board of Trustees. For the year ended October 31, 2018, the expenses incurred under the agreement are shown in the Statement of Operations as Transfer agent fees.
The Trust has entered into master distribution agreements with Invesco Distributors, Inc. (“IDI”) to serve as the distributor for the Class A, Class C, Class Y, Investor Class and Class R6 shares of the Fund. The Trust has adopted plans pursuant to Rule 12b-1 under the 1940 Act with respect to the Fund’s Class A, Class C and Investor Class shares (collectively, the “Plans”). The Fund, pursuant to the Plans, pays IDI compensation at the annual rate of 0.25% of the Fund’s average daily net assets of Class A shares, 1.00% of the average daily net assets of Class C shares and 0.25% of the average daily net assets of Investor Class shares. Prior to their conversion to Class A shares, the Fund paid an annual rate of 1.00% of the average daily net assets of Class B shares. The fees are accrued daily and paid monthly. Of the Plan payments, up to 0.25% of the average daily net assets of each class of shares may be paid to furnish continuing personal shareholder services to customers who purchase and own shares of such classes. Any amounts not paid as a service fee under the Plans would constitute an asset-based sales charge. Rules of the Financial Industry Regulatory Authority
17 Invesco Health Care Fund
(“FINRA”) impose a cap on the total sales charges, including asset-based sales charges, that may be paid by any class of shares of the Fund. For the year ended October 31, 2018, expenses incurred under the Plan are shown in the Statement of Operations as Distribution fees.
Front-end sales commissions and CDSC (collectively, the “sales charges”) are not recorded as expenses of the Fund. Front-end sales commissions are deducted from proceeds from the sales of Fund shares prior to investment in Class A shares of the Fund. CDSC are deducted from redemption proceeds prior to remittance to the shareholder. During the year ended October 31, 2018, IDI advised the Fund that IDI retained $58,809 in front-end sales commissions from the sale of Class A shares and $427 and $1,792 from Class A and Class C shares, respectively, for CDSC imposed on redemptions by shareholders.
For the year ended October 31, 2018, the Fund incurred $13,359 in brokerage commissions with Invesco Capital Markets, Inc., an affiliate of the Adviser and IDI, for portfolio transactions executed on behalf of the Fund.
Certain officers and trustees of the Trust are officers and directors of the Adviser, IIS and/or IDI.
NOTE 3—Additional Valuation Information
GAAP defines fair value as the price that would be received to sell an asset or paid to transfer a liability in an orderly transaction between market participants at the measurement date, under current market conditions. GAAP establishes a hierarchy that prioritizes the inputs to valuation methods, giving the highest priority to readily available unadjusted quoted prices in an active market for identical assets (Level 1) and the lowest priority to significant unobservable inputs (Level 3), generally when market prices are not readily available or are unreliable. Based on the valuation inputs, the securities or other investments are tiered into one of three levels. Changes in valuation methods may result in transfers in or out of an investment’s assigned level:
| | Level 1 — | Prices are determined using quoted prices in an active market for identical assets. |
| | Level 2 — | Prices are determined using other significant observable inputs. Observable inputs are inputs that other market participants may use in pricing a security. These may include quoted prices for similar securities, interest rates, prepayment speeds, credit risk, yield curves, loss severities, default rates, discount rates, volatilities and others. |
| | Level 3 — | Prices are determined using significant unobservable inputs. In situations where quoted prices or observable inputs are unavailable (for example, when there is little or no market activity for an investment at the end of the period), unobservable inputs may be used. Unobservable inputs reflect the Fund’s own assumptions about the factors market participants would use in determining fair value of the securities or instruments and would be based on the best available information. |
The following is a summary of the tiered valuation input levels, as of October 31, 2018. The level assigned to the securities valuations may not be an indication of the risk or liquidity associated with investing in those securities. Because of the inherent uncertainties of valuation, the values reflected in the financial statements may materially differ from the value received upon actual sale of those investments.
| | | | | | | | | | | | | | | | |
| | | Level 1 | | | Level 2 | | | Level 3 | | | Total | |
Investments in Securities | | | | | | | | | | | | | | | | |
Common Stocks & Other Equity Interests | | $ | 1,230,412,722 | | | $ | 65,099,862 | | | $ | — | | | $ | 1,295,512,584 | |
Preferred Stocks | | | — | | | | — | | | | 2 | | | | 2 | |
Money Market Funds | | | 59,463,894 | | | | — | | | | — | | | | 59,463,894 | |
Total Investments | | $ | 1,289,876,616 | | | $ | 65,099,862 | | | $ | 2 | | | $ | 1,354,976,480 | |
NOTE 4—Expense Offset Arrangement(s)
The expense offset arrangement is comprised of transfer agency credits which result from balances in demand deposit accounts used by the transfer agent for clearing shareholder transactions. For the year ended October 31, 2018, the Fund received credits from this arrangement, which resulted in the reduction of the Fund’s total expenses of $31,948.
NOTE 5—Trustees’ and Officers’ Fees and Benefits
Trustees’ and Officers’ Fees and Benefits include amounts accrued by the Fund to pay remuneration to certain Trustees and Officers of the Fund. Trustees have the option to defer compensation payable by the Fund, and Trustees’ and Officers’ Fees and Benefits also include amounts accrued by the Fund to fund such deferred compensation amounts. Those Trustees who defer compensation have the option to select various Invesco Funds in which their deferral accounts shall be deemed to be invested. Finally, certain current Trustees were eligible to participate in a retirement plan that provided for benefits to be paid upon retirement to Trustees over a period of time based on the number of years of service. The Fund may have certain former Trustees who also participate in a retirement plan and receive benefits under such plan. Trustees’ and Officers’ Fees and Benefits include amounts accrued by the Fund to fund such retirement benefits. Obligations under the deferred compensation and retirement plans represent unsecured claims against the general assets of the Fund.
NOTE 6—Cash Balances
The Fund is permitted to temporarily carry a negative or overdrawn balance in its account with State Street Bank and Trust Company, the custodian bank. Such balances, if any at period-end, are shown in the Statement of Assets and Liabilities under the payable caption Amount due custodian. To compensate the custodian bank for such overdrafts, the overdrawn Fund may either (1) leave funds as a compensating balance in the account so the custodian bank can be compensated by earning the additional interest; or (2) compensate by paying the custodian bank at a rate agreed upon by the custodian bank and Invesco, not to exceed the contractually agreed upon rate.
18 Invesco Health Care Fund
NOTE 7—Distributions to Shareholders and Tax Components of Net Assets
Tax Character of Distributions to Shareholders Paid During the Fiscal Years Ended October 31, 2018 and 2017:
| | | | | | | | |
| | | 2018 | | | 2017 | |
Ordinary income | | $ | — | | | $ | 2,952,595 | |
Long-term capital gain | | | 91,553,911 | | | | 30,787,783 | |
Total distributions | | $ | 91,553,911 | | | $ | 33,740,378 | |
Tax Components of Net Assets at Period-End:
| | | | |
| | | 2018 | |
Undistributed ordinary income | | $ | 3,998,146 | |
Undistributed long-term gain | | | 100,132,408 | |
Net unrealized appreciation — investments | | | 391,030,973 | |
Net unrealized appreciation (depreciation) — foreign currencies | | | (17,409 | ) |
Temporary book/tax differences | | | (312,841 | ) |
Shares of beneficial interest | | | 858,617,768 | |
Total net assets | | $ | 1,353,449,045 | |
The difference between book-basis and tax-basis unrealized appreciation (depreciation) is due to differences in the timing of recognition of gains and losses on investments for tax and book purposes. The Fund’s net unrealized appreciation difference is attributable primarily to wash sales.
The temporary book/tax differences are a result of timing differences between book and tax recognition of income and/or expenses. The Fund’s temporary book/tax differences are the result of the trustee deferral of compensation and retirement plan benefits.
Capital loss carryforward is calculated and reported as of a specific date. Results of transactions and other activity after that date may affect the amount of capital loss carryforward actually available for the Fund to utilize. Capital losses generated in years beginning after December 22, 2010 can be carried forward for an unlimited period, whereas previous losses expire in eight tax years. Capital losses with an expiration period may not be used to offset capital gains until all net capital losses without an expiration date have been utilized. Capital loss carryforwards with no expiration date will retain their character as either short-term or long-term capital losses instead of as short-term capital losses as under prior law. The ability to utilize capital loss carryforwards in the future may be limited under the Internal Revenue Code and related regulations based on the results of future transactions.
The Fund does not have a capital loss carryforward as of October 31, 2018.
NOTE 8—Investment Transactions
The aggregate amount of investment securities (other than short-term securities, U.S. Treasury obligations and money market funds, if any) purchased and sold by the Fund during the year ended October 31, 2018 was $471,624,954 and $640,742,887, respectively. Cost of investments, including any derivatives, on a tax basis includes the adjustments for financial reporting purposes as of the most recently completed federal income tax reporting period-end.
| | | | |
| Unrealized Appreciation (Depreciation) of Investments on a Tax Basis | |
Aggregate unrealized appreciation of investments | | $ | 439,374,202 | |
Aggregate unrealized (depreciation) of investments | | | (48,343,229 | ) |
Net unrealized appreciation of investments | | $ | 391,030,973 | |
Cost of investments for tax purposes is $963,945,507.
NOTE 9—Reclassification of Permanent Differences
Primarily as a result of differing book/tax treatment of net operating losses and foreign currency transactions, on October 31, 2018, undistributed net investment income (loss) was increased by $3,164,907 and undistributed net realized gain was decreased by $3,164,907. This reclassification had no effect on the net assets or the distributable earnings of the Fund.
19 Invesco Health Care Fund
NOTE 10—Share Information
| | | | | | | | | | | | | | | | |
| | | Summary of Share Activity | |
| | | Years ended October 31, | |
| | | 2018(a) | | | 2017 | |
| | | Shares | | | Amount | | | Shares | | | Amount | |
Sold: | | | | | | | | | | | | | | | | |
Class A | | | 761,451 | | | $ | 28,428,914 | | | | 1,046,320 | | | $ | 37,489,570 | |
Class B(b) | | | 494 | | | | 13,144 | | | | 6,634 | | | | 167,650 | |
Class C | | | 169,045 | | | | 4,411,958 | | | | 310,753 | | | | 8,133,539 | |
Class Y | | | 378,223 | | | | 14,462,686 | | | | 640,928 | | | | 23,573,301 | |
Investor Class | | | 186,846 | | | | 6,906,616 | | | | 183,690 | | | | 6,634,297 | |
Class R6(c) | | | 828 | | | | 29,709 | | | | 357 | | | | 13,272 | |
| | | | |
Issued as reinvestment of dividends: | | | | | | | | | | | | | | | | |
Class A | | | 1,203,273 | | | | 42,764,338 | | | | 512,170 | | | | 16,973,305 | |
Class B(b) | | | 6,763 | | | | 166,983 | | | | 5,664 | | | | 135,083 | |
Class C | | | 191,734 | | | | 4,743,503 | | | | 79,740 | | | | 1,904,968 | |
Class Y | | | 52,405 | | | | 1,896,535 | | | | 16,752 | | | | 563,212 | |
Investor Class | | | 1,022,012 | | | | 36,332,522 | | | | 396,403 | | | | 13,140,754 | |
Class R6 | | | 5 | | | | 199 | | | | — | | | | — | |
| | | | |
Conversion of Class B shares to Class A shares:(d) | | | | | | | | | | | | | | | | |
Class A | | | 49,944 | | | | 1,906,378 | | | | 66,739 | | | | 2,401,525 | |
Class B | | | (72,114 | ) | | | (1,906,378 | ) | | | (92,917 | ) | | | (2,401,525 | ) |
| | | | |
Reacquired: | | | | | | | | | | | | | | | | |
Class A | | | (2,971,042 | ) | | | (109,563,077 | ) | | | (4,546,739 | ) | | | (162,176,167 | ) |
Class B(b) | | | (11,915 | ) | | | (306,737 | ) | | | (37,363 | ) | | | (952,796 | ) |
Class C | | | (702,791 | ) | | | (18,113,892 | ) | | | (1,086,586 | ) | | | (27,835,299 | ) |
Class Y | | | (409,319 | ) | | | (15,356,968 | ) | | | (397,427 | ) | | | (14,476,073 | ) |
Investor Class | | | (1,566,799 | ) | | | (57,941,573 | ) | | | (1,944,467 | ) | | | (69,398,595 | ) |
Class R6 | | | (123 | ) | | | (4,825 | ) | | | — | | | | — | |
Net increase (decrease) in share activity | | | (1,711,080 | ) | | $ | (61,129,965 | ) | | | (4,839,349 | ) | | $ | (166,109,979 | ) |
| (a) | There are entities that are record owners of more than 5% of the outstanding shares of the Fund and in the aggregate own 13% of the outstanding shares of the Fund. IDI has an agreement with these entities to sell Fund shares. The Fund, Invesco and/or Invesco affiliates may make payments to these entities, which are considered to be related to the Fund, for providing services to the Fund, Invesco and/or Invesco affiliates including but not limited to services such as securities brokerage, distribution, third party record keeping and account servicing. The Fund has no knowledge as to whether all or any portion of the shares owned of record by these entities are also owned beneficially. |
| (b) | Class B shares activity for the period November 1, 2017 through January 26, 2018 (date of conversion). |
| (c) | Commencement date of April 4, 2017. |
| (d) | Effective as of the close of business January 26, 2018, all outstanding Class B shares were converted to Class A shares. |
20 Invesco Health Care Fund
NOTE 11—Financial Highlights
The following schedule presents financial highlights for a share of the Fund outstanding throughout the periods indicated.
| | | | | | | | | | | | | | | | | | | | | | | | | | | | | | | | | | | | | | | | | | | | | | | | | | | | | | | | |
| | | Net asset
value,
beginning
of period | | | Net
investment
income
(loss)(a) | | | Net gains
(losses)
on securities
(both
realized and
unrealized) | | | Total from
investment
operations | | | Dividends
from net
investment
income | | | Distributions
from net
realized
gains | | | Total
distributions | | | Net asset
value, end
of period | | | Total
return(b) | | | Net assets,
end of period
(000’s omitted) | | | Ratio of
expenses
to average
net assets
with fee waivers
and/or expenses
absorbed | | | Ratio of
expenses
to average net
assets without
fee waivers
and/or expenses
absorbed | | | Ratio of net
investment
income (loss)
to average
net assets | | | Portfolio
turnover(c) | |
Class A | | | | | | | | | | | | | | | | | | | | | | | | | | | | | | | | | | | | | | | | | | | | | | | | | | | | | | | | |
Year ended 10/31/18 | | $ | 37.84 | | | $ | (0.02 | ) | | $ | 2.52 | | | $ | 2.50 | | | $ | — | | | $ | (2.45 | ) | | $ | (2.45 | ) | | $ | 37.89 | | | | 7.03 | % | | $ | 687,513 | | | | 1.09 | %(d) | | | 1.09 | %(d) | | | (0.06 | )%(d) | | | 36 | % |
Year ended 10/31/17 | | | 32.93 | | | | (0.05 | ) | | | 5.77 | | | | 5.72 | | | | (0.07 | ) | | | (0.74 | ) | | | (0.81 | ) | | | 37.84 | | | | 17.73 | | | | 722,643 | | | | 1.12 | | | | 1.12 | | | | (0.12 | ) | | | 36 | |
Year ended 10/31/16 | | | 43.70 | | | | 0.08 | | | | (5.09 | ) | | | (5.01 | ) | | | �� | | | | (5.76 | ) | | | (5.76 | ) | | | 32.93 | | | | (12.87 | ) | | | 725,053 | | | | 1.09 | | | | 1.09 | | | | 0.23 | | | | 21 | |
Year ended 10/31/15 | | | 47.08 | | | | 0.02 | | | | 1.53 | | | | 1.55 | | | | — | | | | (4.93 | ) | | | (4.93 | ) | | | 43.70 | | | | 3.56 | | | | 981,963 | | | | 1.04 | | | | 1.05 | | | | 0.04 | | | | 47 | |
Year ended 10/31/14 | | | 40.38 | | | | 0.01 | | | | 10.15 | | | | 10.16 | | | | (0.01 | ) | | | (3.45 | ) | | | (3.46 | ) | | | 47.08 | | | | 27.20 | | | | 906,858 | | | | 1.07 | | | | 1.08 | | | | 0.04 | | | | 24 | |
Class B | | | | | | | | | | | | | | | | | | | | | | | | | | | | | | | | | | | | | | | | | | | | | | | | | | | | | | | | |
Year ended 10/31/18(e) | | | 27.06 | | | | (0.05 | ) | | | 1.93 | | | | 1.88 | | | | — | | | | (2.45 | ) | | | (2.45 | ) | | | 26.49 | | | | 7.60 | | | | — | | | | 1.84 | (d)(g) | | | 1.84 | (d)(g) | | | (0.81 | )(d)(g) | | | 36 | |
Year ended 10/31/17 | | | 23.87 | | | | (0.22 | ) | | | 4.15 | | | | 3.93 | | | | — | | | | (0.74 | ) | | | (0.74 | ) | | | 27.06 | | | | 16.87 | | | | 2,077 | | | | 1.87 | | | | 1.87 | | | | (0.87 | ) | | | 36 | |
Year ended 10/31/16 | | | 33.51 | | | | (0.14 | ) | | | (3.74 | ) | | | (3.88 | ) | | | — | | | | (5.76 | ) | | | (5.76 | ) | | | 23.87 | | | | (13.52 | ) | | | 4,649 | | | | 1.84 | | | | 1.84 | | | | (0.52 | ) | | | 21 | |
Year ended 10/31/15 | | | 37.50 | | | | (0.25 | ) | | | 1.19 | | | | 0.94 | | | | — | | | | (4.93 | ) | | | (4.93 | ) | | | 33.51 | | | | 2.76 | | | | 11,262 | | | | 1.79 | | | | 1.80 | | | | (0.71 | ) | | | 47 | |
Year ended 10/31/14 | | | 33.06 | | | | (0.24 | ) | | | 8.13 | | | | 7.89 | | | | — | | | | (3.45 | ) | | | (3.45 | ) | | | 37.50 | | | | 26.26 | | | | 14,239 | | | | 1.82 | | | | 1.83 | | | | (0.71 | ) | | | 24 | |
Class C | | | | | | | | | | | | | | | | | | | | | | | | | | | | | | | | | | | | | | | | | | | | | | | | | | | | | | | | |
Year ended 10/31/18 | | | 27.10 | | | | (0.21 | ) | | | 1.76 | | | | 1.55 | | | | — | | | | (2.45 | ) | | | (2.45 | ) | | | 26.20 | | | | 6.24 | | | | 45,895 | | | | 1.84 | (d) | | | 1.84 | (d) | | | (0.81 | )(d) | | | 36 | |
Year ended 10/31/17 | | | 23.91 | | | | (0.22 | ) | | | 4.15 | | | | 3.93 | | | | — | | | | (0.74 | ) | | | (0.74 | ) | | | 27.10 | | | | 16.84 | | | | 56,741 | | | | 1.87 | | | | 1.87 | | | | (0.87 | ) | | | 36 | |
Year ended 10/31/16 | | | 33.56 | | | | (0.14 | ) | | | (3.75 | ) | | | (3.89 | ) | | | — | | | | (5.76 | ) | | | (5.76 | ) | | | 23.91 | | | | (13.53 | ) | | | 66,699 | | | | 1.84 | | | | 1.84 | | | | (0.52 | ) | | | 21 | |
Year ended 10/31/15 | | | 37.54 | | | | (0.25 | ) | | | 1.20 | | | | 0.95 | | | | — | | | | (4.93 | ) | | | (4.93 | ) | | | 33.56 | | | | 2.78 | | | | 107,976 | | | | 1.79 | | | | 1.80 | | | | (0.71 | ) | | | 47 | |
Year ended 10/31/14 | | | 33.09 | | | | (0.24 | ) | | | 8.14 | | | | 7.90 | | | | — | | | | (3.45 | ) | | | (3.45 | ) | | | 37.54 | | | | 26.26 | | | | 81,439 | | | | 1.82 | | | | 1.83 | | | | (0.71 | ) | | | 24 | |
Class Y | | | | | | | | | | | | | | | | | | | | | | | | | | | | | | | | | | | | | | | | | | | | | | | | | | | | | | | | |
Year ended 10/31/18 | | | 38.47 | | | | 0.07 | | | | 2.58 | | | | 2.65 | | | | — | | | | (2.45 | ) | | | (2.45 | ) | | | 38.67 | | | | 7.32 | | | | 36,930 | | | | 0.84 | (d) | | | 0.84 | (d) | | | 0.19 | (d) | | | 36 | |
Year ended 10/31/17 | | | 33.48 | | | | 0.05 | | | | 5.85 | | | | 5.90 | | | | (0.17 | ) | | | (0.74 | ) | | | (0.91 | ) | | | 38.47 | | | | 18.01 | | | | 35,924 | | | | 0.87 | | | | 0.87 | | | | 0.13 | | | | 36 | |
Year ended 10/31/16 | | | 44.24 | | | | 0.17 | | | | (5.17 | ) | | | (5.00 | ) | | | — | | | | (5.76 | ) | | | (5.76 | ) | | | 33.48 | | | | (12.67 | ) | | | 22,548 | | | | 0.84 | | | | 0.84 | | | | 0.48 | | | | 21 | |
Year ended 10/31/15 | | | 47.51 | | | | 0.14 | | | | 1.53 | | | | 1.67 | | | | (0.01 | ) | | | (4.93 | ) | | | (4.94 | ) | | | 44.24 | | | | 3.82 | | | | 39,443 | | | | 0.79 | | | | 0.80 | | | | 0.29 | | | | 47 | |
Year ended 10/31/14 | | | 40.71 | | | | 0.13 | | | | 10.22 | | | | 10.35 | | | | (0.10 | ) | | | (3.45 | ) | | | (3.55 | ) | | | 47.51 | | | | 27.52 | | | | 31,016 | | | | 0.82 | | | | 0.83 | | | | 0.29 | | | | 24 | |
Investor Class | | | | | | | | | | | | | | | | | | | | | | | | | | | | | | | | | | | | | | | | | | | | | | | | | | | | | | | | |
Year ended 10/31/18 | | | 37.85 | | | | (0.02 | ) | | | 2.52 | | | | 2.50 | | | | — | | | | (2.45 | ) | | | (2.45 | ) | | | 37.90 | | | | 7.03 | | | | 583,069 | | | | 1.09 | (d) | | | 1.09 | (d) | | | (0.06 | )(d) | | | 36 | |
Year ended 10/31/17 | | | 32.94 | | | | (0.04 | ) | | | 5.76 | | | | 5.72 | | | | (0.07 | ) | | | (0.74 | ) | | | (0.81 | ) | | | 37.85 | | | | 17.72 | | | | 595,801 | | | | 1.12 | | | | 1.12 | | | | (0.12 | ) | | | 36 | |
Year ended 10/31/16 | | | 43.71 | | | | 0.08 | | | | (5.09 | ) | | | (5.01 | ) | | | — | | | | (5.76 | ) | | | (5.76 | ) | | | 32.94 | | | | (12.87 | ) | | | 563,411 | | | | 1.09 | | | | 1.09 | | | | 0.23 | | | | 21 | |
Year ended 10/31/15 | | | 47.09 | | | | 0.02 | | | | 1.53 | | | | 1.55 | | | | — | | | | (4.93 | ) | | | (4.93 | ) | | | 43.71 | | | | 3.57 | | | | 714,351 | | | | 1.04 | | | | 1.05 | | | | 0.04 | | | | 47 | |
Year ended 10/31/14 | | | 40.39 | | | | 0.01 | | | | 10.15 | | | | 10.16 | | | | (0.01 | ) | | | (3.45 | ) | | | (3.46 | ) | | | 47.09 | | | | 27.19 | | | | 730,280 | | | | 1.07 | | | | 1.08 | | | | 0.04 | | | | 24 | |
Class R6 | | | | | | | | | | | | | | | | | | | | | | | | | | | | | | | | | | | | | | | | | | | | | | | | | | | | | | | | |
Year ended 10/31/18 | | | 38.49 | | | | 0.09 | | | | 2.58 | | | | 2.67 | | | | — | | | | (2.45 | ) | | | (2.45 | ) | | | 38.71 | | | | 7.37 | | | | 41 | | | | 0.79 | (d) | | | 0.79 | (d) | | | 0.24 | (d) | | | 36 | |
Year ended 10/31/17(f) | | | 36.35 | | | | 0.05 | | | | 2.09 | | | | 2.14 | | | | — | | | | — | | | | — | | | | 38.49 | | | | 5.89 | | | | 14 | | | | 0.78 | (g) | | | 0.78 | (g) | | | 0.22 | (g) | | | 36 | |
| (a) | Calculated using average shares outstanding. |
| (b) | Includes adjustments in accordance with accounting principles generally accepted in the United States of America and as such, the net asset value for financial reporting purposes and the returns based upon those net asset values may differ from the net asset value and returns for shareholder transactions. Does not include sales charges and is not annualized for periods less than one year, if applicable. |
| (c) | Portfolio turnover is calculated at the fund level and is not annualized for periods less than one year, if applicable. |
| (d) | Ratios are based on average daily net assets (000’s omitted) of $700,315, $1,915, $50,774, $35,054, $589,775 and $33 for Class A, Class B, Class C, Class Y, Investor Class and Class R6 shares, respectively. |
| (e) | Reflects activity for the period November 1, 2017 through January 26, 2018 (date of conversion). |
| (f) | Commencement date of April 4, 2017 for Class R6 shares. |
21 Invesco Health Care Fund
Report of Independent Registered Public Accounting Firm
To the Board of Trustees of AIM Investment Funds (Invesco Investment Funds)
and Shareholders of Invesco Health Care Fund (formerly Invesco Global Health Care Fund):
Opinion on the Financial Statements
We have audited the accompanying statement of assets and liabilities, including the schedule of investments, of Invesco Health Care Fund (formerly Invesco Global Health Care Fund) (one of the funds constituting AIM Investments Funds (Invesco Investments Funds), hereafter referred to as the “Fund”) as of October 31, 2018, the related statement of operations for the year ended October 31, 2018, the statement of changes in net assets for each of the two years in the period ended October 31, 2018, including the related notes, and the financial highlights for each of the periods indicated therein (collectively referred to as the financial statements). In our opinion, the financial statements present fairly, in all material respects, the financial position of the Fund as of October 31, 2018, the results of its operations for the year then ended, the changes in its net assets for each of the two years in the period ended October 31, 2018 and the financial highlights for each of the periods indicated therein in conformity with accounting principles generally accepted in the United States of America.
Basis for Opinion
These financial statements are the responsibility of the Fund’s management. Our responsibility is to express an opinion on the Fund’s financial statements based on our audits. We are a public accounting firm registered with the Public Company Accounting Oversight Board (United States) (PCAOB) and are required to be independent with respect to the Fund in accordance with the U.S. federal securities laws and the applicable rules and regulations of the Securities and Exchange Commission and the PCAOB.
We conducted our audits of these financial statements in accordance with the standards of the PCAOB. Those standards require that we plan and perform the audit to obtain reasonable assurance about whether the financial statements are free of material misstatement, whether due to error or fraud.
Our audits included performing procedures to assess the risks of material misstatement of the financial statements, whether due to error or fraud, and performing procedures that respond to those risks. Such procedures included examining, on a test basis, evidence regarding the amounts and disclosures in the financial statements. Our audits also included evaluating the accounting principles used and significant estimates made by management, as well as evaluating the overall presentation of the financial statements. Our procedures included confirmation of securities owned as of October 31, 2018 by correspondence with the custodian, transfer agent and brokers; when replies were not received from brokers, we performed other auditing procedures. We believe that our audits provide a reasonable basis for our opinion.
PricewaterhouseCoopers LLP
Houston, TX
December 28, 2018
We have served as the auditor of one or more of the investment companies in the Invesco group of investment companies since at least 1995. We have not been able to determine the specific year we began serving as auditor.
22 Invesco Health Care Fund
Calculating your ongoing Fund expenses
Example
As a shareholder of the Fund, you incur two types of costs: (1) transaction costs, which may include sales charges (loads) on purchase payments or contingent deferred sales charges on redemptions, if any; and (2) ongoing costs, including management fees, distribution and/or service (12b-1) fees, and other Fund expenses. This example is intended to help you understand your ongoing costs (in dollars) of investing in the Fund and to compare these costs with ongoing costs of investing in other mutual funds. With the exception of the actual ending account value and expenses of the Class R6 shares, the example is based on an investment of $1,000 invested at the beginning of the period and held for the entire period May 1, 2018 through October 31, 2018.
Actual expenses
The table below provides information about actual account values and actual expenses. You may use the information in this table, together with the amount you invested, to estimate the expenses that you paid over the period. Simply divide your account value by $1,000 (for example, an $8,600 account value divided by $1,000 = 8.6), then multiply the result by the number in the table under the heading entitled “Actual Expenses Paid During Period” to estimate the expenses you paid on your account during this period.
Hypothetical example for comparison purposes
The table below also provides information about hypothetical account values and hypothetical expenses based on the Fund’s actual expense ratio and an assumed rate of return of 5% per year before expenses, which is not the Fund’s actual return.
The hypothetical account values and expenses may not be used to estimate the actual ending account balance or expenses you paid for the period. You may use this information to compare the ongoing costs of investing in the Fund and other funds. To do so, compare this 5% hypothetical example with the 5% hypothetical examples that appear in the shareholder reports of the other funds.
Please note that the expenses shown in the table are meant to highlight your ongoing costs only and do not reflect any transaction costs, such as sales charges (loads) on purchase payments or contingent deferred sales charges on redemptions, if any. Therefore, the hypothetical information is useful in comparing ongoing costs only, and will not help you determine the relative total costs of owning different funds. In addition, if these transaction costs were included, your costs would have been higher.
| | | | | | | | | | | | | | | | | | | | | | | | |
Class | | Beginning
Account Value
(05/01/18) | | | ACTUAL | | | HYPOTHETICAL
(5% annual return before
expenses) | | | Annualized
Expense Ratio | |
| | Ending
Account Value
(10/31/18)1 | | | Expenses
Paid During
Period2 | | | Ending
Account Value
(10/31/18) | | | Expenses
Paid During
Period2 | |
| A | | $ | 1,000.00 | | | $ | 1,084.80 | | | $ | 5.73 | | | $ | 1,019.71 | | | $ | 5.55 | | | | 1.09 | % |
| C | | | 1,000.00 | | | | 1,080.90 | | | | 9.65 | | | | 1,015.93 | | | | 9.35 | | | | 1.84 | |
| Y | | | 1,000.00 | | | | 1,086.20 | | | | 4.42 | | | | 1,020.97 | | | | 4.28 | | | | 0.84 | |
| Investor | | | 1,000.00 | | | | 1,084.70 | | | | 5.73 | | | | 1,019.71 | | | | 5.55 | | | | 1.09 | |
| R6 | | | 1,000.00 | | | | 1,086.70 | | | | 4.10 | | | | 1,021.27 | | | | 3.97 | | | | 0.78 | |
| 1 | The actual ending account value is based on the actual total return of the Fund for the period May 1, 2018 through October 31, 2018, after actual expenses and will differ from the hypothetical ending account value which is based on the Fund’s expense ratio and a hypothetical annual return of 5% before expenses. |
| 2 | Expenses are equal to the Fund’s annualized expense ratio as indicated above multiplied by the average account value over the period, multiplied by 184/365 to reflect the most recent fiscal half year. |
23 Invesco Health Care Fund
Approval of Investment Advisory and Sub-Advisory Contracts
At meetings held on June 5-6, 2018, the Board of Trustees (the Board or the Trustees) of AIM Investment Funds (Invesco Investment Funds) as a whole, and the independent Trustees, who comprise over 75% of the Board, voting separately, approved the continuance of the Invesco Health Care Fund’s (the Fund) Master Investment Advisory Agreement with Invesco Advisers, Inc. (Invesco Advisers and the investment advisory agreement) and the Master Intergroup Sub-Advisory Contract for Mutual Funds with Invesco Asset Management Deutschland GmbH, Invesco Asset Management Limited, Invesco Asset Management (Japan) Limited, Invesco Hong Kong Limited, Invesco Senior Secured Management, Inc. and Invesco Canada Ltd. (collectively, the Affiliated Sub-Advisers and the sub-advisory contracts) for another year, effective July 1, 2018. After evaluating the factors discussed below, among others, the Board approved the renewal of the Fund’s investment advisory agreement and the sub-advisory contracts and determined that the compensation payable by the Fund to Invesco Advisers and by Invesco Advisers to the Affiliated Sub-Advisers is fair and reasonable.
The Board’s Evaluation Process
The Board’s Investments Committee has established three Sub-Committees, which meet throughout the year to review the performance of funds advised by Invesco Advisers (the Invesco Funds). Over the course of each year, the Sub-Committees meet with portfolio managers for their assigned Invesco Funds and other members of management to review detailed information about investment performance and portfolio attributes of these funds. The Board took into account evaluations and reports that it received from the Investments Committee and Sub-Committees, as well as the information provided to such committees and the Board throughout the year, in considering whether to approve each Invesco Fund’s investment advisory agreement and sub-advisory contracts.
As part of the contract renewal process, the Board reviews and considers information provided in response to detailed requests for information submitted to management by the independent Trustees with assistance from legal counsel to the independent Trustees. The Board receives comparative investment performance and fee data regarding the Invesco Funds prepared by Invesco Advisers and Broadridge Financial Solutions, Inc. (Broadridge), an independent mutual fund data provider. The Board also receives an independent written evaluation from the Senior Officer, an officer of the Invesco Funds who reports directly to the independent Trustees. The Senior Officer’s evaluation is prepared as part of his responsibility to manage the process by which the Invesco Funds’ proposed management fees
are negotiated during the annual contract renewal process to ensure they are negotiated in a manner that is at arms’ length and reasonable. In addition to meetings with Invesco Advisers and fund counsel throughout the year, the independent Trustees also discuss the continuance of the investment advisory agreement and sub-advisory contracts in separate sessions with the Senior Officer and with independent legal counsel.
The discussion below is a summary of the Senior Officer’s independent written evaluation with respect to the Fund’s investment advisory agreement, as well as a discussion of the material factors and related conclusions that formed the basis for the Board’s approval of the Fund’s investment advisory agreement and sub-advisory contracts. The Trustees’ review and conclusions are based on the comprehensive consideration of all information presented to them during the course of the year and in prior years and are not the result of any single determinative factor. Moreover, one Trustee may have weighed a particular piece of information or factor differently than another Trustee. This information is current as of June 6, 2018.
Factors and Conclusions and Summary of Independent Written Fee Evaluation
| A. | Nature, Extent and Quality of Services Provided by Invesco Advisers and the Affiliated Sub-Advisers |
The Board reviewed the nature, extent and quality of the advisory services provided to the Fund by Invesco Advisers under the Fund’s investment advisory agreement, and the credentials and experience of the officers and employees of Invesco Advisers who provide these services, including the Fund’s portfolio manager(s). The Board’s review included consideration of Invesco Advisers’ investment process oversight and structure, credit analysis and investment risk management. The Board also considered non-advisory services that Invesco Advisers and its affiliates provide to the Invesco Funds such as various back office support functions, third party oversight, internal audit, valuation, portfolio trading and legal and compliance. The Board also reviewed and considered the benefits to shareholders of investing in a fund that is part of the Invesco family of funds under the umbrella of Invesco Ltd., Invesco Advisers’ parent company, and noted Invesco Ltd.’s depth and experience in conducting an investment management business, as well as its commitment of financial and other resources to such business. The Board concluded that the nature, extent and quality of the services provided to the Fund by Invesco Advisers are appropriate and satisfactory.
The Board reviewed the services that may be provided by the Affiliated Sub-Advisers under the sub-advisory contracts and the credentials
and experience of the officers and employees of the Affiliated Sub-Advisers who provide these services. The Board noted the Affiliated Sub-Advisers’ expertise with respect to certain asset classes and that the Affiliated Sub-Advisers have offices and personnel that are located in financial centers around the world. As a result, the Board noted that the Affiliated Sub-Advisers can provide research and investment analysis on the markets and economies of various countries in which the Fund may invest, make recommendations regarding securities and assist with security trades. The Board concluded that the sub-advisory contracts may benefit the Fund and its shareholders by permitting Invesco Advisers to use the resources and talents of the Affiliated Sub-Advisers in managing the Fund. The Board concluded that the nature, extent and quality of the services that may be provided by the Affiliated Sub-Advisers are appropriate and satisfactory.
| B. | Fund Investment Performance |
The Board considered Fund investment performance as a relevant factor in considering whether to approve the investment advisory agreement. The Board did not view Fund investment performance as a relevant factor in considering whether to approve the sub-advisory contracts for the Fund, as no Affiliated Sub-Adviser currently manages assets of the Fund.
The Board compared the Fund’s investment performance over multiple time periods ending December 31, 2017 to the performance of funds in the Broadridge performance universe and against the Lipper Global Health/Biotechnology Funds Index. The Board noted that performance of Class A shares of the Fund was in the fourth quintile of its performance universe for the one year period and the fifth quintile for the three and five year periods (the first quintile being the best performing funds and the fifth quintile being the worst performing funds). The Board noted that performance of Class A shares of the Fund was reasonably comparable to the performance of the Index for the one year period and below the performance of the Index for the three and five year periods. The Board noted that the Fund’s underweight and overweight exposure to and security selection in certain health care industries negatively impacted performance. The Trustees also reviewed more recent Fund performance and this review did not change their conclusions.
| C. | Advisory and Sub-Advisory Fees and Fund Expenses |
The Board compared the Fund’s contractual management fee rate to the contractual management fee rates of funds in the Fund’s Broadridge expense group. The Board noted that the contractual management fee rate for Class A shares of the Fund was reasonably
24 Invesco Health Care Fund
comparable to the median contractual management fee rate of funds in its expense group. The Board noted that the term “contractual management fee” for funds in the expense group may include both advisory and certain non-portfolio management administrative services fees, but that Broadridge does not provide information on a fund by fund basis as to what is included. The Board also reviewed the methodology used by Broadridge in providing expense group information, which includes using each fund’s contractual management fee schedule (including any applicable breakpoints) as reported in the most recent prospectus or statement of additional information for each fund in the expense group. The Board also considered comparative information regarding the Fund’s total expense ratio and its various components. The Board noted that there were only five funds (including the Fund) in the expense group.
The Board noted that Invesco Advisers has contractually agreed to waive fees and/or limit expenses of the Fund in an amount necessary to limit total annual operating expenses to a specified percentage of average daily net assets for each class of the Fund.
The Board also considered the fees charged by Invesco Advisers and the Affiliated Sub-Advisers to other similarly managed client accounts. The Board noted that Invesco Advisers or the Affiliated Sub-Advisers may charge lower fees to large institutional clients. Invesco Advisers reviewed with the Board differences in the scope of services it provides to the Invesco Funds relative to certain other types of client accounts, including management of cash flows as a result of redemptions and purchases, necessary infrastructure such as officers, office space, technology, legal and distribution, oversight of service providers, costs and business risks associated with launching new funds and sponsoring and maintaining the product line, preparation of annual registration statement updates and financial information and compliance with federal and state laws and regulations.
The Board also considered the services that may be provided by the Affiliated Sub-Advisers pursuant to the sub-advisory contracts, as well as the fees payable by Invesco Advisers to the Affiliated Sub-Advisers pursuant to the sub-advisory contracts.
| D. | Economies of Scale and Breakpoints |
The Board considered the extent to which there may be economies of scale in the provision of advisory services to the Fund. The Board also considered that the Fund benefits from economies of scale through contractual breakpoints in the Fund’s advisory fee schedule, which generally operate to reduce the Fund’s expense ratio as it grows in size. The Board noted that the Fund shares directly in economies of scale through lower fees charged by third party service providers based on the combined size of the Invesco Funds. The Board noted that the Fund may also benefit from
economies of scale through initial fee setting, fee waivers and expense reimbursements.
| E. | Profitability and Financial Resources |
The Board reviewed information from Invesco Advisers concerning the costs of the advisory and other services that Invesco Advisers and its affiliates provide to the Fund and the Invesco Funds and the profitability of Invesco Advisers and its affiliates in providing these services. The Board considered the methodology used for calculating profitability and noted the periodic review of such methodology by an independent consultant. The Board noted that Invesco Advisers continues to operate at a net profit from services Invesco Advisers and its affiliates provide to the Invesco Funds and the Fund. The Board did not deem the level of profits realized by Invesco Advisers and its affiliates from providing services to the Fund to be excessive given the nature, extent and quality of the services provided. The Board received information from Invesco Advisers demonstrating that Invesco Advisers and the Affiliated Sub-Advisers are financially sound and have the resources necessary to perform their obligations under the investment advisory agreement and sub-advisory contracts.
| F. | Collateral Benefits to Invesco Advisers and its Affiliates |
The Board considered various other benefits received by Invesco Advisers and its affiliates from the relationship with the Fund, including the fees received for providing administrative, transfer agency and distribution services to the Fund. The Board considered comparative information regarding fees charged for these services, including information provided by Broadridge and other independent sources. The Board considered the performance of Invesco Advisers and its affiliates in providing these services and the organizational structure employed to provide these services. The Board also considered that these services are provided to the Fund pursuant to written contracts that are reviewed and approved on an annual basis by the Board; and that the services are required for the operation of the Fund.
The Board considered the benefits realized by Invesco Advisers and the Affiliated Sub-Advisers as a result of portfolio brokerage transactions executed through “soft dollar” arrangements. The Board noted that soft dollar arrangements may result in the Fund bearing costs to purchase research that may be used by Invesco Advisers or the Affiliated Sub-Advisers with other clients and may reduce Invesco Advisers’ or the Affiliated Sub-Advisers’ expenses. The Board also considered that it receives periodic reports from Invesco representing that these arrangements are consistent with regulatory requirements. The Board did not deem the soft dollar arrangements to be inappropriate.
The Board considered that the Fund’s uninvested cash and cash collateral from any securities lending arrangements may be invested in money market funds advised by Invesco Advisers pursuant to procedures approved by the Board. The Board noted that
Invesco Advisers receives advisory fees from these affiliated money market funds attributable to such investments, although Invesco Advisers has contractually agreed to waive through varying periods the advisory fees payable by the Invesco Funds with respect to certain investments in the affiliated money market funds. The waiver is in an amount equal to 100% of the net advisory fee Invesco Advisers receives from the affiliated money market funds with respect to the Fund’s investment in the affiliated money market funds of uninvested cash, but not cash collateral. The Board concluded that the amount of advisory fees received by Invesco Advisers from the Fund’s investment of cash collateral from any securities lending arrangements in the affiliated money market funds is fair and reasonable.
The Board also considered that an affiliated broker receives commissions for executing certain trades for the Fund. Invesco Advisers and the Affiliated Sub-Advisers use the affiliated broker to, among other things, control order routing and minimize information leakage, and the Board was advised that such trades are executed in compliance with rules under the federal securities laws and consistent with best execution obligations.
25 Invesco Health Care Fund
Tax Information
Form 1099-DIV, Form 1042-S and other year-end tax information provide shareholders with actual calendar year amounts that should be included in their tax returns. Shareholders should consult their tax advisors.
The following distribution information is being provided as required by the Internal Revenue Code or to meet a specific state’s requirement.
The Fund designates the following amounts or, if subsequently determined to be different, the maximum amount allowable for its fiscal year ended October 31, 2018:
| | | | |
Federal and State Income Tax | |
Long-Term Capital Gain Distributions | | $ | 91,553,912 | |
Qualified Dividend Income* | | | 0.00 | % |
Corporate Dividends Received Deduction* | | | 0.00 | % |
U.S. Treasury Obligations* | | | 0.00 | % |
| | * | The above percentages are based on ordinary income dividends paid to shareholders during the Fund’s fiscal year. |
26 Invesco Health Care Fund
Trustees and Officers
The address of each trustee and officer is AIM Investment Funds (Invesco Investment Funds) (the “Trust”), 11 Greenway Plaza, Suite 1000, Houston, Texas 77046-1173. The trustees serve for the life of the Trust, subject to their earlier death, incapacitation, resignation, retirement or removal as more specifically provided in the Trust’s organizational documents. Each officer serves for a one year term or until their successors are elected and qualified. Column two below includes length of time served with predecessor entities, if any.
| | | | | | | | |
Name, Year of Birth and
Position(s) Held with the Trust | | Trustee and/
or Officer Since | | Principal Occupation(s)
During Past 5 Years | | Number of
Funds in Fund
Complex
Overseen by
Trustee | | Other Directorship(s)
Held by Trustee During
Past 5 Years |
| Interested Persons | | | | | | | | |
| Martin L. Flanagan1 — 1960 Trustee | | 2007 | | Executive Director, Chief Executive Officer and President, Invesco Ltd. (ultimate parent of Invesco and a global investment management firm); Trustee, The Invesco Funds; Vice Chair, Investment Company Institute; and Member of Executive Board, SMU Cox School of Business Formerly: Advisor to the Board, Invesco Advisers, Inc. (formerly known as Invesco Institutional (N.A.), Inc.); Chairman and Chief Executive Officer, Invesco Advisers, Inc. (registered investment adviser); Director, Chairman, Chief Executive Officer and President, Invesco Holding Company (US), Inc. (formerly IVZ Inc.) (holding company), Invesco Group Services, Inc. (service provider) and Invesco North American Holdings, Inc. (holding company); Director, Chief Executive Officer and President, Invesco Holding Company Limited (parent of Invesco and a global investment management firm); Director, Invesco Ltd.; Chairman, Investment Company Institute and President, Co-Chief Executive Officer, Co-President, Chief Operating Officer and Chief Financial Officer, Franklin Resources, Inc. (global investment management organization) | | 158 | | None |
Philip A. Taylor2 — 1954 Trustee and Senior Vice President | | 2006 | | Head of the Americas and Senior Managing Director, Invesco Ltd.; Director, Invesco Advisers, Inc. (formerly known as Invesco Institutional (N.A.), Inc.) (registered investment adviser); Director and Chairman, Invesco Investment Services, Inc. (formerly known as Invesco AIM Investment Services, Inc.) (registered transfer agent); Chief Executive Officer, Invesco Corporate Class Inc. (corporate mutual fund company); Director, Chairman and Chief Executive Officer, Invesco Canada Ltd. (formerly known as Invesco Trimark Ltd./Invesco Trimark Ltèe) (registered investment adviser and registered transfer agent); Trustee and Senior Vice President, The Invesco Funds; Director, Invesco Investment Advisers LLC (formerly known as Van Kampen Asset Management) Formerly: Director, Chairman, Chief Executive Officer and President, Invesco Management Group, Inc. (formerly known as Invesco AIM Management Group, Inc.) (financial services holding company); Co-Chairman, Co-President and Co-Chief Executive Officer, Invesco Advisers, Inc. (formerly known as Invesco Institutional (N.A.), Inc.) (registered investment adviser); Director, Chief Executive Officer and President, Van Kampen Exchange Corp; President and Principal Executive Officer, The Invesco Funds (other than AIM Treasurer’s Series Trust (Invesco Treasurer’s Series Trust), Short-Term Investments Trust and Invesco Management Trust); Executive Vice President, The Invesco Funds (AIM Treasurer’s Series Trust (Invesco Treasurer’s Series Trust), Short-Term Investments Trust and Invesco Management Trust only); Director and President, INVESCO Funds Group, Inc. (registered investment adviser and registered transfer agent); Director and Chairman, IVZ Distributors, Inc. (formerly known as INVESCO Distributors, Inc.) (registered broker dealer); Director, President and Chairman, Invesco Inc. (holding company), Invesco Canada Holdings Inc. (holding company), Trimark Investments Ltd./Placements Trimark Ltèe and Invesco Financial Services Ltd/Services Financiers Invesco Ltèe; Chief Executive Officer, Invesco Canada Fund Inc. (corporate mutual fund company); Director and Chairman, Van Kampen Investor Services Inc.; Director, Chief Executive Officer and President, 1371 Preferred Inc. (holding company) and Van Kampen Investments Inc.; Director and President, AIM GP Canada Inc. (general partner for limited partnerships) and Van Kampen Advisors, Inc.; Director and Chief Executive Officer, Invesco Trimark Dealer Inc. (registered broker dealer); Director, Invesco Distributors, Inc. (formerly known as Invesco AIM Distributors, Inc.) (registered broker dealer); Manager, Invesco Capital Management LLC; Director, Chief Executive Officer and President, Invesco Advisers, Inc.; Director, Chairman, Chief Executive Officer and President, Invesco AIM Capital Management, Inc.; President, Invesco Trimark Dealer Inc. and Invesco Trimark Ltd./Invesco Trimark Ltèe; Director and President, AIM Trimark Corporate Class Inc. and AIM Trimark Canada Fund Inc.; Senior Managing Director, Invesco Holding Company Limited; Director and Chairman, Fund Management Company (former registered broker dealer); President and Principal Executive Officer, The Invesco Funds (AIM Treasurer’s Series Trust (Invesco Treasurer’s Series Trust), and Short-Term Investments Trust only); President, AIM Trimark Global Fund Inc. and AIM Trimark Canada Fund Inc. | | 158 | | None |
| 1 | Mr. Flanagan is considered an interested person (within the meaning of Section 2(a)(19) of the 1940 Act) of the Trust because he is an officer of the Adviser to the Trust, and an officer and a director of Invesco Ltd., ultimate parent of the Adviser. |
| 2 | Mr. Taylor is considered an interested person (within the meaning of Section 2(a)(19) of the 1940 Act) of the Trust because he is an officer and a director of the Adviser. |
T-1 Invesco Health Care Fund
Trustees and Officers—(continued)
| | | | | | | | |
Name, Year of Birth and
Position(s) Held with the Trust | | Trustee and/
or Officer Since | | Principal Occupation(s)
During Past 5 Years | | Number of
Funds in Fund
Complex
Overseen by
Trustee | | Other Directorship(s)
Held by Trustee During
Past 5 Years |
| Independent Trustees | | | | | | | | |
Bruce L. Crockett — 1944 Trustee and Chair | | 2001 | | Chairman, Crockett Technologies Associates (technology consulting company) Formerly: Director, Captaris (unified messaging provider); Director, President and Chief Executive Officer, COMSAT Corporation; Chairman, Board of Governors of INTELSAT (international communications company); ACE Limited (insurance company); Independent Directors Council and Investment Company Institute: Member of the Audit Committee, Investment Company Institute; Member of the Executive Committee and Chair of the Governance Committee, Independent Directors Council | | 158 | | Director and Chairman of the Audit Committee, ALPS (Attorneys Liability Protection Society) (insurance company); Director and Member of the Audit Committee and Compensation Committee, Ferroglobe PLC (metallurgical company) |
David C. Arch — 1945 Trustee | | 2010 | | Chairman of Blistex Inc. (consumer health care products manufacturer); Member, World Presidents’ Organization | | 158 | | Board member of the Illinois Manufacturers’ Association |
Jack M. Fields — 1952 Trustee | | 2001 | | Chief Executive Officer, Twenty First Century Group, Inc. (government affairs company); and Chairman, Discovery Learning Alliance (non-profit) Formerly: Owner and Chief Executive Officer, Dos Angeles Ranch L.P. (cattle, hunting, corporate entertainment); Director, Insperity, Inc. (formerly known as Administaff) (human resources provider); Chief Executive Officer, Texana Timber LP (sustainable forestry company); Director of Cross Timbers Quail Research Ranch (non-profit); and member of the U.S. House of Representatives | | 158 | | None |
Cynthia Hostetler — 1962 Trustee | | 2017 | | Non-Executive Director and Trustee of a number of public and private business corporations Formerly: Director, Aberdeen Investment Funds (4 portfolios); Head of Investment Funds and Private Equity, Overseas Private Investment Corporation; President, First Manhattan Bancorporation, Inc.; Attorney, Simpson Thacher & Bartlett LLP | | 158 | | Vulcan Materials Company (construction materials company); Trilinc Global Impact Fund; Artio Global Investment LLC (mutual fund complex); Edgen Group, Inc. (specialized energy and infrastructure products distributor) |
Eli Jones — 1961 Trustee | | 2016 | | Professor and Dean, Mays Business School — Texas A&M University Formerly: Professor and Dean, Walton College of Business, University of Arkansas and E.J. Ourso College of Business, Louisiana State University; Director, Arvest Bank | | 158 | | Insperity, Inc. (formerly known as Administaff) (human resources provider) |
Prema Mathai-Davis — 1950 Trustee | | 2001 | | Retired | | 158 | | None |
Teresa M. Ressel — 1962 Trustee | | 2017 | | Non-executive director and trustee of a number of public and private business corporations Formerly: Chief Financial Officer, Olayan America, The Olayan Group (international investor/commercial/industrial); Chief Executive Officer, UBS Securities LLC; Group Chief Operating Officer, Americas, UBS AG; Assistant Secretary for Management & Budget and CFO, US Department of the Treasury | | 158 | | Atlantic Power Corporation (power generation company); ON Semiconductor Corp. (semiconductor supplier) |
Ann Barnett Stern — 1957 Trustee | | 2017 | | President and Chief Executive Officer, Houston Endowment Inc. (private philanthropic institution) Formerly: Executive Vice President and General Counsel, Texas Children’s Hospital; Attorney, Beck, Redden and Secrest, LLP; Business Law Instructor, University of St. Thomas; Attorney, Andrews & Kurth LLP | | 158 | | Federal Reserve Bank of Dallas |
Raymond Stickel, Jr. — 1944 Trustee | | 2005 | | Retired Formerly: Director, Mainstay VP Series Funds, Inc. (25 portfolios); Partner, Deloitte & Touche | | 158 | | None |
Robert C. Troccoli — 1949 Trustee | | 2016 | | Adjunct Professor, University of Denver — Daniels College of Business Formerly: Senior Partner, KPMG LLP | | 158 | | None |
Christopher L. Wilson — 1957 Trustee | | 2017 | | Non-executive director and trustee of a number of public and private business corporations Formerly: Director, TD Asset Management USA Inc. (mutual fund complex) (22 portfolios); Managing Partner, CT2, LLC (investing and consulting firm); President/Chief Executive Officer, Columbia Funds, Bank of America Corporation; President/Chief Executive Officer, CDC IXIS Asset Management Services, Inc.; Principal & Director of Operations, Scudder Funds, Scudder, Stevens & Clark, Inc.; Assistant Vice President, Fidelity Investments | | 158 | | ISO New England, Inc. (non-profit organization managing regional electricity market) |
T-2 Invesco Health Care Fund
Trustees and Officers—(continued)
| | | | | | | | |
Name, Year of Birth and
Position(s) Held with the Trust | | Trustee and/
or Officer Since | | Principal Occupation(s)
During Past 5 Years | | Number of
Funds in Fund
Complex
Overseen by
Trustee | | Other Directorship(s)
Held by Trustee During
Past 5 Years |
| Other Officers | | | | | | | | |
Sheri Morris — 1964 President, Principal Executive Officer and Treasurer | | 1999 | | President, Principal Executive Officer and Treasurer, The Invesco Funds; Vice President, Invesco Advisers, Inc. (formerly known as Invesco Institutional (N.A.), Inc.) (registered investment adviser); and Vice President, Invesco Exchange-Traded Fund Trust, Invesco Exchange-Traded Fund Trust II, Invesco India Exchange-Traded Fund Trust, Invesco Actively Managed Exchange-Traded Fund Trust, Invesco Actively Managed Exchange-Traded Commodity Fund Trust and Invesco Exchange-Traded Self-Indexed Fund Trust Formerly: Vice President and Principal Financial Officer, The Invesco Funds; Vice President, Invesco AIM Advisers, Inc., Invesco AIM Capital Management, Inc. and Invesco AIM Private Asset Management, Inc.; Assistant Vice President and Assistant Treasurer, The Invesco Funds and Assistant Vice President, Invesco Advisers, Inc., Invesco AIM Capital Management, Inc. and Invesco AIM Private Asset Management, Inc.; and Treasurer, Invesco Exchange-Traded Fund Trust, Invesco Exchange-Traded Fund Trust II, Invesco India Exchange-Traded Fund Trust and Invesco Actively Managed Exchange-Traded Fund Trust | | N/A | | N/A |
Russell C. Burk — 1958 Senior Vice President and Senior Officer | | 2005 | | Senior Vice President and Senior Officer, The Invesco Funds | | N/A | | N/A |
Jeffrey H. Kupor — 1968 Senior Vice President, Chief Legal Officer and Secretary | | 2018 | | Senior Vice President and Secretary, Invesco Advisers, Inc. (formerly known as Invesco Institutional (N.A.), Inc.) (registered investment adviser); Senior Vice President and Secretary, Invesco Distributors, Inc. (formerly known as Invesco AIM Distributors, Inc.); Vice President and Secretary, Invesco Investment Services, Inc. (formerly known as Invesco AIM Investment Services, Inc.) Senior Vice President, Chief Legal Officer and Secretary, The Invesco Funds; Secretary and General Counsel, Invesco Investment Advisers LLC (formerly known as Van Kampen Asset Management); Secretary and General Counsel, Invesco Capital Markets, Inc. (formerly known as Van Kampen Funds Inc.) and Chief Legal Officer, Invesco Exchange-Traded Fund Trust, Invesco Exchange-Traded Fund Trust II, Invesco India Exchange-Traded Fund Trust, Invesco Actively Managed Exchange-Traded Fund Trust, Invesco Actively Managed Exchange-Traded Commodity Fund Trust and Invesco Exchange-Traded Self-Indexed Fund Trust; Secretary, Invesco Indexing LLC; Secretary and General Counsel, INVESCO Private Capital Investments, Inc.; Secretary, W.L. Ross & Co., LLC; Secretary and Vice President, Jemstep, Inc. Formerly: Senior Vice President, Secretary and General Counsel, Invesco Management Group, Inc. (formerly known as Invesco AIM Management Group, Inc.); Assistant Secretary, INVESCO Asset Management (Bermuda) Ltd.; Secretary and General Counsel, Invesco Private Capital, Inc.; Assistant Secretary and General Counsel, INVESCO Realty, Inc.; Secretary and General Counsel, Invesco Senior Secured Management, Inc.; and Secretary, Sovereign G./P. Holdings Inc. | | N/A | | N/A |
John M. Zerr — 1962 Senior Vice President | | 2006 | | Chief Operating Officer of the Americas; Senior Vice President, Invesco Advisers, Inc. (formerly known as Invesco Institutional (N.A.), Inc.) (registered investment adviser); Senior Vice President, Invesco Distributors, Inc. (formerly known as Invesco AIM Distributors, Inc.); Director and Vice President, Invesco Investment Services, Inc. (formerly known as Invesco AIM Investment Services, Inc.) Senior Vice President, The Invesco Funds; Managing Director, Invesco Capital Management LLC; Director, Invesco Investment Advisers LLC (formerly known as Van Kampen Asset Management); Senior Vice President, Invesco Capital Markets, Inc. (formerly known as Van Kampen Funds Inc.); Manager, Invesco Indexing LLC Formerly: Director and Senior Vice President, Invesco Management Group, Inc. (formerly known as Invesco AIM Management Group, Inc.); Secretary and General Counsel, Invesco Management Group, Inc. (formerly known as Invesco AIM Management Group, Inc.); Secretary, Invesco Investment Services, Inc. (formerly known as Invesco AIM Investment Services, Inc.); Chief Legal Officer and Secretary, The Invesco Funds; Secretary and General Counsel, Invesco Investment Advisers LLC (formerly known as Van Kampen Asset Management); Secretary and General Counsel, Invesco Capital Markets, Inc. (formerly known as Van Kampen Funds Inc.); Chief Legal Officer, Invesco Exchange-Traded Fund Trust, Invesco Exchange-Traded Fund Trust II, Invesco India Exchange-Traded Fund Trust, Invesco Actively Managed Exchange-Traded Fund Trust, Invesco Actively Managed Exchange-Traded Commodity Fund Trust and Invesco Exchange-Traded Self-Indexed Fund Trust; Secretary, Invesco Indexing LLC; Director, Secretary, General Counsel and Senior Vice President, Van Kampen Exchange Corp.; Director, Vice President and Secretary, IVZ Distributors, Inc. (formerly known as INVESCO Distributors, Inc.); Director and Vice President, INVESCO Funds Group, Inc.; Director and Vice President, Van Kampen Advisors Inc.; Director, Vice President, Secretary and General Counsel, Van Kampen Investor Services Inc.; Director and Secretary, Invesco Distributors, Inc. (formerly known as Invesco AIM Distributors, Inc.); Director, Senior Vice President, General Counsel and Secretary, Invesco AIM Advisers, Inc. and Van Kampen Investments Inc.; Director, Vice President and Secretary, Fund Management Company; Director, Senior Vice President, Secretary, General Counsel and Vice President, Invesco AIM Capital Management, Inc.; Chief Operating Officer and General Counsel, Liberty Ridge Capital, Inc. (an investment adviser) | | N/A | | N/A |
T-3 Invesco Health Care Fund
Trustees and Officers—(continued)
| | | | | | | | |
Name, Year of Birth and
Position(s) Held with the Trust | | Trustee and/
or Officer Since | | Principal Occupation(s)
During Past 5 Years | | Number of
Funds in Fund
Complex
Overseen by
Trustee | | Other Directorship(s)
Held by Trustee During
Past 5 Years |
| Other Officers—(continued) | | | | | | | | |
Gregory G. McGreevey — 1962 Senior Vice President | | 2012 | | Senior Managing Director, Invesco Ltd.; Director, Chairman, President, and Chief Executive Officer, Invesco Advisers, Inc. (formerly known as Invesco Institutional (N.A.), Inc.) (registered investment adviser); Director, Invesco Mortgage Capital, Inc. and Invesco Senior Secured Management, Inc.; and Senior Vice President, The Invesco Funds Formerly: Senior Vice President, Invesco Management Group, Inc. and Invesco Advisers, Inc.; Assistant Vice President, The Invesco Funds | | N/A | | N/A |
Kelli Gallegos — 1970 Vice President, Principal Financial Officer and Assistant Treasurer | | 2008 | | Vice President and Treasurer, Invesco Exchange-Traded Fund Trust, Invesco Exchange-Traded Fund Trust II, Invesco India Exchange-Traded Fund Trust, Invesco Actively Managed Exchange-Traded Fund Trust, Invesco Actively Managed Exchange-Traded Commodity Fund Trust and Invesco Exchange-Traded Self-Indexed Fund Trust; Vice President, Principal Financial Officer and Assistant Treasurer, The Invesco Funds; Principal Financial and Accounting Officer — Pooled Investments, Invesco Capital Management LLC Formerly: Assistant Treasurer, Invesco Exchange-Traded Fund Trust, Invesco Exchange-Traded Fund Trust II, Invesco India Exchange-Traded Fund Trust, Invesco Actively Managed Exchange-Traded Fund Trust, Invesco Actively Managed Exchange-Traded Commodity Fund Trust and Invesco Exchange-Traded Self-Indexed Fund Trust; Assistant Treasurer, Invesco Capital Management LLC; Assistant Vice President, The Invesco Funds | | N/A | | N/A |
Tracy Sullivan — 1962 Vice President, Chief Tax Officer and Assistant Treasurer | | 2008 | | Vice President, Chief Tax Officer and Assistant Treasurer, The Invesco Funds; Assistant Treasurer, Invesco Capital Management LLC, Invesco Exchange-Traded Fund Trust, Invesco Exchange-Traded Fund Trust II, Invesco India Exchange-Traded Fund Trust, Invesco Actively Managed Exchange-Traded Fund Trust, Invesco Actively Managed Exchange-Traded Commodity Fund Trust and Invesco Exchange-Traded Self-Indexed Fund Trust Formerly: Assistant Vice President, The Invesco Funds | | N/A | | N/A |
Crissie M. Wisdom — 1969 Anti-Money Laundering Compliance Officer | | 2013 | | Anti-Money Laundering Compliance Officer, Invesco Advisers, Inc. (formerly known as Invesco Institutional (N.A.), Inc.) (registered investment adviser), Invesco Capital Markets, Inc. (formerly known as Van Kampen Funds Inc.), Invesco Distributors, Inc., Invesco Investment Services, Inc., The Invesco Funds, and Invesco Exchange-Traded Fund Trust, Invesco Exchange-Traded Fund Trust II, Invesco India Exchange-Traded Fund Trust, Invesco Actively Managed Exchange-Traded Fund Trust, Invesco Actively Managed Exchange-Traded Commodity Fund Trust and Invesco Exchange-Traded Self-Indexed Fund Trust; Anti-Money Laundering Compliance Officer and Bank Secrecy Act Officer, INVESCO National Trust Company and Invesco Trust Company; and Fraud Prevention Manager and Controls and Risk Analysis Manager for Invesco Investment Services, Inc. Formerly: Anti-Money Laundering Compliance Officer, Van Kampen Exchange Corp. and Invesco Management Group, Inc. | | N/A | | N/A |
Robert R. Leveille — 1969 Chief Compliance Officer | | 2016 | | Chief Compliance Officer, Invesco Advisers, Inc. (registered investment adviser); and Chief Compliance Officer, The Invesco Funds Formerly: Chief Compliance Officer, Putnam Investments and the Putnam Funds | | N/A | | N/A |
The Statement of Additional Information of the Trust includes additional information about the Fund’s Trustees and is available upon request, without charge, by calling 1.800.959.4246. Please refer to the Fund’s Statement of Additional Information for information on the Fund’s sub-advisers.
| | | | | | |
Office of the Fund 11 Greenway Plaza, Suite 1000 Houston, TX 77046-1173 | | Investment Adviser Invesco Advisers, Inc. 1555 Peachtree Street, N.E. Atlanta, GA 30309 | | Distributor Invesco Distributors, Inc. 11 Greenway Plaza, Suite 1000 Houston, TX 77046-1173 | | Auditors PricewaterhouseCoopers LLP 1000 Louisiana Street, Suite 5800 Houston, TX 77002-5021 |
| | | |
| | | | | | |
Counsel to the Fund Stradley Ronon Stevens & Young, LLP 2005 Market Street, Suite 2600 Philadelphia, PA 19103-7018 | | Counsel to the Independent Trustees Goodwin Procter LLP 901 New York Avenue, N.W. Washington, D.C. 20001 | | Transfer Agent Invesco Investment Services, Inc. 11 Greenway Plaza, Suite 1000 Houston, TX 77046-1173 | | Custodian State Street Bank and Trust Company 225 Franklin Street Boston, MA 02110-2801 |
T-4 Invesco Health Care Fund
Explore High-Conviction Investing with Invesco

Go paperless with eDelivery
Visit invesco.com/edelivery to enjoy the convenience and security of anytime electronic access to your investment documents.
With eDelivery, you can elect to have any or all of the following materials delivered straight to your inbox to download, save and print from your own computer:
∎ Fund reports and prospectuses
∎ Quarterly statements
∎ Daily confirmations
∎ Tax forms
Invesco mailing information
Send general correspondence to Invesco Investment Services, Inc., P.O. Box 219078, Kansas City, MO 64121-9078.
Important notice regarding delivery of security holder documents
To reduce Fund expenses, only one copy of most shareholder documents may be mailed to shareholders with multiple accounts at the same address (Householding). Mailing of your shareholder documents may be householded indefinitely unless you instruct us otherwise. If you do not want the mailing of these documents to be combined with those for other members of your household, please contact Invesco Investment Services, Inc. at 800 959 4246 or contact your financial institution. We will begin sending you individual copies for each account within 30 days after receiving your request.
Fund holdings and proxy voting information
The Fund provides a complete list of its holdings four times in each fiscal year, at the quarter ends. For the second and fourth quarters, the lists appear in the Fund’s semiannual and annual reports to shareholders. For the first and third quarters, the Fund files the lists with the Securities and Exchange Commission (SEC) on Form N-Q (or any successor Form). The most recent list of portfolio holdings is available at invesco.com/completeqtrholdings. Shareholders can also look up the Fund’s Forms N-Q (or any successor Form) on the SEC website at sec.gov. The SEC file numbers for the Fund are shown below.
A description of the policies and procedures that the Fund uses to determine how to vote proxies relating to portfolio securities is available without charge, upon request, from our Client Services department at 800 959 4246 or at invesco.com/proxyguidelines. The information is also available on the SEC website, sec.gov.
| | |
Information regarding how the Fund voted proxies related to its portfolio securities during the most recent 12-month period ended June 30 is available at invesco.com/proxysearch. The information is also available on the SEC website, sec.gov. Invesco Advisers, Inc. is an investment adviser; it provides investment advisory services to individual and institutional clients and does not sell securities. Invesco Distributors, Inc. is the US distributor for Invesco Ltd.’s retail mutual funds, exchange-traded funds and institutional money market funds. Both are wholly owned, indirect subsidiaries of Invesco Ltd. | |  |
| | | | | | | | |
| SEC file numbers: 811-05426 and 033-19338 | | Invesco Distributors, Inc. | | GHC-AR-1 | | 12172018 | | 1151 |
| | | | | | |
| | | | |
 | | Annual Report to Shareholders | | October 31, 2018 | | |
| | | | |
| | Invesco Long/Short Equity Fund | | |
| | Nasdaq: | | |
| | A: LSQAX ∎ C: LSQCX ∎ R: LSQRX ∎ Y: LSQYX ∎ R5: LSQFX ∎ R6: LSQSX | | |

Letters to Shareholders
| | |

Philip Taylor | | Dear Shareholders: This annual report includes information about your Fund, including performance data and a complete list of its investments as of the close of the reporting period. Inside is a discussion of how your Fund was managed and the factors that affected its performance during the reporting period. Throughout the reporting period, US economic data remained positive. Robust corporate profits, strong retail sales and unemployment rates near generational lows helped drive US markets to new all-time records multiple times during the reporting period. Against this backdrop, the US Federal Reserve raised the federal funds rate four times during the reporting period. Market volatility, largely non-existent in 2017, returned in 2018. Markets sold off first in February and again sharply in October, amid rising interest rates, concerns about potential trade wars and heightened geopolitical tensions. Despite the volatility, US equity markets were largely positive for the reporting period and fared better than international markets. Emerging markets were |
particularly hard hit due to a strong US dollar. During the October sell-off, investors retreated to more defensive areas of the market and to US Treasuries. The broader bond market declined during the reporting period due to the increase in US Treasury yields and widening credit spreads. As the year progresses, we’ll see how the interplay of economic data, interest rates, geopolitics and a host of other factors affect US and overseas equity and fixed income markets.
Short-term market volatility can prompt some investors to abandon their investment plans – and can cause others to settle for whatever returns the market has to offer. The investment professionals at Invesco, in contrast, invest with high conviction. This means that, no matter the asset class or the strategy, each investment team has a passion to exceed. We want to help investors achieve better outcomes, such as seeking higher returns, helping mitigate risk and generating income. Of course, investing with high conviction can’t guarantee a profit or ensure success; no investment strategy can. To learn more about how we invest with high conviction, visit invesco.com/HighConviction.
You, too, can invest with high conviction by maintaining a long-term investment perspective and by working with your financial adviser on a regular basis. During periods of short-term market volatility or uncertainty, your financial adviser can keep you focused on your long-term investment goals – a new home, a child’s college education or a secure retirement. He or she also can share research about the economy, the markets and individual investment options.
Visit our website for more information on your investments
Our website, invesco.com/us, offers a wide range of market insights and investment perspectives. On the website, you’ll find detailed information about our funds, including performance, holdings and portfolio manager commentaries. You can access information about your account by completing a simple, secure online registration. To do so, select “Log In” on the right side of the homepage, and then select “Register for Individual Account Access.”
In addition to the resources accessible on our website and through our mobile app, you can obtain timely updates to help you stay informed about the markets and the economy by connecting with Invesco on Twitter, LinkedIn or Facebook. You can access our blog at blog.invesco.us.com. Our goal is to provide you the information you want, when and where you want it.
Finally, I’m pleased to share with you Invesco’s commitment to both the Principles for Responsible Investment and to considering environmental, social and governance issues in our robust investment process. I invite you to learn more at invesco.com/esg.
Have questions?
For questions about your account, contact an Invesco client services representative at 800 959 4246. For Invesco-related questions or comments, please email me directly at phil@invesco.com.
All of us at Invesco look forward to serving your investment management needs. Thank you for investing with us.
Sincerely,

Philip Taylor
Senior Managing Director, Invesco Ltd.
| | |
| 2 | | Invesco Long/Short Equity Fund |
| | | | |

Bruce Crockett | | Dear Fellow Shareholders: Among the many important lessons I’ve learned in more than 40 years in a variety of business endeavors is the value of a trusted advocate. As independent chair of the Invesco Funds Board, I can assure you that the members of the Board are strong advocates for the interests of investors in Invesco’s mutual funds. We work hard to represent your interests through oversight of the quality of the investment management services your funds receive and other matters important to your investment, including but not limited to: |
| | ∎ | | Ensuring that Invesco offers a diverse lineup of mutual funds that your financial adviser can use to strive to meet your financial needs as your investment goals change over time. |
| | ∎ | | Monitoring how the portfolio management teams of the Invesco funds are performing in light of changing economic and market conditions. |
| ∎ | | Assessing each portfolio management team’s investment performance within the context of the investment strategy described in the fund’s prospectus. |
| ∎ | | Monitoring for potential conflicts of interests that may impact the nature of the services that your funds receive. |
We believe one of the most important services we provide our fund shareholders is the annual review of the funds’ advisory and sub-advisory contracts with Invesco Advisers and its affiliates. This review is required by the Investment Company Act of 1940 and focuses on the nature and quality of the services Invesco provides as the adviser to the Invesco funds and the reasonableness of the fees that it charges for those services. Each year, we spend months carefully reviewing information received from Invesco and a variety of independent sources, such as performance and fee data prepared by Lipper, Inc. (a subsidiary of Broadridge Financial Solutions, Inc.), an independent, third-party firm widely recognized as a leader in its field. We also meet with our independent legal counsel and other independent advisers to review and help us assess the information that we have received. Our goal is to assure that you receive quality investment management services for a reasonable fee.
I trust the measures outlined above provide assurance that you have a worthy advocate when it comes to choosing the Invesco Funds.
As always, please contact me at bruce@brucecrockett.com with any questions or concerns you may have. On behalf of the Board, we look forward to continuing to represent your interests and serving your needs.
Sincerely,

Bruce L. Crockett
Independent Chair
Invesco Funds Board of Trustees
| | |
| 3 | | Invesco Long/Short Equity Fund |
Management’s Discussion of Fund Performance
| | | | | | | | |
| | |
Performance summary For the fiscal year ended October 31, 2018, Class A shares of Invesco Long/Short Equity Fund (the Fund), at net asset value (NAV), underperformed the S&P 500 Index and the FTSE US 3-Month Treasury Bill Index, the Fund’s broad market and style-specific benchmarks, respectively. Your Fund’s long-term performance appears later in this report. | | | | | |
| | | |
Fund vs. Indexes | | | | | | | | |
Total returns, 10/31/17 to 10/31/18, at net asset value (NAV). Performance shown does not include applicable contingent deferred sales charges (CDSC) or front-end sales charges, which would have reduced performance. | | | | | |
| | |
Class A Shares | | | -2.49 | % | | | | |
Class C Shares | | | -3.24 | | | | | |
Class R Shares | | | -2.81 | | | | | |
Class Y Shares | | | -2.28 | | | | | |
Class R5 Shares | | | -2.17 | | | | | |
Class R6 Shares | | | -2.16 | | | | | |
S&P 500 Indexq (Broad Market Index) | | | 7.35 | | | | | |
FTSE US 3-Month Treasury Bill Indexq (Style-Specific Index) | | | 1.67 | | | | | |
Lipper Alternative Long/Short Equity Funds Index⬛ (Peer Group Index) | | | -0.11 | | | | | |
Source(s): qFactset Research Systems Inc.; ⬛Lipper Inc. | | | | | | | | |
Market conditions and your Fund
The fiscal year proved to be an increasingly volatile time for US equities. The fiscal year began in the final months of 2017 with several major US stock market indexes repeatedly reaching new highs amid strong corporate profits, the prospect of tax reform legislation and exceedingly low stock market volatility.
Stock market euphoria continued in January 2018 as US equity markets steadily moved higher. Investors remained enthused about the passage of
the Tax Cuts and Jobs Act signed into law in late December 2017, which significantly cut corporate tax rates. However, in February 2018, volatility returned to the US stock and bond markets. Worries about how rising interest rates might affect economic growth, concerns about a potential trade war and heightened geopolitical tensions, caused the US stock markets to pull back and volatility to increase.
US equity markets generally recovered in the second quarter of 2018 as strong US retail sales and low unemployment
buoyed markets. Throughout the summer, US equities moved higher as corporate profits surged. Several US equity indexes reached new highs despite potential headwinds including trade tensions, tariff announcements and contagion concerns over a Turkish currency crisis. After a relatively quiet summer, market volatility markedly rose in the final month of the fiscal year. US equity markets suffered a sharp sell-off in October 2018 amid rising interest rates and concerns that higher inflation could mean a more restrictive monetary policy. In this environment, investors fled to more defensive areas of the market and to US Treasuries.
Given signs of a strong economy, the US Federal Reserve raised interest rates four times during the fiscal year: in December 2017 and in March, June and September 2018.1 In contrast, the European Central Bank and central banks in several other countries maintained extraordinarily accommodative monetary policies.
As part of our investment process, we evaluate fundamental and behavioral factors to forecast individual securities’ returns and risks and rank these securities based on their attractiveness relative to industry peers. The Fund generally maintains a net long bias and implements its strategy by purchasing what we consider to be highly-ranked stocks as long positions, and selling short what we consider to be poorly-ranked stocks within
| | | | | | | | | | | | | | | | | | | | |
Portfolio Composition | | | | | | | | | | | | | | |
By sector, based on total net assets | |
| | | Equity Securities | | |
| | | | | Long1 | | | Short2 | | Gross Exposure3 | | | | Net Exposure4 | |
Information Technology | | | | 35.4 | % | | 13.3% | | 48.7% | | | | 22.1% | |
Consumer Discretionary | | | | 27.4 | | | 16.8 | | 44.2 | | | | 10.6 | |
Financials | | | | 24.8 | | | 14.5 | | 39.3 | | | | 10.3 | |
Health Care | | | | 22.0 | | | 9.6 | | 31.6 | | | | 12.4 | |
Energy | | | | 17.8 | | | 8.1 | | 25.9 | | | | 9.7 | |
Industrials | | | | 15.5 | | | 14.4 | | 29.9 | | | | 1.1 | |
Materials | | | | 13.6 | | | 6.1 | | 19.7 | | | | 7.5 | |
Real Estate | | | | 10.2 | | | 5.8 | | 16.0 | | | | 4.4 | |
Utilities | | | | 9.3 | | | – | | 9.3 | | | | 9.3 | |
Communication Services | | | | 7.8 | | | 9.4 | | 17.2 | | | | -1.6 | |
Consumer Staples | | | | 7.8 | | | 1.3 | | 9.1 | | | | 6.5 | |
Money Market Funds Plus Other Assets Less Liabilities | | | | 7.7 | | | – | | 7.7 | | | | 7.7 | |
Total | | | | 199.3 | | | 99.3 | | 298.6 | | | | 100.0 | |
| 1 | Represents the value of equity securities in the portfolio and the equity securities underlying the Fund’s equity long portfolio swap. |
| 2 | Represents the value of the equity securities underlying the Fund’s equity short portfolio swap. |
| 3 | Represents the cumulative exposure of the Fund’s long and short positions. |
| 4 | Represents the net exposure of the Fund’s long and short positions. |
| | | | |
Total Net Assets | | | $81.2 million | |
Data presented here are as of October 31, 2018.
| | |
| 4 | | Invesco Long/Short Equity Fund |
their respective industries. The Fund seeks to add value primarily from stock selection and secondarily by dynamically changing the level of its beta, or market exposure based upon predicted levels of risk in the equity markets. Additionally, the Fund’s net long market position may result in net long/net short exposure in sectors where there is an imbalance between highly-ranked and poorly-ranked stocks. In a long/short construct, a positive spread between the top- and bottom-ranked stocks (long and short candidates for the portfolio), plus a return from market/sector exposure, is intended to result in the Fund achieving attractive risk-adjusted performance relative to the S&P 500 Index over a full market cycle.
During the fiscal year, the Fund’s performance relative to the broad market benchmark benefited most from a positive long/short spread in three of 11 sectors.
Conversely, both long and short holdings detracted from the Fund’s performance relative to the S&P 500 Index for the fiscal year. Relative Fund performance was led by stock selection in the energy, industrials and utilities sectors. Stock selection in the consumer discretionary, materials, information technology (IT), real estate and financials sectors detracted from the Fund’s absolute and relative performance.
The top-contributing sector to the Fund’s performance relative to the broad market benchmark was the industrials sector. Within this sector, the Fund benefited from strong stock selection and expected results from short holdings in the conglomerates and commercial services/supplies industries. The Fund also benefited from a net long allocation in the energy sector and stock selection in long positions in the oil and gas and consumable fuels industries. Long holdings within the utilities sector – specifically, the electric utilities industry – also contributed to the Fund’s relative performance.
Holdings within the consumer discretionary sector, particularly short positions in the specialty retail industry, performed poorly relative to the broad market benchmark during the fiscal year. In addition, both the long and short holdings in the hotel/restaurant and media industries did not perform as expected and hampered the Fund’s relative results. Within the materials sector, the long holdings – specifically, long holdings in the chemicals and metals/mining industries – underperformed our expectations and detracted from the Fund’s returns. Within the IT sector, the Fund’s short holdings in the IT services industry
outperformed its long peers and hurt relative performance.
From a factor perspective, the Fund benefited from exposures to Momentum (both Earnings and Price) while our Quality signals were negative over the course of the fiscal year, despite showing signs of strength during heightened periods of volatility. Our Value signals detracted from overall model strength. We have observed that in this most recent period of yield curve flattening and rising yields, stocks with growth characteristics have outperformed those with value attributes. Perhaps the most observable example of this is that the Russell 1000 Growth Index outperformed the Russell 1000 Value Index by 7.7% during the fiscal year.2 We believe that having a balance of factors that have small, and in the case of Value versus Momentum, negative correlations will smooth out the investment experience relative to relying on more concentrated factor exposures.
At the end of the fiscal year, the Fund’s largest net long sector allocations were in the IT, health care, consumer discretionary, and financials sectors. The Fund did not have any sectors with net short positions.
Please note that the Fund may utilize derivative instruments that include equity total return swaps and futures contracts. During the fiscal year, the Fund utilized equity total return swaps to efficiently implement its strategy, but did not use futures contracts. The implementation impact of using equity total return swaps is a component of transaction costs. Derivatives may amplify traditional investment risks through the creation of leverage and may be less liquid than traditional securities.
Thank you for your investment in Invesco Long/Short Equity Fund.
| 1 | Source: US Federal Reserve |
| 2 | Source: FactSet Research Systems Inc. |
The views and opinions expressed in management’s discussion of Fund performance are those of Invesco Advisers, Inc. These views and opinions are subject to change at any time based on factors such as market and economic conditions. These views and opinions may not be relied upon as investment advice or recommendations, or as an offer for a particular security. The information is not a complete analysis of every aspect of any market, country, industry, security or the Fund. Statements of fact are from sources considered reliable, but Invesco Advisers, Inc. makes no representation or warranty as to their completeness or accuracy. Although historical performance is no guarantee of future results, these insights may help you understand our investment management philosophy.
See important Fund and, if applicable, index disclosures later in this report.
| | |

| | Michael Abata Chartered Financial Analyst, Portfolio Manager, is manager of Invesco Long/Short Equity Fund. He |
| joined Invesco in 2011. Mr. Abata earned a BA in economics from Binghamton University. |
| |

| | Anthony Munchak Chartered Financial Analyst, Portfolio Manager, is manager of Invesco Long/Short Equity Fund. He |
| joined Invesco in 2000. Mr. Munchak earned a BS and an MS in finance from Boston College and an MBA from Bentley College. |
| |

| | Glen Murphy Chartered Financial Analyst, Portfolio Manager, is manager of Invesco Long/Short Equity Fund. He |
| joined Invesco in 1995. Mr. Murphy earned a BA from the University of Massachusetts at Amherst and an MS in finance from Boston College. |
| |

| | Francis Orlando Chartered Financial Analyst, Portfolio Manager, is manager of Invesco Long/Short Equity Fund. He |
| joined Invesco in 1987. Mr. Orlando earned a BA in business administration from Merrimack College and an MBA from Boston University. |
5 Invesco Long/Short Equity Fund
Your Fund’s Long-Term Performance
Results of a $10,000 Investment – Oldest Share Class(es) since Inception
Fund and index data from 12/19/13
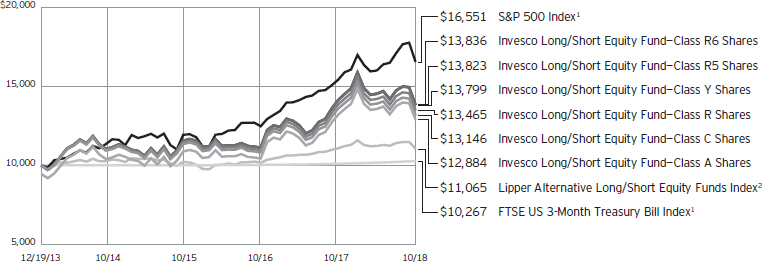
1 Source: FactSet Research Systems Inc.
2 Source: Lipper Inc.
Past performance cannot guarantee comparable future results.
The data shown in the chart include reinvested distributions, applicable sales charges and Fund expenses including
management fees. Index results include reinvested dividends, but they do not reflect sales charges. Performance of the peer group, if applicable, reflects fund expenses and management fees; performance
of a market index does not. Performance shown in the chart and table(s) does not reflect deduction of taxes a shareholder would pay on Fund distributions or sale of Fund shares.
continued from page 8
| ∎ | | Small- and mid-capitalization companies risks. Small- and mid-capitalization companies tend to be more vulnerable to changing market conditions, may have little or no operating history or track record of success, and may have more limited product lines and markets, less experienced management and fewer financial resources than larger companies. These companies’ securities may be more volatile and less liquid than those of more established companies, and their returns may vary, sometimes significantly, from the overall securities market. |
About indexes used in this report
| ∎ | | The S&P 500® Index is an unmanaged index considered representative of the US stock market. |
| ∎ | | The FTSE US 3-Month Treasury Bill Index is an unmanaged index representative of three-month US Treasury bills. |
| ∎ | | The Lipper Alternative Long/Short Equity Funds Index is an unmanaged index considered representative of alternative long/short equity funds tracked by Lipper. |
| ∎ | | The Russell 1000® Growth Index is an unmanaged index considered representative of large-cap growth stocks. The Russell 1000 Growth Index is a trademark/service mark of the Frank Russell Co. Russell® is a trademark of the Frank Russell Co. |
| ∎ | | The Russell 1000® Value Index is an unmanaged index considered representative of large-cap value stocks. The Russell 1000 Value Index is a trademark/service mark of the Frank Russell Co. Russell® is a trademark of the Frank Russell Co. |
| ∎ | | The Fund is not managed to track the performance of any particular index, including the index(es) described here, and consequently, the performance of the Fund may deviate significantly from the performance of the index(es). |
| ∎ | | A direct investment cannot be made in an index. Unless otherwise indicated, index results include reinvested dividends, and they do not reflect sales charges. Performance of the peer group, if applicable, reflects fund expenses; performance of a market index does not. |
Other information
| ∎ | | The returns shown in management’s discussion of Fund performance are based on net asset values (NAVs) calculated for shareholder transactions. Generally accepted accounting principles require adjustments to be made to the net assets of the Fund at period end for financial reporting purposes, and as such, the NAVs for shareholder transactions and the returns based on those NAVs may differ from the NAVs and returns reported in the Financial Highlights. |
| ∎ | | Industry classifications used in this report are generally according to the Global Industry Classification Standard, which was developed by and is the exclusive property and a service mark of MSCI Inc. and Standard & Poor’s. |
| | |
| 6 | | Invesco Long/Short Equity Fund |
| | | | |
| |
Average Annual Total Returns | |
As of 10/31/18, including maximum applicable sales charges | |
| |
Class A Shares | | | | |
Inception (12/19/13) | | | 5.35 | % |
1 Year | | | -7.88 | |
| |
Class C Shares | | | | |
Inception (12/19/13) | | | 5.78 | % |
1 Year | | | -4.08 | |
| |
Class R Shares | | | | |
Inception (12/19/13) | | | 6.30 | % |
1 Year | | | -2.81 | |
| |
Class Y Shares | | | | |
Inception (12/19/13) | | | 6.84 | % |
1 Year | | | -2.28 | |
| |
Class R5 Shares | | | | |
Inception (12/19/13) | | | 6.88 | % |
1 Year | | | -2.17 | |
| |
Class R6 Shares | | | | |
Inception (12/19/13) | | | 6.90 | % |
1 Year | | | -2.16 | |
The performance data quoted represent past performance and cannot guarantee comparable future results; current performance may be lower or higher. Please visit invesco.com/performance for the most recent month-end performance. Performance figures reflect reinvested distributions, changes in net asset value and the effect of the maximum sales charge unless otherwise stated. Investment return and principal value will fluctuate so that you may have a gain or loss when you sell shares.
The net annual Fund operating expense ratio set forth in the most recent Fund prospectus as of the date of this report for Class A, Class C, Class R, Class Y, Class R5 and Class R6 shares was 1.55%, 2.30%, 1.80%, 1.30%, 1.18% and 1.18%, respectively.1 The total annual Fund operating expense ratio set forth in the most recent Fund prospectus as of the date of this report for Class A, Class C, Class R, Class Y, Class R5 and Class R6 shares was 1.56%, 2.31%, 1.81%, 1.31%, 1.19% and 1.19%, respectively. The expense ratios presented above may vary from the expense ratios presented in other sections of this report that are based on expenses incurred during the period covered by this report.
| | | | |
| |
Average Annual Total Returns | |
As of 9/30/18, the most recent calendar quarter end, including maximum applicable sales charges | |
| |
Class A Shares | | | | |
Inception (12/19/13) | | | 7.18 | % |
1 Year | | | 3.49 | |
| |
Class C Shares | | | | |
Inception (12/19/13) | | | 7.64 | % |
1 Year | | | 7.79 | |
| |
Class R Shares | | | | |
Inception (12/19/13) | | | 8.19 | % |
1 Year | | | 9.27 | |
| |
Class Y Shares | | | | |
Inception (12/19/13) | | | 8.74 | % |
1 Year | | | 9.85 | |
| |
Class R5 Shares | | | | |
Inception (12/19/13) | | | 8.78 | % |
1 Year | | | 9.96 | |
| |
Class R6 Shares | | | | |
Inception (12/19/13) | | | 8.80 | % |
1 Year | | | 10.05 | |
Class A share performance reflects the maximum 5.50% sales charge, and Class C share performance reflects the applicable contingent deferred sales charge (CDSC) for the period involved. The CDSC on Class C shares is 1% for the first year after purchase. Class R, Class Y, Class R5 and Class R6 class shares do not have a front-end sales charge or a CDSC; therefore, performance is at net asset value.
The performance of the Fund’s share classes will differ primarily due to different sales charge structures and class expenses.
Fund performance reflects any applicable fee waivers and/or expense reimbursements. Had the adviser not waived fees and/or reimbursed expenses currently or in the past, returns would have been lower. See current prospectus for more information.
| 1 | Total annual Fund operating expenses after any contractual fee waivers and/or expense reimbursements by the adviser in effect through at least June 30, 2020. See current prospectus for more information. |
7 Invesco Long/Short Equity Fund
Invesco Long/Short Equity Fund’s investment objective is to seek long-term capital appreciation.
| ∎ | | Unless otherwise stated, information presented in this report is as of October 31, 2018, and is based on total net assets. |
| ∎ | | Unless otherwise noted, all data provided by Invesco. |
| ∎ | | To access your Fund’s reports/prospectus, visit invesco.com/fundreports. |
About share classes
| ∎ | | Class R shares are generally available only to employer sponsored retirement and benefit plans. Please see the prospectus for more information. |
| ∎ | | Class Y shares are available only to certain investors. Please see the prospectus for more information. |
| ∎ | | Class R5 shares and Class R6 shares are available for use by retirement plans that meet certain standards and for institutional investors. Class R6 shares are also available through intermediaries that have established an agreement with Invesco Distributors, Inc. to make such shares available for use in retail omnibus accounts. Please see the prospectus for more information. |
Principal risks of investing in the Fund
| ∎ | | Active trading risk. Active trading of portfolio securities may result in added expenses, a lower return and increased tax liability. |
| ∎ | | Derivatives risk. The value of a derivative instrument depends largely on (and is derived from) the value of an underlying security, currency, commodity, interest rate, index or other asset (each referred to as an underlying asset). In addition to risks relating to the underlying assets, the use of derivatives may include other, possibly greater, risks, including counterparty, leverage and liquidity risks. Counterparty risk is the risk that the counterparty to the derivative contract will default on its obligation to pay the Fund the amount owed or otherwise perform under the derivative contract. Derivatives create leverage risk because they do not require payment up front equal to the economic exposure created by owning the derivative. As a result, an adverse change in the value of the underlying asset could result in the Fund sustaining a loss that is substantially greater than the amount invested in the derivative, which may make the Fund’s returns |
| | more volatile and increase the risk of loss. Derivative instruments may also be less liquid than more traditional investments and the Fund may be unable to sell or close out its derivative positions at a desirable time or price. This risk may be more acute under adverse market conditions, during which the Fund may be most in need of liquidating its derivative positions. Derivatives may also be harder to value, less tax efficient and subject to changing government regulation that could impact the Fund’s ability to use certain derivatives or their cost. Also, derivatives used for hedging or to gain or limit exposure to a particular market segment may not provide the expected benefits, particularly during adverse market conditions. These risks are greater for the Fund than mutual funds that do not use derivative instruments or that use derivative instruments to a lesser extent than the Fund to implement their investment strategies. |
| ∎ | | Management risk. The Fund is actively managed and depends heavily on the Adviser’s judgment about markets, interest rates or the attractiveness, relative values, liquidity, or potential appreciation of particular investments made for the Fund’s portfolio. The Fund could experience losses if these judgments prove to be incorrect. There is no guarantee that the Fund’s mixture of long and short positions or the portfolio manager’s stock selection process will produce a portfolio with reduced exposure to stock market risk. In addition, the Fund’s long/short investment strategy may cause the Fund to underperform the broader equity markets in which the Fund invests during market rallies. Such underperformance could be significant during sudden or significant market rallies. Additionally, legislative, regulatory, or tax developments may adversely affect management of the Fund and, therefore, the ability of the Fund to achieve its investment objective. |
| ∎ | | Market risk. The market values of the Fund’s investments, and therefore the value of the Fund’s shares, will go up and down, sometimes rapidly or unpredictably. Market risk may affect a single issuer, industry or section of the economy, or it may affect the market as a whole. Individual stock prices tend to go up and down more dramatically than those of certain other types of investments, such as bonds. During a general downturn in the financial markets, multiple asset classes may decline in value. When markets perform well, there can be no assurance that specific investments held by the Fund will rise in value. |
| ∎ | | Sector focus risk. The Fund may from time to time invest a significant amount of its assets (i.e. over 25%) in one market sector or group of related industries. In this event, the Fund’s performance will depend to a greater extent on the overall condition of the sector or group of industries and there is increased risk that the Fund will lose significant value if conditions adversely affect that sector or group of industries. |
| ∎ | | Short position risk. Because the Fund’s potential loss on a short position arises from increases in the value of the asset sold short, the Fund will incur a loss on a short position, which is theoretically unlimited, if the price of the asset sold short increases from the short sale price. The counterparty to a short position or other market factors may prevent the Fund from closing out a short position at a desirable time or price and may reduce or eliminate any gain or result in a loss. In a rising market, the Fund’s short positions will cause the Fund to underperform the overall market and its peers that do not engage in shorting. If the Fund holds both long and short positions, and both positions decline simultaneously, the short positions will not provide any buffer (hedge) from declines in value of the Fund’s long positions. Certain types of short positions involve leverage, which may exaggerate any losses, potentially more than the actual cost of the investment, and will increase the volatility of the Fund’s returns. |
continued on page 6
|
This report must be accompanied or preceded by a currently effective Fund prospectus, which contains more complete information, including sales charges and expenses. Investors should read it carefully before investing. |
|
|
| NOT FDIC INSURED | MAY LOSE VALUE | NO BANK GUARANTEE |
| | |
| 8 | | Invesco Long/Short Equity Fund |
Schedule of Investments(a)
October 31, 2018
| | | | | | | | |
| | | Shares | | | Value | |
Common Stocks & Other Equity Interests–92.26% | |
| Advertising–1.43% | |
Interpublic Group of Cos., Inc. (The) | | | 50,050 | | | $ | 1,159,158 | |
|
| Aerospace & Defense–0.49% | |
Textron Inc. | | | 7,450 | | | | 399,544 | |
|
| Airlines–1.63% | |
United Continental Holdings Inc.(b) | | | 15,500 | | | | 1,325,405 | |
|
| Apparel Retail–1.53% | |
Foot Locker, Inc. | | | 26,300 | | | | 1,239,782 | |
|
| Apparel, Accessories & Luxury Goods–4.51% | |
lululemon Athletica Inc.(b) | | | 3,300 | | | | 464,409 | |
Michael Kors Holdings Ltd.(b) | | | 19,550 | | | | 1,083,266 | |
Ralph Lauren Corp. | | | 12,150 | | | | 1,574,761 | |
VF Corp. | | | 6,500 | | | | 538,720 | |
| | | | | 3,661,156 | |
|
| Application Software–1.55% | |
ANSYS, Inc.(b) | | | 300 | | | | 44,865 | |
Citrix Systems, Inc.(b) | | | 11,800 | | | | 1,209,146 | |
| | | | | 1,254,011 | |
|
| Automotive Retail–1.12% | |
Advance Auto Parts, Inc. | | | 5,700 | | | | 910,632 | |
|
| Biotechnology–3.55% | |
United Therapeutics Corp.(b) | | | 12,150 | | | | 1,346,949 | |
Vertex Pharmaceuticals Inc.(b) | | | 9,050 | | | | 1,533,613 | |
| | | | | 2,880,562 | |
|
| Cable & Satellite–0.52% | |
Liberty Global PLC–Class C(b) | | | 16,900 | | | | 423,176 | |
|
| Communications Equipment–3.62% | |
F5 Networks, Inc.(b) | | | 8,650 | | | | 1,516,172 | |
Motorola Solutions, Inc. | | | 11,600 | | | | 1,421,696 | |
| | | | | 2,937,868 | |
|
| Construction Machinery & Heavy Trucks–1.80% | |
Allison Transmission Holdings, Inc. | | | 33,150 | | | | 1,461,252 | |
|
| Consumer Electronics–0.12% | |
Garmin Ltd. | | | 1,500 | | | | 99,240 | |
|
| Consumer Finance–3.18% | |
Ally Financial Inc. | | | 51,350 | | | | 1,304,803 | |
Santander Consumer USA Holdings Inc. | | | 67,900 | | | | 1,273,125 | |
| | | | | 2,577,928 | |
|
| Copper–0.33% | |
Freeport-McMoRan Inc. | | | 23,000 | | | | 267,950 | |
|
| Data Processing & Outsourced Services–3.83% | |
Broadridge Financial Solutions, Inc. | | | 10,600 | | | | 1,239,564 | |
Sabre Corp. | | | 50,550 | | | | 1,246,057 | |
Total System Services, Inc. | | | 6,800 | | | | 619,820 | |
| | | | | 3,105,441 | |
| | | | | | | | |
| | | Shares | | | Value | |
| Department Stores–4.58% | |
Kohl’s Corp. | | | 21,350 | | | $ | 1,616,835 | |
Macy’s, Inc. | | | 40,050 | | | | 1,373,314 | |
Nordstrom, Inc. | | | 11,050 | | | | 726,759 | |
| | | | | 3,716,908 | |
|
| Diversified Chemicals–2.86% | |
Eastman Chemical Co. | | | 13,200 | | | | 1,034,220 | |
Huntsman Corp. | | | 58,900 | | | | 1,288,732 | |
| | | | | 2,322,952 | |
|
| Diversified Metals & Mining–1.41% | |
Teck Resources Ltd.–Class B | | | 55,450 | | | | 1,146,151 | |
|
| Diversified Support Services–1.66% | |
KAR Auction Services, Inc. | | | 23,600 | | | | 1,343,784 | |
|
| Electric Utilities–1.59% | |
Entergy Corp. | | | 15,370 | | | | 1,290,311 | |
|
| Electronic Equipment & Instruments–1.21% | |
FLIR Systems, Inc. | | | 21,250 | | | | 984,088 | |
|
| Fertilizers & Agricultural Chemicals–3.36% | |
CF Industries Holdings, Inc. | | | 30,300 | | | | 1,455,309 | |
Mosaic Co. (The) | | | 41,050 | | | | 1,270,087 | |
| | | | | 2,725,396 | |
|
| Food Distributors–1.26% | |
US Foods Holding Corp.(b) | | | 35,100 | | | | 1,023,867 | |
|
| Gas Utilities–0.67% | |
UGI Corp. | | | 10,300 | | | | 546,518 | |
|
| Gold–0.20% | |
Newmont Mining Corp. | | | 5,150 | | | | 159,238 | |
|
| Homebuilding–1.57% | |
PulteGroup Inc. | | | 51,750 | | | | 1,271,497 | |
|
| Hotel & Resort REITs–1.39% | |
Host Hotels & Resorts Inc. | | | 59,100 | | | | 1,129,401 | |
|
| Hotels, Resorts & Cruise Lines–1.54% | |
Hyatt Hotels Corp.–Class A | | | 18,100 | | | | 1,252,520 | |
|
| Human Resource & Employment Services–1.54% | |
Robert Half International, Inc. | | | 20,600 | | | | 1,246,918 | |
|
| Independent Power Producers & Energy Traders–1.96% | |
NRG Energy, Inc. | | | 43,950 | | | | 1,590,550 | |
|
| Interactive Media & Services–1.39% | |
IAC/InterActiveCorp.(b) | | | 3,750 | | | | 737,213 | |
TripAdvisor, Inc.(b) | | | 7,500 | | | | 391,050 | |
| | | | | 1,128,263 | |
|
| Life & Health Insurance–0.80% | |
Athene Holding Ltd.–Class A(b) | | | 14,250 | | | | 651,510 | |
|
| Managed Health Care–1.80% | |
WellCare Health Plans, Inc.(b) | | | 5,300 | | | | 1,462,747 | |
|
| Multi-Utilities–1.59% | |
Public Service Enterprise Group Inc. | | | 24,200 | | | | 1,293,006 | |
See accompanying Notes to Financial Statements which are an integral part of the financial statements.
9 Invesco Long/Short Equity Fund
| | | | | | | | |
| | | Shares | | | Value | |
| Office REITs–0.13% | |
SL Green Realty Corp. | | | 1,200 | | | $ | 109,512 | |
|
| Oil & Gas Equipment & Services–0.21% | |
Apergy Corp.(b) | | | 3,200 | | | | 124,768 | |
National Oilwell Varco Inc. | | | 1,300 | | | | 47,840 | |
| | | | | 172,608 | |
|
| Oil & Gas Exploration & Production–4.61% | |
ConocoPhillips | | | 10,750 | | | | 751,425 | |
Marathon Oil Corp. | | | 76,700 | | | | 1,456,533 | |
Murphy Oil Corp. | | | 48,050 | | | | 1,530,873 | |
| | | | | 3,738,831 | |
|
| Oil & Gas Refining & Marketing–1.86% | |
HollyFrontier Corp. | | | 22,350 | | | | 1,507,284 | |
|
| Oil & Gas Storage & Transportation–1.40% | |
Plains GP Holdings LP–Class A(b) | | | 53,050 | | | | 1,133,679 | |
|
| Packaged Foods & Meats–1.08% | |
Hershey Co. (The) | | | 7,450 | | | | 798,268 | |
Kellogg Co. | | | 1,150 | | | | 75,302 | |
| | | | | 873,570 | |
|
| Property & Casualty Insurance–1.10% | |
Fidelity National Financial, Inc. | | | 26,650 | | | | 891,443 | |
|
| Regional Banks–5.49% | |
Citizens Financial Group, Inc. | | | 34,950 | | | | 1,305,382 | |
Comerica Inc. | | | 14,100 | | | | 1,149,996 | |
Commerce Bancshares, Inc. | | | 16,800 | | | | 1,068,480 | |
SVB Financial Group(b) | | | 3,920 | | | | 929,942 | |
| | | | | 4,453,800 | |
|
| Residential REITs–2.80% | |
Equity LifeStyle Properties, Inc. | | | 14,000 | | | | 1,325,660 | |
Sun Communities, Inc. | | | 9,400 | | | | 944,418 | |
| | | | | 2,270,078 | |
|
| Restaurants–1.51% | |
Darden Restaurants, Inc. | | | 11,500 | | | | 1,225,325 | |
| | | | | | | | |
| | | Shares | | | Value | |
| Retail REITs–0.93% | |
National Retail Properties Inc. | | | 16,150 | | | $ | 755,013 | |
|
| Specialized Consumer Services–1.64% | |
H&R Block, Inc. | | | 50,100 | | | | 1,329,654 | |
|
| Specialized REITs–1.68% | |
Extra Space Storage Inc. | | | 15,150 | | | | 1,364,409 | |
|
| Specialty Chemicals–1.51% | |
Celanese Corp. | | | 12,650 | | | | 1,226,291 | |
|
| Systems Software–0.39% | |
Fortinet, Inc.(b) | | | 3,850 | | | | 316,393 | |
|
| Technology Distributors–1.40% | |
Avnet, Inc. | | | 28,400 | | | | 1,137,988 | |
|
| Technology Hardware, Storage & Peripherals–2.51% | |
HP Inc. | | | 64,850 | | | | 1,565,479 | |
Seagate Technology PLC | | | 7,100 | | | | 285,633 | |
Xerox Corp. | | | 6,650 | | | | 185,335 | |
| | | | | 2,036,447 | |
|
| Trading Companies & Distributors–0.42% | |
HD Supply Holdings, Inc.(b) | | | 9,150 | | | | 343,766 | |
Total Common Stocks & Other Equity Interests
(Cost $68,977,333) | | | | 74,874,821 | |
|
Money Market Funds–8.39% | |
Invesco Government & Agency Portfolio–Institutional Class, 2.08%(c) | | | 2,382,421 | | | | 2,382,421 | |
Invesco Liquid Assets Portfolio–Institutional Class, 2.27%(c) | | | 1,701,350 | | | | 1,701,690 | |
Invesco Treasury Portfolio–Institutional Class, 2.09%(c) | | | 2,722,767 | | | | 2,722,767 | |
Total Money Market Funds
(Cost $6,806,855) | | | | 6,806,878 | |
TOTAL INVESTMENTS IN SECURITIES–100.65%
(Cost $75,784,188) | | | | 81,681,699 | |
OTHER ASSETS LESS LIABILITIES–(0.65)% | | | | (528,129 | ) |
NET ASSETS–100.00% | | | $ | 81,153,570 | |
Investment Abbreviations:
| | |
| REIT | | – Real Estate Investment Trust |
Notes to Schedule of Investments:
| (a) | Industry and/or sector classifications used in this report are generally according to the Global Industry Classification Standard, which was developed by and is the exclusive property and a service mark of MSCI Inc. and Standard & Poor’s. |
| (b) | Non-income producing security. |
| (c) | The money market fund and the Fund are affiliated by having the same investment adviser. The rate shown is the 7-day SEC standardized yield as of October 31, 2018. |
| | | | | | | | | | | | | | | | | | | | | | | | | | | | | | | | | | | | |
| Open Over-The-Counter Total Return Swap Agreements | |
| Reference Entity | | Counterparty | | | Maturity
Dates | | | Floating Rate Index(1) | | | Payment
Frequency | | | Notional Amount | | | Upfront
Payments
Paid
(Received) | | | Value | | | Unrealized
Appreciation
(Depreciation) | | | Net Value of
Reference
Entities | |
Equity Securities — Long | | | Morgan Stanley & Co. LLC | | | | 12/23/2019 | | | | Federal Funds floating rate | | | | Monthly | | | $ | 81,980,010 | | | $ | — | | | $ | (1,457,255 | )(2) | | $ | (1,457,255 | )(2) | | $ | 80,502,888 | |
Equity Securities — Short | | | Morgan Stanley & Co. LLC | | | | 12/23/2019 | | | | Federal Funds floating rate | | | | Monthly | | | | (81,495,608 | ) | | | — | | | | 871,329 | (3) | | | 871,329 | (3) | | | (80,613,163 | ) |
Total Return Swap Agreements — Equity Risk | | | | | | | | | | | | | | | | | | | $ | — | | | $ | (585,926 | )(4) | | $ | (585,926 | )(4) | | $ | (110,275 | ) |
| (1) | The Fund receives or pays the total return on the long and short positions underlying the total return swap and pays or receives a specific Federal Funds floating rate. |
| (2) | Amount includes $19,867 of dividends receivable and financing fees related to the reference entities. |
| (3) | Amount includes $(11,116) of dividends payable and financing fees related to the reference entities. |
| (4) | Swaps are collaterized by $169,866 cash held with Morgan Stanley & Co. LLC, the Counterparty. |
See accompanying Notes to Financial Statements which are an integral part of the financial statements.
10 Invesco Long/Short Equity Fund
The following table represents the individual long and short positions and related values of equity securities underlying the total return swap with Morgan Stanley & Co. LLC as of October 31, 2018.
| | | | | | | | | | | | |
| | | Shares | | | Value | | | Percentage of
Reference Entities | |
Equity Securities — Long | |
| Advertising | |
Omnicom Group Inc. | | | 7,050 | | | $ | 523,956 | | | | 0.62 | |
|
| Aerospace & Defense | |
Textron Inc. | | | 14,900 | | | | 799,087 | | | | 1.02 | |
|
| Agricultural Products | |
Archer-Daniels-Midland Co. | | | 26,150 | | | | 1,235,588 | | | | 1.56 | |
|
| Apparel, Accessories & Luxury Goods | |
lululemon Athletica Inc. | | | 5,500 | | | | 774,015 | | | | 0.94 | |
VF Corp. | | | 7,000 | | | | 580,160 | | | | 0.66 | |
| | | | | | | | 1,354,175 | | | | | |
|
| Application Software | |
Adobe Inc. | | | 4,850 | | | | 1,191,936 | | | | 1.49 | |
Intuit Inc. | | | 6,100 | | | | 1,287,100 | | | | 1.59 | |
| | | | | 2,479,036 | | | | | |
|
| Auto Parts & Equipment | |
Magna International Inc. (Canada) | | | 22,650 | | | | 1,115,286 | | | | 1.32 | |
|
| Automotive Retail | |
Advance Auto Parts, Inc. | | | 2,100 | | | | 335,496 | | | | 0.42 | |
|
| Biotechnology | |
AbbVie Inc. | | | 14,900 | | | | 1,159,965 | | | | 1.53 | |
Alexion Pharmaceuticals, Inc. | | | 10,450 | | | | 1,171,132 | | | | 1.58 | |
Amgen Inc. | | | 7,150 | | | | 1,378,449 | | | | 1.73 | |
Biogen Inc. | | | 4,640 | | | | 1,411,813 | | | | 1.79 | |
Celgene Corp. | | | 6,350 | | | | 454,660 | | | | 0.57 | |
Gilead Sciences, Inc. | | | 18,650 | | | | 1,271,557 | | | | 1.65 | |
Regeneron Pharmaceuticals, Inc. | | | 3,360 | | | | 1,139,846 | | | | 1.58 | |
| | | | | 7,987,422 | | | | | |
|
| Cable & Satellite | |
Liberty Global PLC–Class C (United Kingdom) | | | 34,200 | | | | 856,368 | | | | 1.05 | |
|
| Commodity Chemicals | |
LyondellBasell Industries N.V.–Class A | | | 13,650 | | | | 1,218,535 | | | | 1.53 | |
|
| Communications Equipment | |
Cisco Systems, Inc. | | | 29,050 | | | | 1,329,038 | | | | 1.62 | |
|
| Computer & Electronics Retail | |
Best Buy Co., Inc. | | | 16,200 | | | | 1,136,592 | | | | 1.43 | |
|
| Consumer Electronics | |
Garmin Ltd. | | | 17,750 | | | | 1,174,340 | | | | 1.36 | |
| | | | | | | | | | | | |
| | | Shares | | | Value | | | Percentage of
Reference Entities | |
| Consumer Finance | |
Capital One Financial Corp. | | | 13,750 | | | $ | 1,227,875 | | | | 1.48 | |
Discover Financial Services | | | 16,700 | | | | 1,163,489 | | | | 1.51 | |
| | | | | | | | 2,391,364 | | | | | |
|
| Copper | |
Freeport-McMoRan Inc. | | | 87,600 | | | | 1,020,540 | | | | 1.28 | |
|
| Data Processing & Outsourced Services | |
Automatic Data Processing, Inc. | | | 8,800 | | | | 1,267,904 | | | | 1.55 | |
Mastercard Inc.–Class A | | | 7,000 | | | | 1,383,690 | | | | 1.75 | |
Total System Services, Inc. | | | 7,550 | | | | 688,182 | | | | 0.86 | |
| | | | | 3,339,776 | | | | | |
|
| Department Stores | |
Macy’s, Inc. | | | 1,850 | | | | 63,437 | | | | 0.07 | |
|
| Diversified Banks | |
Bank of Montreal (Canada) | | | 14,050 | | | | 1,050,097 | | | | 1.35 | |
Canadian Imperial Bank of Commerce (Canada) | | | 13,350 | | | | 1,152,372 | | | | 1.44 | |
Toronto-Dominion Bank (The) (Canada) | | | 21,950 | | | | 1,217,347 | | | | 1.50 | |
| | | | | 3,419,816 | | | | | |
|
| Diversified Chemicals | |
Eastman Chemical Co. | | | 650 | | | | 50,928 | | | | 0.06 | |
|
| Drug Retail | |
Walgreens Boots Alliance, Inc. | | | 15,950 | | | | 1,272,331 | | | | 1.47 | |
|
| Electric Utilities | |
Entergy Corp. | | | 180 | | | | 15,111 | | | | 0.02 | |
Exelon Corp. | | | 31,550 | | | | 1,382,206 | | | | 1.67 | |
FirstEnergy Corp. | | | 35,650 | | | | 1,329,032 | | | | 1.68 | |
PG&E Corp. | | | 2,350 | | | | 110,003 | | | | 0.14 | |
| | | | | 2,836,352 | | | | | |
|
| Electrical Components & Equipment | |
Emerson Electric Co. | | | 16,850 | | | | 1,143,778 | | | | 1.47 | |
|
| Food Retail | |
Kroger Co. (The) | | | 43,950 | | | | 1,307,952 | | | | 1.50 | |
|
| General Merchandise Stores | |
Target Corp. | | | 18,950 | | | | 1,584,788 | | | | 1.92 | |
|
| Gold | |
Newmont Mining Corp. | | | 28,600 | | | | 884,312 | | | | 1.12 | |
|
| Health Care Facilities | |
HCA Healthcare, Inc. | | | 12,250 | | | | 1,635,743 | | | | 1.98 | |
|
| Homebuilding | |
PulteGroup Inc. | | | 1,700 | | | | 41,769 | | | | 0.04 | |
See accompanying Notes to Financial Statements which are an integral part of the financial statements.
11 Invesco Long/Short Equity Fund
| | | | | | | | | | | | |
| | | Shares | | | Value | | | Percentage of
Reference Entities | |
| Hotel & Resort REITs | |
Host Hotels & Resorts Inc. | | | 4,550 | | | $ | 86,950 | | | | 0.10 | |
|
| Integrated Oil & Gas | |
Imperial Oil Ltd. (Canada) | | | 3,950 | | | | 123,398 | | | | 0.16 | |
Occidental Petroleum Corp. | | | 17,750 | | | | 1,190,492 | | | | 1.57 | |
Suncor Energy, Inc. (Canada) | | | 32,700 | | | | 1,089,237 | | | | 1.41 | |
| | | | | 2,403,127 | | | | | |
|
| Integrated Telecommunication Services | |
Verizon Communications Inc. | | | 25,900 | | | | 1,478,631 | | | | 1.74 | |
|
| Interactive Media & Services | |
IAC/InterActiveCorp. | | | 4,200 | | | | 825,678 | | | | 1.02 | |
|
| Internet & Direct Marketing Retail | |
Booking Holdings Inc. | | | 395 | | | | 740,459 | | | | 0.88 | |
|
| Life & Health Insurance | |
Aflac, Inc. | | | 30,900 | | | | 1,330,863 | | | | 1.67 | |
Sun Life Financial Inc. (Canada) | | | 5,550 | | | | 203,130 | | | | 0.26 | |
| | | | | | | | 1,533,993 | | | | | |
|
| Oil & Gas Equipment & Services | |
National Oilwell Varco Inc. | | | 28,750 | | | | 1,058,000 | | | | 1.41 | |
|
| Oil & Gas Exploration & Production | |
Anadarko Petroleum Corp. | | | 10,650 | | | | 566,580 | | | | 0.83 | |
ConocoPhillips | | | 11,500 | | | | 803,850 | | | | 1.01 | |
Continental Resources, Inc. | | | 9,250 | | | | 487,290 | | | | 0.65 | |
| | | | | | | | 1,857,720 | | | | | |
|
| Oil & Gas Refining & Marketing | |
Phillips 66 | | | 12,400 | | | | 1,274,968 | | | | 1.55 | |
Valero Energy Corp. | | | 13,750 | | | | 1,252,487 | | | | 1.56 | |
| | | | | | | | 2,527,455 | | | | | |
|
| Packaged Foods & Meats | |
Hershey Co. (The) | | | 3,500 | | | | 375,025 | | | | 0.44 | |
McCormick & Co., Inc. | | | 1,950 | | | | 280,800 | | | | 0.33 | |
| | | | | | | | 655,825 | | | | | |
|
| Pharmaceuticals | |
Allergan PLC | | | 6,950 | | | | 1,098,170 | | | | 1.59 | |
Merck & Co., Inc. | | | 16,750 | | | | 1,232,967 | | | | 1.43 | |
Pfizer Inc. | | | 35,200 | | | | 1,515,712 | | | | 1.91 | |
| | | | | | | | 3,846,849 | | | | | |
| | | | | | | | | | | | |
| | | Shares | | | Value | | | Percentage of
Reference Entities | |
| Property & Casualty Insurance | |
Allstate Corp. (The) | | | 10,850 | | | $ | 1,038,562 | | | | 1.28 | |
Progressive Corp. (The) | | | 23,100 | | | | 1,610,070 | | | | 1.98 | |
| | | | | | | | 2,648,632 | | | | | |
|
| Railroads | |
CSX Corp. | | | 17,500 | | | | 1,205,050 | | | | 1.46 | |
Norfolk Southern Corp. | | | 7,200 | | | | 1,208,376 | | | | 1.44 | |
| | | | | 2,413,426 | | | | | |
|
| Regional Banks | |
Citizens Financial Group, Inc. | | | 650 | | | | 24,277 | | | | 0.03 | |
Regions Financial Corp. | | | 10,550 | | | | 179,033 | | | | 0.21 | |
SunTrust Banks, Inc. | | | 20,100 | | | | 1,259,466 | | | | 1.49 | |
SVB Financial Group | | | 160 | | | | 37,957 | | | | 0.05 | |
| | | | | | | | 1,500,733 | | | | | |
|
| Residential REITs | |
Equity Residential | | | 18,050 | | | | 1,172,528 | | | | 1.44 | |
|
| Retail REITs | |
Simon Property Group, Inc. | | | 7,350 | | | | 1,348,872 | | | | 1.54 | |
|
| Semiconductors | |
Intel Corp. | | | 28,250 | | | | 1,324,360 | | | | 1.55 | |
Micron Technology, Inc. | | | 29,100 | | | | 1,097,652 | | | | 1.41 | |
QUALCOMM Inc. | | | 18,900 | | | | 1,188,621 | | | | 1.46 | |
| | | | | | | | 3,610,633 | | | | | |
|
| Systems Software | |
Dell Technologies Inc.–Class V | | | 14,250 | | | | 1,288,058 | | | | 1.65 | |
Fortinet, Inc. | | | 15,350 | | | | 1,261,463 | | | | 1.55 | |
| | | | | | | | 2,549,521 | | | | | |
|
| Technology Hardware, Storage & Peripherals | |
Apple Inc. | | | 5,850 | | | | 1,280,331 | | | | 1.56 | |
HP Inc. | | | 1,450 | | | | 35,003 | | | | 0.04 | |
NetApp, Inc. | | | 19,600 | | | | 1,538,404 | | | | 1.92 | |
Seagate Technology PLC | | | 20,350 | | | | 818,680 | | | | 1.08 | |
| | | | | | | | 3,672,418 | | | | | |
|
| Trading Companies & Distributors | |
HD Supply Holdings, Inc. | | | 21,250 | | | | 798,363 | | | | 0.98 | |
W.W. Grainger, Inc. | | | 4,350 | | | | 1,235,270 | | | | 1.46 | |
| | | | | | | | 2,033,633 | | | | | |
Total Equity Securities — Long | | | $ | 80,502,888 | | | | | |
See accompanying Notes to Financial Statements which are an integral part of the financial statements.
12 Invesco Long/Short Equity Fund
| | | | | | | | | | | | |
| | | Shares | | | Value | | | Percentage of
Reference Entities | |
Equity Securities — Short | |
| Aerospace & Defense | |
BWX Technologies, Inc. | | | (15,700 | ) | | $ | (917,822 | ) | | | 1.12 | |
General Dynamics Corp. | | | (3,050 | ) | | | (526,369 | ) | | | 0.64 | |
| | | | | (1,444,191 | ) | | | | |
|
| Agricultural & Farm Machinery | |
Deere & Co. | | | (8,800 | ) | | | (1,191,872 | ) | | | 1.48 | |
Toro Co. (The) | | | (18,900 | ) | | | (1,064,637 | ) | | | 1.30 | |
| | | | | (2,256,509 | ) | | | | |
|
| Airlines | |
Alaska Air Group, Inc. | | | (18,600 | ) | | | (1,142,412 | ) | | | 1.45 | |
|
| Airport Services | |
Macquarie Infrastructure Corp. | | | (3,250 | ) | | | (120,087 | ) | | | 0.16 | |
|
| Apparel Retail | |
L Brands, Inc. | | | (39,850 | ) | | | (1,291,937 | ) | | | 1.46 | |
|
| Application Software | |
Autodesk, Inc. | | | (8,050 | ) | | | (1,040,463 | ) | | | 1.34 | |
Workday, Inc.–Class A | | | (9,650 | ) | | | (1,283,643 | ) | | | 1.53 | |
| | | | | (2,324,106 | ) | | | | |
|
| Asset Management & Custody Banks | |
Brookfield Asset Management Inc.–Class A (Canada) | | | (28,050 | ) | | | (1,143,038 | ) | | | 1.44 | |
|
| Automobile Manufacturers | |
Tesla Inc. | | | (4,080 | ) | | | (1,376,266 | ) | | | 1.34 | |
|
| Automotive Retail | |
CarMax, Inc. | | | (17,300 | ) | | | (1,174,843 | ) | | | 1.45 | |
|
| Biotechnology | |
Alnylam Pharmaceuticals, Inc. | | | (16,150 | ) | | | (1,298,945 | ) | | | 1.49 | |
Bluebird Bio, Inc. | | | (10,550 | ) | | | (1,210,085 | ) | | | 1.52 | |
Tesaro, Inc. | | | (18,700 | ) | | | (540,056 | ) | | | 0.84 | |
| | | | | | | | (3,049,086 | ) | | | | |
|
| Building Products | |
Owens Corning | | | (27,500 | ) | | | (1,299,925 | ) | | | 1.53 | |
|
| Cable & Satellite | |
Liberty Broadband Corp.–Class C | | | (15,000 | ) | | | (1,243,950 | ) | | | 1.52 | |
|
| Casinos & Gaming | |
Wynn Resorts Ltd. | | | (1,500 | ) | | | (150,900 | ) | | | 0.19 | |
|
| Construction Materials | |
Martin Marietta Materials, Inc. | | | (7,200 | ) | | | (1,233,216 | ) | | | 1.42 | |
Vulcan Materials Co. | | | (12,850 | ) | | | (1,299,649 | ) | | | 1.44 | |
| | | | | | | | (2,532,865 | ) | | | | |
| | | | | | | | | | | | |
| | | Shares | | | Value | | | Percentage of
Reference Entities | |
| Data Processing & Outsourced Services | |
Square, Inc.–Class A | | | (17,000 | ) | | $ | (1,248,650 | ) | | | 1.57 | |
Worldpay, Inc.–Class A | | | (2,100 | ) | | | (192,864 | ) | | | 0.24 | |
| | | | | | | | (1,441,514 | ) | | | | |
|
| Distributors | |
LKQ Corp. | | | (46,000 | ) | | | (1,254,420 | ) | | | 1.54 | |
|
| Electronic Equipment & Instruments | |
Cognex Corp. | | | (28,500 | ) | | | (1,220,940 | ) | | | 1.50 | |
|
| Electronic Manufacturing Services | |
Flex Ltd. | | | (108,450 | ) | | | (852,417 | ) | | | 1.55 | |
IPG Photonics Corp. | | | (9,100 | ) | | | (1,215,305 | ) | | | 1.46 | |
| | | | | (2,067,722 | ) | | | | |
|
| Financial Exchanges & Data | |
Cboe Global Markets, Inc. | | | (11,150 | ) | | | (1,258,278 | ) | | | 1.43 | |
MarketAxess Holdings, Inc. | | | (5,650 | ) | | | (1,184,635 | ) | | | 1.36 | |
Thomson Reuters Corp. (Canada) | | | (25,450 | ) | | | (1,185,970 | ) | | | 1.47 | |
| | | | | | | | (3,628,883 | ) | | | | |
|
| General Merchandise Stores | |
Dollar Tree, Inc. | | | (14,300 | ) | | | (1,205,490 | ) | | | 1.47 | |
|
| Health Care Equipment | |
Teleflex Inc. | | | (4,800 | ) | | | (1,155,552 | ) | | | 1.42 | |
|
| Health Care Supplies | |
Cooper Cos., Inc. (The) | | | (4,700 | ) | | | (1,214,057 | ) | | | 1.47 | |
Dentsply Sirona Inc. | | | (33,250 | ) | | | (1,151,447 | ) | | | 1.47 | |
| | | | | | | | (2,365,504 | ) | | | | |
|
| Home Furnishings | |
Leggett & Platt, Inc. | | | (27,050 | ) | | | (982,185 | ) | | | 1.27 | |
Mohawk Industries, Inc. | | | (8,000 | ) | | | (997,840 | ) | | | 1.46 | |
| | | | | | | | (1,980,025 | ) | | | | |
|
| Household Appliances | |
Whirlpool Corp. | | | (7,800 | ) | | | (856,128 | ) | | | 1.02 | |
|
| Housewares & Specialties | |
Newell Brands, Inc. | | | (46,900 | ) | | | (744,772 | ) | | | 0.94 | |
|
| Industrial Conglomerates | |
3M Co. | | | (6,400 | ) | | | (1,217,664 | ) | | | 1.57 | |
|
| Industrial Machinery | |
Middleby Corp. (The) | | | (10,000 | ) | | | (1,123,000 | ) | | | 1.41 | |
Stanley Black & Decker Inc. | | | (10,450 | ) | | | (1,217,634 | ) | | | 1.50 | |
| | | | | | | | (2,340,634 | ) | | | | |
|
| Interactive Media & Services | |
Facebook, Inc.–Class A | | | (6,150 | ) | | | (933,508 | ) | | | 1.13 | |
Snap Inc.-Class A | | | (179,350 | ) | | | (1,185,503 | ) | | | 1.51 | |
See accompanying Notes to Financial Statements which are an integral part of the financial statements.
13 Invesco Long/Short Equity Fund
| | | | | | | | | | | | |
| | | Shares | | | Value | | | Percentage of
Reference Entities | |
| Interactive Media & Services–(continued) | |
Zillow Group, Inc.–Class C | | | (16,250 | ) | | $ | (654,225 | ) | | | 0.80 | |
| | | | | | | | (2,773,236 | ) | | | | |
|
| Internet & Direct Marketing Retail | |
MercadoLibre Inc. (Argentina) | | | (4,040 | ) | | | (1,310,980 | ) | | | 1.55 | |
|
| Internet Services & Infrastructure | |
Shopify, Inc.–Class A (Canada) | | | (9,650 | ) | | | (1,333,147 | ) | | | 1.59 | |
|
| IT Consulting & Other Services | |
Gartner, Inc. | | | (8,100 | ) | | | (1,194,912 | ) | | | 1.47 | |
|
| Leisure Products | |
Mattel, Inc. | | | (79,700 | ) | | | (1,082,326 | ) | | | 1.38 | |
|
| Life Sciences Tools & Services | |
Mettler-Toledo International Inc. | | | (2,240 | ) | | | (1,224,877 | ) | | | 1.53 | |
|
| Metal & Glass Containers | |
Crown Holdings, Inc. | | | (27,850 | ) | | | (1,177,777 | ) | | | 1.53 | |
|
| Movies & Entertainment | |
Liberty Media Corp.–Class A | | | (4,300 | ) | | | (110,940 | ) | | | 0.14 | |
Liberty Media Corp.–Class C | | | (33,050 | ) | | | (1,093,294 | ) | | | 1.37 | |
Live Nation Entertainment, Inc. | | | (23,600 | ) | | | (1,234,280 | ) | | | 1.52 | |
Netflix Inc. | | | (3,900 | ) | | | (1,176,942 | ) | | | 1.48 | |
| | | | | | | | (3,615,456 | ) | | | | |
|
| Multi-Line Insurance | |
American International Group, Inc. | | | (27,950 | ) | | | (1,154,056 | ) | | | 1.53 | |
|
| Office REIT’s | |
Kilroy Realty Corp. | | | (16,750 | ) | | | (1,153,740 | ) | | | 1.47 | |
|
| Oil & Gas Exploration & Production | |
Cabot Oil & Gas Corp. | | | (15,550 | ) | | | (376,776 | ) | | | 0.40 | |
Concho Resources Inc. | | | (8,750 | ) | | | (1,217,038 | ) | | | 1.53 | |
EQT Corp. | | | (29,200 | ) | | | (991,924 | ) | | | 1.54 | |
| | | | | | | | (2,585,738 | ) | | | | |
|
| Oil & Gas Storage & Transportation | |
Enbridge Inc. (Canada) | | | (35,500 | ) | | | (1,104,405 | ) | | | 1.40 | |
Pembina Pipeline Corp. (Canada) | | | (16,300 | ) | | | (526,816 | ) | | | 0.69 | |
| | | | | | | | | | | | |
| | | Shares | | | Value | | | Percentage of
Reference Entities | |
| Oil & Gas Storage & Transportation–(continued) | |
Targa Resources Corp. | | | (22,800 | ) | | $ | (1,178,076 | ) | | | 1.57 | |
TransCanada Corp. (Canada) | | | (30,550 | ) | | | (1,152,346 | ) | | | 1.51 | |
| | | | | | | | (3,961,643 | ) | | | | |
|
| Personal Products | |
Coty Inc.–Class A | | | (102,300 | ) | | | (1,079,265 | ) | | | 1.32 | |
|
| Property & Casualty Insurance | |
Arch Capital Group Ltd. | | | (20,550 | ) | | | (583,004 | ) | | | 0.69 | |
Cincinnati Financial Corp. | | | (16,150 | ) | | | (1,270,036 | ) | | | 1.49 | |
Markel Corp. | | | (955 | ) | | | (1,044,044 | ) | | | 1.29 | |
| | | | | | | | (2,897,084 | ) | | | | |
|
| Real Estate Development | |
Howard Hughes Corp. (The) | | | (10,950 | ) | | | (1,221,144 | ) | | | 1.48 | |
| | | |
| Regional Banks | | | | | | | | | | | | |
Bank OZK | | | (23,600 | ) | | | (645,696 | ) | | | 0.74 | |
First Republic Bank | | | (12,150 | ) | | | (1,105,528 | ) | | | 1.30 | |
Signature Bank | | | (10,900 | ) | | | (1,197,910 | ) | | | 1.44 | |
| | | | | | | | (2,949,134 | ) | | | | |
|
| Research & Consulting Services | |
Nielsen Holdings PLC | | | (23,950 | ) | | | (622,221 | ) | | | 0.79 | |
|
| Restaurants | |
Starbucks Corp. | | | (20,350 | ) | | | (1,185,794 | ) | | | 1.47 | |
|
| Retail REITs | |
Macerich Co. (The) | | | (12,400 | ) | | | (640,088 | ) | | | 0.76 | |
|
| Semiconductors | |
NVIDIA Corp. | | | (5,900 | ) | | | (1,243,897 | ) | | | 1.63 | |
|
| Specialized REITs | |
Equinix, Inc. | | | (2,820 | ) | | | (1,068,047 | ) | | | 1.42 | |
Iron Mountain Inc. | | | (20,700 | ) | | | (633,627 | ) | | | 0.81 | |
| | | | | (1,701,674 | ) | | | | |
|
| Specialty Chemicals | |
Albemarle Corp. | | | (12,550 | ) | | | (1,245,211 | ) | | | 1.50 | |
|
| Trucking | |
Knight-Swift Transportation Holdings, Inc. | | | (38,450 | ) | | | (1,230,400 | ) | | | 1.45 | |
Total Equity Securities — Short | | | $ | (80,613,163 | ) | | | | |
See accompanying Notes to Financial Statements which are an integral part of the financial statements.
14 Invesco Long/Short Equity Fund
Statement of Assets and Liabilities
October 31, 2018
| | | | |
Assets: | |
Investments in securities, at value (Cost $68,977,333) | | $ | 74,874,821 | |
Investments in affiliated money market funds, at value (Cost $6,806,855) | | | 6,806,878 | |
Other investments: | | | | |
Unrealized appreciation on swap agreements — OTC | | | 871,329 | |
Deposits with brokers: | | | | |
Cash collateral — OTC derivatives | | | 169,866 | |
Foreign currencies, at value (Cost $863) | | | 819 | |
Receivable for: | | | | |
Fund shares sold | | | 10,691 | |
Dividends and interest | | | 80,520 | |
Investment for trustee deferred compensation and retirement plans | | | 9,987 | |
Other assets | | | 62,756 | |
Total assets | | | 82,887,667 | |
|
Liabilities: | |
Other investments: | | | | |
Unrealized depreciation on swap agreements — OTC | | | 1,457,255 | |
Payable for: | | | | |
Fund shares reacquired | | | 96,269 | |
Amount due custodian | | | 61,517 | |
Accrued fees to affiliates | | | 16,716 | |
Accrued trustees’ and officers’ fees and benefits | | | 1,711 | |
Accrued other operating expenses | | | 90,642 | |
Trustee deferred compensation and retirement plans | | | 9,987 | |
Total liabilities | | | 1,734,097 | |
Net assets applicable to shares outstanding | | $ | 81,153,570 | |
|
Net assets consist of: | |
Shares of beneficial interest | | $ | 68,721,956 | |
Distributable earnings | | | 12,431,614 | |
| | | $ | 81,153,570 | |
| | | | |
Net Assets: | |
Class A | | $ | 15,527,836 | |
Class C | | $ | 3,695,896 | |
Class R | | $ | 210,898 | |
Class Y | | $ | 19,286,360 | |
Class R5 | | $ | 42,405 | |
Class R6 | | $ | 42,390,175 | |
|
Shares outstanding, no par value,
with an unlimited number of shares authorized: | |
Class A | | | 1,405,419 | |
Class C | | | 343,640 | |
Class R | | | 19,258 | |
Class Y | | | 1,731,368 | |
Class R5 | | | 3,804 | |
Class R6 | | | 3,798,969 | |
Class A: | | | | |
Net asset value per share | | $ | 11.05 | |
Maximum offering price per share | | | | |
(Net asset value of $11.05 ¸ 94.50%) | | $ | 11.69 | |
Class C: | | | | |
Net asset value and offering price per share | | $ | 10.76 | |
Class R: | | | | |
Net asset value and offering price per share | | $ | 10.95 | |
Class Y: | | | | |
Net asset value and offering price per share | | $ | 11.14 | |
Class R5: | | | | |
Net asset value and offering price per share | | $ | 11.15 | |
Class R6: | | | | |
Net asset value and offering price per share | | $ | 11.16 | |
See accompanying Notes to Financial Statements which are an integral part of the financial statements.
15 Invesco Long/Short Equity Fund
Statement of Operations
For the year ended October 31, 2018
| | | | |
Investment income: | |
Dividends (net of foreign withholding taxes of $4,915) | | $ | 1,155,802 | |
Dividends from affiliated money market funds | | | 100,935 | |
Total investment income | | | 1,256,737 | |
| |
Expenses: | | | | |
Advisory fees | | | 650,088 | |
Administrative services fees | | | 50,000 | |
Custodian fees | | | 5,487 | |
Distribution fees: | | | | |
Class A | | | 38,761 | |
Class C | | | 38,432 | |
Class R | | | 839 | |
Transfer agent fees — A, C, R and Y | | | 56,032 | |
Transfer agent fees — R5 | | | 34 | |
Transfer agent fees — R6 | | | 571 | |
Trustees’ and officers’ fees and benefits | | | 21,623 | |
Registration and filing fees | | | 80,626 | |
Reports to shareholders | | | 18,942 | |
Professional services fees | | | 101,727 | |
Other | | | 18,430 | |
Total expenses | | | 1,081,592 | |
Less: Fees waived and expense offset arrangement(s) | | | (7,134 | ) |
Net expenses | | | 1,074,458 | |
Net investment income | | | 182,279 | |
| |
Realized and unrealized gain (loss) from: | | | | |
Net realized gain (loss) from: | | | | |
Investment securities | | | 6,838,702 | |
Swap agreements | | | (5,112,481 | ) |
| | | | 1,726,221 | |
Change in net unrealized appreciation (depreciation) of: | | | | |
Investment securities | | | (3,421,232 | ) |
Foreign currencies | | | (44 | ) |
Swap agreements | | | (895,174 | ) |
| | | | (4,316,450 | ) |
Net realized and unrealized gain (loss) | | | (2,590,229 | ) |
Net increase (decrease) in net assets resulting from operations | | $ | (2,407,950 | ) |
See accompanying Notes to Financial Statements which are an integral part of the financial statements.
16 Invesco Long/Short Equity Fund
Statement of Changes in Net Assets
For the years ended October 31, 2018 and 2017
| | | | | | | | |
| | | 2018 | | | 2017 | |
Operations: | |
Net investment income | | $ | 182,279 | | | $ | 366,854 | |
Net realized gain | | | 1,726,221 | | | | 11,443,698 | |
Change in net unrealized appreciation (depreciation) | | | (4,316,450 | ) | | | 5,648,778 | |
Net increase (decrease) in net assets resulting from operations | | | (2,407,950 | ) | | | 17,459,330 | |
| | |
Distributions to shareholders from distributable earnings(1): | | | | | | | | |
Class A | | | (1,746,032 | ) | | | (81,636 | ) |
Class C | | | (397,942 | ) | | | (16,680 | ) |
Class R | | | (19,077 | ) | | | (593 | ) |
Class Y | | | (1,815,559 | ) | | | (52,325 | ) |
Class R5 | | | (6,829 | ) | | | (3,814 | ) |
Class R6 | | | (6,658,511 | ) | | | (296,699 | ) |
Total distributions from distributable earnings | | | (10,643,950 | ) | | | (451,747 | ) |
| | |
Share transactions–net: | | | | | | | | |
Class A | | | 6,565,406 | | | | (2,845,486 | ) |
Class C | | | 1,533,990 | | | | (155,873 | ) |
Class R | | | 109,260 | | | | 25,428 | |
Class Y | | | 9,860,608 | | | | 2,198,569 | |
Class R5 | | | 3,429 | | | | (614,953 | ) |
Class R6 | | | 2,307,755 | | | | (10,273,941 | ) |
Net increase (decrease) in net assets resulting from share transactions | | | 20,380,448 | | | | (11,666,256 | ) |
Net increase in net assets | | | 7,328,548 | | | | 5,341,327 | |
| | |
Net assets: | | | | | | | | |
Beginning of year | | | 73,825,022 | | | | 68,483,695 | |
End of year | | $ | 81,153,570 | | | $ | 73,825,022 | |
| (1) | The Securities and Exchange Commission eliminated the requirement to disclose distribution components separately, except for tax return of capital. For the year ended October 31, 2017, distributions to shareholders from distributable earnings consisted of distributions from net realized gains. |
Notes to Financial Statements
October 31, 2018
NOTE 1—Significant Accounting Policies
Invesco Long/Short Equity Fund (the “Fund”) is a series portfolio of AIM Investment Funds (Invesco Investment Funds) (the “Trust”). The Trust is organized as a Delaware statutory trust and is registered under the Investment Company Act of 1940, as amended (the “1940 Act”), as an open-end series management investment company authorized to issue an unlimited number of shares of beneficial interest. Information presented in these financial statements pertains only to the Fund. Matters affecting the Fund or each class will be voted on exclusively by the shareholders of the Fund or each class.
The Fund’s investment objective is to seek long-term capital appreciation.
The Fund currently consists of six different classes of shares: Class A, Class C, Class R, Class Y, Class R5 and Class R6. Class Y shares are available only to certain investors. Class A shares are sold with a front-end sales charge unless certain waiver criteria are met. Under certain circumstances, load waived shares may be subject to contingent deferred sales charges (“CDSC”). Class C shares are sold with a CDSC. Class R, Class Y, Class R5 and Class R6 shares are sold at net asset value.
The Fund is an investment company and accordingly follows the investment company accounting and reporting guidance in accordance with Financial Accounting Standards Board Accounting Standards Codification Topic 946, Financial Services — Investment Companies.
The following is a summary of the significant accounting policies followed by the Fund in the preparation of its financial statements.
| A. | Security Valuations — Securities, including restricted securities, are valued according to the following policy. |
A security listed or traded on an exchange (except convertible securities) is valued at its last sales price or official closing price as of the close of the customary trading session on the exchange where the security is principally traded, or lacking any sales or official closing price on a particular day, the security may be valued at the closing bid price on that day. Securities traded in the over-the-counter market are valued based on prices furnished by independent pricing services or market makers. When such securities are valued by an independent pricing service they may be considered fair valued. Futures contracts are valued at the final settlement price set by an exchange on which they are principally traded. Listed options are valued at the mean between the last bid and asked prices from the exchange on which they are principally traded. Options not
17 Invesco Long/Short Equity Fund
listed on an exchange are valued by an independent source at the mean between the last bid and asked prices. For purposes of determining net asset value (“NAV”) per share, futures and option contracts generally are valued 15 minutes after the close of the customary trading session of the New York Stock Exchange (“NYSE”).
Investments in open-end and closed-end registered investment companies that do not trade on an exchange are valued at the end-of-day net asset value per share. Investments in open-end and closed-end registered investment companies that trade on an exchange are valued at the last sales price or official closing price as of the close of the customary trading session on the exchange where the security is principally traded.
Swap agreements are fair valued using an evaluated quote, if available, provided by an independent pricing service. Evaluated quotes provided by the pricing service are valued based on a model which may include end-of-day net present values, spreads, ratings, industry, company performance and returns of referenced assets. Centrally cleared swap agreements are valued at the daily settlement price determined by the relevant exchange or clearinghouse.
Debt obligations (including convertible securities) and unlisted equities are fair valued using an evaluated quote provided by an independent pricing service. Evaluated quotes provided by the pricing service may be determined without exclusive reliance on quoted prices, and may reflect appropriate factors such as institution-size trading in similar groups of securities, developments related to specific securities, dividend rate (for unlisted equities), yield (for debt obligations), quality, type of issue, coupon rate (for debt obligations), maturity (for debt obligations), individual trading characteristics and other market data. Pricing services generally value debt obligations assuming orderly transactions of institutional round lot size, but a fund may hold or transact in the same securities in smaller, odd lot sizes. Odd lots often trade at lower prices than institutional round lots. Debt obligations are subject to interest rate and credit risks. In addition, all debt obligations involve some risk of default with respect to interest and/or principal payments.
Foreign securities’ (including foreign exchange contracts) prices are converted into U.S. dollar amounts using the applicable exchange rates as of the close of the NYSE. If market quotations are available and reliable for foreign exchange-traded equity securities, the securities will be valued at the market quotations. Because trading hours for certain foreign securities end before the close of the NYSE, closing market quotations may become unreliable. If between the time trading ends on a particular security and the close of the customary trading session on the NYSE, events occur that the investment adviser determines are significant and make the closing price unreliable, the Fund may fair value the security. If the event is likely to have affected the closing price of the security, the security will be valued at fair value in good faith using procedures approved by the Board of Trustees. Adjustments to closing prices to reflect fair value may also be based on a screening process of an independent pricing service to indicate the degree of certainty, based on historical data, that the closing price in the principal market where a foreign security trades is not the current value as of the close of the NYSE. Foreign securities’ prices meeting the approved degree of certainty that the price is not reflective of current value will be priced at the indication of fair value from the independent pricing service. Multiple factors may be considered by the independent pricing service in determining adjustments to reflect fair value and may include information relating to sector indices, American Depositary Receipts and domestic and foreign index futures. Foreign securities may have additional risks including exchange rate changes, potential for sharply devalued currencies and high inflation, political and economic upheaval, the relative lack of issuer information, relatively low market liquidity and the potential lack of strict financial and accounting controls and standards.
Securities for which market prices are not provided by any of the above methods may be valued based upon quotes furnished by independent sources. The last bid price may be used to value equity securities. The mean between the last bid and asked prices is used to value debt obligations, including corporate loans.
Securities for which market quotations are not readily available or became unreliable are valued at fair value as determined in good faith by or under the supervision of the Trust’s officers following procedures approved by the Board of Trustees. Issuer specific events, market trends, bid/asked quotes of brokers and information providers and other market data may be reviewed in the course of making a good faith determination of a security’s fair value.
The Fund may invest in securities that are subject to interest rate risk, meaning the risk that the prices will generally fall as interest rates rise and, conversely, the prices will generally rise as interest rates fall. Specific securities differ in their sensitivity to changes in interest rates depending on their individual characteristics. Changes in interest rates may result in increased market volatility, which may affect the value and/or liquidity of certain Fund investments.
Valuations change in response to many factors including the historical and prospective earnings of the issuer, the value of the issuer’s assets, general economic conditions, interest rates, investor perceptions and market liquidity. Because of the inherent uncertainties of valuation, the values reflected in the financial statements may materially differ from the value received upon actual sale of those investments.
| B. | Securities Transactions and Investment Income — Securities transactions are accounted for on a trade date basis. Realized gains or losses on sales are computed on the basis of specific identification of the securities sold. Interest income (net of withholding tax, if any) is recorded on the accrual basis from settlement date. Dividend income (net of withholding tax, if any) is recorded on the ex-dividend date. |
The Fund may periodically participate in litigation related to Fund investments. As such, the Fund may receive proceeds from litigation settlements. Any proceeds received are included in the Statement of Operations as realized gain (loss) for investments no longer held and as unrealized gain (loss) for investments still held.
Brokerage commissions and mark ups are considered transaction costs and are recorded as an increase to the cost basis of securities purchased and/or a reduction of proceeds on a sale of securities. Such transaction costs are included in the determination of net realized and unrealized gain (loss) from investment securities reported in the Statement of Operations and the Statement of Changes in Net Assets and the net realized and unrealized gains (losses) on securities per share in the Financial Highlights. Transaction costs are included in the calculation of the Fund’s net asset value and, accordingly, they reduce the Fund’s total returns. These transaction costs are not considered operating expenses and are not reflected in net investment income reported in the Statement of Operations and the Statement of Changes in Net Assets, or the net investment income per share and the ratios of expenses and net investment income reported in the Financial Highlights, nor are they limited by any expense limitation arrangements between the Fund and the investment adviser.
The Fund allocates income and realized and unrealized capital gains and losses to a class based on the relative net assets of each class.
| C. | Country Determination — For the purposes of making investment selection decisions and presentation in the Schedule of Investments, the investment adviser may determine the country in which an issuer is located and/or credit risk exposure based on various factors. These factors include the laws of the country under which the issuer is organized, where the issuer maintains a principal office, the country in which the issuer |
18 Invesco Long/Short Equity Fund
| | derives 50% or more of its total revenues and the country that has the primary market for the issuer’s securities, as well as other criteria. Among the other criteria that may be evaluated for making this determination are the country in which the issuer maintains 50% or more of its assets, the type of security, financial guarantees and enhancements, the nature of the collateral and the sponsor organization. Country of issuer and/or credit risk exposure has been determined to be the United States of America, unless otherwise noted. |
| D. | Distributions — Distributions from net investment income and net realized capital gain, if any, are generally declared and paid annually and recorded on the ex-dividend date. The Fund may elect to treat a portion of the proceeds from redemptions as distributions for federal income tax purposes. |
| E. | Federal Income Taxes — The Fund intends to comply with the requirements of Subchapter M of the Internal Revenue Code of 1986, as amended (the “Internal Revenue Code”), necessary to qualify as a regulated investment company and to distribute substantially all of the Fund’s taxable earnings to shareholders. As such, the Fund will not be subject to federal income taxes on otherwise taxable income (including net realized capital gain) that is distributed to shareholders. Therefore, no provision for federal income taxes is recorded in the financial statements. |
The Fund recognizes the tax benefits of uncertain tax positions only when the position is more likely than not to be sustained. Management has analyzed the Fund’s uncertain tax positions and concluded that no liability for unrecognized tax benefits should be recorded related to uncertain tax positions. Management is not aware of any tax positions for which it is reasonably possible that the total amounts of unrecognized tax benefits will change materially in the next 12 months.
The Fund files tax returns in the U.S. Federal jurisdiction and certain other jurisdictions. Generally, the Fund is subject to examinations by such taxing authorities for up to three years after the filing of the return for the tax period.
| F. | Expenses — Fees provided for under the Rule 12b-1 plan of a particular class of the Fund are charged to the operations of such class. Transfer agency fees and expenses and other shareholder recordkeeping fees and expenses attributable to Class R5 and Class R6 are allocated to each share class based on relative net assets. Sub-accounting fees attributable to Class R5 are charged to the operations of the class. Transfer agency fees and expenses and other shareholder recordkeeping fees and expenses relating to all other classes are allocated among those classes based on relative net assets. All other expenses are allocated among the classes based on relative net assets. |
| G. | Accounting Estimates — The preparation of financial statements in conformity with accounting principles generally accepted in the United States of America (“GAAP”) requires management to make estimates and assumptions that affect the reported amounts of assets and liabilities at the date of the financial statements and the reported amounts of revenues and expenses during the reporting period including estimates and assumptions related to taxation. Actual results could differ from those estimates by a significant amount. In addition, the Fund monitors for material events or transactions that may occur or become known after the period-end date and before the date the financial statements are released to print. |
| H. | Indemnifications — Under the Trust’s organizational documents, each Trustee, officer, employee or other agent of the Trust is indemnified against certain liabilities that may arise out of the performance of their duties to the Fund. Additionally, in the normal course of business, the Fund enters into contracts, including the Fund’s servicing agreements, that contain a variety of indemnification clauses. The Fund’s maximum exposure under these arrangements is unknown as this would involve future claims that may be made against the Fund that have not yet occurred. The risk of material loss as a result of such indemnification claims is considered remote. |
| I. | Swap Agreements — The Fund may enter into various swap transactions, including interest rate, total return, volatility, variance, index, currency and credit default swap contracts (“CDS”) for investment purposes or to manage interest rate, equity, currency or credit risk. Such transactions are agreements between two parties (“Counterparties”). These agreements may contain among other conditions, events of default and termination events, and various covenants and representations such as provisions that require the Fund to maintain a pre-determined level of net assets, and/or provide limits regarding the decline of the Fund’s NAV over specific periods of time. If the Fund were to trigger such provisions and have open derivative positions at that time, the Counterparty may be able to terminate such agreement and request immediate payment in an amount equal to the net liability positions, if any. |
Interest rate, total return, volatility, variance, index, and currency swap agreements are two-party contracts entered into primarily to exchange the returns (or differentials in rates of returns) earned or realized on particular predetermined investments or instruments. The gross returns to be exchanged or “swapped” between the parties are calculated with respect to a notional amount, i.e., the return on or increase in value of a particular dollar amount invested at a particular interest rate or return of an underlying asset, in a particular foreign currency, or in a “basket” of securities representing a particular index.
A total return swap is an agreement in which one party makes payments based on a set rate, either fixed or variable, while the other party makes payments based on the return of an underlying asset, which includes both the income generated and capital gains, if any. The unrealized appreciation (depreciation) on total return swaps includes dividends on the underlying equity securities and financing rate payable from the Counterparty. At the maturity date, a net cash flow is exchanged where the total return is equivalent to the return of the underlying reference less a financing rate, if any. As a receiver, the Fund would receive payments based on any positive total return and would owe payments in the event of a negative total return. As the payer, the Fund would owe payments on any net positive total return, and would receive payment in the event of a negative total return.
Changes in the value of swap agreements are recognized as unrealized gains (losses) in the Statement of Operations by “marking to market” on a daily basis to reflect the value of the swap agreement at the end of each trading day. Payments received or paid at the beginning of the agreement are reflected as such on the Statement of Assets and Liabilities and may be referred to as upfront payments. The Fund accrues for the fixed payment stream and amortizes upfront payments, if any, on swap agreements on a daily basis with the net amount, recorded as a component of realized gain (loss) on the Statement of Operations. A liquidation payment received or made at the termination of a swap agreement is recorded as realized gain (loss) on the Statement of Operations. The Fund segregates cash or liquid securities having a value at least equal to the amount of the potential obligation of a Fund under any swap transaction. Cash held as collateral is recorded as deposits with brokers on the Statement of Assets and Liabilities. Entering into these agreements involves, to varying degrees, lack of liquidity and elements of credit, market, and Counterparty risk in excess of amounts recognized on the Statement of Assets and Liabilities. Such risks involve the possibility that a swap is difficult to sell or liquidate; the Counterparty does not honor its obligations under the agreement and unfavorable interest rates and market fluctuations. It is possible that developments in the swaps market, including potential government regulation, could adversely affect the Fund’s ability to terminate existing swap agreements or to realize amounts to be received under such agreements. A short position in a security poses
19 Invesco Long/Short Equity Fund
more risk than holding the same security long. As there is no limit on how much the price of the security can increase, the Fund’s exposure is unlimited.
| J. | Leverage Risk — Leverage exists when the Fund can lose more than it originally invests because it purchases or sells an instrument or enters into a transaction without investing an amount equal to the full economic exposure of the instrument or transaction. |
| K. | Collateral — To the extent the Fund has designated or segregated a security as collateral and that security is subsequently sold, it is the Fund’s practice to replace such collateral no later than the next business day. |
NOTE 2—Advisory Fees and Other Fees Paid to Affiliates
The Trust has entered into a master investment advisory agreement with Invesco Advisers, Inc. (the “Adviser” or “Invesco”). Under the terms of the investment advisory agreement, the Fund accrues daily and pays monthly an advisory fee to the Adviser based on the annual rate of the Fund’s average daily net assets as follows:
| | | | |
| Average Daily Net Assets | | Rate | |
First $250 million | | | 0.80% | |
Next $250 million | | | 0.77% | |
Next $500 million | | | 0.75% | |
Next $1.5 billion | | | 0.72% | |
Next $2.5 billion | | | 0.70% | |
Next $2.5 billion | | | 0.67% | |
Next $2.5 billion | | | 0.65% | |
Over $10 billion | | | 0.62% | |
For the year ended October 31, 2018, the effective advisory fees incurred by the Fund was 0.80%.
Under the terms of a master sub-advisory agreement between the Adviser and each of Invesco Asset Management Deutschland GmbH, Invesco Asset Management Limited, Invesco Asset Management (Japan) Limited, Invesco Hong Kong Limited, Invesco Senior Secured Management, Inc. and Invesco Canada Ltd. and separate sub-advisory agreements with Invesco Capital Management LLC, formerly Invesco PowerShares Capital Management LLC, and Invesco Asset Management (India) Private Limited (collectively, the “Affiliated Sub-Advisers”) the Adviser, not the Fund, will pay 40% of the fees paid to the Adviser to any such Affiliated Sub-Adviser(s) that provide(s) discretionary investment management services to the Fund based on the percentage of assets allocated to such Affiliated Sub-Adviser(s).
The Adviser has contractually agreed, through at least February 29, 2020, to waive advisory fees and/or reimburse expenses to the extent necessary to limit total annual fund operating expenses after fee waiver and/or expense reimbursement (excluding certain items discussed below) of Class A, Class C, Class R, Class Y, Class R5 and Class R6 shares to 1.59%, 2.34%, 1.84%, 1.34%, 1.34% and 1.34%, respectively, of the Fund’s average daily net assets (the “expense limits”). In determining the Adviser’s obligation to waive advisory fees and/or reimburse expenses, the following expenses are not taken into account, and could cause total annual fund operating expenses after fee waiver and/or expense reimbursement to exceed the numbers reflected above: (1) interest; (2) taxes; (3) dividend expense on short sales; (4) extraordinary or non-routine items, including litigation expenses; and (5) expenses that the Fund has incurred but did not actually pay because of an expense offset arrangement. Unless Invesco continues the fee waiver agreement, it will terminate on February 29, 2020. During its term, the fee waiver agreement cannot be terminated or amended to increase the expense limits or reduce the advisory fee waiver without approval of the Board of Trustees. The Adviser did not waive fees and/or reimburse expenses during the period under these expense limits.
Further, the Adviser has contractually agreed, through at least June 30, 2020, to waive the advisory fee payable by the Fund in an amount equal to 100% of the net advisory fees the Adviser receives from the affiliated money market funds on investments by the Fund of uninvested cash in such affiliated money market funds.
For the year ended October 31, 2018, the Adviser waived advisory fees of $6,735.
The Trust has entered into a master administrative services agreement with Invesco pursuant to which the Fund has agreed to pay Invesco for certain administrative costs incurred in providing accounting services to the Fund. For the year ended October 31, 2018, expenses incurred under the agreement are shown in the Statement of Operations as Administrative services fees.
The Trust has entered into a transfer agency and service agreement with Invesco Investment Services, Inc. (“IIS”) pursuant to which the Fund has agreed to pay IIS a fee for providing transfer agency and shareholder services to the Fund and reimburse IIS for certain expenses incurred by IIS in the course of providing such services. IIS may make payments to intermediaries that provide omnibus account services, sub-accounting services and/or networking services. All fees payable by IIS to intermediaries that provide omnibus account services or sub-accounting services are charged back to the Fund, subject to certain limitations approved by the Trust’s Board of Trustees. For the year ended October 31, 2018, expenses incurred under the agreement are shown in the Statement of Operations as Transfer agent fees.
The Trust has entered into master distribution agreements with Invesco Distributors, Inc. (“IDI”) to serve as the distributor for the Class A, Class C, Class R, Class Y, Class R5 and Class R6 shares of the Fund. The Trust has adopted plans pursuant to Rule 12b-1 under the 1940 Act with respect to the Fund’s Class A, Class C and Class R shares (collectively the “Plans”). The Fund, pursuant to the Plans, pays IDI compensation at the annual rate of 0.25% of the Fund’s average daily net assets of Class A shares, 1.00% of the average daily net assets of Class C shares and 0.50% of the average daily net assets of Class R shares. The fees are accrued daily and paid monthly. Of the Plan payments, up to 0.25% of the average daily net assets of each class of shares may be paid to furnish continuing personal shareholder services to customers who purchase and own shares of such classes. Any amounts not paid as a service fee under the Plans would constitute an asset-based sales charge. Rules of the Financial Industry Regulatory Authority (“FINRA”) impose a cap on the total sales charges, including asset-based sales charges, that may be paid by any class of shares of the Fund. For the year ended October 31, 2018, expenses incurred under the Plans are shown in the Statement of Operations as Distribution fees.
Front-end sales commissions and CDSC (collectively, the “sales charges”) are not recorded as expenses of the Fund. Front-end sales commissions are deducted from proceeds from the sales of Fund shares prior to investment in Class A shares of the Fund. CDSC are deducted from redemption proceeds prior to remittance to the shareholder. During the year ended October 31, 2018, IDI advised the Fund that IDI retained $14,325 in
20 Invesco Long/Short Equity Fund
front-end sales commissions from the sale of Class A shares and $1 and $481 from Class A and Class C shares, respectively, for CDSC imposed upon redemptions by shareholders.
Certain officers and trustees of the Trust are officers and directors of the Adviser, IIS and/or IDI.
NOTE 3—Additional Valuation Information
GAAP defines fair value as the price that would be received to sell an asset or paid to transfer a liability in an orderly transaction between market participants at the measurement date, under current market conditions. GAAP establishes a hierarchy that prioritizes the inputs to valuation methods, giving the highest priority to readily available unadjusted quoted prices in an active market for identical assets (Level 1) and the lowest priority to significant unobservable inputs (Level 3), generally when market prices are not readily available or are unreliable. Based on the valuation inputs, the securities or other investments are tiered into one of three levels. Changes in valuation methods may result in transfers in or out of an investment’s assigned level:
| | Level 1 — | Prices are determined using quoted prices in an active market for identical assets. |
| | Level 2 — | Prices are determined using other significant observable inputs. Observable inputs are inputs that other market participants may use in pricing a security. These may include quoted prices for similar securities, interest rates, prepayment speeds, credit risk, yield curves, loss severities, default rates, discount rates, volatilities and others. |
| | Level 3 — | Prices are determined using significant unobservable inputs. In situations where quoted prices or observable inputs are unavailable (for example, when there is little or no market activity for an investment at the end of the period), unobservable inputs may be used. Unobservable inputs reflect the Fund’s own assumptions about the factors market participants would use in determining fair value of the securities or instruments and would be based on the best available information. |
The following is a summary of the tiered valuation input levels, as of October 31, 2018. The level assigned to the securities valuations may not be an indication of the risk or liquidity associated with investing in those securities. Because of the inherent uncertainties of valuation, the values reflected in the financial statements may materially differ from the value received upon actual sale of those investments.
| | | | | | | | | | | | | | | | |
| | | Level 1 | | | Level 2 | | | Level 3 | | | Total | |
Investments in Securities | | | | | | | | | | | | | | | | |
Common Stocks & Equity Securities | | $ | 74,874,821 | | | $ | — | | | $ | — | | | $ | 74,874,821 | |
Money Market Funds | | | 6,806,878 | | | | — | | | | — | | | | 6,806,878 | |
Total Investments in Securities | | | 81,681,699 | | | | — | | | | — | | | | 81,681,699 | |
Other Investments – Assets* | | | | | | | | | | | | | | | | |
Swap Agreements | | | — | | | | 871,329 | | | | — | | | | 871,329 | |
Other Investments – Liabilities* | | | | | | | | | | | | | | | | |
Swap Agreements | | | — | | | | (1,457,255 | ) | | | — | | | | (1,457,255 | ) |
Total Other Investments | | | — | | | | (585,926 | ) | | | — | | | | (585,926 | ) |
Total Investments | | $ | 81,681,699 | | | $ | (585,926 | ) | | $ | — | | | $ | 81,095,773 | |
| * | Unrealized appreciation (depreciation). |
NOTE 4—Derivative Investments
The Fund may enter into an International Swaps and Derivatives Association Master Agreement (“ISDA Master Agreement”) under which a fund may trade OTC derivatives. An OTC transaction entered into under an ISDA Master Agreement typically involves a collateral posting arrangement, payment netting provisions and close-out netting provisions. These netting provisions allow for reduction of credit risk through netting of contractual obligations. The enforceability of the netting provisions of the ISDA Master Agreement depends on the governing law of the ISDA Master Agreement, among other factors.
For financial reporting purposes, the Fund does not offset OTC derivative assets or liabilities that are subject to ISDA Master Agreements in the Statement of Assets and Liabilities.
Value of Derivative Investments at Period-End
The table below summarizes the value of the Fund’s derivative investments, detailed by primary risk exposure, held as of October 31, 2018:
| | | | |
| | | Value | |
| Derivative Assets | | Equity Risk | |
Unrealized appreciation on swap agreements — OTC | | $ | 871,329 | |
Derivatives not subject to master netting agreements | | | — | |
Total Derivative Assets subject to master netting agreements | | $ | 871,329 | |
| |
| | | | |
| | | Value | |
| Derivative Liabilities | | Equity Risk | |
Unrealized depreciation on swap agreements — OTC | | $ | (1,457,255 | ) |
Derivatives not subject to master netting agreements | | | — | |
Total Derivative Liabilities subject to master netting agreements | | $ | (1,457,255 | ) |
21 Invesco Long/Short Equity Fund
Offsetting Assets and Liabilities
The table below reflects the Fund’s exposure to Counterparties subject to either an ISDA Master Agreement or other agreement for OTC derivative transactions as of October 31, 2018.
| | | | | | | | | | | | | | | | | | | | | | | | |
| | | Financial
Derivative
Assets | | | Financial
Derivative
Liabilities | | | | | | Collateral (Received)/Pledged | | | | |
| Counterparty | | Swap
Agreements | | | Swap Agreements | | | Net Value of
Derivatives | | | Non-Cash | | | Cash | | | Net
Amount | |
Morgan Stanley & Co. LLC | | $ | 871,329 | | | $ | (1,457,255 | ) | | $ | (585,926 | ) | | $ | — | | | $ | 169,866 | | | $ | (416,060 | ) |
Effect of Derivative Investments for the year ended October 31, 2018
The table below summarizes the gains (losses) on derivative investments, detailed by primary risk exposure, recognized in earnings during the period:
| | | | |
| | | Location of Gain (Loss) on
Statement of Operations | |
| | | Equity Risk | |
Realized Gain (Loss): | | | | |
Swap agreements | | $ | (5,112,481 | ) |
Change in Net Unrealized Appreciation (Depreciation): | | | | |
Swap agreements | | | (895,174 | ) |
Total | | $ | (6,007,655 | ) |
The table below summarizes the average notional value of swap agreements outstanding during the period.
| | | | |
| | | Swap
Agreements | |
Average notional value | | $ | 162,762,383 | |
NOTE 5—Expense Offset Arrangement(s)
The expense offset arrangement is comprised of transfer agency credits which result from balances in demand deposit accounts used by the transfer agent for clearing shareholder transactions. For the year ended October 31, 2018, the Fund received credits from this arrangement, which resulted in the reduction of the Fund’s total expenses of $399.
NOTE 6—Trustees’ and Officers’ Fees and Benefits
Trustees’ and Officers’ Fees and Benefits include amounts accrued by the Fund to pay remuneration to certain Trustees and Officers of the Fund. Trustees have the option to defer compensation payable by the Fund, and Trustees’ and Officers’ Fees and Benefits also include amounts accrued by the Fund to fund such deferred compensation amounts. Those Trustees who defer compensation have the option to select various Invesco Funds in which their deferral accounts shall be deemed to be invested. Obligations under the deferred compensation plan represent unsecured claims against the general assets of the Fund.
NOTE 7—Cash Balances
The Fund is permitted to temporarily carry a negative or overdrawn balance in its account with State Street Bank and Trust Company, the custodian bank. Such balances, if any at period-end, are shown in the Statement of Assets and Liabilities under the payable caption Amount due custodian. To compensate the custodian bank for such overdrafts, the overdrawn Fund may either (1) leave funds as a compensating balance in the account so the custodian bank can be compensated by earning the additional interest; or (2) compensate by paying the custodian bank at a rate agreed upon by the custodian bank and Invesco, not to exceed the contractually agreed upon rate.
NOTE 8—Distributions to Shareholders and Tax Components of Net Assets
Tax Character of Distributions to Shareholders Paid During the Fiscal Years Ended October 31, 2018 and 2017:
| | | | | | | | |
| | | 2018 | | | 2017 | |
Ordinary income | | $ | 6,913,626 | | | $ | — | |
Long-term capital gain | | | 3,730,324 | | | | 451,747 | |
Total distributions | | $ | 10,643,950 | | | $ | 451,747 | |
22 Invesco Long/Short Equity Fund
Tax Components of Net Assets at Period-End:
| | | | |
| | | 2018 | |
Undistributed long-term gain | | $ | 6,551,900 | |
Net unrealized appreciation — investments | | | 5,888,624 | |
Net unrealized appreciation (depreciation) — foreign currencies | | | (44 | ) |
Temporary book/tax differences | | | (8,866 | ) |
Shares of beneficial interest | | | 68,721,956 | |
Total net assets | | $ | 81,153,570 | |
The difference between book-basis and tax-basis unrealized appreciation (depreciation) is due to differences in the timing of recognition of gains and losses on investments for tax and book purposes. The Fund’s net unrealized appreciation difference is attributable primarily to swap agreements.
The temporary book/tax differences are a result of timing differences between book and tax recognition of income and/or expenses. The Fund’s temporary book/tax differences are the result of the trustee deferral of compensation and retirement plan benefits.
Capital loss carryforward is calculated and reported as of a specific date. Results of transactions and other activity after that date may affect the amount of capital loss carryforward actually available for the Fund to utilize. Capital losses generated in years beginning after December 22, 2010 can be carried forward for an unlimited period, whereas previous losses expire in eight tax years. Capital losses with an expiration period may not be used to offset capital gains until all net capital losses without an expiration date have been utilized. Capital loss carryforwards with no expiration date will retain their character as either short-term or long-term capital losses instead of as short-term capital losses as under prior law. The ability to utilize capital loss carryforwards in the future may be limited under the Internal Revenue Code and related regulations based on the results of future transactions.
The Fund does not have a capital loss carryforward as of October 31, 2018.
NOTE 9—Investment Transactions
The aggregate amount of investment securities (other than short-term securities, U.S. Treasury obligations and money market funds, if any) purchased and sold by the Fund during the year ended October 31, 2018 was $71,019,737 and $69,096,693, respectively. Cost of investments, including any derivatives, on a tax basis includes the adjustments for financial reporting purposes as of the most recently completed federal income tax reporting period-end.
| | | | |
| Unrealized Appreciation (Depreciation) of Investments on a Tax Basis | |
Aggregate unrealized appreciation of investments | | $ | 10,794,324 | |
Aggregate unrealized (depreciation) of investments | | | (4,905,700 | ) |
Net unrealized appreciation of investments | | $ | 5,888,624 | |
Cost of investments for tax purposes is $75,207,149.
NOTE 10—Reclassification of Permanent Differences
Primarily as a result of differing book/tax treatment of net operating losses and swap agreements, on October 31, 2018, undistributed net investment income was increased by $769,763, undistributed net realized gain was increased by $4,869,177 and shares of beneficial interest was decreased by $5,638,940. This reclassification had no effect on the net assets of the Fund.
23 Invesco Long/Short Equity Fund
NOTE 11—Share Information
| | | | | | | | | | | | | | | | |
| | | Summary of Share Activity | |
| | | Years ended October 31, | |
| | | 2018(a) | | | 2017 | |
| | | Shares | | | Amount | | | Shares | | | Amount | |
Sold: | | | | | | | | | | | | | | | | |
Class A | | | 863,426 | | | $ | 10,478,814 | | | | 304,596 | | | $ | 3,646,029 | |
Class C | | | 225,972 | | | | 2,674,620 | | | | 46,302 | | | | 524,043 | |
Class R | | | 10,110 | | | | 120,120 | | | | 3,850 | | | | 46,256 | |
Class Y | | | 1,705,351 | | | | 20,464,440 | | | | 431,307 | | | | 5,111,591 | |
Class R5 | | | 194 | | | | 2,364 | | | | 1,004 | | | | 11,943 | |
Class R6 | | | 343,585 | | | | 3,990,803 | | | | 278,872 | | | | 3,188,531 | |
| | | | |
Issued as reinvestment of dividends: | | | | | | | | | | | | | | | | |
Class A | | | 145,295 | | | | 1,699,951 | | | | 5,622 | | | | 66,343 | |
Class C | | | 32,792 | | | | 375,798 | | | | 1,371 | | | | 15,922 | |
Class R | | | 1,483 | | | | 17,226 | | | | 44 | | | | 519 | |
Class Y | | | 66,645 | | | | 784,426 | | | | 1,371 | | | | 16,268 | |
Class R5 | | | 450 | | | | 5,291 | | | | 11 | | | | 129 | |
Class R6 | | | 565,588 | | | | 6,656,972 | | | | 24,685 | | | | 293,014 | |
| | | | |
Reacquired: | | | | | | | | | | | | | | | | |
Class A | | | (474,277 | ) | | | (5,613,359 | ) | | | (545,259 | ) | | | (6,557,858 | ) |
Class C | | | (133,865 | ) | | | (1,516,428 | ) | | | (60,626 | ) | | | (695,838 | ) |
Class R | | | (2,410 | ) | | | (28,086 | ) | | | (1,834 | ) | | | (21,347 | ) |
Class Y | | | (957,042 | ) | | | (11,388,258 | ) | | | (240,137 | ) | | | (2,929,290 | ) |
Class R5 | | | (366 | ) | | | (4,226 | ) | | | (49,229 | ) | | | (627,025 | ) |
Class R6 | | | (670,861 | ) | | | (8,340,020 | ) | | | (1,150,985 | ) | | | (13,755,486 | ) |
Net increase (decrease) in share activity | | | 1,722,070 | | | $ | 20,380,448 | | | | (949,035 | ) | | $ | (11,666,256 | ) |
| (a) | There are entities that are record owners of more than 5% of the outstanding shares of the Fund and in the aggregate own 26% of the outstanding shares of the Fund. IDI has an agreement with these entities to sell Fund shares. The Fund, Invesco and/or Invesco affiliates may make payments to these entities, which are considered to be related to the Fund, for providing services to the Fund, Invesco and/or Invesco affiliates including but not limited to services such as securities brokerage, distribution, third party record keeping and account servicing. The Fund has no knowledge as to whether all or any portion of the shares owned of record by these entities are also owned beneficially. |
| | In addition, 52% of the outstanding shares of the Fund are owned by the Adviser or an affiliate of the Adviser. |
24 Invesco Long/Short Equity Fund
NOTE 12—Financial Highlights
The following schedule presents financial highlights for a share of the Fund outstanding throughout the periods indicated.
| | | | | | | | | | | | | | | | | | | | | | | | | | | | | | | | | | | | | | | | | | | | | | | | | | | | | | | | |
| | | Net asset
value,
beginning
of period | | | Net
investment
income
(loss)(a) | | | Net gains
(losses)
on securities
(both
realized and
unrealized) | | | Total from
investment
operations | | | Dividends
from net
investment
income | | | Distributions
from net
realized
gains | | | Total
distributions | | | Net asset
value, end
of period | | | Total
return(b) | | | Net assets,
end of period
(000’s omitted) | | | Ratio of
expenses
to average
net assets
with fee waivers
and/or expenses
absorbed | | | Ratio of
expenses
to average net
assets without
fee waivers
and/or expenses
absorbed | | | Ratio of net
investment
income (loss)
to average
net assets | | | Portfolio
turnover(c) | |
Class A | |
Year ended 10/31/18 | | $ | 13.15 | | | $ | (0.00 | ) | | $ | (0.22 | ) | | $ | (0.22 | ) | | $ | (0.93 | ) | | $ | (0.95 | ) | | $ | (1.88 | ) | | $ | 11.05 | | | | (2.49 | )% | | $ | 15,528 | | | | 1.56 | %(d) | | | 1.57 | %(d) | | | (0.01 | )%(d) | | | 92 | % |
Year ended 10/31/17 | | | 10.45 | | | | 0.03 | | | | 2.74 | | | | 2.77 | | | | — | | | | (0.07 | ) | | | (0.07 | ) | | | 13.15 | | | | 26.62 | | | | 11,457 | | | | 1.57 | | | | 1.62 | | | | 0.27 | | | | 95 | |
Year ended 10/31/16 | | | 11.50 | | | | 0.06 | (e) | | | (0.50 | ) | | | (0.44 | ) | | | (0.55 | ) | | | (0.06 | ) | | | (0.61 | ) | | | 10.45 | | | | (4.03 | ) | | | 11,562 | | | | 1.85 | | | | 2.08 | | | | 0.58 | (e) | | | 102 | |
Year ended 10/31/15 | | | 11.00 | | | | 0.01 | | | | 0.49 | | | | 0.50 | | | | — | | | | (0.00 | ) | | | — | | | | 11.50 | | | | 4.57 | | | | 12,854 | | | | 1.85 | | | | 2.76 | | | | 0.11 | | | | 89 | |
Year ended 10/31/14(f) | | | 10.00 | | | | (0.02 | ) | | | 1.02 | | | | 1.00 | | | | — | | | | — | | | | — | | | | 11.00 | | | | 10.00 | | | | 16,796 | | | | 1.85 | (g) | | | 3.04 | (g) | | | (0.25 | )(g) | | | 102 | |
Class C | | | | | | | | | | | | | | | | | | | | | | | | | | | | | | | | | | | | | | | | | | | | | | | | | | | | | | | | |
Year ended 10/31/18 | | | 12.86 | | | | (0.09 | ) | | | (0.22 | ) | | | (0.31 | ) | | | (0.84 | ) | | | (0.95 | ) | | | (1.79 | ) | | | 10.76 | | | | (3.24 | ) | | | 3,696 | | | | 2.31 | (d) | | | 2.32 | (d) | | | (0.76 | )(d) | | | 92 | |
Year ended 10/31/17 | | | 10.30 | | | | (0.06 | ) | | | 2.69 | | | | 2.63 | | | | — | | | | (0.07 | ) | | | (0.07 | ) | | | 12.86 | | | | 25.65 | | | | 2,812 | | | | 2.32 | | | | 2.37 | | | | (0.48 | ) | | | 95 | |
Year ended 10/31/16 | | | 11.34 | | | | (0.02 | )(e) | | | (0.48 | ) | | | (0.50 | ) | | | (0.48 | ) | | | (0.06 | ) | | | (0.54 | ) | | | 10.30 | | | | (4.68 | ) | | | 2,385 | | | | 2.60 | | | | 2.83 | | | | (0.17 | )(e) | | | 102 | |
Year ended 10/31/15 | | | 10.92 | | | | (0.07 | ) | | | 0.49 | | | | 0.42 | | | | — | | | | (0.00 | ) | | | — | | | | 11.34 | | | | 3.87 | | | | 2,350 | | | | 2.60 | | | | 3.51 | | | | (0.64 | ) | | | 89 | |
Year ended 10/31/14(f) | | | 10.00 | | | | (0.10 | ) | | | 1.02 | | | | 0.92 | | | | — | | | | — | | | | — | | | | 10.92 | | | | 9.20 | | | | 2,618 | | | | 2.60 | (g) | | | 3.79 | (g) | | | (1.00 | )(g) | | | 102 | |
Class R | | | | | | | | | | | | | | | | | | | | | | | | | | | | | | | | | | | | | | | | | | | | | | | | | | | | | | | | |
Year ended 10/31/18 | | | 13.06 | | | | (0.03 | ) | | | (0.23 | ) | | | (0.26 | ) | | | (0.90 | ) | | | (0.95 | ) | | | (1.85 | ) | | | 10.95 | | | | (2.81 | ) | | | 211 | | | | 1.81 | (d) | | | 1.82 | (d) | | | (0.26 | )(d) | | | 92 | |
Year ended 10/31/17 | | | 10.40 | | | | 0.00 | | | | 2.73 | | | | 2.73 | | | | — | | | | (0.07 | ) | | | (0.07 | ) | | | 13.06 | | | | 26.37 | | | | 132 | | | | 1.82 | | | | 1.87 | | | | 0.02 | | | | 95 | |
Year ended 10/31/16 | | | 11.45 | | | | 0.04 | (e) | | | (0.50 | ) | | | (0.46 | ) | | | (0.53 | ) | | | (0.06 | ) | | | (0.59 | ) | | | 10.40 | | | | (4.27 | ) | | | 83 | | | | 2.10 | | | | 2.33 | | | | 0.33 | (e) | | | 102 | |
Year ended 10/31/15 | | | 10.98 | | | | (0.02 | ) | | | 0.49 | | | | 0.47 | | | | — | | | | (0.00 | ) | | | — | | | | 11.45 | | | | 4.31 | | | | 40 | | | | 2.10 | | | | 3.01 | | | | (0.14 | ) | | | 89 | |
Year ended 10/31/14(f) | | | 10.00 | | | | (0.04 | ) | | | 1.02 | | | | 0.98 | | | | — | | | | — | | | | — | | | | 10.98 | | | | 9.80 | | | | 27 | | | | 2.10 | (g) | | | 3.29 | (g) | | | (0.50 | )(g) | | | 102 | |
Class Y | | | | | | | | | | | | | | | | | | | | | | | | | | | | | | | | | | | | | | | | | | | | | | | | | | | | | | | | |
Year ended 10/31/18 | | | 13.25 | | | | 0.03 | | | | (0.23 | ) | | | (0.20 | ) | | | (0.96 | ) | | | (0.95 | ) | | | (1.91 | ) | | | 11.14 | | | | (2.28 | ) | | | 19,286 | | | | 1.31 | (d) | | | 1.32 | (d) | | | 0.24 | (d) | | | 92 | |
Year ended 10/31/17 | | | 10.51 | | | | 0.06 | | | | 2.75 | | | | 2.81 | | | | — | | | | (0.07 | ) | | | (0.07 | ) | | | 13.25 | | | | 26.85 | | | | 12,145 | | | | 1.32 | | | | 1.37 | | | | 0.52 | | | | 95 | |
Year ended 10/31/16 | | | 11.56 | | | | 0.09 | (e) | | | (0.50 | ) | | | (0.41 | ) | | | (0.58 | ) | | | (0.06 | ) | | | (0.64 | ) | | | 10.51 | | | | (3.74 | ) | | | 7,604 | | | | 1.60 | | | | 1.83 | | | | 0.83 | (e) | | | 102 | |
Year ended 10/31/15 | | | 11.02 | | | | 0.04 | | | | 0.50 | | | | 0.54 | | | | — | | | | (0.00 | ) | | | — | | | | 11.56 | | | | 4.93 | | | | 7,709 | | | | 1.60 | | | | 2.51 | | | | 0.36 | | | | 89 | |
Year ended 10/31/14(f) | | | 10.00 | | | | 0.00 | | | | 1.02 | | | | 1.02 | | | | — | | | | — | | | | — | | | | 11.02 | | | | 10.20 | | | | 12,389 | | | | 1.60 | (g) | | | 2.79 | (g) | | | 0.00 | (g) | | | 102 | |
Class R5 | | | | | | | | | | | | | | | | | | | | | | | | | | | | | | | | | | | | | | | | | | | | | | | | | | | | | | | | |
Year ended 10/31/18 | | | 13.26 | | | | 0.04 | | | | (0.23 | ) | | | (0.19 | ) | | | (0.97 | ) | | | (0.95 | ) | | | (1.92 | ) | | | 11.15 | | | | (2.17 | ) | | | 42 | | | | 1.23 | (d) | | | 1.24 | (d) | | | 0.32 | (d) | | | 92 | |
Year ended 10/31/17 | | | 10.50 | | | | 0.07 | | | | 2.76 | | | | 2.83 | | | | — | | | | (0.07 | ) | | | (0.07 | ) | | | 13.26 | | | | 27.07 | | | | 47 | | | | 1.22 | | | | 1.25 | | | | 0.62 | | | | 95 | |
Year ended 10/31/16 | | | 11.56 | | | | 0.09 | (e) | | | (0.51 | ) | | | (0.42 | ) | | | (0.58 | ) | | | (0.06 | ) | | | (0.64 | ) | | | 10.50 | | | | (3.83 | ) | | | 543 | | | | 1.60 | | | | 1.71 | | | | 0.83 | (e) | | | 102 | |
Year ended 10/31/15 | | | 11.02 | | | | 0.04 | | | | 0.50 | | | | 0.54 | | | | — | | | | (0.00 | ) | | | — | | | | 11.56 | | | | 4.93 | | | | 578 | | | | 1.60 | | | | 2.38 | | | | 0.36 | | | | 89 | |
Year ended 10/31/14(f) | | | 10.00 | | | | 0.00 | | | | 1.02 | | | | 1.02 | | | | — | | | | — | | | | — | | | | 11.02 | | | | 10.20 | | | | 718 | | | | 1.60 | (g) | | | 2.69 | (g) | | | 0.00 | (g) | | | 102 | |
Class R6 | | | | | | | | | | | | | | | | | | | | | | | | | | | | | | | | | | | | | | | | | | | | | | | | | | | | | | | | |
Year ended 10/31/18 | | | 13.26 | | | | 0.05 | | | | (0.23 | ) | | | (0.18 | ) | | | (0.97 | ) | | | (0.95 | ) | | | (1.92 | ) | | | 11.16 | | | | (2.09 | ) | | | 42,390 | | | | 1.16 | (d) | �� | | 1.17 | (d) | | | 0.39 | (d) | | | 92 | |
Year ended 10/31/17 | | | 10.50 | | | | 0.07 | | | | 2.76 | | | | 2.83 | | | | — | | | | (0.07 | ) | | | (0.07 | ) | | | 13.26 | | | | 27.07 | | | | 47,232 | | | | 1.22 | | | | 1.25 | | | | 0.62 | | | | 95 | |
Year ended 10/31/16 | | | 11.56 | | | | 0.09 | (e) | | | (0.51 | ) | | | (0.42 | ) | | | (0.58 | ) | | | (0.06 | ) | | | (0.64 | ) | | | 10.50 | | | | (3.83 | ) | | | 46,305 | | | | 1.60 | | | | 1.71 | | | | 0.83 | (e) | | | 102 | |
Year ended 10/31/15 | | | 11.02 | | | | 0.04 | | | | 0.50 | | | | 0.54 | | | | — | | | | (0.00 | ) | | | — | | | | 11.56 | | | | 4.93 | | | | 609 | | | | 1.60 | | | | 2.38 | | | | 0.36 | | | | 89 | |
Year ended 10/31/14(f) | | | 10.00 | | | | 0.00 | | | | 1.02 | | | | 1.02 | | | | — | | | | — | | | | — | | | | 11.02 | | | | 10.20 | | | | 562 | | | | 1.60 | (g) | | | 2.69 | (g) | | | 0.00 | (g) | | | 102 | |
| (a) | Calculated using average shares outstanding. |
| (b) | Includes adjustments in accordance with accounting principles generally accepted in the United States of America and as such, the net asset value for financial reporting purposes and the returns based upon those net asset values may differ from the net asset value and returns for shareholder transactions. Does not include sales charges and is not annualized for periods less than one year, if applicable. |
| (c) | Portfolio turnover is calculated at the fund level and is not annualized for periods less than one year, if applicable. |
| (d) | Ratios are based on average daily net assets (000’s omitted) of $15,504, $3,843, $168, $15,612, $47 and $46,087 for Class A, Class C, Class R, Class Y, Class R5 and Class R6 shares, respectively. |
| (e) | Net investment income per share and the ratio of net investment income to average net assets include significant dividends received during the period. Net investment income per share and the ratio of net investment income to average net assets excluding the significant dividends are $(0.00) and (0.00)%, $(0.08) and (0.75)%, $(0.02) and (0.25)%, $0.03 and 0.25%, $0.03 and 0.25% and $0.03 and 0.25% for Class A, Class C, Class R, Class Y, Class R5 and Class R6 shares, respectively. |
| (f) | Commencement date of December 19, 2013. |
25 Invesco Long/Short Equity Fund
Report of Independent Registered Public Accounting Firm
To the Board of Trustees of AIM Investment Funds (Invesco Investment Funds)
and Shareholders of Invesco Long/Short Equity Fund:
Opinion on the Financial Statements
We have audited the accompanying statement of assets and liabilities, including the schedule of investments, of Invesco Long/Short Equity Fund (one of the funds constituting AIM Investment Funds (Invesco Investment Funds), hereafter referred to as the “Fund”) as of October 31, 2018, the related statement of operations for the year ended October 31, 2018, the statement of changes in net assets for each of the two years in the period ended October 31, 2018, including the related notes, and the financial highlights for each of the periods indicated therein (collectively referred to as the financial statements). In our opinion, the financial statements present fairly, in all material respects, the financial position of the Fund as of October 31, 2018, the results of its operations for the year then ended, the changes in its net assets for each of the two years in the period ended October 31, 2018 and the financial highlights for each of the periods indicated therein in conformity with accounting principles generally accepted in the United States of America.
Basis for Opinion
These financial statements are the responsibility of the Fund’s management. Our responsibility is to express an opinion on the Fund’s financial statements based on our audits. We are a public accounting firm registered with the Public Company Accounting Oversight Board (United States) (PCAOB) and are required to be independent with respect to the Fund in accordance with the U.S. federal securities laws and the applicable rules and regulations of the Securities and Exchange Commission and the PCAOB.
We conducted our audits of these financial statements in accordance with the standards of the PCAOB. Those standards require that we plan and perform the audit to obtain reasonable assurance about whether the financial statements are free of material misstatement, whether due to error or fraud.
Our audits included performing procedures to assess the risks of material misstatement of the financial statements, whether due to error or fraud, and performing procedures that respond to those risks. Such procedures included examining, on a test basis, evidence regarding the amounts and disclosures in the financial statements. Our audits also included evaluating the accounting principles used and significant estimates made by management, as well as evaluating the overall presentation of the financial statements. Our procedures included confirmation of securities owned as of October 31, 2018 by correspondence with the custodian, transfer agent and brokers; when replies were not received from brokers, we performed other auditing procedures. We believe that our audits provide a reasonable basis for our opinion.
PricewaterhouseCoopers LLP
Houston, TX
December 28, 2018
We have served as the auditor of one or more of the investment companies in the Invesco group of investment companies since at least 1995. We have not been able to determine the specific year we began serving as auditor.
26 Invesco Long/Short Equity Fund
Calculating your ongoing Fund expenses
Example
As a shareholder of the Fund, you incur two types of costs: (1) transaction costs, which may include sales charges (loads) on purchase payments or contingent deferred sales charges on redemptions, if any; and (2) ongoing costs, including management fees, distribution and/or service (12b-1) fees, and other Fund expenses. This example is intended to help you understand your ongoing costs (in dollars) of investing in the Fund and to compare these costs with ongoing costs of investing in other mutual funds. The example is based on an investment of $1,000 invested at the beginning of the period and held for the entire period May 1, 2018 through October 31, 2018.
Actual expenses
The table below provides information about actual account values and actual expenses. You may use the information in this table, together with the amount you invested, to estimate the expenses that you paid over the period. Simply divide your account value by $1,000 (for example, an $8,600 account value divided by $1,000 = 8.6), then multiply the result by the number in the table under the heading entitled “Actual Expenses Paid During Period” to estimate the expenses you paid on your account during this period.
Hypothetical example for comparison purposes
The table below also provides information about hypothetical account values and hypothetical expenses based on the Fund’s actual expense ratio and an assumed rate of return of 5% per year before expenses, which is not the Fund’s actual return.
The hypothetical account values and expenses may not be used to estimate the actual ending account balance or expenses you paid for the period. You may use this information to compare the ongoing costs of investing in the Fund and other funds. To do so, compare this 5% hypothetical example with the 5% hypothetical examples that appear in the shareholder reports of the other funds.
Please note that the expenses shown in the table are meant to highlight your ongoing costs only and do not reflect any transaction costs, such as sales charges (loads) on purchase payments or contingent deferred sales charges on redemptions, if any. Therefore, the hypothetical information is useful in comparing ongoing costs only, and will not help you determine the relative total costs of owning different funds. In addition, if these transaction costs were included, your costs would have been higher.
| | | | | | | | | | | | | | | | | | | | | | | | |
| Class | | Beginning
Account Value
(05/01/18) | | | ACTUAL | | | HYPOTHETICAL (5% annual return before
expenses) | | | Annualized
Expense
Ratio | |
| | Ending
Account Value
(10/31/18)1 | | | Expenses
Paid During
Period2 | | | Ending
Account Value
(10/31/18) | | | Expenses
Paid During
Period2 | |
| A | | $ | 1,000.00 | | | $ | 949.30 | | | $ | 7.66 | | | $ | 1,017.34 | | | $ | 7.93 | | | | 1.56 | % |
| C | | | 1,000.00 | | | | 945.50 | | | | 11.33 | | | | 1,013.56 | | | | 11.72 | | | | 2.31 | |
| R | | | 1,000.00 | | | | 948.10 | | | | 8.89 | | | | 1,016.08 | | | | 9.20 | | | | 1.81 | |
| Y | | | 1,000.00 | | | | 950.50 | | | | 6.44 | | | | 1,018.60 | | | | 6.67 | | | | 1.31 | |
| R5 | | | 1,000.00 | | | | 950.50 | | | | 6.00 | | | | 1,019.06 | | | | 6.21 | | | | 1.22 | |
| R6 | | | 1,000.00 | | | | 951.40 | | | | 5.61 | | | | 1,019.46 | | | | 5.80 | | | | 1.14 | |
| 1 | The actual ending account value is based on the actual total return of the Fund for the period May 1, 2018 through October 31, 2018, after actual expenses and will differ from the hypothetical ending account value which is based on the Fund’s expense ratio and a hypothetical annual return of 5% before expenses. |
| 2 | Expenses are equal to the Fund’s annualized expense ratio as indicated above multiplied by the average account value over the period, multiplied by 184/365 to reflect the most recent fiscal half year. |
27 Invesco Long/Short Equity Fund
Approval of Investment Advisory and Sub-Advisory Contracts
At meetings held on June 5-6, 2018, the Board of Trustees (the Board or the Trustees) of AIM Investment Funds (Invesco Investment Funds) as a whole, and the independent Trustees, who comprise over 75% of the Board, voting separately, approved the continuance of the Invesco Long/Short Equity Fund’s (the Fund) Master Investment Advisory Agreement with Invesco Advisers, Inc. (Invesco Advisers and the investment advisory agreement) and the Master Intergroup Sub-Advisory Contract for Mutual Funds with Invesco Asset Management Deutschland GmbH, Invesco Asset Management Limited, Invesco Asset Management (Japan) Limited, Invesco Hong Kong Limited, Invesco Senior Secured Management, Inc., Invesco Canada Ltd. and separate Sub-Advisory Contracts with Invesco Capital Management LLC and Invesco Asset Management (India) Private Limited (collectively, the Affiliated Sub-Advisers and the sub-advisory contracts) for another year, effective July 1, 2018. After evaluating the factors discussed below, among others, the Board approved the renewal of the Fund’s investment advisory agreement and the sub-advisory contracts and determined that the compensation payable by the Fund to Invesco Advisers and by Invesco Advisers to the Affiliated Sub-Advisers is fair and reasonable.
The Board’s Evaluation Process
The Board’s Investments Committee has established three Sub-Committees, which meet throughout the year to review the performance of funds advised by Invesco Advisers (the Invesco Funds). Over the course of each year, the Sub-Committees meet with portfolio managers for their assigned Invesco Funds and other members of management to review detailed information about investment performance and portfolio attributes of these funds. The Board took into account evaluations and reports that it received from the Investments Committee and Sub-Committees, as well as the information provided to such committees and the Board throughout the year, in considering whether to approve each Invesco Fund’s investment advisory agreement and sub-advisory contracts.
As part of the contract renewal process, the Board reviews and considers information provided in response to detailed requests for information submitted to management by the independent Trustees with assistance from legal counsel to the independent Trustees. The Board receives comparative investment performance and fee data regarding the Invesco Funds prepared by Invesco Advisers and Broadridge Financial Solutions, Inc. (Broadridge), an independent mutual fund data provider. The Board also receives an independent written evaluation from the Senior Officer, an officer of the Invesco Funds who reports directly to the independent Trustees. The Senior Officer’s
evaluation is prepared as part of his responsibility to manage the process by which the Invesco Funds’ proposed management fees are negotiated during the annual contract renewal process to ensure they are negotiated in a manner that is at arms’ length and reasonable. In addition to meetings with Invesco Advisers and fund counsel throughout the year, the independent Trustees also discuss the continuance of the investment advisory agreement and sub-advisory contracts in separate sessions with the Senior Officer and with independent legal counsel.
The discussion below is a summary of the Senior Officer’s independent written evaluation with respect to the Fund’s investment advisory agreement, as well as a discussion of the material factors and related conclusions that formed the basis for the Board’s approval of the Fund’s investment advisory agreement and sub-advisory contracts. The Trustees’ review and conclusions are based on the comprehensive consideration of all information presented to them during the course of the year and in prior years and are not the result of any single determinative factor. Moreover, one Trustee may have weighed a particular piece of information or factor differently than another Trustee. This information is current as of June 6, 2018.
Factors and Conclusions and Summary of Independent Written Fee Evaluation
| A. | Nature, Extent and Quality of Services Provided by Invesco Advisers and the Affiliated Sub-Advisers |
The Board reviewed the nature, extent and quality of the advisory services provided to the Fund by Invesco Advisers under the Fund’s investment advisory agreement, and the credentials and experience of the officers and employees of Invesco Advisers who provide these services, including the Fund’s portfolio manager(s). The Board’s review included consideration of Invesco Advisers’ investment process oversight and structure, credit analysis and investment risk management. The Board also considered non-advisory services that Invesco Advisers and its affiliates provide to the Invesco Funds such as various back office support functions, third party oversight, internal audit, valuation, portfolio trading and legal and compliance. The Board also reviewed and considered the benefits to shareholders of investing in a fund that is part of the Invesco family of funds under the umbrella of Invesco Ltd., Invesco Advisers’ parent company, and noted Invesco Ltd.’s depth and experience in conducting an investment management business, as well as its commitment of financial and other resources to such business. The Board concluded that the nature, extent and quality of the services provided to the Fund by Invesco Advisers are appropriate and satisfactory.
The Board reviewed the services that may be provided by the Affiliated Sub-Advisers under the sub-advisory contracts and the credentials and experience of the officers and employees of the Affiliated Sub-Advisers who provide these services. The Board noted the Affiliated Sub-Advisers’ expertise with respect to certain asset classes and that the Affiliated Sub-Advisers have offices and personnel that are located in financial centers around the world. As a result, the Board noted that the Affiliated Sub-Advisers can provide research and investment analysis on the markets and economies of various countries in which the Fund may invest, make recommendations regarding securities and assist with security trades. The Board concluded that the sub-advisory contracts may benefit the Fund and its shareholders by permitting Invesco Advisers to use the resources and talents of the Affiliated Sub-Advisers in managing the Fund. The Board concluded that the nature, extent and quality of the services that may be provided by the Affiliated Sub-Advisers are appropriate and satisfactory.
| B. | Fund Investment Performance |
The Board considered Fund investment performance as a relevant factor in considering whether to approve the investment advisory agreement. The Board did not view Fund investment performance as a relevant factor in considering whether to approve the sub-advisory contracts for the Fund, as no Affiliated Sub-Adviser currently manages assets of the Fund.
The Board compared the Fund’s investment performance over multiple time periods ending December 31, 2017 to the performance of funds in the Broadridge performance universe and against the Lipper Alternative Long/Short Equity Funds Index. The Board noted that performance of Class A shares of the Fund was in the first quintile of its performance universe for the one and three year periods (the first quintile being the best performing funds and the fifth quintile being the worst performing funds). The Board noted that performance of Class A shares of the Fund was above the performance of the Index for the one and three year periods. The Trustees also reviewed more recent Fund performance and this review did not change their conclusions.
| C. | Advisory and Sub-Advisory Fees and Fund Expenses |
The Board compared the Fund’s contractual management fee rate to the contractual management fee rates of funds in the Fund’s Broadridge expense group. The Board noted that the contractual management fee rate for Class A shares of the Fund was below the median contractual management fee rate of funds in its expense group. The Board noted that the term “contractual management fee” for funds in the expense group may include both
28 Invesco Long/Short Equity Fund
advisory and certain non-portfolio management administrative services fees, but that Broadridge does not provide information on a fund by fund basis as to what is included. The Board also reviewed the methodology used by Broadridge in providing expense group information, which includes using each fund’s contractual management fee schedule (including any applicable breakpoints) as reported in the most recent prospectus or statement of additional information for each fund in the expense group. The Board also considered comparative information regarding the Fund’s total expense ratio and its various components.
The Board noted that Invesco Advisers has contractually agreed to waive fees and/or limit expenses of the Fund in an amount necessary to limit total annual operating expenses to a specified percentage of average daily net assets for each class of the Fund.
The Board noted that Invesco Advisers and the Affiliated Sub-Advisers do not manage other similarly managed mutual funds or client accounts.
The Board also considered the services that may be provided by the Affiliated Sub-Advisers pursuant to the sub-advisory contracts, as well as the fees payable by Invesco Advisers to the Affiliated Sub-Advisers pursuant to the sub-advisory contracts.
| D. | Economies of Scale and Breakpoints |
The Board considered the extent to which there may be economies of scale in the provision of advisory services to the Fund. The Board also considered that the Fund may benefit from economies of scale through contractual breakpoints in the Fund’s advisory fee schedule, which generally operate to reduce the Fund’s expense ratio as it grows in size. The Board noted that the Fund shares directly in economies of scale through lower fees charged by third party service providers based on the combined size of the Invesco Funds. The Board noted that the Fund may also benefit from economies of scale through initial fee setting, fee waivers and expense reimbursements.
| E. | Profitability and Financial Resources |
The Board reviewed information from Invesco Advisers concerning the costs of the advisory and other services that Invesco Advisers and its affiliates provide to the Fund and the Invesco Funds and the profitability of Invesco Advisers and its affiliates in providing these services. The Board considered the methodology used for calculating profitability and noted the periodic review of such methodology by an independent consultant. The Board noted that Invesco Advisers continues to operate at a net profit from services Invesco Advisers and its affiliates provide to the Invesco Funds and the Fund. The Board did not deem the level of profits realized by Invesco Advisers and its affiliates from providing services to the Fund to be excessive given the nature, extent and quality of the services provided. The Board received information from Invesco Advisers demonstrating that Invesco Advisers and the
Affiliated Sub-Advisers are financially sound and have the resources necessary to perform their obligations under the investment advisory agreement and sub-advisory contracts.
| F. | Collateral Benefits to Invesco Advisers and its Affiliates |
The Board considered various other benefits received by Invesco Advisers and its affiliates from the relationship with the Fund, including the fees received for providing administrative, transfer agency and distribution services to the Fund. The Board considered comparative information regarding fees charged for these services, including information provided by Broadridge and other independent sources. The Board considered the performance of Invesco Advisers and its affiliates in providing these services and the organizational structure employed to provide these services. The Board also considered that these services are provided to the Fund pursuant to written contracts that are reviewed and approved on an annual basis by the Board; and that the services are required for the operation of the Fund.
The Board considered the benefits realized by Invesco Advisers and the Affiliated Sub-Advisers as a result of portfolio brokerage transactions executed through “soft dollar” arrangements. The Board noted that soft dollar arrangements may result in the Fund bearing costs to purchase research that may be used by Invesco Advisers or the Affiliated Sub-Advisers with other clients and may reduce Invesco Advisers’ or the Affiliated Sub-Advisers’ expenses. The Board also considered that it receives periodic reports from Invesco representing that these arrangements are consistent with regulatory requirements. The Board did not deem the soft dollar arrangements to be inappropriate.
The Board considered that the Fund’s uninvested cash and cash collateral from any securities lending arrangements may be invested in money market funds advised by Invesco Advisers pursuant to procedures approved by the Board. The Board noted that Invesco Advisers receives advisory fees from these affiliated money market funds attributable to such investments, although Invesco Advisers has contractually agreed to waive through varying periods the advisory fees payable by the Invesco Funds with respect to certain investments in the affiliated money market funds. The waiver is in an amount equal to 100% of the net advisory fee Invesco Advisers receives from the affiliated money market funds with respect to the Fund’s investment in the affiliated money market funds of uninvested cash, but not cash collateral. The Board concluded that the amount of advisory fees received by Invesco Advisers from the Fund’s investment of cash collateral from any securities lending arrangements in the affiliated money market funds is fair and reasonable.
The Board also considered that an affiliated broker may receive commissions for executing certain trades for the Fund. Invesco Advisers and the Affiliated Sub-Advisers may use the affiliated broker to, among other things, control
order routing and minimize information leakage, and the Board was advised that such trades are executed in compliance with rules under the federal securities laws and consistent with best execution obligations.
29 Invesco Long/Short Equity Fund
Tax Information
Form 1099-DIV, Form 1042-S and other year-end tax information provide shareholders with actual calendar year amounts that should be included in their tax returns. Shareholders should consult their tax advisors.
The following distribution information is being provided as required by the Internal Revenue Code or to meet a specific state’s requirement.
The Fund designates the following amounts or, if subsequently determined to be different, the maximum amount allowable for its fiscal year ended October 31, 2018:
| | | | |
Federal and State Income Tax | |
Long-Term Capital Gain Distributions | | $ | 3,730,324 | |
Qualified Dividend Income* | | | 0 | % |
Corporate Dividends Received Deduction* | | | 0 | % |
U.S. Treasury Obligations* | | | 0 | % |
| | * | The above percentages are based on ordinary income dividends paid to shareholders during the Fund’s fiscal year. |
| | | | |
Non-Resident Alien Shareholders | |
Qualified Short-Term Gains | | $ | 1,621,515 | |
30 Invesco Long/Short Equity Fund
Trustees and Officers
The address of each trustee and officer is AIM Investment Funds (Invesco Investment Funds) (the “Trust”), 11 Greenway Plaza, Suite 1000, Houston, Texas 77046-1173. The trustees serve for the life of the Trust, subject to their earlier death, incapacitation, resignation, retirement or removal as more specifically provided in the Trust’s organizational documents. Each officer serves for a one year term or until their successors are elected and qualified. Column two below includes length of time served with predecessor entities, if any.
| | | | | | | | |
Name, Year of Birth and
Position(s) Held with the Trust | | Trustee and/
or Officer Since | | Principal Occupation(s)
During Past 5 Years | | Number of
Funds in Fund
Complex
Overseen by
Trustee | | Other Directorship(s)
Held by Trustee During
Past 5 Years |
| Interested Persons | | | | | | | | |
| Martin L. Flanagan1 — 1960 Trustee | | 2007 | | Executive Director, Chief Executive Officer and President, Invesco Ltd. (ultimate parent of Invesco and a global investment management firm); Trustee, The Invesco Funds; Vice Chair, Investment Company Institute; and Member of Executive Board, SMU Cox School of Business Formerly: Advisor to the Board, Invesco Advisers, Inc. (formerly known as Invesco Institutional (N.A.), Inc.); Chairman and Chief Executive Officer, Invesco Advisers, Inc. (registered investment adviser); Director, Chairman, Chief Executive Officer and President, Invesco Holding Company (US), Inc. (formerly IVZ Inc.) (holding company), Invesco Group Services, Inc. (service provider) and Invesco North American Holdings, Inc. (holding company); Director, Chief Executive Officer and President, Invesco Holding Company Limited (parent of Invesco and a global investment management firm); Director, Invesco Ltd.; Chairman, Investment Company Institute and President, Co-Chief Executive Officer, Co-President, Chief Operating Officer and Chief Financial Officer, Franklin Resources, Inc. (global investment management organization) | | 158 | | None |
Philip A. Taylor2 — 1954 Trustee and Senior Vice President | | 2006 | | Head of the Americas and Senior Managing Director, Invesco Ltd.; Director, Invesco Advisers, Inc. (formerly known as Invesco Institutional (N.A.), Inc.) (registered investment adviser); Director and Chairman, Invesco Investment Services, Inc. (formerly known as Invesco AIM Investment Services, Inc.) (registered transfer agent); Chief Executive Officer, Invesco Corporate Class Inc. (corporate mutual fund company); Director, Chairman and Chief Executive Officer, Invesco Canada Ltd. (formerly known as Invesco Trimark Ltd./Invesco Trimark Ltèe) (registered investment adviser and registered transfer agent); Trustee and Senior Vice President, The Invesco Funds; Director, Invesco Investment Advisers LLC (formerly known as Van Kampen Asset Management) Formerly: Director, Chairman, Chief Executive Officer and President, Invesco Management Group, Inc. (formerly known as Invesco AIM Management Group, Inc.) (financial services holding company); Co-Chairman, Co-President and Co-Chief Executive Officer, Invesco Advisers, Inc. (formerly known as Invesco Institutional (N.A.), Inc.) (registered investment adviser); Director, Chief Executive Officer and President, Van Kampen Exchange Corp; President and Principal Executive Officer, The Invesco Funds (other than AIM Treasurer’s Series Trust (Invesco Treasurer’s Series Trust), Short-Term Investments Trust and Invesco Management Trust); Executive Vice President, The Invesco Funds (AIM Treasurer’s Series Trust (Invesco Treasurer’s Series Trust), Short-Term Investments Trust and Invesco Management Trust only); Director and President, INVESCO Funds Group, Inc. (registered investment adviser and registered transfer agent); Director and Chairman, IVZ Distributors, Inc. (formerly known as INVESCO Distributors, Inc.) (registered broker dealer); Director, President and Chairman, Invesco Inc. (holding company), Invesco Canada Holdings Inc. (holding company), Trimark Investments Ltd./Placements Trimark Ltèe and Invesco Financial Services Ltd/Services Financiers Invesco Ltèe; Chief Executive Officer, Invesco Canada Fund Inc. (corporate mutual fund company); Director and Chairman, Van Kampen Investor Services Inc.; Director, Chief Executive Officer and President, 1371 Preferred Inc. (holding company) and Van Kampen Investments Inc.; Director and President, AIM GP Canada Inc. (general partner for limited partnerships) and Van Kampen Advisors, Inc.; Director and Chief Executive Officer, Invesco Trimark Dealer Inc. (registered broker dealer); Director, Invesco Distributors, Inc. (formerly known as Invesco AIM Distributors, Inc.) (registered broker dealer); Manager, Invesco Capital Management LLC; Director, Chief Executive Officer and President, Invesco Advisers, Inc.; Director, Chairman, Chief Executive Officer and President, Invesco AIM Capital Management, Inc.; President, Invesco Trimark Dealer Inc. and Invesco Trimark Ltd./Invesco Trimark Ltèe; Director and President, AIM Trimark Corporate Class Inc. and AIM Trimark Canada Fund Inc.; Senior Managing Director, Invesco Holding Company Limited; Director and Chairman, Fund Management Company (former registered broker dealer); President and Principal Executive Officer, The Invesco Funds (AIM Treasurer’s Series Trust (Invesco Treasurer’s Series Trust), and Short-Term Investments Trust only); President, AIM Trimark Global Fund Inc. and AIM Trimark Canada Fund Inc. | | 158 | | None |
| 1 | Mr. Flanagan is considered an interested person (within the meaning of Section 2(a)(19) of the 1940 Act) of the Trust because he is an officer of the Adviser to the Trust, and an officer and a director of Invesco Ltd., ultimate parent of the Adviser. |
| 2 | Mr. Taylor is considered an interested person (within the meaning of Section 2(a)(19) of the 1940 Act) of the Trust because he is an officer and a director of the Adviser. |
T-1 Invesco Long/Short Equity Fund
Trustees and Officers—(continued)
| | | | | | | | |
Name, Year of Birth and
Position(s) Held with the Trust | | Trustee and/
or Officer Since | | Principal Occupation(s)
During Past 5 Years | | Number of
Funds in Fund
Complex
Overseen by
Trustee | | Other Directorship(s)
Held by Trustee During
Past 5 Years |
| Independent Trustees | | | | | | | | |
Bruce L. Crockett — 1944 Trustee and Chair | | 2001 | | Chairman, Crockett Technologies Associates (technology consulting company) Formerly: Director, Captaris (unified messaging provider); Director, President and Chief Executive Officer, COMSAT Corporation; Chairman, Board of Governors of INTELSAT (international communications company); ACE Limited (insurance company); Independent Directors Council and Investment Company Institute: Member of the Audit Committee, Investment Company Institute; Member of the Executive Committee and Chair of the Governance Committee, Independent Directors Council | | 158 | | Director and Chairman of the Audit Committee, ALPS (Attorneys Liability Protection Society) (insurance company); Director and Member of the Audit Committee and Compensation Committee, Ferroglobe PLC (metallurgical company) |
David C. Arch — 1945 Trustee | | 2010 | | Chairman of Blistex Inc. (consumer health care products manufacturer); Member, World Presidents’ Organization | | 158 | | Board member of the Illinois Manufacturers’ Association |
Jack M. Fields — 1952 Trustee | | 2001 | | Chief Executive Officer, Twenty First Century Group, Inc. (government affairs company); and Chairman, Discovery Learning Alliance (non-profit) Formerly: Owner and Chief Executive Officer, Dos Angeles Ranch L.P. (cattle, hunting, corporate entertainment); Director, Insperity, Inc. (formerly known as Administaff) (human resources provider); Chief Executive Officer, Texana Timber LP (sustainable forestry company); Director of Cross Timbers Quail Research Ranch (non-profit); and member of the U.S. House of Representatives | | 158 | | None |
Cynthia Hostetler — 1962 Trustee | | 2017 | | Non-Executive Director and Trustee of a number of public and private business corporations Formerly: Director, Aberdeen Investment Funds (4 portfolios); Head of Investment Funds and Private Equity, Overseas Private Investment Corporation; President, First Manhattan Bancorporation, Inc.; Attorney, Simpson Thacher & Bartlett LLP | | 158 | | Vulcan Materials Company (construction materials company); Trilinc Global Impact Fund; Artio Global Investment LLC (mutual fund complex); Edgen Group, Inc. (specialized energy and infrastructure products distributor) |
Eli Jones — 1961 Trustee | | 2016 | | Professor and Dean, Mays Business School — Texas A&M University Formerly: Professor and Dean, Walton College of Business, University of Arkansas and E.J. Ourso College of Business, Louisiana State University; Director, Arvest Bank | | 158 | | Insperity, Inc. (formerly known as Administaff) (human resources provider) |
Prema Mathai-Davis — 1950 Trustee | | 2001 | | Retired | | 158 | | None |
Teresa M. Ressel — 1962 Trustee | | 2017 | | Non-executive director and trustee of a number of public and private business corporations Formerly: Chief Financial Officer, Olayan America, The Olayan Group (international investor/commercial/industrial); Chief Executive Officer, UBS Securities LLC; Group Chief Operating Officer, Americas, UBS AG; Assistant Secretary for Management & Budget and CFO, US Department of the Treasury | | 158 | | Atlantic Power Corporation (power generation company); ON Semiconductor Corp. (semiconductor supplier) |
Ann Barnett Stern — 1957 Trustee | | 2017 | | President and Chief Executive Officer, Houston Endowment Inc. (private philanthropic institution) Formerly: Executive Vice President and General Counsel, Texas Children’s Hospital; Attorney, Beck, Redden and Secrest, LLP; Business Law Instructor, University of St. Thomas; Attorney, Andrews & Kurth LLP | | 158 | | Federal Reserve Bank of Dallas |
Raymond Stickel, Jr. — 1944 Trustee | | 2005 | | Retired Formerly: Director, Mainstay VP Series Funds, Inc. (25 portfolios); Partner, Deloitte & Touche | | 158 | | None |
Robert C. Troccoli — 1949 Trustee | | 2016 | | Adjunct Professor, University of Denver — Daniels College of Business Formerly: Senior Partner, KPMG LLP | | 158 | | None |
Christopher L. Wilson — 1957 Trustee | | 2017 | | Non-executive director and trustee of a number of public and private business corporations Formerly: Director, TD Asset Management USA Inc. (mutual fund complex) (22 portfolios); Managing Partner, CT2, LLC (investing and consulting firm); President/Chief Executive Officer, Columbia Funds, Bank of America Corporation; President/Chief Executive Officer, CDC IXIS Asset Management Services, Inc.; Principal & Director of Operations, Scudder Funds, Scudder, Stevens & Clark, Inc.; Assistant Vice President, Fidelity Investments | | 158 | | ISO New England, Inc. (non-profit organization managing regional electricity market) |
T-2 Invesco Long/Short Equity Fund
Trustees and Officers—(continued)
| | | | | | | | |
Name, Year of Birth and
Position(s) Held with the Trust | | Trustee and/
or Officer Since | | Principal Occupation(s)
During Past 5 Years | | Number of
Funds in Fund
Complex
Overseen by
Trustee | | Other Directorship(s)
Held by Trustee During
Past 5 Years |
| Other Officers | | | | | | | | |
Sheri Morris — 1964 President, Principal Executive Officer and Treasurer | | 1999 | | President, Principal Executive Officer and Treasurer, The Invesco Funds; Vice President, Invesco Advisers, Inc. (formerly known as Invesco Institutional (N.A.), Inc.) (registered investment adviser); and Vice President, Invesco Exchange-Traded Fund Trust, Invesco Exchange-Traded Fund Trust II, Invesco India Exchange-Traded Fund Trust, Invesco Actively Managed Exchange-Traded Fund Trust, Invesco Actively Managed Exchange-Traded Commodity Fund Trust and Invesco Exchange-Traded Self-Indexed Fund Trust Formerly: Vice President and Principal Financial Officer, The Invesco Funds; Vice President, Invesco AIM Advisers, Inc., Invesco AIM Capital Management, Inc. and Invesco AIM Private Asset Management, Inc.; Assistant Vice President and Assistant Treasurer, The Invesco Funds and Assistant Vice President, Invesco Advisers, Inc., Invesco AIM Capital Management, Inc. and Invesco AIM Private Asset Management, Inc.; and Treasurer, Invesco Exchange-Traded Fund Trust, Invesco Exchange-Traded Fund Trust II, Invesco India Exchange-Traded Fund Trust and Invesco Actively Managed Exchange-Traded Fund Trust | | N/A | | N/A |
Russell C. Burk — 1958 Senior Vice President and Senior Officer | | 2005 | | Senior Vice President and Senior Officer, The Invesco Funds | | N/A | | N/A |
Jeffrey H. Kupor — 1968 Senior Vice President, Chief Legal Officer and Secretary | | 2018 | | Senior Vice President and Secretary, Invesco Advisers, Inc. (formerly known as Invesco Institutional (N.A.), Inc.) (registered investment adviser); Senior Vice President and Secretary, Invesco Distributors, Inc. (formerly known as Invesco AIM Distributors, Inc.); Vice President and Secretary, Invesco Investment Services, Inc. (formerly known as Invesco AIM Investment Services, Inc.) Senior Vice President, Chief Legal Officer and Secretary, The Invesco Funds; Secretary and General Counsel, Invesco Investment Advisers LLC (formerly known as Van Kampen Asset Management); Secretary and General Counsel, Invesco Capital Markets, Inc. (formerly known as Van Kampen Funds Inc.) and Chief Legal Officer, Invesco Exchange-Traded Fund Trust, Invesco Exchange-Traded Fund Trust II, Invesco India Exchange-Traded Fund Trust, Invesco Actively Managed Exchange-Traded Fund Trust, Invesco Actively Managed Exchange-Traded Commodity Fund Trust and Invesco Exchange-Traded Self-Indexed Fund Trust; Secretary, Invesco Indexing LLC; Secretary and General Counsel, INVESCO Private Capital Investments, Inc.; Secretary, W.L. Ross & Co., LLC; Secretary and Vice President, Jemstep, Inc. Formerly: Senior Vice President, Secretary and General Counsel, Invesco Management Group, Inc. (formerly known as Invesco AIM Management Group, Inc.); Assistant Secretary, INVESCO Asset Management (Bermuda) Ltd.; Secretary and General Counsel, Invesco Private Capital, Inc.; Assistant Secretary and General Counsel, INVESCO Realty, Inc.; Secretary and General Counsel, Invesco Senior Secured Management, Inc.; and Secretary, Sovereign G./P. Holdings Inc. | | N/A | | N/A |
John M. Zerr — 1962 Senior Vice President | | 2006 | | Chief Operating Officer of the Americas; Senior Vice President, Invesco Advisers, Inc. (formerly known as Invesco Institutional (N.A.), Inc.) (registered investment adviser); Senior Vice President, Invesco Distributors, Inc. (formerly known as Invesco AIM Distributors, Inc.); Director and Vice President, Invesco Investment Services, Inc. (formerly known as Invesco AIM Investment Services, Inc.) Senior Vice President, The Invesco Funds; Managing Director, Invesco Capital Management LLC; Director, Invesco Investment Advisers LLC (formerly known as Van Kampen Asset Management); Senior Vice President, Invesco Capital Markets, Inc. (formerly known as Van Kampen Funds Inc.); Manager, Invesco Indexing LLC Formerly: Director and Senior Vice President, Invesco Management Group, Inc. (formerly known as Invesco AIM Management Group, Inc.); Secretary and General Counsel, Invesco Management Group, Inc. (formerly known as Invesco AIM Management Group, Inc.); Secretary, Invesco Investment Services, Inc. (formerly known as Invesco AIM Investment Services, Inc.); Chief Legal Officer and Secretary, The Invesco Funds; Secretary and General Counsel, Invesco Investment Advisers LLC (formerly known as Van Kampen Asset Management); Secretary and General Counsel, Invesco Capital Markets, Inc. (formerly known as Van Kampen Funds Inc.); Chief Legal Officer, Invesco Exchange-Traded Fund Trust, Invesco Exchange-Traded Fund Trust II, Invesco India Exchange-Traded Fund Trust, Invesco Actively Managed Exchange-Traded Fund Trust, Invesco Actively Managed Exchange-Traded Commodity Fund Trust and Invesco Exchange-Traded Self-Indexed Fund Trust; Secretary, Invesco Indexing LLC; Director, Secretary, General Counsel and Senior Vice President, Van Kampen Exchange Corp.; Director, Vice President and Secretary, IVZ Distributors, Inc. (formerly known as INVESCO Distributors, Inc.); Director and Vice President, INVESCO Funds Group, Inc.; Director and Vice President, Van Kampen Advisors Inc.; Director, Vice President, Secretary and General Counsel, Van Kampen Investor Services Inc.; Director and Secretary, Invesco Distributors, Inc. (formerly known as Invesco AIM Distributors, Inc.); Director, Senior Vice President, General Counsel and Secretary, Invesco AIM Advisers, Inc. and Van Kampen Investments Inc.; Director, Vice President and Secretary, Fund Management Company; Director, Senior Vice President, Secretary, General Counsel and Vice President, Invesco AIM Capital Management, Inc.; Chief Operating Officer and General Counsel, Liberty Ridge Capital, Inc. (an investment adviser) | | N/A | | N/A |
T-3 Invesco Long/Short Equity Fund
Trustees and Officers—(continued)
| | | | | | | | |
Name, Year of Birth and
Position(s) Held with the Trust | | Trustee and/
or Officer Since | | Principal Occupation(s)
During Past 5 Years | | Number of
Funds in Fund
Complex
Overseen by
Trustee | | Other Directorship(s)
Held by Trustee During
Past 5 Years |
| Other Officers—(continued) | | | | | | | | |
Gregory G. McGreevey — 1962 Senior Vice President | | 2012 | | Senior Managing Director, Invesco Ltd.; Director, Chairman, President, and Chief Executive Officer, Invesco Advisers, Inc. (formerly known as Invesco Institutional (N.A.), Inc.) (registered investment adviser); Director, Invesco Mortgage Capital, Inc. and Invesco Senior Secured Management, Inc.; and Senior Vice President, The Invesco Funds Formerly: Senior Vice President, Invesco Management Group, Inc. and Invesco Advisers, Inc.; Assistant Vice President, The Invesco Funds | | N/A | | N/A |
Kelli Gallegos — 1970 Vice President, Principal Financial Officer and Assistant Treasurer | | 2008 | | Vice President and Treasurer, Invesco Exchange-Traded Fund Trust, Invesco Exchange-Traded Fund Trust II, Invesco India Exchange-Traded Fund Trust, Invesco Actively Managed Exchange-Traded Fund Trust, Invesco Actively Managed Exchange-Traded Commodity Fund Trust and Invesco Exchange-Traded Self-Indexed Fund Trust; Vice President, Principal Financial Officer and Assistant Treasurer, The Invesco Funds; Principal Financial and Accounting Officer — Pooled Investments, Invesco Capital Management LLC Formerly: Assistant Treasurer, Invesco Exchange-Traded Fund Trust, Invesco Exchange-Traded Fund Trust II, Invesco India Exchange-Traded Fund Trust, Invesco Actively Managed Exchange-Traded Fund Trust, Invesco Actively Managed Exchange-Traded Commodity Fund Trust and Invesco Exchange-Traded Self-Indexed Fund Trust; Assistant Treasurer, Invesco Capital Management LLC; Assistant Vice President, The Invesco Funds | | N/A | | N/A |
Tracy Sullivan — 1962 Vice President, Chief Tax Officer and Assistant Treasurer | | 2008 | | Vice President, Chief Tax Officer and Assistant Treasurer, The Invesco Funds; Assistant Treasurer, Invesco Capital Management LLC, Invesco Exchange-Traded Fund Trust, Invesco Exchange-Traded Fund Trust II, Invesco India Exchange-Traded Fund Trust, Invesco Actively Managed Exchange-Traded Fund Trust, Invesco Actively Managed Exchange-Traded Commodity Fund Trust and Invesco Exchange-Traded Self-Indexed Fund Trust Formerly: Assistant Vice President, The Invesco Funds | | N/A | | N/A |
Crissie M. Wisdom — 1969 Anti-Money Laundering Compliance Officer | | 2013 | | Anti-Money Laundering Compliance Officer, Invesco Advisers, Inc. (formerly known as Invesco Institutional (N.A.), Inc.) (registered investment adviser), Invesco Capital Markets, Inc. (formerly known as Van Kampen Funds Inc.), Invesco Distributors, Inc., Invesco Investment Services, Inc., The Invesco Funds, and Invesco Exchange-Traded Fund Trust, Invesco Exchange-Traded Fund Trust II, Invesco India Exchange-Traded Fund Trust, Invesco Actively Managed Exchange-Traded Fund Trust, Invesco Actively Managed Exchange-Traded Commodity Fund Trust and Invesco Exchange-Traded Self-Indexed Fund Trust; Anti-Money Laundering Compliance Officer and Bank Secrecy Act Officer, INVESCO National Trust Company and Invesco Trust Company; and Fraud Prevention Manager and Controls and Risk Analysis Manager for Invesco Investment Services, Inc. Formerly: Anti-Money Laundering Compliance Officer, Van Kampen Exchange Corp. and Invesco Management Group, Inc. | | N/A | | N/A |
Robert R. Leveille — 1969 Chief Compliance Officer | | 2016 | | Chief Compliance Officer, Invesco Advisers, Inc. (registered investment adviser); and Chief Compliance Officer, The Invesco Funds Formerly: Chief Compliance Officer, Putnam Investments and the Putnam Funds | | N/A | | N/A |
The Statement of Additional Information of the Trust includes additional information about the Fund’s Trustees and is available upon request, without charge, by calling 1.800.959.4246. Please refer to the Fund’s Statement of Additional Information for information on the Fund’s sub-advisers.
| | | | | | |
Office of the Fund 11 Greenway Plaza, Suite 1000 Houston, TX 77046-1173 | | Investment Adviser Invesco Advisers, Inc. 1555 Peachtree Street, N.E. Atlanta, GA 30309 | | Distributor Invesco Distributors, Inc. 11 Greenway Plaza, Suite 1000 Houston, TX 77046-1173 | | Auditors PricewaterhouseCoopers LLP 1000 Louisiana Street, Suite 5800 Houston, TX 77002-5021 |
| | | |
| | | | | | |
Counsel to the Fund Stradley Ronon Stevens & Young, LLP 2005 Market Street, Suite 2600 Philadelphia, PA 19103-7018 | | Counsel to the Independent Trustees Goodwin Procter LLP 901 New York Avenue, N.W. Washington, D.C. 20001 | | Transfer Agent Invesco Investment Services, Inc. 11 Greenway Plaza, Suite 1000 Houston, TX 77046-1173 | | Custodian State Street Bank and Trust Company 225 Franklin Street Boston, MA 02110-2801 |
T-4 Invesco Long/Short Equity Fund
Explore High-Conviction Investing with Invesco

Go paperless with eDelivery
Visit invesco.com/edelivery to enjoy the convenience and security of anytime electronic access to your investment documents.
With eDelivery, you can elect to have any or all of the following materials delivered straight to your inbox to download, save and print from your own computer:
∎ Fund reports and prospectuses
∎ Quarterly statements
∎ Daily confirmations
∎ Tax forms
Invesco mailing information
Send general correspondence to Invesco Investment Services, Inc., P.O. Box 219078, Kansas City, MO 64121-9078.
Important notice regarding delivery of security holder documents
To reduce Fund expenses, only one copy of most shareholder documents may be mailed to shareholders with multiple accounts at the same address (Householding). Mailing of your shareholder documents may be householded indefinitely unless you instruct us otherwise. If you do not want the mailing of these documents to be combined with those for other members of your household, please contact Invesco Investment Services, Inc. at 800 959 4246 or contact your financial institution. We will begin sending you individual copies for each account within 30 days after receiving your request.
Fund holdings and proxy voting information
The Fund provides a complete list of its holdings four times in each fiscal year, at the quarter ends. For the second and fourth quarters, the lists appear in the Fund’s semiannual and annual reports to shareholders. For the first and third quarters, the Fund files the lists with the Securities and Exchange Commission (SEC) on Form N-Q (or any successor Form). The most recent list of portfolio holdings is available at invesco.com/completeqtrholdings. Shareholders can also look up the Fund’s Forms N-Q (or any successor Form) on the SEC website at sec.gov. The SEC file numbers for the Fund are shown below.
A description of the policies and procedures that the Fund uses to determine how to vote proxies relating to portfolio securities is available without charge, upon request, from our Client Services department at 800 959 4246 or at invesco.com/proxyguidelines. The information is also available on the SEC website, sec.gov.
| | |
Information regarding how the Fund voted proxies related to its portfolio securities during the most recent 12-month period ended June 30 is available at invesco.com/proxysearch. The information is also available on the SEC website, sec.gov. Invesco Advisers, Inc. is an investment adviser; it provides investment advisory services to individual and institutional clients and does not sell securities. Invesco Distributors, Inc. is the US distributor for Invesco Ltd.’s retail mutual funds, exchange-traded funds and institutional money market funds. Both are wholly owned, indirect subsidiaries of Invesco Ltd. | | 
|
| | | | | | | | |
| SEC file numbers: 811-05426 and 033-19338 | | Invesco Distributors, Inc. | | LSE-AR-1 | | 12242018 | | 0812 |
| | | | | | |
| | | | |

| | Annual Report to Shareholders | | October 31, 2018 | | |
| | | | |
| | Invesco Low Volatility Emerging Markets Fund | | |
| | Nasdaq: |
| | A: LVLAX ∎ C: LVLCX ∎ R: LVLRX ∎ Y: LVLYX ∎ R5: LVLFX ∎ R6: LVLSX |

Letters to Shareholders
| | |

Philip Taylor | | Dear Shareholders: This annual report includes information about your Fund, including performance data and a complete list of its investments as of the close of the reporting period. Inside is a discussion of how your Fund was managed and the factors that affected its performance during the reporting period. Throughout the reporting period, US economic data remained positive. Robust corporate profits, strong retail sales and unemployment rates near generational lows helped drive US markets to new all-time records multiple times during the reporting period. Against this backdrop, the US Federal Reserve raised the federal funds rate four times during the reporting period. Market volatility, largely non-existent in 2017, returned in 2018. Markets sold off first in February and again sharply in October, amid rising interest rates, concerns about potential trade wars and |
heightened geopolitical tensions. Despite the volatility, US equity markets were largely positive for the reporting period and fared better than international markets. Emerging markets were particularly hard hit due to a strong US dollar. During the October sell-off, investors retreated to more defensive areas of the market and to US Treasuries. The broader bond market declined during the reporting period due to the increase in US Treasury yields and widening credit spreads. As the year progresses, we’ll see how the interplay of economic data, interest rates, geopolitics and a host of other factors affect US and overseas equity and fixed income markets.
Short-term market volatility can prompt some investors to abandon their investment plans – and can cause others to settle for whatever returns the market has to offer. The investment professionals at Invesco, in contrast, invest with high conviction. This means that, no matter the asset class or the strategy, each investment team has a passion to exceed. We want to help investors achieve better outcomes, such as seeking higher returns, helping mitigate risk and generating income. Of course, investing with high conviction can’t guarantee a profit or ensure success; no investment strategy can. To learn more about how we invest with high conviction, visit invesco.com/HighConviction.
You, too, can invest with high conviction by maintaining a long-term investment perspective and by working with your financial adviser on a regular basis. During periods of short-term market volatility or uncertainty, your financial adviser can keep you focused on your long-term investment goals – a new home, a child’s college education or a secure retirement. He or she also can share research about the economy, the markets and individual investment options.
Visit our website for more information on your investments
Our website, invesco.com/us, offers a wide range of market insights and investment perspectives. On the website, you’ll find detailed information about our funds, including performance, holdings and portfolio manager commentaries. You can access information about your account by completing a simple, secure online registration. To do so, select “Log In” on the right side of the homepage, and then select “Register for Individual Account Access.”
In addition to the resources accessible on our website and through our mobile app, you can obtain timely updates to help you stay informed about the markets and the economy by connecting with Invesco on Twitter, LinkedIn or Facebook. You can access our blog at blog.invesco.us.com. Our goal is to provide you the information you want, when and where you want it.
Finally, I’m pleased to share with you Invesco’s commitment to both the Principles for Responsible Investment and to considering environmental, social and governance issues in our robust investment process. I invite you to learn more at invesco.com/esg.
Have questions?
For questions about your account, contact an Invesco client services representative at 800 959 4246. For Invesco-related questions or comments, please email me directly at phil@invesco.com.
All of us at Invesco look forward to serving your investment management needs. Thank you for investing with us.
Sincerely,

Philip Taylor
Senior Managing Director, Invesco Ltd.
| | |
| 2 | | Invesco Low Volatility Emerging Markets Fund |
| | | | |

Bruce Crockett | | Dear Fellow Shareholders: Among the many important lessons I’ve learned in more than 40 years in a variety of business endeavors is the value of a trusted advocate. As independent chair of the Invesco Funds Board, I can assure you that the members of the Board are strong advocates for the interests of investors in Invesco’s mutual funds. We work hard to represent your interests through oversight of the quality of the investment management services your funds receive and other matters important to your investment, including but not limited to: |
| | ∎ | | Ensuring that Invesco offers a diverse lineup of mutual funds that your financial adviser can use to strive to meet your financial needs as your investment goals change over time. |
| | ∎ | | Monitoring how the portfolio management teams of the Invesco funds are performing in light of changing economic and market conditions. |
| ∎ | | Assessing each portfolio management team’s investment performance within the context of the investment strategy described in the fund’s prospectus. |
| ∎ | | Monitoring for potential conflicts of interests that may impact the nature of the services that your funds receive. |
We believe one of the most important services we provide our fund shareholders is the annual review of the funds’ advisory and sub-advisory contracts with Invesco Advisers and its affiliates. This review is required by the Investment Company Act of 1940 and focuses on the nature and quality of the services Invesco provides as the adviser to the Invesco funds and the reasonableness of the fees that it charges for those services. Each year, we spend months carefully reviewing information received from Invesco and a variety of independent sources, such as performance and fee data prepared by Lipper, Inc. (a subsidiary of Broadridge Financial Solutions, Inc.), an independent, third-party firm widely recognized as a leader in its field. We also meet with our independent legal counsel and other independent advisers to review and help us assess the information that we have received. Our goal is to assure that you receive quality investment management services for a reasonable fee.
I trust the measures outlined above provide assurance that you have a worthy advocate when it comes to choosing the Invesco Funds.
As always, please contact me at bruce@brucecrockett.com with any questions or concerns you may have. On behalf of the Board, we look forward to continuing to represent your interests and serving your needs.
Sincerely,

Bruce L. Crockett
Independent Chair
Invesco Funds Board of Trustees
| | |
| 3 | | Invesco Low Volatility Emerging Markets Fund |
Management’s Discussion of Fund Performance
| | | | |
| |
Performance summary For the fiscal year ended October 31, 2018, Class A shares of Invesco Low Volatility Emerging Markets Fund (the Fund), at net asset value (NAV), underperformed the MSCI Emerging Markets Index, the Fund’s style-specific benchmark. Your Fund’s long-term performance appears later in this report. | |
| | |
Fund vs. Indexes | | | | |
Total returns, 10/31/17 to 10/31/18, at net asset value (NAV). Performance shown does not include applicable contingent deferred sales charges (CDSC) or front-end sales charges, which would have reduced performance. | |
| |
Class A Shares | | | -14.82 | % |
Class C Shares | | | -15.49 | |
Class R Shares | | | -15.05 | |
Class Y Shares | | | -14.66 | |
Class R5 Shares | | | -14.66 | |
Class R6 Shares | | | -14.67 | |
MSCI All Country World Indexq (Broad Market Index) | | | -0.52 | |
MSCI Emerging Markets Indexq (Style-Specific Index) | | | -12.52 | |
Lipper Emerging Market Funds Index⬛ (Peer Group Index) | | | -13.05 | |
| | |
Source(s): qRIMES Technologies Corp.; ⬛Lipper Inc. | | | | |
Market conditions and your Fund
The fiscal year proved to be an increasingly volatile time for global equities. The fiscal year began in the final months of 2017 with several US stock market indexes repeatedly reaching new highs amid strong corporate profits, the prospect of tax reform legislation and exceedingly low stock market volatility. Despite a sharp uptick in volatility, particularly in October 2018, US markets, in general, still produced positive returns for the fiscal year. International markets, however, were meaningfully less robust, many experiencing flat to negative results for the fiscal year. This divergence between the US and other markets could be attributed to the strength of the US economy and the widely-held belief that the US could win trade wars with other countries.
At the beginning of 2018, markets saw significant turbulence in late January and early February, when stocks were whipsawed – first by concerns about
accelerated US Federal Reserve (the Fed) tightening and then, later in the year, by fears of brewing trade wars and geopolitical tensions. After a relatively quiet summer, market volatility markedly rose again in the final month of the fiscal year. Global equity markets (particularly the US) suffered a sharp sell-off in October 2018 amid rising interest rates and concerns that higher inflation could result in a more restrictive monetary policy.
Global economic growth, in general, was solid despite weakness in emerging markets. During the fiscal year, emerging markets were impacted by both country-specific issues, as well as, more generalized pressure resulting from the Fed’s tightening policy. In this environment, economic growth unsurprisingly slowed in emerging markets. Within the eurozone, economic growth accelerated, although there was divergence among countries. In Japan, economic growth improved over the latter part of the fiscal
year. The US experienced strong growth during the fiscal year due to robust consumer and business spending. In addition, unemployment rates remained low, job creation was strong and inflation remained relatively controlled.
At the close of the fiscal year, equity valuations in developed and emerging markets appeared relatively full in absolute terms, but overseas equity markets were trading at a material discount to those of the US. In sum, while valuations were not cheap, recent earnings growth and upward earnings revisions improved in many non-US developed markets.
The Fund seeks to provide long-term growth of capital while achieving a lower volatility level than its style-specific benchmark over a full market cycle. The Fund seeks long-term capital growth through stock selection using a proprietary multifactor model based on fundamental and behavioral factors to forecast individual security returns and risk and rank companies relative to peers within their respective countries and sectors. The multi-factor model forecasts a return for each stock in the investable universe and is based on four concepts: Earnings Expectations, Market Sentiment, Management and Quality, and Value.1 For the fiscal year, the Fund had a lower volatility level than its style-specific benchmark, the MSCI Emerging Markets Index.
For the fiscal year, stock selection in the utilities, industrials and real estate sectors contributed to the Fund’s performance relative to its style-specific benchmark. In addition, the Fund’s stock selection in and underweight allocation to the communication services sector benefited the Fund’s relative performance. This contribution was offset by adverse stock selection in the information technology (IT), health care and materials sectors. Another detractor from the Fund’s relative returns
| | | | |
| |
Portfolio Composition | |
| By sector | | | % of total net assets | |
| |
Materials | | | 18.1 | % |
Industrials | | | 16.3 | |
Consumer Staples | | | 11.5 | |
Communication Services | | | 9.7 | |
Financials | | | 7.8 | |
Consumer Discretionary | | | 7.6 | |
Health Care | | | 6.3 | |
Energy | | | 5.2 | |
Information Technology | | | 4.9 | |
Utilities | | | 4.7 | |
Real Estate | | | 1.6 | |
Money Market Funds Plus Other Assets Less Liabilities | | | 6.3 | |
| | | | | | |
| | |
Top 10 Equity Holdings* | | | | |
| | % of total net assets | |
| | |
1. | | HEG Ltd. | | | 1.6 | % |
2. | | Engie Brasil Energia S.A. | | | 1.6 | |
3. | | Petronas Chemicals Group Bhd. | | | 1.5 | |
4. | | SK Telecom Co., Ltd. | | | 1.5 | |
5. | | SLC Agricola S.A. | | | 1.5 | |
6. | | PT Bukit Asam Tbk | | | 1.5 | |
7. | | Chunghwa Telecom Co., Ltd. | | | 1.5 | |
8. | | LUKOIL PJSC-ADR | | | 1.5 | |
9. | | Tekfen Holding A.S. | | | 1.4 | |
10. | | Graphite India Ltd. | | | 1.4 | |
| | | | |
| | |
Total Net Assets | | $ | 34.6 million | |
| |
Total Number of Holdings* | | | 104 | |
The Fund’s holdings are subject to change, and there is no assurance that the Fund will continue to hold any particular security.
*Excluding money market fund holdings.
Data presented here are as of October 31, 2018.
| | |
| 4 | | Invesco Low Volatility Emerging Markets Fund |
was underweight exposures to the energy and financials sectors.
From a geographic perspective, stock selection in India was the largest detractor from the Fund’s performance relative to the style-specific benchmark for the fiscal year. Stock selection in Brazil and Taiwan also hampered the Fund’s relative returns. The largest contributor to the Fund’s relative performance was stock selection in and overweight exposure to South Africa. In addition, underweight exposure to China aided the Fund’s relative performance.
The top individual contributor to the Fund’s performance versus its style-specific benchmark for the fiscal year was South African bank Nedbank Group. However, we exited our position in the company before the close of the fiscal year, as we believed valuation had been reached. Also contributing to the Fund’s performance was Russian energy company LUKOIL, which benefited from rising oil prices.
A key detractor from the Fund’s relative performance during the fiscal year was YY. The Chinese live-streaming company’s stock price suffered as its management reported disappointing forward guidance during the fiscal year. Also detracting from the Fund’s relative performance was South Korean chemical company Lotte Fine Chemicals and South African poultry products and services company Astral Foods.
At the close of the fiscal year, relative to the Fund’s style-specific benchmark, the Fund held overweight positions in the consumer staples, industrials, health care, materials and utilities sectors, and underweight positions in the consumer discretionary, energy, financials, IT and communication services sectors. Geographically, the Fund held overweight positions in Brazil, Mexico, South Africa and India, and underweight positions in China and Taiwan.
Please note, the Fund’s strategy is principally implemented through equity investments, but the Fund may also use futures contracts, a derivative instrument, to gain exposure to the equity market. During the fiscal year, the Fund invested in MSCI Emerging Markets Index futures contracts, which generated a negative return. Derivatives can be a cost-effective way to gain exposure to asset classes. However, derivatives may amplify traditional investment risks through the creation of leverage and may be less liquid than traditional securities.
Thank you for your investment in Invesco Low Volatility Emerging Markets Fund.
| 1 | The Model’s investment concepts – Earnings Expectations, Market Sentiment, Management and Quality, and Value are the foundation of the Fund’s stock selection process. Factors considered in the Earnings Expectations concept include, but are not limited to, earnings momentum and earnings revisions. Similarly, Market Sentiment evaluates measures of stock price momentum, while the Management and Quality concept assesses capital efficiency. Lastly, the Value concept evaluates cash flow, dividend and earnings yield. |
The views and opinions expressed in management’s discussion of Fund performance are those of Invesco Advisers, Inc. These views and opinions are subject to change at any time based on factors such as market and economic conditions. These views and opinions may not be relied upon as investment advice or recommendations, or as an offer for a particular security. The information is not a complete analysis of every aspect of any market, country, industry, security or the Fund. Statements of fact are from sources considered reliable, but Invesco Advisers, Inc. makes no representation or warranty as to their completeness or accuracy. Although historical performance is no guarantee of future results, these insights may help you understand our investment management philosophy.
See important Fund and, if applicable, index disclosures later in this report.
| | |
 | | Michael Abata Chartered Financial Analyst, Portfolio Manager, is manager of Invesco Low Volatility Emerging Markets |
| Fund. He joined Invesco in 2011. Mr. Abata earned a BA in economics from Binghamton University. |
| |
 | | Su-Jin Fabian Chartered Financial Analyst, Portfolio Manager, is manager of Invesco Low Volatility Emerging Markets |
| Fund. She joined Invesco in 2007. Ms. Fabian received a Diplom Kauffrau degree from the Goethe University in Frankfurt, Germany. |
| |
 | | Nils Huter Chartered Financial Analyst, Portfolio Manager, is manager of Invesco Low Volatility Emerging Markets |
| Fund. He joined Invesco in 2007. Mr. Huter earned a business administration degree, Diplom Kaufmann (FH), from the University of Applied Sciences and Arts in Hildesheim. |
5 Invesco Low Volatility Emerging Markets Fund
Your Fund’s Long-Term Performance
Results of a $10,000 Investment – Oldest Share Class(es) since Inception
Fund and index data from 12/17/13
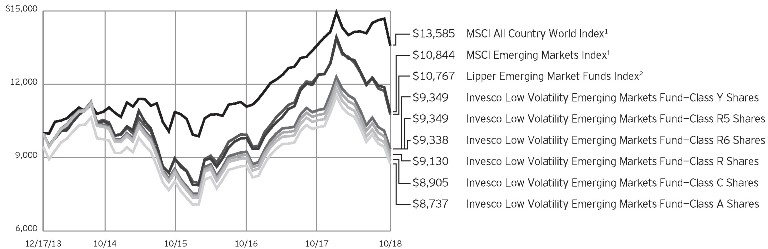
1 Source: RIMES Technologies Corp.
2 Source: Lipper Inc.
Past performance cannot guarantee comparable future results.
The data shown in the chart include reinvested distributions, applicable sales charges and Fund expenses including
management fees. Index results include reinvested dividends, but they do not reflect sales charges. Performance of the peer group, if applicable, reflects fund expenses and management fees; performance
of a market index does not. Performance shown in the chart and table(s) does not reflect deduction of taxes a shareholder would pay on Fund distributions or sale of Fund shares.
| | |
| 6 | | Invesco Low Volatility Emerging Markets Fund |
| | | | |
| |
Average Annual Total Returns | |
As of 10/31/18, including maximum applicable sales charges | |
| |
Class A Shares | | | | |
Inception (12/17/13) | | | -2.73 | % |
1 Year | | | -19.54 | |
| |
Class C Shares | | | | |
Inception (12/17/13) | | | -2.35 | % |
1 Year | | | -16.22 | |
| |
Class R Shares | | | | |
Inception (12/17/13) | | | -1.85 | % |
1 Year | | | -15.05 | |
| |
Class Y Shares | | | | |
Inception (12/17/13) | | | -1.37 | % |
1 Year | | | -14.66 | |
| |
Class R5 Shares | | | | |
Inception (12/17/13) | | | -1.37 | % |
1 Year | | | -14.66 | |
| |
Class R6 Shares | | | | |
Inception (12/17/13) | | | -1.40 | % |
1 Year | | | -14.67 | |
The performance data quoted represent past performance and cannot guarantee comparable future results; current performance may be lower or higher. Please visit invesco.com/performance for the most recent month-end performance. Performance figures reflect reinvested distributions, changes in net asset value and the effect of the maximum sales charge unless otherwise stated. Investment return and principal value will fluctuate so that you may have a gain or loss when you sell shares.
The net annual Fund operating expense ratio set forth in the most recent Fund prospectus as of the date of this report for Class A, Class C, Class R, Class Y, Class R5 and Class R6 shares was 1.33%, 2.08%, 1.58%, 1.08%, 1.08% and 1.08%, respectively.1 The total annual Fund operating expense ratio set forth in the most recent Fund prospectus as of the date of this report for Class A, Class C, Class R, Class Y, Class R5 and Class R6 shares was 2.09%, 2.84%, 2.34%, 1.84%, 1.65% and 1.65%, respectively. The expense ratios presented above may vary from the expense ratios presented in other sections of this report that are based on expenses incurred during the period covered by this report.
Class A share performance reflects the maximum 5.50% sales charge, and Class C share performance reflects the applicable contingent deferred sales
| | | | |
| |
Average Annual Total Returns | |
As of 9/30/18, the most recent calendar quarter end, including maximum applicable sales charges | |
| |
Class A Shares | | | | |
Inception (12/17/13) | | | -1.19 | % |
1 Year | | | -12.29 | |
| |
Class C Shares | | | | |
Inception (12/17/13) | | | -0.79 | % |
1 Year | | | -8.74 | |
| |
Class R Shares | | | | |
Inception (12/17/13) | | | -0.28 | % |
1 Year | | | -7.52 | |
| |
Class Y Shares | | | | |
Inception (12/17/13) | | | 0.21 | % |
1 Year | | | -7.03 | |
| |
Class R5 Shares | | | | |
Inception (12/17/13) | | | 0.21 | % |
1 Year | | | -7.03 | |
| |
Class R6 Shares | | | | |
Inception (12/17/13) | | | 0.19 | % |
1 Year | | | -7.04 | |
charge (CDSC) for the period involved. The CDSC on Class C shares is 1% for the first year after purchase. Class R, Class Y, Class R5 and Class R6 class shares do not have a front-end sales charge or a CDSC; therefore, performance is at net asset value.
The performance of the Fund’s share classes will differ primarily due to different sales charge structures and class expenses.
Fund performance reflects any applicable fee waivers and/or expense reimbursements. Had the adviser not waived fees and/or reimbursed expenses currently or in the past, returns would have been lower. See current prospectus for more information.
| 1 | Total annual Fund operating expenses after any contractual fee waivers and/or expense reimbursements by the adviser in effect through at least February 29, 2020. See current prospectus for more information. |
7 Invesco Low Volatility Emerging Markets Fund
Invesco Low Volatility Emerging Markets Fund’s investment objective is long-term growth of capital.
| ∎ | | Unless otherwise stated, information presented in this report is as of October 31, 2018, and is based on total net assets. |
| ∎ | | Unless otherwise noted, all data provided by Invesco. |
| ∎ | | To access your Fund’s reports/prospectus, visit invesco.com/fundreports. |
About share classes
| ∎ | | Class R shares are generally available only to employer sponsored retirement and benefit plans. Please see the prospectus for more information. |
| ∎ | | Class Y shares are available only to certain investors. Please see the prospectus for more information. |
| ∎ | | Class R5 shares and Class R6 shares are available for use by retirement plans that meet certain standards and for institutional investors. Class R6 shares are also available through intermediaries that have established an agreement with Invesco Distributors, Inc. to make such shares available for use in retail omnibus accounts. Please see the prospectus for more information. |
Principal risks of investing in the Fund
| ∎ | | Depositary receipts risk. Investing in depositary receipts involves the same risks as direct investments in foreign securities. In addition, the underlying issuers of certain depositary receipts are under no obligation to distribute shareholder communications or pass through any voting rights with respect to the deposited securities to the holders of such receipts. The Fund may therefore receive less timely information or have less control than if it invested directly in the foreign issuer. |
| ∎ | | Derivatives risk. The value of a derivative instrument depends largely on (and is derived from) the value of an underlying security, currency, commodity, interest rate, index or other asset (each referred to as an underlying asset). In addition to risks relating to the underlying assets, the use of derivatives may include other, possibly greater, risks, including counterparty, leverage and liquidity risks. Counterparty risk is the risk that the counterparty to the derivative contract will default on its obligation to pay the Fund the amount owed or otherwise perform under the derivative contract. Derivatives create leverage risk because they |
| | do not require payment up front equal to the economic exposure created by owning the derivative. As a result, an adverse change in the value of the underlying asset could result in the Fund sustaining a loss that is substantially greater than the amount invested in the derivative, which may make the Fund’s returns more volatile and increase the risk of loss. Derivative instruments may also be less liquid than more traditional investments and the Fund may be unable to sell or close out its derivative positions at a desirable time or price. This risk may be more acute under adverse market conditions, during which the Fund may be most in need of liquidating its derivative positions. Derivatives may also be harder to value, less tax efficient and subject to changing government regulation that could impact the Fund’s ability to use certain derivatives or their cost. Also, derivatives used for hedging or to gain or limit exposure to a particular market segment may not provide the expected benefits, particularly during adverse market conditions. |
| ∎ | | Emerging markets securities risk. Emerging markets (also referred to as developing markets) are generally subject to greater market volatility, political, social and economic instability, uncertain trading markets and more governmental limitations on foreign investment than more developed markets. In addition, companies operating in emerging markets may be subject to lower trading volume and greater price fluctuations than companies in more developed markets. Securities law and the enforcement of systems of taxation in many emerging market countries may change quickly and unpredictably. The Fund’s investments in China A-shares are subject to trading restrictions, quota limitations and clearing and settlement risks. In addition, investments in emerging markets securities may also be subject to additional transaction costs, delays in settlement procedures, and lack of timely information. |
This report must be accompanied or preceded by a currently effective Fund prospectus, which contains more complete information, including sales charges and expenses. Investors should read it carefully before investing.
NOT FDIC INSURED | MAY LOSE VALUE | NO BANK GUARANTEE
| ∎ | | Foreign securities risk. The Fund’s foreign investments may be adversely affected by political and social instability, changes in economic or taxation policies, difficulty in enforcing obligations, decreased liquidity or increased volatility. Foreign investments also involve the risk of the possible seizure, nationalization or expropriation of the issuer or foreign deposits (in which the Fund could lose its entire investments in a certain market) and the possible adoption of foreign governmental restrictions such as exchange controls. Unless the Fund has hedged its foreign securities risk, foreign securities risk also involves the risk of negative foreign currency rate fluctuations, which may cause the value of securities denominated in such foreign currency (or other instruments through which the Fund has exposure to foreign currencies) to decline in value. Currency exchange rates may fluctuate significantly over short periods of time. Currency hedging strategies, if used, are not always successful. |
| ∎ | | Geographic focus risk. The Fund may from time to time invest a substantial amount of its assets in securities of issuers located in a single country or a limited number of countries. Adverse economic, political or social conditions in those countries may therefore have a significant negative impact on the Fund’s investment performance. |
| ∎ | | Management risk. The Fund is actively managed and depends heavily on the Adviser’s judgment about markets, interest rates or the attractiveness, relative values, liquidity, or potential appreciation of particular investments made for the Fund’s portfolio. The Fund could experience losses if these judgments prove to be incorrect. There is no guarantee that the portfolio manager’s stock selection process will produce lower volatility than the broader markets in which the Fund invests. In addition, the Fund’s investment strategy to seek lower volatility over a full market cycle may cause the Fund to underperform the broader markets in which the Fund invests during market rallies. Such underperformance could be significant during sudden or significant market rallies. Additionally, legislative, regulatory, or tax developments may adversely affect management of |
| | |
| 8 | | Invesco Low Volatility Emerging Markets Fund |
| | the Fund and, therefore, the ability of the Fund to achieve its investment objective. |
| ∎ | | Market risk. The market values of the Fund’s investments, and therefore the value of the Fund’s shares, will go up and down, sometimes rapidly or unpredictably. Market risk may affect a single issuer, industry or section of the economy, or it may affect the market as a whole. Individual stock prices tend to go up and down more dramatically than those of certain other types of investments, such as bonds. During a general downturn in the financial markets, multiple asset classes may decline in value. When markets perform well, there can be no assurance that specific investments held by the Fund will rise in value. |
| ∎ | | Preferred securities risk. Preferred securities are subject to issuer-specific and market risks applicable generally to equity securities. Preferred securities also may be subordinated to bonds or other debt instruments, subjecting them to a greater risk of non-payment, may be less liquid than many other securities, such as common stocks, and generally offer no voting rights with respect to the issuer. |
| ∎ | | Small- and mid-capitalization companies risks. Small- and mid-capitalization companies tend to be more vulnerable to changing market conditions, may have little or no operating history or track record of success, and may have more limited product lines and markets, less experienced management and fewer financial resources than larger companies. These companies’ securities may be more volatile and less liquid than those of more established companies, and their returns may vary, sometimes significantly, from the overall securities market. |
About indexes used in this report
| ∎ | | The MSCI All Country World Index is an unmanaged index considered representative of large- and mid-cap stocks across developed and emerging markets. The index is computed using the net return, which withholds applicable taxes for non-resident investors. |
| ∎ | | The MSCI Emerging Markets Index is an unmanaged index considered representative of stocks of developing countries. The index is computed using the net return, which withholds applicable taxes for non-resident investors. |
| ∎ | | The Lipper Emerging Market Funds Index is an unmanaged index considered representative of emerging market funds tracked by Lipper. |
| ∎ | | The Fund is not managed to track the performance of any particular index, including the index(es) described here, and consequently, the performance of the Fund may deviate significantly from the performance of the index(es). |
| ∎ | | A direct investment cannot be made in an index. Unless otherwise indicated, index results include reinvested dividends, and they do not reflect sales charges. Performance of the peer group, if applicable, reflects fund expenses; performance of a market index does not. |
Other information
| ∎ | | The returns shown in management’s discussion of Fund performance are based on net asset values (NAVs) calculated for shareholder transactions. Generally accepted accounting principles require adjustments to be made to the net assets of the Fund at period end for financial reporting purposes, and as such, the NAVs for shareholder transactions and the returns based on those NAVs may differ from the NAVs and returns reported in the Financial Highlights. |
| ∎ | | Industry classifications used in this report are generally according to the Global Industry Classification Standard, which was developed by and is the exclusive property and a service mark of MSCI Inc. and Standard & Poor’s. |
| | |
| 9 | | Invesco Low Volatility Emerging Markets Fund |
Schedule of Investments
October 31, 2018
| | | | | | | | |
| | | Shares | | | Value | |
Common Stocks & Other Equity Interests–93.71% | |
| Brazil–8.33% | |
Ecorodovias Infraestrutura e Logistica S.A. | | | 156,900 | | | $ | 396,308 | |
Engie Brasil Energia S.A. | | | 51,200 | | | | 547,564 | |
Estacio Participacoes S.A. | | | 29,600 | | | | 184,130 | |
Mahle-Metal Leve S.A. | | | 49,800 | | | | 290,115 | |
Qualicorp Consultoria e Corretora de Seguros S.A. | | | 47,300 | | | | 182,260 | |
SLC Agricola S.A. | | | 34,600 | | | | 525,764 | |
Transmissora Alianca de Energia Eletrica S.A.(a) | | | 71,000 | | | | 428,118 | |
Tupy S.A. | | | 69,100 | | | | 325,307 | |
| | | | | | | | 2,879,566 | |
|
| Chile–0.23% | |
Embotelladora Andina S.A.–Preference Shares–Class B | | | 23,510 | | | | 81,268 | |
|
| China–12.85% | |
Anhui Conch Cement Co. Ltd.–Class A | | | 98,577 | | | | 462,630 | |
Autohome Inc.–ADR | | | 4,775 | | | | 345,615 | |
China Lilang Ltd. | | | 118,000 | | | | 97,599 | |
China Resources Cement Holdings Ltd. | | | 486,000 | | | | 426,684 | |
China Shineway Pharmaceutical Group Ltd. | | | 187,000 | | | | 216,974 | |
Chongqing Rural Commercial Bank Co., Ltd.–Class H | | | 672,000 | | | | 370,194 | |
Daqin Railway Co., Ltd.–Class A | | | 415,467 | | | | 481,168 | |
Jiangsu Expressway Co. Ltd.–Class H | | | 134,000 | | | | 179,761 | |
Longfor Group Holdings Ltd. | | | 87,500 | | | | 213,309 | |
Sany Heavy Industry Co., Ltd.–Class A | | | 403,200 | | | | 456,170 | |
Sinopec Shanghai Petrochemical Co., Ltd.–Class A | | | 600,500 | | | | 454,631 | |
Yantai Changyu Pioneer Wine Co. Ltd.–Class B | | | 64,900 | | | | 138,051 | |
YiChang HEC ChangJiang Pharmaceutical Co.Ltd.–Class H(b) | | | 92,600 | | | | 317,053 | |
YY Inc.–ADR(c) | | | 4,430 | | | | 283,077 | |
| | | | | | | | 4,442,916 | |
|
| Hong Kong–0.21% | |
Kingboard Laminates Holdings Ltd. | | | 96,000 | | | | 73,641 | |
|
| India–12.57% | |
Graphite India Ltd. | | | 38,042 | | | | 489,589 | |
HEG Ltd. | | | 9,451 | | | | 548,186 | |
Hero MotoCorp Ltd. | | | 10,566 | | | | 394,712 | |
JSW Steel Ltd. | | | 99,918 | | | | 459,288 | |
KEC International Ltd. | | | 79,399 | | | | 304,106 | |
NHPC Ltd. | | | 660,346 | | | | 217,782 | |
NMDC Ltd. | | | 322,937 | | | | 476,686 | |
Power Finance Corp. Ltd. | | | 265,111 | | | | 343,374 | |
Rural Electrification Corp. Ltd. | | | 208,383 | | | | 328,025 | |
Sanofi India Ltd. | | | 1,052 | | | | 82,390 | |
Sun TV Network Ltd. | | | 33,520 | | | | 294,991 | |
Tata Steel Ltd. | | | 54,124 | | | | 407,050 | |
| | | | | | | | 4,346,179 | |
| | | | | | | | |
| | | Shares | | | Value | |
| Indonesia–1.52% | |
PT Bukit Asam Tbk | | | 1,873,200 | | | $ | 524,622 | |
|
| Malaysia–4.52% | |
AirAsia Group Bhd. | | | 512,700 | | | | 322,237 | |
Petronas Chemicals Group Bhd. | | | 235,800 | | | | 526,880 | |
Petronas Dagangan Bhd. | | | 31,300 | | | | 194,480 | |
PPB Group Bhd. | | | 54,360 | | | | 217,726 | |
Public Bank Bhd. | | | 51,600 | | | | 303,580 | |
| | | | | | | | 1,564,903 | |
|
| Mexico–6.60% | |
Alfa, S.A.B. de C.V.–Class A | | | 384,900 | | | | 407,008 | |
Coca-Cola FEMSA, S.A.B. de C.V.–Series L | | | 60,300 | | | | 344,376 | |
Grupo Aeroportuario del Centro Norte, S.A.B. de C.V. | | | 73,900 | | | | 387,049 | |
Grupo Comercial Chedraui, S.A. de C.V. | | | 49,900 | | | | 88,116 | |
Industrias Bachoco, S.A.B. de C.V.–Series B | | | 36,100 | | | | 132,026 | |
Megacable Holdings S.A.B. de C.V.–Series CPO(d) | | | 99,700 | | | | 443,253 | |
Wal-Mart de Mexico S.A.B. de C.V.–Series V | | | 188,500 | | | | 481,985 | |
| | | | | | | | 2,283,813 | |
|
| Pakistan–0.61% | |
Engro Fertilizers Ltd. | | | 183,000 | | | | 111,991 | |
Fauji Fertilizer Co. Ltd. | | | 133,500 | | | | 99,045 | |
| | | | | | | | 211,036 | |
|
| Poland–3.17% | |
Jastrzebska Spolka Weglowa S.A.(c) | | | 19,121 | | | | 368,751 | |
LPP S.A. | | | 165 | | | | 337,555 | |
Powszechny Zaklad Ubezpieczen S.A. | | | 38,313 | | | | 390,463 | |
| | | | | | | | 1,096,769 | |
|
| Qatar–0.78% | |
Qatar Islamic Bank (S.A.Q) | | | 6,376 | | | | 268,298 | |
|
| Russia–5.41% | |
LUKOIL PJSC–ADR | | | 6,809 | | | | 508,632 | |
Mobile TeleSystems PJSC–ADR | | | 27,376 | | | | 219,282 | |
Novolipetsk Steel PJSC–GDR | | | 17,448 | | | | 421,544 | |
Rosseti PJSC | | | 10,467,000 | | | | 107,098 | |
Tatneft PJSC–ADR | | | 6,879 | | | | 488,409 | |
Unipro PJSC | | | 3,070,000 | | | | 126,205 | |
| | | | | | | | 1,871,170 | |
|
| South Africa–7.25% | |
Absa Group Ltd. | | | 34,876 | | | | 351,646 | |
AECI Ltd. | | | 17,036 | | | | 109,127 | |
African Rainbow Minerals Ltd. | | | 16,870 | | | | 142,816 | |
Astral Foods Ltd. | | | 31,170 | | | | 418,304 | |
AVI Ltd. | | | 50,529 | | | | 342,511 | |
Kumba Iron Ore Ltd. | | | 18,950 | | | | 371,229 | |
Liberty Holdings Ltd. | | | 46,530 | | | | 340,605 | |
See accompanying Notes to Financial Statements which are an integral part of the financial statements.
10 Invesco Low Volatility Emerging Markets Fund
| | | | | | | | |
| | | Shares | | | Value | |
| South Africa–(continued) | |
Reunert Ltd. | | | 54,452 | | | $ | 294,360 | |
Tsogo Sun Holdings Ltd. | | | 98,915 | | | | 135,440 | |
| | | | | | | | 2,506,038 | |
|
| South Korea–14.85% | |
Chong Kun Dang Pharmaceutical Corp. | | | 4,443 | | | | 339,740 | |
Daewon Pharmaceutical Co., Ltd. | | | 8,376 | | | | 119,087 | |
Grand Korea Leisure Co., Ltd. | | | 19,374 | | | | 379,410 | |
Huchems Fine Chemical Corp. | | | 11,019 | | | | 211,450 | |
Korea United Pharm., Inc. | | | 8,850 | | | | 174,437 | |
KT&G Corp. | | | 5,282 | | | | 473,019 | |
Kwang Dong Pharmaceutical Co., Ltd. | | | 14,396 | | | | 70,734 | |
LG Corp. | | | 6,275 | | | | 366,222 | |
Lotte Chemical Corp. | | | 315 | | | | 72,758 | |
LOTTE Fine Chemical Co., Ltd. | | | 9,067 | | | | 325,719 | |
Lotte Food Co., Ltd. | | | 426 | | | | 246,980 | |
Lotte Himart Co., Ltd. | | | 7,500 | | | | 369,757 | |
LS Industrial Systems Co., Ltd. | | | 5,897 | | | | 255,504 | |
Samjin Pharmaceutical Co., Ltd. | | | 10,328 | | | | 335,735 | |
Samsung Electronics Co., Ltd. | | | 9,672 | | | | 361,729 | |
SK hynix Inc. | | | 6,729 | | | | 405,205 | |
SK Telecom Co., Ltd. | | | 2,238 | | | | 526,334 | |
SL Corp. | | | 8,141 | | | | 103,297 | |
| | | | | | | | 5,137,117 | |
|
| Taiwan–3.97% | |
Chipbond Technology Corp. | | | 238,000 | | | | 440,568 | |
Chunghwa Telecom Co., Ltd. | | | 146,000 | | | | 516,290 | |
Powertech Technology Inc. | | | 161,000 | | | | 349,646 | |
Syncmold Enterprise Corp. | | | 31,500 | | | | 66,238 | |
| | | | | | | | 1,372,742 | |
|
| Thailand–5.46% | |
Advanced Info Service PCL | | | 80,800 | | | | 471,638 | |
Intouch Holdings PCL | | | 172,222 | | | | 272,750 | |
| | | | | | | | |
| | | Shares | | | Value | |
| Thailand–(continued) | |
Mega Lifesciences PCL | | | 305,400 | | | $ | 345,475 | |
PTT Exploration & Production PCL | | | 19,300 | | | | 81,511 | |
PTT Global Chemical PCL | | | 184,700 | | | | 429,017 | |
Ratchaburi Electricity Generating Holding PCL | | | 133,300 | | | | 197,035 | |
Thai Vegetable Oil PCL | | | 108,500 | | | | 92,462 | |
| | | | | | | | 1,889,888 | |
|
| Turkey–2.55% | |
BIM Birlesik Magazalar A.S. | | | 26,973 | | | | 383,150 | |
Tekfen Holding A.S. | | | 130,835 | | | | 497,162 | |
| | | | | | | | 880,312 | |
|
| United Arab Emirates–1.77% | |
Air Arabia PJSC | | | 956,648 | | | | 265,652 | |
Aldar Properties PJSC | | | 737,367 | | | | 347,289 | |
| | | | | | | | 612,941 | |
|
| United Kingdom–1.06% | |
Mondi Ltd. | | | 15,337 | | | | 366,216 | |
Total Common Stocks & Other Equity Interests
(Cost $36,440,877) | | | | 32,409,435 | |
|
Money Market Funds–0.08% | |
Invesco Government & Agency Portfolio–Institutional Class, 2.08%(e) | | | 9,664 | | | | 9,664 | |
Invesco Liquid Assets Portfolio–Institutional Class, 2.27%(e) | | | 6,900 | | | | 6,901 | |
Invesco Treasury Portfolio–Institutional Class, 2.09%(e) | | | 11,044 | | | | 11,044 | |
Total Money Market Funds
(Cost $27,609) | | | | 27,609 | |
TOTAL INVESTMENTS IN SECURITIES–93.79%
(Cost $36,468,486) | | | | 32,437,044 | |
OTHER ASSETS LESS LIABILITIES–6.21% | | | | 2,148,691 | |
NET ASSETS–100.00% | | | $ | 34,585,735 | |
Investment Abbreviations:
| | |
| ADR | | – American Depositary Receipt |
| CPO | | – Certificates of Ordinary Participation |
| GDR | | – Global Depositary Receipt |
Notes to Schedule of Investments:
| (a) | Each unit represents two preferred shares and one common share. |
| (b) | Security purchased or received in transaction exempt from registration under the Securities Act of 1933, as amended (the “1933 Act”). The security may be resold pursuant to an exemption from registration under the 1933 Act, typically to qualified institutional buyers. The value of this security at October 31, 2018 represented less than 1% of the Fund’s Net Assets. |
| (c) | Non-income producing security. |
| (d) | Each CPO represents two Series A shares. |
| (e) | The money market fund and the Fund are affiliated by having the same investment adviser. The rate shown is the 7-day SEC standardized yield as of October 31, 2018. |
| | | | | | | | | | | | | | | | | | | | |
| Open Futures Contracts–Equity Risk | |
| Long Futures Contracts | | Number of
Contracts | | | Expiration Month | | | Notional
Value | | | Value | | | Unrealized
Appreciation
(Depreciation) | |
MSCI Emerging Markets Mini Index | | | 37 | | | | December-2018 | | | $ | 1,769,895 | | | $ | (56,295 | ) | | $ | (56,295 | ) |
See accompanying Notes to Financial Statements which are an integral part of the financial statements.
11 Invesco Low Volatility Emerging Markets Fund
Statement of Assets and Liabilities
October 31, 2018
| | | | |
Assets: | | | | |
Investments in securities, at value (Cost $36,440,877) | | $ | 32,409,435 | |
Investments in affiliated money market funds, at value and cost | | | 27,609 | |
Other investments: | | | | |
Variation margin receivable — futures | | | 150,818 | |
Foreign currencies, at value (Cost $2,065,409) | | | 2,026,646 | |
Receivable for: | | | | |
Dividends and interest | | | 91,249 | |
Fund shares sold | | | 152 | |
Investment for trustee deferred compensation and retirement plans | | | 9,850 | |
Other assets | | | 57,397 | |
Total assets | | | 34,773,156 | |
| |
Liabilities: | | | | |
Payable for: | | | | |
Amount due custodian | | | 34,225 | |
Fund shares repurchased | | | 37,043 | |
Accrued foreign taxes | | | 22,589 | |
Accrued fees to affiliates | | | 5,238 | |
Accrued trustees’ and officers’ fees and benefits | | | 1,675 | |
Accrued other operating expenses | | | 76,801 | |
Trustee deferred compensation and retirement plans | | | 9,850 | |
Total liabilities | | | 187,421 | |
Net assets applicable to shares outstanding | | $ | 34,585,735 | |
| |
Net assets consist of: | | | | |
Shares of beneficial interest | | $ | 33,668,604 | |
Distributable earnings | | | 917,131 | |
| | | $ | 34,585,735 | |
| | | | |
Net Assets: | | | | |
Class A | | $ | 2,063,228 | |
Class C | | $ | 203,177 | |
Class R | | $ | 28,349 | |
Class Y | | $ | 1,705,433 | |
Class R5 | | $ | 7,224 | |
Class R6 | | $ | 30,578,324 | |
|
Shares outstanding, no par value,
with an unlimited number of shares authorized: | |
Class A | | | 291,561 | |
Class C | | | 29,004 | |
Class R | | | 4,016 | |
Class Y | | | 240,571 | |
Class R5 | | | 1,019 | |
Class R6 | | | 4,318,044 | |
Class A: | | | | |
Net asset value per share | | $ | 7.08 | |
Maximum offering price per share | | | | |
(Net asset value of $7.08 ¸ 94.50%) | | $ | 7.49 | |
Class C: | | | | |
Net asset value and offering price per share | | $ | 7.01 | |
Class R: | | | | |
Net asset value and offering price per share | | $ | 7.06 | |
Class Y: | | | | |
Net asset value and offering price per share | | $ | 7.09 | |
Class R5: | | | | |
Net asset value and offering price per share | | $ | 7.09 | |
Class R6: | | | | |
Net asset value and offering price per share | | $ | 7.08 | |
See accompanying Notes to Financial Statements which are an integral part of the financial statements.
12 Invesco Low Volatility Emerging Markets Fund
Statement of Operations
For the year ended October 31, 2018
| | | | |
Investment income: | | | | |
Dividends (net of foreign withholding taxes of $161,412) | | $ | 1,513,558 | |
Dividends from affiliated money market funds | | | 1,241 | |
Total investment income | | | 1,514,799 | |
| |
Expenses: | | | | |
Advisory fees | | | 398,935 | |
Administrative services fees | | | 50,000 | |
Custodian fees | | | 65,657 | |
Distribution fees: | | | | |
Class A | | | 13,988 | |
Class C | | | 2,906 | |
Class R | | | 148 | |
Transfer agent fees — A, C, R and Y | | | 18,316 | |
Transfer agent fees — R6 | | | 124 | |
Trustees’ and officers’ fees and benefits | | | 21,518 | |
Registration and filing fees | | | 81,792 | |
Reports to shareholders | | | 14,864 | |
Professional services fees | | | 99,115 | |
Other | | | 24,896 | |
Total expenses | | | 792,259 | |
Less: Fees waived, expenses reimbursed and expense offset arrangement(s) | | | (314,446 | ) |
Net expenses | | | 477,813 | |
Net investment income | | | 1,036,986 | |
| |
Realized and unrealized gain (loss) from: | | | | |
Net realized gain (loss) from: | | | | |
Investment securities (net of foreign taxes of $80,547) | | | 4,434,561 | |
Foreign currencies | | | (121,538 | ) |
Futures contracts | | | (149,406 | ) |
| | | | 4,163,617 | |
Change in net unrealized appreciation (depreciation) of: | | | | |
Investment securities (net of foreign taxes of $62,262) | | | (10,713,942 | ) |
Foreign currencies | | | (27,908 | ) |
Futures contracts | | | (68,005 | ) |
| | | | (10,809,855 | ) |
Net realized and unrealized gain (loss) | | | (6,646,238 | ) |
Net increase (decrease) in net assets resulting from operations | | $ | (5,609,252 | ) |
See accompanying Notes to Financial Statements which are an integral part of the financial statements.
13 Invesco Low Volatility Emerging Markets Fund
Statement of Changes in Net Assets
For the years ended October 31, 2018 and 2017
| | | | | | | | |
| | | 2018 | | | 2017 | |
Operations: | | | | | | | | |
Net investment income | | $ | 1,036,986 | | | $ | 972,811 | |
Net realized gain | | | 4,163,617 | | | | 5,723,909 | |
Change in net unrealized appreciation (depreciation) | | | (10,809,855 | ) | | | 1,372,754 | |
Net increase (decrease) in net assets resulting from operations | | | (5,609,252 | ) | | | 8,069,474 | |
| | |
Distributions to shareholders from distributable earnings(1): | | | | | | | | |
Class A | | | (1,058,236 | ) | | | (139,844 | ) |
Class C | | | (47,838 | ) | | | (3,973 | ) |
Class R | | | (3,419 | ) | | | (1,170 | ) |
Class Y | | | (287,090 | ) | | | (101,889 | ) |
Class R5 | | | (1,463 | ) | | | (6,448 | ) |
Class R6 | | | (5,381,200 | ) | | | (1,954,196 | ) |
Total distributions to shareholders from distributable earnings | | | (6,779,246 | ) | | | (2,207,520 | ) |
| | |
Share transactions–net: | | | | | | | | |
Class A | | | (3,943,333 | ) | | | 3,026,098 | |
Class C | | | (31,555 | ) | | | 59,423 | |
Class R | | | 14,391 | | | | (5,494 | ) |
Class Y | | | 486,772 | | | | (543,569 | ) |
Class R5 | | | — | | | | (138,308 | ) |
Class R6 | | | 4,260,549 | | | | (5,053,148 | ) |
Net increase (decrease) in net assets resulting from share transactions | | | 786,824 | | | | (2,654,998 | ) |
Net increase (decrease) in net assets | | | (11,601,674 | ) | | | 3,206,956 | |
| | |
Net assets applicable to common shares: | | | | | | | | |
Beginning of year | | | 46,187,409 | | | | 42,980,453 | |
End of year | | $ | 34,585,735 | | | $ | 46,187,409 | |
| (1) | For the year ended October 31, 2017, distributions to shareholders from distributable earnings consisted of distributions from net investment income and distributions from net realized gains. The Securities and Exchange Commission eliminated the requirement to disclose the distribution components separately. For the year ended October 31, 2017, distributions from net investment income were $35,912, $179, $235, $29,372, $1,859 and $563,343 and distributions from net realized gains were $103,932, $3,794, $935, $72,517, $4,589 and $1,390,853 for Class A, Class C, Class R, Class Y, Class R5 and Class R6 shares, respectively. |
Notes to Financial Statements
October 31, 2018
NOTE 1—Significant Accounting Policies
Invesco Low Volatility Emerging Markets Fund (the “Fund”) is a series portfolio of AIM Investment Funds (Invesco Investment Funds) (the “Trust”). The Trust is organized as a Delaware statutory trust and is registered under the Investment Company Act of 1940, as amended (the “1940 Act”), as an open-end series management investment company authorized to issue an unlimited number of shares of beneficial interest. Information presented in these financial statements pertains only to the Fund. Matters affecting the Fund or each class will be voted on exclusively by the shareholders of the Fund or each class.
The Fund’s investment objective is long-term growth of capital.
The Fund currently consists of six different classes of shares: Class A, Class C, Class R, Class Y, Class R5 and Class R6. Class Y shares are available only to certain investors. Class A shares are sold with a front-end sales charge unless certain waiver criteria are met. Under certain circumstances, load waived shares may be subject to contingent deferred sales charges (“CDSC”). Class C shares are sold with a CDSC. Class R, Class Y, Class R5 and Class R6 shares are sold at net asset value.
The Fund is an investment company and accordingly follows the investment company accounting and reporting guidance in accordance with Financial Accounting Standards Board Accounting Standards Codification Topic 946, Financial Services — Investment Companies.
The following is a summary of the significant accounting policies followed by the Fund in the preparation of its financial statements.
| A. | Security Valuations — Securities, including restricted securities, are valued according to the following policy. |
A security listed or traded on an exchange (except convertible securities) is valued at its last sales price or official closing price as of the close of the customary trading session on the exchange where the security is principally traded, or lacking any sales or official closing price on a particular day, the security may be valued at the closing bid price on that day. Securities traded in the over-the-counter market are valued based on prices furnished by independent pricing services or market makers. When such securities are valued by an independent pricing service they
14 Invesco Low Volatility Emerging Markets Fund
may be considered fair valued. Futures contracts are valued at the final settlement price set by an exchange on which they are principally traded. Listed options are valued at the mean between the last bid and asked prices from the exchange on which they are principally traded. Options not listed on an exchange are valued by an independent source at the mean between the last bid and asked prices. For purposes of determining net asset value (“NAV”) per share, futures and option contracts generally are valued 15 minutes after the close of the customary trading session of the New York Stock Exchange (“NYSE”).
Investments in open-end and closed-end registered investment companies that do not trade on an exchange are valued at the end-of-day net asset value per share. Investments in open-end and closed-end registered investment companies that trade on an exchange are valued at the last sales price or official closing price as of the close of the customary trading session on the exchange where the security is principally traded.
Debt obligations (including convertible securities) and unlisted equities are fair valued using an evaluated quote provided by an independent pricing service. Evaluated quotes provided by the pricing service may be determined without exclusive reliance on quoted prices, and may reflect appropriate factors such as institution-size trading in similar groups of securities, developments related to specific securities, dividend rate (for unlisted equities), yield (for debt obligations), quality, type of issue, coupon rate (for debt obligations), maturity (for debt obligations), individual trading characteristics and other market data. Pricing services generally value debt obligations assuming orderly transactions of institutional round lot size, but a fund may hold or transact in the same securities in smaller, odd lot sizes. Odd lots often trade at lower prices than institutional round lots. Debt obligations are subject to interest rate and credit risks. In addition, all debt obligations involve some risk of default with respect to interest and/or principal payments.
Foreign securities’ (including foreign exchange contracts) prices are converted into U.S. dollar amounts using the applicable exchange rates as of the close of the NYSE. If market quotations are available and reliable for foreign exchange-traded equity securities, the securities will be valued at the market quotations. Because trading hours for certain foreign securities end before the close of the NYSE, closing market quotations may become unreliable. If between the time trading ends on a particular security and the close of the customary trading session on the NYSE, events occur that the investment adviser determines are significant and make the closing price unreliable, the Fund may fair value the security. If the event is likely to have affected the closing price of the security, the security will be valued at fair value in good faith using procedures approved by the Board of Trustees. Adjustments to closing prices to reflect fair value may also be based on a screening process of an independent pricing service to indicate the degree of certainty, based on historical data, that the closing price in the principal market where a foreign security trades is not the current value as of the close of the NYSE. Foreign securities’ prices meeting the approved degree of certainty that the price is not reflective of current value will be priced at the indication of fair value from the independent pricing service. Multiple factors may be considered by the independent pricing service in determining adjustments to reflect fair value and may include information relating to sector indices, American Depositary Receipts and domestic and foreign index futures. Foreign securities may have additional risks including exchange rate changes, potential for sharply devalued currencies and high inflation, political and economic upheaval, the relative lack of issuer information, relatively low market liquidity and the potential lack of strict financial and accounting controls and standards.
Securities for which market prices are not provided by any of the above methods may be valued based upon quotes furnished by independent sources. The last bid price may be used to value equity securities. The mean between the last bid and asked prices is used to value debt obligations, including corporate loans.
Securities for which market quotations are not readily available or became unreliable are valued at fair value as determined in good faith by or under the supervision of the Trust’s officers following procedures approved by the Board of Trustees. Issuer specific events, market trends, bid/asked quotes of brokers and information providers and other market data may be reviewed in the course of making a good faith determination of a security’s fair value.
The Fund may invest in securities that are subject to interest rate risk, meaning the risk that the prices will generally fall as interest rates rise and, conversely, the prices will generally rise as interest rates fall. Specific securities differ in their sensitivity to changes in interest rates depending on their individual characteristics. Changes in interest rates may result in increased market volatility, which may affect the value and/or liquidity of certain Fund investments.
Valuations change in response to many factors including the historical and prospective earnings of the issuer, the value of the issuer’s assets, general economic conditions, interest rates, investor perceptions and market liquidity. Because of the inherent uncertainties of valuation, the values reflected in the financial statements may materially differ from the value received upon actual sale of those investments.
| B. | Securities Transactions and Investment Income — Securities transactions are accounted for on a trade date basis. Realized gains or losses on sales are computed on the basis of specific identification of the securities sold. Interest income (net of withholding tax, if any) is recorded on the accrual basis from settlement date. Dividend income (net of withholding tax, if any) is recorded on the ex-dividend date. |
The Fund may periodically participate in litigation related to Fund investments. As such, the Fund may receive proceeds from litigation settlements. Any proceeds received are included in the Statement of Operations as realized gain (loss) for investments no longer held and as unrealized gain (loss) for investments still held.
Brokerage commissions and mark ups are considered transaction costs and are recorded as an increase to the cost basis of securities purchased and/or a reduction of proceeds on a sale of securities. Such transaction costs are included in the determination of net realized and unrealized gain (loss) from investment securities reported in the Statement of Operations and the Statement of Changes in Net Assets and the net realized and unrealized gains (losses) on securities per share in the Financial Highlights. Transaction costs are included in the calculation of the Fund’s net asset value and, accordingly, they reduce the Fund’s total returns. These transaction costs are not considered operating expenses and are not reflected in net investment income reported in the Statement of Operations and the Statement of Changes in Net Assets, or the net investment income per share and the ratios of expenses and net investment income reported in the Financial Highlights, nor are they limited by any expense limitation arrangements between the Fund and the investment adviser.
The Fund allocates income and realized and unrealized capital gains and losses to a class based on the relative net assets of each class.
| C. | Country Determination — For the purposes of making investment selection decisions and presentation in the Schedule of Investments, the investment adviser may determine the country in which an issuer is located and/or credit risk exposure based on various factors. These factors include the laws of the country under which the issuer is organized, where the issuer maintains a principal office, the country in which the issuer derives 50% or more of its total revenues and the country that has the primary market for the issuer’s securities, as well as other criteria. Among the other criteria that may be evaluated for making this determination are the country in which the issuer maintains 50% or more of its assets, |
15 Invesco Low Volatility Emerging Markets Fund
| | the type of security, financial guarantees and enhancements, the nature of the collateral and the sponsor organization. Country of issuer and/or credit risk exposure has been determined to be the United States of America, unless otherwise noted. |
| D. | Distributions — Distributions from net investment income and net realized capital gain, if any, are generally declared and paid annually and recorded on the ex-dividend date. The Fund may elect to treat a portion of the proceeds from redemptions as distributions for federal income tax purposes. |
| E. | Federal Income Taxes — The Fund intends to comply with the requirements of Subchapter M of the Internal Revenue Code of 1986, as amended (the “Internal Revenue Code”), necessary to qualify as a regulated investment company and to distribute substantially all of the Fund’s taxable earnings to shareholders. As such, the Fund will not be subject to federal income taxes on otherwise taxable income (including net realized capital gain) that is distributed to shareholders. Therefore, no provision for federal income taxes is recorded in the financial statements. |
The Fund recognizes the tax benefits of uncertain tax positions only when the position is more likely than not to be sustained. Management has analyzed the Fund’s uncertain tax positions and concluded that no liability for unrecognized tax benefits should be recorded related to uncertain tax positions. Management is not aware of any tax positions for which it is reasonably possible that the total amounts of unrecognized tax benefits will change materially in the next 12 months.
The Fund files tax returns in the U.S. Federal jurisdiction and certain other jurisdictions. Generally, the Fund is subject to examinations by such taxing authorities for up to three years after the filing of the return for the tax period.
| F. | Expenses — Fees provided for under the Rule 12b-1 plan of a particular class of the Fund are charged to the operations of such class. Transfer agency fees and expenses and other shareholder recordkeeping fees and expenses attributable to Class R5 and Class R6 are allocated to each share class based on relative net assets. Sub-accounting fees attributable to Class R5 are charged to the operations of the class. Transfer agency fees and expenses and other shareholder recordkeeping fees and expenses relating to all other classes are allocated among those classes based on relative net assets. All other expenses are allocated among the classes based on relative net assets. |
| G. | Accounting Estimates — The preparation of financial statements in conformity with accounting principles generally accepted in the United States of America (“GAAP”) requires management to make estimates and assumptions that affect the reported amounts of assets and liabilities at the date of the financial statements and the reported amounts of revenues and expenses during the reporting period including estimates and assumptions related to taxation. Actual results could differ from those estimates by a significant amount. In addition, the Fund monitors for material events or transactions that may occur or become known after the period-end date and before the date the financial statements are released to print. |
| H. | Indemnifications — Under the Trust’s organizational documents, each Trustee, officer, employee or other agent of the Trust is indemnified against certain liabilities that may arise out of the performance of their duties to the Fund. Additionally, in the normal course of business, the Fund enters into contracts, including the Fund’s servicing agreements, that contain a variety of indemnification clauses. The Fund’s maximum exposure under these arrangements is unknown as this would involve future claims that may be made against the Fund that have not yet occurred. The risk of material loss as a result of such indemnification claims is considered remote. |
| I. | Foreign Currency Translations — Foreign currency is valued at the close of the NYSE based on quotations posted by banks and major currency dealers. Portfolio securities and other assets and liabilities denominated in foreign currencies are translated into U.S. dollar amounts at the date of valuation. Purchases and sales of portfolio securities (net of foreign taxes withheld on disposition) and income items denominated in foreign currencies are translated into U.S. dollar amounts on the respective dates of such transactions. The Fund does not separately account for the portion of the results of operations resulting from changes in foreign exchange rates on investments and the fluctuations arising from changes in market prices of securities held. The combined results of changes in foreign exchange rates and the fluctuation of market prices on investments (net of estimated foreign tax withholding) are included with the net realized and unrealized gain or loss from investments in the Statement of Operations. Reported net realized foreign currency gains or losses arise from (1) sales of foreign currencies, (2) currency gains or losses realized between the trade and settlement dates on securities transactions, and (3) the difference between the amounts of dividends, interest, and foreign withholding taxes recorded on the Fund’s books and the U.S. dollar equivalent of the amounts actually received or paid. Net unrealized foreign currency gains and losses arise from changes in the fair values of assets and liabilities, other than investments in securities at fiscal period end, resulting from changes in exchange rates. |
The Fund may invest in foreign securities, which may be subject to foreign taxes on income, gains on investments or currency repatriation, a portion of which may be recoverable. Foreign taxes, if any, are recorded based on the tax regulations and rates that exist in the foreign markets in which the Fund invests and are shown in the Statement of Operations.
| J. | Forward Foreign Currency Contracts — The Fund may engage in foreign currency transactions either on a spot (i.e. for prompt delivery and settlement) basis, or through forward foreign currency contracts, to manage or minimize currency or exchange rate risk. |
The Fund may also enter into forward foreign currency contracts for the purchase or sale of a security denominated in a foreign currency in order to “lock in” the U.S. dollar price of that security, or the Fund may also enter into forward foreign currency contracts that do not provide for physical settlement of the two currencies, but instead are settled by a single cash payment calculated as the difference between the agreed upon exchange rate and the spot rate at settlement based upon an agreed upon notional amount (non-deliverable forwards). The Fund will set aside liquid assets in an amount equal to the daily mark-to-market obligation for forward foreign currency contracts.
A forward foreign currency contract is an obligation between two parties (“Counterparties”) to purchase or sell a specific currency for an agreed-upon price at a future date. The use of forward foreign currency contracts does not eliminate fluctuations in the price of the underlying securities the Fund owns or intends to acquire but establishes a rate of exchange in advance. Fluctuations in the value of these contracts are measured by the difference in the contract date and reporting date exchange rates and are recorded as unrealized appreciation (depreciation) until the contracts are closed. When the contracts are closed, realized gains (losses) are recorded. Realized and unrealized gains (losses) on the contracts are included in the Statement of Operations. The primary risks associated with forward foreign currency contracts include failure of the Counterparty to meet the terms of the contract and the value of the foreign currency changing unfavorably. These risks may be in excess of the amounts reflected in the Statement of Assets and Liabilities.
| K. | Futures Contracts — The Fund may enter into futures contracts to manage exposure to interest rate, equity and market price movements and/or currency risks. A futures contract is an agreement between Counterparties to purchase or sell a specified underlying security, currency or commodity (or delivery of a cash settlement price, in the case of an index future) for a fixed price at a future date. The Fund currently invests only |
16 Invesco Low Volatility Emerging Markets Fund
| | in exchange-traded futures and they are standardized as to maturity date and underlying financial instrument. Initial margin deposits required upon entering into futures contracts are satisfied by the segregation of specific securities or cash as collateral at the futures commission merchant (broker). During the period the futures contracts are open, changes in the value of the contracts are recognized as unrealized gains or losses by recalculating the value of the contracts on a daily basis. Subsequent or variation margin payments are received or made depending upon whether unrealized gains or losses are incurred. These amounts are reflected as receivables or payables on the Statement of Assets and Liabilities. When the contracts are closed or expire, the Fund recognizes a realized gain or loss equal to the difference between the proceeds from, or cost of, the closing transaction and the Fund’s basis in the contract. The net realized gain (loss) and the change in unrealized gain (loss) on futures contracts held during the period is included on the Statement of Operations. The primary risks associated with futures contracts are market risk and the absence of a liquid secondary market. If the Fund were unable to liquidate a futures contract and/or enter into an offsetting closing transaction, the Fund would continue to be subject to market risk with respect to the value of the contracts and continue to be required to maintain the margin deposits on the futures contracts. Futures contracts have minimal Counterparty risk since the exchange’s clearinghouse, as Counterparty to all exchange-traded futures, guarantees the futures against default. Risks may exceed amounts recognized in the Statement of Assets and Liabilities. |
| L. | Collateral — To the extent the Fund has designated or segregated a security as collateral and that security is subsequently sold, it is the Fund’s practice to replace such collateral no later than the next business day. |
NOTE 2—Advisory Fees and Other Fees Paid to Affiliates
The Trust has entered into a master investment advisory agreement with Invesco Advisers, Inc. (the “Adviser” or “Invesco”). Under the terms of the investment advisory agreement, the Fund accrues daily and pays monthly an advisory fee to the Adviser based on the annual rate of the Fund’s average daily net assets as follows:
| | | | |
| Average Daily Net Assets | | Rate | |
First $250 million | | | 0.935% | |
Next $250 million | | | 0.910% | |
Next $500 million | | | 0.885% | |
Next $1.5 billion | | | 0.860% | |
Next $2.5 billion | | | 0.835% | |
Next $2.5 billion | | | 0.810% | |
Next $2.5 billion | | | 0.785% | |
Over $10 billion | | | 0.760% | |
For the year ended October 31, 2018, the effective advisory fees incurred by the Fund was 0.935%.
Under the terms of a master sub-advisory agreement between the Adviser and each of Invesco Asset Management Deutschland GmbH, Invesco Asset Management Limited, Invesco Asset Management (Japan) Limited, Invesco Hong Kong Limited, Invesco Senior Secured Management, Inc. and Invesco Canada Ltd. and separate sub-advisory agreements with Invesco Capital Management LLC, formerly Invesco PowerShares Capital Management LLC, and Invesco Asset Management (India) Private Limited (collectively, the “Affiliated Sub-Advisers”) the Adviser, not the Fund, will pay 40% of the fees paid to the Adviser to any such Affiliated Sub-Adviser(s) that provide(s) discretionary investment management services to the Fund based on the percentage of assets allocated to such Affiliated Sub-Adviser(s).
The Adviser has contractually agreed, through at least February 29, 2020, to waive advisory fees and/or reimburse expenses to the extent necessary to limit total annual fund operating expenses after fee waiver and/or expense reimbursement (excluding certain items discussed below) of Class A, Class C, Class R, Class Y, Class R5 and Class R6 shares to 1.33%, 2.08%, 1.58%, 1.08%, 1.08% and 1.08%, respectively, of the Fund’s average daily net assets (the “expense limits”). In determining the Adviser’s obligation to waive advisory fees and/or reimburse expenses, the following expenses are not taken into account, and could cause total annual fund operating expenses after fee waiver and/or expense reimbursement to exceed the numbers reflected above: (1) interest; (2) taxes; (3) dividend expense on short sales; (4) extraordinary or non-routine items, including litigation expenses; and (5) expenses that the Fund has incurred but did not actually pay because of an expense offset arrangement. Unless Invesco continues the fee waiver agreement, it will terminate on February 29, 2020. During its term, the fee waiver agreement cannot be terminated or amended to increase the expense limits or reduce the advisory fee waiver without approval of the Board of Trustees.
Further, the Adviser has contractually agreed, through at least June 30, 2020, to waive the advisory fee payable by the Fund in an amount equal to 100% of the net advisory fees the Adviser receives from the affiliated money market funds on investments by the Fund of uninvested cash in such affiliated money market funds.
For the year ended October 31, 2018, the Adviser waived advisory fees of $296,005 and reimbursed class level expenses of $12,612, $655, $67, $4,634, and $124 of Class A, Class C, Class R, Class Y and Class R6 shares, respectively.
The Trust has entered into a master administrative services agreement with Invesco pursuant to which the Fund has agreed to pay Invesco for certain administrative costs incurred in providing accounting services to the Fund. For the year ended October 31, 2018, expenses incurred under the agreement are shown in the Statement of Operations as Administrative services fees.
The Trust has entered into a transfer agency and service agreement with Invesco Investment Services, Inc. (“IIS”) pursuant to which the Fund has agreed to pay IIS a fee for providing transfer agency and shareholder services to the Fund and reimburse IIS for certain expenses incurred by IIS in the course of providing such services. IIS may make payments to intermediaries that provide omnibus account services, sub-accounting services and/or networking services. All fees payable by IIS to intermediaries that provide omnibus account services or sub-accounting services are charged back to the Fund, subject to certain limitations approved by the Trust’s Board of Trustees. For the year ended October 31, 2018, expenses incurred under the agreement are shown in the Statement of Operations as Transfer agent fees.
The Trust has entered into master distribution agreements with Invesco Distributors, Inc. (“IDI”) to serve as the distributor for the Class A, Class C, Class R, Class Y, Class R5 and Class R6 shares of the Fund. The Trust has adopted plans pursuant to Rule 12b-1 under the 1940 Act with respect to
17 Invesco Low Volatility Emerging Markets Fund
the Fund’s Class A, Class C and Class R shares (collectively the “Plans”). The Fund, pursuant to the Plans, pays IDI compensation at the annual rate of 0.25% of the Fund’s average daily net assets of Class A shares, 1.00% of the average daily net assets of Class C shares and 0.50% of the average daily net assets of Class R shares. The fees are accrued daily and paid monthly. Of the Plan payments, up to 0.25% of the average daily net assets of each class of shares may be paid to furnish continuing personal shareholder services to customers who purchase and own shares of such classes. Any amounts not paid as a service fee under the Plans would constitute an asset-based sales charge. Rules of the Financial Industry Regulatory Authority (“FINRA”) impose a cap on the total sales charges, including asset-based sales charges, that may be paid by any class of shares of the Fund. For the year ended October 31, 2018, expenses incurred under the Plans are shown in the Statement of Operations as Distribution fees.
Front-end sales commissions and CDSC (collectively, the “sales charges”) are not recorded as expenses of the Fund. Front-end sales commissions are deducted from proceeds from the sales of Fund shares prior to investment in Class A shares of the Fund. CDSC are deducted from redemption proceeds prior to remittance to the shareholder. During the year ended October 31, 2018, IDI advised the Fund that IDI retained $1,199 in front-end sales commissions from the sale of Class A shares and $677 and $150 from Class A and Class C shares, respectively, for CDSC imposed upon redemptions by shareholders.
Certain officers and trustees of the Trust are officers and directors of the Adviser, IIS and/or IDI.
NOTE 3—Additional Valuation Information
GAAP defines fair value as the price that would be received to sell an asset or paid to transfer a liability in an orderly transaction between market participants at the measurement date, under current market conditions. GAAP establishes a hierarchy that prioritizes the inputs to valuation methods, giving the highest priority to readily available unadjusted quoted prices in an active market for identical assets (Level 1) and the lowest priority to significant unobservable inputs (Level 3), generally when market prices are not readily available or are unreliable. Based on the valuation inputs, the securities or other investments are tiered into one of three levels. Changes in valuation methods may result in transfers in or out of an investment’s assigned level:
| | Level 1 — | Prices are determined using quoted prices in an active market for identical assets. |
| | Level 2 — | Prices are determined using other significant observable inputs. Observable inputs are inputs that other market participants may use in pricing a security. These may include quoted prices for similar securities, interest rates, prepayment speeds, credit risk, yield curves, loss severities, default rates, discount rates, volatilities and others. |
| | Level 3 — | Prices are determined using significant unobservable inputs. In situations where quoted prices or observable inputs are unavailable (for example, when there is little or no market activity for an investment at the end of the period), unobservable inputs may be used. Unobservable inputs reflect the Fund’s own assumptions about the factors market participants would use in determining fair value of the securities or instruments and would be based on the best available information. |
The following is a summary of the tiered valuation input levels, as of October 31, 2018. The level assigned to the securities valuations may not be an indication of the risk or liquidity associated with investing in those securities. Because of the inherent uncertainties of valuation, the values reflected in the financial statements may materially differ from the value received upon actual sale of those investments.
| | | | | | | | | | | | | | | | |
| | | Level 1 | | | Level 2 | | | Level 3 | | | Total | |
Investments in Securities | | | | | | | | | | | | | | | | |
Brazil | | $ | 2,879,566 | | | $ | — | | | $ | — | | | $ | 2,879,566 | |
Chile | | | 81,268 | | | | — | | | | — | | | | 81,268 | |
China | | | 2,412,961 | | | | 2,029,955 | | | | — | | | | 4,442,916 | |
Hong Kong | | | — | | | | 73,641 | | | | — | | | | 73,641 | |
India | | | 2,066,393 | | | | 2,279,786 | | | | — | | | | 4,346,179 | |
Indonesia | | | — | | | | 524,622 | | | | — | | | | 524,622 | |
Malaysia | | | 1,261,323 | | | | 303,580 | | | | — | | | | 1,564,903 | |
Mexico | | | 2,283,813 | | | | — | | | | — | | | | 2,283,813 | |
Pakistan | | | 211,036 | | | | — | | | | — | | | | 211,036 | |
Poland | | | 706,306 | | | | 390,463 | | | | — | | | | 1,096,769 | |
Qatar | | | — | | | | 268,298 | | | | — | | | | 268,298 | |
Russia | | | 1,637,867 | | | | 233,303 | | | | — | | | | 1,871,170 | |
South Africa | | | 2,154,392 | | | | 351,646 | | | | — | | | | 2,506,038 | |
South Korea | | | 526,334 | | | | 4,610,783 | | | | — | | | | 5,137,117 | |
Taiwan | | | — | | | | 1,372,742 | | | | — | | | | 1,372,742 | |
Thailand | | | 1,889,888 | | | | — | | | | — | | | | 1,889,888 | |
Turkey | | | 880,312 | | | | — | | | | — | | | | 880,312 | |
United Arab Emirates | | | 612,941 | | | | — | | | | — | | | | 612,941 | |
United Kingdom | | | — | | | | 366,216 | | | | — | | | | 366,216 | |
Money Market Funds | | | 27,609 | | | | — | | | | — | | | | 27,609 | |
Total Investments in Securities | | | 19,632,009 | | | | 12,805,035 | | | | — | | | | 32,437,044 | |
Other Investments — Liabilities* | | | | | | | | | | | | | | | | |
Futures Contracts | | | (56,295 | ) | | | — | | | | — | | | | (56,295 | ) |
Total Investments | | $ | 19,575,714 | | | $ | 12,805,035 | | | $ | — | | | $ | 32,380,749 | |
| * | Unrealized appreciation (depreciation). |
18 Invesco Low Volatility Emerging Markets Fund
NOTE 4—Derivative Investments
The Fund may enter into an International Swaps and Derivatives Association Master Agreement (“ISDA Master Agreement”) under which a fund may trade OTC derivatives. An OTC transaction entered into under an ISDA Master Agreement typically involves a collateral posting arrangement, payment netting provisions and close-out netting provisions. These netting provisions allow for reduction of credit risk through netting of contractual obligations. The enforceability of the netting provisions of the ISDA Master Agreement depends on the governing law of the ISDA Master Agreement, among other factors.
Value of Derivative Investments at Period-End
The table below summarizes the value of the Fund’s derivative investments, detailed by primary risk exposure, held as of October 31, 2018:
| | | | |
| | | Value | |
| Derivative Liabilities | | Equity Risk | |
Unrealized depreciation on futures contracts — Exchange-Traded(a) | | $ | (56,295 | ) |
Derivatives not subject to master netting agreements | | | 56,295 | |
Total Derivative Liabilities subject to master netting agreements | | $ | — | |
| (a) | The daily variation margin receivable (payable) at period-end is recorded in the Statement of Assets and Liabilities. |
Effect of Derivative Investments for the year ended October 31, 2018
The table below summarizes the gains (losses) on derivative investments, detailed by primary risk exposure, recognized in earnings during the period:
| | | | |
| | | Location of Gain (Loss) on
Statement of Operations | |
| | | Equity Risk | |
Realized Gain (Loss): | | | | |
Futures contracts | | $ | (149,406 | ) |
Change in Net Unrealized Appreciation (Depreciation): | | | | |
Futures contracts | | | (68,005 | ) |
Total | | $ | (217,411 | ) |
The table below summarizes the average notional value of futures contracts outstanding during the period.
| | | | |
| | | Futures
Contracts | |
Average notional value | | $ | 1,324,748 | |
NOTE 5—Expense Offset Arrangement(s)
The expense offset arrangement is comprised of transfer agency credits which result from balances in demand deposit accounts used by the transfer agent for clearing shareholder transactions. For the year ended October 31, 2018, the Fund received credits from this arrangement, which resulted in the reduction of the Fund’s total expenses of $349.
NOTE 6—Trustees’ and Officers’ Fees and Benefits
Trustees’ and Officers’ Fees and Benefits include amounts accrued by the Fund to pay remuneration to certain Trustees and Officers of the Fund. Trustees have the option to defer compensation payable by the Fund, and Trustees’ and Officers’ Fees and Benefits also include amounts accrued by the Fund to fund such deferred compensation amounts. Those Trustees who defer compensation have the option to select various Invesco Funds in which their deferral accounts shall be deemed to be invested. Obligations under the deferred compensation plan represent unsecured claims against the general assets of the Fund.
NOTE 7—Cash Balances
The Fund is permitted to temporarily carry a negative or overdrawn balance in its account with State Street Bank and Trust Company, the custodian bank. Such balances, if any at period-end, are shown in the Statement of Assets and Liabilities under the payable caption Amount due custodian. To compensate the custodian bank for such overdrafts, the overdrawn Fund may either (1) leave funds as a compensating balance in the account so the custodian bank can be compensated by earning the additional interest; or (2) compensate by paying the custodian bank at a rate agreed upon by the custodian bank and Invesco, not to exceed the contractually agreed upon rate.
NOTE 8—Distributions to Shareholders and Tax Components of Net Assets — PENDING
Tax Character of Distributions to Shareholders Paid During the Fiscal Years Ended October 31, 2018 and 2017:
| | | | | | | | |
| | | 2018 | | | 2017 | |
Ordinary income | | $ | 3,593,067 | | | $ | 2,207,520 | |
Long-term capital gain | | | 3,186,179 | | | | — | |
Total Distributions | | $ | 6,779,246 | | | $ | 2,207,520 | |
19 Invesco Low Volatility Emerging Markets Fund
Tax Components of Net Assets at Period-End:
| | | | |
| | | 2018 | |
Undistributed ordinary income | | $ | 789,880 | |
Undistributed long-term gain | | | 4,311,416 | |
Net unrealized appreciation (depreciation) — investments | | | (4,136,737 | ) |
Net unrealized appreciation (depreciation) — foreign currencies | | | (38,684 | ) |
Temporary book/tax differences | | | (8,744 | ) |
Shares of beneficial interest | | | 33,668,604 | |
Total net assets | | $ | 34,585,735 | |
The difference between book-basis and tax-basis unrealized appreciation (depreciation) is due to differences in the timing of recognition of gains and losses on investments for tax and book purposes. The Fund’s net unrealized appreciation (depreciation) difference is attributable primarily to wash sales, futures contracts and passive foreign investment companies.
The temporary book/tax differences are a result of timing differences between book and tax recognition of income and/or expenses. The Fund’s temporary book/tax differences are the result of the trustee deferral of compensation.
Capital loss carryforward is calculated and reported as of a specific date. Results of transactions and other activity after that date may affect the amount of capital loss carryforward actually available for the Fund to utilize. Capital losses generated in years beginning after December 22, 2010 can be carried forward for an unlimited period, whereas previous losses expire in eight tax years. Capital losses with an expiration period may not be used to offset capital gains until all net capital losses without an expiration date have been utilized. Capital loss carryforwards with no expiration date will retain their character as either short-term or long-term capital losses instead of as short-term capital losses as under prior law. The ability to utilize capital loss carryforwards in the future may be limited under the Internal Revenue Code and related regulations based on the results of future transactions.
The Fund does not have a capital loss carryforward as of October 31, 2018.
NOTE 9—Investment Transactions
The aggregate amount of investment securities (other than short-term securities, U.S. Treasury obligations and money market funds, if any) purchased and sold by the Fund during the year ended October 31, 2018 was $25,131,813 and $30,672,288, respectively. Cost of investments, including any derivatives, on a tax basis includes the adjustments for financial reporting purposes as of the most recently completed federal income tax reporting period-end.
| | | | |
| Unrealized Appreciation (Depreciation) of Investments on a Tax Basis | |
Aggregate unrealized appreciation of investments | | $ | 1,893,686 | |
Aggregate unrealized (depreciation) of investments | | | (6,030,423 | ) |
Net unrealized appreciation (depreciation) of investments | | $ | (4,136,737 | ) |
Cost of investments for tax purposes is $36,517,486.
NOTE 10—Reclassification of Permanent Differences
Primarily as a result of differing book/tax treatment of foreign currency transactions and foreign capital gain tax, on October 31, 2018, undistributed net investment income was decreased by $202,112 and undistributed net realized gain was increased by $202,112. This reclassification had no effect on the net assets or the distributable earnings of the Fund.
20 Invesco Low Volatility Emerging Markets Fund
NOTE 11—Share Information
| | | | | | | | | | | | | | | | |
| | | Summary of Share Activity | |
| | | Years ended October 31, | |
| | | 2018(a) | | | 2017 | |
| | | Shares | | | Amount | | | Shares | | | Amount | |
Sold: | | | | | | | | | | | | | | | | |
Class A | | | 381,199 | | | $ | 3,446,533 | | | | 1,066,732 | | | $ | 9,578,200 | |
Class C | | | 8,334 | | | | 74,056 | | | | 38,430 | | | | 348,928 | |
Class R | | | 2,403 | | | | 21,202 | | | | 459 | | | | 4,242 | |
Class Y | | | 89,593 | | | | 785,974 | | | | 199,976 | | | | 1,764,679 | |
Class R6 | | | 528,440 | | | | 4,239,883 | | | | 1,113,879 | | | | 9,802,466 | |
| | | | |
Issued as reinvestment of dividends: | | | | | | | | | | | | | | | | |
Class A | | | 124,439 | | | | 1,036,572 | | | | 9,568 | | | | 76,541 | |
Class C | | | 5,593 | | | | 46,480 | | | | 456 | | | | 3,652 | |
Class R | | | 243 | | | | 2,025 | | | | 98 | | | | 786 | |
Class Y | | | 33,652 | | | | 280,324 | | | | 5,460 | | | | 43,731 | |
Class R6 | | | 646,603 | | | | 5,379,736 | | | | 243,469 | | | | 1,947,749 | |
| | | | |
Reacquired: | | | | | | | | | | | | | | | | |
Class A | | | (982,782 | ) | | | (8,426,438 | )�� | | | (726,230 | ) | | | (6,628,643 | ) |
Class C | | | (18,419 | ) | | | (152,091 | ) | | | (34,600 | ) | | | (293,157 | ) |
Class R | | | (1,052 | ) | | | (8,836 | ) | | | (1,163 | ) | | | (10,522 | ) |
Class Y | | | (69,785 | ) | | | (579,526 | ) | | | (247,850 | ) | | | (2,351,979 | ) |
Class R5 | | | — | | | | — | | | | (13,982 | ) | | | (138,308 | ) |
Class R6 | | | (610,020 | ) | | | (5,359,070 | ) | | | (1,877,418 | ) | | | (16,803,363 | ) |
Net increase (decrease) in share activity | | | 138,441 | | | $ | 786,824 | | | | (222,716 | ) | | $ | (2,654,998 | ) |
| (a) | There is an entity that is a record owner of more than 5% of the outstanding shares of the Fund and owns 6% of the outstanding shares of the Fund. IDI has an agreement with this entity to sell Fund shares. The Fund, Invesco and/or Invesco affiliates may make payments to this entity, which is considered to be related to the Fund, for providing services to the Fund, Invesco and/or Invesco affiliates including but not limited to services such as securities brokerage, distribution, third party record keeping and account servicing. The Fund has no knowledge as to whether all or any portion of the shares owned of record by this entity are also owned beneficially. |
| | In addition, 88% of the outstanding shares of the Fund are owned by the Adviser or an affiliate of the Adviser. |
21 Invesco Low Volatility Emerging Markets Fund
NOTE 12—Financial Highlights
The following schedule presents financial highlights for a share of the Fund outstanding throughout the periods indicated.
| | | | | | | | | | | | | | | | | | | | | | | | | | | | | | | | | | | | | | | | | | | | | | | | | | | | | | | | |
| | | Net asset
value,
beginning
of period | | | Net
investment
income(a) | | | Net gains
(losses)
on securities
(both
realized and
unrealized) | | | Total from
investment
operations | | | Dividends
from net
investment
income | | | Distributions
from net
realized
gains | | | Total
distributions | | | Net asset
value, end
of period | | | Total
return(b) | | | Net assets,
end of period
(000’s omitted) | | | Ratio of
expenses
to average
net assets
with fee waivers
and/or expenses
absorbed | | | Ratio of
expenses
to average net
assets without
fee waivers
and/or expenses
absorbed | | | Ratio of net
investment
income
to average
net assets | | | Portfolio
turnover(c) | |
Class A | | | | | | | | | | | | | | | | | | | | | | | | | | | | | | | | | | | | | | | | | | | | | | | | | | | | | | | | |
Year ended 10/31/18 | | $ | 9.72 | | | $ | 0.19 | | | $ | (1.42 | ) | | $ | (1.23 | ) | | $ | (0.19 | ) | | $ | (1.22 | ) | | $ | (1.41 | ) | | $ | 7.08 | | | | (14.82 | )% | | $ | 2,063 | | | | 1.33 | %(d) | | | 2.25 | %(d) | | | 2.22 | %(d) | | | 61 | % |
Year ended 10/31/17 | | | 8.64 | | | | 0.17 | | | | 1.32 | | | | 1.49 | | | | (0.10 | ) | | | (0.31 | ) | | | (0.41 | ) | | | 9.72 | | | | 18.29 | | | | 7,471 | | | | 1.39 | | | | 2.09 | | | | 1.89 | | | | 54 | |
Year ended 10/31/16 | | | 8.08 | | | | 0.17 | | | | 0.46 | | | | 0.63 | | | | (0.07 | ) | | | — | | | | (0.07 | ) | | | 8.64 | | | | 7.98 | | | | 3,617 | | | | 1.72 | | | | 2.27 | | | | 2.08 | | | | 63 | |
Year ended 10/31/15 | | | 10.32 | | | | 0.14 | | | | (1.91 | ) | | | (1.77 | ) | | | (0.35 | ) | | | (0.12 | ) | | | (0.47 | ) | | | 8.08 | | | | (17.67 | ) | | | 1,531 | | | | 1.72 | | | | 7.99 | | | | 1.52 | | | | 105 | |
Year ended 10/31/14(e) | | | 10.00 | | | | 0.15 | | | | 0.17 | | | | 0.32 | | | | — | | | | — | | | | — | | | | 10.32 | | | | 3.20 | | | | 1,705 | | | | 1.71 | (f) | | | 10.36 | (f) | | | 1.69 | (f) | | | 38 | |
Class C | | | | | | | | | | | | | | | | | | | | | | | | | | | | | | | | | | | | | | | | | | | | | | | | | | | | | | | | |
Year ended 10/31/18 | | | 9.65 | | | | 0.12 | | | | (1.40 | ) | | | (1.28 | ) | | | (0.14 | ) | | | (1.22 | ) | | | (1.36 | ) | | | 7.01 | | | | (15.49 | ) | | | 203 | | | | 2.08 | (d) | | | 3.00 | (d) | | | 1.47 | (d) | | | 61 | |
Year ended 10/31/17 | | | 8.55 | | | | 0.10 | | | | 1.32 | | | | 1.42 | | | | (0.01 | ) | | | (0.31 | ) | | | (0.32 | ) | | | 9.65 | | | | 17.38 | | | | 323 | | | | 2.14 | | | | 2.84 | | | | 1.14 | | | | 54 | |
Year ended 10/31/16 | | | 8.00 | | | | 0.11 | | | | 0.45 | | | | 0.56 | | | | (0.01 | ) | | | — | | | | (0.01 | ) | | | 8.55 | | | | 7.08 | | | | 250 | | | | 2.47 | | | | 3.02 | | | | 1.33 | | | | 63 | |
Year ended 10/31/15 | | | 10.26 | | | | 0.07 | | | | (1.90 | ) | | | (1.83 | ) | | | (0.31 | ) | | | (0.12 | ) | | | (0.43 | ) | | | 8.00 | | | | (18.29 | ) | | | 41 | | | | 2.47 | | | | 8.74 | | | | 0.77 | | | | 105 | |
Year ended 10/31/14(e) | | | 10.00 | | | | 0.09 | | | | 0.17 | | | | 0.26 | | | | — | | | | — | | | | — | | | | 10.26 | | | | 2.60 | | | | 57 | | | | 2.46 | (f) | | | 11.11 | (f) | | | 0.94 | (f) | | | 38 | |
Class R | | | | | | | | | | | | | | | | | | | | | | | | | | | | | | | | | | | | | | | | | | | | | | | | | | | | | | | | |
Year ended 10/31/18 | | | 9.70 | | | | 0.16 | | | | (1.41 | ) | | | (1.25 | ) | | | (0.17 | ) | | | (1.22 | ) | | | (1.39 | ) | | | 7.06 | | | | (15.05 | ) | | | 28 | | | | 1.58 | (d) | | | 2.50 | (d) | | | 1.97 | (d) | | | 61 | |
Year ended 10/31/17 | | | 8.62 | | | | 0.14 | | | | 1.32 | | | | 1.46 | | | | (0.07 | ) | | | (0.31 | ) | | | (0.38 | ) | | | 9.70 | | | | 17.91 | | | | 23 | | | | 1.64 | | | | 2.34 | | | | 1.64 | | | | 54 | |
Year ended 10/31/16 | | | 8.06 | | | | 0.15 | | | | 0.46 | | | | 0.61 | | | | (0.05 | ) | | | — | | | | (0.05 | ) | | | 8.62 | | | | 7.68 | | | | 26 | | | | 1.97 | | | | 2.52 | | | | 1.83 | | | | 63 | |
Year ended 10/31/15 | | | 10.30 | | | | 0.12 | | | | (1.90 | ) | | | (1.78 | ) | | | (0.34 | ) | | | (0.12 | ) | | | (0.46 | ) | | | 8.06 | | | | (17.81 | ) | | | 23 | | | | 1.97 | | | | 8.24 | | | | 1.27 | | | | 105 | |
Year ended 10/31/14(e) | | | 10.00 | | | | 0.13 | | | | 0.17 | | | | 0.30 | | | | — | | | | — | | | | — | | | | 10.30 | | | | 3.00 | | | | 14 | | | | 1.96 | (f) | | | 10.61 | (f) | | | 1.44 | (f) | | | 38 | |
Class Y | | | | | | | | | | | | | | | | | | | | | | | | | | | | | | | | | | | | | | | | | | | | | | | | | | | | | | | | |
Year ended 10/31/18 | | | 9.74 | | | | 0.21 | | | | (1.42 | ) | | | (1.21 | ) | | | (0.22 | ) | | | (1.22 | ) | | | (1.44 | ) | | | 7.09 | | | | (14.66 | ) | | | 1,705 | | | | 1.08 | (d) | | | 2.00 | (d) | | | 2.47 | (d) | | | 61 | |
Year ended 10/31/17 | | | 8.66 | | | | 0.19 | | | | 1.32 | | | | 1.51 | | | | (0.12 | ) | | | (0.31 | ) | | | (0.43 | ) | | | 9.74 | | | | 18.51 | | | | 1,823 | | | | 1.14 | | | | 1.84 | | | | 2.14 | | | | 54 | |
Year ended 10/31/16 | | | 8.10 | | | | 0.19 | | | | 0.46 | | | | 0.65 | | | | (0.09 | ) | | | — | | | | (0.09 | ) | | | 8.66 | | | | 8.25 | | | | 1,987 | | | | 1.47 | | | | 2.02 | | | | 2.33 | | | | 63 | |
Year ended 10/31/15 | | | 10.35 | | | | 0.16 | | | | (1.92 | ) | | | (1.76 | ) | | | (0.37 | ) | | | (0.12 | ) | | | (0.49 | ) | | | 8.10 | | | | (17.50 | ) | | | 1,337 | | | | 1.47 | | | | 7.74 | | | | 1.77 | | | | 105 | |
Year ended 10/31/14(e) | | | 10.00 | | | | 0.18 | | | | 0.17 | | | | 0.35 | | | | — | | | | — | | | | — | | | | 10.35 | | | | 3.50 | | | | 1,411 | | | | 1.46 | (f) | | | 10.11 | (f) | | | 1.94 | (f) | | | 38 | |
Class R5 | | | | | | | | | | | | | | | | | | | | | | | | | | | | | | | | | | | | | | | | | | | | | | | | | | | | | | | | |
Year ended 10/31/18 | | | 9.74 | | | | 0.21 | | | | (1.42 | ) | | | (1.21 | ) | | | (0.22 | ) | | | (1.22 | ) | | | (1.44 | ) | | | 7.09 | | | | (14.66 | ) | | | 7 | | | | 1.08 | (d) | | | 1.77 | (d) | | | 2.47 | (d) | | | 61 | |
Year ended 10/31/17 | | | 8.66 | | | | 0.19 | | | | 1.32 | | | | 1.51 | | | | (0.12 | ) | | | (0.31 | ) | | | (0.43 | ) | | | 9.74 | | | | 18.51 | | | | 10 | | | | 1.14 | | | | 1.65 | | | | 2.14 | | | | 54 | |
Year ended 10/31/16 | | | 8.10 | | | | 0.18 | | | | 0.47 | | | | 0.65 | | | | (0.09 | ) | | | — | | | | (0.09 | ) | | | 8.66 | | | | 8.25 | | | | 130 | | | | 1.47 | | | | 1.87 | | | | 2.33 | | | | 63 | |
Year ended 10/31/15 | | | 10.35 | | | | 0.16 | | | | (1.92 | ) | | | (1.76 | ) | | | (0.37 | ) | | | (0.12 | ) | | | (0.49 | ) | | | 8.10 | | | | (17.50 | ) | | | 122 | | | | 1.47 | | | | 7.64 | | | | 1.77 | | | | 105 | |
Year ended 10/31/14(e) | | | 10.00 | | | | 0.18 | | | | 0.17 | | | | 0.35 | | | | — | | | | — | | | | — | | | | 10.35 | | | | 3.50 | | | | 477 | | | | 1.46 | (f) | | | 10.06 | (f) | | | 1.94 | (f) | | | 38 | |
Class R6 | | | | | | | | | | | | | | | | | | | | | | | | | | | | | | | | | | | | | | | | | | | | | | | | | | | | | | | | |
Year ended 10/31/18 | | | 9.74 | | | | 0.21 | | | | (1.43 | ) | | | (1.22 | ) | | | (0.22 | ) | | | (1.22 | ) | | | (1.44 | ) | | | 7.08 | | | | (14.76 | ) | | | 30,578 | | | | 1.08 | (d) | | | 1.77 | (d) | | | 2.47 | (d) | | | 61 | |
Year ended 10/31/17 | | | 8.65 | | | | 0.19 | | | | 1.33 | | | | 1.52 | | | | (0.12 | ) | | | (0.31 | ) | | | (0.43 | ) | | | 9.74 | | | | 18.65 | | | | 36,536 | | | | 1.14 | | | | 1.65 | | | | 2.14 | | | | 54 | |
Year ended 10/31/16 | | | 8.10 | | | | 0.19 | | | | 0.45 | | | | 0.64 | | | | (0.09 | ) | | | — | | | | (0.09 | ) | | | 8.65 | | | | 8.12 | | | | 36,970 | | | | 1.47 | | | | 1.87 | | | | 2.33 | | | | 63 | |
Year ended 10/31/15 | | | 10.35 | | | | 0.16 | | | | (1.92 | ) | | | (1.76 | ) | | | (0.37 | ) | | | (0.12 | ) | | | (0.49 | ) | | | 8.10 | | | | (17.50 | ) | | | 122 | | | | 1.47 | | | | 7.64 | | | | 1.77 | | | | 105 | |
Year ended 10/31/14(e) | | | 10.00 | | | | 0.18 | | | | 0.17 | | | | 0.35 | | | | — | | | | — | | | | — | | | | 10.35 | | | | 3.50 | | | | 155 | | | | 1.46 | (f) | | | 10.06 | (f) | | | 1.94 | (f) | | | 38 | |
| (a) | Calculated using average shares outstanding. |
| (b) | Includes adjustments in accordance with accounting principles generally accepted in the United States of America and as such, the net asset value for financial reporting purposes and the returns based upon those net asset values may differ from the net asset value and returns for shareholder transactions. Does not include sales charges and is not annualized for periods less than one year, if applicable. |
| (c) | Portfolio turnover is calculated at the fund level and is not annualized for periods less than one year, if applicable. |
| (d) | Ratios are based on average daily net assets (000’s omitted) of $5,595, $291, $29, $2,056, $9, and $34,687 for Class A, Class C, Class R, Class Y, Class R5 and Class R6 shares, respectively. |
| (e) | Commencement date of December 17, 2013. |
22 Invesco Low Volatility Emerging Markets Fund
Report of Independent Registered Public Accounting Firm
To the Board of Trustees of AIM Investment Funds (Invesco Investment Funds) and Shareholders of Invesco Low Volatility Emerging Markets Fund:
Opinion on the Financial Statements
We have audited the accompanying statement of assets and liabilities, including the schedule of investments, of Invesco Low Volatility Emerging Markets Fund (one of the funds constituting AIM Investment Funds (Invesco Investment Funds), hereafter referred to as the “Fund”) as of October 31, 2018, the related statement of operations for the year ended October 31, 2018, the statement of changes in net assets for each of the two years in the period ended October 31, 2018, including the related notes, and the financial highlights for each of the periods indicated therein (collectively referred to as the financial statements). In our opinion, the financial statements present fairly, in all material respects, the financial position of the Fund as of October 31, 2018, the results of its operations for the year then ended, the changes in its net assets for each of the two years in the period ended October 31, 2018 and the financial highlights for each of the periods indicated therein in conformity with accounting principles generally accepted in the United States of America.
Basis for Opinion
These financial statements are the responsibility of the Fund’s management. Our responsibility is to express an opinion on the Fund’s financial statements based on our audits. We are a public accounting firm registered with the Public Company Accounting Oversight Board (United States) (PCAOB) and are required to be independent with respect to the Fund in accordance with the U.S. federal securities laws and the applicable rules and regulations of the Securities and Exchange Commission and the PCAOB.
We conducted our audits of these financial statements in accordance with the standards of the PCAOB. Those standards require that we plan and perform the audit to obtain reasonable assurance about whether the financial statements are free of material misstatement, whether due to error or fraud.
Our audits included performing procedures to assess the risks of material misstatement of the financial statements, whether due to error or fraud, and performing procedures that respond to those risks. Such procedures included examining, on a test basis, evidence regarding the amounts and disclosures in the financial statements. Our audits also included evaluating the accounting principles used and significant estimates made by management, as well as evaluating the overall presentation of the financial statements. Our procedures included confirmation of securities owned as of October 31, 2018 by correspondence with the custodian, transfer agent and brokers; when replies were not received from brokers, we performed other auditing procedures. We believe that our audits provide a reasonable basis for our opinion.
PricewaterhouseCoopers LLP
Houston, TX
December 28, 2018
We have served as the auditor of one or more of the investment companies in the Invesco group of investment companies since at least 1995. We have not been able to determine the specific year we began serving as auditor.
23 Invesco Low Volatility Emerging Markets Fund
Calculating your ongoing Fund expenses
Example
As a shareholder of the Fund, you incur two types of costs: (1) transaction costs, which may include sales charges (loads) on purchase payments or contingent deferred sales charges on redemptions, if any; and (2) ongoing costs, including management fees, distribution and/or service (12b-1) fees, and other Fund expenses. This example is intended to help you understand your ongoing costs (in dollars) of investing in the Fund and to compare these costs with ongoing costs of investing in other mutual funds. The example is based on an investment of $1,000 invested at the beginning of the period and held for the entire period May 1, 2018 through October 31, 2018.
Actual expenses
The table below provides information about actual account values and actual expenses. You may use the information in this table, together with the amount you invested, to estimate the expenses that you paid over the period. Simply divide your account value by $1,000 (for example, an $8,600 account value divided by $1,000 = 8.6), then multiply the result by the number in the table under the heading entitled “Actual Expenses Paid During Period” to estimate the expenses you paid on your account during this period.
Hypothetical example for comparison purposes
The table below also provides information about hypothetical account values and hypothetical expenses based on the Fund’s actual expense ratio and an assumed rate of return of 5% per year before expenses, which is not the Fund’s actual return.
The hypothetical account values and expenses may not be used to estimate the actual ending account balance or expenses you paid for the period. You may use this information to compare the ongoing costs of investing in the Fund and other funds. To do so, compare this 5% hypothetical example with the 5% hypothetical examples that appear in the shareholder reports of the other funds.
Please note that the expenses shown in the table are meant to highlight your ongoing costs only and do not reflect any transaction costs, such as sales charges (loads) on purchase payments or contingent deferred sales charges on redemptions, if any. Therefore, the hypothetical information is useful in comparing ongoing costs only, and will not help you determine the relative total costs of owning different funds. In addition, if these transaction costs were included, your costs would have been higher.
| | | | | | | | | | | | | | | | | | | | | | | | |
Class | | Beginning
Account Value
(05/01/18) | | | ACTUAL | | | HYPOTHETICAL (5% annual return before
expenses) | | | Annualized
Expense
Ratio | |
| | Ending
Account Value
(10/31/18)1 | | | Expenses
Paid During
Period2 | | | Ending
Account Value
(10/31/18) | | | Expenses
Paid During
Period2 | |
A | | $ | 1,000.00 | | | $ | 819.40 | | | $ | 6.10 | | | $ | 1,018.50 | | | $ | 6.77 | | | | 1.33 | % |
C | | | 1,000.00 | | | | 816.10 | | | | 9.52 | | | | 1,014.72 | | | | 10.56 | | | | 2.08 | |
R | | | 1,000.00 | | | | 817.10 | | | | 7.24 | | | | 1,017.24 | | | | 8.03 | | | | 1.58 | |
Y | | | 1,000.00 | | | | 819.70 | | | | 4.95 | | | | 1,019.76 | | | | 5.50 | | | | 1.08 | |
R5 | | | 1,000.00 | | | | 819.70 | | | | 4.95 | | | | 1,019.76 | | | | 5.50 | | | | 1.08 | |
R6 | | | 1,000.00 | | | | 819.40 | | | | 4.95 | | | | 1,019.76 | | | | 5.50 | | | | 1.08 | |
| 1 | The actual ending account value is based on the actual total return of the Fund for the period May 1, 2018 through October 31, 2018, after actual expenses and will differ from the hypothetical ending account value which is based on the Fund’s expense ratio and a hypothetical annual return of 5% before expenses. |
| 2 | Expenses are equal to the Fund’s annualized expense ratio as indicated above multiplied by the average account value over the period, multiplied by 184/365 to reflect the most recent fiscal half year. |
24 Invesco Low Volatility Emerging Markets Fund
Approval of Investment Advisory and Sub-Advisory Contracts
At meetings held on June 5-6, 2018, the Board of Trustees (the Board or the Trustees) of AIM Investment Funds (Invesco Investment Funds) as a whole, and the independent Trustees, who comprise over 75% of the Board, voting separately, approved the continuance of the Invesco Low Volatility Emerging Markets Fund’s (the Fund) Master Investment Advisory Agreement with Invesco Advisers, Inc. (Invesco Advisers and the investment advisory agreement) and the Master Intergroup Sub-Advisory Contract for Mutual Funds with Invesco Asset Management Deutschland GmbH, Invesco Asset Management Limited, Invesco Asset Management (Japan) Limited, Invesco Hong Kong Limited, Invesco Senior Secured Management, Inc., Invesco Canada Ltd. and separate Sub-Advisory Contracts with Invesco Capital Management LLC and Invesco Asset Management (India) Private Limited (collectively, the Affiliated Sub-Advisers and the sub-advisory contracts) for another year, effective July 1, 2018. After evaluating the factors discussed below, among others, the Board approved the renewal of the Fund’s investment advisory agreement and the sub-advisory contracts and determined that the compensation payable by the Fund to Invesco Advisers and by Invesco Advisers to the Affiliated Sub-Advisers is fair and reasonable.
The Board’s Evaluation Process
The Board’s Investments Committee has established three Sub-Committees, which meet throughout the year to review the performance of funds advised by Invesco Advisers (the Invesco Funds). Over the course of each year, the Sub-Committees meet with portfolio managers for their assigned Invesco Funds and other members of management to review detailed information about investment performance and portfolio attributes of these funds. The Board took into account evaluations and reports that it received from the Investments Committee and Sub-Committees, as well as the information provided to such committees and the Board throughout the year, in considering whether to approve each Invesco Fund’s investment advisory agreement and sub-advisory contracts.
As part of the contract renewal process, the Board reviews and considers information provided in response to detailed requests for information submitted to management by the independent Trustees with assistance from legal counsel to the independent Trustees. The Board receives comparative investment performance and fee data regarding the Invesco Funds prepared by Invesco Advisers and Broadridge Financial Solutions, Inc. (Broadridge), an independent mutual fund data provider. The Board also receives an independent written evaluation from the Senior Officer, an officer of the Invesco Funds who reports directly to the
independent Trustees. The Senior Officer’s evaluation is prepared as part of his responsibility to manage the process by which the Invesco Funds’ proposed management fees are negotiated during the annual contract renewal process to ensure they are negotiated in a manner that is at arms’ length and reasonable. In addition to meetings with Invesco Advisers and fund counsel throughout the year, the independent Trustees also discuss the continuance of the investment advisory agreement and sub-advisory contracts in separate sessions with the Senior Officer and with independent legal counsel.
The discussion below is a summary of the Senior Officer’s independent written evaluation with respect to the Fund’s investment advisory agreement, as well as a discussion of the material factors and related conclusions that formed the basis for the Board’s approval of the Fund’s investment advisory agreement and sub-advisory contracts. The Trustees’ review and conclusions are based on the comprehensive consideration of all information presented to them during the course of the year and in prior years and are not the result of any single determinative factor. Moreover, one Trustee may have weighed a particular piece of information or factor differently than another Trustee. This information is current as of June 6, 2018.
Factors and Conclusions and Summary of Independent Written Fee Evaluation
| A. | Nature, Extent and Quality of Services Provided by Invesco Advisers and the Affiliated Sub-Advisers |
The Board reviewed the nature, extent and quality of the advisory services provided to the Fund by Invesco Advisers under the Fund’s investment advisory agreement, and the credentials and experience of the officers and employees of Invesco Advisers who provide these services, including the Fund’s portfolio manager(s). The Board’s review included consideration of Invesco Advisers’ investment process oversight and structure, credit analysis and investment risk management. The Board also considered non-advisory services that Invesco Advisers and its affiliates provide to the Invesco Funds such as various back office support functions, third party oversight, internal audit, valuation, portfolio trading and legal and compliance. The Board also reviewed and considered the benefits to shareholders of investing in a fund that is part of the Invesco family of funds under the umbrella of Invesco Ltd., Invesco Advisers’ parent company, and noted Invesco Ltd.’s depth and experience in conducting an investment management business, as well as its commitment of financial and other resources to such business. The Board concluded that the nature, extent and quality of the services provided to the Fund by
Invesco Advisers are appropriate and satisfactory.
The Board reviewed the services that may be provided by the Affiliated Sub-Advisers under the sub-advisory contracts and the credentials and experience of the officers and employees of the Affiliated Sub-Advisers who provide these services. The Board noted the Affiliated Sub-Advisers’ expertise with respect to certain asset classes and that the Affiliated Sub-Advisers have offices and personnel that are located in financial centers around the world. As a result, the Board noted that the Affiliated Sub-Advisers can provide research and investment analysis on the markets and economies of various countries in which the Fund may invest, make recommendations regarding securities and assist with security trades. The Board concluded that the sub-advisory contracts may benefit the Fund and its shareholders by permitting Invesco Advisers to use the resources and talents of the Affiliated Sub-Advisers in managing the Fund. The Board concluded that the nature, extent and quality of the services that may be provided by the Affiliated Sub-Advisers are appropriate and satisfactory.
| B. | Fund Investment Performance |
The Board considered Fund investment performance as a relevant factor in considering whether to approve the investment advisory agreement as well as the sub-advisory contracts for the Fund, as Invesco Asset Management Deutschland GmbH currently manages assets of the Fund.
The Board compared the Fund’s investment performance over multiple time periods ending December 31, 2017 to the performance of funds in the Broadridge performance universe and against the Lipper Emerging Markets Funds Index. The Board noted that performance of Class A shares of the Fund was in the fourth quintile of its performance universe for the one and three year periods (the first quintile being the best performing funds and the fifth quintile being the worst performing funds). The Board noted that performance of Class A shares of the Fund was below the performance of the Index for the one and three year periods. The Board noted that underweight and overweight exposure to and stock selection in certain sectors detracted from the Fund’s performance. The Trustees also reviewed more recent Fund performance and this review did not change their conclusions.
| C. | Advisory and Sub-Advisory Fees and Fund Expenses |
The Board compared the Fund’s contractual management fee rate to the contractual management fee rates of funds in the Fund’s Broadridge expense group. The Board noted that the contractual management fee rate for Class A shares of the Fund was below the median contractual management fee rate of funds in its expense group. The Board noted
25 Invesco Low Volatility Emerging Markets Fund
that the term “contractual management fee” for funds in the expense group may include both advisory and certain non-portfolio management administrative services fees, but that Broadridge does not provide information on a fund by fund basis as to what is included. The Board also reviewed the methodology used by Broadridge in providing expense group information, which includes using each fund’s contractual management fee schedule (including any applicable breakpoints) as reported in the most recent prospectus or statement of additional information for each fund in the expense group. The Board also considered comparative information regarding the Fund’s total expense ratio and its various components.
The Board noted that Invesco Advisers has contractually agreed to waive fees and/or limit expenses of the Fund in an amount necessary to limit total annual operating expenses to a specified percentage of average daily net assets for each class of the Fund.
The Board also considered the fees charged by Invesco Advisers and the Affiliated Sub-Advisers to other similarly managed client accounts. The Board noted that Invesco Advisers or the Affiliated Sub-Advisers may charge lower fees to large institutional clients. Invesco Advisers reviewed with the Board differences in the scope of services it provides to the Invesco Funds relative to certain other types of client accounts, including management of cash flows as a result of redemptions and purchases, necessary infrastructure such as officers, office space, technology, legal and distribution, oversight of service providers, costs and business risks associated with launching new funds and sponsoring and maintaining the product line, preparation of annual registration statement updates and financial information and compliance with federal and state laws and regulations.
The Board also considered the services that may be provided by the Affiliated Sub-Advisers pursuant to the sub-advisory contracts, as well as the fees payable by Invesco Advisers to the Affiliated Sub-Advisers pursuant to the sub-advisory contracts. The Board noted that Invesco Advisers retains overall responsibility for, and provides services to, sub-advised Invesco Funds, including oversight of the Affiliated Sub-Advisers as well as the additional services described herein other than day-to-day portfolio management.
| D. | Economies of Scale and Breakpoints |
The Board considered the extent to which there may be economies of scale in the provision of advisory services to the Fund. The Board also considered that the Fund may benefit from economies of scale through contractual breakpoints in the Fund’s advisory fee schedule, which generally operate to reduce the Fund’s expense ratio as it grows in size. The Board noted that the Fund shares directly in economies of scale through lower fees charged by third party service providers based on the combined size of the Invesco Funds. The Board
noted that the Fund may also benefit from economies of scale through initial fee setting, fee waivers and expense reimbursements.
| E. | Profitability and Financial Resources |
The Board reviewed information from Invesco Advisers concerning the costs of the advisory and other services that Invesco Advisers and its affiliates provide to the Fund and the Invesco Funds and the profitability of Invesco Advisers and its affiliates in providing these services. The Board considered the methodology used for calculating profitability and noted the periodic review of such methodology by an independent consultant. The Board noted that Invesco Advisers continues to operate at a net profit from services Invesco Advisers and its affiliates provide to the Invesco Funds. The Board received information from Invesco Advisers demonstrating that Invesco Advisers and the Affiliated Sub-Advisers are financially sound and have the resources necessary to perform their obligations under the investment advisory agreement and sub-advisory contracts.
| F. | Collateral Benefits to Invesco Advisers and its Affiliates |
The Board considered various other benefits received by Invesco Advisers and its affiliates from the relationship with the Fund, including the fees received for providing administrative, transfer agency and distribution services to the Fund. The Board considered comparative information regarding fees charged for these services, including information provided by Broadridge and other independent sources. The Board considered the performance of Invesco Advisers and its affiliates in providing these services and the organizational structure employed to provide these services. The Board also considered that these services are provided to the Fund pursuant to written contracts that are reviewed and approved on an annual basis by the Board; and that the services are required for the operation of the Fund.
The Board considered the benefits realized by Invesco Advisers and the Affiliated Sub-Advisers as a result of portfolio brokerage transactions executed through “soft dollar” arrangements. The Board noted that soft dollar arrangements may result in the Fund bearing costs to purchase research that may be used by Invesco Advisers or the Affiliated Sub-Advisers with other clients and may reduce Invesco Advisers’ or the Affiliated Sub-Advisers’ expenses. The Board also considered that it receives periodic reports from Invesco representing that these arrangements are consistent with regulatory requirements. The Board did not deem the soft dollar arrangements to be inappropriate.
The Board considered that the Fund’s uninvested cash and cash collateral from any securities lending arrangements may be invested in money market funds advised by Invesco Advisers pursuant to procedures approved by the Board. The Board noted that Invesco Advisers receives advisory fees from these affiliated money market funds attributable to such investments, although Invesco Advisers has contractually agreed to
waive through varying periods the advisory fees payable by the Invesco Funds with respect to certain investments in the affiliated money market funds. The waiver is in an amount equal to 100% of the net advisory fee Invesco Advisers receives from the affiliated money market funds with respect to the Fund’s investment in the affiliated money market funds of uninvested cash, but not cash collateral. The Board concluded that the amount of advisory fees received by Invesco Advisers from the Fund’s investment of cash collateral from any securities lending arrangements in the affiliated money market funds is fair and reasonable.
The Board also considered that an affiliated broker may receive commissions for executing certain trades for the Fund. Invesco Advisers and the Affiliated Sub-Advisers may use the affiliated broker to, among other things, control order routing and minimize information leakage, and the Board was advised that such trades are executed in compliance with rules under the federal securities laws and consistent with best execution obligations.
26 Invesco Low Volatility Emerging Markets Fund
Tax Information
Form 1099-DIV, Form 1042-S and other year-end tax information provide shareholders with actual calendar year amounts that should be included in their tax returns. Shareholders should consult their tax advisors.
The following distribution information is being provided as required by the Internal Revenue Code or to meet a specific state’s requirement.
The Fund designates the following amounts or, if subsequently determined to be different, the maximum amount allowable for its fiscal year ended October 31, 2018:
| | | | |
Federal and State Income Tax | |
Long-Term Capital Gain Distributions | | $ | 3,186,179 | |
Qualified Dividend Income* | | | 20.73 | % |
Corporate Dividends Received Deduction* | | | 0.00 | % |
U.S. Treasury Obligations* | | | 0.00 | % |
Foreign Taxes | | $ | 0.0313 | per share |
Foreign Income | | $ | 0.3437 | per share |
| | * | The above percentages are based on ordinary income dividends paid to shareholders during the Fund’s fiscal year. |
| | | | |
Non-Resident Alien Shareholders | |
Qualified Short-Term Gains | | $ | 2,566,394 | |
27 Invesco Low Volatility Emerging Markets Fund
Trustees and Officers
The address of each trustee and officer is AIM Investment Funds (Invesco Investment Funds) (the “Trust”), 11 Greenway Plaza, Suite 1000, Houston, Texas 77046-1173. The trustees serve for the life of the Trust, subject to their earlier death, incapacitation, resignation, retirement or removal as more specifically provided in the Trust’s organizational documents. Each officer serves for a one year term or until their successors are elected and qualified. Column two below includes length of time served with predecessor entities, if any.
| | | | | | | | |
Name, Year of Birth and
Position(s) Held with the Trust | | Trustee and/
or Officer Since | | Principal Occupation(s)
During Past 5 Years | | Number of
Funds in Fund
Complex
Overseen by
Trustee | | Other Directorship(s)
Held by Trustee During
Past 5 Years |
| Interested Persons | | | | | | | | |
| Martin L. Flanagan1 — 1960 Trustee | | 2007 | | Executive Director, Chief Executive Officer and President, Invesco Ltd. (ultimate parent of Invesco and a global investment management firm); Trustee, The Invesco Funds; Vice Chair, Investment Company Institute; and Member of Executive Board, SMU Cox School of Business Formerly: Advisor to the Board, Invesco Advisers, Inc. (formerly known as Invesco Institutional (N.A.), Inc.); Chairman and Chief Executive Officer, Invesco Advisers, Inc. (registered investment adviser); Director, Chairman, Chief Executive Officer and President, Invesco Holding Company (US), Inc. (formerly IVZ Inc.) (holding company), Invesco Group Services, Inc. (service provider) and Invesco North American Holdings, Inc. (holding company); Director, Chief Executive Officer and President, Invesco Holding Company Limited (parent of Invesco and a global investment management firm); Director, Invesco Ltd.; Chairman, Investment Company Institute and President, Co-Chief Executive Officer, Co-President, Chief Operating Officer and Chief Financial Officer, Franklin Resources, Inc. (global investment management organization) | | 158 | | None |
Philip A. Taylor2 — 1954 Trustee and Senior Vice President | | 2006 | | Head of the Americas and Senior Managing Director, Invesco Ltd.; Director, Invesco Advisers, Inc. (formerly known as Invesco Institutional (N.A.), Inc.) (registered investment adviser); Director and Chairman, Invesco Investment Services, Inc. (formerly known as Invesco AIM Investment Services, Inc.) (registered transfer agent); Chief Executive Officer, Invesco Corporate Class Inc. (corporate mutual fund company); Director, Chairman and Chief Executive Officer, Invesco Canada Ltd. (formerly known as Invesco Trimark Ltd./Invesco Trimark Ltèe) (registered investment adviser and registered transfer agent); Trustee and Senior Vice President, The Invesco Funds; Director, Invesco Investment Advisers LLC (formerly known as Van Kampen Asset Management) Formerly: Director, Chairman, Chief Executive Officer and President, Invesco Management Group, Inc. (formerly known as Invesco AIM Management Group, Inc.) (financial services holding company); Co-Chairman, Co-President and Co-Chief Executive Officer, Invesco Advisers, Inc. (formerly known as Invesco Institutional (N.A.), Inc.) (registered investment adviser); Director, Chief Executive Officer and President, Van Kampen Exchange Corp; President and Principal Executive Officer, The Invesco Funds (other than AIM Treasurer’s Series Trust (Invesco Treasurer’s Series Trust), Short-Term Investments Trust and Invesco Management Trust); Executive Vice President, The Invesco Funds (AIM Treasurer’s Series Trust (Invesco Treasurer’s Series Trust), Short-Term Investments Trust and Invesco Management Trust only); Director and President, INVESCO Funds Group, Inc. (registered investment adviser and registered transfer agent); Director and Chairman, IVZ Distributors, Inc. (formerly known as INVESCO Distributors, Inc.) (registered broker dealer); Director, President and Chairman, Invesco Inc. (holding company), Invesco Canada Holdings Inc. (holding company), Trimark Investments Ltd./Placements Trimark Ltèe and Invesco Financial Services Ltd/Services Financiers Invesco Ltèe; Chief Executive Officer, Invesco Canada Fund Inc. (corporate mutual fund company); Director and Chairman, Van Kampen Investor Services Inc.; Director, Chief Executive Officer and President, 1371 Preferred Inc. (holding company) and Van Kampen Investments Inc.; Director and President, AIM GP Canada Inc. (general partner for limited partnerships) and Van Kampen Advisors, Inc.; Director and Chief Executive Officer, Invesco Trimark Dealer Inc. (registered broker dealer); Director, Invesco Distributors, Inc. (formerly known as Invesco AIM Distributors, Inc.) (registered broker dealer); Manager, Invesco Capital Management LLC; Director, Chief Executive Officer and President, Invesco Advisers, Inc.; Director, Chairman, Chief Executive Officer and President, Invesco AIM Capital Management, Inc.; President, Invesco Trimark Dealer Inc. and Invesco Trimark Ltd./Invesco Trimark Ltèe; Director and President, AIM Trimark Corporate Class Inc. and AIM Trimark Canada Fund Inc.; Senior Managing Director, Invesco Holding Company Limited; Director and Chairman, Fund Management Company (former registered broker dealer); President and Principal Executive Officer, The Invesco Funds (AIM Treasurer’s Series Trust (Invesco Treasurer’s Series Trust), and Short-Term Investments Trust only); President, AIM Trimark Global Fund Inc. and AIM Trimark Canada Fund Inc. | | 158 | | None |
| 1 | Mr. Flanagan is considered an interested person (within the meaning of Section 2(a)(19) of the 1940 Act) of the Trust because he is an officer of the Adviser to the Trust, and an officer and a director of Invesco Ltd., ultimate parent of the Adviser. |
| 2 | Mr. Taylor is considered an interested person (within the meaning of Section 2(a)(19) of the 1940 Act) of the Trust because he is an officer and a director of the Adviser. |
T-1 Invesco Low Volatility Emerging Markets Fund
Trustees and Officers—(continued)
| | | | | | | | |
Name, Year of Birth and
Position(s) Held with the Trust | | Trustee and/
or Officer Since | | Principal Occupation(s)
During Past 5 Years | | Number of
Funds in Fund
Complex
Overseen by
Trustee | | Other Directorship(s)
Held by Trustee During
Past 5 Years |
| Independent Trustees | | | | | | | | |
Bruce L. Crockett — 1944 Trustee and Chair | | 2001 | | Chairman, Crockett Technologies Associates (technology consulting company) Formerly: Director, Captaris (unified messaging provider); Director, President and Chief Executive Officer, COMSAT Corporation; Chairman, Board of Governors of INTELSAT (international communications company); ACE Limited (insurance company); Independent Directors Council and Investment Company Institute: Member of the Audit Committee, Investment Company Institute; Member of the Executive Committee and Chair of the Governance Committee, Independent Directors Council | | 158 | | Director and Chairman of the Audit Committee, ALPS (Attorneys Liability Protection Society) (insurance company); Director and Member of the Audit Committee and Compensation Committee, Ferroglobe PLC (metallurgical company) |
David C. Arch — 1945 Trustee | | 2010 | | Chairman of Blistex Inc. (consumer health care products manufacturer); Member, World Presidents’ Organization | | 158 | | Board member of the Illinois Manufacturers’ Association |
Jack M. Fields — 1952 Trustee | | 2001 | | Chief Executive Officer, Twenty First Century Group, Inc. (government affairs company); and Chairman, Discovery Learning Alliance (non-profit) Formerly: Owner and Chief Executive Officer, Dos Angeles Ranch L.P. (cattle, hunting, corporate entertainment); Director, Insperity, Inc. (formerly known as Administaff) (human resources provider); Chief Executive Officer, Texana Timber LP (sustainable forestry company); Director of Cross Timbers Quail Research Ranch (non-profit); and member of the U.S. House of Representatives | | 158 | | None |
Cynthia Hostetler — 1962 Trustee | | 2017 | | Non-Executive Director and Trustee of a number of public and private business corporations Formerly: Director, Aberdeen Investment Funds (4 portfolios); Head of Investment Funds and Private Equity, Overseas Private Investment Corporation; President, First Manhattan Bancorporation, Inc.; Attorney, Simpson Thacher & Bartlett LLP | | 158 | | Vulcan Materials Company (construction materials company); Trilinc Global Impact Fund; Artio Global Investment LLC (mutual fund complex); Edgen Group, Inc. (specialized energy and infrastructure products distributor) |
Eli Jones — 1961 Trustee | | 2016 | | Professor and Dean, Mays Business School — Texas A&M University Formerly: Professor and Dean, Walton College of Business, University of Arkansas and E.J. Ourso College of Business, Louisiana State University; Director, Arvest Bank | | 158 | | Insperity, Inc. (formerly known as Administaff) (human resources provider) |
Prema Mathai-Davis — 1950 Trustee | | 2001 | | Retired | | 158 | | None |
Teresa M. Ressel — 1962 Trustee | | 2017 | | Non-executive director and trustee of a number of public and private business corporations Formerly: Chief Financial Officer, Olayan America, The Olayan Group (international investor/commercial/industrial); Chief Executive Officer, UBS Securities LLC; Group Chief Operating Officer, Americas, UBS AG; Assistant Secretary for Management & Budget and CFO, US Department of the Treasury | | 158 | | Atlantic Power Corporation (power generation company); ON Semiconductor Corp. (semiconductor supplier) |
Ann Barnett Stern — 1957 Trustee | | 2017 | | President and Chief Executive Officer, Houston Endowment Inc. (private philanthropic institution) Formerly: Executive Vice President and General Counsel, Texas Children’s Hospital; Attorney, Beck, Redden and Secrest, LLP; Business Law Instructor, University of St. Thomas; Attorney, Andrews & Kurth LLP | | 158 | | Federal Reserve Bank of Dallas |
Raymond Stickel, Jr. — 1944 Trustee | | 2005 | | Retired Formerly: Director, Mainstay VP Series Funds, Inc. (25 portfolios); Partner, Deloitte & Touche | | 158 | | None |
Robert C. Troccoli — 1949 Trustee | | 2016 | | Adjunct Professor, University of Denver — Daniels College of Business Formerly: Senior Partner, KPMG LLP | | 158 | | None |
Christopher L. Wilson — 1957 Trustee | | 2017 | | Non-executive director and trustee of a number of public and private business corporations Formerly: Director, TD Asset Management USA Inc. (mutual fund complex) (22 portfolios); Managing Partner, CT2, LLC (investing and consulting firm); President/Chief Executive Officer, Columbia Funds, Bank of America Corporation; President/Chief Executive Officer, CDC IXIS Asset Management Services, Inc.; Principal & Director of Operations, Scudder Funds, Scudder, Stevens & Clark, Inc.; Assistant Vice President, Fidelity Investments | | 158 | | ISO New England, Inc. (non-profit organization managing regional electricity market) |
T-2 Invesco Low Volatility Emerging Markets Fund
Trustees and Officers—(continued)
| | | | | | | | |
Name, Year of Birth and
Position(s) Held with the Trust | | Trustee and/
or Officer Since | | Principal Occupation(s)
During Past 5 Years | | Number of
Funds in Fund
Complex
Overseen by
Trustee | | Other Directorship(s)
Held by Trustee During
Past 5 Years |
| Other Officers | | | | | | | | |
Sheri Morris — 1964 President, Principal Executive Officer and Treasurer | | 1999 | | President, Principal Executive Officer and Treasurer, The Invesco Funds; Vice President, Invesco Advisers, Inc. (formerly known as Invesco Institutional (N.A.), Inc.) (registered investment adviser); and Vice President, Invesco Exchange-Traded Fund Trust, Invesco Exchange-Traded Fund Trust II, Invesco India Exchange-Traded Fund Trust, Invesco Actively Managed Exchange-Traded Fund Trust, Invesco Actively Managed Exchange-Traded Commodity Fund Trust and Invesco Exchange-Traded Self-Indexed Fund Trust Formerly: Vice President and Principal Financial Officer, The Invesco Funds; Vice President, Invesco AIM Advisers, Inc., Invesco AIM Capital Management, Inc. and Invesco AIM Private Asset Management, Inc.; Assistant Vice President and Assistant Treasurer, The Invesco Funds and Assistant Vice President, Invesco Advisers, Inc., Invesco AIM Capital Management, Inc. and Invesco AIM Private Asset Management, Inc.; and Treasurer, Invesco Exchange-Traded Fund Trust, Invesco Exchange-Traded Fund Trust II, Invesco India Exchange-Traded Fund Trust and Invesco Actively Managed Exchange-Traded Fund Trust | | N/A | | N/A |
Russell C. Burk — 1958 Senior Vice President and Senior Officer | | 2005 | | Senior Vice President and Senior Officer, The Invesco Funds | | N/A | | N/A |
Jeffrey H. Kupor — 1968 Senior Vice President, Chief Legal Officer and Secretary | | 2018 | | Senior Vice President and Secretary, Invesco Advisers, Inc. (formerly known as Invesco Institutional (N.A.), Inc.) (registered investment adviser); Senior Vice President and Secretary, Invesco Distributors, Inc. (formerly known as Invesco AIM Distributors, Inc.); Vice President and Secretary, Invesco Investment Services, Inc. (formerly known as Invesco AIM Investment Services, Inc.) Senior Vice President, Chief Legal Officer and Secretary, The Invesco Funds; Secretary and General Counsel, Invesco Investment Advisers LLC (formerly known as Van Kampen Asset Management); Secretary and General Counsel, Invesco Capital Markets, Inc. (formerly known as Van Kampen Funds Inc.) and Chief Legal Officer, Invesco Exchange-Traded Fund Trust, Invesco Exchange-Traded Fund Trust II, Invesco India Exchange-Traded Fund Trust, Invesco Actively Managed Exchange-Traded Fund Trust, Invesco Actively Managed Exchange-Traded Commodity Fund Trust and Invesco Exchange-Traded Self-Indexed Fund Trust; Secretary, Invesco Indexing LLC; Secretary and General Counsel, INVESCO Private Capital Investments, Inc.; Secretary, W.L. Ross & Co., LLC; Secretary and Vice President, Jemstep, Inc. Formerly: Senior Vice President, Secretary and General Counsel, Invesco Management Group, Inc. (formerly known as Invesco AIM Management Group, Inc.); Assistant Secretary, INVESCO Asset Management (Bermuda) Ltd.; Secretary and General Counsel, Invesco Private Capital, Inc.; Assistant Secretary and General Counsel, INVESCO Realty, Inc.; Secretary and General Counsel, Invesco Senior Secured Management, Inc.; and Secretary, Sovereign G./P. Holdings Inc. | | N/A | | N/A |
John M. Zerr — 1962 Senior Vice President | | 2006 | | Chief Operating Officer of the Americas; Senior Vice President, Invesco Advisers, Inc. (formerly known as Invesco Institutional (N.A.), Inc.) (registered investment adviser); Senior Vice President, Invesco Distributors, Inc. (formerly known as Invesco AIM Distributors, Inc.); Director and Vice President, Invesco Investment Services, Inc. (formerly known as Invesco AIM Investment Services, Inc.) Senior Vice President, The Invesco Funds; Managing Director, Invesco Capital Management LLC; Director, Invesco Investment Advisers LLC (formerly known as Van Kampen Asset Management); Senior Vice President, Invesco Capital Markets, Inc. (formerly known as Van Kampen Funds Inc.); Manager, Invesco Indexing LLC Formerly: Director and Senior Vice President, Invesco Management Group, Inc. (formerly known as Invesco AIM Management Group, Inc.); Secretary and General Counsel, Invesco Management Group, Inc. (formerly known as Invesco AIM Management Group, Inc.); Secretary, Invesco Investment Services, Inc. (formerly known as Invesco AIM Investment Services, Inc.); Chief Legal Officer and Secretary, The Invesco Funds; Secretary and General Counsel, Invesco Investment Advisers LLC (formerly known as Van Kampen Asset Management); Secretary and General Counsel, Invesco Capital Markets, Inc. (formerly known as Van Kampen Funds Inc.); Chief Legal Officer, Invesco Exchange-Traded Fund Trust, Invesco Exchange-Traded Fund Trust II, Invesco India Exchange-Traded Fund Trust, Invesco Actively Managed Exchange-Traded Fund Trust, Invesco Actively Managed Exchange-Traded Commodity Fund Trust and Invesco Exchange-Traded Self-Indexed Fund Trust; Secretary, Invesco Indexing LLC; Director, Secretary, General Counsel and Senior Vice President, Van Kampen Exchange Corp.; Director, Vice President and Secretary, IVZ Distributors, Inc. (formerly known as INVESCO Distributors, Inc.); Director and Vice President, INVESCO Funds Group, Inc.; Director and Vice President, Van Kampen Advisors Inc.; Director, Vice President, Secretary and General Counsel, Van Kampen Investor Services Inc.; Director and Secretary, Invesco Distributors, Inc. (formerly known as Invesco AIM Distributors, Inc.); Director, Senior Vice President, General Counsel and Secretary, Invesco AIM Advisers, Inc. and Van Kampen Investments Inc.; Director, Vice President and Secretary, Fund Management Company; Director, Senior Vice President, Secretary, General Counsel and Vice President, Invesco AIM Capital Management, Inc.; Chief Operating Officer and General Counsel, Liberty Ridge Capital, Inc. (an investment adviser) | | N/A | | N/A |
T-3 Invesco Low Volatility Emerging Markets Fund
Trustees and Officers—(continued)
| | | | | | | | |
Name, Year of Birth and
Position(s) Held with the Trust | | Trustee and/
or Officer Since | | Principal Occupation(s)
During Past 5 Years | | Number of
Funds in Fund
Complex
Overseen by
Trustee | | Other Directorship(s)
Held by Trustee During
Past 5 Years |
| Other Officers—(continued) | | | | | | | | |
Gregory G. McGreevey — 1962 Senior Vice President | | 2012 | | Senior Managing Director, Invesco Ltd.; Director, Chairman, President, and Chief Executive Officer, Invesco Advisers, Inc. (formerly known as Invesco Institutional (N.A.), Inc.) (registered investment adviser); Director, Invesco Mortgage Capital, Inc. and Invesco Senior Secured Management, Inc.; and Senior Vice President, The Invesco Funds Formerly: Senior Vice President, Invesco Management Group, Inc. and Invesco Advisers, Inc.; Assistant Vice President, The Invesco Funds | | N/A | | N/A |
Kelli Gallegos — 1970 Vice President, Principal Financial Officer and Assistant Treasurer | | 2008 | | Vice President and Treasurer, Invesco Exchange-Traded Fund Trust, Invesco Exchange-Traded Fund Trust II, Invesco India Exchange-Traded Fund Trust, Invesco Actively Managed Exchange-Traded Fund Trust, Invesco Actively Managed Exchange-Traded Commodity Fund Trust and Invesco Exchange-Traded Self-Indexed Fund Trust; Vice President, Principal Financial Officer and Assistant Treasurer, The Invesco Funds; Principal Financial and Accounting Officer — Pooled Investments, Invesco Capital Management LLC Formerly: Assistant Treasurer, Invesco Exchange-Traded Fund Trust, Invesco Exchange-Traded Fund Trust II, Invesco India Exchange-Traded Fund Trust, Invesco Actively Managed Exchange-Traded Fund Trust, Invesco Actively Managed Exchange-Traded Commodity Fund Trust and Invesco Exchange-Traded Self-Indexed Fund Trust; Assistant Treasurer, Invesco Capital Management LLC; Assistant Vice President, The Invesco Funds | | N/A | | N/A |
Tracy Sullivan — 1962 Vice President, Chief Tax Officer and Assistant Treasurer | | 2008 | | Vice President, Chief Tax Officer and Assistant Treasurer, The Invesco Funds; Assistant Treasurer, Invesco Capital Management LLC, Invesco Exchange-Traded Fund Trust, Invesco Exchange-Traded Fund Trust II, Invesco India Exchange-Traded Fund Trust, Invesco Actively Managed Exchange-Traded Fund Trust, Invesco Actively Managed Exchange-Traded Commodity Fund Trust and Invesco Exchange-Traded Self-Indexed Fund Trust Formerly: Assistant Vice President, The Invesco Funds | | N/A | | N/A |
Crissie M. Wisdom — 1969 Anti-Money Laundering Compliance Officer | | 2013 | | Anti-Money Laundering Compliance Officer, Invesco Advisers, Inc. (formerly known as Invesco Institutional (N.A.), Inc.) (registered investment adviser), Invesco Capital Markets, Inc. (formerly known as Van Kampen Funds Inc.), Invesco Distributors, Inc., Invesco Investment Services, Inc., The Invesco Funds, and Invesco Exchange-Traded Fund Trust, Invesco Exchange-Traded Fund Trust II, Invesco India Exchange-Traded Fund Trust, Invesco Actively Managed Exchange-Traded Fund Trust, Invesco Actively Managed Exchange-Traded Commodity Fund Trust and Invesco Exchange-Traded Self-Indexed Fund Trust; Anti-Money Laundering Compliance Officer and Bank Secrecy Act Officer, INVESCO National Trust Company and Invesco Trust Company; and Fraud Prevention Manager and Controls and Risk Analysis Manager for Invesco Investment Services, Inc. Formerly: Anti-Money Laundering Compliance Officer, Van Kampen Exchange Corp. and Invesco Management Group, Inc. | | N/A | | N/A |
Robert R. Leveille — 1969 Chief Compliance Officer | | 2016 | | Chief Compliance Officer, Invesco Advisers, Inc. (registered investment adviser); and Chief Compliance Officer, The Invesco Funds Formerly: Chief Compliance Officer, Putnam Investments and the Putnam Funds | | N/A | | N/A |
The Statement of Additional Information of the Trust includes additional information about the Fund’s Trustees and is available upon request, without charge, by calling 1.800.959.4246. Please refer to the Fund’s Statement of Additional Information for information on the Fund’s sub-advisers.
| | | | | | |
Office of the Fund 11 Greenway Plaza, Suite 1000 Houston, TX 77046-1173 | | Investment Adviser Invesco Advisers, Inc. 1555 Peachtree Street, N.E. Atlanta, GA 30309 | | Distributor Invesco Distributors, Inc. 11 Greenway Plaza, Suite 1000 Houston, TX 77046-1173 | | Auditors PricewaterhouseCoopers LLP 1000 Louisiana Street, Suite 5800 Houston, TX 77002-5021 |
| | | |
| | | | | | |
Counsel to the Fund Stradley Ronon Stevens & Young, LLP 2005 Market Street, Suite 2600 Philadelphia, PA 19103-7018 | | Counsel to the Independent Trustees Goodwin Procter LLP 901 New York Avenue, N.W. Washington, D.C. 20001 | | Transfer Agent Invesco Investment Services, Inc. 11 Greenway Plaza, Suite 1000 Houston, TX 77046-1173 | | Custodian State Street Bank and Trust Company 225 Franklin Street Boston, MA 02110-2801 |
T-4 Invesco Low Volatility Emerging Markets Fund
Explore High-Conviction Investing with Invesco

Go paperless with eDelivery
Visit invesco.com/edelivery to enjoy the convenience and security of anytime electronic access to your investment documents.
With eDelivery, you can elect to have any or all of the following materials delivered straight to your inbox to download, save and print from your own computer:
∎ Fund reports and prospectuses
∎ Quarterly statements
∎ Daily confirmations
∎ Tax forms
Invesco mailing information
Send general correspondence to Invesco Investment Services, Inc., P.O. Box 219078, Kansas City, MO 64121-9078.
Important notice regarding delivery of security holder documents
To reduce Fund expenses, only one copy of most shareholder documents may be mailed to shareholders with multiple accounts at the same address (Householding). Mailing of your shareholder documents may be householded indefinitely unless you instruct us otherwise. If you do not want the mailing of these documents to be combined with those for other members of your household, please contact Invesco Investment Services, Inc. at 800 959 4246 or contact your financial institution. We will begin sending you individual copies for each account within 30 days after receiving your request.
Fund holdings and proxy voting information
The Fund provides a complete list of its holdings four times in each fiscal year, at the quarter ends. For the second and fourth quarters, the lists appear in the Fund’s semiannual and annual reports to shareholders. For the first and third quarters, the Fund files the lists with the Securities and Exchange Commission (SEC) on Form N-Q (or any successor Form). The most recent list of portfolio holdings is available at invesco.com/completeqtrholdings. Shareholders can also look up the Fund’s Forms N-Q (or any successor Form) on the SEC website at sec.gov. The SEC file numbers for the Fund are shown below.
A description of the policies and procedures that the Fund uses to determine how to vote proxies relating to portfolio securities is available without charge, upon request, from our Client Services department at 800 959 4246 or at invesco.com/proxyguidelines. The information is also available on the SEC website, sec.gov.
| | |
Information regarding how the Fund voted proxies related to its portfolio securities during the most recent 12-month period ended June 30 is available at invesco.com/proxysearch. The information is also available on the SEC website, sec.gov. Invesco Advisers, Inc. is an investment adviser; it provides investment advisory services to individual and institutional clients and does not sell securities. Invesco Distributors, Inc. is the US distributor for Invesco Ltd.’s retail mutual funds, exchange-traded funds and institutional money market funds. Both are wholly owned, indirect subsidiaries of Invesco Ltd. | | 
|
| | | | | | | | |
| SEC file numbers: 811-05426 and 033-19338 | | Invesco Distributors, Inc. | | LVEM-AR-1 | | 12242018 | | 0815 |
| | | | | | |
| | | | |
 | | Annual Report to Shareholders | | October 31, 2018 | | |
| | | | |
| | Invesco Macro Allocation Strategy Fund | | |
| | Nasdaq: | | |
| | A: GMSDX ∎ C: GMSEX ∎ R: GMSJX ∎ Y: GMSHX ∎ R5: GMSKX ∎ R6: GMSLX | | |
Letters to Shareholders
| | |

Philip Taylor | | Dear Shareholders: This annual report includes information about your Fund, including performance data and a complete list of its investments as of the close of the reporting period. Inside is a discussion of how your Fund was managed and the factors that affected its performance during the reporting period. Throughout the reporting period, US economic data remained positive. Robust corporate profits, strong retail sales and unemployment rates near generational lows helped drive US markets to new all-time records multiple times during the reporting period. Against this backdrop, the US Federal Reserve raised the federal funds rate four times during the reporting period. Market volatility, largely non-existent in 2017, returned in 2018. Markets sold off first in February and again sharply in October, amid rising interest rates, concerns about potential trade wars and heightened geopolitical tensions. Despite the volatility, US equity markets were largely positive for the reporting period and fared better than international markets. Emerging markets were |
particularly hard hit due to a strong US dollar. During the October sell-off, investors retreated to more defensive areas of the market and to US Treasuries. The broader bond market declined during the reporting period due to the increase in US Treasury yields and widening credit spreads. As the year progresses, we’ll see how the interplay of economic data, interest rates, geopolitics and a host of other factors affect US and overseas equity and fixed income markets.
Short-term market volatility can prompt some investors to abandon their investment plans – and can cause others to settle for whatever returns the market has to offer. The investment professionals at Invesco, in contrast, invest with high conviction. This means that, no matter the asset class or the strategy, each investment team has a passion to exceed. We want to help investors achieve better outcomes, such as seeking higher returns, helping mitigate risk and generating income. Of course, investing with high conviction can’t guarantee a profit or ensure success; no investment strategy can. To learn more about how we invest with high conviction, visit invesco.com/HighConviction.
You, too, can invest with high conviction by maintaining a long-term investment perspective and by working with your financial adviser on a regular basis. During periods of short-term market volatility or uncertainty, your financial adviser can keep you focused on your long-term investment goals – a new home, a child’s college education or a secure retirement. He or she also can share research about the economy, the markets and individual investment options.
Visit our website for more information on your investments
Our website, invesco.com/us, offers a wide range of market insights and investment perspectives. On the website, you’ll find detailed information about our funds, including performance, holdings and portfolio manager commentaries. You can access information about your account by completing a simple, secure online registration. To do so, select “Log In” on the right side of the homepage, and then select “Register for Individual Account Access.”
In addition to the resources accessible on our website and through our mobile app, you can obtain timely updates to help you stay informed about the markets and the economy by connecting with Invesco on Twitter, LinkedIn or Facebook. You can access our blog at blog.invesco.us.com. Our goal is to provide you the information you want, when and where you want it.
Finally, I’m pleased to share with you Invesco’s commitment to both the Principles for Responsible Investment and to considering environmental, social and governance issues in our robust investment process. I invite you to learn more at invesco.com/esg.
Have questions?
For questions about your account, contact an Invesco client services representative at 800 959 4246. For Invesco-related questions or comments, please email me directly at phil@invesco.com.
All of us at Invesco look forward to serving your investment management needs. Thank you for investing with us.
Sincerely,

Philip Taylor
Senior Managing Director, Invesco Ltd.
| | |
| 2 | | Invesco Macro Allocation Strategy Fund |
| | | | |

Bruce Crockett | | Dear Fellow Shareholders: Among the many important lessons I’ve learned in more than 40 years in a variety of business endeavors is the value of a trusted advocate. As independent chair of the Invesco Funds Board, I can assure you that the members of the Board are strong advocates for the interests of investors in Invesco’s mutual funds. We work hard to represent your interests through oversight of the quality of the investment management services your funds receive and other matters important to your investment, including but not limited to: |
| | ∎ | | Ensuring that Invesco offers a diverse lineup of mutual funds that your financial adviser can use to strive to meet your financial needs as your investment goals change over time. |
| | ∎ | | Monitoring how the portfolio management teams of the Invesco funds are performing in light of changing economic and market conditions. |
| ∎ | | Assessing each portfolio management team’s investment performance within the context of the investment strategy described in the fund’s prospectus. |
| ∎ | | Monitoring for potential conflicts of interests that may impact the nature of the services that your funds receive. |
We believe one of the most important services we provide our fund shareholders is the annual review of the funds’ advisory and sub-advisory contracts with Invesco Advisers and its affiliates. This review is required by the Investment Company Act of 1940 and focuses on the nature and quality of the services Invesco provides as the adviser to the Invesco funds and the reasonableness of the fees that it charges for those services. Each year, we spend months carefully reviewing information received from Invesco and a variety of independent sources, such as performance and fee data prepared by Lipper, Inc. (a subsidiary of Broadridge Financial Solutions, Inc.), an independent, third-party firm widely recognized as a leader in its field. We also meet with our independent legal counsel and other independent advisers to review and help us assess the information that we have received. Our goal is to assure that you receive quality investment management services for a reasonable fee.
I trust the measures outlined above provide assurance that you have a worthy advocate when it comes to choosing the Invesco Funds.
As always, please contact me at bruce@brucecrockett.com with any questions or concerns you may have. On behalf of the Board, we look forward to continuing to represent your interests and serving your needs.
Sincerely,

Bruce L. Crockett
Independent Chair
Invesco Funds Board of Trustees
| | |
| 3 | | Invesco Macro Allocation Strategy Fund |
Management’s Discussion of Fund Performance
| | | | |
| |
Performance summary For the fiscal year ended October 31, 2018, Class A shares of Invesco Macro Allocation Strategy Fund (the Fund), at net asset value (NAV), underperformed the Bloomberg Barclays 3-Month Treasury Bellwether Index, the Fund’s broad market/style-specific benchmark. Your Fund’s long-term performance appears later in this report. | |
| | |
Fund vs. Indexes | | | | |
Total returns, 10/31/17 to 10/31/18, at net asset value (NAV). Performance shown does not include applicable contingent deferred sales charges (CDSC) or front-end sales charges, which would have reduced performance. | |
| |
Class A Shares | | | -4.03 | % |
Class C Shares | | | -4.80 | |
Class R Shares | | | -4.24 | |
Class Y Shares | | | -3.80 | |
Class R5 Shares | | | -3.79 | |
Class R6 Shares | | | -3.80 | |
Bloomberg Barclays 3-Month Treasury Bellwether Indexq (Broad Market/Style-Specific Index) | | | 1.69 | |
Lipper Absolute Return Funds Index⬛ (Peer Group Index) | | | -1.06 | |
| | |
Source(s): qFactSet Research Systems Inc.; ⬛Lipper Inc. | | | | |
Market conditions and your Fund
During the fiscal year ended October 31, 2018, the strategic equity and commodity exposures of the Fund detracted from returns while the Fund’s sovereign debt exposure contributed to results. Within the tactical allocation process, commodities contributed to Fund performance during the fiscal year while bonds and equities detracted. The Fund, at NAV, reported negative absolute performance for the fiscal year. The Fund invests in derivatives, such as swaps and futures, which are expected to correspond to the performance of US and international fixed income, equity and commodity markets. The strategic allocation portion of the investment process involves first selecting representative assets for each asset class (equities, fixed income and commodities) from a universe of more than 50 assets. Next, we seek to construct the portfolio so that an approximately equal amount of risk comes from our equity, fixed income and commodity allocations. Tactical adjustments to the Fund’s portfolio, which are designed to drive the majority of results over time,
are made on a monthly basis to try and take advantage of short-term market dynamics.
The results from the smaller strategic allocation were negative for the fiscal year as the risk-balanced exposure to each asset class proved detrimental.
Results from the tactical allocation process were also detrimental in aggregate for the fiscal year, delivering mixed results across each asset class.
The Fund’s largely long exposure to equities worked in favor of Fund performance until the last month of the fiscal year. The atypical strong decline across global equity markets during October 2018 had a meaningful negative impact on the portfolio’s results. While the immediate trigger of the sell-off is debatable, some combination of accumulating challenges to future growth – increases in treasury yields, evidence of slowing growth in many markets or trade conflicts – almost certainly contributed to the decline.
The Fund’s tactical exposure to sovereign debt was also unfavorable for the fiscal year. Results were mixed across the different bond markets the strategy
engages in. Our short bias to US government bonds was the only contributor to Fund results, in line with the asset class’ behavior in periods of interest rate increases. The broader mixed stance to the other sovereign debt markets in the portfolio proved to be detrimental to Fund results for the fiscal year. Canadian government bonds struggled with the incremental increases of local interest rates. Broad defensively positioned European bonds, namely German bunds and UK gilts, detracted from Fund results mainly driven by geopolitical tensions. In the case of Germany, the newly-elected Italian government increased demand for bunds. As for gilts, the uncertainty surrounding a disorderly Brexit made this asset a sought after so-called safe-haven assets at an untimely moment. The Fund’s largely defensive Australian government debt exposure also proved detrimental to Fund results during the fiscal year as a weak Chinese economy triggered uncertainty around risky assets.
The Fund’s tactical allocation to commodities was a net contributor to Fund results for the fiscal year. Overall, our exposure to the energy complex was largely long, while the other three complexes – agriculture, industrial metals and precious metals – experienced varied exposures during the fiscal year. Our long exposure to energy commodities profited from newly imposed sanctions on Iran, draws on US inventories and lack of definition of OPEC’s production cuts, as well as Venezuela’s depleted oil production infrastructure, which made an impact on global prices. As for precious metals, our defensive stance was consistent with an environment of interest rate increases that proved positive for Fund results. Agriculture and industrial metals were mostly impacted by the uncertainties surrounding news on the impending trade wars. Our defensive posture in agriculture commodities resulted in mixed performances across assets, while our largely long exposure to industrial metals detracted from Fund results during the fiscal year.
| | | | |
Target Risk Allocation and Notional Asset Weights as of 10/31/18 | |
By asset class | | | | |
| | | | | | | | |
| | |
Asset Class | |
| Target Risk
Allocation* |
| |
| Notional Asset
Weights** |
|
Equities | | | 75.64 | % | | | 62.11% | |
Fixed Income | | | 0.08 | | | | 6.57 | |
Commodities | | | 24.28 | | | | -4.30 | |
Total | | | 100.00 | | | | 64.38 | |
| * | Reflects the risk that each asset class is expected to contribute to the overall risk of the Fund as measured by standard deviation and estimates of risk based on historical data. Standard deviation measures the annualized fluctuations (volatility) of monthly returns. |
| ** | Proprietary models determine the Notional Asset Weights necessary to achieve the Target Risk Allocations. Total Notional Asset Weight greater than 100% is achieved through derivatives and other instruments that create leverage. |
| | |
Total Net Assets | | $41.8 million |
| | |
| 4 | | Invesco Macro Allocation Strategy Fund |
Please note that our strategy is principally implemented with derivative instruments that include futures and total return swaps. Therefore, all or most of the performance of the strategy, both positive and negative, can be attributed to these instruments. Derivatives can be a cost-effective way to gain exposure to asset classes. However, derivatives may amplify traditional investment risks through the creation of leverage and may be less liquid than traditional securities.
We thank you for your investment in Invesco Macro Allocation Strategy Fund.
The views and opinions expressed in management’s discussion of Fund performance are those of Invesco Advisers, Inc. These views and opinions are subject to change at any time based on factors such as market and economic conditions. These views and opinions may not be relied upon as investment advice or recommendations, or as an offer for a particular security. The information is not a complete analysis of every aspect of any market, country, industry, security or the Fund. Statements of fact are from sources considered reliable, but Invesco Advisers, Inc. makes no representation or warranty as to their completeness or accuracy. Although historical performance is no guarantee of future results, these insights may help you understand our investment management philosophy.
See important Fund and, if applicable, index disclosures later in this report.
| | |
 | | Scott Wolle Chartered Financial Analyst, Portfolio Manager, is lead manager of Invesco |
Macro Allocation Strategy Fund. He joined Invesco in 1999. Mr. Wolle earned a BS in finance from Virginia Polytechnic Institute and State University and an MBA from Duke University Fuqua School of Business. |

| | Mark Ahnrud Chartered Financial Analyst, Portfolio Manager, is manager of Invesco Macro Allocation Strategy |
Fund. He joined Invesco in 2000. Mr. Ahnrud earned a BS in finance and investments from Babson College and an MBA from Duke University Fuqua School of Business. |

| | Chris Devine Chartered Financial Analyst, Portfolio Manager, is manager of Invesco Macro Allocation Strategy |
Fund. He joined Invesco in 1998. Mr. Devine earned a BA in economics from Wake Forest University and an MBA from the University of Georgia. |
| | |

| | Scott Hixon Chartered Financial Analyst, Portfolio Manager, is manager of Invesco Macro Allocation Strategy |
Fund. He joined Invesco in 1994. Mr. Hixon earned a BBA in finance from Georgia Southern University and an MBA in finance from Georgia State University. |
 | | Christian Ulrich Chartered Financial Analyst, Portfolio Manager, is manager of Invesco Macro Allocation Strategy |
Fund. He joined Invesco in 2000. Mr. Ulrich earned the equivalent of a BBA from the KV Zurich Business School in Zurich, Switzerland. |
Assisted by the Invesco Global Asset Allocation Team
5 Invesco Macro Allocation Strategy Fund
Your Fund’s Long-Term Performance
Results of a $10,000 Investment – Oldest Share Class(es) since Inception
Fund and index data from 9/26/12
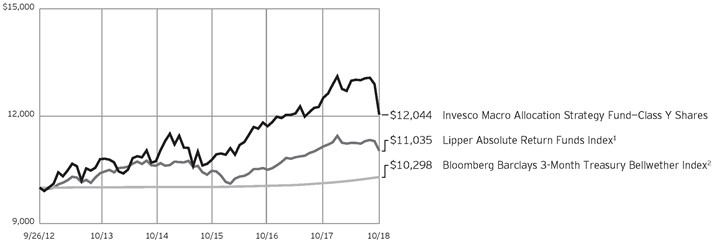
1 Source: Lipper Inc.
2 Source: FactSet Research Systems Inc.
Past performance cannot guarantee comparable future results.
The data shown in the chart include reinvested distributions, applicable sales charges and Fund expenses including
management fees. Index results include reinvested dividends, but they do not reflect sales charges. Performance of the peer group, if applicable, reflects fund expenses and management fees; performance
of a market index does not. Performance shown in the chart and table(s) does not reflect deduction of taxes a shareholder would pay on Fund distributions or sale of Fund shares.
| | |
| 6 | | Invesco Macro Allocation Strategy Fund |
| | | | |
| |
Average Annual Total Returns | |
As of 10/31/18, including maximum applicable sales charges | |
| |
Class A Shares | | | | |
Inception | | | 1.87 | % |
5 Years | | | 0.78 | |
1 Year | | | -9.32 | |
| |
Class C Shares | | | | |
Inception | | | 2.07 | % |
5 Years | | | 1.19 | |
1 Year | | | -5.71 | |
| |
Class R Shares | | | | |
Inception | | | 2.61 | % |
5 Years | | | 1.74 | |
1 Year | | | -4.24 | |
| |
Class Y Shares | | | | |
Inception (9/26/12) | | | 3.10 | % |
5 Years | | | 2.20 | |
1 Year | | | -3.80 | |
| |
Class R5 Shares | | | | |
Inception | | | 3.12 | % |
5 Years | | | 2.25 | |
1 Year | | | -3.79 | |
| |
Class R6 Shares | | | | |
Inception | | | 3.08 | % |
5 Years | | | 2.18 | |
1 Year | | | -3.80 | |
On August 28, 2013, Class H1 shares converted to Class Y shares.
Class A shares incepted on August 28, 2013. Performance shown prior to that date is that of Class H1 shares and includes the 12b-1 fees applicable to Class H1 shares.
Class C shares incepted on August 28, 2013. Performance shown prior to that date is that of Class H1 shares and includes the 12b-1 fees applicable to Class H1 shares.
Class R shares incepted on August 28, 2013. Performance shown prior to that date is that of Class H1 shares and includes the 12b-1 fees applicable to Class H1 shares.
Class R5 shares incepted on August 28, 2013. Performance shown prior to that date is that of Class H1 shares and includes the 12b-1 fees applicable to Class H1 shares.
Class R6 shares incepted on August 28, 2013. Performance shown prior to that date is that of Class H1 shares and includes the 12b-1 fees applicable to Class H1 shares.
The performance data quoted represent past performance and cannot guarantee comparable future results;
| | | | |
| |
Average Annual Total Returns | |
As of 9/30/18, the most recent calendar quarter end, including maximum applicable sales charges | |
| |
Class A Shares | | | | |
Inception | | | 3.08 | % |
5 Years | | | 2.65 | |
1 Year | | | -0.78 | |
| |
Class C Shares | | | | |
Inception | | | 3.29 | % |
5 Years | | | 3.05 | |
1 Year | | | 3.16 | |
| |
Class R Shares | | | | |
Inception | | | 3.83 | % |
5 Years | | | 3.60 | |
1 Year | | | 4.80 | |
| |
Class Y Shares | | | | |
Inception (9/26/12) | | | 4.33 | % |
5 Years | | | 4.08 | |
1 Year | | | 5.22 | |
| |
Class R5 Shares | | | | |
Inception | | | 4.34 | % |
5 Years | | | 4.10 | |
1 Year | | | 5.22 | |
| |
Class R6 Shares | | | | |
Inception | | | 4.31 | % |
5 Years | | | 4.06 | |
1 Year | | | 5.23 | |
current performance may be lower or higher. Please visit invesco.com/performance for the most recent month-end performance. Performance figures reflect reinvested distributions, changes in net asset value and the effect of the maximum sales charge unless otherwise stated. Investment return and principal value will fluctuate so that you may have a gain or loss when you sell shares.
The net annual Fund operating expense ratio set forth in the most recent Fund prospectus as of the date of this report for Class A, Class C, Class R, Class Y, Class R5 and Class R6 shares was 1.46%, 2.21%, 1.71%, 1.21%, 1.21% and 1.21%, respectively.1,2 The total annual Fund operating expense ratio set forth in the most recent Fund prospectus as of the date of this report for Class A, Class C, Class R, Class Y, Class R5 and Class R6 shares was 2.31%, 3.06%, 2.56%, 2.06%, 1.98% and 1.98%, respectively. The expense ratios presented above may vary from the expense ratios presented in other sections of this report that are based on expenses incurred during the period covered by this report.
Class A share performance reflects the maximum 5.50% sales charge, and Class C share performance reflects the applicable contingent deferred sales charge (CDSC) for the period involved. The CDSC on Class C shares is 1% for the first year after purchase. Class R, Class Y, Class R5 and Class R6 shares do not have a front-end sales charge or a CDSC; therefore, performance is at net asset value.
The performance of the Fund’s share classes will differ primarily due to different sales charge structures and class expenses.
Fund performance reflects any applicable fee waivers and/or expense reimbursements. Had the adviser not waived fees and/or reimbursed expenses currently or in the past, returns would have been lower. See current prospectus for more information.
| 1 | Total annual Fund operating expenses after any contractual fee waivers and/or expense reimbursements by the adviser in effect through at least February 29, 2020. See current prospectus for more information. |
| 2 | Total annual Fund operating expenses after any contractual fee waivers and/or expense reimbursements by the adviser in effect through at least June 30, 2020. See current prospectus for more information. |
7 Invesco Macro Allocation Strategy Fund
Invesco Macro Allocation Strategy Fund’s investment objective is to seek a positive absolute return over a complete economic and market cycle.
| ∎ | | Unless otherwise stated, information presented in this report is as of October 31, 2018, and is based on total net assets. |
| ∎ | | Unless otherwise noted, all data provided by Invesco. |
| ∎ | | To access your Fund’s reports/prospectus, visit invesco.com/fundreports. |
About share classes
| ∎ | | Class R shares are generally available only to employer sponsored retirement and benefit plans. Please see the prospectus for more information. |
| ∎ | | Class Y shares are available only to certain investors. Please see the prospectus for more information. |
| ∎ | | Class R5 shares and Class R6 shares are available for use by retirement plans that meet certain standards and for institutional investors. Class R6 shares are also available through intermediaries that have established an agreement with Invesco Distributors, Inc. to make such shares available for use in retail omnibus accounts. Please see the prospectus for more information. |
Principal risks of investing in the Fund
| ∎ | | Changing fixed income market conditions risk. The current low interest rate environment was created in part by the Federal Reserve Board (FRB) and certain foreign central banks keeping the federal funds and equivalent foreign rates near, at or below zero. Increases in the federal funds and equivalent foreign rates may expose fixed income markets to heightened volatility and reduced liquidity for certain fixed income investments, particularly those with longer maturities. In addition, decreases in fixed income dealer market-making capacity may also potentially lead to heightened volatility and reduced liquidity in the fixed income markets. As a result, the value of the Fund’s investments and share price may decline. Changes in central bank policies could also result in higher than normal shareholder redemptions, which could potentially increase portfolio turnover and the Fund’s transaction costs. |
| ∎ | | Commodities tax risk. The tax treatment of commodity-linked derivative instruments may be adversely affected by changes in legislation, regulations or other legally binding authority. If, as a |
| | result of any such adverse action, the income of the Fund from certain commodity-linked derivatives was treated as non-qualifying income, the Fund might fail to qualify as a regulated investment company and be subject to federal income tax at the Fund level. As a result of a recent announcement by the Internal Revenue Service, the Fund intends to invest in commodity-linked notes: (a) directly, relying on an opinion of counsel confirming that income from such investments should be qualifying income because such commodity-linked notes constitute securities under section 2(a)(36) of the 1940 Act or (b) indirectly through the Subsidiary. Should the Internal Revenue Service issue further guidance, or Congress enact legislation, that adversely affects the tax treatment of the Fund’s use of commodity-linked notes or the Subsidiary (which guidance might be applied to the Fund retroactively), it could, among other consequences, limit the Fund’s ability to pursue its investment strategy. |
| ∎ | | Commodity-linked notes risk. In addition to risks associated with the underlying commodities, investments in commodity-linked notes may be subject to additional risks, such as non-payment of interest and loss of principal, counterparty risk, lack of a secondary market and risk of greater volatility than traditional equity and debt securities. The value of the commodity-linked notes the Fund buys may fluctuate significantly because the values of the underlying investments to which they are linked are themselves volatile. Additionally, certain commodity-linked notes employ “economic” leverage by requiring payment by the issuer of an amount that is a multiple of the price increase or decrease of the underlying commodity, commodity index, or other economic variable. Such economic leverage will increase the volatility of the value of these commodity-linked notes and the Fund to the extent it invests in such notes. |
This report must be accompanied or preceded by a currently effective Fund prospectus, which contains more complete information, including sales charges and expenses. Investors should read it carefully before investing.
NOT FDIC INSURED | MAY LOSE VALUE | NO BANK GUARANTEE
| ∎ | | Commodity risk. The Fund may have investment exposure to the commodities markets and/or a particular sector of the commodities markets, which may subject the Fund to greater volatility than investments in traditional securities, such as stocks and bonds. Volatility in the commodities markets may be caused by changes in overall market movements, domestic and foreign political and economic events and policies, war, acts of terrorism, changes in domestic or foreign interest rates and/ or investor expectations concerning interest rates, domestic and foreign inflation rates, investment and trading activities of mutual funds, hedge funds and commodities funds, and factors such as drought, floods, weather, livestock disease, embargoes, tariffs and other regulatory developments or supply and demand disruptions. Because the Fund’s performance may be linked to the performance of volatile commodities, investors should be willing to assume the risks of potentially significant fluctuations in the value of the Fund’s shares. |
| ∎ | | Correlation risk. Because the Fund’s investment strategy seeks to balance risk across three asset classes and, within each asset class, across different countries and investments, to the extent either the asset classes or the selected countries and investments become correlated in a way not anticipated by the Adviser, the Fund’s risk allocation process may result in magnified risks and loss instead of balancing (reducing) the risk of loss. |
| ∎ | | Debt securities risk. The prices of debt securities held by the Fund will be affected by changes in interest rates, the creditworthiness of the issuer and other factors. An increase in prevailing interest rates typically causes the value of existing debt securities to fall and often has a greater impact on longer-duration debt securities and higher quality debt securities. Falling interest rates will cause the Fund to reinvest the proceeds of debt securities that have been repaid by the issuer at lower interest rates. Falling interest rates may also reduce the Fund’s distributable income because interest payments on floating rate debt instruments held by the Fund will decline. The Fund could lose money |
| | |
| 8 | | Invesco Macro Allocation Strategy Fund |
on investments in debt securities if the issuer or borrower fails to meet its obligations to make interest payments and/or to repay principal in a timely manner. Changes in an issuer’s financial strength, the market’s perception of such strength or in the credit rating of the issuer or the security may affect the value of debt securities. The Adviser’s credit analysis may fail to anticipate such changes, which could result in buying a debt security at an inopportune time or failing to sell a debt security in advance of a price decline or other credit event.
| ∎ | | Derivatives risk. The value of a derivative instrument depends largely on (and is derived from) the value of an underlying security, currency, commodity, interest rate, index or other asset (each referred to as an underlying asset). In addition to risks relating to the underlying assets, the use of derivatives may include other, possibly greater, risks, including counterparty, leverage and liquidity risks. Counterparty risk is the risk that the counterparty to the derivative contract will default on its obligation to pay the Fund the amount owed or otherwise perform under the derivative contract. Derivatives create leverage risk because they do not require payment up front equal to the economic exposure created by owning the derivative. As a result, an adverse change in the value of the underlying asset could result in the Fund sustaining a loss that is substantially greater than the amount invested in the derivative, which may make the Fund’s returns more volatile and increase the risk of loss. Derivative instruments may also be less liquid than more traditional investments and the Fund may be unable to sell or close out its derivative positions at a desirable time or price. This risk may be more acute under adverse market conditions, during which the Fund may be most in need of liquidating its derivative positions. Derivatives may also be harder to value, less tax efficient and subject to changing government regulation that could impact the Fund’s ability to use certain derivatives or their cost. The SEC has proposed new regulations related to the use of derivatives and related instruments by registered investment companies. If adopted as proposed, these regulations would limit the Fund’s ability to engage in derivatives transactions and may result in increased costs or require the Fund to modify its investment strategies or to |
liquidate. Also, derivatives used for hedging or to gain or limit exposure to a particular market segment may not provide the expected benefits, particularly during adverse market conditions. These risks are greater for the Fund than most other mutual funds because the Fund will implement its investment strategy primarily through derivative instruments rather than direct investments in stocks/bonds.
| ∎ | | Emerging markets securities risk. Emerging markets (also referred to as developing markets) are generally subject to greater market volatility, political, social and economic instability, uncertain trading markets and more governmental limitations on foreign investment than more developed markets. In addition, companies operating in emerging markets may be subject to lower trading volume and greater price fluctuations than companies in more developed markets. Securities law and the enforcement of systems of taxation in many emerging market countries may change quickly and unpredictably. In addition, investments in emerging markets securities may also be subject to additional transaction costs, delays in settlement procedures, and lack of timely information. |
| ∎ | | Exchange-traded funds risk. In addition to the risks associated with the underlying assets held by the exchange-traded fund, investments in exchange-traded funds are subject to the following additional risks: (1) an exchange-traded fund’s shares may trade above or below its net asset value; (2) an active trading market for the exchange-traded fund’s shares may not develop or be maintained; (3) trading an exchange-traded fund’s shares may be halted by the listing exchange; (4) a passively managed exchange-traded fund may not track the performance of the reference asset; and (5) a passively managed exchange-traded fund may hold troubled securities. Investment in exchange-traded funds may involve duplication of management fees and certain other expenses, as the Fund indirectly bears its proportionate share of any expenses paid by the exchange-traded funds in which it invests. Further, certain exchange-traded funds in which the Fund may invest are leveraged, which may result in economic leverage, permitting the Fund to gain exposure that is greater than would be the case in an unlevered instrument and potentially resulting in greater volatility. |
| ∎ | | Exchange-traded notes risk. Exchange-traded notes are subject to credit risk, counterparty risk, and the risk that the value of the exchange-traded note may drop due to a downgrade in the issuer’s credit rating. The value of an exchange-traded note may also be influenced by time to maturity, level of supply and demand for the exchange-traded note, volatility and lack of liquidity in the underlying market, changes in the applicable interest rates, and economic, legal, political, or geographic events that affect the referenced underlying market or assets. The Fund will bear its proportionate share of any fees and expenses borne by an exchange-traded note in which it invests. For certain exchange-traded notes, there may be restrictions on the Fund’s right to redeem its investment, which is meant to be held until maturity. |
| ∎ | | Foreign government debt risk. Investments in foreign government debt securities (sometimes referred to as sovereign debt securities) involve certain risks in addition to those relating to foreign securities or debt securities generally. The issuer of the debt or the governmental authorities that control the repayment of the debt may be unable or unwilling to repay principal or interest when due in accordance with the terms of such debt, and the Fund may have limited recourse in the event of a default against the defaulting government. Without the approval of debt holders, some governmental debtors have in the past been able to reschedule or restructure their debt payments or declare moratoria on payments. |
| ∎ | | Foreign securities risk. The Fund’s foreign investments may be adversely affected by political and social instability, changes in economic or taxation policies, difficulty in enforcing obligations, decreased liquidity or increased volatility. Foreign investments also involve the risk of the possible seizure, nationalization or expropriation of the issuer or foreign deposits (in which the Fund could lose its entire investments in a certain market) and the possible adoption of foreign governmental restrictions such as exchange controls. Unless the Fund has hedged its foreign securities risk, foreign securities risk also involves the risk of negative foreign currency rate fluctuations, which may cause the value of securities denominated in such foreign currency (or other instruments through which the Fund has exposure to foreign currencies) to decline in value. Currency |
9 Invesco Macro Allocation Strategy Fund
exchange rates may fluctuate significantly over short periods of time. Currency hedging strategies, if used, are not always successful.
| ∎ | | Management risk. The Fund is actively managed and depends heavily on the Adviser’s judgment about markets, interest rates or the attractiveness, relative values, liquidity, or potential appreciation of particular investments made for the Fund’s portfolio. The Fund could experience losses if these judgments prove to be incorrect. Because the Fund’s investment process relies heavily on its asset allocation process, market movements that are counter to the portfolio managers’ expectations may have a significant adverse effect on the Fund’s net asset value. Additionally, legislative, regulatory, or tax developments may adversely affect management of the Fund and, therefore, the ability of the Fund to achieve its investment objective. |
| ∎ | | Market risk. The market values of the Fund’s investments, and therefore the value of the Fund’s shares, will go up and down, sometimes rapidly or unpredictably. Market risk may affect a single issuer, industry or section of the economy, or it may affect the market as a whole. Individual stock prices tend to go up and down more dramatically than those of certain other types of investments, such as bonds. During a general downturn in the financial markets, multiple asset classes may decline in value. When markets perform well, there can be no assurance that specific investments held by the Fund will rise in value. |
| ∎ | | Non-diversification risk. The Fund is non-diversified and can invest a greater portion of its assets in the obligations or securities of a small number of issuers or any single issuer than a diversified fund can. A change in the value of one or a few issuers’ securities will therefore affect the value of the Fund more than if it was a diversified fund. |
| ∎ | | Short position risk. Because the Fund’s potential loss on a short position arises from increases in the value of the asset sold short, the Fund will incur a loss on a short position, which is theoretically unlimited, if the price of the asset sold short increases from the short sale price. The counterparty to a short position or other market factors may prevent the Fund from closing out a short position at a desirable time or price and may reduce or eliminate any gain or result in a loss. In a rising market, the Fund’s short positions will cause the Fund to underperform the overall |
market and its peers that do not engage in shorting. If the Fund holds both long and short positions, and both positions decline simultaneously, the short positions will not provide any buffer (hedge) from declines in value of the Fund’s long positions. Certain types of short positions involve leverage, which may exaggerate any losses, potentially more than the actual cost of the investment, and will increase the volatility of the Fund’s returns.
| ∎ | | Subsidiary risk. By investing in the Subsidiary, the Fund is indirectly exposed to risks associated with the Subsidiary’s investments. The Subsidiary is not registered under the Investment Company Act of 1940, as amended (1940 Act), and, except as otherwise noted in the prospectus, is not subject to the investor protections of the 1940 Act. Changes in the laws of the United States and/or the Cayman Islands, under which the Fund and the Subsidiary, respectively, are organized, could result in the inability of the Fund and/or the Subsidiary to operate as described in the prospectus and the SAI, and could negatively affect the Fund and its shareholders. |
| ∎ | | US government obligations risk. Obligations of US government agencies and authorities receive varying levels of support and may not be backed by the full faith and credit of the US government, which could affect the Fund’s ability to recover should they default. No assurance can be given that the US government will provide financial support to its agencies and authorities if it is not obligated by law to do so. |
| ∎ | | Volatility risk. Although the Fund’s investment strategy targets a specific volatility level, certain of the Fund’s investments may appreciate or decrease significantly in value over short periods of time. This may cause the Fund’s net asset value per share to experience significant increases or declines in value over short periods of time. |
About indexes used in this report
| ∎ | | The Bloomberg Barclays 3-Month Treasury Bellwether Index measures the performance of Treasury bills with maturities of less than three months. |
| ∎ | | The Lipper Absolute Return Funds Index is an unmanaged index considered representative of absolute return funds tracked by Lipper. |
| ∎ | | The Fund is not managed to track the performance of any particular index, including the index(es) described here, and consequently, the performance of the Fund may deviate significantly from the performance of the index(es). |
| ∎ | | A direct investment cannot be made in an index. Unless otherwise indicated, index results include reinvested dividends, and they do not reflect sales charges. Performance of the peer group, if applicable, reflects fund expenses; performance of a market index does not. |
Other information
| ∎ | | The returns shown in management’s discussion of Fund performance are based on net asset values (NAVs) calculated for shareholder transactions. Generally accepted accounting principles require adjustments to be made to the net assets of the Fund at period end for financial reporting purposes, and as such, the NAVs for shareholder transactions and the returns based on those NAVs may differ from the NAVs and returns reported in the Financial Highlights. |
10 Invesco Macro Allocation Strategy Fund
Consolidated Schedule of Investments
October 31, 2018
| | | | | | | | | | | | | | | | |
| | | Interest
Rate | | | Maturity
Date | | | Principal
Amount | | | Value | |
U.S. Treasury Securities–34.28% | | | | | | | | | |
| U.S. Treasury Bills–13.98%(a)(b) | | | | | | | | | |
U.S. Treasury Bills | | | 0.65-0.83 | % | | | 12/27/2018 | | | $ | 2,900,000 | | | $ | 2,890,595 | |
U.S. Treasury Bills | | | 1.17 | % | | | 02/07/2019 | | | | 2,970,000 | | | | 2,951,465 | |
| | | | | | | | | | | | | | | | 5,842,060 | |
| | | | |
| U.S. Treasury Notes–20.30%(c) | | | | | | | | | | | | | | | | |
U.S. Treasury Floating Rate Notes (3 mo. U.S. Treasury Bill Money Market Yield Rate) | | | 2.31 | % | | | 01/31/2020 | | | | 3,100,000 | | | | 3,100,636 | |
U.S. Treasury Floating Rate Notes (3 mo. U.S. Treasury Bill Money Market Yield Rate + 0.03%) | | | 2.35 | % | | | 04/30/2020 | | | | 2,380,000 | | | | 2,380,972 | |
U.S. Treasury Floating Rate Notes (3 mo. U.S. Treasury Bill Money Market Yield Rate + 0.04%) | | | 2.36 | % | | | 07/31/2020 | | | | 3,000,000 | | | | 3,001,168 | |
| | | | | | | | | | | | | | | | 8,482,776 | |
Total U.S. Treasury Securities (Cost $14,322,994) | | | | | | | | | | | | | | | 14,324,836 | |
| | | | |
| | | | | | | | | Shares | | | | |
| | | | |
Money Market Funds–64.01% | | | | | | | | | | | | | | | | |
Invesco Government & Agency Portfolio–Institutional Class, 2.08%(d) | | | | | | | | | | | 11,182,398 | | | | 11,182,398 | |
Invesco Liquid Assets Portfolio–Institutional Class, 2.27%(d) | | | | | | | | | | | 4,752,219 | | | | 4,753,169 | |
Invesco Treasury Portfolio–Institutional Class, 2.09%(d) | | | | | | | | | | | 7,605,027 | | | | 7,605,027 | |
STIC (Global Series) PLC–U.S. Dollar Liquidity Portfolio (Ireland)–Institutional Class, 2.26%(d) | | | | | | | | | | | 3,206,626 | | | | 3,206,626 | |
Total Money Market Funds (Cost $26,747,023) | | | | | | | | | | | | | | | 26,747,220 | |
TOTAL INVESTMENTS IN SECURITIES–98.29% (Cost $41,070,017) | | | | | | | | | | | | | | | 41,072,056 | |
OTHER ASSETS LESS LIABILITIES–1.71% | | | | | | | | | | | | | | | 715,234 | |
NET ASSETS–100.00% | | | | | | | | | | | $ | 41,787,290 | |
| | | | | | | | | | | | | | | | | | | | |
| Open Futures Contracts | |
| Long Futures Contracts | | Number of
Contracts | | | Expiration
Month | | | Notional
Value | | | Value | | | Unrealized
Appreciation
(Depreciation) | |
Brent Crude | | | 14 | | | | March-2019 | | | $ | 1,050,700 | | | $ | (30,855 | ) | | $ | (30,855 | ) |
Gasoline Reformulated Blendstock Oxygenate Blending | | | 10 | | | | November-2018 | | | | 735,588 | | | | (47,103 | ) | | | (47,103 | ) |
Low Sulphur Gas Oil | | | 15 | | | | December-2018 | | | | 1,048,500 | | | | (19,690 | ) | | | (19,690 | ) |
New York Harbor Ultra-Low-Sulfur Diesel | | | 10 | | | | February-2019 | | | | 938,364 | | | | (50,372 | ) | | | (50,372 | ) |
WTI Crude | | | 15 | | | | March-2019 | | | | 988,200 | | | | (97,464 | ) | | | (97,464 | ) |
Subtotal — Commodity Risk | | | | | | | | | | | | | | | (245,484 | ) | | | (245,484 | ) |
EURO STOXX 50 Index | | | 47 | | | | December-2018 | | | | 1,700,312 | | | | (77,518 | ) | | | (77,518 | ) |
E-Mini Russell 2000 Index | | | 34 | | | | December-2018 | | | | 2,570,230 | | | | (351,725 | ) | | | (351,725 | ) |
E-Mini S&P 500 Index | | | 31 | | | | December-2018 | | | | 4,202,205 | | | | (296,468 | ) | | | (296,468 | ) |
FTSE 100 Index | | | 44 | | | | December-2018 | | | | 3,999,284 | | | | (102,320 | ) | | | (102,320 | ) |
Hang Seng Index | | | 9 | | | | November-2018 | | | | 1,429,485 | | | | 7,127 | | | | 7,127 | |
Mini MSCI Emerging Markets Index | | | 18 | | | | December-2018 | | | | 861,030 | | | | (69,020 | ) | | | (69,020 | ) |
S&P/TSX 60 Index | | | 29 | | | | December-2018 | | | | 3,939,656 | | | | (226,493 | ) | | | (226,493 | ) |
Tokyo Stock Price Index | | | 53 | | | | December-2018 | | | | 7,707,981 | | | | (370,585 | ) | | | (370,585 | ) |
Subtotal — Equity Risk | | | | | | | | | | | | | | | (1,487,002 | ) | | | (1,487,002 | ) |
Australia 10 Year Bonds | | | 72 | | | | December-2018 | | | | 6,598,339 | | | | (18,781 | ) | | | (18,781 | ) |
Euro Bund | | | 41 | | | | December-2018 | | | | 7,442,260 | | | | (2,056 | ) | | | (2,056 | ) |
Subtotal — Interest Rate Risk | | | | | | | | | | | | | | | (20,837 | ) | | | (20,837 | ) |
Subtotal — Long Futures Contracts | | | | | | | | | | | | | | $ | (1,753,323 | ) | | $ | (1,753,323 | ) |
See accompanying Notes to Consolidated Financial Statements which are an integral part of the financial statements.
11 Invesco Macro Allocation Strategy Fund
| | | | | | | | | | | | | | | | | | | | |
| Open Futures Contracts–(continued) | |
| Short Futures Contracts | | Number of
Contracts | | | Expiration
Month | | | Notional
Value | | | Value | | | Unrealized
Appreciation
(Depreciation) | |
Cocoa | | | 61 | | | | March-2019 | | | $ | (1,374,330 | ) | | $ | (129,864 | ) | | $ | (129,864 | ) |
Coffee “C” | | | 34 | | | | December-2018 | | | | (1,436,925 | ) | | | (57,158 | ) | | | (57,158 | ) |
Corn | | | 32 | | | | December-2018 | | | | (581,200 | ) | | | 3,689 | | | | 3,689 | |
Cotton No. 2 | | | 17 | | | | December-2018 | | | | (653,310 | ) | | | 18,943 | | | | 18,943 | |
Lean Hogs | | | 29 | | | | December-2018 | | | | (678,020 | ) | | | (107,419 | ) | | | (107,419 | ) |
LME Nickel | | | 4 | | | | December-2018 | | | | (275,196 | ) | | | 26,211 | | | | 26,211 | |
Silver | | | 10 | | | | December-2018 | | | | (714,100 | ) | | | 15,222 | | | | 15,222 | |
Soybean Oil | | | 70 | | | | December-2018 | | | | (1,176,840 | ) | | | 10,764 | | | | 10,764 | |
Soybeans | | | 19 | | | | July-2019 | | | | (846,688 | ) | | | 20,933 | | | | 20,933 | |
Wheat | | | 24 | | | | December-2018 | | | | (600,600 | ) | | | 9,048 | | | | 9,048 | |
Subtotal — Commodity Risk | | | | | | | | | | | | | | | (189,631 | ) | | | (189,631 | ) |
Canada 10 Year Bonds | | | 16 | | | | December-2018 | | | | (1,606,138 | ) | | | (2,579 | ) | | | (2,579 | ) |
10 Year Mini Japanese Government Bonds | | | 37 | | | | December-2018 | | | | (4,936,066 | ) | | | (10,789 | ) | | | (10,789 | ) |
Long Gilt | | | 23 | | | | December-2018 | | | | (3,598,683 | ) | | | (48,279 | ) | | | (48,279 | ) |
U.S. Treasury Long Bonds | | | 7 | | | | December-2018 | | | | (966,875 | ) | | | 13,983 | | | | 13,983 | |
Subtotal — Interest Rate Risk | | | | | | | | | | | | | | | (47,664 | ) | | | (47,664 | ) |
Subtotal — Short Futures Contracts | | | | | | | | | | | | | | | (237,295 | ) | | | (237,295 | ) |
Total Futures Contracts | | | | | | | | | | | | | | $ | (1,990,618 | ) | | $ | (1,990,618 | ) |
| | | | | | | | | | | | | | | | | | | | | | | | | | | | | | | | | | | | | | |
| Open Over-The-Counter Total Return Swap Agreements(e)(f) | |
| Counterparty | | Pay/
Receive | | Reference Entity(g) | | | Fixed
Rate | | | Payment
Frequency | | | Number of
Contracts | | | Maturity
Date | | | Notional
Value | | | Upfront Payments Paid
(Received) | | | Value | | | Unrealized Appreciation (Depreciation) | |
Barclays Bank PLC | | Pay | |
| Barclays Commodity
Strategy 1606 Index |
| | | 0.41 | % | | | Monthly | | | | 800 | | | | July-2019 | | | $ | 171,227 | | | $ | — | | | $ | 3,060 | | | $ | 3,060 | |
Barclays Bank PLC | | Pay | |
| Barclays Soybean Meal S2
Nearby Excess Return Index |
| | | 0.30 | | | | Monthly | | | | 280 | | | | September-2019 | | | | 272,255 | | | | — | | | | 17,151 | | | | 17,151 | |
JPMorgan Chase Bank, N.A. | | Pay | |
| S&P GSCI Gold Index Excess
Return |
| | | 0.08 | | | | Monthly | | | | 5,540 | | | | June-2019 | | | | 538,756 | | | | — | | | | 4,224 | | | | 4,224 | |
Merrill Lynch International | | Pay | |
| Merrill Lynch Gold Excess Return
Index |
| | | 0.14 | | | | Monthly | | | | 5,790 | | | | July-2019 | | | | 875,524 | | | | — | | | | 0 | | | | 0 | |
Merrill Lynch International | | Receive | |
| MLCX Natural Gas Annual Excess
Return Index |
| | | 0.25 | | | | Monthly | | | | 52,200 | | | | November-2018 | | | | 2,425,472 | | | | — | | | | 0 | | | | 0 | |
Merrill Lynch International | | Receive | | | MLCXLXAE Excess Return Index | | | | 0.25 | | | | Monthly | | | | 2,050 | | | | March-2019 | | | | 455,340 | | | | — | | | | 0 | | | | 0 | |
Morgan Stanley Capital Services LLC | | Pay | |
| S&P GSCI Aluminum Dynamic
Roll Index Excess Return |
| | | 0.38 | | | | Monthly | | | | 2,930 | | | | April-2019 | | | | 302,414 | | | | — | | | | 12,712 | | | | 12,712 | |
Subtotal — Appreciation | | | | | | | | | | | | | | | | | | | | | | | | | | | — | | | | 37,147 | | | | 37,147 | |
Barclays Bank PLC | | Receive | |
| Barclays Commodity Strategy
1452 Excess Return Index |
| | | 0.33 | | | | Monthly | | | | 2,000 | | | | October-2019 | | | | 994,773 | | | | — | | | | (32,622 | ) | | | (32,622 | ) |
Barclays Bank PLC | | Receive | |
| Barclays Live Cattle Roll Yield
Excess Return Index |
| | | 0.47 | | | | Monthly | | | | 490 | | | | January-2019 | | | | 61,995 | | | | — | | | | (80 | ) | | | (80 | ) |
Goldman Sachs International | | Pay | |
| S&P GSCI Sugar Excess Return
Index |
| | | 0.15 | | | | Monthly | | | | 5,120 | | | | September-2019 | | | | 851,435 | | | | — | | | | (16,450 | ) | | | (16,450 | ) |
Subtotal — Depreciation | | | | | | | | | | | | | | | | | | | | | | | | | | | — | | | | (49,152 | ) | | | (49,152 | ) |
Total-Open Over-The-Counter Total Return Swap Agreements — Commodity Risk | | | | | | | | | | | | | | | $ | — | | | $ | (12,005 | ) | | $ | (12,005 | ) |
Notes to Consolidated Schedule of Investments:
| (a) | Security traded on a discount basis. The interest rate shown represents the discount rate at the time of purchase by the Fund. |
| (b) | All or a portion of the value was pledged as collateral to cover margin requirements for open futures contracts. See Note 1L. |
| (c) | Interest or dividend rate is redetermined periodically. Rate shown is the rate in effect on October 31, 2018. |
| (d) | The money market fund and the Fund are affiliated by having the same investment adviser. The rate shown is the 7-day SEC standardized yield as of October 31, 2018. |
| (e) | The Fund receives or pays payments based on any positive or negative return on the Reference Entity, respectively. |
| (f) | Open Over-The-Counter Total Return swap agreements are collateralized by cash held with the swap Counterparties in the amount of $300,000. |
| (g) | The table below includes additional information regarding the underlying components of certain reference entities that are not publicly available. |
See accompanying Notes to Consolidated Financial Statements which are an integral part of the financial statements.
12 Invesco Macro Allocation Strategy Fund
| | | | | | |
| Reference Entity Components | |
| Reference Entity | | Underlying Components | | Percentage | |
Barclays Commodity Strategy 1606 Index | |
| | Long Futures Contracts | | | | |
| | Sugar | | | 100.00 | % |
|
Barclays Soybean Meal S2 Nearby Excess Return Index | |
| | Long Futures Contracts | | | | |
| | Soybean Meal | | | 100.00 | % |
|
S&P GSCI Gold Index Excess Return | |
| | Long Futures Contracts | | | | |
| | Gold | | | 100.00 | % |
|
Merrill Lynch Gold Excess Return Index | |
| | Long Futures Contracts | | | | |
| | Gold | | | 100.00 | % |
|
MLCX Natural Gas Annual Excess Return Index | |
| | Long Futures Contracts | | | | |
| | Natural Gas | | | 100.00 | % |
|
MLCXLXAE Excess Return Index | |
| | Long Futures Contracts | | | | |
| | Zinc | | | 100.00 | % |
|
S&P GSCI Aluminum Dynamic Roll Index Excess Return | |
| | Long Futures Contracts | | | | |
| | Aluminum | | | 100.00 | % |
|
Barclays Commodity Strategy 1452 Excess Return Index | |
| | Long Futures Contracts | | | | |
| | Copper | | | 100.00 | % |
|
Barclays Live Cattle Roll Yield Excess Return Index | |
| | Long Futures Contracts | | | | |
| | Live Cattle | | | 100.00 | % |
|
S&P GSCI Sugar Excess Return Index | |
| | Long Futures Contracts | | | | |
| | Sugar | | | 100.00 | % |
See accompanying Notes to Consolidated Financial Statements which are an integral part of the financial statements.
13 Invesco Macro Allocation Strategy Fund
Consolidated Statement of Assets and Liabilities
October 31, 2018
| | | | |
Assets: | | | | |
Investments in securities, at value (Cost $14,322,994) | | $ | 14,324,836 | |
Investments in affiliated money market funds, at value (Cost $26,747,023) | | | 26,747,220 | |
Other investments: | | | | |
Variation margin receivable — futures contracts | | | 280,692 | |
Unrealized appreciation on futures contracts | | | 26,211 | |
Swaps receivable — OTC | | | 134,994 | |
Unrealized appreciation on swap agreements | | | 37,147 | |
Cash | | | 73 | |
Deposits with brokers: | | | | |
Cash collateral — OTC derivatives | | | 300,000 | |
Receivable for: | | | | |
Dividends and interest | | | 56,811 | |
Fund shares sold | | | 141,382 | |
Investment for trustee deferred compensation and retirement plans | | | 17,337 | |
Other assets | | | 51,082 | |
Total assets | | | 42,117,785 | |
| |
Liabilities: | | | | |
Other investments: | | | | |
Swaps payable — OTC | | | 43,346 | |
Unrealized depreciation on swap agreements | | | 49,152 | |
Payable for: | | | | |
Fund shares repurchased | | | 117,317 | |
Accrued fees to affiliates | | | 13,043 | |
Accrued trustees’ and officers’ fees and benefits | | | 1,672 | |
Accrued other operating expenses | | | 87,610 | |
Trustee deferred compensation and retirement plans | | | 18,355 | |
Total liabilities | | | 330,495 | |
Net assets applicable to shares outstanding | | $ | 41,787,290 | |
| |
Net assets consist of: | | | | |
Shares of beneficial interest | | $ | 44,108,027 | |
Distributable earnings | | | (2,320,737 | ) |
| | | $ | 41,787,290 | |
| | | | |
Net Assets: | | | | |
Class A | | $ | 4,491,155 | |
Class C | | $ | 6,166,508 | |
Class R | | $ | 100,394 | |
Class Y | | $ | 30,580,684 | |
Class R5 | | $ | 8,454 | |
Class R6 | | $ | 440,095 | |
|
Shares outstanding, no par value,
with an unlimited number of shares authorized: | |
Class A | | | 509,654 | |
Class C | | | 707,762 | |
Class R | | | 11,411 | |
Class Y | | | 3,447,195 | |
Class R5 | | | 952 | |
Class R6 | | | 49,652 | |
Class A: | | | | |
Net asset value per share | | $ | 8.81 | |
Maximum offering price per share | | | | |
(Net asset value of $8.81 ¸ 94.50%) | | $ | 9.32 | |
Class C: | | | | |
Net asset value and offering price per share | | $ | 8.71 | |
Class R: | | | | |
Net asset value and offering price per share | | $ | 8.80 | |
Class Y: | | | | |
Net asset value and offering price per share | | $ | 8.87 | |
Class R5: | | | | |
Net asset value and offering price per share | | $ | 8.88 | |
Class R6: | | | | |
Net asset value and offering price per share | | $ | 8.86 | |
See accompanying Notes to Consolidated Financial Statements which are an integral part of the financial statements.
14 Invesco Macro Allocation Strategy Fund
Consolidated Statement of Operations
For the year ended October 31, 2018
| | | | |
Investment income: | | | | |
Dividends from affiliated money market funds | | $ | 481,132 | |
Interest | | | 238,980 | |
Total investment income | | | 720,112 | |
| |
Expenses: | | | | |
Advisory fees | | | 479,907 | |
Administrative services fees | | | 50,000 | |
Custodian fees | | | 8,805 | |
Distribution fees: | | | | |
Class A | | | 12,687 | |
Class C | | | 73,804 | |
Class R | | | 399 | |
Transfer agent fees — A, C, R and Y | | | 48,181 | |
Transfer agent fees — R5 | | | 5 | |
Transfer agent fees — R6 | | | 242 | |
Trustees’ and officers’ fees and benefits | | | 21,177 | |
Registration and filing fees | | | 85,710 | |
Reports to shareholders | | | 16,419 | |
Professional services fees | | | 85,680 | |
Other | | | 20,309 | |
Total expenses | | | 903,325 | |
Less: Fees waived, expenses reimbursed and expense offset arrangement(s) | | | (332,808 | ) |
Net expenses | | | 570,517 | |
Net investment income | | | 149,595 | |
| |
Realized and unrealized gain (loss): | | | | |
Net realized gain (loss) from: | | | | |
Investment securities | | | (313 | ) |
Foreign currencies | | | 3,354 | |
Futures contracts | | | 1,746,829 | |
Swap agreements | | | (476,678 | ) |
| | | | 1,273,192 | |
Change in net unrealized appreciation (depreciation) of: | | | | |
Investment securities | | | (4,884 | ) |
Futures contracts | | | (3,352,195 | ) |
Swap agreements | | | 16,907 | |
| | | | (3,340,172 | ) |
Net realized and unrealized gain (loss) | | | (2,066,980 | ) |
Net increase (decrease) in net assets resulting from operations | | $ | (1,917,385 | ) |
See accompanying Notes to Consolidated Financial Statements which are an integral part of the financial statements.
15 Invesco Macro Allocation Strategy Fund
Consolidated Statement of Changes in Net Assets
For the years ended October 31, 2018 and 2017
| | | | | | | | |
| | | 2018 | | | 2017 | |
Operations: | | | | | | | | |
Net investment income (loss) | | $ | 149,595 | | | $ | (259,121 | ) |
Net realized gain | | | 1,273,192 | | | | 2,189,791 | |
Change in net unrealized appreciation (depreciation) | | | (3,340,172 | ) | | | 1,068,041 | |
Net increase (decrease) in net assets resulting from operations | | | (1,917,385 | ) | | | 2,998,711 | |
| | |
Distributions to shareholders from distributable earnings(1): | | | | | | | | |
Class A | | | (212,490 | ) | | | (772,744 | ) |
Class C | | | (323,365 | ) | | | (831,705 | ) |
Class R | | | (2,400 | ) | | | (5,116 | ) |
Class Y | | | (1,337,441 | ) | | | (4,694,776 | ) |
Class R5 | | | (404 | ) | | | (1,244 | ) |
Class R6 | | | (15,400 | ) | | | (30,239 | ) |
Total distributions from distributable earnings | | | (1,891,500 | ) | | | (6,335,824 | ) |
| | |
Share transactions–net: | | | | | | | | |
Class A | | | 250,653 | | | | (789,636 | ) |
Class C | | | (598,785 | ) | | | 283,439 | |
Class C | | | 54,645 | | | | 14,526 | |
Class Y | | | 2,652,842 | | | | (4,893,657 | ) |
Class R6 | | | 128,645 | | | | 121,068 | |
Net increase (decrease) in net assets resulting from share transactions | | | 2,488,000 | | | | (5,264,260 | ) |
Net increase (decrease) in net assets | | | (1,320,885 | ) | | | (8,601,373 | ) |
| | |
Net assets: | | | | | | | | |
Beginning of year | | | 43,108,175 | | | | 51,709,548 | |
End of year | | $ | 41,787,290 | | | $ | 43,108,175 | |
| (1) | The Securities and Exchange Commission eliminated the requirement to disclose distribution components separately, except for tax return of capital. For the year ended October 31, 2017, distributions to shareholders from distributable earnings consisted of distributions from net investment income. |
Notes to Consolidated Financial Statements
October 31, 2018
NOTE 1—Significant Accounting Policies
Invesco Macro Allocation Strategy Fund (the “Fund”) is a series portfolio of AIM Investment Funds (Invesco Investment Funds) (the “Trust”). The Trust is organized as a Delaware statutory trust and is registered under the Investment Company Act of 1940, as amended (the “1940 Act”), as an open-end series management investment company authorized to issue an unlimited number of shares of beneficial interest. Information presented in these consolidated financial statements pertains only to the Fund. Matters affecting the Fund or each class will be voted on exclusively by the shareholders of the Fund or each class.
The Fund will seek to gain exposure to the commodity markets primarily through investments in the Invesco Cayman Commodity Fund V Ltd. (the “Subsidiary”), a wholly-owned subsidiary of the Fund organized under the laws of the Cayman Islands. The Subsidiary was organized by the Fund to invest in commodity-linked derivatives and other securities that may provide leveraged and non-leveraged exposure to commodities. The Fund may invest up to 25% of its total assets in the Subsidiary.
The Fund’s investment objective is to seek a positive absolute return over a complete economic and market cycle.
The Fund currently consists of six different classes of shares: Class A, Class C, Class R, Class Y, Class R5 and Class R6. Class Y shares are available only to certain investors. Class A shares are sold with a front-end sales charge unless certain waiver criteria are met. Under certain circumstances, load waiver shares may be subject to contingent deferred sales charges (“CDSC”). Class C shares are sold with a CDSC. Class R, Class Y, Class R5 and Class R6 shares are sold at net asset value.
The Fund is an investment company and accordingly follows the investment company accounting and reporting guidance in accordance with Financial Accounting Standards Board Accounting Standards Codification Topic 946, Financial Services — Investment Companies.
The following is a summary of the significant accounting policies followed by the Fund in the preparation of its consolidated financial statements.
| A. | Security Valuations — Securities, including restricted securities, are valued according to the following policy. |
Debt obligations (including convertible securities) and unlisted equities are fair valued using an evaluated quote provided by an independent pricing service. Evaluated quotes provided by the pricing service may be determined without exclusive reliance on quoted prices, and may reflect appropriate factors such as institution-size trading in similar groups of securities, developments related to specific securities, dividend rate (for
16 Invesco Macro Allocation Strategy Fund
unlisted equities), yield (for debt obligations), quality, type of issue, coupon rate (for debt obligations), maturity (for debt obligations), individual trading characteristics and other market data. Pricing services generally value debt obligations assuming orderly transactions of institutional round lot size, but a fund may hold or transact in the same securities in smaller, odd lot sizes. Odd lots often trade at lower prices than institutional round lots. Debt obligations are subject to interest rate and credit risks. In addition, all debt obligations involve some risk of default with respect to interest and/or principal payments.
A security listed or traded on an exchange (except convertible securities) is valued at its last sales price or official closing price as of the close of the customary trading session on the exchange where the security is principally traded, or lacking any sales or official closing price on a particular day, the security may be valued at the closing bid price on that day. Securities traded in the over-the-counter market are valued based on prices furnished by independent pricing services or market makers. When such securities are valued by an independent pricing service they may be considered fair valued. Futures contracts are valued at the final settlement price set by an exchange on which they are principally traded. Listed options are valued at the mean between the last bid and asked prices from the exchange on which they are principally traded. Options not listed on an exchange are valued by an independent source at the mean between the last bid and asked prices. For purposes of determining net asset value (“NAV”) per share, futures and option contracts generally are valued 15 minutes after the close of the customary trading session of the New York Stock Exchange (“NYSE”).
Investments in open-end and closed-end registered investment companies that do not trade on an exchange are valued at the end-of-day net asset value per share. Investments in open-end and closed-end registered investment companies that trade on an exchange are valued at the last sales price or official closing price as of the close of the customary trading session on the exchange where the security is principally traded.
Swap agreements are fair valued using an evaluated quote, if available, provided by an independent pricing service. Evaluated quotes provided by the pricing service are valued based on a model which may include end-of-day net present values, spreads, ratings, industry, company performance and returns of referenced assets. Centrally cleared swap agreements are valued at the daily settlement price determined by the relevant exchange or clearinghouse.
Foreign securities’ (including foreign exchange contracts) prices are converted into U.S. dollar amounts using the applicable exchange rates as of the close of the NYSE. If market quotations are available and reliable for foreign exchange-traded equity securities, the securities will be valued at the market quotations. Because trading hours for certain foreign securities end before the close of the NYSE, closing market quotations may become unreliable. If between the time trading ends on a particular security and the close of the customary trading session on the NYSE, events occur that the investment adviser determines are significant and make the closing price unreliable, the Fund may fair value the security. If the event is likely to have affected the closing price of the security, the security will be valued at fair value in good faith using procedures approved by the Board of Trustees. Adjustments to closing prices to reflect fair value may also be based on a screening process of an independent pricing service to indicate the degree of certainty, based on historical data, that the closing price in the principal market where a foreign security trades is not the current value as of the close of the NYSE. Foreign securities’ prices meeting the approved degree of certainty that the price is not reflective of current value will be priced at the indication of fair value from the independent pricing service. Multiple factors may be considered by the independent pricing service in determining adjustments to reflect fair value and may include information relating to sector indices, American Depositary Receipts and domestic and foreign index futures. Foreign securities may have additional risks including exchange rate changes, potential for sharply devalued currencies and high inflation, political and economic upheaval, the relative lack of issuer information, relatively low market liquidity and the potential lack of strict financial and accounting controls and standards.
Securities for which market prices are not provided by any of the above methods may be valued based upon quotes furnished by independent sources. The last bid price may be used to value equity securities. The mean between the last bid and asked prices is used to value debt obligations, including corporate loans.
Securities for which market quotations are not readily available or became unreliable are valued at fair value as determined in good faith by or under the supervision of the Trust’s officers following procedures approved by the Board of Trustees. Issuer specific events, market trends, bid/asked quotes of brokers and information providers and other market data may be reviewed in the course of making a good faith determination of a security’s fair value.
The Fund may invest in securities that are subject to interest rate risk, meaning the risk that the prices will generally fall as interest rates rise and, conversely, the prices will generally rise as interest rates fall. Specific securities differ in their sensitivity to changes in interest rates depending on their individual characteristics. Changes in interest rates may result in increased market volatility, which may affect the value and/or liquidity of certain Fund investments.
Valuations change in response to many factors including the historical and prospective earnings of the issuer, the value of the issuer’s assets, general economic conditions, interest rates, investor perceptions and market liquidity. Because of the inherent uncertainties of valuation, the values reflected in the consolidated financial statements may materially differ from the value received upon actual sale of those investments.
| B. | Securities Transactions and Investment Income — Securities transactions are accounted for on a trade date basis. Realized gains or losses on sales are computed on the basis of specific identification of the securities sold. Interest income (net of withholding tax, if any) is recorded on the accrual basis from settlement date. Bond premiums and discounts are amortized and/or accreted over the lives of the respective securities. Pay-in-kind interest income and non-cash dividend income received in the form of securities in-lieu of cash are recorded at the fair value of the securities received. Dividend income (net of withholding tax, if any) is recorded on the ex-dividend date. |
The Fund may periodically participate in litigation related to Fund investments. As such, the Fund may receive proceeds from litigation settlements. Any proceeds received are included in the Consolidated Statement of Operations as realized gain (loss) for investments no longer held and as unrealized gain (loss) for investments still held.
Brokerage commissions and mark ups are considered transaction costs and are recorded as an increase to the cost basis of securities purchased and/or a reduction of proceeds on a sale of securities. Such transaction costs are included in the determination of net realized and unrealized gain (loss) from investment securities reported in the Consolidated Statement of Operations and the Consolidated Statement of Changes in Net Assets and the net realized and unrealized gains (losses) on securities per share in the Financial Highlights. Transaction costs are included in the calculation of the Fund’s net asset value and, accordingly, they reduce the Fund’s total returns. These transaction costs are not considered operating expenses and are not reflected in net investment income reported in the Consolidated Statement of Operations and the Consolidated Statement of Changes in Net Assets, or the net investment income per share and the ratios of expenses and net investment income reported in the Financial Highlights, nor are they limited by any expense limitation arrangements between the Fund and the investment adviser.
17 Invesco Macro Allocation Strategy Fund
The Fund allocates income and realized and unrealized capital gains and losses to a class based on the relative net assets of each class.
| C. | Country Determination — For the purposes of making investment selection decisions and presentation in the Consolidated Schedule of Investments, the investment adviser may determine the country in which an issuer is located and/or credit risk exposure based on various factors. These factors include the laws of the country under which the issuer is organized, where the issuer maintains a principal office, the country in which the issuer derives 50% or more of its total revenues and the country that has the primary market for the issuer’s securities, as well as other criteria. Among the other criteria that may be evaluated for making this determination are the country in which the issuer maintains 50% or more of its assets, the type of security, financial guarantees and enhancements, the nature of the collateral and the sponsor organization. Country of issuer and/or credit risk exposure has been determined to be the United States of America, unless otherwise noted. |
| D. | Distributions — Distributions from net investment income and net realized capital gain, if any, are generally declared and paid annually and recorded on the ex-dividend date. The Fund may elect to treat a portion of the proceeds from redemptions as distributions for federal income tax purposes. |
| E. | Federal Income Taxes — The Fund intends to comply with the requirements of Subchapter M of the Internal Revenue Code of 1986, as amended (the “Internal Revenue Code”), necessary to qualify as a regulated investment company and to distribute substantially all of the Fund’s taxable earnings to shareholders. As such, the Fund will not be subject to federal income taxes on otherwise taxable income (including net realized capital gain) that is distributed to shareholders. Therefore, no provision for federal income taxes is recorded in the consolidated financial statements. |
The Fund recognizes the tax benefits of uncertain tax positions only when the position is more likely than not to be sustained. Management has analyzed the Fund’s uncertain tax positions and concluded that no liability for unrecognized tax benefits should be recorded related to uncertain tax positions. Management is not aware of any tax positions for which it is reasonably possible that the total amounts of unrecognized tax benefits will change materially in the next 12 months.
The Subsidiary is classified as a controlled foreign corporation under Subchapter N of the Internal Revenue Code. Therefore, the Fund is required to increase its taxable income by its share of the Subsidiary’s income. Net investment losses of the Subsidiary cannot be deducted by the Fund in the current period nor carried forward to offset taxable income in future periods.
The Fund files tax returns in the U.S. Federal jurisdiction and certain other jurisdictions. Generally the Fund is subject to examinations by such taxing authorities for up to three years after the filing of the return for the tax period.
| F. | Expenses — Fees provided for under the Rule 12b-1 plan of a particular class of the Fund are charged to the operations of such class. Transfer agency fees and expenses and other shareholder recordkeeping fees and expenses attributable to Class R5 and Class R6 are allocated to each share class based on relative net assets. Sub-accounting fees attributable to Class R5 are charged to the operations of the class. Transfer agency fees and expenses and other shareholder recordkeeping fees and expenses relating to all other classes are allocated among those classes based on relative net assets. All other expenses are allocated among the classes based on relative net assets. |
| G. | Accounting Estimates — The financial statements are prepared on a consolidated basis in conformity with accounting principles generally accepted in the United States of America (“GAAP”), which requires management to make estimates and assumptions that affect the reported amounts of assets and liabilities at the date of the financial statements and the reported amounts of revenues and expenses during the reporting period including estimates and assumptions related to taxation. Actual results could differ from those estimates by a significant amount. The accompanying financial statements reflect the financial position of the Fund and its Subsidiary and the results of operations on a consolidated basis. All inter-company accounts and transactions have been eliminated in consolidation. |
In addition, the Fund monitors for material events or transactions that may occur or become known after the period-end date and before the date the consolidated financial statements are released to print.
| H. | Indemnifications — Under the Trust’s organizational documents, each Trustee, officer, employee or other agent of the Trust, and under the Subsidiary’s organizational documents, the directors and officers of the Subsidiary, are indemnified against certain liabilities that may arise out of the performance of their duties to the Fund and/or the Subsidiary, respectively. Additionally, in the normal course of business, the Fund enters into contracts, including the Fund’s servicing agreements, that contain a variety of indemnification clauses. The Fund’s maximum exposure under these arrangements is unknown as this would involve future claims that may be made against the Fund that have not yet occurred. The risk of material loss as a result of such indemnification claims is considered remote. |
| I. | Structured Securities — The Fund may invest in structured securities. Structured securities are a type of derivative security whose value is determined by reference to changes in the value of underlying securities, currencies, interest rates, commodities, indices or other financial indicators (“reference instruments”). Most structured securities are fixed-income securities that have maturities of three years or less. Structured securities may be positively or negatively indexed (i.e., their principal value or interest rates may increase or decrease if the underlying reference instrument appreciates) and may have return characteristics similar to direct investments in the underlying reference instrument. |
Structured securities may entail a greater degree of market risk than other types of debt securities because the investor bears the risk of the reference instruments. In addition to the credit risk of structured securities and the normal risks of price changes in response to changes in interest rates, the principal amount of structured notes or indexed securities may decrease as a result of changes in the value of the underlying reference instruments. Changes in the daily value of structured securities are recorded as unrealized gains (losses) in the Consolidated Statement of Operations. When the structured securities mature or are sold, the Fund recognizes a realized gain (loss) on the Consolidated Statement of Operations.
| J. | Foreign Currency Translations — Foreign currency is valued at the close of the NYSE based on quotations posted by banks and major currency dealers. Portfolio securities and other assets and liabilities denominated in foreign currencies are translated into U.S. dollar amounts at the date of valuation. Purchases and sales of portfolio securities (net of foreign taxes withheld on disposition) and income items denominated in foreign currencies are translated into U.S. dollar amounts on the respective dates of such transactions. The Fund does not separately account for the portion of the results of operations resulting from changes in foreign exchange rates on investments and the fluctuations arising from changes in market prices of securities held. The combined results of changes in foreign exchange rates and the fluctuation of market prices on investments (net of estimated foreign tax withholding) are included with the net realized and unrealized gain or loss from investments in the Consolidated Statement of Operations. Reported net realized foreign currency gains or losses arise from (1) sales of foreign currencies, (2) currency gains or losses realized between the trade and settlement dates on securities transactions, and (3) the difference between the amounts of dividends, interest, and foreign withholding taxes recorded on the Fund’s books and the U.S. dollar equivalent of the amounts actually |
18 Invesco Macro Allocation Strategy Fund
| | received or paid. Net unrealized foreign currency gains and losses arise from changes in the fair values of assets and liabilities, other than investments in securities at fiscal period end, resulting from changes in exchange rates. |
The Fund may invest in foreign securities, which may be subject to foreign taxes on income, gains on investments or currency repatriation, a portion of which may be recoverable. Foreign taxes, if any, are recorded based on the tax regulations and rates that exist in the foreign markets in which the Fund invests and are shown in the Consolidated Statement of Operations.
| K. | Forward Foreign Currency Contracts — The Fund may engage in foreign currency transactions either on a spot (i.e. for prompt delivery and settlement) basis, or through forward foreign currency contracts, to manage or minimize currency or exchange rate risk. |
The Fund may also enter into forward foreign currency contracts for the purchase or sale of a security denominated in a foreign currency in order to “lock in” the U.S. dollar price of that security, or the Fund may also enter into forward foreign currency contracts that do not provide for physical settlement of the two currencies, but instead are settled by a single cash payment calculated as the difference between the agreed upon exchange rate and the spot rate at settlement based upon an agreed upon notional amount (non-deliverable forwards). The Fund will set aside liquid assets in an amount equal to the daily mark-to-market obligation for forward foreign currency contracts.
A forward foreign currency contract is an obligation between two parties (“Counterparties”) to purchase or sell a specific currency for an agreed-upon price at a future date. The use of forward foreign currency contracts does not eliminate fluctuations in the price of the underlying securities the Fund owns or intends to acquire but establishes a rate of exchange in advance. Fluctuations in the value of these contracts are measured by the difference in the contract date and reporting date exchange rates and are recorded as unrealized appreciation (depreciation) until the contracts are closed. When the contracts are closed, realized gains (losses) are recorded. Realized and unrealized gains (losses) on the contracts are included in the Consolidated Statement of Operations. The primary risks associated with forward foreign currency contracts include failure of the Counterparty to meet the terms of the contract and the value of the foreign currency changing unfavorably. These risks may be in excess of the amounts reflected in the Consolidated Statement of Assets and Liabilities.
| L. | Futures Contracts — The Fund may enter into futures contracts to equitize the Fund’s cash holdings or to manage exposure to interest rate, equity and market price movements and/or currency risks. A futures contract is an agreement between Counterparties to purchase or sell a specified underlying security, currency or commodity (or delivery of a cash settlement price, in the case of an index future) for a fixed price at a future date. The Fund currently invests only in exchange-traded futures and they are standardized as to maturity date and underlying financial instrument. Initial margin deposits required upon entering into futures contracts are satisfied by the segregation of specific securities or cash as collateral at the futures commission merchant (broker). During the period the futures contracts are open, changes in the value of the contracts are recognized as unrealized gains or losses by recalculating the value of the contracts on a daily basis. Subsequent or variation margin payments are received or made on non-LME futures contracts depending upon whether unrealized gains or losses are incurred. These amounts are reflected as receivables or payables on the Consolidated Statement of Assets and Liabilities. For LME contracts, subsequent or variation margin payments are not made and the value of the contracts is presented as unrealized appreciation or depreciation on the Consolidated Statement of Assets and Liabilities. When LME or non-LME contracts are closed or expire, the Fund recognizes a realized gain or loss equal to the difference between the proceeds from, or cost of, the closing transaction and the Fund’s basis in the contract. The net realized gain (loss) and the change in unrealized gain (loss) on futures contracts held during the period is included on the Consolidated Statement of Operations. The primary risks associated with futures contracts are market risk and the absence of a liquid secondary market. If the Fund were unable to liquidate a futures contract and/or enter into an offsetting closing transaction, the Fund would continue to be subject to market risk with respect to the value of the contracts and continue to be required to maintain the margin deposits on the futures contracts. Futures contracts have minimal Counterparty risk since the exchange’s clearinghouse, as Counterparty to all exchange-traded futures, guarantees the futures against default. Risks may exceed amounts recognized in the Consolidated Statement of Assets and Liabilities. |
| M. | Swap Agreements — The Fund may enter into various swap transactions, including interest rate, total return, index, currency and credit default swap contracts (“CDS”) for investment purposes or to manage interest rate, currency, commodity or credit risk. Such transactions are agreements between Counterparties. These agreements may contain among other conditions, events of default and termination events, and various covenants and representations such as provisions that require the Fund to maintain a pre-determined level of net assets, and/or provide limits regarding the decline of the Fund’s NAV over specific periods of time. If the Fund were to trigger such provisions and have open derivative positions at that time, the Counterparty may be able to terminate such agreement and request immediate payment in an amount equal to the net liability positions, if any. |
Interest rate, total return, index, and currency swap agreements are two-party contracts entered into primarily to exchange the returns (or differentials in rates of returns) earned or realized on particular predetermined investments or instruments. The gross returns to be exchanged or “swapped” between the parties are calculated with respect to a notional amount, i.e., the return on or increase in value of a particular dollar amount invested at a particular interest rate or return of an underlying asset, in a particular foreign currency, or in a “basket” of securities representing a particular index. At the maturity date, a net cash flow is exchanged where the total return is equivalent to the return of the underlying reference less a financing rate, if any. As a receiver, the Fund would receive payments based on any positive total return and would owe payments in the event of a negative total return. As the payer, the Fund would owe payments on any net positive total return, and would receive payment in the event of a negative total return.
Changes in the value of swap agreements are recognized as unrealized gains (losses) in the Consolidated Statement of Operations by “marking to market” on a daily basis to reflect the value of the swap agreement at the end of each trading day. Payments received or paid at the beginning of the agreement are reflected as such on the Consolidated Statement of Assets and Liabilities and may be referred to as upfront payments. The Fund accrues for the fixed payment stream and amortizes upfront payments, if any, on swap agreements on a daily basis with the net amount, recorded as a component of realized gain (loss) on the Consolidated Statement of Operations. A liquidation payment received or made at the termination of a swap agreement is recorded as realized gain (loss) on the Consolidated Statement of Operations. The Fund segregates cash or liquid securities having a value at least equal to the amount of the potential obligation of a Fund under any swap transaction. Cash held as collateral is recorded as deposits with brokers on the Consolidated Statement of Assets and Liabilities. Entering into these agreements involves, to varying degrees, lack of liquidity and elements of credit, market, and Counterparty risk in excess of amounts recognized on the Consolidated Statement of Assets and Liabilities. Such risks involve the possibility that a swap is difficult to sell or liquidate; the Counterparty does not honor its obligations under the agreement and unfavorable interest rates and market fluctuations. It is possible that developments in the swaps market,
19 Invesco Macro Allocation Strategy Fund
including potential government regulation, could adversely affect the Fund’s ability to terminate existing swap agreements or to realize amounts to be received under such agreements. A short position in a security poses more risk than holding the same security long. As there is no limit on how much the price of the security can increase, the Fund’s exposure is unlimited.
| N. | Other Risks — The Fund will seek to gain exposure to commodity markets primarily through an investment in the Subsidiary and through investments in exchange-traded funds and commodity-linked derivatives. The Subsidiary, unlike the Fund, may invest without limitation in commodities, commodity-linked derivatives and other securities, such as exchange-traded and commodity-linked notes, that may provide leveraged and non-leveraged exposure to commodity markets. The Fund is indirectly exposed to the risks associated with the Subsidiary’s investments. |
| O. | Leverage Risk — Leverage exists when the Fund can lose more than it originally invests because it purchases or sells an instrument or enters into a transaction without investing an amount equal to the full economic exposure of the instrument or transaction. |
| P. | Collateral — To the extent the Fund has designated or segregated a security as collateral and that security is subsequently sold, it is the Fund’s practice to replace such collateral no later than the next business day. |
NOTE 2—Advisory Fees and Other Fees Paid to Affiliates
The Trust has entered into a master investment advisory agreement with Invesco Advisers, Inc. (the “Adviser” or “Invesco”). Under the terms of the investment advisory agreement, the Fund accrues daily and pays monthly an advisory fee to the Adviser less the amount paid by the Subsidiary to the Adviser based on the annual rate of the Fund’s average daily net assets as follows:
| | | | |
| Average Daily Net Assets | | Rate | |
First $250 million | | | 1.10% | |
Next $250 million | | | 1.08% | |
Next $500 million | | | 1.05% | |
Next $1.5 billion | | | 1.03% | |
Next $2.5 billion | | | 1.00% | |
Next $2.5 billion | | | 0.98% | |
Next $2.5 billion | | | 0.95% | |
Over $10 billion | | | 0.93% | |
For the year ended October 31, 2018, the effective advisory fees incurred by the Fund was 1.10%.
The Subsidiary has entered into a separate contract with the Adviser whereby the Adviser provides investment advisory and other services to the Subsidiary. In consideration of these services, the Subsidiary pays an advisory fee to the Adviser based on the annual rate of the Subsidiary’s average daily net assets as set forth in the table above.
Under the terms of a master sub-advisory agreement between the Adviser and each of Invesco Asset Management Deutschland GmbH, Invesco Asset Management Limited, Invesco Asset Management (Japan) Limited, Invesco Hong Kong Limited, Invesco Senior Secured Management, Inc. and Invesco Canada Ltd. and separate sub-advisory agreements with Invesco Capital Management LLC, formerly Invesco PowerShares Capital Management LLC, and Invesco Asset Management (India) Private Limited (collectively, the “Affiliated Sub-Advisers”) the Adviser, not the Fund, will pay 40% of the fees paid to the Adviser to any such Affiliated Sub-Adviser(s) that provide(s) discretionary investment management services to the Fund based on the percentage of assets allocated to such Affiliated Sub-Adviser(s).
The Adviser has contractually agreed, through at least February 29, 2020, to waive advisory fees and/or reimburse expenses to the extent necessary to limit total annual fund operating expenses after fee waiver and/or expense reimbursement (excluding certain items discussed below) of Class A, Class C, Class R, Class Y, Class R5 and Class R6 shares to 1.44%, 2.19%, 1.69%, 1.19%, 1.19% and 1.19%, respectively, of average daily net assets (the “expense limits”). In determining the Adviser’s obligation to waive advisory fees and/or reimburse expenses, the following expenses are not taken into account, and could cause total annual fund operating expenses after fee waiver and/or expense reimbursement to exceed the numbers reflected above: (1) interest; (2) taxes; (3) dividend expense on short sales; (4) extraordinary or non-routine items, including litigation expenses; and (5) expenses that the Fund has incurred but did not actually pay because of an expense offset arrangement. Acquired Fund Fees and Expenses are not operating expenses of a Fund directly, but are fees and expenses, including management fees, of the investment companies in which a Fund invests. As a result, the total annual fund operating expenses after expense reimbursement may exceed the expense limits above. Unless Invesco continues the fee waiver agreement, it will terminate on February��29, 2020. During its term, the fee waiver agreement cannot be terminated or amended to increase the expense limits or reduce the advisory fee waiver without approval of the Board of Trustees.
Further, the Adviser has contractually agreed, through at least June 30, 2020, to waive the advisory fee payable by the Fund in an amount equal to 100% of the net advisory fees the Adviser receives from the affiliated money market funds on investments by the Fund of uninvested cash in such affiliated money market funds.
For the year ended October 31, 2018, the Adviser waived advisory fees of $284,379 and reimbursed class level expenses of $5,635, $8,195, $89, $34,066, $6 and $241 of Class A, Class C, Class R, Class Y, Class R5 and Class R6 shares, respectively.
The Trust has entered into a master administrative services agreement with Invesco pursuant to which the Fund has agreed to pay Invesco for certain administrative costs incurred in providing accounting services to the Fund. For the year ended October 31, 2018, expenses incurred under the agreement are shown in the Consolidated Statement of Operations as Administrative services fees.
The Trust has entered into a transfer agency and service agreement with Invesco Investment Services, Inc. (“IIS”) pursuant to which the Fund has agreed to pay IIS a fee for providing transfer agency and shareholder services to the Fund and reimburse IIS for certain expenses incurred by IIS in the course of providing such services. IIS may make payments to intermediaries that provide omnibus account services, sub-accounting services and/or networking services. All fees payable by IIS to intermediaries that provide omnibus account services or sub-accounting services are charged back to the Fund, subject to certain limitations approved by the Trust’s Board of Trustees. For the year ended October 31, 2018, expenses incurred under the agreement are shown in the Consolidated Statement of Operations as Transfer agent fees.
20 Invesco Macro Allocation Strategy Fund
The Trust has entered into master distribution agreements with Invesco Distributors, Inc. (“IDI”) to serve as the distributor for the Class A, Class C, Class R, Class Y, Class R5 and Class R6 shares of the Fund. The Trust has adopted plans pursuant to Rule 12b-1 under the 1940 Act with respect to the Fund’s Class A, Class C and Class R shares (collectively, the “Plans”). The Fund, pursuant to the Plans, pays IDI compensation at the annual rate of 0.25% of the Fund’s average daily net assets of Class A shares, 1.00% of the average daily net assets of Class C shares and 0.50% of the average daily net assets of Class R shares. The fees are accrued daily and paid monthly. Of the Plan payments, up to 0.25% of the average daily net assets of each class of shares may be paid to furnish continuing personal shareholder services to customers who purchase and own shares of such classes. Any amounts not paid as a service fee under the Plans would constitute an asset-based sales charge. Rules of the Financial Industry Regulatory Authority (“FINRA”) impose a cap on the total sales charges, including asset-based sales charges, that may be paid by any class of shares of the Fund. For the year ended October 31, 2018, expenses incurred under the Plans are shown in the Consolidated Statement of Operations as Distribution fees.
Front-end sales commissions and CDSC (collectively, the “sales charges”) are not recorded as expenses of the Fund. Front-end sales commissions are deducted from proceeds from the sales of Fund shares prior to investment in Class A shares of the Fund. CDSC are deducted from redemption proceeds prior to remittance to the shareholder. During the year ended October 31, 2018, IDI advised the Fund that IDI retained $1,304 in front-end sales commissions from the sale of Class A shares and $738 from Class C shares, for CDSC imposed upon redemptions by shareholders.
Certain officers and trustees of the Trust are officers and directors of the Adviser, IIS and/or IDI.
NOTE 3—Additional Valuation Information
GAAP defines fair value as the price that would be received to sell an asset or paid to transfer a liability in an orderly transaction between market participants at the measurement date, under current market conditions. GAAP establishes a hierarchy that prioritizes the inputs to valuation methods, giving the highest priority to readily available unadjusted quoted prices in an active market for identical assets (Level 1) and the lowest priority to significant unobservable inputs (Level 3), generally when market prices are not readily available or are unreliable. Based on the valuation inputs, the securities or other investments are tiered into one of three levels. Changes in valuation methods may result in transfers in or out of an investment’s assigned level:
| | Level 1 — | Prices are determined using quoted prices in an active market for identical assets. |
| | Level 2 — | Prices are determined using other significant observable inputs. Observable inputs are inputs that other market participants may use in pricing a security. These may include quoted prices for similar securities, interest rates, prepayment speeds, credit risk, yield curves, loss severities, default rates, discount rates, volatilities and others. |
| | Level 3 — | Prices are determined using significant unobservable inputs. In situations where quoted prices or observable inputs are unavailable (for example, when there is little or no market activity for an investment at the end of the period), unobservable inputs may be used. Unobservable inputs reflect the Fund’s own assumptions about the factors market participants would use in determining fair value of the securities or instruments and would be based on the best available information. |
The following is a summary of the tiered valuation input levels, as of October 31, 2018. The level assigned to the securities valuations may not be an indication of the risk or liquidity associated with investing in those securities. Because of the inherent uncertainties of valuation, the values reflected in the consolidated financial statements may materially differ from the value received upon actual sale of those investments.
| | | | | | | | | | | | | | | | |
| | | Level 1 | | | Level 2 | | | Level 3 | | | Total | |
Investments in Securities | | | | | | | | | | | | | | | | |
U.S. Treasury Securities | | $ | — | | | $ | 14,324,836 | | | $ | — | | | $ | 14,324,836 | |
Money Market Funds | | | 26,747,220 | | | | — | | | | — | | | | 26,747,220 | |
Total Investments in Securities | | | 26,747,220 | | | | 14,324,836 | | | | — | | | | 41,072,056 | |
Other Investments — Assets* | | | | | | | | | | | | | | | | |
Futures Contracts | | | 125,920 | | | | — | | | | — | | | | 125,920 | |
Swap Agreements | | | — | | | | 37,147 | | | | — | | | | 37,147 | |
| | | | 125,920 | | | | 37,147 | | | | — | | | | 163,067 | |
Other Investments — Liabilities* | | | | | | | | | | | | | | | | |
Futures Contracts | | | (2,116,538 | ) | | | — | | | | — | | | | (2,116,538 | ) |
Swap Agreements | | | — | | | | (49,152 | ) | | | — | | | | (49,152 | ) |
| | | | (2,116,538 | ) | | | (49,152 | ) | | | — | | | | (2,165,690 | ) |
Total Other Investments | | | (1,990,618 | ) | | | (12,005 | ) | | | — | | | | (2,002,623 | ) |
Total Investments | | $ | 24,756,602 | | | $ | 14,312,831 | | | $ | — | | | $ | 39,069,433 | |
| * | Unrealized appreciation (depreciation). |
NOTE 4—Derivative Investments
The Fund may enter into an International Swaps and Derivatives Association Master Agreement (“ISDA Master Agreement”) under which a fund may trade OTC derivatives. An OTC transaction entered into under an ISDA Master Agreement typically involves a collateral posting arrangement, payment netting provisions and close-out netting provisions. These netting provisions allow for reduction of credit risk through netting of contractual obligations. The enforceability of the netting provisions of the ISDA Master Agreement depends on the governing law of the ISDA Master Agreement, among other factors.
21 Invesco Macro Allocation Strategy Fund
For financial reporting purposes, the Fund does not offset OTC derivative assets or liabilities that are subject to ISDA Master Agreements in the Consolidated Statement of Assets and Liabilities.
Value of Derivative Investments at Period-End
The table below summarizes the value of the Fund’s derivative investments, detailed by primary risk exposure, held as of October 31, 2018:
| | | | | | | | | | | | | | | | |
Derivative Assets | | Value | |
| | Commodity
Risk | | | Equity Risk | | | Interest Rate
Risk | | | Total | |
Unrealized appreciation on futures contracts — Exchange-Traded(a) | | $ | 104,810 | | | $ | 7,127 | | | $ | 13,983 | | | $ | 125,920 | |
Unrealized appreciation on swap agreements — OTC | | | 37,147 | | | | — | | | | — | | | | 37,147 | |
Total Derivative Assets | | | 141,957 | | | | 7,127 | | | | 13,983 | | | | 163,067 | |
Derivatives not subject to master netting agreements | | | (104,810 | ) | | | (7,127 | ) | | | (13,983 | ) | | | (125,920 | ) |
Total Derivative Assets subject to master netting agreements | | $ | 37,147 | | | $ | — | | | $ | — | | | $ | 37,147 | |
| |
Derivative Liabilities | | Value | |
| | Commodity
Risk | | | Equity Risk | | | Interest Rate
Risk | | | Total | |
Unrealized depreciation on futures contracts — Exchange-Traded(a) | | $ | (539,925 | ) | | $ | (1,494,129 | ) | | $ | (82,484 | ) | | $ | (2,116,538 | ) |
Unrealized depreciation on swap agreements — OTC | | | (49,152 | ) | | | — | | | | — | | | | (49,152 | ) |
Total Derivative Liabilities | | | (589,077 | ) | | | (1,494,129 | ) | | | (82,484 | ) | | | (2,165,690 | ) |
Derivatives not subject to master netting agreements | | | 539,925 | | | | 1,494,129 | | | | 82,484 | | | | 2,116,538 | |
Total Derivative Liabilities subject to master netting agreements | | $ | (49,152 | ) | | $ | — | | | $ | — | | | $ | (49,152 | ) |
| (a) | The daily variation margin receivable at period-end is recorded in the Consolidated Statement of Assets and Liabilities. |
Offsetting Assets and Liabilities
The table below reflects the Fund’s exposure to Counterparties subject to either an ISDA Master Agreement or other agreement for OTC derivative transactions as of October 31, 2018.
| | | | | | | | | | | | | | | | | | | | | | | | |
| | | Financial
Derivative
Assets | | | Financial
Derivative
Liabilities | | | | | | Collateral (Received)/Pledged | | | | |
| Counterparty | | Swap
Agreements | | | Swap
Agreements | | | Net Value of
Derivatives | | | Non-Cash | | | Cash | | | Net
Amount(a) | |
Subsidiary | | | | | | | | | | | | | | | | | | | | | | | | |
Barclays Bank PLC | | $ | 20,211 | | | $ | (32,702 | ) | | $ | (12,491 | ) | | $ | — | | | $ | 12,491 | | | $ | — | |
Goldman Sachs International | | | — | | | | (16,450 | ) | | | (16,450 | ) | | | — | | | | — | | | | (16,450 | ) |
JPMorgan Chase Bank, N.A. | | | 4,224 | | | | — | | | | 4,224 | | | | — | | | | — | | | | 4,224 | |
Merrill Lynch International | | | 134,994 | | | | (43,346 | ) | | | 91,648 | | | | — | | | | — | | | | 91,648 | |
Morgan Stanley Capital Services LLC | | | 12,712 | | | | — | | | | 12,712 | | | | — | | | | — | | | | 12,712 | |
Total | | $ | 172,141 | | | $ | (92,498 | ) | | $ | 79,643 | | | $ | — | | | $ | 12,491 | | | $ | 92,134 | |
| (a) | The Fund and the Subsidiary are recognized as separate legal entities and as such are subject to separate netting arrangements with the Counterparty. |
Effect of Derivative Investments for the year ended October 31, 2018
The table below summarizes the gains (losses) on derivative investments, detailed by primary risk exposure, recognized in earnings during the period:
| | | | | | | | | | | | | | | | |
| | | Location of Gain (Loss) on Consolidated Statement of Operations | |
| | Commodity
Risk | | | Equity Risk | | | Interest Rate
Risk | | | Total | |
Realized Gain (Loss): | | | | | | | | | | | | | | | | |
Futures contracts | | $ | 1,590,886 | | | $ | 856,245 | | | $ | (700,302 | ) | | $ | 1,746,829 | |
Swap agreements | | | (476,678 | ) | | | — | | | | — | | | | (476,678 | ) |
Change in Net Unrealized Appreciation (Depreciation): | | | | | | | | | | | | | | | | |
Futures contracts | | | (824,665 | ) | | | (2,495,980 | ) | | | (31,550 | ) | | | (3,352,195 | ) |
Swap agreements | | | 16,907 | | | | — | | | | — | | | | 16,907 | |
Total | | $ | 306,450 | | | $ | (1,639,735 | ) | | $ | (731,852 | ) | | $ | (2,065,137 | ) |
The table below summarizes the average notional value of futures contracts and swap agreements outstanding during the period.
| | | | | | | | |
| | | Futures
Contracts | | | Swap
Agreements | |
Average notional value | | $ | 54,633,679 | | | $ | 6,876,069 | |
22 Invesco Macro Allocation Strategy Fund
NOTE 5—Expense Offset Arrangement(s)
The expense offset arrangement is comprised of transfer agency credits which result from balances in demand deposit accounts used by the transfer agent for clearing shareholder transactions. For the year ended October 31, 2018, the Fund received credits from this arrangement, which resulted in the reduction of the Fund’s total expenses of $197.
NOTE 6—Trustees’ and Officers’ Fees and Benefits
Trustees’ and Officers’ Fees and Benefits include amounts accrued by the Fund to pay remuneration to certain Trustees and Officers of the Fund. Trustees have the option to defer compensation payable by the Fund, and Trustees’ and Officers’ Fees and Benefits also include amounts accrued by the Fund to fund such deferred compensation amounts. Those Trustees who defer compensation have the option to select various Invesco Funds in which their deferral accounts shall be deemed to be invested. Finally, certain current Trustees were eligible to participate in a retirement plan that provided for benefits to be paid upon retirement to Trustees over a period of time based on the number of years of service. The Fund may have certain former Trustees who also participate in a retirement plan and receive benefits under such plan. Trustees’ and Officers’ Fees and Benefits include amounts accrued by the Fund to fund such retirement benefits. Obligations under the deferred compensation and retirement plans represent unsecured claims against the general assets of the Fund.
NOTE 7—Cash Balances
The Fund is permitted to temporarily carry a negative or overdrawn balance in its account with State Street Bank and Trust Company, the custodian bank. Such balances, if any at period-end, are shown in the Consolidated Statement of Assets and Liabilities under the payable caption Amount due custodian. To compensate the custodian bank for such overdrafts, the overdrawn Fund may either (1) leave funds as a compensating balance in the account so the custodian bank can be compensated by earning the additional interest; or (2) compensate by paying the custodian bank at a rate agreed upon by the custodian bank and Invesco, not to exceed the contractually agreed upon rate.
NOTE 8—Distributions to Shareholders and Tax Components of Net Assets
Tax Character of Distributions to Shareholders Paid During the Fiscal Years Ended October 31, 2018 and 2017:
| | | | | | | | |
| | | 2018 | | | 2017 | |
Ordinary income | | $ | 800,780 | | | $ | 6,335,824 | |
Long-term capital gain | | | 1,090,720 | | | | — | |
Total distributions | | $ | 1,891,500 | | | $ | 6,335,824 | |
Tax Components of Net Assets at Period-End:
| | | | |
| | | 2018 | |
Undistributed ordinary income | | $ | 42,159 | |
Net unrealized appreciation (depreciation) — investments | | | (600,004 | ) |
Temporary book/tax differences | | | (16,575 | ) |
Capital loss carryforward | | | (1,746,317 | ) |
Shares of beneficial interest | | | 44,108,027 | |
Total net assets | | $ | 41,787,290 | |
The difference between book-basis and tax-basis unrealized appreciation (depreciation) is due to differences in the timing of recognition of gains and losses on investments for tax and book purposes. The Fund’s net unrealized appreciation (depreciation) difference is attributable primarily to futures contracts and swap agreements.
The temporary book/tax differences are a result of timing differences between book and tax recognition of income and/or expenses. The Fund’s temporary book/tax differences are the result of the trustee deferral of compensation and retirement plan benefits.
Capital loss carryforward is calculated and reported as of a specific date. Results of transactions and other activity after that date may affect the amount of capital loss carryforward actually available for the Fund to utilize. Capital losses generated in years beginning after December 22, 2010 can be carried forward for an unlimited period, whereas previous losses expire in eight tax years. Capital losses with an expiration period may not be used to offset capital gains until all net capital losses without an expiration date have been utilized. Capital loss carryforwards with no expiration date will retain their character as either short-term or long-term capital losses instead of as short-term capital losses as under prior law. The ability to utilize capital loss carryforwards in the future may be limited under the Internal Revenue Code and related regulations based on the results of future transactions.
The Fund has a capital loss carryforward as of October 31, 2018, as follows:
| | | | | | | | | | | | |
| Capital Loss Carryforward* | |
| Expiration | | Short-Term | | | Long-Term | | | Total | |
Not subject to expiration | | $ | 910,157 | | | $ | 836,160 | | | $ | 1,746,317 | |
| * | Capital loss carryforward as of the date listed above is reduced for limitations, if any, to the extent required by the Internal Revenue Code and may be further limited depending upon a variety of factors, including the realization of net unrealized gains or losses as of the date of any reorganization. |
23 Invesco Macro Allocation Strategy Fund
NOTE 9—Investment Transactions
The aggregate amount of long-term U.S. Treasury obligations purchased and sold by the Fund during the year ended October 31, 2018 was $8,480,000 and $7,520,000, respectively. Cost of investments, including any derivatives, on a tax basis includes the adjustments for financial reporting purposes as of the most recently completed federal income tax reporting period-end.
| | | | |
| Unrealized Appreciation (Depreciation) of Investments on a Tax Basis | |
Aggregate unrealized appreciation of investments | | $ | 166,040 | |
Aggregate unrealized (depreciation) of investments | | | (766,044 | ) |
Net unrealized appreciation (depreciation) of investments | | $ | (600,004 | ) |
Cost of investments for tax purposes is $39,669,437.
NOTE 10—Reclassification of Permanent Differences
Primarily as a result of differing book/tax treatment of foreign currency transactions, distributions and subsidiary suspended passive losses, on October 31, 2018, undistributed net investment income was decreased by $125,750 and undistributed net realized gain was increased by $125,750. This reclassification had no effect on the net assets or the distributable earnings of the Fund.
NOTE 11—Share Information
| | | | | | | | | | | | | | | | |
| | | Summary of Share Activity | |
| | | Years ended October 31, | |
| | | 2018(a) | | | 2017 | |
| | | Shares | | | Amount | | | Shares | | | Amount | |
Sold: | | | | | | | | | | | | | | | | |
Class A | | | 137,213 | | | $ | 1,303,714 | | | | 262,417 | | | $ | 2,502,087 | |
Class C | | | 132,510 | | | | 1,242,058 | | | | 318,952 | | | | 2,978,514 | |
Class R | | | 5,576 | | | | 52,649 | | | | 1,140 | | | | 10,600 | |
Class Y | | | 1,572,203 | | | | 14,966,087 | | | | 2,196,857 | | | | 20,535,016 | |
Class R6 | | | 23,579 | | | | 221,955 | | | | 24,701 | | | | 230,307 | |
| | | | |
Issued as reinvestment of dividends: | | | | | | | | | | | | | | | | |
Class A | | | 20,650 | | | | 191,636 | | | | 75,549 | | | | 698,067 | |
Class C | | | 31,175 | | | | 287,742 | | | | 68,885 | | | | 638,566 | |
Class R | | | 215 | | | | 1,996 | | | | 423 | | | | 3,926 | |
Class Y | | | 103,763 | | | | 967,067 | | | | 392,090 | | | | 3,630,752 | |
Class R6 | | | 1,610 | | | | 14,997 | | | | 3,135 | | | | 28,995 | |
| | | | |
Reacquired: | | | | | | | | | | | | | | | | |
Class A | | | (131,930 | ) | | | (1,244,697 | ) | | | (426,075 | ) | | | (3,989,790 | ) |
Class C | | | (229,173 | ) | | | (2,128,585 | ) | | | (353,558 | ) | | | (3,333,641 | ) |
Class Y | | | (1,408,612 | ) | | | (13,280,312 | ) | | | (3,102,594 | ) | | | (29,059,425 | ) |
Class R6 | | | (11,341 | ) | | | (108,307 | ) | | | (14,790 | ) | | | (138,234 | ) |
Net increase (decrease) in share activity | | | 247,438 | | | $ | 2,488,000 | | | | (552,868 | ) | | $ | (5,264,260 | ) |
| (a) | There are entities that are record owners of more than 5% of the outstanding shares of the Fund and in the aggregate own 72% of the outstanding shares of the Fund. IDI has an agreement with these entities to sell Fund shares. The Fund, Invesco and/or Invesco affiliates may make payments to these entities, which are considered to be related to the Fund, for providing services to the Fund, Invesco and/or Invesco affiliates including but not limited to services such as securities brokerage, distribution, third party record keeping and account servicing. The Fund has no knowledge as to whether all or any portion of the shares owned of record by these entities are also owned beneficially. |
24 Invesco Macro Allocation Strategy Fund
NOTE 12—Financial Highlights
The following schedule presents financial highlights for a share of the Fund outstanding throughout the periods indicated.
| | | | | | | | | | | | | | | | | | | | | | | | | | | | | | | | | | | | | | | | | | | | | | | | | | | | | | | | |
| | | Net asset
value,
beginning
of period | | | Net
investment
income
(loss)(a) | | | Net gains
(losses)
on securities
(both
realized and
unrealized) | | | Total from
investment
operations | | | Dividends
from net
investment
income | | | Distributions
from net
realized
gains | | | Total
distributions | | | Net asset
value, end
of period | | | Total
return(b) | | | Net assets,
end of period
(000’s omitted) | | | Ratio of
expenses
to average
net assets
with fee waivers
and/or expenses
absorbed | | | Ratio of
expenses
to average net
assets without
fee waivers
and/or expenses
absorbed | | | Ratio of net
investment
income (loss)
to average
net assets | | | Portfolio
turnover(c) | |
Class A | |
Year ended 10/31/18 | | $ | 9.60 | | | $ | 0.03 | | | $ | (0.40 | ) | | $ | (0.37 | ) | | $ | — | | | $ | (0.42 | ) | | $ | (0.42 | ) | | $ | 8.81 | | | | (4.03 | )% | | $ | 4,491 | | | | 1.36 | %(d) | | | 2.12 | %(d) | | | 0.29 | %(d) | | | 94 | % |
Year ended 10/31/17 | | | 10.26 | | | | (0.06 | ) | | | 0.68 | | | | 0.62 | | | | (1.28 | ) | | | — | | | | (1.28 | ) | | | 9.60 | | | | 6.55 | | | | 4,645 | | | | 1.41 | | | | 2.30 | | | | (0.66 | ) | | | 25 | |
Year ended 10/31/16 | | | 9.70 | | | | (0.13 | ) | | | 0.91 | | | | 0.78 | | | | (0.22 | ) | | | — | | | | (0.22 | ) | | | 10.26 | | | | 8.21 | | | | 5,865 | | | | 1.63 | | | | 2.19 | | | | (1.31 | ) | | | 75 | |
Year ended 10/31/15 | | | 10.02 | | | | (0.16 | ) | | | 0.18 | | | | 0.02 | | | | (0.15 | ) | | | (0.19 | ) | | | (0.34 | ) | | | 9.70 | | | | 0.18 | | | | 7,418 | | | | 1.70 | (e) | | | 2.03 | (e) | | | (1.64 | )(e) | | | 0 | |
Year ended 10/31/14 | | | 10.78 | | | | (0.17 | ) | | | 0.09 | | | | (0.08 | ) | | | — | | | | (0.68 | ) | | | (0.68 | ) | | | 10.02 | | | | (0.64 | ) | | | 6,996 | | | | 1.73 | | | | 2.06 | | | | (1.68 | ) | | | 0 | |
Class C | | | | | | | | | | | | | | | | | | | | | | | | | | | | | | | | | | | | | | | | | | | | | | | | | | | | | | | | |
Year ended 10/31/18 | | | 9.57 | | | | (0.04 | ) | | | (0.40 | ) | | | (0.44 | ) | | | — | | | | (0.42 | ) | | | (0.42 | ) | | | 8.71 | | | | (4.80 | ) | | | 6,167 | | | | 2.11 | (d) | | | 2.87 | (d) | | | (0.46 | )(d) | | | 94 | |
Year ended 10/31/17 | | | 10.20 | | | | (0.13 | ) | | | 0.69 | | | | 0.56 | | | | (1.19 | ) | | | — | | | | (1.19 | ) | | | 9.57 | | | | 5.90 | | | | 7,398 | | | | 2.16 | | | | 3.05 | | | | (1.41 | ) | | | 25 | |
Year ended 10/31/16 | | | 9.62 | | | | (0.20 | ) | | | 0.90 | | | | 0.70 | | | | (0.12 | ) | | | — | | | | (0.12 | ) | | | 10.20 | | | | 7.41 | | | | 7,540 | | | | 2.38 | | | | 2.94 | | | | (2.06 | ) | | | 75 | |
Year ended 10/31/15 | | | 9.94 | | | | (0.24 | ) | | | 0.18 | | | | (0.06 | ) | | | (0.07 | ) | | | (0.19 | ) | | | (0.26 | ) | | | 9.62 | | | | (0.63 | ) | | | 8,155 | | | | 2.45 | (e) | | | 2.78 | (e) | | | (2.39 | )(e) | | | 0 | |
Year ended 10/31/14 | | | 10.78 | | | | (0.24 | ) | | | 0.08 | | | | (0.16 | ) | | | — | | | | (0.68 | ) | | | (0.68 | ) | | | 9.94 | | | | (1.42 | ) | | | 12,136 | | | | 2.48 | | | | 2.81 | | | | (2.43 | ) | | | 0 | |
Class R | | | | | | | | | | | | | | | | | | | | | | | | | | | | | | | | | | | | | | | | | | | | | | | | | | | | | | | | |
Year ended 10/31/18 | | | 9.61 | | | | 0.00 | | | | (0.39 | ) | | | (0.39 | ) | | | — | | | | (0.42 | ) | | | (0.42 | ) | | | 8.80 | | | | (4.24 | ) | | | 100 | | | | 1.61 | (d) | | | 2.37 | (d) | | | 0.04 | (d) | | | 94 | |
Year ended 10/31/17 | | | 10.25 | | | | (0.09 | ) | | | 0.70 | | | | 0.61 | | | | (1.25 | ) | | | — | | | | (1.25 | ) | | | 9.61 | | | | 6.42 | | | | 54 | | | | 1.66 | | | | 2.55 | | | | (0.91 | ) | | | 25 | |
Year ended 10/31/16 | | | 9.69 | | | | (0.15 | ) | | | 0.90 | | | | 0.75 | | | | (0.19 | ) | | | — | | | | (0.19 | ) | | | 10.25 | | | | 7.86 | | | | 42 | | | | 1.88 | | | | 2.44 | | | | (1.56 | ) | | | 75 | |
Year ended 10/31/15 | | | 10.00 | | | | (0.19 | ) | | | 0.20 | | | | 0.01 | | | | (0.13 | ) | | | (0.19 | ) | | | (0.32 | ) | | | 9.69 | | | | 0.00 | | | | 24 | | | | 1.95 | (e) | | | 2.28 | (e) | | | (1.89 | )(e) | | | 0 | |
Year ended 10/31/14 | | | 10.78 | | | | (0.19 | ) | | | 0.09 | | | | (0.10 | ) | | | — | | | | (0.68 | ) | | | (0.68 | ) | | | 10.00 | | | | (0.83 | ) | | | 24 | | | | 1.98 | | | | 2.31 | | | | (1.93 | ) | | | 0 | |
Class Y | | | | | | | | | | | | | | | | | | | | | | | | | | | | | | | | | | | | | | | | | | | | | | | | | | | | | | | | |
Year ended 10/31/18 | | | 9.64 | | | | 0.05 | | | | (0.40 | ) | | | (0.35 | ) | | | — | | | | (0.42 | ) | | | (0.42 | ) | | | 8.87 | | | | (3.80 | ) | | | 30,581 | | | | 1.11 | (d) | | | 1.87 | (d) | | | 0.54 | (d) | | | 94 | |
Year ended 10/31/17 | | | 10.29 | | | | (0.04 | ) | | | 0.70 | | | | 0.66 | | | | (1.31 | ) | | | — | | | | (1.31 | ) | | | 9.64 | | | | 6.93 | | | | 30,657 | | | | 1.16 | | | | 2.05 | | | | (0.41 | ) | | | 25 | |
Year ended 10/31/16 | | | 9.73 | | | | (0.10 | ) | | | 0.91 | | | | 0.81 | | | | (0.25 | ) | | | — | | | | (0.25 | ) | | | 10.29 | | | | 8.51 | | | | 38,019 | | | | 1.38 | | | | 1.94 | | | | (1.06 | ) | | | 75 | |
Year ended 10/31/15 | | | 10.05 | | | | (0.14 | ) | | | 0.19 | | | | 0.05 | | | | (0.18 | ) | | | (0.19 | ) | | | (0.37 | ) | | | 9.73 | | | | 0.44 | | | | 47,740 | | | | 1.45 | (e) | | | 1.78 | (e) | | | (1.39 | )(e) | | | 0 | |
Year ended 10/31/14 | | | 10.79 | | | | (0.14 | ) | | | 0.08 | | | | (0.06 | ) | | | — | | | | (0.68 | ) | | | (0.68 | ) | | | 10.05 | | | | (0.44 | ) | | | 36,645 | | | | 1.48 | | | | 1.81 | | | | (1.43 | ) | | | 0 | |
Class R5 | | | | | | | | | | | | | | | | | | | | | | | | | | | | | | | | | | | | | | | | | | | | | | | | | | | | | | | | |
Year ended 10/31/18 | | | 9.65 | | | | 0.05 | | | | (0.40 | ) | | | (0.35 | ) | | | — | | | | (0.42 | ) | | | (0.42 | ) | | | 8.88 | | | | (3.79 | ) | | | 8 | | | | 1.11 | (d) | | | 1.82 | (d) | | | 0.54 | (d) | | | 94 | |
Year ended 10/31/17 | | | 10.30 | | | | (0.04 | ) | | | 0.70 | | | | 0.66 | | | | (1.31 | ) | | | — | | | | (1.31 | ) | | | 9.65 | | | | 6.93 | | | | 9 | | | | 1.15 | | | | 1.97 | | | | (0.40 | ) | | | 25 | |
Year ended 10/31/16 | | | 9.74 | | | | (0.10 | ) | | | 0.91 | | | | 0.81 | | | | (0.25 | ) | | | — | | | | (0.25 | ) | | | 10.30 | | | | 8.50 | | | | 10 | | | | 1.38 | | | | 1.83 | | | | (1.06 | ) | | | 75 | |
Year ended 10/31/15 | | | 10.06 | | | | (0.14 | ) | | | 0.19 | | | | 0.05 | | | | (0.18 | ) | | | (0.19 | ) | | | (0.37 | ) | | | 9.74 | | | | 0.44 | | | | 9 | | | | 1.45 | (e) | | | 1.65 | (e) | | | (1.39 | )(e) | | | 0 | |
Year ended 10/31/14 | | | 10.79 | | | | (0.14 | ) | | | 0.09 | | | | (0.05 | ) | | | — | | | | (0.68 | ) | | | (0.68 | ) | | | 10.06 | | | | (0.34 | ) | | | 10 | | | | 1.48 | | | | 1.69 | | | | (1.43 | ) | | | 0 | |
Class R6 | | | | | | | | | | | | | | | | | | | | | | | | | | | | | | | | | | | | | | | | | | | | | | | | | | | | | | | | |
Year ended 10/31/18 | | | 9.63 | | | | 0.05 | | | | (0.40 | ) | | | (0.35 | ) | | | — | | | | (0.42 | ) | | | (0.42 | ) | | | 8.86 | | | | (3.80 | ) | | | 440 | | | | 1.11 | (d) | | | 1.82 | (d) | | | 0.54 | (d) | | | 94 | |
Year ended 10/31/17 | | | 10.29 | | | | (0.04 | ) | | | 0.69 | | | | 0.65 | | | | (1.31 | ) | | | — | | | | (1.31 | ) | | | 9.63 | | | | 6.83 | | | | 345 | | | | 1.15 | | | | 1.97 | | | | (0.40 | ) | | | 25 | |
Year ended 10/31/16 | | | 9.73 | | | | (0.10 | ) | | | 0.91 | | | | 0.81 | | | | (0.25 | ) | | | — | | | | (0.25 | ) | | | 10.29 | | | | 8.51 | | | | 234 | | | | 1.38 | | | | 1.83 | | | | (1.06 | ) | | | 75 | |
Year ended 10/31/15 | | | 10.05 | | | | (0.14 | ) | | | 0.19 | | | | 0.05 | | | | (0.18 | ) | | | (0.19 | ) | | | (0.37 | ) | | | 9.73 | | | | 0.44 | | | | 100,759 | | | | 1.45 | (e) | | | 1.65 | (e) | | | (1.39 | )(e) | | | 0 | |
Year ended 10/31/14 | | | 10.80 | | | | (0.14 | ) | | | 0.07 | | | | (0.07 | ) | | | — | | | | (0.68 | ) | | | (0.68 | ) | | | 10.05 | | | | (0.53 | ) | | | 112,019 | | | | 1.48 | | | | 1.69 | | | | (1.43 | ) | | | 0 | |
| (a) | Calculated using average shares outstanding. |
| (b) | Includes adjustments in accordance with accounting principles generally accepted in the United States of America and as such, the net asset value for financial reporting purposes and the returns based upon those net asset values may differ from the net asset value and returns for shareholder transactions. Does not include sales charges and is not annualized for periods less than one year, if applicable. |
| (c) | Portfolio turnover is calculated at the fund level and is not annualized for periods less than one year, if applicable. |
| (d) | Ratios are based on average daily net assets (000’s omitted) of $5,075, $7,380, $80, $30,680, $9 and $404 for Class A, Class C, Class R, Class Y, Class R5 and Class R6 shares, respectively. |
| (e) | In addition to the fees and expenses which the Fund bears directly, the Fund indirectly bears a pro rata share of the fees and expenses of the underlying funds in which the Fund invests. Because the underlying funds have varied expenses and fee levels and the Fund may own different proportions at different times, the amount of fees and expenses incurred indirectly by the Fund will vary. Estimated underlying fund expenses are not expenses that are incurred directly by the Fund. They are expenses that are incurred directly by the underlying funds and are deducted from the value of the funds the Fund invests in. The effect of the estimated underlying fund expenses that the Fund bears indirectly is included in the Fund’s total return. Estimated acquired fund fees from underlying funds were 0.11%. |
25 Invesco Macro Allocation Strategy Fund
Report of Independent Registered Public Accounting Firm
To the Board of Trustees of AIM Investment Funds
(Invesco Investment Funds) and Shareholders of Invesco Macro Allocation Strategy Fund:
Opinion on the Financial Statements
We have audited the accompanying consolidated statement of assets and liabilities, including the consolidated schedule of investments, of Invesco Macro Allocation Strategy Fund and its subsidiary (one of the funds constituting AIM Investment Funds (Invesco Investment Funds), hereafter referred to as the “Fund”) as of October 31, 2018, the related consolidated statement of operations for the year ended October 31, 2018, the consolidated statement of changes in net assets for each of the two years in the period ended October 31, 2018, including the related notes, and the financial highlights for each of the five years in the period ended October 31, 2018 (collectively referred to as the financial statements). In our opinion, the financial statements present fairly, in all material respects, the financial position of the Fund as of October 31, 2018, the results of its operations for the year then ended, the changes in its net assets for each of the two years in the period ended October 31, 2018 and the financial highlights for each of the five years in the period ended October 31, 2018 in conformity with accounting principles generally accepted in the United States of America.
Basis for Opinion
These financial statements are the responsibility of the Fund’s management. Our responsibility is to express an opinion on the Fund’s financial statements based on our audits. We are a public accounting firm registered with the Public Company Accounting Oversight Board (United States) (PCAOB) and are required to be independent with respect to the Fund in accordance with the U.S. federal securities laws and the applicable rules and regulations of the Securities and Exchange Commission and the PCAOB.
We conducted our audits of these financial statements in accordance with the standards of the PCAOB. Those standards require that we plan and perform the audit to obtain reasonable assurance about whether the financial statements are free of material misstatement, whether due to error or fraud.
Our audits included performing procedures to assess the risks of material misstatement of the financial statements, whether due to error or fraud, and performing procedures that respond to those risks. Such procedures included examining, on a test basis, evidence regarding the amounts and disclosures in the financial statements. Our audits also included evaluating the accounting principles used and significant estimates made by management, as well as evaluating the overall presentation of the financial statements. Our procedures included confirmation of securities owned as of October 31, 2018 by correspondence with the custodian, transfer agent and brokers; when replies were not received from brokers, we performed other auditing procedures. We believe that our audits provide a reasonable basis for our opinion.
PricewaterhouseCoopers LLP
Houston, TX
December 28, 2018
We have served as the auditor of one or more of the investment companies in the Invesco group of investment companies since at least 1995. We have not been able to determine the specific year we began serving as auditor.
26 Invesco Macro Allocation Strategy Fund
Calculating your ongoing Fund expenses
Example
As a shareholder of the Fund, you incur two types of costs: (1) transaction costs, which may include sales charges (loads) on purchase payments or contingent deferred sales charges on redemptions, if any; and (2) ongoing costs, including management fees, distribution and/or service (12b-1) fees, and other Fund expenses. This example is intended to help you understand your ongoing costs (in dollars) of investing in the Fund and to compare these costs with ongoing costs of investing in other mutual funds. The example is based on an investment of $1,000 invested at the beginning of the period and held for the entire period May 1, 2018 through October 31, 2018.
Actual expenses
The table below provides information about actual account values and actual expenses. You may use the information in this table, together with the amount you invested, to estimate the expenses that you paid over the period. Simply divide your account value by $1,000 (for example, an $8,600 account value divided by $1,000 = 8.6), then multiply the result by the number in the table under the heading entitled “Actual Expenses Paid During Period” to estimate the expenses you paid on your account during this period.
Hypothetical example for comparison purposes
The table below also provides information about hypothetical account values and hypothetical expenses based on the Fund’s actual expense ratio and an assumed rate of return of 5% per year before expenses, which is not the Fund’s actual return.
The hypothetical account values and expenses may not be used to estimate the actual ending account balance or expenses you paid for the period. You may use this information to compare the ongoing costs of investing in the Fund and other funds. To do so, compare this 5% hypothetical example with the 5% hypothetical examples that appear in the shareholder reports of the other funds.
Please note that the expenses shown in the table are meant to highlight your ongoing costs only and do not reflect any transaction costs, such as sales charges (loads) on purchase payments or contingent deferred sales charges on redemptions, if any. Therefore, the hypothetical information is useful in comparing ongoing costs only, and will not help you determine the relative total costs of owning different funds. In addition, if these transaction costs were included, your costs would have been higher.
| | | | | | | | | | | | | | | | | | | | | | | | |
| Class | | Beginning
Account Value
(05/01/18) | | | ACTUAL | | | HYPOTHETICAL (5% annual return before expenses) | | | Annualized
Expense
Ratio | |
| | Ending
Account Value
(10/31/18)1 | | | Expenses
Paid During
Period2 | | | Ending
Account Value
(10/31/18) | | | Expenses
Paid During
Period2 | |
| A | | $ | 1,000.00 | | | $ | 926.40 | | | $ | 6.60 | | | $ | 1,018.35 | | | $ | 6.92 | | | | 1.36 | % |
| C | | | 1,000.00 | | | | 922.70 | | | | 10.23 | | | | 1,014.57 | | | | 10.71 | | | | 2.11 | |
| R | | | 1,000.00 | | | | 925.30 | | | | 7.81 | | | | 1,017.09 | | | | 8.19 | | | | 1.61 | |
| Y | | | 1,000.00 | | | | 926.90 | | | | 5.39 | | | | 1,019.61 | | | | 5.65 | | | | 1.11 | |
| R5 | | | 1,000.00 | | | | 927.90 | | | | 5.39 | | | | 1,019.61 | | | | 5.65 | | | | 1.11 | |
| R6 | | | 1,000.00 | | | | 926.80 | | | | 5.39 | | | | 1,019.61 | | | | 5.65 | | | | 1.11 | |
| 1 | The actual ending account value is based on the actual total return of the Fund for the period May 1, 2018 through October 31, 2018, after actual expenses and will differ from the hypothetical ending account value which is based on the Fund’s expense ratio and a hypothetical annual return of 5% before expenses. |
| 2 | Expenses are equal to the Fund’s annualized expense ratio as indicated above multiplied by the average account value over the period, multiplied by 184/365 to reflect the most recent fiscal half year. |
27 Invesco Macro Allocation Strategy Fund
Approval of Investment Advisory and Sub-Advisory Contracts
At meetings held on June 5-6, 2018, the Board of Trustees (the Board or the Trustees) of AIM Investment Funds (Invesco Investment Funds) as a whole, and the independent Trustees, who comprise over 75% of the Board, voting separately, approved the continuance of the Invesco Macro Allocation Strategy Fund’s (the Fund) Master Investment Advisory Agreement with Invesco Advisers, Inc. (Invesco Advisers and the investment advisory agreement) and the Master Intergroup Sub-Advisory Contract for Mutual Funds with Invesco Asset Management Deutschland GmbH, Invesco Asset Management Limited, Invesco Asset Management (Japan) Limited, Invesco Hong Kong Limited, Invesco Senior Secured Management, Inc., Invesco Canada Ltd. and separate Sub-Advisory Contracts with Invesco Capital Management LLC and Invesco Asset Management (India) Private Limited (collectively, the Affiliated Sub-Advisers and the sub-advisory contracts) for another year, effective July 1, 2018. After evaluating the factors discussed below, among others, the Board approved the renewal of the Fund’s investment advisory agreement and the sub-advisory contracts and determined that the compensation payable by the Fund to Invesco Advisers and by Invesco Advisers to the Affiliated Sub-Advisers is fair and reasonable.
The Board’s Evaluation Process
The Board’s Investments Committee has established three Sub-Committees, which meet throughout the year to review the performance of funds advised by Invesco Advisers (the Invesco Funds). Over the course of each year, the Sub-Committees meet with portfolio managers for their assigned Invesco Funds and other members of management to review detailed information about investment performance and portfolio attributes of these funds. The Board took into account evaluations and reports that it received from the Investments Committee and Sub-Committees, as well as the information provided to such committees and the Board throughout the year, in considering whether to approve each Invesco Fund’s investment advisory agreement and sub-advisory contracts.
As part of the contract renewal process, the Board reviews and considers information provided in response to detailed requests for information submitted to management by the independent Trustees with assistance from legal counsel to the independent Trustees. The Board receives comparative investment performance and fee data regarding the Invesco Funds prepared by Invesco Advisers and Broadridge Financial Solutions, Inc. (Broadridge), an independent mutual fund data provider. The Board also receives an independent written evaluation from the Senior Officer, an officer of the Invesco Funds who reports directly to the independent Trustees. The Senior Officer’s
evaluation is prepared as part of his responsibility to manage the process by which the Invesco Funds’ proposed management fees are negotiated during the annual contract renewal process to ensure they are negotiated in a manner that is at arms’ length and reasonable. In addition to meetings with Invesco Advisers and fund counsel throughout the year, the independent Trustees also discuss the continuance of the investment advisory agreement and sub-advisory contracts in separate sessions with the Senior Officer and with independent legal counsel.
The discussion below is a summary of the Senior Officer’s independent written evaluation with respect to the Fund’s investment advisory agreement, as well as a discussion of the material factors and related conclusions that formed the basis for the Board’s approval of the Fund’s investment advisory agreement and sub-advisory contracts. The Trustees’ review and conclusions are based on the comprehensive consideration of all information presented to them during the course of the year and in prior years and are not the result of any single determinative factor. Moreover, one Trustee may have weighed a particular piece of information or factor differently than another Trustee. This information is current as of June 6, 2018.
Factors and Conclusions and Summary of Independent Written Fee Evaluation
| A. | Nature, Extent and Quality of Services Provided by Invesco Advisers and the Affiliated Sub-Advisers |
The Board reviewed the nature, extent and quality of the advisory services provided to the Fund by Invesco Advisers under the Fund’s investment advisory agreement, and the credentials and experience of the officers and employees of Invesco Advisers who provide these services, including the Fund’s portfolio manager(s). The Board’s review included consideration of Invesco Advisers’ investment process oversight and structure, credit analysis and investment risk management. The Board also considered non-advisory services that Invesco Advisers and its affiliates provide to the Invesco Funds such as various back office support functions, third party oversight, internal audit, valuation, portfolio trading and legal and compliance. The Board also reviewed and considered the benefits to shareholders of investing in a fund that is part of the Invesco family of funds under the umbrella of Invesco Ltd., Invesco Advisers’ parent company, and noted Invesco Ltd.’s depth and experience in conducting an investment management business, as well as its commitment of financial and other resources to such business. The Board concluded that the nature, extent and quality of the services provided to the Fund by Invesco Advisers are appropriate and satisfactory.
The Board reviewed the services that may be provided by the Affiliated Sub-Advisers under the sub-advisory contracts and the credentials and experience of the officers and employees of the Affiliated Sub-Advisers who provide these services. The Board noted the Affiliated Sub-Advisers’ expertise with respect to certain asset classes and that the Affiliated Sub-Advisers have offices and personnel that are located in financial centers around the world. As a result, the Board noted that the Affiliated Sub-Advisers can provide research and investment analysis on the markets and economies of various countries in which the Fund may invest, make recommendations regarding securities and assist with security trades. The Board concluded that the sub-advisory contracts may benefit the Fund and its shareholders by permitting Invesco Advisers to use the resources and talents of the Affiliated Sub-Advisers in managing the Fund. The Board concluded that the nature, extent and quality of the services that may be provided by the Affiliated Sub-Advisers are appropriate and satisfactory.
| B. | Fund Investment Performance |
The Board considered Fund investment performance as a relevant factor in considering whether to approve the investment advisory agreement. The Board did not view Fund investment performance as a relevant factor in considering whether to approve the sub-advisory contracts for the Fund, as no Affiliated Sub-Adviser currently manages assets of the Fund.
The Board compared the Fund’s investment performance over multiple time periods ending December 31, 2017 to the performance of funds in the Broadridge performance universe and against the Lipper Absolute Return Funds Index. The Board noted that performance of Class Y shares of the Fund was in the second quintile of its performance universe for the one year period and the first quintile for the three and five year periods (the first quintile being the best performing funds and the fifth quintile being the worst performing funds). The Board noted that performance of Class Y shares of the Fund was above the performance of the Index for the one, three and five year periods. The Trustees also reviewed more recent Fund performance and this review did not change their conclusions.
| C. | Advisory and Sub-Advisory Fees and Fund Expenses |
The Board compared the Fund’s contractual management fee rate to the contractual management fee rates of funds in the Fund’s Broadridge expense group. The Board noted that the contractual management fee rate for Class Y shares of the Fund was the same as the median contractual management fee rate of funds in its expense group. The Board noted that the term “contractual management fee” for funds in the expense group may include both
28 Invesco Macro Allocation Strategy Fund
advisory and certain non-portfolio management administrative services fees, but that Broadridge does not provide information on a fund by fund basis as to what is included. The Board also reviewed the methodology used by Broadridge in providing expense group information, which includes using each fund’s contractual management fee schedule (including any applicable breakpoints) as reported in the most recent prospectus or statement of additional information for each fund in the expense group. The Board also considered comparative information regarding the Fund’s total expense ratio and its various components.
The Board noted that Invesco Advisers has contractually agreed to waive fees and/or limit expenses of the Fund in an amount necessary to limit total annual operating expenses to a specified percentage of average daily net assets for each class of the Fund.
The Board noted that Invesco Advisers and the Affiliated Sub-Advisers do not manage other mutual funds with investment strategies comparable to those of the Fund.
The Board also considered the services that may be provided by the Affiliated Sub-Advisers pursuant to the sub-advisory contracts, as well as the fees payable by Invesco Advisers to the Affiliated Sub-Advisers pursuant to the sub-advisory contracts.
| D. | Economies of Scale and Breakpoints |
The Board considered the extent to which there may be economies of scale in the provision of advisory services to the Fund. The Board also considered that the Fund may benefit from economies of scale through contractual breakpoints in the Fund’s advisory fee schedule, which generally operate to reduce the Fund’s expense ratio as it grows in size. The Board noted that the Fund shares directly in economies of scale through lower fees charged by third party service providers based on the combined size of the Invesco Funds. The Board noted that the Fund may also benefit from economies of scale through initial fee setting, fee waivers and expense reimbursements.
| E. | Profitability and Financial Resources |
The Board reviewed information from Invesco Advisers concerning the costs of the advisory and other services that Invesco Advisers and its affiliates provide to the Fund and the Invesco Funds and the profitability of Invesco Advisers and its affiliates in providing these services. The Board considered the methodology used for calculating profitability and noted the periodic review of such methodology by an independent consultant. The Board noted that Invesco Advisers continues to operate at a net profit from services Invesco Advisers and its affiliates provide to the Invesco Funds. The Board received information from Invesco Advisers demonstrating that Invesco Advisers and the Affiliated Sub-Advisers are financially sound and have the resources necessary to perform their obligations under the investment advisory agreement and sub-advisory contracts.
| F. | Collateral Benefits to Invesco Advisers and its Affiliates |
The Board considered various other benefits received by Invesco Advisers and its affiliates from the relationship with the Fund, including the fees received for providing administrative, transfer agency and distribution services to the Fund. The Board considered comparative information regarding fees charged for these services, including information provided by Broadridge and other independent sources. The Board considered the performance of Invesco Advisers and its affiliates in providing these services and the organizational structure employed to provide these services. The Board also considered that these services are provided to the Fund pursuant to written contracts that are reviewed and approved on an annual basis by the Board; and that the services are required for the operation of the Fund.
The Board considered the benefits realized by Invesco Advisers and the Affiliated Sub-Advisers as a result of portfolio brokerage transactions executed through “soft dollar” arrangements. The Board noted that the Fund does not execute brokerage transaction through “soft dollar” arrangements to any significant degree.
The Board considered that the Fund’s uninvested cash and cash collateral from any securities lending arrangements may be invested in money market funds advised by Invesco Advisers pursuant to procedures approved by the Board. The Board noted that Invesco Advisers receives advisory fees from these affiliated money market funds attributable to such investments, although Invesco Advisers has contractually agreed to waive through varying periods the advisory fees payable by the Invesco Funds with respect to certain investments in the affiliated money market funds. The waiver is in an amount equal to 100% of the net advisory fee Invesco Advisers receives from the affiliated money market funds with respect to the Fund’s investment in the affiliated money market funds of uninvested cash, but not cash collateral. The Board concluded that the amount of advisory fees received by Invesco Advisers from the Fund’s investment of cash collateral from any securities lending arrangements in the affiliated money market funds is fair and reasonable.
The Board also considered that an affiliated broker may receive commissions for executing certain trades for the Fund. Invesco Advisers and the Affiliated Sub-Advisers may use the affiliated broker to, among other things, control order routing and minimize information leakage, and the Board was advised that such trades are executed in compliance with rules under the federal securities laws and consistent with best execution obligations.
29 Invesco Macro Allocation Strategy Fund
Tax Information
Form 1099-DIV, Form 1042-S and other year-end tax information provide shareholders with actual calendar year amounts that should be included in their tax returns. Shareholders should consult their tax advisors.
The following distribution information is being provided as required by the Internal Revenue Code or to meet a specific state’s requirement.
The Fund designates the following amounts or, if subsequently determined to be different, the maximum amount allowable for its fiscal year ended October 31, 2018:
| | | | |
Federal and State Income Tax | |
Long-Term Capital Gain Distributions | | $ | 1,090,720 | |
Qualified Dividend Income* | | | 0.00 | % |
Corporate Dividends Received Deduction* | | | 0.00 | % |
U.S. Treasury Obligations* | | | 13.06 | % |
| | * | The above percentages are based on ordinary income dividends paid to shareholders during the Fund’s fiscal year. |
30 Invesco Macro Allocation Strategy Fund
Trustees and Officers
The address of each trustee and officer is AIM Investment Funds (Invesco Investment Funds) (the “Trust”), 11 Greenway Plaza, Suite 1000, Houston, Texas 77046-1173. The trustees serve for the life of the Trust, subject to their earlier death, incapacitation, resignation, retirement or removal as more specifically provided in the Trust’s organizational documents. Each officer serves for a one year term or until their successors are elected and qualified. Column two below includes length of time served with predecessor entities, if any.
| | | | | | | | |
Name, Year of Birth and
Position(s) Held with the Trust | | Trustee and/
or Officer Since | | Principal Occupation(s)
During Past 5 Years | | Number of
Funds in Fund
Complex
Overseen by
Trustee | | Other Directorship(s)
Held by Trustee During
Past 5 Years |
| Interested Persons | | | | | | | | |
| Martin L. Flanagan1 — 1960 Trustee | | 2007 | | Executive Director, Chief Executive Officer and President, Invesco Ltd. (ultimate parent of Invesco and a global investment management firm); Trustee, The Invesco Funds; Vice Chair, Investment Company Institute; and Member of Executive Board, SMU Cox School of Business Formerly: Advisor to the Board, Invesco Advisers, Inc. (formerly known as Invesco Institutional (N.A.), Inc.); Chairman and Chief Executive Officer, Invesco Advisers, Inc. (registered investment adviser); Director, Chairman, Chief Executive Officer and President, Invesco Holding Company (US), Inc. (formerly IVZ Inc.) (holding company), Invesco Group Services, Inc. (service provider) and Invesco North American Holdings, Inc. (holding company); Director, Chief Executive Officer and President, Invesco Holding Company Limited (parent of Invesco and a global investment management firm); Director, Invesco Ltd.; Chairman, Investment Company Institute and President, Co-Chief Executive Officer, Co-President, Chief Operating Officer and Chief Financial Officer, Franklin Resources, Inc. (global investment management organization) | | 158 | | None |
Philip A. Taylor2 — 1954 Trustee and Senior Vice President | | 2006 | | Head of the Americas and Senior Managing Director, Invesco Ltd.; Director, Invesco Advisers, Inc. (formerly known as Invesco Institutional (N.A.), Inc.) (registered investment adviser); Director and Chairman, Invesco Investment Services, Inc. (formerly known as Invesco AIM Investment Services, Inc.) (registered transfer agent); Chief Executive Officer, Invesco Corporate Class Inc. (corporate mutual fund company); Director, Chairman and Chief Executive Officer, Invesco Canada Ltd. (formerly known as Invesco Trimark Ltd./Invesco Trimark Ltèe) (registered investment adviser and registered transfer agent); Trustee and Senior Vice President, The Invesco Funds; Director, Invesco Investment Advisers LLC (formerly known as Van Kampen Asset Management) Formerly: Director, Chairman, Chief Executive Officer and President, Invesco Management Group, Inc. (formerly known as Invesco AIM Management Group, Inc.) (financial services holding company); Co-Chairman, Co-President and Co-Chief Executive Officer, Invesco Advisers, Inc. (formerly known as Invesco Institutional (N.A.), Inc.) (registered investment adviser); Director, Chief Executive Officer and President, Van Kampen Exchange Corp; President and Principal Executive Officer, The Invesco Funds (other than AIM Treasurer’s Series Trust (Invesco Treasurer’s Series Trust), Short-Term Investments Trust and Invesco Management Trust); Executive Vice President, The Invesco Funds (AIM Treasurer’s Series Trust (Invesco Treasurer’s Series Trust), Short-Term Investments Trust and Invesco Management Trust only); Director and President, INVESCO Funds Group, Inc. (registered investment adviser and registered transfer agent); Director and Chairman, IVZ Distributors, Inc. (formerly known as INVESCO Distributors, Inc.) (registered broker dealer); Director, President and Chairman, Invesco Inc. (holding company), Invesco Canada Holdings Inc. (holding company), Trimark Investments Ltd./Placements Trimark Ltèe and Invesco Financial Services Ltd/Services Financiers Invesco Ltèe; Chief Executive Officer, Invesco Canada Fund Inc. (corporate mutual fund company); Director and Chairman, Van Kampen Investor Services Inc.; Director, Chief Executive Officer and President, 1371 Preferred Inc. (holding company) and Van Kampen Investments Inc.; Director and President, AIM GP Canada Inc. (general partner for limited partnerships) and Van Kampen Advisors, Inc.; Director and Chief Executive Officer, Invesco Trimark Dealer Inc. (registered broker dealer); Director, Invesco Distributors, Inc. (formerly known as Invesco AIM Distributors, Inc.) (registered broker dealer); Manager, Invesco Capital Management LLC; Director, Chief Executive Officer and President, Invesco Advisers, Inc.; Director, Chairman, Chief Executive Officer and President, Invesco AIM Capital Management, Inc.; President, Invesco Trimark Dealer Inc. and Invesco Trimark Ltd./Invesco Trimark Ltèe; Director and President, AIM Trimark Corporate Class Inc. and AIM Trimark Canada Fund Inc.; Senior Managing Director, Invesco Holding Company Limited; Director and Chairman, Fund Management Company (former registered broker dealer); President and Principal Executive Officer, The Invesco Funds (AIM Treasurer’s Series Trust (Invesco Treasurer’s Series Trust), and Short-Term Investments Trust only); President, AIM Trimark Global Fund Inc. and AIM Trimark Canada Fund Inc. | | 158 | | None |
| 1 | Mr. Flanagan is considered an interested person (within the meaning of Section 2(a)(19) of the 1940 Act) of the Trust because he is an officer of the Adviser to the Trust, and an officer and a director of Invesco Ltd., ultimate parent of the Adviser. |
| 2 | Mr. Taylor is considered an interested person (within the meaning of Section 2(a)(19) of the 1940 Act) of the Trust because he is an officer and a director of the Adviser. |
T-1 Invesco Macro Allocation Strategy Fund
Trustees and Officers—(continued)
| | | | | | | | |
Name, Year of Birth and
Position(s) Held with the Trust | | Trustee and/
or Officer Since | | Principal Occupation(s)
During Past 5 Years | | Number of
Funds in Fund
Complex
Overseen by
Trustee | | Other Directorship(s)
Held by Trustee During
Past 5 Years |
| Independent Trustees | | | | | | | | |
Bruce L. Crockett — 1944 Trustee and Chair | | 2001 | | Chairman, Crockett Technologies Associates (technology consulting company) Formerly: Director, Captaris (unified messaging provider); Director, President and Chief Executive Officer, COMSAT Corporation; Chairman, Board of Governors of INTELSAT (international communications company); ACE Limited (insurance company); Independent Directors Council and Investment Company Institute: Member of the Audit Committee, Investment Company Institute; Member of the Executive Committee and Chair of the Governance Committee, Independent Directors Council | | 158 | | Director and Chairman of the Audit Committee, ALPS (Attorneys Liability Protection Society) (insurance company); Director and Member of the Audit Committee and Compensation Committee, Ferroglobe PLC (metallurgical company) |
David C. Arch — 1945 Trustee | | 2010 | | Chairman of Blistex Inc. (consumer health care products manufacturer); Member, World Presidents’ Organization | | 158 | | Board member of the Illinois Manufacturers’ Association |
Jack M. Fields — 1952 Trustee | | 2001 | | Chief Executive Officer, Twenty First Century Group, Inc. (government affairs company); and Chairman, Discovery Learning Alliance (non-profit) Formerly: Owner and Chief Executive Officer, Dos Angeles Ranch L.P. (cattle, hunting, corporate entertainment); Director, Insperity, Inc. (formerly known as Administaff) (human resources provider); Chief Executive Officer, Texana Timber LP (sustainable forestry company); Director of Cross Timbers Quail Research Ranch (non-profit); and member of the U.S. House of Representatives | | 158 | | None |
Cynthia Hostetler — 1962 Trustee | | 2017 | | Non-Executive Director and Trustee of a number of public and private business corporations Formerly: Director, Aberdeen Investment Funds (4 portfolios); Head of Investment Funds and Private Equity, Overseas Private Investment Corporation; President, First Manhattan Bancorporation, Inc.; Attorney, Simpson Thacher & Bartlett LLP | | 158 | | Vulcan Materials Company (construction materials company); Trilinc Global Impact Fund; Artio Global Investment LLC (mutual fund complex); Edgen Group, Inc. (specialized energy and infrastructure products distributor) |
Eli Jones — 1961 Trustee | | 2016 | | Professor and Dean, Mays Business School — Texas A&M University Formerly: Professor and Dean, Walton College of Business, University of Arkansas and E.J. Ourso College of Business, Louisiana State University; Director, Arvest Bank | | 158 | | Insperity, Inc. (formerly known as Administaff) (human resources provider) |
Prema Mathai-Davis — 1950 Trustee | | 2001 | | Retired | | 158 | | None |
Teresa M. Ressel — 1962 Trustee | | 2017 | | Non-executive director and trustee of a number of public and private business corporations Formerly: Chief Financial Officer, Olayan America, The Olayan Group (international investor/commercial/industrial); Chief Executive Officer, UBS Securities LLC; Group Chief Operating Officer, Americas, UBS AG; Assistant Secretary for Management & Budget and CFO, US Department of the Treasury | | 158 | | Atlantic Power Corporation (power generation company); ON Semiconductor Corp. (semiconductor supplier) |
Ann Barnett Stern — 1957 Trustee | | 2017 | | President and Chief Executive Officer, Houston Endowment Inc. (private philanthropic institution) Formerly: Executive Vice President and General Counsel, Texas Children’s Hospital; Attorney, Beck, Redden and Secrest, LLP; Business Law Instructor, University of St. Thomas; Attorney, Andrews & Kurth LLP | | 158 | | Federal Reserve Bank of Dallas |
Raymond Stickel, Jr. — 1944 Trustee | | 2005 | | Retired Formerly: Director, Mainstay VP Series Funds, Inc. (25 portfolios); Partner, Deloitte & Touche | | 158 | | None |
Robert C. Troccoli — 1949 Trustee | | 2016 | | Adjunct Professor, University of Denver — Daniels College of Business Formerly: Senior Partner, KPMG LLP | | 158 | | None |
Christopher L. Wilson — 1957 Trustee | | 2017 | | Non-executive director and trustee of a number of public and private business corporations Formerly: Director, TD Asset Management USA Inc. (mutual fund complex) (22 portfolios); Managing Partner, CT2, LLC (investing and consulting firm); President/Chief Executive Officer, Columbia Funds, Bank of America Corporation; President/Chief Executive Officer, CDC IXIS Asset Management Services, Inc.; Principal & Director of Operations, Scudder Funds, Scudder, Stevens & Clark, Inc.; Assistant Vice President, Fidelity Investments | | 158 | | ISO New England, Inc. (non-profit organization managing regional electricity market) |
T-2 Invesco Macro Allocation Strategy Fund
Trustees and Officers—(continued)
| | | | | | | | |
Name, Year of Birth and
Position(s) Held with the Trust | | Trustee and/
or Officer Since | | Principal Occupation(s)
During Past 5 Years | | Number of
Funds in Fund
Complex
Overseen by
Trustee | | Other Directorship(s)
Held by Trustee During
Past 5 Years |
| Other Officers | | | | | | | | |
Sheri Morris — 1964 President, Principal Executive Officer and Treasurer | | 1999 | | President, Principal Executive Officer and Treasurer, The Invesco Funds; Vice President, Invesco Advisers, Inc. (formerly known as Invesco Institutional (N.A.), Inc.) (registered investment adviser); and Vice President, Invesco Exchange-Traded Fund Trust, Invesco Exchange-Traded Fund Trust II, Invesco India Exchange-Traded Fund Trust, Invesco Actively Managed Exchange-Traded Fund Trust, Invesco Actively Managed Exchange-Traded Commodity Fund Trust and Invesco Exchange-Traded Self-Indexed Fund Trust Formerly: Vice President and Principal Financial Officer, The Invesco Funds; Vice President, Invesco AIM Advisers, Inc., Invesco AIM Capital Management, Inc. and Invesco AIM Private Asset Management, Inc.; Assistant Vice President and Assistant Treasurer, The Invesco Funds and Assistant Vice President, Invesco Advisers, Inc., Invesco AIM Capital Management, Inc. and Invesco AIM Private Asset Management, Inc.; and Treasurer, Invesco Exchange-Traded Fund Trust, Invesco Exchange-Traded Fund Trust II, Invesco India Exchange-Traded Fund Trust and Invesco Actively Managed Exchange-Traded Fund Trust | | N/A | | N/A |
Russell C. Burk — 1958 Senior Vice President and Senior Officer | | 2005 | | Senior Vice President and Senior Officer, The Invesco Funds | | N/A | | N/A |
Jeffrey H. Kupor — 1968 Senior Vice President, Chief Legal Officer and Secretary | | 2018 | | Senior Vice President and Secretary, Invesco Advisers, Inc. (formerly known as Invesco Institutional (N.A.), Inc.) (registered investment adviser); Senior Vice President and Secretary, Invesco Distributors, Inc. (formerly known as Invesco AIM Distributors, Inc.); Vice President and Secretary, Invesco Investment Services, Inc. (formerly known as Invesco AIM Investment Services, Inc.) Senior Vice President, Chief Legal Officer and Secretary, The Invesco Funds; Secretary and General Counsel, Invesco Investment Advisers LLC (formerly known as Van Kampen Asset Management); Secretary and General Counsel, Invesco Capital Markets, Inc. (formerly known as Van Kampen Funds Inc.) and Chief Legal Officer, Invesco Exchange-Traded Fund Trust, Invesco Exchange-Traded Fund Trust II, Invesco India Exchange-Traded Fund Trust, Invesco Actively Managed Exchange-Traded Fund Trust, Invesco Actively Managed Exchange-Traded Commodity Fund Trust and Invesco Exchange-Traded Self-Indexed Fund Trust; Secretary, Invesco Indexing LLC; Secretary and General Counsel, INVESCO Private Capital Investments, Inc.; Secretary, W.L. Ross & Co., LLC; Secretary and Vice President, Jemstep, Inc. Formerly: Senior Vice President, Secretary and General Counsel, Invesco Management Group, Inc. (formerly known as Invesco AIM Management Group, Inc.); Assistant Secretary, INVESCO Asset Management (Bermuda) Ltd.; Secretary and General Counsel, Invesco Private Capital, Inc.; Assistant Secretary and General Counsel, INVESCO Realty, Inc.; Secretary and General Counsel, Invesco Senior Secured Management, Inc.; and Secretary, Sovereign G./P. Holdings Inc. | | N/A | | N/A |
John M. Zerr — 1962 Senior Vice President | | 2006 | | Chief Operating Officer of the Americas; Senior Vice President, Invesco Advisers, Inc. (formerly known as Invesco Institutional (N.A.), Inc.) (registered investment adviser); Senior Vice President, Invesco Distributors, Inc. (formerly known as Invesco AIM Distributors, Inc.); Director and Vice President, Invesco Investment Services, Inc. (formerly known as Invesco AIM Investment Services, Inc.) Senior Vice President, The Invesco Funds; Managing Director, Invesco Capital Management LLC; Director, Invesco Investment Advisers LLC (formerly known as Van Kampen Asset Management); Senior Vice President, Invesco Capital Markets, Inc. (formerly known as Van Kampen Funds Inc.); Manager, Invesco Indexing LLC Formerly: Director and Senior Vice President, Invesco Management Group, Inc. (formerly known as Invesco AIM Management Group, Inc.); Secretary and General Counsel, Invesco Management Group, Inc. (formerly known as Invesco AIM Management Group, Inc.); Secretary, Invesco Investment Services, Inc. (formerly known as Invesco AIM Investment Services, Inc.); Chief Legal Officer and Secretary, The Invesco Funds; Secretary and General Counsel, Invesco Investment Advisers LLC (formerly known as Van Kampen Asset Management); Secretary and General Counsel, Invesco Capital Markets, Inc. (formerly known as Van Kampen Funds Inc.); Chief Legal Officer, Invesco Exchange-Traded Fund Trust, Invesco Exchange-Traded Fund Trust II, Invesco India Exchange-Traded Fund Trust, Invesco Actively Managed Exchange-Traded Fund Trust, Invesco Actively Managed Exchange-Traded Commodity Fund Trust and Invesco Exchange-Traded Self-Indexed Fund Trust; Secretary, Invesco Indexing LLC; Director, Secretary, General Counsel and Senior Vice President, Van Kampen Exchange Corp.; Director, Vice President and Secretary, IVZ Distributors, Inc. (formerly known as INVESCO Distributors, Inc.); Director and Vice President, INVESCO Funds Group, Inc.; Director and Vice President, Van Kampen Advisors Inc.; Director, Vice President, Secretary and General Counsel, Van Kampen Investor Services Inc.; Director and Secretary, Invesco Distributors, Inc. (formerly known as Invesco AIM Distributors, Inc.); Director, Senior Vice President, General Counsel and Secretary, Invesco AIM Advisers, Inc. and Van Kampen Investments Inc.; Director, Vice President and Secretary, Fund Management Company; Director, Senior Vice President, Secretary, General Counsel and Vice President, Invesco AIM Capital Management, Inc.; Chief Operating Officer and General Counsel, Liberty Ridge Capital, Inc. (an investment adviser) | | N/A | | N/A |
T-3 Invesco Macro Allocation Strategy Fund
Trustees and Officers—(continued)
| | | | | | | | |
Name, Year of Birth and
Position(s) Held with the Trust | | Trustee and/
or Officer Since | | Principal Occupation(s)
During Past 5 Years | | Number of
Funds in Fund
Complex
Overseen by
Trustee | | Other Directorship(s)
Held by Trustee During
Past 5 Years |
| Other Officers—(continued) | | | | | | | | |
Gregory G. McGreevey — 1962 Senior Vice President | | 2012 | | Senior Managing Director, Invesco Ltd.; Director, Chairman, President, and Chief Executive Officer, Invesco Advisers, Inc. (formerly known as Invesco Institutional (N.A.), Inc.) (registered investment adviser); Director, Invesco Mortgage Capital, Inc. and Invesco Senior Secured Management, Inc.; and Senior Vice President, The Invesco Funds Formerly: Senior Vice President, Invesco Management Group, Inc. and Invesco Advisers, Inc.; Assistant Vice President, The Invesco Funds | | N/A | | N/A |
Kelli Gallegos — 1970 Vice President, Principal Financial Officer and Assistant Treasurer | | 2008 | | Vice President and Treasurer, Invesco Exchange-Traded Fund Trust, Invesco Exchange-Traded Fund Trust II, Invesco India Exchange-Traded Fund Trust, Invesco Actively Managed Exchange-Traded Fund Trust, Invesco Actively Managed Exchange-Traded Commodity Fund Trust and Invesco Exchange-Traded Self-Indexed Fund Trust; Vice President, Principal Financial Officer and Assistant Treasurer, The Invesco Funds; Principal Financial and Accounting Officer — Pooled Investments, Invesco Capital Management LLC Formerly: Assistant Treasurer, Invesco Exchange-Traded Fund Trust, Invesco Exchange-Traded Fund Trust II, Invesco India Exchange-Traded Fund Trust, Invesco Actively Managed Exchange-Traded Fund Trust, Invesco Actively Managed Exchange-Traded Commodity Fund Trust and Invesco Exchange-Traded Self-Indexed Fund Trust; Assistant Treasurer, Invesco Capital Management LLC; Assistant Vice President, The Invesco Funds | | N/A | | N/A |
Tracy Sullivan — 1962 Vice President, Chief Tax Officer and Assistant Treasurer | | 2008 | | Vice President, Chief Tax Officer and Assistant Treasurer, The Invesco Funds; Assistant Treasurer, Invesco Capital Management LLC, Invesco Exchange-Traded Fund Trust, Invesco Exchange-Traded Fund Trust II, Invesco India Exchange-Traded Fund Trust, Invesco Actively Managed Exchange-Traded Fund Trust, Invesco Actively Managed Exchange-Traded Commodity Fund Trust and Invesco Exchange-Traded Self-Indexed Fund Trust Formerly: Assistant Vice President, The Invesco Funds | | N/A | | N/A |
Crissie M. Wisdom — 1969 Anti-Money Laundering Compliance Officer | | 2013 | | Anti-Money Laundering Compliance Officer, Invesco Advisers, Inc. (formerly known as Invesco Institutional (N.A.), Inc.) (registered investment adviser), Invesco Capital Markets, Inc. (formerly known as Van Kampen Funds Inc.), Invesco Distributors, Inc., Invesco Investment Services, Inc., The Invesco Funds, and Invesco Exchange-Traded Fund Trust, Invesco Exchange-Traded Fund Trust II, Invesco India Exchange-Traded Fund Trust, Invesco Actively Managed Exchange-Traded Fund Trust, Invesco Actively Managed Exchange-Traded Commodity Fund Trust and Invesco Exchange-Traded Self-Indexed Fund Trust; Anti-Money Laundering Compliance Officer and Bank Secrecy Act Officer, INVESCO National Trust Company and Invesco Trust Company; and Fraud Prevention Manager and Controls and Risk Analysis Manager for Invesco Investment Services, Inc. Formerly: Anti-Money Laundering Compliance Officer, Van Kampen Exchange Corp. and Invesco Management Group, Inc. | | N/A | | N/A |
Robert R. Leveille — 1969 Chief Compliance Officer | | 2016 | | Chief Compliance Officer, Invesco Advisers, Inc. (registered investment adviser); and Chief Compliance Officer, The Invesco Funds Formerly: Chief Compliance Officer, Putnam Investments and the Putnam Funds | | N/A | | N/A |
The Statement of Additional Information of the Trust includes additional information about the Fund’s Trustees and is available upon request, without charge, by calling 1.800.959.4246. Please refer to the Fund’s Statement of Additional Information for information on the Fund’s sub-advisers.
| | | | | | |
Office of the Fund 11 Greenway Plaza, Suite 1000 Houston, TX 77046-1173 | | Investment Adviser Invesco Advisers, Inc. 1555 Peachtree Street, N.E. Atlanta, GA 30309 | | Distributor Invesco Distributors, Inc. 11 Greenway Plaza, Suite 1000 Houston, TX 77046-1173 | | Auditors PricewaterhouseCoopers LLP 1000 Louisiana Street, Suite 5800 Houston, TX 77002-5021 |
| | | |
| | | | | | |
Counsel to the Fund Stradley Ronon Stevens & Young, LLP 2005 Market Street, Suite 2600 Philadelphia, PA 19103-7018 | | Counsel to the Independent Trustees Goodwin Procter LLP 901 New York Avenue, N.W. Washington, D.C. 20001 | | Transfer Agent Invesco Investment Services, Inc. 11 Greenway Plaza, Suite 1000 Houston, TX 77046-1173 | | Custodian State Street Bank and Trust Company 225 Franklin Street Boston, MA 02110-2801 |
T-4 Invesco Macro Allocation Strategy Fund
Explore High-Conviction Investing with Invesco

Go paperless with eDelivery
Visit invesco.com/edelivery to enjoy the convenience and security of anytime electronic access to your investment documents.
With eDelivery, you can elect to have any or all of the following materials delivered straight to your inbox to download, save and print from your own computer:
∎ Fund reports and prospectuses
∎ Quarterly statements
∎ Daily confirmations
∎ Tax forms
Invesco mailing information
Send general correspondence to Invesco Investment Services, Inc., P.O. Box 219078, Kansas City, MO 64121-9078.
Important notice regarding delivery of security holder documents
To reduce Fund expenses, only one copy of most shareholder documents may be mailed to shareholders with multiple accounts at the same address (Householding). Mailing of your shareholder documents may be householded indefinitely unless you instruct us otherwise. If you do not want the mailing of these documents to be combined with those for other members of your household, please contact Invesco Investment Services, Inc. at 800 959 4246 or contact your financial institution. We will begin sending you individual copies for each account within 30 days after receiving your request.
Fund holdings and proxy voting information
The Fund provides a complete list of its holdings four times in each fiscal year, at the quarter ends. For the second and fourth quarters, the lists appear in the Fund’s semiannual and annual reports to shareholders. For the first and third quarters, the Fund files the lists with the Securities and Exchange Commission (SEC) on Form N-Q (or any successor Form). The most recent list of portfolio holdings is available at invesco.com/completeqtrholdings. Shareholders can also look up the Fund’s Forms N-Q (or any successor Form) on the SEC website at sec.gov. The SEC file numbers for the Fund are shown below.
A description of the policies and procedures that the Fund uses to determine how to vote proxies relating to portfolio securities is available without charge, upon request, from our Client Services department at 800 959 4246 or at invesco.com/proxyguidelines. The information is also available on the SEC website, sec.gov.
| | |
Information regarding how the Fund voted proxies related to its portfolio securities during the most recent 12-month period ended June 30 is available at invesco.com/proxysearch. The information is also available on the SEC website, sec.gov. Invesco Advisers, Inc. is an investment adviser; it provides investment advisory services to individual and institutional clients and does not sell securities. Invesco Distributors, Inc. is the US distributor for Invesco Ltd.’s retail mutual funds, exchange-traded funds and institutional money market funds. Both are wholly owned, indirect subsidiaries of Invesco Ltd. | | 
|
| | | | | | | | |
| SEC file numbers: 811-05426 and 033-19338 | | Invesco Distributors, Inc. | | MAS-AR-1 | | 12212018 | | 0941 |
| | | | |
| | |
 | | Annual Report to Shareholders | | October 31, 2018 |
| | |
| | Invesco MLP Fund |
| | Nasdaq: |
| | A: ILPAX ∎ C: ILPCX ∎ R: ILPRX ∎ Y: ILPYX ∎ R5: ILPFX ∎ R6: ILPQX |

Letters to Shareholders
| | |

Philip Taylor | | Dear Shareholders: This annual report includes information about your Fund, including performance data and a complete list of its investments as of the close of the reporting period. Inside is a discussion of how your Fund was managed and the factors that affected its performance during the reporting period. Throughout the reporting period, US economic data remained positive. Robust corporate profits, strong retail sales and unemployment rates near generational lows helped drive US markets to new all-time records multiple times during the reporting period. Against this backdrop, the US Federal Reserve raised the federal funds rate four times during the reporting period. Market volatility, largely non-existent in 2017, returned in 2018. Markets sold off first in February and again sharply in October, amid rising interest rates, concerns about potential trade wars and heightened geopolitical tensions. Despite the volatility, US equity markets were largely |
positive for the reporting period and fared better than international markets. Emerging markets were particularly hard hit due to a strong US dollar. During the October sell-off, investors retreated to more defensive areas of the market and to US Treasuries. The broader bond market declined during the reporting period due to the increase in US Treasury yields and widening credit spreads. As the year progresses, we’ll see how the interplay of economic data, interest rates, geopolitics and a host of other factors affect US and overseas equity and fixed income markets.
Short-term market volatility can prompt some investors to abandon their investment plans – and can cause others to settle for whatever returns the market has to offer. The investment professionals at Invesco, in contrast, invest with high conviction. This means that, no matter the asset class or the strategy, each investment team has a passion to exceed. We want to help investors achieve better outcomes, such as seeking higher returns, helping mitigate risk and generating income. Of course, investing with high conviction can’t guarantee a profit or ensure success; no investment strategy can. To learn more about how we invest with high conviction, visit invesco.com/HighConviction.
You, too, can invest with high conviction by maintaining a long-term investment perspective and by working with your financial adviser on a regular basis. During periods of short-term market volatility or uncertainty, your financial adviser can keep you focused on your long-term investment goals – a new home, a child’s college education or a secure retirement. He or she also can share research about the economy, the markets and individual investment options.
Visit our website for more information on your investments
Our website, invesco.com/us, offers a wide range of market insights and investment perspectives. On the website, you’ll find detailed information about our funds, including performance, holdings and portfolio manager commentaries. You can access information about your account by completing a simple, secure online registration. To do so, select “Log In” on the right side of the homepage, and then select “Register for Individual Account Access.”
In addition to the resources accessible on our website and through our mobile app, you can obtain timely updates to help you stay informed about the markets and the economy by connecting with Invesco on Twitter, LinkedIn or Facebook. You can access our blog at blog.invesco.us.com. Our goal is to provide you the information you want, when and where you want it.
Finally, I’m pleased to share with you Invesco’s commitment to both the Principles for Responsible Investment and to considering environmental, social and governance issues in our robust investment process. I invite you to learn more at invesco.com/esg.
Have questions?
For questions about your account, contact an Invesco client services representative at 800 959 4246. For Invesco-related questions or comments, please email me directly at phil@invesco.com.
All of us at Invesco look forward to serving your investment management needs. Thank you for investing with us.
Sincerely,

Philip Taylor
Senior Managing Director, Invesco Ltd.
| | | | |

Bruce Crockett | | Dear Fellow Shareholders: Among the many important lessons I’ve learned in more than 40 years in a variety of business endeavors is the value of a trusted advocate. As independent chair of the Invesco Funds Board, I can assure you that the members of the Board are strong advocates for the interests of investors in Invesco’s mutual funds. We work hard to represent your interests through oversight of the quality of the investment management services your funds receive and other matters important to your investment, including but not limited to: |
| | ∎ | | Ensuring that Invesco offers a diverse lineup of mutual funds that your financial adviser can use to strive to meet your financial needs as your investment goals change over time. |
| | ∎ | | Monitoring how the portfolio management teams of the Invesco funds are performing in light of changing economic and market conditions. |
| ∎ | | Assessing each portfolio management team’s investment performance within the context of the investment strategy described in the fund’s prospectus. |
| ∎ | | Monitoring for potential conflicts of interests that may impact the nature of the services that your funds receive. |
We believe one of the most important services we provide our fund shareholders is the annual review of the funds’ advisory and sub-advisory contracts with Invesco Advisers and its affiliates. This review is required by the Investment Company Act of 1940 and focuses on the nature and quality of the services Invesco provides as the adviser to the Invesco funds and the reasonableness of the fees that it charges for those services. Each year, we spend months carefully reviewing information received from Invesco and a variety of independent sources, such as performance and fee data prepared by Lipper, Inc. (a subsidiary of Broadridge Financial Solutions, Inc.), an independent, third-party firm widely recognized as a leader in its field. We also meet with our independent legal counsel and other independent advisers to review and help us assess the information that we have received. Our goal is to assure that you receive quality investment management services for a reasonable fee.
I trust the measures outlined above provide assurance that you have a worthy advocate when it comes to choosing the Invesco Funds.
As always, please contact me at bruce@brucecrockett.com with any questions or concerns you may have. On behalf of the Board, we look forward to continuing to represent your interests and serving your needs.
Sincerely,

Bruce L. Crockett
Independent Chair
Invesco Funds Board of Trustees
Management’s Discussion of Fund Performance
| | | | |
| |
Performance summary For the fiscal year ended October 31, 2018, Class A shares of Invesco MLP Fund (the Fund), at net asset value (NAV), outperformed the Fund’s style-specific bench-mark, the Alerian MLP Index. Your Fund’s long-term performance appears later in this report. | |
| | |
Fund vs. Indexes | | | | |
Total returns, 10/31/17 to 10/31/18, at net asset value (NAV). Performance shown does not include applicable contingent deferred sales charges (CDSC) or front-end sales charges, which would have reduced performance. | |
| |
Class A Shares | | | 3.44 | % |
Class C Shares | | | 2.46 | |
Class R Shares | | | 3.18 | |
Class Y Shares | | | 3.52 | |
Class R5 Shares | | | 3.71 | |
Class R6 Shares | | | 3.71 | |
S&P 500 Indexq (Broad Market Index) | | | 7.35 | |
Alerian MLP Indexq (Style-Specific Index) | | | 0.68 | |
Lipper Energy MLP Funds Index⬛ (Peer Group Index) | | | -1.53 | |
| | |
Source(s): qFactSet Research Systems Inc.; ⬛Lipper Inc. | | | | |
Market conditions and your Fund
The fiscal year proved to be an increasingly volatile time for US equities. The fiscal year began in the final months of 2017 with several major US stock market indexes repeatedly reaching new highs amid strong corporate profits, the prospect of tax reform legislation and exceedingly low stock market volatility.
Stock market euphoria continued in January 2018 as US equity markets steadily moved higher. Investors remained enthused about the passage of the Tax Cuts and Jobs Act signed into law in late December 2017, which significantly cut corporate tax rates. However,
| | | | |
| |
Portfolio Composition | |
| By MLP sector | | | % of total investments | |
| | | | |
| |
Refined Products Pipelines & Terminals | | | 27.4% | |
Pipelines & Midstream Diversified | | | 22.5 | |
Gathering & Processing (MLP) | | | 16.4 | |
General Partner (MLP) | | | 14.4 | |
Natural Gas Pipelines & Storage (MLP) | | | 4.7 | |
Natural Gas Pipelines & Storage | | | 3.1 | |
Gathering & Processing | | | 2.6 | |
Global Infrastructure | | | 2.5 | |
General Partner (C-Corp) | | | 2.0 | |
Refinery Logistics | | | 1.8 | |
Upstream | | | 1.7 | |
Money Market Funds | | | 0.9 | |
in February 2018, volatility returned to the US stock and bond markets. Worries about how rising interest rates might affect economic growth, concerns about a potential trade war and heightened geopolitical tensions, caused the US stock markets to pull back and volatility to increase.
US equity markets generally recovered in the second quarter of 2018 as strong US retail sales and low unemployment buoyed markets. Throughout the summer, US equities moved higher as corporate profits surged. Several US equity indexes reached new highs despite potential headwinds including trade tensions,
| | | | | | |
| | |
Top 10 Equity Holdings* | | | | |
| | % of total net assets | |
| | |
1. | | Energy Transfer Equity, L.P. | | | 14.9% | |
2. | | Enterprise Products Partners L.P. | | | 13.8 | |
3. | | Plains All American Pipeline, L.P. | | | 9.6 | |
4. | | Magellan Midstream Partners, L.P. | | | 9.2 | |
5. | | MPLX L.P. | | | 8.1 | |
6. | | EnLink Midstream Partners, L.P. | | | 3.9 | |
7. | | DCP Midstream, L.P. | | | 3.7 | |
8. | | Tallgrass Energy, L.P. | | | 3.2 | |
9. | | Western Gas Partners, L.P. | | | 3.0 | |
10. | | Andeavor Logistics L.P. | | | 2.8 | |
| | | | | | | |
| | | | |
| | |
Total Net Assets | | $ | 11.2 million | |
| |
Total Number of Holdings* | | | 29 | |
The Fund’s holdings are subject to change, and there is no assurance that the Fund will continue to hold any particular security.
*Excluding money market fund holdings.
Data presented here are as of October 31, 2018.
tariff announcements and contagion concerns over a Turkish currency crisis. After a relatively quiet summer, market volatility markedly rose in the final month of the fiscal year. US equity markets suffered a sharp sell-off in October 2018 amid rising interest rates and concerns that higher inflation could mean a more restrictive monetary policy. In this environment, investors fled to more defensive areas of the market and to US Treasuries.
Given signs of a strong economy, the US Federal Reserve raised interest rates four times during the fiscal year: in December 2017 and in March, June and September 2018.1 In contrast, the Euro-pean Central Bank and central banks in several other countries maintained extraordinarily accommodative monetary policies.
Pipeline companies spent 2018 being whipsawed by a regulatory Federal Energy Regulatory Commission (FERC) ruling with respect to tax allowance cost recovery in the rates that pipelines can charge. FERC’s March 2018 ruling negatively affected sentiment toward Master Limited Partnership (MLPs), but FERC’s July 2018 revision to the ruling caused MLPs to rally. Overall, MLPs underper-formed broad market equities, which were driven by the information technology, health care and consumer discretionary sectors during the fiscal year.
The Fund outperformed its style-spe-cific benchmark, the Alerian MLP Index, during the fiscal year due to a combination of security selection and market allocation. Specifically, security selection and an overweight exposure to the pipelines and midstream diversified segment benefited relative Fund returns. Stock selection in natural gas pipelines & storage and gathering & processing MLPs were key contributors to the Fund’s relative outperformance. Underweight exposure to natural gas pipelines & storage and oilfield services was also beneficial to relative returns. Conversely, security selection in refined products pipelines & terminals and an underweight exposure to upstream MLPs were primary detractors from relative performance.
Individual contributors to the Fund’s absolute performance during the fiscal year included Williams Partners and Enterprise Products Partners. The March FERC ruling prompted a handful of pipeline companies to consolidate back into their parent company. The
reorganization of Williams Partners with The Williams Companies was viewed favorably, though FERC ended up reversing some of the adverse consequences for MLPs in its final ruling in July 2018. We exited our position in Williams Partners before the close of the fiscal year.
Enterprise Products Partners announced increases to its quarterly dividend in each quarter of the fiscal year. Enterprise also announced plans to develop an offshore Texas crude export terminal, as well as expand liquefied petroleum gas (LPG) capacity and add vessel fueling capabilities at its Houston Ship Channel terminal. Further, the company produced record earnings results in 2017 and in the first three quarters of 2018.
Individual detractors from the Fund’s absolute performance during the fiscal year included Buckeye Partners and Enbridge Energy Partners, which was reorganized during the fiscal year. Shares of Buckeye fell following a Moody’s Investors Services rating downgrade from stable to negative. Enbridge Energy Partners was negatively impacted by the March FERC ruling and accepted its parent company offer to reorganize during the fiscal year. We exited our position in Enbridge Energy Partners before the close of the fiscal year.
During the fiscal year, the Fund held overweight positions relative to its style-specific benchmark in the following MLP sectors: pipelines & midstream diversified and gathering & processing MLPs. The Fund held underweight positions in the following MLP sectors: natural gas pipelines & storage, upstream and refined products pipelines & terminals. The Fund lacked exposure to coal MLPs and propane MLPs; areas where the style-specific benchmark had minor exposure.
Following the FERC rulings, we believed the degree of cash flow impact on specific pipeline companies would vary depending on their underlying asset exposure and existing contract structure. The July FERC final ruling delivered clarity for the MLP industry that we believed would help investors refocus on company fundamentals. We sought to focus on companies with minimal exposure to the FERC ruling, as well as companies whose stock may have suffered from overreaction to the March ruling. The market’s response to the FERC ruling underscores our belief that active management remains a critical aspect of MLP investing.
In general, we believed OPEC’s agreement to limit crude oil production to be beneficial for US production growth throughout 2017 and into 2018. Further, we believed the presidential
administration’s focus on reducing overall regulation could benefit certain midstream energy companies in the process of receiving specific approvals for new projects. Additionally, we viewed the lifting of the US crude oil export ban as being instrumental for continued US midstream infrastructure buildout, which would also be beneficial for midstream services companies that tend to be influenced more by the volume, rather than the price, of energy.
We believed that the Permian and Marcellus basins remained the strongest basins with drilling economics that were relatively attractive and had production volumes insulated from downward pressure. Expectations for dividend growth among companies focused on refined products, natural gas liquid pipelines and fractionation remain positive given the contractual nature of existing cash flows, combined with a still-healthy project backlog. In general, the Fund remained focused on companies that exhibit a relatively high fee-based cash flow, have access to a growing asset base through both organic capital expenditures and acquisitions, and operate in what we view to be the most attractive natural resource basins in the US.
As always, we thank you for your investment in Invesco MLP Fund.
1 Source: US Federal Reserve
The views and opinions expressed in management’s discussion of Fund performance are those of Invesco Advisers, Inc. These views and opinions are subject to change at any time based on factors such as market and economic conditions. These views and opinions may not be relied upon as investment advice or recommendations, or as an offer for a particular security. The information is not a complete analysis of every aspect of any market, country, industry, security or the Fund. Statements of fact are from sources considered reliable, but Invesco Advisers, Inc. makes no representation or warranty as to their completeness or accuracy. Although historical performance is no guarantee of future results, these insights may help you understand our investment management philosophy.
See important Fund and, if applicable, index disclosures later in this report.
| | |
 | | Joe Rodriguez, Jr. Portfolio Manager, is lead manager of Invesco MLP Fund. He is Head of Global Securities with Invesco Real Estate, |
| where he oversees all phases of the unit, including securities research and administration. Mr. Rodriguez joined Invesco in 1990. He earned a BBA in economics and finance and an MBA in finance from Baylor University. |
| | |
 | | Darin Turner Portfolio Manager, is lead manager of Invesco MLP Fund. He joined Invesco in 2005. Mr. Turner earned a BBA in finance from Baylor |
| University, an MS in real estate from The University of Texas at Arlington and an MBA specializing in investments from Southern Methodist University. |
| |
 | | Mark Blackburn Chartered Financial Analyst, Portfolio Manager, is manager of Invesco MLP Fund. He joined Invesco in 1998. Mr. Blackburn earned |
| a BS in accounting from Louisiana State University and an MBA from Southern Methodist University. He is also a Certified Public Accountant. |
| |
 | | James Cowen Portfolio Manager, is manager of Invesco MLP Fund. He joined Invesco in 2001. Mr. Cowen earned a Master of Town and |
| Country Planning degree from the University of Manchester and a Master of Philosophy degree in land economy from Cambridge University. |
| |
 | | Paul Curbo Chartered Financial Analyst, Portfolio Manager, is manager of Invesco MLP Fund. He joined Invesco in 1998. Mr. Curbo earned a |
| BBA in finance from The University of Texas at Austin. |
| |
 | | Grant Jackson Chartered Financial Analyst, Portfolio Manager, is manager of Invesco MLP Fund. He joined Invesco in 2005. Mr. Jackson earned |
| his BS degree in mechanical engineering from The University of Texas at Austin and his MBA from Southern Methodist University’s Cox School of Business. |
| |
 | | Ping-Ying Wang Chartered Financial Analyst, Portfolio Manager, is manager of Invesco MLP Fund. She joined Invesco in 1998. Ms. Wang earned a |
| BS in international finance from the People’s University of China and a PhD in finance from The University of Texas at Dallas. |
5 Invesco MLP Fund
Your Fund’s Long-Term Performance
Results of a $10,000 Investment – Oldest Share Class(es) since Inception
Fund and index data from 8/29/14
1 Source: FactSet Research Systems Inc.
2 Source: Lipper Inc.
Past performance cannot guarantee comparable future results.
The data shown in the chart include reinvested distributions, applicable sales charges and Fund expenses including management fees. Index results include reinvested dividends, but they do not reflect sales charges. Performance of the
peer group, if applicable, reflects fund expenses and management fees; performance of a market index does not. Performance shown in the chart and table(s) does not reflect deduction of taxes a shareholder would pay on Fund distributions or sale of Fund shares.
| | | | |
Average Annual Total Returns | |
As of 10/31/18, including maximum applicable sales charges | |
| |
Class A Shares | | | | |
Inception (8/29/14) | | | -10.73 | % |
1 Year | | | -2.28 | |
| |
Class C Shares | | | | |
Inception (8/29/14) | | | -10.23 | % |
1 Year | | | 1.49 | |
| |
Class R Shares | | | | |
Inception (8/29/14) | | | -9.74 | % |
1 Year | | | 3.18 | |
| |
Class Y Shares | | | | |
Inception (8/29/14) | | | -9.29 | % |
1 Year | | | 3.52 | |
| |
Class R5 Shares | | | | |
Inception (8/29/14) | | | -9.29 | % |
1 Year | | | 3.71 | |
| |
Class R6 Shares | | | | |
Inception (8/29/14) | | | -9.29 | % |
1 Year | | | 3.71 | |
The performance data quoted represent past performance and cannot guarantee comparable future results; current performance may be lower or higher. Please visit invesco.com/performance for the most recent month-end performance. Performance figures reflect reinvested distributions, changes in net asset value and the effect of the maximum sales charge unless otherwise stated. Investment return and principal value will fluctuate so that you may have a gain or loss when you sell shares.
The net annual Fund operating expense ratio set forth in the most recent Fund prospectus as of the date of this report for Class A, Class C, Class R, Class Y, Class R5 and Class R6 shares was 2.10%, 2.85%, 2.35%, 1.85%, 1.85% and 1.85%, respectively.1 The total annual Fund operating expense ratio set forth in the most recent Fund prospectus as of the date of this report for Class A, Class C, Class R, Class Y, Class R5 and Class R6 shares was 5.70%, 6.45%, 5.95%, 5.45%, 5.37% and 5.37%, respectively. The expense ratios presented above may vary from the expense ratios presented in other sections of this report that are based on expenses incurred during the period covered by this report.
Class A share performance reflects the maximum 5.50% sales charge, and Class C share performance reflects the applicable contingent deferred sales
| | | | |
Average Annual Total Returns | |
As of 9/30/18, the most recent calendar quarter end, including maximum applicable sales charges | |
| |
Class A Shares | | | | |
Inception (8/29/14) | | | -8.97 | % |
1 Year | | | 2.45 | |
| |
Class C Shares | | | | |
Inception (8/29/14) | | | -8.44 | % |
1 Year | | | 6.38 | |
| |
Class R Shares | | | | |
Inception (8/29/14) | | | -7.97 | % |
1 Year | | | 7.92 | |
| |
Class Y Shares | | | | |
Inception (8/29/14) | | | -7.51 | % |
1 Year | | | 8.48 | |
| |
Class R5 Shares | | | | |
Inception (8/29/14) | | | -7.51 | % |
1 Year | | | 8.48 | |
| |
Class R6 Shares | | | | |
Inception (8/29/14) | | | -7.51 | % |
1 Year | | | 8.48 | |
charge (CDSC) for the period involved. The CDSC on Class C shares is 1% for the first year after purchase. Class R, Class Y, Class R5 and Class R6 class shares do not have a front-end sales charge or a CDSC; therefore, performance is at net asset value.
The performance of the Fund’s share classes will differ primarily due to different sales charge structures and class expenses.
Fund performance reflects any applicable fee waivers and/or expense reimbursements. Had the adviser not waived fees and/or reimbursed expenses currently or in the past, returns would have been lower. See current prospectus for more information.
| 1 | Total annual Fund operating expenses after any contractual fee waivers and/or expense reimbursements by the adviser in effect through at least February 29, 2020. See current prospectus for more information. |
7 Invesco MLP Fund
Invesco MLP Fund’s investment objective is capital appreciation and, secondarily, income.
| ∎ | | Unless otherwise stated, information presented in this report is as of October 31, 2018, and is based on total net assets. |
| ∎ | | Unless otherwise noted, all data provided by Invesco. |
| ∎ | | To access your Fund’s reports/prospectus, visit invesco.com/fundreports. |
About share classes
| ∎ | | Class R shares are generally available only to employer sponsored retirement and benefit plans. Please see the prospectus for more information. |
| ∎ | | Class Y shares are available only to certain investors. Please see the prospectus for more information. |
| ∎ | | Class R5 shares and Class R6 shares are available for use by retirement plans that meet certain standards and for institutional investors. Class R6 shares are also available through intermediaries that have established an agreement with Invesco Distributors, Inc. to make such shares available for use in retail omnibus accounts. Please see the prospectus for more information. |
Principal risks of investing in the Fund
| ∎ | | Deferred tax risk. The Fund is classified for federal tax purposes as a taxable regular corporation or so-called Subchapter “C” corporation. As a “C” corporation, the Fund is subject to US federal income tax on its taxable income at the applicable corporate income tax rate, as well as state and local income taxes. The Fund will not benefit from the current favorable federal income tax rates on long-term capital gains and Fund income, losses and expenses will not be passed through to the Fund’s shareholders. An investment strategy whereby a fund is taxed as a regular corporation, or “C” corporation, rather than as a regulated investment company for US federal income tax purposes, is a relatively recent strategy for open-end registered investment companies such as the Fund. This strategy involves complicated accounting, tax, net asset value (NAV) and share valuation aspects that would cause the Fund to differ significantly from most other open-end registered investment companies. |
| ∎ | | Energy infrastructure MLP risk. The Fund will concentrate its investments in the energy sector. Energy infrastructure |
| | MLPs are subject to a variety of industry specific risk factors, including reduced volumes of energy commodities available for transporting, processing, storing or distributing; changes in energy commodity prices; a sustained reduced demand for crude oil, natural gas and refined petroleum products; depletion of the natural gas reserves or other commodities if not replaced; natural disasters, extreme weather and environmental hazards; rising interest rates which could drive investors into other investment opportunities; environmental damage claims; and threats of attack by terrorists on energy assets. In addition, taxes, government regulation, international politics, price and supply fluctuations, volatile interest rates and energy conservation may cause difficulties for energy infrastructure MLPs. |
| ∎ | | Management risk. The Fund is actively managed and depends heavily on the Adviser’s judgment about markets, interest rates or the attractiveness, relative values, liquidity, or potential appreciation of particular investments made for the Fund’s portfolio. The Fund could experience losses if these judgments prove to be incorrect. Additionally, legislative, regulatory, or tax developments may adversely affect management of the Fund and, therefore, the ability of the Fund to achieve its investment objective. |
| ∎ | | Market risk. The market values of the Fund’s investments, and therefore the value of the Fund’s shares, will go up and down, sometimes rapidly or unpredictably. Market risk may affect a single issuer, industry or section of the economy, or it may affect the market as a whole. Individual stock prices tend to go up and down more dramatically than those of certain other types of investments, such as bonds. During a general downturn in the financial markets, multiple asset classes may decline in value. When markets perform well, there can be no assurance that specific investments held by the Fund will rise in value. |
This report must be accompanied or preceded by a currently effective Fund prospectus, which contains more complete information, including sales charges and expenses. Investors should read it carefully before investing.
NOT FDIC INSURED | MAY LOSE VALUE | NO BANK GUARANTEE
| ∎ | | MLP risk. The Fund invests principally in securities of MLPs, which are subject to the following risks: |
| | - | Limited partner risk. An MLP is a public limited partnership or limited liability company taxed as a partnership under the Internal Revenue Code of 1986, as amended (the Code). Although the characteristics of MLPs closely resemble a traditional limited partnership, a major difference is that MLPs may trade on a public exchange or in the over-the-counter market. The risks of investing in an MLP are similar to those of investing in a partnership, including more flexible governance structures, which could result in less protection for investors than investments in a corporation. Investors in an MLP normally would not be liable for the debts of the MLP beyond the amount that the investor has contributed but investors may not be shielded to the same extent that a shareholder of a corporation would be. In certain circumstances, creditors of an MLP would have the right to seek return of capital distributed to a limited partner, which right would continue after an investor sold its investment in the MLP. In addition, MLP distributions may be reduced by fees and other expenses incurred by the MLP. |
| | - | Liquidity risk. The ability to trade on a public exchange or in the over-the-counter market provides a certain amount of liquidity not found in many limited partnership investments. However, MLP interests may be less liquid than conventional publicly traded securities and, therefore, more difficult to trade at desirable times and/or prices. |
| | - | Interest rate risk. MLPs generally are considered interest-rate sensitive investments. During periods of interest rate volatility, these investments may not provide attractive returns. |
| | - | General partner risk. The holder of the general partner or managing member interest can be liable in certain circumstances for amounts greater than the amount of the holder’s investment in the general partner or managing member. |
| ∎ | | MLP tax risk. MLPs taxed as partnerships do not pay US federal income tax at the partnership level. A change in current tax law, or a change in the underlying business mix of a given MLP, however, could result in an MLP being classified as a corporation for US federal income tax purposes, which would have the effect of reducing the amount of cash available for distribution by the MLP and, as a result, could result in a reduction of the value of the Fund’s investment, and consequently your investment in the Fund and lower income. Each year, the Fund will send you an annual tax statement (Form 1099) to assist you in completing your federal, state and local tax returns. If an MLP in which the Fund invests amends its partnership tax return, the Fund will, when necessary, send you a corrected Form 1099, which could, in turn, require you to amend your federal, state or local tax returns. |
| ∎ | | Non-diversification risk. The Fund is non-diversified and can invest a greater portion of its assets in the obligations or securities of a small number of issuers or any single issuer than a diversified fund can. A change in the value of one or a few issuers’ securities will therefore affect the value of the Fund more than if it was a diversified fund. |
| ∎ | | Small- and mid-capitalization companies risks. Small- and mid-capitalization companies tend to be more vulnerable to changing market conditions, may have little or no operating history or track record of success, and may have more limited product lines and markets, less experienced management and fewer financial resources than larger companies. These companies’ securities may be more volatile and less liquid than those of more established companies, and their returns may vary, sometimes significantly, from the overall securities market. |
About indexes used in this report
| ∎ | | The S&P 500® Index is an unmanaged index considered representative of the US stock market. |
| ∎ | | The Alerian MLP Index is designed to capture the performance of energy master limited partnerships (MLPs). |
| ∎ | | The Lipper Energy MLP Funds Index is an unmanaged index considered representative of energy MLP funds tracked by Lipper. |
| ∎ | | The Fund is not managed to track the performance of any particular index, including the index(es) described here, and consequently, the performance of the Fund may deviate significantly from the performance of the index(es). |
| ∎ | | A direct investment cannot be made in an index. Unless otherwise indicated, index results include reinvested dividends, and they do not reflect sales charges. Performance of the peer group, if applicable, reflects fund expenses; performance of a market index does not. |
Other information
| ∎ | | CPA® and Certified Public Accountant® are trademarks owned by the American Institute of Certified Public Accountants. |
| ∎ | | The returns shown in management’s discussion of Fund performance are based on net asset values (NAVs) calculated for shareholder transactions. Generally accepted accounting principles require adjustments to be made to the net assets of the Fund at period end for financial reporting purposes, and as such, the NAVs for shareholder transactions and the returns based on those NAVs may differ from the NAVs and returns reported in the Financial Highlights. |
| ∎ | | Sector classifications used in this report are generally according to the Energy MLP Classification Standard, which was developed by and is the exclusive property and a service mark of Alerian. |
Schedule of Investments(a)
October 31, 2018
| | | | | | | | |
| | | Units | | | Value | |
Master Limited Partnerships–92.05% | |
| Gathering & Processing (MLP)–16.97% | |
Antero Midstream Partners L.P. | | | 7,736 | | | $ | 233,240 | |
Crestwood Equity Partners L.P.(b) | | | 3,062 | | | | 103,220 | |
DCP Midstream, L.P. | | | 11,473 | | | | 412,913 | |
Enable Midstream Partners, L.P. | | | 4,146 | | | | 61,237 | |
EnLink Midstream Partners, L.P. | | | 28,322 | | | | 429,362 | |
EQM Midstream Partners, L.P. | | | 3,668 | | | | 168,398 | |
Hess Midstream Partners L.P.(b) | | | 2,611 | | | | 58,695 | |
Noble Midstream Partners L.P. | | | 2,857 | | | | 97,538 | |
Western Gas Partners, L.P. | | | 8,337 | | | | 329,812 | |
| | | | | | | | 1,894,415 | |
|
| General Partner (MLP)–14.88% | |
Energy Transfer L.P. | | | 106,879 | | | | 1,660,900 | |
|
| Natural Gas Pipelines & Storage (MLP)–4.90% | |
Cheniere Energy Partners, L.P. | | | 3,096 | | | | 104,242 | |
Dominion Energy Midstream Partners, L.P. | | | 15,132 | | | | 274,192 | |
TC Pipelines, L.P. | | | 5,490 | | | | 168,818 | |
| | | | | | | | 547,252 | |
|
| Pipelines & Midstream Diversified–23.36% | |
Enterprise Products Partners, L.P. | | | 57,388 | | | | 1,539,146 | |
Plains All American Pipeline, L.P. | | | 49,044 | | | | 1,067,688 | |
| | | | | | | | 2,606,834 | |
|
| Refined Products Pipelines & Terminals–28.35% | |
Andeavor Logistics L.P. | | | 7,832 | | | | 313,750 | |
Buckeye Partners, L.P. | | | 6,650 | | | | 218,187 | |
Genesis Energy, L.P. | | | 7,194 | | | | 159,059 | |
Magellan Midstream Partners, L.P. | | | 16,649 | | | | 1,026,910 | |
MPLX L.P. | | | 27,027 | | | | 908,377 | |
NuStar Energy L.P. | | | 12,720 | | | | 301,337 | |
Phillips 66 Partners L.P. | | | 3,723 | | | | 182,092 | |
Valero Energy Partners L.P. | | | 1,298 | | | | 54,490 | |
| | | | | | | | 3,164,202 | |
| | | | | | | | |
| | | Units | | | Value | |
| Refinery Logistics–1.84% | |
Shell Midstream Partners, L.P. | | | 10,014 | | | $ | 204,686 | |
|
| Upstream–1.75% | |
Viper Energy Partners L.P. | | | 5,445 | | | | 195,802 | |
Total Master Limited Partnerships
(Cost $10,623,823) | | | | 10,274,091 | |
| | |
| | | Shares | | | | |
Common Stocks &–10.56% | |
| Gathering & Processing–2.73% | | | | | | | | |
Targa Resources Corp. | | | 5,901 | | | | 304,905 | |
|
| General Partner (C-Corp.)–2.07% | |
ONEOK, Inc. | | | 3,516 | | | | 230,650 | |
|
| Global Infrastructure–2.56% | |
Cheniere Energy, Inc.(b) | | | 4,728 | | | | 285,618 | |
|
| Natural Gas Pipelines & Storage–3.20% | |
Tallgrass Energy, L.P. | | | 16,407 | | | | 357,016 | |
Total Common Stocks
(Cost $1,217,853) | | | | | | | 1,178,189 | |
|
Money Market Funds–0.97% | |
Invesco Government & Agency Portfolio–Institutional Class, 2.08%(c) | | | 37,754 | | | | 37,754 | |
Invesco Liquid Assets Portfolio–Institutional Class, 2.27%(c) | | | 26,962 | | | | 26,967 | |
Invesco Treasury Portfolio–Institutional Class,
2.09%(c) | | | 43,147 | | | | 43,147 | |
Total Money Market Funds
(Cost $107,868) | | | | 107,868 | |
TOTAL INVESTMENTS IN SECURITIES–103.58%
(Cost $11,949,544) | | | | 11,560,148 | |
OTHER ASSETS LESS LIABILITIES–(3.58)% | | | | (399,154 | ) |
NET ASSETS–100.00% | | | $ | 11,160,994 | |
Notes to Schedule of Investments:
| (a) | Sector classifications used in this report are generally accordingly to the Energy MLP Classification Standard, which was developed by and is the exclusive property and service mark of Alerian. |
| (b) | Non-income producing security. |
| (c) | The money market fund and the Fund are affiliated by having the same investment adviser. The rate shown is the 7-day SEC standardized yield as of October 31, 2018. |
See accompanying Notes to Financial Statements which are an integral part of the financial statements.
10 Invesco MLP Fund
Statement of Assets and Liabilities
October 31, 2018
| | | | |
Assets: | | | | |
Investments in securities, at value (Cost $11,841,676) | | $ | 11,452,280 | |
Investments in affiliated money market funds, at value and cost | | | 107,868 | |
Receivable for: | | | | |
Fund shares sold | | | 9,519 | |
Dividends | | | 80,168 | |
Fund expenses absorbed | | | 140,653 | |
Deferred tax asset, net | | | 0 | |
Other assets | | | 48,662 | |
Total assets | | | 11,839,150 | |
| |
Liabilities: | | | | |
Payable for: | | | | |
Fund shares reacquired | | | 420,632 | |
Accrued fees to affiliates | | | 12,842 | |
Accrued trustees’ and officers’ fees and benefits | | | 1,640 | |
Accrued other operating expenses | | | 243,042 | |
Total liabilities | | | 678,156 | |
Net assets applicable to shares outstanding | | $ | 11,160,994 | |
| |
Net assets consist of: | | | | |
Shares of beneficial interest | | $ | 15,109,631 | |
Distributable earnings, net of taxes | | | (3,948,637 | ) |
| | | $ | 11,160,994 | |
| | | | |
Net Assets: | | | | |
Class A | | $ | 4,096,932 | |
Class C | | $ | 1,390,692 | |
Class R | | $ | 443,215 | |
Class Y | | $ | 5,219,483 | |
Class R5 | | $ | 5,336 | |
Class R6 | | $ | 5,336 | |
|
Shares outstanding, no par value,
with an unlimited number of shares authorized: | |
Class A | | | 768,261 | |
Class C | | | 261,149 | |
Class R | | | 83,161 | |
Class Y | | | 978,980 | |
Class R5 | | | 1,001 | |
Class R6 | | | 1,001 | |
Class A: | | | | |
Net asset value per share | | $ | 5.33 | |
Maximum offering price per share | | | | |
(Net asset value of $5.33 ¸ 94.50%) | | $ | 5.64 | |
Class C: | | | | |
Net asset value and offering price per share | | $ | 5.33 | |
Class R: | | | | |
Net asset value and offering price per share | | $ | 5.33 | |
Class Y: | | | | |
Net asset value and offering price per share | | $ | 5.33 | |
Class R5: | | | | |
Net asset value and offering price per share | | $ | 5.33 | |
Class R6: | | | | |
Net asset value and offering price per share | | $ | 5.33 | |
See accompanying Notes to Financial Statements which are an integral part of the financial statements.
11 Invesco MLP Fund
Statement of Operations
For the year ended October 31, 2018
| | | | |
Investment income: | | | | |
Dividends (net of return of capital distributions of $802,570) | | $ | 38,960 | |
Dividends from affiliated money market funds | | | 2,669 | |
Total investment income | | | 41,629 | |
| |
Expenses: | | | | |
Advisory fees | | | 115,891 | |
Administrative services fees | | | 50,000 | |
Custodian fees | | | 5,205 | |
Distribution fees: | | | | |
Class A | | | 11,292 | |
Class C | | | 11,955 | |
Class R | | | 2,076 | |
Transfer agent fees — A, C, R and Y | | | 19,603 | |
Transfer agent fees — R5 | | | 6 | |
Transfer agent fees — R6 | | | 6 | |
Trustees’ and officers’ fees and benefits | | | 20,686 | |
Registration and filing fees | | | 80,813 | |
Reports to shareholders | | | 14,107 | |
Professional services fees | | | 227,073 | |
Other | | | 16,852 | |
Total expenses, before waivers and taxes | | | 575,565 | |
Less: Fees waived, expenses reimbursed and expense offset arrangement(s) | | | (430,390 | ) |
Net expenses, before taxes | | | 145,175 | |
Net investment income (loss), before taxes | | | (103,546 | ) |
Net tax expense | | | (12,184 | ) |
Net investment income (loss), net of taxes | | | (115,730 | ) |
| |
Realized and unrealized gain from: | | | | |
Net realized gain from: | | | | |
Investment securities | | | 132,277 | |
Net tax expense | | | 0 | |
Net realized gain, net of taxes | | | 132,277 | |
Change in net unrealized appreciation of: | | | | |
Investment securities | | | 261,179 | |
Net tax expense | | | 0 | |
Net change in net unrealized appreciation of investment securities, net of taxes | | | 261,179 | |
Net realized and unrealized gain, net of taxes | | | 393,456 | |
Net increase in net assets resulting from operations | | $ | 277,726 | |
See accompanying Notes to Financial Statements which are an integral part of the financial statements.
12 �� Invesco MLP Fund
Statement of Changes in Net Assets
For the years ended October 31, 2018 and 2017
| | | | | | | | |
| | | 2018 | | | 2017 | |
Operations: | | | | | | | | |
Net investment income (loss), net of taxes | | $ | (115,730 | ) | | $ | (101,821 | ) |
Net realized gain, net of taxes | | | 132,277 | | | | 282,901 | |
Change in net unrealized appreciation (depreciation), net of taxes | | | 261,179 | | | | (882,581 | ) |
Net increase (decrease) in net assets resulting from operations | | | 277,726 | | | | (701,501 | ) |
| | |
Return of Capital: | | | | | | | | |
Class A | | | (255,736 | ) | | | (241,759 | ) |
Class C | | | (58,447 | ) | | | (55,987 | ) |
Class R | | | (22,183 | ) | | | (14,486 | ) |
Class Y | | | (322,823 | ) | | | (273,122 | ) |
Class R5 | | | (336 | ) | | | (344 | ) |
Class R6 | | | (336 | ) | | | (344 | ) |
Total return of capital | | | (659,861 | ) | | | (586,042 | ) |
| | |
Share transactions–net: | | | | | | | | |
Class A | | | 671,753 | | | | 23,111 | |
Class C | | | 376,989 | | | | (55,702 | ) |
Class R | | | 108,397 | | | | 139,522 | |
Class Y | | | 410,086 | | | | 2,025,103 | |
Net increase in net assets resulting from share transactions | | | 1,567,225 | | | | 2,132,034 | |
Net increase in net assets | | | 1,185,090 | | | | 844,491 | |
| | |
Net assets: | | | | | | | | |
Beginning of year | | | 9,975,904 | | | | 9,131,413 | |
End of year | | $ | 11,160,994 | | | $ | 9,975,904 | |
Notes to Financial Statements
October 31, 2018
NOTE 1—Significant Accounting Policies
Invesco MLP Fund (the “Fund”) is a series portfolio of AIM Investment Funds (Invesco Investment Funds) (the “Trust”). The Trust is organized as a Delaware statutory trust and is registered under the Investment Company Act of 1940, as amended (the “1940 Act”), as an open-end series management investment company authorized to issue an unlimited number of shares of beneficial interest. Information presented in these financial statements pertains only to the Fund. Matters affecting the Fund or each class will be voted on exclusively by the shareholders of the Fund or each class.
The Fund’s investment objective is capital appreciation and, secondarily, income.
The Fund currently consists of six different classes of shares: Class A, Class C, Class R, Class Y, Class R5 and Class R6. Class Y shares are available only to certain investors. Class A shares are sold with a front-end sales charge unless certain waiver criteria are met. Under certain circumstances, load waived shares may be subject to contingent deferred sales charges (“CDSC”). Class C shares are sold with a CDSC. Class R, Class Y, Class R5 and Class R6 shares are sold at net asset value.
The Fund is an investment company and accordingly follows the investment company accounting and reporting guidance in accordance with Financial Accounting Standards Board Accounting Standards Codification Topic 946, Financial Services — Investment Companies.
The following is a summary of the significant accounting policies followed by the Fund in the preparation of its financial statements.
| A. | Security Valuations — Securities, including restricted securities, are valued according to the following policy. |
A security listed or traded on an exchange (except convertible securities) is valued at its last sales price or official closing price as of the close of the customary trading session on the exchange where the security is principally traded, or lacking any sales or official closing price on a particular day, the security may be valued at the closing bid price on that day. Securities traded in the over-the-counter market are valued based on prices furnished by independent pricing services or market makers. When such securities are valued by an independent pricing service they may be considered fair valued. Futures contracts are valued at the final settlement price set by an exchange on which they are principally traded. Listed options are valued at the mean between the last bid and asked prices from the exchange on which they are principally traded. Options not listed on an exchange are valued by an independent source at the mean between the last bid and asked prices. For purposes of determining net asset value (“NAV”) per share, futures and option contracts generally are valued 15 minutes after the close of the customary trading session of the New York Stock Exchange (“NYSE”).
13 Invesco MLP Fund
Investments in open-end and closed-end registered investment companies that do not trade on an exchange are valued at the end-of-day net asset value per share. Investments in open-end and closed-end registered investment companies that trade on an exchange are valued at the last sales price or official closing price as of the close of the customary trading session on the exchange where the security is principally traded.
Debt obligations (including convertible securities) and unlisted equities are fair valued using an evaluated quote provided by an independent pricing service. Evaluated quotes provided by the pricing service may be determined without exclusive reliance on quoted prices, and may reflect appropriate factors such as institution-size trading in similar groups of securities, developments related to specific securities, dividend rate (for unlisted equities), yield (for debt obligations), quality, type of issue, coupon rate (for debt obligations), maturity (for debt obligations), individual trading characteristics and other market data. Pricing services generally value debt obligations assuming orderly transactions of institutional round lot size, but a fund may hold or transact in the same securities in smaller, odd lot sizes. Odd lots often trade at lower prices than institutional round lots. Debt obligations are subject to interest rate and credit risks. In addition, all debt obligations involve some risk of default with respect to interest and/or principal payments.
Foreign securities’ (including foreign exchange contracts) prices are converted into U.S. dollar amounts using the applicable exchange rates as of the close of the NYSE. If market quotations are available and reliable for foreign exchange-traded equity securities, the securities will be valued at the market quotations. Because trading hours for certain foreign securities end before the close of the NYSE, closing market quotations may become unreliable. If between the time trading ends on a particular security and the close of the customary trading session on the NYSE, events occur that the investment adviser determines are significant and make the closing price unreliable, the Fund may fair value the security. If the event is likely to have affected the closing price of the security, the security will be valued at fair value in good faith using procedures approved by the Board of Trustees. Adjustments to closing prices to reflect fair value may also be based on a screening process of an independent pricing service to indicate the degree of certainty, based on historical data, that the closing price in the principal market where a foreign security trades is not the current value as of the close of the NYSE. Foreign securities’ prices meeting the approved degree of certainty that the price is not reflective of current value will be priced at the indication of fair value from the independent pricing service. Multiple factors may be considered by the independent pricing service in determining adjustments to reflect fair value and may include information relating to sector indices, American Depositary Receipts and domestic and foreign index futures. Foreign securities may have additional risks including exchange rate changes, potential for sharply devalued currencies and high inflation, political and economic upheaval, the relative lack of issuer information, relatively low market liquidity and the potential lack of strict financial and accounting controls and standards.
Securities for which market prices are not provided by any of the above methods may be valued based upon quotes furnished by independent sources. The last bid price may be used to value equity securities. The mean between the last bid and asked prices is used to value debt obligations, including corporate loans.
Securities for which market quotations are not readily available or became unreliable are valued at fair value as determined in good faith by or under the supervision of the Trust’s officers following procedures approved by the Board of Trustees. Issuer specific events, market trends, bid/asked quotes of brokers and information providers and other market data may be reviewed in the course of making a good faith determination of a security’s fair value.
The Fund may invest in securities that are subject to interest rate risk, meaning the risk that the prices will generally fall as interest rates rise and, conversely, the prices will generally rise as interest rates fall. Specific securities differ in their sensitivity to changes in interest rates depending on their individual characteristics. Changes in interest rates may result in increased market volatility, which may affect the value and/or liquidity of certain Fund investments.
Valuations change in response to many factors including the historical and prospective earnings of the issuer, the value of the issuer’s assets, general economic conditions, interest rates, investor perceptions and market liquidity. Because of the inherent uncertainties of valuation, the values reflected in the financial statements may materially differ from the value received upon actual sale of those investments.
| B. | Securities Transactions and Investment Income — Securities transactions are accounted for on a trade date basis. Realized gains or losses on sales are computed on the basis of specific identification of the securities sold. Interest income (net of withholding tax, if any) is recorded on the accrual basis from settlement date. Dividend income (net of withholding tax, if any) is recorded on the ex-dividend date. |
The Fund may periodically participate in litigation related to Fund investments. As such, the Fund may receive proceeds from litigation settlements. Any proceeds received are included in the Statement of Operations as realized gain (loss) for investments no longer held and as unrealized gain (loss) for investments still held.
Brokerage commissions and mark ups are considered transaction costs and are recorded as an increase to the cost basis of securities purchased and/or a reduction of proceeds on a sale of securities. Such transaction costs are included in the determination of net realized and unrealized gain (loss) from investment securities reported in the Statement of Operations and the Statement of Changes in Net Assets and the net realized and unrealized gains (losses) on securities per share in the Financial Highlights. Transaction costs are included in the calculation of the Fund’s net asset value and, accordingly, they reduce the Fund’s total returns. These transaction costs are not considered operating expenses and are not reflected in net investment income reported in the Statement of Operations and the Statement of Changes in Net Assets, or the net investment income per share and the ratios of expenses and net investment income reported in the Financial Highlights, nor are they limited by any expense limitation arrangements between the Fund and the investment adviser.
The Fund allocates income and realized and unrealized capital gains and losses to a class based on the relative net assets of each class.
| C. | Country Determination — For the purposes of making investment selection decisions and presentation in the Schedule of Investments, the investment adviser may determine the country in which an issuer is located and/or credit risk exposure based on various factors. These factors include the laws of the country under which the issuer is organized, where the issuer maintains a principal office, the country in which the issuer derives 50% or more of its total revenues and the country that has the primary market for the issuer’s securities, as well as other criteria. Among the other criteria that may be evaluated for making this determination are the country in which the issuer maintains 50% or more of its assets, the type of security, financial guarantees and enhancements, the nature of the collateral and the sponsor organization. Country of issuer and/or credit risk exposure has been determined to be the United States of America, unless otherwise noted. |
| D. | Distributions — Distributions, if any, are declared and paid quarterly and are recorded on the ex-dividend date. The estimated characterization of the distribution paid will be either ordinary income or a return of capital. The actual tax character of a distribution made by the Fund will not be determined until after the Fund’s fiscal year end. It is anticipated that a significant portion of a distribution will be return of capital. |
14 Invesco MLP Fund
| E. | Master Limited Partnerships — The Fund primarily invests in Master Limited Partnerships (“MLPs”). MLPs are publicly traded partnerships and limited liability companies taxed as partnerships under the Internal Revenue Code of 1986, as amended (the “Internal Revenue Code”). The Fund principally invests in MLPs that derive their revenue primarily from businesses involved in the gathering, transporting, processing, treating, storing, refining, distributing, mining or marketing of natural gas, natural gas liquids, crude oil, refined products or coal (“energy infrastructure MLPs”). The Fund is a partner in each MLP; accordingly, the Fund is required to take into account the Fund’s allocable share of income, gains, losses, deductions, expenses, and tax credits recognized by each MLP. |
The Fund is non-diversified and will concentrate its investments in the energy sector. Energy infrastructure MLPs are subject to a variety of industry specific risk factors that may adversely affect their business or operations, including a decrease in production or reduced volumes of natural gas or other energy commodities available for transporting, processing, storing or distributing; changes in energy commodity prices; a sustained reduced demand for crude oil, natural gas and refined petroleum products; depletion of natural gas reserves or other commodities if not replaced; natural disasters, extreme weather and environmental hazards; rising interest rates, how facilities are constructed, maintained and operated, environmental and safety controls, and the prices they may charge for products and services. In addition, taxes, government regulation, international politics, price, and supply fluctuations, volatile interest rates and energy conservation may cause difficulties for energy infrastructure MLPs.
MLPs may be less liquid and subject to more abrupt or erratic price movements than conventional publicly traded securities.
| F. | Return of Capital — Distributions received from the Fund’s investments in MLPs generally are comprised of income and return of capital. The Fund records investment income and return of capital based on estimates made at the time such distributions are received. The return of capital portion of the distribution is a reduction to investment income that results in an equivalent reduction in the cost basis of the associated investments and increases net realized gains (losses) and change in unrealized appreciation (depreciation). Such estimates are based on historical information available from each MLP and other industry sources. These estimates will subsequently be revised and may materially differ primarily based on information received from the MLPs after their tax reporting periods are concluded. For the year ended October 31, 2018, the Fund estimated that 100% of the MLP distributions received would be treated as return of capital. |
| G. | Federal Income Taxes — The Fund does not intend to qualify as a regulated investment company pursuant to Subchapter M of the Internal Revenue Code. The Fund is treated as a regular corporation, or “C” corporation, for U.S. federal income tax purposes and generally is subject to U.S. federal income tax on its taxable income at the graduated rates applicable to corporations. In addition, as a regular corporation, the Fund may be subject to state and local taxes in jurisdictions in which the MLPs operate. The estimate state tax rate is based on a periodic analysis of the Fund’s holdings. The Fund may also be subject to a federal alternative minimum tax on its alternative minimum taxable income to the extent that the alternative minimum tax exceeds the Fund’s regular federal income tax liability. |
Taxes include current and deferred taxes. Current taxes reflect the estimated tax liability of the Fund as of a measurement date based on taxable income. Deferred taxes reflect estimates of (i) taxes on net unrealized gains (losses), which are attributable to the difference between fair market value and tax basis, (ii) the net tax effects of temporary differences between the carrying amounts of assets and liabilities for financial reporting purposes and the amounts used for tax purposes, and (iii) the net tax benefit of accumulated net operating losses, capital loss carryforwards and other tax attributes.
The Fund’s deferred tax asset (“DTA”) and/or liability balances are estimated using estimates of effective tax rates expected to apply to taxable income in the years such balances are realized. A DTA will be recognized for temporary book/tax differences, net of unrealized losses, and carryforwards (net operating losses, capital loss carryforward, or tax credits). To the extent the Fund has a DTA, the Fund will assess whether a valuation allowance is required to offset the value of a portion, or all, of the DTA. Prior year ordinary income or capital gains (carrybacks), unrealized net gains, future reversals of existing taxable timing differences, forecast of future profitability (based on historical evidence), potential tax planning strategies, unsettled circumstances, and other evidence will be used in determining the valuation allowance. The valuation allowance is reviewed periodically and the Fund may modify its estimates or assumptions regarding the net deferred tax asset or liability balances and any applicable valuation allowance.
The Fund recognizes interest and penalties associated with underpayment of federal and state income taxes, if any, in tax expense. The Fund recognizes the tax benefits of uncertain tax positions only when the position is more likely than not to be sustained. Management has analyzed the Fund’s uncertain tax positions and concluded that no liability for unrecognized tax benefits should be recorded related to uncertain tax positions. Management is not aware of any tax positions for which it is reasonably possible that the total amounts of unrecognized tax benefits will change materially in the next 12 months.
The Fund files tax returns in the U.S. Federal jurisdiction and certain other jurisdictions. Generally, the Fund is subject to examinations by such taxing authorities for up to three years after the filing of the return for the tax period.
| H. | Expenses — Fees provided for under the Rule 12b-1 plan of a particular class of the Fund are charged to the operations of such class. Transfer agency fees and expenses and other shareholder recordkeeping fees and expenses attributable to Class R5 and Class R6 are allocated to each share class based on relative net assets. Sub-accounting fees attributable to Class R5 are charged to the operations of the class. Transfer agency fees and expenses and other shareholder recordkeeping fees and expenses relating to all other classes are allocated among those classes based on relative net assets. All other expenses are allocated among the classes based on relative net assets. |
| I. | Accounting Estimates — The preparation of financial statements in conformity with accounting principles generally accepted in the United States of America (“GAAP”) requires management to make estimates and assumptions that affect the reported amounts of assets and liabilities at the date of the financial statements and the reported amounts of revenues and expenses during the reporting period including estimates and assumptions related to taxation. Actual results could differ from those estimates by a significant amount. In addition, the Fund monitors for material events or transactions that may occur or become known after the period-end date and before the date the financial statements are released to print. |
| J. | Indemnifications — Under the Trust’s organizational documents, each Trustee, officer, employee or other agent of the Trust is indemnified against certain liabilities that may arise out of the performance of their duties to the Fund. Additionally, in the normal course of business, the Fund enters into contracts, including the Fund’s servicing agreements, that contain a variety of indemnification clauses. The Fund’s maximum exposure under these arrangements is unknown as this would involve future claims that may be made against the Fund that have not yet occurred. The risk of material loss as a result of such indemnification claims is considered remote. |
15 Invesco MLP Fund
NOTE 2—Advisory Fees and Other Fees Paid to Affiliates
The Trust has entered into a master investment advisory agreement with Invesco Advisers, Inc. (the “Adviser” or “Invesco”). Under the terms of the investment advisory agreement, the Fund accrues daily and pays monthly an advisory fee to the Adviser based on the annual rate of the Fund’s average daily net assets as follows:
| | | | |
| Average Daily Net Assets | | Rate | |
First $1 billion | | | 1.00% | |
Next $1.5 billion | | | 0.95% | |
Next $2 billion | | | 0.93% | |
Next $3.5 billion | | | 0.91% | |
Over $8 billion | | | 0.90% | |
For the year ended October 31, 2018, the effective advisory fees incurred by the Fund was 1.00%.
Under the terms of a master sub-advisory agreement between the Adviser and each of Invesco Asset Management Deutschland GmbH, Invesco Asset Management Limited, Invesco Asset Management (Japan) Limited, Invesco Hong Kong Limited, Invesco Senior Secured Management, Inc. and Invesco Canada Ltd. and separate sub-advisory agreements with Invesco Capital Management LLC, formerly Invesco PowerShares Capital Management LLC, and Invesco Asset Management (India) Private Limited (collectively, the “Affiliated Sub-Advisers”) the Adviser, not the Fund, will pay 40% of the fees paid to the Adviser to any such Affiliated Sub-Adviser(s) that provide(s) discretionary investment management services to the Fund based on the percentage of assets allocated to such Affiliated Sub-Adviser(s).
The Adviser has contractually agreed, through at least February 29, 2020, to waive advisory fees and/or reimburse expenses of all shares to the extent necessary to limit total annual fund operating expenses after fee waiver and/or expense reimbursement (excluding certain items discussed below) of Class A, Class C, Class R, Class Y, Class R5 and Class R6 shares to 1.28%, 2.03%, 1.53%, 1.03%, 1.03% and 1.03%, respectively, of the Fund’s average daily net assets (the “expense limits”). In determining the Adviser’s obligation to waive advisory fees and/or reimburse expenses, the following expenses are not taken into account, and could cause the total annual fund operating expenses after fee waiver and/or expense reimbursement to exceed the numbers reflected above: (1) interest; (2) taxes; (3) dividend expense on short sales; (4) extraordinary or non-routine items, including litigation expenses; and (5) expenses that the Fund has incurred but did not actually pay because of an expense offset arrangement. Unless Invesco continues the fee waiver agreement, it will terminate on February 29, 2020. During its term, the fee waiver agreement cannot be terminated or amended to increase the expense limits or reduce the advisory fee waiver without approval of the Board of Trustees.
Further, the Adviser has contractually agreed, through at least June 30, 2020, to waive the advisory fee payable by the Fund in an amount equal to 100% of the net advisory fees the Adviser receives from the affiliated money market funds on investments by the Fund of uninvested cash in such affiliated money market funds.
For the year ended October 31, 2018, the Adviser waived advisory fees and reimbursed fund level expenses of $410,775 and reimbursed class level expenses of $7,517, $1,990, $691, $9,072, $6 and $6 of Class A, Class C, Class R, Class Y, Class R5 and Class R6 shares, respectively.
The Trust has entered into a master administrative services agreement with Invesco pursuant to which the Fund has agreed to pay Invesco for certain administrative costs incurred in providing accounting services to the Fund. For the year ended October 31, 2018, expenses incurred under the agreement are shown in the Statement of Operations as Administrative services fees.
The Trust has entered into a transfer agency and service agreement with Invesco Investment Services, Inc. (“IIS”) pursuant to which the Fund has agreed to pay IIS a fee for providing transfer agency and shareholder services to the Fund and reimburse IIS for certain expenses incurred by IIS in the course of providing such services. IIS may make payments to intermediaries that provide omnibus account services, sub-accounting services and/or networking services. All fees payable by IIS to intermediaries that provide omnibus account services or sub-accounting services are charged back to the Fund, subject to certain limitations approved by the Trust’s Board of Trustees. For the year ended October 31, 2018, expenses incurred under the agreement are shown in the Statement of Operations as Transfer agent fees.
The Trust has entered into master distribution agreements with Invesco Distributors, Inc. (“IDI”) to serve as the distributor for the Class A, Class C, Class R, Class Y, Class R5 and Class R6 shares of the Fund. The Trust has adopted plans pursuant to Rule 12b-1 under the 1940 Act with respect to the Fund’s Class A, Class C and Class R shares (collectively the “Plans”). The Fund, pursuant to the Plans, pays IDI compensation at the annual rate of 0.25% of the Fund’s average daily net assets of Class A shares, 1.00% of the average daily net assets of Class C shares and 0.50% of the average daily net assets of Class R shares. The fees are accrued daily and paid monthly. Of the Plan payments, up to 0.25% of the average daily net assets of each class of shares may be paid to furnish continuing personal shareholder services to customers who purchase and own shares of such classes. Any amounts not paid as a service fee under the Plans would constitute an asset-based sales charge. Rules of the Financial Industry Regulatory Authority (“FINRA”) impose a cap on the total sales charges, including asset-based sales charges, that may be paid by any class of shares of the Fund. For the year ended October 31, 2018, expenses incurred under the Plans are shown in the Statement of Operations as Distribution fees.
Front-end sales commissions and CDSC (collectively, the “sales charges”) are not recorded as expenses of the Fund. Front-end sales commissions are deducted from proceeds from the sales of Fund shares prior to investment in Class A shares of the Fund. CDSC are deducted from redemption proceeds prior to remittance to the shareholder. During the year ended October 31, 2018, IDI advised the Fund that IDI retained $2,942 in front-end sales commissions from the sale of Class A shares and $253 and $210 from Class A and Class C shares, respectively, for CDSC imposed upon redemptions by shareholders.
Certain officers and trustees of the Trust are officers and directors of the Adviser, IIS and/or IDI.
16 Invesco MLP Fund
NOTE 3—Additional Valuation Information
GAAP defines fair value as the price that would be received to sell an asset or paid to transfer a liability in an orderly transaction between market participants at the measurement date, under current market conditions. GAAP establishes a hierarchy that prioritizes the inputs to valuation methods, giving the highest priority to readily available unadjusted quoted prices in an active market for identical assets (Level 1) and the lowest priority to significant unobservable inputs (Level 3), generally when market prices are not readily available or are unreliable. Based on the valuation inputs, the securities or other investments are tiered into one of three levels. Changes in valuation methods may result in transfers in or out of an investment’s assigned level:
| | Level 1 — | Prices are determined using quoted prices in an active market for identical assets. |
| | Level 2 — | Prices are determined using other significant observable inputs. Observable inputs are inputs that other market participants may use in pricing a security. These may include quoted prices for similar securities, interest rates, prepayment speeds, credit risk, yield curves, loss severities, default rates, discount rates, volatilities and others. |
| | Level 3 — | Prices are determined using significant unobservable inputs. In situations where quoted prices or observable inputs are unavailable (for example, when there is little or no market activity for an investment at the end of the period), unobservable inputs may be used. Unobservable inputs reflect the Fund’s own assumptions about the factors market participants would use in determining fair value of the securities or instruments and would be based on the best available information. |
As of October 31, 2018, all of the securities in this Fund were valued based on Level 1 inputs (see the Schedule of Investments for security categories). The level assigned to the securities valuations may not be an indication of the risk or liquidity associated with investing in those securities. Because of the inherent uncertainties of valuation, the values reflected in the financial statements may materially differ from the value received upon actual sale of those investments.
NOTE 4—Expense Offset Arrangement(s)
The expense offset arrangement is comprised of transfer agency credits which result from balances in demand deposit accounts used by the transfer agent for clearing shareholder transactions. For the year ended October 31, 2018, the Fund received credits from this arrangement, which resulted in the reduction of the Fund’s total expenses of $333.
NOTE 5—Trustees’ and Officers’ Fees and Benefits
Trustees’ and Officers’ Fees and Benefits include amounts accrued by the Fund to pay remuneration to certain Trustees and Officers of the Fund.
NOTE 6—Cash Balances
The Fund is permitted to temporarily carry a negative or overdrawn balance in its account with State Street Bank and Trust Company, the custodian bank. Such balances, if any at period-end, are shown in the Statement of Assets and Liabilities under the payable caption Amount due custodian. To compensate the custodian bank for such overdrafts, the overdrawn Fund may either (1) leave funds as a compensating balance in the account so the custodian bank can be compensated by earning the additional interest; or (2) compensate by paying the custodian bank at a rate agreed upon by the custodian bank and Invesco, not to exceed the contractually agreed upon rate.
NOTE 7—Distributions to Shareholders and Tax Components of Net Assets
On December 22, 2017, the U.S. government enacted comprehensive tax legislation commonly referred to as the Tax Cuts and Jobs Act (the “Tax Act”). The Tax Act makes broad and complex changes to the U.S. tax code, including but not limited to (1) reducing the U.S. federal corporate income tax rate from 35 percent to 21 percent; (2) repealing the alternative minimum tax; and (3) changing rules related to use and limitations of net operating loss carryforwards created in tax years beginning after December 31, 2017.
At October 31, 2017, the Fund had a net U.S. deferred tax asset totaling $856,440. As a result of the reduction in the corporate income tax rate under the Tax Act, the Fund has revalued its net deferred tax asset. The Fund has recorded a decrease in the value of its net deferred tax asset by approximately $302,634, which has been offset by a valuation allowance for the year ended October 31, 2017. The Fund’s revaluation of its deferred tax asset is subject to further clarification of the Tax Act. As a result, the actual impact on the net deferred tax asset may vary from the initially recorded amount due to uncertainties in the Fund’s preliminary review.
The impact of the 2017 Tax Act is based upon our analysis and interpretations of currently available information. Uncertainties remain regarding the impact of the 2017 Tax Act due to future regulatory and rulemaking processes, prospects of additional corrective or supplemental legislation, and potential trade or litigation. These uncertainties, along with our completion of the calculations and potential changes in our initial assumptions as new information becomes available, could cause the actual charge to ultimately differ materially from the provisional amount recorded in 2017 related to the enactment of the 2017 Tax Act.
Total taxes have been computed by applying the federal statutory tax rate of 21% plus a blended state tax rate of 1.87% net of federal benefit. The Fund applied this rate to net investment income (loss) and realized and unrealized gains (losses) on investments before taxes in computing its total tax expense (benefit).
17 Invesco MLP Fund
The provision for taxes differs from the amount derived from applying the statutory tax rate to net investment income (loss) and realized and unrealized gains (losses) before taxes at period-end as follows:
| | | | | | | | |
Provision at statutory rates | | $ | 61,015 | | | | 21.00 | % |
State and other taxes, net of federal tax benefit | | | 5,237 | | | | 1.80 | |
Permanent differences, current period | | | (4,463 | ) | | | (1.54 | ) |
Valuation allowance | | | (357,925 | ) | | | (123.19 | ) |
Return to provision | | | (1,026 | ) | | | (0.35 | ) |
Provisional effect of rate change | | | 309,346 | | | | 106.47 | |
Total | | $ | 12,184 | | | | 4.19 | % |
Components of the Fund’s Net Deferred Tax Asset (Liability) at Period-End:
| | | | |
Deferred Tax Assets: | | | | |
Net operating loss carryforward | | $ | 61,095 | |
Capital loss carryforward | | | 462,009 | |
Unrealized gains on investment securities | | | — | |
Total Deferred Tax Assets | | | 523,104 | |
Valuation allowance | | | (498,514 | ) |
Deferred Tax Asset, Net | | $ | 24,590 | |
| |
Deferred Tax Liabilities: | | | | |
Unrealized gains (losses) on investment securities | | $ | (24,590 | ) |
Total Net Deferred Tax Asset (Liability) | | $ | 0 | |
The Fund has a capital loss carryforward as of October 31, 2018, of $2,020,464. Capital losses may be carried forward for 5 years and accordingly, would begin to expire as of October 31, 2019.
The Fund has a federal net operating loss carryforward as of October 31, 2018, of $267,253, which will be carried forward indefinitely until it is utilized, and a state net operating loss carryforward of $265,581 which will expire in various years.
At October 31, 2018, based on the net unrealized losses on the Fund’s investment securities, the Fund has recorded a valuation allowance to offset the DTA as the Fund has determined at October 31, 2018 based on historical evidence it is unlikely the DTA will be realized.
Tax Character of Distributions to Shareholders Paid During the Fiscal Years Ended October 31, 2018 and 2017:
| | | | | | | | |
| | | 2018 | | | 2017 | |
Return of capital | | $ | 659,861 | | | $ | 586,042 | |
NOTE 8—Investment Transactions
The aggregate amount of investment securities (other than short-term securities, U.S. Treasury obligations and money market funds, if any) purchased and sold by the Fund during the year ended October 31, 2018 was $12,869,470 and $10,883,203, respectively. Cost of investments, including any derivatives, on a tax basis includes the adjustments for financial reporting purposes as of the most recently completed federal income tax reporting period-end.
| | | | |
| Unrealized Appreciation (Depreciation) of Investments on a Tax Basis | |
Aggregate unrealized appreciation of investments | | $ | 146,921 | |
Aggregate unrealized (depreciation) of investments | | | (76,933 | ) |
Net unrealized appreciation of investments | | $ | 69,988 | |
Cost of investments for tax purposes is $11,490,160.
NOTE 9—Reclassification of Permanent Differences
Primarily as a result of differing book/tax treatment of dividends received on October 31, 2018, undistributed net investment income (loss) was decreased by $21,251 and shares of beneficial interest was increased by $21,251. This reclassification had no effect on the net assets of the Fund.
18 Invesco MLP Fund
NOTE 10—Share Information
| | | | | | | | | | | | | | | | |
| | | Summary of Share Activity | |
| | | Years ended October 31, | |
| | | 2018(a) | | | 2017 | |
| | | Shares | | | Amount | | | Shares | | | Amount | |
Sold: | | | | | | | | | | | | | | | | |
Class A | | | 529,504 | | | $ | 3,114,265 | | | | 296,058 | | | $ | 1,878,977 | |
Class C | | | 173,020 | | | | 998,685 | | | | 87,078 | | | | 549,317 | |
Class R | | | 24,579 | | | | 138,529 | | | | 29,368 | | | | 173,908 | |
Class Y | | | 225,310 | | | | 1,242,819 | | | | 640,024 | | | | 4,089,555 | |
| | | | |
Issued as reinvestment of dividends: | | | | | | | | | | | | | | | | |
Class A | | | 35,490 | | | | 195,954 | | | | 27,561 | | | | 166,884 | |
Class C | | | 10,034 | | | | 55,546 | | | | 7,831 | | | | 47,155 | |
Class R | | | 3,951 | | | | 21,875 | | | | 2,368 | | | | 14,173 | |
Class Y | | | 46,708 | | | | 258,103 | | | | 20,960 | | | | 126,518 | |
| | | | |
Reacquired: | | | | | | | | | | | | | | | | |
Class A | | | (459,066 | ) | | | (2,638,466 | ) | | | (329,385 | ) | | | (2,022,750 | ) |
Class C | | | (121,232 | ) | | | (677,242 | ) | | | (107,583 | ) | | | (652,174 | ) |
Class R | | | (8,938 | ) | | | (52,007 | ) | | | (7,876 | ) | | | (48,559 | ) |
Class Y(b) | | | (191,742 | ) | | | (1,090,836 | ) | | | (346,686 | ) | | | (2,190,970 | ) |
Net increase in share activity | | | 267,618 | | | $ | 1,567,225 | | | | 319,718 | | | $ | 2,132,034 | |
| (a) | There are entities that are record owners of more than 5% of the outstanding shares of the Fund and in the aggregate own 50% of the outstanding shares of the Fund. IDI has an agreement with these entities to sell Fund shares. The Fund, Invesco and/or Invesco affiliates may make payments to these entities, which are considered to be related to the Fund, for providing services to the Fund, Invesco and/or Invesco affiliates including but not limited to services such as securities brokerage, distribution, third party record keeping and account servicing. The Trust has no knowledge as to whether all or any portion of the shares owned of record by these entities are also owned beneficially. |
| | In addition, 14% of the outstanding shares of the Fund are owned by the Adviser or an affiliated of the Adviser. |
| (b) | On March 14, 2017, 175,247 Class Y shares valued at $1,140,858 were sold by the Adviser or an affiliate of the Adviser. |
19 Invesco MLP Fund
NOTE 11—Financial Highlights
The following schedule presents financial highlights for a share of the Fund outstanding throughout the periods indicated.
| | | | | | | | | | | | | | | | | | | | |
| | | Class A | |
| | | Years ended October 31, | |
| | | 2018 | | | 2017 | | | 2016 | | | 2015 | | | 2014(a) | |
Net asset value, beginning of period | | $ | 5.46 | | | $ | 6.06 | | | $ | 6.45 | | | $ | 9.35 | | | $ | 10.00 | |
Net investment income (loss)(b) | | | (0.06 | ) | | | (0.06 | ) | | | (0.07 | ) | | | (0.09 | ) | | | (0.01 | ) |
Net gains (losses) on securities (both realized and unrealized) | | | 0.25 | | | | (0.21 | ) | | | 0.02 | | | | (2.51 | ) | | | (0.64 | ) |
Total from investment operations | | | 0.19 | | | | (0.27 | ) | | | (0.05 | ) | | | (2.60 | ) | | | (0.65 | ) |
Less: | | | | | | | | | | | | | | | | | | | | |
Return of capital | | | (0.32 | ) | | | (0.33 | ) | | | (0.34 | ) | | | (0.30 | ) | | | — | |
Net asset value, end of period | | $ | 5.33 | | | $ | 5.46 | | | $ | 6.06 | | | $ | 6.45 | | | $ | 9.35 | |
Total return(c) | �� | | 3.44 | % | | | (4.88 | )% | | | (0.14 | )% | | | (28.30 | )% | | | (6.50 | )% |
Net assets, end of period (000’s omitted) | | $ | 4,097 | | | $ | 3,619 | | | $ | 4,050 | | | $ | 2,489 | | | $ | 1,931 | |
Portfolio turnover rate(d) | | | 97 | % | | | 93 | % | | | 57 | % | | | 107 | % | | | 5 | % |
| | | | |
Ratios/supplemental data based on average net assets: | | | | | | | | | | | | | | | | | |
Ratio of expenses: | | | | | | | | | | | | | | | | | | | | |
With fee waivers and/or expense reimbursements, before taxes | | | 1.28 | %(e) | | | 1.33 | % | | | 1.50 | % | | | 1.50 | % | | | 1.49 | %(f) |
Tax expense (benefit)(g) | | | 0.11 | %(e) | | | 0 | % | | | 0 | % | | | 0 | % | | | 0 | %(f) |
With fee waivers and/or expense reimbursements, after taxes(g) | | | 1.39 | %(e) | | | 1.33 | % | | | 1.50 | % | | | 1.50 | % | | | 1.49 | %(f) |
Without fee waivers and/or expense reimbursements, after taxes(g) | | | 5.10 | %(e) | | | 4.90 | % | | | 4.75 | % | | | 6.37 | % | | | 72.56 | %(f) |
Ratio of net investment income (loss), before taxes | | | (0.92 | )%(e) | | | (0.95 | )% | | | (1.28 | )% | | | (1.16 | )% | | | (0.54 | )%(f) |
Ratio of net investment income (loss), after taxes(h) | | | (1.03 | )%(e) | | | (0.95 | )% | | | (1.28 | )% | | | (1.16 | )% | | | (0.54 | )%(f) |
| (a) | Commencement date of August 29, 2014. |
| (b) | Calculated using average shares outstanding net of taxes, if any. |
| (c) | Includes adjustments in accordance with accounting principles generally accepted in the United States of America and as such, the net asset value for financial reporting purposes and the returns based upon those net asset values may differ from the net asset value and returns for shareholder transactions. Does not include sales charges and is not annualized for periods less than one year, if applicable. |
| (d) | Portfolio turnover is calculated at the fund level and is not annualized for periods less than one year, if applicable. |
| (e) | Ratios are based on average daily net assets (000’s omitted) of $4,517. |
| (g) | Ratio includes tax expense derived from net investment income (loss) and realized and unrealized gains (losses). |
| (h) | Ratio includes tax expense derived from net investment income (loss) only. |
20 Invesco MLP Fund
NOTE 11—Financial Highlights—(continued)
| | | | | | | | | | | | | | | | | | | | |
| | | Class C | |
| | | Years ended October 31, | |
| | | 2018 | | | 2017 | | | 2016 | | | 2015 | | | 2014(a) | |
Net asset value, beginning of period | | $ | 5.46 | | | $ | 6.05 | | | $ | 6.45 | | | $ | 9.34 | | | $ | 10.00 | |
Net investment income (loss)(b) | | | (0.10 | ) | | | (0.10 | ) | | | (0.12 | ) | | | (0.16 | ) | | | (0.02 | ) |
Net gains (losses) on securities (both realized and unrealized) | | | 0.25 | | | | (0.21 | ) | | | 0.02 | | | | (2.49 | ) | | | (0.64 | ) |
Total from investment operations | | | 0.15 | | | | (0.31 | ) | | | (0.10 | ) | | | (2.65 | ) | | | (0.66 | ) |
Less: | | | | | | | | | | | | | | | | | | | | |
Return of capital | | | (0.28 | ) | | | (0.28 | ) | | | (0.30 | ) | | | (0.24 | ) | | | — | |
Net asset value, end of period | | $ | 5.33 | | | $ | 5.46 | | | $ | 6.05 | | | $ | 6.45 | | | $ | 9.34 | |
Total return(c) | | | 2.66 | % | | | (5.45 | )% | | | (1.08 | )% | | | (28.78 | )% | | | (6.60 | )% |
Net assets, end of period (000’s omitted) | | $ | 1,391 | | | $ | 1,088 | | | $ | 1,283 | | | $ | 205 | | | $ | 1,713 | |
Portfolio turnover rate(d) | | | 97 | % | | | 93 | % | | | 57 | % | | | 107 | % | | | 5 | % |
| | | | | |
Ratios/supplemental data based on average net assets: | | | | | | | | | | | | | | | | | | | | |
Ratio of expenses: | | | | | | | | | | | | | | | | | | | | |
With fee waivers and/or expense reimbursements, before taxes | | | 2.03 | %(e) | | | 2.08 | % | | | 2.25 | % | | | 2.25 | % | | | 2.24 | %(f) |
Tax expense (benefit)(g) | | | 0.11 | %(e) | | | 0 | % | | | 0 | % | | | 0 | % | | | 0 | %(f) |
With fee waivers and/or expense reimbursements, after taxes(g) | | | 2.14 | %(e) | | | 2.08 | % | | | 2.25 | % | | | 2.25 | % | | | 2.24 | %(f) |
Without fee waivers and/or expense reimbursements, after taxes(g) | | | 5.85 | %(e) | | | 5.65 | % | | | 5.50 | % | | | 7.12 | % | | | 73.31 | %(f) |
Ratio of net investment income (loss), before taxes | | | (1.67 | )%(e) | | | (1.70 | )% | | | (2.03 | )% | | | (1.91 | )% | | | (1.29 | )%(f) |
Ratio of net investment income (loss), after taxes(h) | | | (1.78 | )%(e) | | | (1.70 | )% | | | (2.03 | )% | | | (1.91 | )% | | | (1.29 | )%(f) |
| (a) | Commencement date of August 29, 2014. |
| (b) | Calculated using average shares outstanding net of taxes, if any. |
| (c) | Includes adjustments in accordance with accounting principles generally accepted in the United States of America and as such, the net asset value for financial reporting purposes and the returns based upon those net asset values may differ from the net asset value and returns for shareholder transactions. Does not include sales charges and is not annualized for periods less than one year, if applicable. |
| (d) | Portfolio turnover is calculated at the fund level and is not annualized for periods less than one year, if applicable. |
| (e) | Ratios are based on average daily net assets (000’s omitted) of $1,196. |
| (g) | Ratio includes tax expense derived from net investment income (loss) and realized and unrealized gains (losses). |
| (h) | Ratio includes tax expense derived from net investment income (loss) only. |
21 Invesco MLP Fund
NOTE 11—Financial Highlights—(continued)
| | | | | | | | | | | | | | | | | | | | |
| | | Class R | |
| | | Years ended October 31, | |
| | | 2018 | | | 2017 | | | 2016 | | | 2015 | | | 2014(a) | |
Net asset value, beginning of period | | $ | 5.46 | | | $ | 6.06 | | | $ | 6.45 | | | $ | 9.35 | | | $ | 10.00 | |
Net investment income (loss)(b) | | | (0.07 | ) | | | (0.07 | ) | | | (0.09 | ) | | | (0.11 | ) | | | (0.01 | ) |
Net gains (losses) on securities (both realized and unrealized) | | | 0.25 | | | | (0.22 | ) | | | 0.03 | | | | (2.51 | ) | | | (0.64 | ) |
Total from investment operations | | | 0.18 | | | | (0.29 | ) | | | (0.06 | ) | | | (2.62 | ) | | | (0.65 | ) |
Less: | | | | | | | | | | | | | | | | | | | | |
Return of capital | | | (0.31 | ) | | | (0.31 | ) | | | (0.33 | ) | | | (0.28 | ) | | | — | |
Net asset value, end of period | | $ | 5.33 | | | $ | 5.46 | | | $ | 6.06 | | | $ | 6.45 | | | $ | 9.35 | |
Total return(c) | | | 3.18 | % | | | (5.12 | )% | | | (0.39 | )% | | | (28.48 | )% | | | (6.50 | )% |
Net assets, end of period (000’s omitted) | | $ | 443 | | | $ | 347 | | | $ | 241 | | | $ | 35 | | | $ | 21 | |
Portfolio turnover rate(d) | | | 97 | % | | | 93 | % | | | 57 | % | | | 107 | % | | | 5 | % |
| | | | | |
Ratios/supplemental data based on average net assets: | | | | | | | | | | | | | | | | | | | | |
Ratio of expenses: | | | | | | | | | | | | | | | | | | | | |
With fee waivers and/or expense reimbursements, before taxes | | | 1.53 | %(e) | | | 1.58 | % | | | 1.75 | % | | | 1.75 | % | | | 1.74 | %(f) |
Tax expense (benefit)(g) | | | 0.11 | %(e) | | | 0 | % | | | 0 | % | | | 0 | % | | | 0 | %(f) |
With fee waivers and/or expense reimbursements, after taxes(g) | | | 1.64 | %(e) | | | 1.58 | % | | | 1.75 | % | | | 1.75 | % | | | 1.74 | %(f) |
Without fee waivers and/or expense reimbursements, after taxes(g) | | | 5.35 | %(e) | | | 5.15 | % | | | 5.00 | % | | | 6.62 | % | | | 72.80 | %(f) |
Ratio of net investment income (loss), before taxes | | | (1.17 | )%(e) | | | (1.20 | )% | | | (1.53 | )% | | | (1.41 | )% | | | (0.79 | )%(f) |
Ratio of net investment income (loss), after taxes(h) | | | (1.28 | )%(e) | | | (1.20 | )% | | | (1.53 | )% | | | (1.41 | )% | | | (0.79 | )%(f) |
| (a) | Commencement date of August 29, 2014. |
| (b) | Calculated using average shares outstanding net of taxes, if any. |
| (c) | Includes adjustments in accordance with accounting principles generally accepted in the United States of America and as such, the net asset value for financial reporting purposes and the returns based upon those net asset values may differ from the net asset value and returns for shareholder transactions. Does not include sales charges and is not annualized for periods less than one year, if applicable. |
| (d) | Portfolio turnover is calculated at the fund level and is not annualized for periods less than one year, if applicable. |
| (e) | Ratios are based on average daily net assets (000’s omitted) of $415. |
| (g) | Ratio includes tax expense derived from net investment income (loss) and realized and unrealized gains (losses). |
| (h) | Ratio includes tax expense derived from net investment income (loss) only. |
22 Invesco MLP Fund
NOTE 11—Financial Highlights—(continued)
| | | | | | | | | | | | | | | | | | | | |
| | | Class Y | |
| | | Years ended October 31, | |
| | | 2018 | | | 2017 | | | 2016 | | | 2015 | | | 2014(a) | |
Net asset value, beginning of period | | $ | 5.47 | | | $ | 6.07 | | | $ | 6.46 | | | $ | 9.36 | | | $ | 10.00 | |
Net investment income (loss)(b) | | | (0.04 | ) | | | (0.04 | ) | | | (0.06 | ) | | | (0.07 | ) | | | (0.01 | ) |
Net gains (losses) on securities (both realized and unrealized) | | | 0.24 | | | | (0.22 | ) | | | 0.03 | | | | (2.51 | ) | | | (0.63 | ) |
Total from investment operations | | | 0.20 | | | | (0.26 | ) | | | (0.03 | ) | | | (2.58 | ) | | | (0.64 | ) |
Less: | | | | | | | | | | | | | | | | | | | | |
Return of capital | | | (0.34 | ) | | | (0.34 | ) | | | (0.36 | ) | | | (0.32 | ) | | | — | |
Net asset value, end of period | | $ | 5.33 | | | $ | 5.47 | | | $ | 6.07 | | | $ | 6.46 | | | $ | 9.36 | |
Total return(c) | | | 3.52 | % | | | (4.61 | )% | | | 0.14 | % | | | (28.07 | )% | | | (6.40 | )% |
Net assets, end of period (000’s omitted) | | $ | 5,219 | | | $ | 4,912 | | | $ | 3,545 | | | $ | 2,094 | | | $ | 1,628 | |
Portfolio turnover rate(d) | | | 97 | % | | | 93 | % | | | 57 | % | | | 107 | % | | | 5 | % |
| | | | | |
Ratios/supplemental data based on average net assets: | | | | | | | | | | | | | | | | | | | | |
Ratio of expenses: | | | | | | | | | | | | | | | | | | | | |
With fee waivers and/or expense reimbursements, before taxes | | | 1.03 | %(e) | | | 1.08 | % | | | 1.25 | % | | | 1.25 | % | | | 1.24 | %(f) |
Tax expense (benefit)(g) | | | 0.11 | %(e) | | | 0 | % | | | 0 | % | | | 0 | % | | | 0 | %(f) |
With fee waivers and/or expense reimbursements, after taxes(g) | | | 1.14 | %(e) | | | 1.08 | % | | | 1.25 | % | | | 1.25 | % | | | 1.24 | %(f) |
Without fee waivers and/or expense reimbursements, after taxes(g) | | | 4.85 | %(e) | | | 4.65 | % | | | 4.50 | % | | | 6.12 | % | | | 72.31 | %(f) |
Ratio of net investment income (loss), before taxes | | | (0.67 | )%(e) | | | (0.70 | )% | | | (1.03 | )% | | | (0.91 | )% | | | (0.29 | )%(f) |
Ratio of net investment income (loss), after taxes(h) | | | (0.78 | )%(e) | | | (0.70 | )% | | | (1.03 | )% | | | (0.91 | )% | | | (0.29 | )%(f) |
| (a) | Commencement date of August 29, 2014. |
| (b) | Calculated using average shares outstanding net of taxes, if any. |
| (c) | Includes adjustments in accordance with accounting principles generally accepted in the United States of America and as such, the net asset value for financial reporting purposes and the returns based upon those net asset values may differ from the net asset value and returns for shareholder transactions. Does not include sales charges and is not annualized for periods less than one year, if applicable. |
| (d) | Portfolio turnover is calculated at the fund level and is not annualized for periods less than one year, if applicable. |
| (e) | Ratios are based on average daily net assets (000’s omitted) of $5,451. |
| (g) | Ratio includes tax expense derived from net investment income (loss) and realized and unrealized gains (losses). |
| (h) | Ratio includes tax expense derived from net investment income (loss) only. |
23 Invesco MLP Fund
NOTE 11—Financial Highlights—(continued)
| | | | | | | | | | | | | | | | | | | | |
| | | Class R5 | |
| | | Years ended October 31, | |
| | | 2018 | | | 2017 | | | 2016 | | | 2015 | | | 2014(a) | |
Net asset value, beginning of period | | $ | 5.46 | | | $ | 6.06 | | | $ | 6.46 | | | $ | 9.36 | | | $ | 10.00 | |
Net investment income (loss)(b) | | | (0.04 | ) | | | (0.04 | ) | | | (0.06 | ) | | | (0.07 | ) | | | (0.01 | ) |
Net gains (losses) on securities (both realized and unrealized) | | | 0.25 | | | | (0.22 | ) | | | 0.02 | | | | (2.51 | ) | | | (0.63 | ) |
Total from investment operations | | | 0.21 | | | | (0.26 | ) | | | (0.04 | ) | | | (2.58 | ) | | | (0.64 | ) |
Less: | | | | | | | | | | | | | | | | | | | | |
Return of capital | | | (0.34 | ) | | | (0.34 | ) | | | (0.36 | ) | | | (0.32 | ) | | | — | |
Net asset value, end of period | | $ | 5.33 | | | $ | 5.46 | | | $ | 6.06 | | | $ | 6.46 | | | $ | 9.36 | |
Total return(c) | | | 3.71 | % | | | (4.63 | )% | | | (0.03 | )% | | | (28.07 | )% | | | (6.40 | )% |
Net assets, end of period (000’s omitted) | | $ | 5 | | | $ | 5 | | | $ | 6 | | | $ | 6 | | | $ | 9 | |
Portfolio turnover rate(d) | | | 97 | % | | | 93 | % | | | 57 | % | | | 107 | % | | | 5 | % |
| | | | | |
Ratios/supplemental data based on average net assets: | | | | | | | | | | | | | | | | | | | | |
Ratio of expenses: | | | | | | | | | | | | | | | | | | | | |
With fee waivers and/or expense reimbursements, before taxes | | | 1.03 | %(e) | | | 1.08 | % | | | 1.25 | % | | | 1.25 | % | | | 1.24 | %(f) |
Tax expense (benefit)(g) | | | 0.11 | %(e) | | | 0 | % | | | 0 | % | | | 0 | % | | | 0 | %(f) |
With fee waivers and/or expense reimbursements, after taxes(g) | | | 1.14 | %(e) | | | 1.08 | % | | | 1.25 | % | | | 1.25 | % | | | 1.24 | %(f) |
Without fee waivers and/or expense reimbursements, after taxes(g) | | | 4.78 | %(e) | | | 4.57 | % | | | 4.44 | % | | | 6.10 | % | | | 72.28 | %(f) |
Ratio of net investment income (loss), before taxes | | | (0.67 | )%(e) | | | (0.70 | )% | | | (1.03 | )% | | | (0.91 | )% | | | (0.29 | )%(f) |
Ratio of net investment income (loss), after taxes(h) | | | (0.78 | )%(e) | | | (0.70 | )% | | | (1.03 | )% | | | (0.91 | )% | | | (0.29 | )%(f) |
| (a) | Commencement date of August 29, 2014. |
| (b) | Calculated using average shares outstanding net of taxes, if any. |
| (c) | Includes adjustments in accordance with accounting principles generally accepted in the United States of America and as such, the net asset value for financial reporting purposes and the returns based upon those net asset values may differ from the net asset value and returns for shareholder transactions. Does not include sales charges and is not annualized for periods less than one year, if applicable. |
| (d) | Portfolio turnover is calculated at the fund level and is not annualized for periods less than one year, if applicable. |
| (e) | Ratios are based on average daily net assets (000’s omitted) of $6. |
| (g) | Ratio includes tax expense derived from net investment income (loss) and realized and unrealized gains (losses). |
| (h) | Ratio includes tax expense derived from net investment income (loss) only. |
24 Invesco MLP Fund
NOTE 11—Financial Highlights—(continued)
| | | | | | | | | | | | | | | | | | | | |
| | | Class R6 | |
| | | Years ended October 31, | |
| | | 2018 | | | 2017 | | | 2016 | | | 2015 | | | 2014(a) | |
Net asset value, beginning of period | | $ | 5.46 | | | $ | 6.06 | | | $ | 6.46 | | | $ | 9.36 | | | $ | 10.00 | |
Net investment income (loss)(b) | | | (0.04 | ) | | | (0.04 | ) | | | (0.06 | ) | | | (0.07 | ) | | | (0.01 | ) |
Net gains (losses) on securities (both realized and unrealized) | | | 0.25 | | | | (0.22 | ) | | | 0.02 | | | | (2.51 | ) | | | (0.63 | ) |
Total from investment operations | | | 0.21 | | | | (0.26 | ) | | | (0.04 | ) | | | (2.58 | ) | | | (0.64 | ) |
Less: | | | | | | | | | | | | | | | | | | | | |
Return of capital | | | (0.34 | ) | | | (0.34 | ) | | | (0.36 | ) | | | (0.32 | ) | | | — | |
Net asset value, end of period | | $ | 5.33 | | | $ | 5.46 | | | $ | 6.06 | | | $ | 6.46 | | | $ | 9.36 | |
Total return(c) | | | 3.71 | % | | | (4.63 | )% | | | (0.03 | )% | | | (28.07 | )% | | | (6.40 | )% |
Net assets, end of period (000’s omitted) | | $ | 5 | | | $ | 5 | | | $ | 6 | | | $ | 6 | | | $ | 9 | |
Portfolio turnover rate(d) | | | 97 | % | | | 93 | % | | | 57 | % | | | 107 | % | | | 5 | % |
| | | | | |
Ratios/supplemental data based on average net assets: | | | | | | | | | | | | | | | | | | | | |
Ratio of expenses: | | | | | | | | | | | | | | | | | | | | |
With fee waivers and/or expense reimbursements, before taxes | | | 1.03 | %(e) | | | 1.08 | % | | | 1.25 | % | | | 1.25 | % | | | 1.24 | %(f) |
Tax expense (benefit)(g) | | | 0.11 | %(e) | | | 0 | % | | | 0 | % | | | 0 | % | | | 0 | %(f) |
With fee waivers and/or expense reimbursements, after taxes(g) | | | 1.14 | %(e) | | | 1.08 | % | | | 1.25 | % | | | 1.25 | % | | | 1.24 | %(f) |
Without fee waivers and/or expense reimbursements, after taxes(g) | | | 4.78 | %(e) | | | 4.57 | % | | | 4.44 | % | | | 6.10 | % | | | 72.23 | %(f) |
Ratio of net investment income (loss), before taxes | | | (0.67 | )%(e) | | | (0.70 | )% | | | (1.03 | )% | | | (0.91 | )% | | | (0.29 | )%(f) |
Ratio of net investment income (loss), after taxes(h) | | | (0.78 | )%(e) | | | (0.70 | )% | | | (1.03 | )% | | | (0.91 | )% | | | (0.29 | )%(f) |
| (a) | Commencement date of August 29, 2014. |
| (b) | Calculated using average shares outstanding net of taxes, if any. |
| (c) | Includes adjustments in accordance with accounting principles generally accepted in the United States of America and as such, the net asset value for financial reporting purposes and the returns based upon those net asset values may differ from the net asset value and returns for shareholder transactions. Does not include sales charges and is not annualized for periods less than one year, if applicable. |
| (d) | Portfolio turnover is calculated at the fund level and is not annualized for periods less than one year, if applicable. |
| (e) | Ratios are based on average daily net assets (000’s omitted) of $6. |
| (g) | Ratio includes tax expense derived from net investment income (loss) and realized and unrealized gains (losses). |
| (h) | Ratio includes tax expense derived from net investment income (loss) only. |
25 Invesco MLP Fund
Report of Independent Registered Public Accounting Firm
To the Board of Trustees of AIM Investment Funds (Invesco Investment Funds)
and Shareholders of Invesco MLP Fund:
Opinion on the Financial Statements
We have audited the accompanying statement of assets and liabilities, including the schedule of investments, of Invesco MLP Fund (one of the funds constituting AIM Investment Funds (Invesco Investment Funds), hereafter referred to as the “Fund”) as of October 31, 2018, the related statement of operations for the year ended October 31, 2018, the statement of changes in net assets for each of the two years in the period ended October 31, 2018, including the related notes, and the financial highlights for each of the periods indicated therein (collectively referred to as the financial statements). In our opinion, the financial statements present fairly, in all material respects, the financial position of the Fund as of October 31, 2018, the results of its operations for the year then ended, the changes in its net assets for each of the two years in the period ended October 31, 2018 and the financial highlights for each of the periods indicated therein in conformity with accounting principles generally accepted in the United States of America.
Basis for Opinion
These financial statements are the responsibility of the Fund’s management. Our responsibility is to express an opinion on the Fund’s financial statements based on our audits. We are a public accounting firm registered with the Public Company Accounting Oversight Board (United States) (PCAOB) and are required to be independent with respect to the Fund in accordance with the U.S. federal securities laws and the applicable rules and regulations of the Securities and Exchange Commission and the PCAOB.
We conducted our audits of these financial statements in accordance with the standards of the PCAOB. Those standards require that we plan and perform the audit to obtain reasonable assurance about whether the financial statements are free of material misstatement, whether due to error or fraud.
Our audits included performing procedures to assess the risks of material misstatement of the financial statements, whether due to error or fraud, and performing procedures that respond to those risks. Such procedures included examining, on a test basis, evidence regarding the amounts and disclosures in the financial statements. Our audits also included evaluating the accounting principles used and significant estimates made by management, as well as evaluating the overall presentation of the financial statements. Our procedures included confirmation of securities owned as of October 31, 2018 by correspondence with the custodian and transfer agent. We believe that our audits provide a reasonable basis for our opinion.
PricewaterhouseCoopers LLP
Houston, TX
December 28, 2018
We have served as the auditor of one or more of the investment companies in the Invesco group of investment companies since at least 1995. We have not been able to determine the specific year we began serving as auditor.
26 Invesco MLP Fund
Calculating your ongoing Fund expenses
Example
As a shareholder of the Fund, you incur two types of costs: (1) transaction costs, which may include sales charges (loads) on purchase payments or contingent deferred sales charges on redemptions, if any; and (2) ongoing costs, including management fees, distribution and/or service (12b-1) fees, and other Fund expenses. This example is intended to help you understand your ongoing costs (in dollars) of investing in the Fund and to compare these costs with ongoing costs of investing in other mutual funds. The example is based on an investment of $1,000 invested at the beginning of the period and held for the entire period May 1, 2018 through October 31, 2018.
Actual expenses
The table below provides information about actual account values and actual expenses. You may use the information in this table, together with the amount you invested, to estimate the expenses that you paid over the period. Simply divide your account value by $1,000 (for example, an $8,600 account value divided by $1,000 = 8.6), then multiply the result by the number in the table under the heading entitled “Actual Expenses Paid During Period” to estimate the expenses you paid on your account during this period.
Hypothetical example for comparison purposes
The table below also provides information about hypothetical account values and hypothetical expenses based on the Fund’s actual expense ratio and an assumed rate of return of 5% per year before expenses, which is not the Fund’s actual return.
The hypothetical account values and expenses may not be used to estimate the actual ending account balance or expenses you paid for the period. You may use this information to compare the ongoing costs of investing in the Fund and other funds. To do so, compare this 5% hypothetical example with the 5% hypothetical examples that appear in the shareholder reports of the other funds.
Please note that the expenses shown in the table are meant to highlight your ongoing costs only and do not reflect any transaction costs, such as sales charges (loads) on purchase payments or contingent deferred sales charges on redemptions, if any. Therefore, the hypothetical information is useful in comparing ongoing costs only, and will not help you determine the relative total costs of owning different funds. In addition, if these transaction costs were included, your costs would have been higher.
| | | | | | | | | | | | | | | | | | | | | | | | |
| | | | | | ACTUAL | | | HYPOTHETICAL (5% annual return before
expenses) | | | | |
| Class | | Beginning
Account Value
(05/01/18) | | | Ending
Account Value
(10/31/18)1 | | | Expenses
Paid During
Period2 | | | Ending
Account Value
(10/31/18) | | | Expenses
Paid During
Period2 | | | Annualized
Expense
Ratio | |
A | | $ | 1,000.00 | | | $ | 1,016.70 | | | $ | 7.42 | | | $ | 1,017.85 | | | $ | 7.43 | | | | 1.46 | % |
C | | | 1,000.00 | | | | 1,012.80 | | | | 11.21 | | | | 1,014.06 | | | | 11.22 | | | | 2.21 | |
R | | | 1,000.00 | | | | 1,015.40 | | | | 8.69 | | | | 1,016.59 | | | | 8.69 | | | | 1.71 | |
Y | | | 1,000.00 | | | | 1,018.00 | | | | 6.21 | | | | 1,019.06 | | | | 6.21 | | | | 1.22 | |
R5 | | | 1,000.00 | | | | 1,018.00 | | | | 6.21 | | | | 1,019.06 | | | | 6.21 | | | | 1.22 | |
| R6 | | | 1,000.00 | | | | 1,018.00 | | | | 6.21 | | | | 1,019.06 | | | | 6.21 | | | | 1.22 | |
| 1 | The actual ending account value is based on the actual total return of the Fund for the period May 1, 2018 through October 31, 2018, after actual expenses and will differ from the hypothetical ending account value which is based on the Fund’s expense ratio and a hypothetical annual return of 5% before expenses. |
| 2 | Expenses are equal to the Fund’s annualized expense ratio as indicated above multiplied by the average account value over the period, multiplied by 184/365 to reflect the most recent fiscal half year. |
27 Invesco MLP Fund
Approval of Investment Advisory and Sub-Advisory Contracts
At meetings held on June 5-6, 2018, the Board of Trustees (the Board or the Trustees) of AIM Investment Funds (Invesco Investment Funds) as a whole, and the independent Trustees, who comprise over 75% of the Board, voting separately, approved the continuance of the Invesco MLP Fund’s (the Fund) Master Investment Advisory Agreement with Invesco Advisers, Inc. (Invesco Advisers and the investment advisory agreement) and the Master Intergroup Sub-Advisory Contract for Mutual Funds with Invesco Asset Management Deutschland GmbH, Invesco Asset Management Limited, Invesco Asset Management (Japan) Limited, Invesco Hong Kong Limited, Invesco Senior Secured Management, Inc., Invesco Canada Ltd. and separate Sub-Advisory Contracts with Invesco Capital Management LLC and Invesco Asset Management (India) Private Limited (collectively, the Affiliated Sub-Advisers and the sub-advisory contracts) for another year, effective July 1, 2018. After evaluating the factors discussed below, among others, the Board approved the renewal of the Fund’s investment advisory agreement and the sub-advisory contracts and determined that the compensation payable by the Fund to Invesco Advisers and by Invesco Advisers to the Affiliated Sub-Advisers is fair and reasonable.
The Board’s Evaluation Process
The Board’s Investments Committee has established three Sub-Committees, which meet throughout the year to review the performance of funds advised by Invesco Advisers (the Invesco Funds). Over the course of each year, the Sub-Committees meet with portfolio managers for their assigned Invesco Funds and other members of management to review detailed information about investment performance and portfolio attributes of these funds. The Board took into account evaluations and reports that it received from the Investments Committee and Sub-Committees, as well as the information provided to such committees and the Board throughout the year, in considering whether to approve each Invesco Fund’s investment advisory agreement and sub-advisory contracts.
As part of the contract renewal process, the Board reviews and considers information provided in response to detailed requests for information submitted to management by the independent Trustees with assistance from legal counsel to the independent Trustees. The Board receives comparative investment performance and fee data regarding the Invesco Funds prepared by Invesco Advisers and Broadridge Financial Solutions, Inc. (Broadridge), an independent mutual fund data provider. The Board also receives an independent written evaluation from the Senior Officer, an officer of the Invesco Funds who reports directly to the independent Trustees. The Senior Officer’s
evaluation is prepared as part of his responsibility to manage the process by which the Invesco Funds’ proposed management fees are negotiated during the annual contract renewal process to ensure they are negotiated in a manner that is at arms’ length and reasonable. In addition to meetings with Invesco Advisers and fund counsel throughout the year, the independent Trustees also discuss the continuance of the investment advisory agreement and sub-advisory contracts in separate sessions with the Senior Officer and with independent legal counsel.
The discussion below is a summary of the Senior Officer’s independent written evaluation with respect to the Fund’s investment advisory agreement, as well as a discussion of the material factors and related conclusions that formed the basis for the Board’s approval of the Fund’s investment advisory agreement and sub-advisory contracts. The Trustees’ review and conclusions are based on the comprehensive consideration of all information presented to them during the course of the year and in prior years and are not the result of any single determinative factor. Moreover, one Trustee may have weighed a particular piece of information or factor differently than another Trustee. This information is current as of June 6, 2018.
Factors and Conclusions and Summary of Independent Written Fee Evaluation
| A. | Nature, Extent and Quality of Services Provided by Invesco Advisers and the Affiliated Sub-Advisers |
The Board reviewed the nature, extent and quality of the advisory services provided to the Fund by Invesco Advisers under the Fund’s investment advisory agreement, and the credentials and experience of the officers and employees of Invesco Advisers who provide these services, including the Fund’s portfolio manager(s). The Board’s review included consideration of Invesco Advisers’ investment process oversight and structure, credit analysis and investment risk management. The Board also considered non-advisory services that Invesco Advisers and its affiliates provide to the Invesco Funds such as various back office support functions, third party oversight, internal audit, valuation, portfolio trading and legal and compliance. The Board also reviewed and considered the benefits to shareholders of investing in a fund that is part of the Invesco family of funds under the umbrella of Invesco Ltd., Invesco Advisers’ parent company, and noted Invesco Ltd.’s depth and experience in conducting an investment management business, as well as its commitment of financial and other resources to such business. The Board concluded that the nature, extent and quality of the services provided to the Fund by Invesco Advisers are appropriate and satisfactory.
The Board reviewed the services that may be provided by the Affiliated Sub-Advisers under the sub-advisory contracts and the credentials and experience of the officers and employees of the Affiliated Sub-Advisers who provide these services. The Board noted the Affiliated Sub-Advisers’ expertise with respect to certain asset classes and that the Affiliated Sub-Advisers have offices and personnel that are located in financial centers around the world. As a result, the Board noted that the Affiliated Sub-Advisers can provide research and investment analysis on the markets and economies of various countries in which the Fund may invest, make recommendations regarding securities and assist with security trades. The Board concluded that the sub-advisory contracts may benefit the Fund and its shareholders by permitting Invesco Advisers to use the resources and talents of the Affiliated Sub-Advisers in managing the Fund. The Board concluded that the nature, extent and quality of the services that may be provided by the Affiliated Sub-Advisers are appropriate and satisfactory.
| B. | Fund Investment Performance |
The Board considered Fund investment performance as a relevant factor in considering whether to approve the investment advisory agreement as well as the sub-advisory contracts for the Fund, as Invesco Asset Management Limited currently manages assets of the Fund.
The Board compared the Fund’s investment performance over multiple time periods ending December 31, 2017 to the performance of funds in the Broadridge performance universe and against the Lipper Energy MLP Funds Index. The Board noted that performance of Class A shares of the Fund was in the third quintile of its performance universe for the one year period and the fourth quintile for the three year period (the first quintile being the best performing funds and the fifth quintile being the worst performing funds). The Board noted that performance of Class A shares of the Fund was reasonably comparable to the performance of the Index for the one year period, and below the performance of the Index for the three year period. The Board noted that the Fund is taxed as a regular corporation, or “C” corporation, rather than as a regulated investment company for U.S. federal income tax purposes. The Board further noted that due to the timing of the Fund’s launch, the Fund had not yet incurred any tax liability and that this has negatively impacted the Fund’s peer group rankings. The Trustees also reviewed more recent Fund performance and this review did not change their conclusions.
| C. | Advisory and Sub-Advisory Fees and Fund Expenses |
The Board compared the Fund’s contractual management fee rate to the contractual management fee rates of funds in the Fund’s Broadridge expense group. The Board noted
28 Invesco MLP Fund
that the contractual management fee rate for Class A shares of the Fund was the same as the median contractual management fee rate of funds in its expense group. The Board noted that the term “contractual management fee” for funds in the expense group may include both advisory and certain non-portfolio management administrative services fees, but that Broadridge does not provide information on a fund by fund basis as to what is included. The Board also reviewed the methodology used by Broadridge in providing expense group information, which includes using each fund’s contractual management fee schedule (including any applicable breakpoints) as reported in the most recent prospectus or statement of additional information for each fund in the expense group. The Board also considered comparative information regarding the Fund’s total expense ratio and its various components.
The Board noted that Invesco Advisers has contractually agreed to waive fees and/or limit expenses of the Fund in an amount necessary to limit total annual operating expenses to a specified percentage of average daily net assets for each class of the Fund.
The Board noted that Invesco Advisers and the Affiliated Sub-Advisers do not manage other similarly managed mutual funds or client accounts.
The Board also considered the services that may be provided by the Affiliated Sub-Advisers pursuant to the sub-advisory contracts, as well as the fees payable by Invesco Advisers to the Affiliated Sub-Advisers pursuant to the sub-advisory contracts. The Board noted that Invesco Advisers retains overall responsibility for, and provides services to, sub-advised Invesco Funds, including oversight of the Affiliated Sub-Advisers as well as the additional services described herein other than day-to-day portfolio management.
| D. | Economies of Scale and Breakpoints |
The Board considered the extent to which there may be economies of scale in the provision of advisory services to the Fund. The Board also considered that the Fund may benefit from economies of scale through contractual breakpoints in the Fund’s advisory fee schedule, which generally operate to reduce the Fund’s expense ratio as it grows in size. The Board noted that the Fund shares directly in economies of scale through lower fees charged by third party service providers based on the combined size of the Invesco Funds. The Board noted that the Fund may also benefit from economies of scale through initial fee setting, fee waivers and expense reimbursements.
| E. | Profitability and Financial Resources |
The Board reviewed information from Invesco Advisers concerning the costs of the advisory and other services that Invesco Advisers and its affiliates provide to the Fund and the Invesco Funds and the profitability of Invesco Advisers and its affiliates in providing these services. The Board considered the methodology used for calculating profitability and noted the periodic
review of such methodology by an independent consultant. The Board noted that Invesco Advisers continues to operate at a net profit from services Invesco Advisers and its affiliates provide to the Invesco Funds. The Board received information from Invesco Advisers demonstrating that Invesco Advisers and the Affiliated Sub-Advisers are financially sound and have the resources necessary to perform their obligations under the investment advisory agreement and sub-advisory contracts.
| F. | Collateral Benefits to Invesco Advisers and its Affiliates |
The Board considered various other benefits received by Invesco Advisers and its affiliates from the relationship with the Fund, including the fees received for providing administrative, transfer agency and distribution services to the Fund. The Board considered comparative information regarding fees charged for these services, including information provided by Broadridge and other independent sources. The Board considered the performance of Invesco Advisers and its affiliates in providing these services and the organizational structure employed to provide these services. The Board also considered that these services are provided to the Fund pursuant to written contracts that are reviewed and approved on an annual basis by the Board; and that the services are required for the operation of the Fund.
The Board considered the benefits realized by Invesco Advisers and the Affiliated Sub-Advisers as a result of portfolio brokerage transactions executed through “soft dollar” arrangements. The Board noted that soft dollar arrangements may result in the Fund bearing costs to purchase research that may be used by Invesco Advisers or the Affiliated Sub-Advisers with other clients and may reduce Invesco Advisers’ or the Affiliated Sub-Advisers’ expenses. The Board also considered that it receives periodic reports from Invesco representing that these arrangements are consistent with regulatory requirements. The Board did not deem the soft dollar arrangements to be inappropriate.
The Board considered that the Fund’s uninvested cash and cash collateral from any securities lending arrangements may be invested in money market funds advised by Invesco Advisers pursuant to procedures approved by the Board. The Board noted that Invesco Advisers receives advisory fees from these affiliated money market funds attributable to such investments, although Invesco Advisers has contractually agreed to waive through varying periods the advisory fees payable by the Invesco Funds with respect to certain investments in the affiliated money market funds. The waiver is in an amount equal to 100% of the net advisory fee Invesco Advisers receives from the affiliated money market funds with respect to the Fund’s investment in the affiliated money market funds of uninvested cash, but not cash collateral. The Board concluded that the amount of advisory fees received by Invesco Advisers from the Fund’s investment of cash collateral from any
securities lending arrangements in the affiliated money market funds is fair and reasonable.
The Board also considered that an affiliated broker may receive commissions for executing certain trades for the Fund. Invesco Advisers and the Affiliated Sub-Advisers may use the affiliated broker to, among other things, control order routing and minimize information leakage, and the Board was advised that such trades are executed in compliance with rules under the federal securities laws and consistent with best execution obligations.
29 Invesco MLP Fund
Trustees and Officers
The address of each trustee and officer is AIM Investment Funds (Invesco Investment Funds) (the “Trust”), 11 Greenway Plaza, Suite 1000, Houston, Texas 77046-1173. The trustees serve for the life of the Trust, subject to their earlier death, incapacitation, resignation, retirement or removal as more specifically provided in the Trust’s organizational documents. Each officer serves for a one year term or until their successors are elected and qualified. Column two below includes length of time served with predecessor entities, if any.
| | | | | | | | |
Name, Year of Birth and
Position(s) Held with the Trust | | Trustee and/
or Officer Since | | Principal Occupation(s)
During Past 5 Years | | Number of
Funds in Fund
Complex
Overseen by
Trustee | | Other Directorship(s)
Held by Trustee During
Past 5 Years |
| Interested Persons | | | | | | | | |
| Martin L. Flanagan1 — 1960 Trustee | | 2007 | | Executive Director, Chief Executive Officer and President, Invesco Ltd. (ultimate parent of Invesco and a global investment management firm); Trustee, The Invesco Funds; Vice Chair, Investment Company Institute; and Member of Executive Board, SMU Cox School of Business Formerly: Advisor to the Board, Invesco Advisers, Inc. (formerly known as Invesco Institutional (N.A.), Inc.); Chairman and Chief Executive Officer, Invesco Advisers, Inc. (registered investment adviser); Director, Chairman, Chief Executive Officer and President, Invesco Holding Company (US), Inc. (formerly IVZ Inc.) (holding company), Invesco Group Services, Inc. (service provider) and Invesco North American Holdings, Inc. (holding company); Director, Chief Executive Officer and President, Invesco Holding Company Limited (parent of Invesco and a global investment management firm); Director, Invesco Ltd.; Chairman, Investment Company Institute and President, Co-Chief Executive Officer, Co-President, Chief Operating Officer and Chief Financial Officer, Franklin Resources, Inc. (global investment management organization) | | 158 | | None |
Philip A. Taylor2 — 1954 Trustee and Senior Vice President | | 2006 | | Head of the Americas and Senior Managing Director, Invesco Ltd.; Director, Invesco Advisers, Inc. (formerly known as Invesco Institutional (N.A.), Inc.) (registered investment adviser); Director and Chairman, Invesco Investment Services, Inc. (formerly known as Invesco AIM Investment Services, Inc.) (registered transfer agent); Chief Executive Officer, Invesco Corporate Class Inc. (corporate mutual fund company); Director, Chairman and Chief Executive Officer, Invesco Canada Ltd. (formerly known as Invesco Trimark Ltd./Invesco Trimark Ltèe) (registered investment adviser and registered transfer agent); Trustee and Senior Vice President, The Invesco Funds; Director, Invesco Investment Advisers LLC (formerly known as Van Kampen Asset Management) Formerly: Director, Chairman, Chief Executive Officer and President, Invesco Management Group, Inc. (formerly known as Invesco AIM Management Group, Inc.) (financial services holding company); Co-Chairman, Co-President and Co-Chief Executive Officer, Invesco Advisers, Inc. (formerly known as Invesco Institutional (N.A.), Inc.) (registered investment adviser); Director, Chief Executive Officer and President, Van Kampen Exchange Corp; President and Principal Executive Officer, The Invesco Funds (other than AIM Treasurer’s Series Trust (Invesco Treasurer’s Series Trust), Short-Term Investments Trust and Invesco Management Trust); Executive Vice President, The Invesco Funds (AIM Treasurer’s Series Trust (Invesco Treasurer’s Series Trust), Short-Term Investments Trust and Invesco Management Trust only); Director and President, INVESCO Funds Group, Inc. (registered investment adviser and registered transfer agent); Director and Chairman, IVZ Distributors, Inc. (formerly known as INVESCO Distributors, Inc.) (registered broker dealer); Director, President and Chairman, Invesco Inc. (holding company), Invesco Canada Holdings Inc. (holding company), Trimark Investments Ltd./Placements Trimark Ltèe and Invesco Financial Services Ltd/Services Financiers Invesco Ltèe; Chief Executive Officer, Invesco Canada Fund Inc. (corporate mutual fund company); Director and Chairman, Van Kampen Investor Services Inc.; Director, Chief Executive Officer and President, 1371 Preferred Inc. (holding company) and Van Kampen Investments Inc.; Director and President, AIM GP Canada Inc. (general partner for limited partnerships) and Van Kampen Advisors, Inc.; Director and Chief Executive Officer, Invesco Trimark Dealer Inc. (registered broker dealer); Director, Invesco Distributors, Inc. (formerly known as Invesco AIM Distributors, Inc.) (registered broker dealer); Manager, Invesco Capital Management LLC; Director, Chief Executive Officer and President, Invesco Advisers, Inc.; Director, Chairman, Chief Executive Officer and President, Invesco AIM Capital Management, Inc.; President, Invesco Trimark Dealer Inc. and Invesco Trimark Ltd./Invesco Trimark Ltèe; Director and President, AIM Trimark Corporate Class Inc. and AIM Trimark Canada Fund Inc.; Senior Managing Director, Invesco Holding Company Limited; Director and Chairman, Fund Management Company (former registered broker dealer); President and Principal Executive Officer, The Invesco Funds (AIM Treasurer’s Series Trust (Invesco Treasurer’s Series Trust), and Short-Term Investments Trust only); President, AIM Trimark Global Fund Inc. and AIM Trimark Canada Fund Inc. | | 158 | | None |
| 1 | Mr. Flanagan is considered an interested person (within the meaning of Section 2(a)(19) of the 1940 Act) of the Trust because he is an officer of the Adviser to the Trust, and an officer and a director of Invesco Ltd., ultimate parent of the Adviser. |
| 2 | Mr. Taylor is considered an interested person (within the meaning of Section 2(a)(19) of the 1940 Act) of the Trust because he is an officer and a director of the Adviser. |
T-1 Invesco MLP Fund
Trustees and Officers—(continued)
| | | | | | | | |
Name, Year of Birth and
Position(s) Held with the Trust | | Trustee and/
or Officer Since | | Principal Occupation(s)
During Past 5 Years | | Number of
Funds in Fund
Complex
Overseen by
Trustee | | Other Directorship(s)
Held by Trustee During
Past 5 Years |
| Independent Trustees | | | | | | | | |
Bruce L. Crockett — 1944 Trustee and Chair | | 2001 | | Chairman, Crockett Technologies Associates (technology consulting company) Formerly: Director, Captaris (unified messaging provider); Director, President and Chief Executive Officer, COMSAT Corporation; Chairman, Board of Governors of INTELSAT (international communications company); ACE Limited (insurance company); Independent Directors Council and Investment Company Institute: Member of the Audit Committee, Investment Company Institute; Member of the Executive Committee and Chair of the Governance Committee, Independent Directors Council | | 158 | | Director and Chairman of the Audit Committee, ALPS (Attorneys Liability Protection Society) (insurance company); Director and Member of the Audit Committee and Compensation Committee, Ferroglobe PLC (metallurgical company) |
David C. Arch — 1945 Trustee | | 2010 | | Chairman of Blistex Inc. (consumer health care products manufacturer); Member, World Presidents’ Organization | | 158 | | Board member of the Illinois Manufacturers’ Association |
Jack M. Fields — 1952 Trustee | | 2001 | | Chief Executive Officer, Twenty First Century Group, Inc. (government affairs company); and Chairman, Discovery Learning Alliance (non-profit) Formerly: Owner and Chief Executive Officer, Dos Angeles Ranch L.P. (cattle, hunting, corporate entertainment); Director, Insperity, Inc. (formerly known as Administaff) (human resources provider); Chief Executive Officer, Texana Timber LP (sustainable forestry company); Director of Cross Timbers Quail Research Ranch (non-profit); and member of the U.S. House of Representatives | | 158 | | None |
Cynthia Hostetler — 1962 Trustee | | 2017 | | Non-Executive Director and Trustee of a number of public and private business corporations Formerly: Director, Aberdeen Investment Funds (4 portfolios); Head of Investment Funds and Private Equity, Overseas Private Investment Corporation; President, First Manhattan Bancorporation, Inc.; Attorney, Simpson Thacher & Bartlett LLP | | 158 | | Vulcan Materials Company (construction materials company); Trilinc Global Impact Fund; Artio Global Investment LLC (mutual fund complex); Edgen Group, Inc. (specialized energy and infrastructure products distributor) |
Eli Jones — 1961 Trustee | | 2016 | | Professor and Dean, Mays Business School — Texas A&M University Formerly: Professor and Dean, Walton College of Business, University of Arkansas and E.J. Ourso College of Business, Louisiana State University; Director, Arvest Bank | | 158 | | Insperity, Inc. (formerly known as Administaff) (human resources provider) |
Prema Mathai-Davis — 1950 Trustee | | 2001 | | Retired | | 158 | | None |
Teresa M. Ressel — 1962 Trustee | | 2017 | | Non-executive director and trustee of a number of public and private business corporations Formerly: Chief Financial Officer, Olayan America, The Olayan Group (international investor/commercial/industrial); Chief Executive Officer, UBS Securities LLC; Group Chief Operating Officer, Americas, UBS AG; Assistant Secretary for Management & Budget and CFO, US Department of the Treasury | | 158 | | Atlantic Power Corporation (power generation company); ON Semiconductor Corp. (semiconductor supplier) |
Ann Barnett Stern — 1957 Trustee | | 2017 | | President and Chief Executive Officer, Houston Endowment Inc. (private philanthropic institution) Formerly: Executive Vice President and General Counsel, Texas Children’s Hospital; Attorney, Beck, Redden and Secrest, LLP; Business Law Instructor, University of St. Thomas; Attorney, Andrews & Kurth LLP | | 158 | | Federal Reserve Bank of Dallas |
Raymond Stickel, Jr. — 1944 Trustee | | 2005 | | Retired Formerly: Director, Mainstay VP Series Funds, Inc. (25 portfolios); Partner, Deloitte & Touche | | 158 | | None |
Robert C. Troccoli — 1949 Trustee | | 2016 | | Adjunct Professor, University of Denver — Daniels College of Business Formerly: Senior Partner, KPMG LLP | | 158 | | None |
Christopher L. Wilson — 1957 Trustee | | 2017 | | Non-executive director and trustee of a number of public and private business corporations Formerly: Director, TD Asset Management USA Inc. (mutual fund complex) (22 portfolios); Managing Partner, CT2, LLC (investing and consulting firm); President/Chief Executive Officer, Columbia Funds, Bank of America Corporation; President/Chief Executive Officer, CDC IXIS Asset Management Services, Inc.; Principal & Director of Operations, Scudder Funds, Scudder, Stevens & Clark, Inc.; Assistant Vice President, Fidelity Investments | | 158 | | ISO New England, Inc. (non-profit organization managing regional electricity market) |
T-2 Invesco MLP Fund
Trustees and Officers—(continued)
| | | | | | | | |
Name, Year of Birth and
Position(s) Held with the Trust | | Trustee and/
or Officer Since | | Principal Occupation(s)
During Past 5 Years | | Number of
Funds in Fund
Complex
Overseen by
Trustee | | Other Directorship(s)
Held by Trustee During
Past 5 Years |
| Other Officers | | | | | | | | |
Sheri Morris — 1964 President, Principal Executive Officer and Treasurer | | 1999 | | President, Principal Executive Officer and Treasurer, The Invesco Funds; Vice President, Invesco Advisers, Inc. (formerly known as Invesco Institutional (N.A.), Inc.) (registered investment adviser); and Vice President, Invesco Exchange-Traded Fund Trust, Invesco Exchange-Traded Fund Trust II, Invesco India Exchange-Traded Fund Trust, Invesco Actively Managed Exchange-Traded Fund Trust, Invesco Actively Managed Exchange-Traded Commodity Fund Trust and Invesco Exchange-Traded Self-Indexed Fund Trust Formerly: Vice President and Principal Financial Officer, The Invesco Funds; Vice President, Invesco AIM Advisers, Inc., Invesco AIM Capital Management, Inc. and Invesco AIM Private Asset Management, Inc.; Assistant Vice President and Assistant Treasurer, The Invesco Funds and Assistant Vice President, Invesco Advisers, Inc., Invesco AIM Capital Management, Inc. and Invesco AIM Private Asset Management, Inc.; and Treasurer, Invesco Exchange-Traded Fund Trust, Invesco Exchange-Traded Fund Trust II, Invesco India Exchange-Traded Fund Trust and Invesco Actively Managed Exchange-Traded Fund Trust | | N/A | | N/A |
Russell C. Burk — 1958 Senior Vice President and Senior Officer | | 2005 | | Senior Vice President and Senior Officer, The Invesco Funds | | N/A | | N/A |
Jeffrey H. Kupor — 1968 Senior Vice President, Chief Legal Officer and Secretary | | 2018 | | Senior Vice President and Secretary, Invesco Advisers, Inc. (formerly known as Invesco Institutional (N.A.), Inc.) (registered investment adviser); Senior Vice President and Secretary, Invesco Distributors, Inc. (formerly known as Invesco AIM Distributors, Inc.); Vice President and Secretary, Invesco Investment Services, Inc. (formerly known as Invesco AIM Investment Services, Inc.) Senior Vice President, Chief Legal Officer and Secretary, The Invesco Funds; Secretary and General Counsel, Invesco Investment Advisers LLC (formerly known as Van Kampen Asset Management); Secretary and General Counsel, Invesco Capital Markets, Inc. (formerly known as Van Kampen Funds Inc.) and Chief Legal Officer, Invesco Exchange-Traded Fund Trust, Invesco Exchange-Traded Fund Trust II, Invesco India Exchange-Traded Fund Trust, Invesco Actively Managed Exchange-Traded Fund Trust, Invesco Actively Managed Exchange-Traded Commodity Fund Trust and Invesco Exchange-Traded Self-Indexed Fund Trust; Secretary, Invesco Indexing LLC; Secretary and General Counsel, INVESCO Private Capital Investments, Inc.; Secretary, W.L. Ross & Co., LLC; Secretary and Vice President, Jemstep, Inc. Formerly: Senior Vice President, Secretary and General Counsel, Invesco Management Group, Inc. (formerly known as Invesco AIM Management Group, Inc.); Assistant Secretary, INVESCO Asset Management (Bermuda) Ltd.; Secretary and General Counsel, Invesco Private Capital, Inc.; Assistant Secretary and General Counsel, INVESCO Realty, Inc.; Secretary and General Counsel, Invesco Senior Secured Management, Inc.; and Secretary, Sovereign G./P. Holdings Inc. | | N/A | | N/A |
John M. Zerr — 1962 Senior Vice President | | 2006 | | Chief Operating Officer of the Americas; Senior Vice President, Invesco Advisers, Inc. (formerly known as Invesco Institutional (N.A.), Inc.) (registered investment adviser); Senior Vice President, Invesco Distributors, Inc. (formerly known as Invesco AIM Distributors, Inc.); Director and Vice President, Invesco Investment Services, Inc. (formerly known as Invesco AIM Investment Services, Inc.) Senior Vice President, The Invesco Funds; Managing Director, Invesco Capital Management LLC; Director, Invesco Investment Advisers LLC (formerly known as Van Kampen Asset Management); Senior Vice President, Invesco Capital Markets, Inc. (formerly known as Van Kampen Funds Inc.); Manager, Invesco Indexing LLC Formerly: Director and Senior Vice President, Invesco Management Group, Inc. (formerly known as Invesco AIM Management Group, Inc.); Secretary and General Counsel, Invesco Management Group, Inc. (formerly known as Invesco AIM Management Group, Inc.); Secretary, Invesco Investment Services, Inc. (formerly known as Invesco AIM Investment Services, Inc.); Chief Legal Officer and Secretary, The Invesco Funds; Secretary and General Counsel, Invesco Investment Advisers LLC (formerly known as Van Kampen Asset Management); Secretary and General Counsel, Invesco Capital Markets, Inc. (formerly known as Van Kampen Funds Inc.); Chief Legal Officer, Invesco Exchange-Traded Fund Trust, Invesco Exchange-Traded Fund Trust II, Invesco India Exchange-Traded Fund Trust, Invesco Actively Managed Exchange-Traded Fund Trust, Invesco Actively Managed Exchange-Traded Commodity Fund Trust and Invesco Exchange-Traded Self-Indexed Fund Trust; Secretary, Invesco Indexing LLC; Director, Secretary, General Counsel and Senior Vice President, Van Kampen Exchange Corp.; Director, Vice President and Secretary, IVZ Distributors, Inc. (formerly known as INVESCO Distributors, Inc.); Director and Vice President, INVESCO Funds Group, Inc.; Director and Vice President, Van Kampen Advisors Inc.; Director, Vice President, Secretary and General Counsel, Van Kampen Investor Services Inc.; Director and Secretary, Invesco Distributors, Inc. (formerly known as Invesco AIM Distributors, Inc.); Director, Senior Vice President, General Counsel and Secretary, Invesco AIM Advisers, Inc. and Van Kampen Investments Inc.; Director, Vice President and Secretary, Fund Management Company; Director, Senior Vice President, Secretary, General Counsel and Vice President, Invesco AIM Capital Management, Inc.; Chief Operating Officer and General Counsel, Liberty Ridge Capital, Inc. (an investment adviser) | | N/A | | N/A |
T-3 Invesco MLP Fund
Trustees and Officers—(continued)
| | | | | | | | |
Name, Year of Birth and
Position(s) Held with the Trust | | Trustee and/
or Officer Since | | Principal Occupation(s)
During Past 5 Years | | Number of
Funds in Fund
Complex
Overseen by
Trustee | | Other Directorship(s)
Held by Trustee During
Past 5 Years |
| Other Officers—(continued) | | | | | | | | |
Gregory G. McGreevey — 1962 Senior Vice President | | 2012 | | Senior Managing Director, Invesco Ltd.; Director, Chairman, President, and Chief Executive Officer, Invesco Advisers, Inc. (formerly known as Invesco Institutional (N.A.), Inc.) (registered investment adviser); Director, Invesco Mortgage Capital, Inc. and Invesco Senior Secured Management, Inc.; and Senior Vice President, The Invesco Funds Formerly: Senior Vice President, Invesco Management Group, Inc. and Invesco Advisers, Inc.; Assistant Vice President, The Invesco Funds | | N/A | | N/A |
Kelli Gallegos — 1970 Vice President, Principal Financial Officer and Assistant Treasurer | | 2008 | | Vice President and Treasurer, Invesco Exchange-Traded Fund Trust, Invesco Exchange-Traded Fund Trust II, Invesco India Exchange-Traded Fund Trust, Invesco Actively Managed Exchange-Traded Fund Trust, Invesco Actively Managed Exchange-Traded Commodity Fund Trust and Invesco Exchange-Traded Self-Indexed Fund Trust; Vice President, Principal Financial Officer and Assistant Treasurer, The Invesco Funds; Principal Financial and Accounting Officer — Pooled Investments, Invesco Capital Management LLC Formerly: Assistant Treasurer, Invesco Exchange-Traded Fund Trust, Invesco Exchange-Traded Fund Trust II, Invesco India Exchange-Traded Fund Trust, Invesco Actively Managed Exchange-Traded Fund Trust, Invesco Actively Managed Exchange-Traded Commodity Fund Trust and Invesco Exchange-Traded Self-Indexed Fund Trust; Assistant Treasurer, Invesco Capital Management LLC; Assistant Vice President, The Invesco Funds | | N/A | | N/A |
Tracy Sullivan — 1962 Vice President, Chief Tax Officer and Assistant Treasurer | | 2008 | | Vice President, Chief Tax Officer and Assistant Treasurer, The Invesco Funds; Assistant Treasurer, Invesco Capital Management LLC, Invesco Exchange-Traded Fund Trust, Invesco Exchange-Traded Fund Trust II, Invesco India Exchange-Traded Fund Trust, Invesco Actively Managed Exchange-Traded Fund Trust, Invesco Actively Managed Exchange-Traded Commodity Fund Trust and Invesco Exchange-Traded Self-Indexed Fund Trust Formerly: Assistant Vice President, The Invesco Funds | | N/A | | N/A |
Crissie M. Wisdom — 1969 Anti-Money Laundering Compliance Officer | | 2013 | | Anti-Money Laundering Compliance Officer, Invesco Advisers, Inc. (formerly known as Invesco Institutional (N.A.), Inc.) (registered investment adviser), Invesco Capital Markets, Inc. (formerly known as Van Kampen Funds Inc.), Invesco Distributors, Inc., Invesco Investment Services, Inc., The Invesco Funds, and Invesco Exchange-Traded Fund Trust, Invesco Exchange-Traded Fund Trust II, Invesco India Exchange-Traded Fund Trust, Invesco Actively Managed Exchange-Traded Fund Trust, Invesco Actively Managed Exchange-Traded Commodity Fund Trust and Invesco Exchange-Traded Self-Indexed Fund Trust; Anti-Money Laundering Compliance Officer and Bank Secrecy Act Officer, INVESCO National Trust Company and Invesco Trust Company; and Fraud Prevention Manager and Controls and Risk Analysis Manager for Invesco Investment Services, Inc. Formerly: Anti-Money Laundering Compliance Officer, Van Kampen Exchange Corp. and Invesco Management Group, Inc. | | N/A | | N/A |
Robert R. Leveille — 1969 Chief Compliance Officer | | 2016 | | Chief Compliance Officer, Invesco Advisers, Inc. (registered investment adviser); and Chief Compliance Officer, The Invesco Funds Formerly: Chief Compliance Officer, Putnam Investments and the Putnam Funds | | N/A | | N/A |
The Statement of Additional Information of the Trust includes additional information about the Fund’s Trustees and is available upon request, without charge, by calling 1.800.959.4246. Please refer to the Fund’s Statement of Additional Information for information on the Fund’s sub-advisers.
| | | | | | |
Office of the Fund 11 Greenway Plaza, Suite 1000 Houston, TX 77046-1173 | | Investment Adviser Invesco Advisers, Inc. 1555 Peachtree Street, N.E. Atlanta, GA 30309 | | Distributor Invesco Distributors, Inc. 11 Greenway Plaza, Suite 1000 Houston, TX 77046-1173 | | Auditors PricewaterhouseCoopers LLP 1000 Louisiana Street, Suite 5800 Houston, TX 77002-5021 |
| | | |
| | | | | | |
Counsel to the Fund Stradley Ronon Stevens & Young, LLP 2005 Market Street, Suite 2600 Philadelphia, PA 19103-7018 | | Counsel to the Independent Trustees Goodwin Procter LLP 901 New York Avenue, N.W. Washington, D.C. 20001 | | Transfer Agent Invesco Investment Services, Inc. 11 Greenway Plaza, Suite 1000 Houston, TX 77046-1173 | | Custodian State Street Bank and Trust Company 225 Franklin Street Boston, MA 02110-2801 |
T-4 Invesco MLP Fund
Explore High-Conviction Investing with Invesco

Go paperless with eDelivery
Visit invesco.com/edelivery to enjoy the convenience and security of anytime electronic access to your investment documents.
With eDelivery, you can elect to have any or all of the following materials delivered straight to your inbox to download, save and print from your own computer:
∎ Fund reports and prospectuses
∎ Quarterly statements
∎ Daily confirmations
∎ Tax forms
Invesco mailing information
Send general correspondence to Invesco Investment Services, Inc., P.O. Box 219078, Kansas City, MO 64121-9078.
Important notice regarding delivery of security holder documents
To reduce Fund expenses, only one copy of most shareholder documents may be mailed to shareholders with multiple accounts at the same address (Householding). Mailing of your shareholder documents may be householded indefinitely unless you instruct us otherwise. If you do not want the mailing of these documents to be combined with those for other members of your household, please contact Invesco Investment Services, Inc. at 800 959 4246 or contact your financial institution. We will begin sending you individual copies for each account within 30 days after receiving your request.
Fund holdings and proxy voting information
The Fund provides a complete list of its holdings four times in each fiscal year, at the quarter ends. For the second and fourth quarters, the lists appear in the Fund’s semiannual and annual reports to shareholders. For the first and third quarters, the Fund files the lists with the Securities and Exchange Commission (SEC) on Form N-Q (or any successor Form). The most recent list of portfolio holdings is available at invesco.com/completeqtrholdings. Shareholders can also look up the Fund’s Forms N-Q (or any successor Form) on the SEC website at sec.gov. The SEC file numbers for the Fund are shown below.
A description of the policies and procedures that the Fund uses to determine how to vote proxies relating to portfolio securities is available without charge, upon request, from our Client Services department at 800 959 4246 or at invesco.com/proxyguidelines. The information is also available on the SEC website, sec.gov.
Information regarding how the Fund voted proxies related to its portfolio securities during the most recent 12-month period ended June 30 is available at invesco.com/proxysearch. The information is also available on the SEC website, sec.gov.
Invesco Advisers, Inc. is an investment adviser; it provides investment advisory services to individual and institutional clients and does not sell securities. Invesco Distributors, Inc. is the US distributor for Invesco Ltd.’s retail mutual funds, exchange-traded funds and institutional money market funds. Both are wholly owned, indirect subsidiaries of Invesco Ltd.
| | | | | | | | |
| SEC file numbers: 811-05426 and 033-19338 | | Invesco Distributors, Inc. | | MLP-AR-1 | | 12182018 | | 0841 |
| | | | |
| | |
 | | Annual Report to Shareholders | | October 31, 2018 |
| | |
| | Invesco Multi-Asset Income Fund Nasdaq: A: PIAFX ∎ C: PICFX ∎ R: PIRFX ∎ Y: PIYFX ∎ R5: IPNFX ∎ R6: PIFFX |

Letters to Shareholders
| | |

Philip Taylor | | Dear Shareholders: This annual report includes information about your Fund, including performance data and a complete list of its investments as of the close of the reporting period. Inside is a discussion of how your Fund was managed and the factors that affected its performance during the reporting period. Throughout the reporting period, US economic data remained positive. Robust corporate profits, strong retail sales and unemployment rates near generational lows helped drive US markets to new all-time records multiple times during the reporting period. Against this backdrop, the US Federal Reserve raised the federal funds rate four times during the reporting period. Market volatility, largely non-existent in 2017, returned in 2018. Markets sold off first in February and again sharply in October, amid rising interest rates, concerns about potential trade wars and heightened geopolitical tensions. Despite the volatility, US equity markets were largely positive for the |
reporting period and fared better than international markets. Emerging markets were particularly hard hit due to a strong US dollar. During the October sell-off, investors retreated to more defensive areas of the market and to US Treasuries. The broader bond market declined during the reporting period due to the increase in US Treasury yields and widening credit spreads. As the year progresses, we’ll see how the interplay of economic data, interest rates, geopolitics and a host of other factors affect US and overseas equity and fixed income markets. Short-term market volatility can prompt some investors to abandon their investment plans – and can cause others to settle for whatever returns the market has to offer. The investment professionals at Invesco, in contrast, invest with high conviction. This means that, no matter the asset class or the strategy, each investment team has a passion to exceed. We want to help investors achieve better outcomes, such as seeking higher returns, helping mitigate risk and generating income. Of course, investing with high conviction can’t guarantee a profit or ensure success; no investment strategy can. To learn more about how we invest with high conviction, visit invesco.com/HighConviction. You, too, can invest with high conviction by maintaining a long-term investment perspective and by working with your financial adviser on a regular basis. During periods of short-term market volatility or uncertainty, your financial adviser can keep you focused on your long-term investment goals – a new home, a child’s college education or a secure retirement. He or she also can share research about the economy, the markets and individual investment options. Visit our website for more information on your investments Our website, invesco.com/us, offers a wide range of market insights and investment perspectives. On the website, you’ll find detailed information about our funds, including performance, holdings and portfolio manager commentaries. You can access information about your account by completing a simple, secure online registration. To do so, select “Log In” on the right side of the homepage, and then select “Register for Individual Account Access.” In addition to the resources accessible on our website and through our mobile app, you can obtain timely updates to help you stay informed about the markets and the economy by connecting with Invesco on Twitter, LinkedIn or Facebook. You can access our blog at blog.invesco.us.com. Our goal is to provide you the information you want, when and where you want it. Finally, I’m pleased to share with you Invesco’s commitment to both the Principles for Responsible Investment and to considering environmental, social and governance issues in our robust investment process. I invite you to learn more at invesco.com/esg. Have questions? For questions about your account, contact an Invesco client services representative at 800 959 4246. For Invesco-related questions or comments, please email me directly at phil@invesco.com. All of us at Invesco look forward to serving your investment management needs. Thank you for investing with us. Sincerely, 
Philip Taylor Senior Managing Director, Invesco Ltd. |
|
| 2 Invesco Multi-Asset Income Fund |
| | |

Bruce Crockett | | Dear Fellow Shareholders: Among the many important lessons I’ve learned in more than 40 years in a variety of business endeavors is the value of a trusted advocate. As independent chair of the Invesco Funds Board, I can assure you that the members of the Board are strong advocates for the interests of investors in Invesco’s mutual funds. We work hard to represent your interests through oversight of the quality of the investment management services your funds receive and other matters important to your investment, including but not limited to: ∎ Ensuring that Invesco offers a diverse lineup of mutual funds that your financial adviser can use to strive to meet your financial needs as your investment goals change over time. ∎ Monitoring how the portfolio management teams of the Invesco funds are performing in light of changing economic and market conditions. |
∎ Assessing each portfolio management team’s investment performance within the context of the investment strategy described in the fund’s prospectus. ∎ Monitoring for potential conflicts of interests that may impact the nature of the services that your funds receive. We believe one of the most important services we provide our fund shareholders is the annual review of the funds’ advisory and sub-advisory contracts with Invesco Advisers and its affiliates. This review is required by the Investment Company Act of 1940 and focuses on the nature and quality of the services Invesco provides as the adviser to the Invesco funds and the reasonableness of the fees that it charges for those services. Each year, we spend months carefully reviewing information received from Invesco and a variety of independent sources, such as performance and fee data prepared by Lipper, Inc. (a subsidiary of Broadridge Financial Solutions, Inc.), an independent, third-party firm widely recognized as a leader in its field. We also meet with our independent legal counsel and other independent advisers to review and help us assess the information that we have received. Our goal is to assure that you receive quality investment management services for a reasonable fee. I trust the measures outlined above provide assurance that you have a worthy advocate when it comes to choosing the Invesco Funds. As always, please contact me at bruce@brucecrockett.com with any questions or concerns you may have. On behalf of the Board, we look forward to continuing to represent your interests and serving your needs. |
|
Sincerely, 
Bruce L. Crockett Independent Chair Invesco Funds Board of Trustees |
|
| 3 Invesco Multi-Asset Income Fund |
Management’s Discussion of Fund Performance
| | | | | |
Performance summary | |
For the fiscal year ended October 31, 2018, Class A shares of Invesco Multi-Asset Income Fund (the Fund), at net asset value (NAV), underperformed the Custom Invesco Multi-Asset Income Index, the Fund’s style-specific benchmark. Your Fund’s long-term performance appears later in this report. | |
Fund vs. Indexes | |
Total returns, 10/31/17 to 10/31/18, at net asset value (NAV). Performance shown does not include applicable contingent deferred sales charges (CDSC) or front-end sales charges, which would have reduced performance. | |
| |
Class A Shares | | | | -3.13% | |
Class C Shares | | | | -3.87 | |
Class R Shares | | | | -3.38 | |
Class Y Shares | | | | -2.89 | |
Class R5 Shares | | | | -2.79 | |
Class R6 Shares | | | | -2.89 | |
Bloomberg Barclays U.S. Aggregate Bond Index▼ (Broad Market Index) | | | | -2.05 | |
Custom Invesco Multi-Asset Income Index⬛ (Style-Specific Index) | | | | 2.87 | |
Lipper Mixed-Asset Target Allocation Conservative Funds Index◆ (Peer Group Index) | | | | -0.38 | |
Source(s): ▼FactSet Research Systems Inc.; ⬛Invesco, FactSet Research Systems Inc.; ◆ Lipper Inc. | |
| | |
Market conditions and your Fund For the fiscal year ended October 31, 2018, Invesco Multi-Asset Income Fund provided negative returns. Strategically, the Fund’s exposure to US master limited partnerships (MLPs) and US mortgage real estate investment trusts (REITs) posted marginally positive results, but were not enough to counter the drag from the Fund’s largest detractors, US 30-year STRIPS (Separate Trading of Registered Interest and Principal of Securities) and emerging markets government bonds. Tactical allocation shifts also detracted from the Fund’s performance during the fiscal year, mainly due to inopportune long exposures to equities during periods of increased market volatility. The tactical step of the investment process allows the Fund to adapt to short-term market dynamics by shifting its sensitivity to equity or fixed income markets, which are used as proxies for risk metrics incurred within the strategic allocation. | | Interest rate sensitive US 30-year STRIPS were the largest detractor from the Fund’s results for the fiscal year. After three increases of the federal funds rate in 2017 (the last one in December of that year), the US Federal Reserve (the Fed) anticipated three additional increases in 2018, which took effect in March, June and September. These increases meaningfully impacted long duration of highly interest rate sensitive US 30-year STRIPS. As a reminder, this asset is included in the portfolio to add protection in periods of broad market contraction. Exposure to emerging market debt also detracted from Fund results during the fiscal year. Performance for this asset class often exhibits an inherent inverse correlation with the valuation of the US dollar that is affected by interest rate moves. Higher US rates make short-term money market investments denominated in that currency more attractive for |
investors seeking safe-haven assets in the US economy. This in turn makes the US currency more valuable relative to local currencies. Consequently, dollar-denominated emerging market debt becomes more expensive to service with a weaker local currency. This phenomenon was experienced throughout the entire fiscal year and highlighted by strong devaluations in the Turkish lira and Argentine peso. Both countries’ currency devaluations were additionally exacerbated by increasing geopolitical tensions.
Preferred securities also detracted from the Fund’s results during the fiscal year. The performance of the asset class was consistent with ongoing tightening monetary policy. At the close of the fiscal year, it was our view that an end to current restrictive practices was not foreseeable in the near term.
US high yield securities were a marginal contributor to the Fund’s performance during the fiscal year. While the market environment was difficult for risky assets such as high yield, energy prices, which rallied substantially over the fiscal year, exerted positive influence on the performance of high yield securities, countering the negative effect from the broader market volatility.
Mortgage REITs (i.e., bundles of mortgages that pass homeowners’ payments on to investors) were the strongest performers for the fiscal year and contributed to Fund performance. While tightening monetary policies are generally negative for this asset class, the broad positive outlook for the US economy for 2018 – which included steadily falling mortgage default rates, rising housing prices, a stronger economy and a declining unemployment rate – enhanced homeowners’ ability to service their debt, which in turn aided mortgage REIT dividend payments and security prices.
| | | | | | | | | | |
Portfolio Composition |
By security type | | % of total net assets |
| | |
| U.S. Dollar Denominated Bonds & Notes | | 49.0% |
Preferred Stocks | | 20.9 |
| Common Stocks & Other Equity Interests | | 9.5 |
Exchange Traded Notes | | 8.9 |
U.S. Treasury Securities | | 8.2 |
Exchange-Traded Funds | | 1.2 |
Non-U.S. Dollar Denominated Bonds & Notes | | 0.4 |
| Variable Rate Senior Loan Interests | | 0.2 |
Money Market Funds Plus Other Assets Less Liabilities | | 1.7 |
| | | | | |
Top Five Debt Issuers |
| % of total net assets |
| | |
| |
1. U.S. Treasury Securities | | 8.0% |
2. GS Finance Corp. | | 3.2 |
3. Citigroup Global Markets
Holdings Inc. | | 3.1 |
4. Morgan Stanley Finance LLC | | 2.1 |
5. Sprint Corp. | | 0.5 |
| | | | | | | | | | |
Total Net Assets | | $561.7 million | |
| | | | | | | | | | |
| | |
Total Number of Holdings* | | | | 697 | | | |
The Fund’s holdings are subject to change, and there is no assurance that the Fund will continue to hold any particular security.
*Excluding money market fund holdings.
Data presented here are as of October 31, 2018.
|
| 4 Invesco Multi-Asset Income Fund |
MLPs were another contributor to the Fund’s performance for the fiscal year. This is consistent with the performance in the energy sector. Much of the news that kept energy prices buoyed related to newly imposed sanctions on Iran, draws on US inventories and lack of definition of OPEC’s production cuts, as well as Venezuela’s depleted oil production infrastructure, which made an impact on global prices.
The Fund’s tactical allocation was a detractor to overall Fund results for the fiscal year. While overweight exposure to equity markets proved beneficial to the Fund’s performance during most of the fiscal year, October’s fierce return to market volatility was enough to derail the previous eleven month’s positive path into negative territory. The generally defensive posture in German bunds and UK gilts detracted from Fund results as geopolitical tensions and a potential failure of Brexit negotiations increased demand for these safe-haven assets. Conversely, our broad defensive posture to US treasuries countered part of the negative behavior of this component.
Increased tariff measures from the US continue to be a source of concern for investors as companies have increasingly highlighted the potential rise in costs that higher tariffs will bring. While the Fed appears undeterred in its path to continue increasing rates well into 2019, much of this stance will depend on how the coming months pan out as these tariffs take effect and broader macroeconomic data becomes available.
Please note that our strategy utilizes derivative instruments that include futures and total return swaps. Therefore, some of the performance of the strategy, both positive and negative, can be attributed to these instruments. Derivatives can be a cost-effective way to gain exposure to asset classes. However, derivatives may amplify traditional investment risks through the creation of leverage and may be less liquid than traditional securities.
Thank you for your continued investment in Invesco Multi-Asset Income Fund.
The views and opinions expressed in management’s discussion of Fund performance are those of Invesco Advisers, Inc. These views and opinions are subject to change at any time based on factors such as market and economic conditions. These views and opinions may not be relied upon as investment advice or recommendations, or as an offer for a particular security. The information is not a complete analysis of every aspect of any market, country, industry, security or the Fund. Statements of fact are from sources considered reliable, but Invesco Advisers, Inc. makes no representation or warranty as to their completeness or accuracy. Although historical performance is no guarantee of future results, these insights may help you understand our investment management philosophy.
See important Fund and, if applicable, index disclosures later in this report.
| | |
 | | Scott Wolle Chartered Financial Analyst, Portfolio Manager, is lead manager of Invesco Multi-Asset Income |
| Fund. He joined Invesco in 1999. Mr. Wolle earned a BS in finance from Virginia Polytechnic Institute and State University and an MBA from Duke University Fuqua School of Business. |
| | |
 | | Mark Ahnrud Chartered Financial Analyst, Portfolio Manager, is manager of Invesco Multi-Asset Income Fund. He joined |
| Invesco in 2000. Mr. Ahnrud earned a BS in finance and investments from Babson College and an MBA from Duke University Fuqua School of Business. |
| | |
 | | Chris Devine Chartered Financial Analyst, Portfolio Manager, is manager of Invesco Multi-Asset Income Fund. He joined |
| Invesco in 1998. Mr. Devine earned a BA in economics from Wake Forest University and an MBA from the University of Georgia. |
| | |
 | | Scott Hixon Chartered Financial Analyst, Portfolio Manager, is manager of Invesco Multi-Asset Income Fund. He joined |
| Invesco in 1994. Mr. Hixon earned a BBA in finance from Georgia Southern University and an MBA in finance from Georgia State University. |
| | |
 | | Peter Hubbard Portfolio Manager, is manager of a portion of Invesco Multi-Asset Income Fund. He joined Invesco and/or its |
| investment advisory affiliates in 2005. Mr. Hubbard earned a BA in business and economics from Wheaton College. |
| | |
 | | Christian Ulrich Chartered Financial Analyst, Portfolio Manager, is manager of Invesco Multi-Asset Income Fund. He joined |
| Invesco in 2000. Mr. Ulrich earned the equivalent of a BBA from the KV Zurich Business School in Zurich, Switzerland. |
|
| 5 Invesco Multi-Asset Income Fund |
Your Fund’s Long-Term Performance
Results of a $10,000 Investment – Oldest Share Class(es) since Inception
Fund and index data from 12/14/11

Past performance cannot guarantee comparable future results.
The data shown in the chart include reinvested distributions, applicable sales charges and Fund expenses including management fees. Index results include reinvested dividends, but they do not reflect sales charges. Performance of the
peer group, if applicable, reflects fund expenses and management fees; performance of a market index does not. Performance shown in the chart and table(s) does not reflect deduction of taxes a shareholder would pay on Fund distributions or sale of Fund shares.
|
| 6 Invesco Multi-Asset Income Fund |
| | | | | |
Average Annual Total Returns | |
| As of 10/31/18, including maximum applicable sales charges | |
| |
Class A Shares | | | | | |
Inception (12/14/11) | | | | 4.58 | % |
5 Years | | | | 4.03 | |
1 Year | | | | -8.45 | |
| |
Class C Shares | | | | | |
Inception (12/14/11) | | | | 4.65 | % |
5 Years | | | | 4.41 | |
1 Year | | | | -4.78 | |
| |
Class R Shares | | | | | |
Inception (12/14/11) | | | | 5.18 | % |
5 Years | | | | 4.96 | |
1 Year | | | | -3.38 | |
| |
Class Y Shares | | | | | |
Inception (12/14/11) | | | | 5.69 | % |
5 Years | | | | 5.44 | |
1 Year | | | | -2.89 | |
| |
Class R5 Shares | | | | | |
Inception (12/14/11) | | | | 5.71 | % |
5 Years | | | | 5.46 | |
1 Year | | | | -2.79 | |
| |
Class R6 Shares | | | | | |
Inception | | | | 5.67 | % |
5 Years | | | | 5.46 | |
1 Year | | | | -2.89 | |
Class R6 shares incepted on September 24, 2012. Performance shown prior to that date is that of Class A shares and includes the 12b-1 fees applicable to Class A shares.
The performance data quoted represent past performance and cannot guarantee comparable future results; current performance may be lower or higher. Please visit invesco.com/performance for the most recent month-end performance. Performance figures reflect reinvested distributions, changes in net asset value and the effect of the maximum sales charge unless otherwise stated. Investment return and principal value will fluctuate so that you may have a gain or loss when you sell shares.
The net annual Fund operating expense ratio set forth in the most recent Fund prospectus as of the date of this report for Class A, Class C, Class R, Class Y, Class R5 and Class R6 shares was 0.85%, 1.60%, 1.10%, 0.60%, 0.60% and 0.60%, respectively.1,2 The total annual Fund operating expense ratio set forth in the most recent Fund prospectus as of the date of this report for Class A, Class C, Class R, Class Y,
| | | | | |
Average Annual Total Returns | |
| As of 9/30/18, the most recent calendar quarter end, including maximum applicable sales charges | |
| |
Class A Shares | | | | | |
Inception (12/14/11) | | | | 5.35 | % |
5 Years | | | | 5.53 | |
1 Year | | | | -4.35 | |
| |
Class C Shares | | | | | |
Inception (12/14/11) | | | | 5.43 | % |
5 Years | | | | 5.93 | |
1 Year | | | | -0.54 | |
| |
Class R Shares | | | | | |
Inception (12/14/11) | | | | 5.97 | % |
5 Years | | | | 6.48 | |
1 Year | | | | 0.92 | |
| |
Class Y Shares | | | | | |
Inception (12/14/11) | | | | 6.49 | % |
5 Years | | | | 6.99 | |
1 Year | | | | 1.43 | |
| |
Class R5 Shares | | | | | |
Inception (12/14/11) | | | | 6.50 | % |
5 Years | | | | 7.01 | |
1 Year | | | | 1.43 | |
| |
Class R6 Shares | | | | | |
Inception | | | | 6.48 | % |
5 Years | | | | 7.01 | |
1 Year | | | | 1.53 | |
Class R5 and Class R6 shares was 1.06%, 1.81%, 1.31%, 0.81%, 0.72% and 0.69%, respectively. The expense ratios presented above may vary from the expense ratios presented in other sections of this report that are based on expenses incurred during the period covered by this report.
Class A share performance reflects the maximum 5.50% sales charge, and Class C share performance reflects the applicable contingent deferred sales charge (CDSC) for the period involved. The CDSC on Class C shares is 1% for the first year after purchase. Class R, Class Y, Class R5 and Class R6 shares do not have a front-end sales charge or a CDSC; therefore, performance is at net asset value.
The performance of the Fund’s share classes will differ primarily due to different sales charge structures and class expenses.
Fund performance reflects any applicable fee waivers and/or expense reimbursements. Had the adviser not waived fees and/or reimbursed expenses currently or in the past, returns would have been lower. See current prospectus for more information.
| 1 | Total annual Fund operating expenses after any contractual fee waivers and/or expense reimbursements by the adviser in effect through at least February 29, 2020. See current prospectus for more information. |
| 2 | Total annual Fund operating expenses after any contractual fee waivers and/or expense reimbursements by the adviser in effect through at least June 30, 2020. See current prospectus for more information. |
|
| 7 Invesco Multi-Asset Income Fund |
Invesco Multi-Asset Income Fund’s investment objective is to provide current income.
| ∎ | | Unless otherwise stated, information presented in this report is as of October 31, 2018, and is based on total net assets. |
| ∎ | | Unless otherwise noted, all data provided by Invesco. |
| ∎ | | To access your Fund’s reports/prospectus, visit invesco.com/fundreports. |
About share classes
| ∎ | | Class R shares are generally available only to employer sponsored retirement and benefit plans. Please see the prospectus for more information. |
| ∎ | | Class Y shares are available only to certain investors. Please see the prospectus for more information. |
| ∎ | | Class R5 shares and Class R6 shares are available for use by retirement plans that meet certain standards and for institutional investors. Class R6 shares are also available through intermediaries that have established an agreement with Invesco Distributors, Inc. to make such shares available for use in retail omnibus accounts. Please see the prospectus for more information. |
Principal risks of investing in the Fund
| ∎ | | Active trading risk. Active trading of portfolio securities may result in added expenses, a lower return and increased tax liability. |
| ∎ | | Bank loan risk. There are a number of risks associated with an investment in bank loans including credit risk, interest rate risk, liquidity risk and prepayment risk. Lack of an active trading market, restrictions on resale, irregular trading activity, wide bid/ask spreads and extended trade settlement periods may impair the Fund’s ability to sell bank loans within its desired time frame or at an acceptable price and its ability to accurately value existing and prospective investments. Extended trade settlement periods may result in cash not being immediately available to the Fund. As a result, the Fund may have to sell other investments or engage in borrowing transactions to raise cash to meet its obligations. The risk of holding bank loans is also directly tied to the risk of insolvency or bankruptcy of the issuing banks. These risks could cause the Fund to lose income or principal on a particular investment, which in turn could affect the Fund’s returns. |
| | The value of bank loans can be affected by and sensitive to changes in government regulation and to economic downturns in the United States and abroad. Bank loans generally are floating rate loans, which are subject to interest rate risk as the interest paid on the floating rate loans adjusts periodically based on changes in widely accepted reference rates. |
| ∎ | | Changing fixed income market conditions risk. The current low interest rate environment was created in part by the Federal Reserve Board (FRB) and certain foreign central banks keeping the federal funds and equivalent foreign rates near, at or below zero. Increases in the federal funds and equivalent foreign rates may expose fixed income markets to heightened volatility and reduced liquidity for certain fixed income investments, particularly those with longer maturities. In addition, decreases in fixed income dealer market-making capacity may also potentially lead to heightened volatility and reduced liquidity in the fixed income markets. As a result, the value of the Fund’s investments and share price may decline. Changes in central bank policies could also result in higher than normal shareholder redemptions, which could potentially increase portfolio turnover and the Fund’s transaction costs. |
| ∎ | | Commodities tax risk. The tax treatment of commodity-linked derivative instruments may be adversely affected by changes in legislation, regulations or other legally binding authority. If, as a result of any such adverse action, the income of the Fund from certain commodity-linked derivatives was treated as non-qualifying income, the Fund might fail to qualify as a regulated investment company and be subject to federal income tax at the Fund level. As a result of a recent announcement by the Internal Revenue Service, the Fund intends to invest in commodity-linked notes: (a) directly, relying on an opinion of counsel confirming that income |
|
This report must be accompanied or preceded by a currently effective Fund prospectus, which contains more complete information, including sales charges and expenses. Investors should read it carefully before investing. |
NOT FDIC INSURED | MAY LOSE VALUE | NO BANK GUARANTEE |
| | from such investments should be qualifying income because such commodity-linked notes constitute securities under section 2(a)(36) of the 1940 Act or (b) indirectly through the Subsidiary. Should the Internal Revenue Service issue further guidance, or Congress enact legislation, that adversely affects the tax treatment of the Fund’s use of commodity-linked notes or the Subsidiary (which guidance might be applied to the Fund retroactively), it could, among other consequences, limit the Fund’s ability to pursue its investment strategy. |
| ∎ | | Commodity risk. The Fund may have investment exposure to the commodities markets and/or a particular sector of the commodities markets, which may subject the Fund to greater volatility than investments in traditional securities, such as stocks and bonds. Volatility in the commodities markets may be caused by changes in overall market movements, domestic and foreign political and economic events and policies, war, acts of terrorism, changes in domestic or foreign interest rates and/ or investor expectations concerning interest rates, domestic and foreign inflation rates, investment and trading activities of mutual funds, hedge funds and commodities funds, and factors such as drought, floods, weather, livestock disease, embargoes, tariffs and other regulatory developments or supply and demand disruptions. Because the Fund’s performance may be linked to the performance of volatile commodities, investors should be willing to assume the risks of potentially significant fluctuations in the value of the Fund’s shares. |
| ∎ | | Credit linked notes risk. Risks of credit linked notes include those risks associated with the underlying reference obligation including but not limited to market risk, interest rate risk, credit risk, default risk and, in some cases, foreign currency risk. An investor in a credit linked note bears counterparty risk or the risk that the issuer of the credit linked note will default or become bankrupt and not make timely payment of principal and interest of the structured security. Credit linked notes may be less liquid than other investments |
|
| 8 Invesco Multi-Asset Income Fund |
| | and therefore harder to dispose of at the desired time and price. In addition, credit linked notes may be leveraged and, as a result, small changes in the value of the underlying reference obligation may produce disproportionate losses to the Fund. |
| ∎ | | Debt securities risk. The prices of debt securities held by the Fund will be affected by changes in interest rates, the creditworthiness of the issuer and other factors. An increase in prevailing interest rates typically causes the value of existing debt securities to fall and often has a greater impact on longer-duration debt securities and higher quality debt securities. Falling interest rates will cause the Fund to reinvest the proceeds of debt securities that have been repaid by the issuer at lower interest rates. Falling interest rates may also reduce the Fund’s distributable income because interest payments on floating rate debt instruments held by the Fund will decline. The Fund could lose money on investments in debt securities if the issuer or borrower fails to meet its obligations to make interest payments and/or to repay principal in a timely manner. Changes in an issuer’s financial strength, the market’s perception of such strength or in the credit rating of the issuer or the security may affect the value of debt securities. The Adviser’s credit analysis may fail to anticipate such changes, which could result in buying a debt security at an inopportune time or failing to sell a debt security in advance of a price decline or other credit event. |
| ∎ | | Derivatives risk. The value of a derivative instrument depends largely on (and is derived from) the value of an underlying security, currency, commodity, interest rate, index or other asset (each referred to as an underlying asset). In addition to risks relating to the underlying assets, the use of derivatives may include other, possibly greater, risks, including counterparty, leverage and liquidity risks. Counterparty risk is the risk that the counterparty to the derivative contract will default on its obligation to pay the Fund the amount owed or otherwise perform under the derivative contract. Derivatives create leverage risk because they do not require payment up |
| | | front equal to the economic exposure created by owning the derivative. As a result, an adverse change in the value of the underlying asset could result in the Fund sustaining a loss that is substantially greater than the amount invested in the derivative, which may make the Fund’s returns more volatile and increase the risk of loss. Derivative instruments may also be less liquid than more traditional investments and the Fund may be unable to sell or close out its derivative positions at a desirable time or price. This risk may be more acute under adverse market conditions, during which the Fund may be most in need of liquidating its derivative positions. Derivatives may also be harder to value, less tax efficient and subject to changing government regulation that could impact the Fund’s ability to use certain derivatives or their cost. Also, derivatives used for hedging or to gain or limit exposure to a particular market segment may not provide the expected benefits, particularly during adverse market conditions. These risks are greater for the Fund than mutual funds that do not use derivative instruments or that use derivative instruments to a lesser extent than the Fund to implement their investment strategies. |
| ∎ | | Dividend paying security risk. Securities that pay high dividends as a group can fall out of favor with the market, causing such companies to under-perform companies that do not pay high dividends. Also, changes in the dividend policies of such companies and the capital resources available for such companies’ dividend payments may affect the fund. |
| ∎ | | Emerging markets securities risk. Emerging markets (also referred to as developing markets) are generally subject to greater market volatility, political, social and economic instability, uncertain trading markets and more governmental limitations on foreign investment than more developed markets. In addition, companies operating in emerging markets may be subject to lower trading volume and greater price fluctuations than companies in more developed markets. Securities law and the enforcement of systems of taxation in many emerging market countries |
| | may change quickly and unpredictably. In addition, investments in emerging markets securities may also be subject to additional transaction costs, delays in settlement procedures, and lack of timely information. |
| ∎ | | Equity linked notes risk. ELNs may not perform as anticipated and could cause the Fund to realize significant losses including its entire principal investment. Other risks include those of underlying securities, as well as counterparty risk, liquidity risk and imperfect correlation between ELNs and the underlying securities. |
| ∎ | | Exchange-traded funds risk. In addition to the risks associated with the underlying assets held by the exchange-traded fund, investments in exchange-traded funds are subject to the following additional risks: (1) an exchange-traded fund’s shares may trade above or below its net asset value; (2) an active trading market for the exchange-traded fund’s shares may not develop or be maintained; (3) trading an exchange-traded fund’s shares may be halted by the listing exchange; (4) a passively managed exchange-traded fund may not track the performance of the reference asset; and (5) a passively managed exchange-traded fund may hold troubled securities. Investment in exchange-traded funds may involve duplication of management fees and certain other expenses, as the Fund indirectly bears its proportionate share of any expenses paid by the exchange-traded funds in which it invests. Further, certain exchange-traded funds in which the Fund may invest are leveraged, which may result in economic leverage, permitting the Fund to gain exposure that is greater than would be the case in an unlevered instrument and potentially resulting in greater volatility. |
| ∎ | | Exchange-traded notes risk. Exchange-traded notes are subject to credit risk, counterparty risk, and the risk that the value of the exchange-traded note may drop due to a downgrade in the issuer’s credit rating. The value of an exchange-traded note may also be influenced by time to maturity, level of supply and demand for the exchange-traded note, volatility and lack of liquidity in the underlying market, changes in the applicable interest rates, and economic, |
|
| 9 Invesco Multi-Asset Income Fund |
| | legal, political, or geographic events that affect the referenced underlying market or assets. The Fund will bear its proportionate share of any fees and expenses borne by an exchange-traded note in which it invests. For certain exchange-traded notes, there may be restrictions on the Fund’s right to redeem its investment, which is meant to be held until maturity. |
| ∎ | | Financial services sector risk. The Fund may be susceptible to adverse economic or regulatory occurrences affecting the financial services sector. Financial services companies are subject to extensive government regulation and are disproportionately affected by unstable interest rates, each of which could adversely affect the profitability of such companies. Financial services companies may also have concentrated portfolios, which makes them especially vulnerable to unstable economic conditions. |
| ∎ | | Foreign currency tax risk. If the US Treasury Department were to exercise its authority to issue regulations that exclude from the definition of “qualifying income” foreign currency gains not directly related to the Fund’s business of investing in securities, the Fund may be unable to qualify as a regulated investment company for one or more years. In this event, the Fund’s Board of Trustees may authorize a significant change in investment strategy or other action. |
| ∎ | | Foreign government debt risk. Investments in foreign government debt securities (sometimes referred to as sovereign debt securities) involve certain risks in addition to those relating to foreign securities or debt securities generally. The issuer of the debt or the governmental authorities that control the repayment of the debt may be unable or unwilling to repay principal or interest when due in accordance with the terms of such debt, and the Fund may have limited recourse in the event of a default against the defaulting government. Without the approval of debt holders, some governmental debtors have in the past been able to reschedule or restructure their debt payments or declare moratoria on payments. |
| ∎ | | Foreign securities risk. The Fund’s foreign investments may be adversely affected by political and social instability, changes in economic or taxation policies, difficulty in enforcing obligations, decreased liquidity or increased volatility. Foreign investments also involve the risk of the possible seizure, nationalization or expropriation of the issuer or foreign deposits (in which the Fund |
| | | could lose its entire investments in a certain market) and the possible adoption of foreign governmental restrictions such as exchange controls. Unless the Fund has hedged its foreign securities risk, foreign securities risk also involves the risk of negative foreign currency rate fluctuations, which may cause the value of securities denominated in such foreign currency (or other instruments through which the Fund has exposure to foreign currencies) to decline in value. Currency exchange rates may fluctuate significantly over short periods of time. Currency hedging strategies, if used, are not always successful. |
| ∎ | | High yield debt securities (junk bond) risk. Investments in high yield debt securities (“junk bonds”) and other lower-rated securities will subject the Fund to substantial risk of loss. These securities are considered to be speculative with respect to the issuer’s ability to pay interest and principal when due, are more susceptible to default or decline in market value and are less liquid than investment grade debt securities. Prices of high yield debt securities tend to be very volatile. |
| ∎ | | Indexing risk. Certain portions of the Fund’s assets are managed pursuant to an indexing approach (Indexed Assets) and, therefore, the adverse performance of a particular security necessarily will not result in the elimination of the security from the Indexed Assets. Ordinarily, the Fund will not sell portfolio securities of the Indexed Assets except to reflect additions or deletions of the securities that comprise the index the Fund seeks to track with respect to the Indexed Assets (Underlying Index), or as may be necessary to raise cash to pay Fund shareholders who sell Fund shares. As such, the Indexed Assets, and therefore the Fund, will be negatively affected by declines in the securities represented by the Underlying Index. Also, there is no guarantee that the Fund will be able to correlate the performance of the Indexed Assets with that of the Underlying Index. |
| ∎ | | Investment companies risk. Investing in other investment companies could result in the duplication of certain fees, including management and administrative fees, and may expose the Fund to the risks of owning the underlying investments that the other investment company holds. |
| ∎ | | Liquidity risk. The Fund may be unable to sell illiquid investments at the time or price it desires and, as a result, could lose its entire investment in such |
| | | investments. Liquid securities can become illiquid during periods of market stress. If a significant amount of the Fund’s securities become illiquid, the Fund may not be able to timely pay redemption proceeds and may need to sell securities at significantly reduced prices. |
| ∎ | | Management risk. Certain portions of the Fund’s assets are actively managed and depend heavily on the Adviser’s judgment about markets, interest rates or the attractiveness, relative values, liquidity, or potential appreciation of particular investments made for the Fund’s portfolio. The Fund could experience losses if these judgments prove to be incorrect. Because the Fund’s investment process relies heavily on its asset allocation process, market movements that are counter to the portfolio managers’ expectations may have a significant adverse effect on the Fund’s net asset value. Additionally, legislative, regulatory, or tax developments may adversely affect management of the Fund and, therefore, the ability of the Fund to achieve its investment objective. |
| ∎ | | Market risk. The market values of the Fund’s investments, and therefore the value of the Fund’s shares, will go up and down, sometimes rapidly or unpredictably. Market risk may affect a single issuer, industry or section of the economy, or it may affect the market as a whole. Individual stock prices tend to go up and down more dramatically than those of certain other types of investments, such as bonds. During a general downturn in the financial markets, multiple asset classes may decline in value. When markets perform well, there can be no assurance that specific investments held by the Fund will rise in value. |
| ∎ | | MLP risk. The Fund invests in securities of MLPs, which are subject to the following risks: |
| | - | Limited partner risk. An MLP is a public limited partnership or limited liability company taxed as a partnership under the Internal Revenue Code of 1986, as amended (the Code). Although the characteristics of MLPs closely resemble a traditional limited partnership, a major difference is that MLPs may trade on a public exchange or in the over-the-counter market. The risks of investing in an MLP are similar to those of investing in a partnership, including more flexible governance structures, which could result in less protection for investors than investments in a corporation. Investors in |
|
| 10 Invesco Multi-Asset Income Fund |
| | an MLP normally would not be liable for the debts of the MLP beyond the amount that the investor has contributed but investors may not be shielded to the same extent that a shareholder of a corporation would be. In certain circumstances, creditors of an MLP would have the right to seek return of capital distributed to a limited partner, which right would continue after an investor sold its investment in the MLP. In addition, MLP distributions may be reduced by fees and other expenses incurred by the MLP. |
| | - | Liquidity risk. The ability to trade on a public exchange or in the over-the-counter market provides a certain amount of liquidity not found in many limited partnership investments. However, MLP interests may be less liquid than conventional publicly traded securities and, therefore, more difficult to trade at desirable times and/or prices. |
| | - | Interest rate risk. MLPs generally are considered interest-rate sensitive investments. During periods of interest rate volatility, these investments may not provide attractive returns. |
| | - | General partner risk. The holder of the general partner or managing member interest can be liable in certain circumstances for amounts greater than the amount of the holder’s investment in the general partner or managing member. |
Additionally, if the Fund were to invest more than 25% of its total assets in MLPs that are taxed as partnerships this could cause the Fund to lose its status as regulated investment company under Subchapter M of the Code.
| ∎ | | MLP tax risk. MLPs taxed as partnerships do not pay US federal income tax at the partnership level. A change in current tax law, or a change in the underlying business mix of a given MLP, however, could result in an MLP being classified as a corporation for US federal income tax purposes, which would have the effect of reducing the amount of cash available for distribution by the MLP and, as a result, could result in a reduction of the value of the Fund’s investment, and consequently your investment in the Fund and lower income. Each year, the Fund will send you an annual tax statement (Form 1099) to assist you in completing your federal, state and local tax returns. If an MLP in which the Fund invests |
| | | amends its partnership tax return, the Fund will, when necessary, send you a corrected Form 1099, which could, in turn, require you to amend your federal, state or local tax returns. |
| ∎ | | Mortgage- and asset-backed securities risk. Mortgage- and asset-backed securities, including collateralized debt obligations and collateralized mortgage obligations, are subject to prepayment or call risk, which is the risk that a borrower’s payments may be received earlier or later than expected due to changes in prepayment rates on underlying loans. This could result in the Fund reinvesting these early payments at lower interest rates, thereby reducing the Fund’s income. Mortgage- and asset-backed securities also are subject to extension risk, which is the risk that an unexpected rise in interest rates could reduce the rate of prepayments, causing the price of the mortgage- and asset-backed securities and the Fund’s share price to fall. An unexpectedly high rate of defaults on the mortgages held by a mortgage pool may adversely affect the value of mortgage-backed securities and could result in losses to the Fund. The Fund may invest in mortgage pools that include subprime mortgages, which are loans made to borrowers with weakened credit histories or with lower capacity to make timely payments on their mortgages. Privately issued mortgage-related securities are not subject to the same underwriting requirements as those with government or government-sponsored entity guarantees and, therefore, mortgage loans underlying privately issued mortgage-related securities may have less favorable collateral, credit risk or other underwriting characteristics, and wider variances in interest rate, term, size, purpose and borrower characteristics. |
| ∎ | | Non-correlation risk. The return of the Fund’s assets managed pursuant to an indexing approach (Indexed Assets) may not match the return of the index the Fund seeks to track with respect to the Indexed Assets (Underlying Index) for a number of reasons. For example, the Fund incurs operating expenses not applicable to the Underlying Index, and incurs costs in buying and selling securities, especially when rebalancing securities holdings to reflect changes in the Underlying Index. In addition, the performance of the Indexed Assets and the Underlying Index may vary due to asset valuation differences and differences between the Indexed Assets and the Underlying Index resulting from |
| | | legal restrictions, costs or liquidity constraints. |
| ∎ | | Preferred securities risk. Preferred securities are subject to issuer-specific and market risks applicable generally to equity securities. Preferred securities also may be subordinated to bonds or other debt instruments, subjecting them to a greater risk of non-payment, may be less liquid than many other securities, such as common stocks, and generally offer no voting rights with respect to the issuer. |
| ∎ | | REIT risk/real estate risk. Investments in real estate related instruments may be affected by economic, legal, cultural, environmental or technological factors that affect property values, rents or occupancies of real estate related to the Fund’s holdings. Shares of real estate related companies, which tend to be small- and mid-cap companies, may be more volatile and less liquid. |
| ∎ | | Sampling risk. The Fund’s use of a sampling methodology with respect to assets managed pursuant to an indexing approach (Indexed Assets) may result in the Indexed Assets including a smaller number of securities than are in the index the Fund seeks to track with respect to the Indexed Assets (Underlying Index), and in the Indexed Assets including securities that are not included in the Underlying Index. As a result, an adverse development to an issuer of securities included in the Indexed Assets could result in a greater decline in the Fund’s NAV than would be the case if all of the securities in the Underlying Index were included in the Indexed Assets. The Fund’s use of a sampling methodology may also include the risk that the Indexed Assets may not track the return of the Underlying Index as well as they would have if the Indexed Assets included all of the securities in the Underlying Index. To the extent the assets in the Indexed Assets are smaller, these risks will be greater. |
| ∎ | | Short position risk. Because the Fund’s potential loss on a short position arises from increases in the value of the asset sold short, the Fund will incur a loss on a short position, which is theoretically unlimited, if the price of the asset sold short increases from the short sale price. The counterparty to a short position or other market factors may prevent the Fund from closing out a short position at a desirable time or price and may reduce or eliminate any gain or result in a loss. In a rising market, the Fund’s short positions will cause the Fund to underperform the overall |
|
| 11 Invesco Multi-Asset Income Fund |
| | market and its peers that do not engage in shorting. If the Fund holds both long and short positions, and both positions decline simultaneously, the short positions will not provide any buffer (hedge) from declines in value of the Fund’s long positions. Certain types of short positions involve leverage, which may exaggerate any losses, potentially more than the actual cost of the investment, and will increase the volatility of the Fund’s returns. |
| ∎ | | Subsidiary risk. By investing in the Subsidiary, the Fund is indirectly exposed to risks associated with the Subsidiary’s investments. The Subsidiary is not registered under the Investment Company Act of 1940, as amended (1940 Act), and, except as otherwise noted in this prospectus, is not subject to the investor protections of the 1940 Act. Changes in the laws of the United States and/or the Cayman Islands, under which the Fund and the Subsidiary, respectively, are organized, could result in the inability of the Fund and/or the Subsidiary to operate as described in this prospectus and the SAI, and could negatively affect the Fund and its shareholders. |
| ∎ | | US government obligations risk. Obligations of US government agencies and authorities receive varying levels of support and may not be backed by the full faith and credit of the US government, which could affect the Fund’s ability to recover should they default. No assurance can be given that the US government will provide financial support to its agencies and authorities if it is not obligated by law to do so. |
About indexes used in this report
| ∎ | | The Bloomberg Barclays U.S. Aggregate Bond Index is an unmanaged index considered representative of the US investment grade, fixed-rate bond market. |
| ∎ | | The Custom Invesco Multi-Asset Income Index is composed of the following indexes: S&P 500 and Bloomberg Barclays U.S. Universal. |
| ∎ | | The Lipper Mixed-Asset Target Allocation Conservative Funds Index is an unmanaged index considered representative of mixed-asset target allocation conservative funds tracked by Lipper. |
| ∎ | | The S&P 500® Index is an unmanaged index considered representative of the US stock market. |
| ∎ | | The Bloomberg Barclays U.S. Universal Index is an unmanaged index composed of US dollar-denominated, taxable bonds that are rated investment grade or below investment grade. |
| ∎ | | The Fund is not managed to track the performance of any particular index, including the index(es) described here, and consequently, the performance of the Fund may deviate significantly from the performance of the index(es). |
| ∎ | | A direct investment cannot be made in an index. Unless otherwise indicated, index results include reinvested dividends, and they do not reflect sales charges. Performance of the peer group, if applicable, reflects fund expenses; performance of a market index does not. |
Other information
| ∎ | | The returns shown in management’s discussion of Fund performance are based on net asset values (NAVs) calculated for shareholder transactions. Generally accepted accounting principles require adjustments to be made to the net assets of the Fund at period end for financial reporting purposes, and as such, the NAVs for shareholder transactions and the returns based on those NAVs may differ from the NAVs and returns reported in the Financial Highlights. |
|
| 12 Invesco Multi-Asset Income Fund |
Schedule of Investments(a)
October 31, 2018
| | | | | | | | |
| | | Principal
Amount | | | Value | |
U.S. Dollar Denominated Bonds & Notes–49.00% | |
| Aerospace & Defense–0.47% | | | | | |
BBA U.S. Holdings, Inc., Sr. Unsec. Notes, 5.38%, 05/01/2026(b) | | $ | 173,000 | | | $ | 171,486 | |
Bombardier Inc. (Canada),
Sr. Unsec. Notes, 6.13%, 01/15/2023(b) | | | 516,000 | | | | 512,130 | |
7.50%, 03/15/2025(b) | | | 512,000 | | | | 514,407 | |
TransDigm Inc., Sr. Unsec. Gtd. Sub. Global Notes, 6.50%, 07/15/2024 | | | 245,000 | | | | 248,268 | |
TransDigm UK Holdings PLC, Sr. Unsec. Sub. Gtd. Notes, 6.88%, 05/15/2026(b) | | | 601,000 | | | | 601,000 | |
Triumph Group, Inc., Sr. Unsec. Gtd. Global Notes, 7.75%, 08/15/2025 | | | 650,000 | | | | 612,625 | |
| | | | | | | | 2,659,916 | |
| |
| Agricultural & Farm Machinery–0.14% | | | | | |
Titan International, Inc., Sr. Sec. Gtd. First Lien Global Notes, 6.50%, 11/30/2023 | | | 830,000 | | | | 776,050 | |
| |
| Agricultural Products–0.06% | | | | | |
Kernel Holding S.A. (Ukraine), REGS, Sr. Unsec. Gtd. Euro Notes, 8.75%, 01/31/2022(b) | | | 350,000 | | | | 352,574 | |
| |
| Airlines–0.08% | | | | | |
Air Canada (Canada), Sr. Unsec. Gtd. Notes, 7.75%, 04/15/2021(b) | | | 425,000 | | | | 456,833 | |
| |
| Alternative Carriers–0.35% | | | | | |
CenturyLink, Inc.,
Series S, Sr. Unsec. Notes, 6.45%, 06/15/2021 | | | 535,000 | | | | 549,044 | |
Series Y, Sr. Unsec. Global Notes, 7.50%, 04/01/2024 | | | 477,000 | | | | 502,043 | |
Level 3 Financing, Inc., Sr. Unsec. Gtd. Global Notes,
5.25%, 03/15/2026 | | | 627,000 | | | | 603,487 | |
5.38%, 05/01/2025 | | | 296,000 | | | | 289,710 | |
| | | | | | | | 1,944,284 | |
| |
| Aluminum–0.14% | | | | | |
Novelis Corp., Sr. Unsec. Gtd. Notes, 5.88%, 09/30/2026(b) | | | 53,000 | | | | 50,085 | |
6.25%, 08/15/2024(b) | | | 731,000 | | | | 725,517 | |
| | | | | | | | 775,602 | |
| | |
| Apparel Retail–0.32% | | | | | | | | |
Hot Topic, Inc., Sr. Sec. Gtd. First Lien Notes, 9.25%, 06/15/2021(b) | | | 481,000 | | | | 477,392 | |
L Brands, Inc., Sr. Unsec. Gtd. Global Notes,
5.63%, 02/15/2022 | | | 1,146,000 | | | | 1,167,487 | |
6.75%, 07/01/2036 | | | 30,000 | | | | 24,863 | |
6.88%, 11/01/2035 | | | 120,000 | | | | 102,600 | |
| | | | | | | | 1,772,342 | |
| | | | | | | | |
| | | Principal
Amount | | | Value | |
| Asset Management & Custody Banks–0.22% | | | | | |
Prime Security Services Borrower, LLC/Prime Finance, Inc., Sec. Gtd. Second Lien Notes, 9.25%, 05/15/2023(b) | | $ | 1,165,000 | | | $ | 1,233,968 | |
| |
| Auto Parts & Equipment–0.17% | | | | | |
Dana Financing Luxembourg S.a.r.l., Sr. Unsec. Gtd. Notes, 5.75%, 04/15/2025(b) | | | 100,000 | | | | 96,000 | |
Dana Inc., Sr. Unsec. Notes, 5.50%, 12/15/2024 | | | 520,000 | | | | 503,620 | |
Flexi-Van Leasing, Inc., Sec. Second Lien Notes, 10.00%, 02/15/2023(b) | | | 281,000 | | | | 234,635 | |
Hertz Corp. (The), Sec. Gtd. Second Lien Notes, 7.63%, 06/01/2022(b) | | | 134,000 | | | | 128,700 | |
| | | | | | | | 962,955 | |
| |
| Automobile Manufacturers–0.16% | | | | | |
J.B. Poindexter & Co., Inc., Sr. Unsec. Bonds, 7.13%, 04/15/2026(b) | | | 872,000 | | | | 902,520 | |
| | |
| Automotive Retail–0.25% | | | | | | | | |
Lithia Motors, Inc., Sr. Unsec. Gtd. Notes, 5.25%, 08/01/2025(b) | | | 177,000 | | | | 167,265 | |
Murphy Oil USA, Inc., Sr. Unsec. Gtd. Global Notes, 5.63%, 05/01/2027 | | | 590,000 | | | | 577,462 | |
Penske Automotive Group Inc., Sr. Unsec. Sub. Gtd. Notes, 5.50%, 05/15/2026 | | | 699,000 | | | | 667,545 | |
| | | | | | | | 1,412,272 | |
| | |
| Broadcasting–0.68% | | | | | | | | |
AMC Networks Inc., Sr. Unsec. Gtd. Global Notes,
4.75%, 08/01/2025 | | | 86,000 | | | | 80,161 | |
5.00%, 04/01/2024 | | | 565,000 | | | | 541,807 | |
Clear Channel Worldwide Holdings, Inc.,
Series B, Sr. Unsec. Gtd. Global Notes,
6.50%, 11/15/2022 | | | 335,000 | | | | 341,767 | |
Sr. Unsec. Gtd. Sub. Global Notes, 7.63%, 03/15/2020 | | | 1,070,000 | | | | 1,072,675 | |
Netflix, Inc.,
Sr. Unsec. Global Notes, 5.75%, 03/01/2024 | | | 423,000 | | | | 431,460 | |
Sr. Unsec. Notes, 5.88%, 11/15/2028(b) | | | 372,000 | | | | 367,350 | |
Nexstar Broadcasting, Inc., Sr. Unsec. Gtd. Notes, 5.63%, 08/01/2024(b) | | | 492,000 | | | | 471,090 | |
Tribune Media Co., Sr. Unsec. Gtd. Global Notes, 5.88%, 07/15/2022 | | | 139,000 | | | | 141,432 | |
See accompanying Notes to Financial Statements which are an integral part of the financial statements.
13 Invesco Multi-Asset Income Fund
| | | | | | | | |
| | | Principal
Amount | | | Value | |
| Broadcasting–(continued) | |
TV Azteca, S.A.B. de C.V. (Mexico), Sr. Unsec. Gtd. Euro Notes, 8.25%, 08/09/2024(b) | | $ | 350,000 | | | $ | 347,532 | |
| | | | | | | | 3,795,274 | |
| |
| Building Products–0.15% | | | | | |
Builders FirstSource, Inc., Sr. Sec. Gtd. First Lien Notes,
5.63%, 09/01/2024(b) | | | 195,000 | | | | 182,569 | |
Standard Industries Inc., Sr. Unsec. Notes,
5.00%, 02/15/2027(b) | | | 314,000 | | | | 287,310 | |
6.00%, 10/15/2025(b) | | | 384,000 | | | | 379,200 | |
| | | | | | | | 849,079 | |
| |
| Cable & Satellite–2.36% | | | | | |
Altice Financing S.A. (Luxembourg), Sr. Sec. Gtd. First Lien Bonds, 7.50%, 05/15/2026(b) | | | 600,000 | | | | 565,500 | |
Altice Luxembourg S.A. (Luxembourg), Sr. Unsec. Gtd. Notes, 7.75%, 05/15/2022(b) | | | 750,000 | | | | 696,563 | |
Altice US Finance I Corp., Sr. Sec. Gtd. First Lien Notes,
5.50%, 05/15/2026(b) | | | 415,000 | | | | 405,272 | |
CCO Holdings LLC/CCO Holdings Capital Corp.,
Sr. Unsec. Global Notes,
5.75%, 09/01/2023 | | | 510,000 | | | | 515,100 | |
Sr. Unsec. Notes, 5.75%, 02/15/2026(b) | | | 1,580,000 | | | | 1,568,150 | |
CSC Holdings LLC, Sr. Unsec. Notes,
10.13%, 01/15/2023(b) | | | 1,450,000 | | | | 1,577,556 | |
10.88%, 10/15/2025(b) | | | 400,000 | | | | 462,500 | |
DISH DBS Corp., Sr. Unsec. Gtd. Global Notes,
5.88%, 11/15/2024 | | | 2,145,000 | | | | 1,831,294 | |
7.88%, 09/01/2019 | | | 725,000 | | | | 748,417 | |
Intelsat Jackson Holdings S.A. (Luxembourg),
Sr. Sec. Gtd. First Lien Notes, 8.00%, 02/15/2024(b) | | | 175,000 | | | | 183,531 | |
Sr. Unsec. Gtd. Global Bonds, 5.50%, 08/01/2023 | | | 1,222,000 | | | | 1,096,745 | |
Sr. Unsec. Gtd. Notes, 8.50%, 10/15/2024(b) | | | 404,000 | | | | 397,435 | |
Sirius XM Radio Inc., Sr. Unsec. Gtd. Notes,
5.38%, 04/15/2025(b) | | | 2,000 | | | | 1,986 | |
6.00%, 07/15/2024(b) | | | 632,000 | | | | 647,674 | |
Unitymedia Hessen GmbH & Co. KG/Unitymedia NRW GmbH (Germany), Sr. Sec. Gtd. First Lien Bonds, 5.00%, 01/15/2025(b) | | | 700,000 | | | | 710,262 | |
UPC Holding B.V. (Netherlands), Sr. Sec. First Lien Notes, 5.50%, 01/15/2028(b) | | | 200,000 | | | | 185,500 | |
UPCB Finance IV Ltd. (Netherlands), Sr. Sec. First Lien Notes, 5.38%, 01/15/2025(b) | | | 200,000 | | | | 195,100 | |
| | | | | | | | |
| | | Principal
Amount | | | Value | |
| Cable & Satellite–(continued) | |
Virgin Media Finance PLC (United Kingdom), Sr. Unsec. Gtd. Notes, 6.00%, 10/15/2024(b) | | $ | 400,000 | | | $ | 392,000 | |
Virgin Media Secured Finance PLC (United Kingdom), Sr. Sec. Gtd. First Lien Notes, 5.50%, 08/15/2026(b) | | | 200,000 | | | | 189,000 | |
VTR Finance B.V. (Chile), Sr. Sec. First Lien Notes,
6.88%, 01/15/2024(b) | | | 539,000 | | | | 547,759 | |
Ziggo B.V. (Netherlands), Sr. Sec. Gtd. First Lien Notes, 5.50%, 01/15/2027(b) | | | 400,000 | | | | 368,000 | |
| | | | | | | | 13,285,344 | |
| | |
| Casinos & Gaming–0.44% | | | | | | | | |
Boyd Gaming Corp., Sr. Unsec. Gtd. Global Notes, 6.00%, 08/15/2026 | | | 180,000 | | | | 174,600 | |
6.38%, 04/01/2026 | | | 278,000 | | | | 276,610 | |
Codere Finance 2 (Luxembourg) S.A. (Spain), Sr. Sec. Gtd. First Lien Notes, 7.63%, 11/01/2021(b) | | | 200,000 | | | | 184,287 | |
MGM Resorts International, Sr. Unsec. Gtd. Global Notes,
6.63%, 12/15/2021 | | | 45,000 | | | | 47,236 | |
Sr. Unsec. Gtd. Notes, 4.63%, 09/01/2026 | | | 792,000 | | | | 718,740 | |
Scientific Games International Inc., Sr. Unsec. Gtd. Global Notes, 10.00%, 12/01/2022 | | | 703,000 | | | | 737,271 | |
Wynn Las Vegas LLC/Wynn Las Vegas Capital Corp., Sr. Unsec. Gtd. Notes, 5.50%, 03/01/2025(b) | | | 334,000 | | | | 318,553 | |
| | | | | | | | 2,457,297 | |
| |
| Coal & Consumable Fuels–0.08% | | | | | |
SunCoke Energy Partners, L.P./SunCoke Energy Partners Finance Corp., Sr. Unsec. Gtd. Notes, 7.50%, 06/15/2025(b) | | | 463,000 | | | | 472,260 | |
| |
| Commodity Chemicals–0.17% | | | | | |
Koppers Inc., Sr. Unsec. Gtd. Notes, 6.00%, 02/15/2025(b) | | | 356,000 | | | | 342,757 | |
Nufarm Australia Ltd./Nufarm Americas Inc. (Australia), Sr. Unsec. Gtd. Notes, 5.75%, 04/30/2026(b) | | | 247,000 | | | | 231,871 | |
Valvoline Inc., Sr. Unsec. Gtd. Global Notes, 5.50%, 07/15/2024 | | | 403,000 | | | | 401,489 | |
| | | | | | | | 976,117 | |
| |
| Communications Equipment–0.15% | | | | | |
Hughes Satellite Systems Corp., Sr. Sec. Gtd. First Lien Global Notes, 5.25%, 08/01/2026 | | | 486,000 | | | | 463,522 | |
Sr. Unsec. Gtd. Global Notes, 7.63%, 06/15/2021 | | | 357,000 | | | | 379,491 | |
| | | | | | | | 843,013 | |
See accompanying Notes to Financial Statements which are an integral part of the financial statements.
14 Invesco Multi-Asset Income Fund
| | | | | | | | |
| | | Principal
Amount | | | Value | |
| Construction & Engineering–0.02% | | | | | |
William Lyon Homes, Inc., Sr. Unsec. Gtd. Global Notes, 6.00%, 09/01/2023 | | $ | 116,000 | | | $ | 106,430 | |
|
| Construction Machinery & Heavy Trucks–0.18% | |
Meritor Inc., Sr. Unsec. Gtd. Notes, 6.25%, 02/15/2024 | | | 658,000 | | | | 651,420 | |
Terex Corp., Sr. Unsec. Gtd. Notes, 5.63%, 02/01/2025(b) | | | 358,000 | | | | 340,995 | |
| | | | | | | | 992,415 | |
| |
| Consumer Finance–0.46% | | | | | |
Ally Financial Inc.,
Sr. Unsec. Global Notes,
5.13%, 09/30/2024 | | | 725,000 | | | | 738,594 | |
Sr. Unsec. Gtd. Global Notes, 8.00%, 03/15/2020 | | | 280,000 | | | | 294,350 | |
Discover Financial Services, Series C, Jr. Unsec. Sub. Global Notes,
5.50%(c) | | | 316,000 | | | | 299,015 | |
Navient Corp., Sr. Unsec. Medium-Term Notes,
7.25%, 01/25/2022 | | | 230,000 | | | | 240,063 | |
8.00%, 03/25/2020 | | | 705,000 | | | | 737,606 | |
Unifin Financiera, S.A.B. de C.V., SOFOM, E.N.R. (Mexico), Sr. Unsec. Notes, 7.38%, 02/12/2026(b) | | | 293,000 | | | | 274,321 | |
| | | | | | | | 2,583,949 | |
| |
| Copper–0.43% | | | | | |
First Quantum Minerals Ltd. (Zambia), Sr. Unsec. Gtd. Notes,
7.00%, 02/15/2021(b) | | | 284,000 | | | | 278,320 | |
7.50%, 04/01/2025(b) | | | 1,033,000 | | | | 925,826 | |
Freeport-McMoRan Inc., Sr. Unsec. Gtd. Global Notes,
5.40%, 11/14/2034 | | | 1,010,000 | | | | 888,800 | |
Taseko Mines Ltd. (Canada), Sr. Sec. Gtd. First Lien Notes, 8.75%, 06/15/2022(b) | | | 344,000 | | | | 339,700 | |
| | | | | | | | 2,432,646 | |
|
| Data Processing & Outsourced Services–0.31% | |
First Data Corp.,
Sr. Sec. Gtd. First Lien Notes, 5.00%, 01/15/2024(b) | | | 60,000 | | | | 59,625 | |
Sr. Unsec. Gtd. Notes, 7.00%, 12/01/2023(b) | | | 1,626,000 | | | | 1,687,178 | |
| | | | | | | | 1,746,803 | |
| | |
| Diversified Banks–0.64% | | | | | | | | |
Barclays Bank PLC (United Kingdom), Unsec. Sub. Global Notes, 7.63%, 11/21/2022 | | | 200,000 | | | | 213,875 | |
Barclays PLC (United Kingdom), Jr. Unsec. Sub. Global Bonds, 7.75%(c) | | | 250,000 | | | | 250,050 | |
REGS, Jr. Unsec. Sub. Euro Bonds, 7.88%(b)(c) | | | 207,000 | | | | 213,728 | |
| | | | | | | | |
| | | Principal
Amount | | | Value | |
| Diversified Banks–(continued) | |
Credit Agricole S.A. (France), REGS, Jr. Unsec. Sub. Euro Notes,
8.13%(b)(c) | | $ | 247,000 | | | $ | 265,548 | |
Dresdner Funding Trust I (Germany), REGS, Jr. Unsec. Sub. Euro Notes, 8.15%, 06/30/2031(b) | | | 346,000 | | | | 430,789 | |
ING Groep N.V. (Netherlands), Jr. Unsec. Sub. Euro Bonds,
6.88%(b)(c) | | | 223,000 | | | | 225,648 | |
Jr. Unsec. Sub. Global Notes, 6.50%(c) | | | 218,000 | | | | 207,209 | |
Lloyds Banking Group PLC (United Kingdom), Jr. Unsec. Sub. Global Bonds, 7.50%(c) | | | 221,000 | | | | 223,486 | |
Royal Bank of Scotland Group PLC (The) (United Kingdom),
Jr. Unsec. Sub. Bonds, 7.50%(c) | | | 580,000 | | | | 591,020 | |
Jr. Unsec. Sub. Notes, 8.63%(c) | | | 207,000 | | | | 218,126 | |
Unsec. Sub. Global Bonds, 6.13%, 12/15/2022 | | | 285,000 | | | | 295,107 | |
Société Générale S.A. (France), REGS, Jr. Unsec. Sub. Euro Notes, 7.38%(b)(c) | | | 246,000 | | | | 249,997 | |
Standard Chartered PLC (United Kingdom), REGS, Jr. Unsec. Sub. Euro Bonds, 7.50%(b)(c) | | | 207,000 | | | �� | 209,588 | |
| | | | | | | | 3,594,171 | |
| |
| Diversified Capital Markets–6.42% | | | | | |
Citigroup Global Markets Holdings Inc., Series 1, Sr. Unsec. Notes, 7.65%, 12/21/2018(b) | | | 18,000,000 | | | | 17,605,800 | |
Credit Suisse Group AG (Switzerland), REGS, Jr. Unsec. Sub. Euro Bonds, 7.13%(b)(c) | | | 224,000 | | | | 227,640 | |
GS Finance Corp., Series 00H8, Sr. Unsec. Euro Notes, 0.00%, 01/23/2019(d) | | | 18,000,000 | | | | 18,220,086 | |
| | | | | | | | 36,053,526 | |
| | |
| Diversified Chemicals–0.07% | | | | | | | | |
Chemours Co. (The), Sr. Unsec. Gtd. Global Notes, 7.00%, 05/15/2025 | | | 70,000 | | | | 72,450 | |
Trinseo Materials Operating S.C.A./Trinseo Materials Finance, Inc., Sr. Unsec. Gtd. Notes, 5.38%, 09/01/2025(b) | | | 354,000 | | | | 330,105 | |
| | | | | | | | 402,555 | |
|
| Diversified Metals & Mining–0.15% | |
HudBay Minerals, Inc. (Canada), Sr. Unsec. Gtd. Notes, 7.63%, 01/15/2025(b) | | | 437,000 | | | | 440,277 | |
Teck Resources Ltd. (Canada), Sr. Unsec. Notes, 6.13%, 10/01/2035 | | | 390,000 | | | | 396,825 | |
| | | | | | | | 837,102 | |
See accompanying Notes to Financial Statements which are an integral part of the financial statements.
15 Invesco Multi-Asset Income Fund
| | | | | | | | |
| | | Principal
Amount | | | Value | |
| Electric Utilities–0.24% | | | | | | | | |
NextEra Energy Capital Holdings, Inc., Jr. Unsec. Gtd. Sub. Investment Units, 5.00%, 01/15/2073 | | $ | 23,200 | | | $ | 511,560 | |
Series K, Jr. Unsec. Gtd. Sub. Investment Units, 5.25%, 06/01/2076 | | | 34,800 | | | | 815,016 | |
| | | | | | | | 1,326,576 | |
|
| Electrical Components & Equipment–0.12% | |
EnerSys, Sr. Unsec. Gtd. Notes, 5.00%, 04/30/2023(b) | | | 693,000 | | | | 687,803 | |
|
| Electronic Equipment & Instruments–0.07% | |
Itron, Inc., Sr. Unsec. Gtd. Notes, 5.00%, 01/15/2026(b) | | | 443,000 | | | | 413,651 | |
|
| Environmental & Facilities Services–0.35% | |
Advanced Disposal Services, Inc., Sr. Unsec. Gtd. Notes, 5.63%, 11/15/2024(b) | | | 112,000 | | | | 109,480 | |
Core & Main LP, Sr. Unsec. Notes, 6.13%, 08/15/2025(b) | | | 478,000 | | | | 450,515 | |
Hulk Finance Corp. (Canada), Sr. Unsec. Notes, 7.00%, 06/01/2026(b) | | | 1,031,000 | | | | 951,097 | |
Waste Pro USA, Inc., Sr. Unsec. Notes, 5.50%, 02/15/2026(b) | | | 339,000 | | | | 322,050 | |
Wrangler Buyer Corp., Sr. Unsec. Notes, 6.00%, 10/01/2025(b) | | | 107,000 | | | | 115,025 | |
| | | | | | | | 1,948,167 | |
|
| Fertilizers & Agricultural Chemicals–0.08% | |
OCI N.V. (Netherlands), Sr. Sec. Gtd. Notes, 6.63%, 04/15/2023(b) | | | 460,000 | | | | 473,225 | |
|
| Financial Exchanges & Data–0.04% | |
MSCI Inc., Sr. Unsec. Gtd. Notes, 5.25%, 11/15/2024(b) | | | 235,000 | | | | 237,938 | |
| | |
| Food Distributors–0.10% | | | | | | | | |
US Foods, Inc., Sr. Unsec. Gtd. Notes, 5.88%, 06/15/2024(b) | | | 568,000 | | | | 565,160 | |
| | |
| Food Retail–0.14% | | | | | | | | |
Albertsons Cos. LLC/ Safeway Inc./New Albertson’s L.P./Albertson’s LLC, Sr. Unsec. Gtd. Global Notes, 6.63%, 06/15/2024 | | | 587,000 | | | | 557,650 | |
Ingles Markets, Inc., Sr. Unsec. Global Notes, 5.75%, 06/15/2023 | | | 207,000 | | | | 207,000 | |
| | | | | | | | 764,650 | |
| | |
| Gas Utilities–0.41% | | | | | | | | |
AmeriGas Partners, L.P./AmeriGas Finance Corp., Sr. Unsec. Global Notes, 5.88%, 08/20/2026 | | | 875,000 | | | | 831,250 | |
Ferrellgas L.P./Ferrellgas Finance Corp.,
Sr. Unsec. Global Notes, 6.50%, 05/01/2021 | | | 400,000 | | | | 360,000 | |
Sr. Unsec. Gtd. Global Notes, 6.75%, 06/15/2023 | | | 109,000 | | | | 94,557 | |
| | | | | | | | |
| | | Principal
Amount | | | Value | |
| Gas Utilities–(continued) | | | | | | | | |
Suburban Propane Partners, L.P./Suburban Energy Finance Corp., Sr. Unsec. Global Notes, 5.50%, 06/01/2024 | | $ | 1,072,000 | | | $ | 1,023,760 | |
| | | | | | | | 2,309,567 | |
|
| Health Care Equipment–0.10% | |
Hill-Rom Holdings, Inc., Sr. Unsec. Gtd. Notes, 5.00%, 02/15/2025(b) | | | 495,000 | | | | 480,150 | |
Teleflex Inc., Sr. Unsec. Gtd. Global Notes, 4.88%, 06/01/2026 | | | 56,000 | | | | 54,880 | |
| | | | | | | | 535,030 | |
| | |
| Health Care Facilities–1.10% | | | | | | | | |
Acadia Healthcare Co., Inc., Sr. Unsec. Gtd. Global Notes, 6.50%, 03/01/2024 | | | 575,000 | | | | 587,363 | |
Community Health Systems, Inc.,
Sec. Gtd. Second Lien Notes, 8.13%, 06/30/2024(b) | | | 11,000 | | | | 8,745 | |
Sr. Sec. Gtd. First Lien Global Notes, 5.13%, 08/01/2021 | | | 450,000 | | | | 428,625 | |
Sr. Sec. Gtd. First Lien Notes, 6.25%, 03/31/2023 | | | 612,000 | | | | 565,151 | |
Encompass Health Corp., Sr. Unsec. Gtd. Global Notes, 5.75%, 09/15/2025 | | | 540,000 | | | | 537,300 | |
HCA, Inc.,
Sr. Sec. Gtd. First Lien Notes,
5.25%, 04/15/2025 | | | 1,467,000 | | | | 1,501,841 | |
Sr. Unsec. Gtd. Global Notes, 7.50%, 02/15/2022 | | | 116,000 | | | | 126,150 | |
Sr. Unsec. Gtd. Notes, 5.38%, 02/01/2025 | | | 270,000 | | | | 272,363 | |
5.38%, 09/01/2026 | | | 169,000 | | | | 168,155 | |
5.88%, 02/15/2026 | | | 790,000 | | | | 809,750 | |
Tenet Healthcare Corp.,
Sec. Gtd. Second Lien Notes,
7.50%, 01/01/2022(b) | | | 31,000 | | | | 32,414 | |
Sr. Sec. Gtd. First Lien Global Notes, 6.00%, 10/01/2020 | | | 100,000 | | | | 102,655 | |
Sr. Unsec. Global Notes, 6.75%, 06/15/2023 | | | 1,035,000 | | | | 1,035,983 | |
| | | | | | | | 6,176,495 | |
|
| Health Care REITs–0.12% | |
MPT Operating Partnership L.P./MPT Finance Corp., Sr. Unsec. Gtd. Global Notes, 5.00%, 10/15/2027 | | | 736,000 | | | | 693,459 | |
| | |
| Health Care Services–0.45% | | | | | | | | |
DaVita Inc., Sr. Unsec. Gtd. Global Notes, 5.00%, 05/01/2025 | | | 380,000 | | | | 359,100 | |
Eagle Holding Co. II, LLC, Sr. Unsec. PIK Notes, 8.38% PIK Rate, 7.63% Cash Rate, 05/15/2022(b)(e) | | | 679,000 | | | | 684,092 | |
See accompanying Notes to Financial Statements which are an integral part of the financial statements.
16 Invesco Multi-Asset Income Fund
| | | | | | | | |
| | | Principal
Amount | | | Value | |
| Health Care Services–(continued) | |
Heartland Dental, LLC, Sr. Unsec. Notes, 8.50%, 05/01/2026(b) | | $ | 498,000 | | | $ | 475,590 | |
MPH Acquisition Holdings LLC, Sr. Unsec. Gtd. Notes, 7.13%, 06/01/2024(b) | | | 207,000 | | | | 210,792 | |
Surgery Center Holdings, Inc., Sr. Unsec. Gtd. Notes, 6.75%, 07/01/2025(b) | | | 171,000 | | | | 161,168 | |
8.88%, 04/15/2021(b) | | | 375,000 | | | | 387,188 | |
Team Health Holdings, Inc., Sr. Unsec. Gtd. Notes, 6.38%, 02/01/2025(b) | | | 315,000 | | | | 272,475 | |
| | | | | | | | 2,550,405 | |
| | |
| Home Furnishings–0.04% | | | | | | | | |
Prestige Brands, Inc., Sr. Unsec. Gtd. Notes, 6.38%, 03/01/2024(b) | | | 201,000 | | | | 199,493 | |
|
| Home Improvement Retail–0.12% | |
Hillman Group Inc. (The), Sr. Unsec. Gtd. Notes, 6.38%, 07/15/2022(b) | | | 771,000 | | | | 682,335 | |
| | |
| Homebuilding–0.60% | | | | | | | | |
Ashton Woods USA LLC/Ashton Woods Finance Co., Sr. Unsec. Notes, 6.88%, 02/15/2021(b) | | | 395,000 | | | | 396,975 | |
Beazer Homes USA, Inc., Sr. Unsec. Gtd. Global Notes,
5.88%, 10/15/2027 | | | 72,000 | | | | 58,500 | |
6.75%, 03/15/2025 | | | 395,000 | | | | 348,094 | |
8.75%, 03/15/2022 | | | 250,000 | | | | 253,125 | |
KB Home, Sr. Unsec. Gtd. Notes, 7.50%, 09/15/2022 | | | 223,000 | | | | 236,380 | |
Lennar Corp., Sr. Unsec. Gtd. Global Notes,
5.25%, 06/01/2026 | | | 255,000 | | | | 244,497 | |
5.38%, 10/01/2022 | | | 702,000 | | | | 716,040 | |
8.38%, 01/15/2021 | | | 50,000 | | | | 54,125 | |
Meritage Homes Corp., Sr. Unsec. Gtd. Global Notes,
6.00%, 06/01/2025 | | | 216,000 | | | | 211,140 | |
7.15%, 04/15/2020 | | | 65,000 | | | | 66,869 | |
SRS Distribution Inc., Sr. Unsec. Gtd. Notes, 8.25%, 07/01/2026(b) | | | 250,000 | | | | 235,000 | |
Taylor Morrison Communities Inc./ Taylor Morrison Holdings II, Inc., Sr. Unsec. Gtd. Notes, 5.88%, 04/15/2023(b) | | | 569,000 | | | | 564,732 | |
| | | | | | | | 3,385,477 | |
| | |
| Household Products–0.35% | | | | | | | | |
Reynolds Group Issuer Inc./LLC, Sr. Sec. Gtd. First Lien Notes, 5.13%, 07/15/2023(b) | | | 41,000 | | | | 40,180 | |
Sr. Unsec. Gtd. Notes, 7.00%, 07/15/2024(b) | | | 1,288,000 | | | | 1,293,635 | |
Spectrum Brands, Inc., Sr. Unsec. Gtd. Global Notes, 5.75%, 07/15/2025 | | | 635,000 | | | | 619,125 | |
| | | | | | | | 1,952,940 | |
| | | | | | | | |
| | | Principal
Amount | | | Value | |
| Independent Power Producers & Energy Traders–0.30% | |
AES Corp. (The), Sr. Unsec. Notes, 5.50%, 04/15/2025 | | $ | 279,000 | | | $ | 281,092 | |
Calpine Corp., Sr. Unsec. Global Notes, 5.38%, 01/15/2023 | | | 234,000 | | | | 222,593 | |
NRG Energy, Inc., Sr. Unsec. Gtd. Global Notes, 6.25%, 05/01/2024 | | | 404,000 | | | | 414,456 | |
6.63%, 01/15/2027 | | | 113,000 | | | | 117,379 | |
7.25%, 05/15/2026 | | | 335,000 | | | | 357,612 | |
Vistra Energy Corp., Sr. Unsec. Gtd. Global Notes, 7.38%, 11/01/2022 | | | 260,000 | | | | 270,400 | |
| | | | | | | | 1,663,532 | |
| | |
| Industrial Machinery–0.31% | | | | | | | | |
Cleaver-Brooks, Inc., Sr. Sec. Notes, 7.88%, 03/01/2023(b) | | | 706,000 | | | | 711,295 | |
EnPro Industries, Inc., Sr. Unsec. Notes, 5.75%, 10/15/2026(b) | | | 277,000 | | | | 274,313 | |
Mueller Industries, Inc., Unsec. Sub. Deb., 6.00%, 03/01/2027 | | | 485,000 | | | | 466,812 | |
Mueller Water Products, Inc., Sr. Unsec. Gtd. Notes, 5.50%, 06/15/2026(b) | | | 123,000 | | | | 122,078 | |
Stevens Holding Co., Inc., Sr. Unsec. Gtd. Notes, 6.13%, 10/01/2026(b) | | | 170,000 | | | | 169,808 | |
| | | | | | | | 1,744,306 | |
| | |
| Integrated Oil & Gas–0.19% | | | | | | | | |
Petrobras Global Finance B.V. (Brazil), Sr. Unsec. Gtd. Global Notes, 5.75%, 02/01/2029 | | | 591,000 | | | | 548,152 | |
Petróleos Mexicanos (Mexico), Sr. Unsec. Gtd. Global Notes, 6.88%, 08/04/2026 | | | 169,000 | | | | 168,747 | |
Sr. Unsec. Gtd. Notes, 5.35%, 02/12/2028(b) | | | 418,000 | | | | 373,441 | |
| | | | | | | | 1,090,340 | |
|
| Integrated Telecommunication Services–0.59% | |
Altice France S.A. (France),
Sr. Sec. Gtd. First Lien Bonds, 6.25%, 05/15/2024(b) | | | 466,000 | | | | 449,107 | |
Sr. Sec. Gtd. First Lien Notes, 7.38%, 05/01/2026(b) | | | 600,000 | | | | 578,250 | |
Cequel Communications Holdings I, LLC/ Capital Corp., Sr. Unsec. Notes, 7.75%, 07/15/2025(b) | | | 340,000 | | | | 360,400 | |
Cincinnati Bell Inc.,
Sr. Unsec. Gtd. Notes, 7.00%, 07/15/2024(b) | | | 502,000 | | | | 454,310 | |
Sr. Unsec. Notes, 8.00%, 10/15/2025(b) | | | 72,000 | | | | 65,880 | |
Frontier Communications Corp., Sr. Unsec. Global Notes, 10.50%, 09/15/2022 | | | 940,000 | | | | 787,250 | |
11.00%, 09/15/2025 | | | 378,000 | | | | 278,775 | |
See accompanying Notes to Financial Statements which are an integral part of the financial statements.
17 Invesco Multi-Asset Income Fund
| | | | | | | | |
| | | Principal
Amount | | | Value | |
| Integrated Telecommunication Services–(continued) | |
Telecom Italia Capital S.A. (Italy),
Sr. Unsec. Gtd. Global Notes, 6.38%, 11/15/2033 | | $ | 47,000 | | | $ | 43,240 | |
7.20%, 07/18/2036 | | | 320,000 | | | | 315,645 | |
| | | | | | | | 3,332,857 | |
|
| Internet Services & Infrastructure–0.08% | |
Rackspace Hosting, Inc., Sr. Unsec. Gtd. Notes, 8.63%, 11/15/2024(b) | | | 498,000 | | | | 469,365 | |
|
| Investment Banking & Brokerage–2.06% | |
Morgan Stanley Finance LLC, Series 38, Sr. Unsec. Notes, 0.00%, 11/07/2018(d) | | | 12,000,000 | | | | 11,578,644 | |
|
| Leisure Products–0.08% | |
Mattel, Inc.,
Sr. Unsec. Gtd. Notes, 6.75%, 12/31/2025(b) | | | 362,000 | | | | 346,503 | |
Sr. Unsec. Notes, 6.20%, 10/01/2040 | | | 113,000 | | | | 92,660 | |
| | | | | | | | 439,163 | |
|
| Life Sciences Tools & Services–0.02% | |
Charles River Laboratories International, Inc., Sr. Unsec. Gtd. Notes, 5.50%, 04/01/2026(b) | | | 138,000 | | | | 138,000 | |
|
| Managed Health Care–0.20% | |
Centene Corp., Sr. Unsec. Notes, 5.38%, 06/01/2026(b) | | | 276,000 | | | | 280,830 | |
Molina Healthcare, Inc., Sr. Unsec. Gtd. Notes, 4.88%, 06/15/2025(b) | | | 192,000 | | | | 184,320 | |
WellCare Health Plans Inc., Sr. Unsec. Notes,
5.25%, 04/01/2025 | | | 420,000 | | | | 420,000 | |
5.38%, 08/15/2026(b) | | | 238,000 | | | | 238,000 | |
| | | | | | | | 1,123,150 | |
|
| Metal & Glass Containers–0.19% | |
Ardagh Packaging Finance PLC / Ardagh Holdings USA Inc. (Ireland), Sr. Unsec. Gtd. Notes, 6.00%, 02/15/2025(b) | | | 600,000 | | | | 564,000 | |
Flex Acquisition Co., Inc., Sr. Unsec. Notes, 7.88%, 07/15/2026(b) | | | 405,000 | | | | 391,959 | |
OI European Group B.V., Sr. Unsec. Gtd. Notes, 4.00%, 03/15/2023(b) | | | 133,000 | | | | 124,854 | |
| | | | | | | | 1,080,813 | |
|
| Movies & Entertainment–0.10% | |
AMC Entertainment Holdings, Inc., Sr. Unsec. Gtd. Sub. Global Notes, 5.75%, 06/15/2025 | | | 585,000 | | | | 543,319 | |
| | |
| Multi-Utilities–0.34% | | | | | | | | |
Dominion Energy, Inc., Series A, Jr. Unsec. Sub. Investment Units, 5.25%, 07/30/2076 | | | 32,900 | | | | 758,674 | |
| | | | | | | | |
| | | Principal
Amount | | | Value | |
| Multi-Utilities–(continued) | | | | | | | | |
DTE Energy Co.,
Series B, Jr. Unsec. Sub. Investment Units, 5.38%, 06/01/2076 | | $ | 17,200 | | | $ | 395,772 | |
Series E, Jr. Unsec. Sub. Investment Units, 5.25%, 12/01/2077 | | | 17,200 | | | | 393,880 | |
Series F, Jr. Unsec. Sub. Investment Units, 6.00%, 12/15/2076 | | | 14,400 | | | | 373,536 | |
| | | | | | | | 1,921,862 | |
| | |
| Oil & Gas Drilling–0.48% | | | | | | | | |
Diamond Offshore Drilling, Inc., Sr. Unsec. Global Notes, 4.88%, 11/01/2043 | | | 192,000 | | | | 131,520 | |
Ensco PLC, Sr. Unsec. Global Notes, 4.50%, 10/01/2024 | | | 27,000 | | | | 22,039 | |
7.75%, 02/01/2026 | | | 619,000 | | | | 579,539 | |
Noble Holding International Ltd., Sr. Unsec. Gtd. Global Notes, 7.75%, 01/15/2024 | | | 731,000 | | | | 686,226 | |
Precision Drilling Corp. (Canada), Sr. Unsec. Gtd. Global Notes, 5.25%, 11/15/2024 | | | 610,000 | | | | 568,825 | |
6.50%, 12/15/2021 | | | 73,499 | | | | 74,417 | |
7.75%, 12/15/2023 | | | 25,000 | | | | 26,125 | |
Transocean Inc., Sr. Unsec. Gtd. Global Notes, 7.50%, 04/15/2031 | | | 647,000 | | | | 601,710 | |
| | | | | | | | 2,690,401 | |
|
| Oil & Gas Equipment & Services–0.28% | |
Archrock Partners, L.P./Archrock Partners Finance Corp., Sr. Unsec. Gtd. Global Notes, 6.00%, 10/01/2022 | | | 510,000 | | | | 507,450 | |
SESI, L.L.C., Sr. Unsec. Gtd. Global Notes, 7.13%, 12/15/2021 | | | 487,000 | | | | 484,565 | |
Weatherford International Ltd., Sr. Unsec. Gtd. Notes, 6.50%, 08/01/2036 | | | 365,000 | | | | 244,550 | |
8.25%, 06/15/2023 | | | 405,000 | | | | 311,850 | |
| | | | | | | | 1,548,415 | |
|
| Oil & Gas Exploration & Production–1.69% | |
Ascent Resources Utica Holdings, LLC /ARU Finance Corp., Sr. Unsec. Notes, 10.00%, 04/01/2022(b) | | | 290,000 | | | | 320,813 | |
California Resources Corp., Sec. Gtd. Second Lien Notes, 8.00%, 12/15/2022(b) | | | 328,000 | | | | 292,740 | |
Callon Petroleum Co., Sr. Unsec. Gtd. Global Notes, 6.13%, 10/01/2024 | | | 699,000 | | | | 685,020 | |
Denbury Resources Inc., Sr. Unsec. Gtd. Sub. Notes, 5.50%, 05/01/2022 | | | 198,000 | | | | 172,260 | |
See accompanying Notes to Financial Statements which are an integral part of the financial statements.
18 Invesco Multi-Asset Income Fund
| | | | | | | | |
| | | Principal
Amount | | | Value | |
| Oil & Gas Exploration & Production–(continued) | |
EP Energy LLC/Everest Acquisition Finance Inc., Sr. Sec. Gtd. First Lien Notes, 8.00%, 11/29/2024(b) | | $ | 611,000 | | | $ | 592,670 | |
Gulfport Energy Corp., Sr. Unsec. Gtd. Global Notes, 6.00%, 10/15/2024 | | | 216,000 | | | | 203,580 | |
6.63%, 05/01/2023 | | | 230,000 | | | | 231,150 | |
Jagged Peak Energy LLC, Sr. Unsec. Gtd. Notes, 5.88%, 05/01/2026(b) | | | 592,000 | | | | 578,680 | |
Oasis Petroleum Inc., Sr. Unsec. Gtd. Global Notes, 6.88%, 01/15/2023 | | | 647,000 | | | | 653,470 | |
Parsley Energy, LLC/Finance Corp., Sr. Unsec. Gtd. Notes, 5.63%, 10/15/2027(b) | | | 243,000 | | | | 240,150 | |
6.25%, 06/01/2024(b) | | | 533,000 | | | | 548,990 | |
QEP Resources, Inc., Sr. Unsec. Global Notes, 5.63%, 03/01/2026 | | | 438,000 | | | | 413,910 | |
Range Resources Corp., Sr. Unsec. Gtd. Global Notes, 4.88%, 05/15/2025 | | | 1,116,000 | | | | 1,037,880 | |
SM Energy Co., Sr. Unsec. Global Notes,
6.13%, 11/15/2022 | | | 345,000 | | | | 351,037 | |
6.63%, 01/15/2027 | | | 74,000 | | | | 74,740 | |
6.75%, 09/15/2026 | | | 225,000 | | | | 226,688 | |
Southwestern Energy Co., Sr. Unsec. Gtd. Global Notes, 7.50%, 04/01/2026 | | | 313,000 | | | | 320,043 | |
7.75%, 10/01/2027 | | | 327,000 | | | | 335,175 | |
Tullow Oil PLC (Ghana), Sr. Unsec. Notes, 7.00%, 03/01/2025(b) | | | 295,000 | | | | 289,498 | |
Whiting Petroleum Corp., Sr. Unsec. Gtd. Global Notes, 6.25%, 04/01/2023 | | | 510,000 | | | | 517,650 | |
WildHorse Resource Development Corp., Sr. Unsec. Gtd. Global Notes, 6.88%, 02/01/2025 | | | 828,000 | | | | 828,000 | |
WPX Energy Inc., Sr. Unsec. Notes, 5.25%, 09/15/2024 | | | 569,000 | | | | 564,732 | |
| | | | | | | | 9,478,876 | |
|
| Oil & Gas Refining & Marketing–0.13% | |
Parkland Fuel Corp. (Canada), Sr. Unsec. Notes, 6.00%, 04/01/2026(b) | | | 345,000 | | | | 338,100 | |
Sunoco LP/Sunoco Finance Corp., Sr. Unsec. Gtd. Notes, 4.88%, 01/15/2023(b) | | | 385,000 | | | | 372,006 | |
| | | | | | | | 710,106 | |
|
| Oil & Gas Storage & Transportation–0.36% | |
Antero Midstream Partners LP/Antero Midstream Finance Corp., Sr. Unsec. Gtd. Global Notes, 5.38%, 09/15/2024 | | | 350,000 | | | | 343,000 | |
Energy Transfer Equity, L.P., Sr. Sec. First Lien Notes, 5.88%, 01/15/2024 | | | 134,000 | | | | 141,035 | |
| | | | | | | | |
| | | Principal
Amount | | | Value | |
| Oil & Gas Storage & Transportation–(continued) | |
Plains All American Pipeline, L.P., Series B, Jr. Unsec. Sub. Notes, 6.13%(c) | | $ | 351,000 | | | $ | 330,818 | |
SemGroup Corp., Sr. Unsec. Gtd. Global Notes, 6.38%, 03/15/2025 | | | 535,000 | | | | 520,287 | |
Targa Resources Partners L.P./Targa Resources Partners Finance Corp.,
Sr. Unsec. Gtd. Global Bonds, 5.13%, 02/01/2025 | | | 442,000 | | | | 432,055 | |
Sr. Unsec. Gtd. Notes, 5.88%, 04/15/2026(b) | | | 227,000 | | | | 229,412 | |
| | | | | | | | 1,996,607 | |
|
| Other Diversified Financial Services–0.33% | |
Lincoln Finance Ltd. (Netherlands), Sr. Sec. Gtd. First Lien Notes, 7.38%, 04/15/2021(b) | | | 200,000 | | | | 203,750 | |
Lions Gate Capital Holdings LLC, Sr. Unsec. Gtd. Notes, 5.88%, 11/01/2024(b) | | | 395,000 | | | | 398,950 | |
LPL Holdings Inc., Sr. Unsec. Gtd. Notes, 5.75%, 09/15/2025(b) | | | 390,000 | | | | 379,275 | |
Mexico City Airport Trust (Mexico), REGS, Sr. Sec. Euro Bonds, 5.50%, 07/31/2047(b) | | | 243,000 | | | | 192,577 | |
Telenet Finance Luxembourg Notes S.a r.l. (Belgium), Sr. Sec. First Lien Notes, 5.50%, 03/01/2028(b) | | | 200,000 | | | | 186,500 | |
Tempo Acquisition, LLC/Finance Corp., Sr. Unsec. Notes, 6.75%, 06/01/2025(b) | | | 425,000 | | | | 405,747 | |
VFH Parent LLC/Orchestra Co-Issuer Inc., Sec. Gtd. Second Lien Notes, 6.75%, 06/15/2022(b) | | | 101,000 | | | | 103,273 | |
| | | | | | | | 1,870,072 | |
|
| Packaged Foods & Meats–0.22% | |
B&G Foods, Inc., Sr. Unsec. Gtd. Notes, 5.25%, 04/01/2025 | | | 286,000 | | | | 273,488 | |
JBS Investments GmbH, Sr. Unsec. Gtd. Notes, 7.25%, 04/03/2024(b) | | | 590,000 | | | | 597,375 | |
TreeHouse Foods, Inc., Sr. Unsec. Gtd. Notes, 6.00%, 02/15/2024(b) | | | 357,000 | | | | 357,892 | |
| | | | | | | | 1,228,755 | |
|
| Paper Packaging–0.08% | |
Plastipak Holdings Inc., Sr. Unsec. Notes, 6.25%, 10/15/2025(b) | | | 461,000 | | | | 424,120 | |
|
| Paper Products–0.16% | |
Mercer International Inc. (Canada), Sr. Unsec. Global Notes, 5.50%, 01/15/2026 | | | 163,000 | | | | 158,469 | |
6.50%, 02/01/2024 | | | 329,000 | | | | 333,112 | |
7.75%, 12/01/2022 | | | 24,000 | | | | 24,960 | |
See accompanying Notes to Financial Statements which are an integral part of the financial statements.
19 Invesco Multi-Asset Income Fund
| | | | | | | | |
| | | Principal
Amount | | | Value | |
| Paper Products–(continued) | |
Schweitzer-Mauduit International, Inc., Sr. Unsec. Notes, 6.88%, 10/01/2026(b) | | $ | 394,000 | | | $ | 399,910 | |
| | | | | | | | 916,451 | |
|
| Pharmaceuticals–0.49% | |
Bausch Health Cos. Inc.,
Sr. Sec. Gtd. First Lien Notes, 5.50%, 11/01/2025(b) | | | 307,000 | | | | 302,011 | |
Sr. Unsec. Gtd. Notes, 6.13%, 04/15/2025(b) | | | 100,000 | | | | 92,220 | |
9.00%, 12/15/2025(b) | | | 829,000 | | | | 867,341 | |
9.25%, 04/01/2026(b) | | | 301,000 | | | | 316,426 | |
Endo DAC/Endo Finance LLC/Endo Finco Inc., Sr. Unsec. Gtd. Notes, 6.00%, 07/15/2023(b) | | | 200,000 | | | | 173,440 | |
HLF Financing S.a.r.l., LLC/ Herbalife International, Inc., Sr. Unsec. Gtd. Notes, 7.25%, 08/15/2026(b) | | | 325,000 | | | | 329,469 | |
Teva Pharmaceutical Finance IV, B.V. (Israel), Sr. Unsec. Gtd. Global Notes, 3.65%, 11/10/2021 | | | 450,000 | | | | 431,404 | |
Teva Pharmaceutical Finance Netherlands III B.V. (Israel), Sr. Unsec. Gtd. Global Notes, 6.00%, 04/15/2024 | | | 268,000 | | | | 267,013 | |
| | | | | | | | 2,779,324 | |
|
| Publishing–0.16% | |
Meredith Corp., Sr. Unsec. Gtd. Notes, 6.88%, 02/01/2026(b) | | | 886,000 | | | | 888,215 | |
|
| Railroads–0.16% | |
Kenan Advantage Group Inc. (The), Sr. Unsec. Notes, 7.88%, 07/31/2023(b) | | | 876,000 | | | | 884,760 | |
|
| Regional Banks–0.08% | |
CIT Group Inc.,
Sr. Unsec. Global Notes, 5.00%, 08/15/2022 | | | 106,000 | | | | 107,060 | |
5.00%, 08/01/2023 | | | 260,000 | | | | 261,300 | |
Unsec. Sub. Global Notes, 6.13%, 03/09/2028 | | | 87,000 | | | | 90,480 | |
| | | | | | | | 458,840 | |
|
| Restaurants–0.39% | |
1011778 BC ULC/ New Red Finance, Inc. (Canada), Sec. Gtd. Second Lien Notes, 5.00%, 10/15/2025(b) | | | 1,447,000 | | | | 1,360,180 | |
IRB Holding Corp., Sr. Unsec. Gtd. Notes, 6.75%, 02/15/2026(b) | | | 603,000 | | | | 578,880 | |
KFC Holding Co./Pizza Hut Holdings LLC/Taco Bell of America LLC, Sr. Unsec. Gtd. Notes, 4.75%, 06/01/2027(b) | | | 240,000 | | | | 226,200 | |
| | | | | | | | 2,165,260 | |
|
| Security & Alarm Services–0.05% | |
Brink’s Co. (The), Sr. Unsec. Gtd. Notes, 4.63%, 10/15/2027(b) | | | 322,000 | | | | 297,045 | |
| | | | | | | | |
| | | Principal
Amount | | | Value | |
| Semiconductors–0.14% | |
NXP B.V./NXP Funding LLC (Netherlands), Sr. Unsec. Gtd. Notes, 4.63%, 06/01/2023(b) | | $ | 785,000 | | | $ | 780,094 | |
|
| Sovereign Debt–16.72% | |
Abu Dhabi Government International Bond (United Arab Emirates), REGS, Sr. Unsec. Euro Notes,
3.13%, 10/11/2027(b) | | | 900,000 | | | | 837,671 | |
4.13%, 10/11/2047(b) | | | 900,000 | | | | 835,079 | |
Argentine Republic Government International Bond (Argentina), Sr. Unsec. Global Bonds, 7.13%, 07/06/2036 | | | 950,000 | | | | 733,281 | |
7.63%, 04/22/2046 | | | 850,000 | | | | 672,669 | |
Sr. Unsec. Global Notes, 7.13%, 06/28/2117 | | | 1,018,000 | | | | 762,228 | |
Bahrain Government International Bond (Bahrain), REGS, Sr. Unsec. Euro Bonds, 6.00%, 09/19/2044(b) | | | 1,000,000 | | | | 810,840 | |
7.50%, 09/20/2047(b) | | | 1,000,000 | | | | 926,916 | |
Sr. Unsec. Euro Notes, 6.75%, 09/20/2029(b) | | | 900,000 | | | | 862,493 | |
Brazilian Government International Bond (Brazil), Sr. Unsec. Global Bonds,
5.63%, 01/07/2041 | | | 1,000,000 | | | | 924,250 | |
5.63%, 02/21/2047 | | | 900,000 | | | | 810,563 | |
8.25%, 01/20/2034 | | | 725,000 | | | | 870,906 | |
Chile Government International Bond (Chile), Sr. Unsec. Global Notes,
3.13%, 01/21/2026 | | | 900,000 | | | | 854,510 | |
3.24%, 02/06/2028 | | | 900,000 | | | | 845,100 | |
3.86%, 06/21/2047 | | | 1,100,000 | | | | 994,686 | |
China Government International Bond (China), REGS, Sr. Unsec. Euro Bonds,
2.13%, 11/02/2022(b) | | | 1,400,000 | | | | 1,342,845 | |
2.63%, 11/02/2027(b) | | | 1,400,000 | | | | 1,291,942 | |
Colombia Government International Bond (Colombia), Sr. Unsec. Global Bonds,
5.63%, 02/26/2044 | | | 800,000 | | | | 820,000 | |
6.13%, 01/18/2041 | | | 900,000 | | | | 972,909 | |
7.38%, 09/18/2037 | | | 700,000 | | | | 847,875 | |
Costa Rica Government International Bond (Costa Rica), REGS, Sr. Unsec. Euro Notes,
5.63%, 04/30/2043(b) | | | 1,100,000 | | | | 805,750 | |
7.00%, 04/04/2044(b) | | | 800,000 | | | | 663,200 | |
7.16%, 03/12/2045(b) | | | 800,000 | | | | 671,200 | |
Croatia Government International Bond (Croatia), REGS, Sr. Unsec. Euro Notes,
5.50%, 04/04/2023(b) | | | 1,200,000 | | | | 1,261,582 | |
6.00%, 01/26/2024(b) | | | 1,300,000 | | | | 1,403,724 | |
See accompanying Notes to Financial Statements which are an integral part of the financial statements.
20 Invesco Multi-Asset Income Fund
| | | | | | | | |
| | | Principal
Amount | | | Value | |
| Sovereign Debt–(continued) | |
Dominican Republic International Bond (Dominican Republic), REGS, Sr. Unsec. Euro Bonds, 7.45%, 04/30/2044(b) | | $ | 725,000 | | | $ | 759,891 | |
Sr. Unsec. Euro Notes, 6.50%, 02/15/2048(b) | | | 950,000 | | | | 902,144 | |
6.85%, 01/27/2045(b) | | | 850,000 | | | | 839,906 | |
Ecuador Government International Bond (Ecuador), REGS, Sr. Unsec. Euro Bonds, 9.65%, 12/13/2026(b) | | | 800,000 | | | | 747,000 | |
Sr. Unsec. Euro Notes,
8.88%, 10/23/2027(b) | | | 800,000 | | | | 706,200 | |
9.63%, 06/02/2027(b) | | | 800,000 | | | | 740,600 | |
Egypt Government International Bond (Egypt),
REGS, Sr. Unsec. Euro Notes,
6.88%, 04/30/2040(b) | | | 961,000 | | | | 808,571 | |
7.90%, 02/21/2048(b) | | | 800,000 | | | | 718,255 | |
Sr. Unsec. Global Notes, 8.50%, 01/31/2047(b) | | | 800,000 | | | | 757,591 | |
El Salvador Government International Bond (El Salvador), REGS, Sr. Unsec. Euro Notes, 7.63%, 02/01/2041(b) | | | 800,000 | | | | 729,120 | |
7.65%, 06/15/2035(b) | | | 900,000 | | | | 829,125 | |
8.25%, 04/10/2032(b) | | | 847,000 | | | | 834,346 | |
Emirate of Dubai Government International Bonds (United Arab Emirates), REGS, Sr. Unsec. Medium-Term Euro Notes, 5.25%, 01/30/2043(b) | | | 1,000,000 | | | | 976,124 | |
Hungary Government International Bond (Hungary), Sr. Unsec. Global Notes,
5.38%, 03/25/2024 | | | 860,000 | | | | 913,664 | |
5.75%, 11/22/2023 | | | 850,000 | | | | 912,308 | |
7.63%, 03/29/2041 | | | 560,000 | | | | 762,601 | |
Indonesia Government International Bond (Indonesia), REGS, Sr. Unsec. Euro Bonds,
6.63%, 02/17/2037(b) | | | 800,000 | | | | 899,860 | |
7.75%, 01/17/2038(b) | | | 650,000 | | | | 812,450 | |
8.50%, 10/12/2035(b) | | | 650,000 | | | | 853,114 | |
Jordan Government International Bond (Jordan), REGS, Sr. Unsec. Euro Bonds,
7.38%, 10/10/2047(b) | | | 800,000 | | | | 726,552 | |
Sr. Unsec. Euro Notes, 5.75%, 01/31/2027(b) | | | 1,000,000 | | | | 921,486 | |
6.13%, 01/29/2026(b) | | | 800,000 | | | | 767,378 | |
Kazakhstan Government International Bond (Kazakhstan), REGS, Sr. Unsec. Euro Notes, 4.88%, 10/14/2044(b) | | | 850,000 | | | | 837,080 | |
Sr. Unsec. Medium-Term Euro Notes, 5.13%, 07/21/2025(b) | | | 950,000 | | | | 1,003,917 | |
6.50%, 07/21/2045(b) | | | 700,000 | | | | 836,170 | |
| | | | | | | | |
| | | Principal
Amount | | | Value | |
| Sovereign Debt–(continued) | |
Lebanon Government International Bond (Lebanon), REGS, Sr. Unsec. Euro Bonds, 7.25%, 03/23/2037(b) | | $ | 1,009,000 | | | $ | 791,571 | |
Sr. Unsec. Euro Notes, 6.75%, 11/29/2027(b) | | | 1,003,000 | | | | 807,174 | |
Sr. Unsec. Medium-Term Global Euro Notes, 6.65%, 02/26/2030(b) | | | 969,000 | | | | 755,219 | |
Lithuania Government International Bond (Lithuania), REGS, Sr. Unsec. Euro Notes, 6.63%, 02/01/2022(b) | | | 1,150,000 | | | | 1,257,456 | |
Mexico Government International Bond (Mexico),
Sr. Unsec. Global Notes, 4.60%, 01/23/2046 | | | 1,050,000 | | | | 910,623 | |
Sr. Unsec. Medium-Term Global Notes, 5.75%, 10/12/2110 | | | 850,000 | | | | 788,694 | |
Series A, Sr. Unsec. Medium-Term Global Notes, 6.05%, 01/11/2040 | | | 812,000 | | | | 848,134 | |
Nigeria Government International Bond (Nigeria), REGS, Sr. Unsec. Euro Notes, 7.70%, 02/23/2038(b) | | | 1,000,000 | | | | 904,474 | |
7.88%, 02/16/2032(b) | | | 800,000 | | | | 772,664 | |
Sr. Unsec. Medium-Term Euro Notes, 7.63%, 11/28/2047(b) | | | 800,000 | | | | 707,832 | |
Oman Government International Bond (Oman), REGS, Sr. Unsec. Euro Notes,
5.63%, 01/17/2028(b) | | | 1,000,000 | | | | 954,975 | |
6.50%, 03/08/2047(b) | | | 800,000 | | | | 717,060 | |
6.75%, 01/17/2048(b) | | | 1,000,000 | | | | 915,300 | |
Pakistan Government International Bond (Pakistan), REGS, Sr. Unsec. Euro Notes, 6.88%, 12/05/2027(b) | | | 1,000,000 | | | | 926,972 | |
8.25%, 04/15/2024(b) | | | 800,000 | | | | 820,208 | |
8.25%, 09/30/2025(b) | | | 810,000 | | | | 829,233 | |
Panama Government International Bond (Panama), Sr. Unsec. Global Bonds, 3.88%, 03/17/2028 | | | 800,000 | | | | 770,408 | |
7.13%, 01/29/2026 | | | 750,000 | | | | 880,673 | |
8.88%, 09/30/2027 | | | 669,000 | | | | 884,752 | |
Paraguay Government International Bond (Paraguay),
REGS, Sr. Unsec. Euro Bonds, 5.00%, 04/15/2026(b) | | | 800,000 | | | | 802,000 | |
Sr. Unsec. Euro Notes, 5.60%, 03/13/2048(b) | | | 900,000 | | | | 865,125 | |
6.10%, 08/11/2044(b) | | | 800,000 | | | | 808,000 | |
Peruvian Government International Bond (Peru), Sr. Unsec. Global Bonds,
5.63%, 11/18/2050 | | | 802,000 | | | | 898,240 | |
7.35%, 07/21/2025 | | | 750,000 | | | | 905,625 | |
8.75%, 11/21/2033 | | | 521,000 | | | | 746,333 | |
See accompanying Notes to Financial Statements which are an integral part of the financial statements.
21 Invesco Multi-Asset Income Fund
| | | | | | | | |
| | | Principal
Amount | | | Value | |
| Sovereign Debt–(continued) | |
Philippine Government International Bond (Philippines), Sr. Unsec. Global Bonds, 6.38%, 10/23/2034 | | $ | 750,000 | | | $ | 913,252 | |
7.75%, 01/14/2031 | | | 700,000 | | | | 918,684 | |
9.50%, 02/02/2030 | | | 587,000 | | | | 847,127 | |
Poland Government International Bond (Poland), Sr. Unsec. Global Notes, 3.25%, 04/06/2026 | | | 954,000 | | | | 915,656 | |
Qatar Government International Bond (Qatar), REGS, Sr. Unsec. Euro Notes, 5.10%, 04/23/2048(b) | | | 900,000 | | | | 915,812 | |
5.75%, 01/20/2042(b) | | | 925,000 | | | | 1,065,228 | |
6.40%, 01/20/2040(b) | | | 700,000 | | | | 859,165 | |
Republic of Poland Government International Bond (Poland), Sr. Unsec. Global Notes, 3.00%, 03/17/2023 | | | 874,000 | | | | 852,332 | |
4.00%, 01/22/2024 | | | 895,000 | | | | 905,483 | |
Republic of South Africa Government International Bond (South Africa), Sr. Unsec. Global Bonds, 5.38%, 07/24/2044 | | | 850,000 | | | | 705,544 | |
6.30%, 06/22/2048 | | | 900,000 | | | | 811,663 | |
Sr. Unsec. Global Notes, 6.25%, 03/08/2041 | | | 800,000 | | | | 746,560 | |
Romanian Government International Bond (Romania),
REGS, Sr. Unsec. Euro Notes, 5.13%, 06/15/2048(b) | | | 850,000 | | | | 789,414 | |
Sr. Unsec. Medium-Term Euro Notes,
4.88%, 01/22/2024(b) | | | 852,000 | | | | 869,594 | |
6.13%, 01/22/2044(b) | | | 780,000 | | | | 843,086 | |
Russian Foreign Bond (Russia), Sr. Unsec. Euro Bonds, 4.88%, 09/16/2023(b) | | | 800,000 | | | | 819,596 | |
5.63%, 04/04/2042(b) | | | 800,000 | | | | 814,956 | |
5.88%, 09/16/2043(b) | | | 800,000 | | | | 841,915 | |
Saudi Government International Bond (Saudi Arabia), REGS, Sr. Unsec. Medium-Term Euro Notes, 4.50%, 10/26/2046(b) | | | 900,000 | | | | 818,364 | |
4.63%, 10/04/2047(b) | | | 1,000,000 | | | | 919,962 | |
5.00%, 04/17/2049(b) | | | 800,000 | | | | 769,949 | |
Serbia International Bond (Serbia), REGS, Sr. Unsec. Euro Notes, 7.25%, 09/28/2021(b) | | | 1,100,000 | | | | 1,188,343 | |
7.25%, 09/28/2021(b) | | | 200,000 | | | | 216,062 | |
Slovenia Government International Bond (Slovenia), REGS, Sr. Unsec. Euro Notes, 5.25%, 02/18/2024(b) | | | 1,200,000 | | | | 1,291,630 | |
Sri Lanka Government International Bond (Sri Lanka),
REGS, Sr. Unsec. Euro Bonds, 6.83%, 07/18/2026(b) | | | 850,000 | | | | 766,087 | |
6.85%, 11/03/2025(b) | | | 750,000 | | | | 682,545 | |
Sr. Unsec. Euro Notes, 6.13%, 06/03/2025(b) | | | 1,050,000 | | | | 923,863 | |
| | | | | | | | |
| | | Principal
Amount | | | Value | |
| Sovereign Debt–(continued) | |
Trinidad & Tobago Government International Bond (Trinidad), REGS, Sr. Unsec. Euro Notes, 4.50%, 08/04/2026(b) | | $ | 1,500,000 | | | $ | 1,394,250 | |
Unsec. Euro Notes, 4.38%, 01/16/2024(b) | | | 1,200,000 | | | | 1,156,224 | |
Turkey Government International Bond (Turkey), Sr. Unsec. Global Notes, 6.88%, 03/17/2036 | | | 798,000 | | | | 711,962 | |
7.25%, 03/05/2038 | | | 850,000 | | | | 784,737 | |
8.00%, 02/14/2034 | | | 810,000 | | | | 807,276 | |
Ukraine Government International Bond (Ukraine), REGS, Sr. Unsec. Euro Notes, 7.75%, 09/01/2025(b) | | | 800,000 | | | | 737,387 | |
7.75%, 09/01/2026(b) | | | 900,000 | | | | 815,927 | |
7.75%, 09/01/2027(b) | | | 900,000 | | | | 807,264 | |
| | | | | | | | 93,913,316 | |
|
| Specialized Consumer Services–0.21% | |
ServiceMaster Co., LLC (The), Sr. Unsec. Gtd. Notes, 5.13%, 11/15/2024(b) | | | 942,000 | | | | 909,030 | |
Sr. Unsec. Notes, 7.45%, 08/15/2027 | | | 254,000 | | | | 266,700 | |
| | | | | | | | 1,175,730 | |
| | |
| Specialized Finance–0.04% | | | | | | | | |
AerCap Global Aviation Trust (Ireland), Jr. Unsec. Gtd. Sub. Notes, 6.50%, 06/15/2045(b) | | | 200,000 | | | | 206,000 | |
| | |
| Specialized REITs–0.49% | | | | | | | | |
Equinix Inc., Sr. Unsec. Notes, 5.88%, 01/15/2026 | | | 1,045,000 | | | | 1,063,287 | |
Iron Mountain Inc.,
Sr. Unsec. Gtd. Notes, 6.00%, 08/15/2023 | | | 203,000 | | | | 208,329 | |
Sr. Unsec. Sub. Gtd. Global Notes, 5.75%, 08/15/2024 | | | 115,000 | | | | 113,131 | |
Iron Mountain US Holdings, Inc., Sr. Unsec. Gtd. Notes, 5.38%, 06/01/2026(b) | | | 303,000 | | | | 280,275 | |
Rayonier A.M. Products Inc., Sr. Unsec. Gtd. Notes, 5.50%, 06/01/2024(b) | | | 865,000 | | | | 813,100 | |
SBA Communications Corp., Sr. Unsec. Global Notes, 4.88%, 07/15/2022 | | | 79,000 | | | | 78,803 | |
4.88%, 09/01/2024 | | | 227,000 | | | | 219,906 | |
| | | | | | | | 2,776,831 | |
| | |
| Specialty Chemicals–0.08% | | | | | | | | |
Platform Specialty Products Corp., Sr. Unsec. Gtd. Notes, 5.88%, 12/01/2025(b) | | | 444,000 | | | | 422,910 | |
See accompanying Notes to Financial Statements which are an integral part of the financial statements.
22 Invesco Multi-Asset Income Fund
| | | | | | | | |
| | | Principal
Amount | | | Value | |
| Steel–0.34% | | | | | | | | |
ArcelorMittal (Luxembourg), Sr. Unsec. Global Notes, 7.00%, 10/15/2039 | | $ | 325,000 | | | $ | 360,573 | |
Cleveland-Cliffs Inc., Sr. Unsec. Gtd. Global Notes, 5.75%, 03/01/2025 | | | 663,000 | | | | 629,021 | |
United States Steel Corp., Sr. Unsec. Global Notes, 6.88%, 08/15/2025 | | | 951,000 | | | | 936,735 | |
| | | | | | | | 1,926,329 | |
|
| Systems Software–0.14% | |
CommScope Technologies LLC, Sr. Unsec. Gtd. Notes, 6.00%, 06/15/2025(b) | | | 790,000 | | | | 772,225 | |
|
| Technology Hardware, Storage & Peripherals–0.21% | |
Dell International LLC/ EMC Corp., Sr. Unsec. Gtd. Notes, 7.13%, 06/15/2024(b) | | | 1,135,000 | | | | 1,202,143 | |
|
| Textiles–0.13% | |
Eagle Intermediate Global Holding B.V./Ruyi US Finance LLC (China), Sr. Sec. Gtd. First Lien Bonds, 7.50%, 05/01/2025(b) | | | 739,000 | | | | 716,830 | |
|
| Trading Companies & Distributors–0.44% | |
BMC East, LLC, Sr. Sec. Gtd. First Lien Notes, 5.50%, 10/01/2024(b) | | | 576,000 | | | | 541,440 | |
H&E Equipment Services, Inc., Sr. Unsec. Gtd. Global Notes, 5.63%, 09/01/2025 | | | 717,000 | | | | 684,735 | |
Herc Rentals Inc., Sec. Gtd. Second Lien Notes, 7.75%, 06/01/2024(b) | | | 438,000 | | | | 464,280 | |
United Rentals North America, Inc., Sr. Unsec. Gtd. Global Notes, 6.50%, 12/15/2026 | | | 175,000 | | | | 177,406 | |
Sr. Unsec. Gtd. Notes, 5.50%, 05/15/2027 | | | 151,000 | | | | 143,828 | |
5.88%, 09/15/2026 | | | 475,000 | | | | 467,281 | |
| | | | | | | | 2,478,970 | |
|
| Trucking–0.07% | |
Avis Budget Car Rental LLC/Avis Budget Finance Inc., Sr. Unsec. Gtd. Notes, 5.25%, 03/15/2025(b) | | | 180,000 | | | | 161,775 | |
6.38%, 04/01/2024(b) | | | 230,000 | | | | 220,513 | |
| | | | | | | | 382,288 | |
|
| Wireless Telecommunication Services–0.97% | |
Digicel Group Ltd. (Jamaica), Sr. Unsec. Notes, 8.25%, 09/30/2020(b) | | | 403,000 | | | | 289,656 | |
Oztel Holdings SPC Ltd. (Oman), Sr. Sec. Gtd. Notes, 5.63%, 10/24/2023(b) | | | 382,000 | | | | 382,773 | |
Sprint Capital Corp., Sr. Unsec. Gtd. Global Notes, 8.75%, 03/15/2032 | | | 267,000 | | | | 291,057 | |
| | | | | | | | |
| | | Principal
Amount | | | Value | |
| Wireless Telecommunication Services–(continued) | |
Sprint Communications Inc., Sr. Unsec. Global Notes, 11.50%, 11/15/2021 | | $ | 235,000 | | | $ | 276,713 | |
Sprint Corp., Sr. Unsec. Gtd. Global Notes, 7.25%, 09/15/2021 | | | 1,104,000 | | | | 1,155,060 | |
7.63%, 02/15/2025 | | | 84,000 | | | | 87,465 | |
7.88%, 09/15/2023 | | | 1,558,000 | | | | 1,667,060 | |
T-Mobile USA, Inc., Sr. Unsec. Gtd. Global Bonds, 6.50%, 01/15/2026 | | | 1,209,000 | | | | 1,278,517 | |
| | | | | | | | 5,428,301 | |
Total U.S. Dollar Denominated Bonds & Notes
(Cost $287,471,618) | | | | 275,224,233 | |
| | |
| | | Shares | | | | |
|
Preferred Stocks–20.87% | |
| Alternative Carriers–0.55% | |
Qwest Corp., 6.13% Pfd. | | | 15,800 | | | | 338,278 | |
Qwest Corp., 6.50% Pfd. | | | 38,600 | | | | 851,516 | |
Qwest Corp., 6.63% Pfd. | | | 23,200 | | | | 537,080 | |
Qwest Corp., 6.75% Pfd. | | | 38,600 | | | | 892,818 | |
Qwest Corp., 6.88% Pfd. | | | 19,700 | | | | 476,740 | |
| | | | | | | | 3,096,432 | |
|
| Asset Management & Custody Banks–1.26% | |
Apollo Global Management LLC, Series A, 6.38% Pfd. | | | 12,600 | | | | 312,984 | |
Apollo Global Management LLC, Series B, 6.38% Pfd. | | | 11,600 | | | | 286,404 | |
Apollo Investment Corp., 6.88% Pfd. | | | 7,400 | | | | 186,110 | |
Ares Management, L.P., Series A, 7.00% Pfd. | | | 13,300 | | | | 345,667 | |
Bank of New York Mellon Corp. (The), 5.20% Pfd. | | | 22,400 | | | | 539,840 | |
BrightSphere Investment Group PLC, 5.13% Pfd. | | | 6,600 | | | | 136,422 | |
Carlyle Group LP (The), Series A, 5.88% Pfd. | | | 16,400 | | | | 361,456 | |
KKR & Co. Inc., Series A, 6.75% Pfd. | | | 10,300 | | | | 271,817 | |
KKR & Co. Inc., Series B, 6.50% Pfd. | | | 10,300 | | | | 268,521 | |
Legg Mason, Inc., 5.45% Pfd. | | | 20,600 | | | | 483,688 | |
Legg Mason, Inc., 6.38% Pfd. | | | 11,600 | | | | 295,336 | |
Northern Trust Corp., Series C, 5.85% Pfd. | | | 17,200 | | | | 437,568 | |
Oaktree Capital Group, LLC, Series A, 6.63% Pfd. | | | 8,000 | | | | 200,880 | |
Oaktree Capital Group, LLC, Series B, 6.55% Pfd. | | | 9,300 | | | | 233,895 | |
Prospect Capital Corp., 6.25% Pfd. | | | 9,500 | | | | 237,975 | |
State Street Corp., Series C, 5.25% Pfd. | | | 11,600 | | | | 278,748 | |
State Street Corp., Series D, 5.90% Pfd. | | | 20,600 | | | | 536,424 | |
State Street Corp., Series E, 6.00% Pfd. | | | 38,600 | | | | 981,212 | |
See accompanying Notes to Financial Statements which are an integral part of the financial statements.
23 Invesco Multi-Asset Income Fund
| | | | | | | | |
| | | Shares | | | Value | |
| Asset Management & Custody Banks–(continued) | |
State Street Corp., Series G, 5.35% Pfd. | | | 27,800 | | | $ | 704,452 | |
| | | | | | | | 7,099,399 | |
|
| Catalog Retail–0.04% | |
QVC Inc., 6.38% Pfd. | | | 10,000 | | | | 232,800 | |
|
| Consumer Finance–0.66% | |
Capital One Financial Corp., Series B, 6.00% Pfd. | | | 17,200 | | | | 429,656 | |
Capital One Financial Corp., Series C, 6.25% Pfd. | | | 12,300 | | | | 312,912 | |
Capital One Financial Corp., Series D, 6.70% Pfd. | | | 17,200 | | | | 446,340 | |
Capital One Financial Corp., Series F, 6.20% Pfd. | | | 19,100 | | | | 487,241 | |
Capital One Financial Corp., Series G, 5.20% Pfd. | | | 35,700 | | | | 825,027 | |
Capital One Financial Corp., Series H, 6.00% Pfd. | | | 36,700 | | | | 937,685 | |
Navient Corp., 6.00% Pfd. | | | 12,200 | | | | 247,050 | |
| | | | | | | | 3,685,911 | |
|
| Diversified Banks–6.02% | |
Bank of America Corp., Series W, 6.63% Pfd. | | | 48,300 | | | | 1,246,623 | |
Bank of America Corp., Series Y, 6.50% Pfd. | | | 59,900 | | | | 1,540,628 | |
Bank of America Corp., Series CC, 6.20% Pfd. | | | 50,200 | | | | 1,298,674 | |
Bank of America Corp., Series EE, 6.00% Pfd. | | | 46,400 | | | | 1,177,632 | |
Bank of America Corp., Series GG, 6.00% Pfd. | | | 48,300 | | | | 1,213,779 | |
Bank of America Corp., Series HH, 5.88% Pfd. | | | 35,000 | | | | 872,200 | |
Barclays Bank PLC (United Kingdom), Series 5, 8.13% Pfd. | | | 40,000 | | | | 1,015,200 | |
Citigroup Inc., Series J, 7.13% Pfd. | | | 38,600 | | | | 1,052,236 | |
Citigroup Inc., Series K, 6.88% Pfd. | | | 48,300 | | | | 1,320,039 | |
Citigroup Inc., Series L, 6.88% Pfd. | | | 19,300 | | | | 495,045 | |
Citigroup Inc., Series S, 6.30% Pfd. | | | 38,600 | | | | 1,005,144 | |
ING Groep N.V. (Netherlands), 6.38% Pfd. | | | 30,000 | | | | 759,300 | |
JPMorgan Chase & Co., Series P, 5.45% Pfd. | | | 9,500 | | | | 234,365 | |
JPMorgan Chase & Co., Series T, 6.70% Pfd. | | | 12,300 | | | | 310,575 | |
JPMorgan Chase & Co., Series W, 6.30% Pfd. | | | 12,300 | | | | 311,928 | |
JPMorgan Chase & Co., Series Y, 6.13% Pfd. | | | 57,200 | | | | 1,443,728 | |
JPMorgan Chase & Co., Series AA, 6.10% Pfd. | | | 82,800 | | | | 2,094,840 | |
JPMorgan Chase & Co., Series BB, 6.15% Pfd. | | | 83,800 | | | | 2,120,978 | |
JPMorgan Chase & Co., Series DD, 5.75% Pfd. | | | 70,000 | | | | 1,741,600 | |
Royal Bank of Scotland Group PLC (The) (United Kingdom), Series S, 6.60% Pfd. | | | 22,100 | | | | 558,467 | |
| | | | | | | | |
| | | Shares | | | Value | |
| Diversified Banks–(continued) | |
US Bancorp., Series F, 6.50% Pfd. | | | 63,800 | | | $ | 1,723,238 | |
US Bancorp., Series K, 5.50% Pfd. | | | 20,700 | | | | 510,876 | |
Wells Fargo & Co., 5.20% Pfd. | | | 56,000 | | | | 1,303,680 | |
Wells Fargo & Co., Class A, Series L, $75.00 Conv. Pfd. | | | 581 | | | | 739,026 | |
Wells Fargo & Co., Series O, 5.13% Pfd. | | | 48,300 | | | | 1,121,043 | |
Wells Fargo & Co., Series P, 5.25% Pfd. | | | 16,400 | | | | 387,532 | |
Wells Fargo & Co., Series Q, 5.85% Pfd. | | | 26,700 | | | | 683,520 | |
Wells Fargo & Co., Series R, 6.63% Pfd. | | | 26,700 | | | | 734,517 | |
Wells Fargo & Co., Series T, 6.00% Pfd. | | | 34,800 | | | | 887,052 | |
Wells Fargo & Co., Series V, 6.00% Pfd. | | | 24,700 | | | | 632,073 | |
Wells Fargo & Co., Series W, 5.70% Pfd. | | | 28,800 | | | | 721,152 | |
Wells Fargo & Co., Series X, 5.50% Pfd. | | | 65,700 | | | | 1,610,964 | |
Wells Fargo & Co., Series Y, 5.63% Pfd. | | | 38,600 | | | | 959,210 | |
| | | | | | | | 33,826,864 | |
|
| Diversified Capital Markets–0.39% | |
Deutsche Bank Contingent Capital Trust V (Germany), 8.05% Pfd. | | | 86,100 | | | | 2,195,550 | |
|
| Diversified REITs–0.34% | |
PS Business Parks, Inc., Series U, 5.75% Pfd. | | | 8,900 | | | | 211,731 | |
PS Business Parks, Inc., Series W, 5.20% Pfd. | | | 11,100 | | | | 240,537 | |
PS Business Parks, Inc., Series X, 5.25% Pfd. | | | 10,500 | | | | 228,585 | |
PS Business Parks, Inc., Series Y, 5.20% Pfd. | | | 8,200 | | | | 176,546 | |
VEREIT Inc., Series F, 6.70% Pfd. | | | 41,400 | | | | 1,030,032 | |
| | | | | | | | 1,887,431 | |
|
| Electric Utilities–1.31% | |
Alabama Power Co., Series A, 5.00% Pfd. | | | 11,600 | | | | 289,652 | |
Duke Energy Corp., 5.13% Pfd. | | | 20,600 | | | | 482,040 | |
Duke Energy Corp., 5.63% Pfd. | | | 19,300 | | | | 469,955 | |
Entergy Arkansas, Inc., 4.88% Pfd. | | | 14,400 | | | | 314,640 | |
Entergy Arkansas, Inc., 4.90% Pfd. | | | 11,600 | | | | 266,336 | |
Entergy Louisiana, LLC, 4.88% Pfd. | | | 16,400 | | | | 357,684 | |
Entergy Louisiana, LLC, 5.25% Pfd. | | | 10,500 | | | | 250,425 | |
Entergy Mississippi, Inc., 4.90% Pfd. | | | 12,900 | | | | 278,898 | |
Entergy Texas Inc., 5.63% Pfd. | | | 9,200 | | | | 229,632 | |
Georgia Power Co., Series 2017A, 5.00% Pfd. | | | 12,000 | | | | 277,080 | |
Interstate Power & Light Co., Series D, 5.10% Pfd. | | | 9,000 | | | | 230,130 | |
Pacific Gas & Electric Co., Series A, 6.00% Pfd. | | | 5,300 | | | | 135,150 | |
SCE Trust IV, Series J, 5.38% Pfd. | | | 20,300 | | | | 482,937 | |
SCE Trust V, Series K, 5.45% Pfd. | | | 15,500 | | | | 379,130 | |
SCE Trust VI, 5.00% Pfd. | | | 35,000 | | | | 739,200 | |
Southern Co. (The), 5.25% Pfd. | | | 43,200 | | | | 978,048 | |
Southern Co. (The), 5.25% Pfd. | | | 18,500 | | | | 425,870 | |
Southern Co. (The), 6.25% Pfd. | | | 30,800 | | | | 788,172 | |
| | | | | | | | 7,374,979 | |
See accompanying Notes to Financial Statements which are an integral part of the financial statements.
24 Invesco Multi-Asset Income Fund
| | | | | | | | |
| | | Shares | | | Value | |
| Health Care REITs–0.09% | |
Senior Housing Properties Trust, 5.63% Pfd. | | | 23,200 | | | $ | 505,528 | |
|
| Industrial Machinery–0.13% | |
Stanley Black & Decker Inc., 5.75% Investment Units | | | 29,000 | | | | 723,840 | |
|
| Insurance Brokers–0.11% | |
Argo Group US Inc., 6.50% Pfd. | | | 6,800 | | | | 171,496 | |
Assured Guaranty Municipal Holdings Inc., 6.25% Pfd. | | | 18,500 | | | | 465,645 | |
| | | | | | | | 637,141 | |
|
| Integrated Telecommunication Services–0.44% | |
AT&T Inc.,5.63% Pfd. | | | 31,900 | | | | 755,073 | |
AT&T Inc., 5.35% Pfd. | | | 51,100 | | | | 1,204,427 | |
Verizon Communications Inc., 5.90% Pfd. | | | 20,600 | | | | 524,270 | |
| | | | | | | | 2,483,770 | |
|
| Internet & Direct Marketing Retail–0.14% | |
eBay Inc., 6.00% Pfd. | | | 30,800 | | | | 774,004 | |
|
| Investment Banking & Brokerage–1.52% | |
Charles Schwab Corp. (The), Series C, 6.00% Pfd. | | | 20,300 | | | | 522,116 | |
Charles Schwab Corp. (The), Series D, 5.95% Pfd. | | | 31,900 | | | | 824,615 | |
Goldman Sachs Group, Inc. (The), Series J, 5.50% Pfd. | | | 17,200 | | | | 434,128 | |
Goldman Sachs Group, Inc. (The), Series K, 6.38% Pfd. | | | 38,600 | | | | 1,013,636 | |
Goldman Sachs Group, Inc. (The), Series N, 6.30% Pfd. | | | 40,600 | | | | 1,037,330 | |
Morgan Stanley, Series E, 7.13% Pfd. | | | 13,300 | | | | 362,691 | |
Morgan Stanley, Series F, 6.88% Pfd. | | | 26,700 | | | | 715,827 | |
Morgan Stanley, Series G, 6.63% Pfd. | | | 20,600 | | | | 526,124 | |
Morgan Stanley, Series I, 6.38% Pfd. | | | 58,000 | | | | 1,518,440 | |
Morgan Stanley, Series K, 5.85% Pfd. | | | 48,300 | | | | 1,217,160 | |
Stifel Financial Corp., 5.20% Pfd. | | | 9,300 | | | | 206,367 | |
Stifel Financial Corp., Series A, 6.25% Pfd. | | | 6,500 | | | | 163,020 | |
| | | | | | | | 8,541,454 | |
|
| Life & Health Insurance–0.77% | |
Aegon N.V. (Netherlands), 6.38% Pfd. | | | 4,600 | | | | 116,380 | |
Brighthouse Financial Inc., 6.25% Pfd. | | | 16,100 | | | | 397,670 | |
MetLife, Inc., Series E, 5.63% Pfd. | | | 33,100 | | | | 819,556 | |
Prudential Financial Inc., 5.70% Pfd. | | | 27,400 | | | | 675,684 | |
Prudential Financial Inc., 5.75% Pfd. | | | 20,700 | | | | 514,809 | |
Prudential Financial Inc.,5.63% Pfd. | | | 22,300 | | | | 537,653 | |
Prudential PLC (United Kingdom), 6.50% Pfd. | | | 4,300 | | | | 110,080 | |
Prudential PLC (United Kingdom), 6.75% Pfd. | | | 19,300 | | | | 495,817 | |
Torchmark Corp., 6.13% Pfd. | | | 13,300 | | | | 336,490 | |
Unum Group, 6.25% Pfd. | | | 13,300 | | | | 333,165 | |
| | | | | | | | 4,337,304 | |
| | | | | | | | |
| | | Shares | | | Value | |
| Mortgage REITs–0.10% | |
Ventas Realty L.P. / Ventas Capital Corp., 5.45% Pfd. | | | 10,200 | | | $ | 242,760 | |
Wells Fargo Real Estate Investment Corp., Series A, 6.38% Pfd. | | | 12,300 | | | | 313,281 | |
| | | | | | | | 556,041 | |
|
| Multi-Line Insurance–0.18% | |
American Financial Group Inc., 6.00% Pfd. | | | 12,900 | | | | 323,016 | |
Hartford Financial Services Group Inc. (The), 7.88% Pfd. | | | 24,700 | | | | 679,003 | |
| | | | | | | | 1,002,019 | |
|
| Multi-Utilities–0.16% | |
CMS Energy Corp., 5.63% Pfd. | | | 8,600 | | | | 207,260 | |
CMS Energy Corp., 5.88% Pfd. | | | 9,700 | | | | 243,470 | |
Integrys Holding, Inc., 6.00% Pfd. | | | 17,750 | | | | 449,696 | |
| | | | | | | | 900,426 | |
|
| Office REITs–0.29% | |
Boston Properties, Inc., Series B, 5.25% Pfd. | | | 9,000 | | | | 218,250 | |
Government Properties Income Trust, 5.88% Pfd. | | | 13,700 | | | | 338,390 | |
SL Green Realty Corp., Series I, 6.50% Pfd. | | | 9,900 | | | | 244,728 | |
Vornado Realty Trust, Series L, 5.40% Pfd. | | | 35,500 | | | | 827,150 | |
| | | | | | | | 1,628,518 | |
|
| Office Services & Supplies–0.07% | |
Pitney Bowes Inc., 6.70% Pfd. | | | 18,300 | | | | 415,410 | |
|
| Oil & Gas Refining & Marketing–0.14% | |
NuStar Energy L.P., Series A, 8.50% Pfd. | | | 26,800 | | | | 618,544 | |
NuStar Energy L.P., Series C, 9.00% Pfd. | | | 7,700 | | | | 183,414 | |
| | | | | | | | 801,958 | |
|
| Oil & Gas Storage & Transportation–0.33% | |
DCP Midstream L.P., Series B, 7.88% Pfd. | | | 7,100 | | | | 173,950 | |
Enbridge Inc. (Canada), Series B, 6.38% Pfd. | | | 25,700 | | | | 634,276 | |
Energy Transfer Operating, L.P., Series D, 7.63% Pfd. | | | 18,300 | | | | 458,415 | |
Energy Transfer Operating, L.P., Series C, 7.38% Pfd. | | | 17,400 | | | | 430,476 | |
Targa Resources Partners L.P., Series A, 9.00% Pfd. | | | 6,200 | | | | 165,912 | |
| | | | | | | | 1,863,029 | |
|
| Other Diversified Financial Services–0.08% | |
PPL Capital Funding, Inc., Series B, 5.90% Pfd. | | | 17,400 | | | | 433,956 | |
|
| Property & Casualty Insurance–1.07% | |
Allstate Corp. (The), 5.10% Pfd. | | | 18,500 | | | | 464,350 | |
Allstate Corp. (The), Series A, 5.63% Pfd. | | | 6,600 | | | | 164,340 | |
Allstate Corp. (The), Series E, 6.63% Pfd. | | | 30,900 | | | | 783,006 | |
Allstate Corp. (The), Series F, 6.25% Pfd. | | | 18,500 | | | | 478,780 | |
See accompanying Notes to Financial Statements which are an integral part of the financial statements.
25 Invesco Multi-Asset Income Fund
| | | | | | | | |
| | | Shares | | | Value | |
| Property & Casualty Insurance–(continued) | |
Allstate Corp. (The), Series G, 5.63% Pfd. | | | 26,700 | | | $ | 653,349 | |
Arch Capital Group Ltd., Series E, 5.25% Pfd. | | | 16,500 | | | | 366,465 | |
Arch Capital Group Ltd., Series F, 5.45% Pfd. | | | 14,800 | | | | 333,592 | |
Aspen Insurance Holdings Ltd. (Bermuda), 5.95% Pfd. | | | 7,500 | | | | 187,800 | |
Aspen Insurance Holdings Ltd. (Bermuda), 5.63% Pfd. | | | 14,000 | | | | 319,760 | |
Axis Capital Holdings Ltd., Series E, 5.50% Pfd. | | | 31,900 | | | | 736,890 | |
Hanover Insurance Group, Inc. (The), 6.35% Pfd. | | | 8,700 | | | | 218,979 | |
Kemper Corp., 7.38% Pfd. | | | 5,900 | | | | 151,040 | |
Selective Insurance Group, Inc., 5.88% Pfd. | | | 8,700 | | | | 213,498 | |
WR Berkley Corp., 5.63% Pfd. | | | 11,600 | | | | 267,496 | |
WR Berkley Corp., 5.70% Pfd. | | | 8,000 | | | | 187,200 | |
WR Berkley Corp., 5.75% Pfd. | | | 19,400 | | | | 452,990 | |
| | | | | | | | 5,979,535 | |
|
| Regional Banks–2.28% | |
Associated Banc-Corp., Series E, 5.88% Pfd. | | | 4,300 | | | | 103,501 | |
BB&T Corp., 5.63% Pfd. | | | 58,900 | | | | 1,475,445 | |
BB&T Corp., Series G, 5.20% Pfd. | | | 5,000 | | | | 120,150 | |
BB&T Corp., 5.85% Pfd. | | | 11,300 | | | | 284,308 | |
BB&T Corp., Series E, 5.63% Pfd. | | | 46,400 | | | | 1,130,304 | |
BOK Financial Corp., 5.38% Pfd. | | | 7,100 | | | | 164,933 | |
CIT Group Inc., Series A, 5.80% Pfd. | | | 70,000 | | | | 69,020 | |
Commerce Bancshares Inc., Series B, 6.00% Pfd. | | | 6,900 | | | | 174,984 | |
Cullen/Frost Bankers, Inc., 5.38% Pfd. | | | 7,100 | | | | 174,234 | |
Fifth Third Bancorp, Series I, 6.63% Pfd. | | | 18,500 | | | | 506,345 | |
First Horizon National Corp., Series A, 6.20% Pfd. | | | 5,500 | | | | 137,940 | |
First Republic Bank, Series D, 5.50% Pfd. | | | 6,500 | | | | 155,350 | |
First Republic Bank, Series E, 7.00% Pfd. | | | 4,500 | | | | 113,805 | |
First Republic Bank, Series F, 5.70% Pfd. | | | 8,200 | | | | 201,146 | |
First Republic Bank, Series G, 5.50% Pfd. | | | 9,500 | | | | 225,340 | |
First Republic Bank, Series H, 5.13% Pfd. | | | 7,900 | | | | 181,700 | |
First Republic Bank, Series I, 5.50% Pfd. | | | 13,500 | | | | 319,950 | |
FNB Corp., 7.25% Pfd. | | | 5,600 | | | | 153,328 | |
Hancock Whitney Corp., 5.95% Pfd. | | | 7,400 | | | | 182,262 | |
Huntington Bancshares, Inc., Series C, 5.88% Pfd. | | | 8,200 | | | | 202,130 | |
Huntington Bancshares, Inc., Series D, 6.25% Pfd. | | | 20,600 | | | | 528,596 | |
KeyCorp, Series E, 6.13% Pfd. | | | 20,600 | | | | 541,780 | |
KeyCorp., Series F, 5.65% Pfd. | | | 17,500 | | | | 424,025 | |
MB Financial Inc., Series C, 6.00% Pfd. | | | 8,200 | | | | 206,476 | |
People’s United Financial, Inc., Series A, 5.63% Pfd. | | | 11,600 | | | | 290,348 | |
PNC Financial Services Group, Inc. (The), Series P, 6.13% Pfd. | | | 79,800 | | | | 2,102,730 | |
| | | | | | | | |
| | | Shares | | | Value | |
| Regional Banks–(continued) | |
PNC Financial Services Group, Inc. (The), Series Q, 5.38% Pfd. | | | 3,000 | | | $ | 74,010 | |
Regions Financial Corp., Series A, 6.38% Pfd. | | | 15,100 | | | | 382,181 | |
Regions Financial Corp., Series B, 6.38% Pfd. | | | 26,600 | | | | 708,624 | |
Synovus Financial Corp., Series D, 6.30% Pfd. | | | 8,600 | | | | 219,730 | |
TCF Financial Corp., Series C, 5.70% Pfd. | | | 6,900 | | | | 165,876 | |
Texas Capital Bancshares, Inc., Series A, 6.50% Pfd. | | | 10,100 | | | | 253,510 | |
Valley National Bancorp, Series A, 6.25% Pfd. | | | 4,700 | | | | 119,991 | |
Valley National Bancorp, Series B, 5.50% Pfd. | | | 3,900 | | | | 97,500 | |
Webster Financial Corp., Series F, 5.25% Pfd. | | | 7,900 | | | | 176,407 | |
Wintrust Financial Corp., Series D, 6.50% Pfd. | | | 6,300 | | | | 162,792 | |
Zions Bancorp., Series G, 6.30% Pfd. | | | 10,400 | | | | 275,392 | |
| | | | | | | | 12,806,143 | |
|
| Reinsurance–0.47% | |
Enstar Group Ltd. (Bermuda), Series D, 7.00% Pfd. | | | 17,200 | | | | 441,868 | |
PartnerRe Ltd. (Bermuda), Series H, 7.25% Pfd. | | | 24,700 | | | | 663,936 | |
Reinsurance Group of America, Inc., 5.75% Pfd. | | | 20,600 | | | | 517,884 | |
Reinsurance Group of America, Inc., 6.20% Pfd. | | | 12,900 | | | | 339,270 | |
RenaissanceRe Holdings Ltd. (Bermuda), Series E, 5.38% Pfd. | | | 16,400 | | | | 385,072 | |
RenaissanceRe Holdings Ltd. (Bermuda), Series F, 5.75% Pfd. | | | 11,200 | | | | 272,720 | |
| | | | | | | | 2,620,750 | |
|
| Residential REITs–0.05% | |
American Homes 4 Rent, Series F, 5.88% Pfd. | | | 7,900 | | | | 176,170 | |
American Homes 4 Rent, Series G, 5.88% Pfd. | | | 4,500 | | | | 99,540 | |
| | | | | | | | 275,710 | |
|
| Retail REITs–0.50% | |
CBL & Associates Properties, Inc., Series D, 7.38% Pfd. | | | 25,800 | | | | 396,030 | |
Federal Realty Investment Trust, Series C, 5.00% Pfd. | | | 6,600 | | | | 156,288 | |
Kimco Realty Corp., Series I, 6.00% Pfd. | | | 3,762 | | | | 93,749 | |
Kimco Realty Corp., Series J, 5.50% Pfd. | | | 9,900 | | | | 223,245 | |
Kimco Realty Corp., Series L, 5.13% Pfd. | | | 13,800 | | | | 289,800 | |
Kimco Realty Corp., Class M, 5.25% Pfd. | | | 13,800 | | | | 287,592 | |
National Retail Properties, Inc., Series E, 5.70% Pfd. | | | 9,200 | | | | 219,052 | |
National Retail Properties, Inc., Series F, 5.20% Pfd. | | | 16,400 | | | | 355,224 | |
SITE Centers Corp., Series A, 6.38% Pfd., , | | | 11,600 | | | | 272,948 | |
See accompanying Notes to Financial Statements which are an integral part of the financial statements.
26 Invesco Multi-Asset Income Fund
| | | | | | | | |
| | | Shares | | | Value | |
| Retail REITs–(continued) | |
SITE Centers Corp., Series J, 6.50% Pfd. | | | 11,300 | | | $ | 263,855 | |
Spirit Realty Capital Inc., Series A, 6.00% Pfd. | | | 7,800 | | | | 173,862 | |
Washington Prime Group Inc., Series H, 7.50% Pfd. | | | 4,400 | | | | 92,268 | |
| | | | | | | | 2,823,913 | |
|
| Specialized REITs–0.93% | |
Digital Realty Trust, Inc., Series C, 6.63% Pfd. | | | 8,400 | | | | 220,416 | |
Digital Realty Trust, Inc., Series G, 5.88% Pfd. | | | 13,300 | | | | 325,717 | |
Digital Realty Trust, Inc., Series H, 7.38% Pfd. | | | 15,800 | | | | 402,742 | |
Digital Realty Trust, Inc., Series J, 5.25% Pfd. | | | 15,500 | | | | 341,930 | |
EPR Properties, Series G, 5.75% Pfd. | | | 7,600 | | | | 174,420 | |
Public Storage, Series A, 5.88% Pfd. | | | 8,400 | | | | 213,024 | |
Public Storage, Series B, 5.40% Pfd. | | | 27,100 | | | | 642,541 | |
Public Storage, Series C, 5.13% Pfd. | | | 26,700 | | | | 613,566 | |
Public Storage, Series D, 4.95% Pfd. | | | 30,900 | | | | 683,508 | |
Public Storage, Series E, 4.90% Pfd. | | | 32,900 | | | | 721,826 | |
Public Storage, Series F, 5.15% Pfd. | | | 9,700 | | | | 221,063 | |
Public Storage, Series G, 5.05% Pfd. | | | 11,600 | | | | 266,800 | |
Public Storage, Series W, 5.20% Pfd. | | | 7,700 | | | | 175,945 | |
Public Storage, Series Y, 6.38% Pfd. | | | 8,100 | | | | 206,955 | |
| | | | | | | | 5,210,453 | |
|
| Thrifts & Mortgage Finance–0.10% | |
New York Community Bancorp Inc., Series A, 6.38% Pfd. | | | 21,200 | | | | 537,632 | |
|
| Trading Companies & Distributors–0.03% | |
GATX Corp., 5.63% Pfd. | | | 6,800 | | | | 162,112 | |
|
| Wireless Telecommunication Services–0.32% | |
Telephone & Data Systems Inc., 5.88% Pfd. | | | 12,900 | | | | 289,218 | |
Telephone & Data Systems Inc., 7.00% Pfd. | | | 23,100 | | | | 583,275 | |
United States Cellular Corp., 6.95% Pfd. | | | 7,600 | | | | 190,152 | |
United States Cellular Corp., 7.25% Pfd. | | | 15,400 | | | | 390,236 | |
United States Cellular Corp., 7.25% Pfd. | | | 14,400 | | | | 363,888 | |
| | | | | | | | 1,816,769 | |
Total Preferred Stocks
(Cost $121,865,726) | | | | 117,236,781 | |
|
Common Stocks & Other Equity Interests–9.50% | |
| Mortgage REITs–9.50% | |
AG Mortgage Investment Trust, Inc. | | | 28,564 | | | | 494,142 | |
AGNC Investment Corp. | | | 137,599 | | | | 2,454,766 | |
Annaly Capital Management, Inc. | | | 579,735 | | | | 5,721,985 | |
Anworth Mortgage Asset Corp. | | | 108,159 | | | | 471,573 | |
Apollo Commercial Real Estate Finance, Inc. | | | 142,361 | | | | 2,663,574 | |
Arbor Realty Trust, Inc. | | | 112,050 | | | | 1,353,564 | |
| | | | | | | | |
| | | Shares | | | Value | |
| Mortgage REITs–(continued) | |
Ares Commercial Real Estate Corp. | | | 19,611 | | | $ | 283,771 | |
Blackstone Mortgage Trust, Inc.–Class A | | | 134,244 | | | | 4,529,393 | |
Capstead Mortgage Corp. | | | 176,955 | | | | 1,213,911 | |
Cherry Hill Mortgage Investment Corp. | | | 14,624 | | | | 261,916 | |
Chimera Investment Corp. | | | 290,052 | | | | 5,394,967 | |
Ladder Capital Corp. | | | 183,916 | | | | 3,097,145 | |
MFA Financial, Inc. | | | 550,116 | | | | 3,812,304 | |
New Residential Investment Corp. | | | 293,120 | | | | 5,240,986 | |
New York Mortgage Trust, Inc. | | | 338,737 | | | | 2,079,845 | |
Orchid Island Capital Inc. | | | 72,956 | | | | 477,132 | |
PennyMac Mortgage Investment Trust | | | 70,915 | | | | 1,369,369 | |
Redwood Trust, Inc. | | | 133,519 | | | | 2,192,382 | |
Starwood Property Trust, Inc. | | | 246,137 | | | | 5,346,096 | |
Two Harbors Investment Corp. | | | 334,577 | | | | 4,914,936 | |
| | | | | | | | 53,373,757 | |
Total Common Stocks & Other Equity Interests
(Cost $51,831,547) | | | | 53,373,757 | |
| | |
| | | Principal
Amount | | | | |
Exchange Traded Notes–8.91% | |
ETRACS Alerian MLP Infrastructure Index ETN, 7.43% (linked to the Alerian MLP Infrastructure Index –0.21%),
04/02/2040(f) | | $ | 1,100,000 | | | | 24,079,000 | |
JPMorgan Alerian MLP Index ETN, 6.70% (linked to the Alerian MLP Index – 0.21%), 05/24/2024(f) | | | 1,040,000 | | | | 25,989,600 | |
Total Exchange Traded Notes
(Cost $55,453,251) | | | | 50,068,600 | |
|
U.S. Treasury Securities–8.19% | |
| U.S. Treasury Bills–0.18% | | | | | | | | |
0.98%-1.12%, 01/24/2019(g)(h) | | | 1,025,000 | | | | 1,019,595 | |
|
| U.S. Treasury STRIPS–8.01% | |
1.91%-2.11%, 11/15/2045(g)(i) | | | 112,500,000 | | | | 45,011,470 | |
Total U.S. Treasury Securities
(Cost $50,144,379) | | | | 46,031,065 | |
| | |
| | | Shares | | | | |
Exchange-Traded Fund–1.21% | |
Vanguard Real Estate ETF (Cost $7,131,437) | | | 87,000 | | | | 6,813,840 | |
| | |
| | | Principal
Amount | | | | |
Non-U.S. Dollar Denominated Bonds & Notes–0.41%(j) | |
| Beverage & Tobacco–0.04% | | | | | | | | |
Sunshine Mid B.V. (Netherlands), Sr. Sec. Gtd. First Lien Notes,
6.50%, 05/15/2026(b) | | EUR | 200,000 | | | | 219,128 | |
See accompanying Notes to Financial Statements which are an integral part of the financial statements.
27 Invesco Multi-Asset Income Fund
| | | | | | | | |
| | | Principal
Amount | | | Value | |
| Cable & Satellite–0.03% | |
Tele Columbus AG (Germany), Sr. Sec. Notes, 3.88%, 05/02/2025(b) | | EUR | 150,000 | | | $ | 157,713 | |
|
| Casinos & Gaming–0.04% | |
PizzaExpress Financing 2 PLC (United Kingdom), REGS, Sr. Sec. Gtd. First Lien Euro Bonds, 6.63%, 08/01/2021(b) | | GBP | 200,000 | | | | 228,968 | |
|
| Diversified Banks–0.13% | |
ABN AMRO Bank N.V. (Netherlands), Jr. Unsec. Sub. Euro Bonds, 4.75%(b)(c) | | EUR | 200,000 | | | | 214,597 | |
CaixaBank, S.A. (Spain), REGS, Jr. Unsec. Sub. Euro Bonds, 6.75%(b)(c) | | EUR | 200,000 | | | | 238,552 | |
Erste Group Bank AG (Austria), REGS, Jr. Unsec. Sub. Euro Bonds, 6.50%(b)(c) | | EUR | 200,000 | | | | 237,359 | |
| | | | | | | | 690,508 | |
|
| Diversified Chemicals–0.07% | |
Chemours Co. (The), Sr. Unsec. Gtd. Euro Bonds, 4.00%, 05/15/2026 | | EUR | 375,000 | | | | 407,926 | |
|
| Other Diversified Financial Services–0.05% | |
Iceland Bondco PLC (United Kingdom), Sr. Sec. Gtd. First Lien Notes, 4.63%, 03/15/2025(b) | | GBP | 250,000 | | | | 287,595 | |
|
| Packaged Foods & Meats–0.03% | |
Darling Global Finance B.V., Sr. Unsec. Gtd. Bonds, 3.63%, 05/15/2026(b) | | EUR | 150,000 | | | | 173,078 | |
| | | | | | | | |
| | | Principal
Amount | | | Value | |
| Textiles–0.02% | |
Eagle Intermediate Global Holding B.V./Ruyi US Finance LLC (China), Sr. Sec. Gtd. First Lien Bonds, 5.38%, 05/01/2023(b) | | EUR | 100,000 | | | $ | 110,620 | |
Total Non-U.S. Dollar Denominated Bonds & Notes
(Cost $2,493,187) | | | | 2,275,536 | |
|
Variable Rate Senior Loan Interests–0.25%(k) | |
| Food Retail–0.25% | | | | | | | | |
Albertson’s LLC, Term Loan B-4, 4.99% (1 mo. USD LIBOR + 2.75%), 08/25/2021 (Cost $1,354,489) | | $ | 1,388,922 | | | | 1,388,610 | |
| | |
| | | Shares | | | | |
Money Market Funds–0.70% | |
Invesco Government & Agency Portfolio–Institutional Class, 2.08%(l) | | | 1,377,097 | | | | 1,377,097 | |
Invesco Liquid Assets Portfolio–Institutional Class, 2.27%(l) | | | 980,871 | | | | 981,068 | |
Invesco Treasury Portfolio–Institutional Class, 2.09%(l) | | | 1,573,825 | | | | 1,573,825 | |
Total Money Market Funds
(Cost $3,931,990) | | | | | | | 3,931,990 | |
TOTAL INVESTMENTS IN SECURITIES–99.04%
(Cost $581,677,624) | | | | 556,344,412 | |
OTHER ASSETS LESS LIABILITIES–0.96% | | | | 5,386,225 | |
NET ASSETS–100.00% | | | $ | 561,730,637 | |
Investment Abbreviations:
| | |
| Conv. | | – Convertible |
| Deb. | | – Debentures |
| ETN | | – Exchange Traded Notes |
| ETF | | – Exchange-Traded Fund |
| EUR | | – Euro |
| GBP | | – British Pound |
| Gtd. | | – Guaranteed |
| Jr. | | – Junior |
| | |
| LIBOR | | – London Interbank Offered Rate |
| MLP | | – Master Limited Partnership |
| Pfd. | | – Preferred |
| PIK | | – Pay-in-Kind |
| REGS | | – Regulation S |
| REIT | | – Real Estate Investment Trust |
| Sec. | | – Secured |
| Sr. | | – Senior |
| | |
| STRIPS | | – Separately Traded Registered Interest and Principal Security |
| Sub. | | – Subordinated |
| UK | | – Unitied Kingdom |
| Unsec. | | – Unsecured |
| USD | | – U.S. Dollar |
Notes to Schedule of Investments:
| (a) | Industry and/or sector classifications used in this report are generally according to the Global Industry Classification Standard, which was developed by and is the exclusive property and a service mark of MSCI Inc. and Standard & Poor’s. |
| (b) | Security purchased or received in a transaction exempt from registration under the Securities Act of 1933, as amended (the “1933 Act”). The security may be resold pursuant to an exemption from registration under the 1933 Act, typically to qualified institutional buyers. The aggregate value of these securities at October 31, 2018 was $147,617,062, which represented 26.28% of the Fund’s Net Assets. |
| (c) | Perpetual bond with no specified maturity date. |
| (d) | Zero coupon bond issued at a discount. |
| (e) | All or a portion of this security is Pay-in-Kind. Pay-in-Kind securities pay interest income in the form of securities. |
| (f) | Interest or dividend rate is redetermined periodically. Rate shown is the rate in effect on October 31, 2018. |
| (g) | Security traded on a discount basis. The interest rate shown represents the discount rate at the time of purchase by the Fund. |
| (h) | All or a portion of the value was designated as collateral to cover margin requirements for swap agreements. See Note 1P. |
| (i) | All or a portion of the value was pledged as collateral to cover margin requirements for open futures contracts. See Note 1M. |
| (j) | Foreign denominated security. Principal amount is denominated in the currency indicated. |
| (k) | Variable rate senior loan interests are, at present, not readily marketable, not registered under the Securities Act of 1933 and may be subject to contractual and legal restrictions on sale. Variable rate senior loan interests in the Fund’s portfolio generally have variable rates which adjust to a base, such as the London Interbank Offered Rate ("LIBOR"), on set dates, typically every 30 days but not greater than one year; and/or have interest rates that float at a margin above a widely recognized base lending rate such as the Prime Rate of a designated U.S. bank. |
| (l) | The money market fund and the Fund are affiliated by having the same investment adviser. The rate shown is the 7-day SEC standardized yield as of October 31, 2018. |
See accompanying Notes to Financial Statements which are an integral part of the financial statements.
28 Invesco Multi-Asset Income Fund
| | | | | | | | | | | | | | | | | | | | |
| Open Futures Contracts | |
| Long Futures Contracts | | Number of
Contracts | | | Expiration
Month | | | Notional
Value | | | Value | | | Unrealized
Appreciation
(Depreciation) | |
E-Mini Russell 2000 Index | | | 195 | | | | December-2018 | | | $ | 14,741,025 | | | $ | (2,025,275 | ) | | $ | (2,025,275 | ) |
E-Mini S&P 500 Index | | | 198 | | | | December-2018 | | | | 26,839,890 | | | | (1,869,187 | ) | | | (1,869,187 | ) |
EURO STOXX 50 Index | | | 185 | | | | December-2018 | | | | 6,692,718 | | | | (309,410 | ) | | | (309,410 | ) |
FTSE 100 Index | | | 269 | | | | December-2018 | | | | 24,450,169 | | | | (576,446 | ) | | | (576,446 | ) |
Hang Seng Index | | | 39 | | | | November-2018 | | | | 6,194,435 | | | | 33,435 | | | | 33,435 | |
Topix Stock Price Index | | | 289 | | | | December-2018 | | | | 42,030,310 | | | | (1,928,759 | ) | | | (1,928,759 | ) |
Subtotal — Equity Risk | | | | | | | | | | | | | | | (6,675,642 | ) | | | (6,675,642 | ) |
Euro Bonds | | | 217 | | | | December-2018 | | | | 39,389,524 | | | | (31,116 | ) | | | (31,116 | ) |
Subtotal — Interest Rate Risk | | | | | | | | | | | | | | | (31,116 | ) | | | (31,116 | ) |
Subtotal — Long Futures Contracts | | | | | | | | | | | | | | | (6,706,758 | ) | | | (6,706,758 | ) |
| | | | | |
| | | | | | | | | | | | | | | | | | | | |
| Short Futures Contracts | | | | | | | | | | | | | | | |
Long Gilt | | | 239 | | | | December-2018 | | | | (37,395,015 | ) | | | (519,938 | ) | | | (519,938 | ) |
U.S. Treasury Long Bonds | | | 155 | | | | December-2018 | | | | (21,409,375 | ) | | | 280,569 | | | | 280,569 | |
Subtotal — Short Futures Contracts — Interest Rate Risk | | | | | | | | | | | | | | | (239,369 | ) | | | (239,369 | ) |
Total Futures Contracts | | | | | | | | | | | | | | $ | (6,946,127 | ) | | $ | (6,946,127 | ) |
| | | | | | | | | | | | | | | | | | | | | | |
| Open Forward Foreign Currency Contracts | |
Settlement Date | | Counterparty | | | | | Unrealized
Appreciation | |
| | Contract to | |
| | Deliver | | | Receive | |
11/30/2018 | | Barclays Bank PLC | | | EUR | | | | 1,531,174 | | | | USD | | | | 1,806,842 | | | $ | 68,810 | |
11/30/2018 | | Canadian Imperial Bank of Commerce | | | GBP | | | | 353,982 | | | | USD | | | | 458,625 | | | | 5,623 | |
Total Forward Foreign Currency Contracts — Currency Risk | | | | | | | | | | | | | | | $ | 74,433 | |
Currency Abbreviations:
| | |
| EUR | | – Euro |
| GBP | | – British Pound Sterling |
| USD | | – U.S. Dollar |
| | | | | | | | | | | | | | | | | | | | | | | | | | | | | | | | | | | | | | | | |
| Open Centrally Cleared Credit Default Swap Agreements | |
| Reference Entity | | Buy/Sell
Protection | | | (Pay)/Receive
Fixed Rate | | | Payment
Frequency | | | Maturity
Date | | | Implied
Credit
Spread(m) | | | Notional
Value | | | Upfront
Payments
Paid | | | Value | | | Unrealized
Appreciation (Depreciation)(n) | |
Markit CDX North America High Yield Index, Series 31,
Version 1 | | | Sell | | | | 5.00 | % | | | Quarterly | | | | 12/20/2023 | | | | 3.748 | % | | | USD | | | | 9,000,000 | | | $ | 583,983 | | | $ | 477,683 | | | $ | (106,300 | ) |
Markit iTraxx Europe Crossover Index, Series 29, Version 1 | | | Sell | | | | 5.00 | | | | Quarterly | | | | 06/20/2023 | | | | 2.961 | | | | EUR | | | | 4,300,000 | | | | 388,146 | | | | 416,166 | | | | 28,020 | |
Total Centrally Cleared Credit Default Swap Agreements — Credit Risk | | | $ | 972,129 | | | $ | 893,849 | | | $ | (78,280 | ) |
| (m) | Implied credit spreads represent the current level, as of October 31, 2018 at which protection could be bought or sold given the terms of the existing credit default swap agreement and serve as an indicator of the current status of the payment/performance risk of the credit default swap agreement. An implied credit spread that has widened or increased since entry into the initial agreement may indicate a deteriorating credit profile and increased risk of default for the reference entity. A declining or narrowing spread may indicate an improving credit profile or decreased risk of default for the reference entity. Alternatively, credit spreads may increase or decrease reflecting the general tolerance for risk in the credit markets generally. |
| (n) | The daily variation margin receivable at period-end is recorded in the Statement of Assets and Liabilities. |
See accompanying Notes to Financial Statements which are an integral part of the financial statements.
29 Invesco Multi-Asset Income Fund
Statement of Assets and Liabilities
October 31, 2018
| | | | |
Assets: | | | | |
Investments in securities, at value (Cost $577,745,634) | | $ | 552,412,422 | |
Investments in affiliated money market funds, at value and cost | | | 3,931,990 | |
Other investments: | | | | |
Variation margin receivable — futures contracts | | | 1,742,130 | |
Variation margin receivable — centrally cleared swap agreements | | | 31,293 | |
Unrealized appreciation on forward foreign currency contracts outstanding | | | 74,433 | |
Cash | | | 92,532 | |
Foreign currencies, at value (Cost $42,735) | | | 52,935 | |
Receivable for: | | | | |
Investments sold | | | 230,473 | |
Dividends and interest | | | 4,126,004 | |
Fund shares sold | | | 901,658 | |
Fund expenses absorbed | | | 6,352 | |
Investment for trustee deferred compensation and retirement plans | | | 28,106 | |
Other assets | | | 67,370 | |
Total assets | | | 563,697,698 | |
| |
Liabilities: | | | | |
Payable for: | | | | |
Fund shares reacquired | | | 1,446,188 | |
Accrued fees to affiliates | | | 227,981 | |
Accrued trustees’ and officers’ fees and benefits | | | 2,715 | |
Accrued other operating expenses | | | 257,528 | |
Trustee deferred compensation and retirement plans | | | 32,649 | |
Total liabilities | | | 1,967,061 | |
Net assets applicable to shares outstanding | | $ | 561,730,637 | |
| |
Net assets consist of: | | | | |
Shares of beneficial interest | | $ | 609,244,332 | |
Distributable earnings | | | (47,513,695 | ) |
| | | $ | 561,730,637 | |
| | | | |
Net Assets: | |
Class A | | $ | 131,970,850 | |
Class C | | $ | 85,370,351 | |
Class R | | $ | 2,219,639 | |
Class Y | | $ | 288,116,378 | |
Class R5 | | $ | 149,616 | |
Class R6 | | $ | 53,903,803 | |
|
Shares outstanding, no par value,
with an unlimited number of shares authorized: | |
Class A | | | 13,103,844 | |
Class C | | | 8,484,267 | |
Class R | | | 220,439 | |
Class Y | | | 28,603,861 | |
Class R5 | | | 14,846 | |
Class R6 | | | 5,351,177 | |
Class A: | | | | |
Net asset value per share | | $ | 10.07 | |
Maximum offering price per share | | | | |
(Net asset value of $10.07 ¸ 94.50%) | | $ | 10.66 | |
Class C: | | | | |
Net asset value and offering price per share | | $ | 10.06 | |
Class R: | | | | |
Net asset value and offering price per share | | $ | 10.07 | |
Class Y: | | | | |
Net asset value and offering price per share | | $ | 10.07 | |
Class R5: | | | | |
Net asset value and offering price per share | | $ | 10.08 | |
Class R6: | | | | |
Net asset value and offering price per share | | $ | 10.07 | |
See accompanying Notes to Financial Statements which are an integral part of the financial statements.
30 Invesco Multi-Asset Income Fund
Statement of Operations
For the year ended October 31, 2018
| | | | |
Investment income: | | | | |
Interest | | $ | 16,981,553 | |
Dividends (net of foreign withholding taxes of $3,390) | | | 17,991,571 | |
Dividends from affiliated money market funds | | | 314,998 | |
Total investment income | | | 35,288,122 | |
| |
Expenses: | | | | |
Advisory fees | | | 3,081,040 | |
Administrative services fees | | | 169,698 | |
Custodian fees | | | 53,214 | |
Distribution fees: | | | | |
Class A | | | 391,670 | |
Class C | | | 862,620 | |
Class R | | | 10,404 | |
Transfer agent fees — A, C, R and Y | | | 693,720 | |
Transfer agent fees — R5 | | | 57 | |
Transfer agent fees — R6 | | | 1,600 | |
Trustees’ and officers’ fees and benefits | | | 29,880 | |
Registration and filing fees | | | 150,602 | |
Licensing fees | | | 217,834 | |
Reports to shareholders | | | 70,255 | |
Professional services fees | | | 78,048 | |
Other | | | 78,373 | |
Total expenses | | | 5,889,015 | |
Less: Fees waived, expenses reimbursed and expense offset arrangement(s) | | | (873,726 | ) |
Net expenses | | | 5,015,289 | |
Net investment income | | | 30,272,833 | |
| |
Realized and unrealized gain (loss) from: | | | | |
Net realized gain (loss) from: | | | | |
Investment securities | | | (14,423,318 | ) |
Foreign currencies | | | 142,788 | |
Forward foreign currency contracts | | | 3,726 | |
Futures contracts | | | 4,658,939 | |
Option contracts written | | | (61,516 | ) |
Swap agreements | | | 151,615 | |
| | | | (9,527,766 | ) |
Change in net unrealized appreciation (depreciation) of: | | | | |
Investment securities | | | (28,719,311 | ) |
Foreign currencies | | | 8,760 | |
Forward foreign currency contracts | | | 82,363 | |
Futures contracts | | | (11,748,258 | ) |
Swap agreements | | | (197,460 | ) |
| | | | (40,573,906 | ) |
Net realized and unrealized gain (loss) | | | (50,101,672 | ) |
Net increase (decrease) in net assets resulting from operations | | $ | (19,828,839 | ) |
See accompanying Notes to Financial Statements which are an integral part of the financial statements.
31 Invesco Multi-Asset Income Fund
Statement of Changes in Net Assets
For the years ended October 31, 2018 and 2017
| | | | | | | | |
| | | 2018 | | | 2017 | |
Operations: | | | | | | | | |
Net investment income | | $ | 30,272,833 | | | $ | 17,255,203 | |
Net realized gain (loss) | | | (9,527,766 | ) | | | 10,588,385 | |
Change in net unrealized appreciation (depreciation) | | | (40,573,906 | ) | | | 3,221,889 | |
Net increase (decrease) in net assets resulting from operations | | | (19,828,839 | ) | | | 31,065,477 | |
| | |
Distributions to shareholders from distributable earnings(1): | | | | | | | | |
Class A | | | (9,472,855 | ) | | | (5,659,946 | ) |
Class C | | | (4,242,332 | ) | | | (1,660,348 | ) |
Class R | | | (111,408 | ) | | | (45,346 | ) |
Class Y | | | (19,669,652 | ) | | | (7,006,185 | ) |
Class R5 | | | (4,901 | ) | | | (1,289 | ) |
Class R6 | | | (3,632,822 | ) | | | (2,679,432 | ) |
Total distributions from distributable earnings | | | (37,133,970 | ) | | | (17,052,546 | ) |
| | |
Share transactions-net: | | | | | | | | |
Class A | | | (44,754,951 | ) | | | 94,789,727 | |
Class C | | | 18,810,856 | | | | 48,232,871 | |
Class R | | | 801,652 | | | | 1,023,387 | |
Class Y | | | (11,409,554 | ) | | | 293,115,564 | |
Class R5 | | | 126,787 | | | | 9,180 | |
Class R6 | | | (2,001,854 | ) | | | 9,119,307 | |
Net increase (decrease) in net assets resulting from share transactions | | | (38,427,064 | ) | | | 446,290,036 | |
Net increase (decrease) in net assets | | | (95,389,873 | ) | | | 460,302,967 | |
| | |
Net assets: | | | | | | | | |
Beginning of year | | | 657,120,510 | | | | 196,817,543 | |
End of year | | $ | 561,730,637 | | | $ | 657,120,510 | |
| (1) | The Securities and Exchange Commission eliminated the requirement to disclose distribution components separately, except for tax return of capital. For the year ended October 31, 2017, distributions to shareholders from distributable earnings consisted of distributions from net investment income. |
Notes to Financial Statements
October 31, 2018
NOTE 1—Significant Accounting Policies
Invesco Multi-Asset Income Fund (the “Fund”) is a series portfolio of AIM Investment Funds (Invesco Investment Funds) (the “Trust”). The Trust is organized as a Delaware statutory trust and is registered under the Investment Company Act of 1940, as amended (the “1940 Act”), as an open-end series management investment company authorized to issue an unlimited number of shares of beneficial interest. Information presented in these financial statements pertains only to the Fund. Matters affecting the Fund or each class will be voted on exclusively by the shareholders of the Fund or each class.
The Fund’s investment objective is to provide current income.
The Fund currently consists of six different classes of shares: Class A, Class C, Class R, Class Y, Class R5 and Class R6. Class Y shares are available only to certain investors. Class A shares are sold with a front-end sales charge unless certain waiver criteria are met. Under certain circumstances, load waived shares may be subject to contingent deferred sales charges (“CDSC”). Class C shares are sold with a CDSC. Class R, Class Y, Class R5 and Class R6 shares are sold at net asset value.
The Fund is an investment company and accordingly follows the investment company accounting and reporting guidance in accordance with Financial Accounting Standards Board Accounting Standards Codification Topic 946, Financial Services — Investment Companies.
The following is a summary of the significant accounting policies followed by the Fund in the preparation of its financial statements.
| A. | Security Valuations — Securities, including restricted securities, are valued according to the following policy. |
Debt obligations (including convertible securities) and unlisted equities are fair valued using an evaluated quote provided by an independent pricing service. Evaluated quotes provided by the pricing service may be determined without exclusive reliance on quoted prices, and may reflect appropriate factors such as institution-size trading in similar groups of securities, developments related to specific securities, dividend rate (for unlisted equities), yield (for debt obligations), quality, type of issue, coupon rate (for debt obligations), maturity (for debt obligations), individual trading characteristics and other market data. Pricing services generally value debt obligations assuming orderly transactions of institutional round lot size, but a fund may hold or transact in the same securities in smaller, odd lot sizes. Odd lots often trade at lower prices than
32 Invesco Multi-Asset Income Fund
institutional round lots. Debt obligations are subject to interest rate and credit risks. In addition, all debt obligations involve some risk of default with respect to interest and/or principal payments.
A security listed or traded on an exchange (except convertible securities) is valued at its last sales price or official closing price as of the close of the customary trading session on the exchange where the security is principally traded, or lacking any sales or official closing price on a particular day, the security may be valued at the closing bid price on that day. Securities traded in the over-the-counter market are valued based on prices furnished by independent pricing services or market makers. When such securities are valued by an independent pricing service they may be considered fair valued. Futures contracts are valued at the final settlement price set by an exchange on which they are principally traded. Listed options are valued at the mean between the last bid and asked prices from the exchange on which they are principally traded. Options not listed on an exchange are valued by an independent source at the mean between the last bid and asked prices. For purposes of determining net asset value (“NAV”) per share, futures and option contracts generally are valued 15 minutes after the close of the customary trading session of the New York Stock Exchange (“NYSE”).
Investments in open-end and closed-end registered investment companies that do not trade on an exchange are valued at the end-of-day net asset value per share. Investments in open-end and closed-end registered investment companies that trade on an exchange are valued at the last sales price or official closing price as of the close of the customary trading session on the exchange where the security is principally traded.
Swap agreements are fair valued using an evaluated quote, if available, provided by an independent pricing service. Evaluated quotes provided by the pricing service are valued based on a model which may include end-of-day net present values, spreads, ratings, industry, company performance and returns of referenced assets. Centrally cleared swap agreements are valued at the daily settlement price determined by the relevant exchange or clearinghouse.
Foreign securities’ (including foreign exchange contracts) prices are converted into U.S. dollar amounts using the applicable exchange rates as of the close of the NYSE. If market quotations are available and reliable for foreign exchange-traded equity securities, the securities will be valued at the market quotations. Because trading hours for certain foreign securities end before the close of the NYSE, closing market quotations may become unreliable. If between the time trading ends on a particular security and the close of the customary trading session on the NYSE, events occur that the investment adviser determines are significant and make the closing price unreliable, the Fund may fair value the security. If the event is likely to have affected the closing price of the security, the security will be valued at fair value in good faith using procedures approved by the Board of Trustees. Adjustments to closing prices to reflect fair value may also be based on a screening process of an independent pricing service to indicate the degree of certainty, based on historical data, that the closing price in the principal market where a foreign security trades is not the current value as of the close of the NYSE. Foreign securities’ prices meeting the approved degree of certainty that the price is not reflective of current value will be priced at the indication of fair value from the independent pricing service. Multiple factors may be considered by the independent pricing service in determining adjustments to reflect fair value and may include information relating to sector indices, American Depositary Receipts and domestic and foreign index futures. Foreign securities may have additional risks including exchange rate changes, potential for sharply devalued currencies and high inflation, political and economic upheaval, the relative lack of issuer information, relatively low market liquidity and the potential lack of strict financial and accounting controls and standards.
Securities for which market prices are not provided by any of the above methods may be valued based upon quotes furnished by independent sources. The last bid price may be used to value equity securities. The mean between the last bid and asked prices is used to value debt obligations, including corporate loans.
Securities for which market quotations are not readily available or became unreliable are valued at fair value as determined in good faith by or under the supervision of the Trust’s officers following procedures approved by the Board of Trustees. Issuer specific events, market trends, bid/asked quotes of brokers and information providers and other market data may be reviewed in the course of making a good faith determination of a security’s fair value.
The Fund may invest in securities that are subject to interest rate risk, meaning the risk that the prices will generally fall as interest rates rise and, conversely, the prices will generally rise as interest rates fall. Specific securities differ in their sensitivity to changes in interest rates depending on their individual characteristics. Changes in interest rates may result in increased market volatility, which may affect the value and/or liquidity of certain Fund investments.
Valuations change in response to many factors including the historical and prospective earnings of the issuer, the value of the issuer’s assets, general economic conditions, interest rates, investor perceptions and market liquidity. Because of the inherent uncertainties of valuation, the values reflected in the financial statements may materially differ from the value received upon actual sale of those investments.
| B. | Securities Transactions and Investment Income — Securities transactions are accounted for on a trade date basis. Realized gains or losses on sales are computed on the basis of specific identification of the securities sold. Interest income (net of withholding tax, if any) is recorded on the accrual basis from settlement date. Bond premiums and discounts are amortized and/or accreted over the lives of the respective securities. Pay-in-kind interest income and non-cash dividend income received in the form of securities in-lieu of cash are recorded at the fair value of the securities received. Paydown gains and losses on mortgage and asset-backed securities are recorded as adjustments to interest income. Dividend income (net of withholding tax, if any) is recorded on the ex-dividend date. |
The Fund may periodically participate in litigation related to Fund investments. As such, the Fund may receive proceeds from litigation settlements. Any proceeds received are included in the Statement of Operations as realized gain (loss) for investments no longer held and as unrealized gain (loss) for investments still held.
Brokerage commissions and mark ups are considered transaction costs and are recorded as an increase to the cost basis of securities purchased and/or a reduction of proceeds on a sale of securities. Such transaction costs are included in the determination of net realized and unrealized gain (loss) from investment securities reported in the Statement of Operations and the Statement of Changes in Net Assets and the net realized and unrealized gains (losses) on securities per share in the Financial Highlights. Transaction costs are included in the calculation of the Fund’s net asset value and, accordingly, they reduce the Fund’s total returns. These transaction costs are not considered operating expenses and are not reflected in net investment income reported in the Statement of Operations and the Statement of Changes in Net Assets, or the net investment income per share and the ratios of expenses and net investment income reported in the Financial Highlights, nor are they limited by any expense limitation arrangements between the Fund and the investment adviser.
The Fund allocates income and realized and unrealized capital gains and losses to a class based on the relative net assets of each class.
33 Invesco Multi-Asset Income Fund
The Fund recharacterizes distributions received from REIT investments based on information provided by the REIT into the following categories: ordinary income, long-term and short-term capital gains, and return of capital. If information is not available on a timely basis from the REIT, the recharacterization will be based on available information which may include the previous year’s allocation. If new or additional information becomes available from the REIT at a later date, a recharacterization will be made in the following year. The Fund records as dividend income the amount recharacterized as ordinary income and as realized gain the amount recharacterized as capital gain in the Statement of Operations, and the amount recharacterized as return of capital as a reduction of the cost of the related investment. These recharacterizations are reflected in the accompanying financial statements.
| C. | Country Determination — For the purposes of making investment selection decisions and presentation in the Schedule of Investments, the investment adviser may determine the country in which an issuer is located and/or credit risk exposure based on various factors. These factors include the laws of the country under which the issuer is organized, where the issuer maintains a principal office, the country in which the issuer derives 50% or more of its total revenues and the country that has the primary market for the issuer’s securities, as well as other criteria. Among the other criteria that may be evaluated for making this determination are the country in which the issuer maintains 50% or more of its assets, the type of security, financial guarantees and enhancements, the nature of the collateral and the sponsor organization. Country of issuer and/or credit risk exposure has been determined to be the United States of America, unless otherwise noted. |
| D. | Distributions — Distributions from net investment income, if any, are declared and paid monthly. Distributions from net realized capital gain, if any, are generally declared and paid annually and recorded on the ex-dividend date. The Fund may elect to treat a portion of the proceeds from redemptions as distributions for federal income tax purposes. |
| E. | Master Limited Partnerships — The Fund invests in Master Limited Partnerships (“MLPs”). MLPs are publicly traded partnerships and limited liability companies taxed as partnerships under the Internal Revenue Code of 1986, as amended (the “Internal Revenue Code”). The Fund invests in MLPs engaged in, among other things, the exploring, producing, transporting, processing, storing, refining, mining or marketing of minerals and natural resources. The Fund is a partner in each MLP; accordingly, the Fund is required to take into account the Fund’s allocable share of income, gains, losses, deductions, expenses, and tax credits recognized by each MLP. |
MLPs may be less liquid and subject to more abrupt or erratic price movements than conventional publicly traded securities.
| F. | Federal Income Taxes — The Fund intends to comply with the requirements of Subchapter M of the Internal Revenue Code of 1986, as amended (the “Internal Revenue Code”), necessary to qualify as a regulated investment company and to distribute substantially all of the Fund’s taxable earnings to shareholders. As such, the Fund will not be subject to federal income taxes on otherwise taxable income (including net realized capital gain) that is distributed to shareholders. Therefore, no provision for federal income taxes is recorded in the financial statements. |
The Fund recognizes the tax benefits of uncertain tax positions only when the position is more likely than not to be sustained. Management has analyzed the Fund’s uncertain tax positions and concluded that no liability for unrecognized tax benefits should be recorded related to uncertain tax positions. Management is not aware of any tax positions for which it is reasonably possible that the total amounts of unrecognized tax benefits will change materially in the next 12 months.
The Fund files tax returns in the U.S. Federal jurisdiction and certain other jurisdictions. Generally, the Fund is subject to examinations by such taxing authorities for up to three years after the filing of the return for the tax period.
| G. | Expenses — Fees provided for under the Rule 12b-1 plan of a particular class of the Fund are charged to the operations of such class. Transfer agency fees and expenses and other shareholder recordkeeping fees and expenses attributable to Class R5 and Class R6 are allocated to each share class based on relative net assets. Sub-accounting fees attributable to Class R5 are charged to the operations of the class. Transfer agency fees and expenses and other shareholder recordkeeping fees and expenses relating to all other classes are allocated among those classes based on relative net assets. All other expenses are allocated among the classes based on relative net assets. |
| H. | Accounting Estimates — The preparation of financial statements in conformity with accounting principles generally accepted in the United States of America (“GAAP”) requires management to make estimates and assumptions that affect the reported amounts of assets and liabilities at the date of the financial statements and the reported amounts of revenues and expenses during the reporting period including estimates and assumptions related to taxation. Actual results could differ from those estimates by a significant amount. In addition, the Fund monitors for material events or transactions that may occur or become known after the period-end date and before the date the financial statements are released to print. |
| I. | Indemnifications — Under the Trust’s organizational documents, each Trustee, officer, employee or other agent of the Trust is indemnified against certain liabilities that may arise out of the performance of their duties to the Fund. Additionally, in the normal course of business, the Fund enters into contracts, including the Fund’s servicing agreements, that contain a variety of indemnification clauses. The Fund’s maximum exposure under these arrangements is unknown as this would involve future claims that may be made against the Fund that have not yet occurred. The risk of material loss as a result of such indemnification claims is considered remote. |
| J. | Exchange-traded Notes — The Fund may invest in exchange-traded notes (“ETNs”) which are senior, unsecured, unsubordinated debt securities whose returns are linked to the performance of a particular market benchmark or strategy, minus applicable fees. ETNs can be traded on an exchange and/or they can be held to maturity. At maturity, the issuer pays the investor a cash amount equal to the principal amount, subject to the day’s market benchmark or strategy factor. ETNs do not make periodic coupon payments or provide principal protection. The value of an ETN may be influenced by time to maturity, level of supply and demand for the ETN, volatility and lack of liquidity in the underlying market, changes in the applicable interest rates, and economic, legal, political or geographic events that affect the referenced underlying market or assets. ETNs are subject to credit risk, including the credit risk of the issuer and counterparty risk. |
| K. | Foreign Currency Translations — Foreign currency is valued at the close of the NYSE based on quotations posted by banks and major currency dealers. Portfolio securities and other assets and liabilities denominated in foreign currencies are translated into U.S. dollar amounts at the date of valuation. Purchases and sales of portfolio securities (net of foreign taxes withheld on disposition) and income items denominated in foreign currencies are translated into U.S. dollar amounts on the respective dates of such transactions. The Fund does not separately account for the portion of the results of operations resulting from changes in foreign exchange rates on investments and the fluctuations arising from changes in market prices of securities held. The combined results of changes in foreign exchange rates and the fluctuation of market prices on investments (net of estimated foreign tax withholding) are included with the net realized and unrealized gain or loss from investments in the Statement of Operations. Reported net realized foreign currency gains or losses arise from (1) sales of foreign currencies, (2) currency gains or losses realized between the trade and settlement dates on securities transactions, and (3) the difference between the amounts of dividends, |
34 Invesco Multi-Asset Income Fund
| | interest, and foreign withholding taxes recorded on the Fund’s books and the U.S. dollar equivalent of the amounts actually received or paid. Net unrealized foreign currency gains and losses arise from changes in the fair values of assets and liabilities, other than investments in securities at fiscal period end, resulting from changes in exchange rates. |
The Fund may invest in foreign securities, which may be subject to foreign taxes on income, gains on investments or currency repatriation, a portion of which may be recoverable. Foreign taxes, if any, are recorded based on the tax regulations and rates that exist in the foreign markets in which the Fund invests and are shown in the Statement of Operations.
| L. | Forward Foreign Currency Contracts — The Fund may engage in foreign currency transactions either on a spot (i.e. for prompt delivery and settlement) basis, or through forward foreign currency contracts, to manage or minimize currency or exchange rate risk. |
The Fund may also enter into forward foreign currency contracts for the purchase or sale of a security denominated in a foreign currency in order to “lock in” the U.S. dollar price of that security, or the Fund may also enter into forward foreign currency contracts that do not provide for physical settlement of the two currencies, but instead are settled by a single cash payment calculated as the difference between the agreed upon exchange rate and the spot rate at settlement based upon an agreed upon notional amount (non-deliverable forwards). The Fund will set aside liquid assets in an amount equal to the daily mark-to-market obligation for forward foreign currency contracts.
A forward foreign currency contract is an obligation between two parties (“Counterparties”) to purchase or sell a specific currency for an agreed-upon price at a future date. The use of forward foreign currency contracts does not eliminate fluctuations in the price of the underlying securities the Fund owns or intends to acquire but establishes a rate of exchange in advance. Fluctuations in the value of these contracts are measured by the difference in the contract date and reporting date exchange rates and are recorded as unrealized appreciation (depreciation) until the contracts are closed. When the contracts are closed, realized gains (losses) are recorded. Realized and unrealized gains (losses) on the contracts are included in the Statement of Operations. The primary risks associated with forward foreign currency contracts include failure of the Counterparty to meet the terms of the contract and the value of the foreign currency changing unfavorably. These risks may be in excess of the amounts reflected in the Statement of Assets and Liabilities.
| M. | Futures Contracts — The Fund may enter into futures contracts to manage exposure to interest rate, equity and market price movements and/or currency risks. A futures contract is an agreement between Counterparties to purchase or sell a specified underlying security, currency or commodity (or delivery of a cash settlement price, in the case of an index future) for a fixed price at a future date. The Fund currently invests only in exchange-traded futures and they are standardized as to maturity date and underlying financial instrument. Initial margin deposits required upon entering into futures contracts are satisfied by the segregation of specific securities or cash as collateral at the futures commission merchant (broker). During the period the futures contracts are open, changes in the value of the contracts are recognized as unrealized gains or losses by recalculating the value of the contracts on a daily basis. Subsequent or variation margin payments are received or made depending upon whether unrealized gains or losses are incurred. These amounts are reflected as receivables or payables on the Statement of Assets and Liabilities. When the contracts are closed or expire, the Fund recognizes a realized gain or loss equal to the difference between the proceeds from, or cost of, the closing transaction and the Fund’s basis in the contract. The net realized gain (loss) and the change in unrealized gain (loss) on futures contracts held during the period is included on the Statement of Operations. The primary risks associated with futures contracts are market risk and the absence of a liquid secondary market. If the Fund were unable to liquidate a futures contract and/or enter into an offsetting closing transaction, the Fund would continue to be subject to market risk with respect to the value of the contracts and continue to be required to maintain the margin deposits on the futures contracts. Futures contracts have minimal Counterparty risk since the exchange’s clearinghouse, as Counterparty to all exchange-traded futures, guarantees the futures against default. Risks may exceed amounts recognized in the Statement of Assets and Liabilities. |
| N. | Call Options Purchased and Written — The Fund may write call options and/or buy call options. A covered call option gives the purchaser of such option the right to buy, and the writer the obligation to sell, the underlying security or foreign currency at the stated exercise price during the option period. An uncovered call option exists without the ownership of the underlying security. Options written by the Fund normally will have expiration dates between three and nine months from the date written. The exercise price of a call option may be below, equal to, or above the current market value of the underlying security at the time the option is written. |
Additionally, the Fund may enter into an option on a swap agreement, also called a “swaption”. A swaption is an option that gives the buyer the right, but not the obligation, to enter into a swap on a future date in exchange for paying a market-based premium. A receiver swaption gives the owner the right to receive the total return of a specified asset, reference rate or index. Swaptions also include options that allow an existing swap to be terminated or extended by one of the Counterparties.
When the Fund writes a covered call option, an amount equal to the premium received by the Fund is recorded as an asset and an equivalent liability in the Statement of Assets and Liabilities. The amount of the liability is subsequently “marked-to-market” to reflect the current market value of the option written. If a written covered call option expires on the stipulated expiration date, or if the Fund enters into a closing purchase transaction, the Fund realizes a gain (or a loss if the closing purchase transaction exceeds the premium received when the option was written) without regard to any unrealized gain or loss on the underlying security, and the liability related to such option is extinguished. If a written covered call option is exercised, the Fund realizes a gain or a loss from the sale of the underlying security and the proceeds of the sale are increased by the premium originally received. Realized and unrealized gains and losses on call options written are included in the Statement of Operations as Net realized gain (loss) from and Change in net unrealized appreciation (depreciation) of Option contracts written. A risk in writing a covered call option is that the Fund gives up the opportunity for profit if the market price of the security increases and the option is exercised. The risk in writing an uncovered call option is that the Fund may incur significant losses if the value of the written security exceeds the exercise price of the option.
When the Fund buys a call option, an amount equal to the premium paid by the Fund is recorded as an investment on the Statement of Assets and Liabilities. The amount of the investment is subsequently “marked-to-market” to reflect the current value of the option purchased. Realized and unrealized gains and losses on call options purchased are included in the Statement of Operations as Net realized gain (loss) from and Change in net unrealized appreciation (depreciation) of Investment securities. A risk in buying an option is that the Fund pays a premium whether or not the option is exercised. In addition, there can be no assurance that a liquid secondary market will exist for any option purchased.
| O. | Put Options Purchased — The Fund may purchase put options including options on securities indexes, or foreign currency and/or futures contracts. By purchasing a put option, the Fund obtains the right (but not the obligation) to sell the option’s underlying instrument at a fixed strike price. In return for this right, the Fund pays an option premium. The option’s underlying instrument may be a security, securities index, or a |
35 Invesco Multi-Asset Income Fund
| | futures contract. Put options may be used by the Fund to hedge securities it owns by locking in a minimum price at which the Fund can sell. If security prices fall, the put option could be exercised to offset all or a portion of the Fund’s resulting losses. At the same time, because the maximum the Fund has at risk is the cost of the option, purchasing put options does not eliminate the potential for the Fund to profit from an increase in the value of the securities hedged. Realized and unrealized gains and losses on put options purchased are included in the Statement of Operations as Net realized gain (loss) from and Change in net unrealized appreciation (depreciation) of Investment securities. A risk in buying an option is that the Fund pays a premium whether or not the option is exercised. In addition, there can be no assurance that a liquid secondary market will exist for any option purchased. |
| P. | Swap Agreements — The Fund may enter into various swap transactions, including interest rate, total return, index, currency and credit default swap contracts (“CDS”) for investment purposes or to manage interest rate, currency or credit risk. Such transactions are agreements between Counterparties. A swap agreement may be negotiated bilaterally and traded over-the-counter (“OTC”) between two parties (“uncleared/OTC”) or, in some instances, must be transacted through a future commission merchant (“FCM”) and cleared through a clearinghouse that serves as a central Counterparty (“centrally cleared swap”). These agreements may contain among other conditions, events of default and termination events, and various covenants and representations such as provisions that require the Fund to maintain a pre-determined level of net assets, and/or provide limits regarding the decline of the Fund’s NAV over specific periods of time. If the Fund were to trigger such provisions and have open derivative positions at that time, the Counterparty may be able to terminate such agreement and request immediate payment in an amount equal to the net liability positions, if any. |
Interest rate, total return, index, and currency swap agreements are two-party contracts entered into primarily to exchange the returns (or differentials in rates of returns) earned or realized on particular predetermined investments or instruments. The gross returns to be exchanged or “swapped” between the parties are calculated with respect to a notional amount, i.e., the return on or increase in value of a particular dollar amount invested at a particular interest rate or return of an underlying asset, in a particular foreign currency, or in a “basket” of securities representing a particular index.
In a centrally cleared swap, the Fund’s ultimate Counterparty is a central clearinghouse. The Fund initially will enter into centrally cleared swaps through an executing broker. When a fund enters into a centrally cleared swap, it must deliver to the central Counterparty (via the FCM) an amount referred to as “initial margin.” Initial margin requirements are determined by the central Counterparty, but an FCM may require additional initial margin above the amount required by the central Counterparty. Initial margin deposits required upon entering into centrally cleared swaps are satisfied by cash or securities as collateral at the FCM. Securities deposited as initial margin are designated on the Schedule of Investments and cash deposited is recorded on the Statement of Assets and Liabilities. During the term of a cleared swap agreement, a “variation margin” amount may be required to be paid by the Fund or may be received by the Fund, based on the daily change in price of the underlying reference instrument subject to the swap agreement and is recorded as a receivable or payable for variation margin in the Statement of Assets and Liabilities until the centrally cleared swap is terminated at which time a realized gain or loss is recorded.
A CDS is an agreement between Counterparties to exchange the credit risk of an issuer. A buyer of a CDS is said to buy protection by paying a fixed payment over the life of the agreement and in some situations an upfront payment to the seller of the CDS. If a defined credit event occurs (such as payment default or bankruptcy), the Fund as a protection buyer would cease paying its fixed payment, the Fund would deliver eligible bonds issued by the reference entity to the seller, and the seller would pay the full notional value, or the “par value”, of the referenced obligation to the Fund. A seller of a CDS is said to sell protection and thus would receive a fixed payment over the life of the agreement and an upfront payment, if applicable. If a credit event occurs, the Fund as a protection seller would cease to receive the fixed payment stream, the Fund would pay the buyer “par value” or the full notional value of the referenced obligation, and the Fund would receive the eligible bonds issued by the reference entity. In turn, these bonds may be sold in order to realize a recovery value. Alternatively, the seller of the CDS and its Counterparty may agree to net the notional amount and the market value of the bonds and make a cash payment equal to the difference to the buyer of protection. If no credit event occurs, the Fund receives the fixed payment over the life of the agreement. As the seller, the Fund would effectively add leverage to its portfolio because, in addition to its total net assets, the Fund would be subject to investment exposure on the notional amount of the CDS. In connection with these agreements, cash and securities may be identified as collateral in accordance with the terms of the respective swap agreements to provide assets of value and recourse in the event of default under the swap agreement or bankruptcy/insolvency of a party to the swap agreement. If a Counterparty becomes bankrupt or otherwise fails to perform its obligations due to financial difficulties, the Fund may experience significant delays in obtaining any recovery in a bankruptcy or other reorganization proceeding. The Fund may obtain only limited recovery or may obtain no recovery in such circumstances. The Fund’s maximum risk of loss from Counterparty risk, either as the protection seller or as the protection buyer, is the value of the contract. The risk may be mitigated by having a master netting arrangement between the Fund and the Counterparty and by the designation of collateral by the Counterparty to cover the Fund’s exposure to the Counterparty.
Implied credit spreads represent the current level at which protection could be bought or sold given the terms of the existing CDS contract and serve as an indicator of the current status of the payment/performance risk of the CDS. An implied spread that has widened or increased since entry into the initial contract may indicate a deteriorating credit profile and increased risk of default for the reference entity. A declining or narrowing spread may indicate an improving credit profile or decreased risk of default for the reference entity. Alternatively, credit spreads may increase or decrease reflecting the general tolerance for risk in the credit markets.
An interest rate swap is an agreement between Counterparties pursuant to which the parties exchange a floating rate payment for a fixed rate payment based on a specified notional amount.
Changes in the value of centrally cleared and OTC swap agreements are recognized as unrealized gains (losses) in the Statement of Operations by “marking to market” on a daily basis to reflect the value of the swap agreement at the end of each trading day. Payments received or paid at the beginning of the agreement are reflected as such on the Statement of Assets and Liabilities and may be referred to as upfront payments. The Fund accrues for the fixed payment stream and amortizes upfront payments, if any, on swap agreements on a daily basis with the net amount, recorded as a component of realized gain (loss) on the Statement of Operations. A liquidation payment received or made at the termination of a swap agreement is recorded as realized gain (loss) on the Statement of Operations. The Fund segregates cash or liquid securities having a value at least equal to the amount of the potential obligation of a Fund under any swap transaction. Cash held as collateral is recorded as deposits with brokers on the Statement of Assets and Liabilities. Entering into these agreements involves, to varying degrees, lack of liquidity and elements of credit, market, and Counterparty risk in excess of amounts recognized on the Statement of Assets and Liabilities. Such risks involve the possibility
36 Invesco Multi-Asset Income Fund
that a swap is difficult to sell or liquidate; the Counterparty does not honor its obligations under the agreement and unfavorable interest rates and market fluctuations. It is possible that developments in the swaps market, including potential government regulation, could adversely affect the Fund’s ability to terminate existing swap agreements or to realize amounts to be received under such agreements. A short position in a security poses more risk than holding the same security long. As there is no limit on how much the price of the security can increase, the Fund’s exposure is unlimited.
Notional amounts of each individual credit default swap agreement outstanding as of October 31, 2018 for which the Fund is the seller of protection are disclosed in the open swap agreements table. These potential amounts would be partially offset by any recovery values of the respective referenced obligations, upfront payments received upon entering into the agreement, or net amounts received from the settlement of buy protection credit default swap agreements entered into by the Fund for the same referenced entity or entities.
| Q. | Other Risks — The Fund may invest in lower-quality debt securities, i.e., “junk bonds”. Investments in lower-rated securities or unrated securities of comparable quality tend to be more sensitive to economic conditions than higher rated securities. Junk bonds involve a greater risk of default by the issuer because such securities are generally unsecured and are often subordinated to other creditors’ claim. |
| R. | Leverage Risk — Leverage exists when the Fund can lose more than it originally invests because it purchases or sells an instrument or enters into a transaction without investing an amount equal to the full economic exposure of the instrument or transaction. |
| S. | Collateral — To the extent the Fund has designated or segregated a security as collateral and that security is subsequently sold, it is the Fund’s practice to replace such collateral no later than the next business day. |
NOTE 2—Advisory Fees and Other Fees Paid to Affiliates
The Trust has entered into a master investment advisory agreement with Invesco Advisers, Inc. (the “Adviser” or “Invesco”). Under the terms of the investment advisory agreement, the Fund accrues daily and pays monthly an advisory fee to the Adviser based on the annual rate of the Fund’s average daily net assets as follows:
| | | | |
| Average Daily Net Assets | | Rate | |
First $500 million | | | 0.50% | |
Next $500 million | | | 0.45% | |
Next $500 million | | | 0.40% | |
Over $1.5 billion | | | 0.39% | |
For the year ended October 31, 2018, the effective advisory fees incurred by the Fund was 0.49%.
Under the terms of a master sub-advisory agreement between the Adviser and each of Invesco Asset Management Deutschland GmbH, Invesco Asset Management Limited, Invesco Asset Management (Japan) Limited, Invesco Hong Kong Limited, Invesco Senior Secured Management, Inc. and Invesco Canada Ltd. and separate sub-advisory agreements with Invesco Capital Management LLC, formerly Invesco PowerShares Capital Management LLC, and Invesco Asset Management (India) Private Limited (collectively, the “Affiliated Sub-Advisers”) the Adviser, not the Fund, will pay 40% of the fees paid to the Adviser to any such Affiliated Sub-Adviser(s) that provide(s) discretionary investment management services to the Fund based on the percentage of assets allocated to such Affiliated Sub-Adviser(s).
The Adviser has contractually agreed, through at least February 29, 2020, to waive advisory fees and/or reimburse expenses of all shares to the extent necessary to limit total annual fund operating expenses after fee waiver and/or expense reimbursement (excluding certain items discussed below) of Class A, Class C, Class R, Class Y, Class R5 and Class R6 shares to 0.85%, 1.60%, 1.10%, 0.60%, 0.60% and 0.60%, respectively, of the Fund’s average daily net assets (the “expense limits”). In determining the Adviser’s obligation to waive advisory fees and/or reimburse expenses, the following expenses are not taken into account, and could cause the total annual fund operating expenses after fee waiver and/or expense reimbursement to exceed the numbers reflected above: (1) interest; (2) taxes; (3) dividend expense on short sales; (4) extraordinary or non-routine items, including litigation expenses; and (5) expenses that the Fund has incurred but did not actually pay because of an expense offset arrangement. Unless Invesco continues the fee waiver agreement, it will terminate on February 29, 2020. During its term, the fee waiver agreement cannot be terminated or amended to increase the expense limits or reduce the advisory fee waiver without approval of the Board of Trustees.
Further, the Adviser has contractually agreed, through at least June 30, 2020, to waive the advisory fee payable by the Fund in an amount equal to 100% of the net advisory fees the Adviser receives from the affiliated money market funds on investments by the Fund of uninvested cash in such affiliated money market funds.
For the year ended October 31, 2018, the Adviser waived advisory fees of $178,349 and reimbursed class level expenses of $190,601, $104,946, $2,531, $393,951, $57 and $1,600 of Class A, Class C, Class R, Class Y, Class R5 and Class R6 shares, respectively.
The Trust has entered into a master administrative services agreement with Invesco pursuant to which the Fund has agreed to pay Invesco for certain administrative costs incurred in providing accounting services to the Fund. For the year ended October 31, 2018, expenses incurred under the agreement are shown in the Statement of Operations as Administrative services fees.
The Trust has entered into a transfer agency and service agreement with Invesco Investment Services, Inc. (“IIS”) pursuant to which the Fund has agreed to pay IIS a fee for providing transfer agency and shareholder services to the Fund and reimburse IIS for certain expenses incurred by IIS in the course of providing such services. IIS may make payments to intermediaries that provide omnibus account services, sub-accounting services and/or networking services. All fees payable by IIS to intermediaries that provide omnibus account services or sub-accounting services are charged back to the Fund, subject to certain limitations approved by the Trust’s Board of Trustees. For the year ended October 31, 2018, expenses incurred under the agreement are shown in the Statement of Operations as Transfer agent fees.
The Trust has entered into master distribution agreements with Invesco Distributors, Inc. (“IDI”) to serve as the distributor for the Class A, Class C, Class R, Class Y, Class R5 and Class R6 shares of the Fund. The Trust has adopted plans pursuant to Rule 12b-1 under the 1940 Act with respect to the Fund’s Class A, Class C and Class R shares (collectively the “Plans”). The Fund, pursuant to the Plans, pays IDI compensation at the annual rate of 0.25% of the Fund’s average daily net assets of Class A shares, 1.00% of the average daily net assets of Class C shares and 0.50% of the average daily net assets of Class R shares. The fees are accrued daily and paid monthly. Of the Plan payments, up to 0.25% of the average daily net assets of each class of shares may be paid to furnish continuing personal shareholder services to customers who purchase and own shares of such classes. Any
37 Invesco Multi-Asset Income Fund
amounts not paid as a service fee under the Plans would constitute an asset-based sales charge. Rules of the Financial Industry Regulatory Authority (“FINRA”) impose a cap on the total sales charges, including asset-based sales charges, that may be paid by any class of shares of the Fund. For the year ended October 31, 2018, expenses incurred under the Plans are shown in the Statement of Operations as Distribution fees.
Front-end sales commissions and CDSC (collectively, the “sales charges”) are not recorded as expenses of the Fund. Front-end sales commissions are deducted from proceeds from the sales of Fund shares prior to investment in Class A shares of the Fund. CDSC are deducted from redemption proceeds prior to remittance to the shareholder. During the year ended October 31, 2018, IDI advised the Fund that IDI retained $86,326 in front-end sales commissions from the sale of Class A shares and $3,800 and $24,318 from Class A and Class C shares, respectively, for CDSC imposed upon redemptions by shareholders.
Certain officers and trustees of the Trust are officers and directors of the Adviser, IIS and/or IDI.
NOTE 3—Additional Valuation Information
GAAP defines fair value as the price that would be received to sell an asset or paid to transfer a liability in an orderly transaction between market participants at the measurement date, under current market conditions. GAAP establishes a hierarchy that prioritizes the inputs to valuation methods, giving the highest priority to readily available unadjusted quoted prices in an active market for identical assets (Level 1) and the lowest priority to significant unobservable inputs (Level 3), generally when market prices are not readily available or are unreliable. Based on the valuation inputs, the securities or other investments are tiered into one of three levels. Changes in valuation methods may result in transfers in or out of an investment’s assigned level:
| | Level 1 — | Prices are determined using quoted prices in an active market for identical assets. |
| | Level 2 — | Prices are determined using other significant observable inputs. Observable inputs are inputs that other market participants may use in pricing a security. These may include quoted prices for similar securities, interest rates, prepayment speeds, credit risk, yield curves, loss severities, default rates, discount rates, volatilities and others. |
| | Level 3 — | Prices are determined using significant unobservable inputs. In situations where quoted prices or observable inputs are unavailable (for example, when there is little or no market activity for an investment at the end of the period), unobservable inputs may be used. Unobservable inputs reflect the Fund’s own assumptions about the factors market participants would use in determining fair value of the securities or instruments and would be based on the best available information. |
The following is a summary of the tiered valuation input levels, as of October 31, 2018. The level assigned to the securities valuations may not be an indication of the risk or liquidity associated with investing in those securities. Because of the inherent uncertainties of valuation, the values reflected in the financial statements may materially differ from the value received upon actual sale of those investments.
| | | | | | | | | | | | | | | | |
| | | Level 1 | | | Level 2 | | | Level 3 | | | Total | |
Investments in Securities | | | | | | | | | | | | | | | | |
U.S. Dollar Denominated Bonds & Notes | | $ | — | | | $ | 275,224,233 | | | $ | — | | | $ | 275,224,233 | |
Preferred Stocks | | | 116,718,065 | | | | 518,716 | | | | — | | | | 117,236,781 | |
Common Stocks & Other Equity Interests | | | 53,373,757 | | | | — | | | | — | | | | 53,373,757 | |
Exchange-Traded Notes | | | 50,068,600 | | | | — | | | | — | | | | 50,068,600 | |
U.S. Treasury Securities | | | — | | | | 46,031,065 | | | | — | | | | 46,031,065 | |
Exchange-Traded Fund | | | 6,813,840 | | | | — | | | | — | | | | 6,813,840 | |
Non-U.S. Dollar Denominated Bonds & Notes | | | — | | | | 2,275,536 | | | | — | | | | 2,275,536 | |
Variable Rate Senior Loan Interests | | | — | | | | 1,388,610 | | | | — | | | | 1,388,610 | |
Money Market Funds | | | 3,931,990 | | | | — | | | | — | | | | 3,931,990 | |
Total Investments in Securities | | | 230,906,252 | | | | 325,438,160 | | | | — | | | | 556,344,412 | |
Other Investments — Assets* | | | | | | | | | | | | | | | | |
Forward Foreign Currency Contracts | | | — | | | | 74,433 | | | | — | | | | 74,433 | |
Futures Contracts | | | 314,004 | | | | — | | | | — | | | | 314,004 | |
Swap Agreements | | | — | | | | 28,020 | | | | — | | | | 28,020 | |
| | | | 314,004 | | | | 102,453 | | | | — | | | | 416,457 | |
Other Investments — Liabilities* | | | | | | | | | | | | | | | | |
Futures Contracts | | | (7,260,131 | ) | | | — | | | | — | | | | (7,260,131 | ) |
Swap Agreements | | | — | | | | (106,300 | ) | | | — | | | | (106,300 | ) |
| | | | (7,260,131 | ) | | | (106,300 | ) | | | — | | | | (7,366,431 | ) |
Total Other Investments | | | (6,946,127 | ) | | | (3,847 | ) | | | — | | | | (6,949,974 | ) |
Total Investments | | $ | 223,960,125 | | | $ | 325,434,313 | | | $ | — | | | $ | 549,394,438 | |
| * | Unrealized appreciation (depreciation). |
38 Invesco Multi-Asset Income Fund
NOTE 4—Derivative Investments
The Fund may enter into an International Swaps and Derivatives Association Master Agreement (“ISDA Master Agreement”) under which a fund may trade OTC derivatives. An OTC transaction entered into under an ISDA Master Agreement typically involves a collateral posting arrangement, payment netting provisions and close-out netting provisions. These netting provisions allow for reduction of credit risk through netting of contractual obligations. The enforceability of the netting provisions of the ISDA Master Agreement depends on the governing law of the ISDA Master Agreement, among other factors.
For financial reporting purposes, the Fund does not offset OTC derivative assets or liabilities that are subject to ISDA Master Agreements in the Statement of Assets and Liabilities.
Value of Derivative Investments at Period-End
The table below summarizes the value of the Fund’s derivative investments, detailed by primary risk exposure, held as of October 31, 2018:
| | | | | | | | | | | | | | | | | | | | |
| | | Value | |
| Derivative Assets | | Credit
Risk | | | Currency
Risk | | | Equity
Risk | | | Interest
Rate Risk | | | Total | |
Unrealized appreciation on futures contracts — Exchange-Traded(a) | | $ | — | | | $ | — | | | $ | 33,435 | | | $ | 280,569 | | | $ | 314,004 | |
Unrealized appreciation on swap agreements — Centrally Cleared(a) | | | 28,020 | | | | — | | | | — | | | | — | | | | 28,020 | |
Unrealized appreciation on forward foreign currency contracts outstanding | | | — | | | | 74,433 | | | | — | | | | — | | | | 74,433 | |
Total Derivative Assets | | | 28,020 | | | | 74,433 | | | | 33,435 | | | | 280,569 | | | | 416,457 | |
Derivatives not subject to master netting agreements | | | (28,020 | ) | | | — | | | | (33,435 | ) | | | (280,569 | ) | | | (342,024 | ) |
Total Derivative Assets subject to master netting agreements | | $ | — | | | $ | 74,433 | | | $ | — | | | $ | — | | | $ | 74,433 | |
| | | | | |
| | | | | | | | | | | | | | | | | | | | |
| | | Value | |
| Derivative Liabilities | | Credit
Risk | | | Currency
Risk | | | Equity
Risk | | | Interest
Rate Risk | | | Total | |
Unrealized depreciation on futures contracts — Exchange-Traded(a) | | $ | — | | | $ | — | | | $ | (6,709,077 | ) | | $ | (551,054 | ) | | $ | (7,260,131 | ) |
Unrealized depreciation on swap agreements — Centrally Cleared(a) | | | (106,300 | ) | | | — | | | | — | | | | — | | | | (106,300 | ) |
Total Derivative Liabilities | | | (106,300 | ) | | | — | | | | (6,709,077 | ) | | | (551,054 | ) | | | (7,366,431 | ) |
Derivatives not subject to master netting agreements | | | 106,300 | | | | — | | | | 6,709,077 | | | | 551,054 | | | | 7,366,431 | |
Total Derivative Liabilities subject to master netting agreements | | $ | — | | | $ | — | | | $ | — | | | $ | — | | | $ | — | |
| (a) | The daily variation margin receivable at period-end is recorded in the Statement of Assets and Liabilities. |
Offsetting Assets and Liabilities
The table below reflects the Fund’s exposure to Counterparties subject to either an ISDA Master Agreement or other agreement for OTC derivative transactions as of October 31, 2018.
| | | | | | | | | | | | | | | | | | | | | | | | |
| | | Financial
Derivative
Assets | | | Financial
Derivative
Liabilities | | | | | | Collateral
(Received)/Pledged | | | | |
| Counterparty | | Forward
Foreign Currency
Contracts | | | Forward
Foreign Currency
Contracts | | | Net Value of
Derivatives | | | Non-Cash | | | Cash | | | Net
Amount | |
Barclays Bank PLC | | $ | 68,810 | | | $ | — | | | $ | 68,810 | | | $ | — | | | $ | — | | | $ | 68,810 | |
Canadian Imperial Bank of Commerce | | | 5,623 | | | | — | | | | 5,623 | | | | — | | | | — | | | | 5,623 | |
Total | | $ | 74,433 | | | $ | — | | | $ | 74,433 | | | $ | — | | | $ | — | | | $ | 74,433 | |
39 Invesco Multi-Asset Income Fund
Effect of Derivative Investments for the year ended October 31, 2018
The table below summarizes the gains (losses) on derivative investments, detailed by primary risk exposure, recognized in earnings during the period:
| | | | | | | | | | | | | | | | | | | | |
| | | Location of Gain (Loss) on Statement of Operations | |
| | | Credit
Risk | | | Currency
Risk | | | Equity
Risk | | | Interest Rate
Risk | | | Total | |
Realized Gain (Loss): | | | | | | | | | | | | | | | | | | | | |
Forward foreign currency contracts | | $ | — | | | $ | 3,726 | | | $ | — | | | $ | — | | | $ | 3,726 | |
Futures contracts | | | — | | | | — | | | | 6,071,888 | | | | (1,412,949 | ) | | | 4,658,939 | |
Options purchased(a) | | | — | | | | — | | | | — | | | | (28,848 | ) | | | (28,848 | ) |
Options written | | | (26,448 | ) | | | — | | | | — | | | | (35,068 | ) | | | (61,516 | ) |
Swap agreements | | | 151,615 | | | | — | | | | — | | | | — | | | | 151,615 | |
Change in Net Unrealized Appreciation (Depreciation): | | | | | | | | | | | | | | | | | | | | |
Forward foreign currency contracts | | | — | | | | 82,363 | | | | — | | | | — | | | | 82,363 | |
Futures contracts | | | — | | | | — | | | | (11,532,859 | ) | | | (215,399 | ) | | | (11,748,258 | ) |
Swap agreements | | | (197,460 | ) | | | — | | | | — | | | | — | | | | (197,460 | ) |
Total | | $ | (72,293 | ) | | $ | 86,089 | | | $ | (5,460,971 | ) | | $ | (1,692,264 | ) | | $ | (7,139,439 | ) |
| (a) | Options purchased are included in the net realized gain (loss) from investment securities. |
The table below summarizes the twelve month average notional value of forward foreign currency contracts and futures contracts, eight day average notional value of options purchased, one and one half month average notional value of options written and nine month average notional value of swap agreements outstanding during the period.
| | | | | | | | | | | | | | | | | | | | |
| | | Forward
Foreign Currency
Contracts | | | Futures
Contracts | | | Options
Purchased | | | Options
Written | | | Swap
Agreements | |
Average notional value | | $ | 1,751,194 | | | $ | 178,781,969 | | | $ | 425,205 | | | $ | 1,689,589 | | | $ | 7,577,942 | |
NOTE 5—Expense Offset Arrangement(s)
The expense offset arrangement is comprised of transfer agency credits which result from balances in demand deposit accounts used by the transfer agent for clearing shareholder transactions. For the year ended October 31, 2018, the Fund received credits from this arrangement, which resulted in the reduction of the Fund’s total expenses of $1,691.
NOTE 6—Trustees’ and Officers’ Fees and Benefits
Trustees’ and Officers’ Fees and Benefits include amounts accrued by the Fund to pay remuneration to certain Trustees and Officers of the Fund. Trustees have the option to defer compensation payable by the Fund, and Trustees’ and Officers’ Fees and Benefits also include amounts accrued by the Fund to fund such deferred compensation amounts. Those Trustees who defer compensation have the option to select various Invesco Funds in which their deferral accounts shall be deemed to be invested. Finally, certain current Trustees were eligible to participate in a retirement plan that provided for benefits to be paid upon retirement to Trustees over a period of time based on the number of years of service. The Fund may have certain former Trustees who also participate in a retirement plan and receive benefits under such plan. Trustees’ and Officers’ Fees and Benefits include amounts accrued by the Fund to fund such retirement benefits. Obligations under the deferred compensation and retirement plans represent unsecured claims against the general assets of the Fund.
NOTE 7—Cash Balances
The Fund is permitted to temporarily carry a negative or overdrawn balance in its account with State Street Bank and Trust Company, the custodian bank. Such balances, if any at period-end, are shown in the Statement of Assets and Liabilities under the payable caption Amount due custodian. To compensate the custodian bank for such overdrafts, the overdrawn Fund may either (1) leave funds as a compensating balance in the account so the custodian bank can be compensated by earning the additional interest; or (2) compensate by paying the custodian bank at a rate agreed upon by the custodian bank and Invesco, not to exceed the contractually agreed upon rate.
40 Invesco Multi-Asset Income Fund
NOTE 8—Distributions to Shareholders and Tax Components of Net Assets
Tax Character of Distributions to Shareholders Paid During the Fiscal Years Ended October 31, 2018 and 2017:
| | | | | | | | |
| | | 2018 | | | 2017 | |
Ordinary income | | $ | 32,572,785 | | | $ | 17,052,546 | |
Long-term capital gain | | | 4,561,185 | | | | — | |
Total distributions | | $ | 37,133,970 | | | $ | 17,052,546 | |
Tax Components of Net Assets at Period-End:
| | | | |
| | | 2018 | |
Undistributed ordinary income | | $ | 2,333,878 | |
Net unrealized appreciation (depreciation) — investments | | | (34,397,904 | ) |
Net unrealized appreciation — foreign currencies | | | 9,214 | |
Temporary book/tax differences | | | (30,149 | ) |
Capital loss carryforward | | | (15,428,734 | ) |
Shares of beneficial interest | | | 609,244,332 | |
Total net assets | | $ | 561,730,637 | |
The difference between book-basis and tax-basis unrealized appreciation (depreciation) is due to differences in the timing of recognition of gains and losses on investments for tax and book purposes. The Fund’s net unrealized appreciation (depreciation) difference is attributable primarily to wash sales and bond premiums.
The temporary book/tax differences are a result of timing differences between book and tax recognition of income and/or expenses. The Fund’s temporary book/tax differences are the result of the trustee deferral of compensation and retirement plan benefits.
Capital loss carryforward is calculated and reported as of a specific date. Results of transactions and other activity after that date may affect the amount of capital loss carryforward actually available for the Fund to utilize. Capital losses generated in years beginning after December 22, 2010 can be carried forward for an unlimited period, whereas previous losses expire in eight tax years. Capital losses with an expiration period may not be used to offset capital gains until all net capital losses without an expiration date have been utilized. Capital loss carryforwards with no expiration date will retain their character as either short-term or long-term capital losses instead of as short-term capital losses as under prior law. The ability to utilize capital loss carryforwards in the future may be limited under the Internal Revenue Code and related regulations based on the results of future transactions.
The Fund has a capital loss carryforward as of October 31, 2018 as follows:
| | | | | | | | | | | | | | | | |
| Capital Loss Carryforward* | |
| Expiration | | | | | Short-Term | | | Long-Term | | | Total | |
Not subject to expiration | | | | | | $ | 9,084,345 | | | $ | 6,344,389 | | | $ | 15,428,734 | |
| * | Capital loss carryforward as of the date listed above is reduced for limitations, if any, to the extent required by the Internal Revenue Code and may be further limited depending upon a variety of factors, including the realization of net unrealized gains or losses as of the date of any reorganization. |
NOTE 9—Investment Transactions
The aggregate amount of investment securities (other than short-term securities, U.S. Treasury obligations and money market funds, if any) purchased and sold by the Fund during the year ended October 31, 2018 was $323,384,376 and $380,532,513, respectively. During the same period, purchases and sales of U.S. Treasury obligations were $19,814,911 and $25,045,495, respectively. Cost of investments, including any derivatives, on a tax basis includes the adjustments for financial reporting purposes as of the most recently completed federal income tax reporting period-end.
| | | | |
| Unrealized Appreciation (Depreciation) of Investments on a Tax Basis | |
Aggregate unrealized appreciation of investments | | $ | 5,849,455 | |
Aggregate unrealized (depreciation) of investments | | | (40,247,359 | ) |
Net unrealized appreciation (depreciation) of investments | | $ | (34,397,904 | ) |
Cost of investments for tax purposes is $584,764,471.
NOTE 10—Reclassification of Permanent Differences
Primarily as a result of differing book/tax treatment of bond premium amortization, futures contracts and swap agreement income, on October 31, 2018, undistributed net investment income was increased by $1,744,351 and undistributed net realized gain (loss) was decreased by $1,744,351. This reclassification had no effect on the net assets or the distributable earnings of the Fund.
41 Invesco Multi-Asset Income Fund
NOTE 11—Share Information
| | | | | | | | | | | | | | | | |
| | | Summary of Share Activity | |
| | | Years ended October 31, | |
| | | 2018(a) | | | 2017 | |
| | | Shares | | | Amount | | | Shares | | | Amount | |
Sold: | | | | | | | | | | | | | | | | |
Class A | | | 6,711,689 | | | $ | 72,173,241 | | | | 14,849,703 | | | $ | 161,218,349 | |
Class C | | | 3,387,904 | | | | 36,193,139 | | | | 4,808,469 | | | | 52,215,702 | |
Class R | | | 106,045 | | | | 1,135,961 | | | | 107,694 | | | | 1,162,484 | |
Class Y | | | 17,453,638 | | | | 186,994,732 | | | | 31,062,629 | | | | 338,133,338 | |
Class R5 | | | 12,597 | | | | 131,905 | | | | 1,574 | | | | 16,577 | |
Class R6 | | | 901,885 | | | | 9,518,938 | | | | 628,573 | | | | 6,736,724 | |
| | | | |
Issued as reinvestment of dividends: | | | | | | | | | | | | | | | | |
Class A | | | 800,753 | | | | 8,552,192 | | | | 466,849 | | | | 5,048,168 | |
Class C | | | 289,651 | | | | 3,084,082 | | | | 119,493 | | | | 1,292,176 | |
Class R | | | 10,392 | | | | 110,374 | | | | 4,152 | | | | 44,882 | |
Class Y | | | 1,427,830 | | | | 15,212,966 | | | | 521,000 | | | | 5,680,154 | |
Class R5 | | | 382 | | | | 4,023 | | | | 72 | | | | 771 | |
Class R6 | | | 341,361 | | | | 3,632,071 | | | | 248,948 | | | | 2,679,432 | |
| | | | |
Reacquired: | | | | | | | | | | | | | | | | |
Class A | | | (11,796,159 | ) | | | (125,480,384 | ) | | | (6,642,263 | ) | | | (71,476,790 | ) |
Class C | | | (1,940,964 | ) | | | (20,466,365 | ) | | | (488,324 | ) | | | (5,275,007 | ) |
Class R | | | (42,138 | ) | | | (444,683 | ) | | | (16,941 | ) | | | (183,979 | ) |
Class Y | | | (20,140,304 | ) | | | (213,617,252 | ) | | | (4,673,930 | ) | | | (50,697,928 | ) |
Class R5 | | | (867 | ) | | | (9,141 | ) | | | (757 | ) | | | (8,168 | ) |
Class R6 | | | (1,439,258 | ) | | | (15,152,863 | ) | | | (27,712 | ) | | | (296,849 | ) |
Net increase (decrease) in share activity | | | (3,915,563 | ) | | $ | (38,427,064 | ) | | | 40,969,229 | | | $ | 446,290,036 | |
| (a) | There are entities that are record owners of more than 5% of the outstanding shares of the Fund and in the aggregate own 68% of the outstanding shares of the Fund. IDI has an agreement with these entities to sell Fund shares. The Fund, Invesco and/or Invesco affiliates may make payments to these entities, which are considered to be related to the Fund, for providing services to the Fund, Invesco and/or Invesco affiliates including but not limited to services such as securities brokerage, distribution, third party record keeping and account servicing. The Fund has no knowledge as to whether all or any portion of the shares owned of record by these entities are also owned beneficially. |
| | In addition, 9% of the outstanding shares of the Fund are owned by the Adviser or an affiliate of the Adviser. |
42 Invesco Multi-Asset Income Fund
NOTE 12—Financial Highlights
The following schedule presents financial highlights for a share of the Fund outstanding throughout the periods indicated.
| | | | | | | | | | | | | | | | | | | | | | | | | | | | | | | | | | | | | | | | | | | | | | | | | | | | | | | | |
| | | Net asset
value,
beginning
of period | | | Net
investment
income(a) | | | Net gains
(losses)
on securities
(both
realized and
unrealized) | | | Total from
investment
operations | | | Dividends
from net
investment
income | | | Distributions
from net
realized
gains | | | Total
distributions | | | Net asset
value, end
of period | | | Total
return(b) | | | Net assets,
end of period
(000’s omitted) | | | Ratio of
expenses
to average
net assets
with fee waivers
and/or expenses
absorbed | | | Ratio of
expenses
to average net
assets without
fee waivers
and/or expenses
absorbed | | | Ratio of net
investment
income
to average
net assets | | | Portfolio
turnover(c) | |
Class A | |
Year ended 10/31/18 | | $ | 11.01 | | | $ | 0.51 | | | $ | (0.84 | ) | | $ | (0.33 | ) | | $ | (0.52 | ) | | $ | (0.09 | ) | | $ | (0.61 | ) | | $ | 10.07 | | | | (3.13 | )% | | $ | 131,971 | | | | 0.85 | %(d) | | | 1.00 | %(d) | | | 4.76 | %(d) | | | 59 | % |
Year ended 10/31/17 | | | 10.51 | | | | 0.49 | | | | 0.50 | | | | 0.99 | | | | (0.49 | ) | | | — | | | | (0.49 | ) | | | 11.01 | | | | 9.64 | | | | 191,395 | | | | 0.86 | | | | 1.06 | | | | 4.53 | | | | 40 | |
Year ended 10/31/16 | | | 10.09 | | | | 0.47 | | | | 0.45 | | | | 0.92 | | | | (0.50 | ) | | | — | | | | (0.50 | ) | | | 10.51 | | | | 9.44 | | | | 91,585 | | | | 1.04 | | | | 1.28 | | | | 4.60 | | | | 101 | |
Year ended 10/31/15 | | | 10.37 | | | | 0.46 | | | | (0.25 | ) | | | 0.21 | | | | (0.49 | ) | | | — | | | | (0.49 | ) | | | 10.09 | | | | 2.02 | | | | 52,613 | | | | 0.99 | | | | 1.27 | | | | 4.52 | | | | 120 | |
Year ended 10/31/14 | | | 10.04 | | | | 0.48 | | | | 0.37 | | | | 0.85 | | | | (0.52 | ) | | | — | | | | (0.52 | ) | | | 10.37 | | | | 8.66 | | | | 42,104 | | | | 0.88 | | | | 1.28 | | | | 4.69 | | | | 89 | |
Class C | | | | | | | | | | | | | | | | | | | | | | | | | | | | | | | | | | | | | | | | | | | | | | | | | | | | | | | | |
Year ended 10/31/18 | | | 11.00 | | | | 0.43 | | | | (0.84 | ) | | | (0.41 | ) | | | (0.44 | ) | | | (0.09 | ) | | | (0.53 | ) | | | 10.06 | | | | (3.87 | ) | | | 85,370 | | | | 1.60 | (d) | | | 1.75 | (d) | | | 4.01 | (d) | | | 59 | |
Year ended 10/31/17 | | | 10.50 | | | | 0.41 | | | | 0.50 | | | | 0.91 | | | | (0.41 | ) | | | — | | | | (0.41 | ) | | | 11.00 | | | | 8.83 | | | | 74,211 | | | | 1.61 | | | | 1.81 | | | | 3.78 | | | | 40 | |
Year ended 10/31/16 | | | 10.08 | | | | 0.39 | | | | 0.45 | | | | 0.84 | | | | (0.42 | ) | | | — | | | | (0.42 | ) | | | 10.50 | | | | 8.62 | | | | 24,238 | | | | 1.79 | | | | 2.03 | | | | 3.85 | | | | 101 | |
Year ended 10/31/15 | | | 10.36 | | | | 0.39 | | | | (0.26 | ) | | | 0.13 | | | | (0.41 | ) | | | — | | | | (0.41 | ) | | | 10.08 | | | | 1.26 | | | | 17,133 | | | | 1.74 | | | | 2.02 | | | | 3.77 | | | | 120 | |
Year ended 10/31/14 | | | 10.03 | | | | 0.40 | | | | 0.37 | | | | 0.77 | | | | (0.44 | ) | | | — | | | | (0.44 | ) | | | 10.36 | | | | 7.85 | | | | 14,854 | | | | 1.63 | | | | 2.03 | | | | 3.94 | | | | 89 | |
Class R | | | | | | | | | | | | | | | | | | | | | | | | | | | | | | | | | | | | | | | | | | | | | | | | | | | | | | | | |
Year ended 10/31/18 | | | 11.01 | | | | 0.48 | | | | (0.84 | ) | | | (0.36 | ) | | | (0.49 | ) | | | (0.09 | ) | | | (0.58 | ) | | | 10.07 | | | | (3.38 | ) | | | 2,220 | | | | 1.10 | (d) | | | 1.25 | (d) | | | 4.51 | (d) | | | 59 | |
Year ended 10/31/17 | | | 10.51 | | | | 0.46 | | | | 0.50 | | | | 0.96 | | | | (0.46 | ) | | | — | | | | (0.46 | ) | | | 11.01 | | | | 9.37 | | | | 1,608 | | | | 1.11 | | | | 1.31 | | | | 4.28 | | | | 40 | |
Year ended 10/31/16 | | | 10.08 | | | | 0.44 | | | | 0.46 | | | | 0.90 | | | | (0.47 | ) | | | — | | | | (0.47 | ) | | | 10.51 | | | | 9.28 | | | | 538 | | | | 1.29 | | | | 1.53 | | | | 4.35 | | | | 101 | |
Year ended 10/31/15 | | | 10.36 | | | | 0.44 | | | | (0.26 | ) | | | 0.18 | | | | (0.46 | ) | | | — | | | | (0.46 | ) | | | 10.08 | | | | 1.77 | | | | 339 | | | | 1.24 | | | | 1.52 | | | | 4.27 | | | | 120 | |
Year ended 10/31/14 | | | 10.03 | | | | 0.46 | | | | 0.36 | | | | 0.82 | | | | (0.49 | ) | | | — | | | | (0.49 | ) | | | 10.36 | | | | 8.39 | | | | 141 | | | | 1.13 | | | | 1.53 | | | | 4.44 | | | | 89 | |
Class Y | | | | | | | | | | | | | | | | | | | | | | | | | | | | | | | | | | | | | | | | | | | | | | | | | | | | | | | | |
Year ended 10/31/18 | | | 11.01 | | | | 0.53 | | | | (0.83 | ) | | | (0.30 | ) | | | (0.55 | ) | | | (0.09 | ) | | | (0.64 | ) | | | 10.07 | | | | (2.89 | ) | | | 288,116 | | | | 0.60 | (d) | | | 0.75 | (d) | | | 5.01 | (d) | | | 59 | |
Year ended 10/31/17 | | | 10.51 | | | | 0.52 | | | | 0.50 | | | | 1.02 | | | | (0.52 | ) | | | — | | | | (0.52 | ) | | | 11.01 | | | | 9.91 | | | | 328,798 | | | | 0.61 | | | | 0.81 | | | | 4.78 | | | | 40 | |
Year ended 10/31/16 | | | 10.09 | | | | 0.50 | | | | 0.44 | | | | 0.94 | | | | (0.52 | ) | | | — | | | | (0.52 | ) | | | 10.51 | | | | 9.71 | | | | 31,049 | | | | 0.79 | | | | 1.03 | | | | 4.85 | | | | 101 | |
Year ended 10/31/15 | | | 10.37 | | | | 0.49 | | | | (0.26 | ) | | | 0.23 | | | | (0.51 | ) | | | — | | | | (0.51 | ) | | | 10.09 | | | | 2.28 | | | | 12,424 | | | | 0.74 | | | | 1.02 | | | | 4.77 | | | | 120 | |
Year ended 10/31/14 | | | 10.05 | | | | 0.51 | | | | 0.35 | | | | 0.86 | | | | (0.54 | ) | | | — | | | | (0.54 | ) | | | 10.37 | | | | 8.82 | | | | 6,725 | | | | 0.63 | | | | 1.03 | | | | 4.94 | | | | 89 | |
Class R5 | | | | | | | | | | | | | | | | | | | | | | | | | | | | | | | | | | | | | | | | | | | | | | | | | | | | | | | | |
Year ended 10/31/18 | | | 11.01 | | | | 0.53 | | | | (0.82 | ) | | | (0.29 | ) | | | (0.55 | ) | | | (0.09 | ) | | | (0.64 | ) | | | 10.08 | | | | (2.79 | ) | | | 150 | | | | 0.60 | (d) | | | 0.69 | (d) | | | 5.01 | (d) | | | 59 | |
Year ended 10/31/17 | | | 10.52 | | | | 0.52 | | | | 0.49 | | | | 1.01 | | | | (0.52 | ) | | | — | | | | (0.52 | ) | | | 11.01 | | | | 9.81 | | | | 30 | | | | 0.61 | | | | 0.72 | | | | 4.78 | | | | 40 | |
Year ended 10/31/16 | | | 10.09 | | | | 0.50 | | | | 0.45 | | | | 0.95 | | | | (0.52 | ) | | | — | | | | (0.52 | ) | | | 10.52 | | | | 9.82 | | | | 19 | | | | 0.79 | | | | 0.90 | | | | 4.85 | | | | 101 | |
Year ended 10/31/15 | | | 10.37 | | | | 0.49 | | | | (0.26 | ) | | | 0.23 | | | | (0.51 | ) | | | — | | | | (0.51 | ) | | | 10.09 | | | | 2.28 | | | | 10 | | | | 0.74 | | | | 0.89 | | | | 4.77 | | | | 120 | |
Year ended 10/31/14 | | | 10.05 | | | | 0.50 | | | | 0.36 | | | | 0.86 | | | | (0.54 | ) | | | — | | | | (0.54 | ) | | | 10.37 | | | | 8.82 | | | | 10 | | | | 0.63 | | | | 0.90 | | | | 4.94 | | | | 89 | |
Class R6 | | | | | | | | | | | | | | | | | | | | | | | | | | | | | | | | | | | | | | | | | | | | | | | | | | | | | | | | |
Year ended 10/31/18 | | | 11.01 | | | | 0.53 | | | | (0.83 | ) | | | (0.30 | ) | | | (0.55 | ) | | | (0.09 | ) | | | (0.64 | ) | | | 10.07 | | | | (2.89 | ) | | | 53,904 | | | | 0.60 | (d) | | | 0.63 | (d) | | | 5.01 | (d) | | | 59 | |
Year ended 10/31/17 | | | 10.51 | | | | 0.52 | | | | 0.50 | | | | 1.02 | | | | (0.52 | ) | | | — | | | | (0.52 | ) | | | 11.01 | | | | 9.91 | | | | 61,077 | | | | 0.61 | | | | 0.69 | | | | 4.78 | | | | 40 | |
Year ended 10/31/16 | | | 10.09 | | | | 0.49 | | | | 0.45 | | | | 0.94 | | | | (0.52 | ) | | | — | | | | (0.52 | ) | | | 10.51 | | | | 9.71 | | | | 49,388 | | | | 0.79 | | | | 0.90 | | | | 4.85 | | | | 101 | |
Year ended 10/31/15 | | | 10.37 | | | | 0.49 | | | | (0.26 | ) | | | 0.23 | | | | (0.51 | ) | | | — | | | | (0.51 | ) | | | 10.09 | | | | 2.28 | | | | 67,568 | | | | 0.74 | | | | 0.89 | | | | 4.77 | | | | 120 | |
Year ended 10/31/14 | | | 10.04 | | | | 0.50 | | | | 0.37 | | | | 0.87 | | | | (0.54 | ) | | | — | | | | (0.54 | ) | | | 10.37 | | | | 8.93 | | | | 51,057 | | | | 0.63 | | | | 0.90 | | | | 4.94 | | | | 89 | |
| (a) | Calculated using average shares outstanding. |
| (b) | Includes adjustments in accordance with accounting principles generally accepted in the United States of America and as such, the net asset value for financial reporting purposes and the returns based upon those net asset values may differ from the net asset value and returns for shareholder transactions. Does not include sales charges and is not annualized for periods less than one year, if applicable. |
| (c) | Portfolio turnover is calculated at the fund level and is not annualized for periods less than one year, if applicable. |
| (d) | Ratios are based on average daily net assets (000’s omitted) of $156,668, $86,262, $2,081, $323,815, $92 and $60,202 for Class A, Class C, Class R, Class Y, Class R5 and Class R6 shares, respectively. |
43 Invesco Multi-Asset Income Fund
Report of Independent Registered Public Accounting Firm
To the Board of Trustees of AIM Investment Funds (Invesco Investment Funds)
and Shareholders of Invesco Multi-Asset Income Fund:
Opinion on the Financial Statements
We have audited the accompanying statement of assets and liabilities, including the schedule of investments, of Invesco Multi-Asset Income Fund (one of the funds constituting AIM Investment Funds (Invesco Investment Funds), hereafter referred to as the “Fund”) as of October 31, 2018, the related statement of operations for the year ended October 31, 2018, the statement of changes in net assets for each of the two years in the period ended October 31, 2018, including the related notes, and the financial highlights for each of the five years in the period ended October 31, 2018 (collectively referred to as the financial statements). In our opinion, the financial statements present fairly, in all material respects, the financial position of the Fund as of October 31, 2018, the results of its operations for the year then ended, the changes in its net assets for each of the two years in the period ended October 31, 2018 and the financial highlights each of the five years in the period ended October 31, 2018 in conformity with accounting principles generally accepted in the United States of America.
Basis for Opinion
These financial statements are the responsibility of the Fund’s management. Our responsibility is to express an opinion on the Fund’s financial statements based on our audits. We are a public accounting firm registered with the Public Company Accounting Oversight Board (United States) (PCAOB) and are required to be independent with respect to the Fund in accordance with the U.S. federal securities laws and the applicable rules and regulations of the Securities and Exchange Commission and the PCAOB.
We conducted our audits of these financial statements in accordance with the standards of the PCAOB. Those standards require that we plan and perform the audit to obtain reasonable assurance about whether the financial statements are free of material misstatement, whether due to error or fraud.
Our audits included performing procedures to assess the risks of material misstatement of the financial statements, whether due to error or fraud, and performing procedures that respond to those risks. Such procedures included examining, on a test basis, evidence regarding the amounts and disclosures in the financial statements. Our audits also included evaluating the accounting principles used and significant estimates made by management, as well as evaluating the overall presentation of the financial statements. Our procedures included confirmation of securities owned as of October 31, 2018 by correspondence with the custodian, transfer agent and brokers; when replies were not received from brokers, we performed other auditing procedures. We believe that our audits provide a reasonable basis for our opinion.
PricewaterhouseCoopers LLP
Houston, TX
December 28, 2018
We have served as the auditor of one or more of the investment companies in the Invesco group of investment companies since at least 1995. We have not been able to determine the specific year we began serving as auditor.
44 Invesco Multi-Asset Income Fund
Calculating your ongoing Fund expenses
Example
As a shareholder of the Fund, you incur two types of costs: (1) transaction costs, which may include sales charges (loads) on purchase payments or contingent deferred sales charges on redemptions, if any; and (2) ongoing costs, including management fees, distribution and/or service (12b-1) fees, and other Fund expenses. This example is intended to help you understand your ongoing costs (in dollars) of investing in the Fund and to compare these costs with ongoing costs of investing in other mutual funds. The example is based on an investment of $1,000 invested at the beginning of the period and held for the entire period May 1, 2018 through October 31, 2018.
Actual expenses
The table below provides information about actual account values and actual expenses. You may use the information in this table, together with the amount you invested, to estimate the expenses that you paid over the period. Simply divide your account value by $1,000 (for example, an $8,600 account value divided by $1,000 = 8.6), then multiply the result by the number in the table under the heading entitled “Actual Expenses Paid During Period” to estimate the expenses you paid on your account during this period.
Hypothetical example for comparison purposes
The table below also provides information about hypothetical account values and hypothetical expenses based on the Fund’s actual expense ratio and an assumed rate of return of 5% per year before expenses, which is not the Fund’s actual return.
The hypothetical account values and expenses may not be used to estimate the actual ending account balance or expenses you paid for the period. You may use this information to compare the ongoing costs of investing in the Fund and other funds. To do so, compare this 5% hypothetical example with the 5% hypothetical examples that appear in the shareholder reports of the other funds.
Please note that the expenses shown in the table are meant to highlight your ongoing costs only and do not reflect any transaction costs, such as sales charges (loads) on purchase payments or contingent deferred sales charges on redemptions, if any. Therefore, the hypothetical information is useful in comparing ongoing costs only, and will not help you determine the relative total costs of owning different funds. In addition, if these transaction costs were included, your costs would have been higher.
| | | | | | | | | | | | | | | | | | | | | | | | |
Class | | Beginning
Account Value
(05/01/18) | | | ACTUAL | | | HYPOTHETICAL (5% annual return before
expenses) | | | Annualized
Expense Ratio | |
| | Ending
Account Value
(10/31/18)1 | | | Expenses
Paid During
Period2 | | | Ending
Account Value
(10/31/18) | | | Expenses
Paid During
Period2 | |
A | | $ | 1,000.00 | | | $ | 989.00 | | | $ | 4.26 | | | $ | 1,020.92 | | | $ | 4.33 | | | | 0.85 | % |
C | | | 1,000.00 | | | | 985.30 | | | | 8.01 | | | | 1,017.14 | | | | 8.13 | | | | 1.60 | |
R | | | 1,000.00 | | | | 987.80 | | | | 5.51 | | | | 1,019.66 | | | | 5.60 | | | | 1.10 | |
Y | | | 1,000.00 | | | | 990.30 | | | | 3.01 | | | | 1,022.18 | | | | 3.06 | | | | 0.60 | |
R5 | | | 1,000.00 | | | | 991.20 | | | | 3.01 | | | | 1,022.18 | | | | 3.06 | | | | 0.60 | |
R6 | | | 1,000.00 | | | | 990.30 | | | | 3.01 | | | | 1,022.18 | | | | 3.06 | | | | 0.60 | |
| 1 | The actual ending account value is based on the actual total return of the Fund for the period May 1, 2018 through October 31, 2018, after actual expenses and will differ from the hypothetical ending account value which is based on the Fund’s expense ratio and a hypothetical annual return of 5% before expenses. |
| 2 | Expenses are equal to the Fund’s annualized expense ratio as indicated above multiplied by the average account value over the period, multiplied by 184/365 to reflect the most recent fiscal half year. |
45 Invesco Multi-Asset Income Fund
Approval of Investment Advisory and Sub-Advisory Contracts
At meetings held on June 5-6, 2018, the Board of Trustees (the Board or the Trustees) of AIM Investment Funds (Invesco Investment Funds) as a whole, and the independent Trustees, who comprise over 75% of the Board, voting separately, approved the continuance of the Invesco Multi-Asset Income Fund’s (the Fund) Master Investment Advisory Agreement with Invesco Advisers, Inc. (Invesco Advisers and the investment advisory agreement) and the Master Intergroup Sub-Advisory Contract for Mutual Funds with Invesco Asset Management Deutschland GmbH, Invesco Asset Management Limited, Invesco Asset Management (Japan) Limited, Invesco Hong Kong Limited, Invesco Senior Secured Management, Inc., Invesco Canada Ltd. and separate Sub-Advisory Contracts with Invesco Capital Management LLC and Invesco Asset Management (India) Private Limited (collectively, the Affiliated Sub-Advisers and the sub-advisory contracts) for another year, effective July 1, 2018. After evaluating the factors discussed below, among others, the Board approved the renewal of the Fund’s investment advisory agreement and the sub-advisory contracts and determined that the compensation payable by the Fund to Invesco Advisers and by Invesco Advisers to the Affiliated Sub-Advisers is fair and reasonable.
The Board’s Evaluation Process
The Board’s Investments Committee has established three Sub-Committees, which meet throughout the year to review the performance of funds advised by Invesco Advisers (the Invesco Funds). Over the course of each year, the Sub-Committees meet with portfolio managers for their assigned Invesco Funds and other members of management to review detailed information about investment performance and portfolio attributes of these funds. The Board took into account evaluations and reports that it received from the Investments Committee and Sub-Committees, as well as the information provided to such committees and the Board throughout the year, in considering whether to approve each Invesco Fund’s investment advisory agreement and sub-advisory contracts.
As part of the contract renewal process, the Board reviews and considers information provided in response to detailed requests for information submitted to management by the independent Trustees with assistance from legal counsel to the independent Trustees. The Board receives comparative investment performance and fee data regarding the Invesco Funds prepared by Invesco Advisers and Broadridge Financial Solutions, Inc. (Broadridge), an independent mutual fund data provider. The Board also receives an independent written evaluation from the Senior Officer, an officer of the Invesco Funds who reports directly to the independent Trustees. The Senior Officer’s
evaluation is prepared as part of his responsibility to manage the process by which the Invesco Funds’ proposed management fees are negotiated during the annual contract renewal process to ensure they are negotiated in a manner that is at arms’ length and reasonable. In addition to meetings with Invesco Advisers and fund counsel throughout the year, the independent Trustees also discuss the continuance of the investment advisory agreement and sub-advisory contracts in separate sessions with the Senior Officer and with independent legal counsel.
The discussion below is a summary of the Senior Officer’s independent written evaluation with respect to the Fund’s investment advisory agreement, as well as a discussion of the material factors and related conclusions that formed the basis for the Board’s approval of the Fund’s investment advisory agreement and sub-advisory contracts. The Trustees’ review and conclusions are based on the comprehensive consideration of all information presented to them during the course of the year and in prior years and are not the result of any single determinative factor. Moreover, one Trustee may have weighed a particular piece of information or factor differently than another Trustee. This information is current as of June 6, 2018.
Factors and Conclusions and Summary of Independent Written Fee Evaluation
| A. | Nature, Extent and Quality of Services Provided by Invesco Advisers and the Affiliated Sub-Advisers |
The Board reviewed the nature, extent and quality of the advisory services provided to the Fund by Invesco Advisers under the Fund’s investment advisory agreement, and the credentials and experience of the officers and employees of Invesco Advisers who provide these services, including the Fund’s portfolio manager(s). The Board’s review included consideration of Invesco Advisers’ investment process oversight and structure, credit analysis and investment risk management. The Board also considered non-advisory services that Invesco Advisers and its affiliates provide to the Invesco Funds such as various back office support functions, third party oversight, internal audit, valuation, portfolio trading and legal and compliance. The Board also reviewed and considered the benefits to shareholders of investing in a fund that is part of the Invesco family of funds under the umbrella of Invesco Ltd., Invesco Advisers’ parent company, and noted Invesco Ltd.’s depth and experience in conducting an investment management business, as well as its commitment of financial and other resources to such business. The Board concluded that the nature, extent and quality of the services provided to the Fund by Invesco Advisers are appropriate and satisfactory.
The Board reviewed the services that may be provided by the Affiliated Sub-Advisers under the sub-advisory contracts and the credentials and experience of the officers and employees of the Affiliated Sub-Advisers who provide these services. The Board noted the Affiliated Sub-Advisers’ expertise with respect to certain asset classes and that the Affiliated Sub-Advisers have offices and personnel that are located in financial centers around the world. As a result, the Board noted that the Affiliated Sub-Advisers can provide research and investment analysis on the markets and economies of various countries in which the Fund may invest, make recommendations regarding securities and assist with security trades. The Board concluded that the sub-advisory contracts may benefit the Fund and its shareholders by permitting Invesco Advisers to use the resources and talents of the Affiliated Sub-Advisers in managing the Fund. The Board concluded that the nature, extent and quality of the services that may be provided by the Affiliated Sub-Advisers are appropriate and satisfactory.
| B. | Fund Investment Performance |
The Board considered Fund investment performance as a relevant factor in considering whether to approve the investment advisory agreement as well as the sub-advisory contracts for the Fund, as Invesco Capital Management LLC currently manages assets of the Fund.
The Board compared the Fund’s investment performance over multiple time periods ending December 31, 2017 to the performance of funds in the Broadridge performance universe and against the Lipper Mixed-Asset Target Allocation Conservative Funds Index. The Board noted that performance of Class A shares of the Fund was in the first quintile of its performance universe for the one and three year periods and the second quintile for the five year periods (the first quintile being the best performing funds and the fifth quintile being the worst performing funds). The Board noted that performance of Class A shares of the Fund was above the performance of the Index for the one, three and five year periods. The Trustees also reviewed more recent Fund performance and this review did not change their conclusions.
| C. | Advisory and Sub-Advisory Fees and Fund Expenses |
The Board compared the Fund’s contractual management fee rate to the contractual management fee rates of funds in the Fund’s Broadridge expense group. The Board noted that the contractual management fee rate for Class A shares of the Fund was below the median contractual management fee rate of funds in its expense group. The Board noted that the term “contractual management fee” for funds in the expense group may include both advisory and certain non-portfolio management administrative services fees, but that Broadridge does not provide information on a
46 Invesco Multi-Asset Income Fund
fund by fund basis as to what is included. The Board also reviewed the methodology used by Broadridge in providing expense group information, which includes using each fund’s contractual management fee schedule (including any applicable breakpoints) as reported in the most recent prospectus or statement of additional information for each fund in the expense group. The Board also considered comparative information regarding the Fund’s total expense ratio and its various components.
The Board noted that Invesco Advisers has contractually agreed to waive fees and/or limit expenses of the Fund in an amount necessary to limit total annual operating expenses to a specified percentage of average daily net assets for each class of the Fund.
The Board noted that Invesco Advisers and the Affiliated Sub-Advisers do not manage other mutual funds or client accounts with investment strategies comparable to those of the Fund.
The Board also considered the services that may be provided by the Affiliated Sub-Advisers pursuant to the sub-advisory contracts, as well as the fees payable by Invesco Advisers to the Affiliated Sub-Advisers pursuant to the sub-advisory contracts. The Board noted that Invesco Advisers retains overall responsibility for, and provides services to, sub-advised Invesco Funds, including oversight of the Affiliated Sub-Advisers as well as the additional services described herein other than day-to-day portfolio management.
| D. | Economies of Scale and Breakpoints |
The Board considered the extent to which there may be economies of scale in the provision of advisory services to the Fund. The Board also considered that the Fund benefits from economies of scale through contractual breakpoints in the Fund’s advisory fee schedule, which generally operate to reduce the Fund’s expense ratio as it grows in size. The Board noted that the Fund shares directly in economies of scale through lower fees charged by third party service providers based on the combined size of the Invesco Funds. The Board noted that the Fund may also benefit from economies of scale through initial fee setting, fee waivers and expense reimbursements.
| E. | Profitability and Financial Resources |
The Board reviewed information from Invesco Advisers concerning the costs of the advisory and other services that Invesco Advisers and its affiliates provide to the Fund and the Invesco Funds and the profitability of Invesco Advisers and its affiliates in providing these services. The Board considered the methodology used for calculating profitability and noted the periodic review of such methodology by an independent consultant. The Board noted that Invesco Advisers continues to operate at a net profit from services Invesco Advisers and its affiliates provide to the Invesco Funds. The Board received information from Invesco Advisers demonstrating that Invesco Advisers and the Affiliated Sub-Advisers are financially sound and have the resources necessary to perform their
obligations under the investment advisory agreement and sub-advisory contracts.
| F. | Collateral Benefits to Invesco Advisers and its Affiliates |
The Board considered various other benefits received by Invesco Advisers and its affiliates from the relationship with the Fund, including the fees received for providing administrative, transfer agency and distribution services to the Fund. The Board considered comparative information regarding fees charged for these services, including information provided by Broadridge and other independent sources. The Board considered the performance of Invesco Advisers and its affiliates in providing these services and the organizational structure employed to provide these services. The Board also considered that these services are provided to the Fund pursuant to written contracts that are reviewed and approved on an annual basis by the Board; and that the services are required for the operation of the Fund.
The Board considered the benefits realized by Invesco Advisers and the Affiliated Sub-Advisers as a result of portfolio brokerage transactions executed through “soft dollar” arrangements. The Board noted that soft dollar arrangements may result in the Fund bearing costs to purchase research that may be used by Invesco Advisers or the Affiliated Sub-Advisers with other clients and may reduce Invesco Advisers’ or the Affiliated Sub-Advisers’ expenses. The Board also considered that it receives periodic reports from Invesco representing that these arrangements are consistent with regulatory requirements. The Board did not deem the soft dollar arrangements to be inappropriate.
The Board considered that the Fund’s uninvested cash and cash collateral from any securities lending arrangements may be invested in money market funds advised by Invesco Advisers pursuant to procedures approved by the Board. The Board noted that Invesco Advisers receives advisory fees from these affiliated money market funds attributable to such investments, although Invesco Advisers has contractually agreed to waive through varying periods the advisory fees payable by the Invesco Funds with respect to certain investments in the affiliated money market funds. The waiver is in an amount equal to 100% of the net advisory fee Invesco Advisers receives from the affiliated money market funds with respect to the Fund’s investment in the affiliated money market funds of uninvested cash, but not cash collateral. The Board concluded that the amount of advisory fees received by Invesco Advisers from the Fund’s investment of cash collateral from any securities lending arrangements in the affiliated money market funds is fair and reasonable.
The Board also considered that an affiliated broker may receive commissions for executing certain trades for the Fund. Invesco Advisers and the Affiliated Sub-Advisers may use the affiliated broker to, among other things, control order routing and minimize information leakage, and the Board was advised that such
trades are executed in compliance with rules under the federal securities laws and consistent with best execution obligations.
47 Invesco Multi-Asset Income Fund
Tax Information
Form 1099-DIV, Form 1042-S and other year–end tax information provide shareholders with actual calendar year amounts that should be included in their tax returns. Shareholders should consult their tax advisors.
The following distribution information is being provided as required by the Internal Revenue Code or to meet a specific state’s requirement.
The Fund designates the following amounts or, if subsequently determined to be different, the maximum amount allowable for its fiscal year ended October 31, 2018:
| | | | |
Federal and State Income Tax | |
Long-Term Capital Gain Distributions | | $ | 4,561,185 | |
Qualified Dividend Income* | | | 16.42 | % |
Corporate Dividends Received Deduction* | | | 15.43 | % |
U.S. Treasury Obligations* | | | 4.10 | % |
| | * | The above percentages are based on ordinary income dividends paid to shareholders during the Fund’s fiscal year. |
| | | | |
Non-Resident Alien Shareholders | |
Qualified Short-Term Gains | | $ | 1,530,664 | |
48 Invesco Multi-Asset Income Fund
Trustees and Officers
The address of each trustee and officer is AIM Investment Funds (Invesco Investment Funds) (the “Trust”), 11 Greenway Plaza, Suite 1000, Houston, Texas 77046-1173. The trustees serve for the life of the Trust, subject to their earlier death, incapacitation, resignation, retirement or removal as more specifically provided in the Trust’s organizational documents. Each officer serves for a one year term or until their successors are elected and qualified. Column two below includes length of time served with predecessor entities, if any.
| | | | | | | | |
Name, Year of Birth and
Position(s) Held with the Trust | | Trustee and/
or Officer Since | | Principal Occupation(s)
During Past 5 Years | | Number of
Funds in Fund
Complex
Overseen by
Trustee | | Other Directorship(s)
Held by Trustee During
Past 5 Years |
| Interested Persons | | | | | | | | |
| Martin L. Flanagan1 — 1960 Trustee | | 2007 | | Executive Director, Chief Executive Officer and President, Invesco Ltd. (ultimate parent of Invesco and a global investment management firm); Trustee, The Invesco Funds; Vice Chair, Investment Company Institute; and Member of Executive Board, SMU Cox School of Business Formerly: Advisor to the Board, Invesco Advisers, Inc. (formerly known as Invesco Institutional (N.A.), Inc.); Chairman and Chief Executive Officer, Invesco Advisers, Inc. (registered investment adviser); Director, Chairman, Chief Executive Officer and President, Invesco Holding Company (US), Inc. (formerly IVZ Inc.) (holding company), Invesco Group Services, Inc. (service provider) and Invesco North American Holdings, Inc. (holding company); Director, Chief Executive Officer and President, Invesco Holding Company Limited (parent of Invesco and a global investment management firm); Director, Invesco Ltd.; Chairman, Investment Company Institute and President, Co-Chief Executive Officer, Co-President, Chief Operating Officer and Chief Financial Officer, Franklin Resources, Inc. (global investment management organization) | | 158 | | None |
Philip A. Taylor2 — 1954 Trustee and Senior Vice President | | 2006 | | Head of the Americas and Senior Managing Director, Invesco Ltd.; Director, Invesco Advisers, Inc. (formerly known as Invesco Institutional (N.A.), Inc.) (registered investment adviser); Director and Chairman, Invesco Investment Services, Inc. (formerly known as Invesco AIM Investment Services, Inc.) (registered transfer agent); Chief Executive Officer, Invesco Corporate Class Inc. (corporate mutual fund company); Director, Chairman and Chief Executive Officer, Invesco Canada Ltd. (formerly known as Invesco Trimark Ltd./Invesco Trimark Ltèe) (registered investment adviser and registered transfer agent); Trustee and Senior Vice President, The Invesco Funds; Director, Invesco Investment Advisers LLC (formerly known as Van Kampen Asset Management) Formerly: Director, Chairman, Chief Executive Officer and President, Invesco Management Group, Inc. (formerly known as Invesco AIM Management Group, Inc.) (financial services holding company); Co-Chairman, Co-President and Co-Chief Executive Officer, Invesco Advisers, Inc. (formerly known as Invesco Institutional (N.A.), Inc.) (registered investment adviser); Director, Chief Executive Officer and President, Van Kampen Exchange Corp; President and Principal Executive Officer, The Invesco Funds (other than AIM Treasurer’s Series Trust (Invesco Treasurer’s Series Trust), Short-Term Investments Trust and Invesco Management Trust); Executive Vice President, The Invesco Funds (AIM Treasurer’s Series Trust (Invesco Treasurer’s Series Trust), Short-Term Investments Trust and Invesco Management Trust only); Director and President, INVESCO Funds Group, Inc. (registered investment adviser and registered transfer agent); Director and Chairman, IVZ Distributors, Inc. (formerly known as INVESCO Distributors, Inc.) (registered broker dealer); Director, President and Chairman, Invesco Inc. (holding company), Invesco Canada Holdings Inc. (holding company), Trimark Investments Ltd./Placements Trimark Ltèe and Invesco Financial Services Ltd/Services Financiers Invesco Ltèe; Chief Executive Officer, Invesco Canada Fund Inc. (corporate mutual fund company); Director and Chairman, Van Kampen Investor Services Inc.; Director, Chief Executive Officer and President, 1371 Preferred Inc. (holding company) and Van Kampen Investments Inc.; Director and President, AIM GP Canada Inc. (general partner for limited partnerships) and Van Kampen Advisors, Inc.; Director and Chief Executive Officer, Invesco Trimark Dealer Inc. (registered broker dealer); Director, Invesco Distributors, Inc. (formerly known as Invesco AIM Distributors, Inc.) (registered broker dealer); Manager, Invesco Capital Management LLC; Director, Chief Executive Officer and President, Invesco Advisers, Inc.; Director, Chairman, Chief Executive Officer and President, Invesco AIM Capital Management, Inc.; President, Invesco Trimark Dealer Inc. and Invesco Trimark Ltd./Invesco Trimark Ltèe; Director and President, AIM Trimark Corporate Class Inc. and AIM Trimark Canada Fund Inc.; Senior Managing Director, Invesco Holding Company Limited; Director and Chairman, Fund Management Company (former registered broker dealer); President and Principal Executive Officer, The Invesco Funds (AIM Treasurer’s Series Trust (Invesco Treasurer’s Series Trust), and Short-Term Investments Trust only); President, AIM Trimark Global Fund Inc. and AIM Trimark Canada Fund Inc. | | 158 | | None |
| 1 | Mr. Flanagan is considered an interested person (within the meaning of Section 2(a)(19) of the 1940 Act) of the Trust because he is an officer of the Adviser to the Trust, and an officer and a director of Invesco Ltd., ultimate parent of the Adviser. |
| 2 | Mr. Taylor is considered an interested person (within the meaning of Section 2(a)(19) of the 1940 Act) of the Trust because he is an officer and a director of the Adviser. |
T-1 Invesco Multi-Asset Income Fund
Trustees and Officers—(continued)
| | | | | | | | |
Name, Year of Birth and
Position(s) Held with the Trust | | Trustee and/
or Officer Since | | Principal Occupation(s)
During Past 5 Years | | Number of
Funds in Fund
Complex
Overseen by
Trustee | | Other Directorship(s)
Held by Trustee During
Past 5 Years |
| Independent Trustees | | | | | | | | |
Bruce L. Crockett — 1944 Trustee and Chair | | 2001 | | Chairman, Crockett Technologies Associates (technology consulting company) Formerly: Director, Captaris (unified messaging provider); Director, President and Chief Executive Officer, COMSAT Corporation; Chairman, Board of Governors of INTELSAT (international communications company); ACE Limited (insurance company); Independent Directors Council and Investment Company Institute: Member of the Audit Committee, Investment Company Institute; Member of the Executive Committee and Chair of the Governance Committee, Independent Directors Council | | 158 | | Director and Chairman of the Audit Committee, ALPS (Attorneys Liability Protection Society) (insurance company); Director and Member of the Audit Committee and Compensation Committee, Ferroglobe PLC (metallurgical company) |
David C. Arch — 1945 Trustee | | 2010 | | Chairman of Blistex Inc. (consumer health care products manufacturer); Member, World Presidents’ Organization | | 158 | | Board member of the Illinois Manufacturers’ Association |
Jack M. Fields — 1952 Trustee | | 2001 | | Chief Executive Officer, Twenty First Century Group, Inc. (government affairs company); and Chairman, Discovery Learning Alliance (non-profit) Formerly: Owner and Chief Executive Officer, Dos Angeles Ranch L.P. (cattle, hunting, corporate entertainment); Director, Insperity, Inc. (formerly known as Administaff) (human resources provider); Chief Executive Officer, Texana Timber LP (sustainable forestry company); Director of Cross Timbers Quail Research Ranch (non-profit); and member of the U.S. House of Representatives | | 158 | | None |
Cynthia Hostetler — 1962 Trustee | | 2017 | | Non-Executive Director and Trustee of a number of public and private business corporations Formerly: Director, Aberdeen Investment Funds (4 portfolios); Head of Investment Funds and Private Equity, Overseas Private Investment Corporation; President, First Manhattan Bancorporation, Inc.; Attorney, Simpson Thacher & Bartlett LLP | | 158 | | Vulcan Materials Company (construction materials company); Trilinc Global Impact Fund; Artio Global Investment LLC (mutual fund complex); Edgen Group, Inc. (specialized energy and infrastructure products distributor) |
Eli Jones — 1961 Trustee | | 2016 | | Professor and Dean, Mays Business School — Texas A&M University Formerly: Professor and Dean, Walton College of Business, University of Arkansas and E.J. Ourso College of Business, Louisiana State University; Director, Arvest Bank | | 158 | | Insperity, Inc. (formerly known as Administaff) (human resources provider) |
Prema Mathai-Davis — 1950 Trustee | | 2001 | | Retired | | 158 | | None |
Teresa M. Ressel — 1962 Trustee | | 2017 | | Non-executive director and trustee of a number of public and private business corporations Formerly: Chief Financial Officer, Olayan America, The Olayan Group (international investor/commercial/industrial); Chief Executive Officer, UBS Securities LLC; Group Chief Operating Officer, Americas, UBS AG; Assistant Secretary for Management & Budget and CFO, US Department of the Treasury | | 158 | | Atlantic Power Corporation (power generation company); ON Semiconductor Corp. (semiconductor supplier) |
Ann Barnett Stern — 1957 Trustee | | 2017 | | President and Chief Executive Officer, Houston Endowment Inc. (private philanthropic institution) Formerly: Executive Vice President and General Counsel, Texas Children’s Hospital; Attorney, Beck, Redden and Secrest, LLP; Business Law Instructor, University of St. Thomas; Attorney, Andrews & Kurth LLP | | 158 | | Federal Reserve Bank of Dallas |
Raymond Stickel, Jr. — 1944 Trustee | | 2005 | | Retired Formerly: Director, Mainstay VP Series Funds, Inc. (25 portfolios); Partner, Deloitte & Touche | | 158 | | None |
Robert C. Troccoli — 1949 Trustee | | 2016 | | Adjunct Professor, University of Denver — Daniels College of Business Formerly: Senior Partner, KPMG LLP | | 158 | | None |
Christopher L. Wilson — 1957 Trustee | | 2017 | | Non-executive director and trustee of a number of public and private business corporations Formerly: Director, TD Asset Management USA Inc. (mutual fund complex) (22 portfolios); Managing Partner, CT2, LLC (investing and consulting firm); President/Chief Executive Officer, Columbia Funds, Bank of America Corporation; President/Chief Executive Officer, CDC IXIS Asset Management Services, Inc.; Principal & Director of Operations, Scudder Funds, Scudder, Stevens & Clark, Inc.; Assistant Vice President, Fidelity Investments | | 158 | | ISO New England, Inc. (non-profit organization managing regional electricity market) |
T-2 Invesco Multi-Asset Income Fund
Trustees and Officers—(continued)
| | | | | | | | |
Name, Year of Birth and
Position(s) Held with the Trust | | Trustee and/
or Officer Since | | Principal Occupation(s)
During Past 5 Years | | Number of
Funds in Fund
Complex
Overseen by
Trustee | | Other Directorship(s)
Held by Trustee During
Past 5 Years |
| Other Officers | | | | | | | | |
Sheri Morris — 1964 President, Principal Executive Officer and Treasurer | | 1999 | | President, Principal Executive Officer and Treasurer, The Invesco Funds; Vice President, Invesco Advisers, Inc. (formerly known as Invesco Institutional (N.A.), Inc.) (registered investment adviser); and Vice President, Invesco Exchange-Traded Fund Trust, Invesco Exchange-Traded Fund Trust II, Invesco India Exchange-Traded Fund Trust, Invesco Actively Managed Exchange-Traded Fund Trust, Invesco Actively Managed Exchange-Traded Commodity Fund Trust and Invesco Exchange-Traded Self-Indexed Fund Trust Formerly: Vice President and Principal Financial Officer, The Invesco Funds; Vice President, Invesco AIM Advisers, Inc., Invesco AIM Capital Management, Inc. and Invesco AIM Private Asset Management, Inc.; Assistant Vice President and Assistant Treasurer, The Invesco Funds and Assistant Vice President, Invesco Advisers, Inc., Invesco AIM Capital Management, Inc. and Invesco AIM Private Asset Management, Inc.; and Treasurer, Invesco Exchange-Traded Fund Trust, Invesco Exchange-Traded Fund Trust II, Invesco India Exchange-Traded Fund Trust and Invesco Actively Managed Exchange-Traded Fund Trust | | N/A | | N/A |
Russell C. Burk — 1958 Senior Vice President and Senior Officer | | 2005 | | Senior Vice President and Senior Officer, The Invesco Funds | | N/A | | N/A |
Jeffrey H. Kupor — 1968 Senior Vice President, Chief Legal Officer and Secretary | | 2018 | | Senior Vice President and Secretary, Invesco Advisers, Inc. (formerly known as Invesco Institutional (N.A.), Inc.) (registered investment adviser); Senior Vice President and Secretary, Invesco Distributors, Inc. (formerly known as Invesco AIM Distributors, Inc.); Vice President and Secretary, Invesco Investment Services, Inc. (formerly known as Invesco AIM Investment Services, Inc.) Senior Vice President, Chief Legal Officer and Secretary, The Invesco Funds; Secretary and General Counsel, Invesco Investment Advisers LLC (formerly known as Van Kampen Asset Management); Secretary and General Counsel, Invesco Capital Markets, Inc. (formerly known as Van Kampen Funds Inc.) and Chief Legal Officer, Invesco Exchange-Traded Fund Trust, Invesco Exchange-Traded Fund Trust II, Invesco India Exchange-Traded Fund Trust, Invesco Actively Managed Exchange-Traded Fund Trust, Invesco Actively Managed Exchange-Traded Commodity Fund Trust and Invesco Exchange-Traded Self-Indexed Fund Trust; Secretary, Invesco Indexing LLC; Secretary and General Counsel, INVESCO Private Capital Investments, Inc.; Secretary, W.L. Ross & Co., LLC; Secretary and Vice President, Jemstep, Inc. Formerly: Senior Vice President, Secretary and General Counsel, Invesco Management Group, Inc. (formerly known as Invesco AIM Management Group, Inc.); Assistant Secretary, INVESCO Asset Management (Bermuda) Ltd.; Secretary and General Counsel, Invesco Private Capital, Inc.; Assistant Secretary and General Counsel, INVESCO Realty, Inc.; Secretary and General Counsel, Invesco Senior Secured Management, Inc.; and Secretary, Sovereign G./P. Holdings Inc. | | N/A | | N/A |
John M. Zerr — 1962 Senior Vice President | | 2006 | | Chief Operating Officer of the Americas; Senior Vice President, Invesco Advisers, Inc. (formerly known as Invesco Institutional (N.A.), Inc.) (registered investment adviser); Senior Vice President, Invesco Distributors, Inc. (formerly known as Invesco AIM Distributors, Inc.); Director and Vice President, Invesco Investment Services, Inc. (formerly known as Invesco AIM Investment Services, Inc.) Senior Vice President, The Invesco Funds; Managing Director, Invesco Capital Management LLC; Director, Invesco Investment Advisers LLC (formerly known as Van Kampen Asset Management); Senior Vice President, Invesco Capital Markets, Inc. (formerly known as Van Kampen Funds Inc.); Manager, Invesco Indexing LLC Formerly: Director and Senior Vice President, Invesco Management Group, Inc. (formerly known as Invesco AIM Management Group, Inc.); Secretary and General Counsel, Invesco Management Group, Inc. (formerly known as Invesco AIM Management Group, Inc.); Secretary, Invesco Investment Services, Inc. (formerly known as Invesco AIM Investment Services, Inc.); Chief Legal Officer and Secretary, The Invesco Funds; Secretary and General Counsel, Invesco Investment Advisers LLC (formerly known as Van Kampen Asset Management); Secretary and General Counsel, Invesco Capital Markets, Inc. (formerly known as Van Kampen Funds Inc.); Chief Legal Officer, Invesco Exchange-Traded Fund Trust, Invesco Exchange-Traded Fund Trust II, Invesco India Exchange-Traded Fund Trust, Invesco Actively Managed Exchange-Traded Fund Trust, Invesco Actively Managed Exchange-Traded Commodity Fund Trust and Invesco Exchange-Traded Self-Indexed Fund Trust; Secretary, Invesco Indexing LLC; Director, Secretary, General Counsel and Senior Vice President, Van Kampen Exchange Corp.; Director, Vice President and Secretary, IVZ Distributors, Inc. (formerly known as INVESCO Distributors, Inc.); Director and Vice President, INVESCO Funds Group, Inc.; Director and Vice President, Van Kampen Advisors Inc.; Director, Vice President, Secretary and General Counsel, Van Kampen Investor Services Inc.; Director and Secretary, Invesco Distributors, Inc. (formerly known as Invesco AIM Distributors, Inc.); Director, Senior Vice President, General Counsel and Secretary, Invesco AIM Advisers, Inc. and Van Kampen Investments Inc.; Director, Vice President and Secretary, Fund Management Company; Director, Senior Vice President, Secretary, General Counsel and Vice President, Invesco AIM Capital Management, Inc.; Chief Operating Officer and General Counsel, Liberty Ridge Capital, Inc. (an investment adviser) | | N/A | | N/A |
T-3 Invesco Multi-Asset Income Fund
Trustees and Officers—(continued)
| | | | | | | | |
Name, Year of Birth and
Position(s) Held with the Trust | | Trustee and/
or Officer Since | | Principal Occupation(s)
During Past 5 Years | | Number of
Funds in Fund
Complex
Overseen by
Trustee | | Other Directorship(s)
Held by Trustee During
Past 5 Years |
| Other Officers—(continued) | | | | | | | | |
Gregory G. McGreevey — 1962 Senior Vice President | | 2012 | | Senior Managing Director, Invesco Ltd.; Director, Chairman, President, and Chief Executive Officer, Invesco Advisers, Inc. (formerly known as Invesco Institutional (N.A.), Inc.) (registered investment adviser); Director, Invesco Mortgage Capital, Inc. and Invesco Senior Secured Management, Inc.; and Senior Vice President, The Invesco Funds Formerly: Senior Vice President, Invesco Management Group, Inc. and Invesco Advisers, Inc.; Assistant Vice President, The Invesco Funds | | N/A | | N/A |
Kelli Gallegos — 1970 Vice President, Principal Financial Officer and Assistant Treasurer | | 2008 | | Vice President and Treasurer, Invesco Exchange-Traded Fund Trust, Invesco Exchange-Traded Fund Trust II, Invesco India Exchange-Traded Fund Trust, Invesco Actively Managed Exchange-Traded Fund Trust, Invesco Actively Managed Exchange-Traded Commodity Fund Trust and Invesco Exchange-Traded Self-Indexed Fund Trust; Vice President, Principal Financial Officer and Assistant Treasurer, The Invesco Funds; Principal Financial and Accounting Officer — Pooled Investments, Invesco Capital Management LLC Formerly: Assistant Treasurer, Invesco Exchange-Traded Fund Trust, Invesco Exchange-Traded Fund Trust II, Invesco India Exchange-Traded Fund Trust, Invesco Actively Managed Exchange-Traded Fund Trust, Invesco Actively Managed Exchange-Traded Commodity Fund Trust and Invesco Exchange-Traded Self-Indexed Fund Trust; Assistant Treasurer, Invesco Capital Management LLC; Assistant Vice President, The Invesco Funds | | N/A | | N/A |
Tracy Sullivan — 1962 Vice President, Chief Tax Officer and Assistant Treasurer | | 2008 | | Vice President, Chief Tax Officer and Assistant Treasurer, The Invesco Funds; Assistant Treasurer, Invesco Capital Management LLC, Invesco Exchange-Traded Fund Trust, Invesco Exchange-Traded Fund Trust II, Invesco India Exchange-Traded Fund Trust, Invesco Actively Managed Exchange-Traded Fund Trust, Invesco Actively Managed Exchange-Traded Commodity Fund Trust and Invesco Exchange-Traded Self-Indexed Fund Trust Formerly: Assistant Vice President, The Invesco Funds | | N/A | | N/A |
Crissie M. Wisdom — 1969 Anti-Money Laundering Compliance Officer | | 2013 | | Anti-Money Laundering Compliance Officer, Invesco Advisers, Inc. (formerly known as Invesco Institutional (N.A.), Inc.) (registered investment adviser), Invesco Capital Markets, Inc. (formerly known as Van Kampen Funds Inc.), Invesco Distributors, Inc., Invesco Investment Services, Inc., The Invesco Funds, and Invesco Exchange-Traded Fund Trust, Invesco Exchange-Traded Fund Trust II, Invesco India Exchange-Traded Fund Trust, Invesco Actively Managed Exchange-Traded Fund Trust, Invesco Actively Managed Exchange-Traded Commodity Fund Trust and Invesco Exchange-Traded Self-Indexed Fund Trust; Anti-Money Laundering Compliance Officer and Bank Secrecy Act Officer, INVESCO National Trust Company and Invesco Trust Company; and Fraud Prevention Manager and Controls and Risk Analysis Manager for Invesco Investment Services, Inc. Formerly: Anti-Money Laundering Compliance Officer, Van Kampen Exchange Corp. and Invesco Management Group, Inc. | | N/A | | N/A |
Robert R. Leveille — 1969 Chief Compliance Officer | | 2016 | | Chief Compliance Officer, Invesco Advisers, Inc. (registered investment adviser); and Chief Compliance Officer, The Invesco Funds Formerly: Chief Compliance Officer, Putnam Investments and the Putnam Funds | | N/A | | N/A |
The Statement of Additional Information of the Trust includes additional information about the Fund’s Trustees and is available upon request, without charge, by calling 1.800.959.4246. Please refer to the Fund’s Statement of Additional Information for information on the Fund’s sub-advisers.
| | | | | | |
Office of the Fund 11 Greenway Plaza, Suite 1000 Houston, TX 77046-1173 | | Investment Adviser Invesco Advisers, Inc. 1555 Peachtree Street, N.E. Atlanta, GA 30309 | | Distributor Invesco Distributors, Inc. 11 Greenway Plaza, Suite 1000 Houston, TX 77046-1173 | | Auditors PricewaterhouseCoopers LLP 1000 Louisiana Street, Suite 5800 Houston, TX 77002-5021 |
| | | |
| | | | | | |
Counsel to the Fund Stradley Ronon Stevens & Young, LLP 2005 Market Street, Suite 2600 Philadelphia, PA 19103-7018 | | Counsel to the Independent Trustees Goodwin Procter LLP 901 New York Avenue, N.W. Washington, D.C. 20001 | | Transfer Agent Invesco Investment Services, Inc. 11 Greenway Plaza, Suite 1000 Houston, TX 77046-1173 | | Custodian State Street Bank and Trust Company 225 Franklin Street Boston, MA 02110-2801 |
T-4 Invesco Multi-Asset Income Fund
Explore High-Conviction Investing with Invesco

Go paperless with eDelivery
Visit invesco.com/edelivery to enjoy the convenience and security of anytime electronic access to your investment documents.
With eDelivery, you can elect to have any or all of the following materials delivered straight to your inbox to download, save and print from your own computer:
∎ Fund reports and prospectuses
∎ Quarterly statements
∎ Daily confirmations
∎ Tax forms
Invesco mailing information
Send general correspondence to Invesco Investment Services, Inc., P.O. Box 219078, Kansas City, MO 64121-9078.
Important notice regarding delivery of security holder documents
To reduce Fund expenses, only one copy of most shareholder documents may be mailed to shareholders with multiple accounts at the same address (Householding). Mailing of your shareholder documents may be householded indefinitely unless you instruct us otherwise. If you do not want the mailing of these documents to be combined with those for other members of your household, please contact Invesco Investment Services, Inc. at 800 959 4246 or contact your financial institution. We will begin sending you individual copies for each account within 30 days after receiving your request.
Fund holdings and proxy voting information
The Fund provides a complete list of its holdings four times in each fiscal year, at the quarter ends. For the second and fourth quarters, the lists appear in the Fund’s semiannual and annual reports to shareholders. For the first and third quarters, the Fund files the lists with the Securities and Exchange Commission (SEC) on Form N-Q (or any successor Form). The most recent list of portfolio holdings is available at invesco.com/completeqtrholdings. Shareholders can also look up the Fund’s Forms N-Q (or any successor Form) on the SEC website at sec.gov. The SEC file numbers for the Fund are shown below.
A description of the policies and procedures that the Fund uses to determine how to vote proxies relating to portfolio securities is available without charge, upon request, from our Client Services department at 800 959 4246 or at invesco.com/proxyguidelines. The information is also available on the SEC website, sec.gov.
| | |
Information regarding how the Fund voted proxies related to its portfolio securities during the most recent 12-month period ended June 30 is available at invesco.com/proxysearch. The information is also available on the SEC website, sec.gov. Invesco Advisers, Inc. is an investment adviser; it provides investment advisory services to individual and institutional clients and does not sell securities. Invesco Distributors, Inc. is the US distributor for Invesco Ltd.’s retail mutual funds, exchange-traded funds and institutional money market funds. Both are wholly owned, indirect subsidiaries of Invesco Ltd. | |  |
SEC file numbers: 811-05426 and 033-19338 Invesco Distributors, Inc. MAIN-AR-1 12262018 1117
| | | | |
| | |
 | | Annual Report to Shareholders | | October 31, 2018 |
| | |
| | Invesco Pacific Growth Fund Nasdaq: A: TGRAX ∎ C: TGRCX ∎ R: TGRRX ∎ Y: TGRDX ∎ R5: TGRSX ∎ R6: TGRUX |

Letters to Shareholders
| | |

Philip Taylor | | Dear Shareholders: This annual report includes information about your Fund, including performance data and a complete list of its investments as of the close of the reporting period. Inside is a discussion of how your Fund was managed and the factors that affected its performance during the reporting period. Throughout the reporting period, US economic data remained positive. Robust corporate profits, strong retail sales and unemployment rates near generational lows helped drive US markets to new all-time records multiple times during the reporting period. Against this backdrop, the US Federal Reserve raised the federal funds rate four times during the reporting period. Market volatility, largely non-existent in 2017, returned in 2018. Markets sold off first in February and again sharply in October, amid rising interest rates, concerns about potential trade wars and heightened geo-political tensions. Despite the volatility, US equity markets were largely positive for the reporting |
period and fared better than international markets. Emerging markets were particularly hard hit due to a strong US dollar.
During the October sell-off, investors retreated to more defensive areas of the market and to US Treasuries. The broader bond market declined during the reporting period due to the increase in US Treasury yields and widening credit spreads. As the year progresses, we’ll see how the interplay of economic data, interest rates, geopolitics and a host of other factors affect US and overseas equity and fixed income markets.
Short-term market volatility can prompt some investors to abandon their investment plans – and can cause others to settle for whatever returns the market has to offer. The investment professionals at Invesco, in contrast, invest with high conviction. This means that, no matter the asset class or the strategy, each investment team has a passion to exceed. We want to help investors achieve better outcomes, such as seeking higher returns, helping mitigate risk and generating income. Of course, investing with high conviction can’t guarantee a profit or ensure success; no investment strategy can. To learn more about how we invest with high conviction, visit invesco.com/HighConviction.
You, too, can invest with high conviction by maintaining a long-term investment perspective and by working with your financial adviser on a regular basis. During periods of short-term market volatility or uncertainty, your financial adviser can keep you focused on your long-term investment goals – a new home, a child’s college education or a secure retirement. He or she also can share research about the economy, the markets and individual investment options.
Visit our website for more information on your investments
Our website, invesco.com/us, offers a wide range of market insights and investment perspectives. On the website, you’ll find detailed information about our funds, including performance, holdings and portfolio manager commentaries. You can access information about your account by completing a simple, secure online registration. To do so, select “Log In” on the right side of the homepage, and then select “Register for Individual Account Access.”
In addition to the resources accessible on our website and through our mobile app, you can obtain timely updates to help you stay informed about the markets and the economy by connecting with Invesco on Twitter, LinkedIn or Facebook. You can access our blog at blog.invesco.us.com. Our goal is to provide you the information you want, when and where you want it.
Finally, I’m pleased to share with you Invesco’s commitment to both the Principles for Responsible Investment and to considering environmental, social and governance issues in our robust investment process. I invite you to learn more at invesco.com/esg.
Have questions?
For questions about your account, contact an Invesco client services representative at 800 959 4246. For Invesco-related questions or comments, please email me directly at phil@invesco.com.
All of us at Invesco look forward to serving your investment management needs. Thank you for investing with us.
Sincerely,

Philip Taylor
Senior Managing Director, Invesco Ltd.
|
| 2 Invesco Pacific Growth Fund |
| | |

Bruce Crockett | | Dear Fellow Shareholders: Among the many important lessons I’ve learned in more than 40 years in a variety of business endeavors is the value of a trusted advocate. As independent chair of the Invesco Funds Board, I can assure you that the members of the Board are strong advocates for the interests of investors in Invesco’s mutual funds. We work hard to represent your interests through oversight of the quality of the investment management services your funds receive and other matters important to your investment, including but not limited to: ∎ Ensuring that Invesco offers a diverse lineup of mutual funds that your financial adviser can use to strive to meet your financial needs as your investment goals change over time. ∎ Monitoring how the portfolio management teams of the Invesco funds are performing in light of changing economic and market conditions. |
∎ Assessing each portfolio management team’s investment performance within the context of the investment strategy described in the fund’s prospectus.
∎ Monitoring for potential conflicts of interests that may impact the nature of the services that your funds receive.
We believe one of the most important services we provide our fund shareholders is the annual review of the funds’ advisory and sub-advisory contracts with Invesco Advisers and its affiliates. This review is required by the Investment Company Act of 1940 and focuses on the nature and quality of the services Invesco provides as the adviser to the Invesco funds and the reasonableness of the fees that it charges for those services. Each year, we spend months carefully reviewing information received from Invesco and a variety of independent sources, such as performance and fee data prepared by Lipper, Inc. (a subsidiary of Broadridge Financial Solutions, Inc.), an independent, third-party firm widely recognized as a leader in its field. We also meet with our independent legal counsel and other independent advisers to review and help us assess the information that we have received. Our goal is to assure that you receive quality investment management services for a reasonable fee.
I trust the measures outlined above provide assurance that you have a worthy advocate when it comes to choosing the Invesco Funds.
As always, please contact me at bruce@brucecrockett.com with any questions or concerns you may have. On behalf of the Board, we look forward to continuing to represent your interests and serving your needs.
Sincerely,

Bruce L. Crockett
Independent Chair
Invesco Funds Board of Trustees
|
| 3 Invesco Pacific Growth Fund |
Management’s Discussion of Fund Performance
| | | | | |
Performance summary For the fiscal year ended October 31, 2018, Class A shares of Invesco Pacific Growth Fund (the Fund), at net asset value (NAV), underperformed the MSCI All Country Asia Pacific Index, the Fund’s style-specific benchmark. Your Fund’s long-term performance appears later in this report. | |
Fund vs. Indexes | | | | | |
Total returns, 10/31/17 to 10/31/18, at net asset value (NAV). Performance shown does not include applicable contingent deferred sales charges (CDSC) or front-end sales charges, which would have reduced performance. | |
| |
Class A Shares | | | | -12.97% | |
Class C Shares | | | | -13.60 | |
Class R Shares | | | | -13.18 | |
Class Y Shares | | | | -12.73 | |
Class R5 Shares | | | | -12.69 | |
Class R6 Shares | | | | -12.69 | |
MSCI EAFE Index▼ (Broad Market Index) | | | | -6.85 | |
MSCI All Country Asia Pacific Index▼ (Style-Specific Index) | | | | -8.89 | |
Lipper Pacific Region Funds Index∎ (Peer Group Index) | | | | -9.64 | |
| |
Source(s): ▼RIMES Technologies Corp.; ∎Lipper Inc. | | | | | |
| | |
Market conditions and your Fund The fiscal year began with Asia Pacific ex-Japan equities posting gains. The health care and consumer staples sectors led the rally, while defensive sectors lagged. Japanese equities outperformed most overseas markets in yen terms, against a backdrop of Prime Minister Abe’s landslide election victory, robust economic growth in Japan and better-than-expected global corporate earnings. After a strong start to 2018, Asia Pacific ex-Japan markets experienced heightened volatility beginning in late January. Investors’ sentiment was weighed down by external uncertainties, particularly the trajectory of US interest rate hikes and rising trade tensions. Though Japan’s equity markets started 2018 on a high note and Japanese companies posted better-than-expected quarterly earnings results, these markets fell due to US inflation fears, the US and China trade dispute and resulting yen appreciation. | | Asia Pacific ex-Japan equities extended weakness throughout 2018, against a challenging global backdrop of rising crude oil prices, a strengthening US dollar and ongoing trade tension. In China, there were concerns about possible escalation of trade tensions after two rounds of US tariffs. In Japan, trade tensions and weaker emerging market economies initially weighed on Japan’s equity market, but fears eventually eased amid the US labor market’s sustained improvement and stabilization of the Japanese yen and other emerging markets currencies. Trade dispute concerns largely abated until October 2018 when global equity markets sold off sharply – Japan was not immune to this trend. On a geographic basis, underweight exposure to and stock selection in China were the leading contributors to the Fund’s performance relative to the MSCI All Country Asia Pacific Index during the fiscal year. In contrast, negative stock |
selection in Japan was the leading detractor from the Fund’s relative performance. Holdings in South Korea, Taiwan and India underperformed those of the style-specific index and negatively affected the Fund’s relative returns.
At the sector level, stock selection in and an underweight allocation to the industrials sector contributed to Fund performance relative to the style-specific index during the fiscal year. Contributors included Japan-based Mitsubishi and Recruit Holdings.
During the fiscal year, stock selection in the financials and communication services sectors also contributed to the Fund’s performance relative to the style-specific index. In financials, India-based non-banking financial company Bajaj Finance was the largest contributor within the sector. We exited our position in Bajaj Finance before the close of the fiscal year. Kakaku.com, a Japanese comparison shopping and restaurant review website operator, was a leading contributor within the communication services sector.
Conversely, stock selection in and an overweight allocation to the weaker consumer discretionary sector was the largest driver of the Fund’s underperformance relative to the style-specific benchmark. India-based companies Maruti Suzuki India, an automobile manufacturer, and Eicher Motors, a lifestyle motorcycle manufacturer, were the leading detractors from the Fund’s relative performance during the fiscal year.
Stock selection in the consumer staples sector detracted from both absolute and relative performance relative to the style-specific index. South Korean beauty and cosmetic company AmorePacific was a notable detractor during the fiscal year due to limited visibility of new policies introduced such as minimum wages and
| | | | | | | | | |
Portfolio Composition | | | | | |
By sector | | % of total net assets | | | | | |
| | | | | | | | | | | | |
| | |
Consumer Discretionary | | | | 23.6 | % | | | | | |
Industrials | | | | 22.7 | | | | | | |
Information Technology | | | | 19.9 | | | | | | |
Financials | | | | 11.7 | | | | | | |
Communication Services | | | | 10.0 | | | | | | |
Materials | | | | 4.4 | | | | | | |
Consumer Staples | | | | 2.6 | | | | | | |
Health Care | | | | 2.3 | | | | | | |
Real Estate | | | | 1.8 | | | | | | |
Money Market Funds Plus | | | | | | | | | | |
Other Assets Less Liabilities | | | | 1.0 | | | | | | |
| | | | | | | | | | |
| Top 10 Equity Holdings* | | |
| % of total net assets | | |
| | | | | |
| |
1. Taiwan Semiconductor Manufacturing Co., Ltd. | | | | 6.9 | % |
2. Alibaba Group Holding Ltd.-ADR | | | | 4.8 | |
3. Tencent Holdings Ltd. | | | | 4.7 | |
4. Samsung Electronics Co., Ltd. | | | | 3.9 | |
5. Ping An Insurance (Group) Co. of China Ltd.-Class H | | | | 3.0 | |
6. Fukushima Industries Corp. | | | | 2.4 | |
7. Sompo Holdings, Inc. | | | | 2.3 | |
8. Orora Ltd. | | | | 2.2 | |
9. Nidec Corp. | | | | 2.2 | |
10. China Construction Bank Corp.-Class H | | | | 2.1 | |
| | | | | | | | | | |
Total Net Assets | | | | $90.6 million | | | |
| | | | | | | | | | |
| | |
Total Number of Holdings* | | | | 57 | | | |
The Fund’s holdings are subject to change, and there is no assurance that the Fund will continue to hold any particular security.
*Excluding money market fund holdings.
Data presented here are as of October 31, 2018.
|
| 4 Invesco Pacific Growth Fund |
limitations on operating hours. Additionally, the company’s share price was negatively affected by weaker-than-expected sales in China. We exited our position in AmorePacific before the close of the fiscal year.
During the fiscal year, underweight exposure to the positive-performing health care sector and lack of exposure to the energy sector, the fiscal year’s best-performing sector, also hampered the Fund’s relative results.
During the fiscal year, the Fund’s Asia Pacific ex-Japan allocation favored consumer-related sectors, with overweight positions in the IT, consumer discretionary and consumer staples sectors and underweight positions in the financials and energy sectors. The Fund’s Japan position focused on attractively priced stocks across a broad range of sectors that we believe have sound corporate governance and competent management and are transforming to create sustainable corporate value.
We thank you for your continued investment in Invesco Pacific Growth Fund.
The views and opinions expressed in management’s discussion of Fund performance are those of Invesco Advisers, Inc. These views and opinions are subject to change at any time based on factors such as market and economic conditions. These views and opinions may not be relied upon as investment advice or recommendations, or as an offer for a particular security. The information is not a complete analysis of every aspect of any market, country, industry, security or the Fund. Statements of fact are from sources considered reliable, but Invesco Advisers, Inc. makes no representation or warranty as to their completeness or accuracy. Although historical performance is no guarantee of future results, these insights may help you understand our investment management philosophy.
See important Fund and, if applicable, index disclosures later in this report.
| | |
 | | Daiji Ozawa Chartered Financial Analyst, Portfolio Manager, is manager of Invesco Pacific Growth Fund. He joined |
| Invesco in 2010. Mr. Ozawa earned a BA in political science from Waseda University. |
| | |
 | | William Yuen Chartered Financial Analyst, Portfolio Manager, is manager of Invesco Pacific Growth Fund. He joined |
| Invesco in 2004. Mr. Yuen earned a Master of Commerce degree and a Bachelor of Economics degree from the University of Sydney, Australia. |
Effective December 28, 2018, after the close of the fiscal year, Paul Chan will no longer be a member of the portfolio management team.
|
| 5 Invesco Pacific Growth Fund |
Your Fund’s Long-Term Performance
Results of a $10,000 Investment – Oldest Share Class(es)
Fund and index data from 10/31/08*
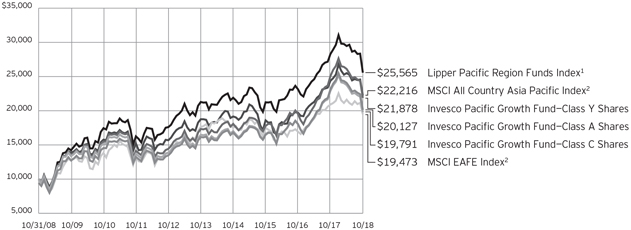
1 Source: Lipper Inc.
2 Source: RIMES Technologies Corp.
| *Effective | January 26, 2018, Class B shares were converted to Class A shares. Class A, Class C and Class Y shares |
| (now | the Fund’s oldest share classes) have replaced Class B shares (formerly the Fund’s oldest share class) on the chart. |
Past performance cannot guarantee comparable future results.
The data shown in the chart include reinvested distributions, applicable sales charges and Fund expenses including management fees. Index results include reinvested dividends, but they do not reflect sales charges. Performance of the
peer group, if applicable, reflects fund expenses and management fees; performance of a market index does not. Performance shown in the chart and table(s) does not reflect deduction of taxes a shareholder would pay on Fund distributions or sale of Fund shares.
6 Invesco Pacific Growth Fund
| | | | | |
Average Annual Total Returns | |
| As of 10/31/18, including maximum applicable sales charges | |
| |
Class A Shares | | | | | |
Inception (7/28/97) | | | | 2.24 | % |
10 Years | | | | 7.25 | |
5 Years | | | | 3.34 | |
1 Year | | | | -17.76 | |
| |
Class C Shares | | | | | |
Inception (7/28/97) | | | | 1.77 | % |
10 Years | | | | 7.06 | |
5 Years | | | | 3.73 | |
1 Year | | | | -14.47 | |
| |
Class R Shares | | | | | |
Inception (3/31/08) | | | | 2.41 | % |
10 Years | | | | 7.58 | |
5 Years | | | | 4.24 | |
1 Year | | | | -13.18 | |
| |
Class Y Shares | | | | | |
Inception (7/28/97) | | | | 2.77 | % |
10 Years | | | | 8.14 | |
5 Years | | | | 4.77 | |
1 Year | | | | -12.73 | |
| |
Class R5 Shares | | | | | |
10 Years | | | | 8.15 | % |
5 Years | | | | 4.88 | |
1 Year | | | | -12.69 | |
| |
Class R6 Shares | | | | | |
10 Years | | | | 7.91 | % |
5 Years | | | | 4.62 | |
1 Year | | | | -12.69 | |
Effective June 1, 2010, Class A, Class C, Class R, Class W and Class I shares of the predecessor fund, Morgan Stanley Pacific Growth Fund Inc., advised by Morgan Stanley Investment Advisors Inc. were reorganized into Class A, Class C, Class R, Class A and Class Y shares, respectively, of Invesco Pacific Growth Fund. Returns shown above, prior to June 1, 2010, for Class A, Class C, Class R and Class Y shares are blended returns of the predecessor fund and Invesco Pacific Growth Fund. Share class returns will differ from the predecessor fund because of different expenses.
Class R5 shares incepted on May 23, 2011. Performance shown prior to that date is that of the Fund’s and the predecessor fund’s Class A shares and includes the 12b-1 fees applicable to Class A shares.
Class R6 shares incepted on April 4, 2017. Performance shown prior to that date is that of the Fund’s and the predecessor fund’s Class A shares and includes the 12b-1 fees applicable to Class A shares.
| | | | | |
Average Annual Total Returns | |
| As of 9/30/18, the most recent calendar quarter end, including maximum applicable sales charges | |
| |
Class A Shares | | | | | |
Inception (7/28/97) | | | | 2.77 | % |
10 Years | | | | 5.92 | |
5 Years | | | | 6.25 | |
1 Year | | | | -3.06 | |
| |
Class C Shares | | | | | |
Inception (7/28/97) | | | | 2.30 | % |
10 Years | | | | 5.73 | |
5 Years | | | | 6.65 | |
1 Year | | | | 0.77 | |
| |
Class R Shares | | | | | |
Inception (3/31/08) | | | | 3.49 | % |
10 Years | | | | 6.24 | |
5 Years | | | | 7.17 | |
1 Year | | | | 2.29 | |
| |
Class Y Shares | | | | | |
Inception (7/28/97) | | | | 3.30 | % |
10 Years | | | | 6.79 | |
5 Years | | | | 7.73 | |
1 Year | | | | 2.84 | |
| |
Class R5 Shares | | | | | |
10 Years | | | | 6.81 | % |
5 Years | | | | 7.85 | |
1 Year | | | | 2.87 | |
| |
Class R6 Shares | | | | | |
10 Years | | | | 6.56 | % |
5 Years | | | | 7.56 | |
1 Year | | | | 2.87 | |
The performance data quoted represent past performance and cannot guarantee comparable future results; current performance may be lower or higher. Please visit invesco.com/performance for the most recent month-end performance. Performance figures reflect reinvested distributions, changes in net asset value and the effect of the maximum sales charge unless otherwise stated. Investment return and principal value will fluctuate so that you may have a gain or loss when you sell shares.
The total annual Fund operating expense ratio set forth in the most recent Fund prospectus as of the date of this report for Class A, Class C, Class R, Class Y, Class R5 and Class R6 shares was 1.75%, 2.49%, 2.00%, 1.50%, 1.42% and 1.42%, respectively. The expense ratios presented above may vary from the expense ratios presented in other sections of this report that are based on expenses incurred during the period covered by this report.
Class A share performance reflects the maximum 5.50% sales charge, and Class C share performance reflects the applicable contingent deferred sales charge (CDSC) for the period involved. The CDSC on Class C shares is 1% for the first year after purchase. Class R, Class Y, Class R5 and Class R6 shares do not have a front-end sales charge or a CDSC; therefore, performance is at net asset value.
The performance of the Fund’s share classes will differ primarily due to different sales charge structures and class expenses.
Fund performance reflects any applicable fee waivers and/or expense reimbursements. Had the adviser not waived fees and/or reimbursed expenses currently or in the past, returns would have been lower. See current prospectus for more information.
|
| 7 Invesco Pacific Growth Fund |
Invesco Pacific Growth’s Fund’s investment objective is long-term growth of capital.
| ∎ | | Unless otherwise stated, information presented in this report is as of October 31, 2018, and is based on total net assets. |
| ∎ | | Unless otherwise noted, all data provided by Invesco. |
| ∎ | | To access your Fund’s reports/prospectus, visit invesco.com/fundreports. |
| | | | |
About share classes ∎ Class R shares are generally available only to employer sponsored retirement and benefit plans. Please see the prospectus for more information. ∎ Class Y shares are available only to certain investors. Please see the prospectus for more information. ∎ Class R5 shares and Class R6 shares are available for use by retirement plans that meet certain standards and for institutional investors. Class R6 shares are also available through intermediaries that have established an agreement with Invesco Distributors, Inc. to make such shares available for use in retail omnibus accounts. Please see the prospectus for more information. Principal risks of investing in the Fund ∎ Asia Pacific region risk (including Japan). The level of development of the economies of countries in the Asia Pacific region varies greatly. Furthermore, since the economies of the countries in the region are largely intertwined, if an economic recession is experienced by any of these countries, it will likely adversely impact the economic performance of other countries in the region. Certain economies in the region may be adversely affected by increased competition, high inflation rates, undeveloped financial services sectors, currency fluctuations or restrictions, political and social instability and increased economic volatility. The Fund’s investments in China A-shares are subject to trading restrictions, quota limitations and clearing and settlement risks. The Fund’s Japanese investments may be adversely affected by protectionist trade policies, slow economic activity worldwide, dependence on exports and international trade, increasing competition from Asia’s other low-cost emerging economies, political and social instability, regional and global conflicts and natural disasters, as well as by commodity | | markets fluctuations related to Japan’s limited natural resource supply. ∎ Depositary receipts risk. Investing in depositary receipts involves the same risks as direct investments in foreign securities. In addition, the underlying issuers of certain depositary receipts are under no obligation to distribute shareholder communications or pass through any voting rights with respect to the deposited securities to the holders of such receipts. The Fund may therefore receive less timely information or have less control than if it invested directly in the foreign issuer. ∎ Derivatives risk. The value of a derivative instrument depends largely on (and is derived from) the value of an underlying security, currency, commodity, interest rate, index or other asset (each referred to as an underlying asset). In addition to risks relating to the underlying assets, the use of derivatives may include other, possibly greater, risks, including counterparty, leverage and liquidity risks. Counterparty risk is the risk that the counterparty to the derivative contract will default on its obligation to pay the Fund the amount owed or otherwise perform under the derivative contract. Derivatives create leverage risk because they do not require payment up front equal to the economic exposure created by owning the derivative. As a result, an adverse change in the value of the underlying asset could result in the Fund sustaining a loss that is substantially greater than the amount invested in the derivative, which may make the Fund’s returns more volatile and increase the risk of loss. Derivative instruments may also be less liquid than more traditional investments and the Fund may be unable to sell or close out its derivative positions at a desirable time or price. This risk may be more acute under adverse market conditions, during which the Fund may be most in need of liquidating its derivative positions. Derivatives may also be | | harder to value, less tax efficient and subject to changing government regulation that could impact the Fund’s ability to use certain derivatives or their cost. Also, derivatives used for hedging or to gain or limit exposure to a particular market segment may not provide the expected benefits, particularly during adverse market conditions. ∎ Emerging markets securities risk. Emerging markets (also referred to as developing markets) are generally subject to greater market volatility, political, social and economic instability, uncertain trading markets and more governmental limitations on foreign investment than more developed markets. In addition, companies operating in emerging markets may be subject to lower trading volume and greater price fluctuations than companies in more developed markets. Securities law and the enforcement of systems of taxation in many emerging market countries may change quickly and unpredictably. In addition, investments in emerging markets securities may also be subject to additional transaction costs, delays in settlement procedures, and lack of timely information. ∎ Foreign securities risk. The Fund’s foreign investments may be adversely affected by political and social instability, changes in economic or taxation policies, difficulty in enforcing obligations, decreased liquidity or increased volatility. Foreign investments also involve the risk of the possible seizure, nationalization or expropriation of the issuer or foreign deposits (in which the Fund could lose its entire investments in a certain market) and the possible adoption of foreign governmental restrictions such as exchange controls. Unless the Fund has hedged its foreign securities risk, foreign securities risk also involves the risk of negative foreign currency rate fluctuations, which may cause the value of securities denominated in such foreign currency (or other instruments through which the Fund has exposure to foreign currencies) to decline in value. Currency exchange rates may fluctuate significantly over short periods of time. Currency hedging strategies, if used, are not always successful. |
This report must be accompanied or preceded by a currently effective Fund prospectus, which contains more complete information, including sales charges and expenses. Investors should read it carefully before investing. |
| |
| NOT FDIC INSURED | MAY LOSE VALUE | NO BANK GUARANTEE |
|
|
| 8 Invesco Pacific Growth Fund |
| ∎ | | Geographic focus risk. The Fund may from time to time invest a substantial amount of its assets in securities of issuers located in a single country or a limited number of countries. Adverse economic, political or social conditions in those countries may therefore have a significant negative impact on the Fund’s investment performance. |
| ∎ | | Growth investing risk. Growth stocks tend to be more expensive relative to the issuing company’s earnings or assets compared with other types of stock. As a result, they tend to be more sensitive to changes in, or investors’ expectations of, the issuing company’s earnings and can be more volatile. |
| ∎ | | Management risk. The Fund is actively managed and depends heavily on the Adviser’s judgment about markets, interest rates or the attractiveness, relative values, liquidity, or potential appreciation of particular investments made for the Fund’s portfolio. The Fund could experience losses if these judgments prove to be incorrect. Additionally, legislative, regulatory, or tax developments may adversely affect management of the Fund and, therefore, the ability of the Fund to achieve its investment objective. |
| ∎ | | Market risk. The market values of the Fund’s investments, and therefore the value of the Fund’s shares, will go up and down, sometimes rapidly or unpredictably. Market risk may affect a single issuer, industry or section of the economy, or it may affect the market as a whole. Individual stock prices tend to go up and down more dramatically than those of certain other types of investments, such as bonds. During a general downturn in the financial markets, multiple asset classes may decline in value. When markets perform well, there can be no assurance that specific investments held by the Fund will rise in value. |
| ∎ | | Preferred securities risk. Preferred securities are subject to issuer-specific and market risks applicable generally to equity securities. Preferred securities also may be subordinated to bonds or other debt instruments, subjecting them to a greater risk of non-payment, may be less liquid than many other securities, such as common stocks, and generally offer no voting rights with respect to the issuer. |
| ∎ | | Sector focus risk. The Fund may from time to time invest a significant amount of its assets (i.e. over 25%) in one market sector or group of related industries. In this event, the Fund’s performance will depend to a greater extent on the overall condition of the sector or group of industries and there is increased risk that the Fund will lose significant value if conditions adversely affect that sector or group of industries. |
| ∎ | | Small- and mid-capitalization companies risks. Small- and mid-capitalization companies tend to be more vulnerable to changing market conditions, may have little or no operating history or track record of success, and may have more limited product lines and markets, less experienced management and fewer financial resources than larger companies. These companies’ securities may be more volatile and less liquid than those of more established companies, and their returns may vary, sometimes significantly, from the overall securities market. |
About indexes used in this report
| ∎ | | The MSCI EAFE® Index is an unmanaged index considered representative of stocks of Europe, Australasia and the Far East. The index is computed using the net return, which withholds applicable taxes for non-resident investors. |
| ∎ | | The MSCI All Country Asia Pacific Index is an unmanaged index considered representative of Asia Pacific region stock markets. The index is computed using the net return, which withholds applicable taxes for non-resident investors. |
| ∎ | | The Lipper Pacific Region Funds Index is an unmanaged index considered representative of Pacific region funds tracked by Lipper. |
| ∎ | | The Fund is not managed to track the performance of any particular index, including the index(es) described here, and consequently, the performance of the Fund may deviate significantly from the performance of the index(es). |
| ∎ | | A direct investment cannot be made in an index. Unless otherwise indicated, index results include reinvested dividends, and they do not reflect sales charges. Performance of the peer group, if applicable, reflects fund expenses; performance of a market index does not. |
Other information
| ∎ | | The returns shown in management’s discussion of Fund performance are based on net asset values (NAVs) calculated for shareholder transactions. Generally accepted accounting principles require adjustments to be made to the net assets of the Fund at period end for financial reporting purposes, and as such, the NAVs for shareholder transactions and the returns based on those NAVs may differ from the NAVs and returns reported in the Financial Highlights. |
| ∎ | | Industry classifications used in this report are generally according to the Global Industry Classification Standard, which was developed by and is the exclusive property and a service mark of MSCI Inc. and Standard & Poor’s. |
9 Invesco Pacific Growth Fund
Schedule of Investments
October 31, 2018
| | | | | | | | |
| | | Shares | | | Value | |
Common Stocks & Other Equity Interests–99.00% | |
| Australia–7.21% | |
Cochlear Ltd. | | | 8,261 | | | $ | 1,043,523 | |
Computershare Ltd. | | | 90,749 | | | | 1,272,945 | |
National Australia Bank Ltd. | | | 30,256 | | | | 541,729 | |
Orora Ltd. | | | 838,156 | | | | 1,994,295 | |
Treasury Wine Estates Ltd. | | | 156,500 | | | | 1,680,668 | |
| | | | | | | | 6,533,160 | |
|
| China–19.67% | |
Alibaba Group Holding Ltd.–ADR(a) | | | 30,800 | | | | 4,382,224 | |
Brilliance China Automotive Holdings Ltd. | | | 1,000,000 | | | | 878,905 | |
China Animal Healthcare Ltd.(a)(b) | | | 349,000 | | | | 0 | |
China Construction Bank Corp.–Class H | | | 2,450,000 | | | | 1,937,520 | |
China Vanke Co., Ltd.–Class H | | | 243,000 | | | | 745,061 | |
Ctrip.com International, Ltd.–ADR(a) | | | 41,000 | | | | 1,364,480 | |
Ping An Insurance (Group) Co. of China
Ltd.–Class H | | | 285,000 | | | | 2,697,229 | |
Sinopharm Group Co. Ltd.–Class H | | | 210,000 | | | | 1,017,298 | |
Tencent Holdings Ltd. | | | 126,600 | | | | 4,291,114 | |
ZTE Corp.–Class H(a) | | | 329,000 | | | | 499,489 | |
| | | | | | | | 17,813,320 | |
|
| Hong Kong–4.10% | |
AIA Group Ltd. | | | 243,600 | | | | 1,852,827 | |
CK Hutchison Holdings Ltd. | | | 185,000 | | | | 1,858,704 | |
| | | | | | | | 3,711,531 | |
|
| India–4.90% | |
Eicher Motors Ltd. | | | 3,724 | | | | 1,105,628 | |
HDFC Bank Ltd. | | | 55,000 | | | | 1,427,466 | |
Maruti Suzuki India Ltd. | | | 21,270 | | | | 1,903,182 | |
| | | | | | | | 4,436,276 | |
|
| Indonesia–1.79% | |
PT Telekomunikasi Indonesia Persero Tbk | | | 6,400,000 | | | | 1,617,874 | |
|
| Japan–45.24% | |
Aida Engineering, Ltd. | | | 202,000 | | | | 1,656,395 | |
Benesse Holdings, Inc. | | | 52,000 | | | | 1,453,763 | |
Daikin Industries, Ltd. | | | 16,400 | | | | 1,898,250 | |
Daiwa House Industry Co., Ltd. | | | 30,300 | | | | 911,739 | |
Dentsu Inc. | | | 12,700 | | | | 588,630 | |
Fukushima Industries Corp. | | | 47,100 | | | | 2,135,982 | |
H.I.S. Co., Ltd. | | | 54,700 | | | | 1,669,517 | |
Hitachi High-Technologies Corp. | | | 39,800 | | | | 1,490,415 | |
Kakaku.com, Inc. | | | 96,000 | | | | 1,733,940 | |
Kokuyo Co., Ltd. | | | 83,400 | | | | 1,323,972 | |
Komatsu Ltd. | | | 71,400 | | | | 1,851,406 | |
Konoike Transport Co., Ltd. | | | 106,600 | | | | 1,610,139 | |
Mitsubishi Corp. | | | 59,500 | | | | 1,670,097 | |
| | | | | | | | |
| | | Shares | | | Value | |
| Japan–(continued) | |
Nidec Corp. | | | 15,100 | | | $ | 1,954,293 | |
Nifco Inc. | | | 57,800 | | | | 1,324,497 | |
Omron Corp. | | | 35,900 | | | | 1,450,259 | |
Otsuka Corp. | | | 47,900 | | | | 1,585,449 | |
Paltac Corp. | | | 26,800 | | | | 1,361,729 | |
Pilot Corp. | | | 24,700 | | | | 1,360,199 | |
Recruit Holdings Co., Ltd. | | | 59,600 | | | | 1,597,347 | |
Resorttrust, Inc. | | | 76,300 | | | | 1,169,577 | |
SCSK Corp. | | | 35,600 | | | | 1,515,547 | |
Sekisui Chemical Co., Ltd. | | | 107,100 | | | | 1,675,505 | |
Seria Co., Ltd. | | | 21,000 | | | | 708,158 | |
Sompo Holdings, Inc. | | | 50,600 | | | | 2,092,551 | |
Sumitomo Metal Mining Co., Ltd. | | | 34,900 | | | | 1,095,535 | |
Yamaha Motor Co., Ltd. | | | 69,200 | | | | 1,635,774 | |
Yaskawa Electric Corp. | | | 15,700 | | | | 451,685 | |
| | | | | | | | 40,972,350 | |
|
| Philippines–0.85% | |
Jollibee Foods Corp. | | | 150,000 | | | | 773,759 | |
|
| Singapore–1.82% | |
ComfortDelGro Corp. Ltd. | | | 590,000 | | | | 958,380 | |
Singapore Technologies Engineering Ltd. | | | 270,000 | | | | 693,207 | |
| | | | | | | | 1,651,587 | |
|
| South Korea–6.52% | |
LG Chem Ltd. | | | 3,000 | | | | 917,581 | |
NAVER Corp. | | | 8,526 | | | | 860,456 | |
Ottogi Corp. | | | 1,079 | | | | 625,073 | |
Samsung Electronics Co., Ltd. | | | 93,600 | | | | 3,500,605 | |
| | | | | | | | 5,903,715 | |
|
| Taiwan–6.90% | |
Taiwan Semiconductor Manufacturing Co., Ltd. | | | 841,143 | | | | 6,249,385 | |
Total Common Stocks & Other Equity Interests
(Cost $84,173,529) | | | | 89,662,957 | |
|
Money Market Funds–0.35% | |
Invesco Government & Agency
Portfolio–Institutional Class, 2.08%(c) | | | 108,858 | | | | 108,858 | |
Invesco Liquid Assets
Portfolio–Institutional Class, 2.27%(c) | | | 77,725 | | | | 77,740 | |
Invesco Treasury
Portfolio–Institutional Class, 2.09%(c) | | | 124,410 | | | | 124,410 | |
Total Money Market Funds
(Cost $311,008) | | | | 311,008 | |
TOTAL INVESTMENTS IN SECURITIES–99.35%
(Cost $84,484,537) | | | | 89,973,965 | |
OTHER ASSETS LESS LIABILITIES–0.65% | | | | 590,799 | |
NET ASSETS–100.00% | | | $ | 90,564,764 | |
Investment Abbreviations:
| | |
| ADR | | – American Depositary Receipt |
Notes to Schedule of Investments:
| (a) | Non-income producing security. |
| (b) | Security valued using significant unobservable inputs (Level 3). See Note 3. |
| (c) | The money market fund and the Fund are affiliated by having the same investment adviser. The rate shown is the 7-day SEC standardized yield as of October 31, 2018. |
See accompanying Notes to Financial Statements which are an integral part of the financial statements.
10 Invesco Pacific Growth Fund
Statement of Assets and Liabilities
October 31, 2018
| | | | |
Assets: | | | | |
Investments in securities, at value (Cost $84,173,529) | | $ | 89,662,957 | |
Investments in affiliated money market funds, at value and cost | | | 311,008 | |
Foreign currencies, at value (Cost $49,973) | | | 49,804 | |
Receivable for: | | | | |
Dividends and interest | | | 388,359 | |
Fund shares sold | | | 252,332 | |
Investment for trustee deferred compensation and retirement plans | | | 41,077 | |
Other assets | | | 151,161 | |
Total assets | | | 90,856,698 | |
| |
Liabilities: | | | | |
Payable for: | | | | |
Fund shares repurchased | | | 89,113 | |
Accrued fees to affiliates | | | 43,408 | |
Accrued trustees’ and officers’ fees and benefits | | | 1,755 | |
Accrued other operating expenses | | | 68,606 | |
Trustee deferred compensation and retirement plans | | | 89,052 | |
Total liabilities | | | 291,934 | |
Net assets applicable to shares outstanding | | $ | 90,564,764 | |
| |
Net assets consist of: | | | | |
Shares of beneficial interest | | $ | 79,552,154 | |
Distributable earnings | | | 11,012,610 | |
| | | $ | 90,564,764 | |
| | | | |
Net Assets: | | | | |
Class A | | $ | 65,057,459 | |
Class C | | $ | 6,080,100 | |
Class R | | $ | 409,147 | |
Class Y | | $ | 13,911,075 | |
Class R5 | | $ | 15,659 | |
Class R6 | | $ | 5,091,324 | |
| |
Shares outstanding, no par value,
with an unlimited number of shares authorized: | | | | |
Class A | | | 2,222,366 | |
Class C | | | 226,353 | |
Class R | | | 14,175 | |
Class Y | | | 465,607 | |
Class R5 | | | 523 | |
Class R6 | | | 170,049 | |
Class A: | | | | |
Net asset value per share | | $ | 29.27 | |
Maximum offering price per share | | | | |
(Net asset value of $29.27 ¸ 94.50%) | | | 30.97 | |
Class C: | | | | |
Net asset value and offering price per share | | $ | 26.86 | |
Class R: | | | | |
Net asset value and offering price per share | | $ | 28.86 | |
Class Y: | | | | |
Net asset value and offering price per share | | $ | 29.88 | |
Class R5: | | | | |
Net asset value and offering price per share | | $ | 29.94 | |
Class R6: | | | | |
Net asset value and offering price per share | | $ | 29.94 | |
See accompanying Notes to Financial Statements which are an integral part of the financial statements.
11 Invesco Pacific Growth Fund
Statement of Operations
For the year ended October 31, 2018
| | | | |
Investment income: | | | | |
Dividends (net of foreign withholding taxes of $214,008) | | $ | 2,704,347 | |
Dividends from affiliated money market funds | | | 29,391 | |
Total investment income | | | 2,733,738 | |
| |
Expenses: | | | | |
Advisory fees | | | 1,008,958 | |
Administrative services fees | | | 50,000 | |
Custodian fees | | | 61,692 | |
Distribution fees: | | | | |
Class A | | | 201,429 | |
Class B | | | 274 | |
Class C | | | 72,542 | |
Class R | | | 2,097 | |
Transfer agent fees — A, B, C, R and Y | | | 128,013 | |
Transfer agent fees — R5 | | | 8 | |
Transfer agent fees — R6 | | | 2,050 | |
Trustees’ and officers’ fees and benefits | | | 22,789 | |
Registration and filing fees | | | 105,915 | |
Reports to shareholders | | | 26,711 | |
Professional services fees | | | 71,787 | |
Taxes | | | 310 | |
Other | | | 21,837 | |
Total expenses | | | 1,776,412 | |
Less: Fees waived and expense offset arrangement(s) | | | (3,684 | ) |
Net expenses | | | 1,772,728 | |
Net investment income | | | 961,010 | |
| |
Realized and unrealized gain (loss) from: | | | | |
Net realized gain (loss) from: | | | | |
Investment securities (net of foreign taxes of $132,395) | | | 5,052,411 | |
Foreign currencies | | | (157,484 | ) |
| | | | 4,894,927 | |
Change in net unrealized appreciation (depreciation) of: | | | | |
Investment securities (net of foreign taxes of $116,695) | | | (20,949,902 | ) |
Foreign currencies | | | 1,614 | |
| | | | (20,948,288 | ) |
Net realized and unrealized gain (loss) | | | (16,053,361 | ) |
Net increase (decrease) in net assets resulting from operations | | $ | (15,092,351 | ) |
See accompanying Notes to Financial Statements which are an integral part of the financial statements.
12 Invesco Pacific Growth Fund
Statement of Changes in Net Assets
For the years ended October 31, 2018 and 2017
| | | | | | | | |
| | | 2018 | | | 2017 | |
Operations: | | | | | | | | |
Net investment income (loss) | | $ | 961,010 | | | $ | (270,807 | ) |
Net realized gain | | | 4,894,927 | | | | 7,457,880 | |
Change in net unrealized appreciation (depreciation) | | | (20,948,288 | ) | | | 14,019,025 | |
Net increase (decrease) in net assets resulting from operations | | | (15,092,351 | ) | | | 21,206,098 | |
| | |
Distributions to shareholders from distributable earnings(1): | | | | | | | | |
Class A | | | — | | | | (127,208 | ) |
Class Y | | | — | | | | (33,986 | ) |
Class R5 | | | — | | | | (79 | ) |
Total Distributions to shareholders from distributable earnings | | | — | | | | (161,273 | ) |
| | |
Share transactions–net: | | | | | | | | |
Class A | | | (5,091,409 | ) | | | (1,865,239 | ) |
Class B | | | (127,047 | ) | | | (39,194 | ) |
Class C | | | 1,691,625 | | | | (95,579 | ) |
Class R | | | 194,398 | | | | (18,654 | ) |
Class Y | | | (2,389,945 | ) | | | 5,284,080 | |
Class R6 | | | 6,592,803 | | | | 10,005 | |
Net change in net assets resulting from share transactions | | | 870,425 | | | | 3,275,419 | |
Net increase (decrease) in net assets | | | (14,221,926 | ) | | | 24,320,244 | |
| | |
Net assets: | | | | | | | | |
Beginning of year | | | 104,786,690 | | | | 80,466,446 | |
End of year | | $ | 90,564,764 | | | $ | 104,786,690 | |
| (1) | The Securities and Exchange Commission eliminated the requirement to disclose distribution components separately, except for tax return of capital. For the year ended October 31, 2017, distributions to shareholders from distributable earnings consisted of distributions from net investment income. |
Notes to Financial Statements
October 31, 2018
NOTE 1—Significant Accounting Policies
Invesco Pacific Growth Fund (the “Fund”) is a series portfolio of AIM Investment Funds (Invesco Investment Funds) (the “Trust”). The Trust is organized as a Delaware statutory trust and is registered under the Investment Company Act of 1940, as amended (the “1940 Act”), as an open-end series management investment company authorized to issue an unlimited number of shares of beneficial interest. Information presented in these financial statements pertains only to the Fund. Matters affecting the Fund or each class will be voted on exclusively by the shareholders of the Fund or each class.
The Fund’s investment objective is long-term growth of capital.
The Fund currently consists of six different classes of shares: Class A, Class C, Class R, Class Y, Class R5 and Class R6. Class Y shares are available only to certain investors. Class A shares are sold with a front-end sales charge unless certain waiver criteria are met. Under certain circumstances, load waived shares may be subject to contingent deferred sales charges (“CDSC”). Class C shares are sold with a CDSC. Class R, Class Y, Class R5 and Class R6 shares are sold at net asset value. Effective November 30, 2010, new or additional investments in Class B shares are no longer permitted. Existing shareholders of Class B shares were permitted to continue to reinvest dividends and capital gains distributions in Class B shares until their conversion to Class A shares. Also, shareholders in Class B shares were able to exchange those shares for Class B shares of other Invesco Funds offering such shares until they converted to Class A shares. Generally, Class B shares automatically converted to Class A shares on or about the month-end, which was at least eight years after the date of purchase. Redemptions of Class B shares prior to the conversion date were subject to a CDSC. Effective January 26, 2018, all of the Fund’s outstanding Class B shares were converted to Class A shares, in advance of their normally scheduled conversion. No CDSC was paid in connection with this early conversion.
The Fund is an investment company and accordingly follows the investment company accounting and reporting guidance in accordance with Financial Accounting Standards Board Accounting Standards Codification Topic 946, Financial Services — Investment Companies.
The following is a summary of the significant accounting policies followed by the Fund in the preparation of its financial statements.
| A. | Security Valuations — Securities, including restricted securities, are valued according to the following policy. |
A security listed or traded on an exchange (except convertible securities) is valued at its last sales price or official closing price as of the close of the customary trading session on the exchange where the security is principally traded, or lacking any sales or official closing price on a particular day, the security may be valued at the closing bid price on that day. Securities traded in the over-the-counter market are valued based
13 Invesco Pacific Growth Fund
on prices furnished by independent pricing services or market makers. When such securities are valued by an independent pricing service they may be considered fair valued. Futures contracts are valued at the final settlement price set by an exchange on which they are principally traded. Listed options are valued at the mean between the last bid and asked prices from the exchange on which they are principally traded. Options not listed on an exchange are valued by an independent source at the mean between the last bid and asked prices. For purposes of determining net asset value (“NAV”) per share, futures and option contracts generally are valued 15 minutes after the close of the customary trading session of the New York Stock Exchange (“NYSE”).
Investments in open-end and closed-end registered investment companies that do not trade on an exchange are valued at the end-of-day net asset value per share. Investments in open-end and closed-end registered investment companies that trade on an exchange are valued at the last sales price or official closing price as of the close of the customary trading session on the exchange where the security is principally traded.
Debt obligations (including convertible securities) and unlisted equities are fair valued using an evaluated quote provided by an independent pricing service. Evaluated quotes provided by the pricing service may be determined without exclusive reliance on quoted prices, and may reflect appropriate factors such as institution-size trading in similar groups of securities, developments related to specific securities, dividend rate (for unlisted equities), yield (for debt obligations), quality, type of issue, coupon rate (for debt obligations), maturity (for debt obligations), individual trading characteristics and other market data. Pricing services generally value debt obligations assuming orderly transactions of institutional round lot size, but a fund may hold or transact in the same securities in smaller, odd lot sizes. Odd lots often trade at lower prices than institutional round lots. Debt obligations are subject to interest rate and credit risks. In addition, all debt obligations involve some risk of default with respect to interest and/or principal payments.
Foreign securities’ (including foreign exchange contracts) prices are converted into U.S. dollar amounts using the applicable exchange rates as of the close of the NYSE. If market quotations are available and reliable for foreign exchange-traded equity securities, the securities will be valued at the market quotations. Because trading hours for certain foreign securities end before the close of the NYSE, closing market quotations may become unreliable. If between the time trading ends on a particular security and the close of the customary trading session on the NYSE, events occur that the investment adviser determines are significant and make the closing price unreliable, the Fund may fair value the security. If the event is likely to have affected the closing price of the security, the security will be valued at fair value in good faith using procedures approved by the Board of Trustees. Adjustments to closing prices to reflect fair value may also be based on a screening process of an independent pricing service to indicate the degree of certainty, based on historical data, that the closing price in the principal market where a foreign security trades is not the current value as of the close of the NYSE. Foreign securities’ prices meeting the approved degree of certainty that the price is not reflective of current value will be priced at the indication of fair value from the independent pricing service. Multiple factors may be considered by the independent pricing service in determining adjustments to reflect fair value and may include information relating to sector indices, American Depositary Receipts and domestic and foreign index futures. Foreign securities may have additional risks including exchange rate changes, potential for sharply devalued currencies and high inflation, political and economic upheaval, the relative lack of issuer information, relatively low market liquidity and the potential lack of strict financial and accounting controls and standards.
Securities for which market prices are not provided by any of the above methods may be valued based upon quotes furnished by independent sources. The last bid price may be used to value equity securities. The mean between the last bid and asked prices is used to value debt obligations, including corporate loans.
Securities for which market quotations are not readily available or became unreliable are valued at fair value as determined in good faith by or under the supervision of the Trust’s officers following procedures approved by the Board of Trustees. Issuer specific events, market trends, bid/asked quotes of brokers and information providers and other market data may be reviewed in the course of making a good faith determination of a security’s fair value.
The Fund may invest in securities that are subject to interest rate risk, meaning the risk that the prices will generally fall as interest rates rise and, conversely, the prices will generally rise as interest rates fall. Specific securities differ in their sensitivity to changes in interest rates depending on their individual characteristics. Changes in interest rates may result in increased market volatility, which may affect the value and/or liquidity of certain Fund investments.
Valuations change in response to many factors including the historical and prospective earnings of the issuer, the value of the issuer’s assets, general economic conditions, interest rates, investor perceptions and market liquidity. Because of the inherent uncertainties of valuation, the values reflected in the financial statements may materially differ from the value received upon actual sale of those investments.
| B. | Securities Transactions and Investment Income — Securities transactions are accounted for on a trade date basis. Realized gains or losses on sales are computed on the basis of specific identification of the securities sold. Interest income (net of withholding tax, if any) is recorded on the accrual basis from settlement date. Dividend income (net of withholding tax, if any) is recorded on the ex-dividend date. |
The Fund may periodically participate in litigation related to Fund investments. As such, the Fund may receive proceeds from litigation settlements. Any proceeds received are included in the Statement of Operations as realized gain (loss) for investments no longer held and as unrealized gain (loss) for investments still held.
Brokerage commissions and mark ups are considered transaction costs and are recorded as an increase to the cost basis of securities purchased and/or a reduction of proceeds on a sale of securities. Such transaction costs are included in the determination of net realized and unrealized gain (loss) from investment securities reported in the Statement of Operations and the Statement of Changes in Net Assets and the net realized and unrealized gains (losses) on securities per share in the Financial Highlights. Transaction costs are included in the calculation of the Fund’s net asset value and, accordingly, they reduce the Fund’s total returns. These transaction costs are not considered operating expenses and are not reflected in net investment income reported in the Statement of Operations and the Statement of Changes in Net Assets, or the net investment income per share and the ratios of expenses and net investment income reported in the Financial Highlights, nor are they limited by any expense limitation arrangements between the Fund and the investment adviser.
The Fund allocates income and realized and unrealized capital gains and losses to a class based on the relative net assets of each class.
| C. | Country Determination — For the purposes of making investment selection decisions and presentation in the Schedule of Investments, the investment adviser may determine the country in which an issuer is located and/or credit risk exposure based on various factors. These factors include the laws of the country under which the issuer is organized, where the issuer maintains a principal office, the country in which the issuer derives 50% or more of its total revenues and the country that has the primary market for the issuer’s securities, as well as other criteria. Among |
14 Invesco Pacific Growth Fund
| | the other criteria that may be evaluated for making this determination are the country in which the issuer maintains 50% or more of its assets, the type of security, financial guarantees and enhancements, the nature of the collateral and the sponsor organization. Country of issuer and/or credit risk exposure has been determined to be the United States of America, unless otherwise noted. |
| D. | Distributions — Distributions from net investment income and net realized capital gain, if any, are generally declared and paid annually and recorded on the ex-dividend date. The Fund may elect to treat a portion of the proceeds from redemptions as distributions for federal income tax purposes. |
| E. | Federal Income Taxes — The Fund intends to comply with the requirements of Subchapter M of the Internal Revenue Code of 1986, as amended (the “Internal Revenue Code”), necessary to qualify as a regulated investment company and to distribute substantially all of the Fund’s taxable earnings to shareholders. As such, the Fund will not be subject to federal income taxes on otherwise taxable income (including net realized capital gain) that is distributed to shareholders. Therefore, no provision for federal income taxes is recorded in the financial statements. |
The Fund recognizes the tax benefits of uncertain tax positions only when the position is more likely than not to be sustained. Management has analyzed the Fund’s uncertain tax positions and concluded that no liability for unrecognized tax benefits should be recorded related to uncertain tax positions. Management is not aware of any tax positions for which it is reasonably possible that the total amounts of unrecognized tax benefits will change materially in the next 12 months.
The Fund files tax returns in the U.S. Federal jurisdiction and certain other jurisdictions. Generally, the Fund is subject to examinations by such taxing authorities for up to three years after the filing of the return for the tax period.
| F. | Expenses — Fees provided for under the Rule 12b-1 plan of a particular class of the Fund are charged to the operations of such class. Transfer agency fees and expenses and other shareholder recordkeeping fees and expenses attributable to Class R5 are charged to such class. Transfer agency fees and expenses and other shareholder recordkeeping fees and expenses relating to all other classes are allocated among those classes based on relative net assets. All other expenses are allocated among the classes based on relative net assets. |
| G. | Accounting Estimates — The preparation of financial statements in conformity with accounting principles generally accepted in the United States of America (“GAAP”) requires management to make estimates and assumptions that affect the reported amounts of assets and liabilities at the date of the financial statements and the reported amounts of revenues and expenses during the reporting period including estimates and assumptions related to taxation. Actual results could differ from those estimates by a significant amount. In addition, the Fund monitors for material events or transactions that may occur or become known after the period-end date and before the date the financial statements are released to print. |
| H. | Indemnifications — Under the Trust’s organizational documents, each Trustee, officer, employee or other agent of the Trust is indemnified against certain liabilities that may arise out of the performance of their duties to the Fund. Additionally, in the normal course of business, the Fund enters into contracts, including the Fund’s servicing agreements, that contain a variety of indemnification clauses. The Fund’s maximum exposure under these arrangements is unknown as this would involve future claims that may be made against the Fund that have not yet occurred. The risk of material loss as a result of such indemnification claims is considered remote. |
| I. | Securities Lending — The Fund may lend portfolio securities having a market value up to one-third of the Fund’s total assets. Such loans are secured by collateral equal to no less than the market value of the loaned securities determined daily by the securities lending provider. Such collateral will be cash or debt securities issued or guaranteed by the U.S. Government or any of its sponsored agencies. Cash collateral received in connection with these loans is invested in short-term money market instruments or affiliated money market funds and is shown as such on the Schedule of Investments. The Fund bears the risk of loss with respect to the investment of collateral. It is the Fund’s policy to obtain additional collateral from or return excess collateral to the borrower by the end of the next business day, following the valuation date of the securities loaned. Therefore, the value of the collateral held may be temporarily less than the value of the securities on loan. When loaning securities, the Fund retains certain benefits of owning the securities, including the economic equivalent of dividends or interest generated by the security. Lending securities entails a risk of loss to the Fund if, and to the extent that, the market value of the securities loaned were to increase and the borrower did not increase the collateral accordingly, and the borrower failed to return the securities. The securities loaned are subject to termination at the option of the borrower or the Fund. Upon termination, the borrower will return to the Fund the securities loaned and the Fund will return the collateral. Upon the failure of the borrower to return the securities, collateral may be liquidated and the securities may be purchased on the open market to replace the loaned securities. The Fund could experience delays and costs in gaining access to the collateral and the securities may lose value during the delay which could result in potential losses to the Fund. Some of these losses may be indemnified by the lending agent. The Fund bears the risk of any deficiency in the amount of the collateral available for return to the borrower due to any loss on the collateral invested. Dividends received on cash collateral investments for securities lending transactions, which are net of compensation to counterparties, are included in Dividends from affiliated money market funds on the Statement of Operations. The aggregate value of securities out on loan, if any, is shown as a footnote on the Statement of Assets and Liabilities. |
| J. | Foreign Currency Translations — Foreign currency is valued at the close of the NYSE based on quotations posted by banks and major currency dealers. Portfolio securities and other assets and liabilities denominated in foreign currencies are translated into U.S. dollar amounts at the date of valuation. Purchases and sales of portfolio securities (net of foreign taxes withheld on disposition) and income items denominated in foreign currencies are translated into U.S. dollar amounts on the respective dates of such transactions. The Fund does not separately account for the portion of the results of operations resulting from changes in foreign exchange rates on investments and the fluctuations arising from changes in market prices of securities held. The combined results of changes in foreign exchange rates and the fluctuation of market prices on investments (net of estimated foreign tax withholding) are included with the net realized and unrealized gain or loss from investments in the Statement of Operations. Reported net realized foreign currency gains or losses arise from (1) sales of foreign currencies, (2) currency gains or losses realized between the trade and settlement dates on securities transactions, and (3) the difference between the amounts of dividends, interest, and foreign withholding taxes recorded on the Fund’s books and the U.S. dollar equivalent of the amounts actually received or paid. Net unrealized foreign currency gains and losses arise from changes in the fair values of assets and liabilities, other than investments in securities at fiscal period end, resulting from changes in exchange rates. |
The Fund may invest in foreign securities, which may be subject to foreign taxes on income, gains on investments or currency repatriation, a portion of which may be recoverable. Foreign taxes, if any, are recorded based on the tax regulations and rates that exist in the foreign markets in which the Fund invests and are shown in the Statement of Operations.
15 Invesco Pacific Growth Fund
| K. | Forward Foreign Currency Contracts — The Fund may engage in foreign currency transactions either on a spot (i.e. for prompt delivery and settlement) basis, or through forward foreign currency contracts, to manage or minimize currency or exchange rate risk. |
The Fund may also enter into forward foreign currency contracts for the purchase or sale of a security denominated in a foreign currency in order to “lock in” the U.S. dollar price of that security, or the Fund may also enter into forward foreign currency contracts that do not provide for physical settlement of the two currencies, but instead are settled by a single cash payment calculated as the difference between the agreed upon exchange rate and the spot rate at settlement based upon an agreed upon notional amount (non-deliverable forwards). The Fund will set aside liquid assets in an amount equal to the daily mark-to-market obligation for forward foreign currency contracts.
A forward foreign currency contract is an obligation between two parties (“Counterparties”) to purchase or sell a specific currency for an agreed-upon price at a future date. The use of forward foreign currency contracts does not eliminate fluctuations in the price of the underlying securities the Fund owns or intends to acquire but establishes a rate of exchange in advance. Fluctuations in the value of these contracts are measured by the difference in the contract date and reporting date exchange rates and are recorded as unrealized appreciation (depreciation) until the contracts are closed. When the contracts are closed, realized gains (losses) are recorded. Realized and unrealized gains (losses) on the contracts are included in the Statement of Operations. The primary risks associated with forward foreign currency contracts include failure of the Counterparty to meet the terms of the contract and the value of the foreign currency changing unfavorably. These risks may be in excess of the amounts reflected in the Statement of Assets and Liabilities.
NOTE 2—Advisory Fees and Other Fees Paid to Affiliates
The Trust has entered into a master investment advisory agreement with Invesco Advisers, Inc. (the “Adviser” or “Invesco”). Under the terms of the investment advisory agreement, the Fund accrues daily and pays monthly an advisory fee to the Adviser based on the annual rate of the Fund’s average daily net assets as follows:
| | | | |
| Average Daily Net Assets | | Rate | |
First $1 billion | | | 0.87% | |
Next $1 billion | | | 0.82% | |
Over $2 billion | | | 0.77% | |
For the year ended October 31, 2018, the effective advisory fees incurred by the Fund was 0.87%.
Under the terms of a master sub-advisory agreement between the Adviser and each of Invesco Asset Management Deutschland GmbH, Invesco Asset Management Limited, Invesco Asset Management (Japan) Limited, Invesco Hong Kong Limited, Invesco Senior Secured Management, Inc. and Invesco Canada Ltd. (collectively, the “Affiliated Sub-Advisers”) the Adviser, not the Fund, will pay 40% of the fees paid to the Adviser to any such Affiliated Sub-Adviser(s) that provide(s) discretionary investment management services to the Fund based on the percentage of assets allocated to such Affiliated Sub-Adviser(s).
The Adviser has contractually agreed, through at least June 30, 2019, to waive advisory fees and/or reimburse expenses of all shares to the extent necessary to limit total annual fund operating expenses after fee waiver and/or expense reimbursement (excluding certain items discussed below) of Class A, Class C, Class R, Class Y, Class R5 and Class R6 shares to 2.25%, 3.00%, 2.50%, 2.00%, 2.00% and 2.00%, respectively, of the Fund’s average daily net assets (the “expense limits”). Prior to their conversion to Class A shares, the expense limit for Class B shares was 3.00% of average daily net assets. In determining the Adviser’s obligation to waive advisory fees and/or reimburse expenses, the following expenses are not taken into account, and could cause the total annual fund operating expenses after fee waiver and/or expense reimbursement to exceed the numbers reflected above: (1) interest; (2) taxes; (3) dividend expense on short sales; (4) extraordinary or non-routine items, including litigation expenses; and (5) expenses that the Fund has incurred but did not actually pay because of an expense offset arrangement. Unless Invesco continues the fee waiver agreement, it will terminate on June 30, 2019. During its term, the fee waiver agreement cannot be terminated or amended to increase the expense limits or reduce the advisory fee waiver without approval of the Board of Trustees. The Adviser did not waive fees and/or reimburse expenses during the period under these expense limits.
Further, the Adviser has contractually agreed, through at least June 30, 2020, to waive the advisory fee payable by the Fund in an amount equal to 100% of the net advisory fees the Adviser receives from the affiliated money market funds on investments by the Fund of uninvested cash (excluding investments of cash collateral from securities lending) in such affiliated money market funds.
For the year ended October 31, 2018, the Adviser waived advisory fees of $2,620.
The Trust has entered into a master administrative services agreement with Invesco pursuant to which the Fund has agreed to pay Invesco for certain administrative costs incurred in providing accounting services to the Fund. For the year ended October 31, 2018, expenses incurred under the agreement are shown in the Statement of Operations as Administrative services fees.
The Trust has entered into a transfer agency and service agreement with Invesco Investment Services, Inc. (“IIS”) pursuant to which the Fund has agreed to pay IIS a fee for providing transfer agency and shareholder services to the Fund and reimburse IIS for certain expenses incurred by IIS in the course of providing such services. IIS may make payments to intermediaries that provide omnibus account services, sub-accounting services and/or networking services. All fees payable by IIS to intermediaries that provide omnibus account services or sub-accounting services are charged back to the Fund, subject to certain limitations approved by the Trust’s Board of Trustees. For the year ended October 31, 2018, expenses incurred under the agreement are shown in the Statement of Operations as Transfer agent fees.
Shares of the Fund are distributed by Invesco Distributors, Inc. (“IDI”), an affiliate of the Adviser. The Fund has adopted a Plan of Distribution (the “Plan”) pursuant to Rule 12b-1 under the 1940 Act. The Plan provides that the Fund will reimburse IDI for distribution related expenses that IDI incurs up to a maximum of the following annual rates: (1) Class A — up to 0.25% of the average daily net assets of Class A shares; and (2) Class C — up to 1.00% of the average daily net assets of Class C shares; and (3) Class R — up to 0.50% of the average daily net assets of Class R shares. Prior to their conversion to Class A shares, the Fund paid an annual rate of 1.00% of the average daily net assets of Class B shares. The fees are accrued daily and paid monthly.
For the year ended October 31, 2018, expenses incurred under these agreements are shown in the Statement of Operations as Distribution fees.
16 Invesco Pacific Growth Fund
Front-end sales commissions and CDSC (collectively, the “sales charges”) are not recorded as expenses of the Fund. Front-end sales commissions are deducted from proceeds from the sales of Fund shares prior to investment in Class A shares of the Fund. CDSC are deducted from redemption proceeds prior to remittance to the shareholder. During the year ended October 31, 2018, IDI advised the Fund that IDI retained $22,676 in front-end sales commissions from the sale of Class A shares and $20 and $1,581 from Class A and Class C shares, respectively, for CDSC imposed on redemptions by shareholders.
Certain officers and trustees of the Trust are officers and directors of the Adviser, IIS and/or IDI.
NOTE 3—Additional Valuation Information
GAAP defines fair value as the price that would be received to sell an asset or paid to transfer a liability in an orderly transaction between market participants at the measurement date, under current market conditions. GAAP establishes a hierarchy that prioritizes the inputs to valuation methods, giving the highest priority to readily available unadjusted quoted prices in an active market for identical assets (Level 1) and the lowest priority to significant unobservable inputs (Level 3), generally when market prices are not readily available or are unreliable. Based on the valuation inputs, the securities or other investments are tiered into one of three levels. Changes in valuation methods may result in transfers in or out of an investment’s assigned level:
| | Level 1 — | Prices are determined using quoted prices in an active market for identical assets. |
| | Level 2 — | Prices are determined using other significant observable inputs. Observable inputs are inputs that other market participants may use in pricing a security. These may include quoted prices for similar securities, interest rates, prepayment speeds, credit risk, yield curves, loss severities, default rates, discount rates, volatilities and others. |
| | Level 3 — | Prices are determined using significant unobservable inputs. In situations where quoted prices or observable inputs are unavailable (for example, when there is little or no market activity for an investment at the end of the period), unobservable inputs may be used. Unobservable inputs reflect the Fund’s own assumptions about the factors market participants would use in determining fair value of the securities or instruments and would be based on the best available information. |
The following is a summary of the tiered valuation input levels, as of October 31, 2018. The level assigned to the securities valuations may not be an indication of the risk or liquidity associated with investing in those securities. Because of the inherent uncertainties of valuation, the values reflected in the financial statements may materially differ from the value received upon actual sale of those investments.
| | | | | | | | | | | | | | | | |
| | | Level 1 | | | Level 2 | | | Level 3 | | | Total | |
Investments in Securities | | | | | | | | | | | | | | | | |
Australia | | $ | 1,994,295 | | | $ | 4,538,865 | | | $ | — | | | $ | 6,533,160 | |
China | | | 5,746,704 | | | | 12,066,616 | | | | 0 | | | | 17,813,320 | |
Hong Kong | | | — | | | | 3,711,531 | | | | — | | | | 3,711,531 | |
India | | | 1,903,182 | | | | 2,533,094 | | | | — | | | | 4,436,276 | |
Indonesia | | | — | | | | 1,617,874 | | | | — | | | | 1,617,874 | |
Japan | | | 708,158 | | | | 40,264,192 | | | | — | | | | 40,972,350 | |
Philippines | | | 773,759 | | | | — | | | | — | | | | 773,759 | |
Singapore | | | 958,380 | | | | 693,207 | | | | — | | | | 1,651,587 | |
South Korea | | | — | | | | 5,903,715 | | | | — | | | | 5,903,715 | |
Taiwan | | | — | | | | 6,249,385 | | | | — | | | | 6,249,385 | |
Money Market Funds | | | 311,008 | | | | — | | | | — | | | | 311,008 | |
Total Investments | | $ | 12,395,486 | | | $ | 77,578,479 | | | $ | 0 | | | $ | 89,973,965 | |
NOTE 4—Expense Offset Arrangement(s)
The expense offset arrangement is comprised of transfer agency credits which result from balances in demand deposit accounts used by the transfer agent for clearing shareholder transactions. For the year ended October 31, 2018, the Fund received credits from this arrangement, which resulted in the reduction of the Fund’s total expenses of $1,064.
NOTE 5—Trustees’ and Officers’ Fees and Benefits
Trustees’ and Officers’ Fees and Benefits include amounts accrued by the Fund to pay remuneration to certain Trustees and Officers of the Fund. Trustees have the option to defer compensation payable by the Fund, and Trustees’ and Officers’ Fees and Benefits also include amounts accrued by the Fund to fund such deferred compensation amounts. Those Trustees who defer compensation have the option to select various Invesco Funds in which their deferral accounts shall be deemed to be invested. Finally, certain current Trustees were eligible to participate in a retirement plan that provided for benefits to be paid upon retirement to Trustees over a period of time based on the number of years of service. The Fund may have certain former Trustees who also participate in a retirement plan and receive benefits under such plan. Trustees’ and Officers’ Fees and Benefits include amounts accrued by the Fund to fund such retirement benefits. Obligations under the deferred compensation and retirement plans represent unsecured claims against the general assets of the Fund.
17 Invesco Pacific Growth Fund
NOTE 6—Cash Balances
The Fund is permitted to temporarily carry a negative or overdrawn balance in its account with State Street Bank and Trust Company, the custodian bank. Such balances, if any at period-end, are shown in the Statement of Assets and Liabilities under the payable caption Amount due custodian. To compensate the custodian bank for such overdrafts, the overdrawn Fund may either (1) leave funds as a compensating balance in the account so the custodian bank can be compensated by earning the additional interest; or (2) compensate by paying the custodian bank at a rate agreed upon by the custodian bank and Invesco, not to exceed the contractually agreed upon rate.
NOTE 7—Distributions to Shareholders and Tax Components of Net Assets
Tax Character of Distributions to Shareholders Paid During the Fiscal Years Ended October 31, 2018 and 2017:
| | | | | | | | |
| | | 2018 | | | 2017 | |
Ordinary income | | $ | — | | | $ | 161,273 | |
Tax Components of Net Assets at Period-End:
| | | | |
| | | 2018 | |
Undistributed ordinary income | | $ | 451,906 | |
Undistributed long-term gain | | | 5,597,015 | |
Net unrealized appreciation — investments | | | 5,048,684 | |
Net unrealized appreciation (depreciation) — foreign currencies | | | (881 | ) |
Temporary book/tax differences | | | (84,114 | ) |
Shares of beneficial interest | | | 79,552,154 | |
Total net assets | | $ | 90,564,764 | |
The difference between book-basis and tax-basis unrealized appreciation (depreciation) is due to differences in the timing of recognition of gains and losses on investments for tax and book purposes. The Fund’s net unrealized appreciation difference is attributable primarily to wash sales.
The temporary book/tax differences are a result of timing differences between book and tax recognition of income and/or expenses. The Fund’s temporary book/tax differences are the result of the trustee deferral of compensation and retirement plan benefits.
Capital loss carryforward is calculated and reported as of a specific date. Results of transactions and other activity after that date may affect the amount of capital loss carryforward actually available for the Fund to utilize. Capital losses generated in years beginning after December 22, 2010 can be carried forward for an unlimited period, whereas previous losses expire in eight tax years. Capital losses with an expiration period may not be used to offset capital gains until all net capital losses without an expiration date have been utilized. Capital loss carryforwards with no expiration date will retain their character as either short-term or long-term capital losses instead of as short-term capital losses as under prior law. The ability to utilize capital loss carryforwards in the future may be limited under the Internal Revenue Code and related regulations based on the results of future transactions.
The Fund does not have a capital loss carryforward as of October 31, 2018.
NOTE 8—Investment Transactions
The aggregate amount of investment securities (other than short-term securities, U.S. Treasury obligations and money market funds, if any) purchased and sold by the Fund during the year ended October 31, 2018 was $63,433,789 and $60,132,089, respectively. Cost of investments, including any derivatives, on a tax basis includes the adjustments for financial reporting purposes as of the most recently completed federal income tax reporting period-end.
| | | | |
| Unrealized Appreciation (Depreciation) of Investments on a Tax Basis | |
Aggregate unrealized appreciation of investments | | $ | 10,711,925 | |
Aggregate unrealized (depreciation) of investments | | | (5,663,241 | ) |
Net unrealized appreciation of investments | | $ | 5,048,684 | |
Cost of investments for tax purposes is $84,925,281.
NOTE 9—Reclassification of Permanent Differences
Primarily as a result of differing book/tax treatment of foreign currency transactions, on October 31, 2018, undistributed net investment income was decreased by $289,879 and undistributed net realized gain was increased by $289,879. This reclassification had no effect on the net assets or the distributable earnings of the Fund.
18 Invesco Pacific Growth Fund
NOTE 10—Share Information
| | | | | | | | | | | | | | | | |
| | | Summary of Share Activity | |
| | | Years ended October 31, | |
| | | 2018(a) | | | 2017 | |
| | | Shares | | | Amount | | | Shares | | | Amount | |
Sold: | | | | | | | | | | | | | | | | |
Class A | | | 393,005 | | | $ | 13,799,458 | | | | 290,634 | | | $ | 8,440,185 | |
Class B(b) | | | 61 | | | | 2,081 | | | | 729 | | | | 18,298 | |
Class C | | | 119,211 | | | | 3,897,312 | | | | 26,250 | | | | 727,646 | |
Class R | | | 9,845 | | | | 335,050 | | | | 3,293 | | | | 94,438 | |
Class Y | | | 426,480 | | | | 15,401,637 | | | | 511,747 | | | | 15,124,117 | |
Class R6(c) | | | 222,544 | | | | 8,326,947 | | | | 363 | | | | 10,005 | |
| | | | |
Issued as reinvestment of dividends: | | | | | | | | | | | | | | | | |
Class A | | | — | | | | — | | | | 4,418 | | | | 109,144 | |
Class Y | | | — | | | | — | | | | 1,176 | | | | 29,500 | |
| | | | |
Conversion of Class B shares to Class A shares:(d) | | | | | | | | | | | | | | | | |
Class A | | | 3,073 | | | | 116,562 | | | | 1,408 | | | | 40,737 | |
Class B | | | (3,339 | ) | | | (116,562 | ) | | | (1,522 | ) | | | (40,737 | ) |
| | | | |
Reacquired: | | | | | | | | | | | | | | | | |
Class A | | | (562,139 | ) | | | (19,007,429 | ) | | | (382,697 | ) | | | (10,455,305 | ) |
Class B(b) | | | (381 | ) | | | (12,566 | ) | | | (716 | ) | | | (16,755 | ) |
Class C | | | (70,877 | ) | | | (2,205,687 | ) | | | (31,304 | ) | | | (823,225 | ) |
Class R | | | (4,192 | ) | | | (140,652 | ) | | | (4,061 | ) | | | (113,092 | ) |
Class Y | | | (501,340 | ) | | | (17,791,582 | ) | | | (364,417 | ) | | | (9,869,537 | ) |
Class R6 | | | (52,858 | ) | | | (1,734,144 | ) | | | — | | | | — | |
Net increase (decrease) in share activity | | | (20,907 | ) | | $ | 870,425 | | | | 55,301 | | | $ | 3,275,419 | |
| (a) | There are entities that are record owners of more than 5% of the outstanding shares of the Fund and in the aggregate own 63% of the outstanding shares of the Fund. IDI has an agreement with these entities to sell Fund shares. The Fund, Invesco and/or Invesco affiliates may make payments to these entities, which are considered to be related to the Fund, for providing services to the Fund, Invesco and/or Invesco affiliates including but not limited to services such as securities brokerage, distribution, third party record keeping and account servicing. The Fund has no knowledge as to whether all or any portion of the shares owned of record by these entities are also owned beneficially. |
| (b) | Class B shares activity for the period November 1, 2017 through January 26, 2018 (date of conversion). |
| (c) | Commencement date of April 4, 2017. |
| (d) | Effective as of close of business January 26, 2018, all outstanding Class B shares were converted to Class A shares. |
19 Invesco Pacific Growth Fund
NOTE 11—Financial Highlights
The following schedule presents financial highlights for a share of the Fund outstanding throughout the periods indicated.
| | | | | | | | | | | | | | | | | | | | | | | | | | | | | | | | | | | | | | | | | | | | | | | | |
| | | Net asset
value,
beginning
of period | | | Net
investment
income
(loss)(a) | | | Net gains
(losses)
on securities
(both
realized and
unrealized) | | | Total from
investment
operations | | | Dividends
from net
investment
income | | | Net asset
value, end
of period | | | Total
return(b) | | | Net assets,
end of period
(000’s omitted) | | | Ratio of
expenses
to average
net assets
with fee waivers
and/or expenses
absorbed | | | Ratio of
expenses
to average net
assets without
fee waivers
and/or expenses
absorbed | | | Ratio of net
investment
income (loss)
to average
net assets | | | Portfolio
turnover(c) | |
Class A | | | | | | | | | | | | | | | | | | | | | | | | | | | | | | | | | | | | | | | | | | | | | | | | |
Year ended 10/31/18 | | $ | 33.63 | | | $ | 0.28 | (d) | | $ | (4.64 | ) | | $ | (4.36 | ) | | $ | — | | | $ | 29.27 | | | | (12.97 | )%(f) | | $ | 65,057 | | | | 1.54 | %(e)(f) | | | 1.54 | %(e)(f) | | | 0.82 | %(d)(e)(f) | | | 54 | % |
Year ended 10/31/17 | | | 26.31 | | | | (0.09 | ) | | | 7.46 | | | | 7.37 | | | | (0.05 | ) | | | 33.63 | | | | 28.09 | | | | 80,319 | | | | 1.75 | | | | 1.75 | | | | (0.32 | ) | | | 59 | |
Year ended 10/31/16 | | | 24.03 | | | | 0.04 | | | | 2.24 | | | | 2.28 | | | | — | | | | 26.31 | | | | 9.49 | | | | 65,107 | | | | 1.64 | | | | 1.64 | | | | 0.17 | | | | 31 | |
Year ended 10/31/15 | | | 24.51 | | | | 0.05 | | | | (0.50 | ) | | | (0.45 | ) | | | (0.03 | ) | | | 24.03 | | | | (1.84 | ) | | | 66,599 | | | | 1.78 | | | | 1.78 | | | | 0.21 | | | | 137 | |
Year ended 10/31/14 | | | 23.90 | | | | 0.14 | | | | 0.82 | | | | 0.96 | | | | (0.35 | ) | | | 24.51 | | | | 4.10 | (f) | | | 73,457 | | | | 1.77 | (f) | | | 1.77 | (f) | | | 0.60 | (f) | | | 63 | |
Class B | | | | | | | | | | | | | | | | | | | | | | | | | | | | | | | | | | | | | | | | | | | | | | | | |
Year ended 10/31/18(g) | | | 31.02 | | | | 0.01 | (d) | | | 3.90 | | | | 3.91 | | | | — | | | | 34.93 | | | | 12.60 | | | | — | | | | 2.30 | (e)(j) | | | 2.30 | (e)(j) | | | 0.06 | (d)(e)(j) | | | 54 | |
Year ended 10/31/17 | | | 24.40 | | | | (0.28 | ) | | | 6.90 | | | | 6.62 | | | | — | | | | 31.02 | | | | 27.13 | | | | 114 | | | | 2.50 | | | | 2.50 | | | | (1.07 | ) | | | 59 | |
Year ended 10/31/16 | | | 22.46 | | | | (0.13 | ) | | | 2.07 | | | | 1.94 | | | | — | | | | 24.40 | | | | 8.64 | | | | 126 | | | | 2.39 | | | | 2.39 | | | | (0.58 | ) | | | 31 | |
Year ended 10/31/15 | | | 23.05 | | | | (0.12 | ) | | | (0.47 | ) | | | (0.59 | ) | | | — | | | | 22.46 | | | | (2.56 | ) | | | 272 | | | | 2.53 | | | | 2.53 | | | | (0.54 | ) | | | 137 | |
Year ended 10/31/14 | | | 22.49 | | | | (0.04 | ) | | | 0.77 | | | | 0.73 | | | | (0.17 | ) | | | 23.05 | | | | 3.28 | | | | 480 | | | | 2.53 | | | | 2.53 | | | | (0.16 | ) | | | 63 | |
Class C | | | | | | | | | | | | | | | | | | | | | | | | | | | | | | | | | | | | | | | | | | | | | | | | |
Year ended 10/31/18 | | | 31.09 | | | | 0.02 | (d) | | | (4.25 | ) | | | (4.23 | ) | | | — | | | | 26.86 | | | | (13.60 | ) | | | 6,080 | | | | 2.30 | (e) | | | 2.30 | (e) | | | 0.06 | (d)(e) | | | 54 | |
Year ended 10/31/17 | | | 24.46 | | | | (0.28 | ) | | | 6.91 | | | | 6.63 | | | | — | | | | 31.09 | | | | 27.11 | (h) | | | 5,535 | | | | 2.49 | (h) | | | 2.49 | (h) | | | (1.06 | )(h) | | | 59 | |
Year ended 10/31/16 | | | 22.50 | | | | (0.13 | ) | | | 2.09 | | | | 1.96 | | | | — | | | | 24.46 | | | | 8.71 | (h) | | | 4,477 | | | | 2.37 | (h) | | | 2.37 | (h) | | | (0.56 | )(h) | | | 31 | |
Year ended 10/31/15 | | | 23.09 | | | | (0.12 | ) | | | (0.47 | ) | | | (0.59 | ) | | | — | | | | 22.50 | | | | (2.55 | ) | | | 4,880 | | | | 2.53 | | | | 2.53 | | | | (0.54 | ) | | | 137 | |
Year ended 10/31/14 | | | 22.53 | | | | (0.03 | ) | | | 0.76 | | | | 0.73 | | | | (0.17 | ) | | | 23.09 | | | | 3.28 | (h) | | | 4,638 | | | | 2.52 | (h) | | | 2.52 | (h) | | | (0.15 | )(h) | | | 63 | |
Class R | | | | | | | | | | | | | | | | | | | | | | | | | | | | | | | | | | | | | | | | | | | | | | | | |
Year ended 10/31/18 | | | 33.24 | | | | 0.19 | (d) | | | (4.57 | ) | | | (4.38 | ) | | | — | | | | 28.86 | | | | (13.18 | ) | | | 409 | | | | 1.80 | (e) | | | 1.80 | (e) | | | 0.56 | (d)(e) | | | 54 | |
Year ended 10/31/17 | | | 26.02 | | | | (0.16 | ) | | | 7.38 | | | | 7.22 | | | | — | | | | 33.24 | | | | 27.75 | | | | 283 | | | | 2.00 | | | | 2.00 | | | | (0.57 | ) | | | 59 | |
Year ended 10/31/16 | | | 23.82 | | | | (0.02 | ) | | | 2.22 | | | | 2.20 | | | | — | | | | 26.02 | | | | 9.24 | | | | 242 | | | | 1.89 | | | | 1.89 | | | | (0.08 | ) | | | 31 | |
Year ended 10/31/15 | | | 24.33 | | | | (0.01 | ) | | | (0.50 | ) | | | (0.51 | ) | | | — | | | | 23.82 | | | | (2.10 | ) | | | 245 | | | | 2.03 | | | | 2.03 | | | | (0.04 | ) | | | 137 | |
Year ended 10/31/14 | | | 23.74 | | | | 0.08 | | | | 0.80 | | | | 0.88 | | | | (0.29 | ) | | | 24.33 | | | | 3.78 | | | | 344 | | | | 2.03 | | | | 2.03 | | | | 0.34 | | | | 63 | |
Class Y | | | | | | | | | | | | | | | | | | | | | | | | | | | | | | | | | | | | | | | | | | | | | | | | |
Year ended 10/31/18 | | | 34.24 | | | | 0.37 | (d) | | | (4.73 | ) | | | (4.36 | ) | | | — | | | | 29.88 | | | | (12.73 | ) | | | 13,911 | | | | 1.30 | (e) | | | 1.30 | (e) | | | 1.06 | (d)(e) | | | 54 | |
Year ended 10/31/17 | | | 26.79 | | | | (0.02 | ) | | | 7.59 | | | | 7.57 | | | | (0.12 | ) | | | 34.24 | | | | 28.43 | | | | 18,505 | | | | 1.50 | | | | 1.50 | | | | (0.07 | ) | | | 59 | |
Year ended 10/31/16 | | | 24.41 | | | | 0.11 | | | | 2.27 | | | | 2.38 | | | | — | | | | 26.79 | | | | 9.75 | | | | 10,501 | | | | 1.39 | | | | 1.39 | | | | 0.42 | | | | 31 | |
Year ended 10/31/15 | | | 24.90 | | | | 0.12 | | | | (0.52 | ) | | | (0.40 | ) | | | (0.09 | ) | | | 24.41 | | | | (1.59 | ) | | | 3,587 | | | | 1.53 | | | | 1.53 | | | | 0.46 | | | | 137 | |
Year ended 10/31/14 | | | 24.28 | | | | 0.20 | | | | 0.82 | | | | 1.02 | | | | (0.40 | ) | | | 24.90 | | | | 4.34 | | | | 2,944 | | | | 1.53 | | | | 1.53 | | | | 0.84 | | | | 63 | |
Class R5 | | | | | | | | | | | | | | | | | | | | | | | | | | | | | | | | | | | | | | | | | | | | | | | | |
Year ended 10/31/18 | | | 34.29 | | | | 0.40 | (d) | | | (4.75 | ) | | | (4.35 | ) | | | — | | | | 29.94 | | | | (12.69 | ) | | | 16 | | | | 1.22 | (e) | | | 1.22 | (e) | | | 1.14 | (d)(e) | | | 54 | |
Year ended 10/31/17 | | | 26.84 | | | | 0.00 | | | | 7.60 | | | | 7.60 | | | | (0.15 | ) | | | 34.29 | | | | 28.53 | | | | 18 | | | | 1.42 | | | | 1.42 | | | | 0.01 | | | | 59 | |
Year ended 10/31/16 | | | 24.42 | | | | 0.13 | | | | 2.29 | | | | 2.42 | | | | — | | | | 26.84 | | | | 9.91 | | | | 14 | | | | 1.28 | | | | 1.28 | | | | 0.53 | | | | 31 | |
Year ended 10/31/15 | | | 24.92 | | | | 0.15 | | | | (0.52 | ) | | | (0.37 | ) | | | (0.13 | ) | | | 24.42 | | | | (1.47 | ) | | | 13 | | | | 1.39 | | | | 1.39 | | | | 0.60 | | | | 137 | |
Year ended 10/31/14 | | | 24.30 | | | | 0.24 | | | | 0.82 | | | | 1.06 | | | | (0.44 | ) | | | 24.92 | | | | 4.48 | | | | 13 | | | | 1.37 | | | | 1.37 | | | | 1.00 | | | | 63 | |
Class R6 | | | | | | | | | | | | | | | | | | | | | | | | | | | | | | | | | | | | | | | | | | | | | | | | |
Year ended 10/31/18 | | | 34.29 | | | | 0.39 | (d) | | | (4.74 | ) | | | (4.35 | ) | | | — | | | | 29.94 | | | | (12.69 | ) | | | 5,091 | | | | 1.22 | (e) | | | 1.22 | (e) | | | 1.14 | (d)(e) | | | 54 | |
Year ended 10/31/17(i) | | | 27.48 | | | | 0.00 | | | | 6.81 | | | | 6.81 | | | | — | | | | 34.29 | | | | 24.78 | | | | 12 | | | | 1.39 | (j) | | | 1.39 | (j) | | | 0.04 | (j) | | | 59 | |
| (a) | Calculated using average shares outstanding. |
| (b) | Includes adjustments in accordance with accounting principles generally accepted in the United States of America and as such, the net asset value for financial reporting purposes and the returns based upon those net asset values may differ from the net asset value and returns for shareholder transactions. Does not include sales charges and is not annualized for periods less than one year, if applicable. |
| (c) | Portfolio turnover is calculated at the fund level and is not annualized for periods less than one year, if applicable. |
| (d) | Net investment income (loss) per share and the ratio of net investment income (loss) to average net assets includes significant dividends received during year ended October 31, 2018. Net investment income (loss) per share and the ratio of net investment income (loss) to average net assets excluding the significant dividends are $0.04 and 0.11%, $(0.23) and (0.65)%, $(0.22) and (0.65)%, $(0.05) and (0.15)%, $0.13 and 0.35%, $0.16 and 0.43%, and $0.15 and 0.43% for Class A, Class B, Class C, Class R, Class Y, Class R5 and Class R6 shares, respectively. |
| (e) | Ratios are based on average daily net assets (000’s omitted) of $83,055, $115, $7,268, $419, $20,290, $18 and $4,894 for Class A, Class B, Class C, Class R, Class Y, Class R5 and Class R6 shares, respectively. |
| (f) | The total return, ratio of expenses to average net assets and ratio of net investment income (loss) to average net assets reflect actual 12b-1 fees of 0.24% for Class A shares for the years ended October 31, 2018 and October 31, 2014. |
| (g) | Reflects activity for the period November 1, 2017 through January 26, 2018 (date of conversion). |
| (h) | The total return, ratio of expenses to average net assets and ratio of net investment income (loss) to average net assets reflect actual 12b-1 fees of 0.99%, 0.98% and 0.99% for Class C shares for the years ended October 31, 2017, 2016 and 2014, respectively. |
| (i) | Commencement date of April 4, 2017. |
20 Invesco Pacific Growth Fund
Report of Independent Registered Public Accounting Firm
To the Board of Trustees of AIM Investment Fund (Invesco Investment Fund)
and Shareholders of Invesco Pacific Growth Fund:
Opinion on the Financial Statements
We have audited the accompanying statement of assets and liabilities, including the schedule of investments, of Invesco Pacific Growth Fund (one of the funds constituting AIM Investment Funds (Invesco Investment Funds), hereafter referred to as the “Fund”) as of October 31, 2018, the related statement of operations for the year ended October 31, 2018, the statement of changes in net assets for each of the two years in the period ended October 31, 2018, including the related notes, and the financial highlights for each of the periods indicated therein (collectively referred to as the financial statements). In our opinion, the financial statements present fairly, in all material respects, the financial position of the Fund as of October 31, 2018, the results of its operations for the year then ended, the changes in its net assets for each of the two years in the period ended October 31, 2018 and the financial highlights for each of the periods indicated therein in conformity with accounting principles generally accepted in the United States of America.
Basis for Opinion
These financial statements are the responsibility of the Fund’s management. Our responsibility is to express an opinion on the Fund’s financial statements based on our audits. We are a public accounting firm registered with the Public Company Accounting Oversight Board (United States) (PCAOB) and are required to be independent with respect to the Fund in accordance with the U.S. federal securities laws and the applicable rules and regulations of the Securities and Exchange Commission and the PCAOB.
We conducted our audits of these financial statements in accordance with the standards of the PCAOB. Those standards require that we plan and perform the audit to obtain reasonable assurance about whether the financial statements are free of material misstatement, whether due to error or fraud.
Our audits included performing procedures to assess the risks of material misstatement of the financial statements, whether due to error or fraud, and performing procedures that respond to those risks. Such procedures included examining, on a test basis, evidence regarding the amounts and disclosures in the financial statements. Our audits also included evaluating the accounting principles used and significant estimates made by management, as well as evaluating the overall presentation of the financial statements. Our procedures included confirmation of securities owned as of October 31, 2018 by correspondence with the custodian and transfer agent. We believe that our audits provide a reasonable basis for our opinion.
PricewaterhouseCoopers LLP
Houston, TX
December 28, 2018
We have served as the auditor of one or more of the investment companies in the Invesco group of investment companies since at least 1995. We have not been able to determine the specific year we began serving as auditor.
21 Invesco Pacific Growth Fund
Calculating your ongoing Fund expenses
Example
As a shareholder of the Fund, you incur two types of costs: (1) transaction costs, which may include sales charges (loads) on purchase payments or contingent deferred sales charges on redemptions, if any; and (2) ongoing costs, including management fees, distribution and/or service (12b-1) fees, and other Fund expenses. This example is intended to help you understand your ongoing costs (in dollars) of investing in the Fund and to compare these costs with ongoing costs of investing in other mutual funds. The example is based on an investment of $1,000 invested at the beginning of the period and held for the entire period May 1, 2018 through October 31, 2018.
Actual expenses
The table below provides information about actual account values and actual expenses. You may use the information in this table, together with the amount you invested, to estimate the expenses that you paid over the period. Simply divide your account value by $1,000 (for example, an $8,600 account value divided by $1,000 = 8.6), then multiply the result by the number in the table under the heading entitled “Actual Expenses Paid During Period” to estimate the expenses you paid on your account during this period.
Hypothetical example for comparison purposes
The table below also provides information about hypothetical account values and hypothetical expenses based on the Fund’s actual expense ratio and an assumed rate of return of 5% per year before expenses, which is not the Fund’s actual return.
The hypothetical account values and expenses may not be used to estimate the actual ending account balance or expenses you paid for the period. You may use this information to compare the ongoing costs of investing in the Fund and other funds. To do so, compare this 5% hypothetical example with the 5% hypothetical examples that appear in the shareholder reports of the other funds.
Please note that the expenses shown in the table are meant to highlight your ongoing costs only and do not reflect any transaction costs, such as sales charges (loads) on purchase payments or contingent deferred sales charges on redemptions, if any. Therefore, the hypothetical information is useful in comparing ongoing costs only, and will not help you determine the relative total costs of owning different funds. In addition, if these transaction costs were included, your costs would have been higher.
| | | | | | | | | | | | | | | | | | | | | | | | |
Class | | Beginning
Account Value
(05/01/18) | | | ACTUAL | | | HYPOTHETICAL (5% annual return before expenses) | | | Annualized
Expense Ratio | |
| | Ending
Account Value
(10/31/18)1 | | | Expenses
Paid During
Period2 | | | Ending
Account Value
(10/31/18) | | | Expenses
Paid During
Period2 | |
A | | $ | 1,000.00 | | | $ | 836.50 | | | $ | 7.08 | | | $ | 1,017.49 | | | $ | 7.78 | | | | 1.53 | % |
C | | | 1,000.00 | | | | 833.40 | | | | 10.58 | | | | 1,013.66 | | | | 11.62 | | | | 2.29 | |
R | | | 1,000.00 | | | | 835.60 | | | | 8.28 | | | | 1,016.18 | | | | 9.10 | | | | 1.79 | |
Y | | | 1,000.00 | | | | 837.70 | | | | 5.98 | | | | 1,018.70 | | | | 6.56 | | | | 1.29 | |
R5 | | | 1,000.00 | | | | 838.20 | | | | 5.65 | | | | 1,019.06 | | | | 6.21 | | | | 1.22 | |
R6 | | | 1,000.00 | | | | 838.20 | | | | 5.65 | | | | 1,019.06 | | | | 6.21 | | | | 1.22 | |
| 1 | The actual ending account value is based on the actual total return of the Fund for the period May 1, 2018 through October 31, 2018, after actual expenses and will differ from the hypothetical ending account value which is based on the Fund’s expense ratio and a hypothetical annual return of 5% before expenses. |
| 2 | Expenses are equal to the Fund’s annualized expense ratio as indicated above multiplied by the average account value over the period, multiplied by 184/365 to reflect the most recent fiscal half year. |
22 Invesco Pacific Growth Fund
Approval of Investment Advisory and Sub-Advisory Contracts
At meetings held on June 5-6, 2018, the Board of Trustees (the Board or the Trustees) of AIM Investment Funds (Invesco Investment Funds) as a whole, and the independent Trustees, who comprise over 75% of the Board, voting separately, approved the continuance of the Invesco Pacific Growth Fund’s (the Fund) Master Investment Advisory Agreement with Invesco Advisers, Inc. (Invesco Advisers and the investment advisory agreement) and the Master Intergroup Sub-Advisory Contract for Mutual Funds with Invesco Asset Management Deutschland GmbH, Invesco Asset Management Limited, Invesco Asset Management (Japan) Limited, Invesco Hong Kong Limited, Invesco Senior Secured Management, Inc. and Invesco Canada Ltd. (collectively, the Affiliated Sub-Advisers and the sub-advisory contracts) for another year, effective July 1, 2018. After evaluating the factors discussed below, among others, the Board approved the renewal of the Fund’s investment advisory agreement and the sub-advisory contracts and determined that the compensation payable by the Fund to Invesco Advisers and by Invesco Advisers to the Affiliated Sub-Advisers is fair and reasonable.
The Board’s Evaluation Process
The Board’s Investments Committee has established three Sub-Committees, which meet throughout the year to review the performance of funds advised by Invesco Advisers (the Invesco Funds). Over the course of each year, the Sub-Committees meet with portfolio managers for their assigned Invesco Funds and other members of management to review detailed information about investment performance and portfolio attributes of these funds. The Board took into account evaluations and reports that it received from the Investments Committee and Sub-Committees, as well as the information provided to such committees and the Board throughout the year, in considering whether to approve each Invesco Fund’s investment advisory agreement and sub-advisory contracts.
As part of the contract renewal process, the Board reviews and considers information provided in response to detailed requests for information submitted to management by the independent Trustees with assistance from legal counsel to the independent Trustees. The Board receives comparative investment performance and fee data regarding the Invesco Funds prepared by Invesco Advisers and Broadridge Financial Solutions, Inc. (Broadridge), an independent mutual fund data provider. The Board also receives an independent written evaluation from the Senior Officer, an officer of the Invesco Funds who reports directly to the independent Trustees. The Senior Officer’s evaluation is prepared as part of his responsibility to manage the process by which the Invesco Funds’ proposed management fees
are negotiated during the annual contract renewal process to ensure they are negotiated in a manner that is at arms’ length and reasonable. In addition to meetings with Invesco Advisers and fund counsel throughout the year, the independent Trustees also discuss the continuance of the investment advisory agreement and sub-advisory contracts in separate sessions with the Senior Officer and with independent legal counsel.
The discussion below is a summary of the Senior Officer’s independent written evaluation with respect to the Fund’s investment advisory agreement, as well as a discussion of the material factors and related conclusions that formed the basis for the Board’s approval of the Fund’s investment advisory agreement and sub-advisory contracts. The Trustees’ review and conclusions are based on the comprehensive consideration of all information presented to them during the course of the year and in prior years and are not the result of any single determinative factor. Moreover, one Trustee may have weighed a particular piece of information or factor differently than another Trustee. This information is current as of June 6, 2018.
Factors and Conclusions and Summary of Independent Written Fee Evaluation
| A. | Nature, Extent and Quality of Services Provided by Invesco Advisers and the Affiliated Sub-Advisers |
The Board reviewed the nature, extent and quality of the advisory services provided to the Fund by Invesco Advisers under the Fund’s investment advisory agreement, and the credentials and experience of the officers and employees of Invesco Advisers who provide these services, including the Fund’s portfolio manager(s). The Board’s review included consideration of Invesco Advisers’ investment process oversight and structure, credit analysis and investment risk management. The Board also considered non-advisory services that Invesco Advisers and its affiliates provide to the Invesco Funds such as various back office support functions, third party oversight, internal audit, valuation, portfolio trading and legal and compliance. The Board also reviewed and considered the benefits to shareholders of investing in a fund that is part of the Invesco family of funds under the umbrella of Invesco Ltd., Invesco Advisers’ parent company, and noted Invesco Ltd.’s depth and experience in conducting an investment management business, as well as its commitment of financial and other resources to such business. The Board concluded that the nature, extent and quality of the services provided to the Fund by Invesco Advisers are appropriate and satisfactory.
The Board reviewed the services that may be provided by the Affiliated Sub-Advisers under the sub-advisory contracts and the credentials
and experience of the officers and employees of the Affiliated Sub-Advisers who provide these services. The Board noted the Affiliated Sub-Advisers’ expertise with respect to certain asset classes and that the Affiliated Sub-Advisers have offices and personnel that are located in financial centers around the world. As a result, the Board noted that the Affiliated Sub-Advisers can provide research and investment analysis on the markets and economies of various countries in which the Fund may invest, make recommendations regarding securities and assist with security trades. The Board concluded that the sub-advisory contracts may benefit the Fund and its shareholders by permitting Invesco Advisers to use the resources and talents of the Affiliated Sub-Advisers in managing the Fund. The Board concluded that the nature, extent and quality of the services that may be provided by the Affiliated Sub-Advisers are appropriate and satisfactory.
| B. | Fund Investment Performance |
The Board considered Fund investment performance as a relevant factor in considering whether to approve the investment advisory agreement as well as the sub-advisory contracts for the Fund, as Invesco Asset Management (Japan) Limited and Invesco Hong Kong Limited currently manage assets of the Fund.
The Board compared the Fund’s investment performance over multiple time periods ending December 31, 2017 to the performance of funds in the Broadridge performance universe and against the Lipper Pacific Region Funds Index. The Board noted that performance of Class A shares of the Fund was in the first quintile of its performance universe for the one, three and five year periods (the first quintile being the best performing funds and the fifth quintile being the worst performing funds). The Board noted that performance of Class A shares of the Fund was above the performance of the Index for the one, three and five year periods. The Trustees also reviewed more recent Fund performance and this review did not change their conclusions.
| C. | Advisory and Sub-Advisory Fees and Fund Expenses |
The Board compared the Fund’s contractual management fee rate to the contractual management fee rates of funds in the Fund’s Broadridge expense group. The Board noted that the contractual management fee rate for Class A shares of the Fund was below the median contractual management fee rate of funds in its expense group. The Board noted that the term “contractual management fee” for funds in the expense group may include both advisory and certain non-portfolio management administrative services fees, but that Broadridge does not provide information on a fund by fund basis as to what is included. The Board also reviewed the methodology used by Broadridge in providing expense group
23 Invesco Pacific Growth Fund
information, which includes using each fund’s contractual management fee schedule (including any applicable breakpoints) as reported in the most recent prospectus or statement of additional information for each fund in the expense group. The Board also considered comparative information regarding the Fund’s total expense ratio and its various components. The Board noted that there were only four funds (including the Fund) in the expense group.
The Board noted that Invesco Advisers has contractually agreed to waive fees and/or limit expenses of the Fund in an amount necessary to limit total annual operating expenses to a specified percentage of average daily net assets for each class of the Fund.
The Board noted that Invesco Advisers and the Affiliated Sub-Advisers do not manage other similarly managed mutual funds or client accounts.
The Board also considered the services that may be provided by the Affiliated Sub-Advisers pursuant to the sub-advisory contracts, as well as the fees payable by Invesco Advisers to the Affiliated Sub-Advisers pursuant to the sub-advisory contracts.
| D. | Economies of Scale and Breakpoints |
The Board considered the extent to which there may be economies of scale in the provision of advisory services to the Fund. The Board also considered that the Fund may benefit from economies of scale through contractual breakpoints in the Fund’s advisory fee schedule, which generally operate to reduce the Fund’s expense ratio as it grows in size. The Board noted that the Fund shares directly in economies of scale through lower fees charged by third party service providers based on the combined size of the Invesco Funds. The Board noted that the Fund may also benefit from economies of scale through initial fee setting, fee waivers and expense reimbursements.
| E. | Profitability and Financial Resources |
The Board reviewed information from Invesco Advisers concerning the costs of the advisory and other services that Invesco Advisers and its affiliates provide to the Fund and the Invesco Funds and the profitability of Invesco Advisers and its affiliates in providing these services. The Board considered the methodology used for calculating profitability and noted the periodic review of such methodology by an independent consultant. The Board noted that Invesco Advisers continues to operate at a net profit from services Invesco Advisers and its affiliates provide to the Invesco Funds and the Fund. The Board did not deem the level of profits realized by Invesco Advisers and its affiliates from providing services to the Fund to be excessive given the nature, extent and quality of the services provided. The Board received information from Invesco Advisers demonstrating that Invesco Advisers and the Affiliated Sub-Advisers are financially sound and have the resources necessary to perform their obligations under the investment advisory agreement and sub-advisory contracts.
| F. | Collateral Benefits to Invesco Advisers and its Affiliates |
The Board considered various other benefits received by Invesco Advisers and its affiliates from the relationship with the Fund, including the fees received for providing administrative, transfer agency and distribution services to the Fund. The Board considered comparative information regarding fees charged for these services, including information provided by Broadridge and other independent sources. The Board considered the performance of Invesco Advisers and its affiliates in providing these services and the organizational structure employed to provide these services. The Board also considered that these services are provided to the Fund pursuant to written contracts that are reviewed and approved on an annual basis by the Board; and that the services are required for the operation of the Fund.
The Board considered the benefits realized by Invesco Advisers and the Affiliated Sub-Advisers as a result of portfolio brokerage transactions executed through “soft dollar” arrangements. The Board noted that soft dollar arrangements may result in the Fund bearing costs to purchase research that may be used by Invesco Advisers or the Affiliated Sub-Advisers with other clients and may reduce Invesco Advisers’ or the Affiliated Sub-Advisers’ expenses. The Board also considered that it receives periodic reports from Invesco representing that these arrangements are consistent with regulatory requirements. The Board did not deem the soft dollar arrangements to be inappropriate.
The Board considered that the Fund’s uninvested cash and cash collateral from any securities lending arrangements may be invested in money market funds advised by Invesco Advisers pursuant to procedures approved by the Board. The Board noted that Invesco Advisers receives advisory fees from these affiliated money market funds attributable to such investments, although Invesco Advisers has contractually agreed to waive through varying periods the advisory fees payable by the Invesco Funds with respect to certain investments in the affiliated money market funds. The waiver is in an amount equal to 100% of the net advisory fee Invesco Advisers receives from the affiliated money market funds with respect to the Fund’s investment in the affiliated money market funds of uninvested cash, but not cash collateral. The Board concluded that the amount of advisory fees received by Invesco Advisers from the Fund’s investment of cash collateral from any securities lending arrangements in the affiliated money market funds is fair and reasonable.
The Board also considered that an affiliated broker may receive commissions for executing certain trades for the Fund. Invesco Advisers and the Affiliated Sub-Advisers may use the affiliated broker to, among other things, control order routing and minimize information leakage, and the Board was advised that such trades are executed in compliance with rules under the federal securities laws and consistent with best execution obligations.
24 Invesco Pacific Growth Fund
Trustees and Officers
The address of each trustee and officer is AIM Investment Funds (Invesco Investment Funds) (the “Trust”), 11 Greenway Plaza, Suite 1000, Houston, Texas 77046-1173. The trustees serve for the life of the Trust, subject to their earlier death, incapacitation, resignation, retirement or removal as more specifically provided in the Trust’s organizational documents. Each officer serves for a one year term or until their successors are elected and qualified. Column two below includes length of time served with predecessor entities, if any.
| | | | | | | | |
Name, Year of Birth and
Position(s) Held with the Trust | | Trustee and/
or Officer Since | | Principal Occupation(s)
During Past 5 Years | | Number of
Funds in Fund
Complex
Overseen by
Trustee | | Other Directorship(s)
Held by Trustee During
Past 5 Years |
| Interested Persons | | | | | | | | |
| Martin L. Flanagan1 — 1960 Trustee | | 2007 | | Executive Director, Chief Executive Officer and President, Invesco Ltd. (ultimate parent of Invesco and a global investment management firm); Trustee, The Invesco Funds; Vice Chair, Investment Company Institute; and Member of Executive Board, SMU Cox School of Business Formerly: Advisor to the Board, Invesco Advisers, Inc. (formerly known as Invesco Institutional (N.A.), Inc.); Chairman and Chief Executive Officer, Invesco Advisers, Inc. (registered investment adviser); Director, Chairman, Chief Executive Officer and President, Invesco Holding Company (US), Inc. (formerly IVZ Inc.) (holding company), Invesco Group Services, Inc. (service provider) and Invesco North American Holdings, Inc. (holding company); Director, Chief Executive Officer and President, Invesco Holding Company Limited (parent of Invesco and a global investment management firm); Director, Invesco Ltd.; Chairman, Investment Company Institute and President, Co-Chief Executive Officer, Co-President, Chief Operating Officer and Chief Financial Officer, Franklin Resources, Inc. (global investment management organization) | | 158 | | None |
Philip A. Taylor2 — 1954 Trustee and Senior Vice President | | 2006 | | Head of the Americas and Senior Managing Director, Invesco Ltd.; Director, Invesco Advisers, Inc. (formerly known as Invesco Institutional (N.A.), Inc.) (registered investment adviser); Director and Chairman, Invesco Investment Services, Inc. (formerly known as Invesco AIM Investment Services, Inc.) (registered transfer agent); Chief Executive Officer, Invesco Corporate Class Inc. (corporate mutual fund company); Director, Chairman and Chief Executive Officer, Invesco Canada Ltd. (formerly known as Invesco Trimark Ltd./Invesco Trimark Ltèe) (registered investment adviser and registered transfer agent); Trustee and Senior Vice President, The Invesco Funds; Director, Invesco Investment Advisers LLC (formerly known as Van Kampen Asset Management) Formerly: Director, Chairman, Chief Executive Officer and President, Invesco Management Group, Inc. (formerly known as Invesco AIM Management Group, Inc.) (financial services holding company); Co-Chairman, Co-President and Co-Chief Executive Officer, Invesco Advisers, Inc. (formerly known as Invesco Institutional (N.A.), Inc.) (registered investment adviser); Director, Chief Executive Officer and President, Van Kampen Exchange Corp; President and Principal Executive Officer, The Invesco Funds (other than AIM Treasurer’s Series Trust (Invesco Treasurer’s Series Trust), Short-Term Investments Trust and Invesco Management Trust); Executive Vice President, The Invesco Funds (AIM Treasurer’s Series Trust (Invesco Treasurer’s Series Trust), Short-Term Investments Trust and Invesco Management Trust only); Director and President, INVESCO Funds Group, Inc. (registered investment adviser and registered transfer agent); Director and Chairman, IVZ Distributors, Inc. (formerly known as INVESCO Distributors, Inc.) (registered broker dealer); Director, President and Chairman, Invesco Inc. (holding company), Invesco Canada Holdings Inc. (holding company), Trimark Investments Ltd./Placements Trimark Ltèe and Invesco Financial Services Ltd/Services Financiers Invesco Ltèe; Chief Executive Officer, Invesco Canada Fund Inc. (corporate mutual fund company); Director and Chairman, Van Kampen Investor Services Inc.; Director, Chief Executive Officer and President, 1371 Preferred Inc. (holding company) and Van Kampen Investments Inc.; Director and President, AIM GP Canada Inc. (general partner for limited partnerships) and Van Kampen Advisors, Inc.; Director and Chief Executive Officer, Invesco Trimark Dealer Inc. (registered broker dealer); Director, Invesco Distributors, Inc. (formerly known as Invesco AIM Distributors, Inc.) (registered broker dealer); Manager, Invesco Capital Management LLC; Director, Chief Executive Officer and President, Invesco Advisers, Inc.; Director, Chairman, Chief Executive Officer and President, Invesco AIM Capital Management, Inc.; President, Invesco Trimark Dealer Inc. and Invesco Trimark Ltd./Invesco Trimark Ltèe; Director and President, AIM Trimark Corporate Class Inc. and AIM Trimark Canada Fund Inc.; Senior Managing Director, Invesco Holding Company Limited; Director and Chairman, Fund Management Company (former registered broker dealer); President and Principal Executive Officer, The Invesco Funds (AIM Treasurer’s Series Trust (Invesco Treasurer’s Series Trust), and Short-Term Investments Trust only); President, AIM Trimark Global Fund Inc. and AIM Trimark Canada Fund Inc. | | 158 | | None |
| 1 | Mr. Flanagan is considered an interested person (within the meaning of Section 2(a)(19) of the 1940 Act) of the Trust because he is an officer of the Adviser to the Trust, and an officer and a director of Invesco Ltd., ultimate parent of the Adviser. |
| 2 | Mr. Taylor is considered an interested person (within the meaning of Section 2(a)(19) of the 1940 Act) of the Trust because he is an officer and a director of the Adviser. |
T-1 Invesco Pacific Growth Fund
Trustees and Officers—(continued)
| | | | | | | | |
Name, Year of Birth and
Position(s) Held with the Trust | | Trustee and/
or Officer Since | | Principal Occupation(s)
During Past 5 Years | | Number of
Funds in Fund
Complex
Overseen by
Trustee | | Other Directorship(s)
Held by Trustee During
Past 5 Years |
| Independent Trustees | | | | | | | | |
Bruce L. Crockett — 1944 Trustee and Chair | | 2001 | | Chairman, Crockett Technologies Associates (technology consulting company) Formerly: Director, Captaris (unified messaging provider); Director, President and Chief Executive Officer, COMSAT Corporation; Chairman, Board of Governors of INTELSAT (international communications company); ACE Limited (insurance company); Independent Directors Council and Investment Company Institute: Member of the Audit Committee, Investment Company Institute; Member of the Executive Committee and Chair of the Governance Committee, Independent Directors Council | | 158 | | Director and Chairman of the Audit Committee, ALPS (Attorneys Liability Protection Society) (insurance company); Director and Member of the Audit Committee and Compensation Committee, Ferroglobe PLC (metallurgical company) |
David C. Arch — 1945 Trustee | | 2010 | | Chairman of Blistex Inc. (consumer health care products manufacturer); Member, World Presidents’ Organization | | 158 | | Board member of the Illinois Manufacturers’ Association |
Jack M. Fields — 1952 Trustee | | 2001 | | Chief Executive Officer, Twenty First Century Group, Inc. (government affairs company); and Chairman, Discovery Learning Alliance (non-profit) Formerly: Owner and Chief Executive Officer, Dos Angeles Ranch L.P. (cattle, hunting, corporate entertainment); Director, Insperity, Inc. (formerly known as Administaff) (human resources provider); Chief Executive Officer, Texana Timber LP (sustainable forestry company); Director of Cross Timbers Quail Research Ranch (non-profit); and member of the U.S. House of Representatives | | 158 | | None |
Cynthia Hostetler — 1962 Trustee | | 2017 | | Non-Executive Director and Trustee of a number of public and private business corporations Formerly: Director, Aberdeen Investment Funds (4 portfolios); Head of Investment Funds and Private Equity, Overseas Private Investment Corporation; President, First Manhattan Bancorporation, Inc.; Attorney, Simpson Thacher & Bartlett LLP | | 158 | | Vulcan Materials Company (construction materials company); Trilinc Global Impact Fund; Artio Global Investment LLC (mutual fund complex); Edgen Group, Inc. (specialized energy and infrastructure products distributor) |
Eli Jones — 1961 Trustee | | 2016 | | Professor and Dean, Mays Business School — Texas A&M University Formerly: Professor and Dean, Walton College of Business, University of Arkansas and E.J. Ourso College of Business, Louisiana State University; Director, Arvest Bank | | 158 | | Insperity, Inc. (formerly known as Administaff) (human resources provider) |
Prema Mathai-Davis — 1950 Trustee | | 2001 | | Retired | | 158 | | None |
Teresa M. Ressel — 1962 Trustee | | 2017 | | Non-executive director and trustee of a number of public and private business corporations Formerly: Chief Financial Officer, Olayan America, The Olayan Group (international investor/commercial/industrial); Chief Executive Officer, UBS Securities LLC; Group Chief Operating Officer, Americas, UBS AG; Assistant Secretary for Management & Budget and CFO, US Department of the Treasury | | 158 | | Atlantic Power Corporation (power generation company); ON Semiconductor Corp. (semiconductor supplier) |
Ann Barnett Stern — 1957 Trustee | | 2017 | | President and Chief Executive Officer, Houston Endowment Inc. (private philanthropic institution) Formerly: Executive Vice President and General Counsel, Texas Children’s Hospital; Attorney, Beck, Redden and Secrest, LLP; Business Law Instructor, University of St. Thomas; Attorney, Andrews & Kurth LLP | | 158 | | Federal Reserve Bank of Dallas |
Raymond Stickel, Jr. — 1944 Trustee | | 2005 | | Retired Formerly: Director, Mainstay VP Series Funds, Inc. (25 portfolios); Partner, Deloitte & Touche | | 158 | | None |
Robert C. Troccoli — 1949 Trustee | | 2016 | | Adjunct Professor, University of Denver — Daniels College of Business Formerly: Senior Partner, KPMG LLP | | 158 | | None |
Christopher L. Wilson — 1957 Trustee | | 2017 | | Non-executive director and trustee of a number of public and private business corporations Formerly: Director, TD Asset Management USA Inc. (mutual fund complex) (22 portfolios); Managing Partner, CT2, LLC (investing and consulting firm); President/Chief Executive Officer, Columbia Funds, Bank of America Corporation; President/Chief Executive Officer, CDC IXIS Asset Management Services, Inc.; Principal & Director of Operations, Scudder Funds, Scudder, Stevens & Clark, Inc.; Assistant Vice President, Fidelity Investments | | 158 | | ISO New England, Inc. (non-profit organization managing regional electricity market) |
T-2 Invesco Pacific Growth Fund
Trustees and Officers—(continued)
| | | | | | | | |
Name, Year of Birth and
Position(s) Held with the Trust | | Trustee and/
or Officer Since | | Principal Occupation(s)
During Past 5 Years | | Number of
Funds in Fund
Complex
Overseen by
Trustee | | Other Directorship(s)
Held by Trustee During
Past 5 Years |
| Other Officers | | | | | | | | |
Sheri Morris — 1964 President, Principal Executive Officer and Treasurer | | 1999 | | President, Principal Executive Officer and Treasurer, The Invesco Funds; Vice President, Invesco Advisers, Inc. (formerly known as Invesco Institutional (N.A.), Inc.) (registered investment adviser); and Vice President, Invesco Exchange-Traded Fund Trust, Invesco Exchange-Traded Fund Trust II, Invesco India Exchange-Traded Fund Trust, Invesco Actively Managed Exchange-Traded Fund Trust, Invesco Actively Managed Exchange-Traded Commodity Fund Trust and Invesco Exchange-Traded Self-Indexed Fund Trust Formerly: Vice President and Principal Financial Officer, The Invesco Funds; Vice President, Invesco AIM Advisers, Inc., Invesco AIM Capital Management, Inc. and Invesco AIM Private Asset Management, Inc.; Assistant Vice President and Assistant Treasurer, The Invesco Funds and Assistant Vice President, Invesco Advisers, Inc., Invesco AIM Capital Management, Inc. and Invesco AIM Private Asset Management, Inc.; and Treasurer, Invesco Exchange-Traded Fund Trust, Invesco Exchange-Traded Fund Trust II, Invesco India Exchange-Traded Fund Trust and Invesco Actively Managed Exchange-Traded Fund Trust | | N/A | | N/A |
Russell C. Burk — 1958 Senior Vice President and Senior Officer | | 2005 | | Senior Vice President and Senior Officer, The Invesco Funds | | N/A | | N/A |
Jeffrey H. Kupor — 1968 Senior Vice President, Chief Legal Officer and Secretary | | 2018 | | Senior Vice President and Secretary, Invesco Advisers, Inc. (formerly known as Invesco Institutional (N.A.), Inc.) (registered investment adviser); Senior Vice President and Secretary, Invesco Distributors, Inc. (formerly known as Invesco AIM Distributors, Inc.); Vice President and Secretary, Invesco Investment Services, Inc. (formerly known as Invesco AIM Investment Services, Inc.) Senior Vice President, Chief Legal Officer and Secretary, The Invesco Funds; Secretary and General Counsel, Invesco Investment Advisers LLC (formerly known as Van Kampen Asset Management); Secretary and General Counsel, Invesco Capital Markets, Inc. (formerly known as Van Kampen Funds Inc.) and Chief Legal Officer, Invesco Exchange-Traded Fund Trust, Invesco Exchange-Traded Fund Trust II, Invesco India Exchange-Traded Fund Trust, Invesco Actively Managed Exchange-Traded Fund Trust, Invesco Actively Managed Exchange-Traded Commodity Fund Trust and Invesco Exchange-Traded Self-Indexed Fund Trust; Secretary, Invesco Indexing LLC; Secretary and General Counsel, INVESCO Private Capital Investments, Inc.; Secretary, W.L. Ross & Co., LLC; Secretary and Vice President, Jemstep, Inc. Formerly: Senior Vice President, Secretary and General Counsel, Invesco Management Group, Inc. (formerly known as Invesco AIM Management Group, Inc.); Assistant Secretary, INVESCO Asset Management (Bermuda) Ltd.; Secretary and General Counsel, Invesco Private Capital, Inc.; Assistant Secretary and General Counsel, INVESCO Realty, Inc.; Secretary and General Counsel, Invesco Senior Secured Management, Inc.; and Secretary, Sovereign G./P. Holdings Inc. | | N/A | | N/A |
John M. Zerr — 1962 Senior Vice President | | 2006 | | Chief Operating Officer of the Americas; Senior Vice President, Invesco Advisers, Inc. (formerly known as Invesco Institutional (N.A.), Inc.) (registered investment adviser); Senior Vice President, Invesco Distributors, Inc. (formerly known as Invesco AIM Distributors, Inc.); Director and Vice President, Invesco Investment Services, Inc. (formerly known as Invesco AIM Investment Services, Inc.) Senior Vice President, The Invesco Funds; Managing Director, Invesco Capital Management LLC; Director, Invesco Investment Advisers LLC (formerly known as Van Kampen Asset Management); Senior Vice President, Invesco Capital Markets, Inc. (formerly known as Van Kampen Funds Inc.); Manager, Invesco Indexing LLC Formerly: Director and Senior Vice President, Invesco Management Group, Inc. (formerly known as Invesco AIM Management Group, Inc.); Secretary and General Counsel, Invesco Management Group, Inc. (formerly known as Invesco AIM Management Group, Inc.); Secretary, Invesco Investment Services, Inc. (formerly known as Invesco AIM Investment Services, Inc.); Chief Legal Officer and Secretary, The Invesco Funds; Secretary and General Counsel, Invesco Investment Advisers LLC (formerly known as Van Kampen Asset Management); Secretary and General Counsel, Invesco Capital Markets, Inc. (formerly known as Van Kampen Funds Inc.); Chief Legal Officer, Invesco Exchange-Traded Fund Trust, Invesco Exchange-Traded Fund Trust II, Invesco India Exchange-Traded Fund Trust, Invesco Actively Managed Exchange-Traded Fund Trust, Invesco Actively Managed Exchange-Traded Commodity Fund Trust and Invesco Exchange-Traded Self-Indexed Fund Trust; Secretary, Invesco Indexing LLC; Director, Secretary, General Counsel and Senior Vice President, Van Kampen Exchange Corp.; Director, Vice President and Secretary, IVZ Distributors, Inc. (formerly known as INVESCO Distributors, Inc.); Director and Vice President, INVESCO Funds Group, Inc.; Director and Vice President, Van Kampen Advisors Inc.; Director, Vice President, Secretary and General Counsel, Van Kampen Investor Services Inc.; Director and Secretary, Invesco Distributors, Inc. (formerly known as Invesco AIM Distributors, Inc.); Director, Senior Vice President, General Counsel and Secretary, Invesco AIM Advisers, Inc. and Van Kampen Investments Inc.; Director, Vice President and Secretary, Fund Management Company; Director, Senior Vice President, Secretary, General Counsel and Vice President, Invesco AIM Capital Management, Inc.; Chief Operating Officer and General Counsel, Liberty Ridge Capital, Inc. (an investment adviser) | | N/A | | N/A |
T-3 Invesco Pacific Growth Fund
Trustees and Officers—(continued)
| | | | | | | | |
Name, Year of Birth and
Position(s) Held with the Trust | | Trustee and/
or Officer Since | | Principal Occupation(s)
During Past 5 Years | | Number of
Funds in Fund
Complex
Overseen by
Trustee | | Other Directorship(s)
Held by Trustee During
Past 5 Years |
| Other Officers—(continued) | | | | | | | | |
Gregory G. McGreevey — 1962 Senior Vice President | | 2012 | | Senior Managing Director, Invesco Ltd.; Director, Chairman, President, and Chief Executive Officer, Invesco Advisers, Inc. (formerly known as Invesco Institutional (N.A.), Inc.) (registered investment adviser); Director, Invesco Mortgage Capital, Inc. and Invesco Senior Secured Management, Inc.; and Senior Vice President, The Invesco Funds Formerly: Senior Vice President, Invesco Management Group, Inc. and Invesco Advisers, Inc.; Assistant Vice President, The Invesco Funds | | N/A | | N/A |
Kelli Gallegos — 1970 Vice President, Principal Financial Officer and Assistant Treasurer | | 2008 | | Vice President and Treasurer, Invesco Exchange-Traded Fund Trust, Invesco Exchange-Traded Fund Trust II, Invesco India Exchange-Traded Fund Trust, Invesco Actively Managed Exchange-Traded Fund Trust, Invesco Actively Managed Exchange-Traded Commodity Fund Trust and Invesco Exchange-Traded Self-Indexed Fund Trust; Vice President, Principal Financial Officer and Assistant Treasurer, The Invesco Funds; Principal Financial and Accounting Officer — Pooled Investments, Invesco Capital Management LLC Formerly: Assistant Treasurer, Invesco Exchange-Traded Fund Trust, Invesco Exchange-Traded Fund Trust II, Invesco India Exchange-Traded Fund Trust, Invesco Actively Managed Exchange-Traded Fund Trust, Invesco Actively Managed Exchange-Traded Commodity Fund Trust and Invesco Exchange-Traded Self-Indexed Fund Trust; Assistant Treasurer, Invesco Capital Management LLC; Assistant Vice President, The Invesco Funds | | N/A | | N/A |
Tracy Sullivan — 1962 Vice President, Chief Tax Officer and Assistant Treasurer | | 2008 | | Vice President, Chief Tax Officer and Assistant Treasurer, The Invesco Funds; Assistant Treasurer, Invesco Capital Management LLC, Invesco Exchange-Traded Fund Trust, Invesco Exchange-Traded Fund Trust II, Invesco India Exchange-Traded Fund Trust, Invesco Actively Managed Exchange-Traded Fund Trust, Invesco Actively Managed Exchange-Traded Commodity Fund Trust and Invesco Exchange-Traded Self-Indexed Fund Trust Formerly: Assistant Vice President, The Invesco Funds | | N/A | | N/A |
Crissie M. Wisdom — 1969 Anti-Money Laundering Compliance Officer | | 2013 | | Anti-Money Laundering Compliance Officer, Invesco Advisers, Inc. (formerly known as Invesco Institutional (N.A.), Inc.) (registered investment adviser), Invesco Capital Markets, Inc. (formerly known as Van Kampen Funds Inc.), Invesco Distributors, Inc., Invesco Investment Services, Inc., The Invesco Funds, and Invesco Exchange-Traded Fund Trust, Invesco Exchange-Traded Fund Trust II, Invesco India Exchange-Traded Fund Trust, Invesco Actively Managed Exchange-Traded Fund Trust, Invesco Actively Managed Exchange-Traded Commodity Fund Trust and Invesco Exchange-Traded Self-Indexed Fund Trust; Anti-Money Laundering Compliance Officer and Bank Secrecy Act Officer, INVESCO National Trust Company and Invesco Trust Company; and Fraud Prevention Manager and Controls and Risk Analysis Manager for Invesco Investment Services, Inc. Formerly: Anti-Money Laundering Compliance Officer, Van Kampen Exchange Corp. and Invesco Management Group, Inc. | | N/A | | N/A |
Robert R. Leveille — 1969 Chief Compliance Officer | | 2016 | | Chief Compliance Officer, Invesco Advisers, Inc. (registered investment adviser); and Chief Compliance Officer, The Invesco Funds Formerly: Chief Compliance Officer, Putnam Investments and the Putnam Funds | | N/A | | N/A |
The Statement of Additional Information of the Trust includes additional information about the Fund’s Trustees and is available upon request, without charge, by calling 1.800.959.4246. Please refer to the Fund’s Statement of Additional Information for information on the Fund’s sub-advisers.
| | | | | | |
Office of the Fund 11 Greenway Plaza, Suite 1000 Houston, TX 77046-1173 | | Investment Adviser Invesco Advisers, Inc. 1555 Peachtree Street, N.E. Atlanta, GA 30309 | | Distributor Invesco Distributors, Inc. 11 Greenway Plaza, Suite 1000 Houston, TX 77046-1173 | | Auditors PricewaterhouseCoopers LLP 1000 Louisiana Street, Suite 5800 Houston, TX 77002-5021 |
| | | |
| | | | | | |
Counsel to the Fund Stradley Ronon Stevens & Young, LLP 2005 Market Street, Suite 2600 Philadelphia, PA 19103-7018 | | Counsel to the Independent Trustees Goodwin Procter LLP 901 New York Avenue, N.W. Washington, D.C. 20001 | | Transfer Agent Invesco Investment Services, Inc. 11 Greenway Plaza, Suite 1000 Houston, TX 77046-1173 | | Custodian State Street Bank and Trust Company 225 Franklin Street Boston, MA 02110-2801 |
T-4 Invesco Pacific Growth Fund
Explore High-Conviction Investing with Invesco

Go paperless with eDelivery
Visit invesco.com/edelivery to enjoy the convenience and security of anytime electronic access to your investment documents.
With eDelivery, you can elect to have any or all of the following materials delivered straight to your inbox to download, save and print from your own computer:
∎ Fund reports and prospectuses
∎ Quarterly statements
∎ Daily confirmations
∎ Tax forms
Invesco mailing information
Send general correspondence to Invesco Investment Services, Inc., P.O. Box 219078, Kansas City, MO 64121-9078.
Important notice regarding delivery of security holder documents
To reduce Fund expenses, only one copy of most shareholder documents may be mailed to shareholders with multiple accounts at the same address (Householding). Mailing of your shareholder documents may be householded indefinitely unless you instruct us otherwise. If you do not want the mailing of these documents to be combined with those for other members of your household, please contact Invesco Investment Services, Inc. at 800 959 4246 or contact your financial institution. We will begin sending you individual copies for each account within 30 days after receiving your request.
Fund holdings and proxy voting information
The Fund provides a complete list of its holdings four times in each fiscal year, at the quarter ends. For the second and fourth quarters, the lists appear in the Fund’s semiannual and annual reports to shareholders. For the first and third quarters, the Fund files the lists with the Securities and Exchange Commission (SEC) on Form N-Q (or any successor Form). The most recent list of portfolio holdings is available at invesco.com/completeqtrholdings. Shareholders can also look up the Fund’s Forms N-Q (or any successor Form) on the SEC website at sec.gov. The SEC file numbers for the Fund are shown below.
A description of the policies and procedures that the Fund uses to determine how to vote proxies relating to portfolio securities is available without charge, upon request, from our Client Services department at 800 959 4246 or at invesco.com/proxyguidelines. The information is also available on the SEC website, sec.gov.
| | |
Information regarding how the Fund voted proxies related to its portfolio securities during the most recent 12-month period ended June 30 is available at invesco.com/proxysearch. The information is also available on the SEC website, sec.gov. Invesco Advisers, Inc. is an investment adviser; it provides investment advisory services to individual and institutional clients and does not sell securities. Invesco Distributors, Inc. is the US distributor for Invesco Ltd.’s retail mutual funds, exchange-traded funds and institutional money market funds. Both are wholly owned, indirect subsidiaries of Invesco Ltd. | |  |
SEC file numbers: 811-05426 and 033-19338 Invesco Distributors, Inc. MS-PGRO-AR-1 12192018 1535
| | | | | | |
| | | | |

| | Annual Report to Shareholders | | October 31, 2018 | | |
| | | | |
| | Invesco Select Companies Fund | | |
| | Nasdaq: | | |
| | A: ATIAX ∎ C: ATICX ∎ R: ATIRX ∎ Y: ATIYX ∎ R5: ATIIX ∎ R6: ATISX | | |

Letters to Shareholders
| | |

Philip Taylor | | Dear Shareholders: This annual report includes information about your Fund, including performance data and a complete list of its investments as of the close of the reporting period. Inside is a discussion of how your Fund was managed and the factors that affected its performance during the reporting period. Throughout the reporting period, US economic data remained positive. Robust corporate profits, strong retail sales and unemployment rates near generational lows helped drive US markets to new all-time records multiple times during the reporting period. Against this backdrop, the US Federal Reserve raised the federal funds rate four times during the reporting period. Market volatility, largely non-existent in 2017, returned in 2018. Markets sold off first in February and again sharply in October, amid rising interest rates, concerns about potential trade wars and |
heightened geopolitical tensions. Despite the volatility, US equity markets were largely positive for the reporting period and fared better than international markets. Emerging markets were particularly hard hit due to a strong US dollar. During the October sell-off, investors retreated to more defensive areas of the market and to US Treasuries. The broader bond market declined during the reporting period due to the increase in US Treasury yields and widening credit spreads. As the year progresses, we’ll see how the interplay of economic data, interest rates, geopolitics and a host of other factors affect US and overseas equity and fixed income markets.
Short-term market volatility can prompt some investors to abandon their investment plans – and can cause others to settle for whatever returns the market has to offer. The investment professionals at Invesco, in contrast, invest with high conviction. This means that, no matter the asset class or the strategy, each investment team has a passion to exceed. We want to help investors achieve better outcomes, such as seeking higher returns, helping mitigate risk and generating income. Of course, investing with high conviction can’t guarantee a profit or ensure success; no investment strategy can. To learn more about how we invest with high conviction, visit invesco.com/HighConviction.
You, too, can invest with high conviction by maintaining a long-term investment perspective and by working with your financial adviser on a regular basis. During periods of short-term market volatility or uncertainty, your financial adviser can keep you focused on your long-term investment goals – a new home, a child’s college education or a secure retirement. He or she also can share research about the economy, the markets and individual investment options.
Visit our website for more information on your investments
Our website, invesco.com/us, offers a wide range of market insights and investment perspectives. On the website, you’ll find detailed information about our funds, including performance, holdings and portfolio manager commentaries. You can access information about your account by completing a simple, secure online registration. To do so, select “Log In” on the right side of the homepage, and then select “Register for Individual Account Access.”
In addition to the resources accessible on our website and through our mobile app, you can obtain timely updates to help you stay informed about the markets and the economy by connecting with Invesco on Twitter, LinkedIn or Facebook. You can access our blog at blog.invesco.us.com. Our goal is to provide you the information you want, when and where you want it.
Finally, I’m pleased to share with you Invesco’s commitment to both the Principles for Responsible Investment and to considering environmental, social and governance issues in our robust investment process. I invite you to learn more at invesco.com/esg.
Have questions?
For questions about your account, contact an Invesco client services representative at 800 959 4246. For Invesco-related questions or comments, please email me directly at phil@invesco.com.
All of us at Invesco look forward to serving your investment management needs. Thank you for investing with us.
Sincerely,

Philip Taylor
Senior Managing Director, Invesco Ltd.
| | |
| 2 | | Invesco Select Companies Fund |
| | | | |

Bruce Crockett | | Dear Fellow Shareholders: Among the many important lessons I’ve learned in more than 40 years in a variety of business endeavors is the value of a trusted advocate. As independent chair of the Invesco Funds Board, I can assure you that the members of the Board are strong advocates for the interests of investors in Invesco’s mutual funds. We work hard to represent your interests through oversight of the quality of the investment management services your funds receive and other matters important to your investment, including but not limited to: |
| | ∎ | | Ensuring that Invesco offers a diverse lineup of mutual funds that your financial adviser can use to strive to meet your financial needs as your investment goals change over time. |
| | ∎ | | Monitoring how the portfolio management teams of the Invesco funds are performing in light of changing economic and market conditions. |
| ∎ | | Assessing each portfolio management team’s investment performance within the context of the investment strategy described in the fund’s prospectus. |
| ∎ | | Monitoring for potential conflicts of interests that may impact the nature of the services that your funds receive. |
We believe one of the most important services we provide our fund shareholders is the annual review of the funds’ advisory and sub-advisory contracts with Invesco Advisers and its affiliates. This review is required by the Investment Company Act of 1940 and focuses on the nature and quality of the services Invesco provides as the adviser to the Invesco funds and the reasonableness of the fees that it charges for those services. Each year, we spend months carefully reviewing information received from Invesco and a variety of independent sources, such as performance and fee data prepared by Lipper, Inc. (a subsidiary of Broadridge Financial Solutions, Inc.), an independent, third-party firm widely recognized as a leader in its field. We also meet with our independent legal counsel and other independent advisers to review and help us assess the information that we have received. Our goal is to assure that you receive quality investment management services for a reasonable fee.
I trust the measures outlined above provide assurance that you have a worthy advocate when it comes to choosing the Invesco Funds.
As always, please contact me at bruce@brucecrockett.com with any questions or concerns you may have. On behalf of the Board, we look forward to continuing to represent your interests and serving your needs.
Sincerely,

Bruce L. Crockett
Independent Chair
Invesco Funds Board of Trustees
| | |
| 3 | | Invesco Select Companies Fund |
Management’s Discussion of Fund Performance
| | | | |
| |
Performance summary For the fiscal year ended October 31, 2018, Class A shares of Invesco Select Companies Fund (the Fund), at net asset value (NAV), outperformed the Fund’s style-specific benchmark, the Russell 2000 Index. Your Fund’s long-term performance appears later in this report. | |
| | |
Fund vs. Indexes | | | | |
Total returns, 10/31/17 to 10/31/18, at net asset value (NAV). Performance shown does not include applicable contingent deferred sales charges (CDSC) or front-end sales charges, which would have reduced performance. | |
| |
Class A Shares | | | 2.76 | % |
Class C Shares | | | 2.01 | |
Class R Shares | | | 2.55 | |
Class Y Shares | | | 3.07 | |
Class R5 Shares | | | 3.14 | |
Class R6 Shares | | | 3.19 | |
S&P 500 Indexq (Broad Market Index) | | | 7.35 | |
Russell 2000 Indexq (Style-Specific Index) | | | 1.85 | |
Lipper Small-Cap Core Funds Index⬛ (Peer Group Index) | | | 1.37 | |
Source(s): qFactSet Research Systems Inc.; ⬛Lipper Inc. | | | | |
Market conditions and your Fund
The fiscal year proved to be an increasingly volatile time for US equities. The fiscal year began in the final months of 2017 with several major US stock market indexes repeatedly reaching new highs amid strong corporate profits, the prospect of tax reform legislation and exceedingly low stock market volatility.
Stock market euphoria continued in January 2018 as US equity markets steadily moved higher. Investors remained enthused about the passage of the Tax Cuts and Jobs Act signed into law in late December 2017, which significantly cut corporate tax rates. However, in February 2018, volatility returned to the US stock and bond markets. Worries about how rising interest rates might affect economic growth, concerns about a potential trade war and heightened geopolitical tensions, caused the US stock markets to pull back and volatility to increase.
US equity markets generally recovered in the second quarter of 2018 as strong US retail sales and low unemployment
buoyed markets. Throughout the summer, US equities moved higher as corporate profits surged. Several US equity indexes reached new highs despite potential headwinds including trade tensions, tariff announcements and contagion concerns over a Turkish currency crisis. After a relatively quiet summer, market volatility markedly rose in the final month of the fiscal year. US equity markets suffered a sharp sell-off in October 2018 amid rising interest rates and concerns that higher inflation could mean a more restrictive monetary policy. In this environment, investors fled to more defensive areas of the market and to US Treasuries.
Given signs of a strong economy, the US Federal Reserve raised interest rates four times during the fiscal year: in December 2017 and in March, June and September 2018.1 In contrast, the European Central Bank and central banks in several other countries maintained extraordinarily accommodative monetary policies.
Before we discuss the Fund’s results during the fiscal year, it is helpful to briefly explain how we manage the Fund for shareholders. We view ourselves as business people buying businesses, and we consider the purchase of a stock as an ownership interest in a business. We strive to develop a proprietary view of a business through in-depth, fundamental research that includes careful financial statement analysis and meetings with company management. We then seek to purchase businesses whose stock prices are below what we have calculated to be the true value of the company based on an estimate of its future free cash flows.
Our investment approach focuses on individual businesses rather than market sectors. Therefore, the Fund shares little in common with sector weightings of various market indexes. However, if we were to broadly categorize businesses with which we had the most success during the fiscal year, our investments in select industrials, energy and information technology (IT) were the largest contributors to the Fund’s absolute performance.
Relative to the Fund’s style-specific benchmark, security selection in the industrials, energy and IT sectors benefited the Fund’s performance during the fiscal year. Conversely, security selection in the financials, materials and health care sectors detracted from the Fund’s relative performance.
During the fiscal year, top contributors to the Fund’s performance relative to the style-specific benchmark included Spirit Airlines and SiteOne Landscape Supply.
Spirit Airlines is an ultra-low-cost US airline operator. Throughout the fiscal year, the company reported earnings that beat analyst expectations due to increased revenue per passenger from ancillary offerings and lower operating expenses. We believe the company is positioned to perform very well over the long term since the lowest-cost operator
| | | | |
| |
Portfolio Composition | |
| By sector | | | % of total net assets | |
| |
Information Technology | | | 35.3% | |
Industrials | | | 11.9 | |
Health Care | | | 9.4 | |
Communication Services | | | 8.9 | |
Materials | | | 6.8 | |
Energy | | | 6.6 | |
Real Estate | | | 4.5 | |
Financials | | | 4.3 | |
Consumer Discretionary | | | 1.5 | |
Money Market Funds Plus Other Assets Less Liabilities | | | 10.8 | |
| | | | | | |
| | |
Top 10 Equity Holdings* | | | | |
| | % of total net assets | |
| | |
1. | | Liberty Broadband Corp.-Class A | | | 5.8% | |
2. | | GasLog Ltd. | | | 5.4 | |
3. | | Booz Allen Hamilton Holding Corp. | | | 5.2 | |
4. | | Charles River Laboratories International, Inc. | | | 5.1 | |
5. | | Sabre Corp. | | | 5.0 | |
6. | | Global Payments Inc. | | | 5.0 | |
7. | | Nuance Communications, Inc. | | | 4.7 | |
8. | | Spirit Airlines, Inc. | | | 4.5 | |
9. | | CommScope Holding Co., Inc. | | | 4.5 | |
10. | | Regal-Beloit Corp. | | | 4.5 | |
| | | | |
| | |
Total Net Assets | | $ | 406.3 million | |
| |
Total Number of Holdings* | | | 25 | |
The Fund’s holdings are subject to change, and there is no assurance that the Fund will continue to hold any particular security.
*Excluding money market fund holdings.
Data presented here are as of October 31, 2018.
| | |
| 4 | | Invesco Select Companies Fund |
has significant room for growth and a capable management team at the helm.
SiteOne Landscape Supply is a leading wholesale distributor of landscape supplies in the US. SiteOne���s main customers are primarily residential and commercial landscape professionals who specialize in the design, installation and maintenance of lawns, gardens, golf courses and other outdoor spaces. The company’s leadership position, economies of scale and access to capital markets provide a strong competitive advantage moving forward. Throughout the fiscal year, the company continued to prove the strength and scalability of its business model as the leader of the highly-fragmented landscape supply distribution industry. SiteOne showed strong organic and inorganic growth, as new residential construction, and repair and upgrade markets performed well. It is our view that SiteOne reached full valuation and, as such, we sold our position in the company before the close of the fiscal year.
During the fiscal year, the top detractors from the Fund’s performance relative to the style-specific benchmark were
Encore Capital Group and CommScope.
Encore Capital Group is a financial company that buys consumer receivables from major banks and credit unions, and works to collect as much of the outstanding debt as possible. The company’s share price fell after it posted quarterly earnings results that were slightly below expectations, and following the announcement that it would purchase the remaining equity interest in Cabot Credit Management (not a Fund holding). However, we view the recent transaction with Cabot Credit Management favorably and we remain optimistic about the large tailwind that is to come in the form of rising credit card balances combined with an increasing number of cardholder delinquencies.
CommScope provides connectivity and essential infrastructure solutions for wireless, business enterprise and residential broadband networks. During the fiscal year, the company’s stock price fell more than 30% after it reported first-quarter results that missed analyst expectations, and revised its outlook to reflect higher input costs and price reductions. Nevertheless, we are confident in the company’s longer-term prospects going forward, as it is a highly cash-flow generative business that is a top provider globally in the markets it competes in.
During the fiscal year, we made new investments in Insight Enterprises, a global technology company that provides business-to-business and IT services for enterprises; Tempur Sealy International, a manufacturer of mattresses and bedding products; and CoreLogic, which provides real estate-related information and analytics to its customers. Generally, we sell Fund holdings when they reach full valuation; if new, relatively more attractive investment opportunities exist; or if new information changes our thesis on the future of a business. As such, we sold SiteOne Landscape Supply, Microsemi, Americas Car-Mart and Team.
During the fiscal year, we continued to focus on finding quality businesses we believed were trading at attractive values relative to their long-term prospects. In contrast, the market is often driven by short-term events or outlooks in both good times and bad. Market volatility allows us to take advantage of investment opportunities we believe may benefit the Fund in the long term. While we can never predict future Fund performance, we pledge to you that we will adhere to our discipline of being business people who buy businesses – and we will continually strive to upgrade the quality of the Fund’s portfolio.
As always, we thank you for your investment in Invesco Select Companies Fund and for sharing our long-term investment perspective.
1 Source: US Federal Reserve
The views and opinions expressed in management’s discussion of Fund performance are those of Invesco Advisers, Inc. These views and opinions are subject to change at any time based on factors such as market and economic conditions. These views and opinions may not be relied upon as investment advice or recommendations, or as an offer for a particular security. The information is not a complete analysis of every aspect of any market, country, industry, security or the Fund. Statements of fact are from sources considered reliable, but Invesco Advisers, Inc. makes no representation or warranty as to their completeness or accuracy. Although historical performance is no guarantee of future results, these insights may help you understand our investment management philosophy.
See important Fund and, if applicable, index disclosures later in this report.
| | |
 | | Rob Mikalachki Chartered Financial Analyst, Portfolio Manager, is lead manager of Invesco Select Companies Fund. He |
| joined Invesco in 1999. Mr. Mikalachki earned a business degree from Wilfrid Laurier University. |
| |
 | | Virginia Au Chartered Financial Analyst, Portfolio Manager, is manager of Invesco Select Companies Fund. She joined Invesco |
| in 2006. Ms. Au earned a Bachelor of Commerce degree in finance from The University of British Columbia. |
| |
 | | Jason Whiting Chartered Financial Analyst, Portfolio Manager, is manager of Invesco Select Companies Fund. He joined Invesco in |
| 2003. Mr. Whiting earned a BBA from Wilfrid Laurier University. |
5 Invesco Select Companies Fund
Your Fund’s Long-Term Performance
Results of a $10,000 Investment – Oldest Share Class(es)
Fund and index data from 10/31/08
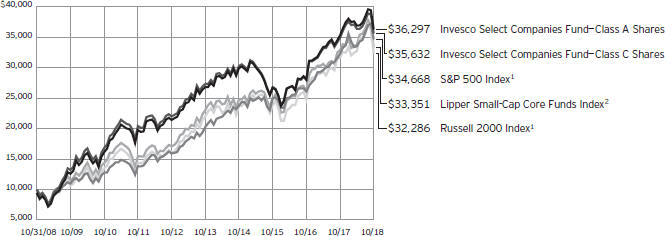
1 Source: FactSet Research Systems Inc.
2 Source: Lipper Inc.
Past performance cannot guarantee comparable future results.
The data shown in the chart include reinvested distributions, applicable sales charges and Fund expenses including management fees. Index results include reinvested dividends, but they do not reflect sales charges. Performance of the
peer group, if applicable, reflects fund expenses and management fees; performance of a market index does not. Performance shown in the chart and table(s) does not reflect deduction of taxes a shareholder would pay on Fund distributions or sale of Fund shares.
continued from page 8
government will provide financial support to its agencies and authorities if it is not obligated by law to do so.
| ∎ | | Value investing style risk. A value investing style subjects the Fund to the risk that the valuations never improve or that the returns on value equity securities are less than returns on other styles of investing or the overall stock market. |
About indexes used in this report
| ∎ | | The S&P 500® Index is an unmanaged index considered representative of the US stock market. |
| ∎ | | The Russell 2000® Index is an unmanaged index considered representative of small-cap stocks. The Russell 2000 Index is a trademark/service mark of the Frank Russell Co. Russell® is a trademark of the Frank Russell Co. |
| ∎ | | The Lipper Small-Cap Core Funds Index is an unmanaged index considered representative of small-cap core funds tracked by Lipper. |
| ∎ | | The Fund is not managed to track the performance of any particular index, including the index(es) described here, and consequently, the performance of the Fund may deviate significantly from the performance of the index(es). |
| ∎ | | A direct investment cannot be made in an index. Unless otherwise indicated, index results include reinvested dividends, and they do not reflect sales charges. Performance of the peer group, if applicable, reflects fund expenses; performance of a market index does not. |
Other information
| ∎ | | The returns shown in management’s discussion of Fund performance are based on net asset values (NAVs) calculated for shareholder transactions. Generally accepted accounting principles require adjustments to be made to the net assets of the Fund at period end for financial reporting purposes, and as such, the NAVs for shareholder transactions and the returns based on those NAVs may differ from the NAVs and returns reported in the Financial Highlights. |
| ∎ | | Industry classifications used in this report are generally according to the Global Industry Classification Standard, which was developed by and is the exclusive property and a service mark of MSCI Inc. and Standard & Poor’s. |
| | |
| 6 | | Invesco Select Companies Fund |
| | | | |
| |
Average Annual Total Returns | |
As of 10/31/18, including maximum applicable sales charges | |
| |
| |
Class A Shares | | | | |
Inception (11/4/03) | | | 9.51 | % |
10 Years | | | 13.76 | |
5 Years | | | 5.05 | |
1 Year | | | -2.88 | |
| |
Class C Shares | | | | |
Inception (11/4/03) | | | 9.11 | % |
10 Years | | | 13.55 | |
5 Years | | | 5.45 | |
1 Year | | | 1.14 | |
| |
Class R Shares | | | | |
Inception (4/30/04) | | | 9.60 | % |
10 Years | | | 14.13 | |
5 Years | | | 5.98 | |
1 Year | | | 2.55 | |
| |
Class Y Shares | | | | |
Inception (10/3/08) | | | 13.01 | % |
10 Years | | | 14.69 | |
5 Years | | | 6.51 | |
1 Year | | | 3.07 | |
| |
Class R5 Shares | | | | |
Inception (4/30/04) | | | 10.30 | % |
10 Years | | | 14.84 | |
5 Years | | | 6.60 | |
1 Year | | | 3.14 | |
| |
Class R6 Shares | | | | |
10 Years | | | 14.48 | % |
5 Years | | | 6.38 | |
1 Year | | | 3.19 | |
Class Y shares incepted on October 3, 2008. Performance shown prior to that date is that of Class A shares and includes the 12b-1 fees applicable to Class A shares.
Class R6 shares incepted on April 4, 2017. Performance shown prior to that date is that of Class A shares and includes the 12b-1 fees applicable to Class A shares.
The performance data quoted represent past performance and cannot guarantee comparable future results; current performance may be lower or higher. Please visit invesco.com/performance for the most recent month-end performance. Performance figures reflect reinvested distributions, changes in net asset value and the effect of the maximum sales charge unless otherwise stated. Investment return and principal value will fluctuate so that you may have a gain or loss when you sell shares.
| | | | |
| |
Average Annual Total Returns | |
As of 9/30/18, the most recent calendar quarter end, including maximum applicable sales charges | |
| |
Class A Shares | | | | |
Inception (11/4/03) | | | 10.18 | % |
10 Years | | | 12.28 | |
5 Years | | | 7.14 | |
1 Year | | | 8.06 | |
| |
Class C Shares | | | | |
Inception (11/4/03) | | | 9.78 | % |
10 Years | | | 12.06 | |
5 Years | | | 7.55 | |
1 Year | | | 12.46 | |
| |
Class R Shares | | | | |
Inception (4/30/04) | | | 10.29 | % |
10 Years | | | 12.63 | |
5 Years | | | 8.10 | |
1 Year | | | 14.04 | |
| |
Class Y Shares | | | | |
10 Years | | | 13.19 | % |
5 Years | | | 8.63 | |
1 Year | | | 14.64 | |
| |
Class R5 Shares | | | | |
Inception (4/30/04) | | | 11.00 | % |
10 Years | | | 13.34 | |
5 Years | | | 8.72 | |
1 Year | | | 14.67 | |
| |
Class R6 Shares | | | | |
10 Years | | | 12.98 | % |
5 Years | | | 8.49 | |
1 Year | | | 14.77 | |
The net annual Fund operating expense ratio set forth in the most recent Fund prospectus as of the date of this report for Class A, Class C, Class R, Class Y, Class R5 and Class R6 shares was 1.28%, 2.03%, 1.53%, 1.03%, 0.93% and 0.85%, respectively.1 The total annual Fund operating expense ratio set forth in the most recent Fund prospectus as of the date of this report for Class A, Class C, Class R, Class Y, Class R5 and Class R6 shares was 1.29%, 2.04%, 1.54%, 1.04%, 0.94% and 0.86%, respectively. The expense ratios presented above may vary from the expense ratios presented in other sections of this report that are based on expenses incurred during the period covered by this report.
Class A share performance reflects the maximum 5.50% sales charge, and Class C share performance reflects the applicable contingent deferred sales charge (CDSC) for the period involved.
The CDSC on Class C shares is 1% for the first year after purchase. Class R, Class Y, Class R5 and Class R6 shares do not have a front-end sales charge or a CDSC; therefore, performance is at net asset value.
The performance of the Fund’s share classes will differ primarily due to different sales charge structures and class expenses.
Fund performance reflects any applicable fee waivers and/or expense reimbursements. Had the adviser not waived fees and/or reimbursed expenses currently or in the past, returns would have been lower. See current prospectus for more information.
| 1 | Total annual Fund operating expenses after any contractual fee waivers and/or expense reimbursements by the adviser in effect through at least June 30, 2020. See current prospectus for more information. |
7 Invesco Select Companies Fund
Invesco Select Companies Fund’s investment objective is long-term growth of capital.
| ∎ | | Unless otherwise stated, information presented in this report is as of October 31, 2018, and is based on total net assets. |
| ∎ | | Unless otherwise noted, all data provided by Invesco. |
| ∎ | | To access your Fund’s reports/prospectus, visit invesco.com/fundreports. |
About share classes
| ∎ | | Class R shares are generally available only to employer sponsored retirement and benefit plans. Please see the prospectus for more information. |
| ∎ | | Class Y shares are available only to certain investors. Please see the prospectus for more information. |
| ∎ | | Class R5 shares and Class R6 shares are available for use by retirement plans that meet certain standards and for institutional investors. Class R6 shares are also available through intermediaries that have established an agreement with Invesco Distributors, Inc. to make such shares available for use in retail omnibus accounts. Please see the prospectus for more information. |
Principal risks of investing in the Fund
| ∎ | | Cash/cash equivalents risk. In rising markets, holding cash or cash equivalents will negatively affect the Fund’s performance relative to its benchmark. |
| ∎ | | Debt securities risk. The prices of debt securities held by the Fund will be affected by changes in interest rates, the creditworthiness of the issuer and other factors. An increase in prevailing interest rates typically causes the value of existing debt securities to fall and often has a greater impact on longer-duration debt securities and higher quality debt securities. Falling interest rates will cause the Fund to reinvest the proceeds of debt securities that have been repaid by the issuer at lower interest rates. Falling interest rates may also reduce the Fund’s distributable income because interest payments on floating rate debt instruments held by the Fund will decline. The Fund could lose money on investments in debt securities if the issuer or borrower fails to meet its obligations to make interest payments and/or to repay principal in a timely manner. Changes in an issuer’s financial strength, the market’s perception of such strength or in the credit rating |
| | of the issuer or the security may affect the value of debt securities. The Adviser’s credit analysis may fail to anticipate such changes, which could result in buying a debt security at an inopportune time or failing to sell a debt security in advance of a price decline or other credit event. |
| ∎ | | Foreign securities risk. The Fund’s foreign investments may be adversely affected by political and social instability, changes in economic or taxation policies, difficulty in enforcing obligations, decreased liquidity or increased volatility. Foreign investments also involve the risk of the possible seizure, nationalization or expropriation of the issuer or foreign deposits (in which the Fund could lose its entire investments in a certain market) and the possible adoption of foreign governmental restrictions such as exchange controls. Unless the Fund has hedged its foreign securities risk, foreign securities risk also involves the risk of negative foreign currency rate fluctuations, which may cause the value of securities denominated in such foreign currency (or other instruments through which the Fund has exposure to foreign currencies) to decline in value. Currency exchange rates may fluctuate significantly over short periods of time. Currency hedging strategies, if used, are not always successful. |
| ∎ | | Limited number of holdings risk. The Fund holds a more limited number of securities than other funds with a similar investment strategy. As a result, each investment has a greater effect on the Fund’s overall performance and any change in the value of these securities could significantly affect the value of your investment in the Fund. |
| ∎ | | Management risk. The Fund is actively managed and depends heavily on the Adviser’s judgment about markets, interest rates or the attractiveness, relative values, liquidity, or potential appreciation of particular investments made for the Fund’s portfolio. The Fund could |
This report must be accompanied or preceded by a currently effective Fund prospectus, which contains more complete information, including sales charges and expenses. Investors should read it carefully before investing.
NOT FDIC INSURED | MAY LOSE VALUE | NO BANK GUARANTEE
| | experience losses if these judgments prove to be incorrect. Additionally, legislative, regulatory, or tax developments may adversely affect management of the Fund and, therefore, the ability of the Fund to achieve its investment objective. |
| ∎ | | Market risk. The market values of the Fund’s investments, and therefore the value of the Fund’s shares, will go up and down, sometimes rapidly or unpredictably. Market risk may affect a single issuer, industry or section of the economy, or it may affect the market as a whole. Individual stock prices tend to go up and down more dramatically than those of certain other types of investments, such as bonds. During a general downturn in the financial markets, multiple asset classes may decline in value. When markets perform well, there can be no assurance that specific investments held by the Fund will rise in value. |
| ∎ | | Sector focus risk. The Fund may from time to time invest a significant amount of its assets (i.e. over 25%) in one market sector or group of related industries. In this event, the Fund’s performance will depend to a greater extent on the overall condition of the sector or group of industries and there is increased risk that the Fund will lose significant value if conditions adversely affect that sector or group of industries. |
| ∎ | | Small- and mid-capitalization companies risks. Small- and mid-capitalization companies tend to be more vulnerable to changing market conditions, may have little or no operating history or track record of success, and may have more limited product lines and markets, less experienced management and fewer financial resources than larger companies. These companies’ securities may be more volatile and less liquid than those of more established companies, and their returns may vary, sometimes significantly, from the overall securities market. |
| ∎ | | US government obligations risk. Obligations of US government agencies and authorities receive varying levels of support and may not be backed by the full faith and credit of the US government, which could affect the Fund’s ability to recover should they default. No assurance can be given that the US |
continued on page 6
| | |
| 8 | | Invesco Select Companies Fund |
Schedule of Investments(a)
October 31, 2018
| | | | | | | | |
| | | Shares | | | Value | |
Common Stocks–89.17% | |
| Airlines–4.54% | |
Spirit Airlines, Inc.(b) | | | 355,732 | | | $ | 18,462,491 | |
|
| Application Software–4.75% | |
Nuance Communications, Inc.(b) | | | 1,109,274 | | | | 19,290,275 | |
|
| Cable & Satellite–5.85% | |
Liberty Broadband Corp.–Class A(b) | | | 287,097 | | | | 23,768,761 | |
|
| Commodity Chemicals–2.44% | |
Chemtrade Logistics Income Fund (Canada) | | | 1,045,784 | | | | 9,929,963 | |
|
| Communications Equipment–4.52% | |
CommScope Holding Co., Inc.(b) | | | 764,012 | | | | 18,382,129 | |
|
| Consumer Finance–4.27% | |
Encore Capital Group, Inc.(b) | | | 681,989 | | | | 17,329,340 | |
|
| Data Processing & Outsourced Services–15.03% | |
Alliance Data Systems Corp. | | | 59,127 | | | | 12,190,805 | |
CoreLogic, Inc.(b) | | | 52,235 | | | | 2,121,786 | |
Equiniti Group PLC (United Kingdom)(c) | | | 2,350,450 | | | | 6,474,365 | |
Global Payments Inc. | | | 176,167 | | | | 20,123,557 | |
Sabre Corp. | | | 817,556 | | | | 20,152,755 | |
| | | | | | | | 61,063,268 | |
|
| Diversified Support Services–2.83% | |
Performant Financial Corp.(b)(d) | | | 5,527,196 | | | | 11,496,568 | |
|
| Electrical Components & Equipment–4.50% | |
Regal Beloit Corp. | | | 255,025 | | | | 18,285,292 | |
|
| Health Care Supplies–4.30% | |
Cooper Cos., Inc. (The) | | | 67,612 | | | | 17,464,856 | |
|
| Home Furnishings–1.55% | |
Tempur Sealy International, Inc.(b) | | | 136,150 | | | | 6,291,491 | |
|
| IT Consulting & Other Services–5.24% | |
Booz Allen Hamilton Holding Corp. | | | 429,587 | | | | 21,281,740 | |
|
| Life Sciences Tools & Services–5.06% | |
Charles River Laboratories International, Inc.(b) | | | 168,881 | | | | 20,573,083 | |
| | | | | | | | |
| | | Shares | | | Value | |
| Oil & Gas Equipment & Services–1.22% | |
ION Geophysical Corp.(b) | | | 419,538 | | | $ | 4,954,744 | |
|
| Oil & Gas Storage & Transportation–5.39% | |
GasLog Ltd. (Monaco) | | | 1,070,152 | | | | 21,895,310 | |
|
| Other Diversified Financial Services–0.00% | |
Brompton Corp. (Canada)(b)(e) | | | 69,374 | | | | 0 | |
|
| Publishing–3.09% | |
John Wiley & Sons, Inc.–Class A | | | 231,098 | | | | 12,534,756 | |
|
| Real Estate Services–4.47% | |
Colliers International Group Inc. (Canada) | | | 267,453 | | | | 18,162,709 | |
|
| Specialty Chemicals–4.38% | |
Axalta Coating Systems Ltd.(b) | | | 720,716 | | | | 17,787,271 | |
|
| Systems Software–2.38% | |
TiVo Corp. | | | 879,815 | | | | 9,677,965 | |
|
| Technology Distributors–3.36% | |
Insight Enterprises, Inc.(b) | | | 264,202 | | | | 13,656,601 | |
Total Common Stocks
(Cost $302,527,655) | | | | 362,288,613 | |
|
Money Market Funds–10.99% | |
Invesco Government & Agency Portfolio–Institutional Class, 2.08%(f) | | | 15,634,512 | | | | 15,634,512 | |
Invesco Liquid Assets Portfolio–Institutional Class, 2.27%(f) | | | 11,165,356 | | | | 11,167,589 | |
Invesco Treasury Portfolio–Institutional Class, 2.09%(f) | | | 17,868,013 | | | | 17,868,013 | |
Total Money Market Funds
(Cost $44,669,235) | | | | 44,670,114 | |
TOTAL INVESTMENTS IN SECURITIES–100.16%
(Cost $347,196,890) | | | | 406,958,727 | |
OTHER ASSETS LESS LIABILITIES–(0.16)% | | | | (647,164 | ) |
NET ASSETS–100.00% | | | $ | 406,311,563 | |
Notes to Schedule of Investments:
| (a) | Industry and/or sector classifications used in this report are generally according to the Global Industry Classification Standard, which was developed by and is the exclusive property and a service mark of MSCI Inc. and Standard & Poor’s. |
| (b) | Non-income producing security. |
| (c) | Security purchased or received in transaction exempt from registration under the Securities Act of 1933, as amended (the “1933 Act”). The security may be resold pursuant to an exemption from registration under the 1933 Act, typically to qualified institutional buyers. The value of this security at October 31, 2018 represented 1.59% of the Fund’s Net Assets. |
| (d) | Affiliated company during the period. The Investment Company Act of 1940 defines an “affiliated person” as an issuance in which a fund holds 5% or more of the outstanding voting securities. The Fund has not owned enough of the outstanding voting securities of the issuer to have control (as defined in the Investment Company Act of 1940) of that issuer. The value of this security as of October 31, 2018 represented 2.83% of the Fund’s Net Assets. See Note 4. |
| (e) | Security valued using significant unobservable inputs (Level 3). See Note 3. |
| (f) | The money market fund and the Fund are affiliated by having the same investment adviser. The rate shown is the 7-day SEC standardized yield as of October 31, 2018. |
See accompanying Notes to Financial Statements which are an integral part of the financial statements.
9 Invesco Select Companies Fund
Statement of Assets and Liabilities
October 31, 2018
| | | | |
Assets: | | | | |
Investments in securities, at value (Cost $258,069,540) | | $ | 350,792,045 | |
Investments in affiliates, at value (Cost $89,127,350) | | | 56,166,682 | |
Foreign currencies, at value (Cost $90,890) | | | 90,630 | |
Receivable for: | | | | |
Dividends and interest | | | 157,356 | |
Fund shares sold | | | 188,163 | |
Investment for trustee deferred compensation and retirement plans | | | 147,285 | |
Other assets | | | 47,444 | |
Total assets | | | 407,589,605 | |
| |
Liabilities: | | | | |
Payable for: | | | | |
Investments purchased | | | 23,135 | |
Fund shares repurchased | | | 771,215 | |
Accrued foreign taxes | | | 11,935 | |
Accrued fees to affiliates | | | 228,135 | |
Accrued trustees’ and officers’ fees and benefits | | | 2,093 | |
Accrued other operating expenses | | | 79,189 | |
Trustee deferred compensation and retirement plans | | | 162,340 | |
Total liabilities | | | 1,278,042 | |
Net assets applicable to shares outstanding | | $ | 406,311,563 | |
| |
Net assets consists of: | | | | |
Shares of beneficial interest | | $ | 324,617,077 | |
Distributable earnings | | | 81,694,486 | |
| | | $ | 406,311,563 | |
| | | | |
Net Assets: | | | | |
Class A | | $ | 220,107,389 | |
Class C | | $ | 49,959,311 | |
Class R | | $ | 16,426,751 | |
Class Y | | $ | 95,958,207 | |
Class R5 | | $ | 23,088,178 | |
Class R6 | | $ | 771,727 | |
|
Shares outstanding, no par value,
with an unlimited number of shares authorized: | |
Class A | | | 12,091,111 | |
Class C | | | 3,276,116 | |
Class R | | | 951,302 | |
Class Y | | | 5,125,959 | |
Class R5 | | | 1,176,609 | |
Class R6 | | | 39,271 | |
Class A: | | | | |
Net asset value per share | | $ | 18.20 | |
Maximum offering price per share | | | | |
(Net asset value of $18.20 ¸ 94.50%) | | $ | 19.26 | |
Class C: | | | | |
Net asset value and offering price per share | | $ | 15.25 | |
Class R: | | | | |
Net asset value and offering price per share | | $ | 17.27 | |
Class Y: | | | | |
Net asset value and offering price per share | | $ | 18.72 | |
Class R5: | | | | |
Net asset value and offering price per share | | $ | 19.62 | |
Class R6: | | | | |
Net asset value and offering price per share | | $ | 19.65 | |
See accompanying Notes to Financial Statements which are an integral part of the financial statements.
10 Invesco Select Companies Fund
Statement of Operations
For the year ended October 31, 2018
| | | | |
Investment income: | | | | |
Dividends (net of foreign withholding taxes of $150,654) | | $ | 4,234,073 | |
Dividends from affiliates | | | 614,526 | |
Total investment income | | | 4,848,599 | |
| |
Expenses: | | | | |
Advisory fees | | | 3,405,418 | |
Administrative services fees | | | 132,304 | |
Custodian fees | | | 17,434 | |
Distribution fees: | | | | |
Class A | | | 621,879 | |
Class B | | | 2,712 | |
Class C | | | 726,242 | |
Class R | | | 100,052 | |
Transfer agent fees — A, B, C, R and Y | | | 731,513 | |
Transfer agent fees — R5 | | | 27,931 | |
Transfer agent fees — R6 | | | 142 | |
Trustees’ and officers’ fees and benefits | | | 26,968 | |
Registration and filing fees | | | 104,330 | |
Reports to shareholders | | | 53,864 | |
Professional services fees | | | 73,334 | |
Other | | | 25,580 | |
Total expenses | | | 6,049,703 | |
Less: Fees waived and expense offset arrangement(s) | | | (46,862 | ) |
Net expenses | | | 6,002,841 | |
Net investment income (loss) | | | (1,154,242 | ) |
| |
Realized and unrealized gain (loss): | | | | |
Net realized gain (loss) from: | | | | |
Investment securities | | | 24,106,296 | |
Foreign currencies | | | (33,205 | ) |
| | | | 24,073,091 | |
Change in net unrealized appreciation (depreciation) of: | | | | |
Investment securities | | | (6,930,082 | ) |
Foreign currencies | | | 12,693 | |
| | | | (6,917,389 | ) |
Net realized and unrealized gain | | | 17,155,702 | |
Net increase in net assets resulting from operations | | $ | 16,001,460 | |
See accompanying Notes to Financial Statements which are an integral part of the financial statements.
11 Invesco Select Companies Fund
Statement of Changes in Net Assets
For the years ended October 31, 2018 and 2017
| | | | | | | | |
| | | 2018 | | | 2017 | |
Operations: | | | | | | | | |
Net investment income (loss) | | $ | (1,154,242 | ) | | $ | (2,622,151 | ) |
Net realized gain | | | 24,073,091 | | | | 67,386,302 | |
Change in net unrealized appreciation (depreciation) | | | (6,917,389 | ) | | | 59,567,310 | |
Net increase in net assets resulting from operations | | | 16,001,460 | | | | 124,331,461 | |
| | |
Distributions to shareholders from distributable earnings(1): | | | | | | | | |
Class A | | | (32,431,701 | ) | | | (11,477,261 | ) |
Class B | | | (169,180 | ) | | | (93,782 | ) |
Class C | | | (13,319,235 | ) | | | (4,283,225 | ) |
Class R | | | (3,056,204 | ) | | | (1,126,806 | ) |
Class Y | | | (10,068,006 | ) | | | (1,868,112 | ) |
Class R5 | | | (3,307,865 | ) | | | (1,176,563 | ) |
Class R6 | | | (1,367 | ) | | | — | |
Total distributions from distributable earnings | | | (62,353,558 | ) | | | (20,025,749 | ) |
| | |
Share transactions–net: | | | | | | | | |
Class A | | | (6,611,839 | ) | | | (109,707,186 | ) |
Class B | | | (1,130,324 | ) | | | (1,432,978 | ) |
Class C | | | (35,866,971 | ) | | | (22,745,157 | ) |
Class R | | | (4,126,871 | ) | | | (12,166,848 | ) |
Class Y | | | 23,695,448 | | | | (18,922,200 | ) |
Class R5 | | | (1,602,493 | ) | | | (12,357,659 | ) |
Class R6 | | | 758,179 | | | | 10,034 | |
Net increase (decrease) in net assets resulting from share transactions | | | (24,884,871 | ) | | | (177,321,994 | ) |
Net increase (decrease) in net assets | | | (71,236,969 | ) | | | (73,016,282 | ) |
| | |
Net assets: | | | | | | | | |
Beginning of year | | | 477,548,532 | | | | 550,564,814 | |
End of year | | $ | 406,311,563 | | | $ | 477,548,532 | |
| (1) | The Securities and Exchange Commission eliminated the requirement to disclose distribution components separately, except for tax return of capital. For the year ended October 31, 2017, distributions to shareholders from distributable earnings consisted of distributions from net realized gains. |
Notes to Financial Statements
October 31, 2018
NOTE 1—Significant Accounting Policies
Invesco Select Companies Fund (the “Fund”) is a series portfolio of AIM Investment Funds (Invesco Investment Funds) (the “Trust”). The Trust is organized as a Delaware statutory trust and is registered under the Investment Company Act of 1940, as amended (the “1940 Act”), as an open-end series management investment company authorized to issue an unlimited number of shares of beneficial interest. Information presented in these financial statements pertains only to the Fund. Matters affecting the Fund or each class will be voted on exclusively by the shareholders of the Fund or each class.
The Fund’s investment objective is long-term growth of capital.
The Fund currently consists of six different classes of shares: Class A, Class C, Class R, Class Y, Class R5 and Class R6. Class Y shares are available only to certain investors. Class A shares are sold with a front-end sales charge unless certain waiver criteria are met. Under certain circumstances, load waived shares may be subject to contingent deferred sales charges (“CDSC”). Class C shares are sold with a CDSC. Class R, Class Y, Class R5 and Class R6 shares are sold at net asset value. Effective November 30, 2010, new or additional investments in Class B shares are no longer permitted. Existing shareholders of Class B shares were permitted to continue to reinvest dividends and capital gains distributions in Class B shares until their conversion to Class A shares. Also, shareholders in Class B shares were able to exchange those shares for Class B shares of other Invesco Funds offering such shares until they converted to Class A shares. Generally, Class B shares automatically converted to Class A shares on or about the month-end, which was at least eight years after the date of purchase. Redemptions of Class B shares prior to the conversion date were subject to a CDSC. Effective January 26, 2018, all of the Fund’s outstanding Class B shares were converted to Class A shares, in advance of their normally scheduled conversion. No CDSC was paid in connection with this early conversion.
12 Invesco Select Companies Fund
The Fund is an investment company and accordingly follows the investment company accounting and reporting guidance in accordance with Financial Accounting Standards Board Accounting Standards Codification Topic 946, Financial Services — Investment Companies.
The following is a summary of the significant accounting policies followed by the Fund in the preparation of its financial statements.
| A. | Security Valuations — Securities, including restricted securities, are valued according to the following policy. |
A security listed or traded on an exchange (except convertible securities) is valued at its last sales price or official closing price as of the close of the customary trading session on the exchange where the security is principally traded, or lacking any sales or official closing price on a particular day, the security may be valued at the closing bid price on that day. Securities traded in the over-the-counter market are valued based on prices furnished by independent pricing services or market makers. When such securities are valued by an independent pricing service they may be considered fair valued. Futures contracts are valued at the final settlement price set by an exchange on which they are principally traded. Listed options are valued at the mean between the last bid and asked prices from the exchange on which they are principally traded. Options not listed on an exchange are valued by an independent source at the mean between the last bid and asked prices. For purposes of determining net asset value (“NAV”) per share, futures and option contracts generally are valued 15 minutes after the close of the customary trading session of the New York Stock Exchange (“NYSE”).
Investments in open-end and closed-end registered investment companies that do not trade on an exchange are valued at the end-of-day net asset value per share. Investments in open-end and closed-end registered investment companies that trade on an exchange are valued at the last sales price or official closing price as of the close of the customary trading session on the exchange where the security is principally traded.
Debt obligations (including convertible securities) and unlisted equities are fair valued using an evaluated quote provided by an independent pricing service. Evaluated quotes provided by the pricing service may be determined without exclusive reliance on quoted prices, and may reflect appropriate factors such as institution-size trading in similar groups of securities, developments related to specific securities, dividend rate (for unlisted equities), yield (for debt obligations), quality, type of issue, coupon rate (for debt obligations), maturity (for debt obligations), individual trading characteristics and other market data. Pricing services generally value debt obligations assuming orderly transactions of institutional round lot size, but a fund may hold or transact in the same securities in smaller, odd lot sizes. Odd lots often trade at lower prices than institutional round lots. Debt obligations are subject to interest rate and credit risks. In addition, all debt obligations involve some risk of default with respect to interest and/or principal payments.
Foreign securities’ (including foreign exchange contracts) prices are converted into U.S. dollar amounts using the applicable exchange rates as of the close of the NYSE. If market quotations are available and reliable for foreign exchange-traded equity securities, the securities will be valued at the market quotations. Because trading hours for certain foreign securities end before the close of the NYSE, closing market quotations may become unreliable. If between the time trading ends on a particular security and the close of the customary trading session on the NYSE, events occur that the investment adviser determines are significant and make the closing price unreliable, the Fund may fair value the security. If the event is likely to have affected the closing price of the security, the security will be valued at fair value in good faith using procedures approved by the Board of Trustees. Adjustments to closing prices to reflect fair value may also be based on a screening process of an independent pricing service to indicate the degree of certainty, based on historical data, that the closing price in the principal market where a foreign security trades is not the current value as of the close of the NYSE. Foreign securities’ prices meeting the approved degree of certainty that the price is not reflective of current value will be priced at the indication of fair value from the independent pricing service. Multiple factors may be considered by the independent pricing service in determining adjustments to reflect fair value and may include information relating to sector indices, American Depositary Receipts and domestic and foreign index futures. Foreign securities may have additional risks including exchange rate changes, potential for sharply devalued currencies and high inflation, political and economic upheaval, the relative lack of issuer information, relatively low market liquidity and the potential lack of strict financial and accounting controls and standards.
Securities for which market prices are not provided by any of the above methods may be valued based upon quotes furnished by independent sources. The last bid price may be used to value equity securities. The mean between the last bid and asked prices is used to value debt obligations, including corporate loans.
Securities for which market quotations are not readily available or became unreliable are valued at fair value as determined in good faith by or under the supervision of the Trust’s officers following procedures approved by the Board of Trustees. Issuer specific events, market trends, bid/asked quotes of brokers and information providers and other market data may be reviewed in the course of making a good faith determination of a security’s fair value.
The Fund may invest in securities that are subject to interest rate risk, meaning the risk that the prices will generally fall as interest rates rise and, conversely, the prices will generally rise as interest rates fall. Specific securities differ in their sensitivity to changes in interest rates depending on their individual characteristics. Changes in interest rates may result in increased market volatility, which may affect the value and/or liquidity of certain Fund investments.
Valuations change in response to many factors including the historical and prospective earnings of the issuer, the value of the issuer’s assets, general economic conditions, interest rates, investor perceptions and market liquidity. Because of the inherent uncertainties of valuation, the values reflected in the financial statements may materially differ from the value received upon actual sale of those investments.
| B. | Securities Transactions and Investment Income — Securities transactions are accounted for on a trade date basis. Realized gains or losses on sales are computed on the basis of specific identification of the securities sold. Interest income (net of withholding tax, if any) is recorded on the accrual basis from settlement date. Dividend income (net of withholding tax, if any) is recorded on the ex-dividend date. |
The Fund may periodically participate in litigation related to Fund investments. As such, the Fund may receive proceeds from litigation settlements. Any proceeds received are included in the Statement of Operations as realized gain (loss) for investments no longer held and as unrealized gain (loss) for investments still held.
Brokerage commissions and mark ups are considered transaction costs and are recorded as an increase to the cost basis of securities purchased and/or a reduction of proceeds on a sale of securities. Such transaction costs are included in the determination of net realized and unrealized gain (loss) from investment securities reported in the Statement of Operations and the Statement of Changes in Net Assets and the net realized and unrealized gains (losses) on securities per share in the Financial Highlights. Transaction costs are included in the calculation of the Fund’s net asset value and, accordingly, they reduce the Fund’s total returns. These transaction costs are not considered operating expenses and are not reflected in net investment income reported in the Statement of Operations and the Statement of Changes in Net Assets, or the net
13 Invesco Select Companies Fund
investment income per share and the ratios of expenses and net investment income reported in the Financial Highlights, nor are they limited by any expense limitation arrangements between the Fund and the investment adviser.
The Fund allocates income and realized and unrealized capital gains and losses to a class based on the relative net assets of each class.
| C. | Country Determination — For the purposes of making investment selection decisions and presentation in the Schedule of Investments, the investment adviser may determine the country in which an issuer is located and/or credit risk exposure based on various factors. These factors include the laws of the country under which the issuer is organized, where the issuer maintains a principal office, the country in which the issuer derives 50% or more of its total revenues and the country that has the primary market for the issuer’s securities, as well as other criteria. Among the other criteria that may be evaluated for making this determination are the country in which the issuer maintains 50% or more of its assets, the type of security, financial guarantees and enhancements, the nature of the collateral and the sponsor organization. Country of issuer and/or credit risk exposure has been determined to be the United States of America, unless otherwise noted. |
| D. | Distributions — Distributions from net investment income and net realized capital gain, if any, are generally declared and paid annually and recorded on the ex-dividend date. The Fund may elect to treat a portion of the proceeds from redemptions as distributions for federal income tax purposes. |
| E. | Federal Income Taxes — The Fund intends to comply with the requirements of Subchapter M of the Internal Revenue Code of 1986, as amended (the “Internal Revenue Code”), necessary to qualify as a regulated investment company and to distribute substantially all of the Fund’s taxable earnings to shareholders. As such, the Fund will not be subject to federal income taxes on otherwise taxable income (including net realized capital gain) that is distributed to shareholders. Therefore, no provision for federal income taxes is recorded in the financial statements. |
The Fund recognizes the tax benefits of uncertain tax positions only when the position is more likely than not to be sustained. Management has analyzed the Fund’s uncertain tax positions and concluded that no liability for unrecognized tax benefits should be recorded related to uncertain tax positions. Management is not aware of any tax positions for which it is reasonably possible that the total amounts of unrecognized tax benefits will change materially in the next 12 months.
The Fund files tax returns in the U.S. Federal jurisdiction and certain other jurisdictions. Generally, the Fund is subject to examinations by such taxing authorities for up to three years after the filing of the return for the tax period.
| F. | Expenses — Fees provided for under the Rule 12b-1 plan of a particular class of the Fund are charged to the operations of such class. Transfer agency fees and expenses and other shareholder recordkeeping fees and expenses attributable to Class R5 are charged to such class. Transfer agency fees and expenses and other shareholder recordkeeping fees and expenses relating to all other classes are allocated among those classes based on relative net assets. All other expenses are allocated among the classes based on relative net assets. |
| G. | Accounting Estimates — The preparation of financial statements in conformity with accounting principles generally accepted in the United States of America (“GAAP”) requires management to make estimates and assumptions that affect the reported amounts of assets and liabilities at the date of the financial statements and the reported amounts of revenues and expenses during the reporting period including estimates and assumptions related to taxation. Actual results could differ from those estimates by a significant amount. In addition, the Fund monitors for material events or transactions that may occur or become known after the period-end date and before the date the financial statements are released to print. |
| H. | Indemnifications — Under the Trust’s organizational documents, each Trustee, officer, employee or other agent of the Trust is indemnified against certain liabilities that may arise out of the performance of their duties to the Fund. Additionally, in the normal course of business, the Fund enters into contracts, including the Fund’s servicing agreements, that contain a variety of indemnification clauses. The Fund’s maximum exposure under these arrangements is unknown as this would involve future claims that may be made against the Fund that have not yet occurred. The risk of material loss as a result of such indemnification claims is considered remote. |
| I. | Foreign Currency Translations — Foreign currency is valued at the close of the NYSE based on quotations posted by banks and major currency dealers. Portfolio securities and other assets and liabilities denominated in foreign currencies are translated into U.S. dollar amounts at the date of valuation. Purchases and sales of portfolio securities (net of foreign taxes withheld on disposition) and income items denominated in foreign currencies are translated into U.S. dollar amounts on the respective dates of such transactions. The Fund does not separately account for the portion of the results of operations resulting from changes in foreign exchange rates on investments and the fluctuations arising from changes in market prices of securities held. The combined results of changes in foreign exchange rates and the fluctuation of market prices on investments (net of estimated foreign tax withholding) are included with the net realized and unrealized gain or loss from investments in the Statement of Operations. Reported net realized foreign currency gains or losses arise from (1) sales of foreign currencies, (2) currency gains or losses realized between the trade and settlement dates on securities transactions, and (3) the difference between the amounts of dividends, interest, and foreign withholding taxes recorded on the Fund’s books and the U.S. dollar equivalent of the amounts actually received or paid. Net unrealized foreign currency gains and losses arise from changes in the fair values of assets and liabilities, other than investments in securities at fiscal period end, resulting from changes in exchange rates. |
The Fund may invest in foreign securities, which may be subject to foreign taxes on income, gains on investments or currency repatriation, a portion of which may be recoverable. Foreign taxes, if any, are recorded based on the tax regulations and rates that exist in the foreign markets in which the Fund invests and are shown in the Statement of Operations.
| J. | Forward Foreign Currency Contracts — The Fund may engage in foreign currency transactions either on a spot (i.e. for prompt delivery and settlement) basis, or through forward foreign currency contracts, to manage or minimize currency or exchange rate risk. |
The Fund may also enter into forward foreign currency contracts for the purchase or sale of a security denominated in a foreign currency in order to “lock in” the U.S. dollar price of that security, or the Fund may also enter into forward foreign currency contracts that do not provide for physical settlement of the two currencies, but instead are settled by a single cash payment calculated as the difference between the agreed upon exchange rate and the spot rate at settlement based upon an agreed upon notional amount (non-deliverable forwards). The Fund will set aside liquid assets in an amount equal to the daily mark-to-market obligation for forward foreign currency contracts.
A forward foreign currency contract is an obligation between two parties (“Counterparties”) to purchase or sell a specific currency for an agreed-upon price at a future date. The use of forward foreign currency contracts does not eliminate fluctuations in the price of the underlying securities the Fund owns or intends to acquire but establishes a rate of exchange in advance. Fluctuations in the value of these contracts are measured by the difference in the contract date and reporting date exchange rates and are recorded as unrealized appreciation (depreciation)
14 Invesco Select Companies Fund
until the contracts are closed. When the contracts are closed, realized gains (losses) are recorded. Realized and unrealized gains (losses) on the contracts are included in the Statement of Operations. The primary risks associated with forward foreign currency contracts include failure of the Counterparty to meet the terms of the contract and the value of the foreign currency changing unfavorably. These risks may be in excess of the amounts reflected in the Statement of Assets and Liabilities.
NOTE 2—Advisory Fees and Other Fees Paid to Affiliates
The Trust has entered into a master investment advisory agreement with Invesco Advisers, Inc. (the “Adviser” or “Invesco”). Under the terms of the investment advisory agreement, the Fund accrues daily and pays monthly an advisory fee to the Adviser based on the annual rate of the Fund’s average daily net assets as follows:
| | | | | | | | |
| Average Daily Net Assets | | Rate | |
First $250 million | | | 0 | .745% | | | | |
Next $250 million | | | 0 | .73% | | | | |
Next $500 million | | | 0 | .715% | | | | |
Next $1.5 billion | | | 0 | .70% | | | | |
Next $2.5 billion | | | 0 | .685% | | | | |
Next $2.5 billion | | | 0 | .67% | | | | |
Next $2.5 billion | | | 0 | .655% | | | | |
Over $10 billion | | | 0 | .64% | | | | |
For the year ended October 31, 2018, the effective advisory fees incurred by the Fund was 0.74%.
Under the terms of a master sub-advisory agreement between the Adviser and each of Invesco Asset Management Deutschland GmbH, Invesco Asset Management Limited, Invesco Asset Management (Japan) Limited, Invesco Hong Kong Limited, Invesco Senior Secured Management, Inc. and Invesco Canada Ltd. (collectively, the “Affiliated Sub-Advisers”) the Adviser, not the Fund, will pay 40% of the fees paid to the Adviser to any such Affiliated Sub-Adviser(s) that provide(s) discretionary investment management services to the Fund based on the percentage of assets allocated to such Affiliated Sub-Adviser(s).
The Adviser has contractually agreed, through at least June 30, 2019, to waive advisory fees and/or reimburse expenses to the extent necessary to limit total annual fund operating expenses after fee waivers and/or expense reimbursements (excluding certain items discussed below) of Class A, Class C, Class R, Class Y, Class R5 and Class R6 shares to 2.00%, 2.75%, 2.25%, 1.75%, 1.75% and 1.75%, respectively of the Fund’s average daily net assets (the “expense limits”). Prior to their conversion to Class A shares, the expense limit for Class B shares was 2.75% of average daily net assets. In determining the Adviser’s obligation to waive advisory fees and/or reimburse expenses, the following expenses are not taken into account, and could cause the total annual fund operating expenses after fee waivers and/or expense reimbursements to exceed the numbers reflected above: (1) interest; (2) taxes; (3) dividend expense on short sales; (4) extraordinary or non-routine items, including litigation expenses; and (5) expenses that the Fund has incurred but did not actually pay because of an expense offset arrangement. Unless Invesco continues the fee waiver agreement, it will terminate on June 30, 2019. During its term, the fee waiver agreement cannot be terminated or amended to increase the expense limits or reduce the advisory fee waiver without approval of the Board of Trustees. The Adviser did not waive fees and/or reimburse expenses during the period under these expense limits.
Further, the Adviser has contractually agreed, through at least June 30, 2020, to waive the advisory fee payable by the Fund in an amount equal to 100% of the net advisory fees the Adviser receives from the affiliated money market funds on investments by the Fund of uninvested cash in such affiliated money market funds.
For the year ended October 31, 2018, the Adviser waived advisory fees of $41,184.
The Trust has entered into a master administrative services agreement with Invesco pursuant to which the Fund has agreed to pay Invesco for certain administrative costs incurred in providing accounting services to the Fund. For the year ended October 31, 2018, expenses incurred under the agreement are shown in the Statement of Operations as Administrative services fees.
The Trust has entered into a transfer agency and service agreement with Invesco Investment Services, Inc. (“IIS”) pursuant to which the Fund has agreed to pay IIS a fee for providing transfer agency and shareholder services to the Fund and reimburse IIS for certain expenses incurred by IIS in the course of providing such services. IIS may make payments to intermediaries that provide omnibus account services, sub-accounting services and/or networking services. All fees payable by IIS to intermediaries that provide omnibus account services or sub-accounting services are charged back to the Fund, subject to certain limitations approved by the Trust’s Board of Trustees. For the year ended October 31, 2018, expenses incurred under the agreement are shown in the Statement of Operations as Transfer agent fees.
The Trust has entered into master distribution agreements with Invesco Distributors, Inc. (“IDI”) to serve as the distributor for the Class A, Class C, Class R, Class Y, Class R5 and Class R6 shares of the Fund. The Trust has adopted plans pursuant to Rule 12b-1 under the 1940 Act with respect to the Fund’s Class A, Class C and Class R shares (collectively, the “Plans”). The Fund, pursuant to the Plans, pays IDI compensation at the annual rate of 0.25% of the Fund’s average daily net assets of Class A shares, 1.00% of the average daily net assets of Class C shares and 0.50% of the average daily net assets of Class R shares. Prior to their conversion to Class A shares, the Fund paid an annual rate of 1.00% of the average daily net assets of Class B shares. The fees are accrued daily and paid monthly. Of the Plan payments, up to 0.25% of the average daily net assets of each class of shares may be paid to furnish continuing personal shareholder services to customers who purchase and own shares of such classes. Any amounts not paid as a service fee under the Plans would constitute an asset-based sales charge. Rules of the Financial Industry Regulatory Authority (“FINRA”) impose a cap on the total sales charges, including asset-based sales charges, that may be paid by any class of shares of the Fund. For the year ended October 31, 2018, expenses incurred under the Plans are shown in the Statement of Operations as Distribution fees.
Front-end sales commissions and CDSC (collectively, the “sales charges”) are not recorded as expenses of the Fund. Front-end sales commissions are deducted from proceeds from the sales of Fund shares prior to investment in Class A shares of the Fund. CDSC are deducted from redemption proceeds prior to remittance to the shareholder. During the year ended October 31, 2018, IDI advised the Fund that IDI retained $29,247 in
15 Invesco Select Companies Fund
front-end sales commissions from the sale of Class A shares and $381 and $352 from Class A and Class C shares, respectively, for CDSC imposed on redemptions by shareholders.
Certain officers and trustees of the Trust are officers and directors of the Adviser, IIS and/or IDI.
NOTE 3—Additional Valuation Information
GAAP defines fair value as the price that would be received to sell an asset or paid to transfer a liability in an orderly transaction between market participants at the measurement date, under current market conditions. GAAP establishes a hierarchy that prioritizes the inputs to valuation methods, giving the highest priority to readily available unadjusted quoted prices in an active market for identical assets (Level 1) and the lowest priority to significant unobservable inputs (Level 3), generally when market prices are not readily available or are unreliable. Based on the valuation inputs, the securities or other investments are tiered into one of three levels. Changes in valuation methods may result in transfers in or out of an investment’s assigned level:
| | Level 1 — | Prices are determined using quoted prices in an active market for identical assets. |
| | Level 2 — | Prices are determined using other significant observable inputs. Observable inputs are inputs that other market participants may use in pricing a security. These may include quoted prices for similar securities, interest rates, prepayment speeds, credit risk, yield curves, loss severities, default rates, discount rates, volatilities and others. |
| | Level 3 — | Prices are determined using significant unobservable inputs. In situations where quoted prices or observable inputs are unavailable (for example, when there is little or no market activity for an investment at the end of the period), unobservable inputs may be used. Unobservable inputs reflect the Fund’s own assumptions about the factors market participants would use in determining fair value of the securities or instruments and would be based on the best available information. |
The following is a summary of the tiered valuation input levels, as of October 31, 2018. The level assigned to the securities valuations may not be an indication of the risk or liquidity associated with investing in those securities. Because of the inherent uncertainties of valuation, the values reflected in the financial statements may materially differ from the value received upon actual sale of those investments.
| | | | | | | | | | | | | | | | |
| | | Level 1 | | | Level 2 | | | Level 3 | | | Total | |
Investments in Securities | | | | | | | | | | | | | | | | |
Common Stocks | | $ | 362,288,613 | | | $ | — | | | $ | 0 | | | $ | 362,288,613 | |
Money Market Funds | | | 44,670,114 | | | | — | | | | — | | | | 44,670,114 | |
Total Investments | | $ | 406,958,727 | | | $ | — | | | $ | 0 | | | $ | 406,958,727 | |
NOTE 4—Investments in Other Affiliates
The 1940 Act defines an “affiliated person” as an issuance in which a fund holds 5% or more of the outstanding voting securities. The Fund has not owned enough of the outstanding voting securities of the issuer to have control (as defined in the 1940 Act) of that issuer. The following is a summary of the investments in other affiliates (excluding affiliated money market funds) for the year ended October 31, 2018.
| | | | | | | | | | | | | | | | | | | | | | | | | | | | |
| | | Value
10/31/17 | | | Purchases
at Cost | | | Proceeds
from Sales | | | Change in
Unrealized
Appreciation | | | Realized
Gain (Loss) | | | Value
10/31/18 | | | Dividend
Income | |
ION Geophysical Corp(a) | | $ | 7,320,183 | | | $ | — | | | $ | (8,687,010 | ) | | $ | 47,683,173 | | | $ | (41,361,602 | ) | | $ | 4,954,744 | | | $ | — | |
Performant Financial Corp | | | 10,280,585 | | | | — | | | | — | | | | 1,215,983 | | | | — | | | | 11,496,568 | | | | — | |
Total | | $ | 17,600,768 | | | $ | — | | | $ | (8,687,010 | ) | | $ | 48,899,156 | | | $ | (41,361,602 | ) | | $ | 16,451,312 | | | $ | — | |
| (a) | As of October 31, 2018, this security is no longer considered as an affiliate of the fund. |
NOTE 5—Expense Offset Arrangement(s)
The expense offset arrangement is comprised of transfer agency credits which result from balances in demand deposit accounts used by the transfer agent for clearing shareholder transactions. For the year ended October 31, 2018, the Fund received credits from this arrangement, which resulted in the reduction of the Fund’s total expenses of $5,678.
NOTE 6—Trustees’ and Officers’ Fees and Benefits
Trustees’ and Officers’ Fees and Benefits include amounts accrued by the Fund to pay remuneration to certain Trustees and Officers of the Fund. Trustees have the option to defer compensation payable by the Fund, and Trustees’ and Officers’ Fees and Benefits also include amounts accrued by the Fund to fund such deferred compensation amounts. Those Trustees who defer compensation have the option to select various Invesco Funds in which their deferral accounts shall be deemed to be invested. Finally, certain current Trustees were eligible to participate in a retirement plan that provided for benefits to be paid upon retirement to Trustees over a period of time based on the number of years of service. The Fund may have certain former Trustees who also participate in a retirement plan and receive benefits under such plan. Trustees’ and Officers’ Fees and Benefits include amounts accrued by the Fund to fund such retirement benefits. Obligations under the deferred compensation and retirement plans represent unsecured claims against the general assets of the Fund.
16 Invesco Select Companies Fund
NOTE 7—Cash Balances
The Fund is permitted to temporarily carry a negative or overdrawn balance in its account with State Street Bank and Trust Company, the custodian bank. Such balances, if any at period-end, are shown in the Statement of Assets and Liabilities under the payable caption Amount due custodian. To compensate the custodian bank for such overdrafts, the overdrawn Fund may either (1) leave funds as a compensating balance in the account so the custodian bank can be compensated by earning the additional interest; or (2) compensate by paying the custodian bank at a rate agreed upon by the custodian bank and Invesco, not to exceed the contractually agreed upon rate.
NOTE 8—Distributions to Shareholders and Tax Components of Net Assets
Tax Character of Distributions to Shareholders Paid During the Fiscal Years Ended October 31, 2018 and 2017:
| | | | | | | | |
| | | 2018 | | | 2017 | |
Long-term capital gain | | $ | 62,353,558 | | | $ | 20,025,749 | |
Tax Components of Net Assets at Period-End:
| | | | |
| | | 2018 | |
Undistributed ordinary income | | $ | 2,223,893 | |
Undistributed long-term gain | | | 20,060,860 | |
Net unrealized appreciation — investments | | | 59,563,420 | |
Net unrealized appreciation (depreciation) — foreign currencies | | | (366 | ) |
Temporary book/tax differences | | | (153,321 | ) |
Shares of beneficial interest | | | 324,617,077 | |
Total net assets | | $ | 406,311,563 | |
The difference between book-basis and tax-basis unrealized appreciation (depreciation) is due to differences in the timing of recognition of gains and losses on investments for tax and book purposes. The Fund’s net unrealized appreciation difference is attributable primarily to wash sales.
The temporary book/tax differences are a result of timing differences between book and tax recognition of income and/or expenses. The Fund’s temporary book/tax differences are the result of the trustee deferral of compensation.
Capital loss carryforward is calculated and reported as of a specific date. Results of transactions and other activity after that date may affect the amount of capital loss carryforward actually available for the Fund to utilize. Capital losses generated in years beginning after December 22, 2010 can be carried forward for an unlimited period, whereas previous losses expire in eight tax years. Capital losses with an expiration period may not be used to offset capital gains until all net capital losses without an expiration date have been utilized. Capital loss carryforwards with no expiration date will retain their character as either short-term or long-term capital losses instead of as short-term capital losses as under prior law. The ability to utilize capital loss carryforwards in the future may be limited under the Internal Revenue Code and related regulations based on the results of future transactions.
The Fund does not have a capital loss carryforward as of October 31, 2018.
NOTE 9—Investment Transactions
The aggregate amount of investment securities (other than short-term securities, U.S. Treasury obligations and money market funds, if any) purchased and sold by the Fund during the year ended October 31, 2018 was $48,745,500 and $150,133,677, respectively. Cost of investments, including any derivatives, on a tax basis includes the adjustments for financial reporting purposes as of the most recently completed federal income tax reporting period-end.
| | | | |
| Unrealized Appreciation (Depreciation) of Investments on a Tax Basis | |
Aggregate unrealized appreciation of investments | | $ | 132,145,937 | |
Aggregate unrealized (depreciation) of investments | | | (72,582,517 | ) |
Net unrealized appreciation of investments | | $ | 59,563,420 | |
Cost of investments for tax purposes is $347,395,307.
NOTE 10—Reclassification of Permanent Differences
Primarily as a result of differing book/tax treatment of net operating loss, on October 31, 2018, undistributed net investment income (loss) was increased by $1,691,841 and undistributed net realized gain was decreased by $1,691,841. This reclassification had no effect on the net assets or distributable earnings of the Fund.
17 Invesco Select Companies Fund
NOTE 11—Share Information
| | | | | | | | | | | | | | | | |
| | | Summary of Share Activity | |
| | | Years ended October 31, | |
| | | 2018(a) | | | 2017 | |
| | | Shares | | | Amount | | | Shares | | | Amount | |
Sold: | | | | | | | | | | | | | | | | |
Class A | | | 1,490,770 | | | $ | 28,520,738 | | | | 1,845,496 | | | $ | 34,443,840 | |
Class B(b) | | | 778 | | | | 12,773 | | | | 2,943 | | | | 48,034 | |
Class C | | | 210,020 | | | | 3,381,331 | | | | 408,324 | | | | 6,540,411 | |
Class R | | | 172,246 | | | | 3,147,900 | | | | 253,977 | | | | 4,586,806 | |
Class Y | | | 2,689,477 | | | | 53,051,246 | | | | 4,260,684 | | | | 80,495,148 | |
Class R5 | | | 277,970 | | | | 5,703,058 | | | | 331,743 | | | | 6,615,166 | |
Class R6(c) | | | 90,603 | | | | 1,846,098 | | | | 508 | | | | 10,034 | |
| | | | |
Issued as reinvestment of dividends: | | | | | | | | | | | | | | | | |
Class A | | | 1,729,041 | | | | 31,606,869 | | | | 633,827 | | | | 11,434,236 | |
Class B(b) | | | 10,306 | | | | 159,223 | | | | 5,839 | | | | 91,796 | |
Class C | | | 847,400 | | | | 13,066,901 | | | | 270,789 | | | | 4,248,675 | |
Class R | | | 175,781 | | | | 3,055,075 | | | | 65,096 | | | | 1,126,806 | |
Class Y | | | 498,347 | | | | 9,348,985 | | | | 99,489 | | | | 1,831,586 | |
Class R5 | | | 167,857 | | | | 3,298,381 | | | | 61,424 | | | | 1,176,274 | |
| | | | |
Conversion of Class B shares to Class A shares:(d) | | | | | | | | | | | | | | | | |
Class A | | | 57,801 | | | | 1,120,189 | | | | 55,745 | | | | 1,070,373 | |
Class B | | | (68,385 | ) | | | (1,120,189 | ) | | | (64,158 | ) | | | (1,070,373 | ) |
| | | | |
Reacquired: | | | | | | | | | | | | | | | | |
Class A | | | (3,534,201 | ) | | | (67,859,635 | ) | | | (8,433,372 | ) | | | (156,655,635 | ) |
Class B(b) | | | (10,939 | ) | | | (182,131 | ) | | | (30,697 | ) | | | (502,435 | ) |
Class C | | | (3,224,768 | ) | | | (52,315,203 | ) | | | (2,032,569 | ) | | | (33,534,243 | ) |
Class R | | | (567,572 | ) | | | (10,329,846 | ) | | | (992,218 | ) | | | (17,880,460 | ) |
Class Y | | | (1,944,459 | ) | | | (38,704,783 | ) | | | (5,247,516 | ) | | | (101,248,934 | ) |
Class R5 | | | (515,697 | ) | | | (10,603,932 | ) | | | (1,010,295 | ) | | | (20,149,099 | ) |
Class R6 | | | (51,840 | ) | | | (1,087,919 | ) | | | — | | | | — | |
Net increase (decrease) in share activity | | | (1,499,464 | ) | | $ | (24,884,871 | ) | | | (9,514,941 | ) | | $ | (177,321,994 | ) |
| (a) | There are entities that are record owners of more than 5% of the outstanding shares of the Fund and in the aggregate own 23% of the outstanding shares of the Fund. IDI has an agreement with these entities to sell Fund shares. The Fund, Invesco and/or Invesco affiliates may make payments to these entities, which are considered to be related to the Fund, for providing services to the Fund, Invesco and/or Invesco affiliates including but not limited to services such as securities brokerage, distribution, third party record keeping and account servicing. The Fund has no knowledge as to whether all or any portion of the shares owned of record by these entities are also owned beneficially. |
| (b) | Class B shares activity for the period November 1, 2017 through January 26, 2018 (date of conversion). |
| (c) | Commencement date of April 4, 2017. |
| (d) | Effective as of the close of business January 26, 2018, all outstanding Class B shares were converted to Class A shares. |
18 Invesco Select Companies Fund
NOTE 12—Financial Highlights
The following schedule presents financial highlights for a share of the Fund outstanding throughout the periods indicated.
| | | | | | | | | | | | | | | | | | | | | | | | | | | | | | | | | | | | | | | | | | | | | | | | |
| | | Net asset
value,
beginning
of period | | | Net
investment
income
(loss)(a) | | | Net gains
(losses) on securities
(both
realized and
unrealized) | | | Total from
investment
operations | | | Distributions
from net
realized
gains | | | Net asset
value, end
of period | | | Total
return(b) | | | Net assets,
end of period
(000’s omitted) | | | Ratio of
expenses
to average net assets
with fee waivers
and/or expenses
absorbed | | | Ratio of
expenses
to average net
assets without
fee waivers
and/or expenses
absorbed | | | Ratio of net
investment
income (loss)
to average
net assets | | | Portfolio
turnover(c) | |
Class A | | | | | | | | | | | | | | | | | | | | | | | | | | | | | | | | | | | | | | | | | | | | | | | | |
Year ended 10/31/18 | | $ | 20.30 | | | $ | (0.04 | ) | | $ | 0.61 | | | $ | 0.57 | | | $ | (2.67 | ) | | $ | 18.20 | | | | 2.76 | % | | $ | 220,107 | | | | 1.24 | %(d) | | | 1.25 | %(d) | | | (0.19 | )%(d) | | | 12 | % |
Year ended 10/31/17 | | | 16.72 | | | | (0.07 | ) | | | 4.29 | | | | 4.22 | | | | (0.64 | ) | | | 20.30 | | | | 25.71 | | | | 250,619 | | | | 1.27 | | | | 1.28 | | | | (0.39 | ) | | | 16 | |
Year ended 10/31/16 | | | 20.44 | | | | (0.08 | ) | | | 0.56 | | | | 0.48 | | | | (4.20 | ) | | | 16.72 | | | | 5.22 | | | | 305,003 | | | | 1.24 | | | | 1.25 | | | | (0.53 | ) | | | 20 | |
Year ended 10/31/15 | | | 25.47 | | | | (0.19 | ) | | | (2.37 | ) | | | (2.56 | ) | | | (2.47 | ) | | | 20.44 | | | | (10.79 | ) | | | 475,536 | | | | 1.17 | | | | 1.20 | | | | (0.86 | ) | | | 14 | |
Year ended 10/31/14 | | | 23.95 | | | | (0.06 | ) | | | 2.71 | | | | 2.65 | | | | (1.13 | ) | | | 25.47 | | | | 11.66 | | | | 754,310 | | | | 1.16 | | | | 1.20 | | | | (0.28 | ) | | | 10 | |
Class B | | | | | | | | | | | | | | | | | | | | | | | | | | | | | | | | | | | | | | | | | | | | | | | | |
Year ended 10/31/18(e) | | | 17.57 | | | | (0.04 | ) | | | 1.51 | | | | 1.47 | | | | (2.67 | ) | | | 16.37 | | | | 9.28 | | | | — | | | | 1.99 | (d)(g) | | | 2.00 | (d)(g) | | | (0.94 | )(d)(g) | | | 12 | |
Year ended 10/31/17 | | | 14.65 | | | | (0.19 | ) | | | 3.75 | | | | 3.56 | | | | (0.64 | ) | | | 17.57 | | | | 24.80 | | | | 1,199 | | | | 2.02 | | | | 2.03 | | | | (1.14 | ) | | | 16 | |
Year ended 10/31/16 | | | 18.59 | | | | (0.18 | ) | | | 0.44 | | | | 0.26 | | | | (4.20 | ) | | | 14.65 | | | | 4.36 | | | | 2,261 | | | | 1.99 | | | | 2.00 | | | | (1.28 | ) | | | 20 | |
Year ended 10/31/15 | | | 23.55 | | | | (0.33 | ) | | | (2.16 | ) | | | (2.49 | ) | | | (2.47 | ) | | | 18.59 | | | | (11.44 | ) | | | 4,027 | | | | 1.92 | | | | 1.95 | | | | (1.61 | ) | | | 14 | |
Year ended 10/31/14 | | | 22.40 | | | | (0.23 | ) | | | 2.51 | | | | 2.28 | | | | (1.13 | ) | | | 23.55 | | | | 10.77 | | | | 9,039 | | | | 1.91 | | | | 1.95 | | | | (1.03 | ) | | | 10 | |
Class C | | | | | | | | | | | | | | | | | | | | | | | | | | | | | | | | | | | | | | | | | | | | | | | | |
Year ended 10/31/18 | | | 17.54 | | | | (0.15 | ) | | | 0.53 | | | | 0.38 | | | | (2.67 | ) | | | 15.25 | | | | 2.01 | | | | 49,959 | | | | 1.99 | (d) | | | 2.00 | (d) | | | (0.94 | )(d) | | | 12 | |
Year ended 10/31/17 | | | 14.63 | | | | (0.19 | ) | | | 3.74 | | | | 3.55 | | | | (0.64 | ) | | | 17.54 | | | | 24.77 | | | | 95,457 | | | | 2.02 | | | | 2.03 | | | | (1.14 | ) | | | 16 | |
Year ended 10/31/16 | | | 18.57 | | | | (0.18 | ) | | | 0.44 | | | | 0.26 | | | | (4.20 | ) | | | 14.63 | | | | 4.39 | | | | 99,413 | | | | 1.99 | | | | 2.00 | | | | (1.28 | ) | | | 20 | |
Year ended 10/31/15 | | | 23.53 | | | | (0.33 | ) | | | (2.16 | ) | | | (2.49 | ) | | | (2.47 | ) | | | 18.57 | | | | (11.45 | ) | | | 125,947 | | | | 1.92 | | | | 1.95 | | | | (1.61 | ) | | | 14 | |
Year ended 10/31/14 | | | 22.37 | | | | (0.23 | ) | | | 2.52 | | | | 2.29 | | | | (1.13 | ) | | | 23.53 | | | | 10.83 | | | | 180,853 | | | | 1.91 | | | | 1.95 | | | | (1.03 | ) | | | 10 | |
Class R | | | | | | | | | | | | | | | | | | | | | | | | | | | | | | | | | | | | | | | | | | | | | | | | |
Year ended 10/31/18 | | | 19.43 | | | | (0.08 | ) | | | 0.59 | | | | 0.51 | | | | (2.67 | ) | | | 17.27 | | | | 2.55 | | | | 16,427 | | | | 1.49 | (d) | | | 1.50 | (d) | | | (0.44 | )(d) | | | 12 | |
Year ended 10/31/17 | | | 16.06 | | | | (0.11 | ) | | | 4.12 | | | | 4.01 | | | | (0.64 | ) | | | 19.43 | | | | 25.45 | | | | 22,747 | | | | 1.52 | | | | 1.53 | | | | (0.64 | ) | | | 16 | |
Year ended 10/31/16 | | | 19.86 | | | | (0.12 | ) | | | 0.52 | | | | 0.40 | | | | (4.20 | ) | | | 16.06 | | | | 4.90 | | | | 29,623 | | | | 1.49 | | | | 1.50 | | | | (0.78 | ) | | | 20 | |
Year ended 10/31/15 | | | 24.88 | | | | (0.24 | ) | | | (2.31 | ) | | | (2.55 | ) | | | (2.47 | ) | | | 19.86 | | | | (11.03 | ) | | | 45,561 | | | | 1.42 | | | | 1.45 | | | | (1.11 | ) | | | 14 | |
Year ended 10/31/14 | | | 23.48 | | | | (0.12 | ) | | | 2.65 | | | | 2.53 | | | | (1.13 | ) | | | 24.88 | | | | 11.37 | | | | 70,177 | | | | 1.41 | | | | 1.45 | | | | (0.53 | ) | | | 10 | |
Class Y | | | | | | | | | | | | | | | | | | | | | | | | | | | | | | | | | | | | | | | | | | | | | | | | |
Year ended 10/31/18 | | | 20.75 | | | | 0.01 | | | | 0.63 | | | | 0.64 | | | | (2.67 | ) | | | 18.72 | | | | 3.07 | | | | 95,958 | | | | 0.99 | (d) | | | 1.00 | (d) | | | 0.06 | (d) | | | 12 | |
Year ended 10/31/17 | | | 17.04 | | | | (0.01 | ) | | | 4.36 | | | | 4.35 | | | | (0.64 | ) | | | 20.75 | | | | 26.00 | | | | 80,572 | | | | 1.02 | | | | 1.03 | | | | (0.14 | ) | | | 16 | |
Year ended 10/31/16 | | | 20.71 | | | | (0.04 | ) | | | 0.57 | | | | 0.53 | | | | (4.20 | ) | | | 17.04 | | | | 5.44 | | | | 81,269 | | | | 0.99 | | | | 1.00 | | | | (0.28 | ) | | | 20 | |
Year ended 10/31/15 | | | 25.71 | | | | (0.13 | ) | | | (2.40 | ) | | | (2.53 | ) | | | (2.47 | ) | | | 20.71 | | | | (10.56 | ) | | | 147,927 | | | | 0.92 | | | | 0.95 | | | | (0.61 | ) | | | 14 | |
Year ended 10/31/14 | | | 24.11 | | | | (0.01 | ) | | | 2.74 | | | | 2.73 | | | | (1.13 | ) | | | 25.71 | | | | 11.92 | | | | 304,629 | | | | 0.91 | | | | 0.95 | | | | (0.03 | ) | | | 10 | |
Class R5 | | | | | | | | | | | | | | | | | | | | | | | | | | | | | | | | | | | | | | | | | | | | | | | | |
Year ended 10/31/18 | | | 21.62 | | | | 0.03 | | | | 0.64 | | | | 0.67 | | | | (2.67 | ) | | | 19.62 | | | | 3.09 | | | | 23,088 | | | | 0.92 | (d) | | | 0.93 | (d) | | | 0.13 | (d) | | | 12 | |
Year ended 10/31/17 | | | 17.71 | | | | (0.01 | ) | | | 4.56 | | | | 4.55 | | | | (0.64 | ) | | | 21.62 | | | | 26.15 | | | | 26,943 | | | | 0.92 | | | | 0.93 | | | | (0.04 | ) | | | 16 | |
Year ended 10/31/16 | | | 21.33 | | | | (0.03 | ) | | | 0.61 | | | | 0.58 | | | | (4.20 | ) | | | 17.71 | | | | 5.54 | | | | 32,996 | | | | 0.89 | | | | 0.90 | | | | (0.18 | ) | | | 20 | |
Year ended 10/31/15 | | | 26.38 | | | | (0.12 | ) | | | (2.46 | ) | | | (2.58 | ) | | | (2.47 | ) | | | 21.33 | | | | (10.47 | ) | | | 51,659 | | | | 0.85 | | | | 0.88 | | | | (0.54 | ) | | | 14 | |
Year ended 10/31/14 | | | 24.69 | | | | 0.01 | | | | 2.81 | | | | 2.82 | | | | (1.13 | ) | | | 26.38 | | | | 12.01 | | | | 66,042 | | | | 0.84 | | | | 0.88 | | | | 0.04 | | | | 10 | |
Class R6 | | | | | | | | | | | | | | | | | | | | | | | | | | | | | | | | | | | | | | | | | | | | | | | | |
Year ended 10/31/18 | | | 21.63 | | | | 0.04 | | | | 0.65 | | | | 0.69 | | | | (2.67 | ) | | | 19.65 | | | | 3.19 | | | | 772 | | | | 0.84 | (d) | | | 0.85 | (d) | | | 0.21 | (d) | | | 12 | |
Year ended 10/31/17(f) | | | 20.05 | | | | 0.01 | | | | 1.57 | | | | 1.58 | | | | — | | | | 21.63 | | | | 7.88 | | | | 11 | | | | 0.84 | (g) | | | 0.85 | (g) | | | 0.04 | (g) | | | 16 | |
| (a) | Calculated using average shares outstanding. |
| (b) | Includes adjustments in accordance with accounting principles generally accepted in the United States of America and as such, the net asset value for financial reporting purposes and the returns based upon those net asset values may differ from the net asset value and returns for shareholder transactions. Does not include sales charges and is not annualized for periods less than one year, if applicable. |
| (c) | Portfolio turnover is calculated at the fund level and is not annualized for periods less than one year, if applicable. |
| (d) | Ratios are based on average daily net assets (000’s omitted) of $248,751, $1,139, $72,624, $20,010, $91,046, $27,906 and $750 for Class A, Class B, Class C, Class R, Class Y, Class R5 and Class R6 shares, respectively. |
| (e) | Reflects activity for the period November 1, 2017 through January 26, 2018 (date of conversion). |
| (f) | Commencement date of April 4, 2017. |
19 Invesco Select Companies Fund
Report of Independent Registered Public Accounting Firm
To the Board of Trustees of AIM Investment Fund (Invesco Investment Funds)
and Shareholders of Invesco Select Companies Fund:
Opinion on the Financial Statements
We have audited the accompanying statement of assets and liabilities, including the schedule of investments, of Invesco Select Companies Fund (one of the funds constituting AIM Investment Funds (Invesco Investment Funds), hereafter referred to as the “Fund”) as of October 31, 2018, the related statement of operations for the year ended October 31, 2018, the statement of changes in net assets for each of the two years in the period ended October 31, 2018, including the related notes, and the financial highlights for each of the periods indicated therein (collectively referred to as the financial statements). In our opinion, the financial statements present fairly, in all material respects, the financial position of the Fund as of October 31, 2018, the results of its operations for the year then ended, the changes in its net assets for each of the two years in the period ended October 31, 2018 and the financial highlights for each of the periods indicated therein in conformity with accounting principles generally accepted in the United States of America.
Basis for Opinion
These financial statements are the responsibility of the Fund’s management. Our responsibility is to express an opinion on the Fund’s financial statements based on our audits. We are a public accounting firm registered with the Public Company Accounting Oversight Board (United States) (PCAOB) and are required to be independent with respect to the Fund in accordance with the U.S. federal securities laws and the applicable rules and regulations of the Securities and Exchange Commission and the PCAOB.
We conducted our audits of these financial statements in accordance with the standards of the PCAOB. Those standards require that we plan and perform the audit to obtain reasonable assurance about whether the financial statements are free of material misstatement, whether due to error or fraud.
Our audits included performing procedures to assess the risks of material misstatement of the financial statements, whether due to error or fraud, and performing procedures that respond to those risks. Such procedures included examining, on a test basis, evidence regarding the amounts and disclosures in the financial statements. Our audits also included evaluating the accounting principles used and significant estimates made by management, as well as evaluating the overall presentation of the financial statements. Our procedures included confirmation of securities owned as of October 31, 2018 by correspondence with the custodian, transfer agent and brokers; when replies were not received from brokers, we performed other auditing procedures. We believe that our audits provide a reasonable basis for our opinion.
PricewaterhouseCoopers LLP
Houston, TX
December 28, 2018
We have served as the auditor of one or more of the investment companies in the Invesco group of investment companies since at least 1995. We have not been able to determine the specific year we began serving as auditor.
20 Invesco Select Companies Fund
Calculating your ongoing Fund expenses
Example
As a shareholder of the Fund, you incur two types of costs: (1) transaction costs, which may include sales charges (loads) on purchase payments or contingent deferred sales charges on redemptions, if any; and (2) ongoing costs, including management fees, distribution and/or service (12b-1) fees, and other Fund expenses. This example is intended to help you understand your ongoing costs (in dollars) of investing in the Fund and to compare these costs with ongoing costs of investing in other mutual funds. The example is based on an investment of $1,000 invested at the beginning of the period and held for the entire period May 1, 2018 through October 31, 2018.
Actual expenses
The table below provides information about actual account values and actual expenses. You may use the information in this table, together with the amount you invested, to estimate the expenses that you paid over the period. Simply divide your account value by $1,000 (for example, an $8,600 account value divided by $1,000 = 8.6), then multiply the result by the number in the table under the heading entitled “Actual Expenses Paid During Period” to estimate the expenses you paid on your account during this period.
Hypothetical example for comparison purposes
The table below also provides information about hypothetical account values and hypothetical expenses based on the Fund’s actual expense ratio and an assumed rate of return of 5% per year before expenses, which is not the Fund’s actual return.
The hypothetical account values and expenses may not be used to estimate the actual ending account balance or expenses you paid for the period. You may use this information to compare the ongoing costs of investing in the Fund and other funds. To do so, compare this 5% hypothetical example with the 5% hypothetical examples that appear in the shareholder reports of the other funds.
Please note that the expenses shown in the table are meant to highlight your ongoing costs only and do not reflect any transaction costs, such as sales charges (loads) on purchase payments or contingent deferred sales charges on redemptions, if any. Therefore, the hypothetical information is useful in comparing ongoing costs only, and will not help you determine the relative total costs of owning different funds. In addition, if these transaction costs were included, your costs would have been higher.
| | | | | | | | | | | | | | | | | | | | | | | | |
Class | | Beginning
Account Value
(05/01/18) | | | ACTUAL | | | HYPOTHETICAL (5% annual return before
expenses) | | | Annualized
Expense Ratio | |
| | Ending
Account Value
(10/31/18)1 | | | Expenses
Paid During
Period2 | | | Ending
Account Value
(10/31/18) | | | Expenses
Paid During
Period2 | |
| A | | $ | 1,000.00 | | | $ | 982.70 | | | $ | 6.10 | | | $ | 1,019.06 | | | $ | 6.21 | | | | 1.22 | % |
| C | | | 1,000.00 | | | | 979.40 | | | | 9.83 | | | | 1,015.27 | | | | 10.01 | | | | 1.97 | |
| R | | | 1,000.00 | | | | 981.80 | | | | 7.34 | | | | 1,017.80 | | | | 7.48 | | | | 1.47 | |
| Y | | | 1,000.00 | | | | 984.20 | | | | 4.85 | | | | 1,020.32 | | | | 4.94 | | | | 0.97 | |
| R5 | | | 1,000.00 | | | | 984.50 | | | | 4.60 | | | | 1,020.57 | | | | 4.69 | | | | 0.92 | |
| R6 | | | 1,000.00 | | | | 985.00 | | | | 4.20 | | | | 1,020.97 | | | | 4.28 | | | | 0.84 | |
| 1 | The actual ending account value is based on the actual total return of the Fund for the period May 1, 2018 through October 31, 2018, after actual expenses and will differ from the hypothetical ending account value which is based on the Fund’s expense ratio and a hypothetical annual return of 5% before expenses. |
| 2 | Expenses are equal to the Fund’s annualized expense ratio as indicated above multiplied by the average account value over the period, multiplied by 184/365 to reflect the most recent fiscal half year. |
21 Invesco Select Companies Fund
Approval of Investment Advisory and Sub-Advisory Contracts
At meetings held on June 5-6, 2018, the Board of Trustees (the Board or the Trustees) of AIM Investment Funds (Invesco Investment Funds) as a whole, and the independent Trustees, who comprise over 75% of the Board, voting separately, approved the continuance of the Invesco Select Companies Fund’s (the Fund) Master Investment Advisory Agreement with Invesco Advisers, Inc. (Invesco Advisers and the investment advisory agreement) and the Master Intergroup Sub-Advisory Contract for Mutual Funds with Invesco Asset Management Deutschland GmbH, Invesco Asset Management Limited, Invesco Asset Management (Japan) Limited, Invesco Hong Kong Limited, Invesco Senior Secured Management, Inc. and Invesco Canada Ltd. (collectively, the Affiliated Sub-Advisers and the sub-advisory contracts) for another year, effective July 1, 2018. After evaluating the factors discussed below, among others, the Board approved the renewal of the Fund’s investment advisory agreement and the sub-advisory contracts and determined that the compensation payable by the Fund to Invesco Advisers and by Invesco Advisers to the Affiliated Sub-Advisers is fair and reasonable.
The Board’s Evaluation Process
The Board’s Investments Committee has established three Sub-Committees, which meet throughout the year to review the performance of funds advised by Invesco Advisers (the Invesco Funds). Over the course of each year, the Sub-Committees meet with portfolio managers for their assigned Invesco Funds and other members of management to review detailed information about investment performance and portfolio attributes of these funds. The Board took into account evaluations and reports that it received from the Investments Committee and Sub-Committees, as well as the information provided to such committees and the Board throughout the year, in considering whether to approve each Invesco Fund’s investment advisory agreement and sub-advisory contracts.
As part of the contract renewal process, the Board reviews and considers information provided in response to detailed requests for information submitted to management by the independent Trustees with assistance from legal counsel to the independent Trustees. The Board receives comparative investment performance and fee data regarding the Invesco Funds prepared by Invesco Advisers and Broadridge Financial Solutions, Inc. (Broadridge), an independent mutual fund data provider. The Board also receives an independent written evaluation from the Senior Officer, an officer of the Invesco Funds who reports directly to the independent Trustees. The Senior Officer’s evaluation is prepared as part of his responsibility to manage the process by which the Invesco Funds’ proposed management fees
are negotiated during the annual contract renewal process to ensure they are negotiated in a manner that is at arms’ length and reasonable. In addition to meetings with Invesco Advisers and fund counsel throughout the year, the independent Trustees also discuss the continuance of the investment advisory agreement and sub-advisory contracts in separate sessions with the Senior Officer and with independent legal counsel.
The discussion below is a summary of the Senior Officer’s independent written evaluation with respect to the Fund’s investment advisory agreement, as well as a discussion of the material factors and related conclusions that formed the basis for the Board’s approval of the Fund’s investment advisory agreement and sub-advisory contracts. The Trustees’ review and conclusions are based on the comprehensive consideration of all information presented to them during the course of the year and in prior years and are not the result of any single determinative factor. Moreover, one Trustee may have weighed a particular piece of information or factor differently than another Trustee. This information is current as of June 6, 2018.
Factors and Conclusions and Summary of Independent Written Fee Evaluation
| A. | Nature, Extent and Quality of Services Provided by Invesco Advisers and the Affiliated Sub-Advisers |
The Board reviewed the nature, extent and quality of the advisory services provided to the Fund by Invesco Advisers under the Fund’s investment advisory agreement, and the credentials and experience of the officers and employees of Invesco Advisers who provide these services, including the Fund’s portfolio manager(s). The Board’s review included consideration of Invesco Advisers’ investment process oversight and structure, credit analysis and investment risk management. The Board also considered non-advisory services that Invesco Advisers and its affiliates provide to the Invesco Funds such as various back office support functions, third party oversight, internal audit, valuation, portfolio trading and legal and compliance. The Board also reviewed and considered the benefits to shareholders of investing in a fund that is part of the Invesco family of funds under the umbrella of Invesco Ltd., Invesco Advisers’ parent company, and noted Invesco Ltd.’s depth and experience in conducting an investment management business, as well as its commitment of financial and other resources to such business. The Board concluded that the nature, extent and quality of the services provided to the Fund by Invesco Advisers are appropriate and satisfactory.
The Board reviewed the services that may be provided by the Affiliated Sub-Advisers under the sub-advisory contracts and the credentials
and experience of the officers and employees of the Affiliated Sub-Advisers who provide these services. The Board noted the Affiliated Sub-Advisers’ expertise with respect to certain asset classes and that the Affiliated Sub-Advisers have offices and personnel that are located in financial centers around the world. As a result, the Board noted that the Affiliated Sub-Advisers can provide research and investment analysis on the markets and economies of various countries in which the Fund may invest, make recommendations regarding securities and assist with security trades. The Board concluded that the sub-advisory contracts may benefit the Fund and its shareholders by permitting Invesco Advisers to use the resources and talents of the Affiliated Sub-Advisers in managing the Fund. The Board concluded that the nature, extent and quality of the services that may be provided by the Affiliated Sub-Advisers are appropriate and satisfactory.
| B. | Fund Investment Performance |
The Board considered Fund investment performance as a relevant factor in considering whether to approve the investment advisory agreement as well as the sub-advisory contracts for the Fund, as Invesco Canada Ltd. currently manages assets of the Fund.
The Board compared the Fund’s investment performance over multiple time periods ending December 31, 2017 to the performance of funds in the Broadridge performance universe and against the Lipper Small-Cap Core Funds Index. The Board noted that performance of Class A shares of the Fund was in the first quintile of its performance universe for the one year period, the fourth quintile for the three year period and the fifth quintile for the five year period (the first quintile being the best performing funds and the fifth quintile being the worst performing funds). The Board noted that performance of Class A shares of the Fund was above the performance of the Index for the one year period and below the performance of the Index for the three and five year periods. The Board noted that the Fund’s cash position and underweight and overweight exposure to and stock selection in certain sectors detracted from performance. The Trustees also reviewed more recent Fund performance and this review did not change their conclusions.
| C. | Advisory and Sub-Advisory Fees and Fund Expenses |
The Board compared the Fund’s contractual management fee rate to the contractual management fee rates of funds in the Fund’s Broadridge expense group. The Board noted that the contractual management fee rate for Class A shares of the Fund was below the median contractual management fee rate of funds in its expense group. The Board noted that the term “contractual management fee” for funds in the expense group may include both
22 Invesco Select Companies Fund
advisory and certain non-portfolio management administrative services fees, but that Broadridge does not provide information on a fund by fund basis as to what is included. The Board also reviewed the methodology used by Broadridge in providing expense group information, which includes using each fund’s contractual management fee schedule (including any applicable breakpoints) as reported in the most recent prospectus or statement of additional information for each fund in the expense group. The Board also considered comparative information regarding the Fund’s total expense ratio and its various components. The Board noted that the Fund’s total expense ratio was in the fourth quintile of its expense group and discussed with management reasons for such relative total expenses.
The Board noted that Invesco Advisers has contractually agreed to waive fees and/or limit expenses of the Fund in an amount necessary to limit total annual operating expenses to a specified percentage of average daily net assets for each class of the Fund.
The Board also considered the fees charged by Invesco Advisers and the Affiliated Sub-Advisers to other similarly managed client accounts. The Board noted that Invesco Advisers or the Affiliated Sub-Advisers may charge lower fees to large institutional clients. Invesco Advisers reviewed with the Board differences in the scope of services it provides to the Invesco Funds relative to certain other types of client accounts, including management of cash flows as a result of redemptions and purchases, necessary infrastructure such as officers, office space, technology, legal and distribution, oversight of service providers, costs and business risks associated with launching new funds and sponsoring and maintaining the product line, preparation of annual registration statement updates and financial information and compliance with federal and state laws and regulations.
The Board also compared the Fund’s effective advisory fee rate (the advisory fee rate after advisory fee waivers and before other expense limitations/waivers) to the effective advisory fee rates of other similarly managed third-party mutual funds advised or sub-advised by Invesco Advisers and its affiliates, based on asset balances as of December 31, 2017.
The Board also considered the services that may be provided by the Affiliated Sub-Advisers pursuant to the sub-advisory contracts, as well as the fees payable by Invesco Advisers to the Affiliated Sub-Advisers pursuant to the sub-advisory contracts. The Board noted that Invesco Advisers retains overall responsibility for, and provides services to, sub-advised Invesco Funds, including oversight of the Affiliated Sub-Advisers as well as the additional services described herein other than day-to-day portfolio management.
| D. | Economies of Scale and Breakpoints |
The Board considered the extent to which there may be economies of scale in the provision of
advisory services to the Fund. The Board also considered that the Fund benefits from economies of scale through contractual breakpoints in the Fund’s advisory fee schedule, which generally operate to reduce the Fund’s expense ratio as it grows in size. The Board noted that the Fund shares directly in economies of scale through lower fees charged by third party service providers based on the combined size of the Invesco Funds. The Board noted that the Fund may also benefit from economies of scale through initial fee setting, fee waivers and expense reimbursements.
| E. | Profitability and Financial Resources |
The Board reviewed information from Invesco Advisers concerning the costs of the advisory and other services that Invesco Advisers and its affiliates provide to the Fund and the Invesco Funds and the profitability of Invesco Advisers and its affiliates in providing these services. The Board considered the methodology used for calculating profitability and noted the periodic review of such methodology by an independent consultant. The Board noted that Invesco Advisers continues to operate at a net profit from services Invesco Advisers and its affiliates provide to the Invesco Funds. The Board received information from Invesco Advisers demonstrating that Invesco Advisers and the Affiliated Sub-Advisers are financially sound and have the resources necessary to perform their obligations under the investment advisory agreement and sub-advisory contracts.
| F. | Collateral Benefits to Invesco Advisers and its Affiliates |
The Board considered various other benefits received by Invesco Advisers and its affiliates from the relationship with the Fund, including the fees received for providing administrative, transfer agency and distribution services to the Fund. The Board considered comparative information regarding fees charged for these services, including information provided by Broadridge and other independent sources. The Board considered the performance of Invesco Advisers and its affiliates in providing these services and the organizational structure employed to provide these services. The Board also considered that these services are provided to the Fund pursuant to written contracts that are reviewed and approved on an annual basis by the Board; and that the services are required for the operation of the Fund.
The Board considered the benefits realized by Invesco Advisers and the Affiliated Sub-Advisers as a result of portfolio brokerage transactions executed through “soft dollar” arrangements. The Board noted that soft dollar arrangements may result in the Fund bearing costs to purchase research that may be used by Invesco Advisers or the Affiliated Sub-Advisers with other clients and may reduce Invesco Advisers’ or the Affiliated Sub-Advisers’ expenses. The Board also considered that it receives periodic reports from Invesco representing that these arrangements are consistent with regulatory requirements. The Board did not deem the soft dollar arrangements to be inappropriate.
The Board considered that the Fund’s uninvested cash and cash collateral from any securities lending arrangements may be invested in money market funds advised by Invesco Advisers pursuant to procedures approved by the Board. The Board noted that Invesco Advisers receives advisory fees from these affiliated money market funds attributable to such investments, although Invesco Advisers has contractually agreed to waive through varying periods the advisory fees payable by the Invesco Funds with respect to certain investments in the affiliated money market funds. The waiver is in an amount equal to 100% of the net advisory fee Invesco Advisers receives from the affiliated money market funds with respect to the Fund’s investment in the affiliated money market funds of uninvested cash, but not cash collateral. The Board concluded that the amount of advisory fees received by Invesco Advisers from the Fund’s investment of cash collateral from any securities lending arrangements in the affiliated money market funds is fair and reasonable.
The Board also considered that an affiliated broker may receive commissions for executing certain trades for the Fund. Invesco Advisers and the Affiliated Sub-Advisers may use the affiliated broker to, among other things, control order routing and minimize information leakage, and the Board was advised that such trades are executed in compliance with rules under the federal securities laws and consistent with best execution obligations.
23 Invesco Select Companies Fund
Tax Information
Form 1099-DIV, Form 1042-S and other year-end tax information provide shareholders with actual calendar year amounts that should be included in their tax returns. Shareholders should consult their tax advisors.
The following distribution information is being provided as required by the Internal Revenue Code or to meet a specific state’s requirement.
The Fund designates the following amounts or, if subsequently determined to be different, the maximum amount allowable for its fiscal year ended October 31, 2018:
| | | | |
Federal and State Income Tax | |
Long-Term Capital Gain Distributions | | $ | 62,353,558 | |
Qualified Dividend Income* | | | 0.00 | % |
Corporate Dividends Received Deduction* | | | 0.00 | % |
U.S. Treasury Obligations* | | | 0.00 | % |
| | * | The above percentages are based on ordinary income dividends paid to shareholders during the Fund’s fiscal year. |
24 Invesco Select Companies Fund
Trustees and Officers
The address of each trustee and officer is AIM Investment Funds (Invesco Investment Funds) (the “Trust”), 11 Greenway Plaza, Suite 1000, Houston, Texas 77046-1173. The trustees serve for the life of the Trust, subject to their earlier death, incapacitation, resignation, retirement or removal as more specifically provided in the Trust’s organizational documents. Each officer serves for a one year term or until their successors are elected and qualified. Column two below includes length of time served with predecessor entities, if any.
| | | | | | | | |
Name, Year of Birth and
Position(s) Held with the Trust | | Trustee and/
or Officer Since | | Principal Occupation(s)
During Past 5 Years | | Number of
Funds in Fund
Complex
Overseen by
Trustee | | Other Directorship(s)
Held by Trustee During
Past 5 Years |
| Interested Persons | | | | | | | | |
| Martin L. Flanagan1 — 1960 Trustee | | 2007 | | Executive Director, Chief Executive Officer and President, Invesco Ltd. (ultimate parent of Invesco and a global investment management firm); Trustee, The Invesco Funds; Vice Chair, Investment Company Institute; and Member of Executive Board, SMU Cox School of Business Formerly: Advisor to the Board, Invesco Advisers, Inc. (formerly known as Invesco Institutional (N.A.), Inc.); Chairman and Chief Executive Officer, Invesco Advisers, Inc. (registered investment adviser); Director, Chairman, Chief Executive Officer and President, Invesco Holding Company (US), Inc. (formerly IVZ Inc.) (holding company), Invesco Group Services, Inc. (service provider) and Invesco North American Holdings, Inc. (holding company); Director, Chief Executive Officer and President, Invesco Holding Company Limited (parent of Invesco and a global investment management firm); Director, Invesco Ltd.; Chairman, Investment Company Institute and President, Co-Chief Executive Officer, Co-President, Chief Operating Officer and Chief Financial Officer, Franklin Resources, Inc. (global investment management organization) | | 158 | | None |
Philip A. Taylor2 — 1954 Trustee and Senior Vice President | | 2006 | | Head of the Americas and Senior Managing Director, Invesco Ltd.; Director, Invesco Advisers, Inc. (formerly known as Invesco Institutional (N.A.), Inc.) (registered investment adviser); Director and Chairman, Invesco Investment Services, Inc. (formerly known as Invesco AIM Investment Services, Inc.) (registered transfer agent); Chief Executive Officer, Invesco Corporate Class Inc. (corporate mutual fund company); Director, Chairman and Chief Executive Officer, Invesco Canada Ltd. (formerly known as Invesco Trimark Ltd./Invesco Trimark Ltèe) (registered investment adviser and registered transfer agent); Trustee and Senior Vice President, The Invesco Funds; Director, Invesco Investment Advisers LLC (formerly known as Van Kampen Asset Management) Formerly: Director, Chairman, Chief Executive Officer and President, Invesco Management Group, Inc. (formerly known as Invesco AIM Management Group, Inc.) (financial services holding company); Co-Chairman, Co-President and Co-Chief Executive Officer, Invesco Advisers, Inc. (formerly known as Invesco Institutional (N.A.), Inc.) (registered investment adviser); Director, Chief Executive Officer and President, Van Kampen Exchange Corp; President and Principal Executive Officer, The Invesco Funds (other than AIM Treasurer’s Series Trust (Invesco Treasurer’s Series Trust), Short-Term Investments Trust and Invesco Management Trust); Executive Vice President, The Invesco Funds (AIM Treasurer’s Series Trust (Invesco Treasurer’s Series Trust), Short-Term Investments Trust and Invesco Management Trust only); Director and President, INVESCO Funds Group, Inc. (registered investment adviser and registered transfer agent); Director and Chairman, IVZ Distributors, Inc. (formerly known as INVESCO Distributors, Inc.) (registered broker dealer); Director, President and Chairman, Invesco Inc. (holding company), Invesco Canada Holdings Inc. (holding company), Trimark Investments Ltd./Placements Trimark Ltèe and Invesco Financial Services Ltd/Services Financiers Invesco Ltèe; Chief Executive Officer, Invesco Canada Fund Inc. (corporate mutual fund company); Director and Chairman, Van Kampen Investor Services Inc.; Director, Chief Executive Officer and President, 1371 Preferred Inc. (holding company) and Van Kampen Investments Inc.; Director and President, AIM GP Canada Inc. (general partner for limited partnerships) and Van Kampen Advisors, Inc.; Director and Chief Executive Officer, Invesco Trimark Dealer Inc. (registered broker dealer); Director, Invesco Distributors, Inc. (formerly known as Invesco AIM Distributors, Inc.) (registered broker dealer); Manager, Invesco Capital Management LLC; Director, Chief Executive Officer and President, Invesco Advisers, Inc.; Director, Chairman, Chief Executive Officer and President, Invesco AIM Capital Management, Inc.; President, Invesco Trimark Dealer Inc. and Invesco Trimark Ltd./Invesco Trimark Ltèe; Director and President, AIM Trimark Corporate Class Inc. and AIM Trimark Canada Fund Inc.; Senior Managing Director, Invesco Holding Company Limited; Director and Chairman, Fund Management Company (former registered broker dealer); President and Principal Executive Officer, The Invesco Funds (AIM Treasurer’s Series Trust (Invesco Treasurer’s Series Trust), and Short-Term Investments Trust only); President, AIM Trimark Global Fund Inc. and AIM Trimark Canada Fund Inc. | | 158 | | None |
| 1 | Mr. Flanagan is considered an interested person (within the meaning of Section 2(a)(19) of the 1940 Act) of the Trust because he is an officer of the Adviser to the Trust, and an officer and a director of Invesco Ltd., ultimate parent of the Adviser. |
| 2 | Mr. Taylor is considered an interested person (within the meaning of Section 2(a)(19) of the 1940 Act) of the Trust because he is an officer and a director of the Adviser. |
T-1 Invesco Select Companies Fund
Trustees and Officers—(continued)
| | | | | | | | |
Name, Year of Birth and
Position(s) Held with the Trust | | Trustee and/
or Officer Since | | Principal Occupation(s)
During Past 5 Years | | Number of
Funds in Fund
Complex
Overseen by
Trustee | | Other Directorship(s)
Held by Trustee During
Past 5 Years |
| Independent Trustees | | | | | | | | |
Bruce L. Crockett — 1944 Trustee and Chair | | 2001 | | Chairman, Crockett Technologies Associates (technology consulting company) Formerly: Director, Captaris (unified messaging provider); Director, President and Chief Executive Officer, COMSAT Corporation; Chairman, Board of Governors of INTELSAT (international communications company); ACE Limited (insurance company); Independent Directors Council and Investment Company Institute: Member of the Audit Committee, Investment Company Institute; Member of the Executive Committee and Chair of the Governance Committee, Independent Directors Council | | 158 | | Director and Chairman of the Audit Committee, ALPS (Attorneys Liability Protection Society) (insurance company); Director and Member of the Audit Committee and Compensation Committee, Ferroglobe PLC (metallurgical company) |
David C. Arch — 1945 Trustee | | 2010 | | Chairman of Blistex Inc. (consumer health care products manufacturer); Member, World Presidents’ Organization | | 158 | | Board member of the Illinois Manufacturers’ Association |
Jack M. Fields — 1952 Trustee | | 2001 | | Chief Executive Officer, Twenty First Century Group, Inc. (government affairs company); and Chairman, Discovery Learning Alliance (non-profit) Formerly: Owner and Chief Executive Officer, Dos Angeles Ranch L.P. (cattle, hunting, corporate entertainment); Director, Insperity, Inc. (formerly known as Administaff) (human resources provider); Chief Executive Officer, Texana Timber LP (sustainable forestry company); Director of Cross Timbers Quail Research Ranch (non-profit); and member of the U.S. House of Representatives | | 158 | | None |
Cynthia Hostetler — 1962 Trustee | | 2017 | | Non-Executive Director and Trustee of a number of public and private business corporations Formerly: Director, Aberdeen Investment Funds (4 portfolios); Head of Investment Funds and Private Equity, Overseas Private Investment Corporation; President, First Manhattan Bancorporation, Inc.; Attorney, Simpson Thacher & Bartlett LLP | | 158 | | Vulcan Materials Company (construction materials company); Trilinc Global Impact Fund; Artio Global Investment LLC (mutual fund complex); Edgen Group, Inc. (specialized energy and infrastructure products distributor) |
Eli Jones — 1961 Trustee | | 2016 | | Professor and Dean, Mays Business School — Texas A&M University Formerly: Professor and Dean, Walton College of Business, University of Arkansas and E.J. Ourso College of Business, Louisiana State University; Director, Arvest Bank | | 158 | | Insperity, Inc. (formerly known as Administaff) (human resources provider) |
Prema Mathai-Davis — 1950 Trustee | | 2001 | | Retired | | 158 | | None |
Teresa M. Ressel — 1962 Trustee | | 2017 | | Non-executive director and trustee of a number of public and private business corporations Formerly: Chief Financial Officer, Olayan America, The Olayan Group (international investor/commercial/industrial); Chief Executive Officer, UBS Securities LLC; Group Chief Operating Officer, Americas, UBS AG; Assistant Secretary for Management & Budget and CFO, US Department of the Treasury | | 158 | | Atlantic Power Corporation (power generation company); ON Semiconductor Corp. (semiconductor supplier) |
Ann Barnett Stern — 1957 Trustee | | 2017 | | President and Chief Executive Officer, Houston Endowment Inc. (private philanthropic institution) Formerly: Executive Vice President and General Counsel, Texas Children’s Hospital; Attorney, Beck, Redden and Secrest, LLP; Business Law Instructor, University of St. Thomas; Attorney, Andrews & Kurth LLP | | 158 | | Federal Reserve Bank of Dallas |
Raymond Stickel, Jr. — 1944 Trustee | | 2005 | | Retired Formerly: Director, Mainstay VP Series Funds, Inc. (25 portfolios); Partner, Deloitte & Touche | | 158 | | None |
Robert C. Troccoli — 1949 Trustee | | 2016 | | Adjunct Professor, University of Denver — Daniels College of Business Formerly: Senior Partner, KPMG LLP | | 158 | | None |
Christopher L. Wilson — 1957 Trustee | | 2017 | | Non-executive director and trustee of a number of public and private business corporations Formerly: Director, TD Asset Management USA Inc. (mutual fund complex) (22 portfolios); Managing Partner, CT2, LLC (investing and consulting firm); President/Chief Executive Officer, Columbia Funds, Bank of America Corporation; President/Chief Executive Officer, CDC IXIS Asset Management Services, Inc.; Principal & Director of Operations, Scudder Funds, Scudder, Stevens & Clark, Inc.; Assistant Vice President, Fidelity Investments | | 158 | | ISO New England, Inc. (non-profit organization managing regional electricity market) |
T-2 Invesco Select Companies Fund
Trustees and Officers—(continued)
| | | | | | | | |
Name, Year of Birth and
Position(s) Held with the Trust | | Trustee and/
or Officer Since | | Principal Occupation(s)
During Past 5 Years | | Number of
Funds in Fund
Complex
Overseen by
Trustee | | Other Directorship(s)
Held by Trustee During
Past 5 Years |
| Other Officers | | | | | | | | |
Sheri Morris — 1964 President, Principal Executive Officer and Treasurer | | 1999 | | President, Principal Executive Officer and Treasurer, The Invesco Funds; Vice President, Invesco Advisers, Inc. (formerly known as Invesco Institutional (N.A.), Inc.) (registered investment adviser); and Vice President, Invesco Exchange-Traded Fund Trust, Invesco Exchange-Traded Fund Trust II, Invesco India Exchange-Traded Fund Trust, Invesco Actively Managed Exchange-Traded Fund Trust, Invesco Actively Managed Exchange-Traded Commodity Fund Trust and Invesco Exchange-Traded Self-Indexed Fund Trust Formerly: Vice President and Principal Financial Officer, The Invesco Funds; Vice President, Invesco AIM Advisers, Inc., Invesco AIM Capital Management, Inc. and Invesco AIM Private Asset Management, Inc.; Assistant Vice President and Assistant Treasurer, The Invesco Funds and Assistant Vice President, Invesco Advisers, Inc., Invesco AIM Capital Management, Inc. and Invesco AIM Private Asset Management, Inc.; and Treasurer, Invesco Exchange-Traded Fund Trust, Invesco Exchange-Traded Fund Trust II, Invesco India Exchange-Traded Fund Trust and Invesco Actively Managed Exchange-Traded Fund Trust | | N/A | | N/A |
Russell C. Burk — 1958 Senior Vice President and Senior Officer | | 2005 | | Senior Vice President and Senior Officer, The Invesco Funds | | N/A | | N/A |
Jeffrey H. Kupor — 1968 Senior Vice President, Chief Legal Officer and Secretary | | 2018 | | Senior Vice President and Secretary, Invesco Advisers, Inc. (formerly known as Invesco Institutional (N.A.), Inc.) (registered investment adviser); Senior Vice President and Secretary, Invesco Distributors, Inc. (formerly known as Invesco AIM Distributors, Inc.); Vice President and Secretary, Invesco Investment Services, Inc. (formerly known as Invesco AIM Investment Services, Inc.) Senior Vice President, Chief Legal Officer and Secretary, The Invesco Funds; Secretary and General Counsel, Invesco Investment Advisers LLC (formerly known as Van Kampen Asset Management); Secretary and General Counsel, Invesco Capital Markets, Inc. (formerly known as Van Kampen Funds Inc.) and Chief Legal Officer, Invesco Exchange-Traded Fund Trust, Invesco Exchange-Traded Fund Trust II, Invesco India Exchange-Traded Fund Trust, Invesco Actively Managed Exchange-Traded Fund Trust, Invesco Actively Managed Exchange-Traded Commodity Fund Trust and Invesco Exchange-Traded Self-Indexed Fund Trust; Secretary, Invesco Indexing LLC; Secretary and General Counsel, INVESCO Private Capital Investments, Inc.; Secretary, W.L. Ross & Co., LLC; Secretary and Vice President, Jemstep, Inc. Formerly: Senior Vice President, Secretary and General Counsel, Invesco Management Group, Inc. (formerly known as Invesco AIM Management Group, Inc.); Assistant Secretary, INVESCO Asset Management (Bermuda) Ltd.; Secretary and General Counsel, Invesco Private Capital, Inc.; Assistant Secretary and General Counsel, INVESCO Realty, Inc.; Secretary and General Counsel, Invesco Senior Secured Management, Inc.; and Secretary, Sovereign G./P. Holdings Inc. | | N/A | | N/A |
John M. Zerr — 1962 Senior Vice President | | 2006 | | Chief Operating Officer of the Americas; Senior Vice President, Invesco Advisers, Inc. (formerly known as Invesco Institutional (N.A.), Inc.) (registered investment adviser); Senior Vice President, Invesco Distributors, Inc. (formerly known as Invesco AIM Distributors, Inc.); Director and Vice President, Invesco Investment Services, Inc. (formerly known as Invesco AIM Investment Services, Inc.) Senior Vice President, The Invesco Funds; Managing Director, Invesco Capital Management LLC; Director, Invesco Investment Advisers LLC (formerly known as Van Kampen Asset Management); Senior Vice President, Invesco Capital Markets, Inc. (formerly known as Van Kampen Funds Inc.); Manager, Invesco Indexing LLC Formerly: Director and Senior Vice President, Invesco Management Group, Inc. (formerly known as Invesco AIM Management Group, Inc.); Secretary and General Counsel, Invesco Management Group, Inc. (formerly known as Invesco AIM Management Group, Inc.); Secretary, Invesco Investment Services, Inc. (formerly known as Invesco AIM Investment Services, Inc.); Chief Legal Officer and Secretary, The Invesco Funds; Secretary and General Counsel, Invesco Investment Advisers LLC (formerly known as Van Kampen Asset Management); Secretary and General Counsel, Invesco Capital Markets, Inc. (formerly known as Van Kampen Funds Inc.); Chief Legal Officer, Invesco Exchange-Traded Fund Trust, Invesco Exchange-Traded Fund Trust II, Invesco India Exchange-Traded Fund Trust, Invesco Actively Managed Exchange-Traded Fund Trust, Invesco Actively Managed Exchange-Traded Commodity Fund Trust and Invesco Exchange-Traded Self-Indexed Fund Trust; Secretary, Invesco Indexing LLC; Director, Secretary, General Counsel and Senior Vice President, Van Kampen Exchange Corp.; Director, Vice President and Secretary, IVZ Distributors, Inc. (formerly known as INVESCO Distributors, Inc.); Director and Vice President, INVESCO Funds Group, Inc.; Director and Vice President, Van Kampen Advisors Inc.; Director, Vice President, Secretary and General Counsel, Van Kampen Investor Services Inc.; Director and Secretary, Invesco Distributors, Inc. (formerly known as Invesco AIM Distributors, Inc.); Director, Senior Vice President, General Counsel and Secretary, Invesco AIM Advisers, Inc. and Van Kampen Investments Inc.; Director, Vice President and Secretary, Fund Management Company; Director, Senior Vice President, Secretary, General Counsel and Vice President, Invesco AIM Capital Management, Inc.; Chief Operating Officer and General Counsel, Liberty Ridge Capital, Inc. (an investment adviser) | | N/A | | N/A |
T-3 Invesco Select Companies Fund
Trustees and Officers—(continued)
| | | | | | | | |
Name, Year of Birth and
Position(s) Held with the Trust | | Trustee and/
or Officer Since | | Principal Occupation(s)
During Past 5 Years | | Number of
Funds in Fund
Complex
Overseen by
Trustee | | Other Directorship(s)
Held by Trustee During
Past 5 Years |
| Other Officers—(continued) | | | | | | | | |
Gregory G. McGreevey — 1962 Senior Vice President | | 2012 | | Senior Managing Director, Invesco Ltd.; Director, Chairman, President, and Chief Executive Officer, Invesco Advisers, Inc. (formerly known as Invesco Institutional (N.A.), Inc.) (registered investment adviser); Director, Invesco Mortgage Capital, Inc. and Invesco Senior Secured Management, Inc.; and Senior Vice President, The Invesco Funds Formerly: Senior Vice President, Invesco Management Group, Inc. and Invesco Advisers, Inc.; Assistant Vice President, The Invesco Funds | | N/A | | N/A |
Kelli Gallegos — 1970 Vice President, Principal Financial Officer and Assistant Treasurer | | 2008 | | Vice President and Treasurer, Invesco Exchange-Traded Fund Trust, Invesco Exchange-Traded Fund Trust II, Invesco India Exchange-Traded Fund Trust, Invesco Actively Managed Exchange-Traded Fund Trust, Invesco Actively Managed Exchange-Traded Commodity Fund Trust and Invesco Exchange-Traded Self-Indexed Fund Trust; Vice President, Principal Financial Officer and Assistant Treasurer, The Invesco Funds; Principal Financial and Accounting Officer — Pooled Investments, Invesco Capital Management LLC Formerly: Assistant Treasurer, Invesco Exchange-Traded Fund Trust, Invesco Exchange-Traded Fund Trust II, Invesco India Exchange-Traded Fund Trust, Invesco Actively Managed Exchange-Traded Fund Trust, Invesco Actively Managed Exchange-Traded Commodity Fund Trust and Invesco Exchange-Traded Self-Indexed Fund Trust; Assistant Treasurer, Invesco Capital Management LLC; Assistant Vice President, The Invesco Funds | | N/A | | N/A |
Tracy Sullivan — 1962 Vice President, Chief Tax Officer and Assistant Treasurer | | 2008 | | Vice President, Chief Tax Officer and Assistant Treasurer, The Invesco Funds; Assistant Treasurer, Invesco Capital Management LLC, Invesco Exchange-Traded Fund Trust, Invesco Exchange-Traded Fund Trust II, Invesco India Exchange-Traded Fund Trust, Invesco Actively Managed Exchange-Traded Fund Trust, Invesco Actively Managed Exchange-Traded Commodity Fund Trust and Invesco Exchange-Traded Self-Indexed Fund Trust Formerly: Assistant Vice President, The Invesco Funds | | N/A | | N/A |
Crissie M. Wisdom — 1969 Anti-Money Laundering Compliance Officer | | 2013 | | Anti-Money Laundering Compliance Officer, Invesco Advisers, Inc. (formerly known as Invesco Institutional (N.A.), Inc.) (registered investment adviser), Invesco Capital Markets, Inc. (formerly known as Van Kampen Funds Inc.), Invesco Distributors, Inc., Invesco Investment Services, Inc., The Invesco Funds, and Invesco Exchange-Traded Fund Trust, Invesco Exchange-Traded Fund Trust II, Invesco India Exchange-Traded Fund Trust, Invesco Actively Managed Exchange-Traded Fund Trust, Invesco Actively Managed Exchange-Traded Commodity Fund Trust and Invesco Exchange-Traded Self-Indexed Fund Trust; Anti-Money Laundering Compliance Officer and Bank Secrecy Act Officer, INVESCO National Trust Company and Invesco Trust Company; and Fraud Prevention Manager and Controls and Risk Analysis Manager for Invesco Investment Services, Inc. Formerly: Anti-Money Laundering Compliance Officer, Van Kampen Exchange Corp. and Invesco Management Group, Inc. | | N/A | | N/A |
Robert R. Leveille — 1969 Chief Compliance Officer | | 2016 | | Chief Compliance Officer, Invesco Advisers, Inc. (registered investment adviser); and Chief Compliance Officer, The Invesco Funds Formerly: Chief Compliance Officer, Putnam Investments and the Putnam Funds | | N/A | | N/A |
The Statement of Additional Information of the Trust includes additional information about the Fund’s Trustees and is available upon request, without charge, by calling 1.800.959.4246. Please refer to the Fund’s Statement of Additional Information for information on the Fund’s sub-advisers.
| | | | | | |
Office of the Fund 11 Greenway Plaza, Suite 1000 Houston, TX 77046-1173 | | Investment Adviser Invesco Advisers, Inc. 1555 Peachtree Street, N.E. Atlanta, GA 30309 | | Distributor Invesco Distributors, Inc. 11 Greenway Plaza, Suite 1000 Houston, TX 77046-1173 | | Auditors PricewaterhouseCoopers LLP 1000 Louisiana Street, Suite 5800 Houston, TX 77002-5021 |
| | | |
| | | | | | |
Counsel to the Fund Stradley Ronon Stevens & Young, LLP 2005 Market Street, Suite 2600 Philadelphia, PA 19103-7018 | | Counsel to the Independent Trustees Goodwin Procter LLP 901 New York Avenue, N.W. Washington, D.C. 20001 | | Transfer Agent Invesco Investment Services, Inc. 11 Greenway Plaza, Suite 1000 Houston, TX 77046-1173 | | Custodian State Street Bank and Trust Company 225 Franklin Street Boston, MA 02110-2801 |
T-4 Invesco Select Companies Fund
Explore High-Conviction Investing with Invesco

Go paperless with eDelivery
Visit invesco.com/edelivery to enjoy the convenience and security of anytime electronic access to your investment documents.
With eDelivery, you can elect to have any or all of the following materials delivered straight to your inbox to download, save and print from your own computer:
∎ Fund reports and prospectuses
∎ Quarterly statements
∎ Daily confirmations
∎ Tax forms
Invesco mailing information
Send general correspondence to Invesco Investment Services, Inc., P.O. Box 219078, Kansas City, MO 64121-9078.
Important notice regarding delivery of security holder documents
To reduce Fund expenses, only one copy of most shareholder documents may be mailed to shareholders with multiple accounts at the same address (Householding). Mailing of your shareholder documents may be householded indefinitely unless you instruct us otherwise. If you do not want the mailing of these documents to be combined with those for other members of your household, please contact Invesco Investment Services, Inc. at 800 959 4246 or contact your financial institution. We will begin sending you individual copies for each account within 30 days after receiving your request.
Fund holdings and proxy voting information
The Fund provides a complete list of its holdings four times in each fiscal year, at the quarter ends. For the second and fourth quarters, the lists appear in the Fund’s semiannual and annual reports to shareholders. For the first and third quarters, the Fund files the lists with the Securities and Exchange Commission (SEC) on Form N-Q (or any successor Form). The most recent list of portfolio holdings is available at invesco.com/completeqtrholdings. Shareholders can also look up the Fund’s Forms N-Q (or any successor Form) on the SEC website at sec.gov. The SEC file numbers for the Fund are shown below.
A description of the policies and procedures that the Fund uses to determine how to vote proxies relating to portfolio securities is available without charge, upon request, from our Client Services department at 800 959 4246 or at invesco.com/proxyguidelines. The information is also available on the SEC website, sec.gov.
| | |
Information regarding how the Fund voted proxies related to its portfolio securities during the most recent 12-month period ended June 30 is available at invesco.com/proxysearch. The information is also available on the SEC website, sec.gov. Invesco Advisers, Inc. is an investment adviser; it provides investment advisory services to individual and institutional clients and does not sell securities. Invesco Distributors, Inc. is the US distributor for Invesco Ltd.’s retail mutual funds, exchange-traded funds and institutional money market funds. Both are wholly owned, indirect subsidiaries of Invesco Ltd. | | 
|
| | | | | | | | |
| SEC file numbers: 811-05426 and 033-19338 | | Invesco Distributors, Inc. | | SCO-AR-1 | | 12142018 | | 1538 |
| | | | | | |
| | | | |
 | | Annual Report to Shareholders | | October 31, 2018 | | |
| | | | |
| | Invesco U.S. Managed Volatility Fund | | |
| | Nasdaq: | | |
| | R6: USMVX | | |
Letters to Shareholders
| | |

Philip Taylor | | Dear Shareholders: This annual report includes information about your Fund, including performance data and a complete list of its investments as of the close of the reporting period. Inside is a discussion of how your Fund was managed and the factors that affected its performance during the reporting period. Throughout the reporting period, US economic data remained positive. Robust corporate profits, strong retail sales and unemployment rates near generational lows helped drive US markets to new all-time records multiple times during the reporting period. Against this backdrop, the US Federal Reserve raised the federal funds rate four times during the reporting period. Market volatility, largely non-existent in 2017, returned in 2018. Markets sold off first in February and again sharply in October, amid rising interest rates, concerns about potential trade wars and heightened geopolitical tensions. Despite the volatility, US equity markets were largely positive |
for the reporting period and fared better than international markets. Emerging markets were particularly hard hit due to a strong US dollar. During the October sell-off, investors retreated to more defensive areas of the market and to US Treasuries. The broader bond market declined during the reporting period due to the increase in US Treasury yields and widening credit spreads. As the year progresses, we’ll see how the interplay of economic data, interest rates, geopolitics and a host of other factors affect US and overseas equity and fixed income markets.
Short-term market volatility can prompt some investors to abandon their investment plans – and can cause others to settle for whatever returns the market has to offer. The investment professionals at Invesco, in contrast, invest with high conviction. This means that, no matter the asset class or the strategy, each investment team has a passion to exceed. We want to help investors achieve better outcomes, such as seeking higher returns, helping mitigate risk and generating income. Of course, investing with high conviction can’t guarantee a profit or ensure success; no investment strategy can. To learn more about how we invest with high conviction, visit invesco.com/HighConviction.
You, too, can invest with high conviction by maintaining a long-term investment perspective and by working with your financial adviser on a regular basis. During periods of short-term market volatility or uncertainty, your financial adviser can keep you focused on your long-term investment goals – a new home, a child’s college education or a secure retirement. He or she also can share research about the economy, the markets and individual investment options.
Visit our website for more information on your investments
Our website, invesco.com/us, offers a wide range of market insights and investment perspectives. On the website, you’ll find detailed information about our funds, including performance, holdings and portfolio manager commentaries. You can access information about your account by completing a simple, secure online registration. To do so, select “Log In” on the right side of the homepage, and then select “Register for Individual Account Access.”
In addition to the resources accessible on our website and through our mobile app, you can obtain timely updates to help you stay informed about the markets and the economy by connecting with Invesco on Twitter, LinkedIn or Facebook. You can access our blog at blog.invesco.us.com. Our goal is to provide you the information you want, when and where you want it.
Finally, I’m pleased to share with you Invesco’s commitment to both the Principles for Responsible Investment and to considering environmental, social and governance issues in our robust investment process. I invite you to learn more at invesco.com/esg.
Have questions?
For questions about your account, contact an Invesco client services representative at 800 959 4246. For Invesco-related questions or comments, please email me directly at phil@invesco.com.
All of us at Invesco look forward to serving your investment management needs. Thank you for investing with us.
Sincerely,

Philip Taylor
Senior Managing Director, Invesco Ltd.
| | |
| 2 | | Invesco U.S. Managed Volatility Fund |
| | | | |

Bruce Crockett | | Dear Fellow Shareholders: Among the many important lessons I’ve learned in more than 40 years in a variety of business endeavors is the value of a trusted advocate. As independent chair of the Invesco Funds Board, I can assure you that the members of the Board are strong advocates for the interests of investors in Invesco’s mutual funds. We work hard to represent your interests through oversight of the quality of the investment management services your funds receive and other matters important to your investment, including but not limited to: |
| | ∎ | | Ensuring that Invesco offers a diverse lineup of mutual funds that your financial adviser can use to strive to meet your financial needs as your investment goals change over time. |
| | ∎ | | Monitoring how the portfolio management teams of the Invesco funds are performing in light of changing economic and market conditions. |
| ∎ | | Assessing each portfolio management team’s investment performance within the context of the investment strategy described in the fund’s prospectus. |
| ∎ | | Monitoring for potential conflicts of interests that may impact the nature of the services that your funds receive. |
We believe one of the most important services we provide our fund shareholders is the annual review of the funds’ advisory and sub-advisory contracts with Invesco Advisers and its affiliates. This review is required by the Investment Company Act of 1940 and focuses on the nature and quality of the services Invesco provides as the adviser to the Invesco funds and the reasonableness of the fees that it charges for those services. Each year, we spend months carefully reviewing information received from Invesco and a variety of independent sources, such as performance and fee data prepared by Lipper, Inc. (a subsidiary of Broadridge Financial Solutions, Inc.), an independent, third-party firm widely recognized as a leader in its field. We also meet with our independent legal counsel and other independent advisers to review and help us assess the information that we have received. Our goal is to assure that you receive quality investment management services for a reasonable fee.
I trust the measures outlined above provide assurance that you have a worthy advocate when it comes to choosing the Invesco Funds.
As always, please contact me at bruce@brucecrockett.com with any questions or concerns you may have. On behalf of the Board, we look forward to continuing to represent your interests and serving your needs.
Sincerely,

Bruce L. Crockett
Independent Chair
Invesco Funds Board of Trustees
| | |
| 3 | | Invesco U.S. Managed Volatility Fund |
Management’s Discussion of Fund Performance
| | | | |
| |
Performance summary Invesco U.S. Managed Volatility Fund (the Fund) incepted on December 18, 2017. From the Fund’s inception to the end of the reporting period on October 31, 2018, Class R6 shares of the Fund underperformed the Fund’s style-specific index, the Invesco US Large Cap Index. Additional information about your Fund’s performance appears later in this report. | |
| | |
Fund vs. Indexes | | | | |
Cumulative total returns, 12/18/17 (inception date) to 10/31/18. | | | | |
| |
Class R6 Shares | | | 1.40 | % |
S&P 500 Indexq (Broad Market Index) | | | 2.43 | |
Invesco US Large Cap Index⬛ (Style-Specific Index) | | | 2.64 | |
Lipper S&P 500 Funds Index◆ (Peer Group Index) | | | 2.10 | |
| | |
Source(s): qFactSet Research Systems Inc.; ⬛RIMES Technologies Corp.; ◆Lipper Inc. | | | | |
Market conditions and your Fund
Invesco U.S. Managed Volatility Fund incepted on December 18, 2017, just before the close of the calendar year. At the Fund’s inception, US markets were rising amid the passage of the Tax Cuts and Jobs Act signed into law in late December 2017, which significantly cut corporate tax rates. Several major US stock market indexes repeatedly reached new highs to close out the calendar year, which saw record low stock market volatility.
Stock market euphoria continued in January 2018 as US equity markets steadily moved higher. Investors remained enthused about the passage of tax reform legislation. However, in February 2018, volatility returned to the US stock and bond markets. Worries about how rising interest rates might affect economic growth, concerns about a potential trade war and heightened geopolitical tensions caused the US stock markets to pull back and volatility to increase.
US equity markets generally recovered in the second quarter of 2018 as strong US retail sales and low unemployment
buoyed markets. Throughout the summer, US equities moved higher as corporate profits surged. Several US equity indexes reached new highs despite potential headwinds including trade tensions, tariff announcements and contagion concerns over a Turkish currency crisis. After a relatively quiet summer, market volatility markedly rose in the final month of the fiscal year. US equity markets suffered a sharp sell-off in October 2018 amid rising interest rates and concerns that higher inflation could mean a more restrictive monetary policy. In this environment, investors fled to more defensive areas of the market and to US Treasuries.
Given signs of a strong economy, the US Federal Reserve raised interest rates four times during the fiscal year: in December 2017 and in March, June and September 2018.1 In contrast, the European Central Bank and central banks in several other countries maintained extraordinarily accommodative monetary policies.
Invesco U.S. Managed Volatility Fund is a domestic large-cap core equity strategy focused on providing capital appreciation while managing portfolio volatility. The
strategy seeks equity-like exposure during periods of economic strength and downside protection during economic stress. The Fund seeks to accomplish this by investing in the Invesco US Large Cap Index with a futures overlay component designed to manage volatility. The futures overlay component is designed to manage the Fund’s overall risk by selling short exchange-traded equity index futures in periods of high market volatility. This risk management overlay is implemented when the Fund’s forecasted annualized volatility exceeds the target volatility level.
Fund performance benefited from holdings in the information technology (IT), health care and consumer discretionary sectors. In contrast, Fund holdings in the financials, industrials and materials sectors detracted from performance. The Fund’s volatility overlay also detracted from Fund performance. The overlay was first implemented in late March and early April as volatility began to increase; the overlay was used again in late October 2018 during the market sell-off.
Although the overlay acted as a head-wind in terms of performance, the Fund’s overall volatility was lower than the style-specific during the fiscal year.
The leading individual contributor to Fund performance during the fiscal year was IT sector constituent, Apple. The technology giant reported solid earnings and services growth, which helped the stock maintain positive momentum and profitability. Amazon.com was another leading contributor to Fund performance. During the fiscal year, the retail and e-commerce giant reported solid quarterly results with better revenue growth and improving profit margins across all segments. Conversely, industrials sector constituent, General Electric (GE) and
| | | | |
| |
Portfolio Composition | |
| By sector | | | % of total net assets | |
| | | | |
| |
Information Technology | | | 21.6 | % |
Health Care | | | 15.2 | |
Financials | | | 13.0 | |
Consumer Discretionary | | | 10.5 | |
Communication Services | | | 9.6 | |
Industrials | | | 8.8 | |
Consumer Staples | | | 7.8 | |
Energy | | | 5.8 | |
Utilities | | | 2.8 | |
Real Estate | | | 2.4 | |
Materials | | | 2.3 | |
Money Market Funds Plus Other Assets Less Liabilities | | | 0.2 | |
| | | | | | |
| | |
Top 10 Equity Holdings* | | | | |
| | % of total net assets | |
| | | | | | |
| | |
1. | | Apple Inc. | | | 4.7 | % |
2. | | Microsoft Corp. | | | 3.7 | |
3. | | Amazon.com Inc. | | | 3.0 | |
4. | | Alphabet Inc. - Class A | | | 3.0 | |
5. | | Johnson & Johnson | | | 1.7 | |
6. | | Facebook, Inc. - Class A | | | 1.6 | |
7. | | JPMorgan Chase & Co. | | | 1.6 | |
8. | | Exxon Mobil Corp. | | | 1.5 | |
9. | | Berkshire Hathaway Inc. - Class B | | | 1.3 | |
10. | | Bank of America Corp. | | | 1.2 | |
| | | | |
| | |
Total Net Assets | | $ | 5.9 million | |
| |
Total Number of Holdings* | | | 408 | |
The Fund’s holdings are subject to change, and there is no assurance that the Fund will continue to hold any particular security.
*Excluding money market fund holdings.
Data presented here are as of October 31, 2018.
| | |
| 4 | | Invesco U.S. Managed Volatility Fund |
communication services sector constituent, Facebook were the leading detractors from Fund performance. GE faced several headwinds during the fiscal year driven by rising debt and leadership changes. The stock fell to its lowest level in three years during the fiscal year. Face-book also faced its share of difficulties during the fiscal year due to fallout from a data scandal, which revealed that the personal data of millions of Facebook pro-files had been harvested without consent and used for political purposes. Following the revelation, Facebook provided guidance for slower-than-expected revenue growth resulting from the many changes implemented after the scandal.
Please note, the Fund’s strategy is principally implemented through equity investments, but we may also use futures contracts, a derivative instrument, to manage volatility. Derivatives can be a cost-effective way to gain exposure to asset classes. However, derivatives may amplify traditional investment risks through the creation of leverage and may be less liquid than traditional securities.
Thank you for your investment in Invesco U.S. Managed Volatility Fund.
| 1 | Source: US Federal Reserve |
The views and opinions expressed in management’s discussion of Fund performance are those of Invesco Advisers, Inc. These views and opinions are subject to change at any time based on factors such as market and economic conditions. These views and opinions may not be relied upon as investment advice or recommendations, or as an offer for a particular security. The information is not a complete analysis of every aspect of any market, country, industry, security or the Fund. Statements of fact are from sources considered reliable, but Invesco Advisers, Inc. makes no representation or warranty as to their completeness or accuracy. Although historical performance is no guarantee of future results, these insights may help you understand our investment management philosophy.
See important Fund and, if applicable, index disclosures later in this report.
Duy Nguyen
Chartered Financial Analyst, Portfolio Manager and Chief Investment Officer of Invesco’s Global Solutions Development and Implementation Team, is manager of Invesco U.S. Managed Volatility Fund. He joined Invesco in 2000. Mr. Nguyen earned a BBA from The University of Texas at Austin and an MS from the University of Houston.
Jacob Borbidge
Chartered Financial Analyst, Portfolio Manager and Head of Research for Inves-co’s Global Solutions Development and Implementation Team, is manager of Invesco U.S. Managed Volatility Fund. He joined Invesco in 2004. Mr. Borbidge earned a BS in mechanical engineering from Lehigh University and an MS in finance from the University of Houston.
David Hemming
Portfolio Manager, is manager of Invesco U.S. Managed Volatility Fund. He joined Invesco in 2016. Mr. Hemming earned an MSc in investment management from City University’s Cass Business School and an MA degree with honors in economics and international relations from the University of St. Andrews.
Theodore (Ted) Samulowitz
Portfolio Manager, is manager of Invesco U.S. Managed Volatility Fund. He joined Invesco in 2012. Mr. Samulowitz earned a BS degree in agricultural economics from Purdue University.
5 Invesco U.S. Managed Volatility Fund
Your Fund’s Long-Term Performance
Results of a $10,000 Investment – Oldest Share Class(es) since inception
Fund and index data from 12/18/17
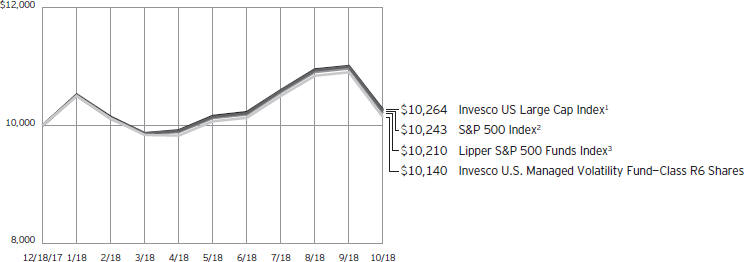
1 Source: RIMES Technologies Corp.
2 Source: FactSet Research Systems Inc.
3 Source: Lipper Inc.
Past performance cannot guarantee comparable future results.
The data shown in the chart include reinvested distributions, applicable sales charges and Fund expenses including management fees. Index results include reinvested dividends, but they do not reflect sales charges. Performance of the
peer group, if applicable, reflects fund expenses and management fees; performance of a market index does not. Performance shown in the chart and table(s) does not reflect deduction of taxes a shareholder would pay on Fund distributions or sale of Fund shares.
| | |
| 6 | | Invesco U.S. Managed Volatility Fund |
| | | | |
| |
Cumulative Total Returns | |
As of 10/31/18, including maximum applicable sales charges | |
| |
Class R6 Shares | | | | |
Inception (12/18/17) | | | 1.40 | % |
The performance data quoted represent past performance and cannot guarantee comparable future results; current performance may be lower or higher. Please visit invesco.com/performance for the most recent month-end performance. Performance figures reflect reinvested distributions and changes in net asset value. Investment return and principal value will fluctuate so that you may have a gain or loss when you sell shares.
The net annual Fund operating expense ratio set forth in the most recent Fund prospectus as of the date of this report for Class R6 shares 0.15%.1 The total annual Fund operating expense ratio set forth in the most recent Fund prospectus as of the date of this report for Class R6 shares was 3.80%. The expense ratios presented above may vary from the expense ratios presented in other sections of this report that are based on expenses incurred during the period covered by this report.
Class R6 class shares do not have a front-end sales charge or a CDSC; therefore, performance is at net asset value.
The performance of the Fund’s share classes will differ primarily due to different sales charge structures and class expenses.
Fund performance reflects any applicable fee waivers and/or expense reimbursements. Had the adviser not waived fees and/or reimbursed expenses currently or in the past, returns would have been lower. See current prospectus for more information.
| 1 | Total annual Fund operating expenses after any contractual fee waivers and/or expense reimbursements by the adviser in effect through at least February 29, 2020. See current prospectus for more information. |
| | | | |
| |
Cumulative Total Returns | |
As of 9/30/18, the most recent calendar quarter end, including maximum applicable sales charges | |
| |
Class R6 Shares | | | | |
Inception (12/18/17) | | | 9.00 | % |
7 Invesco U.S. Managed Volatility Fund
Invesco U.S. Managed Volatility Fund’s investment objective is to seek to provide capital appreciation while managing portfolio volatility.
| ∎ | | Unless otherwise stated, information presented in this report is as of October 31, 2018, and is based on total net assets. |
| ∎ | | Unless otherwise noted, all data provided by Invesco. |
| ∎ | | To access your Fund’s reports/prospectus, visit invesco.com/fundreports. |
About share classes
| ∎ | | Class R6 shares are available for use by retirement plans that meet certain standards and for institutional investors. Class R6 shares are also available through intermediaries that have established an agreement with Invesco Distributors, Inc. to make such shares available for use in retail omnibus accounts. Please see the prospectus for more information. |
Principal risks of investing in the Fund
| ∎ | | Derivatives risk. The value of a derivative instrument depends largely on (and is derived from) the value of an underlying security, currency, commodity, interest rate, index or other asset (each referred to as an underlying asset). In addition to risks relating to the underlying assets, the use of derivatives may include other, possibly greater, risks, including counterparty, leverage and liquidity risks. Counter-party risk is the risk that the counter-party to the derivative contract will default on its obligation to pay the Fund the amount owed or otherwise perform under the derivative contract. Derivatives create leverage risk because they do not require payment up front equal to the economic exposure created by owning the derivative. As a result, an adverse change in the value of the underlying asset could result in the Fund sustaining a loss that is substantially greater than the amount invested in the derivative, which may make the Fund’s returns more volatile and increase the risk of loss. Derivative instruments may also be less liquid than more traditional investments and the Fund may be unable to sell or close out its derivative positions at a desirable time or price. This risk may be more acute under adverse market conditions, during which the Fund may be most in need of liquidating its derivative positions. Derivatives may also be harder to value, less tax efficient and |
| | subject to changing government regulation that could impact the Fund’s ability to use certain derivatives or their cost. Also, derivatives used for hedging or to gain or limit exposure to a particular market segment may not provide the expected benefits, particularly during adverse market conditions. |
| ∎ | | Indexing risk. Certain portions of the Fund’s assets are managed pursuant to an indexing approach (Indexed Assets) and, therefore, the adverse performance of a particular security necessarily will not result in the elimination of the security from the Indexed Assets. Ordinarily, the Fund will not sell portfolio securities of the Indexed Assets except to reflect additions or deletions of the securities that comprise the index the Fund seeks to track with respect to the Indexed Assets (Underlying Index), or as may be necessary to raise cash to pay Fund shareholders who sell Fund shares. As such, the Indexed Assets, and therefore the Fund, will be negatively affected by declines in the securities represented by the Underlying Index. Also, there is no guarantee that the Fund will be able to correlate the performance of the Indexed Assets with that of the Underlying Index. |
| ∎ | | Management risk. The Fund is actively managed and depends heavily on the Adviser’s judgment about markets, interest rates or the attractiveness, relative values, liquidity, or potential appreciation of particular investments made for the Fund’s portfolio. The Fund could experience losses if these judgments prove to be incorrect. There is no guarantee that the portfolio manager’s stock selection process will produce lower volatility than the broader markets in which the Fund invests. In addition, the Fund’s investment strategy to seek lower volatility may cause the Fund to underperform the broader markets in which the Fund invests during market rallies. Such under performance could be significant during sudden or significant market rallies. |
This report must be accompanied or preceded by a currently effective Fund prospectus, which contains more complete information, including sales charges and expenses. Investors should read it carefully before investing.
NOT FDIC INSURED | MAY LOSE VALUE | NO BANK GUARANTEE
| | Additionally, legislative, regulatory, or tax developments may adversely affect management of the Fund and, therefore, the ability of the Fund to achieve its investment objective. |
| ∎ | | Market risk. The market values of the Fund’s investments, and therefore the value of the Fund’s shares, will go up and down, sometimes rapidly or unpredictably. Market risk may affect a single issuer, industry or section of the economy, or it may affect the market as a whole. Individual stock prices tend to go up and down more dramatically than those of certain other types of investments, such as bonds. During a general downturn in the financial markets, multiple asset classes may decline in value. When markets perform well, there can be no assurance that specific investments held by the Fund will rise in value. |
| ∎ | | Non-correlation risk. The return of the Fund’s assets managed pursuant to an indexing approach (Indexed Assets) may not match the return of the index the Fund seeks to track with respect to the Indexed Assets (Underlying Index) for a number of reasons. For example, the Fund incurs operating expenses not applicable to the Underlying Index, and incurs costs in buying and selling securities, especially when rebalancing securities holdings to reflect changes in the Underlying Index. In addition, the performance of the Indexed Assets and the Underlying Index may vary due to asset valuation differences and differences between the Indexed Assets and the Underlying Index resulting from legal restrictions, costs or liquidity constraints. |
| ∎ | | Sampling risk. The Fund’s use of a sampling methodology with respect to assets managed pursuant to an indexing approach (Indexed Assets) may result in the Indexed Assets including a smaller number of securities than are in the index the Fund seeks to track with respect to the Indexed Assets (Underlying Index), and in the Indexed Assets including securities that are not included in the Underlying Index. As a result, an adverse development to an issuer of securities included in the Indexed Assets could result in a greater decline in the Fund’s NAV than would be the case if all of the securities in the Underlying Index were included in the Indexed Assets. The Fund’s use of a sampling |
| | |
| 8 | | Invesco U.S. Managed Volatility Fund |
| | methodology may also include the risk that the Indexed Assets may not track the return of the Underlying Index as well as they would have if the Indexed Assets included all of the securities in the Underlying Index. To the extent the assets in the Indexed Assets are smaller, these risks will be greater. |
| ∎ | | Short position risk. Because the Fund’s potential loss on a short position arises from increases in the value of the asset sold short, the Fund will incur a loss on a short position, which is theoretically unlimited, if the price of the asset sold short increases from the short sale price. The counterparty to a short position or other market factors may prevent the Fund from closing out a short position at a desirable time or price and may reduce or eliminate any gain or result in a loss. In a rising market, the Fund’s short positions will cause the Fund to underperform the overall market and its peers that do not engage in shorting. If the Fund holds both long and short positions, and both positions decline simultaneously, the short positions will not provide any buffer (hedge) from declines in value of the Fund’s long positions. Certain types of short positions involve leverage, which may exaggerate any losses, potentially more than the actual cost of the investment, and will increase the volatility of the Fund’s returns. |
| ∎ | | Volatility risk. Although the Fund’s investment strategy seeks to not exceed a target volatility level (the threshold volatility level), certain of the Fund’s investments may appreciate or decrease significantly in value over short periods of time. This may cause the Fund’s net asset value per share to experience significant increases or declines in value over short periods of time. |
| ∎ | | Volatility management risk. The Adviser’s strategy for managing portfolio volatility may not produce the desired result and there can be no guarantee that the Fund will stay below a target volatility level (the threshold volatility level). Additionally, maintenance of the threshold volatility level will not ensure that the Fund will deliver competitive returns. The use of derivatives in connection with the Fund’s managed volatility strategy may expose the Fund to losses (some of which may be sudden) |
| | | that it would not have otherwise been exposed to if it had only invested directly in equity and/or fixed income securities. Efforts to manage the Fund’s volatility could limit the Fund’s gains in rising markets and may expose the Fund to costs to which it would otherwise not have been exposed. The Adviser uses a combination of proprietary and third-party systems and risk models to help it estimate the Fund’s expected volatility, which may perform differently than expected and may negatively affect performance and the ability of the Fund to maintain its volatility at or below its threshold volatility level. |
About indexes used in this report
| ∎ | | The S&P 500® Index is an unmanaged index considered representative of the US stock market. |
| ∎ | | The Invesco US Large Cap Index is a broad-based benchmark measuring the aggregate performance of US large-cap equities. |
| ∎ | | The Lipper S&P 500 Funds Index is an unmanaged index considered representative of S&P 500 funds tracked by Lipper. |
| ∎ | | A direct investment cannot be made in an index. Unless otherwise indicated, index results include reinvested dividends, and they do not reflect sales charges. Performance of the peer group, if applicable, reflects fund expenses; performance of a market index does not. |
Other information
| ∎ | | The returns shown in management’s discussion of Fund performance are based on net asset values (NAVs) calculated for shareholder transactions. Generally accepted accounting principles require adjustments to be made to the net assets of the Fund at period end for financial reporting purposes, and as such, the NAVs for shareholder transactions and the returns based on those NAVs may differ from the NAVs and returns reported in the Financial Highlights. |
| ∎ | | Industry classifications used in this report are generally according to the Global Industry Classification Standard, which was developed by and is the exclusive property and a service mark of MSCI Inc. and Standard & Poor’s. |
| | |
| 9 | | Invesco U.S. Managed Volatility Fund |
Schedule of Investments(a)
October 31, 2018
| | | | | | | | |
| | | Shares | | | Value | |
Common Stocks & Other Equity Interests–99.79% | |
| Advertising–0.07% | |
Omnicom Group Inc. | | | 59 | | | $ | 4,385 | |
|
| Aerospace & Defense–2.82% | |
Arconic Inc. | | | 127 | | | | 2,582 | |
Boeing Co. (The)(b) | | | 151 | | | | 53,584 | |
General Dynamics Corp. | | | 79 | | | | 13,634 | |
Harris Corp. | | | 31 | | | | 4,610 | |
L3 Technologies, Inc.(b) | | | 21 | | | | 3,979 | |
Lockheed Martin Corp. | | | 79 | | | | 23,214 | |
Northrop Grumman Corp.(b) | | | 46 | | | | 12,050 | |
Raytheon Co. | | | 76 | | | | 13,303 | |
Rockwell Collins, Inc.(b) | | | 44 | | | | 5,633 | |
Textron Inc. | | | 64 | | | | 3,432 | |
TransDigm Group, Inc.(b) | | | 13 | | | | 4,293 | |
United Technologies Corp. | | | 214 | | | | 26,581 | |
| | | | | | | | 166,895 | |
|
| Agricultural & Farm Machinery–0.20% | |
Deere & Co. | | | 86 | | | | 11,648 | |
|
| Agricultural Products–0.16% | |
Archer-Daniels-Midland Co. | | | 146 | | | | 6,899 | |
Bunge Ltd. | | | 38 | | | | 2,348 | |
| | | | | | | | 9,247 | |
|
| Air Freight & Logistics–0.69% | |
C.H. Robinson Worldwide, Inc. | | | 36 | | | | 3,205 | |
Expeditors International of Washington, Inc.(b) | | | 46 | | | | 3,090 | |
FedEx Corp. | | | 65 | | | | 14,322 | |
United Parcel Service, Inc.–Class B | | | 187 | | | | 19,923 | |
| | | | | | | | 40,540 | |
|
| Airlines–0.12% | |
American Airlines Group Inc. | | | 30 | | | | 1,052 | |
Delta Air Lines, Inc. | | | 45 | | | | 2,463 | |
Southwest Airlines Co.(b) | | | 38 | | | | 1,866 | |
United Continental Holdings Inc.(b) | | | 18 | | | | 1,539 | |
| | | | | | | | 6,920 | |
|
| Alternative Carriers–0.10% | |
CenturyLink Inc.(b) | | | 287 | | | | 5,924 | |
|
| Apparel Retail–0.54% | |
Gap, Inc. (The) | | | 57 | | | | 1,556 | |
L Brands, Inc. | | | 60 | | | | 1,945 | |
Ross Stores, Inc. | | | 98 | | | | 9,702 | |
TJX Cos., Inc. (The) | | | 168 | | | | 18,460 | |
| | | | | | | | 31,663 | |
|
| Apparel, Accessories & Luxury Goods–0.20% | |
Tapestry, Inc. | | | 77 | | | | 3,258 | |
VF Corp. | | | 106 | | | | 8,785 | |
| | | | | | | | 12,043 | |
| | | | | | | | |
| | | Shares | | | Value | |
| Application Software–1.56% | |
Adobe Inc.(b) | | | 130 | | | $ | 31,949 | |
Autodesk, Inc.(b) | | | 58 | | | | 7,496 | |
Citrix Systems, Inc.(b) | | | 36 | | | | 3,689 | |
Intuit Inc. | | | 66 | | | | 13,926 | |
salesforce.com, inc.(b) | | | 192 | | | | 26,350 | |
Splunk Inc.(b) | | | 38 | | | | 3,794 | |
Workday, Inc.–Class A(b) | | | 39 | | | | 5,188 | |
| | | | | | | | 92,392 | |
|
| Asset Management & Custody Banks–0.93% | |
Ameriprise Financial, Inc. | | | 37 | | | | 4,708 | |
Bank of New York Mellon Corp. (The) | | | 261 | | | | 12,353 | |
BlackRock, Inc. | | | 41 | | | | 16,868 | |
Franklin Resources, Inc.(b) | | | 78 | | | | 2,379 | |
Northern Trust Corp.(b) | | | 58 | | | | 5,456 | |
State Street Corp. | | | 105 | | | | 7,219 | |
T. Rowe Price Group Inc. | | | 64 | | | | 6,207 | |
| | | | | | | | 55,190 | |
|
| Auto Parts & Equipment–0.04% | |
BorgWarner, Inc.(b) | | | 55 | | | | 2,168 | |
Garrett Motion Inc. (Switzerland)(b) | | | 20 | | | | 303 | |
| | | | | | | | 2,471 | |
|
| Automobile Manufacturers–0.60% | |
Ford Motor Co.(b) | | | 1,046 | | | | 9,989 | |
General Motors Co. | | | 378 | | | | 13,831 | |
Tesla, Inc.(b) | | | 34 | | | | 11,469 | |
| | | | | | | | 35,289 | |
|
| Automotive Retail–0.26% | |
AutoZone, Inc | | | 7 | | | | 5,134 | |
CarMax, Inc.(b) | | | 47 | | | | 3,192 | |
O’Reilly Automotive, Inc.(b) | | | 21 | | | | 6,736 | |
| | | | | | | | 15,062 | |
|
| Biotechnology–2.53% | |
AbbVie Inc. | | | 405 | | | | 31,529 | |
Alexion Pharmaceuticals, Inc. | | | 59 | | | | 6,612 | |
Amgen Inc.(b) | | | 168 | | | | 32,389 | |
Biogen Inc.(b) | | | 51 | | | | 15,518 | |
BioMarin Pharmaceutical Inc.(b) | | | 47 | | | | 4,332 | |
Celgene Corp.(b) | | | 187 | | | | 13,389 | |
Gilead Sciences, Inc. | | | 344 | | | | 23,454 | |
Incyte Corp.(b) | | | 57 | | | | 3,695 | |
Regeneron Pharmaceuticals, Inc.(b) | | | 21 | | | | 7,124 | |
Vertex Pharmaceuticals Inc.(b) | | | 68 | | | | 11,523 | |
| | | | | | | | 149,565 | |
|
| Brewers–0.06% | |
Molson Coors Brewing Co.–Class B | | | 52 | | | | 3,328 | |
See accompanying Notes to Financial Statements which are an integral part of the financial statements.
10 Invesco U.S. Managed Volatility Fund
| | | | | | | | |
| | | Shares | | | Value | |
| Broadcasting–0.08% | |
CBS Corp.–Class B | | | 87 | | | $ | 4,989 | |
|
| Building Products–0.15% | |
Johnson Controls International PLC | | | 246 | | | | 7,865 | |
Resideo Technologies, Inc.(b) | | | 33 | | | | 691 | |
| | | | | | | | 8,556 | |
|
| Cable & Satellite–1.21% | |
Charter Communications, Inc.–Class A(b) | | | 45 | | | | 14,417 | |
Comcast Corp.–Class A | | | 1,210 | | | | 46,149 | |
Liberty Broadband Corp.–Class C(b) | | | 46 | | | | 3,815 | |
Liberty Media Corp-Liberty SiriusXM–Series C(b) | | | 126 | | | | 5,200 | |
Sirius XM Holdings Inc. | | | 353 | | | | 2,125 | |
| | | | | | | | 71,706 | |
|
| Casinos & Gaming–0.18% | |
Las Vegas Sands Corp. | | | 95 | | | | 4,848 | |
MGM Resorts International(b) | | | 127 | | | | 3,388 | |
Wynn Resorts Ltd. | | | 25 | | | | 2,515 | |
| | | | | | | | 10,751 | |
|
| Commodity Chemicals–0.01% | |
Westlake Chemical Corp.(b) | | | 10 | | | | 713 | |
|
| Communications Equipment–1.21% | |
Arista Networks Inc.(b) | | | 15 | | | | 3,455 | |
Cisco Systems, Inc. | | | 1,221 | | | | 55,861 | |
Juniper Networks, Inc. | | | 89 | | | | 2,605 | |
Motorola Solutions, Inc. | | | 43 | | | | 5,270 | |
Palo Alto Networks, Inc.(b) | | | 24 | | | | 4,393 | |
| | | | | | | | 71,584 | |
|
| Computer & Electronics Retail–0.08% | |
Best Buy Co., Inc.(b) | | | 64 | | | | 4,490 | |
|
| Construction Machinery & Heavy Trucks–0.51% | |
Caterpillar Inc. | | | 158 | | | | 19,169 | |
Cummins Inc. | | | 43 | | | | 5,878 | |
PACCAR Inc.(b) | | | 92 | | | | 5,263 | |
| | | | | | | | 30,310 | |
|
| Construction Materials–0.11% | |
Martin Marietta Materials, Inc. | | | 17 | | | | 2,912 | |
Vulcan Materials Co. | | | 35 | | | | 3,540 | |
| | | | | | | | 6,452 | |
|
| Consumer Finance–0.84% | |
Ally Financial Inc. | | | 110 | | | | 2,795 | |
American Express Co. | | | 230 | | | | 23,628 | |
Capital One Financial Corp. | | | 125 | | | | 11,163 | |
Discover Financial Services | | | 90 | | | | 6,270 | |
Synchrony Financial | | | 192 | | | | 5,545 | |
| | | | | | | | 49,401 | |
|
| Copper–0.08% | |
Freeport-McMoRan Inc. | | | 387 | | | | 4,509 | |
| | | | | | | | |
| | | Shares | | | Value | |
| Data Processing & Outsourced Services–3.66% | |
Alliance Data Systems Corp. | | | 14 | | | $ | 2,887 | |
Automatic Data Processing, Inc. | | | 116 | | | | 16,713 | |
Fidelity National Information Services, Inc. | | | 87 | | | | 9,057 | |
Fiserv, Inc.(b) | | | 107 | | | | 8,485 | |
FleetCor Technologies Inc.(b) | | | 23 | | | | 4,601 | |
Global Payments Inc. | | | 40 | | | | 4,569 | |
Mastercard Inc.–Class A | | | 273 | | | | 53,964 | |
Paychex, Inc.(b) | | | 86 | | | | 5,632 | |
PayPal Holdings, Inc. | | | 300 | | | | 25,257 | |
Square, Inc.–Class A(b) | | | 81 | | | | 5,949 | |
Total System Services, Inc. | | | 48 | | | | 4,375 | |
Visa Inc.–Class A | | | 473 | | | | 65,203 | |
Western Union Co. (The)(b) | | | 116 | | | | 2,093 | |
Worldpay, Inc.–Class A(b) | | | 81 | | | | 7,439 | |
| | | | | | | | 216,224 | |
|
| Distillers & Vintners–0.21% | |
Brown-Forman Corp.–Class B(b) | | | 77 | | | | 3,568 | |
Constellation Brands, Inc.–Class A | | | 43 | | | | 8,567 | |
| | | | | | | | 12,135 | |
|
| Distributors–0.06% | |
Genuine Parts Co. | | | 39 | | | | 3,819 | |
|
| Diversified Banks–5.11% | |
Bank of America Corp. | | | 2,626 | | | | 72,215 | |
Citigroup Inc. | | | 664 | | | | 43,465 | |
JPMorgan Chase & Co. | | | 881 | | | | 96,047 | |
U.S. Bancorp | | | 432 | | | | 22,581 | |
Wells Fargo & Co. | | | 1,272 | | | | 67,708 | |
| | | | | | | | 302,016 | |
|
| Diversified Chemicals–0.61% | |
DowDuPont Inc. | | | 613 | | | | 33,053 | |
Eastman Chemical Co. | | | 37 | | | | 2,899 | |
| | | | | | | | 35,952 | |
|
| Diversified Support Services–0.07% | |
Cintas Corp.(b) | | | 23 | | | | 4,183 | |
|
| Drug Retail–0.31% | |
Walgreens Boots Alliance, Inc. | | | 226 | | | | 18,028 | |
|
| Electric Utilities–1.88% | |
American Electric Power Co., Inc. | | | 132 | | | | 9,683 | |
Avangrid, Inc. | | | 15 | | | | 705 | |
Duke Energy Corp. | | | 194 | | | | 16,030 | |
Edison International | | | 87 | | | | 6,037 | |
Entergy Corp. | | | 48 | | | | 4,030 | |
Eversource Energy | | | 84 | | | | 5,314 | |
Exelon Corp. | | | 258 | | | | 11,303 | |
FirstEnergy Corp. | | | 132 | | | | 4,921 | |
NextEra Energy, Inc. | | | 126 | | | | 21,735 | |
PG&E Corp.(b) | | | 138 | | | | 6,460 | |
PPL Corp. | | | 187 | | | | 5,685 | |
See accompanying Notes to Financial Statements which are an integral part of the financial statements.
11 Invesco U.S. Managed Volatility Fund
| | | | | | | | |
| | | Shares | | | Value | |
| Electric Utilities–(continued) | |
Southern Co. (The)(b) | | | 272 | | | $ | 12,248 | |
Xcel Energy, Inc. | | | 136 | | | | 6,665 | |
| | | | | | | | 110,816 | |
|
| Electrical Components & Equipment–0.49% | |
AMETEK, Inc.(b) | | | 61 | | | | 4,092 | |
Eaton Corp. PLC | | | 115 | | | | 8,242 | |
Emerson Electric Co. | | | 167 | | | | 11,336 | |
Rockwell Automation, Inc.(b) | | | 32 | | | | 5,271 | |
| | | | | | | | 28,941 | |
|
| Electronic Components–0.24% | |
Amphenol Corp.–Class A | | | 80 | | | | 7,160 | |
Corning Inc. | | | 211 | | | | 6,741 | |
| | | | | | | | 13,901 | |
|
| Environmental & Facilities Services–0.28% | |
Republic Services, Inc. | | | 86 | | | | 6,251 | |
Waste Management, Inc. | | | 113 | | | | 10,110 | |
| | | | | | | | 16,361 | |
|
| Fertilizers & Agricultural Chemicals–0.05% | |
Mosaic Co. (The) | | | 94 | | | | 2,908 | |
|
| Financial Exchanges & Data–0.81% | |
CME Group Inc.–Class A | | | 91 | | | | 16,675 | |
Intercontinental Exchange, Inc. | | | 150 | | | | 11,556 | |
Moody’s Corp.(b) | | | 51 | | | | 7,420 | |
S&P Global Inc. | | | 67 | | | | 12,215 | |
| | | | | | | | 47,866 | |
|
| Food Distributors–0.17% | |
Sysco Corp. | | | 139 | | | | 9,915 | |
|
| Food Retail–0.10% | |
Kroger Co. (The) | | | 207 | | | | 6,160 | |
|
| Footwear–0.43% | |
NIKE, Inc.–Class B | | | 335 | | | | 25,138 | |
|
| General Merchandise Stores–0.42% | |
Dollar General Corp. | | | 71 | | | | 7,908 | |
Dollar Tree, Inc.(b) | | | 62 | | | | 5,226 | |
Target Corp. | | | 141 | | | | 11,792 | |
| | | | | | | | 24,926 | |
|
| Gold–0.07% | |
Newmont Mining Corp. | | | 142 | | | | 4,391 | |
|
| Health Care Distributors–0.30% | |
AmerisourceBergen Corp. | | | 42 | | | | 3,696 | |
Cardinal Health, Inc. | | | 82 | | | | 4,149 | |
Henry Schein, Inc.(b) | | | 40 | | | | 3,320 | |
McKesson Corp. | | | 53 | | | | 6,612 | |
| | | | | | | | 17,777 | |
| | | | | | | | |
| | | Shares | | | Value | |
| Health Care Equipment–2.92% | |
Abbott Laboratories(b) | | | 466 | | | $ | 32,126 | |
ABIOMED, Inc.(b) | | | 11 | | | | 3,753 | |
Baxter International Inc. | | | 142 | | | | 8,876 | |
Becton, Dickinson and Co.(b) | | | 71 | | | | 16,366 | |
Boston Scientific Corp.(b) | | | 370 | | | | 13,372 | |
Danaher Corp. | | | 166 | | | | 16,500 | |
Edwards Lifesciences Corp.(b) | | | 55 | | | | 8,118 | |
IDEXX Laboratories, Inc.(b) | | | 23 | | | | 4,879 | |
Intuitive Surgical, Inc.(b) | | | 30 | | | | 15,635 | |
Medtronic PLC | | | 360 | | | | 32,335 | |
Stryker Corp. | | | 89 | | | | 14,438 | |
Zimmer Biomet Holdings, Inc. | | | 54 | | | | 6,134 | |
| | | | | | | | 172,532 | |
|
| Health Care Facilities–0.16% | |
HCA Healthcare, Inc. | | | 72 | | | | 9,614 | |
|
| Health Care REITs–0.26% | |
HCP, Inc. | | | 126 | | | | 3,471 | |
Ventas, Inc. | | | 95 | | | | 5,514 | |
Welltower Inc. | | | 99 | | | | 6,541 | |
| | | | | | | | 15,526 | |
|
| Health Care Services–0.76% | |
CVS Health Corp. | | | 272 | | | | 19,690 | |
DaVita Inc.(b) | | | 42 | | | | 2,828 | |
Express Scripts Holding Co.(b) | | | 150 | | | | 14,546 | |
Laboratory Corp. of America Holdings(b) | | | 27 | | | | 4,335 | |
Quest Diagnostics Inc. | | | 37 | | | | 3,482 | |
| | | | | | | | 44,881 | |
|
| Health Care Supplies–0.11% | |
Align Technology, Inc.(b) | | | 20 | | | | 4,424 | |
DENTSPLY SIRONA Inc. | | | 58 | | | | 2,009 | |
| | | | | | | | 6,433 | |
|
| Health Care Technology–0.08% | |
Cerner Corp.(b) | | | 83 | | | | 4,754 | |
|
| Home Furnishings–0.04% | |
Mohawk Industries, Inc.(b) | | | 17 | | | | 2,120 | |
|
| Home Improvement Retail–1.25% | |
Home Depot, Inc. (The) | | | 303 | | | | 53,292 | |
Lowe’s Cos., Inc. | | | 214 | | | | 20,377 | |
| | | | | | | | 73,669 | |
|
| Homebuilding–0.11% | |
D.R. Horton, Inc. | | | 92 | | | | 3,308 | |
Lennar Corp.–Class A(b) | | | 80 | | | | 3,439 | |
| | | | | | | | 6,747 | |
|
| Hotel & Resort REITs–0.06% | |
Host Hotels & Resorts Inc. | | | 196 | | | | 3,746 | |
See accompanying Notes to Financial Statements which are an integral part of the financial statements.
12 Invesco U.S. Managed Volatility Fund
| | | | | | | | |
| | | Shares | | | Value | |
| Hotels, Resorts & Cruise Lines–0.43% | |
Carnival Corp. | | | 118 | | | $ | 6,613 | |
Hilton Worldwide Holdings Inc. | | | 78 | | | | 5,551 | |
Marriott International Inc.–Class A | | | 76 | | | | 8,884 | |
Royal Caribbean Cruises Ltd. | | | 44 | | | | 4,608 | |
| | | | | | | | 25,656 | |
|
| Household Appliances–0.03% | |
Whirlpool Corp. | | | 17 | | | | 1,866 | |
|
| Household Products–1.53% | |
Church & Dwight Co., Inc. | | | 66 | | | | 3,918 | |
Clorox Co. (The)(b) | | | 34 | | | | 5,047 | |
Colgate-Palmolive Co. | | | 230 | | | | 13,697 | |
Kimberly-Clark Corp. | | | 92 | | | | 9,596 | |
Procter & Gamble Co. (The) | | | 658 | | | | 58,351 | |
| | | | | | | | 90,609 | |
|
| Housewares & Specialties–0.03% | |
Newell Brands, Inc. | | | 122 | | | | 1,937 | |
|
| Hypermarkets & Super Centers–1.07% | |
Costco Wholesale Corp. | | | 117 | | | | 26,750 | |
Walmart Inc.(b) | | | 366 | | | | 36,702 | |
| | | | | | | | 63,452 | |
|
| Industrial Conglomerates–1.51% | |
3M Co. | | | 155 | | | | 29,490 | |
General Electric Co. | | | 2,313 | | | | 23,361 | |
Honeywell International Inc. | | | 197 | | | | 28,530 | |
Roper Technologies, Inc. | | | 27 | | | | 7,638 | |
| | | | | | | | 89,019 | |
|
| Industrial Gases–0.56% | |
Air Products and Chemicals, Inc.(b) | | | 58 | | | | 8,952 | |
Linde PLC (United Kingdom) | | | 147 | | | | 24,324 | |
| | | | | | | | 33,276 | |
|
| Industrial Machinery–0.62% | |
Dover Corp.(b) | | | 37 | | | | 3,065 | |
Fortive Corp. | | | 83 | | | | 6,163 | |
Illinois Tool Works Inc.(b) | | | 89 | | | | 11,354 | |
Ingersoll-Rand PLC | | | 65 | | | | 6,236 | |
Parker-Hannifin Corp. | | | 35 | | | | 5,307 | |
Stanley Black & Decker Inc. | | | 40 | | | | 4,661 | |
| | | | | | | | 36,786 | |
|
| Industrial REITs–0.18% | |
Prologis, Inc. | | | 167 | | | | 10,766 | |
|
| Insurance Brokers–0.19% | |
Marsh & McLennan Cos., Inc. | | | 134 | | | | 11,357 | |
|
| Integrated Oil & Gas–2.73% | |
Chevron Corp. | | | 514 | | | | 57,388 | |
Exxon Mobil Corp. | | | 1,131 | | | | 90,118 | |
Occidental Petroleum Corp. | | | 204 | | | | 13,682 | |
| | | | | | | | 161,188 | |
| | | | | | | | |
| | | Shares | | | Value | |
| Integrated Telecommunication Services–2.08% | |
AT&T Inc. | | | 1,943 | | | $ | 59,611 | |
Verizon Communications Inc. | | | 1,106 | | | | 63,142 | |
| | | | | | | | 122,753 | |
|
| Interactive Home Entertainment–0.36% | |
Activision Blizzard, Inc. | | | 202 | | | | 13,948 | |
Electronic Arts Inc.(b) | | | 80 | | | | 7,279 | |
| | | | | | | | 21,227 | |
|
| Interactive Media & Services–4.74% | |
Alphabet Inc.–Class A(b) | | | 161 | | | | 175,583 | |
Facebook, Inc.–Class A(b) | | | 638 | | | | 96,842 | |
Snap Inc.–Class A(b) | | | 136 | | | | 899 | |
Twitter, Inc.(b) | | | 202 | | | | 7,020 | |
| | | | | | | | 280,344 | |
|
| Internet & Direct Marketing Retail–3.59% | |
Amazon.com, Inc. | | | 110 | | | | 175,781 | |
Booking Holdings Inc.(b) | | | 12 | | | | 22,495 | |
eBay Inc.(b) | | | 247 | | | | 7,170 | |
Expedia Group, Inc. | | | 32 | | | | 4,014 | |
Qurate Retail, Inc.–Class A(b) | | | 114 | | | | 2,501 | |
| | | | | | | | 211,961 | |
|
| Internet Services & Infrastructure–0.13% | |
Akamai Technologies, Inc.(b) | | | 44 | | | | 3,179 | |
VeriSign, Inc.(b) | | | 32 | | | | 4,561 | |
| | | | | | | | 7,740 | |
|
| Investment Banking & Brokerage–1.05% | |
Charles Schwab Corp. (The)(b) | | | 312 | | | | 14,427 | |
E*TRADE Financial Corp. | | | 68 | | | | 3,361 | |
Goldman Sachs Group, Inc. (The) | | | 95 | | | | 21,410 | |
Morgan Stanley | | | 347 | | | | 15,844 | |
TD Ameritrade Holding Corp. | | | 138 | | | | 7,137 | |
| | | | | | | | 62,179 | |
|
| IT Consulting & Other Services–1.20% | |
Accenture PLC–Class A | | | 171 | | | | 26,953 | |
Cognizant Technology Solutions Corp.–Class A | | | 153 | | | | 10,562 | |
DXC Technology Co. | | | 74 | | | | 5,389 | |
International Business Machines Corp. | | | 243 | | | | 28,050 | |
| | | | | | | | 70,954 | |
|
| Life & Health Insurance–0.62% | |
Aflac, Inc. | | | 201 | | | | 8,657 | |
Lincoln National Corp.(b) | | | 57 | | | | 3,431 | |
MetLife, Inc. | | | 260 | | | | 10,709 | |
Principal Financial Group, Inc. | | | 75 | | | | 3,530 | |
Prudential Financial, Inc.(b) | | | 111 | | | | 10,410 | |
| | | | | | | | 36,737 | |
|
| Life Sciences Tools & Services–0.95% | |
Agilent Technologies, Inc. | | | 85 | | | | 5,507 | |
Illumina, Inc.(b) | | | 39 | | | | 12,135 | |
See accompanying Notes to Financial Statements which are an integral part of the financial statements.
13 Invesco U.S. Managed Volatility Fund
| | | | | | | | |
| | | Shares | | | Value | |
| Life Sciences Tools & Services–(continued) | |
IQVIA Holdings Inc.(b) | | | 45 | | | $ | 5,532 | |
Mettler-Toledo International Inc.(b) | | | 7 | | | | 3,828 | |
Thermo Fisher Scientific, Inc. | | | 108 | | | | 25,234 | |
Waters Corp.(b) | | | 19 | | | | 3,604 | |
| | | | | | | | 55,840 | |
|
| Managed Health Care–2.31% | |
Aetna Inc. | | | 87 | | | | 17,261 | |
Anthem, Inc. | | | 71 | | | | 19,565 | |
Centene Corp.(b) | | | 53 | | | | 6,907 | |
Cigna Corp. | | | 65 | | | | 13,898 | |
Humana Inc. | | | 37 | | | | 11,855 | |
UnitedHealth Group Inc. | | | 256 | | | | 66,906 | |
| | | | | | | | 136,392 | |
|
| Metal & Glass Containers–0.07% | |
Ball Corp. | | | 90 | | | | 4,032 | |
|
| Mortgage REITs–0.06% | |
Annaly Capital Management, Inc. | | | 347 | | | | 3,425 | |
|
| Movies & Entertainment–1.79% | |
Netflix, Inc.(b) | | | 114 | | | | 34,403 | |
Twenty-First Century Fox, Inc.–Class A | | | 493 | | | | 22,442 | |
Viacom Inc.–Class B | | | 98 | | | | 3,134 | |
Walt Disney Co. (The) | | | 398 | | | | 45,702 | |
| | | | | | | | 105,681 | |
|
| Multi-Line Insurance–0.30% | |
American International Group, Inc. | | | 235 | | | | 9,703 | |
Hartford Financial Services Group, Inc. (The) | | | 96 | | | | 4,360 | |
Loews Corp.(b) | | | 73 | | | | 3,399 | |
| | | | | | | | 17,462 | |
|
| Multi-Sector Holdings–1.27% | |
Berkshire Hathaway Inc.–Class B(b) | | | 365 | | | | 74,927 | |
|
| Multi-Utilities–0.88% | |
Ameren Corp.(b) | | | 65 | | | | 4,198 | |
Consolidated Edison, Inc. | | | 83 | | | | 6,308 | |
Dominion Energy, Inc. | | | 175 | | | | 12,498 | |
DTE Energy Co.(b) | | | 48 | | | | 5,395 | |
NiSource Inc. | | | 97 | | | | 2,460 | |
Public Service Enterprise Group Inc. | | | 135 | | | | 7,213 | |
Sempra Energy | | | 76 | | | | 8,369 | |
WEC Energy Group, Inc. | | | 84 | | | | 5,746 | |
| | | | | | | | 52,187 | |
|
| Office REITs–0.13% | |
Boston Properties, Inc.(b) | | | 41 | | | | 4,951 | |
Vornado Realty Trust(b) | | | 44 | | | | 2,996 | |
| | | | | | | | 7,947 | |
|
| Oil & Gas Equipment & Services–0.57% | |
Baker Hughes, a GE Co. | | | 111 | | | | 2,963 | |
Halliburton Co. | | | 236 | | | | 8,184 | |
| | | | | | | | |
| | | Shares | | | Value | |
| Oil & Gas Equipment & Services–(continued) | |
National Oilwell Varco Inc. | | | 102 | | | $ | 3,754 | |
Schlumberger Ltd. | | | 369 | | | | 18,933 | |
| | | | | | | | 33,834 | |
|
| Oil & Gas Exploration & Production–1.44% | |
Anadarko Petroleum Corp. | | | 136 | | | | 7,235 | |
Apache Corp. | | | 102 | | | | 3,859 | |
Cabot Oil & Gas Corp. | | | 113 | | | | 2,738 | |
Concho Resources Inc.(b) | | | 53 | | | | 7,372 | |
ConocoPhillips | | | 309 | | | | 21,599 | |
Continental Resources, Inc.(b) | | | 23 | | | | 1,212 | |
Devon Energy Corp. | | | 129 | | | | 4,179 | |
EOG Resources, Inc. | | | 154 | | | | 16,222 | |
EQT Corp. | | | 70 | | | | 2,378 | |
Hess Corp. | | | 69 | | | | 3,961 | |
Marathon Oil Corp. | | | 228 | | | | 4,330 | |
Noble Energy, Inc. | | | 127 | | | | 3,156 | |
Pioneer Natural Resources Co. | | | 45 | | | | 6,627 | |
| | | | | | | | 84,868 | |
|
| Oil & Gas Refining & Marketing–0.61% | |
Marathon Petroleum Corp. | | | 185 | | | | 13,033 | |
Phillips 66 | | | 124 | | | | 12,750 | |
Valero Energy Corp. | | | 113 | | | | 10,293 | |
| | | | | | | | 36,076 | |
|
| Oil & Gas Storage & Transportation–0.47% | |
Cheniere Energy, Inc.(b) | | | 70 | | | | 4,229 | |
Kinder Morgan, Inc. | | | 506 | | | | 8,612 | |
ONEOK, Inc. | | | 109 | | | | 7,150 | |
Williams Cos., Inc. (The) | | | 330 | | | | 8,029 | |
| | | | | | | | 28,020 | |
|
| Packaged Foods & Meats–1.14% | |
Campbell Soup Co. | | | 53 | | | | 1,983 | |
Conagra Brands, Inc. | | | 103 | | | | 3,667 | |
General Mills, Inc. | | | 160 | | | | 7,008 | |
Hershey Co. (The) | | | 40 | | | | 4,286 | |
Hormel Foods Corp.(b) | | | 142 | | | | 6,197 | |
JM Smucker Co. (The)(b) | | | 30 | | | | 3,250 | |
Kellogg Co. | | | 92 | | | | 6,024 | |
Kraft Heinz Co. (The) | | | 248 | | | | 13,632 | |
Mondelez International, Inc.–Class A | | | 389 | | | | 16,330 | |
Tyson Foods, Inc.–Class A(b) | | | 78 | | | | 4,674 | |
| | | | | | | | 67,051 | |
|
| Paper Packaging–0.13% | |
International Paper Co. | | | 108 | | | | 4,899 | |
WestRock Co. | | | 67 | | | | 2,879 | |
| | | | | | | | 7,778 | |
|
| Personal Products–0.16% | |
Coty Inc.–Class A(b) | | | 121 | | | | 1,277 | |
Estee Lauder Cos. Inc. (The)–Class A(b) | | | 59 | | | | 8,109 | |
| | | | | | | | 9,386 | |
See accompanying Notes to Financial Statements which are an integral part of the financial statements.
14 Invesco U.S. Managed Volatility Fund
| | | | | | | | |
| | | Shares | | | Value | |
| Pharmaceuticals–5.10% | |
Allergan PLC | | | 91 | | | $ | 14,379 | |
Bristol-Myers Squibb Co. | | | 435 | | | | 21,985 | |
Eli Lilly and Co. | | | 284 | | | | 30,797 | |
Johnson & Johnson | | | 718 | | | | 100,513 | |
Merck & Co., Inc. | | | 703 | | | | 51,748 | |
Perrigo Co. PLC | | | 36 | | | | 2,531 | |
Pfizer Inc. | | | 1,572 | | | | 67,690 | |
Zoetis Inc. | | | 128 | | | | 11,539 | |
| | | | | | | | 301,182 | |
|
| Property & Casualty Insurance–0.55% | |
Allstate Corp. (The) | | | 91 | | | | 8,711 | |
Markel Corp.(b) | | | 4 | | | | 4,373 | |
Progressive Corp. (The) | | | 155 | | | | 10,803 | |
Travelers Cos., Inc. (The) | | | 71 | | | | 8,884 | |
| | | | | | | | 32,771 | |
|
| Railroads–0.98% | |
CSX Corp. | | | 225 | | | | 15,494 | |
Kansas City Southern | | | 27 | | | | 2,753 | |
Norfolk Southern Corp. | | | 74 | | | | 12,419 | |
Union Pacific Corp. | | | 188 | | | | 27,489 | |
| | | | | | | | 58,155 | |
|
| Real Estate Services–0.06% | |
CBRE Group, Inc.–Class A(b) | | | 90 | | | | 3,626 | |
|
| Regional Banks–1.25% | |
BB&T Corp.(b) | | | 205 | | | | 10,078 | |
Citizens Financial Group, Inc. | | | 125 | | | | 4,669 | |
Comerica Inc. | | | 45 | | | | 3,670 | |
Fifth Third Bancorp | | | 173 | | | | 4,669 | |
First Republic Bank | | | 43 | | | | 3,913 | |
Huntington Bancshares Inc.(b) | | | 292 | | | | 4,184 | |
KeyCorp | | | 278 | | | | 5,049 | |
M&T Bank Corp. | | | 37 | | | | 6,120 | |
PNC Financial Services Group, Inc. (The) | | | 123 | | | | 15,804 | |
Regions Financial Corp. | | | 289 | | | | 4,904 | |
SunTrust Banks, Inc. | | | 122 | | | | 7,645 | |
SVB Financial Group(b) | | | 14 | | | | 3,321 | |
| | | | | | | | 74,026 | |
|
| Research & Consulting Services–0.18% | |
Equifax Inc. | | | 32 | | | | 3,246 | |
Nielsen Holdings PLC | | | 95 | | | | 2,468 | |
Verisk Analytics, Inc.–Class A(b) | | | 43 | | | | 5,153 | |
| | | | | | | | 10,867 | |
|
| Residential REITs–0.29% | |
AvalonBay Communities, Inc.(b) | | | 37 | | | | 6,489 | |
Equity Residential | | | 97 | | | | 6,301 | |
Essex Property Trust, Inc.(b) | | | 18 | | | | 4,514 | |
| | | | | | | | 17,304 | |
| | | | | | | | |
| | | Shares | | | Value | |
| Restaurants–1.19% | |
Chipotle Mexican Grill, Inc.(b) | | | 7 | | | $ | 3,222 | |
McDonald’s Corp. | | | 205 | | | | 36,265 | |
Starbucks Corp. | | | 343 | | | | 19,987 | |
Yum China Holdings, Inc. (China) | | | 93 | | | | 3,355 | |
Yum! Brands, Inc. | | | 83 | | | | 7,504 | |
| | | | | | | | 70,333 | |
|
| Retail REITs–0.34% | |
Realty Income Corp.(b) | | | 79 | | | | 4,761 | |
Simon Property Group, Inc. | | | 82 | | | | 15,049 | |
| | | | | | | | 19,810 | |
|
| Semiconductor Equipment–0.30% | |
Applied Materials, Inc. | | | 256 | | | | 8,417 | |
KLA-Tencor Corp. | | | 42 | | | | 3,845 | |
Lam Research Corp.(b) | | | 40 | | | | 5,669 | |
| | | | | | | | 17,931 | |
|
| Semiconductors–3.35% | |
Analog Devices, Inc. | | | 99 | | | | 8,287 | |
Broadcom Inc. | | | 112 | | | | 25,031 | |
Intel Corp. | | | 1,221 | | | | 57,241 | |
Maxim Integrated Products, Inc. | | | 73 | | | | 3,651 | |
Microchip Technology Inc. | | | 62 | | | | 4,078 | |
Micron Technology, Inc.(b) | | | 297 | | | | 11,203 | |
NVIDIA Corp. | | | 148 | | | | 31,203 | |
QUALCOMM Inc. | | | 372 | | | | 23,395 | |
Skyworks Solutions, Inc. | | | 47 | | | | 4,078 | |
Texas Instruments Inc.(b) | | | 258 | | | | 23,950 | |
Xilinx, Inc.(b) | | | 67 | | | | 5,720 | |
| | | | | | | | 197,837 | |
|
| Soft Drinks–1.75% | |
Coca-Cola Co. (The) | | | 1,129 | | | | 54,056 | |
Keurig Dr Pepper Inc. | | | 49 | | | | 1,274 | |
Monster Beverage Corp.(b) | | | 106 | | | | 5,602 | |
PepsiCo, Inc. | | | 376 | | | | 42,255 | |
| | | | | | | | 103,187 | |
|
| Specialized REITs–1.06% | |
American Tower Corp.–Class A | | | 118 | | | | 18,386 | |
Crown Castle International Corp. | | | 111 | | | | 12,070 | |
Digital Realty Trust, Inc.(b) | | | 55 | | | | 5,679 | |
Equinix, Inc. | | | 21 | | | | 7,954 | |
Public Storage | | | 40 | | | | 8,219 | |
SBA Communications Corp.–Class A(b) | | | 30 | | | | 4,865 | |
Weyerhaeuser Co. | | | 202 | | | | 5,379 | |
| | | | | | | | 62,552 | |
|
| Specialty Chemicals–0.54% | |
Celanese Corp.–Series A | | | 36 | | | | 3,490 | |
Ecolab Inc. | | | 77 | | | | 11,792 | |
PPG Industries, Inc.(b) | | | 63 | | | | 6,621 | |
Sherwin-Williams Co. (The) | | | 25 | | | | 9,837 | |
| | | | | | | | 31,740 | |
See accompanying Notes to Financial Statements which are an integral part of the financial statements.
15 Invesco U.S. Managed Volatility Fund
| | | | | | | | |
| | | Shares | | | Value | |
| Specialty Stores–0.07% | |
Ulta Beauty, Inc.(b) | | | 15 | | | $ | 4,118 | |
|
| Steel–0.08% | |
Nucor Corp. | | | 84 | | | | 4,966 | |
|
| Systems Software–4.78% | |
CA, Inc. | | | 84 | | | | 3,726 | |
Dell Technologies Inc.–Class V(b) | | | 53 | | | | 4,791 | |
Microsoft Corp. | | | 2,018 | | | | 215,542 | |
Oracle Corp. | | | 743 | | | | 36,288 | |
Red Hat, Inc.(b) | | | 47 | | | | 8,067 | |
ServiceNow, Inc.(b) | | | 47 | | | | 8,509 | |
Symantec Corp.(b) | | | 165 | | | | 2,995 | |
VMware, Inc.–Class A(b) | | | 20 | | | | 2,828 | |
| | | | | | | | 282,746 | |
|
| Technology Hardware, Storage & Peripherals–5.17% | |
Apple Inc.(c) | | | 1,269 | | | | 277,733 | |
Hewlett Packard Enterprise Co. | | | 390 | | | | 5,948 | |
HP Inc. | | | 415 | | | | 10,018 | |
NetApp, Inc. | | | 68 | | | | 5,337 | |
Seagate Technology PLC | | | 76 | | | | 3,058 | |
Western Digital Corp. | | | 76 | | | | 3,273 | |
| | | | | | | | 305,367 | |
|
| Tobacco–1.17% | |
Altria Group, Inc. | | | 502 | | | | 32,650 | |
Philip Morris International Inc. | | | 415 | | | | 36,549 | |
| | | | | | | | 69,199 | |
| | | | | | | | |
| | | Shares | | | Value | |
| Trading Companies & Distributors–0.12% | |
Fastenal Co.(b) | | | 76 | | | $ | 3,907 | |
W.W. Grainger, Inc. | | | 12 | | | | 3,408 | |
| | | | | | | | 7,315 | |
|
| Water Utilities–0.07% | |
American Water Works Co., Inc. | | | 49 | | | | 4,338 | |
|
| Wireless Telecommunication Services–0.10% | |
T-Mobile US, Inc.(b) | | | 82 | | | | 5,621 | |
Total Common Stocks & Other Equity Interests
(Cost $5,856,529) | | | | 5,897,206 | |
|
Money Market Funds–0.46% | |
Invesco Government & Agency Portfolio–Institutional Class, 2.08%(d) | | | 9,517 | | | | 9,517 | |
Invesco Liquid Assets Portfolio–Institutional Class, 2.27%(d) | | | 6,793 | | | | 6,795 | |
Invesco Treasury Portfolio–Institutional Class, 2.09%(d) | | | 10,877 | | | | 10,877 | |
Total Money Market Funds
(Cost $27,189) | | | | 27,189 | |
TOTAL INVESTMENTS IN SECURITIES–100.25%
(Cost $5,883,718) | | | | 5,924,395 | |
OTHER ASSETS LESS LIABILITIES–(0.25)% | | | | (14,687 | ) |
NET ASSETS–100.00% | | | $ | 5,909,708 | |
Investment Abbreviations:
| | |
| REIT | | – Real Estate Investment Trust |
Notes to Schedule of Investments:
| (a) | Industry and/or sector classifications used in this report are generally according to the Global Industry Classification Standard, which was developed by and is the exclusive property and a service mark of MSCI Inc. and Standard & Poor’s. |
| (b) | Non-income producing security. |
| (c) | All or a portion of the value was pledged as collateral to cover margin requirements for open futures contracts. See Note 1H. |
| (d) | The money market fund and the Fund are affiliated by having the same investment adviser. The rate shown is the 7-day SEC standardized yield as of October 31, 2018. |
| | | | | | | | | | | | | | | | | | | | |
| Open Futures Contracts — Equity Risk | |
| Short Futures Contracts | | Number of
Contracts | | | Expiration Month | | | Notional Value | | | Value | | | Unrealized
Appreciation
(Depreciation) | |
E-Mini S&P 500 Index | | | 15 | | | | December-2018 | | | $ | (2,033,325 | ) | | $ | (30,465 | ) | | $ | (30,465 | ) |
See accompanying Notes to Financial Statements which are an integral part of the financial statements.
16 Invesco U.S. Managed Volatility Fund
Statement of Assets and Liabilities
October 31, 2018
| | | | |
Assets: | | | | |
Investments in securities, at value (Cost $5,856,529) | | $ | 5,897,206 | |
Investments in affiliated money market funds, at value and cost | | | 27,189 | |
Receivable for: | | | | |
Dividends | | | 5,375 | |
Fund shares sold | | | 12,949 | |
Fund expenses absorbed | | | 22,048 | |
Other assets | | | 16,744 | |
Total assets | | | 5,981,511 | |
| |
Liabilities: | | | | |
Other investments: | | | | |
Variation margin payable — futures contracts | | | 21,748 | |
Payable for: | | | | |
Investments purchased | | | 11,515 | |
Accrued trustees’ and officers’ fees and benefits | | | 1,631 | |
Accrued other operating expenses | | | 36,909 | |
Total liabilities | | | 71,803 | |
Net assets applicable to shares outstanding | | $ | 5,909,708 | |
| | | | |
Net assets consist of: | | | | |
Shares of beneficial interest | | $ | 5,836,974 | |
Distributable earnings | | | 72,734 | |
| | | $ | 5,909,708 | |
|
Shares outstanding, no par value,
with an unlimited number of shares authorized: | |
Class R6 | | | 582,556 | |
Class R6: | | | | |
Net asset value and offering price per share | | $ | 10.14 | |
See accompanying Notes to Financial Statements which are an integral part of the financial statements.
17 Invesco U.S. Managed Volatility Fund
Statement of Operations
For the period December 18, 2017 (commencement date) through October 31, 2018
| | | | |
Investment income: | | | | |
Dividends (net of foreign withholding taxes of $8) | | $ | 95,723 | |
Dividends from affiliated money market funds | | | 888 | |
Total investment income | | | 96,611 | |
| |
Expenses: | | | | |
Advisory fees | | | 5,099 | |
Administrative services fees | | | 43,562 | |
Custodian fees | | | 10,165 | |
Trustees’ and officers’ fees and benefits | | | 17,004 | |
Registration and filing fees | | | 28,274 | |
Reports to shareholders | | | 17,894 | |
Professional services fees | | | 39,600 | |
Other | | | 11,892 | |
Total expenses | | | 173,490 | |
Less: Fees waived and expenses reimbursed | | | (165,912 | ) |
Net expenses | | | 7,578 | |
Net investment income | | | 89,033 | |
| |
Realized and unrealized gain (loss) from: | | | | |
Net realized gain (loss) from: | | | | |
Investment securities | | | (8,548 | ) |
Futures contracts | | | (17,963 | ) |
| | | | (26,511 | ) |
Change in net unrealized appreciation (depreciation) of: | | | | |
Investment securities | | | 40,677 | |
Futures contracts | | | (30,465 | ) |
| | | | 10,212 | |
Net realized and unrealized gain (loss) | | | (16,299 | ) |
Net increase in net assets resulting from operations | | $ | 72,734 | |
See accompanying Notes to Financial Statements which are an integral part of the financial statements.
18 Invesco U.S. Managed Volatility Fund
Statement of Changes in Net Assets
For the period December 18, 2017 (commencement date) through October 31, 2018
| | | | |
| | | December 18, 2017
(commencement date)
through October 31,
2018 | |
Operations: | | | | |
Net investment income | | $ | 89,033 | |
Net realized gain (loss) | | | (26,511 | ) |
Change in net unrealized appreciation | | | 10,212 | |
Net increase in net assets resulting from operations | | | 72,734 | |
Share transactions–net | | | 5,836,974 | |
Net increase in net assets | | | 5,909,708 | |
| |
Net assets: | | | | |
Beginning of period | | | — | |
End of period | | $ | 5,909,708 | |
Notes to Financial Statements
October 31, 2018
NOTE 1—Significant Accounting Policies
Invesco U.S. Managed Volatility Fund (the “Fund”) is a series portfolio of AIM Investment Funds (Invesco Investment Funds) (the “Fund”). The Fund is organized as a Delaware statutory Fund and is registered under the Investment Company Act of 1940, as amended (the “1940 Act”), as an open-end series management investment company authorized to issue an unlimited number of shares of beneficial interest. Information presented in these financial statements pertains only to the Fund. Matters affecting the Fund or each class will be voted on exclusively by the shareholders of the Fund or each class.
The Fund’s investment objective is to seek to provide capital appreciation while managing portfolio volatility.
The Fund currently consists of one class of shares, Class R6. Class R6 shares are sold at net asset value.
The Fund is an investment company and accordingly follows the investment company accounting and reporting guidance in accordance with Financial Accounting Standards Board Accounting Standards Codification Topic 946, Financial Services — Investment Companies.
The following is a summary of the significant accounting policies followed by the Fund in the preparation of its financial statements.
| A. | Security Valuations — Securities, including restricted securities, are valued according to the following policy. |
A security listed or traded on an exchange (except convertible securities) is valued at its last sales price or official closing price as of the close of the customary trading session on the exchange where the security is principally traded, or lacking any sales or official closing price on a particular day, the security may be valued at the closing bid price on that day. Securities traded in the over-the-counter market are valued based on prices furnished by independent pricing services or market makers. When such securities are valued by an independent pricing service they may be considered fair valued. Futures contracts are valued at the final settlement price set by an exchange on which they are principally traded. Listed options are valued at the mean between the last bid and asked prices from the exchange on which they are principally traded. Options not listed on an exchange are valued by an independent source at the mean between the last bid and asked prices. For purposes of determining net asset value (“NAV”) per share, futures and option contracts generally are valued 15 minutes after the close of the customary trading session of the New York Stock Exchange (“NYSE”).
Investments in open-end and closed-end registered investment companies that do not trade on an exchange are valued at the end-of-day net asset value per share. Investments in open-end and closed-end registered investment companies that trade on an exchange are valued at the last sales price or official closing price as of the close of the customary trading session on the exchange where the security is principally traded.
Debt obligations (including convertible securities) and unlisted equities are fair valued using an evaluated quote provided by an independent pricing service. Evaluated quotes provided by the pricing service may be determined without exclusive reliance on quoted prices, and may reflect appropriate factors such as institution-size trading in similar groups of securities, developments related to specific securities, dividend rate (for unlisted equities), yield (for debt obligations), quality, type of issue, coupon rate (for debt obligations), maturity (for debt obligations), individual trading characteristics and other market data. Pricing services generally value debt obligations assuming orderly transactions of institutional round lot size, but a fund may hold or transact in the same securities in smaller, odd lot sizes. Odd lots often trade at lower prices than institutional round lots. Debt obligations are subject to interest rate and credit risks. In addition, all debt obligations involve some risk of default with respect to interest and/or principal payments.
Foreign securities’ (including foreign exchange contracts) prices are converted into U.S. dollar amounts using the applicable exchange rates as of the close of the NYSE. If market quotations are available and reliable for foreign exchange-traded equity securities, the securities will be valued at the market quotations. Because trading hours for certain foreign securities end before the close of the NYSE, closing market quotations may become unreliable. If between the time trading ends on a particular security and the close of the customary trading session on the NYSE, events occur that the investment adviser determines are significant and make the closing price unreliable, the Fund may fair value the security. If the event is likely to have affected the closing price of the security, the security will be valued at fair value in good faith using procedures approved by the Board of Trustees. Adjustments to closing prices to reflect fair value may also be based on a screening process of an independent pricing
19 Invesco U.S. Managed Volatility Fund
service to indicate the degree of certainty, based on historical data, that the closing price in the principal market where a foreign security trades is not the current value as of the close of the NYSE. Foreign securities’ prices meeting the approved degree of certainty that the price is not reflective of current value will be priced at the indication of fair value from the independent pricing service. Multiple factors may be considered by the independent pricing service in determining adjustments to reflect fair value and may include information relating to sector indices, American Depositary Receipts and domestic and foreign index futures. Foreign securities may have additional risks including exchange rate changes, potential for sharply devalued currencies and high inflation, political and economic upheaval, the relative lack of issuer information, relatively low market liquidity and the potential lack of strict financial and accounting controls and standards.
Securities for which market prices are not provided by any of the above methods may be valued based upon quotes furnished by independent sources. The last bid price may be used to value equity securities. The mean between the last bid and asked prices is used to value debt obligations, including corporate loans.
Securities for which market quotations are not readily available or became unreliable are valued at fair value as determined in good faith by or under the supervision of the Fund’s officers following procedures approved by the Board of Trustees. Issuer specific events, market trends, bid/asked quotes of brokers and information providers and other market data may be reviewed in the course of making a good faith determination of a security’s fair value.
The Fund may invest in securities that are subject to interest rate risk, meaning the risk that the prices will generally fall as interest rates rise and, conversely, the prices will generally rise as interest rates fall. Specific securities differ in their sensitivity to changes in interest rates depending on their individual characteristics. Changes in interest rates may result in increased market volatility, which may affect the value and/or liquidity of certain Fund investments.
Valuations change in response to many factors including the historical and prospective earnings of the issuer, the value of the issuer’s assets, general economic conditions, interest rates, investor perceptions and market liquidity. Because of the inherent uncertainties of valuation, the values reflected in the financial statements may materially differ from the value received upon actual sale of those investments.
| B. | Securities Transactions and Investment Income — Securities transactions are accounted for on a trade date basis. Realized gains or losses on sales are computed on the basis of specific identification of the securities sold. Interest income (net of withholding tax, if any) is recorded on the accrual basis from settlement date. Dividend income (net of withholding tax, if any) is recorded on the ex-dividend date. |
The Fund may periodically participate in litigation related to Fund investments. As such, the Fund may receive proceeds from litigation settlements. Any proceeds received are included in the Statement of Operations as realized gain (loss) for investments no longer held and as unrealized gain (loss) for investments still held.
Brokerage commissions and mark ups are considered transaction costs and are recorded as an increase to the cost basis of securities purchased and/or a reduction of proceeds on a sale of securities. Such transaction costs are included in the determination of net realized and unrealized gain (loss) from investment securities reported in the Statement of Operations and the Statement of Changes in Net Assets and the net realized and unrealized gains (losses) on securities per share in the Financial Highlights. Transaction costs are included in the calculation of the Fund’s net asset value and, accordingly, they reduce the Fund’s total returns. These transaction costs are not considered operating expenses and are not reflected in net investment income reported in the Statement of Operations and the Statement of Changes in Net Assets, or the net investment income per share and the ratios of expenses and net investment income reported in the Financial Highlights, nor are they limited by any expense limitation arrangements between the Fund and the investment adviser.
The Fund allocates income and realized and unrealized capital gains and losses to a class based on the relative net assets of each class.
| C. | Country Determination — For the purposes of making investment selection decisions and presentation in the Schedule of Investments, the investment adviser may determine the country in which an issuer is located and/or credit risk exposure based on various factors. These factors include the laws of the country under which the issuer is organized, where the issuer maintains a principal office, the country in which the issuer derives 50% or more of its total revenues and the country that has the primary market for the issuer’s securities, as well as other criteria. Among the other criteria that may be evaluated for making this determination are the country in which the issuer maintains 50% or more of its assets, the type of security, financial guarantees and enhancements, the nature of the collateral and the sponsor organization. Country of issuer and/or credit risk exposure has been determined to be the United States of America, unless otherwise noted. |
| D. | Distributions — Distributions from net investment income and net realized capital gain, if any, are generally declared and paid annually and recorded on the ex-dividend date. The Fund may elect to treat a portion of the proceeds from redemptions as distributions for federal income tax purposes. |
| E. | Federal Income Taxes — The Fund intends to comply with the requirements of Subchapter M of the Internal Revenue Code of 1986, as amended (the “Internal Revenue Code”), necessary to qualify as a regulated investment company and to distribute substantially all of the Fund’s taxable earnings to shareholders. As such, the Fund will not be subject to federal income taxes on otherwise taxable income (including net realized capital gain) that is distributed to shareholders. Therefore, no provision for federal income taxes is recorded in the financial statements. |
The Fund recognizes the tax benefits of uncertain tax positions only when the position is more likely than not to be sustained. Management has analyzed the Fund’s uncertain tax positions and concluded that no liability for unrecognized tax benefits should be recorded related to uncertain tax positions. Management is not aware of any tax positions for which it is reasonably possible that the total amounts of unrecognized tax benefits will change materially in the next 12 months.
The Fund files tax returns in the U.S. Federal jurisdiction and certain other jurisdictions. Generally, the Fund is subject to examinations by such taxing authorities for up to three years after the filing of the return for the tax period.
| F. | Accounting Estimates — The preparation of financial statements in conformity with accounting principles generally accepted in the United States of America (“GAAP”) requires management to make estimates and assumptions that affect the reported amounts of assets and liabilities at the date of the financial statements and the reported amounts of revenues and expenses during the reporting period including estimates and assumptions related to taxation. Actual results could differ from those estimates by a significant amount. In addition, the Fund monitors for material events or transactions that may occur or become known after the period-end date and before the date the financial statements are released to print. |
| G. | Indemnifications — Under the Fund’s organizational documents, each Trustee, officer, employee or other agent of the Fund is indemnified against certain liabilities that may arise out of the performance of their duties to the Fund. Additionally, in the normal course of business, the |
20 Invesco U.S. Managed Volatility Fund
| | Fund enters into contracts, including the Fund’s servicing agreements, that contain a variety of indemnification clauses. The Fund’s maximum exposure under these arrangements is unknown as this would involve future claims that may be made against the Fund that have not yet occurred. The risk of material loss as a result of such indemnification claims is considered remote. |
| H. | Futures Contracts — The Fund may enter into futures contracts to manage exposure to interest rate, equity and market price movements and/or currency risks. A futures contract is an agreement between two parties (“Counterparties”) to purchase or sell a specified underlying security, currency or commodity (or delivery of a cash settlement price, in the case of an index future) for a fixed price at a future date. The Fund currently invests only in exchange-traded futures and they are standardized as to maturity date and underlying financial instrument. Initial margin deposits required upon entering into futures contracts are satisfied by the segregation of specific securities or cash as collateral at the futures commission merchant (broker). During the period the futures contracts are open, changes in the value of the contracts are recognized as unrealized gains or losses by recalculating the value of the contracts on a daily basis. Subsequent or variation margin payments are received or made depending upon whether unrealized gains or losses are incurred. These amounts are reflected as receivables or payables on the Statement of Assets and Liabilities. When the contracts are closed or expire, the Fund recognizes a realized gain or loss equal to the difference between the proceeds from, or cost of, the closing transaction and the Fund’s basis in the contract. The net realized gain (loss) and the change in unrealized gain (loss) on futures contracts held during the period is included on the Statement of Operations. The primary risks associated with futures contracts are market risk and the absence of a liquid secondary market. If the Fund were unable to liquidate a futures contract and/or enter into an offsetting closing transaction, the Fund would continue to be subject to market risk with respect to the value of the contracts and continue to be required to maintain the margin deposits on the futures contracts. Futures contracts have minimal Counterparty risk since the exchange’s clearinghouse, as Counterparty to all exchange-traded futures, guarantees the futures against default. Risks may exceed amounts recognized in the Statement of Assets and Liabilities. |
NOTE 2—Advisory Fees and Other Fees Paid to Affiliates
The Fund has entered into a master investment advisory agreement with Invesco Advisers, Inc. (the “Adviser” or “Invesco”). Under the terms of the investment advisory agreement, the Fund accrues daily and pays monthly an advisory fee to the Adviser at the annual rate of 0.10% of the Fund’s average daily net assets.
Under the terms of a master sub-advisory agreement between the Adviser and each of Invesco Asset Management Deutschland GmbH, Invesco Asset Management Limited, Invesco Asset Management (Japan) Limited, Invesco Hong Kong Limited, Invesco Senior Secured Management, Inc. and Invesco Canada Ltd. and separate sub-advisory agreements with Invesco Capital Management LLC (formerly PowerShares Capital Management LLC) and Invesco Asset Management (India) Private Limited (collectively, the “Affiliated Sub-Advisers”) the Adviser, not the Fund, will pay 40% of the fees paid to the Adviser to any such Affiliated Sub-Adviser(s) that provide(s) discretionary investment management services to the Fund based on the percentage of assets allocated to such Affiliated Sub-Adviser(s).
The Adviser has contractually agreed, through at least February 29, 2020, to waive advisory fees and/or reimburse expenses to the extent necessary to limit total annual fund operating expenses after fee waiver and/or reimbursement (excluding certain items discussed below) of Class R6 shares to 0.15% of the Fund’s average daily net assets (the “expense limit”). In determining the Adviser’s obligation to waive advisory fees and/or reimburse expenses, the following expenses are not taken into account, and could cause the total annual fund operating expenses after fee waiver and/or expense reimbursement to exceed the numbers reflected above: (1) interest; (2) taxes; (3) dividend expense on short sales; (4) extraordinary or non-routine items, including litigation expenses; and (5) expenses that the Fund has incurred but did not actually pay because of an expense offset arrangement. Unless Invesco continues the fee waiver agreement, it will terminate on February 29, 2020. During its term, the fee waiver agreement cannot be terminated or amended to increase the expense limits or reduce the advisory fee waiver without approval of the Board of Trustees.
The Adviser has contractually agreed, through at least June 30, 2020, to waive the advisory fee payable by the Fund in an amount equal to 100% of the net advisory fees the Adviser receives from the affiliated money market funds on investments by the Fund of uninvested cash in such affiliated money market funds.
For the period December 18, 2017 (commencement date) through October 31, 2018, the Adviser waived advisory fees and reimbursed fund level expenses of $165,912.
The Fund has entered into a master administrative services agreement with Invesco pursuant to which the Fund has agreed to pay Invesco for certain administrative costs incurred in providing accounting services to the Fund. For the period December 18, 2017 (commencement date) through October 31, 2018, expenses incurred under the agreement are shown in the Statement of Operations as Administrative services fees.
The Fund has entered into a transfer agency and service agreement with Invesco Investment Services, Inc. (“IIS”) pursuant to which the Fund has agreed to pay IIS a fee for providing transfer agency and shareholder services to the Fund and reimburse IIS for certain expenses incurred by IIS in the course of providing such services. IIS may make payments to intermediaries that provide omnibus account services, sub-accounting services and/or networking services. All fees payable by IIS to intermediaries that provide omnibus account services or sub-accounting services are charged back to the Fund, subject to certain limitations approved by the Fund’s Board of Trustees. For the period December 18, 2017 (commencement date) through October 31, 2018, the expenses incurred under the agreement are shown in the Statement of Operations as Transfer agent fees.
The Fund has entered into a master distribution agreement with Invesco Distributors, Inc. (“IDI”) to serve as the distributor for the Fund’s shares. The Fund does not pay a distribution fee to IDI under the agreement.
Certain officers and trustees of the Fund are officers and directors of the Adviser, IIS and/or IDI.
NOTE 3—Additional Valuation Information
GAAP defines fair value as the price that would be received to sell an asset or paid to transfer a liability in an orderly transaction between market participants at the measurement date, under current market conditions. GAAP establishes a hierarchy that prioritizes the inputs to valuation methods, giving the highest priority to readily available unadjusted quoted prices in an active market for identical assets (Level 1) and the lowest priority to significant unobservable inputs (Level 3), generally when market prices are not readily available or are unreliable. Based on the valuation inputs, the securities or other investments are tiered into one of three levels. Changes in valuation methods may result in transfers in or out of an investment’s assigned level:
| | Level 1 — | Prices are determined using quoted prices in an active market for identical assets. |
21 Invesco U.S. Managed Volatility Fund
| | Level 2 — | Prices are determined using other significant observable inputs. Observable inputs are inputs that other market participants may use in pricing a security. These may include quoted prices for similar securities, interest rates, prepayment speeds, credit risk, yield curves, loss severities, default rates, discount rates, volatilities and others. |
| | Level 3 — | Prices are determined using significant unobservable inputs. In situations where quoted prices or observable inputs are unavailable (for example, when there is little or no market activity for an investment at the end of the period), unobservable inputs may be used. Unobservable inputs reflect the Fund’s own assumptions about the factors market participants would use in determining fair value of the securities or instruments and would be based on the best available information. |
The following is a summary of tiered valuation input levels, as of October 31, 2018. The level assigned to the securities valuations may not be an indication of the risk or liquidity associated with investing in those securities. Because of the inherent uncertainties of valuation, the values reflected in the financial statements may materially differ from the value received upon actual sale of those investments.
| | | | | | | | | | | | | | | | |
| | | Level 1 | | | Level 2 | | | Level 3 | | | Total | |
Investments in Securities | | | | | | | | | | | | | | | | |
Common Stocks & Other Equity Interests | | $ | 5,897,206 | | | $ | — | | | $ | — | | | $ | 5,897,206 | |
Money Market Funds | | | 27,189 | | | | — | | | | — | | | | 27,189 | |
Total Investments in Securities | | | 5,924,395 | | | | — | | | | — | | | | 5,924,395 | |
Other Investments — Liabilities* | | | | | | | | | | | | | | | | |
Futures Contracts | | | (30,465 | ) | | | — | | | | — | | | | (30,465 | ) |
Total Investments | | $ | 5,893,930 | | | $ | — | | | $ | — | | | $ | 5,893,930 | |
| * | Unrealized appreciation (depreciation). |
NOTE 4—Derivative Investments
The Fund may enter into an International Swaps and Derivatives Association Master Agreement (“ISDA Master Agreement”) under which a fund may trade OTC derivatives. An OTC transaction entered into under an ISDA Master Agreement typically involves a collateral posting arrangement, payment netting provisions and close-out netting provisions. These netting provisions allow for reduction of credit risk through netting of contractual obligations. The enforceability of the netting provisions of the ISDA Master Agreement depends on the governing law of the ISDA Master Agreement, among other factors.
For financial reporting purposes, the Fund does not offset OTC derivative assets or liabilities that are subject to ISDA Master Agreements in the Statement of Assets and Liabilities.
Value of Derivative Investments at Period-End
The table below summarizes the value of the Fund’s derivative investments, detailed by primary risk exposure, held as of October 31, 2018:
| | | | |
| | | Value | |
| Derivative Liabilities | | Equity
Risk | |
Unrealized depreciation on futures contracts — Exchange-Traded(a) | | $ | (30,465 | ) |
Derivatives not subject to master netting agreements | | | 30,465 | |
Total Derivative Liabilities subject to master netting agreements | | $ | — | |
| (a) | The daily variation margin receivable (payable) at period-end is recorded on the Statement of Assets and Liabilities. |
Effect of Derivative Investments for the period December 18, 2017 (commencement date) through October 31, 2018
The table below summarizes the gains (losses) on derivative investments, detailed by primary risk exposure, recognized in earnings during the period:
| | | | |
| | | Location of Gain (Loss) on
Statement of Operations | |
| | | Equity
Risk | |
Realized Gain (Loss): | | | | |
Futures contracts | | $ | (17,963 | ) |
Change in Net Unrealized Appreciation (Depreciation): | | | | |
Futures contracts | | | (30,465 | ) |
Total | | $ | (48,428 | ) |
The table below summarizes the three month average notional value of futures contracts outstanding during the period.
| | | | |
| | | Futures
Contracts | |
Average notional value | | $ | 1,031,697 | |
22 Invesco U.S. Managed Volatility Fund
NOTE 5—Trustees’ and Officers’ Fees and Benefits
Trustees’ and Officers’ Fees and Benefits include amounts accrued by the Fund to pay remuneration to certain Trustees and Officers of the Fund. Trustees have the option to defer compensation payable by the Fund, and Trustees’ and Officers’ Fees and Benefits also include amounts accrued by the Fund to fund such deferred compensation amounts. Those Trustees who defer compensation have the option to select various Invesco Funds in which their deferral accounts shall be deemed to be invested. Finally, certain current Trustees were eligible to participate in a retirement plan that provided for benefits to be paid upon retirement to Trustees over a period of time based on the number of years of service. The Fund may have certain former Trustees who also participate in a retirement plan and receive benefits under such plan. Trustees’ and Officers’ Fees and Benefits include amounts accrued by the Fund to fund such retirement benefits. Obligations under the deferred compensation and retirement plans represent unsecured claims against the general assets of the Fund.
NOTE 6—Cash Balances
The Fund is permitted to temporarily carry a negative or overdrawn balance in its account with State Street Bank and Trust Company, the custodian bank. Such balances, if any at period-end, are shown in the Statement of Assets and Liabilities under the payable caption Amount due custodian. To compensate the custodian bank for such overdrafts, the overdrawn Fund may either (1) leave funds as a compensating balance in the account so the custodian bank can be compensated by earning the additional interest; or (2) compensate by paying the custodian bank at a rate agreed upon by the custodian bank and Invesco, not to exceed the contractually agreed upon rate.
NOTE 7—Distributions to Shareholders and Tax Components of Net Assets
Tax Components of Net Assets at Period-End:
| | | | |
| | | 2018 | |
Undistributed ordinary income | | $ | 98,759 | |
Undistributed long-term gain | | | 15,024 | |
Net unrealized appreciation (depreciation) — investments | | | (41,049 | ) |
Shares of beneficial interest | | | 5,836,974 | |
Total net assets | | $ | 5,909,708 | |
The difference between book-basis and tax-basis unrealized appreciation (depreciation) is due to differences in the timing of recognition of gains and losses on investments for tax and book purposes. The Fund’s net unrealized appreciation (depreciation) difference is attributable primarily to straddle losses deferred.
Capital loss carryforward is calculated and reported as of a specific date. Results of transactions and other activity after that date may affect the amount of capital loss carryforward actually available for the Fund to utilize. Capital losses generated in years beginning after December 22, 2010 can be carried forward for an unlimited period, whereas previous losses expire in eight tax years. Capital losses with an expiration period may not be used to offset capital gains until all net capital losses without an expiration date have been utilized. Capital loss carryforwards with no expiration date will retain their character as either short-term or long-term capital losses instead of as short-term capital losses as under prior law. The ability to utilize capital loss carryforwards in the future may be limited under the Internal Revenue Code and related regulations based on the results of future transactions.
The Fund does not have a capital loss carryforward as of October 31, 2018.
NOTE 8—Investment Transactions
The aggregate amount of investment securities (other than short-term securities, U.S. Treasury obligations and money market funds, if any) purchased and sold by the Fund during the period December 18, 2017 (commencement date) through October 31, 2018 was $6,420,335 and $545,397, respectively. Cost of investments, including any derivatives, on a tax basis includes the adjustments for financial reporting purposes as of the most recently completed federal income tax reporting period-end.
| | | | |
| Unrealized Appreciation (Depreciation) of Investments on a Tax Basis | |
Aggregate unrealized appreciation of investments | | $ | 371,266 | |
Aggregate unrealized (depreciation) of investments | | | (412,315 | ) |
Net unrealized appreciation (depreciation) of investments | | $ | (41,049 | ) |
Cost of investments for tax purposes is $5,934,979.
NOTE 9—Reclassification of Permanent Differences
Primarily as a result of differing book/tax treatment of litigation settlements, on October 31, 2018, undistributed net investment income was increased by $504 and undistributed net realized loss was decreased by $504. This reclassification had no effect on the net assets or the distributable earnings of the Fund.
23 Invesco U.S. Managed Volatility Fund
NOTE 10—Share Information
| | | | | | | | |
| | | Summary of Share Activity | |
| | | December 18, 2017
(commencement date) through
October 31, 2018(a) | |
| | | Shares | | | Amount | |
Sold | | | 594,574 | | | $ | 5,962,973 | |
Reacquired | | | (12,018 | ) | | | (125,999 | ) |
Net increase in share activity | | | 582,556 | | | $ | 5,836,974 | |
| (a) | 86% of the outstanding shares of the Fund are owned by the Adviser or an affiliate of the Adviser. |
NOTE 11—Financial Highlights
The following schedule presents financial highlights for a share of the Fund outstanding throughout the periods indicated.
| | | | | | | | | | | | | | | | | | | | | | | | | | | | | | | | | | | | | | | | | | | | |
| | | Net asset
value,
beginning
of period | | | Net
investment
income(a) | | | Net gains
(losses)
on securities
(both
realized and
unrealized) | | | Total from
investment
operations | | | Net asset
value, end
of period | | | Total
return(b) | | | Net assets,
end of period
(000’s omitted) | | | Ratio of
expenses
to average
net assets
with fee waivers
and/or expenses
absorbed | | | Ratio of
expenses
to average net
assets without
fee waivers
and/or expenses
absorbed | | | Ratio of net
investment
income
to average
net assets | | | Portfolio
turnover(c) | |
Period ended 10/31/18(d) | | $ | 10.00 | | | $ | 0.16 | | | $ | (0.02 | ) | | $ | 0.14 | | | $ | 10.14 | | | | 1.40 | % | | $ | 5,910 | | | | 0.15 | %(e) | | | 3.40 | %(e) | | | 1.74 | %(e) | | | 9 | % |
| (a) | Calculated using average shares outstanding. |
| (b) | Includes adjustments in accordance with accounting principles generally accepted in the United States of America and as such, the net asset value for financial reporting purposes and the returns based upon those net asset values may differ from the net asset value and returns for shareholder transactions. Does not include sales charges and is not annualized for periods less than one year, if applicable. |
| (c) | Portfolio turnover is not annualized for periods less than one year, if applicable. |
| (d) | Commencement date of December 18, 2017. |
| (e) | Ratios are annualized and based on average daily net assets (000’s omitted) of $5,853 for Class R6 shares. |
24 Invesco U.S. Managed Volatility Fund
Report of Independent Registered Public Accounting Firm
To the Board of Trustees of AIM Investment Funds (Invesco Investment Funds)
and Shareholders of Invesco U.S. Managed Volatility Fund:
Opinion on the Financial Statements
We have audited the accompanying statement of assets and liabilities, including the schedule of investments, of Invesco U.S. Managed Volatility Fund (one of the funds constituting AIM Investment Funds (Invesco Investment Funds), hereafter referred to as the “Fund”) as of October 31, 2018, the related statement of operations and changes in net assets for the period from December 18, 2017 (commencement of operations) to October 31, 2018, including the related notes, and the financial highlights for the period December 18, 2017 (commencement of operations) to October 31, 2018 (collectively referred to as the financial statements). In our opinion, the financial statements present fairly, in all material respects, the financial position of the Fund as of October 31, 2018, the results of its operations, the changes in its net assets and the financial highlights for the period December 18, 2017 (commencement of operations) to October 31, 2018 in conformity with accounting principles generally accepted in the United States of America.
Basis for Opinion
These financial statements are the responsibility of the Fund’s management. Our responsibility is to express an opinion on the Fund’s financial statements based on our audit. We are a public accounting firm registered with the Public Company Accounting Oversight Board (United States) (PCAOB) and are required to be independent with respect to the Fund in accordance with the U.S. federal securities laws and the applicable rules and regulations of the Securities and Exchange Commission and the PCAOB.
We conducted our audit of these financial statements in accordance with the standards of the PCAOB. Those standards require that we plan and perform the audit to obtain reasonable assurance about whether the financial statements are free of material misstatement, whether due to error or fraud.
Our audit included performing procedures to assess the risks of material misstatement of the financial statements, whether due to error or fraud, and performing procedures that respond to those risks. Such procedures included examining, on a test basis, evidence regarding the amounts and disclosures in the financial statements. Our audit also included evaluating the accounting principles used and significant estimates made by management, as well as evaluating the overall presentation of the financial statements. Our procedures included confirmation of securities owned as of October 31, 2018 by correspondence with the custodian, transfer agent and brokers; when replies were not received from brokers, we performed other auditing procedures. We believe that our audit provide a reasonable basis for our opinion.
PricewaterhouseCoopers LLP
Houston, TX
December 28, 2018
We have served as the auditor of one or more of the investment companies in the Invesco group of investment companies since at least 1995. We have not been able to determine the specific year we began serving as auditor.
25 Invesco U.S. Managed Volatility Fund
Calculating your ongoing Fund expenses
Example
As a shareholder of the Fund, you incur two types of costs: (1) transaction costs, which may include sales charges (loads) on purchase payments or contingent deferred sales charges on redemptions, if any; and (2) ongoing costs, including management fees, distribution and/or service (12b-1) fees, and other Fund expenses. This example is intended to help you understand your ongoing costs (in dollars) of investing in the Fund and to compare these costs with ongoing costs of investing in other mutual funds. The example is based on an investment of $1,000 invested at the beginning of the period and held for the entire period May 1, 2018 through October 31, 2018.
Actual expenses
The table below provides information about actual account values and actual expenses. You may use the information in this table, together with the amount you invested, to estimate the expenses that you paid over the period. Simply divide your account value by $1,000 (for example, an $8,600 account value divided by $1,000 = 8.6), then multiply the result by the number in the table under the heading entitled “Actual Expenses Paid During Period” to estimate the expenses you paid on your account during this period.
Hypothetical example for comparison purposes
The table below also provides information about hypothetical account values and hypothetical expenses based on the Fund’s actual expense ratio and an assumed rate of return of 5% per year before expenses, which is not the Fund’s actual return.
The hypothetical account values and expenses may not be used to estimate the actual ending account balance or expenses you paid for the period. You may use this information to compare the ongoing costs of investing in the Fund and other funds. To do so, compare this 5% hypothetical example with the 5% hypothetical examples that appear in the shareholder reports of the other funds.
Please note that the expenses shown in the table are meant to highlight your ongoing costs only and do not reflect any transaction costs, such as sales charges (loads) on purchase payments or contingent deferred sales charges on redemptions, if any. Therefore, the hypothetical information is useful in comparing ongoing costs only, and will not help you determine the relative total costs of owning different funds. In addition, if these transaction costs were included, your costs would have been higher.
| | | | | | | | | | | | | | | | | | | | | | | | |
| Class | | Beginning
Account Value
(05/01/18) | | | ACTUAL | | | HYPOTHETICAL (5% annual return before
expenses) | | | Annualized
Expense Ratio | |
| | Ending
Account Value
(10/31/18)1 | �� | | Expenses
Paid During
Period2 | | | Ending
Account Value
(10/31/18) | | | Expenses
Paid During
Period2 | |
| R6 | | $ | 1,000.00 | | | $ | 1,031.50 | | | $ | 0.77 | | | $ | 1,024.45 | | | $ | 0.77 | | | | 0.15 | % |
| 1 | The actual ending account value is based on the actual total return of the Fund for the period May 1, 2018 through October 31, 2018, after actual expenses and will differ from the hypothetical ending account value which is based on the Fund’s expense ratio and a hypothetical annual return of 5% before expenses. |
| 2 | Expenses are equal to the Fund’s annualized expense ratio as indicated above multiplied by the average account value over the period, multiplied by 184/365 to reflect the most recent fiscal half year. |
26 Invesco U.S. Managed Volatility Fund
Approval of Investment Advisory and Sub-Advisory Contracts
At meetings held on June 5-6, 2018, the Board of Trustees (the Board or the Trustees) of AIM Investment Funds (Invesco Investment Funds) as a whole, and the independent Trustees, who comprise over 75% of the Board, voting separately, approved the continuance of the Invesco U.S. Managed Volatility Fund’s (the Fund) Master Investment Advisory Agreement with Invesco Advisers, Inc. (Invesco Advisers and the investment advisory agreement) and the Master Intergroup Sub-Advisory Contract for Mutual Funds with Invesco Asset Management Deutschland GmbH, Invesco Asset Management Limited, Invesco Asset Management (Japan) Limited, Invesco Hong Kong Limited, Invesco Senior Secured Management, Inc., Invesco Canada Ltd. and separate Sub-Advisory Contracts with Invesco Capital Management LLC and Invesco Asset Management (India) Private Limited (collectively, the Affiliated Sub-Advisers and the sub-advisory contracts) for another year, effective July 1, 2018. After evaluating the factors discussed below, among others, the Board approved the renewal of the Fund’s investment advisory agreement and the sub-advisory contracts and determined that the compensation payable by the Fund to Invesco Advisers and by Invesco Advisers to the Affiliated Sub-Advisers is fair and reasonable.
The Board’s Evaluation Process
The Board’s Investments Committee has established three Sub-Committees, which meet throughout the year to review the performance of funds advised by Invesco Advisers (the Invesco Funds). Over the course of each year, the Sub-Committees meet with portfolio managers for their assigned Invesco Funds and other members of management to review detailed information about investment performance and portfolio attributes of these funds. The Board took into account evaluations and reports that it received from the Investments Committee and Sub-Committees, as well as the information provided to such committees and the Board throughout the year, in considering whether to approve each Invesco Fund’s investment advisory agreement and sub-advisory contracts.
As part of the contract renewal process, the Board reviews and considers information provided in response to detailed requests for information submitted to management by the independent Trustees with assistance from legal counsel to the independent Trustees. The Board receives comparative investment performance and fee data regarding the Invesco Funds prepared by Invesco Advisers and Broadridge Financial Solutions, Inc. (Broadridge), an independent mutual fund data provider. The Board also receives an independent written evaluation from the Senior Officer, an officer of the Invesco Funds who reports directly to the independent Trustees. The Senior Officer’s
evaluation is prepared as part of his responsibility to manage the process by which the Invesco Funds’ proposed management fees are negotiated during the annual contract renewal process to ensure they are negotiated in a manner that is at arms’ length and reasonable. In addition to meetings with Invesco Advisers and fund counsel throughout the year, the independent Trustees also discuss the continuance of the investment advisory agreement and sub-advisory contracts in separate sessions with the Senior Officer and with independent legal counsel.
The discussion below is a summary of the Senior Officer’s independent written evaluation with respect to the Fund’s investment advisory agreement, as well as a discussion of the material factors and related conclusions that formed the basis for the Board’s approval of the Fund’s investment advisory agreement and sub-advisory contracts. The Trustees’ review and conclusions are based on the comprehensive consideration of all information presented to them during the course of the year and in prior years and are not the result of any single determinative factor. Moreover, one Trustee may have weighed a particular piece of information or factor differently than another Trustee. This information is current as of June 6, 2018.
Factors and Conclusions and Summary of Independent Written Fee Evaluation
| A. | Nature, Extent and Quality of Services Provided by Invesco Advisers and the Affiliated Sub-Advisers |
The Board reviewed the nature, extent and quality of the advisory services provided to the Fund by Invesco Advisers under the Fund’s investment advisory agreement, and the credentials and experience of the officers and employees of Invesco Advisers who provide these services, including the Fund’s portfolio manager(s). The Board’s review included consideration of Invesco Advisers’ investment process oversight and structure, credit analysis and investment risk management. The Board also considered non-advisory services that Invesco Advisers and its affiliates provide to the Invesco Funds such as various back office support functions, third party oversight, internal audit, valuation, portfolio trading and legal and compliance. The Board also reviewed and considered the benefits to shareholders of investing in a fund that is part of the Invesco family of funds under the umbrella of Invesco Ltd., Invesco Advisers’ parent company, and noted Invesco Ltd.’s depth and experience in conducting an investment management business, as well as its commitment of financial and other resources to such business. The Board concluded that the nature, extent and quality of the services provided to the Fund by Invesco Advisers are appropriate and satisfactory.
The Board reviewed the services that may be provided by the Affiliated Sub-Advisers under the sub-advisory contracts and the credentials and experience of the officers and employees of the Affiliated Sub-Advisers who provide these services. The Board noted the Affiliated Sub-Advisers’ expertise with respect to certain asset classes and that the Affiliated Sub-Advisers have offices and personnel that are located in financial centers around the world. As a result, the Board noted that the Affiliated Sub-Advisers can provide research and investment analysis on the markets and economies of various countries in which the Fund may invest, make recommendations regarding securities and assist with security trades. The Board concluded that the sub-advisory contracts may benefit the Fund and its shareholders by permitting Invesco Advisers to use the resources and talents of the Affiliated Sub-Advisers in managing the Fund. The Board concluded that the nature, extent and quality of the services that may be provided by the Affiliated Sub-Advisers are appropriate and satisfactory.
| B. | Fund Investment Performance |
The Board did not consider historical performance information for the Fund because the Fund is new and has no performance history. The Board did review performance expectations for the Fund and for the types of instruments purchased for its portfolio. The Board noted that Invesco Capital Management LLC currently manages assets of the Fund.
| C. | Advisory and Sub-Advisory Fees and Fund Expenses |
The Board compared the Fund’s contractual management fee rate to the median contractual management fee rate of the Fund’s Broadridge expense group, as provided by management. The Board noted that the contractual management fee rate for shares of the Fund was below the median contractual management fee rate of funds in its expense group. The Board also considered comparative information regarding the Fund’s total expense ratio and its various components.
The Board noted that Invesco Advisers has contractually agreed to waive fees and/or limit expenses of the Fund in an amount necessary to limit total annual operating expenses to a specified percentage of average daily net assets for each class of the Fund.
The Board noted that Invesco Advisers and the Affiliated Sub-Advisers do not manage other similarly managed mutual funds or client accounts.
The Board also considered the services that may be provided by the Affiliated Sub-Advisers pursuant to the sub-advisory contracts, as well as the fees payable by Invesco Advisers to the Affiliated Sub-Advisers pursuant to the sub-advisory contracts.
27 Invesco U.S. Managed Volatility Fund
| D. | Economies of Scale and Breakpoints |
The Board considered the extent to which there may be economies of scale in the provision of advisory services to the Fund. The Board noted that the Fund does not benefit from economies of scale through contractual breakpoints, but does share in economies of scale through lower fees charged by third party service providers based on the combined size of the Invesco Funds. The Board noted that the Funds may also benefit from economies of scale through initial fee setting, fee waivers and expense reimbursements.
| E. | Profitability and Financial Resources |
The Board reviewed information from Invesco Advisers concerning the costs of the advisory and other services that Invesco Advisers and its affiliates provide to the Fund and the Invesco Funds and the profitability of Invesco Advisers and its affiliates in providing these services. The Board considered the methodology used for calculating profitability and noted the periodic review of such methodology by an independent consultant. The Board noted that Invesco Advisers continues to operate at a net profit from services Invesco Advisers and its affiliates provide to the Invesco Funds. The Board received information from Invesco Advisers demonstrating that Invesco Advisers and the Affiliated Sub-Advisers are financially sound and have the resources necessary to perform their obligations under the investment advisory agreement and sub-advisory contracts.
| F. | Collateral Benefits to Invesco Advisers and its Affiliates |
The Board considered various other benefits received by Invesco Advisers and its affiliates from the relationship with the Fund, including the fees received for providing administrative, transfer agency and distribution services to the Fund. The Board considered comparative information regarding fees charged for these services, including information provided by Broadridge and other independent sources. The Board considered the performance of Invesco Advisers and its affiliates in providing these services and the organizational structure employed to provide these services. The Board also considered that these services will be provided to the Fund pursuant to written contracts that are reviewed and approved on an annual basis by the Board; and that the services are required for the operation of the Fund.
The Board considered the benefits realized by Invesco Advisers and the Affiliated Sub-Advisers as a result of portfolio brokerage transactions executed through “soft dollar” arrangements. The Board noted that soft dollar arrangements may result in the Fund bearing costs to purchase research that may be used by Invesco Advisers or the Affiliated Sub-Advisers with other clients and may reduce Invesco Advisers’ or the Affiliated Sub-Advisers’ expenses. The Board also considered that it receives periodic reports from Invesco representing that these arrangements are consistent with regulatory requirements. The Board did not deem the soft dollar arrangements to be inappropriate.
The Board considered that the Fund’s uninvested cash and cash collateral from any securities lending arrangements may be invested in money market funds advised by Invesco Advisers pursuant to procedures approved by the Board. The Board noted that Invesco Advisers receives advisory fees from these affiliated money market funds attributable to such investments, although Invesco Advisers has contractually agreed to waive through varying periods the advisory fees payable by the Invesco Funds with respect to certain investments in the affiliated money market funds. The waiver is in an amount equal to 100% of the net advisory fee Invesco Advisers receives from the affiliated money market funds with respect to the Fund’s investment in the affiliated money market funds of uninvested cash, but not cash collateral. The Board concluded that the amount of advisory fees received by Invesco Advisers from the Fund’s investment of cash collateral from any securities lending arrangements in the affiliated money market funds is fair and reasonable.
The Board also considered that an affiliated broker may receive commissions for executing certain trades for the Fund. Invesco Advisers and the Affiliated Sub-Advisers may use the affiliated broker to, among other things, control order routing and minimize information leakage, and the Board was advised that such trades are executed in compliance with rules under the federal securities laws and consistent with best execution obligations.
28 Invesco U.S. Managed Volatility Fund
Tax Information
Form 1099-DIV, Form 1042-S and other year-end tax information provide shareholders with actual calendar year amounts that should be included in their tax returns. Shareholders should consult their tax advisors.
The following distribution information is being provided as required by the Internal Revenue Code or to meet a specific state’s requirement.
The Fund designates the following amounts or, if subsequently determined to be different, the maximum amount allowable for its fiscal year ended October 31, 2018:
| | | | |
Federal and State Income Tax | |
Qualified Dividend Income* | | | 0 | % |
Corporate Dividends Received Deduction* | | | 0 | % |
U.S. Treasury Obligations* | | | 0 | % |
| | * | The above percentages are based on ordinary income dividends paid to shareholders during the Fund’s fiscal year. |
29 Invesco U.S. Managed Volatility Fund
Trustees and Officers
The address of each trustee and officer is AIM Investment Funds (Invesco Investment Funds) (the “Trust”), 11 Greenway Plaza, Suite 1000, Houston, Texas 77046-1173. The trustees serve for the life of the Trust, subject to their earlier death, incapacitation, resignation, retirement or removal as more specifically provided in the Trust’s organizational documents. Each officer serves for a one year term or until their successors are elected and qualified. Column two below includes length of time served with predecessor entities, if any.
| | | | | | | | |
Name, Year of Birth and
Position(s) Held with the Trust | | Trustee and/
or Officer Since | | Principal Occupation(s)
During Past 5 Years | | Number of
Funds in Fund
Complex
Overseen by
Trustee | | Other Directorship(s)
Held by Trustee During
Past 5 Years |
| Interested Persons | | | | | | | | |
| Martin L. Flanagan1 — 1960 Trustee | | 2007 | | Executive Director, Chief Executive Officer and President, Invesco Ltd. (ultimate parent of Invesco and a global investment management firm); Trustee, The Invesco Funds; Vice Chair, Investment Company Institute; and Member of Executive Board, SMU Cox School of Business Formerly: Advisor to the Board, Invesco Advisers, Inc. (formerly known as Invesco Institutional (N.A.), Inc.); Chairman and Chief Executive Officer, Invesco Advisers, Inc. (registered investment adviser); Director, Chairman, Chief Executive Officer and President, Invesco Holding Company (US), Inc. (formerly IVZ Inc.) (holding company), Invesco Group Services, Inc. (service provider) and Invesco North American Holdings, Inc. (holding company); Director, Chief Executive Officer and President, Invesco Holding Company Limited (parent of Invesco and a global investment management firm); Director, Invesco Ltd.; Chairman, Investment Company Institute and President, Co-Chief Executive Officer, Co-President, Chief Operating Officer and Chief Financial Officer, Franklin Resources, Inc. (global investment management organization) | | 158 | | None |
Philip A. Taylor2 — 1954 Trustee and Senior Vice President | | 2006 | | Head of the Americas and Senior Managing Director, Invesco Ltd.; Director, Invesco Advisers, Inc. (formerly known as Invesco Institutional (N.A.), Inc.) (registered investment adviser); Director and Chairman, Invesco Investment Services, Inc. (formerly known as Invesco AIM Investment Services, Inc.) (registered transfer agent); Chief Executive Officer, Invesco Corporate Class Inc. (corporate mutual fund company); Director, Chairman and Chief Executive Officer, Invesco Canada Ltd. (formerly known as Invesco Trimark Ltd./Invesco Trimark Ltèe) (registered investment adviser and registered transfer agent); Trustee and Senior Vice President, The Invesco Funds; Director, Invesco Investment Advisers LLC (formerly known as Van Kampen Asset Management) Formerly: Director, Chairman, Chief Executive Officer and President, Invesco Management Group, Inc. (formerly known as Invesco AIM Management Group, Inc.) (financial services holding company); Co-Chairman, Co-President and Co-Chief Executive Officer, Invesco Advisers, Inc. (formerly known as Invesco Institutional (N.A.), Inc.) (registered investment adviser); Director, Chief Executive Officer and President, Van Kampen Exchange Corp; President and Principal Executive Officer, The Invesco Funds (other than AIM Treasurer’s Series Trust (Invesco Treasurer’s Series Trust), Short-Term Investments Trust and Invesco Management Trust); Executive Vice President, The Invesco Funds (AIM Treasurer’s Series Trust (Invesco Treasurer’s Series Trust), Short-Term Investments Trust and Invesco Management Trust only); Director and President, INVESCO Funds Group, Inc. (registered investment adviser and registered transfer agent); Director and Chairman, IVZ Distributors, Inc. (formerly known as INVESCO Distributors, Inc.) (registered broker dealer); Director, President and Chairman, Invesco Inc. (holding company), Invesco Canada Holdings Inc. (holding company), Trimark Investments Ltd./Placements Trimark Ltèe and Invesco Financial Services Ltd/Services Financiers Invesco Ltèe; Chief Executive Officer, Invesco Canada Fund Inc. (corporate mutual fund company); Director and Chairman, Van Kampen Investor Services Inc.; Director, Chief Executive Officer and President, 1371 Preferred Inc. (holding company) and Van Kampen Investments Inc.; Director and President, AIM GP Canada Inc. (general partner for limited partnerships) and Van Kampen Advisors, Inc.; Director and Chief Executive Officer, Invesco Trimark Dealer Inc. (registered broker dealer); Director, Invesco Distributors, Inc. (formerly known as Invesco AIM Distributors, Inc.) (registered broker dealer); Manager, Invesco Capital Management LLC; Director, Chief Executive Officer and President, Invesco Advisers, Inc.; Director, Chairman, Chief Executive Officer and President, Invesco AIM Capital Management, Inc.; President, Invesco Trimark Dealer Inc. and Invesco Trimark Ltd./Invesco Trimark Ltèe; Director and President, AIM Trimark Corporate Class Inc. and AIM Trimark Canada Fund Inc.; Senior Managing Director, Invesco Holding Company Limited; Director and Chairman, Fund Management Company (former registered broker dealer); President and Principal Executive Officer, The Invesco Funds (AIM Treasurer’s Series Trust (Invesco Treasurer’s Series Trust), and Short-Term Investments Trust only); President, AIM Trimark Global Fund Inc. and AIM Trimark Canada Fund Inc. | | 158 | | None |
| 1 | Mr. Flanagan is considered an interested person (within the meaning of Section 2(a)(19) of the 1940 Act) of the Trust because he is an officer of the Adviser to the Trust, and an officer and a director of Invesco Ltd., ultimate parent of the Adviser. |
| 2 | Mr. Taylor is considered an interested person (within the meaning of Section 2(a)(19) of the 1940 Act) of the Trust because he is an officer and a director of the Adviser. |
T-1 Invesco U.S. Managed Volatility Fund
Trustees and Officers—(continued)
| | | | | | | | |
Name, Year of Birth and
Position(s) Held with the Trust | | Trustee and/
or Officer Since | | Principal Occupation(s)
During Past 5 Years | | Number of
Funds in Fund
Complex
Overseen by
Trustee | | Other Directorship(s)
Held by Trustee During
Past 5 Years |
| Independent Trustees | | | | | | | | |
Bruce L. Crockett — 1944 Trustee and Chair | | 2001 | | Chairman, Crockett Technologies Associates (technology consulting company) Formerly: Director, Captaris (unified messaging provider); Director, President and Chief Executive Officer, COMSAT Corporation; Chairman, Board of Governors of INTELSAT (international communications company); ACE Limited (insurance company); Independent Directors Council and Investment Company Institute: Member of the Audit Committee, Investment Company Institute; Member of the Executive Committee and Chair of the Governance Committee, Independent Directors Council | | 158 | | Director and Chairman of the Audit Committee, ALPS (Attorneys Liability Protection Society) (insurance company); Director and Member of the Audit Committee and Compensation Committee, Ferroglobe PLC (metallurgical company) |
David C. Arch — 1945 Trustee | | 2010 | | Chairman of Blistex Inc. (consumer health care products manufacturer); Member, World Presidents’ Organization | | 158 | | Board member of the Illinois Manufacturers’ Association |
Jack M. Fields — 1952 Trustee | | 2001 | | Chief Executive Officer, Twenty First Century Group, Inc. (government affairs company); and Chairman, Discovery Learning Alliance (non-profit) Formerly: Owner and Chief Executive Officer, Dos Angeles Ranch L.P. (cattle, hunting, corporate entertainment); Director, Insperity, Inc. (formerly known as Administaff) (human resources provider); Chief Executive Officer, Texana Timber LP (sustainable forestry company); Director of Cross Timbers Quail Research Ranch (non-profit); and member of the U.S. House of Representatives | | 158 | | None |
Cynthia Hostetler — 1962 Trustee | | 2017 | | Non-Executive Director and Trustee of a number of public and private business corporations Formerly: Director, Aberdeen Investment Funds (4 portfolios); Head of Investment Funds and Private Equity, Overseas Private Investment Corporation; President, First Manhattan Bancorporation, Inc.; Attorney, Simpson Thacher & Bartlett LLP | | 158 | | Vulcan Materials Company (construction materials company); Trilinc Global Impact Fund; Artio Global Investment LLC (mutual fund complex); Edgen Group, Inc. (specialized energy and infrastructure products distributor) |
Eli Jones — 1961 Trustee | | 2016 | | Professor and Dean, Mays Business School — Texas A&M University Formerly: Professor and Dean, Walton College of Business, University of Arkansas and E.J. Ourso College of Business, Louisiana State University; Director, Arvest Bank | | 158 | | Insperity, Inc. (formerly known as Administaff) (human resources provider) |
Prema Mathai-Davis — 1950 Trustee | | 2001 | | Retired | | 158 | | None |
Teresa M. Ressel — 1962 Trustee | | 2017 | | Non-executive director and trustee of a number of public and private business corporations Formerly: Chief Financial Officer, Olayan America, The Olayan Group (international investor/commercial/industrial); Chief Executive Officer, UBS Securities LLC; Group Chief Operating Officer, Americas, UBS AG; Assistant Secretary for Management & Budget and CFO, US Department of the Treasury | | 158 | | Atlantic Power Corporation (power generation company); ON Semiconductor Corp. (semiconductor supplier) |
Ann Barnett Stern — 1957 Trustee | | 2017 | | President and Chief Executive Officer, Houston Endowment Inc. (private philanthropic institution) Formerly: Executive Vice President and General Counsel, Texas Children’s Hospital; Attorney, Beck, Redden and Secrest, LLP; Business Law Instructor, University of St. Thomas; Attorney, Andrews & Kurth LLP | | 158 | | Federal Reserve Bank of Dallas |
Raymond Stickel, Jr. — 1944 Trustee | | 2005 | | Retired Formerly: Director, Mainstay VP Series Funds, Inc. (25 portfolios); Partner, Deloitte & Touche | | 158 | | None |
Robert C. Troccoli — 1949 Trustee | | 2016 | | Adjunct Professor, University of Denver — Daniels College of Business Formerly: Senior Partner, KPMG LLP | | 158 | | None |
Christopher L. Wilson — 1957 Trustee | | 2017 | | Non-executive director and trustee of a number of public and private business corporations Formerly: Director, TD Asset Management USA Inc. (mutual fund complex) (22 portfolios); Managing Partner, CT2, LLC (investing and consulting firm); President/Chief Executive Officer, Columbia Funds, Bank of America Corporation; President/Chief Executive Officer, CDC IXIS Asset Management Services, Inc.; Principal & Director of Operations, Scudder Funds, Scudder, Stevens & Clark, Inc.; Assistant Vice President, Fidelity Investments | | 158 | | ISO New England, Inc. (non-profit organization managing regional electricity market) |
T-2 Invesco U.S. Managed Volatility Fund
Trustees and Officers—(continued)
| | | | | | | | |
Name, Year of Birth and
Position(s) Held with the Trust | | Trustee and/
or Officer Since | | Principal Occupation(s)
During Past 5 Years | | Number of
Funds in Fund
Complex
Overseen by
Trustee | | Other Directorship(s)
Held by Trustee During
Past 5 Years |
| Other Officers | | | | | | | | |
Sheri Morris — 1964 President, Principal Executive Officer and Treasurer | | 1999 | | President, Principal Executive Officer and Treasurer, The Invesco Funds; Vice President, Invesco Advisers, Inc. (formerly known as Invesco Institutional (N.A.), Inc.) (registered investment adviser); and Vice President, Invesco Exchange-Traded Fund Trust, Invesco Exchange-Traded Fund Trust II, Invesco India Exchange-Traded Fund Trust, Invesco Actively Managed Exchange-Traded Fund Trust, Invesco Actively Managed Exchange-Traded Commodity Fund Trust and Invesco Exchange-Traded Self-Indexed Fund Trust Formerly: Vice President and Principal Financial Officer, The Invesco Funds; Vice President, Invesco AIM Advisers, Inc., Invesco AIM Capital Management, Inc. and Invesco AIM Private Asset Management, Inc.; Assistant Vice President and Assistant Treasurer, The Invesco Funds and Assistant Vice President, Invesco Advisers, Inc., Invesco AIM Capital Management, Inc. and Invesco AIM Private Asset Management, Inc.; and Treasurer, Invesco Exchange-Traded Fund Trust, Invesco Exchange-Traded Fund Trust II, Invesco India Exchange-Traded Fund Trust and Invesco Actively Managed Exchange-Traded Fund Trust | | N/A | | N/A |
Russell C. Burk — 1958 Senior Vice President and Senior Officer | | 2005 | | Senior Vice President and Senior Officer, The Invesco Funds | | N/A | | N/A |
Jeffrey H. Kupor — 1968 Senior Vice President, Chief Legal Officer and Secretary | | 2018 | | Senior Vice President and Secretary, Invesco Advisers, Inc. (formerly known as Invesco Institutional (N.A.), Inc.) (registered investment adviser); Senior Vice President and Secretary, Invesco Distributors, Inc. (formerly known as Invesco AIM Distributors, Inc.); Vice President and Secretary, Invesco Investment Services, Inc. (formerly known as Invesco AIM Investment Services, Inc.) Senior Vice President, Chief Legal Officer and Secretary, The Invesco Funds; Secretary and General Counsel, Invesco Investment Advisers LLC (formerly known as Van Kampen Asset Management); Secretary and General Counsel, Invesco Capital Markets, Inc. (formerly known as Van Kampen Funds Inc.) and Chief Legal Officer, Invesco Exchange-Traded Fund Trust, Invesco Exchange-Traded Fund Trust II, Invesco India Exchange-Traded Fund Trust, Invesco Actively Managed Exchange-Traded Fund Trust, Invesco Actively Managed Exchange-Traded Commodity Fund Trust and Invesco Exchange-Traded Self-Indexed Fund Trust; Secretary, Invesco Indexing LLC; Secretary and General Counsel, INVESCO Private Capital Investments, Inc.; Secretary, W.L. Ross & Co., LLC; Secretary and Vice President, Jemstep, Inc. Formerly: Senior Vice President, Secretary and General Counsel, Invesco Management Group, Inc. (formerly known as Invesco AIM Management Group, Inc.); Assistant Secretary, INVESCO Asset Management (Bermuda) Ltd.; Secretary and General Counsel, Invesco Private Capital, Inc.; Assistant Secretary and General Counsel, INVESCO Realty, Inc.; Secretary and General Counsel, Invesco Senior Secured Management, Inc.; and Secretary, Sovereign G./P. Holdings Inc. | | N/A | | N/A |
John M. Zerr — 1962 Senior Vice President | | 2006 | | Chief Operating Officer of the Americas; Senior Vice President, Invesco Advisers, Inc. (formerly known as Invesco Institutional (N.A.), Inc.) (registered investment adviser); Senior Vice President, Invesco Distributors, Inc. (formerly known as Invesco AIM Distributors, Inc.); Director and Vice President, Invesco Investment Services, Inc. (formerly known as Invesco AIM Investment Services, Inc.) Senior Vice President, The Invesco Funds; Managing Director, Invesco Capital Management LLC; Director, Invesco Investment Advisers LLC (formerly known as Van Kampen Asset Management); Senior Vice President, Invesco Capital Markets, Inc. (formerly known as Van Kampen Funds Inc.); Manager, Invesco Indexing LLC Formerly: Director and Senior Vice President, Invesco Management Group, Inc. (formerly known as Invesco AIM Management Group, Inc.); Secretary and General Counsel, Invesco Management Group, Inc. (formerly known as Invesco AIM Management Group, Inc.); Secretary, Invesco Investment Services, Inc. (formerly known as Invesco AIM Investment Services, Inc.); Chief Legal Officer and Secretary, The Invesco Funds; Secretary and General Counsel, Invesco Investment Advisers LLC (formerly known as Van Kampen Asset Management); Secretary and General Counsel, Invesco Capital Markets, Inc. (formerly known as Van Kampen Funds Inc.); Chief Legal Officer, Invesco Exchange-Traded Fund Trust, Invesco Exchange-Traded Fund Trust II, Invesco India Exchange-Traded Fund Trust, Invesco Actively Managed Exchange-Traded Fund Trust, Invesco Actively Managed Exchange-Traded Commodity Fund Trust and Invesco Exchange-Traded Self-Indexed Fund Trust; Secretary, Invesco Indexing LLC; Director, Secretary, General Counsel and Senior Vice President, Van Kampen Exchange Corp.; Director, Vice President and Secretary, IVZ Distributors, Inc. (formerly known as INVESCO Distributors, Inc.); Director and Vice President, INVESCO Funds Group, Inc.; Director and Vice President, Van Kampen Advisors Inc.; Director, Vice President, Secretary and General Counsel, Van Kampen Investor Services Inc.; Director and Secretary, Invesco Distributors, Inc. (formerly known as Invesco AIM Distributors, Inc.); Director, Senior Vice President, General Counsel and Secretary, Invesco AIM Advisers, Inc. and Van Kampen Investments Inc.; Director, Vice President and Secretary, Fund Management Company; Director, Senior Vice President, Secretary, General Counsel and Vice President, Invesco AIM Capital Management, Inc.; Chief Operating Officer and General Counsel, Liberty Ridge Capital, Inc. (an investment adviser) | | N/A | | N/A |
T-3 Invesco U.S. Managed Volatility Fund
Trustees and Officers—(continued)
| | | | | | | | |
Name, Year of Birth and
Position(s) Held with the Trust | | Trustee and/
or Officer Since | | Principal Occupation(s)
During Past 5 Years | | Number of
Funds in Fund
Complex
Overseen by
Trustee | | Other Directorship(s)
Held by Trustee During
Past 5 Years |
| Other Officers—(continued) | | | | | | | | |
Gregory G. McGreevey — 1962 Senior Vice President | | 2012 | | Senior Managing Director, Invesco Ltd.; Director, Chairman, President, and Chief Executive Officer, Invesco Advisers, Inc. (formerly known as Invesco Institutional (N.A.), Inc.) (registered investment adviser); Director, Invesco Mortgage Capital, Inc. and Invesco Senior Secured Management, Inc.; and Senior Vice President, The Invesco Funds Formerly: Senior Vice President, Invesco Management Group, Inc. and Invesco Advisers, Inc.; Assistant Vice President, The Invesco Funds | | N/A | | N/A |
Kelli Gallegos — 1970 Vice President, Principal Financial Officer and Assistant Treasurer | | 2008 | | Vice President and Treasurer, Invesco Exchange-Traded Fund Trust, Invesco Exchange-Traded Fund Trust II, Invesco India Exchange-Traded Fund Trust, Invesco Actively Managed Exchange-Traded Fund Trust, Invesco Actively Managed Exchange-Traded Commodity Fund Trust and Invesco Exchange-Traded Self-Indexed Fund Trust; Vice President, Principal Financial Officer and Assistant Treasurer, The Invesco Funds; Principal Financial and Accounting Officer — Pooled Investments, Invesco Capital Management LLC Formerly: Assistant Treasurer, Invesco Exchange-Traded Fund Trust, Invesco Exchange-Traded Fund Trust II, Invesco India Exchange-Traded Fund Trust, Invesco Actively Managed Exchange-Traded Fund Trust, Invesco Actively Managed Exchange-Traded Commodity Fund Trust and Invesco Exchange-Traded Self-Indexed Fund Trust; Assistant Treasurer, Invesco Capital Management LLC; Assistant Vice President, The Invesco Funds | | N/A | | N/A |
Tracy Sullivan — 1962 Vice President, Chief Tax Officer and Assistant Treasurer | | 2008 | | Vice President, Chief Tax Officer and Assistant Treasurer, The Invesco Funds; Assistant Treasurer, Invesco Capital Management LLC, Invesco Exchange-Traded Fund Trust, Invesco Exchange-Traded Fund Trust II, Invesco India Exchange-Traded Fund Trust, Invesco Actively Managed Exchange-Traded Fund Trust, Invesco Actively Managed Exchange-Traded Commodity Fund Trust and Invesco Exchange-Traded Self-Indexed Fund Trust Formerly: Assistant Vice President, The Invesco Funds | | N/A | | N/A |
Crissie M. Wisdom — 1969 Anti-Money Laundering Compliance Officer | | 2013 | | Anti-Money Laundering Compliance Officer, Invesco Advisers, Inc. (formerly known as Invesco Institutional (N.A.), Inc.) (registered investment adviser), Invesco Capital Markets, Inc. (formerly known as Van Kampen Funds Inc.), Invesco Distributors, Inc., Invesco Investment Services, Inc., The Invesco Funds, and Invesco Exchange-Traded Fund Trust, Invesco Exchange-Traded Fund Trust II, Invesco India Exchange-Traded Fund Trust, Invesco Actively Managed Exchange-Traded Fund Trust, Invesco Actively Managed Exchange-Traded Commodity Fund Trust and Invesco Exchange-Traded Self-Indexed Fund Trust; Anti-Money Laundering Compliance Officer and Bank Secrecy Act Officer, INVESCO National Trust Company and Invesco Trust Company; and Fraud Prevention Manager and Controls and Risk Analysis Manager for Invesco Investment Services, Inc. Formerly: Anti-Money Laundering Compliance Officer, Van Kampen Exchange Corp. and Invesco Management Group, Inc. | | N/A | | N/A |
Robert R. Leveille — 1969 Chief Compliance Officer | | 2016 | | Chief Compliance Officer, Invesco Advisers, Inc. (registered investment adviser); and Chief Compliance Officer, The Invesco Funds Formerly: Chief Compliance Officer, Putnam Investments and the Putnam Funds | | N/A | | N/A |
The Statement of Additional Information of the Trust includes additional information about the Fund’s Trustees and is available upon request, without charge, by calling 1.800.959.4246. Please refer to the Fund’s Statement of Additional Information for information on the Fund’s sub-advisers.
| | | | | | |
Office of the Fund 11 Greenway Plaza, Suite 1000 Houston, TX 77046-1173 | | Investment Adviser Invesco Advisers, Inc. 1555 Peachtree Street, N.E. Atlanta, GA 30309 | | Distributor Invesco Distributors, Inc. 11 Greenway Plaza, Suite 1000 Houston, TX 77046-1173 | | Auditors PricewaterhouseCoopers LLP 1000 Louisiana Street, Suite 5800 Houston, TX 77002-5021 |
| | | |
| | | | | | |
Counsel to the Fund Stradley Ronon Stevens & Young, LLP 2005 Market Street, Suite 2600 Philadelphia, PA 19103-7018 | | Counsel to the Independent Trustees Goodwin Procter LLP 901 New York Avenue, N.W. Washington, D.C. 20001 | | Transfer Agent Invesco Investment Services, Inc. 11 Greenway Plaza, Suite 1000 Houston, TX 77046-1173 | | Custodian State Street Bank and Trust Company 225 Franklin Street Boston, MA 02110-2801 |
T-4 Invesco U.S. Managed Volatility Fund
Explore High-Conviction Investing with Invesco

Go paperless with eDelivery
Visit invesco.com/edelivery to enjoy the convenience and security of anytime electronic access to your investment documents.
With eDelivery, you can elect to have any or all of the following materials delivered straight to your inbox to download, save and print from your own computer:
∎ Fund reports and prospectuses
∎ Quarterly statements
∎ Daily confirmations
∎ Tax forms
Invesco mailing information
Send general correspondence to Invesco Investment Services, Inc., P.O. Box 219078, Kansas City, MO 64121-9078.
Important notice regarding delivery of security holder documents
To reduce Fund expenses, only one copy of most shareholder documents may be mailed to shareholders with multiple accounts at the same address (Householding). Mailing of your shareholder documents may be householded indefinitely unless you instruct us otherwise. If you do not want the mailing of these documents to be combined with those for other members of your household, please contact Invesco Investment Services, Inc. at 800 959 4246 or contact your financial institution. We will begin sending you individual copies for each account within 30 days after receiving your request.
Fund holdings and proxy voting information
The Fund provides a complete list of its holdings four times in each fiscal year, at the quarter ends. For the second and fourth quarters, the lists appear in the Fund’s semiannual and annual reports to shareholders. For the first and third quarters, the Fund files the lists with the Securities and Exchange Commission (SEC) on Form N-Q (or any successor Form). The most recent list of portfolio holdings is available at invesco.com/completeqtrholdings. Shareholders can also look up the Fund’s Forms N-Q (or any successor Form) on the SEC website at sec.gov. The SEC file numbers for the Fund are shown below.
A description of the policies and procedures that the Fund uses to determine how to vote proxies relating to portfolio securities is available without charge, upon request, from our Client Services department at 800 959 4246 or at invesco.com/proxyguidelines. The information is also available on the SEC website, sec.gov.
| | |
Information regarding how the Fund voted proxies related to its portfolio securities during the most recent 12-month period ended June 30 is available at invesco.com/proxysearch. The information is also available on the SEC website, sec.gov. Invesco Advisers, Inc. is an investment adviser; it provides investment advisory services to individual and institutional clients and does not sell securities. Invesco Distributors, Inc. is the US distributor for Invesco Ltd.’s retail mutual funds, exchange-traded funds and institutional money market funds. Both are wholly owned, indirect subsidiaries of Invesco Ltd. | | 
|
| | | | | | | | |
| SEC file numbers: 811-06463 and 033-44611 | | Invesco Distributors, Inc. | | USMGV-AR-1 | | 12262018 | | 0901 |
| | | | | | |
| | | | |
 | | Annual Report to Shareholders | | October 31, 2018 | | |
| | | | |
| | Invesco World Bond Fund | | |
| | Nasdaq: | | |
| | A: AUBAX ∎ C: AUBCX ∎ Y: AUBYX ∎ R5: AUBIX ∎ R6: AUBFX | | |

Letters to Shareholders
| | |

Philip Taylor | | Dear Shareholders: This annual report includes information about your Fund, including performance data and a complete list of its investments as of the close of the reporting period. Inside is a discussion of how your Fund was managed and the factors that affected its performance during the reporting period. Throughout the reporting period, US economic data remained positive. Robust corporate profits, strong retail sales and unemployment rates near generational lows helped drive US markets to new all-time records multiple times during the reporting period. Against this backdrop, the US Federal Reserve raised the federal funds rate four times during the reporting period. Market volatility, largely non-existent in 2017, returned in 2018. Markets sold off first in February and again sharply in October, amid rising interest rates, concerns about potential trade wars and heightened geopolitical tensions. Despite the volatility, US equity markets were largely positive for the reporting period and fared better than international markets. Emerging markets were |
particularly hard hit due to a strong US dollar. During the October sell-off, investors retreated to more defensive areas of the market and to US Treasuries. The broader bond market declined during the reporting period due to the increase in US Treasury yields and widening credit spreads. As the year progresses, we’ll see how the interplay of economic data, interest rates, geopolitics and a host of other factors affect US and overseas equity and fixed income markets.
Short-term market volatility can prompt some investors to abandon their investment plans – and can cause others to settle for whatever returns the market has to offer. The investment professionals at Invesco, in contrast, invest with high conviction. This means that, no matter the asset class or the strategy, each investment team has a passion to exceed. We want to help investors achieve better outcomes, such as seeking higher returns, helping mitigate risk and generating income. Of course, investing with high conviction can’t guarantee a profit or ensure success; no investment strategy can. To learn more about how we invest with high conviction, visit invesco.com/HighConviction.
You, too, can invest with high conviction by maintaining a long-term investment perspective and by working with your financial adviser on a regular basis. During periods of short-term market volatility or uncertainty, your financial adviser can keep you focused on your long-term investment goals – a new home, a child’s college education or a secure retirement. He or she also can share research about the economy, the markets and individual investment options.
Visit our website for more information on your investments
Our website, invesco.com/us, offers a wide range of market insights and investment perspectives. On the website, you’ll find detailed information about our funds, including performance, holdings and portfolio manager commentaries. You can access information about your account by completing a simple, secure online registration. To do so, select “Log In” on the right side of the homepage, and then select “Register for Individual Account Access.”
In addition to the resources accessible on our website and through our mobile app, you can obtain timely updates to help you stay informed about the markets and the economy by connecting with Invesco on Twitter, LinkedIn or Facebook. You can access our blog at blog.invesco.us.com. Our goal is to provide you the information you want, when and where you want it.
Finally, I’m pleased to share with you Invesco’s commitment to both the Principles for Responsible Investment and to considering environmental, social and governance issues in our robust investment process. I invite you to learn more at invesco.com/esg.
Have questions?
For questions about your account, contact an Invesco client services representative at 800 959 4246. For Invesco-related questions or comments, please email me directly at phil@invesco.com.
All of us at Invesco look forward to serving your investment management needs. Thank you for investing with us.
Sincerely,

Philip Taylor
Senior Managing Director, Invesco Ltd.
| | |
| 2 | | Invesco World Bond Fund |
| | | | |

Bruce Crockett | | Dear Fellow Shareholders: Among the many important lessons I’ve learned in more than 40 years in a variety of business endeavors is the value of a trusted advocate. As independent chair of the Invesco Funds Board, I can assure you that the members of the Board are strong advocates for the interests of investors in Invesco’s mutual funds. We work hard to represent your interests through oversight of the quality of the investment management services your funds receive and other matters important to your investment, including but not limited to: |
| | ∎ | | Ensuring that Invesco offers a diverse lineup of mutual funds that your financial adviser can use to strive to meet your financial needs as your investment goals change over time. |
| | ∎ | | Monitoring how the portfolio management teams of the Invesco funds are performing in light of changing economic and market conditions. |
| ∎ | | Assessing each portfolio management team’s investment performance within the context of the investment strategy described in the fund’s prospectus. |
| ∎ | | Monitoring for potential conflicts of interests that may impact the nature of the services that your funds receive. |
We believe one of the most important services we provide our fund shareholders is the annual review of the funds’ advisory and sub-advisory contracts with Invesco Advisers and its affiliates. This review is required by the Investment Company Act of 1940 and focuses on the nature and quality of the services Invesco provides as the adviser to the Invesco funds and the reasonableness of the fees that it charges for those services. Each year, we spend months carefully reviewing information received from Invesco and a variety of independent sources, such as performance and fee data prepared by Lipper, Inc. (a subsidiary of Broadridge Financial Solutions, Inc.), an independent, third-party firm widely recognized as a leader in its field. We also meet with our independent legal counsel and other independent advisers to review and help us assess the information that we have received. Our goal is to assure that you receive quality investment management services for a reasonable fee.
I trust the measures outlined above provide assurance that you have a worthy advocate when it comes to choosing the Invesco Funds.
As always, please contact me at bruce@brucecrockett.com with any questions or concerns you may have. On behalf of the Board, we look forward to continuing to represent your interests and serving your needs.
Sincerely,

Bruce L. Crockett
Independent Chair
Invesco Funds Board of Trustees
| | |
| 3 | | Invesco World Bond Fund |
Management’s Discussion of Fund Performance
| | | | | | | | |
| | |
Performance summary For the fiscal year ended October 31, 2018, Class A shares of Invesco World Bond Fund (the Fund), at net asset value (NAV), underperformed the Fund’s broad market/style-specific index, the Bloomberg Barclays Global Aggregate Index. Your Fund’s long-term performance appears later in this report. | | | | | |
| | | |
Fund vs. Indexes | | | | | | | | |
Total returns, 10/31/17 to 10/31/18, at net asset value (NAV). Performance shown does not include applicable contingent deferred sales charges (CDSC) or front-end sales charges, which would have reduced performance. | | | | | |
| | |
Class A Shares | | | -4.89 | % | | | | |
Class C Shares | | | -5.62 | | | | | |
Class Y Shares | | | -4.66 | | | | | |
Class R5 Shares | | | -4.75 | | | | | |
Class R6 Shares | | | -4.65 | | | | | |
Bloomberg Barclays Global Aggregate Indexq (Broad Market/Style-Specific Index) | | | -2.05 | | | | | |
Lipper Global Income Funds Index⬛ (Peer Group Index) | | | -1.35 | | | | | |
| | | |
Source(s): qFactSet Research Systems Inc.; ⬛Lipper Inc. | | | | | | | | |
Market conditions and your Fund
The fiscal year was plagued by periods of elevated volatility in global government and corporate bond markets due to central bank policy announcements, ongoing trade tensions and increasing interest rates. In the US, economic data remained positive. In the second quarter of 2018, economic growth was particularly strong. The US economy continued to add jobs, pushing the unemployment rate down to 3.7% at the end of the third quarter of 2018.1 Inflation increased in the second quarter but began to soften into the close of the fiscal year and remained within the US Federal Reserve’s (the Fed) targeted range. Against this backdrop, the Fed raised the federal funds target rate from a range of 1.00% to 1.25% at the start of the fiscal year to a range of 2.00% to 2.25% at the close of the fiscal year. This was accomplished with four 0.25% rate hikes in December 2017, March 2018, June 2018 and September 2018.2 Working against these positive developments, however, were global macroeconomic headwinds in the form of geopolitical trade tension, benign global inflation and
the increasingly strong US dollar, which could pose a challenge to emerging market countries’ ability to refinance their outstanding debt. The Bank of Japan and the European Central Bank maintained their negative interest rates in a continued attempt to stimulate growth and inflation by encouraging investors to spend rather than save. These actions continued to drive overseas investments into higher yielding segments of the fixed income markets.
The US 10-year Treasury yield continued to move upward at the start of the fiscal year and spiked in early 2018 due to the continued strength in the global economy, the rising risks of inflation and the high probability of additional Fed rate hikes throughout the year. Due to these factors, the US 10-year Treasury note steadily increased throughout the fiscal year, resulting in higher government yields. The 10-year US Treasury yield ended the fiscal year at 3.15%, 77 basis points higher than at the beginning of the fiscal year.3 (A basis point is one one-hundredth of a percentage point.) In addition to US yields, 10-year yields were
higher across all major developed markets with the Japanese 10-year yield up six basis points to 0.13%, UK gilts 10-year yield up 11 basis points to 1.44% and German bunds 10-year yield up two basis points ending the fiscal year at 0.39%.4
The broader bond market, as represented by the Bloomberg Barclays Global Aggregate Index, fell 2.05% for the fiscal year. Poor performance was largely attributable to the broad increase in US Treasury yields and widening of credit spreads during the fiscal year. All four primary sectors of the Bloomberg Barclays Global Aggregate Index – government-related, corporate, securitized and treasury – posted negative returns for the fiscal year. Global high yield and US dollar-denominated emerging market (EM) corporate debt, also experienced negative returns as concerns over higher interest rates, trade tensions and the strengthening dollar weighed on the sectors. The US dollar, as represented by the Trade-Weighted Dollar Index (DXY), rose 2.59% throughout the fiscal year, indicating increased strength relative to other developed market currencies.4
The Fund generated negative returns for the fiscal year and, at NAV, underperformed its broad market/style-specific benchmark, the Bloomberg Barclays Global Aggregate Index. The Fund’s overweight exposure to emerging market debt denominated in local currencies was the most notable detractor from the Fund’s relative performance throughout the fiscal year. Underperformance in emerging markets was driven by the appreciating US dollar and rising US interest rates that pressured countries needing to refinance outstanding debt.
The Fund’s underweight allocation to government-related debt, specifically in Spain and Italy, was the largest contributor to the Fund’s performance relative to its broad market/style-specific
| | | | |
Portfolio Composition | |
| By sector | | | % of total net assets | |
| | | | |
| |
Sovereign Debt | | | 30.8 | % |
Financials | | | 21.1 | |
U.S. Treasury Securities | | | 18.0 | |
Energy | | | 6.9 | |
Communication Services | | | 4.5 | |
Materials | | | 3.2 | |
Utilities | | | 2.5 | |
Industrials | | | 2.4 | |
Other Sectors, Each less than 2% | | | 3.6 | |
Money Market Funds Plus Other Assets Less Liabilities | | | 7.0 | |
| | | | | | |
Top Five Debt Issuers* | |
| | % of total net assets | |
| | |
1. | | U.S. Treasury Securities | | | 18.0% | |
2. | | Republic of South Africa Government Bond | | | 4.8 | |
3. | | Japan Government Forty Year Bond | | | 3.3 | |
4. | | Italy Buoni Poliennali del Tesoro | | | 3.1 | |
5. | | Indonesia Treasury Bond | | | 3.1 | |
| | | | |
Total Net Assets | | $ | 24.9 million | |
| |
| Total Number of Holdings* | | | 74 | |
The Fund’s holdings are subject to change, and there is no assurance that the Fund will continue to hold any particular security.
*Excluding money market fund holdings.
Data presented here are as of October 31, 2018.
| | |
| 4 | | Invesco World Bond Fund |
benchmark for the fiscal year. Security selection in investment grade corporate bonds also aided the Fund’s relative performance. This was driven by European financial institutions.
With respect to foreign currencies, the Fund’s exposure to the Indian rupee, South African rand and the Indonesian rupiah detracted from its performance relative to its broad market/style-specific benchmark for the fiscal year, while exposure to the British pound contributed to the Fund’s relative performance.
During the fiscal year, the Fund’s active duration and yield curve positioning contributed positive returns versus its broad market/ style-specific benchmark. Duration measures a portfolio’s price sensitivity to interest rate changes. Yield curve positioning refers to actively emphasizing points (maturities) along the yield curve with favorable risk-return expectations. Duration was managed with cash bonds and futures positions. Buying and selling interest rate futures contracts across multiple global yield curves was an important tool we used to manage interest rate risk and maintain our targeted portfolio duration. European and Japanese interest rate positioning was the largest contributor to the Fund’s duration and yield curve returns, while exposure to Indian and South African interest rates was the largest detractor from the Fund’s relative performance.
Please note that we implemented our strategy using derivative instruments, including futures, forwards, swaps and options. Therefore, a portion of the performance of the strategy, both positive and negative, can be attributed to these instruments. Derivatives can be a cost-effective way to gain or hedge exposure to certain risks. However, derivatives may amplify traditional investment risks through the creation of leverage and may be less liquid than traditional securities.
Part of the Fund’s strategy to manage credit and currency risk in the portfolio during the fiscal year entailed purchasing and selling credit and currency derivatives. We sought to manage credit market risk by purchasing and selling protection through credit default swaps at various points throughout the fiscal year. The currency management was carried out via currency forwards and options on an as-needed basis and we believe this strategy was effective in managing the currency positioning within the Fund.
We wish to remind you that the Fund is subject to interest rate risk, meaning when interest rates rise, the value of fixed income securities tends to fall. The
risk may be greater in the current market environment because interest rates are near historic lows. The degree to which the value of fixed income securities may decline due to rising interest rates may vary depending on the speed and magnitude of the increase in interest rates, as well as individual security characteristics such as price, maturity, duration and coupon and market forces such as supply and demand for similar securities. We are monitoring interest rates, and the market, economic and geopolitical factors that may impact the direction, speed and magnitude of changes to interest rates across the maturity spectrum, including the potential impact of monetary policy changes by the Fed and certain foreign central banks. If interest rates rise, markets may experience increased volatility, which may affect the value and/or liquidity of certain of the Fund’s investments.
Thank you for investing in Invesco World Bond Fund and for sharing our long-term investment horizon.
1 Source: Bureau of Labor Statistics
2 Source: US Federal Reserve
3 Source: US Treasury Department
4 Source: Bloomberg
The views and opinions expressed in management’s discussion of Fund performance are those of Invesco Advisers, Inc. These views and opinions are subject to change at any time based on factors such as market and economic conditions. These views and opinions may not be relied upon as investment advice or recommendations, or as an offer for a particular security. The information is not a complete analysis of every aspect of any market, country, industry, security or the Fund. Statements of fact are from sources considered reliable, but Invesco Advisers, Inc. makes no representation or warranty as to their completeness or accuracy. Although historical performance is no guarantee of future results, these insights may help you understand our investment management philosophy.
See important Fund and, if applicable, index disclosures later in this report.
| | |
 | | Gareth Isaac Chartered Financial Analyst, Portfolio Manager, is lead manager of Invesco World Bond Fund. He |
| joined Invesco in 2017. Mr. Isaac earned a BSc degree from the University of Glamorgan in Wales. |
|
Tom Sartain Portfolio Manager, is lead manager of Invesco World Bond Fund. He joined Invesco in 2018. Mr. Sartain earned a BA degree in management and business administration from the University of Reading in the United Kingdom. |
| | |
 | | Raymund Uy Chartered Financial Analyst, Portfolio Manager and Head of Currencies for Invesco Fixed Income, |
| is manager of Invesco World Bond Fund. He joined Invesco in 2012. Mr. Uy earned a BBA from Hofstra University. |
| | |
 | | Robert Waldner Chartered Financial Analyst, Portfolio Manager, is manager of Invesco World Bond Fund. He |
| joined Invesco in 2013. Mr. Waldner earned a BSE degree in civil engineering from Princeton University. |
5 Invesco World Bond Fund
Your Fund’s Long-Term Performance
Results of a $10,000 Investment – Oldest Share Class(es)
Fund and index data from 10/31/08
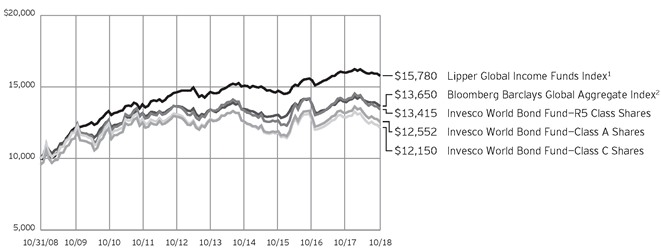
1 Source: Lipper Inc.
2 Source: FactSet Research Systems Inc.
Past performance cannot guarantee comparable future results.
The data shown in the chart include reinvested distributions, applicable sales charges and Fund expenses including management fees. Performance of the peer group, if applicable, reflects fund expenses
and management fees; performance of a market index does not. Performance shown in the chart and table(s) does not reflect deduction of taxes a shareholder would pay on Fund distributions or sale of Fund shares.
| | |
| 6 | | Invesco World Bond Fund |
| | | | |
| |
Average Annual Total Returns | |
As of 10/31/18, including maximum applicable sales charges | |
Class A Shares | | | | |
Inception (3/31/06) | | | 2.50 | % |
10 Years | | | 2.30 | |
5 Years | | | -1.10 | |
1 Year | | | -8.91 | |
| |
Class C Shares | | | | |
Inception (3/31/06) | | | 2.07 | % |
10 Years | | | 1.97 | |
5 Years | | | -0.99 | |
1 Year | | | -6.55 | |
| |
Class Y Shares | | | | |
Inception (10/3/08) | | | 2.39 | % |
10 Years | | | 2.99 | |
5 Years | | | 0.01 | |
1 Year | | | -4.66 | |
| |
Class R5 Shares | | | | |
Inception (3/31/06) | | | 3.09 | % |
10 Years | | | 2.98 | |
5 Years | | | -0.03 | |
1 Year | | | -4.75 | |
| |
Class R6 Shares | | | | |
10 Years | | | 2.90 | % |
5 Years | | | 0.01 | |
1 Year | | | -4.65 | |
Class Y shares incepted on October 3, 2008. Performance shown prior to that date is that of Class A shares and includes the 12b-1 fees applicable to Class A shares.
Class R6 shares incepted on September 24, 2012. Performance shown prior to that date is that of Class A shares and includes the 12b-1 fees applicable to Class A shares.
The performance data quoted represent past performance and cannot guarantee comparable future results; current performance may be lower or higher. Please visit invesco.com/performance for the most recent month-end performance. Performance figures reflect reinvested distributions, changes in net asset value and the effect of the maximum sales charge unless otherwise stated. Investment return and principal value will fluctuate so that you may have a gain or loss when you sell shares.
The net annual Fund operating expense ratio set forth in the most recent Fund prospectus as of the date of this report for Class A, Class C, Class Y, Class R5 and Class R6 shares was 0.94%, 1.69%, 0.69%, 0.69% and
| | | | |
| |
Average Annual Total Returns | |
As of 9/30/18, the most recent calendar quarter end, including maximum applicable sales charges | |
| |
Class A Shares | | | | |
Inception (3/31/06) | | | 2.64 | % |
10 Years | | | 1.88 | |
5 Years | | | -0.47 | |
1 Year | | | -7.57 | |
| |
Class C Shares | | | | |
Inception (3/31/06) | | | 2.21 | % |
10 Years | | | 1.55 | |
5 Years | | | -0.36 | |
1 Year | | | -5.19 | |
| |
Class Y Shares | | | | |
10 Years | | | 2.57 | % |
5 Years | | | 0.64 | |
1 Year | | | -3.27 | |
| |
Class R5 Shares | | | | |
Inception (3/31/06) | | | 3.23 | % |
10 Years | | | 2.56 | |
5 Years | | | 0.60 | |
1 Year | | | -3.37 | |
| |
Class R6 Shares | | | | |
10 Years | | | 2.48 | % |
5 Years | | | 0.64 | |
1 Year | | | -3.27 | |
0.69%, respectively.1,2 The total annual Fund operating expense ratio set forth in the most recent Fund prospectus as of the date of this report for Class A, Class C, Class Y, Class R5 and Class R6 shares was 2.22%, 2.97%, 1.97%, 1.78% and 1.78%, respectively. The expense ratios presented above may vary from the expense ratios presented in other sections of this report that are based on expenses incurred during the period covered by this report.
Class A share performance reflects the maximum 4.25% sales charge, and Class C share performance reflects the applicable contingent deferred sales charge (CDSC) for the period involved. The CDSC on Class C shares is 1% for the first year after purchase. Class Y, Class R5 and Class R6 shares do not have a front-end sales charge or a CDSC; therefore, performance is at net asset value.
The performance of the Fund’s share classes will differ primarily due to different sales charge structures and class expenses.
Fund performance reflects any applicable fee waivers and/or expense reimbursements. Had the adviser not
waived fees and/or reimbursed expenses currently or in the past, returns would have been lower. See current prospectus for more information.
| 1 | Total annual Fund operating expenses after any contractual fee waivers and/or expense reimbursements by the adviser in effect through at least February 29, 2020. See current prospectus for more information. |
| 2 | Total annual Fund operating expenses after any contractual fee waivers and/or expense reimbursements by the adviser in effect through at least June 30, 2020. See current prospectus for more information. |
7 Invesco World Bond Fund
Invesco World Bond Fund’s investment objective is total return, comprised of current income and capital appreciation.
| ∎ | | Unless otherwise stated, information presented in this report is as of October 31, 2018, and is based on total net assets. |
| ∎ | | Unless otherwise noted, all data provided by Invesco. |
| ∎ | | To access your Fund’s reports/prospectus, visit invesco.com/fundreports. |
About share classes
| ∎ | | Class Y shares are available to only certain investors. Please see the prospectus for more information. |
| ∎ | | Class R5 shares and Class R6 shares are available for use by retirement plans that meet certain standards and for institutional investors. Class R6 shares are also available through intermediaries that have established an agreement with Invesco Distributors, Inc. to make such shares available for use in retail omnibus accounts. Please see the prospectus for more information. |
Principal risks of investing
in the Fund
| ∎ | | Active trading risk. Active trading of portfolio securities may result in added expenses, a lower return and increased tax liability. |
| ∎ | | Changing fixed income market conditions risk. The current low interest rate environment was created in part by the Federal Reserve Board (FRB) and certain foreign central banks keeping the federal funds and equivalent foreign rates near, at or below zero. Increases in the federal funds and equivalent foreign rates may expose fixed income markets to heightened volatility and reduced liquidity for certain fixed income investments, particularly those with longer maturities. In addition, decreases in fixed income dealer market-making capacity may also potentially lead to heightened volatility and reduced liquidity in the fixed income markets. As a result, the value of the Fund’s investments and share price may decline. Changes in central bank policies could also result in higher than normal shareholder redemptions, which could potentially increase portfolio turnover and the Fund’s transaction costs. |
| ∎ | | Debt securities risk. The prices of debt securities held by the Fund will be affected by changes in interest rates, the creditworthiness of the issuer and other factors. An increase in prevailing interest |
| | | rates typically causes the value of existing debt securities to fall and often has a greater impact on longer-duration debt securities and higher quality debt securities. Falling interest rates will cause the Fund to reinvest the proceeds of debt securities that have been repaid by the issuer at lower interest rates. Falling interest rates may also reduce the Fund’s distributable income because interest payments on floating rate debt instruments held by the Fund will decline. The Fund could lose money on investments in debt securities if the issuer or borrower fails to meet its obligations to make interest payments and/or to repay principal in a timely manner. Changes in an issuer’s financial strength, the market’s perception of such strength or in the credit rating of the issuer or the security may affect the value of debt securities. The Adviser’s credit analysis may fail to anticipate such changes, which could result in buying a debt security at an inopportune time or failing to sell a debt security in advance of a price decline or other credit event. |
| ∎ | | Derivatives risk. The value of a derivative instrument depends largely on (and is derived from) the value of an underlying security, currency, commodity, interest rate, index or other asset (each referred to as an underlying asset). In addition to risks relating to the underlying assets, the use of derivatives may include other, possibly greater, risks, including counterparty, leverage and liquidity risks. Counterparty risk is the risk that the counterparty to the derivative contract will default on its obligation to pay the Fund the amount owed or otherwise perform under the derivative contract. Derivatives create leverage risk because they do not require payment up front equal to the economic exposure created by owning the derivative. As a result, an adverse change in the value of the underlying asset could result in the Fund sustaining a loss that is substantially |
This report must be accompanied or preceded by a currently effective Fund prospectus, which contains more complete information, including sales charges and expenses. Investors should read it carefully before investing.
NOT FDIC INSURED | MAY LOSE VALUE | NO BANK GUARANTEE
| | | greater than the amount invested in the derivative, which may make the Fund’s returns more volatile and increase the risk of loss. Derivative instruments may also be less liquid than more traditional investments and the Fund may be unable to sell or close out its derivative positions at a desirable time or price. This risk may be more acute under adverse market conditions, during which the Fund may be most in need of liquidating its derivative positions. Derivatives may also be harder to value, less tax efficient and subject to changing government regulation that could impact the Fund’s ability to use certain derivatives or their cost. Also, derivatives used for hedging or to gain or limit exposure to a particular market segment may not provide the expected benefits, particularly during adverse market conditions. |
| ∎ | | Emerging markets securities risk. Emerging markets (also referred to as developing markets) are generally subject to greater market volatility, political, social and economic instability, uncertain trading markets and more governmental limitations on foreign investment than more developed markets. In addition, companies operating in emerging markets may be subject to lower trading volume and greater price fluctuations than companies in more developed markets. Securities law and the enforcement of systems of taxation in many emerging market countries may change quickly and unpredictably. In addition, investments in emerging markets securities may also be subject to additional transaction costs, delays in settlement procedures, and lack of timely information. |
| ∎ | | Foreign currency tax risk. If the US Treasury Department were to exercise its authority to issue regulations that exclude from the definition of “qualifying income” foreign currency gains not directly related to the Fund’s business of investing in securities, the Fund may be unable to qualify as a regulated investment company for one or more years. In this event, the Fund’s Board of Trustees may authorize a significant change in investment strategy or other action. |
| ∎ | | Foreign government debt risk. Investments in foreign government debt securities (sometimes referred to as sovereign debt securities) involve certain |
| | |
| 8 | | Invesco World Bond Fund |
risks in addition to those relating to foreign securities or debt securities generally. The issuer of the debt or the governmental authorities that control the repayment of the debt may be unable or unwilling to repay principal or interest when due in accordance with the terms of such debt, and the Fund may have limited recourse in the event of a default against the defaulting government. Without the approval of debt holders, some governmental debtors have in the past been able to reschedule or restructure their debt payments or declare moratoria on payments.
| ∎ | | Foreign securities risk. The Fund’s foreign investments may be adversely affected by political and social instability, changes in economic or taxation policies, difficulty in enforcing obligations, decreased liquidity or increased volatility. Foreign investments also involve the risk of the possible seizure, nationalization or expropriation of the issuer or foreign deposits (in which the Fund could lose its entire investments in a certain market) and the possible adoption of foreign governmental restrictions such as exchange controls. Unless the Fund has hedged its foreign securities risk, foreign securities risk also involves the risk of negative foreign currency rate fluctuations, which may cause the value of securities denominated in such foreign currency (or other instruments through which the Fund has exposure to foreign currencies) to decline in value. Currency exchange rates may fluctuate significantly over short periods of time. Currency hedging strategies, if used, are not always successful. |
| ∎ | | High yield debt securities (junk bond) risk. Investments in high yield debt securities (“junk bonds”) and other lower-rated securities will subject the Fund to substantial risk of loss. These securities are considered to be speculative with respect to the issuer’s ability to pay interest and principal when due, are more susceptible to default or decline in market value and are less liquid than investment grade debt securities. Prices of high yield debt securities tend to be very volatile. |
| ∎ | | Liquidity risk. The Fund may be unable to sell illiquid investments at the time or price it desires and, as a result, could |
| | lose its entire investment in such investments. Liquid securities can become illiquid during periods of market stress. If a significant amount of the Fund’s securities become illiquid, the Fund may not be able to timely pay redemption proceeds and may need to sell securities at significantly reduced prices. |
| ∎ | | Management risk. The Fund is actively managed and depends heavily on the Adviser’s judgment about markets, interest rates or the attractiveness, relative values, liquidity, or potential appreciation of particular investments made for the Fund’s portfolio. The Fund could experience losses if these judgments prove to be incorrect. Additionally, legislative, regulatory, or tax developments may adversely affect management of the Fund and, therefore, the ability of the Fund to achieve its investment objective. |
| ∎ | | Market risk. The market values of the Fund’s investments, and therefore the value of the Fund’s shares, will go up and down, sometimes rapidly or unpredictably. Market risk may affect a single issuer, industry or section of the economy, or it may affect the market as a whole. Individual stock prices tend to go up and down more dramatically than those of certain other types of investments, such as bonds. During a general downturn in the financial markets, multiple asset classes may decline in value. When markets perform well, there can be no assurance that specific investments held by the Fund will rise in value. |
| ∎ | | Mortgage- and asset-backed securities risk. Mortgage- and asset-backed securities, including collateralized debt obligations and collateralized mortgage obligations, are subject to prepayment or call risk, which is the risk that a borrower’s payments may be received earlier or later than expected due to changes in prepayment rates on underlying loans. This could result in the Fund reinvesting these early payments at lower interest rates, thereby reducing the Fund’s income. Mortgage- and asset-backed securities also are subject to extension risk, which is the risk that an unexpected rise in interest rates could reduce the rate of prepayments, causing the price of the mortgage- and asset-backed securities and the Fund’s share price to fall. An unexpectedly |
| | high rate of defaults on the mortgages held by a mortgage pool may adversely affect the value of mortgage-backed securities and could result in losses to the Fund. The Fund may invest in mortgage pools that include subprime mortgages, which are loans made to borrowers with weakened credit histories or with lower capacity to make timely payments on their mortgages. Privately issued mortgage-related securities are not subject to the same underwriting requirements as those with government or government-sponsored entity guarantees and, therefore, mortgage loans underlying privately issued mortgage-related securities may have less favorable collateral, credit risk or other underwriting characteristics, and wider variances in interest rate, term, size, purpose and borrower characteristics. |
| ∎ | | Non-diversification risk. The Fund is non-diversified and can invest a greater portion of its assets in the obligations or securities of a small number of issuers or any single issuer than a diversified fund can. A change in the value of one or a few issuers’ securities will therefore affect the value of the Fund more than if it was a diversified fund. |
| ∎ | | Sector focus risk. The Fund may from time to time invest a significant amount of its assets (i.e. over 25%) in one market sector or group of related industries. In this event, the Fund’s performance will depend to a greater extent on the overall condition of the sector or group of industries and there is increased risk that the Fund will lose significant value if conditions adversely affect that sector or group of industries. |
| ∎ | | US government obligations risk. Obligations of US government agencies and authorities receive varying levels of support and may not be backed by the full faith and credit of the US government, which could affect the Fund’s ability to recover should they default. No assurance can be given that the US government will provide financial support to its agencies and authorities if it is not obligated by law to do so. |
| ∎ | | When-issued, delayed delivery and forward commitment risks. When-issued and delayed delivery transactions subject the Fund to market risk because the value or yield of a security at delivery may be more or less than the purchase |
| | |
| 9 | | Invesco World Bond Fund |
| | price or yield generally available when delivery occurs, and counterparty risk because the Fund relies on the buyer or seller, as the case may be, to consummate the transaction. These transactions also have a leveraging effect on the Fund because the Fund commits to purchase securities that it does not have to pay for until a later date, which increases the Fund’s overall investment exposure and, as a result, its volatility. |
| ∎ | | Zero coupon or pay-in-kind securities risk. The value, interest rates, and liquidity of non-cash paying instruments, such as zero coupon and pay-in-kind securities, are subject to greater fluctuation than other types of securities. The higher yields and interest rates on pay-in-kind securities reflect the payment deferral and increased credit risk associated with such instruments and that such investments may represent a higher credit risk than loans that periodically pay interest. |
About indexes used in this report
| ∎ | | The Bloomberg Barclays Global Aggregate Index is an unmanaged index considered representative of global investment grade, fixed-income markets. |
| ∎ | | The Lipper Global Income Funds Index is an unmanaged index considered representative of global income funds tracked by Lipper. |
| ∎ | | The Fund is not managed to track the performance of any particular index, including the index(es) described here, and consequently, the performance of the Fund may deviate significantly from the performance of the
index(es). |
| ∎ | | A direct investment cannot be made in an index. Unless otherwise indicated, index results include reinvested dividends, and they do not reflect sales charges. Performance of the peer group, if applicable, reflects fund expenses; performance of a market index does not. |
Other information
| ∎ | | The returns shown in management’s discussion of Fund performance are based on net asset values (NAVs) calculated for shareholder transactions. Generally accepted accounting principles require adjustments to be made to the net assets of the Fund at period end for financial reporting purposes, and as such, the NAVs for shareholder transactions and the returns based on those NAVs may differ from the NAVs and returns reported in the Financial Highlights. |
| | |
| 10 | | Invesco World Bond Fund |
Schedule of Investments
October 31, 2018
| | | | | | | | |
| | | Principal Amount | | | Value | |
Non-U.S. Dollar Denominated Bonds &
Notes–45.71%(a) | |
| Australia–1.19% | |
Australia Government Bond, REGS, Series 136, Sr. Unsec. Bonds, 4.75%, 04/21/2027(b) | | AUD | 360,000 | | | $ | 297,369 | |
|
| Belgium–0.51% | |
Solvay Finance S.A., REGS, Jr. Unsec. Gtd. Sub. Euro Bonds, 5.87%(b)(c) | | EUR | 100,000 | | | | 127,667 | |
|
| Canada–2.04% | |
Canadian Government Bond, Sr. Unsec. Bonds, 2.00%, 06/01/2028 | | CAD | 700,000 | | | | 509,694 | |
|
| China–0.44% | |
Eagle Intermediate Global Holding B.V./Ruyi US Finance LLC, Sr. Sec. Gtd. First Lien Bonds, 5.38%, 05/01/2023(b) | | EUR | 100,000 | | | | 110,620 | |
|
| Denmark–0.73% | |
DKT Finance ApS, Sr. Sec. Gtd. First Lien Notes,
7.00%, 06/17/2023(b) | | EUR | 150,000 | | | | 182,686 | |
|
| France–3.87% | |
Electricite de France S.A., REGS, Jr. Unsec. Sub. Medium-Term Euro Notes, 4.13%(b)(c) | | EUR | 100,000 | | | | 119,408 | |
Orange S.A., REGS, Jr. Unsec. Sub. Euro Notes, 5.88%(b)(c) | | GBP | 200,000 | | | | 273,034 | |
TOTAL S.A., REGS, Jr. Unsec. Sub. Medium-Term Euro Notes,
2.63%(b)(c) | | EUR | 200,000 | | | | 229,228 | |
UNEDIC, REGS, Sr. Unsec. Gtd. Medium-Term Euro Notes, 1.25%, 05/25/2033(b) | | EUR | 300,000 | | | | 343,284 | |
| | | | | | | | 964,954 | |
|
| Germany–1.72% | |
Bundesrepublik Deutschland Bundesanleihe, REGS, Unsec. Euro Bonds, 0.50%, 02/15/2028(b) | | EUR | 261,000 | | | | 300,361 | |
Evonik Industries AG, REGS, Jr. Unsec. Sub. Euro Bonds, 2.13%, 07/07/2077(b) | | EUR | 115,000 | | | | 128,808 | |
| | | | | | | | 429,169 | |
|
| India–1.60% | |
Province of British Columbia, Sr. Unsec. Bonds, 6.60%, 01/09/2020(b) | | INR | 30,000,000 | | | | 400,253 | |
| | | | | | | | |
| | | Principal Amount | | | Value | |
| Indonesia–4.78% | |
Indonesia Treasury Bond | | | | | | | | |
Series FR54, Sr. Unsec. Bonds, 9.50%, 07/15/2031 | | IDR | 6,200,000,000 | | | $ | 430,092 | |
Series FR72, Sr. Unsec. Bonds, 8.25%, 05/15/2036 | | IDR | 6,149,000,000 | | | | 380,103 | |
Series FR75, Sr. Unsec. Bonds, 7.50%, 05/15/2038 | | IDR | 6,726,000,000 | | | | 381,593 | |
| | | | | | | | 1,191,788 | |
|
| Italy–3.11% | |
Italy Buoni Poliennali del Tesoro, REGS, Sr. Unsec. Euro Bonds, 4.75%, 09/01/2028(b) | | EUR | 614,000 | | | | 777,268 | |
|
| Japan–3.29% | |
Japan Government Forty Year Bond, Series 9, Sr. Unsec. Bonds, 0.40%, 03/20/2056 | | JPY | 112,950,000 | | | | 820,376 | |
|
| Mexico–0.89% | |
Mexican Bonos, Series M, Sr. Unsec. Bonds, 7.75%, 11/13/2042 | | MXN | 5,180,000 | | | | 222,110 | |
|
| Netherlands–2.02% | |
Coöperatieve Rabobank U.A., REGS, Jr. Unsec. Sub. Euro Bonds, 5.50%(b)(c) | | EUR | 200,000 | | | | 238,421 | |
Rabobank Capital Funding Trust IV, REGS, Jr. Unsec. Gtd. Sub. Euro Bonds, 5.56%(b)(c) | | GBP | 200,000 | | | | 264,760 | |
| | | | | | | | 503,181 | |
|
| Russia–1.04% | |
Russian Federal Bond — OFZ, Series 6218, Unsec. Bonds, 8.50%, 09/17/2031 | | RUB | 17,000,000 | | | | 258,388 | |
|
| South Africa–4.81% | |
Republic of South Africa Government Bond Series 2048, Unsec. Bonds, 8.75%, 02/28/2048 | | ZAR | 12,553,000 | | | | 732,546 | |
8.75%, 02/28/2048 | | ZAR | 8,000,000 | | | | 466,850 | |
| | | | | | | | 1,199,396 | |
|
| Spain–1.55% | |
Spain Government Inflation Linked Bond, REGS, Sr. Unsec. Euro Bonds, 0.70%, 11/30/2033(b) | | EUR | 338,055 | | | | 386,532 | |
|
| Sweden–0.56% | |
Intrum AB, REGS, Sr. Unsec. Euro Bonds, 2.75%, 07/15/2022(b) | | EUR | 125,000 | | | | 138,484 | |
|
| Switzerland–1.48% | |
Credit Suisse AG, REGS, Unsec. Sub. Euro Bonds, 5.75%, 09/18/2025(b) | | EUR | 100,000 | | | | 122,808 | |
See accompanying Notes to Financial Statements which are an integral part of the financial statements.
11 Invesco World Bond Fund
| | | | | | | | |
| | | Principal Amount | | | Value | |
| Switzerland–(continued) | |
UBS Group Funding (Switzerland) AG, REGS, Jr. Unsec. Gtd. Sub. Euro Bonds, 5.75%(b)(c) | | EUR | 200,000 | | | $ | 246,688 | |
| | | | | | | | 369,496 | |
|
| United Kingdom–6.16% | |
Coventry Building Society (The), REGS, Jr. Unsec. Sub. Euro Bonds, 6.38%(b)(c) | | GBP | 280,000 | | | | 361,736 | |
Direct Line Insurance Group PLC, REGS, Unsec. Gtd. Sub. Euro Notes, 9.25%, 04/27/2042(b) | | GBP | 100,000 | | | | 153,185 | |
Iceland Bondco PLC, REGS, Sr. Sec. Gtd. First Lien Euro Notes, 4.63%, 03/15/2025(b) | | GBP | 100,000 | | | | 115,038 | |
National Building Society, REGS, Jr. Unsec. Sub. Medium-Term Euro Notes, 6.88%(b)(c) | | GBP | 200,000 | | | | 260,076 | |
NGG Finance PLC, REGS, Unsec. Gtd. Sub. Euro Notes,
5.63%, 06/18/2073(b) | | GBP | 250,000 | | | | 346,525 | |
United Kingdom Gilt, REGS, Unsec. Bonds, 3.50%, 07/22/2068(b) | | GBP | 150,000 | | | | 300,122 | |
| | | | | | | | 1,536,682 | |
|
| United States–3.92% | |
Chemours Co. (The), Sr. Unsec. Gtd. Euro Bonds, 4.00%, 05/15/2026 | | EUR | 275,000 | | | | 299,146 | |
MPT Operating Partnership L.P./MPT Finance Corp., Sr. Unsec. Gtd. Euro Bonds, 3.33%, 03/24/2025 | | EUR | 100,000 | | | | 115,942 | |
Netflix, Inc., Sr. Unsec. Euro Notes, 3.63%, 05/15/2027 | | EUR | 200,000 | | | | 225,214 | |
UGI International LLC, Sr. Unsec. Bonds, 3.25%, 11/01/2025(b) | | EUR | 100,000 | | | | 113,902 | |
Verizon Communications Inc., Sr. Unsec. Euro Notes, 2.88%, 01/15/2038 | | EUR | 200,000 | | | | 222,896 | |
| | | | | | | | 977,100 | |
Total Non U.S. Dollar Denominated Bonds & Notes (Cost $12,314,562) | | | | 11,403,213 | |
|
U.S. Dollar Denominated Bonds & Notes–28.92% | |
| Brazil–1.58% | | | | | | | | |
Petrobras Global Finance B.V., Sr. Unsec. Gtd. Global Notes, 5.75%, 02/01/2029 | | $ | 424,000 | | | | 393,260 | |
|
| Canada–1.21% | |
Toronto-Dominion Bank (The), Sr. Unsec. Medium-Term Global Notes, 3.15%, 09/17/2020 | | | 161,000 | | | | 160,801 | |
Enbridge Inc., Series 16-A, Unsec. Sub. Global Notes, 6.00%, 01/15/2077 | | | 150,000 | | | | 140,986 | |
| | | | | | | | 301,787 | |
| | | | | | | | |
| | | Principal Amount | | | Value | |
| Colombia–0.80% | |
Avianca Holdings S.A./ Avianca Leasing, LLC/ Grupo Taca Holdings Ltd., REGS, Sr. Unsec. Gtd. Euro Notes, 8.38%, 05/10/2020(b) | | $ | 200,000 | | | $ | 200,252 | |
|
| Finland–1.21% | |
Nordea Bank Abp, Sr. Unsec. Notes, 3.75%, 08/30/2023(b) | | | 307,000 | | | | 301,408 | |
|
| France–0.98% | |
BPCE S.A., Sr. Unsec. Notes, 4.00%, 09/12/2023(b) | | | 250,000 | | | | 245,503 | |
|
| Ireland–1.10% | |
AerCap Global Aviation Trust, Jr. Unsec. Gtd. Sub. Notes, 6.50%, 06/15/2045(b) | | | 267,000 | | | | 275,010 | |
|
| Lebanon–0.63% | |
Lebanon Government International Bond, REGS, Sr. Unsec. Euro Bonds, 7.25%, 03/23/2037(b) | | | 200,000 | | | | 156,902 | |
|
| Luxembourg–0.36% | |
Intelsat Jackson Holdings S.A., Sr. Unsec. Gtd. Global Bonds, 5.50%, 08/01/2023 | | | 100,000 | | | | 89,750 | |
|
| Mexico–1.60% | |
Petróleos Mexicanos, Sr. Unsec. Gtd. Notes, 6.50%, 01/23/2029(b) | | | 225,000 | | | | 215,381 | |
Unifin Financiera, S.A.B. de C.V., SOFOM, E.N.R., Unsec. Sub. Notes, 8.88%(b)(c) | | | 200,000 | | | | 184,102 | |
| | | | | | | | 399,483 | |
|
| Oman–0.81% | |
Oztel Holdings SPC Ltd., Sr. Sec. Gtd. Bonds, 6.63%, 04/24/2028(b) | | | 206,000 | | | | 202,483 | |
|
| South Africa–2.44% | |
Eskom Holdings SOC Ltd., Sr. Unsec. Gtd. Notes, 6.35%, 08/10/2028(b) | | | 200,000 | | | | 193,330 | |
Sasol Financing USA LLC, Sr. Unsec. Gtd. Global Notes, 6.50%, 09/27/2028 | | | 410,000 | | | | 415,734 | |
| | | | | | | | 609,064 | |
|
| Sweden–1.30% | |
Svensk Exportkredit AB, Sr. Unsec. Medium-Term Global Notes, 2.75%, 10/07/2020 | | | 325,000 | | | | 323,175 | |
|
| Switzerland–0.82% | |
Credit Suisse Group AG, Jr. Unsec. Sub. Bonds, 7.50%(b)(c) | | | 200,000 | | | | 204,000 | |
See accompanying Notes to Financial Statements which are an integral part of the financial statements.
12 Invesco World Bond Fund
| | | | | | | | |
| | | Principal Amount | | | Value | |
| Turkey–1.71% | |
Turkey Government International Bond, Sr. Unsec. Global Notes, 7.25%, 12/23/2023 | | $ | 430,000 | | | $ | 427,442 | |
|
| Ukraine–1.70% | |
Ukraine Government International Bond, Sr. Unsec. Notes, 9.75%, 11/01/2028(b) | | | 429,000 | | | | 424,399 | |
|
| United Kingdom–1.55% | |
HSBC Holdings PLC, Jr. Unsec. Sub. Global Bonds, 6.25%(c) | | | 200,000 | | | | 194,500 | |
Lloyds Banking Group PLC, Sr. Unsec. Global Notes, 4.55%, 08/16/2028 | | | 200,000 | | | | 193,473 | |
| | | | | | | | 387,973 | |
|
| United States–8.04% | |
AbbVie Inc., Sr. Unsec. Global Notes, 4.25%, 11/14/2028 | | | 88,000 | | | | 85,011 | |
Clear Channel Worldwide Holdings, Inc., Series B, Sr. Unsec. Gtd. Sub. Global Notes, 7.63%, 03/15/2020 | | | 100,000 | | | | 100,250 | |
CVS Health Corp., Sr. Unsec. Global Notes, 4.78%, 03/25/2038 | | | 214,000 | | | | 205,638 | |
Energy Transfer Partners, L.P., Series B, Jr. Unsec. Sub. Global Notes, 6.63%(c) | | | 281,000 | | | | 260,803 | |
Enterprise Products Operating LLC, Series D, Jr. Unsec. Gtd. Sub. Deb., 4.88%, 08/16/2077 | | | 150,000 | | | | 139,494 | |
Halfmoon Parent, Inc., Sr. Sec. Notes, 4.38%, 10/15/2028(b) | | | 161,000 | | | | 157,537 | |
L Brands, Inc., Sr. Unsec. Gtd. Global Notes, 5.63%, 02/15/2022 | | | 100,000 | | | | 101,875 | |
Mattel, Inc., Sr. Unsec. Global Notes, 5.45%, 11/01/2041 | | | 200,000 | | | | 161,000 | |
Morgan Stanley, Sr. Unsec. Floating Rate Notes, 3.65% (3 mo. USD LIBOR + 1.18%), 01/20/2022(d) | | | 150,000 | | | | 151,737 | |
Plains All American Pipeline, L.P., Series B, Jr. Unsec. Sub. Notes,
6.13%(c) | | | 355,000 | | | | 334,587 | |
| | | | | | | | |
| | | Principal Amount | | | Value | |
| United States–(continued) | |
Plastipak Holdings Inc., Sr. Unsec. Notes, 6.25%, 10/15/2025(b) | | $ | 120,000 | | | $ | 110,400 | |
Southern Co. (The), Series B, Jr. Unsec. Sub. Global Notes, 5.50%, 03/15/2057 | | | 197,000 | | | | 196,982 | |
| | | | | | | | 2,005,314 | |
|
| Zambia–1.08% | |
First Quantum Minerals Ltd., Sr. Unsec. Gtd. Notes, 7.50%, 04/01/2025(b) | | | 300,000 | | | | 268,875 | |
Total U.S. Dollar Denominated Bonds & Notes
(Cost $7,390,534) | | | | 7,216,080 | |
|
U.S. Treasury Securities–18.01% | |
2.00%, 11/15/2026 | | | 4,300,000 | | | | 3,962,551 | |
2.88%, 05/15/2028 | | | 543,000 | | | | 531,026 | |
Total U.S. Treasury Securities
(Cost $4,636,649) | | | | 4,493,577 | |
|
U.S. Government Sponsored Agency Mortgage-Backed Securities–0.33% | |
Freddie Mac Multifamily Securitization, Series K038, Class X1, IO, Variable Rate Pass Through Ctfs., 1.17%, 03/25/2024 (Cost $94,407)(e) | | | 1,620,832 | | | | 82,352 | |
| | |
| | | Shares | | | | |
Money Market Funds–1.13% | |
Invesco Government & Agency Portfolio–Institutional Class, 2.08%(f) | | | 81,363 | | | | 81,363 | |
Invesco Liquid Assets Portfolio–Institutional Class, 2.27%(f) | | | 106,504 | | | | 106,525 | |
Invesco Treasury Portfolio–Institutional Class, 2.09%(f) | | | 92,986 | | | | 92,986 | |
Total Money Market Funds
(Cost $280,860) | | | | 280,874 | |
TOTAL INVESTMENTS IN SECURITIES–94.10%
(Cost $24,717,012) | | | | 23,476,096 | |
OTHER ASSETS LESS LIABILITIES–5.90% | | | | 1,471,641 | |
NET ASSETS–100.00% | | | $ | 24,947,737 | |
Investment Abbreviations:
| | |
| AUD | | – Australian Dollar |
| CAD | | – Canadian Dollar |
| Ctfs. | | – Certificates |
| Deb. | | – Debentures |
| EUR | | – Euro |
| GBP | | – British Pound Sterling |
| Gtd. | | – Guaranteed |
| IDR | | – Indonesian Rupiah |
| INR | | – Indian Rupee |
| JPY | | – Japanese Yen |
| Jr. | | – Junior |
| | |
| LIBOR | | – London Interbank Offered Rate |
| MXN | | – Mexican Peso |
| Pfd. | | – Preferred |
| REGS | | – Regulation S |
| RUB | | – Russian Ruble |
| Sec. | | – Secured |
| Sr. | | – Senior |
| Sub. | | – Subordinated |
| Unsec. | | – Unsecured |
| USD | | – U.S. Dollar |
| ZAR | | – South African Rand |
See accompanying Notes to Financial Statements which are an integral part of the financial statements.
13 Invesco World Bond Fund
Notes to Schedule of Investments:
| (a) | Foreign denominated security. Principal amount is denominated in the currency indicated. |
| (b) | Security purchased or received in a transaction exempt from registration under the Securities Act of 1933, as amended (the “1933 Act”). The security may be resold pursuant to an exemption from registration under the 1933 Act, typically to qualified institutional buyers. The aggregate value of these securities at October 31, 2018 was $9,477,843, which represented 37.99% of the Fund’s Net Assets. |
| (c) | Perpetual bond with no specified maturity date. |
| (d) | Interest or dividend rate is redetermined periodically. Rate shown is the rate in effect on October 31, 2018. |
| (e) | Interest rate is redetermined periodically based on the cash flows generated by the pool of assets backing the security, less any applicable fees. The rate shown is the rate in effect on October 31, 2018. |
| (f) | The money market fund and the Fund are affiliated by having the same investment adviser. The rate shown is the 7-day SEC standardized yield as of October 31, 2018. |
| | | | | | | | | | | | | | | | | | | | |
| Open Futures Contracts | |
| Long Futures Contracts | | Number of
Contracts | | | Expiration Month | | | Notional Value | | | Value | | | Unrealized
Appreciation
(Depreciation) | |
Euro Bond | | | 7 | | | | December-2018 | | | $ | 1,270,630 | | | $ | 15,863 | | | $ | 15,863 | |
10 Year Mini Japanese Government Bonds | | | 1 | | | | December-2018 | | | | 1,334,958 | | | | 3,536 | | | | 3,536 | |
U.S. Treasury 10 Year Ultra Bonds | | | 25 | | | | December-2018 | | | | 3,127,734 | | | | 19,862 | | | | 19,862 | |
Subtotal — Long Futures Contracts | | | | | | | | | | | | | | | 39,261 | | | | 39,261 | |
| | | | | |
| | | | | | | | | | | | | | | | | | | | |
| Short Futures Contracts | | | | | | | | | | | | | | | |
Euro-OAT | | | 3 | | | | December-2018 | | | | (516,353 | ) | | | (152 | ) | | | (152 | ) |
U.S. Treasury 10 Year Notes | | | 9 | | | | December-2018 | | | | (1,065,938 | ) | | | 14,254 | | | | 14,254 | |
Subtotal — Short Futures Contracts | | | | | | | | | | | | | | | 14,102 | | | | 14,102 | |
Total Futures Contracts — Interest Rate Risk | | | $ | 53,363 | | | $ | 53,363 | |
| | | | | | | | | | | | | | | | | | | | | | |
| Open Forward Foreign Currency Contracts | |
Settlement
Date | | | | Contract to | | | Unrealized
Appreciation
(Depreciation) | |
| | Counterparty | | Deliver | | | Receive | |
12/20/2018 | | Citibank, N.A. | | | BRL | | | | 707,085 | | | | USD | | | | 190,000 | | | $ | 762 | |
12/20/2018 | | Citibank, N.A. | | | JPY | | | | 57,570,000 | | | | USD | | | | 515,079 | | | | 2,796 | |
12/20/2018 | | Citibank, N.A. | | | MXN | | | | 5,070,000 | | | | USD | | | | 265,606 | | | | 17,854 | |
12/20/2018 | | Citibank, N.A. | | | USD | | | | 355,342 | | | | ARS | | | | 15,500,000 | | | | 51,433 | |
12/20/2018 | | Goldman Sachs International | | | EUR | | | | 195,723 | | | | USD | | | | 229,700 | | | | 7,052 | |
12/20/2018 | | Goldman Sachs International | | | GBP | | | | 685,000 | | | | USD | | | | 900,306 | | | | 22,574 | |
12/20/2018 | | Goldman Sachs International | | | IDR | | | | 4,881,925,000 | | | | USD | | | | 319,707 | | | | 623 | |
12/20/2018 | | Goldman Sachs International | | | INR | | | | 15,150,000 | | | | USD | | | | 205,898 | | | | 2,191 | |
12/20/2018 | | Goldman Sachs International | | | MXN | | | | 5,075,000 | | | | USD | | | | 262,819 | | | | 14,823 | |
12/20/2018 | | Goldman Sachs International | | | NOK | | | | 903,969 | | | | USD | | | | 110,339 | | | | 2,863 | |
12/20/2018 | | Goldman Sachs International | | | USD | | | | 183,280 | | | | BRL | | | | 775,000 | | | | 24,134 | |
12/20/2018 | | Goldman Sachs International | | | USD | | | | 879,593 | | | | TRY | | | | 5,380,000 | | | | 55,065 | |
12/20/2018 | | Morgan Stanley Bank, N.A. | | | TRY | | | | 2,750,000 | | | | USD | | | | 479,737 | | | | 1,984 | |
12/20/2018 | | Morgan Stanley Bank, N.A. | | | USD | | | | 625,659 | | | | TRY | | | | 3,800,000 | | | | 34,509 | |
12/20/2018 | | State Street Bank & Trust Co. | | | EUR | | | | 571,234 | | | | GBP | | | | 510,000 | | | | 3,680 | |
02/12/2019 | | Morgan Stanley Bank, N.A. | | | TRY | | | | 2,750,000 | | | | USD | | | | 465,919 | | | | 3,279 | |
Subtotal — Appreciation | | | | 245,622 | |
12/20/2018 | | Citibank, N.A. | | | ARS | | | | 15,928,500 | | | | USD | | | | 370,000 | | | | (48,020 | ) |
12/20/2018 | | Citibank, N.A. | | | TRY | | | | 2,544,839 | | | | USD | | | | 390,000 | | | | (52,110 | ) |
12/20/2018 | | Citibank, N.A. | | | USD | | | | 182,512 | | | | IDR | | | | 2,755,025,000 | | | | (2,443 | ) |
12/20/2018 | | Goldman Sachs International | | | GBP | | | | 513,137 | | | | EUR | | | | 570,000 | | | | (9,104 | ) |
12/20/2018 | | Goldman Sachs International | | | JPY | | | | 43,042,341 | | | | EUR | | | | 335,000 | | | | (1,927 | ) |
12/20/2018 | | Goldman Sachs International | | | TRY | | | | 3,610,000 | | | | USD | | | | 618,284 | | | | (8,875 | ) |
12/20/2018 | | Goldman Sachs International | | | USD | | | | 28,711 | | | | AUD | | | | 40,000 | | | | (370 | ) |
12/20/2018 | | Goldman Sachs International | | | USD | | | | 92,284 | | | | CAD | | | | 120,000 | | | | (1,038 | ) |
12/20/2018 | | Goldman Sachs International | | | USD | | | | 177,558 | | | | CHF | | | | 170,000 | | | | (7,945 | ) |
See accompanying Notes to Financial Statements which are an integral part of the financial statements.
14 Invesco World Bond Fund
| | | | | | | | | | | | | | | | | | | | | | |
| Open Forward Foreign Currency Contracts—(continued) | |
Settlement
Date | | | | Contract to | | | Unrealized
Appreciation
(Depreciation) | |
| | Counterparty | | Deliver | | | Receive | |
12/20/2018 | | Goldman Sachs International | | | USD | | | | 345,001 | | | | EUR | | | | 300,000 | | | $ | (3,732 | ) |
12/20/2018 | | Goldman Sachs International | | | USD | | | | 9,630 | | | | HUF | | | | 2,670,000 | | | | (281 | ) |
12/20/2018 | | Goldman Sachs International | | | USD | | | | 4,815,250 | | | | JPY | | | | 535,846,320 | | | | (47,056 | ) |
12/20/2018 | | Goldman Sachs International | | | USD | | | | 347,488 | | | | KRW | | | | 391,000,000 | | | | (3,876 | ) |
12/20/2018 | | Goldman Sachs International | | | USD | | | | 340,141 | | | | MXN | | | | 6,510,000 | | | | (22,022 | ) |
12/20/2018 | | Goldman Sachs International | | | USD | | | | 107,376 | | | | SEK | | | | 957,819 | | | | (2,222 | ) |
12/20/2018 | | Goldman Sachs International | | | ZAR | | | | 18,262,588 | | | | USD | | | | 1,211,240 | | | | (19,354 | ) |
Subtotal — Depreciation | | | | (230,375 | ) |
Total Open Forward Foreign Currency Contracts — Currency Risk | | | $ | 15,247 | |
Currency Abbreviations:
| | |
| ARS | | – Argentine Peso |
| AUD | | – Australian Dollar |
| BRL | | – Brazilian Real |
| CAD | | – Canadian Dollar |
| CHF | | – Swiss Franc |
| EUR | | – Euro |
| GBP | | – British Pound Sterling |
| HUF | | – Hungarian Forint |
| IDR | | – Indonesian Rupiah |
| INR | | – Indian Rupee |
| JPY | | – Japanese Yen |
| KRW | | – South Korean Won |
| MXN | | – Mexican Peso |
| NOK | | – Norwegian Krone |
| SEK | | – Swedish Krona |
| TRY | | – Turkish Lira |
| USD | | – U.S. Dollar |
| ZAR | | – South African Rand |
See accompanying Notes to Financial Statements which are an integral part of the financial statements.
15 Invesco World Bond Fund
Statement of Assets and Liabilities
October 31, 2018
| | | | |
Assets: | | | | |
Investments in securities, at value (Cost $24,436,152) | | $ | 23,195,222 | |
Investments in affiliated money market funds, at value (Cost $280,860) | | | 280,874 | |
Other Investments: | | | | |
Variation margin receivable — futures contracts | | | 89,555 | |
Unrealized appreciation on forward foreign currency contracts outstanding | | | 245,622 | |
Cash | | | 4,352 | |
Foreign currencies, at value (Cost $1,608,687) | | | 1,585,112 | |
Receivable for: | | | | |
Dividends and interest | | | 328,555 | |
Fund shares sold | | | 12,033 | |
Investment for trustee deferred compensation and retirement plans | | | 37,806 | |
Other assets | | | 31,171 | |
Total assets | | | 25,810,302 | |
| |
Liabilities: | | | | |
Other investments: | | | | |
Unrealized depreciation on forward foreign currency contracts outstanding | | | 230,375 | |
Payable for: | | | | |
Investments purchased | | | 429,000 | |
Fund shares repurchased | | | 81,694 | |
Accrued fees to affiliates | | | 11,827 | |
Accrued trustees’ and officers’ fees and benefits | | | 1,680 | |
Accrued other operating expenses | | | 68,082 | |
Trustee deferred compensation and retirement plans | | | 39,907 | |
Total liabilities | | | 862,565 | |
Net assets applicable to shares outstanding | | $ | 24,947,737 | |
| |
Net assets consist of: | | | | |
Shares of beneficial interest | | $ | 27,351,030 | |
Distributable earnings | | | (2,403,293 | ) |
| | | $ | 24,947,737 | |
| | | | |
Net Assets: | | | | |
Class A | | $ | 18,347,399 | |
Class C | | $ | 3,591,036 | |
Class Y | | $ | 2,902,565 | |
Class R5 | | $ | 781 | |
Class R6 | | $ | 105,956 | |
|
Shares outstanding, no par value,
with an unlimited number of shares authorized: | |
Class A | | | 1,899,084 | |
Class C | | | 372,321 | |
Class Y | | | 300,683 | |
Class R5 | | | 81 | |
Class R6 | | | 10,965 | |
Class A: | | | | |
Net asset value per share | | $ | 9.66 | |
Maximum offering price per share | | | | |
(Net asset value of $9.66 ¸ 95.75%) | | $ | 10.09 | |
Class C: | | | | |
Net asset value and offering price per share | | $ | 9.64 | |
Class Y: | | | | |
Net asset value and offering price per share | | $ | 9.65 | |
Class R5: | | | | |
Net asset value and offering price per share | | $ | 9.64 | |
Class R6: | | | | |
Net asset value and offering price per share | | $ | 9.66 | |
See accompanying Notes to Financial Statements which are an integral part of the financial statements.
16 Invesco World Bond Fund
Statement of Operations
For the year ended October 31, 2018
| | | | |
Investment income: | | | | |
Interest (net of foreign withholding taxes of $5,676) | | $ | 1,211,823 | |
Dividends from affiliated money market funds | | | 21,908 | |
Total investment income | | | 1,233,731 | |
| |
Expenses: | | | | |
Advisory fees | | | 192,045 | |
Administrative services fees | | | 50,000 | |
Custodian fees | | | 30,325 | |
Distribution fees: | | | | |
Class A | | | 53,071 | |
Class B | | | 487 | |
Class C | | | 41,269 | |
Transfer agent fees — A, B, C and Y | | | 83,400 | |
Transfer agent fees — R6 | | | 43 | |
Trustees’ and officers’ fees and benefits | | | 20,584 | |
Registration and filing fees | | | 84,288 | |
Reports to shareholders | | | 25,220 | |
Professional services fees | | | 68,378 | |
Other | | | 25,937 | |
Total expenses | | | 675,047 | |
Less: Fees waived, expenses reimbursed and expense offset arrangement(s) | | | (378,057 | ) |
Net expenses | | | 296,990 | |
Net investment income | | | 936,741 | |
| |
Realized and unrealized gain (loss) from: | | | | |
Net realized gain (loss) from: | | | | |
Investment securities | | | 99,438 | |
Foreign currencies | | | (56,838 | ) |
Forward foreign currency contracts | | | (302,652 | ) |
Futures contracts | | | (42,676 | ) |
Option contracts written | | | 28,998 | |
Swap agreements | | | (196,179 | ) |
| | | | (469,909 | ) |
Change in net unrealized appreciation (depreciation) of: | | | | |
Investment securities | | | (2,206,477 | ) |
Foreign currencies | | | (13,864 | ) |
Forward foreign currency contracts | | | 193,151 | |
Futures contracts | | | 94,614 | |
Option contracts written | | | (563 | ) |
Swap agreements | | | 90,034 | |
| | | | (1,843,105 | ) |
Net realized and unrealized gain (loss) | | | (2,313,014 | ) |
Net increase (decrease) in net assets resulting from operations | | $ | (1,376,273 | ) |
See accompanying Notes to Financial Statements which are an integral part of the financial statements.
17 Invesco World Bond Fund
Statement of Changes in Net Assets
For the years ended October 31, 2018 and 2017
| | | | | | | | |
| | | 2018 | | | 2017 | |
Operations: | | | | | | | | |
Net investment income | | $ | 936,741 | | | $ | 1,120,225 | |
Net realized gain (loss) | | | (469,909 | ) | | | (1,845,787 | ) |
Change in net unrealized appreciation (depreciation) | | | (1,843,105 | ) | | | 1,159,852 | |
Net increase (decrease) in net assets resulting from operations | | | (1,376,273 | ) | | | 434,290 | |
| | |
Distributions to shareholders from distributable earnings(1): | | | | | | | | |
Class A | | | (438,683 | ) | | | (87,346 | ) |
Class B | | | (938 | ) | | | (1,299 | ) |
Class C | | | (54,593 | ) | | | (15,969 | ) |
Class Y | | | (92,519 | ) | | | (27,636 | ) |
Class R5 | | | (19 | ) | | | (3 | ) |
Class R6 | | | (1,936 | ) | | | (39 | ) |
Total distributions from distributable earnings | | | (588,688 | ) | | | (132,292 | ) |
| | |
Return of capital: | | | | | | | | |
Class A | | | (122,829 | ) | | | (536,224 | ) |
Class B | | | (4 | ) | | | (5,196 | ) |
Class C | | | (23,715 | ) | | | (63,221 | ) |
Class Y | | | (23,195 | ) | | | (188,272 | ) |
Class R5 | | | (5 | ) | | | (22 | ) |
Class R6 | | | (453 | ) | | | (272 | ) |
Total return of capital | | | (170,201 | ) | | | (793,207 | ) |
| | |
Share transactions–net: | | | | | | | | |
Class A | | | (2,234,131 | ) | | | (6,443,931 | ) |
Class B | | | (222,690 | ) | | | (243,332 | ) |
Class C | | | (240,689 | ) | | | (935,714 | ) |
Class Y | | | (2,643,691 | ) | | | (4,540,530 | ) |
Class R5 | | | — | | | | 9 | |
Class R6 | | | 101,408 | | | | — | |
Net increase (decrease) in net assets resulting from share transactions | | | (5,239,793 | ) | | | (12,163,498 | ) |
Net increase (decrease) in net assets | | | (7,374,955 | ) | | | (12,654,707 | ) |
| | |
Net assets: | | | | | | | | |
Beginning of year | | | 32,322,692 | | | | 44,977,399 | |
End of year | | $ | 24,947,737 | | | $ | 32,322,692 | |
| (1) | The Securities and Exchange Commission eliminated the requirement to disclose distribution components separately, except for tax return of capital. For the year ended October 31, 2017, distributions to shareholders from distributable earnings consisted of distributions from net investment income. |
Notes to Financial Statements
October 31, 2018
NOTE 1—Significant Accounting Policies
Invesco World Bond Fund (the “Fund”) is a series portfolio of AIM Investment Funds (Invesco Investment Funds) (the “Trust”). The Trust is organized as a Delaware statutory trust and is registered under the Investment Company Act of 1940, as amended (the “1940 Act”), as an open-end series management investment company authorized to issue an unlimited number of shares of beneficial interest. Information presented in these financial statements pertains only to the Fund. Matters affecting the Fund or each class will be voted on exclusively by the shareholders of the Fund or each class.
The Fund’s investment objective is total return, comprised of current income and capital appreciation.
The Fund currently consists of five different classes of shares: Class A, Class C, Class Y, Class R5 and Class R6. Class Y shares are available only to certain investors. Class A shares are sold with a front-end sales charge unless certain waiver criteria are met. Under certain circumstances, load waived shares may be subject to contingent deferred sales charges (“CDSC”). Class C shares are sold with a CDSC. Class Y, Class R5 and
18 Invesco World Bond Fund
Class R6 shares are sold at net asset value. Effective November 30, 2010, new or additional investments in Class B shares are no longer permitted. Existing shareholders of Class B shares were permitted to continue to reinvest dividends and capital gains distributions in Class B shares until their conversion to Class A shares. Also, shareholders in Class B shares were able to exchange those shares for Class B shares of other Invesco Funds offering such shares until they converted to Class A shares. Generally, Class B shares automatically converted to Class A shares on or about the month-end, which was at least eight years after the date of purchase. Redemptions of Class B shares prior to the conversion date were subject to a CDSC. Effective January 26, 2018, all of the Fund’s outstanding Class B shares were converted to Class A shares, in advance of their normally scheduled conversion. No CDSC was paid in connection with this early conversion.
The Fund is an investment company and accordingly follows the investment company accounting and reporting guidance in accordance with Financial Accounting Standards Board Accounting Standards Codification Topic 946, Financial Services — Investment Companies.
The following is a summary of the significant accounting policies followed by the Fund in the preparation of its financial statements.
| A. | Security Valuations — Securities, including restricted securities, are valued according to the following policy. |
Debt obligations (including convertible securities) and unlisted equities are fair valued using an evaluated quote provided by an independent pricing service. Evaluated quotes provided by the pricing service may be determined without exclusive reliance on quoted prices, and may reflect appropriate factors such as institution-size trading in similar groups of securities, developments related to specific securities, dividend rate (for unlisted equities), yield (for debt obligations), quality, type of issue, coupon rate (for debt obligations), maturity (for debt obligations), individual trading characteristics and other market data. Pricing services generally value debt obligations assuming orderly transactions of institutional round lot size, but a fund may hold or transact in the same securities in smaller, odd lot sizes. Odd lots often trade at lower prices than institutional round lots. Debt obligations are subject to interest rate and credit risks. In addition, all debt obligations involve some risk of default with respect to interest and/or principal payments.
A security listed or traded on an exchange (except convertible securities) is valued at its last sales price or official closing price as of the close of the customary trading session on the exchange where the security is principally traded, or lacking any sales or official closing price on a particular day, the security may be valued at the closing bid price on that day. Securities traded in the over-the-counter market are valued based on prices furnished by independent pricing services or market makers. When such securities are valued by an independent pricing service they may be considered fair valued. Futures contracts are valued at the final settlement price set by an exchange on which they are principally traded. Listed options are valued at the mean between the last bid and asked prices from the exchange on which they are principally traded. Options not listed on an exchange are valued by an independent source at the mean between the last bid and asked prices. For purposes of determining net asset value (“NAV”) per share, futures and option contracts generally are valued 15 minutes after the close of the customary trading session of the New York Stock Exchange (“NYSE”).
Investments in open-end and closed-end registered investment companies that do not trade on an exchange are valued at the end-of-day net asset value per share. Investments in open-end and closed-end registered investment companies that trade on an exchange are valued at the last sales price or official closing price as of the close of the customary trading session on the exchange where the security is principally traded.
Swap agreements are fair valued using an evaluated quote, if available, provided by an independent pricing service. Evaluated quotes provided by the pricing service are valued based on a model which may include end-of-day net present values, spreads, ratings, industry, company performance and returns of referenced assets. Centrally cleared swap agreements are valued at the daily settlement price determined by the relevant exchange or clearinghouse.
Foreign securities’ (including foreign exchange contracts) prices are converted into U.S. dollar amounts using the applicable exchange rates as of the close of the NYSE. If market quotations are available and reliable for foreign exchange-traded equity securities, the securities will be valued at the market quotations. Because trading hours for certain foreign securities end before the close of the NYSE, closing market quotations may become unreliable. If between the time trading ends on a particular security and the close of the customary trading session on the NYSE, events occur that the investment adviser determines are significant and make the closing price unreliable, the Fund may fair value the security. If the event is likely to have affected the closing price of the security, the security will be valued at fair value in good faith using procedures approved by the Board of Trustees. Adjustments to closing prices to reflect fair value may also be based on a screening process of an independent pricing service to indicate the degree of certainty, based on historical data, that the closing price in the principal market where a foreign security trades is not the current value as of the close of the NYSE. Foreign securities’ prices meeting the approved degree of certainty that the price is not reflective of current value will be priced at the indication of fair value from the independent pricing service. Multiple factors may be considered by the independent pricing service in determining adjustments to reflect fair value and may include information relating to sector indices, American Depositary Receipts and domestic and foreign index futures. Foreign securities may have additional risks including exchange rate changes, potential for sharply devalued currencies and high inflation, political and economic upheaval, the relative lack of issuer information, relatively low market liquidity and the potential lack of strict financial and accounting controls and standards.
Securities for which market prices are not provided by any of the above methods may be valued based upon quotes furnished by independent sources. The last bid price may be used to value equity securities. The mean between the last bid and asked prices is used to value debt obligations, including corporate loans.
Securities for which market quotations are not readily available or became unreliable are valued at fair value as determined in good faith by or under the supervision of the Trust’s officers following procedures approved by the Board of Trustees. Issuer specific events, market trends, bid/asked quotes of brokers and information providers and other market data may be reviewed in the course of making a good faith determination of a security’s fair value.
The Fund may invest in securities that are subject to interest rate risk, meaning the risk that the prices will generally fall as interest rates rise and, conversely, the prices will generally rise as interest rates fall. Specific securities differ in their sensitivity to changes in interest rates depending on their individual characteristics. Changes in interest rates may result in increased market volatility, which may affect the value and/or liquidity of certain Fund investments.
Valuations change in response to many factors including the historical and prospective earnings of the issuer, the value of the issuer’s assets, general economic conditions, interest rates, investor perceptions and market liquidity. Because of the inherent uncertainties of valuation, the values reflected in the financial statements may materially differ from the value received upon actual sale of those investments.
19 Invesco World Bond Fund
| B. | Securities Transactions and Investment Income — Securities transactions are accounted for on a trade date basis. Realized gains or losses on sales are computed on the basis of specific identification of the securities sold. Interest income (net of withholding tax, if any) is recorded on the accrual basis from settlement date. Bond premiums and discounts are amortized and/or accreted over the lives of the respective securities. Pay-in-kind interest income and non-cash dividend income received in the form of securities in-lieu of cash are recorded at the fair value of the securities received. Dividend income (net of withholding tax, if any) is recorded on the ex-dividend date. |
The Fund may periodically participate in litigation related to Fund investments. As such, the Fund may receive proceeds from litigation settlements. Any proceeds received are included in the Statement of Operations as realized gain (loss) for investments no longer held and as unrealized gain (loss) for investments still held.
Brokerage commissions and mark ups are considered transaction costs and are recorded as an increase to the cost basis of securities purchased and/or a reduction of proceeds on a sale of securities. Such transaction costs are included in the determination of net realized and unrealized gain (loss) from investment securities reported in the Statement of Operations and the Statement of Changes in Net Assets and the net realized and unrealized gains (losses) on securities per share in the Financial Highlights. Transaction costs are included in the calculation of the Fund’s net asset value and, accordingly, they reduce the Fund’s total returns. These transaction costs are not considered operating expenses and are not reflected in net investment income reported in the Statement of Operations and the Statement of Changes in Net Assets, or the net investment income per share and the ratios of expenses and net investment income reported in the Financial Highlights, nor are they limited by any expense limitation arrangements between the Fund and the investment adviser.
The Fund allocates income and realized and unrealized capital gains and losses to a class based on the relative net assets of each class.
| C. | Country Determination — For the purposes of making investment selection decisions and presentation in the Schedule of Investments, the investment adviser may determine the country in which an issuer is located and/or credit risk exposure based on various factors. These factors include the laws of the country under which the issuer is organized, where the issuer maintains a principal office, the country in which the issuer derives 50% or more of its total revenues and the country that has the primary market for the issuer’s securities, as well as other criteria. Among the other criteria that may be evaluated for making this determination are the country in which the issuer maintains 50% or more of its assets, the type of security, financial guarantees and enhancements, the nature of the collateral and the sponsor organization. Country of issuer and/or credit risk exposure has been determined to be the United States of America, unless otherwise noted. |
| D. | Distributions — Distributions from net investment income, if any, are declared and paid monthly. Distributions from net realized capital gain, if any, are generally declared and paid annually and recorded on the ex-dividend date. The Fund may elect to treat a portion of the proceeds from redemptions as distributions for federal income tax purposes. |
| E. | Federal Income Taxes — The Fund intends to comply with the requirements of Subchapter M of the Internal Revenue Code of 1986, as amended (the “Internal Revenue Code”), necessary to qualify as a regulated investment company and to distribute substantially all of the Fund’s taxable earnings to shareholders. As such, the Fund will not be subject to federal income taxes on otherwise taxable income (including net realized capital gain) that is distributed to shareholders. Therefore, no provision for federal income taxes is recorded in the financial statements. |
The Fund recognizes the tax benefits of uncertain tax positions only when the position is more likely than not to be sustained. Management has analyzed the Fund’s uncertain tax positions and concluded that no liability for unrecognized tax benefits should be recorded related to uncertain tax positions. Management is not aware of any tax positions for which it is reasonably possible that the total amounts of unrecognized tax benefits will change materially in the next 12 months.
The Fund files tax returns in the U.S. Federal jurisdiction and certain other jurisdictions. Generally, the Fund is subject to examinations by such taxing authorities for up to three years after the filing of the return for the tax period.
| F. | Expenses — Fees provided for under the Rule 12b-1 plan of a particular class of the Fund are charged to the operations of such class. Transfer agency fees and expenses and other shareholder recordkeeping fees and expenses attributable to Class R5 and Class R6 are allocated to each share class based on relative net assets. Sub-accounting fees attributable to Class R5 are charged to the operations of the class. Transfer agency fees and expenses and other shareholder recordkeeping fees and expenses relating to all other classes are allocated among those classes based on relative net assets. All other expenses are allocated among the classes based on relative net assets. |
| G. | Accounting Estimates — The preparation of financial statements in conformity with accounting principles generally accepted in the United States of America (“GAAP”) requires management to make estimates and assumptions that affect the reported amounts of assets and liabilities at the date of the financial statements and the reported amounts of revenues and expenses during the reporting period including estimates and assumptions related to taxation. Actual results could differ from those estimates by a significant amount. In addition, the Fund monitors for material events or transactions that may occur or become known after the period-end date and before the date the financial statements are released to print. |
| H. | Indemnifications — Under the Trust’s organizational documents, each Trustee, officer, employee or other agent of the Trust is indemnified against certain liabilities that may arise out of the performance of their duties to the Fund. Additionally, in the normal course of business, the Fund enters into contracts, including the Fund’s servicing agreements, that contain a variety of indemnification clauses. The Fund’s maximum exposure under these arrangements is unknown as this would involve future claims that may be made against the Fund that have not yet occurred. The risk of material loss as a result of such indemnification claims is considered remote. |
| I. | Treasury Inflation-Protected Securities — The Fund may invest in Treasury Inflation-Protected Securities (“TIPS”). TIPS are fixed income securities whose principal value is periodically adjusted to the rate of inflation. The principal value of TIPS will be adjusted upward or downward, and any increase or decrease in the principal amount of TIPS will be shown as Treasury Inflation — Protected Securities inflation adjustments in the Statement of Operations, even though investors do not receive their principal until maturity. |
| J. | Foreign Currency Translations — Foreign currency is valued at the close of the NYSE based on quotations posted by banks and major currency dealers. Portfolio securities and other assets and liabilities denominated in foreign currencies are translated into U.S. dollar amounts at the date of valuation. Purchases and sales of portfolio securities (net of foreign taxes withheld on disposition) and income items denominated in foreign currencies are translated into U.S. dollar amounts on the respective dates of such transactions. The Fund does not separately account for the portion of the results of operations resulting from changes in foreign exchange rates on investments and the fluctuations arising from changes in market prices of securities held. The combined results of changes in foreign exchange rates and the fluctuation of market prices on investments (net of estimated foreign tax withholding) are included with the net realized and unrealized gain or loss from investments in the |
20 Invesco World Bond Fund
| | Statement of Operations. Reported net realized foreign currency gains or losses arise from (1) sales of foreign currencies, (2) currency gains or losses realized between the trade and settlement dates on securities transactions, and (3) the difference between the amounts of dividends, interest, and foreign withholding taxes recorded on the Fund’s books and the U.S. dollar equivalent of the amounts actually received or paid. Net unrealized foreign currency gains and losses arise from changes in the fair values of assets and liabilities, other than investments in securities at fiscal period end, resulting from changes in exchange rates. |
The Fund may invest in foreign securities, which may be subject to foreign taxes on income, gains on investments or currency repatriation, a portion of which may be recoverable. Foreign taxes, if any, are recorded based on the tax regulations and rates that exist in the foreign markets in which the Fund invests and are shown in the Statement of Operations.
| K. | Forward Foreign Currency Contracts — The Fund may engage in foreign currency transactions either on a spot (i.e. for prompt delivery and settlement) basis, or through forward foreign currency contracts, to manage or minimize currency or exchange rate risk. |
The Fund may also enter into forward foreign currency contracts for the purchase or sale of a security denominated in a foreign currency in order to “lock in” the U.S. dollar price of that security, or the Fund may also enter into forward foreign currency contracts that do not provide for physical settlement of the two currencies, but instead are settled by a single cash payment calculated as the difference between the agreed upon exchange rate and the spot rate at settlement based upon an agreed upon notional amount (non-deliverable forwards). The Fund will set aside liquid assets in an amount equal to the daily mark-to-market obligation for forward foreign currency contracts.
A forward foreign currency contract is an obligation between two parties (“Counterparties”) to purchase or sell a specific currency for an agreed-upon price at a future date. The use of forward foreign currency contracts does not eliminate fluctuations in the price of the underlying securities the Fund owns or intends to acquire but establishes a rate of exchange in advance. Fluctuations in the value of these contracts are measured by the difference in the contract date and reporting date exchange rates and are recorded as unrealized appreciation (depreciation) until the contracts are closed. When the contracts are closed, realized gains (losses) are recorded. Realized and unrealized gains (losses) on the contracts are included in the Statement of Operations. The primary risks associated with forward foreign currency contracts include failure of the Counterparty to meet the terms of the contract and the value of the foreign currency changing unfavorably. These risks may be in excess of the amounts reflected in the Statement of Assets and Liabilities.
| L. | Futures Contracts — The Fund may enter into futures contracts to manage exposure to interest rate, equity and market price movements and/or currency risks. A futures contract is an agreement between Counterparties to purchase or sell a specified underlying security, currency or commodity (or delivery of a cash settlement price, in the case of an index future) for a fixed price at a future date. The Fund currently invests only in exchange-traded futures and they are standardized as to maturity date and underlying financial instrument. Initial margin deposits required upon entering into futures contracts are satisfied by the segregation of specific securities or cash as collateral at the futures commission merchant (broker). During the period the futures contracts are open, changes in the value of the contracts are recognized as unrealized gains or losses by recalculating the value of the contracts on a daily basis. Subsequent or variation margin payments are received or made depending upon whether unrealized gains or losses are incurred. These amounts are reflected as receivables or payables on the Statement of Assets and Liabilities. When the contracts are closed or expire, the Fund recognizes a realized gain or loss equal to the difference between the proceeds from, or cost of, the closing transaction and the Fund’s basis in the contract. The net realized gain (loss) and the change in unrealized gain (loss) on futures contracts held during the period is included on the Statement of Operations. The primary risks associated with futures contracts are market risk and the absence of a liquid secondary market. If the Fund were unable to liquidate a futures contract and/or enter into an offsetting closing transaction, the Fund would continue to be subject to market risk with respect to the value of the contracts and continue to be required to maintain the margin deposits on the futures contracts. Futures contracts have minimal Counterparty risk since the exchange’s clearinghouse, as Counterparty to all exchange-traded futures, guarantees the futures against default. Risks may exceed amounts recognized in the Statement of Assets and Liabilities. |
| M. | Call Options Purchased and Written — The Fund may write call options and/or buy call options. A covered call option gives the purchaser of such option the right to buy, and the writer the obligation to sell, the underlying security or foreign currency at the stated exercise price during the option period. An uncovered call option exists without the ownership of the underlying security. Options written by the Fund normally will have expiration dates between three and nine months from the date written. The exercise price of a call option may be below, equal to, or above the current market value of the underlying security at the time the option is written. |
Additionally, the Fund may enter into an option on a swap agreement, also called a “swaption”. A swaption is an option that gives the buyer the right, but not the obligation, to enter into a swap on a future date in exchange for paying a market-based premium. A receiver swaption gives the owner the right to receive the total return of a specified asset, reference rate or index. Swaptions also include options that allow an existing swap to be terminated or extended by one of the Counterparties.
When the Fund writes a covered call option, an amount equal to the premium received by the Fund is recorded as an asset and an equivalent liability in the Statement of Assets and Liabilities. The amount of the liability is subsequently “marked-to-market” to reflect the current market value of the option written. If a written covered call option expires on the stipulated expiration date, or if the Fund enters into a closing purchase transaction, the Fund realizes a gain (or a loss if the closing purchase transaction exceeds the premium received when the option was written) without regard to any unrealized gain or loss on the underlying security, and the liability related to such option is extinguished. If a written covered call option is exercised, the Fund realizes a gain or a loss from the sale of the underlying security and the proceeds of the sale are increased by the premium originally received. Realized and unrealized gains and losses on call options written are included in the Statement of Operations as Net realized gain (loss) from and Change in net unrealized appreciation (depreciation) of Option contracts written. A risk in writing a covered call option is that the Fund gives up the opportunity for profit if the market price of the security increases and the option is exercised. The risk in writing an uncovered call option is that the Fund may incur significant losses if the value of the written security exceeds the exercise price of the option.
When the Fund buys a call option, an amount equal to the premium paid by the Fund is recorded as an investment on the Statement of Assets and Liabilities. The amount of the investment is subsequently “marked-to-market” to reflect the current value of the option purchased. Realized and unrealized gains and losses on call options purchased are included in the Statement of Operations as Net realized gain (loss) from and Change in net unrealized appreciation (depreciation) of Investment securities. A risk in buying an option is that the Fund pays a premium whether or not the option is exercised. In addition, there can be no assurance that a liquid secondary market will exist for any option purchased.
21 Invesco World Bond Fund
| N. | Put Options Purchased and Written — The Fund may purchase and write put options including options on securities indexes, or foreign currency and/or futures contracts. By purchasing a put option, the Fund obtains the right (but not the obligation) to sell the option’s underlying instrument at a fixed strike price. In return for this right, the Fund pays an option premium. The option’s underlying instrument may be a security, securities index, or a futures contract. |
Additionally, the Fund may enter into an option on a swap agreement, also called a “swaption”. A swaption is an option that gives the buyer the right, but not the obligation, to enter into a swap on a future date in exchange for paying a market-based premium. A receiver swaption gives the owner the right to receive the total return of a specified asset, reference rate or index. Swaptions also include options that allow an existing swap to be terminated or extended by one of the Counterparties.
Put options may be used by the Fund to hedge securities it owns by locking in a minimum price at which the Fund can sell. If security prices fall, the put option could be exercised to offset all or a portion of the Fund’s resulting losses. At the same time, because the maximum the Fund has at risk is the cost of the option, purchasing put options does not eliminate the potential for the Fund to profit from an increase in the value of the underlying portfolio securities. The Fund may write put options to earn additional income in the form of option premiums if it expects the price of the underlying instrument to remain stable or rise during the option period so that the option will not be exercised. The risk in this strategy is that the price of the underlying securities may decline by an amount greater than the premium received. Put options written are reported as a liability in the Statement of Assets and Liabilities. Realized and unrealized gains and losses on put options purchased and put options written are included in the Statement of Operations as Net realized gain (loss) from and Change in net unrealized appreciation (depreciation) of Investment securities and Option contracts written, respectively. A risk in buying an option is that the Fund pays a premium whether or not the option is exercised. In addition, there can be no assurance that a liquid secondary market will exist for any option purchased.
| O. | Swap Agreements — The Fund may enter into various swap transactions, including interest rate, total return, index, currency and credit default swap contracts (“CDS”) for investment purposes or to manage interest rate, currency or credit risk. Such transactions are agreements between Counterparties. A swap agreement may be negotiated bilaterally and traded over-the-counter (“OTC”) between two parties (“uncleared/OTC”) or, in some instances, must be transacted through a future commission merchant (“FCM”) and cleared through a clearinghouse that serves as a central Counterparty (“centrally cleared swap”). These agreements may contain among other conditions, events of default and termination events, and various covenants and representations such as provisions that require the Fund to maintain a pre-determined level of net assets, and/or provide limits regarding the decline of the Fund’s NAV over specific periods of time. If the Fund were to trigger such provisions and have open derivative positions at that time, the Counterparty may be able to terminate such agreement and request immediate payment in an amount equal to the net liability positions, if any. |
Interest rate, total return, index, and currency swap agreements are two-party contracts entered into primarily to exchange the returns (or differentials in rates of returns) earned or realized on particular predetermined investments or instruments. The gross returns to be exchanged or “swapped” between the parties are calculated with respect to a notional amount, i.e., the return on or increase in value of a particular dollar amount invested at a particular interest rate or return of an underlying asset, in a particular foreign currency, or in a “basket” of securities representing a particular index.
In a centrally cleared swap, the Fund’s ultimate Counterparty is a central clearinghouse. The Fund initially will enter into centrally cleared swaps through an executing broker. When a fund enters into a centrally cleared swap, it must deliver to the central Counterparty (via the FCM) an amount referred to as “initial margin.” Initial margin requirements are determined by the central Counterparty, but an FCM may require additional initial margin above the amount required by the central Counterparty. Initial margin deposits required upon entering into centrally cleared swaps are satisfied by cash or securities as collateral at the FCM. Securities deposited as initial margin are designated on the Schedule of Investments and cash deposited is recorded on the Statement of Assets and Liabilities. During the term of a cleared swap agreement, a “variation margin” amount may be required to be paid by the Fund or may be received by the Fund, based on the daily change in price of the underlying reference instrument subject to the swap agreement and is recorded as a receivable or payable for variation margin in the Statement of Assets and Liabilities until the centrally cleared swap is terminated at which time a realized gain or loss is recorded.
A CDS is an agreement between Counterparties to exchange the credit risk of an issuer. A buyer of a CDS is said to buy protection by paying a fixed payment over the life of the agreement and in some situations an upfront payment to the seller of the CDS. If a defined credit event occurs (such as payment default or bankruptcy), the Fund as a protection buyer would cease paying its fixed payment, the Fund would deliver eligible bonds issued by the reference entity to the seller, and the seller would pay the full notional value, or the “par value”, of the referenced obligation to the Fund. A seller of a CDS is said to sell protection and thus would receive a fixed payment over the life of the agreement and an upfront payment, if applicable. If a credit event occurs, the Fund as a protection seller would cease to receive the fixed payment stream, the Fund would pay the buyer “par value” or the full notional value of the referenced obligation, and the Fund would receive the eligible bonds issued by the reference entity. In turn, these bonds may be sold in order to realize a recovery value. Alternatively, the seller of the CDS and its Counterparty may agree to net the notional amount and the market value of the bonds and make a cash payment equal to the difference to the buyer of protection. If no credit event occurs, the Fund receives the fixed payment over the life of the agreement. As the seller, the Fund would effectively add leverage to its portfolio because, in addition to its total net assets, the Fund would be subject to investment exposure on the notional amount of the CDS. In connection with these agreements, cash and securities may be identified as collateral in accordance with the terms of the respective swap agreements to provide assets of value and recourse in the event of default under the swap agreement or bankruptcy/insolvency of a party to the swap agreement. If a Counterparty becomes bankrupt or otherwise fails to perform its obligations due to financial difficulties, the Fund may experience significant delays in obtaining any recovery in a bankruptcy or other reorganization proceeding. The Fund may obtain only limited recovery or may obtain no recovery in such circumstances. The Fund’s maximum risk of loss from Counterparty risk, either as the protection seller or as the protection buyer, is the value of the contract. The risk may be mitigated by having a master netting arrangement between the Fund and the Counterparty and by the designation of collateral by the Counterparty to cover the Fund’s exposure to the Counterparty.
Implied credit spreads represent the current level at which protection could be bought or sold given the terms of the existing CDS contract and serve as an indicator of the current status of the payment/performance risk of the CDS. An implied spread that has widened or increased since entry into the initial contract may indicate a deteriorating credit profile and increased risk of default for the reference entity. A declining or
22 Invesco World Bond Fund
narrowing spread may indicate an improving credit profile or decreased risk of default for the reference entity. Alternatively, credit spreads may increase or decrease reflecting the general tolerance for risk in the credit markets.
An interest rate swap is an agreement between Counterparties pursuant to which the parties exchange a floating rate payment for a fixed rate payment based on a specified notional amount.
Changes in the value of centrally cleared and OTC swap agreements are recognized as unrealized gains (losses) in the Statement of Operations by “marking to market” on a daily basis to reflect the value of the swap agreement at the end of each trading day. Payments received or paid at the beginning of the agreement are reflected as such on the Statement of Assets and Liabilities and may be referred to as upfront payments. The Fund accrues for the fixed payment stream and amortizes upfront payments, if any, on swap agreements on a daily basis with the net amount, recorded as a component of realized gain (loss) on the Statement of Operations. A liquidation payment received or made at the termination of a swap agreement is recorded as realized gain (loss) on the Statement of Operations. The Fund segregates cash or liquid securities having a value at least equal to the amount of the potential obligation of a Fund under any swap transaction. Cash held as collateral is recorded as deposits with brokers on the Statement of Assets and Liabilities. Entering into these agreements involves, to varying degrees, lack of liquidity and elements of credit, market, and Counterparty risk in excess of amounts recognized on the Statement of Assets and Liabilities. Such risks involve the possibility that a swap is difficult to sell or liquidate; the Counterparty does not honor its obligations under the agreement and unfavorable interest rates and market fluctuations. It is possible that developments in the swaps market, including potential government regulation, could adversely affect the Fund’s ability to terminate existing swap agreements or to realize amounts to be received under such agreements. A short position in a security poses more risk than holding the same security long. As there is no limit on how much the price of the security can increase, the Fund’s exposure is unlimited.
Notional amounts of each individual credit default swap agreement outstanding as of October 31, 2018 for which the Fund is the seller of protection are disclosed in the open swap agreements table. These potential amounts would be partially offset by any recovery values of the respective referenced obligations, upfront payments received upon entering into the agreement, or net amounts received from the settlement of buy protection credit default swap agreements entered into by the Fund for the same referenced entity or entities.
| P. | Leverage Risk — Leverage exists when the Fund can lose more than it originally invests because it purchases or sells an instrument or enters into a transaction without investing an amount equal to the full economic exposure of the instrument or transaction. |
| Q. | Collateral — To the extent the Fund has designated or segregated a security as collateral and that security is subsequently sold, it is the Fund’s practice to replace such collateral no later than the next business day. |
NOTE 2—Advisory Fees and Other Fees Paid to Affiliates
The Trust has entered into a master investment advisory agreement with Invesco Advisers, Inc. (the “Adviser” or “Invesco”). Under the terms of the investment advisory agreement, the Fund accrues daily and pays monthly an advisory fee to the Adviser based on the annual rate of the Fund’s average daily net assets as follows:
| | | | | | | | |
| Average Daily Net Assets | | Rate | |
First $250 million | | | 0 | .65% | | | | |
Next $250 million | | | 0 | .59% | | | | |
Next $500 million | | | 0 | .565% | | | | |
Next $1.5 billion | | | 0 | .54% | | | | |
Next $2.5 billion | | | 0 | .515% | | | | |
Next $5 billion | | | 0 | .49% | | | | |
Over $10 billion | | | 0 | .465% | | | | |
For the year ended October 31, 2018, the effective advisory fees incurred by the Fund was 0.65%.
Under the terms of a master sub-advisory agreement between the Adviser and each of Invesco Asset Management Deutschland GmbH, Invesco Asset Management Limited, Invesco Asset Management (Japan) Limited, Invesco Hong Kong Limited, Invesco Senior Secured Management, Inc. and Invesco Canada Ltd. (collectively, the “Affiliated Sub-Advisers”) the Adviser, not the Fund, will pay 40% of the fees paid to the Adviser to any such Affiliated Sub-Adviser(s) that provide(s) discretionary investment management services to the Fund based on the percentage of assets allocated to such Affiliated Sub-Adviser(s).
The Adviser has contractually agreed, through at least February 29, 2020, to waive advisory fees and/or reimburse expenses to the extent necessary to limit total annual fund operating expenses after fee waiver and/or expense reimbursement (excluding certain items discussed below) of Class A, Class C, Class Y, Class R5 and Class R6 shares to 0.94%, 1.69%, 0.69%, 0.69% and 0.69%, respectively, of the Fund’s average daily net assets (the “expense limits”). Prior to their conversion to Class A shares, the expense limit for Class B was 1.69% of average daily net assets. In determining the Adviser’s obligation to waive advisory fees and/or reimburse expenses, the following expenses are not taken into account, and could cause total annual fund operating expenses after fee waiver and/or expense reimbursement to exceed the numbers reflected above: (1) interest; (2) taxes; (3) dividend expense on short sales; (4) extraordinary or non-routine items, including litigation expenses; and (5) expenses that the Fund has incurred but did not actually pay because of an expense offset arrangement. Unless Invesco continues the fee waiver agreement, it will terminate on February 29, 2020. During its term, the fee waiver agreement cannot be terminated or amended to increase the expense limits or reduce the advisory fee waiver without approval of the Board of Trustees.
Further, the Adviser has contractually agreed, through at least June 30, 2020, to waive the advisory fee payable by the Fund in an amount equal to 100% of the net advisory fees the Adviser receives from the affiliated money market funds on investments by the Fund of uninvested cash in such affiliated money market funds.
For the year ended October 31, 2018, the Adviser waived advisory fees and reimbursed fund level expenses of $294,613 and reimbursed class level expenses of $59,108, $136, $11,491, $11,311 and $44 of Class A, Class B, Class C, Class Y and Class R6 shares, respectively.
23 Invesco World Bond Fund
The Trust has entered into a master administrative services agreement with Invesco pursuant to which the Fund has agreed to pay Invesco for certain administrative costs incurred in providing accounting services to the Fund. For the year ended October 31, 2018, expenses incurred under the agreement are shown in the Statement of Operations as Administrative services fees.
The Trust has entered into a transfer agency and service agreement with Invesco Investment Services, Inc. (“IIS”) pursuant to which the Fund has agreed to pay IIS a fee for providing transfer agency and shareholder services to the Fund and reimburse IIS for certain expenses incurred by IIS in the course of providing such services. IIS may make payments to intermediaries that provide omnibus account services, sub-accounting services and/or networking services. All fees payable by IIS to intermediaries that provide omnibus account services or sub-accounting services are charged back to the Fund, subject to certain limitations approved by the Trust’s Board of Trustees. For the year ended October 31, 2018, expenses incurred under the agreement are shown in the Statement of Operations as Transfer agent fees.
The Trust has entered into master distribution agreements with Invesco Distributors, Inc. (“IDI”) to serve as the distributor for the Class A, Class C, Class Y, Class R5 and Class R6 shares of the Fund. The Trust has adopted plans pursuant to Rule 12b-1 under the 1940 Act with respect to the Fund’s Class A and Class C shares (collectively, the “Plans”). The Fund, pursuant to the Plans, pays IDI compensation at the annual rate of 0.25% of the Fund’s average daily net assets of Class A shares and 1.00% of the average daily net assets of Class C shares. Prior to their conversion to Class A shares, the Fund paid an annual rate of 1.00% of the average daily net assets of Class B shares. The fees are accrued daily and paid monthly. Of the Plan payments, up to 0.25% of the average daily net assets of each class of shares may be paid to furnish continuing personal shareholder services to customers who purchase and own shares of such classes. Any amounts not paid as a service fee under the Plans would constitute an asset-based sales charge. Rules of the Financial Industry Regulatory Authority (“FINRA”) impose a cap on the total sales charges, including asset-based sales charges, that may be paid by any class of shares of the Fund. For the year ended October 31, 2018, expenses incurred under the Plans are shown in the Statement of Operations as Distribution fees.
Front-end sales commissions and CDSC (collectively, the “sales charges”) are not recorded as expenses of the Fund. Front-end sales commissions are deducted from proceeds from the sales of Fund shares prior to investment in Class A shares of the Fund. CDSC are deducted from redemption proceeds prior to remittance to the shareholder. During the year ended October 31, 2018, IDI advised the Fund that IDI retained $2,119 in front-end sales commissions from the sale of Class A shares and $307 and $214 from Class A and Class C shares, respectively, for CDSC imposed on redemptions by shareholders.
Certain officers and trustees of the Trust are officers and directors of the Adviser, IIS and/or IDI.
NOTE 3—Additional Valuation Information
GAAP defines fair value as the price that would be received to sell an asset or paid to transfer a liability in an orderly transaction between market participants at the measurement date, under current market conditions. GAAP establishes a hierarchy that prioritizes the inputs to valuation methods, giving the highest priority to readily available unadjusted quoted prices in an active market for identical assets (Level 1) and the lowest priority to significant unobservable inputs (Level 3), generally when market prices are not readily available or are unreliable. Based on the valuation inputs, the securities or other investments are tiered into one of three levels. Changes in valuation methods may result in transfers in or out of an investment’s assigned level:
| | Level 1 — | Prices are determined using quoted prices in an active market for identical assets. |
| | Level 2 — | Prices are determined using other significant observable inputs. Observable inputs are inputs that other market participants may use in pricing a security. These may include quoted prices for similar securities, interest rates, prepayment speeds, credit risk, yield curves, loss severities, default rates, discount rates, volatilities and others. |
| | Level 3 — | Prices are determined using significant unobservable inputs. In situations where quoted prices or observable inputs are unavailable (for example, when there is little or no market activity for an investment at the end of the period), unobservable inputs may be used. Unobservable inputs reflect the Fund’s own assumptions about the factors market participants would use in determining fair value of the securities or instruments and would be based on the best available information. |
24 Invesco World Bond Fund
The following is a summary of the tiered valuation input levels, as of October 31, 2018. The level assigned to the securities valuations may not be an indication of the risk or liquidity associated with investing in those securities. Because of the inherent uncertainties of valuation, the values reflected in the financial statements may materially differ from the value received upon actual sale of those investments.
| | | | | | | | | | | | | | | | |
| | | Level 1 | | | Level 2 | | | Level 3 | | | Total | |
Investments in Securities | | | | | | | | | | | | | | | | |
Non-U.S. Denominated Bonds & Notes | | $ | — | | | $ | 11,403,213 | | | $ | — | | | $ | 11,403,213 | |
U.S. Dollar Denominated Bonds & Notes | | | — | | | | 7,216,080 | | | | — | | | | 7,216,080 | |
U.S. Treasury Securities | | | — | | | | 4,493,577 | | | | — | | | | 4,493,577 | |
U.S. Government Sponsored Agency Mortgage-Backed Securities | | | — | | | | 82,352 | | | | — | | | | 82,352 | |
Money Market Funds | | | 280,874 | | | | — | | | | — | | | | 280,874 | |
Total Investments in Securities | | | 280,874 | | | | 23,195,222 | | | | — | | | | 23,476,096 | |
Other Investments — Assets* | | | | | | | | | | | | | | | | |
Forward Foreign Currency Contracts | | | — | | | | 245,622 | | | | — | | | | 245,622 | |
Futures Contracts | | | 53,515 | | | | — | | | | — | | | | 53,515 | |
| | | | 53,515 | | | | 245,622 | | | | — | | | | 299,137 | |
Other Investments — Liabilities* | | | | | | | | | | | | | | | | |
Forward Foreign Currency Contracts | | | — | | | | (230,375 | ) | | | — | | | | (230,375 | ) |
Futures Contracts | | | (152 | ) | | | — | | | | — | | | | (152 | ) |
| | | | (152 | ) | | | (230,375 | ) | | | — | | | | (230,527 | ) |
Total Other Investments | | | 53,363 | | | | 15,247 | | | | — | | | | 68,610 | |
Total Investments | | $ | 334,237 | | | $ | 23,210,469 | | | $ | — | | | $ | 23,544,706 | |
| * | Unrealized appreciation (depreciation). |
NOTE 4—Derivative Investments
The Fund may enter into an International Swaps and Derivatives Association Master Agreement (“ISDA Master Agreement”) under which a fund may trade OTC derivatives. An OTC transaction entered into under an ISDA Master Agreement typically involves a collateral posting arrangement, payment netting provisions and close-out netting provisions. These netting provisions allow for reduction of credit risk through netting of contractual obligations. The enforceability of the netting provisions of the ISDA Master Agreement depends on the governing law of the ISDA Master Agreement, among other factors.
For financial reporting purposes, the Fund does not offset OTC derivative assets or liabilities that are subject to ISDA Master Agreements in the Statement of Assets and Liabilities.
Value of Derivative Investments at Period-End
The table below summarizes the value of the Fund’s derivative investments, detailed by primary risk exposure, held as of October 31, 2018:
| | | | | | | | | | | | |
| | | Value | |
| Derivative Assets | | Currency
Risk | | | Interest Rate
Risk | | | Total | |
Unrealized appreciation on futures contracts — Exchange-Traded(a) | | $ | — | | | $ | 53,515 | | | $ | 53,515 | |
Unrealized appreciation on forward foreign currency contracts outstanding | | | 245,622 | | | | — | | | | 245,622 | |
Total Derivative Assets | | | 245,622 | | | | 53,515 | | | | 299,137 | |
Derivatives not subject to master netting agreements | | | — | | | | (53,515 | ) | | | (53,515 | ) |
Total Derivative Assets subject to master netting agreements | | $ | 245,622 | | | $ | — | | | $ | 245,622 | |
| |
| | | Value | |
| Derivative Liabilities | | Currency
Risk | | | Interest Rate
Risk | | | Total | |
Unrealized depreciation on futures contracts — Exchange-Traded(a) | | $ | — | | | $ | (152 | ) | | $ | (152 | ) |
Unrealized depreciation on forward foreign currency contracts outstanding | | | (230,375 | ) | | | — | | | | (230,375 | ) |
Total Derivative Liabilities | | | (230,375 | ) | | | (152 | ) | | | (230,527 | ) |
Derivatives not subject to master netting agreements | | | — | | | | 152 | | | | 152 | |
Total Derivative Liabilities subject to master netting agreements | | $ | (230,375 | ) | | $ | — | | | $ | (230,375 | ) |
| (a) | The daily variation margin receivable at period-end is recorded in the Statement of Assets and Liabilities. |
25 Invesco World Bond Fund
Offsetting Assets and Liabilities
The table below reflects the Fund’s exposure to Counterparties subject to either an ISDA Master Agreement or other agreement for OTC derivative transactions as of October 31, 2018.
| | | | | | | | | | | | | | | | | | | | | | | | |
| | | Financial
Derivative
Assets | | | Financial
Derivative
Liabilities | | | | | | Collateral (Received)/Pledged | | | | |
| Counterparty | | Forward
Foreign Currency
Contracts | | | Forward
Foreign Currency
Contracts | | | Net Value of
Derivatives | | | Non-Cash | | | Cash | | | Net
Amount | |
Citibank, N.A. | | $ | 72,845 | | | $ | (102,573 | ) | | $ | (29,728 | ) | | $ | — | | | $ | — | | | $ | (29,728 | ) |
Goldman Sachs International | | | 129,325 | | | | (127,802 | ) | | | 1,523 | | | | — | | | | — | | | | 1,523 | |
Morgan Stanley Bank, N.A. | | | 39,772 | | | | — | | | | 39,772 | | | | — | | | | — | | | | 39,772 | |
State Street Bank & Trust Co. | | | 3,680 | | | | — | | | | 3,680 | | | | — | | | | — | | | | 3,680 | |
Total | | $ | 245,622 | | | $ | (230,375 | ) | | $ | 15,247 | | | $ | — | | | $ | — | | | $ | 15,247 | |
Effect of Derivative Investments for the year ended October 31, 2018
The table below summarizes the gains (losses) on derivative investments, detailed by primary risk exposure, recognized in earnings during the period:
| | | | | | | | | | | | | | | | |
| | | Location of Gain (Loss) on
Statement of Operations | |
| | | Credit
Risk | | | Currency
Risk | | | Interest Rate
Risk | | | Total | |
Realized Gain (Loss): | | | | | | | | | | | | | | | | |
Forward foreign currency contracts | | $ | — | | | $ | (302,652 | ) | | $ | — | | | $ | (302,652 | ) |
Futures contracts | | | — | | | | — | | | | (42,676 | ) | | | (42,676 | ) |
Options purchased(a) | | | — | | | | (47,840 | ) | | | 113,038 | | | | 65,198 | |
Options written | | | — | | | | 28,998 | | | | — | | | | 28,998 | |
Swap agreements | | | (10,057 | ) | | | — | | | | (186,122 | ) | | | (196,179 | ) |
Change in Net Unrealized Appreciation (Depreciation): | | | | | | | | | | | | | | | | |
Forward foreign currency contracts | | | — | | | | 193,151 | | | | — | | | | 193,151 | |
Futures contracts | | | — | | | | — | | | | 94,614 | | | | 94,614 | |
Options purchased(a) | | | — | | | | 11,509 | | | | (10,004 | ) | | | 1,505 | |
Options written | | | — | | | | (563 | ) | | | — | | | | (563 | ) |
Swap agreements | | | (14,063 | ) | | | — | | | | 104,097 | | | | 90,034 | |
Total | | $ | (24,120 | ) | | $ | (117,397 | ) | | $ | 72,947 | | | $ | (68,570 | ) |
| (a) | Options purchased are included in the net realized gain (loss) from investment securities and the change in net unrealized appreciation (depreciation) of investment securities. |
The table below summarizes the twelve months average notional value of forward foreign currency contracts, the seven months average notional value of futures contracts, the nine months average notional value of swap agreements, the ten months average notional value of options purchased and options written outstanding during the period.
| | | | | | | | | | | | | | | | | | | | |
| | | Forward
Foreign Currency
Contracts | | | Futures
Contracts | | | Options
Purchased | | | Options
Written | | | Swap
Agreements | |
Average notional value | | $ | 27,230,088 | | | $ | 4,138,538 | | | $ | 3,156,231 | | | $ | 1,700,000 | | | $ | 6,977,594 | |
NOTE 5—Expense Offset Arrangement(s)
The expense offset arrangement is comprised of transfer agency credits which result from balances in demand deposit accounts used by the transfer agent for clearing shareholder transactions. For the year ended October 31, 2018, the Fund received credits from this arrangement, which resulted in the reduction of the Fund’s total expenses of $1,354.
NOTE 6—Trustees’ and Officers’ Fees and Benefits
Trustees’ and Officers’ Fees and Benefits include amounts accrued by the Fund to pay remuneration to certain Trustees and Officers of the Fund. Trustees have the option to defer compensation payable by the Fund, and Trustees’ and Officers’ Fees and Benefits also include amounts accrued by the Fund to fund such deferred compensation amounts. Those Trustees who defer compensation have the option to select various Invesco Funds in which their deferral accounts shall be deemed to be invested. Finally, certain current Trustees were eligible to participate in a retirement plan that provided for benefits to be paid upon retirement to Trustees over a period of time based on the number of years of service. The Fund may have certain former Trustees who also participate in a retirement plan and receive benefits under such plan. Trustees’ and Officers’ Fees and Benefits include amounts accrued by the Fund to fund such retirement benefits. Obligations under the deferred compensation and retirement plans represent unsecured claims against the general assets of the Fund.
26 Invesco World Bond Fund
NOTE 7—Cash Balances
The Fund may borrow for leveraging in an amount up to 5% of the Fund’s total assets (excluding the amount borrowed) at the time the borrowing is made. In doing so, the Fund is permitted to temporarily carry a negative or overdrawn balance in its account with State Street Bank and Trust Company, the custodian bank. Such balances, if any at period end, are shown in the Statement of Assets and Liabilities under the payable caption Amount due custodian. To compensate the custodian bank for such overdrafts, the overdrawn Fund may either (1) leave funds as a compensating balance in the account so the custodian bank can be compensated by earning the additional interest; or (2) compensate by paying the custodian bank at a rate agreed upon by the custodian bank and Invesco, not to exceed the contractually agreed upon rate. The Fund may not purchase additional securities when any borrowings from banks exceed 5% of the Fund’s total assets.
NOTE 8—Distributions to Shareholders and Tax Components of Net Assets
Tax Character of Distributions to Shareholders Paid During the Fiscal Years Ended October 31, 2018 and 2017:
| | | | | | | | |
| | | 2018 | | | 2017 | |
Ordinary income | | $ | 588,688 | | | $ | 132,292 | |
Return of capital | | | 170,201 | | | | 793,207 | |
Total distributions | | $ | 758,889 | | | $ | 925,499 | |
Tax Components of Net Assets at Period-End:
| | | | |
| | | 2018 | |
Net unrealized appreciation (depreciation) — investments | | $ | (1,333,403 | ) |
Net unrealized appreciation (depreciation) — foreign currencies | | | (32,398 | ) |
Temporary book/tax differences | | | (36,226 | ) |
Capital loss carryforward | | | (1,001,266 | ) |
Shares of beneficial interest | | | 27,351,030 | |
Total net assets | | $ | 24,947,737 | |
The difference between book-basis and tax-basis unrealized appreciation (depreciation) is due to differences in the timing of recognition of gains and losses on investments for tax and book purposes. The Fund’s net unrealized appreciation (depreciation) difference is attributable primarily to futures contracts, straddles and wash sales.
The temporary book/tax differences are a result of timing differences between book and tax recognition of income and/or expenses. The Fund’s temporary book/tax differences are the result of the trustee deferral of compensation and retirement plan benefits.
Capital loss carryforward is calculated and reported as of a specific date. Results of transactions and other activity after that date may affect the amount of capital loss carryforward actually available for the Fund to utilize. Capital losses generated in years beginning after December 22, 2010 can be carried forward for an unlimited period, whereas previous losses expire in eight tax years. Capital losses with an expiration period may not be used to offset capital gains until all net capital losses without an expiration date have been utilized. Capital loss carryforwards with no expiration date will retain their character as either short-term or long-term capital losses instead of as short-term capital losses as under prior law. The ability to utilize capital loss carryforwards in the future may be limited under the Internal Revenue Code and related regulations based on the results of future transactions.
The Fund has a capital loss carryforward as of October 31, 2018, as follows:
| | | | | | | | | | | | |
| Capital Loss Carryforward* | |
| Expiration | | Short-Term | | | Long-Term | | | Total | |
Not subject to expiration | | $ | 760,391 | | | $ | 240,875 | | | $ | 1,001,266 | |
| * | Capital loss carryforward as of the date listed above is reduced for limitations, if any, to the extent required by the Internal Revenue Code and may be further limited depending upon a variety of factors, including the realization of net unrealized gains or losses as of the date of any reorganization. |
NOTE 9—Investment Transactions
The aggregate amount of investment securities (other than short-term securities, U.S. Treasury obligations and money market funds, if any) purchased and sold by the Fund during the year ended October 31, 2018 was $29,101,268 and $32,167,797, respectively. During the same period, purchases and sales of U.S. Treasury obligations were $5,842,741 and $6,977,593, respectively. Cost of investments, including any derivatives, on a tax basis includes the adjustments for financial reporting purposes as of the most recently completed federal income tax reporting period-end.
| | | | |
| Unrealized Appreciation (Depreciation) of Investments on a Tax Basis | |
Aggregate unrealized appreciation of investments | | $ | 431,150 | |
Aggregate unrealized (depreciation) of investments | | | (1,764,553 | ) |
Net unrealized appreciation (depreciation) of investments | | | (1,333,403 | ) |
Cost of investments for tax purposes is $24,878,109.
27 Invesco World Bond Fund
NOTE 10—Reclassification of Permanent Differences
Primarily as a result of differing book/tax treatment of foreign currency transactions, swap agreement income and return of capital distributions, on October 31, 2018, undistributed net investment income was decreased by $300,611, undistributed net realized gain (loss) was increased by $489,079 and shares of beneficial interest was decreased by $188,468. This reclassification had no effect on the net assets of the Fund.
NOTE 11—Share Information
| | | | | | | | | | | | | | | | |
| | | Summary of Share Activity | |
| | | Years ended October 31, | |
| | | 2018(a) | | | 2017 | |
| | | Shares | | | Amount | | | Shares | | | Amount | |
Sold: | | | | | | | | | | | | | | | | |
Class A | | | 386,231 | | | $ | 3,997,153 | | | | 386,135 | | | $ | 3,976,564 | |
Class B(b) | | | — | | | | — | | | | 2,297 | | | | 22,928 | |
Class C | | | 94,499 | | | | 976,792 | | | | 88,362 | | | | 906,574 | |
Class Y | | | 257,352 | | | | 2,612,923 | | | | 611,943 | | | | 6,211,858 | |
Class R5 | | | — | | | | — | | | | 2,567 | | | | 27,121 | |
Class R6 | | | 9,758 | | | | 99,645 | | | | — | | | | — | |
| | | | |
Issued as reinvestment of dividends: | | | | | | | | | | | | | | | | |
Class A | | | 50,935 | | | | 520,184 | | | | 56,789 | | | | 577,805 | |
Class B(b) | | | 88 | | | | 924 | | | | 600 | | | | 6,090 | |
Class C | | | 6,882 | | | | 70,106 | | | | 6,981 | | | | 70,996 | |
Class Y | | | 8,912 | | | | 91,682 | | | | 18,568 | | | | 188,436 | |
Class R6 | | | 206 | | | | 2,086 | | | | — | | �� | | — | |
| | | | |
Conversion of Class B shares to Class A shares:(c) | | | | | | | | | | | | | | | | |
Class A | | | 18,932 | | | | 202,956 | | | | 18,145 | | | | 185,281 | |
Class B | | | (18,980 | ) | | | (202,956 | ) | | | (18,156 | ) | | | (185,281 | ) |
| | | | |
Reacquired: | | | | | | | | | | | | | | | | |
Class A | | | (681,579 | ) | | | (6,954,424 | ) | | | (1,101,023 | ) | | | (11,183,581 | ) |
Class B(b) | | | (1,970 | ) | | | (20,658 | ) | | | (8,550 | ) | | | (87,069 | ) |
Class C | | | (127,453 | ) | | | (1,287,587 | ) | | | (188,446 | ) | | | (1,913,284 | ) |
Class Y | | | (521,993 | ) | | | (5,348,296 | ) | | | (1,081,055 | ) | | | (10,940,824 | ) |
Class R5 | | | — | | | | — | | | | (2,567 | ) | | | (27,112 | ) |
Class R6 | | | (31 | ) | | | (323 | ) | | | — | | | | — | |
Net increase (decrease) in share activity | | | (518,211 | ) | | $ | (5,239,793 | ) | | | (1,207,410 | ) | | $ | (12,163,498 | ) |
| (a) | There are entities that are record owners of more than 5% of the outstanding shares of the Fund and in the aggregate own 33% of the outstanding shares of the Fund. IDI has an agreement with these entities to sell Fund shares. The Fund, Invesco and/or Invesco affiliates may make payments to these entities, which are considered to be related to the Fund, for providing services to the Fund, Invesco and/or Invesco affiliates including but not limited to services such as securities brokerage, distribution, third party record keeping and account servicing. The Fund has no knowledge as to whether all or any portion of the shares owned of record by these entities are also owned beneficially. |
| (b) | Reflects activity for the period November 1, 2017 through January 26, 2018 (date of conversion). |
| (c) | Effective as of the close of business on January 26, 2018, all outstanding Class B shares were converted to Class A shares. |
28 Invesco World Bond Fund
NOTE 12—Financial Highlights
The following schedule presents financial highlights for a share of the Fund outstanding throughout the periods indicated.
| | | | | | | | | | | | | | | | | | | | | | | | | | | | | | | | | | | | | | | | | | | | | | | | | | | | | | | | | | | | |
| | | Net asset
value,
beginning
of period | | | Net
investment
income(a) | | | Net gains
(losses)
on securities
(both
realized and
unrealized) | | | Total from
investment
operations | | | Dividends
from net
investment
income | | | Distributions
from net
realized
gains | | | Return of
capital | | | Total
distributions | | | Net asset
value, end
of period | | | Total
return(b) | | | Net assets,
end of period
(000’s omitted) | | | Ratio of
expenses
to average
net assets
with fee waivers
and/or expenses
absorbed | | | Ratio of
expenses
to average net
assets without
fee waivers
and/or expenses
absorbed | | | Ratio of net
investment
income
to average
net assets | | | Portfolio
turnover(c) | |
Class A | | | | | | | | | | | | | | | | | | | | | | | | | | | | | | | | | | | | | | | | | | | | | | | | | | | | | | | | | | | | |
Year ended 10/31/18 | | $ | 10.43 | | | $ | 0.33 | | | $ | (0.83 | ) | | $ | (0.50 | ) | | $ | (0.21 | ) | | $ | — | | | $ | (0.06 | ) | | $ | (0.27 | ) | | $ | 9.66 | | | | (4.89 | )% | | $ | 18,347 | | | | 0.93 | %(d) | | | 2.21 | %(d) | | | 3.25 | %(d) | | | 131 | % |
Year ended 10/31/17 | | | 10.44 | | | | 0.33 | | | | (0.07 | ) | | | 0.26 | | | | (0.04 | ) | | | — | | | | (0.23 | ) | | | (0.27 | ) | | | 10.43 | | | | 2.63 | | | | 22,150 | | | | 0.95 | | | | 2.21 | | | | 3.22 | | | | 245 | |
Year ended 10/31/16 | | | 9.81 | | | | 0.25 | | | | 0.54 | | | | 0.79 | | | | (0.08 | ) | | | — | | | | (0.08 | ) | | | (0.16 | ) | | | 10.44 | | | | 8.02 | | | | 28,870 | | | | 1.10 | | | | 1.84 | | | | 2.36 | | | | 246 | |
Year ended 10/31/15 | | | 10.63 | | | | 0.18 | | | | (0.74 | ) | | | (0.56 | ) | | | — | | | | (0.14 | ) | | | (0.12 | ) | | | (0.26 | ) | | | 9.81 | | | | (5.38 | ) | | | 26,426 | | | | 1.10 | | | | 1.72 | | | | 1.79 | | | | 135 | |
Year ended 10/31/14 | | | 11.07 | | | | 0.20 | | | | (0.30 | ) | | | (0.10 | ) | | | (0.12 | ) | | | (0.22 | ) | | | — | | | | (0.34 | ) | | | 10.63 | | | | (0.97 | ) | | | 32,668 | | | | 1.10 | | | | 1.68 | | | | 1.83 | | | | 237 | |
Class B | | | | | | | | | | | | | | | | | | | | | | | | | | | | | | | | | | | | | | | | | | | | | | | | | | | | | | | | | | | | |
Year ended 10/31/18(e) | | | 10.42 | | | | 0.06 | | | | 0.28 | | | | 0.34 | | | | (0.05 | ) | | | — | | | | (0.00 | ) | | | (0.05 | ) | | | 10.71 | | | | 3.26 | | | | — | | | | 1.68 | (d)(f) | | | 2.96 | (d)(f) | | | 2.50 | (d)(f) | | | 131 | |
Year ended 10/31/17 | | | 10.43 | | | | 0.25 | | | | (0.07 | ) | | | 0.18 | | | | (0.03 | ) | | | — | | | | (0.16 | ) | | | (0.19 | ) | | | 10.42 | | | | 1.80 | | | | 217 | | | | 1.70 | | | | 2.96 | | | | 2.47 | | | | 245 | |
Year ended 10/31/16 | | | 9.79 | | | | 0.16 | | | | 0.56 | | | | 0.72 | | | | (0.05 | ) | | | — | | | | (0.03 | ) | | | (0.08 | ) | | | 10.43 | | | | 7.35 | | | | 466 | | | | 1.85 | | | | 2.59 | | | | 1.61 | | | | 246 | |
Year ended 10/31/15 | | | 10.62 | | | | 0.10 | | | | (0.75 | ) | | | (0.65 | ) | | | — | | | | (0.14 | ) | | | (0.04 | ) | | | (0.18 | ) | | | 9.79 | | | | (6.19 | ) | | | 898 | | | | 1.85 | | | | 2.47 | | | | 1.04 | | | | 135 | |
Year ended 10/31/14 | | | 11.05 | | | | 0.12 | | | | (0.30 | ) | | | (0.18 | ) | | | (0.03 | ) | | | (0.22 | ) | | | — | | | | (0.25 | ) | | | 10.62 | | | | (1.63 | ) | | | 1,867 | | | | 1.85 | | | | 2.43 | | | | 1.08 | | | | 237 | |
Class C | | | | | | | | | | | | | | | | | | | | | | | | | | | | | | | | | | | | | | | | | | | | | | | | | | | | | | | | | | | | |
Year ended 10/31/18 | | | 10.41 | | | | 0.26 | | | | (0.84 | ) | | | (0.58 | ) | | | (0.15 | ) | | | — | | | | (0.04 | ) | | | (0.19 | ) | | | 9.64 | | | | (5.62 | ) | | | 3,591 | | | | 1.68 | (d) | | | 2.96 | (d) | | | 2.50 | (d) | | | 131 | |
Year ended 10/31/17 | | | 10.42 | | | | 0.25 | | | | (0.07 | ) | | | 0.18 | | | | (0.03 | ) | | | — | | | | (0.16 | ) | | | (0.19 | ) | | | 10.41 | | | | 1.80 | | | | 4,147 | | | | 1.70 | | | | 2.96 | | | | 2.47 | | | | 245 | |
Year ended 10/31/16 | | | 9.79 | | | | 0.17 | | | | 0.54 | | | | 0.71 | | | | (0.05 | ) | | | — | | | | (0.03 | ) | | | (0.08 | ) | | | 10.42 | | | | 7.24 | | | | 5,121 | | | | 1.85 | | | | 2.59 | | | | 1.61 | | | | 246 | |
Year ended 10/31/15 | | | 10.61 | | | | 0.10 | | | | (0.74 | ) | | | (0.64 | ) | | | — | | | | (0.14 | ) | | | (0.04 | ) | | | (0.18 | ) | | | 9.79 | | | | (6.10 | ) | | | 4,998 | | | | 1.85 | | | | 2.47 | | | | 1.04 | | | | 135 | |
Year ended 10/31/14 | | | 11.04 | | | | 0.12 | | | | (0.30 | ) | | | (0.18 | ) | | | (0.03 | ) | | | (0.22 | ) | | | — | | | | (0.25 | ) | | | 10.61 | | | | (1.63 | ) | | | 6,441 | | | | 1.85 | | | | 2.43 | | | | 1.08 | | | | 237 | |
Class Y | | | | | | | | | | | | | | | | | | | | | | | | | | | | | | | | | | | | | | | | | | | | | | | | | | | | | | | | | | | | |
Year ended 10/31/18 | | | 10.42 | | | | 0.36 | | | | (0.83 | ) | | | (0.47 | ) | | | (0.23 | ) | | | — | | | | (0.07 | ) | | | (0.30 | ) | | | 9.65 | | | | (4.66 | ) | | | 2,903 | | | | 0.68 | (d) | | | 1.96 | (d) | | | 3.50 | (d) | | | 131 | |
Year ended 10/31/17 | | | 10.44 | | | | 0.35 | | | | (0.07 | ) | | | 0.28 | | | | (0.04 | ) | | | — | | | | (0.26 | ) | | | (0.30 | ) | | | 10.42 | | | | 2.81 | | | | 5,797 | | | | 0.70 | | | | 1.96 | | | | 3.47 | | | | 245 | |
Year ended 10/31/16 | | | 9.80 | | | | 0.27 | | | | 0.55 | | | | 0.82 | | | | (0.07 | ) | | | — | | | | (0.11 | ) | | | (0.18 | ) | | | 10.44 | | | | 8.40 | | | | 10,509 | | | | 0.85 | | | | 1.59 | | | | 2.61 | | | | 246 | |
Year ended 10/31/15 | | | 10.63 | | | | 0.21 | | | | (0.76 | ) | | | (0.55 | ) | | | — | | | | (0.14 | ) | | | (0.14 | ) | | | (0.28 | ) | | | 9.80 | | | | (5.23 | ) | | | 1,716 | | | | 0.85 | | | | 1.47 | | | | 2.04 | | | | 135 | |
Year ended 10/31/14 | | | 11.06 | | | | 0.23 | | | | (0.30 | ) | | | (0.07 | ) | | | (0.14 | ) | | | (0.22 | ) | | | — | | | | (0.36 | ) | | | 10.63 | | | | (0.63 | ) | | | 4,989 | | | | 0.85 | | | | 1.43 | | | | 2.08 | | | | 237 | |
Class R5 | | | | | | | | | | | | | | | | | | | | | | | | | | | | | | | | | | | | | | | | | | | | | | | | | | | | | | | | | | | | |
Year ended 10/31/18 | | | 10.42 | | | | 0.36 | | | | (0.84 | ) | | | (0.48 | ) | | | (0.23 | ) | | | — | | | | (0.07 | ) | | | (0.30 | ) | | | 9.64 | | | | (4.75 | ) | | | 1 | | | | 0.68 | (d) | | | 1.73 | (d) | | | 3.50 | (d) | | | 131 | |
Year ended 10/31/17 | | | 10.44 | | | | 0.36 | | | | (0.08 | ) | | | 0.28 | | | | (0.04 | ) | | | — | | | | (0.26 | ) | | | (0.30 | ) | | | 10.42 | | | | 2.81 | | | | 1 | | | | 0.70 | | | | 1.77 | | | | 3.47 | | | | 245 | |
Year ended 10/31/16 | | | 9.81 | | | | 0.27 | | | | 0.54 | | | | 0.81 | | | | (0.07 | ) | | | — | | | | (0.11 | ) | | | (0.18 | ) | | | 10.44 | | | | 8.29 | | | | 1 | | | | 0.85 | | | | 1.30 | | | | 2.61 | | | | 246 | |
Year ended 10/31/15 | | | 10.64 | | | | 0.21 | | | | (0.76 | ) | | | (0.55 | ) | | | — | | | | (0.14 | ) | | | (0.14 | ) | | | (0.28 | ) | | | 9.81 | | | | (5.23 | ) | | | 1 | | | | 0.85 | | | | 1.16 | | | | 2.04 | | | | 135 | |
Year ended 10/31/14 | | | 11.07 | | | | 0.23 | | | | (0.30 | ) | | | (0.07 | ) | | | (0.14 | ) | | | (0.22 | ) | | | — | | | | (0.36 | ) | | | 10.64 | | | | (0.63 | ) | | | 118 | | | | 0.85 | | | | 1.15 | | | | 2.08 | | | | 237 | |
Class R6 | | | | | | | | | | | | | | | | | | | | | | | | | | | | | | | | | | | | | | | | | | | | | | | | | | | | | | | | | | | | |
Year ended 10/31/18 | | | 10.43 | | | | 0.35 | | | | (0.82 | ) | | | (0.47 | ) | | | (0.23 | ) | | | — | | | | (0.07 | ) | | | (0.30 | ) | | | 9.66 | | | | (4.65 | ) | | | 106 | | | | 0.68 | (d) | | | 1.73 | (d) | | | 3.50 | (d) | | | 131 | |
Year ended 10/31/17 | | | 10.44 | | | | 0.36 | | | | (0.07 | ) | | | 0.29 | | | | (0.04 | ) | | | — | | | | (0.26 | ) | | | (0.30 | ) | | | 10.43 | | | | 2.91 | | | | 11 | | | | 0.70 | | | | 1.77 | | | | 3.47 | | | | 245 | |
Year ended 10/31/16 | | | 9.81 | | | | 0.25 | | | | 0.56 | | | | 0.81 | | | | (0.07 | ) | | | — | | | | (0.11 | ) | | | (0.18 | ) | | | 10.44 | | | | 8.29 | | | | 11 | | | | 0.85 | | | | 1.30 | | | | 2.61 | | | | 246 | |
Year ended 10/31/15 | | | 10.63 | | | | 0.20 | | | | (0.74 | ) | | | (0.54 | ) | | | — | | | | (0.14 | ) | | | (0.14 | ) | | | (0.28 | ) | | | 9.81 | | | | (5.14 | ) | | | 19,413 | | | | 0.85 | | | | 1.16 | | | | 2.04 | | | | 135 | |
Year ended 10/31/14 | | | 11.07 | | | | 0.23 | | | | (0.31 | ) | | | (0.08 | ) | | | (0.14 | ) | | | (0.22 | ) | | | — | | | | (0.36 | ) | | | 10.63 | | | | (0.72 | ) | | | 12,637 | | | | 0.85 | | | | 1.14 | | | | 2.08 | | | | 237 | |
| (a) | Calculated using average shares outstanding. |
| (b) | Includes adjustments in accordance with accounting principles generally accepted in the United States of America and as such, the net asset value for financial reporting purposes and the returns based upon those net asset values may differ from the net asset value and returns for shareholder transactions. Does not include sales charges and is not annualized for periods less than one year, if applicable. |
| (c) | Portfolio turnover is calculated at the fund level and is not annualized for periods less than one year, if applicable. |
| (d) | Ratios are based on average daily net assets (000’s omitted) of $21,228, $205, $4,127, $4,062, $1 and $78 for Class A, Class B, Class C, Class Y, Class R5 and Class R6 shares, respectively. |
| (e) | Reflects activity for the period November 1, 2017 through January 26, 2018 (date of conversion). |
29 Invesco World Bond Fund
Report of Independent Registered Public Accounting Firm
To the Board of Trustees of AIM Investment Funds (Invesco Investment Funds)
and Shareholders of Invesco World Bond Fund:
Opinion on the Financial Statements
We have audited the accompanying statement of assets and liabilities, including the schedule of investments, of Invesco World Bond Fund (one of the funds constituting AIM Investment Funds (Invesco Investment Funds), hereafter referred to as the “Fund”) as of October 31, 2018, the related statement of operations for the year ended October 31, 2018, the statement of changes in net assets for each of the two years in the period ended October 31, 2018, including the related notes, and the financial highlights for each of the periods indicated therein (collectively referred to as the financial statements). In our opinion, the financial statements present fairly, in all material respects, the financial position of the Fund as of October 31, 2018, the results of its operations for the year then ended, the changes in its net assets for each of the two years in the period ended October 31, 2018 and the financial highlights for each of the periods indicated therein in conformity with accounting principles generally accepted in the United States of America.
Basis for Opinion
These financial statements are the responsibility of the Fund’s management. Our responsibility is to express an opinion on the Fund’s financial statements based on our audits. We are a public accounting firm registered with the Public Company Accounting Oversight Board (United States) (PCAOB) and are required to be independent with respect to the Fund in accordance with the U.S. federal securities laws and the applicable rules and regulations of the Securities and Exchange Commission and the PCAOB.
We conducted our audits of these financial statements in accordance with the standards of the PCAOB. Those standards require that we plan and perform the audit to obtain reasonable assurance about whether the financial statements are free of material misstatement, whether due to error or fraud.
Our audits included performing procedures to assess the risks of material misstatement of the financial statements, whether due to error or fraud, and performing procedures that respond to those risks. Such procedures included examining, on a test basis, evidence regarding the amounts and disclosures in the financial statements. Our audits also included evaluating the accounting principles used and significant estimates made by management, as well as evaluating the overall presentation of the financial statements. Our procedures included confirmation of securities owned as of October 31, 2018 by correspondence with the custodian, transfer agent and brokers; when replies were not received from brokers, we performed other auditing procedures. We believe that our audits provide a reasonable basis for our opinion.
PricewaterhouseCoopers LLP
Houston, TX
December 28, 2018
We have served as the auditor of one or more of the investment companies in the Invesco group of investment companies since at least 1995. We have not been able to determine the specific year we began serving as auditor.
30 Invesco World Bond Fund
Calculating your ongoing Fund expenses
Example
As a shareholder of the Fund, you incur two types of costs: (1) transaction costs, which may include sales charges (loads) on purchase payments or contingent deferred sales charges on redemptions, if any; and (2) ongoing costs, including management fees, distribution and/or service (12b-1) fees, and other Fund expenses. This example is intended to help you understand your ongoing costs (in dollars) of investing in the Fund and to compare these costs with ongoing costs of investing in other mutual funds. The example is based on an investment of $1,000 invested at the beginning of the period and held for the entire period May 1, 2018 through October 31, 2018.
Actual expenses
The table below provides information about actual account values and actual expenses. You may use the information in this table, together with the amount you invested, to estimate the expenses that you paid over the period. Simply divide your account value by $1,000 (for example, an $8,600 account value divided by $1,000 = 8.6), then multiply the result by the number in the table under the heading entitled “Actual Expenses Paid During Period” to estimate the expenses you paid on your account during this period.
Hypothetical example for comparison purposes
The table below also provides information about hypothetical account values and hypothetical expenses based on the Fund’s actual expense ratio and an assumed rate of return of 5% per year before expenses, which is not the Fund’s actual return.
The hypothetical account values and expenses may not be used to estimate the actual ending account balance or expenses you paid for the period. You may use this information to compare the ongoing costs of investing in the Fund and other funds. To do so, compare this 5% hypothetical example with the 5% hypothetical examples that appear in the shareholder reports of the other funds.
Please note that the expenses shown in the table are meant to highlight your ongoing costs only and do not reflect any transaction costs, such as sales charges (loads) on purchase payments or contingent deferred sales charges on redemptions, if any. Therefore, the hypothetical information is useful in comparing ongoing costs only, and will not help you determine the relative total costs of owning different funds. In addition, if these transaction costs were included, your costs would have been higher.
| | | | | | | | | | | | | | | | | | | | | | | | |
Class | | Beginning
Account Value
(05/01/18) | | | ACTUAL | | | HYPOTHETICAL
(5% annual return before
expenses) | | | Annualized
Expense Ratio | |
| | Ending
Account Value
(10/31/18)1 | | | Expenses
Paid During
Period2 | | | Ending Account Value
(10/31/18) | | | Expenses
Paid During
Period2 | |
| A | | $ | 1,000.00 | | | $ | 948.90 | | | $ | 4.57 | | | $ | 1,020.52 | | | $ | 4.74 | | | | 0.93 | % |
| C | | | 1,000.00 | | | | 945.20 | | | | 8.24 | | | | 1,016.74 | | | | 8.54 | | | | 1.68 | |
| Y | | | 1,000.00 | | | | 950.10 | | | | 3.34 | | | | 1,021.78 | | | | 3.47 | | | | 0.68 | |
| R5 | | | 1,000.00 | | | | 950.00 | | | | 3.34 | | | | 1,021.78 | | | | 3.47 | | | | 0.68 | |
| R6 | | | 1,000.00 | | | | 950.10 | | | | 3.34 | | | | 1,021.78 | | | | 3.47 | | | | 0.68 | |
| 1 | The actual ending account value is based on the actual total return of the Fund for the period May 1, 2018 through October 31, 2018, after actual expenses and will differ from the hypothetical ending account value which is based on the Fund’s expense ratio and a hypothetical annual return of 5% before expenses. |
| 2 | Expenses are equal to the Fund’s annualized expense ratio as indicated above multiplied by the average account value over the period, multiplied by 184/365 to reflect the most recent fiscal half year. |
31 Invesco World Bond Fund
Approval of Investment Advisory and Sub-Advisory Contracts
At meetings held on June 5-6, 2018, the Board of Trustees (the Board or the Trustees) of AIM Investment Funds (Invesco Investment Funds) as a whole, and independent Trustees, who comprise over 75% of the Board, voting separately, approved the continuance of the Invesco World Bond Fund’s (the Fund) Master Investment Advisory Agreement with Invesco Advisers, Inc. (Invesco Advisers and the investment advisory agreement) and the Master Intergroup Sub-Advisory Contract for Mutual Funds with Invesco Asset Management Deutschland GmbH, Invesco Asset Management Limited, Invesco Asset Management (Japan) Limited, Invesco Hong Kong Limited, Invesco Senior Secured Management, Inc. and Invesco Canada Ltd. (collectively, the Affiliated Sub-Advisers and the sub-advisory contracts) for another year, effective July 1, 2018. After evaluating the factors discussed below, among others, the Board approved the renewal of the Fund’s investment advisory agreement and the sub-advisory contracts and determined that the compensation payable by the Fund to Invesco Advisers and by Invesco Advisers to the Affiliated Sub-Advisers is fair and reasonable.
The Board’s Evaluation Process
The Board’s Investments Committee has established three Sub-Committees, which meet throughout the year to review the performance of funds advised by Invesco Advisers (the Invesco Funds). Over the course of each year, the Sub-Committees meet with portfolio managers for their assigned Invesco Funds and other members of management to review detailed information about investment performance and portfolio attributes of these funds. The Board took into account evaluations and reports that it received from the Investments Committee and Sub-Committees, as well as the information provided to such committees and the Board throughout the year, in considering whether to approve each Invesco Fund’s investment advisory agreement and sub-advisory contracts.
As part of the contract renewal process, the Board reviews and considers information provided in response to detailed requests for information submitted to management by the independent Trustees with assistance from legal counsel to the independent Trustees. The Board receives comparative investment performance and fee data regarding the Invesco Funds prepared by Invesco Advisers and Broadridge Financial Solutions, Inc. (Broadridge), an independent mutual fund data provider. The Board also receives an independent written evaluation from the Senior Officer, an officer of the Invesco Funds who reports directly to the independent Trustees. The Senior Officer’s evaluation is prepared as part of his responsibility to manage the process by which the Invesco Funds’ proposed management fees
are negotiated during the annual contract renewal process to ensure they are negotiated in a manner that is at arms’ length and reasonable. In addition to meetings with Invesco Advisers and fund counsel throughout the year, the independent Trustees also discuss the continuance of the investment advisory agreement and sub-advisory contracts in separate sessions with the Senior Officer and with independent legal counsel.
The discussion below is a summary of the Senior Officer’s independent written evaluation with respect to the Fund’s investment advisory agreement, as well as a discussion of the material factors and related conclusions that formed the basis for the Board’s approval of the Fund’s investment advisory agreement and sub-advisory contracts. The Trustees’ review and conclusions are based on the comprehensive consideration of all information presented to them during the course of the year and in prior years and are not the result of any single determinative factor. Moreover, one Trustee may have weighed a particular piece of information or factor differently than another Trustee. This information is current as of June 6, 2018.
Factors and Conclusions and Summary of Independent Written Fee Evaluation
| A. | Nature, Extent and Quality of Services Provided by Invesco Advisers and the Affiliated Sub-Advisers |
The Board reviewed the nature, extent and quality of the advisory services provided to the Fund by Invesco Advisers under the Fund’s investment advisory agreement, and the credentials and experience of the officers and employees of Invesco Advisers who provide these services, including the Fund’s portfolio manager(s). The Board’s review included consideration of Invesco Advisers’ investment process oversight and structure, credit analysis and investment risk management. The Board also considered non-advisory services that Invesco Advisers and its affiliates provide to the Invesco Funds such as various back office support functions, third party oversight, internal audit, valuation, portfolio trading and legal and compliance. The Board also reviewed and considered the benefits to shareholders of investing in a fund that is part of the Invesco family of funds under the umbrella of Invesco Ltd., Invesco Advisers’ parent company, and noted Invesco Ltd.’s depth and experience in conducting an investment management business, as well as its commitment of financial and other resources to such business. The Board concluded that the nature, extent and quality of the services provided to the Fund by Invesco Advisers are appropriate and satisfactory.
The Board reviewed the services that may be provided by the Affiliated Sub-Advisers under
the sub-advisory contracts and the credentials and experience of the officers and employees of the Affiliated Sub-Advisers who provide these services. The Board noted the Affiliated Sub-Advisers’ expertise with respect to certain asset classes and that the Affiliated Sub-Advisers have offices and personnel that are located in financial centers around the world. As a result, the Board noted that the Affiliated Sub-Advisers can provide research and investment analysis on the markets and economies of various countries in which the Fund may invest, make recommendations regarding securities and assist with security trades. The Board concluded that the sub-advisory contracts may benefit the Fund and its shareholders by permitting Invesco Advisers to use the resources and talents of the Affiliated Sub-Advisers in managing the Fund. The Board concluded that the nature, extent and quality of the services that may be provided by the Affiliated Sub-Advisers are appropriate and satisfactory.
| B. | Fund Investment Performance |
The Board considered Fund investment performance as a relevant factor in considering whether to approve the investment advisory agreement as well as the sub-advisory contracts for the Fund, as Invesco Asset Management Limited currently manages assets of the Fund.
The Board noted that the name and strategy of the Fund was changed and the benchmark was changed to the Lipper Global Income Funds Index effective December 1, 2016. The Board compared the Fund’s investment performance for the one year ended December 31, 2017 to the performance of funds in the Broadridge performance universe and against the Lipper Global Income Funds Index. The Board noted that performance of Class A shares of the Fund was in the first quintile of its performance universe for the one year period (the first quintile being the best performing funds and the fifth quintile being the worst performing funds). The Board noted that performance of Class A shares of the Fund was above the performance of the Index for the one year period. The Trustees also reviewed more recent Fund performance and this review did not change their conclusions.
| C. | Advisory and Sub-Advisory Fees and Fund Expenses |
The Board compared the Fund’s contractual management fee rate to the contractual management fee rates of funds in the Fund’s Broadridge expense group. The Board noted that the contractual management fee rate for Class A shares of the Fund was above the median contractual management fee rate of funds in its expense group. The Board noted that the term “contractual management fee” for funds in the expense group may include both advisory and certain non-portfolio management administrative services fees, but that
32 Invesco World Bond Fund
Broadridge does not provide information on a fund by fund basis as to what is included. The Board also reviewed the methodology used by Broadridge in providing expense group information, which includes using each fund’s contractual management fee schedule (including any applicable breakpoints) as reported in the most recent prospectus or statement of additional information for each fund in the expense group. The Board also considered comparative information regarding the Fund’s total expense ratio and its various components. The Board noted that the Fund’s contractual management fees were in the fourth quintile of its expense group and discussed with management reasons for such relative contractual management fees.
The Board noted that Invesco Advisers has contractually agreed to waive fees and/or limit expenses of the Fund in an amount necessary to limit total annual operating expenses to a specified percentage of average daily net assets for each class of the Fund.
The Board also considered the fees charged by Invesco Advisers and the Affiliated Sub-Advisers to other similarly managed client accounts. The Board noted that Invesco Advisers or the Affiliated Sub-Advisers may charge lower fees to large institutional clients. Invesco Advisers reviewed with the Board differences in the scope of services it provides to the Invesco Funds relative to certain other types of client accounts, including management of cash flows as a result of redemptions and purchases, necessary infrastructure such as officers, office space, technology, legal and distribution, oversight of service providers, costs and business risks associated with launching new funds and sponsoring and maintaining the product line, preparation of annual registration statement updates and financial information and compliance with federal and state laws and regulations.
The Board also considered the services that may be provided by the Affiliated Sub-Advisers pursuant to the sub-advisory contracts, as well as the fees payable by Invesco Advisers to the Affiliated Sub-Advisers pursuant to the sub-advisory contracts. The Board noted that Invesco Advisers retains overall responsibility for, and provides services to, sub-advised Invesco Funds, including oversight of the Affiliated Sub-Advisers as well as the additional services described herein other than day-to-day portfolio management.
| D. | Economies of Scale and Breakpoints |
The Board considered the extent to which there may be economies of scale in the provision of advisory services to the Fund. The Board also considered that the Fund may benefit from economies of scale through contractual breakpoints in the Fund’s advisory fee schedule, which generally operate to reduce the Fund’s expense ratio as it grows in size. The Board noted that the Fund shares directly in economies of scale through lower fees charged by third party service providers based on the combined size of the Invesco Funds. The Board
noted that the Fund may also benefit from economies of scale through initial fee setting, fee waivers and expense reimbursements.
| E. | Profitability and Financial Resources |
The Board reviewed information from Invesco Advisers concerning the costs of the advisory and other services that Invesco Advisers and its affiliates provide to the Fund and the Invesco Funds and the profitability of Invesco Advisers and its affiliates in providing these services. The Board considered the methodology used for calculating profitability and noted the periodic review of such methodology by an independent consultant. The Board noted that Invesco Advisers continues to operate at a net profit from services Invesco Advisers and its affiliates provide to the Invesco Funds. The Board received information from Invesco Advisers demonstrating that Invesco Advisers and the Affiliated Sub-Advisers are financially sound and have the resources necessary to perform their obligations under the investment advisory agreement and sub-advisory contracts.
| F. | Collateral Benefits to Invesco Advisers and its Affiliates |
The Board considered various other benefits received by Invesco Advisers and its affiliates from the relationship with the Fund, including the fees received for providing administrative, transfer agency and distribution services to the Fund. The Board considered comparative information regarding fees charged for these services, including information provided by Broadridge and other independent sources. The Board considered the performance of Invesco Advisers and its affiliates in providing these services and the organizational structure employed to provide these services. The Board also considered that these services are provided to the Fund pursuant to written contracts that are reviewed and approved on an annual basis by the Board; and that the services are required for the operation of the Fund.
The Board considered the benefits realized by Invesco Advisers and the Affiliated Sub-Advisers as a result of portfolio brokerage transactions executed through “soft dollar” arrangements. Invesco Advisers noted that the Fund does not execute brokerage transactions through “soft dollar” arrangements to any significant degree.
The Board considered that the Fund’s uninvested cash and cash collateral from any securities lending arrangements may be invested in money market funds advised by Invesco Advisers pursuant to procedures approved by the Board. The Board noted that Invesco Advisers receives advisory fees from these affiliated money market funds attributable to such investments, although Invesco Advisers has contractually agreed to waive through varying periods the advisory fees payable by the Invesco Funds with respect to certain investments in the affiliated money market funds. The waiver is in an amount equal to 100% of the net advisory fee Invesco Advisers receives from the affiliated money market funds with respect to the Fund’s investment in the affiliated money market funds
of uninvested cash, but not cash collateral. The Board concluded that the amount of advisory fees received by Invesco Advisers from the Fund’s investment of cash collateral from any securities lending arrangements in the affiliated money market funds is fair and reasonable.
33 Invesco World Bond Fund
Tax Information
Form 1099-DIV, Form 1042-S and other year-end tax information provide shareholders with actual calendar year amounts that should be included in their tax returns. Shareholders should consult their tax advisors.
The following distribution information is being provided as required by the Internal Revenue Code or to meet a specific state’s requirement.
The Fund designates the following amounts or, if subsequently determined to be different, the maximum amount allowable for its fiscal year ended October 31, 2018:
| | | | |
Federal and State Income Tax | | | |
Qualified Dividend Income* | |
| 2.25
| %
|
Corporate Dividends Received Deduction* | |
| 2.25
| %
|
U.S. Treasury Obligations* | | | 9.09 | % |
| | * | The above percentages are based on ordinary income dividends paid to shareholders during the Fund’s fiscal year. |
34 Invesco World Bond Fund
Trustees and Officers
The address of each trustee and officer is AIM Investment Funds (Invesco Investment Funds) (the “Trust”), 11 Greenway Plaza, Suite 1000, Houston, Texas 77046-1173. The trustees serve for the life of the Trust, subject to their earlier death, incapacitation, resignation, retirement or removal as more specifically provided in the Trust’s organizational documents. Each officer serves for a one year term or until their successors are elected and qualified. Column two below includes length of time served with predecessor entities, if any.
| | | | | | | | |
Name, Year of Birth and
Position(s) Held with the Trust | | Trustee and/
or Officer Since | | Principal Occupation(s)
During Past 5 Years | | Number of
Funds in Fund
Complex
Overseen by
Trustee | | Other Directorship(s)
Held by Trustee During
Past 5 Years |
| Interested Persons | | | | | | | | |
| Martin L. Flanagan1 — 1960 Trustee | | 2007 | | Executive Director, Chief Executive Officer and President, Invesco Ltd. (ultimate parent of Invesco and a global investment management firm); Trustee, The Invesco Funds; Vice Chair, Investment Company Institute; and Member of Executive Board, SMU Cox School of Business Formerly: Advisor to the Board, Invesco Advisers, Inc. (formerly known as Invesco Institutional (N.A.), Inc.); Chairman and Chief Executive Officer, Invesco Advisers, Inc. (registered investment adviser); Director, Chairman, Chief Executive Officer and President, Invesco Holding Company (US), Inc. (formerly IVZ Inc.) (holding company), Invesco Group Services, Inc. (service provider) and Invesco North American Holdings, Inc. (holding company); Director, Chief Executive Officer and President, Invesco Holding Company Limited (parent of Invesco and a global investment management firm); Director, Invesco Ltd.; Chairman, Investment Company Institute and President, Co-Chief Executive Officer, Co-President, Chief Operating Officer and Chief Financial Officer, Franklin Resources, Inc. (global investment management organization) | | 158 | | None |
Philip A. Taylor2 — 1954 Trustee and Senior Vice President | | 2006 | | Head of the Americas and Senior Managing Director, Invesco Ltd.; Director, Invesco Advisers, Inc. (formerly known as Invesco Institutional (N.A.), Inc.) (registered investment adviser); Director and Chairman, Invesco Investment Services, Inc. (formerly known as Invesco AIM Investment Services, Inc.) (registered transfer agent); Chief Executive Officer, Invesco Corporate Class Inc. (corporate mutual fund company); Director, Chairman and Chief Executive Officer, Invesco Canada Ltd. (formerly known as Invesco Trimark Ltd./Invesco Trimark Ltèe) (registered investment adviser and registered transfer agent); Trustee and Senior Vice President, The Invesco Funds; Director, Invesco Investment Advisers LLC (formerly known as Van Kampen Asset Management) Formerly: Director, Chairman, Chief Executive Officer and President, Invesco Management Group, Inc. (formerly known as Invesco AIM Management Group, Inc.) (financial services holding company); Co-Chairman, Co-President and Co-Chief Executive Officer, Invesco Advisers, Inc. (formerly known as Invesco Institutional (N.A.), Inc.) (registered investment adviser); Director, Chief Executive Officer and President, Van Kampen Exchange Corp; President and Principal Executive Officer, The Invesco Funds (other than AIM Treasurer’s Series Trust (Invesco Treasurer’s Series Trust), Short-Term Investments Trust and Invesco Management Trust); Executive Vice President, The Invesco Funds (AIM Treasurer’s Series Trust (Invesco Treasurer’s Series Trust), Short-Term Investments Trust and Invesco Management Trust only); Director and President, INVESCO Funds Group, Inc. (registered investment adviser and registered transfer agent); Director and Chairman, IVZ Distributors, Inc. (formerly known as INVESCO Distributors, Inc.) (registered broker dealer); Director, President and Chairman, Invesco Inc. (holding company), Invesco Canada Holdings Inc. (holding company), Trimark Investments Ltd./Placements Trimark Ltèe and Invesco Financial Services Ltd/Services Financiers Invesco Ltèe; Chief Executive Officer, Invesco Canada Fund Inc. (corporate mutual fund company); Director and Chairman, Van Kampen Investor Services Inc.; Director, Chief Executive Officer and President, 1371 Preferred Inc. (holding company) and Van Kampen Investments Inc.; Director and President, AIM GP Canada Inc. (general partner for limited partnerships) and Van Kampen Advisors, Inc.; Director and Chief Executive Officer, Invesco Trimark Dealer Inc. (registered broker dealer); Director, Invesco Distributors, Inc. (formerly known as Invesco AIM Distributors, Inc.) (registered broker dealer); Manager, Invesco Capital Management LLC; Director, Chief Executive Officer and President, Invesco Advisers, Inc.; Director, Chairman, Chief Executive Officer and President, Invesco AIM Capital Management, Inc.; President, Invesco Trimark Dealer Inc. and Invesco Trimark Ltd./Invesco Trimark Ltèe; Director and President, AIM Trimark Corporate Class Inc. and AIM Trimark Canada Fund Inc.; Senior Managing Director, Invesco Holding Company Limited; Director and Chairman, Fund Management Company (former registered broker dealer); President and Principal Executive Officer, The Invesco Funds (AIM Treasurer’s Series Trust (Invesco Treasurer’s Series Trust), and Short-Term Investments Trust only); President, AIM Trimark Global Fund Inc. and AIM Trimark Canada Fund Inc. | | 158 | | None |
| 1 | Mr. Flanagan is considered an interested person (within the meaning of Section 2(a)(19) of the 1940 Act) of the Trust because he is an officer of the Adviser to the Trust, and an officer and a director of Invesco Ltd., ultimate parent of the Adviser. |
| 2 | Mr. Taylor is considered an interested person (within the meaning of Section 2(a)(19) of the 1940 Act) of the Trust because he is an officer and a director of the Adviser. |
T-1 Invesco World Bond Fund
Trustees and Officers—(continued)
| | | | | | | | |
Name, Year of Birth and
Position(s) Held with the Trust | | Trustee and/
or Officer Since | | Principal Occupation(s)
During Past 5 Years | | Number of
Funds in Fund
Complex
Overseen by
Trustee | | Other Directorship(s)
Held by Trustee During
Past 5 Years |
| Independent Trustees | | | | | | | | |
Bruce L. Crockett — 1944 Trustee and Chair | | 2001 | | Chairman, Crockett Technologies Associates (technology consulting company) Formerly: Director, Captaris (unified messaging provider); Director, President and Chief Executive Officer, COMSAT Corporation; Chairman, Board of Governors of INTELSAT (international communications company); ACE Limited (insurance company); Independent Directors Council and Investment Company Institute: Member of the Audit Committee, Investment Company Institute; Member of the Executive Committee and Chair of the Governance Committee, Independent Directors Council | | 158 | | Director and Chairman of the Audit Committee, ALPS (Attorneys Liability Protection Society) (insurance company); Director and Member of the Audit Committee and Compensation Committee, Ferroglobe PLC (metallurgical company) |
David C. Arch — 1945 Trustee | | 2010 | | Chairman of Blistex Inc. (consumer health care products manufacturer); Member, World Presidents’ Organization | | 158 | | Board member of the Illinois Manufacturers’ Association |
Jack M. Fields — 1952 Trustee | | 2001 | | Chief Executive Officer, Twenty First Century Group, Inc. (government affairs company); and Chairman, Discovery Learning Alliance (non-profit) Formerly: Owner and Chief Executive Officer, Dos Angeles Ranch L.P. (cattle, hunting, corporate entertainment); Director, Insperity, Inc. (formerly known as Administaff) (human resources provider); Chief Executive Officer, Texana Timber LP (sustainable forestry company); Director of Cross Timbers Quail Research Ranch (non-profit); and member of the U.S. House of Representatives | | 158 | | None |
Cynthia Hostetler — 1962 Trustee | | 2017 | | Non-Executive Director and Trustee of a number of public and private business corporations Formerly: Director, Aberdeen Investment Funds (4 portfolios); Head of Investment Funds and Private Equity, Overseas Private Investment Corporation; President, First Manhattan Bancorporation, Inc.; Attorney, Simpson Thacher & Bartlett LLP | | 158 | | Vulcan Materials Company (construction materials company); Trilinc Global Impact Fund; Artio Global Investment LLC (mutual fund complex); Edgen Group, Inc. (specialized energy and infrastructure products distributor) |
Eli Jones — 1961 Trustee | | 2016 | | Professor and Dean, Mays Business School — Texas A&M University Formerly: Professor and Dean, Walton College of Business, University of Arkansas and E.J. Ourso College of Business, Louisiana State University; Director, Arvest Bank | | 158 | | Insperity, Inc. (formerly known as Administaff) (human resources provider) |
Prema Mathai-Davis — 1950 Trustee | | 2001 | | Retired | | 158 | | None |
Teresa M. Ressel — 1962 Trustee | | 2017 | | Non-executive director and trustee of a number of public and private business corporations Formerly: Chief Financial Officer, Olayan America, The Olayan Group (international investor/commercial/industrial); Chief Executive Officer, UBS Securities LLC; Group Chief Operating Officer, Americas, UBS AG; Assistant Secretary for Management & Budget and CFO, US Department of the Treasury | | 158 | | Atlantic Power Corporation (power generation company); ON Semiconductor Corp. (semiconductor supplier) |
Ann Barnett Stern — 1957 Trustee | | 2017 | | President and Chief Executive Officer, Houston Endowment Inc. (private philanthropic institution) Formerly: Executive Vice President and General Counsel, Texas Children’s Hospital; Attorney, Beck, Redden and Secrest, LLP; Business Law Instructor, University of St. Thomas; Attorney, Andrews & Kurth LLP | | 158 | | Federal Reserve Bank of Dallas |
Raymond Stickel, Jr. — 1944 Trustee | | 2005 | | Retired Formerly: Director, Mainstay VP Series Funds, Inc. (25 portfolios); Partner, Deloitte & Touche | | 158 | | None |
Robert C. Troccoli — 1949 Trustee | | 2016 | | Adjunct Professor, University of Denver — Daniels College of Business Formerly: Senior Partner, KPMG LLP | | 158 | | None |
Christopher L. Wilson — 1957 Trustee | | 2017 | | Non-executive director and trustee of a number of public and private business corporations Formerly: Director, TD Asset Management USA Inc. (mutual fund complex) (22 portfolios); Managing Partner, CT2, LLC (investing and consulting firm); President/Chief Executive Officer, Columbia Funds, Bank of America Corporation; President/Chief Executive Officer, CDC IXIS Asset Management Services, Inc.; Principal & Director of Operations, Scudder Funds, Scudder, Stevens & Clark, Inc.; Assistant Vice President, Fidelity Investments | | 158 | | ISO New England, Inc. (non-profit organization managing regional electricity market) |
T-2 Invesco World Bond Fund
Trustees and Officers—(continued)
| | | | | | | | |
Name, Year of Birth and
Position(s) Held with the Trust | | Trustee and/
or Officer Since | | Principal Occupation(s)
During Past 5 Years | | Number of
Funds in Fund
Complex
Overseen by
Trustee | | Other Directorship(s)
Held by Trustee During
Past 5 Years |
| Other Officers | | | | | | | | |
Sheri Morris — 1964 President, Principal Executive Officer and Treasurer | | 1999 | | President, Principal Executive Officer and Treasurer, The Invesco Funds; Vice President, Invesco Advisers, Inc. (formerly known as Invesco Institutional (N.A.), Inc.) (registered investment adviser); and Vice President, Invesco Exchange-Traded Fund Trust, Invesco Exchange-Traded Fund Trust II, Invesco India Exchange-Traded Fund Trust, Invesco Actively Managed Exchange-Traded Fund Trust, Invesco Actively Managed Exchange-Traded Commodity Fund Trust and Invesco Exchange-Traded Self-Indexed Fund Trust Formerly: Vice President and Principal Financial Officer, The Invesco Funds; Vice President, Invesco AIM Advisers, Inc., Invesco AIM Capital Management, Inc. and Invesco AIM Private Asset Management, Inc.; Assistant Vice President and Assistant Treasurer, The Invesco Funds and Assistant Vice President, Invesco Advisers, Inc., Invesco AIM Capital Management, Inc. and Invesco AIM Private Asset Management, Inc.; and Treasurer, Invesco Exchange-Traded Fund Trust, Invesco Exchange-Traded Fund Trust II, Invesco India Exchange-Traded Fund Trust and Invesco Actively Managed Exchange-Traded Fund Trust | | N/A | | N/A |
Russell C. Burk — 1958 Senior Vice President and Senior Officer | | 2005 | | Senior Vice President and Senior Officer, The Invesco Funds | | N/A | | N/A |
Jeffrey H. Kupor — 1968 Senior Vice President, Chief Legal Officer and Secretary | | 2018 | | Senior Vice President and Secretary, Invesco Advisers, Inc. (formerly known as Invesco Institutional (N.A.), Inc.) (registered investment adviser); Senior Vice President and Secretary, Invesco Distributors, Inc. (formerly known as Invesco AIM Distributors, Inc.); Vice President and Secretary, Invesco Investment Services, Inc. (formerly known as Invesco AIM Investment Services, Inc.) Senior Vice President, Chief Legal Officer and Secretary, The Invesco Funds; Secretary and General Counsel, Invesco Investment Advisers LLC (formerly known as Van Kampen Asset Management); Secretary and General Counsel, Invesco Capital Markets, Inc. (formerly known as Van Kampen Funds Inc.) and Chief Legal Officer, Invesco Exchange-Traded Fund Trust, Invesco Exchange-Traded Fund Trust II, Invesco India Exchange-Traded Fund Trust, Invesco Actively Managed Exchange-Traded Fund Trust, Invesco Actively Managed Exchange-Traded Commodity Fund Trust and Invesco Exchange-Traded Self-Indexed Fund Trust; Secretary, Invesco Indexing LLC; Secretary and General Counsel, INVESCO Private Capital Investments, Inc.; Secretary, W.L. Ross & Co., LLC; Secretary and Vice President, Jemstep, Inc. Formerly: Senior Vice President, Secretary and General Counsel, Invesco Management Group, Inc. (formerly known as Invesco AIM Management Group, Inc.); Assistant Secretary, INVESCO Asset Management (Bermuda) Ltd.; Secretary and General Counsel, Invesco Private Capital, Inc.; Assistant Secretary and General Counsel, INVESCO Realty, Inc.; Secretary and General Counsel, Invesco Senior Secured Management, Inc.; and Secretary, Sovereign G./P. Holdings Inc. | | N/A | | N/A |
John M. Zerr — 1962 Senior Vice President | | 2006 | | Chief Operating Officer of the Americas; Senior Vice President, Invesco Advisers, Inc. (formerly known as Invesco Institutional (N.A.), Inc.) (registered investment adviser); Senior Vice President, Invesco Distributors, Inc. (formerly known as Invesco AIM Distributors, Inc.); Director and Vice President, Invesco Investment Services, Inc. (formerly known as Invesco AIM Investment Services, Inc.) Senior Vice President, The Invesco Funds; Managing Director, Invesco Capital Management LLC; Director, Invesco Investment Advisers LLC (formerly known as Van Kampen Asset Management); Senior Vice President, Invesco Capital Markets, Inc. (formerly known as Van Kampen Funds Inc.); Manager, Invesco Indexing LLC Formerly: Director and Senior Vice President, Invesco Management Group, Inc. (formerly known as Invesco AIM Management Group, Inc.); Secretary and General Counsel, Invesco Management Group, Inc. (formerly known as Invesco AIM Management Group, Inc.); Secretary, Invesco Investment Services, Inc. (formerly known as Invesco AIM Investment Services, Inc.); Chief Legal Officer and Secretary, The Invesco Funds; Secretary and General Counsel, Invesco Investment Advisers LLC (formerly known as Van Kampen Asset Management); Secretary and General Counsel, Invesco Capital Markets, Inc. (formerly known as Van Kampen Funds Inc.); Chief Legal Officer, Invesco Exchange-Traded Fund Trust, Invesco Exchange-Traded Fund Trust II, Invesco India Exchange-Traded Fund Trust, Invesco Actively Managed Exchange-Traded Fund Trust, Invesco Actively Managed Exchange-Traded Commodity Fund Trust and Invesco Exchange-Traded Self-Indexed Fund Trust; Secretary, Invesco Indexing LLC; Director, Secretary, General Counsel and Senior Vice President, Van Kampen Exchange Corp.; Director, Vice President and Secretary, IVZ Distributors, Inc. (formerly known as INVESCO Distributors, Inc.); Director and Vice President, INVESCO Funds Group, Inc.; Director and Vice President, Van Kampen Advisors Inc.; Director, Vice President, Secretary and General Counsel, Van Kampen Investor Services Inc.; Director and Secretary, Invesco Distributors, Inc. (formerly known as Invesco AIM Distributors, Inc.); Director, Senior Vice President, General Counsel and Secretary, Invesco AIM Advisers, Inc. and Van Kampen Investments Inc.; Director, Vice President and Secretary, Fund Management Company; Director, Senior Vice President, Secretary, General Counsel and Vice President, Invesco AIM Capital Management, Inc.; Chief Operating Officer and General Counsel, Liberty Ridge Capital, Inc. (an investment adviser) | | N/A | | N/A |
T-3 Invesco World Bond Fund
Trustees and Officers—(continued)
| | | | | | | | |
Name, Year of Birth and
Position(s) Held with the Trust | | Trustee and/
or Officer Since | | Principal Occupation(s)
During Past 5 Years | | Number of
Funds in Fund
Complex
Overseen by
Trustee | | Other Directorship(s)
Held by Trustee During
Past 5 Years |
| Other Officers—(continued) | | | | | | | | |
Gregory G. McGreevey — 1962 Senior Vice President | | 2012 | | Senior Managing Director, Invesco Ltd.; Director, Chairman, President, and Chief Executive Officer, Invesco Advisers, Inc. (formerly known as Invesco Institutional (N.A.), Inc.) (registered investment adviser); Director, Invesco Mortgage Capital, Inc. and Invesco Senior Secured Management, Inc.; and Senior Vice President, The Invesco Funds Formerly: Senior Vice President, Invesco Management Group, Inc. and Invesco Advisers, Inc.; Assistant Vice President, The Invesco Funds | | N/A | | N/A |
Kelli Gallegos — 1970 Vice President, Principal Financial Officer and Assistant Treasurer | | 2008 | | Vice President and Treasurer, Invesco Exchange-Traded Fund Trust, Invesco Exchange-Traded Fund Trust II, Invesco India Exchange-Traded Fund Trust, Invesco Actively Managed Exchange-Traded Fund Trust, Invesco Actively Managed Exchange-Traded Commodity Fund Trust and Invesco Exchange-Traded Self-Indexed Fund Trust; Vice President, Principal Financial Officer and Assistant Treasurer, The Invesco Funds; Principal Financial and Accounting Officer — Pooled Investments, Invesco Capital Management LLC Formerly: Assistant Treasurer, Invesco Exchange-Traded Fund Trust, Invesco Exchange-Traded Fund Trust II, Invesco India Exchange-Traded Fund Trust, Invesco Actively Managed Exchange-Traded Fund Trust, Invesco Actively Managed Exchange-Traded Commodity Fund Trust and Invesco Exchange-Traded Self-Indexed Fund Trust; Assistant Treasurer, Invesco Capital Management LLC; Assistant Vice President, The Invesco Funds | | N/A | | N/A |
Tracy Sullivan — 1962 Vice President, Chief Tax Officer and Assistant Treasurer | | 2008 | | Vice President, Chief Tax Officer and Assistant Treasurer, The Invesco Funds; Assistant Treasurer, Invesco Capital Management LLC, Invesco Exchange-Traded Fund Trust, Invesco Exchange-Traded Fund Trust II, Invesco India Exchange-Traded Fund Trust, Invesco Actively Managed Exchange-Traded Fund Trust, Invesco Actively Managed Exchange-Traded Commodity Fund Trust and Invesco Exchange-Traded Self-Indexed Fund Trust Formerly: Assistant Vice President, The Invesco Funds | | N/A | | N/A |
Crissie M. Wisdom — 1969 Anti-Money Laundering Compliance Officer | | 2013 | | Anti-Money Laundering Compliance Officer, Invesco Advisers, Inc. (formerly known as Invesco Institutional (N.A.), Inc.) (registered investment adviser), Invesco Capital Markets, Inc. (formerly known as Van Kampen Funds Inc.), Invesco Distributors, Inc., Invesco Investment Services, Inc., The Invesco Funds, and Invesco Exchange-Traded Fund Trust, Invesco Exchange-Traded Fund Trust II, Invesco India Exchange-Traded Fund Trust, Invesco Actively Managed Exchange-Traded Fund Trust, Invesco Actively Managed Exchange-Traded Commodity Fund Trust and Invesco Exchange-Traded Self-Indexed Fund Trust; Anti-Money Laundering Compliance Officer and Bank Secrecy Act Officer, INVESCO National Trust Company and Invesco Trust Company; and Fraud Prevention Manager and Controls and Risk Analysis Manager for Invesco Investment Services, Inc. Formerly: Anti-Money Laundering Compliance Officer, Van Kampen Exchange Corp. and Invesco Management Group, Inc. | | N/A | | N/A |
Robert R. Leveille — 1969 Chief Compliance Officer | | 2016 | | Chief Compliance Officer, Invesco Advisers, Inc. (registered investment adviser); and Chief Compliance Officer, The Invesco Funds Formerly: Chief Compliance Officer, Putnam Investments and the Putnam Funds | | N/A | | N/A |
The Statement of Additional Information of the Trust includes additional information about the Fund’s Trustees and is available upon request, without charge, by calling 1.800.959.4246. Please refer to the Fund’s Statement of Additional Information for information on the Fund’s sub-advisers.
| | | | | | |
Office of the Fund 11 Greenway Plaza, Suite 1000 Houston, TX 77046-1173 | | Investment Adviser Invesco Advisers, Inc. 1555 Peachtree Street, N.E. Atlanta, GA 30309 | | Distributor Invesco Distributors, Inc. 11 Greenway Plaza, Suite 1000 Houston, TX 77046-1173 | | Auditors PricewaterhouseCoopers LLP 1000 Louisiana Street, Suite 5800 Houston, TX 77002-5021 |
| | | |
| | | | | | |
Counsel to the Fund Stradley Ronon Stevens & Young, LLP 2005 Market Street, Suite 2600 Philadelphia, PA 19103-7018 | | Counsel to the Independent Trustees Goodwin Procter LLP 901 New York Avenue, N.W. Washington, D.C. 20001 | | Transfer Agent Invesco Investment Services, Inc. 11 Greenway Plaza, Suite 1000 Houston, TX 77046-1173 | | Custodian State Street Bank and Trust Company 225 Franklin Street Boston, MA 02110-2801 |
T-4 Invesco World Bond Fund
Explore High-Conviction Investing with Invesco

Go paperless with eDelivery
Visit invesco.com/edelivery to enjoy the convenience and security of anytime electronic access to your investment documents.
With eDelivery, you can elect to have any or all of the following materials delivered straight to your inbox to download, save and print from your own computer:
∎ Fund reports and prospectuses
∎ Quarterly statements
∎ Daily confirmations
∎ Tax forms
Invesco mailing information
Send general correspondence to Invesco Investment Services, Inc., P.O. Box 219078, Kansas City, MO 64121-9078.
Important notice regarding delivery of security holder documents
To reduce Fund expenses, only one copy of most shareholder documents may be mailed to shareholders with multiple accounts at the same address (Householding). Mailing of your shareholder documents may be householded indefinitely unless you instruct us otherwise. If you do not want the mailing of these documents to be combined with those for other members of your household, please contact Invesco Investment Services, Inc. at 800 959 4246 or contact your financial institution. We will begin sending you individual copies for each account within 30 days after receiving your request.
Fund holdings and proxy voting information
The Fund provides a complete list of its holdings four times in each fiscal year, at the quarter ends. For the second and fourth quarters, the lists appear in the Fund’s semiannual and annual reports to shareholders. For the first and third quarters, the Fund files the lists with the Securities and Exchange Commission (SEC) on Form N-Q (or any successor Form). The most recent list of portfolio holdings is available at invesco.com/completeqtrholdings. Shareholders can also look up the Fund’s Forms N-Q (or any successor Form) on the SEC website at sec.gov. The SEC file numbers for the Fund are shown below.
A description of the policies and procedures that the Fund uses to determine how to vote proxies relating to portfolio securities is available without charge, upon request, from our Client Services department at 800 959 4246 or at invesco.com/proxyguidelines. The information is also available on the SEC website, sec.gov.
| | |
Information regarding how the Fund voted proxies related to its portfolio securities during the most recent 12-month period ended June 30 is available at invesco.com/proxysearch. The information is also available on the SEC website, sec.gov. Invesco Advisers, Inc. is an investment adviser; it provides investment advisory services to individual and institutional clients and does not sell securities. Invesco Distributors, Inc. is the US distributor for Invesco Ltd.’s retail mutual funds, exchange-traded funds and institutional money market funds. Both are wholly owned, indirect subsidiaries of Invesco Ltd. | | 
|
| | | | | | | | |
| SEC file numbers: 811-05426 and 033-19338 | | Invesco Distributors, Inc. | | WBD-AR-1 | | 12272018 | | 0730 |
ITEM 2. CODE OF ETHICS.
On May 2, 2018, the Board of Trustees of the Invesco Funds amended the Code of Ethics (the “Code”) that applies to the Registrant’s Principal Executive Officer (“PEO”) and Principal Financial Officer (“PFO”) during the period covered by the report. The Registrant did not grant any waivers, including implicit waivers, from any provisions of the Code to the PEO or PFO during the period covered by this report.
ITEM 3. AUDIT COMMITTEE FINANCIAL EXPERT.
The Board of Trustees has determined that the Registrant has at least one audit committee financial expert serving on its Audit Committee. The Audit Committee financial experts are David C. Arch, Bruce L. Crockett, Cynthia Hostetler, Teresa M. Ressel, Raymond Stickel, Jr. and Robert C. Troccoli. David C. Arch, Bruce L. Crockett, Cynthia Hostetler, Teresa M. Ressel, Raymond Stickel, Jr. and Robert Troccoli are “independent” within the meaning of that term as used in Form N-CSR.
ITEM 4. PRINCIPAL ACCOUNTANT FEES AND SERVICES.
PricewaterhouseCoopers LLP (“PwC”) informed the Trust that it has identified an issue related to its independence under Rule 2-01(c)(1)(ii)(A) of Regulation S-X (referred to as the Loan Rule). The Loan Rule prohibits accounting firms, such as PricewaterhouseCoopers LLP, from being deemed independent if they have certain financial relationships with their audit clients or certain affiliates of those clients. The Trust is required under various securities laws to have its financial statements audited by an independent accounting firm.
The Loan Rule specifically provides that an accounting firm would not be independent if it or certain affiliates and covered persons receives a loan from a lender that is a record or beneficial owner of more than ten percent of an audit client’s equity securities (referred to as a “more than ten percent owner”). For purposes of the Loan Rule, audit clients include the Funds as well as all registered investment companies advised by the Adviser and its affiliates, including other subsidiaries of the Adviser’s parent company, Invesco Ltd. (collectively, the Invesco Fund Complex). PricewaterhouseCoopers LLP informed the Trust it and certain affiliates and covered persons have relationships with lenders who hold, as record owner, more than ten percent of the shares of certain funds within the Invesco Fund Complex.
On June 20, 2016, the SEC Staff issued a “no-action” letter to another mutual fund complex (see Fidelity Management & Research Company et al., No-Action Letter) related to the audit independence issue described above. In that letter, the SEC confirmed that it would not recommend enforcement action against a fund that relied on audit services performed by an audit firm that was not in compliance with the Loan Rule in certain specified circumstances. On May 2, 2018, the SEC proposed amendments to the Loan Rule that, if adopted as proposed, would address many of the issues that led to issuance of the no-action letter. In connection with prior independence determinations, PricewaterhouseCoopers LLP communicated, as contemplated by the no-action letter, that it believes that it remains objective and impartial and that a reasonable investor possessing all the facts would conclude that PricewaterhouseCoopers LLP is able to exhibit the requisite objectivity and impartiality to report on the Funds’ financial statements as the independent registered public accounting firm. PricewaterhouseCoopers LLP also represented that it has complied with PCAOB Rule 3526(b)(1) and (2), which are conditions to the Funds relying on the no action letter, and affirmed that it is an independent accountant within the meaning of PCAOB Rule 3520. Therefore, the Adviser, the Funds and PricewaterhouseCoopers LLP concluded that PricewaterhouseCoopers LLP could continue as the Funds’ independent registered public accounting firm. The Invesco Fund Complex relied upon the no-action letter in reaching this conclusion.
If in the future the independence of PricewaterhouseCoopers LLP is called into question under the Loan Rule by circumstances that are not addressed in the SEC’s no-action letter, the Funds will need to take other action in order for the Funds’ filings with the SEC containing financial statements to be deemed compliant with applicable securities laws. Such additional actions could result in additional costs, impair the ability of the Funds to issue new shares or have other material adverse effects on the Funds. The SEC no-action relief was initially set to expire 18 months from issuance but has been extended by the SEC without an expiration date, except that the no-action letter will be withdrawn upon the effectiveness of any amendments to the Loan Rule designed to address the concerns expressed in the letter.
PwC advised the Registrant’s Audit Committee that PwC had identified two matters for consideration under the SEC’s auditor independence rules. PwC stated that a PwC manager and a PwC Senior Manager each held financial interests in investment companies within the Invesco Fund complex that were inconsistent with the requirements of Rule 2-01(c)(1) of Regulation S-X.
PwC advised the Audit Committee that it believes its objectivity and impartiality had not been adversely affected by these matters as they related to the audit of the Registrant. In reaching this conclusion, PwC noted, among other things, that during the time of its audit, the engagement team was not aware of the investments, neither individual was in the chain of command of the audit or the audit partners of Invesco or the affiliate of the Registrant, the services each individual provided were not relied upon by the audit engagement team with respect to the audit of the affiliate of the Registrant and the investments were not material to the net worth of either individual or their immediate family members.
(a) to (d)
Fees Billed by PwC Related to the Registrant
PwC billed the Registrant aggregate fees for services rendered to the Registrant for the last two fiscal years as follows:
| | | | | | | | | | |
| | | Fees Billed for Services
Rendered to the
Registrant for fiscal year
end 2018 | | Fees Billed for
Services Rendered to
the Registrant for
fiscal year end 2017 |
| | |
Audit Fees | | | $ | 942,000 | | | | $ | 821,050 | |
Audit-Related Fees(1) | | | $ | 0 | | | | $ | 13,500 | |
Tax Fees(2) | | | $ | 298,550 | | | | $ | 488,039 | |
All Other Fees | | | $ | 0 | | | | $ | 0 | |
| | | | | | | | | | |
Total Fees | | | $ | 1,240,550 | | | | $ | 1,322,589 | |
(g) PwC billed the Registrant aggregate non-audit fees of $298,550 for the fiscal year ended 2018, and $501,539 for the fiscal year ended 2017, for non-audit services rendered to the Registrant. | |
| | (1) | Audit-Related Fees for the fiscal year end 2017 include fees billed for reviewing regulatory filings. |
| | (2) | Tax Fees for the fiscal year end October 31, 2018 includes fees billed for reviewing tax returns and/or services related to tax compliance. Tax Fees for fiscal year end October 31, 2017 includes fees billed for reviewing tax returns and/or services related to tax compliance. |
Fees Billed by PwC Related to Invesco and Invesco Affiliates
PwC billed Invesco Advisers, Inc. (“Invesco”), the Registrant’s adviser, and any entity controlling, controlled by or under common control with Invesco that provides ongoing services to the Registrant (“Invesco Affiliates”) aggregate fees for pre-approved non-audit services rendered to Invesco and Invesco Affiliates for the last two fiscal years as follows:
| | | | | | | | | | |
| | | Fees Billed for Non-Audit Services
Rendered to Invesco and Invesco
Affiliates for fiscal year end 2018
That Were Required to be Pre-Approved by the Registrant’s Audit Committee | | Fees Billed for Non-Audit Services
Rendered to Invesco and Invesco
Affiliates for fiscal year end 2017 That
Were Required to be Pre-Approved by the Registrant’s Audit Committee |
| | |
Audit-Related Fees(1) | | | $ | 662,000 | | | | $ | 662,000 | |
Tax Fees | | | $ | 0 | | | | $ | 0 | |
All Other Fees(2) | | | $ | 0 | | | | $ | 1,245,000 | |
| | | | | | | | | | |
Total Fees | | | $ | 662,000 | | | | $ | 1,907,000 | |
| | (1) | Audit-Related Fees for the year end 2018 include fees billed related to reviewing controls at a service organization. Audit-Related Fees for the year end 2017 include fees billed related to reviewing controls at a service organization. |
| | (2) | All Other Fees for the year end 2017 include fees billed related to the assessments for certain of the company’s risk management tools, current state analysis against regulatory requirements and identification of structural and organizational alternatives, informed by industry practices, for certain of the company’s administrative activities and functions. |
(e)(2) There were no amounts that were pre-approved by the Audit Committee pursuant to the de minimis exception under Rule 2-01 of Regulation S-X.
(g) Including the fees for services not required to be pre-approved by the registrant’s audit committee, PwC billed Invesco and Invesco Affiliates aggregate non-audit fees of $3,639,000 for the fiscal year ended October 31, 2018, and $4,890,000 for the fiscal year ended October 31, 2017, for non-audit services rendered to Invesco and Invesco Affiliates.
PwC provided audit services to the Investment Company complex of approximately $24 million.
(h) The Audit Committee also has considered whether the provision of non-audit services that were rendered to Invesco and Invesco Affiliates that were not required to be pre-approved pursuant to SEC regulations, if any, is compatible with maintaining PwC’s independence.
(e)(1)
PRE-APPROVAL OF AUDIT AND NON-AUDIT SERVICES
POLICIES AND PROCEDURES
As adopted by the Audit Committees
of the Invesco Funds (the “Funds”)
Last Amended March 29, 2017
| | I. | Statement of Principles |
The Audit Committees (the “Audit Committee”) of the Boards of Trustees of the Funds (the “Board”) have adopted these policies and procedures (the “Procedures”) with respect to the pre-approval of audit and non-audit services to be provided by the Funds’ independent auditor (the “Auditor”) to the Funds, and to the Funds’ investment adviser(s) and any entity controlling, controlled by, or under common control with the investment adviser(s) that provides ongoing services to the Funds (collectively, “Service Affiliates”).
Under Section 202 of the Sarbanes-Oxley Act of 2002, all audit and non-audit services provided to the Funds by the Auditor must be preapproved by the Audit Committee. Rule 2-01 of Regulation S-X requires that the Audit Committee also pre-approve a Service Affiliate’s engagement of the Auditor for non-audit services if the engagement relates directly to the operations and financial reporting of the Funds (a “Service Affiliate’s Covered Engagement”).
These Procedures set forth the procedures and the conditions pursuant to which the Audit Committee may pre-approve audit and non-audit services for the Funds and a Service Affiliate’s Covered Engagement pursuant to rules and regulations of the Securities and Exchange Commission (“SEC”) and other organizations and regulatory bodies applicable to the Funds (“Applicable Rules”).1 They address both general pre-approvals without consideration of specific case-by-case services (“general pre-approvals”) and pre-approvals on a case-by-case basis (“specific pre-approvals”). Any services requiring pre-approval that are not within the scope of general pre-approvals hereunder are subject to specific pre-approval. These Procedures also address the delegation by the Audit Committee of pre-approval authority to the Audit Committee Chair or Vice Chair.
| | II. | Pre-Approval of Fund Audit Services |
The annual Fund audit services engagement, including terms and fees, is subject to specific pre-approval by the Audit Committee. Audit services include the annual financial statement audit and other procedures required to be performed by an independent auditor to be able to form an opinion on the Funds’ financial statements. The Audit Committee will receive, review and consider sufficient information concerning a proposed Fund audit engagement to make a reasonable evaluation of the Auditor’s qualifications and independence. The Audit Committee will oversee the Fund audit services engagement as necessary, including approving any changes in terms, audit scope, conditions and fees.
In addition to approving the Fund audit services engagement at least annually and specifically approving any changes, the Audit Committee may generally or specifically pre-approve engagements for other audit services, which are those services that only an independent auditor reasonably can provide. Other audit services may include services associated with SEC registration statements, periodic reports and other documents filed with the SEC.
| | III. | General and Specific Pre-Approval of Non-Audit Fund Services |
1 Applicable Rules include, for example, New York Stock Exchange (“NYSE”) rules applicable to closed-end funds managed by Invesco and listed on NYSE.
The Audit Committee will consider, at least annually, the list of General Pre-Approved Non-Audit Services which list may be terminated or modified at any time by the Audit Committee. To inform the Audit Committee’s review and approval of General Pre-Approved Non-Audit Services, the Funds’ Treasurer (or his or her designee) and Auditor shall provide such information regarding independence or other matters as the Audit Committee may request.
Any services or fee ranges that are not within the scope of General Pre-Approved Non-Audit Services have not received general pre-approval and require specific pre-approval. Each request for specific pre-approval by the Audit Committee for services to be provided by the Auditor to the Funds must be submitted to the Audit Committee by the Funds’ Treasurer (or his or her designee) and must include detailed information about the services to be provided, the fees or fee ranges to be charged, and other relevant information sufficient to allow the Audit Committee to consider whether to pre-approve such engagement, including evaluating whether the provision of such services will impair the independence of the Auditor and is otherwise consistent with Applicable Rules.
| | IV. | Non-Audit Service Types |
The Audit Committee may provide either general or specific pre-approval of audit-related, tax or other services, each as described in more detail below.
“Audit-related services” are assurance and related services that are reasonably related to the performance of the audit or review of the Fund’s financial statements or that are traditionally performed by an independent auditor. Audit-related services include, among others, accounting consultations related to accounting, financial reporting or disclosure matters not classified as “Audit services”; assistance with understanding and implementing new accounting and financial reporting guidance from rulemaking authorities; services related to mergers, acquisitions or dispositions; compliance with ratings agency requirements and interfund lending activities; and assistance with internal control reporting requirements.
“Tax services” include, but are not limited to, the review and signing of the Funds’ federal tax returns, the review of required distributions by the Funds and consultations regarding tax matters such as the tax treatment of new investments or the impact of new regulations. The Audit Committee will not approve proposed services of the Auditor which the Audit Committee believes are to be provided in connection with a service or transaction initially recommended by the Auditor, the sole business purpose of which may be tax avoidance and the tax treatment of which may not be supported in the Internal Revenue Code and related regulations. The Audit Committee will consult with the Funds’ Treasurer (or his or her designee) and may consult with outside counsel or advisers as necessary to ensure the consistency of tax services rendered by the Auditor with the foregoing policy. The Auditor shall not represent any Fund or any Service Affiliate before a tax court, district court or federal court of claims.
Each request to provide tax services under either the general or specific pre-approval of the Audit Committee will include a description from the Auditor in writing of (i) the scope of the service, the fee structure for the engagement, and any side letter or other amendment to the engagement letter, or any other agreement (whether oral, written, or otherwise) between the Auditor and the Funds, relating to the service; and (ii) any compensation arrangement or other agreement, such as a referral agreement, a referral fee or fee-sharing arrangement, between the Auditor (or an affiliate of the Auditor) and any person (other than the Funds or Service Affiliates
receiving the services) with respect to the promoting, marketing, or recommending of a transaction covered by the service. The Auditor will also discuss with the Audit Committee the potential effects of the services on the independence of the Auditor, and document the substance of its discussion with the Audit Committee.
The Audit Committee may pre-approve other non-audit services so long as the Audit Committee believes that the service will not impair the independence of the Auditor. Appendix I includes a list of services that the Auditor is prohibited from performing by the SEC rules. Appendix I also includes a list of services that would impair the Auditor’s independence unless the Audit Committee reasonably concludes that the results of the services will not be subject to audit procedures during an audit of the Funds’ financial statements.
| | V. | Pre-Approval of Service Affiliate’s Covered Engagements |
Rule 2-01 of Regulation S-X requires that the Audit Committee pre-approve a Service Affiliate’s engagement of the Auditor for non-audit services if the engagement relates directly to the operations and financial reporting of the Funds, defined above as a “Service Affiliate’s Covered Engagement”.
The Audit Committee may provide either general or specific pre-approval of any Service Affiliate’s Covered Engagement, including for audit-related, tax or other services, as described above, if the Audit Committee believes that the provision of the services to a Service Affiliate will not impair the independence of the Auditor with respect to the Funds. Any Service Affiliate’s Covered Engagements that are not within the scope of General Pre-Approved Non-Audit Services have not received general pre-approval and require specific pre-approval.
Each request for specific pre-approval by the Audit Committee of a Service Affiliate’s Covered Engagement must be submitted to the Audit Committee by the Funds’ Treasurer (or his or her designee) and must include detailed information about the services to be provided, the fees or fee ranges to be charged, a description of the current status of the pre-approval process involving other audit committees in the Invesco investment company complex (as defined in Rule 2-201 of Regulation S-X) with respect to the proposed engagement, and other relevant information sufficient to allow the Audit Committee to consider whether the provision of such services will impair the independence of the Auditor from the Funds. Additionally, the Funds’ Treasurer (or his or her designee) and the Auditor will provide the Audit Committee with a statement that the proposed engagement requires pre-approval by the Audit Committee, the proposed engagement, in their view, will not impair the independence of the Auditor and is consistent with Applicable Rules, and the description of the proposed engagement provided to the Audit Committee is consistent with that presented to or approved by the Invesco audit committee.
Information about all Service Affiliate engagements of the Auditor for non-audit services, whether or not subject to pre-approval by the Audit Committee, shall be provided to the Audit Committee at least quarterly, to allow the Audit Committee to consider whether the provision of such services is compatible with maintaining the Auditor’s independence from the Funds. The Funds’ Treasurer and Auditor shall provide the Audit Committee with sufficiently detailed information about the scope of services provided and the fees for such services, to ensure that the
Audit Committee can adequately consider whether the provision of such services is compatible with maintaining the Auditor’s independence from the Funds.
| | VI. | Pre-Approved Fee Levels or Established Amounts |
Pre-approved fee levels or ranges for audit and non-audit services to be provided by the Auditor to the Funds, and for a Service Affiliate’s Covered Engagement, under general pre-approval or specific pre-approval will be set periodically by the Audit Committee. Any proposed fees exceeding 110% of the maximum pre-approved fee levels or ranges for such services or engagements will be promptly presented to the Audit Committee and will require specific pre-approval by the Audit Committee before payment of any additional fees is made.
The Audit Committee hereby delegates, subject to the dollar limitations set forth below, specific authority to its Chair, or in his or her absence, Vice Chair, to pre-approve audit and non-audit services proposed to be provided by the Auditor to the Funds and/or a Service Affiliate’s Covered Engagement, between Audit Committee meetings. Such delegation does not preclude the Chair or Vice Chair from declining, on a case by case basis, to exercise his or her delegated authority and instead convening the Audit Committee to consider and pre-approve any proposed services or engagements.
Notwithstanding the foregoing, the Audit Committee must pre-approve: (a) any non-audit services to be provided to the Funds for which the fees are estimated to exceed $500,000; (b) any Service Affiliate’s Covered Engagement for which the fees are estimated to exceed $500,000; or (c) any cost increase to any previously approved service or engagement that exceeds the greater of $250,000 or 50% of the previously approved fees up to a maximum increase of $500,000.
| | VIII. | Compliance with Procedures |
Notwithstanding anything herein to the contrary, failure to pre-approve any services or engagements that are not required to be pre-approved pursuant to the de minimis exception provided for in Rule 2-01(c)(7)(i)(C) of Regulation S-X shall not constitute a violation of these Procedures. The Audit Committee has designated the Funds’ Treasurer to ensure services and engagements are pre-approved in compliance with these Procedures. The Funds’ Treasurer will immediately report to the Chair of the Audit Committee, or the Vice Chair in his or her absence, any breach of these Procedures that comes to the attention of the Funds’ Treasurer or any services or engagements that are not required to be pre-approved pursuant to the de minimis exception provided for in Rule 2-01(c)(7)(i)(C) of Regulation S-X.
On at least an annual basis, the Auditor will provide the Audit Committee with a summary of all non-audit services provided to any entity in the investment company complex (as defined in section 2-01(f)(14) of Regulation S-X, including the Funds and Service Affiliates) that were not pre-approved, including the nature of services provided and the associated fees.
| | IX. | Amendments to Procedures |
All material amendments to these Procedures must be approved in advance by the Audit Committee. Non-material amendments to these Procedures may be made by the Legal and Compliance Departments and will be reported to the Audit Committee at the next regularly scheduled meeting of the Audit Committee.
Appendix I
Non-Audit Services That May Impair the Auditor’s Independence
The Auditor is not independent if, at any point during the audit and professional engagement, the Auditor provides the following non-audit services:
| | ● | | Broker-dealer, investment adviser, or investment banking services ; |
| | ● | | Expert services unrelated to the audit; |
| | ● | | Any service or product provided for a contingent fee or a commission; |
| | ● | | Services related to marketing, planning, or opining in favor of the tax treatment of confidential transactions or aggressive tax position transactions, a significant purpose of which is tax avoidance; |
| | ● | | Tax services for persons in financial reporting oversight roles at the Fund; and |
| | ● | | Any other service that the Public Company Oversight Board determines by regulation is impermissible. |
An Auditor is not independent if, at any point during the audit and professional engagement, the Auditor provides the following non-audit services unless it is reasonable to conclude that the results of the services will not be subject to audit procedures during an audit of the Funds’ financial statements:
| | ● | | Bookkeeping or other services related to the accounting records or financial statements of the audit client; |
| | ● | | Financial information systems design and implementation; |
| | ● | | Appraisal or valuation services, fairness opinions, or contribution-in-kind reports; |
| | ● | | Actuarial services; and |
| | ● | | Internal audit outsourcing services. |
ITEM 5. AUDIT COMMITTEE OF LISTED REGISTRANTS.
Not applicable.
ITEM 6. SCHEDULE OF INVESTMENTS.
Investments in securities of unaffiliated issuers is included as part of the reports to stockholders filed under Item 1 of this Form.
| ITEM 7. | DISCLOSURE OF PROXY VOTING POLICIES AND PROCEDURES FOR CLOSED-END MANAGEMENT INVESTMENT COMPANIES. |
Not applicable.
| ITEM 8. | PORTFOLIO MANAGERS OF CLOSED-END MANAGEMENT COMPANIES. |
Not applicable.
| ITEM 9. | PURCHASES OF EQUITY SECURITIES BY CLOSED-END MANAGEMENT INVESTMENT COMPANY AND AFFILIATED PURCHASERS. |
Not applicable.
| ITEM 10. | SUBMISSION OF MATTERS TO A VOTE OF SECURITY HOLDERS. |
None
| ITEM 11. | CONTROLS AND PROCEDURES. |
| (a) | As of December 20, 2018, an evaluation was performed under the supervision and with the participation of the officers of the Registrant, including the PEO and PFO, to assess the effectiveness of the Registrant’s disclosure controls and procedures, as that term is defined in Rule 30a-3(c) under the Investment Company Act of 1940 (the “Act”), as amended. Based on that evaluation, the Registrant’s officers, including the PEO and PFO, concluded that, as of December 20, 2018, the Registrant’s disclosure controls and procedures were reasonably designed to ensure: (1) that information required to be disclosed by the Registrant on Form N-CSR is recorded, processed, summarized and reported within the time periods specified by the rules and forms of the Securities and Exchange Commission; and (2) that material information relating to the Registrant is made known to the PEO and PFO as appropriate to allow timely decisions regarding required disclosure. |
| (b) | There have been no changes in the Registrant’s internal control over financial reporting (as defined in Rule 30a-3(d) under the Act) that occurred during the second fiscal quarter of the period covered by this report that have materially affected, or are reasonably likely to materially affect, the Registrant’s internal control over financial reporting. |
| ITEM 12. | DISCLOSURE OF SECURITIES LENDING ACTIVITIES FOR CLOSED-END MANAGEMENT INVESTMENT COMPANIES. |
Not applicable.
| 13(a) (2) | Certifications of principal executive officer and principal financial officer as required by Rule 30a-2(a) under the Investment Company Act of 1940. |
| 13(b) | Certifications of principal executive officer and principal financial officer as required by Rule 30a-2(b) under the Investment Company Act of 1940. |
SIGNATURES
Pursuant to the requirements of the Securities Exchange Act of 1934 and the Investment Company Act of 1940, the Registrant has duly caused this report to be signed on its behalf by the undersigned, thereunto duly authorized.
Registrant: AIM Investment Funds (Invesco Investment Funds)
| | |
| By: | | /s/ Sheri Morris |
| | Sheri Morris |
| | Principal Executive Officer |
| |
| Date: | | January 4, 2019 |
Pursuant to the requirements of the Securities and Exchange Act of 1934 and the Investment Company Act of 1940, this report has been signed below by the following persons on behalf of the Registrant and in the capacities and on the dates indicated.
| | |
| By: | | /s/ Sheri Morris |
| | Sheri Morris |
| | Principal Executive Officer |
| |
| Date: | | January 4, 2019 |
| | |
| By: | | /s/ Kelli Gallegos |
| | Kelli Gallegos |
| | Principal Financial Officer |
| |
| Date: | | January 4, 2019 |
EXHIBIT INDEX
| | |
| 13(a) (1) | | Code of Ethics. |
| |
| 13(a) (2) | | Certifications of principal executive officer and principal financial officer as required by Rule 30a-2(a) under the Investment Company Act of 1940. |
| |
| 13(a) (3) | | Not applicable. |
| |
| 13(a) (4) | | Not applicable. |
