UNITED STATES
SECURITIES AND EXCHANGE COMMISSION
Washington, D.C. 20549
FORMN-CSR
CERTIFIED SHAREHOLDER REPORT OF REGISTERED
MANAGEMENT INVESTMENT COMPANIES
Investment Company Act file number 811-05426
AIM Investment Funds (Invesco Investment Funds)
(Exact name of registrant as specified in charter)
11 Greenway Plaza, Suite 1000 Houston, Texas 77046
(Address of principal executive offices) (Zip code)
Sheri Morris 11 Greenway Plaza, Suite 1000 Houston, Texas 77046
(Name and address of agent for service)
Registrant’s telephone number, including area code: (713)626-1919
Date of fiscal year end: October 31
Date of reporting period: 10/31/19
| Item 1. | Reports to Stockholders. |
| | | | | | |
 | | | | Annual Report 10/31/2019 Annual Report 9/30/2019 | | |
| | | | |
| | | | Invesco Oppenheimer Global Strategic Income Fund* Beginning on January 1, 2021, as permitted by regulations adopted by the Securities and Exchange Commission, paper copies of the Fund’s shareholder reports will no longer be sent by mail, unless you specifically request paper copies of the reports from the Fund or from your financial intermediary, such as a broker-dealer or bank. Instead, the reports will be made available on the Fund’s website, and you will be notified by mail each time a report is posted and provided with a website link to access the report. If you already elected to receive shareholder reports electronically, you will not be affected by this change and you need not take any action. You may elect to receive shareholder reports and other communications from the Fund electronically by contacting your financial intermediary (such as a broker-dealer or bank) or, if you are a direct investor, by enrolling at invesco.com/edelivery. You may elect to receive all future reports in paper free of charge. If you invest through a financial intermediary, you can contact your financial intermediary to request that you continue to receive paper copies of your shareholder reports. If you invest directly with the Fund, you can call 800 959 4246 to let the Fund know you wish to continue receiving paper copies of your shareholder reports. Your election to receive reports in paper will apply to all funds held with your financial intermediary or all funds held with the fund complex if you invest directly with the Fund. *Prior to the close of business on May 24, 2019, the Fund’s name was Oppenheimer Global Strategic Income Fund. See Important Update on the following page for more information. |
Important Update
On October 18, 2018, Massachusetts Mutual Life Insurance Company, an indirect corporate parent of OppenheimerFunds, Inc. and its subsidiaries OFI Global Asset Management, Inc., OFI SteelPath, Inc. and OFI Advisors, LLC, announced that it had entered into an agreement whereby Invesco Ltd., a global investment management company would acquire OppenheimerFunds and its subsidiaries (together, “OppenheimerFunds”). After the close of business on May 24, 2019 Invesco Ltd. completed the acquisition of OppenheimerFunds. This Fund was included in that acquisition and as of that date, became part of the Invesco family of funds. Please visit invesco.com for more information or call Invesco’s Client Services team at 800-959-4246.
Table of Contents
Class A Shares
AVERAGE ANNUAL TOTAL RETURNS AT 10/31/19
| | | | | | |
| | | Class A Shares of the Fund | | |
| | Without Sales Charge | | With Sales Charge | | Bloomberg Barclays
U.S. Aggregate Bond
Index |
| 1-Year | | 7.96% | | 3.42% | | 11.51% |
| 5-Year | | 2.47 | | 1.61 | | 3.24 |
| 10-Year | | 4.66 | | 4.22 | | 3.73 |
|
AVERAGE ANNUAL TOTAL RETURNS AT 9/30/19 |
| | | Class A Shares of the Fund | | |
| | Without Sales Charge | | With Sales Charge | | Bloomberg Barclays
U.S. Aggregate Bond
Index |
| 1-Year | | 5.25% | | 0.65% | | 10.30% |
| 5-Year | | 2.38 | | 1.51 | | 3.38 |
| 10-Year | | 4.69 | | 4.25 | | 3.75 |
3 INVESCO OPPENHEIMER GLOBAL STRATEGIC INCOME FUND
Performance quoted is past performance and cannot guarantee comparable future results; current performance may be lower or higher. Visit invesco.com for the most recent month-end performance. Performance figures reflect reinvested distributions and changes in net asset value (NAV). Investment return and principal value will vary so that you may have a gain or a loss when you sell shares. Fund returns include changes in share price, reinvested distributions and a 4.25% maximum applicable sales charge except where “without sales charge” is indicated. Returns for periods of less than one year are cumulative and not annualized. As the result of a reorganization after the close of business on May 24, 2019, the returns of the Fund for periods on or prior to May 24, 2019 reflect performance of the Oppenheimer predecessor fund. Share class returns will differ from those of the predecessor fund because they have different expenses. Returns do not consider capital gains or income taxes on an individual’s investment. See Fund prospectus and summary prospectus for more information on share classes, sales charges and new fee agreements, if any. Fund literature is available at invesco.com.
4 INVESCO OPPENHEIMER GLOBAL STRATEGIC INCOME FUND
Fund Performance Discussion
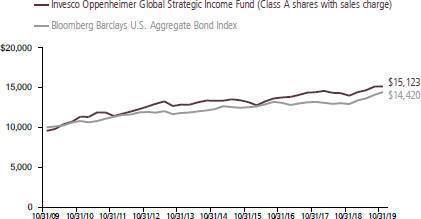
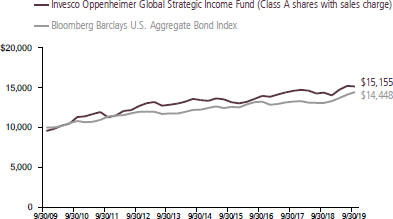
For the one-year period ended September 30, 2019, the Fund’s Class A shares (without sales charge) returned 5.25%, underperforming the Bloomberg Barclays U.S. Aggregate Bond Index (the “Index”), which returned 10.30%. For the one-year period ended October 31, 2019, the Fund’s Class A shares (without sales charge) returned 7.96%, underperforming the Index, which returned 11.51%. Please note that the fiscal year-end for Invesco Oppenheimer Strategic Income Fund has changed from September 30 to October 31. Therefore, the period covered by this discussion is from September 30, 2018, the date of the last annual report, through October 31, 2019, the Fund’s new fiscal year-end.
| | | | |
MARKET OVERVIEW | | | | |
| After hitting a wall to close 2018, 2019 has been volatile and eventful through September 30, 2019. In the last quarter of 2018, several shocks negatively affected market sentiment. The U.S. Federal Reserve (Fed) once again decided to hike interest rates, as was nearly universally expected, but the post-meeting conference was more hawkish than expected. | | | | Markets were expecting a clear message that the Fed might consider a pause in any future rate increases, but that was not initially communicated. Equity markets sold off, bonds rallied, and the U.S. dollar weakened. The sell-offs were sizable, which led some to think a recession might be imminent. As 2019 began, rising global growth concerns came to the |
COMPARISON OF CHANGE IN VALUE OF $10,000 HYPOTHETICAL INVESTMENTS IN:
5 INVESCO OPPENHEIMER GLOBAL STRATEGIC INCOME FUND
forefront. In January, we saw the strongest indications yet that the game plan may be changing. As 2019 progressed, the Fed cut rates as it dealt with an array of both global and domestic concerns. Q2 started with some hopes for stabilization, with China’s stimulus kicking in, U.S. data recovering from weakness in Q1, but these positive signs proved premature. Due to renewed tensions in the U.S.-China trade dispute and increasing risks regarding global trade, industrial production and global trade weakened noticeably. For most of the world, growth projections were revised down. Recent data show that trade policy uncertainty is taking its toll on global growth. The stabilization we had projected for the second half of 2019 was based on an expectation for a trade deal between China and the U.S. There is still hope for a limited trade deal, but we think the broader uncertainty around US-China relationship will continue to undermine investment sentiment, especially against the backdrop of slower global demand.
Besides trade issues and a slowdown in US and Europe, emerging markets are also facing a structurally slowing China. As China rebalances away from investment-led growth to consumption-led growth, it will not be providing the same lift to emerging market exports going forward as it did in the past.
On the positive side, we expect further monetary and fiscal easing from China, to mitigate some, but not all the impact of the tariffs and the global slowdown on emerging markets. We believe that easier global financial conditions and expectation of further easing by the Federal Reserve will remain supportive of emerging market assets.
The third quarter continued to see weaker global growth led primarily by the rest of the world as the US surprised to the upside versus much lowered expectations. As expected, global growth slowed, and policy makers responded by moving towards easier monetary conditions in almost every
6 INVESCO OPPENHEIMER GLOBAL STRATEGIC INCOME FUND
major global economy. The Federal Reserve delivered the first of its two rate cuts so far this year. Most emerging market central banks also continued to reduce rates.
The markets were roiled in August by the unexpected and significant increase in trade tensions between the US and China with the US putting tariffs on almost all Chinese imports. In August we saw a significant drop in developed market yields as market expectations of global growth ratcheted down. We also saw losses in emerging market currencies as the dollar strengthened in a knee jerk reaction.
As we expected, the first quarter was mired in further data weaknesses for Asian emerging markets, despite some stabilization in China. We see this as a manifestation of global trade weakness as global exports and industrial production fell sharply. In addition, Asia is also feeling the headwinds from a slowing technology cycle. In China, front-loading of exports before tariffs took effect and the domestic policy easing were behind the stabilizing growth numbers in the first quarter. However, forward-looking indicators point to the potential for further weakness ahead for the region as global demand weakens. The stabilization we had expected in the second half of 2019 was rooted in our expectation for a trade deal between China and the U.S. Despite the recent truce at the G-20 meeting, the higher tariff rates as well as continued uncertainty about a deal pose further downside risks to China’s and Asian emerging markets’ growth in the
second half, notwithstanding the ongoing stimulus in China. We see this uncertainty a key driver for weak global investment, which in turn negatively affects Asian exports. On the positive side, we expect further easing from China, should second-quarter data surprise significantly. We believe that this global backdrop, benign demand-led inflation pressures and widening output gaps may allow room for more interest rate cuts in several countries, such as India, Indonesia, Korea, Malaysia, Philippines, Russia, and South Africa.
The emerging market economies of Latin America have underperformed growth expectations, and we are therefore cutting our 2019 and 2020 growth forecasts across the board. The disappointing slowdown has broadened from the region’s larger economies, which we expect to see traction later, to the smaller economies. We have not materially changed our inflation outlook, as output gaps are even wider and inflation risks are lower. We expect easier global monetary conditions to curb exchange rate pressures and allow all regional central banks to add stimulus.
Colombia’s lagged economic recovery soldiers on while Argentina has been the larger exception in the region with negative growth and double-digit inflation. Yet these two economies are still improving from last year. We believe the bar is now too high for the Argentinian economy not to contract this year, but we are hopeful for a background of macro-stabilization.
7 INVESCO OPPENHEIMER GLOBAL STRATEGIC INCOME FUND
Mexico’s growth was hurt by the U.S. slowdown and uncertainties over domestic policy. In our opinion, while the Mexican economy benefits from a good starting point with low debt levels, its economic fundamentals are deteriorating with President López Obrador (AMLO) and his heterodox policy mix. Within this context, we are constructive because we see inflation convergence with central bank easing, high real rates, and fiscal prudence. We do not see Mexican sovereign debt ratings going to below investment grade, while the national oil company may be downgraded again and removed from investment grade mandates.
In Brazil, we are more optimistic with the approval of the strong pension reform, and we expect the central bank to drive expansionary conditions. Economic activity has faltered on global and local shocks that allowed a large negative output gap, with domestic uncertainties failing to support a more benign environment. We think traction will come, with higher growth more likely to materialize next year. All in, decreasing global interest rates allow for more accommodative monetary policy, which would support EM assets. The primary risk to emerging markets is a full-blown trade war, instead of a protracted conflict-resolution solution, leading to recession. However, we see this as unlikely.
First quarter GDP growth in the U.S. economy was relatively strong. However, GDP growth in the second quarter was more modest. Unemployment has remained very low and job creation has been strong. Inflation has
remained relatively low. However, a tight labor market suggests we could see more pressure on wage growth in the future. The Fed reversed course from late 2018 and reduced rates two times in 2019, over the reporting period.
Government bond yields fell across many markets during the one-year reporting period. U.S. Treasury 10-year rates trended lower during the reporting period and ended at 1.67%. German 10-year yields ended at -0.58%, Japanese 10-year yields closed at -0.22% while Indian 10-year yields ended at 6.70%. Brazilian 10-year yields ended the period at 7.04%.
FUND REVIEW
The Fund’s underperformance relative to the Index this reporting period was largely the result of its allocation to international fixed income, predominantly emerging market debt. U.S. fixed income outperformed international fixed income over the reporting period. Out of benchmark exposure to Argentinian bonds and the Argentine peso detracted from returns as Argentina sold off after an unfavorable market outcome to a primary election.
Contributing positively to performance this reporting period was our allocation to developed market corporate and sovereign debt. Lastly, our exposure to high yield also benefitted performance.
8 INVESCO OPPENHEIMER GLOBAL STRATEGIC INCOME FUND
MARKET OUTLOOK & PORTFOLIO POSITIONING
Looking forward, we see the potential for global growth to continue falling but balanced by easing global financial conditions and most importantly in the U.S.
In a continuation of our view, we still see global growth momentum slowing in Q4 but at a slower rate. The stability we had been expecting in non-U.S. growth has been pushed out further amid concerns that a comprehensive trade deal between U.S. and China is now out of reach and even a narrower focused one may be difficult. We do believe that China will provide stimulus, however, that will be aimed at the domestic economy through policy measures such as tax cuts and should have limited global impact.
We expect global growth, which we estimate to be 2.6% currently to fall further in to Q1 of next year, however, we put the probability of a global recession to be low. In such an environment we believe financial conditions and valuations will be the primary driver of market returns. We expect the Fed to ease further at least 2 if not 3 times as growth slows. We also expect other central banks notably in Brazil, Mexico, Chile, India, Indonesia and Russia to be accommodative. We continue to expect that the mix of moderate growth with falling inflation will have a positive impact on asset prices.
From an asset valuation perspective, the shift in economics and policy environment is
allowing us to keep a stable outlook for our portfolio positioning. We continue to believe that the U.S. dollar will continue to slowly decline as the easier financial conditions reduce the cost of being long other developed market currencies such as Euro and Yen. As financial conditions effect market performance we expect emerging market currencies will benefit from carry while developed market currencies could benefit from valuations. In our portfolios, we are favoring carry from currencies such as Brazilian real, Indian rupee, Indonesian rupiah and South African rand.
With these valuations, we continue to favor emerging market interest rates over developed market interest rates. Real yields in emerging markets remain close to highs when compared to a combination of developed market yields. We favor long end interest rates in Brazil, India, South Africa, Indonesia and Russia and the front-end interest rates in Mexico and Colombia.
Given the excellent performance in credit in the first half of the year we are reducing our credit exposure both in emerging markets and in Europe. We are looking to redeploy that capital into emerging market rates. We will continue to monitor the global financial markets as we seek opportunities to generate income.
The positive momentum that supported the global fixed income markets during September continued into October. Despite mounting tensions in the lead-up to US-China trade negotiations in Washington, hopes
9 INVESCO OPPENHEIMER GLOBAL STRATEGIC INCOME FUND
remain that the two sides will emerge with an interim deal. The canceled APEC summit in Chile clouded the completion of a “phase 1” US-China agreement, with China signaling skepticism about a comprehensive deal.
August data showed a let-up in Germany’s manufacturing recession, balanced against surprisingly large production declines in France and the UK. In the US, the Fed announced a plan for monthly treasury bill purchases intended to permanently resolve ongoing pressures in overnight funding markets. The global easing cycle lost urgency, with the FOMC signaling a transition back to data dependence and the Bank of Japan opting to hold rates steady. Following stronger-than-anticipated incoming data for US payrolls and GDP, markets continued their constructive advance. Recent weeks have brought positive news on the risk front, including a possible breakthrough in Brexit. With the EU having agreed to a Brexit extension, the markets have somewhat assumed an orderly departure following a general election, upgrading the UK outlook.
10 INVESCO OPPENHEIMER GLOBAL STRATEGIC INCOME FUND
Top Holdings and Allocations
| | | | |
| PORTFOLIO ALLOCATION – 10/31/19 | |
Corporate Bonds and Notes | | | 29.2 | % |
Mortgage-Backed Obligations | | | | |
Agency | | | 13.0 | |
CMOs | | | 0.9 | |
Non-Agency | | | 8.3 | |
Foreign Government Obligations | | | 21.4 | |
Investment Companies | | | 14.8 | |
U.S. Government Obligations | | | 5.4 | |
Asset-Backed Securities | | | 5.2 | |
Over-the-Counter Options Purchased | | | 0.5 | |
Structured Securities | | | 0.5 | |
Short-Term Notes | | | 0.3 | |
Corporate Loans | | | 0.2 | |
Over-the-Counter Interest Rate Swaptions Purchased | | | 0.2 | |
Exchange-Traded Options Purchased | | | 0.1 | |
Common Stocks | | | —* | |
Preferred Stocks | | | —* | |
| Over-the-Counter Credit Default Swaptions Purchased | | | —* | |
Over-the-Counter Currency Swaptions Purchased | | | —* | |
Rights, Warrants and Certificates | | | —* | |
| * | Represents a value of less than 0.05%. |
Portfolio holdings and allocations are subject to change. Percentages are as of October 31, 2019, and are based on the total market value of investments.
| | | | |
| PORTFOLIO ALLOCATION – 9/30/19 | | | | |
Corporate Bonds and Notes | | | 29.9 | % |
Mortgage-Backed Obligations | | | | |
Agency | | | 13.0 | |
CMOs | | | 0.9 | |
Non-Agency | | | 7.3 | |
Foreign Government Obligations | | | 21.5 | |
Investment Companies | | | 15.4 | |
U.S. Government Obligations | | | 5.4 | |
Asset-Backed Securities | | | 4.6 | |
Structured Securities | | | 0.5 | |
Over-the-Counter Options Purchased | | | 0.5 | |
Short-Term Notes | | | 0.3 | |
Corporate Loans | | | 0.3 | |
Over-the-Counter Interest Rate Swaptions Purchased | | | 0.2 | |
| Over-the-Counter Credit Default Swaptions Purchased | | | 0.1 | |
Exchange-Traded Options Purchased | | | 0.1 | |
Common Stocks | | | —* | |
Rights, Warrants and Certificates | | | —* | |
Preferred Stocks | | | —* | |
| * | Represents a value of less than 0.05%. |
Portfolio holdings and allocations are subject to change. Percentages are as of September 30, 2019, and are based on the total market value of investments.
11 INVESCO OPPENHEIMER GLOBAL STRATEGIC INCOME FUND
| | | | |
TOP TEN HOLDINGS – 10/31/2019 | | | | |
| Invesco Government & Agency Portfolio, Institutional Class | | | 12.7 | % |
| Federal National Mortgage Assn., TBA, 4.50%, 11/1/49 | | | 6.1 | |
| United States Treasury Inflation-Protected Securities Collateral, 1.00%, 2/15/49 | | | 5.2 | |
| Federal National Mortgage Assn., TBA, 3.50%, 11/1/48 | | | 2.9 | |
| Invesco Oppenheimer Master Event-Linked Bond Fund | | | 2.1 | |
| Republic of Italy, 2.80% Bonds, 3/1/67 | | | 1.5 | |
| Invesco Oppenheimer Ultra-Short Duration Fund, Cl. Y | | | 1.4 | |
| Federal National Mortgage Assn., TBA, 3.00%, 11/1/48 | | | 1.2 | |
| Hellenic Republic, 3.90% Bonds, 1/30/33 | | | 1.1 | |
| Paragon Mortgages No 13 plc, Series 13X, Cl. A1, 1.007% [BP0003M+24], 1/15/39 | | | 1.1 | |
Holdings and allocations are subject to change and are not buy/sell recommendations. Percentages are as of October 31, 2019, and are based on net assets.
For more current Fund holdings, please visit invesco.com.
| | | | |
TOP TEN HOLDINGS – 9/30/2019 | | | | |
| Invesco Government & Agency Portfolio, Institutional Class | | | 12.7 | % |
| Federal National Mortgage Assn., TBA, 4.50%, 11/1/49 | | | 6.1 | |
| United States Treasury Inflation-Protected Securities Collateral, 1.00%, 2/15/49 | | | 5.3 | |
| Federal National Mortgage Assn., TBA, 3.50%, 11/1/48 | | | 2.9 | |
| Invesco Oppenheimer Master Event-Linked Bond Fund | | | 2.1 | |
| Republic of Italy, 2.80% Bonds, 3/1/67 | | | 1.5 | |
| Invesco Oppenheimer Ultra-Short Duration Fund, Cl. Y | | | 1.4 | |
| Federal National Mortgage Assn., TBA, 3.50%, 9/1/49 | | | 1.4 | |
| New Zealand, 1.50% Sr. Unsec. Nts., 5/15/31 | | | 1.3 | |
| Federal National Mortgage Assn., TBA, 3.00%, 10/1/48 | | | 1.2 | |
Holdings and allocations are subject to change and are not buy/sell recommendations. Percentages are as of September 30, 2019, and are based on net assets.
12 INVESCO OPPENHEIMER GLOBAL STRATEGIC INCOME FUND
Share Class Performance
AVERAGE ANNUAL TOTAL RETURNS WITHOUT SALES CHARGE AS OF 10/31/19
| | | | | | | | | | | | | | | | |
| |
| Inception
Date |
| | | 1-Year | | | | 5-Year | | | | 10-Year | |
| Class A (OPSIX) | | | 10/16/89 | | | | 7.96 | % | | | 2.47 | % | | | 4.66 | % |
| Class C (OSICX) | | | 5/26/95 | | | | 7.15 | | | | 1.70 | | | | 3.88 | |
| Class R (OSINX) | | | 3/1/01 | | | | 7.68 | | | | 2.21 | | | | 4.33 | |
| Class Y (OSIYX) | | | 1/26/98 | | | | 8.51 | | | | 2.77 | | | | 4.93 | |
| Class R5 (GLSSX)1 | | | 5/24/19 | | | | 8.06 | | | | 2.49 | | | | 4.67 | |
| Class R6 (OSIIX)2 | | | 1/27/12 | | | | 8.38 | | | | 2.88 | | | | 3.71 | 3 |
AVERAGE ANNUAL TOTAL RETURNS WITH SALES CHARGE AS OF 10/31/19
| | | | | | | | | | | | | | | | |
| |
| Inception
Date |
| | | 1-Year | | | | 5-Year | | | | 10-Year | |
| Class A (OPSIX) | | | 10/16/89 | | | | 3.42 | % | | | 1.61 | % | | | 4.22 | % |
| Class C (OSICX) | | | 5/26/95 | | | | 6.15 | | | | 1.70 | | | | 3.88 | |
| Class R (OSINX) | | | 3/1/01 | | | | 7.68 | | | | 2.21 | | | | 4.33 | |
| Class Y (OSIYX) | | | 1/26/98 | | | | 8.51 | | | | 2.77 | | | | 4.93 | |
| Class R5 (GLSSX)1 | | | 5/24/19 | | | | 8.06 | | | | 2.49 | | | | 4.67 | |
| Class R6 (OSIIX)2 | | | 1/27/12 | | | | 8.38 | | | | 2.88 | | | | 3.71 | 3 |
AVERAGE ANNUAL TOTAL RETURNS WITHOUT SALES CHARGE AS OF 9/30/19
| | | | | | | | | | | | | | | | |
| |
| Inception
Date |
| | | 1-Year | | | | 5-Year | | | | 10-Year | |
| Class A (OPSIX) | | | 10/16/89 | | | | 5.25 | % | | | 2.38 | % | | | 4.69 | % |
| Class C (OSICX) | | | 5/26/95 | | | | 4.45 | | | | 1.61 | | | | 3.88 | |
| Class R (OSINX) | | | 3/1/01 | | | | 4.98 | | | | 2.12 | | | | 4.33 | |
| Class Y (OSIYX) | | | 1/26/98 | | | | 5.21 | | | | 2.57 | | | | 4.90 | |
| Class R5 (GLSSX)1 | | | 5/24/19 | | | | 5.31 | | | | 2.40 | | | | 4.70 | |
| Class R6 (OSIIX)2 | | | 1/27/12 | | | | 5.65 | | | | 2.79 | | | | 3.59 | 3 |
AVERAGE ANNUAL TOTAL RETURNS WITH SALES CHARGE AS OF 9/30/19
| | | | | | | | | | | | | | | | |
| |
| Inception
Date |
| | | 1-Year | | | | 5-Year | | | | 10-Year | |
| Class A (OPSIX) | | | 10/16/89 | | | | 0.65 | % | | | 1.51 | % | | | 4.25 | % |
| Class C (OSICX) | | | 5/26/95 | | | | 3.45 | | | | 1.61 | | | | 3.88 | |
| Class R (OSINX) | | | 3/1/01 | | | | 4.98 | | | | 2.12 | | | | 4.33 | |
| Class Y (OSIYX) | | | 1/26/98 | | | | 5.21 | | | | 2.57 | | | | 4.90 | |
| Class R5 (GLSSX)1 | | | 5/24/19 | | | | 5.31 | | | | 2.40 | | | | 4.70 | |
| Class R6 (OSIIX)2 | | | 1/27/12 | | | | 5.65 | | | | 2.79 | | | | 3.59 | 3 |
13 INVESCO OPPENHEIMER GLOBAL STRATEGIC INCOME FUND
1. Class R5 shares’ performance shown prior to the inception date (after the close of business on May 24, 2019) is that of the predecessor fund’s Class A shares at net asset value (NAV) and includes the 12b-1 fees applicable to Class A shares. Class A shares’ performance reflects any applicable fee waivers and/or expense reimbursements.
2. Pursuant to the closing of the transaction described in the Notes to Financial Statements, after the close of business on May 24, 2019, Class I shares were reorganized as Class R6 shares.
3. Shows performance since inception.
Performance quoted is past performance and cannot guarantee comparable future results; current performance may be lower or higher.Visit invesco.com for the most recent month-end performance. Performance figures reflect reinvested distributions and changes in net asset value (NAV). Investment return and principal value will vary so that you may have a gain or a loss when you sell shares. Performance shown at NAV does not include the applicable front-end sales charge, which would have reduced the performance. The current maximum initial sales charge for Class A shares is 4.25%, and the contingent deferred sales charge for Class C shares is 1% for the 1-year period. Class R, Class Y, Class R5 and Class R6 shares have no sales charge; therefore, performance is at NAV. Effective after the close of business on May 24, 2019, Class A, Class C, Class R, Class Y, and Class I shares of the predecessor fund were reorganized into Class A, Class C, Class R, Class Y, and Class R6 shares, respectively, of the Fund. Class R5 shares’ performance shown prior to the inception date is that of the predecessor fund’s Class A shares at NAV and includes the 12b-1 fees applicable to Class A shares. Class A shares’ performance reflects any applicable fee waivers and/or expense reimbursements. Returns shown for Class A, Class C, Class R, Class Y, Class R5, and Class R6 shares are blended returns of the predecessor fund and the Fund. Share class returns will differ from those of the predecessor fund because of different expenses. See Fund prospectuses and summary prospectuses for more information on share classes, sales charges and new fee agreements, if any. Fund literature is available at invesco.com.
The Fund’s performance is compared to the performance of the Bloomberg Barclays U.S. Aggregate Bond Index, an index of U.S dollar-denominated, investment-grade U.S. corporate government and mortgage-backed securities. The Index is unmanaged and cannot be purchased directly by investors. While index comparisons may be useful to provide a benchmark for the Fund’s performance, it must be noted that the Fund’s investments are not limited to the investments comprising the Index. Index performance includes reinvestment of income, but does not reflect transaction costs, fees, expenses or taxes. Index performance is shown for illustrative purposes only as a benchmark for the Fund’s performance, and does not predict or depict performance of the Fund. The Fund’s performance reflects the effects of the Fund’s business and operating expenses.
The views and opinions expressed in management’s discussion of Fund performance are those of Invesco Advisers, Inc. These views and opinions are subject to change at any time based on factors such as market and economic conditions. These views and opinions may not be relied upon as investment advice or recommendations, or as an offer for a particular security. The information is not a complete analysis of every aspect of any market, country, industry, security or the Fund. Statements of fact are from sources considered reliable, but Invesco Advisers, Inc. makes no representation or warranty as to their completeness or accuracy. Although historical performance is no guarantee of future results, these insights may help you understand our investment management philosophy.
Before investing, investors should carefully read the prospectus and/or summary prospectus and carefully consider the investment objectives, risks, charges and expenses. For this and more complete information about the fund(s), investors
14 INVESCO OPPENHEIMER GLOBAL STRATEGIC INCOME FUND
should ask their advisors for a prospectus/summary prospectus or visit invesco.com/fundprospectus.
Shares of Invesco funds are not deposits or obligations of any bank, are not guaranteed by any bank, are not insured by the FDIC or any other agency, and involve investment risks, including the possible loss of the principal amount invested.
15 INVESCO OPPENHEIMER GLOBAL STRATEGIC INCOME FUND
Fund Expenses
Fund Expenses. As a shareholder of the Fund, you incur two types of costs: (1) transaction costs, which may include sales charges (loads) on purchase payments and/or contingent deferred sales charges on redemptions; and (2) ongoing costs, including management fees; distribution and service fees; and other Fund expenses. These examples are intended to help you understand your ongoing costs (in dollars) of investing in the Fund and to compare these costs with the ongoing costs of investing in other mutual funds.
The examples are based on an investment of $1,000.00 invested at the beginning of the period and held for the entire 6-month period ended October 31, 2019.
Actual Expenses. The first section of the table provides information about actual account values and actual expenses. You may use the information in this section for the class of shares you hold, together with the amount you invested, to estimate the expense that you paid over the period. Simply divide your account value by $1,000.00 (for example, an $8,600.00 account value divided by $1,000.00 = 8.60), then multiply the result by the number in the first section under the heading entitled “Expenses Paid During 6 Months Ended October 31, 2019” to estimate the expenses you paid on your account during this period.
Hypothetical Example for Comparison Purposes. The second section of the table provides information about hypothetical account values and hypothetical expenses based on the Fund’s actual expense ratio for each class of shares, and an assumed rate of return of 5% per year for each class before expenses, which is not the Fund’s actual return. The hypothetical account values and expenses may not be used to estimate the actual ending account balance or expenses you paid for the period. You may use this information to compare the ongoing costs of investing in the Fund and other funds. To do so, compare this 5% hypothetical example for the class of shares you hold with the 5% hypothetical examples that appear in the shareholder reports of the other funds.
Please note that the expenses shown in the table are meant to highlight your ongoing costs only and do not reflect any transactional costs, such as front-end or contingent deferred sales charges (loads). Therefore, the “hypothetical” section of the table is useful in comparing ongoing costs only, and will not help you determine the relative total costs of owning different funds. In addition, if these transactional costs were included, your costs would have been higher.
16 INVESCO OPPENHEIMER GLOBAL STRATEGIC INCOME FUND
| | | | | | | | | | | | |
| Actual | | Beginning
Account Value May 1, 2019 | | | Ending Account Value
October 31, 2019 | | | Expenses
Paid During
6 Months Ended
October 31, 20191,2 | |
Class A | | $ | 1,000.00 | | | $ | 1,029.80 | | | $ | 4.92 | |
Class C | | | 1,000.00 | | | | 1,025.90 | | | | 8.82 | |
Class R | | | 1,000.00 | | | | 1,028.50 | | | | 6.26 | |
Class Y | | | 1,000.00 | | | | 1,031.00 | | | | 3.69 | |
Class R5 | | | 1,000.00 | | | | 1,030.80 | | | | 3.12 | |
Class R6 | | | 1,000.00 | | | | 1,031.80 | | | | 2.92 | |
| |
Hypothetical (5% return before expenses) | | | | | |
Class A | | | 1,000.00 | | | | 1,020.37 | | | | 4.90 | |
Class C | | | 1,000.00 | | | | 1,016.53 | | | | 8.78 | |
Class R | | | 1,000.00 | | | | 1,019.06 | | | | 6.23 | |
Class Y | | | 1,000.00 | | | | 1,021.58 | | | | 3.68 | |
Class R5 | | | 1,000.00 | | | | 1,021.68 | | | | 3.57 | |
Class R6 | | | 1,000.00 | | | | 1,022.33 | | | | 2.91 | |
1. Actual expenses paid for Class A, C, R, Y, and R6 are equal to the Fund’s annualized expense ratio for that class, multiplied by the average account value over the period, multiplied by 184/365 (to reflect the one-half year period). Actual expenses paid for Class R5 are equal to the Fund’s annualized expense ratio for that class, multiplied by the average account value over the period, multiplied by 160/365 to reflect the period from after the close of business on May 24, 2019 (inception of offering) to October 31, 2019.
2.Hypothetical expenses paid for all classes are equal to the Fund’s annualized expense ratio for that class, multiplied by the average account value over the period, multiplied by 184/365 (to reflect the one-half year period).
Those annualized expense ratios, excluding indirect expenses from affiliated funds, based on the 6-month period ended October 31, 2019 for Classes A, C, R, Y and R6 and for the period from after the close of business on May 24, 2019 (inception of offering) to October 31, 2019 for Class R5 are as follows:
| | | | |
| Class | | Expense Ratios | |
Class A | | | 0.96 | % |
Class C | | | 1.72 | |
Class R | | | 1.22 | |
Class Y | | | 0.72 | |
Class R5 | | | 0.70 | |
Class R6 | | | 0.57 | |
The expense ratios reflect voluntary and/or contractual waivers and/or reimbursements of expenses by the Fund’s Manager. Some of these undertakings may be modified or terminated at any time, as indicated in the Fund’s prospectus. The “Consolidated Financial Highlights” tables in the Fund’s financial statements, included in this report, also show the gross expense ratios, without such waivers or reimbursements and reduction to custodian expenses, if applicable.
17 INVESCO OPPENHEIMER GLOBAL STRATEGIC INCOME FUND
Fund Expenses. As a shareholder of the Fund, you incur two types of costs: (1) transaction costs, which may include sales charges (loads) on purchase payments and/or contingent deferred sales charges on redemptions; and (2) ongoing costs, including management fees; distribution and service fees; and other Fund expenses. These examples are intended to help you understand your ongoing costs (in dollars) of investing in the Fund and to compare these costs with the ongoing costs of investing in other mutual funds.
The examples are based on an investment of $1,000.00 invested at the beginning of the period and held for the entire 6-month period ended September 30, 2019.
Actual Expenses. The first section of the table provides information about actual account values and actual expenses. You may use the information in this section for the class of shares you hold, together with the amount you invested, to estimate the expense that you paid over the period. Simply divide your account value by $1,000.00 (for example, an $8,600.00 account value divided by $1,000.00 = 8.60), then multiply the result by the number in the first section under the heading entitled “Expenses Paid During 6 Months Ended September 30, 2019” to estimate the expenses you paid on your account during this period.
Hypothetical Example for Comparison Purposes. The second section of the table provides information about hypothetical account values and hypothetical expenses based on the Fund’s actual expense ratio for each class of shares, and an assumed rate of return of 5% per year for each class before expenses, which is not the Fund’s actual return. The hypothetical account values and expenses may not be used to estimate the actual ending account balance or expenses you paid for the period. You may use this information to compare the ongoing costs of investing in the Fund and other funds. To do so, compare this 5% hypothetical example for the class of shares you hold with the 5% hypothetical examples that appear in the shareholder reports of the other funds.
Please note that the expenses shown in the table are meant to highlight your ongoing costs only and do not reflect any transactional costs, such as front-end or contingent deferred sales charges (loads). Therefore, the “hypothetical” section of the table is useful in comparing ongoing costs only, and will not help you determine the relative total costs of owning different funds. In addition, if these transactional costs were included, your costs would have been higher.
18 INVESCO OPPENHEIMER GLOBAL STRATEGIC INCOME FUND
| | | | | | | | | | | | |
| Actual | | Beginning Account Value April 1, 2019 | | | Ending Account Value
September 30, 2019 | | | Expenses Paid During
6 Months Ended
September 30, 20191,2 | |
Class A | | $ | 1,000.00 | | | $ | 1,026.00 | | | $ | 4.63 | |
Class C | | | 1,000.00 | | | | 1,022.00 | | | | 8.40 | |
Class R | | | 1,000.00 | | | | 1,024.60 | | | | 5.96 | |
Class Y | | | 1,000.00 | | | | 1,024.40 | | | | 3.41 | |
Class R5 | | | 1,000.00 | | | | 1,026.60 | | | | 2.26 | |
Class R6 | | | 1,000.00 | | | | 1,027.90 | | | | 2.70 | |
| |
Hypothetical (5% return before expenses) | | | | | |
Class A | | | 1,000.00 | | | | 1,020.51 | | | | 4.62 | |
Class C | | | 1,000.00 | | | | 1,016.80 | | | | 8.38 | |
Class R | | | 1,000.00 | | | | 1,019.20 | | | | 5.94 | |
Class Y | | | 1,000.00 | | | | 1,021.71 | | | | 3.40 | |
Class R5 | | | 1,000.00 | | | | 1,021.91 | | | | 3.20 | |
Class R6 | | | 1,000.00 | | | | 1,022.41 | | | | 2.69 | |
1. Actual expenses paid for Class A, C, R, Y, and R6 are equal to the Fund’s annualized expense ratio for that class, multiplied by the average account value over the period, multiplied by 183/365 (to reflect the one-half year period). Actual expenses paid for Class R5 are equal to the Fund’s annualized expense ratio for that class, multiplied by the average account value over the period, multiplied by 129/365 to reflect the period from after the close of business on May 24, 2019 (inception of offering) to September 30, 2019.
2.Hypothetical expenses paid for all classes are equal to the Fund’s annualized expense ratio for that class, multiplied by the average account value over the period, multiplied by 183/365 (to reflect the one-half year period).
Those annualized expense ratios, excluding indirect expenses from affiliated funds, based on the 6-month period ended September 30, 2019 for Classes A, C, R, Y and R6 and for the period from after the close of business on May 24, 2019 (inception of offering) to September 30, 2019 for Class R5 are as follows:
| | | | |
| Class | | Expense Ratios | |
Class A | | | 0.91 | % |
Class C | | | 1.65 | |
Class R | | | 1.17 | |
Class Y | | | 0.67 | |
Class R5 | | | 0.63 | |
Class R6 | | | 0.53 | |
The expense ratios reflect voluntary and/or contractual waivers and/or reimbursements of expenses by the Fund’s Manager. Some of these undertakings may be modified or terminated at any time, as indicated in the Fund’s prospectus. The “Consolidated Financial Highlights”
19 INVESCO OPPENHEIMER GLOBAL STRATEGIC INCOME FUND
tables in the Fund’s financial statements, included in this report, also show the gross expense ratios, without such waivers or reimbursements and reduction to custodian expenses, if applicable.
20 INVESCO OPPENHEIMER GLOBAL STRATEGIC INCOME FUND
CONSOLIDATED SCHEDULE OF INVESTMENTSOctober 31, 2019
| | | | | | | | |
| | | Principal Amount | | | Value | |
Asset-Backed Securities—5.7% | | | | | |
American Credit Acceptance Receivables Trust: | | | | | | | | |
Series 2017-4, Cl. C, 2.94%, 1/10/241 | | $ | 873,430 | | | $ | 875,056 | |
Series 2017-4, Cl. D, 3.57%, 1/10/241 | | | 1,747,000 | | | | 1,769,747 | |
Series 2018-3, Cl. D, 4.14%, 10/15/241 | | | 690,000 | | | | 706,804 | |
Series 2019-2, Cl. D, 3.41%, 6/12/251 | | | 3,925,000 | | | | 4,004,201 | |
Series 2019-3, Cl. C, 2.76%, 9/12/251 | | | 4,270,000 | | | | 4,304,940 | |
AmeriCredit Automobile Receivables Trust: | | | | | | | | |
Series 2017-2, Cl. D, 3.42%, 4/18/23 | | | 2,270,000 | | | | 2,320,966 | |
Series 2017-4, Cl. D, 3.08%, 12/18/23 | | | 985,000 | | | | 1,004,832 | |
Series 2019-2, Cl. C, 2.74%, 4/18/25 | | | 2,705,000 | | | | 2,744,082 | |
Series 2019-2, Cl. D, 2.99%, 6/18/25 | | | 7,510,000 | | | | 7,651,077 | |
Series 2019-3, Cl. D, 2.58%, 9/18/25 | | | 3,605,000 | | | | 3,632,916 | |
Capital Auto Receivables Asset Trust, Series 2017-1, Cl. D, 3.15%, 2/20/251 | | | 290,000 | | | | 294,177 | |
CarMax Auto Owner Trust: | | | | | | | | |
Series 2015-3, Cl. D, 3.27%, 3/15/22 | | | 1,805,000 | | | | 1,805,669 | |
Series 2016-1, Cl. D, 3.11%, 8/15/22 | | | 1,370,000 | | | | 1,373,254 | |
Series 2017-1, Cl. D, 3.43%, 7/17/23 | | | 1,775,000 | | | | 1,800,147 | |
Series 2017-4, Cl. D, 3.30%, 5/15/24 | | | 750,000 | | | | 763,375 | |
Series 2018-1, Cl. D, 3.37%, 7/15/24 | | | 510,000 | | | | 520,608 | |
Series 2019-3, Cl. D, 2.85%, 1/15/26 | | | 2,285,000 | | | | 2,304,401 | |
CCG Receivables Trust: | | | | | | | | |
Series 2017-1, Cl. B, 2.75%, 11/14/231 | | | 1,725,000 | | | | 1,728,212 | |
Series 2018-1, Cl. B, 3.09%, 6/16/251 | | | 615,000 | | | | 622,272 | |
Series 2018-1, Cl. C, 3.42%, 6/16/251 | | | 175,000 | | | | 177,603 | |
Series 2019-1, Cl. B, 3.22%, 9/14/261 | | | 335,000 | | | | 344,068 | |
Series 2019-1, Cl. C, 3.57%, 9/14/261 | | | 80,000 | | | | 82,000 | |
Chase Funding Trust, Series 2003-2, Cl. 2A2, 2.383% [US0001M+56], 2/25/332 | | | 15,989 | | | | 15,734 | |
CNH Equipment Trust, Series 2017-C, Cl. B, 2.54%, 5/15/25 | | | 495,000 | | | | 501,375 | |
CPS Auto Receivables Trust, Series 2018-A, Cl. B, 2.77%, 4/18/221 | | | 896,943 | | | | 898,626 | |
CPS Auto Trust, Series 2017-A, Cl. B, 2.68%, 5/17/211 | | | 2,607 | | | | 2,607 | |
Credit Acceptance Auto Loan Trust: | | | | | | | | |
Series 2017-3A, Cl. C, 3.48%, 10/15/261 | | | 1,505,000 | | | | 1,531,084 | |
Series 2018-1A, Cl. B, 3.60%, 4/15/271 | | | 2,520,000 | | | | 2,579,071 | |
Series 2018-1A, Cl. C, 3.77%, 6/15/271 | | | 2,535,000 | | | | 2,592,993 | |
Series 2019-1A, Cl. B, 3.75%, 4/17/281 | | | 200,000 | | | | 207,211 | |
Series 2019-1A, Cl. C, 3.94%, 6/15/281 | | | 1,240,000 | | | | 1,287,054 | |
CWHEQ Revolving Home Equity Loan Trust: | | | | | | | | |
Series 2005-G, Cl. 2A, 2.144% [US0001M+23], 12/15/352 | | | 43,301 | | | | 42,773 | |
Series 2006-H, Cl. 2A1A, 2.071% [US0001M+15], 11/15/362 | | | 41,885 | | | | 33,283 | |
Dell Equipment Finance Trust: | | | | | | | | |
Series 2017-2, Cl. B, 2.47%, 10/24/221 | | | 500,000 | | | | 500,963 | |
Series 2019-1, Cl. C, 3.14%, 3/22/241 | | | 650,000 | | | | 661,640 | |
Series 2019-2, Cl. D, 2.48%, 4/22/251 | | | 2,980,000 | | | | 2,974,607 | |
Drive Auto Receivables Trust: | | | | | | | | |
Series 2018-1, Cl. D, 3.81%, 5/15/24 | | | 1,000,000 | | | | 1,016,858 | |
Series 2018-3, Cl. D, 4.30%, 9/16/24 | | | 440,000 | | | | 453,375 | |
21 INVESCO OPPENHEIMER GLOBAL STRATEGIC INCOME FUND
CONSOLIDATED SCHEDULE OF INVESTMENTSContinued
| | | | | | | | | | | | |
| | | | | | Principal Amount | | | Value | |
Asset-Backed Securities (Continued) | | | | | |
Drive Auto Receivables Trust: (Continued) | | | | | | | | | | | | |
Series 2019-3, Cl. C, 2.90%, 8/15/25 | | | | | | $ | 5,145,000 | | | $ | 5,218,676 | |
Series 2019-3, Cl. D, 3.18%, 10/15/26 | | | | | | | 5,820,000 | | | | 5,925,715 | |
DT Auto Owner Trust: | | | | | | | | | | | | |
Series 2017-1A, Cl. D, 3.55%, 11/15/221 | | | | | | | 1,076,839 | | | | 1,083,976 | |
Series 2017-1A, Cl. E, 5.79%, 2/15/241 | | | | | | | 1,160,000 | | | | 1,203,516 | |
Series 2017-2A, Cl. D, 3.89%, 1/15/231 | | | | | | | 1,330,000 | | | | 1,341,517 | |
Series 2017-3A, Cl. E, 5.60%, 8/15/241 | | | | | | | 3,105,000 | | | | 3,229,537 | |
Series 2017-4A, Cl. D, 3.47%, 7/17/231 | | | | | | | 1,410,000 | | | | 1,420,549 | |
Series 2017-4A, Cl. E, 5.15%, 11/15/241 | | | | | | | 4,525,000 | | | | 4,680,473 | |
Series 2019-2A, Cl. D, 3.48%, 2/18/251 | | | | | | | 655,000 | | | | 669,974 | |
Series 2019-3A, Cl. D, 2.96%, 4/15/251 | | | | | | | 1,995,000 | | | | 2,011,395 | |
Series 2019-4A, Cl. D, 2.85%, 7/15/251 | | | | | | | 6,025,000 | | | | 6,034,008 | |
Element Rail Leasing I LLC, Series 2014-1A, Cl. A1, 2.299%, 4/19/441 | | | | | | | 280,295 | | | | 280,615 | |
Exeter Automobile Receivables Trust: | | | | | | | | | | | | |
Series 2018-1A, Cl. B, 2.75%, 4/15/221 | | | | | | | 496,093 | | | | 496,486 | |
Series 2019-1A, Cl. D, 4.13%, 12/16/241 | | | | | | | 5,000,000 | | | | 5,194,567 | |
Series 2019-2A, Cl. C, 3.30%, 3/15/241 | | | | | | | 9,023,000 | | | | 9,200,450 | |
Series 2019-4A, Cl. D, 2.58%, 9/15/251 | | | | | | | 6,290,000 | | | | 6,270,229 | |
Flagship Credit Auto Trust, Series 2016-1, Cl. C, 6.22%, 6/15/221 | | | | | | | 2,725,000 | | | | 2,812,229 | |
GLS Auto Receivables Trust, Series 2018-1A, Cl. A, 2.82%, 7/15/221 | | | | | | | 859,496 | | | | 862,360 | |
MASTR Asset Backed Securities Trust, Series 2006-WMC3, Cl. A3, 1.923% [US0001M+10], 8/25/362 | | | | | | | 3,630,742 | | | | 1,725,277 | |
Navistar Financial Dealer Note Master Owner Trust II: | | | | | | | | | | | | |
Series 2019-1, Cl. C, 2.773% [US0001M+95], 5/25/241,2 | | | | | | | 605,000 | | | | 605,446 | |
Series 2019-1, Cl. D, 3.273% [US0001M+145], 5/25/241,2 | | | | | | | 580,000 | | | | 580,211 | |
Prestige Auto Receivables Trust, Series 2019-1A, Cl. C, 2.70%, 10/15/241 | | | | | | | 3,250,000 | | | | 3,284,992 | |
Prosil Acquisition SA SER 1 CL A V/R, 1.622%, 10/31/393 | | | EUR | | | | 7,480,000 | | | | 8,277,983 | |
Santander Drive Auto Receivables Trust: | | | | | | | | | | | | |
Series 2017-1, Cl. E, 5.05%, 7/15/241 | | | | | | | 2,460,000 | | | | 2,537,915 | |
Series 2017-3, Cl. D, 3.20%, 11/15/23 | | | | | | | 2,030,000 | | | | 2,057,082 | |
Series 2018-1, Cl. D, 3.32%, 3/15/24 | | | | | | | 750,000 | | | | 760,549 | |
Series 2018-2, Cl. D, 3.88%, 2/15/24 | | | | | | | 370,000 | | | | 379,749 | |
Series 2019-2, Cl. D, 3.22%, 7/15/25 | | | | | | | 380,000 | | | | 388,269 | |
Series 2019-3, Cl. D, 2.68%, 10/15/25 | | | | | | | 4,445,000 | | | | 4,458,152 | |
Santander Retail Auto Lease Trust: | | | | | | | | | | | | |
Series 2019-A, Cl. C, 3.30%, 5/22/231 | | | | | | | 6,210,000 | | | | 6,345,416 | |
Series 2019-B, Cl. C, 2.77%, 8/21/231 | | | | | | | 3,250,000 | | | | 3,274,823 | |
Series 2019-C, Cl. C, 2.39%, 11/20/231 | | | | | | | 5,490,000 | | | | 5,482,280 | |
SLM Student Loan Trust, Series 2004-5X, Cl. A6, 0.00% [EUR003M+40], 10/25/391,2 | | | EUR | | | | 25,408,270 | | | | 27,614,975 | |
United Auto Credit Securitization Trust: | | | | | | | | | | | | |
Series 2018-1, Cl. C, 3.05%, 9/10/211 | | | | | | | 523,111 | | | | 523,335 | |
Series 2019-1, Cl. C, 3.16%, 8/12/241 | | | | | | | 290,000 | | | | 292,789 | |
22 INVESCO OPPENHEIMER GLOBAL STRATEGIC INCOME FUND
| | | | | | | | |
| | | Principal Amount | | | Value | |
Asset-Backed Securities (Continued) | | | | | |
Veros Automobile Receivables Trust, Series 2017-1, Cl. A, 2.84%, 4/17/231 | | $ | 17,646 | | | $ | 17,645 | |
Westlake Automobile Receivables Trust: | | | | | | | | |
Series 2017-2A, Cl. E, 4.63%, 7/15/241 | | | 1,845,000 | | | | 1,883,586 | |
Series 2018-1A, Cl. D, 3.41%, 5/15/231 | | | 2,075,000 | | | | 2,099,843 | |
Series 2019-2A, Cl. C, 2.84%, 7/15/241 | | | 5,770,000 | | | | 5,828,040 | |
| | | | | | | | |
Total Asset-Backed Securities (Cost $192,779,749) | | | | | | | 192,484,290 | |
Mortgage-Backed Obligations—24.3% | | | | | |
Agency—14.2% | | | | | | | | |
U.S. Agency Securities—14.2% | | | | | | | | |
Federal Home Loan Mortgage Corp. Gold Pool: | | | | | | | | |
5.00%, 12/1/34 | | | 360,584 | | | | 394,373 | |
5.50%, 9/1/39 | | | 762,997 | | | | 854,691 | |
6.00%, 10/1/22-7/1/24 | | | 214,391 | | | | 237,043 | |
6.50%, 2/1/22-6/1/35 | | | 323,145 | | | | 363,880 | |
7.00%, 8/1/21-3/1/35 | | | 460,394 | | | | 518,954 | |
7.50%, 1/1/32-2/1/32 | | | 959,511 | | | | 1,110,271 | |
8.50%, 8/1/31 | | | 31,736 | | | | 36,460 | |
10.00%, 5/1/20 | | | 26 | | | | 26 | |
Federal Home Loan Mortgage Corp. Non Gold Pool, 10.50%, 5/1/20 | | | 910 | | | | 913 | |
Federal Home Loan Mortgage Corp., Interest-Only Stripped Mtg.-Backed Security: | | | | | | | | |
Series 183, Cl. IO, 99.407%, 4/1/274 | | | 77,000 | | | | 12,065 | |
Series 192, Cl. IO, 99.999%, 2/1/284 | | | 32,781 | | | | 4,935 | |
Series 205, Cl. IO, 72.352%, 9/1/294 | | | 204,964 | | | | 39,140 | |
Series 206, Cl. IO, 0.00%, 12/15/294,5 | | | 93,451 | | | | 19,066 | |
Series 207, Cl. IO, 0.00%, 4/1/304,5 | | | 80,732 | | | | 15,683 | |
Series 214, Cl. IO, 0.00%, 6/1/314,5 | | | 61,907 | | | | 12,050 | |
Series 243, Cl. 6, 19.51%, 12/15/324 | | | 180,051 | | | | 30,152 | |
| Federal Home Loan Mortgage Corp., Multifamily Structured Pass-Through Certificates, Interest-Only Stripped Mtg.-Backed Security, Series K734, Cl. X1, 0.00%, 2/25/264,5 | | | 4,063,258 | | | | 145,196 | |
Federal Home Loan Mortgage Corp., Real Estate Mtg. Investment Conduit Multiclass Pass-Through Certificates: | |
Series 1360, Cl. PZ, 7.50%, 9/15/22 | | | 498,063 | | | | 524,589 | |
Series 151, Cl. F, 9.00%, 5/15/21 | | | 59 | | | | 59 | |
Series 1590, Cl. IA, 2.971% [LIBOR01M+105], 10/15/232 | | | 351,532 | | | | 356,428 | |
Series 1674, Cl. Z, 6.75%, 2/15/24 | | | 15,512 | | | | 16,504 | |
Series 2034, Cl. Z, 6.50%, 2/15/28 | | | 4,706 | | | | 5,202 | |
Series 2042, Cl. N, 6.50%, 3/15/28 | | | 4,877 | | | | 5,354 | |
Series 2043, Cl. ZP, 6.50%, 4/15/28 | | | 533,174 | | | | 598,884 | |
Series 2053, Cl. Z, 6.50%, 4/15/28 | | | 4,268 | | | | 4,813 | |
Series 2116, Cl. ZA, 6.00%, 1/15/29 | | | 264,946 | | | | 295,118 | |
Series 2122, Cl. F, 2.371% [LIBOR01M+45], 2/15/292 | | | 14,046 | | | | 13,709 | |
Series 2279, Cl. PK, 6.50%, 1/15/31 | | | 8,399 | | | | 9,359 | |
Series 2326, Cl. ZP, 6.50%, 6/15/31 | | | 66,798 | | | | 74,622 | |
Series 2344, Cl. FP, 2.871% [LIBOR01M+95], 8/15/312 | | | 188,116 | | | | 192,759 | |
Series 2368, Cl. PR, 6.50%, 10/15/31 | | | 9,952 | | | | 11,384 | |
Series 2401, Cl. FA, 2.571% [LIBOR01M+65], 7/15/292 | | | 22,284 | | | | 22,526 | |
Series 2412, Cl. GF, 2.871% [LIBOR01M+95], 2/15/322 | | | 220,667 | | | | 226,240 | |
23 INVESCO OPPENHEIMER GLOBAL STRATEGIC INCOME FUND
CONSOLIDATED SCHEDULE OF INVESTMENTSContinued
| | | | | | | | |
| | | Principal Amount | | | Value | |
U.S. Agency Securities (Continued) | | | | | | | | |
Federal Home Loan Mortgage Corp., Real Estate Mtg. Investment Conduit Multiclass Pass-Through Certificates: (Continued) | |
Series 2427, Cl. ZM, 6.50%, 3/15/32 | | $ | 363,207 | | | $ | 406,252 | |
Series 2451, Cl. FD, 2.921% [LIBOR01M+100], 3/15/322 | | | 108,069 | | | | 110,997 | |
Series 2461, Cl. PZ, 6.50%, 6/15/32 | | | 41,543 | | | | 46,826 | |
Series 2464, Cl. FI, 2.921% [LIBOR01M+100], 2/15/322 | | | 104,382 | | | | 107,228 | |
Series 2470, Cl. AF, 2.921% [LIBOR01M+100], 3/15/322 | | | 174,361 | | | | 179,084 | |
Series 2470, Cl. LF, 2.921% [LIBOR01M+100], 2/15/322 | | | 106,754 | | | | 109,665 | |
Series 2475, Cl. FB, 2.921% [LIBOR01M+100], 2/15/322 | | | 146,206 | | | | 149,367 | |
Series 2517, Cl. GF, 2.921% [LIBOR01M+100], 2/15/322 | | | 88,266 | | | | 90,673 | |
Series 2551, Cl. LF, 2.421% [LIBOR01M+50], 1/15/332 | | | 12,909 | | | | 13,005 | |
Series 2635, Cl. AG, 3.50%, 5/15/32 | | | 141,965 | | | | 147,288 | |
Series 2676, Cl. KY, 5.00%, 9/15/23 | | | 172,620 | | | | 179,613 | |
Series 3025, Cl. SJ, 17.705% [-3.6667 x LIBOR01M+2,475], 8/15/352 | | | 221,423 | | | | 310,861 | |
Series 3857, Cl. GL, 3.00%, 5/15/40 | | | 7,506 | | | | 7,640 | |
Series 3917, Cl. BA, 4.00%, 6/15/38 | | | 188,764 | | | | 199,769 | |
Series 4221, Cl. HJ, 1.50%, 7/15/23 | | | 274,981 | | | | 273,299 | |
| Federal Home Loan Mortgage Corp., Real Estate Mtg. Investment Conduit Multiclass Pass-Through Certificates, Interest-Only Stripped Mtg.-Backed Security: | |
Series 2035, Cl. PE, 68.839%, 3/15/284 | | | 11,088 | | | | 1,886 | |
Series 2049, Cl. PL, 99.999%, 4/15/284 | | | 61,041 | | | | 10,742 | |
Series 2074, Cl. S, 99.999%, 7/17/284 | | | 39,500 | | | | 3,719 | |
Series 2079, Cl. S, 99.999%, 7/17/284 | | | 76,939 | | | | 8,703 | |
Series 2177, Cl. SB, 99.999%, 8/15/294 | | | 59,083 | | | | 10,836 | |
Series 2526, Cl. SE, 73.471%, 6/15/294 | | | 107,831 | | | | 19,157 | |
Series 2682, Cl. TQ, 99.999%, 10/15/334 | | | 463,669 | | | | 82,837 | |
Series 2795, Cl. SH, 70.669%, 3/15/244 | | | 552,233 | | | | 41,505 | |
Series 2920, Cl. S, 99.999%, 1/15/354 | | | 798,990 | | | | 143,910 | |
Series 2981, Cl. BS, 99.999%, 5/15/354 | | | 955,112 | | | | 176,857 | |
Series 3004, Cl. SB, 99.999%, 7/15/354 | | | 1,105,057 | | | | 135,078 | |
Series 3397, Cl. GS, 9.197%, 12/15/374 | | | 263,216 | | | | 57,379 | |
Series 3424, Cl. EI, 0.00%, 4/15/384,5 | | | 83,871 | | | | 10,447 | |
Series 3450, Cl. BI, 18.895%, 5/15/384 | | | 407,936 | | | | 79,291 | |
Series 3606, Cl. SN, 16.24%, 12/15/394 | | | 193,371 | | | | 31,729 | |
Federal National Mortgage Assn. Grantor Trust, Interest-Only Stripped Mtg.-Backed Security: | | | | | | | | |
Series 2001-T10, Cl. IO, 99.999%, 12/25/414 | | | 22,737,699 | | | | 260,376 | |
Series 2001-T3, Cl. IO, 0.00%, 11/25/404,5 | | | 4,113,690 | | | | 42,659 | |
Federal National Mortgage Assn. Pool: | | | | | | | | |
4.50%, 12/1/20 | | | 9,237 | | | | 9,526 | |
5.00%, 3/1/21-12/1/21 | | | 2,698 | | | | 2,782 | |
5.50%, 1/1/22-5/1/36 | | | 316,620 | | | | 351,108 | |
6.50%, 12/1/29-1/1/34 | | | 1,750,825 | | | | 1,960,246 | |
7.00%, 9/1/21-4/1/34 | | | 2,802,572 | | | | 3,215,999 | |
7.50%, 2/1/27-3/1/33 | | | 1,507,969 | | | | 1,750,843 | |
8.50%, 7/1/32 | | | 4,775 | | | | 4,826 | |
9.50%, 3/15/21 | | | 1,501 | | | | 1,516 | |
Federal National Mortgage Assn., Interest-Only Stripped Mtg.-Backed Security: | | | | | | | | |
Series 221, Cl. 2, 99.999%, 5/25/234 | | | 56,801 | | | | 5,256 | |
24 INVESCO OPPENHEIMER GLOBAL STRATEGIC INCOME FUND
| | | | | | | | |
| | | Principal Amount | | | Value | |
U.S. Agency Securities (Continued) | | | | | | | | |
Federal National Mortgage Assn., Interest-Only Stripped Mtg.-Backed Security: (Continued) | | | | | | | | |
Series 247, Cl. 2, 99.999%, 10/25/234 | | $ | 28,442 | | | $ | 2,733 | |
Series 252, Cl. 2, 99.999%, 11/25/234 | | | 6,810 | | | | 680 | |
Series 254, Cl. 2, 99.999%, 1/25/244 | | | 22,568 | | | | 2,409 | |
Series 301, Cl. 2, 25.559%, 4/25/294 | | | 92,575 | | | | 16,747 | |
Series 303, Cl. IO, 99.999%, 11/25/294 | | | 98,644 | | | | 20,915 | |
Series 313, Cl. 2, 99.999%, 6/25/314 | | | 802,359 | | | | 152,451 | |
Series 319, Cl. 2, 17.484%, 2/25/324 | | | 277,363 | | | | 52,605 | |
Series 321, Cl. 2, 37.496%, 4/25/324 | | | 508,457 | | | | 97,093 | |
Series 324, Cl. 2, 99.999%, 7/25/324 | | | 201,513 | | | | 37,825 | |
Series 328, Cl. 2, 0.00%, 12/25/324,5 | | | 179,695 | | | | 34,963 | |
Series 331, Cl. 5, 99.999%, 2/25/334 | | | 422,018 | | | | 72,520 | |
Series 332, Cl. 2, 0.00%, 3/25/334,5 | | | 834,633 | | | | 158,305 | |
Series 334, Cl. 10, 15.534%, 2/25/334 | | | 344,621 | | | | 67,276 | |
Series 334, Cl. 12, 99.999%, 3/25/334 | | | 495,950 | | | | 93,488 | |
Series 339, Cl. 7, 0.00%, 11/25/334,5 | | | 1,017,070 | | | | 192,019 | |
Series 345, Cl. 9, 0.00%, 1/25/344,5 | | | 300,012 | | | | 53,192 | |
Series 351, Cl. 10, 0.00%, 4/25/344,5 | | | 126,951 | | | | 23,327 | |
Series 351, Cl. 8, 0.00%, 4/25/344,5 | | | 231,680 | | | | 43,044 | |
Series 356, Cl. 10, 0.00%, 6/25/354,5 | | | 164,820 | | | | 27,432 | |
Series 356, Cl. 12, 0.00%, 2/25/354,5 | | | 80,019 | | | | 13,830 | |
Series 362, Cl. 13, 0.00%, 8/25/354,5 | | | 11,577 | | | | 2,245 | |
Federal National Mortgage Assn., Real Estate Mtg. Investment Conduit Multiclass Pass-Through Certificates: | | | | | | | | |
Series 1996-35, Cl. Z, 7.00%, 7/25/26 | | | 22,322 | | | | 24,486 | |
Series 1997-45, Cl. CD, 8.00%, 7/18/27 | | | 261,077 | | | | 300,022 | |
Series 1998-58, Cl. PC, 6.50%, 10/25/28 | | | 152,383 | | | | 169,639 | |
Series 1999-14, Cl. MB, 6.50%, 4/25/29 | | | 7,455 | | | | 8,167 | |
Series 1999-54, Cl. LH, 6.50%, 11/25/29 | | | 280,491 | | | | 312,168 | |
Series 2001-19, Cl. Z, 6.00%, 5/25/31 | | | 116,108 | | | | 128,633 | |
Series 2001-65, Cl. F, 2.423% [LIBOR01M+60], 11/25/312 | | | 205,936 | | | | 208,204 | |
Series 2001-80, Cl. ZB, 6.00%, 1/25/32 | | | 223,213 | | | | 249,208 | |
Series 2002-21, Cl. PE, 6.50%, 4/25/32 | | | 273,570 | | | | 312,752 | |
Series 2002-29, Cl. F, 2.823% [LIBOR01M+100], 4/25/322 | | | 113,113 | | | | 116,211 | |
Series 2002-64, Cl. FJ, 2.823% [LIBOR01M+100], 4/25/322 | | | 34,766 | | | | 35,718 | |
Series 2002-68, Cl. FH, 2.378% [LIBOR01M+50], 10/18/322 | | | 72,527 | | | | 73,048 | |
Series 2002-81, Cl. FM, 2.323% [LIBOR01M+50], 12/25/322 | | | 132,090 | | | | 131,098 | |
Series 2002-84, Cl. FB, 2.823% [LIBOR01M+100], 12/25/322 | | | 21,940 | | | | 22,539 | |
Series 2003-11, Cl. FA, 2.823% [LIBOR01M+100], 9/25/322 | | | 29,940 | | | | 30,757 | |
Series 2003-116, Cl. FA, 2.223% [LIBOR01M+40], 11/25/332 | | | 73,755 | | | | 72,963 | |
Series 2005-71, Cl. DB, 4.50%, 8/25/25 | | | 380,655 | | | | 389,762 | |
Series 2006-11, Cl. PS, 17.883% [-3.6667 x LIBOR01M+2,456.67], 3/25/362 | | | 252,154 | | | | 385,076 | |
Series 2006-46, Cl. SW, 17.516% [-3.6665 x LIBOR01M+2,419.92], 6/25/362 | | | 311,229 | | | | 466,919 | |
Series 2009-113, Cl. DB, 3.00%, 12/25/20 | | | 3,375 | | | | 3,370 | |
Series 2009-36, Cl. FA, 2.763% [LIBOR01M+94], 6/25/372 | | | 122,791 | | | | 125,910 | |
Series 2010-43, Cl. KG, 3.00%, 1/25/21 | | | 3,145 | | | | 3,149 | |
Series 2011-122, Cl. EC, 1.50%, 1/25/20 | | | 777 | | | | 776 | |
Series 2011-15, Cl. DA, 4.00%, 3/25/41 | | | 137,422 | | | | 143,774 | |
25 INVESCO OPPENHEIMER GLOBAL STRATEGIC INCOME FUND
CONSOLIDATED SCHEDULE OF INVESTMENTSContinued
| | | | | | | | |
| | | Principal Amount | | | Value | |
U.S. Agency Securities (Continued) | | | | | | | | |
| Federal National Mortgage Assn., Real Estate Mtg. Investment Conduit Multiclass Pass-Through Certificates: (Continued) | |
Series2011-3, Cl. EL, 3.00%, 5/25/20 | | $ | 1,250 | | | $ | 1,248 | |
Series2011-3, Cl. KA, 5.00%, 4/25/40 | | | 448,630 | | | | 470,805 | |
Series2011-6, Cl. BA, 2.75%, 6/25/20 | | | 1,051 | | | | 1,053 | |
Series2011-82, Cl. AD, 4.00%, 8/25/26 | | | 18,538 | | | | 18,632 | |
Series2012-20, Cl. FD, 2.223% [LIBOR01M+40], 3/25/422 | | | 777,431 | | | | 778,642 | |
| Federal National Mortgage Assn., Real Estate Mtg. Investment Conduit Multiclass Pass-Through Certificates, Interest- Only Stripped Mtg.-Backed Security: | |
| Series2001-61, Cl. SH, 58.271%, 11/18/314 | | | 233,747 | | | | 43,469 | |
| Series2001-63, Cl. SD, 45.715%, 12/18/314 | | | 6,372 | | | | 1,059 | |
| Series2001-68, Cl. SC, 99.999%, 11/25/314 | | | 4,809 | | | | 924 | |
| Series2001-81, Cl. S, 65.745%, 1/25/324 | | | 61,334 | | | | 10,910 | |
| Series2002-28, Cl. SA, 53.264%, 4/25/324 | | | 56,946 | | | | 10,546 | |
| Series2002-38, Cl. SO, 99.999%, 4/25/324 | | | 70,371 | | | | 12,406 | |
| Series2002-39, Cl. SD, 75.387%, 3/18/324 | | | 109,486 | | | | 22,879 | |
| Series2002-48, Cl. S, 56.159%, 7/25/324 | | | 80,642 | | | | 16,305 | |
| Series2002-52, Cl. SL, 48.866%, 9/25/324 | | | 54,288 | | | | 10,376 | |
| Series2002-53, Cl. SK, 92.109%, 4/25/324 | | | 68,249 | | | | 14,559 | |
| Series2002-56, Cl. SN, 57.399%, 7/25/324 | | | 110,597 | | | | 22,363 | |
| Series2002-65, Cl. SC, 67.44%, 6/25/264 | | | 186,081 | | | | 25,677 | |
| Series2002-77, Cl. IS, 73.497%, 12/18/324 | | | 119,890 | | | | 24,328 | |
| Series2002-77, Cl. SH, 52.167%, 12/18/324 | | | 80,937 | | | | 14,078 | |
| Series2002-89, Cl. S, 99.999%, 1/25/334 | | | 581,754 | | | | 126,253 | |
| Series2002-9, Cl. MS, 49.632%, 3/25/324 | | | 91,507 | | | | 18,483 | |
| Series2003-13, Cl. IO, 65.766%, 3/25/334 | | | 505,908 | | | | 109,980 | |
| Series2003-26, Cl. DI, 60.597%, 4/25/334 | | | 292,357 | | | | 71,651 | |
| Series2003-26, Cl. IK, 68.84%, 4/25/334 | | | 51,235 | | | | 11,841 | |
| Series2003-33, Cl. SP, 99.999%, 5/25/334 | | | 273,790 | | | | 60,430 | |
| Series2003-4, Cl. S, 34.969%, 2/25/334 | | | 129,540 | | | | 27,617 | |
| Series2003-46, Cl. IH, 0.00%, 6/25/234,5 | | | 28,185 | | | | 1,931 | |
| Series2004-56, Cl. SE, 17.924%, 10/25/334 | | | 297,030 | | | | 59,396 | |
| Series2005-14, Cl. SE, 54.356%, 3/25/354 | | | 190,590 | | | | 29,784 | |
| Series2005-40, Cl. SA, 99.999%, 5/25/354 | | | 1,114,930 | | | | 197,768 | |
| Series2005-40, Cl. SB, 99.999%, 5/25/354 | | | 499,464 | | | | 69,855 | |
| Series2005-52, Cl. JH, 34.49%, 5/25/354 | | | 599,259 | | | | 87,304 | |
| Series2006-90, Cl. SX, 99.999%, 9/25/364 | | | 1,232,666 | | | | 245,196 | |
| Series2007-88, Cl. XI, 0.00%, 6/25/374,5 | | | 1,657,731 | | | | 326,196 | |
| Series2008-55, Cl. SA, 0.00%, 7/25/384,5 | | | 64,222 | | | | 7,850 | |
| Series2009-8, Cl. BS, 0.00%, 2/25/244,5 | | | 2,489 | | | | 149 | |
| Series2010-95, Cl. DI, 0.00%, 11/25/204,5 | | | 4,118 | | | | 50 | |
| Series2011-96, Cl. SA, 10.272%, 10/25/414 | | | 300,128 | | | | 53,554 | |
| Series2012-134, Cl. SA, 1.05%, 12/25/424 | | | 965,268 | | | | 178,832 | |
Series2012-40, Cl. PI, 24.701%, 4/25/414 | | | 2,314,446 | | | | 228,618 | |
Federal National Mortgage Assn., Stripped Mtg.-Backed Security, Series 302, Cl. 2, 6.00%, 5/1/29 | | | 2,586 | | | | 410 | |
| Federal National Mortgage Assn., TBA: | | | | | | | | |
| 2.50%, 11/1/346 | | | 10,185,000 | | | | 10,295,603 | |
| 3.00%,11/1/33-11/1/486 | | | 50,045,000 | | | | 50,925,962 | |
26 INVESCO OPPENHEIMER GLOBAL STRATEGIC INCOME FUND
| | | | | | | | |
| | | Principal Amount | | | Value | |
U.S. Agency Securities (Continued) | | | | | | | | |
Federal National Mortgage Assn., TBA: (Continued) 3.50%, 11/1/486 | | $ | 94,460,000 | | | $ | 96,998,613 | |
4.50%, 11/1/496 | | | 193,530,000 | | | | 203,554,380 | |
| FREMF Mortgage Trust: | | | | | | | | |
| Series2012-K20, Cl. C, 3.87%, 5/25/451,7 | | | 12,875,000 | | | | 13,315,001 | |
| Series2013-K25, Cl. C, 3.619%, 11/25/451,7 | | | 1,975,000 | | | | 2,024,285 | |
| Series2013-K26, Cl. C, 3.598%, 12/25/451,7 | | | 335,000 | | | | 343,604 | |
| Series2013-K28, Cl. C, 3.49%, 6/25/461,7 | | | 7,865,000 | | | | 8,060,200 | |
| Series2013-K29, Cl. C, 3.481%, 5/25/461,7 | | | 4,700,000 | | | | 4,842,570 | |
| Series 2014-K715, Cl. C, 4.117%, 2/25/461,7 | | | 25,000 | | | | 25,514 | |
| Series2015-K44, Cl. B, 3.681%, 1/25/481,7 | | | 7,345,000 | | | | 7,637,823 | |
| Series2015-K45, Cl. B, 3.59%, 4/25/481,7 | | | 13,050,000 | | | | 13,633,666 | |
| Series2016-K54, Cl. C, 4.051%, 4/25/481,7 | | | 4,190,000 | | | | 4,411,729 | |
| Series2017-K62, Cl. B, 3.874%, 1/25/501,7 | | | 840,000 | | | | 890,229 | |
Series 2017-K724, Cl. B, 3.485%, 11/25/231,7 | | | 4,465,000 | | | | 4,616,220 | |
| Government National Mortgage Assn. I Pool: | | | | | | | | |
| 7.00%,1/15/28-8/15/28 | | | 254,327 | | | | 267,185 | |
8.00%,1/15/28-9/15/28 | | | 200,378 | | | | 211,343 | |
| Government National Mortgage Assn. II Pool: | | | | | | | | |
| 3.25% [H15T1Y+150], 7/20/272 | | | 1,717 | | | | 1,775 | |
7.00%, 1/20/30 | | | 42,425 | | | | 48,971 | |
| Government National Mortgage Assn. II Pool, TBA, 3.50%, 11/1/496 | | | 29,940,000 | | | | 31,069,767 | |
| Government National Mortgage Assn., Interest-Only Stripped Mtg.-Backed Security, Series2011-52, Cl. HS, 19.779%, 4/16/414 | | | 1,432,523 | | | | 229,967 | |
| Vendee Mortgage Trust, Interest-Only Stripped Mtg.-Backed Security: | | | | | | | | |
| Series1992-2, Cl. IO, 0.00%, 9/15/224,5 | | | 1,068,052 | | | | 1 | |
| Series1995-2B, Cl. 2IO, 99.999%, 6/15/254 | | | 154,731 | | | | 2,254 | |
| Series1995-3, Cl. 1IO, 0.00%, 9/15/254,5 | | | 5,069,726 | | | | 505 | |
| | | | | | | | |
| | | | | | 478,603,250 | |
| | | | | | | | | |
CMOs—1.0% | | | | | | | | |
Collateralized Mortgage Obligations—1.0% | | | | | | | | |
| Bear Stearns ARM Trust, Series2006-1, Cl. A1, 3.842% [H15T1Y+225], 2/25/362 | | | 34,988 | | | | 36,122 | |
COMM Mortgage Trust, Series 2014-CR20, Cl. ASB, 3.305%, 11/10/47 | | | 474,994 | | | | 489,270 | |
| Federal Home Loan Mortgage Corp., Multifamily Structured Pass Through Certificates, Series K735, Cl. X1, 0.00%, 5/25/264,5 | | | 7,173,311 | | | | 399,074 | |
| Federal Home Loan Mortgage Corp., Multifamily Structured Pass-Through Certificates, Interest-Only Stripped Mtg.-Backed Security, Series K093, Cl. X1, 0.00%, 5/25/294,5 | | | 45,863,108 | | | | 3,556,138 | |
| Federal Home Loan Mortgage Corp., Real Estate Mtg. Investment Conduit Multiclass Pass-Through Certificates: | |
| Series 3010, Cl. WB, 4.50%, 7/15/20 | | | 172 | | | | 172 | |
| Series 3848, Cl. WL, 4.00%, 4/15/40 | | | 280,211 | | | | 285,568 | |
| Federal Home Loan Mortgage Corp., Real Estate Mtg. Investment Conduit Multiclass Pass-Through Certificates, Interest-Only Stripped Mtg.-Backed Security: | |
| Series 2922, Cl. SE, 24.485%, 2/15/354 | | | 51,803 | | | | 8,474 | |
| Series 2981, Cl. AS, 2.767%, 5/15/354 | | | 348,669 | | | | 50,619 | |
27 INVESCO OPPENHEIMER GLOBAL STRATEGIC INCOME FUND
CONSOLIDATED SCHEDULE OF INVESTMENTSContinued
| | | | | | | | |
| | | Principal Amount | | | Value | |
Collateralized Mortgage Obligations (Continued) | | | | | | | | |
| Federal National Mortgage Assn., Real Estate Mtg. Investment Conduit Multiclass Pass-Through Certificates, Interest-Only Stripped Mtg.-Backed Security, Series2005-12, Cl. SC, 34.811%, 3/25/354 | | $ | 23,441 | | | $ | 3,811 | |
| FREMF Mortgage Trust: | | | | | | | | |
| Series2013-K27, Cl. C, 3.496%, 1/25/461,7 | | | 4,187,000 | | | | 4,320,548 | |
Series 2016-K723, Cl. C, 3.58%, 11/25/231,7 | | | 1,885,000 | | | | 1,921,098 | |
| Government National Mortgage Assn., Interest-Only Stripped Mtg.-Backed Security,Series 2007-17, Cl. AI, 44.889%, 4/16/374 | | | 818,363 | | | | 130,222 | |
| JP Morgan Chase Commercial Mortgage Securities Trust, Series2014-C20, Cl. AS, 4.043%, 7/15/47 | | | 1,685,000 | | | | 1,795,205 | |
| Structured Agency Credit Risk Debt Nts.: | | | | | | | | |
| Series2013-DN2, Cl. M2, 6.073% [US0001M+425], 11/25/232 | | | 2,051,449 | | | | 2,214,183 | |
| Series2014-DN1, Cl. M3, 6.323% [US0001M+450], 2/25/242 | | | 2,085,000 | | | | 2,266,091 | |
| Series2014-DN2, Cl. M3, 5.423% [US0001M+360], 4/25/242 | | | 2,160,000 | | | | 2,282,131 | |
| Series2014-DN3, Cl. M3, 5.823% [US0001M+400], 8/25/242 | | | 4,617,039 | | | | 4,873,792 | |
| Series2014-HQ2, Cl. M3, 5.573% [US0001M+375], 9/25/242 | | | 2,495,000 | | | | 2,696,689 | |
| Series 2015-HQA2, Cl. M2, 4.623% [US0001M+280], 5/25/282 | | | 349,316 | | | | 351,369 | |
| Wells Fargo Mortgage-Backed Securities Trust: | | | | | | | | |
| Series2005-AR1, Cl. 1A1, 5.08%, 2/25/357 | | | 1,227,861 | | | | 1,280,909 | |
| Series2006-AR2, Cl. 2A3, 4.929%, 3/25/367 | | | 1,827,173 | | | | 1,881,080 | |
| WF-RBS Commercial Mortgage Trust, Series2013-C14, Cl. AS, 3.488%, 6/15/46 | | | 1,800,000 | | | | 1,868,789 | |
| | | | | | | | |
| | | | | | | 32,711,354 | |
| | | | | | | | | |
Non-Agency—9.1% | | | | | | | | |
Adjustable-Rate Mortgages—9.1% | | | | | | | | |
| Alba plc, Series2007-1, Cl. F, 4.033% [BP0003M+325], 3/17/391,2 | | | 1,354,179 | | | | 1,689,201 | |
| Benchmark Mortgage Trust, Interest-Only Commercial Mtg. Pass-Through Certificates,Series 2018-B1, Cl. XA, 10.797%, 1/15/514 | | | 13,192,638 | | | | 459,143 | |
| Capital Lease Funding Securitization LP, Interest-Only Commercial Mtg. Pass-Through Certificates, Series 1997-CTL1, Cl. IO, 0.00%, 6/22/241,4,5,8 | | | 41,675 | | | | 682 | |
| CD Mortgage Trust, Interest-Only Commercial Mtg. Pass-Through Certificates,Series 2017-CD6, Cl. XA, 12.532%, 11/13/504 | | | 5,468,761 | | | | 294,923 | |
| CHL Mortgage Pass-Through Trust: | | | | | | | | |
| Series2005-17, Cl. 1A8, 5.50%, 9/25/35 | | | 1,039,752 | | | | 1,048,050 | |
| Series2005-J4, Cl. A7, 5.50%, 11/25/35 | | | 917,630 | | | | 925,825 | |
| Citigroup Commercial Mortgage Trust, Series 2014-GC21, Cl. AAB, 3.477%, 5/10/47 | | | 662,745 | | | | 684,062 | |
| Citigroup Commercial Mortgage Trust, Interest-Only Commercial Mtg. Pass-Through Certificates,Series 2017-C4, Cl. XA, 11.921%, 10/12/504 | | | 15,428,270 | | | | 1,011,323 | |
| Citigroup Mortgage Loan Trust, Inc.: | | | | | | | | |
| Series2005-2, Cl. 1A3, 4.923%, 5/25/357 | | | 1,118,171 | | | | 1,148,845 | |
| Series2006-AR1, Cl. 1A1, 4.63% [H15T1Y+240], 10/25/352 | | | 279,580 | | | | 281,747 | |
| Series2009-8, Cl. 7A2, 4.929%, 3/25/361,7 | | | 14,026,840 | | | | 14,183,144 | |
28 INVESCO OPPENHEIMER GLOBAL STRATEGIC INCOME FUND
| | | | | | | | |
| | | Principal Amount | | | Value | |
Adjustable-Rate Mortgages (Continued) | | | | | | | | |
| Citigroup Mortgage Loan Trust, Inc.: (Continued) | |
| Series2014-8, Cl. 1A2, 2.136% [US0001M+29], 7/20/361,2 | | $ | 1,601,901 | | | $ | 1,599,148 | |
| COMM Mortgage Trust: | |
| Series 2014-CR21, Cl. AM, 3.987%, 12/10/47 | | | 70,000 | | | | 75,307 | |
| Series 2014-LC15, Cl. AM, 4.198%, 4/10/47 | | | 690,000 | | | | 737,281 | |
| Series 2014-UBS6, Cl. AM, 4.048%, 12/10/47 | | | 4,690,000 | | | | 5,000,420 | |
| COMM Mortgage Trust, Interest-Only Stripped Mtg.-Backed Security, Series2012-CR5, Cl. XA, 20.516%, 12/10/454 | | | 6,956,845 | | | | 284,209 | |
| Connecticut Avenue Securities: | |
| Series2014-C03, Cl. 1M2, 4.823% [US0001M+300], 7/25/242 | | | 1,973,218 | | | | 2,073,548 | |
| Series2016-C05, Cl. 2M2, 6.273% [US0001M+445], 1/25/292 | | | 3,880,545 | | | | 4,087,701 | |
| Series2017-C01, Cl. 1M2, 5.373% [US0001M+355], 7/25/292 | | | 11,610,000 | | | | 12,166,549 | |
| Series2017-C06, Cl. 1M1, 2.573% [US0001M+75], 2/25/302 | | | 118,440 | | | | 118,453 | |
| Series2017-C07, Cl. 1M2, 4.223% [US0001M+240], 5/25/302 | | | 1,540,000 | | | | 1,564,695 | |
| Series2018-C02, Cl. 2M1, 2.473% [US0001M+65], 8/25/302 | | | 146,991 | | | | 146,995 | |
| Series2018-C06, Cl. 2M2, 3.923% [US0001M+210], 3/25/312 | | | 6,720,000 | | | | 6,746,383 | |
| Connecticut Avenue Securities Trust: | |
| Series2018-R07, Cl. 1M2, 4.223% [US0001M+240], 4/25/311,2 | | | 8,090,000 | | | | 8,161,134 | |
| Series2019-R02, Cl. 1M2, 4.123% [US0001M+230], 8/25/311,2 | | | 3,797,000 | | | | 3,824,419 | |
| Series2019-R03, Cl. 1M2, 3.973% [US0001M+215], 9/25/311,2 | | | 3,475,111 | | | | 3,490,624 | |
| Deutsche Mortgage Securities, Inc., Series2013-RS1, Cl. 1A2, 2.066% [US0001M+22], 7/22/361,2 | | | 613,106 | | | | 607,555 | |
| Eurosail2006-2bl plc, Series2006-2X, Cl. E1C, 4.031% [BP0003M+325], 12/15/441,2 | | | 5,550,000 | | | | 6,275,079 | |
| Federal Home Loan Mortgage Corp., STACR Trust, Series 2019-HRP1, Cl. M2, 3.223% [US0001M+140], 2/25/491,2 | | | 1,705,000 | | | | 1,706,207 | |
| Gemgarto2018-1 plc SER2018-1 CL E V/R, 3.031%, 9/16/65 | | | 6,523,475 | | | | 8,202,086 | |
| GS Mortgage Securities Trust: | |
| Series 2013-GC12, Cl. AAB, 2.678%, 6/10/46 | | | 180,580 | | | | 182,136 | |
| Series 2013-GC16, Cl. AS, 4.649%, 11/10/46 | | | 390,000 | | | | 425,504 | |
| Series 2014-GC18, Cl. AAB, 3.648%, 1/10/47 | | | 531,352 | | | | 547,814 | |
| GSR Mortgage Loan Trust, Series2005-AR4, Cl. 6A1, 4.658%, 7/25/357 | | | 171,154 | | | | 176,033 | |
| Hawksmoor Mortgage Funding2019-1 plc SER2019-1X CL B V/R, 0.00%, 5/25/533 | | | 26,230,000 | | | | 34,115,367 | |
| Hawksmoor Mortgage Funding2019-1 plc SER2019-1X CL C V/R, 0.00%, 5/25/533 | | | 12,312,000 | | | | 16,021,567 | |
| HomeBanc Mortgage Trust, Series2005-3, Cl. A2, 2.133% [US0001M+31], 7/25/352 | | | 27,564 | | | | 27,713 | |
| JP Morgan Chase Commercial Mortgage Securities Trust, Series 2013-LC11, Cl. AS, 3.216%, 4/15/46 | | | 425,000 | | | | 436,337 | |
| JP Morgan Mortgage Trust, Series2007-A1, Cl. 5A1, 4.581%, 7/25/357 | | | 125,060 | | | | 128,540 | |
29 INVESCO OPPENHEIMER GLOBAL STRATEGIC INCOME FUND
CONSOLIDATED SCHEDULE OF INVESTMENTSContinued
| | | | | | | | |
| | | Principal Amount | | | Value | |
Adjustable-Rate Mortgages (Continued) | | | | | | | | |
| JPMBB Commercial Mortgage Securities Trust: | | | | | | | | |
| Series2014-C18, Cl. A3, 3.578%, 2/15/47 | | $ | 308,172 | | | $ | 312,442 | |
| Series2014-C24, Cl. B, 4.116%, 11/15/477 | | | 1,655,000 | | | | 1,741,663 | |
| Series2014-C25, Cl. AS, 4.065%, 11/15/47 | | | 2,980,000 | | | | 3,199,470 | |
| Lehman Structured Securities Corp., Series2002-GE1, Cl. A, 0.00%, 7/26/241,7 | | | 36,316 | | | | 24,034 | |
| Morgan Stanley Bank of America Merrill Lynch Trust: | | | | | | | | |
| Series2013-C9, Cl. AS, 3.456%, 5/15/46 | | | 1,565,000 | | | | 1,624,824 | |
| Series2014-C14, Cl. B, 4.745%, 2/15/477 | | | 680,000 | | | | 734,469 | |
| Morgan Stanley Capital I, Inc., Interest-Only Commercial Mtg. Pass-Through Certificates, Series2017-HR2, Cl. XA, 10.526%, 12/15/504 | | | 4,976,598 | | | | 263,304 | |
| Morgan StanleyRe-Remic Trust, Series2012-R3, Cl. 1B, 3.524%, 11/26/361,7 | | | 11,360,846 | | | | 11,093,508 | |
| Morgan Stanley Resecuritization Trust, Series2013-R9, Cl. 3A, 4.027%, 6/26/461,7 | | | 7,770 | | | | 7,795 | |
| Multifamily Connecticut Avenue Securities Trust, Series2019-01, Cl. M10, 5.05% [US0001M+325], 10/15/491,2 | | | 320,000 | | | | 330,846 | |
| Paragon Mortgages No 13 plc, Series 13X, Cl. A1, 1.007% [BP0003M+24], 1/15/391,2 | | | 30,120,702 | | | | 36,803,697 | |
| RALI Trust, Series 2006-QS13, Cl. 1A8, 6.00%, 9/25/36 | | | 49,414 | | | | 45,286 | |
| Residential Asset Securitization Trust, Series 2005-A6CB, Cl. A7, 6.00%, 6/25/35 | | | 4,056,803 | | | | 3,867,994 | |
| Stratton Mortgage Funding2019-1 plc, Series2019-1, Cl. A, 0.00% [SONIA3M IR+120], 5/25/511,2,3 | | | 14,000,000 | | | | 18,130,565 | |
| Structured Agency Credit Risk Debt Nts.: | | | | | | | | |
| Series 2016-DNA1, Cl. M2, 4.723% [US0001M+290], 7/25/282 | | | 418,308 | | | | 420,913 | |
| Series 2016-DNA2, Cl. M3, 6.473% [US0001M+465], 10/25/282 | | | 2,427,448 | | | | 2,603,969 | |
| Series 2016-DNA3, Cl. M3, 6.823% [US0001M+500], 12/25/282 | | | 7,155,000 | | | | 7,722,505 | |
| Series 2016-DNA4, Cl. M3, 5.623% [US0001M+380], 3/25/292 | | | 13,920,000 | | | | 14,804,571 | |
| Series 2016-HQA3, Cl. M3, 5.673% [US0001M+385], 3/25/292 | | | 9,805,000 | | | | 10,347,280 | |
| Series 2016-HQA4, Cl. M3, 5.723% [US0001M+390], 4/25/292 | | | 9,480,000 | | | | 10,113,458 | |
| Series 2017-DNA1, Cl. M2, 5.073% [US0001M+325], 7/25/292 | | | 5,390,000 | | | | 5,656,099 | |
| Series 2018-DNA1, Cl. M2, 3.623% [US0001M+180], 7/25/302 | | | 3,110,000 | | | | 3,112,013 | |
| Towd Point Mortgage Funding 2019-Granite4 plc: | | | | | | | | |
| 2.58%, 10/20/51 | | | 11,300,000 | | | | 14,660,508 | |
| Series 2019-GR4X, Cl. B, 2.195% [BP0003M+140], 10/20/511,2 | | | 7,480,000 | | | | 9,682,077 | |
| UBS Commercial Mortgage Trust, Interest-Only Commercial Mtg. Pass- Through Certificates,Series 2017-C5, Cl. XA, 0.00%, 11/15/504,5 | | | 9,719,621 | | | | 570,785 | |
| WaMu Mortgage Pass-Through Certificates Trust, Series 2003-AR10, Cl. A7, 4.197%, 10/25/337 | | | 76,098 | | | | 77,791 | |
30 INVESCO OPPENHEIMER GLOBAL STRATEGIC INCOME FUND
| | | | | | | | | | | | |
| | | | | | Principal Amount | | | Value | |
Adjustable-Rate Mortgages (Continued) | | | | | | | | | | | | |
| Wells Fargo Commercial Mortgage Trust, Interest-Only Commercial Mtg. Pass-Through Certificates, Series2017-C42, Cl. XA, 10.477%, 12/15/504 | | | | | | $ | 6,537,841 | | | $ | 396,706 | |
Wells Fargo Mortgage-Backed Securities Trust: | | | | | | | | | | | | |
Series 2005-AR15, Cl. 1A2, 4.775%, 9/25/357 | | | | | | | 312,516 | | | | 313,140 | |
Series 2005-AR15, Cl. 1A6, 4.775%, 9/25/357 | | | | | | | 3,090,982 | | | | 3,097,152 | |
Series2005-AR4, Cl. 2A2, 5.079%, 4/25/357 | | | | | | | 71,840 | | | | 73,340 | |
WF-RBS Commercial Mortgage Trust: | | | | | | | | | | | | |
Series2014-C20, Cl. AS, 4.176%, 5/15/47 | | | | | | | 1,455,000 | | | | 1,560,300 | |
Series 2014-LC14, Cl. AS, 4.351%, 3/15/477 | | | | | | | 1,135,000 | | | | 1,223,347 | |
| WF-RBS Commercial Mortgage Trust, Interest-Only Commercial Mtg. Pass-Through Certificates, Series2011-C3, Cl. XA, 0.00%, 3/15/441,4,5 | | | | | | | 12,184,727 | | | | 189,323 | |
| | | | | | | | | | | | |
| | | | | | | | | | | 305,460,923 | |
| | | | | | | | | | | | |
Total Mortgage-Backed Obligations (Cost $800,571,728) | | | | | | | | | | | 816,775,527 | |
| | | | | | | | | | | | |
U.S. Government Obligations—5.9% | | | | | |
United States Treasury Inflation-Protected Securities, 1.00%, 2/15/469 | | | | | | | 21,484,846 | | | | 23,779,329 | |
United States Treasury Inflation-Protected Securities, 1.00%, 2/15/499,10 | | | | | | | 155,798,964 | | | | 174,463,376 | |
| | | | | | | | | | | | |
Total U.S. Government Obligations (Cost $179,489,160) | | | | | | | | | | | 198,242,705 | |
| | | | | | | | | | | | |
Foreign Government Obligations—23.5% | | | | | |
Angola—0.2% | | | | | | | | | | | | |
Republic of Angola, 9.375% Sr. Unsec. Nts., 5/8/481 | | | | | | | 5,495,000 | | | | 5,825,249 | |
| | | | | | | | | | | | |
Argentina—0.9% | | | | | | | | | | | | |
Argentine Republic: | | | | | | | | | | | | |
Unsec. Nts., 7/29/2011 | | | ARS | | | | 503,100,000 | | | | 5,438,509 | |
0.202% Unsec. Nts., 10/29/2011 | | | ARS | | | | 1,223,958,176 | | | | 10,626,330 | |
5.625% Sr. Unsec. Nts., 1/26/22 | | | | | | | 5,355,000 | | | | 2,297,349 | |
6.875% Sr. Unsec. Nts., 1/26/27 | | | | | | | 7,790,000 | | | | 3,096,603 | |
7.50% Sr. Unsec. Nts., 4/22/26 | | | | | | | 15,105,000 | | | | 6,457,538 | |
9.80% Unsec. Nts., 5/28/2011 | | | ARS | | | | 135,400,000 | | | | 1,525,498 | |
18.20% Unsec. Nts., 10/3/21 | | | ARS | | | | 25,715,000 | | | | 154,848 | |
| | | | | | | | | | | | |
| | | | | | | | | | | 29,596,675 | |
| | | | | | | | | | | | |
Austria—0.5% | | | | | | | | | | | | |
Republic of Austria, 1.50% Sr. Unsec. Nts., 11/2/861 | | | EUR | | | | 11,435,000 | | | | 17,502,715 | |
| | | | | | | | | | | | |
Brazil—0.5% | | | | | | | | | | | | |
Federative Republic of Brazil: | | | | | | | | | | | | |
6.00% Nts., 5/15/459 | | | BRL | | | | 10,550,000 | | | | 12,424,166 | |
6.00% Nts., 8/15/509 | | | BRL | | | | 2,100,000 | | | | 2,566,394 | |
10.00% Nts., 1/1/29 | | | BRL | | | | 10,500,000 | | | | 3,233,589 | |
| | | | | | | | | | | | |
| | | | | | | | | | | 18,224,149 | |
| | | | | | | | | | | | |
Colombia—0.4% | | | | | | | | | | | | |
Republic of Colombia: | | | | | | | | | | | | |
Series B, 6.25% Bonds, 11/26/25 | | | COP | | | | 21,300,000,000 | | | | 6,555,653 | |
31 INVESCO OPPENHEIMER GLOBAL STRATEGIC INCOME FUND
CONSOLIDATED SCHEDULE OF INVESTMENTSContinued
| | | | | | | | | | | | |
| | | | | | Principal Amount | | | Value | |
Colombia (Continued) | | | | | | | | | | | | |
Republic of Colombia: (Continued) | | | | | | | | | | | | |
Series B, 10.00% Bonds, 7/24/24 | | | COP | | | | 14,854,000,000 | | | $ | 5,281,093 | |
| | | | | | | | | | | | |
| | | | | | | | | | | 11,836,746 | |
| | | | | | | | | | | | |
Cyprus—0.2% | | | | | | | | | | | | |
Republic of Cyprus, 2.75% Sr. Unsec. Nts., 5/3/491 | | | EUR | | | | 4,225,000 | | | | 6,174,923 | |
| | | | | | | | | | | | |
Dominican Republic—0.3% | | | | | | | | | | | | |
Dominican Republic: | | | | | | | | | | | | |
6.40% Sr. Unsec. Nts., 6/5/491 | | | | | | | 3,490,000 | | | | 3,786,685 | |
7.50% Sr. Unsec. Nts., 5/6/211 | | | | | | | 6,980,000 | | | | 7,285,445 | |
| | | | | | | | | | | | |
| | | | | | | | | | | 11,072,130 | |
| | | | | | | | | | | | |
Ecuador—0.3% | | | | | | | | | | | | |
Republic of Ecuador: | | | | | | | | | | | | |
8.875% Sr. Unsec. Nts., 10/23/271 | | | | | | | 1,875,000 | | | | 1,752,422 | |
9.50% Sr. Unsec. Nts., 3/27/301 | | | | | | | 6,385,000 | | | | 6,164,570 | |
10.75% Sr. Unsec. Nts., 1/31/291 | | | | | | | 1,680,000 | | | | 1,703,117 | |
| | | | | | | | | | | | |
| | | | | | | | | | | 9,620,109 | |
| | | | | | | | | | | | |
Egypt—2.0% | | | | | | | | | | | | |
Arab Republic of Egypt: | | | | | | | | | | | | |
4.75% Sr. Unsec. Nts., 4/16/261 | | | EUR | | | | 4,800,000 | | | | 5,502,480 | |
5.577% Sr. Unsec. Nts., 2/21/231 | | | | | | | 6,950,000 | | | | 7,143,321 | |
6.125% Sr. Unsec. Nts., 1/31/221 | | | | | | | 10,150,000 | | | | 10,517,897 | |
8.50% Sr. Unsec. Nts., 1/31/471 | | | | | | | 3,570,000 | | | | 3,767,692 | |
8.70% Sr. Unsec. Nts., 3/1/491 | | | | | | | 6,047,000 | | | | 6,497,411 | |
16.00% Bonds, 6/11/22 | | | EGP | | | | 375,200,000 | | | | 24,092,693 | |
18.15% Unsec. Nts., 12/11/21 | | | EGP | | | | 90,000,000 | | | | 5,968,789 | |
Series 3YR, 16.00% Unsec. Nts., 12/12/20 | | | EGP | | | | 72,000,000 | | | | 4,496,494 | |
| | | | | | | | | | | | |
| | | | | | | | | | | 67,986,777 | |
| | | | | | | | | | | | |
El Salvador—0.1% | | | | | | | | | | | | |
Republic of El Salvador, 7.125% Sr. Unsec. Nts., 1/20/501 | | | | | | | 3,381,500 | | | | 3,443,212 | |
| | | | | | | | | | | | |
Fiji—0.1% | | | | | | | | | | | | |
Republic of Fiji, 6.625% Sr. Unsec. Nts., 10/2/201 | | | | | | | 3,726,000 | | | | 3,735,315 | |
| | | | | | | | | | | | |
France—0.8% | | | | | | | | | | | | |
French Republic, 1.75% Bonds, 6/25/391 | | | EUR | | | | 19,136,991 | | | | 26,884,639 | |
| | | | | | | | | | | | |
Greece—2.7% | | | | | | | | | | | | |
Hellenic Republic: | | | | | | | | | | | | |
Bonds, 10/15/427 | | | EUR | | | | 76,770,000 | | | | 336,065 | |
3.875% Sr. Unsec. Nts., 3/12/291 | | | EUR | | | | 21,000,000 | | | | 29,042,608 | |
3.90% Bonds, 1/30/331 | | | EUR | | | | 26,609,000 | | | | 37,747,564 | |
4.00% Bonds, 1/30/371 | | | EUR | | | | 16,100,000 | | | | 23,369,847 | |
| | | | | | | | | | | | |
| | | | | | | | | | | 90,496,084 | |
32 INVESCO OPPENHEIMER GLOBAL STRATEGIC INCOME FUND
| | | | | | | | | | | | |
| | | | | | Principal Amount | | | Value | |
India—2.0% | | | | | | | | | | | | |
Export-Import Bank of India: | | | | | | | | | | | | |
7.35% Sr. Unsec. Nts., 5/18/22 | | | INR | | | | 180,000,000 | | | $ | 2,594,841 | |
8.00% Sr. Unsec. Nts., 5/27/21 | | | INR | | | | 720,000,000 | | | | 10,352,884 | |
Republic of India: | | | | | | | | | | | | |
7.17% Sr. Unsec. Nts., 1/8/28 | | | INR | | | | 900,000,000 | | | | 13,100,809 | |
7.59% Sr. Unsec. Nts., 1/11/26 | | | INR | | | | 1,400,000,000 | | | | 20,747,425 | |
7.72% Sr. Unsec. Nts., 5/25/25 | | | INR | | | | 35,000,000 | | | | 522,073 | |
8.20% Sr. Unsec. Nts., 9/24/25 | | | INR | | | | 849,400,000 | | | | 12,970,371 | |
8.24% Sr. Unsec. Nts., 2/15/27 | | | INR | | | | 400,000,000 | | | | 6,127,929 | |
| | | | | | | | | | | | |
| | | | | | | | | | | 66,416,332 | |
| | | | | | | | | | | | |
Indonesia—2.2% | | | | | | | | | | | | |
Perusahaan Penerbit SBSN Indonesia III: | | | | | | | | | | | | |
4.35% Sr. Unsec. Nts., 9/10/241 | | | | | | | 1,330,000 | | | | 1,429,750 | |
4.55% Sr. Unsec. Nts., 3/29/261 | | | | | | | 2,005,000 | | | | 2,190,463 | |
Republic of Indonesia: | | | | | | | | | | | | |
3.85% Sr. Unsec. Nts., 7/18/271 | | | | | | | 1,075,000 | | | | 1,142,428 | |
4.125% Sr. Unsec. Nts., 1/15/251 | | | | | | | 1,260,000 | | | | 1,344,233 | |
8.125% Sr. Unsec. Nts., 5/15/24 | | | IDR | | | | 179,000,000,000 | | | | 13,628,713 | |
8.25% Sr. Unsec. Nts., 5/15/29 | | | IDR | | | | 70,900,000,000 | | | | 5,504,309 | |
Series FR56, 8.375% Sr. Unsec. Nts., 9/15/26 | | | IDR | | | | 260,905,000,000 | | | | 20,353,055 | |
Series FR59, 7.00% Sr. Unsec. Nts., 5/15/27 | | | IDR | | | | 45,000,000,000 | | | | 3,257,106 | |
Series FR64, 6.125% Sr. Unsec. Nts., 5/15/28 | | | IDR | | | | 40,000,000,000 | | | | 2,726,057 | |
Series FR74, 7.50% Sr. Unsec. Nts., 8/15/32 | | | IDR | | | | 287,520,000,000 | | | | 20,780,045 | |
| | | | | | | | | | | | |
| | | | | | | | | | | 72,356,159 | |
| | | | | | | | | | | | |
Italy—1.5% | | | | | | | | | | | | |
Republic of Italy, 2.80% Bonds, 3/1/671 | | | EUR | | | | 39,570,000 | | | | 51,099,032 | |
| | | | | | | | | | | | |
Ivory Coast—0.2% | | | | | | | | | | | | |
Republic of Cote d’Ivoire: | | | | | | | | | | | | |
5.25% Sr. Unsec. Nts., 3/22/301 | | | EUR | | | | 5,125,000 | | | | 5,678,359 | |
6.875% Sr. Unsec. Nts., 10/17/401 | | | EUR | | | | 2,450,000 | | | | 2,792,477 | |
| | | | | | | | | | | | |
| | | | | | | | | | | 8,470,836 | |
| | | | | | | | | | | | |
Kenya—0.2% | | | | | | | | | | | | |
Republic of Kenya: | | | | | | | | | | | | |
6.875% Sr. Unsec. Nts., 6/24/241 | | | | | | | 3,750,000 | | | | 3,992,280 | |
8.25% Sr. Unsec. Nts., 2/28/481 | | | | | | | 1,400,000 | | | | 1,472,166 | |
| | | | | | | | | | | | |
| | | | | | | | | | | 5,464,446 | |
| | | | | | | | | | | | |
Mexico—1.3% | | | | | | | | | | | | |
United Mexican States: | | | | | | | | | | | | |
Series M, 5.75% Bonds, 3/5/26 | | | MXN | | | | 172,455,000 | | | | 8,541,124 | |
Series M20, 8.50% Sr. Unsec. Nts., 5/31/29 | | | MXN | | | | 613,300,000 | | | | 35,751,310 | |
| | | | | | | | | | | | |
| | | | | | | | | | | 44,292,434 | |
33 INVESCO OPPENHEIMER GLOBAL STRATEGIC INCOME FUND
CONSOLIDATED SCHEDULE OF INVESTMENTSContinued
| | | | | | | | | | | | |
| | | | | | Principal Amount | | | Value | |
New Zealand—0.3% | | | | | | | | | | | | |
New Zealand, 1.50% Sr. Unsec. Nts., 5/15/31 | | | NZD | | | | 16,795,000 | | | $ | 10,813,651 | |
| | | | | | | | | | | | |
Oman—0.3% | | | | | | | | | | | | |
Sultanate of Oman: | | | | | | | | | | | | |
3.875% Sr. Unsec. Nts., 3/8/221 | | | | | | | 7,045,000 | | | | 7,069,509 | |
6.75% Sr. Unsec. Nts., 1/17/481 | | | | | | | 4,885,000 | | | | 4,597,518 | |
| | | | | | | | | | | | |
| | | | | | | | | | | 11,667,027 | |
| | | | | | | | | | | | |
Panama—0.2% | | | | | | | | | | | | |
Republic of Panama, 3.75% Sr. Unsec. Nts., 4/17/261 | | | | | | | 5,150,000 | | | | 5,376,600 | |
| | | | | | | | | | | | |
Paraguay—0.2% | | | | | | | | | | | | |
Republic of Paraguay, 4.625% Sr. Unsec. Nts., 1/25/231 | | | | | | | 6,950,000 | | | | 7,344,482 | |
| | | | | | | | | | | | |
Russia—1.1% | | | | | | | | | | | | |
Russian Federation: | | | | | | | | | | | | |
4.875% Sr. Unsec. Nts., 9/16/231 | | | | | | | 6,950,000 | | | | 7,612,085 | |
7.25% Bonds, 5/10/34 | | | RUB | | | | 1,312,500,000 | | | | 21,737,178 | |
7.70%, 3/23/33 | | | RUB | | | | 375,000,000 | | | | 6,441,684 | |
| | | | | | | | | | | | |
| | | | | | | | | | | 35,790,947 | |
| | | | | | | | | | | | |
Senegal—0.4% | | | | | | | | | | | | |
Republic of Senegal: | | | | | | | | | | | | |
6.25% Sr. Unsec. Nts., 7/30/241 | | | | | | | 3,750,000 | | | | 4,105,688 | |
6.75% Sr. Unsec. Nts., 3/13/481 | | | | | | | 9,175,000 | | | | 9,029,466 | |
| | | | | | | | | | | | |
| | | | | | | | | | | 13,135,154 | |
| | | | | | | | | | | | |
South Africa—2.2% | | | | | | | | | | | | |
Republic of South Africa: | | | | | | | | | | | | |
5.875% Sr. Unsec. Nts., 5/30/22 | | | | | | | 3,495,000 | | | | 3,764,954 | |
Series 2023, 7.75% Sr. Unsec. Nts., 2/28/23 | | | ZAR | | | | 62,500,000 | | | | 4,163,289 | |
Series 2030, 8.00% Sr. Unsec. Nts., 1/31/30 | | | ZAR | | | | 207,900,000 | | | | 12,664,164 | |
Series 2037, 8.50% Sr. Unsec. Nts., 1/31/37 | | | ZAR | | | | 264,900,000 | | | | 15,466,579 | |
Series 2048, 8.75% Sr. Unsec. Nts., 2/28/48 | | | ZAR | | | | 230,000,000 | | | | 13,260,713 | |
Series R186, 10.50% Sr. Unsec. Nts., 12/21/26 | | | ZAR | | | | 290,825,000 | | | | 21,132,712 | |
Series R214, 6.50% Sr. Unsec. Nts., 2/28/41 | | | ZAR | | | | 60,000,000 | | | | 2,753,913 | |
| | | | | | | | | | | | |
| | | | | | | | | | | 73,206,324 | |
| | | | | | | | | | | | |
Sri Lanka—0.8% | | | | | | | | | | | | |
Democratic Socialist Republic of Sri Lanka: | | | | | | | | | | | | |
5.75% Sr. Unsec. Nts., 4/18/231 | | | | | | | 3,610,000 | | | | 3,622,497 | |
5.875% Sr. Unsec. Nts., 7/25/221 | | | | | | | 3,370,000 | | | | 3,413,709 | |
6.25% Sr. Unsec. Nts., 10/4/201 | | | | | | | 7,520,000 | | | | 7,651,600 | |
6.25% Sr. Unsec. Nts., 7/27/211 | | | | | | | 6,990,000 | | | | 7,119,315 | |
6.35% Sr. Unsec. Nts., 6/28/241 | | | | | | | 2,790,000 | | | | 2,838,709 | |
7.85% Sr. Unsec. Nts., 3/14/291 | | | | | | | 2,085,000 | | | | 2,162,921 | |
| | | | | | | | | | | | |
| | | | | | | | | | | 26,808,751 | |
34 INVESCO OPPENHEIMER GLOBAL STRATEGIC INCOME FUND
| | | | | | | | | | | | |
| | | | | | Principal Amount | | | Value | |
Supranational—0.1% | | | | | | | | | | | | |
| European Bank for Reconstruction & Development, 6.85% Sr. Unsec. Nts., 6/21/21 | | | IDR | | | | 20,200,000,000 | | | $ | 1,452,458 | |
| International Finance Corp., 16.721% Sr. Unsec. Nts., 2/15/291,11 | | | TRY | | | | 10,300,000 | | | | 686,568 | |
| | | | | | | | | | | | |
| | | | | | | | | | | 2,139,026 | |
| | | | | | | | | | | | |
Thailand—0.5% | | | | | | | | | | | | |
| Kingdom of Thailand, 2.125% Sr. Unsec. Nts., 12/17/26 | | | THB | | | | 490,000,000 | | | | 16,901,389 | |
| | | | | | | | | | | | |
Turkey—0.6% | | | | | | | | | | | | |
| Republic of Turkey: | | | | | | | | | | | | |
| 8.50% Bonds, 9/14/22 | | | TRY | | | | 39,500,000 | | | | 6,314,749 | |
| 10.70% Bonds, 2/17/21 | | | TRY | | | | 54,955,000 | | | | 9,491,987 | |
| 12.40% Bonds, 3/8/28 | | | TRY | | | | 33,500,000 | | | | 5,853,601 | |
| | | | | | | | | | | | |
| | | | | | | | | | | 21,660,337 | |
| | | | | | | | | | | | |
Ukraine—0.3% | | | | | | | | | | | | |
| Ukraine, 7.75% Sr. Unsec. Nts., 9/1/261 | | | | | | | 9,160,000 | | | | 9,865,219 | |
| | | | | | | | | | | | |
United Arab Emirates—0.1% | | | | | | | | | | | | |
| United Arab Emirates, 3.125% Sr. Unsec. Nts., 9/30/491 | | | | | | | 3,465,000 | | | | 3,343,344 | |
| | | | | | | | | | | | |
| Total Foreign Government Obligations (Cost $834,228,658) | | | | | | | | | | | 788,550,213 | |
| | | | | | | | | | | | |
Corporate Loans—0.3% | | | | | |
| Albertson’s LLC, Sr. Sec. Credit Facilities 1st Lien Term Loan, Tranche B7, 4.536% [LIBOR12+275], 11/17/2512,13 | | | | | | | 301,733 | | | | 303,572 | |
| American Greetings Corp., Sr. Sec. Credit Facilities 1st Lien Term Loan, Tranche B, 6.286% [LIBOR12+450], 4/6/2412,13 | | | | | | | 1,302,607 | | | | 1,270,042 | |
| Caesars Growth Properties Holdings LLC, Sr. Sec. Credit Facilities 1st Lien Term Loan, 4.536% [LIBOR4+275], 12/23/2412,13 | | | | | | | 1,675,736 | | | | 1,653,390 | |
| Claire’s Stores, Inc., Sr. Sec. Credit Facilities Term Loan, 9.188% [LIBOR4+725], 10/12/3812,13 | | | | | | | 97,198 | | | | 174,956 | |
| Dun & Bradstreet Corp. (The), Sr. Sec. Credit Facilities 1st Lien Term Loan, Tranche B, 6.804% [LIBOR12+500], 2/6/2612,13 | | | | | | | 1,043,000 | | | | 1,047,235 | |
| iHeartCommunications, Inc., Sr. Sec. Credit Facilities 1st Lien Exit Term Loan, 6.032% [LIBOR12+400], 5/1/2612,13 | | | | | | | 492,578 | | | | 494,886 | |
| Murray Energy Corp., Sr. Sec. Credit Facilities 1st Lien Term Loan, Tranche B2, 9.354% [LIBOR4+725], 10/17/2212,13 | | | | | | | 1,264,153 | | | | 416,304 | |
| Neiman Marcus Group Ltd. LLC, Sr. Sec. Credit Facilities 1st Lien Term Loan, 1.00% PIK Rate, 7.490% Cash Rate, [LIBOR12+650], 10/25/236,12,13,14 | | | | | | | 1,994 | | | | 1,469 | |
| PetSmart, Inc., Sr. Sec. Credit Facilities 1st Lien Term Loan, Tranche B, 5.93% [LIBOR12+400], 3/11/2212,13 | | | | | | | 1,165,202 | | | | 1,138,740 | |
| Scientific Games International, Inc., Sr. Sec. Credit Facilities 1st Lien Term Loan, Tranche B5, 4.536% [LIBOR6+275], 8/14/246,12,13 | | | | | | | 1,615,220 | | | | 1,599,189 | |
35 INVESCO OPPENHEIMER GLOBAL STRATEGIC INCOME FUND
CONSOLIDATED SCHEDULE OF INVESTMENTSContinued
| | | | | | | | | | | | |
| | | | | | Principal Amount | | | Value | |
Corporate Loans (Continued) | | | | | |
| Windstream Services LLC, Sr. Sec. Credit Facilities Term Loan, Tranche B6, 9.75% [PRIME4+500], 3/29/2112,13,15 | | | | | | $ | 382,540 | | | $ | 388,039 | |
| | | | | | | | | | | | |
| Total Corporate Loans (Cost $9,096,059) | | | | | | | | | | | 8,487,822 | |
| | | | | | | | | | | | |
Corporate Bonds and Notes—32.0% | | | | | |
Consumer Discretionary—5.9% | | | | | | | | | | | | |
Auto Components—0.2% | | | | | | | | | | | | |
| American Axle & Manufacturing, Inc., 6.25% Sr. Unsec. Nts., 4/1/25 | | | | | | | 1,383,000 | | | | 1,339,782 | |
| Dana Financing Luxembourg Sarl, 6.50% Sr. Unsec. Nts., 6/1/261 | | | | | | | 784,000 | | | | 827,120 | |
| Dana, Inc., 5.50% Sr. Unsec. Nts., 12/15/24 | | | | | | | 1,245,000 | | | | 1,283,906 | |
| Delphi Technologies plc, 5.00% Sr. Unsec. Nts., 10/1/251 | | | | | | | 1,305,000 | | | | 1,135,350 | |
| Goodyear Tire & Rubber Co. (The), 5.00% Sr. Unsec. Nts., 5/31/26 | | | | | | | 606,000 | | | | 628,725 | |
| Panther BF Aggregator 2 LP/Panther Finance Co., Inc.: | | | | | | | | | | | | |
| 6.25% Sr. Sec. Nts., 5/15/261 | | | | | | | 373,000 | | | | 395,268 | |
8.50% Sr. Unsec. Nts., 5/15/271 | | | | | | | 804,000 | | | | 810,030 | |
| Tenneco, Inc., 5.375% Sr. Unsec. Nts., 12/15/24 | | | | | | | 1,801,000 | | | | 1,593,885 | |
| | | | | | | | | | | | |
| | | | | | | | | | | 8,014,066 | |
| | | | | | | | | | | | |
Automobiles—0.6% | | | | | | | | | | | | |
| Ford Motor Credit Co. LLC: | | | | | | | | | | | | |
| 5.113% Sr. Unsec. Nts., 5/3/29 | | | | | | | 2,500,000 | | | | 2,533,706 | |
| 5.584% Sr. Unsec. Nts., 3/18/24 | | | | | | | 3,490,000 | | | | 3,722,925 | |
5.75% Sr. Unsec. Nts., 2/1/21 | | | | | | | 3,540,000 | | | | 3,664,995 | |
| General Motors Financial Co., Inc.: | | | | | | | | | | | | |
| 4.20% Sr. Unsec. Nts., 11/6/21 | | | | | | | 3,540,000 | | | | 3,659,199 | |
5.10% Sr. Unsec. Nts., 1/17/24 | | | | | | | 3,490,000 | | | | 3,772,120 | |
| JB Poindexter & Co., Inc., 7.125% Sr. Unsec. Nts., 4/15/261 | | | | | | | 2,637,000 | | | | 2,762,257 | |
| | | | | | | | | | | | |
| | | | | | | | | | | 20,115,202 | |
| | | | | | | | | | | | |
Distributors—0.1% | | | | | | | | | | | | |
| Core & Main Holdings LP, 9.375% PIK Rate, 8.625% Cash Rate, 8.625% Sr. Unsec. Nts., 9/15/241,14 | | | | | | | 3,525,000 | | | | 3,520,594 | |
| LKQ Corp., 4.75% Sr. Unsec. Nts., 5/15/23 | | | | | | | 458,000 | | | | 468,158 | |
| | | | | | | | | | | | |
| | | | | | | | | | | 3,988,752 | |
| | | | | | | | | | | | |
Diversified Consumer Services—0.1% | | | | | | | | | | | | |
| GEMS MENASA Cayman Ltd./GEMS Education Delaware LLC, 7.125% Sr. Sec. Nts., 7/31/261 | | | | | | | 2,370,000 | | | | 2,464,800 | |
| Service Corp. International, 4.625% Sr. Unsec. Nts., 12/15/27 | | | | | | | 405,000 | | | | 424,744 | |
| | | | | | | | | | | | |
| | | | | | | | | | | 2,889,544 | |
| | | | | | | | | | | | |
Entertainment—0.3% | | | | | | | | | | | | |
| AMC Entertainment Holdings, Inc.: | | | | | | | | | | | | |
| 5.75% Sr. Sub. Nts., 6/15/25 | | | | | | | 652,000 | | | | 621,910 | |
| 5.875% Sr. Sub. Nts., 11/15/26 | | | | | | | 1,981,000 | | | | 1,815,091 | |
36 INVESCO OPPENHEIMER GLOBAL STRATEGIC INCOME FUND
| | | | | | | | | | | | |
| | | | | | Principal Amount | | | Value | |
Entertainment (Continued) | | | | | | | | | | | | |
Netflix, Inc.: | | | | | | | | | | | | |
5.375% Sr. Unsec. Nts., 11/15/291 | | | | | | $ | 780,000 | | | $ | 823,875 | |
5.75% Sr. Unsec. Nts., 3/1/24 | | | | | | | 1,418,000 | | | | 1,566,234 | |
5.875% Sr. Unsec. Nts., 11/15/28 | | | | | | | 4,902,000 | | | | 5,410,583 | |
| | | | | | | | | | | | |
| | | | | | | | | | | 10,237,693 | |
| | | | | | | | | | | | |
Hotels, Restaurants & Leisure—1.6% | | | | | | | | | | | | |
| 1011778 B.C. ULC/New Red Finance, Inc.: | | | | | | | | | | | | |
| 4.25% Sr. Sec. Nts., 5/15/241 | | | | | | | 829,000 | | | | 852,834 | |
5.00% Sec. Nts., 10/15/251 | | | | | | | 2,454,000 | | | | 2,533,755 | |
| Aramark Services, Inc.: | | | | | | | | | | | | |
| 4.75% Sr. Unsec. Nts., 6/1/26 | | | | | | | 549,000 | | | | 564,784 | |
| 5.00% Sr. Unsec. Nts., 4/1/251 | | | | | | | 3,490,000 | | | | 3,642,687 | |
5.00% Sr. Unsec. Nts., 2/1/281 | | | | | | | 653,000 | | | | 684,834 | |
| Boyd Gaming Corp.: | | | | | | | | | | | | |
| 6.00% Sr. Unsec. Nts., 8/15/26 | | | | | | | 1,615,000 | | | | 1,717,956 | |
| 6.375% Sr. Unsec. Nts., 4/1/26 | | | | | | | 259,000 | | | | 276,159 | |
| CEC Entertainment, Inc., 8.00% Sr. Unsec. Nts., 2/15/22 | | | | | | | 548,000 | | | | 513,750 | |
| Diamond Resorts International, Inc., 7.75% Sr. Sec. Nts., 9/1/231 | | | | | | | 382,000 | | | | 396,722 | |
| Downstream Development Authority of the Quapaw Tribe of Oklahoma, 10.50% Sr. Sec. Nts., 2/15/231 | | | | | | | 389,000 | | | | 411,368 | |
| International Game Technology plc, 6.25% Sr. Sec. Nts., 2/15/221 | | | | | | | 7,025,000 | | | | 7,428,938 | |
| KFC Holding Co./Pizza Hut Holdings LLC/Taco Bell of America LLC: | | | | | | | | | | | | |
| 4.75% Sr. Unsec. Nts., 6/1/271 | | | | | | | 428,000 | | | | 448,330 | |
| 5.25% Sr. Unsec. Nts., 6/1/261 | | | | | | | 1,002,000 | | | | 1,062,120 | |
| Marriott Ownership Resorts, Inc., 4.75% Sr. Unsec. Nts., 1/15/281 | | | | | | | 3,034,000 | | | | 3,110,760 | |
| Melco Resorts Finance Ltd.: | | | | | | | | | | | | |
| 4.875% Sr. Unsec. Nts., 6/6/251 | | | | | | | 1,750,000 | | | | 1,795,133 | |
| 5.625% Sr. Unsec. Nts., 7/17/271 | | | | | | | 675,000 | | | | 705,691 | |
| MGM China Holdings Ltd.: | | | | | | | | | | | | |
| 5.375% Sr. Unsec. Nts., 5/15/241 | | | | | | | 3,495,000 | | | | 3,669,750 | |
| 5.875% Sr. Unsec. Nts., 5/15/261 | | | | | | | 3,200,000 | | | | 3,392,000 | |
| MGM Resorts International: | | | | | | | | | | | | |
| 4.625% Sr. Unsec. Nts., 9/1/26 | | | | | | | 1,290,000 | | | | 1,357,725 | |
| 5.75% Sr. Unsec. Nts., 6/15/25 | | | | | | | 538,000 | | | | 599,870 | |
| 6.00% Sr. Unsec. Nts., 3/15/23 | | | | | | | 3,276,000 | | | | 3,621,028 | |
| 6.625% Sr. Unsec. Nts., 12/15/21 | | | | | | | 423,000 | | | | 459,484 | |
| Party City Holdings, Inc., 6.625% Sr. Unsec. Nts., 8/1/261 | | | | | | | 645,000 | | | | 625,650 | |
| Penn National Gaming, Inc., 5.625% Sr. Unsec. Nts., 1/15/271 | | | | | | | 817,000 | | | | 845,595 | |
| Viking Cruises Ltd., 5.875% Sr. Unsec. Nts., 9/15/271 | | | | | | | 449,000 | | | | 478,185 | |
| Wynn Las Vegas LLC/Wynn Las Vegas Capital Corp.: | | | | | | | | | | | | |
| 5.25% Sr. Unsec. Nts., 5/15/271 | | | | | | | 1,075,000 | | | | 1,122,031 | |
| 5.50% Sr. Unsec. Nts., 3/1/251 | | | | | | | 1,395,000 | | | | 1,485,675 | |
| Wynn Macau Ltd.: | | | | | | | | | | | | |
| 4.875% Sr. Unsec. Nts., 10/1/241 | | | | | | | 7,297,000 | | | | 7,367,781 | |
| 5.50% Sr. Unsec. Nts., 10/1/271 | | | | | | | 164,000 | | | | 169,176 | |
37 INVESCO OPPENHEIMER GLOBAL STRATEGIC INCOME FUND
CONSOLIDATED SCHEDULE OF INVESTMENTSContinued
| | | | | | | | | | | | |
| | | | | | Principal Amount | | | Value | |
Hotels, Restaurants & Leisure (Continued) | | | | | | | | | | | | |
Wynn Resorts Finance LLC / Wynn Resorts Capital Corp., 5.125% Sr. Unsec. Nts., 10/1/291 | | | | | | $ | 1,020,000 | | | $ | 1,067,813 | |
| | | | | | | | | | | | |
| | | | | | | | | | | 52,407,584 | |
| | | | | | | | | | | | |
Household Durables—0.7% | | | | | | | | | | | | |
Beazer Homes USA, Inc., 6.75% Sr. Unsec. Nts., 3/15/25 | | | | | | | 1,508,000 | | | | 1,566,435 | |
| Eagle Intermediate Global Holding BV/Ruyi US Finance LLC, 7.50% Sr. Sec. Nts., 5/1/251 | | | | | | | 690,000 | | | | 604,612 | |
Lennar Corp.: | | | | | | | | | | | | |
4.50% Sr. Unsec. Nts., 4/30/24 | | | | | | | 419,000 | | | | 444,140 | |
4.75% Sr. Unsec. Nts., 4/1/21 | | | | | | �� | 7,075,000 | | | | 7,261,073 | |
4.75% Sr. Unsec. Nts., 5/30/25 | | | | | | | 1,067,000 | | | | 1,147,025 | |
5.00% Sr. Unsec. Nts., 6/15/27 | | | | | | | 1,645,000 | | | | 1,782,769 | |
5.25% Sr. Unsec. Nts., 6/1/26 | | | | | | | 705,000 | | | | 778,144 | |
Meritage Homes Corp., 5.125% Sr. Unsec. Nts., 6/6/27 | | | | | | | 1,458,000 | | | | 1,574,640 | |
Spectrum Brands, Inc., 5.00% Sr. Unsec. Nts., 10/1/291 | | | | | | | 2,230,000 | | | | 2,285,750 | |
Taylor Morrison Communities, Inc., 5.75% Sr. Unsec. Nts., 1/15/281 | | | | | | | 1,179,000 | | | | 1,307,216 | |
| Taylor Morrison Communities, Inc./Taylor Morrison Holdings II, Inc., 5.875% Sr. Unsec. Nts., 4/15/231 | | | | | | | 3,232,000 | | | | 3,506,720 | |
William Lyon Homes, Inc., 5.875% Sr. Unsec. Nts., 1/31/25 | | | | | | | 868,000 | | | | 887,530 | |
| | | | | | | | | | | | |
| | | | | | | | | | | 23,146,054 | |
| | | | | | | | | | | | |
Leisure Equipment & Products—0.0% | | | | | | | | | | | | |
Mattel, Inc., 6.75% Sr. Unsec. Nts., 12/31/251 | | | | | | | 1,217,000 | | | | 1,276,329 | |
| | | | | | | | | | | | |
Media—1.6% | | | | | | | | | | | | |
| Affinion Group, Inc., 14% PIK Rate, 12.50% Cash Rate, 12.50% Sr. Unsec. Nts., 11/10/221,14 | | | | | | | 2,717,163 | | | | 1,603,126 | |
Altice Financing SA: | | | | | | | | | | | | |
6.625% Sr. Sec. Nts., 2/15/231 | | | | | | | 243,000 | | | | 250,217 | |
7.50% Sr. Sec. Nts., 5/15/261 | | | | | | | 891,000 | | | | 948,915 | |
AMC Networks, Inc.: | | | | | | | | | | | | |
4.75% Sr. Unsec. Nts., 8/1/25 | | | | | | | 659,000 | | | | 668,061 | |
5.00% Sr. Unsec. Nts., 4/1/24 | | | | | | | 2,504,000 | | | | 2,556,734 | |
Belo Corp., 7.75% Sr. Unsec. Nts., 6/1/27 | | | | | | | 898,000 | | | | 1,041,680 | |
Cable Onda SA, 4.50% Sr. Unsec. Nts., 1/30/301 | | | | | | | 730,000 | | | | 741,147 | |
Cablevision Systems Corp., 5.875% Sr. Unsec. Nts., 9/15/22 | | | | | | | 411,000 | | | | 444,394 | |
CCO Holdings LLC/CCO Holdings Capital Corp.: | | | | | | | | | | | | |
4.00% Sr. Unsec. Nts., 3/1/231 | | | | | | | 411,000 | | | | 419,220 | |
5.00% Sr. Unsec. Nts., 2/1/281 | | | | | | | 749,000 | | | | 785,514 | |
5.125% Sr. Unsec. Nts., 5/1/231 | | | | | | | 632,000 | | | | 648,590 | |
5.125% Sr. Unsec. Nts., 5/1/271 | | | | | | | 1,091,000 | | | | 1,152,369 | |
5.375% Sr. Unsec. Nts., 5/1/251 | | | | | | | 245,000 | | | | 254,800 | |
5.75% Sr. Unsec. Nts., 2/15/261 | | | | | | | 3,250,000 | | | | 3,440,125 | |
5.875% Sr. Unsec. Nts., 4/1/241 | | | | | | | 376,000 | | | | 392,920 | |
5.875% Sr. Unsec. Nts., 5/1/271 | | | | | | | 245,000 | | | | 260,312 | |
Clear Channel Commuications, Inc., 9.00% Sr. Nts., 12/15/198,15,16 | | | | | | | 4,005,000 | | | | — | |
38 INVESCO OPPENHEIMER GLOBAL STRATEGIC INCOME FUND
| | | | | | | | | | | | |
| | | | | | Principal Amount | | | Value | |
Media (Continued) | | | | | | | | | | | | |
| CSC Holdings LLC: | | | | | | | | | | | | |
| 5.25% Sr. Unsec. Nts., 6/1/24 | | | | | | $ | 761,000 | | | $ | 821,880 | |
| 5.375% Sr. Unsec. Nts., 7/15/231 | | | | | | | 402,000 | | | | 413,047 | |
| 5.50% Sr. Unsec. Nts., 5/15/261 | | | | | | | 525,000 | | | | 554,531 | |
| 5.50% Sr. Unsec. Nts., 4/15/271 | | | | | | | 1,676,000 | | | | 1,780,767 | |
| 6.50% Sr. Unsec. Nts., 2/1/291 | | | | | | | 1,618,000 | | | | 1,815,194 | |
| 6.625% Sr. Unsec. Nts., 10/15/251 | | | | | | | 956,000 | | | | 1,020,530 | |
| 10.875% Sr. Unsec. Nts., 10/15/251 | | | | | | | 778,000 | | | | 879,401 | |
| Cumulus Media New Holdings, Inc., 6.75% Sr. Sec. Nts., 7/1/261 | | | | | | | 1,308,000 | | | | 1,389,750 | |
| Diamond Sports Group LLC/Diamond Sports Finance Co.: | | | | | | | | | | | | |
| 5.375% Sr. Sec. Nts., 8/15/261 | | | | | | | 3,482,000 | | | | 3,643,042 | |
| 6.625% Sr. Unsec. Nts., 8/15/271 | | | | | | | 1,489,000 | | | | 1,537,392 | |
| DISH DBS Corp., 5.875% Sr. Unsec. Nts., 11/15/24 | | | | | | | 3,090,000 | | | | 3,109,313 | |
| Gray Television, Inc.: | | | | | | | | | | | | |
| 5.125% Sr. Unsec. Nts., 10/15/241 | | | | | | | 607,000 | | | | 630,521 | |
| 5.875% Sr. Unsec. Nts., 7/15/261 | | | | | | | 581,000 | | | | 612,240 | |
| iHeartCommunications, Inc., 6.375% Sr. Sec. Nts., 5/1/26 | | | | | | | 214,227 | | | | 231,633 | |
| Lamar Media Corp., 5.75% Sr. Unsec. Nts., 2/1/26 | | | | | | | 780,000 | | | | 828,750 | |
| MDC Partners, Inc., 6.50% Sr. Unsec. Nts., 5/1/241 | | | | | | | 420,000 | | | | 403,725 | |
| Meredith Corp., 6.875% Sr. Unsec. Nts., 2/1/26 | | | | | | | 1,656,000 | | | | 1,715,169 | |
| Sinclair Television Group, Inc., 5.625% Sr. Unsec. Nts., 8/1/241 | | | | | | | 1,001,000 | | | | 1,033,533 | |
| Sirius XM Radio, Inc.: | | | | | | | | | | | | |
| 4.625% Sr. Unsec. Nts., 7/15/241 | | | | | | | 1,330,000 | | | | 1,393,175 | |
| 5.375% Sr. Unsec. Nts., 7/15/261 | | | | | | | 1,780,000 | | | | 1,884,575 | |
| 5.50% Sr. Unsec. Nts., 7/1/291 | | | | | | | 1,280,000 | | | | 1,386,400 | |
| TEGNA, Inc., 5.50% Sr. Unsec. Nts., 9/15/241 | | | | | | | 609,000 | | | | 628,601 | |
| Telenet Finance Luxembourg Notes Sarl, 5.50% Sr. Sec. Nts., 3/1/281 | | | | | | | 2,125,000 | | | | 2,270,563 | |
| UPC Holding BV, 5.50% Sr. Sec. Nts., 1/15/281 | | | | | | | 2,000,000 | | | | 2,045,000 | |
| Virgin Media Secured Finance plc: | | | | | | | | | | | | |
| 5.50% Sr. Sec. Nts., 8/15/261 | | | | | | | 1,951,000 | | | | 2,055,866 | |
| 5.50% Sr. Sec. Nts., 5/15/291 | | | | | | | 317,000 | | | | 337,605 | |
| VTR Finance BV, 6.875% Sr. Sec. Nts., 1/15/241 | | | | | | | 2,222,000 | | | | 2,283,105 | |
| Ziggo BV, 5.50% Sr. Sec. Nts., 1/15/271 | | | | | | | 1,039,000 | | | | 1,097,423 | |
| | | | | | | | | | | | |
| | | | | | | | | | | 53,410,855 | |
| | | | | | | | | | | | |
Multiline Retail—0.1% | | | | | | | | | | | | |
| Michaels Stores, Inc., 8.00% Sr. Unsec. Nts., 7/15/271 | | | | | | | 1,776,000 | | | | 1,759,927 | |
| | | | | | | | | | | | |
Specialty Retail—0.3% | | | | | | | | | | | | |
| eG Global Finance plc, 8.50% Sr. Sec. Nts., 10/30/251 | | | | | | | 688,000 | | | | 724,120 | |
| L Brands, Inc.: | | | | | | | | | | | | |
| 5.25% Sr. Unsec. Nts., 2/1/28 | | | | | | | 326,000 | | | | 303,180 | |
| 6.875% Sr. Unsec. Nts., 11/1/35 | | | | | | | 2,294,000 | | | | 1,961,370 | |
| 7.50% Sr. Unsec. Nts., 6/15/29 | | | | | | | 1,360,000 | | | | 1,352,792 | |
| Lithia Motors, Inc., 5.25% Sr. Unsec. Nts., 8/1/251 | | | | | | | 1,953,000 | | | | 2,053,091 | |
| Penske Automotive Group, Inc., 5.50% Sr. Sub. Nts., 5/15/26 | | | | | | | 2,186,000 | | | | 2,292,568 | |
| PetSmart, Inc., 5.875% Sr. Sec. Nts., 6/1/251 | | | | | | | 746,000 | | | | 738,540 | |
39 INVESCO OPPENHEIMER GLOBAL STRATEGIC INCOME FUND
CONSOLIDATED SCHEDULE OF INVESTMENTSContinued
| | | | | | | | | | | | |
| | | | | | Principal Amount | | | Value | |
Specialty Retail (Continued) | | | | | | | | | | | | |
Suburban Propane Partners LP/Suburban Energy Finance Corp., 5.875% Sr. Unsec. Nts., 3/1/27 | | | | | | $ | 1,048,000 | | | $ | 1,089,920 | |
| | | | | | | | | | | | |
| | | | | | | | | | | 10,515,581 | |
| | | | | | | | | | | | |
Textiles, Apparel & Luxury Goods—0.3% | | | | | | | | | | | | |
Hanesbrands, Inc.: | | | | | | | | | | | | |
4.625% Sr. Unsec. Nts., 5/15/241 | | | | | | | 4,435,000 | | | | 4,684,247 | |
4.875% Sr. Unsec. Nts., 5/15/261 | | | | | | | 2,397,000 | | | | 2,546,812 | |
William Carter Co. (The), 5.625% Sr. Unsec. Nts., 3/15/271 | | | | | | | 2,122,000 | | | | 2,270,540 | |
| | | | | | | | | | | | |
| | | | | | | | | | | 9,501,599 | |
| | | | | | | | | | | | |
Consumer Staples—0.8% | | | | | | | | | | | | |
Beverages—0.3% | | | | | | | | | | | | |
Coca-Cola Icecek AS, 4.215% Sr. Unsec. Nts., 9/19/241 | | | | | | | 7,030,000 | | | | 7,046,942 | |
Simmons Foods, Inc., 5.75% Sec. Nts., 11/1/241 | | | | | | | 1,294,000 | | | | 1,271,355 | |
| | | | | | | | | | | | |
| | | | | | | | | | | 8,318,297 | |
| | | | | | | | | | | | |
Food & Staples Retailing—0.1% | | | | | | | | | | | | |
Albertsons Cos LLC/Safeway, Inc./New Albertsons LP/ Albertson’s LLC, 5.875% Sr. Unsec. Nts., 2/15/281 | | | | | | | 695,000 | | | | 747,994 | |
Albertsons Cos. LLC/Safeway, Inc./New Albertsons LP/Albertson’s LLC: | | | | | | | | | | | | |
5.75% Sr. Unsec. Nts., 3/15/25 | | | | | | | 396,000 | | | | 411,721 | |
7.50% Sr. Unsec. Nts., 3/15/261 | | | | | | | 690,000 | | | | 770,212 | |
Ingles Markets, Inc., 5.75% Sr. Unsec. Nts., 6/15/23 | | | | | | | 791,000 | | | | 809,786 | |
US Foods, Inc., 5.875% Sr. Unsec. Nts., 6/15/241 | | | | | | | 1,722,000 | | | | 1,780,118 | |
| | | | | | | | | | | | |
| | | | | | | | | | | 4,519,831 | |
| | | | | | | | | | | | |
Food Products—0.2% | | | | | | | | | | | | |
Darling Ingredients, Inc., 5.25% Sr. Unsec. Nts., 4/15/271 | | | | | | | 322,000 | | | | 339,307 | |
JBS USA LUX SA/JBS USA Food Co./JBS USA Finance, Inc., 5.50% Sr. Unsec. Nts., 1/15/301 | | | | | | | 1,448,000 | | | | 1,563,840 | |
Lamb Weston Holdings, Inc., 4.625% Sr. Unsec. Nts., 11/1/241 | | | | | | | 695,000 | | | | 734,094 | |
Pilgrim’s Pride Corp.: | | | | | | | | | | | | |
5.75% Sr. Unsec. Nts., 3/15/251 | | | | | | | 664,000 | | | | 690,560 | |
5.875% Sr. Unsec. Nts., 9/30/271 | | | | | | | 1,682,000 | | | | 1,808,604 | |
Simmons Foods, Inc., 7.75% Sr. Sec. Nts., 1/15/241 | | | | | | | 324,000 | | | | 351,945 | |
TreeHouse Foods, Inc., 6.00% Sr. Unsec. Nts., 2/15/241 | | | | | | | 1,972,000 | | | | 2,050,880 | |
| | | | | | | | | | | | |
| | | | | | | | | | | 7,539,230 | |
| | | | | | | | | | | | |
Household Products—0.2% | | | | | | | | | | | | |
Controladora Mabe SA de CV, 5.60% Sr. Unsec. Nts., 10/23/281 | | | | | | | 5,215,000 | | | | 5,750,842 | |
Energizer Holdings, Inc.: | | | | | | | | | | | | |
6.375% Sr. Unsec. Nts., 7/15/261 | | | | | | | 264,000 | | | | 282,163 | |
7.75% Sr. Unsec. Nts., 1/15/271 | | | | | | | 949,000 | | | | 1,053,390 | |
Spectrum Brands, Inc., 6.125% Sr. Unsec. Nts., 12/15/24 | | | | | | | 695,000 | | | | 721,931 | |
| | | | | | | | | | | | |
| | | | | | | | | | | 7,808,326 | |
40 INVESCO OPPENHEIMER GLOBAL STRATEGIC INCOME FUND
| | | | | | | | |
| | | Principal Amount | | | Value | |
Personal Products—0.0% | | | | | | | | |
First Quality Finance Co., Inc., 5.00% Sr. Unsec. Nts., 7/1/251 | | $ | 641,000 | | | $ | 665,166 | |
Energy—4.0% | | | | | | | | |
Energy Equipment & Services—0.1% | | | | | | | | |
| ADES International Holding plc, 8.625% Sr. Sec. Nts., 4/24/241 | | | 1,300,000 | | | | 1,340,625 | |
| Antero Midstream Partners LP/Antero Midstream Finance Corp., 5.75% Sr. Unsec. Nts., 1/15/281 | | | 1,822,000 | | | | 1,361,945 | |
| Basic Energy Services, Inc., 10.75% Sr. Sec. Nts., 10/15/231 | | | 529,000 | | | | 383,525 | |
| CSI Compressco LP/CSI Compressco Finance, Inc., 7.50% Sr. Sec. Nts., 4/1/251 | | | 481,000 | | | | 468,975 | |
| Ensign Drilling, Inc., 9.25% Sr. Unsec. Nts., 4/15/241 | | | 402,000 | | | | 342,705 | |
| McDermott Technology Americas, Inc./McDermott Technology US, Inc., 10.625% Sr. Unsec. Nts., 5/1/241 | | | 3,530,000 | | | | 688,350 | |
| Precision Drilling Corp., 7.125% Sr. Unsec. Nts., 1/15/261 | | | 456,000 | | | | 396,720 | |
Tervita Escrow Corp., 7.625% Sec. Nts., 12/1/211 | | | 405,000 | | | | 400,950 | |
| | | | | | | | |
| | | | | | | 5,383,795 | |
| | | | | | | | | |
Oil, Gas & Consumable Fuels—3.9% | | | | | | | | |
| Antero Resources Corp.: | | | | | | | | |
| 5.125% Sr. Unsec. Nts., 12/1/22 | | | 296,000 | | | | 223,110 | |
| 5.375% Sr. Unsec. Nts., 11/1/21 | | | 695,000 | | | | 623,762 | |
| Ascent Resources Utica Holdings LLC/ARU Finance Corp., 10.00% Sr. Unsec. Nts., 4/1/221 | | | 1,035,000 | | | | 984,595 | |
| Callon Petroleum Co., 6.375% Sr. Unsec. Nts., 7/1/26 | | | 1,799,000 | | | | 1,686,562 | |
| Calumet Specialty Products Partners LP/Calumet Finance Corp., 7.625% Sr. Unsec. Nts., 1/15/22 | | | 1,591,000 | | | | 1,559,180 | |
| Carrizo Oil & Gas, Inc.: | | | | | | | | |
| 6.25% Sr. Unsec. Nts., 4/15/23 | | | 160,000 | | | | 149,600 | |
| 8.25% Sr. Unsec. Nts., 7/15/25 | | | 324,000 | | | | 309,420 | |
| CITGO Petroleum Corp., 6.25% Sr. Sec. Nts., 8/15/221 | | | 195,000 | | | | 197,681 | |
| CNX Resources Corp., 5.875% Sr. Unsec. Nts., 4/15/22 | | | 323,000 | | | | 316,944 | |
| Comstock Resources, Inc., 9.75% Sr. Unsec. Nts., 8/15/26 | | | 459,000 | | | | 364,905 | |
| Cosan Ltd., 5.50% Sr. Unsec. Nts., 9/20/291 | | | 4,070,000 | | | | 4,235,852 | |
| Crestwood Midstream Partners LP/Crestwood Midstream Finance Corp.: | | | | | | | | |
| 5.625% Sr. Unsec. Nts., 5/1/271 | | | 1,321,000 | | | | 1,334,236 | |
| 5.75% Sr. Unsec. Nts., 4/1/25 | | | 185,000 | | | | 191,937 | |
| 6.25% Sr. Unsec. Nts., 4/1/23 | | | 211,000 | | | | 215,684 | |
| DCP Midstream Operating LP: | | | | | | | | |
| 4.75% Sr. Unsec. Nts., 9/30/211 | | | 695,000 | | | | 710,637 | |
| 5.125% Sr. Unsec. Nts., 5/15/29 | | | 1,902,000 | | | | 1,937,663 | |
| Energy Transfer Operating LP: | | | | | | | | |
| 6.25% [US0003M+402.8] Jr. Sub. Perpetual Bonds2,17 | | | 834,000 | | | | 776,888 | |
| 7.50% Sr. Unsec. Nts., 10/15/20 | | | 710,000 | | | | 745,137 | |
| EnLink Midstream LLC, 5.375% Sr. Unsec. Nts., 6/1/29 | | | 160,000 | | | | 142,400 | |
| EnLink Midstream Partners LP: | | | | | | | | |
| 4.40% Sr. Unsec. Nts., 4/1/24 | | | 160,000 | | | | 150,600 | |
| 4.85% Sr. Unsec. Nts., 7/15/26 | | | 1,779,000 | | | | 1,634,456 | |
| 5.60% Sr. Unsec. Nts., 4/1/44 | | | 1,689,000 | | | | 1,304,753 | |
41 INVESCO OPPENHEIMER GLOBAL STRATEGIC INCOME FUND
CONSOLIDATED SCHEDULE OF INVESTMENTSContinued
| | | | | | | | | | | | |
| | | | | | Principal Amount | | | Value | |
Oil, Gas & Consumable Fuels (Continued) | | | | | | | | | | | | |
| Eterna Capital Pte Ltd., 7.5% PIK Rate, 7.50% Sr. Sec. Nts., 12/11/221,14 | | | | | | $ | 3,182,367 | | | $ | 2,606,392 | |
| Eterna Capital Pte Ltd., 8% PIK Rate, 8.00% Sr. Sec. Nts., 12/11/2214 | | | | | | | 4,118,525 | | | | 2,450,439 | |
| Genesis Energy LP/Genesis Energy Finance Corp.: | | | | | | | | | | | | |
| 6.25% Sr. Unsec. Nts., 5/15/26 | | | | | | | 1,208,000 | | | | 1,123,440 | |
| 6.50% Sr. Unsec. Nts., 10/1/25 | | | | | | | 620,000 | | | | 591,325 | |
| 6.75% Sr. Unsec. Nts., 8/1/22 | | | | | | | 285,000 | | | | 287,494 | |
| Golden Nugget, Inc., 8.75% Sr. Sub. Nts., 10/1/251 | | | | | | | 1,323,000 | | | | 1,395,765 | |
| Gulfport Energy Corp.: | | | | | | | | | | | | |
| 6.00% Sr. Unsec. Nts., 10/15/24 | | | | | | | 1,050,000 | | | | 679,875 | |
| 6.375% Sr. Unsec. Nts., 5/15/25 | | | | | | | 324,000 | | | | 197,640 | |
| 6.625% Sr. Unsec. Nts., 5/1/23 | | | | | | | 1,670,000 | | | | 1,256,675 | |
| Hess Infrastructure Partners LP/Hess Infrastructure Partners Finance Corp., 5.625% Sr. Unsec. Nts., 2/15/261 | | | | | | | 2,011,000 | | | | 2,114,064 | |
| HighPoint Operating Corp., 8.75% Sr. Unsec. Nts., 6/15/25 | | | | | | | 216,000 | | | | 193,320 | |
| Hilcorp Energy I LP/Hilcorp Finance Co., 5.75% Sr. Unsec. Nts., 10/1/251 | | | | | | | 315,000 | | | | 282,713 | |
| Holly Energy Partners LP/Holly Energy Finance Corp., 6.00% Sr. Unsec. Nts., 8/1/241 | | | | | | | 710,000 | | | | 742,838 | |
| Indigo Natural Resources LLC, 6.875% Sr. Unsec. Nts., 2/15/261 | | | | | | | 465,000 | | | | 425,475 | |
| KazTransGas JSC, 4.375% Sr. Unsec. Nts., 9/26/271 | | | | | | | 4,645,000 | | | | 4,884,403 | |
| Kinder Morgan Energy Partners LP, 3.45% Sr. Unsec. Nts., 2/15/23 | | | | | | | 3,545,000 | | | | 3,666,038 | |
| Murphy Oil USA, Inc., 5.625% Sr. Unsec. Nts., 5/1/27 | | | | | | | 1,656,000 | | | | 1,785,527 | |
| Murray Energy Corp., 3% PIK Rate, 9% Cash Rate, 12.00% Sec. Nts., 4/15/241,14,15 | | | | | | | 5,744,632 | | | | 53,856 | |
| Nabors Industries, Inc., 5.75% Sr. Unsec. Nts., 2/1/25 | | | | | | | 685,000 | | | | 513,956 | |
| NGL Energy Partners LP/NGL Energy Finance Corp.: | | | | | | | | | | | | |
| 6.125% Sr. Unsec. Nts., 3/1/25 | | | | | | | 1,087,000 | | | | 1,010,910 | |
| 7.50% Sr. Unsec. Nts., 11/1/23 | | | | | | | 338,000 | | | | 338,429 | |
| NuStar Logistics LP: | | | | | | | | | | | | |
| 4.80% Sr. Unsec. Nts., 9/1/20 | | | | | | | 695,000 | | | | 703,875 | |
| 6.00% Sr. Unsec. Nts., 6/1/26 | | | | | | | 2,349,000 | | | | 2,522,121 | |
| Oasis Petroleum, Inc., 6.875% Sr. Unsec. Nts., 1/15/23 | | | | | | | 1,400,000 | | | | 1,218,000 | |
| Occidental Petroleum Corp., 2.70% Sr. Unsec. Nts., 8/15/22 | | | | | | | 2,100,000 | | | | 2,123,118 | |
| Oil India International Pte Ltd., 4.00% Sr. Unsec. Nts., 4/21/271 | | | | | | | 4,881,000 | | | | 5,066,602 | |
| Parkland Fuel Corp., 6.00% Sr. Unsec. Nts., 4/1/261 | | | | | | | 2,449,000 | | | | 2,598,267 | |
| PBF Holding Co. LLC/PBF Finance Corp.: | | | | | | | | | | | | |
| 7.00% Sr. Unsec. Nts., 11/15/23 | | | | | | | 435,000 | | | | 450,225 | |
| 7.25% Sr. Unsec. Nts., 6/15/25 | | | | | | | 488,000 | | | | 511,790 | |
| Pertamina Persero PT, 4.70% Sr. Unsec. Nts., 7/30/491 | | | | | | | 1,510,000 | | | | 1,580,762 | |
| Petrobras Global Finance BV: | | | | | | | | | | | | |
| 6.85% Sr. Unsec. Nts., 6/5/15 | | | | | | | 520,000 | | | | 599,300 | |
| 6.90% Sr. Unsec. Nts., 3/19/49 | | | | | | | 3,145,000 | | | | 3,661,724 | |
| Petroleos Mexicanos: | | | | | | | | | | | | |
| 3.75% Sr. Unsec. Nts., 4/16/261 | | | EUR | | | | 3,560,000 | | | | 4,015,493 | |
42 INVESCO OPPENHEIMER GLOBAL STRATEGIC INCOME FUND
| | | | | | | | | | | | |
| | | | | | Principal Amount | | | Value | |
Oil, Gas & Consumable Fuels (Continued) | | | | | | | | | | | | |
Petroleos Mexicanos: (Continued) 4.50% Sr. Unsec. Nts., 1/23/26 | | | | | | $ | 7,000,000 | | | $ | 6,942,250 | |
| 7.69% Sr. Unsec. Nts., 1/23/501 | | | | | | | 5,209,000 | | | | 5,692,916 | |
| Puma International Financing SA, 5.00% Sr. Unsec. Nts., 1/24/261 | | | | | | | 2,600,000 | | | | 2,502,956 | |
| QEP Resources, Inc.: | | | | | | | | | | | | |
| 5.625% Sr. Unsec. Nts., 3/1/26 | | | | | | | 2,450,000 | | | | 2,217,250 | |
| 6.875% Sr. Unsec. Nts., 3/1/21 | | | | | | | 695,000 | | | | 699,344 | |
| Reliance Industries Ltd., 7.00% Unsec. Nts., 8/31/22 | | | INR | | | | 540,000,000 | | | | 7,768,578 | |
| SemGroup Corp./Rose Rock Finance Corp.: | | | | | | | | | | | | |
| 5.625% Sr. Unsec. Nts., 7/15/22 | | | | | | | 308,000 | | | | 312,934 | |
| 5.625% Sr. Unsec. Nts., 11/15/23 | | | | | | | 745,000 | | | | 765,488 | |
| Southern Gas Corridor CJSC, 6.875% Sr. Unsec. Nts., 3/24/261 | | | | | | | 7,215,000 | | | | 8,426,081 | |
| Southwestern Energy Co.: | | | | | | | | | | | | |
| 6.20% Sr. Unsec. Nts., 1/23/25 | | | | | | | 162,000 | | | | 143,370 | |
| 7.50% Sr. Unsec. Nts., 4/1/26 | | | | | | | 1,415,000 | | | | 1,248,865 | |
| SRC Energy, Inc., 6.25% Sr. Unsec. Nts., 12/1/25 | | | | | | | 443,000 | | | | 416,331 | |
| State Oil Co. of the Azerbaijan Republic, 4.75% Sr. Unsec. Nts., 3/13/231 | | | | | | | 3,475,000 | | | | 3,629,151 | |
| Sunoco LP/Sunoco Finance Corp.: | | | | | | | | | | | | |
| 4.875% Sr. Unsec. Nts., 1/15/23 | | | | | | | 409,000 | | | | 420,759 | |
| 5.50% Sr. Unsec. Nts., 2/15/26 | | | | | | | 217,000 | | | | 224,888 | |
| 5.875% Sr. Unsec. Nts., 3/15/28 | | | | | | | 2,104,000 | | | | 2,214,502 | |
| 6.00% Sr. Unsec. Nts., 4/15/27 | | | | | | | 322,000 | | | | 338,905 | |
| Targa Resources Partners LP/Targa Resources Partners Finance Corp.: | | | | | | | | | | | | |
| 5.00% Sr. Unsec. Nts., 1/15/28 | | | | | | | 1,067,000 | | | | 1,061,665 | |
| 5.125% Sr. Unsec. Nts., 2/1/25 | | | | | | | 1,692,000 | | | | 1,742,794 | |
| 5.25% Sr. Unsec. Nts., 5/1/23 | | | | | | | 2,005,000 | | | | 2,017,531 | |
| 5.875% Sr. Unsec. Nts., 4/15/26 | | | | | | | 3,328,000 | | | | 3,486,413 | |
| 6.50% Sr. Unsec. Nts., 7/15/271 | | | | | | | 319,000 | | | | 342,134 | |
| Terraform Global Operating LLC, 6.125% Sr. Unsec. Nts., 3/1/261 | | | | | | | 976,000 | | | | 1,000,400 | |
| Transcanada Trust, 5.875% [US0003M+464] Jr. Sub. Nts., 8/15/762 | | | | | | | 3,545,000 | | | | 3,851,713 | |
| Whiting Petroleum Corp.: | | | | | | | | | | | | |
| 5.75% Sr. Unsec. Nts., 3/15/21 | | | | | | | 296,000 | | | | 279,720 | |
| 6.625% Sr. Unsec. Nts., 1/15/26 | | | | | | | 1,105,000 | | | | 690,625 | |
| WPX Energy, Inc., 8.25% Sr. Unsec. Nts., 8/1/23 | | | | | | | 205,000 | | | | 229,600 | |
| | | | | | | | | | | | |
| | | | | | | | | | | 130,115,016 | |
| | | | | | | | | | | | | |
Financials—9.8% | | | | | | | | | | | | |
Capital Markets—1.3% | | | | | | | | | | | | |
| Credit Suisse Group AG, 7.50% [USSW5+459.8] Jr. Sub. Perpetual Bonds1,2,17 | | | | | | | 10,330,000 | | | | 11,478,903 | |
| MSCI, Inc., 5.75% Sr. Unsec. Nts., 8/15/251 | | | | | | | 1,701,000 | | | | 1,792,429 | |
| Prime Security Services Borrower LLC/Prime Finance, Inc., 9.25% Sec. Nts., 5/15/231 | | | | | | | 2,031,000 | | | | 2,140,420 | |
| Standard Life Aberdeen plc, 4.25%, 6/30/28 | | | | | | | 5,625,000 | | | | 5,819,766 | |
43 INVESCO OPPENHEIMER GLOBAL STRATEGIC INCOME FUND
CONSOLIDATED SCHEDULE OF INVESTMENTSContinued
| | | | | | | | | | | | |
| | | | | | Principal Amount | | | Value | |
Capital Markets (Continued) | | | | | | | | | | | | |
| UBS Group Funding Switzerland AG: | | | | | | | | | | | | |
| 6.875% [USISDA05+549.65] Jr. Sub. Perpetual Bonds1,2,17 | | | | | | $ | 11,105,000 | | | $ | 11,561,271 | |
| 7.00% [USSW5+486.6] Jr. Sub. Perpetual Bonds1,2,17 | | | | | | | 5,245,000 | | | | 5,862,357 | |
| 7.125% [USSW5+588.3] Jr. Sub. Perpetual Bonds1,2,17 | | | | | | | 5,426,000 | | | | 5,717,794 | |
| | | | | | | | | | | | |
| | | | | | | | | | | 44,372,940 | |
| | | | | | | | | | | | | |
Commercial Banks—4.5% | | | | | | | | | | | | |
| Banca Monte dei Paschi di Siena SpA, 5.375% [EUSA5+500.5] Sub. Nts., 1/18/281,2 | | | EUR | | | | 3,750,000 | | | | 3,264,636 | |
| Banco Bilbao Vizcaya Argentaria SA: | | | | | | | | | | | | |
| 6.00% [EUSA5+603.9] Jr. Sub. Perpetual Bonds1,2,17 | | | EUR | | | | 2,860,000 | | | | 3,454,042 | |
| 8.875% [EUSA5+917.7] Jr. Sub. Perpetual Bonds1,2,17 | | | EUR | | | | 4,305,000 | | | | 5,294,323 | |
| Banco Comercial Portugues SA: | | | | | | | | | | | | |
| 4.50% [EUSA5+426.7] Sub. Nts., 12/7/271,2 | | | EUR | | | | 1,700,000 | | | | 1,976,700 | |
| 9.25% [EUSA5+941.4] Jr. Sub. Perpetual Bonds1,2,17 | | | EUR | | | | 2,947,000 | | | | 3,572,687 | |
| Banco do Brasil SA (Cayman), 4.75% Sr. Unsec. Nts., 3/20/241 | | | | | | | 2,562,000 | | | | 2,688,178 | |
| Banco Santander SA, 6.75% [EUSA5+680.3] Jr. Sub. Perpetual Bonds1,2,17 | | | EUR | | | | 10,710,000 | | | | 13,019,901 | |
| Banco Votorantim SA, 4.50% Sr. Unsec. Nts., 9/24/241 | | | | | | | 3,500,000 | | | | 3,613,400 | |
| Bank of China Ltd., 5.00% Sub. Nts., 11/13/241 | | | | | | | 3,535,000 | | | | 3,858,217 | |
| Bankinter SA, 8.625% [EUSA5+886.7] Jr. Sub. Perpetual Bonds1,2,17 | | | EUR | | | | 3,255,000 | | | | 4,042,922 | |
| Barclays plc: | | | | | | | | | | | | |
| 2.00% [EUSA5+190] Sub. Nts., 2/7/281,2 | | | EUR | | | | 3,495,000 | | | | 3,933,913 | |
| 6.375% [GUKG5+601.6] Jr. Sub. Perpetual Bonds1,2,3,17 | | | GBP | | | | 3,000,000 | | | | 4,061,423 | |
| 7.875% [USSW5+677.2] Jr. Sub. Perpetual Bonds1,2,17 | | | | | | | 3,140,000 | | | | 3,357,646 | |
| BBVA Bancomer SA, 5.875% [H15T5Y+430.8] Sub. Nts., 9/13/341,2 | | | | | | | 5,200,000 | | | | 5,296,200 | |
| BNP Paribas SA: | | | | | | | | | | | | |
| 6.625% [USSW5+414.9] Jr. Sub. Perpetual Bonds1,2,17 | | | | | | | 2,835,000 | | | | 3,021,302 | |
| 7.625% [USSW5+631.4] Jr. Sub. Perpetual Bonds1,2,17 | | | | | | | 2,720,000 | | | | 2,856,952 | |
| 7.625% [USSW5+631.4] Jr. Sub. Perpetual Bonds1,2,17 | | | | | | | 6,835,000 | | | | 7,179,142 | |
| CaixaBank SA, 6.75% [EUSA5+649.8] Jr. Sub. Perpetual Bonds1,2,17 | | | EUR | | | | 5,270,000 | | | | 6,496,193 | |
| CIT Group, Inc.: | | | | | | | | | | | | |
| 4.125% Sr. Unsec. Nts., 3/9/21 | | | | | | | 1,150,000 | | | | 1,178,750 | |
| 5.00% Sr. Unsec. Nts., 8/15/22 | | | | | | | 350,000 | | | | 372,949 | |
| 5.25% Sr. Unsec. Nts., 3/7/25 | | | | | | | 690,000 | | | | 761,588 | |
| Cooperatieve Rabobank UA, 6.625% [EUSA5+669.7] Jr. Sub. Perpetual Bonds1,2,17 | | | EUR | | | | 7,085,000 | | | | 8,620,657 | |
| Credit Agricole SA: | | | | | | | | | | | | |
| 6.875% [USSW5+431.9] Jr. Sub. Perpetual Bonds1,2,17 | | | | | | | 1,725,000 | | | | 1,877,171 | |
| 7.875% [USSW5+489.8] Jr. Sub. Perpetual Bonds1,2,17 | | | | | | | 3,540,000 | | | | 4,000,051 | |
| Credit Suisse AG, 6.50% Sub. Nts., 8/8/231 | | | | | | | 7,080,000 | | | | 7,893,924 | |
| Global Bank Corp., 5.25% [US0003M+330] Sr. Unsec. Nts., 4/16/291,2 | | | | | | | 4,810,000 | | | | 5,155,118 | |
| HSBC Holdings plc: | | | | | | | | | | | | |
| 5.25% [EUSA5+438.3] Jr. Sub. Perpetual Bonds1,2,17 | | | EUR | | | | 2,510,000 | | | | 3,023,305 | |
| 6.00% [EUSA5+533.8] Jr. Sub. Perpetual Bonds1,2,17 | | | EUR | | | | 2,995,000 | | | | 3,804,565 | |
44 INVESCO OPPENHEIMER GLOBAL STRATEGIC INCOME FUND
| | | | | | | | | | |
| | | | | Principal Amount | | | Value | |
Commercial Banks (Continued) | | | | | | | | | | |
| Icahn Enterprises LP/Icahn Enterprises Finance Corp., 6.375% Sr. Unsec. Nts., 12/15/25 | | | | $ | 569,000 | | | $ | 598,873 | |
| Lions Gate Capital Holdings LLC, 6.375% Sr. Unsec. Nts., 2/1/241 | | | | | 690,000 | | | | 664,712 | |
| Lloyds Bank plc, 7.50% Sr. Unsec. Nts., 4/2/321,7 | | | | | 7,175,000 | | | | 6,167,377 | |
| Novo Banco SA, 8.50% [EUSA5+823.3] Sub. Nts., 7/6/281,2 | | EUR | | | 1,745,000 | | | | 2,080,136 | |
| Skandinaviska Enskilda Banken AB, 5.75% [USSW5+385] Jr. Sub. Perpetual Bonds1,2,17 | | | | | 1,500,000 | | | | 1,518,729 | |
| Societe Generale SA, 7.375% [USSW5+623.8] Jr. Sub. Perpetual Bonds1,2,17 | | | | | 11,225,000 | | | | 11,842,375 | |
| Standard Chartered plc, 7.75% [USSW5+572.3] Jr. Sub. Perpetual Bonds1,2,17 | | | | | 8,745,000 | | | | 9,527,371 | |
| | | | | | | | | | |
| | | | | | | | | 150,075,428 | |
| | | | | | | | | | | |
Consumer Finance—0.5% | | | | | | | | | | |
| Ally Financial, Inc.: | | | | | | | | | | |
| 5.125% Sr. Unsec. Nts., 9/30/24 | | | | | 2,369,000 | | | | 2,608,766 | |
| 5.75% Sub. Nts., 11/20/25 | | | | | 2,288,000 | | | | 2,556,840 | |
| 8.00% Sr. Unsec. Nts., 11/1/31 | | | | | 1,099,000 | | | | 1,541,347 | |
| Navient Corp.: | | | | | | | | | | |
| 5.875% Sr. Unsec. Nts., 10/25/24 | | | | | 913,000 | | | | 938,107 | |
| 6.125% Sr. Unsec. Nts., 3/25/24 | | | | | 1,247,000 | | | | 1,309,724 | |
| 6.50% Sr. Unsec. Nts., 6/15/22 | | | | | 659,000 | | | | 706,778 | |
| 6.625% Sr. Unsec. Nts., 7/26/21 | | | | | 682,000 | | | | 722,920 | |
| 6.75% Sr. Unsec. Nts., 6/25/25 | | | | | 863,000 | | | | 912,364 | |
| 6.75% Sr. Unsec. Nts., 6/15/26 | | | | | 486,000 | | | | 509,085 | |
| Springleaf Finance Corp.: | | | | | | | | | | |
| 6.875% Sr. Unsec. Nts., 3/15/25 | | | | | 1,874,000 | | | | 2,126,990 | |
| 7.125% Sr. Unsec. Nts., 3/15/26 | | | | | 2,346,000 | | | | 2,684,704 | |
| | | | | | | | | | |
| | | | | | | | | 16,617,625 | |
| | | | | | | | | | | |
Diversified Financial Services—1.0% | | | | | | | | | | |
| Astana Finance JSC, 9.16% Sr. Unsec. Nts., 12/22/248,15 | | | | | 1,186,225 | | | | — | |
| Banco Invex SA/Hipotecaria Credito y Casa SA de CV, 6.45%, 3/13/348,9,15 | | MXN | | | 17,961,653 | | | | — | |
| Docuformas SAPI de CV, 10.25% Sr. Unsec. Nts., 7/24/241 | | | | | 835,000 | | | | 848,777 | |
| eG Global Finance plc, 6.25% Sr. Sec. Nts., 10/30/251 | | EUR | | | 600,000 | | | | 692,372 | |
| Greenko Mauritius Ltd., 6.25% Sr. Unsec. Nts., 2/21/231 | | | | | 3,500,000 | | | | 3,560,446 | |
| Icahn Enterprises LP/Icahn Enterprises Finance Corp.: | | | | | | | | | | |
| 5.875% Sr. Unsec. Nts., 2/1/22 | | | | | 416,000 | | | | 420,680 | |
| 6.25% Sr. Unsec. Nts., 5/15/261 | | | | | 405,000 | | | | 430,313 | |
| JP Morgan/Hipotecaria su Casita, 6.47%, 8/26/351 | | MXN | | | 20,232,960 | | | | 116,393 | |
| Lions Gate Capital Holdings LLC, 5.875% Sr. Unsec. Nts., 11/1/241 | | | | | 873,000 | | | | 827,168 | |
| National Bank for Agriculture & Rural Development, 8.39% Sr. Unsec. Nts., 7/19/21 | | INR | | | 145,000,000 | | | | 2,099,325 | |
| Power Finance Corp. Ltd.: | | | | | | | | | | |
| 7.27% Sr. Unsec. Nts., 12/22/21 | | INR | | | 360,000,000 | | | | 5,091,418 | |
| 7.42% Sr. Unsec. Nts., 6/26/20 | | INR | | | 107,000,000 | | | | 1,517,108 | |
45 INVESCO OPPENHEIMER GLOBAL STRATEGIC INCOME FUND
CONSOLIDATED SCHEDULE OF INVESTMENTSContinued
| | | | | | | | | | |
| | | | | Principal Amount | | | Value | |
Diversified Financial Services (Continued) | | | | | | | | | | |
Power Finance Corp. Ltd.: (Continued) 7.50% Sr. Unsec. Nts., 8/16/21 | | INR | | | 360,000,000 | | | $ | 5,108,567 | |
| Quicken Loans, Inc.: | | | | | | | | | | |
| 5.25% Sr. Unsec. Nts., 1/15/281 | | | | | 425,000 | | | | 439,875 | |
| 5.75% Sr. Unsec. Nts., 5/1/251 | | | | | 401,000 | | | | 414,826 | |
| Rural Electrification Corp. Ltd.: | | | | | | | | | | |
| 7.24% Sr. Unsec. Nts., 10/21/21 | | INR | | | 360,000,000 | | | | 5,097,764 | |
| 7.60% Sr. Unsec. Nts., 4/17/21 | | INR | | | 350,000,000 | | | | 4,980,624 | |
| Swiss Insured Brazil Power Finance Sarl, 9.85% Sr. Sec. Nts., 7/16/321 | | BRL | | | 12,250,000 | | | | 3,550,835 | |
| | | | | | | | | | |
| | | | | | | | | 35,196,491 | |
| | | | | | | | | | | |
Insurance—0.6% | | | | | | | | | | |
| AXA SA, 3.875% [EUSA11+325] Jr. Sub. Perpetual Bonds1,2,17 | | EUR | | | 2,695,000 | | | | 3,406,097 | |
| Caisse Nationale de Reassurance Mutuelle Agricole Groupama, 6.375% [EUR003M+577] Jr. Sub. Perpetual Bonds1,2,17 | | EUR | | | 5,900,000 | | | | 7,720,203 | |
| La Mondiale SAM, 5.05% [EUSA5+505] Jr. Sub. Perpetual Bonds1,2,17 | | EUR | | | 2,475,000 | | | | 3,186,757 | |
| NN Group NV, 4.375% [EUR003M+390] Jr. Sub. Perpetual Bonds1,2,17 | | EUR | | | 3,535,000 | | | | 4,349,263 | |
| VIVAT NV, 6.25% [USSW5+417.4] Jr. Sub. Perpetual Bonds1,2,17 | | | | | 3,535,000 | | | | 3,545,906 | |
| | | | | | | | | | |
| | | | | | | | | 22,208,226 | |
| | | | | | | | | | | |
Real Estate Investment Trusts (REITs)—0.5% | | | | | | | | | | |
| CoreCivic, Inc.: | | | | | | | | | | |
| 4.625% Sr. Unsec. Nts., 5/1/23 | | | | | 281,000 | | | | 264,491 | |
| 5.00% Sr. Unsec. Nts., 10/15/22 | | | | | 160,000 | | | | 159,200 | |
| Equinix, Inc., 5.875% Sr. Unsec. Nts., 1/15/26 | | | | | 2,155,000 | | | | 2,294,428 | |
| GLP Capital LP/GLP Financing II, Inc., 5.375% Sr. Unsec. Nts., 11/1/23 | | | | | 1,617,000 | | | | 1,762,449 | |
| Iron Mountain US Holdings, Inc., 5.375% Sr. Unsec. Nts., 6/1/261 | | | | | 2,515,000 | | | | 2,621,888 | |
| Iron Mountain, Inc.: | | | | | | | | | | |
| 4.875% Sr. Unsec. Nts., 9/15/271 | | | | | 488,000 | | | | 505,080 | |
| 4.875% Sr. Unsec. Nts., 9/15/291 | | | | | 1,043,000 | | | | 1,070,379 | |
| iStar, Inc., 4.75% Sr. Unsec. Nts., 10/1/24 | | | | | 2,527,000 | | | | 2,612,286 | |
| MGM Growth Properties Operating Partnership LP/MGP Finance Co.-Issuer, Inc.: | | | | | | | | | | |
| 5.625% Sr. Unsec. Nts., 5/1/24 | | | | | 1,039,000 | | | | 1,148,095 | |
| 5.75% Sr. Unsec. Nts., 2/1/271 | | | | | 319,000 | | | | 360,869 | |
| MPT Operating Partnership LP/MPT Finance Corp.: | | | | | | | | | | |
| 4.625% Sr. Unsec. Nts., 8/1/29 | | | | | 2,695,000 | | | | 2,816,315 | |
| 5.00% Sr. Unsec. Nts., 10/15/27 | | | | | 238,000 | | | | 251,685 | |
| 6.375% Sr. Unsec. Nts., 3/1/24 | | | | | 250,000 | | | | 261,250 | |
| SBA Communications Corp., 4.00% Sr. Unsec. Nts., 10/1/22 | | | | | 812,000 | | | | 832,422 | |
| | | | | | | | | | |
| | | | | | | | | 16,960,837 | |
46 INVESCO OPPENHEIMER GLOBAL STRATEGIC INCOME FUND
| | | | | | | | | | |
| | | | | Principal Amount | | | Value | |
Real Estate Management & Development—1.3% | | | | | | | | | | |
| Agile Group Holdings Ltd., 9.00% Sr. Sec. Nts., 5/21/201 | | | | $ | 6,610,000 | | | $ | 6,752,231 | |
| China Aoyuan Group Ltd., 7.50% Sr. Sec. Nts., 5/10/211 | | | | | 1,499,000 | | | | 1,544,104 | |
| CIFI Holdings Group Co. Ltd.: | | | | | | | | | | |
| 6.375% Sr. Unsec. Nts., 5/2/201 | | | | | 3,495,000 | | | | 3,528,203 | |
| 7.625% Sr. Unsec. Nts., 3/2/211 | | | | | 9,746,000 | | | | 10,091,983 | |
| Consus Real Estate AG, 9.625% Sr. Sec. Nts., 5/15/241 | | EUR | | | 1,810,000 | | | | 1,907,564 | |
| Country Garden Holdings Co. Ltd., 7.50% Sr. Sec. Nts., 3/9/201 | | | | | 3,915,000 | | | | 3,971,572 | |
| Logan Property Holdings Co. Ltd., 6.875% Sr. Unsec. Nts., 4/24/211 | | | | | 760,000 | | | | 781,660 | |
| Times China Holdings Ltd.: | | | | | | | | | | |
| 6.25% Sr. Sec. Nts., 1/23/201 | | | | | 1,230,000 | | | | 1,235,972 | |
| 7.85% Sr. Sec. Nts., 6/4/211 | | | | | 11,518,000 | | | | 11,869,299 | |
| Yuzhou Properties Co. Ltd., 6.375% Sr. Sec. Nts., 3/6/211 | | | | | 1,499,000 | | | | 1,511,741 | |
| | | | | | | | | | |
| | | | | | | | | 43,194,329 | |
| | | | | | | | | | | |
Thrifts & Mortgage Finance—0.1% | | | | | | | | | | |
| LIC Housing Finance Ltd., 7.45% Sr. Sec. Nts., 10/17/22 | | INR | | | 180,000,000 | | | | 2,558,910 | |
| | | | | | | | | | | |
Health Care—1.3% | | | | | | | | | | |
Health Care Equipment & Supplies—0.0% | | | | | | | | | | |
| Teleflex, Inc., 4.875% Sr. Unsec. Nts., 6/1/26 | | | | | 1,697,000 | | | | 1,787,683 | |
| | | | | | | | | | | |
Health Care Providers & Services—1.0% | | | | | | | | | | |
| Acadia Healthcare Co., Inc.: | | | | | | | | | | |
| 5.625% Sr. Unsec. Nts., 2/15/23 | | | | | 259,000 | | | | 264,180 | |
| 6.50% Sr. Unsec. Nts., 3/1/24 | | | | | 338,000 | | | | 351,520 | |
| Centene Corp.: | | | | | | | | | | |
| 4.75% Sr. Unsec. Nts., 5/15/22 | | | | | 763,000 | | | | 782,075 | |
| 5.375% Sr. Unsec. Nts., 6/1/261 | | | | | 2,422,000 | | | | 2,569,742 | |
| 6.125% Sr. Unsec. Nts., 2/15/24 | | | | | 650,000 | | | | 676,611 | |
| Encompass Health Corp., 5.75% Sr. Unsec. Nts., 11/1/24 | | | | | 262,000 | | | | 265,439 | |
| Hadrian Merger Sub, Inc., 8.50% Sr. Unsec. Nts., 5/1/261 | | | | | 2,030,000 | | | | 2,002,087 | |
| HCA, Inc.: | | | | | | | | | | |
| 4.125% Sr. Sec. Nts., 6/15/29 | | | | | 2,045,000 | | | | 2,171,803 | |
| 5.375% Sr. Unsec. Nts., 2/1/25 | | | | | 1,745,000 | | | | 1,921,681 | |
| 5.375% Sr. Unsec. Nts., 9/1/26 | | | | | 2,775,000 | | | | 3,031,688 | |
| 5.50% Sr. Sec. Nts., 6/15/47 | | | | | 1,000,000 | | | | 1,140,112 | |
| 5.625% Sr. Unsec. Nts., 9/1/28 | | | | | 1,446,000 | | | | 1,628,557 | |
| 5.875% Sr. Unsec. Nts., 2/15/26 | | | | | 324,000 | | | | 365,310 | |
| 7.50% Sr. Unsec. Nts., 2/15/22 | | | | | 1,221,000 | | | | 1,357,752 | |
| MPH Acquisition Holdings LLC, 7.125% Sr. Unsec. Nts., 6/1/241 | | | | | 2,234,000 | | | | 2,094,375 | |
| Omnicare, Inc., 4.75% Sr. Unsec. Nts., 12/1/22 | | | | | 5,295,000 | | | | 5,656,440 | |
| Tenet Healthcare Corp.: | | | | | | | | | | |
| 5.125% Sr. Sec. Nts., 11/1/271 | | | | | 3,375,000 | | | | 3,522,589 | |
| 6.25% Sec. Nts., 2/1/271 | | | | | 741,000 | | | | 783,608 | |
47 INVESCO OPPENHEIMER GLOBAL STRATEGIC INCOME FUND
CONSOLIDATED SCHEDULE OF INVESTMENTSContinued
| | | | | | | | |
| | | Principal Amount | | | Value | |
Health Care Providers & Services (Continued) | | | | | | | | |
| WellCare Health Plans, Inc., 5.375% Sr. Unsec. Nts., 8/15/261 | | $ | 1,698,000 | | | $ | 1,810,493 | |
| | | | | | | | |
| | | | | | | 32,396,062 | |
| | | | | | | | | |
Life Sciences Tools & Services—0.1% | | | | | | | | |
| Charles River Laboratories International, Inc., 4.25% Sr. Unsec. Nts., 5/1/281 | | | 1,932,000 | | | | 1,973,248 | |
| | | | | | | | | |
Pharmaceuticals—0.2% | | | | | | | | |
| Bausch Health Americas, Inc., 8.50% Sr. Unsec. Nts., 1/31/271 | | | 817,000 | | | | 921,168 | |
| Bausch Health Cos., Inc.: | | | | | | | | |
| 5.50% Sr. Sec. Nts., 11/1/251 | | | 1,675,000 | | | | 1,756,673 | |
| 5.75% Sr. Sec. Nts., 8/15/271 | | | 695,000 | | | | 756,464 | |
| 7.00% Sr. Sec. Nts., 3/15/241 | | | 1,535,000 | | | | 1,609,716 | |
| Par Pharmaceutical, Inc., 7.50% Sr. Sec. Nts., 4/1/271 | | | 1,403,000 | | | | 1,336,357 | |
| | | | | | | | |
| | | | | | | 6,380,378 | |
| | | | | | | | | |
Industrials—2.4% | | | | | | | | |
Aerospace & Defense—0.2% | | | | | | | | |
| Bombardier, Inc.: | | | | | | | | |
| 7.50% Sr. Unsec. Nts., 3/15/251 | | | 664,000 | | | | 637,440 | |
| 7.875% Sr. Unsec. Nts., 4/15/271 | | | 643,000 | | | | 609,242 | |
| TransDigm, Inc.: | | | | | | | | |
| 6.25% Sr. Sec. Nts., 3/15/261 | | | 690,000 | | | | 740,888 | |
| 6.375% Sr. Sub. Nts., 6/15/26 | | | 2,028,000 | | | | 2,129,400 | |
| 6.50% Sr. Sub. Nts., 7/15/24 | | | 1,420,000 | | | | 1,471,475 | |
| Triumph Group, Inc., 7.75% Sr. Unsec. Nts., 8/15/25 | | | 1,777,000 | | | | 1,781,443 | |
| | | | | | | | |
| | | | | | | 7,369,888 | |
| | | | | | | | | |
Air Freight & Couriers—0.2% | | | | | | | | |
| Algeco Global Finance plc, 8.00% Sr. Sec. Nts., 2/15/231 | | | 326,000 | | | | 322,740 | |
| Allison Transmission, Inc., 5.875% Sr. Unsec. Nts., 6/1/291 | | | 322,000 | | | | 347,760 | |
| Mexico City Airport Trust, 3.875% Sr. Sec. Nts., 4/30/281 | | | 1,400,000 | | | | 1,406,300 | |
| Rumo Luxembourg Sarl, 5.875% Sr. Unsec. Nts., 1/18/251 | | | 3,475,000 | | | | 3,694,359 | |
| XPO Logistics, Inc.: | | | | | | | | |
| 6.125% Sr. Unsec. Nts., 9/1/231 | | | 1,390,000 | | | | 1,435,175 | |
| 6.75% Sr. Unsec. Nts., 8/15/241 | | | 643,000 | | | | 696,048 | |
| | | | | | | | |
| | | | | | | 7,902,382 | |
| | | | | | | | | |
Airlines—0.2% | | | | | | | | |
| American Airlines Group, Inc.: | | | | | | | | |
| 4.625% Sr. Unsec. Nts., 3/1/201 | | | 756,000 | | | | 762,615 | |
| 5.00% Sr. Unsec. Nts., 6/1/221 | | | 1,261,000 | | | | 1,316,169 | |
| Gol Finance SA, 7.00% Sr. Unsec. Nts., 1/31/251 | | | 1,240,000 | | | | 1,274,100 | |
| United Continental Holdings, Inc.: | | | | | | | | |
| 4.25% Sr. Unsec. Nts., 10/1/22 | | | 988,000 | | | | 1,021,562 | |
| 4.875% Sr. Unsec. Nts., 1/15/25 | | | 791,000 | | | | 832,211 | |
| | | | | | | | |
| | | | | | | 5,206,657 | |
48 INVESCO OPPENHEIMER GLOBAL STRATEGIC INCOME FUND
| | | | | | | | |
| | | Principal Amount | | | Value | |
Building Products—0.2% | | | | | | | | |
| Advanced Drainage Systems, Inc., 5.00% Sr. Sec. Nts., 9/30/271 | | $ | 384,000 | | | $ | 393,600 | |
| Builders FirstSource, Inc., 6.75% Sr. Sec. Nts., 6/1/271 | | | 170,000 | | | | 185,300 | |
| Standard Industries, Inc.: | | | | | | | | |
| 5.00% Sr. Unsec. Nts., 2/15/271 | | | 497,000 | | | | 519,986 | |
| 5.375% Sr. Unsec. Nts., 11/15/241 | | | 1,032,000 | | | | 1,064,302 | |
| 6.00% Sr. Unsec. Nts., 10/15/251 | | | 2,294,000 | | | | 2,420,170 | |
| William Lyon Homes, Inc., 6.00% Sr. Unsec. Nts., 9/1/23 | | | 1,405,000 | | | | 1,461,200 | |
| | | | | | | | |
| | | | | | | 6,044,558 | |
| | | | | | | | | |
Commercial Services & Supplies—0.4% | | | | | | | | |
| ACCO Brands Corp., 5.25% Sr. Unsec. Nts., 12/15/241 | | | 1,261,000 | | | | 1,311,440 | |
| ADT Security Corp. (The), 6.25% Sr. Sec. Nts., 10/15/21 | | | 1,892,000 | | | | 2,031,535 | |
| Brink’s Co. (The), 4.625% Sr. Unsec. Nts., 10/15/271 | | | 2,556,000 | | | | 2,594,340 | |
| GWB-CR Security Corp., 9.50% Sr. Unsec. Nts., 11/1/271 | | | 902,000 | | | | 929,060 | |
| Murphy Oil USA, Inc., 4.75% Sr. Unsec. Nts., 9/15/29 | | | 1,109,000 | | | | 1,160,291 | |
| Prime Security Services Borrower LLC / Prime Finance, Inc., 5.75% Sr. Sec. Nts., 4/15/261 | | | 1,256,000 | | | | 1,291,325 | |
| Resideo Funding, Inc., 6.125% Sr. Unsec. Nts., 11/1/261 | | | 627,000 | | | | 633,270 | |
| RR Donnelley & Sons Co., 7.875% Sr. Unsec. Nts., 3/15/21 | | | 426,000 | | | | 443,040 | |
| Waste Pro USA, Inc., 5.50% Sr. Unsec. Nts., 2/15/261 | | | 1,244,000 | | | | 1,290,650 | |
| West Corp., 5.375% Sr. Unsec. Nts., 7/15/221 | | | 1,815,000 | | | | 1,724,250 | |
| | | | | | | | |
| | | | | | | 13,409,201 | |
| | | | | | | | | |
Construction & Engineering—0.2% | | | | | | | | |
| AECOM, 5.125% Sr. Unsec. Nts., 3/15/27 | | | 1,420,000 | | | | 1,504,774 | |
| GMR Hyderabad International Airport Ltd., 5.375% Sr. Sec. Nts., 4/10/241 | | | 3,475,000 | | | | 3,594,583 | |
| | | | | | | | |
| | | | | | | 5,099,357 | |
| | | | | | | | | |
Electrical Equipment—0.1% | | | | | | | | |
| EnerSys, 5.00% Sr. Unsec. Nts., 4/30/231 | | | 2,217,000 | | | | 2,297,366 | |
| Sensata Technologies BV, 5.625% Sr. Unsec. Nts., 11/1/241 | | | 708,000 | | | | 780,570 | |
| | | | | | | | |
| | | | | | | 3,077,936 | |
| | | | | | | | | |
Industrial Conglomerates—0.0% | | | | | | | | |
| Icahn Enterprises LP/Icahn Enterprises Finance Corp., 6.75% Sr. Unsec. Nts., 2/1/24 | | | 641,000 | | | | 670,646 | |
| | | | | | | | | |
Machinery—0.4% | | | | | | | | |
| Allison Transmission, Inc., 5.00% Sr. Unsec. Nts., 10/1/241 | | | 1,455,000 | | | | 1,495,012 | |
| Amsted Industries, Inc., 5.625% Sr. Unsec. Nts., 7/1/271 | | | 680,000 | | | | 719,100 | |
| Cleaver-Brooks, Inc., 7.875% Sr. Sec. Nts., 3/1/231 | | | 2,706,000 | | | | 2,563,935 | |
| Colfax Corp.: | | | | | | | | |
| 6.00% Sr. Unsec. Nts., 2/15/241 | | | 638,000 | | | | 680,268 | |
| 6.375% Sr. Unsec. Nts., 2/15/261 | | | 319,000 | | | | 346,115 | |
| EnPro Industries, Inc., 5.75% Sr. Unsec. Nts., 10/15/26 | | | 2,623,000 | | | | 2,780,380 | |
| IHS Netherlands Holdco BV, 8.00% Sr. Unsec. Nts., 9/18/271 | | | 2,000,000 | | | | 2,095,000 | |
49 INVESCO OPPENHEIMER GLOBAL STRATEGIC INCOME FUND
CONSOLIDATED SCHEDULE OF INVESTMENTSContinued
| | | | | | | | | | |
| | | | | Principal Amount | | | Value | |
Machinery (Continued) | | | | | | | | | | |
| Titan International, Inc., 6.50% Sr. Sec. Nts., 11/30/23 | | | | $ | 2,478,000 | | | $ | 2,038,155 | |
| | | | | | | | | | |
| | | | | | | | | 12,717,965 | |
| | | | | | | | | | | |
Road & Rail—0.2% | | | | | | | | | | |
| Avis Budget Car Rental LLC/Avis Budget Finance, Inc., 5.75% Sr. Unsec. Nts., 7/15/271 | | | | | 1,475,000 | | | | 1,510,031 | |
| Fideicomiso PA Pacifico Tres, 8.25% Sr. Sec. Nts., 1/15/351 | | | | | 1,255,000 | | | | 1,415,025 | |
| Kenan Advantage Group, Inc. (The), 7.875% Sr. Unsec. Nts., 7/31/231 | | | | | 1,878,000 | | | | 1,706,633 | |
| United Rentals North America, Inc., 5.25% Sr. Unsec. Nts., 1/15/30 | | | | | 1,447,000 | | | | 1,526,585 | |
| | | | | | | | | | |
| | | | | | | | | 6,158,274 | |
| | | | | | | | | | | |
Trading Companies & Distributors—0.3% | | | | | | | | | | |
| AerCap Global Aviation Trust, 6.50% [US0003M+430] Jr. Sub. Nts., 6/15/451,2 | | | | | 1,623,000 | | | | 1,787,329 | |
| BMC East LLC, 5.50% Sr. Sec. Nts., 10/1/241 | | | | | 1,730,000 | | | | 1,805,687 | |
| Herc Holdings, Inc., 5.50% Sr. Unsec. Nts., 7/15/271 | | | | | 1,277,000 | | | | 1,328,080 | |
| United Rentals North America, Inc.: | | | | | | | | | | |
| 4.875% Sr. Unsec. Nts., 1/15/28 | | | | | 811,000 | | | | 840,399 | |
| 5.875% Sr. Unsec. Nts., 9/15/26 | | | | | 2,700,000 | | | | 2,875,500 | |
| 6.50% Sr. Unsec. Nts., 12/15/26 | | | | | 1,380,000 | | | | 1,499,025 | |
| | | | | | | | | | |
| | | | | | | | | 10,136,020 | |
| | | | | | | | | | | |
Transportation Infrastructure—0.0% | | | | | | | | | | |
| Jasa Marga Persero Tbk PT, 7.50% Sr. Unsec. Nts., 12/11/201 | | IDR | | | 24,180,000,000 | | | | 1,700,890 | |
| | | | | | | | | | | |
Information Technology—0.7% | | | | | | | | | | |
Communications Equipment—0.1% | | | | | | | | | | |
| Hughes Satellite Systems Corp.: | | | | | | | | | | |
| 5.25% Sr. Sec. Nts., 8/1/26 | | | | | 585,000 | | | | 628,875 | |
| 6.625% Sr. Unsec. Nts., 8/1/26 | | | | | 1,190,000 | | | | 1,291,150 | |
| | | | | | | | | | |
| | | | | | | | | 1,920,025 | |
| | | | | | | | | | | |
Electronic Equipment, Instruments, & Components—0.1% | | | | | | | | | | |
| Itron, Inc., 5.00% Sr. Unsec. Nts., 1/15/261 | | | | | 1,480,000 | | | | 1,535,500 | |
| MTS Systems Corp., 5.75% Sr. Unsec. Nts., 8/15/271 | | | | | 1,360,000 | | | | 1,428,000 | |
| | | | | | | �� | | | |
| | | | | | | | | 2,963,500 | |
| | | | | | | | | | | |
IT Services—0.0% | | | | | | | | | | |
| Harland Clarke Holdings Corp.: | | | | | | | | | | |
| 6.875% Sr. Sec. Nts., 3/1/201 | | | | | 658,000 | | | | 648,130 | |
| 8.375% Sr. Sec. Nts., 8/15/221 | | | | | 464,000 | | | | 372,360 | |
| | | | | | | | | | |
| | | | | | | | | 1,020,490 | |
| | | | | | | | | | | |
Semiconductors & Semiconductor Equipment—0.1% | | | | | | | | | | |
| Micron Technology, Inc., 4.663% Sr. Unsec. Nts., 2/15/30 | | | | | 1,958,000 | | | | 2,059,034 | |
50 INVESCO OPPENHEIMER GLOBAL STRATEGIC INCOME FUND
| | | | | | | | | | | | |
| | | | | | Principal Amount | | | Value | |
Software—0.0% | | | | | | | | | | | | |
Camelot Finance SA, 4.50% Sr. Sec. Nts., 11/1/261 | | | | | | $ | 583,000 | | | $ | 590,521 | |
Technology Hardware, Storage & Peripherals—0.4% | | | | | | | | | | | | |
Dell International LLC/EMC Corp.: | | | | | | | | | | | | |
4.42% Sr. Sec. Nts., 6/15/211 | | | | | | | 7,084,000 | | | | 7,319,747 | |
7.125% Sr. Unsec. Nts., 6/15/241 | | | | | | | 1,720,000 | | | | 1,825,780 | |
EMC Corp., 2.65% Sr. Unsec. Nts., 6/1/20 | | | | | | | 560,000 | | | | 560,700 | |
Everi Payments, Inc., 7.50% Sr. Unsec. Nts., 12/15/251 | | | | | | | 981,000 | | | | 1,036,181 | |
Western Digital Corp., 4.75% Sr. Unsec. Nts., 2/15/26 | | | | | | | 3,948,000 | | | | 4,029,428 | |
| | | | | | | | | | | | |
| | | | | | | | | | | 14,771,836 | |
Materials—4.0% | | | | | | | | | | | | |
Chemicals—1.2% | | | | | | | | | | | | |
Ashland LLC: | | | | | | | | | | | | |
4.75% Sr. Unsec. Nts., 8/15/22 | | | | | | | 690,000 | | | | 725,362 | |
6.875% Sr. Unsec. Nts., 5/15/43 | | | | | | | 396,000 | | | | 453,420 | |
Blue Cube Spinco LLC, 9.75% Sr. Unsec. Nts., 10/15/23 | | | | | | | 319,000 | | | | 348,507 | |
Braskem Netherlands Finance BV: | | | | | | | | | | | | |
4.50% Sr. Unsec. Nts., 1/31/301 | | | | | | | 1,095,000 | | | | 1,086,787 | |
5.875% Sr. Unsec. Nts., 1/31/501,6 | | | | | | | 4,290,000 | | | | 4,270,695 | |
Celanese US Holdings LLC, 5.875% Sr. Unsec. Nts., 6/15/21 | | | | | | | 3,441,000 | | | | 3,635,420 | |
CF Industries, Inc., 3.40% Sr. Sec. Nts., 12/1/211 | | | | | | | 6,265,000 | | | | 6,373,289 | |
Chemours Co. (The), 6.625% Sr. Unsec. Nts., 5/15/23 | | | | | | | 411,000 | | | | 410,355 | |
Element Solutions, Inc., 5.875% Sr. Unsec. Nts., 12/1/251 | | | | | | | 1,406,000 | | | | 1,474,764 | |
ENN Clean Energy International Investment Ltd., 7.50% Sr. Unsec. Nts., 2/27/211 | | | | | | | 3,750,000 | | | | 3,901,875 | |
Koppers, Inc., 6.00% Sr. Unsec. Nts., 2/15/251 | | | | | | | 1,637,000 | | | | 1,640,209 | |
OCP SA, 4.50% Sr. Unsec. Nts., 10/22/251 | | | | | | | 3,735,000 | | | | 3,961,326 | |
Olin Corp.: | | | | | | | | | | | | |
5.00% Sr. Unsec. Nts., 2/1/30 | | | | | | | 333,000 | | | | 329,254 | |
5.125% Sr. Unsec. Nts., 9/15/27 | | | | | | | 312,000 | | | | 322,561 | |
5.625% Sr. Unsec. Nts., 8/1/29 | | | | | | | 2,710,000 | | | | 2,820,487 | |
Rain CII Carbon LLC/CII Carbon Corp., 7.25% Sec. Nts., 4/1/251 | | | | | | | 409,000 | | | | 399,797 | |
Sociedad Quimica y Minera de Chile SA, 4.25% Sr. Unsec. Nts., 5/7/291 | | | | | | | 1,805,000 | | | | 1,913,751 | |
Starfruit Finco BV/Starfruit US Holdco LLC, 6.50% Sr. Unsec. Nts., 10/1/261 | | | EUR | | | | 3,545,000 | | | | 3,991,853 | |
Unigel Luxembourg SA, 8.75% Sr. Unsec. Nts., 10/1/261 | | | | | | | 2,850,000 | | | | 2,867,813 | |
| | | | | | | | | | | | |
| | | | | | | | | | | 40,927,525 | |
Construction Materials—0.2% | | | | | | | | | | | | |
Cemex Finance LLC, 6.00% Sr. Sec. Nts., 4/1/241 | | | | | | | 3,475,000 | | | | 3,569,868 | |
InterCement Financial Operations BV, 5.75% Sr. Unsec. Nts., 7/17/241 | | | | | | | 1,915,000 | | | | 1,417,119 | |
| | | | | | | | | | | | |
| | | | | | | | | | | 4,986,987 | |
51 INVESCO OPPENHEIMER GLOBAL STRATEGIC INCOME FUND
CONSOLIDATED SCHEDULE OF INVESTMENTSContinued
| | | | | | | | |
| | | Principal Amount | | | Value | |
Containers & Packaging—0.5% | | | | | | | | |
Ardagh Packaging Finance plc/Ardagh Holdings USA, Inc.: | | | | | | | | |
4.125% Sr. Sec. Nts., 8/15/261 | | $ | 1,350,000 | | | $ | 1,368,157 | |
4.25% Sr. Sec. Nts., 9/15/221 | | | 282,000 | | | | 286,230 | |
4.625% Sr. Sec. Nts., 5/15/231 | | | 160,000 | | | | 163,920 | |
6.00% Sr. Unsec. Nts., 2/15/251 | | | 1,101,000 | | | | 1,158,802 | |
Ball Corp., 4.375% Sr. Unsec. Nts., 12/15/20 | | | 4,150,000 | | | | 4,235,594 | |
Berry Global, Inc., 4.875% Sr. Sec. Nts., 7/15/261 | | | 1,227,000 | | | | 1,292,951 | |
Flex Acquisition Co., Inc.: | | | | | | | | |
6.875% Sr. Unsec. Nts., 1/15/251 | | | 814,000 | | | | 767,195 | |
7.875% Sr. Unsec. Nts., 7/15/261 | | | 648,000 | | | | 610,740 | |
Graphic Packaging International LLC: | | | | | | | | |
4.75% Sr. Unsec. Nts., 4/15/21 | | | 3,540,000 | | | | 3,656,156 | |
4.875% Sr. Unsec. Nts., 11/15/22 | | | 615,000 | | | | 647,288 | |
Greif, Inc., 6.50% Sr. Unsec. Nts., 3/1/271 | | | 399,000 | | | | 429,923 | |
Mauser Packaging Solutions Holding Co., 5.50% Sr. Sec. Nts., 4/15/241 | | | 405,000 | | | | 418,163 | |
OI European Group BV, 4.00% Sr. Unsec. Nts., 3/15/231 | | | 1,420,000 | | | | 1,423,550 | |
Owens-Brockway Glass Container, Inc., 5.00% Sr. Unsec. Nts., 1/15/221 | | | 629,000 | | | | 651,801 | |
| Reynolds Group Issuer, Inc./Reynolds Group Issuer LLC/Reynolds Group Issuer Luxembourg SA, 5.125% Sr. Sec. Nts., 7/15/231 | | | 872,000 | | | | 896,808 | |
Trivium Packaging Finance BV, 5.50% Sr. Sec. Nts., 8/15/261 | | | 335,000 | | | | 352,169 | |
| | | | | | | | |
| | | | | | | 18,359,447 | |
Metals & Mining—1.6% | | | | | | | | |
ArcelorMittal, 6.125% Sr. Unsec. Nts., 6/1/25 | | | 3,490,000 | | | | 3,974,613 | |
Celtic Resources Holdings DAC, 4.125% Sr. Unsec. Nts., 10/9/241 | | | 7,000,000 | | | | 7,038,538 | |
Corp. Nacional del Cobre de Chile, 3.00% Sr. Unsec. Nts., 9/30/291 | | | 2,775,000 | | | | 2,771,354 | |
CSN Resources SA, 7.625% Sr. Unsec. Nts., 2/13/231 | | | 2,790,000 | | | | 2,891,486 | |
Evraz plc, 5.375% Sr. Unsec. Nts., 3/20/231 | | | 5,215,000 | | | | 5,579,007 | |
First Quantum Minerals Ltd.: | | | | | | | | |
7.00% Sr. Unsec. Nts., 2/15/211 | | | 182,000 | | | | 183,251 | |
7.25% Sr. Unsec. Nts., 4/1/231 | | | 3,674,000 | | | | 3,703,851 | |
FMG Resources August 2006 Pty Ltd., 4.75% Sr. Unsec. Nts., 5/15/221 | | | 322,000 | | | | 332,867 | |
Freeport-McMoRan, Inc.: | | | | | | | | |
3.55% Sr. Unsec. Nts., 3/1/22 | | | 398,000 | | | | 403,473 | |
4.55% Sr. Unsec. Nts., 11/14/24 | | | 285,000 | | | | 297,113 | |
5.40% Sr. Unsec. Nts., 11/14/34 | | | 7,200,000 | | | | 7,065,000 | |
5.45% Sr. Unsec. Nts., 3/15/43 | | | 287,000 | | | | 268,345 | |
Hudbay Minerals, Inc., 7.625% Sr. Unsec. Nts., 1/15/251 | | | 1,535,000 | | | | 1,570,497 | |
Industrias Penoles SAB de CV, 5.65% Sr. Unsec. Nts., 9/12/491 | | | 2,200,000 | | | | 2,268,750 | |
JSW Steel Ltd.: | | | | | | | | |
4.75% Sr. Unsec. Nts., 11/12/191 | | | 2,370,000 | | | | 2,370,474 | |
5.25% Sr. Unsec. Nts., 4/13/221 | | | 3,600,000 | | | | 3,664,748 | |
Metinvest BV, 7.75% Sr. Unsec. Nts., 10/17/291 | | | 2,680,000 | | | | 2,657,890 | |
52 INVESCO OPPENHEIMER GLOBAL STRATEGIC INCOME FUND
| | | | | | | | |
| | | Principal Amount | | | Value | |
Metals & Mining (Continued) | | | | | | | | |
Southern Copper Corp., 7.50% Sr. Unsec. Nts., 7/27/35 | | $ | 1,270,000 | | | $ | 1,711,871 | |
SunCoke Energy Partners LP/SunCoke Energy Partners Finance Corp., 7.50% Sr. Unsec. Nts., 6/15/251 | | | 3,590,000 | | | | 3,069,450 | |
Taseko Mines Ltd., 8.75% Sr. Sec. Nts., 6/15/221 | | | 2,457,000 | | | | 2,174,445 | |
| | | | | | | | |
| | | | | | | 53,997,023 | |
Paper & Forest Products—0.5% | | | | | | | | |
Boise Cascade Co., 5.625% Sr. Unsec. Nts., 9/1/241 | | | 1,598,000 | | | | 1,669,910 | |
Louisiana-Pacific Corp., 4.875% Sr. Unsec. Nts., 9/15/24 | | | 2,579,000 | | | | 2,662,817 | |
Mercer International, Inc.: | | | | | | | | |
5.50% Sr. Unsec. Nts., 1/15/26 | | | 1,056,000 | | | | 1,017,118 | |
6.50% Sr. Unsec. Nts., 2/1/24 | | | 1,736,000 | | | | 1,794,590 | |
Norbord, Inc., 5.75% Sr. Sec. Nts., 7/15/271 | | | 2,565,000 | | | | 2,661,188 | |
Suzano Austria GmbH, 5.00% Sr. Unsec. Nts., 1/15/30 | | | 6,965,000 | | | | 7,182,656 | |
| | | | | | | | |
| | | | | | | 16,988,279 | |
Telecommunication Services—1.6% | | | | | | | | |
Diversified Telecommunication Services—1.3% | | | | | | | | |
Altice France SA: | | | | | | | | |
7.375% Sr. Sec. Nts., 5/1/261 | | | 1,157,000 | | | | 1,241,860 | |
8.125% Sr. Sec. Nts., 2/1/271 | | | 645,000 | | | | 716,756 | |
Axtel SAB de CV, 6.375% Sr. Unsec. Nts., 11/14/241 | | | 3,550,000 | | | | 3,718,802 | |
CenturyLink, Inc.: | | | | | | | | |
5.625% Sr. Unsec. Nts., 4/1/25 | | | 995,000 | | | | 1,051,018 | |
Series S, 6.45% Sr. Unsec. Nts., 6/15/21 | | | 1,235,000 | | | | 1,302,925 | |
Series Y, 7.50% Sr. Unsec. Nts., 4/1/24 | | | 1,815,000 | | | | 2,064,562 | |
Cincinnati Bell, Inc., 8.00% Sr. Unsec. Nts., 10/15/251 | | | 1,280,000 | | | | 1,148,800 | |
CommScope, Inc., 6.00% Sr. Sec. Nts., 3/1/261 | | | 3,280,000 | | | | 3,386,600 | |
Frontier Communications Corp.: | | | | | | | | |
10.50% Sr. Unsec. Nts., 9/15/22 | | | 4,321,000 | | | | 2,041,673 | |
11.00% Sr. Unsec. Nts., 9/15/25 | | | 1,243,000 | | | | 587,318 | |
GTH Finance BV, 7.25% Sr. Unsec. Nts., 4/26/231 | | | 5,250,000 | | | | 5,877,449 | |
HTA Group Ltd., 9.125% Sr. Unsec. Nts., 3/8/221 | | | 3,925,000 | | | | 4,102,724 | |
iHeartCommunications, Inc., 5.25% Sr. Sec. Nts., 8/15/271 | | | 1,345,000 | | | | 1,390,999 | |
Inmarsat Finance plc, 4.875% Sr. Unsec. Nts., 5/15/221 | | | 560,000 | | | | 568,400 | |
Level 3 Financing, Inc.: | | | | | | | | |
5.25% Sr. Unsec. Nts., 3/15/26 | | | 2,850,000 | | | | 2,981,813 | |
5.375% Sr. Unsec. Nts., 5/1/25 | | | 1,989,000 | | | | 2,061,101 | |
Oi SA, 10% Cash Rate or 4% PIK Rate and 8% Cash Rate, 10.00% Sr. Unsec. Nts., 7/27/2514 | | | 2,144,000 | | | | 1,948,360 | |
Qwest Corp., 6.875% Sr. Unsec. Nts., 9/15/33 | | | 831,000 | | | | 837,025 | |
Telecom Italia Capital SA, 7.20% Sr. Unsec. Nts., 7/18/36 | | | 2,982,000 | | | | 3,488,940 | |
Telecom Italia SpA, 5.303% Sr. Unsec. Nts., 5/30/241 | | | 1,045,000 | | | | 1,122,069 | |
Zayo Group LLC/Zayo Capital, Inc., 6.00% Sr. Unsec. Nts., 4/1/23 | | | 1,004,000 | | | | 1,037,644 | |
| | | | | | | | |
| | | | | | | 42,676,838 | |
Wireless Telecommunication Services—0.3% | | | | | | | | |
Bharti Airtel Ltd., 4.375% Sr. Unsec. Nts., 6/10/251 | | | 5,060,000 | | | | 5,097,283 | |
53 INVESCO OPPENHEIMER GLOBAL STRATEGIC INCOME FUND
CONSOLIDATED SCHEDULE OF INVESTMENTSContinued
| | | | | | | | |
| | | Principal Amount | | | Value | |
Wireless Telecommunication Services (Continued) | | | | | | | | |
Intelsat Jackson Holdings SA, 8.50% Sr. Unsec. Nts., 10/15/241 | | $ | 1,524,000 | | | $ | 1,538,767 | |
T-Mobile USA, Inc.: | | | | | | | | |
4.00% Sr. Unsec. Nts., 4/15/22 | | | 863,000 | | | | 892,955 | |
4.75% Sr. Unsec. Nts., 2/1/28 | | | 1,226,000 | | | | 1,296,495 | |
5.125% Sr. Unsec. Nts., 4/15/25 | | | 384,000 | | | | 400,435 | |
6.00% Sr. Unsec. Nts., 4/15/24 | | | 671,000 | | | | 697,840 | |
| | | | | | | | |
| | | | | | | 9,923,775 | |
Utilities—1.5% | | | | | | | | |
Electric Utilities—0.5% | | | | | | | | |
DPL, Inc., 4.35% Sr. Unsec. Nts., 4/15/291 | | | 803,000 | | | | 802,799 | |
Empresa de Transmision Electrica SA, 5.125% Sr. Unsec. Nts., 5/2/491 | | | 1,810,000 | | | | 2,079,237 | |
Eskom Holdings SOC Ltd., 6.75% Sr. Unsec. Nts., 8/6/231 | | | 3,500,000 | | | | 3,604,244 | |
Perusahaan Listrik Negara PT, 4.125% Sr. Unsec. Nts., 5/15/271 | | | 6,955,000 | | | | 7,288,214 | |
Rockpoint Gas Storage Canada Ltd., 7.00% Sr. Sec. Nts., 3/31/231 | | | 435,000 | | | | 436,087 | |
Talen Energy Supply LLC, 7.25% Sr. Sec. Nts., 5/15/271 | | | 393,000 | | | | 393,983 | |
TerraForm Power Operating LLC, 5.00% Sr. Unsec. Nts., 1/31/281 | | | 134,000 | | | | 142,000 | |
Vistra Operations Co. LLC: | | | | | | | | |
5.00% Sr. Unsec. Nts., 7/31/271 | | | 1,360,000 | | | | 1,411,000 | |
5.50% Sr. Unsec. Nts., 9/1/261 | | | 362,000 | | | | 383,438 | |
5.625% Sr. Unsec. Nts., 2/15/271 | | | 645,000 | | | | 686,119 | |
| | | | | | | | |
| | | | | | | 17,227,121 | |
Gas Utilities—0.2% | | | | | | | | |
AmeriGas Partners LP/AmeriGas Finance Corp.: | | | | | | | | |
5.50% Sr. Unsec. Nts., 5/20/25 | | | 648,000 | | | | 698,285 | |
5.875% Sr. Unsec. Nts., 8/20/26 | | | 1,875,000 | | | | 2,085,938 | |
NGL Energy Partners LP/NGL Energy Finance Corp., 7.50% Sr. Unsec. Nts., 4/15/261 | | | 440,000 | | | | 422,272 | |
Superior Plus LP/Superior General Partner, Inc., 7.00% Sr. Unsec. Nts., 7/15/261 | | | 1,416,000 | | | | 1,529,280 | |
| | | | | | | | |
| | | | | | | 4,735,775 | |
Independent Power and Renewable Electricity Producers—0.8% | | | | | | | | |
| AES Andres BV/Dominican Power Partners/Empresa Generadora de Electricidad Itabo SA, 7.95% Sr. Unsec. Nts., 5/11/261 | | | 1,230,000 | | | | 1,316,112 | |
AES Corp.: | | | | | | | | |
4.00% Sr. Unsec. Nts., 3/15/21 | | | 700,000 | | | | 713,125 | |
6.00% Sr. Unsec. Nts., 5/15/26 | | | 423,000 | | | | 453,266 | |
AES Gener SA, 6.35% [H15T5Y+491.7] Jr. Sub. Nts., 10/7/791,2 | | | 1,750,000 | | | | 1,760,150 | |
Azure Power Energy Ltd., 5.50% Sr. Sec. Nts., 11/3/221 | | | 3,485,000 | | | | 3,534,923 | |
54 INVESCO OPPENHEIMER GLOBAL STRATEGIC INCOME FUND
| | | | | | | | |
| | | Principal Amount | | | Value | |
Independent Power and Renewable Electricity Producers (Continued) | | | | | | | | |
Azure Power Solar Energy Pvt Ltd., 5.65% Sr. Sec. Nts., 12/24/241 | | $ | 1,400,000 | | | $ | 1,409,450 | |
Calpine Corp.: | | | | | | | | |
5.25% Sr. Sec. Nts., 6/1/261 | | | 1,036,000 | | | | 1,081,325 | |
5.75% Sr. Unsec. Nts., 1/15/25 | | | 243,000 | | | | 249,986 | |
5.875% Sr. Sec. Nts., 1/15/241 | | | 326,000 | | | | 333,987 | |
Clearway Energy Operating LLC, 5.75% Sr. Unsec. Nts., 10/15/25 | | | 319,000 | | | | 328,570 | |
Inkia Energy Ltd., 5.875% Sr. Unsec. Nts., 11/9/271 | | | 4,145,000 | | | | 4,310,841 | |
Listrindo Capital BV, 4.95% Sr. Unsec. Nts., 9/14/261 | | | 5,215,000 | | | | 5,303,655 | |
NRG Energy, Inc.: | | | | | | | | |
5.25% Sr. Unsec. Nts., 6/15/291 | | | 2,371,000 | | | | 2,551,789 | |
6.625% Sr. Unsec. Nts., 1/15/27 | | | 2,342,000 | | | | 2,546,925 | |
SMC Global Power Holdings Corp., 5.95% Jr. Sub. Perpetual Bonds3,6,17 | | | 1,750,000 | | | | 1,770,781 | |
| | | | | | | | |
| | | | | | | 27,664,885 | |
Multi-Utilities—0.0% | | | | | | | | |
TerraForm Power Operating LLC, 4.25% Sr. Unsec. Nts., 1/31/231 | | | 446,000 | | | | 461,610 | |
| | | | | | | | |
Total Corporate Bonds and Notes (Cost $1,079,432,961) | | | | | | | 1,076,103,449 | |
| | | Shares | | | | |
Preferred Stock—0.0% | | | | | |
Claire’s Holdings LLC, 0.00%, Series A18(Cost $97,198) | | | 170 | | | | 29,750 | |
Common Stocks—0.0% | | | | | |
Claire’s Holdings LLC18 | | | 614 | | | | 399,100 | |
Clear Channel Outdoor Holdings, Inc., Cl. A18 | | | 153,942 | | | | 358,685 | |
Hexion Holdings Corp., Cl. B18 | | | 64,100 | | | | 647,410 | |
JSC Astana Finance, GDR (Cost $0, Acquisition Date 6/5/15)1,8,18 | | | 1,681,847 | | | | — | |
Quicksilver Resources, Inc.8,18 | | | 12,760,000 | | | | — | |
Sabine Oil & Gas Holdings, Inc. | | | 2,510 | | | | 150,600 | |
| | | | | | | | |
Total Common Stocks (Cost $15,951,361) | | | | | | | 1,555,795 | |
| | | Units | | | | |
Rights, Warrants and Certificates—0.0% | | | | | |
Agro Holdings, Inc. Wts., Exp. 4/10/248,18 | | | 2,297 | | | | — | |
Sabine Oil Tranche 1 Wts., Strike Price $4.49, Exp. 8/11/2618 | | | 7,821 | | | | 89,941 | |
Sabine Oil Tranche 2 Wts., Strike Price $2.72, Exp. 8/11/2618 | | | 1,643 | | | | 27,110 | |
| | | | | | | | |
Total Rights, Warrants and Certificates (Cost $1,051,289) | | | | | | | 117,051 | |
| | | Principal Amount | | | | |
Structured Securities—0.5% | | | | | |
Deutsche Bank AG, Coriolanus Ltd. Sec. Credit Linked Bonds: | | | | | | | | |
3.003% Sr. Sec. Nts., 4/30/251,11 | | | 1,977,466 | | | | 1,904,846 | |
3.054% Sr. Sec. Nts., 4/30/251,11 | | | 2,519,596 | | | | 2,427,067 | |
3.098% Sr. Sec. Nts., 4/30/251,11 | | | 2,175,268 | | | | 2,095,384 | |
3.131% Sr. Sec. Nts., 4/30/251,11 | | | 1,944,415 | | | | 1,873,008 | |
3.179% Sr. Sec. Nts., 4/30/251,11 | | | 2,420,954 | | | | 2,332,047 | |
55 INVESCO OPPENHEIMER GLOBAL STRATEGIC INCOME FUND
CONSOLIDATED SCHEDULE OF INVESTMENTSContinued
| | | | | | | | | | | | |
| | | | | | Principal Amount | | | Value | |
Structured Securities (Continued) | | | | | |
Deutsche Bank AG, Coriolanus Ltd. Sec. Credit Linked Bonds: (Continued) | | | | | | | | | | | | |
3.23% Sr. Sec. Nts., 4/30/251,11 | | | | | | $ | 2,763,152 | | | $ | 2,661,679 | |
3.265% Sr. Sec. Nts., 4/30/251,11 | | | | | | | 2,207,435 | | | | 2,126,370 | |
3.346% Sr. Sec. Nts., 4/30/251,11 | | | | | | | 2,074,895 | | | | 1,998,696 | |
Morgan Stanley, Russian Federation Total Return Linked | | | | | | | | | | | | |
Bonds, Series 007, Cl. VR, 5.00%, 8/22/34 | | | RUB | | | | 77,409,829 | | | | 185,283 | |
| | | | | | | | | | | | |
Total Structured Securities (Cost $18,268,445) | | | | | | | | | | | 17,604,380 | |
| | | | | | | | | | | | |
Short-Term Notes—0.4% | | | | | |
Arab Republic of Egypt Treasury Bills, 17.01%, 5/5/2011 | | | EGP | | | | 146,400,000 | | | | 8,476,311 | |
Argentine Republic Treasury Bills, 5.043%, 5/29/2011 | | | ARS | | | | 349,300,000 | | | | 3,394,831 | |
| | | | | | | | | | | | |
Total Short-Term Notes (Cost $16,859,846) | | | | | | | | | | | 11,871,142 | |
| | | | | | | | | | | | | | | | | | | | |
| | | Exercise Price | | | Expiration
Date | | | Notional Amount
(000’s) | | | Contracts
(000’s) | | | | |
Exchange-Traded Options Purchased—0.1% | | | | | | | | | | | | | | | | | | | | |
| | | | | | | | | | | | | | | USD | | | | | |
| | | | | | | | | | | USD | | | | | | | | | |
S&P 500 Index Put | | USD | 2,675.000 | | | | 3/20/20 | | | | 134,285 | | | | 1 | | | | 1,631,500 | |
| | | | | | | | | | | | | | | USD | | | | | |
S&P 500 Index Put | | USD | 2,625.000 | | | | 2/21/20 | | | | USD 69,563 | | | | 0 | 19 | | | 495,550 | |
| | | | | | | | | | | | | | | | | | | | |
Total Exchange-Traded Options Purchased (Cost $6,008,743) | | | | | | | | 2,127,050 | |
| | | | | | | | | | | | |
| | | Counterparty | | Exercise Price | | Expiration Date | | Notional Amount (000’s) | | | | |
Over-the-Counter Options Purchased—0.5% |
| | | | | | | | | | BRL | | |
BRL Currency Put | | GSCO-OT | | BRL 3.432 | | 3/27/20 | | BRL 3,540 | | 3,540 | | 144,625 |
| | | | | | | | | | BRL | | |
BRL Currency Put | | GSCO-OT | | BRL 3.350 | | 12/6/19 | | BRL 1,414 | | 1,414 | | 1 |
| | | | | | | | | | BRL | | |
BRL Currency Put | | GSCO-OT | | BRL 3.400 | | 12/10/19 | | BRL 1,414 | | 1,414 | | 31 |
| | | | | | | | | | BRL | | |
BRL Currency Call | | CITNA-B | | BRL 3.861 | | 11/18/19 | | BRL 135,118 | | 135,118 | | 29,941 |
| | | | | | | | | | BRL | | |
BRL Currency Put | | GSCO-OT | | BRL 3.430 | | 3/30/20 | | BRL 3,543 | | 3,543 | | 147,951 |
| | | | | | | | | | BRL | | |
BRL Currency Put | | GSCO-OT | | BRL 3.430 | | 3/30/20 | | BRL 3,543 | | 3,543 | | 147,951 |
| | | | | | | | | | EUR | | |
EUR Currency Put | | BOA | | PLN 4.250 | | 11/20/19 | | EUR 140,000 | | 140,000 | | 241,011 |
| | | | | | | | | | EUR | | |
EUR Currency Put | | MSCO | | NOK 9.757 | | 8/20/20 | | EUR 105,000 | | 105,000 | | 427,413 |
56 INVESCO OPPENHEIMER GLOBAL STRATEGIC INCOME FUND
| | | | | | | | | | | | | | |
| | | Counterparty | | | | Exercise Price | | Expiration
Date | | Notional Amount (000’s) | | Contracts
(000’s) | | Value |
Over-the-Counter Options Purchased (Continued) |
| | | | | | | | | | | | EUR | | |
EUR Currency Put | | JPM | | NOK | | 8.900 | | 8/26/21 | | EUR 8,750 | | 8,750 | | $ 589,410 |
| | | | | | | | | | | | EUR | | |
EUR Currency Call | | GSCOI | | SGD | | 1.395 | | 12/31/19 | | EUR 70,000 | | 70,000 | | 27,030 |
| | | | | | | | | | | | EUR | | |
EUR Currency Put | | BOA | | SEK | | 9.250 | | 4/29/20 | | EUR 7,200 | | 7,200 | | 628 |
| | | | | | | | | | | | EUR | | |
EUR Currency Put | | JPM | | CLP | | 699.000 | | 1/17/20 | | EUR 75,000 | | 75,000 | | 155,373 |
| | | | | | | | | | | | EUR | | |
EUR Currency Put | | SCB | | IDR | | 14400.000 | | 10/22/20 | | EUR 75,000 | | 75,000 | | 1,358,301 |
| | | | | | | | | | | | EUR | | |
EUR Currency Put | | GSCOI | | IDR | | 14435.000 | | 10/22/20 | | EUR 56,250 | | 56,250 | | 1,079,144 |
| | | | | | | | | | | | EUR | | |
EUR Currency Put | | JPM | | IDR | | 14420.000 | | 10/26/20 | | EUR 37,500 | | 37,500 | | 704,970 |
| | | | | | | | | | | | EUR | | |
EUR Currency Put | | JPM | | BRL | | 3.970 | | 1/24/20 | | EUR 37,500 | | 37,500 | | 628,372 |
| | | | | | | | | | | | EUR | | |
EUR Currency Put | | GSCO-OT | | INR | | 74.875 | | 8/5/20 | | EUR 3,500 | | 3,500 | | 659,218 |
| | | | | | | | | | | | EUR | | |
EUR Currency Put | | JPM | | ZAR | | 15.720 | | 1/23/20 | | EUR 34,900 | | 34,900 | | 88,159 |
| | | | | | | | | | | | EUR | | |
EUR Currency Put | | GSCOI | | MXN | | 19.626 | | 10/30/20 | | EUR 75,000 | | 75,000 | | 2,257,500 |
| | | | | | | | | | | | EUR | | |
EUR Currency Put | | GSCO-OT | | NOK | | 8.648 | | 1/6/21 | | EUR 8,850 | | 8,850 | | 83,056 |
| | | | | | | | | | | | EUR | | |
EUR Currency Put | | GSCO-OT | | NOK | | 8.360 | | 1/6/21 | | EUR 8,850 | | 8,850 | | 18,548 |
| | | | | | | | | | | | EUR | | |
EUR Currency Put | | BOA | | INR | | 72.500 | | 10/27/20 | | EUR 75,000 | | 75,000 | | 1,067,609 |
| | | | | | | | | | | | INR | | |
INR Currency Put | | GSCO-OT | | INR | | 65.600 | | 5/6/20 | | INR 5,220 | | 5,220 | | 101,709 |
| | | | | | | | | | | | INR | | |
INR Currency Put | | JPM | | INR | | 66.092 | | 4/29/20 | | INR 3,500 | | 3,500 | | 86,983 |
| | | | | | | | | | | | KRW | | |
KRW Currency Call | | GSCO-OT | | KRW | | 1159.700 | | 1/17/20 | | KRW 40,450,000 | | 40,450,000 | | 280,318 |
57 INVESCO OPPENHEIMER GLOBAL STRATEGIC INCOME FUND
CONSOLIDATED SCHEDULE OF INVESTMENTSContinued
| | | | | | | | | | | | | | |
| | | Counterparty | | | | Exercise Price | | Expiration
Date | | Notional Amount
(000’s) | | Contracts
(000’s) | | Value |
Over-the-Counter Options Purchased (Continued) |
| | | | | | | | | | | | MXN | | |
MXN Currency Put | | JPM | | MXN | | 19.655 | | 11/26/19 | | MXN 330,204 | | 330,204 | | $ 60,008 |
| | | | | | | | | | | | MXN | | |
MXN Currency Call | | JPM | | MXN | | 19.655 | | 11/26/19 | | MXN 330,204 | | 330,204 | | 364,321 |
| | | | | | | | | | | | MXN | | |
MXN Currency Call | | JPM | | MXN | | 19.375 | | 6/2/20 | | MXN 673,200 | | 673,200 | | 685,923 |
| | | | | | | | | | | | MXN | | |
MXN Currency Call | | BOA | | MXN | | 18.553 | | 1/14/20 | | MXN 1,312,540 | | 1,312,540 | | 153,095 |
| | | | | | | | | | | | MXN | | |
MXN Currency Call | | CITNA-B | | MXN | | 19.350 | | 6/2/20 | | MXN 672,300 | | 672,300 | | 667,090 |
| | | | | | | | | | | | PHP | | |
PHP Currency Call | | GSCO-OT | | PHP | | 51.000 | | 11/11/19 | | PHP 890,000 | | 890,000 | | 102,617 |
| | | | | | | | | | | | RUB | | |
RUB Currency Put | | GSCO-OT | | RUB | | 58.500 | | 8/4/20 | | RUB 3,850 | | 3,850 | | 676,236 |
| | | | | | | | | | | | RUB | | |
RUB Currency Put | | GSCO-OT | | RUB | | 57.300 | | 3/30/20 | | RUB 7,086 | | 7,086 | | 193,452 |
| | | | | | | | | | | | RUB | | |
RUB Currency Call | | JPM | | RUB | | 70.000 | | 2/25/21 | | RUB 3,714,800 | | 3,714,800 | | 3,768,182 |
| | | | | | | | | | | | RUB | | |
RUB Currency Put | | JPM | | RUB | | 59.000 | | 8/5/20 | | RUB 3,850 | | 3,850 | | 822,325 |
| | | | | | | | | | | | RUB | | |
RUB Currency Call | | GSCO-OT | | RUB | | 60.000 | | 12/18/19 | | RUB 3,974,300 | | 3,974,300 | | 1,908 |
| | | | | | | | | | | | ZAR | | |
ZAR Currency Call | | GSCO-OT | | ZAR | | 13.613 | | 1/27/20 | | ZAR 240,801 | | 240,801 | | 17,680 |
| | | | | | | | | | | | ZAR | | |
ZAR Currency Call | | GSCO-OT | | ZAR | | 14.500 | | 7/23/20 | | ZAR 531,300 | | 531,300 | | 688,474 |
| | | | | | | | | | | | | | |
TotalOver-the-Counter Options Purchased (Cost $34,849,797) | | | | 18,526,563 |
| | | | | | | | | | | | | | |
| | | Counterparty | | Buy /Sell Protection | | Reference Asset | | Fixed Rate | | Expiration
Date | | Notional Amount (000’s) | | |
Over-the-Counter Credit Default Swaptions Purchased—0.0% |
Credit Default Swap maturing 6/20/24 Call | | JPM | | Sell | | iTraxx Europe Crossover Series 31 Version 1 | | 3.00% | | 12/18/19 | | EUR 105,000 | | 367,869 |
58 INVESCO OPPENHEIMER GLOBAL STRATEGIC INCOME FUND
| | | | | | | | | | | | | | |
| | | Counterparty | | Buy /Sell Protection | | Reference Asset | | Fixed Rate | | Expiration
Date | | Notional
Amount
(000’s) | | Value |
Over-the-Counter Credit Default Swaptions Purchased (Continued) |
| Credit Default Swap maturing 1/15/20 Put | | CITNA-B | | Sell | | Markit CDX North America High Yield Index, Series 33,
Version 1 | | 5.00 | | 1/15/20 | | USD 51,000 | | 466,378 |
| | | | | | | | | | | | | | |
TotalOver-the-Counter Credit Default Swaptions Purchased (Cost $1,786,937) | | 834,247 |
| | | | | | | | | | | | | | | | | | | | | | |
| | | Counterparty | | Pay/Receive
Floating Rate | | Floating Rate | | | | Fixed Rate | | | Expiration
Date | | | Notional
Amount (000’s) | | | |
Over-the-Counter Interest Rate Swaptions Purchased—0.2% | |
Interest Rate Swap maturing 1/9/20 Call | | GSCOI | | Pay | | Three- Month USD BBA LIBOR | | | | | 1.600 | % | | | 1/9/20 | | | USD 534,300 | | $ | 1,747,166 | |
Interest Rate Swap maturing 11/14/19 Put | | JPM | | Receive | | Three- Month USD BBA LIBOR | | | | | 1.865 | | | | 11/14/19 | | | USD 42,000 | | | 178,811 | |
Interest Rate Swap maturing 3/27/20 Put | | MSCO | | Receive | | Six-Month EUR EURIBOR | | | | | 0.434 | | | | 3/27/20 | | | EUR 43,600 | | | 104,733 | |
Interest Rate Swap Maturing 3/29/21 Put | | JPM | | Receive | | Six-Month EUR EURIBOR | | | | | 1.122 | | | | 3/29/21 | | | EUR 353,800 | | | 44,881 | |
Interest Rate Swap Maturing 3/30/20 Put | | BOA | | Receive | | Three- Month CAD BA CDOR | | | | | 2.588 | | | | 3/30/20 | | | CAD 472,000 | | | 74,540 | |
Interest Rate Swap Maturing 4/12/21 Put | | JPM | | Receive | | Six-Month EUR EURIBOR | | | | | 0.615 | | | | 4/12/21 | | | EUR 353,750 | | | 6,766 | |
Interest Rate Swap Maturing 4/6/21 Put | | JPM | | Receive | | Six-Month EUR EURIBOR | | | | | 0.608 | | | | 4/6/21 | | | EUR 354,000 | | | 6,546 | |
Interest Rate Swap maturing 8/16/24 Put | | JPM | | Receive | | Six-Month EUR EURIBOR | | | | | 2.098 | | | | 8/16/24 | | | EUR 70,000 | | | 1,136,373 | |
59 INVESCO OPPENHEIMER GLOBAL STRATEGIC INCOME FUND
CONSOLIDATED SCHEDULE OF INVESTMENTSContinued
| | | | | | | | | | | | | | | | |
| | | | | Pay/Receive | | | | | | | | | Notional | | |
| | | | | Floating | | Floating | | Fixed | | Expiration | | | Amount | | |
| | | Counterparty | | Rate | | Rate | | Rate | | Date | | | (000’s) | | Value |
Over-the-Counter Interest Rate Swaptions Purchased (Continued) |
Interest Rate Swap maturing 8/17/20 Put | | MSCO | | Receive | | Three- Month USD BBA LIBOR | | 1.695% | | | 8/17/20 | | | USD 121,500 | | $ 2,142,789 |
Interest Rate Swap maturing 8/17/20 Put | | GSCOI | | Receive | | Three- Month USD BBA LIBOR | | 2.500 | | | 8/17/20 | | | USD 175,000 | | 1,253,465 |
Interest Rate Swap maturing 8/26/20 Put | | MSCO | | Receive | | Three- Month USD BBA LIBOR | | 2.500 | | | 8/26/20 | | | USD 175,000 | | 378,607 |
Interest Rate Swap maturing 8/28/20 Put | | GSCOI | | Pay | | Three- Month KRW CD | | 2.000 | | | 8/28/20 | | | KRW 84,000,000 | | 200,227 |
| | | | | | | | | | | | | | | | |
TotalOver-the-Counter Interest Rate Swaptions Purchased (Cost $10,184,586) | | | | | 7,274,904 |
| | | | | | | | |
| | | Shares | | | | |
Investment Companies—16.3% | | | | | | | | |
Invesco Government & Agency Portfolio, Institutional Class, 1.71%20 | | | 428,982,245 | | | | 428,982,245 | |
Invesco Oppenheimer Master Event-Linked Bond Fund21 | | | 4,409,321 | | | | 70,479,468 | |
Invesco Oppenheimer Ultra-Short Duration Fund21 | | | 9,392,309 | | | | 46,961,543 | |
OFI Carlyle Private Credit Fund, Cl. I21 | | | 164,371 | | | | 1,530,295 | |
| | | | | | | | |
Total Investment Companies (Cost $559,809,791) | | | | | | | 547,953,551 | |
Total Investments, at Value (Cost $3,760,466,308) | | | 109.7 | % | | | 3,688,538,439 | |
Net Other Assets (Liabilities) | | | (9.7 | ) | | | (326,947,738 | ) |
| | | | |
Net Assets | | | 100.0 | % $ | | | 3 ,361,590,701 | |
| | | | |
Footnotesto Consolidated Schedule of Investments
1. Security purchased or received in a transaction exempt from registration under the Securities Act of 1933, as amended (the “1933 Act”). The security may be resold pursuant to an exemption from registration under the 1933 Act, typically to qualified institutional buyers. The aggregate value of these securities at October 31, 2019 was $1,430,307,250, which represented 42.55% of the Fund’s Net Assets.
2. Represents the current interest rate for a variable or increasing rate security, which may be fixed for a predetermined period. The interest rate is, or will be as of an established date, determined as [Referenced Rate + Basis-point spread].
3. All or a portion of this security is owned by the subsidiary.
4. Interest-Only Strips represent the right to receive the monthly interest payments on an underlying pool of mortgage loans. These securities typically decline in price as interest rates decline. Most other fixed income securities increase in price when interest rates decline. The principal amount of the underlying pool represents the notional amount on which current interest is calculated. The price of these securities is typically more sensitive to changes in prepayment rates than traditional mortgage-backed securities (for example, GNMA pass-throughs). Interest rates disclosed represent current yields based upon the current cost basis and estimated timing and amount of future cash flows. These securities amount to $12,559,833 or 0.37% of the Fund’s net assets at period end.
5. Interest rate is less than 0.0005%.
60 INVESCO OPPENHEIMER GLOBAL STRATEGIC INCOME FUND
Footnotes to Consolidated Schedule of Investments (continued)
6. All or a portion of the security position is when-issued or delayed delivery to be delivered and settled after period end. See Note 1 of the accompanying Consolidated Notes.
7. This interest rate resets periodically. Interest rate shown reflects the rate in effect at period end. The rate on this variable rate security is not based on a published reference rate and spread but is determined by the issuer or agent based on current market conditions.
8. The value of this security was determined using significant unobservable inputs. See Note 3 of the accompanying Consolidated Notes.
9. Denotes an inflation-indexed security: coupon or principal are indexed to a consumer price index.
10. All or a portion of the security position is held in segregated accounts and pledged to cover margin requirements under certain derivative contracts. The aggregate market value of such securities is $10,897,278. See Note 1 of the accompanying Consolidated Notes.
11. Zero coupon bond reflects effective yield on the original acquisition date.
12. Variable rate senior loan interests are, at present, not readily marketable, not registered under the Securities Act of 1933, as amended (the “1933 Act”), and may be subject to contractual and legal restrictions on sale. Variable rate senior loan interests in the Fund’s portfolio generally have variable rates which adjust to a base, such as the London Interbank Offered Rate (“LIBOR”), on set dates, typically every 30 days but not greater than one year; and/ or have interest rates that float at a margin above a widely recognized base lending rate such as the Prime Rate of a designated U.S. bank.
13. Variable rate senior loan interests often require prepayments from excess cash flow or permit the borrower to repay at its election. The degree to which borrowers repay, whether as a contractual requirement or at their election, cannot be predicted with accuracy. As a result, the actual remaining maturity may be substantially less than the stated maturities shown. However, it is anticipated that the variable rate senior loan interests will have an expected average life of three to five years.
14. Interest or dividend ispaid-in-kind, when applicable.
15. This security is not accruing income because its issuer has missed or is expected to miss interest and/or principal payments. The rate shown is the contractual interest rate.
16. Security received as the result of issuer reorganization.
17. This bond has no contractual maturity date, is not redeemable and contractually pays an indefinite stream of interest.
18.Non-income producing security.
19. Number of contracts are less than 500.
20. The money market fund and the Fund are affiliated by having the same investment adviser. The rate shown is the7-day SEC standardized yield as of October 31, 2019.
21. Is or was an affiliate, as defined in the Investment Company Act of 1940, as amended, at or during the reporting period, by virtue of the Fund owning at least 5% of the voting securities of the issuer or as a result of the Fund and the issuer having the same investment adviser. Transactions during the reporting period in which the issuer was an affiliate are as follows:
| | | | | | | | | | | | | | | | |
| | | Shares
September 30,
2019 | | | Gross
Additions | | | Gross
Reductions | | | Shares October 31, 2019 | |
Investment Company | | | | | | | | | | | | | | | | |
Invesco Oppenheimer Limited-Term Bond Fund | | | 4,077,028 | | | | 10,555 | | | | 4,087,583 | | | | — | |
Invesco Oppenheimer Master Event-Linked Bond Fund | | | 4,436,854 | | | | — | | | | 27,533 | | | | 4,409,321 | |
Invesco Oppenheimer Ultra-Short Duration Fund, Cl. Y | | | 9,375,659 | | | | 16,650 | | | | — | | | | 9,392,309 | |
OFI Carlyle Private Credit Fund, Cl. I | | | 328,742 | | | | — | | | | 164,371 | | | | 164,371 | |
61 INVESCO OPPENHEIMER GLOBAL STRATEGIC INCOME FUND
CONSOLIDATED SCHEDULE OF INVESTMENTSContinued
Footnotes to Consolidated Schedule of Investments (continued)
| | | | | | | | | | | | | | | | |
| | | Value | | | Income | | | Realized
Gain (Loss) | | | Change in
Unrealized
Gain (Loss) | |
Investment Company | | | | | | | | | | | | | | | | |
Invesco Oppenheimer Limited-Term Bond Fund | | $ | — | | | $ | 22,679 | | | $ | 522,028 | | | $ | (522,028 | ) |
Invesco Oppenheimer Master Event-Linked Bond Fund | | | 70,479,468 | | | | 439,248 | a,b | | | (128,585 | )a | | | 412,772 | a |
Invesco Oppenheimer Ultra-Short Duration Fund, Cl. Y | | | 46,961,543 | | | | 88,203 | | | | — | | | | — | |
OFI Carlyle Private Credit Fund, Cl. I | | | 1,530,295 | | | | — | | | | (70,680 | ) | | | (13,337 | ) |
| | | | |
Total | | $ | 118,971,306 | | | $ | 550,130 | | | $ | 322,763 | | | $ | (122,593 | ) |
| | | | |
a. Represents the amount allocated to the fund from Invesco Oppenheimer Master Event-Linked Bond Fund.
b.Net of expenses allocated to the fund from Invesco Oppenheimer Master Event-Linked Bond Fund.
Distribution of investments representing geographic holdings, as a percentage of total investments at value, is as follows:
| | | | | | | | | | | | |
| Geographic Holdings | | Value | | | Percent | | | | |
United States | | $ | 2,120,113,018 | | | | 57.5 | % | | | | |
United Kingdom | | | 197,015,155 | | | | 5.3 | | | | | |
India | | | 130,852,652 | | | | 3.5 | | | | | |
Indonesia | | | 95,723,955 | | | | 2.6 | | | | | |
Greece | | | 90,496,084 | | | | 2.5 | | | | | |
Mexico | | | 85,849,462 | | | | 2.3 | | | | | |
South Africa | | | 77,604,881 | | | | 2.1 | | | | | |
Egypt | | | 76,463,089 | | | | 2.1 | | | | | |
France | | | 73,933,306 | | | | 2.0 | | | | | |
Brazil | | | 64,305,687 | | | | 1.7 | | | | | |
Italy | | | 58,974,677 | | | | 1.6 | | | | | |
Russia | | | 52,894,787 | | | | 1.4 | | | | | |
China | | | 49,651,470 | | | | 1.3 | | | | | |
Switzerland | | | 42,514,249 | | | | 1.2 | | | | | |
Argentina | | | 32,991,506 | | | | 0.9 | | | | | |
Spain | | | 32,307,380 | | | | 0.9 | | | | | |
Turkey | | | 28,707,279 | | | | 0.8 | | | | | |
Sri Lanka | | | 26,808,751 | | | | 0.7 | | | | | |
Netherlands | | | 24,002,270 | | | | 0.7 | | | | | |
Ireland | | | 22,183,536 | | | | 0.6 | | | | | |
Canada | | | 21,879,337 | | | | 0.6 | | | | | |
Austria | | | 17,502,715 | | | | 0.5 | | | | | |
Thailand | | | 16,901,389 | | | | 0.5 | | | | | |
Luxembourg | | | 14,990,496 | | | | 0.4 | | | | | |
Macau | | | 14,598,707 | | | | 0.4 | | | | | |
Panama | | | 13,352,102 | | | | 0.4 | | | | | |
Colombia | | | 13,251,771 | | | | 0.4 | | | | | |
Senegal | | | 13,135,154 | | | | 0.4 | | | | | |
Ukraine | | | 12,523,109 | | | | 0.3 | | | | | |
Dominican Republic | | | 12,388,242 | | | | 0.3 | | | | | |
Azerbaijan | | | 12,055,232 | | | | 0.3 | | | | | |
62 INVESCO OPPENHEIMER GLOBAL STRATEGIC INCOME FUND
| | | | | | | | | | | | |
| Geographic Holdings (Continued) | | Value | | | Percent | | | | |
Oman | | $ | 11,667,027 | | | | 0.3 | % | | | | |
New Zealand | | | 10,813,651 | | | | 0.3 | | | | | |
Ecuador | | | 9,620,109 | | | | 0.3 | | | | | |
Chile | | | 8,883,733 | | | | 0.2 | | | | | |
Ivory Coast | | | 8,470,836 | | | | 0.2 | | | | | |
Portugal | | | 7,629,523 | | | | 0.2 | | | | | |
Paraguay | | | 7,344,482 | | | | 0.2 | | | | | |
United Arab Emirates | | | 7,148,769 | | | | 0.2 | | | | | |
Cyprus | | | 6,174,923 | | | | 0.2 | | | | | |
Peru | | | 6,022,713 | | | | 0.2 | | | | | |
Angola | | | 5,825,250 | | | | 0.2 | | | | | |
Kenya | | | 5,464,446 | | | | 0.1 | | | | | |
Kazakhstan | | | 4,884,403 | | | | 0.1 | | | | | |
Germany | | | 4,719,272 | | | | 0.1 | | | | | |
Mauritius | | | 4,102,724 | | | | 0.1 | | | | | |
Morocco | | | 3,961,326 | | | | 0.1 | | | | | |
Zambia | | | 3,887,103 | | | | 0.1 | | | | | |
Fiji | | | 3,735,315 | | | | 0.1 | | | | | |
El Salvador | | | 3,443,212 | | | | 0.1 | | | | | |
Singapore | | | 2,529,986 | | | | 0.1 | | | | | |
Hong Kong | | | 2,500,824 | | | | 0.1 | | | | | |
Belgium | | | 2,270,563 | | | | 0.1 | | | | | |
Supranational | | | 2,139,026 | | | | 0.1 | | | | | |
Nigeria | | | 2,095,000 | | | | 0.1 | | | | | |
Philippines | | | 1,873,398 | | | | 0.0 | | | | | |
Eurozone | | | 1,667,168 | | | | 0.0 | | | | | |
Sweden | | | 1,519,357 | | | | 0.0 | | | | | |
Norway | | | 1,118,428 | | | | 0.0 | | | | | |
South Korea | | | 480,545 | | | | 0.0 | | | | | |
Australia | | | 332,868 | | | | 0.0 | | | | | |
Poland | | | 241,011 | | | | 0.0 | | | | | |
| | | | |
Total | | $ | 3,688,538,439 | | | | 100.0 | % | | | | |
| | | | |
| | | | | | | | | | | | | | | | | | | | | | | | | | |
Forward Currency Exchange Contracts as of October 31, 2019 | |
| Counterparty | | Settlement Month(s) | | | | | Currency Purchased (000’s) | | | | | | Currency Sold
(000’s) | | | Unrealized Appreciation | | | Unrealized Depreciation | |
BAC | | | 05/2020 | | | CLP | | | 1,578,600 | | | | USD | | | | 2,305 | | | $ | — | | | $ | (165,282 | ) |
BAC | | | 11/2019 | | | EUR | | | 69,965 | | | | USD | | | | 78,201 | | | | — | | | | (75,489 | ) |
BAC | | | 12/2019 | | | MYR | | | 2,190 | | | | USD | | | | 519 | | | | 6,120 | | | | — | |
BAC | | | 11/2019 | | | NOK | | | 44,500 | | | | USD | | | | 5,005 | | | | — | | | | (165,231 | ) |
BAC | | | 11/2019 | | | USD | | | 45,090 | | | | NZD | | | | 71,000 | | | | — | | | | (446,281 | ) |
BAC | | | 12/2019 | | | ZAR | | | 120,580 | | | | USD | | | | 7,786 | | | | 145,344 | | | | — | |
BNP | | | 11/2019 | | | EUR | | | 6,300 | | | | USD | | | | 6,959 | | | | 75,560 | | | | — | |
BOA | | | 11/2019 - 01/2020 | | | EUR | | | 92,740 | | | | USD | | | | 102,167 | | | | 1,525,098 | | | | (85,456 | ) |
BOA | | | 01/2020 | | | IDR | | | 188,850,000 | | | | USD | | | | 13,208 | | | | 82,577 | | | | — | |
BOA | | | 11/2019 - 01/2020 | | | JPY | | | 2,096,000 | | | | USD | | | | 19,771 | | | | — | | | | (293,736 | ) |
BOA | | | 12/2019 | | | KRW | | | 7,520,050 | | | | USD | | | | 6,175 | | | | 256,478 | | | | — | |
BOA | | | 11/2019 - 01/2020 | | | NOK | | | 80,000 | | | | USD | | | | 8,892 | | | | — | | | | (190,611 | ) |
BOA | | | 01/2020 | | | NZD | | | 9,000 | | | | USD | | | | 5,705 | | | | 74,184 | | | | — | |
BOA | | | 11/2019 - 01/2020 | | | SEK | | | 775,200 | | | | USD | | | | 80,242 | | | | 776,915 | | | | (491,928 | ) |
63 INVESCO OPPENHEIMER GLOBAL STRATEGIC INCOME FUND
CONSOLIDATED SCHEDULE OF INVESTMENTSContinued
| | | | | | | | | | | | | | | | | | | | | | | | |
Forward Currency Exchange Contracts (Continued) | |
| Counterparty | | Settlement
Month(s) | | | | | Currency
Purchased (000’s) | | | | | Currency Sold
(000’s) | | | Unrealized
Appreciation | | | Unrealized
Depreciation | |
BOA | | | 12/2019 | | | TRY | | | 30,550 | | | USD | | | 5,233 | | | $ | 47,105 | | | $ | — | |
BOA | | | 11/2019 | | | USD | | | 474 | | | CAD | | | 625 | | | | — | | | | (872 | ) |
BOA | | | 11/2019 - 01/2020 | | | USD | | | 163,087 | | | EUR | | | 146,710 | | | | 303,680 | | | | (1,385,637 | ) |
BOA | | | 01/2020 | | | USD | | | 33,980 | | | GBP | | | 27,380 | | | | — | | | | (1,588,385 | ) |
BOA | | | 11/2019 | | | USD | | | 9,760 | | | JPY | | | 1,048,000 | | | | 45,665 | | | | — | |
BOA | | | 11/2019 | | | USD | | | 4,389 | | | NOK | | | 40,000 | | | | 38,873 | | | | — | |
BOA | | | 11/2019 | | | USD | | | 39,374 | | | SEK | | | 387,600 | | | | — | | | | (807,625 | ) |
BOA | | | 12/2019 - 03/2020 | | | USD | | | 10,308 | | | TRY | | | 61,100 | | | | — | | | | (129,277 | ) |
BOA | | | 03/2020 | | | USD | | | 15,319 | | | ZAR | | | 237,120 | | | | — | | | | (105,187 | ) |
BOA | | | 03/2020 | | | ZAR | | | 474,240 | | | USD | | | 31,832 | | | | 101,543 | | | | (1,102,109 | ) |
CITNA-B | | | 11/2019 | | | BRL | | | 361,697 | | | USD | | | 87,381 | | | | 2,847,745 | | | | (40,926 | ) |
CITNA-B | | | 11/2019 - 01/2020 | | | CAD | | | 1,250 | | | USD | | | 943 | | | | 6,654 | | | | — | |
CITNA-B | | | 05/2020 | | | CLP | | | 5,156,400 | | | USD | | | 7,528 | | | | — | | | | (540,160 | ) |
CITNA-B | | | 12/2019 | | | COP | | | 82,083,935 | | | USD | | | 23,770 | | | | 474,690 | | | | — | |
CITNA-B | | | 11/2019 - 01/2020 | | | EUR | | | 210,450 | | | USD | | | 232,127 | | | | 2,930,477 | | | | (33,125 | ) |
CITNA-B | | | 11/2019 | | | GBP | | | 54,875 | | | USD | | | 68,182 | | | | 2,940,876 | | | | — | |
CITNA-B | | | 12/2019 | | | MXN | | | 804,459 | | | USD | | | 40,405 | | | | 1,126,482 | | | | — | |
CITNA-B | | | 11/2019 - 01/2020 | | | NOK | | | 854,500 | | | USD | | | 94,477 | | | | — | | | | (1,530,639 | ) |
CITNA-B | | | 12/2019 | | | RUB | | | 2,266,200 | | | USD | | | 34,378 | | | | 735,237 | | | | — | |
CITNA-B | | | 11/2019 | | | USD | | | 89,162 | | | BRL | | | 361,697 | | | | 103,226 | | | | (1,129,062 | ) |
CITNA-B | | | 11/2019 | | | USD | | | 469 | | | CAD | | | 625 | | | | — | | | | (5,148 | ) |
CITNA-B | | | 11/2019 - 12/2019 | | | USD | | | 20,113 | | | CLP | | | 14,347,162 | | | | 753,399 | | | | — | |
CITNA-B | | | 12/2019 | | | USD | | | 13,180 | | | COP | | | 45,513,700 | | | | — | | | | (263,205 | ) |
CITNA-B | | | 11/2019 - 01/2020 | | | USD | | | 443,337 | | | EUR | | | 398,410 | | | | 471,604 | | | | (3,076,662 | ) |
CITNA-B | | | 11/2019 - 01/2020 | | | USD | | | 139,779 | | | GBP | | | 112,880 | | | | — | | | | (6,697,216 | ) |
CITNA-B | | | 12/2019 - 03/2020 | | | USD | | | 80,392 | | | MXN | | | 1,608,919 | | | | — | | | | (2,117,817 | ) |
CITNA-B | | | 11/2019 | | | USD | | | 46,837 | | | NOK | | | 427,250 | | | | 372,555 | | | | — | |
CITNA-B | | | 12/2019 | | | USD | | | 336 | | | PEN | | | 1,140 | | | | — | | | | (4,667 | ) |
CITNA-B | | | 12/2019 | | | USD | | | 30,329 | | | RUB | | | 1,985,100 | | | | 13,550 | | | | (441,248 | ) |
CITNA-B | | | 12/2019 | | | USD | | | 16,731 | | | THB | | | 515,050 | | | | — | | | | (334,973 | ) |
CITNA-B | | | 12/2019 | | | USD | | | 20,825 | | | TRY | | | 121,260 | | | | — | | | | (133,109 | ) |
DEU | | | 11/2019 | | | USD | | | 7,407 | | | GBP | | | 6,000 | | | | — | | | | (370,052 | ) |
GSCO-OT | | | 03/2021 | | | BRL | | | 95,000 | | | USD | | | 22,903 | | | | 62,284 | | | | — | |
GSCO-OT | | | 11/2019 | | | CAD | | | 625 | | | USD | | | 472 | | | | 2,321 | | | | — | |
GSCO-OT | | | 11/2019 | | | CLP | | | 12,539,600 | | | USD | | | 17,606 | | | | — | | | | (685,928 | ) |
GSCO-OT | | | 11/2019 - 01/2021 | | | EUR | | | 168,186 | | | USD | | | 194,305 | | | | 810,285 | | | | (4,823,144 | ) |
GSCO-OT | | | 05/2020 | | | INR | | | 3,598,746 | | | USD | | | 49,590 | | | | — | | | | (101,235 | ) |
GSCO-OT | | | 02/2021 | | | RUB | | | 1,589,400 | | | USD | | | 23,350 | | | | 101,376 | | | | — | |
GSCO-OT | | | 02/2020 - 03/2020 | | | TRY | | | 85,120 | | | USD | | | 14,292 | | | | 117,557 | | | | — | |
GSCO-OT | | | 03/2021 | | | USD | | | 78,466 | | | BRL | | | 321,838 | | | | 104,563 | | | | (722,984 | ) |
GSCO-OT | | | 11/2019 | | | USD | | | 474 | | | CAD | | | 625 | | | | — | | | | (965 | ) |
GSCO-OT | | | 11/2019 - 05/2020 | | | USD | | | 29,014 | | | CLP | | | 20,036,765 | | | | 1,909,084 | | | | — | |
GSCO-OT | | | 11/2019 - 05/2020 | | | USD | | | 89,434 | | | EUR | | | 80,496 | | | | 438,020 | | | | (1,198,828 | ) |
GSCO-OT | | | 10/2020 | | | USD | | | 27,400 | | | IDR | | | 402,095,000 | | | | 52,276 | | | | — | |
GSCO-OT | | | 05/2020 - 08/2020 | | | USD | | | 83,765 | | | INR | | | 6,127,731 | | | | 149,427 | | | | (296,207 | ) |
GSCO-OT | | | 01/2021 | | | USD | | | 69,698 | | | NOK | | | 585,800 | | | | 6,100,835 | | | | — | |
GSCO-OT | | | 12/2019 | | | USD | | | 23,231 | | | RUB | | | 1,519,700 | | | | 20,719 | | | | (335,403 | ) |
GSCO-OT | | | 02/2020 | | | USD | | | 8,007 | | | TRY | | | 49,560 | | | | — | | | | (399,800 | ) |
64 INVESCO OPPENHEIMER GLOBAL STRATEGIC INCOME FUND
| | | | | | | | | | | | | | | | | | | | | | | | | | |
Forward Currency Exchange Contracts (Continued) | |
| Counterparty | | Settlement
Month(s) | | | | | Currency
Purchased (000’s) | | | | | | Currency Sold
(000’s) | | | Unrealized
Appreciation | | | Unrealized
Depreciation | |
GSCO-OT | | | 01/2020 - 03/2020 | | | USD | | | 47,740 | | | | ZAR | | | | 730,840 | | | $ | 191,058 | | | $ | (76,615 | ) |
GSCO-OT | | | 01/2020 - 03/2020 | | | ZAR | | | 520,120 | | | | USD | | | | 33,853 | | | | 87,356 | | | | (6,890 | ) |
HSBC | | | 11/2019 | | | EUR | | | 3,165 | | | | USD | | | | 3,528 | | | | 6,246 | | | | — | |
HSBC | | | 11/2019 | | | NOK | | | 45,000 | | | | USD | | | | 5,062 | | | | — | | | | (168,219 | ) |
HSBC | | | 11/2019 | | | USD | | | 43,833 | | | | EUR | | | | 38,945 | | | | 352,047 | | | | (3,952 | ) |
HSBC | | | 11/2019 | | | USD | | | 9,923 | | | | JPY | | | | 1,048,000 | | | | 208,761 | | | | — | |
JPM | | | 11/2019 - 04/2020 | | | BRL | | | 773,044 | | | | USD | | | | 191,782 | | | | 660,788 | | | | (103,226 | ) |
JPM | | | 11/2019 - 05/2020 | | | CLP | | | 10,715,465 | | | | USD | | | | 14,980 | | | | — | | | | (506,368 | ) |
JPM | | | 11/2019 - 08/2021 | | | EUR | | | 274,034 | | | | USD | | | | 305,798 | | | | 2,641,227 | | | | (157,803 | ) |
JPM | | | 11/2019 - 01/2020 | | | GBP | | | 32,315 | | | | USD | | | | 39,771 | | | | 2,126,501 | | | | — | |
JPM | | | 12/2019 | | | HUF | | | 16,000 | | | | USD | | | | 53 | | | | 1,314 | | | | — | |
JPM | | | 12/2019 | | | IDR | | | 399,523,000 | | | | USD | | | | 27,495 | | | | 737,220 | | | | — | |
JPM | | | 12/2019 - 08/2020 | | | INR | | | 3,934,624 | | | | USD | | | | 53,632 | | | | 463,042 | | | | — | |
JPM | | | 11/2019 - 01/2020 | | | JPY | | | 5,400,000 | | | | USD | | | | 50,552 | | | | — | | | | (458,364 | ) |
JPM | | | 03/2020 | | | MXN | | | 83,913 | | | | USD | | | | 4,295 | | | | — | | | | (20,786 | ) |
JPM | | | 01/2020 | | | NZD | | | 45,550 | | | | USD | | | | 28,939 | | | | 313,297 | | | | (2,629 | ) |
JPM | | | 12/2019 - 03/2020 | | | PLN | | | 1,880 | | | | USD | | | | 483 | | | | 9,676 | | | | — | |
JPM | | | 12/2019 | | | RUB | | | 1,589,400 | | | | USD | | | | 24,625 | | | | — | | | | (3,815 | ) |
JPM | | | 12/2019 | | | THB | | | 515,050 | | | | USD | | | | 16,873 | | | | 192,468 | | | | — | |
JPM | | | 12/2019 - 03/2020 | | | TRY | | | 242,520 | | | | USD | | | | 40,500 | | | | 928,506 | | | | — | |
JPM | | | 11/2019 - 12/2019 | | | USD | | | 115,481 | | | | BRL | | | | 464,387 | | | | 40,927 | | | | (305,108 | ) |
JPM | | | 12/2019 | | | USD | | | 11,219 | | | | CLP | | | | 8,137,165 | | | | 234,115 | | | | — | |
JPM | | | 11/2019 - 08/2020 | | | USD | | | 285,061 | | | | EUR | | | | 256,750 | | | | 448,142 | | | | (3,304,426 | ) |
JPM | | | 11/2019 - 01/2020 | | | USD | | | 67,516 | | | | GBP | | | | 55,150 | | | | — | | | | (4,046,366 | ) |
JPM | | | 12/2019 - 03/2020 | | | USD | | | 109 | | | | HUF | | | | 32,000 | | | | 984 | | | | (1,316 | ) |
JPM | | | 12/2019 - 01/2020 | | | USD | | | 93,000 | | | | IDR | | | | 1,346,970,000 | | | | — | | | | (2,127,670 | ) |
JPM | | | 12/2019 | | | USD | | | 103,733 | | | | INR | | | | 7,469,800 | | | | — | | | | (815,996 | ) |
JPM | | | 11/2019 | | | USD | | | 41,589 | | | | JPY | | | | 4,462,367 | | | | 229,610 | | | | — | |
JPM | | | 08/2021 | | | USD | | | 42,144 | | | | NOK | | | | 378,550 | | | | 1,146,517 | | | | — | |
JPM | | | 12/2019 | | | USD | | | 239 | | | | PLN | | | | 940 | | | | — | | | | (6,966 | ) |
JPM | | | 12/2019 - 02/2021 | | | USD | | | 51,808 | | | | RUB | | | | 3,435,330 | | | | 140,047 | | | | (140,417 | ) |
JPM | | | 12/2019 - 03/2020 | | | USD | | | 33,613 | | | | THB | | | | 1,030,100 | | | | — | | | | (541,676 | ) |
JPM | | | 12/2019 - 03/2020 | | | USD | | | 61,312 | | | | TRY | | | | 363,780 | | | | — | | | | (1,074,478 | ) |
JPM | | | 12/2019 - 03/2020 | | | USD | | | 150,114 | | | | ZAR | | | | 2,315,390 | | | | 70,683 | | | | (1,371,494 | ) |
JPM | | | 12/2019 - 03/2020 | | | ZAR | | | 1,305,070 | | | | USD | | | | 85,740 | | | | 121,552 | | | | (94,816 | ) |
MOS | | | 05/2020 | | | CLP | | | 2,586,700 | | | | USD | | | | 3,764 | | | | — | | | | (258,743 | ) |
RBC | | | 11/2019 - 01/2020 | | | EUR | | | 114,420 | | | | USD | | | | 126,288 | | | | 1,617,798 | | | | (71,851 | ) |
RBC | | | 11/2019 - 01/2020 | | | GBP | | | 7,400 | | | | USD | | | | 9,208 | | | | 394,538 | | | | — | |
RBC | | | 11/2019 - 01/2020 | | | JPY | | | 3,760,000 | | | | USD | | | | 35,498 | | | | — | | | | (559,083 | ) |
RBC | | | 11/2019 - 01/2020 | | | USD | | | 219,344 | | | | EUR | | | | 196,625 | | | | 823,907 | | | | (1,559,441 | ) |
RBC | | | 11/2019 | | | USD | | | 4,561 | | | | GBP | | | | 3,700 | | | | — | | | | (234,333 | ) |
RBC | | | 11/2019 | | | USD | | | 17,600 | | | | JPY | | | | 1,880,000 | | | | 173,914 | | | | — | |
| | | | | | | | | | | | | | | | | | | | | | |
Total Unrealized Appreciation and Depreciation | | | | | | | | | | | $ | 40,486,625 | | | $ | (50,338,456 | ) |
| | | | | | | | | | | | | | | | | | | | | | |
65 INVESCO OPPENHEIMER GLOBAL STRATEGIC INCOME FUND
CONSOLIDATED SCHEDULE OF INVESTMENTSContinued
| | | | | | | | | | | | | | | | | | | | | | | | |
Futures Contracts as of October 31, 2019 | | | | | | | | | | | | | | | | | | | | | | | | |
Description | | Buy/Sell | | | Expiration
Date | | | Number
of Contracts | | | Notional Amount
(000’s) | | | Value | | | Unrealized
Appreciation/
(Depreciation) | |
Euro BUXL | | | Sell | | | | 12/6/19 | | | | 256 | | | | EUR 61,268 | | | $ | 59,947,107 | | | $ | 1,320,766 | |
Euro-BTP | | | Sell | | | | 12/6/19 | | | | 1,272 | | | | EUR 204,927 | | | | 204,954,040 | | | | (27,191 | ) |
United States Treasury Long Bonds | | | Buy | | | | 12/19/19 | | | | 9 | | | | USD 1,490 | | | | 1,452,375 | | | | (37,140 | ) |
United States Treasury Long Bonds | | | Sell | | | | 12/19/19 | | | | 741 | | | | USD 122,376 | | | | 119,578,875 | | | | 2,797,232 | |
United States Treasury Nts., 10 yr. | | | Buy | | | | 12/19/19 | | | | 1,260 | | | | USD 163,449 | | | | 164,174,063 | | | | 725,027 | |
United States Treasury Nts., 10 yr. | | | Sell | | | | 12/19/19 | | | | 48 | | | | USD 6,335 | | | | 6,254,250 | | | | 81,083 | |
United States Treasury Nts., 2 yr. | | | Sell | | | | 12/31/19 | | | | 2,254 | | | | USD 486,801 | | | | 485,965,921 | | | | 835,055 | |
United States Treasury Nts., 5 yr. | | | Buy | | | | 12/31/19 | | | | 373 | | | | USD 44,749 | | | | 44,462,766 | | | | (286,164 | ) |
United States Ultra Bonds | | | Buy | | | | 12/19/19 | | | | 324 | | | | USD 63,091 | | | | 61,479,000 | | | | (1,611,650 | ) |
| | | | | | | | | | | | | | | | | | | | | | | | |
| | | | | | | | | | | | | | | | | | | | | | $ | 3,797,018 | |
| | | | | | | | | | | | | | | | | | | | | | | | |
| | | | | | | | | | | | | | | | | | | | | | | | |
Exchange-Traded Options Written at October 31, 2019 | |
| Description | | Exercise
Price | | | Expiration
Date | | | Number of
Contracts
(000’s) | | | Notional Amount (000’s) | | | Premiums
Received | | | Value | |
S&P 500 Index Put | |
| USD
2,400.000 |
| | | 3/20/20 | | | | USD (1) | | | | USD 120,480 | | | $ | 2,059,686 | | | $ | (597,380) | |
S&P 500 Index Put | |
| USD
2,350.000 |
| | | 2/21/20 | | | | USD (0)1 | | | | USD 62,275 | | | | 627,232 | | | | (160,325) | |
| | | | | | | | | | | | | | | | | | | | |
Total Exchange-Traded Options Written | | | | | | | | | | | | | | | | | | $ | 2,686,918 | | | $ | (757,705) | |
| | | | | | | | | | | | | | | | | | | | |
| | | | | | | | | | | | | | | | | | | | | | | | | | | | |
Over-the-Counter Options Written at October 31, 2019 | | | | | | | | | | | | | |
| Description | | Counterparty | | | Exercise
Price | | | Expiration
Date | | | Number of
Contracts
(000’s) | | | Notional Amount (000’s) | | | Premiums
Received | | | Value | |
BRL Currency Put1 | | | CITNA-B | | | | BRL 4.239 | | | | 11/18/19 | | | | BRL (148,348) | | | | BRL 148,348 | | | $ | 390,010 | | | $ | (25,645) | |
BRL Currency Put | | | GSCO-OT | | | | BRL 4.500 | | | | 12/6/19 | | | | BRL (1,414) | | | | BRL 1,414 | | | | 250,561 | | | | (14,546) | |
BRL Currency Put1 | | | GSCO-OT | | | | BRL 4.500 | | | | 12/10/19 | | | | BRL (1,414) | | | | BRL 1,414 | | | | 294,112 | | | | (17,313) | |
BRL Currency Put2 | | | GSCO-OT | | | | BRL 4.500 | | | | 3/30/20 | | | | BRL (3,543) | | | | BRL 3,543 | | | | 619,316 | | | | (396,307) | |
BRL Currency Put2 | | | GSCO-OT | | | | BRL 4.500 | | | | 3/30/20 | | | | BRL (3,543) | | | | BRL 3,543 | | | | 619,317 | | | | (396,307) | |
66 INVESCO OPPENHEIMER GLOBAL STRATEGIC INCOME FUND
| | | | | | | | | | | | | | | | | | | | | | | | | | | | |
Over-the-Counter Options Written (Continued) | | | | | | | | | | | | | |
| Description | | Counterarty | | | Exercise
Price | | | Expiration
Date | | | Number of
Contracts
(000’s) | | | Notional Amount
(000’s) | | | Premiums
Received | | | Value | |
BRL Currency Put2 | | | GSCO-OT | | | | BRL 4.500 | | | | 3/27/20 | | | | BRL (3,540) | | | | BRL 3,540 | | | $ | 617,376 | | | $ | (390,801) | |
BRL Currency Put3 | | | GSCO-OT | | | | BRL 4.230 | | | | 3/4/21 | | | | BRL (149,900) | | | | BRL 149,900 | | | | 1,679,022 | | | | (1,752,454) | |
BRL Currency Put | | | JPM | | | | BRL 4.250 | | | | 3/4/21 | | | | BRL (150,600) | | | | BRL 150,600 | | | | 1,589,273 | | | | (1,695,197) | |
CLP Currency Put4 | | | GSCO-OT | | | | CLP 700.000 | | | | 5/11/20 | | | | CLP (24,360,000) | | | | CLP 24,360,000 | | | | 890,880 | | | | (2,068,651) | |
EUR Currency Call | | | BOA | | | | ZAR 20.000 | | | | 8/5/20 | | | | EUR (3,500) | | | | EUR 3,500 | | | | 763,768 | | | | (486,005) | |
EUR Currency Call | | | BOA | | | | INR 77.550 | | | | 10/27/20 | | | | EUR (75,000) | | | | EUR 75,000 | | | | 818,250 | | | | (853,662) | |
EUR Currency Put | | | BOA | | | | INR 69.300 | | | | 10/27/20 | | | | EUR (75,000) | | | | EUR 75,000 | | | | 342,750 | | | | (259,965) | |
EUR Currency Call | | | BOA | | | | RUB 73.090 | | | | 12/20/19 | | | | EUR (34,900) | | | | EUR 34,900 | | | | 416,416 | | | | (307,432) | |
EUR Currency Put | | | GSCOI | | | | TRY 5.500 | | | | 10/12/20 | | | | EUR (26,250) | | | | EUR 26,250 | | | | 307,335 | | | | (370,620) | |
EUR Currency Put | | | GSCOI | | | | MXN 18.205 | | | | 10/30/20 | | | | EUR (75,000) | | | | EUR 75,000 | | | | 587,400 | | | | (587,400) | |
EUR Currency Call | | | GSCOI | | | | IDR 15640.000 | | | | 10/22/20 | | | | EUR (56,250) | | | | EUR 56,250 | | | | 725,625 | | | | (688,533) | |
EUR Currency Put | | | GSCOI | | | | IDR 13685.000 | | | | 10/22/20 | | | | EUR (56,250) | | | | EUR 56,250 | | | | 320,625 | | | | (265,876) | |
EUR Currency Call | | | GSCOI | | | | RUB 72.860 | | | | 12/16/19 | | | | EUR (62,600) | | | | EUR 62,600 | | | | 696,924 | | | | (553,680) | |
EUR Currency Call | | | GSCOI | | | | MXN 22.036 | | | | 10/30/20 | | | | EUR (75,000) | | | | EUR 75,000 | | | | 1,449,675 | | | | (1,449,675) | |
EUR Currency Call | | | GSCOI | | | | TRY 7.750 | | | | 10/12/20 | | | | EUR (26,250) | | | | EUR 26,250 | | | | 964,870 | | | | (529,170) | |
EUR Currency Call | | | GSCO-OT | | | | INR 90.000 | | | | 8/5/20 | | | | EUR (3,500) | | | | EUR 3,500 | | | | 684,103 | | | | (506,541) | |
EUR Currency Call5 | | | GSCO-OT | | | | NOK 11.000 | | | | 1/6/21 | | | | EUR (7,075) | | | | EUR 7,075 | | | | 1,417,482 | | | | (2,057,072) | |
EUR Currency Call | | | GSCO-OT | | | | ZAR 20.000 | | | | 8/4/20 | | | | EUR (3,500) | | | | EUR 3,500 | | | | 549,827 | | | | (489,727) | |
67 INVESCO OPPENHEIMER GLOBAL STRATEGIC INCOME FUND
CONSOLIDATED SCHEDULE OF INVESTMENTS Continued
| | | | | | | | | | | | | | | | | | | | | | | | | | | | |
Over-the-Counter Options Written (Continued) | | | | | | | | | | | | | |
| Description | | Counterparty | | | Exercise
Price | | | Expiration
Date | | | Number of
Contracts
(000’s) | | | Notional
Amount (000’s) | | | Premiums
Received | | | Value | |
EUR Currency Call | | | GSCO-OT | | | | INR 90.000 | | | | 5/6/20 | | | | EUR (5,220) | | | | EUR 5,220 | | | $ | 916,901 | | | $ | (351,238) | |
EUR Currency Call | | | JPM | | | | ZAR 17.290 | | | | 1/23/20 | | | | EUR (34,900) | | | | EUR 34,900 | | | | 642,073 | | | | (832,383) | |
EUR Currency Put | | | JPM | | | | ZAR 14.760 | | | | 1/23/20 | | | | EUR (34,900) | | | | EUR 34,900 | | | | 241,264 | | | | (8,711) | |
EUR Currency Call | | | JPM | | | | NOK 11.000 | | | | 8/26/21 | | | | EUR (4,375) | | | | EUR 4,375 | | | | 1,302,085 | | | | (1,757,967) | |
EUR Currency Put | | | JPM | | | | BRL 3.790 | | | | 1/24/20 | | | | EUR (37,500) | | | | EUR 37,500 | | | | 173,625 | | | | (154,443) | |
EUR Currency Call | | | JPM | | | | IDR 15625.000 | | | | 10/26/20 | | | | EUR (37,500) | | | | EUR 37,500 | | | | 490,687 | | | | (472,940) | |
EUR Currency Put | | | JPM | | | | IDR 13660.000 | | | | 10/26/20 | | | | EUR (37,500) | | | | EUR 37,500 | | | | 212,250 | | | | (171,157) | |
EUR Currency Call | | | JPM | | | | BRL 4.230 | | | | 1/24/20 | | | | EUR (37,500) | | | | EUR 37,500 | | | | 394,875 | | | | (331,190) | |
EUR Currency Put | | | JPM | | | | MXN 18.265 | | | | 6/2/20 | | | | EUR (37,500) | | | | EUR 37,500 | | | | 206,250 | | | | (167,436) | |
EUR Currency Call | | | JPM | | | | MXN 21.170 | | | | 6/2/20 | | | | EUR (37,500) | | | | EUR 37,500 | | | | 540,000 | | | | (492,995) | |
EUR Currency Put | | | JPM | | | | CLP 675.000 | | | | 1/17/20 | | | | EUR (75,000) | | | | EUR 75,000 | | | | 270,000 | | | | (32,992) | |
EUR Currency Put | | | JPM | | | | CLP 733.000 | | | | 1/17/20 | | | | EUR (75,000) | | | | EUR 75,000 | | | | 577,500 | | | | (1,737,527) | |
EUR Currency Call6 | | | JPM | | | | INR 90.000 | | | | 4/29/20 | | | | EUR (3,500) | | | | EUR 3,500 | | | | 556,686 | | | | (220,511) | |
EUR Currency Call | | | MSCO | | | | NOK 10.758 | | | | 8/20/20 | | | | EUR (105,000) | | | | EUR 105,000 | | | | 1,243,520 | | | | (1,572,847) | |
EUR Currency Call | | | MSCO | | | | BRL 5.250 | | | | 8/24/21 | | | | EUR (26,200) | | | | EUR 26,200 | | | | 1,472,448 | | | | (1,337,265) | |
EUR Currency Put | | | SCB | | | | IDR 13700.000 | | | | 10/22/20 | | | | EUR (75,000) | | | | EUR 75,000 | | | | 444,375 | | | | (365,184) | |
EUR Currency Call | | | SCB | | | | IDR 15600.000 | | | | 10/22/20 | | | | EUR (75,000) | | | | EUR 75,000 | | | | 961,575 | | | | (947,736) | |
IDR Currency Put | | | GSCO-OT | | | | IDR 15360.000 | | | | 6/18/20 | | | | USD (1,137,000,000) | | |
| USD
1,137,000,000 |
| | | 1,598,906 | | | | (523,020) | |
68 INVESCO OPPENHEIMER GLOBAL STRATEGIC INCOME FUND
| | | | | | | | | | | | | | | | | | | | | | | | | | | | |
Over-the-Counter Options Written (Continued) | | | | | | | | | | | | | |
| Description | | Counterparty | | | Exercise
Price | | | Expiration
Date | | | Number of
Contracts
(000’s) | | | Notional Amount (000’s) | | | Premiums Received | | | Value | |
KRW Currency Call | | | GSCO-OT | | | | KRW 1122.350 | | | | 1/17/20 | | | | KRW (39,100,000) | | | | KRW 39,100,000 | | | $ | 119,807 | | | $ | (38,318) | |
KRW Currency Put | | | GSCO-OT | | | | KRW 1213.250 | | | | 1/17/20 | | | | KRW (42,000,000) | | | | KRW 42,000,000 | | | | 246,478 | | | | (81,480) | |
MXN Currency Put | | | BOA | | | | MXN 22.363 | | | | 1/14/20 | | | | MXN (1,582,090) | | | | MXN 1,582,090 | | | | 1,599,246 | | | | (38,809) | |
MXN Currency Put | | | CITNA-B | | | | MXN 22.940 | | | | 6/2/20 | | | | MXN (797,000) | | | | MXN 797,000 | | | | 757,519 | | | | (169,474) | |
MXN Currency Put | | | JPM | | | | MXN 20.240 | | | | 5/27/20 | | | | MXN (425,040) | | | | MXN 425,040 | | | | 924,840 | | | | (492,634) | |
MXN Currency Call | | | JPM | | | | MXN 20.240 | | | | 5/27/20 | | | | MXN (425,040) | | | | MXN 425,040 | | | | 924,840 | | | | (930,289) | |
RUB Currency Call | | | CITNA-B | | | | RUB 63.040 | | | | 12/16/19 | | | | RUB (1,972,200) | | | | RUB 1,972,200 | | | | 279,530 | | | | (87,369) | |
RUB Currency Call | | | JPM | | | | RUB 60.000 | | | | 2/25/21 | | | | RUB (3,184,100) | | | | RUB 3,184,100 | | | | 578,180 | | | | (438,896) | |
RUB Currency Put | | | JPM | | | | RUB 80.000 | | | | 2/25/21 | | | | RUB (4,245,500) | | | | RUB 4,245,500 | | | | 2,365,858 | | | | (821,419) | |
THB Currency Put | | | SCB | | | | THB 31.500 | | | | 12/20/19 | | | | THB (2,196,300) | | | | THB 2,196,300 | | | | 396,101 | | | | (23,984) | |
ZAR Currency Put | | | GSCO-OT | | | | ZAR 16.000 | | | | 7/23/20 | | | | ZAR (781,700) | | | | ZAR 781,700 | | | | 1,422,401 | | | | (2,047,335) | |
ZAR Currency Put | | | GSCO-OT | | | | ZAR 16.208 | | | | 1/27/20 | | | | ZAR (286,705) | | | | ZAR 286,705 | | | | 518,413 | | | | (183,096) | |
| | | | | | | | | | | | | | | | | | | | | | | | |
TotalOver-the-Counter Options Written | | | | | | | | | | | | | | | $ | 39,373,150 | | | $ | (32,993,224) | |
| | | | | | | | | | | | | | | | | | | | | | | | |
1.Knock-out option is ineligible for exercise if at any time spot rates are greater than or equal to 3.6 BRL per 1 USD.
2.Knock-out option is ineligible for exercise if at any time spot rates are greater than or equal to 3.7 BRL per 1 USD.
3.Knock-out option is ineligible for exercise if at any time spot rates are greater than or equal to 3.61 BRL per 1 USD.
4.Knock-out option is ineligible for exercise if at any time spot rates are greater than or equal to 650 CLP per 1 USD.
5.Knock-out option is ineligible for exercise if at any time spot rates are greater than or equal to 9.40 NOK per 1 EUR.
6. Upper Barrier Level: 90 INR/EUR Lower Barrier Level: 75 INR/EUR If at any time during the Event Period, the Spot Exchange Rate, in accordance with the Barrier Event Rate Source B, is equal to or less than the Lower Barrier Level this Transaction will automatically terminate without any payment obligation on the part of either party (except in respect of the Premium). Provided aKnock-Out event has not occurred, if at the Expiration Time on the Expiration Date: (i) the Spot Exchange Rate, in accordance with the Barrier Event Rate Source A, is equal to or greater than the Upper Barrier Level, this Transaction will be automatically exercised and the Seller shall pay the Settlement Amount to the Buyer on the Settlement Date. (ii) the Spot Exchange Rate, in accordance with the Barrier Event Rate Source A, is not equal to or greater than the Upper Barrier Level, this Transaction shall expire without any payment obligation on the part of either party (except in respect of the Premium) at the Expiration Time on the Expiration Date. If a
69 INVESCO OPPENHEIMER GLOBAL STRATEGIC INCOME FUND
CONSOLIDATED SCHEDULE OF INVESTMENTSContinued
Knock-Out event has occurred, notwithstanding the above, this Transaction will automatically terminate without any payment obligation on the part of either party (except in respect of the Premium).
| | | | | | | | | | | | | | | | | | | | | | | | | | | | |
Centrally Cleared Credit Default Swaps at October 31, 2019 | |
| Reference Asset | | Buy/Sell
Protection | | | Fixed
Rate | | | Maturity
Date | | | Notional Amount (000’s) | | | Premiums Received/(Paid) | | | Value | | | Unrealized Appreciation/ (Depreciation) | |
Brazilian Government International | | | Sell | | | | 1.000 | % | | | 6/20/22 | | | | USD 7,500 | | | $ | 464,303 | | | $ | 73,288 | | | $ | 537,591 | |
CDX.EM.31 | | | Buy | | | | 1.000 | | | | 6/20/24 | | | | USD 21,450 | | | | (969,151 | ) | | | 840,698 | | | | (128,453 | ) |
CDX.NA.HY.33 | | | Buy | | | | 5.000 | | | | 12/20/24 | | | | USD 189,350 | | | | 11,454,449 | | | | (14,567,673 | ) | | | (3,113,224 | ) |
Colombia Government International | | | Buy | | | | 1.000 | | | | 12/20/24 | | | | USD 7,000 | | | | 20,678 | | | | (70,467 | ) | | | (49,789 | ) |
Indonesia Government International | | | Buy | | | | 1.000 | | | | 12/20/24 | | | | USD 7,000 | | | | 32,526 | | | | (88,983 | ) | | | (56,457 | ) |
Turkey Government International Bond | | | Buy | | | | 1.000 | | | | 12/20/24 | | | | USD 7,500 | | | | (890,025 | ) | | | 790,357 | | | | (99,668 | ) |
| | | | | | | | | | | | | | | | | | | | |
Total Centrally Cleared Credit Default Swaps | | | | | | | | | | | | | | | | | | $ | 10,112,780 | | | $ | (13,022,780 | ) | | $ | (2,910,000 | ) |
| | | | | | | | | | | | | | | | | | | | |
| | | | | | | | | | | | | | | | | | | | | | | | | | | | | | | | | | | | |
Over-the-Counter Credit Default Swaps at October 31, 2019 | |
Reference Asset | | Counterparty | | | Buy/Sell Protection | | | Fixed
Rate | | | Maturity
Date | | | Notional Amount (000’s) | | | Premiums
Received/(Paid) | | | Value | | | Unrealized Appreciation/ (Depreciation) | |
| iTraxx Europe Crossover Series 28(20-35%) | | | JPM | | | | Sell | | | | 5.000 | | | | 12/20/22 | | | | EUR | | | | 10,000 | | | $ | (1,549,814 | ) | | $ | 890,646 | | | $ | (659,168 | ) |
| Hellenic Republic | | | BAC | | | | Sell | | | | 1.000 | | | | 6/20/25 | | | | USD | | | | 3,586 | | | | 596,602 | | | | (119,881 | ) | | | 476,721 | |
| Hellenic Republic | | | BAC | | | | Sell | | | | 1.000 | | | | 6/20/25 | | | | USD | | | | 8,966 | | | | 1,343,371 | | | | (299,736 | ) | | | 1,043,635 | |
| Hellenic Republic | | | BAC | | | | Sell | | | | 1.000 | | | | 12/20/25 | | | | USD | | | | 8,350 | | | | 1,298,472 | | | | (341,125 | ) | | | 957,347 | |
| Hellenic Republic | | | BAC | | | | Sell | | | | 1.000 | | | | 12/20/19 | | | | USD | | | | 6,000 | | | | 90,026 | | | | 12,040 | | | | 102,066 | |
| Hellenic Republic | | | GSCOI | | | | Sell | | | | 1.000 | | | | 6/20/25 | | | | USD | | | | 3,590 | | | | 566,429 | | | | (120,015 | ) | | | 446,414 | |
| Hellenic Republic Government Bond | | | BAC | | | | Sell | | | | 1.000 | | | | 6/20/24 | | | | USD | | | | 6,000 | | | | 413,483 | | | | (112,025 | ) | | | 301,458 | |
| Hellenic Republic Government Bond | | | BAC | | | | Sell | | | | 1.000 | | | | 6/20/26 | | | | USD 14,000 | | | | | | | | 1,616,439 | | | | (671,993 | ) | | | 944,446 | |
| Hellenic Republic Government Bond | | | BAC | | | | Sell | | | | 1.000 | | | | 6/20/29 | | | | USD | | | | 8,750 | | | | 1,683,593 | | | | (743,726 | ) | | | 939,867 | |
| Hellenic Republic Government Bond | | | BAC | | | | Sell | | | | 1.000 | | | | 6/20/26 | | | | USD 13,250 | | | | | | | | 1,652,965 | | | | (635,993 | ) | | | 1,016,972 | |
| Hellenic Republic Government Bond | | | BOA | | | | Sell | | | | 1.000 | | | | 6/20/26 | | | | USD | | | | 7,000 | | | | 849,356 | | | | (335,996 | ) | | | 513,360 | |
| Hellenic Republic Government Bond | | | BOA | | | | Sell | | | | 1.000 | | | | 6/20/24 | | | | USD | | | | 3,500 | | | | 286,767 | | | | (65,348 | ) | | | 221,419 | |
| Intesa Sanpaolo S.p.A. | | | JPM | | | | Sell | | | | 5.000 | | | | 12/20/22 | | | | EUR 35,000 | | | | | | | | (5,717,660 | ) | | | 5,826,301 | | | | 108,641 | |
| iTraxx Europe Crossover Series 24 Version 1 | | | JPM | | | | Sell | | | | 5.000 | | | | 12/20/20 | | | | EUR | | | | 7,100 | | | | (513,179 | ) | | | 305,970 | | | | (207,209 | ) |
70 INVESCO OPPENHEIMER GLOBAL STRATEGIC INCOME FUND
| | | | | | | | | | | | | | | | | | | | | | | | | | | | | | | | | | | | |
Over-the-Counter Credit Default Swaps (Continued) | |
Reference Asset | | Counterparty | | | Buy/Sell Protection | | | Fixed Rate | | | Maturity
Date | | | Notional Amount (000’s) | | | Premiums Received/(Paid) | | | Value | | | Unrealized
Appreciation/
(Depreciation) | |
Lloyds Banking Group plc | | | JPM | | | | Buy | | | | 1.000% | | | | 6/20/24 | | | | EUR | | | | 1,750 | | | $ | (76,780 | ) | | $ | 13,284 | | | $ | (63,496 | ) |
Oriental Republic of Uruguay | | | BOA | | | | Sell | | | | 1.000 | | | | 12/20/21 | | | | USD | | | | 7,501 | | | | 135,567 | | | | 56,432 | | | | 191,999 | |
Royal Bank Of Scotland Group plc | | | JPM | | | | Buy | | | | 1.000 | | | | 6/20/24 | | | | EUR | | | | 1,750 | | | | (88,150 | ) | | | 19,777 | | | | (68,373 | ) |
| | | | | | | | | | | | | | | | | | | | | | | | | | | | |
TotalOver-the-Counter Credit Default Swaps | | | | | | | | | | | | | | | $ | 2,587,487 | | | $ | 3,678,612 | | | $ | 6,266,099 | |
| | | | | | | | | | | | | | | | | | | | | | | | | | | | |
| | | | | | | | | | | | | | | | | | | | | | | | | | | | | | | | |
| Centrally Cleared Interest Rate Swaps at October 31, 2019 | |
| Counterparty | | Pay/Receive
Floating
Rate | | | Floating Rate | | | Fixed
Rate | | | Maturity
Date | | | Notional
Amount (000’s) | | | Premiums
Received / (Paid) | | | Value | | | Unrealized
Appreciation/
(Depreciation) | |
BAC | | | Receive | | |
| Six-Month EUR
EURIBOR |
| | | 1.123% | | | | 3/8/28 | | | | EUR 5,775 | | | | — | | | | (719,580 | ) | | | (719,580 | ) |
BOA | | | Pay | | | | BZDIOVRA | | | | 6.630 | | | | 1/2/25 | | | | BRL 39,200 | | | | — | | | | 294,563 | | | | 294,563 | |
BOA | | | Receive | | | | BBSW6M | | | | 1.655 | | | | 7/16/29 | | | | AUD 26,000 | | | | — | | | | (659,342 | ) | | | (659,342 | ) |
CITNA-B | | | Pay | | | | COOVIBR | | | | 5.200 | | | | 8/1/29 | | | | COP 30,347,000 | | | | — | | | | (93,986 | ) | | | (93,986 | ) |
CITNA-B | | | Pay | | | | COOVIBR | | | | 5.220 | | | | 8/12/29 | | | | COP 14,450,000 | | | | — | | | | (40,439 | ) | | | (40,439 | ) |
CITNA-B | | | Pay | | | | COOVIBR | | | | 5.560 | | | | 8/26/26 | | | | COP 29,197,000 | | | | — | | | | 305,823 | | | | 305,823 | |
CITNA-B | | | Receive | | |
| Three-Month
USD BBA LIBOR |
| | | 1.535 | | | | 1/3/30 | | | | USD 56,245 | | | | — | | | | 322,599 | | | | 322,599 | |
CITNA-B | | | Receive | | |
| Three-Month
USD BBA LIBOR |
| | | 1.475 | | | | 1/7/30 | | | | USD 56,035 | | | | — | | | | 630,444 | | | | 630,444 | |
CITNA-B | | | Pay | | |
| Three-Month
USD BBA LIBOR |
| | | 1.395 | | | | 1/7/22 | | | | USD 267,610 | | | | — | | | | (564,638 | ) | | | (564,638 | ) |
CITNA-B | | | Pay | | |
| Three-Month
USD BBA LIBOR |
| | | 1.476 | | | | 1/3/22 | | | | USD 267,505 | | | | — | | | | (155,105 | ) | | | (155,105 | ) |
CITNA-B | | | Pay | | | | CDOR03 | | | | 1.803 | | | | 10/1/21 | | | | CAD 117,950 | | | | (1,637 | ) | | | (24,240 | ) | | | (25,877 | ) |
CITNA-B | | | Pay | | | | CDOR03 | | | | 1.848 | | | | 10/11/21 | | | | CAD 350,000 | | | | — | | | | 291,033 | | | | 291,033 | |
CITNA-B | | | Pay | | | | CDOR03 | | | | 1.840 | | | | 10/11/21 | | | | CAD 350,000 | | | | — | | | | 271,627 | | | | 271,627 | |
CITNA-B | | | Receive | | |
| Three-Month
USD BBA LIBOR |
| | | 1.693 | | | | 1/17/30 | | | | USD 56,500 | | | | — | | | | (496,992 | ) | | | (496,992 | ) |
CITNA-B | | | Pay | | | | CDOR03 | | | | 1.880 | | | | 10/17/21 | | | | CAD 505,500 | | | | — | | | | 445,900 | | | | 445,900 | |
CITNA-B | | | Pay | | |
| Six-Month HUF
BUBOR |
| | | 2.205 | | | | 3/8/28 | | | | HUF 1,925,000 | | | | — | | | | 690,567 | | | | 690,567 | |
CITNA-B | | | Pay | | | | CDOR03 | | | | 1.917 | | | | 10/24/29 | | | | CAD 106,500 | | | | — | | | | 630,799 | | | | 630,799 | |
CITNA-B | | | Receive | | | | CDOR03 | | | | 1.740 | | | | 10/1/29 | | | | CAD 24,850 | | | | 473 | | | | 166,899 | | | | 167,372 | |
CITNA-B | | | Pay | | | | CDOR03 | | | | 1.953 | | | | 10/25/29 | | | | CAD 54,375 | | | | — | | | | 457,466 | | | | 457,466 | |
DEU | | | Pay | | |
| MXN TIIE
BANXICO |
| | | 7.340 | | | | 7/24/29 | | | | MXN 92,200 | | | | — | | | | 256,260 | | | | 256,260 | |
DEU | | | Pay | | |
| Three-Month ZAR
JIBAR SAFEX |
| | | 7.675 | | | | 2/21/22 | | | | ZAR 73,535 | | | | — | | | | 105,182 | | | | 105,182 | |
DEU | | | Pay | | |
| MXN TIIE
BANXICO |
| | | 8.120 | | | | 5/5/21 | | | | MXN 1,131,020 | | | | — | | | | 1,309,257 | | | | 1,309,257 | |
71 INVESCO OPPENHEIMER GLOBAL STRATEGIC INCOME FUND
CONSOLIDATED SCHEDULE OF INVESTMENTSContinued
| | | | | | | | | | | | | | | | | | | | | | | | | | | | | | | | |
| Centrally Cleared Interest Rate Swaps (Continued) | |
| Counterparty | | Pay/Receive
Floating
Rate | | | Floating Rate | | | Fixed
Rate | | | Maturity
Date | | | Notional Amount (000’s) | | | Premiums
Received / (Paid) | | | Value | | | Unrealized
Appreciation/
(Depreciation) | |
DEU | | | Pay | | |
| MXN TIIE
BANXICO |
| | | 8.525% | | | | 1/15/24 | | | | MXN 169,550 | | | $ | — | | | $ | 734,044 | | | $ | 734,044 | |
DEU | | | Pay | | | | JIBA3M | | | | 8.420 | | | | 8/29/28 | | | | ZAR 156,300 | | | | — | | | | 543,768 | | | | 543,768 | |
GSCOI | | | Receive | | | | CPURNSA | | | | 1.873 | | | | 7/25/24 | | | | USD 122,000 | | | | — | | | | (1,887,536 | ) | | | (1,887,536 | ) |
GSCOI | | | Receive | | | | CPURNSA | | | | 1.869 | | | | 7/22/24 | | | | USD 113,000 | | | | — | | | | (1,567,161 | ) | | | (1,567,161 | ) |
GSCOI | | | Pay | | |
| MXN TIIE
BANXICO |
| | | 8.620 | | | | 12/26/28 | | | | MXN 86,300 | | | | — | | | | 651,653 | | | | 651,653 | |
GSCOI | | | Pay | | |
| MXN TIIE
BANXICO |
| | | 7.845 | | | | 12/7/23 | | | | MXN 333,700 | | | | — | | | | 976,950 | | | | 976,950 | |
GSCOI | | | Pay | | | | BZDI | | | | 6.825 | | | | 1/4/21 | | | | BRL 32,300 | | | | — | | | | 223,956 | | | | 223,956 | |
GSCOI | | | Receive | | | | WIBR6M | | | | 2.095 | | | | 5/30/24 | | | | PLN 35,000 | | | | — | | | | (154,565 | ) | | | (154,565 | ) |
GSCOI | | | Receive | | | | CPURNSA | | | | 1.883 | | | | 7/19/24 | | | | USD 113,000 | | | | — | | | | (1,807,399 | ) | | | (1,807,399 | ) |
GSCOI | | | Pay | | |
| MXN TIIE
BANXICO |
| | | 7.200 | | | | 7/27/22 | | | | MXN 443,400 | | | | — | | | | 501,761 | | | | 501,761 | |
GSCOI | | | Receive | | |
| Three-Month USD
BBA LIBOR |
| | | 1.666 | | | | 8/7/29 | | | | USD 3,760 | | | | — | | | | (19,652 | ) | | | (19,652 | ) |
HSBC | | | Pay | | |
| MXN TIIE
BANXICO |
| | | 7.210 | | | | 7/17/24 | | | | MXN 316,295 | | | | — | | | | 604,406 | | | | 604,406 | |
JPM | | | Pay | | |
| MXN TIIE
BANXICO |
| | | 6.765 | | | | 10/11/29 | | | | MXN 97,500 | | | | — | | | | 48,447 | | | | 48,447 | |
JPM | | | Pay | | | | COOVIBR | | | | 4.890 | | | | 10/17/20 | | | | COP 113,100,000 | | | | — | | | | 211,463 | | | | 211,463 | |
JPM | | | Pay | | |
| MXN TIIE
BANXICO |
| | | 8.750 | | | | 10/29/20 | | | | MXN 1,561,000 | | | | — | | | | 1,472,822 | | | | 1,472,822 | |
JPM | | | Pay | | |
| Three-Month ZAR
JIBAR SAFEX |
| | | 7.930 | | | | 11/27/22 | | | | ZAR 45,000 | | | | — | | | | 96,266 | | | | 96,266 | |
JPM | | | Receive | | |
| MXN TIIE
BANXICO |
| | | 6.975 | | | | 10/22/20 | | | | MXN 740,625 | | | | — | | | | (17,064 | ) | | | (17,064 | ) |
JPM | | | Pay | | |
| MXN TIIE
BANXICO |
| | | 6.520 | | | | 9/29/22 | | | | MXN 252,000 | | | | — | | | | 69,473 | | | | 69,473 | |
JPM | | | Pay | | |
| MXN TIIE
BANXICO |
| | | 6.710 | | | | 9/23/21 | | | | MXN 358,750 | | | | — | | | | 74,410 | | | | 74,410 | |
JPM | | | Receive | | |
| Three-Month USD
BBA LIBOR |
| | | 1.747 | | | | 11/14/49 | | | | USD 29,500 | | | | — | | | | 261,317 | | | | 261,317 | |
JPM | | | Pay | | |
| Three-Month USD
BBA LIBOR |
| | | 1.460 | | | | 11/14/21 | | | | USD 357,000 | | | | — | | | | (587,643 | ) | | | (587,643 | ) |
JPM | | | Pay | | |
| MXN TIIE
BANXICO |
| | | 7.810 | | | | 12/7/23 | | | | MXN 403,200 | | | | — | | | | 1,153,148 | | | | 1,153,148 | |
JPM | | | Pay | | | | BZDIOVRA | | | | 6.528 | | | | 1/2/24 | | | | BRL 45,400 | | | | — | | | | 331,321 | | | | 331,321 | |
JPM | | | Pay | | | | BZDIOVRA | | | | 7.060 | | | | 7/1/22 | | | | BRL 1,067,100 | | | | — | | | | 1,031,587 | | | | 1,031,587 | |
JPM | | | Pay | | | | BZDI | | | | 2.280 | | | | 1/4/27 | | | | BRL 106,000 | | | | — | | | | 3,073,294 | | | | 3,073,294 | |
JPM | | | Pay | | |
| MXN TIIE
BANXICO |
| | | 6.395 | | | | 10/21/24 | | | | MXN 825,000 | | | | — | | | | 125,121 | | | | 125,121 | |
MSCO | | | Receive | | | | CPURNSA | | | | 1.856 | | | | 7/30/24 | | | | USD 153,750 | | | | — | | | | (2,034,011 | ) | | | (2,034,011 | ) |
SIB | | | Pay | | | | BZDI | | | | 8.415 | | | | 1/2/25 | | | | BRL 95,000 | | | | — | | | | 2,327,032 | | | | 2,327,032 | |
SIB | | | Pay | | |
| MXN TIIE
BANXICO |
| | | 7.880 | | | | 6/9/22 | | | | MXN 382,300 | | | | — | | | | 739,047 | | | | 739,047 | |
| | | | | | | | | | | | | | | | | | | | | | | | |
Total Centrally Cleared Interest Rate Swaps | | | | | | | | | | | | | | | | $ (1,164) | | | $ | 10,600,352 | | | $ | 10,599,188 | |
| | | | | | | | | | | | | | | | | | | | | | | | |
72 INVESCO OPPENHEIMER GLOBAL STRATEGIC INCOME FUND
| | | | | | | | | | | | | | | | | | | | | | | | | | | | | | |
Over-the-Counter Interest Rate Swaps at October 31, 2019 | |
| Counterparty | | Pay/Receive
Floating
Rate | | | Floating Rate | | Fixed
Rate | | | Maturity
Date | | | Notional Amount (000’s) | | | Premiums
Received /
(Paid) | | | Value | | | Unrealized
Appreciation/ (Depreciation) | |
BOA | | | Pay | | | Six-Month INR FBIL MIBOR OIS Compound | | | 6.330% | | | | 1/31/22 | | | | INR 590,000 | | | $ | — | | | $ | 261,568 | | | $ | 261,568 | |
BOA | | | Receive | | | Six-Month INR FBIL MIBOR OIS Compound | | | 5.740 | | | | 5/16/21 | | |
| INR
2,643,000 |
| | | — | | | | (437,249 | ) | | | (437,249 | ) |
BOA | | | Receive | | | INR FBIL MIBOR OIS Compound | | | 5.670 | | | | 5/27/21 | | |
| INR
2,600,000 |
| | | — | | | | (343,955 | ) | | | (343,955 | ) |
GSCOI | | | Pay | | | MOSKP3 | | | 8.270 | | | | 5/23/24 | | | | RUB 230,000 | | | | — | | | | 299,264 | | | | 299,264 | |
GSCOI | | | Pay | | | MOSKP3 | | | 8.360 | | | | 6/24/29 | | | | RUB 301,575 | | | | — | | | | 584,116 | | | | 584,116 | |
GSCOI | | | Pay | | | MOSKP3 | | | 6.580 | | | | 10/25/21 | | |
| RUB
6,510,000 |
| | | — | | | | (24,858 | ) | | | (24,858 | ) |
SCB | | | Receive | | | Six-Month INR FBIL MIBOR OIS Compound | | | 6.438 | | | | 1/10/24 | | | | INR 600,000 | | | | — | | | | (477,739 | ) | | | (477,739 | ) |
| | | | | | | | | | | | | | | | | | | | | | |
TotalOver-the-Counter Interest Rate Swaps | | | | | | | | | | | | | | $ | — | | | $ | (138,853 | ) | | $ | (138,853 | ) |
| | | | | | | | | | | | | | | | | | | | | | |
| | | | | | | | | | | | | | | | | | | | | | | | | | | | | | | | | | |
| Over-the-Counter Credit Default Swaptions Written at October 31, 2019 | |
| Description | | Counterparty | | | Buy/Sell Protection | | | Reference Asset | | Fixed
Rate | | | Expiration Date | | | Notional Amount (000’s) | | | Premiums Received | | | Value | |
| Credit Default Swap maturing 6/20/24 Put | | | JPM | | | | Buy | | | iTraxx Europe Crossover Series 31 Version 1 | | | 5.000% | | | | 12/18/19 | | | | EUR | | |
| 105,000
|
| | $ | 1,045,028 | | | $ | (546,672 | ) |
| Credit Default Swap maturing 6/20/24 Call | | | JPM | | | | Sell | | | iTraxx Europe Crossover Series 31 Version 1 | | | 5.000 | | | | 12/18/19 | | | | EUR | | | | 105,000 | | | | 638,628 | | | | (51,787 | ) |
| Credit Default Swap maturing 6/20/24 Call | | | JPM | | | | Sell | | | iTraxx Europe Crossover Series 31 Version 1 | | | 5.000 | | | | 12/18/19 | | | | EUR | | | | 105,000 | | | | 197,394 | | | | (1,641 | ) |
| Credit Default Swap maturing 6/20/24 Put | | | JPM | | | | Buy | | | CDX. NA.HY.33. V1 | | | 5.000 | | | | 11/20/19 | | | | USD | | | | 99,389 | | | | 337,923 | | | | (59,122 | ) |
| Credit Default Swap maturing 6/20/24 Put | | | JPM | | | | Buy | | | CDX. NA.HY.33. V1 | | | 5.000 | | | | 12/18/19 | | | | USD | | | | 75,000 | | | | 262,500 | | | | (207,305 | ) |
| Credit Default Swap maturing 6/20/24 Put | | | JPM | | | | Buy | | | CDX. NA.HY.33. V1 | | | 5.000 | | | | 12/18/19 | | | | USD | | | | 112,500 | | | | 483,750 | | | | (390,558 | ) |
73 INVESCO OPPENHEIMER GLOBAL STRATEGIC INCOME FUND
CONSOLIDATED SCHEDULE OF INVESTMENTSContinued
| | | | | | | | | | | | | | | | | | | | | | | | | | | | | | | | | | |
| Over-the-Counter Credit Default Swaptions Written (Continued) | |
| Description | | Counterparty | | | Buy/Sell Protection | | | Reference Asset | | Fixed
Rate | | | Expiration Date | | | Notional Amount (000’s) | | | Premiums Received | | | Value | |
| Credit Default Swap maturing 1/15/20 Put | | | CITNA-B | | | | Sell | | | Markit CDX North America High Yield Index, Series 33, Version 1 | | | 5.0% | | | | 1/15/20 | | | | USD | | | | 51,000 | | | $ | 169,575 | | | $ | (193,194 | ) |
| | | | | | | | | | | | | | | | | | | | | | | | | | | | | | |
TotalOver-the-Counter Credit Default Swaptions Written | | | | | | | | | | | | | | | | | | $ | 3,134,798 | | | $ | (1,450,279 | ) |
| | | | | | | | | | | | | | | | | | | | | | | | | | | | | | |
| | | | | | | | | | | | | | | | | | | | | | | | | | | | | | | | | | |
| Over-the-Counter Interest Rate Swaptions Written at October 31, 2019 | | | | | | | |
| Description | | Counterparty | | | Pay/Receive
Floating
Rate | | | Floating
Rate | | Fixed
Rate | | | Expiration
Date | | | Notional Amount (000’s) | | | Premiums Received | | | Value | |
| Interest Rate Swap maturing 4/24/20 Call | | | BOA | | | | Pay | | | Three- Month USD BBA LIBOR | | | 1.% | | | | 4/24/20 | | | | USD | | | | 112,500 | | | $ | 607,725 | | | $ | (738,838 | ) |
| Interest Rate Swap maturing 4/24/20 Put | | | BOA | | | | Receive | | | Three- Month USD BBA LIBOR | | | 1.725 | | | | 4/24/20 | | | | USD | | | | 112,500 | | | | 607,725 | | | | (404,110 | ) |
| Interest Rate Swap maturing 4/24/20 Call | | | JPM | | | | Pay | | | Three- Month USD BBA LIBOR | | | 1.340 | | | | 4/24/20 | | | | USD | | | | 450,000 | | | | 2,520,000 | | | | (3,073,991 | ) |
| Interest Rate Swap maturing 4/24/20 Put | | | JPM | | | | Receive | | | Three- Month USD BBA LIBOR | | | 1.661 | | | | 4/24/20 | | | | USD | | | | 337,500 | | | | 837,000 | | | | (611,442 | ) |
| Interest Rate Swap maturing 4/24/20 Put | | | JPM | | | | Receive | | | Three- Month USD BBA LIBOR | | | 1.740 | | | | 4/24/20 | | | | USD | | | | 450,000 | | | | 2,295,000 | | | | (1,530,450 | ) |
| Interest Rate Swap maturing 4/24/20 Call | | | JPM | | | | Pay | | | Three- Month USD BBA LIBOR | | | 1.361 | | | | 4/24/20 | | | | USD | | | | 337,500 | | | | 833,625 | | | | (986,057 | ) |
| Interest Rate Swap maturing 4/24/20 Put | | | MSCO | | | | Receive | | | Three- Month USD BBA LIBOR | | | 1.667 | | | | 4/24/20 | | | | USD | | | | 225,000 | | | | 558,000 | | | | (398,684 | ) |
| Interest Rate Swap maturing 4/24/20 Call | | | MSCO | | | | Pay | | | Three- Month USD BBA LIBOR | | | 1.368 | | | | 4/24/20 | | | | USD | | | | 225,000 | | | | 558,000 | | | | (667,431 | ) |
| Interest Rate Swap maturing 6/15/20 Put | | | GSCOI | | | | Receive | | | Three- Month RUB MOSPRIME NFEA | | | 8.080 | | | | 6/15/20 | | | | RUB | | | | 582,700 | | | | 181,226 | | | | (75,499 | ) |
74 INVESCO OPPENHEIMER GLOBAL STRATEGIC INCOME FUND
| | | | | | | | | | | | | | | | | | | | | | | | | | | | | | | | | | |
| Over-the-Counter Interest Rate Swaptions Written (Continued) | | | | | | | |
| Description | | Counterparty | | | Pay/Receive
Floating
Rate | | | Floating
Rate | | Fixed
Rate | | | Expiration
Date | | | Notional Amount (000’s) | | | Premiums Received | | | Value | |
| Interest Rate Swap maturing 1/9/20 Call | | | GSCOI | | | | Pay | | | Three- Month USD BBA LIBOR | | | 1.600% | | | | 1/9/20 | | | | USD | | | | 232,500 | | | $ | 1,243,875 | | | $ | (2,232,535 | ) |
| Interest Rate Swap maturing 11/14/19 Put | | | JPM | | | | Receive | | | Three- Month USD BBA LIBOR | | | 1.630 | | | | 11/14/19 | | | | USD | | | | 222,000 | | | | 670,189 | | | | (77,922 | ) |
| Interest Rate Swap maturing 8/17/20 Put | | | MSCO | | | | Receive | | | Three- Month USD BBA LIBOR | | | 1.530 | | | | 8/17/20 | | | | USD | | | | 520,000 | | | | 1,908,065 | | | | (1,829,214 | ) |
| Interest Rate Swap maturing 3/27/20 Call | | | MSCO | | | | Pay | | | Six- Month EUR EURIBOR | | | 0.000 | | | | 3/27/20 | | | | EUR | | | | 43,500 | | | | 414,117 | | | | (68,596 | ) |
| | | | | | | | | | | | | | | | | | | | | | | | | | | | | | |
| TotalOver-the-Counter Interest Rate Swaptions Written | | | | | | | | | | | | | | | | | | $ | 13,234,547 | | | $ | (12,694,769 | ) |
| | | | | | | | | | | | | | | | | | | | | | | | | | | | | | |
| | |
Glossary: |
Counterparty Abbreviations |
BAC | | Barclays Bank plc |
BNP | | BNP Paribas |
BOA | | Bank of America NA |
CITNA-B | | Citibank NA |
DEU | | Deutsche Bank AG |
GSCOI | | Goldman Sachs International |
GSCO-OT | | Goldman Sachs Bank USA |
HSBC | | HSBC Bank USA NA |
JPM | | JPMorgan Chase Bank NA |
MSCO | | Morgan Stanley Capital Services, Inc. |
RBC | | RBC Dominion Securities |
SCB | | Standard Chartered Bank |
SIB | | Banco Santander SA |
|
Currency abbreviations indicate amounts reporting in currencies |
ARS | | Argentine Peso |
AUD | | Australian Dollar |
BRL | | Brazilian Real |
CAD | | Canadian Dollar |
CLP | | Chilean Peso |
COP | | Colombian Peso |
EGP | | Egyptian Pounds |
EUR | | Euro |
GBP | | British Pound Sterling |
HUF | | Hungarian Forint |
IDR | | Indonesian Rupiah |
INR | | Indian Rupee |
JPY | | Japanese Yen |
KRW | | South Korean Won |
75 INVESCO OPPENHEIMER GLOBAL STRATEGIC INCOME FUND
CONSOLIDATED SCHEDULE OF INVESTMENTSContinued
| | |
Currency abbreviations indicate amounts reporting in currencies (Continued) |
MXN | | Mexican Nuevo Peso |
MYR | | Malaysian Ringgit |
NOK | | Norwegian Krone |
NZD | | New Zealand Dollar |
PEN | | Peruvian New Sol |
PHP | | Philippine Peso |
PLN | | Polish Zloty |
RUB | | Russian Ruble |
SEK | | Swedish Krona |
SGD | | Singapore Dollar |
THB | | Thailand Baht |
TRY | | New Turkish Lira |
ZAR | | South African Rand |
|
Definitions |
BA CDOR | | Canada Bankers Acceptances Deposit Offering Rate |
BANXICO | | Banco de Mexico |
BBA LIBOR | | British Bankers’ Association London - Interbank Offered Rate |
BBSW6M | | ASX Australian Bank Bill Short Term Rate 6 Month Mid |
BP0003M | | ICE LIBOR GBP 3 Month |
BTP | | Italian Treasury Bonds |
BUBOR | | Budapest Interbank Offered Rate |
BUXL | | German Federal Obligation |
BZDI | | Brazil Interbank Deposit Rate |
BZDIOVRA | | Brazil Ceptip DI Interbank Deposit Rate |
CD | | Certificate of Deposit |
CDOR03 | | Canada Bankers Acceptance 3 Months |
CDX.EM.31 | | Markit CDX Emerging Markets Index |
CDX.NA.HY.33 | | Markit CDX North American High Yield |
COOVIBR | | Colombia IBR Overnight Nominal Interbank Reference Rate |
CPURNSA | | US Consumer Price Index Urban Consumers |
EUR003M | | EURIBOR 3 Month ACT/360 |
EURIBOR | | Euro Interbank Offered Rate |
EUSA5 | | EUR Swap Annual 5 Year |
EUSA11 | | EUR Swap Annual 11 Year |
FBIL | | Financial Benchmarks India Private Ltd. |
GDR | | Global Depositary Receipts |
GUKG5 | | UK Government Bonds 5 Year Note Generic Bid Yield |
H15T1Y | | US Treasury Yield Curve Rate T Note Constant Maturity 1 Year |
H15T5Y | | US Treasury Yield Curve Rate T Note Constant Maturity 5 Year |
iTraxx Europe | | |
Crossover Series 24 |
Version 1 | | Credit Default Swap Trading Index for a Specific Basket of Securities |
iTraxx Europe | | |
Crossover Series 28 Credit Default Swap Trading Index for a Specific Basket of Securities |
iTraxx Europe | | |
Crossover Series 31 |
Version 1 | | Credit Default Swap Trading Index for a Specific Basket of Securities |
JIBA3M | | South Africa Johannesburg Interbank Agreed Rate 3 Month |
JIBAR SAFEX | | South Africa Johannesburg Interbank Agreed Rate/Futures Exchange |
76 INVESCO OPPENHEIMER GLOBAL STRATEGIC INCOME FUND
| | |
Definitions (Continued) |
LIBOR01M | | ICE LIBOR USD 1 Month |
LIBOR4 | | London Interbank Offered Rate-Quarterly |
LIBOR6 | | London Interbank OfferedRate-Bi-Monthly |
LIBOR12 | | London Interbank Offered Rate-Monthly |
MIBOR | | Mumbai Interbank Offered Rate |
MOSKP3 | | National Finance Assoc. Moscow Prime Offered 3 Month Rate |
MOSPRIME NFEA | | Moscow Prime Offered Rate |
MSCI | | Morgan Stanley Capital International |
OIS | | Overnight Index Swap |
PRIME4 | | United States Prime Rate-Quarterly |
S&P | | Standard & Poor’s |
SONIA3M | | Sterling Overnight Index Average |
TIIE | | Interbank Equilibrium Interest Rate |
US0001M | | ICE LIBOR USD 1 Month |
US0003M | | ICE LIBOR USD 3 Month |
USISDA05 | | USD ICE Swap Rate 11:00am NY 5 Year |
USSW5 | | USD Swap Semi 30/360 5 Year |
WIBR6M | | GBP Benchmark WIBOR PLN 6 month |
See accompanying Notes to Consolidated Financial Statements.
77 INVESCO OPPENHEIMER GLOBAL STRATEGIC INCOME FUND
CONSOLIDATED SCHEDULE OF INVESTMENTSSeptember 30, 2019
| | | | | | | | | | | | |
| | | | | | Principal Amount | | | Value | |
Asset-Backed Securities—5.0% | | | | | | | | | | | | |
American Credit Acceptance Receivables Trust: | | | | | | | | | | | | |
| Series2017-4, Cl. C, 2.94%, 1/10/241 | | | | | | $ | 988,051 | | | $ | 989,825 | |
| Series2017-4, Cl. D, 3.57%, 1/10/241 | | | | | | | 1,747,000 | | | | 1,769,607 | |
| Series2018-3, Cl. D, 4.14%, 10/15/241 | | | | | | | 690,000 | | | | 707,123 | |
| Series2019-2, Cl. D, 3.41%, 6/12/251 | | | | | | | 3,925,000 | | | | 3,984,265 | |
Series2019-3, Cl. C, 2.76%, 9/12/251 | | | | | | | 4,270,000 | | | | 4,297,092 | |
AmeriCredit Automobile Receivables Trust: | | | | | | | | | | | | |
| Series2017-2, Cl. D, 3.42%, 4/18/23 | | | | | | | 2,270,000 | | | | 2,316,451 | |
| Series2017-4, Cl. D, 3.08%, 12/18/23 | | | | | | | 985,000 | | | | 1,004,480 | |
| Series2019-2, Cl. C, 2.74%, 4/18/25 | | | | | | | 2,705,000 | | | | 2,732,458 | |
| Series2019-2, Cl. D, 2.99%, 6/18/25 | | | | | | | 7,510,000 | | | | 7,640,301 | |
Series2019-3, Cl. D, 2.58%, 9/18/25 | | | | | | | 3,605,000 | | | | 3,615,120 | |
Capital Auto Receivables Asset Trust, Series2017-1, Cl. D, 3.15%, 2/20/251 | | | | | | | 290,000 | | | | 294,012 | |
CarMax Auto Owner Trust: | | | | | | | | | | | | |
| Series2015-3, Cl. D, 3.27%, 3/15/22 | | | | | | | 1,805,000 | | | | 1,807,133 | |
| Series2016-1, Cl. D, 3.11%, 8/15/22 | | | | | | | 1,370,000 | | | | 1,373,294 | |
| Series2017-1, Cl. D, 3.43%, 7/17/23 | | | | | | | 1,775,000 | | | | 1,800,025 | |
| Series2017-4, Cl. D, 3.30%, 5/15/24 | | | | | | | 750,000 | | | | 761,120 | |
| Series2018-1, Cl. D, 3.37%, 7/15/24 | | | | | | | 510,000 | | | | 519,030 | |
Series2019-3, Cl. D, 2.85%, 1/15/26 | | | | | | | 2,285,000 | | | | 2,308,484 | |
CCG Receivables Trust: | | | | | | | | | | | | |
| Series2017-1, Cl. B, 2.75%, 11/14/231 | | | | | | | 1,725,000 | | | | 1,727,463 | |
| Series2018-1, Cl. B, 3.09%, 6/16/251 | | | | | | | 615,000 | | | | 621,716 | |
| Series2018-1, Cl. C, 3.42%, 6/16/251 | | | | | | | 175,000 | | | | 177,469 | |
| Series2019-1, Cl. B, 3.22%, 9/14/261 | | | | | | | 335,000 | | | | 343,858 | |
Series2019-1, Cl. C, 3.57%, 9/14/261 | | | | | | | 80,000 | | | | 81,942 | |
CIG Auto Receivables Trust, Series2017-1A, Cl. A, 2.71%, 5/15/231 | | | | | | | 194,240 | | | | 194,458 | |
CNH Equipment Trust, Series2017-C, Cl. B, 2.54%, 5/15/25 | | | | | | | 495,000 | | | | 500,835 | |
CPS Auto Receivables Trust, Series2018-A, Cl. B, 2.77%, 4/18/221 | | | | | | | 975,000 | | | | 976,706 | |
CPS Auto Trust, Series2017-A, Cl. B, 2.68%, 5/17/211 | | | | | | | 19,287 | | | | 19,288 | |
Credit Acceptance Auto Loan Trust: | | | | | | | | | | | | |
| Series2017-3A, Cl. C, 3.48%, 10/15/261 | | | | | | | 1,505,000 | | | | 1,528,660 | |
| Series2018-1A, Cl. B, 3.60%, 4/15/271 | | | | | | | 2,520,000 | | | | 2,573,739 | |
| Series2018-1A, Cl. C, 3.77%, 6/15/271 | | | | | | | 2,535,000 | | | | 2,591,408 | |
| Series2019-1A, Cl. B, 3.75%, 4/17/281 | | | | | | | 200,000 | | | | 207,080 | |
Series2019-1A, Cl. C, 3.94%, 6/15/281 | | | | | | | 1,240,000 | | | | 1,286,142 | |
| CWHEQ Revolving Home Equity Loan Trust: | | | | | | | | | | | | |
| Series2005-G, Cl. 2A, 2.258% [US0001M+23], 12/15/352 | | | | | | | 44,835 | | | | 44,259 | |
Series2006-H, Cl. 2A1A, 2.178% [US0001M+15], 11/15/362 | | | | | | | 42,923 | | | | 34,157 | |
Dell Equipment Finance Trust: | | | | | | | | | | | | |
| Series2017-2, Cl. B, 2.47%, 10/24/221 | | | | | | | 500,000 | | | | 500,675 | |
Series2019-1, Cl. C, 3.14%, 3/22/241 | | | | | | | 650,000 | | | | 661,130 | |
Drive Auto Receivables Trust: | | | | | | | | | | | | |
| Series2018-1, Cl. D, 3.81%, 5/15/24 | | | | | | | 1,000,000 | | | | 1,018,596 | |
| Series2018-3, Cl. D, 4.30%, 9/16/24 | | | | | | | 440,000 | | | | 452,365 | |
| Series2019-3, Cl. C, 2.90%, 8/15/25 | | | | | | | 5,145,000 | | | | 5,197,711 | |
78 INVESCO OPPENHEIMER GLOBAL STRATEGIC INCOME FUND
| | | | | | | | | | | | |
| | | | | | Principal Amount | | | Value | |
Asset-Backed Securities (Continued) | | | | | | | | | | | | |
Drive Auto Receivables Trust: (Continued) | | | | | | | | | | | | |
Series2019-3, Cl. D, 3.18%, 10/15/26 | | | | | | $ | 5,820,000 | | | $ | 5,924,846 | |
DT Auto Owner Trust: | | | | | | | | | | | | |
Series2016-4A, Cl. E, 6.49%, 9/15/231 | | | | | | | 555,000 | | | | 572,306 | |
Series2017-1A, Cl. D, 3.55%, 11/15/221 | | | | | | | 1,120,000 | | | | 1,127,581 | |
Series2017-1A, Cl. E, 5.79%, 2/15/241 | | | | | | | 1,160,000 | | | | 1,205,338 | |
Series2017-2A, Cl. D, 3.89%, 1/15/231 | | | | | | | 1,330,000 | | | | 1,340,477 | |
Series2017-3A, Cl. E, 5.60%, 8/15/241 | | | | | | | 3,105,000 | | | | 3,240,129 | |
Series2017-4A, Cl. D, 3.47%, 7/17/231 | | | | | | | 1,410,000 | | | | 1,420,846 | |
Series2017-4A, Cl. E, 5.15%, 11/15/241 | | | | | | | 4,525,000 | | | | 4,675,493 | |
Series2019-2A, Cl. D, 3.48%, 2/18/251 | | | | | | | 655,000 | | | | 669,820 | |
Series2019-3A, Cl. D, 2.96%, 4/15/251 | | | | | | | 1,995,000 | | | | 2,009,673 | |
Element Rail Leasing I LLC, Series2014-1A, Cl. A1, 2.299%, 4/19/441 | | | | | | | 298,770 | | | | 298,810 | |
Exeter Automobile Receivables Trust: | | | | | | | | | | | | |
Series2018-1A, Cl. B, 2.75%, 4/15/221 | | | | | | | 617,465 | | | | 617,926 | |
Series2019-1A, Cl. D, 4.13%, 12/16/241 | | | | | | | 5,000,000 | | | | 5,196,454 | |
Series2019-2A, Cl. C, 3.30%, 3/15/241 | | | | | | | 9,023,000 | | | | 9,184,387 | |
Flagship Credit Auto Trust, Series2016-1, Cl. C, 6.22%, 6/15/221 | | | | | | | 2,725,000 | | | | 2,816,122 | |
GLS Auto Receivables Trust, Series2018-1A, Cl. A, 2.82%, 7/15/221 | | | | | | | 934,763 | | | | 937,443 | |
GM Financial Automobile Leasing Trust, Series2017-3, Cl. C, 2.73%, 9/20/21 | | | | | | | 850,000 | | | | 850,946 | |
| MASTR Asset Backed Securities Trust, Series 2006-WMC3, Cl. A3, 2.118% [US0001M+10], 8/25/362 | | | | | | | 3,650,039 | | | | 1,729,483 | |
Navistar Financial Dealer Note Master Owner Trust II: | | | | | | | | | | | | |
Series2019-1, Cl. C, 2.968% [US0001M+95], 5/25/241,2 | | | | | | | 605,000 | | | | 605,823 | |
Series2019-1, Cl. D, 3.468% [US0001M+145], 5/25/241,2 | | | | | | | 580,000 | | | | 579,869 | |
Prestige Auto Receivables Trust, Series2019-1A, Cl. C, 2.70%, 10/15/241 | | | | | | | 3,250,000 | | | | 3,282,619 | |
Prosil Acquisition SA SER 1 CL A V/R, 1.622%, 10/31/393 | | | EUR | | | | 6,980,000 | | | | 7,558,617 | |
Santander Drive Auto Receivables Trust: | | | | | | | | | | | | |
Series2017-1, Cl. E, 5.05%, 7/15/241 | | | | | | | 2,460,000 | | | | 2,536,502 | |
Series2017-3, Cl. D, 3.20%, 11/15/23 | | | | | | | 2,030,000 | | | | 2,056,120 | |
Series2018-1, Cl. D, 3.32%, 3/15/24 | | | | | | | 750,000 | | | | 759,649 | |
Series2018-2, Cl. D, 3.88%, 2/15/24 | | | | | | | 370,000 | | | | 376,924 | |
Series2019-2, Cl. D, 3.22%, 7/15/25 | | | | | | | 380,000 | | | | 387,857 | |
Series2019-3, Cl. D, 2.68%, 10/15/25 | | | | | | | 4,445,000 | | | | 4,466,932 | |
Santander Retail Auto Lease Trust: | | | | | | | | | | | | |
Series2019-A, Cl. C, 3.30%, 5/22/231 | | | | | | | 6,210,000 | | | | 6,337,757 | |
Series2019-B, Cl. C, 2.77%, 8/21/231 | | | | | | | 3,250,000 | | | | 3,270,789 | |
SLM Student Loan Trust, Series2004-5X, Cl. A6, 0.027% [EUR003M+40], 10/25/391,2 | | | EUR | | | | 24,210,543 | | | | 25,749,644 | |
United Auto Credit Securitization Trust: | | | | | | | | | | | | |
Series2018-1, Cl. C, 3.05%, 9/10/211 | | | | | | | 803,420 | | | | 803,879 | |
Series2019-1, Cl. C, 3.16%, 8/12/241 | | | | | | | 290,000 | | | | 291,685 | |
Veros Automobile Receivables Trust, Series2017-1, Cl. A, 2.84%, 4/17/231 | | | | | | | 43,218 | | | | 43,215 | |
79 INVESCO OPPENHEIMER GLOBAL STRATEGIC INCOME FUND
CONSOLIDATED SCHEDULE OF INVESTMENTSContinued
| | | | | | | | | | | | |
| | | | | | Principal Amount | | | Value | |
Asset-Backed Securities (Continued) | | | | | | | | | | | | |
Westlake Automobile Receivables Trust: | | | | | | | | | | | | |
Series2017-2A, Cl. E, 4.63%, 7/15/241 | | | | | | $ | 1,845,000 | | | $ | 1,884,994 | |
Series2018-1A, Cl. D, 3.41%, 5/15/231 | | | | | | | 2,075,000 | | | | 2,096,638 | |
Series2019-2A, Cl. C, 2.84%, 7/15/241 | | | | | | | 5,770,000 | | | | 5,820,674 | |
| | | | | | | | | | | | |
Total Asset-Backed Securities (Cost $172,604,830) | | | | | | | | | | | 171,387,744 | |
Mortgage-Backed Obligations—23.2% | | | | | | | | | | | | |
Agency—14.2% | | | | | | | | | | | | |
U.S. Agency Securities—14.2% | | | | | | | | | | | | |
Chase Funding Trust, Series2003-2, Cl. 2A2, 2.578% [US0001M+56], 2/25/332 | | | | | | | 15,989 | | | | 15,687 | |
Federal Home Loan Mortgage Corp. Gold Pool: | | | | | | | | | | | | |
5.00%, 12/1/34 | | | | | | | 362,858 | | | | 397,143 | |
5.50%, 9/1/39 | | | | | | | 764,870 | | | | 859,608 | |
6.00%,10/1/22-7/1/24 | | | | | | | 219,790 | | | | 242,964 | |
6.50%,2/1/22-6/1/35 | | | | | | | 327,511 | | | | 368,612 | |
7.00%,8/1/21-3/1/35 | | | | | | | 469,219 | | | | 528,662 | |
7.50%,1/1/32-2/1/32 | | | | | | | 970,772 | | | | 1,123,000 | |
8.50%, 8/1/31 | | | | | | | 31,929 | | | | 36,679 | |
10.00%, 5/1/20 | | | | | | | 37 | | | | 37 | |
Federal Home Loan Mortgage Corp. Non Gold Pool, 10.50%, 5/1/20 | | | | | | | 1,036 | | | | 1,041 | |
Federal Home Loan Mortgage Corp., Interest-Only Stripped Mtg.-Backed Security: | | | | | | | | | | | | |
Series 183, Cl. IO, 99.407%, 4/1/274 | | | | | | | 79,964 | | | | 12,610 | |
Series 192, Cl. IO, 99.999%, 2/1/284 | | | | | | | 33,119 | | | | 5,001 | |
Series 205, Cl. IO, 70.616%, 9/1/294 | | | | | | | 206,872 | | | | 39,585 | |
Series 206, Cl. IO, 0.00%, 12/15/294,5 | | | | | | | 95,331 | | | | 19,497 | |
Series 207, Cl. IO, 0.00%, 4/1/304,5 | | | | | | | 81,472 | | | | 15,850 | |
Series 214, Cl. IO, 0.00%, 6/1/314,5 | | | | | | | 62,461 | | | | 12,155 | |
Series 243, Cl. 6, 18.787%, 12/15/324 | | | | | | | 181,517 | | | | 30,310 | |
| Federal Home Loan Mortgage Corp., Multifamily Structured Pass-Through Certificates, Interest-Only Stripped Mtg.-Backed Security, Series K734, Cl. X1, 0.00%, 2/25/264,5 | | | | | | | 4,063,565 | | | | 147,509 | |
| Federal Home Loan Mortgage Corp., Real Estate Mtg. Investment Conduit Multiclass Pass-Through Certificates: | |
Series 1360, Cl. PZ, 7.50%, 9/15/22 | | | | | | | 514,769 | | | | 541,808 | |
Series 151, Cl. F, 9.00%, 5/15/21 | | | | | | | 76 | | | | 76 | |
Series 1590, Cl. IA, 3.078% [LIBOR01M+105], 10/15/232 | | | | | | | 363,453 | | | | 368,612 | |
Series 1674, Cl. Z, 6.75%, 2/15/24 | | | | | | | 15,980 | | | | 16,990 | |
Series 2034, Cl. Z, 6.50%, 2/15/28 | | | | | | | 4,767 | | | | 5,268 | |
Series 2042, Cl. N, 6.50%, 3/15/28 | | | | | | | 5,141 | | | | 5,645 | |
Series 2043, Cl. ZP, 6.50%, 4/15/28 | | | | | | | 547,057 | | | | 614,353 | |
Series 2053, Cl. Z, 6.50%, 4/15/28 | | | | | | | 4,324 | | | | 4,874 | |
Series 2116, Cl. ZA, 6.00%, 1/15/29 | | | | | | | 269,460 | | | | 300,319 | |
Series 2122, Cl. F, 2.478% [LIBOR01M+45], 2/15/292 | | | | | | | 14,170 | | | | 13,829 | |
Series 2279, Cl. PK, 6.50%, 1/15/31 | | | | | | | 8,616 | | | | 9,595 | |
Series 2326, Cl. ZP, 6.50%, 6/15/31 | | | | | | | 67,218 | | | | 75,036 | |
Series 2344, Cl. FP, 2.978% [LIBOR01M+95], 8/15/312 | | | | | | | 189,608 | | | | 194,292 | |
Series 2368, Cl. PR, 6.50%, 10/15/31 | | | | | | | 10,032 | | | | 11,467 | |
Series 2401, Cl. FA, 2.678% [LIBOR01M+65], 7/15/292 | | | | | | | 22,620 | | | | 22,867 | |
Series 2412, Cl. GF, 2.978% [LIBOR01M+95], 2/15/322 | | | | | | | 222,138 | | | | 227,749 | |
80 INVESCO OPPENHEIMER GLOBAL STRATEGIC INCOME FUND
| | | | | | | | | | | | |
| | | | | | Principal Amount | | | Value | |
U.S. Agency Securities (Continued) | | | | | | | | | | | | |
| Federal Home Loan Mortgage Corp., Real Estate Mtg. Investment Conduit Multiclass Pass-Through Certificates: (Continued) | |
Series 2427, Cl. ZM, 6.50%, 3/15/32 | | | | | | $ | 366,119 | | | $ | 410,188 | |
Series 2451, Cl. FD, 3.028% [LIBOR01M+100], 3/15/322 | | | | | | | 108,859 | | | | 111,808 | |
Series 2461, Cl. PZ, 6.50%, 6/15/32 | | | | | | | 42,287 | | | | 47,631 | |
Series 2464, Cl. FI, 3.028% [LIBOR01M+100], 2/15/322 | | | | | | | 105,497 | | | | 108,374 | |
Series 2470, Cl. AF, 3.028% [LIBOR01M+100], 3/15/322 | | | | | | | 175,635 | | | | 180,392 | |
Series 2470, Cl. LF, 3.028% [LIBOR01M+100], 2/15/322 | | | | | | | 107,894 | | | | 110,836 | |
Series 2475, Cl. FB, 3.028% [LIBOR01M+100], 2/15/322 | | | | | | | 147,768 | | | | 151,797 | |
Series 2517, Cl. GF, 3.028% [LIBOR01M+100], 2/15/322 | | | | | | | 89,209 | | | | 91,641 | |
Series 2551, Cl. LF, 2.528% [LIBOR01M+50], 1/15/332 | | | | | | | 13,183 | | | | 13,282 | |
Series 2635, Cl. AG, 3.50%, 5/15/32 | | | | | | | 143,939 | | | | 149,108 | |
Series 2676, Cl. KY, 5.00%, 9/15/23 | | | | | | | 179,404 | | | | 186,296 | |
Series 3025, Cl. SJ, 17.316%[-3.67 x LIBOR01M+2,475], 8/15/352 | | | | | | | 225,614 | | | | 314,965 | |
Series 3857, Cl. GL, 3.00%, 5/15/40 | | | | | | | 7,676 | | | | 7,801 | |
Series 3917, Cl. BA, 4.00%, 6/15/38 | | | | | | | 200,651 | | | | 212,218 | |
Series 4221, Cl. HJ, 1.50%, 7/15/23 | | | | | | | 284,350 | | | | 281,882 | |
| Federal Home Loan Mortgage Corp., Real Estate Mtg. Investment Conduit Multiclass Pass-Through Certificates, Interest-Only Stripped Mtg.-Backed Security: | |
Series 2035, Cl. PE, 67.688%, 3/15/284 | | | | | | | 11,400 | | | | 1,949 | |
Series 2049, Cl. PL, 99.999%, 4/15/284 | | | | | | | 62,948 | | | | 11,129 | |
Series 2074, Cl. S, 99.999%, 7/17/284 | | | | | | | 41,047 | | | | 3,864 | |
Series 2079, Cl. S, 99.999%, 7/17/284 | | | | | | | 78,959 | | | | 8,969 | |
Series 2177, Cl. SB, 99.999%, 8/15/294 | | | | | | | 60,161 | | | | 11,072 | |
Series 2526, Cl. SE, 70.01%, 6/15/294 | | | | | | | 109,400 | | | | 19,217 | |
Series 2682, Cl. TQ, 99.999%, 10/15/334 | | | | | | | 467,697 | | | | 82,221 | |
Series 2795, Cl. SH, 67.284%, 3/15/244 | | | | | | | 568,387 | | | | 42,616 | |
Series 2920, Cl. S, 99.999%, 1/15/354 | | | | | | | 807,762 | | | | 145,912 | |
Series 2981, Cl. BS, 99.999%, 5/15/354 | | | | | | | 963,062 | | | | 179,127 | |
Series 3004, Cl. SB, 99.999%, 7/15/354 | | | | | | | 1,128,697 | | | | 136,705 | |
Series 3397, Cl. GS, 7.486%, 12/15/374 | | | | | | | 264,004 | | | | 58,212 | |
Series 3424, Cl. EI, 0.00%, 4/15/384,5 | | | | | | | 84,091 | | | | 10,533 | |
Series 3450, Cl. BI, 17.338%, 5/15/384 | | | | | | | 411,252 | | | | 79,232 | |
Series 3606, Cl. SN, 15.901%, 12/15/394 | | | | | | | 199,438 | | | | 32,988 | |
Federal National Mortgage Assn. Grantor Trust, Interest-Only Stripped Mtg.-Backed Security: | | | | | | | | | | | | |
Series2001-T10, Cl. IO, 99.999%, 12/25/414 | | | | | | | 22,955,727 | | | | 263,123 | |
Series2001-T3, Cl. IO, 99.999%, 11/25/404 | | | | | | | 4,331,848 | | | | 46,003 | |
Federal National Mortgage Assn. Pool: | | | | | | | | | | | | |
4.50%, 12/1/20 | | | | | | | 13,482 | | | | 13,888 | |
5.00%,3/1/21-12/1/21 | | | | | | | 2,932 | | | | 3,025 | |
5.50%,1/1/22-5/1/36 | | | | | | | 322,642 | | | | 358,667 | |
6.50%,12/1/29-1/1/34 | | | | | | | 1,786,425 | | | | 2,000,130 | |
7.00%,9/1/21-4/1/34 | | | | | | | 2,928,576 | | | | 3,366,037 | |
7.50%,2/1/27-3/1/33 | | | | | | | 1,521,435 | | | | 1,766,653 | |
8.50%, 7/1/32 | | | | | | | 4,867 | | | | 4,918 | |
9.50%, 3/15/21 | | | | | | | 1,861 | | | | 1,880 | |
Federal National Mortgage Assn., Interest-Only Stripped Mtg.-Backed Security: | | | | | | | | | | | | |
Series 221, Cl. 2, 99.999%, 5/25/234 | | | | | | | 58,604 | | | | 5,532 | |
81 INVESCO OPPENHEIMER GLOBAL STRATEGIC INCOME FUND
CONSOLIDATED SCHEDULE OF INVESTMENTSContinued
| | | | | | | | | | | | |
| | | | | | Principal Amount | | | Value | |
U.S. Agency Securities (Continued) | | | | | | | | | | | | |
Federal National Mortgage Assn., Interest-Only Stripped Mtg.-Backed Security: (Continued) | | | | | |
Series 247, Cl. 2, 99.999%, 10/25/234 | | | | | | $ | 29,575 | | | $ | 2,898 | |
Series 252, Cl. 2, 99.999%, 11/25/234 | | | | | | | 7,034 | | | | 717 | |
Series 254, Cl. 2, 99.999%, 1/25/244 | | | | | | | 23,227 | | | | 2,521 | |
Series 301, Cl. 2, 23.596%, 4/25/294 | | | | | | | 94,260 | | | | 17,093 | |
Series 303, Cl. IO, 99.999%, 11/25/294 | | | | | | | 100,587 | | | | 21,562 | |
Series 313, Cl. 2, 99.999%, 6/25/314 | | | | | | | 820,221 | | | | 157,887 | |
Series 319, Cl. 2, 15.659%, 2/25/324 | | | | | | | 281,833 | | | | 53,261 | |
Series 321, Cl. 2, 35.215%, 4/25/324 | | | | | | | 512,399 | | | | 97,378 | |
Series 324, Cl. 2, 99.999%, 7/25/324 | | | | | | | 209,592 | | | | 39,016 | |
Series 328, Cl. 2, 0.00%, 12/25/324,5 | | | | | | | 182,434 | | | | 35,141 | |
Series 331, Cl. 5, 99.999%, 2/25/334 | | | | | | | 429,513 | | | | 73,009 | |
Series 332, Cl. 2, 0.00%, 3/25/334,5 | | | | | | | 844,526 | | | | 159,244 | |
Series 334, Cl. 10, 14.446%, 2/25/334 | | | | | | | 347,717 | | | | 67,182 | |
Series 334, Cl. 12, 99.999%, 3/25/334 | | | | | | | 504,829 | | | | 94,152 | |
Series 339, Cl. 7, 0.00%, 11/25/334,5 | | | | | | | 1,030,806 | | | | 190,446 | |
Series 345, Cl. 9, 0.00%, 1/25/344,5 | | | | | | | 305,691 | | | | 53,256 | |
Series 351, Cl. 10, 0.00%, 4/25/344,5 | | | | | | | 129,379 | | | | 23,442 | |
Series 351, Cl. 8, 0.00%, 4/25/344,5 | | | | | | | 236,287 | | | | 43,401 | |
Series 356, Cl. 10, 0.00%, 6/25/354,5 | | | | | | | 167,844 | | | | 27,496 | |
Series 356, Cl. 12, 0.00%, 2/25/354,5 | | | | | | | 81,557 | | | | 13,897 | |
Series 362, Cl. 13, 0.00%, 8/25/354,5 | | | | | | | 11,754 | | | | 2,245 | |
Federal National Mortgage Assn., Real Estate Mtg. Investment Conduit Multiclass Pass-Through Certificates: | |
Series1996-35, Cl. Z, 7.00%, 7/25/26 | | | | | | | 22,631 | | | | 24,811 | |
Series1997-45, Cl. CD, 8.00%, 7/18/27 | | | | | | | 263,953 | | | | 303,280 | |
Series1998-58, Cl. PC, 6.50%, 10/25/28 | | | | | | | 154,308 | | | | 171,689 | |
Series1999-14, Cl. MB, 6.50%, 4/25/29 | | | | | | | 7,565 | | | | 8,295 | |
Series1999-54, Cl. LH, 6.50%, 11/25/29 | | | | | | | 286,093 | | | | 318,249 | |
Series2001-19, Cl. Z, 6.00%, 5/25/31 | | | | | | | 117,055 | | | | 129,756 | |
Series2001-65, Cl. F, 2.618% [LIBOR01M+60], 11/25/312 | | | | | | | 208,235 | | | | 210,536 | |
Series2001-80, Cl. ZB, 6.00%, 1/25/32 | | | | | | | 226,047 | | | | 252,595 | |
Series2002-21, Cl. PE, 6.50%, 4/25/32 | | | | | | | 278,206 | | | | 317,869 | |
Series2002-29, Cl. F, 3.018% [LIBOR01M+100], 4/25/322 | | | | | | | 114,354 | | | | 117,486 | |
Series2002-64, Cl. FJ, 3.018% [LIBOR01M+100], 4/25/322 | | | | | | | 35,148 | | | | 36,110 | |
Series2002-68, Cl. FH, 2.541% [LIBOR01M+50], 10/18/322 | | | | | | | 73,337 | | | | 73,867 | |
Series2002-81, Cl. FM, 2.518% [LIBOR01M+50], 12/25/322 | | | | | | | 134,901 | | | | 133,901 | |
Series2002-84, Cl. FB, 3.018% [LIBOR01M+100], 12/25/322 | | | | | | | 22,407 | | | | 23,018 | |
Series2003-11, Cl. FA, 3.018% [LIBOR01M+100], 9/25/322 | | | | | | | 30,577 | | | | 31,411 | |
Series2003-116, Cl. FA, 2.418% [LIBOR01M+40], 11/25/332 | | | | | | | 75,028 | | | | 74,229 | |
Series2005-31, Cl. PB, 5.50%, 4/25/35 | | | | | | | 2,865,000 | | | | 3,215,605 | |
Series2005-71, Cl. DB, 4.50%, 8/25/25 | | | | | | | 393,602 | | | | 402,306 | |
Series2006-11, Cl. PS, 17.166%[-3.67 x LIBOR01M+2,456.67], 3/25/362 | | | | | | | 253,613 | | | | 386,664 | |
Series2006-46, Cl. SW, 16.799%[-3.67 x LIBOR01M+2,419.92], 6/25/362 | | | | | | | 313,989 | | | | 470,067 | |
Series2008-75, Cl. DB, 4.50%, 9/25/23 | | | | | | | 1 | | | | 1 | |
Series2009-113, Cl. DB, 3.00%, 12/25/20 | | | | | | | 4,213 | | | | 4,205 | |
Series2009-36, Cl. FA, 2.958% [LIBOR01M+94], 6/25/372 | | | | | | | 123,426 | | | | 126,548 | |
Series2010-43, Cl. KG, 3.00%, 1/25/21 | | | | | | | 3,642 | | | | 3,644 | |
82 INVESCO OPPENHEIMER GLOBAL STRATEGIC INCOME FUND
| | | | | | | | | | | | |
| | | | | | Principal Amount | | | Value | |
U.S. Agency Securities (Continued) | | | | | | | | | | | | |
| Federal National Mortgage Assn., Real Estate Mtg. Investment Conduit Multiclass Pass-Through Certificates: (Continued) | |
Series2011-122, Cl. EC, 1.50%, 1/25/20 | | | | | | $ | 1,341 | | | $ | 1,338 | |
Series2011-15, Cl. DA, 4.00%, 3/25/41 | | | | | | | 137,819 | | | | 144,025 | |
Series2011-3, Cl. EL, 3.00%, 5/25/20 | | | | | | | 1,794 | | | | 1,791 | |
Series2011-3, Cl. KA, 5.00%, 4/25/40 | | | | | | | 463,680 | | | | 486,604 | |
Series2011-6, Cl. BA, 2.75%, 6/25/20 | | | | | | | 1,427 | | | | 1,429 | |
Series2011-82, Cl. AD, 4.00%, 8/25/26 | | | | | | | 20,465 | | | | 20,541 | |
Series2012-20, Cl. FD, 2.418% [LIBOR01M+40], 3/25/422 | | | | | | | 781,428 | | | | 782,632 | |
| Federal National Mortgage Assn., Real Estate Mtg. Investment Conduit Multiclass Pass-Through Certificates, Interest- Only Stripped Mtg.-Backed Security: | |
Series2001-61, Cl. SH, 53.903%, 11/18/314 | | | | | | | 236,357 | | | | 43,697 | |
Series2001-63, Cl. SD, 42.842%, 12/18/314 | | | | | | | 6,485 | | | | 1,069 | |
Series2001-68, Cl. SC, 99.999%, 11/25/314 | | | | | | | 4,878 | | | | 931 | |
Series2001-81, Cl. S, 61.36%, 1/25/324 | | | | | | | 62,700 | | | | 11,159 | |
Series2002-28, Cl. SA, 48.356%, 4/25/324 | | | | | | | 57,387 | | | | 10,485 | |
Series2002-38, Cl. SO, 99.999%, 4/25/324 | | | | | | | 71,450 | | | | 12,523 | |
Series2002-39, Cl. SD, 70.946%, 3/18/324 | | | | | | | 111,165 | | | | 23,073 | |
Series2002-48, Cl. S, 54.182%, 7/25/324 | | | | | | | 83,875 | | | | 16,200 | |
Series2002-52, Cl. SL, 44.332%, 9/25/324 | | | | | | | 54,709 | | | | 10,316 | |
Series2002-53, Cl. SK, 86.528%, 4/25/324 | | | | | | | 69,295 | | | | 14,679 | |
Series2002-56, Cl. SN, 55.399%, 7/25/324 | | | | | | | 115,031 | | | | 22,220 | |
Series2002-65, Cl. SC, 62.99%, 6/25/264 | | | | | | | 190,195 | | | | 26,184 | |
Series2002-77, Cl. IS, 69.402%, 12/18/324 | | | | | | | 121,729 | | | | 24,603 | |
Series2002-77, Cl. SH, 49.093%, 12/18/324 | | | | | | | 82,410 | | | | 14,254 | |
Series2002-89, Cl. S, 99.999%, 1/25/334 | | | | | | | 588,083 | | | | 126,788 | |
Series2002-9, Cl. MS, 45.621%, 3/25/324 | | | | | | | 92,981 | | | | 18,611 | |
Series2003-13, Cl. IO, 64.259%, 3/25/334 | | | | | | | 515,739 | | | | 112,048 | |
Series2003-26, Cl. DI, 58.226%, 4/25/334 | | | | | | | 299,156 | | | | 73,630 | |
Series2003-26, Cl. IK, 66.279%, 4/25/334 | | | | | | | 52,426 | | | | 12,170 | |
Series2003-33, Cl. SP, 99.999%, 5/25/334 | | | | | | | 277,157 | | | | 60,860 | |
Series2003-4, Cl. S, 31.91%, 2/25/334 | | | | | | | 131,515 | | | | 27,842 | |
Series2003-46, Cl. IH, 0.00%, 6/25/234,5 | | | | | | | 29,249 | | | | 2,045 | |
Series2004-56, Cl. SE, 15.958%, 10/25/334 | | | | | | | 301,841 | | | | 59,816 | |
Series2005-14, Cl. SE, 49.983%, 3/25/354 | | | | | | | 192,752 | | | | 30,005 | |
Series2005-40, Cl. SA, 99.999%, 5/25/354 | | | | | | | 1,128,021 | | | | 199,756 | |
Series2005-40, Cl. SB, 99.999%, 5/25/354 | | | | | | | 506,112 | | | | 70,681 | |
Series2005-52, Cl. JH, 32.172%, 5/25/354 | | | | | | | 609,748 | | | | 89,241 | |
Series2006-90, Cl. SX, 99.999%, 9/25/364 | | | | | | | 1,241,991 | | | | 247,902 | |
Series2007-88, Cl. XI, 0.00%, 6/25/374,5 | | | | | | | 1,695,438 | | | | 355,904 | |
Series2008-55, Cl. SA, 0.00%, 7/25/384,5 | | | | | | | 64,379 | | | | 7,258 | |
Series2009-8, Cl. BS, 0.00%, 2/25/244,5 | | | | | | | 2,613 | | | | 156 | |
Series2010-95, Cl. DI, 0.00%, 11/25/204,5 | | | | | | | 4,833 | | | | 65 | |
Series2011-96, Cl. SA, 8.869%, 10/25/414 | | | | | | | 304,805 | | | | 53,781 | |
Series2012-134, Cl. SA, 0.448%, 12/25/424 | | | | | | | 984,027 | | | | 179,369 | |
Series2012-40, Cl. PI, 24.78%, 4/25/414 | | | | | | | 2,353,001 | | | | 229,126 | |
| Federal National Mortgage Assn., Stripped Mtg.-Backed Security, Series 302, Cl. 2, 6.00%, 5/1/29 | | | | | | | 2,586 | | | | 415 | |
83 INVESCO OPPENHEIMER GLOBAL STRATEGIC INCOME FUND
CONSOLIDATED SCHEDULE OF INVESTMENTSContinued
| | | | | | | | | | | | |
| | | | | | Principal Amount | | | Value | |
U.S. Agency Securities (Continued) | | | | | | | | | | | | |
Federal National Mortgage Assn., TBA: | | | | | | | | | | | | |
2.50%, 10/1/486 | | | | | | $ | 10,185,000 | | | $ | 10,273,522 | |
3.00%,10/1/34-10/1/486 | | | | | | | 50,045,000 | | | | 50,873,073 | |
3.50%, 10/1/496 | | | | | | | 94,460,000 | | | | 96,921,125 | |
4.50%, 10/1/496 | | | | | | | 193,530,000 | | | | 203,675,477 | |
FREMF Mortgage Trust: | | | | | | | | | | | | |
Series2012-K20, Cl. C, 4.006%, 5/25/451,7 | | | | | | | 12,875,000 | | | | 13,275,285 | |
Series2013-K25, Cl. C, 3.744%, 11/25/451,7 | | | | | | | 1,975,000 | | | | 2,036,996 | |
Series2013-K26, Cl. C, 3.721%, 12/25/451,7 | | | | | | | 335,000 | | | | 343,083 | |
Series2013-K28, Cl. C, 3.609%, 6/25/461,7 | | | | | | | 7,865,000 | | | | 8,111,695 | |
Series2013-K29, Cl. C, 3.601%, 5/25/461,7 | | | | | | | 4,700,000 | | | | 4,852,386 | |
Series 2013-K713, Cl. C, 3.261%, 4/25/461,7 | | | | | | | 420,000 | | | | 420,545 | |
Series 2014-K714, Cl. C, 3.986%, 1/25/471,7 | | | | | | | 200,000 | | | | 202,625 | |
Series 2014-K715, Cl. C, 4.258%, 2/25/461,7 | | | | | | | 25,000 | | | | 25,419 | |
Series2015-K44, Cl. B, 3.807%, 1/25/481,7 | | | | | | | 7,345,000 | | | | 7,624,585 | |
Series2015-K45, Cl. B, 3.713%, 4/25/481,7 | | | | | | | 13,050,000 | | | | 13,578,133 | |
Series2016-K54, Cl. C, 4.189%, 4/25/481,7 | | | | | | | 4,190,000 | | | | 4,413,480 | |
Series2017-K62, Cl. B, 4.004%, 1/25/501,7 | | | | | | | 840,000 | | | | 888,821 | |
Series 2017-K724, Cl. B, 3.599%, 11/25/231,7 | | | | | | | 4,465,000 | | | | 4,583,448 | |
Government National Mortgage Assn. I Pool: | | | | | | | | | | | | |
7.00%,1/15/28-8/15/28 | | | | | | | 257,162 | | | | 269,990 | |
8.00%,1/15/28-9/15/28 | | | | | | | 202,212 | | | | 213,171 | |
Government National Mortgage Assn. II Pool: | | | | | | | | | | | | |
3.75% [H15T1Y+150], 7/20/272 | | | | | | | 1,753 | | | | 1,814 | |
7.00%, 1/20/30 | | | | | | | 42,765 | | | | 49,347 | |
Government National Mortgage Assn. II Pool, TBA, 3.50%, 10/1/486 | | | | | | | 24,120,000 | | | | 24,993,408 | |
| Government National Mortgage Assn., Interest-Only Stripped Mtg.-Backed Security, Series2011-52, Cl. HS, 19.164%, 4/16/414 | | | | | | | 1,462,377 | | | | 232,587 | |
Vendee Mortgage Trust, Interest-Only Stripped Mtg.-Backed Security: | | | | | | | | | | | | |
Series1992-2, Cl. IO, 0.332%, 9/15/224 | | | | | | | 1,112,570 | | | | 1 | |
Series1995-2B, Cl. 2IO, 99.999%, 6/15/254 | | | | | | | 158,806 | | | | 2,336 | |
Series1995-3, Cl. 1IO, 0.00%, 9/15/254,5 | | | | | | | 5,200,365 | | | | 656 | |
| | | | | | | | | | | | |
| | | | | | | | | | | 476,802,167 | |
CMOs—1.0% | | | | | | | | | | | | |
Collateralized Mortgage Obligations—1.0% | | | | | | | | | | | | |
| Bear Stearns ARM Trust, Series2006-1, Cl. A1, 4.91% [H15T1Y+225], 2/25/362 | | | | | | | 36,537 | | | | 37,598 | |
| COMM Mortgage Trust, Series 2014-CR20, Cl. ASB, 3.305%, 11/10/47 | | | | | | | 475,000 | | | | 489,160 | |
| Federal Home Loan Mortgage Corp., Multifamily Structured Pass Through Certificates, Series K735, Cl. X1, 0.00%, 5/25/264,5 | | | | | | | 7,173,910 | | | | 404,708 | |
| Federal Home Loan Mortgage Corp., Multifamily Structured Pass-Through Certificates, Interest-Only Stripped Mtg.-Backed Security, Series K093, Cl. X1, 0.00%, 5/25/294,5 | | | | | | | 45,870,131 | | | | 3,590,420 | |
| Federal Home Loan Mortgage Corp., Real Estate Mtg. Investment Conduit Multiclass Pass-Through Certificates: | |
Series 3010, Cl. WB, 4.50%, 7/15/20 | | | | | | | 225 | | | | 225 | |
Series 3848, Cl. WL, 4.00%, 4/15/40 | | | | | | | 284,840 | | | | 289,936 | |
84 INVESCO OPPENHEIMER GLOBAL STRATEGIC INCOME FUND
| | | | | | | | | | | | |
| | | | | | Principal Amount | | | Value | |
Collateralized Mortgage Obligations (Continued) | | | | | | | | | | | | |
| Federal Home Loan Mortgage Corp., Real Estate Mtg. Investment Conduit MulticlassPass-Through Certificates, Interest-Only Stripped Mtg.-Backed Security: | |
| Series 2922, Cl. SE, 23.262%, 2/15/354 | | | | | | $ | 52,727 | | | $ | 8,606 | |
| Series 2981, Cl. AS, 2.658%, 5/15/354 | | | | | | | 360,932 | | | | 52,407 | |
| Federal National Mortgage Assn., Real Estate Mtg. Investment Conduit Multiclass Pass-Through Certificates, Interest-Only Stripped Mtg.-Backed Security, Series2005-12, Cl. SC, 31.938%, 3/25/354 | | | | | | | 23,759 | | | | 3,846 | |
| FREMF Mortgage Trust, Series2013-K27, Cl. C, 3.615%, 1/25/461,7 | | | | | | | 4,187,000 | | | | 4,314,228 | |
| Government National Mortgage Assn., Interest-Only Stripped Mtg.-Backed Security, Series2007-17, Cl. AI, 42.856%, 4/16/374 | | | | | | | 828,284 | | | | 130,400 | |
| JP Morgan Chase Commercial Mortgage Securities Trust: | | | | | | | | | | | | |
| Series2013-C10, Cl. AS, 3.372%, 12/15/47 | | | | | | | 2,345,000 | | | | 2,417,066 | |
| Series2014-C20, Cl. AS, 4.043%, 7/15/47 | | | | | | | 1,685,000 | | | | 1,791,997 | |
| Structured Agency Credit Risk Debt Nts.: | | | | | | | | | | | | |
| Series2013-DN2, Cl. M2, 6.268% [US0001M+425], 11/25/232 | | | | | | | 2,078,378 | | | | 2,238,136 | |
| Series2014-DN1, Cl. M3, 6.518% [US0001M+450], 2/25/242 | | | | | | | 2,085,000 | | | | 2,269,596 | |
| Series2014-DN2, Cl. M3, 5.618% [US0001M+360], 4/25/242 | | | | | | | 2,160,000 | | | | 2,293,225 | |
| Series2014-DN3, Cl. M3, 6.018% [US0001M+400], 8/25/242 | | | | | | | 4,726,012 | | | | 4,998,103 | |
| Series2014-HQ2, Cl. M3, 5.768% [US0001M+375], 9/25/242 | | | | | | | 2,495,000 | | | | 2,704,126 | |
| Series 2015-HQA2, Cl. M2, 4.818% [US0001M+280], 5/25/282 | | | | | | | 398,861 | | | | 401,566 | |
| Wells Fargo Mortgage-Backed Securities Trust: | | | | | | | | | | | | |
| Series2005-AR1, Cl. 1A1, 5.084%, 2/25/357 | | | | | | | 1,251,955 | | | | 1,303,022 | |
| Series2006-AR2, Cl. 2A3, 4.991%, 3/25/367 | | | | | | | 1,866,845 | | | | 1,916,158 | |
| WF-RBS Commercial Mortgage Trust, Series2013-C14, Cl. AS, 3.488%, 6/15/46 | | | | | | | 1,800,000 | | | | 1,868,426 | |
| | | | | | | | | | | | |
| | | | | | | | | | | | 33,522,955 | |
Non-Agency—8.0% | | | | | | | | | | | | |
Adjustable-Rate Mortgages—8.0% | | | | | | | | | | | | |
| Alba plc, Series2007-1, Cl. F, 4.033% [BP0003M+325], 3/17/391,2 | | | | | | | 1,281,763 | | | | 1,519,790 | |
| BCAP LLC Trust, Series2011-R11, Cl. 18A5, 4.69% [H15T1Y+210], 9/26/351,2 | | | | | | | 593 | | | | 594 | |
| Benchmark Mortgage Trust, Interest-Only Commercial Mtg. Pass-Through Certificates, Series2018-B1, Cl. XA, 14.698%, 1/15/514 | | | | | | | 13,196,249 | | | | 465,136 | |
| Capital Lease Funding Securitization LP, Interest-Only Commercial Mtg. Pass-Through Certificates, Series 1997-CTL1, Cl. IO, 0.00%, 6/22/241,4,5,8 | | | | | | | 43,689 | | | | 715 | |
| CD Mortgage Trust, Interest-Only Commercial Mtg. Pass-Through Certificates, Series2017-CD6, Cl. XA, 14.97%, 11/13/504 | | | | | | | 5,473,570 | | | | 299,211 | |
| CHL Mortgage Pass-Through Trust: | | | | | | | | | | | | |
| Series2005-17, Cl. 1A8, 5.50%, 9/25/35 | | | | | | | 1,043,680 | | | | 1,050,278 | |
| Series2005-J4, Cl. A7, 5.50%, 11/25/35 | | | | | | | 976,758 | | | | 987,686 | |
| Citigroup Commercial Mortgage Trust, Series 2014-GC21, Cl. AAB, 3.477%, 5/10/47 | | | | | | | 672,785 | | | | 693,973 | |
85 INVESCO OPPENHEIMER GLOBAL STRATEGIC INCOME FUND
CONSOLIDATED SCHEDULE OF INVESTMENTSContinued
| | | | | | | | | | | | |
| | | | | | Principal Amount | | | Value | |
Adjustable-Rate Mortgages (Continued) | | | | | | | | | | | | |
| Citigroup Commercial Mortgage Trust, Interest-Only Commercial Mtg. Pass-Through Certificates, Series2017-C4, Cl. XA, 14.047%, 10/12/504 | | | | | | $ | 15,437,663 | | | $ | 1,021,135 | |
| Citigroup Mortgage Loan Trust, Inc.: | | | | | | | | | | | | |
| Series2005-2, Cl. 1A3, 4.948%, 5/25/357 | | | | | | | 1,157,602 | | | | 1,185,576 | |
| Series2006-AR1, Cl. 1A1, 4.97% [H15T1Y+240], 10/25/352 | | | | | | | 294,657 | | | | 296,099 | |
| Series2009-8, Cl. 7A2, 4.991%, 3/25/361,7 | | | | | | | 14,332,310 | | | | 14,435,492 | |
| Series2014-8, Cl. 1A2, 2.334% [US0001M+29], 7/20/361,2 | | | | | | | 1,635,000 | | | | 1,631,656 | |
| COMM Mortgage Trust: | | | | | | | | | | | | |
| Series2013-CR6, Cl. AM, 3.147%, 3/10/461 | | | | | | | 2,825,000 | | | | 2,901,590 | |
| Series 2014-CR21, Cl. AM, 3.987%, 12/10/47 | | | | | | | 70,000 | | | | 75,311 | |
| Series 2014-LC15, Cl. AM, 4.198%, 4/10/47 | | | | | | | 690,000 | | | | 737,810 | |
| Series 2014-UBS6, Cl. AM, 4.048%, 12/10/47 | | | | | | | 4,690,000 | | | | 5,004,568 | |
| COMM Mortgage Trust, Interest-Only Stripped Mtg.-Backed Security, Series2012-CR5, Cl. XA, 22.865%, 12/10/454 | | | | | | | 6,974,623 | | | | 293,343 | |
| Connecticut Avenue Securities: | | | | | | | | | | | | |
| Series2014-C03, Cl. 1M2, 5.018% [US0001M+300], 7/25/242 | | | | | | | 2,002,505 | | | | 2,104,093 | |
| Series2016-C05, Cl. 2M2, 6.468% [US0001M+445], 1/25/292 | | | | | | | 4,116,376 | | | | 4,228,719 | |
| Series2017-C01, Cl. 1M2, 5.568% [US0001M+355], 7/25/292 | | | | | | | 11,610,000 | | | | 12,213,715 | |
| Series2017-C06, Cl. 1M1, 2.768% [US0001M+75], 2/25/302 | | | | | | | 154,977 | | | | 155,005 | |
| Series2017-C07, Cl. 1M2, 4.418% [US0001M+240], 5/25/302 | | | | | | | 1,540,000 | | | | 1,560,024 | |
| Series2018-C02, Cl. 2M1, 2.668% [US0001M+65], 8/25/302 | | | | | | | 238,327 | | | | 238,347 | |
| Series2018-C06, Cl. 2M2, 4.118% [US0001M+210], 3/25/312 | | | | | | | 6,720,000 | | | | 6,769,440 | |
| Connecticut Avenue Securities Trust: | | | | | | | | | | | | |
| Series2018-R07, Cl. 1M2, 4.418% [US0001M+240], 4/25/311,2 | | | | | | | 8,090,000 | | | | 8,174,560 | |
| Series2019-R02, Cl. 1M2, 4.318% [US0001M+230], 8/25/311,2 | | | | | | | 3,797,000 | | | | 3,821,258 | |
| Series2019-R03, Cl. 1M2, 4.168% [US0001M+215], 9/25/311,2 | | | | | | | 3,475,111 | | | | 3,495,876 | |
| Deutsche Mortgage Securities, Inc., Series2013-RS1, Cl. 1A2, 2.264% [US0001M+22], 7/22/361,2 | | | | | | | 638,213 | | | | 631,321 | |
| Eurosail2006-2bl plc, Series2006-2X, Cl. E1C, 4.031% [BP0003M+325], 12/15/441,2 | | | | | | | 5,150,000 | | | | 5,538,393 | |
| Federal Home Loan Mortgage Corp., STACR Trust, Series 2019-HRP1, Cl. M2, 3.418% [US0001M+140], 2/25/491,2 | | | | | | | 1,705,000 | | | | 1,707,239 | |
| Gemgarto2018-1 plc SER2018-1 CL E V/R, 3.031%, 9/16/65 | | | | | | | 6,123,569 | | | | 7,310,238 | |
| GS Mortgage Securities Trust: | | | | | | | | | | | | |
| Series 2013-GC12, Cl. AAB, 2.678%, 6/10/46 | | | | | | | 185,091 | | | | 186,039 | |
| Series 2013-GC16, Cl. AS, 4.649%, 11/10/46 | | | | | | | 390,000 | | | | 425,834 | |
| Series 2014-GC18, Cl. AAB, 3.648%, 1/10/47 | | | | | | | 541,620 | | | | 558,148 | |
| GSR Mortgage Loan Trust, Series2005-AR4, Cl. 6A1, 4.643%, 7/25/357 | | | | | | | 171,675 | | | | 176,162 | |
| Hawksmoor Mortgage Funding2019-1 plc SER2019-1X CL B V/R: | | | | | | | | | | | | |
| 0.00%, 5/25/533,7 | | | | | | | 35,842,000 | | | | 44,237,521 | |
86 INVESCO OPPENHEIMER GLOBAL STRATEGIC INCOME FUND
| | | | | | | | | | | | |
| | | | | | Principal Amount | | | Value | |
Adjustable-Rate Mortgages (Continued) | | | | | | | | | | | | |
| HomeBanc Mortgage Trust, Series2005-3, Cl. A2, 2.328% [US0001M+31], 7/25/352 | | | | | | $ | 28,808 | | | $ | 28,922 | |
| JP Morgan Chase Commercial Mortgage Securities Trust: | | | | | | | | | | | | |
| Series2013-C16, Cl. AS, 4.517%, 12/15/46 | | | | | | | 2,395,000 | | | | 2,591,262 | |
| Series 2013-LC11, Cl. AS, 3.216%, 4/15/46 | | | | | | | 425,000 | | | | 435,272 | |
| JP Morgan Mortgage Trust, Series2007-A1, Cl. 5A1, 4.627%, 7/25/357 | | | | | | | 126,276 | | | | 129,448 | |
| JPMBB Commercial Mortgage Securities Trust: | | | | | | | | | | | | |
| Series2014-C18, Cl. A3, 3.578%, 2/15/47 | | | | | | | 308,172 | | | | 312,520 | |
| Series2014-C24, Cl. B, 4.116%, 11/15/477 | | | | | | | 1,655,000 | | | | 1,743,554 | |
| Series2014-C25, Cl. AS, 4.065%, 11/15/47 | | | | | | | 2,980,000 | | | | 3,190,918 | |
| Lehman Structured Securities Corp., Series2002-GE1, Cl. A, 0.00%, 7/26/241,7,8 | | | | | | | 37,090 | | | | 24,777 | |
| Marble Arch Residential Securitisation No 4 plc, Series 4X, Cl. E1C, 4.679% [BP0003M+390], 3/20/401,2 | | | | | | | 4,220,000 | | | | 5,037,549 | |
| Morgan Stanley Bank of America Merrill Lynch Trust: | | | | | | | | | | | | |
| Series2013-C9, Cl. AS, 3.456%, 5/15/46 | | | | | | | 1,565,000 | | | | 1,625,053 | |
| Series2014-C14, Cl. B, 4.91%, 2/15/477 | | | | | | | 680,000 | | | | 739,962 | |
| Morgan Stanley Capital I, Inc., Interest-Only Commercial Mtg. Pass-Through Certificates, Series2017-HR2, Cl. XA, 13.142%, 12/15/504 | | | | | | | 4,978,138 | | | | 266,476 | |
| Morgan StanleyRe-Remic Trust, Series2012-R3, Cl. 1B, 3.601%, 11/26/361,7 | | | | | | | 11,552,207 | | | | 11,266,286 | |
| Morgan Stanley Resecuritization Trust, Series2013-R9, Cl. 3A, 4.052%, 6/26/461,7 | | | | | | | 11,678 | | | | 11,726 | |
| RALI Trust, Series 2006-QS13, Cl. 1A8, 6.00%, 9/25/36 | | | | | | | 49,772 | | | | 45,615 | |
| Residential Asset Securitization Trust, Series 2005-A6CB, Cl. A7, 6.00%, 6/25/35 | | | | | | | 4,118,061 | | | | 3,810,621 | |
| Stratton Mortgage Funding2019-1 plc, Series2019-1, Cl. A, 0.00% [SONIA3M IR+120], 12/10/501,2,3 | | | | | | | 14,000,000 | | | | 17,220,688 | |
| Structured Agency Credit Risk Debt Nts.: | | | | | | | | | | | | |
| Series 2016-DNA1, Cl. M2, 5.045% [US0001M+290], 7/25/282 | | | | | | | 488,496 | | | | 491,904 | |
| Series 2016-DNA2, Cl. M3, 6.668% [US0001M+465], 10/25/282 | | | | | | | 2,460,000 | | | | 2,638,792 | |
| Series 2016-DNA3, Cl. M3, 7.018% [US0001M+500], 12/25/282 | | | | | | | 7,155,000 | | | | 7,760,221 | |
| Series 2016-DNA4, Cl. M3, 5.818% [US0001M+380], 3/25/292 | | | | | | | 13,920,000 | | | | 14,762,419 | |
| Series 2016-HQA3, Cl. M3, 5.868% [US0001M+385], 3/25/292 | | | | | | | 9,805,000 | | | | 10,407,515 | |
| Series 2016-HQA4, Cl. M3, 5.918% [US0001M+390], 4/25/292 | | | | | | | 9,480,000 | | | | 10,127,603 | |
| Series 2017-DNA1, Cl. M2, 5.268% [US0001M+325], 7/25/292 | | | | | | | 5,390,000 | | | | 5,656,904 | |
| Series 2017-HQA2, Cl. M1, 2.818% [US0001M+80], 12/25/292 | | | | | | | 608,554 | | | | 608,836 | |
| Series 2018-DNA1, Cl. M2, 3.818% [US0001M+180], 7/25/302 | | | | | | | 3,110,000 | | | | 3,113,443 | |
| Towd Point Mortgage Funding 2019-Granite4 plc: | | | | | | | | | | | | |
| 2.23%, 10/20/51 | | | | | | | 7,080,000 | | | | 8,716,896 | |
| 2.58%, 10/20/51 | | | | | | | 10,600,000 | | | | 13,058,110 | |
87 INVESCO OPPENHEIMER GLOBAL STRATEGIC INCOME FUND
CONSOLIDATED SCHEDULE OF INVESTMENTSContinued
| | | | | | | | | | | | |
| | | | | | Principal Amount | | | Value | |
Adjustable-Rate Mortgages (Continued) | | | | | | | | | | | | |
| UBS Commercial Mortgage Trust, Interest-Only Commercial Mtg. Pass-Through Certificates, Series2017-C5, Cl. XA, 14.70%, 11/15/504 | | | | | | $ | 9,726,206 | | | $ | 578,669 | |
| WaMu Mortgage Pass-Through Certificates Trust, Series 2003-AR10, Cl. A7, 4.416%, 10/25/337 | | | | | | | 76,431 | | | | 78,032 | |
| Wells Fargo Commercial Mortgage Trust, Interest-Only Commercial Mtg. Pass-Through Certificates, Series2017-C42, Cl. XA, 12.88%, 12/15/504 | | | | | | | 6,540,627 | | | | 401,406 | |
| Wells Fargo Mortgage-Backed Securities Trust: | | | | | | | | | | | | |
| Series 2005-AR15, Cl. 1A2, 4.774%, 9/25/357 | | | | | | | 320,950 | | | | 320,406 | |
| Series 2005-AR15, Cl. 1A6, 4.774%, 9/25/357 | | | | | | | 3,174,391 | | | | 3,169,012 | |
| Series2005-AR4, Cl. 2A2, 5.088%, 4/25/357 | | | | | | | 74,069 | | | | 75,512 | |
| WF-RBS Commercial Mortgage Trust: | | | | | | | | | | | | |
| Series2014-C20, Cl. AS, 4.176%, 5/15/47 | | | | | | | 1,455,000 | | | | 1,560,932 | |
| Series 2014-LC14, Cl. AS, 4.351%, 3/15/477 | | | | | | | 1,135,000 | | | | 1,223,934 | |
| WF-RBS Commercial Mortgage Trust, Interest-Only Commercial Mtg. Pass-Through Certificates, Series2011-C3, Cl. XA, 29.195%, 3/15/441,4 | | | | | | | 12,224,600 | | | | 203,449 | |
| | | | | | | | | | | | |
| | | | | | | | | | | 269,566,539 | |
| | | | | | | | | | | | |
| Total Mortgage-Backed Obligations (Cost $770,008,767) | | | | | | | | | | | 779,891,661 | |
U.S. Government Obligations—6.0% | | | | | | | | | | | | |
| United States Treasury Inflation-Protected Securities, 1.00%, 2/15/499,10 | | | | | | | 155,806,604 | | | | 176,510,213 | |
| United States Treasury Inflation-Protected Securities, 1.00%, 2/15/469 | | | | | | | 21,485,838 | | | | 23,999,461 | |
| | | | | | | | | | | | |
| Total U.S. Government Obligations (Cost $192,042,210) | | | | | | | | | | | 200,509,674 | |
Foreign Government Obligations—23.6% | | | | | | | | | | | | |
| Angola—0.2% | | | | | | | | | | | | |
| Republic of Angola, 9.375% Sr. Unsec. Nts., 5/8/481 | | | | | | | 5,495,000 | | | | 5,807,688 | |
| Argentina—0.8% | | | | | | | | | | | | |
| Argentine Republic: | | | | | | | | | | | | |
| 0.000% Unsec. Nts., 7/29/2011 | | | ARS | | | | 503,100,000 | | | | 4,500,074 | |
| 0.202% Unsec. Nts., 10/29/2011 | | | ARS | | | | 1,223,958,176 | | | | 9,128,136 | |
| 5.625% Sr. Unsec. Nts., 1/26/22 | | | | | | | 5,355,000 | | | | 2,329,479 | |
| 6.875% Sr. Unsec. Nts., 1/26/27 | | | | | | | 7,790,000 | | | | 3,293,300 | |
| 7.50% Sr. Unsec. Nts., 4/22/26 | | | | | | | 15,105,000 | | | | 6,740,757 | |
| 9.80% Unsec. Nts., 5/28/2011 | | | ARS | | | | 135,400,000 | | | | 1,295,470 | |
| 18.20% Unsec. Nts., 10/3/21 | | | ARS | | | | 25,715,000 | | | | 129,196 | |
| | | | | | | | | | | | |
| | | | | | | | | | | | 27,416,412 | |
| Austria—0.5% | | | | | | | | | | | | |
| Republic of Austria, 1.50% Sr. Unsec. Nts., 11/2/861 | | | EUR | | | | 10,935,000 | | | | 17,639,008 | |
| Bahrain—0.1% | | | | | | | | | | | | |
| Kingdom of Bahrain, 5.625% Sr. Unsec. Nts., 9/30/311 | | | | | | | 3,120,000 | | | | 3,153,075 | |
| Brazil—0.5% | | | | | | | | | | | | |
| Federative Republic of Brazil: | | | | | | | | | | | | |
| 6.00% Nts., 5/15/459 | | | BRL | | | | 10,550,000 | | | | 11,554,421 | |
88 INVESCO OPPENHEIMER GLOBAL STRATEGIC INCOME FUND
| | | | | | | | | | |
| | | | | Principal Amount | | | Value | |
Brazil (Continued) | | | | | | | | | | |
Federative Republic of Brazil: (Continued) | | | | | | | | | | |
| 6.00% Nts., 8/15/509 | | BRL | | | 2,100,000 | | | $ | 2,376,136 | |
| 10.00% Nts., 1/1/29 | | BRL | | | 10,500,000 | | | | 3,018,520 | |
| | | | | | | | | | |
| | | | | | | | | 16,949,077 | |
Colombia—0.3% | | | | | | | | | | |
| Republic of Colombia: | | | | | | | | | | |
| Series B, 6.25% Bonds, 11/26/25 | | COP | | | 21,300,000,000 | | | | 6,395,478 | |
| Series B, 10.00% Bonds, 7/24/24 | | COP | | | 14,854,000,000 | | | | 5,155,558 | |
| | | | | | | | | | |
| | | | | | | | | 11,551,036 | |
Costa Rica—0.0% | | | | | | | | | | |
| Republic of Costa Rica, 5.625% Sr. Unsec. Nts., 4/30/431 | | | | | 1,015,000 | | | | 885,851 | |
Cyprus—0.2% | | | | | | | | | | |
| Republic of Cyprus, 2.75% Sr. Unsec. Nts., 5/3/491 | | EUR | | | 4,225,000 | | | | 6,086,811 | |
Dominican Republic—0.3% | | | | | | | | | | |
| Dominican Republic: | | | | | | | | | | |
| 6.40% Sr. Unsec. Nts., 6/5/491 | | | | | 3,490,000 | | | | 3,725,610 | |
| 7.50% Sr. Unsec. Nts., 5/6/211 | | | | | 6,980,000 | | | | 7,302,825 | |
| | | | | | | | | | |
| | | | | | | | | 11,028,435 | |
Ecuador—0.3% | | | | | | | | | | |
| Republic of Ecuador: | | | | | | | | | | |
| 9.50% Sr. Unsec. Nts., 3/27/301 | | | | | 6,385,000 | | | | 6,485,040 | |
| 10.75% Sr. Unsec. Nts., 1/31/291 | | | | | 1,680,000 | | | | 1,819,667 | |
| | | | | | | | | | |
| | | | | | | | | 8,304,707 | |
Egypt—1.9% | | | | | | | | | | |
| Arab Republic of Egypt: | | | | | | | | | | |
| 4.75% Sr. Unsec. Nts., 4/16/261 | | EUR | | | 4,800,000 | | | | 5,378,730 | |
| 5.577% Sr. Unsec. Nts., 2/21/231 | | | | | 6,950,000 | | | | 7,111,817 | |
| 6.125% Sr. Unsec. Nts., 1/31/221 | | | | | 7,150,000 | | | | 7,384,663 | |
| 8.50% Sr. Unsec. Nts., 1/31/471 | | | | | 3,570,000 | | | | 3,791,294 | |
| 8.70% Sr. Unsec. Nts., 3/1/491 | | | | | 6,047,000 | | | | 6,520,087 | |
| 16.00% Bonds, 6/11/22 | | EGP | | | 375,200,000 | | | | 24,005,705 | |
| 18.15% Unsec. Nts., 12/11/21 | | EGP | | | 90,000,000 | | | | 5,863,175 | |
| Series 3YR, 16.00% Unsec. Nts., 12/12/20 | | EGP | | | 72,000,000 | | | | 4,499,294 | |
| | | | | | | | | | |
| | | | | | | | | 64,554,765 | |
El Salvador—0.1% | | | | | | | | | | |
| Republic of El Salvador, 7.125% Sr. Unsec. Nts., 1/20/501 | | | | | 3,381,500 | | | | 3,453,357 | |
Fiji—0.1% | | | | | | | | | | |
Republic of Fiji, 6.625% Sr. Unsec. Nts., 10/2/201 | | | | | 3,726,000 | | | | 3,725,999 | |
89 INVESCO OPPENHEIMER GLOBAL STRATEGIC INCOME FUND
CONSOLIDATED SCHEDULE OF INVESTMENTSContinued
| | | | | | | | | | |
| | | | | Principal Amount | | | Value | |
France—0.8% | | | | | | | | | | |
| French Republic, 1.75% Bonds, 6/25/391 | | EUR | | | 18,650,000 | | | $ | 26,365,607 | |
Greece—1.7% | | | | | | | | | | |
| Hellenic Republic: | | | | | | | | | | |
| Bonds, 10/15/427 | | EUR | | | 76,770,000 | | | | 343,069 | |
| 1.875% Bonds, 7/23/261 | | EUR | | | 11,845,000 | | | | 13,592,840 | |
| 3.90% Bonds, 1/30/331 | | EUR | | | 26,609,000 | | | | 36,297,444 | |
| 4.00% Bonds, 1/30/371 | | EUR | | | 3,850,000 | | | | 5,382,268 | |
| | | | | | | | | | |
| | | | | | | | | 55,615,621 | |
India—2.0% | | | | | | | | | | |
| Export-Import Bank of India: | | | | | | | | | | |
| 7.35% Sr. Unsec. Nts., 5/18/22 | | INR | | | 180,000,000 | | | | 2,581,589 | |
| 8.00% Sr. Unsec. Nts., 5/27/21 | | INR | | | 720,000,000 | | | | 10,333,795 | |
| Republic of India: | | | | | | | | | | |
| 7.17% Sr. Unsec. Nts., 1/8/28 | | INR | | | 900,000,000 | | | | 13,012,049 | |
| 7.59% Sr. Unsec. Nts., 1/11/26 | | INR | | | 1,400,000,000 | | | | 20,709,422 | |
| 7.72% Sr. Unsec. Nts., 5/25/25 | | INR | | | 35,000,000 | | | | 520,046 | |
| 8.20% Sr. Unsec. Nts., 9/24/25 | | INR | | | 849,400,000 | | | | 12,911,616 | |
| 8.24% Sr. Unsec. Nts., 2/15/27 | | INR | | | 400,000,000 | | | | 6,098,941 | |
| | | | | | | | | | |
| | | | | | | | | 66,167,458 | |
Indonesia—2.1% | | | | | | | | | | |
| Perusahaan Penerbit SBSN Indonesia III: | | | | | | | | | | |
| 4.35% Sr. Unsec. Nts., 9/10/241 | | | | | 1,330,000 | | | | 1,429,750 | |
| 4.55% Sr. Unsec. Nts., 3/29/261 | | | | | 2,005,000 | | | | 2,192,467 | |
| Republic of Indonesia: | | | | | | | | | | |
| 3.85% Sr. Unsec. Nts., 7/18/271 | | | | | 1,075,000 | | | | 1,137,302 | |
| 4.125% Sr. Unsec. Nts., 1/15/251 | | | | | 1,260,000 | | | | 1,343,907 | |
| 8.125% Sr. Unsec. Nts., 5/15/24 | | IDR | | | 179,000,000,000 | | | | 13,349,024 | |
| 8.25% Sr. Unsec. Nts., 5/15/29 | | IDR | | | 70,900,000,000 | | | | 5,343,498 | |
| Series FR56, 8.375% Sr. Unsec. Nts., 9/15/26 | | IDR | | | 260,905,000,000 | | | | 19,736,880 | |
| Series FR59, 7.00% Sr. Unsec. Nts., 5/15/27 | | IDR | | | 45,000,000,000 | | | | 3,155,041 | |
| Series FR64, 6.125% Sr. Unsec. Nts., 5/15/28 | | IDR | | | 40,000,000,000 | | | | 2,616,132 | |
| Series FR74, 7.50% Sr. Unsec. Nts., 8/15/32 | | IDR | | | 287,520,000,000 | | | | 20,129,438 | |
| | | | | | | | | | |
| | | | | | | | | 70,433,439 | |
Italy—2.4% | | | | | | | | | | |
| Republic of Italy: | | | | | | | | | | |
| 2.80% Bonds, 3/1/671 | | EUR | | | 39,570,000 | | | | 51,383,755 | |
| 2.95% Bonds, 9/1/381 | | EUR | | | 21,470,000 | | | | 28,758,647 | |
| | | | | | | | | | |
| | | | | | | | | 80,142,402 | |
Ivory Coast—0.3% | | | | | | | | | | |
| Republic of Cote d’Ivoire: | | | | | | | | | | |
| 5.125% Sr. Unsec. Nts., 6/15/251 | | EUR | | | 3,495,000 | | | | 4,078,793 | |
| 5.25% Sr. Unsec. Nts., 3/22/301 | | EUR | | | 5,125,000 | | | | 5,625,794 | |
| | | | | | | | | | |
| | | | | | | | | 9,704,587 | |
90 INVESCO OPPENHEIMER GLOBAL STRATEGIC INCOME FUND
| | | | | | | | | | |
| | | | | Principal Amount | | | Value | |
Kenya—0.0% | | | | | | | | | | |
| Republic of Kenya, 8.25% Sr. Unsec. Nts., 2/28/481 | | | | $ | 1,400,000 | | | $ | 1,433,533 | |
Malaysia—0.1% | | | | | | | | | | |
| Federation of Malaysia, 4.127% Sr. Unsec. Nts., 4/15/32 | | MYR | | | 17,400,000 | | | | 4,378,862 | |
Mexico—1.3% | | | | | | | | | | |
| United Mexican States: | | | | | | | | | | |
| Series M, 5.75% Bonds, 3/5/26 | | MXN | | | 172,455,000 | | | | 8,279,920 | |
| Series M20, 8.50% Sr. Unsec. Nts., 5/31/29 | | MXN | | | 613,300,000 | | | | 34,621,273 | |
| | | | | | | | | | |
| | | | | | | | | 42,901,193 | |
New Zealand—1.3% | | | | | | | | | | |
| New Zealand, 1.50% Sr. Unsec. Nts., 5/15/31 | | NZD | | | 70,000,000 | | | | 45,178,779 | |
Oman—0.4% | | | | | | | | | | |
| Sultanate of Oman: | | | | | | | | | | |
| 3.875% Sr. Unsec. Nts., 3/8/221 | | | | | 7,045,000 | | | | 7,034,045 | |
| 6.75% Sr. Unsec. Nts., 1/17/481 | | | | | 6,700,000 | | | | 6,339,875 | |
| | | | | | | | | | |
| | | | | | | | | 13,373,920 | |
Panama—0.2% | | | | | | | | | | |
| Republic of Panama, 3.75% Sr. Unsec. Nts., 4/17/261 | | | | | 5,150,000 | | | | 5,446,125 | |
Paraguay—0.2% | | | | | | | | | | |
| Republic of Paraguay, 4.625% Sr. Unsec. Nts., 1/25/231 | | | | | 6,950,000 | | | | 7,327,107 | |
Peru—0.0% | | | | | | | | | | |
| Republic of Peru, 5.40% Sr. Unsec. Nts., 8/12/341 | | PEN | | | 1,045,000 | | | | 331,140 | |
Russia—0.2% | | | | | | | | | | |
| Russian Federation, 4.875% Sr. Unsec. Nts., 9/16/231 | | | | | 6,950,000 | | | | 7,600,909 | |
Senegal—0.3% | | | | | | | | | | |
| Republic of Senegal, 6.75% Sr. Unsec. Nts., 3/13/481 | | | | | 9,175,000 | | | | 8,865,674 | |
South Africa—2.2% | | | | | | | | | | |
| Republic of South Africa: | | | | | | | | | | |
| 5.875% Sr. Unsec. Nts., 5/30/22 | | | | | 3,495,000 | | | | 3,746,203 | |
| Series 2023, 7.75% Sr. Unsec. Nts., 2/28/23 | | ZAR | | | 62,500,000 | | | | 4,165,772 | |
| Series 2030, 8.00% Sr. Unsec. Nts., 1/31/30 | | ZAR | | | 207,900,000 | | | | 12,824,552 | |
| Series 2037, 8.50% Sr. Unsec. Nts., 1/31/37 | | ZAR | | | 264,900,000 | | | | 15,716,099 | |
| Series 2048, 8.75% Sr. Unsec. Nts., 2/28/48 | | ZAR | | | 230,000,000 | | | | 13,434,259 | |
| Series R186, 10.50% Sr. Unsec. Nts., 12/21/26 | | ZAR | | | 290,825,000 | | | | 21,445,583 | |
| Series R214, 6.50% Sr. Unsec. Nts., 2/28/41 | | ZAR | | | 60,000,000 | | | | 2,787,653 | |
| | | | | | | | | | |
| | | | | | | | | 74,120,121 | |
Spain—0.4% | | | | | | | | | | |
| Kingdom of Spain, 0.60% Nts., 10/31/291 | | EUR | | | 11,380,000 | | | | 12,974,247 | |
91 INVESCO OPPENHEIMER GLOBAL STRATEGIC INCOME FUND
CONSOLIDATED SCHEDULE OF INVESTMENTSContinued
| | | | | | | | | | |
| | | | | Principal Amount | | | Value | |
Sri Lanka—0.8% | | | | | | | | | | |
| Democratic Socialist Republic of Sri Lanka: | | | | | | | | | | |
| 5.75% Sr. Unsec. Nts., 4/18/231 | | | | $ | 3,610,000 | | | $ | 3,588,503 | |
| 5.875% Sr. Unsec. Nts., 7/25/221 | | | | | 3,370,000 | | | | 3,391,872 | |
| 6.25% Sr. Unsec. Nts., 10/4/201 | | | | | 7,520,000 | | | | 7,640,316 | |
| 6.25% Sr. Unsec. Nts., 7/27/211 | | | | | 6,990,000 | | | | 7,105,135 | |
| 6.35% Sr. Unsec. Nts., 6/28/241 | | | | | 2,790,000 | | | | 2,799,932 | |
| 7.85% Sr. Unsec. Nts., 3/14/291 | | | | | 2,800,000 | | | | 2,821,170 | |
| | | | | | | | | | |
| | | | | | | | | 27,346,928 | |
Supranational—0.1% | | | | | | | | | | |
| European Bank for Reconstruction & Development, 6.85% Sr. | | | | | | | | | | |
| Unsec. Nts., 6/21/21 | | IDR | | | 20,200,000,000 | | | | 1,434,491 | |
| International Finance Corp., 16.721% Sr. Unsec. Nts., 2/15/291,11 | | TRY | | | 10,300,000 | | | | 603,700 | |
| | | | | | | | | | |
| | | | | | | | | 2,038,191 | |
Thailand—0.5% | | | | | | | | | | |
| Kingdom of Thailand, 2.125% Sr. Unsec. Nts., 12/17/26 | | THB | | | 490,000,000 | | | | 16,776,449 | |
Turkey—0.6% | | | | | | | | | | |
| Republic of Turkey: | | | | | | | | | | |
| 8.50% Bonds, 9/14/22 | | TRY | | | 39,500,000 | | | | 6,223,681 | |
| 10.70% Bonds, 2/17/21 | | TRY | | | 54,955,000 | | | | 9,434,898 | |
| 12.40% Bonds, 3/8/28 | | TRY | | | 33,500,000 | | | | 5,718,789 | |
| | | | | | | | | | |
| | | | | | | | | 21,377,368 | |
Ukraine—0.3% | | | | | | | | | | |
| Ukraine, 7.75% Sr. Unsec. Nts., 9/1/261 | | | | | 9,160,000 | | | | 9,581,296 | |
United Arab Emirates—0.1% | | | | | | | | | | |
| United Arab Emirates, 3.125% Sr. Unsec. Nts., 9/30/491 | | | | | 3,465,000 | | | | 3,365,381 | |
| | | | | | | | | | |
| Total Foreign Government Obligations (Cost $844,246,066) | | | | | | | | | 793,402,558 | |
Corporate Loans—0.3% | | | | | | | | | | |
| Albertson’s LLC, Sr. Sec. Credit Facilities 1st Lien Term Loan, Tranche B7, 4.794% [LIBOR12+275], 11/17/2512,13 | | | | | 301,733 | | | | 303,923 | |
| Aleris International, Inc., Sr. Sec. Credit Facilities 1st Lien Term Loan, 6.794% [LIBOR12+475], 2/27/236,12,13 | | | | | 642,211 | | | | 644,057 | |
| American Greetings Corp., Sr. Sec. Credit Facilities 1st Lien Term Loan, Tranche B, 6.544% [LIBOR12+450], 4/6/2412,13 | | | | | 1,302,607 | | | | 1,295,547 | |
| Caesars Growth Properties Holdings LLC, Sr. Sec. Credit Facilities 1st Lien Term Loan, 4.794% [LIBOR4+275], 12/23/2412,13 | | | | | 1,675,736 | | | | 1,666,628 | |
| Claire’s Stores, Inc., Sr. Sec. Credit Facilities Term Loan, 9.569% [LIBOR4+725], 10/12/3812,13 | | | | | 97,198 | | | | 179,816 | |
| Dun & Bradstreet Corp. (The), Sr. Sec. Credit Facilities 1st Lien Term Loan, Tranche B, 7.145% [LIBOR12+500], 2/6/2612,13 | | | | | 1,043,000 | | | | 1,050,729 | |
| iHeartCommunications, Inc., Sr. Sec. Credit Facilities 1st Lien Exit Term Loan, 6.10% [LIBOR12+400], 5/1/2612,13 | | | | | 492,578 | | | | 496,356 | |
92 INVESCO OPPENHEIMER GLOBAL STRATEGIC INCOME FUND
| | | | | | | | | | | | |
| | | | | | Principal Amount | | | Value | |
Corporate Loans (Continued) | | | | | | | | | | | | |
| KIK Custom Products, Inc., Sr. Sec. Credit Facilities 1st Lien Term Loan, Tranche B, 6.256% [LIBOR12+400], 5/15/2312,13 | | | | | | $ | 638,000 | | | $ | 606,897 | |
| Murray Energy Corp., Sr. Sec. Credit Facilities 1st Lien Term Loan, Tranche B2, 9.354% [LIBOR4+725], 10/17/2212,13 | | | | | | | 1,260,959 | | | | 493,035 | |
| Neiman Marcus Group Ltd. LLC, Sr. Sec. Credit Facilities 1st Lien Term Loan, 1.00% PIK Rate, 7.557% Cash Rate, [LIBOR12+650], 10/25/2312,13,14 | | | | | | | 533,061 | | | | 408,903 | |
| PetSmart, Inc., Sr. Sec. Credit Facilities 1st Lien Term Loan, Tranche B, 6.04% [LIBOR12+400], 3/11/2212,13 | | | | | | | 1,165,202 | | | | 1,138,927 | |
| Scientific Games International, Inc., Sr. Sec. Credit Facilities 1st Lien Term Loan, Tranche B5, 4.794% [LIBOR6+275], 8/14/246,12,13 | | | | | | | 1,615,211 | | | | 1,603,913 | |
| Windstream Services LLC, Sr. Sec. Credit Facilities Term Loan, Tranche B6, 10.00% [PRIME4+500], 3/29/216,12,13,15 | | | | | | | 382,540 | | | | 389,753 | |
| | | | | | | | | | | | |
| Total Corporate Loans (Cost $10,821,795) | | | | | | | | | | | 10,278,484 | |
Corporate Bonds and Notes—32.8% | | | | | | | | | | | | |
Consumer Discretionary—5.6% | | | | | | | | | | | | |
Auto Components—0.1% | | | | | | | | | | | | |
| American Axle & Manufacturing, Inc., 6.25% Sr. Unsec. Nts., 4/1/25 | | | | | | | 1,383,000 | | | | 1,343,239 | |
| Dana Financing Luxembourg Sarl, 6.50% Sr. Unsec. Nts., 6/1/261 | | | | | | | 784,000 | | | | 831,040 | |
| Delphi Technologies plc, 5.00% Sr. Unsec. Nts., 10/1/251 | | | | | | | 695,000 | | | | 618,550 | |
| Goodyear Tire & Rubber Co. (The), 5.00% Sr. Unsec. Nts., 5/31/26 | | | | | | | 606,000 | | | | 615,726 | |
| Panther BF Aggregator 2 LP/Panther Finance Co., Inc.: | | | | | | | | | | | | |
| 6.25% Sr. Sec. Nts., 5/15/261 | | | | | | | 373,000 | | | | 393,515 | |
| 8.50% Sr. Unsec. Nts., 5/15/271 | | | | | | | 804,000 | | | | 816,060 | |
| | | | | | | | | | | | |
| | | | | | | | | | | 4,618,130 | |
Automobiles—0.4% | | | | | | | | | | | | |
| Ford Motor Credit Co. LLC: | | | | | | | | | | | | |
| 5.584% Sr. Unsec. Nts., 3/18/24 | | | | | | | 3,490,000 | | | | 3,714,369 | |
| 5.75% Sr. Unsec. Nts., 2/1/21 | | | | | | | 3,540,000 | | | | 3,660,596 | |
| General Motors Financial Co., Inc.: | | | | | | | | | | | | |
| 4.20% Sr. Unsec. Nts., 11/6/21 | | | | | | | 3,540,000 | | | | 3,653,115 | |
| 5.10% Sr. Unsec. Nts., 1/17/24 | | | | | | | 3,490,000 | | | | 3,754,925 | |
| Tesla, Inc., 5.30% Sr. Unsec. Nts., 8/15/251 | | | | | | | 459,000 | | | | 413,674 | |
| | | | | | | | | | | | |
| | | | | | | | | | | 15,196,679 | |
Distributors—0.1% | | | | | | | | | | | | |
| Core & Main Holdings LP, 9.375% PIK Rate, 8.625% Cash Rate Sr. Unsec. Nts., 9/15/241,14 | | | | | | | 3,525,000 | | | | 3,564,656 | |
| LKQ Corp., 4.75% Sr. Unsec. Nts., 5/15/23 | | | | | | | 458,000 | | | | 466,015 | |
| | | | | | | | | | | | |
| | | | | | | | | | | 4,030,671 | |
Diversified Consumer Services—0.1% | | | | | | | | | | | | |
| Cengage Learning, Inc., 9.50% Sr. Unsec. Nts., 6/15/241 | | | | | | | 200,000 | | | | 184,000 | |
93 INVESCO OPPENHEIMER GLOBAL STRATEGIC INCOME FUND
CONSOLIDATED SCHEDULE OF INVESTMENTSContinued
| | | | | | | | | | | | |
| | | | | | Principal Amount | | | Value | |
Diversified Consumer Services (Continued) | | | | | | | | | | | | |
| GEMS MENASA Cayman Ltd./GEMS Education Delaware LLC, 7.125% Sr. Sec. Nts., 7/31/261 | | | | | | $ | 2,370,000 | | | $ | 2,452,950 | |
| Service Corp. International, 4.625% Sr. Unsec. Nts., 12/15/27 | | | | | | | 405,000 | | | | 422,719 | |
| | | | | | | | | | | | |
| | | | | | | | | | | 3,059,669 | |
Entertainment—0.1% | | | | | | | | | | | | |
| AMC Entertainment Holdings, Inc.: | | | | | | | | | | | | |
| 5.75% Sr. Sub. Nts., 6/15/25 | | | | | | | 652,000 | | | | 623,899 | |
| 5.875% Sr. Sub. Nts., 11/15/26 | | | | | | | 700,000 | | | | 639,392 | |
| Cinemark USA, Inc., 4.875% Sr. Unsec. Nts., 6/1/23 | | | | | | | 583,000 | | | | 593,203 | |
| Live Nation Entertainment, Inc., 5.625% Sr. Unsec. Nts., 3/15/261 | | | | | | | 564,000 | | | | 601,365 | |
| Netflix, Inc.: | | | | | | | | | | | | |
| 5.375% Sr. Unsec. Nts., 11/15/291 | | | | | | | 780,000 | | | | 813,150 | |
| 5.875% Sr. Unsec. Nts., 11/15/28 | | | | | | | 700,000 | | | | 762,160 | |
| | | | | | | | | | | | |
| | | | | | | | | | | 4,033,169 | |
Hotels, Restaurants & Leisure—1.8% | | | | | | | | | | | | |
| 1011778 B.C. ULC/New Red Finance, Inc.: | | | | | | | | | | | | |
| 4.25% Sr. Sec. Nts., 5/15/241 | | | | | | | 829,000 | | | | 854,873 | |
| 5.00% Sec. Nts., 10/15/251 | | | | | | | 3,555,000 | | | | 3,681,203 | |
| Aramark Services, Inc.: | | | | | | | | | | | | |
| 4.75% Sr. Unsec. Nts., 6/1/26 | | | | | | | 549,000 | | | | 566,842 | |
| 5.00% Sr. Unsec. Nts., 4/1/251 | | | | | | | 3,490,000 | | | | 3,612,150 | |
| 5.00% Sr. Unsec. Nts., 2/1/281 | | | | | | | 653,000 | | | | 679,120 | |
| Boyd Gaming Corp.: | | | | | | | | | | | | |
| 6.00% Sr. Unsec. Nts., 8/15/26 | | | | | | | 1,615,000 | | | | 1,709,732 | |
| 6.375% Sr. Unsec. Nts., 4/1/26 | | | | | | | 259,000 | | | | 275,511 | |
| CEC Entertainment, Inc., 8.00% Sr. Unsec. Nts., 2/15/22 | | | | | | | 548,000 | | | | 521,970 | |
| Cedar Fair LP, 5.25% Sr. Unsec. Nts., 7/15/291 | | | | | | | 995,000 | | | | 1,068,381 | |
| Diamond Resorts International, Inc.: | | | | | | | | | | | | |
| 7.75% Sr. Sec. Nts., 9/1/231 | | | | | | | 382,000 | | | | 394,892 | |
| 10.75% Sr. Unsec. Nts., 9/1/241 | | | | | | | 266,000 | | | | 275,310 | |
| Downstream Development Authority of the Quapaw Tribe of Oklahoma, 10.50% Sr. Sec. Nts., 2/15/231 | | | | | | | 389,000 | | | | 416,230 | |
| Eldorado Resorts, Inc.: | | | | | | | | | | | | |
| 6.00% Sr. Unsec. Nts., 4/1/25 | | | | | | | 429,000 | | | | 453,667 | |
| 6.00% Sr. Unsec. Nts., 9/15/26 | | | | | | | 481,000 | | | | 529,100 | |
| Golden Nugget, Inc., 6.75% Sr. Unsec. Nts., 10/15/241 | | | | | | | 1,587,000 | | | | 1,630,642 | |
| Hilton Domestic Operating Co., Inc., 4.25% Sr. Unsec. Nts., 9/1/24 | | | | | | | 606,000 | | | | 618,877 | |
| Hilton Grand Vacations Borrower LLC/Hilton Grand Vacations Borrower, Inc., 6.125% Sr. Unsec. Nts., 12/1/24 | | | | | | | 803,000 | | | | 857,202 | |
| International Game Technology plc, 6.25% Sr. Sec. Nts., 2/15/221 | | | | | | | 8,000,000 | | | | 8,482,140 | |
| KFC Holding Co./Pizza Hut Holdings LLC/Taco Bell of America LLC: | | | | | | | | | | | | |
| 4.75% Sr. Unsec. Nts., 6/1/271 | | | | | | | 428,000 | | | | 446,725 | |
| 5.25% Sr. Unsec. Nts., 6/1/261 | | | | | | | 1,002,000 | | | | 1,063,122 | |
94 INVESCO OPPENHEIMER GLOBAL STRATEGIC INCOME FUND
| | | | | | | | | | | | |
| | | | | | Principal Amount | | | Value | |
Hotels, Restaurants & Leisure (Continued) | | | | | | | | | | | | |
| Marriott Ownership Resorts, Inc., 4.75% Sr. Unsec. Nts., 1/15/281,6 | | | | | | $ | 3,034,000 | | | $ | 3,071,925 | |
| Melco Resorts Finance Ltd.: | | | | | | | | | | | | |
| 4.875% Sr. Unsec. Nts., 6/6/251 | | | | | | | 1,750,000 | | | | 1,774,678 | |
| 5.625% Sr. Unsec. Nts., 7/17/271 | | | | | | | 675,000 | | | | 702,237 | |
| MGM China Holdings Ltd.: | | | | | | | | | | | | |
| 5.375% Sr. Unsec. Nts., 5/15/241 | | | | | | | 3,495,000 | | | | 3,634,800 | |
| 5.875% Sr. Unsec. Nts., 5/15/261 | | | | | | | 3,200,000 | | | | 3,360,000 | |
| MGM Resorts International: | | | | | | | | | | | | |
| 5.75% Sr. Unsec. Nts., 6/15/25 | | | | | | | 538,000 | | | | 595,162 | |
| 6.00% Sr. Unsec. Nts., 3/15/23 | | | | | | | 731,000 | | | | 807,170 | |
| 6.625% Sr. Unsec. Nts., 12/15/21 | | | | | | | 423,000 | | | | 459,801 | |
| Party City Holdings, Inc., 6.625% Sr. Unsec. Nts., 8/1/261 | | | | | | | 645,000 | | | | 640,163 | |
| Penn National Gaming, Inc., 5.625% Sr. Unsec. Nts., 1/15/271 | | | | | | | 817,000 | | | | 845,595 | |
| Sabre GLBL, Inc., 5.25% Sr. Sec. Nts., 11/15/231 | | | | | | | 943,000 | | | | 973,648 | |
| Scientific Games International, Inc.: | | | | | | | | | | | | |
| 8.25% Sr. Unsec. Nts., 3/15/261 | | | | | | | 643,000 | | | | 686,403 | |
| 10.00% Sr. Unsec. Nts., 12/1/22 | | | | | | | 1,008,000 | | | | 1,052,100 | |
| Six Flags Entertainment Corp., 4.875% Sr. Unsec. Nts., 7/31/241 | | | | | | | 673,000 | | | | 698,238 | |
| Viking Cruises Ltd., 5.875% Sr. Unsec. Nts., 9/15/271 | | | | | | | 449,000 | | | | 476,883 | |
| Wyndham Hotels & Resorts, Inc., 5.375% Sr. Unsec. Nts., 4/15/261 | | | | | | | 1,280,000 | | | | 1,347,200 | |
| Wynn Las Vegas LLC/Wynn Las Vegas Capital Corp.: | | | | | | | | | | | | |
| 5.25% Sr. Unsec. Nts., 5/15/271 | | | | | | | 1,075,000 | | | | 1,105,906 | |
| 5.50% Sr. Unsec. Nts., 3/1/251 | | | | | | | 1,395,000 | | | | 1,468,238 | |
| Wynn Macau Ltd.: | | | | | | | | | | | | |
| 4.875% Sr. Unsec. Nts., 10/1/241 | | | | | | | 7,297,000 | | | | 7,287,879 | |
| 5.50% Sr. Unsec. Nts., 10/1/271 | | | | | | | 164,000 | | | | 166,460 | |
| Wynn Resorts Finance LLC / Wynn Resorts Capital Corp., 5.125% Sr. Unsec. Nts., 10/1/291 | | | | | | | 1,020,000 | | | | 1,070,771 | |
| | | | | | | | | | | | |
| | | | | | | | | | | 60,362,946 | |
Household Durables—0.9% | | | | | | | | | | | | |
| Avon International Operations, Inc., 7.875% Sr. Sec. Nts., 8/15/221 | | | | | | | 2,225,000 | | | | 2,327,283 | |
| Beazer Homes USA, Inc.: | | | | | | | | | | | | |
| 5.875% Sr. Unsec. Nts., 10/15/27 | | | | | | | 885,000 | | | | 863,981 | |
| 6.75% Sr. Unsec. Nts., 3/15/25 | | | | | | | 2,795,000 | | | | 2,861,381 | |
| Brookfield Residential Properties, Inc./Brookfield Residential US Corp., 6.125% Sr. Unsec. Nts., 7/1/221 | | | | | | | 402,000 | | | | 409,278 | |
| Eagle Intermediate Global Holding BV/Ruyi US Finance LLC, 7.50% Sr. Sec. Nts., 5/1/251 | | | | | | | 690,000 | | | | 622,725 | |
| Lennar Corp.: | | | | | | | | | | | | |
| 4.50% Sr. Unsec. Nts., 4/30/24 | | | | | | | 419,000 | | | | 442,464 | |
| 4.75% Sr. Unsec. Nts., 4/1/21 | | | | | | | 7,075,000 | | | | 7,243,031 | |
| 4.75% Sr. Unsec. Nts., 5/30/25 | | | | | | | 1,067,000 | | | | 1,144,358 | |
| 5.00% Sr. Unsec. Nts., 6/15/27 | | | | | | | 481,000 | | | | 516,474 | |
| 5.25% Sr. Unsec. Nts., 6/1/26 | | | | | | | 705,000 | | | | 764,925 | |
95 INVESCO OPPENHEIMER GLOBAL STRATEGIC INCOME FUND
CONSOLIDATED SCHEDULE OF INVESTMENTSContinued
| | | | | | | | | | | | |
| | | | | | Principal Amount | | | Value | |
Household Durables (Continued) | | | | | | | | | | | | |
| LGI Homes, Inc., 6.875% Sr. Unsec. Nts., 7/15/261 | | | | | | $ | 322,000 | | | $ | 336,490 | |
| M/I Homes, Inc., 5.625% Sr. Unsec. Nts., 8/1/25 | | | | | | | 988,000 | | | | 1,022,580 | |
| Mattamy Group Corp., 6.875% Sr. Unsec. Nts., 12/15/231 | | | | | | | 511,000 | | | | 533,995 | |
| MDC Holdings, Inc., 6.00% Sr. Unsec. Nts., 1/15/43 | | | | | | | 3,035,000 | | | | 3,148,812 | |
| PulteGroup, Inc., 5.50% Sr. Unsec. Nts., 3/1/26 | | | | | | | 986,000 | | | | 1,080,902 | |
| Spectrum Brands, Inc., 5.00% Sr. Unsec. Nts., 10/1/291 | | | | | | | 2,230,000 | | | | 2,274,600 | |
| Taylor Morrison Communities, Inc., 5.75% Sr. Unsec. Nts., 1/15/281 | | | | | | | 675,000 | | | | 734,063 | |
| Taylor Morrison Communities, Inc./Taylor Morrison Holdings II, Inc., 5.875% Sr. Unsec. Nts., 4/15/231 | | | | | | | 1,345,000 | | | | 1,442,513 | |
| William Lyon Homes, Inc., 5.875% Sr. Unsec. Nts., 1/31/25 | | | | | | | 868,000 | | | | 881,020 | |
| | | | | | | | | | | | |
| | | | | | | | | | | 28,650,875 | |
Internet & Catalog Retail—0.0% | | | | | | | | | | | | |
| GrubHub Holdings, Inc., 5.50% Sr. Unsec. Nts., 7/1/271 | | | | | | | 1,360,000 | | | | 1,390,600 | |
Leisure Equipment & Products—0.1% | | | | | | | | | | | | |
| Mattel, Inc.: | | | | | | | | | | | | |
| 4.35% Sr. Unsec. Nts., 10/1/20 | | | | | | | 580,000 | | | | 585,800 | |
| 6.75% Sr. Unsec. Nts., 12/31/251 | | | | | | | 1,787,000 | | | | 1,869,095 | |
| | | | | | | | | | | | |
| | | | | | | | | | | | 2,454,895 | |
Media—1.5% | | | | | | | | | | | | |
| Affinion Group, Inc., 14% PIK Rate, 12.50% Cash Rate, Sr. Unsec. Nts., 11/10/221,14 | | | | | | | 2,717,163 | | | | 1,793,328 | |
| Altice Financing SA: | | | | | | | | | | | | |
| 6.625% Sr. Sec. Nts., 2/15/231 | | | | | | | 243,000 | | | | 249,986 | |
| 7.50% Sr. Sec. Nts., 5/15/261 | | | | | | | 891,000 | | | | 948,906 | |
| Altice Finco SA, 8.125% Sec. Nts., 1/15/241 | | | | | | | 881,000 | | | | 914,037 | |
| Altice Luxembourg SA: | | | | | | | | | | | | |
| 7.625% Sr. Unsec. Nts., 2/15/251 | | | | | | | 322,000 | | | | 336,892 | |
| 7.75% Sr. Unsec. Nts., 5/15/221 | | | | | | | 200,000 | | | | 204,750 | |
| 10.50% Sr. Sec. Nts., 5/15/271 | | | | | | | 601,000 | | | | 678,829 | |
| AMC Networks, Inc.: | | | | | | | | | | | | |
| 4.75% Sr. Unsec. Nts., 8/1/25 | | | | | | | 659,000 | | | | 682,065 | |
| 5.00% Sr. Unsec. Nts., 4/1/24 | | | | | | | 700,000 | | | | 722,750 | |
| Belo Corp., 7.75% Sr. Unsec. Nts., 6/1/27 | | | | | | | 898,000 | | | | 1,039,435 | |
| Block Communications, Inc., 6.875% Sr. Unsec. Nts., 2/15/251 | | | | | | | 578,000 | | | | 605,455 | |
| Cablevision Systems Corp., 5.875% Sr. Unsec. Nts., 9/15/22 | | | | | | | 411,000 | | | | 443,880 | |
| CCO Holdings LLC/CCO Holdings Capital Corp.: | | | | | | | | | | | | |
| 4.00% Sr. Unsec. Nts., 3/1/231 | | | | | | | 411,000 | | | | 418,706 | |
| 5.00% Sr. Unsec. Nts., 2/1/281 | | | | | | | 749,000 | | | | 776,151 | |
| 5.125% Sr. Unsec. Nts., 5/1/231 | | | | | | | 632,000 | | | | 649,215 | |
| 5.125% Sr. Unsec. Nts., 5/1/271 | | | | | | | 1,091,000 | | | | 1,141,459 | |
| 5.375% Sr. Unsec. Nts., 5/1/251 | | | | | | | 245,000 | | | | 254,800 | |
| 5.75% Sr. Unsec. Nts., 2/15/261 | | | | | | | 3,250,000 | | | | 3,436,875 | |
| 5.875% Sr. Unsec. Nts., 4/1/241 | | | | | | | 376,000 | | | | 393,281 | |
| 5.875% Sr. Unsec. Nts., 5/1/271 | | | | | | | 245,000 | | | | 259,700 | |
96 INVESCO OPPENHEIMER GLOBAL STRATEGIC INCOME FUND
| | | | | | | | | | | | |
| | | | | | Principal Amount | | | Value | |
Media (Continued) | | | | | | | | | | | | |
| Clear Channel Communications, Inc., 9.00% Sr. Nts., 12/15/198,15,16 | | | | | | $ | 4,005,000 | | | $ | — | |
| CSC Holdings LLC: | | | | | | | | | | | | |
| 5.25% Sr. Unsec. Nts., 6/1/24 | | | | | | | 761,000 | | | | 819,977 | |
| 5.375% Sr. Unsec. Nts., 7/15/231 | | | | | | | 402,000 | | | | 413,557 | |
| 5.50% Sr. Unsec. Nts., 5/15/261 | | | | | | | 525,000 | | | | 553,823 | |
| 5.50% Sr. Unsec. Nts., 4/15/271 | | | | | | | 625,000 | | | | 662,431 | |
| 6.50% Sr. Unsec. Nts., 2/1/291 | | | | | | | 690,000 | | | | 768,212 | |
| 10.875% Sr. Unsec. Nts., 10/15/251 | | | | | | | 778,000 | | | | 882,505 | |
| Cumulus Media New Holdings, Inc., 6.75% Sr. Sec. Nts., 7/1/261 | | | | | | | 680,000 | | | | 714,850 | |
| Diamond Sports Group LLC/Diamond Sports Finance Co.: | | | | | | | | | | | | |
| 5.375% Sr. Sec. Nts., 8/15/261 | | | | | | | 3,640,000 | | | | 3,785,600 | |
| 6.625% Sr. Unsec. Nts., 8/15/271 | | | | | | | 1,625,000 | | | | 1,687,644 | |
| DISH DBS Corp.: | | | | | | | | | | | | |
| 5.125% Sr. Unsec. Nts., 5/1/20 | | | | | | | 695,000 | | | | 704,556 | |
| 5.875% Sr. Unsec. Nts., 7/15/22 | | | | | | | 561,000 | | | | 585,544 | |
| 5.875% Sr. Unsec. Nts., 11/15/24 | | | | | | | 5,025,000 | | | | 4,999,875 | |
| 6.75% Sr. Unsec. Nts., 6/1/21 | | | | | | | 322,000 | | | | 339,646 | |
| 7.75% Sr. Unsec. Nts., 7/1/26 | | | | | | | 715,000 | | | | 730,373 | |
| Gray Television, Inc.: | | | | | | | | | | | | |
| 5.125% Sr. Unsec. Nts., 10/15/241 | | | | | | | 607,000 | | | | 630,521 | |
| 5.875% Sr. Unsec. Nts., 7/15/261 | | | | | | | 581,000 | | | | 605,693 | |
| iHeartCommunications, Inc.: | | | | | | | | | | | | |
| 6.375% Sr. Sec. Nts., 5/1/26 | | | | | | | 214,227 | | | | 232,436 | |
| 8.375% Sr. Unsec. Nts., 5/1/27 | | | | | | | 671,037 | | | | 728,075 | |
| Lamar Media Corp., 5.75% Sr. Unsec. Nts., 2/1/26 | | | | | | | 780,000 | | | | 827,580 | |
| MDC Partners, Inc., 6.50% Sr. Unsec. Nts., 5/1/241 | | | | | | | 420,000 | | | | 384,825 | |
| Outfront Media Capital LLC/Outfront Media Capital Corp., 5.00% Sr. Unsec. Nts., 8/15/271 | | | | | | | 170,000 | | | | 178,925 | |
| Sinclair Television Group, Inc., 5.625% Sr. Unsec. Nts., 8/1/241 | | | | | | | 1,001,000 | | | | 1,032,281 | |
| Sirius XM Radio, Inc.: | | | | | | | | | | | | |
| 4.625% Sr. Unsec. Nts., 7/15/241 | | | | | | | 1,330,000 | | | | 1,382,309 | |
| 5.375% Sr. Unsec. Nts., 7/15/261 | | | | | | | 1,780,000 | | | | 1,875,426 | |
| 5.50% Sr. Unsec. Nts., 7/1/291 | | | | | | | 1,280,000 | | | | 1,369,600 | |
| TEGNA, Inc., 5.50% Sr. Unsec. Nts., 9/15/241 | | | | | | | 609,000 | | | | 630,315 | |
| Telenet Finance Luxembourg Notes Sarl, 5.50% Sr. Sec. Nts., 3/1/281 | | | | | | | 2,125,000 | | | | 2,236,563 | |
| Univision Communications, Inc.: | | | | | | | | | | | | |
| 5.125% Sr. Sec. Nts., 5/15/231 | | | | | | | 425,000 | | | | 426,062 | |
| 5.125% Sr. Sec. Nts., 2/15/251 | | | | | | | 797,000 | | | | 779,068 | |
| Virgin Media Secured Finance plc: | | | | | | | | | | | | |
| 5.50% Sr. Sec. Nts., 8/15/261 | | | | | | | 791,000 | | | | 831,776 | |
| 5.50% Sr. Sec. Nts., 5/15/291 | | | | | | | 317,000 | | | | 331,265 | |
| Ziggo BV, 5.50% Sr. Sec. Nts., 1/15/271 | | | | | | | 1,039,000 | | | | 1,088,353 | |
| | | | | | | | | | | | |
| | | | | | | | | | | 49,170,166 | |
97 INVESCO OPPENHEIMER GLOBAL STRATEGIC INCOME FUND
CONSOLIDATED SCHEDULE OF INVESTMENTSContinued
| | | | | | | | | | | | |
| | | | | | Principal Amount | | | Value | |
Multiline Retail—0.0% | | | | | | | | | | | | |
| Michaels Stores, Inc., 8.00% Sr. Unsec. Nts., 7/15/271 | | | | | | $ | 1,325,000 | | | $ | 1,331,625 | |
Specialty Retail—0.3% | | | | | | | | | | | | |
| GameStop Corp., 6.75% Sr. Unsec. Nts., 3/15/211 | | | | | | | 1,360,000 | | | | 1,336,200 | |
| L Brands, Inc.: | | | | | | | | | | | | |
| 5.25% Sr. Unsec. Nts., 2/1/28 | | | | | | | 326,000 | | | | 304,125 | |
| 6.875% Sr. Unsec. Nts., 11/1/35 | | | | | | | 1,921,000 | | | | 1,677,994 | |
| 7.50% Sr. Unsec. Nts., 6/15/29 | | | | | | | 1,360,000 | | | | 1,356,600 | |
| Lithia Motors, Inc., 5.25% Sr. Unsec. Nts., 8/1/251 | | | | | | | 1,425,000 | | | | 1,490,906 | |
| PetSmart, Inc., 5.875% Sr. Sec. Nts., 6/1/251 | | | | | | | 746,000 | | | | 746,000 | |
| Sonic Automotive, Inc., 6.125% Sr. Sub. Nts., 3/15/27 | | | | | | | 833,000 | | | | 850,701 | |
| Suburban Propane Partners LP/Suburban Energy Finance Corp., 5.875% Sr. Unsec. Nts., 3/1/27 | | | | | | | 833,000 | | | | 855,508 | |
| | | | | | | | | | | | |
| | | | | | | | | | | 8,618,034 | |
Textiles, Apparel & Luxury Goods—0.2% | | | | | | | | | | | | |
| Hanesbrands, Inc.: | | | | | | | | | | | | |
| 4.625% Sr. Unsec. Nts., 5/15/241 | | | | | | | 4,435,000 | | | | 4,695,601 | |
| 4.875% Sr. Unsec. Nts., 5/15/261 | | | | | | | 980,000 | | | | 1,040,270 | |
| William Carter Co. (The), 5.625% Sr. Unsec. Nts., 3/15/271 | | | | | | | 695,000 | | | | 746,256 | |
| | | | | | | | | | | | |
| | | | | | | | | | | 6,482,127 | |
Consumer Staples—1.1% | | | | | | | | | | | | |
Beverages—0.2% | | | | | | | | | | | | |
| Coca-Cola Icecek AS, 4.215% Sr. Unsec. Nts., 9/19/241 | | | | | | | 7,030,000 | | | | 7,014,372 | |
| Simmons Foods, Inc., 5.75% Sec. Nts., 11/1/241 | | | | | | | 1,294,000 | | | | 1,268,120 | |
| | | | | | | | | | | | |
| | | | | | | | | | | 8,282,492 | |
Food & Staples Retailing—0.2% | | | | | | | | | | | | |
| Albertsons Cos LLC/Safeway, Inc./New Albertsons LP/ Albertson’s LLC, 5.875% Sr. Unsec. Nts., 2/15/281 | | | | | | | 3,030,000 | | | | 3,214,648 | |
Albertsons Cos. LLC/Safeway, Inc./New Albertsons LP/Albertson’s LLC: | | | | | | | | | | | | |
| 5.75% Sr. Unsec. Nts., 3/15/25 | | | | | | | 396,000 | | | | 409,860 | |
| 7.50% Sr. Unsec. Nts., 3/15/261 | | | | | | | 690,000 | | | | 771,075 | |
| Fresh Market, Inc. (The), 9.75% Sr. Sec. Nts., 5/1/231 | | | | | | | 884,000 | | | | 517,140 | |
| Ingles Markets, Inc., 5.75% Sr. Unsec. Nts., 6/15/23 | | | | | | | 791,000 | | | | 809,787 | |
| | | | | | | | | | | | |
| | | | | | | | | | | 5,722,510 | |
Food Products—0.5% | | | | | | | | | | | | |
| Darling Ingredients, Inc., 5.25% Sr. Unsec. Nts., 4/15/271 | | | | | | | 322,000 | | | | 339,307 | |
| JBS Investments II GmbH, 7.00% Sr. Unsec. Nts., 1/15/261 | | | | | | | 1,040,000 | | | | 1,124,750 | |
| JBS USA LUX SA/JBS USA Finance, Inc., 6.75% Sr. Unsec. Nts., 2/15/281 | | | | | | | 1,400,000 | | | | 1,555,750 | |
| JBS USA LUX SA/JBS USA Food Co./JBS USA Finance, Inc.: | | | | | | | | | | | | |
| 5.50% Sr. Unsec. Nts., 1/15/301 | | | | | | | 2,695,000 | | | | 2,863,383 | |
| 6.50% Sr. Unsec. Nts., 4/15/291 | | | | | | | 1,390,000 | | | | 1,546,375 | |
| Lamb Weston Holdings, Inc., 4.625% Sr. Unsec. Nts., 11/1/241 | | | | | | | 695,000 | | | | 734,893 | |
| NBM US Holdings, Inc., 6.625% Sr. Unsec. Nts., 8/6/291 | | | | | | | 5,075,000 | | | | 5,208,219 | |
98 INVESCO OPPENHEIMER GLOBAL STRATEGIC INCOME FUND
| | | | | | | | | | | | |
| | | | | | Principal Amount | | | Value | |
Food Products (Continued) | | | | | | | | | | | | |
| Pilgrim’s Pride Corp.: | | | | | | | | | | | | |
| 5.75% Sr. Unsec. Nts., 3/15/251 | | | | | | $ | 664,000 | | | $ | 688,900 | |
| 5.875% Sr. Unsec. Nts., 9/30/271 | | | | | | | 328,000 | | | | 353,502 | |
| Post Holdings, Inc.: | | | | | | | | | | | | |
| 5.00% Sr. Unsec. Nts., 8/15/261 | | | | | | | 655,000 | | | | 681,757 | |
| 5.75% Sr. Unsec. Nts., 3/1/271 | | | | | | | 988,000 | | | | 1,052,418 | |
| Simmons Foods, Inc., 7.75% Sr. Sec. Nts., 1/15/241 | | | | | | | 324,000 | | | | 352,350 | |
| | | | | | | | | | | | |
| | | | | | | | | | | 16,501,604 | |
Household Products—0.2% | | | | | | | | | | | | |
| Controladora Mabe SA de CV, 5.60% Sr. Unsec. Nts., 10/23/281 | | | | | | | 5,215,000 | | | | 5,632,252 | |
| Energizer Holdings, Inc., 6.375% Sr. Unsec. Nts., 7/15/261 | | | | | | | 264,000 | | | | 283,441 | |
| Spectrum Brands, Inc., 6.125% Sr. Unsec. Nts., 12/15/24 | | | | | | | 695,000 | | | | 724,711 | |
| | | | | | | | | | | | |
| | | | | | | | | | | 6,640,404 | |
Personal Products—0.0% | | | | | | | | | | | | |
| First Quality Finance Co., Inc., 5.00% Sr. Unsec. Nts., 7/1/251 | | | | | | | 641,000 | | | | 663,435 | |
Energy—4.6% | | | | | | | | | | | | |
Energy Equipment & Services—0.3% | | | | | | | | | | | | |
| ADES International Holding plc, 8.625% Sr. Sec. Nts., 4/24/241 | | | | | | | 1,300,000 | | | | 1,298,375 | |
| Antero Midstream Partners LP/Antero Midstream Finance Corp., 5.75% Sr. Unsec. Nts., 1/15/281 | | | | | | | 1,350,000 | | | | 1,127,250 | |
| Basic Energy Services, Inc., 10.75% Sr. Sec. Nts., 10/15/231 | | | | | | | 529,000 | | | | 388,815 | |
| CSI Compressco LP/CSI Compressco Finance, Inc.: | | | | | | | | | | | | |
| 7.25% Sr. Unsec. Nts., 8/15/22 | | | | | | | 345,000 | | | | 313,812 | |
| 7.50% Sr. Sec. Nts., 4/1/251 | | | | | | | 481,000 | | | | 474,987 | |
| Ensign Drilling, Inc., 9.25% Sr. Unsec. Nts., 4/15/241 | | | | | | | 402,000 | | | | 376,875 | |
| Exterran Energy Solutions LP/EES Finance Corp., 8.125% Sr. Unsec. Nts., 5/1/25 | | | | | | | 720,000 | | | | 720,900 | |
| McDermott Technology Americas, Inc./McDermott Technology US, Inc., 10.625% Sr. Unsec. Nts., 5/1/241 | | | | | | | 3,530,000 | | | | 856,025 | |
| Precision Drilling Corp., 7.125% Sr. Unsec. Nts., 1/15/261 | | | | | | | 456,000 | | | | 424,080 | |
| Rowan Cos., Inc., 7.375% Sr. Unsec. Nts., 6/15/25 | | | | | | | 570,000 | | | | 339,150 | |
| Tervita Escrow Corp., 7.625% Sec. Nts., 12/1/211 | | | | | | | 405,000 | | | | 413,606 | |
| Transocean Pontus Ltd., 6.125% Sr. Sec. Nts., 8/1/251 | | | | | | | 307,050 | | | | 313,191 | |
| Transocean Poseidon Ltd., 6.875% Sr. Sec. Nts., 2/1/271 | | | | | | | 160,000 | | | | 165,600 | |
| Transocean Sentry Ltd., 5.375% Sr. Sec. Nts., 5/15/231 | | | | | | | 611,000 | | | | 612,528 | |
| Transocean, Inc., 9.00% Sr. Unsec. Nts., 7/15/231 | | | | | | | 837,000 | | | | 871,526 | |
| USA Compression Partners LP/USA Compression Finance Corp.: | | | | | | | | | | | | |
| 6.875% Sr. Unsec. Nts., 4/1/26 | | | | | | | 486,000 | | | | 506,655 | |
| 6.875% Sr. Unsec. Nts., 9/1/271 | | | | | | | 481,000 | | | | 499,038 | |
| Valaris plc: | | | | | | | | | | | | |
| 5.20% Sr. Unsec. Nts., 3/15/25 | | | | | | | 481,000 | | | | 264,550 | |
| 7.75% Sr. Unsec. Nts., 2/1/26 | | | | | | | 164,000 | | | | 88,593 | |
| | | | | | | | | | | | |
| | | | | | | | | | | 10,055,556 | |
99 INVESCO OPPENHEIMER GLOBAL STRATEGIC INCOME FUND
CONSOLIDATED SCHEDULE OF INVESTMENTSContinued
| | | | | | | | | | | | |
| | | | | | Principal Amount | | | Value | |
Oil, Gas & Consumable Fuels—4.3% | | | | | | | | | | | | |
| Aker BP ASA, 4.75% Sr. Unsec. Nts., 6/15/241 | | | | | | $ | 680,000 | | | $ | 711,960 | |
| Antero Resources Corp.: | | | | | | | | | | | | |
| 5.125% Sr. Unsec. Nts., 12/1/22 | | | | | | | 296,000 | | | | 261,220 | |
| 5.375% Sr. Unsec. Nts., 11/1/21 | | | | | | | 695,000 | | | | 675,019 | |
| Ascent Resources Utica Holdings LLC/ARU Finance Corp., 10.00% Sr. Unsec. Nts., 4/1/221 | | | | | | | 1,785,000 | | | | 1,793,389 | |
| Blue Racer Midstream LLC/Blue Racer Finance Corp., 6.625% Sr. Unsec. Nts., 7/15/261 | | | | | | | 803,000 | | | | 796,977 | |
| Calfrac Holdings LP, 8.50% Sr. Unsec. Nts., 6/15/261 | | | | | | | 503,000 | | | | 226,350 | |
| California Resources Corp.: | | | | | | | | | | | | |
| 5.00% Sr. Unsec. Nts., 1/15/20 | | | | | | | 1,035,000 | | | | 962,550 | |
| 8.00% Sec. Nts., 12/15/221 | | | | | | | 781,000 | | | | 390,500 | |
| Callon Petroleum Co., 6.375% Sr. Unsec. Nts., 7/1/26 | | | | | | | 2,478,000 | | | | 2,430,546 | |
| Calumet Specialty Products Partners LP/Calumet Finance Corp.: | | | | | | | | | | | | |
| 6.50% Sr. Unsec. Nts., 4/15/21 | | | | | | | 442,000 | | | | 442,851 | |
| 7.625% Sr. Unsec. Nts., 1/15/22 | | | | | | | 1,591,000 | | | | 1,543,270 | |
| Carrizo Oil & Gas, Inc.: | | | | | | | | | | | | |
| 6.25% Sr. Unsec. Nts., 4/15/23 | | | | | | | 160,000 | | | | 152,400 | |
| 8.25% Sr. Unsec. Nts., 7/15/25 | | | | | | | 324,000 | | | | 319,010 | |
| Centennial Resource Production LLC: | | | | | | | | | | | | |
| 5.375% Sr. Unsec. Nts., 1/15/261 | | | | | | | 160,000 | | | | 153,600 | |
| 6.875% Sr. Unsec. Nts., 4/1/271 | | | | | | | 2,332,000 | | | | 2,337,830 | |
| Cheniere Corpus Christi Holdings LLC: | | | | | | | | | | | | |
| 5.125% Sr. Sec. Nts., 6/30/27 | | | | | | | 662,000 | | | | 726,545 | |
| 7.00% Sr. Sec. Nts., 6/30/24 | | | | | | | 777,000 | | | | 894,521 | |
| Chesapeake Energy Corp.: | | | | | | | | | | | | |
| 7.00% Sr. Unsec. Nts., 10/1/24 | | | | | | | 194,000 | | | | 139,922 | |
| 7.50% Sr. Unsec. Nts., 10/1/26 | | | | | | | 268,000 | | | | 183,580 | |
| 8.00% Sr. Unsec. Nts., 3/15/261 | | | | | | | 297,000 | | | | 204,930 | |
| 8.00% Sr. Unsec. Nts., 6/15/27 | | | | | | | 450,000 | | | | 304,875 | |
| CITGO Petroleum Corp., 6.25% Sr. Sec. Nts., 8/15/221 | | | | | | | 195,000 | | | | 197,925 | |
| CNX Resources Corp., 5.875% Sr. Unsec. Nts., 4/15/22 | | | | | | | 323,000 | | | | 311,695 | |
| Comstock Resources, Inc., 9.75% Sr. Unsec. Nts., 8/15/26 | | | | | | | 459,000 | | | | 385,560 | |
| Cosan Ltd., 5.50% Sr. Unsec. Nts., 9/20/291 | | | | | | | 4,070,000 | | | | 4,180,907 | |
| Crestwood Midstream Partners LP/Crestwood Midstream Finance Corp.: | | | | | | | | | | | | |
| 5.625% Sr. Unsec. Nts., 5/1/271 | | | | | | | 1,321,000 | | | | 1,351,964 | |
| 5.75% Sr. Unsec. Nts., 4/1/25 | | | | | | | 185,000 | | | | 191,012 | |
| 6.25% Sr. Unsec. Nts., 4/1/23 | | | | | | | 211,000 | | | | 217,594 | |
| CrownRock LP/CrownRock Finance, Inc., 5.625% Sr. Unsec. Nts., 10/15/251 | | | | | | | 805,000 | | | | 813,034 | |
| DCP Midstream Operating LP: | | | | | | | | | | | | |
| 4.75% Sr. Unsec. Nts., 9/30/211 | | | | | | | 695,000 | | | | 714,112 | |
| 5.125% Sr. Unsec. Nts., 5/15/29 | | | | | | | 315,000 | | | | 321,300 | |
| Denbury Resources, Inc.: | | | | | | | | | | | | |
| 9.00% Sec. Nts., 5/15/211 | | | | | | | 627,000 | | | | 584,677 | |
| 9.25% Sec. Nts., 3/31/221 | | | | | | | 403,000 | | | | 354,640 | |
| Energy Transfer Operating LP, 7.50% Sr. Unsec. Nts., 10/15/20 | | | | | | | 710,000 | | | | 746,315 | |
| EnLink Midstream LLC, 5.375% Sr. Unsec. Nts., 6/1/29 | | | | | | | 160,000 | | | | 153,200 | |
100 INVESCO OPPENHEIMER GLOBAL STRATEGIC INCOME FUND
| | | | | | | | | | | | |
| | | | | | Principal Amount | | | Value | |
Oil, Gas & Consumable Fuels (Continued) | | | | | | | | | | | | |
| EnLink Midstream Partners LP: | | | | | | | | | | | | |
| 4.40% Sr. Unsec. Nts., 4/1/24 | | | | | | $ | 160,000 | | | $ | 154,688 | |
| 5.60% Sr. Unsec. Nts., 4/1/44 | | | | | | | 280,000 | | | | 230,300 | |
| Enviva Partners LP/Enviva Partners Finance Corp., 8.50% Sr. Unsec. Nts., 11/1/21 | | | | | | | 1,174,000 | | | | 1,204,817 | |
| EP Energy LLC/Everest Acquisition Finance, Inc.: | | | | | | | | | | | | |
| 7.75% Sr. Sec. Nts., 5/15/261 | | | | | | | 1,018,000 | | | | 768,590 | |
| 8.00% Sr. Sec. Nts., 11/29/241 | | | | | | | 2,082,000 | | | | 806,775 | |
| Eterna Capital Pte Ltd., 7.5% PIK Rate, 0.00% Cash Rate, Sr. Sec. Nts., 12/11/221,14 | | | | | | | 3,365,052 | | | | 3,167,350 | |
| Eterna Capital Pte Ltd., 8% PIK Rate, 0.00 Cash Rate, Sr. Sec. Nts., 12/11/2214 | | | | | | | 4,032,500 | | | | 2,907,433 | |
| Genesis Energy LP/Genesis Energy Finance Corp.: | | | | | | | | | | | | |
| 6.25% Sr. Unsec. Nts., 5/15/26 | | | | | | | 1,208,000 | | | | 1,168,740 | |
| 6.50% Sr. Unsec. Nts., 10/1/25 | | | | | | | 620,000 | | | | 606,825 | |
| 6.75% Sr. Unsec. Nts., 8/1/22 | | | | | | | 285,000 | | | | 290,230 | |
| Golden Nugget, Inc., 8.75% Sr. Sub. Nts., 10/1/251 | | | | | | | 1,323,000 | | | | 1,382,535 | |
| Gulfport Energy Corp.: | | | | | | | | | | | | |
| 6.00% Sr. Unsec. Nts., 10/15/24 | | | | | | | 1,050,000 | | | | 764,767 | |
| 6.375% Sr. Unsec. Nts., 5/15/25 | | | | | | | 324,000 | | | | 231,660 | |
| 6.625% Sr. Unsec. Nts., 5/1/23 | | | | | | | 3,135,000 | | | | 2,460,975 | |
| Hess Infrastructure Partners LP/Hess Infrastructure Partners Finance Corp., 5.625% Sr. Unsec. Nts., 2/15/261 | | | | | | | 405,000 | | | | 425,250 | |
| HighPoint Operating Corp., 8.75% Sr. Unsec. Nts., 6/15/25 | | | | | | | 216,000 | | | | 194,400 | |
| Hilcorp Energy I LP/Hilcorp Finance Co., 5.75% Sr. Unsec. Nts., 10/1/251 | | | | | | | 315,000 | | | | 294,525 | |
| Holly Energy Partners LP/Holly Energy Finance Corp., 6.00% Sr. Unsec. Nts., 8/1/241 | | | | | | | 710,000 | | | | 744,612 | |
| Indigo Natural Resources LLC, 6.875% Sr. Unsec. Nts., 2/15/261 | | | | | | | 465,000 | | | | 421,406 | |
| KazTransGas JSC, 4.375% Sr. Unsec. Nts., 9/26/271 | | | | | | | 4,645,000 | | | | 4,878,500 | |
| Kinder Morgan Energy Partners LP, 3.45% Sr. Unsec. Nts., 2/15/23 | | | | | | | 3,545,000 | | | | 3,658,419 | |
| Laredo Petroleum, Inc.: | | | | | | | | | | | | |
| 5.625% Sr. Unsec. Nts., 1/15/22 | | | | | | | 685,000 | | | | 647,325 | |
| 6.25% Sr. Unsec. Nts., 3/15/23 | | | | | | | 132,000 | | | | 116,490 | |
| MEG Energy Corp.: | | | | | | | | | | | | |
| 6.50% Sec. Nts., 1/15/251 | | | | | | | 803,000 | | | | 822,071 | |
| 7.00% Sr. Unsec. Nts., 3/31/241 | | | | | | | 192,000 | | | | 186,240 | |
| Murray Energy Corp., 3% PIK Rate, 9% Cash Rate, Sec. Nts., 4/15/241,14 | | | | | | | 5,744,632 | | | | 71,808 | |
| MV24 Capital BV, 6.748% Sr. Sec. Nts., 6/1/341 | | | | | | | 2,155,000 | | | | 2,228,378 | |
| Nabors Industries, Inc., 5.75% Sr. Unsec. Nts., 2/1/25 | | | | | | | 685,000 | | | | 510,325 | |
| Newfield Exploration Co., 5.625% Sr. Unsec. Nts., 7/1/24 | | | | | | | 730,000 | | | | 806,558 | |
| NGL Energy Partners LP/NGL Energy Finance Corp.: | | | | | | | | | | | | |
| 6.125% Sr. Unsec. Nts., 3/1/25 | | | | | | | 1,087,000 | | | | 1,040,803 | |
| 7.50% Sr. Unsec. Nts., 11/1/23 | | | | | | | 338,000 | | | | 346,028 | |
| NGPL PipeCo LLC: | | | | | | | | | | | | |
| 4.375% Sr. Unsec. Nts., 8/15/221 | | | | | | | 640,000 | | | | 663,859 | |
101 INVESCO OPPENHEIMER GLOBAL STRATEGIC INCOME FUND
CONSOLIDATED SCHEDULE OF INVESTMENTSContinued
| | | | | | | | | | |
| | | | | Principal Amount | | | Value | |
Oil, Gas & Consumable Fuels (Continued) | | | | | | | | | | |
| NGPL PipeCo LLC: (Continued) 4.875% Sr. Unsec. Nts., 8/15/271 | | | | $ | 457,000 | | | $ | 490,714 | |
| NuStar Logistics LP: | | | | | | | | | | |
| 4.80% Sr. Unsec. Nts., 9/1/20 | | | | | 695,000 | | | | 709,769 | |
| 6.00% Sr. Unsec. Nts., 6/1/26 | | | | | 680,000 | | | | 737,664 | |
| Oasis Petroleum, Inc., 6.875% Sr. Unsec. Nts., 1/15/23 | | | | | 2,940,000 | | | | 2,704,800 | |
| Occidental Petroleum Corp., 2.70% Sr. Unsec. Nts., 8/15/22 | | | | | 2,100,000 | | | | 2,119,250 | |
| Parkland Fuel Corp., 6.00% Sr. Unsec. Nts., 4/1/261 | | | | | 700,000 | | | | 742,000 | |
| Parsley Energy LLC/Parsley Finance Corp., 5.625% Sr. Unsec. Nts., 10/15/271 | | | | | 1,065,000 | | | | 1,104,938 | |
| PBF Holding Co. LLC/PBF Finance Corp.: | | | | | | | | | | |
| 7.00% Sr. Unsec. Nts., 11/15/23 | | | | | 435,000 | | | | 450,772 | |
| 7.25% Sr. Unsec. Nts., 6/15/25 | | | | | 488,000 | | | | 507,520 | |
| PBF Logistics LP/PBF Logistics Finance Corp., 6.875% Sr. Unsec. Nts., 5/15/23 | | | | | 474,000 | | | | 489,699 | |
| PDC Energy, Inc., 5.75% Sr. Unsec. Nts., 5/15/26 | | | | | 657,000 | | | | 648,853 | |
| Peabody Energy Corp.: | | | | | | | | | | |
| 6.00% Sr. Sec. Nts., 3/31/221 | | | | | 366,000 | | | | 369,660 | |
| 6.375% Sr. Sec. Nts., 3/31/251 | | | | | 648,000 | | | | 641,928 | |
| Pertamina Persero PT, 3.65% Sr. Unsec. Nts., 7/30/291 | | | | | 3,490,000 | | | | 3,590,347 | |
| Petrobras Global Finance BV: | | | | | | | | | | |
| 6.85% Sr. Unsec. Nts., 6/5/15 | | | | | 520,000 | | | | 595,504 | |
| 6.90% Sr. Unsec. Nts., 3/19/49 | | | | | 3,145,000 | | | | 3,613,605 | |
| Petroleos Mexicanos: | | | | | | | | | | |
| 3.75% Sr. Unsec. Nts., 4/16/261 | | EUR | | | 3,560,000 | | | | 3,902,898 | |
| 6.49% Sr. Unsec. Nts., 1/23/271 | | | | | 2,115,000 | | | | 2,207,320 | |
| 6.84% Sr. Unsec. Nts., 1/23/301 | | | | | 4,929,000 | | | | 5,106,198 | |
| 7.69% Sr. Unsec. Nts., 1/23/501 | | | | | 5,209,000 | | | | 5,444,968 | |
| Puma International Financing SA, 5.00% Sr. Unsec. Nts., 1/24/261 | | | | | 2,600,000 | | | | 2,463,356 | |
| QEP Resources, Inc.: | | | | | | | | | | |
| 5.625% Sr. Unsec. Nts., 3/1/26 | | | | | 2,450,000 | | | | 2,119,250 | |
| 6.875% Sr. Unsec. Nts., 3/1/21 | | | | | 695,000 | | | | 693,263 | |
| Range Resources Corp.: | | | | | | | | | | |
| 5.00% Sr. Unsec. Nts., 3/15/23 | | | | | 322,000 | | | | 282,555 | |
| 5.75% Sr. Unsec. Nts., 6/1/21 | | | | | 695,000 | | | | 693,263 | |
| Reliance Industries Ltd.: | | | | | | | | | | |
| 6.78% Unsec. Nts., 9/16/20 | | INR | | | 180,000,000 | | | | 2,554,674 | |
| 7.00% Unsec. Nts., 8/31/22 | | INR | | | 540,000,000 | | | | 7,737,291 | |
| Sanchez Energy Corp.: | | | | | | | | | | |
| 6.125% Sr. Unsec. Nts., 1/15/23 | | | | | 807,000 | | | | 54,473 | |
| 7.25% Sr. Sec. Nts., 2/15/231 | | | | | 322,000 | | | | 233,450 | |
| 7.75% Sr. Unsec. Nts., 6/15/21 | | | | | 1,169,000 | | | | 75,985 | |
| SemGroup Corp./Rose Rock Finance Corp.: | | | | | | | | | | |
| 5.625% Sr. Unsec. Nts., 7/15/22 | | | | | 308,000 | | | | 314,163 | |
| 5.625% Sr. Unsec. Nts., 11/15/23 | | | | | 745,000 | | | | 766,419 | |
| SM Energy Co.: | | | | | | | | | | |
| 6.625% Sr. Unsec. Nts., 1/15/27 | | | | | 2,775,000 | | | | 2,400,375 | |
| 6.75% Sr. Unsec. Nts., 9/15/26 | | | | | 427,000 | | | | 375,760 | |
102 INVESCO OPPENHEIMER GLOBAL STRATEGIC INCOME FUND
| | | | | | | | | | |
| | | | | Principal Amount | | | Value | |
Oil, Gas & Consumable Fuels (Continued) | | | | | | | | | | |
| Southern Gas Corridor CJSC, 6.875% Sr. Unsec. Nts., 3/24/261 | | | | $ | 7,215,000 | | | $ | 8,387,221 | |
| Southwestern Energy Co.: | | | | | | | | | | |
| 6.20% Sr. Unsec. Nts., 1/23/25 | | | | | 162,000 | | | | 144,180 | |
| 7.50% Sr. Unsec. Nts., 4/1/26 | | | | | 1,415,000 | | | | 1,238,125 | |
| SRC Energy, Inc., 6.25% Sr. Unsec. Nts., 12/1/25 | | | | | 443,000 | | | | 440,776 | |
| State Oil Co. of the Azerbaijan Republic, 4.75% Sr. Unsec. Nts., 3/13/231 | | | | | 3,475,000 | | | | 3,614,459 | |
| Summit Midstream Holdings LLC/Summit Midstream Finance Corp., 5.75% Sr. Unsec. Nts., 4/15/25 | | | | | 1,124,000 | | | | 954,501 | |
| Sunoco LP/Sunoco Finance Corp.: | | | | | | | | | | |
| 4.875% Sr. Unsec. Nts., 1/15/23 | | | | | 409,000 | | | | 420,759 | |
| 5.50% Sr. Unsec. Nts., 2/15/26 | | | | | 217,000 | | | | 227,019 | |
| 5.875% Sr. Unsec. Nts., 3/15/28 | | | | | 491,000 | | | | 522,301 | |
| 6.00% Sr. Unsec. Nts., 4/15/27 | | | | | 322,000 | | | | 342,125 | |
| Tallgrass Energy Partners LP/Tallgrass Energy Finance Corp.: | | | | | | | | | | |
| 5.50% Sr. Unsec. Nts., 9/15/241 | | | | | 699,000 | | | | 699,000 | |
| 5.50% Sr. Unsec. Nts., 1/15/281 | | | | | 291,000 | | | | 285,878 | |
| Targa Resources Partners LP/Targa Resources Partners Finance Corp.: | | | | | | | | | | |
| 5.00% Sr. Unsec. Nts., 1/15/28 | | | | | 453,000 | | | | 459,251 | |
| 5.875% Sr. Unsec. Nts., 4/15/26 | | | | | 1,400,000 | | | | 1,484,000 | |
| 6.50% Sr. Unsec. Nts., 7/15/271 | | | | | 319,000 | | | | 348,855 | |
| Terraform Global Operating LLC, 6.125% Sr. Unsec. Nts., 3/1/261 | | | | | 976,000 | | | | 1,005,280 | |
| Transcanada Trust, 5.875% [US0003M+464] Jr. Sub. Nts., 8/15/762 | | | | | 3,545,000 | | | | 3,755,502 | |
| Transocean, Inc., 7.50% Sr. Unsec. Nts., 1/15/261 | | | | | 328,000 | | | | 292,740 | |
| Whiting Petroleum Corp.: | | | | | | | | | | |
| 5.75% Sr. Unsec. Nts., 3/15/21 | | | | | 296,000 | | | | 283,799 | |
| 6.625% Sr. Unsec. Nts., 1/15/26 | | | | | 2,305,000 | | | | 1,567,400 | |
| WPX Energy, Inc., 8.25% Sr. Unsec. Nts., 8/1/23 | | | | | 205,000 | | | | 231,650 | |
| | | | | | | | | | |
| | | | | | | | | 144,025,967 | |
Financials—10.0% | | | | | | | | | | |
Capital Markets—1.2% | | | | | | | | | | |
| Credit Suisse Group AG: | | | | | | | | | | |
| 7.50% [USSW5+460] Jr. Sub. Perpetual Bonds1,2,17 | | | | | 2,440,000 | | | | 2,609,494 | |
| 7.50% [USSW5+459.8] Jr. Sub. Perpetual Bonds1,2,17 | | | | | 10,330,000 | | | | 11,441,033 | |
| Prime Security Services Borrower LLC/Prime Finance, Inc., 9.25% Sec. Nts., 5/15/231 | | | | | 2,031,000 | | | | 2,138,999 | |
| UBS Group Funding Switzerland AG: | | | | | | | | | | |
| 6.875% [USISDA05+549.65] Jr. Sub. Perpetual Bonds1,2,17 | | | | | 11,105,000 | | | | 11,549,866 | |
| 7.00% [USSW5+486.6] Jr. Sub. Perpetual Bonds1,2,17 | | | | | 5,245,000 | | | | 5,767,192 | |
| 7.125% [USSW5+588.3] Jr. Sub. Perpetual Bonds1,2,17 | | | | | 5,426,000 | | | | 5,704,083 | |
| | | | | | | | | | |
| | | | | | | | | 39,210,667 | |
Commercial Banks—4.8% | | | | | | | | | | |
| Banca Monte dei Paschi di Siena SpA, 5.375% [EUSA5+500.5] Sub. Nts., 1/18/281,2 | | EUR | | | 5,405,000 | | | | 4,286,081 | |
103 INVESCO OPPENHEIMER GLOBAL STRATEGIC INCOME FUND
CONSOLIDATED SCHEDULE OF INVESTMENTSContinued
| | | | | | | | | | |
| | | | | Principal Amount | | | Value | |
Commercial Banks (Continued) | | | | | | | | | | |
| Banco Bilbao Vizcaya Argentaria SA: | | | | | | | | | | |
| 6.00% [EUSA5+603.9] Jr. Sub. Perpetual Bonds1,2,17 | | EUR | | | 4,060,000 | | | $ | 4,759,746 | |
| 8.875% [EUSA5+917.7] Jr. Sub. Perpetual Bonds1,2,17 | | EUR | | | 4,305,000 | | | | 5,198,104 | |
| Banco Comercial Portugues SA: | | | | | | | | | | |
| 4.50% [EUSA5+426.7] Sub. Nts., 12/7/271,2 | | EUR | | | 1,700,000 | | | | 1,926,511 | |
| 9.25% [EUSA5+941.4] Jr. Sub. Perpetual Bonds1,2,17 | | EUR | | | 1,747,000 | | | | 2,071,298 | |
| Banco do Brasil SA (Cayman): | | | | | | | | | | |
| 3.875% Sr. Unsec. Nts., 10/10/22 | | | | | 3,650,000 | | | | 3,727,599 | |
| 4.75% Sr. Unsec. Nts., 3/20/241 | | | | | 2,562,000 | | | | 2,691,381 | |
| Banco Mercantil del Norte SA (Grand Cayman), 7.625% [H15T10Y+535.3] Jr. Sub. Perpetual Bonds1,2,17 | | | | | 969,000 | | | | 992,023 | |
| Banco Santander SA: | | | | | | | | | | |
| 5.25% [EUSA5+499.9] Jr. Sub. Perpetual Bonds1,2,17 | | EUR | | | 2,600,000 | | | | 2,931,117 | |
| 6.75% [EUSA5+680.3] Jr. Sub. Perpetual Bonds1,2,17 | | EUR | | | 10,710,000 | | | | 12,708,582 | |
| Banco Votorantim SA, 4.50% Sr. Unsec. Nts., 9/24/241 | | | | | 3,500,000 | | | | 3,602,813 | |
| Bangkok Bank PCL (Hong Kong), 3.733% [H15T5Y+190] Sub. Nts., 9/25/341,2 | | | | | 3,500,000 | | | | 3,558,505 | |
| Bank of China Ltd., 5.00% Sub. Nts., 11/13/241 | | | | | 3,535,000 | | | | 3,853,934 | |
| Bankinter SA, 8.625% [EUSA5+886.7] Jr. Sub. Perpetual Bonds1,2,17 | | EUR | | | 3,255,000 | | | | 3,962,275 | |
| Barclays plc: | | | | | | | | | | |
| 2.00% [EUSA5+190] Sub. Nts., 2/7/281,2 | | EUR | | | 3,495,000 | | | | 3,782,289 | |
| 7.875% [USSW5+677.2] Jr. Sub. Perpetual Bonds1,2,17 | | | | | 3,140,000 | | | | 3,328,733 | |
| 8.00% [H15T5Y+567.2] Jr. Sub. Perpetual Bonds2,17 | | | | | 3,480,000 | | | | 3,703,468 | |
| BBVA Bancomer SA, 5.875% [H15T5Y+430.8] Sub. Nts., 9/13/341,2 | | | | | 5,200,000 | | | | 5,180,500 | |
| BNP Paribas SA: | | | | | | | | | | |
| 6.625% [USSW5+414.9] Jr. Sub. Perpetual Bonds1,2,17 | | | | | 2,835,000 | | | | 2,989,408 | |
| 7.625% [USSW5+631.4] Jr. Sub. Perpetual Bonds1,2,17 | | | | | 2,720,000 | | | | 2,867,152 | |
| 7.625% [USSW5+631.4] Jr. Sub. Perpetual Bonds1,2,17 | | | | | 6,835,000 | | | | 7,204,774 | |
| CaixaBank SA, 6.75% [EUSA5+649.8] Jr. Sub. Perpetual Bonds1,2,17 | | EUR | | | 4,270,000 | | | | 5,121,799 | |
| CIT Group, Inc.: | | | | | | | | | | |
| 4.125% Sr. Unsec. Nts., 3/9/21 | | | | | 1,150,000 | | | | 1,173,000 | |
| 5.00% Sr. Unsec. Nts., 8/15/22 | | | | | 350,000 | | | | 371,665 | |
| 5.25% Sr. Unsec. Nts., 3/7/25 | | | | | 690,000 | | | | 754,653 | |
| Commerzbank AG, 7.00% [USSW5+522.8] Jr. Sub. Perpetual Bonds1,2,17 | | | | | 3,600,000 | | | | 3,715,830 | |
| Cooperatieve Rabobank UA, 6.625% [EUSA5+669.7] Jr. Sub. Perpetual Bonds1,2,17 | | EUR | | | 7,085,000 | | | | 8,434,175 | |
| Credit Agricole SA: | | | | | | | | | | |
| 6.875% [USSW5+431.9] Jr. Sub. Perpetual Bonds1,2,17 | | | | | 1,725,000 | | | | 1,855,608 | |
| 7.875% [USSW5+489.8] Jr. Sub. Perpetual Bonds1,2,17 | | | | | 3,540,000 | | | | 3,958,163 | |
| Credit Suisse AG, 6.50% Sub. Nts., 8/8/231 | | | | | 7,080,000 | | | | 7,901,733 | |
| Global Bank Corp., 5.25% [US0003M+330] Sr. Unsec. Nts., 4/16/291,2 | | | | | 4,810,000 | | | | 5,108,220 | |
| HSBC Holdings plc: | | | | | | | | | | |
| 5.25% [EUSA5+438.3] Jr. Sub. Perpetual Bonds1,2,17 | | EUR | | | 2,510,000 | | | | 2,947,797 | |
| 6.00% [EUSA5+533.8] Jr. Sub. Perpetual Bonds1,2,17 | | EUR | | | 2,995,000 | | | | 3,719,177 | |
104 INVESCO OPPENHEIMER GLOBAL STRATEGIC INCOME FUND
| | | | | | | | | | | | |
| | | | | | Principal Amount | | | Value | |
Commercial Banks (Continued) | | | | | | | | | | | | |
| Icahn Enterprises LP/Icahn Enterprises Finance Corp., 6.375% Sr. Unsec. Nts., 12/15/25 | | | | | | $ | 569,000 | | | $ | 599,733 | |
| Lions Gate Capital Holdings LLC, 6.375% Sr. Unsec. Nts., 2/1/241 | | | | | | | 690,000 | | | | 731,317 | |
| Lloyds Bank plc, 7.50% Sr. Unsec. Nts., 4/2/321,7 | | | | | | | 7,175,000 | | | | 5,948,730 | |
| Novo Banco SA, 8.50% [EUSA5+823.3] Sub. Nts., 7/6/281,2 | | | EUR | | | | 1,745,000 | | | | 2,043,360 | |
| Societe Generale SA, 7.375% [USSW5+623.8] Jr. Sub. Perpetual Bonds1,2,17 | | | | | | | 11,225,000 | | | | 11,837,885 | |
| Standard Chartered plc, 7.75% [USSW5+572.3] Jr. Sub. Perpetual Bonds1,2,17 | | | | | | | 8,745,000 | | | | 9,456,275 | |
| | | | | | | | | | | | |
| | | | | | | | | | | 161,005,413 | |
Consumer Finance—0.4% | | | | | | | | | | | | |
| Ally Financial, Inc.: | | | | | | | | | | | | |
| 3.875% Sr. Unsec. Nts., 5/21/24 | | | | | | | 830,000 | | | | 860,959 | |
| 4.625% Sr. Unsec. Nts., 5/19/22 | | | | | | | 555,000 | | | | 577,200 | |
| 4.625% Sr. Unsec. Nts., 3/30/25 | | | | | | | 692,000 | | | | 747,360 | |
| 5.125% Sr. Unsec. Nts., 9/30/24 | | | | | | | 555,000 | | | | 606,337 | |
| 5.75% Sub. Nts., 11/20/25 | | | | | | | 1,158,000 | | | | 1,301,326 | |
| 8.00% Sr. Unsec. Nts., 11/1/31 | | | | | | | 527,000 | | | | 731,212 | |
| Navient Corp.: | | | | | | | | | | | | |
| 5.875% Sr. Unsec. Nts., 10/25/24 | | | | | | | 913,000 | | | | 924,413 | |
| 6.50% Sr. Unsec. Nts., 6/15/22 | | | | | | | 659,000 | | | | 703,483 | |
| 6.625% Sr. Unsec. Nts., 7/26/21 | | | | | | | 682,000 | | | | 717,805 | |
| 6.75% Sr. Unsec. Nts., 6/25/25 | | | | | | | 863,000 | | | | 892,126 | |
| 6.75% Sr. Unsec. Nts., 6/15/26 | | | | | | | 486,000 | | | | 498,296 | |
| Springleaf Finance Corp.: | | | | | | | | | | | | |
| 6.125% Sr. Unsec. Nts., 5/15/22 | | | | | | | 867,000 | | | | 932,025 | |
| 6.125% Sr. Unsec. Nts., 3/15/24 | | | | | | | 641,000 | | | | 691,479 | |
| 6.625% Sr. Unsec. Nts., 1/15/28 | | | | | | | 993,000 | | | | 1,070,255 | |
| 6.875% Sr. Unsec. Nts., 3/15/25 | | | | | | | 643,000 | | | | 710,113 | |
| 7.125% Sr. Unsec. Nts., 3/15/26 | | | | | | | 962,000 | | | | 1,068,974 | |
| 8.25% Sr. Unsec. Nts., 12/15/20 | | | | | | | 753,000 | | | | 801,945 | |
| | | | | | | | | | | | |
| | | | | | | | | | | 13,835,308 | |
Diversified Financial Services—1.1% | | | | | | | | | | | | |
| Astana Finance JSC, 9.16% Sr. Unsec. Nts., 12/22/248,15 | | | | | | | 1,186,225 | | | | — | |
| Banco Invex SA/Hipotecaria Credito y Casa SA de CV, 6.45%, 3/13/348,9,15 | | | MXN | | | | 17,961,653 | | | | — | |
| Docuformas SAPI de CV, 10.25% Sr. Unsec. Nts., 7/24/241 | | | | | | | 835,000 | | | | 826,191 | |
| Freedom Mortgage Corp.: | | | | | | | | | | | | |
| 8.125% Sr. Unsec. Nts., 11/15/241 | | | | | | | 493,000 | | | | 456,025 | |
| 8.25% Sr. Unsec. Nts., 4/15/251 | | | | | | | 891,000 | | | | 821,947 | |
| Greenko Mauritius Ltd., 6.25% Sr. Unsec. Nts., 2/21/231 | | | | | | | 3,500,000 | | | | 3,551,087 | |
| Icahn Enterprises LP/Icahn Enterprises Finance Corp.: | | | | | | | | | | | | |
| 5.875% Sr. Unsec. Nts., 2/1/22 | | | | | | | 416,000 | | | | 421,460 | |
| 6.25% Sr. Unsec. Nts., 5/15/261 | | | | | | | 405,000 | | | | 425,250 | |
| JP Morgan/Hipotecaria su Casita, 6.47%, 8/26/351 | | | MXN | | | | 20,232,960 | | | | 112,895 | |
105 INVESCO OPPENHEIMER GLOBAL STRATEGIC INCOME FUND
CONSOLIDATED SCHEDULE OF INVESTMENTSContinued
| | | | | | | | | | | | |
| | | | | | Principal Amount | | | Value | |
Diversified Financial Services (Continued) | | | | | | | | | | | | |
| Lions Gate Capital Holdings LLC, 5.875% Sr. Unsec. Nts., 11/1/241 | | | | | | $ | 873,000 | | | $ | 901,372 | |
| National Bank for Agriculture & Rural Development, 8.39% Sr. Unsec. Nts., 7/19/21 | | | INR | | | | 145,000,000 | | | | 2,095,408 | |
| PetSmart, Inc., 7.125% Sr. Unsec. Nts., 3/15/231 | | | | | | | 695,000 | | | | 656,775 | |
| Power Finance Corp. Ltd.: | | | | | | | | | | | | |
| 7.27% Sr. Unsec. Nts., 12/22/21 | | | INR | | | | 360,000,000 | | | | 5,071,226 | |
| 7.42% Sr. Unsec. Nts., 6/26/20 | | | INR | | | | 107,000,000 | | | | 1,515,820 | |
| 7.50% Sr. Unsec. Nts., 8/16/21 | | | INR | | | | 360,000,000 | | | | 5,093,042 | |
| Quicken Loans, Inc.: | | | | | | | | | | | | |
| 5.25% Sr. Unsec. Nts., 1/15/281 | | | | | | | 425,000 | | | | 440,194 | |
| 5.75% Sr. Unsec. Nts., 5/1/251 | | | | | | | 401,000 | | | | 415,536 | |
| Rio Oil Finance Trust Series2014-1, 9.25% Sr. Sec. Nts., 7/6/241 | | | | | | | 414,324 | | | | 464,047 | |
| Rural Electrification Corp. Ltd.: | | | | | | | | | | | | |
| 7.24% Sr. Unsec. Nts., 10/21/21 | | | INR | | | | 360,000,000 | | | | 5,078,813 | |
| 7.60% Sr. Unsec. Nts., 4/17/21 | | | INR | | | | 350,000,000 | | | | 4,968,974 | |
| Swiss Insured Brazil Power Finance Sarl, 9.85% Sr. Sec. Nts., 7/16/321 | | | BRL | | | | 12,250,000 | | | | 3,346,310 | |
| Venator Finance Sarl/Venator Materials LLC, 5.75% Sr. Unsec. Nts., 7/15/251 | | | | | | | 697,000 | | | | 590,707 | |
| | | | | | | | | | | | |
| | | | | | | | | | | 37,253,079 | |
Insurance—0.5% | | | | | | | | | | | | |
| AXA SA, 3.875% [EUSA11+325] Jr. Sub. Perpetual Bonds1,2,17 | | | EUR | | | | 2,695,000 | | | | 3,310,100 | |
| Caisse Nationale de Reassurance Mutuelle Agricole Groupama, 6.375% [EUR003M+577] Jr. Sub. Perpetual Bonds1,2,17 | | | EUR | | | | 3,500,000 | | | | 4,458,119 | |
| Fidelity & Guaranty Life Holdings, Inc., 5.50% Sr. Unsec. Nts., 5/1/251 | | | | | | | 621,000 | | | | 669,127 | |
| NN Group NV, 4.375% [EUR003M+390] Jr. Sub. Perpetual Bonds1,2,17 | | | EUR | | | | 3,535,000 | | | | 4,226,230 | |
| VIVAT NV, 6.25% [USSW5+417.4] Jr. Sub. Perpetual Bonds1,2,17 | | | | | | | 3,535,000 | | | | 3,550,282 | |
| | | | | | | | | | | | |
| | | | | | | | | | | 16,213,858 | |
Real Estate Investment Trusts (REITs)—0.7% | | | | | | | | | | | | |
| Brookfield Property REIT, Inc./BPR Cumulus LLC/BPR Nimbus LLC/GGSI Sellco LL, 5.75% Sr. Sec. Nts., 5/15/261 | | | | | | | 615,000 | | | | 644,981 | |
| CoreCivic, Inc.: | | | | | | | | | | | | |
| 4.625% Sr. Unsec. Nts., 5/1/23 | | | | | | | 281,000 | | | | 273,663 | |
| 5.00% Sr. Unsec. Nts., 10/15/22 | | | | | | | 160,000 | | | | 160,200 | |
| Equinix, Inc.: | | | | | | | | | | | | |
| 5.375% Sr. Unsec. Nts., 5/15/27 | | | | | | | 824,000 | | | | 890,435 | |
| 5.875% Sr. Unsec. Nts., 1/15/26 | | | | | | | 2,155,000 | | | | 2,298,114 | |
| GLP Capital LP/GLP Financing II, Inc., 5.375% Sr. Unsec. Nts., 11/1/23 | | | | | | | 481,000 | | | | 522,121 | |
| Iron Mountain US Holdings, Inc., 5.375% Sr. Unsec. Nts., 6/1/261 | | | | | | | 2,515,000 | | | | 2,603,025 | |
106 INVESCO OPPENHEIMER GLOBAL STRATEGIC INCOME FUND
| | | | | | | | | | | | |
| | | | | | Principal Amount | | | Value | |
Real Estate Investment Trusts (REITs) (Continued) | | | | | | | | | | | | |
Iron Mountain, Inc.: | | | | | | | | | | | | |
| 4.875% Sr. Unsec. Nts., 9/15/271 | | | | | | $ | 488,000 | | | $ | 501,508 | |
| 4.875% Sr. Unsec. Nts., 9/15/291 | | | | | | | 1,043,000 | | | | 1,061,565 | |
iStar, Inc.: | | | | | | | | | | | | |
| 4.75% Sr. Unsec. Nts., 10/1/24 | | | | | | | 3,303,000 | | | | 3,364,931 | |
| 5.25% Sr. Unsec. Nts., 9/15/22 | | | | | | | 988,000 | | | | 1,011,465 | |
| 6.00% Sr. Unsec. Nts., 4/1/22 | | | | | | | 1,314,000 | | | | 1,356,179 | |
MGM Growth Properties Operating Partnership LP/MGP Finance Co.-Issuer, Inc.: | | | | | | | | | | | | |
| 5.625% Sr. Unsec. Nts., 5/1/24 | | | | | | | 1,039,000 | | | | 1,142,900 | |
| 5.75% Sr. Unsec. Nts., 2/1/271 | | | | | | | 319,000 | | | | 358,572 | |
MPT Operating Partnership LP/MPT Finance Corp.: | | | | | | | | | | | | |
| 4.625% Sr. Unsec. Nts., 8/1/29 | | | | | | | 2,695,000 | | | | 2,780,903 | |
| 5.00% Sr. Unsec. Nts., 10/15/27 | | | | | | | 238,000 | | | | 249,900 | |
| 6.375% Sr. Unsec. Nts., 3/1/24 | | | | | | | 250,000 | | | | 262,385 | |
| Outfront Media Capital LLC/Outfront Media Capital Corp., 5.875% Sr. Unsec. Nts., 3/15/25 | | | | | | | 588,000 | | | | 608,580 | |
SBA Communications Corp., 4.00% Sr. Unsec. Nts., 10/1/22 | | | | | | | 812,000 | | | | 832,300 | |
Starwood Property Trust, Inc.: | | | | | | | | | | | | |
| 4.75% Sr. Unsec. Nts., 3/15/25 | | | | | | | 819,000 | | | | 849,139 | |
| 5.00% Sr. Unsec. Nts., 12/15/21 | | | | | | | 805,000 | | | | 839,213 | |
| | | | | | | | | | | | |
| | | | | | | | | | | 22,612,079 | |
Real Estate Management & Development—1.2% | | | | | | | | | | | | |
| Agile Group Holdings Ltd., 9.00% Sr. Sec. Nts., 5/21/201 | | | | | | | 6,610,000 | | | | 6,749,215 | |
| China Aoyuan Group Ltd., 7.50% Sr. Sec. Nts., 5/10/211 | | | | | | | 1,499,000 | | | | 1,532,658 | |
CIFI Holdings Group Co. Ltd.: | | | | | | | | | | | | |
| 6.375% Sr. Unsec. Nts., 5/2/201 | | | | | | | 3,495,000 | | | | 3,521,212 | |
| 7.625% Sr. Unsec. Nts., 3/2/211 | | | | | | | 9,746,000 | | | | 10,062,513 | |
| Country Garden Holdings Co. Ltd., 7.50% Sr. Sec. Nts., 3/9/201 | | | | | | | 3,915,000 | | | | 3,975,683 | |
| Forestar Group, Inc., 8.00% Sr. Unsec. Nts., 4/15/241 | | | | | | | 695,000 | | | | 754,075 | |
| Greystar Real Estate Partners LLC, 5.75% Sr. Sec. Nts., 12/1/251 | | | | | | | 802,000 | | | | 827,062 | |
Times China Holdings Ltd.: | | | | | | | | | | | | |
| 6.25% Sr. Sec. Nts., 1/23/201 | | | | | | | 1,230,000 | | | | 1,234,405 | |
| 7.85% Sr. Sec. Nts., 6/4/211 | | | | | | | 11,518,000 | | | | 11,817,450 | |
| Yuzhou Properties Co. Ltd., 6.375% Sr. Sec. Nts., 3/6/211 | | | | | | | 1,499,000 | | | | 1,500,464 | |
| | | | | | | | | | | | |
| | | | | | | | | | | 41,974,737 | |
Thrifts & Mortgage Finance—0.1% | | | | | | | | | | | | |
| LIC Housing Finance Ltd., 7.45% Sr. Sec. Nts., 10/17/22 | | | INR | | | | 180,000,000 | | | | 2,546,888 | |
| Nationstar Mortgage Holdings, Inc., 8.125% Sr. Unsec. Nts., 7/15/231 | | | | | | | 526,000 | | | | 549,670 | |
| Radian Group, Inc., 4.50% Sr. Unsec. Nts., 10/1/24 | | | | | | | 606,000 | | | | 628,725 | |
| | | | | | | | | | | | |
| | | | | | | | | | | 3,725,283 | |
Health Care—1.4% | | | | | | | | | | | | |
Health Care Equipment & Supplies—0.0% | | | | | | | | | | | | |
| Hill-Rom Holdings, Inc., 5.75% Sr. Unsec. Nts., 9/1/231 | | | | | | | 616,000 | | | | 633,987 | |
107 INVESCO OPPENHEIMER GLOBAL STRATEGIC INCOME FUND
CONSOLIDATED SCHEDULE OF INVESTMENTSContinued
| | | | | | | | | | | | |
| | | | | | Principal Amount | | | Value | |
Health Care Equipment & Supplies (Continued) | | | | | | | | | | | | |
| Hologic, Inc., 4.375% Sr. Unsec. Nts., 10/15/251 | | | | | | $ | 497,000 | | | $ | 511,910 | |
| | | | | | | | | | | | |
| | | | | | | | | | | 1,145,897 | |
Health Care Providers & Services—1.0% | | | | | | | | | | | | |
Acadia Healthcare Co., Inc.: | | | | | | | | | | | | |
| 5.625% Sr. Unsec. Nts., 2/15/23 | | | | | | | 259,000 | | | | 265,151 | |
| 6.50% Sr. Unsec. Nts., 3/1/24 | | | | | | | 338,000 | | | | 353,210 | |
Centene Corp.: | | | | | | | | | | | | |
| 4.75% Sr. Unsec. Nts., 5/15/22 | | | | | | | 763,000 | | | | 781,274 | |
| 5.375% Sr. Unsec. Nts., 6/1/261 | | | | | | | 1,945,000 | | | | 2,042,250 | |
| 6.125% Sr. Unsec. Nts., 2/15/24 | | | | | | | 650,000 | | | | 678,568 | |
CHS/Community Health Systems, Inc.: | | | | | | | | | | | | |
| 6.25% Sr. Sec. Nts., 3/31/23 | | | | | | | 1,416,000 | | | | 1,411,894 | |
| 6.875% Sr. Unsec. Nts., 2/1/22 | | | | | | | 423,000 | | | | 323,066 | |
| 8.00% Sr. Sec. Nts., 3/15/261 | | | | | | | 643,000 | | | | 643,000 | |
DaVita, Inc.: | | | | | | | | | | | | |
| 5.00% Sr. Unsec. Nts., 5/1/25 | | | | | | | 324,000 | | | | 324,000 | |
| 5.125% Sr. Unsec. Nts., 7/15/24 | | | | | | | 1,487,000 | | | | 1,514,881 | |
| Encompass Health Corp., 5.75% Sr. Unsec. Nts., 11/1/24 | | | | | | | 262,000 | | | | 265,720 | |
HCA, Inc.: | | | | | | | | | | | | |
| 4.125% Sr. Sec. Nts., 6/15/29 | | | | | | | 2,045,000 | | | | 2,145,438 | |
| 5.375% Sr. Unsec. Nts., 2/1/25 | | | | | | | 1,745,000 | | | | 1,910,775 | |
| 5.375% Sr. Unsec. Nts., 9/1/26 | | | | | | | 2,775,000 | | | | 3,055,830 | |
| 5.50% Sr. Sec. Nts., 6/15/47 | | | | | | | 1,000,000 | | | | 1,132,240 | |
| 5.625% Sr. Unsec. Nts., 9/1/28 | | | | | | | 1,446,000 | | | | 1,614,893 | |
| 5.875% Sr. Unsec. Nts., 2/15/26 | | | | | | | 324,000 | | | | 363,042 | |
| 7.50% Sr. Unsec. Nts., 2/15/22 | | | | | | | 1,221,000 | | | | 1,356,287 | |
| MPH Acquisition Holdings LLC, 7.125% Sr. Unsec. Nts., 6/1/241 | | | | | | | 930,000 | | | | 861,413 | |
| Omnicare, Inc., 4.75% Sr. Unsec. Nts., 12/1/22 | | | | | | | 5,295,000 | | | | 5,650,462 | |
| RegionalCare Hospital Partners Holdings, Inc./LifePoint Health, Inc., 9.75% Sr. Unsec. Nts., 12/1/261 | | | | | | | 737,000 | | | | 790,359 | |
Tenet Healthcare Corp.: | | | | | | | | | | | | |
| 5.125% Sr. Sec. Nts., 11/1/271 | | | | | | | 3,375,000 | | | | 3,491,775 | |
| 6.25% Sec. Nts., 2/1/271 | | | | | | | 319,000 | | | | 332,127 | |
| 6.75% Sr. Unsec. Nts., 6/15/23 | | | | | | | 1,328,000 | | | | 1,399,619 | |
| 8.125% Sr. Unsec. Nts., 4/1/22 | | | | | | | 805,000 | | | | 874,431 | |
| | | | | | | | | | | | |
| | | | | | | | | | | 33,581,705 | |
Pharmaceuticals—0.4% | | | | | | | | | | | | |
| Bausch Health Americas, Inc., 8.50% Sr. Unsec. Nts., 1/31/271 | | | | | | | 817,000 | | | | 918,962 | |
Bausch Health Cos., Inc.: | | | | | | | | | | | | |
| 5.50% Sr. Sec. Nts., 11/1/251 | | | | | | | 1,675,000 | | | | 1,758,918 | |
| 5.75% Sr. Sec. Nts., 8/15/271 | | | | | | | 695,000 | | | | 752,914 | |
| 6.125% Sr. Unsec. Nts., 4/15/251 | | | | | | | 708,000 | | | | 736,320 | |
| 7.00% Sr. Sec. Nts., 3/15/241 | | | | | | | 1,535,000 | | | | 1,617,061 | |
| 7.00% Sr. Unsec. Nts., 1/15/281 | | | | | | | 301,000 | | | | 324,960 | |
| 7.25% Sr. Unsec. Nts., 5/30/291 | | | | | | | 301,000 | | | | 329,535 | |
| 9.00% Sr. Unsec. Nts., 12/15/251 | | | | | | | 1,152,000 | | | | 1,297,440 | |
108 INVESCO OPPENHEIMER GLOBAL STRATEGIC INCOME FUND
| | | | | | | | | | | | |
| | | | | | Principal Amount | | | Value | |
Pharmaceuticals (Continued) | | | | | | | �� | | | | | |
| Endo Dac/Endo Finance LLC/Endo Finco, Inc., 5.875% Sr. Sec. Nts., 10/15/241 | | | | | | $ | 710,000 | | | $ | 631,900 | |
| Par Pharmaceutical, Inc., 7.50% Sr. Sec. Nts., 4/1/271 | | | | | | | 1,875,000 | | | | 1,710,937 | |
| Prestige Brands, Inc., 6.375% Sr. Unsec. Nts., 3/1/241 | | | | | | | 845,000 | | | | 883,025 | |
| Teva Pharmaceutical Finance Co. BV, 3.65% Sr. Unsec. Nts., 11/10/21 | | | | | | | 423,000 | | | | 392,861 | |
Teva Pharmaceutical Finance Netherlands III BV: | | | | | | | | | | | | |
| 3.15% Sr. Unsec. Nts., 10/1/26 | | | | | | | 270,000 | | | | 189,675 | |
| 6.00% Sr. Unsec. Nts., 4/15/24 | | | | | | | 951,000 | | | | 823,209 | |
| | | | | | | | | | | | |
| | | | | | | | | | | 12,367,717 | |
Industrials—2.3% | | | | | | | | | | | | |
Aerospace & Defense—0.3% | | | | | | | | | | | | |
Arconic, Inc.: | | | | | | | | | | | | |
| 5.125% Sr. Unsec. Nts., 10/1/24 | | | | | | | 657,000 | | | | 700,175 | |
| 5.40% Sr. Unsec. Nts., 4/15/21 | | | | | | | 590,000 | | | | 610,582 | |
| 6.15% Sr. Unsec. Nts., 8/15/20 | | | | | | | 695,000 | | | | 716,566 | |
Bombardier, Inc.: | | | | | | | | | | | | |
| 6.00% Sr. Unsec. Nts., 10/15/221 | | | | | | | 497,000 | | | | 498,864 | |
| 7.50% Sr. Unsec. Nts., 12/1/241 | | | | | | | 969,000 | | | | 974,814 | |
| 7.50% Sr. Unsec. Nts., 3/15/251 | | | | | | | 664,000 | | | | 665,660 | |
| 7.875% Sr. Unsec. Nts., 4/15/271 | | | | | | | 643,000 | | | | 641,939 | |
| Embraer Netherlands Finance BV, 5.40% Sr. Unsec. Nts., 2/1/27 | | | | | | | 1,391,000 | | | | 1,578,799 | |
TransDigm, Inc.: | | | | | | | | | | | | |
| 6.25% Sr. Sec. Nts., 3/15/261 | | | | | | | 690,000 | | | | 742,612 | |
| 6.375% Sr. Sub. Nts., 6/15/26 | | | | | | | 1,590,000 | | | | 1,677,450 | |
| 6.50% Sr. Sub. Nts., 7/15/24 | | | | | | | 1,420,000 | | | | 1,469,700 | |
| Triumph Group, Inc., 5.25% Sr. Unsec. Nts., 6/1/22 | | | | | | | 590,000 | | | | 589,764 | |
| | | | | | | | | | | | |
| | | | | | | | | | | 10,866,925 | |
Air Freight & Couriers—0.2% | | | | | | | | | | | | |
| Algeco Global Finance plc, 8.00% Sr. Sec. Nts., 2/15/231 | | | | | | | 326,000 | | | | 326,913 | |
| Allison Transmission, Inc., 5.875% Sr. Unsec. Nts., 6/1/291 | | | | | | | 322,000 | | | | 350,175 | |
| Rumo Luxembourg Sarl, 5.875% Sr. Unsec. Nts., 1/18/251 | | | | | | | 3,475,000 | | | | 3,672,675 | |
XPO Logistics, Inc.: | | | | | | | | | | | | |
| 6.125% Sr. Unsec. Nts., 9/1/231 | | | | | | | 1,390,000 | | | | 1,438,650 | |
| 6.75% Sr. Unsec. Nts., 8/15/241 | | | | | | | 643,000 | | | | 697,655 | |
| | | | | | | | | | | | |
| | | | | | | | | | | 6,486,068 | |
Airlines—0.1% | | | | | | | | | | | | |
American Airlines Group, Inc.: | | | | | | | | | | | | |
| 4.625% Sr. Unsec. Nts., 3/1/201 | | | | | | | 756,000 | | | | 763,560 | |
| 5.00% Sr. Unsec. Nts., 6/1/221 | | | | | | | 1,261,000 | | | | 1,310,936 | |
| Gol Finance SA, 7.00% Sr. Unsec. Nts., 1/31/251 | | | | | | | 1,240,000 | | | | 1,215,200 | |
United Continental Holdings, Inc.: | | | | | | | | | | | | |
| 4.25% Sr. Unsec. Nts., 10/1/22 | | | | | | | 988,000 | | | | 1,023,123 | |
109 INVESCO OPPENHEIMER GLOBAL STRATEGIC INCOME FUND
CONSOLIDATED SCHEDULE OF INVESTMENTSContinued
| | | | | | | | | | | | |
| | | | | | Principal Amount | | | Value | |
Airlines (Continued) | | | | | | | | | | | | |
United Continental Holdings, Inc.: (Continued) | | | | | | | | | | | | |
4.875% Sr. Unsec. Nts., 1/15/25 | | | | | | $ | 791,000 | | | $ | 834,189 | |
| | | | | | | | | | | | |
| | | | | | | | | | | 5,147,008 | |
Building Products—0.2% | | | | | | | | | | | | |
| Advanced Drainage Systems, Inc., 5.00% Sr. Sec. Nts., 9/30/271 | | | | | | | 384,000 | | | | 390,236 | |
| Builders FirstSource, Inc., 6.75% Sr. Sec. Nts., 6/1/271 | | | | | | | 170,000 | | | | 184,025 | |
| Cornerstone Building Brands, Inc., 8.00% Sr. Unsec. Nts., 4/15/261 | | | | | | | 659,000 | | | | 650,762 | |
| Masonite International Corp., 5.375% Sr. Unsec. Nts., 2/1/281 | | | | | | | 2,015,000 | | | | 2,108,194 | |
Standard Industries, Inc.: | | | | | | | | | | | | |
| 5.375% Sr. Unsec. Nts., 11/15/241 | | | | | | | 1,032,000 | | | | 1,066,830 | |
| 6.00% Sr. Unsec. Nts., 10/15/251 | | | | | | | 812,000 | | | | 855,410 | |
| William Lyon Homes, Inc., 6.00% Sr. Unsec. Nts., 9/1/23 | | | | | | | 1,405,000 | | | | 1,468,225 | |
| | | | | | | | | | | | |
| | | | | | | | | | | 6,723,682 | |
Commercial Services & Supplies—0.3% | | | | | | | | | | | | |
| ACCO Brands Corp., 5.25% Sr. Unsec. Nts., 12/15/241 | | | | | | | 1,261,000 | | | | 1,308,287 | |
| ADT Security Corp. (The), 6.25% Sr. Sec. Nts., 10/15/21 | | | | | | | 1,040,000 | | | | 1,112,800 | |
| Brink’s Co. (The), 4.625% Sr. Unsec. Nts., 10/15/271 | | | | | | | 2,080,000 | | | | 2,096,926 | |
| Clean Harbors, Inc., 4.875% Sr. Unsec. Nts., 7/15/271 | | | | | | | 665,000 | | | | 695,756 | |
Covanta Holding Corp.: | | | | | | | | | | | | |
| 5.875% Sr. Unsec. Nts., 7/1/25 | | | | | | | 385,000 | | | | 402,806 | |
| 6.00% Sr. Unsec. Nts., 1/1/27 | | | | | | | 599,000 | | | | 633,442 | |
| Murphy Oil USA, Inc., 4.75% Sr. Unsec. Nts., 9/15/29 | | | | | | | 1,109,000 | | | | 1,136,725 | |
| Resideo Funding, Inc., 6.125% Sr. Unsec. Nts., 11/1/261 | | | | | | | 627,000 | | | | 663,053 | |
| RR Donnelley & Sons Co., 7.875% Sr. Unsec. Nts., 3/15/21 | | | | | | | 939,000 | | | | 974,213 | |
West Corp.: | | | | | | | | | | | | |
| 5.375% Sr. Unsec. Nts., 7/15/221 | | | | | | | 1,815,000 | | | | 1,735,594 | |
| 8.50% Sr. Unsec. Nts., 10/15/251 | | | | | | | 484,000 | | | | 391,435 | |
| | | | | | | | | | | | |
| | | | | | | | | | | 11,151,037 | |
Construction & Engineering—0.2% | | | | | | | | | | | | |
| AECOM, 5.125% Sr. Unsec. Nts., 3/15/27 | | | | | | | 1,420,000 | | | | 1,498,100 | |
| GMR Hyderabad International Airport Ltd., 5.375% Sr. Sec. Nts., 4/10/241 | | | | | | | 3,475,000 | | | | 3,577,648 | |
| New Enterprise Stone & Lime Co., Inc., 6.25% Sr. Sec. Nts., 3/15/261 | | | | | | | 405,000 | | | | 415,125 | |
| Zekelman Industries, Inc., 9.875% Sr. Sec. Nts., 6/15/231 | | | | | | | 144,000 | | | | 151,830 | |
| | | | | | | | | | | | |
| | | | | | | | | | | 5,642,703 | |
Electrical Equipment—0.1% | | | | | | | | | | | | |
| Sensata Technologies BV, 5.625% Sr. Unsec. Nts., 11/1/241 | | | | | | | 708,000 | | | | 773,490 | |
| Vertiv Group Corp., 9.25% Sr. Unsec. Nts., 10/15/241 | | | | | | | 738,000 | | | | 714,938 | |
Vertiv Intermediate Holding Corp., 13% PIK Rate, 12% Cash Rate, Sr. Unsec. Nts., 2/15/221,14 | | | | | | | 641,000 | | | | 577,701 | |
| | | | | | | | | | | | |
| | | | | | | | | | | 2,066,129 | |
110 INVESCO OPPENHEIMER GLOBAL STRATEGIC INCOME FUND
| | | | | | | | | | | | |
| | | | | | Principal Amount | | | Value | |
Industrial Conglomerates—0.1% | | | | | | | | | | | | |
| Ahern Rentals, Inc., 7.375% Sec. Nts., 5/15/231 | | | | | | $ | 715,000 | | | $ | 612,218 | |
| Brand Industrial Services, Inc., 8.50% Sr. Unsec. Nts., 7/15/251 | | | | | | | 694,000 | | | | 662,770 | |
| CVR Refining LLC/Coffeyville Finance, Inc., 6.50% Sr. Unsec. Nts., 11/1/22 | | | | | | | 1,272,000 | | | | 1,289,490 | |
| Icahn Enterprises LP/Icahn Enterprises Finance Corp., 6.75% Sr. Unsec. Nts., 2/1/24 | | | | | | | 641,000 | | | | 669,044 | |
| | | | | | | | | | | | |
| | | | | | | | | | | 3,233,522 | |
Machinery—0.2% | | | | | | | | | | | | |
| Allison Transmission, Inc., 5.00% Sr. Unsec. Nts., 10/1/241 | | | | | | | 1,455,000 | | | | 1,489,556 | |
| Amsted Industries, Inc., 5.625% Sr. Unsec. Nts., 7/1/271 | | | | | | | 680,000 | | | | 719,100 | |
| Colfax Corp.: | | | | | | | | | | | | |
| 6.00% Sr. Unsec. Nts., 2/15/241 | | | | | | | 638,000 | | | | 677,620 | |
| 6.375% Sr. Unsec. Nts., 2/15/261 | | | | | | | 319,000 | | | | 343,623 | |
| IHS Netherlands Holdco BV, 8.00% Sr. Unsec. Nts., 9/18/271 | | | | | | | 2,000,000 | | | | 2,047,500 | |
| JB Poindexter & Co., Inc., 7.125% Sr. Unsec. Nts., 4/15/261 | | | | | | | 1,215,000 | | | | 1,263,600 | |
| | | | | | | | | | | | |
| | | | | | | | | | | 6,540,999 | |
Professional Services—0.0% | | | | | | | | | | | | |
| Nielsen Finance LLC/Nielsen Finance Co., 5.00% Sr. Unsec. Nts., 4/15/221 | | | | | | | 829,000 | | | | 835,466 | |
Road & Rail—0.3% | | | | | | | | | | | | |
| Avis Budget Car Rental LLC/Avis Budget Finance, Inc., 5.75% Sr. Unsec. Nts., 7/15/271 | | | | | | | 1,005,000 | | | | 1,039,371 | |
| DAE Funding LLC: | | | | | | | | | | | | |
| 4.00% Sr. Unsec. Nts., 8/1/201 | | | | | | | 328,000 | | | | 330,870 | |
| 4.50% Sr. Unsec. Nts., 8/1/221 | | | | | | | 629,000 | | | | 640,007 | |
| Fideicomiso PA Pacifico Tres, 8.25% Sr. Sec. Nts., 1/15/351 | | | | | | | 1,255,000 | | | | 1,430,700 | |
| Kenan Advantage Group, Inc. (The), 7.875% Sr. Unsec. Nts., 7/31/231 | | | | | | | 619,000 | | | | 557,100 | |
| Rumo Luxembourg Sarl, 7.375% Sr. Unsec. Nts., 2/9/241 | | | | | | | 3,475,000 | | | | 3,748,691 | |
| Uber Technologies, Inc.: | | | | | | | | | | | | |
| 7.50% Sr. Unsec. Nts., 11/1/231 | | | | | | | 319,000 | | | | 322,190 | |
| 8.00% Sr. Unsec. Nts., 11/1/261 | | | | | | | 319,000 | | | | 323,785 | |
| United Rentals North America, Inc., 5.25% Sr. Unsec. Nts., 1/15/30 | | | | | | | 695,000 | | | | 731,057 | |
| | | | | | | | | | | | |
| | | | | | | | | | | 9,123,771 | |
Trading Companies & Distributors—0.3% | | | | | | | | | | | | |
| Fly Leasing Ltd., 5.25% Sr. Unsec. Nts., 10/15/24 | | | | | | | 618,000 | | | | 639,630 | |
| Fortress Transportation & Infrastructure Investors LLC, 6.75% Sr. Unsec. Nts., 3/15/221 | | | | | | | 690,000 | | | | 722,775 | |
| H&E Equipment Services, Inc., 5.625% Sr. Unsec. Nts., 9/1/25 | | | | | | | 1,950,000 | | | | 2,014,643 | |
| United Rentals North America, Inc.: | | | | | | | | | | | | |
| 4.875% Sr. Unsec. Nts., 1/15/28 | | | | | | | 811,000 | | | | 846,481 | |
| 5.875% Sr. Unsec. Nts., 9/15/26 | | | | | | | 2,700,000 | | | | 2,889,135 | |
111 INVESCO OPPENHEIMER GLOBAL STRATEGIC INCOME FUND
CONSOLIDATED SCHEDULE OF INVESTMENTSContinued
| | | | | | | | | | | | |
| | | | | | Principal Amount | | | Value | |
Trading Companies & Distributors (Continued) | | | | | | | | | | | | |
United Rentals North America, Inc.: (Continued) 6.50% Sr. Unsec. Nts., 12/15/26 | | | | | | $ | 1,380,000 | | | $ | 1,508,685 | |
| | | | | | | | | | | | |
| | | | | | | | | | | 8,621,349 | |
Transportation Infrastructure—0.0% | | | | | | | | | | | | |
| Jasa Marga Persero Tbk PT, 7.50% Sr. Unsec. Nts., 12/11/201 | | | IDR | | | | 24,180,000,000 | | | | 1,673,151 | |
Information Technology—1.0% | | | | | | | | | | | | |
Communications Equipment—0.1% | | | | | | | | | | | | |
| CommScope Technologies LLC, 6.00% Sr. Unsec. Nts., 6/15/251 | | | | | | | 2,560,000 | | | | 2,323,200 | |
| Gogo Intermediate Holdings LLC/Gogo Finance Co., Inc., 9.875% Sr. Sec. Nts., 5/1/241 | | | | | | | 695,000 | | | | 745,387 | |
| Hughes Satellite Systems Corp.: | | | | | | | | | | | | |
| 5.25% Sr. Sec. Nts., 8/1/26 | | | | | | | 585,000 | | | | 628,144 | |
| 6.625% Sr. Unsec. Nts., 8/1/26 | | | | | | | 590,000 | | | | 641,896 | |
| Plantronics, Inc., 5.50% Sr. Unsec. Nts., 5/31/231 | | | | | | | 636,000 | | | | 639,180 | |
| ViaSat, Inc.: | | | | | | | | | | | | |
| 5.625% Sr. Unsec. Nts., 9/15/251 | | | | | | | 328,000 | | | | 332,100 | |
| 5.625% Sr. Sec. Nts., 4/15/271 | | | | | | | 481,000 | | | | 506,253 | |
| | | | | | | | | | | | |
| | | | | | | | | | | 5,816,160 | |
Electronic Equipment, Instruments, & Components—0.1% | | | | | | | | | | | | |
| CDW LLC/CDW Finance Corp., 5.00% Sr. Unsec. Nts., 9/1/23 | | | | | | | 518,000 | | | | 531,416 | |
| MTS Systems Corp., 5.75% Sr. Unsec. Nts., 8/15/271 | | | | | | | 1,360,000 | | | | 1,417,800 | |
| TTM Technologies, Inc., 5.625% Sr. Unsec. Nts., 10/1/251 | | | | | | | 823,000 | | | | 825,058 | |
| | | | | | | | | | | | |
| | | | | | | | | | | 2,774,274 | |
IT Services—0.1% | | | | | | | | | | | | |
| Exela Intermediate LLC/Exela Finance, Inc., 10.00% Sr. Sec. Nts., 7/15/231 | | | | | | | 817,000 | | | | 459,563 | |
| Gartner, Inc., 5.125% Sr. Unsec. Nts., 4/1/251 | | | | | | | 999,000 | | | | 1,047,701 | |
| Harland Clarke Holdings Corp.: | | | | | | | | | | | | |
| 6.875% Sr. Sec. Nts., 3/1/201 | | | | | | | 658,000 | | | | 651,420 | |
| 8.375% Sr. Sec. Nts., 8/15/221 | | | | | | | 464,000 | | | | 382,800 | |
| VeriSign, Inc., 4.75% Sr. Unsec. Nts., 7/15/27 | | | | | | | 516,000 | | | | 542,445 | |
| | | | | | | | | | | | |
| | | | | | | | | | | 3,083,929 | |
Semiconductors & Semiconductor Equipment—0.1% | | | | | | | | | | | | |
| Micron Technology, Inc., 4.663% Sr. Unsec. Nts., 2/15/30 | | | | | | | 1,345,000 | | | | 1,403,668 | |
| Qorvo, Inc., 5.50% Sr. Unsec. Nts., 7/15/26 | | | | | | | 1,012,000 | | | | 1,071,455 | |
| Versum Materials, Inc., 5.50% Sr. Unsec. Nts., 9/30/241 | | | | | | | 335,000 | | | | 357,613 | |
| | | | | | | | | | | | |
| | | | | | | | | | | 2,832,736 | |
Software—0.2% | | | | | | | | | | | | |
| Banff Merger Sub, Inc., 9.75% Sr. Unsec. Nts., 9/1/261 | | | | | | | 879,000 | | | | 843,401 | |
| Informatica LLC, 7.125% Sr. Unsec. Nts., 7/15/231 | | | | | | | 1,002,000 | | | | 1,022,040 | |
| j2 Cloud Services LLC/j2 Global Co.-Obligor, Inc., 6.00% Sr. Unsec. Nts., 7/15/251 | | | | | | | 990,000 | | | | 1,049,004 | |
112 INVESCO OPPENHEIMER GLOBAL STRATEGIC INCOME FUND
| | | | | | | | | | | | |
| | | | | | Principal Amount | | | Value | |
Software (Continued) | | | | | | | | | | | | |
| Symantec Corp.: | | | | | | | | | | | | |
| 4.20% Sr. Unsec. Nts., 9/15/20 | | | | | | $ | 610,000 | | | $ | 617,774 | |
| 5.00% Sr. Unsec. Nts., 4/15/251 | | | | | | | 641,000 | | | | 648,558 | |
| TIBCO Software, Inc., 11.375% Sr. Unsec. Nts., 12/1/211 | | | | | | | 752,000 | | | | 785,135 | |
| Veritas US, Inc./Veritas Bermuda Ltd., 7.50% Sr. Sec. Nts., 2/1/231 | | | | | | | 1,053,000 | | | | 1,046,095 | |
| | | | | | | | | | | | |
| | | | | | | | | | | 6,012,007 | |
Technology Hardware, Storage & Peripherals—0.4% | | | | | | | | | | | | |
| Dell International LLC/EMC Corp.: | | | | | | | | | | | | |
| 4.42% Sr. Sec. Nts., 6/15/211 | | | | | | | 7,084,000 | | | | 7,306,137 | |
| 7.125% Sr. Unsec. Nts., 6/15/241 | | | | | | | 1,720,000 | | | | 1,817,610 | |
| EMC Corp., 2.65% Sr. Unsec. Nts., 6/1/20 | | | | | | | 560,000 | | | | 560,262 | |
| Everi Payments, Inc., 7.50% Sr. Unsec. Nts., 12/15/251 | | | | | | | 981,000 | | | | 1,036,181 | |
| NCR Corp., 6.375% Sr. Unsec. Nts., 12/15/23 | | | | | | | 571,000 | | | | 588,130 | |
| Western Digital Corp., 4.75% Sr. Unsec. Nts., 2/15/26 | | | | | | | 864,000 | | | | 891,000 | |
| Xerox Corp., 2.80% Sr. Unsec. Nts., 5/15/20 | | | | | | | 645,000 | | | | 646,103 | |
| | | | | | | | | | | | |
| | | | | | | | | | | 12,845,423 | |
Materials—3.8% | | | | | | | | | | | | |
Chemicals—1.1% | | | | | | | | | | | | |
| Ashland LLC: | | | | | | | | | | | | |
| 4.75% Sr. Unsec. Nts., 8/15/22 | | | | | | | 690,000 | | | | 725,362 | |
| 6.875% Sr. Unsec. Nts., 5/15/43 | | | | | | | 396,000 | | | | 456,390 | |
| Blue Cube Spinco LLC, 9.75% Sr. Unsec. Nts., 10/15/23 | | | | | | | 319,000 | | | | 348,507 | |
| Celanese US Holdings LLC, 5.875% Sr. Unsec. Nts., 6/15/21 | | | | | | | 3,441,000 | | | | 3,633,774 | |
| CF Industries, Inc.: | | | | | | | | | | | | |
| 3.40% Sr. Sec. Nts., 12/1/211 | | | | | | | 6,265,000 | | | | 6,376,933 | |
| 5.15% Sr. Unsec. Nts., 3/15/34 | | | | | | | 423,000 | | | | 442,564 | |
| 5.375% Sr. Unsec. Nts., 3/15/44 | | | | | | | 266,000 | | | | 269,199 | |
| Chemours Co. (The), 6.625% Sr. Unsec. Nts., 5/15/23 | | | | | | | 411,000 | | | | 407,404 | |
| CVR Partners LP/CVR Nitrogen Finance Corp., 9.25% Sec. Nts., 6/15/231 | | | | | | | 500,000 | | | | 523,125 | |
| Element Solutions, Inc., 5.875% Sr. Unsec. Nts., 12/1/251 | | | | | | | 388,000 | | | | 408,021 | |
| Koppers, Inc., 6.00% Sr. Unsec. Nts., 2/15/251 | | | | | | | 413,000 | | | | 415,325 | |
| NOVA Chemicals Corp.: | | | | | | | | | | | | |
| 4.875% Sr. Unsec. Nts., 6/1/241 | | | | | | | 715,000 | | | | 737,951 | |
| 5.25% Sr. Unsec. Nts., 8/1/231 | | | | | | | 420,000 | | | | 426,300 | |
| OCP SA, 4.50% Sr. Unsec. Nts., 10/22/251 | | | | | | | 3,735,000 | | | | 3,935,756 | |
| Olin Corp.: | | | | | | | | | | | | |
| 5.00% Sr. Unsec. Nts., 2/1/30 | | | | | | | 333,000 | | | | 334,782 | |
| 5.125% Sr. Unsec. Nts., 9/15/27 | | | | | | | 312,000 | | | | 320,580 | |
| 5.625% Sr. Unsec. Nts., 8/1/29 | | | | | | | 1,685,000 | | | | 1,757,118 | |
| Orbia Advance Corp. SAB de CV, 4.875% Sr. Unsec. Nts., 9/19/221 | | | | | | | 3,545,000 | | | | 3,722,285 | |
| PQ Corp.: | | | | | | | | | | | | |
| 5.75% Sr. Unsec. Nts., 12/15/251 | | | | | | | 328,000 | | | | 339,480 | |
| 6.75% Sr. Sec. Nts., 11/15/221 | | | | | | | 690,000 | | | | 716,737 | |
113 INVESCO OPPENHEIMER GLOBAL STRATEGIC INCOME FUND
CONSOLIDATED SCHEDULE OF INVESTMENTSContinued
| | | | | | | | | | | | |
| | | | | | Principal Amount | | | Value | |
Chemicals (Continued) | | | | | | | | | | | | |
| Rain CII Carbon LLC/CII Carbon Corp., 7.25% Sec. Nts., 4/1/251 | | | | | | $ | 409,000 | | | $ | 392,640 | |
| Sociedad Quimica y Minera de Chile SA, 4.25% Sr. Unsec. Nts., 5/7/291 | | | | | | | 1,805,000 | | | | 1,926,386 | |
| Starfruit Finco BV/Starfruit US Holdco LLC: | | | | | | | | | | | | |
| 6.50% Sr. Unsec. Nts., 10/1/261 | | | EUR | | | | 3,545,000 | | | | 3,954,249 | |
| 8.00% Sr. Unsec. Nts., 10/1/261 | | | | | | | 599,000 | | | | 600,498 | |
| Tronox Finance plc, 5.75% Sr. Unsec. Nts., 10/1/251 | | | | | | | 657,000 | | | | 624,643 | |
| Tronox, Inc., 6.50% Sr. Unsec. Nts., 4/15/261 | | | | | | | 402,000 | | | | 384,915 | |
| Unigel Luxembourg SA, 8.75% Sr. Unsec. Nts., 10/1/261 | | | | | | | 2,850,000 | | | | 2,850,000 | |
| WR Grace & Co.-Conn, 5.125% Sr. Unsec. Nts., 10/1/211 | | | | | | | 595,000 | | | | 621,091 | |
| | | | | | | | | | | | |
| | | | | | | | | | | 37,652,015 | |
Construction Materials—0.2% | | | | | | | | | | | | |
| Cemex Finance LLC, 6.00% Sr. Sec. Nts., 4/1/241 | | | | | | | 3,475,000 | | | | 3,575,775 | |
| CIMPOR Financial Operations BV, 5.75% Sr. Unsec. Nts., 7/17/241 | | | | | | | 3,350,000 | | | | 2,520,875 | |
| | | | | | | | | | | | |
| | | | | | | | | | | 6,096,650 | |
Containers & Packaging—0.8% | | | | | | | | | | | | |
| ARD Finance SA, 7.875% PIK Rate, 7.875% Cash Rate, Sr. Sec. Nts., 9/15/2314 | | | | | | | 645,000 | | | | 667,575 | |
| ARD Securities Finance Sarl, 3% PIK Rate, 8.75% Cash Rate, Sr. Sec. Nts., 1/31/231,14 | | | | | | | 1,115,144 | | | | 1,159,750 | |
| Ardagh Packaging Finance plc/Ardagh Holdings USA, Inc.: | | | | | | | | | | | | |
| 4.125% Sr. Sec. Nts., 8/15/261 | | | | | | | 1,350,000 | | | | 1,361,812 | |
| 4.25% Sr. Sec. Nts., 9/15/221 | | | | | | | 282,000 | | | | 286,365 | |
| 4.625% Sr. Sec. Nts., 5/15/231 | | | | | | | 160,000 | | | | 164,200 | |
| 6.00% Sr. Unsec. Nts., 2/15/251 | | | | | | | 1,101,000 | | | | 1,153,958 | |
| Ball Corp., 4.375% Sr. Unsec. Nts., 12/15/20 | | | | | | | 4,150,000 | | | | 4,245,491 | |
| Berry Global, Inc., 4.875% Sr. Sec. Nts., 7/15/261 | | | | | | | 393,000 | | | | 407,207 | |
| Crown Americas LLC/Crown Americas Capital Corp. IV, 4.50% Sr. Unsec. Nts., 1/15/23 | | | | | | | 613,000 | | | | 645,182 | |
| Flex Acquisition Co., Inc.: | | | | | | | | | | | | |
| 6.875% Sr. Unsec. Nts., 1/15/251 | | | | | | | 219,000 | | | | 200,845 | |
| 7.875% Sr. Unsec. Nts., 7/15/261 | | | | | | | 648,000 | | | | 596,160 | |
| Graphic Packaging International LLC: | | | | | | | | | | | | |
| 4.75% Sr. Unsec. Nts., 4/15/21 | | | | | | | 3,540,000 | | | | 3,668,325 | |
| 4.875% Sr. Unsec. Nts., 11/15/22 | | | | | | | 615,000 | | | | 644,213 | |
| Greif, Inc., 6.50% Sr. Unsec. Nts., 3/1/271 | | | | | | | 399,000 | | | | 424,137 | |
| Intertape Polymer Group, Inc., 7.00% Sr. Unsec. Nts., 10/15/261 | | | | | | | 638,000 | | | | 666,710 | |
| LABL Escrow Issuer LLC, 6.75% Sr. Sec. Nts., 7/15/261 | | | | | | | 665,000 | | | | 692,847 | |
| Mauser Packaging Solutions Holding Co.: | | | | | | | | | | | | |
| 5.50% Sr. Sec. Nts., 4/15/241 | | | | | | | 405,000 | | | | 419,094 | |
| 7.25% Sr. Unsec. Nts., 4/15/251 | | | | | | | 645,000 | | | | 612,137 | |
| OI European Group BV, 4.00% Sr. Unsec. Nts., 3/15/231 | | | | | | | 1,420,000 | | | | 1,432,425 | |
| Owens-Brockway Glass Container, Inc., 5.00% Sr. Unsec. Nts., 1/15/221 | | | | | | | 629,000 | | | | 651,141 | |
114 INVESCO OPPENHEIMER GLOBAL STRATEGIC INCOME FUND
| | | | | | | | | | | | |
| | | | | | Principal Amount | | | Value | |
Containers & Packaging (Continued) | | | | | | | | | | | | |
| Plastipak Holdings, Inc., 6.25% Sr. Unsec. Nts., 10/15/251 | | | | | | $ | 1,122,000 | | | $ | 939,675 | |
| Reynolds Group Issuer, Inc./Reynolds Group Issuer LLC/Reynolds Group Issuer Luxembourg SA: | |
| 5.125% Sr. Sec. Nts., 7/15/231 | | | | | | | 872,000 | | | | 894,890 | |
| 7.00% Sr. Unsec. Nts., 7/15/241 | | | | | | | 948,000 | | | | 984,143 | |
| Sealed Air Corp.: | | | | | | | | | | | | |
| 4.875% Sr. Unsec. Nts., 12/1/221 | | | | | | | 666,000 | | | | 701,798 | |
| 6.875% Sr. Unsec. Nts., 7/15/331 | | | | | | | 326,000 | | | | 383,050 | |
| Trivium Packaging Finance BV: | | | | | | | | | | | | |
| 5.50% Sr. Sec. Nts., 8/15/261 | | | | | | | 335,000 | | | | 352,990 | |
| 8.50% Sr. Unsec. Nts., 8/15/271 | | | | | | | 335,000 | | | | 363,056 | |
| | | | | | | | | | | | |
| | | | | | | | | | | 24,719,176 | |
Metals & Mining—1.3% | | | | | | | | | | | | |
| Alcoa Nederland Holding BV: | | | | | | | | | | | | |
| 6.125% Sr. Unsec. Nts., 5/15/281 | | | | | | | 518,000 | | | | 552,913 | |
| 6.75% Sr. Unsec. Nts., 9/30/241 | | | | | | | 328,000 | | | | 345,630 | |
| 7.00% Sr. Unsec. Nts., 9/30/261 | | | | | | | 319,000 | | | | 347,720 | |
| Aleris International, Inc., 10.75% Sec. Nts., 7/15/231 | | | | | | | 324,000 | | | | 341,820 | |
| Allegheny Technologies, Inc.: | | | | | | | | | | | | |
| 5.95% Sr. Unsec. Nts., 1/15/21 | | | | | | | 695,000 | | | | 713,678 | |
| 7.875% Sr. Unsec. Nts., 8/15/23 | | | | | | | 322,000 | | | | 350,503 | |
| ArcelorMittal: | | | | | | | | | | | | |
| 6.125% Sr. Unsec. Nts., 6/1/25 | | | | | | | 3,490,000 | | | | 3,930,538 | |
| 6.75% Sr. Unsec. Nts., 3/1/41 | | | | | | | 315,000 | | | | 374,639 | |
| 7.00% Sr. Unsec. Nts., 10/15/39 | | | | | | | 345,000 | | | | 418,709 | |
| Cleveland-Cliffs, Inc.: | | | | | | | | | | | | |
| 5.75% Sr. Unsec. Nts., 3/1/25 | | | | | | | 361,000 | | | | 355,585 | |
| 5.875% Sr. Unsec. Nts., 6/1/271 | | | | | | | 578,000 | | | | 548,869 | |
| Corp. Nacional del Cobre de Chile, 3.00% Sr. Unsec. Nts., 9/30/291 | | | | | | | 2,775,000 | | | | 2,768,395 | |
| CSN Resources SA, 7.625% Sr. Unsec. Nts., 2/13/231 | | | | | | | 2,790,000 | | | | 2,919,037 | |
| Evraz plc, 5.375% Sr. Unsec. Nts., 3/20/231 | | | | | | | 5,215,000 | | | | 5,557,834 | |
| First Quantum Minerals Ltd.: | | | | | | | | | | | | |
| 7.00% Sr. Unsec. Nts., 2/15/211 | | | | | | | 182,000 | | | | 183,820 | |
| 7.25% Sr. Unsec. Nts., 4/1/231 | | | | | | | 3,674,000 | | | | 3,637,260 | |
| FMG Resources August 2006 Pty Ltd., 4.75% Sr. Unsec. Nts., 5/15/221 | | | | | | | 322,000 | | | | 331,660 | |
| Freeport-McMoRan, Inc.: | | | | | | | | | | | | |
| 3.55% Sr. Unsec. Nts., 3/1/22 | | | | | | | 398,000 | | | | 399,990 | |
| 4.55% Sr. Unsec. Nts., 11/14/24 | | | | | | | 285,000 | | | | 292,781 | |
| 5.40% Sr. Unsec. Nts., 11/14/34 | | | | | | | 1,455,000 | | | | 1,389,525 | |
| 5.45% Sr. Unsec. Nts., 3/15/43 | | | | | | | 287,000 | | | | 259,844 | |
| Hudbay Minerals, Inc., 7.625% Sr. Unsec. Nts., 1/15/251 | | | | | | | 940,000 | | | | 957,625 | |
| IAMGOLD Corp., 7.00% Sr. Unsec. Nts., 4/15/251 | | | | | | | 510,000 | | | | 536,775 | |
| Industrias Penoles SAB de CV, 5.65% Sr. Unsec. Nts., 9/12/491 | | | | | | | 2,200,000 | | | | 2,281,840 | |
| JSW Steel Ltd.: | | | | | | | | | | | | |
| 4.75% Sr. Unsec. Nts., 11/12/191 | | | | | | | 2,370,000 | | | | 2,372,685 | |
| 5.25% Sr. Unsec. Nts., 4/13/221 | | | | | | | 3,600,000 | | | | 3,650,302 | |
| 5.95% Sr. Unsec. Nts., 4/18/241 | | | | | | | 2,130,000 | | | | 2,202,390 | |
115 INVESCO OPPENHEIMER GLOBAL STRATEGIC INCOME FUND
CONSOLIDATED SCHEDULE OF INVESTMENTSContinued
| | | | | | | | | | | | |
| | | | | | Principal Amount | | | Value | |
Metals & Mining (Continued) | | | | | | | | | | | | |
| Kinross Gold Corp., 4.50% Sr. Unsec. Nts., 7/15/27 | | | | | | $ | 467,000 | | | $ | 490,924 | |
| Southern Copper Corp., 7.50% Sr. Unsec. Nts., 7/27/35 | | | | | | | 1,270,000 | | | | 1,704,975 | |
| SunCoke Energy Partners LP/SunCoke Energy Partners Finance Corp., 7.50% Sr. Unsec. Nts., 6/15/251 | | | | | | | 3,590,000 | | | | 3,208,563 | |
| | | | | | | | | | | | |
| | | | | | | | | | | 43,426,829 | |
Paper & Forest Products—0.4% | | | | | | | | | | | | |
| Boise Cascade Co., 5.625% Sr. Unsec. Nts., 9/1/241 | | | | | | | 1,598,000 | | | | 1,659,922 | |
| Louisiana-Pacific Corp., 4.875% Sr. Unsec. Nts., 9/15/24 | | | | | | | 2,579,000 | | | | 2,669,265 | |
| Mercer International, Inc.: | | | | | | | | | | | | |
| 5.50% Sr. Unsec. Nts., 1/15/26 | | | | | | | 655,000 | | | | 632,894 | |
| 6.50% Sr. Unsec. Nts., 2/1/24 | | | | | | | 315,000 | | | | 324,056 | |
| Norbord, Inc., 5.75% Sr. Sec. Nts., 7/15/271 | | | | | | | 1,841,000 | | | | 1,891,628 | |
| Suzano Austria GmbH, 5.00% Sr. Unsec. Nts., 1/15/30 | | | | | | | 6,965,000 | | | | 6,995,994 | |
| | | | | | | | | | | | |
| | | | | | | | | | | 14,173,759 | |
Telecommunication Services—1.7% | | | | | | | | | | | | |
Diversified Telecommunication Services—1.1% | | | | | | | | | | | | |
| Altice France SA: | | | | | | | | | | | | |
| 7.375% Sr. Sec. Nts., 5/1/261 | | | | | | | 1,157,000 | | | | 1,244,886 | |
| 8.125% Sr. Sec. Nts., 2/1/271 | | | | | | | 645,000 | | | | 713,531 | |
| Axtel SAB de CV, 6.375% Sr. Unsec. Nts., 11/14/241 | | | | | | | 3,550,000 | | | | 3,665,410 | |
| CenturyLink, Inc.: | | | | | | | | | | | | |
| 5.625% Sr. Unsec. Nts., 4/1/25 | | | | | | | 995,000 | | | | 1,034,800 | |
| Series S, 6.45% Sr. Unsec. Nts., 6/15/21 | | | | | | | 1,235,000 | | | | 1,299,837 | |
| Series Y, 7.50% Sr. Unsec. Nts., 4/1/24 | | | | | | | 1,815,000 | | | | 2,034,343 | |
| Cincinnati Bell, Inc., 8.00% Sr. Unsec. Nts., 10/15/251 | | | | | | | 710,000 | | | | 628,705 | |
| CommScope, Inc., 6.00% Sr. Sec. Nts., 3/1/261 | | | | | | | 3,280,000 | | | | 3,410,544 | |
| Frontier Communications Corp.: | | | | | | | | | | | | |
| 10.50% Sr. Unsec. Nts., 9/15/22 | | | | | | | 4,321,000 | | | | 2,001,163 | |
| 11.00% Sr. Unsec. Nts., 9/15/25 | | | | | | | 1,243,000 | | | | 567,896 | |
| GCI LLC, 6.625% Sr. Unsec. Nts., 6/15/241 | | | | | | | 340,000 | | | | 367,625 | |
| GTH Finance BV, 7.25% Sr. Unsec. Nts., 4/26/231 | | | | | | | 5,250,000 | | | | 5,867,936 | |
| HTA Group Ltd., 9.125% Sr. Unsec. Nts., 3/8/221 | | | | | | | 3,925,000 | | | | 4,102,724 | |
| iHeartCommunications, Inc., 5.25% Sr. Sec. Nts., 8/15/271 | | | | | | | 1,345,000 | | | | 1,402,163 | |
| Inmarsat Finance plc, 4.875% Sr. Unsec. Nts., 5/15/221 | | | | | | | 560,000 | | | | 569,626 | |
| Level 3 Financing, Inc., 5.25% Sr. Unsec. Nts., 3/15/26 | | | | | | | 2,850,000 | | | | 2,970,698 | |
| Oi SA, 10% Cash Rate or 4% PIK Rate and 8% Cash Rate, Sr. Unsec. Nts., 7/27/2514 | | | | | | | 2,144,000 | | | | 1,972,694 | |
| Qwest Corp., 6.875% Sr. Unsec. Nts., 9/15/33 | | | | | | | 831,000 | | | | 832,332 | |
| Telecom Italia SpA, 5.303% Sr. Unsec. Nts., 5/30/241 | | | | | | | 1,045,000 | | | | 1,130,899 | |
| Zayo Group LLC/Zayo Capital, Inc., 6.00% Sr. Unsec. Nts., 4/1/23 | | | | | | | 1,004,000 | | | | 1,035,375 | |
| | | | | | | | | | | | |
| | | | | | | | | | | 36,853,187 | |
Wireless Telecommunication Services—0.6% | | | | | | | | | | | | |
| Bharti Airtel Ltd., 4.375% Sr. Unsec. Nts., 6/10/251 | | | | | | | 655,000 | | | | 678,525 | |
| Intelsat Connect Finance SA, 9.50% Sr. Unsec. Nts., 2/15/231 | | | | | | | 1,750,000 | | | | 1,626,957 | |
116 INVESCO OPPENHEIMER GLOBAL STRATEGIC INCOME FUND
| | | | | | | | | | | | |
| | | | | | Principal Amount | | | Value | |
Wireless Telecommunication Services (Continued) | | | | | | | | | | | | |
| Intelsat Jackson Holdings SA: | | | | | | | | | | | | |
| 5.50% Sr. Unsec. Nts., 8/1/23 | | | | | | $ | 2,790,000 | | | $ | 2,616,741 | |
| 8.50% Sr. Unsec. Nts., 10/15/241 | | | | | | | 1,524,000 | | | | 1,538,768 | |
| 9.75% Sr. Unsec. Nts., 7/15/251 | | | | | | | 1,004,000 | | | | 1,053,698 | |
| Intelsat Luxembourg SA, 7.75% Sr. Unsec. Nts., 6/1/21 | | | | | | | 1,078,000 | | | | 1,029,490 | |
| Sprint Communications, Inc.: | | | | | | | | | | | | |
| 6.00% Sr. Unsec. Nts., 11/15/22 | | | | | | | 1,616,000 | | | | 1,721,040 | |
| 7.00% Sr. Unsec. Nts., 3/1/201 | | | | | | | 2,100,000 | | | | 2,139,375 | |
| Sprint Corp.: | | | | | | | | | | | | |
| 7.625% Sr. Unsec. Nts., 3/1/26 | | | | | | | 972,000 | | | | 1,075,275 | |
| 7.875% Sr. Unsec. Nts., 9/15/23 | | | | | | | 2,519,000 | | | | 2,773,318 | |
| T-Mobile USA, Inc.: | | | | | | | | | | | | |
| 4.00% Sr. Unsec. Nts., 4/15/22 | | | | | | | 863,000 | | | | 886,732 | |
| 5.125% Sr. Unsec. Nts., 4/15/25 | | | | | | | 384,000 | | | | 398,880 | |
| 6.00% Sr. Unsec. Nts., 4/15/24 | | | | | | | 671,000 | | | | 697,840 | |
| Trilogy International Partners LLC/Trilogy International Finance, Inc., 8.875% Sr. Sec. Nts., 5/1/221 | | | | | | | 643,000 | | | | 615,673 | |
| Windstream Services LLC/Windstream Finance Corp., 8.625% Sr. Sec. Nts., 10/31/251,15 | | | | | | | 601,000 | | | | 614,523 | |
| | | | | | | | | | | | |
| | | | | | | | | | | 19,466,835 | |
Utilities—1.3% | | | | | | | | | | | | |
Electric Utilities—0.5% | | | | | | | | | | | | |
| DPL, Inc., 4.35% Sr. Unsec. Nts., 4/15/291 | | | | | | | 430,000 | | | | 425,327 | |
| Empresa de Transmision Electrica SA, 5.125% Sr. Unsec. Nts., 5/2/491 | | | | | | | 1,810,000 | | | | 2,089,419 | |
| Eskom Holdings SOC Ltd., 7.125% Sr. Unsec. Nts., 2/11/251 | | | | | | | 3,500,000 | | | | 3,612,094 | |
| Perusahaan Listrik Negara PT, 4.125% Sr. Unsec. Nts., 5/15/271 | | | | | | | 6,955,000 | | | | 7,358,875 | |
| Rockpoint Gas Storage Canada Ltd., 7.00% Sr. Sec. Nts., 3/31/231 | | | | | | | 435,000 | | | | 439,350 | |
| Talen Energy Supply LLC, 7.25% Sr. Sec. Nts., 5/15/271 | | | | | | | 393,000 | | | | 401,371 | |
| TerraForm Power Operating LLC, 5.00% Sr. Unsec. Nts., 1/31/281 | | | | | | | 134,000 | | | | 140,030 | |
| Vistra Operations Co. LLC: | | | | | | | | | | | | |
| 5.00% Sr. Unsec. Nts., 7/31/271 | | | | | | | 1,360,000 | | | | 1,403,765 | |
| 5.50% Sr. Unsec. Nts., 9/1/261 | | | | | | | 362,000 | | | | 379,629 | |
| 5.625% Sr. Unsec. Nts., 2/15/271 | | | | | | | 645,000 | | | | 681,075 | |
| | | | | | | | | | | | |
| | | | | | | | | | | 16,930,935 | |
Gas Utilities—0.1% | | | | | | | | | | | | |
| AmeriGas Partners LP/AmeriGas Finance Corp., 5.50% Sr. Unsec. Nts., 5/20/25 | | | | | | | 648,000 | | | | 699,030 | |
| NGL Energy Partners LP/NGL Energy Finance Corp., 7.50% Sr. Unsec. Nts., 4/15/261 | | | | | | | 440,000 | | | | 443,080 | |
| Superior Plus LP/Superior General Partner, Inc., 7.00% Sr. Unsec. Nts., 7/15/261 | | | | | | | 324,000 | | | | 343,447 | |
| | | | | | | | | | | | |
| | | | | | | | | | | 1,485,557 | |
117 INVESCO OPPENHEIMER GLOBAL STRATEGIC INCOME FUND
CONSOLIDATED SCHEDULE OF INVESTMENTSContinued
| | | | | | | | | | | | |
| | | | | | Principal Amount | | | Value | |
Independent Power and Renewable Electricity Producers—0.7% | | | | | | | | | | | | |
| Adani Green Energy UP Ltd./Prayatna Developers Pvt Ltd./Parampujya Solar Energy, 6.25% Sr. Sec. Nts., 12/10/241 | | | | | | $ | 3,695,000 | | | $ | 3,867,372 | |
| AES Andres BV/Dominican Power Partners/Empresa Generadora de Electricidad Itabo SA, 7.95% Sr. Unsec. Nts., 5/11/261 | | | | | | | 1,230,000 | | | | 1,314,562 | |
| AES Corp.: | | | | | | | | | | | | |
| 4.00% Sr. Unsec. Nts., 3/15/21 | | | | | | | 700,000 | | | | 714,875 | |
| 6.00% Sr. Unsec. Nts., 5/15/26 | | | | | | | 423,000 | | | | 450,495 | |
| Azure Power Energy Ltd., 5.50% Sr. Sec. Nts., 11/3/221 | | | | | | | 3,485,000 | | | | 3,533,414 | |
| Azure Power Solar Energy Pvt Ltd., 5.65% Sr. Sec. Nts., 12/24/241 | | | | | | | 1,400,000 | | | | 1,405,950 | |
| Calpine Corp.: | | | | | | | | | | | | |
| 5.25% Sr. Sec. Nts., 6/1/261 | | | | | | | 1,036,000 | | | | 1,076,145 | |
| 5.75% Sr. Unsec. Nts., 1/15/25 | | | | | | | 243,000 | | | | 249,986 | |
| 5.875% Sr. Sec. Nts., 1/15/241 | | | | | | | 326,000 | | | | 334,150 | |
| Clearway Energy Operating LLC, 5.75% Sr. Unsec. Nts., 10/15/251 | | | | | | | 319,000 | | | | 336,944 | |
| Inkia Energy Ltd., 5.875% Sr. Unsec. Nts., 11/9/271 | | | | | | | 4,145,000 | | | | 4,316,023 | |
| Listrindo Capital BV, 4.95% Sr. Unsec. Nts., 9/14/261 | | | | | | | 5,215,000 | | | | 5,304,959 | |
| NRG Energy, Inc.: | | | | | | | | | | | | |
| 6.625% Sr. Unsec. Nts., 1/15/27 | | | | | | | 824,000 | | | | 895,770 | |
| 7.25% Sr. Unsec. Nts., 5/15/26 | | | | | | | 578,000 | | | | 635,222 | |
| | | | | | | | | | | | |
| | | | | | | | | | | 24,435,867 | |
Multi-Utilities—0.0% | | | | | | | | | | | | |
| TerraForm Power Operating LLC, 4.25% Sr. Unsec. Nts., 1/31/231 | | | | | | | 446,000 | | | | 457,150 | |
| | | | | | | | | | | | |
| Total Corporate Bonds and Notes (Cost $1,109,437,763) | | | | | | | | | | | 1,101,391,596 | |
| | | | | | Shares | | | | |
Preferred Stock—0.0% | | | | | | | | | | | | |
| Claire’s Holdings LLC, 0.00%, Series A18(Cost $97,198) | | | | | | | 170 | | | | 29,750 | |
Common Stocks—0.1% | | | | | | | | | | | | |
| Claire’s Holdings LLC18 | | | | | | | 614 | | | | 383,750 | |
| Clear Channel Outdoor Holdings, Inc., Cl. A18 | | | | | | | 153,942 | | | | 387,934 | |
| Hexion Holdings Corp., Cl. B18 | | | | | | | 64,100 | | | | 721,125 | |
| JSC Astana Finance, GDR (Cost $0, Acquisition Date 6/5/15)1,8,18 | | | | | | | 1,681,847 | | | | — | |
| Quicksilver Resources, Inc.8,18 | | | | | | | 12,760,000 | | | | — | |
| Sabine Oil & Gas Holdings, Inc. | | | | | | | 2,510 | | | | 131,775 | |
| | | | | | | | | | | | |
| Total Common Stocks (Cost $15,951,361) | | | | | | | | | | | 1,624,584 | |
| | | | | | Units | | | | |
Rights, Warrants and Certificates—0.0% | | | | | | | | | | | | |
| Affinion Group Wts., Exp. 11/10/228,18 | | | | | | | 26,104 | | | | — | |
| Sabine Oil Tranche 1 Wts., Strike Price $4.49, Exp. 8/11/268,18 | | | | | | | 7,821 | | | | 82,120 | |
| Sabine Oil Tranche 2 Wts., Strike Price $2.72, Exp. 8/11/268,18 | | | | | | | 1,643 | | | | 20,538 | |
| | | | | | | | | | | | |
| Total Rights, Warrants and Certificates (Cost $1,590,968) | | | | | | | | | | | 102,658 | |
118 INVESCO OPPENHEIMER GLOBAL STRATEGIC INCOME FUND
| | | | | | | | | | | | |
| | | | | | Principal Amount | | | Value | |
Structured Securities—0.6% | | | | | | | | | | | | |
| Deutsche Bank AG, Coriolanus Ltd. Sec. Credit Linked Bonds: | | | | | | | | | | | | |
| 3.003% Sr. Sec. Nts., 4/30/251,11 | | | | | | $ | 2,157,236 | | | $ | 2,079,794 | |
| 3.054% Sr. Sec. Nts., 4/30/251,11 | | | | | | | 2,748,651 | | | | 2,649,977 | |
| 3.098% Sr. Sec. Nts., 4/30/251,11 | | | | | | | 2,373,020 | | | | 2,287,831 | |
| 3.131% Sr. Sec. Nts., 4/30/251,11 | | | | | | | 2,121,180 | | | | 2,045,032 | |
| 3.179% Sr. Sec. Nts., 4/30/251,11 | | | | | | | 2,641,041 | | | | 2,546,231 | |
| 3.23% Sr. Sec. Nts., 4/30/251,11 | | | | | | | 3,014,348 | | | | 2,906,136 | |
| 3.265% Sr. Sec. Nts., 4/30/251,11 | | | | | | | 2,408,111 | | | | 2,321,663 | |
| 3.346% Sr. Sec. Nts., 4/30/251,11 | | | | | | | 2,263,521 | | | | 2,182,264 | |
| Morgan Stanley, Russian Federation Total Return Linked Bonds, Series 007, Cl. VR, 5.00%, 8/22/348 | | | RUB | | | | 78,147,214 | | | | 175,129 | |
| | | | | | | | | | | | |
| Total Structured Securities (Cost $19,685,921) | | | | | | | | | | | 19,194,057 | |
Short-Term Notes—0.3% | | | | | | | | | | | | |
| Arab Republic of Egypt Treasury Bills, 17.01%, 5/5/2011 | | | EGP | | | | 146,400,000 | | | | 8,307,280 | |
| Argentine Republic Treasury Bills, 5.043%, 5/29/2011 | | | ARS | | | | 349,300,000 | | | | 2,690,354 | |
| | | | | | | | | | | | |
| Total Short-Term Notes (Cost $16,433,718) | | | | | | | | | | | 10,997,634 | |
| | | | | | | | | | | | | | | | | | | | | | | | | | | | |
| | | | | | | | | Exercise
Price | | | Expiration
Date | | | Notional
Amount
(000’s) | | | Contracts
(000’s) | | | | |
Exchange-Traded Options Purchased—0.1% | | | | | | | | | | | | | | | | | |
| | | | | | | | | | | | | | | | | | | | | | | USD | | | | | |
| | | | | | | | | | | | | | | | | | | USD | | | | | | | | | |
| S&P 500 Index Put | | | | USD | | | | 2,675.000 | | | | 3/20/20 | | | | 134,285 | | | | 1 | | | | 2,748,450 | |
| | | | | | | | | | | | | | | | | | | | | | | USD | | | | | |
| S&P 500 Index Put | | | | USD | | | | 2,625.000 | | | | 2/21/20 | | | | USD 69,563 | | | | 0 | 19 | | | 1,000,375 | |
| | | | | | | | | | | | | | | | | | | | | | | | | | | | |
| Total Exchange-Traded Options Purchased (Cost $6,008,743) | | | | | | | | | | | | 3,748,825 | |
| | | | | | | |
| | | Counterparty | | | | | | Exercise
Price | | | Expiration
Date | | | Notional
Amount
(000’s) | | | | | | | |
Over-the-Counter Options Purchased—0.5% | | | | | | | | | | | | | | | | | |
| | | | | | | | | | | | | | | | | | | | | | | BRL | | | | | |
| BRL Currency | | | | | | | | | | | | | | | | | | | | | | | | | | | | |
| Put | | | GSCO-OT | | | | BRL | | | | 3.430 | | | | 3/30/20 | | | | BRL 3,543 | | | | 3,543 | | | | 88,161 | |
| | | | | | | | | | | | | | | | | | | | | | | BRL | | | | | |
| BRL Currency | | | | | | | | | | | | | | | | | | | | | | | | | | | | |
| Call | | | JPM | | | | BRL | | | | 3.918 | | | | 11/19/19 | | | | BRL 137,130 | | | | 137,130 | | | | 72,513 | |
| | | | | | | | | | | | | | | | | | | | | | | BRL | | | | | |
| BRL Currency | | | | | | | | | | | | | | | | | | | | | | | | | | | | |
| Put | | | GSCO-OT | | | | BRL | | | | 3.430 | | | | 3/30/20 | | | | BRL 3,543 | | | | 3,543 | | | | 88,161 | |
| | | | | | | | | | | | | | | | | | | | | | | BRL | | | | | |
| BRL Currency | | | | | | | | | | | | | | | | | | | | | | | | | | | | |
| Put | | | GSCO-OT | | | | BRL | | | | 3.432 | | | | 3/27/20 | | | | BRL 3,540 | | | | 3,540 | | | | 86,201 | |
| | | | | | | | | | | | | | | | | | | | | | | BRL | | | | | |
| BRL Currency | | | | | | | | | | | | | | | | | | | | | | | | | | | | |
| Call | | | CITNA-B | | | | BRL | | | | 3.861 | | | | 11/18/19 | | | | BRL 135,118 | | | | 135,118 | | | | 35,517 | |
| | | | | | | | | | | | | | | | | | | | | | | BRL | | | | | |
| BRL Currency | | | | | | | | | | | | | | | | | | | | | | | | | | | | |
| Put | | | GSCO-OT | | | | BRL | | | | 3.350 | | | | 12/6/19 | | | | BRL 1,414 | | | | 1,414 | | | | 85 | |
119 INVESCO OPPENHEIMER GLOBAL STRATEGIC INCOME FUND
CONSOLIDATED SCHEDULE OF INVESTMENTSContinued
| | | | | | | | | | | | | | | | | | | | | | | | | | | | |
| | | | | | | |
| | | Counterparty | | | | | | Exercise
Price | | | Expiration
Date | | | Notional
Amount
(000’s) | | | Contracts
(000’s) | | | Value | |
Over-the-Counter Options Purchased (Continued) | | | | | | | | | | | | | | | | | |
| | | | | | | | | | | | | | | | | | | | | | | BRL | | | | | |
| BRL Currency | | | | | | | | | | | | | | | | | | | | | | | | | | | | |
| Call20 | | | JPM | | | | BRL | | | | 3.200 | | | | 10/17/19 | | | | BRL 3,586 | | | | 3,586 | | | $ | — | |
| | | | | | | | | | | | | | | | | | | | | | | BRL | | | | | |
| BRL Currency | | | | | | | | | | | | | | | | | | | | | | | | | | | | |
| Put | | | GSCO-OT | | | | BRL | | | | 3.400 | | | | 12/10/19 | | | | BRL 1,414 | | | | 1,414 | | | | 395 | |
| | | | | | | | | | | | | | | | | | | | | | | CLP | | | | | |
| CLP Currency | | | | | | | | | | | | | | | | | | | CLP | | | | | | | | | |
| Call | | | JPM | | | | CLP | | | | 677.500 | | | | 10/21/19 | | | | 47,000,000 | | | | 47,000,000 | | | | 470 | |
| | | | | | | | | | | | | | | | | | | | | | | EUR | | | | | |
| EUR Currency | | | | | | | | | | | | | | | | | | | | | | | | | | | | |
| Put18 | | | GSCO-OT | | | | NOK | | | | 8.648 | | | | 1/6/21 | | | | EUR 8,850 | | | | 8,850 | | | | 301,435 | |
| | | | | | | | | | | | | | | | | | | | | | | EUR | | | | | |
| EUR Currency | | | | | | | | | | | | | | | | | | | | | | | | | | | | |
| Put | | | SCB | | | | IDR | | | | 15760.000 | | | | 1/17/20 | | | | EUR 26,160 | | | | 26,160 | | | | 413,782 | |
| | | | | | | | | | | | | | | | | | | | | | | EUR | | | | | |
| EUR Currency | | | | | | | | | | | | | | | | | | | | | | | | | | | | |
| Put | | | JPM | | | | NOK | | | | 8.900 | | | | 8/26/21 | | | | EUR 8,750 | | | | 8,750 | | | | 1,301,978 | |
| | | | | | | | | | | | | | | | | | | | | | | EUR | | | | | |
| EUR Currency | | | | | | | | | | | | | | | | | | | EUR | | | | | | | | | |
| Call | | | CITNA-B | | | | USD | | | | 1.178 | | | | 10/3/19 | | | | 212,400 | | | | 212,400 | | | | — | |
| | | | | | | | | | | | | | | | | | | | | | | EUR | | | | | |
| EUR Currency | | | | | | | | | | | | | | | | | | | | | | | | | | | | |
| Put | | | JPM | | | | ZAR | | | | 15.720 | | | | 1/23/20 | | | | EUR 34,900 | | | | 34,900 | | | | 247,302 | |
| | | | | | | | | | | | | | | | | | | | | | | EUR | | | | | |
| EUR Currency | | | | | | | | | | | | | | | | | | | | | | | | | | | | |
| Put | | | GSCO-OT | | | | INR | | | | 74.875 | | | | 8/5/20 | | | | EUR 3,500 | | | | 3,500 | | | | 1,773,110 | |
| | | | | | | | | | | | | | | | | | | | | | | EUR | | | | | |
| EUR Currency | | | | | | | | | | | | | | | | | | | | | | | | | | | | |
| Put | | | BOA | | | | SEK | | | | 9.250 | | | | 4/29/20 | | | | EUR 7,200 | | | | 7,200 | | | | 3,401 | |
| | | | | | | | | | | | | | | | | | | | | | | EUR | | | | | |
| EUR Currency | | | | | | | | | | | | | | | | | | | EUR | | | | | | | | | |
| Call | | | BOA | | | | USD | | | | 1.170 | | | | 10/31/19 | | | | 212,400 | | | | 212,400 | | | | 1,128 | |
| | | | | | | | | | | | | | | | | | | | | | | EUR | | | | | |
| EUR Currency | | | | | | | | | | | | | | | | | | | EUR | | | | | | | | | |
| Put | | | BOA | | | | PLN | | | | 4.250 | | | | 11/20/19 | | | | 140,000 | | | | 140,000 | | | | 59,816 | |
| | | | | | | | | | | | | | | | | | | | | | | EUR | | | | | |
| EUR Currency | | | | | | | | | | | | | | | | | | | EUR | | | | | | | | | |
| Put | | | MSCO | | | | NOK | | | | 9.757 | | | | 8/20/20 | | | | 105,000 | | | | 105,000 | | | | 1,098,369 | |
| | | | | | | | | | | | | | | | | | | | | | | EUR | | | | | |
| EUR Currency | | | | | | | | | | | | | | | | | | | | | | | | | | | | |
| Put | | | GSCO-OT | | | | NOK | | | | 8.360 | | | | 1/6/21 | | | | EUR 8,850 | | | | 8,850 | | | | 84,469 | |
| | | | | | | | | | | | | | | | | | | | | | | EUR | | | | | |
| Euro-Bund | | | | | | | | | | | | | | | | | | | EUR | | | | | | | | | |
| Futures Put | | | MOS | | | | EUR | | | | 170.000 | | | | 10/25/19 | | | | 142,630 | | | | 1 | | | | 27,434 | |
| | | | | | | | | | | | | | | | | | | | | | | IDR | | | | | |
| IDR Currency | | | | | | | | | | | | | | | | | | | IDR | | | | | | | | | |
| Call | | | JPM | | | | IDR | | | | 13885.000 | | | | 1/20/20 | | | | 484,534,000 | | | | 484,534,000 | | | | 96,907 | |
| | | | | | | | | | | | | | | | | | | | | | | INR | | | | | |
| INR Currency | | | | | | | | | | | | | | | | | | | | | | | | | | | | |
| Put | | | JPM | | | | INR | | | | 66.092 | | | | 4/29/20 | | | | INR 3,500 | | | | 3,500 | | | | 285,333 | |
120 INVESCO OPPENHEIMER GLOBAL STRATEGIC INCOME FUND
| | | | | | | | | | | | | | | | | | | | | | | | | | | | |
| | | | | | | |
| | | Counterparty | | | | | | Exercise
Price | | | Expiration
Date | | | Notional
Amount
(000’s) | | | Contracts
(000’s) | | | Value | |
Over-the-Counter Options Purchased (Continued) | | | | | | | | | | | | | | | | | |
| | | | | | | | | | | | | | | | | | | | | | | INR | | | | | |
| INR Currency | | | | | | | | | | | | | | | | | | | | | | | | | | | | |
| Put | | | GSCO-OT | | | | INR | | | | 65.600 | | | | 5/6/20 | | | | INR 5,220 | | | | 5,220 | | | $ | 322,178 | |
| | | | | | | | | | | | | | | | | | | | | | | KRW | | | | | |
| KRW | | | | | | | | | | | | | | | | | | | KRW | | | | | | | | | |
| Currency Call | | | GSCO-OT | | | | KRW | | | | 1159.700 | | | | 1/17/20 | | | | 40,450,000 | | | | 40,450,000 | | | | 161,800 | |
| | | | | | | | | | | | | | | | | | | | | | | MXN | | | | | |
| MXN | | | | | | | | | | | | | | | | | | | MXN | | | | | | | | | |
| Currency Call | | | GSCO-OT | | | | MXN | | | | 19.558 | | | | 7/21/20 | | | | 665,441 | | | | 665,441 | | | | 568,420 | |
| | | | | | | | | | | | | | | | | | | | | | | MXN | | | | | |
| MXN | | | | | | | | | | | | | | | | | | | MXN | | | | | | | | | |
| Currency Call | | | JPM | | | | MXN | | | | 19.655 | | | | 11/26/19 | | | | 330,204 | | | | 330,204 | | | | 144,755 | |
| | | | | | | | | | | | | | | | | | | | | | | MXN | | | | | |
| MXN | | | | | | | | | | | | | | | | | | | MXN | | | | | | | | | |
| Currency Call | | | JPM | | | | MXN | | | | 19.375 | | | | 6/2/20 | | | | 673,200 | | | | 673,200 | | | | 436,752 | |
| | | | | | | | | | | | | | | | | | | | | | | MXN | | | | | |
| MXN | | | | | | | | | | | | | | | | | | | MXN | | | | | | | | | |
| Currency Put | | | JPM | | | | MXN | | | | 19.655 | | | | 11/26/19 | | | | 330,204 | | | | 330,204 | | | | 372,335 | |
| | | | | | | | | | | | | | | | | | | | | | | MXN | | | | | |
| MXN | | | | | | | | | | | | | | | | | | | MXN | | | | | | | | | |
| Currency Call | | | BOA | | | | MXN | | | | 18.553 | | | | 1/14/20 | | | | 1,312,540 | | | | 1,312,540 | | | | 104,124 | |
| MXN | | | | | | | | | | | | | | | | | | | | | | | MXN | | | | | |
| Currency | | | | | | | | | | | | | | | | | | | | | | | | | | | | |
| Call21 | | | CITNA-B | | | | MXN | | | | 18.000 | | | | 10/23/19 | | | | MXN 1,750 | | | | 1,750 | | | | 911 | |
| | | | | | | | | | | | | | | | | | | | | | | MXN | | | | | |
| MXN | | | | | | | | | | | | | | | | | | | MXN | | | | | | | | | |
| Currency Call | | | CITNA-B | | | | MXN | | | | 19.350 | | | | 6/2/20 | | | | 672,300 | | | | 672,300 | | | | 424,907 | |
| | | | | | | | | | | | | | | | | | | | | | | MXN | | | | | |
| MXN | | | | | | | | | | | | | | | | | | | MXN | | | | | | | | | |
| Currency Call | | | CITNA-B | | | | MXN | | | | 19.380 | | | | 8/5/20 | | | | 169,575 | | | | 169,575 | | | | 127,203 | |
| | | | | | | | | | | | | | | | | | | | | | | PHP | | | | | |
| PHP Currency | | | | | | | | | | | | | | | | | | | PHP | | | | | | | | | |
| Call | | | GSCO-OT | | | | PHP | | | | 51.000 | | | | 11/11/19 | | | | 890,000 | | | | 890,000 | | | | 25,454 | |
| | | | | | | | | | | | | | | | | | | | | | | RUB | | | | | |
| RUB Currency | | | | | | | | | | | | | | | | | | | RUB | | | | | | | | | |
| Call | | | GSCO-OT | | | | RUB | | | | 60.000 | | | | 12/18/19 | | | | 3,974,300 | | | | 3,974,300 | | | | 15,778 | |
| | | | | | | | | | | | | | | | | | | | | | | RUB | | | | | |
| RUB Currency | | | | | | | | | | | | | | | | | | | | | | | | | | | | |
| Put | | | GSCO-OT | | | | RUB | | | | 58.500 | | | | 8/4/20 | | | | RUB 3,850 | | | | 3,850 | | | | 689,024 | |
| | | | | | | | | | | | | | | | | | | | | | | RUB | | | | | |
| RUB Currency | | | | | | | | | | | | | | | | | | | | | | | | | | | | |
| Put | | | GSCO-OT | | | | RUB | | | | 57.300 | | | | 3/30/20 | | | | RUB 7,086 | | | | 7,086 | | | | 298,964 | |
| | | | | | | | | | | | | | | | | | | | | | | RUB | | | | | |
| RUB Currency | | | | | | | | | | | | | | | | | | | RUB | | | | | | | | | |
| Call | | | JPM | | | | RUB | | | | 70.000 | | | | 2/25/21 | | �� | | 3,714,800 | | | | 3,714,800 | | | | 3,286,929 | |
| | | | | | | | | | | | | | | | | | | | | | | RUB | | | | | |
| RUB Currency | | | | | | | | | | | | | | | | | | | | | | | | | | | | |
| Put | | | JPM | | | | RUB | | | | 59.000 | | | | 8/5/20 | | | | RUB 3,850 | | | | 3,850 | | | | 817,232 | |
| | | | | | | | | | | | | | | | | | | | | | | USD | | | | | |
| S&P 500 | | | | | | | | | | | | | | | | | | | | | | | | | | | | |
| Index Put | | | BOA | | | | USD | | | | 2632.590 | | | | 2/21/20 | | | | USD 69,764 | | | | 0 | 21 | | | 1,066,848 | |
121 INVESCO OPPENHEIMER GLOBAL STRATEGIC INCOME FUND
CONSOLIDATED SCHEDULE OF INVESTMENTSContinued
| | | | | | | | | | | | | | | | | | | | | | | | | | | | |
| | | Counterparty | | | | | | Exercise
Price | | | Expiration
Date | | | Notional
Amount
(000’s) | | | Contracts
(000’s) | | | Value | |
Over-the-Counter Options Purchased (Continued) | | | | | | | | | | | | | | | | | |
| | | | | | | | | | | | | | | | | | | | | | | SGD | | | | | |
| SGD Currency | | | | | | | | | | | | | | | | | | | | | | | | | | | | |
| Put | | | GSCO-OT | | | | CNY | | | | 5.050 | | | | 10/21/19 | | | | SGD 52,000 | | | | 52,000 | | | $ | 10,701 | |
| | | | | | | | | | | | | | | | | | | | | | | ZAR | | | | | |
| ZAR Currency | | | | | | | | | | | | | | | | | | | ZAR | | | | | | | | | |
| Call | | | GSCO-OT | | | | ZAR | | | | 14.500 | | | | 7/23/20 | | | | 531,300 | | | | 531,300 | | | | 751,657 | |
| | | | | | | | | | | | | | | | | | | | | | | ZAR | | | | | |
| ZAR Currency | | | | | | | | | | | | | | | | | | | ZAR | | | | | | | | | |
| Call | | | GSCO-OT | | | | ZAR | | | | 13.613 | | | | 1/27/20 | | | | 240,801 | | | | 240,801 | | | | 35,891 | |
| | | | | | | | | | | | | | | | | | | | | | | | | | | | |
| TotalOver-the-Counter Options Purchased (Cost $31,885,490) | | | | | | | | | | | | 15,727,830 | |
| | | | | | | |
| | | Counterparty | | | Buy /Sell
Protection | | | Reference
Asset | | | Fixed Rate | | | Expiration
Date | | | Notional
Amount
(000’s) | | | | |
Over-the-Counter Credit Default Swaptions Purchased—0.1% | | | | | | | | | | | | | | | | | |
| Credit Default Swap maturing 6/20/24 Call | | | JPM | | | | Sell | | |
| iTraxx
Europe
Crossover
Series 31
Version 1 |
| | | 3.00 | % | | | 12/18/19 | | |
| EUR
105,000 |
| | | 793,836 | |
| Credit Default Swap maturing 6/20/24 Put | | | JPM | | | | Buy | | |
| iTraxx
Europe
Crossover
Series 31
Version 1 |
| | | 3.00 | | | | 12/18/19 | | |
| EUR
105,000 |
| | | 1,309,306 | |
| | | | | | | | | | | | | | | | | | | | | | | | | | | | |
TotalOver-the-Counter Credit Default Swaptions Purchased
(Cost $2,809,965) | | | | | | | | | | | | 2,103,142 | |
| | | | | | | |
| | | Counterparty | | | Pay/Receive
Floating
Rate | | | Floating
Rate | | | Fixed
Rate | | | Expiration
Date | | | Notional
Amount
(000’s) | | | | |
Over-the-Counter Interest Rate Swaptions Purchased—0.2% | | | | | | | | | | | | | | | | | |
| Interest Rate Swap maturing 1/9/20 Call | | | GSCOI | | | | Pay | | |
| Three-
Month USD
BBA LIBOR |
| | | 1.600 | | | | 1/9/20 | | |
| USD
534,300 |
| | | 1,943,719 | |
| Interest Rate Swap maturing 11/14/19 Put | | | JPM | | | | Receive | | |
| Three-
Month USD
BBA LIBOR |
| | | 1.865 | | | | 11/14/19 | | |
| USD
42,000 |
| | | 502,729 | |
| Interest Rate Swap maturing 3/27/20 Put | | | MSCO | | | | Receive | | |
| Six-Month
EUR
EURIBOR |
| | | 0.434 | | | | 3/27/20 | | |
| EUR
43,600 |
| | | 54,744 | |
| Interest Rate Swap Maturing 3/29/21 Put | | | JPM | | | | Receive | | |
| Six-Month
EUR
EURIBOR |
| | | 1.122 | | | | 3/29/21 | | |
| EUR
353,800 |
| | | 32,855 | |
122 INVESCO OPPENHEIMER GLOBAL STRATEGIC INCOME FUND
| | | | | | | | | | | | | | | | | | | | | | | | | | | | |
| | | Counterparty | | | Pay/Receive
Floating
Rate | | | Floating
Rate | | | Fixed
Rate | | | Expiration
Date | | | Notional
Amount
(000’s) | | | Value | |
Over-the-Counter Interest Rate Swaptions Purchased (Continued) | | | | | | | | | | | | | | | | | |
| Interest Rate Swap Maturing 3/30/20 Put | | | BOA | | | | Receive | | |
| Three-
Month CAD
BA CDOR |
| | | 2.588% | | | | 3/30/20 | | |
| CAD
472,000 |
| | $ | 448,266 | |
| Interest Rate Swap Maturing 4/12/21 Put | | | JPM | | | | Receive | | |
| Six-Month
EUR
EURIBOR |
| | | 0.615 | | | | 4/12/21 | | |
| EUR
353,750 |
| | | 6,732 | |
| Interest Rate Swap Maturing 4/6/21 Put | | | JPM | | | | Receive | | |
| Six-Month
EUR
EURIBOR |
| | | 0.608 | | | | 4/6/21 | | |
| EUR
354,000 |
| | | 6,563 | |
| Interest Rate Swap maturing 8/16/24 Put | | | JPM | | | | Receive | | |
| Six-Month
EUR
EURIBOR |
| | | 2.098 | | | | 8/16/24 | | |
| EUR
70,000 |
| | | 1,014,309 | |
| Interest Rate Swap maturing 8/17/20 Put | | | MSCO | | | | Receive | | |
| Three-
Month USD
BBA LIBOR |
| | | 1.695 | | | | 8/17/20 | | |
| USD
121,500 |
| | | 2,161,588 | |
| Interest Rate Swap maturing 8/17/20 Put | | | GSCOI | | | | Receive | | |
| Three-
Month USD
BBA LIBOR |
| | | 2.500 | | | | 8/17/20 | | |
| USD
175,000 |
| | | 1,366,710 | |
| Interest Rate Swap maturing 8/26/20 Put | | | MSCO | | | | Receive | | |
| Three-
Month USD
BBA LIBOR |
| | | 2.500 | | | | 8/26/20 | | |
| USD
175,000 |
| | | 370,139 | |
| Interest Rate Swap maturing 8/28/20 Put | | | GSCOI | | | | Receive | | |
| Three-
Month KRW
CD |
| | | 2.000 | | | | 8/28/20 | | |
| KRW
84,000,000 |
| | | 139,454 | |
| | | | | | | | | | | | | | | | | | | | | | | | | | | | |
TotalOver-the-Counter Interest Rate Swaptions Purchased (Cost $10,184,586) | | | | | | | | | | | | 8,047,808 | |
| | | | | | | | |
| | | Shares | | | | |
Investment Companies—16.8% | | | | | | | | |
| Invesco Government & Agency Portfolio, Institutional Class, 1.83%22 | | | 426,545,351 | | | | 426,545,351 | |
| Invesco Oppenheimer Limited-Term Bond Fund23 | | | 4,077,028 | | | | 18,632,020 | |
| Invesco Oppenheimer Master Event-Linked Bond Fund23 | | | 4,436,854 | | | | 70,194,574 | |
| Invesco Oppenheimer Ultra-Short Duration Fund23 | | | 9,375,659 | | | | 46,878,296 | |
| OFI Carlyle Private Credit Fund, Cl. I23 | | | 328,742 | | | | 3,154,469 | |
| | | | | | | | |
| Total Investment Companies (Cost $577,138,357) | | | | | | | 565,404,710 | |
| Total Investments, at Value (Cost $3,780,947,738) | | | 109.6% | | | | 3,683,842,715 | |
| Net Other Assets (Liabilities) | | | (9.6) | | | | (322,198,063 | ) |
| | | | |
| Net Assets | | | 100.0% | | | $ | 3,361,644,652 | |
| | | | |
123 INVESCO OPPENHEIMER GLOBAL STRATEGIC INCOME FUND
CONSOLIDATED SCHEDULE OF INVESTMENTSContinued
Footnotes to Consolidated Schedule of Investments
1. Security purchased or received in a transaction exempt from registration under the Securities Act of 1933, as amended (the “1933 Act”). The security may be resold pursuant to an exemption from registration under the 1933 Act, typically to qualified institutional buyers. The aggregate value of these securities at September 30, 2019 was $1,400,757,347, which represented 41.67% of the Fund’s Net Assets.
2. Represents the current interest rate for a variable or increasing rate security, which may be fixed for a predetermined period. The interest rate is, or will be as of an established date, determined as [Referenced Rate + Basis-point spread].
3. All or a portion of this security is owned by the subsidiary.
4. Interest-Only Strips represent the right to receive the monthly interest payments on an underlying pool of mortgage loans. These securities typically decline in price as interest rates decline. Most other fixed income securities increase in price when interest rates decline. The principal amount of the underlying pool represents the notional amount on which current interest is calculated. The price of these securities is typically more sensitive to changes in prepayment rates than traditional mortgage-backed securities (for example, GNMA pass-throughs). Interest rates disclosed represent current yields based upon the current cost basis and estimated timing and amount of future cash flows. These securities amount to $12,740,119 or 0.38% of the Fund’s net assets at period end.
5. Interest rate is less than 0.0005%.
6. All or a portion of the security position is when-issued or delayed delivery to be delivered and settled after period end. See Note 1 of the accompanying Consolidated Notes.
7. This interest rate resets periodically. Interest rate shown reflects the rate in effect at period end. The rate on this variable rate security is not based on a published reference rate and spread but is determined by the issuer or agent based on current market conditions.
8. The value of this security was determined using significant unobservable inputs. See Note 3 of the accompanying Consolidated Notes.
9. Denotes an inflation-indexed security: coupon or principal are indexed to a consumer price index.
10. All or a portion of the security position is held in segregated accounts and pledged to cover margin requirements under certain derivative contracts. The aggregate market value of such securities is $28,161,121. See Note 1 of the accompanying Consolidated Notes.
11. Zero coupon bond reflects effective yield on the original acquisition date.
12. Variable rate senior loan interests are, at present, not readily marketable, not registered under the Securities Act of 1933, as amended (the “1933 Act”), and may be subject to contractual and legal restrictions on sale. Variable rate senior loan interests in the Fund’s portfolio generally have variable rates which adjust to a base, such as the London Interbank Offered Rate (“LIBOR”), on set dates, typically every 30 days but not greater than one year; and/ or have interest rates that float at a margin above a widely recognized base lending rate such as the Prime Rate of a designated U.S. bank.
13. Variable rate senior loan interests often require prepayments from excess cash flow or permit the borrower to repay at its election. The degree to which borrowers repay, whether as a contractual requirement or at their election, cannot be predicted with accuracy. As a result, the actual remaining maturity may be substantially less than the stated maturities shown. However, it is anticipated that the variable rate senior loan interests will have an expected average life of three to five years.
14. Interest or dividend is paid-in-kind, when applicable.
15. This security is not accruing income because its issuer has missed or is expected to miss interest and/or principal payments. The rate shown is the contractual interest rate.
16. Security received as the result of issuer reorganization.
17. This bond has no contractual maturity date, is not redeemable and contractually pays an indefinite stream of interest.
18. Non-income producing security.
19. Number of contracts are less than 500.
20. One-Touch Binary option becomes eligible for exercise if at any time spot rates are less than or equal to 3.2 BRL per 1 USD.
21. One-Touch Binary option becomes eligible for exercise if at any time spot rates are less than or equal to 18 MXN per 1 USD.
124 INVESCO OPPENHEIMER GLOBAL STRATEGIC INCOME FUND
Footnotes to Consolidated Schedule of Investments (continued)
22. The money market fund and the Fund are affiliated by having the same investment adviser. The rate shown is the 7-day SEC standardized yield as of September 30, 2019.
23. Is or was an affiliate, as defined in the Investment Company Act of 1940, as amended, at or during the reporting period, by virtue of the Fund owning at least 5% of the voting securities of the issuer or as a result of the Fund and the issuer having the same investment adviser. Transactions during the reporting period in which the issuer was an affiliate are as follows:
| | | | | | | | | | | | | | | | |
| | | Shares
September 30,
2018 | | | Gross
Additions | | | Gross
Reductions | | | Shares
September 30,
2019 | |
| |
Investment Company | | | | | | | | | | | | | | | | |
| Invesco Oppenheimer Limited-Term Bond Fund | | | — | | | | 4,077,028 | | | | — | | | | 4,077,028 | |
| Invesco Oppenheimer Master Event-Linked Bond Fund | | | 4,789,523 | | | | 57,699 | | | | 410,368 | | | | 4,436,854 | |
| Invesco Oppenheimer Master Loan Fund | | | 31,598,009 | | | | 72 | | | | 31,598,081 | | | | — | |
| Invesco Oppenheimer Ultra-Short Duration Fund | | | 9,155,142 | | | | 220,517 | | | | — | | | | 9,375,659 | |
| OFI Carlyle Private Credit Fund | | | — | | | | 328,742 | | | | — | | | | 328,742 | |
| | | | |
| | | Value | | | Income | | | Realized
Gain (Loss) | | | Change in
Unrealized
Gain (Loss) | |
| |
Investment Company | | | | | | | | | | | | | | | | |
| Invesco Oppenheimer Limited-Term Bond Fund | | $ | 18,632,020 | | | $ | 487,029 | | | $ | — | | | $ | 522,028 | |
| Invesco Oppenheimer Master Event-Linked Bond Fund | | | 70,194,574 | | | | 5,481,441 | a,b | | | (2,839,045 | )a | | | (2,589,913 | )a |
| Invesco Oppenheimer Master Loan Fund | | | — | | | | 10,824,074 | c,d | | | (14,113,576 | )c | | | 82,634 | c |
| Invesco Oppenheimer Ultra-Short Duration Fund | | | 46,878,296 | | | | 1,183,126 | | | | — | | | | 393 | |
| OFI Carlyle Private Credit Fund | | | 3,154,469 | | | | 185,794 | | | | — | | | | (65,650 | ) |
| | | | |
Total | | $ | 138,859,359 | | | $ | 18,161,464 | | | $ | (16,952,621 | ) | | $ | (2,050,508 | ) |
| | | | |
| | a. | Represents the amount allocated to the fund from Invesco Oppenheimer Master Event-Linked Fund. |
| | b. | Net of expenses allocated to the Fund from Invesco Oppenheimer Master Event-Linked Fund. |
| | c. | Represents the amount allocated to the fund from Invesco Oppenheimer Master Loan Fund. |
| | d. | Net of expenses allocated to the Fund from Invesco Oppenheimer Master Loan Fund. |
Distribution of investments representing geographic holdings, as a percentage of total investments at value, is as follows:
| | | | | | | | | | | | | | | |
| Geographic Holdings | | Value | | Percent | | |
| |
United States | | | $ | 2,154,928,967 | | | | | 58.5 | % | | | | | |
United Kingdom | | | | 139,912,518 | | | | | 3.8 | | | | | | |
India | | | | 130,049,586 | | | | | 3.5 | | | | | | |
Indonesia | | | | 94,946,241 | | | | | 2.6 | | | | | | |
Mexico | | | | 87,731,155 | | | | | 2.4 | | | | | | |
Italy | | | | 85,559,381 | | | | | 2.3 | | | | | | |
South Africa | | | | 78,767,066 | | | | | 2.1 | | | | | | |
Brazil | | | | 74,452,839 | | | | | 2.0 | | | | | | |
Egypt | | | | 72,862,045 | | | | | 2.0 | | | | | | |
125 INVESCO OPPENHEIMER GLOBAL STRATEGIC INCOME FUND
CONSOLIDATED SCHEDULE OF INVESTMENTSContinued
| | | | | | | | | | | | | | | |
| Geographic Holdings (Continued) | | Value | | Percent | | |
| |
France | | | $ | 66,805,232 | | | | | 1.8 | % | | | | | |
Greece | | | | 55,615,621 | | | | | 1.5 | | | | | | |
Spain | | | | 47,655,871 | | | | | 1.3 | | | | | | |
New Zealand | | | | 45,794,451 | | | | | 1.2 | | | | | | |
Switzerland | | | | 44,973,402 | | | | | 1.2 | | | | | | |
China | | | | 44,870,259 | | | | | 1.2 | | | | | | |
Argentina | | | | 30,106,766 | | | | | 0.8 | | | | | | |
Turkey | | | | 28,391,740 | | | | | 0.8 | | | | | | |
Sri Lanka | | | | 27,346,928 | | | | | 0.7 | | | | | | |
Luxembourg | | | | 25,308,882 | | | | | 0.7 | | | | | | |
Russia | | | | 24,309,734 | | | | | 0.7 | | | | | | |
Canada | | | | 23,052,033 | | | | | 0.6 | | | | | | |
Ireland | | | | 22,624,894 | | | | | 0.6 | | | | | | |
Netherlands | | | | 22,569,832 | | | | | 0.6 | | | | | | |
Thailand | | | | 20,334,954 | | | | | 0.6 | | | | | | |
Austria | | | | 17,639,008 | | | | | 0.5 | | | | | | |
Macau | | | | 14,449,139 | | | | | 0.4 | | | | | | |
Oman | | | | 13,373,920 | | | | | 0.4 | | | | | | |
Colombia | | | | 12,981,736 | | | | | 0.4 | | | | | | |
Panama | | | | 12,643,764 | | | | | 0.3 | | | | | | |
Dominican Republic | | | | 12,342,997 | | | | | 0.3 | | | | | | |
Azerbaijan | | | | 12,001,680 | | | | | 0.3 | | | | | | |
Ivory Coast | | | | 9,704,587 | | | | | 0.3 | | | | | | |
Ukraine | | | | 9,581,296 | | | | | 0.3 | | | | | | |
Senegal | | | | 8,865,674 | | | | | 0.2 | | | | | | |
Ecuador | | | | 8,304,707 | | | | | 0.2 | | | | | | |
United Arab Emirates | | | | 8,087,584 | | | | | 0.2 | | | | | | |
Paraguay | | | | 7,327,107 | | | | | 0.2 | | | | | | |
Peru | | | | 6,352,138 | | | | | 0.2 | | | | | | |
Cyprus | | | | 6,086,811 | | | | | 0.2 | | | | | | |
Portugal | | | | 6,041,169 | | | | | 0.2 | | | | | | |
Angola | | | | 5,807,688 | | | | | 0.2 | | | | | | |
Kazakhstan | | | | 4,878,500 | | | | | 0.1 | | | | | | |
Germany | | | | 4,700,214 | | | | | 0.1 | | | | | | |
Chile | | | | 4,695,252 | | | | | 0.1 | | | | | | |
Malaysia | | | | 4,378,861 | | | | | 0.1 | | | | | | |
Mauritius | | | | 4,102,724 | | | | | 0.1 | | | | | | |
Morocco | | | | 3,935,756 | | | | | 0.1 | | | | | | |
Zambia | | | | 3,821,080 | | | | | 0.1 | | | | | | |
Fiji | | | | 3,725,999 | | | | | 0.1 | | | | | | |
Norway | | | | 3,498,211 | | | | | 0.1 | | | | | | |
El Salvador | | | | 3,453,357 | | | | | 0.1 | | | | | | |
Eurozone | | | | 3,218,345 | | | | | 0.1 | | | | | | |
Bahrain | | | | 3,153,075 | | | | | 0.1 | | | | | | |
Hong Kong | | | | 2,487,615 | | | | | 0.1 | | | | | | |
Singapore | | | | 2,463,356 | | | | | 0.1 | | | | | | |
Belgium | | | | 2,236,563 | | | | | 0.1 | | | | | | |
Nigeria | | | | 2,047,500 | | | | | 0.1 | | | | | | |
Supranational | | | | 2,038,191 | | | | | 0.1 | | | | | | |
Kenya | | | | 1,433,533 | | | | | 0.0 | | | | | | |
126 INVESCO OPPENHEIMER GLOBAL STRATEGIC INCOME FUND
| | | | | | | | | | | | | | | |
| Geographic Holdings (Continued) | | Value | | Percent | | |
| |
Israel | | | $ | 1,405,746 | | | | | 0.0 | % | | | | | |
Costa Rica | | | | 885,851 | | | | | 0.0 | | | | | | |
Australia | | | | 331,660 | | | | | 0.0 | | | | | | |
South Korea | | | | 301,253 | | | | | 0.0 | | | | | | |
Poland | | | | 59,816 | | | | | 0.0 | | | | | | |
Philippines | | | | 25,454 | | | | | 0.0 | | | | | | |
Sweden | | | | 3,401 | | | | | 0.0 | | | | | | |
| | | | | |
Total | | | $ | 3,683,842,715 | | | | | 100.0 | % | | | | | |
| | | | | |
| | | | | | | | | | | | | | | | | | | | | | | | |
Forward Currency Exchange Contracts as of September 30, 2019 | |
| Counterparty | | Settlement Month(s) | | | Currency Purchased (000’s) | | | Currency Sold (000’s) | | | Unrealized
Appreciation | | | Unrealized
Depreciation | |
| |
BAC | | | 05/2020 | | | CLP | | | 1,578,600 | | | USD | | | 2,305 | | | $ | — | | | $ | (128,024 | ) |
BAC | | | 10/2019 - 11/2019 | | | EUR | | | 85,115 | | | USD | | | 94,964 | | | | — | | | | (1,898,226 | ) |
BAC | | | 10/2019 | | | KRW | | | 19,970,700 | | | USD | | | 16,653 | | | | 42,463 | | | | — | |
BAC | | | 12/2019 | | | MYR | | | 2,190 | | | USD | | | 519 | | | | 2,411 | | | | — | |
BAC | | | 11/2019 | | | NOK | | | 44,500 | | | USD | | | 5,005 | | | | — | | | | (109,407 | ) |
BAC | | | 10/2019 | | | USD | | | 16,770 | | | KRW | | | 19,970,700 | | | | 73,997 | | | | — | |
BAC | | | 11/2019 | | | USD | | | 45,090 | | | NZD | | | 71,000 | | | | 576,328 | | | | — | |
BAC | | | 12/2019 | | | ZAR | | | 120,580 | | | USD | | | 7,786 | | | | 95,041 | | | | — | |
BNP | | | 11/2019 | | | EUR | | | 6,300 | | | USD | | | 6,959 | | | | — | | | | (65,992 | ) |
BOA | | | 11/2019 | | | EUR | | | 21,680 | | | USD | | | 24,140 | | | | — | | | | (418,785 | ) |
BOA | | | 01/2020 | | | IDR | | | 188,850,000 | | | USD | | | 13,208 | | | | — | | | | (88,230 | ) |
BOA | | | 11/2019 | | | JPY | | | 1,048,000 | | | USD | | | 9,957 | | | | — | | | | (231,450 | ) |
BOA | | | 12/2019 | | | KRW | | | 7,520,050 | | | USD | | | 6,175 | | | | 109,885 | | | | — | |
BOA | | | 11/2019 | | | NOK | | | 40,000 | | | USD | | | 4,499 | | | | — | | | | (99,004 | ) |
BOA | | | 11/2019 | | | SEK | | | 387,600 | | | USD | | | 40,674 | | | | — | | | | (1,166,773 | ) |
BOA | | | 10/2019 | | | USD | | | 600 | | | ARS | | | 35,400 | | | | — | | | | (2,235 | ) |
BOA | | | 11/2019 | | | USD | | | 474 | | | CAD | | | 625 | | |
| 1,545
|
| | | — | |
BOA | | | 11/2019 | | | USD | | | 85,860 | | | EUR | | | 76,660 | | | | 1,981,831 | | | | — | |
BOA | | | 03/2020 | | | ZAR | | | 237,120 | | | USD | |
| 16,526
|
| | | — | | | | (1,196,376 | ) |
CITNA-B | | | 10/2019 - 11/2019 | | | BRL | | | 620,704 | | | USD | | | 148,453 | | | | 782,811 | | | | — | |
CITNA-B | | | 05/2020 | | | CLP | | | 5,156,400 | | | USD | | | 7,528 | | | | — | | | | (418,456 | ) |
CITNA-B | | | 12/2019 | | | COP | | | 82,083,935 | | | USD | | | 23,770 | | | | — | | | | (269,684 | ) |
CITNA-B | | | 11/2019 | | | EUR | | | 11,800 | | | USD | |
| 13,166
|
| | | — | | | | (254,690 | ) |
CITNA-B | | | 11/2019 | | | NOK | | | 427,250 | | | USD | | | 47,607 | | | | — | | | | (606,889 | ) |
CITNA-B | | | 12/2019 | | | RUB | | | 1,133,100 | | | USD | | | 17,176 | | | | 112,669 | | | | — | |
CITNA-B | | | 10/2019 | | | TRY | | | 21,500 | | | USD | | | 3,610 | | | | 176,723 | | | | — | |
CITNA-B | | | 10/2019 - 11/2019 | | | USD | | | 110,988 | | | BRL | | | 464,387 | | | | — | | | | (718,751 | ) |
CITNA-B | | | 11/2019 - 12/2019 | | | USD | | | 20,113 | | | CLP | | | 14,347,162 | | | | 412,222 | | | | — | |
CITNA-B | | | 12/2019 | | | USD | | | 13,180 | | | COP | | | 45,513,700 | | | | 149,534 | | | | — | |
CITNA-B | | | 11/2019 | | | USD | | | 223,343 | | | EUR | | | 199,760 | | | | 4,773,223 | | | | — | |
CITNA-B | | | 11/2019 | | | USD | | | 67,385 | | | GBP | | | 54,875 | | | | — | | | | (225,377 | ) |
CITNA-B | | | 12/2019 | | | USD | | | 40,556 | | | MXN | | | 804,459 | | |
| 296,543
|
| | | — | |
CITNA-B | | | 12/2019 | | | USD | | | 336 | | | PEN | | | 1,140 | | | | — | | | | (1,442 | ) |
CITNA-B | | | 12/2019 | | | USD | | | 13,127 | | | RUB | | | 852,000 | | | | 169,953 | | | | (38,929 | ) |
CITNA-B | | | 12/2019 | | | USD | | | 16,731 | | | THB | | | 515,050 | | | | — | | | | (135,183 | ) |
CITNA-B | | | 10/2019 - 12/2019 | | | USD | | | 28,940 | | | TRY | | | 173,310 | | | | — | | | | (1,163,344 | ) |
DEU | | | 11/2019 | | | USD | | | 7,407 | | | GBP | | | 6,000 | | | | 14,035 | | | | — | |
GSCO-OT | | | 03/2021 | | | BRL | | | 95,000 | | | USD | | | 22,903 | | | | — | | | | (932,302 | ) |
127 INVESCO OPPENHEIMER GLOBAL STRATEGIC INCOME FUND
CONSOLIDATED SCHEDULE OF INVESTMENTSContinued
| | | | | | | | | | | | | | | | | | | | | | | | |
Forward Currency Exchange Contracts (Continued) | |
| Counterparty | | Settlement
Month(s) | | | | | Currency Purchased (000’s) | | | Currency Sold (000’s) | | | Unrealized Appreciation | | | Unrealized Depreciation | |
| |
GSCO-OT | | | 11/2019 | | | CLP | | | 12,539,600 | | | USD | | | 17,606 | | | $ | — | | | $ | (387,574 | ) |
GSCO-OT | | | 10/2019 -01/2021 | | | EUR | | | 202,316 | | | USD | | | 233,063 | | | | — | | | | (8,606,051 | ) |
GSCO-OT | | | 05/2020 | | | INR | | | 3,598,746 | | | USD | | | 49,590 | | | | — | | | | (80,276 | ) |
GSCO-OT | | | 10/2019 | | | KRW | | | 49,635,000 | | | USD | | | 41,877 | | | | — | | | | (381,560 | ) |
GSCO-OT | | | 02/2021 | | | RUB | | | 1,589,400 | | | USD | | | 23,350 | | | | — | | | | (326,449 | ) |
GSCO-OT | | | 10/2019 - 02/2020 | | | TRY | | | 202,460 | | | USD | | | 33,705 | | | | 1,609,452 | | | | — | |
GSCO-OT | | | 03/2020 - 03/2021 | | | USD | | | 78,466 | | | BRL | | | 321,838 | | | | 2,497,587 | | | | — | |
GSCO-OT | | | 11/2019 | | | USD | | | 474 | | | CAD | | | 625 | | | | 1,452 | | | | — | |
GSCO-OT | | | 11/2019 - 05/2020 | | | USD | | | 29,014 | | | CLP | | | 20,036,765 | | | | 1,434,617 | | | | — | |
GSCO-OT | | | 10/2019 - 05/2020 | | | USD | | | 111,313 | | | EUR | | | 100,026 | | | | 1,744,080 | | | | — | |
GSCO-OT | | | 05/2020 - 08/2020 | | | USD | | | 83,765 | | | INR | | | 6,127,731 | | | | 128,467 | | | | (288,505 | ) |
GSCO-OT | | | 10/2019 | | | USD | | | 41,390 | | | KRW | | | 49,635,000 | | | | — | | | | (105,538 | ) |
GSCO-OT | | | 01/2021 | | | USD | | | 69,698 | | | NOK | | | 585,800 | | | | 5,258,555 | | | | — | |
GSCO-OT | | | 12/2019 | | | USD | | | 23,231 | | | RUB | | | 1,519,700 | | | | 142,310 | | | | (95,874 | ) |
GSCO-OT | | | 10/2019 - 02/2020 | | | USD | | | 25,263 | | | TRY | | | 166,900 | | | | — | | | | (4,036,227 | ) |
GSCO-OT | | | 01/2020 - 03/2020 | | | USD | | | 34,125 | | | ZAR | | | 520,120 | | | | 400,251 | | | | — | |
GSCO-OT | | | 01/2020 - 03/2020 | | | ZAR | | | 309,400 | | | USD | | | 20,220 | | | | — | | | | (118,174 | ) |
HSBC | | | 11/2019 | | | EUR | | | 3,165 | | | USD | | | 3,528 | | | | — | | | | (64,866 | ) |
HSBC | | | 11/2019 | | | NOK | | | 45,000 | | | USD | | | 5,062 | | | | — | | | | (111,768 | ) |
HSBC | | | 11/2019 | | | USD | | | 43,833 | | | EUR | | | 38,945 | | | | 1,223,249 | | | | — | |
HSBC | | | 11/2019 | | | USD | | | 9,923 | | | JPY | | | 1,048,000 | | | | 197,569 | | | | — | |
JPM | | | 10/2019 - 04/2020 | | | BRL | | | 818,717 | | | USD | | | 201,912 | | | | 139,285 | | | | (5,406,747 | ) |
JPM | | | 05/2020 | | | CLP | | | 2,578,300 | | | USD | | | 3,764 | | | | — | | | | (209,099 | ) |
JPM | | | 11/2019 - 08/2021 | | | EUR | | | 196,740 | | | USD | | | 219,315 | | | | — | | | | (2,043,756 | ) |
JPM | | | 12/2019 | | | IDR | | | 399,523,000 | | | USD | | | 27,495 | | | | 403,151 | | | | — | |
JPM | | | 12/2019 - 08/2020 | | | INR | | | 3,934,624 | | | USD | | | 53,632 | | | | 484,434 | | | | — | |
JPM | | | 11/2019 | | | JPY | | | 4,462,367 | | | USD | | | 41,789 | | | | — | | | | (382,210 | ) |
JPM | | | 12/2019 | | | PLN | | | 940 | | | USD | | | 243 | | | | — | | | | (8,580 | ) |
JPM | | | 12/2019 | | | RUB | | | 1,589,400 | | | USD | | | 24,625 | | | | — | | | | (381,491 | ) |
JPM | | | 10/2019 | | | USD | | | 162,404 | | | BRL | | | 666,377 | | | | 2,246,820 | | | | (224,658 | ) |
JPM | | | 11/2019 - 08/2020 | | | USD | | | 189,257 | | | EUR | | | 170,260 | | | | 2,163,381 | | | | — | |
JPM | | | 11/2019 | | | USD | | | 33,636 | | | GBP | | | 27,575 | | | | — | | | | (338,990 | ) |
JPM | | | 12/2019 | | | USD | | | 55 | | | HUF | | | 16,000 | | | | 3,095 | | | | — | |
JPM | | | 12/2019 - 01/2020 | | | USD | | | 93,000 | | | IDR | | | 1,346,970,000 | | | | 86,805 | | | | (1,075,285 | ) |
JPM | | | 12/2019 | | | USD | | | 103,733 | | | INR | | | 7,469,800 | | | | — | | | | (971,041 | ) |
JPM | | | 11/2019 | | | USD | | | 32,873 | | | JPY | | | 3,524,733 | | | | 167,956 | | | | — | |
JPM | | | 08/2021 | | | USD | | | 42,144 | | | NOK | | | 378,550 | | | | 549,774 | | | | — | |
JPM | | | 02/2021 | | | USD | | | 23,311 | | | RUB | | | 1,589,400 | | | | 287,408 | | | | — | |
JPM | | | 12/2019 | | | USD | | | 71,548 | | | ZAR | | | 1,108,570 | | | | — | | | | (909,023 | ) |
JPM | | | 12/2019 | | | ZAR | | | 98,250 | | | USD | | | 6,341 | | | | 80,565 | | | | — | |
MOS | | | 05/2020 | | | CLP | | | 2,586,700 | | | USD | | | 3,764 | | | | — | | | | (197,691 | ) |
RBC | | | 11/2019 | | | EUR | | | 10,935 | | | USD | | | 12,282 | | | | — | | | | (317,544 | ) |
RBC | | | 11/2019 | | | GBP | | | 3,700 | | | USD | | | 4,634 | | | | — | | | | (75,258 | ) |
RBC | | | 11/2019 | | | JPY | | | 1,880,000 | | | USD | | | 17,801 | | | | — | | | | (355,151 | ) |
RBC | | | 11/2019 | | | USD | | | 113,941 | | | EUR | | | 101,305 | | | | 3,100,226 | | | | — | |
SCB | | | 10/2019 | | | KRW | | | 29,664,300 | | | USD | | | 24,737 | | | | 63,075 | | | | — | |
SCB | | | 10/2019 | | | USD | | | 24,471 | | | KRW | | | 29,664,300 | | | | — | | | | (328,359 | ) |
| | | | | | | | | | | | | | | | | | | | |
Total Unrealized Appreciation and Depreciation | | | $ | 34,184,778 | | | $ | (37,997,294 | ) |
| | | | | | | | | | | | | | | | | | | | |
128 INVESCO OPPENHEIMER GLOBAL STRATEGIC INCOME FUND
| | | | | | | | | | | | | | | | | | | | | | | | |
Futures Contracts as of September 30, 2019 | |
| Description | | Buy/Sell | | | Expiration
Date | | | Number
of Contracts | | | Notional Amount (000’s) | | | Value | | | Unrealized Appreciation/ (Depreciation) | |
Euro BUXL | | | Sell | | | | 12/6/19 | | | | 251 | | | | EUR 59,232 | | | $ | 59,503,094 | | | $ | (270,888 | ) |
Euro-BTP | | | Sell | | | | 12/6/19 | | | | 1,272 | | | | EUR 200,269 | | | | 202,194,964 | | | | (1,925,963 | ) |
United States Treasury Long Bonds | | | Buy | | | | 12/19/19 | | | | 9 | | | | USD 1,490 | | | | 1,460,813 | | | | (28,703 | ) |
United States Treasury Long Bonds | | | Sell | | | | 12/19/19 | | | | 752 | | | | USD 124,198 | | | | 122,059,000 | | | | 2,139,059 | |
United States Treasury Nts., 10 yr. | | | Buy | | | | 12/19/19 | | | | 320 | | | | USD 42,082 | | | | 41,700,000 | | | | (381,816 | ) |
United States Treasury Nts., 10 yr. | | | Sell | | | | 12/19/19 | | | | 48 | | | | USD 6,335 | | | | 6,255,000 | | | | 80,333 | |
United States Treasury Nts., 2 yr. | | | Sell | | | | 12/31/19 | | | | 2,225 | | | | USD 480,547 | | | | 479,487,500 | | | | 1,059,916 | |
United States Treasury Nts., 5 yr. | | | Buy | | | | 12/31/19 | | | | 373 | | | | USD 44,749 | | | | 44,442,367 | | | | (306,562 | ) |
United States Ultra Bonds | | | Buy | | | | 12/19/19 | | | | 324 | | | | USD 63,091 | | | | 62,177,625 | | | | (913,025 | ) |
| | | | | | | | | | | | | | | | | | | | | | | | |
| | | | | | | | | | | | | | | | | | | | | | $ | (547,649 | ) |
| | | | | | | | | | | | | | | | | | | | | | | | |
| | | | | | | | | | | | | | | | | | | | | | | | |
Exchange-Traded Options Written at September 30, 2019 | |
| Description | | Exercise
Price | | | Expiration
Date | | | Number of
Contracts (000’s) | | | Notional Amount (000’s) | | | Premiums Received | | | Value | |
S&P 500 Index Put | |
| USD
2,400.000 |
| | | 3/20/20 | | | | USD (1) | | | | USD 120,480 | | | $ | 2,059,686 | | | $ | (1,129,500 | ) |
S&P 500 Index Put | |
| USD
2,350.000 |
| | | 2/21/20 | | | | USD (0)1 | | | | USD 62,275 | | | | 627,232 | | | | (360,400 | ) |
| | | | | | | | | | | | | | | | | | | | |
Total Exchange-Traded Options Written | | | | | | | | | | | | | | | | | | $ | 2,686,918 | | | $ | (1,489,900 | ) |
| | | | | | | | | | | | | | | | | | | | |
| | | | | | | | | | | | | | | | | | | | | | | | | | | | |
Over-the-Counter Options Written at September 30, 2019 | |
| Description | | Counterparty | | | Exercise
Price | | | Expiration
Date | | | Number of
Contracts (000’s) | | | Notional Amount (000’s) | | | Premiums
Received | | | Value | |
| | | | | | | BRL | | | | | | | | BRL | | | | | | | | | | | | | |
| | | | | | | |
BRL Currency Put | | | CITNA-B | | | | 4.239 | | | | 11/18/19 | | | | (148,348) | | | | BRL 148,348 | | | $ | 390,010 | | | $ | (429,248) | |
| | | | | | | BRL | | | | | | | | BRL | | | | | | | | | | | | | |
| | | | | | | |
BRL Currency Put1 | | | GSCO-OT | | | | 4.500 | | | | 12/6/19 | | | | (1,414) | | | | BRL 1,414 | | | | 250,561 | | | | (138,306) | |
| | | | | | | BRL | | | | | | | | BRL | | | | | | | | | | | | | |
| | | | | | | |
BRL Currency Put2 | | | GSCO-OT | | | | 4.500 | | | | 3/30/20 | | | | (3,543) | | | | BRL 3,543 | | | | 619,316 | | | | (725,376) | |
| | | | | | | BRL | | | | | | | | BRL | | | | | | | | | | | | | |
| | | | | | | |
BRL Currency Put3 | | | GSCO-OT | | | | 4.500 | | | | 3/27/20 | | | | (3,540) | | | | BRL 3,540 | | | | 617,376 | | | | (721,337) | |
| | | | | | | BRL | | | | | | | | BRL | | | | | | | | | | | | | |
| | | | | | | |
BRL Currency Put4 | | | GSCO-OT | | | | 4.230 | | | | 3/4/21 | | | | (149,900) | | | | BRL 149,900 | | | | 1,679,022 | | | | (2,465,029) | |
129 INVESCO OPPENHEIMER GLOBAL STRATEGIC INCOME FUND
CONSOLIDATED SCHEDULE OF INVESTMENTSContinued
| | | | | | | | | | | | | | | | | | | | | | | | | | | | |
Over-the-Counter Options Written (Continued) | |
| Description | | Counterparty | | | Exercise
Price | | | Expiration
Date | | | Number of
Contracts
(000’s) | | | Notional
Amount (000’s) | | | Premiums
Received | | | Value | |
| | | | | | | BRL | | | | | | | | BRL | | | | | | | | | | | | | |
| | | | | | | |
BRL Currency Put5 | | | GSCO-OT | | | | 4.500 | | | | 3/30/20 | | | | (3,543) | | | | BRL 3,543 | | | $ | 619,316 | | | $ | (725,377) | |
| | | | | | | BRL | | | | | | | | BRL | | | | | | | | | | | | | |
| | | | | | | |
BRL Currency Put6 | | | GSCO-OT | | | | 4.500 | | | | 12/10/19 | | | | (1,414) | | | | BRL 1,414 | | | | 294,112 | | | | (144,805) | |
| | | | | | | BRL | | | | | | | | BRL | | | | | | | | | | | | | |
| | | | | | | |
BRL Currency Put7 | | | JPM | | | | 4.250 | | | | 3/4/21 | | | | (150,600) | | | | BRL 150,600 | | | | 1,589,273 | | | | (2,400,501) | |
| | | | | | | BRL | | | | | | | | BRL | | | | | | | | | | | | | |
| | | | | | | |
BRL Currency Put | | | JPM | | | | 4.306 | | | | 11/19/19 | | | | (150,710) | | | | BRL 150,710 | | | | 403,200 | | | | (293,185) | |
| | | | | | | COD | | | | | | | | BRL | | | | | | | | | | | | | |
| | | | | | | |
BRL Currency Put | | | MSCO | | | | 3305.000 | | | | 10/9/19 | | | | (115,280,750) | | | | BRL 115,280,750 | | | | 410,895 | | | | (1,766,101) | |
| | | | | | | CLP | | | | | | | | CLP | | | | | | | | | | | | | |
| | | | | | | |
CLP Currency Put8 | | | GSCO-OT | | | | 700.000 | | | | 5/11/20 | | | | (24,360,000) | | | | CLP 24,360,000 | | | | 890,880 | | | | (1,677,430) | |
| | | | | | | CLP | | | | | | | | CLP | | | | | | | | | | | | | |
| | | | | | | |
CLP Currency Put | | | JPM | | | | 707.450 | | | | 10/21/19 | | | | (49,345,000) | | | | CLP 49,345,000 | | | | 498,717 | | | | (2,104,564) | |
| | | | | | | CLP | | | | | | | | CLP | | | | | | | | | | | | | |
| | | | | | | |
CLP Currency Call | | | JPM | | | | 657.050 | | | | 10/21/19 | | | | (46,000,000) | | | | CLP 46,000,000 | | | | 213,530 | | | | — | |
| | | | | | | ZAR | | | | | | | | EUR | | | | | | | | | | | | | |
| | | | | | | |
EUR Currency Call | | | BOA | | | | 20.000 | | | | 8/5/20 | | | | (3,500) | | | | EUR 3,500 | | | | 763,768 | | | | (675,534) | |
| | | | | | | USD | | | | | | | | EUR | | | | | | | | | | | | | |
| | | | | | | |
EUR Currency Call | | | BOA | | | | 1.150 | | | | 10/31/19 | | | | (70,800) | | | | EUR 70,800 | | | | 249,389 | | | | (2,339) | |
| | | | | | | RUB | | | | | | | | EUR | | | | | | | | | | | | | |
| | | | | | | |
EUR Currency Call | | | BOA | | | | 73.090 | | | | 12/20/19 | | | | (34,900) | | | | EUR 34,900 | | | | 416,416 | | | | (517,334) | |
| | | | | | | USD | | | | | | | | EUR | | | | | | | | | | | | | |
| | | | | | | |
EUR Currency Call | | | CITNA-B | | | | 1.155 | | | | 10/3/19 | | | | (70,800) | | | | EUR 70,800 | | | | 596,500 | | | | — | |
| | | | | | | RUB | | | | | | | | EUR | | | | | | | | | | | | | |
| | | | | | | |
EUR Currency Call | | | GSCOI | | | | 72.860 | | | | 12/16/19 | | | | (62,600) | | | | EUR 62,600 | | | | 696,924 | | | | (927,940) | |
| | | | | | | INR | | | | | | | | EUR | | | | | | | | | | | | | |
| | | | | | | |
EUR Currency Call | | | GSCO-OT | | | | 90.000 | | | | 8/5/20 | | | | (3,500) | | | | EUR 3,500 | | | | 684,103 | | | | (292,169) | |
| | | | | | | ZAR | | | | | | | | EUR | | | | | | | | | | | | | |
| | | | | | | |
EUR Currency Cal | | | GSCO-OT | | | | 20.000 | | | | 8/4/20 | | | | (3,500) | | | | EUR 3,500 | | | | 549,827 | | | | (673,324) | |
| | | | | | | NOK | | | | | | | | EUR | | | | | | | | | | | | | |
| | | | | | | |
EUR Currency Call9 | | | GSCO-OT | | | | 11.000 | | | | 1/6/21 | | | | (7,075) | | | | EUR 7,075 | | | | 1,417,482 | | | | (1,180,797) | |
| | | | | | | INR | | | | | | | | EUR | | | | | | | | | | | | | |
| | | | | | | |
EUR Currency Call | | | GSCO-OT | | | | 90.000 | | | | 5/6/20 | | | | (5,220) | | | | EUR 5,220 | | | | 916,901 | | | | (279,505) | |
| | | | | | | NOK | | | | | | | | EUR | | | | | | | | | | | | | |
| | | | | | | |
EUR Currency Call | | | JPM | | | | 11.000 | | | | 8/26/21 | | | | (4,375) | | �� | | EUR 4,375 | | | | 1,302,085 | | | | (1,194,043) | |
130 INVESCO OPPENHEIMER GLOBAL STRATEGIC INCOME FUND
| | | | | | | | | | | | | | | | | | | | | | | | | | | | |
Over-the-Counter Options Written (Continued) | |
| Description | | Counterparty | | | Exercise
Price | | | Expiration
Date | | | Number of
Contracts (000’s) | | | Notional Amount (000’s) | | | Premiums
Received | | | Value | |
| | | | | | | ZAR | | | | | | | | EUR | | | | | | | | | | | | | |
| | | | | | | |
EUR Currency Put | | | JPM | | | | 14.760 | | | | 1/23/20 | | | | (34,900) | | | | EUR 34,900 | | | $ | 241,264 | | | $ | (37,459) | |
| | | | | | | ZAR | | | | | | | | EUR | | | | | | | | | | | | | |
| | | | | | | |
EUR Currency Call | | | JPM | | | | 17.290 | | | | 1/23/20 | | | | (34,900) | | | | EUR 34,900 | | | | 642,073 | | | | (923,578) | |
| | | | | | | INR | | | | | | | | EUR | | | | | | | | | | | | | |
| | | | | | | |
EUR Currency Call10 | | | JPM | | | | 90.000 | | | | 4/29/20 | | | | (3,500) | | | | EUR 3,500 | | | | 556,686 | | | | (181,465) | |
| | | | | | | NOK | | | | | | | | EUR | | | | | | | | | | | | | |
| | | | | | | |
EUR Currency Call | | | MSCO | | | | 10.758 | | | | 8/20/20 | | | | (105,000) | | | | EUR 105,000 | | | | 1,243,520 | | | | (871,870) | |
| | | | | | | BRL | | | | | | | | EUR | | | | | | | | | | | | | |
| | | | | | | |
EUR Currency Call | | | MSCO | | | | 5.250 | | | | 8/24/21 | | | | (26,200) | | | | EUR 26,200 | | | | 1,472,448 | | | | (1,658,429) | |
| | | | | | | IDR | | | | | | | | EUR | | | | | | | | | | | | | |
| | | | | | | |
EUR Currency Call | | | SCB | | | | 16890.000 | | | | 1/17/20 | | | | (26,160) | | | | EUR 26,160 | | | | 223,787 | | | | (95,655) | |
| | | | | | | IDR | | | | | | | | IDR | | | | | | | | | | | | | |
| | | | | | | |
IDR Currency Put | | | GSCO-OT | | | | 15360.000 | | | | 6/18/20 | | | | (1,137,000,000) | | | | IDR 1,137,000,000 | | | | 1,598,906 | | | | (955,080) | |
| | | | | | | IDR | | | | | | | | IDR | | | | | | | | | | | | | |
| | | | | | | |
IDR Currency Put | | | JPM | | | | 14830.000 | | | | 1/20/20 | | | | (517,511,000) | | | | IDR 517,511,000 | | | | 268,063 | | | | (222,530) | |
| | | | | | | KRW | | | | | | | | KRW | | | | | | | | | | | | | |
| | | | | | | |
KRW Currency Call | | | GSCO-OT | | | | 1122.350 | | | | 1/17/20 | | | | (39,100,000) | | | | KRW 39,100,000 | | | | 119,807 | | | | (32,062) | |
| | | | | | | KRW | | | | | | | | KRW | | | | | | | | | | | | | |
| | | | | | | |
KRW Currency Put | | | GSCO-OT | | | | 1213.250 | | | | 1/17/20 | | | | (42,000,000) | | | | KRW 42,000,000 | | | | 246,478 | | | | (349,440) | |
| | | | | | | MXN | | | | | | | | MXN | | | | | | | | | | | | | |
| | | | | | | |
MXN Currency Put | | | BOA | | | | 22.363 | | | | 1/14/20 | | | | (1,582,090) | | | | MXN 1,582,090 | | | | 1,599,246 | | | | (195,404) | |
| | | | | | | MXN | | | | | | | | MXN | | | | | | | | | | | | | |
| | | | | | | |
MXN Currency Put | | | CITNA-B | | | | 22.940 | | | | 6/2/20 | | | | (797,000) | | | | MXN 797,000 | | | | 757,519 | | | | (340,709) | |
| | | | | | | MXN | | | | | | | | MXN | | | | | | | | | | | | | |
| | | | | | | |
MXN Currency Put | | | CITNA-B | | | | 22.880 | | | | 8/5/20 | | | | (200,200) | | | | MXN 200,200 | | | | 178,166 | | | | (133,165) | |
| | | | | | | MXN | | | | | | | | MXN | | | | | | | | | | | | | |
| | | | | | | |
MXN Currency Put | | | GSCO-OT | | | | 21.996 | | | | 7/21/20 | | | | (997,880) | | | | MXN 997,880 | | | | 894,944 | | | | (942,697) | |
| | | | | | | MXN | | | | | | | | MXN | | | | | | | | | | | | | |
| | | | | | | |
MXN Currency Put | | | JPM | | | | 23.005 | | | | 6/2/20 | | | | (799,300) | | | | MXN 799,300 | | | | 752,221 | | | | (330,159) | |
| | | | | | | MXN | | | | | | | | MXN | | | | | | | | | | | | | |
| | | | | | | |
MXN Currency Put | | | JPM | | | | 20.240 | | | | 5/27/20 | | | | (425,040) | | | | MXN 425,040 | | | | 924,840 | | | | (842,655) | |
| | | | | | | MXN | | | | | | | | MXN | | | | | | | | | | | | | |
| | | | | | | |
MXN Currency Call | | | JPM | | | | 20.240 | | | | 5/27/20 | | | | (425,040) | | | | MXN 425,040 | | | | 924,840 | | | | (620,223) | |
| | | | | | | RUB | | | | | | | | RUB | | | | | | | | | | | | | |
| | | | | | | |
RUB Currency Call | | | CITNA-B | | | | 63.040 | | | | 12/16/19 | | | | (1,972,200) | | | | RUB 1,972,200 | | | | 279,530 | | | | (111,705) | |
131 INVESCO OPPENHEIMER GLOBAL STRATEGIC INCOME FUND
CONSOLIDATED SCHEDULE OF INVESTMENTSContinued
| | | | | | | | | | | | | | | | | | | | | | | | | | | | |
Over-the-Counter Options Written (Continued) | |
| Description | | Counterparty | | | Exercise Price | | | Expiration
Date | | | Number of Contracts (000’s) | | | Notional Amount (000’s) | | | Premiums
Received | | | Value | |
| | | | | | | RUB | | | | | | | | RUB | | | | | | | | | | | | | |
| | | | | | | |
RUB Currency Put | | | JPM | | | | 80.000 | | | | 2/25/21 | | | | (4,245,500) | | | | RUB 4,245,500 | | | $ | 2,365,858 | | | $ | (1,097,929) | |
| | | | | | | RUB | | | | | | | | RUB | | | | | | | | | | | | | |
| | | | | | | |
RUB Currency Call | | | JPM | | | | 60.000 | | | | 2/25/21 | | | | (3,184,100) | | | | RUB 3,184,100 | | | | 578,180 | | | | (376,233) | |
| | | | | | | | | | | | | | | USD | | | | | | | | | | | | | |
| | | | | | | |
S&P 500 Index Put | | | BOA | | | | 2355.470 | | | | 2/21/20 | | | | 011 | | | | USD 62,420 | | | | 649,770 | | | | (383,015) | |
| | | | | | | CNY | | | | | | | | SGD | | | | | | | | | | | | | |
| | | | | | | |
SGD Currency Call | | | GSCO-OT | | | | 5.110 | | | | 10/21/19 | | | | (52,000) | | | | SGD 52,000 | | | | 141,470 | | | | (463,324) | |
| | | | | | | CNY | | | | | | | | SGD | | | | | | | | | | | | | |
| | | | | | | |
SGD Currency Put | | | GSCO-OT | | | | 4.990 | | | | 10/21/19 | | | | (52,000) | | | | SGD 52,000 | | | | 49,706 | | | | (3,761) | |
| | | | | | | THB | | | | | | | | THB | | | | | | | | | | | | | |
| | | | | | | |
THB Currency Put | | | SCB | | | | 31.500 | | | | 12/20/19 | | | | (2,196,300) | | | | THB 2,196,300 | | | | 396,101 | | | | (142,408) | |
| | | | | | | TRY | | | | | | | | TRY | | | | | | | | | | | | | |
| | | | | | | |
TRY Currency Put | | | GSCO-OT | | | | 6.750 | | | | 1/15/20 | | | | (238,810) | | | | TRY 238,810 | | | | 1,660,420 | | | | (240,876) | |
| | | | | | | TRY | | | | | | | | TRY | | | | | | | | | | | | | |
| | | | | | | |
TRY Currency Put | | | GSCO-OT | | | | 6.726 | | | | 1/28/20 | | | | (234,680) | | | | TRY 234,680 | | | | 764,402 | | | | (302,272) | |
| | | | | | | TRY | | | | | | | | TRY | | | | | | | | | | | | | |
| | | | | | | |
TRY Currency Call | | | GSCO-OT | | | | 5.652 | | | | 1/28/20 | | | | (394,410) | | | | TRY 394,410 | | | | 926,570 | | | | (1,176,257) | |
| | | | | | | ZAR | | | | | | | | ZAR | | | | | | | | | | | | | |
| | | | | | | |
ZAR Currency Put | | | GSCO-OT | | | | 16.208 | | | | 1/27/20 | | | | (286,705) | | | | ZAR 286,705 | | | | 518,413 | | | | (318,727) | |
| | | | | | | ZAR | | | | | | | | ZAR | | | | | | | | | | | | | |
| | | | | | | |
ZAR Currency Put | | | GSCO-OT | | | | 16.000 | | | | 7/23/20 | | | | (781,700) | | | | ZAR 781,700 | | | | 1,422,401 | | | | (2,426,639) | |
| | | | | | | | | | | | | | | | | | | | | | | | |
Total Over-the-Counter Options Written | | | | | | | | | | | | | | | | | | | $ | 38,467,232 | | | $ | (35,109,970) | |
| | | | | | | | | | | | | | | | | | | | | | | | |
1. Knock-out option is ineligible for exercise if at any time spot rates are greater than or equal to 3.6 BRL per 1 USD.
2. Knock-out option is ineligible for exercise if at any time spot rates are greater than or equal to 3.7 BRL per 1 USD.
3.Knock-out option is ineligible for exercise if at any time spot rates are greater than or equal to 3.7 BRL per 1 USD.
4.Knock-out option is ineligible for exercise if at any time spot rates are greater than or equal to 3.61 BRL per 1 USD.
5. Knock-out option is ineligible for exercise if at any time spot rates are greater than or equal to 3.7 BRL per 1 USD.
6. Knock-out option is ineligible for exercise if at any time spot rates are greater than or equal to 3.6 BRL per 1 USD.
7. Knock-out option is ineligible for exercise if at any time spot rates are greater than or equal to 3.61 BRL per 1 USD.
8. Knock-out option is ineligible for exercise if at any time spot rates are greater than or equal to 650 CLP per 1 USD.
9. Knock-out option is ineligible for exercise if at any time spot rates are greater than or equal to 9.40 NOK per 1 EUR.
10. Upper Barrier Level: 90 INR/EUR Lower Barrier Level: 75 INR/EUR If at any time during the Event Period, the Spot Exchange Rate, in accordance with the Barrier Event Rate Source B, is equal to or less than the Lower Barrier Level this Transaction will automatically terminate without any payment obligation on the part of either party (except in respect of the Premium). Provided a Knock-Out event has not occurred, if at the Expiration Time on the Expiration Date: (i) the Spot Exchange Rate, in accordance with the Barrier Event Rate Source A, is equal to or greater than the Upper Barrier Level, this Transaction will be automatically exercised and the Seller shall pay the Settlement Amount to the Buyer on the Settlement Date. (ii) the Spot Exchange Rate, in accordance with the Barrier Event Rate Source A, is not equal to or greater than the Upper Barrier Level, this Transaction shall expire without any payment obligation on
132 INVESCO OPPENHEIMER GLOBAL STRATEGIC INCOME FUND
the part of either party (except in respect of the Premium) at the Expiration Time on the Expiration Date. If a KnockOut event has occurred, notwithstanding the above, this Transaction will automatically terminate without any payment obligation on the part of either party (except in respect of the Premium).
| 11. Number | of contracts are less than 500. |
| | | | | | | | | | | | | | | | | | | | | | | | | | | | | | | | |
Centrally Cleared Credit Default Swaps at September 30, 2019 | |
| Reference Asset | | Buy/Sell Protection | | | Fixed Rate | | | Maturity
Date | | | | | | Notional Amount (000’s) | | | Premiums Received/ (Paid) | | | Value | | | Unrealized Appreciation/ (Depreciation) | |
Brazilian Government International | | | Sell | | | | 1.000 | % | | | 6/20/22 | | | | USD | | | | 7,500 | | | $ | 464,303 | | | $ | 41,733 | | | $ | 506,036 | |
Brazilian Government International | | | Buy | | | | 1.000 | | | | 12/20/24 | | | | USD | | | | 4,500 | | | | (91,745 | ) | | | 79,994 | | | | (11,751 | ) |
CDX.EM.31 | | | Buy | | | | 1.000 | | | | 6/20/24 | | | | USD | | | | 28,950 | | | | (1,334,034 | ) | | | 1,349,935 | | | | 15,901 | |
CDX.NA.HY.32 | | | Buy | | | | 5.000 | | | | 6/20/24 | | | | USD | | | | 97,763 | | | | 6,936,478 | | | | (7,047,291 | ) | | | (110,813 | ) |
CDX.NA.HY.32 | | | Buy | | | | 5.000 | | | | 6/20/24 | | | | USD | | | | 68,904 | | | | 4,728,346 | | | | (4,967,002 | ) | | | (238,656 | ) |
CDX.NA.HY.33 | | | Buy | | | | 5.000 | | | | 12/20/24 | | | | USD | | | | 70,000 | | | | 4,669,000 | | | | (4,669,000 | ) | | | — | |
Colombia Government International | | | Buy | | | | 1.000 | | | | 12/20/24 | | | | USD | | | | 7,000 | | | | 20,678 | | | | (24,215 | ) | | | (3,537 | ) |
Indonesia Government International | | | Buy | | | | 1.000 | | | | 12/20/24 | | | | USD | | | | 7,000 | | | | 32,526 | | | | (34,492 | ) | | | (1,966 | ) |
Mexico Government International | | | Buy | | | | 1.000 | | | | 12/20/24 | | | | USD | | | | 8,750 | | | | (72,830 | ) | | | 67,196 | | | | (5,634 | ) |
Republic of South Africa Government | | | Buy | | | | 1.000 | | | | 12/20/24 | | | | USD | | | | 3,500 | | | | (161,727 | ) | | | 154,410 | | | | (7,317 | ) |
| | | | | | | | | | | | | | | | | | | | | | | | |
Total Centrally Cleared Credit Default Swaps | | | | | | | | | | | | | | | $ | 15,190,995 | | | $ | (15,048,732 | ) | | $ | 142,263 | |
| | | | | | | | | | | | | | | | | | | | | | | | |
| | | | | | | | | | | | | | | | | | | | | | | | | | | | | | | | | | | | |
Over-the-Counter Credit Default Swaps at September 30, 2019 | |
Reference Asset | | Counterparty | | | Buy/Sell
Protection | | | Fixed Rate | | | Maturity Date | | | | | | Notional Amount (000’s) | | | Premiums Received/ (Paid) | | | Value | | | Unrealized Appreciation/ (Depreciation) | |
Hellenic Republic | | | BAC | | | | Sell | | | | 1.000 | | | | 6/20/25 | | | | USD | | | | 3,586 | | | $ | 596,602 | | | $ | (228,874) | | | $ | 367,728 | |
Hellenic Republic | | | BAC | | | | Sell | | | | 1.000 | | | | 6/20/25 | | | | USD | | | | 8,966 | | | | 1,343,371 | | | | (572,248) | | | | 771,123 | |
Hellenic Republic | | | BAC | | | | Sell | | | | 1.000 | | | | 12/20/25 | | | | USD | | | | 8,350 | | | | 1,298,472 | | | | (621,086) | | | | 677,386 | |
Hellenic Republic | | | BAC | | | | Sell | | | | 1.000 | | | | 12/20/19 | | | | USD | | | | 6,000 | | | | 90,026 | | | | 10,955 | | | | 100,981 | |
Hellenic Republic | | | GSCOI | | | | Sell | | | | 1.000 | | | | 6/20/25 | | | | USD | | | | 3,590 | | | | 566,429 | | | | (229,129) | | | | 337,300 | |
Hellenic Republic Government Bond | | | BAC | | | | Sell | | | | 1.000 | | | | 6/20/29 | | | | USD | | | | 8,750 | | | | 1,683,593 | | | | (1,167,491) | | | | 516,102 | |
Hellenic Republic Government Bond | | | BAC | | | | Sell | | | | 1.000 | | | | 6/20/26 | | | | USD | | | | 13,250 | | | | 1,652,965 | | | | (1,119,931) | | | | 533,034 | |
Hellenic Republic Government Bond | | | BAC | | | | Sell | | | | 1.000 | | | | 6/20/26 | | | | USD | | | | 14,000 | | | | 1,616,439 | | | | (1,183,323) | | | | 433,116 | |
Hellenic Republic Government Bond | | | BAC | | | | Sell | | | | 1.000 | | | | 6/20/24 | | | | USD | | | | 6,000 | | | | 413,483 | | | | (254,390) | | | | 159,093 | |
Hellenic Republic Government Bond | | | BOA | | | | Sell | | | | 1.000 | | | | 6/20/24 | | | | USD | | | | 3,500 | | | | 286,767 | | | | (148,394) | | | | 138,373 | |
Hellenic Republic Government Bond | | | BOA | | | | Sell | | | | 1.000 | | | | 6/20/26 | | | | USD | | | | 7,000 | | | | 849,356 | | | | (591,662) | | | | 257,694 | |
133 INVESCO OPPENHEIMER GLOBAL STRATEGIC INCOME FUND
CONSOLIDATED SCHEDULE OF INVESTMENTSContinued
| | | | | | | | | | | | | | | | | | | | | | | | | | | | | | | | |
| Over-the-Counter Credit Default Swaps (Continued) | |
Reference Asset | | Counterparty | | | Buy/Sell Protection | | | Fixed Rate | | | Maturity Date | | | Notional
Amount
(000’s) | | | Premiums Received/ (Paid) | | | Value | | | Unrealized
Appreciation/
(Depreciation) | |
| Intesa Sanpaolo S.p.A. | | | JPM | | | | Sell | | | | 5.000% | | | | 12/20/22 | | | | EUR 35,000 | | | $ | (5,717,660 | ) | | $ | 5,322,861 | | | $ | (394,799 | ) |
| iTraxx Europe Crossover Series 24 Version 1 | | | JPM | | | | Sell | | | | 5.000 | | | | 12/20/20 | | | | EUR 7,100 | | | | (665,797 | ) | | | 379,166 | | | | (286,631 | ) |
| Lloyds Banking Group plc | | | JPM | | | | Buy | | | | 1.000 | | | | 6/20/24 | | | | EUR 1,750 | | | | (76,780 | ) | | | 41,877 | | | | (34,903 | ) |
| Oriental Republic of Uruguay | | | BOA | | | | Sell | | | | 1.000 | | | | 12/20/21 | | | | USD 7,501 | | | | 135,567 | | | | (14,458 | ) | | | 121,109 | |
| Royal Bank Of Scotland Group plc | | | JPM | | | | Buy | | | | 1.000 | | | | 6/20/24 | | | | EUR 1,750 | | | | (88,148 | ) | | | 51,540 | | | | (36,608 | ) |
| | | | | | | | | | | | | | | | | | | | | | | | |
Total Over-the-Counter Credit Default Swaps | | | | | | | | | | | | | | | $ | 3,984,685 | | | $ | (324,587 | ) | | $ | 3,660,098 | |
| | | | | | | | | | | | | | | | | | | | | | | | |
| | | | | | | | | | | | | | | | | | | | | | | | | | | | | | | | |
| Centrally Cleared Interest Rate Swaps at September 30, 2019 | |
| | | | | | | | |
| Counterparty | | Pay/Receive Floating Rate | | | Floating Rate | | | Fixed Rate | | | Maturity Date | | | Notional Amount (000’s) | | | Premiums Received / (Paid) | | | Value | | | Unrealized Appreciation/ (Depreciation) | |
BAC | | | Receive | | |
| Six-Month EUR
EURIBOR |
| | | 1.123% | | | | 3/8/28 | | | | EUR 5,775 | | | | — | | | | (795,227 | ) | | | (795,227 | ) |
BOA | | | Receive | | | | CDOR03 | | | | 2.000 | | | | 8/14/29 | | | | CAD 139,125 | | | | — | | | | (2,444,766 | ) | | | (2,444,766 | ) |
BOA | | | Receive | | | | BZDIOVRA | | | | 6.630 | | | | 1/2/25 | | | | BRL 39,200 | | | | — | | | | 64,207 | | | | 64,207 | |
BOA | | | Receive | | | | BBSW6M | | | | 1.655 | | | | 7/16/29 | | | | AUD 26,000 | | | | — | | | | (804,424 | ) | | | (804,424 | ) |
CITNA-B | | | Pay | | | | COOVIBR | | | | 5.560 | | | | 8/26/26 | | | | COP 29,197,000 | | | | — | | | | 385,013 | | | | 385,013 | |
CITNA-B | | | Pay | | |
| Six-Month HUF
BUBOR |
| | | 2.205 | | | | 3/8/28 | | | | HUF 1,925,000 | | | | — | | | | 648,957 | | | | 648,957 | |
CITNA-B | | | Pay | | | | COOVIBR | | | | 5.220 | | | | 8/12/29 | | | | COP 14,450,000 | | | | — | | | | 12,580 | | | | 12,580 | |
CITNA-B | | | Pay | | | | COOVIBR | | | | 5.200 | | | | 8/1/29 | | | | COP 30,347,000 | | | | — | | | | 18,374 | | | | 18,374 | |
DEU | | | Pay | | |
| MXN TIIE
BANXICO |
| | | 7.340 | | | | 7/24/29 | | | | MXN 92,200 | | | | — | | | | 187,723 | | | | 187,723 | |
DEU | | | Pay | | |
| MXN TIIE
BANXICO |
| | | 8.120 | | | | 5/5/21 | | | | MXN 1,131,020 | | | | — | | | | 1,181,873 | | | | 1,181,873 | |
DEU | | | Pay | | |
| Three-Month ZAR
JIBAR SAFEX |
| | | 7.675 | | | | 2/21/22 | | | | ZAR 73,535 | | | | — | | | | 112,939 | | | | 112,939 | |
DEU | | | Pay | | | | JIBA3M | | | | 8.420 | | | | 8/29/28 | | | | ZAR 156,300 | | | | — | | | | 617,620 | | | | 617,620 | |
DEU | | | Pay | | |
| MXN TIIE
BANXICO |
| | | 8.525 | | | | 1/15/24 | | | | MXN 169,550 | | | | — | | | | 656,821 | | | | 656,821 | |
GSCOI | | | Pay | | | | SORF6M | | | | 1.980 | | | | 3/4/21 | | | | SGD 121,800 | | | | — | | | | 474,997 | | | | 474,997 | |
GSCOI | | | Pay | | |
| Six-Month GBP
BBA LIBOR |
| | | 3.450 | | | | 10/15/25 | | | | GBP 17,570 | | | | — | | | | (329,092 | ) | | | (329,092 | ) |
GSCOI | | | Receive | | |
| Three-Month USD
BBA LIBOR |
| | | 1.666 | | | | 8/7/29 | | | | USD 3,760 | | | | — | | | | (29,377 | ) | | | (29,377 | ) |
GSCOI | | | Pay | | |
| MXN TIIE
BANXICO |
| | | 7.200 | | | | 7/27/22 | | | | MXN 443,400 | | | | — | | | | 382,049 | | | | 382,049 | |
GSCOI | | | Receive | | | | CPURNSA | | | | 1.873 | | | | 7/25/24 | | | | USD 122,000 | | | | — | | | | (1,892,913 | ) | | | (1,892,913 | ) |
GSCOI | | | Receive | | | | SORF6M | | | | 2.073 | | | | 3/4/24 | | | | SGD 49,900 | | | | — | | | | (796,875 | ) | | | (796,875 | ) |
GSCOI | | | Receive | | | | CPURNSA | | | | 1.883 | | | | 7/19/24 | | | | USD 113,000 | | | | — | | | | (1,810,667 | ) | | | (1,810,667 | ) |
134 INVESCO OPPENHEIMER GLOBAL STRATEGIC INCOME FUND
| | | | | | | | | | | | | | | | | | | | | | | | | | | | | | | | |
| Centrally Cleared Interest Rate Swaps (Continued) | |
| Counterparty | | Pay/Receive
Floating
Rate | | | Floating
Rate | | | Fixed
Rate | | | Maturity
Date | | | Notional
Amount
(000’s) | | | Premiums
Received /
(Paid) | | | Value | | | Unrealized
Appreciation/
(Depreciation) | |
| GSCOI | | | Pay | | |
| MXN TIIE
BANXICO |
| | | 8.620% | | | | 12/26/28 | | | | MXN 86,300 | | | $ | — | | | $ | 581,374 | | | $ | 581,374 | |
| GSCOI | | | Receive | | | | WIBR6M | | | | 2.095 | | | | 5/30/24 | | | | PLN 35,000 | | | | — | | | | (183,389 | ) | | | (183,389 | ) |
| GSCOI | | | Receive | | | | CPURNSA | | | | 1.869 | | | | 7/22/24 | | | | USD 113,000 | | | | — | | | | (1,571,630 | ) | | | (1,571,630 | ) |
| GSCOI | | | Pay | | | | BZDI | | | | 6.825 | | | | 1/4/21 | | | | BRL 32,300 | | | | — | | | | 180,039 | | | | 180,039 | |
| GSCOI | | | Pay | | |
| MXN TIIE
BANXICO |
| | | 7.845 | | | | 12/7/23 | | | | MXN 333,700 | | | | — | | | | 832,805 | | | | 832,805 | |
| HSBC | | | Pay | | |
| MXN TIIE
BANXICO |
| | | 7.210 | | | | 7/17/24 | | | | MXN 316,295 | | | | — | | | | 450,388 | | | | 450,388 | |
| JPM | | | Pay | | | | BZDIOVRA | | | | 7.060 | | | | 7/1/22 | | | | BRL 1,067,100 | | | | — | | | | 229,258 | | | | 229,258 | |
| JPM | | | Pay | | |
| Three-Month ZAR
JIBAR SAFEX |
| | | 7.930 | | | | 11/27/22 | | | | ZAR 45,000 | | | | — | | | | 103,579 | | | | 103,579 | |
| JPM | | | Receive | | |
| Three-Month USD
BBA LIBOR |
| | | 1.747 | | | | 11/14/49 | | | | USD 29,500 | | | | — | | | | (202,072 | ) | | | (202,072 | ) |
| JPM | | | Pay | | |
| Three-Month USD
BBA LIBOR |
| | | 1.460 | | | | 11/14/21 | | | | USD 357,000 | | | | — | | | | (874,047 | ) | | | (874,047 | ) |
| JPM | | | Pay | | | | BZDIOVRA | | | | 6.528 | | | | 1/2/24 | | | | BRL 45,400 | | | | — | | | | 88,162 | | | | 88,162 | |
| JPM | | | Pay | | | | COOVIBR | | | | 4.890 | | | | 10/17/20 | | | | COP 113,100,000 | | | | — | | | | 314,912 | | | | 314,912 | |
| JPM | | | Pay | | |
| MXN TIIE
BANXICO |
| | | 7.810 | | | | 12/7/23 | | | | MXN 403,200 | | | | — | | | | 979,343 | | | | 979,343 | |
| JPM | | | Pay | | |
| MXN TIIE
BANXICO |
| | | 6.710 | | | | 9/23/21 | | | | MXN 358,750 | | | | — | | | | 11,078 | | | | 11,078 | |
| JPM | | | Pay | | | | BZDI | | | | 2.280 | | | | 1/4/27 | | | | BRL 106,000 | | | | — | | | | 2,221,779 | | | | 2,221,779 | |
| JPM | | | Receive | | | | NDBB3M | | | | 1.368 | | | | 5/15/31 | | | | NZD 35,000 | | | | — | | | | (199,535 | ) | | | (199,535 | ) |
| JPM | | | Pay | | |
| MXN TIIE
BANXICO |
| | | 8.750 | | | | 10/29/20 | | | | MXN 1,561,000 | | | | — | | | | 1,459,850 | | | | 1,459,850 | |
| MSCO | | | Pay | | | | EUR006M | | | | 1.282 | | | | 4/29/49 | | | | EUR 45,225 | | | | — | | | | 4,956,044 | | | | 4,956,044 | |
| MSCO | | | Receive | | | | EUR006M | | | | 1.060 | | | | 4/30/59 | | | | EUR 50,245 | | | | — | | | | (5,837,001 | ) | | | (5,837,001 | ) |
| MSCO | | | Receive | | | | CPURNSA | | | | 1.856 | | | | 7/30/24 | | | | USD 153,750 | | | | — | | | | (2,043,191 | ) | | | (2,043,191 | ) |
| SIB | | | Pay | | | | BZDI | | | | 8.415 | | | | 1/2/25 | | | | BRL 95,000 | | | | — | | | | 1,692,316 | | | | 1,692,316 | |
| SIB | | | Pay | | |
| MXN TIIE
BANXICO |
| | | 7.880 | | | | 6/9/22 | | | | MXN 382,300 | | | | — | | | | 637,621 | | | | 637,621 | |
| UBS | | | Pay | | | | BBSW3M | | | | 1.560 | | | | 3/21/21 | | | | AUD 255,400 | | | | — | | | | 1,924,161 | | | | 1,924,161 | |
| UBS | | | Receive | | | | BBSW6M | | | | 1.823 | | | | 3/21/24 | | | | AUD 104,400 | | | | — | | | | (2,867,761 | ) | | | (2,867,761 | ) |
| | | | | | | | | | | | | | | | | | | | | | | | |
| Total Centrally Cleared Interest Rate Swaps | | | | | | | | | | | | | | | $ | — | | | $ | (1,276,105 | ) | | $ | (1,276,105 | ) |
| | | | | | | | | | | | | | | | | | | | | | | | |
| | | | | | | | | | | | | | | | | | | | | | | | | | | | | | | | |
| Over-the-Counter Interest Rate Swaps at September 30, 2019 | |
| Counterparty | | Pay/Receive
Floating
Rate | | | Floating
Rate | | | Fixed
Rate | | | Maturity
Date | | | Notional
Amount
(000’s) | | | Premiums
Received /
(Paid) | | | Value | | | Unrealized
Appreciation/
(Depreciation) | |
BOA | | | Pay | | |
| Six-Month INR
FBIL MIBOR OIS
Compound |
| | | 6.330% | | | | 1/31/22 | | | | INR 590,000 | | | $ | — | | | $ | 266,101 | | | $ | 266,101 | |
BOA | | | Receive | | |
| Six-Month INR
FBIL MIBOR OIS
Compound |
| | | 5.740 | | | | 5/16/21 | | | | INR 2,643,000 | | | | — | | | | (451,841 | ) | | | (451,841 | ) |
135 INVESCO OPPENHEIMER GLOBAL STRATEGIC INCOME FUND
CONSOLIDATED SCHEDULE OF INVESTMENTSContinued
| | | | | | | | | | | | | | | | | | | | | | | | | | | | |
| Over-the-Counter Interest Rate Swaps (Continued) | |
Counterparty | | Pay/Receive
Floating
Rate | | Floating
Rate | | Fixed
Rate | | | Maturity
Date | | | Notional
Amount
(000’s) | | | Premiums
Received /
(Paid) | | | Value | | | Unrealized
Appreciation/
(Depreciation) | |
BOA | | Receive | | INR FBIL MIBOR OIS Compound | | | 5.670% | | | | 5/27/21 | | |
| INR
2,600,000 |
| | $ | — | | | $ | (359,368 | ) | | $ | (359,368 | ) |
GSCOI | | Receive | | KWCDC | | | 1.705 | | | | 4/25/24 | | |
| KRW
82,782,690 |
| | | — | | | | (1,518,981 | ) | | | (1,518,981 | ) |
GSCOI | | Pay | | KWCDC | | | 1.743 | | | | 4/25/21 | | |
| KRW
204,605,145 |
| | | — | | | | 1,255,039 | | | | 1,255,039 | |
GSCOI | | Pay | | MOSKP3 | | | 8.270 | | | | 5/23/24 | | | | RUB 230,000 | | | | — | | | | 220,335 | | | | 220,335 | |
GSCOI | | Pay | | MOSKP3 | | | 8.360 | | | | 6/24/29 | | | | RUB 301,575 | | | | — | | | | 383,294 | | | | 383,294 | |
SCB | | Receive | | Six-Month INR FBIL MIBOR OIS Compound | | | 6.438 | | | | 1/10/24 | | | | INR 600,000 | | | | — | | | | (485,217 | ) | | | (485,217 | ) |
| | | | | | | | | | | | | | | | | | | | |
Total Over-the-Counter Interest Rate Swaps | | | | | | | | | | | | | | $ | — | | | $ | (690,638 | ) | | $ | (690,638 | ) |
| | | | | | | | | | | | | | | | | | | | |
| | | | | | | | | | | | | | | | | | | | | | | | | | | | | | |
Over-the-Counter Credit Default Swaptions Written at September 30, 2019 | |
| Description | | Counterparty | | Buy/Sell
Protection | | Reference
Asset | | Fixed
Rate | | | Expiration
Date | | | | | | Notional
Amount
(000’s) | | | Premiums
Received | | | Value | |
| Credit Default Swap maturing 6/20/24 Put | | JPM | | Buy | | iTraxx Europe Crossover Series 31 Version 1 | | | 5.000% | | | | 12/18/19 | | | | EUR | | | | 105,000 | | | $ | 777,965 | | | $ | (551,267 | ) |
Credit Default Swap maturing 6/20/24 Put | | JPM | | Buy | | iTraxx Europe Crossover Series 31 Version 1 | | | 5.000 | | | | 12/18/19 | | | | EUR | | | | 105,000 | | | | 1,045,028 | | | | (836,170 | ) |
Credit Default Swap maturing 6/20/24 Call | | JPM | | Sell | | iTraxx Europe Crossover Series 31 Version 1 | | | 5.000 | | | | 12/18/19 | | | | EUR | | | | 105,000 | | | | 638,629 | | | | (224,098 | ) |
Credit Default Swap maturing 6/20/24 Call | | JPM | | Sell | | iTraxx Europe Crossover Series 31 Version 1 | | | 5.000 | | | | 12/18/19 | | | | EUR | | | | 105,000 | | | | 197,394 | | | | (53,627 | ) |
| Credit Default Swap maturing 6/20/24 Put | | JPM | | Buy | | CDX NA.HY.32 | | | 5.000 | | | | 10/16/19 | | | | USD | | | | 35,000 | | | | 254,678 | | | | (24,125 | ) |
| Credit Default Swap maturing 6/20/24 Put | | JPM | | Buy | | CDX. NA.HY.32 | | | 5.000 | | | | 10/16/19 | | | | USD | | | | 35,000 | | | | 190,575 | | | | (24,124 | ) |
| Credit Default Swap maturing 6/20/24 Put | | JPM | | Buy | | CDX. NA.HY.32 | | | 5.000 | | | | 10/16/19 | | | | USD | | | | 35,000 | | | | 141,750 | | | | (24,124 | ) |
| Credit Default Swap maturing 6/20/24 Put | | JPM | | Buy | | CDX. NA.HY.32 | | | 5.000 | | | | 12/18/19 | | | | USD | | | | 140,000 | | | | 994,000 | | | | (1,148,003 | ) |
| Credit Default Swap maturing 6/20/24 Put | | JPM | | Buy | | CDX. NA.HY.32 | | | 5.000 | | | | 11/20/19 | | | | USD | | | | 70,000 | | | | 406,000 | | | | (406,000 | ) |
| | | | | | | | | | | | | | | | | | | | | | | | | | |
Total Over-the-Counter Credit Default Swaptions Written | | | | | | | | | | | | | | | $ | 4,646,019 | | | $ | (3,291,538 | ) |
| | | | | | | | | | | | | | | | | | | | | | | | | | |
136 INVESCO OPPENHEIMER GLOBAL STRATEGIC INCOME FUND
| | | | | | | | | | | | | | | | | | | | | | | | | | | | | | | | | | |
| Over-the-Counter Interest Rate Swaptions Written at September 30, 2019 | |
| Description | | Counterparty | | | Pay /
Receive
Floating
Rate | | | Floating
Rate | | Fixed
Rate | | | Expiration
Date | | | Notional Amount
(000’s) | | | Premiums
Received | | | Value | |
| |
| Interest Rate Swap maturing 8/6/20 Call | | | BOA | | | | Pay | | | Three-Month USD BBA LIBOR | | | 1.435% | | | | 8/6/20 | | | | USD | | | | 70,000 | | | $ | 955,500 | | | $ | (846,773 | ) |
| Interest Rate Swap maturing 8/6/20 Call | | | BOA | | | | Pay | | | Three-Month USD BBA LIBOR | | | 1.235 | | | | 8/6/20 | | | | USD | | | | 70,000 | | | | 694,400 | | | | (582,320 | ) |
| Interest Rate Swap maturing 6/15/20 Put | | | GSCOI | | | | Receive | | | Three-Month RUB MOSPRIME NFEA | | | 8.080 | | | | 6/15/20 | | | | RUB | | | | 582,700 | | | | 181,226 | | | | (131,812 | ) |
| Interest Rate Swap maturing 1/9/20 Call | | | GSCOI | | | | Pay | | | Three-Month USD BBA LIBOR | | | 1.600 | | | | 1/9/20 | | | | USD | | | | 232,500 | | | | 1,243,875 | | | | (2,527,119 | ) |
| Interest Rate Swap Maturing 5/5/20 Call | | | JPM | | | | Pay | | | Three-Month USD BBA LIBOR | | | 2.159 | | | | 5/5/20 | | | | USD | | | | 174,470 | | | | 1,308,525 | | | | (8,081,587 | ) |
| Interest Rate Swap Maturing 6/8/20 Put | | | JPM | | | | Receive | | | Three-Month USD BBA LIBOR | | | 1.693 | | | | 6/8/20 | | | | USD | | | | 348,000 | | | | 2,072,340 | | | | (813,429 | ) |
| Interest Rate Swap Maturing 6/8/20 Call | | | JPM | | | | Pay | | | Three-Month USD BBA LIBOR | | | 1.693 | | | | 6/8/20 | | | | USD | | | | 348,000 | | | | 2,072,340 | | | | (2,482,768 | ) |
| Interest Rate Swap maturing 7/9/20 Put | | | JPM | | | | Receive | | | Three-Month USD BBA LIBOR | | | 1.801 | | | | 7/9/20 | | | | USD | | | | 232,300 | | | | 2,880,520 | | | | (1,127,940 | ) |
| Interest Rate Swap maturing 7/9/20 Call | | | JPM | | | | Pay | | | Three-Month USD BBA LIBOR | | | 1.501 | | | | 7/9/20 | | | | USD | | | | 232,300 | | | | 1,591,255 | | | | (3,041,636 | ) |
| Interest Rate Swap maturing 7/20/20 Put | | | JPM | | | | Receive | | | Three-Month USD BBA LIBOR | | | 1.803 | | | | 7/20/20 | | | | USD | | | | 174,480 | | | | 2,189,724 | | | | (872,013 | ) |
| Interest Rate Swap maturing 7/20/20 Call | | | JPM | | | | Pay | | | Three-Month USD BBA LIBOR | | | 1.403 | | | | 7/20/20 | | | | USD | | | | 174,480 | | | | 1,008,494 | | | | (1,936,751 | ) |
| Interest Rate Swap maturing 11/14/19 Put | | | JPM | | | | Receive | | | Three-Month USD BBA LIBOR | | | 1.630 | | | | 11/14/19 | | | | USD | | | | 222,000 | | | | 670,189 | | | | (542,062 | ) |
137 INVESCO OPPENHEIMER GLOBAL STRATEGIC INCOME FUND
CONSOLIDATED SCHEDULE OF INVESTMENTSContinued
| | | | | | | | | | | | | | | | | | | | | | | | | | | | | | | | | | |
| Over-the-Counter Interest Rate Swaptions Written (Continued) | |
| Description | | Counterparty | | | Pay/
Receive
Floating
Rate | | | Floating
Rate | | Fixed
Rate | | | Expiration
Date | | | Notional Amount
(000’s) | | | Premiums
Received | | | Value | |
| |
| Interest Rate Swap maturing 2/14/20 Put | | | MSCO | | | | Receive | | | Three-Month USD BBA LIBOR | | | 1.600 | % | | | 2/14/20 | | | | USD | | | | 349,000 | | | $ | 750,350 | | | $ | (895,436 | ) |
| Interest Rate Swap maturing 8/17/20 Put | | | MSCO | | | | Receive | | | Three-Month USD BBA LIBOR | | | 1.530 | | | | 8/17/20 | | | | USD | | | | 520,000 | | | | 1,908,065 | | | | (2,056,506 | ) |
| Interest Rate Swap maturing 3/27/20 Call | | | MSCO | | | | Pay | | | Six-Month EUR EURIBOR | | | 0.000 | | | | 3/27/20 | | | | EUR | | | | 43,500 | | | | 414,117 | | | | (215,611 | ) |
| | | | | | | | | | | | | | | | | | | | | | | | | | | | | | |
Total Over-the-Counter Interest Rate Swaptions Written | | | | | | | | | | | $ | 19,940,920 | | | $ | (26,153,763 | ) |
| | | | | | | | | | | | | | | | | | | | | | | | | | | | | | |
| | |
Glossary: |
Counterparty Abbreviations |
BAC | | Barclays Bank plc |
BNP | | BNP Paribas |
BOA | | Bank of America NA |
CITNA-B | | Citibank NA |
DEU | | Deutsche Bank AG |
GSCOI | | Goldman Sachs International |
GSCO-OT | | Goldman Sachs Bank USA |
HSBC | | HSBC Bank USA NA |
JPM | | JPMorgan Chase Bank NA |
MOS | | Morgan Stanley & Co., Inc. |
MSCO | | Morgan Stanley Capital Services, Inc. |
RBC | | RBC Dominion Securities |
SCB | | Standard Chartered Bank |
SIB | | Banco Santander SA |
UBS | | UBS AG |
|
Currency abbreviations indicate amounts reporting in currencies |
ARS | | Argentine Peso |
AUD | | Australian Dollar |
BRL | | Brazilian Real |
CAD | | Canadian Dollar |
CLP | | Chilean Peso |
CNY | | Chinese Renminbi |
COP | | Colombian Peso |
EGP | | Egyptian Pounds |
EUR | | Euro |
GBP | | British Pound Sterling |
HUF | | Hungarian Forint |
IDR | | Indonesian Rupiah |
INR | | Indian Rupee |
JPY | | Japanese Yen |
KRW | | South Korean Won |
138 INVESCO OPPENHEIMER GLOBAL STRATEGIC INCOME FUND
| | |
Currency abbreviations indicate amounts reporting in currencies (Continued) |
MXN | | Mexican Nuevo Peso |
MYR | | Malaysian Ringgit |
NOK | | Norwegian Krone |
NZD | | New Zealand Dollar |
PEN | | Peruvian New Sol |
PHP | | Philippine Peso |
PLN | | Polish Zloty |
RUB | | Russian Ruble |
SEK | | Swedish Krona |
SGD | | Singapore Dollar |
THB | | Thailand Baht |
TRY | | New Turkish Lira |
ZAR | | South African Rand |
|
Definitions |
BA CDOR | | Canada Bankers Acceptances Deposit Offering Rate |
BANXICO | | Banco de Mexico |
BBA LIBOR | | British Bankers’ Association London - Interbank Offered Rate |
BBSW3M | | ASX Australian Bank Bill Short Term Rate 3 Month Mid |
BBSW6M | | ASX Australian Bank Bill Short Term Rate 6 Month Mid |
BP0003M | | ICE LIBOR GBP 3 Month |
BTP | | Italian Treasury Bonds |
BUBOR | | Budapest Interbank Offered Rate |
BUND | | German Federal Obligation |
BUXL | | German Federal Obligation |
BZDI | | Brazil Interbank Deposit Rate |
BZDIOVRA | | Brazil Ceptip DI Interbank Deposit Rate |
CD | | Certificate of Deposit |
CDOR03 | | Canada Bankers Acceptance 3 Months |
CDX.EM.31 | | Markit CDX Emerging Markets Index |
CDX.NA.HY.32 | | Markit CDX North American High Yield |
CDX.NA.HY.33 | | Markit CDX North American High Yield |
COOVIBR | | Colombia IBR Overnight Nominal Interbank Reference Rate |
CPURNSA | | US Consumer Price Index Urban Consumers |
EUR003M | | EURIBOR 3 Month ACT/360 |
EUR006M | | EURIBOR 6 Month ACT/360 |
EURIBOR | | Euro Interbank Offered Rate |
EUSA5 | | EUR Swap Annual 5 Year |
EUSA11 | | EUR Swap Annual 11 Year |
FBIL | | Financial Benchmarks India Private Ltd. |
GDR | | Global Depositary Receipts |
H15T10Y | | US Treasury Yield Curve Rate T Note Constant Maturity 10 Year |
H15T1Y | | US Treasury Yield Curve Rate T Note Constant Maturity 1 Year |
H15T5Y | | US Treasury Yield Curve Rate T Note Constant Maturity 5 Year |
iTraxx Europe |
Crossover Series 31 |
Version 1 | | Credit Default Swap Trading Index for a Specific Basket of Securities |
JIBA3M | | South Africa Johannesburg Interbank Agreed Rate 3 Month |
JIBAR SAFEX | | South Africa Johannesburg Interbank Agreed Rate/Futures Exchange |
KWCDC | | South Korean Won Index |
139 INVESCO OPPENHEIMER GLOBAL STRATEGIC INCOME FUND
CONSOLIDATED SCHEDULE OF INVESTMENTSContinued
| | |
Definitions (Continued) |
LIBOR01M | | ICE LIBOR USD 1 Month |
LIBOR4 | | London Interbank Offered Rate-Quarterly |
LIBOR6 | | London Interbank Offered Rate-Bi-Monthly |
LIBOR12 | | London Interbank Offered Rate-Monthly |
MIBOR | | Mumbai Interbank Offered Rate |
MOSKP3 | | National Finance Assoc. Moscow Prime Offered 3 Month Rate |
MOSPRIME NFEA | | Moscow Prime Offered Rate |
NDBB3M | | New Zealand Bank Bill 3 Month |
OIS | | Overnight Index Swap |
PRIME4 | | United States Prime Rate-Quarterly |
S&P | | Standard & Poor’s |
SONIA3M | | Sterling Overnight Index Average |
SORF6M | | Association of Banks in Singapore Swap Offer Rate Fixing 6 Month |
TIIE | | Interbank Equilibrium Interest Rate |
US0001M | | ICE LIBOR USD 1 Month |
US0003M | | ICE LIBOR USD 3 Month |
USISDA05 | | USD ICE Swap Rate 11:00am NY 5 Year |
USSW5 | | USD Swap Semi 30/360 5 Year |
WIBR6M | | GBP Benchmark WIBOR PLN 6 month |
See accompanying Notes to Consolidated Financial Statements.
140 INVESCO OPPENHEIMER GLOBAL STRATEGIC INCOME FUND
CONSOLIDATED STATEMENT OF
ASSETS AND LIABILITIES
| | | | | | | | |
| | | October 31, 2019 September 30, 2019 | |
Assets | | | | | | | | |
Investments, at value—see accompanying consolidated schedule of investments: | | | | | | | | |
Unaffiliated companies (cost $3,200,656,517 and $3,203,809,381) | | $ | 3,140,584,888 | | | $ | 3,118,438,005 | |
Affiliated companies (cost $559,809,791 and $577,138,357) | | | 547,953,551 | | | | 565,404,710 | |
| | | | |
| | | | 3,688,538,439 | | | | 3,683,842,715 | |
Cash | | | 35,287,292 | | | | 35,314,744 | |
Cash—foreign currencies (cost $— and $2,879,177) | | | — | | | | 2,857,293 | |
Cash used for collateral on OTC derivatives | | | 16,990,000 | | | | 21,301,000 | |
Cash used for collateral on centrally cleared swaps | | | 55,416,740 | | | | 44,538,166 | |
Unrealized appreciation on forward currency exchange contracts | | | 40,486,625 | | | | 34,184,778 | |
Swaps, at value (net premiums paid $7,719,990 and $6,458,359) | | | 8,269,398 | | | | 7,931,168 | |
Variation margin receivable - centrally cleared swaps | | | — | | | | 1,159,875 | |
Receivables and other assets: | | | | | | | | |
Interest, dividends and principal paydowns | | | 36,349,188 | | | | 32,374,493 | |
Investments sold | | | 19,304,442 | | | | 25,753,404 | |
Variation margin receivable - futures contracts | | | 10,083,101 | | | | 9,110,081 | |
Shares of beneficial interest sold | | | 1,222,810 | | | | 1,894,869 | |
Other | | | 771,953 | | | | 5,163,574 | |
| | | | |
Total assets | | | 3,912,719,988 | | | | 3,905,426,160 | |
Liabilities | | | | | | | | |
Amount due to custodian-foreign | | | 7,230,140 | | | | — | |
Unrealized depreciation on forward currency exchange contracts | | | 50,338,456 | | | | 37,997,294 | |
Options written, at value (premiums received $42,060,068 and $41,154,150) | | | 33,750,929 | | | | 36,599,870 | |
Swaps, at value (premiums received $10,307,477 and $10,443,044) | | | 4,729,639 | | | | 8,946,393 | |
Variation margin payable - centrally cleared swaps | | | 1,361,596 | | | | — | |
Swaptions written, at value (premiums received $16,369,345 and $24,586,939) | | | 14,145,048 | | | | 29,445,301 | |
Payables and other liabilities: | | | | | | | | |
Investments purchased | | | 430,511,156 | | | | 419,998,801 | |
Shares of beneficial interest redeemed | | | 4,349,730 | | | | 5,410,711 | |
Transfer and shareholder servicing agent fees | | | 1,148,715 | | | | 1,079,698 | |
Dividends | | | 807,965 | | | | 849,426 | |
Distribution and service plan fees | | | 764,477 | | | | 782,763 | |
Foreign capital gains tax | | | 565,783 | | | | 477,689 | |
Trustees’ compensation | | | 455,246 | | | | 501,655 | |
Shareholder communications | | | 275,000 | | | | 275,000 | |
Advisory fees | | | 51,283 | | | | 52,136 | |
Administration fees | | | 1,303 | | | | 443 | |
Other | | | 642,821 | | | | 1,364,328 | |
| | | | |
Total liabilities | | | 551,129,287 | | | | 543,781,508 | |
Net Assets | | $ | 3,361,590,701 | | | $ | 3,361,644,652 | |
| | | | |
141 INVESCO OPPENHEIMER GLOBAL STRATEGIC INCOME FUND
CONSOLIDATED STATEMENT OF
ASSETS AND LIABILITIESContinued
| | | | | | | | |
| | | October 31, 2019 September 30, 2019 | |
Composition of Net Assets | | | | | | | | |
Shares of beneficial interest | | $ | 4,161,681,055 | | | $ | 4,196,112,942 | |
Total accumulated loss | | | (800,090,354 | ) | | | (834,468,290 | ) |
| | | | |
Net Assets | | $ | 3,361,590,701 | | | $ | 3,361,644,652 | |
| | | | | | | | |
| | | | | | | | |
Net Asset Value Per Share | | | | | | | | |
| | |
| Class A Shares: | | | | | | | | |
| | |
| Net asset value and redemption price per share (based on net assets and shares of beneficial interest outstanding of $2,669,174,803 and 711,899,542 at October 31, 2019 and $2,671,045,523 and 718,706,251 at September 30, 2019) | | | $3.75 | | | | $3.72 | |
| | |
| Maximum offering price per share (net asset value plus sales charge of 4.25% of offering price) | | | $3.92 | | | | $3.89 | |
| | |
| Class C Shares: | | | | | | | | |
| | |
| Net asset value, redemption price (excludes applicable contingent deferred sales charge) and offering price per share (based on net assets and shares of beneficial interest outstanding of $220,077,403 and 58,865,956 at October 31, 2019 and $224,034,778 and 60,328,426 at September 30, 2019) | | | $3.74 | | | | $3.71 | |
| | |
| Class R Shares: | | | | | | | | |
| | |
| Net asset value, redemption price and offering price per share (based on net assets and shares of beneficial interest outstanding of $99,919,718 and 26,628,506 at October 31, 2019 and $100,111,732 and 26,911,436 at September 30, 2019) | | | $3.75 | | | | $3.72 | |
| | |
| Class Y Shares: | | | | | | | | |
| | |
| Net asset value, redemption price and offering price per share (based on net assets and shares of beneficial interest outstanding of $335,775,040 and 89,625,210 at October 31, 2019 and $329,963,256 and 88,844,090 at September 30, 2019) | | | $3.75 | | | | $3.71 | |
| | |
| Class R5 Shares: | | | | | | | | |
| | |
| Net asset value, redemption price and offering price per share (based on net assets and shares of beneficial interest outstanding of $10,171 and 2,710 at October 31, 2019 and $10,082 and 2,710 at September 30, 2019) | | | $3.75 | | | | $3.72 | |
| | |
| Class R6 Shares: | | | | | | | | |
| | |
| Net asset value, redemption price and offering price per share (based on net assets and shares of beneficial interest outstanding of $36,633,566 and 9,813,940 at October 31, 2019 and $36,479,281 and 9,856,404 at September 30, 2019) | | | $3.73 | | | | $3.70 | |
See accompanying Notes to Consolidated Financial Statements.
142 INVESCO OPPENHEIMER GLOBAL STRATEGIC INCOME FUND
CONSOLIDATED STATEMENT OF
OPERATIONS
| | | | | | | | |
| | | One Month Ended | | | Year Ended | |
| | | October 31, 2019 | | | September 30, 2019 | |
Investment Income | | | | | | | | |
Interest: | | | | | | | | |
Unaffiliated companies | | $ | 12,483,566 | | | $ | 192,550,075 | |
Affiliated companies (net of foreign withholding taxes of $67,736 and $1,444,059, respectively) | | | 438,275 | | | | 16,047,525 | |
Dividends: | | | | | | | | |
Unaffiliated companies (net of foreign withholding taxes of $— and $109, respectively) | | | — | | | | 1,668,291 | |
Affiliated companies | | | 624,087 | | | | 7,362,261 | |
| | | | |
Total investment income | | | 13,545,928 | | | | 217,628,152 | |
Expenses | | | | | | | | |
Advisory fees | | | 1,586,287 | | | | 19,409,801 | |
Administration fees | | | 40,330 | | | | 168,002 | |
Distribution and service plan fees: | | | | | | | | |
Class A | | | 533,530 | | | | 6,153,929 | |
Class C | | | 188,570 | | | | 4,278,061 | |
Class R | | | 42,414 | | | | 525,402 | |
Transfer and shareholder servicing agent fees: | | | | | | | | |
Class A | | | 366,141 | | | | 4,340,855 | |
Class C | | | 30,548 | | | | 720,572 | |
Class R | | | 13,742 | | | | 176,400 | |
Class Y | | | 45,524 | | | | 563,753 | |
Class R5 | | | 1 | | | | 2 | |
Class R6 | | | 496 | | | | 10,138 | |
Shareholder communications: | | | | | | | | |
Class A | | | 7 | | | | 253,479 | |
Class C | | | 37 | | | | 30,553 | |
Class R | | | 6 | | | | 9,705 | |
Class Y | | | — | | | | 31,202 | |
Class R5 | | | — | | | | 1 | |
Class R6 | | | — | | | | 3,175 | |
Custodian fees and expenses | | | 40,419 | | | | 493,191 | |
Trustees’ compensation | | | 4,951 | | | | 89,536 | |
Borrowing fees | | | — | | | | 68,795 | |
Other | | | 49,196 | | | | 372,056 | |
| | | | |
Total expenses | | | 2,942,199 | | | | 37,698,608 | |
Less waivers, reimbursement of expenses and offset arrangement(s) | | | (130,719 | ) | | | (1,704,962 | ) |
| | | | |
Net expenses | | | 2,811,480 | | | | 35,993,646 | |
Net Investment Income | | | 10,734,448 | | | | 181,634,506 | |
143 INVESCO OPPENHEIMER GLOBAL STRATEGIC INCOME FUND
CONSOLIDATED STATEMENT OF
OPERATIONSContinued
| | | | | | | | |
| | | One Month Ended | | | Year Ended | |
| | | October 31, 2019 | | | September 30, 2019 | |
Realized and Unrealized Gain (Loss) | | | | | | | | |
Net realized gain (loss) on: | | | | | | | | |
Investment transactions in: | | | | | | | | |
Unaffiliated companies (net of foreign capital gains tax of $— and $766,901, respectively) | | $ | (15,087,001 | ) | | $ | (21,529,315 | ) |
Affiliated companies | | | 322,763 | | | | (16,952,621 | ) |
Option contracts written | | | 5,267,770 | | | | 45,584,363 | |
Futures contracts | | | 1,875,289 | | | | (41,042,997 | ) |
Foreign currency transactions | | | (616,553 | ) | | | 1,889,262 | |
Swap contracts | | | (791,871 | ) | | | (13,183,552 | ) |
Swaption contracts written | | | (2,841,803 | ) | | | (15,054,791 | ) |
Forward currency exchange contracts | | | (6,782,108 | ) | | | (29,008,858 | ) |
| | | | |
Net realized loss | | | (18,653,514 | ) | | | (89,298,509 | ) |
Net change in unrealized appreciation/(depreciation) on: | | | | | | | | |
Investment transactions in: | | | | | | | | |
Unaffiliated companies (net of foreign capital gains tax of $88,094 and $477,689, respectively) | | | 25,211,653 | | | | 50,777,307 | |
Affiliated companies | | | (122,593 | ) | | | (2,050,508 | ) |
Translation of assets and liabilities denominated in foreign currencies | | | 741,355 | | | | 50,626 | |
Forward currency exchange contracts | | | (6,039,315 | ) | | | 13,130,261 | |
Futures contracts | | | 4,344,667 | | | | (603,713 | ) |
Option contracts written | | | 3,754,859 | | | | 7,310,380 | |
Swap contracts | | | 11,980,816 | | | | 6,469,636 | |
Swaption contracts written | | | 7,082,659 | | | | (6,784,446 | ) |
| | | | |
Net change in unrealized appreciation/(depreciation) | | | 46,954,101 | | | | 68,299,543 | |
Net Increase in Net Assets Resulting from Operations | | $ | 39,035,035 | | | $ | 160,635,540 | |
| | | | |
See accompanying Notes to Consolidated Financial Statements.
144 INVESCO OPPENHEIMER GLOBAL STRATEGIC INCOME FUND
CONSOLIDATED STATEMENT OF CHANGES IN NET ASSETS
| | | | | | | | | | | | |
| | | One Month Ended
October 31, 2019 | | | Year Ended
September 30, 2019 | | | Year Ended
September 30, 2018 | |
Operations | | | | | | | | | | | | |
Net investment income | | $ | 10,734,448 | | | $ | 181,634,506 | | | $ | 195,712,532 | |
Net realized gain (loss) | | | (18,653,514 | ) | | | (89,298,509 | ) | | | (66,649,729 | ) |
Net change in unrealized appreciation/(depreciation) | | | 46,954,101 | | | | 68,299,543 | | | | (183,248,754 | ) |
| | | | |
Net increase (decrease) in net assets resulting from operations | | | 39,035,035 | | | | 160,635,540 | | | | (54,185,951 | ) |
Dividends and/or Distributions to Shareholders | | | | | | | | | | | | |
Distributions to shareholders from distributable earnings:1 | | | | | | | | | | | | |
Class A | | | (3,800,606 | ) | | | (87,772,855 | ) | | | (138,286,611 | ) |
Class B2 | | | — | | | | — | | | | (206,061 | ) |
Class C | | | (248,545 | ) | | | (12,840,455 | ) | | | (24,713,582 | ) |
Class R | | | (132,004 | ) | | | (3,399,687 | ) | | | (5,305,616 | ) |
Class Y | | | (504,387 | ) | | | (11,958,984 | ) | | | (22,346,153 | ) |
Class R5 | | | (16 | ) | | | (105 | ) | | | — | |
Class R6 | | | (57,732 | ) | | | (1,460,735 | ) | | | (2,325,655 | ) |
| | | | |
Total distributions from distributable earnings | | | (4,743,290 | ) | | | (117,432,821 | ) | | | (193,183,678 | ) |
Tax return of capital distribution: | | | | | | | | | | | | |
Class A | | | (4,205,210 | ) | | | (44,853,599 | ) | | | — | |
Class B2 | | | — | | | | — | | | | — | |
Class C | | | (275,004 | ) | | | (6,561,716 | ) | | | — | |
Class R | | | (146,056 | ) | | | (1,737,304 | ) | | | — | |
Class Y | | | (558,082 | ) | | | (6,111,268 | ) | | | — | |
Class R5 | | | (18 | ) | | | (54 | ) | | | — | |
Class R6 | | | (63,879 | ) | | | (746,463 | ) | | | — | |
| | | | |
Total return of capital distribution | | | (5,248,249 | ) | | | (60,010,404 | ) | | | — | |
Beneficial Interest Transactions | | | | | | | | | | | | |
Net increase (decrease) in net assets resulting from beneficial interest transactions: | | | | | | | | | | | | |
Class A | | | (25,362,027 | ) | | | (13,542,333 | ) | | | (251,385,480 | ) |
Class B2 | | | — | | | | — | | | | (15,557,890 | ) |
Class C | | | (5,447,267 | ) | | | (317,660,779 | ) | | | (119,417,713 | ) |
Class R | | | (1,057,362 | ) | | | (11,280,336 | ) | | | (4,958,722 | ) |
Class Y | | | 2,927,053 | | | | (39,068,226 | ) | | | (96,067,367 | ) |
Class R5 | | | — | | | | 10,000 | | | | — | |
Class R6 | | | (157,844 | ) | | | (4,870,151 | ) | | | (3,188,283 | ) |
| | | | |
Total beneficial interest transactions | | | (29,097,447 | ) | | | (386,411,825 | ) | | | (490,575,455 | ) |
Net Assets | | | | | | | | | | | | |
Total decrease | | | (53,951 | ) | | | (403,219,510 | ) | | | (737,945,084 | ) |
Beginning of period | | | 3,361,644,652 | | | | 3,764,864,162 | | | | 4,502,809,246 | |
| | | | |
End of period | | $ | 3,361,590,701 | | | $ | 3,361,644,652 | | | $ | 3,764,864,162 | |
| | | | |
1. The Securities Exchange Commission eliminated the requirement to disclose the distribution components separately, except for tax return of capital. For the year ended September 30, 2018, distributions to shareholders from
145 INVESCO OPPENHEIMER GLOBAL STRATEGIC INCOME FUND
CONSOLIDATED STATEMENT OF CHANGES IN NET ASSETSContinued
distributable earnings consisted of distributions from net investment income.
2. Effective June 1, 2018, all Class B shares converted to Class A shares.
See accompanying Notes to Consolidated Financial Statements.
146 INVESCO OPPENHEIMER GLOBAL STRATEGIC INCOME FUND
CONSOLIDATED FINANCIAL HIGHLIGHTS
| | | | | | | | | | | | | | | | | | | | | | | | |
Class A | | One Month
Ended
October 31,
2019 | | | Year Ended
September 30,
2019 | | | Year Ended
September 30,
2018 | | | Year Ended
September 30,
2017 | | | Year Ended
September 30,
2016 | | | Year Ended
September 30,
2015 | |
Per Share Operating Data | | | | | | | | | | | | | | | | | | | | | | | | |
Net asset value, beginning of period | | | $3.72 | | | | $3.73 | | | | $3.96 | | | | $3.95 | | | | $3.87 | | | | $4.13 | |
Income (loss) from investment operations: | | | | | | | | | | | | | | | | | | | | | | | | |
Net investment income1 | | | 0.01 | | | | 0.19 | | | | 0.18 | | | | 0.16 | | | | 0.15 | | | | 0.18 | |
Net realized and unrealized gain (loss) | | | 0.03 | | | | (0.01) | | | | (0.23) | | | | 0.01 | | | | 0.08 | | | | (0.26) | |
Total from investment operations | | | 0.04 | | | | 0.18 | | | | (0.05) | | | | 0.17 | | | | 0.23 | | | | (0.08) | |
Dividends and/or distributions to shareholders: | | | | | | | | | | | | | | | | | | | | | | | | |
Dividends from net investment income | | | (0.00)2 | | | | (0.13) | | | | (0.18) | | | | (0.11) | | | | (0.14) | | | | (0.17) | |
Tax return of capital distribution | | | (0.01) | | | | (0.06) | | | | 0.00 | | | | (0.05) | | | | (0.01) | | | | (0.01) | |
| Total dividends and/or distributions to shareholders | | | (0.01) | | | | (0.19) | | | | (0.18) | | | | (0.16) | | | | (0.15) | | | | (0.18) | |
Net asset value, end of period | | | $3.75 | | | | $3.72 | | | | $3.73 | | | | $3.96 | | | | $3.95 | | | | $3.87 | |
| | | | |
| | | | | | | | | | | | | | | | | | | | | | | | |
Total Return, at Net Asset Value3 | | | 1.11% | | | | 5.08% | | | | (1.49)% | | | | 4.45% | | | | 6.07% | | | | (2.06)% | |
| | | | | | | | | | | | | | | | | | | | | | | | |
Ratios/Supplemental Data | | | | | | | | | | | | | | | | | | | | | | | | |
Net assets, end of period (in thousands) | | | $2,669,175 | | | | $2,671,046 | | | | $2,699,688 | | | | $3,124,887 | | | | $3,607,387 | | | | $4,008,783 | |
Average net assets (in thousands) | | | $2,666,111 | | | | $2,596,952 | | | | $2,920,657 | | | | $3,321,318 | | | | $3,745,267 | | | | $4,432,764 | |
Ratios to average net assets:4 | | | | | | | | | | | | | | | | | | | | | | | | |
Net investment income5 | | | 3.80% | | | | 5.25% | | | | 4.79% | | | | 4.13% | | | | 3.87% | | | | 4.43% | |
| Expenses excluding specific expenses listed below | | | 1.00% | | | | 1.00% | | | | 1.07%6 | | | | 1.08%6 | | | | 1.06%6 | | | | 1.05%6 | |
Interest and fees from borrowings | | | 0.00% | | | | 0.00%7 | | | | 0.00%7 | | | | 0.00%7 | | | | 0.00%7 | | | | 0.00%7 | |
Total expenses8 | | | 1.00% | | | | 1.00% | | | | 1.07%6 | | | | 1.08%6 | | | | 1.06%6 | | | | 1.05%6 | |
| Expenses after payments, waivers and/or reimbursements and reduction to custodian expenses | | | 0.96% | | | | 0.95% | | | | 1.00%6 | | | | 1.01%6 | | | | 1.02%6 | | | | 1.00%6 | |
Portfolio turnover rate9,10 | | | 25% | | | | 114% | | | | 67% | | | | 69% | | | | 78% | | | | 79% | |
147 INVESCO OPPENHEIMER GLOBAL STRATEGIC INCOME FUND
CONSOLIDATED FINANCIAL HIGHLIGHTSContinued
1. Per share amounts calculated based on the average shares outstanding during the period.
2. Less than $0.005 per share.
3. Includes adjustments in accordance with accounting principles generally accepted in the United States of America and as such, the net asset value for financial reporting purposes and the returns based upon those net asset values may differ from the net asset value and returns for shareholder transactions. Does not include sales charges and is not annualized for periods less than one year, if applicable.
4. Annualized for periods less than one full year.
5. Includes the Fund’s share of the allocated net investment income from Invesco Oppenheimer Master Event-Linked Bond Fund and Invesco Oppenheimer Master Loan Fund.
6. Includes the Fund’s share of the allocated expenses from Invesco Oppenheimer Master Event-Linked Bond and Invesco Oppenheimer Master Loan.
7. Less than 0.005%.
8. Total expenses including indirect expenses from affiliated fund fees and expenses were as follows:
| | | | | | |
One Month Ended October 31, 2019 | | | 1.04 | % | | |
Year Ended September 30, 2019 | | | 1.04 | % | | |
Year Ended September 30, 2018 | | | 1.08 | % | | |
Year Ended September 30, 2017 | | | 1.09 | % | | |
Year Ended September 30, 2016 | | | 1.07 | % | | |
Year Ended September 30, 2015 | | | 1.06 | % | | |
9. The portfolio turnover rate excludes purchase and sale transactions of To Be Announced (TBA) mortgage-related securities as follows:
| | | | | | | | |
| | | Purchase Transactions | | | Sale Transactions | |
One Month Ended October 31, 2019 | | | $364,949,527 | | | | $405,130,315 | |
Year Ended September 30, 2019 | | | $5,760,311,794 | | | | $5,754,174,138 | |
Year Ended September 30, 2018 | | | $6,366,360,171 | | | | $6,415,700,475 | |
Year Ended September 30, 2017 | | | $5,559,676,349 | | | | $5,415,035,851 | |
Year Ended September 30, 2016 | | | $4,468,857,111 | | | | $4,304,402,600 | |
Year Ended September 30, 2015 | | | $4,009,637,043 | | | | $4,100,638,359 | |
10. Portfolio turnover is calculated at the fund level and is not annualized for periods less than one year, if applicable.
See accompanying Notes to Consolidated Financial Statements.
148 INVESCO OPPENHEIMER GLOBAL STRATEGIC INCOME FUND
| | | | | | | | | | | | | | | | | | | | | | | | |
| Class C | | One Month
Ended
October 31,
2019 | | | Year Ended
September 30,
2019 | | | Year Ended
September 30,
2018 | | | Year Ended
September 30,
2017 | | | Year Ended
September 30,
2016 | | | Year Ended
September 30,
2015 | |
Per Share Operating Data | | | | | | | | | | | | | | | | | | | | | | | | |
| Net asset value, beginning of period | | | $3.71 | | | | $3.72 | | | | $3.95 | | | | $3.94 | | | | $3.87 | | | | $4.12 | |
| Income (loss) from investment operations: | | | | | | | | | | | | | | | | | | | | | | | | |
| Net investment income1 | | | 0.01 | | | | 0.17 | | | | 0.16 | | | | 0.13 | | | | 0.12 | | | | 0.15 | |
| Net realized and unrealized gain (loss) | | | 0.03 | | | | (0.02) | | | | (0.24) | | | | 0.01 | | | | 0.07 | | | | (0.25) | |
| | | | |
| Total from investment operations | | | 0.04 | | | | 0.15 | | | | (0.08) | | | | 0.14 | | | | 0.19 | | | | (0.10) | |
| Dividends and/or distributions to shareholders: | | | | | | | | | | | | | | | | | | | | | | | | |
| Dividends from net investment income | | | (0.00)2 | | | | (0.11) | | | | (0.15) | | | | (0.09) | | | | (0.11) | | | | (0.14) | |
Tax return of capital distribution | | | (0.01) | | | | (0.05) | | | | 0.00 | | | | (0.04) | | | | (0.01) | | | | (0.01) | |
Total dividends and/or distributions to shareholders | | | (0.01) | | | | (0.16) | | | | (0.15) | | | | (0.13) | | | | (0.12) | | | | (0.15) | |
Net asset value, end of period | | | $3.74 | | | | $3.71 | | | | $3.72 | | | | $3.95 | | | | $3.94 | | | | $3.87 | |
| | | | |
| | | | | | | | | | | | | | | | | | | | | | | | |
Total Return, at Net Asset Value3 | | | 1.04% | | | | 4.28% | | | | (2.26)% | | | | 3.67% | | | | 5.01% | | | | (2.56)% | |
| | | | | | | | | | | | | | | | | | | | | | | | |
Ratios/Supplemental Data | | | | | | | | | | | | | | | | | | | | | | | | |
| Net assets, end of period (in thousands) | | | $220,077 | | | | $224,035 | | | | $540,465 | | | | $696,936 | | | | $850,319 | | | | $977,069 | |
Average net assets (in thousands) | | | $222,327 | | | | $427,719 | | | | $623,092 | | | | $769,686 | | | | $897,334 | | | | $1,087,495 | |
| Ratios to average net assets:4 | | | | | | | | | | | | | | | | | | | | | | | | |
| Net investment income5 | | | 3.03% | | | | 4.49% | | | | 4.03% | | | | 3.37% | | | | 3.12% | | | | 3.67% | |
| Expenses excluding specific expenses listed below | | | 1.76% | | | | 1.76% | | | | 1.83%6 | | | | 1.84%6 | | | | 1.81%6 | | | | 1.80%6 | |
| Interest and fees from borrowings | | | 0.00% | | | | 0.00%7 | | | | 0.00%7 | | | | 0.00%7 | | | | 0.00%7 | | | | 0.00%7 | |
| Total expenses8 | | | 1.76% | | | | 1.76% | | | | 1.83%6 | | | | 1.84%6 | | | | 1.81%6 | | | | 1.80%6 | |
Expenses after payments, waivers and/or reimbursements and reduction to custodian expenses | | | 1.72% | | | | 1.71% | | | | 1.76%6 | | | | 1.77%6 | | | | 1.77%6 | | | | 1.76%6 | |
Portfolio turnover rate9,10 | | | 25% | | | | 114% | | | | 67% | | | | 69% | | | | 78% | | | | 79% | |
149 INVESCO OPPENHEIMER GLOBAL STRATEGIC INCOME FUND
CONSOLIDATED FINANCIAL HIGHLIGHTSContinued
1. Per share amounts calculated based on the average shares outstanding during the period.
2. Less than $0.005 per share.
3. Includes adjustments in accordance with accounting principles generally accepted in the United States of America and as such, the net asset value for financial reporting purposes and the returns based upon those net asset values may differ from the net asset value and returns for shareholder transactions. Does not include sales charges and is not annualized for periods less than one year, if applicable.
4. Annualized for periods less than one full year.
5. Includes the Fund’s share of the allocated net investment income from Invesco Oppenheimer Master Event-Linked Bond Fund and Invesco Oppenheimer Master Loan Fund.
6. Includes the Fund’s share of the allocated expenses from Invesco Oppenheimer Master Event-Linked Bond and Invesco Oppenheimer Master Loan.
7. Less than 0.005%.
8. Total expenses including indirect expenses from affiliated fund fees and expenses were as follows:
| | | | | | |
One Month Ended October 31, 2019 | | | 1.80 | % | | |
Year Ended September 30, 2019 | | | 1.80 | % | | |
Year Ended September 30, 2018 | | | 1.84 | % | | |
Year Ended September 30, 2017 | | | 1.85 | % | | |
Year Ended September 30, 2016 | | | 1.82 | % | | |
Year Ended September 30, 2015 | | | 1.81 | % | | |
9. The portfolio turnover rate excludes purchase and sale transactions of To Be Announced (TBA) mortgage-related securities as follows:
| | | | | | | | |
| | | Purchase Transactions | | | Sale Transactions | |
One Month Ended October 31, 2019 | | | $364,949,527 | | | | $405,130,315 | |
Year Ended September 30, 2019 | | | $5,760,311,794 | | | | $5,754,174,138 | |
Year Ended September 30, 2018 | | | $6,366,360,171 | | | | $6,415,700,475 | |
Year Ended September 30, 2017 | | | $5,559,676,349 | | | | $5,415,035,851 | |
Year Ended September 30, 2016 | | | $4,468,857,111 | | | | $4,304,402,600 | |
Year Ended September 30, 2015 | | | $4,009,637,043 | | | | $4,100,638,359 | |
10. Portfolio turnover is calculated at the fund level and is not annualized for periods less than one year, if applicable.
See accompanying Notes to Consolidated Financial Statements.
150 INVESCO OPPENHEIMER GLOBAL STRATEGIC INCOME FUND
| | | | | | | | | | | | | | | | | | | | | | | | |
| Class R | | One Month
Ended
October 31,
2019 | | | Year Ended
September 30,
2019 | | | Year Ended
September 30,
2018 | | | Year Ended
September 30,
2017 | | | Year Ended
September 30,
2016 | | | Year Ended
September 30,
2015 | |
Per Share Operating Data | | | | | | | | | | | | | | | | | | | | | | | | |
Net asset value, beginning of period | | | $3.72 | | | | $3.73 | | | | $3.96 | | | | $3.95 | | | | $3.88 | | | | $4.13 | |
Income (loss) from investment operations: | | | | | | | | | | | | | | | | | | | | | | | | |
Net investment income1 | | | 0.01 | | | | 0.18 | | | | 0.17 | | | | 0.15 | | | | 0.14 | | | | 0.17 | |
Net realized and unrealized gain (loss) | | | 0.03 | | | | (0.01) | | | | (0.23) | | | | 0.01 | | | | 0.07 | | | | (0.25) | |
| | | | |
Total from investment operations | | | 0.04 | | | | 0.17 | | | | (0.06) | | | | 0.16 | | | | 0.21 | | | | (0.08) | |
Dividends and/or distributions to shareholders: | | | | | | | | | | | | | | | | | | | | | | | | |
Dividends from net investment income | | | (0.00)2 | | | | (0.12) | | | | (0.17) | | | | (0.10) | | | | (0.13) | | | | (0.16) | |
Tax return of capital distribution | | | (0.01) | | | | (0.06) | | | | 0.00 | | | | (0.05) | | | | (0.01) | | | | (0.01) | |
| | | | |
Total dividends and/or distributions to shareholders | | | (0.01) | | | | (0.18) | | | | (0.17) | | | | (0.15) | | | | (0.14) | | | | (0.17) | |
Net asset value, end of period | | | $3.75 | | | | $3.72 | | | | $3.73 | | | | $3.96 | | | | $3.95 | | | | $3.88 | |
| | | | |
| | | | | | | | | | | | | | | | | | | | | | | | |
| | |
Total Return, at Net Asset Value3 | | | 1.09% | | | | 4.81% | | | | (1.75)% | | | | 4.19% | | | | 5.53% | | | | (2.06)% | |
| | |
Ratios/Supplemental Data | | | | | | | | | | | | | | | | | | | | | | | | |
Net assets, end of period (in thousands) | | | $99,920 | | | | $100,112 | | | | $111,816 | | | | $123,825 | | | | $149,098 | | | | $162,623 | |
Average net assets (in thousands) | | | $100,053 | | | | $105,418 | | | | $118,510 | | | | $134,309 | | | | $152,830 | | | | $175,389 | |
Ratios to average net assets:4 | | | | | | | | | | | | | | | | | | | | | | | | |
Net investment income5 | | | 3.53% | | | | 4.99% | | | | 4.53% | | | | 3.87% | | | | 3.61% | | | | 4.17% | |
Expenses excluding specific expenses listed below | | | 1.26% | | | | 1.26% | | | | 1.33%6 | | | | 1.34%6 | | | | 1.31%6 | | | | 1.30%6 | |
Interest and fees from borrowings | | | 0.00% | | | | 0.00%7 | | | | 0.00%7 | | | | 0.00%7 | | | | 0.00%7 | | | | 0.00%7 | |
| | | | |
Total expenses8 | | | 1.26% | | | | 1.26% | | | | 1.33%6 | | | | 1.34%6 | | | | 1.31%6 | | | | 1.30%6 | |
| Expenses after payments, waivers and/or reimbursements and reduction to custodian expenses | | | 1.22% | | | | 1.21% | | | | 1.26%6 | | | | 1.27%6 | | | | 1.27%6 | | | | 1.26%6 | |
Portfolio turnover rate9,10 | | | 25% | | | | 114% | | | | 67% | | | | 69% | | | | 78% | | | | 79% | |
151 INVESCO OPPENHEIMER GLOBAL STRATEGIC INCOME FUND
CONSOLIDATED FINANCIAL HIGHLIGHTSContinued
1. Per share amounts calculated based on the average shares outstanding during the period.
2. Less than $0.005 per share.
3. Includes adjustments in accordance with accounting principles generally accepted in the United States of America and as such, the net asset value for financial reporting purposes and the returns based upon those net asset values may differ from the net asset value and returns for shareholder transactions. Does not include sales charges and is not annualized for periods less than one year, if applicable.
4. Annualized for periods less than one full year.
5. Includes the Fund’s share of the allocated net investment income from Invesco Oppenheimer Master Event-Linked Bond Fund and Invesco Oppenheimer Master Loan Fund.
6. Includes the Fund’s share of the allocated expenses from Invesco Oppenheimer Master Event-Linked Bond and Invesco Oppenheimer Master Loan.
7. Less than 0.005%.
8. Total expenses including indirect expenses from affiliated fund fees and expenses were as follows:
| | | | | | |
One Month Ended October 31, 2019 | | | 1.30 | % | | |
Year Ended September 30, 2019 | | | 1.30 | % | | |
Year Ended September 30, 2018 | | | 1.34 | % | | |
Year Ended September 30, 2017 | | | 1.35 | % | | |
Year Ended September 30, 2016 | | | 1.32 | % | | |
Year Ended September 30, 2015 | | | 1.31 | % | | |
9. The portfolio turnover rate excludes purchase and sale transactions of To Be Announced (TBA) mortgage-related securities as follows:
| | | | | | | | |
| | | Purchase Transactions | | | Sale Transactions | |
One Month Ended October 31, 2019 | | | $364,949,527 | | | | $405,130,315 | |
Year Ended September 30, 2019 | | | $5,760,311,794 | | | | $5,754,174,138 | |
Year Ended September 30, 2018 | | | $6,366,360,171 | | | | $6,415,700,475 | |
Year Ended September 30, 2017 | | | $5,559,676,349 | | | | $5,415,035,851 | |
Year Ended September 30, 2016 | | | $4,468,857,111 | | | | $4,304,402,600 | |
Year Ended September 30, 2015 | | | $4,009,637,043 | | | | $4,100,638,359 | |
10. Portfolio turnover is calculated at the fund level and is not annualized for periods less than one year, if applicable.
See accompanying Notes to Consolidated Financial Statements.
152 INVESCO OPPENHEIMER GLOBAL STRATEGIC INCOME FUND
| | | | | | | | | | | | | | | | | | | | | | | | |
| Class Y | | One Month Ended October 31,
2019 | | | Year Ended September 30, 2019 | | | Year Ended September 30, 2018 | | | Year Ended September 30, 2017 | | | Year Ended September 30, 2016 | | | Year Ended September 30, 2015 | |
Per Share Operating Data | | | | | | | | | | | | | | | | | | | | | | | | |
Net asset value, beginning of period | | | $3.71 | | | | $3.73 | | | | $3.96 | | | | $3.95 | | | | $3.87 | | | | $4.13 | |
Income (loss) from investment operations: | | | | | | | | | | | | | | | | | | | | | | | | |
Net investment income1 | | | 0.01 | | | | 0.20 | | | | 0.19 | | | | 0.17 | | | | 0.16 | | | | 0.19 | |
Net realized and unrealized gain (loss) | | | 0.04 | | | | (0.02) | | | | (0.23) | | | | 0.01 | | | | 0.08 | | | | (0.26) | |
Total from investment operations | | | 0.05 | | | | 0.18 | | | | (0.04) | | | | 0.18 | | | | 0.24 | | | | (0.07) | |
Dividends and/or distributions to shareholders: | | | | | | | | | | | | | | | | | | | | | | | | |
Dividends from net investment income | | | (0.00)2 | | | | (0.13) | | | | (0.19) | | | | (0.11) | | | | (0.15) | | | | (0.18) | |
Tax return of capital distribution | | | (0.01) | | | | (0.07) | | | | 0.00 | | | | (0.06) | | | | (0.01) | | | | (0.01) | |
Total dividends and/or distributions to shareholders | | | (0.01) | | | | (0.20) | | | | (0.19) | | | | (0.17) | | | | (0.16) | | | | (0.19) | |
Net asset value, end of period | | | $3.75 | | | | $3.71 | | | | $3.73 | | | | $3.96 | | | | $3.95 | | | | $3.87 | |
| | | | |
| | | | | | | | | | | | | | | | | | | | | | | | |
Total Return, at Net Asset Value3 | | | 1.40% | | | | 5.05% | | | | (1.26)% | | | | 4.70% | | | | 6.33% | | | | (1.83)% | |
| | | | | | | | | | | | | | | | | | | | | | | | |
Ratios/Supplemental Data | | | | | | | | | | | | | | | | | | | | | | | | |
Net assets, end of period (in thousands) | | | $335,775 | | | | $329,963 | | | | $371,434 | | | | $494,017 | | | | $369,088 | | | | $403,252 | |
Average net assets (in thousands) | | | $331,755 | | | | $336,841 | | | | $450,170 | | | | $417,814 | | | | $372,918 | | | | $453,869 | |
Ratios to average net assets:4 | | | | | | | | | | | | | | | | | | | | | | | | |
Net investment income5 | | | 4.03% | | | | 5.49% | | | | 5.03% | | | | 4.43% | | | | 4.11% | | | | 4.68% | |
Expenses excluding specific expenses listed below | | | 0.77% | | | | 0.77% | | | | 0.83%6 | | | | 0.84%6 | | | | 0.81%6 | | | | 0.80%6 | |
Interest and fees from borrowings | | | 0.00% | | | | 0.00%7 | | | | 0.00%7 | | | | 0.00%7 | | | | 0.00%7 | | | | 0.00%7 | |
Total expenses8 | | | 0.77% | | | | 0.77% | | | | 0.83%6 | | | | 0.84%6 | | | | 0.81%6 | | | | 0.80%6 | |
| Expenses after payments, waivers and/or reimbursements and reduction to custodian expenses | | | 0.72% | | | | 0.72% | | | | 0.76%6 | | | | 0.77%6 | | | | 0.77%6 | | | | 0.76%6 | |
Portfolio turnover rate9,10 | | | 25% | | | | 114% | | | | 67% | | | | 69% | | | | 78% | | | | 79% | |
153 INVESCO OPPENHEIMER GLOBAL STRATEGIC INCOME FUND
CONSOLIDATED FINANCIAL HIGHLIGHTSContinued
1. Per share amounts calculated based on the average shares outstanding during the period.
2. Less than $0.005 per share.
3. Includes adjustments in accordance with accounting principles generally accepted in the United States of America and as such, the net asset value for financial reporting purposes and the returns based upon those net asset values may differ from the net asset value and returns for shareholder transactions. Does not include sales charges and is not annualized for periods less than one year, if applicable.
4. Annualized for periods less than one full year.
5. Includes the Fund’s share of the allocated net investment income from Invesco Oppenheimer Master Event-Linked Bond Fund and Invesco Oppenheimer Master Loan Fund.
6. Includes the Fund’s share of the allocated expenses from Invesco Oppenheimer Master Event-Linked Bond and Invesco Oppenheimer Master Loan.
7. Less than 0.005%.
8. Total expenses including indirect expenses from affiliated fund fees and expenses were as follows:
| | | | |
One Month Ended October 31, 2019 | | | 0.81 | % |
Year Ended September 30, 2019 | | | 0.81 | % |
Year Ended September 30, 2018 | | | 0.84 | % |
Year Ended September 30, 2017 | | | 0.85 | % |
Year Ended September 30, 2016 | | | 0.82 | % |
Year Ended September 30, 2015 | | | 0.81 | % |
9. The portfolio turnover rate excludes purchase and sale transactions of To Be Announced (TBA) mortgage-related securities as follows:
| | | | | | | | |
| | | Purchase Transactions | | | Sale Transactions | |
One Month Ended October 31, 2019 | | | $364,949,527 | | | | $405,130,315 | |
Year Ended September 30, 2019 | | | $5,760,311,794 | | | | $5,754,174,138 | |
Year Ended September 30, 2018 | | | $6,366,360,171 | | | | $6,415,700,475 | |
Year Ended September 30, 2017 | | | $5,559,676,349 | | | | $5,415,035,851 | |
Year Ended September 30, 2016 | | | $4,468,857,111 | | | | $4,304,402,600 | |
Year Ended September 30, 2015 | | | $4,009,637,043 | | | | $4,100,638,359 | |
10. Portfolio turnover is calculated at the fund level and is not annualized for periods less than one year, if applicable.
See accompanying Notes to Consolidated Financial Statements.
154 INVESCO OPPENHEIMER GLOBAL STRATEGIC INCOME FUND
| | | | | | | | |
| Class R5 | | One Month
Ended
October 31,
2019 | | | Period Ended
September 30,
20191 | |
Per Share Operating Data | | | | | | | | |
| Net asset value, beginning of period | | | $3.72 | | | | $3.69 | |
| Income (loss) from investment operations: | | | | | | | | |
| Net investment income2 | | | 0.01 | | | | 0.07 | |
| Net realized and unrealized gain | | | 0.03 | | | | 0.02 | |
| | | | |
| Total from investment operations | | | 0.04 | | | | 0.09 | |
| Dividends and/or distributions to shareholders: | | | | | | | | |
| Dividends from net investment income | | | (0.00) | 3 | | | (0.04 | ) |
| Tax return of capital distribution | | | (0.01 | ) | | | (0.02 | ) |
| | | | |
| Total dividends and/or distributions to shareholders | | | (0.01 | ) | | | (0.06 | ) |
| Net asset value, end of period | | | $3.75 | | | | $3.72 | |
| | | | |
| Total Return, at Net Asset Value4 | | | 1.14% | | | | 2.40% | |
| | | | | | | | |
| Ratios/Supplemental Data | | | | | | | | |
| Net assets, end of period (in thousands) | | | $10 | | | | $10 | |
| Average net assets (in thousands) | | | $10 | | | | $10 | |
| Ratios to average net assets:5 | | | | | | | | |
| Net investment income6 | | | 4.05% | | | | 5.58% | |
| Expenses excluding specific expenses listed below | | | 0.72% | | | | 0.68% | |
| Interest and fees from borrowings | | | 0.00% | | | | 0.00% | |
| | | | |
| Total expenses7 | | | 0.72% | | | | 0.68% | |
| Expenses after payments, waivers and/or reimbursements and reduction to custodian expenses | | | 0.70% | | | | 0.63% | |
| Portfolio turnover rate8,9 | | | 25% | | | | 114% | |
155 INVESCO OPPENHEIMER GLOBAL STRATEGIC INCOME FUND
CONSOLIDATED FINANCIAL HIGHLIGHTSContinued
1. For the period from after the close of business on May 24, 2019 (inception of offering) to August 31, 2019.
2. Per share amounts calculated based on the average shares outstanding during the period.
3. Less than $0.005 per share.
4. Includes adjustments in accordance with accounting principles generally accepted in the United States of America and as such, the net asset value for financial reporting purposes and the returns based upon those net asset values may differ from the net asset value and returns for shareholder transactions. Does not include sales charges and is not annualized for periods less than one year, if applicable.
5. Annualized for periods less than one full year.
6. Includes the Fund’s share of the allocated net investment income from Invesco Oppenheimer Master Event-Linked Bond Fund and Invesco Oppenheimer Master Loan Fund.
7. Total expenses including indirect expenses from affiliated fund fees and expenses were as follows:
| | | | |
One Month Ended October 31, 2019 | | | 0.76 | % |
Period Ended September 30, 2019 | | | 0.72 | % |
8. The portfolio turnover rate excludes purchase and sale transactions of To Be Announced (TBA) mortgage-related securities as follows:
| | | | | | | | |
| | | Purchase Transactions | | | Sale Transactions | |
One Month Ended October 31, 2019 | | | $364,949,527 | | | | $405,130,315 | |
Period Ended September 30, 2019 | | | $5,760,311,794 | | | | $5,754,174,138 | |
9. Portfolio turnover is calculated at the fund level and is not annualized for periods less than one year, if applicable.
See accompanying Notes to Consolidated Financial Statements.
156 INVESCO OPPENHEIMER GLOBAL STRATEGIC INCOME FUND
| | | | | | | | | | | | | | | | | | | | | | | | |
| Class R6 | | One Month
Ended
October 31,
2019 | | | Year Ended
September 30,
2019 | | | Year Ended
September 30,
2018 | | | Year Ended
September 30,
2017 | | | Year Ended
September 30,
2016 | | | Year Ended
September 30,
2015 | |
| Per Share Operating Data | | | | | | | | | | | | | | | | | | | | | | | | |
| Net asset value, beginning of period | | | $3.70 | | | | $3.71 | | | | $3.94 | | | | $3.93 | | | | $3.86 | | | | $4.11 | |
| Income (loss) from investment operations: | | | | | | | | | | | | | | | | | | | | | | | | |
| Net investment income1 | | | 0.01 | | | | 0.21 | | | | 0.20 | | | | 0.18 | | | | 0.16 | | | | 0.20 | |
| Net realized and unrealized gain (loss) | | | 0.03 | | | | (0.01) | | | | (0.23) | | | | 0.01 | | | | 0.07 | | | | (0.25) | |
| Total from investment operations | | | 0.04 | | | | 0.20 | | | | (0.03) | | | | 0.19 | | | | 0.23 | | | | (0.05) | |
Dividends and/or distributions to shareholders: Dividends from net investment income | | | (0.00)2 | | | | (0.14) | | | | (0.20) | | | | (0.12) | | | | (0.15) | | | | (0.19) | |
| Tax return of capital distribution | | | (0.01) | | | | (0.07) | | | | 0.00 | | | | (0.06) | | | | (0.01) | | | | (0.01) | |
| Total dividends and/or distributions to shareholders | | | (0.01) | | | | (0.21) | | | | (0.20) | | | | (0.18) | | | | (0.16) | | | | (0.20) | |
| Net asset value, end of period | | | $3.73 | | | | $3.70 | | | | $3.71 | | | | $3.94 | | | | $3.93 | | | | $3.86 | |
| | | | | | | | | | | | | | | | | | | | | | | | |
| | | | | | | | | | | | | | | | | | | | | | | | |
| Total Return, at Net Asset Value3 | | | 1.14% | | | | 5.49% | | | | (1.15)% | | | | 4.89% | | | | 6.27% | | | | (1.41)% | |
| | | | | | | | | | | | | | | | | | | | | | | | |
| Ratios/Supplemental Data | | | | | | | | | | | | | | | | | | | | | | | | |
| Net assets, end of period (in thousands) | | | $36,634 | | | | $36,479 | | | | $41,461 | | | | $47,348 | | | | $45,840 | | | | $48,488 | |
| Average net assets (in thousands) | | | $36,561 | | | | $39,927 | | | | $45,391 | | | | $45,371 | | | | $46,967 | | | | $121,467 | |
| Ratios to average net assets:4 | | | | | | | | | | | | | | | | | | | | | | | | |
| Net investment income5 | | | 4.18% | | | | 5.63% | | | | 5.18% | | | | 4.57% | | | | 4.30% | | | | 4.87% | |
| Expenses excluding specific expenses listed below | | | 0.62% | | | | 0.62% | | | | 0.68%6 | | | | 0.65%6 | | | | 0.62%6 | | | | 0.60%6 | |
| Interest and fees from borrowings | | | 0.00% | | | | 0.00%7 | | | | 0.00%7 | | | | 0.00%7 | | | | 0.00%7 | | | | 0.00%7 | |
| Total expenses7 | | | 0.62% | | | | 0.62% | | | | 0.68%6 | | | | 0.65%6 | | | | 0.62%6 | | | | 0.60%6 | |
| Expenses after payments, waivers and/or reimbursements and reduction to custodian expenses | | | 0.57% | | | | 0.57% | | | | 0.61%6 | | | | 0.59%6 | | | | 0.58%6 | | | | 0.57%6 | |
| Portfolio turnover rate9,10 | | | 25% | | | | 114% | | | | 67% | | | | 69% | | | | 78% | | | | 79% | |
157 INVESCO OPPENHEIMER GLOBAL STRATEGIC INCOME FUND
CONSOLIDATED FINANCIAL HIGHLIGHTSContinued
1. Per share amounts calculated based on the average shares outstanding during the period.
2. Less than $0.005 per share.
3. Includes adjustments in accordance with accounting principles generally accepted in the United States of America and as such, the net asset value for financial reporting purposes and the returns based upon those net asset values may differ from the net asset value and returns for shareholder transactions. Does not include sales charges and is not annualized for periods less than one year, if applicable.
4. Annualized for periods less than one full year.
5. Includes the Fund’s share of the allocated net investment income from Invesco Oppenheimer Master Event-Linked Bond Fund.
6. Includes the Fund’s share of the allocated expenses from Invesco Oppenheimer Master Event-Linked Bond Fund.
7. Less than 0.005%.
8. Total expenses including indirect expenses from affiliated fund fees and expenses were as follows:
| | | | | | | | |
One Month Ended October 31, 2019 | | | 0.66 | % | | | | |
Year Ended September 30, 2019 | | | 0.66 | % | | | | |
Year Ended September 30, 2018 | | | 0.69 | % | | | | |
Year Ended September 30, 2017 | | | 0.66 | % | | | | |
Year Ended September 30, 2016 | | | 0.63 | % | | | | |
Year Ended September 30, 2015 | | | 0.61 | % | | | | |
9. The portfolio turnover rate excludes purchase and sale transactions of To Be Announced (TBA) mortgage-related securities as follows:
| | | | | | | | | | |
| | | Purchase Transactions | | | Sale Transactions | | | |
| | | |
One Month Ended October 31, 2019 | | | $364,949,527 | | | | $405,130,315 | | | |
Year Ended September 30, 2019 | | | $5,760,311,794 | | | | $5,754,174,138 | | | |
Year Ended September 30, 2018 | | | $6,366,360,171 | | | | $6,415,700,475 | | | |
Year Ended September 30, 2017 | | | $5,559,676,349 | | | | $5,415,035,851 | | | |
Year Ended September 30, 2016 | | | $4,468,857,111 | | | | $4,304,402,600 | | | |
Year Ended September 30, 2015 | | | $4,009,637,043 | | | | $4,100,638,359 | | | |
10. Portfolio turnover is calculated at the fund level and is not annualized for periods less than one year, if applicable.
See accompanying Notes to Consolidated Financial Statements.
158 INVESCO OPPENHEIMER GLOBAL STRATEGIC INCOME FUND
NOTES TO CONSOLIDATED
FINANCIAL STATEMENTSOctober 31, 2019 and September 30, 2019
Note 1 - Significant Accounting Policies
Invesco Oppenheimer Global Strategic Income Fund (the “Fund”) is a series portfolio of AIM Investment Funds (Invesco Investment Funds) (the “Trust”). The Trust is a Delaware statutory trust registered under the Investment Company Act of 1940, as amended (the “1940 Act”), as anopen-end series management investment company authorized to issue an unlimited number of shares of beneficial interest. Information presented in these consolidated financial statements pertains only to the Fund. Matters affecting the Fund or each class will be voted on exclusively by the shareholders of such Fund or each class.
Prior to the close of business on May 24, 2019, the Fund operated as Oppenheimer Global Strategic Income Fund (the “Acquired Fund” or “Predecessor Fund”). The Acquired Fund was reorganized after the close of business on May 24, 2019 (the “Reorganization Date”) through the transfer of all of its assets and liabilities to the Fund (the “Reorganization”).
Upon closing of the Reorganization, holders of the Acquired Fund’s Class A, Class C, Class R, and Class Y shares received the corresponding class of shares of the Fund and holders of the Acquired Fund’s Class I shares received Class R6 shares of the Fund. Information for the Acquired Fund’s Class I shares prior to the Reorganization is included with Class R6 shares throughout this report. Class R5 shares commenced operations on the Reorganization Date.
Effective October 31, 2019 the Fund’s fiscal year end changed from September 30 to October 31.
The Fund will seek to gain exposure to Regulation S securities primarily through investments in the Invesco Oppenheimer Global Strategic Income Fund (Cayman) Ltd. (the “Subsidiary”), a wholly-owned and controlled subsidiary by the Fund organized under the laws of the Cayman Islands. The Subsidiary was organized by the Fund to invest in Regulation S securities. The Fund may invest up to 25% of its total assets in the Subsidiary.
The Fund’s investment objective is to seek total return.
The Fund currently consists of six different classes of shares: Class A, Class C, Class R, Class Y, Class R5 and Class R6. Class Y shares are available only to certain investors. Class A shares are sold with afront-end sales charge unless certain waiver criteria are met and under certain circumstances load waived shares may be subject to contingent deferred sales charges (“CDSC”). Class C shares are sold with a CDSC. Class R, Class Y, Class R5 and Class R6 shares are sold at net asset value.
The Fund is an investment company and accordingly follows the investment company accounting and reporting guidance in accordance with Financial Accounting Standards Board Accounting Standards Codification Topic 946, Financial Services – Investment Companies.
The following is a summary of the significant accounting policies followed by the Fund in the preparation of its consolidated financial statements.
A. Security Valuations - Securities, including restricted securities, are valued according to the following policy.
Debt obligations (including convertible securities) and unlisted equities are fair valued using an evaluated quote provided by an independent pricing service. Evaluated quotes provided by the pricing service may be determined without exclusive reliance on quoted prices, and may reflect appropriate factors such asinstitution-size trading in similar groups
159 INVESCO OPPENHEIMER GLOBAL STRATEGIC INCOME FUND
NOTES TO CONSOLIDATED
FINANCIAL STATEMENTSContinued
of securities, developments related to specific securities, dividend rate (for unlisted equities), yield (for debt obligations), quality, type of issue, coupon rate (for debt obligations), maturity (for debt obligations), individual trading characteristics and other market data. Pricing services generally value debt obligations assuming orderly transactions of institutional round lot size, but a fund may hold or transact in the same securities in smaller, odd lot sizes. Odd lots often trade at lower prices than institutional round lots. Debt obligations are subject to interest rate and credit risks. In addition, all debt obligations involve some risk of default with respect to interest and/or principal payments.
A security listed or traded on an exchange (except convertible securities) is valued at its last sales price or official closing price as of the close of the customary trading session on the exchange where the security is principally traded, or lacking any sales or official closing price on a particular day, the security may be valued at the closing bid price on that day. Securities traded in theover-the-counter market are valued based on prices furnished by independent pricing services or market makers. When such securities are valued by an independent pricing service they may be considered fair valued. Futures contracts are valued at the final settlement price set by an exchange on which they are principally traded. Listed options are valued at the mean between the last bid and asked prices from the exchange on which they are principally traded. Options not listed on an exchange are valued by an independent source at the mean between the last bid and asked prices. For purposes of determining net asset value (“NAV”) per share, futures and option contracts generally are valued 15 minutes after the close of the customary trading session of the New York Stock Exchange (“NYSE”).
Investments inopen-end andclosed-end registered investment companies that do not trade on an exchange are valued at theend-of-day net asset value per share. Investments inopen-end andclosed-end registered investment companies that trade on an exchange are valued at the last sales price or official closing price as of the close of the customary trading session on the exchange where the security is principally traded.
Swap agreements are fair valued using an evaluated quote, if available, provided by an independent pricing service. Evaluated quotes provided by the pricing service are valued based on a model which may includeend-of-day net present values, spreads, ratings, industry, company performance and returns of referenced assets. Centrally cleared swap agreements are valued at the daily settlement price determined by the relevant exchange or clearinghouse.
Foreign securities’ (including foreign exchange contracts) prices are converted into U.S. dollar amounts using the applicable exchange rates as of the close of the NYSE. If market quotations are available and reliable for foreign exchange-traded equity securities, the securities will be valued at the market quotations. Because trading hours for certain foreign securities end before the close of the NYSE, closing market quotations may become unreliable. If between the time trading ends on a particular security and the close of the customary trading session on the NYSE, events occur that the investment adviser determines are significant and make the closing price unreliable, the Fund may fair value the security. If the event is likely to have affected the closing price of the security, the security will be valued at fair value in good faith using procedures approved by the Board
160 INVESCO OPPENHEIMER GLOBAL STRATEGIC INCOME FUND
of Trustees. Adjustments to closing prices to reflect fair value may also be based on a screening process of an independent pricing service to indicate the degree of certainty, based on historical data, that the closing price in the principal market where a foreign security trades is not the current value as of the close of the NYSE. Foreign securities’ prices meeting the approved degree of certainty that the price is not reflective of current value will be priced at the indication of fair value from the independent pricing service. Multiple factors may be considered by the independent pricing service in determining adjustments to reflect fair value and may include information relating to sector indices, American Depositary Receipts and domestic and foreign index futures. Foreign securities may have additional risks including exchange rate changes, potential for sharply devalued currencies and high inflation, political and economic upheaval, the relative lack of issuer information, relatively low market liquidity and the potential lack of strict financial and accounting controls and standards.
Securities for which market prices are not provided by any of the above methods may be valued based upon quotes furnished by independent sources. The last bid price may be used to value equity securities. The mean between the last bid and asked prices is used to value debt obligations, including corporate loans.
Securities for which market quotations are not readily available or became unreliable are valued at fair value as determined in good faith by or under the supervision of the Trust’s officers following procedures approved by the Board of Trustees. Issuer specific events, market trends, bid/asked quotes of brokers and information providers and other market data may be reviewed in the course of making a good faith determination of a security’s fair value.
The Fund may invest in securities that are subject to interest rate risk, meaning the risk that the prices will generally fall as interest rates rise and, conversely, the prices will generally rise as interest rates fall. Specific securities differ in their sensitivity to changes in interest rates depending on their individual characteristics. Changes in interest rates may result in increased market volatility, which may affect the value and/or liquidity of certain Fund investments.
Valuations change in response to many factors including the historical and prospective earnings of the issuer, the value of the issuer’s assets, general economic conditions, interest rates, investor perceptions and market liquidity. Because of the inherent uncertainties of valuation, the values reflected in the financial statements may materially differ from the value received upon actual sale of those investments.
| B. | Securities Transactions and Investment Income -Securities transactions are accounted for on a trade date basis. Realized gains or losses on sales are computed on the basis of specific identification of the securities sold. Interest income (net of withholding tax, if any) is recorded on the accrual basis from settlement date. Bond premiums and discounts are amortized and/or accreted over the lives of the respective securities.Pay-in-kind interest income andnon-cash dividend income received in the form of securitiesin-lieu of cash are recorded at the fair value of the securities received. Paydown gains and losses on mortgage and asset-backed securities are recorded as adjustments to interest income. Dividend income (net of withholding tax, if any) is recorded on theex-dividend date. |
161 INVESCO OPPENHEIMER GLOBAL STRATEGIC INCOME FUND
NOTES TO CONSOLIDATED
FINANCIAL STATEMENTSContinued
The Fund may periodically participate in litigation related to Fund investments. As such, the Fund may receive proceeds from litigation settlements. Any proceeds received are included in the Consolidated Statement of Operations as realized gain (loss) for investments no longer held and as unrealized gain (loss) for investments still held.
Brokerage commissions and mark ups are considered transaction costs and are recorded as an increase to the cost basis of securities purchased and/or a reduction of proceeds on a sale of securities. Such transaction costs are included in the determination of net realized and unrealized gain (loss) from investment transactions reported in the Consolidated Statement of Operations and the Consolidated Statement of Changes in Net Assets and the net realized and unrealized gains (losses) on securities per share in the Consolidated Financial Highlights. Transaction costs are included in the calculation of the Fund’s net asset value and, accordingly, they reduce the Fund’s total returns. These transaction costs are not considered operating expenses and are not reflected in net investment income reported in the Consolidated Statement of Operations and the Consolidated Statement of Changes in Net Assets, or the net investment income per share and the ratios of expenses and net investment income reported in the Consolidated Financial Highlights, nor are they limited by any expense limitation arrangements between the Fund and the investment adviser.
The Fund allocates income and realized and unrealized capital gains and losses to a class based on the relative net assets of each class.
| C. | Country Determination- For the purposes of making investment selection decisions and presentation in the Consolidated Schedule of Investments, the investment adviser may determine the country in which an issuer is located and/or credit risk exposure based on various factors. These factors include the laws of the country under which the issuer is organized, where the issuer maintains a principal office, the country in which the issuer derives 50% or more of its total revenues and the country that has the primary market for the issuer’s securities, as well as other criteria. Among the other criteria that may be evaluated for making this determination are the country in which the issuer maintains 50% or more of its assets, the type of security, financial guarantees and enhancements, the nature of the collateral and the sponsor organization. Country of issuer and/or credit risk exposure has been determined to be the United States of America, unless otherwise noted. |
| D. | Distributions -Dividends and distributions to shareholders, which are determined in accordance with income tax regulations and may differ from accounting principles generally accepted in the United States of America (“GAAP”), are recorded on theex-dividend date. Income distributions, if any, are declared and paid monthly. Capital gain distributions, if any, are declared and paid annually or at other times as determined necessary by the Adviser. |
| E. | Federal Income Taxes -The Fund intends to comply with provisions of the Internal Revenue Code applicable to regulated investment companies and to distribute substantially all of its investment company taxable income, including any net realized gain on investments not offset by capital loss carryforwards, if any, to shareholders. Therefore, no federal income or excise tax provision is required. The Fund files income tax returns in U.S. federal and applicable state jurisdictions. The statute of limitations on the Fund’s tax return filings generally remains open for the three preceding fiscal reporting period ends. The Fund has analyzed its tax positions for the one month ended October 31, 2019 and the fiscal |
162 INVESCO OPPENHEIMER GLOBAL STRATEGIC INCOME FUND
year ended September 30, 2019, including open tax years, and does not believe there are any uncertain tax positions requiring recognition in the Fund’s financial statements.
Subchapter M requires, among other things, that at least 90% of the Fund’s gross income be derived from securities or derived with respect to its business of investing in securities (typically referred to as “qualifying income”). Income from commodity-linked derivatives may not be treated as “qualifying income” for purposes of the 90% gross income requirement. The Internal Revenue Service (IRS) has previously issued a number of private letter rulings which conclude that income derived from commodity index-linked notes and investments in a wholly-owned subsidiary will be “qualifying income.” As a result, the Fund will gain exposure to commodities through commodity-linked notes and its wholly-owned subsidiary.
The IRS has suspended the granting of private letter rulings pending further review. As a result, there can be no assurance that the IRS will not change its position with respect to commodity-linked notes and wholly-owned subsidiaries. In addition, future legislation and guidance from the Treasury and the IRS may adversely affect the Fund’s ability to gain exposure to commodities through commodity-linked notes and its wholly-owned subsidiary.
The Fund is required to include in income for federal income tax purposes all of the subsidiary’s net income and gains whether or not such income is distributed by the subsidiary. Net income and gains from the subsidiary are generally treated as ordinary income by the Fund, regardless of the character of the subsidiary’s underlying income. Net losses from the subsidiary do not pass through to the Fund for federal income tax purposes.
The tax components of capital shown in the following table for the one month ended October 31, 2019, represent distribution requirements the Fund must satisfy under the income tax regulations, losses the Fund may be able to offset against income and gains realized in future years and unrealized appreciation or depreciation of securities and other investments for federal income tax purposes.
| | | | | | | | | | | | |
Undistributed Net Investment Income | | Undistributed
Long-Term
Gain | | | Accumulated
Loss
Carryforward1,2,3,4 | | | Net Unrealized
Depreciation
Based on cost of
Securities and
Other Investments
for Federal Income
Tax Purposes | |
| $— | | | $— | | | | $746,927,475 | | | | $57,639,531 | |
1.At period end, the Fund had $741,946,260 of net capital loss carryforward available to offset future realized capital gains, if any, and thereby reduce future taxable gain distributions.
2.The Fund had $4,981,215 of straddle losses which were deferred.
3. During the reporting period, the Fund did not utilize any capital loss carryforward.
4.During the previous reporting period ended September 30, 2019, the Fund did not utilize any capital loss carryforward.
The tax components of capital shown in the following table for the year ended September 30, 2019, represent distribution requirements the Fund must satisfy under the income tax
163 INVESCO OPPENHEIMER GLOBAL STRATEGIC INCOME FUND
NOTES TO CONSOLIDATED
FINANCIAL STATEMENTSContinued
regulations, losses the Fund may be able to offset against income and gains realized in future years and unrealized appreciation or depreciation of securities and other investments for federal income tax purposes.
| | | | | | | | | | | | |
Undistributed Net Investment Income | | Undistributed
Long-Term
Gain | | | Accumulated
Loss
Carryforward1,2,3,4 | | | Net Unrealized
Depreciation
Based on cost of
Securities and
Other Investments
for Federal Income
Tax Purposes | |
$— | | | $— | | | | $737,357,431 | | | | $101,326,218 | |
1.At period end, the Fund had $732,588,314 of net capital loss carryforward available to offset future realized capital gains, if any, and thereby reduce future taxable gain distributions.
2.The Fund had $4,769,117 of straddle losses which were deferred.
3. During the reporting period, the Fund did not utilize any capital loss carryforward.
4.During the previous reporting period ended September 30, 2018, the Fund did not utilize any capital loss carryforward.
Net investment income (loss) and net realized gain (loss) may differ for financial statement and tax purposes. The character of dividends and distributions made during the fiscal year from net investment income or net realized gains are determined in accordance with federal income tax requirements, which may differ from the character of net investment income or net realized gains presented in those financial statements in accordance with U.S. GAAP. Also, due to timing of dividends and distributions, the fiscal year in which amounts are distributed may differ from the fiscal year in which the income or net realized gain was recorded by the Fund.
Accordingly, for the one month ended October 31, 2019, the following amounts have been reclassified for the reporting period. Net assets of the Fund were unaffected by the reclassifications.
| | | | |
Reduction toPaid-in Capital | | Reduction to
Accumulated Net
Loss on Investments | |
$5,334,440 | | | $5,334,440 | |
Accordingly, for the fiscal year ended September 30, 2019, the following amounts have been reclassified for the reporting period. Net assets of the Fund were unaffected by the reclassifications.
| | | | |
Reduction toPaid-in Capital | | Reduction to
Accumulated Net
Loss on Investments | |
$60,693,331 | | | $60,693,331 | |
The tax character of distributions paid during the reporting periods:
164 INVESCO OPPENHEIMER GLOBAL STRATEGIC INCOME FUND
| | | | | | | | | | | | |
| | | One Month Ended
October 31, 2019 | | | Year Ended
September 30, 2019 | | | Year Ended
September 30, 2018 | |
Distributions paid from: | | | | | | | | | | | | |
Ordinary income | | | $ 4,743,290 | | | | $ 117,432,821 | | | | $ 193,183,678 | |
Return of capital | | | 5,248,249 | | | | 60,010,404 | | | | — | |
| | | | |
Total | | | $ 9,991,539 | | | | $ 177,443,225 | | | | $ 193,183,678 | |
| | | | |
The aggregate cost of securities and other investments and the composition of unrealized appreciation and depreciation of securities and other investments for federal income tax purposes at period end are noted in the following table. The primary difference between book and tax appreciation or depreciation of securities and other investments, if applicable, is attributable to the tax deferral of losses or tax realization of financial statement unrealized gain or loss.
| | | | | | | | |
| | | One Month
Ended October
31, 2019 | | | Year Ended
September 30,
2019 | |
Federal tax cost of securities | | $ | 3,766,694,742 | | | $ | 3,782,018,304 | |
Federal tax cost of other investments | | | (690,265,598 | ) | | | (801,911,794 | ) |
| | | | |
Total federal tax cost | | $ | 3,076,429,144 | | | $ | 2,980,106,510 | |
| | | | |
| | |
Gross unrealized appreciation | | $ | 165,127,522 | | | $ | 155,966,750 | |
Gross unrealized depreciation | | | (222,767,053 | ) | | | (257,292,968 | ) |
| | | | |
Net unrealized depreciation | | $ | (57,639,531 | ) | | $ | (101,326,218 | ) |
| | | | |
Certain foreign countries impose a tax on capital gains which is accrued by the Fund based on unrealized appreciation, if any, on affected securities. The tax is paid when the gain is realized.
| F. | Expenses -Fees provided for under the Rule12b-1 plan of a particular class of the Fund are charged to the operations of such class. Transfer agency fees and expenses and other shareholder recordkeeping fees and expenses attributable to Class R5 and Class R6 are allocated to each share class based on relative net assets.Sub-accounting fees attributable to Class R5 are charged to the operations of the class. Transfer agency fees and expenses and other shareholder recordkeeping fees and expenses relating to all other classes are allocated among those classes based on relative net assets. All other expenses are allocated among the classes based on relative net assets. |
| G. | Accounting Estimates -The financial statements are prepared on a consolidated basis in conformity with GAAP, which requires management to make estimates and assumptions that affect the reported amounts of assets and liabilities at the date of the financial statements and the reported amounts of revenues and expenses during the reporting period including estimates and assumptions related to taxation. Actual results could differ from those estimates by a significant amount. The accompanying financial statements reflect the financial position of the Fund and its Subsidiary and the results of operations on a consolidated basis. All inter-company accounts and transactions have been eliminated in consolidation. In addition, the Fund monitors for material events or transactions that may occur or become known after theperiod-end date and before the date the consolidated |
165 INVESCO OPPENHEIMER GLOBAL STRATEGIC INCOME FUND
NOTES TO CONSOLIDATED
FINANCIAL STATEMENTSContinued
financial statements are released to print.
| H. | Indemnifications -Under the Trust’s organizational documents, each Trustee, officer, employee or other agent of the Trust, and under the Subsidiary’s organizational documents, the directors and officers of the Subsidiary, are indemnified against certain liabilities that may arise out of the performance of their duties to the Fund and/or the Subsidiary, respectively. Additionally, in the normal course of business, the Fund enters into contracts, including the Fund’s servicing agreements, that contain a variety of indemnification clauses. The Fund’s maximum exposure under these arrangements is unknown as this would involve future claims that may be made against the Fund that have not yet occurred. The risk of material loss as a result of such indemnification claims is considered remote. |
| I. | Foreign Currency Translations -Foreign currency is valued at the close of the NYSE based on quotations posted by banks and major currency dealers. Portfolio securities and other assets and liabilities denominated in foreign currencies are translated into U.S. dollar amounts at the date of valuation. Purchases and sales of portfolio securities (net of foreign taxes withheld on disposition) and income items denominated in foreign currencies are translated into U.S. dollar amounts on the respective dates of such transactions. The Fund does not separately account for the portion of the results of operations resulting from changes in foreign exchange rates on investments and the fluctuations arising from changes in market prices of securities held. The combined results of changes in foreign exchange rates and the fluctuation of market prices on investments (net of estimated foreign tax withholding) are included with the net realized and unrealized gain or loss from investments in the Consolidated Statement of Operations. Reported net realized foreign currency gains or losses arise from (1) sales of foreign currencies, (2) currency gains or losses realized between the trade and settlement dates on securities transactions, and (3) the difference between the amounts of dividends, interest, and foreign withholding taxes recorded on the Fund’s books and the U.S. dollar equivalent of the amounts actually received or paid. Net unrealized foreign currency gains and losses arise from changes in the fair values of assets and liabilities, other than investments in securities at fiscal period end, resulting from changes in exchange rates. The Fund may invest in foreign securities, which may be subject to foreign taxes on income, gains on investments or currency repatriation, a portion of which may be recoverable. Foreign taxes, if any, are recorded based on the tax regulations and rates that exist in the foreign markets in which the Fund invests and are shown in the Consolidated Statement of Operations. |
| J. | Structured Securities - The Fund may invest in structured securities. Structured securities are a type of derivative security whose value is determined by reference to changes in the value of underlying securities, currencies, interest rates, commodities, indices or other financial indicators (“reference instruments”). Most structured securities are fixed-income securities that have maturities of three years or less. Structured securities may be positively or negatively indexed (i.e., their principal value or interest rates may increase or decrease if the underlying reference instrument appreciates) and may have return characteristics similar to direct investments in the underlying reference instrument. |
Structured securities may entail a greater degree of market risk than other types of debt securities because the investor bears the risk of the reference instruments. In addition to
166 INVESCO OPPENHEIMER GLOBAL STRATEGIC INCOME FUND
the credit risk of structured securities and the normal risks of price changes in response to changes in interest rates, the principal amount of structured notes or indexed securities may decrease as a result of changes in the value of the underlying reference instruments. Changes in the daily value of structured securities are recorded as unrealized gains (losses) in the Consolidated Statement of Operations. When the structured securities mature or are sold, the Fund recognizes a realized gain (loss) on the Consolidated Statement of Operations.”
| K. | Forward Foreign Currency Contracts - The Fund may engage in foreign currency transactions either on a spot (i.e. for prompt delivery and settlement) basis, or through forward foreign currency contracts, to manage or minimize currency or exchange rate risk. |
The Fund may also enter into forward foreign currency contracts for the purchase or sale of a security denominated in a foreign currency in order to “lock in” the U.S. dollar price of that security, or the Fund may also enter into forward foreign currency contracts that do not provide for physical settlement of the two currencies, but instead are settled by a single cash payment calculated as the difference between the agreed upon exchange rate and the spot rate at settlement based upon an agreed upon notional amount(non-deliverable forwards). The Fund will set aside liquid assets in an amount equal to the dailymark-to-market obligation for forward foreign currency contracts.
A forward foreign currency contract is an obligation between two parties (“Counterparties”) to purchase or sell a specific currency for an agreed-upon price at a future date. The use of forward foreign currency contracts does not eliminate fluctuations in the price of the underlying securities the Fund owns or intends to acquire but establishes a rate of exchange in advance. Fluctuations in the value of these contracts are measured by the difference in the contract date and reporting date exchange rates and are recorded as unrealized appreciation (depreciation) until the contracts are closed. When the contracts are closed, realized gains (losses) are recorded. Realized and unrealized gains (losses) on the contracts are included in the Consolidated Statement of Operations. The primary risks associated with forward foreign currency contracts include failure of the Counterparty to meet the terms of the contract and the value of the foreign currency changing unfavorably. These risks may be in excess of the amounts reflected in the Consolidated Statement of Assets and Liabilities.
| L. | Treasury Inflation-Protected Securities -The Fund may invest in Treasury Inflation-Protected Securities (“TIPS”). TIPS are fixed income securities whose principal value is periodically adjusted to the rate of inflation. The principal value of TIPS will be adjusted upward or downward, and any increase or decrease in the principal amount of TIPS will be shown as Treasury Inflation-Protected Securities inflation adjustments in the Consolidated Statement of Operations, even though investors do not receive their principal until maturity. |
| M. | Futures Contracts- The Fund may enter into futures contracts to manage exposure to interest rate, equity and market price movements and/or currency risks. A futures contract is an agreement between Counterparties to purchase or sell a specified underlying security, currency or commodity (or delivery of a cash settlement price, in the case of an index future) for a fixed price at a future date. The Fund currently invests only in exchange-traded futures and they are standardized as to maturity date and underlying financial instrument. |
167 INVESCO OPPENHEIMER GLOBAL STRATEGIC INCOME FUND
NOTES TO CONSOLIDATED
FINANCIAL STATEMENTSContinued
Initial margin deposits required upon entering into futures contracts are satisfied by the segregation of specific securities or cash as collateral at the futures commission merchant (broker). During the period the futures contracts are open, changes in the value of the contracts are recognized as unrealized gains or losses by recalculating the value of the contracts on a daily basis. Subsequent or variation margin payments are received or made depending upon whether unrealized gains or losses are incurred. These amounts are reflected as receivables or payables on the Consolidated Statement of Assets and Liabilities. When the contracts are closed or expire, the Fund recognizes a realized gain or loss equal to the difference between the proceeds from, or cost of, the closing transaction and the Fund’s basis in the contract. The net realized gain (loss) and the change in unrealized gain (loss) on futures contracts held during the period is included on the Consolidated Statement of Operations. The primary risks associated with futures contracts are market risk and the absence of a liquid secondary market. If the Fund were unable to liquidate a futures contract and/or enter into an offsetting closing transaction, the Fund would continue to be subject to market risk with respect to the value of the contracts and continue to be required to maintain the margin deposits on the futures contracts. Futures contracts have minimal Counterparty risk since the exchange’s clearinghouse, as Counterparty to all exchange-traded futures, guarantees the futures against default. Risks may exceed amounts recognized in the Consolidated Statement of Assets and Liabilities.
| N. | Swap Agreements - The Fund may enter into various swap transactions, including interest rate, total return, index, currency and credit default swap contracts (“CDS”) for investment purposes or to manage interest rate, currency or credit risk. Such transactions are agreements between Counterparties. A swap agreement may be negotiated bilaterally and tradedover-the-counter (“OTC”) between two parties (“uncleared/OTC”) or, in some instances, must be transacted through a future commission merchant (“FCM”) and cleared through a clearinghouse that serves as a central Counterparty (“centrally cleared swap”). These agreements may contain among other conditions, events of default and termination events, and various covenants and representations such as provisions that require the Fund to maintain apre-determined level of net assets, and/or provide limits regarding the decline of the Fund’s NAV over specific periods of time. If the Fund were to trigger such provisions and have open derivative positions at that time, the Counterparty may be able to terminate such agreement and request immediate payment in an amount equal to the net liability positions, if any. |
Interest rate, total return, index, and currency swap agreements aretwo-party contracts entered into primarily to exchange the returns (or differentials in rates of returns) earned or realized on particular predetermined investments or instruments. The gross returns to be exchanged or “swapped” between the parties are calculated with respect to a notional amount, i.e., the return on or increase in value of a particular dollar amount invested at a particular interest rate or return of an underlying asset, in a particular foreign currency, or in a “basket” of securities representing a particular index.
In a centrally cleared swap, the Fund’s ultimate Counterparty is a central clearinghouse. The Fund initially will enter into centrally cleared swaps through an executing broker. When a fund enters into a centrally cleared swap, it must deliver to the central Counterparty
168 INVESCO OPPENHEIMER GLOBAL STRATEGIC INCOME FUND
(via the FCM) an amount referred to as “initial margin.” Initial margin requirements are determined by the central Counterparty, but an FCM may require additional initial margin above the amount required by the central Counterparty. Initial margin deposits required upon entering into centrally cleared swaps are satisfied by cash or securities as collateral at the FCM. Securities deposited as initial margin are designated on the Consolidated Schedule of Investments and cash deposited is recorded on the Consolidated Statement of Assets and Liabilities. During the term of a cleared swap agreement, a “variation margin” amount may be required to be paid by the Fund or may be received by the Fund, based on the daily change in price of the underlying reference instrument subject to the swap agreement and is recorded as a receivable or payable for variation margin in the Consolidated Statement of Assets and Liabilities until the centrally cleared swap is terminated at which time a realized gain or loss is recorded.
A CDS is an agreement between Counterparties to exchange the credit risk of an issuer. A buyer of a CDS is said to buy protection by paying a fixed payment over the life of the agreement and in some situations an upfront payment to the seller of the CDS. If a defined credit event occurs (such as payment default or bankruptcy), the Fund as a protection buyer would cease paying its fixed payment, the Fund would deliver eligible bonds issued by the reference entity to the seller, and the seller would pay the full notional value, or the “par value”, of the referenced obligation to the Fund. A seller of a CDS is said to sell protection and thus would receive a fixed payment over the life of the agreement and an upfront payment, if applicable. If a credit event occurs, the Fund as a protection seller would cease to receive the fixed payment stream, the Fund would pay the buyer “par value” or the full notional value of the referenced obligation, and the Fund would receive the eligible bonds issued by the reference entity. In turn, these bonds may be sold in order to realize a recovery value. Alternatively, the seller of the CDS and its Counterparty may agree to net the notional amount and the market value of the bonds and make a cash payment equal to the difference to the buyer of protection. If no credit event occurs, the Fund receives the fixed payment over the life of the agreement. As the seller, the Fund would effectively add leverage to its portfolio because, in addition to its total net assets, the Fund would be subject to investment exposure on the notional amount of the CDS. In connection with these agreements, cash and securities may be identified as collateral in accordance with the terms of the respective swap agreements to provide assets of value and recourse in the event of default under the swap agreement or bankruptcy/insolvency of a party to the swap agreement. If a Counterparty becomes bankrupt or otherwise fails to perform its obligations due to financial difficulties, the Fund may experience significant delays in obtaining any recovery in a bankruptcy or other reorganization proceeding. The Fund may obtain only limited recovery or may obtain no recovery in such circumstances. The Fund’s maximum risk of loss from Counterparty risk, either as the protection seller or as the protection buyer, is the value of the contract. The risk may be mitigated by having a master netting arrangement between the Fund and the Counterparty and by the designation of collateral by the Counterparty to cover the Fund’s exposure to the Counterparty.
Implied credit spreads represent the current level at which protection could be bought or sold given the terms of the existing CDS contract and serve as an indicator of the current
169 INVESCO OPPENHEIMER GLOBAL STRATEGIC INCOME FUND
NOTES TO CONSOLIDATED
FINANCIAL STATEMENTSContinued
status of the payment/performance risk of the CDS. An implied spread that has widened or increased since entry into the initial contract may indicate a deteriorating credit profile and increased risk of default for the reference entity. A declining or narrowing spread may indicate an improving credit profile or decreased risk of default for the reference entity. Alternatively, credit spreads may increase or decrease reflecting the general tolerance for risk in the credit markets.
An interest rate swap is an agreement between Counterparties pursuant to which the parties exchange a floating rate payment for a fixed rate payment based on a specified notional amount.
Changes in the value of centrally cleared and OTC swap agreements are recognized as unrealized gains (losses) in the Consolidated Statement of Operations by “marking to market” on a daily basis to reflect the value of the swap agreement at the end of each trading day. Payments received or paid at the beginning of the agreement are reflected as such on the Consolidated Statement of Assets and Liabilities and may be referred to as upfront payments. The Fund accrues for the fixed payment stream and amortizes upfront payments, if any, on swap agreements on a daily basis with the net amount, recorded as a component of realized gain (loss) on the Consolidated Statement of Operations. A liquidation payment received or made at the termination of a swap agreement is recorded as realized gain (loss) on the Consolidated Statement of Operations. The Fund segregates cash or liquid securities having a value at least equal to the amount of the potential obligation of a Fund under any swap transaction. Cash held as collateral is recorded as deposits with brokers on the Consolidated Statement of Assets and Liabilities. Entering into these agreements involves, to varying degrees, lack of liquidity and elements of credit, market, and Counterparty risk in excess of amounts recognized on the Consolidated Statement of Assets and Liabilities. Such risks involve the possibility that a swap is difficult to sell or liquidate; the Counterparty does not honor its obligations under the agreement and unfavorable interest rates and market fluctuations. It is possible that developments in the swaps market, including potential government regulation, could adversely affect the Fund’s ability to terminate existing swap agreements or to realize amounts to be received under such agreements. A short position in a security poses more risk than holding the same security long. As there is no limit on how much the price of the security can increase, the Fund’s exposure is unlimited.
Notional amounts of each individual credit default swap agreement outstanding as of October 31, 2019 and September 30, 2019 for which the Fund is the seller of protection are disclosed in the open swap agreements tables. These potential amounts would be partially offset by any recovery values of the respective referenced obligations, upfront payments received upon entering into the agreement, or net amounts received from the settlement of buy protection credit default swap agreements entered into by the Fund for the same referenced entity or entities.
| O. | Put Options Purchased and Written - The Fund may purchase and write put options including options on securities indexes, or foreign currency and/or futures contracts. By purchasing a put option, the Fund obtains the right (but not the obligation) to sell the option’s underlying instrument at a fixed strike price. In return for this right, the Fund pays |
170 INVESCO OPPENHEIMER GLOBAL STRATEGIC INCOME FUND
| | an option premium. The option’s underlying instrument may be a security, securities index, or a futures contract. |
Additionally, the Fund may enter into an option on a swap agreement, also called a “swaption”. A swaption is an option that gives the buyer the right, but not the obligation, to enter into a swap on a future date in exchange for paying a market-based premium. A receiver swaption gives the owner the right to receive the total return of a specified asset, reference rate or index. Swaptions also include options that allow an existing swap to be terminated or extended by one of the Counterparties.
Put options may be used by the Fund to hedge securities it owns by locking in a minimum price at which the Fund can sell. If security prices fall, the put option could be exercised to offset all or a portion of the Fund’s resulting losses. At the same time, because the maximum the Fund has at risk is the cost of the option, purchasing put options does not eliminate the potential for the Fund to profit from an increase in the value of the underlying portfolio securities. The Fund may write put options to earn additional income in the form of option premiums if it expects the price of the underlying instrument to remain stable or rise during the option period so that the option will not be exercised. The risk in this strategy is that the price of the underlying securities may decline by an amount greater than the premium received. Put options written are reported as a liability in the Consolidated Statement of Assets and Liabilities. Realized and unrealized gains and losses on put options purchased and put options written are included in the Consolidated Statement of Operations as Net realized gain (loss) from and Change in net unrealized appreciation (depreciation) of Investment securities and Option contracts written, respectively. A risk in buying an option is that the Fund pays a premium whether or not the option is exercised. In addition, there can be no assurance that a liquid secondary market will exist for any option purchased.
| P. | Call Options Purchased and Written - The Fund may write call options and/or buy call options. A covered call option gives the purchaser of such option the right to buy, and the writer the obligation to sell, the underlying security or foreign currency at the stated exercise price during the option period. An uncovered call option exists without the ownership of the underlying security. Options written by the Fund normally will have expiration dates between three and nine months from the date written. The exercise price of a call option may be below, equal to, or above the current market value of the underlying security at the time the option is written. |
Additionally, the Fund may enter into an option on a swap agreement, also called a “swaption”. A swaption is an option that gives the buyer the right, but not the obligation, to enter into a swap on a future date in exchange for paying a market-based premium. A receiver swaption gives the owner the right to receive the total return of a specified asset, reference rate or index. Swaptions also include options that allow an existing swap to be terminated or extended by one of the Counterparties.
When the Fund writes a covered call option, an amount equal to the premium received by the Fund is recorded as an asset and an equivalent liability in the Consolidated Statement of Assets and Liabilities. The amount of the liability is subsequently“marked-to-market” to reflect the current market value of the option written. If a written covered
171 INVESCO OPPENHEIMER GLOBAL STRATEGIC INCOME FUND
NOTES TO CONSOLIDATED
FINANCIAL STATEMENTSContinued
call option expires on the stipulated expiration date, or if the Fund enters into a closing purchase transaction, the Fund realizes a gain (or a loss if the closing purchase transaction exceeds the premium received when the option was written) without regard to any unrealized gain or loss on the underlying security, and the liability related to such option is extinguished. If a written covered call option is exercised, the Fund realizes a gain or a loss from the sale of the underlying security and the proceeds of the sale are increased by the premium originally received. Realized and unrealized gains and losses on call options written are included in the Consolidated Statement of Operations as Net realized gain (loss) from and Change in net unrealized appreciation (depreciation) of Option contracts written. A risk in writing a covered call option is that the Fund gives up the opportunity for profit if the market price of the security increases and the option is exercised. The risk in writing an uncovered call option is that the Fund may incur significant losses if the value of the written security exceeds the exercise price of the option.
When the Fund buys a call option, an amount equal to the premium paid by the Fund is recorded as an investment on the Consolidated Statement of Assets and Liabilities. The amount of the investment is subsequently“marked-to-market” to reflect the current value of the option purchased. Realized and unrealized gains and losses on call options purchased are included in the Consolidated Statement of Operations as Net realized gain (loss) from and Change in net unrealized appreciation (depreciation) of Investment securities. A risk in buying an option is that the Fund pays a premium whether or not the option is exercised. In addition, there can be no assurance that a liquid secondary market will exist for any option purchased.
| Q. | Securities on a When-Issued or Delayed Delivery Basis -The Fund may purchase securities on a “when-issued” basis, and may purchase or sell securities on a “delayed delivery” basis, with payment and delivery scheduled for a future date. No income accrues to the Fund on the securities in connection with such transactions prior to the date the Fund actually takes delivery of the securities. These transactions are subject to market fluctuations and are subject to the risk that the value at delivery may be more or less than the trade date purchase price. Although the Fund will generally purchase these securities with the intention on acquiring such securities, they may sell such securities prior to the settlement date. |
| R. | Dollar Rolls and Forward Commitment Transactions- The Fund may enter into dollar roll transactions to enhance the Fund’s performance. The Fund executes its dollar roll transactions in the to be announced (“TBA”) market whereby the Fund makes a forward commitment to purchase a security and, instead of accepting delivery, the position is offset by the sale of the security with a simultaneous agreement to repurchase at a future date. |
The Fund accounts for dollar roll transactions as purchases and sales and realizes gains and losses on these transactions. The Fund will segregate liquid assets in an amount equal to its dollar roll commitments. Dollar roll transactions involve the risk that a Counterparty to the transaction may fail to complete the transaction. If this occurs, the Fund may lose the opportunity to purchase or sell the security at the agreed upon price. Dollar roll transactions also involve the risk that the value of the securities retained by the Fund may decline below the price of the securities that the Fund has sold but is obligated to purchase under
172 INVESCO OPPENHEIMER GLOBAL STRATEGIC INCOME FUND
the agreement. Dollar roll transactions covered in this manner are not treated as senior securities for purposes of a Fund’s fundamental investment limitation on senior securities and borrowings.
| S. | Other Risks- The Fund isnon-diversified and may invest in securities of fewer issuers than if it were diversified. Thus, the value of the Fund’s shares may vary more widely and the Fund may be subject to greater market and credit risk than if the Fund invested more broadly. |
The Fund may invest in lower-quality debt securities, i.e., “junk bonds”. Investments in lower-rated securities or unrated securities of comparable quality tend to be more sensitive to economic conditions than higher rated securities. Junk bonds involve a greater risk of default by the issuer because such securities are generally unsecured and are often subordinated to other creditors’ claim. The Fund will seek to gain exposure to Regulation S securities primarily through an investment in the Subsidiary. Regulation S securities may be relatively less liquid as a result of legal or contractual restrictions on resale. The Fund is indirectly exposed to the risks associated with the Subsidiary’s investments.
Investments in obligations issued by agencies and instrumentalities of the U.S. Government may vary in the level of support they receive from the government. The government may choose not to provide financial support to government sponsored agencies or instrumentalities if it is not legally obligated to do so. In this case, if the issuer defaulted, the Fund may not be able to recover its investment in such issuer from the U.S. Government.
| T. | Leverage Risk- Leverage exists when the Fund can lose more than it originally invests because it purchases or sells an instrument or enters into a transaction without investing an amount equal to the full economic exposure of the instrument or transaction. |
| U. | Collateral- To the extent the Fund has designated or segregated a security as collateral and that security is subsequently sold, it is the Fund’s practice to replace such collateral no later than the next business day. |
Note 2 - Advisory Fees and Other Fees Paid to Affiliates
The Trust has entered into a master investment advisory agreement with Invesco Advisers, Inc. (the “Adviser” or “Invesco”). Under the terms of the investment advisory agreement, the Fund accrues daily and pays monthly an advisory fee to the Adviser based on the annual rate of the Fund’s average daily net assets as follows:
| | | | | | |
| Fee Schedule* | | | | | �� |
Up to $200 million | | | 0.75 | % |
Next $200 million | | | 0.72 | |
Next $200 million | | | 0.69 | |
Next $200 million | | | 0.66 | |
Next $200 million | | | 0.60 | |
Next $4 billion | | | 0.50 | |
Next $5 billion | | | 0.48 | |
Over $10 billion | | | 0.46 | |
*The advisory fee paid by the Fund shall be reduced by any amounts paid by the Fund under the administrative
173 INVESCO OPPENHEIMER GLOBAL STRATEGIC INCOME FUND
NOTES TO CONSOLIDATED
FINANCIAL STATEMENTSContinued
services agreement with the Adviser.
For the one month ended October 31, 2019 and the yearended September 30, 2019, the effective advisory fee incurred by the Fund was 0.56% and 0.55% annualized, respectively.
The Subsidiary has entered into a separate contract with the Adviser whereby the Adviser provides investment advisory and other services to the Subsidiary. In consideration of these services, the Subsidiary pays an advisory fee to the Adviser based on the annual rate of the Subsidiary’s average daily net assets as set forth in the table above.
From October 1, 2018 until the date of the Reorganization, the Acquired Fund paid $12,653,535 in advisory fees to OFI Global Asset Management, Inc. based on the annual rates above of the Acquired Fund’s average daily net assets.
Under the terms of a mastersub-advisory agreement between the Adviser and each of Invesco Asset Management Deutschland GmbH, Invesco Asset Management Limited, Invesco Asset Management (Japan) Limited, Invesco Hong Kong Limited, Invesco Senior Secured Management, Inc. and Invesco Canada Ltd. and separatesub-advisory agreements with Invesco Capital Management LLC, and Invesco Asset Management (India) Private Limited (collectively, the “AffiliatedSub-Advisers”) the Adviser, not the Fund, will pay 40% of the fees paid to the Adviser to any such AffiliatedSub-Adviser(s) that provide(s) discretionary investment management services to the Fund based on the percentage of assets allocated to such AffiliatedSub-Adviser(s). Invesco has also entered into aSub-Advisory Agreement with OppenheimerFunds, Inc. to provide discretionary management services to the Funds.
Effective on the Reorganization Date, the Adviser has contractually agreed, through at least May 31, 2021, to waive advisory fees and/or reimburse expenses of all shares to the extent necessary to limit the total annual fund operating expenses after fee waiver and/ or expense reimbursement (excluding certain items discussed below) ofClass A, Class C, Class R, Class Y, Class R5 and Class R6 shares to 1.04%, 1.79%, 1.29%, 0.79%, 0.70% and 0.65%, respectively, of the Fund’s average daily net assets (the “expense limits”). In determining the Adviser’s obligation to waive advisory fees and/or reimburse expenses, the following expenses are not taken into account, and could cause total annual fund operating expenses after fee waivers and/or expense reimbursement to exceed the numbers reflected above: (1) interest; (2) taxes; (3) dividend expenses on short sales; (4) extraordinary ornon-routine items, including litigation expenses; and (5) expenses that the Fund has incurred but did not actually pay because of an expense offset arrangement. Acquired Fund Fees and Expenses are not operating expenses of the Fund directly, but are fees and expenses, including management fees of the investment companies in which the Fund invests. As a result, the total annual fund operating expenses after expense reimbursement may exceed the expense limits above. Unless Invesco continues the fee waiver agreement, it will terminate May 31, 2021. During its term, the fee waiver agreement cannot be terminated or amended to increase the expense limits or reduce the advisory fee waiver without approval of the Board of Trustees.
Further, the Adviser has contractually agreed, through at least June 30, 2021, to waive the advisory fee payable by the Fund in an amount equal to 100% of the net advisory fees the Adviser receives from the affiliated money market funds on investments by the Fund of uninvested cash in such affiliated money market funds.
174 INVESCO OPPENHEIMER GLOBAL STRATEGIC INCOME FUND
For the one month ended October 31, 2019, the Adviser waived advisory fees of $130,719. For theyearended September 30, 2019, the Adviser waived advisory fees of $1,486,647.
The Trust has entered into a master administrative services agreement with Invesco pursuant to which the Fund has agreed to pay Invesco for certain administrative costs incurred in providing accounting services to the Fund. For the one month ended October 31, 2019 and the yearended September 30, 2019, expenses incurred under the agreement are shown in the Consolidated Statement of Operations as Administration fees. Additionally, Invesco has entered into service agreements whereby JPMorgan Chase Bankserves as custodian to the Fund. Prior to the Reorganization, the Acquired Fund paid administrative fees to OFI Global Asset Management, Inc.
The Trust has entered into a transfer agency and service agreement with Invesco Investment Services, Inc. (“IIS”) pursuant to which the Fund has agreed to pay IIS a fee for providing transfer agency and shareholder services to the Fund and reimburse IIS for certain expenses incurred by IIS in the course of providing such services. IIS may make payments to intermediaries that provide omnibus account services,sub-accounting services and/or networking services. All fees payable by IIS to intermediaries that provide omnibus account services orsub-accounting services are charged back to the Fund, subject to certain limitations approved by the Trust’s Board of Trustees. Prior to the Reorganization, the Acquired Fund paid transfer agent fees to OFI Global Asset Management, Inc. and Shareholder Services, Inc. For the one month ended October 31, 2019 and the yearended September 30, 2019, expenses incurred under these agreements are shown in the Consolidated Statement of Operations as Transfer and shareholder servicing agent fees.
The Trust has entered into master distribution agreements with Invesco Distributors, Inc. (“IDI”) to serve as the distributor for theClass A, Class C, Class R, Class Y, Class R5 and Class R6 shares of the Fund. The Trust has adopted plans pursuant to Rule12b-1 under the 1940 Act with respect to the Fund’s Class A, Class C and Class R shares(collectively the “Plan”). The Fund, pursuant to the Class A Plan, reimburses IDI in an amount up to an annual rate of 0.25% of the average daily net assets of Class A shares. The Fund pursuant to the Class C and Class R Plan, pays IDI compensation at the annual rate of 1.00% of the average daily net assets of Class C shares and 0.50% of the average daily net assets of Class R shares. The fees are accrued daily and paid monthly. Of the Plan payments, up to 0.25% of the average daily net assets of each class of shares may be paid to furnish continuing personal shareholder services to customers who purchase and own shares of such classes. Any amounts not paid as a service fee under the Plan would constitute an asset-based sales charge. Rules of the Financial Industry Regulatory Authority (“FINRA”) impose a cap on the total sales charges, including asset-based sales charges, that may be paid by any class of shares of the Fund plans. Prior to the Reorganization, the Acquired Fund paid distribution fees to OppenheimerFunds Distributor, Inc. For the one month ended October 31, 2019 and the yearended September 30, 2019, expenses incurred under the plans are shown in the Consolidated Statement of Operations as Distribution and service plan fees.
Front-end sales commissions and CDSC (collectively, the “sales charges”) are not recorded as expenses of the Fund.Front-end sales commissions are deducted from proceeds from the sales of Fund shares prior to investment in Class A shares of the Fund. CDSC are deducted
175 INVESCO OPPENHEIMER GLOBAL STRATEGIC INCOME FUND
NOTES TO CONSOLIDATED
FINANCIAL STATEMENTSContinued
from redemption proceeds prior to remittance to the shareholder. During the one month ended October 31, 2019, IDI advised the Fund that IDI retained $12,558 infront-end sales commissions from the sale of Class A shares and $172 and $1,354 from Class A and Class C shares, respectively, for CDSC imposed on redemptions by shareholders. During the year ended September 30, 2019, IDI advised the Fund that IDI retained $52,150 infront-end sales commissions from the sale of Class A shares and $1,687 and $4,167 from Class A and Class C shares, respectively, for CDSC imposed on redemptions by shareholders. From October 31, 2018 to the date of the Reorganization, OppenheimerFunds Distributor, Inc. retained $178,226 in front–end sales commissions from the sale of Class A shares and $1,116 and $11,992 from Class A and Class C shares, respectively, for CDSC imposed on redemption by shareholders.
Certain officers and trustees of the Trust are officers and directors of the Adviser, IIS and/or IDI.
Note 3 - Additional Valuation Information
GAAP defines fair value as the price that would be received to sell an asset or paid to transfer a liability in an orderly transaction between market participants at the measurement date, under current market conditions. GAAP establishes a hierarchy that prioritizes the inputs to valuation methods, giving the highest priority to readily available unadjusted quoted prices in an active market for identical assets (Level 1) and the lowest priority to significant unobservable inputs (Level 3), generally when market prices are not readily available or are unreliable. Based on the valuation inputs, the securities or other investments are tiered into one of three levels. Changes in valuation methods may result in transfers in or out of an investment’s assigned level:
Level 1 — Prices are determined using quoted prices in an active market for identical assets.
Level 2 — Prices are determined using other significant observable inputs. Observable inputs are inputs that other market participants may use in pricing a security. These may include quoted prices for similar securities, interest rates, prepayment speeds, credit risk, yield curves, loss severities, default rates, discount rates, volatilities and others.
Level 3 — Prices are determined using significant unobservable inputs. In situations where quoted prices or observable inputs are unavailable (for example, when there is little or no market activity for an investment at the end of the period), unobservable inputs may be used. Unobservable inputs reflect the Fund’s own assumptions about the factors market participants would use in determining fair value of the securities or instruments and would be based on the best available information.
The level assigned to the securities valuations may not be an indication of the risk or liquidity associated with investing in those securities. Because of the inherent uncertainties of valuation, the values reflected in the financial statements may materially differ from the value received upon actual sale of those investments.
176 INVESCO OPPENHEIMER GLOBAL STRATEGIC INCOME FUND
The following is a summary of the tiered valuation input levels as of October 31, 2019:
| | | | | | | | | | | | | | | | |
| | | Level 1—
Unadjusted
Quoted Prices | | | Level 2—
Other Significant
Observable Inputs | | | Level 3—
Significant
Unobservable
Inputs | | | Value | |
Assets Table | | | | | | | | | | | | | | | | |
Investments, at Value: | | | | | | | | | | | | | | | | |
Asset-Backed Securities | | $ | — | | | $ | 192,484,290 | | | $ | — | | | $ | 192,484,290 | |
Mortgage-Backed Obligations | | | — | | | | 816,774,845 | | | | 682 | | | | 816,775,527 | |
U.S. Government Obligations | | | — | | | | 198,242,705 | | | | — | | | | 198,242,705 | |
Foreign Government Obligations | | | — | | | | 788,550,213 | | | | — | | | | 788,550,213 | |
Corporate Loans | | | — | | | | 8,487,822 | | | | — | | | | 8,487,822 | |
Corporate Bonds and Notes | | | — | | | | 1,076,103,449 | | | | — | | | | 1,076,103,449 | |
Preferred Stock | | | — | | | | 29,750 | | | | — | | | | 29,750 | |
Common Stocks | | | 1,555,795 | | | | — | | | | — | | | | 1,555,795 | |
Rights, Warrants and Certificates | | | 117,051 | | | | — | | | | — | | | | 117,051 | |
Structured Securities | | | — | | | | 17,604,380 | | | | — | | | | 17,604,380 | |
Short-Term Notes | | | — | | | | 11,871,142 | | | | — | | | | 11,871,142 | |
Exchange-Traded Options Purchased | | | 2,127,050 | | | | — | | | | — | | | | 2,127,050 | |
Over-the-Counter Options Purchased | | | — | | | | 18,526,563 | | | | — | | | | 18,526,563 | |
Over-the-Counter Credit Default | | | | | | | | | | | | | | | | |
Swaption Purchased | | | — | | | | 834,247 | | | | — | | | | 834,247 | |
Over-the-Counter Interest Rate | | | | | | | | | | | | | | | | |
Swaptions Purchased | | | — | | | | 7,274,904 | | | | — | | | | 7,274,904 | |
Investment Companies | | | 546,423,256 | | | | 1,530,295 | | | | — | | | | 547,953,551 | |
| | | | |
Total Investments, at Value | | | 550,223,152 | | | | 3,138,314,605 | | | | 682 | | | | 3,688,538,439 | |
Other Financial Instruments: | | | | | | | | | | | | | | | | |
Swaps, at value | | | — | | | | 8,269,398 | | | | — | | | | 8,269,398 | |
Centrally cleared swaps, at value | | | — | | | | 23,134,048 | | | | — | | | | 23,134,048 | |
Futures contracts | | | 5,759,163 | | | | — | | | | — | | | | 5,759,163 | |
Forward currency exchange contracts | | | — | | | | 40,486,625 | | | | — | | | | 40,486,625 | |
| | | | |
Total Assets | | $ | 555,982,315 | | | $ | 3,210,204,676 | | | $ | 682 | | | $ | 3,766,187,673 | |
| | | | |
| | | | |
Liabilities Table | | | | | | | | | | | | | | | | |
Other Financial Instruments: | | | | | | | | | | | | | | | | |
Swaps, at value | | $ | — | | | $ | (4,729,639 | ) | | $ | — | | | $ | (4,729,639 | ) |
Centrally cleared swaps, at value | | | — | | | | (25,556,476 | ) | | | — | | | | (25,556,476 | ) |
Futures contracts | | | (1,962,145 | ) | | | — | | | | — | | | | (1,962,145 | ) |
Options written, at value | | | — | | | | (33,750,929 | ) | | | — | | | | (33,750,929 | ) |
Forward currency exchange contracts | | | — | | | | (50,338,456 | ) | | | — | | | | (50,338,456 | ) |
Swaptions written, at value | | | — | | | | (14,145,048 | ) | | | — | | | | (14,145,048 | ) |
| | | | |
Total Liabilities | | $ | (1,962,145 | ) | | $ | (128,520,548 | ) | | $ | — | | | $ | (130,482,693 | ) |
| | | | |
Forward currency exchange contracts and futures contracts, if any, are reported at their unrealized appreciation/depreciation at measurement date, which represents the change in the contract’s value from trade date. All additional assets and liabilities included in the above table are reported at their market value at measurement date.
The following is a summary of the tiered valuation input levels as of September 30, 2019:
177 INVESCO OPPENHEIMER GLOBAL STRATEGIC INCOME FUND
NOTES TO CONSOLIDATED
FINANCIAL STATEMENTSContinued
| | | | | | | | | | | | | | | | |
| | | Level 1—
Unadjusted
Quoted Prices | | | Level 2—
Other Significant
Observable Inputs | | | Level 3—
Significant
Unobservable
Inputs | | | Value | |
Assets Table | | | | | | | | | | | | | | | | |
Investments, at Value: | | | | | | | | | | | | | | | | |
Asset-Backed Securities | | $ | — | | | $ | 171,387,744 | | | $ | — | | | $ | 171,387,744 | |
Mortgage-Backed Obligations | | | — | | | | 779,866,169 | | | | 25,492 | | | | 779,891,661 | |
U.S. Government Obligations | | | — | | | | 200,509,674 | | | | — | | | | 200,509,674 | |
Foreign Government Obligations | | | — | | | | 793,402,558 | | | | — | | | | 793,402,558 | |
Corporate Loans | | | — | | | | 10,278,484 | | | | — | | | | 10,278,484 | |
Corporate Bonds and Notes | | | — | | | | 1,101,391,596 | | | | — | | | | 1,101,391,596 | |
Preferred Stock | | | — | | | | 29,750 | | | | — | | | | 29,750 | |
Common Stocks | | | 1,240,834 | | | | 383,750 | | | | — | | | | 1,624,584 | |
Rights, Warrants and Certificates | | | — | | | | — | | | | 102,658 | | | | 102,658 | |
Structured Securities | | | — | | | | 19,018,928 | | | | 175,129 | | | | 19,194,057 | |
Short-Term Notes | | | — | | | | 10,997,634 | | | | — | | | | 10,997,634 | |
Exchange-Traded Options Purchased | | | 3,748,825 | | | | — | | | | — | | | | 3,748,825 | |
Over-the-Counter Options Purchased | | | 27,434 | | | | 15,700,396 | | | | — | | | | 15,727,830 | |
Over-the-Counter Credit Default | | | | | | | | | | | | | | | | |
Swaptions Purchased | | | — | | | | 2,103,142 | | | | — | | | | 2,103,142 | |
Over-the-Counter Interest Rate | | | | | | | | | | | | | | | | |
Swaptions Purchased | | | — | | | | 8,047,808 | | | | — | | | | 8,047,808 | |
Investment Companies | | | 562,250,241 | | | | 3,154,469 | | | | — | | | | 565,404,710 | |
| | | | |
Total Investments, at Value | | | 567,267,334 | | | | 3,116,272,102 | | | | 303,279 | | | | 3,683,842,715 | |
Other Financial Instruments: | | | | | | | | | | | | | | | | |
Swaps, at value | | | — | | | | 7,931,168 | | | | — | | | | 7,931,168 | |
Centrally cleared swaps, at value | | | — | | | | 23,099,130 | | | | — | | | | 23,099,130 | |
Futures contracts | | | 3,279,308 | | | | — | | | | — | | | | 3,279,308 | |
Forward currency exchange contracts | | | — | | | | 34,184,778 | | | | — | | | | 34,184,778 | |
| | | | |
Total Assets | | $ | 570,546,642 | | | $ | 3,181,487,178 | | | $ | 303,279 | | | $ | 3,752,337,099 | |
| | | | |
| | | | |
Liabilities Table | | | | | | | | | | | | | | | | |
Other Financial Instruments: | | | | | | | | | | | | | | | | |
Swaps, at value | | $ | — | | | $ | (8,946,393 | ) | | $ | — | | | $ | (8,946,393 | ) |
Centrally cleared swaps, at value | | | — | | | | (39,423,967 | ) | | | — | | | | (39,423,967 | ) |
Futures contracts | | | (3,826,957 | ) | | | — | | | | — | | | | (3,826,957 | ) |
Options written, at value | | | — | | | | (36,599,870 | ) | | | — | | | | (36,599,870 | ) |
Forward currency exchange contracts | | | — | | | | (37,997,294 | ) | | | — | | | | (37,997,294 | ) |
Swaptions written, at value | | | — | | | | (29,445,301 | ) | | | — | | | | (29,445,301 | ) |
| | | | |
Total Liabilities | | $ | (3,826,957 | ) | | $ | (152,412,825 | ) | | $ | — | | | $ | (156,239,782 | ) |
| | | | |
Forward currency exchange contracts and futures contracts, if any, are reported at their unrealized appreciation/depreciation at measurement date, which represents the change in the contract’s value from trade date. All additional assets and liabilities included in the above table are reported at their market value at measurement date.
178 INVESCO OPPENHEIMER GLOBAL STRATEGIC INCOME FUND
Note 4 - Derivative Investments
The Fund may enter into an International Swaps and Derivatives Association Master Agreement (“ISDA Master Agreement”) under which a fund may trade OTC derivatives. An OTC transaction entered into under an ISDA Master Agreement typically involves a collateral posting arrangement, payment netting provisions andclose-out netting provisions. These netting provisions allow for reduction of credit risk through netting of contractual obligations. The enforceability of the netting provisions of the ISDA Master Agreement depends on the governing law of the ISDA Master Agreement, among other factors. For financial reporting purposes, the Fund does not offset OTC derivative assets or liabilities that are subject to ISDA Master Agreements in the Consolidated Statement of Assets and Liabilities.
Offsetting Assets and Liabilities as of October 31, 2019
The table below reflects the Fund’s exposure to Counterparties subject to either an ISDA Master Agreement or other agreement for OTC derivative asset transactions as of October 31, 2019:
| | | | | | | | | | | | | | | | | | | | |
| | | | | | Gross Amounts Not Offset in the Consolidated
Statement of Assets & Liabilities | | | | |
| Counterparty | | Gross Amounts
Not Offset in the
Consolidated
Statement
of Assets &
Liabilities* | | | Financial
Instruments
Available for
Offset | | | Financial
Instruments
Collateral
Received** | | | Cash Collateral
Received** | | | Net Amount | |
Bank of America NA | | $ | 5,107,001 | | | $ | (5,107,001) | | | $ | – | | | $ | – | | | $ | – | |
Barclays Bank plc | | | 163,504 | | | | (163,504) | | | | – | | | | – | | | | – | |
BNP Paribas | | | 75,560 | | | | – | | | | – | | | | – | | | | 75,560 | |
Citibank NA | | | 13,939,904 | | | | (13,939,904) | | | | – | | | | – | | | | – | |
Goldman Sachs Bank USA | | | 13,410,936 | | | | (13,410,936) | | | | – | | | | – | | | | – | |
Goldman Sachs International | | | 7,447,912 | | | | (6,897,861) | | | | (550,051 | ) | | | – | | | | – | |
HSBC Bank USA NA | | | 567,054 | | | | (172,171) | | | | (394,883 | ) | | | – | | | | – | |
JPMorgan Chase Bank NA | | | 27,257,866 | | | | (27,257,866) | | | | – | | | | – | | | | – | |
Morgan Stanley Capital Services, Inc. | | | 3,053,542 | | | | (3,053,542) | | | | – | | | | – | | | | – | |
RBC Dominion Securities | | | 3,010,157 | | | | (2,424,708) | | | | – | | | | – | | | | 585,449 | |
Standard Chartered Bank | | | 1,358,301 | | | | (1,358,301) | | | | – | | | | – | | | | – | |
| | | | |
| | $ | 75,391,737 | | | $ | (73,785,794) | | | $ | (944,934 | ) | | $ | – | | | $ | 661,009 | |
| | | | |
*OTC derivatives are reported gross on the Consolidated Statement of Assets and Liabilities. Exchange traded options and margin related to centrally cleared swaps and futures, if any, are excluded from these reported amounts.
**Reported collateral posted for the benefit of the Fund within this table is limited to the net outstanding amount due from an individual counterparty. The collateral posted for the benefit of the Fund may exceed these amounts.
179 INVESCO OPPENHEIMER GLOBAL STRATEGIC INCOME FUND
NOTES TO CONSOLIDATED
FINANCIAL STATEMENTSContinued
The table below reflects the Fund’s exposure to Counterparties subject to either an ISDA Master Agreement or other agreement for OTC derivative liability transactions as of October 31, 2019:
| | | | | | | | | | | | | | | | | | | | |
| | | | | | Gross Amounts Not Offset in the Consolidated | |
| | | | | | Statement of Assets & Liabilities | |
| Counterparty | | Gross Amounts
Not Offset in the
Consolidated
Statement
of Assets &
Liabilities* | | | Financial
Instruments
Available for
Offset | | | Financial
Instruments
Collateral
Pledged** | | | Cash Collateral
Pledged** | | | Net Amount | |
Bank of America NA | | $ | (10,452,192 | ) | | $ | 5,107,001 | | | $ | — | | | $ | 5,248,000 | | | $ | (97,191 | ) |
Barclays Bank plc | | | (3,776,762 | ) | | | 163,504 | | | | 3,363,556 | | | | — | | | | (249,702 | ) |
Citibank NA | | | (16,823,639 | ) | | | 13,939,904 | | | | — | | | | 2,270,000 | | | | (613,735 | ) |
Deutsche Bank AG | | | (370,052 | ) | | | — | | | | — | | | | — | | | | (370,052 | ) |
Goldman Sachs Bank USA | | | (19,962,205 | ) | | | 13,410,936 | | | | — | | | | 5,496,000 | | | | (1,055,269 | ) |
Goldman Sachs International | | | (6,897,861 | ) | | | 6,897,861 | | | | — | | | | — | | | | — | |
HSBC Bank USA NA | | | (172,171 | ) | | | 172,171 | | | | — | | | | — | | | | — | |
JPMorgan Chase Bank NA | | | (33,379,354 | ) | | | 27,257,866 | | | | 5,469,488 | | | | 652,000 | | | | — | |
Morgan Stanley & Co., Inc. | | | (258,743 | ) | | | — | | | | — | | | | — | | | | (258,743 | ) |
Morgan Stanley Capital Services, Inc. | | | (5,874,037 | ) | | | 3,053,542 | | | | — | | | | 2,586,000 | | | | (234,495 | ) |
RBC Dominion Securities | | | (2,424,708 | ) | | | 2,424,708 | | | | — | | | | — | | | | — | |
Standard Chartered Bank | | | (1,814,643 | ) | | | 1,358,301 | | | | — | | | | 375,000 | | | | (81,342 | ) |
| | | | |
| | $ | (102,206,367 | ) | | $ | 73,785,794 | | | $ | 8,833,044 | | | $ | 16,627,000 | | | $ | (2,960,529 | ) |
| | | | |
*OTC derivatives are reported gross on the Consolidated Statement of Assets and Liabilities. Exchange traded options and margin related to centrally cleared swaps and futures, if any, are excluded from these reported amounts.
**Reported collateral pledged within this table is limited to the net outstanding amount due from the Fund. The securities pledged as collateral by the Fund as reported on the Consolidated Statement of Investments may exceed these amounts.
Value of Derivative Instruments at October 31, 2019
The table below reflects the Fund’s exposure to Counterparties subject to either an ISDA Master Agreement or other agreement for OTC derivative liability transactions as of October 31, 2019:
| | | | | | | | | | | | | | |
| | | Asset Derivatives | | | | | Liability Derivatives | |
Derivatives
Not Accounted
for as Hedging
Instruments | | Consolidated
Statement of Assets
and Liabilities Location | | Value | | | | | Consolidated
Statement of Assets
and Liabilities Location | | Value | |
Credit contracts | | Swaps, at value | | $ | 7,124,450 | | | | | Swaps, at value | | $ | 3,445,838 | |
Interest rate contracts | | Swaps, at value | | | 1,144,948 | | | | | Swaps, at value | | | 1,283,801 | |
180 INVESCO OPPENHEIMER GLOBAL STRATEGIC INCOME FUND
| | | | | | | | | | | | | | |
| | | Asset Derivatives | | | | | Liability Derivatives | |
Derivatives
Not Accounted
for as Hedging
Instruments | | Consolidated
Statement of Assets
and Liabilities Location | | Value | | | | | Consolidated
Statement of Assets
and Liabilities Location | | Value | |
Credit contracts | | Centrally cleared swaps, at value | | | $ 1,704,3431 | | | | | Centrally cleared swaps, at value | | | $14,727,1231 | |
Interest rate contracts | | Centrally cleared swaps, at value | | | 21,429,7051 | | | | | Centrally cleared swaps, at value | | | 10,829,3531 | |
Interest rate contracts | | Futures contracts | | | 5,759,1632 | | | | | Futures contracts | | | 1,962,1452 | |
Forward currency exchange contracts | | Unrealized appreciation on forward currency exchange contracts | | | 40,486,625 | | | | | Unrealized depreciation on forward currency exchange contracts | | | 50,338,456 | |
Equity contracts | | | | | | | | | | Options written, at value | | | 757,705 | |
Forward exchange contracts | | | | | | | | | | Options written, at value | | | 32,993,224 | |
Credit contracts | | | | | | | | | | Swaptions written, at value | | | 1,450,279 | |
Interest rate contracts | | | | | | | | | | Swaptions written, at value | | | 12,694,769 | |
Credit contracts | | Investments, at value | | | 834,2473 | | | | | | | | | |
Equity contracts | | Investments, at value | | | 2,127,0503 | | | | | | | | | |
Forward currency exchange contracts | | Investments, at value | | | 18,526,5633 | | | | | | | | | |
Interest rate contracts | | Investments, at value | | | 7,274,9043 | | | | | | | | | |
| | | | | | | | | | | | | | |
Total | | | | | $106,411,998 | | | | | | | | $130,482,693 | |
| | | | | | | | | | | | | | |
1.Includes only the current day’s variation margin. Prior variation margin movements have been reflected in cash on the Consolidated Statement of Assets and Liabilities upon receipt or payment.
2. The daily variation margin receivable (payable) at period end is recorded in the Consolidated Statement of Assets and Liabilities.
3.Amounts relate to purchased option contracts and purchased swaption contracts, if any.
Effect of Derivative Investments for the One Month Ended October 31, 2019
The tables below summarize the gains (losses) on derivative investments, detailed by primary risk exposure, recognized in earnings during the period:
| | | | | | | | | | | | | | | | | | | | |
Amount of Realized Gain or (Loss) Recognized on Derivatives | |
Derivatives
Not Accounted
for as Hedging
Instruments | | Investment
transactions
in unaffiliated
companies* | | | Swaption
contracts
written | | | Option
contracts
written | | | Futures
contracts | | | Forward
currency
exchange
contracts | |
Credit contracts | | $ | 519,941 | | | $ | 374,032 | | | $ | — | | | $ | — | | | $ | — | |
Currency contracts | | | (3,030,842 | ) | | | — | | | | 5,242,605 | | | | — | | | | — | |
Equity contracts | | | (57,780 | ) | | | — | | | | 25,165 | | | | — | | | | — | |
Forward currency exchange contracts | | | — | | | | — | | | | — | | | | — | | | | (6,782,108 | ) |
Interest rate contracts | | | (123,976 | ) | | | (3,215,835 | ) | | | — | | | | 1,875,289 | | | | — | |
| | | | |
Total | | $ | (2,692,657 | ) | | $ | (2,841,803 | ) | | $ | 5,267,770 | | | $ | 1,875,289 | | | $ | (6,782,108 | ) |
| | | | |
181 INVESCO OPPENHEIMER GLOBAL STRATEGIC INCOME FUND
NOTES TO CONSOLIDATED
FINANCIAL STATEMENTSContinued
| | | | | | | | |
| Amount of Realized Gain or (Loss) Recognized on Derivatives | |
Derivatives
Not Accounted
for as Hedging
Instruments | | Swap contracts | | | Total | |
Credit contracts | | $ | 851,714 | | | $ | 1,745,687 | |
Currency contracts | | | — | | | | 2,211,763 | |
Equity contracts | | | — | | | | (32,615 | ) |
Forward currency exchange contracts | | | — | | | | (6,782,108 | ) |
Interest rate contracts | | | (1,643,585 | ) | | | (3,108,107 | ) |
| | | | |
Total | | $ | (791,871 | ) | | $ | (5,965,380 | ) |
| | | | |
* Purchased option contracts and purchased swaption contracts, if any, are included in the realized gain (loss) from investment transactions in unaffiliated companies.
| | | | | | | | | | | | | | | | | | | | |
| Amount of Change in Unrealized Gain or (Loss) Recognized on Derivatives | |
Derivatives
Not Accounted
for as Hedging
Instruments | | Investment
transactions
in unaffiliated
companies* | | | Swaption
contracts
written | | | Option
contracts
written | | | Futures
contracts | | | Forward
currency
exchange
contracts | |
Credit contracts | | $ | (245,867 | ) | | $ | 330,038 | | | $ | — | | | $ | — | | | $ | — | |
Currency contracts | | | (798,673 | ) | | | — | | | | 3,289,419 | | | | — | | | | — | |
Equity contracts | | | (1,097,818 | ) | | | — | | | | 465,440 | | | | — | | | | — | |
Forward currency exchange contracts | | | — | | | | — | | | | — | | | | — | | | | (6,039,315 | ) |
Interest rate contracts | | | (663,762 | ) | | | 6,752,621 | | | | — | | | | 4,344,667 | | | | — | |
| | | | |
Total | | $ | (2,806,120 | ) | | $ | 7,082,659 | | | $ | 3,754,859 | | | $ | 4,344,667 | | | $ | (6,039,315 | ) |
| | | | |
| | | | | | | | |
| Amount of Change in Unrealized Gain or (Loss) Recognized on Derivatives | |
Derivatives
Not Accounted
for as Hedging
Instruments | | Swap contracts | | | Total | |
Credit contracts | | $ | (446,262 | ) | | $ | (362,091 | ) |
Currency contracts | | | — | | | | 2,490,746 | |
Equity contracts | | | — | | | | (632,378 | ) |
Forward currency exchange contracts | | | — | | | | (6,039,315 | ) |
Interest rate contracts | | | 12,427,078 | | | | 22,860,604 | |
| | | | |
Total | | $ | 11,980,816 | | | $ | 18,317,566 | |
| | | | |
* Purchased option contracts and purchased swaption contracts, if any, are included in the change in unrealized gain (loss) from investment transactions in unaffiliated companies.
The table below summarizes the average notional value of forward foreign currency contracts, futures contracts, swap agreements, options purchased and swaptions purchased during the one month ended October 31, 2019.
182 INVESCO OPPENHEIMER GLOBAL STRATEGIC INCOME FUND
| | | | | | | | | | | | | | | | | | | | |
| | | | | | Forward foreign currency
contracts | | | Futures
contracts | | | Index options
purchased* | | | Currency options
purchased* | |
Average notional amount | | | | | | $ | 5,464,004,299 | | | $ | 1,154,485,268 | | | $ | 203,847,500 | | | $ | 54,146,581,862 | |
Average contracts | | | | | | | | | | | | | | | 767 | | | | 54,110,026,000 | |
| | | | | |
| | | Swaptions
purchased* | | | Written index
options | | | Written FX
options | | | Written
swaptions | | | Swaps | |
Average notional amount | | $ | 2,957,113,417 | | | $ | 182,755,000 | | | $ | 1,260,175,099,798 | | | $ | 3,971,311,341 | | | $ | 4,128,376,159 | |
Average contracts | | | | | | | 767 | | | | 1,260,137,146,500 | | | | | | | | | |
Offsetting Assets and Liabilities at September 30, 2019
The table below reflects the Fund’s exposure to Counterparties subject to either an ISDA Master Agreement or other agreement for OTC derivative asset transactions as of September 30, 2019:
| | | | | | | | | | | | | | | | | | | | |
| | | | | | Gross Amounts Not Offset in the Consolidated
Statement of Assets & Liabilities | | | | |
| Counterparty | | Gross Amounts
Not Offset in the
Consolidated
Statement
of Assets &
Liabilities* | | | Financial
Instruments
Available for
Offset | | | Financial
Instruments
Collateral
Received** | | | Cash Collateral
Received** | | | Net Amount | |
Bank of America NA | | $ | 4,042,945 | | | $ | (4,042,945 | ) | | $ | – | | | $ | – | | | $ | – | |
Barclays Bank plc | | | 801,195 | | | | (801,195 | ) | | | – | | | | – | | | | – | |
Citibank NA | | | 7,462,216 | | | | (4,847,572 | ) | | | – | | | | – | | | | 2,614,644 | |
Deutsche Bank AG | | | 14,035 | | | | – | | | | – | | | | – | | | | 14,035 | |
Goldman Sachs Bank USA | | | 18,518,655 | | | | (18,518,655 | ) | | | – | | | | – | | | | – | |
Goldman Sachs International | | | 5,308,551 | | | | (5,308,551 | ) | | | – | | | | – | | | | – | |
HSBC Bank USA NA | | | 1,420,818 | | | | (176,634 | ) | | | (1,060,132 | ) | | | – | | | | 184,052 | |
JPMorgan Chase Bank NA | | | 23,136,954 | | | | (23,136,954 | ) | | | – | | | | – | | | | – | |
Morgan Stanley & Co., Inc. | | | 27,434 | | | | (27,434 | ) | | | – | | | | – | | | | – | |
Morgan Stanley Capital Services, Inc. | | | 3,684,840 | | | | (3,684,840 | ) | | | – | | | | – | | | | – | |
RBC Dominion Securities | | | 3,100,226 | | | | (747,953 | ) | | | – | | | | (1,990,000 | ) | | | 362,273 | |
Standard Chartered Bank | | | 476,857 | | | | (476,857 | ) | | | – | | | | – | | | | – | |
| | | | |
| | $ | 67,994,726 | | | $ | (61,769,590 | ) | | $ | (1,060,132 | ) | | $ | (1,990,000 | ) | | $ | 3,175,004 | |
| | | | |
183 INVESCO OPPENHEIMER GLOBAL STRATEGIC INCOME FUND
NOTES TO CONSOLIDATED
FINANCIAL STATEMENTSContinued
*OTC derivatives are reported gross on the Consolidated Statement of Assets and Liabilities. Exchange traded options and margin related to centrally cleared swaps and futures, if any, are excluded from these reported amounts.
**Reported collateral posted for the benefit of the Fund within this table is limited to the net outstanding amount due from an individual counterparty. The collateral posted for the benefit of the Fund may exceed these amounts.
The table below reflects the Fund’s exposure to Counterparties subject to either an ISDA Master Agreement or other agreement for OTC derivative liability transactions as of September 30, 2019:
| | | | | | | | | | | | | | | | | | | | |
| | | | | |
| Gross Amounts Not Offset in the Consolidated
Statement of Assets & Liabilities |
| | | | |
Counterparty | |
| Gross Amounts
Not Offset in the
Consolidated
Statement
of Assets &
Liabilities* |
| |
| Financial
Instruments
Available for
Offset |
| |
| Financial
Instruments
Collateral
Pledged** |
| |
| Cash Collateral
Pledged** |
| | | Net Amount | |
Bank of America NA | | $ | (7,971,295 | ) | | $ | 4,042,945 | | | $ | – | | | $ | 3,928,350 | | | $ | – | |
Barclays Bank plc | | | (7,283,000 | ) | | | 801,195 | | | | 4,831,805 | | | | 1,650,000 | | | | – | |
BNP Paribas | | | (65,992 | ) | | | – | | | | – | | | | – | | | | (65,992 | ) |
Citibank NA | | | (4,847,572 | ) | | | 4,847,572 | | | | – | | | | – | | | | – | |
Goldman Sachs Bank USA | | | (31,593,120 | ) | | | 18,518,655 | | | | – | | | | 10,776,000 | | | | (2,298,465 | ) |
Goldman Sachs International | | | (5,334,981 | ) | | | 5,308,551 | | | | – | | | | – | | | | (26,430 | ) |
HSBC Bank USA NA | | | (176,634 | ) | | | 176,634 | | | | – | | | | – | | | | – | |
JPMorgan Chase Bank NA | | | (44,765,128 | ) | | | 23,136,954 | | | | 21,228,174 | | | | 400,000 | | | | – | |
Morgan Stanley & Co., Inc. | | | (197,691 | ) | | | 27,434 | | | | – | | | | – | | | | (170,257 | ) |
Morgan Stanley Capital Services, Inc. | | | (7,463,953 | ) | | | 3,684,840 | | | | – | | | | 3,426,000 | | | | (353,113 | ) |
RBC Dominion Securities | | | (747,953 | ) | | | 747,953 | | | | – | | | | – | | | | – | |
Standard Chartered Bank | | | (1,051,639 | ) | | | 476,857 | | | | – | | | | 574,782 | | | | – | |
| | | | |
| | $ | (111,498,958 | ) | | $ | 61,769,590 | | | $ | 26,059,979 | | | $ | 20,755,132 | | | $ | (2,914,257 | ) |
| | | | |
*OTC derivatives are reported gross on the Consolidated Statement of Assets and Liabilities. Exchange traded options and margin related to centrally cleared swaps and futures, if any, are excluded from these reported amounts.
**Reported collateral pledged within this table is limited to the net outstanding amount due from the Fund. The securities pledged as collateral by the Fund as reported on the Consolidated Schedule of Investments may exceed these amounts.
Value of Derivative Instruments at September 30, 2019
The table below reflects the Fund’s exposure to Counterparties subject to either an ISDA Master Agreement or other agreement for OTC derivative liability transactions as of September 30, 2019:
184 INVESCO OPPENHEIMER GLOBAL STRATEGIC INCOME FUND
| | | | | | | | | | | | |
| | | Asset Derivatives | | | Liability Derivatives | |
Derivatives
Not Accounted
for as Hedging
Instruments | | Consolidated
Statement of Assets
and Liabilities Location | | Value | | | Consolidated
Statement of Assets
and Liabilities Location | | Value | |
Credit contracts | | Swaps, at value | | $ | 5,806,399 | | | Swaps, at value | | | $ 6,130,986 | |
Interest rate contracts | | Swaps, at value | | | 2,124,769 | | | Swaps, at value | | | 2,815,407 | |
Credit contracts | | Centrally cleared swaps, at value | | | 1,693,2681 | | | Centrally cleared swaps,
at value | | | 16,742,0001 | |
Interest rate contracts | | Centrally cleared swaps, at value | | | 21,405,8621 | | | Centrally cleared swaps,
at value | | | 22,681,9671 | |
Interest rate contracts | | Futures contracts | | | 3,279,3082 | | | Futures contracts | | | 3,826,9572 | |
Forward currency exchange contracts | | Unrealized appreciation on forward currency exchange contracts | | | 34,184,778 | | | Unrealized depreciation on forward currency exchange contracts | | | 37,997,294 | |
Equity contracts | | | | | | | | Options written, at value | | | 1,872,915 | |
Currency contracts | | | | | | | | Options written, at value | | | 34,726,955 | |
Credit contracts | | | | | | | | Swaptions written, at value | | | 3,291,538 | |
Interest rate contracts | | | | | | | | Swaptions written, at value | | | 26,153,763 | |
Credit contracts | | Investments, at value | | | 2,103,1423 | | | | | | | |
Equity contracts | | Investments, at value | | | 4,815,6733 | | | | | | | |
Currency contracts | | Investments, at value | | | 14,633,5483 | | | | | | | |
Interest rate contracts | | Investments, at value | | | 8,075,2423 | | | | | | | |
| | | | | | | | | | | | |
Total | | | | | $ 98,121,989 | | | | | | $ 156,239,782 | |
| | | | | | | | | | | | |
1. The daily variation margin receivable (payable) at period end is recorded in the Consolidated Statement of Assets and Liabilities.
2. Includes only the current day’s variation margin. Prior variation margin movements have been reflected in cash on the Consolidated Statement of Assets and Liabilities upon receipt or payment.
3. Amounts relate to purchased option contracts and purchased swaption contracts, if any.
Effect of Derivative Investments for the Year Ended September 30, 2019
The tables below summarize the gains (losses) on derivative investments, detailed by primary risk exposure, recognized in earnings during the period:
| | | | | | | | | | | | | | | | |
| Amount of Realized Gain or (Loss) Recognized on Derivatives | |
| | | | | |
Derivatives
Not Accounted
for as Hedging
Instruments | | Investment
transactions
in unaffiliated
companies* | | | Swaption
contracts
written | | | Option
contracts
written | | | Futures
contracts | |
Credit contracts | | $ | (3,459,549 | ) | | $ | 7,738,842 | | | $ | — | | | $ | — | |
Currency contracts | | | (17,539,924 | ) | | | — | | | | 50,509,528 | | | | — | |
Equity contracts | | | 497,700 | | | | — | | | | 202,280 | | | | — | |
Forward currency exchange contracts | | | — | | | | — | | | | — | | | | — | |
Interest rate contracts | | | 12,528,130 | | | | (22,793,633 | ) | | | (5,127,445 | ) | | | (41,042,997 | ) |
| | | | |
Total | | $ | (7,973,643 | ) | | $ | (15,054,791 | ) | | $ | 45,584,363 | | | $ | (41,042,997 | ) |
| | | | |
185 INVESCO OPPENHEIMER GLOBAL STRATEGIC INCOME FUND
NOTES TO CONSOLIDATED
FINANCIAL STATEMENTSContinued
| | | | | | | | | | | | |
| Amount of Realized Gain or (Loss) Recognized on Derivatives | |
| | | | |
Derivatives
Not Accounted
for as Hedging
Instruments | | Forward
currency
exchange
contracts | | | Swap contracts | | | Total | |
Credit contracts | | $ | — | | | $ | (5,611,844 | ) | | $ | (1,332,551 | ) |
Currency contracts | | | — | | | | — | | | | 32,969,604 | |
Equity contracts | | | — | | | | — | | | | 699,980 | |
Forward currency exchange contracts | | | (29,008,858 | ) | | | — | | | | (29,008,858 | ) |
Interest rate contracts | | | — | | | | (7,571,708 | ) | | | (64,007,653 | ) |
| | | | |
Total | | $ | (29,008,858 | ) | | $ | (13,183,552 | ) | | $ | (60,679,478 | ) |
| | | | |
* Purchased option contracts and purchased swaption contracts, if any, are included in the realized gain (loss) from investment transactions in unaffiliated companies.
| | | | | | | | | | | | | | | | |
| Amount of Change in Unrealized Gain or (Loss) Recognized on Derivatives | |
| | | | | |
Derivatives
Not Accounted
for as Hedging
Instruments | | Investment
transactions
in unaffiliated
companies* | | | Swaption
contracts
written | | | Option
contracts
written | | | Futures
contracts | |
Credit contracts | | $ | (657,820 | ) | | $ | 1,320,469 | | | $ | — | | | $ | — | |
Currency contracts | | | (8,845,226 | ) | | | – | | | | 6,758,785 | | | | — | |
Equity contracts | | | (801,750 | ) | | | – | | | | 551,595 | | | | — | |
Forward currency exchange contracts | | | — | | | | – | | | | — | | | | — | |
Interest rate contracts | | | 25,534 | | | | (8,104,915 | ) | | | — | | | | (603,713 | ) |
| | | | |
Total | | $ | (10,279,262 | ) | | $ | (6,784,446 | ) | | $ | 7,310,380 | | | $ | (603,713 | ) |
| | | | |
| | | | | | | | | | | | |
| Amount of Change in Unrealized Gain or (Loss) Recognized on Derivatives | |
| | | | |
Derivatives
Not Accounted
for as Hedging
Instruments | | Forward
currency
exchange
contracts | | | Swap contracts | | | Total | |
Credit contracts | | $ | — | | | $ | 4,580,837 | | | $ | 5,243,486 | |
Currency contracts | | | — | | | | — | | | | (2,086,441 | ) |
Equity contracts | | | — | | | | — | | | | (250,155 | ) |
Forward currency exchange contracts | | | 13,130,261 | | | | — | | | | 13,130,261 | |
Interest rate contracts | | | — | | | | 1,888,799 | | | | (6,794,295 | ) |
| | | | |
Total | | $ | 13,130,261 | | | $ | 6,469,636 | | | $ | 9,242,856 | |
| | | | |
*Purchased option contracts and purchased swaption contracts, if any, are included in the change in unrealized gain (loss) from investment transactions in unaffiliated companies.
The table below summarizes the average notional value of forward foreign currency contracts, futures contracts, swap agreements, currency options purchased, written currency options, swaptions purchased and swaptions written during the year ended September 30, 2019.
186 INVESCO OPPENHEIMER GLOBAL STRATEGIC INCOME FUND
| | | | | | | | | | | | | | | | | | | | |
| | | Forward
foreign
currency
contracts | | | Futures
contracts | | | Index options
purchased* | | | Currency
options
purchased | | | Fixed Income
options
purchased* | |
| |
Average notional amount | | $
| 2,669,810,836
|
| | $ | 838,688,696 | | | $ | 259,821,519 | | | $ | 595,886,761,912 | | | $ | 123,421,750 | |
Average contracts | | | | | | | | | | | 75,538 | | | | 595,882,649,663 | | | | 109,786,000 | |
| | | | | |
| | | Purchased
option on a
future* | | | Written index
options* | | | Written
currency
options | | | Written
fixed
income
options* | | | Purchased
swaptions | |
| |
Average notional amount | | $ | 143,166,019 | | | $ | 232,293,414 | | | $ | 2,644,071,879,347 | | | $ | 106,938,803 | | | $ | 2,158,360,950 | |
Average contracts | | | 768 | | | | 75,538 | | | | 2,644,054,084,590 | | | | 94,961,167 | | | | | |
| | | | | |
| | | | | | | | | | | | Written
swaptions | | | Swaps | |
| |
Average notional amount | | | | | | | | | | | | | | $ | 4,408,627,835 | | | $ | 2,707,863,291 | |
*Summarizes the 8 month average notional value and contracts of index options purchased and index options written, the 6 month average notional value and contracts of fixed income options purchased and index options written and the 4 month average notional value and contracts of purchased options on a future.
Note 5 - Investment in Invesco Oppenheimer Master Event-Linked Fund
The Fund is permitted to invest in entities sponsored and/or advised by the Adviser or an affiliate. Certain of these entities in which the Fund invests are mutual funds registered under the 1940 Act, as amended, that expect to be treated as partnerships for tax purposes, specifically Invesco Oppenheimer Master Event-Linked Fund (the “Master Event-Linked Fund”). The Master Event-Linked Fund has its own investment risks, and those risks can affect the value of the Fund’s investments and therefore the value of the Fund’s shares. To the extent that the Fund invests more of its assets in the Master Event-Linked Fund, the Fund will have greater exposure to the risks of the Master Event-Linked Fund.
The investment objective of the Master Event-Linked Fund is to seek total return. The Fund’s investment in the Master Event-Linked Fund is included in the Consolidated Schedule of Investments. The Fund recognizes income and gain/(loss) on its investment in the Master Event-Linked Fund according to its allocatedpro-rata share, based on its relative proportion of total outstanding Master Event-Linked Fund shares held, of the total net income earned and the net gain/(loss) realized on investments sold by the Master Event-Linked Fund. The Fund’s allocated share of net income and gain/(loss) is included in the Consolidated Statement of Operations as Investment Income from Affiliated Companies and Realized/Unrealized Gain (Loss) from Affiliated Companies, respectively. As a shareholder, the Fund is subject to its proportional share of the Master Event-Linked Fund’s expenses, including its management fee. The Adviser will waive fees and/or reimburse Fund expenses in an amount equal to the indirect management fees incurred through the Fund’s investment in the Master Event-Linked Fund.
187 INVESCO OPPENHEIMER GLOBAL STRATEGIC INCOME FUND
NOTES TO CONSOLIDATED
FINANCIAL STATEMENTSContinued
Note 6 - Expense Offset Arrangement
The expense offset arrangement is comprised of custodian credits which result from periodic overnight cash balances at the custodian. For the one month ended October 31, 2019 the Fund did not receive credits from this arrangement. For the year ended September 30, 2019, the Fund received credits from this arrangement, which resulted in the reduction of the Fund’s total expenses of $218,315.
Note 7 - Trustee and Officer Fees and Benefits
Certain Trustees have executed a Deferred Compensation Agreement pursuant to which they have the option to elect to defer receipt of all or a portion of the annual compensation they are entitled to receive from the Fund. For purposes of determining the amount owed to the Trustees under the plan, deferred amounts are treated as though equal dollar amounts had been invested in shares of the Fund or in other Invesco and/or Invesco Oppenheimer funds selected by the Trustees. The Fund purchases shares of the funds selected for deferral by the Trustees in amounts equal to his or her deemed investment, resulting in a Fund asset equal to the deferred compensation liability. Such assets are included as a component of “Other” within the asset section of the Consolidated Statement of Assets and Liabilities. Deferral of Trustees’ fees under the plan will not affect the net assets of the Fund and will not materially affect the Fund’s assets, liabilities or net investment income per share. Amounts will be deferred until distributed in accordance with the compensation deferral plan.
Note 8 - Cash Balances
The Fund is permitted to temporarily carry a negative or overdrawn balance in its account with JPMorgan Chase Bank, the custodian bank. Such balances, if any atperiod-end, are shown in the Consolidated Statement of Assets and Liabilities under the payable caption Amount due to custodian. To compensate the custodian bank for such overdrafts, the overdrawn Fund may either (1) leave funds as a compensating balance in the account so the custodian bank can be compensated by earning the additional interest; or (2) compensate by paying the custodian bank at a rate agreed upon by the custodian bank and Invesco, not to exceed the contractually agreed upon rate.
Note 9 - Investment Transactions
The aggregate amount of investment securities (other than short-term securities, U.S. Treasury obligations and money market funds, if any) purchased and sold by the Fund for the one month period ended October 31, 2019 was $684,800,924 and $708,422,767, respectively, and during the year ended September 30, 2019 was $3,257,274,867 and $3,300,156,862, respectively.
188 INVESCO OPPENHEIMER GLOBAL STRATEGIC INCOME FUND
Note 10 - Share Information
Transactions in shares of beneficial interest were as follows:
| | | | | | | | | | | | | | | | | | | | | | | | |
| | | One Month Ended October | | | Year Ended September 30, | | | Year Ended September 30, | |
| | | Shares | | | 31, 20191
Amount | | | Shares | | | 20192
Amount | | | Shares | | | 2018
Amount | |
Class A | | | | | | | | | | | | | | | | | | | | | | | | |
Sold | | | 3,502,381 | | | $ | 13,076,926 | | | | 97,740,334 | | | $ | 366,266,996 | | | | 45,219,211 | | | $ | 174,958,678 | |
Dividends and/or distributions reinvested | | | 1,973,066 | | | | 7,381,031 | | | | 33,657,168 | | | | 124,308,085 | | | | 32,590,219 | | | | 125,317,871 | |
Redeemed | | | (12,282,156 | ) | | | (45,819,984 | ) | | | (136,359,676 | ) | | | (504,117,414 | ) | | | (143,187,491 | ) | | | (551,662,029 | ) |
| | | | |
Net increase (decrease) | | | (6,806,709 | ) | | $ | (25,362,027 | ) | | | (4,962,174 | ) | | $ | (13,542,333 | ) | | | (65,378,061 | ) | | $ | (251,385,480 | ) |
| | | | |
| | | | | | | | | | | | | | | | | | | | | | | | | |
Class B | | | | | | | | | | | | | | | | | | | | | | | | |
Sold | | | — | | | $ | — | | | | — | | | $ | — | | | | 25,013 | | | $ | 98,072 | |
Dividends and/or distributions reinvested | | | — | | | | — | | | | — | | | | — | | | | 51,419 | | | | 202,425 | |
Redeemed3 | | | — | | | | — | | | | — | | | | — | | | | (4,051,560 | ) | | | (15,858,387 | ) |
| | | | |
Net increase (decrease) | | | — | | | $ | — | | | | — | | | $ | — | | | | (3,975,128 | ) | | $ | (15,557,890 | ) |
| | | | |
| | | | | | | | | | | | | | | | | | | | | | | | | |
Class C | | | | | | | | | | | | | | | | | | | | | | | | |
Sold | | | 664,592 | | | $ | 2,469,921 | | | | 6,876,726 | | | $ | 25,377,218 | | | | 8,727,719 | | | $ | 33,818,381 | |
Dividends and/or distributions reinvested | | | 133,352 | | | | 497,859 | | | | 5,134,688 | | | | 18,860,505 | | | | 6,081,273 | | | | 23,366,153 | |
Redeemed | | | (2,260,414 | ) | | | (8,415,047 | ) | | | (96,846,338 | ) | | | (361,898,502 | ) | | | (45,976,966 | ) | | | (176,602,247 | ) |
| | | | |
Net increase (decrease) | | | (1,462,470 | ) | | $ | (5,447,267 | ) | | | (84,834,924 | ) | | $ | (317,660,779 | ) | | | (31,167,974 | ) | | $ | (119,417,713 | ) |
| | | | |
| | | | | | | | | | | | | | | | | | | | | | | | | |
Class R | | | | | | | | | | | | | | | | | | | | | | | | |
Sold | | | 231,474 | | | $ | 863,273 | | | | 3,511,582 | | | $ | 13,005,802 | | | | 5,031,105 | | | $ | 19,473,916 | |
Dividends and/or distributions reinvested | | | 71,072 | | | | 266,435 | | | | 1,345,120 | | | | 4,971,262 | | | | 1,273,744 | | | | 4,902,998 | |
Redeemed | | | (585,476 | ) | | | (2,187,070 | ) | | | (7,895,947 | ) | | | (29,257,400 | ) | | | (7,598,526 | ) | | | (29,335,636 | ) |
| | | | |
Net increase (decrease) | | | (282,930 | ) | | $ | (1,057,362 | ) | | | (3,039,245 | ) | | $ | (11,280,336 | ) | | | (1,293,677 | ) | | $ | (4,958,722 | ) |
| | | | |
189 INVESCO OPPENHEIMER GLOBAL STRATEGIC INCOME FUND
NOTES TO CONSOLIDATED
FINANCIAL STATEMENTSContinued
| | | | | | | | | | | | | | | | | | | | | | | | |
| | | One Month Ended October | | | Year Ended September 30, | | | Year Ended September 30, | |
| | | Shares | | | 31, 20191
Amount | | | Shares | | | 20192
Amount | | | Shares | | | 2018
Amount | |
Class Y | | | | | | | | | | | | | | | | | | | | | | | | |
Sold | | | 2,403,508 | | | $ | 8,971,911 | | | | 24,687,266 | | | $ | 91,370,991 | | | | 27,622,778 | | | $ | 106,371,546 | |
Dividends and/or distributions reinvested | | | 268,826 | | | | 1,008,098 | | | | 4,731,719 | | | | 17,473,621 | | | | 5,418,455 | | | | 20,844,909 | |
Redeemed | | | (1,891,214 | ) | | | (7,052,956 | ) | | | (40,225,951 | ) | | | (147,912,838 | ) | | | (58,250,444 | ) | | | (223,283,822 | ) |
| | | | |
Net increase (decrease) | | | 781,120 | | | $ | 2,927,053 | | | | (10,806,966 | ) | | $ | (39,068,226 | ) | | | (25,209,211 | ) | | $ | (96,067,367 | ) |
| | | | |
| | | | | | | | | | | | | | | | | | | | | | | | | |
Class R54 | | | | | | | | | | | | | | | | | | | | | | | | |
Sold | | | — | | | $ | — | | | | 2,710 | | | $ | 10,000 | | | | — | | | $ | — | |
Dividends and/or distributions reinvested | | | — | | | | — | | | | — | | | | — | | | | — | | | | — | |
Redeemed | | | — | | | | — | | | | — | | | | — | | | | — | | | | — | |
| | | | |
Net increase (decrease) | | | — | | | $ | — | | | | 2,710 | | | $ | 10,000 | | | | — | | | $ | — | |
| | | | |
| | | | | | | | | | | | | | | | | | | | | | | | | |
Class R6 | | | | | | | | | | | | | | | | | | | | | | | | |
Sold | | | 84,172 | | | $ | 311,904 | | | | 2,204,222 | | | $ | 8,143,953 | | | | 3,153,820 | | | $ | 12,196,482 | |
Dividends and/or distributions reinvested | | | 32,355 | | | | 120,681 | | | | 610,572 | | | | 2,207,198 | | | | 601,762 | | | | 2,305,887 | |
Redeemed | | | (158,991 | ) | | | (590,429 | ) | | | (4,122,974 | ) | | | (15,221,302 | ) | | | (4,601,422 | ) | | | (17,690,652 | ) |
| | | | |
Net increase (decrease) | | | (42,464 | ) | | $ | (157,844 | ) | | | (1,308,180 | ) | | $ | (4,870,151 | ) | | | (845,840 | ) | | $ | (3,188,283 | ) |
| | | | |
1.There are entities that are record owners of more than 5% of the outstanding shares of the Fund and own 13% of the outstanding shares of the Fund. IDI has an agreement with these entities to sell Fund shares. The Fund, Invesco and/or Invesco affiliates may make payments to these entities, which are considered to be related to the Fund, for providing services to the Fund, Invesco and/or Invesco affiliates, including but not limited to services such as securities brokerage, distribution, third party record keeping and account servicing. The Fund has no knowledge as to whether all or any portion of the shares owned of record by these entities are also owned beneficially.
2.There are entities that are record owners of more than 5% of the outstanding shares of the Fund and own 13% of the outstanding shares of the Fund. IDI has an agreement with these entities to sell Fund shares. The Fund, Invesco and/or Invesco affiliates may make payments to these entities, which are considered to be related to the Fund, for providing services to the Fund, Invesco and/or Invesco affiliates, including but not limited to services such as securities brokerage, distribution, third party record keeping and account servicing. The Fund has no knowledge as to whether all or any portion of the shares owned of record by these entities are also owned beneficially.
3.All outstanding Class B shares converted to Class A shares on June 1, 2018.
4. Commencement date after the close of business on May 24, 2019.
Note 11 - Borrowings
Joint Credit Facility.A number of mutual funds managed by the Adviser participate in a $1.95 billion revolving credit facility (the “Facility”) intended to provide short-term financing, if necessary, subject to certain restrictions in connection with atypical redemption activity.
190 INVESCO OPPENHEIMER GLOBAL STRATEGIC INCOME FUND
Expenses and fees related to the Facility are paid by the participating funds and are disclosed separately or as other expenses on the Consolidated Statement of Operations. The Fund did not utilize the Facility during the reporting period.The Facility terminated May 24, 2019.
191 INVESCO OPPENHEIMER GLOBAL STRATEGIC INCOME FUND
REPORT OF INDEPENDENT REGISTERED PUBLIC ACCOUNTING FIRM
To the Board of Trustees of AIM Investment Funds (Invesco Investment Funds) and
Shareholders of Invesco Oppenheimer Global Strategic Income Fund
Opinion on the Financial Statements
We have audited the consolidated accompanying statements of assets and liabilities, including the consolidated schedules of investments, of Invesco Oppenheimer Global Strategic Income Fund and its subsidiary (one of the funds constituting AIM Investment Funds (Invesco Investment Funds), referred to hereafter as the “Fund”) as of October 31, 2019 and September 30, 2019, the related consolidated statements of operations and the consolidated statements of changes in net assets for the period from October 1, 2019 to October 31, 2019 and the year ended September 30, 2019, including the related notes, and the consolidated financial highlights for each of the periods ended October 31, 2019 and September 30, 2019 (collectively referred to as the “consolidated financial statements”). In our opinion, the consolidated financial statements present fairly, in all material respects, the financial position of the Fund as of October 31, 2019 and September 30, 2019, the results of its operations and changes in its net assets for the period from October 1, 2019 to October 31, 2019 and the year ended September 30, 2019 and the financial highlights for each of the periods ended October 31, 2019 and September 30, 2019 in conformity with accounting principles generally accepted in the United States of America.
The consolidated financial statements of Invesco Oppenheimer Global Strategic Income Fund (formerly known as Oppenheimer Global Strategic Income Fund) as of and for the year ended September 30, 2018 and the consolidated financial highlights for each of the periods ended on or prior to September 30, 2018 (not presented herein, other than the consolidated statement of changes in net assets and the consolidated financial highlights) were audited by other auditors whose report dated November 28, 2018 expressed an unqualified opinion on those consolidated financial statements and consolidated financial highlights.
Basis for Opinion
These consolidated financial statements are the responsibility of the Fund’s management. Our responsibility is to express an opinion on the Fund’s consolidated financial statements based on our audits. We are a public accounting firm registered with the Public Company Accounting Oversight Board (United States) (PCAOB) and are required to be independent with respect to the Fund in accordance with the U.S. federal securities laws and the applicable rules and regulations of the Securities and Exchange Commission and the PCAOB.
We conducted our audits of these consolidated financial statements in accordance with the standards of the PCAOB. Those standards require that we plan and perform the audit to obtain reasonable assurance about whether the consolidated financial statements are free of material misstatement, whether due to error or fraud.
192 INVESCO OPPENHEIMER GLOBAL STRATEGIC INCOME FUND
Our audits included performing procedures to assess the risks of material misstatement of the consolidated financial statements, whether due to error or fraud, and performing procedures that respond to those risks. Such procedures included examining, on a test basis, evidence regarding the amounts and disclosures in the consolidated financial statements. Our audits also included evaluating the accounting principles used and significant estimates made by management, as well as evaluating the overall presentation of the consolidated financial statements. Our procedures included confirmation of securities owned as of October 31, 2019 and September 30, 2019 by correspondence with the custodian, transfer agent, brokers and agent banks; when replies were not received from brokers or agent banks, we performed other auditing procedures. We believe that our audits provide a reasonable basis for our opinion.
/s/PricewaterhouseCoopers LLP
Houston, TX
December 16, 2019
We have served as the auditor of one or more investment companies in the Invesco group of investment companies since at least 1995. We have not been able to determine the specific year we began serving as auditor.
193 INVESCO OPPENHEIMER GLOBAL STRATEGIC INCOME FUND
INDEPENDENT REGISTERED PUBLIC ACCOUNTING FIRM
The Audit Committee of the Board of Trustees appointed, and the Board of Trustees ratified and approved, PricewaterhouseCoopers LLP (“PwC”) as the independent registered public accounting firm of the Fund for the fiscal periods ending after May 24, 2019. Prior to the close of business on May 24, 2019, the Predecessor Fund was a separate series of an unaffiliated investment company and its financial statements were audited by a different independent registered public accounting firm (the “Prior Auditor”).
Effective after the close of business on May 24, 2019, the Prior Auditor resigned as the independent registered public accounting firm of the Fund. The Prior Auditor’s report on the financial statements of the Predecessor Fund for the past two fiscal years did not contain an adverse or disclaimer of opinion, and was not qualified or modified as to uncertainty, audit scope or accounting principles. During the Predecessor Fund’s two most recent fiscal years and through the close of business on May 24, 2019, there were no (1) disagreements with the Prior Auditor on any matter of accounting principles or practices, financial statement disclosure, or auditing scope or procedure, which disagreements, if not resolved to the Prior Auditor’s satisfaction, would have caused it to make reference to that matter in connection with its report; or (2) “reportable events,” as that term is defined in Item 304(a)(1)(v) of RegulationS-K under the Securities Exchange Act of 1934.
194 INVESCO OPPENHEIMER GLOBAL STRATEGIC INCOME FUND
FEDERAL INCOME TAX INFORMATION
In early 2019, if applicable, shareholders of record received information regarding all dividends and distributions paid to them by the Fund during calendar year 2018.
None of the dividends paid by the Fund during the reporting period ended October 31, 2019 are eligible for the corporate dividend-received deduction.
Dividends, if any, paid by the Fund during the reporting period ended September 30, 2019, which are not designated as capital gain distributions should be multiplied by the maximum amount allowable but not less than 1.98% to arrive at the amount eligible for the corporate dividend-received deduction.
A portion, if any, of the dividends paid by the Fund during the reporting period which are not designated as capital gain distributions are eligible for lower individual income tax rates to the extent that the Fund has received qualified dividend income as stipulated by recent tax legislation. The maximum amount allowable but not less than $918,219 and $14,896,266 of the Fund’s fiscal year taxable income for the one month ended October 31, 2019 and the fiscal year ended September 30, 2019, respectively, may be eligible for the lower individual income tax rates. In early 2019, shareholders of record received information regarding the percentage of distributions that are eligible for lower individual income tax rates.
Recent tax legislation allows a regulated investment company to designate distributions not designated as capital gain distributions, as either interest related dividends or short-term capital gain dividends, both of which are exempt from the U.S. withholding tax applicable to non U.S. taxpayers. For the reporting period, the maximum amount allowable but not less than $4,007,089 and $53,620,590 of the ordinary distributions to be paid by the Fund for the one month ended October 31, 2019 and the fiscal year ended September 30, 2019, respectively, qualifies as an interest related dividend.
The foregoing information is presented to assist shareholders in reporting distributions received from the Fund to the Internal Revenue Service. Because of the complexity of the federal regulations which may affect your individual tax return and the many variations in state and local tax regulations, we recommend that you consult your tax advisor for specific guidance.
195 INVESCO OPPENHEIMER GLOBAL STRATEGIC INCOME FUND
APPROVAL OF INVESTMENT ADVISORY ANDSUB-ADVISORY CONTRACTS
At meetings held on December 14, 2018, the Board of Trustees (the Board or the Trustees) of AIM Investment Funds (Invesco Investment Funds) (the Trust) as a whole, and the independent Trustees, who comprise over 75% of the Board, voting separately, approved (i) an amendment to the Trust’s Master Investment Advisory Agreement with Invesco Advisers, Inc. (Invesco Advisers and the investment advisory agreement) to add Invesco Oppenheimer Global Strategic Income Fund (the Fund), (ii) an amendment to the Master IntergroupSub-Advisory Contract for Mutual Funds with Invesco Asset Management Deutschland GmbH, Invesco Asset Management Limited, Invesco Asset Management (Japan) Limited, Invesco Hong Kong Limited, Invesco Senior Secured Management, Inc. and Invesco Canada Ltd. to add the Fund, (iii) an amendment to the separatesub-advisory contract with Invesco Capital Management LLC to add the Fund, (iv) an amendment to the separatesub-advisory contract with Invesco Asset Management (India) Private Limited to add the Fund, and (v) an initialsub-advisory contract with OppenheimerFunds, Inc. (collectively, the AffiliatedSub-Advisers and thesub-advisory contracts). Additionally, on March 26, 2019, the Boardre-approved an initialsub-advisory contract with OppenheimerFunds, Inc. following its change of control as a result of the acquisition of OppenheimerFunds, Inc. and its subsidiaries, including the Oppenheimer mutual funds (each, an Oppenheimer Fund), by Invesco Ltd. (the OFI Transaction). After evaluating the factors discussed below, among others, the Board approved the Fund’s investment advisory agreement and thesub-advisory contracts and determined that the compensation payable by the Fund to Invesco Advisers and by Invesco Advisers to the AffiliatedSub-Advisers is fair and reasonable.
The Board’s Evaluation Process
The Board noted that it had previously approved establishing the Fund at the Board meeting held on October 23, 2018 and that the Fund was formed to acquire the assets and liabilities of an Oppenheimer Fund (the Acquired Fund) with the same investment objective and substantially similar principal investment strategies and risks. At the time of approval, the Fund had no assets and no performance history and the portfolio managers were not employed by Invesco Advisers or any of the AffiliatedSub-Advisers except OppenheimerFunds, Inc., which was not affiliated with Invesco at that time.
In approving the investment advisory agreement andsub-advisory contracts, the Board followed a process similar to the process that it follows in annually reviewing and approving investment advisory agreements andsub-advisory contracts for the series portfolios of funds advised by Invesco Advisers and considered the information provided in the most recent annual review process for those funds as well as the information provided with respect to the Fund. As part of the approval process, the Board reviewed and considered information provided in response to detailed requests for information submitted to management by the independent Trustees with assistance from legal counsel to the independent Trustees. The Board reviewed comparative investment performance and fee data prepared by Invesco Advisers and an independent mutual fund data provider. The Board was assisted in its review by the Senior Officer, an officer of the Invesco Funds who reports directly to the independent Trustees, and by independent legal counsel.
196 INVESCO OPPENHEIMER GLOBAL STRATEGIC INCOME FUND
The discussion below serves as a summary of the material factors and related conclusions that formed the basis for the Board’s approval of the Fund’s investment advisory agreement andsub-advisory contracts. The Trustees’ review and conclusions are based on the comprehensive consideration of all information presented to them and are not the result of any single determinative factor. Moreover, one Trustee may have weighed a particular piece of information or factor differently than another Trustee. This information is current as of December 14, 2018 and March 26, 2019 for thesub-advisory contract with OppenheimerFunds, Inc.
Factors and Conclusions and Summary of Independent Written Fee Evaluation
A. Nature, Extent and Quality of Services Provided by Invesco Advisers and the AffiliatedSub-Advisers
The Board reviewed the nature, extent and quality of the advisory services to be provided to the Fund by Invesco Advisers under the Fund’s investment advisory agreement, and the credentials and experience of the officers and employees of Invesco Advisers who will provide these services. The Board’s review included consideration of the investment process oversight and structure, credit analysis and investment risk management to be employed in providing advisory services to the Fund. The Board also considerednon-advisory services that Invesco Advisers and its affiliates provide to the Invesco Funds and will provide to the Fund, such as various back office support functions, third party oversight, internal audit, valuation, portfolio trading and legal and compliance. The Board also received and reviewed information about Invesco Advisers’ role as administrator of the Invesco Funds’ liquidity risk management program. The Board also reviewed and considered the benefits to shareholders of investing in a fund that is part of the Invesco family of funds under the umbrella of Invesco Ltd., Invesco Advisers’ parent company, and noted Invesco Ltd.’s depth and experience in conducting an investment management business, as well as its commitment of financial and other resources to such business. The Board reviewed and considered information about the resources that Invesco Advisers intends to continue to commit to managing the Invesco family of funds, including the Fund, following the OFI Transaction. The Board concluded that the nature, extent and quality of the services to be provided to the Fund by Invesco Advisers are appropriate and satisfactory.
The Board reviewed the services that may be provided by the AffiliatedSub-Advisers under thesub-advisory contracts and the credentials and experience of the officers and employees of the AffiliatedSub-Advisers who provide these services. The Board noted the AffiliatedSub-Advisers’ expertise with respect to certain asset classes and that the AffiliatedSub-Advisers have offices and personnel that are located in financial centers around the world. As a result, the Board noted that the AffiliatedSub-Advisers can provide research and investment analysis on the markets and economies of various countries in which the Fund may invest, make recommendations regarding securities and assist with security trades. The Board concluded that thesub-advisory contracts may benefit the Fund and its shareholders by permitting Invesco Advisers to use the resources and talents of the AffiliatedSub-Advisers
197 INVESCO OPPENHEIMER GLOBAL STRATEGIC INCOME FUND
APPROVAL OF INVESTMENT ADVISORY ANDSUB-ADVISORY CONTRACTSContinued
in managing the Fund. The Board concluded that the nature, extent and quality of the services that may be provided by the AffiliatedSub-Advisers are appropriate and satisfactory.
B. Fund Investment Performance
The Board noted that the Fund would continue the historical performance information of the Acquired Fund following the consummation of the OFI Transaction. The Board considered the performance of the Acquired Fund and the fact that, at the closing of the OFI Transaction, management anticipates that the Fund will be managed pursuant to substantially similar investment strategies and by substantially the same portfolio management team as managed the Acquired Fund. The Board did not view Fund performance as a relevant factor in considering whether to approve thesub-advisory contracts for the Fund, as no Affiliated Sub-Adviser currently manages assets of the Fund.
The Board compared the Fund’s investment performance over multiple time periods ending December 31, 2017 to the performance of funds in the Morningstar performance universe and against the Fund’s benchmark index. The Trustees also reviewed more recent Fund performance and this review did not change their conclusions.
C. Advisory andSub-Advisory Fees and Fund Expenses
The Board compared the Fund’s contractual management fee rate to the contractual management fee rates of funds in the Fund’s Morningstar expense group. The Board also considered comparative information regarding the Fund’s total expense ratio and its various components.
The Board noted that Invesco Advisers has contractually agreed to waive fees and/or limit expenses of the Fund for at least two years from the closing date of the OFI Transaction in an amount necessary to limit total annual operating expenses to a specified percentage of average daily net assets for each class of the Fund.
The Board noted that Invesco Advisers and the AffiliatedSub-Advisers do not manage other similarly managed mutual funds or client accounts.
The Board also considered the services that may be provided by the AffiliatedSub-Advisers pursuant to thesub-advisory contracts, as well as the fees payable by Invesco Advisers to the AffiliatedSub-Advisers pursuant to thesub-advisory contracts.
D. Economies of Scale and Breakpoints
The Board considered the extent to which there may be economies of scale in the provision of advisory services to the Fund. The Board considered Invesco’s reinvestment in its business, including investments in business infrastructure and cybersecurity. The Board also considered that the Fund may benefit from economies of scale through contractual breakpoints in the Fund’s advisory fee schedule, which generally operate to reduce the Fund’s expense ratio as it grows in size. The Board noted that the Fund will share directly in economies of scale through lower fees charged by third party service providers based on the
198 INVESCO OPPENHEIMER GLOBAL STRATEGIC INCOME FUND
combined size of the Invesco Funds. The Board noted that the Fund may also benefit from economies of scale through initial fee setting, fee waivers and expense reimbursements.
E. Profitability and Financial Resources
The Board reviewed information from the 2018 contract renewal process provided by Invesco Advisers concerning the costs of the advisory and other services that Invesco Advisers and its affiliates provide to the Invesco Funds and the profitability of Invesco Advisers and its affiliates in providing these services. The Board considered the methodology used for calculating profitability and noted the periodic review of such methodology by an independent consultant. The Board noted that Invesco Advisers will continue to operate at a net profit from services Invesco Advisers and its affiliates provide to the Invesco Funds. The Board did not deem the level of profits realized by Invesco Advisers and its affiliates from providing services to the Invesco Funds, and the profits estimated to be realized by the Fund, to be excessive given the nature, extent and quality of the services provided. The Board received information from Invesco Advisers demonstrating that Invesco Advisers and the AffiliatedSub-Advisers are financially sound and have the resources necessary to perform their obligations under the investment advisory agreement andsub-advisory contracts.
F. Collateral Benefits to Invesco Advisers and its Affiliates
The Board considered various other benefits to be received by Invesco Advisers and its affiliates from the relationship with the Fund, including the fees to be received for providing administrative, transfer agency and distribution services to the Fund. The Board considered the performance of Invesco Advisers and its affiliates in providing these services to other Invesco Funds and the organizational structure employed to provide these services. The Board also considered that these services will be provided to the Fund pursuant to written contracts that are reviewed and approved on an annual basis by the Board; and that the services are required for the operation of the Fund.
The Board considered the benefits realized by Invesco Advisers and the Affiliated Sub-Advisers as a result of portfolio brokerage transactions executed through “soft dollar” arrangements. Invesco Advisers noted that the Fund will not execute brokerage transactions through “soft dollar” arrangements to any significant degree.
The Board considered that the Fund’s uninvested cash and cash collateral from any securities lending arrangements may be invested in money market funds advised by Invesco Advisers pursuant to procedures approved by the Board. The Board considered that Invesco Advisers will receive advisory fees from these affiliated money market funds attributable to such investments, although Invesco Advisers has contractually agreed to waive through varying periods the advisory fees payable by the Invesco Funds with respect to certain investments in the affiliated money market funds. The waiver is in an amount equal to 100% of the net advisory fee Invesco Advisers will receive from the affiliated money market funds with respect to the Fund’s investment in the affiliated money market funds of uninvested cash, but not cash collateral. The Board concluded that the amount of advisory fees to be
199 INVESCO OPPENHEIMER GLOBAL STRATEGIC INCOME FUND
APPROVAL OF INVESTMENT ADVISORY ANDSUB-ADVISORY CONTRACTSContinued
received by Invesco Advisers from the Fund’s investment of cash collateral from any securities lending arrangements in the affiliated money market funds is fair and reasonable.
200 INVESCO OPPENHEIMER GLOBAL STRATEGIC INCOME FUND
PORTFOLIO PROXY VOTING POLICIES AND GUIDELINES;
UPDATES TO SCHEDULE OF INVESTMENTS
Go paperless with eDelivery
Visit invesco.com/edelivery to enjoy the convenience and security of anytime electronic access to your investment documents.
With eDelivery, you can elect to have any or all of the following materials delivered straight to your inbox to download, save and print from your own computer:
| ● | | Fund reports and prospectuses |
Invesco mailing information
Send general correspondence to Invesco Investment Services, Inc., P.O. Box 219078, Kansas City, MO 64121-9078.
Important notice regarding delivery of security holder documents
To reduce Fund expenses, only one copy of most shareholder documents may be mailed to shareholders with multiple accounts at the same address (Householding). Mailing of your shareholder documents may be householded indefinitely unless you instruct us otherwise. If you do not want the mailing of these documents to be combined with those for other members of your household, please contact Invesco Investment Services, Inc. at 800 959 4246 or contact your financial institution. We will begin sending you individual copies for each account within 30 days after receiving your request.
Fund holdings and proxy voting information
The Fund provides a complete list of its holdings four times in each fiscal year, at the quarter ends. For the second and fourth quarters, the lists appear in the Fund’s semiannual and annual reports to shareholders. For the first and third quarters, the Fund files the lists with the Securities and Exchange Commission (SEC) as an exhibit to its reports on FormN-PORT. The most recent list of portfolio holdings is available at invesco.com/completeqtrholdings. Shareholders can also look up the Fund’s FormsN-PORT on the SEC website at sec.gov.
A description of the policies and procedures that the Fund uses to determine how to vote proxies relating to portfolio securities is available without charge, upon request, from our Client Services department at 800 959 4246 or at invesco.com/proxyguidelines. The information is also available on the SEC website, sec.gov.
Information regarding how the Fund voted proxies related to its portfolio securities during the most recent12-month period ended June 30 is available at invesco.com/proxysearch. The information is also available on the SEC website, sec.gov.
Invesco Advisers, Inc. is an investment adviser; it provides investment advisory services to individual and institutional clients and does not sell securities. Invesco Distributors, Inc. is the US distributor for Invesco Ltd.’s retail mutual funds, exchange-traded funds and institutional money market funds. Both are wholly owned, indirect subsidiaries of Invesco Ltd.
201 INVESCO OPPENHEIMER GLOBAL STRATEGIC INCOME FUND
SHAREHOLDER PROXY
A Special Meeting (“Meeting”) of Shareholders of Invesco Oppenheimer Global Strategic Income Fund was held on April 12, 2019. The Meeting was held for the following purpose:
(1) Approval of an Agreement and Plan of Reorganization that provides for the reorganization of Oppenheimer Global Strategic Income Fund into Invesco Oppenheimer Global Strategic Income Fund.
The results of the voting on the above matter was as follows:
| | | | | | | | | | | | | | | | |
Matter | |
| Votes
For |
| |
| Votes
Against |
| |
| Votes
Abstain |
| |
| Broker
Non-Votes |
|
(1) Approval of an Agreement and Plan of Reorganization | | | 440,976,191 | | | | 20,712,942 | | | | 49,042,998 | | | | 0 | |
202 INVESCO OPPENHEIMER GLOBAL STRATEGIC INCOME FUND
TRUSTEES AND OFFICERS
The address of each trustee and officer is AIM Investment Funds (Invesco Investment Funds) (the “Trust”), 11 Greenway Plaza, Suite 1000, Houston, Texas 77046-1173. The trustees serve for the life of the Trust, subject to their earlier death, incapacitation, resignation, retirement or removal as more specifically provided in the Trust’s organizational documents. Each officer serves for a one year term or until their successors are elected and qualified. Column two below includes length of time served with predecessor entities, if any.
| | | | | | | | |
| | | | | |
Name, Year of Birth and
Position(s) Held with the Trust | | Trustee and/or Officer Since | | Principal Occupation(s)
During Past 5 Years | | Number of Funds
in Fund Complex
Overseen by Trustee | | Other Directorship(s)
Held by Trustee During
Past 5 Years |
INTERESTED PERSONS | | | | | | | | |
| | | | | |
Martin L. Flanagan1— 1960 Trustee and Vice Chair | | 2007 | | Executive Director, Chief Executive Officer and President, Invesco Ltd. (ultimate parent of Invesco and a global investment management firm); Trustee and Vice Chair, The Invesco Funds; Vice Chair, Investment Company Institute; and Member of Executive Board, SMU Cox School of Business Formerly: Advisor to the Board, Invesco Advisers, Inc. (formerly known as Invesco Institutional (N.A.), Inc.); Chairman and Chief Executive Officer, Invesco Advisers, Inc. (registered investment adviser); Director, Chairman, Chief Executive Officer and President, Invesco Holding Company (US), Inc. (formerly IVZ Inc.) (holding company), Invesco Group Services, Inc. (service provider) and Invesco North American Holdings, Inc. (holding company); Director, Chief Executive Officer and President, Invesco Holding Company Limited (parent of Invesco and a global investment management firm); Director, Invesco Ltd.; Chairman, Investment Company Institute and President,Co-Chief Executive Officer,Co-President, Chief Operating Officer and Chief Financial Officer, Franklin Resources, Inc. (global investment management organization) | | 229 | | None |
| | | | | |
Philip A. Taylor2— 1954 Trustee | | 2006 | | Vice Chair, Invesco Ltd.; Trustee, The Invesco Funds Formerly: Director, Invesco Canada Ltd. (formerly known as Invesco Trimark Ltd./Invesco Trimark Ltèe) (registered investment adviser and registered transfer agent); Head of the Americas and Senior Managing Director, Invesco Ltd.; Director, Invesco Advisers, Inc. (formerly known as Invesco Institutional (N.A.), Inc.) (registered investment adviser); | | 229 | | None |
| |
| 1 Mr. Flanagan is considered an interested person (within the meaning of Section 2(a)(19) of the 1940 Act) of the Trust because he is an officer of the Adviser to the Trust, and an officer and a director of Invesco Ltd., ultimate parent of the Adviser. |
| |
| 2 Mr. Taylor is considered an interested person (within the meaning of Section 2(a)(19) of the 1940 Act) of the Trust because he is an officer of Invesco Ltd., ultimate parent of the Adviser. |
203 INVESCO OPPENHEIMER GLOBAL STRATEGIC INCOME FUND
TRUSTEES AND OFFICERSContinued
| | | | | | | | |
| | | | | |
Name, Year of Birth and
Position(s) Held with the Trust | | Trustee and/or Officer Since | | Principal Occupation(s)
During Past 5 Years | | Number of Funds
in Fund Complex
Overseen by Trustee | | Other Directorship(s)
Held by Trustee During
Past 5 Years |
| | | | | |
| INTERESTED PERSONS (CONTINUED) | | | | | | | | |
| | | | | |
Philip A. Taylor (Continued) | | | | Director and Chairman, Invesco Investment Services, Inc. (formerly known as Invesco AIM Investment Services, Inc.) (registered transfer agent); Chief Executive Officer, Invesco Corporate Class Inc. (corporate mutual fund company); Chairman and Chief Executive Officer, Invesco Canada Ltd. (formerly known as Invesco Trimark Ltd./Invesco Trimark Ltèe) (registered investment adviser and registered transfer agent); Senior Vice President, The Invesco Funds; Director, Invesco Investment Advisers LLC (formerly known as Van Kampen Asset Management); Director, Chairman, Chief Executive Officer and President, Invesco Management Group, Inc. (formerly known as Invesco AIM Management Group, Inc.) (financial services holding company);Co-Chairman,Co-President andCo-Chief Executive Officer, Invesco Advisers, Inc. (formerly known as Invesco Institutional (N.A.), Inc.) (registered investment adviser); Director, Chief Executive Officer and President, Van Kampen Exchange Corp; President and Principal Executive Officer, The Invesco Funds (other than AIM Treasurer’s Series Trust (Invesco Treasurer’s Series Trust), Short-Term Investments Trust and Invesco Management Trust); Executive Vice President, The Invesco Funds (AIM Treasurer’s Series Trust (Invesco Treasurer’s Series Trust), Short-Term Investments Trust and Invesco Management Trust only); Director and President, INVESCO Funds Group, Inc. (registered investment adviser and registered transfer agent); Director and Chairman, IVZ Distributors, Inc. (formerly known as INVESCO Distributors, Inc.) (registered broker dealer); Director, President and Chairman, Invesco Inc. (holding company), Invesco Canada Holdings Inc. (holding company), Trimark Investments Ltd./Placements Trimark Ltèe and Invesco Financial Services Ltd/Services Financiers Invesco Ltèe; Chief Executive Officer, Invesco Canada Fund Inc. (corporate mutual fund company); Director and Chairman, Van Kampen Investor Services Inc.; Director, Chief Executive Officer and President, 1371 Preferred Inc. (holding | | | | |
204 INVESCO OPPENHEIMER GLOBAL STRATEGIC INCOME FUND
| | | | | | | | |
| | | | | |
Name, Year of Birth and
Position(s) Held with the Trust | | Trustee and/or Officer Since | | Principal Occupation(s)
During Past 5 Years | | Number of Funds
in Fund Complex
Overseen by Trustee | | Other Directorship(s)
Held by Trustee During
Past 5 Years |
| | | | | |
| INTERESTED PERSONS (CONTINUED) | | | | | | | | |
| | | | | |
Philip A. Taylor (Continued) | | | | company) and Van Kampen Investments Inc.; Director and President, AIM GP Canada Inc. (general partner for limited partnerships) and Van Kampen Advisors, Inc.; Director and Chief Executive Officer, Invesco Trimark Dealer Inc. (registered broker dealer); Director, Invesco Distributors, Inc. (formerly known as Invesco AIM Distributors, Inc.) (registered broker dealer); Manager, Invesco Capital Management LLC; Director, Chief Executive Officer and President, Invesco Advisers, Inc.; Director, Chairman, Chief Executive Officer and President, Invesco AIM Capital Management, Inc.; President, Invesco Trimark Dealer Inc. and Invesco Trimark Ltd./Invesco Trimark Ltèe; Director and President, AIM Trimark Corporate Class Inc. and AIM Trimark Canada Fund Inc.; Senior Managing Director, Invesco Holding Company Limited; Director and Chairman, Fund Management Company (former registered broker dealer); President and Principal Executive Officer, The Invesco Funds (AIM Treasurer’s Series Trust (Invesco Treasurer’s Series Trust), and Short-Term Investments Trust only); President, AIM Trimark Global Fund Inc. and AIM Trimark Canada Fund Inc. | | | | |
205 INVESCO OPPENHEIMER GLOBAL STRATEGIC INCOME FUND
TRUSTEES AND OFFICERSContinued
| | | | | | | | |
| | | | | |
Name, Year of Birth and
Position(s) Held with the Trust | | Trustee and/or Officer Since | | Principal Occupation(s)
During Past 5 Years | | Number of Funds
in Fund Complex
Overseen by Trustee | | Other Directorship(s)
Held by Trustee During
Past 5 Years |
| | | | | |
| INDEPENDENT TRUSTEES | | | | | | | | |
| | | | | |
Bruce L. Crockett – 1944 Trustee and Chair | | 2003 | | Chairman, Crockett Technologies Associates (technology consulting company) Formerly: Director, Captaris (unified messaging provider); Director, President and Chief Executive Officer, COMSAT Corporation; Chairman, Board of Governors of INTELSAT (international communications company); ACE Limited (insurance company); Independent Directors Council and Investment Company Institute: Member of the Audit Committee, Investment Company Institute; Member of the Executive Committee and Chair of the Governance Committee, Independent Directors Council | | 229 | | Director and Chairman of the Audit Committee, ALPS (Attorneys Liability Protection Society) (insurance company); Director and Member of the Audit Committee and Compensation Committee, Ferroglobe PLC (metallurgical company) |
| | | | | |
David C. Arch – 1945 Trustee | | 2010 | | Chairman of Blistex Inc. (consumer health care products manufacturer); Member, World Presidents’ Organization | | 229 | | Board member of the Illinois Manufacturers’ Association |
| | | | | |
Beth Ann Brown – 1968 Trustee | | 2019 | | Independent Consultant Formerly: Head of Intermediary Distribution, Managing Director, Strategic Relations, Managing Director, Head of National Accounts, Senior Vice President, National Account Manager and Senior Vice President, Key Account Manager, Columbia Management Investment Advisers LLC; Vice President, Key Account Manager, Liberty Funds Distributor, Inc.; and Trustee of certain Oppenheimer Funds | | 229 | | Director, Board of Directors of Caron Engineering Inc.; Advisor, Board of Advisors of Caron Engineering Inc.; President and Director, of Acton Shapleigh Youth Conservation Corps (non -profit); and Vice President and Director of Grahamtastic Connection (non- profit) |
| | | | | |
Jack M. Fields – 1952 Trustee | | 2003 | | Chief Executive Officer, Twenty First Century Group, Inc. (government affairs company); and Chairman, Discovery Learning Alliance(non-profit) Formerly: Owner and Chief Executive Officer, Dos Angeles Ranch L.P. (cattle, hunting, corporate entertainment); Director, Insperity, Inc. (formerly known as Administaff) (human resources provider); Chief Executive Officer, Texana Timber LP (sustainable forestry company); Director of Cross Timbers Quail Research Ranch(non-profit); and member of the U.S. House of Representatives | | 229 | | None |
206 INVESCO OPPENHEIMER GLOBAL STRATEGIC INCOME FUND
| | | | | | | | |
| | | | | |
Name, Year of Birth and
Position(s) Held with the Trust | | Trustee and/or Officer Since | | Principal Occupation(s)
During Past 5 Years | | Number of Funds
in Fund Complex
Overseen by Trustee | | Other Directorship(s)
Held by Trustee During
Past 5 Years |
| | | | | |
| INDEPENDENT TRUSTEES (CONTINUED) | | | | | | | | |
| | | | | |
Cynthia Hostetler —1962 Trustee | | 2017 | | Non-Executive Director and Trustee of a number of public and private business corporations Formerly: Director, Aberdeen Investment Funds (4 portfolios); Head of Investment Funds and Private Equity, Overseas Private Investment Corporation; President, First Manhattan Bancorporation, Inc.; Attorney, Simpson Thacher & Bartlett LLP | | 229 | | Vulcan Materials Company (construction materials company); Trilinc Global Impact Fund; Genesee & Wyoming, Inc. (railroads); Artio Global Investment LLC (mutual fund complex); Edgen Group, Inc. (specialized energy and infrastructure products distributor); Investment Company Institute (professional organization); Independent Directors Council (professional organization) |
| | | | | |
Eli Jones – 1961 Trustee | | 2016 | | Professor and Dean, Mays Business School - Texas A&M University Formerly: Professor and Dean, Walton College of Business, University of Arkansas and E.J. Ourso College of Business, Louisiana State University; Director, Arvest Bank | | 229 | | Insperity, Inc. (formerly known as Administaff) (human resources provider) |
| | | | | |
Elizabeth Krentzman – 1959 Trustee | | 2019 | | Formerly: Principal and Chief Regulatory Advisor for Asset Management Services and U.S. Mutual Fund Leader of Deloitte & Touche LLP; General Counsel of the Investment Company Institute (trade association); National Director of the Investment Management Regulatory Consulting Practice, Principal, Director and Senior Manager of Deloitte & Touche LLP; Assistant Director of the Division of Investment Management - Office of Disclosure and Investment Adviser Regulation of the U.S. Securities and Exchange Commission and various positions with the Division of Investment Management – Office of Regulatory Policy of the U.S. Securities and Exchange Commission; Associate at Ropes & Gray LLP.; Advisory Board Member of the Securities and Exchange Commission Historical Society; and Trustee of certain Oppenheimer Funds | | 229 | | Trustee of the University of Florida National Board Foundation and Audit Committee Member; Member of the Cartica Funds Board of Directors (private investment funds); Member of the University of Florida Law Center Association, Inc. Board of Trustees and Audit Committee Member |
207 INVESCO OPPENHEIMER GLOBAL STRATEGIC INCOME FUND
TRUSTEES AND OFFICERSContinued
| | | | | | | | |
| | | | | |
Name, Year of Birth and
Position(s) Held with the Trust | | Trustee and/or Officer Since | | Principal Occupation(s)
During Past 5 Years | | Number of Funds
in Fund Complex
Overseen by Trustee | | Other Directorship(s)
Held by Trustee During
Past 5 Years |
| | | | | |
| INDEPENDENT TRUSTEES (CONTINUED) | | | | | | | | |
| | | | | |
Anthony J. LaCava, Jr. – 1956 Trustee | | 2019 | | Formerly: Director and Member of the Audit Committee, Blue Hills Bank (publicly traded financial institution) and Managing Partner, KPMG LLP | | 229 | | Blue Hills Bank; Chairman of Bentley University; Member, Business School Advisory Council; and Nominating Committee, KPMG LLP |
| | | | | |
Prema Mathai-Davis – 1950 Trustee | | 2003 | | Retired Co-Owner & Partner of Quantalytics Research, LLC, (a FinTech Investment Research Platform for the Self-Directed Investor) | | 229 | | None |
| | | | | |
Joel W. Motley – 1952 Trustee | | 2019 | | Director of Office of Finance, Federal Home Loan Bank; Member of the Vestry of Trinity Wall Street; Managing Director of Carmona Motley Hoffman, Inc. (privately held financial advisor); Member of the Finance and Budget Committee of the Council on Foreign Relations, Member of the Investment Committee and Board of Human Rights Watch and Member of the Investment Committee and Board of Historic Hudson Valley (non-profit cultural organization). Formerly: Managing Director of Public Capital Advisors, LLC (privately held financial advisor); Managing Director of Carmona Motley Hoffman, Inc. (privately held financial advisor); Trustee of certain Oppenheimer Funds; and Director of Columbia Equity Financial Corp. (privately held financial advisor) | | 229 | | Director of Greenwall Foundation (bioethics research foundation); Member of Board and Investment Committee of The Greenwall Foundation; Director of Southern Africa Legal Services Foundation; Board Member and Investment Committee Member of Pulitzer Center for Crisis Reporting(non-profit journalism) |
| | | | | |
Teresa M. Ressel — 1962 Trustee | | 2017 | | Non-executive director and trustee of a number of public and private business corporations Formerly: Chief Financial Officer, Olayan America, The Olayan Group (international investor/commercial/industrial); Chief Executive Officer, UBS Securities LLC; Group Chief Operating Officer, Americas, UBS AG; Assistant Secretary for Management & Budget and CFO, US Department of the Treasury | | 229 | | Atlantic Power Corporation (power generation company); ON Semiconductor Corp. (semiconductor supplier) |
| | | | | |
Ann Barnett Stern – 1957 Trustee | | 2017 | | President and Chief Executive Officer, Houston Endowment Inc. (private philanthropic institution) Formerly: Executive Vice President and General Counsel, Texas Children’s Hospital; | | 229 | | Federal Reserve Bank of Dallas |
208 INVESCO OPPENHEIMER GLOBAL STRATEGIC INCOME FUND
| | | | | | | | |
| | | | | |
Name, Year of Birth and
Position(s) Held with the Trust | | Trustee and/or Officer Since | | Principal Occupation(s)
During Past 5 Years | | Number of Funds
in Fund Complex
Overseen by Trustee | | Other Directorship(s)
Held by Trustee During
Past 5 Years |
| | | | | |
| INDEPENDENT TRUSTEES (CONTINUED) | | | | | | | | |
| | | | | |
Ann Barnett Stern (Continued) | | | | Attorney, Beck, Redden and Secrest, LLP; Business Law Instructor, University of St. Thomas; Attorney, Andrews & Kurth LLP | | | | |
| | | | | |
Raymond Stickel, Jr. – 1944 Trustee | | 2005 | | Retired Formerly: Director, Mainstay VP Series Funds, Inc. (25 portfolios); Partner, Deloitte & Touche | | 229 | | None |
| | | | | |
Robert C. Troccoli – 1949 Trustee | | 2016 | | Retired Formerly: Adjunct Professor, University of Denver – Daniels College of Business, Senior Partner, KPMG LLP | | 229 | | None |
| | | | | |
Daniel S. Vandivort –1954 Trustee | | 2019 | | Treasurer, Chairman of the Audit and Finance Committee, and Trustee, Board of Trustees, Huntington Disease Foundation of America; and President, Flyway Advisory Services LLC (consulting and property management). Formerly: Trustee and Governance Chair, of certain Oppenheimer Funds | | 229 | | Chairman and Lead Independent Director, Chairman of the Audit Committee, and Director, Board of Directors, Value Line Funds |
| | | | | |
James D. Vaughn – 1945 Trustee | | 2019 | | Retired Formerly: Managing Partner, Deloitte & Touche LLP; Trustee and Chairman of the Audit Committee, Schroder Funds; Board Member, Mile High United Way, Boys and Girls Clubs, Boy Scouts, Colorado Business Committee for the Arts, Economic Club of Colorado and Metro Denver Network (economic development corporation); and Trustee of certain Oppenheimer Funds | | 229 | | Board member and Chairman of Audit Committee of AMG National Trust Bank; Trustee and Investment Committee member, University of South Dakota Foundation; Board member, Audit Committee Member and past Board Chair, Junior Achievement(non-profit) |
| | | | | |
Christopher L. Wilson – 1957 Trustee, Vice Chair and Chair Designate | | 2017 | | Retired Formerly: Director, TD Asset Management USA Inc. (mutual fund complex) (22 portfolios); Managing Partner, CT2, LLC (investing and consulting firm); President/Chief Executive Officer, Columbia Funds, Bank of America Corporation; President/Chief Executive Officer, CDC IXIS Asset Management Services, Inc.; Principal & Director of Operations, Scudder Funds, Scudder, Stevens & Clark, Inc.; Assistant Vice President, Fidelity Investments | | 229 | | ISO New England, Inc.(non-profit organization managing regional electricity market) |
209 INVESCO OPPENHEIMER GLOBAL STRATEGIC INCOME FUND
TRUSTEES AND OFFICERSContinued
| | | | | | | | |
| | | | | |
Name, Year of Birth and
Position(s) Held with the Trust | | Trustee and/or Officer Since | | Principal Occupation(s)
During Past 5 Years | | Number of Funds
in Fund Complex
Overseen by Trustee | | Other Directorship(s)
Held by Trustee During
Past 5 Years |
| | | | | |
| OTHER OFFICERS | | | | | | | | |
| | | | | |
Sheri Morris — 1964 President, Principal Executive Officer and Treasurer | | 2003 | | Head of Global Fund Services, Invesco Ltd.; President, Principal Executive Officer and Treasurer, The Invesco Funds; Vice President, Invesco Advisers, Inc. (formerly known as Invesco Institutional (N.A.), Inc.) (registered investment adviser); and Vice President, Invesco Exchange-Traded Fund Trust, Invesco Exchange-Traded Fund Trust II, Invesco India Exchange-Traded Fund Trust, Invesco Actively Managed Exchange-Traded Fund Trust, Invesco Actively Managed Exchange-Traded Commodity Fund Trust and Invesco Exchange- Traded Self-Indexed Fund Trust, and Vice President, OppenheimerFunds, Inc. Formerly: Vice President and Principal Financial Officer, The Invesco Funds; Vice President, Invesco AIM Advisers, Inc., Invesco AIM Capital Management, Inc. and Invesco AIM Private Asset Management, Inc.; Assistant Vice President and Assistant Treasurer, The Invesco Funds and Assistant Vice President, Invesco Advisers, Inc., Invesco AIM Capital Management, Inc. and Invesco AIM Private Asset Management, Inc.; and Treasurer, Invesco Exchange-Traded Fund Trust, Invesco Exchange-Traded Fund Trust II, Invesco India Exchange-Traded Fund Trust and Invesco Actively Managed Exchange-Traded Fund Trust | | N/A | | N/A |
| | | | | |
Russell C. Burk — 1958 Senior Vice President and Senior Officer | | 2005 | | Senior Vice President and Senior Officer, The Invesco Funds | | N/A | | N/A |
| | | | | |
Jeffrey H. Kupor – 1968 Senior Vice President, Chief Legal Officer and Secretary | | 2018 | | Head of Legal of the Americas, Invesco Ltd.; Senior Vice President and Secretary, Invesco Advisers, Inc. (formerly known as Invesco Institutional (N.A.), Inc.) (registered investment adviser); Senior Vice President and Secretary, Invesco Distributors, Inc. (formerly known as Invesco AIM Distributors, Inc.); Vice President and Secretary, Invesco Investment Services, Inc. (formerly known as Invesco AIM Investment Services, Inc.) Senior Vice President, Chief Legal Officer and Secretary, The Invesco Funds; Secretary and General Counsel, Invesco Investment Advisers LLC (formerly known as Van Kampen Asset Management); Secretary and General Counsel, Invesco Capital Markets, Inc. (formerly known as Van Kampen Funds Inc.) and Chief Legal | | N/A | | N/A |
210 INVESCO OPPENHEIMER GLOBAL STRATEGIC INCOME FUND
| | | | | | | | |
| | | | | |
Name, Year of Birth and
Position(s) Held with the Trust | | Trustee and/or Officer Since | | Principal Occupation(s)
During Past 5 Years | | Number of Funds
in Fund Complex
Overseen by Trustee | | Other Directorship(s)
Held by Trustee During
Past 5 Years |
| | | | | |
| OTHER OFFICERS (CONTINUED) | | | | | | | | |
| | | | | |
Jeffrey H. Kupor (Continued) | | | | Officer, Invesco Exchange-Traded Fund Trust, Invesco Exchange-Traded Fund Trust II, Invesco India Exchange-Traded Fund Trust, Invesco Actively Managed Exchange-Traded Fund Trust, Invesco Actively Managed Exchange- Traded Commodity Fund Trust and Invesco Exchange-Traded Self-Indexed Fund Trust; Secretary, Invesco Indexing LLC; Secretary, W.L. Ross & Co., LLC Formerly: Secretary and Vice President, Jemstep, Inc.; Head of Legal, Worldwide Institutional, Invesco Ltd.; Secretary and General Counsel, INVESCO Private Capital Investments, Inc.; Senior Vice President, Secretary and General Counsel, Invesco Management Group, Inc. (formerly known as Invesco AIM Management Group, Inc.); Assistant Secretary, INVESCO Asset Management (Bermuda) Ltd.; Secretary and General Counsel, Invesco Private Capital, Inc.; Assistant Secretary and General Counsel, INVESCO Realty, Inc.; Secretary and General Counsel, Invesco Senior Secured Management, Inc.; and Secretary, Sovereign G./P. Holdings Inc. | | | | |
| | | | | |
Andrew R. Schlossberg – 1974 Senior Vice President | | 2019 | | Head of the Americas and Senior Managing Director, Invesco Ltd.; Director and Senior Vice President, Invesco Advisers, Inc. (formerly known as Invesco Institutional (N.A.), Inc.) (registered investment adviser); Director and Chairman, Invesco Investment Services, Inc. (formerly known as Invesco AIM Investment Services, Inc.) (registered transfer agent); Senior Vice President, The Invesco Funds; Director, Invesco Investment Advisers LLC (formerly known as Van Kampen Asset Management); Director, President and Chairman, Invesco Insurance Agency, Inc. Formerly: Director, Invesco UK Limited; Director and Chief Executive, Invesco Asset Management Limited and Invesco Fund Managers Limited; Assistant Vice President, The Invesco Funds; Senior Vice President, Invesco Advisers, Inc. (formerly known as Invesco Institutional (N.A.), Inc.) (registered investment adviser); Director and Chief Executive, Invesco Administration Services | | N/A | | N/A |
211 INVESCO OPPENHEIMER GLOBAL STRATEGIC INCOME FUND
TRUSTEES AND OFFICERSContinued
| | | | | | | | |
| | | | | |
Name, Year of Birth and
Position(s) Held with the Trust | | Trustee and/or Officer Since | | Principal Occupation(s)
During Past 5 Years | | Number of Funds
in Fund Complex
Overseen by Trustee | | Other Directorship(s)
Held by Trustee During
Past 5 Years |
| | | | | |
| OTHER OFFICERS (CONTINUED) | | | | | | | | |
| | | | | |
Andrew R. Schlossberg (Continued) | | | | Limited and Invesco Global Investment Funds Limited; Director, Invesco Distributors, Inc.; Head of EMEA, Invesco Ltd.; President, Invesco Actively Managed Exchange-Traded Commodity Fund Trust, Invesco Actively Managed Exchange-Traded Fund Trust, Invesco Exchange-Traded Fund Trust, Invesco Exchange-Traded Fund Trust II and Invesco India Exchange-Traded Fund Trust; Managing Director and Principal Executive Officer, Invesco Capital Management LLC | | | | |
| | | | | |
John M. Zerr — 1962 Senior Vice President | | 2006 | | Chief Operating Officer of the Americas; Senior Vice President, Invesco Advisers, Inc. (formerly known as Invesco Institutional (N.A.), Inc.) (registered investment adviser); Senior Vice President, Invesco Distributors, Inc. (formerly known as Invesco AIM Distributors, Inc.); Director and Vice President, Invesco Investment Services, Inc. (formerly known as Invesco AIM Investment Services, Inc.) Senior Vice President, The Invesco Funds; Managing Director, Invesco Capital Management LLC; Director, Invesco Investment Advisers LLC (formerly known as Van Kampen Asset Management); Senior Vice President, Invesco Capital Markets, Inc. (formerly known as Van Kampen Funds Inc.); Manager, Invesco Indexing LLC; Manager, Invesco Specialized Products, LLC; Director and Senior Vice President, Invesco Insurance Agency, Inc.; Member, Invesco Canada Funds Advisory Board; Director, President and Chief Executive Officer, Invesco Corporate Class Inc. (corporate mutual fund company); and Director, Chairman, President and Chief Executive Officer, Invesco Canada Ltd. (formerly known as Invesco Trimark Ltd./Invesco Trimark Ltèe) (registered investment adviser and registered transfer agent) Formerly: Director and Senior Vice President, Invesco Management Group, Inc. (formerly known as Invesco AIM Management Group, Inc.); Secretary and General Counsel, Invesco Management Group, Inc. (formerly known as Invesco AIM Management Group, Inc.); Secretary, Invesco Investment Services, Inc. (formerly known as Invesco AIM Investment Services, Inc.); Chief Legal Officer and | | N/A | | N/A |
212 INVESCO OPPENHEIMER GLOBAL STRATEGIC INCOME FUND
| | | | | | | | |
| | | | | |
Name, Year of Birth and
Position(s) Held with the Trust | | Trustee and/or Officer Since | | Principal Occupation(s)
During Past 5 Years | | Number of Funds
in Fund Complex
Overseen by Trustee | | Other Directorship(s)
Held by Trustee During
Past 5 Years |
| | | | | |
| OTHER OFFICERS (CONTINUED) | | | | | | | | |
| | | | | |
John M. Zerr (Continued) | | | | Secretary, The Invesco Funds; Secretary and General Counsel, Invesco Investment Advisers LLC (formerly known as Van Kampen Asset Management); Secretary and General Counsel, Invesco Capital Markets, Inc. (formerly known as Van Kampen Funds Inc.); Chief Legal Officer, Invesco Exchange-Traded Fund Trust, Invesco Exchange-Traded Fund Trust II, Invesco India Exchange-Traded Fund Trust, Invesco Actively Managed Exchange-Traded Fund Trust, Invesco Actively Managed Exchange- Traded Commodity Fund Trust and Invesco Exchange-Traded Self-Indexed Fund Trust; Secretary, Invesco Indexing LLC; Director, Secretary, General Counsel and Senior Vice President, Van Kampen Exchange Corp.; Director, Vice President and Secretary, IVZ Distributors, Inc. (formerly known as INVESCO Distributors, Inc.); Director and Vice President, INVESCO Funds Group, Inc.; Director and Vice President, Van Kampen Advisors Inc.; Director, Vice President, Secretary and General Counsel, Van Kampen Investor Services Inc.; Director and Secretary, Invesco Distributors, Inc. (formerly known as Invesco AIM Distributors, Inc.); Director, Senior Vice President, General Counsel and Secretary, Invesco AIM Advisers, Inc. and Van Kampen Investments Inc.; Director, Vice President and Secretary, Fund Management Company; Director, Senior Vice President, Secretary, General Counsel and Vice President, Invesco AIM Capital Management, Inc.; Chief Operating Officer and General Counsel, Liberty Ridge Capital, Inc. (an investment adviser) | | | | |
| | | | | |
Gregory G. McGreevey - 1962 Senior Vice President | | 2012 | | Senior Managing Director, Invesco Ltd.; Director, Chairman, President, and Chief Executive Officer, Invesco Advisers, Inc. (formerly known as Invesco Institutional (N.A.), Inc.) (registered investment adviser); Director, Invesco Mortgage Capital, Inc. and Invesco Senior Secured Management, Inc.; and Senior Vice President, The Invesco Funds; and President, SNW Asset Management Corporation Formerly: Senior Vice President, Invesco | | N/A | | N/A |
213 INVESCO OPPENHEIMER GLOBAL STRATEGIC INCOME FUND
TRUSTEES AND OFFICERSContinued
| | | | | | | | |
| | | | | |
Name, Year of Birth and
Position(s) Held with the Trust | | Trustee and/or Officer Since | | Principal Occupation(s)
During Past 5 Years | | Number of Funds
in Fund Complex
Overseen by Trustee | | Other Directorship(s)
Held by Trustee During
Past 5 Years |
| | | | | |
| OTHER OFFICERS (CONTINUED) | | | | | | | | |
| | | | | |
Gregory G. McGreevey (Continued) | | | | Management Group, Inc. and Invesco Advisers, Inc.; Assistant Vice President, The Invesco Funds | | | | |
| | | | | |
Kelli Gallegos – 1970 Vice President, Principal Financial Officer and Assistant Treasurer | | 2008 | | Principal Financial and Accounting Officer – Investments Pool, Invesco Specialized Products, LLC; Vice President, Principal Financial Officer and Assistant Treasurer, The Invesco Funds; Principal Financial and Accounting Officer – Pooled Investments, Invesco Capital Management LLC; Vice President and Treasurer, Invesco Exchange- Traded Fund Trust, Invesco Exchange-Traded Fund Trust II, Invesco India Exchange-Traded Fund Trust, Invesco Actively Managed Exchange-Traded Fund Trust, Invesco Actively Managed Exchange-Traded Commodity Fund Trust and Invesco Exchange-Traded Self- Indexed Fund Trust Formerly: Assistant Treasurer, Invesco Specialized Products, LLC; Assistant Treasurer, Invesco Exchange-Traded Fund Trust, Invesco Exchange-Traded Fund Trust II, Invesco India Exchange-Traded Fund Trust, Invesco Actively Managed Exchange-Traded Fund Trust, Invesco Actively Managed Exchange-Traded Commodity Fund Trust and Invesco Exchange- Traded Self-Indexed Fund Trust; Assistant Treasurer, Invesco Capital Management LLC; Assistant Vice President, The Invesco Funds | | N/A | | N/A |
| | | | | |
Crissie M. Wisdom – 1969 Anti-Money Laundering Compliance Officer | | 2013 | | Anti-Money Laundering Compliance Officer, Invesco Advisers, Inc. (formerly known as Invesco Institutional (N.A.), Inc.) (registered investment adviser), Invesco Capital Markets, Inc. (formerly known as Van Kampen Funds Inc.), Invesco Distributors, Inc., Invesco Investment Services, Inc., The Invesco Funds, and Invesco Exchange-Traded Fund Trust, Invesco Exchange-Traded Fund Trust II, Invesco India Exchange-Traded Fund Trust, Invesco Actively Managed Exchange-Traded Fund Trust, Invesco Actively Managed Exchange- Traded Commodity Fund Trust and Invesco Exchange-Traded Self-Indexed Fund Trust; Anti-Money Laundering Compliance Officer and Bank Secrecy Act Officer, INVESCO National Trust Company and Invesco Trust Company; and Fraud Prevention Manager and | | N/A | | N/A |
214 INVESCO OPPENHEIMER GLOBAL STRATEGIC INCOME FUND
| | | | | | | | |
| | | | | |
Name, Year of Birth and
Position(s) Held with the Trust | | Trustee and/or Officer Since | | Principal Occupation(s)
During Past 5 Years | | Number of Funds
in Fund Complex
Overseen by Trustee | | Other Directorship(s)
Held by Trustee During
Past 5 Years |
| | | | | |
| OTHER OFFICERS (CONTINUED) | | | | | | | | |
| | | | | |
Crissie M. Wisdom (Continued) | | | | Controls and Risk Analysis Manager for Invesco Investment Services, Inc. Formerly: Anti-Money Laundering Compliance Officer, Van Kampen Exchange Corp. and Invesco Management Group, Inc. | | | | |
| | | | | |
Robert R. Leveille – 1969 Chief Compliance Officer | | 2016 | | Chief Compliance Officer, Invesco Advisers, Inc. (registered investment adviser); and Chief Compliance Officer, The Invesco Funds Formerly: Chief Compliance Officer, Putnam Investments and the Putnam Funds | | N/A | | N/A |
The Statement of Additional Information of the Trust includes additional information about the Fund’s Trustees and is available upon request, without charge, by calling 1.800.959.4246. Please refer to the Fund’s Statement of Additional Information for information on the Fund’ssub-advisers.
| | | | | | |
Office of the Fund | | Investment Adviser | | Distributor | | Auditors |
11 Greenway Plaza, | | Invesco Advisers, Inc. | | Invesco Distributors, Inc. | | PricewaterhouseCoopers |
Suite 1000 | | 1555 Peachtree Street, N.E. | | 11 Greenway Plaza, | | LLP |
Houston, TX 77046-1173 | | Atlanta, GA 30309 | | Suite 1000 | | 1000 Louisiana Street, |
| | | | Houston, TX | | Suite 5800 |
| | | | 77046-1173 | | Houston, TX 77002-5021 |
Counsel to the Fund | | Counsel to the | | Transfer Agent | | Custodian |
Stradley Ronon Stevens & Young, | | Independent Trustees | | Invesco Investment | | JPMorgan Chase Bank |
LLP | | Goodwin Procter LLP | | Services, Inc. | | 4 Chase Metro Tech |
2005 Market Street, | | 901 New York Avenue, N.W. | | 11 Greenway Plaza, | | Center |
Suite 2600 | | Washington, D.C. 20001 | | Suite 1000 | | Brooklyn, NY 11245 |
Philadelphia, PA 19103-7018 | | | | Houston, TX | | |
| | | | 77046-1173 | | |
215 INVESCO OPPENHEIMER GLOBAL STRATEGIC INCOME FUND
Invesco recognizes the importance of protecting your personal and financial information when you visit our website located atwww.invesco.com (the “Website”). The following information is designed to help you understand the information collection practices at this Website. We will not sell, share or rent your personally identifiable information to others in contravention of this Privacy Policy. When we refer to ourselves as “we” or “Invesco” in this Privacy Policy, we mean our entire company including our affiliates, such as subsidiaries.
By visiting this Website, you are accepting the practices described in this Privacy Policy. If you do not agree to this policy, you may not use this Website. This Privacy Policy is subject to change without notice, from time to time in our sole discretion. You acknowledge that by accessing the Website after we have posted changes to this Privacy Policy, you are agreeing to this Privacy Policy as modified. Please review the Terms of Use1 to learn of other terms and conditions applicable to your use of the Website.
Please note that this Privacy Policy is not an exclusive statement of our privacy principles across all products and services. Other privacy principles or policies may apply depending on the products or services you obtain from Invesco, or the jurisdiction in which you transact with Invesco.
This Privacy Policy was last updated on May 6, 2018.
Information We Collect and Use
We collect personal information you choose to submit to the Website in order to process transactions requested by you and meet our contractual obligations. For example, you can choose to provide your name, contact information, social security number, or tax identification number in connection with accessing your account, or you can choose to provide your personal information when you fill out a secure account question form. Any information collected about you from the Website can, from time to time, be associated with other identifying information we have about you.
In addition, we may gather information about you automatically through your use of the Website, e.g. your IP address, how you navigate the Website, the organization from which you are accessing the Website, and the websites that you access before and after you visit the Website.
When you access the Website, we may also collect information such as unique device identifiers, your screen resolution and other device settings, information about your location, and analytical information about how you use the device from which you are viewing the Website. Where applicable, we may ask your permission before collecting certain information, such as precise geolocation information.
From time to time, we use or augment the personal information we have about you with information obtained from third parties. For example, we use third party information to confirm contact or financial information or to better understand your interests by associating demographic information from third parties with the information you have provided.
How We Use Personal Information
We use your personal information to respond to your inquiries and provide the products and services you request. We also use your information from time to time to deliver the content and services we believe
1NTD
216 INVESCO OPPENHEIMER GLOBAL STRATEGIC INCOME FUND
you will find the most relevant and to provide customer service and support.
We also use the information you provide to further develop and improve our products and services. We aggregate and/orde-identify data about visitors to the Website for various business purposes including product and service development and improvement activities.
How We Share Personal Information
We collaborate with other companies and individuals to perform services for us and on our behalf and we collaborate with our affiliates, other companies and individuals with respect to particular products or services (“Providers”). Examples of Providers include data analysis firms, customer service and support providers, email and SMS vendors, andweb-hosting and development companies. Some Providers collect information for us or on our behalf on our Website. These Providers can be provided with access to personal information needed to perform their functions.
We reserve the right to disclose your personal information as required by law, when we believe disclosure is necessary to comply with a regulatory requirement, judicial proceeding, court order or legal process served on us, to protect the safety, rights or property of our customers, the public or Invesco or to enforce the Terms of Use.
If we sell or transfer a business unit (such as a subsidiary) or an asset (such as a website) to another company, we will share your personal information with such company. You will receive notice of such an event and the new entity will inform you of any changes to the practices in this Privacy Policy. If the new entity wishes to make additional use of your information, you have the right to decline such use at that time.
We occasionally disclose aggregate orde-identified data that is not personally identifiable with third parties.
Cookies and Other Tools
Invesco and its Providers collect information about you by using cookies, tracking pixels and other technologies. We use this information to better understand, customize and improve user experience with our websites, services and offerings as well as to manage our advertising. For example, we use web analytics services that use these technologies to gather information to help us understand how visitors engage with and navigate our Website, e.g., how and when pages in a site are visited and by how many visitors. We are also able to offer our visitors a more customized, relevant experience on our sites using these technologies by delivering content and functionality based on your preferences and interests.
Depending on their purpose, some cookies will only operate for the length of a single browsing session, while others have a longer life span to ensure that they fulfill their longer-term purposes. Your web browser can be set to allow you to control whether you will accept cookies or reject cookies, to notify you each time a cookie is sent to your browser, or to delete cookies that have already been set. If your browser is set to reject cookies, certain aspects of the Website that are cookie-enabled will not recognize you when you return to the website, and some Website functionality may be lost. The “Help” section of your browser may tell you how to prevent your browser from accepting cookies. To find out more about cookies, visitwww.aboutcookies.org.
217 INVESCO OPPENHEIMER GLOBAL STRATEGIC INCOME FUND
| | | | |
| | INVESCO’S PRIVACY NOTICEContinued |
| | | | |
Security
No data transmission over the internet can be 100% secure, so Invesco cannot ensure or warrant the security of any information you submit to us on this Website. However, Invesco seeks to protect your personal information from unauthorized access or use when you transact business on our Website using technical, administrative and procedural measures. Invesco makes no representation as to the reasonableness, efficacy, or appropriateness of the measures we use to safeguard such information.
Users are responsible for maintaining the secrecy of their own passwords. If you have reason to believe that your interaction with us is no longer secure (for example, if you feel that the security of any account you might have with us has been compromised), please immediately notify us by contacting us as specified below.
Transfer of Data to Other Countries
Any information you provide to Invesco through use of the Website may be stored and processed, transferred between and accessed from the United States, Canada and other countries which do not guarantee the same level of protection of personal information as the one in which you reside. However, Invesco will handle your personal information in accordance with this Privacy Policy regardless of where your personal information is stored/accessed.
Children’s Privacy
We are committed to protecting the privacy of children. We do not knowingly collect personal information from children under the age of 18. If you are under the age of 18, do not provide us with any personal information.
Contact Us
Please contact us if you have any questions or concerns about your personal information or require assistance in managing your choices.
Invesco Ltd.
1555 Peachtree St. NE
Atlanta, GA 30309
By phone:
(404)439-3236
By fax:
(404)962-8288
By email:
Anne.Gerry@invesco.com
Please update your account information by logging in or contact us by email or telephone as specified above to update your account information whenever such information ceases to be complete or accurate.
You may also contact us to:
218 INVESCO OPPENHEIMER GLOBAL STRATEGIC INCOME FUND
| | ● | | Request that we amend, rectify, delete or update the personal data we hold about you; |
| | ● | | Where possible (e.g. in relation to marketing) amend or update your choices around processing; |
| | ● | | Request a copy of personal data held by us. |
Disclaimer
Where the Website contains links to third-party websites/content/services that are not owned or controlled by Invesco, Invesco is not responsible for how these properties operate or treat your personal information so we recommend that you read the privacy policies and terms associated with these third party properties carefully.
219 INVESCO OPPENHEIMER GLOBAL STRATEGIC INCOME FUND
THIS PAGE INTENTIONALLY LEFT BLANK.
THIS PAGE INTENTIONALLY LEFT BLANK.
THIS PAGE INTENTIONALLY LEFT BLANK.
THIS PAGE INTENTIONALLY LEFT BLANK.
| | |
| Explore High-Conviction Investing with Invesco | | |
| |
| | | |
| |
 | | |
| |
Go paperless with eDelivery Visit invesco.com/edelivery to enjoy the convenience and security of anytime electronic access to your investment documents. With eDelivery, you can elect to have any or all of the following materials delivered straight to your inbox to download, save and print from your own computer: ◾ Fund reports and prospectuses ◾ Quarterly statements ◾ Daily confirmations ◾ Tax forms | | |
Invesco mailing information Send general correspondence to Invesco Investment Services, Inc., P.O. Box 219078, Kansas City, MO 64121-9078. | | |
| |
| |  |
| | | | |
Invesco Distributors, Inc. | | O-GLSI-AR-1 | | 11272019 |
| | |
 | | Annual Report 10/31/2019 Annual Report 9/30/2019 |
| | Invesco Oppenheimer International Bond Fund* Beginning on January 1, 2021, as permitted by regulations adopted by the Securities and Exchange Commission, paper copies of the Fund’s shareholder reports will no longer be sent by mail, unless you specifically request paper copies of the reports from the Fund or from your financial intermediary, such as a broker-dealer or bank. Instead, the reports will be made available on the Fund’s website, and you will be notified by mail each time a report is posted and provided with a website link to access the report. If you already elected to receive shareholder reports electronically, you will not be affected by this change and you need not take any action. You may elect to receive shareholder reports and other communications from the Fund electronically by contacting your financial intermediary (such as a broker-dealer or bank) or, if you are a direct investor, by enrolling at invesco.com/edelivery. You may elect to receive all future reports in paper free of charge. If you invest through a financial intermediary, you can contact your financial intermediary to request that you continue to receive paper copies of your shareholder reports. If you invest directly with the Fund, you can call 800 959 4246 to let the Fund know you wish to continue receiving paper copies of your shareholder reports. Your election to receive reports in paper will apply to all funds held with your financial intermediary or all funds held with the fund complex if you invest directly with the Fund. *Prior to the close of business on May 24, 2019, the Fund’s name was Oppenheimer International Bond Fund. See Important Update on the following page for more information. |
Important Updates
On October 18, 2018, Massachusetts Mutual Life Insurance Company, an indirect corporate parent of OppenheimerFunds, Inc. and its subsidiaries OFI Global Asset Management, Inc., OFI SteelPath, Inc. and OFI Advisors, LLC, announced that it had entered into an agreement whereby Invesco Ltd., a global investment management company would acquire OppenheimerFunds and its subsidiaries (together, “OppenheimerFunds”). After the close of business on May 24, 2019 Invesco Ltd. completed the acquisition of OppenheimerFunds. This Fund was included in that acquisition and as of that date, became part of the Invesco family of funds. Please visit invesco.com for more information or call Invesco’s Client Services team at800-959-4246.
Table of Contents
Class A Shares
AVERAGE ANNUAL TOTAL RETURNS AT 10/31/19
| | | | | | | | | | | | |
| | | 1-Year | | | 5-Year | | | 10-Year | |
| | | |
Class A Shares of the Fund without Sales Charge | | | 9.20 | % | | | 2.53 | % | | | 2.69 | % |
Class A Shares of the Fund with Sales Charge | | | 4.49 | | | | 1.64 | | | | 2.24 | |
FTSENon-U.S. Dollar World Government Bond Index | | | 9.25 | | | | 1.61 | | | | 1.22 | |
JP Morgan Government Bond Index-Emerging Markets Global Diversified | | | 15.59 | | | | 0.82 | | | | 2.67 | |
JP Morgan Emerging Markets Bond Index Global Diversified | | | 14.35 | | | | 5.44 | | | | 6.90 | |
Reference Index | | | 12.20 | | | | 2.23 | | | | 2.67 | |
3 INVESCO OPPENHEIMER INTERNATIONAL BOND FUND
AVERAGE ANNUAL TOTAL RETURNS AT 9/30/19
| | | | | | | | | | | | |
| | | 1-Year | | | 5-Year | | | 10-Year | |
| | | |
Class A Shares of the Fund without Sales Charge | | | 4.34 | % | | | 2.10 | % | | | 2.46 | % |
Class A Shares of the Fund with Sales Charge | | | -0.06 | | | | 1.20 | | | | 2.01 | |
FTSENon-U.S. Dollar World Government Bond Index | | | 6.78 | | | | 1.28 | | | | 1.15 | |
JP Morgan Government Bond Index-Emerging Markets Global Diversified | | | 10.13 | | | | 0.55 | | | | 2.47 | |
JP Morgan Emerging Markets Bond Index Global Diversified | | | 11.57 | | | | 5.74 | | | | 6.88 | |
Reference Index | | | 8.79 | | | | 2.05 | | | | 2.56 | |
Performance quoted is past performance and cannot guarantee comparable future results; current performance may be lower or higher.Visit invesco.com for the most recentmonth-end performance. Performance figures reflect reinvested distributions and changes in net asset value (NAV). Investment return and principal value will vary so that you may have a gain or a loss when you sell shares. Fund returns include changes in share price, reinvested distributions and a 4.25% maximum applicable sales charge except where “without sales charge” is indicated. Returns for periods of less than one year are cumulative and not annualized. As the result of a reorganization after the close of business on May 24, 2019, the returns of the Fund for periods on or prior to May 24, 2019 reflect performance of the Oppenheimer predecessor fund. Share class returns will differ from those of the predecessor fund because they have different expenses. Returns do not consider capital gains or income taxes on an individual’s investment. See Fund prospectus and summary prospectus for more information on share classes, sales charges and new fee agreements, if any. Fund literature is available at invesco.com.
4 INVESCO OPPENHEIMER INTERNATIONAL BOND FUND
Fund Performance Discussion
For theone-year period ended September 30, 2019, the Fund’s Class A shares (without sales charge) returned 4.34%, underperforming the FTSENon-U.S. Dollar World Government Bond Index (the “Index”), which returned 6.78%. For theone-year period ended October 31, 2019, the Fund’s Class A shares (without sales charge) returned 9.20%, underperforming the Index, which returned 9.25%. Please note that the fiscalyear-end for Invesco Oppenheimer International Bond Fund has changed from September 30 to October 31. Therefore, the period covered by this discussion is from September 30, 2018, the date of the last annual report, through October 31, 2019, the Fund’s new fiscalyear-end.
MARKET OVERVIEW
After hitting a wall to close 2018, 2019 has been volatile and eventful through September 30, 2019. In the last quarter of 2018, several shocks negatively affected market sentiment. The U.S. Federal Reserve (Fed) once again decided to hike interest rates, as was nearly universally expected, but the post-meeting conference was more hawkish than expected.
Markets were expecting a clear message that the Fed might consider a pause in any future rate increases, but that was not initially communicated. Equity markets sold off, bonds rallied, and the U.S. dollar weakened. The sell-offs were sizable, which led some to think a recession might be imminent. As 2019 began, rising global growth concerns came to the
COMPARISON OF CHANGE IN VALUE OF $10,000 HYPOTHETICAL INVESTMENTS IN AT OCTOBER 31, 2019:
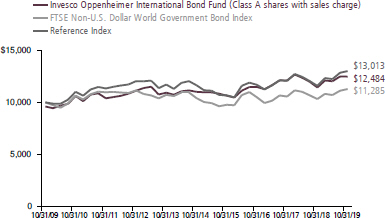
5 INVESCO OPPENHEIMER INTERNATIONAL BOND FUND
COMPARISON OF CHANGE IN VALUE OF $10,000 HYPOTHETICAL INVESTMENTS IN AT SEPTEMBER 30, 2019:
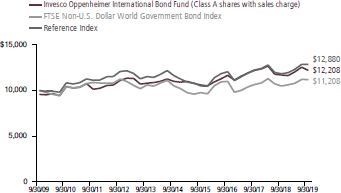
forefront. In January, we saw the strongest indications yet that the game plan may be changing. As 2019 progressed, the Fed cut rates as it dealt with an array of both global and domestic concerns. Q2 started with some hopes for stabilization, with China’s stimulus kicking in, U.S. data recovering from weakness in Q1, but these positive signs proved premature. Due to renewed tensions in the U.S.-China trade dispute and increasing risks regarding global trade, industrial production and global trade weakened noticeably. For most of the world, growth projections were revised down. Recent data show that trade policy uncertainty is taking its toll on global growth. The stabilization we had projected for the second half of 2019 was based on an expectation for a trade deal between China and the U.S. There is still hope for a limited trade deal, but we think the broader uncertainty aroundUS-China relationship will continue to undermine investment sentiment, especially against the
backdrop of slower global demand. Besides trade issues and a slowdown in U.S. and Europe, emerging markets (EM) are also facing a structurally slowing China. As China rebalances away frominvestment-led growth toconsumption-led growth, it will not be providing the same lift to emerging market exports going forward as it did in the past.
On the positive side, we expect further monetary and fiscal easing from China, to mitigate some, but not all the impact of the tariffs and the global slowdown on emerging markets. We believe that easier global financial conditions and expectation of further easing by the Federal Reserve will remain supportive of emerging market assets.
The third quarter continued to see weaker global growth led primarily by the rest of the world as the U.S. surprised to the upside versus much lowered expectations. As expected, global growth slowed, and
6 INVESCO OPPENHEIMER INTERNATIONAL BOND FUND
policy makers responded by moving towards easier monetary conditions in almost every major global economy. The Federal Reserve delivered the first of its two rate cuts so far this year. Most emerging market central banks also continued to reduce rates.
The markets were roiled in August by the unexpected and significant increase in trade tensions between the U.S. and China with the U.S. putting tariffs on almost all Chinese imports. In August we saw a significant drop in developed market (DM) yields as market expectations of global growth ratcheted down. We also saw losses in emerging market currencies as the U.S. dollar strengthened in a knee jerk reaction.
As we expected, the first quarter was mired in further data weaknesses for Asian emerging markets, despite some stabilization in China. We see this as a manifestation of global trade weakness as global exports and industrial production fell sharply. In addition, Asia is also feeling the headwinds from a slowing technology cycle. In China, front-loading of exports before tariffs took effect and the domestic policy easing were behind the stabilizing growth numbers in the first quarter. However, forward-looking indicators point to the potential for further weakness ahead for the region as global demand weakens. The stabilization we had expected in the second half of 2019 was rooted in our expectation for a trade deal between China and the U.S. Despite the recent truce at theG-20 meeting, the higher tariff rates as well as continued uncertainty about a
deal pose further downside risks to China’s and Asian emerging markets’ growth in the second half, notwithstanding the ongoing stimulus in China. We see this uncertainty a key driver for weak global investment, which in turn negatively affects Asian exports. On the positive side, we expect further easing from China, should second-quarter data surprise significantly. We believe that this global backdrop, benigndemand-led inflation pressures and widening output gaps may allow room for more interest rate cuts in several countries, such as India, Indonesia, Korea, Malaysia, Philippines, Russia, and South Africa.
The emerging market economies of Latin America have underperformed growth expectations, and we are therefore cutting our 2019 and 2020 growth forecasts across the board. The disappointing slowdown has broadened from the region’s larger economies, which we expect to see traction later, to the smaller economies. We have not materially changed our inflation outlook, as output gaps are even wider and inflation risks are lower. We expect easier global monetary conditions to curb exchange rate pressures and allow all regional central banks to add stimulus.
Colombia’s lagged economic recovery soldiers on while Argentina has been the larger exception in the region with negative growth and double-digit inflation. Yet these two economies are still improving from last year. We believe the bar is now too high for the Argentinian economy not to contract this
7 INVESCO OPPENHEIMER INTERNATIONAL BOND FUND
year, but we are hopeful for a background of macro-stabilization.
Mexico’s growth was hurt by the U.S. slowdown and uncertainties over domestic policy. In our opinion, while the Mexican economy benefits from a good starting point with low debt levels, its economic fundamentals are deteriorating with President López Obrador (AMLO) and his heterodox policy mix. Within this context, we are constructive because we see inflation convergence with central bank easing, high real rates, and fiscal prudence. We do not see Mexican sovereign debt ratings going to below investment grade, while the national oil company may be downgraded again and removed from investment grade mandates.
In Brazil, we are more optimistic with the approval of the strong pension reform, and we expect the central bank to drive expansionary conditions. Economic activity has faltered on global and local shocks that allowed a large negative output gap, with domestic uncertainties failing to support a more benign environment. We think traction will come, with higher growth more likely to materialize next year. All in, decreasing global interest rates allow for more accommodative monetary policy, which would support EM assets. The primary risk to emerging markets is a full-blown trade war, instead of a protracted conflict-resolution solution, leading to recession. However, we see this as unlikely.
First quarter GDP growth in the U.S. economy was relatively strong. However, GDP growth
in the second quarter was more modest. Unemployment has remained very low and job creation has been strong. Inflation has remained relatively low. However, a tight labor market suggests we could see more pressure on wage growth in the future. The Fed reversed course from late 2018 and reduced rates two times in 2019, over the reporting period.
Government bond yields fell across many markets during theone-year reporting period. U.S. Treasury10-year rates trended lower during the reporting period and ended at 1.67%. German10-year yields ended at-0.58%, Japanese10-year yields closed at-0.22% while Indian10-year yields ended at 6.70%. Brazilian10-year yields ended the period at 7.04%.
FUND REVIEW
The Fund’s underperformance relative to the Index this reporting period was largely the result of its allocation to international fixed income, predominantly emerging market debt. Out of benchmark exposure to Argentinian bonds and the Argentine peso detracted from returns as Argentina sold off after an unfavorable market outcome to a primary election. Our underweight allocation to core Eurozone and Japanese government debt was also a detractor to relative returns given our underweight to these sectors. Interest rates in these large markets rallied over the reporting period.
8 INVESCO OPPENHEIMER INTERNATIONAL BOND FUND
Contributing positively to performance this reporting period was our allocation to developed and emerging market corporate
debt. Lastly, our exposure to high yield also benefitted performance.
MARKET OUTLOOK & PORTFOLIO POSITIONING
Looking forward, we see the potential for global growth to continue falling but balanced by easing global financial conditions and most importantly in the U.S.
In a continuation of our view, we still see global growth momentum slowing in Q4 but at a slower rate. The stability we had been expecting innon-U.S. growth has been pushed out further amid concerns that a comprehensive trade deal between U.S. and China is now out of reach and even a narrower focused one may be difficult. We do believe that China will provide stimulus, however, that will be aimed at the domestic economy through policy measures such as tax cuts and should have limited global impact.
We expect global growth, which we estimate to be 2.6% currently to fall further in to Q1 of next year, however, we put the probability of a global recession to be low. In such an environment we believe financial conditions and valuations will be the primary driver of market returns. We expect the Fed to ease further at least 2 if not 3 times as growth slows. We also expect other central banks notably in Brazil, Mexico, Chile, India,
Indonesia, and Russia to be accommodative. We continue to expect that the mix of moderate growth with falling inflation will have a positive impact on asset prices.
The shift in economics and policy environment is allowing us to keep a stable outlook for our portfolio positioning. We continue to believe that the U.S. dollar will continue to slowly decline as the easier financial conditions reduce the cost of being long other developed market currencies such as the euro and Japanese yen. As financial conditions effect market performance we expect EM currencies will benefit from carry while DM currencies could benefit from valuations. In our portfolios, we are favoring carry from currencies such as Brazilian real, Indian rupee, Indonesian Rupiah and South African rand. We also favor the Norwegian krone, and Polish Zloty over the Euro.
We continue to favor emerging market interest rates over developed market interest rates. Real yields in emerging markets remain close to highs when compared to a combination of developed market yields. We favor long end interest rates in Brazil, India, South Africa, Indonesia, and Russia and thefront-end interest rates in Mexico and Colombia.
Given the excellent performance in credit in the first half of the year we are reducing our credit exposure both in emerging markets and in Europe. We are looking to redeploy that capital into emerging market rates.
9 INVESCO OPPENHEIMER INTERNATIONAL BOND FUND
The positive momentum that supported the global fixed income markets during September continued into October.
Despite mounting tensions in thelead-up toUS-China trade negotiations in Washington, hopes remain that the two sides will emerge with an interim deal. The cancelled APEC summit in Chile clouded the completion of a “phase 1”US-China agreement, with China signaling skepticism about a comprehensive deal.
August data showed alet-up in Germany’s manufacturing recession, balanced against surprisingly large production declines in France and the UK. In the US, the Fed announced a plan for monthly treasury bill purchases intended to permanently resolve ongoing pressures in overnight funding markets. The global easing cycle lost urgency, with the FOMC signaling a transition back to data dependence and the Bank of Japan opting to hold rates steady. Following stronger-than-anticipated incoming data for US payrolls and GDP, markets continued their constructive advance. Recent weeks have brought positive news on the risk front, including a possible breakthrough in Brexit. With the EU having agreed to a Brexit extension, the markets have somewhat assumed an orderly departure following a general election, upgrading the UK outlook.
10 INVESCO OPPENHEIMER INTERNATIONAL BOND FUND
Top Holdings and Allocations
| | |
TOP TEN HOLDINGS – 10/31/19 | | |
Invesco Government & Agency
Portfolio, Institutional Class | | 6.2% |
United States Treasury Bills,
1.655%, 12/10/19 | | 5.3 |
United Mexican States, Series M,
8.00% Sr. Unsec. Nts., 12/7/23 | | 3.0 |
United States Treasury Bills,
1.948%, 11/14/19 | | 2.7 |
United Kingdom Gilt, 1.75%
Bonds, 1/22/49 | | 2.5 |
Hellenic Republic, 3.90% Bonds,
1/30/33 | | 2.3 |
Republic of Italy, 2.80% Bonds,
3/1/67 | | 2.0 |
Republic of India, 8.24% Sr. Unsec. Nts.,
2/15/27 | | 2.0 |
Russian Federation, Series 6211,
7.00% Bonds, 1/25/23 | | 1.8 |
United Mexican States, Series M20,
8.50% Sr. Unsec. Nts.,
5/31/29 | | 1.7 |
Holdings and allocations are subject to change and are not buy/sell recommendations. Percentages are as of October 31, 2019, and are based on net assets.
| | |
TOP TEN HOLDINGS – 9/30/19 | | |
Invesco Government & Agency
Portfolio, Institutional Class | | 5.7% |
United States Treasury Bills,
1.873%, 10/17/19 | | 5.4 |
United Mexican States, Series M,
8.00% Sr. Unsec. Nts., 12/7/23 | | 2.9 |
United States Treasury Bills,
1.948%, 11/14/19 | | 2.7 |
United Kingdom Gilt, 1.75%
Bonds, 1/22/49 | | 2.5 |
Hellenic Republic, 3.90% Bonds,
1/30/33 | | 2.3 |
Republic of Italy, 2.80% Bonds,
3/1/67 | | 2.0 |
Republic of India, 8.24% Sr.
Unsec. Nts., 2/15/27 | | 2.0 |
Russian Federation, Series 6211,
7.00% Bonds, 1/25/23 | | 1.7 |
New Zealand, 1.50% Sr. Unsec.
Nts., 5/15/31 | | 1.7 |
Holdings and allocations are subject to change and are not buy/sell recommendations. Percentages are as of September 30, 2019, and are based on net assets.
For more current Fund holdings, please visit invesco.com.
11 INVESCO OPPENHEIMER INTERNATIONAL BOND FUND
Share Class Performance
AVERAGE ANNUAL TOTAL RETURNS WITHOUT SALES CHARGE AS OF 10/31/19
| | | | | | | | | | | | | | | | |
| | | Inception
Date | | | 1-Year | | | 5-Year | | | 10-Year | |
Class A (OIBAX) | | | 6/15/95 | | | | 9.20 | % | | | 2.53 | % | | | 2.69 | % |
Class C (OIBCX) | | | 6/15/95 | | | | 8.39 | | | | 1.76 | | | | 1.94 | |
Class R (OIBNX) | | | 3/1/01 | | | | 8.93 | | | | 2.28 | | | | 2.37 | |
Class Y (OIBYX) | | | 9/27/04 | | | | 9.46 | | | | 2.79 | | | | 2.96 | |
Class R5 (INBQX)1 | | | 5/24/19 | | | | 9.25 | | | | 2.54 | | | | 2.69 | |
Class R6 (OIBIX)2 | | | 1/27/12 | | | | 9.83 | | | | 2.96 | | | | 2.71 | 3 |
AVERAGE ANNUAL TOTAL RETURNS WITH SALES CHARGE AS OF 10/31/19
| | | | | | | | | | | | | | | | |
| | | Inception
Date | | | 1-Year | | | 5-Year | | | 10-Year | |
Class A (OIBAX) | | | 6/15/95 | | | | 4.49 | % | | | 1.64 | % | | | 2.24 | % |
Class C (OIBCX) | | | 6/15/95 | | | | 7.39 | | | | 1.76 | | | | 1.94 | |
Class R (OIBNX) | | | 3/1/01 | | | | 8.93 | | | | 2.28 | | | | 2.37 | |
Class Y (OIBYX) | | | 9/27/04 | | | | 9.46 | | | | 2.79 | | | | 2.96 | |
Class R5 (INBQX)1 | | | 5/24/19 | | | | 9.25 | | | | 2.54 | | | | 2.69 | |
Class R6 (OIBIX)2 | | | 1/27/12 | | | | 9.83 | | | | 2.96 | | | | 2.71 | 3 |
AVERAGE ANNUAL TOTAL RETURNS WITHOUT SALES CHARGE AS OF 9/30/19
| | | | | | | | | | | | | | | | |
| | | Inception
Date | | | 1-Year | | | 5-Year | | | 10-Year | |
Class A (OIBAX) | | | 6/15/95 | | | | 4.34 | % | | | 2.10 | % | | | 2.46 | % |
Class C (OIBCX) | | | 6/15/95 | | | | 3.55 | | | | 1.33 | | | | 1.71 | |
Class R (OIBNX) | | | 3/1/01 | | | | 4.07 | | | | 1.83 | | | | 2.14 | |
Class Y (OIBYX) | | | 9/27/04 | | | | 4.59 | | | | 2.35 | | | | 2.73 | |
Class R5 (INBQX)1 | | | 5/24/19 | | | | 4.37 | | | | 2.10 | | | | 2.46 | |
Class R6 (OIBIX)2 | | | 1/27/12 | | | | 4.74 | | | | 2.52 | | | | 2.36 | 3 |
AVERAGE ANNUAL TOTAL RETURNS WITH SALES CHARGE AS OF 9/30/19
| | | | | | | | | | | | | | | | |
| | | Inception
Date | | | 1-Year | | | 5-Year | | | 10-Year | |
Class A (OIBAX) | | | 6/15/95 | | | | -0.06 | % | | | 1.20 | % | | | 2.01 | % |
Class C (OIBCX) | | | 6/15/95 | | | | 2.56 | | | | 1.33 | | | | 1.71 | |
Class R (OIBNX) | | | 3/1/01 | | | | 4.07 | | | | 1.83 | | | | 2.14 | |
Class Y (OIBYX) | | | 9/27/04 | | | | 4.59 | | | | 2.35 | | | | 2.73 | |
Class R5 (INBQX)1 | | | 5/24/19 | | | | 4.37 | | | | 2.10 | | | | 2.46 | |
Class R6 (OIBIX)2 | | | 1/27/12 | | | | 4.74 | | | | 2.52 | | | | 2.36 | 3 |
12 INVESCO OPPENHEIMER INTERNATIONAL BOND FUND
1. Class R5 shares’ performance shown prior to the inception date (after the close of business on May 24, 2019) is that of the predecessor fund’s Class A shares at net asset value (NAV) and includes the12b-1 fees applicable to Class A shares. Class A shares’ performance reflects any applicable fee waivers and/or expense reimbursements.
2. Pursuant to the closing of the transaction described in the Notes to Financial Statements, after the close of business on May 24, 2019, Class I shares were reorganized as Class R6 shares.
3. Shows performance since inception.
Performance quoted is past performance and cannot guarantee comparable future results; current performance may be lower or higher.Visit invesco.com for the most recentmonth-end performance. Performance figures reflect reinvested distributions and changes in net asset value (NAV). Investment return and principal value will vary so that you may have a gain or a loss when you sell shares. Performance shown at NAV does not include the applicablefront-end sales charge, which would have reduced the performance. The current maximum initial sales charge for Class A shares is 4.25%, and the contingent deferred sales charge for Class C shares is 1% for the1-year period. Class R, Class Y, Class R5 and Class R6 shares have no sales charge; therefore, performance is at NAV. Effective after the close of business on May 24, 2019, Class A, Class C, Class R, Class Y, and Class I shares of the predecessor fund were reorganized into Class A, Class C, Class R, Class Y, and Class R6 shares, respectively, of the Fund. Class R5 shares’ performance shown prior to the inception date is that of the predecessor fund’s Class A shares at NAV and includes the12b-1 fees applicable to Class A shares. Class A shares’ performance reflects any applicable fee waivers and/or expense reimbursements. Returns shown for Class A, Class C, Class R, Class Y, Class R5, and Class R6 shares are blended returns of the predecessor fund and the Fund. Share class returns will differ from those of the predecessor fund because of different expenses. See Fund prospectuses and summary prospectuses for more information on share classes, sales charges and new fee agreements, if any. Fund literature is available at invesco.com.
The Fund’s performance is compared to the FTSENon-U.S. Dollar World Government Bond Index, JP Morgan Government Bond Index -Emerging Markets Global Diversified, JP Morgan Emerging Markets Bond Index Global Diversified, and the Fund’s Reference Index. The FTSENon-U.S. Dollar World Government Bond Index is an index of fixed rate government bonds with a maturity of one year or longer and amounts outstanding of at least U.S. $25 million. The JPMorgan Government Bond Index-Emerging Markets Global Diversified is a comprehensive, global local Emerging Markets Index, and consists of regularly traded, liquid fixed-rate, domestic currency government bonds to which international investors can gain exposure. The JPMorgan Emerging Markets Bond Index Global Diversified is a composite index representing an unleveraged investment in emerging market bonds that is broadly based across the spectrum of emerging market bonds and includes reinvestment of income (to represent real assets).The indices areunmanaged and cannot be purchased directly by investors. While index comparisons may be useful to provide a benchmark for the Fund’s performance, it must be noted that the Fund’s investments are not limited to the investments comprising theindices. Index performance includes reinvestment of income, but does not reflect transaction costs, fees, expenses or taxes. Index performance is shown for illustrative purposes only as a benchmark for the Fund’s performance, and does not predict or depict performance of the Fund. The Fund’s performance reflects the effects of the Fund’s business and operating expenses.
The views and opinions expressed in management’s discussion of Fund performance are those of Invesco Advisers, Inc. These views and opinions are subject to change at any time based on factors such as market and economic conditions. These views and opinions may not be relied upon as investment advice or recommendations, or as an offer for a particular security. The
13 INVESCO OPPENHEIMER INTERNATIONAL BOND FUND
information is not a complete analysis of every aspect of any market, country, industry, security or the Fund. Statements of fact are from sources considered reliable, but Invesco Advisers, Inc. makes no representation or warranty as to their completeness or accuracy. Although historical performance is no guarantee of future results, these insights may help you understand our investment management philosophy.
Before investing, investors should carefully read the prospectus and/or summary prospectus and carefully consider the investment objectives, risks, charges and expenses. For this and more complete information about the fund(s), investors should ask their advisors for a prospectus/summary prospectus or visit invesco.com/fundprospectus.
Shares of Invesco funds are not deposits or obligations of any bank, are not guaranteed by any bank, are not insured by the FDIC or any other agency, and involve investment risks, including the possible loss of the principal amount invested.
14 INVESCO OPPENHEIMER INTERNATIONAL BOND FUND
Fund Expenses
Fund Expenses. As a shareholder of the Fund, you incur two types of costs: (1) transaction costs, which may include sales charges (loads) on purchase payments and/or contingent deferred sales charges on redemptions; and (2) ongoing costs, including management fees; distribution and service fees; and other Fund expenses. These examples are intended to help you understand your ongoing costs (in dollars) of investing in the Fund and to compare these costs with the ongoing costs of investing in other mutual funds.
The examples are based on an investment of $1,000.00 invested at the beginning of the period and held for the entire6-month period ended October 31, 2019.
Actual Expenses. The first section of the table provides information about actual account values and actual expenses. You may use the information in this section for the class of shares you hold, together with the amount you invested, to estimate the expense that you paid over the period. Simply divide your account value by $1,000.00 (for example, an $8,600.00 account value divided by $1,000.00 = 8.60), then multiply the result by the number in the first section under the heading entitled “Expenses Paid During 6 Months Ended October 31, 2019” to estimate the expenses you paid on your account during this period.
Hypothetical Example for Comparison Purposes.The second section of the table provides information about hypothetical account values and hypothetical expenses based on the Fund’s actual expense ratio for each class of shares, and an assumed rate of return of 5% per year for each class before expenses, which is not the Fund’s actual return. The hypothetical account values and expenses may not be used to estimate the actual ending account balance or expenses you paid for the period. You may use this information to compare the ongoing costs of investing in the Fund and other funds. To do so, compare this 5% hypothetical example for the class of shares you hold with the 5% hypothetical examples that appear in the shareholder reports of the other funds.
Please note that the expenses shown in the table are meant to highlight your ongoing costs only and do not reflect any transactional costs, such asfront-end or contingent deferred sales charges (loads). Therefore, the “hypothetical” section of the table is useful in comparing ongoing costs only, and will not help you determine the relative total costs of owning different funds. In addition, if these transactional costs were included, your costs would have been higher.
15 INVESCO OPPENHEIMER INTERNATIONAL BOND FUND
| | | | | | | | | | | | |
| Actual | | Beginning
Account
Value
May 1, 2019 | | | Ending
Account
Value
October 31, 2019 | | | Expenses
Paid During
6 Months Ended
October 31, 20191,2 | |
Class A | | $ | 1,000.00 | | | $ | 1,037.60 | | | $ | 5.20 | |
Class C | | | 1,000.00 | | | | 1,033.70 | | | | 9.11 | |
Class R | | | 1,000.00 | | | | 1,038.30 | | | | 6.55 | |
Class Y | | | 1,000.00 | | | | 1,038.90 | | | | 3.96 | |
Class R5 | | | 1,000.00 | | | | 1,038.10 | | | | 3.04 | |
Class R6 | | | 1,000.00 | | | | 1,041.60 | | | | 3.09 | |
| | | |
Hypothetical
(5% return before expenses) | | | | | | | | | |
Class A | | | 1,000.00 | | | | 1,020.11 | | | | 5.16 | |
Class C | | | 1,000.00 | | | | 1,016.28 | | | | 9.04 | |
Class R | | | 1,000.00 | | | | 1,018.80 | | | | 6.48 | |
Class Y | | | 1,000.00 | | | | 1,021.32 | | | | 3.93 | |
Class R5 | | | 1,000.00 | | | | 1,021.78 | | | | 3.47 | |
Class R6 | | | 1,000.00 | | | | 1,022.18 | | | | 3.06 | |
1. Actual expenses paid for Class A, C, R, Y, and R6 are equal to the Fund’s annualized expense ratio for that class, multiplied by the average account value over the period, multiplied by 184/365(to reflect theone-half year period). Actual expenses paid for Class R5 are equal to the Fund’s annualized expense ratio for that class, multiplied by the average account value over the period, multiplied by 160/365to reflect the period from after the close of business on May 24, 2019 (inception of offering) to October 31, 2019.
2.Hypothetical expenses paid for all classes are equal to the Fund’s annualized expense ratio for that class, multiplied by the average account value over the period, multiplied by 184/365 (to reflect theone-half year period).
Those annualized expense ratios, excluding indirect expenses from affiliated funds, based on the6-month period ended October 31, 2019 for Classes A, C, R, Y and R6and for the period from after the close of business on May 24, 2019 (inception of offering) to October 31, 2019 for Class R5 are as follows:
| | | | |
| Class | | Expense Ratios | |
| Class A | | | 1.01 | % |
| Class C | | | 1.77 | |
| Class R | | | 1.27 | |
| Class Y | | | 0.77 | |
| Class R5 | | | 0.68 | |
| Class R6 | | | 0.60 | |
The expense ratios reflect voluntary and/or contractual waivers and/or reimbursements of expenses by the Fund’s Manager. Some of these undertakings may be modified or terminated at any time, as indicated in the Fund’s prospectus. The “Consolidated Financial Highlights” tables in the Fund’s financial statements, included in this report, also show the gross expense ratios, without such waivers or reimbursements and reduction to custodian expenses, if applicable.
16 INVESCO OPPENHEIMER INTERNATIONAL BOND FUND
Fund Expenses. As a shareholder of the Fund, you incur two types of costs: (1) transaction costs, which may include sales charges (loads) on purchase payments and/or contingent deferred sales charges on redemptions; and (2) ongoing costs, including management fees; distribution and service fees; and other Fund expenses. These examples are intended to help you understand your ongoing costs (in dollars) of investing in the Fund and to compare these costs with the ongoing costs of investing in other mutual funds.
The examples are based on an investment of $1,000.00 invested at the beginning of the period and held for the entire6-month period ended September 30, 2019.
Actual Expenses. The first section of the table provides information about actual account values and actual expenses. You may use the information in this section for the class of shares you hold, together with the amount you invested, to estimate the expense that you paid over the period. Simply divide your account value by $1,000.00 (for example, an $8,600.00 account value divided by $1,000.00 = 8.60), then multiply the result by the number in the first section under the heading entitled “Expenses Paid During 6 Months Ended September 30, 2019” to estimate the expenses you paid on your account during this period.
Hypothetical Example for Comparison Purposes.The second section of the table provides information about hypothetical account values and hypothetical expenses based on the Fund’s actual expense ratio for each class of shares, and an assumed rate of return of 5% per year for each class before expenses, which is not the Fund’s actual return. The hypothetical account values and expenses may not be used to estimate the actual ending account balance or expenses you paid for the period. You may use this information to compare the ongoing costs of investing in the Fund and other funds. To do so, compare this 5% hypothetical example for the class of shares you hold with the 5% hypothetical examples that appear in the shareholder reports of the other funds.
Please note that the expenses shown in the table are meant to highlight your ongoing costs only and do not reflect any transactional costs, such asfront-end or contingent deferred sales charges (loads). Therefore, the “hypothetical” section of the table is useful in comparing ongoing costs only, and will not help you determine the relative total costs of owning different funds. In addition, if these transactional costs were included, your costs would have been higher.
17 INVESCO OPPENHEIMER INTERNATIONAL BOND FUND
| | | | | | | | | | | | |
| Actual | | Beginning Account Value April 1, 2019 | | | Ending Account Value September 30, 2019 | | | Expenses Paid During 6 Months Ended September 30, 20191,2 | |
| Class A | | $ | 1,000.00 | | | $ | 1,013.70 | | | $ | 4.96 | |
| Class C | | | 1,000.00 | | | | 1,009.80 | | | | 8.86 | |
| Class R | | | 1,000.00 | | | | 1,012.40 | | | | 6.27 | |
| Class Y | | | 1,000.00 | | | | 1,014.90 | | | | 3.74 | |
| Class R5 | | | 1,000.00 | | | | 1,014.00 | | | | 2.32 | |
| Class R6 | | | 1,000.00 | | | | 1,015.60 | | | | 3.04 | |
| | | |
| Hypothetical | | | | | | | | | | | | |
| (5% return before expenses) | | | | | | | | | | | | |
| Class A | | | 1,000.00 | | | | 1,020.16 | | | | 4.97 | |
| Class C | | | 1,000.00 | | | | 1,016.29 | | | | 8.88 | |
| Class R | | | 1,000.00 | | | | 1,018.85 | | | | 6.29 | |
| Class Y | | | 1,000.00 | | | | 1,021.36 | | | | 3.76 | |
| Class R5 | | | 1,000.00 | | | | 1,021.81 | | | | 3.30 | |
| Class R6 | | | 1,000.00 | | | | 1,022.06 | | | | 3.05 | |
1. Actual expenses paid for Class A, C, R, Y, and R6are equal to the Fund’s annualized expense ratio for that class, multiplied by the average account value over the period, multiplied by 183/365 (to reflect theone-half year period).
Actual expenses paid for Class R5 are equal to the Fund’s annualized expense ratio for that class, multiplied by the average account value over the period, multiplied by 129/365 to reflect the period from after the close of business on
May 24, 2019 (inception of offering) to September 30, 2019.
2.Hypothetical expenses paid for all classes are equal to the Fund’s annualized expense ratio for that class, multiplied by the average account value over the period, multiplied by 183/365(to reflect theone-half year period).
Those annualized expense ratios, excluding indirect expenses from affiliated funds, based on the6-month period ended September 30, 2019 for Classes A, C, R, Y and R6 and for the period from after the close of business on May 24, 2019 (inception of offering) to September 30, 2019 for Class R5 are as follows:
| | | | |
| Class | | Expense Ratios | |
| Class A | | | 0.98 | % |
| Class C | | | 1.75 | |
| Class R | | | 1.24 | |
| Class Y | | | 0.74 | |
| Class R5 | | | 0.65 | |
| Class R6 | | | 0.60 | |
The expense ratios reflect voluntary and/or contractual waivers and/or reimbursements of expenses by the Fund’s Manager. Some of these undertakings may be modified or terminated at any time, as indicated in the Fund’s prospectus. The “Consolidated Financial Highlights” tables in the Fund’s financial statements, included in this report, also show the gross expense ratios, without such waivers or reimbursements and reduction to custodian expenses, if applicable.
18 INVESCO OPPENHEIMER INTERNATIONAL BOND FUND
CONSOLIDATED SCHEDULE OF INVESTMENTSOctober 31, 2019
| | | | | | | | | | |
| | | | | | Principal Amount | | | | Value | |
| Mortgage-Backed Obligations—4.8% | | | | | | | | | | |
| Alba plc, Series2007-1, Cl. F, 4.033% [BP0003M+325], 3/17/391,2 | | GBP | | | 1,810,400 | | | $ | 2,258,291 | |
| |
| Bancaja Fondo de Titulizacion, Series 10, Cl. C, 0.079% [EUR003M+50], 5/22/501,2,3 | | EUR | | | 12,000,000 | | | | 11,108,415 | |
| |
| Capital Mortgage Srl, Series2007-1, Cl. B, 0.00% [EUR003M+22], 1/30/471,2 | | EUR | | | 8,000,000 | | | | 6,634,973 | |
| |
| Eurohome UK Mortgages plc: | | | | | | | | | | |
| Series2007-1, Cl. B1, 1.685% [BP0003M+90], 6/15/441,2 | | GBP | | | 5,275,000 | | | | 5,440,828 | |
| Series2007-1, Cl. M1, 1.085% [BP0003M+30], 6/15/441,2 | | GBP | | | 5,200,000 | | | | 5,903,771 | |
| Series2007-1, Cl. M2, 1.285% [BP0003M+50], 6/15/441,2 | | GBP | | | 4,000,000 | | | | 4,287,018 | |
| Series2007-2, Cl. B1, 2.185% [BP0003M+140], 9/15/441,2 | | GBP | | | 4,000,000 | | | | 4,344,562 | |
| Series2007-2, Cl. M1, 1.135% [BP0003M+35], 9/15/441,2 | | GBP | | | 10,340,000 | | | | 12,061,023 | |
| |
| Eurosail plc, Series2006-3X, Cl. D1C, 1.672% [BP0003M+90], 9/10/441,2 | | GBP | | | 11,000,000 | | | | 11,546,655 | |
| |
| Great Hall Mortgages No 1 plc, Series2007-1, Cl. DA, 1.556% [BP0003M+78], 3/18/391,2 | | GBP | | | 8,000,000 | | | | 8,946,733 | |
| |
| Grifonas Finance plc: | | | | | | | | | | |
| Series 1, Cl. A, [EUR006M+28], 8/28/391,2 | | EUR | | | 17,128,370 | | | | 17,934,476 | |
| Series 1, Cl. B, 0.105% [EUR006M+52], 8/28/391,2 | | EUR | | | 5,000,000 | | | | 4,854,438 | |
| |
| IM Pastor 4 Fondo de Titulizacion de Activos: | | | | | | | | | | |
| Series 4, Cl. A, [EUR003M+14], 3/22/441,2 | | EUR | | | 14,655,466 | | | | 15,156,517 | |
| Series 4, Cl. B, [EUR003M+19], 3/22/441,2 | | EUR | | | 3,800,000 | | | | 2,747,031 | |
| |
| Ludgate Funding plc, Series2007-1, 0.00%, 1/1/616 | | GBP | | | 207,500,000 | | | | 11,763,113 | |
| |
| Newgate Funding plc, Series2007-2X, Cl. CB, 0.007% [EUR003M+44], 12/15/501,2 | | EUR | | | 3,127,671 | | | | 3,031,698 | |
| |
| Sestante Finance Srl, Series 3, Cl. C1, 0.382% [EUR003M+80], 7/15/451,2 | | EUR | | | 9,700,000 | | | | 5,259,943 | |
| |
| TDA 27 Hipocat 9 Fondo de Titulizacion de Activos, Series 27, Cl. A3, 0.00% [EUR003M+19], 12/28/501,2 | | EUR | | | 35,000,000 | | | | 34,657,942 | |
| |
| Towd Point Mortgage Funding 2019-Granite4 plc, Series 2019-GR4X, Cl. B, 2.195% [BP0003M+140], 10/20/511,2 | | GBP | | | 10,000,000 | | | | 12,943,953 | |
| | | | | | | | | | |
| Total Mortgage-Backed Obligations (Cost $178,764,093) | | | | | | | | | 180,881,380 | |
| U.S. Government Obligation—0.1% | | | | | | | | | | |
United States Treasury Note, 1.625%, 8/15/29 (Cost $4,055,156) | | | | | 4,100,000 | | | | 4,076,057 | |
| Foreign Government Obligations—61.1% | | | | | | | | | | |
| Angola—0.4% | | | | | | | | | | |
| Republic of Angola, 9.375% Sr. Unsec. Nts., 5/8/481 | | | | | 13,805,000 | | | | 14,634,681 | |
| | | | | | | | | | |
| |
| Argentina—1.4% | | | | | | | | | | |
| Argentine Republic: | | | | | | | | | | |
| 0.00% Unsec. Nts., 7/29/204 | | ARS | | | 722,500,000 | | | | 7,810,222 | |
| 0.202% Unsec. Nts., 10/29/204 | | ARS | | | 1,307,200,000 | | | | 11,349,030 | |
| 5.625% Sr. Unsec. Nts., 1/26/22 | | | | | 12,395,000 | | | | 5,317,579 | |
| 6.875% Sr. Unsec. Nts., 1/26/27 | | | | | 17,110,000 | | | | 6,801,396 | |
| 7.50% Sr. Unsec. Nts., 4/22/26 | | | | | 34,345,000 | | | | 14,682,831 | |
| 9.80% Unsec. Nts., 5/28/204 | | ARS | | | 152,100,000 | | | | 1,713,651 | |
19 INVESCO OPPENHEIMER INTERNATIONAL BOND FUND
CONSOLIDATED SCHEDULE OF INVESTMENTSContinued
| | | | | | | | | | |
| | | | | | Principal Amount | | | | Value | |
| Argentina (Continued) | | | | | | | | | | |
| Argentine Republic: (Continued) | | | | | | | | | | |
| 15.50% Bonds, 10/17/26 | | ARS | | | 135,000,000 | | | $ | 877,180 | |
| 18.20% Unsec. Nts., 10/3/21 | | ARS | | | 212,805,000 | | | | 1,281,446 | |
| 54.21% [BADLARPP+325] Unsec. Nts., 3/1/202 | | ARS | | | 180,336,000 | | | | 1,738,884 | |
| 57.612% [BADLARPP+375] Unsec. Nts., 4/12/251,2 | | ARS | | | 120,000,000 | | | | 686,137 | |
| | | | | | | | | | |
| | | | | | | | | 52,258,356 | |
| |
| Austria—0.5% | | | | | | | | | | |
Republic of Austria, 1.50% Sr. Unsec. Nts., 11/2/861 | | EUR | | | 13,130,000 | | | | 20,097,127 | |
| |
| Brazil—2.3% | | | | | | | | | | |
| Federative Republic of Brazil: | | | | | | | | | | |
| 6.00% Nts., 8/15/225 | | BRL | | | 170,000 | | | | 154,664 | |
| 6.00% Nts., 5/15/455 | | BRL | | | 40,900,000 | | | | 48,165,725 | |
| 6.00% Nts., 8/15/505 | | BRL | | | 6,000,000 | | | | 7,332,555 | |
| 10.00% Nts., 1/1/29 | | BRL | | | 100,000,000 | | | | 30,796,079 | |
| | | | | | | | | | |
| | | | | | | | | 86,449,023 | |
| |
| Colombia—1.3% | | | | | | | | | | |
Republic of Colombia, Series B, 6.25% Bonds, 11/26/25 | | COP | | | 155,000,000,000 | | | | 47,705,459 | |
| |
| Cyprus—0.7% | | | | | | | | | | |
| Republic of Cyprus: | | | | | | | | | | |
| 2.75% Sr. Unsec. Nts., 2/26/341 | | EUR | | | 13,510,000 | | | | 18,838,607 | |
| 2.75% Sr. Unsec. Nts., 5/3/491 | | EUR | | | 5,975,000 | | | | 8,732,584 | |
| | | | | | | | | | |
| | | | | | | | | 27,571,191 | |
| |
| Dominican Republic—0.3% | | | | | | | | | | |
| Dominican Republic: | | | | | | | | | | |
| 6.40% Sr. Unsec. Nts., 6/5/491 | | | | | 5,000,000 | | | | 5,425,050 | |
| 6.85% Sr. Unsec. Nts., 1/27/451 | | | | | 6,370,000 | | | | 7,206,126 | |
| | | | | | | | | | |
| | | | | | | | | 12,631,176 | |
| |
| Ecuador—0.8% | | | | | | | | | | |
| Republic of Ecuador: | | | | | | | | | | |
| 8.875% Sr. Unsec. Nts., 10/23/271 | | | | | 13,845,000 | | | | 12,939,883 | |
| 9.50% Sr. Unsec. Nts., 3/27/301 | | | | | 10,785,000 | | | | 10,412,670 | |
| 10.75% Sr. Unsec. Nts., 1/31/291 | | | | | 5,600,000 | | | | 5,677,056 | |
| | | | | | | | | | |
| | | | | | | | | 29,029,609 | |
| |
| Egypt—2.6% | | | | | | | | | | |
| Arab Republic of Egypt: | | | | | | | | | | |
| 4.75% Sr. Unsec. Nts., 4/16/261 | | EUR | | | 12,900,000 | | | | 14,787,914 | |
| 6.125% Sr. Unsec. Nts., 1/31/221 | | | | | 9,710,000 | | | | 10,061,949 | |
| 8.50% Sr. Unsec. Nts., 1/31/471 | | | | | 9,480,000 | | | | 10,004,964 | |
| 8.70% Sr. Unsec. Nts., 3/1/491 | | | | | 14,387,000 | | | | 15,458,616 | |
| 16.00% Bonds, 6/11/22 | | EGP | | | 330,000,000 | | | | 21,190,269 | |
| 16.30% Bonds, 1/1/23 | | EGP | | | 10,200,000 | | | | 667,218 | |
| 18.15% Bonds, 6/13/20 | | EGP | | | 57,000,000 | | | | 3,587,930 | |
20 INVESCO OPPENHEIMER INTERNATIONAL BOND FUND
| | | | | | | | | | |
| | | | | Principal Amount | | | Value | |
Egypt (Continued) | | | | | | | | | | |
| Arab Republic of Egypt: (Continued) | | | | | | | | | | |
18.15% Unsec. Nts., 12/11/21 | | EGP | | | 173,000,000 | | | $ | 11,473,339 | |
Series 3YR, 15.00% Bonds, 10/3/20 | | EGP | | | 157,150,000 | | | | 9,717,710 | |
| | | | | | | | | | |
| | | | | | | | | 96,949,909 | |
| |
El Salvador—0.3% | | | | | | | | | | |
Republic of El Salvador, 7.125% Sr. Unsec. Nts., 1/20/501 | | | | | 10,253,000 | | | | 10,440,117 | |
| |
Fiji—0.2% | | | | | | | | | | |
Republic of Fiji, 6.625% Sr. Unsec. Nts., 10/2/201 | | | | | 9,265,000 | | | | 9,288,163 | |
| |
France—0.8% | | | | | | | | | | |
French Republic, 1.75% Bonds, 6/25/391 | | EUR | | | 20,823,295 | | | | 29,253,646 | |
| |
Gabon—0.2% | | | | | | | | | | |
Gabonese Republic, 6.375% Bonds, 12/12/241 | | | | | 6,370,000 | | | | 6,356,464 | |
| |
Greece—4.4% | | | | | | | | | | |
Hellenic Republic: | | | | | | | | | | |
0.00% Bonds, 10/15/426 | | EUR | | | 107,000,000 | | | | 468,398 | |
3.875% Sr. Unsec. Nts., 3/12/291 | | EUR | | | 30,000,000 | | | | 41,489,441 | |
3.90% Bonds, 1/30/331 | | EUR | | | 61,676,000 | | | | 87,493,658 | |
4.00% Bonds, 1/30/371 | | EUR | | | 25,325,000 | | | | 36,760,334 | |
| | | | | | | | | | |
| | | | | | | | | 166,211,831 | |
| |
India—8.6% | | | | | | | | | | |
Republic of India: | | | | | | | | | | |
6.84% Sr. Unsec. Nts., 12/19/22 | | INR | | | 1,000,000,000 | | | | 14,483,529 | |
7.17% Sr. Unsec. Nts., 1/8/28 | | INR | | | 3,715,000,000 | | | | 54,077,228 | |
7.68% Sr. Unsec. Nts., 12/15/23 | | INR | | | 1,300,000,000 | | | | 19,282,903 | |
7.72% Sr. Unsec. Nts., 5/25/25 | | INR | | | 730,000,000 | | | | 10,888,955 | |
8.15% Sr. Unsec. Nts., 11/24/26 | | INR | | | 500,000,000 | | | | 7,640,435 | |
8.20% Sr. Unsec. Nts., 9/24/25 | | INR | | | 3,715,000,000 | | | | 56,728,192 | |
8.24% Sr. Unsec. Nts., 2/15/27 | | INR | | | 4,935,000,000 | | | | 75,603,327 | |
8.40% Sr. Unsec. Nts., 7/28/24 | | INR | | | 3,997,000,000 | | | | 61,117,355 | |
| |
State of Gujarat, 7.52% Sr. Unsec. Nts., 5/24/27 | | INR | | | 500,000,000 | | | | 7,215,988 | |
| |
State of Maharastra, 7.99% Sr. Unsec. Nts., 10/28/25 | | INR | | | 500,000,000 | | | | 7,436,235 | |
| |
State of Tamil Nadu, 8.53% Sr. Unsec. Nts., 3/9/26 | | INR | | | 500,000,000 | | | | 7,663,734 | |
| | | | | | | | | | |
| | | | | | | | | 322,137,881 | |
| |
Indonesia—5.9% | | | | | | | | | | |
Perusahaan Penerbit SBSN Indonesia III, 4.55% Sr. Unsec. Nts., 3/29/261 | | | | | 5,680,000 | | | | 6,205,400 | |
| |
Republic of Indonesia: | | | | | | | | | | |
4.125% Sr. Unsec. Nts., 1/15/251 | | | | | 3,050,000 | | | | 3,253,898 | |
8.125% Sr. Unsec. Nts., 5/15/24 | | IDR | | | 540,000,000,000 | | | | 41,114,555 | |
8.25% Sr. Unsec. Nts., 5/15/29 | | IDR | | | 398,080,000,000 | | | | 30,904,870 | |
Series FR56, 8.375% Sr. Unsec. Nts., 9/15/26 | | IDR | | | 288,430,000,000 | | | | 22,500,265 | |
Series FR59, 7.00% Sr. Unsec. Nts., 5/15/27 | | IDR | | | 480,750,000,000 | | | | 34,796,752 | |
21 INVESCO OPPENHEIMER INTERNATIONAL BOND FUND
CONSOLIDATED SCHEDULE OF INVESTMENTSContinued
| | | | | | | | | | |
| | | | | Principal Amount | | | Value | |
Indonesia (Continued) | | | | | | | | | | |
| Republic of Indonesia: (Continued) | | | | | | | | | | |
| Series FR64, 6.125% Sr. Unsec. Nts., 5/15/28 | | IDR | | | 120,000,000,000 | | | $ | 8,178,169 | |
| Series FR71, 9.00% Sr. Unsec. Nts., 3/15/29 | | IDR | | | 359,350,000,000 | | | | 29,013,763 | |
| Series FR73, 8.75% Sr. Unsec. Nts., 5/15/31 | | IDR | | | 560,080,000,000 | | | | 44,615,074 | |
| | | | | | | | | | |
| | | | | | | | | 220,582,746 | |
| |
Italy—2.0% | | | | | | | | | | |
Republic of Italy, 2.80% Bonds, 3/1/671 | | EUR | | | 59,150,000 | | | | 76,383,820 | |
| |
Ivory Coast—0.5% | | | | | | | | | | |
| Republic of Cote d’Ivoire: | | | | | | | | | | |
| 5.25% Sr. Unsec. Nts., 3/22/301 | | EUR | | | 12,765,000 | | | | 14,143,269 | |
| 6.875% Sr. Unsec. Nts., 10/17/401 | | EUR | | | 3,500,000 | | | | 3,989,252 | |
| | | | | | | | | | |
| | | | | | | | | 18,132,521 | |
| |
Kenya—0.3% | | | | | | | | | | |
| Republic of Kenya: | | | | | | | | | | |
| 8.00% Sr. Unsec. Nts., 5/22/321 | | | | | 4,140,000 | | | | 4,420,945 | |
| 8.25% Sr. Unsec. Nts., 2/28/481 | | | | | 5,500,000 | | | | 5,783,508 | |
| | | | | | | | | | |
| | | | | | | | | 10,204,453 | |
| |
Malaysia—1.4% | | | | | | | | | | |
| Federation of Malaysia: | | | | | | | | | | |
| 3.844% Sr. Unsec. Nts., 4/15/33 | | MYR | | | 50,000,000 | | | | 12,115,670 | |
| 4.127% Sr. Unsec. Nts., 4/15/32 | | MYR | | | 25,000,000 | | | | 6,239,802 | |
| 4.498% Sr. Unsec. Nts., 4/15/30 | | MYR | | | 32,000,000 | | | | 8,256,046 | |
| 4.642% Sr. Unsec. Nts., 11/7/33 | | MYR | | | 100,000,000 | | | | 26,262,686 | |
| | | | | | | | | | |
| | | | | | | | | 52,874,204 | |
| |
Mexico—7.2% | | | | | | | | | | |
| United Mexican States: | | | | | | | | | | |
| Series M, 5.75% Bonds, 3/5/26 | | MXN | | | 660,000,000 | | | | 32,687,609 | |
| Series M, 6.50% Bonds, 6/10/21 | | MXN | | | 400,000,000 | | | | 20,768,227 | |
| Series M, 8.00% Sr. Unsec. Nts., 12/7/23 | | MXN | | | 2,050,000,000 | | | | 112,126,842 | |
| Series M20, 8.50% Sr. Unsec. Nts., 5/31/29 | | MXN | | | 1,110,000,000 | | | | 64,705,617 | |
| Series M20, 10.00% Bonds, 12/5/24 | | MXN | | | 698,700,000 | | | | 41,638,692 | |
| | | | | | | | | | |
| | | | | | | | | 271,926,987 | |
| |
New Zealand—0.4% | | | | | | | | | | |
New Zealand, 1.50% Sr. Unsec. Nts., 5/15/31 | | NZD | | | 23,990,000 | | | | 15,446,233 | |
| |
Nigeria—0.1% | | | | | | | | | | |
Federal Republic of Nigeria, 7.696% Sr. Unsec. Nts., 2/23/381 | | | | | 4,385,000 | | | | 4,399,909 | |
| |
Oman—0.3% | | | | | | | | | | |
| Sultanate of Oman, 6.75% Sr. Unsec. Nts., 1/17/481 | | | | | 11,115,000 | | | | 10,460,882 | |
22 INVESCO OPPENHEIMER INTERNATIONAL BOND FUND
| | | | | | | | | | |
| | | | | Principal Amount | | | Value | |
Peru—1.4% | | | | | | | | | | |
| Republic of Peru: | | | | | | | | | | |
| 5.40% Sr. Unsec. Nts., 8/12/341 | | PEN | | | 2,730,000 | | | $ | 877,783 | |
| 5.94% Sr. Unsec. Nts., 2/12/291 | | PEN | | | 21,000,000 | | | | 7,122,704 | |
| 6.35% Sr. Unsec. Nts., 8/12/281 | | PEN | | | 100,140,000 | | | | 34,917,878 | |
| 6.90% Sr. Unsec. Nts., 8/12/371 | | PEN | | | 31,300,000 | | | | 11,579,853 | |
| | | | | | | | | | |
| | | | | | | | | 54,498,218 | |
| |
Russia—3.1% | | | | | | | | | | |
| Russian Federation: | | | | | | | | | | |
| 7.25% Bonds, 5/10/34 | | RUB | | | 2,400,000,000 | | | | 39,747,982 | |
| 7.70%, 3/23/33 | | RUB | | | 500,000,000 | | | | 8,588,912 | |
| Series 6211, 7.00% Bonds, 1/25/23 | | RUB | | | 4,200,000,000 | | | | 67,345,409 | |
| | | | | | | | | | |
| | | | | | | | | 115,682,303 | |
| |
Senegal—0.7% | | | | | | | | | | |
Republic of Senegal, 6.75% Sr. Unsec. Nts., 3/13/481 | | | | | 26,035,000 | | | | 25,622,033 | |
| |
South Africa—4.5% | | | | | | | | | | |
| Republic of South Africa: | | | | | | | | | | |
| Series 2030, 8.00% Sr. Unsec. Nts., 1/31/30 | | ZAR | | | 959,000,000 | | | | 58,417,191 | |
| Series 2037, 8.50% Sr. Unsec. Nts., 1/31/37 | | ZAR | | | 421,800,000 | | | | 24,627,418 | |
| Series 2048, 8.75% Sr. Unsec. Nts., 2/28/48 | | ZAR | | | 730,125,000 | | | | 42,095,556 | |
| Series R186, 10.50% Sr. Unsec. Nts., 12/21/26 | | ZAR | | | 459,700,000 | | | | 33,403,964 | |
| Series R214, 6.50% Sr. Unsec. Nts., 2/28/41 | | ZAR | | | 255,000,000 | | | | 11,704,129 | |
| | | | | | | | | | |
| | | | | | | | | 170,248,258 | |
| |
Sri Lanka—1.0% | | | | | | | | | | |
| Democratic Socialist Republic of Sri Lanka: | | | | | | | | | | |
| 5.75% Sr. Unsec. Nts., 4/18/231 | | | | | 9,690,000 | | | | 9,723,546 | |
| 5.875% Sr. Unsec. Nts., 7/25/221 | | | | | 8,995,000 | | | | 9,111,665 | |
| 6.25% Sr. Unsec. Nts., 10/4/201 | | | | | 6,130,000 | | | | 6,237,275 | |
| 7.85% Sr. Unsec. Nts., 3/14/291 | | | | | 11,925,000 | | | | 12,370,661 | |
| | | | | | | | | | |
| | | | | | | | | 37,443,147 | |
| |
Supranational—0.1% | | | | | | | | | | |
European Bank for Reconstruction & Development, 6.85% Sr. Unsec. Nts., 6/21/21 | | IDR | | | 60,400,000,000 | | | | 4,342,994 | |
| |
Tajikistan—0.2% | | | | | | | | | | |
Republic of Tajikistan, 7.125% Sr. Unsec. Nts., 9/14/271 | | | | | 9,540,000 | | | | 8,128,881 | |
| |
Thailand—2.3% | | | | | | | | | | |
| Kingdom of Thailand: | | | | | | | | | | |
| 1.875% Sr. Unsec. Nts., 6/17/22 | | THB | | | 620,000,000 | | | | 20,788,291 | |
| 2.125% Sr. Unsec. Nts., 12/17/26 | | THB | | | 650,000,000 | | | | 22,420,210 | |
| 3.30% Sr. Unsec. Nts., 6/17/38 | | THB | | | 1,030,000,000 | | | | 43,056,938 | |
| | | | | | | | | | |
| | | | | | | | | 86,265,439 | |
23 INVESCO OPPENHEIMER INTERNATIONAL BOND FUND
CONSOLIDATED SCHEDULE OF INVESTMENTSContinued
| | | | | | | | | | |
| | | | | Principal Amount | | | Value | |
Turkey—1.4% | | | | | | | | | | |
| Republic of Turkey: | | | | | | | | | | |
| 8.50% Bonds, 9/14/22 | | TRY | | | 71,500,000 | | | $ | 11,430,495 | |
| 10.70% Bonds, 2/17/21 | | TRY | | | 155,600,000 | | | | 26,875,683 | |
| 12.40% Bonds, 3/8/28 | | TRY | | | 77,000,000 | | | | 13,454,546 | |
| | | | | | | | | | |
| | | �� | | | | | | 51,760,724 | |
| |
Ukraine—0.9% | | | | | | | | | | |
| Ukraine: | | | | | | | | | | |
| 7.75% Sr. Unsec. Nts., 9/1/261 | | | | | 20,340,000 | | | | 21,905,956 | |
| 8.994% Sr. Unsec. Nts., 2/1/241 | | | | | 9,670,000 | | | | 10,787,949 | |
| | | | | | | | | | |
| | | | | | | | | 32,693,905 | |
| |
United Arab Emirates—0.1% | | | | | | | | | | |
United Arab Emirates, 3.125% Sr. Unsec. Nts., 9/30/491 | | | | | 5,070,000 | | | | 4,891,992 | |
| |
United Kingdom—2.5% | | | | | | | | | | |
| United Kingdom Gilt, 1.75% Bonds, 1/22/491 | | GBP | | | 62,500,000 | | | | 93,449,136 | |
| | | | | | | | | | |
Total Foreign Government Obligations (Cost $2,355,548,100) | | | | | | | | | 2,296,453,418 | |
| Corporate Bonds and Notes—15.2% | | | | | | | | | | |
Consumer Discretionary—0.3% | | | | | | | | | | |
| |
Diversified Consumer Services—0.1% | | | | | | | | | | |
| |
GEMS MENASA Cayman Ltd./GEMS Education Delaware LLC, 7.125% Sr. Sec. Nts., 7/31/261 | | | | | 3,395,000 | | | | 3,530,800 | |
| |
Hotels, Restaurants & Leisure—0.2% | | | | | | | | | | |
| |
| Melco Resorts Finance Ltd., 4.875% Sr. Unsec. Nts., 6/6/251 | | | | | 2,500,000 | | | | 2,564,476 | |
| |
| MGM China Holdings Ltd., 5.875% Sr. Unsec. Nts., 5/15/261 | | | | | 2,500,000 | | | | 2,650,000 | |
| | | | | | | | | | |
| | | | | | | | | 5,214,476 | |
| |
Consumer Staples—0.1% | | | | | | | | | | |
| |
Beverages—0.1% | | | | | | | | | | |
| |
Coca-Cola Icecek AS, 4.215% Sr. Unsec. Nts., 9/19/241 | | | | | 3,010,000 | | | | 3,017,254 | |
| |
Energy—2.7% | | | | | | | | | | |
| |
Energy Equipment & Services—0.1% | | | | | | | | | | |
| |
ADES International Holding plc, 8.625% Sr. Sec. Nts., 4/24/241 | | | | | 2,750,000 | | | | 2,835,938 | |
| |
Oil, Gas & Consumable Fuels—2.6% | | | | | | | | | | |
| |
| Cosan Ltd., 5.50% Sr. Unsec. Nts., 9/20/291 | | | | | 5,835,000 | | | | 6,072,776 | |
| |
| Eterna Capital Pte Ltd., 7.5% PIK Rate, 0.00% Cash Rate, Sr. Sec. Nts., 12/11/221,7 | | | | | 4,310,799 | | | | 3,530,589 | |
| |
| Eterna Capital Pte Ltd., 8% PIK Rate, 0.00% Cash Rate, Sr. Sec. Nts., 12/11/227 | | | | | 11,379,328 | | | | 6,770,469 | |
| |
| KazTransGas JSC, 4.375% Sr. Unsec. Nts., 9/26/271 | | | | | 12,065,000 | | | | 12,686,830 | |
| |
| Pertamina Persero PT, 4.70% Sr. Unsec. Nts., 7/30/491 | | | | | 5,000,000 | | | | 5,234,311 | |
| |
| Petrobras Global Finance BV: | | | | | | | | | | |
| 6.85% Sr. Unsec. Nts., 6/5/15 | | | | | 9,255,000 | | | | 10,666,388 | |
24 INVESCO OPPENHEIMER INTERNATIONAL BOND FUND
| | | | | | | | | | |
| | | | | | Principal Amount | | | | Value | |
| Oil, Gas & Consumable Fuels (Continued) | | | | | | | | | | |
| Petrobras Global Finance BV: (Continued) | | | | | | | | | | |
| 6.90% Sr. Unsec. Nts., 3/19/49 | | | | $ | 5,575,000 | | | $ | 6,490,973 | |
| |
| Petroleos Mexicanos: | | | | | | | | | | |
| 3.75% Sr. Unsec. Nts., 4/16/261 | | EUR | | | 9,470,000 | | | | 10,681,663 | |
| 7.69% Sr. Unsec. Nts., 1/23/501 | | | | | 8,688,000 | | | | 9,495,115 | |
| |
| Puma International Financing SA, 5.00% Sr. Unsec. Nts., 1/24/261 | | | | | 7,005,000 | | | | 6,743,541 | |
| |
| Reliance Industries Ltd., 6.78% Unsec. Nts., 9/16/20 | | INR | | | 500,000,000 | | | | 7,103,367 | |
| |
| Southern Gas Corridor CJSC, 6.875% Sr. Unsec. Nts., 3/24/261 | | | | | 9,720,000 | | | | 11,351,560 | |
| |
| YPF SA, 63.354% [BADLARPP+400] Sr. Unsec. Nts., 7/7/201,2 | | | | | 8,000,000 | | | | 1,780,800 | |
| | | | | | | | | | |
| | | | | | | | | 98,608,382 | |
| |
| Financials—8.9% | | | | | | | | | | |
| |
| Capital Markets—2.3% | | | | | | | | | | |
| |
| Credit Suisse Group AG, 7.50% [USSW5+459.8] Jr. Sub. Perpetual Bonds1,2,8 | | | | | 20,000,000 | | | | 22,224,400 | |
| |
| Morgan Stanley, 7.50% Sr. Unsec. Nts., 4/2/326 | | | | | 25,000,000 | | | | 22,051,276 | |
| |
| Standard Life Aberdeen plc, 4.25%, 6/30/28 | | | | | 7,500,000 | | | | 7,759,688 | |
| |
| UBS Group Funding Switzerland AG: | | | | | | | | | | |
| 6.875% [USISDA05+549.65] Jr. Sub. Perpetual Bonds1,2,8 | | | | | 15,520,000 | | | | 16,157,670 | |
| 7.00% [USSW5+486.6] Jr. Sub. Perpetual Bonds1,2,8 | | | | | 10,500,000 | | | | 11,735,892 | |
| 7.125% [USSW5+588.3] Jr. Sub. Perpetual Bonds1,2,8 | | | | | 5,000,000 | | | | 5,268,885 | |
| | | | | | | | | | |
| | | | | | | | | 85,197,811 | |
| |
| Commercial Banks—4.5% | | | | | | | | | | |
| |
| Banca Monte dei Paschi di Siena SpA, 5.375% [EUSA5+500.5] Sub. Nts., 1/18/281,2 | | EUR | | | 5,000,000 | | | | 4,352,849 | |
| |
| Banco Bilbao Vizcaya Argentaria SA: | | | | | | | | | | |
| 6.00% [EUSA5+603.9] Jr. Sub. Perpetual Bonds1,2,8 | | EUR | | | 2,845,000 | | | | 3,435,927 | |
| 8.875% [EUSA5+917.7] Jr. Sub. Perpetual Bonds1,2,8 | | EUR | | | 10,000,000 | | | | 12,298,078 | |
| |
| Banco Comercial Portugues SA: | | | | | | | | | | |
| 4.50% [EUSA5+426.7] Sub. Nts., 12/7/271,2 | | EUR | | | 2,500,000 | | | | 2,906,912 | |
| 9.25% [EUSA5+941.4] Jr. Sub. Perpetual Bonds1,2,8 | | EUR | | | 5,700,000 | | | | 6,910,186 | |
| |
| Banco Hipotecario SA, 63.507% [BADLARPP+615] Sr. Unsec. Nts., 2/15/212,10 | | ARS | | | 79,018,000 | | | | 1,419,264 | |
| |
| Banco Mercantil del Norte SA (Grand Cayman), 7.50% [H15T10Y+547] Jr. Sub. Perpetual Bonds1,2,8 | | | | | 3,840,000 | | | | 4,008,960 | |
| |
| Bangkok Bank PCL (Hong Kong), 3.733% [H15T5Y+190] Sub. Nts., 9/25/341,2 | | | | | 5,000,000 | | | | 5,087,785 | |
| |
| Bank of Ireland, 10.00% Sub. Nts., 12/19/221 | | EUR | | | 9,500,000 | | | | 13,565,936 | |
| |
| Barclays plc: | | | | | | | | | | |
| 2.00% [EUSA5+190] Sub. Nts., 2/7/281,2 | | EUR | | | 5,000,000 | | | | 5,627,915 | |
| 6.375% [GUKG5+601.6] Jr. Sub. Perpetual Bonds1,2,8,9 | | GBP | | | 4,000,000 | | | | 5,415,231 | |
| |
| BBVA Bancomer SA, 5.875% [H15T5Y+430.8] Sub. Nts., 9/13/341,2 | | | | | 7,350,000 | | | | 7,485,975 | |
| |
| BNP Paribas SA: | | | | | | | | | | |
| 2.139% [US0006M+7.5] Jr. Sub. Perpetual Bonds2,8 | | | | | 5,500,000 | | | | 3,650,625 | |
| 7.625% [USSW5+631.4] Jr. Sub. Perpetual Bonds1,2,8 | | | | | 7,235,000 | | | | 7,599,282 | |
25 INVESCO OPPENHEIMER INTERNATIONAL BOND FUND
CONSOLIDATED SCHEDULE OF INVESTMENTSContinued
| | | | | | | | | | |
| | | | | Principal Amount | | | Value | |
Commercial Banks (Continued) | | | | | | | | | | |
| |
| CaixaBank SA, 6.75% [EUSA5+649.8] Jr. Sub. Perpetual Bonds1,2,8 | | EUR | | | 10,515,000 | | | $ | 12,961,569 | |
| |
| Credit Agricole SA: | | | | | | | | | | |
| 6.875% [USSW5+431.9] Jr. Sub. Perpetual Bonds1,2,8 | | | | | 2,500,000 | | | | 2,720,537 | |
| 7.875% [USSW5+489.8] Jr. Sub. Perpetual Bonds1,2,8 | | | | | 5,000,000 | | | | 5,649,790 | |
| |
| Credit Suisse AG, 6.50% Sub. Nts., 8/8/231 | | | | | 5,010,000 | | | | 5,585,955 | |
| |
| Global Bank Corp., 5.25% [US0003M+330] Sr. Unsec. Nts., 4/16/291,2 | | | | | 5,090,000 | | | | 5,455,208 | |
| |
| HSBC Holdings plc: | | | | | | | | | | |
| 5.25% [EUSA5+438.3] Jr. Sub. Perpetual Bonds1,2,8 | | EUR | | | 4,520,000 | | | | 5,444,358 | |
| 6.00% [EUSA5+533.8] Jr. Sub. Perpetual Bonds1,2,8 | | EUR | | | 5,750,000 | | | | 7,304,257 | |
| |
| Lloyds Bank plc, 7.50% Sr. Unsec. Nts., 4/2/321,6 | | | | | 10,000,000 | | | | 8,595,647 | |
| |
| Novo Banco SA, 8.50% [EUSA5+823.3] Sub. Nts., 7/6/281,2 | | EUR | | | 2,500,000 | | | | 2,980,137 | |
| |
| Societe Generale SA, 7.375% [USSW5+623.8] Jr. Sub. Perpetual Bonds1,2,8 | | | | | 11,100,000 | | | | 11,710,500 | |
| |
| Standard Chartered Bank, 5.375% [BP0003M+189] Jr. Sub. Perpetual Bonds2,8 | | GBP | | | 4,000,000 | | | | 5,285,157 | |
| |
| Standard Chartered plc: | | | | | | | | | | |
| 7.50% [USSW5+630.1] Jr. Sub. Perpetual Bonds1,2,8 | | | | | 5,260,000 | | | | 5,588,750 | |
| 7.75% [USSW5+572.3] Jr. Sub. Perpetual Bonds1,2,8 | | | | | 7,500,000 | | | | 8,170,988 | |
| | | | | | | | | | |
| | | | | | | | | 171,217,778 | |
| |
| Diversified Financial Services—1.1% | | | | | | | | | | |
| |
| Astana Finance JSC, 9.16% Sr. Unsec. Nts., 12/22/243,10 | | | | | 612,810 | | | | — | |
| |
| Banco Invex SA/Hipotecaria Credito y Casa SA de CV, 6.45%, 3/13/343,5,10 | | MXN | | | 27,602,566 | | | | — | |
| |
| Caixa Geral de Depositos SA, 10.75% [EUSA5+1092.5] Jr. Sub. Perpetual Bonds1,2,8 | | EUR | | | 7,000,000 | | | | 9,146,307 | |
| |
| Docuformas SAPI de CV, 10.25% Sr. Unsec. Nts., 7/24/241 | | | | | 1,800,000 | | | | 1,829,700 | |
| |
| Fideicomiso PA Costera, 6.25% Sr. Sec. Nts., 1/15/341,5 | | COP | | | 5,916,031,565 | | | | 1,866,290 | |
| |
| Greenko Mauritius Ltd., 6.25% Sr. Unsec. Nts., 2/21/231 | | | | | 5,000,000 | | | | 5,086,351 | |
| |
| JP Morgan/Hipotecaria su Casita, 6.47%, 8/26/351 | | MXN | | | 34,101,099 | | | | 196,172 | |
| |
| National Bank for Agriculture & Rural Development, 8.39% Sr. Unsec. Nts., 7/19/21 | | INR | | | 300,000,000 | | | | 4,343,430 | |
| |
| Power Finance Corp. Ltd.: | | | | | | | | | | |
| 7.42% Sr. Unsec. Nts., 6/26/20 | | INR | | | 350,000,000 | | | | 4,962,503 | |
| 7.99% Sr. Unsec. Nts., 12/20/22 | | INR | | | 400,000,000 | | | | 5,789,170 | |
| 8.53% Sr. Unsec. Nts., 7/24/20 | | INR | | | 330,000,000 | | | | 4,735,060 | |
| |
| Swiss Insured Brazil Power Finance Sarl, 9.85% Sr. Sec. Nts., 7/16/321 | | BRL | | | 17,500,000 | | | | 5,072,622 | |
| | | | | | | | | | |
| | | | | | | | | 43,027,605 | |
| |
| Insurance—0.4% | | | | | | | | | | |
| |
| Caisse Nationale de Reassurance Mutuelle Agricole Groupama, 6.375% [EUR003M+577] Jr. Sub. Perpetual Bonds1,2,8 | | EUR | | | 8,400,000 | | | | 10,991,475 | |
| |
| VIVAT NV, 6.25% [USSW5+417.4] Jr. Sub. Perpetual Bonds1,2,8 | | | | | 5,000,000 | | | | 5,015,425 | |
| | | | | | | | | | |
| | | | | | | | | 16,006,900 | |
26 INVESCO OPPENHEIMER INTERNATIONAL BOND FUND
| | | | | | | | | | |
| | | | | Principal Amount | | | Value | |
| Real Estate Management & Development—0.4% | | | | | | | | | | |
| |
| Agile Group Holdings Ltd., 9.00% Sr. Sec. Nts., 5/21/201 | | | | $ | 3,270,000 | | | $ | 3,340,362 | |
| |
| Consus Real Estate AG, 9.625% Sr. Sec. Nts., 5/15/241 | | EUR | | | 3,424,000 | | | | 3,608,563 | |
| |
| Country Garden Holdings Co. Ltd., 7.50% Sr. Sec. Nts., 3/9/201 | | | | | 3,280,000 | | | | 3,327,396 | |
| |
| Times China Holdings Ltd., 6.25% Sr. Sec. Nts., 1/23/201 | | | | | 3,280,000 | | | | 3,295,925 | |
| | | | | | | | | | |
| | | | | | | | | 13,572,246 | |
| |
| Thrifts & Mortgage Finance—0.2% | | | | | | | | | | |
| |
| Housing Development Finance Corp. Ltd.: | | | | | | | | | | |
| 8.75% Sr. Sec. Nts., 1/13/20 | | INR | | | 330,000,000 | | | | 4,676,270 | |
| 8.95% Sec. Nts., 10/19/20 | | INR | | | 125,000,000 | | | | 1,807,544 | |
| | | | | | | | | | |
| | | | | | | | | 6,483,814 | |
| |
| Industrials—0.6% | | | | | | | | | | |
| |
| Airlines—0.1% | | | | | | | | | | |
| |
Gol Finance SA, 7.00% Sr. Unsec. Nts., 1/31/251 | | | | | 3,245,000 | | | | 3,334,238 | |
| |
| Construction & Engineering—0.2% | | | | | | | | | | |
| |
| Fideicomiso PA Concesion Ruta al Mar, 6.75% Sr. Sec. Nts., 2/15/441,5 | | COP | | | 8,000,000,000 | | | | 2,322,954 | |
| |
| GMR Hyderabad International Airport Ltd., 4.25% Sr. Sec. Nts., 10/27/271 | | | | | 6,495,000 | | | | 6,101,183 | |
| | | | | | | | | | |
| | | | | | | | | 8,424,137 | |
| |
| Industrial Conglomerates—0.1% | | | | | | | | | | |
| |
Turkiye Sise ve Cam Fabrikalari AS, 6.95% Sr. Unsec. Nts., 3/14/261 | | | | | 4,090,000 | | | | 4,268,938 | |
| |
| Machinery—0.1% | | | | | | | | | | |
| |
IHS Netherlands Holdco BV, 8.00% Sr. Unsec. Nts., 9/18/271 | | | | | 2,900,000 | | | | 3,037,750 | |
| |
| Road & Rail—0.1% | | | | | | | | | | |
| |
Indian Railway Finance Corp. Ltd., 8.83% Sr. Sec. Nts., 3/25/23 | | INR | | | 250,000,000 | | | | 3,691,302 | |
| |
| Information Technology—0.1% | | | | | | | | | | |
| |
| Communications Equipment—0.1% | | | | | | | | | | |
| |
Reliance Jio Infocomm Ltd., 8.32% Sec. Nts., 7/8/21 | | INR | | | 335,000,000 | | | | 4,876,716 | |
| |
| Materials—1.1% | | | | | | | | | | |
| |
| Chemicals—0.2% | | | | | | | | | | |
| |
| Braskem Netherlands Finance BV, 5.875% Sr. Unsec. Nts., 1/31/501,11 | | | | | 4,000,000 | | | | 3,982,000 | |
| |
| Unigel Luxembourg SA, 8.75% Sr. Unsec. Nts., 10/1/261 | | | | | 2,900,000 | | | | 2,918,125 | |
| | | | | | | | | | |
| | | | | | | | | 6,900,125 | |
27 INVESCO OPPENHEIMER INTERNATIONAL BOND FUND
CONSOLIDATED SCHEDULE OF INVESTMENTSContinued
| | | | | | | | |
| | | | Principal Amount | | | | Value | |
Construction Materials—0.1% | | | | | | | | |
| |
InterCement Financial Operations BV, 5.75% Sr. Unsec. Nts., 7/17/241 | | $ | 4,435,000 | | | $ | 3,281,945 | |
| |
Metals & Mining—0.8% | | | | | | | | |
| |
| Corp. Nacional del Cobre de Chile, 3.00% Sr. Unsec. Nts., 9/30/291 | | | 4,050,000 | | | | 4,044,678 | |
| |
| CSN Resources SA: | | | | | | | | |
| 7.625% Sr. Unsec. Nts., 2/13/231 | | | 6,000,000 | | | | 6,218,250 | |
| 7.625% Sr. Unsec. Nts., 4/17/261 | | | 5,000,000 | | | | 5,087,500 | |
| |
| Industrias Penoles SAB de CV, 5.65% Sr. Unsec. Nts., 9/12/491 | | | 1,800,000 | | | | 1,856,250 | |
| |
| JSW Steel Ltd., 4.75% Sr. Unsec. Nts., 11/12/191 | | | 6,330,000 | | | | 6,331,266 | |
| |
| Metinvest BV, 7.75% Sr. Unsec. Nts., 10/17/291 | | | 3,840,000 | | | | 3,808,320 | |
| |
| Southern Copper Corp., 7.50% Sr. Unsec. Nts., 7/27/35 | | | 3,550,000 | | | | 4,785,152 | |
| | | | | | | | |
| | | | | | | 32,131,416 | |
| |
Telecommunication Services—0.7% | | | | | | | | |
| |
Diversified Telecommunication Services—0.4% | | | | | | | | |
| |
| Axtel SAB de CV, 6.375% Sr. Unsec. Nts., 11/14/241 | | | 5,000,000 | | | | 5,237,750 | |
| |
| HTA Group Ltd., 9.125% Sr. Unsec. Nts., 3/8/221 | | | 3,170,000 | | | | 3,313,537 | |
| |
| Oi SA, 10% Cash Rate or 4% PIK Rate and 8% Cash Rate, 10.00% Sr. Unsec. Nts., 7/27/257 | | | 4,973,000 | | | | 4,519,214 | |
| | | | | | | | |
| | | | | | | 13,070,501 | |
| |
Wireless Telecommunication Services—0.3% | | | | | | | | |
| |
Bharti Airtel Ltd., 4.375% Sr. Unsec. Nts., 6/10/251 | | | 11,390,000 | | | | 11,473,924 | |
| |
Utilities—0.7% | | | | | | | | |
| |
Electric Utilities—0.3% | | | | | | | | |
| |
| Empresa de Transmision Electrica SA, 5.125% Sr. Unsec. Nts., 5/2/491 | | | 4,440,000 | | | | 5,100,450 | |
| |
| Eskom Holdings SOC Ltd., 6.75% Sr. Unsec. Nts., 8/6/231 | | | 5,000,000 | | | | 5,148,920 | |
| | | | | | | | |
| | | | | | | 10,249,370 | |
| |
Independent Power and Renewable Electricity Producers—0.4% | | | | | | | | |
| |
| AES Andres BV/Dominican Power Partners/Empresa Generadora de Electricidad Itabo SA, 7.95% Sr. Unsec. Nts., 5/11/261 | | | 3,325,000 | | | | 3,557,783 | |
| |
| AES Gener SA, 6.35% [H15T5Y+491.7] Jr. Sub. Nts., 10/7/791,2 | | | 2,500,000 | | | | 2,514,500 | |
| |
| Azure Power Solar Energy Pvt Ltd., 5.65% Sr. Sec. Nts., 12/24/241 | | | 2,000,000 | | | | 2,013,500 | |
| |
| Inkia Energy Ltd., 5.875% Sr. Unsec. Nts., 11/9/271 | | | 5,865,000 | | | | 6,099,659 | |
| |
| SMC Global Power Holdings Corp., 5.95% Jr. Sub. Perpetual Bonds6,8,9,11 | | | 2,125,000 | | | | 2,150,234 | |
| | | | | | | | |
| | | | | | | 16,335,676 | |
| | | | | | | | |
| Total Corporate Bonds and Notes (Cost $583,462,427) | | | | | | | 569,789,042 | |
28 INVESCO OPPENHEIMER INTERNATIONAL BOND FUND
| | | | | | | | | | | | |
| | | | | | Shares | | | Value | |
Common Stock—0.0% | | | | | | | | | | | | |
| JSC Astana Finance, GDR1,10,12(Cost $0, Acquisition date 6/5/15) | | | | | | | 868,851 | | | $ | — | |
| | | |
| | | | | | Principal Amount | | | | |
Structured Securities—0.4% | | | | | | | | | | | | |
| Deutsche Bank AG, Coriolanus Ltd. Sec. Credit Linked Bonds: | | | | | | | | | | | | |
| 3.003% Sr. Sec. Nts., 4/30/251,4 | | | | | | | 1,817,055 | | | | 1,750,326 | |
| 3.054% Sr. Sec. Nts., 4/30/251,4 | | | | | | | 2,315,208 | | | | 2,230,185 | |
| 3.098% Sr. Sec. Nts., 4/30/251,4 | | | | | | | 1,998,812 | | | | 1,925,407 | |
| 3.131% Sr. Sec. Nts., 4/30/251,4 | | | | | | | 1,786,686 | | | | 1,721,071 | |
| 3.179% Sr. Sec. Nts., 4/30/251,4 | | | | | | | 2,224,569 | | | | 2,142,874 | |
| 3.231% Sr. Sec. Nts., 4/30/251,4 | | | | | | | 2,539,007 | | | | 2,445,765 | |
| 3.265% Sr. Sec. Nts., 4/30/251,4 | | | | | | | 2,028,369 | | | | 1,953,880 | |
| 3.346% Sr. Sec. Nts., 4/30/251,4 | | | | | | | 1,906,581 | | | | 1,836,564 | |
| Morgan Stanley, Russian Federation Total Return Linked Bonds, Series 007, Cl. VR, 5.00%, 8/22/34 | | | RUB | | | | 109,740,006 | | | | 262,666 | |
| | | | | | | | | | | | |
| Total Structured Securities (Cost $18,132,963) | | | | | | | | | | | 16,268,738 | |
| | | | | | | | | | | | | |
Short-Term Notes—8.4% | | | | | | | | | | | | |
| Arab Republic of Egypt Treasury Bills, 15.39%, 3/17/204 | | | EGP | | | | 168,200,000 | | | | 9,926,686 | |
| Argentine Republic Treasury Bills, 5.106%, 5/29/204 | | | ARS | | | | 455,700,000 | | | | 4,428,928 | |
| United States Treasury Bills: | | | | | | | | | | | | |
| 1.655%, 12/10/194,13 | | | | | | | 200,000,000 | | | | 199,677,852 | |
| 1.948%, 11/14/194,13 | | | | | | | 100,000,000 | | | | 99,946,276 | |
| | | | | | | | | | | | |
| Total Short-Term Notes (Cost $320,696,384) | | | | | | | | | | | 313,979,742 | |
| | | | | | | | | | | | | | | | | | | | | | | | | | | | |
| | | | | | Exercise
Price | | | Expiration
Date | | | Notional
Amount
(000’s) | | | | | | Contracts
(000’s) | | | | |
Exchange-Traded Options Purchased—0.0% | | | | | | | | | | | | | | | | | | | | | | | | | | | | |
| S&P 500 Index Put | | | USD | | | | 2,675.000 | | | | 3/20/20 | | | | USD 94,695 | | | | | | | | USD 0 | 14 | | | 1,150,500 | |
| S&P 500 Index Put | | | USD | | | | 2,625.000 | | | | 2/21/20 | | | | USD 49,350 | | | | | | | | USD 0 | 14 | | | 351,560 | |
| | | | | | | | | | | | | | | | | | | | | | | | | | | | |
| Total Exchange-Traded Options Purchased (Cost $4,243,671) | | | | | | | | 1,502,060 | |
| | | | | | |
| | | Counterparty | | | Exercise Price | | | Expiration
Date | | | Notional
Amount
(000’s) | | | | | | | |
Over-the-Counter Options Purchased—0.9% | | | | | | | | | | | | | | | | | | | | | | | | | | | | |
| BRL Currency Put | | | GSCO-OT | | | | BRL | | | | 3.430 | | | | 3/30/20 | | | | BRL 5,000 | | | | BRL 5,000 | | | | 208,794 | |
| BRL Currency Call | | | CITNA-B | | | | BRL | | | | 3.861 | | | | 11/18/19 | | | | BRL 193,025 | | | | BRL 193,025 | | | | 42,772 | |
| BRL Currency Call | | | SCB | | | | BRL | | | | 3.508 | | | | 11/1/19 | | | | BRL 350,800 | | | | BRL 350,800 | | | | — | |
29 INVESCO OPPENHEIMER INTERNATIONAL BOND FUND
CONSOLIDATED SCHEDULE OF INVESTMENTSContinued
| | | | | | | | | | | | | | | | | | | | | | | | |
| | | Counterparty | | | | | Exercise
Price | | | Expiration
Date | | | Notional
Amount
(000’s) | | | Contracts (000’s) | | Value | |
Over-the-Counter Options Purchased (Continued) | | | | | | | | | | | |
| BRL Currency Put | | | GSCO-OT | | | BRL | | | 3.350 | | | | 12/6/19 | | | | BRL 3,000 | | | BRL 3,000 | | $ | 2 | |
| BRL Currency Put | | | GSCO-OT | | | BRL | | | 3.400 | | | | 12/10/19 | | | | BRL 3,000 | | | BRL 3,000 | | | 65 | |
| BRL Currency Call | | | MSCO | | | BRL | | | 3.750 | | | | 8/27/20 | | | | BRL 20,000 | | | BRL 20,000 | | | 4,159,792 | |
| BRL Currency Put | | | GSCO-OT | | | BRL | | | 3.432 | | | | 3/27/20 | | | | BRL 5,000 | | | BRL 5,000 | | | 204,273 | |
| BRL Currency Put | | | GSCO-OT | | | BRL | | | 3.430 | | | | 3/30/20 | | | | BRL 5,000 | | | BRL 5,000 | | | 208,794 | |
| EUR Currency Put | | | JPM | | | NOK | | | 8.900 | | | | 8/26/21 | | | | EUR 12,500 | | | EUR 12,500 | | | 842,015 | |
| EUR Currency Call | | | GSCOI | | | USD | | | 1.395 | | | | 12/31/19 | | | | EUR 100,000 | | | EUR 100,000 | | | 38,615 | |
| EUR Currency Put | | | GSCOI | | | PLN | | | 4.296 | | | | 4/21/20 | | | | EUR 150,000 | | | EUR 150,000 | | | 1,586,927 | |
| EUR Currency Put | | | SCB | | | IDR | | | 14400.000 | | | | 10/22/20 | | | | EUR 100,000 | | | EUR 100,000 | | | 1,811,068 | |
| EUR Currency Put | | | JPM | | | NOK | | | 8.200 | | | | 11/27/19 | | | | EUR 5,000 | | | EUR 5,000 | | | — | |
| EUR Currency Put | | | GSCO-OT | | | INR | | | 74.875 | | | | 8/5/20 | | | | EUR 5,000 | | | EUR 5,000 | | | 941,740 | |
| EUR Currency Put | | | JPM | | | IDR | | | 14420.000 | | | | 10/26/20 | | | | EUR 50,000 | | | EUR 50,000 | | | 939,959 | |
| EUR Currency Put | | | JPM | | | BRL | | | 3.970 | | | | 1/24/20 | | | | EUR 50,000 | | | EUR 50,000 | | | 837,830 | |
| EUR Currency Put | | | BOA | | | INR | | | 72.500 | | | | 10/27/20 | | | | EUR 100,000 | | | EUR 100,000 | | | 1,423,479 | |
| EUR Currency Put | | | CITNA-B | | | MXN | | | 19.605 | | | | 10/29/20 | | | | EUR 100,000 | | | EUR 100,000 | | | 2,691,890 | |
| EUR Currency Put | | | JPM | | | IDR | | | 14385.000 | | | | 10/29/20 | | | | EUR 165,000 | | | EUR 165,000 | | | 2,906,396 | |
| EUR Currency Put | | | GSCOI | | | IDR | | | 14435.000 | | | | 10/22/20 | | | | EUR 75,000 | | | EUR 75,000 | | | 1,438,858 | |
30 INVESCO OPPENHEIMER INTERNATIONAL BOND FUND
| | | | | | | | | | | | | | | | | | | | | | | | |
| | | Counterparty | | | | | Exercise
Price | | | Expiration
Date | | | Notional
Amount (000’s) | | | Contracts (000’s) | | Value | |
Over-the-Counter Options Purchased (Continued) | | | | | | | | | | | |
| EUR Currency Put | | | JPM | | | ZAR | | | 15.720 | | | | 1/23/20 | | | | EUR 50,000 | | | EUR 50,000 | | $ | 126,302 | |
| EUR Currency Put | | | GSCOI | | | MXN | | | 19.626 | | | | 10/30/20 | | | | EUR 100,000 | | | EUR 100,000 | | | 3,010,000 | |
| EUR Currency Call | | | BOA | | | USD | | | 1.153 | | | | 12/17/19 | | | | EUR 250,000 | | | EUR 250,000 | | | 160,395 | |
| EUR Currency Put | | | BOA | | | NOK | | | 8.200 | | | | 11/27/19 | | | | EUR 5,000 | | | EUR 5,000 | | | — | |
| EUR Currency Put | | | JPM | | | SEK | | | 9.250 | | | | 4/29/20 | | | | EUR 10,000 | | | EUR 10,000 | | | 872 | |
| EUR Currency Put | | | GSCO-OT | | | NOK | | | 8.710 | | | | 12/17/20 | | | | EUR 12,500 | | | EUR 12,500 | | | 133,727 | |
| EUR Currency Put | | | GSCO-OT | | | NOK | | | 8.402 | | | | 12/17/20 | | | | EUR 12,500 | | | EUR 12,500 | | | 26,295 | |
| EUR Currency Put | | | SCB | | | INR | | | 72.700 | | | | 10/29/20 | | | | EUR 150,000 | | | EUR 150,000 | | | 2,290,835 | |
| INR Currency Put | | | GSCO-OT | | | INR | | | 65.600 | | | | 5/6/20 | | | | INR 2,500 | | | INR 2,500 | | | 48,711 | |
| INR Currency Put | | | JPM | | | INR | | | 66.092 | | | | 4/29/20 | | | | INR 5,000 | | | INR 5,000 | | | 124,261 | |
| KRW Currency Call | | | GSCO-OT | | | KRW | | | 1159.700 | | | | 1/17/20 | | | | KRW 57,985,000 | | | KRW 57,985,000 | | | 401,836 | |
| MXN Currency Call | | | JPM | | | MXN | | | 19.655 | | | | 11/26/19 | | | | MXN 471,720 | | | MXN 471,720 | | | 520,458 | |
| MXN Currency Call | | | JPM | | | MXN | | | 19.375 | | | | 6/2/20 | | | | MXN 968,750 | | | MXN 968,750 | | | 987,059 | |
| MXN Currency Call | | | CITNA-B | | | MXN | | | 19.350 | | | | 6/2/20 | | | | MXN 967,500 | | | MXN 967,500 | | | 960,002 | |
| MXN Currency Put | | | JPM | | | MXN | | | 19.655 | | | | 11/26/19 | | | | MXN 471,720 | | | MXN 471,720 | | | 85,726 | |
| PHP Currency Call | | | GSCO-OT | | | PHP | | | 51.000 | | | | 11/11/19 | | | | PHP 3,825,000 | | | PHP 3,825,000 | | | 441,022 | |
| RUB Currency Call | | | GSCO-OT | | | RUB | | | 62.000 | | | | 4/8/20 | | | | RUB 7,750,000 | | | RUB 7,750,000 | | | 628,990 | |
31 INVESCO OPPENHEIMER INTERNATIONAL BOND FUND
CONSOLIDATED SCHEDULE OF INVESTMENTSContinued
| | | | | | | | | | | | | | | | | | | | | | |
| | | Counterparty | | | | Exercise
Price | | | Expiration
Date | | | Notional
Amount
(000’s) | | | Contracts (000’s) | | Value | |
Over-the-Counter Options Purchased (Continued) | | | | | | | | | | | | | | | | | | |
| RUB Currency Put | | GSCO-OT | | RUB | | | 57.300 | | | | 3/30/20 | | | | RUB 10,000 | | | RUB 10,000 | | $ | 273,005 | |
| RUB Currency Put | | JPM | | RUB | | | 59.000 | | | | 8/5/20 | | | | RUB 5,500 | | | RUB 5,500 | | | 1,174,750 | |
| RUB Currency Put | | GSCO-OT | | RUB | | | 58.500 | | | | 8/4/20 | | | | RUB 5,500 | | | RUB 5,500 | | | 966,052 | |
| RUB Currency Call | | GSCO-OT | | RUB | | | 60.000 | | | | 12/18/19 | | |
| RUB
5,700,000 |
| | RUB 5,700,000 | | | 2,736 | |
| ZAR Currency Call | | GSCO-OT | | ZAR | | | 13.613 | | | | 1/27/20 | | |
| ZAR
680,625 |
| | ZAR 680,625 | | | 49,971 | |
| ZAR Currency Call | | GSCO-OT | | ZAR | | | 14.500 | | | | 7/23/20 | | |
| ZAR
1,413,750 |
| | ZAR 1,413,750 | | | 1,831,980 | |
| | | | | | | | | | | | | | | | | | | | | | |
| TotalOver-the-Counter Options Purchased (Cost $61,979,250) | | | | | | | | | | | | | | 34,528,254 | |
| | | | | | | |
| | | Counterparty | | Buy /Sell
Protection | | Reference
Asset | | | Fixed Rate | | | Expiration
Date | | | Notional Amount (000’s) | | | |
Over-the-Counter Credit Default Swaption Purchased—0.0% | |
| Credit Default Swap maturing 6/20/24 Call (Cost $646,922) | | JPM | | Sell | |
| iTraxx
Europe
Crossover
Series 31
Version 1 |
| | | 3.00% | | | | 12/18/19 | | | EUR 50,000 | | | 175,176 | |
| | | Counterparty | | Pay/Receive
Floating
Rate | | Floating Rate | | | Fixed Rate | | | Expiration
Date | | | Notional Amount (000’s) | | | |
Over-the-Counter Interest Rate Swaptions Purchased—0.4% | |
| Interest Rate Swap maturing 1/9/20 Call | | GSCOI | | Receive | |
| Three-Month
USD BBA
LIBOR |
| | | 1.600% | | | | 1/9/20 | | | USD 384,100 | | | 1,256,011 | |
| Interest Rate Swap maturing 11/14/19 Put | | JPM | | Pay | |
| Three-Month
USD BBA
LIBOR |
| | | 1.865 | | | | 11/14/19 | | | USD 40,000 | | | 170,296 | |
| Interest Rate Swap maturing 3/27/20 Put | | MSCO | | Pay | |
| Six-Month
EUR
EURIBOR |
| | | 0.434 | | | | 3/27/20 | | | EUR 187,500 | | | 450,398 | |
| Interest Rate Swap Maturing 3/29/21 Put | | JPM | | Pay | |
| Six-Month
EUR
EURIBOR |
| | | 1.122 | | | | 3/29/21 | | | EUR 1,500,000 | | | 190,281 | |
32 INVESCO OPPENHEIMER INTERNATIONAL BOND FUND
| | | | | | | | | | | | | | | | | | | | | | |
| | | Counterparty | | | Pay/Receive
Floating Rate | | Floating Rate | | Fixed
Rate | | | Expiration
Date | | | Notional Amount (000’s) | | Value | |
Over-the-Counter Interest Rate Swaptions Purchased (Continued) | |
| Interest Rate Swap Maturing 3/30/20 Put | | | BOA | | | Pay | | Three-Month CAD BA CDOR | | | 2.588% | | | | 3/30/20 | | | CAD 1,333,000 | | $ | 210,511 | |
| Interest Rate Swap Maturing 4/12/21 Put | | | JPM | | | Pay | | Six-Month EUR EURIBOR | | | 0.615 | | | | 4/12/21 | | | EUR 500,000 | | | 9,564 | |
| Interest Rate Swap Maturing 4/6/21 Put | | | JPM | | | Pay | | Six-Month EUR EURIBOR | | | 0.608 | | | | 4/6/21 | | | EUR 500,000 | | | 9,246 | |
| Interest Rate Swap maturing 8/16/24 Put | | | JPM | | | Pay | | Six-Month EUR EURIBOR | | | 2.098 | | | | 8/16/24 | | | EUR 100,000 | | | 1,623,390 | |
| Interest Rate Swap maturing 8/17/20 Put | | | MSCO | | | Pay | | Three-Month USD BBA LIBOR | | | 1.695 | | | | 8/17/20 | | | USD 116,000 | | | 2,045,790 | |
| Interest Rate Swap maturing 8/17/20 Put | | | JPM | | | Pay | | Three-Month USD BBA LIBOR | | | 2.500 | | | | 8/17/20 | | | USD 500,000 | | | 3,581,330 | |
| Interest Rate Swap maturing 8/17/20 Put | | | GSCOI | | | Pay | | Three-Month USD BBA LIBOR | | | 2.500 | | | | 8/17/20 | | | USD 250,000 | | | 1,790,665 | |
| Interest Rate Swap maturing 8/26/20 Put | | | MSCO | | | Pay | | Three-Month USD BBA LIBOR | | | 2.500 | | | | 8/26/20 | | | USD 750,000 | | | 1,622,602 | |
| | | | | | | | | | | | | | | | | | | | | | |
TotalOver-the-Counter Interest Rate Swaptions Purchased (Cost $22,302,444) | | | | | | 12,960,084 | |
| | | | | | | | |
| | | Shares | | | | |
Investment Companies—6.2% | | | | | | | | |
| Invesco Government & Agency Portfolio, Institutional Class, 1.71%15 | | | 232,541,098 | | | | 232,541,098 | |
| OFI Carlyle Private Credit Fund, Cl. I16 | | | 164,371 | | | | 1,530,295 | |
| | | | | | | | |
| Total Investment Companies (Cost $234,150,380) | | | | | | | 234,071,393 | |
| Total Investments, at Value (Cost $3,783,981,790) | | | 97.5% | | | | 3,664,685,344 | |
| Net Other Assets (Liabilities) | | | 2.5 | | | | 93,254,609 | |
| | | | |
| Net Assets | | | 100.0% | | | $ | 3,757,939,953 | |
| | | | |
33 INVESCO OPPENHEIMER INTERNATIONAL BOND FUND
CONSOLIDATED SCHEDULE OF INVESTMENTSContinued
Footnotes to Consolidated Statement of Investments
1. Security purchased or received in a transaction exempt from registration under the Securities Act of 1933, as amended (the “1933 Act”). The security may be resold pursuant to an exemption from registration under the 1933 Act, typically to qualified institutional buyers. The aggregate value of these securities at October 31, 2019 was $1,399,192,961, which represented 37.23% of the Fund’s Net Assets.
2. Represents the current interest rate for a variable or increasing rate security, which may be fixed for a predetermined period. The interest rate is, or will be as of an established date, determined as [Referenced Rate + Basis-point spread].
3. This security is not accruing income because its issuer has missed or is expected to miss interest and/or principal payments. The rate shown is the contractual interest rate.
4. Zero coupon bond reflects effective yield on the original acquisition date.
5. Denotes an inflation-indexed security: coupon or principal are indexed to a consumer price index.
6. This interest rate resets periodically. Interest rate shown reflects the rate in effect at period end. The rate on this variable rate security is not based on a published reference rate and spread but is determined by the issuer or agent based on current market conditions.
7. Interest or dividend ispaid-in-kind, when applicable.
8. This bond has no contractual maturity date, is not redeemable and contractually pays an indefinite stream of interest.
9. All or a portion of this security is owned by the subsidiary. See Note 1 of the accompanying Consolidated Notes.
10. The value of this security was determined using significant unobservable inputs. See Note 3 of the accompanying Consolidated Notes.
11. All or a portion of the security position is when-issued or delayed delivery to be delivered and settled after period end. See Note 1 of the accompanying Consolidated Notes.
12.Non-income producing security.
13. All or a portion of the security position is held in segregated accounts and pledged to cover margin requirements under certain derivative contracts. The aggregate market value of such securities is $95,236,386. See Note 4 of the accompanying Consolidated Notes.
14. Number of contracts are less than 500.
15. The money market fund and the Fund are affiliated by having the same investment adviser. The rate shown is the7-day SEC standardized yield as of October 31, 2019.
16. Is or was an affiliate, as defined in the Investment Company Act of 1940, as amended, at or during the reporting period, by virtue of the Fund owning at least 5% of the voting securities of the issuer or as a result of the Fund and the issuer having the same investment adviser. Transactions during the reporting period in which the issuer was an affiliate are as follows:
| | | | | | | | | | | | | | | | |
| | | Shares
September 30,
2019 | | | Gross
Additions | | | Gross
Reductions | | | Shares
October 31, 2019 | |
Investment Company | | | | | | | | | | | | | | | | |
| OFI Carlyle Private Credit Fund, Cl. I | | | 328,742 | | | | — | | | | 164,371 | | | | 164,371 | |
| | | | |
| | | Value | | | Income | | | Realized
Gain (Loss) | | | Change in
Unrealized Gain (Loss) | |
Investment Company | | | | | | | | | | | | | | | | |
| OFI Carlyle Private Credit Fund, Cl. I | | $ | 1,530,295 | | | $ | — | | | | $ (70,680 | ) | | | $ (10,771 | ) |
34 INVESCO OPPENHEIMER INTERNATIONAL BOND FUND
Distribution of investments representing geographic holdings, as a percentage of total investments at value, is as follows:
| | | | | | | | | | |
| Geographic Holdings | | Value | | | Percent | | | |
| United States | | $ | 575,901,962 | | | | 15.7 | % | | |
| India | | | 399,958,494 | | | | 10.9 | | | |
| Mexico | | | 317,963,707 | | | | 8.7 | | | |
| United Kingdom | | | 257,957,685 | | | | 7.0 | | | |
| Indonesia | | | 242,274,438 | | | | 6.6 | | | |
| South Africa | | | 177,405,431 | | | | 4.8 | | | |
| Greece | | | 166,211,831 | | | | 4.5 | | | |
| Brazil | | | 149,755,374 | | | | 4.1 | | | |
| Russia | | | 118,990,502 | | | | 3.3 | | | |
| Egypt | | | 106,876,595 | | | | 2.9 | | | |
| Italy | | | 92,631,585 | | | | 2.5 | | | |
| Spain | | | 92,365,478 | | | | 2.5 | | | |
| Thailand | | | 91,353,225 | | | | 2.5 | | | |
| France | | | 71,575,857 | | | | 2.0 | | | |
| Peru | | | 65,383,029 | | | | 1.8 | | | |
| Switzerland | | | 60,972,802 | | | | 1.7 | | | |
| Argentina | | | 59,887,348 | | | | 1.6 | | | |
| Turkey | | | 59,046,916 | | | | 1.6 | | | |
| Malaysia | | | 52,874,204 | | | | 1.4 | | | |
| Colombia | | | 51,894,703 | | | | 1.4 | | | |
| Sri Lanka | | | 37,443,147 | | | | 1.0 | | | |
| Ukraine | | | 36,502,225 | | | | 1.0 | | | |
| Ireland | | | 29,572,009 | | | | 0.8 | | | |
| Ecuador | | | 29,029,609 | | | | 0.8 | | | |
| Cyprus | | | 27,571,190 | | | | 0.8 | | | |
| Senegal | | | 25,622,033 | | | | 0.7 | | | |
| Portugal | | | 21,943,542 | | | | 0.6 | | | |
| Austria | | | 20,097,127 | | | | 0.6 | | | |
| Ivory Coast | | | 18,132,521 | | | | 0.5 | | | |
| Dominican Republic | | | 16,188,959 | | | | 0.4 | | | |
| New Zealand | | | 15,446,233 | | | | 0.4 | | | |
| Angola | | | 14,634,680 | | | | 0.4 | | | |
| Kazakhstan | | | 12,686,830 | | | | 0.3 | | | |
| Azerbaijan | | | 11,351,560 | | | | 0.3 | | | |
| United Arab Emirates | | | 11,258,730 | | | | 0.3 | | | |
| Panama | | | 10,555,657 | | | | 0.3 | | | |
| Oman | | | 10,460,882 | | | | 0.3 | | | |
| El Salvador | | | 10,440,117 | | | | 0.3 | | | |
| Kenya | | | 10,204,453 | | | | 0.3 | | | |
| China | | | 9,963,683 | | | | 0.3 | | | |
| Fiji | | | 9,288,162 | | | | 0.3 | | | |
| Tajikistan | | | 8,128,881 | | | | 0.2 | | | |
| Nigeria | | | 7,437,659 | | | | 0.2 | | | |
| Singapore | | | 6,782,156 | | | | 0.2 | | | |
| Chile | | | 6,559,178 | | | | 0.2 | | | |
| Gabon | | | 6,356,464 | | | | 0.2 | | | |
| Netherlands | | | 5,015,425 | | | | 0.1 | | | |
| Supranational | | | 4,342,994 | | | | 0.1 | | | |
35 INVESCO OPPENHEIMER INTERNATIONAL BOND FUND
CONSOLIDATED SCHEDULE OF INVESTMENTSContinued
| | | | | | | | | | |
| Geographic Holdings (Continued) | | Value | | | Percent | | | |
| Germany | | $ | 3,608,563 | | | | 0.1 | % | | |
| Mauritius | | | 3,313,538 | | | | 0.1 | | | |
| Macau | | | 2,650,000 | | | | 0.1 | | | |
| Philippines | | | 2,591,257 | | | | 0.1 | | | |
| Hong Kong | | | 2,564,476 | | | | 0.1 | | | |
| Eurozone | | | 2,458,055 | | | | 0.1 | | | |
| Poland | | | 1,586,927 | | | | 0.0 | | | |
| Norway | | | 1,002,037 | | | | 0.0 | | | |
| South Korea | | | 401,836 | | | | 0.0 | | | |
| Canada | | | 210,511 | | | | 0.0 | | | |
| Sweden | | | 872 | | | | 0.0 | | | |
| Japan | | | — | | | | — | | | |
| | | |
Total | | $ | 3,664,685,344 | | | | 100.0 | % | | |
| | | |
| | | | | | | | | | |
| | | | | | | | | | | | | | | | | | | | | | | | | | | | |
Forward Currency Exchange Contracts as of October 31, 2019 | |
| Counterparty | | Settlement Month(s) | | | Currency Purchased (000’s) | | | Currency Sold (000’s) | | | Unrealized
Appreciation | | | Unrealized
Depreciation | |
| BAC | | | 05/2020 | | | | CLP | | | | 2,018,340 | | | | USD | | | | 2,946 | | | $ | — | | | $ | (211,324 | ) |
| BAC | | | 11/2019 | | | | EUR | | | | 153,140 | | | | USD | | | | 171,112 | | | | — | | | | (111,176 | ) |
| BAC | | | 11/2019 | | | | NOK | | | | 728,800 | | | | USD | | | | 81,964 | | | | — | | | | (2,706,075 | ) |
| BAC | | | 11/2019 | | | | USD | | | | 2,950 | | | | EUR | | | | 2,635 | | | | 8,012 | | | | — | |
| BAC | | | 11/2019 | | | | USD | | | | 20,192 | | | | GBP | | | | 16,450 | | | | — | | | | (1,128,343 | ) |
| BAC | | | 12/2019 | | | | USD | | | | 19,165 | | | | MYR | | | | 80,805 | | | | — | | | | (225,810 | ) |
| BAC | | | 11/2019 | | | | USD | | | | 157,344 | | | | NOK | | | | 1,413,525 | | | | 3,620,180 | | | | — | |
| BAC | | | 11/2019 | | | | USD | | | | 64,460 | | | | NZD | | | | 101,500 | | | | — | | | | (637,994 | ) |
| BAC | | | 12/2019 | | | | USD | | | | 18,131 | | | | SGD | | | | 25,130 | | | | — | | | | (349,597 | ) |
| BAC | | | 12/2019 | | | | ZAR | | | | 489,479 | | | | USD | | | | 32,537 | | | | 106,410 | | | | (446,428 | ) |
| BNP | | | 11/2019 | | | | EUR | | | | 9,450 | | | | USD | | | | 10,439 | | | | 113,164 | | | | — | |
| BOA | | | 11/2019 - 01/2020 | | | | CAD | | | | 201,310 | | | | USD | | | | 152,536 | | | | 344,685 | | | | — | |
| BOA | | | 11/2019 - 01/2020 | | | | EUR | | | | 225,880 | | | | USD | | | | 249,577 | | | | 3,333,604 | | | | (367,499 | ) |
| BOA | | | 01/2020 | | | | IDR | | | | 278,850,000 | | | | USD | | | | 19,502 | | | | 121,930 | | | | — | |
| BOA | | | 11/2019 - 01/2020 | | | | JPY | | | | 30,000,000 | | | | USD | | | | 282,977 | | | | — | | | | (4,204,244 | ) |
| BOA | | | 12/2019 | | | | KRW | | | | 12,237,650 | | | | USD | | | | 10,049 | | | | 417,376 | | | | — | |
| BOA | | | 11/2019 - 01/2020 | | | | NOK | | | | 1,320,000 | | | | USD | | | | 146,725 | | | | — | | | | (3,145,067 | ) |
| BOA | | | 11/2019 - 01/2020 | | | | NZD | | | | 22,150 | | | | USD | | | | 14,109 | | | | 180,343 | | | | (69,367 | ) |
| BOA | | | 12/2019 - 03/2020 | | | | TRY | | | | 60,480 | | | | USD | | | | 10,204 | | | | 127,965 | | | | — | |
| BOA | | | 11/2019 | | | | USD | | | | 76,171 | | | | CAD | | | | 100,655 | | | | — | | | | (253,545 | ) |
| BOA | | | 11/2019 - 01/2020 | | | | USD | | | | 311,317 | | | | EUR | | | | 280,530 | | | | 724,565 | | | | (3,275,005 | ) |
| BOA | | | 11/2019 | | | | USD | | | | 139,699 | | | | JPY | | | | 15,000,000 | | | | 653,595 | | | | — | |
| BOA | | | 11/2019 | | | | USD | | | | 72,418 | | | | NOK | | | | 660,000 | | | | 641,401 | | | | — | |
| BOA | | | 11/2019 | | | | USD | | | | 2,891 | | | | NZD | | | | 4,625 | | | | — | | | | (74,873 | ) |
| BOA | | | 12/2019 | | | | USD | | | | 5,180 | | | | TRY | | | | 30,240 | | | | — | | | | (46,627 | ) |
| BOA | | | 03/2020 | | | | USD | | | | 42,695 | | | | ZAR | | | | 660,880 | | | | — | | | | (293,168 | ) |
| BOA | | | 03/2020 | | | | ZAR | | | | 1,321,760 | | | | USD | | | | 88,720 | | | | 283,012 | | | | (3,071,701 | ) |
| CITNA-B | | | 11/2019 | | | | BRL | | | | 608,283 | | | | USD | | | | 149,135 | | | | 2,682,888 | | | | (145,178 | ) |
| CITNA-B | | | 12/2019 - 05/2020 | | | | CLP | | | | 36,873,359 | | | | USD | | | | 52,200 | | | | — | | | | (2,388,331 | ) |
| CITNA-B | | | 12/2019 | | | | COP | | | | 70,005,250 | | | | USD | | | | 20,273 | | | | 404,840 | | | | — | |
| CITNA-B | | | 11/2019 - 01/2020 | | | | EUR | | | | 632,195 | | | | USD | | | | 701,115 | | | | 6,089,636 | | | | (180,030 | ) |
| CITNA-B | | | 11/2019 - 01/2020 | | | | GBP | | | | 8,520 | | | | USD | | | | 10,583 | | | | 472,760 | | | | — | |
| CITNA-B | | | 11/2019 - 01/2020 | | | | JPY | | | | 48,169,242 | | | | USD | | | | 453,058 | | | | — | | | | (5,460,847 | ) |
36 INVESCO OPPENHEIMER INTERNATIONAL BOND FUND
| | | | | | | | | | | | | | | | | | | | | | | | | | | | |
Forward Currency Exchange Contracts (Continued) | |
| Counterparty | | Settlement
Month(s) | | | Currency
Purchased (000’s) | | | | | | Currency Sold (000’s) | | | Unrealized Appreciation | | | Unrealized
Depreciation | |
| CITNA-B | | | 12/2019 | | | | MXN | | | | 7,663,522 | | | | USD | | | | 384,908 | | | $ | 10,731,208 | | | $ | — | |
| CITNA-B | | | 11/2019 - 01/2020 | | | | NOK | | | | 1,460,000 | | | | USD | | | | 162,833 | | | | — | | | | (4,035,777 | ) |
| CITNA-B | | | 12/2019 - 03/2020 | | | | PLN | | | | 235,140 | | | | USD | | | | 59,886 | | | | 1,685,501 | | | | — | |
| CITNA-B | | | 12/2019 | | | | RUB | | | | 3,259,800 | | | | USD | | | | 49,451 | | | | 1,057,598 | | | | — | |
| CITNA-B | | | 11/2019 | | | | SEK | | | | 604,450 | | | | USD | | | | 61,647 | | | | 1,015,232 | | | | — | |
| CITNA-B | | | 11/2019 | | | | USD | | | | 147,765 | | | | BRL | | | | 608,283 | | | | 97,250 | | | | (4,005,096 | ) |
| CITNA-B | | | 11/2019 - 12/2019 | | | | USD | | | | 76,217 | | | | CLP | | | | 54,358,700 | | | | 2,864,475 | | | | — | |
| CITNA-B | | | 12/2019 | | | | USD | | | | 57,483 | | | | COP | | | | 198,501,700 | | | | — | | | | (1,147,933 | ) |
| CITNA-B | | | 11/2019 - 01/2020 | | | | USD | | | | 717,654 | | | | EUR | | | | 647,445 | | | | 121,757 | | | | (6,604,962 | ) |
| CITNA-B | | | 11/2019 - 01/2020 | | | | USD | | | | 10,686 | | | | GBP | | | | 8,435 | | | | — | | | | (258,741 | ) |
| CITNA-B | | | 11/2019 | | | | USD | | | | 226,372 | | | | JPY | | | | 24,084,621 | | | | 3,126,793 | | | | — | |
| CITNA-B | | | 12/2019 - 03/2020 | | | | USD | | | | 765,843 | | | | MXN | | | | 15,327,042 | | | | — | | | | (20,174,960 | ) |
| CITNA-B | | | 11/2019 | | | | USD | | | | 109,375 | | | | NOK | | | | 990,000 | | | | 1,710,218 | | | | — | |
| CITNA-B | | | 12/2019 | | | | USD | | | | 54,654 | | | | PEN | | | | 185,600 | | | | — | | | | (759,810 | ) |
| CITNA-B | | | 12/2019 | | | | USD | | | | 29,878 | | | | PLN | | | | 117,570 | | | | — | | | | (904,546 | ) |
| CITNA-B | | | 12/2019 | | | | USD | | | | 116,940 | | | | RUB | | | | 7,725,400 | | | | 19,435 | | | | (2,771,329 | ) |
| CITNA-B | | | 11/2019 - 01/2020 | | | | USD | | | | 124,963 | | | | SEK | | | | 1,208,900 | | | | 378,678 | | | | (994,856 | ) |
| CITNA-B | | | 12/2019 | | | | USD | | | | 82,917 | | | | THB | | | | 2,552,600 | | | | — | | | | (1,660,132 | ) |
| CITNA-B | | | 12/2019 - 03/2020 | | | | USD | | | | 47,224 | | | | ZAR | | | | 717,240 | | | | 419,428 | | | | (86,889 | ) |
| CITNA-B | | | 12/2019 | | | | ZAR | | | | 358,620 | | | | USD | | | | 23,501 | | | | 88,754 | | | | — | |
| DEU | | | 11/2019 | | | | SEK | | | | 1,000,000 | | | | USD | | | | 104,962 | | | | — | | | | (1,293,805 | ) |
| GSCO-OT | | | 11/2019 | | | | AUD | | | | 75,010 | | | | USD | | | | 50,347 | | | | 1,387,748 | | | | — | |
| GSCO-OT | | | 03/2021 | | | | BRL | | | | 138,847 | | | | USD | | | | 33,473 | | | | 91,031 | | | | — | |
| GSCO-OT | | | 11/2019 | | | | CAD | | | | 100,645 | | | | USD | | | | 75,634 | | | | 782,666 | | | | — | |
| GSCO-OT | | | 11/2019 | | | | CLP | | | | 45,054,400 | | | | USD | | | | 63,257 | | | | — | | | | (2,464,518 | ) |
| GSCO-OT | | | 11/2019 - 12/2020 | | | | EUR | | | | 205,300 | | | | USD | | | | 237,341 | | | | 987,686 | | | | (6,056,561 | ) |
| GSCO-OT | | | 05/2020 | | | | INR | | | | 1,723,538 | | | | USD | | | | 23,750 | | | | — | | | | (48,484 | ) |
| GSCO-OT | | | 02/2021 | | | | RUB | | | | 2,279,500 | | | | USD | | | | 33,488 | | | | 145,393 | | | | — | |
| GSCO-OT | | | 02/2020 | | | | TRY | | | | 57,153 | | | | USD | | | | 9,600 | | | | 94,769 | | | | — | |
| GSCO-OT | | | 11/2019 - 01/2020 | | | | USD | | | | 101,333 | | | | AUD | | | | 150,020 | | | | — | | | | (2,222,250 | ) |
| GSCO-OT | | | 03/2021 | | | | USD | | | | 111,931 | | | | BRL | | | | 459,119 | | | | 152,824 | | | | (1,020,777 | ) |
| GSCO-OT | | | 11/2019 - 01/2020 | | | | USD | | | | 151,870 | | | | CAD | | | | 201,290 | | | | — | | | | (996,292 | ) |
| GSCO-OT | | | 11/2019 - 05/2020 | | | | USD | | | | 65,638 | | | | CLP | | | | 45,467,415 | | | | 4,199,760 | | | | — | |
| GSCO-OT | | | 01/2020 | | | | USD | | | | 26,500 | | | | COP | | | | 91,892,778 | | | | — | | | | (607,334 | ) |
| GSCO-OT | | | 11/2019 - 05/2020 | | | | USD | | | | 97,416 | | | | EUR | | | | 88,215 | | | | 209,780 | | | | (1,518,005 | ) |
| GSCO-OT | | | 10/2020 | | | | USD | | | | 36,500 | | | | IDR | | | | 535,637,500 | | | | 69,638 | | | | — | |
| GSCO-OT | | | 05/2020 - 08/2020 | | | | USD | | | | 72,522 | | | | INR | | | | 5,336,153 | | | | 71,565 | | | | (423,153 | ) |
| GSCO-OT | | | 12/2020 | | | | USD | | | | 90,750 | | | | NOK | | | | 768,075 | | | | 7,348,947 | | | | — | |
| GSCO-OT | | | 12/2019 | | | | USD | | | | 33,363 | | | | RUB | | | | 2,182,500 | | | | 29,712 | | | | (482,042 | ) |
| GSCO-OT | | | 02/2020 - 03/2020 | | | | USD | | | | 18,711 | | | | TRY | | | | 114,303 | | | | — | | | | (631,246 | ) |
| GSCO-OT | | | 01/2020 - 03/2020 | | | | USD | | | | 128,400 | | | | ZAR | | | | 1,966,470 | | | | 488,400 | | | | (215,713 | ) |
| GSCO-OT | | | 01/2020 - 03/2020 | | | | ZAR | | | | 1,373,180 | | | | USD | | | | 89,352 | | | | 241,732 | | | | (17,641 | ) |
| HSBC | | | 11/2019 | | | | EUR | | | | 3,180 | | | | USD | | | | 3,538 | | | | 12,923 | | | | — | |
| HSBC | | | 11/2019 | | | | JPY | | | | 12,592,000 | | | | USD | | | | 119,652 | | | | — | | | | (2,928,441 | ) |
| HSBC | | | 11/2019 | | | | NOK | | | | 600,000 | | | | USD | | | | 67,494 | | | | — | | | | (2,242,916 | ) |
| HSBC | | | 11/2019 | | | | USD | | | | 153,890 | | | | EUR | | | | 136,645 | | | | 1,329,592 | | | | (12,713 | ) |
| JPM | | | 11/2019 - 01/2020 | | | | AUD | | | | 150,000 | | | | USD | | | | 101,744 | | | | 1,798,339 | | | | — | |
| JPM | | | 11/2019 - 04/2020 | | | | BRL | | | | 1,106,348 | | | | USD | | | | 274,340 | | | | 1,072,904 | | | | (97,250 | ) |
37 INVESCO OPPENHEIMER INTERNATIONAL BOND FUND
CONSOLIDATED SCHEDULE OF INVESTMENTSContinued
| | | | | | | | | | | | | | | | | | | | | | | | | | | | |
Forward Currency Exchange Contracts (Continued) | |
| Counterparty | | Settlement
Month(s) | | | Currency
Purchased (000’s) | | | | | | Currency Sold (000’s) | | | Unrealized
Appreciation | | | Unrealized
Depreciation | |
| JPM | | | 01/2020 | | | | CAD | | | | 982 | | | | USD | | | | 743 | | | $ | 2,793 | | | $ | — | |
| JPM | | | 11/2019 - 05/2020 | | | | CLP | | | | 42,337,375 | | | | USD | | | | 58,755 | | | | — | | | | (1,603,732 | ) |
| JPM | | | 11/2019 - 08/2021 | | | | EUR | | | | 693,050 | | | | USD | | | | 777,063 | | | | 5,846,481 | | | | (4,542,488 | ) |
| JPM | | | 11/2019 - 01/2020 | | | | GBP | | | | 471,255 | | | | USD | | | | 577,371 | | | | 33,872,267 | | | | — | |
| JPM | | | 12/2019 - 03/2020 | | | | HUF | | | | 53,552,500 | | | | USD | | | | 178,685 | | | | 3,757,599 | | | | — | |
| JPM | | | 12/2019 - 10/2020 | | | | IDR | | | | 3,528,073,061 | | | | USD | | | | 242,590 | | | | 5,498,849 | | | | (201,938 | ) |
| JPM | | | 12/2019 - 08/2020 | | | | INR | | | | 8,807,315 | | | | USD | | | | 120,870 | | | | 1,006,597 | | | | — | |
| JPM | | | 11/2019 - 01/2020 | | | | JPY | | | | 53,085,000 | | | | USD | | | | 499,354 | | | | — | | | | (6,204,935 | ) |
| JPM | | | 11/2019 - 03/2020 | | | | MXN | | | | 5,588,161 | | | | USD | | | | 278,680 | | | | 8,253,732 | | | | (89,374 | ) |
| JPM | | | 12/2020 | | | | NOK | | | | 1,536,150 | | | | USD | | | | 175,403 | | | | — | | | | (8,450,992 | ) |
| JPM | | | 01/2020 | | | | NZD | | | | 64,950 | | | | USD | | | | 41,265 | | | | 446,449 | | | | (3,758 | ) |
| JPM | | | 12/2019 - 03/2020 | | | | PLN | | | | 398,230 | | | | USD | | | | 101,941 | | | | 2,333,292 | | | | — | |
| JPM | | | 12/2019 | | | | RUB | | | | 3,823,635 | | | | USD | | | | 59,274 | | | | 6,486 | | | | (42,927 | ) |
| JPM | | | 11/2019 - 01/2020 | | | | SEK | | | | 829,850 | | | | USD | | | | 86,338 | | | | 546,205 | | | | (752,734 | ) |
| JPM | | | 12/2019 | | | | SGD | | | | 25,473 | | | | USD | | | | 18,569 | | | | 163,579 | | | | — | |
| JPM | | | 12/2019 | | | | THB | | | | 2,552,600 | | | | USD | | | | 83,623 | | | | 953,878 | | | | — | |
| JPM | | | 12/2019 - 03/2020 | | | | TRY | | | | 624,310 | | | | USD | | | | 104,236 | | | | 2,413,056 | | | | — | |
| JPM | | | 11/2019 | | | | USD | | | | 50,739 | | | | AUD | | | | 75,000 | | | | — | | | | (988,938 | ) |
| JPM | | | 11/2019 - 12/2019 | | | | USD | | | | 250,529 | | | | BRL | | | | 1,007,085 | | | | 145,178 | | | | (547,482 | ) |
| JPM | | | 12/2019 | | | | USD | | | | 41,710 | | | | CLP | | | | 30,252,675 | | | | 870,403 | | | | — | |
| JPM | | | 11/2019 - 12/2020 | | | | USD | | | | 458,516 | | | | EUR | | | | 407,488 | | | | 5,520,794 | | | | (5,400,116 | ) |
| JPM | | | 11/2019 - 01/2020 | | | | USD | | | | 605,666 | | | | GBP | | | | 494,600 | | | | — | | | | (35,903,790 | ) |
| JPM | | | 12/2019 - 03/2020 | | | | USD | | | | 179,225 | | | | HUF | | | | 53,279,000 | | | | 810,576 | | | | (3,310,964 | ) |
| JPM | | | 12/2019 - 01/2020 | | | | USD | | | | 438,081 | | | | IDR | | | | 6,305,804,000 | | | | 398,841 | | | | (7,827,934 | ) |
| JPM | | | 12/2019 | | | | USD | | | | 370,103 | | | | INR | | | | 26,651,100 | | | | — | | | | (2,911,349 | ) |
| JPM | | | 11/2019 - 01/2020 | | | | USD | | | | 444,628 | | | | JPY | | | | 47,703,348 | | | | 1,907,944 | | | | (297,279 | ) |
| JPM | | | 11/2019 - 03/2020 | | | | USD | | | | 152,108 | | | | MXN | | | | 3,028,219 | | | | 102,108 | | | | (4,434,857 | ) |
| JPM | | | 12/2019 - 08/2021 | | | | USD | | | | 234,487 | | | | NOK | | | | 2,076,925 | | | | 8,968,145 | | | | — | |
| JPM | | | 12/2019 - 03/2020 | | | | USD | | | | 98,812 | | | | PLN | | | | 386,110 | | | | — | | | | (2,288,171 | ) |
| JPM | | | 12/2019 - 02/2021 | | | | USD | | | | 71,429 | | | | RUB | | | | 4,740,800 | | | | 186,732 | | | | (201,384 | ) |
| JPM | | | 11/2019 | | | | USD | | | | 60,575 | | | | SEK | | | | 587,230 | | | | 263,653 | | | | (565,669 | ) |
| JPM | | | 12/2019 - 03/2020 | | | | USD | | | | 166,588 | | | | THB | | | | 5,105,200 | | | | — | | | | (2,684,559 | ) |
| JPM | | | 12/2019 - 03/2020 | | | | USD | | | | 198,547 | | | | TRY | | | | 1,172,810 | | | | — | | | | (3,002,270 | ) |
| JPM | | | 12/2019 - 03/2020 | | | | USD | | | | 436,497 | | | | ZAR | | | | 6,736,770 | | | | 224,511 | | | | (4,157,067 | ) |
| JPM | | | 12/2019 - 03/2020 | | | | ZAR | | | | 3,830,352 | | | | USD | | | | 252,408 | | | | — | | | | (830,302 | ) |
| MOS | | | 05/2020 | | | | CLP | | | | 3,307,200 | | | | USD | | | | 4,813 | | | | — | | | | (330,814 | ) |
| MOS | | | 11/2019 | | | | NOK | | | | 546,570 | | | | USD | | | | 61,416 | | | | — | | | | (1,975,286 | ) |
| MOS | | | 11/2019 | | | | PLN | | | | 401,140 | | | | USD | | | | 103,807 | | | | 1,196,519 | | | | — | |
| MOS | | | 08/2020 | | | | USD | | | | 43,200 | | | | BRL | | | | 184,118 | | | | — | | | | (1,947,475 | ) |
| MOS | | | 11/2019 | | | | USD | | | | 66,545 | | | | SEK | | | | 638,170 | | | | 387,311 | | | | — | |
| RBC | | | 11/2019 - 01/2020 | | | | EUR | | | | 290,210 | | | | USD | | | | 321,861 | | | | 2,998,974 | | | | (620,017 | ) |
| RBC | | | 11/2019 - 01/2020 | | | | GBP | | | | 77,350 | | | | USD | | | | 95,068 | | | | 5,300,457 | | | | — | |
| RBC | | | 11/2019 - 01/2020 | | | | JPY | | | | 27,020,000 | | | | USD | | | | 255,092 | | | | — | | | | (4,017,668 | ) |
| RBC | | | 11/2019 - 01/2020 | | | | USD | | | | 475,795 | | | | EUR | | | | 425,890 | | | | 2,141,576 | | | | (2,838,499 | ) |
| RBC | | | 11/2019 | | | | USD | | | | 47,677 | | | | GBP | | | | 38,675 | | | | — | | | | (2,449,415 | ) |
| RBC | | | 11/2019 | | | | USD | | | | 126,476 | | | | JPY | | | | 13,510,000 | | | | 1,249,772 | | | | — | |
| SCB | | | 12/2019 | | | | USD | | | | 72,030 | | | | INR | | | | 5,137,200 | | | | 129,010 | | | | — | |
| | | | | | | | | | | | | | | | | | | | | | | | |
| Total Unrealized Appreciation and Depreciation | | | | | | | $ | 162,061,869 | | | $ | (206,900,584 | ) |
| | | | | | | | | | | | | | | | | | | | | | | | |
38 INVESCO OPPENHEIMER INTERNATIONAL BOND FUND
| | | | | | | | | | | | | | | | | | | | | | | | |
| |
| Futures Contracts as of October 31, 2019 | |
| Description | | Buy/Sell | | | Expiration
Date | | | Number
of Contracts | | | Notional Amount
(000’s) | | | Value | | | Unrealized
Appreciation/
(Depreciation) | |
| Euro BUXL | | | Sell | | | | 12/6/19 | | | | 278 | | | | EUR 67,022 | | | $ | 65,098,811 | | | $ | 1,923,498 | |
| Euro-BTP | | | Sell | | | | 12/6/19 | | | | 458 | | | | EUR 73,720 | | | | 73,796,344 | | | | (76,621) | |
| Euro-BUND | | | Sell | | | | 12/6/19 | | | | 45 | | | | EUR 8,613 | | | | 8,620,377 | | | | (7,610) | |
| | | | | | | | | | | | | | | | | | | | | | | | |
| | | | | | | | | | | | | | | | | | | | | | $ | 1,839,267 | |
| | | | | | | | | | | | | | | | | | | | | | | | |
| | | | | | | | | | | | | | | | | | | | | | | | |
| |
| Exchange-Traded Options Written at October 31, 2019 | |
| Description | | Exercise
Price | | | Expiration
Date | | | Number of
Contracts
(000’s) | | | Notional
Amount
(000’s) | | | Premiums
Received | | | Value | |
| | | USD | | | | | | | | | | | | | | | | | | | | | |
S&P 500 Index Put | | | 2,400.000 | | | | 3/20/20 | | | | USD (0) | 1 | | | USD 84,960 | | | $ | 1,452,448 | | | $ | (421,260) | |
| | | USD | | | | | | | | | | | | | | | | | | | | | |
S&P 500 Index Put | | | 2,350.000 | | | | 2/21/20 | | | | USD (0) | 1 | | | USD 44,180 | | | | 444,980 | | | | (113,740) | |
| | | | | | | | | | | | | | | | | | | | |
Total Exchange-Traded Options Written | | | | | | | | | | | | | | | $ | 1,897,428 | | | $ | (535,000) | |
| | | | | | | | | | | | | | | | | | | | |
1.Number of contracts are less than 500.
| | | | | | | | | | | | | | | | | | | | | | | | | | | | |
| |
| Over-the-Counter Options Written at October 31, 2019 | |
| Description | | Counterparty | | | Exercise
Price | | | Expiration
Date | | | Number of
Contracts
(000’s) | | | Notional
Amount
(000’s) | | | Premiums
Received | | | Value | |
| | | | | | | BRL | | | | | | | | BRL | | | | | | | | | | | | | |
| | | | | | | |
BRL Currency Put | | | CITNA-B | | | | 4.239 | | | | 11/18/19 | | | | (211,925) | | | | BRL 211,925 | | | $ | 557,158 | | | $ | (36,636) | |
| | | | | | | BRL | | | | | | | | BRL | | | | | | | | | | | | | |
| | | | | | | |
BRL Currency Put1 | | | GSCO-OT | | | | 4.500 | | | | 12/6/19 | | | | (3,000) | | | | BRL 3,000 | | | | 531,600 | | | | (30,861) | |
| | | | | | | BRL | | | | | | | | BRL | | | | | | | | | | | | | |
| | | | | | | |
BRL Currency Put1 | | | GSCO-OT | | | | 4.500 | | | | 12/10/19 | | | | (3,000) | | | | BRL 3,000 | | | | 624,000 | | | | (36,731) | |
| | | | | | | BRL | | | | | | | | BRL | | | | | | | | | | | | | |
| | | | | | | |
BRL Currency Put2 | | | GSCO-OT | | | | 4.500 | | | | 3/30/20 | | | | (5,000) | | | | BRL 5,000 | | | | 874,000 | | | | (559,282) | |
| | | | | | | BRL | | | | | | | | BRL | | | | | | | | | | | | | |
| | | | | | | |
BRL Currency Put3 | | | GSCO-OT | | | | 4.230 | | | | 3/4/21 | | | | (211,500) | | | | BRL 211,500 | | | | 2,369,000 | | | | (2,472,608) | |
| | | | | | | BRL | | | | | | | | BRL | | | | | | | | | | | | | |
| | | | | | | |
BRL Currency Put2 | | | GSCO-OT | | | | 4.500 | | | | 3/27/20 | | | | (5,000) | | | | BRL 5,000 | | | | 872,000 | | | | (551,979) | |
| | | | | | | BRL | | | | | | | | BRL | | | | | | | | | | | | | |
| | | | | | | |
BRL Currency Put2 | | | GSCO-OT | | | | 4.500 | | | | 3/30/20 | | | | (5,000) | | | | BRL 5,000 | | | | 874,000 | | | | (559,282) | |
| | | | | | | BRL | | | | | | | | BRL | | | | | | | | | | | | | |
| | | | | | | |
BRL Currency Put3 | | | JPM | | | | 4.250 | | | | 3/4/21 | | | | (212,500) | | | | BRL 212,500 | | | | 2,242,500 | | | | (2,391,962) | |
| | | | | | | CLP | | | | | | | | CLP | | | | | | | | | | | | | |
| | | | | | | |
CLP Currency Put4 | | | GSCO-OT | | | | 700.000 | | | | 5/11/20 | | | | (35,000,000) | | | | CLP 35,000,000 | | | | 1,280,000 | | | | (2,972,200) | |
| | | | | | | RUB | | | | | | | | EUR | | | | | | | | | | | | | |
| | | | | | | |
EUR Currency Call | | | BOA | | | | 73.090 | | | | 12/20/19 | | | | (50,000) | | | | EUR 50,000 | | | | 596,585 | | | | (440,447) | |
39 INVESCO OPPENHEIMER INTERNATIONAL BOND FUND
CONSOLIDATED SCHEDULE OF INVESTMENTSContinued
| | | | | | | | | | | | | | | | | | | | | | | | | | | | |
| |
| Over-the-Counter Options Written (Continued) | |
| Description | | Counterparty | | | Exercise
Price | | | Expiration
Date | | | Number of
Contracts
(000’s) | | | Notional
Amount
(000’s) | | | Premiums
Received | | | Value | |
| | | | | | | ZAR | | | | | | | | EUR | | | | | | | | | | | | | |
| | | | | | | |
EUR Currency Call | | | BOA | | | | 20.000 | | | | 8/5/20 | | | | (5,000) | | | | EUR 5,000 | | | $ | 1,091,097 | | | $ | (694,293) | |
| | | | | | | USD | | | | | | | | EUR | | | | | | | | | | | | | |
| | | | | | | |
EUR Currency Put | | | BOA | | | | 1.109 | | | | 12/17/19 | | | | (250,000) | | | | EUR 250,000 | | | | 1,746,675 | | | | (912,210) | |
| | | | | | | INR | | | | | | | | EUR | | | | | | | | | | | | | |
| | | | | | | |
EUR Currency Put | | | BOA | | | | 69.300 | | | | 10/27/20 | | | | (100,000) | | | | EUR 100,000 | | | | 457,000 | | | | (346,620) | |
| | | | | | | INR | | | | | | | | EUR | | | | | | | | | | | | | |
| | | | | | | |
EUR Currency Call | | | BOA | | | | 77.550 | | | | 10/27/20 | | | | (100,000) | | | | EUR 100,000 | | | | 1,091,000 | | | | (1,138,216) | |
| | | | | | | USD | | | | | | | | EUR | | | | | | | | | | | | | |
| | | | | | | |
EUR Currency Call | | | BOA | | | | 1.194 | | | | 12/17/19 | | | | (250,000) | | | | EUR 250,000 | | | | 915,500 | | | | (9,737) | |
| | | | | | | MXN | | | | | | | | EUR | | | | | | | | | | | | | |
| | | | | | | |
EUR Currency Call | | | CITNA-B | | | | 22.005 | | | | 10/29/20 | | | | (100,000) | | | | EUR 100,000 | | | | 1,906,852 | | | | (1,946,546) | |
| | | | | | | MXN | | | | | | | | EUR | | | | | | | | | | | | | |
| | | | | | | |
EUR Currency Put | | | CITNA-B | | | | 18.190 | | | | 10/29/20 | | | | (100,000) | | | | EUR 100,000 | | | | 832,047 | | | | (697,709) | |
| | | | | | | IDR | | | | | | | | EUR | | | | | | | | | | | | | |
| | | | | | | |
EUR Currency Call | | | GSCOI | | | | 15640.000 | | | | 10/22/20 | | | | (75,000) | | | | EUR 75,000 | | | | 967,500 | | | | (918,044) | |
| | | | | | | MXN | | | | | | | | EUR | | | | | | | | | | | | | |
| | | | | | | |
EUR Currency Put | | | GSCOI | | | | 18.205 | | | | 10/30/20 | | | | (100,000) | | | | EUR 100,000 | | | | 783,200 | | | | (783,200) | |
| | | | | | | RUB | | | | | | | | EUR | | | | | | | | | | | | | |
| | | | | | | |
EUR Currency Call | | | GSCOI | | | | 72.860 | | | | 12/16/19 | | | | (90,000) | | | | EUR 90,000 | | | | 1,001,968 | | | | (796,025) | |
| | | | | | | TRY | | | | | | | | EUR | | | | | | | | | | | | | |
| | | | | | | |
EUR Currency Call | | | GSCOI | | | | 7.750 | | | | 10/12/20 | | | | (37,500) | | | | EUR 37,500 | | | | 1,378,386 | | | | (755,957) | |
| | | | | | | MXN | | | | | | | | EUR | | | | | | | | | | | | | |
| | | | | | | |
EUR Currency Call | | | GSCOI | | | | 22.036 | | | | 10/30/20 | | | | (100,000) | | | | EUR 100,000 | | | | 1,932,900 | | | | (1,932,900) | |
| | | | | | | TRY | | | | | | | | EUR | | | | | | | | | | | | | |
| | | | | | | |
EUR Currency Put | | | GSCOI | | | | 5.500 | | | | 10/12/20 | | | | (37,500) | | | | EUR 37,500 | | | | 439,050 | | | | (529,458) | |
| | | | | | | IDR | | | | | | | | EUR | | | | | | | | | | | | | |
| | | | | | | |
EUR Currency Put | | | GSCOI | | | | 13685.000 | | | | 10/22/20 | | | | (75,000) | | | | EUR 75,000 | | | | 427,500 | | | | (354,502) | |
| | | | | | | PLN | | | | | | | | EUR | | | | | | | | | | | | | |
| | | | | | | |
EUR Currency Put | | | GSCOI | | | | 4.197 | | | | 4/21/20 | | | | (150,000) | | | | EUR 150,000 | | | | 413,981 | | | | (372,367) | |
| | | | | | | ZAR | | | | | | | | EUR | | | | | | | | | | | | | |
| | | | | | | |
EUR Currency Call | | | GSCO-OT | | | | 20.000 | | | | 8/4/20 | | | | (5,000) | | | | EUR 5,000 | | | | 785,466 | | | | (699,610) | |
| | | | | | | INR | | | | | | | | EUR | | | | | | | | | | | | | |
| | | | | | | |
EUR Currency Call | | | GSCO-OT | | | | 90.000 | | | | 8/5/20 | | | | (5,000) | | | | EUR 5,000 | | | | 977,289 | | | | (723,630) | |
| | | | | | | INR | | | | | | | | EUR | | | | | | | | | | | | | |
| | | | | | | |
EUR Currency Call5 | | | GSCO-OT | | | | 90.000 | | | | 5/6/20 | | | | (2,500) | | | | EUR 2,500 | | | | 439,129 | | | | (168,218) | |
40 INVESCO OPPENHEIMER INTERNATIONAL BOND FUND
| | | | | | | | | | | | | | | | | | | | | | | | | | | | |
| |
| Over-the-Counter Options Written (Continued) | |
| Description | | Counterparty | | | Exercise
Price | | | Expiration
Date | | | Number of
Contracts
(000’s) | | | Notional
Amount
(000’s) | | | Premiums
Received | | | Value | |
| | | | | | | NOK | | | | | | | | EUR | | | | | | | | | | | | | |
| | | | | | | |
EUR Currency Call6 | | | GSCO-OT | | | | 11.000 | | | | 12/17/20 | | | | (10,000) | | | | EUR 10,000 | | | $ | 2,161,338 | | | $ | (2,802,837) | |
| | | | | | | NOK | | | | | | | | EUR | | | | | | | | | | | | | |
| | | | | | | |
EUR Currency Call | | | JPM | | | | 11.000 | | | | 8/26/21 | | | | (6,250) | | | | EUR 6,250 | | | | 1,860,122 | | | | (2,511,381) | |
| | | | | | | BRL | | | | | | | | EUR | | | | | | | | | | | | | |
| | | | | | | |
EUR Currency Call | | | JPM | | | | 4.230 | | | | 1/24/20 | | | | (50,000) | | | | EUR 50,000 | | | | 526,500 | | | | (441,586) | |
| | | | | | | INR | | | | | | | | EUR | | | | | | | | | | | | | |
| | | | | | | |
EUR Currency Call7 | | | JPM | | | | 90.000 | | | | 4/29/20 | | | | (5,000) | | | | EUR 5,000 | | | | 795,265 | | | | (315,016) | |
| | | | | | | MXN | | | | | | | | EUR | | | | | | | | | | | | | |
| | | | | | | |
EUR Currency Call | | | JPM | | | | 21.170 | | | | 6/2/20 | | | | (50,000) | | | | EUR 50,000 | | | | 720,000 | | | | (657,326) | |
| | | | | | | ZAR | | | | | | | | EUR | | | | | | | | | | | | | |
| | | | | | | |
EUR Currency Call | | | JPM | | | | 17.290 | | | | 1/23/20 | | | | (50,000) | | | | EUR 50,000 | | | | 919,875 | | | | (1,192,526) | |
| | | | | | | IDR | | | | | | | | EUR | | | | | | | | | | | | | |
| | | | | | | |
EUR Currency Call | | | JPM | | | | 15625.000 | | | | 10/26/20 | | | | (50,000) | | | | EUR 50,000 | | | | 654,250 | | | | (630,587) | |
| | | | | | | IDR | | | | | | | | EUR | | | | | | | | | | | | | |
| | | | | | | |
EUR Currency Put | | | JPM | | | | 13685.000 | | | | 10/28/20 | | | | (165,000) | | | | EUR 165,000 | | | | 988,350 | | | | (789,867) | |
| | | | | | | MXN | | | | | | | | EUR | | | | | | | | | | | | | |
| | | | | | | |
EUR Currency Put | | | JPM | | | | 18.265 | | | | 6/2/20 | | | | (50,000) | | | | EUR 50,000 | | | | 275,000 | | | | (223,247) | |
| | | | | | | IDR | | | | | | | | EUR | | | | | | | | | | | | | |
| | | | | | | |
EUR Currency Call | | | JPM | | | | 15555.000 | | | | 10/28/20 | | | | (165,000) | | | | EUR 165,000 | | | | 2,180,145 | | | | (2,233,163) | |
| | | | | | | BRL | | | | | | | | EUR | | | | | | | | | | | | | |
| | | | | | | |
EUR Currency Put | | | JPM | | | | 3.790 | | | | 1/24/20 | | | | (50,000) | | | | EUR 50,000 | | | | 231,500 | | | | (205,924) | |
| | | | | | | IDR | | | | | | | | EUR | | | | | | | | | | | | | |
| | | | | | | |
EUR Currency Put | | | JPM | | | | 13660.000 | | | | 10/26/20 | | | | (50,000) | | | | EUR 50,000 | | | | 283,000 | | | | (228,209) | |
| | | | | | | ZAR | | | | | | | | EUR | | | | | | | | | | | | | |
| | | | | | | |
EUR Currency Put | | | JPM | | | | 14.760 | | | | 1/23/20 | | | | (50,000) | | | | EUR 50,000 | | | | 345,650 | | | | (12,480) | |
| | | | | | | BRL | | | | | | | | EUR | | | | | | | | | | | | | |
| | | | | | | |
EUR Currency Call | | | MSCO | | | | 5.250 | | | | 8/24/21 | | | | (37,500) | | | | EUR 37,500 | | | | 2,107,511 | | | | (1,914,024) | |
| | | | | | | IDR | | | | | | | | EUR | | | | | | | | | | | | | |
| | | | | | | |
EUR Currency Call | | | SCB | | | | 15600.000 | | | | 10/22/20 | | | | (100,000) | | | | EUR 100,000 | | | | 1,282,100 | | | | (1,263,648) | |
| | | | | | | INR | | | | | | | | EUR | | | | | | | | | | | | | |
| | | | | | | |
EUR Currency Call | | | SCB | | | | 77.650 | | | | 10/29/20 | | | | (150,000) | | | | EUR 150,000 | | | | 1,696,500 | | | | (1,690,263) | |
| | | | | | | IDR | | | | | | | | EUR | | | | | | | | | | | | | |
| | | | | | | |
EUR Currency Put | | | SCB | | | | 13700.000 | | | | 10/22/20 | | | | (100,000) | | | | EUR 100,000 | | | | 592,500 | | | | (486,912) | |
| | | | | | | INR | | | | | | | | EUR | | | | | | | | | | | | | |
| | | | | | | |
EUR Currency Put | | | SCB | | | | 69.450 | | | | 10/29/20 | | | | (150,000) | | | | EUR 150,000 | | | | 653,250 | | | | (559,613) | |
41 INVESCO OPPENHEIMER INTERNATIONAL BOND FUND
CONSOLIDATED SCHEDULE OF INVESTMENTSContinued
| | | | | | | | | | | | | | | | | | | | | | | | | | | | |
| |
| Over-the-Counter Options Written (Continued) | |
| Description | | Counterparty | | | Exercise
Price | | | Expiration
Date | | | Number of
Contracts
(000’s) | | | Notional
Amount
(000’s) | | | Premiums
Received | | | Value | |
| | | | | | | IDR | | | | | | | | IDR | | | | | | | | | | | | | |
| | | | | | | |
IDR Currency Put | | | GSCO-OT | | | | 15360.000 | | | | 6/18/20 | | | | (1,536,000,000) | | | | IDR 1,536,000,000 | | | $ | 2,160,000 | | | $ | (706,560) | |
| | | | | | | KRW | | | | | | | | KRW | | | | | | | | | | | | | |
| | | | | | | |
KRW Currency Put | | | GSCO-OT | | | | 1213.250 | | | | 1/17/20 | | | | (60,662,500) | | | | KRW 60,662,500 | | | | 355,999 | | | | (117,685) | |
| | | | | | | KRW | | | | | | | | KRW | | | | | | | | | | | | | |
| | | | | | | |
KRW Currency Call | | | GSCO-OT | | | | 1122.350 | | | | 1/17/20 | | | | (56,117,500) | | | | KRW 56,117,500 | | | | 171,950 | | | | (54,995) | |
| | | | | | | MXN | | | | | | | | MXN | | | | | | | | | | | | | |
| | | | | | | |
MXN Currency Put | | | CITNA-B | | | | 22.940 | | | | 6/2/20 | | | | (1,147,000) | | | | MXN 1,147,000 | | | | 1,090,181 | | | | (243,898) | |
| | | | | | | MXN | | | | | | | | MXN | | | | | | | | | | | | | |
| | | | | | | |
MXN Currency Put | | | JPM | | | | 20.240 | | | | 5/27/20 | | | | (607,200) | | | | MXN 607,200 | | | | 1,321,200 | | | | (703,763) | |
| | | | | | | MXN | | | | | | | | MXN | | | | | | | | | | | | | |
| | | | | | | |
MXN Currency Call | | | JPM | | | | 20.240 | | | | 5/27/20 | | | | (607,200) | | | | MXN 607,200 | | | | 1,321,200 | | | | (1,328,985) | |
| | | | | | | RUB | | | | | | | | RUB | | | | | | | | | | | | | |
| | | | | | | |
RUB Currency Call | | | CITNA-B | | | | 63.040 | | | | 12/16/19 | | | | (2,836,800) | | | | RUB 2,836,800 | | | | 402,075 | | | | (125,670) | |
| | | | | | | RUB | | | | | | | | RUB | | | | | | | | | | | | | |
| | | | | | | |
RUB Currency Put | | | GSCO-OT | | | | 72.000 | | | | 4/8/20 | | | | (9,000,000) | | | | RUB 9,000,000 | | | | 3,902,625 | | | | (666,540) | |
| | | | | | | THB | | | | | | | | THB | | | | | | | | | | | | | |
| | | | | | | |
THB Currency Put | | | SCB | | | | 31.500 | | | | 12/20/19 | | | | (3,150,000) | | | | THB 3,150,000 | | | | 568,100 | | | | (34,398) | |
| | | | | | | ZAR | | | | | | | | ZAR | | | | | | | | | | | | | |
| | | | | | | |
ZAR Currency Put | | | GSCO-OT | | | | 16.208 | | | | 1/27/20 | | | | (810,376) | | | | ZAR 810,376 | | | | 1,465,301 | | | | (517,522) | |
| | | | | | | ZAR | | | | | | | | ZAR | | | | | | | | | | | | | |
| | | | | | | |
ZAR Currency Put | | | GSCO-OT | | | | 16.000 | | | | 7/23/20 | | | | (2,080,000) | | | | ZAR 2,080,000 | | | | 3,784,820 | | | | (5,447,687) | |
| | | | | | | | | | | | | | | | | | | | | | | | |
TotalOver-the-Counter Options Written | | | | | | | | | | | | | | | | | | | $ | 63,223,690 | | | $ | (51,937,542) | |
| | | | | | | | | | | | | | | | | | | | | | | | |
1.Knock-out option is ineligible for exercise if at any time spot rates are greater than or equal to 3.6 BRL per 1 USD.
2.Knock-out option is ineligible for exercise if at any time spot rates are greater than or equal to 3.7 BRL per 1 USD.
3.Knock-out option is ineligible for exercise if at any time spot rates are greater than or equal to 3.61 BRL per 1 USD.
4.Knock-out option is ineligible for exercise if at any time spot rates are greater than or equal to 650 CLP per 1 USD.
5.Knock-out option is ineligible for exercise if at any time spot rates are greater than or equal to 75 INR per 1 USD.
6.Knock-out option is ineligible for exercise if at any time spot rates are greater than or equal to 9.40 NOK per 1 EUR.
7. Upper Barrier Level: 90 INR/EUR. Lower Barrier Level: 75 INR/EUR. If at any time during the Event Period, the Spot Exchange Rate, in accordance with the Barrier Event Rate Source B, is equal to or less than the Lower Barrier Level this Transaction will automatically terminate without any payment obligation on the part of either party (except in respect of the Premium).Provided aKnock-Out event has not occurred, if at the Expiration Time on the Expiration Date: (i) the Spot Exchange Rate, in accordance with the Barrier Event Rate Source A, is equal to or greater than the Upper Barrier Level, this Transaction will be automatically exercised and the Seller shall pay the Settlement Amount to the Buyer on the Settlement Date. (ii) the Spot Exchange Rate, in accordance with the Barrier Event Rate Source A, is not equal to or greater than the Upper Barrier Level, this Transaction shall expire without any payment obligation on the part of either party (except in respect of the Premium) at the Expiration Time on the Expiration Date. If aKnock-Out event has occurred, notwithstanding the above, this Transaction will automatically terminate without any payment obligation on the part of either party (except in respect of the Premium).
42 INVESCO OPPENHEIMER INTERNATIONAL BOND FUND
| | | | | | | | | | | | | | | | | | | | | | | | | | | | |
Centrally Cleared Credit Default Swaps at October 31, 2019 | |
| Reference Asset | | Buy/Sell
Protection | | | Fixed
Rate | | | Maturity
Date | | | Notional Amount (000’s) | | | Premiums Received/(Paid) | | | Value | | | Unrealized Appreciation/ (Depreciation) | |
Brazilian Government International | | | Sell | | | | 1.000% | | | | 6/20/22 | | | USD | 15,000 | | | $ | 928,605 | | | $ | 146,576 | | | $ | 1,075,181 | |
CDX.EM.31 | | | Buy | | | | 1.000 | | | | 6/20/24 | | | USD | 48,700 | | | | (2,211,727 | ) | | | 1,908,717 | | | | (303,010 | ) |
Colombia Government International | | | Buy | | | | 1.000 | | | | 12/20/24 | | | USD | 15,000 | | | | 44,311 | | | | (151,001 | ) | | | (106,690 | ) |
Indonesia Government International | | | Buy | | | | 1.000 | | | | 12/20/24 | | | USD | 15,000 | | | | 69,698 | | | | (190,678 | ) | | | (120,980 | ) |
Intesa Sanpaolo S.p.A. | | | Buy | | | | 1.000 | | | | 12/20/21 | | | EUR | 15,000 | | | | (548,711 | ) | | | (229,427 | ) | | | (778,138 | ) |
Republic Of Italy Government I | | | Sell | | | | 1.000 | | | | 12/20/21 | | | USD | 16,000 | | | | 585,507 | | | | 163,975 | | | | 749,482 | |
Turkey Government International Bond | | | Buy | | | | 1.000 | | | | 12/20/24 | | | USD | 10,000 | | | | (1,186,701 | ) | | | 1,053,810 | | | | (132,891 | ) |
| | | | | | | | | | | | | | | | | | | | |
Total Centrally Cleared Credit Default Swaps | | | | | | | | | | | | | | | | | | $ | (2,319,018 | ) | | $ | 2,701,972 | | | $ | 382,954 | |
| | | | | | | | | | | | | | | | | | | | |
| | | | | | | | | | | | | | | | | | | | | | | | | | | | | | | | |
Over-the-Counter Credit Default Swaps at October 31, 2019 | |
Reference Asset | | Counterparty | | | Buy/Sell
Protection | | | Fixed
Rate | | | Maturity
Date | | | Notional
Amount
(000’s) | | | Premiums Received/(Paid) | | | Value | | | Unrealized
Appreciation/
(Depreciation) | |
Hellenic Republic | | | BAC | | | | Sell | | | | 1.000% | | | | 6/20/25 | | | USD | 5,000 | | | $ | 831,849 | | | $ | (167,151 | ) | | $ | 664,698 | |
Hellenic Republic | | | BAC | | | | Sell | | | | 1.000 | | | | 6/20/25 | | | USD | 12,500 | | | | 1,872,869 | | | | (417,878 | ) | | | 1,454,991 | |
Hellenic Republic | | | BAC | | | | Sell | | | | 1.000 | | | | 12/20/25 | | | USD | 23,250 | | | | 3,615,506 | | | | (949,840 | ) | | | 2,665,666 | |
Hellenic Republic | | | BAC | | | | Sell | | | | 1.000 | | | | 12/20/19 | | | USD | 16,650 | | | | 249,821 | | | | 33,412 | | | | 283,233 | |
Hellenic Republic | | | GSCOI | | | | Sell | | | | 1.000 | | | | 6/20/25 | | | USD | 5,000 | | | | 788,898 | | | | (167,151 | ) | | | 621,747 | |
Hellenic Republic Government Bond | | | BAC | | | | Sell | | | | 1.000 | | | | 6/20/29 | | | USD | 12,500 | | | | 2,405,132 | | | | (1,062,466 | ) | | | 1,342,666 | |
Hellenic Republic Government Bond | | | BAC | | | | Sell | | | | 1.000 | | | | 6/20/26 | | | USD | 18,750 | | | | 2,339,101 | | | | (899,990 | ) | | | 1,439,111 | |
Hellenic Republic Government Bond | | | BAC | | | | Sell | | | | 1.000 | | | | 6/20/26 | | | USD | 20,000 | | | | 2,309,198 | | | | (959,989 | ) | | | 1,349,209 | |
Hellenic Republic Government Bond | | | BAC | | | | Sell | | | | 1.000 | | | | 6/20/24 | | | USD | 16,500 | | | | 1,137,077 | | | | (308,068 | ) | | | 829,009 | |
Hellenic Republic Government Bond | | | BOA | | | | Sell | | | | 1.000 | | | | 6/20/24 | | | USD | 5,000 | | | | 409,667 | | | | (93,354 | ) | | | 316,313 | |
Hellenic Republic Government Bond | | | BOA | | | | Sell | | | | 1.000 | | | | 6/20/26 | | | USD | 20,500 | | | | 2,487,399 | | | | (983,989 | ) | | | 1,503,410 | |
ICICI Bank Ltd. | | | GSCO-OT | | | | Sell | | | | 1.000 | | | | 12/20/19 | | | USD | 10,000 | | | | 359,971 | | | | 24,150 | | | | 384,121 | |
| iTraxx Europe Crossover Series 24 Version 1 | | | JPM | | | | Sell | | | | 5.000 | | | | 12/20/20 | | | EUR | 5,000 | | | | (361,394 | ) | | | 215,472 | | | | (145,922 | ) |
Lloyds Banking Group plc | | | JPM | | | | Buy | | | | 1.000 | | | | 6/20/24 | | | EUR | 2,500 | | | | (109,686 | ) | | | 18,977 | | | | (90,709 | ) |
Oriental Republic of Uruguay | | | BOA | | | | Sell | | | | 1.000 | | | | 12/20/21 | | | USD | 14,802 | | | | 267,519 | | | | 111,359 | | | | 378,878 | |
43 INVESCO OPPENHEIMER INTERNATIONAL BOND FUND
CONSOLIDATED SCHEDULE OF INVESTMENTSContinued
| | | | | | | | | | | | | | | | | | | | | | | | | | | | | | | | |
Over-the-Counter Credit Default Swaps (Continued) | |
Reference Asset | | Counterparty | | | Buy/Sell
Protection | | | Fixed
Rate | | | Maturity
Date | | | Notional
Amount
(000’s) | | | Premiums
Received/(Paid) | | | Value | | | Unrealized
Appreciation/
(Depreciation) | |
Royal Bank Of Scotland Group plc | | | JPM | | | | Buy | | | | 1.000% | | | | 6/20/24 | | | EUR | 2,500 | | | $ | (125,923 | ) | | $ | 28,250 | | | $ | (97,673 | ) |
| | | | | | | | | | | | | | | | | | | | | | | | |
TotalOver-the-Counter Credit Default Swaps | | | | | | | | | | | | | | | | | | | | | | $ | 18,477,004 | | | $ | (5,578,256 | ) | | $ | 12,898,748 | |
| | | | | | | | | | | | | | | | | | | | | | | | |
| | | | | | | | | | | | | | | | | | | | | | | | | | | | | | | | |
Centrally Cleared Interest Rate Swaps at October 31, 2019 | |
| Counterparty | | Pay/Receive
Floating
Rate | | | Floating Rate | | | Fixed
Rate | | | Maturity
Date | | | Notional Amount (000’s) | | | Premiums
Received / (Paid) | | | Value | | | Unrealized
Appreciation/
(Depreciation) | |
BAC | | | Receive | | |
| Six-Month EUR
EURIBOR |
| | | 1.123% | | | | 3/8/28 | | | | EUR 8,250 | | | $ | — | | | $ | (1,027,972 | ) | | $ | (1,027,972 | ) |
BNP | | | Pay | | | | BZDIOVRA | | | | – | | | | 1/4/27 | | | | BRL 191,000 | | | | — | | | | 1,807,894 | | | | 1,807,894 | |
BOA | | | Receive | | |
| Three-Month USD
BBA LIBOR |
| | | 2.307 | | | | 4/2/24 | | | | USD 52,900 | | | | — | | | | (1,852,118 | ) | | | (1,852,118 | ) |
BOA | | | Pay | | |
| MXN TIIE
BANXICO |
| | | 6.500 | | | | 11/24/26 | | | | MXN 500,000 | | | | (7 | ) | | | 37,685 | | | | 37,678 | |
BOA | | | Receive | | | | BBSW6M | | | | 1.655 | | | | 7/16/29 | | | | AUD 113,025 | | | | — | | | | (2,866,237 | ) | | | (2,866,237 | ) |
BOA | | | Pay | | | | BZDIOVRA | | | | 6.630 | | | | 1/2/25 | | | | BRL 113,600 | | | | — | | | | 853,631 | | | | 853,631 | |
CITNA-B | | | Receive | | | | EUR006M | | | | 0.346 | | | | 10/18/69 | | | | EUR 15,000 | | | | — | | | | (237,263 | ) | | | (237,263 | ) |
CITNA-B | | | Receive | | | | COOVIBR | | | | 4.990 | | | | 5/2/20 | | | | COP 105,000,000 | | | | 218,366 | | | | (197,323 | ) | | | 21,043 | |
CITNA-B | | | Receive | | |
| Three-Month USD
BBA LIBOR |
| | | 1.535 | | | | 1/3/30 | | | | USD 80,350 | | | | — | | | | 460,856 | | | | 460,856 | |
CITNA-B | | | Pay | | | | CDOR03 | | | | 1.840 | | | | 10/11/21 | | | | CAD 500,000 | | | | — | | | | 388,038 | | | | 388,038 | |
CITNA-B | | | Pay | | | | CDOR03 | | | | 1.848 | | | | 10/11/21 | | | | CAD 500,000 | | | | — | | | | 415,762 | | | | 415,762 | |
CITNA-B | | | Pay | | | | CDOR03 | | | | 1.880 | | | | 10/17/21 | | | | CAD 1,146,000 | | | | — | | | | 1,010,883 | | | | 1,010,883 | |
CITNA-B | | | Pay | | | | CDOR03 | | | | 1.953 | | | | 10/25/29 | | | | CAD 72,500 | | | | — | | | | 609,954 | | | | 609,954 | |
CITNA-B | | | Receive | | |
| Three-Month USD
BBA LIBOR |
| | | 1.475 | | | | 1/7/30 | | | | USD 80,050 | | | | — | | | | 900,635 | | | | 900,635 | |
CITNA-B | | | Pay | | | | COOVIBR | | | | 5.220 | | | | 8/12/29 | | | | COP 40,650,000 | | | | — | | | | (113,761 | ) | | | (113,761 | ) |
CITNA-B | | | Pay | | |
| Six-Month HUF
BUBOR |
| | | 2.205 | | | | 3/8/28 | | | | HUF 2,750,000 | | | | — | | | | 986,525 | | | | 986,525 | |
CITNA-B | | | Receive | | | | CDOR03 | | | | 1.740 | | | | 10/1/29 | | | | CAD 35,500 | | | | 675 | | | | 238,427 | | | | 239,102 | |
CITNA-B | | | Pay | | | | CDOR03 | | | | 1.803 | | | | 10/1/21 | | | | CAD 168,500 | | | | (2,339 | ) | | | (34,629 | ) | | | (36,968 | ) |
CITNA-B | | | Pay | | |
| Three-Month USD
BBA LIBOR |
| | | 1.476 | | | | 1/3/22 | | | | USD 382,150 | | | | — | | | | (221,578 | ) | | | (221,578 | ) |
CITNA-B | | | Pay | | |
| Three-Month USD
BBA LIBOR |
| | | 1.395 | | | | 1/7/22 | | | | USD 382,300 | | | | — | | | | (806,626 | ) | | | (806,626 | ) |
CITNA-B | | | Pay | | | | COOVIBR | | | | 5.200 | | | | 8/1/29 | | | | COP 44,884,000 | | | | — | | | | (139,008 | ) | | | (139,008 | ) |
DEU | | | Pay | | | | JIBA3M | | | | 8.420 | | | | 8/29/28 | | | | ZAR 556,000 | | | | — | | | | 1,934,326 | | | | 1,934,326 | |
DEU | | | Pay | | |
| MXN TIIE
BANXICO |
| | | 8.120 | | | | 5/5/21 | | | | MXN 1,625,000 | | | | — | | | | 1,881,082 | | | | 1,881,082 | |
DEU | | | Pay | | |
| MXN TIIE
BANXICO |
| | | 7.340 | | | | 7/24/29 | | | | MXN 263,300 | | | | — | | | | 731,815 | | | | 731,815 | |
44 INVESCO OPPENHEIMER INTERNATIONAL BOND FUND
| | | | | | | | | | | | | | | | | | | | | | | | | | | | | | | | |
| Centrally Cleared Interest Rate Swaps (Continued) | |
| Counterparty | | Pay/Receive
Floating
Rate | | | Floating Rate | | | Fixed
Rate | | | Maturity
Date | | | Notional Amount (000’s) | | | Premiums
Received / (Paid) | | | Value | | | Unrealized
Appreciation/
(Depreciation) | |
DEU | | | Pay | | |
| MXN TIIE
BANXICO |
| | | 8.525% | | | | 1/15/24 | | | MXN | 480,000 | | | $ | — | | | $ | 2,078,096 | | | $ | 2,078,096 | |
GSCOI | | | Pay | | | | JIBA3M | | | | 8.690 | | | | 8/8/29 | | | ZAR | 644,500 | | | | — | | | | (53,685 | ) | | | (53,685 | ) |
GSCOI | | | Receive | | |
| Three-Month USD
BBA LIBOR |
| | | 1.666 | | | | 8/7/29 | | | USD | 10,730 | | | | — | | | | (56,081 | ) | | | (56,081 | ) |
GSCOI | | | Receive | | | | CPURNSA | | | | 1.869 | | | | 7/22/24 | | | USD | 108,000 | | | | — | | | | (1,497,817 | ) | | | (1,497,817 | ) |
GSCOI | | | Receive | | | | CPURNSA | | | | 1.873 | | | | 7/25/24 | | | USD | 175,000 | | | | — | | | | (2,707,532 | ) | | | (2,707,532 | ) |
GSCOI | | | Receive | | | | CPURNSA | | | | 1.883 | | | | 7/19/24 | | | USD | 108,000 | | | | — | | | | (1,727,425 | ) | | | (1,727,425 | ) |
GSCOI | | | Receive | | | | WIBR6M | | | | 2.095 | | | | 5/30/24 | | | PLN | 99,000 | | | | — | | | | (437,197 | ) | | | (437,197 | ) |
GSCOI | | | Receive | | |
| Three-Month USD
BBA LIBOR |
| | | 2.512 | | | | 4/29/29 | | | USD | 16,800 | | | | — | | | | (1,372,860 | ) | | | (1,372,860 | ) |
GSCOI | | | Pay | | |
| MXN TIIE
BANXICO |
| | | 8.620 | | | | 12/26/28 | | | MXN | 247,400 | | | | — | | | | 1,868,122 | | | | 1,868,122 | |
GSCOI | | | Pay | | |
| Six-Month PLN
WIBOR WIBO |
| | | 2.580 | | | | 2/6/23 | | | PLN | 115,000 | | | | — | | | | 1,251,434 | | | | 1,251,434 | |
GSCOI | | | Pay | | |
| Six-Month PLN
WIBOR WIBO |
| | | 1.775 | | | | 10/10/21 | | | PLN | 95,000 | | | | 3,197 | | | | 13,172 | | | | 16,369 | |
GSCOI | | | Pay | | |
| Six-Month PLN
WIBOR WIBO |
| | | 1.780 | | | | 6/10/21 | | | PLN | 200,000 | | | | (30,941 | ) | | | 14,118 | | | | (16,823 | ) |
GSCOI | | | Pay | | |
| MXN TIIE
BANXICO |
| | | 7.200 | | | | 7/27/22 | | | MXN | 1,252,000 | | | | — | | | | 1,416,790 | | | | 1,416,790 | |
HSBC | | | Pay | | |
| MXN TIIE
BANXICO |
| | | 7.210 | | | | 7/17/24 | | | MXN | 677,750 | | | | — | | | | 1,295,109 | | | | 1,295,109 | |
HSBC | | | Pay | | |
| MXN TIIE
BANXICO |
| | | 8.185 | | | | 4/13/29 | | | MXN | 410,000 | | | | — | | | | 2,460,687 | | | | 2,460,687 | |
JPM | | | Receive | | |
| MXN TIIE
BANXICO |
| | | 6.975 | | | | 10/22/20 | | | MXN | 1,975,000 | | | | — | | | | (45,504 | ) | | | (45,504 | ) |
JPM | | | Pay | | |
| MXN TIIE
BANXICO |
| | | 6.765 | | | | 10/11/29 | | | MXN | 260,000 | | | | — | | | | 129,192 | | | | 129,192 | |
JPM | | | Pay | | |
| Three-Month USD
BBA LIBOR |
| | | 1.476 | | | | 1/2/29 | | | BRL | 8,724 | | | | — | | | | 68,100 | | | | 68,100 | |
JPM | | | Pay | | |
| Six-Month PLN
WIBOR WIBO |
| | | 2.315 | | | | 1/15/26 | | | PLN | 90,200 | | | | (23,445 | ) | | | 1,088,492 | | | | 1,065,047 | |
JPM | | | Pay | | | | BZDIOVRA | | | | 7.060 | | | | 7/1/22 | | | BRL | 1,581,700 | | | | — | | | | 1,529,061 | | | | 1,529,061 | |
JPM | | | Pay | | |
| MXN TIIE
BANXICO |
| | | 6.710 | | | | 9/23/21 | | | MXN | 1,025,000 | | | | — | | | | 212,601 | | | | 212,601 | |
JPM | | | Pay | | | | WIBR6M | | | | 1.638 | | | | 4/25/22 | | | PLN | 51,500 | | | | — | | | | (2,064 | ) | | | (2,064 | ) |
JPM | | | Pay | | | | WIBR6M | | | | 1.630 | | | | 1/25/23 | | | PLN | 64,000 | | | | — | | | | (55,854 | ) | | | (55,854 | ) |
JPM | | | Pay | | | | BZDIOVRA | | | | 6.528 | | | | 1/2/24 | | | BRL | 129,900 | | | | — | | | | 947,987 | | | | 947,987 | |
JPM | | | Pay | | |
| MXN TIIE
BANXICO |
| | | 8.750 | | | | 10/29/20 | | | MXN | 2,210,000 | | | | — | | | | 2,085,161 | | | | 2,085,161 | |
JPM | | | Receive | | |
| Three-Month USD
BBA LIBOR |
| | | 2.097 | | | | 6/8/27 | | | USD | 12,000 | | | | — | | | | (546,654 | ) | | | (546,654 | ) |
JPM | | | Pay | | |
| Six-Month PLN
WIBOR WIBO |
| | | 2.090 | | | | 1/11/22 | | | PLN | 160,000 | | | | — | | | | 783,044 | | | | 783,044 | |
JPM | | | Pay | | |
| MXN TIIE
BANXICO |
| | | 6.520 | | | | 9/29/22 | | | MXN | 720,000 | | | | — | | | | 198,495 | | | | 198,495 | |
JPM | | | Pay | | |
| MXN TIIE
BANXICO |
| | | 6.395 | | | | 10/21/24 | | | MXN | 1,100,000 | | | | — | | | | 166,828 | | | | 166,828 | |
45 INVESCO OPPENHEIMER INTERNATIONAL BOND FUND
CONSOLIDATED SCHEDULE OF INVESTMENTSContinued
| | | | | | | | | | | | | | | | | | | | | | | | | | | | |
Centrally Cleared Interest Rate Swaps (Continued) | |
| Counterparty | | Pay/Receive Floating Rate | | Floating Rate | | Fixed Rate | | | Maturity Date | | | Notional Amount (000’s) | | | Premiums Received / (Paid) | | | Value | | | Unrealized Appreciation/ (Depreciation) | |
| |
MSCO | | Receive | | CPURNSA | | | 1.856% | | | | 7/30/24 | | | USD | 220,750 | | | $ | — | | | $ | (2,920,377 | ) | | $ | (2,920,377 | ) |
| |
SAN | | Pay | | BZDIOVRA | | | 6.900 | | | | 1/2/27 | | | BRL | 212,000 | | | | — | | | | 1,925,026 | | | | 1,925,026 | |
| |
| SIB | | Pay | | MXN TIIE BANXICO | | | 7.770 | | | | 3/25/24 | | |
| MXN
1,150,000 |
| | | — | | | | 3,399,911 | | | | 3,399,911 | |
| | | | | | | | | | | | | | | | | | | | |
| Total Centrally Cleared Interest Rate Swaps | | | | | | | | | | | | | | $ | 165,506 | | | $ | 16,269,374 | | | $ | 16,434,880 | |
| | | | | | | | | | | | | | | | | | | | |
| | | | | | | | | | | | | | | | | | | | | | | | | | | | |
Over-the-Counter Interest Rate Swaps at October 31, 2019 | | | | | | | | | | | | | |
| Counterparty | | Pay/Receive Floating Rate | | Floating Rate | | Fixed Rate | | | Maturity Date | | | Notional Amount (000’s) | | | Premiums Received / (Paid) | | | Value | | | Unrealized Appreciation/ (Depreciation) | |
| | | | Six-Month INR | | | | | | | | | | | | | | | | | | | | | | | | |
| | | | FBIL MIBOR OIS | | | | | | | | | | | INR | | | | | | | | | | | | | |
BOA | | Receive | | Compound | | | 5.740% | | | | 5/16/21 | | | | 5,700,000 | | | $ | — | | | $ | (942,989 | ) | | $ | (942,989 | ) |
| |
| | | | INR FBIL MIBOR | | | | | | | | | | | INR | | | | | | | | | | | | | |
BOA | | Receive | | OIS Compound | | | 5.670 | | | | 5/27/21 | | | | 4,536,000 | | | | — | | | | (600,068 | ) | | | (600,068 | ) |
| |
CITNA-B | | Receive | | JIBA3M | | | 8.139 | | | | 1/31/30 | | | | ZAR 367,000 | | | | — | | | | (545,941 | ) | | | (545,941 | ) |
| |
| | | | Three-Month | | | | | | | | | | | | | | | | | | | | | | | | |
| | | | COP IBR OIS | | | | | | | | | | | COP | | | | | | | | | | | | | |
GSCOI | | Pay | | Compound | | | 6.470 | | | | 9/29/26 | | | | 55,000,000 | | | | — | | | | 1,439,795 | | | | 1,439,795 | |
| |
GSCOI | | Pay | | MOSKP3 | | | 8.360 | | | | 6/24/29 | | | | RUB 432,500 | | | | — | | | | 837,702 | | | | 837,702 | |
| |
GSCOI | | Pay | | MOSKP3 | | | 6.580 | | | | 10/25/21 | | |
| RUB
8,680,000 |
| | | — | | | | (33,144 | ) | | | (33,144 | ) |
| |
| | | | Three-Month | | | | | | | | | | | | | | | | | | | | | | | | |
| | | | COP IBR OIS | | | | | | | | | | | COP | | | | | | | | | | | | | |
JPM | | Pay | | Compound | | | 7.300 | | | | 6/1/26 | | | | 39,425,000 | | | | — | | | | 1,609,286 | | | | 1,609,286 | |
| |
| | | | Three-Month | | | | | | | | | | | | | | | | | | | | | | | | |
| | | | COP IBR OIS | | | | | | | | | | | COP | | | | | | | | | | | | | |
JPM | | Pay | | Compound | | | 4.990 | | | | 5/2/20 | | | | 105,000,000 | | | | — | | | | 197,323 | | | | 197,323 | |
| |
JPM | | Receive | | JIBA3M | | | 7.955 | | | | 1/31/30 | | | | ZAR 385,000 | | | | — | | | | (234,752 | ) | | | (234,752 | ) |
| |
| | | | Six-Month INR | | | | | | | | | | | | | | | | | | | | | | | | |
| | | | FBIL MIBOR OIS | | | | | | | | | | | INR | | | | | | | | | | | | | |
SCB | | Receive | | Compound | | | 6.438 | | | | 1/10/24 | | | | 1,700,000 | | | | — | | | | (1,353,594 | ) | | | (1,353,594 | ) |
| | | | | | | | | | | | | | | | | | | | |
TotalOver-the-Counter Interest Rate Swaps | | | | | | | | | | | | | | $ | — | | | $ | 373,618 | | | $ | 373,618 | |
| | | | | | | | | | | | | | | | | | | | |
| | | | | | | | | | | | | | | | | | | | | | | | | | | | | | |
Over-the-Counter Credit Default Swaptions Written at October 31, 2019 | |
| | | | | | | | | | | | | | | | | | | | | Notional | | | | | | | | | |
| | | Counterparty | | | Buy/Sell | | | Reference | | | | Fixed | | | | Expiration | | | | Amount | | | | Premiums | | | | | |
| Description | | Protection | | | Asset | | | | Rate | | | | Date | | | | (000’s | ) | | | Received | | | | Value | |
| |
| | | | | | | | | iTraxx | | | | | | | | | | | | | | | | | | | | | |
| | | | | | | | | Europe | | | | | | | | | | | | | | | | | | | | | |
| | | | | | | | | Crossover | | | | | | | | | | | | | | | | | | | | | |
Credit Default Swap | | | | | | | | | Series 31 | | | | | | | | | | | | | | | | | | | | | |
maturing 6/20/24 Put | | | JPM | | | Buy | | | Version 1 | | | | 5.000% | | | | 12/18/19 | | | EUR | 50,000 | | | $ | 497,633 | | | $ | (260,320 | ) |
| |
| | | | | | | | | iTraxx | | | | | | | | | | | | | | | | | | | | | |
| | | | | | | | | Europe | | | | | | | | | | | | | | | | | | | | | |
Credit Default Swap | | | | | | | | | Crossover | | | | | | | | | | | | | | | | | | | | | |
maturing 6/20/24 | | | | | | | | | Series 31 | | | | | | | | | | | | | | | | | | | | | |
Call | | | JPM | | | Sell | | | Version 1 | | | | 5.000 | | | | 12/18/19 | | | EUR | 50,000 | | | | 304,109 | | | | (24,660 | ) |
46 INVESCO OPPENHEIMER INTERNATIONAL BOND FUND
| | | | | | | | | | | | | | | | | | | | | | | | | | | | | | | | | | | | |
| Over-the-Counter Credit Default Swaptions Written (Continued) | | | | | | | | | | | | | |
| Description | | Counterparty | | | Buy/Sell
Protection | | | Reference
Asset | | | Fixed
Rate | | | Expiration
Date | | | | | | Notional
Amount
(000’s) | | | Premiums
Received | | | Value | |
| |
Credit Default Swap maturing 6/20/24 Call | | | JPM | | | | Sell | | |
| iTraxx
Europe
Crossover
Series 31
Version 1 |
| | | 5.000% | | | | 12/18/19 | | | | EUR | | | | 50,000 | | | $ | 93,997 | | | $ | (781) | |
| | | | | | | | | | | | | | | | | | | | | | | | | | | | | | | | |
TotalOver-the-Counter Credit Default Swaptions Written | | | | | | | | | | | | | | | | | | | $ | 895,739 | | | $ | (285,761) | |
| | | | | | | | | | | | | | | | | | | | | | | | | | | | | | | | |
| | | | | | | | | | | | | | | | | | | | | | | | | | | | | | | | | | |
| Over-the-Counter Interest Rate Swaptions Written at October 31, 2019 | |
| Description | | Counterparty | | | Pay/
Receive
Floating
Rate | | | Floating
Rate | | | Fixed
Rate | | | Expiration
Date | | | Notional Amount
(000’s) | | | Premiums
Received | | | Value | |
| |
| Interest Rate Swap maturing 4/24/20 Call | | | BOA | | | | Pay | | |
| Three-
Month
USD BBA
LIBOR |
| | | 1.325% | | | | 4/24/20 | | | USD | | | 100,000 | | | $ | 540,200 | | | $ | (656,745) | |
| Interest Rate Swap maturing 4/24/20 Put | | | BOA | | | | Receive | | |
| Three-
Month
USD BBA
LIBOR |
| | | 1.725 | | | | 4/24/20 | | | USD | | | 100,000 | | | | 540,200 | | | | (359,209) | |
| Interest Rate Swap maturing 6/15/20 Put | | | GSCOI | | | | Receive | | |
| Three-
Month RUB
MOSPRIME
NFEA |
| | | 8.080 | | | | 6/15/20 | | | RUB | | | 1,676,500 | | | | 521,411 | | | | (217,219) | |
| Interest Rate Swap maturing 1/9/20 Call | | | GSCOI | | | | Pay | | |
| Three-
Month
USD BBA
LIBOR |
| | | 1.600 | | | | 1/9/20 | | | USD | | | 166,700 | | | | 891,845 | | | | (1,600,704) | |
| Interest Rate Swap maturing 11/14/19 Put | | | JPM | | | | Receive | | |
| Three-
Month
USD BBA
LIBOR |
| | | 1.630 | | | | 11/14/19 | | | USD | | | 212,000 | | | | 640,000 | | | | (74,412) | |
| Interest Rate Swap maturing 4/24/20 Call | | | JPM | | | | Pay | | |
| Three-
Month
USD BBA
LIBOR |
| | | 1.340 | | | | 4/24/20 | | | USD | | | 400,000 | | | | 2,240,000 | | | | (2,732,436) | |
| Interest Rate Swap maturing 4/24/20 Put | | | JPM | | | | Receive | | |
| Three-
Month
USD BBA
LIBOR |
| | | 1.661 | | | | 4/24/20 | | | USD | | | 300,000 | | | | 744,000 | | | | (543,504) | |
| Interest Rate Swap maturing 4/24/20 Put | | | JPM | | | | Receive | | |
| Three-
Month
USD BBA
LIBOR |
| | | 1.740 | | | | 4/24/20 | | | USD | | | 400,000 | | | | 2,040,000 | | | | (1,360,400) | |
| Interest Rate Swap maturing 4/24/20 Call | | | JPM | | | | Pay | | |
| Three-
Month
USD BBA
LIBOR |
| | | 1.361 | | | | 4/24/20 | | | USD | | | 300,000 | | | | 741,000 | | | | (876,495) | |
| Interest Rate Swap maturing 8/17/20 Put | | | MSCO | | | | Receive | | |
| Three-
Month
USD BBA
LIBOR |
| | | 1.530 | | | | 8/17/20 | | | USD | | | 496,000 | | | | 1,820,000 | | | | (1,744,789) | |
47 INVESCO OPPENHEIMER INTERNATIONAL BOND FUND
CONSOLIDATED SCHEDULE OF INVESTMENTSContinued
| | | | | | | | | | | | | | | | | | | | | | | | | | | | | | | | | | |
| Over-the-Counter Interest Rate Swaptions Written (Continued) | |
| Description | | Counterparty | | | Pay/
Receive
Floating
Rate | | | Floating
Rate | | | Fixed
Rate | | | Expiration
Date | | | Notional Amount
(000’s) | | | Premiums
Received | | | Value | |
| |
| Interest Rate Swap maturing 3/27/20 Call | | | MSCO | | | | Pay | | |
| Six-
Month
EUR
EURIBOR |
| | | 0.000% | | | | 3/27/20 | | | EUR | | | 187,500 | | | $ | 1,784,988 | | | $ | (295,676) | |
| |
| Interest Rate Swap maturing 4/24/20 Put | | | MSCO | | | | Receive | | |
| Three-
Month
USD BBA
LIBOR |
| | | 1.667 | | | | 4/24/20 | | | USD | | | 200,000 | | | | 496,000 | | | | (354,386) | |
| |
| Interest Rate Swap maturing 4/24/20 Call | | | MSCO | | | | Pay | | |
| Three-
Month
USD BBA
LIBOR |
| | | 1.368 | | | | 4/24/20 | | | USD | | | 200,000 | | | | 496,000 | | | | (593,272) | |
| | | | | | | | | | | | | | | | | | | | | | | | | | | | | | |
| TotalOver-the-Counter Interest Rate Swaptions Written | | | | | | | | | $ | 13,495,644 | | | $ | (11,409,247) | |
| | | | | | | | | | | | | | | | | | | | | | | | | | | | | | |
Glossary:
Counterparty Abbreviations
| | |
| BAC | | Barclays Bank plc |
| BNP | | BNP Paribas |
| BOA | | Bank of America NA |
| CITNA-B | | Citibank NA |
| DEU | | Deutsche Bank AG |
| GSCOI | | Goldman Sachs International |
| GSCO-OT | | Goldman Sachs Bank USA |
| HSBC | | HSBC Bank USA NA |
| JPM | | JPMorgan Chase Bank NA |
| MOS | | Morgan Stanley & Co., Inc. |
| MSCO | | Morgan Stanley Capital Services, Inc. |
| RBC | | RBC Dominion Securities |
| SAN | | Santander |
| SCB | | Standard Chartered Bank |
| SIB | | Banco Santander SA |
|
Currency abbreviations indicate amounts reporting in currencies |
| ARS | | Argentine Peso |
| AUD | | Australian Dollar |
| BRL | | Brazilian Real |
| CAD | | Canadian Dollar |
| CLP | | Chilean Peso |
| COP | | Colombian Peso |
| EGP | | Egyptian Pounds |
| EUR | | Euro |
| GBP | | British Pound Sterling |
| HUF | | Hungarian Forint |
| IDR | | Indonesian Rupiah |
| INR | | Indian Rupee |
| JPY | | Japanese Yen |
| KRW | | South Korean Won |
| MXN | | Mexican Nuevo Peso |
48 INVESCO OPPENHEIMER INTERNATIONAL BOND FUND
Currency abbreviations indicate amounts reporting in currencies (Continued)
| | |
| MYR | | Malaysian Ringgit |
| NOK | | Norwegian Krone |
| NZD | | New Zealand Dollar |
| PEN | | Peruvian New Sol |
| PHP | | Philippine Peso |
| PLN | | Polish Zloty |
| RUB | | Russian Ruble |
| SEK | | Swedish Krona |
| SGD | | Singapore Dollar |
| THB | | Thailand Baht |
| TRY | | New Turkish Lira |
| ZAR | | South African Rand |
| |
| Definitions | | |
| BA CDOR | | Canada Bankers Acceptances Deposit Offering Rate |
| BADLARPP | | Argentina Deposit Rates Badlar Private Banks ARS 30 to 35 Days |
| BANXICO | | Banco de Mexico |
| BBA LIBOR | | British Bankers’ Association London - Interbank Offered Rate |
| BBSW6M | | ASX Australian Bank Bill Short Term Rate 6 Month Mid |
| BP0003M | | ICE LIBOR GBP 3 Month |
| BTP | | Italian Treasury Bonds |
| BUND | | German Federal Obligation |
| BUXL | | German Federal Obligation |
| BURBOR | | Budapest Interbank Offered Rate |
| BZDIOVRA | | Brazil Ceptip DI Interbank Deposit Rate |
| CDOR03 | | Canada Bankers Acceptence 3 Months |
| CDX.EM.31 | | Markit CDX Emerging Markets Index |
| COOVIBR | | Colombia IBR Overnight Nominal Interbank Reference Rate |
| CPURNSA | | US Consumer Price Index Urban Consumers |
| EUR003M | | EURIBOR 3 Month ACT/360 |
| EUR006M | | EURIBOR 6 Month ACT/360 |
| EURIBOR | | Euro Interbank Offered Rate |
| EUSA5 | | EUR Swap Annual 5 Year |
| FBIL | | Financial Benchmarks India Private Ltd. |
| GDR | | Global Depositary Receipt |
| GUKG5 | | UK Government Bonds 5 Year Note Generic Bid Yield |
| H15T10Y | | US Treasury Yield Curve Rate T Note Constant Maturity 10 Year |
| H15T5Y | | US Treasury Yield Curve Rate T Note Constant Maturity 5 Year |
| IBR | | Indicador Bancario de Referencia |
| ICE LIBOR | | Intercontinental Exchange London Interbank Offered Rate |
| JIBA3M | | South Africa Johannesburg Interbank Agreed Rate 3 Month |
| MIBOR | | Mumbai Interbank Offered Rate |
| MOSKP3 | | National Finance Assoc. Moscow Prime Offered 3 Month Rate |
| MOSPRIME NEFA | | Moscow Prime Offered Rate |
| OIS | | Overnight Index Swap |
| S&P | | Standard & Poor’s |
| TIIE | | Interbank Equilibrium Interest Rate |
| US0003M | | ICE LIBOR USD 3 Month |
| US0006M | | ICE LIBOR USD 6 Month |
| USISDA05 | | USD ICE Swap Rate 11:00am NY 5 Year |
49 INVESCO OPPENHEIMER INTERNATIONAL BOND FUND
CONSOLIDATED SCHEDULE OF INVESTMENTSContinued
Definitions (Continued)
| | |
| USSW5 | | USD Swap Semi 30/360 5 Year |
| WIBOR WIBO | | Poland Warsaw Interbank Offer Bid Rate |
| WIBR6M | | GBP Benchmark WIBOR PLN 6 month |
See accompanying Notes to Consolidated Financial Statements.
50 INVESCO OPPENHEIMER INTERNATIONAL BOND FUND
CONSOLIDATED SCHEDULE OF INVESTMENTSSeptember 30, 2019
| | | | | | | | | | |
| | | | | Principal Amount | | | Value | |
Mortgage-Backed Obligations—4.8% | | | | | | | | | | |
| Alba plc, Series2007-1, Cl. F, 4.033% [BP0003M+325], 3/17/391,2 | | GBP | | | 1,810,400 | | | $ | 2,146,597 | |
| |
| Bancaja Fondo de Titulizacion, Series 10, Cl. C, 0.079% [EUR003M+50], 5/22/501,2,3 | | EUR | | | 12,000,000 | | | | 10,839,853 | |
| |
| Capital Mortgage Srl, Series2007-1, Cl. B, 0.00% [EUR003M+22], 1/30/471,2 | | EUR | | | 8,000,000 | | | | 5,961,747 | |
| |
| Eurohome UK Mortgages plc: | | | | | | | | | | |
| Series2007-1, Cl. B1, 1.685% [BP0003M+90], 6/15/441,2 | | GBP | | | 5,275,000 | | | | 5,179,452 | |
| Series2007-1, Cl. M1, 1.085% [BP0003M+30], 6/15/441,2 | | GBP | | | 5,200,000 | | | | 5,596,773 | |
| Series2007-1, Cl. M2, 1.285% [BP0003M+50], 6/15/441,2 | | GBP | | | 4,000,000 | | | | 4,103,810 | |
| Series2007-2, Cl. B1, 2.185% [BP0003M+140], 9/15/441,2 | | GBP | | | 4,000,000 | | | | 4,138,247 | |
| Series2007-2, Cl. M1, 1.135% [BP0003M+35], 9/15/441,2 | | GBP | | | 10,340,000 | | | | 11,434,640 | |
| |
| Eurosail plc, Series2006-3X, Cl. D1C, 1.672% [BP0003M+90], 9/10/441,2 | | GBP | | | 11,000,000 | | | | 10,933,190 | |
| |
| Great Hall Mortgages No 1 plc, Series2007-1, Cl. DA, 1.556% [BP0003M+78], 3/18/391,2 | | GBP | | | 8,000,000 | | | | 8,306,436 | |
| |
| Grifonas Finance plc: | | | | | | | | | | |
| Series 1, Cl. A, [EUR006M+28], 8/28/391,2 | | EUR | | | 17,128,370 | | | | 17,194,342 | |
| Series 1, Cl. B, 0.105% [EUR006M+52], 8/28/391,2 | | EUR | | | 5,000,000 | | | | 4,344,988 | |
| |
| IM Pastor 4 Fondo de Titulizacion de Activos: | | | | | | | | | | |
| Series 4, Cl. A, [EUR003M+14], 3/22/441,2 | | EUR | | | 14,655,466 | | | | 14,791,605 | |
| Series 4, Cl. B, [EUR003M+19], 3/22/441,2 | | EUR | | | 3,000,000 | | | | 2,113,020 | |
| |
| Ludgate Funding plc, Series2007-1, 0.00%, 1/1/616 | | GBP | | | 207,500,000 | | | | 10,673,431 | |
| |
| Marble Arch Residential Securitisation No 4 plc, Series 4X, Cl. E1C, 4.679% [BP0003M+390], 3/20/401,2 | | GBP | | | 5,960,000 | | | | 7,114,642 | |
| |
| Newgate Funding plc, Series2007-2X, Cl. CB, 0.007% [EUR003M+44], 12/15/501,2 | | EUR | | | 3,127,671 | | | | 2,964,236 | |
| |
| Sestante Finance Srl, Series 3, Cl. C1, 0.436% [EUR003M+80], 7/15/451,2 | | EUR | | | 9,700,000 | | | | 5,096,174 | |
| |
| TDA 27 Hipocat 9 Fondo de Titulizacion de Activos, Series 27, Cl. A3, 0.00% [EUR003M+19], 12/28/501,2 | | EUR | | | 35,000,000 | | | | 33,802,477 | |
| |
| Towd Point Mortgage Funding 2019-Granite4 plc, 2.23%, 10/20/51 | | GBP | | | 10,000,000 | | | | 12,312,000 | |
| | | | | | | | | | |
| Total Mortgage-Backed Obligations (Cost $186,037,949) | | | | | | | | | 179,047,660 | |
| | | | | | | | | | |
Foreign Government Obligations—61.7% | | | | | | | | | | |
Angola—0.4% | | | | | | | | | | |
| Republic of Angola, 9.375% Sr. Unsec. Nts., 5/8/481 | | | | | 13,805,000 | | | | 14,590,560 | |
|
| |
Argentina—1.3% | | | | | | | | | | |
| Argentine Republic: | | | | | | | | | | |
| 0.00% Unsec. Nts., 7/29/204 | | ARS | | | 722,500,000 | | | | 6,462,539 | |
| 0.202% Unsec. Nts., 10/29/204 | | ARS | | | 1,307,200,000 | | | | 9,748,944 | |
| 5.625% Sr. Unsec. Nts., 1/26/22 | | | | | 12,395,000 | | | | 5,391,949 | |
| 6.875% Sr. Unsec. Nts., 1/26/27 | | | | | 17,110,000 | | | | 7,233,424 | |
| 7.50% Sr. Unsec. Nts., 4/22/26 | | | | | 34,345,000 | | | | 15,326,800 | |
| 9.80% Unsec. Nts., 5/28/204 | | ARS | | | 152,100,000 | | | | 1,455,251 | |
| 15.50% Bonds, 10/17/26 | | ARS | | | 135,000,000 | | | | 771,100 | |
| 18.20% Unsec. Nts., 10/3/21 | | ARS | | | 212,805,000 | | | | 1,069,162 | |
51 INVESCO OPPENHEIMER INTERNATIONAL BOND FUND
CONSOLIDATED SCHEDULE OF INVESTMENTSContinued
| | | | | | | | | | |
| | | | | Principal Amount | | | Value | |
Argentina (Continued) | | | | | | | | | | |
Argentine Republic: (Continued)
58.111% [BADLARPP+375] Unsec. Nts., 4/12/251,2 | | ARS | | | 120,000,000 | | | $ | 801,638 | |
| 62.614% [BADLARPP+325] Unsec. Nts., 3/1/202 | | ARS | | | 180,336,000 | | | | 1,748,180 | |
| | | | | | | | | | |
| | | | | | | | | 50,008,987 | |
|
| |
Austria—0.9% | | | | | | | | | | |
| Republic of Austria, 1.50% Sr. Unsec. Nts., 11/2/861 | | EUR | | | 20,130,000 | | | | 32,471,260 | |
|
| |
Bahrain—0.1% | | | | | | | | | | |
| Kingdom of Bahrain, 5.625% Sr. Unsec. Nts., 9/30/311 | | | | | 4,500,000 | | | | 4,547,705 | |
|
| |
Brazil—2.2% | | | | | | | | | | |
| Federative Republic of Brazil: | | | | | | | | | | |
| 6.00% Nts., 8/15/225 | | BRL | | | 170,000 | | | | 147,173 | |
| 6.00% Nts., 5/15/455 | | BRL | | | 40,900,000 | | | | 44,793,915 | |
| 6.00% Nts., 8/15/505 | | BRL | | | 6,000,000 | | | | 6,788,961 | |
| 10.00% Nts., 1/1/29 | | BRL | | | 100,000,000 | | | | 28,747,812 | |
| | | | | | | | | | |
| | | | | | | | | 80,477,861 | |
|
| |
Colombia—1.3% | | | | | | | | | | |
| Republic of Colombia, Series B, 6.25% Bonds, 11/26/25 | | COP | | | 155,000,000,000 | | | | 46,539,863 | |
|
| |
Costa Rica—0.1% | | | | | | | | | | |
| Republic of Costa Rica, 5.625% Sr. Unsec. Nts., 4/30/431 | | | | | 2,925,000 | | | | 2,552,823 | |
|
| |
Cyprus—0.7% | | | | | | | | | | |
| Republic of Cyprus: | | | | | | | | | | |
| 2.75% Sr. Unsec. Nts., 2/26/341 | | EUR | | | 13,510,000 | | | | 18,468,553 | |
| 2.75% Sr. Unsec. Nts., 5/3/491 | | EUR | | | 5,975,000 | | | | 8,607,976 | |
| | | | | | | | | | |
| | | | | | | | | 27,076,529 | |
|
| |
Dominican Republic—0.5% | | | | | | | | | | |
| Dominican Republic: | | | | | | | | | | |
| 6.40% Sr. Unsec. Nts., 6/5/491 | | | | | 5,000,000 | | | | 5,337,550 | |
| 6.85% Sr. Unsec. Nts., 1/27/451 | | | | | 6,370,000 | | | | 7,118,475 | |
| 7.45% Sr. Unsec. Nts., 4/30/441 | | | | | 6,360,000 | | | | 7,560,514 | |
| | | | | | | | | | |
| | | | | | | | | 20,016,539 | |
|
| |
Ecuador—0.8% | | | | | | | | | | |
| Republic of Ecuador: | | | | | | | | | | |
| 8.875% Sr. Unsec. Nts., 10/23/271 | | | | | 11,345,000 | | | | 11,345,114 | |
| 9.50% Sr. Unsec. Nts., 3/27/301 | | | | | 10,785,000 | | | | 10,953,979 | |
| 10.75% Sr. Unsec. Nts., 1/31/291 | | | | | 5,600,000 | | | | 6,065,556 | |
| | | | | | | | | | |
| | | | | | | | | 28,364,649 | |
|
| |
Egypt—2.5% | | | | | | | | | | |
| Arab Republic of Egypt: | | | | | | | | | | |
| 4.75% Sr. Unsec. Nts., 4/16/261 | | EUR | | | 12,900,000 | | | | 14,455,338 | |
| 6.125% Sr. Unsec. Nts., 1/31/221 | | | | | 9,710,000 | | | | 10,028,682 | |
52 INVESCO OPPENHEIMER INTERNATIONAL BOND FUND
| | | | | | | | | | |
| | | | | Principal Amount | | | Value | |
Egypt (Continued) | | | | | | | | | | |
| Arab Republic of Egypt: (Continued) | | | | | | | | | | |
| 8.50% Sr. Unsec. Nts., 1/31/471 | | | | $ | 9,480,000 | | | $ | 10,067,637 | |
| 8.70% Sr. Unsec. Nts., 3/1/491 | | | | | 14,387,000 | | | | 15,512,567 | |
| 16.00% Bonds, 6/11/22 | | EGP | | | 330,000,000 | | | | 21,113,760 | |
| 16.30% Bonds, 1/1/23 | | EGP | | | 10,200,000 | | | | 662,787 | |
| 18.15% Bonds, 6/13/20 | | EGP | | | 57,000,000 | | | | 3,584,846 | |
| 18.15% Unsec. Nts., 12/11/21 | | EGP | | | 128,000,000 | | | | 8,338,738 | |
| Series 3YR, 15.00% Bonds, 10/3/20 | | EGP | | | 157,150,000 | | | | 9,711,871 | |
| | | | | | | | | | |
| | | | | | | | | 93,476,226 | |
|
| |
El Salvador—0.3% | | | | | | | | | | |
| Republic of El Salvador, 7.125% Sr. Unsec. Nts., 1/20/501 | | | | | 10,253,000 | | | | 10,470,876 | |
|
| |
Fiji—0.2% | | | | | | | | | | |
| Republic of Fiji, 6.625% Sr. Unsec. Nts., 10/2/201 | | | | | 9,265,000 | | | | 9,264,996 | |
|
| |
France—0.7% | | | | | | | | | | |
| French Republic, 1.75% Bonds, 6/25/391 | | EUR | | | 17,750,000 | | | | 25,093,272 | |
|
| |
Gabon—0.2% | | | | | | | | | | |
| Gabonese Republic, 6.375% Bonds, 12/12/241 | | | | | 6,370,000 | | | | 6,288,783 | |
|
| |
Greece—3.1% | | | | | | | | | | |
| Hellenic Republic: | | | | | | | | | | |
| 0.00%, Bonds, 10/15/426 | | EUR | | | 107,000,000 | | | | 478,161 | |
| 1.875% Bonds, 7/23/261 | | EUR | | | 17,000,000 | | | | 19,508,508 | |
| 3.90% Bonds, 1/30/331 | | EUR | | | 61,676,000 | | | | 84,132,479 | |
| 4.00% Bonds, 1/30/371 | | EUR | | | 8,325,000 | | | | 11,638,280 | |
| | | | | | | | | | |
| | | | | | | | | 115,757,428 | |
|
| |
India—8.6% | | | | | | | | | | |
| Republic of India: | | | | | | | | | | |
| 6.84% Sr. Unsec. Nts., 12/19/22 | | INR | | | 1,000,000,000 | | | | 14,423,437 | |
| 7.17% Sr. Unsec. Nts., 1/8/28 | | INR | | | 3,715,000,000 | | | | 53,710,846 | |
| 7.68% Sr. Unsec. Nts., 12/15/23 | | INR | | | 1,300,000,000 | | | | 19,228,287 | |
| 7.72% Sr. Unsec. Nts., 5/25/25 | | INR | | | 730,000,000 | | | | 10,846,663 | |
| 8.15% Sr. Unsec. Nts., 11/24/26 | | INR | | | 500,000,000 | | | | 7,579,076 | |
| 8.20% Sr. Unsec. Nts., 9/24/25 | | INR | | | 3,715,000,000 | | | | 56,471,221 | |
| 8.24% Sr. Unsec. Nts., 2/15/27 | | INR | | | 4,935,000,000 | | | | 75,245,690 | |
| 8.40% Sr. Unsec. Nts., 7/28/24 | | INR | | | 3,997,000,000 | | | | 60,831,989 | |
| |
| State of Gujarat, 7.52% Sr. Unsec. Nts., 5/24/27 | | INR | | | 500,000,000 | | | | 7,242,510 | |
| |
| State of Maharastra, 7.99% Sr. Unsec. Nts., 10/28/25 | | INR | | | 500,000,000 | | | | 7,418,963 | |
| |
| State of Tamil Nadu, 8.53% Sr. Unsec. Nts., 3/9/26 | | INR | | | 500,000,000 | | | | 7,628,137 | |
| | | | | | | | | | |
| | | | | | | | | 320,626,819 | |
|
| |
Indonesia—5.7% | | | | | | | | | | |
| Perusahaan Penerbit SBSN Indonesia III, 4.55% Sr. Unsec. Nts., 3/29/261 | | | | | 5,680,000 | | | | 6,211,080 | |
53 INVESCO OPPENHEIMER INTERNATIONAL BOND FUND
CONSOLIDATED SCHEDULE OF INVESTMENTSContinued
| | | | | | | | | | |
| | | | | Principal Amount | | | Value | |
Indonesia (Continued) | | | | | | | | | | |
| |
| Republic of Indonesia: | | | | | | | | | | |
| 4.125% Sr. Unsec. Nts., 1/15/251 | | | | $ | 3,050,000 | | | $ | 3,253,109 | |
| 8.125% Sr. Unsec. Nts., 5/15/24 | | IDR | | | 540,000,000,000 | | | | 40,270,800 | |
| 8.25% Sr. Unsec. Nts., 5/15/29 | | IDR | | | 398,080,000,000 | | | | 30,001,967 | |
| Series FR56, 8.375% Sr. Unsec. Nts., 9/15/26 | | IDR | | | 288,430,000,000 | | | | 21,819,084 | |
| Series FR59, 7.00% Sr. Unsec. Nts., 5/15/27 | | IDR | | | 433,000,000,000 | | | | 30,358,501 | |
| Series FR64, 6.125% Sr. Unsec. Nts., 5/15/28 | | IDR | | | 120,000,000,000 | | | | 7,848,397 | |
| Series FR71, 9.00% Sr. Unsec. Nts., 3/15/29 | | IDR | | | 359,350,000,000 | | | | 28,089,297 | |
| Series FR73, 8.75% Sr. Unsec. Nts., 5/15/31 | | IDR | | | 560,080,000,000 | | | | 43,195,406 | |
| | | | | | | | | | |
| | | | | | | | | 211,047,641 | |
|
| |
Italy—2.0% | | | | | | | | | | |
| Republic of Italy, 2.80% Bonds, 3/1/671 | | EUR | | | 58,150,000 | | | | 75,510,876 | |
|
| |
Ivory Coast—0.4% | | | | | | | | | | |
| Republic of Cote d’Ivoire, 5.25% Sr. Unsec. Nts., 3/22/301 | | EUR | | | 12,765,000 | | | | 14,012,343 | |
|
| |
Kenya—0.3% | | | | | | | | | | |
| Republic of Kenya: | | | | | | | | | | |
| 8.00% Sr. Unsec. Nts., 5/22/321 | | | | | 4,140,000 | | | | 4,349,343 | |
| 8.25% Sr. Unsec. Nts., 2/28/481 | | | | | 5,500,000 | | | | 5,631,736 | |
| | | | | | | | | | |
| | | | | | | | | 9,981,079 | |
|
| |
Malaysia—1.7% | | | | | | | | | | |
| Federation of Malaysia: | | | | | | | | | | |
| 3.733% Sr. Unsec. Nts., 6/15/28 | | MYR | | | 42,000,000 | | | | 10,140,973 | |
| 3.844% Sr. Unsec. Nts., 4/15/33 | | MYR | | | 50,000,000 | | | | 12,248,394 | |
| 4.127% Sr. Unsec. Nts., 4/15/32 | | MYR | | | 25,000,000 | | | | 6,291,468 | |
| 4.498% Sr. Unsec. Nts., 4/15/30 | | MYR | | | 32,000,000 | | | | 8,275,783 | |
| 4.642% Sr. Unsec. Nts., 11/7/33 | | MYR | | | 100,000,000 | | | | 26,460,901 | |
| | | | | | | | | | |
| | | | | | | | | 63,417,519 | |
|
| |
Mexico—7.0% | | | | | | | | | | |
| United Mexican States: | | | | | | | | | | |
| Series M, 5.75% Bonds, 3/5/26 | | MXN | | | 560,000,000 | | | | 26,886,754 | |
| Series M, 6.50% Bonds, 6/10/21 | | MXN | | | 400,000,000 | | | | 20,219,925 | |
| Series M, 8.00% Sr. Unsec. Nts., 12/7/23 | | MXN | | | 2,050,000,000 | | | | 108,841,973 | |
| Series M20, 8.50% Sr. Unsec. Nts., 5/31/29 | | MXN | | | 1,110,000,000 | | | | 62,660,383 | |
| Series M20, 10.00% Bonds, 12/5/24 | | MXN | | | 698,700,000 | | | | 40,523,467 | |
| | | | | | | | | | |
| | | | | | | | | 259,132,502 | |
|
| |
New Zealand—1.7% | | | | | | | | | | |
| New Zealand, 1.50% Sr. Unsec. Nts., 5/15/31 | | NZD | | | 100,000,000 | | | | 64,541,112 | |
|
| |
Nigeria—0.1% | | | | | | | | | | |
| Federal Republic of Nigeria, 7.696% Sr. Unsec. Nts., 2/23/381 | | | | | 4,385,000 | | | | 4,473,292 | |
54 INVESCO OPPENHEIMER INTERNATIONAL BOND FUND
| | | | | | | | | | |
| | | | | Principal Amount | | | Value | |
Oman—0.4% | | | | | | | | | | |
| Sultanate of Oman, 6.75% Sr. Unsec. Nts., 1/17/481 | | | | $ | 17,365,000 | | | $ | 16,431,631 | |
|
| |
Peru—1.4% | | | | | | | | | | |
| Republic of Peru: | | | | | | | | | | |
| 5.40% Sr. Unsec. Nts., 8/12/341 | | PEN | | | 2,730,000 | | | | 865,084 | |
| 5.94% Sr. Unsec. Nts., 2/12/291 | | PEN | | | 21,000,000 | | | | 7,070,314 | |
| 6.35% Sr. Unsec. Nts., 8/12/281 | | PEN | | | 100,140,000 | | | | 34,647,977 | |
| 6.90% Sr. Unsec. Nts., 8/12/371 | | PEN | | | 31,300,000 | | | | 11,373,255 | |
| | | | | | | | | | |
| | | | | | | | | 53,956,630 | |
|
| |
Russia—2.0% | | | | | | | | | | |
| Russian Federation: | | | | | | | | | | |
| 7.25% Bonds, 5/10/34 | | RUB | | | 650,000,000 | | | | 10,121,879 | |
| Series 6211, 7.00% Bonds, 1/25/23 | | RUB | | | 4,200,000,000 | | | | 65,584,242 | |
| | | | | | | | | | |
| | | | | | | | | 75,706,121 | |
|
| |
Senegal—0.7% | | | | | | | | | | |
| Republic of Senegal, 6.75% Sr. Unsec. Nts., 3/13/481 | | | | | 26,035,000 | | | | 25,157,256 | |
|
| |
Singapore—0.5% | | | | | | | | | | |
| Republic of Singapore, 2.25% Sr. Unsec. Nts., 6/1/21 | | SGD | | | 25,000,000 | | | | 18,273,923 | |
|
| |
South Africa—4.6% | | | | | | | | | | |
| Republic of South Africa: | | | | | | | | | | |
| Series 2030, 8.00% Sr. Unsec. Nts., 1/31/30 | | ZAR | | | 959,000,000 | | | | 59,157,025 | |
| Series 2037, 8.50% Sr. Unsec. Nts., 1/31/37 | | ZAR | | | 421,800,000 | | | | 25,024,728 | |
| Series 2048, 8.75% Sr. Unsec. Nts., 2/28/48 | | ZAR | | | 712,000,000 | | | | 41,587,792 | |
| Series R186, 10.50% Sr. Unsec. Nts., 12/21/26 | | ZAR | | | 459,700,000 | | | | 33,898,512 | |
| Series R214, 6.50% Sr. Unsec. Nts., 2/28/41 | | ZAR | | | 255,000,000 | | | | 11,847,524 | |
| | | | | | | | | | |
| | | | | | | | | 171,515,581 | |
|
| |
Spain—0.7% | | | | | | | | | | |
| Kingdom of Spain: | | | | | | | | | | |
| 0.60% Nts., 10/31/291 | | EUR | | | 16,370,000 | | | | 18,663,307 | |
| 1.85% Sr. Unsec. Nts., 7/30/351 | | EUR | | | 7,105,000 | | | | 9,246,185 | |
| | | | | | | | | | |
| | | | | | | | | 27,909,492 | |
|
| |
Sri Lanka—1.1% | | | | | | | | | | |
| Democratic Socialist Republic of Sri Lanka: | | | | | | | | | | |
| 5.75% Sr. Unsec. Nts., 4/18/231 | | | | | 9,690,000 | | | | 9,632,298 | |
| 5.875% Sr. Unsec. Nts., 7/25/221 | | | | | 8,995,000 | | | | 9,053,381 | |
| 6.25% Sr. Unsec. Nts., 10/4/201 | | | | | 6,130,000 | | | | 6,228,076 | |
| 7.85% Sr. Unsec. Nts., 3/14/291 | | | | | 15,995,000 | | | | 16,115,936 | |
| | | | | | | | | | |
| | | | | | | | | 41,029,691 | |
|
| |
Supranational—0.1% | | | | | | | | | | |
| European Bank for Reconstruction & Development, 6.85% Sr. Unsec. Nts., 6/21/21 | | IDR | | | 60,400,000,000 | | | | 4,289,271 | |
55 INVESCO OPPENHEIMER INTERNATIONAL BOND FUND
CONSOLIDATED SCHEDULE OF INVESTMENTSContinued
| | | | | | | | | | |
| | | | | Principal Amount | | | Value | |
Tajikistan—0.2% | | | | | | | | | | |
| Republic of Tajikistan, 7.125% Sr. Unsec. Nts., 9/14/271 | | | | $ | 9,540,000 | | | $ | 8,435,316 | |
|
| |
Thailand—2.3% | | | | | | | | | | |
| Kingdom of Thailand: | | | | | | | | | | |
| 1.875% Sr. Unsec. Nts., 6/17/22 | | THB | | | 620,000,000 | | | | 20,551,133 | |
| 2.125% Sr. Unsec. Nts., 12/17/26 | | THB | | | 650,000,000 | | | | 22,254,473 | |
| 3.30% Sr. Unsec. Nts., 6/17/38 | | THB | | | 1,030,000,000 | | | | 43,340,460 | |
| | | | | | | | | | |
| | | | | | | | | 86,146,066 | |
|
| |
Turkey—1.4% | | | | | | | | | | |
| Republic of Turkey: | | | | | | | | | | |
| 8.50% Bonds, 9/14/22 | | TRY | | | 71,500,000 | | | | 11,265,650 | |
| 10.70% Bonds, 2/17/21 | | TRY | | | 155,600,000 | | | | 26,714,043 | |
| 12.40% Bonds, 3/8/28 | | TRY | | | 77,000,000 | | | | 13,144,678 | |
| | | | | | | | | | |
| | | | | | | | | 51,124,371 | |
|
| |
Ukraine—0.9% | | | | | | | | | | |
| Ukraine: | | | | | | | | | | |
| 7.75% Sr. Unsec. Nts., 9/1/261 | | | | | 20,340,000 | | | | 21,275,497 | |
| 8.994% Sr. Unsec. Nts., 2/1/241 | | | | | 9,670,000 | | | | 10,633,635 | |
| | | | | | | | | | |
| | | | | | | | | 31,909,132 | |
|
| |
United Arab Emirates—0.1% | | | | | | | | | | |
| United Arab Emirates, 3.125% Sr. Unsec. Nts., 9/30/491 | | | | | 5,070,000 | | | | 4,924,238 | |
|
| |
United Kingdom—2.5% | | | | | | | | | | |
| United Kingdom Gilt, 1.75% Bonds, 1/22/491 | | GBP | | | 62,500,000 | | | | 92,095,904 | |
| | | | | | | | | | |
| Total Foreign Government Obligations (Cost $2,386,513,306) | | | | | | | | | 2,298,646,163 | |
|
| | |
Corporate Bonds and Notes—15.9% | | | | | | | | | | |
Consumer Discretionary—0.4% | | | | | | | | | | |
| |
Auto Components—0.0% | | | | | | | | | | |
| |
| Adler Pelzer Holding GmbH, 4.125% Sr. Sec. Nts., 4/1/241 | | EUR | | | 1,300,000 | | | | 1,327,796 | |
|
| |
Automobiles—0.1% | | | | | | | | | | |
| |
| Aston Martin Capital Holdings Ltd., 6.50% Sr. Sec. Nts., 4/15/221 | | | | | 3,500,000 | | | | 3,097,244 | |
|
| |
Diversified Consumer Services—0.1% | | | | | | | | | | |
| |
| GEMS MENASA Cayman Ltd./GEMS Education Delaware LLC, 7.125% Sr. Sec. Nts., 7/31/261 | | | | | 3,395,000 | | | | 3,513,825 | |
|
| |
Hotels, Restaurants & Leisure—0.2% | | | | | | | | | | |
| |
| Melco Resorts Finance Ltd., 4.875% Sr. Unsec. Nts., 6/6/251 | | | | | 2,500,000 | | | | 2,535,254 | |
| |
| MGM China Holdings Ltd., 5.875% Sr. Unsec. Nts., 5/15/261 | | | | | 2,500,000 | | | | 2,625,000 | |
| | | | | | | | | | |
| | | | | | | | | 5,160,254 | |
56 INVESCO OPPENHEIMER INTERNATIONAL BOND FUND
| | | | | | | | | | |
| | | | | Principal Amount | | | Value | |
| |
Consumer Staples—0.3% | | | | | | | | | | |
| |
Beverages—0.1% | | | | | | | | | | |
| |
Coca-Cola Icecek AS, 4.215% Sr. Unsec. Nts., 9/19/241 | | | | $ | 3,010,000 | | | $ | 3,003,309 | |
|
| |
Food Products—0.2% | | | | | | | | | | |
| |
NBM US Holdings, Inc., 6.625% Sr. Unsec. Nts., 8/6/291 | | | | | 7,275,000 | | | | 7,465,968 | |
|
| |
Energy—3.1% | | | | | | | | | | |
| |
Energy Equipment & Services—0.1% | | | | | | | | | | |
| |
ADES International Holding plc, 8.625% Sr. Sec. Nts., 4/24/241 | | | | | 2,750,000 | | | | 2,746,562 | |
|
| |
Oil, Gas & Consumable Fuels—3.0% | | | | | | | | | | |
| |
Cosan Ltd., 5.50% Sr. Unsec. Nts., 9/20/291 | | | | | 5,835,000 | | | | 5,994,004 | |
| |
| Eterna Capital Pte Ltd., 7.5% PIK Rate, 0.00% Cash Rate, Sr. Sec. Nts., 12/11/221,7 | | | | | 4,558,262 | | | | 4,290,457 | |
| |
| Eterna Capital Pte Ltd., 8% PIK Rate, 0.00% Cash Rate, Sr. Sec. Nts., 12/11/227 | | | | | 11,141,644 | | | | 8,033,125 | |
| |
KazTransGas JSC, 4.375% Sr. Unsec. Nts., 9/26/271 | | | | | 12,065,000 | | | | 12,671,496 | |
| |
MV24 Capital BV, 6.748% Sr. Sec. Nts., 6/1/341 | | | | | 1,910,000 | | | | 1,975,036 | |
| |
Pertamina Persero PT, 3.65% Sr. Unsec. Nts., 7/30/291 | | | | | 5,000,000 | | | | 5,143,763 | |
| |
Petrobras Global Finance BV:
6.85% Sr. Unsec. Nts., 6/5/15 | | | | | 9,255,000 | | | | 10,598,826 | |
| 6.90% Sr. Unsec. Nts., 3/19/49 | | | | | 5,575,000 | | | | 6,405,675 | |
| |
Petroleos Mexicanos:
3.75% Sr. Unsec. Nts., 4/16/261 | | EUR | | | 9,470,000 | | | | 10,382,147 | |
6.49% Sr. Unsec. Nts., 1/23/271 | | | | | 3,000,000 | | | | 3,130,950 | |
6.84% Sr. Unsec. Nts., 1/23/301 | | | | | 8,013,000 | | | | 8,301,067 | |
7.69% Sr. Unsec. Nts., 1/23/501 | | | | | 8,688,000 | | | | 9,081,566 | |
| |
Puma International Financing SA, 5.00% Sr. Unsec. Nts., 1/24/261 | | | | | 7,005,000 | | | | 6,636,850 | |
| |
Reliance Industries Ltd., 6.78% Unsec. Nts., 9/16/20 | | INR | | | 500,000,000 | | | | 7,096,316 | |
| |
Southern Gas Corridor CJSC, 6.875% Sr. Unsec. Nts., 3/24/261 | | | | | 9,720,000 | | | | 11,299,208 | |
| |
YPF SA, 51.625% [BADLARPP+400] Sr. Unsec. Nts., 7/7/201,2 | | | | | 8,000,000 | | | | 1,951,314 | |
| | | | | | | | | | |
| | | | | | | | | 112,991,800 | |
|
| |
Financials—9.3% | | | | | | | | | | |
| |
Capital Markets—2.2% | | | | | | | | | | |
| |
Credit Suisse Group AG:
7.50% [USSW5+460] Jr. Sub. Perpetual Bonds1,2,8 | | | | | 3,500,000 | | | | 3,743,128 | |
7.50% [USSW5+459.8] Jr. Sub. Perpetual Bonds1,2,8 | | | | | 20,000,000 | | | | 22,151,080 | |
| |
Morgan Stanley, 7.50% Sr. Unsec. Nts., 4/2/326 | | | | | 25,000,000 | | | | 21,052,933 | |
| |
UBS Group Funding Switzerland AG:
6.875% [USISDA05+549.65] Jr. Sub. Perpetual Bonds1,2,8 | | | | | 15,520,000 | | | | 16,141,731 | |
7.00% [USSW5+486.6] Jr. Sub. Perpetual Bonds1,2,8 | | | | | 10,500,000 | | | | 11,545,380 | |
7.125% [USSW5+588.3] Jr. Sub. Perpetual Bonds1,2,8 | | | | | 5,000,000 | | | | 5,256,250 | |
| | | | | | | | | | |
| | | | | | | | | 79,890,502 | |
57 INVESCO OPPENHEIMER INTERNATIONAL BOND FUND
CONSOLIDATED SCHEDULE OF INVESTMENTSContinued
| | | | | | | | | | |
| | | | | Principal Amount | | | Value | |
| |
Commercial Banks—4.9% | | | | | | | | | | |
| |
| Banca Monte dei Paschi di Siena SpA, 5.375% [EUSA5+500.5] Sub. Nts., 1/18/281,2 | | EUR | | | 7,500,000 | | | $ | 5,947,383 | |
| |
Banco Bilbao Vizcaya Argentaria SA:
6.00% [EUSA5+603.9] Jr. Sub. Perpetual Bonds1,2,8 | | EUR | | | 5,845,000 | | | | 6,852,393 | |
| 8.875% [EUSA5+917.7] Jr. Sub. Perpetual Bonds1,2,8 | | EUR | | | 10,000,000 | | | | 12,074,575 | |
| |
Banco Comercial Portugues SA:
4.50% [EUSA5+426.7] Sub. Nts., 12/7/271,2 | | EUR | | | 2,500,000 | | | | 2,833,104 | |
| 9.25% [EUSA5+941.4] Jr. Sub. Perpetual Bonds1,2,8 | | EUR | | | 2,500,000 | | | | 2,964,078 | |
| |
| Banco Hipotecario SA, 64.82% [BADLARPP+615] Unsec. Nts., 2/15/212 | | ARS | | | 79,018,000 | | | | 1,097,453 | |
| |
Banco Mercantil del Norte SA (Grand Cayman):
7.50% [H15T10Y+547] Jr. Sub. Perpetual Bonds1,2,8 | | | | | 3,840,000 | | | | 3,902,400 | |
| 7.625% [H15T10Y+535.3] Jr. Sub. Perpetual Bonds1,2,8 | | | | | 2,316,000 | | | | 2,371,028 | |
| |
Banco Santander SA:
5.25% [EUSA5+499.9] Jr. Sub. Perpetual Bonds1,2,8 | | EUR | | | 3,795,000 | | | | 4,278,304 | |
| 6.25% [EUSA5+564] Jr. Sub. Perpetual Bonds1,2,8 | | EUR | | | 2,500,000 | | | | 2,881,555 | |
| |
| Bangkok Bank PCL (Hong Kong), 3.733% [H15T5Y+190] Sub. Nts., 9/25/341,2 | | | | | 5,000,000 | | | | 5,083,579 | |
| |
| Bank of Ireland, 10.00% Sub. Nts., 12/19/221 | | EUR | | | 9,500,000 | | | | 13,263,038 | |
| |
Barclays plc:
2.00% [EUSA5+190] Sub. Nts., 2/7/281,2 | | EUR | | | 5,000,000 | | | | 5,411,000 | |
| 8.00% [H15T5Y+567.2] Jr. Sub. Perpetual Bonds2,8 | | | | | 3,500,000 | | | | 3,724,753 | |
| |
| BBVA Bancomer SA, 5.875% [H15T5Y+430.8] Sub. Nts., 9/13/341,2 | | | | | 7,350,000 | | | | 7,322,437 | |
| |
BNP Paribas SA:
2.139% [US0006M+7.5] Jr. Sub. Perpetual Bonds2,8 | | | | | 5,500,000 | | | | 3,361,875 | |
| 7.625% [USSW5+631.4] Jr. Sub. Perpetual Bonds1,2,8 | | | | | 7,235,000 | | | | 7,626,414 | |
| |
| Caixa Geral de Depositos SA, 1.00%, 1/27/221 | | EUR | | | 3,000,000 | | | | 3,370,793 | |
| |
| CaixaBank SA, 6.75% [EUSA5+649.8] Jr. Sub. Perpetual Bonds1,2,8 | | EUR | | | 9,115,000 | | | | 10,933,301 | |
| |
| Commerzbank AG, 7.00% [USSW5+522.8] Jr. Sub. Perpetual Bonds1,2,8 | | | | | 5,000,000 | | | | 5,160,875 | |
| |
Credit Agricole SA:
6.875% [USSW5+431.9] Jr. Sub. Perpetual Bonds1,2,8 | | | | | 2,500,000 | | | | 2,689,288 | |
| 7.875% [USSW5+489.8] Jr. Sub. Perpetual Bonds1,2,8 | | | | | 5,000,000 | | | | 5,590,625 | |
| |
| Credit Suisse AG, 6.50% Sub. Nts., 8/8/231 | | | | | 5,010,000 | | | | 5,591,481 | |
| |
| Global Bank Corp., 5.25% [US0003M+330] Sr. Unsec. Nts., 4/16/291,2 | | | | | 5,090,000 | | | | 5,405,580 | |
| |
HSBC Holdings plc:
5.25% [EUSA5+438.3] Jr. Sub. Perpetual Bonds1,2,8 | | EUR | | | 4,520,000 | | | | 5,308,383 | |
| 6.00% [EUSA5+533.8] Jr. Sub. Perpetual Bonds1,2,8 | | EUR | | | 5,750,000 | | | | 7,140,323 | |
| |
| Lloyds Bank plc, 7.50% Sr. Unsec. Nts., 4/2/321,6 | | | | | 10,000,000 | | | | 8,290,913 | |
| |
| Novo Banco SA, 8.50% [EUSA5+823.3] Sub. Nts., 7/6/281,2 | | EUR | | | 2,500,000 | | | | 2,927,450 | |
| |
| Societe Generale SA, 7.375% [USSW5+623.8] Jr. Sub. Perpetual Bonds1,2,8 | | | | | 11,100,000 | | | | 11,706,060 | |
| |
| Standard Chartered Bank, 5.375% [BP0003M+189] Jr. Sub. Perpetual Bonds2,8 | | GBP | | | 4,000,000 | | | | 5,021,974 | |
| |
Standard Chartered plc:
7.50% [USSW5+630.1] Jr. Sub. Perpetual Bonds1,2,8 | | | | | 5,460,000 | | | | 5,780,775 | |
58 INVESCO OPPENHEIMER INTERNATIONAL BOND FUND
| | | | | | | | | | |
| | | | | Principal Amount | | | Value | |
| |
Commercial Banks (Continued) | | | | | | | | | | |
| |
Standard Chartered plc: (Continued)
7.75% [USSW5+572.3] Jr. Sub. Perpetual Bonds1,2,8 | | | | $ | 7,500,000 | | | $ | 8,110,013 | |
| | | | | | | | | | |
| | | | | | | | | 184,023,203 | |
|
| |
Diversified Financial Services—1.2% | | | | | | | | | | |
| |
| Astana Finance JSC, 9.16% Sr. Unsec. Nts., 12/22/243,9 | | | | | 612,810 | | | | — | |
| |
| Banco Invex SA/Hipotecaria Credito y Casa SA de CV, 6.45%, 3/13/343,5,9 | | MXN | | | 27,602,566 | | | | — | |
| |
| Caixa Geral de Depositos SA, 10.75% [EUSA5+1092.5] Jr. Sub. Perpetual Bonds1,2,8 | | EUR | | | 7,000,000 | | | | 8,888,618 | |
| |
| Docuformas SAPI de CV, 10.25% Sr. Unsec. Nts., 7/24/241 | | | | | 1,800,000 | | | | 1,781,010 | |
| |
| Fideicomiso PA Costera, 6.25% Sr. Sec. Nts., 1/15/341,5 | | COP | | | 5,916,031,565 | | | | 1,802,036 | |
| |
| Greenko Mauritius Ltd., 6.25% Sr. Unsec. Nts., 2/21/231 | | | | | 5,000,000 | | | | 5,072,981 | |
| |
| JP Morgan/Hipotecaria su Casita, 6.47%, 8/26/351 | | MXN | | | 34,101,099 | | | | 190,276 | |
| |
| National Bank for Agriculture & Rural Development, 8.39% Sr. Unsec. Nts., 7/19/21 | | INR | | | 300,000,000 | | | | 4,335,326 | |
| |
Power Finance Corp. Ltd.:
7.42% Sr. Unsec. Nts., 6/26/20 | | INR | | | 350,000,000 | | | | 4,958,290 | |
| 7.99% Sr. Unsec. Nts., 12/20/22 | | INR | | | 400,000,000 | | | | 5,790,023 | |
| 8.53% Sr. Unsec. Nts., 7/24/20 | | INR | | | 330,000,000 | | | | 4,736,416 | |
| |
| REC Ltd., 9.04% Sr. Unsec. Nts., 10/12/19 | | INR | | | 250,000,000 | | | | 3,529,361 | |
| |
| Swiss Insured Brazil Power Finance Sarl, 9.85% Sr. Sec. Nts., 7/16/321 | | BRL | | | 17,500,000 | | | | 4,780,442 | |
| | | | | | | | | | |
| | | | | | | | | 45,864,779 | |
|
| |
Insurance—0.3% | | | | | | | | | | |
| |
| Caisse Nationale de Reassurance Mutuelle Agricole Groupama, 6.375% [EUR003M+577] Jr. Sub. Perpetual Bonds1,2,8 | | EUR | | | 5,000,000 | | | | 6,368,741 | |
| |
| VIVAT NV, 6.25% [USSW5+417.4] Jr. Sub. Perpetual Bonds1,2,8 | | | | | 5,000,000 | | | | 5,021,615 | |
| | | | | | | | | | |
| | | | | | | | | 11,390,356 | |
|
| |
Real Estate Management & Development—0.5% | | | | | | | | | | |
| |
| Agile Group Holdings Ltd., 9.00% Sr. Sec. Nts., 5/21/201 | | | | | 10,770,000 | | | | 10,996,830 | |
| |
| Country Garden Holdings Co. Ltd., 7.50% Sr. Sec. Nts., 3/9/201 | | | | | 3,280,000 | | | | 3,330,840 | |
| |
| Times China Holdings Ltd., 6.25% Sr. Sec. Nts., 1/23/201 | | | | | 3,280,000 | | | | 3,291,746 | |
| | | | | | | | | | |
| | | | | | | | | 17,619,416 | |
|
| |
Thrifts & Mortgage Finance—0.2% | | | | | | | | | | |
| |
Housing Development Finance Corp. Ltd.:
8.75% Sr. Sec. Nts., 1/13/20 | | INR | | | 330,000,000 | | | | 4,683,800 | |
| 8.95% Sec. Nts., 10/19/20 | | INR | | | 125,000,000 | | | | 1,807,674 | |
| | | | | | | | | | |
| | | | | | | | | 6,491,474 | |
|
| |
Industrials—0.6% | | | | | | | | | | |
| |
Airlines—0.1% | | | | | | | | | | |
| |
Gol Finance SA, 7.00% Sr. Unsec. Nts., 1/31/251 | | | | | 3,245,000 | | | | 3,180,100 | |
59 INVESCO OPPENHEIMER INTERNATIONAL BOND FUND
CONSOLIDATED SCHEDULE OF INVESTMENTSContinued
| | | | | | | | | | |
| | | | | Principal Amount | | | Value | |
| |
Construction & Engineering—0.2% | | | | | | | | | | |
| |
| Fideicomiso PA Concesion Ruta al Mar, 6.75% Sr. Sec. Nts., 2/15/441,5 | | COP | | | 8,000,000,000 | | | $ | 2,255,667 | |
| |
| GMR Hyderabad International Airport Ltd., 4.25% Sr. Sec. Nts., 10/27/271 | | | | | 6,495,000 | | | | 6,039,903 | |
| | | | | | | | | | |
| | | | | | | | | 8,295,570 | |
| |
Industrial Conglomerates—0.1% | | | | | | | | | | |
| |
| Turkiye Sise ve Cam Fabrikalari AS, 6.95% Sr. Unsec. Nts., 3/14/261 | | | | | 4,090,000 | | | | 4,216,259 | |
| |
Machinery—0.1% | | | | | | | | | | |
| |
| IHS Netherlands Holdco BV, 8.00% Sr. Unsec. Nts., 9/18/271 | | | | | 2,900,000 | | | | 2,968,875 | |
| |
Road & Rail—0.1% | | | | | | | | | | |
| |
| Indian Railway Finance Corp. Ltd., 8.83% Sr. Sec. Nts., 3/25/23 | | INR | | | 250,000,000 | | | | 3,675,233 | |
| |
Information Technology—0.1% | | | | | | | | | | |
| |
Communications Equipment—0.1% | | | | | | | | | | |
| |
| Reliance Jio Infocomm Ltd., 8.32% Sec. Nts., 7/8/21 | | INR | | | 335,000,000 | | | | 4,868,231 | |
| |
Materials—1.1% | | | | | | | | | | |
| |
Chemicals—0.1% | | | | | | | | | | |
| |
| Unigel Luxembourg SA, 8.75% Sr. Unsec. Nts., 10/1/261 | | | | | 2,900,000 | | | | 2,900,000 | |
| |
Construction Materials—0.1% | | | | | | | | | | |
| |
| CIMPOR Financial Operations BV, 5.75% Sr. Unsec. Nts., 7/17/241 | | | | | 8,400,000 | | | | 6,321,000 | |
| |
Metals & Mining—0.9% | | | | | | | | | | |
| |
| Corp. Nacional del Cobre de Chile, 3.00% Sr. Unsec. Nts., 9/30/291 | | | | | 4,050,000 | | | | 4,040,361 | |
| |
CSN Resources SA: | | | | | | | | | | |
| 7.625% Sr. Unsec. Nts., 2/13/231 | | | | | 6,000,000 | | | | 6,277,500 | |
| 7.625% Sr. Unsec. Nts., 4/17/261 | | | | | 5,000,000 | | | | 5,200,575 | |
| |
| Industrias Penoles SAB de CV, 5.65% Sr. Unsec. Nts., 9/12/491 | | | | | 1,800,000 | | | | 1,866,960 | |
| |
JSW Steel Ltd.: | | | | | | | | | | |
| 4.75% Sr. Unsec. Nts., 11/12/191 | | | | | 6,330,000 | | | | 6,337,172 | |
| 5.95% Sr. Unsec. Nts., 4/18/241 | | | | | 3,895,000 | | | | 4,027,376 | |
| |
| Southern Copper Corp., 7.50% Sr. Unsec. Nts., 7/27/35 | | | | | 3,550,000 | | | | 4,765,875 | |
| | | | | | | | | | |
| | | | | | | | | 32,515,819 | |
| |
Telecommunication Services—0.4% | | | | | | | | | | |
| |
Diversified Telecommunication Services—0.3% | | | | | | | | | | |
| |
| Axtel SAB de CV, 6.375% Sr. Unsec. Nts., 11/14/241 | | | | | 5,000,000 | | | | 5,162,550 | |
| |
| HTA Group Ltd., 9.125% Sr. Unsec. Nts., 3/8/221 | | | | | 3,170,000 | | | | 3,313,538 | |
60 INVESCO OPPENHEIMER INTERNATIONAL BOND FUND
| | | | | | | | | | |
| | | | | Principal Amount | | | Value | |
| |
Diversified Telecommunication Services (Continued) | | | | | | | | | | |
| |
| Oi SA, 10% Cash Rate or 4% PIK Rate and 8% Cash Rate, Sr. Unsec. Nts., 7/27/257 | | | | $ | 4,973,000 | | | $ | 4,575,657 | |
| | | | | | | | | | |
| | | | | | | | | 13,051,745 | |
| |
Wireless Telecommunication Services—0.1% | | | | | | | | | | |
| |
| Bharti Airtel Ltd., 4.375% Sr. Unsec. Nts., 6/10/251 | | | | | 3,195,000 | | | | 3,309,752 | |
| |
Utilities—0.6% | | | | | | | | | | |
| |
Electric Utilities—0.3% | | | | | | | | | | |
| |
| Empresa de Transmision Electrica SA, 5.125% Sr. Unsec. Nts., 5/2/491 | | | | | 4,440,000 | | | | 5,125,425 | |
| |
| Eskom Holdings SOC Ltd., 7.125% Sr. Unsec. Nts., 2/11/251 | | | | | 5,000,000 | | | | 5,160,135 | |
| | | | | | | | | | |
| | | | | | | | | 10,285,560 | |
| |
Independent Power and Renewable Electricity Producers—0.3% | | | | | | | | |
| |
| AES Andres BV/Dominican Power Partners/Empresa Generadora de Electricidad Itabo SA, 7.95% Sr. Unsec. Nts., 5/11/261 | | | | | 3,325,000 | | | | 3,553,594 | |
| |
| Azure Power Solar Energy Pvt Ltd., 5.65% Sr. Sec. Nts., 12/24/241 | | | | | 2,000,000 | | | | 2,008,500 | |
| |
| Inkia Energy Ltd., 5.875% Sr. Unsec. Nts., 11/9/271 | | | | | 5,865,000 | | | | 6,106,990 | |
| | | | | | | | | | |
| | | | | | | | | 11,669,084 | |
| | | | | | | | | | |
| Total Corporate Bonds and Notes (Cost $612,520,205) | | | | | | | | | 591,843,716 | |
| | | |
| | | | | Shares | | | | |
Common Stock—0.0% | | | | | | | | | | |
| JSC Astana Finance, GDR1,9,10(Cost $0, Acquisition date 6/5/15) | | | | | 868,851 | | | | — | |
| | | |
| | | | | Principal Amount | | | | |
Structured Securities—0.5% | | | | | | | | | | |
Deutsche Bank AG, Coriolanus Ltd. Sec. Credit Linked Bonds: | | | | | | | | | | |
| 3.003% Sr. Sec. Nts., 4/30/251,4 | | | | | 1,982,242 | | | | 1,911,082 | |
| 3.054% Sr. Sec. Nts., 4/30/251,4 | | | | | 2,525,682 | | | | 2,435,013 | |
| 3.098% Sr. Sec. Nts., 4/30/251,4 | | | | | 2,180,522 | | | | 2,102,243 | |
| 3.131% Sr. Sec. Nts., 4/30/251,4 | | | | | 1,949,112 | | | | 1,879,141 | |
| 3.179% Sr. Sec. Nts., 4/30/251,4 | | | | | 2,426,802 | | | | 2,339,683 | |
| 3.231% Sr. Sec. Nts., 4/30/251,4 | | | | | 2,769,826 | | | | 2,670,392 | |
| 3.265% Sr. Sec. Nts., 4/30/251,4 | | | | | 2,212,767 | | | | 2,133,331 | |
| 3.346% Sr. Sec. Nts., 4/30/251,4 | | | | | 2,079,907 | | | | 2,005,241 | |
| |
| Morgan Stanley, Russian Federation Total Return Linked Bonds, Series 007, Cl. VR, 5.00%, 8/22/349 | | RUB | | | 110,785,361 | | | | 248,271 | |
| | | | | | | | | | |
Total Structured Securities (Cost $19,449,800) | | | | | | | | | 17,724,397 | |
Short-Term Notes—8.4% | | | | | | | | | | |
Arab Republic of Egypt Treasury Bills: | | | | | | | | | | |
| 15.585%, 3/17/204 | | EGP | | | 81,000,000 | | | | 4,678,367 | |
| 16.866%, 10/22/194 | | EGP | | | 92,000,000 | | | | 5,613,864 | |
| |
| Argentine Republic Treasury Bills, 5.106%, 5/29/204 | | ARS | | | 455,700,000 | | | | 3,509,861 | |
| |
United States Treasury Bills: | | | | | | | | | | |
| 1.873%, 10/17/194,11,12 | | | | | 200,000,000 | | | | 199,841,852 | |
61 INVESCO OPPENHEIMER INTERNATIONAL BOND FUND
CONSOLIDATED SCHEDULE OF INVESTMENTSContinued
| | | | | | | | | | | | |
| | | | | | Principal Amount | | | Value | |
Short-Term Notes (Continued) | | | | | | | | | | | | |
United States Treasury Bills: (Continued) 1.948%, 11/14/194,12 | | | | | | $ | 100,000,000 | | | $ | 99,780,306 | |
| | | | | | | | | | | | |
| Total Short-Term Notes (Cost $320,438,523) | | | | | | | | | | | 313,424,250 | |
| | | | | | | | | | | | | | | | | | | | |
| | | | | Exercise
Price | | Expiration
Date | | | Notional
Amount
(000’s) | | | Contracts
(000’s) | | | | |
Exchange-Traded Options Purchased—0.1% | | | | | | | | | | | | | | | | |
| | | | | | | | | | | | | EUR | | | | |
| Euro-Bund Futures Put | | EUR | | 170.000 | | 10/25/19 | | | EUR
136,000 | | | 1 | | | 26,159 | |
| | | | | | | | | | | | | USD | | | | |
S&P 500 Index Put | | USD | | 2,675.000 | | | 3/20/20 | | | | USD 94,695 | | | | 013 | | | | 1,938,150 | |
| | | | | | | | | | | | | USD | | | | |
S&P 500 Index Put | | USD | | 2,625.000 | | | 2/21/20 | | | | USD 49,350 | | | | 013 | | | | 709,700 | |
| | | | | | | | | | | | | | | | | | | | |
| Total Exchange-Traded Options Purchased (Cost $4,373,898) | | | | | | | | | | | | 2,674,009 | |
| | | | | | | | | | | | | | | | | | | | | | |
| | | Counterparty | | | | Exercise
Price | | Expiration
Date | | | Notional
Amount
(000’s) | | | | | | | |
Over-the-Counter Options Purchased—0.6% | | | | | | | | | | | | | | | | |
| | | | | | | | | | | | | | | BRL | | | | |
| | | | | | | |
| BRL Currency Call | | CITNA-B | | BRL | | 3.861 | | 11/18/19 | | | BRL 193,025 | | | 193,025 | | | 50,739 | |
| | | | | | | | | | | | | | | BRL | | | | |
| | | | | | | |
| BRL Currency Call | | MSCO | | BRL | | 3.750 | | 8/27/20 | | | BRL 20,000 | | | 20,000 | | | 1,689,096 | |
| | | | | | | | | | | | | | | BRL | | | | |
| | | | | | | |
| BRL Currency Call14 | | JPM | | BRL | | 3.200 | | 10/17/19 | | | BRL 5,000 | | | 5,000 | | | — | |
| | | | | | | | | | | | | | | BRL | | | | |
| | | | | | | |
| BRL Currency Call | | JPM | | BRL | | 3.918 | | 11/19/19 | | | BRL 195,900 | | | 195,900 | | | 103,590 | |
| | | | | | | | | | | | | | | BRL | | | | |
| | | | | | | |
| BRL Currency Call | | GSCO-OT | | BRL | | 3.513 | | 10/30/19 | | | BRL 351,250 | | | 351,250 | | | — | |
| | | | | | | | | | | | | | | BRL | | | | |
| | | | | | | |
| BRL Currency Call | | SCB | | BRL | | 3.508 | | 11/1/19 | | | BRL 350,800 | | | 350,800 | | | 351 | |
| | | | | | | | | | | | | | | BRL | | | | |
| | | | | | | |
| BRL Currency Put | | GSCO-OT | | BRL | | 3.350 | | 12/6/19 | | | BRL 3,000 | | | 3,000 | | | 180 | |
| | | | | | | | | | | | | | | BRL | | | | |
| | | | | | | |
| BRL Currency Put | | GSCO-OT | | BRL | | 3.400 | | 12/10/19 | | | BRL 3,000 | | | 3,000 | | | 839 | |
| | | | | | | | | | | | | | | BRL | | | | |
| | | | | | | |
| BRL Currency Put | | GSCO-OT | | BRL | | 3.430 | | 3/30/20 | | | BRL 5,000 | | | 5,000 | | | 124,415 | |
| | | | | | | | | | | | | | | BRL | | | | |
| | | | | | | |
| BRL Currency Put | | GSCO-OT | | BRL | | 3.432 | | 3/27/20 | | | BRL 5,000 | | | 5,000 | | | 121,753 | |
62 INVESCO OPPENHEIMER INTERNATIONAL BOND FUND
| | | | | | | | | | | | | | |
| | | Counterparty | | | | Exercise
Price | | Expiration
Date | | Notional
Amount
(000’s) | | Contracts
(000’s) | | Value |
Over-the-Counter Options Purchased (Continued) | | | | | | |
BRL Currency Put | | GSCO-OT | | BRL | | 3.430 | | 3/30/20 | | BRL 5,000 | | BRL 5,000 | | $ 124,415 |
| | | | | | | | | | | | EUR | | |
| | | | | | | |
EUR Currency Call | | BOA | | USD | | 1.153 | | 12/17/19 | | EUR 250,000 | | 250,000 | | 145,850 |
| | | | | | | | | | | | EUR | | |
| | | | | | | |
EUR Currency Put | | SCB | | IDR | | 15760.000 | | 1/17/20 | | EUR 37,500 | | 37,500 | | 593,151 |
| | | | | | | | | | | | EUR | | |
| | | | | | | |
EUR Currency Put | | JPM | | ZAR | | 15.720 | | 1/23/20 | | EUR 50,000 | | 50,000 | | 354,301 |
| | | | | | | | | | | | EUR | | |
| | | | | | | |
EUR Currency Put | | JPM | | NOK | | 8.200 | | 11/27/19 | | EUR 5,000 | | 5,000 | | — |
| | | | | | | | | | | | EUR | | |
| | | | | | | |
EUR Currency Put | | GSCO-OT | | INR | | 74.875 | | 8/5/20 | | EUR 5,000 | | 5,000 | | 2,533,014 |
| | | | | | | | | | | | EUR | | |
| | | | | | | |
EUR Currency Call | | CITNA-B | | USD | | 1.178 | | 10/3/19 | | EUR 300,000 | | 300,000 | | — |
| | | | | | | | | | | | EUR | | |
| | | | | | | |
EUR Currency Put | | JPM | | NOK | | 8.900 | | 8/26/21 | | EUR 12,500 | | 12,500 | | 1,859,969 |
| | | | | | | | | | | | EUR | | |
| | | | | | | |
EUR Currency Call | | BOA | | USD | | 1.170 | | 10/31/19 | | EUR 300,000 | | 300,000 | | 1,593 |
| | | | | | | | | | | | EUR | | |
| | | | | | | |
EUR Currency Put | | BOA | | JPY | | 96.000 | | 10/25/19 | | EUR 100,000 | | 100,000 | | 446 |
| | | | | | | | | | | | EUR | | |
| | | | | | | |
EUR Currency Put | | CITNA-B | | JPY | | 96.000 | | 10/31/19 | | EUR 100,000 | | 100,000 | | 735 |
| | | | | | | | | | | | EUR | | |
| | | | | | | |
EUR Currency Put | | BOA | | NOK | | 8.200 | | 11/27/19 | | EUR 5,000 | | 5,000 | | — |
| | | | | | | | | | | | EUR | | |
| | | | | | | |
EUR Currency Put | | JPM | | SEK | | 9.250 | | 4/29/20 | | EUR 10,000 | | 10,000 | | 4,724 |
| | | | | | | | | | | | EUR | | |
| | | | | | | |
EUR Currency Put | | GSCO-OT | | NOK | | 8.710 | | 12/17/20 | | EUR 12,500 | | 12,500 | | 491,727 |
| | | | | | | | | | | | EUR | | |
| | | | | | | |
EUR Currency Put | | GSCO-OT | | NOK | | 8.402 | | 12/17/20 | | EUR 12,500 | | 12,500 | | 124,780 |
| | | | | | | | | | | | IDR | | |
| | | | | | | |
IDR Currency Call | | JPM | | IDR | | 13885.000 | | 1/20/20 | | IDR 694,250,000 | | 694,250,000 | | 138,850 |
| | | | | | | | | | | | INR | | |
| | | | | | | |
INR Currency Put | | GSCO-OT | | INR | | 65.600 | | 5/6/20 | | INR 2,500 | | 2,500 | | 154,300 |
63 INVESCO OPPENHEIMER INTERNATIONAL BOND FUND
CONSOLIDATED SCHEDULE OF INVESTMENTSContinued
| | | | | | | | | | | | | | |
| | | Counterparty | | | | Exercise
Price | | Expiration
Date | | Notional
Amount
(000’s) | | Contracts
(000’s) | | Value |
| Over-the-Counter Options Purchased (Continued) | | | | | | |
| | | | | | | | | | | | INR | | |
| | | | | | | |
INR Currency Put | | JPM | | INR | | 66.092 | | 4/29/20 | | INR 5,000 | | 5,000 | | $ 407,618 |
| | | | | | | | | | | | KRW | | |
| | | | | | | |
KRW Currency Call | | GSCO-OT | | KRW | | 1159.700 | | 1/17/20 | | KRW 57,985,000 | | 57,985,000 | | 231,940 |
| | | | | | | | | | | | MXN | | |
| | | | | | | |
MXN Currency Put | | JPM | | MXN | | 19.655 | | 11/26/19 | | MXN 471,720 | | 471,720 | | 531,907 |
| | | | | | | | | | | | MXN | | |
| | | | | | | |
MXN Currency Call15 | | CITNA-B | | MXN | | 18.000 | | 10/23/19 | | MXN 2,500 | | 2,500 | | 1,302 |
| | | | | | | | | | | | MXN | | |
| | | | | | | |
MXN Currency Call | | CITNA-B | | MXN | | 19.380 | | 8/5/20 | | MXN 726,750 | | 726,750 | | 545,157 |
| | | | | | | | | | | | MXN | | |
| | | | | | | |
MXN Currency Call | | JPM | | MXN | | 19.655 | | 11/26/19 | | MXN 471,720 | | 471,720 | | 206,793 |
| | | | | | | | | | | | MXN | | |
| | | | | | | |
MXN Currency Call | | CITNA-B | | MXN | | 19.350 | | 6/2/20 | | MXN 967,500 | | 967,500 | | 611,479 |
| | | | | | | | | | | | MXN | | |
| | | | | | | |
MXN Currency Call | | GSCO-OT | | MXN | | 19.558 | | 7/21/20 | | MXN 1,980,197 | | 1,980,197 | | 1,691,484 |
| | | | | | | | | | | | MXN | | |
| | | | | | | |
MXN Currency Call | | CITNA-B | | MXN | | 18.905 | | 5/21/20 | | MXN 1,890,500 | | 1,890,500 | | 693,038 |
| | | | | | | | | | | | MXN | | |
| | | | | | | |
MXN Currency Call | | JPM | | MXN | | 19.375 | | 6/2/20 | | MXN 968,750 | | 968,750 | | 628,496 |
| | | | | | | | | | | | PHP | | |
| | | | | | | |
PHP Currency Call | | GSCO-OT | | PHP | | 51.000 | | 11/11/19 | | PHP 3,825,000 | | 3,825,000 | | 109,395 |
| | | | | | | | | | | | RUB | | |
| | | | | | | |
RUB Currency Put | | GSCO-OT | | RUB | | 58.500 | | 8/4/20 | | RUB 5,500 | | 5,500 | | 984,320 |
| | | | | | | | | | | | RUB | | |
| | | | | | | |
RUB Currency Put | | JPM | | RUB | | 59.000 | | 8/5/20 | | RUB 5,500 | | 5,500 | | 1,167,473 |
| | | | | | | | | | | | RUB | | |
| | | | | | | |
RUB Currency Call | | GSCO-OT | | RUB | | 62.000 | | 4/8/20 | | RUB 7,750,000 | | 7,750,000 | | 625,735 |
| | | | | | | | | | | | RUB | | |
| | | | | | | |
RUB Currency Call | | GSCO-OT | | RUB | | 60.000 | | 12/18/19 | | RUB 5,700,000 | | 5,700,000 | | 22,629 |
| | | | | | | | | | | | RUB | | |
| | | | | | | |
RUB Currency Put | | GSCO-OT | | RUB | | 57.300 | | 3/30/20 | | RUB 10,000 | | 10,000 | | 421,908 |
| | | | | | | | | | | | USD | | |
| | | | | | | |
S&P 500 Index Put | | BOA | | USD | | 2632.590 | | 2/21/20 | | USD 49,493 | | 013 | | 756,858 |
64 INVESCO OPPENHEIMER INTERNATIONAL BOND FUND
| | | | | | | | | | | | | | |
| | | Counterparty | | | | Exercise
Price | | Expiration
Date | | Notional
Amount
(000’s) | | Contracts
(000’s) | | Value |
| Over-the-Counter Options Purchased (Continued) | | | | | | |
| | | | | | | | | | | | SGD | | |
| | | | | | | |
SGD Currency Put | | GSCO-OT | | CNH | | 5.050 | | 10/21/19 | | SGD 75,000 | | 75,000 | | $ 15,434 |
| | | | | | | | | | | | ZAR | | |
| | | | | | | |
ZAR Currency Call | | GSCO-OT | | ZAR | | 13.613 | | 1/27/20 | | ZAR 680,625 | | 680,625 | | 101,447 |
| | | | | | | | | | | | ZAR | | |
| | | | | | | |
ZAR Currency Call | | GSCO-OT | | ZAR | | 14.500 | | 7/23/20 | | ZAR 1,413,750 | | 1,413,750 | | 2,000,103 |
| | | | | | | | | | | | | | |
TotalOver-the-Counter Options Purchased (Cost $52,330,325) | | | | | | 20,373,334 |
| | | | | | | | | | | | | | |
| | | Counterparty | | Buy /Sell
Protection | | Reference Asset | | Fixed Rate | | Expiration
Date | | Notional
Amount
(000’s) | | |
Over-the-Counter Credit Default Swaptions Purchased—0.0% | | | | |
| Credit Default Swap maturing 6/20/24 Call | | JPM | | Sell | | iTraxx Europe Crossover Series 31 Version 1 | | 3.00% | | 12/18/19 | | EUR 50,000 | | 378,017 |
| Credit Default Swap maturing 6/20/24 Put | | JPM | | Buy | | iTraxx Europe Crossover Series 31 Version 1 | | 3.00 | | 12/18/19 | | EUR 50,000 | | 623,479 |
| | | | | | | | | | | | | | |
| TotalOver-the-Counter Credit Default Swaptions Purchased (Cost $1,338,078) | | | | | | 1,001,496 |
| | | | | | | | | | | | | | |
| | | Counterparty | | Pay/Receive
Floating Rate | | Floating Rate | | Fixed Rate | | Expiration
Date | | Notional
Amount
(000’s) | | |
Over-the-Counter Interest Rate Swaptions Purchased—0.9% | | | | |
| Interest Rate Swap maturing 1/9/20 Call | | GSCOI | | Pay | | Three-Month USD BBA LIBOR | | 1.600% | | 1/9/20 | | USD 384,100 | | 1,397,310 |
| Interest Rate Swap maturing 11/14/19 Put | | JPM | | Receive | | Three-Month USD BBA LIBOR | | 1.865 | | 11/14/19 | | USD 40,000 | | 478,790 |
| Interest Rate Swap maturing 3/27/20 Put | | MSCO | | Receive | | Six-Month EUR EURIBOR | | 0.434 | | 3/27/20 | | EUR 187,500 | | 235,425 |
| Interest Rate Swap Maturing 3/29/21 Put | | JPM | | Receive | | Six-Month EUR EURIBOR | | 1.122 | | 3/29/21 | | EUR 1,500,000 | | 139,296 |
65 INVESCO OPPENHEIMER INTERNATIONAL BOND FUND
CONSOLIDATED SCHEDULE OF INVESTMENTSContinued
| | | | | | | | | | | | | | | | | | |
| | | | | Pay/Receive
Floating | | Floating | | Fixed | | | Expiration | | | Notional
Amount | | |
| | | Counterparty | | Rate | | Rate | | Rate | | | Date | | | (000’s) | | Value |
Over-the-Counter Interest Rate Swaptions Purchased (Continued) |
| Interest Rate Swap Maturing 3/30/20 Put | | BOA | | Receive | | Three- Month CAD BA CDOR | | | 2.588% | | | | 3/30/20 | | | CAD
1,333,000 | | $ 1,265,970 |
| Interest Rate Swap Maturing 4/12/21 Put | | JPM | | Receive | | Six-Month EUR EURIBOR | | | 0.615 | | | | 4/12/21 | | | EUR
500,000 | | 9,515 |
| Interest Rate Swap Maturing 4/6/21 Put | | JPM | | Receive | | Six-Month EUR EURIBOR | | | 0.608 | | | | 4/6/21 | | | EUR
500,000 | | 9,270 |
| Interest Rate Swap maturing 8/16/24 Put | | JPM | | Receive | | Six-Month EUR EURIBOR | | | 2.098 | | | | 8/16/24 | | | EUR
100,000 | | 1,449,012 |
| Interest Rate Swap maturing 8/17/20 Put | | MSCO | | Receive | | Three-Month USD BBA LIBOR | | | 1.695 | | | | 8/17/20 | | | USD
116,000 | | 2,063,739 |
| Interest Rate Swap maturing 8/17/20 Put | | JPM | | Receive | | Three-Month USD BBA LIBOR | | | 2.500 | | | | 8/17/20 | | | USD
500,000 | | 3,904,885 |
| Interest Rate Swap maturing 8/17/20 Put | | GSCOI | | Receive | | Three-Month USD BBA LIBOR | | | 2.500 | | | | 8/17/20 | | | USD
250,000 | | 1,952,442 |
| Interest Rate Swap maturing 8/26/20 Put | | MSCO | | Receive | | Three-Month USD BBA LIBOR | | | 2.500 | | | | 8/26/20 | | | USD
750,000 | | 1,586,310 |
Interest Rate Swap maturing 9/17/77 Put | | JPM | | Pay | | Six-Month EUR EURIBOR | | | 1.600 | | | | 9/15/37 | | | EUR
160,000 | | 18,973,139 |
TotalOver-the-Counter Interest Rate Swaptions Purchased
(Cost $61,542,723) | | | | | | | | | 33,465,103 |
| | | | | | | | |
| | | Shares | | | | |
Investment Companies—5.8% | | | | | | | | |
Invesco Government & Agency Portfolio, Institutional Class, 1.83%16 | | | 212,617,419 | | | | 212,617,419 | |
OFI Carlyle Private Credit Fund, Cl. I17 | | | 328,742 | | | | 3,151,903 | |
| | | | | | | | |
Total Investment Companies (Cost $215,837,538) | | | | | | | 215,769,322 | |
Total Investments, at Value (Cost $3,860,382,345) | | | 98.7% | | | | 3,673,969,450 | |
Net Other Assets (Liabilities) | | | 1.3 | | | | 49,532,875 | |
| | | | |
Net Assets | | | 100.0% | | | $ | 3,723,502,325 | |
| | | | |
66 INVESCO OPPENHEIMER INTERNATIONAL BOND FUND
Footnotes to Consolidated Statement of Investments
1. Security purchased or received in a transaction exempt from registration under the Securities Act of 1933, as amended (the “1933 Act”). The security may be resold pursuant to an exemption from registration under the 1933 Act, typically to qualified institutional buyers. The aggregate value of these securities at September 30, 2019 was $1,413,437,445, which represented 37.96% of the Fund’s Net Assets.
2. Represents the current interest rate for a variable or increasing rate security, which may be fixed for a predetermined period. The interest rate is, or will be as of an established date, determined as [Referenced Rate + Basis-point spread].
3. This security is not accruing income because its issuer has missed or is expected to miss interest and/or principal payments. The rate shown is the contractual interest rate.
4. Zero coupon bond reflects effective yield on the original acquisition date.
5. Denotes an inflation-indexed security: coupon or principal are indexed to a consumer price index.
6. This interest rate resets periodically. Interest rate shown reflects the rate in effect at period end. The rate on this variable rate security is not based on a published reference rate and spread but is determined by the issuer or agent based on current market conditions.
7. Interest or dividend ispaid-in-kind, when applicable.
8. This bond has no contractual maturity date, is not redeemable and contractually pays an indefinite stream of interest.
9. The value of this security was determined using significant unobservable inputs. See Note 3 of the accompanying Consolidated Notes.
10.Non-income producing security.
11. All or a portion of the security position is held in accounts at a futures clearing merchant and pledged to cover margin requirements on open futures contracts and written options on futures, if applicable. The aggregate market value of such securities is $5,295,809. See Note 4 of the accompanying Consolidated Notes.
12. All or a portion of the security position is held in segregated accounts and pledged to cover margin requirements under certain derivative contracts. The aggregate market value of such securities is $116,608,350. See Note 4 of the accompanying Consolidated Notes.
13. Number of contracts are less than 500.
14.One-Touch Binary option becomes eligible for exercise if at any time spot rates are less than or equal to 3.2 BRL per 1 USD.
15.One-Touch Binary option becomes eligible for exercise if at any time spot rates are less than or equal to 18 MXN per 1 USD.
16. The money market fund and the Fund are affiliated by having the same investment adviser. The rate shown is the7-day SEC standardized yield as of September 30, 2019.
17. Is or was an affiliate, as defined in the Investment Company Act of 1940, as amended, at or during the reporting period, by virtue of the Fund owning at least 5% of the voting securities of the issuer or as a result of the Fund and the issuer having the same investment adviser. Transactions during the reporting period in which the issuer was an affiliate are as follows:
| | | | | | | | | | | | | | | | |
| | | Shares
September 30,
2018 | | | Gross
Additions | | | Gross
Reductions | | | Shares
September 30,
2019 | |
Investment Company | | | | | | | | | | | | | | | | |
OFI Carlyle Private Credit Fund, Cl. I | | | — | | | | 328,742 | | | | — | | | | 328,742 | |
| | | | |
| | | Value | | | Income | | | Realized
Gain (Loss) | | | Change in
Unrealized
Gain (Loss) | |
Investment Company | | | | | | | | | | | | | | | | |
OFI Carlyle Private Credit Fund, Cl. I | | $ | 3,151,903 | | | $ | 185,794 | | | $ | — | | | $ | (68,216 | ) |
67 INVESCO OPPENHEIMER INTERNATIONAL BOND FUND
CONSOLIDATED SCHEDULE OF INVESTMENTSContinued
Distribution of investments representing geographic holdings, as a percentage of total investments at value, is as follows:
| | | | | | | | |
| Geographic Holdings (Unaudited) | | Value | | | Percent | |
United States | | $ | 551,380,039 | | | | 15.1 | % |
India | | | 395,998,105 | | | | 10.7 | |
Mexico | | | 317,534,551 | | | | 8.6 | |
United Kingdom | | | 247,326,820 | | | | 6.7 | |
Indonesia | | | 229,246,987 | | | | 6.2 | |
South Africa | | | 179,131,566 | | | | 4.9 | |
Brazil | | | 148,368,024 | | | | 4.0 | |
Spain | | | 126,476,576 | | | | 3.4 | |
Greece | | | 115,757,428 | | | | 3.1 | |
Egypt | | | 103,768,458 | | | | 2.8 | |
Italy | | | 92,516,180 | | | | 2.5 | |
Thailand | | | 91,229,645 | | | | 2.5 | |
Russia | | | 79,176,458 | | | | 2.2 | |
Peru | | | 64,829,495 | | | | 1.8 | |
New Zealand | | | 64,541,112 | | | | 1.8 | |
Switzerland | | | 64,429,049 | | | | 1.8 | |
Malaysia | | | 63,417,519 | | | | 1.7 | |
France | | | 62,436,274 | | | | 1.7 | |
Turkey | | | 58,343,938 | | | | 1.6 | |
Argentina | | | 56,567,615 | | | | 1.5 | |
Colombia | | | 50,597,565 | | | | 1.4 | |
Sri Lanka | | | 41,029,691 | | | | 1.1 | |
Austria | | | 32,471,260 | | | | 0.9 | |
Ukraine | | | 31,909,132 | | | | 0.9 | |
Ireland | | | 30,739,165 | | | | 0.8 | |
Ecuador | | | 28,364,649 | | | | 0.8 | |
Cyprus | | | 27,076,528 | | | | 0.7 | |
Senegal | | | 25,157,256 | | | | 0.7 | |
Singapore | | | 24,910,773 | | | | 0.7 | |
Dominican Republic | | | 23,570,132 | | | | 0.6 | |
Eurozone | | | 21,817,154 | | | | 0.6 | |
Portugal | | | 20,984,045 | | | | 0.6 | |
China | | | 17,619,416 | | | | 0.5 | |
Oman | | | 16,431,631 | | | | 0.4 | |
Angola | | | 14,590,560 | | | | 0.4 | |
Ivory Coast | | | 14,012,343 | | | | 0.4 | |
Kazakhstan | | | 12,671,496 | | | | 0.3 | |
Azerbaijan | | | 11,299,208 | | | | 0.3 | |
United Arab Emirates | | | 11,184,625 | | | | 0.3 | |
Panama | | | 10,531,005 | | | | 0.3 | |
El Salvador | | | 10,470,876 | | | | 0.3 | |
Kenya | | | 9,981,079 | | | | 0.3 | |
Fiji | | | 9,264,996 | | | | 0.3 | |
Tajikistan | | | 8,435,316 | | | | 0.2 | |
Nigeria | | | 7,442,167 | | | | 0.2 | |
Germany | | | 6,514,829 | | | | 0.2 | |
68 INVESCO OPPENHEIMER INTERNATIONAL BOND FUND
| | | | | | | | |
| Geographic Holdings (Unaudited) (Continued) | | Value | | | Percent | |
| Gabon | | $ | 6,288,783 | | | | 0.2 | % |
| Netherlands | | | 5,021,615 | | | | 0.1 | |
| Bahrain | | | 4,547,705 | | | | 0.1 | |
| Supranational | | | 4,289,271 | | | | 0.1 | |
| Chile | | | 4,040,361 | | | | 0.1 | |
| Mauritius | | | 3,313,538 | | | | 0.1 | |
| Jersey, Channel Islands | | | 3,097,245 | | | | 0.1 | |
| Macau | | | 2,625,000 | | | | 0.1 | |
| Costa Rica | | | 2,552,823 | | | | 0.1 | |
| Hong Kong | | | 2,550,688 | | | | 0.1 | |
| Norway | | | 2,476,475 | | | | 0.1 | |
| Canada | | | 1,265,970 | | | | 0.0 | |
| South Korea | | | 231,940 | | | | 0.0 | |
| Philippines | | | 109,395 | | | | 0.0 | |
| Sweden | | | 4,724 | | | | 0.0 | |
| Japan | | | 1,181 | | | | 0.0 | |
| | | | |
Total | | $ | 3,673,969,450 | | | | 100.0 | % |
| | | | |
| | | | | | | | | | | | | | |
| Forward Currency Exchange Contracts as of September 30, 2019 | | | | |
| Counterparty | | Settlement
Month(s) | | Currency
Purchased (000’s) | | Currency Sold
(000’s) | | Unrealized
Appreciation | | Unrealized
Depreciation |
| BAC | | 05/2020 | | CLP | | 2,018,340 | | USD | | 2,946 | | $ — | | $ (163,686) |
| BAC | | 10/2019 - 11/2019 | | EUR | | 173,140 | | USD | | 193,242 | | — | | (3,882,996) |
| BAC | | 10/2019 | | KRW | | 26,354,000 | | USD | | 21,976 | | 56,036 | | — |
| BAC | | 11/2019 | | NOK | | 728,800 | | USD | | 81,964 | | — | | (1,791,817) |
| BAC | | 11/2019 | | USD | | 2,950 | | EUR | | 2,635 | | 67,216 | | — |
| BAC | | 11/2019 | | USD | | 20,192 | | GBP | | 16,450 | | — | | (75,306) |
| BAC | | 10/2019 | | USD | | 22,130 | | KRW | | 26,354,000 | | 97,648 | | — |
| BAC | | 12/2019 | | USD | | 38,330 | | MYR | | 161,610 | | — | | (177,940) |
| BAC | | 11/2019 | | USD | | 157,344 | | NOK | | 1,413,525 | | 1,846,954 | | — |
| BAC | | 11/2019 | | USD | | 64,460 | | NZD | | 101,500 | | 823,905 | | — |
| BAC | | 12/2019 | | USD | | 18,131 | | SGD | | 25,130 | | — | | (67,790) |
| BAC | | 12/2019 | | ZAR | | 489,479 | | USD | | 32,537 | | 69,581 | | (613,800) |
| BNP | | 11/2019 | | EUR | | 9,450 | | USD | | 10,439 | | — | | (99,164) |
| BOA | | 11/2019 | | CAD | | 100,655 | | USD | | 76,284 | | — | | (248,767) |
| BOA | | 11/2019 | | EUR | | 57,310 | | USD | | 64,279 | | — | | (1,572,800) |
| BOA | | 01/2020 | | IDR | | 278,850,000 | | USD | | 19,502 | | — | | (130,277) |
| BOA | | 11/2019 | | JPY | | 15,000,000 | | USD | | 142,518 | | — | | (3,312,743) |
| BOA | | 12/2019 | | KRW | | 12,237,650 | | USD | | 10,049 | | 178,820 | | — |
| BOA | | 11/2019 | | NOK | | 660,000 | | USD | | 74,238 | | — | | (1,633,562) |
| BOA | | 11/2019 | | NZD | | 4,625 | | USD | | 3,036 | | — | | (135,981) |
| BOA | | 10/2019 | | USD | | 2,142 | | ARS | | 126,400 | | — | | (7,982) |
| BOA | | 11/2019 | | USD | | 127,290 | | EUR | | 113,400 | | 3,211,401 | | — |
| BOA | | 03/2020 | | ZAR | | 660,880 | | USD | | 46,060 | | — | | (3,334,434) |
| CITNA-B | | 10/2019 - 11/2019 | | BRL | | 852,296 | | USD | | 203,746 | | 1,237,982 | | — |
| CITNA-B | | 12/2019 - 05/2020 | | CLP | | 36,873,359 | | USD | | 52,200 | | — | | (1,515,334) |
| CITNA-B | | 12/2019 | | COP | | 70,005,250 | | USD | | 20,273 | | — | | (230,000) |
| CITNA-B | | 11/2019 | | EUR | | 219,135 | | USD | | 244,790 | | — | | (5,019,952) |
| CITNA-B | | 11/2019 | | GBP | | 4,260 | | USD | | 5,277 | | — | | (27,883) |
| CITNA-B | | 12/2019 | | HUF | | 13,456,500 | | USD | | 45,303 | | — | | (1,289,732) |
69 INVESCO OPPENHEIMER INTERNATIONAL BOND FUND
CONSOLIDATED SCHEDULE OF INVESTMENTSContinued
| | | | | | | | | | | | | | |
| Forward Currency Exchange Contracts (Continued) | | | | | | |
| Counterparty | | Settlement
Month(s) | | Currency
Purchased (000’s) | | Currency Sold
(000’s) | | Unrealized
Appreciation | | Unrealized
Depreciation |
| CITNA-B | | 11/2019 | | JPY | | 24,084,621 | | USD | | 225,495 | | $ — | | $ (1,992,264) |
| CITNA-B | | 11/2019 | | NOK | | 990,000 | | USD | | 111,274 | | — | | (2,367,273) |
| CITNA-B | | 12/2019 | | PLN | | 117,570 | | USD | | 29,959 | | — | | (606,701) |
| CITNA-B | | 12/2019 | | RUB | | 1,629,900 | | USD | | 24,707 | | 162,068 | | — |
| CITNA-B | | 10/2019 | | TRY | | 30,240 | | USD | | 5,078 | | 248,563 | | — |
| CITNA-B | | 10/2019 - 11/2019 | | USD | | 232,568 | | BRL | | 972,553 | | — | | (1,287,266) |
| CITNA-B | | 11/2019 - 12/2019 | | USD | | 76,217 | | CLP | | 54,358,700 | | 1,572,068 | | — |
| CITNA-B | | 12/2019 | | USD | | 57,483 | | COP | | 198,501,700 | | 652,171 | | — |
| CITNA-B | | 11/2019 | | USD | | 261,245 | | EUR | | 234,385 | | 4,789,244 | | — |
| CITNA-B | | 12/2019 | | USD | | 386,348 | | MXN | | 7,663,522 | | 2,824,964 | | — |
| CITNA-B | | 11/2019 | | USD | | 57,851 | | NOK | | 520,000 | | 648,061 | | — |
| CITNA-B | | 12/2019 | | USD | | 54,654 | | PEN | | 185,600 | | — | | (234,820) |
| CITNA-B | | 12/2019 | | USD | | 92,196 | | RUB | | 6,095,500 | | 243,774 | | (1,034,758) |
| CITNA-B | | 11/2019 | | USD | | 63,041 | | SEK | | 604,450 | | 1,431,078 | | — |
| CITNA-B | | 12/2019 | | USD | | 82,917 | | THB | | 2,552,600 | | — | | (669,972) |
| CITNA-B | | 12/2019 | | USD | | 49,268 | | TRY | | 286,885 | | — | | (263,067) |
| CITNA-B | | 12/2019 | | USD | | 24,009 | | ZAR | | 358,620 | | 569,036 | | — |
| DEU | | 11/2019 | | SEK | | 1,000,000 | | USD | | 104,962 | | — | | (3,034,891) |
| GSCO-OT | | 03/2021 | | BRL | | 138,847 | | USD | | 33,473 | | — | | (1,362,604) |
| GSCO-OT | | 11/2019 | | CLP | | 45,054,400 | | USD | | 63,257 | | — | | (1,392,543) |
| GSCO-OT | | 10/2019 - 12/2020 | | EUR | | 257,085 | | USD | | 296,069 | | — | | (10,898,306) |
| GSCO-OT | | 05/2020 | | INR | | 1,723,538 | | USD | | 23,750 | | — | | (38,447) |
| GSCO-OT | | 10/2019 | | KRW | | 65,500,000 | | USD | | 55,263 | | — | | (503,519) |
| GSCO-OT | | 02/2021 | | RUB | | 2,279,500 | | USD | | 33,488 | | — | | (468,190) |
| GSCO-OT | | 10/2019 | | TRY | | 255,592 | | USD | | 42,733 | | 2,284,671 | | — |
| GSCO-OT | | 11/2019 | | USD | | 50,891 | | AUD | | 75,010 | | 175,636 | | — |
| GSCO-OT | | 03/2020 - 03/2021 | | USD | | 111,931 | | BRL | | 459,119 | | 3,580,913 | | — |
| GSCO-OT | | 11/2019 | | USD | | 76,173 | | CAD | | 100,645 | | 145,038 | | — |
| GSCO-OT | | 11/2019 - 05/2020 | | USD | | 65,638 | | CLP | | 45,467,415 | | 3,120,855 | | — |
| GSCO-OT | | 10/2019 - 05/2020 | | USD | | 139,680 | | EUR | | 125,750 | | 2,009,346 | | — |
| GSCO-OT | | 05/2020 - 08/2020 | | USD | | 72,522 | | INR | | 5,336,153 | | 61,526 | | (412,150) |
| GSCO-OT | | 10/2019 | | USD | | 54,620 | | KRW | | 65,500,000 | | — | | (139,272) |
| GSCO-OT | | 12/2020 | | USD | | 90,750 | | NOK | | 768,075 | | 6,252,807 | | — |
| GSCO-OT | | 12/2019 | | USD | | 33,363 | | RUB | | 2,182,500 | | 204,079 | | (137,791) |
| GSCO-OT | | 10/2019 - 02/2020 | | USD | | 46,588 | | TRY | | 312,745 | | — | | (8,098,004) |
| GSCO-OT | | 01/2020 - 03/2020 | | USD | | 90,065 | | ZAR | | 1,373,180 | | 1,040,398 | | — |
| GSCO-OT | | 01/2020 - 03/2020 | | ZAR | | 779,890 | | USD | | 50,966 | | — | | (298,191) |
| HSBC | | 11/2019 | | EUR | | 1,060 | | USD | | 1,184 | | — | | (23,714) |
| HSBC | | 11/2019 | | JPY | | 12,592,000 | | USD | | 119,652 | | — | | (2,793,977) |
| HSBC | | 11/2019 | | NOK | | 600,000 | | USD | | 67,494 | | — | | (1,490,233) |
| HSBC | | 11/2019 | | USD | | 152,719 | | EUR | | 135,585 | | 4,376,426 | | — |
| JPM | | 11/2019 - 01/2020 | | AUD | | 150,000 | | USD | | 101,744 | | — | | (234,817) |
| JPM | | 10/2019 - 04/2020 | | BRL | | 1,667,961 | | USD | | 408,978 | | 429,611 | | (8,534,653) |
| JPM | | 12/2019 - 05/2020 | | CLP | | 12,084,700 | | USD | | 17,056 | | — | | (438,766) |
| JPM | | 11/2019 - 08/2021 | | EUR | | 487,260 | | USD | | 547,650 | | — | | (10,890,114) |
| JPM | | 11/2019 | | GBP | | 144,890 | | USD | | 176,735 | | 1,781,189 | | — |
| JPM | | 12/2019 | | IDR | | 2,976,730,000 | | USD | | 204,854 | | 3,003,760 | | — |
| JPM | | 12/2019 - 08/2020 | | INR | | 8,754,900 | | USD | | 120,139 | | 1,099,456 | | — |
70 INVESCO OPPENHEIMER INTERNATIONAL BOND FUND
| | | | | | | | | | | | | | |
| Forward Currency Exchange Contracts (Continued) | | | | |
| Counterparty | | Settlement
Month(s) | | Currency
Purchased (000’s) | | Currency Sold
(000’s) | | Unrealized
Appreciation | | Unrealized
Depreciation |
| JPM | | 11/2019 | | JPY | | 29,224,348 | | USD | | 276,244 | | $ — | | $ (5,048,986) |
| JPM | | 11/2019 | | MXN | | 2,602,694 | | USD | | 130,861 | | — | | (241,288) |
| JPM | | 12/2019 - 12/2020 | | NOK | | 1,536,150 | | USD | | 175,403 | | — | | (6,369,890) |
| JPM | | 12/2019 | | PLN | | 132,910 | | USD | | 34,395 | | — | | (1,213,091) |
| JPM | | 12/2019 | | RUB | | 2,279,500 | | USD | | 35,316 | | — | | (547,130) |
| JPM | | 11/2019 | | SEK | | 587,230 | | USD | | 61,630 | | — | | (1,775,152) |
| JPM | | 10/2019 | | TRY | | 25,274 | | USD | | 4,400 | | 49,885 | | — |
| JPM | | 11/2019 | | USD | | 50,739 | | AUD | | 75,000 | | 30,263 | | — |
| JPM | | 10/2019 | | USD | | 354,908 | | BRL | | 1,452,973 | | 5,574,958 | | (363,933) |
| JPM | | 11/2019 - 12/2020 | | USD | | 343,440 | | EUR | | 303,560 | | 8,284,109 | | — |
| JPM | | 11/2019 | | USD | | 213,285 | | GBP | | 174,855 | | — | | (2,149,560) |
| JPM | | 12/2019 | | USD | | 45,669 | | HUF | | 13,183,000 | | 2,549,736 | | — |
| JPM | | 12/2019 - 01/2020 | | USD | | 320,292 | | IDR | | 4,644,549,000 | | 128,173 | | (4,053,442) |
| JPM | | 12/2019 | | USD | | 370,103 | | INR | | 26,651,100 | | — | | (3,464,527) |
| JPM | | 11/2019 | | USD | | 49,996 | | JPY | | 5,363,695 | | 225,226 | | — |
| JPM | | 12/2019 - 08/2021 | | USD | | 234,487 | | NOK | | 2,076,925 | | 6,034,569 | | — |
| JPM | | 12/2019 | | USD | | 32,762 | | PLN | | 126,600 | | 1,155,499 | | — |
| JPM | | 02/2021 | | USD | | 33,432 | | RUB | | 2,279,500 | | 412,198 | | — |
| JPM | | 11/2019 | | USD | | 35,989 | | SEK | | 344,610 | | 863,649 | | — |
| JPM | | 12/2019 | | USD | | 216,867 | | ZAR | | 3,360,130 | | — | | (2,755,294) |
| MOS | | 05/2020 | | CLP | | 3,307,200 | | USD | | 4,813 | | — | | (252,755) |
| MOS | | 11/2019 | | NOK | | 546,570 | | USD | | 61,416 | | — | | (1,289,630) |
| MOS | | 11/2019 | | PLN | | 401,140 | | USD | | 103,807 | | — | | (3,703,403) |
| MOS | | 08/2020 | | USD | | 43,200 | | BRL | | 184,118 | | — | | (164,555) |
| MOS | | 11/2019 | | USD | | 66,545 | | SEK | | 638,170 | | 1,498,420 | | — |
| RBC | | 11/2019 | | EUR | | 94,360 | | USD | | 105,985 | | — | | (2,740,145) |
| RBC | | 11/2019 | | GBP | | 38,675 | | USD | | 47,261 | | 570,030 | | (180,213) |
| RBC | | 11/2019 | | JPY | | 13,510,000 | | USD | | 127,922 | | — | | (2,552,176) |
| RBC | | 11/2019 | | USD | | 282,407 | | EUR | | 251,000 | | 7,781,630 | | — |
| SCB | | 10/2019 | | KRW | | 39,146,000 | | USD | | 32,643 | | 83,236 | | — |
| SCB | | 10/2019 | | USD | | 32,293 | | KRW | | 39,146,000 | | — | | (433,314) |
| | | | | | | | | | | | |
| Total Unrealized Appreciation and Depreciation | | | | | | $ 85,537,862 | | $ (124,276,733) |
| | | | | | | | | | | | |
| | | | | | | | | | | | |
| Futures Contracts as of September 30, 2019 | | | | | | |
| Description | | Buy/Sell | | Expiration
Date | | Number of
Contracts | | Notional Amount
(000’s) | | Value | | Unrealized
Appreciation/
(Depreciation) |
| Euro BUXL | | Sell | | 12/6/19 | | 367 | | EUR 86,370 | | $ 87,002,532 | | $ (632,764) |
| Euro-BTP | | Sell | | 12/6/19 | | 458 | | EUR 72,044 | | 72,802,904 | | (758,780) |
United States | | | | | | | | | | | | |
Treasury Long | | | | | | | | | | | | |
| Bonds | | Sell | | 12/19/19 | | 36 | | USD 5,946 | | 5,843,250 | | 103,140 |
| | | | | | | | | | | | |
| | | | | | | | | | | | $ (1,288,404) |
| | | | | | | | | | | | |
71 INVESCO OPPENHEIMER INTERNATIONAL BOND FUND
CONSOLIDATED SCHEDULE OF INVESTMENTSContinued
| | | | | | | | | | | | | | | | | | | | | | | | |
| |
| Exchange-Traded Options Written at September 30, 2019 | |
| Description | | Exercise
Price | | | Expiration
Date | | | Number of
Contracts
(000’s) | | | Notional
Amount
(000’s) | | | Premiums
Received | | | Value | |
| | | USD | | | | | | | | | | | | | | | | | | | | | |
S&P 500 Index Put | | | 2,400.000 | | | | 3/20/20 | | | | USD (0)1 | | | | USD 84,960 | | | $ | 1,452,448 | | | $ | (796,500) | |
| | | USD | | | | | | | | | | | | | | | | | | | | | |
S&P 500 Index Put | | | 2,350.000 | | | | 2/21/20 | | | | USD (0)1 | | | | USD 44,180 | | | | 444,980 | | | | (255,680) | |
| | | | | | | | | | | | | | | | | | | | |
Total Exchange-Traded Options Written | | | | | | | | | | | | | | | | | | $ | 1,897,428 | | | $ | (1,052,180) | |
| | | | | | | | | | | | | | | | | | | | |
1. Number of contracts less than 500.
| | | | | | | | | | | | | | | | | | | | | | | | | | | | |
| | | | |
| Over-the-Counter Options Written at September 30, 2019 | | | | | | | | | | |
| Description | | Counterparty | | | Exercise
Price | | | Expiration
Date | | | Number of
Contracts
(000’s) | | | Notional
Amount
(000’s) | | | Premiums
Received | | | Value | |
| | | | | | | BRL | | | | | | | | BRL | | | | | | | | | | | | | |
| | | | | | | |
BRL Currency Put | | | CITNA-B | | | | 4.239 | | | | 11/18/19 | | | | (211,925) | | | | BRL 211,925 | | | $ | 557,158 | | | $ | (613,211) | |
| | | | | | | BRL | | | | | | | | BRL | | | | | | | | | | | | | |
| | | | | | | |
BRL Currency Put1 | | | GSCO-OT | | | | 4.500 | | | | 12/6/19 | | | | (3,000) | | | | BRL 3,000 | | | | 531,600 | | | | (293,435) | |
| | | | | | | BRL | | | | | | | | BRL | | | | | | | | | | | | | |
| | | | | | | |
BRL Currency Put | | | GSCO-OT | | | | 4.026 | | | | 10/30/19 | | | | (201,275) | | | | BRL 201,275 | | | | 1,132,450 | | | | (1,766,597) | |
| | | | | | | BRL | | | | | | | | BRL | | | | | | | | | | | | | |
| | | | | | | |
BRL Currency Put2 | | | GSCO-OT | | | | 4.500 | | | | 3/30/20 | | | | (5,000) | | | | BRL 5,000 | | | | 874,000 | | | | (1,023,675) | |
| | | | | | | BRL | | | | | | | | BRL | | | | | | | | | | | | | |
| | | | | | | |
BRL Currency Put2 | | | GSCO-OT | | | | 4.500 | | | | 3/30/20 | | | | (5,000) | | | | BRL 5,000 | | | | 874,000 | | | | (1,023,675) | |
| | | | | | | BRL | | | | | | | | BRL | | | | | | | | | | | | | |
| | | | | | | |
BRL Currency Put2 | | | GSCO-OT | | | | 4.500 | | | | 3/27/20 | | | | (5,000) | | | | BRL 5,000 | | | | 872,000 | | | | (1,018,838) | |
| | | | | | | BRL | | | | | | | | BRL | | | | | | | | | | | | | |
| | | | | | | |
BRL Currency Put1 | | | GSCO-OT | | | | 4.500 | | | | 12/10/19 | | | | (3,000) | | | | BRL 3,000 | | | | 624,000 | | | | (307,224) | |
| | | | | | | BRL | | | | | | | | BRL | | | | | | | | | | | | | |
| | | | | | | |
BRL Currency Put3 | | | GSCO-OT | | | | 4.230 | | | | 3/4/21 | | | | (211,500) | | | | BRL 211,500 | | | | 2,369,000 | | | | (3,478,010) | |
| | | | | | | BRL | | | | | | | | BRL | | | | | | | | | | | | | |
| | | | | | | |
BRL Currency Put3 | | | JPM | | | | 4.250 | | | | 3/4/21 | | | | (212,500) | | | | BRL 212,500 | | | | 2,242,500 | | | | (3,387,161) | |
| | | | | | | BRL | | | | | | | | BRL | | | | | | | | | | | | | |
| | | | | | | |
BRL Currency Put | | | JPM | | | | 4.306 | | | | 11/19/19 | | | | (215,300) | | | | BRL 215,300 | | | | 576,000 | | | | (418,836) | |
| | | | | | | BRL | | | | | | | | BRL | | | | | | | | | | | | | |
| | | | | | | |
BRL Currency Put | | | MSCO | | | | 3305.000 | | | | 10/9/19 | | | | (165,250,000) | | | | BRL 165,250,000 | | | | 589,000 | | | | (2,531,630) | |
| | | | | | | CLP | | | | | | | | CLP | | | | | | | | | | | | | |
| | | | | | | |
CLP Currency Put4 | | | GSCO-OT | | | | 700.000 | | | | 5/11/20 | | | | (35,000,000) | | | | CLP 35,000,000 | | | | 1,280,000 | | | | (2,410,100) | |
| | | | | | | COP | | | | | | | | COP | | | | | | | | | | | | | |
| | | | | | | |
COP Currency Put | | | GSCO-OT | | | | 3330.000 | | | | 10/24/19 | | | | (249,750,000) | | | | COP 249,750,000 | | | | 553,575 | | | | (3,331,665) | |
72 INVESCO OPPENHEIMER INTERNATIONAL BOND FUND
| | | | | | | | | | | | | | | | | | | | | | | | | | | | |
| | | | |
| Over-the-Counter Options Written (Continued) | | | | | | | | | | |
| Description | | Counterparty | | | Exercise
Price | | | Expiration
Date | | | Number of
Contracts
(000’s) | | | Notional
Amount
(000’s) | | | Premiums
Received | | | Value | |
| | | | | | | USD | | | | | | | | EUR | | | | | | | | | | | | | |
| | | | | | | |
EUR Currency Put | | | BOA | | | | 1.109 | | | | 12/17/19 | | | | (250,000) | | | | EUR 250,000 | | | $ | 1,746,675 | | | $ | (4,296,400) | |
| | | | | | | ZAR | | | | | | | | EUR | | | | | | | | | | | | | |
| | | | | | | |
EUR Currency Call | | | BOA | | | | 20.000 | | | | 8/5/20 | | | | (5,000) | | | | EUR 5,000 | | | | 1,091,097 | | | | (965,049) | |
| | | | | | | USD | | | | | | | | EUR | | | | | | | | | | | | | |
| | | | | | | |
EUR Currency Call | | | BOA | | | | 1.150 | | | | 10/31/19 | | | | (100,000) | | | | EUR 100,000 | | | | 352,245 | | | | (3,304) | |
| | | | | | | USD | | | | | | | | EUR | | | | | | | | | | | | | |
| | | | | | | |
EUR Currency Call | | | BOA | | | | 1.194 | | | | 12/17/19 | | | | (250,000) | | | | EUR 250,000 | | | | 915,499 | | | | (20,208) | |
| | | | | | | RUB | | | | | | | | EUR | | | | | | | | | | | | | |
| | | | | | | |
EUR Currency Call | | | BOA | | | | 73.090 | | | | 12/20/19 | | | | (50,000) | | | | EUR 50,000 | | | | 596,585 | | | | (741,166) | |
| | | | | | | USD | | | | | | | | EUR | | | | | | | | | | | | | |
| | | | | | | |
EUR Currency Call | | | CITNA-B | | | | 1.155 | | | | 10/3/19 | | | | (100,000) | | | | EUR 100,000 | | | | 842,515 | | | | — | |
| | | | | | | RUB | | | | | | | | EUR | | | | | | | | | | | | | |
| | | | | | | |
EUR Currency Call | | | GSCOI | | | | 72.860 | | | | 12/16/19 | | | | (90,000) | | | | EUR 90,000 | | | | 1,001,968 | | | | (1,334,099) | |
| | | | | | | INR | | | | | | | | EUR | | | | | | | | | | | | | |
| | | | | | | |
EUR Currency Call | | | GSCO-OT | | | | 90.000 | | | | 8/5/20 | | | | (5,000) | | | | EUR 5,000 | | | | 977,289 | | | | (417,384) | |
| | | | | | | ZAR | | | | | | | | EUR | | | | | | | | | | | | | |
| | | | | | | |
EUR Currency Call | | | GSCO-OT | | | | 20.000 | | | | 8/4/20 | | | | (5,000) | | | | EUR 5,000 | | | | 785,466 | | | | (961,892) | |
| | | | | | | NOK | | | | | | | | EUR | | | | | | | | | | | | | |
| | | | | | | |
EUR Currency Call5 | | | GSCO-OT | | | | 11.000 | | | | 12/17/20 | | | | (10,000) | | | | EUR 10,000 | | | | 2,161,338 | | | | (1,617,178) | |
| | | | | | | INR | | | | | | | | EUR | | | | | | | | | | | | | |
| | | | | | | |
EUR Currency Call6 | | | GSCO-OT | | | | 90.000 | | | | 5/6/20 | | | | (2,500) | | | | EUR 2,500 | | | | 439,129 | | | | (133,863) | |
| | | | | | | INR | | | | | | | | EUR | | | | | | | | | | | | | |
| | | | | | | |
EUR Currency Call7 | | | JPM | | | | 90.000 | | | | 4/29/20 | | | | (5,000) | | | | EUR 5,000 | | | | 795,265 | | | | (259,236) | |
| | | | | | | ZAR | | | | | | | | EUR | | | | | | | | | | | | | |
| | | | | | | |
EUR Currency Call | | | JPM | | | | 17.290 | | | | 1/23/20 | | | | (50,000) | | | | EUR 50,000 | | | | 919,875 | | | | (1,323,177) | |
| | | | | | | ZAR | | | | | | | | EUR | | | | | | | | | | | | | |
| | | | | | | |
EUR Currency Put | | | JPM | | | | 14.760 | | | | 1/23/20 | | | | (50,000) | | | | EUR 50,000 | | | | 345,650 | | | | (53,666) | |
| | | | | | | NOK | | | | | | | | EUR | | | | | | | | | | | | | |
| | | | | | | |
EUR Currency Call | | | JPM | | | | 11.000 | | | | 8/26/21 | | | | (6,250) | | | | EUR 6,250 | | | | 1,860,122 | | | | (1,705,776) | |
| | | | | | | ZAR | | | | | | | | EUR | | | | | | | | | | | | | |
| | | | | | | |
EUR Currency Call | | | JPM | | | | 18.395 | | | | 2/20/20 | | | | (100,000) | | | | EUR 100,000 | | | | 3,189,751 | | | | (1,527,587) | |
| | | | | | | BRL | | | | | | | | EUR | | | | | | | | | | | | | |
| | | | | | | |
EUR Currency Call | | | MSCO | | | | 5.250 | | | | 8/24/21 | | | | (37,500) | | | | EUR 37,500 | | | | 2,107,511 | | | | (2,373,705) | |
| | | | | | | IDR | | | | | | | | EUR | | | | | | | | | | | | | |
| | | | | | | |
EUR Currency Call | | | SCB | | | | 16890.000 | | | | 1/17/20 | | | | (37,500) | | | | EUR 37,500 | | | | 320,796 | | | | (137,120) | |
73 INVESCO OPPENHEIMER INTERNATIONAL BOND FUND
CONSOLIDATED SCHEDULE OF INVESTMENTSContinued
| | | | | | | | | | | | | | | | | | | | | | | | | | | | |
| | | | |
| Over-the-Counter Options Written (Continued) | | | | | | | | | | |
| Description | | Counterparty | | | Exercise
Price | | | Expiration
Date | | | Number of
Contracts
(000’s) | | | Notional
Amount
(000’s) | | | Premiums
Received | | | Value | |
| | | | | | | IDR | | | | | | | | IDR | | | | | | | | | | | | | |
| | | | | | | |
IDR Currency Put | | | GSCO-OT | | | | 15360.000 | | | | 6/18/20 | | | | (1,536,000,000) | | | | IDR 1,536,000,000 | | | $ | 2,160,000 | | | $ | (1,290,240) | |
| | | | | | | IDR | | | | | | | | IDR | | | | | | | | | | | | | |
| | | | | | | |
IDR Currency Put | | | JPM | | | | 14830.000 | | | | 1/20/20 | | | | (741,500,000) | | | | IDR 741,500,000 | | | | 384,086 | | | | (318,845) | |
| | | | | | | IDR | | | | | | | | IDR | | | | | | | | | | | | | |
| | | | | | | |
IDR Currency Put | | | SCB | | | | 14700.000 | | | | 11/27/19 | | | | (1,470,000,000) | | | | IDR 1,470,000,000 | | | | 903,020 | | | | (279,300) | |
| | | | | | | JPY | | | | | | | | JPY | | | | | | | | | | | | | |
| | | | | | | |
JPY Currency Call | | | BOA | | | | 106.500 | | | | 10/25/19 | | | | (10,650,000) | | | | JPY 10,650,000 | | | | 688,000 | | | | (253,896) | |
| | | | | | | JPY | | | | | | | | JPY | | | | | | | | | | | | | |
| | | | | | | |
JPY Currency Call | | | CITNA-B | | | | 106.500 | | | | 10/31/19 | | | | (10,650,000) | | | | JPY 10,650,000 | | | | 728,000 | | | | (369,555) | |
| | | | | | | JPY | | | | | | | | JPY | | | | | | | | | | | | | |
| | | | | | | |
JPY Currency Call | | | SCB | | | | 106.650 | | | | 10/28/19 | | | | (15,997,500) | | | | JPY 15,997,500 | | | | 1,071,000 | | | | (458,488) | |
| | | | | | | KRW | | | | | | | | KRW | | | | | | | | | | | | | |
| | | | | | | |
KRW Currency Put | | | GSCO-OT | | | | 1213.250 | | | | 1/17/20 | | | | (60,662,500) | | | | KRW 60,662,500 | | | | 355,999 | | | | (504,712) | |
| | | | | | | KRW | | | | | | | | KRW | | | | | | | | | | | | | |
| | | | | | | |
KRW Currency Call | | | GSCO-OT | | | | 1122.350 | | | | 1/17/20 | | | | (56,117,500) | | | | KRW 56,117,500 | | | | 171,950 | | | | (46,016) | |
| | | | | | | MXN | | | | | | | | MXN | | | | | | | | | | | | | |
| | | | | | | |
MXN Currency Put | | | CITNA-B | | | | 22.880 | | | | 8/5/20 | | | | (858,000) | | | | MXN 858,000 | | | | 763,568 | | | | (570,707) | |
| | | | | | | MXN | | | | | | | | MXN | | | | | | | | | | | | | |
| | | | | | | |
MXN Currency Put | | | CITNA-B | | | | 22.100 | | | | 5/21/20 | | | | (2,210,000) | | | | MXN 2,210,000 | | | | 1,879,881 | | | | (1,391,991) | |
| | | | | | | MXN | | | | | | | | MXN | | | | | | | | | | | | | |
| | | | | | | |
MXN Currency Put | | | CITNA-B | | | | 22.940 | | | | 6/2/20 | | | | (1,147,000) | | | | MXN 1,147,000 | | | | 1,090,181 | | | | (490,331) | |
| | | | | | | MXN | | | | | | | | MXN | | | | | | | | | | | | | |
| | | | | | | |
MXN Currency Put | | | GSCO-OT | | | | 21.996 | | | | 7/21/20 | | | | (2,969,460) | | | | MXN 2,969,460 | | | | 2,663,145 | | | | (2,805,249) | |
| | | | | | | MXN | | | | | | | | MXN | | | | | | | | | | | | | |
| | | | | | | |
MXN Currency Call | | | JPM | | | | 20.240 | | | | 5/27/20 | | | | (607,200) | | | | MXN 607,200 | | | | 1,321,200 | | | | (886,033) | |
| | | | | | | MXN | | | | | | | | MXN | | | | | | | | | | | | | |
| | | | | | | |
MXN Currency Put | | | JPM | | | | 20.240 | | | | 5/27/20 | | | | (607,200) | | | | MXN 607,200 | | | | 1,321,200 | | | | (1,203,792) | |
| | | | | | | MXN | | | | | | | | MXN | | | | | | | | | | | | | |
| | | | | | | |
MXN Currency Put | | | JPM | | | | 23.005 | | | | 6/2/20 | | | | (1,150,250) | | | | MXN 1,150,250 | | | | 1,082,500 | | | | (475,122) | |
| | | | | | | PLN | | | | | | | | PLN | | | | | | | | | | | | | |
| | | | | | | |
PLN Currency Put | | | GSCO-OT | | | | 4.050 | | | | 2/26/20 | | | | (1,012,500) | | | | PLN 1,012,500 | | | | 4,090,750 | | | | (3,965,993) | |
| | | | | | | RUB | | | | | | | | RUB | | | | | | | | | | | | | |
| | | | | | | |
RUB Currency Call | | | CITNA-B | | | | 63.040 | | | | 12/16/19 | | | | (2,836,800) | | | | RUB 2,836,800 | | | | 402,075 | | | | (160,676) | |
| | | | | | | RUB | | | | | | | | RUB | | | | | | | | | | | | | |
| | | | | | | |
RUB Currency Put | | | GSCO-OT | | | | 72.000 | | | | 4/8/20 | | | | (9,000,000) | | | | RUB 9,000,000 | | | | 3,902,625 | | | | (1,312,740) | |
74 INVESCO OPPENHEIMER INTERNATIONAL BOND FUND
| | | | | | | | | | | | | | | | | | | | | | | | | | | | |
| | | | |
| Over-the-Counter Options Written (Continued) | | | | | | | | | | |
| Description | | Counterparty | | | Exercise
Price | | | Expiration
Date | | | Number of
Contracts
(000’s) | | | Notional
Amount
(000’s) | | | Premiums
Received | | | Value | |
| | | | | | | USD | | | | | | | | USD | | | | | | | | | | | | | |
| | | | | | | |
S&P 500 Index Put | | | BOA | | | | 2355.470 | | | | 2/21/20 | | | | 0 | 1 | | | USD 44,283 | | | $ | 460,969 | | | $ | (271,724) | |
| | | | | | | CNH | | | | | | | | SGD | | | | | | | | | | | | | |
| | | | | | | |
SGD Currency Call | | | GSCO-OT | | | | 5.110 | | | | 10/21/19 | | | | (75,000) | | | | SGD 75,000 | | | | 204,044 | | | | (668,256) | |
| | | | | | | CNH | | | | | | | | SGD | | | | | | | | | | | | | |
| | | | | | | |
SGD Currency Put | | | GSCO-OT | | | | 4.990 | | | | 10/21/19 | | | | (75,000) | | | | SGD 75,000 | | | | 71,691 | | | | (5,424) | |
| | | | | | | THB | | | | | | | | THB | | | | | | | | | | | | | |
| | | | | | | |
THB Currency Put | | | SCB | | | | 31.500 | | | | 12/20/19 | | | | (3,150,000) | | | | THB 3,150,000 | | | | 568,100 | | | | (204,246) | |
| | | | | | | TRY | | | | | | | | TRY | | | | | | | | | | | | | |
| | | | | | | |
TRY Currency Put | | | GSCO-OT | | | | 6.750 | | | | 1/15/20 | | | | (337,500) | | | | TRY 337,500 | | | | 2,346,600 | | | | (340,420) | |
| | | | | | | TRY | | | | | | | | TRY | | | | | | | | | | | | | |
| | | | | | | |
TRY Currency Call | | | GSCO-OT | | | | 5.652 | | | | 1/28/20 | | | | (565,200) | | | | TRY 565,200 | | | | 1,327,800 | | | | (1,685,607) | |
| | | | | | | TRY | | | | | | | | TRY | | | | | | | | | | | | | |
| | | | | | | |
TRY Currency Put | | | GSCO-OT | | | | 6.726 | | | | 1/28/20 | | | | (336,300) | | | | TRY 336,300 | | | | 1,095,400 | | | | (433,161) | |
| | | | | | | ZAR | | | | | | | | ZAR | | | | | | | | | | | | | |
| | | | | | | |
ZAR Currency Put | | | GSCO-OT | | | | 16.208 | | | | 1/27/20 | | | | (810,376) | | | | ZAR 810,376 | | | | 1,465,301 | | | | (900,886) | |
| | | | | | | ZAR | | | | | | | | ZAR | | | | | | | | | | | | | |
| | | | | | | |
ZAR Currency Put | | | GSCO-OT | | | | 16.000 | | | | 7/23/20 | | | | (2,080,000) | | | | ZAR 2,080,000 | | | | 3,784,819 | | | | (6,456,965) | |
| | | | | | | | | | | | | | | | | | | | | | | | |
TotalOver-the-Counter Options Written | | | | | | | | | | | | | | | | | | | $ | 69,827,963 | | | $ | (67,225,242) | |
| | | | | | | | | | | | | | | | | | | | | | | | |
1.Knock-out option is ineligible for exercise if at any time spot rates are greater than or equal to 3.6 BRL per 1 USD.
2.Knock-out option is ineligible for exercise if at any time spot rates are greater than or equal to 3.7 BRL per 1 USD.
3.Knock-out option is ineligible for exercise if at any time spot rates are greater than or equal to 3.61 BRL per 1 USD.
4.Knock-out option is ineligible for exercise if at any time spot rates are greater than or equal to 650 CLP per 1 USD.
5.Knock-out option is ineligible for exercise if at any time spot rates are greater than or equal to 9.40 NOK per 1 EUR.
6.Knock-out option is ineligible for exercise if at any time spot rates are greater than or equal to 75 INR per 1 USD.
7. Upper Barrier Level: 90 INR/EUR. Lower Barrier Level: 75 INR/EUR. If at any time during the Event Period, the Spot Exchange Rate, in accordance with the Barrier Event Rate Source B, is equal to or less than the Lower Barrier Level this Transaction will automatically terminate without any payment obligation on the part of either party (except in respect of the Premium). Provided aKnock-Out event has not occurred, if at the Expiration Time on the Expiration Date: (i) the Spot Exchange Rate, in accordance with the Barrier Event Rate Source A, is equal to or greater than the Upper Barrier Level, this Transaction will be automatically exercised and the Seller shall pay the Settlement Amount to the Buyer on the Settlement Date. (ii) the Spot Exchange Rate, in accordance with the Barrier Event Rate Source A, is not equal to or greater than the Upper Barrier Level, this Transaction shall expire without any payment obligation on the part of either party (except in respect of the Premium) at the Expiration Time on the Expiration Date. If aKnock-Out event has occurred, notwithstanding the above, this Transaction will automatically terminate without any payment obligation on the part of either party (except in respect of the Premium).
| | | | | | | | | | | | | | | | | | | | | | | | | | | | |
| |
| Centrally Cleared Credit Default Swaps at September 30, 2019 | |
| Reference Asset | | Buy/Sell
Protection | | | Fixed
Rate | | | Maturity
Date | | | Notional
Amount
(000’s) | | | Premiums
Received/
(Paid) | | | Value | | | Unrealized
Appreciation/
(Depreciation) | |
Brazilian Government International | | | Sell | | | | 1.000 | % | | | 6/20/22 | | | | USD 15,000 | | | $ | 928,605 | | | $ | 83,466 | | | $ | 1,012,071 | |
75 INVESCO OPPENHEIMER INTERNATIONAL BOND FUND
CONSOLIDATED SCHEDULE OF INVESTMENTSContinued
| | | | | | | | | | | | | | | | | | | | | | | | | | | | |
| |
| Centrally Cleared Credit Default Swaps (Continued) | |
| Reference Asset | | Buy/Sell
Protection | | | Fixed
Rate | | | Maturity
Date | | | Notional
Amount
(000’s) | | | Premiums
Received/
(Paid) | | | Value | | | Unrealized
Appreciation/
(Depreciation) | |
| Brazilian Government International | | | Buy | | | | 1.000% | | | | 12/20/24 | | | | USD 13,750 | | | $ | (280,330) | | | $ | 244,426 | | | $ | (35,904) | |
| CDX.EM.31 | | | Buy | | | | 1.000 | | | | 6/20/24 | | | | USD 58,700 | | | | (2,707,007) | | | | 2,737,174 | | | | 30,167 | |
| Colombia Government International | | | Buy | | | | 1.000 | | | | 12/20/24 | | | | USD 15,000 | | | | 44,311 | | | | (51,890) | | | | (7,579) | |
| Indonesia Government International | | | Buy | | | | 1.000 | | | | 12/20/24 | | | | USD 15,000 | | | | 69,698 | | | | (73,911) | | | | (4,213) | |
| Intesa Sanpaolo S.p.A. | | | Buy | | | | 1.000 | | | | 12/20/21 | | | | EUR 15,000 | | | | (548,711) | | | | (192,998) | | | | (741,709) | |
| Mexico Government International | | | Buy | | | | 1.000 | | | | 12/20/24 | | | | USD 27,500 | | | | (228,893) | | | | 211,187 | | | | (17,706) | |
| Republic Of Italy Government I | | | Sell | | | | 1.000 | | | | 12/20/21 | | | | USD 16,000 | | | | 585,507 | | | | 121,708 | | | | 707,215 | |
| Republic Of South Africa Gover | | | Buy | | | | 1.000 | | | | 12/20/24 | | | | USD 5,000 | | | | (231,039) | | | | 220,586 | | | | (10,453) | |
| | | | | | | | | | | | | | | | | | | | |
| Total Centrally Cleared Credit Default Swaps | | | | | | | | | | | | | | | $ | (2,367,859) | | | $ | 3,299,748 | | | $ | 931,889 | |
| | | | | | | | | | | | | | | | | | | | |
| | | | | | | | | | | | | | | | | | | | | | | | | | | | | | | | |
| |
| Over-the-Counter Credit Default Swaps at September 30, 2019 | |
Reference Asset | | Counterparty | | | Buy/Sell
Protection | | | Fixed
Rate | | | Maturity
Date | | | Notional
Amount
(000’s) | | | Premiums
Received/
(Paid) | | | Value | | | Unrealized
Appreciation/
(Depreciation) | |
| Hellenic Republic | | | BAC | | | | Sell | | | | 1.000% | | | | 6/20/25 | | | | USD 5,000 | | | $ | 831,849 | | | $ | (319,121) | | | $ | 512,728 | |
| Hellenic Republic | | | BAC | | | | Sell | | | | 1.000 | | | | 6/20/25 | | | | USD 12,500 | | | | 1,872,869 | | | | (797,803) | | | | 1,075,066 | |
| Hellenic Republic | | | BAC | | | | Sell | | | | 1.000 | | | | 12/20/25 | | | | USD 23,250 | | | | 3,615,506 | | | | (1,729,371) | | | | 1,886,135 | |
| Hellenic Republic | | | BAC | | | | Sell | | | | 1.000 | | | | 12/20/19 | | | | USD 16,650 | | | | 249,821 | | | | 30,400 | | | | 280,221 | |
| Hellenic Republic | | | GSCOI | | | | Sell | | | | 1.000 | | | | 6/20/25 | | | | USD 5,000 | | | | 788,898 | | | | (319,121) | | | | 469,777 | |
| Hellenic Republic | | | | | | | | | | | | | | | | | | | | | | | | | | | | | | | | |
| Government Bond | | | BAC | | | | Sell | | | | 1.000 | | | | 6/20/29 | | | | USD 12,500 | | | | 2,405,132 | | | | (1,667,844) | | | | 737,288 | |
| Hellenic Republic | | | | | | | | | | | | | | | | | | | | | | | | | | | | | | | | |
| Government Bond | | | BAC | | | | Sell | | | | 1.000 | | | | 6/20/26 | | | | USD 18,750 | | | | 2,339,101 | | | | (1,584,808) | | | | 754,293 | |
| Hellenic Republic | | | | | | | | | | | | | | | | | | | | | | | | | | | | | | | | |
| Government Bond | | | BAC | | | | Sell | | | | 1.000 | | | | 6/20/26 | | | | USD 20,000 | | | | 2,309,198 | | | | (1,690,461) | | | | 618,737 | |
| Hellenic Republic | | | | | | | | | | | | | | | | | | | | | | | | | | | | | | | | |
| Government Bond | | | BAC | | | | Sell | | | | 1.000 | | | | 6/20/24 | | | | USD 16,500 | | | | 1,137,077 | | | | (699,572) | | | | 437,505 | |
| Hellenic Republic | | | | | | | | | | | | | | | | | | | | | | | | | | | | | | | | |
| Government Bond | | | BOA | | | | Sell | | | | 1.000 | | | | 6/20/24 | | | | USD 5,000 | | | | 409,667 | | | | (211,991) | | | | 197,676 | |
| Hellenic Republic | | | | | | | | | | | | | | | | | | | | | | | | | | | | | | | | |
| Government Bond | | | BOA | | | | Sell | | | | 1.000 | | | | 6/20/26 | | | | USD 20,500 | | | | 2,487,399 | | | | (1,732,723) | | | | 754,676 | |
| ICICI Bank Ltd. | | | GSCO-OT | | | | Sell | | | | 1.000 | | | | 12/20/19 | | | | USD 10,000 | | | | 359,971 | | | | 23,996 | | | | 383,967 | |
| iTraxx Europe | | | | | | | | | | | | | | | | | | | | | | | | | | | | | | | | |
| Crossover Series 24 | | | | | | | | | | | | | | | | | | | | | | | | | | | | | | | | |
| Version 1 | | | JPM | | | | Sell | | | | 5.000 | | | | 12/20/20 | | | | EUR 5,000 | | | | (361,394) | | | | 231,652 | | | | (129,742) | |
| Lloyds Banking | | | | | | | | | | | | | | | | | | | | | | | | | | | | | | | | |
| Group plc | | | JPM | | | | Buy | | | | 1.000 | | | | 6/20/24 | | | | EUR 2,500 | | | | (109,686) | | | | 59,824 | | | | (49,862) | |
| Oriental Republic of | | | | | | | | | | | | | | | | | | | | | | | | | | | | | | | | |
| Uruguay | | | BOA | | | | Sell | | | | 1.000 | | | | 12/20/21 | | | | USD 14,802 | | | | 267,519 | | | | (28,531) | | | | 238,988 | |
76 INVESCO OPPENHEIMER INTERNATIONAL BOND FUND
| | | | | | | | | | | | | | | | | | | | | | | | | | | | | | |
| Over-the-Counter Credit Default Swaps (Continued) | |
Reference Asset | | Counterparty | | Buy/Sell
Protection | | | Fixed
Rate | | | Maturity
Date | | | Notional
Amount
(000’s) | | | Premiums
Received/ (Paid) | | | Value | | | Unrealized
Appreciation/
(Depreciation) | |
| | | | | | | | |
| Royal Bank Of Scotland Group plc | | JPM | | | Buy | | | | 1.000% | | | | 6/20/24 | | | | EUR 2,500 | | | $ | (125,923 | ) | | $ | 73,622 | | | $ | (52,301 | ) |
| | | | | | | | | | | | | | | | | | | | | | |
TotalOver-the-Counter Credit Default Swaps | | | | | | | $ | 18,477,004 | | | $ | (10,361,852 | ) | | $ | 8,115,152 | |
| | | | | | | | | | | | | | | | | | | | | | |
| | | | | | | | | | | | | | | | | | | | | | | | | | | | |
| Centrally Cleared Interest Rate Swaps at September 30, 2019 | | | | | | | | | |
| Counterparty | | Pay/Receive
Floating
Rate | | | Floating Rate | | Fixed
Rate | | | Maturity
Date | | | Notional Amount (000’s) | | Premiums Received /
(Paid) | | | Value | | | Unrealized
Appreciation/
(Depreciation) | |
BAC | | | Receive | | | Six-Month EUR EURIBOR | | | 1.123% | | | | 3/8/28 | | | EUR 8,250 | | $ | — | | | $ | (1,136,038 | ) | | $ | (1,136,038 | ) |
BNP | | | Pay | | | BZDIOVRA | | | – | | | | 1/4/27 | | | BRL 191,000 | | | — | | | | 440,575 | | | | 440,575 | |
BOA | | | Receive | | | BBSW6M | | | 1.655 | | | | 7/16/29 | | | AUD 113,025 | | | — | | | | (3,496,923 | ) | | | (3,496,923 | ) |
BOA | | | Receive | | | Three-Month USD BBA LIBOR | | | 2.307 | | | | 4/2/24 | | | USD 52,900 | | | — | | | | (2,117,969 | ) | | | (2,117,969 | ) |
BOA | | | Pay | | | MXN TIIE BANXICO | | | 6.500 | | | | 11/24/26 | | | MXN 500,000 | | | (7 | ) | | | (242,939 | ) | | | (242,946 | ) |
BOA | | | Pay | | | BZDIOVRA | | | 6.630 | | | | 1/2/25 | | | BRL 113,600 | | | — | | | | 186,071 | | | | 186,071 | |
CITNA-B | | | Pay | | | COOVIBR | | | 5.220 | | | | 8/12/29 | | | COP 40,650,000 | | | — | | | | 35,389 | | | | 35,389 | |
CITNA-B | | | Pay | | | COOVIBR | | | 5.200 | | | | 8/1/29 | | | COP 44,884,000 | | | — | | | | 27,176 | | | | 27,176 | |
CITNA-B | | | Pay | | | COOVIBR | | | 4.990 | | | | 5/2/20 | | | COP 105,000,000 | | | 218,366 | | | | (196,353 | ) | | | 22,013 | |
CITNA-B | | | Pay | | | Six-Month HUF BUBOR | | | 2.205 | | | | 3/8/28 | | | HUF 2,750,000 | | | — | | | | 927,082 | | | | 927,082 | |
DEU | | | Pay | | | JIBA3M | | | 8.420 | | | | 8/29/28 | | | ZAR 556,000 | | | — | | | | 2,197,037 | | | | 2,197,037 | |
DEU | | | Pay | | | MXN TIIE BANXICO | | | 8.525 | | | | 1/15/24 | | | MXN 480,000 | | | — | | | | 1,859,476 | | | | 1,859,476 | |
DEU | | | Pay | | | MXN TIIE BANXICO | | | 8.120 | | | | 5/5/21 | | | MXN 1,625,000 | | | — | | | | 1,698,063 | | | | 1,698,063 | |
DEU | | | Pay | | | MXN TIIE BANXICO | | | 7.340 | | | | 7/24/29 | | | MXN 263,300 | | | — | | | | 536,091 | | | | 536,091 | |
GSCOI | | | Receive | | | CPURNSA | | | 1.883 | | | | 7/19/24 | | | USD 108,000 | | | — | | | | (1,730,549 | ) | | | (1,730,549 | ) |
GSCOI | | | Pay | | | Six-Month PLN WIBOR WIBO | | | 1.780 | | | | 6/10/21 | | | PLN 200,000 | | | (30,941 | ) | | | 31,413 | | | | 472 | |
GSCOI | | | Receive | | | WIBR6M | | | 2.095 | | | | 5/30/24 | | | PLN 99,000 | | | — | | | | (518,729 | ) | | | (518,729 | ) |
GSCOI | | | Receive | | | Three-Month USD BBA LIBOR | | | 1.666 | | | | 8/7/29 | | | USD 10,730 | | | — | | | | (83,834 | ) | | | (83,834 | ) |
GSCOI | | | Receive | | | Three-Month USD BBA LIBOR | | | 2.512 | | | | 4/29/29 | | | USD 16,800 | | | — | | | | (1,524,266 | ) | | | (1,524,266 | ) |
GSCOI | | | Pay | | | JIBA3M | | | 8.690 | | | | 8/8/29 | | | ZAR 644,500 | | | — | | | | 129,172 | | | | 129,172 | |
GSCOI | | | Pay | | | Six-Month PLN WIBOR WIBO | | | 1.775 | | | | 10/10/21 | | | PLN 95,000 | | | 3,197 | | | | 234,988 | | | | 238,185 | |
GSCOI | | | Pay | | | MXN TIIE BANXICO | | | 7.200 | | | | 7/27/22 | | | MXN 1,252,000 | | | — | | | | 1,078,767 | | | | 1,078,767 | |
GSCOI | | | Pay | | | SORF6M | | | 1.980 | | | | 3/4/21 | | | SGD 172,000 | | | — | | | | 670,768 | | | | 670,768 | |
GSCOI | | | Receive | | | SORF6M | | | 2.073 | | | | 3/4/24 | | | SGD 70,500 | | | — | | | | (1,125,846 | ) | | | (1,125,846 | ) |
77 INVESCO OPPENHEIMER INTERNATIONAL BOND FUND
CONSOLIDATED SCHEDULE OF INVESTMENTSContinued
| | | | | | | | | | | | | | | | | | | | | | | | | | | | | | |
| Centrally Cleared Interest Rate Swaps (Continued) | | | | | | | | | | | | | |
| Counterparty | | Pay/Receive
Floating
Rate | | | Floating Rate | | Fixed
Rate | | | Maturity
Date | | | Notional Amount
(000’s) | | | Premiums
Received /
(Paid) | | | Value | | | Unrealized
Appreciation/
(Depreciation) | |
| GSCOI | | | Pay | | | MXN TIIE BANXICO | | | 8.620% | | | | 12/26/28 | | | | MXN 247,400 | | | $ | — | | | $ | 1,666,651 | | | $ | 1,666,651 | |
| GSCOI | | | Pay | | | Six-Month PLN WIBOR WIBO | | | 2.580 | | | | 2/6/23 | | | | PLN 115,000 | | | | — | | | | 1,256,711 | | | | 1,256,711 | |
| GSCOI | | | Pay | | | Six-Month GBP BBA LIBOR | | | 3.450 | | | | 10/15/25 | | | | GBP 49,000 | | | | — | | | | (917,787 | ) | | | (917,787 | ) |
| GSCOI | | | Receive | | | CPURNSA | | | 1.869 | | | | 7/22/24 | | | | USD 108,000 | | | | — | | | | (1,502,089 | ) | | | (1,502,089 | ) |
| GSCOI | | | Receive | | | CPURNSA | | | 1.873 | | | | 7/25/24 | | | | USD 175,000 | | | | — | | | | (2,715,244 | ) | | | (2,715,244 | ) |
| HSBC | | | Pay | | | MXN TIIE BANXICO | | | 7.210 | | | | 7/17/24 | | | | MXN 677,750 | | | | — | | | | 965,083 | | | | 965,083 | |
| HSBC | | | Pay | | | MXN TIIE BANXICO | | | 8.185 | | | | 4/13/29 | | | | MXN 410,000 | | | | — | | | | 2,137,889 | | | | 2,137,889 | |
| JPM | | | Pay | | | WIBR6M | | | 1.638 | | | | 4/25/22 | | | | PLN 51,500 | | | | — | | | | (15,837 | ) | | | (15,837 | ) |
| JPM | | | Pay | | | WIBR6M | | | 1.630 | | | | 1/25/23 | | | | PLN 64,000 | | | | — | | | | (18,723 | ) | | | (18,723 | ) |
| JPM | | | Pay | | | BZDIOVRA | | | 6.528 | | | | 1/2/24 | | | | BRL 129,900 | | | | — | | | | 252,251 | | | | 252,251 | |
| JPM | | | Pay | | | Six-Month PLN WIBOR WIBO | | | 2.315 | | | | 1/15/26 | | | | PLN 90,200 | | | | (23,448 | ) | | | 1,189,956 | | | | 1,166,508 | |
| JPM | | | Pay | | | MXN TIIE BANXICO | | | 6.710 | | | | 9/23/21 | | |
| MXN
1,025,000 |
| | | — | | | | 31,652 | | | | 31,652 | |
| JPM | | | Receive | | | NDBB3M | | | 1.368 | | | | 5/15/31 | | | | NZD 50,000 | | | | — | | | | (285,050 | ) | | | (285,050 | ) |
| JPM | | | Pay | | | MXN TIIE BANXICO | | | 8.750 | | | | 10/29/20 | | |
| MXN
2,210,000 |
| | | — | | | | 2,066,796 | | | | 2,066,796 | |
| JPM | | | Receive | | | Three-Month USD BBA LIBOR | | | 2.097 | | | | 6/8/27 | | | | USD 12,000 | | | | — | | | | (555,671 | ) | | | (555,671 | ) |
| JPM | | | Pay | | | Six-Month PLN WIBOR WIBO | | | 2.090 | | | | 1/11/22 | | | | PLN 160,000 | | | | — | | | | 781,907 | | | | 781,907 | |
| JPM | | | Pay | | | BZDIOVRA | | | 7.060 | | | | 7/1/22 | | |
| BRL
1,581,700 |
| | | — | | | | 339,816 | | | | 339,816 | |
| MSCO | | | Receive | | | CPURNSA | | | 1.856 | | | | 7/30/24 | | | | USD 220,750 | | | | — | | | | (2,933,558 | ) | | | (2,933,558 | ) |
| MSCO | | | Receive | | | EUR006M | | | 1.060 | | | | 4/30/59 | | | | EUR 71,050 | | | | — | | | | (8,253,934 | ) | | | (8,253,934 | ) |
| MSCO | | | Pay | | | EUR006M | | | 1.282 | | | | 4/29/49 | | | | EUR 63,950 | | | | — | | | | 7,008,049 | | | | 7,008,049 | |
| SAN | | | Pay | | | BZDIOVRA | | | 6.900 | | | | 1/2/27 | | | | BRL 212,000 | | | | — | | | | 411,029 | | | | 411,029 | |
| SIB | | | Pay | | | MXN TIIE BANXICO | | | 7.770 | | | | 3/25/24 | | |
| MXN
1,150,000 |
| | | — | | | | 2,863,126 | | | | 2,863,126 | |
| UBS | | | Pay | | | BBSW3M | | | 1.560 | | | | 3/21/21 AUD 361,000 | | | | — | | | | 2,719,743 | | | | 2,719,743 | |
| UBS | | | Receive | | | BBSW6M | | | 1.823 | | | | 3/21/24 AUD 147,500 | | | | — | | | | (4,051,674 | ) | | | (4,051,674 | ) |
| | | | | | | | | | | | | | | | | | | | | | |
| Total Centrally Cleared Interest Rate Swaps | | | | | | | | | | | $ | 167,167 | | | $ | 319,714 | | | $ | 486,881 | |
| | | | | | | | | | | | | | | | | | | | | | |
| | | | | | | | | | | | | | | | | | | | | | | | | | | | | | |
| Over-the-Counter Interest Rate Swaps at September 30, 2019 | |
| Counterparty | | Pay/Receive Floating Rate | | | Floating Rate | | Fixed
Rate | | | Maturity
Date | | | Notional Amount
(000’s) | | | Premiums
Received /
(Paid) | | | Value | | | Unrealized
Appreciation/
(Depreciation) | |
| BOA | | | Receive | | | Six-Month INR FBIL MIBOR OIS Compound | | | 5.740 | % | | | 5/16/21 | | |
| INR
5,700,000 |
| | $ | — | | | $ | (974,459 | ) | | $ | (974,459 | ) |
| BOA | | | Receive | | | INR FBIL MIBOR OIS Compound | | | 5.670 | | | | 5/27/21 | | |
| INR
4,536,000 |
| | | — | | | | (626,959 | ) | | | (626,959 | ) |
| CITNA-B | | | Receive | | | JIBA3M | | | 8.139 | | | | 1/31/30 | | | | ZAR 367,000 | | | | — | | | | (852,676 | ) | | | (852,676 | ) |
78 INVESCO OPPENHEIMER INTERNATIONAL BOND FUND
| | | | | | | | | | | | | | | | | | | | | | | | | | | | | | | | |
Over-the-Counter Interest Rate Swaps (Continued) | |
Counterparty | |
| Pay/Receive
Floating Rate |
| | | Floating Rate | | | | Fixed Rate | | | | Maturity Date | | |
| Notional
Amount (000’s) |
| |
| Premiums
Received / (Paid) |
| | | Value | | |
| Unrealized
Appreciation/ (Depreciation) |
|
|
|
| GSCOI | | | Pay | | |
| Three-Month
COP IBR OIS
Compound |
| | | 6.470% | | | | 9/29/26 | | |
| COP
55,000,000 |
| | $ | — | | | $ | 1,568,550 | | | $ | 1,568,550 | |
| GSCOI | | | Receive | | | | KWCDC | | | | 1.705 | | | | 4/25/24 | | |
| KRW
117,050,000 |
| | | — | | | | (2,147,752 | ) | | | (2,147,752 | ) |
| GSCOI | | | Pay | | | | KWCDC | | | | 1.743 | | | | 4/25/21 | | |
| KRW
289,300,000 |
| | | — | | | | 1,774,553 | | | | 1,774,553 | |
| GSCOI | | | Pay | | | | MOSKP3 | | | | 8.360 | | | | 6/24/29 | | |
| RUB
432,500 |
| | | — | | | | 549,696 | | | | 549,696 | |
| JPM | | | Pay | | |
| Three-Month
COP IBR OIS
Compound |
| | | 7.300 | | | | 6/1/26 | | |
| COP
39,425,000 |
| | | — | | | | 1,683,389 | | | | 1,683,389 | |
| JPM | | | Receive | | |
| Three-Month
COP IBR OIS
Compound |
| | | 4.990 | | | | 5/2/20 | | |
| COP
105,000,000 |
| | | — | | | | 196,353 | | | | 196,353 | |
| JPM | | | Pay | | |
| Five-Year EUR
CPI EXT |
| | | 2.080 | | | | 5/24/37 | | | | EUR 50,000 | | | | — | | | | 1,921,666 | | | | 1,921,666 | |
| JPM | | | Receive | | |
| Five-Year EUR
CPI EXT |
| | | 1.603 | | | | 5/24/27 | | | | EUR 50,000 | | | | — | | | | (1,956,835 | ) | | | (1,956,835 | ) |
| JPM | | | Receive | | | | JIBA3M | | | | 7.955 | | | | 1/31/30 | | | | ZAR 385,000 | | | | — | | | | (546,171 | ) | | | (546,171 | ) |
| SCB | | | Receive | | |
| Six-Month INR
FBIL MIBOR OIS
Compound |
| | | 6.438 | | | | 1/10/24 | | |
| INR
1,700,000 |
| | | — | | | | (1,374,781 | ) | | | (1,374,781 | ) |
| | | | | | | | | | | | | | | | | | | | | | | | |
TotalOver-the-Counter Interest Rate Swaps | | | | | | | | | | | | | | | $ | — | | | $ | (785,426 | ) | | $ | (785,426 | ) |
| | | | | | | | | | | | | | | | | | | | | | | | |
| | | | | | | | | | | | | | | | | | | | | | | | | | | | | | | | |
| Over-the-Counter Credit Default Swaptions Written at September 30, 2019 | | | | | | | |
Description | | | Counterparty | | |
| Buy/Sell
Protection |
| |
| Reference
Asset |
| |
| Fixed
Rate |
| |
| Expiration
Date |
| | | Notional Amount (000’s) | | |
| Premiums
Received |
| | | Value | |
Credit Default Swap maturing 6/20/24 Put | | | JPM | | | | Buy | | |
| iTraxx
Europe
Crossover
Series 31 Version 1 |
| | | 5.000% | | | | 12/18/19 | | | | EUR 50,000 | | | $ | 370,460 | | | $ | (262,508 | ) |
Credit Default Swap maturing 6/20/24 Put | | | JPM | | | | Buy | | |
| iTraxx
Europe
Crossover
Series 31 Version 1 |
| | | 5.000 | | | | 12/18/19 | | | | EUR 50,000 | | | | 497,632 | | | | (398,176 | ) |
Credit Default Swap maturing 6/20/24 Call | | | JPM | | | | Sell | | |
| iTraxx
Europe
Crossover
Series 31 Version 1 |
| | | 5.000 | | | | 12/18/19 | | | | EUR 50,000 | | | | 304,109 | | | | (106,713 | ) |
Credit Default Swap maturing 6/20/24 Call | | | JPM | | | | Sell | | |
| iTraxx
Europe
Crossover
Series 31 Version 1 |
| | | 5.000 | | | | 12/18/19 | | | | EUR 50,000 | | | | 93,997 | | | | (25,537 | ) |
| | | | | | | | | | | | | | | | | | | | | | | | | | | | |
TotalOver-the-Counter Credit Default Swaptions Written | | | | | | | | | | | | | | | | | | | $ | 1,266,198 | | | $ | (792,934 | ) |
| | | | | | | | | | | | | | | | | | | | | | | | | | | | |
79 INVESCO OPPENHEIMER INTERNATIONAL BOND FUND
CONSOLIDATED SCHEDULE OF INVESTMENTSContinued
| | | | | | | | | | | | | | | | | | | | | | | | | | | | | | | | | | |
| Over-the-Counter Interest Rate Swaptions Written at September 30, 2019 | |
| Description | | Counterparty | | | Pay/
Receive
Floating
Rate | | | Floating
Rate | | | Fixed
Rate | | | Expiration
Date | | | Notional Amount
(000’s) | | | Premiums
Received | | | Value | |
| |
Interest Rate Swap maturing 8/6/20 Call | | | BOA | | | | Pay | | |
| Three-
Month
USD BBA
LIBOR |
| | | 1.435% | | | | 8/6/20 | | | USD | | | 100,000 | | | $ | 1,365,000 | | | $ | (1,209,676) | |
| |
Interest Rate Swap maturing 8/6/20 Call | | | BOA | | | | Pay | | |
| Three-
Month
USD BBA
LIBOR |
| | | 1.235 | | | | 8/6/20 | | | USD | | | 100,000 | | | | 992,000 | | | | (831,886) | |
| |
Interest Rate Swap maturing 6/15/20 Put | | | GSCOI | | | | Receive | | |
| Three-
Month RUB
MOSPRIME
NFEA |
| | | 8.080 | | | | 6/15/20 | | | RUB | | | 1,676,500 | | | | 521,411 | | | | (379,241) | |
| |
Interest Rate Swap maturing 1/9/20 Call | | | GSCOI | | | | Pay | | |
| Three-
Month
USD BBA
LIBOR |
| | | 1.600 | | | | 1/9/20 | | | USD | | | 166,700 | | | | 891,845 | | | | (1,811,917) | |
| |
Interest Rate Swap maturing 9/17/67 Put | | | JPM | | | | Pay | | |
| Six-Month
EUR
EURIBOR |
| | | 3.100 | | | | 9/15/37 | | | EUR | | | 200,000 | | | | 19,261,234 | | | | (7,251,043) | |
| |
Interest Rate Swap Maturing 5/5/20 Call | | | JPM | | | | Pay | | |
| Three-
Month
USD BBA
LIBOR |
| | | 2.159 | | | | 5/5/20 | | | USD | | | 250,000 | | | | 1,875,000 | | | | (11,580,195) | |
| |
Interest Rate Swap Maturing 6/8/20 Put | | | JPM | | | | Receive | | |
| Three-
Month
USD BBA
LIBOR |
| | | 1.693 | | | | 6/8/20 | | | USD | | | 250,000 | | | | 1,488,750 | | | | (584,360) | |
| |
Interest Rate Swap Maturing 6/8/20 Call | | | JPM | | | | Pay | | |
| Three-
Month
USD BBA
LIBOR |
| | | 1.693 | | | | 6/8/20 | | | USD | | | 250,000 | | | | 1,488,750 | | | | (1,783,597) | |
| |
Interest Rate Swap maturing 7/9/20 Put | | | JPM | | | | Pay | | |
| Three-
Month
USD BBA
LIBOR |
| | | 1.801 | | | | 7/9/20 | | | USD | | | 167,000 | | | | 2,070,800 | | | | (810,874) | |
| |
Interest Rate Swap maturing 7/9/20 Call | | | JPM | | | | Pay | | |
| Three-
Month
USD BBA
LIBOR |
| | | 1.501 | | | | 7/9/20 | | | USD | | | 167,000 | | | | 1,143,950 | | | | (2,186,626) | |
| |
Interest Rate Swap maturing 7/20/20 Put | | | JPM | | | | Receive | | |
| Three-
Month
USD BBA
LIBOR |
| | | 1.803 | | | | 7/20/20 | | | USD | | | 250,000 | | | | 3,137,500 | | | | (1,249,445) | |
| |
Interest Rate Swap maturing 7/20/20 Call | | | JPM | | | | Pay | | |
| Three-
Month
USD BBA
LIBOR |
| | | 1.403 | | | | 7/20/20 | | | USD | | | 250,000 | | | | 1,445,000 | | | | (2,775,032) | |
| |
80 INVESCO OPPENHEIMER INTERNATIONAL BOND FUND
| | | | | | | | | | | | | | | | | | | | | | |
| |
| Over-the-Counter Interest Rate Swaptions Written (Continued) | |
| Description | | Counterparty | | Pay/
Receive
Floating
Rate | | Floating
Rate | | Fixed
Rate | | | Expiration
Date | | Notional Amount
(000’s) | | Premiums
Received | | | Value | |
| Interest Rate Swap maturing 11/14/19 Put | | JPM | | Receive | | Three-Month USD BBA LIBOR | | | 1.630% | | | 11/14/19 | | USD 212,000 | | | $ 640,000 | | | | $ (517,645) | |
| Interest Rate Swap maturing 2/14/20 Put | | MSCO | | Receive | | Three-Month USD BBA LIBOR | | | 1.600 | | | 2/14/20 | | USD 500,000 | | | 1,075,000 | | | | (1,282,860) | |
| Interest Rate Swap maturing 8/17/20 Put | | MSCO | | Receive | | Three-Month USD BBA LIBOR | | | 1.530 | | | 8/17/20 | | USD 496,000 | | | 1,820,000 | | | | (1,961,591) | |
| Interest Rate Swap maturing 3/27/20 Call | | MSCO | | Pay | | Six-Month EUR
EURIBOR | | | 0.000 | | | 3/27/20 | | EUR 187,500 | | | 1,784,989 | | | | (929,358) | |
| | | | | | | | | | | | | | | | | | |
| TotalOver-the-Counter Interest Rate Swaptions Written | | | | | | | | $ 41,001,229 | | | | $ (37,145,346) | |
| | | | | | | | | | | | | | | | | | |
| | |
| Glossary: | | |
| Counterparty Abbreviations |
| |
| BAC | | Barclays Bank plc |
| |
| BNP | | BNP Paribas |
| |
| BOA | | Bank of America NA |
| |
| CITNA-B | | Citibank NA |
| |
| DEU | | Deutsche Bank AG |
| |
| GSCOI | | Goldman Sachs International |
| |
| GSCO-OT | | Goldman Sachs Bank USA |
| |
| HSBC | | HSBC Bank USA NA |
| |
| JPM | | JPMorgan Chase Bank NA |
| |
| MOS | | Morgan Stanley & Co., Inc. |
| |
| MSCO | | Morgan Stanley Capital Services, Inc. |
| |
| RBC | | RBC Dominion Securities |
| |
| SAN | | Santander |
| |
| SCB | | Standard Chartered Bank |
| |
| SIB | | Banco Santander SA |
| |
| UBS | | UBS AG |
| | |
| Currency abbreviations indicate amounts reporting in currencies |
| |
| ARS | | Argentine Peso |
| |
| AUD | | Australian Dollar |
| |
| BRL | | Brazilian Real |
| |
| CAD | | Canadian Dollar |
| |
| CLP | | Chilean Peso |
| |
| CNH | | Offshore Chinese Renminbi |
| |
| COP | | Colombian Peso |
| |
| EGP | | Egyptian Pounds |
| |
| EUR | | Euro |
| |
| GBP | | British Pound Sterling |
81 INVESCO OPPENHEIMER INTERNATIONAL BOND FUND
CONSOLIDATED SCHEDULE OF INVESTMENTSContinued
| | |
| Currency abbreviations indicate amounts reporting in currencies (Continued) |
| |
| HUF | | Hungarian Forint |
| |
| IDR | | Indonesian Rupiah |
| |
| INR | | Indian Rupee |
| |
| JPY | | Japanese Yen |
| |
| KRW | | South Korean Won |
| |
| MXN | | Mexican Nuevo Peso |
| |
| MYR | | Malaysian Ringgit |
| |
| NOK | | Norwegian Krone |
| |
| NZD | | New Zealand Dollar |
| |
| PEN | | Peruvian New Sol |
| |
| PHP | | Philippine Peso |
| |
| PLN | | Polish Zloty |
| |
| RUB | | Russian Ruble |
| |
| SEK | | Swedish Krona |
| |
| SGD | | Singapore Dollar |
| |
| THB | | Thailand Baht |
| |
| TRY | | New Turkish Lira |
| |
| ZAR | | South African Rand |
| | |
| Definitions | | |
| |
| BA CDOR | | Canada Bankers Acceptances Deposit Offering Rate |
| |
| BADLARPP | | Argentina Deposit Rates Badlar Private Banks ARS 30 to 35 Days |
| |
| BANXICO | | Banco de Mexico |
| |
| BBA LIBOR | | British Bankers’ Association London - Interbank Offered Rate |
| |
| BBSW3M | | ASX Australian Bank Bill Short Term Rate 3 Month Mid |
| |
| BBSW6M | | ASX Australian Bank Bill Short Term Rate 6 Month Mid |
| |
| BP0003M | | ICE LIBOR GBP 3 Month |
| |
| BTP | | Italian Treasury Bonds |
| |
| BUND | | German Federal Obligation |
| |
| BUXL | | German Federal Obligation |
| |
| BZDIOVRA | | Brazil Ceptip DI Interbank Deposit Rate |
| |
| CDX.EM.31 | | Markit CDX Emerging Markets Index |
| |
| COOVIBR | | Colombia IBR Overnight Nominal Interbank Reference Rate |
| |
| CPI EXT | | Excluding Tobacco Consumer Price Index |
| |
| CPURNSA | | US Consumer Price Index Urban Consumers |
| |
| EUR003M | | EURIBOR 3 Month ACT/360 |
| |
| EUR006M | | EURIBOR 6 Month ACT/360 |
| |
| EURIBOR | | Euro Interbank Offered Rate |
| |
| EUSA5 | | EUR Swap Annual 5 Year |
| |
| FBIL | | Financial Benchmarks India Private Ltd. |
| |
| GDR | | Global Depositary Receipt |
| |
| H15T10Y | | US Treasury Yield Curve Rate T Note Constant Maturity 10 Year |
| |
| H15T5Y | | US Treasury Yield Curve Rate T Note Constant Maturity 5 Year |
| |
| IBR | | Indicador Bancario de Referencia |
| |
| ICE LIBOR | | Intercontinental Exchange London Interbank Offered Rate |
| |
| JIBA3M | | South Africa Johannesburg Interbank Agreed Rate 3 Month |
| |
| JIBA3M | | South Africa Johannesburg Interbank Agreed Rate 3 Month |
| |
| KWCDC | | South Korean Won Index |
| |
| MIBOR | | Mumbai Interbank Offered Rate |
| |
| MOSKP3 | | National Finance Assoc. Moscow Prime Offered 3 Month Rate |
82 INVESCO OPPENHEIMER INTERNATIONAL BOND FUND
| | |
| Definitions (Continued) |
| |
| MOSPRIME NEFA | | Moscow Prime Offered Rate |
| |
| NDBB3M | | New Zealand Bank Bill 3 Month |
| |
| OIS | | Overnight Index Swap |
| |
| S&P | | Standard & Poor’s |
| |
| SORF6M | | Association of Banks in Singapore Swap Offer Rate Fixing 6 Month |
| |
| TIIE | | Interbank Equilibrium Interest Rate |
| |
| US0003M | | ICE LIBOR USD 3 Month |
| |
| US0006M | | ICE LIBOR USD 6 Month |
| |
| USISDA05 | | USD ICE Swap Rate 11:00am NY 5 Year |
| |
| USSW5 | | USD Swap Semi 30/360 5 Year |
| |
| WIBOR WIBO | | Poland Warsaw Interbank Offer Bid Rate |
| |
| WIBR6M | | GBP Benchmark WIBOR PLN 6 month |
See accompanying Notes to Consolidated Financial Statements.
83 INVESCO OPPENHEIMER INTERNATIONAL BOND FUND
CONSOLIDATED STATEMENT OF
ASSETS AND LIABILITIES
| | | | | | | | |
| | | | October 31, 2019 September 30, 2019 | |
Assets | | | | | | | | |
| Investments, at value—see accompanying consolidated schedule of investments: | | | | | | | | |
Unaffiliated companies (cost $3,549,831,410 and $3,644,544,807) | | $ | 3,430,613,951 | | | $ | 3,458,200,128 | |
Affiliated companies (cost $234,150,380 and $215,837,538) | | | 234,071,393 | | | | 215,769,322 | |
| | | | |
| | | | 3,664,685,344 | | | | 3,673,969,450 | |
| Cash | | | 41,988,877 | | | | 77,008,331 | |
| Cash—foreign currencies (cost $38,995,594 and $40,763,724) | | | 39,608,483 | | | | 43,558,674 | |
| Cash used for collateral on OTC derivatives | | | 2,840,000 | | | | 4,230,000 | |
| Cash used for collateral on centrally cleared swaps | | | 90,993,089 | | | | 74,308,734 | |
| Unrealized appreciation on forward currency exchange contracts | | | 162,061,869 | | | | 85,537,862 | |
| Swaps, at value (net premiums received $280,308 and $12,789) | | | 4,515,726 | | | | 8,113,701 | |
| Variation margin receivable - centrally cleared swaps | | | — | | | | 3,245,801 | |
| | |
Receivables and other assets: | | | | | | | | |
| | |
Interest and dividends | | | 61,227,777 | | | | 51,583,998 | |
| | |
Investments sold | | | 47,083,960 | | | | 26,807,525 | |
| | |
Shares of beneficial interest sold | | | 3,469,119 | | | | 4,595,737 | |
| | |
Variation margin receivable - futures contracts | | | 3,813,860 | | | | 144,913 | |
| | |
Other | | | 647,398 | | | | 2,245,649 | |
| | | | |
Total assets | | | 4,122,935,502 | | | | 4,055,350,375 | |
Liabilities | | | | | | | | |
| Unrealized depreciation on forward currency exchange contracts | | | 206,900,584 | | | | 124,276,733 | |
| Options written, at value (premiums received $65,121,118 and $71,725,391) | | | 52,472,542 | | | | 68,277,422 | |
| Swaps, at value (premiums received $18,196,696 and $18,464,215) | | | 9,720,364 | | | | 19,260,979 | |
| Variation margin payable - centrally cleared swaps | | | 1,616,247 | | | | — | |
| Swaptions written, at value (premiums received $14,391,383 and $42,267,427) | | | 11,695,008 | | | | 37,938,280 | |
| | |
Payables and other liabilities: | | | | | | | | |
| | |
Investments purchased | | | 63,629,572 | | | | 64,074,112 | |
| | |
Shares of beneficial interest redeemed | | | 6,741,734 | | | | 10,133,032 | |
| | |
Foreign capital gains tax | | | 3,095,826 | | | | 2,770,983 | |
| | |
Transfer and shareholder servicing agent fees | | | 1,351,628 | | | | 1,445,095 | |
| | |
Dividends | | | 898,373 | | | | 896,595 | |
| | |
Shareholder communications | | | 486,000 | | | | 486,000 | |
| | |
Trustees’ compensation | | | 391,838 | | | | 432,547 | |
| | |
Distribution and service plan fees | | | 347,598 | | | | 358,261 | |
| | |
Advisory fees | | | 55,450 | | | | 56,205 | |
| | |
Administration fees | | | 1,453 | | | | 461 | |
| | |
Other | | | 5,591,332 | | | | 1,441,345 | |
| | | | |
Total liabilities | | | 364,995,549 | | | | 331,848,050 | |
| | |
Net Assets | | $ | 3,757,939,953 | | | $ | 3,723,502,325 | |
| | | | |
84 INVESCO OPPENHEIMER INTERNATIONAL BOND FUND
| | | | | | | | | | | | |
October 31, 2019 September 30, 2019 | |
Composition of Net Assets | | | | | | | | | | | | |
Shares of beneficial interest | | $ | 4,003,443,957 | | | | | | | $ | 4,101,502,336 | |
Total accumulated loss | | | (245,504,004 | ) | | | | | | | (378,000,011 | ) |
Net Assets | | $ | 3,757,939,953 | | | | | | | $ | 3,723,502,325 | |
| | | | | | | | | | | | |
| | | | | | | | | | | | |
Net Asset Value Per Share | | | | | | | | | | | | |
Class A Shares: | | | | | | | | | | | | |
| | | |
| Net asset value and redemption price per share (based on net assets and shares of beneficial interest outstanding of $1,043,265,354 and 188,618,423 at October 31, 2019 and $1,039,682,791 and 192,277,732 at September 30, 2019) | | | $5.53 | | | | | | | | $5.41 | |
| | | |
| Maximum offering price per share (net asset value plus sales charge of 4.25% of offering price) | | | $5.78 | | | | | | | | $5.65 | |
| | | |
| Class C Shares: | | | | | | | | | | | | |
| | | |
| Net asset value, redemption price (excludes applicable contingent deferred sales charge) and offering price per share (based on net assets and shares of beneficial interest outstanding of $113,328,942 and 20,566,884 at October 31, 2019 and $116,134,476 and 21,558,589 at September 30, 2019) | | | $5.51 | | | | | | | | $5.39 | |
| | | |
| Class R Shares: | | | | | | | | | | | | |
| | | |
| Net asset value, redemption price and offering price per share (based on net assets and shares of beneficial interest outstanding of $99,079,528 and 17,965,547 at October 31, 2019 and $98,379,672 and 18,247,317 at September 30, 2019) | | | $5.51 | | | | | | | | $5.39 | |
| | | |
| Class Y Shares: | | | | | | | | | | | | |
| | | |
| Net asset value, redemption price and offering price per share (based on net assets and shares of beneficial interest outstanding of $1,623,640,080 and 293,626,083 at October 31, 2019 and $1,611,796,908 and 298,160,897 at September 30, 2019) | | | $5.53 | | | | | | | | $5.41 | |
| | | |
| Class R5 Shares: | | | | | | | | | | | | |
| | | |
| Net asset value, redemption price and offering price per share (based on net assets and shares of beneficial interest outstanding of $10,228 and 1,848 at October 31, 2019 and $9,999 and 1,848 at September 30, 2019) | | | $5.53 | | | | | | | | $5.41 | |
| | | |
| Class R6 Shares: | | | | | | | | | | | | |
| | | |
| Net asset value, redemption price and offering price per share (based on net assets and shares of beneficial interest outstanding of $878,615,821 and 159,031,066 at October 31, 2019 and $857,498,479 and 158,765,031 at September 30, 2019) | | | $5.52 | | | | | | | | $5.40 | |
See accompanying Notes to Consolidated Financial Statements.
85 INVESCO OPPENHEIMER INTERNATIONAL BOND FUND
CONSOLIDATED STATEMENT OF
OPERATIONS
| | | | | | | | |
| | | One Month Ended
October 31, 2019 | | | Year Ended
September 30, 2019 | |
Investment Income | | | | | | | | |
| Interest (net of foreign withholding taxes of $327,602 and $3,753,519, respectively) | | $ | 17,607,816 | | | $ | 283,213,963 | |
| Dividends: | | | | | | | | |
| Affiliated companies | | | 216,015 | | | | 5,303,282 | |
| Total investment income | | | 17,823,831 | | | | 288,517,245 | |
| Expenses | | | | | | | | |
| Advisory fees | | | 1,715,049 | | | | 25,410,396 | |
| Administration fees | | | 44,934 | | | | 208,988 | |
| Distribution and service plan fees: | | | | | | | | |
| Class A | | | 207,291 | | | | 2,523,252 | |
| Class C | | | 98,405 | | | | 2,330,813 | |
| Class R | | | 41,914 | | | | 539,387 | |
| Transfer and shareholder servicing agent fees: | | | | | | | | |
| Class A | | | 160,442 | | | | 1,778,793 | |
| Class C | | | 17,910 | | | | 403,418 | |
| Class R | | | 15,256 | | | | 188,156 | |
| Class Y | | | 249,222 | | | | 3,964,435 | |
| Class R5 | | | 1 | | | | 2 | |
| Class R6 | | | 5,148 | | | | 244,488 | |
| Shareholder communications: | | | | | | | | |
| Class A | | | — | | | | 132,985 | |
| Class C | | | 55 | | | | 20,577 | |
| Class R | | | 1 | | | | 11,928 | |
| Class Y | | | 76 | | | | 253,054 | |
| Class R5 | | | — | | | | 1 | |
| Class R6 | | | — | | | | 106,462 | |
| Custodian fees and expenses | | | 80,775 | | | | 1,036,902 | |
| Trustees’ compensation | | | 5,947 | | | | 117,123 | |
| Borrowing fees | | | — | | | | 98,669 | |
| Other | | | 83,043 | | | | 505,738 | |
| Total expenses | | | 2,725,469 | | | | 39,875,567 | |
| Less waivers and reimbursements of expenses | | | (48,521 | ) | | | (1,393,718 | ) |
| Net expenses | | | 2,676,948 | | | | 38,481,849 | |
| Net Investment Income | | | 15,146,883 | | | | 250,035,396 | |
86 INVESCO OPPENHEIMER INTERNATIONAL BOND FUND
| | | | | | | | |
| | | One Month Ended
October 31, 2019 | | | Year Ended
September 30, 2019 | |
| Realized and Unrealized Gain (Loss) | | | | | | | | |
| Net realized gain (loss) on: | | | | | | | | |
| Investment transactions in: | | | | | | | | |
Unaffiliated companies(net of foreign capital gains tax of $84,707 and $403,891, respectively) | | $ | (23,574,153 | ) | | $ | (77,478,872 | ) |
Affiliated companies | | | (70,680 | ) | | | — | |
| Option contracts written | | | 18,068,594 | | | | 110,647,503 | |
| Futures contracts | | | 1,951,730 | | | | (72,464,074 | ) |
| Foreign currency transactions | | | 1,348,669 | | | | (1,548,666 | ) |
| Forward currency exchange contracts | | | (5,307,938 | ) | | | (173,301,278 | ) |
| Swap contracts | | | (2,340,580 | ) | | | (26,245,328 | ) |
| Swaption contracts written | | | 4,833,271 | | | | (35,777,355 | ) |
| Net realized loss | | | (5,091,087 | ) | | | (276,168,070 | ) |
| Net change in unrealized appreciation/(depreciation) on: | | | | | | | | |
| Investment transactions in: | | | | | | | | |
Unaffiliated companies (net of foreign capital gains tax of $324,843 and $2,770,983, respectively) | | | 66,802,377 | | | | 181,187,103 | |
Affiliated companies | | | (10,771 | ) | | | (68,216 | ) |
| Translation of assets and liabilities denominated in foreign currencies | | | (3,381,293 | ) | | | 4,883,310 | |
| Forward currency exchange contracts | | | (6,099,844 | ) | | | 34,344,968 | |
| Futures contracts | | | 3,127,671 | | | | (6,439,303 | ) |
| Option contracts written | | | 9,200,607 | | | | 21,339,984 | |
| Swap contracts | | | 21,341,704 | | | | 16,842,578 | |
| Swaption contracts written | | | (1,632,772 | ) | | | (2,041,819 | ) |
| Net change in unrealized appreciation/(depreciation) | | | 89,347,679 | | | | 250,048,605 | |
| Net Increase in Net Assets Resulting from Operations | | $ | 99,403,475 | | | $ | 223,915,931 | |
| | | | |
See accompanying Notes to Consolidated Financial Statements.
87 INVESCO OPPENHEIMER INTERNATIONAL BOND FUND
CONSOLIDATED STATEMENT OF CHANGES IN NET ASSETS
| | | | | | | | | | | | |
| | | One Month Ended
October 31, 2019 | | | Year Ended
September 30, 2019 | | | Year Ended
September 30, 2018 | |
Operations | | | | | | | | | | | | |
| Net investment income | | $ | 15,146,883 | | | $ | 250,035,396 | | | $ | 249,387,859 | |
| Net realized gain (loss) | | | (5,091,087 | ) | | | (276,168,070 | ) | | | 49,393,784 | |
| Net change in unrealized appreciation/(depreciation) | | | 89,347,679 | | | | 250,048,605 | | | | (546,567,656 | ) |
| | | | |
| Net increase (decrease) in net assets resulting from operations | | | 99,403,475 | | | | 223,915,931 | | | | (247,786,013 | ) |
Dividends and/or Distributions to Shareholders | | | | | | | | | | | | |
| Distributions to shareholders from distributable earnings:1 | | | | | | | | | | | | |
| Class A | | | — | | | | — | | | | (27,440,410 | ) |
| Class B | | | — | | | | — | | | | (38,410 | ) |
| Class C | | | — | | | | — | | | | (6,338,822 | ) |
| Class R | | | — | | | | — | | | | (2,664,591 | ) |
| Class Y | | | — | | | | — | | | | (62,572,404 | ) |
| Class R5 | | | — | | | | — | | | | — | |
| Class R6 | | | — | | | | — | | | | (31,579,039 | ) |
| | | | |
| Total distributions from distributable earnings | | | — | | | | — | | | | (130,633,676 | ) |
| Tax return of capital distribution: | | | | | | | | | | | | |
| Class A | | | (3,965,134 | ) | | | (52,731,735 | ) | | | (24,741,533 | ) |
| Class B | | | — | | | | — | | | | (34,633 | ) |
| Class C | | | (367,267 | ) | | | (10,455,145 | ) | | | (5,715,373 | ) |
| Class R | | | (354,905 | ) | | | (5,328,769 | ) | | | (2,402,517 | ) |
| Class Y | | | (6,486,852 | ) | | | (123,937,645 | ) | | | (56,418,149 | ) |
| Class R5 | | | (41 | ) | | | (176 | ) | | | — | |
| Class R6 | | | (3,610,322 | ) | | | (59,436,588 | ) | | | (28,473,110 | ) |
| | | | |
| Total return of capital distribution | | | (14,784,521 | ) | | | (251,890,058 | ) | | | (117,785,315 | ) |
Beneficial Interest Transactions | | | | | | | | | | | | |
| Net increase (decrease) in net assets resulting from beneficial interest transactions: | | | | | | | | | | | | |
| Class A | | | (19,951,766 | ) | | | (27,973,352 | ) | | | (98,153,512 | ) |
| Class B | | | — | | | | — | | | | (6,285,572 | ) |
| Class C | | | (5,433,229 | ) | | | (176,957,426 | ) | | | (50,277,315 | ) |
| Class R | | | (1,538,186 | ) | | | (18,127,871 | ) | | | (3,074,235 | ) |
| Class Y | | | (24,711,199 | ) | | | (978,206,520 | ) | | | 496,898,414 | |
| Class R5 | | | — | | | | 10,000 | | | | — | |
| Class R6 | | | 1,453,054 | | | | (541,379,288 | ) | | | 322,995,519 | |
| | | | |
| Total beneficial interest transactions | | | (50,181,326 | ) | | | (1,742,634,457 | ) | | | 662,103,299 | |
Net Assets | | | | | | | | | | | | |
| Total increase (decrease) | | | 34,437,628 | | | | (1,770,608,584 | ) | | | 165,898,295 | |
| Beginning of period | | | 3,723,502,325 | | | | 5,494,110,909 | | | | 5,328,212,614 | |
| | | | |
| End of period | | $ | 3,757,939,953 | | | $ | 3,723,502,325 | | | $ | 5,494,110,909 | |
| | | | |
1. The Securities Exchange Commission eliminated the requirement to disclose the distribution components
88 INVESCO OPPENHEIMER INTERNATIONAL BOND FUND
separately, except for tax return of capital. For the year ended September 30, 2018, distributions to shareholders from distributable earnings consisted of distributions from net investment income.
See accompanying Notes to Consolidated Financial Statements.
89 INVESCO OPPENHEIMER INTERNATIONAL BOND FUND
CONSOLIDATED FINANCIAL HIGHLIGHTS
| | | | | | | | | | | | | | | | | | | | | | | | |
| Class A | | One Month
Ended
October 31,
2019 | | | Year Ended
September
30, 2019 | | | Year Ended
September
30, 2018 | | | Year Ended
September
30, 2017 | | | Year Ended
September
30, 2016 | | | Year Ended
September
30, 2015 | |
| | | | | | |
Per Share Operating Data | | | | | | | | | | | | | | | | | | | | | | | | |
| | | | | | |
| Net asset value, beginning of period | | | $5.41 | | | | $5.47 | | | | $5.95 | | | | $5.95 | | | | $5.62 | | | | $6.01 | |
| | | | | | |
| Income (loss) from investment operations: | | | | | | | | | | | | | | | | | | | | | | | | |
| | | | | | |
| Net investment income1 | | | 0.02 | | | | 0.28 | | | | 0.25 | | | | 0.23 | | | | 0.22 | | | | 0.18 | |
| | | | | | |
| Net realized and unrealized gain (loss) | | | 0.12 | | | | (0.06) | | | | (0.48) | | | | 0.03 | | | | 0.33 | | | | (0.39) | |
| | | | | | |
| Total from investment operations | | | 0.14 | | | | 0.22 | | | | (0.23) | | | | 0.26 | | | | 0.55 | | | | (0.21) | |
| | | | | | |
| Dividends and/or distributions to shareholders: | | | | | | | | | | | | | | | | | | | | | | | | |
| | | | | | |
| Dividends from net investment income | | | 0.00 | | | | 0.00 | | | | (0.13) | | | | (0.10) | | | | (0.10) | | | | (0.14) | |
| | | | | | |
| Tax return of capital distribution | | | (0.02) | | | | (0.28) | | | | (0.12) | | | | (0.16) | | | | (0.12) | | | | (0.04) | |
| | | | | | |
| Total dividends and/or distributions to shareholders | | | (0.02) | | | | (0.28) | | | | (0.25) | | | | (0.26) | | | | (0.22) | | | | (0.18) | |
| | | | | | |
| Net asset value, end of period | | | $5.53 | | | | $5.41 | | | | $5.47 | | | | $5.95 | | | | $5.95 | | | | $5.62 | |
| | | | |
| |
| | | | | | | |
| Total Return, at Net Asset Value2 | | | 2.60% | | | | 4.15% | | | | (4.20)% | | | | 4.67% | | | | 9.95% | | | | (3.57)% | |
|
| | |
Ratios/Supplemental Data | | | | | | | | | | | | | | | | | | | | | | | | |
| | | | | | |
| Net assets, end of period (in thousands) | | | $1,043,265 | | | | $1,039,683 | | | | $1,082,539 | | | | $1,280,770 | | | | $1,611,584 | | | | $2,010,994 | |
| | | | | | |
| Average net assets (in thousands) | | | $1,040,236 | | | | $1,021,107 | | | | $1,215,253 | | | | $1,391,397 | | | | $1,753,796 | | | | $2,556,904 | |
| | | | | | |
| Ratios to average net assets:3 | | | | | | | | | | | | | | | | | | | | | | | | |
| | | | | | |
| Net investment income | | | 4.60% | | | | 5.15% | | | | 4.31% | | | | 3.94% | | | | 3.78% | | | | 3.03% | |
| | | | | | |
| Expenses excluding specific expenses listed below | | | 1.03% | | | | 1.02% | | | | 1.01% | | | | 1.05% | | | | 1.05% | | | | 1.02% | |
| | | | | | |
| Interest and fees from borrowings | | | 0.00% | | | | 0.00%4 | | | | 0.00%4 | | | | 0.00%4 | | | | 0.00%4 | | | | 0.00%4 | |
| | | | | | |
| Total expenses5 | | | 1.03% | | | | 1.02% | | | | 1.01% | | | | 1.05% | | | | 1.05% | | | | 1.02% | |
| | | | | | |
| Expenses after payments, waivers and/or reimbursements and reduction to custodian expenses | | | 1.01% | | | | 0.99% | | | | 0.99%6 | | | | 1.02% | | | | 1.03% | | | | 1.02%6 | |
| | | | | | |
| Portfolio turnover rate7 | | | 7% | | | | 105% | | | | 115% | | | | 96% | | | | 128% | | | | 111% | |
90 INVESCO OPPENHEIMER INTERNATIONAL BOND FUND
1. Per share amounts calculated based on the average shares outstanding during the period.
2. Includes adjustments in accordance with accounting principles generally accepted in the United States of America and as such, the net asset value for financial reporting purposes and the returns based upon those net asset values may differ from the net asset value and returns for shareholder transactions. Does not include sales charges and is not annualized for periods less than one year, if applicable.
3. Annualized for periods less than one full year.
4. Less than 0.005%.
5. Total expenses including indirect expenses from affiliated fund fees and expenses were as follows:
| | | | | | |
| One Month Ended October 31, 2019 | | | 1.04 | % | | |
| Year Ended September 30, 2019 | | | 1.03 | % | | |
| Year Ended September 30, 2018 | | | 1.02 | % | | |
| Year Ended September 30, 2017 | | | 1.06 | % | | |
| Year Ended September 30, 2016 | | | 1.05 | % | | |
| Year Ended September 30, 2015 | | | 1.02 | % | | |
6. Waiver was less than 0.005%.
7. Portfolio turnover is calculated at the fund level and is not annualized for periods less than one year, if applicable.
See accompanying Notes to Consolidated Financial Statements.
91 INVESCO OPPENHEIMER INTERNATIONAL BOND FUND
CONSOLIDATED FINANCIAL HIGHLIGHTSContinued
| | | | | | | | | | | | | | | | | | | | | | | | |
| Class C | | One Month Ended October 31, 2019 | | Year Ended
September
30, 2019 | | | Year Ended
September
30, 2018 | | | Year Ended
September
30, 2017 | | | Year Ended
September
30, 2016 | | | Year Ended
September
30, 2015 | |
| Per Share Operating Data | | | | | | | | | | | | | | | | | | | | | | | | |
| Net asset value, beginning of period | | | $5.39 | | | | $5.45 | | | | $5.93 | | | | $5.92 | | | | $5.60 | | | | $5.99 | |
| Income (loss) from investment operations: | | | | | | | | | | | | | | | | | | | | | | | | |
| Net investment income1 | | | 0.02 | | | | 0.24 | | | | 0.21 | | | | 0.18 | | | | 0.17 | | | | 0.13 | |
| Net realized and unrealized gain (loss) | | | 0.12 | | | | (0.06) | | | | (0.48) | | | | 0.05 | | | | 0.32 | | | | (0.38) | |
| | | | |
| Total from investment operations | | | 0.14 | | | | 0.18 | | | | (0.27) | | | | 0.23 | | | | 0.49 | | | | (0.25) | |
| Dividends and/or distributions to shareholders: | | | | | | | | | | | | | | | | | | | | | | | | |
| Dividends from net investment income | | | 0.00 | | | | 0.00 | | | | (0.11) | | | | (0.08) | | | | (0.07) | | | | (0.11) | |
| Tax return of capital distribution | | | (0.02) | | | | (0.24) | | | | (0.10) | | | | (0.14) | | | | (0.10) | | | | (0.03) | |
| | | | |
| Total dividends and/or distributions to shareholders | | | (0.02) | | | | (0.24) | | | | (0.21) | | | | (0.22) | | | | (0.17) | | | | (0.14) | |
| Net asset value, end of period | | | $5.51 | | | | $5.39 | | | | $5.45 | | | | $5.93 | | | | $5.92 | | | | $5.60 | |
| | | | |
| | | | | | | | | | | | | | | | | | | | | | | | |
| Total Return, at Net Asset Value2 | | | 2.55% | | | | 3.36% | | | | (4.79)% | | | | 3.89% | | | | 8.97% | | | | (4.31)% | |
| | | | | | | | | | | | | | | | | | | | | | | | |
| Ratios/Supplemental Data | | | | | | | | | | | | | | | | | | | | | | | | |
| Net assets, end of period (in thousands) | | | $113,329 | | | | $116,134 | | | | $291,793 | | | | $369,679 | | | | $493,319 | | | | $585,788 | |
| Average net assets (in thousands) | | | $116,029 | | | | $232,700 | | | | $340,435 | | | | $414,939 | | | | $524,002 | | | | $713,793 | |
| Ratios to average net assets:3 | | | | | | | | | | | | | | | | | | | | | | | | |
| Net investment income | | | 3.84% | | | | 4.39% | | | | 3.56% | | | | 3.20% | | | | 3.04% | | | | 2.30% | |
| Expenses excluding specific expenses listed below | | | 1.79% | | | | 1.77% | | | | 1.76% | | | | 1.80% | | | | 1.80% | | | | 1.77% | |
| Interest and fees from borrowings | | | 0.00% | | | | 0.00%4 | | | | 0.00%4 | | | | 0.00%4 | | | | 0.00%4 | | | | 0.00%4 | |
| | | | |
| Total expenses5 | | | 1.79% | | | | 1.77% | | | | 1.76% | | | | 1.80% | | | | 1.80% | | | | 1.77% | |
| Expenses after payments, waivers and/or reimbursements and reduction to custodian expenses | | | 1.77% | | | | 1.74% | | | | 1.74% | | | | 1.77% | | | | 1.78% | | | | 1.77%6 | |
| Portfolio turnover rate7 | | | 7% | | | | 105% | | | | 115% | | | | 96% | | | | 128% | | | | 111% | |
92 INVESCO OPPENHEIMER INTERNATIONAL BOND FUND
1. Per share amounts calculated based on the average shares outstanding during the period.
2. Includes adjustments in accordance with accounting principles generally accepted in the United States of America and as such, the net asset value for financial reporting purposes and the returns based upon those net asset values may differ from the net asset value and returns for shareholder transactions. Does not include sales charges and is not annualized for periods less than one year, if applicable.
3. Annualized for periods less than one full year.
4. Less than 0.005%.
5. Total expenses including indirect expenses from affiliated fund fees and expenses were as follows:
| | | | | | |
| One Month Ended October 31, 2019 | | | 1.80 | % | | |
| Year Ended September 30, 2019 | | | 1.78 | % | | |
| Year Ended September 30, 2018 | | | 1.77 | % | | |
| Year Ended September 30, 2017 | | | 1.81 | % | | |
| Year Ended September 30, 2016 | | | 1.80 | % | | |
| Year Ended September 30, 2015 | | | 1.77 | % | | |
6. Waiver was less than 0.005%.
7. Portfolio turnover is calculated at the fund level and is not annualized for periods less than one year, if applicable.
See accompanying Notes to Consolidated Financial Statements.
93 INVESCO OPPENHEIMER INTERNATIONAL BOND FUND
CONSOLIDATED FINANCIAL HIGHLIGHTSContinued
| | | | | | | | | | | | | | | | | | | | | | | | |
| Class R | | One Month
Ended
October 31,
2019 | | Year Ended
September
30, 2019 | | Year Ended
September
30, 2018 | | | Year Ended
September
30, 2017 | | | Year Ended
September
30, 2016 | | | Year Ended
September
30, 2015 | |
| Per Share Operating Data | | | | | | | | | | | | | | | | | | | | | | | | |
| Net asset value, beginning of period | | | $5.39 | | | | $5.45 | | | | $5.93 | | | | $5.93 | | | | $5.60 | | | | $5.99 | |
| Income (loss) from investment operations: | | | | | | | | | | | | | | | | | | | | | | | | |
| Net investment income1 | | | 0.02 | | | | 0.27 | | | | 0.24 | | | | 0.21 | | | | 0.20 | | | | 0.16 | |
| Net realized and unrealized gain (loss) | | | 0.12 | | | | (0.06) | | | | (0.49) | | | | 0.04 | | | | 0.33 | | | | (0.39) | |
| | | | |
| Total from investment operations | | | 0.14 | | | | 0.21 | | | | (0.25) | | | | 0.25 | | | | 0.53 | | | | (0.23) | |
| Dividends and/or distributions to shareholders: | | | | | | | | | | | | | | | | | | | | | | | | |
| Dividends from net investment income | | | 0.00 | | | | 0.00 | | | | (0.12) | | | | (0.09) | | | | (0.09) | | | | (0.12) | |
| Tax return of capital distribution | | | (0.02) | | | | (0.27) | | | | (0.11) | | | | (0.16) | | | | (0.11) | | | | (0.04) | |
| | | | |
| Total dividends and/or distributions to shareholders | | | (0.02) | | | | (0.27) | | | | (0.23) | | | | (0.25) | | | | (0.20) | | | | (0.16) | |
| Net asset value, end of period | | | $5.51 | | | | $5.39 | | | | $5.45 | | | | $5.93 | | | | $5.93 | | | | $5.60 | |
| | | | |
| | | | | | | | | | | | | | | | | | | | | | | | |
| Total Return, at Net Asset Value2 | | | 2.59% | | | | 3.88% | | | | (4.47)% | | | | 4.41% | | | | 9.70% | | | | (3.84)% | |
| | | | | | | | | | | | | | | | | | | | | | | | |
| Ratios/Supplemental Data | | | | | | | | | | | | | | | | | | | | | | | | |
| Net assets, end of period (in thousands) | | | $99,080 | | | | $98,380 | | | | $117,668 | | | | $131,112 | | | | $146,479 | | | | $166,932 | |
| Average net assets (in thousands) | | | $98,909 | | | | $108,114 | | | | $125,233 | | | | $133,661 | | | | $149,525 | | | | $192,512 | |
| Ratios to average net assets:3 | | | | | | | | | | | | | | | | | | | | | | | | |
| Net investment income | | | 4.34% | | | | 4.90% | | | | 4.06% | | | | 3.67% | | | | 3.54% | | | | 2.81% | |
| Expenses excluding specific expenses listed below | | | 1.29% | | | | 1.27% | | | | 1.25% | | | | 1.30% | | | | 1.29% | | | | 1.27% | |
| Interest and fees from borrowings | | | 0.00% | | | | 0.00%4 | | | | 0.00%4 | | | | 0.00%4 | | | | 0.00%4 | | | | 0.00%4 | |
| | | | |
| Total expenses5 | | | 1.29% | | | | 1.27% | | | | 1.25% | | | | 1.30% | | | | 1.29% | | | | 1.27% | |
| Expenses after payments, waivers and/or reimbursements and reduction to custodian expenses | | | 1.27% | | | | 1.24% | | | | 1.23% | | | | 1.27% | | | | 1.27% | | | | 1.27%6 | |
| Portfolio turnover rate7 | | | 7% | | | | 105% | | | | 115% | | | | 96% | | | | 128% | | | | 111% | |
94 INVESCO OPPENHEIMER INTERNATIONAL BOND FUND
1. Per share amounts calculated based on the average shares outstanding during the period.
2. Includes adjustments in accordance with accounting principles generally accepted in the United States of America and as such, the net asset value for financial reporting purposes and the returns based upon those net asset values may differ from the net asset value and returns for shareholder transactions. Does not include sales charges and is not annualized for periods less than one year, if applicable.
3. Annualized for periods less than one full year.
4. Less than 0.005%.
5. Total expenses including indirect expenses from affiliated fund fees and expenses were as follows:
| | | | | | |
| One Month Ended October 31, 2019 | | | 1.30 | % | | |
| Year Ended September 30, 2019 | | | 1.28 | % | | |
| Year Ended September 30, 2018 | | | 1.26 | % | | |
| Year Ended September 30, 2017 | | | 1.31 | % | | |
| Year Ended September 30, 2016 | | | 1.29 | % | | |
| Year Ended September 30, 2015 | | | 1.27 | % | | |
6. Waiver was less than 0.005%.
7. Portfolio turnover is calculated at the fund level and is not annualized for periods less than one year, if applicable.
See accompanying Notes to Consolidated Financial Statements.
95 INVESCO OPPENHEIMER INTERNATIONAL BOND FUND
CONSOLIDATED FINANCIAL HIGHLIGHTSContinued
| | | | | | | | | | | | | | | | | | | | | | | | |
| Class Y | | One Month
Ended
October 31,
2019 | | Year Ended
September
30, 2019 | | | Year Ended
September
30, 2018 | | | Year Ended
September
30, 2017 | | | Year Ended
September
30, 2016 | | | Year Ended
September
30, 2015 | |
| Per Share Operating Data | | | | | | | | | | | | | | | | | | | | | | | | |
| Net asset value, beginning of period | | | $5.41 | | | | $5.47 | | | | $5.95 | | | | $5.95 | | | | $5.61 | | | | $6.01 | |
| Income (loss) from investment operations: | | | | | | | | | | | | | | | | | | | | | | | | |
| Net investment income1 | | | 0.02 | | | | 0.29 | | | | 0.26 | | | | 0.24 | | | | 0.23 | | | | 0.20 | |
| Net realized and unrealized gain (loss) | | | 0.12 | | | | (0.05) | | | | (0.48) | | | | 0.04 | | | | 0.34 | | | | (0.41) | |
| | | | |
| Total from investment operations | | | 0.14 | | | | 0.24 | | | | (0.22) | | | | 0.28 | | | | 0.57 | | | | (0.21) | |
| Dividends and/or distributions to shareholders: | | | | | | | | | | | | | | | | | | | | | | | | |
| Dividends from net investment income | | | 0.00 | | | | 0.00 | | | | (0.14) | | | | (0.11) | | | | (0.10) | | | | (0.15) | |
| Tax return of capital distribution | | | (0.02) | | | | (0.30) | | | | (0.12) | | | | (0.17) | | | | (0.13) | | | | (0.04) | |
| | | | |
| Total dividends and/or distributions to shareholders | | | (0.02) | | | | (0.30) | | | | (0.26) | | | | (0.28) | | | | (0.23) | | | | (0.19) | |
| Net asset value, end of period | | | $5.53 | | | | $5.41 | | | | $5.47 | | | | $5.95 | | | | $5.95 | | | | $5.61 | |
| | | | |
| | | | | | | | | | | | | | | | | | | | | | | | |
| Total Return, at Net Asset Value2 | | | 2.62% | | | | 4.40% | | | | (3.80)% | | | | 4.75% | | | | 10.42% | | | | (3.50)% | |
| | | | | | | | | | | | | | | | | | | | | | | | |
| Ratios/Supplemental Data | | | | | | | | | | | | | | | | | | | | | | | | |
| Net assets, end of period (in thousands) | | | $1,623,640 | | | | $1,611,797 | | | | $2,597,821 | | | | $2,345,993 | | | | $2,072,160 | | | | $2,781,868 | |
| Average net assets (in thousands) | | | $1,616,370 | | | | $2,278,029 | | | | $2,618,549 | | | | $2,088,382 | | | | $2,399,267 | | | | $3,128,046 | |
| Ratios to average net assets:3 | | | | | | | | | | | | | | | | | | | | | | | | |
| Net investment income | | | 4.84% | | | | 5.39% | | | | 4.56% | | | | 4.13% | | | | 4.03% | | | | 3.32% | |
| Expenses excluding specific expenses listed below | | | 0.79% | | | | 0.77% | | | | 0.76% | | | | 0.80% | | | | 0.80% | | | | 0.77% | |
| Interest and fees from borrowings | | | 0.00% | | | | 0.00%4 | | | | 0.00%4 | | | | 0.00%4 | | | | 0.00%4 | | | | 0.00%4 | |
| | | | |
| Total expenses5 | | | 0.79% | | | | 0.77% | | | | 0.76% | | | | 0.80% | | | | 0.80% | | | | 0.77% | |
| Expenses after payments, waivers and/or reimbursements and reduction to custodian expenses | | | 0.77% | | | | 0.74% | | | | 0.74% | | | | 0.77% | | | | 0.78% | | | | 0.77%6 | |
| Portfolio turnover rate7 | | | 7% | | | | 105% | | | | 115% | | | | 96% | | | | 128% | | | | 111% | |
96 INVESCO OPPENHEIMER INTERNATIONAL BOND FUND
1. Per share amounts calculated based on the average shares outstanding during the period.
2. Includes adjustments in accordance with accounting principles generally accepted in the United States of America and as such, the net asset value for financial reporting purposes and the returns based upon those net asset values may differ from the net asset value and returns for shareholder transactions. Does not include sales charges and is not annualized for periods less than one year, if applicable.
3. Annualized for periods less than one full year.
4. Less than 0.005%.
5. Total expenses including indirect expenses from affiliated fund fees and expenses were as follows:
| | | | | | |
| One Month Ended October 31, 2019 | | | 0.80 | % | | |
| Year Ended September 30, 2019 | | | 0.78 | % | | |
| Year Ended September 30, 2018 | | | 0.77 | % | | |
| Year Ended September 30, 2017 | | | 0.81 | % | | |
| Year Ended September 30, 2016 | | | 0.80 | % | | |
| Year Ended September 30, 2015 | | | 0.77 | % | | |
6. Waiver was less than 0.005%.
7. Portfolio turnover is calculated at the fund level and is not annualized for periods less than one year, if applicable.
See accompanying Notes to Consolidated Financial Statements.
97 INVESCO OPPENHEIMER INTERNATIONAL BOND FUND
CONSOLIDATED FINANCIAL HIGHLIGHTSContinued
| | | | | | | | |
| Class R5 | | One Month
Ended
October 31,
2019 | | Period Ended
September 30,
20191 | |
Per Share Operating Data | | | | | | | | |
| Net asset value, beginning of period | | | $5.41 | | | | $5.41 | |
| Income (loss) from investment operations: | | | | | | | | |
| Net investment income2 | | | 0.02 | | | | 0.11 | |
| Net realized and unrealized gain (loss) | | | 0.12 | | | | (0.01) | |
| | | | |
| Total from investment operations | | | 0.14 | | | | 0.10 | |
| Dividends and/or distributions to shareholders: | | | | | | | | |
| Dividends from net investment income | | | 0.00 | | | | 0.00 | |
| Tax return of capital distribution | | | (0.02) | | | | (0.10) | |
| | | | |
| Total dividends and/or distributions to shareholders | | | (0.02) | | | | (0.10) | |
| Net asset value, end of period | | | $5.53 | | | | $5.41 | |
| | | | |
| | | | | | | | |
| Total Return, at Net Asset Value3 | | | 2.62% | | | | 1.74% | |
| | | | | | | | |
| | | |
| Ratios/Supplemental Data | | | | | | | | |
| Net assets, end of period (in thousands) | | | $10 | | | | $10 | |
| Average net assets (in thousands) | | | $10 | | | | $10 | |
| Ratios to average net assets:4 | | | | | | | | |
| Net investment income | | | 4.93% | | | | 5.48% | |
| Expenses excluding specific expenses listed below | | | 0.68% | | | | 0.67% | |
| Interest and fees from borrowings | | | 0.00% | | | | 0.00% | |
| | | | |
| Total expenses5 | | | 0.68% | | | | 0.67% | |
| Expenses after payments, waivers and/or reimbursements and reduction to custodian expenses | | | 0.68% | | | | 0.65% | |
| Portfolio turnover rate6 | | | 7% | | | | 105% | |
1. For the period from after the close of business on May 24, 2019 (inception of offering) to September 30, 2019.
2. Per share amounts calculated based on the average shares outstanding during the period.
3. Includes adjustments in accordance with accounting principles generally accepted in the United States of America and as such, the net asset value for financial reporting purposes and the returns based upon those net asset values may differ from the net asset value and returns for shareholder transactions. Does not include sales charges and is not annualized for periods less than one year, if applicable.
4. Annualized for periods less than one full year.
5. Total expenses including indirect expenses from affiliated fund fees and expenses were as follows:
| | | | | | |
| One Month Ended October 31, 2019 | | | 0.69 | % | | |
| Period Ended September 30, 2019 | | | 0.68 | % | | |
6. Portfolio turnover is calculated at the fund level and is not annualized for periods less than one year, if applicable.
See accompanying Notes to Consolidated Financial Statements.
98 INVESCO OPPENHEIMER INTERNATIONAL BOND FUND
| | | | | | | | | | | | | | | | | | | | | | | | |
| Class R6 | | One Month
Ended
October 31,
2019 | | Year Ended
September
30, 2019 | | | Year Ended
September
30, 2018 | | | Year Ended
September
30, 2017 | | | Year Ended
September
30, 2016 | | | Year Ended
September
30, 2015 | |
| Per Share Operating Data | | | | | | | | | | | | | | | | | | | | | | | | |
| Net asset value, beginning of period | | | $5.40 | | | | $5.46 | | | | $5.94 | | | | $5.94 | | | | $5.61 | | | | $6.00 | |
| Income (loss) from investment operations: | | | | | | | | | | | | | | | | | | | | | | | | |
| Net investment income1 | | | 0.02 | | | | 0.30 | | | | 0.27 | | | | 0.25 | | | | 0.24 | | | | 0.21 | |
| Net realized and unrealized gain (loss) | | | 0.12 | | | | (0.06) | | | | (0.48) | | | | 0.04 | | | | 0.33 | | | | (0.39) | |
| | | | |
| Total from investment operations | | | 0.14 | | | | 0.24 | | | | (0.21) | | | | 0.29 | | | | 0.57 | | | | (0.18) | |
| Dividends and/or distributions to shareholders: | | | | | | | | | | | | | | | | | | | | | | | | |
| Dividends from net investment income | | | 0.00 | | | | 0.00 | | | | (0.14) | | | | (0.11) | | | | (0.10) | | | | (0.16) | |
| Tax return of capital distribution | | | (0.02) | | | | (0.30) | | | | (0.13) | | | | (0.18) | | | | (0.14) | | | | (0.05) | |
| | | | |
| Total dividends and/or distributions to shareholders | | | (0.02) | | | | (0.30) | | | | (0.27) | | | | (0.29) | | | | (0.24) | | | | (0.21) | |
| Net asset value, end of period | | | $5.52 | | | | $5.40 | | | | $5.46 | | | | $5.94 | | | | $5.94 | | | | $5.61 | |
| | | | |
| | | | | | | | | | | | | | | | | | | | | | | | |
| Total Return, at Net Asset Value2 | | | 2.64% | | | | 4.55% | | | | (3.83)% | | | | 5.12% | | | | 10.45% | | | | (3.16)% | |
| | | | | | | | | | | | | | | | | | | | | | | | |
| Ratios/Supplemental Data | | | | | | | | | | | | | | | | | | | | | | | | |
| Net assets, end of period (in thousands) | | | $878,616 | | | | $857,498 | | | | $1,404,290 | | | | $1,194,372 | | | | $1,631,480 | | | | $1,154,225 | |
| Average net assets (in thousands) | | | $868,548 | | | | $1,065,312 | | | | $1,278,527 | | | | $1,327,997 | | | | $1,406,045 | | | | $918,521 | |
| Ratios to average net assets:3 | | | | | | | | | | | | | | | | | | | | | | | | |
| Net investment income | | | 5.01% | | | | 5.53% | | | | 4.71% | | | | 4.37% | | | | 4.28% | | | | 3.54% | |
| Expenses excluding specific expenses listed below | | | 0.62% | | | | 0.62% | | | | 0.60% | | | | 0.61% | | | | 0.60% | | | | 0.57% | |
| Interest and fees from borrowings | | | 0.00% | | | | 0.00%4 | | | | 0.00%4 | | | | 0.00%4 | | | | 0.00%4 | | | | 0.00%4 | |
| | | | |
| Total expenses5 | | | 0.62% | | | | 0.62% | | | | 0.60% | | | | 0.61% | | | | 0.60% | | | | 0.57% | |
| Expenses after payments, waivers and/or reimbursements and reduction to custodian expenses | | | 0.60% | | | | 0.60% | | | | 0.58% | | | | 0.59% | | | | 0.58% | | | | 0.57%6 | |
| Portfolio turnover rate7 | | | 7% | | | | 105% | | | | 115% | | | | 96% | | | | 128% | | | | 111% | |
99 INVESCO OPPENHEIMER INTERNATIONAL BOND FUND
CONSOLIDATED FINANCIAL HIGHLIGHTSContinued
1. Per share amounts calculated based on the average shares outstanding during the period.
2. Includes adjustments in accordance with accounting principles generally accepted in the United States of America and as such, the net asset value for financial reporting purposes and the returns based upon those net asset values may differ from the net asset value and returns for shareholder transactions. Does not include sales charges and is not annualized for periods less than one year, if applicable.
3. Annualized for periods less than one full year.
4. Less than 0.005%.
5. Total expenses including indirect expenses from affiliated fund fees and expenses were as follows:
| | | | | | |
| One Month Ended October 31, 2019 | | | 0.63 | % | | |
| Year Ended September 30, 2019 | | | 0.63 | % | | |
| Year Ended September 30, 2018 | | | 0.61 | % | | |
| Year Ended September 30, 2017 | | | 0.62 | % | | |
| Year Ended September 30, 2016 | | | 0.60 | % | | |
| Year Ended September 30, 2015 | | | 0.57 | % | | |
6. Waiver was less than 0.005%.
7. Portfolio turnover is calculated at the fund level and is not annualized for periods less than one year, if applicable.
See accompanying Notes to Consolidated Financial Statements.
100 INVESCO OPPENHEIMER INTERNATIONAL BOND FUND
NOTES TO CONSOLIDATED
FINANCIAL STATEMENTSOctober 31, 2019 and September 30, 2019
Note 1 - Significant Accounting Policies
Invesco Oppenheimer International Bond Fund (the “Fund”) is a series portfolio of AIM Investment Funds (Invesco Investment Funds) (the “Trust”). The Trust is a Delaware statutory trust registered under the Investment Company Act of 1940, as amended (the “1940 Act”), as anopen-end series management investment company authorized to issue an unlimited number of shares of beneficial interest. Information presented in these consolidated financial statements pertains only to the Fund. Matters affecting the Fund or each class will be voted on exclusively by the shareholders of such Fund or each class.
Prior to the close of business on May 24, 2019, the Fund operated as Oppenheimer International Bond Fund (the “Acquired Fund” or “Predecessor Fund”). The Acquired Fund was reorganized after the close of business on May 24, 2019 (the “Reorganization Date”) through the transfer of all of its assets and liabilities to the Fund (the “Reorganization”).
Upon closing of the Reorganization, holders of the Acquired Fund’s Class A, Class C, Class R, and Class Y shares received the corresponding class of shares of the Fund and holders of the Acquired Fund’s Class I shares received Class R6 shares of the Fund. Information for the Acquired Fund’s Class I shares prior to the Reorganization is included with Class R6 shares throughout this report. Class R5 shares commenced operations on the Reorganization Date.
Effective October 31, 2019, the Fund’s fiscal year end changed from September 30 to
October 31.
The Fund will seek to gain exposure to Regulation S securities primarily through investments in the Invesco Oppenheimer International Bond Fund (Cayman) Ltd. (the “Subsidiary”), a wholly-owned and controlled subsidiary by the Fund organized under the laws of the Cayman Islands. The Subsidiary was organized by the Fund to invest in Regulation S securities. The Fund may invest up to 25% of its total assets in the Subsidiary.
The Fund’s investment objective is to seek total return.
The Fund currently consists of six different classes of shares: Class A, Class C, Class R, Class Y, Class R5 and Class R6. Class Y shares are available only to certain investors. Class A shares are sold with afront-end sales charge unless certain waiver criteria are met and under certain circumstances load waived shares may be subject to contingent deferred sales charges (“CDSC”). Class C shares are sold with a CDSC. Class R, Class Y, Class R5 and Class R6 shares are sold at net asset value.
The Fund is an investment company and accordingly follows the investment company accounting and reporting guidance in accordance with Financial Accounting Standards Board Accounting Standards Codification Topic 946, Financial Services – Investment Companies.
The following is a summary of the significant accounting policies followed by the Fund in the preparation of its consolidated financial statements.
A. Security Valuations - Securities, including restricted securities, are valued according to the following policy.
Debt obligations (including convertible securities) and unlisted equities are fair valued using an evaluated quote provided by an independent pricing service. Evaluated quotes provided by the pricing service may be determined without exclusive reliance on quoted prices, and may reflect appropriate factors such asinstitution-size trading in similar groups
101 INVESCO OPPENHEIMER INTERNATIONAL BOND FUND
NOTES TO CONSOLIDATED
FINANCIAL STATEMENTSContinued
of securities, developments related to specific securities, dividend rate (for unlisted equities), yield (for debt obligations), quality, type of issue, coupon rate (for debt obligations), maturity (for debt obligations), individual trading characteristics and other market data. Pricing services generally value debt obligations assuming orderly transactions of institutional round lot size, but a fund may hold or transact in the same securities in smaller, odd lot sizes. Odd lots often trade at lower prices than institutional round lots. Debt obligations are subject to interest rate and credit risks. In addition, all debt obligations involve some risk of default with respect to interest and/or principal payments.
A security listed or traded on an exchange (except convertible securities) is valued at its last sales price or official closing price as of the close of the customary trading session on the exchange where the security is principally traded, or lacking any sales or official closing price on a particular day, the security may be valued at the closing bid price on that day. Securities traded in theover-the-counter market are valued based on prices furnished by independent pricing services or market makers. When such securities are valued by an independent pricing service they may be considered fair valued. Futures contracts are valued at the final settlement price set by an exchange on which they are principally traded. Listed options are valued at the mean between the last bid and asked prices from the exchange on which they are principally traded. Options not listed on an exchange are valued by an independent source at the mean between the last bid and asked prices. For purposes of determining net asset value (“NAV”) per share, futures and option contracts generally are valued 15 minutes after the close of the customary trading session of the New York Stock Exchange (“NYSE”).
Investments inopen-end andclosed-end registered investment companies that do not trade on an exchange are valued at theend-of-day net asset value per share. Investments inopen-end andclosed-end registered investment companies that trade on an exchange are valued at the last sales price or official closing price as of the close of the customary trading session on the exchange where the security is principally traded.
Swap agreements are fair valued using an evaluated quote, if available, provided by an independent pricing service. Evaluated quotes provided by the pricing service are valued based on a model which may includeend-of-day net present values, spreads, ratings, industry, company performance and returns of referenced assets. Centrally cleared swap agreements are valued at the daily settlement price determined by the relevant exchange or clearinghouse.
Foreign securities’ (including foreign exchange contracts) prices are converted into U.S. dollar amounts using the applicable exchange rates as of the close of the NYSE. If market quotations are available and reliable for foreign exchange-traded equity securities, the securities will be valued at the market quotations. Because trading hours for certain foreign securities end before the close of the NYSE, closing market quotations may become unreliable. If between the time trading ends on a particular security and the close of the customary trading session on the NYSE, events occur that the investment adviser determines are significant and make the closing price unreliable, the Fund may fair value the security. If the event is likely to have affected the closing price of the security, the security will be valued at fair value in good faith using procedures approved by the Board
102 INVESCO OPPENHEIMER INTERNATIONAL BOND FUND
of Trustees. Adjustments to closing prices to reflect fair value may also be based on a screening process of an independent pricing service to indicate the degree of certainty, based on historical data, that the closing price in the principal market where a foreign security trades is not the current value as of the close of the NYSE. Foreign securities’ prices meeting the approved degree of certainty that the price is not reflective of current value will be priced at the indication of fair value from the independent pricing service. Multiple factors may be considered by the independent pricing service in determining adjustments to reflect fair value and may include information relating to sector indices, American Depositary Receipts and domestic and foreign index futures. Foreign securities may have additional risks including exchange rate changes, potential for sharply devalued currencies and high inflation, political and economic upheaval, the relative lack of issuer information, relatively low market liquidity and the potential lack of strict financial and accounting controls and standards.
Securities for which market prices are not provided by any of the above methods may be valued based upon quotes furnished by independent sources. The last bid price may be used to value equity securities. The mean between the last bid and asked prices is used to value debt obligations, including corporate loans.
Securities for which market quotations are not readily available or became unreliable are valued at fair value as determined in good faith by or under the supervision of the Trust’s officers following procedures approved by the Board of Trustees. Issuer specific events, market trends, bid/asked quotes of brokers and information providers and other market data may be reviewed in the course of making a good faith determination of a security’s fair value.
The Fund may invest in securities that are subject to interest rate risk, meaning the risk that the prices will generally fall as interest rates rise and, conversely, the prices will generally rise as interest rates fall. Specific securities differ in their sensitivity to changes in interest rates depending on their individual characteristics. Changes in interest rates may result in increased market volatility, which may affect the value and/or liquidity of certain Fund investments.
Valuations change in response to many factors including the historical and prospective earnings of the issuer, the value of the issuer’s assets, general economic conditions, interest rates, investor perceptions and market liquidity. Because of the inherent uncertainties of valuation, the values reflected in the financial statements may materially differ from the value received upon actual sale of those investments.
B. Securities Transactions and Investment Income -Securities transactions are accounted for on a trade date basis. Realized gains or losses on sales are computed on the basis of specific identification of the securities sold. Interest income (net of withholding tax, if any) is recorded on the accrual basis from settlement date. Bond premiums and discounts are amortized and/or accreted over the lives of the respective securities.Pay-in-kind interest income andnon-cash dividend income received in the form of securitiesin-lieu of cash are recorded at the fair value of the securities received. Paydown gains and losses on mortgage and asset-backed securities are recorded as adjustments to interest income. Dividend income (net of withholding tax, if any) is recorded on theex-dividend date.
103 INVESCO OPPENHEIMER INTERNATIONAL BOND FUND
NOTES TO CONSOLIDATED
FINANCIAL STATEMENTSContinued
The Fund may periodically participate in litigation related to Fund investments. As such, the Fund may receive proceeds from litigation settlements. Any proceeds received are included in the Consolidated Statement of Operations as realized gain (loss) for investments no longer held and as unrealized gain (loss) for investments still held.
Brokerage commissions and mark ups are considered transaction costs and are recorded as an increase to the cost basis of securities purchased and/or a reduction of proceeds on a sale of securities. Such transaction costs are included in the determination of net realized and unrealized gain (loss) from investment transactions reported in the Consolidated Statement of Operations and the Consolidated Statement of Changes in Net Assets and the net realized and unrealized gains (losses) on securities per share in the Consolidated Financial Highlights. Transaction costs are included in the calculation of the Fund’s net asset value and, accordingly, they reduce the Fund’s total returns. These transaction costs are not considered operating expenses and are not reflected in net investment income reported in the Consolidated Statement of Operations and the Consolidated Statement of Changes in Net Assets, or the net investment income per share and the ratios of expenses and net investment income reported in the Consolidated Financial Highlights, nor are they limited by any expense limitation arrangements between the Fund and the investment adviser.
The Fund allocates income and realized and unrealized capital gains and losses to a class based on the relative net assets of each class.
C. Country Determination- For the purposes of making investment selection decisions and presentation in the Consolidated Schedule of Investments, the investment adviser may determine the country in which an issuer is located and/or credit risk exposure based on various factors. These factors include the laws of the country under which the issuer is organized, where the issuer maintains a principal office, the country in which the issuer derives 50% or more of its total revenues and the country that has the primary market for the issuer’s securities, as well as other criteria. Among the other criteria that may be evaluated for making this determination are the country in which the issuer maintains 50% or more of its assets, the type of security, financial guarantees and enhancements, the nature of the collateral and the sponsor organization. Country of issuer and/or credit risk exposure has been determined to be the United States of America, unless otherwise noted.
D. Distributions -Dividends and distributions to shareholders, which are determined in accordance with income tax regulations and may differ from accounting principles generally accepted in the United States of America (“GAAP”), are recorded on theex-dividend date. Income distributions, if any, are declared daily and paid monthly. Capital gain distributions, if any, are declared and paid annually or at other times as determined necessary by the Adviser.
E. Federal Income Taxes -The Fund intends to comply with provisions of the Internal Revenue Code applicable to regulated investment companies and to distribute substantially all of its investment company taxable income, including any net realized gain on investments not offset by capital loss carryforwards, if any, to shareholders. Therefore, no federal income or excise tax provision is required. The Fund files income tax returns in U.S. federal and applicable state jurisdictions. The statute of limitations on the Fund’s tax return filings generally remains open for the three preceding fiscal reporting period ends. The Fund
104 INVESCO OPPENHEIMER INTERNATIONAL BOND FUND
has analyzed its tax positions for the one month ended October 31, 2019 and the fiscal year ended September 30, 2019, including open tax years, and does not believe there are any uncertain tax positions requiring recognition in the Fund’s financial statements.
Subchapter M requires, among other things, that at least 90% of the Fund’s gross income be derived from securities or derived with respect to its business of investing in securities (typically referred to as “qualifying income”). Income from commodity-linked derivatives may not be treated as “qualifying income” for purposes of the 90% gross income requirement. The Internal Revenue Service (IRS) has previously issued a number of private letter rulings which conclude that income derived from commodity index-linked notes and investments in a wholly-owned subsidiary will be “qualifying income.” As a result, the Fund will gain exposure to commodities through commodity-linked notes and its wholly-owned subsidiary.
The IRS has suspended the granting of private letter rulings pending further review. As a result, there can be no assurance that the IRS will not change its position with respect to commodity-linked notes and wholly-owned subsidiaries. In addition, future legislation and guidance from the Treasury and the IRS may adversely affect the Fund’s ability to gain exposure to commodities through commodity-linked notes and its wholly-owned subsidiary.
The Fund is required to include in income for federal income tax purposes all of the subsidiary’s net income and gains whether or not such income is distributed by the subsidiary. Net income and gains from the subsidiary are generally treated as ordinary income by the Fund, regardless of the character of the subsidiary’s underlying income. Net losses from the subsidiary do not pass through to the Fund for federal income tax purposes.
The tax components of capital shown in the following table for the one month ended October 31, 2019, represent distribution requirements the Fund must satisfy under the income tax regulations, losses the Fund may be able to offset against income and gains realized in future years and unrealized appreciation or depreciation of securities and other investments for federal income tax purposes.
| | | | | | | | | | | | |
Undistributed Net Investment Income | | Undistributed
Long-Term
Gain | | | Accumulated Loss
Carryforward1,2,3,4 | | | Net Unrealized Depreciation Based on cost of Securities and Other Investments for Federal Income
Tax Purposes | |
| $— | | | $— | | | | $142,251,510 | | | | $115,747,298 | |
1.At period end, the Fund had $129,370,079 of net capital loss carryforward available to offset future realized capital gains, if any, and thereby reduce future taxable gain distributions.
2.The Fund had $12,881,431 of straddle losses which were deferred.
3. During the one month reporting period ended October 31, 2019, the Fund utilized $3,876,970 of capital loss carryforward to offset capital gains realized in that fiscal year.
4.During the previous reporting period ended September 30, 2019, the Fund did not utilize any capital loss carryforward.
The tax components of capital shown in the following table for the fiscal year ended
105 INVESCO OPPENHEIMER INTERNATIONAL BOND FUND
NOTES TO CONSOLIDATED
FINANCIAL STATEMENTSContinued
September 30, 2019, represent distribution requirements the Fund must satisfy under the income tax regulations, losses the Fund may be able to offset against income and gains realized in future years and unrealized appreciation or depreciation of securities and other investments for federal income tax purposes.
| | | | | | | | | | | | |
Undistributed
Net Investment
Income | | Undistributed
Long-Term
Gain | | | Accumulated
Loss
Carryforward1,2,3,4,5
| | | Net Unrealized
Depreciation
Based on cost of
Securities and Other Investments
for Federal Income Tax Purposes | |
| $— | | | $— | | | | $191,628,038 | | | | $195,417,876 | |
1.At period end, the Fund had $133,247,049 of net capital loss carryforward available to offset future realized capital gains, if any, and thereby reduce future taxable gain distributions.
2.The Fund had $48,904,239 of post-October foreign currency losses which were deferred.
3.The Fund had $9,476,750 of straddle losses which were deferred.
4. During the reporting period ended September 30, 2019, the Fund did not utilize any capital loss carryforward.
5.During the previous reporting period ended September 30, 2018, the Fund utilized $50,756,055 of capital loss carryforward to offset capital gains realized in that fiscal year.
Net investment income (loss) and net realized gain (loss) may differ for financial statement and tax purposes. The character of dividends and distributions made during the fiscal year from net investment income or net realized gains are determined in accordance with federal income tax requirements, which may differ from the character of net investment income or net realized gains presented in those financial statements in accordance with U.S. GAAP. Also, due to timing of dividends and distributions, the fiscal year in which amounts are distributed may differ from the fiscal year in which the income or net realized gain was recorded by the Fund.
Accordingly, for the one month ended October 31, 2019, the following amounts have been reclassified for the reporting period. Net assets of the Fund were unaffected by the reclassifications.
| | | | |
Reduction to Paid-in Capital | | Reduction
to Accumulated Net Loss | |
| $47,877,053 | | | $47,877,053 | |
Accordingly, for the fiscal year ended September 30, 2019, the following amounts have been reclassified for the reporting period. Net assets of the Fund were unaffected by the reclassifications.
| | | | |
Reduction to Paid-in Capital | | Reduction to Accumulated Net
Loss | |
| $255,344,150 | | | $255,344,150 | |
106 INVESCO OPPENHEIMER INTERNATIONAL BOND FUND
The tax character of distributions paid during the reporting periods:
| | | | | | | | | | | | |
| | | One Month Ended
October 31, 2019 | | | Year Ended
September 30, 2019 | | | Year Ended
September 30, 2018 | |
Distributions paid from: | | | | | | | | | | | | |
Ordinary income | | $ | — | | | $ | — | | | $ | 130,633,676 | |
Return of capital | | | 14,784,521 | | | | 251,890,058 | | | | 117,785,315 | |
| | | | |
Total | | $ | 14,784,521 | | | $ | 251,890,058 | | | $ | 248,418,991 | |
| | | | |
The aggregate cost of securities and other investments and the composition of unrealized appreciation and depreciation of securities and other investments for federal income tax purposes at period end are noted in the following table. The primary difference between book and tax appreciation or depreciation of securities and other investments, if applicable, is attributable to the tax deferral of losses or tax realization of financial statement unrealized gain or loss.
| | | | | | | | |
| | | One Month
Ended October
31, 2019 | | | Year Ended
September 30,
2019 | |
Federal tax cost of securities | | $ | 3,801,663,469 | | | $ | 3,873,815,904 | |
Federal tax cost of other investments | | | (229,196,853 | ) | | | (282,296,325 | ) |
| | | | |
Total federal tax cost | | $ | 3,572,466,616 | | | $ | 3,591,519,579 | |
| | | | |
Gross unrealized appreciation | | $ | 275,906,288 | | | $ | 272,916,299 | |
Gross unrealized depreciation | | | (391,653,586 | ) | | | (468,334,175 | ) |
| | | | |
Net unrealized depreciation | | $ | (115,747,298 | ) | | $ | (195,417,876 | ) |
| | | | |
Certain foreign countries impose a tax on capital gains which is accrued by the Fund based on unrealized appreciation, if any, on affected securities. The tax is paid when the gain is realized.
F. Expenses -Fees provided for under the Rule12b-1 plan of a particular class of the Fund are charged to the operations of such class. Transfer agency fees and expenses and other shareholder recordkeeping fees and expenses attributable to Class R5 and Class R6 are allocated to each share class based on relative net assets.Sub-accounting fees attributable to Class R5 are charged to the operations of the class. Transfer agency fees and expenses and other shareholder recordkeeping fees and expenses relating to all other classes are allocated among those classes based on relative net assets. All other expenses are allocated among the classes based on relative net assets.
G. Accounting Estimates -The financial statements are prepared on a consolidated basis in conformity with GAAP, which requires management to make estimates and assumptions that affect the reported amounts of assets and liabilities at the date of the financial statements and the reported amounts of revenues and expenses during the reporting period including estimates and assumptions related to taxation. Actual results could differ from those estimates by a significant amount. The accompanying financial statements reflect the financial position of the Fund and its Subsidiary and the results of operations on a consolidated basis. All inter-company accounts and transactions have been eliminated in consolidation. In addition, the Fund monitors for material events or transactions that may
107 INVESCO OPPENHEIMER INTERNATIONAL BOND FUND
NOTES TO CONSOLIDATED
FINANCIAL STATEMENTSContinued
occur or become known after theperiod-end date and before the date the consolidated financial statements are released to print.
H. Indemnifications -Under the Trust’s organizational documents, each Trustee, officer, employee or other agent of the Trust, and under the Subsidiary’s organizational documents, the directors and officers of the Subsidiary, are indemnified against certain liabilities that may arise out of the performance of their duties to the Fund and/or the Subsidiary, respectively. Additionally, in the normal course of business, the Fund enters into contracts, including the Fund’s servicing agreements, that contain a variety of indemnification clauses. The Fund’s maximum exposure under these arrangements is unknown as this would involve future claims that may be made against the Fund that have not yet occurred. The risk of material loss as a result of such indemnification claims is considered remote.
I. Foreign Currency Translations -Foreign currency is valued at the close of the NYSE based on quotations posted by banks and major currency dealers. Portfolio securities and other assets and liabilities denominated in foreign currencies are translated into U.S. dollar amounts at the date of valuation. Purchases and sales of portfolio securities (net of foreign taxes withheld on disposition) and income items denominated in foreign currencies are translated into U.S. dollar amounts on the respective dates of such transactions. The Fund does not separately account for the portion of the results of operations resulting from changes in foreign exchange rates on investments and the fluctuations arising from changes in market prices of securities held. The combined results of changes in foreign exchange rates and the fluctuation of market prices on investments (net of estimated foreign tax withholding) are included with the net realized and unrealized gain or loss from investments in the Consolidated Statement of Operations. Reported net realized foreign currency gains or losses arise from (1) sales of foreign currencies, (2) currency gains or losses realized between the trade and settlement dates on securities transactions, and (3) the difference between the amounts of dividends, interest, and foreign withholding taxes recorded on the Fund’s books and the U.S. dollar equivalent of the amounts actually received or paid. Net unrealized foreign currency gains and losses arise from changes in the fair values of assets and liabilities, other than investments in securities at fiscal period end, resulting from changes in exchange rates. The Fund may invest in foreign securities, which may be subject to foreign taxes on income, gains on investments or currency repatriation, a portion of which may be recoverable. Foreign taxes, if any, are recorded based on the tax regulations and rates that exist in the foreign markets in which the Fund invests and are shown in the Consolidated Statement of Operations.
J. Structured Securities -The Fund may invest in structured securities. Structured securities are a type of derivative security whose value is determined by reference to changes in the value of underlying securities, currencies, interest rates, commodities, indices or other financial indicators (“reference instruments”). Most structured securities are fixed-income securities that have maturities of three years or less. Structured securities may be positively or negatively indexed (i.e., their principal value or interest rates may increase or decrease if the underlying reference instrument appreciates) and may have return characteristics similar to direct investments in the underlying reference instrument.
Structured securities may entail a greater degree of market risk than other types of debt
108 INVESCO OPPENHEIMER INTERNATIONAL BOND FUND
securities because the investor bears the risk of the reference instruments. In addition to the credit risk of structured securities and the normal risks of price changes in response to changes in interest rates, the principal amount of structured notes or indexed securities may decrease as a result of changes in the value of the underlying reference instruments. Changes in the daily value of structured securities are recorded as unrealized gains (losses) in the Consolidated Statement of Operations. When the structured securities mature or are sold, the Fund recognizes a realized gain (loss) on the Consolidated Statement of Operations.”
K. Forward Foreign Currency Contracts - The Fund may engage in foreign currency transactions either on a spot (i.e. for prompt delivery and settlement) basis, or through forward foreign currency contracts, to manage or minimize currency or exchange rate risk.
The Fund may also enter into forward foreign currency contracts for the purchase or sale of a security denominated in a foreign currency in order to “lock in” the U.S. dollar price of that security, or the Fund may also enter into forward foreign currency contracts that do not provide for physical settlement of the two currencies, but instead are settled by a single cash payment calculated as the difference between the agreed upon exchange rate and the spot rate at settlement based upon an agreed upon notional amount(non-deliverable forwards). The Fund will set aside liquid assets in an amount equal to the dailymark-to-market obligation for forward foreign currency contracts.
A forward foreign currency contract is an obligation between two parties (“Counterparties”) to purchase or sell a specific currency for an agreed-upon price at a future date. The use of forward foreign currency contracts does not eliminate fluctuations in the price of the underlying securities the Fund owns or intends to acquire but establishes a rate of exchange in advance. Fluctuations in the value of these contracts are measured by the difference in the contract date and reporting date exchange rates and are recorded as unrealized appreciation (depreciation) until the contracts are closed. When the contracts are closed, realized gains (losses) are recorded. Realized and unrealized gains (losses) on the contracts are included in the Consolidated Statement of Operations. The primary risks associated with forward foreign currency contracts include failure of the Counterparty to meet the terms of the contract and the value of the foreign currency changing unfavorably. These risks may be in excess of the amounts reflected in the Consolidated Statement of Assets and Liabilities.
L. Treasury Inflation-Protected Securities -The Fund may invest in Treasury Inflation-Protected Securities (“TIPS”). TIPS are fixed income securities whose principal value is periodically adjusted to the rate of inflation. The principal value of TIPS will be adjusted upward or downward, and any increase or decrease in the principal amount of TIPS will be shown as Treasury Inflation-Protected Securities inflation adjustments in the Consolidated Statement of Operations, even though investors do not receive their principal until maturity.
M. Futures Contracts- The Fund may enter into futures contracts to manage exposure to interest rate, equity and market price movements and/or currency risks. A futures contract is an agreement between Counterparties to purchase or sell a specified underlying security, currency or commodity (or delivery of a cash settlement price, in the case of an index future) for a fixed price at a future date. The Fund currently invests only in exchange-traded
109 INVESCO OPPENHEIMER INTERNATIONAL BOND FUND
NOTES TO CONSOLIDATED
FINANCIAL STATEMENTSContinued
futures and they are standardized as to maturity date and underlying financial instrument. Initial margin deposits required upon entering into futures contracts are satisfied by the segregation of specific securities or cash as collateral at the futures commission merchant (broker). During the period the futures contracts are open, changes in the value of the contracts are recognized as unrealized gains or losses by recalculating the value of the contracts on a daily basis. Subsequent or variation margin payments are received or made depending upon whether unrealized gains or losses are incurred. These amounts are reflected as receivables or payables on the Consolidated Statement of Assets and Liabilities. When the contracts are closed or expire, the Fund recognizes a realized gain or loss equal to the difference between the proceeds from, or cost of, the closing transaction and the Fund’s basis in the contract. The net realized gain (loss) and the change in unrealized gain (loss) on futures contracts held during the period is included on the Consolidated Statement of Operations. The primary risks associated with futures contracts are market risk and the absence of a liquid secondary market. If the Fund were unable to liquidate a futures contract and/or enter into an offsetting closing transaction, the Fund would continue to be subject to market risk with respect to the value of the contracts and continue to be required to maintain the margin deposits on the futures contracts. Futures contracts have minimal Counterparty risk since the exchange’s clearinghouse, as Counterparty to all exchange-traded futures, guarantees the futures against default. Risks may exceed amounts recognized in the Consolidated Statement of Assets and Liabilities.
N. Swap Agreements - The Fund may enter into various swap transactions, including interest rate, total return, index, currency and credit default swap contracts (“CDS”) for investment purposes or to manage interest rate, currency or credit risk. Such transactions are agreements between Counterparties. A swap agreement may be negotiated bilaterally and tradedover-the-counter (“OTC”) between two parties (“uncleared/OTC”) or, in some instances, must be transacted through a future commission merchant (“FCM”) and cleared through a clearinghouse that serves as a central Counterparty (“centrally cleared swap”). These agreements may contain among other conditions, events of default and termination events, and various covenants and representations such as provisions that require the Fund to maintain apre-determined level of net assets, and/or provide limits regarding the decline of the Fund’s NAV over specific periods of time. If the Fund were to trigger such provisions and have open derivative positions at that time, the Counterparty may be able to terminate such agreement and request immediate payment in an amount equal to the net liability positions, if any.
Interest rate, total return, index, and currency swap agreements aretwo-party contracts entered into primarily to exchange the returns (or differentials in rates of returns) earned or realized on particular predetermined investments or instruments. The gross returns to be exchanged or “swapped” between the parties are calculated with respect to a notional amount, i.e., the return on or increase in value of a particular dollar amount invested at a particular interest rate or return of an underlying asset, in a particular foreign currency, or in a “basket” of securities representing a particular index.
In a centrally cleared swap, the Fund’s ultimate Counterparty is a central clearinghouse. The Fund initially will enter into centrally cleared swaps through an executing broker. When
110 INVESCO OPPENHEIMER INTERNATIONAL BOND FUND
a fund enters into a centrally cleared swap, it must deliver to the central Counterparty (via the FCM) an amount referred to as “initial margin.” Initial margin requirements are determined by the central Counterparty, but an FCM may require additional initial margin above the amount required by the central Counterparty. Initial margin deposits required upon entering into centrally cleared swaps are satisfied by cash or securities as collateral at the FCM. Securities deposited as initial margin are designated on the Consolidated Schedule of Investments and cash deposited is recorded on the Consolidated Statement of Assets and Liabilities. During the term of a cleared swap agreement, a “variation margin” amount may be required to be paid by the Fund or may be received by the Fund, based on the daily change in price of the underlying reference instrument subject to the swap agreement and is recorded as a receivable or payable for variation margin in the Consolidated Statement of Assets and Liabilities until the centrally cleared swap is terminated at which time a realized gain or loss is recorded.
A CDS is an agreement between Counterparties to exchange the credit risk of an issuer. A buyer of a CDS is said to buy protection by paying a fixed payment over the life of the agreement and in some situations an upfront payment to the seller of the CDS. If a defined credit event occurs (such as payment default or bankruptcy), the Fund as a protection buyer would cease paying its fixed payment, the Fund would deliver eligible bonds issued by the reference entity to the seller, and the seller would pay the full notional value, or the “par value”, of the referenced obligation to the Fund. A seller of a CDS is said to sell protection and thus would receive a fixed payment over the life of the agreement and an upfront payment, if applicable. If a credit event occurs, the Fund as a protection seller would cease to receive the fixed payment stream, the Fund would pay the buyer “par value” or the full notional value of the referenced obligation, and the Fund would receive the eligible bonds issued by the reference entity. In turn, these bonds may be sold in order to realize a recovery value. Alternatively, the seller of the CDS and its Counterparty may agree to net the notional amount and the market value of the bonds and make a cash payment equal to the difference to the buyer of protection. If no credit event occurs, the Fund receives the fixed payment over the life of the agreement. As the seller, the Fund would effectively add leverage to its portfolio because, in addition to its total net assets, the Fund would be subject to investment exposure on the notional amount of the CDS. In connection with these agreements, cash and securities may be identified as collateral in accordance with the terms of the respective swap agreements to provide assets of value and recourse in the event of default under the swap agreement or bankruptcy/insolvency of a party to the swap agreement. If a Counterparty becomes bankrupt or otherwise fails to perform its obligations due to financial difficulties, the Fund may experience significant delays in obtaining any recovery in a bankruptcy or other reorganization proceeding. The Fund may obtain only limited recovery or may obtain no recovery in such circumstances. The Fund’s maximum risk of loss from Counterparty risk, either as the protection seller or as the protection buyer, is the value of the contract. The risk may be mitigated by having a master netting arrangement between the Fund and the Counterparty and by the designation of collateral by the Counterparty to cover the Fund’s exposure to the Counterparty.
Implied credit spreads represent the current level at which protection could be bought or
111 INVESCO OPPENHEIMER INTERNATIONAL BOND FUND
NOTES TO CONSOLIDATED
FINANCIAL STATEMENTSContinued
sold given the terms of the existing CDS contract and serve as an indicator of the current status of the payment/performance risk of the CDS. An implied spread that has widened or increased since entry into the initial contract may indicate a deteriorating credit profile and increased risk of default for the reference entity. A declining or narrowing spread may indicate an improving credit profile or decreased risk of default for the reference entity. Alternatively, credit spreads may increase or decrease reflecting the general tolerance for risk in the credit markets.
An interest rate swap is an agreement between Counterparties pursuant to which the parties exchange a floating rate payment for a fixed rate payment based on a specified notional amount.
Changes in the value of centrally cleared and OTC swap agreements are recognized as unrealized gains (losses) in the Consolidated Statement of Operations by “marking to market” on a daily basis to reflect the value of the swap agreement at the end of each trading day. Payments received or paid at the beginning of the agreement are reflected as such on the Consolidated Statement of Assets and Liabilities and may be referred to as upfront payments. The Fund accrues for the fixed payment stream and amortizes upfront payments, if any, on swap agreements on a daily basis with the net amount, recorded as a component of realized gain (loss) on the Consolidated Statement of Operations. A liquidation payment received or made at the termination of a swap agreement is recorded as realized gain (loss) on the Consolidated Statement of Operations. The Fund segregates cash or liquid securities having a value at least equal to the amount of the potential obligation of a Fund under any swap transaction. Cash held as collateral is recorded as deposits with brokers on the Consolidated Statement of Assets and Liabilities. Entering into these agreements involves, to varying degrees, lack of liquidity and elements of credit, market, and Counterparty risk in excess of amounts recognized on the Consolidated Statement of Assets and Liabilities. Such risks involve the possibility that a swap is difficult to sell or liquidate; the Counterparty does not honor its obligations under the agreement and unfavorable interest rates and market fluctuations. It is possible that developments in the swaps market, including potential government regulation, could adversely affect the Fund’s ability to terminate existing swap agreements or to realize amounts to be received under such agreements. A short position in a security poses more risk than holding the same security long. As there is no limit on how much the price of the security can increase, the Fund’s exposure is unlimited.
Notional amounts of each individual credit default swap agreement outstanding as of September 30, 2019 for which the Fund is the seller of protection are disclosed in the open swap agreements tables. These potential amounts would be partially offset by any recovery values of the respective referenced obligations, upfront payments received upon entering into the agreement, or net amounts received from the settlement of buy protection credit default swap agreements entered into by the Fund for the same referenced entity or entities.
O. Put Options Purchased and Written - The Fund may purchase and write put options including options on securities indexes, or foreign currency and/or futures contracts. By purchasing a put option, the Fund obtains the right (but not the obligation) to sell the
112 INVESCO OPPENHEIMER INTERNATIONAL BOND FUND
option’s underlying instrument at a fixed strike price. In return for this right, the Fund pays an option premium. The option’s underlying instrument may be a security, securities index, or a futures contract.
Additionally, the Fund may enter into an option on a swap agreement, also called a “swaption”. A swaption is an option that gives the buyer the right, but not the obligation, to enter into a swap on a future date in exchange for paying a market-based premium. A receiver swaption gives the owner the right to receive the total return of a specified asset, reference rate or index. Swaptions also include options that allow an existing swap to be terminated or extended by one of the Counterparties.
Put options may be used by the Fund to hedge securities it owns by locking in a minimum price at which the Fund can sell. If security prices fall, the put option could be exercised to offset all or a portion of the Fund’s resulting losses. At the same time, because the maximum the Fund has at risk is the cost of the option, purchasing put options does not eliminate the potential for the Fund to profit from an increase in the value of the underlying portfolio securities. The Fund may write put options to earn additional income in the form of option premiums if it expects the price of the underlying instrument to remain stable or rise during the option period so that the option will not be exercised. The risk in this strategy is that the price of the underlying securities may decline by an amount greater than the premium received. Put options written are reported as a liability in the Consolidated Statement of Assets and Liabilities. Realized and unrealized gains and losses on put options purchased and put options written are included in the Consolidated Statement of Operations as Net realized gain (loss) from and Change in net unrealized appreciation (depreciation) of Investment securities and Option contracts written, respectively. A risk in buying an option is that the Fund pays a premium whether or not the option is exercised. In addition, there can be no assurance that a liquid secondary market will exist for any option purchased.
P. Call Options Purchased and Written - The Fund may write call options and/or buy call options. A covered call option gives the purchaser of such option the right to buy, and the writer the obligation to sell, the underlying security or foreign currency at the stated exercise price during the option period. An uncovered call option exists without the ownership of the underlying security. Options written by the Fund normally will have expiration dates between three and nine months from the date written. The exercise price of a call option may be below, equal to, or above the current market value of the underlying security at the time the option is written.
Additionally, the Fund may enter into an option on a swap agreement, also called a “swaption”. A swaption is an option that gives the buyer the right, but not the obligation, to enter into a swap on a future date in exchange for paying a market-based premium. A receiver swaption gives the owner the right to receive the total return of a specified asset, reference rate or index. Swaptions also include options that allow an existing swap to be terminated or extended by one of the Counterparties.
When the Fund writes a covered call option, an amount equal to the premium received by the Fund is recorded as an asset and an equivalent liability in the Consolidated Statement of Assets and Liabilities. The amount of the liability is subsequently
113 INVESCO OPPENHEIMER INTERNATIONAL BOND FUND
NOTES TO CONSOLIDATED
FINANCIAL STATEMENTSContinued
“marked-to-market” to reflect the current market value of the option written. If a written covered call option expires on the stipulated expiration date, or if the Fund enters into a closing purchase transaction, the Fund realizes a gain (or a loss if the closing purchase transaction exceeds the premium received when the option was written) without regard to any unrealized gain or loss on the underlying security, and the liability related to such option is extinguished. If a written covered call option is exercised, the Fund realizes a gain or a loss from the sale of the underlying security and the proceeds of the sale are increased by the premium originally received. Realized and unrealized gains and losses on call options written are included in the Consolidated Statement of Operations as Net realized gain (loss) from and Change in net unrealized appreciation (depreciation) of Option contracts written. A risk in writing a covered call option is that the Fund gives up the opportunity for profit if the market price of the security increases and the option is exercised. The risk in writing an uncovered call option is that the Fund may incur significant losses if the value of the written security exceeds the exercise price of the option.
When the Fund buys a call option, an amount equal to the premium paid by the Fund is recorded as an investment on the Consolidated Statement of Assets and Liabilities. The amount of the investment is subsequently“marked-to-market” to reflect the current value of the option purchased. Realized and unrealized gains and losses on call options purchased are included in the Consolidated Statement of Operations as Net realized gain (loss) from and Change in net unrealized appreciation (depreciation) of Investment securities. A risk in buying an option is that the Fund pays a premium whether or not the option is exercised. In addition, there can be no assurance that a liquid secondary market will exist for any option purchased.
Q. Securities on a When-Issued or Delayed Delivery Basis-The Fund may purchase securities on a “when-issued” basis, and may purchase or sell securities on a “delayed delivery” basis, with payment and delivery scheduled for a future date. No income accrues to the Fund on the securities in connection with such transactions prior to the date the Fund actually takes delivery of the securities. These transactions are subject to market fluctuations and are subject to the risk that the value at delivery may be more or less than the trade date purchase price. Although the Fund will generally purchase these securities with the intention on acquiring such securities, they may sell such securities prior to the settlement date.
R. Other Risks- The Fund may invest in lower-quality debt securities, i.e., “junk bonds”. Investments in lower-rated securities or unrated securities of comparable quality tend to be more sensitive to economic conditions than higher rated securities. Junk bonds involve a greater risk of default by the issuer because such securities are generally unsecured and are often subordinated to other creditors’ claim. The Fund will seek to gain exposure to Regulation S securities primarily through an investment in the Subsidiary. Regulation S securities may be relatively less liquid as a result of legal or contractual restrictions on resale. The Fund is indirectly exposed to the risks associated with the Subsidiary’s investments.
The Fund isnon-diversified and may invest in securities of fewer issuers than if it were diversified. Thus, the value of the Fund’s shares may vary more widely and the Fund may be
114 INVESCO OPPENHEIMER INTERNATIONAL BOND FUND
subject to greater market and credit risk than if the Fund invested more broadly.
S. Leverage Risk- Leverage exists when the Fund can lose more than it originally invests because it purchases or sells an instrument or enters into a transaction without investing an amount equal to the full economic exposure of the instrument or transaction.
T. Collateral- To the extent the Fund has designated or segregated a security as collateral and that security is subsequently sold, it is the Fund’s practice to replace such collateral no later than the next business day.
Note 2 – Advisory Fees and Other Fees Paid to Affiliates
The Trust has entered into a master investment advisory agreement with Invesco Advisers, Inc. (the “Adviser” or “Invesco”). Under the terms of the investment advisory agreement, the Fund accrues daily and pays monthly an advisory fee to the Adviser based on the annual rate of the Fund’s average daily net assets as follows:
| | | | |
Fee Schedule* | | | | |
Up to $200 million | | | 0.75% | |
Next $200 million | | | 0.72 | |
Next $200 million | | | 0.69 | |
Next $200 million | | | 0.66 | |
Next $200 million | | | 0.60 | |
Next $4 billion | | | 0.50 | |
Next $10 billion | | | 0.48 | |
Over $15 billion | | | 0.45 | |
*The advisory fee paid by the Fund shall be reduced by any amounts paid by the Fund under the administrative services agreement with the Adviser.
For the one month ended October 31, 2019 and the yearended September 30, 2019, the effective advisory fee incurred by the Fund was 0.53% and 0.54% annualized, respectively.
The Subsidiary has entered into a separate contract with the Adviser whereby the Adviser provides investment advisory and other services to the Subsidiary. In consideration of these services, the Subsidiary pays an advisory fee to the Adviser based on the annual rate of the Subsidiary’s average daily net assets as set forth in the table above. From October 1, 2018 until the date of the Reorganization, the Acquired Fund paid $17,282,656 in advisory fees to OFI Global Asset Management, Inc. based on the annual rates above of the Acquired Fund’s average daily net assets.
Under the terms of a mastersub-advisory agreement between the Adviser and each of Invesco Asset Management Deutschland GmbH, Invesco Asset Management Limited, Invesco Asset Management (Japan) Limited, Invesco Hong Kong Limited, Invesco Senior Secured Management, Inc. and Invesco Canada Ltd. and separatesub-advisory agreements with Invesco Capital Management LLC, and Invesco Asset Management (India) Private Limited (collectively, the “AffiliatedSub-Advisers”) the Adviser, not the Fund, will pay 40% of the fees paid to the Adviser to any such AffiliatedSub-Adviser(s) that provide(s) discretionary investment management services to the Fund based on the percentage of assets allocated to such AffiliatedSub-Adviser(s). Invesco has also entered into aSub-Advisory Agreement with OppenheimerFunds, Inc. to provide discretionary management services to the Funds.
115 INVESCO OPPENHEIMER INTERNATIONAL BOND FUND
NOTES TO CONSOLIDATED
FINANCIAL STATEMENTSContinued
Effective on the Reorganization Date, the Adviser has contractually agreed, through at least May 31, 2021, to waive advisory fees and/or reimburse expenses of all shares to the extent necessary to limit the total annual fund operating expenses after fee waiver and/or expense reimbursement (excluding certain items discussed below) ofClass A, Class C, Class R, Class Y, Class R5 and Class R6 shares to1.01%, 1.76%, 1.26%, 0.76%, 0.67% and 0.62%, respectively, of the Fund’s average daily net assets (the “expense limits”). In determining the Adviser’s obligation to waive advisory fees and/or reimburse expenses, the following expenses are not taken into account, and could cause total annual fund operating expenses after fee waivers and/or expense reimbursement to exceed the numbers reflected above: (1) interest; (2) taxes; (3) dividend expenses on short sales; (4) extraordinary ornon-routine items, including litigation expenses; and (5) expenses that the Fund has incurred but did not actually pay because of an expense offset arrangement. Acquired Fund Fees and Expenses are not operating expenses of the Fund directly, but are fees and expenses, including management fees of the investment companies in which the Fund invests. As a result, the total annual fund operating expenses after expense reimbursement may exceed the expense limits above. Unless Invesco continues the fee waiver agreement, it will terminate May 31, 2021. During its term, the fee waiver agreement cannot be terminated or amended to increase the expense limits or reduce the advisory fee waiver without approval of the Board of Trustees.
Further, the Adviser has contractually agreed, through at least June 30, 2021, to waive the advisory fee payable by the Fund in an amount equal to 100% of the net advisory fees the Adviser receives from the affiliated money market funds on investments by the Fund of uninvested cash in such affiliated money market funds.
For the one month ended October 31, 2019, the Adviser waived advisory fees of $43,064 and reimbursed fund expenses of $294, $271 and $4,892for Class C, Class R and Class Y, respectively. For the year ended September 30, 2019, the Adviser waived advisory fees of $491,078 and reimbursed fund expenses of $173,459, $19,617, $16,772, $284,908 and $28,836for Class A, Class C, Class R, Class Y and Class R6, respectively.
The Trust has entered into a master administrative services agreement with Invesco pursuant to which the Fund has agreed to pay Invesco for certain administrative costs incurred in providing accounting services to the Fund. For one month ended October 31,2019 and the year ended September 30, 2019, expenses incurred under the agreement are shown in the Consolidated Statement of Operations as Administration fees. Additionally, Invesco has entered into service agreements whereby JPMorgan Chase Bankserves as custodian to the Fund. Prior to the Reorganization, the Acquired Fund paid administrative fees to OFI Global Asset Management, Inc.
The Trust has entered into a transfer agency and service agreement with Invesco Investment Services, Inc. (“IIS”) pursuant to which the Fund has agreed to pay IIS a fee for providing transfer agency and shareholder services to the Fund and reimburse IIS for certain expenses incurred by IIS in the course of providing such services. IIS may make payments to intermediaries that provide omnibus account services,sub-accounting services and/or networking services. All fees payable by IIS to intermediaries that provide omnibus account services orsub-accounting services are charged back to the Fund, subject to certain limitations approved by the Trust’s Board of Trustees. Prior to the Reorganization, the Acquired Fund paid
116 INVESCO OPPENHEIMER INTERNATIONAL BOND FUND
transfer agent fees to OFI Global Asset Management, Inc. and Shareholder Services, Inc. For the one month ended October 31, 2019 and the year ended September 30, 2019, expenses incurred under these agreements are shown in the Consolidated Statement of Operations as Transfer and shareholder servicing agent fees.
The Trust has entered into master distribution agreements with Invesco Distributors, Inc. (“IDI”) to serve as the distributor for theClass A, Class C, Class R, Class Y, Class R5 and Class R6 shares of the Fund. The Trust has adopted plans pursuant to Rule12b-1 under the 1940 Act with respect to the Fund’s Class A, Class C and Class R shares(collectively the “Plan”). The Fund, pursuant to the Class A Plan, reimburses IDI in an amount up to an annual rate of 0.25% of the average daily net assets of Class A shares. The Fund pursuant to the Class C and Class R Plan, pays IDI compensation at the annual rate of 1.00% of the average daily net assets of Class C shares and 0.50% of the average daily net assets of Class R shares. The fees are accrued daily and paid monthly. Of the Plan payments, up to 0.25% of the average daily net assets of each class of shares may be paid to furnish continuing personal shareholder services to customers who purchase and own shares of such classes. Any amounts not paid as a service fee under the Plan would constitute an asset-based sales charge. Rules of the Financial Industry Regulatory Authority (“FINRA”) impose a cap on the total sales charges, including asset-based sales charges, that may be paid by any class of shares of the Fund plans. Prior to the Reorganization, the Acquired Fund paid distribution fees to OppenheimerFunds Distributor, Inc. For the one month ended October 31, 2019 and year ended September 30, 2019, expenses incurred under the plans are shown in the Consolidated Statement of Operations as Distribution and service plan fees.
Front-end sales commissions and CDSC (collectively, the “sales charges”) are not recorded as expenses of the Fund.Front-end sales commissions are deducted from proceeds from the sales of Fund shares prior to investment in Class A shares of the Fund. CDSC are deducted from redemption proceeds prior to remittance to the shareholder. During the one month ended October 31, 2019, IDI advised the Fund that IDI retained $4,137 infront-end sales commissions from the sale of Class A shares and $610 and $127 from Class A and Class C shares, respectively, for CDSC imposed on redemptions by shareholders. During the year ended September 30, 2019, IDI advised the Fund that IDI retained $9,409 infront-end sales commissions from the sale of Class A shares and $4,130 and $2,220 from Class A and Class C shares, respectively, for CDSC imposed on redemptions by shareholders. From the beginning of the fiscal year to the date of the Reorganization, OppenheimerFunds Distributor, Inc. retained $45,640 in front–end sales commissions from the sale of Class A shares and $3,866 and $8,952 from Class A and Class C shares, respectively, for CDSC imposed on redemption by shareholders.
Certain officers and trustees of the Trust are officers and directors of the Adviser, IIS and/or IDI.
Note 3 – Additional Valuation Information
GAAP defines fair value as the price that would be received to sell an asset or paid to transfer a liability in an orderly transaction between market participants at the measurement date,
117 INVESCO OPPENHEIMER INTERNATIONAL BOND FUND
NOTES TO CONSOLIDATED
FINANCIAL STATEMENTSContinued
under current market conditions. GAAP establishes a hierarchy that prioritizes the inputs to valuation methods, giving the highest priority to readily available unadjusted quoted prices in an active market for identical assets (Level 1) and the lowest priority to significant unobservable inputs (Level 3), generally when market prices are not readily available or are unreliable. Based on the valuation inputs, the securities or other investments are tiered into one of three levels. Changes in valuation methods may result in transfers in or out of an investment’s assigned level:
Level 1 — Prices are determined using quoted prices in an active market for identical assets.
Level 2 — Prices are determined using other significant observable inputs. Observable inputs are inputs that other market participants may use in pricing a security. These may include quoted prices for similar securities, interest rates, prepayment speeds, credit risk, yield curves, loss severities, default rates, discount rates, volatilities and others.
Level 3 — Prices are determined using significant unobservable inputs. In situations where quoted prices or observable inputs are unavailable (for example, when there is little or no market activity for an investment at the end of the period), unobservable inputs may be used. Unobservable inputs reflect the Fund’s own assumptions about the factors market participants would use in determining fair value of the securities or instruments and would be based on the best available information.
The level assigned to the securities valuations may not be an indication of the risk or liquidity associated with investing in those securities. Because of the inherent uncertainties of valuation, the values reflected in the financial statements may materially differ from the value received upon actual sale of those investments.
The following is a summary of the tiered valuation input levels, as of October 31, 2019:
| | | | | | | | | | | | | | | | |
| | | Level 1—
Unadjusted
Quoted Prices | | | Level 2— Other Significant Observable Inputs | | | Level 3—
Significant
Unobservable
Inputs | | | Value | |
Assets Table | | | | | | | | | | | | | | | | |
Investments, at Value: | | | | | | | | | | | | | | | | |
| Mortgage-Backed Obligations | | $ | — | | | $ | 180,881,380 | | | $ | — | | | $ | 180,881,380 | |
| U.S. Government Obligation | | | — | | | | 4,076,057 | | | | — | | | | 4,076,057 | |
| Foreign Government Obligations | | | — | | | | 2,296,453,418 | | | | — | | | | 2,296,453,418 | |
| Corporate Bonds and Notes | | | — | | | | 568,369,778 | | | | 1,419,264 | | | | 569,789,042 | |
| Common Stock | | | — | | | | — | | | | — | | | | — | |
| Structured Securities | | | — | | | | 16,268,738 | | | | — | | | | 16,268,738 | |
| Short-Term Notes | | | — | | | | 313,979,742 | | | | — | | | | 313,979,742 | |
| Exchange-Traded Options Purchased | | | 1,502,060 | | | | — | | | | — | | | | 1,502,060 | |
| Over-the-Counter Options Purchased | | | — | | | | 34,528,254 | | | | — | | | | 34,528,254 | |
| Over-the-Counter Credit Default Swaption Purchased | | | — | | | | 175,176 | | | | — | | | | 175,176 | |
| Over-the-Counter Interest Rate Swaptions Purchased | | | — | | | | 12,960,084 | | | | — | | | | 12,960,084 | |
118 INVESCO OPPENHEIMER INTERNATIONAL BOND FUND
NOTES TO CONSOLIDATED
FINANCIAL STATEMENTSContinued
| | | | | | | | | | | | | | | | |
| | | Level 1—
Unadjusted
Quoted Prices | | | Level 2— Other Significant Observable Inputs | | | Level 3—
Significant
Unobservable
Inputs | | | Value | |
Investments, at Value: (Continued) | | | | | | | | | | | | | | | | |
| Investment Companies | | $ | 232,541,098 | | | $ | 1,530,295 | | | $ | — | | | $ | 234,071,393 | |
| | | | |
| Total Investments, at Value | | | 234,043,158 | | | | 3,429,222,922 | | | | 1,419,264 | | | | 3,664,685,344 | |
Other Financial Instruments: | | | | | | | | | | | | | | | | |
| Swaps, at value | | | — | | | | 4,515,726 | | | | — | | | | 4,515,726 | |
| Centrally cleared swaps, at value | | | — | | | | 38,462,017 | | | | — | | | | 38,462,017 | |
| Futures contracts | | | 1,923,498 | | | | — | | | | — | | | | 1,923,498 | |
| Forward currency exchange contracts | | | — | | | | 162,061,869 | | | | — | | | | 162,061,869 | |
| | | | |
| Total Assets | | $ | 235,966,656 | | | $ | 3,634,262,534 | | | $ | 1,419,264 | | | $ | 3,871,648,454 | |
| | | | |
| | | | |
Liabilities Table | | | | | | | | | | | | | | | | |
Other Financial Instruments: | | | | | | | | | | | | | | | | |
| Swaps, at value | | $ | — | | | $ | (9,720,364 | ) | | $ | — | | | $ | (9,720,364 | ) |
| Centrally cleared swaps, at value | | | — | | | | (19,490,671 | ) | | | — | | | | (19,490,671 | ) |
| Exchange-Traded Options written, at value | | | (535,000 | ) | | | — | | | | — | | | | (535,000 | ) |
| Options written, at value | | | — | | | | (51,937,542 | ) | | | — | | | | (51,937,542 | ) |
| Futures contracts | | | (84,231 | ) | | | — | | | | — | | | | (84,231 | ) |
| Forward currency exchange contracts | | | — | | | | (206,900,584 | ) | | | — | | | | (206,900,584 | ) |
| Swaptions written, at value | | | — | | | | (11,695,008 | ) | | | — | | | | (11,695,008 | ) |
| | | | |
| Total Liabilities | | $ | (619,231 | ) | | $ | (299,744,169 | ) | | $ | — | | | $ | (300,363,400 | ) |
| | | | |
|
Forward currency exchange contracts and futures contracts, if any, are reported at their unrealized appreciation/depreciation at measurement date, which represents the change in the contract’s value from trade date. All additional assets and liabilities included in the above table are reported at their market value at measurement date. The following is a summary of the tiered valuation input levels, as of September 30, 2019: | |
| | | Level 1—
Unadjusted
Quoted Prices | | | Level 2— Other Significant Observable Inputs | | | Level 3—
Significant
Unobservable
Inputs | | | Value | |
Assets Table | | | | | | | | | | | | | | | | |
Investments, at Value: | | | | | | | | | | | | | | | | |
| Mortgage-Backed Obligations | | $ | — | | | $ | 179,047,660 | | | $ | — | | | $ | 179,047,660 | |
| Foreign Government Obligations | | | — | | | | 2,298,646,163 | | | | — | | | | 2,298,646,163 | |
| Corporate Bonds and Notes | | | — | | | | 591,843,716 | | | | — | | | | 591,843,716 | |
| Common Stock | | | — | | | | — | | | | — | | | | — | |
| Structured Securities | | | — | | | | 17,476,126 | | | | 248,271 | | | | 17,724,397 | |
| Short-Term Notes | | | — | | | | 313,424,250 | | | | — | | | | 313,424,250 | |
| Exchange-Traded Options Purchased | | | 2,674,009 | | | | — | | | | — | | | | 2,674,009 | |
| Over-the-Counter Options Purchased | | | — | | | | 20,373,334 | | | | — | | | | 20,373,334 | |
| Over-the-Counter Credit Default Swaptions Purchased | | | — | | | | 1,001,496 | | | | — | | | | 1,001,496 | |
| Over-the-Counter Interest Rate Swaptions Purchased | | | — | | | | 33,465,103 | | | | — | | | | 33,465,103 | |
| Investment Companies | | | 212,617,419 | | | | 3,151,903 | | | | — | | | | 215,769,322 | |
| | | | |
| Total Investments, at Value | | | 215,291,428 | | | | 3,458,429,751 | | | | 248,271 | | | | 3,673,969,450 | |
119 INVESCO OPPENHEIMER INTERNATIONAL BOND FUND
NOTES TO CONSOLIDATED
FINANCIAL STATEMENTSContinued
| | | | | | | | | | | | | | | | |
| | | Level 1—
Unadjusted
Quoted Prices | | | Level 2— Other Significant Observable Inputs | | | Level 3—
Significant
Unobservable
Inputs | | | Value | |
Other Financial Instruments: | | | | | | | | | | | | | | | | |
| Swaps, at value | | $ | — | | | $ | 8,113,701 | | | $ | — | | | $ | 8,113,701 | |
| Centrally cleared swaps, at value | | | — | | | | 37,361,274 | | | | — | | | | 37,361,274 | |
| Futures contracts | | | 103,140 | | | | — | | | | — | | | | 103,140 | |
| Forward currency exchange contracts | | | — | | | | 85,537,862 | | | | — | | | | 85,537,862 | |
| | | | |
| Total Assets | | $ | 215,394,568 | | | $ | 3,589,442,588 | | | $ | 248,271 | | | $ | 3,805,085,427 | |
| | | | |
Liabilities Table | | | | | | | | | | | | | | | | |
Other Financial Instruments: | | | | | | | | | | | | | | | | |
| Swaps, at value | | $ | — | | | $ | (19,260,979 | ) | | $ | — | | | $ | (19,260,979 | ) |
| Centrally cleared swaps, at value | | | — | | | | (33,741,812 | ) | | | — | | | | (33,741,812 | ) |
| Exchange-Traded Options, at value | | | (1,052,180 | ) | | | — | | | | — | | | | (1,052,180 | ) |
| Options written, at value | | | — | | | | (67,225,242 | ) | | | — | | | | (67,225,242 | ) |
| Futures contracts | | | (1,391,544 | ) | | | — | | | | — | | | | (1,391,544 | ) |
| Forward currency exchange contracts | | | — | | | | (124,276,733 | ) | | | — | | | | (124,276,733 | ) |
| Swaptions written, at value | | | — | | | | (37,938,280 | ) | | | — | | | | (37,938,280 | ) |
| | | | |
| Total Liabilities | | $ | (2,443,724 | ) | | $ | (282,443,046 | ) | | $ | — | | | $ | (284,886,770 | ) |
| | | | |
Forward currency exchange contracts and futures contracts, if any, are reported at their unrealized appreciation/depreciation at measurement date, which represents the change in the contract’s value from trade date. All additional assets and liabilities included in the above table are reported at their market value at measurement date.
Note 4 - Derivative Investments
The Fund may enter into an International Swaps and Derivatives Association Master Agreement (“ISDA Master Agreement”) under which a fund may trade OTC derivatives. An OTC transaction entered into under an ISDA Master Agreement typically involves a collateral posting arrangement, payment netting provisions andclose-out netting provisions. These netting provisions allow for reduction of credit risk through netting of contractual obligations. The enforceability of the netting provisions of the ISDA Master Agreement depends on the governing law of the ISDA Master Agreement, among other factors. For financial reporting purposes, the Fund does not offset OTC derivative assets or liabilities that are subject to ISDA Master Agreements in the Consolidated Statement of Assets and Liabilities.
Offsetting Assets and Liabilities as of October 31, 2019
The table below reflects the Fund’s exposure to Counterparties subject to either an ISDA Master Agreement or other agreement for OTC derivative asset transactions as of October 31, 2019:
120 INVESCO OPPENHEIMER INTERNATIONAL BOND FUND
| | | | | | | | | | | | | | | | | | | | |
| | | | | | Gross Amounts Not Offset in the Consolidated
Statement of Assets & Liabilities | | | | |
| Counterparty | | Gross Amounts
Not Offset in the
Consolidated
Statement of Assets &
Liabilities* | | | Financial
Instruments
Available for
Offset | | | Financial
Instruments
Collateral
Received** | | | Cash Collateral
Received** | | | Net Amount | |
| Bank of America NA | | $ | 8,734,220 | | | $ | (8,734,220 | ) | | $ | – | | | $ | – | | | $ | – | |
| Barclays Bank plc | | | 3,768,014 | | | | (3,768,014 | ) | | | – | | | | – | | | | – | |
| BNP Paribas | | | 113,164 | | | | – | | | | – | | | | – | | | | 113,164 | |
| Citibank NA | | | 36,661,115 | | | | (36,661,115 | ) | | | – | | | | – | | | | – | |
| Goldman Sachs Bank USA | | | 22,693,794 | | | | (22,693,794 | ) | | | – | | | | – | | | | – | |
| Goldman Sachs International | | | 11,398,573 | | | | (8,460,671 | ) | | | (2,644,262 | ) | | | – | | | | 293,640 | |
| HSBC Bank USA NA | | | 1,342,515 | | | | (1,342,515 | ) | | | – | | | | – | | | | – | |
| JPMorgan Chase Bank NA | | | 103,745,610 | | | | (103,745,610 | ) | | | – | | | | – | | | | – | |
| Morgan Stanley & Co., Inc. | | | 1,583,830 | | | | (1,583,830 | ) | | | – | | | | – | | | | – | |
| Morgan Stanley Capital Services, Inc. | | | 8,278,582 | | | | (4,902,147 | ) | | | – | | | | (1,605,000 | ) | | | 1,771,435 | |
| RBC Dominion Securities | | | 11,690,779 | | | | (9,925,599 | ) | | | – | | | | (710,000 | ) | | | 1,055,180 | |
| Standard Chartered Bank | | | 4,230,913 | | | | (4,230,913 | ) | | | – | | | | – | | | | – | |
| | | | |
| | $ | 214,241,109 | | | $ | (206,048,428 | ) | | $ | (2,644,262 | ) | | $ | (2,315,000 | ) | | $ | 3,233,419 | |
| | | | |
*OTC derivatives are reported gross on the Consolidated Statement of Assets and Liabilities. Exchange traded options and margin related to centrally cleared swaps and futures, if any, are excluded from these reported amounts.
**Reported collateral posted for the benefit of the Fund within this table is limited to the net outstanding amount due from an individual counterparty. The collateral posted for the benefit of the Fund may exceed these amounts.
The table below reflects the Fund’s exposure to Counterparties subject to either an ISDA Master Agreement or other agreement for OTC derivative liability transactions as of October 31, 2019:
| | | | | | | | | | | | | | | | | | | | |
| | | | | | Gross Amounts Not Offset in the Consolidated
Statement of Assets & Liabilities | | | | |
| Counterparty | | Gross Amounts
Not Offset in the
Consolidated
Statement of Assets &
Liabilities* | | | Financial
Instruments
Available for
Offset | | | Financial
Instruments
Collateral
Pledged** | | | Cash Collateral
Pledged** | | | Net Amount | |
| Bank of America NA | | $ | (21,978,973 | ) | | $ | 8,734,220 | | | $ | 13,244,753 | | | $ | – | | | $ | – | |
| Barclays Bank plc | | | (10,582,129 | ) | | | 3,768,014 | | | | 6,091,225 | | | | – | | | | (722,890 | ) |
| Citibank NA | | | (55,175,817 | ) | | | 36,661,115 | | | | 18,514,702 | | | | – | | | | – | |
| Deutsche Bank AG | | | (1,293,805 | ) | | | – | | | | – | | | | – | | | | (1,293,805 | ) |
| Goldman Sachs Bank USA | | | (35,792,243 | ) | | | 22,693,794 | | | | 7,352,542 | | | | 2,840,000 | | | | (2,905,907 | ) |
121 INVESCO OPPENHEIMER INTERNATIONAL BOND FUND
NOTES TO CONSOLIDATED
FINANCIAL STATEMENTSContinued
| | | | | | | | | | | | | | | | | | | | |
| | | | | | Gross Amounts Not Offset in the Consolidated
Statement of Assets & Liabilities | | | | |
| Counterparty | | Gross Amounts
Not Offset in the
Consolidated
Statement
of Assets &
Liabilities* | | | Financial
Instruments
Available for
Offset | | | Financial
Instruments
Collateral
Pledged** | | | Cash Collateral
Pledged** | | | Net Amount | |
| Goldman Sachs International | | $ | (8,460,671 | ) | | $ | 8,460,671 | | | $ | – | | | $ | – | | | $ | – | |
| HSBC Bank USA NA | | | (5,184,070 | ) | | | 1,342,515 | | | | 3,841,555 | | | | – | | | | – | |
| JPMorgan Chase Bank NA | | | (117,316,041 | ) | | | 103,745,610 | | | | 13,570,431 | | | | – | | | | – | |
| Morgan Stanley & Co., Inc. | | | (4,253,575 | ) | | | 1,583,830 | | | | – | | | | – | | | | (2,669,745 | ) |
| Morgan Stanley Capital Services, Inc. | | | (4,902,147 | ) | | | 4,902,147 | | | | – | | | | – | | | | – | |
| RBC Dominion Securities | | | (9,925,599 | ) | | | 9,925,599 | | | | – | | | | – | | | | – | |
| Standard Chartered Bank | | | (5,388,428 | ) | | | 4,230,913 | | | | 1,157,515 | | | | – | | | | – | |
| | | | |
| | $ | (280,253,498 | ) | | $ | 206,048,428 | | | $ | 63,772,723 | | | $ | 2,840,000 | | | $ | (7,592,347 | ) |
| | | | |
*OTC derivatives are reported gross on the Consolidated Statement of Assets and Liabilities. Exchange traded options and margin related to centrally cleared swaps and futures, if any, are excluded from these reported amounts.
**Reported collateral pledged within this table is limited to the net outstanding amount due from the Fund. The securities pledged as collateral by the Fund as reported on the Consolidated Schedule of Investments may exceed these amounts.
Value of Derivative Instruments at October 31, 2019
The table below reflects the Fund’s exposure to Counterparties subject to either an ISDA Master Agreement or other agreement for OTC derivative liability transactions as of October 31, 2019:
| | | | | | | | | | | | |
| | | Asset Derivatives | | | Liability Derivatives | |
Derivatives
Not Accounted
for as Hedging
Instruments | | Consolidated
Statement of Assets
and Liabilities Location | | Value | | | Consolidated
Statement of Assets
and Liabilities Location | | Value | |
| Credit contracts | | Swaps, at value | | $ | 431,620 | | | Swaps, at value | | $ | 6,009,876 | |
| Interest rate contracts | | Swaps, at value | | | 4,084,106 | | | Swaps, at value | | | 3,710,488 | |
| Credit contracts | | Centrally cleared swaps, at value | | | 3,273,078 | 1 | | Centrally cleared swaps, at value | | | 571,106 | 1 |
| Interest rate contracts | | Centrally cleared swaps, at value | | | 35,188,939 | 1 | | Centrally cleared swaps, at value | | | 18,919,565 | 1 |
| Interest rate contracts | | Variation margin receivable | | | 1,923,498 | 2 | | Variation margin payable | | | 84,231 | 2 |
| Forward currency exchange contracts | | Unrealized appreciation on foreign currency exchange contracts | | | 162,061,869 | | | Unrealized depreciation on foreign currency exchange contracts | | | 206,900,584 | |
| Equity contracts | | | | | | | | Options written, at value | | | 535,000 | |
122 INVESCO OPPENHEIMER INTERNATIONAL BOND FUND
| | | | | | | | | | | | | | |
| | | Asset Derivatives | | | | | Liability Derivatives | |
Derivatives
Not Accounted
for as Hedging
Instruments | | Consolidated
Statement of Assets
and Liabilities Location | | Value | | | | | Consolidated
Statement of Assets
and Liabilities Location | | Value | |
| |
Currency contracts | | | | | | | | | | Options written, at value | | $ | 51,937,542 | |
Credit contracts | | Investments, at value | | $ | 175,1763 | | | | | Swaptions written, at value | | | 285,761 | |
Equity contracts | | Investments, at value | | | 1,502,0603 | | | | | | | | | |
Currency contracts | | Investments, at value | | | 34,528,2543 | | | | | | | | | |
Interest rate contracts Investments, at value | | | 12,960,0843 | | | | | Swaptions written, at value | | | 11,409,247 | |
| | | | | | | | | | | | | | |
Total | | | | $ | 256,128,684 | | | | | | | $ | 300,363,400 | |
| | | | | | | | | | | | | | |
1. The daily variation margin receivable (payable) at period end is recorded in the Consolidated Statement of Assets and Liabilities
2. Includes only the current day’s variation margin. Prior variation margin movements have been reflected in cash on the Consolidated Statement of Assets and Liabilities upon receipt or payment.
3.Amounts relate to purchased option contracts and purchased swaption contracts, if any.
Effect of Derivative Investments for the One Month Ended October 31, 2019
The tables below summarize the gains (losses) on derivative investments, detailed by primary risk exposure, recognized in earnings during the period:
| | | | | | | | | | | | | | | | | | | | |
| Amount of Realized Gain or (Loss) Recognized on Derivatives | |
| |
Derivatives
Not Accounted
for as Hedging
Instruments | | Investment
transactions
in unaffiliated
companies* | | | Swaption
contracts
written | | | Option
contracts
written | | | Futures
contracts | | | Forward
currency
exchange
contracts | |
| |
Credit contracts | | $ | 247,591 | | | $ | (35,782) | | | $ | — | | | $ | — | | | $ | — | |
Currency contracts | | | (5,674,114) | | | | — | | | | 18,050,741 | | | | — | | | | — | |
Equity contracts | | | (40,991) | | | | — | | | | 17,853 | | | | — | | | | — | |
Forward currency exchange contracts | | | — | | | | — | | | | — | | | | — | | | | (5,307,938) | |
Interest rate contracts | | | (20,253,142) | | | | 4,869,053 | | | | — | | | | 1,951,730 | | | | — | |
| | | | |
Total | | $ | (25,720,656) | | | $ | 4,833,271 | | | $ | 18,068,594 | | | $ | 1,951,730 | | | $ | (5,307,938) | |
| | | | |
| | | | | | | | |
| Amount of Realized Gain or (Loss) Recognized on Derivatives | |
Derivatives
Not Accounted
for as Hedging
Instruments | | Swap contracts | | | Total | |
Credit contracts | | $ | (389,497 | ) | | $ | (177,688) | |
Currency contracts | | | — | | | | 12,376,627 | |
Equity contracts | | | — | | | | (23,138) | |
Forward currency exchange contracts | | | — | | | | (5,307,938) | |
Interest rate contracts | | | (1,951,083 | ) | | | (15,383,442) | |
| | | | |
Total | | $ | (2,340,580 | ) | | $ | (8,515,579) | |
| | | | |
* Purchased option contracts and purchased swaption contracts, if any, are included in the realized gain (loss) from investment transactions in unaffiliated companies.
123 INVESCO OPPENHEIMER INTERNATIONAL BOND FUND
NOTES TO CONSOLIDATED
FINANCIAL STATEMENTSContinued
| | | | | | | | | | | | | | | | | | | | |
| Amount of Change in Unrealized Gain or (Loss) Recognized on Derivatives | |
Derivatives
Not Accounted
for as Hedging
Instruments | | Investment
transactions
in unaffiliated
companies* | | | Swaption contracts written | | | Option contracts written | | | Futures contracts | | | Forward currency exchange contracts | |
| Credit contracts | | $ | (135,164 | ) | | $ | 136,714 | | | $ | — | | | $ | — | | | $ | — | |
| Currency contracts | | | 4,134,282 | | | | — | | | | 8,872,672 | | | | — | | | | — | |
| Equity contracts | | | (774,077 | ) | | | — | | | | 327,935 | | | | — | | | | — | |
| Forward currency exchange contracts | | | — | | | | — | | | | — | | | | — | | | | (6,099,844 | ) |
| Interest rate contracts | | | 18,839,328 | | | | (1,769,486 | ) | | | — | | | | 3,127,671 | | | | — | |
| | | | |
| Total | | $ | 22,064,369 | | | $ | (1,632,772 | ) | | $ | 9,200,607 | | | $ | 3,127,671 | | | $ | (6,099,844 | ) |
| | | | |
|
| Amount of Change in Unrealized Gain or (Loss) Recognized on Derivatives | |
Derivatives Not Accounted for as Hedging Instruments | | | | | | | | | | | Swap contracts | | | Total | |
| Credit contracts | | | | | | | | | | | | | | $ | 4,234,661 | | | $ | 4,236,211 | |
| Currency contracts | | | | | | | | | | | | | | | — | | | | 13,006,954 | |
| Equity contracts | | | | | | | | | | | | | | | — | | | | (446,142 | ) |
| Forward currency exchange contracts | | | | | | | | — | | | | (6,099,844 | ) |
| Interest rate contracts | | | | | | | | | | | | | | | 17,107,043 | | | | 37,304,556 | |
| | | | | | | | | | | | | | | | |
| Total | | | | | | | | | | | | | | $ | 21,341,704 | | | $ | 48,001,735 | |
| | | | | | | | | | | | | | | | |
* Purchased option contracts and purchased swaption contracts, if any, are included in the change in unrealized gain (loss) from investment transactions in unaffiliated companies.
The table below summarizes theaverage notional value of forward foreign currency contracts, futures contracts, swap agreements, options purchased and written and swaptions purchased and written during the one month ended October 31, 2019.
| | | | | | | | | | | | | | | | | | | | |
| | | Forward foreign currency contracts | | | Futures contracts | | | Swaptions
purchased | | | Swaptions written | | | Swap agreements | |
| Average notional amount | | $ | 18,991,613,479 | | | $ | 149,354,800 | | | $ | 6,216,835,701 | | | $ | 3,277,259,016 | | | $ | 5,984,369,247 | |
| | | | | | | | | | | | | | | | |
| | | Index options purchased | | | Index options written | | | Currency options purchased | | | Currency options written | |
| Average notional amount | | $ | 144,045,000 | | | $ | 129,140,000 | | | $ | 82,380,156,248 | | | $ | 1,711,650,509,121 | |
| Average contracts | | | 542 | | | | 542 | | | | 82,349,890,000 | | | | 1,711,596,750,500 | |
124 INVESCO OPPENHEIMER INTERNATIONAL BOND FUND
Offsetting Assets and Liabilities as of September 30, 2019
The table below reflects the Fund’s exposure to Counterparties subject to either an ISDA Master Agreement or other agreement for OTC derivative asset transactions as of September 30, 2019:
| | | | | | | | | | | | | | | | | | | | |
| | | | | | Gross Amounts Not Offset in the Consolidated Statement of Assets & Liabilities | | | | |
| Counterparty | | Gross Amounts
Not Offset in the
Consolidated Statement
of Assets & Liabilities* | | | Financial Instruments
Available for Offset | | | Financial
Instruments
Collateral
Received** | | | Cash Collateral
Received** | | | Net Amount | |
| Bank of America NA | | $ | 5,560,938 | | | $ | (5,560,938 | ) | | $ | – | | | $ | – | | | $ | – | |
| Barclays Bank plc | | | 2,991,740 | | | | (2,991,740 | ) | | | – | | | | – | | | | – | |
| Citibank NA | | | 16,281,459 | | | | (16,281,459 | ) | | | – | | | | – | | | | – | |
| Goldman Sachs Bank USA | | | 28,779,083 | | | | (28,779,083 | ) | | | – | | | | – | | | | – | |
| Goldman Sachs International | | | 7,242,551 | | | | (5,992,130 | ) | | | (1,250,421 | ) | | | – | | | | – | |
| HSBC Bank USA NA | | | 4,376,426 | | | | (4,307,924 | ) | | | – | | | | – | | | | 68,502 | |
| JPMorgan Chase Bank NA | | | 67,157,911 | | | | (67,157,911 | ) | | | – | | | | – | | | | – | |
| Morgan Stanley & Co., Inc. | | | 1,498,420 | | | | (1,498,420 | ) | | | – | | | | – | | | | – | |
| Morgan Stanley Capital Services, Inc. | | | 5,574,570 | | | | (5,574,570 | ) | | | – | | | | – | | | | – | |
| RBC Dominion Securities | | | 8,351,660 | | | | (5,472,534 | ) | | | – | | | | (2,430,000 | ) | | | 449,126 | |
| Standard Chartered Bank | | | 676,738 | | | | (676,738 | ) | | | – | | | | – | | | | – | |
| | | | |
| | $ | 148,491,496 | | | $ | (144,293,447 | ) | | $ | (1,250,421 | ) | | $ | (2,430,000 | ) | | $ | 517,628 | |
| | | | |
*OTC derivatives are reported gross on the Consolidated Statement of Assets and Liabilities. Exchange traded options and margin related to centrally cleared swaps and futures, if any, are excluded from these reported amounts.
**Reported collateral posted for the benefit of the Fund within this table is limited to the net outstanding amount due from an individual counterparty. The collateral posted for the benefit of the Fund may exceed these amounts.
The table below reflects the Fund’s exposure to Counterparties subject to either an ISDA Master Agreement or other agreement for OTC derivative liability transactions as of September 30, 2019:
| | | | | | | | | | | | | | | | | | | | |
| | | | | | Gross Amounts Not Offset in the Consolidated Statement of Assets & Liabilities | | | | |
| Counterparty | | Gross Amounts Not Offset in the
Consolidated Statement of Assets & Liabilities* | | | Financial Instruments Available for Offset | | | Financial
Instruments
Collateral
Pledged** | | | Cash Collateral
Pledged** | | | Net Amount | |
| Bank of America NA | | $ | (22,544,518 | ) | | $ | 5,560,938 | | | $ | 16,983,580 | | | $ | – | | | $ | – | |
| Barclays Bank plc | | | (15,262,315 | ) | | | 2,991,740 | | | | 11,886,173 | | | | – | | | | (384,402 | ) |
125 INVESCO OPPENHEIMER INTERNATIONAL BOND FUND
NOTES TO CONSOLIDATED
FINANCIAL STATEMENTSContinued
| | | | | | | | | | | | | | | | | | | | |
| | | | | | Gross Amounts Not Offset in the Consolidated Statement of Assets & Liabilities | | | | |
| Counterparty | | Gross Amounts Not Offset in the
Consolidated Statement
of Assets &
Liabilities* | | | Financial
Instruments
Available for
Offset | | | Financial Instruments
Collateral
Pledged** | | | Cash Collateral
Pledged** | | | Net Amount | |
| BNP Paribas | | $ | (99,164 | ) | | $ | – | | | $ | – | | | $ | – | | | $ | (99,164) | |
| Citibank NA | | | (20,988,169 | ) | | | 16,281,459 | | | | 4,706,710 | | | | – | | | | – | |
| Deutsche Bank AG | | | (3,034,891 | ) | | | – | | | | – | | | | – | | | | (3,034,891 | ) |
| Goldman Sachs Bank USA | | | (61,948,222 | ) | | | 28,779,083 | | | | 22,771,958 | | | | 2,840,000 | | | | (7,557,181 | ) |
| Goldman Sachs International | | | (5,992,130 | ) | | | 5,992,130 | | | | – | | | | – | | | | – | |
| HSBC Bank USA NA | | | (4,307,924 | ) | | | 4,307,924 | | | | – | | | | – | | | | – | |
| JPMorgan Chase Bank NA | | | (91,674,631 | ) | | | 67,157,911 | | | | 24,516,720 | | | | – | | | | – | |
| Morgan Stanley & Co., Inc. | | | (5,410,343 | ) | | | 1,498,420 | | | | – | | | | – | | | | (3,911,923 | ) |
| Morgan Stanley Capital Services, Inc. | | | (9,079,144 | ) | | | 5,574,570 | | | | 3,504,574 | | | | – | | | | – | |
| RBC Dominion Securities | | | (5,472,534 | ) | | | 5,472,534 | | | | – | | | | – | | | | – | |
| Standard Chartered Bank | | | (2,887,249 | ) | | | 676,738 | | | | 820,511 | | | | 1,390,000 | | | | – | |
| | | | |
| | $ | (248,701,234 | ) | | $ | 144,293,447 | | | $ | 85,190,226 | | | $ | 4,230,000 | | | $ | (14,987,561) | |
| | | | |
*OTC derivatives are reported gross on the Consolidated Statement of Assets and Liabilities. Exchange traded options and margin related to centrally cleared swaps and futures, if any, are excluded from these reported amounts.
**Reported collateral pledged within this table is limited to the net outstanding amount due from the Fund. The securities pledged as collateral by the Fund as reported on the Consolidated Schedule of Investments may exceed these amounts.
Value of Derivative Instruments at September 30, 2019
The table below reflects the Fund’s exposure to Counterparties subject to either an ISDA Master Agreement or other agreement for OTC derivative liability transactions as of September 30, 2019:
| | | | | | | | | | | | | | |
| | | Asset Derivatives | | | | | Liability Derivatives | |
Derivatives Not Accounted for as Hedging Instruments | | Consolidated
Statement of Assets
and Liabilities Location | | Value | | | | | Consolidated
Statement of Assets
and Liabilities Location | | Value | |
| Credit contracts | | Swaps, at value | | $ | 419,494 | | | | | Swaps, at value | | $ | 10,781,346 | |
| Interest rate contracts | | Swaps, at value | | | 7,694,207 | | | | | Swaps, at value | | | 8,479,633 | |
| Credit contracts | | Centrally cleared swaps,
at value | | | 3,618,547 | 1 | | | | Centrally cleared swaps,
at value | | | 318,799 | 1 |
| Interest rate contracts | | Centrally cleared swaps,
at value | | | 33,742,727 | 1 | | | | Centrally cleared
swaps, at value | | | 33,423,013 | 1 |
| Interest rate contracts | | Futures contracts | | | 103,140 | 2 | | | | Futures contracts | | | 1,391,544 | 2 |
126 INVESCO OPPENHEIMER INTERNATIONAL BOND FUND
| | | | | | | | | | | | | | |
| | | Asset Derivatives | | | | | Liability Derivatives | |
Derivatives Not Accounted for as Hedging Instruments | | Consolidated Statement of Assets and Liabilities Location | | Value | | | | | Consolidated
Statement of Assets
and Liabilities Location | | Value | |
| Forward currency exchange contracts | | Unrealized appreciation on foreign currency exchange contracts | | $ | 85,537,862 | | | | | Unrealized depreciation on foreign currency exchange contracts | | $ | 124,276,733 | |
| Equity contracts | | | | | | | | | | Options written, at value | | | 1,323,904 | |
| Currency contracts | | | | | | | | | | Options written, at value | | | 66,953,518 | |
| Credit contracts | | | | | | | | | | Swaptions written, at value | | | 792,934 | |
| Interest rate contracts | | | | | | | | | | Swaptions written, at value | | | 37,145,346 | |
| Credit contracts | | Investments, at value | | | 1,001,4963 | | | | | | | | | |
| Equity contracts | | Investments, at value | | | 3,404,7083 | | | | | | | | | |
| Currency contracts | | Investments, at value | | | 19,616,4763 | | | | | | | | | |
| Interest rate contracts | | Investments, at value | | | 33,491,2623 | | | | | | | | | |
| | | | | | | | | | | | | | |
| Total | | | | $ | 188,629,919 | | | | | | | $ | 284,886,770 | |
| | | | | | | | | | | | | | |
1.The daily variation margin receivable (payable) at period end is recorded in the Consolidated Statement of Assets and Liabilities.
2. Includes only the current day’s variation margin. Prior variation margin movements have been reflected in cash on the Consolidated Statement of Assets and Liabilities upon receipt or payment.
3.Amounts relate to purchased option contracts and purchased swaption contracts, if any.
| | | | | | | | | | | | | | | | | | | | |
Effect of Derivative Investments for the Year Ended September 30, 2019 | |
|
| The tables below summarize the gains (losses) on derivative investments, detailed by primary risk exposure, recognized in earnings during the period: | |
|
Amount of Realized Gain or (Loss) Recognized on Derivatives | |
Derivatives Not Accounted for as Hedging Instruments | | Investment transactions in unaffiliated companies* | | | Swaption contracts written | | | Option contracts written | | | Futures contracts | | | Forward currency exchange contracts | |
| Credit contracts | | $ | (3,405,961 | ) | | $ | 4,729,061 | | | $ | — | | | $ | — | | | $ | — | |
| Currency Contracts | | | (36,809,576 | ) | | | — | | | | 126,089,733 | | | | — | | | | — | |
| Equity contracts | | | 2,929,830 | | | | — | | | | (935,022 | ) | | | — | | | | — | |
| Forward currency exchange contracts | | | — | | | | — | | | | — | | | | — | | | | (173,301,278 | ) |
| Interest rate contracts | | | 10,754,342 | | | | (40,506,416 | ) | | | (14,507,208 | ) | | | (72,464,074 | ) | | | — | |
| | | | |
| Total | | $ | (26,531,365 | ) | | $ | (35,777,355 | ) | | $ | 110,647,503 | | | $ | (72,464,074 | ) | | $ | (173,301,278 | ) |
| | | | |
127 INVESCO OPPENHEIMER INTERNATIONAL BOND FUND
NOTES TO CONSOLIDATED
FINANCIAL STATEMENTSContinued
| | | | | | | | |
| Amount of Realized Gain or (Loss) Recognized on Derivatives | |
| |
Derivatives
Not Accounted
for as Hedging
Instruments | | Swap contracts | | | Total | |
| |
| Credit contracts | | $ | (8,238,190 | ) | | $ | (6,915,090 | ) |
| Currency Contracts | | | — | | | | 89,280,157 | |
| Equity contracts | | | — | | | | 1,994,808 | |
| Forward currency exchange contracts | | | — | | | | (173,301,278 | ) |
| Interest rate contracts | | | (18,007,138 | ) | | | (134,730,494 | ) |
| | | | | | | | |
| Total | | $ | (26,245,328 | ) | | $ | (223,671,897 | ) |
| | | | | | | | |
* Purchased option contracts and purchased swaption contracts, if any, are included in the realized gain (loss) from investment transactions in unaffiliated companies.
| | | | | | | | | | | | | | | | | | | | |
| Amount of Change in Unrealized Gain or (Loss) Recognized on Derivatives | |
| |
Derivatives
Not Accounted
for as Hedging
Instruments | | Investment
transactions
in unaffiliated
companies* | | | Swaption
contracts
written | | | Option
contracts
written | | | Futures
contracts | | | Forward
currency
exchange
contracts | |
| |
| Credit contracts | | $ | (200,061 | ) | | $ | 378,510 | | | $ | — | | | $ | — | | | $ | — | |
| Currency contracts | | | (1,427,278 | ) | | | — | | | | 21,577,229 | | | | — | | | | — | |
| Equity contracts | | | 795,898 | | | | — | | | | (237,245 | ) | | | — | | | | — | |
| Forward currency exchange contracts | | | — | | | | — | | | | — | | | | — | | | | 34,344,968 | |
| Interest rate contracts | | | (23,062,663 | ) | | | (2,420,329 | ) | | | — | | | | (6,439,303 | ) | | | — | |
| | | | | | | | | | | | | | | | | | | | |
| Total | | $ | (23,894,104 | ) | | $ | (2,041,819 | ) | | $ | 21,339,984 | | | $ | (6,439,303 | ) | | $ | 34,344,968 | |
| | | | | | | | | | | | | | | | | | | | |
| | | | | | | | |
| Amount of Change in Unrealized Gain or (Loss) Recognized on Derivatives | |
| |
Derivatives
Not Accounted
for as Hedging
Instruments | | Swap contracts | | | Total | |
| |
| Credit contracts | | $ | 11,206,348 | | | $ | 11,384,797 | |
| Currency contracts | | | — | | | | 20,149,951 | |
| Equity contracts | | | — | | | | 558,653 | |
| Forward currency exchange contracts | | | — | | | | 34,344,968 | |
| Interest rate contracts | | | 5,636,230 | | | | (26,286,065 | ) |
| | | | | | | | |
| Total | | $ | 16,842,578 | | | $ | 40,152,304 | |
| | | | | | | | |
* Purchased option contracts and purchased swaption contracts, if any, are included in the change in unrealized gain (loss) from investment transactions in unaffiliated companies.
The table below summarizes the average notional value of forward foreign currency contracts, futures contracts, swap agreements, options purchased and written, and swaptions purchased and written during the year ended September 30, 2019.
128 INVESCO OPPENHEIMER INTERNATIONAL BOND FUND
| | | | | | | | | | | | | | | | |
| | | Forward foreign currency contracts | | | Futures
contracts | | Swaptions
purchased | | Swaptions
written | | | Swap
agreements | |
| Average notional amount | | $ | 10,667,378,962 | | | $ 532,460,309 | | $ 4,033,277,699 | | $ | 5,400,353,734 | | | $ | 4,877,000,115 | |
| | | | | |
| | | Index options
purchased* | | | Index options
written* | | Fixed income
options purchased* | | Fixed income
options
written* | | | Option on a
future
purchased* | |
| Average notional amount | | $ | 210,236,742 | | | $ 193,503,105 | | $ 490,316,289 | | $ | 337,341,488 | | | $ | 171,287,469 | |
| Average contracts | | | 63,388 | | | 65,733 | | 436,222,222 | | | 299,422,278 | | | | 920 | |
| | | | | | | | | | |
| | | Option on a future written* | | | Currency options purchased | | Currency options written | | |
| Average notional amount | | $ | 182,284,372 | | | $ 2,761,845,006,187 | | $ 7,286,583,480,809 | | |
| Average contracts | | | 1,000 | | | 2,761,843,545,542 | | 7,286,556,467,673 | | |
*Summarizes the eight month average notional value of index options purchased and written, the six month average notional value of fixed income options purchased and written, the five month average notional of options on a future purchased and the one month average notional value of options on a future written.
Note 5 – Expense Offset Arrangement
The expense offset arrangement is comprised of custodian credits which result from periodic overnight cash balances at the custodian. For the one month ended October 31, 2019 the Fund received no credits from this arrangement. For the year ended September 30, 2019, the Fund received credits from this arrangement, which resulted in the reduction of the Fund’s total expenses of $379,048.
Note 6 – Trustee and Officer Fees and Benefits
Certain Trustees have executed a Deferred Compensation Agreement pursuant to which they have the option to elect to defer receipt of all or a portion of the annual compensation they are entitled to receive from the Fund. For purposes of determining the amount owed to the Trustees under the plan, deferred amounts are treated as though equal dollar amounts had been invested in shares of the Fund or in other Invesco and/or Invesco Oppenheimer funds selected by the Trustees. The Fund purchases shares of the funds selected for deferral by the Trustees in amounts equal to his or her deemed investment, resulting in a Fund asset equal to the deferred compensation liability. Such assets are included as a component of “Other” within the asset section of the Consolidated Statement of Assets and Liabilities. Deferral of Trustees’ fees under the plan will not affect the net assets of the Fund and will not materially affect the Fund’s assets, liabilities or net investment income per share. Amounts will be
129 INVESCO OPPENHEIMER INTERNATIONAL BOND FUND
NOTES TO CONSOLIDATED
FINANCIAL STATEMENTSContinued
deferred until distributed in accordance with the compensation deferral plan.
Note 7 – Cash Balances
The Fund is permitted to temporarily carry a negative or overdrawn balance in its account with JPMorgan Chase Bank, the custodian bank. Such balances, if any atperiod-end, are shown in the Consolidated Statement of Assets and Liabilities under the payable caption Amount due to custodian. To compensate the custodian bank for such overdrafts, the overdrawn Fund may either (1) leave funds as a compensating balance in the account so the custodian bank can be compensated by earning the additional interest; or (2) compensate by paying the custodian bank at a rate agreed upon by the custodian bank and Invesco, not to exceed the contractually agreed upon rate.
Note 8 – Investment Transactions
The aggregate amount of investment securities (other than short-term securities, U.S. Treasury obligations and money market funds, if any) purchased and sold by the Fund for the one month period ended October 31, 2019 was $225,960,516 and $299,226,241, respectively, and during the year ended September 30, 2019 was $4,304,780,959 and $6,223,887,689, respectively.
Note 9 – Share Information
Transactions in shares of beneficial interest were as follows:
| | | | | | | | | | | | | | | | | | | | | | | | |
| | | One Months Ended
October 31, 20191 | | | Year Ended
September 30, 20192 | | | Year Ended
September 30, 2018 | |
| | | Shares | | | Amount | | | Shares | | | Amount | | | Shares | | | Amount | |
Class A | | | | | | | | | | | | | | | | | | | | | | | | |
| Sold | | | 2,132,170 | | | $ | 11,702,100 | | | | 46,707,276 | | | $ | 257,635,501 | | | | 42,674,811 | | | $ | 249,905,235 | |
| Dividends and/or distributions reinvested | | | 668,094 | | | | 3,691,378 | | | | 8,909,930 | | | | 48,606,856 | | | | 8,272,570 | | | | 48,015,112 | |
| Redeemed | | | (6,459,573 | ) | | | (35,345,244 | ) | | | (61,358,992 | ) | | | (334,215,709 | ) | | | (68,276,202 | ) | | | (396,073,859 | ) |
| | | | |
| Net increase (decrease) | | | (3,659,309 | ) | | $ | (19,951,766 | ) | | | (5,741,786 | ) | | $ | (27,973,352 | ) | | | (17,328,821 | ) | | $ | (98,153,512 | ) |
| | | | |
Class B | | | | | | | | | | | | | | | | | | | | | | | | |
| Sold | | | — | | | $ | — | | | | — | | | $ | — | | | | 4,820 | | | $ | 28,765 | |
| Dividends and/or distributions reinvested | | | — | | | | — | | | | — | | | | — | | | | 11,786 | | | | 70,078 | |
| Redeemed3 | | | — | | | | — | | | | — | | | | — | | | | (1,077,352 | ) | | | (6,384,415 | ) |
| | | | |
| Net increase (decrease) | | | — | | | $ | — | | | | — | | | $ | — | | | | (1,060,746 | ) | | $ | (6,285,572 | ) |
| | | | |
130 INVESCO OPPENHEIMER INTERNATIONAL BOND FUND
| | | | | | | | | | | | | | | | | | | | | | | | |
| | | One Months Ended
October 31, 20191 | | | Year Ended
September 30, 20192 | | | Year Ended
September 30, 2018 | |
| | | Shares | | | Amount | | | Shares | | | Amount | | | Shares | | | Amount | |
Class C | | | | | | | | | | | | | | | | | | | | | | | | |
| Sold | | | 142,846 | | | $ | 775,884 | | | | 2,127,191 | | | $ | 11,585,168 | | | | 5,778,272 | | | $ | 33,966,614 | |
| Dividends and/or distributions reinvested | | | 59,609 | | | | 328,035 | | | | 1,782,006 | | | | 9,681,973 | | | | 1,921,742 | | | | 11,113,665 | |
| Redeemed | | | (1,194,160 | ) | | | (6,537,148 | ) | | | (35,923,525 | ) | | | (198,224,567 | ) | | | (16,515,106 | ) | | | (95,357,594 | ) |
| | | | |
Net increase (decrease) | | | (991,705 | ) | | $ | (5,433,229 | ) | | | (32,014,328 | ) | | $ | (176,957,426 | ) | | | (8,815,092 | ) | | $ | (50,277,315 | ) |
| | | | |
| | | | | | | | | | | | | | | | | | | | | | | | |
Class R | | | | | | | | | | | | | | | | | | | | | | | | |
| Sold | | | 178,269 | | | $ | 973,465 | | | | 2,563,830 | | | $ | 13,975,234 | | | | 4,559,765 | | | $ | 26,435,800 | |
| Dividends and/or distributions reinvested | | | 62,026 | | | | 342,303 | | | | 931,053 | | | | 5,063,654 | | | | 829,378 | | | | 4,793,502 | |
| Redeemed | | | (522,065 | ) | | | (2,853,954 | ) | | | (6,834,225 | ) | | | (37,166,759 | ) | | | (5,911,392 | ) | | | (34,303,537 | ) |
| | | | |
| Net increase (decrease) | | | (281,770 | ) | | $ | (1,538,186 | ) | | | (3,339,342 | ) | | $ | (18,127,871 | ) | | | (522,249 | ) | | $ | (3,074,235 | ) |
| | | | |
| | | | | | | | | | | | | | | | | | | | | | | | |
Class Y | | | | | | | | | | | | | | | | | | | | | | | | |
| Sold | | | 4,979,925 | | | $ | 27,290,342 | | | | 91,187,125 | | | $ | 498,357,038 | | | | 214,651,641 | | | $ | 1,260,130,600 | |
| Dividends and/or distributions reinvested | | | 1,088,978 | | | | 6,022,050 | | | | 21,383,562 | | | | 116,687,657 | | | | 19,137,649 | | | | 110,695,020 | |
| Redeemed | | | (10,603,717 | ) | | | (58,023,591 | ) | | | (289,686,550 | ) | | | (1,593,251,215 | ) | | | (153,046,264 | ) | | | (873,927,206 | ) |
| | | | |
Net increase (decrease) | | | (4,534,814 | ) | | $ | (24,711,199 | ) | | | (177,115,863 | ) | | $ | (978,206,520 | ) | | | 80,743,026 | | | $ | 496,898,414 | |
| | | | |
| | | | | | | | | | | | | | | | | | | | | | | | |
Class R54 | | | | | | | | | | | | | | | | | | | | | | | | |
| Sold | | | — | | | $ | — | | | | 1,848 | | | $ | 10,000 | | | | — | | | $ | — | |
| Dividends and/or distributions reinvested | | | — | | | | — | | | | — | | | | — | | | | — | | | | — | |
| Redeemed | | | — | | | | — | | | | — | | | | — | | | | — | | | | — | |
| | | | |
Net increase (decrease) | | | — | | | $ | — | | | | 1,848 | | | $ | 10,000 | | | | — | | | $ | — | |
| | | | |
| | | | | | | | | | | | | | | | | | | | | | | | |
Class R6 | | | | | | | | | | | | | | | | | | | | | | | | |
| Sold | | | 1,984,096 | | | $ | 10,816,472 | | | | 72,871,683 | | | $ | 394,934,516 | | | | 172,301,770 | | | $ | 980,079,104 | |
| Dividends and/or distributions reinvested | | | 636,035 | | | | 3,517,275 | | | | 10,541,778 | | | | 57,440,267 | | | | 9,948,927 | | | | 57,437,582 | |
| Redeemed | | | (2,354,096 | ) | | | (12,880,693 | ) | | | (181,831,910 | ) | | | (993,754,071 | ) | | | (126,133,503 | ) | | | (714,521,167 | ) |
| | | | |
Net increase (decrease) | | | 266,035 | | | $ | 1,453,054 | | | | (98,418,449 | ) | | $ | (541,379,288 | ) | | | 56,117,194 | | | $ | 322,995,519 | |
| | | | |
1.There are entities that are record owners of more than 5% of the outstanding shares of the Fund and own 32% of the outstanding shares of the Fund. IDI has an agreement with these entities to sell Fund shares. The Fund, Invesco and/or Invesco affiliates may make payments to these entities, which are considered to be related to the Fund, for providing services to the Fund, Invesco and/or Invesco affiliates, including but not limited to services such as securities
131 INVESCO OPPENHEIMER INTERNATIONAL BOND FUND
NOTES TO CONSOLIDATED
FINANCIAL STATEMENTSContinued
brokerage, distribution, third party record keeping and account servicing. The Fund has no knowledge as to whether all or any portion of the shares owned of record by these entities are also owned beneficially.
In addition, 10% of the outstanding shares of the Fund are owned by the Adviser or an affiliate of the Adviser.
2.There are entities that are record owners of more than 5% of the outstanding shares of the Fund and own 26% of the outstanding shares of the Fund. IDI has an agreement with these entities to sell Fund shares. The Fund, Invesco and/or Invesco affiliates may make payments to these entities, which are considered to be related to the Fund, for providing services to the Fund, Invesco and/or Invesco affiliates, including but not limited to services such as securities brokerage, distribution, third party record keeping and account servicing. The Fund has no knowledge as to whether all or any portion of the shares owned of record by these entities are also owned beneficially.
In addition, 10% of the outstanding shares of the Fund are owned by the Adviser or an affiliate of the Adviser.
3.All outstanding Class B shares converted to Class A shares on June 1, 2018.
4. Commencement date after the close of business on May 24, 2019.
Note 10 – Borrowings
Joint Credit Facility.A number of mutual funds managed by the Adviser participate in a $1.95 billion revolving credit facility (the “Facility”) intended to provide short-term financing, if necessary, subject to certain restrictions in connection with atypical redemption activity. Expenses and fees related to the Facility are paid by the participating funds and are disclosed separately or as other expenses on the Consolidated Statement of Operations. The Fund did not utilize the Facility during the reporting period.The Facility terminated May 24, 2019.
132 INVESCO OPPENHEIMER INTERNATIONAL BOND FUND
REPORT OF INDEPENDENT REGISTERED PUBLIC ACCOUNTING FIRM
To the Board of Trustees of AIM Investment Funds (Invesco Investment Funds) and Shareholders of Invesco Oppenheimer International Bond Fund
Opinion on the Financial Statements
We have audited the accompanying consolidated statements of assets and liabilities, including the consolidated schedules of investments, of Invesco Oppenheimer International Bond Fund and its subsidiary (one of the funds constituting AIM Investment Funds (Invesco Investment Funds), referred to hereafter as the “Fund”) as of October 31, 2019 and September 30, 2019, the related consolidated statements of operations and the consolidated statements of changes in net assets for the period from October 1, 2019 to October 31, 2019 and the year ended September 30, 2019, including the related notes, and the consolidated financial highlights for each of the periods ended October 31, 2019 and September 30, 2019 (collectively referred to as the “consolidated financial statements”). In our opinion, the consolidated financial statements present fairly, in all material respects, the financial position of the Fund as of October 31, 2019 and September 30, 2019, the results of its operations and changes in its net assets for the period from October 1, 2019 to October 31, 2019 and the year ended September 30, 2019 and the financial highlights for each of the periods ended October 31, 2019 and September 30, 2019 in conformity with accounting principles generally accepted in the United States of America.
The consolidated financial statements of Invesco Oppenheimer International Bond Fund (formerly known as Oppenheimer International Bond Fund) as of and for the year ended September 30, 2018 and the consolidated financial highlights for each of the periods ended on or prior to September 30, 2018 (not presented herein, other than the consolidated statement of changes in net assets and the consolidated financial highlights) were audited by other auditors whose report dated November 28, 2018 expressed an unqualified opinion on those consolidated financial statements and consolidated financial highlights.
Basis for Opinion
These consolidated financial statements are the responsibility of the Fund’s management. Our responsibility is to express an opinion on the Fund’s consolidated financial statements based on our audits. We are a public accounting firm registered with the Public Company Accounting Oversight Board (United States) (PCAOB) and are required to be independent with respect to the Fund in accordance with the U.S. federal securities laws and the applicable rules and regulations of the Securities and Exchange Commission and the PCAOB.
We conducted our audits of these consolidated financial statements in accordance with the standards of the PCAOB. Those standards require that we plan and perform the audit to obtain reasonable assurance about whether the consolidated financial statements are free of material misstatement, whether due to error or fraud.
133 INVESCO OPPENHEIMER INTERNATIONAL BOND FUND
REPORT OF INDEPENDENT REGISTERED PUBLIC ACCOUNTING FIRM
Our audits included performing procedures to assess the risks of material misstatement of the consolidated financial statements, whether due to error or fraud, and performing procedures that respond to those risks. Such procedures included examining, on a test basis, evidence regarding the amounts and disclosures in the consolidated financial statements. Our audits also included evaluating the accounting principles used and significant estimates made by management, as well as evaluating the overall presentation of the consolidated financial statements. Our procedures included confirmation of securities owned as of October 31, 2019 and September 30, 2019 by correspondence with the custodian, transfer agent and brokers; when replies were not received from brokers, we performed other auditing procedures. We believe that our audits provide a reasonable basis for our opinion.
/s/ PricewaterhouseCoopers LLP
Houston, TX
December 16, 2019
We have served as the auditor of one or more investment companies in the Invesco group of investment companies since at least 1995. We have not been able to determine the specific year we began serving as auditor.
134 INVESCO OPPENHEIMER INTERNATIONAL BOND FUND
INDEPENDENT REGISTERED PUBLIC ACCOUNTING FIRM
The Audit Committee of the Board of Trustees appointed, and the Board of Trustees ratified and approved, PricewaterhouseCoopers LLP (“PwC”) as the independent registered public accounting firm of the Fund for the fiscal periods ending after May 24, 2019. Prior to the close of business on May 24, 2019, the Predecessor Fund was a separate series of an unaffiliated investment company and its financial statements were audited by a different independent registered public accounting firm (the “Prior Auditor”).
Effective after the close of business on May 24, 2019, the Prior Auditor resigned as the independent registered public accounting firm of the Fund. The Prior Auditor’s report on the financial statements of the Predecessor Fund for the past two fiscal years did not contain an adverse or disclaimer of opinion, and was not qualified or modified as to uncertainty, audit scope or accounting principles. During the Predecessor Fund’s two most recent fiscal years and through the close of business on May 24, 2019, there were no (1) disagreements with the Prior Auditor on any matter of accounting principles or practices, financial statement disclosure, or auditing scope or procedure, which disagreements, if not resolved to the Prior Auditor’s satisfaction, would have caused it to make reference to that matter in connection with its report; or (2) “reportable events,” as that term is defined in Item 304(a)(1)(v) of RegulationS-K under the Securities Exchange Act of 1934.
135 INVESCO OPPENHEIMER INTERNATIONAL BOND FUND
FEDERAL INCOME TAX INFORMATION
In early 2019, if applicable, shareholders of record received information regarding all dividends and distributions paid to them by the Fund during calendar year 2018.
None of the dividends paid by the Fund during the reporting period are eligible for the corporate dividend-received deduction.
A portion, if any, of the dividends paid by the Fund during the reporting period which are not designated as capital gain distributions are eligible for lower individual income tax rates to the extent that the Fund has received qualified dividend income as stipulated by recent tax legislation. The maximum amount allowable but not less than $23,669,482 of the Fund’s fiscal year taxable income for the year ended September 30, 2019, may be eligible for the lower individual income tax rates. In early 2019, shareholders of record received information regarding the percentage of distributions that are eligible for lower individual income tax rates.
Recent tax legislation allows a regulated investment company to designate distributions not designated as capital gain distributions, as either interest related dividends or short-term capital gain dividends, both of which are exempt from the U.S. withholding tax applicable to non U.S. taxpayers. For the reporting period, the maximum amount allowable but not less than $2,057,347 and $10,534,490 of the ordinary distributions to be paid by the Fund for the one month ended October 31, 2019 and the fiscal year ended September 30, 2019, respectively, qualifies as an interest related dividend.
The foregoing information is presented to assist shareholders in reporting distributions received from the Fund to the Internal Revenue Service. Because of the complexity of the federal regulations which may affect your individual tax return and the many variations in state and local tax regulations, we recommend that you consult your tax advisor for specific guidance.
136 INVESCO OPPENHEIMER INTERNATIONAL BOND FUND
APPROVAL OF INVESTMENT ADVISORY ANDSUB-ADVISORY CONTRACTS
At meetings held on December 14, 2018, the Board of Trustees (the Board or the Trustees) of AIM Investment Funds (Invesco Investment Funds) (the Trust) as a whole, and the independent Trustees, who comprise over 75% of the Board, voting separately, approved (i) an amendment to the Trust’s Master Investment Advisory Agreement with Invesco Advisers, Inc. (Invesco Advisers and the investment advisory agreement) to add Invesco Oppenheimer International Bond Fund (the Fund), (ii) an amendment to the Master IntergroupSub-Advisory Contract for Mutual Funds with Invesco Asset Management Deutschland GmbH, Invesco Asset Management Limited, Invesco Asset Management (Japan) Limited, Invesco Hong Kong Limited, Invesco Senior Secured Management, Inc. and Invesco Canada Ltd. to add the Fund, (iii) an amendment to the separatesub-advisory contract with Invesco Capital Management LLC to add the Fund, (iv) an amendment to the separatesub-advisory contract with Invesco Asset Management (India) Private Limited to add the Fund, and (v) an initialsub-advisory contract with OppenheimerFunds, Inc. (collectively, the AffiliatedSub-Advisers and thesub-advisory contracts). Additionally, on March 26, 2019, the Boardre-approved an initialsub-advisory contract with OppenheimerFunds, Inc. following its change of control as a result of the acquisition of OppenheimerFunds, Inc. and its subsidiaries, including the Oppenheimer mutual funds (each, an Oppenheimer Fund), by Invesco Ltd. (the OFI Transaction). After evaluating the factors discussed below, among others, the Board approved the Fund’s investment advisory agreement and thesub-advisory contracts and determined that the compensation payable by the Fund to Invesco Advisers and by Invesco Advisers to the AffiliatedSub-Advisers is fair and reasonable.
The Board’s Evaluation Process
The Board noted that it had previously approved establishing the Fund at the Board meeting held on October 23, 2018 and that the Fund was formed to acquire the assets and liabilities of an Oppenheimer Fund (the Acquired Fund) with the same investment objective and substantially similar principal investment strategies and risks. At the time of approval, the Fund had no assets and no performance history and the portfolio managers were not employed by Invesco Advisers or any of the AffiliatedSub-Advisers except OppenheimerFunds, Inc., which was not affiliated with Invesco at that time.
In approving the investment advisory agreement andsub-advisory contracts, the Board followed a process similar to the process that it follows in annually reviewing and approving investment advisory agreements andsub-advisory contracts for the series portfolios of funds advised by Invesco Advisers and considered the information provided in the most recent annual review process for those funds as well as the information provided with respect to the Fund. As part of the approval process, the Board reviewed and considered information provided in response to detailed requests for information submitted to management by the independent Trustees with assistance from legal counsel to the independent Trustees. The Board reviewed comparative investment performance and fee data prepared by Invesco Advisers and an independent mutual fund data provider. The Board was assisted in its review by the Senior Officer, an officer of the Invesco Funds who reports directly to the independent Trustees, and by independent legal counsel.
137 INVESCO OPPENHEIMER INTERNATIONAL BOND FUND
APPROVAL OF INVESTMENT ADVISORY ANDSUB-ADVISORY CONTRACTSContinued
The discussion below serves as a summary of the material factors and related conclusions that formed the basis for the Board’s approval of the Fund’s investment advisory agreement andsub-advisory contracts. The Trustees’ review and conclusions are based on the comprehensive consideration of all information presented to them and are not the result of any single determinative factor. Moreover, one Trustee may have weighed a particular piece of information or factor differently than another Trustee. This information is current as of December 14, 2018 and March 26, 2019 for thesub-advisory contract with OppenheimerFunds, Inc.
Factors and Conclusions and Summary of Independent Written Fee Evaluation
A. Nature, Extent and Quality of Services Provided by Invesco Advisers and the AffiliatedSub-Advisers
The Board reviewed the nature, extent and quality of the advisory services to be provided to the Fund by Invesco Advisers under the Fund’s investment advisory agreement, and the credentials and experience of the officers and employees of Invesco Advisers who will provide these services. The Board’s review included consideration of the investment process oversight and structure, credit analysis and investment risk management to be employed in providing advisory services to the Fund. The Board also considerednon-advisory services that Invesco Advisers and its affiliates provide to the Invesco Funds and will provide to the Fund, such as various back office support functions, third party oversight, internal audit, valuation, portfolio trading and legal and compliance. The Board also received and reviewed information about Invesco Advisers’ role as administrator of the Invesco Funds’ liquidity risk management program. The Board also reviewed and considered the benefits to shareholders of investing in a fund that is part of the Invesco family of funds under the umbrella of Invesco Ltd., Invesco Advisers’ parent company, and noted Invesco Ltd.’s depth and experience in conducting an investment management business, as well as its commitment of financial and other resources to such business. The Board reviewed and considered information about the resources that Invesco Advisers intends to continue to commit to managing the Invesco family of funds, including the Fund, following the OFI Transaction. The Board concluded that the nature, extent and quality of the services to be provided to the Fund by Invesco Advisers are appropriate and satisfactory.
The Board reviewed the services that may be provided by the AffiliatedSub-Advisers under thesub-advisory contracts and the credentials and experience of the officers and employees of the AffiliatedSub-Advisers who provide these services. The Board noted the AffiliatedSub-Advisers’ expertise with respect to certain asset classes and that the AffiliatedSub-Advisers have offices and personnel that are located in financial centers around the world. As a result, the Board noted that the AffiliatedSub-Advisers can provide research and investment analysis on the markets and economies of various countries in which the Fund may invest, make recommendations regarding securities and assist with security trades. The Board concluded that thesub-advisory contracts may benefit the Fund and its shareholders by permitting Invesco Advisers to use the resources and talents of the AffiliatedSub-Advisers
138 INVESCO OPPENHEIMER INTERNATIONAL BOND FUND
in managing the Fund. The Board concluded that the nature, extent and quality of the services that may be provided by the AffiliatedSub-Advisers are appropriate and satisfactory.
B. Fund Investment Performance
The Board noted that the Fund would continue the historical performance information of the Acquired Fund following the consummation of the OFI Transaction. The Board considered the performance of the Acquired Fund and the fact that, at the closing of the OFI Transaction, management anticipates that the Fund will be managed pursuant to substantially similar investment strategies and by substantially the same portfolio management team as managed the Acquired Fund. The Board did not view Fund performance as a relevant factor in considering whether to approve thesub-advisory contracts for the Fund, as no Affiliated Sub-Adviser currently manages assets of the Fund.
The Board compared the Fund’s investment performance over multiple time periods ending December 31, 2017 to the performance of funds in the Morningstar performance universe and against the Fund’s benchmark index. The Trustees also reviewed more recent Fund performance and this review did not change their conclusions.
C. Advisory andSub-Advisory Fees and Fund Expenses
The Board compared the Fund’s contractual management fee rate to the contractual management fee rates of funds in the Fund’s Morningstar expense group. The Board also considered comparative information regarding the Fund’s total expense ratio and its various components.
The Board noted that Invesco Advisers has contractually agreed to waive fees and/or limit expenses of the Fund for at least two years from the closing date of the OFI Transaction in an amount necessary to limit total annual operating expenses to a specified percentage of average daily net assets for each class of the Fund.
The Board noted that Invesco Advisers and the AffiliatedSub-Advisers do not manage other similarly managed mutual funds or client accounts.
The Board also considered the services that may be provided by the AffiliatedSub-Advisers pursuant to thesub-advisory contracts, as well as the fees payable by Invesco Advisers to the AffiliatedSub-Advisers pursuant to thesub-advisory contracts.
D. Economies of Scale and Breakpoints
The Board considered the extent to which there may be economies of scale in the provision of advisory services to the Fund. The Board considered Invesco’s reinvestment in its business, including investments in business infrastructure and cybersecurity. The Board also considered that the Fund may benefit from economies of scale through contractual breakpoints in the Fund’s advisory fee schedule, which generally operate to reduce the Fund’s expense ratio as it grows in size. The Board noted that the Fund will share directly in economies of scale through lower fees charged by third party service providers based on the
139 INVESCO OPPENHEIMER INTERNATIONAL BOND FUND
APPROVAL OF INVESTMENT ADVISORY ANDSUB-ADVISORY CONTRACTSContinued
combined size of the Invesco Funds. The Board noted that the Fund may also benefit from economies of scale through initial fee setting, fee waivers and expense reimbursements.
E. Profitability and Financial Resources
The Board reviewed information from the 2018 contract renewal process provided by Invesco Advisers concerning the costs of the advisory and other services that Invesco Advisers and its affiliates provide to the Invesco Funds and the profitability of Invesco Advisers and its affiliates in providing these services. The Board considered the methodology used for calculating profitability and noted the periodic review of such methodology by an independent consultant. The Board noted that Invesco Advisers will continue to operate at a net profit from services Invesco Advisers and its affiliates provide to the Invesco Funds. The Board did not deem the level of profits realized by Invesco Advisers and its affiliates from providing services to the Invesco Funds, and the profits estimated to be realized by the Fund, to be excessive given the nature, extent and quality of the services provided. The Board received information from Invesco Advisers demonstrating that Invesco Advisers and the AffiliatedSub-Advisers are financially sound and have the resources necessary to perform their obligations under the investment advisory agreement andsub-advisory contracts.
F. Collateral Benefits to Invesco Advisers and its Affiliates
The Board considered various other benefits to be received by Invesco Advisers and its affiliates from the relationship with the Fund, including the fees to be received for providing administrative, transfer agency and distribution services to the Fund. The Board considered the performance of Invesco Advisers and its affiliates in providing these services to other Invesco Funds and the organizational structure employed to provide these services. The Board also considered that these services will be provided to the Fund pursuant to written contracts that are reviewed and approved on an annual basis by the Board; and that the services are required for the operation of the Fund.
The Board considered the benefits realized by Invesco Advisers and the Affiliated Sub-Advisers as a result of portfolio brokerage transactions executed through “soft dollar” arrangements. Invesco Advisers noted that the Fund will not execute brokerage transactions through “soft dollar” arrangements to any significant degree.
The Board considered that the Fund’s uninvested cash and cash collateral from any securities lending arrangements may be invested in money market funds advised by Invesco Advisers pursuant to procedures approved by the Board. The Board considered that Invesco Advisers will receive advisory fees from these affiliated money market funds attributable to such investments, although Invesco Advisers has contractually agreed to waive through varying periods the advisory fees payable by the Invesco Funds with respect to certain investments in the affiliated money market funds. The waiver is in an amount equal to 100% of the net advisory fee Invesco Advisers will receive from the affiliated money market funds with respect to the Fund’s investment in the affiliated money market funds of uninvested cash, but not cash collateral. The Board concluded that the amount of advisory fees to be
140 INVESCO OPPENHEIMER INTERNATIONAL BOND FUND
received by Invesco Advisers from the Fund’s investment of cash collateral from any securities lending arrangements in the affiliated money market funds is fair and reasonable.
141 INVESCO OPPENHEIMER INTERNATIONAL BOND FUND
PORTFOLIO PROXY VOTING POLICIES AND GUIDELINES;
UPDATES TO SCHEDULE OF INVESTMENTS
Go paperless with eDelivery
Visit invesco.com/edelivery to enjoy the convenience and security of anytime electronic access to your investment documents.
With eDelivery, you can elect to have any or all of the following materials delivered straight to your inbox to download, save and print from your own computer:
| 🌑 | | Fund reports and prospectuses |
Invesco mailing information
Send general correspondence to Invesco Investment Services, Inc., P.O. Box 219078, Kansas City, MO 64121-9078.
Important notice regarding delivery of security holder documents
To reduce Fund expenses, only one copy of most shareholder documents may be mailed to shareholders with multiple accounts at the same address (Householding). Mailing of your shareholder documents may be householded indefinitely unless you instruct us otherwise. If you do not want the mailing of these documents to be combined with those for other members of your household, please contact Invesco Investment Services, Inc. at 800 959 4246 or contact your financial institution. We will begin sending you individual copies for each account within 30 days after receiving your request.
Fund holdings and proxy voting information
The Fund provides a complete list of its holdings four times in each fiscal year, at the quarter ends. For the second and fourth quarters, the lists appear in the Fund’s semiannual and annual reports to shareholders. For the first and third quarters, the Fund files the lists with the Securities and Exchange Commission (SEC) as an exhibit to its reports on FormN-PORT. The most recent list of portfolio holdings is available at invesco.com/completeqtrholdings. Shareholders can also look up the Fund’s FormsN-PORT on the SEC website at sec.gov.
A description of the policies and procedures that the Fund uses to determine how to vote proxies relating to portfolio securities is available without charge, upon request, from our Client Services department at 800 959 4246 or at invesco.com/proxyguidelines. The information is also available on the SEC website, sec.gov.
Information regarding how the Fund voted proxies related to its portfolio securities during the most recent12-month period ended June 30 is available at invesco.com/proxysearch. The information is also available on the SEC website, sec.gov.
Invesco Advisers, Inc. is an investment adviser; it provides investment advisory services to individual and institutional clients and does not sell securities. Invesco Distributors, Inc. is the US distributor for Invesco Ltd.’s retail mutual funds, exchange-traded funds and institutional money market funds. Both are wholly owned, indirect subsidiaries of Invesco Ltd.
142 INVESCO OPPENHEIMER INTERNATIONAL BOND FUND
SHAREHOLDER PROXY
A Special Meeting (“Meeting”) of Shareholders of Invesco Oppenheimer International Bond Fund was held on April 12, 2019. The Meeting was held for the following purpose:
(1) Approval of an Agreement and Plan of Reorganization that provides for the reorganization of Oppenheimer International Bond Fund into Invesco Oppenheimer International Bond Fund.
The results of the voting on the above matter was as follows:
| | | | | | | | | | | | | | | | |
| Matter | | Votes For | | | Votes
Against | | | Votes
Abstain | | | Broker
Non-Votes | |
| (1) Approval of an Agreement and Plan of Reorganization | | | 514,630,992 | | | | 4,910,632 | | | | 17,454,284 | | | | 0 | |
143 INVESCO OPPENHEIMER INTERNATIONAL BOND FUND
TRUSTEES AND OFFICERS
The address of each trustee and officer is AIM Investment Funds (Invesco Investment Funds) (the “Trust”), 11 Greenway Plaza, Suite 1000, Houston, Texas 77046-1173. The trustees serve for the life of the Trust, subject to their earlier death, incapacitation, resignation, retirement or removal as more specifically provided in the Trust’s organizational documents. Each officer serves for a one year term or until their successors are elected and qualified. Column two below includes length of time served with predecessor entities, if any.
| | | | | | | | |
Name, Year of Birth and Position(s) Held with the Trust | | Trustee
and/or
Officer
Since | | Principal Occupation(s) During Past 5 Years | | Number of Funds in Fund Complex Overseen by Trustee | | Other Directorship(s) Held by Trustee During Past 5 Years |
INTERESTED PERSONS | | | | | | | | |
| | | | | |
| Martin L. Flanagan1— 1960 Trustee and Vice Chair | | 2007 | | Executive Director, Chief Executive Officer and President, Invesco Ltd. (ultimate parent of Invesco and a global investment management firm); Trustee and Vice Chair, The Invesco Funds; Vice Chair, Investment Company Institute; and Member of Executive Board, SMU Cox School of Business Formerly: Advisor to the Board, Invesco Advisers, Inc. (formerly known as Invesco Institutional (N.A.), Inc.); Chairman and Chief Executive Officer, Invesco Advisers, Inc. (registered investment adviser); Director, Chairman, Chief Executive Officer and President, Invesco Holding Company (US), Inc. (formerly IVZ Inc.) (holding company), Invesco Group Services, Inc. (service provider) and Invesco North American Holdings, Inc. (holding company); Director, Chief Executive Officer and President, Invesco Holding Company Limited (parent of Invesco and a global investment management firm); Director, Invesco Ltd.; Chairman, Investment Company Institute and President,Co-Chief Executive Officer,Co-President, Chief Operating Officer and Chief Financial Officer, Franklin Resources, Inc. (global investment management organization) | | 229 | | None |
| | | | | |
| Philip A. Taylor2— 1954 Trustee | | 2006 | | Vice Chair, Invesco Ltd.; Trustee, The Invesco Funds Formerly: Director, Invesco Canada Ltd. (formerly known as Invesco Trimark Ltd./ Invesco Trimark Ltèe) (registered investment adviser and registered transfer agent); Head of the Americas and Senior Managing Director, Invesco Ltd.; Director, Invesco Advisers, Inc. (formerly known as Invesco Institutional (N.A.), Inc.) (registered investment adviser); | | 229 | | None |
1 Mr. Flanagan is considered an interested person (within the meaning of Section 2(a)(19) of the 1940 Act) of the Trust because he is an officer of the Adviser to the Trust, and an officer and a director of Invesco Ltd., ultimate parent of the Adviser. |
2 Mr. Taylor is considered an interested person (within the meaning of Section 2(a)(19) of the 1940 Act) of the Trust because he is an officer of Invesco Ltd., ultimate parent of the Adviser. |
144 INVESCO OPPENHEIMER INTERNATIONAL BOND FUND
| | | | | | | | |
Name, Year of Birth and Position(s) Held with the Trust | | Trustee
and/or
Officer
Since | | Principal Occupation(s) During Past 5 Years | | Number of Funds in Fund Complex Overseen by Trustee | | Other Directorship(s) Held by Trustee During Past 5 Years |
| | | | | |
| INTERESTED PERSONS (CONTINUED) | | | | | | | | |
| | | | | |
| Philip A. Taylor (Continued) | | | | Director and Chairman, Invesco Investment Services, Inc. (formerly known as Invesco AIM Investment Services, Inc.) (registered transfer agent); Chief Executive Officer, Invesco Corporate Class Inc. (corporate mutual fund company); Chairman and Chief Executive Officer, Invesco Canada Ltd. (formerly known as Invesco Trimark Ltd./Invesco Trimark Ltèe) (registered investment adviser and registered transfer agent); Senior Vice President, The Invesco Funds; Director, Invesco Investment Advisers LLC (formerly known as Van Kampen Asset Management); Director, Chairman, Chief Executive Officer and President, Invesco Management Group, Inc. (formerly known as Invesco AIM Management Group, Inc.) (financial services holding company);Co-Chairman,Co-President andCo-Chief Executive Officer, Invesco Advisers, Inc. (formerly known as Invesco Institutional (N.A.), Inc.) (registered investment adviser); Director, Chief Executive Officer and President, Van Kampen Exchange Corp; President and Principal Executive Officer, The Invesco Funds (other than AIM Treasurer’s Series Trust (Invesco Treasurer’s Series Trust), Short-Term Investments Trust and Invesco Management Trust); Executive Vice President, The Invesco Funds (AIM Treasurer’s Series Trust (Invesco Treasurer’s Series Trust), Short-Term Investments Trust and Invesco Management Trust only); Director and President, INVESCO Funds Group, Inc. (registered investment adviser and registered transfer agent); Director and Chairman, IVZ Distributors, Inc. (formerly known as INVESCO Distributors, Inc.) (registered broker dealer); Director, President and Chairman, Invesco Inc. (holding company), Invesco Canada Holdings Inc. (holding company), Trimark Investments Ltd./ Placements Trimark Ltèe and Invesco Financial Services Ltd/Services Financiers Invesco Ltèe; Chief Executive Officer, Invesco Canada Fund Inc. (corporate mutual fund company); Director and Chairman, Van Kampen Investor Services Inc.; Director, Chief Executive Officer and President, 1371 Preferred Inc. (holding | | | | |
145 INVESCO OPPENHEIMER INTERNATIONAL BOND FUND
TRUSTEES AND OFFICERSContinued
| | | | | | | | |
Name, Year of Birth and Position(s) Held with the Trust | | Trustee
and/or
Officer
Since | | Principal Occupation(s) During Past 5 Years | | Number of Funds in Fund Complex Overseen by Trustee | | Other Directorship(s) Held by Trustee During Past 5 Years |
| | | | | |
| INTERESTED PERSONS (CONTINUED) | | | | | | | | |
| | | | | |
| Philip A. Taylor (Continued) | | | | company) and Van Kampen Investments Inc.; Director and President, AIM GP Canada Inc. (general partner for limited partnerships) and Van Kampen Advisors, Inc.; Director and Chief Executive Officer, Invesco Trimark Dealer Inc. (registered broker dealer); Director, Invesco Distributors, Inc. (formerly known as Invesco AIM Distributors, Inc.) (registered broker dealer); Manager, Invesco Capital Management LLC; Director, Chief Executive Officer and President, Invesco Advisers, Inc.; Director, Chairman, Chief Executive Officer and President, Invesco AIM Capital Management, Inc.; President, Invesco Trimark Dealer Inc. and Invesco Trimark Ltd./Invesco Trimark Ltèe; Director and President, AIM Trimark Corporate Class Inc. and AIM Trimark Canada Fund Inc.; Senior Managing Director, Invesco Holding Company Limited; Director and Chairman, Fund Management Company (former registered broker dealer); President and Principal Executive Officer, The Invesco Funds (AIM Treasurer’s Series Trust (Invesco Treasurer’s Series Trust), and Short-Term Investments Trust only); President, AIM Trimark Global Fund Inc. and AIM Trimark Canada Fund Inc. | | | | |
146 INVESCO OPPENHEIMER INTERNATIONAL BOND FUND
| | | | | | | | |
Name, Year of Birth and Position(s) Held with the Trust | | Trustee
and/or
Officer
Since | | Principal Occupation(s) During Past 5 Years | | Number of Funds in Fund Complex Overseen by Trustee | | Other Directorship(s) Held by Trustee During Past 5 Years |
INDEPENDENT TRUSTEES | | | | | | | | |
| | | | | |
Bruce L. Crockett – 1944 Trustee and Chair | | 2003 | | Chairman, Crockett Technologies Associates (technology consulting company) Formerly: Director, Captaris (unified messaging provider); Director, President and Chief Executive Officer, COMSAT Corporation; Chairman, Board of Governors of INTELSAT (international communications company); ACE Limited (insurance company); Independent Directors Council and Investment Company Institute: Member of the Audit Committee, Investment Company Institute; Member of the Executive Committee and Chair of the Governance Committee, Independent Directors Council | | 229 | | Director and Chairman of the Audit Committee, ALPS (Attorneys Liability Protection Society) (insurance company); Director and Member of the Audit Committee and Compensation Committee, Ferroglobe PLC (metallurgical company) |
| | | | | |
David C. Arch – 1945 Trustee | | 2010 | | Chairman of Blistex Inc. (consumer health care products manufacturer); Member, World Presidents’ Organization | | 229 | | Board member of the Illinois Manufacturers’ Association |
| | | | | |
Beth Ann Brown – 1968 Trustee | | 2019 | | Independent Consultant Formerly: Head of Intermediary Distribution, Managing Director, Strategic Relations, Managing Director, Head of National Accounts, Senior Vice President, National Account Manager and Senior Vice President, Key Account Manager, Columbia Management Investment Advisers LLC; Vice President, Key Account Manager, Liberty Funds Distributor, Inc.; and Trustee of certain Oppenheimer Funds | | 229 | | Director, Board of Directors of Caron Engineering Inc.; Advisor, Board of Advisors of Caron Engineering Inc.; President and Director, of Acton Shapleigh Youth Conservation Corps (non-profit); and Vice President and Director of Grahamtastic Connection (non-profit) |
| | | | | |
Jack M. Fields – 1952 Trustee | | 2003 | | Chief Executive Officer, Twenty First Century Group, Inc. (government affairs company); and Chairman, Discovery Learning Alliance(non-profit) Formerly: Owner and Chief Executive Officer, Dos Angeles Ranch L.P. (cattle, hunting, corporate entertainment); Director, Insperity, Inc. (formerly known as Administaff) (human resources provider); Chief Executive Officer, Texana Timber LP (sustainable forestry company); Director of Cross Timbers Quail Research Ranch(non-profit); and member of the U.S. House of Representatives | | 229 | | None |
147 INVESCO OPPENHEIMER INTERNATIONAL BOND FUND
TRUSTEES AND OFFICERSContinued
| | | | | | | | |
Name, Year of Birth and Position(s) Held with the Trust | | Trustee
and/or
Officer
Since | | Principal Occupation(s) During Past 5 Years | | Number of Funds in Fund Complex Overseen by Trustee | | Other Directorship(s) Held by Trustee During Past 5 Years |
INDEPENDENT TRUSTEES (CONTINUED) | | | | | | | | |
| | | | | |
Cynthia Hostetler —1962 Trustee | | 2017 | | Non-Executive Director and Trustee of a number of public and private business corporations Formerly: Director, Aberdeen Investment Funds (4 portfolios); Head of Investment Funds and Private Equity, Overseas Private Investment Corporation; President, First Manhattan Bancorporation, Inc.; Attorney, Simpson Thacher & Bartlett LLP | | 229 | | Vulcan Materials Company (construction materials company); Trilinc Global Impact Fund; Genesee & Wyoming, Inc. (railroads); Artio Global Investment LLC (mutual fund complex); Edgen Group, Inc. (specialized energy and infrastructure products distributor); Investment Company Institute (professional organization); Independent Directors Council (professional organization) |
| | | | | |
Eli Jones – 1961 Trustee | | 2016 | | Professor and Dean, Mays Business School - Texas A&M University Formerly: Professor and Dean, Walton College of Business, University of Arkansas and E.J. Ourso College of Business, Louisiana State University; Director, Arvest Bank | | 229 | | Insperity, Inc. (formerly known as Administaff) (human resources provider) |
| | | | | |
Elizabeth Krentzman – 1959 Trustee | | 2019 | | Formerly: Principal and Chief Regulatory Advisor for Asset Management Services and U.S. Mutual Fund Leader of Deloitte & Touche LLP; General Counsel of the Investment Company Institute (trade association); National Director of the Investment Management Regulatory Consulting Practice, Principal, Director and Senior Manager of Deloitte & Touche LLP; Assistant Director of the Division of Investment Management - Office of Disclosure and Investment Adviser Regulation of the U.S. Securities and Exchange Commission and various positions with the Division of Investment Management – Office of Regulatory Policy of the U.S. Securities and Exchange Commission; Associate at Ropes & Gray LLP.; Advisory Board Member of the Securities and Exchange Commission Historical Society; and Trustee of certain Oppenheimer Funds | | 229 | | Trustee of the University of Florida National Board Foundation and Audit Committee Member; Member of the Cartica Funds Board of Directors (private investment funds); Member of the University of Florida Law Center Association, Inc. Board of Trustees and Audit Committee Member |
148 INVESCO OPPENHEIMER INTERNATIONAL BOND FUND
| | | | | | | | |
Name, Year of Birth and Position(s) Held with the Trust | | Trustee
and/or
Officer
Since | | Principal Occupation(s) During Past 5 Years | | Number of Funds in Fund Complex Overseen by Trustee | | Other Directorship(s) Held by Trustee During Past 5 Years |
| | | | | |
| INDEPENDENT TRUSTEES (CONTINUED) | | | | | | | | |
| | | | | |
Anthony J. LaCava, Jr. – 1956 Trustee | | 2019 | | Formerly: Director and Member of the Audit Committee, Blue Hills Bank (publicly traded financial institution) and Managing Partner, KPMG LLP | | 229 | | Blue Hills Bank; Chairman of Bentley University; Member, Business School Advisory Council; and Nominating Committee, KPMG LLP |
| | | | | |
Prema Mathai-Davis – 1950 Trustee | | 2003 | | Retired Co-Owner & Partner of Quantalytics Research, LLC, (a FinTech Investment Research Platform for the Self-Directed Investor) | | 229 | | None |
| | | | | |
Joel W. Motley – 1952 Trustee | | 2019 | | Director of Office of Finance, Federal Home Loan Bank; Member of the Vestry of Trinity Wall Street; Managing Director of Carmona Motley Hoffman, Inc. (privately held financial advisor); Member of the Finance and Budget Committee of the Council on Foreign Relations, Member of the Investment Committee and Board of Human Rights Watch and Member of the Investment Committee and Board of Historic Hudson Valley (non-profit cultural organization). Formerly: Managing Director of Public Capital Advisors, LLC (privately held financial advisor); Managing Director of Carmona Motley Hoffman, Inc. (privately held financial advisor); Trustee of certain Oppenheimer Funds; and Director of Columbia Equity Financial Corp. (privately held financial advisor) | | 229 | | Director of Greenwall Foundation (bioethics research foundation); Member of Board and Investment Committee of The Greenwall Foundation; Director of Southern Africa Legal Services Foundation; Board Member and Investment Committee Member of Pulitzer Center for Crisis Reporting(non-profit journalism) |
| | | | | |
Teresa M. Ressel — 1962 Trustee | | 2017 | | Non-executive director and trustee of a number of public and private business corporations Formerly: Chief Financial Officer, Olayan America, The Olayan Group (international investor/commercial/industrial); Chief Executive Officer, UBS Securities LLC; Group Chief Operating Officer, Americas, UBS AG; Assistant Secretary for Management & Budget and CFO, US Department of the Treasury | | 229 | | Atlantic Power Corporation (power generation company); ON Semiconductor Corp. (semiconductor supplier) |
| | | | | |
Ann Barnett Stern – 1957 Trustee | | 2017 | | President and Chief Executive Officer, Houston Endowment Inc. (private philanthropic institution) Formerly: Executive Vice President and General Counsel, Texas Children’s Hospital; | | 229 | | Federal Reserve Bank of Dallas |
149 INVESCO OPPENHEIMER INTERNATIONAL BOND FUND
TRUSTEES AND OFFICERSContinued
| | | | | | | | |
Name, Year of Birth and Position(s) Held with the Trust | | Trustee
and/or
Officer
Since | | Principal Occupation(s) During Past 5 Years | | Number of Funds in Fund Complex Overseen by Trustee | | Other Directorship(s) Held by Trustee During Past 5 Years |
| | | | | |
| INDEPENDENT TRUSTEES (CONTINUED) | | | | | | | | |
| | | | | |
| Ann Barnett Stern (Continued) | | | | Attorney, Beck, Redden and Secrest, LLP; Business Law Instructor, University of St. Thomas; Attorney, Andrews & Kurth LLP | | | | |
| | | | | |
| Raymond Stickel, Jr. – 1944 Trustee | | 2005 | | Retired Formerly: Director, Mainstay VP Series Funds, Inc. (25 portfolios); Partner, Deloitte & Touche | | 229 | | None |
| | | | | |
| Robert C. Troccoli – 1949 Trustee | | 2016 | | Retired Formerly: Adjunct Professor, University of Denver – Daniels College of Business, Senior Partner, KPMG LLP | | 229 | | None |
| | | | | |
| Daniel S. Vandivort –1954 Trustee | | 2019 | | Treasurer, Chairman of the Audit and Finance Committee, and Trustee, Board of Trustees, Huntington Disease Foundation of America; and President, Flyway Advisory Services LLC (consulting and property management). Formerly: Trustee and Governance Chair, of certain Oppenheimer Funds | | 229 | | Chairman and Lead Independent Director, Chairman of the Audit Committee, and Director, Board of Directors, Value Line Funds |
| | | | | |
| James D. Vaughn – 1945 Trustee | | 2019 | | Retired Formerly: Managing Partner, Deloitte & Touche LLP; Trustee and Chairman of the Audit Committee, Schroder Funds; Board Member, Mile High United Way, Boys and Girls Clubs, Boy Scouts, Colorado Business Committee for the Arts, Economic Club of Colorado and Metro Denver Network (economic development corporation); and Trustee of certain Oppenheimer Funds | | 229 | | Board member and Chairman of Audit Committee of AMG National Trust Bank; Trustee and Investment Committee member, University of South Dakota Foundation; Board member, Audit Committee Member and past Board Chair, Junior Achievement(non-profit) |
| | | | | |
| Christopher L. Wilson – 1957 Trustee, Vice Chair and Chair Designate | | 2017 | | Retired Formerly: Director, TD Asset Management USA Inc. (mutual fund complex) (22 portfolios); Managing Partner, CT2, LLC (investing and consulting firm); President/Chief Executive Officer, Columbia Funds, Bank of America Corporation; President/Chief Executive Officer, CDC IXIS Asset Management Services, Inc.; Principal & Director of Operations, Scudder Funds, Scudder, Stevens & Clark, Inc.; Assistant Vice President, Fidelity Investments | | 229 | | ISO New England, Inc.(non-profit organization managing regional electricity market) |
150 INVESCO OPPENHEIMER INTERNATIONAL BOND FUND
| | | | | | | | |
Name, Year of Birth and Position(s) Held with the Trust | | Trustee
and/or
Officer
Since | | Principal Occupation(s) During Past 5 Years | | Number of Funds in Fund Complex Overseen by Trustee | | Other Directorship(s) Held by Trustee During Past 5 Years |
| | | | | |
OTHER OFFICERS | | | | | | | | |
| | | | | |
| Sheri Morris — 1964 President, Principal Executive Officer and Treasurer | | 2003 | | Head of Global Fund Services, Invesco Ltd.; President, Principal Executive Officer and Treasurer, The Invesco Funds; Vice President, Invesco Advisers, Inc. (formerly known as Invesco Institutional (N.A.), Inc.) (registered investment adviser); and Vice President, Invesco Exchange-Traded Fund Trust, Invesco Exchange-Traded Fund Trust II, Invesco India Exchange-Traded Fund Trust, Invesco Actively Managed Exchange-Traded Fund Trust, Invesco Actively Managed Exchange-Traded Commodity Fund Trust and Invesco Exchange- Traded Self-Indexed Fund Trust, and Vice President, OppenheimerFunds, Inc. Formerly: Vice President and Principal Financial Officer, The Invesco Funds; Vice President, Invesco AIM Advisers, Inc., Invesco AIM Capital Management, Inc. and Invesco AIM Private Asset Management, Inc.; Assistant Vice President and Assistant Treasurer, The Invesco Funds and Assistant Vice President, Invesco Advisers, Inc., Invesco AIM Capital Management, Inc. and Invesco AIM Private Asset Management, Inc.; and Treasurer, Invesco Exchange-Traded Fund Trust, Invesco Exchange-Traded Fund Trust II, Invesco India Exchange-Traded Fund Trust and Invesco Actively Managed Exchange-Traded Fund Trust | | N/A | | N/A |
| | | | | |
| Russell C. Burk — 1958 Senior Vice President and Senior Officer | | 2005 | | Senior Vice President and Senior Officer, The Invesco Funds | | N/A | | N/A |
| | | | | |
| Jeffrey H. Kupor – 1968 Senior Vice President, Chief Legal Officer and Secretary | | 2018 | | Head of Legal of the Americas, Invesco Ltd.; Senior Vice President and Secretary, Invesco Advisers, Inc. (formerly known as Invesco Institutional (N.A.), Inc.) (registered investment adviser); Senior Vice President and Secretary, Invesco Distributors, Inc. (formerly known as Invesco AIM Distributors, Inc.); Vice President and Secretary, Invesco Investment Services, Inc. (formerly known as Invesco AIM Investment Services, Inc.) Senior Vice President, Chief Legal Officer and Secretary, The Invesco Funds; Secretary and General Counsel, Invesco Investment Advisers LLC (formerly known as Van Kampen Asset Management); Secretary and General Counsel, Invesco Capital Markets, Inc. (formerly known as Van Kampen Funds Inc.) and Chief Legal | | N/A | | N/A |
151 INVESCO OPPENHEIMER INTERNATIONAL BOND FUND
TRUSTEES AND OFFICERSContinued
| | | | | | | | |
Name, Year of Birth and Position(s) Held with the Trust | | Trustee
and/or
Officer
Since | | Principal Occupation(s) During Past 5 Years | | Number of Funds in Fund Complex Overseen by Trustee | | Other Directorship(s) Held by Trustee During Past 5 Years |
| | | | | |
| OTHER OFFICERS (CONTINUED) | | | | | | | | |
| | | | | |
| Jeffrey H. Kupor (Continued) | | | | Officer, Invesco Exchange-Traded Fund Trust, Invesco Exchange-Traded Fund Trust II, Invesco India Exchange-Traded Fund Trust, Invesco Actively Managed Exchange-Traded Fund Trust, Invesco Actively Managed Exchange- Traded Commodity Fund Trust and Invesco Exchange-Traded Self-Indexed Fund Trust; Secretary, Invesco Indexing LLC; Secretary, W.L. Ross & Co., LLC Formerly: Secretary and Vice President, Jemstep, Inc.; Head of Legal, Worldwide Institutional, Invesco Ltd.; Secretary and General Counsel, INVESCO Private Capital Investments, Inc.; Senior Vice President, Secretary and General Counsel, Invesco Management Group, Inc. (formerly known as Invesco AIM Management Group, Inc.); Assistant Secretary, INVESCO Asset Management (Bermuda) Ltd.; Secretary and General Counsel, Invesco Private Capital, Inc.; Assistant Secretary and General Counsel, INVESCO Realty, Inc.; Secretary and General Counsel, Invesco Senior Secured Management, Inc.; and Secretary, Sovereign G./P. Holdings Inc. | | | | |
| | | | | |
Andrew R. Schlossberg – 1974 Senior Vice President | | 2019 | | Head of the Americas and Senior Managing Director, Invesco Ltd.; Director and Senior Vice President, Invesco Advisers, Inc. (formerly known as Invesco Institutional (N.A.), Inc.) (registered investment adviser); Director and Chairman, Invesco Investment Services, Inc. (formerly known as Invesco AIM Investment Services, Inc.) (registered transfer agent); Senior Vice President, The Invesco Funds; Director, Invesco Investment Advisers LLC (formerly known as Van Kampen Asset Management); Director, President and Chairman, Invesco Insurance Agency, Inc. Formerly: Director, Invesco UK Limited; Director and Chief Executive, Invesco Asset Management Limited and Invesco Fund Managers Limited; Assistant Vice President, The Invesco Funds; Senior Vice President, Invesco Advisers, Inc. (formerly known as Invesco Institutional (N.A.), Inc.) (registered investment adviser); Director and Chief Executive, Invesco Administration Services | | N/A | | N/A |
152 INVESCO OPPENHEIMER INTERNATIONAL BOND FUND
| | | | | | | | |
Name, Year of Birth and Position(s) Held with the Trust | | Trustee
and/or
Officer
Since | | Principal Occupation(s) During Past 5 Years | | Number of Funds in Fund Complex Overseen by Trustee | | Other Directorship(s) Held by Trustee During Past 5 Years |
| | | | | |
| OTHER OFFICERS (CONTINUED) | | | | | | | | |
| | | | | |
| Andrew R. Schlossberg (Continued) | | | | Limited and Invesco Global Investment Funds Limited; Director, Invesco Distributors, Inc.; Head of EMEA, Invesco Ltd.; President, Invesco Actively Managed Exchange-Traded Commodity Fund Trust, Invesco Actively Managed Exchange-Traded Fund Trust, Invesco Exchange-Traded Fund Trust, Invesco Exchange-Traded Fund Trust II and Invesco India Exchange-Traded Fund Trust; Managing Director and Principal Executive Officer, Invesco Capital Management LLC | | | | |
| | | | | |
John M. Zerr — 1962 Senior Vice President | | 2006 | | Chief Operating Officer of the Americas; Senior Vice President, Invesco Advisers, Inc. (formerly known as Invesco Institutional (N.A.), Inc.) (registered investment adviser); Senior Vice President, Invesco Distributors, Inc. (formerly known as Invesco AIM Distributors, Inc.); Director and Vice President, Invesco Investment Services, Inc. (formerly known as Invesco AIM Investment Services, Inc.) Senior Vice President, The Invesco Funds; Managing Director, Invesco Capital Management LLC; Director, Invesco Investment Advisers LLC (formerly known as Van Kampen Asset Management); Senior Vice President, Invesco Capital Markets, Inc. (formerly known as Van Kampen Funds Inc.); Manager, Invesco Indexing LLC; Manager, Invesco Specialized Products, LLC; Director and Senior Vice President, Invesco Insurance Agency, Inc.; Member, Invesco Canada Funds Advisory Board; Director, President and Chief Executive Officer, Invesco Corporate Class Inc. (corporate mutual fund company); and Director, Chairman, President and Chief Executive Officer, Invesco Canada Ltd. (formerly known as Invesco Trimark Ltd./Invesco Trimark Ltèe) (registered investment adviser and registered transfer agent) Formerly: Director and Senior Vice President, Invesco Management Group, Inc. (formerly known as Invesco AIM Management Group, Inc.); Secretary and General Counsel, Invesco Management Group, Inc. (formerly known as Invesco AIM Management Group, Inc.); Secretary, Invesco Investment Services, Inc. (formerly known as Invesco AIM Investment Services, Inc.); Chief Legal Officer and | | N/A | | N/A |
153 INVESCO OPPENHEIMER INTERNATIONAL BOND FUND
TRUSTEES AND OFFICERSContinued
| | | | | | | | |
Name, Year of Birth and Position(s) Held with the Trust | | Trustee
and/or
Officer
Since | | Principal Occupation(s) During Past 5 Years | | Number of Funds in Fund Complex Overseen by Trustee | | Other Directorship(s) Held by Trustee During Past 5 Years |
| | | | | |
| OTHER OFFICERS (CONTINUED) | | | | | | | | |
| | | | | |
| John M. Zerr (Continued) | | | | Secretary, The Invesco Funds; Secretary and General Counsel, Invesco Investment Advisers LLC (formerly known as Van Kampen Asset Management); Secretary and General Counsel, Invesco Capital Markets, Inc. (formerly known as Van Kampen Funds Inc.); Chief Legal Officer, Invesco Exchange-Traded Fund Trust, Invesco Exchange-Traded Fund Trust II, Invesco India Exchange-Traded Fund Trust, Invesco Actively Managed Exchange-Traded Fund Trust, Invesco Actively Managed Exchange- Traded Commodity Fund Trust and Invesco Exchange-Traded Self-Indexed Fund Trust; Secretary, Invesco Indexing LLC; Director, Secretary, General Counsel and Senior Vice President, Van Kampen Exchange Corp.; Director, Vice President and Secretary, IVZ Distributors, Inc. (formerly known as INVESCO Distributors, Inc.); Director and Vice President, INVESCO Funds Group, Inc.; Director and Vice President, Van Kampen Advisors Inc.; Director, Vice President, Secretary and General Counsel, Van Kampen Investor Services Inc.; Director and Secretary, Invesco Distributors, Inc. (formerly known as Invesco AIM Distributors, Inc.); Director, Senior Vice President, General Counsel and Secretary, Invesco AIM Advisers, Inc. and Van Kampen Investments Inc.; Director, Vice President and Secretary, Fund Management Company; Director, Senior Vice President, Secretary, General Counsel and Vice President, Invesco AIM Capital Management, Inc.; Chief Operating Officer and General Counsel, Liberty Ridge Capital, Inc. (an investment adviser) | | | | |
| | | | | |
Gregory G. McGreevey - 1962 Senior Vice President | | 2012 | | Senior Managing Director, Invesco Ltd.; Director, Chairman, President, and Chief Executive Officer, Invesco Advisers, Inc. (formerly known as Invesco Institutional (N.A.), Inc.) (registered investment adviser); Director, Invesco Mortgage Capital, Inc. and Invesco Senior Secured Management, Inc.; and Senior Vice President, The Invesco Funds; and President, SNW Asset Management Corporation Formerly: Senior Vice President, Invesco | | N/A | | N/A |
154 INVESCO OPPENHEIMER INTERNATIONAL BOND FUND
| | | | | | | | |
Name, Year of Birth and Position(s) Held with the Trust | | Trustee
and/or
Officer
Since | | Principal Occupation(s) During Past 5 Years | | Number of Funds in Fund Complex Overseen by Trustee | | Other Directorship(s) Held by Trustee During Past 5 Years |
| | | | | |
| OTHER OFFICERS (CONTINUED) | | | | | | | | |
| | | | | |
| Gregory G. McGreevey (Continued) | | | | Management Group, Inc. and Invesco Advisers, Inc.; Assistant Vice President, The Invesco Funds | | | | |
| | | | | |
| Kelli Gallegos – 1970 Vice President, Principal Financial Officer and Assistant Treasurer | | 2008 | | Principal Financial and Accounting Officer – Investments Pool, Invesco Specialized Products, LLC; Vice President, Principal Financial Officer and Assistant Treasurer, The Invesco Funds; Principal Financial and Accounting Officer – Pooled Investments, Invesco Capital Management LLC; Vice President and Treasurer, Invesco Exchange- Traded Fund Trust, Invesco Exchange-Traded Fund Trust II, Invesco India Exchange-Traded Fund Trust, Invesco Actively Managed Exchange-Traded Fund Trust, Invesco Actively Managed Exchange-Traded Commodity Fund Trust and Invesco Exchange-Traded Self-Indexed Fund Trust Formerly: Assistant Treasurer, Invesco Specialized Products, LLC; Assistant Treasurer, Invesco Exchange-Traded Fund Trust, Invesco Exchange-Traded Fund Trust II, Invesco India Exchange-Traded Fund Trust, Invesco Actively Managed Exchange-Traded Fund Trust, Invesco Actively Managed Exchange-Traded Commodity Fund Trust and Invesco Exchange-Traded Self-Indexed Fund Trust; Assistant Treasurer, Invesco Capital Management LLC; Assistant Vice President, The Invesco Funds | | N/A | | N/A |
| | | | | |
| Crissie M. Wisdom – 1969 Anti-Money Laundering Compliance Officer | | 2013 | | Anti-Money Laundering Compliance Officer, Invesco Advisers, Inc. (formerly known as Invesco Institutional (N.A.), Inc.) (registered investment adviser), Invesco Capital Markets, Inc. (formerly known as Van Kampen Funds Inc.), Invesco Distributors, Inc., Invesco Investment Services, Inc., The Invesco Funds, and Invesco Exchange-Traded Fund Trust, Invesco Exchange-Traded Fund Trust II, Invesco India Exchange-Traded Fund Trust, Invesco Actively Managed Exchange-Traded Fund Trust, Invesco Actively Managed Exchange- Traded Commodity Fund Trust and Invesco Exchange-Traded Self-Indexed Fund Trust; Anti-Money Laundering Compliance Officer and Bank Secrecy Act Officer, INVESCO National Trust Company and Invesco Trust Company; and Fraud Prevention Manager and | | N/A | | N/A |
155 INVESCO OPPENHEIMER INTERNATIONAL BOND FUND
TRUSTEES AND OFFICERSContinued
| | | | | | | | |
Name, Year of Birth and Position(s) Held with the Trust | | Trustee
and/or
Officer
Since | | Principal Occupation(s) During Past 5 Years | | Number of Funds in Fund Complex Overseen by Trustee | | Other Directorship(s) Held by Trustee During Past 5 Years |
| | | | | |
| OTHER OFFICERS (CONTINUED) | | | | | | | | |
| | | | | |
| Crissie M. Wisdom (Continued) | | | | Controls and Risk Analysis Manager for Invesco Investment Services, Inc. Formerly: Anti-Money Laundering Compliance Officer, Van Kampen Exchange Corp. and Invesco Management Group, Inc. | | | | |
| | | | | |
| Robert R. Leveille – 1969 Chief Compliance Officer | | 2016 | | Chief Compliance Officer, Invesco Advisers, Inc. (registered investment adviser); and Chief Compliance Officer, The Invesco Funds Formerly: Chief Compliance Officer, Putnam Investments and the Putnam Funds | | N/A | | N/A |
The Statement of Additional Information of the Trust includes additional information about the Fund’s Trustees and is available upon request, without charge, by calling 1.800.959.4246. Please refer to the Fund’s Statement of Additional Information for information on the Fund’ssub-advisers.
| | | | | | |
| Office of the Fund | | Investment Adviser | | Distributor | | Auditors |
| 11 Greenway Plaza, | | Invesco Advisers, Inc. | | Invesco Distributors, Inc. | | PricewaterhouseCoopers |
| Suite 1000 | | 1555 Peachtree Street, N.E. | | 11 Greenway Plaza, | | LLP |
| Houston, TX 77046-1173 | | Atlanta, GA 30309 | | Suite 1000 | | 1000 Louisiana Street, |
| | | | Houston, TX | | Suite 5800 |
| | | | 77046-1173 | | Houston, TX 77002-5021 |
| | | |
| Counsel to the Fund | | Counsel to the | | Transfer Agent | | Custodian |
| Stradley Ronon Stevens & Young, | | Independent Trustees | | Invesco Investment | | JPMorgan Chase Bank |
| LLP | | Goodwin Procter LLP | | Services, Inc. | | 4 Chase Metro Tech |
| 2005 Market Street, | | 901 New York Avenue, N.W. | | 11 Greenway Plaza, | | Center |
| Suite 2600 | | Washington, D.C. 20001 | | Suite 1000 | | Brooklyn, NY 11245 |
| Philadelphia, PA 19103-7018 | | | | Houston, TX | | |
| | | | 77046-1173 | | |
156 INVESCO OPPENHEIMER INTERNATIONAL BOND FUND
Invesco recognizes the importance of protecting your personal and financial information when you visit our website located atwww.invesco.com (the “Website”). The following information is designed to help you understand the information collection practices at this Website. We will not sell, share or rent your personally identifiable information to others in contravention of this Privacy Policy. When we refer to ourselves as “we” or “Invesco” in this Privacy Policy, we mean our entire company including our affiliates, such as subsidiaries.
By visiting this Website, you are accepting the practices described in this Privacy Policy. If you do not agree to this policy, you may not use this Website. This Privacy Policy is subject to change without notice, from time to time in our sole discretion. You acknowledge that by accessing the Website after we have posted changes to this Privacy Policy, you are agreeing to this Privacy Policy as modified. Please review the Terms of Use1 to learn of other terms and conditions applicable to your use of the Website.
Please note that this Privacy Policy is not an exclusive statement of our privacy principles across all products and services. Other privacy principles or policies may apply depending on the products or services you obtain from Invesco, or the jurisdiction in which you transact with Invesco.
This Privacy Policy was last updated on May 6, 2018.
Information We Collect and Use
We collect personal information you choose to submit to the Website in order to process transactions requested by you and meet our contractual obligations. For example, you can choose to provide your name, contact information, social security number, or tax identification number in connection with accessing your account, or you can choose to provide your personal information when you fill out a secure account question form. Any information collected about you from the Website can, from time to time, be associated with other identifying information we have about you.
In addition, we may gather information about you automatically through your use of the Website, e.g. your IP address, how you navigate the Website, the organization from which you are accessing the Website, and the websites that you access before and after you visit the Website.
When you access the Website, we may also collect information such as unique device identifiers, your screen resolution and other device settings, information about your location, and analytical information about how you use the device from which you are viewing the Website. Where applicable, we may ask your permission before collecting certain information, such as precise geolocation information.
From time to time, we use or augment the personal information we have about you with information obtained from third parties. For example, we use third party information to confirm contact or financial information or to better understand your interests by associating demographic information from third parties with the information you have provided.
How We Use Personal Information
We use your personal information to respond to your inquiries and provide the products and services you request. We also use your information from time to time to deliver the content and services we believe
1NTD
157 INVESCO OPPENHEIMER INTERNATIONAL BOND FUND
| | |
| | INVESCO’S PRIVACY NOTICEContinued |
you will find the most relevant and to provide customer service and support.
We also use the information you provide to further develop and improve our products and services. We aggregate and/orde-identify data about visitors to the Website for various business purposes including product and service development and improvement activities.
How We Share Personal Information
We collaborate with other companies and individuals to perform services for us and on our behalf and we collaborate with our affiliates, other companies and individuals with respect to particular products or services (“Providers”). Examples of Providers include data analysis firms, customer service and support providers, email and SMS vendors, andweb-hosting and development companies. Some Providers collect information for us or on our behalf on our Website. These Providers can be provided with access to personal information needed to perform their functions.
We reserve the right to disclose your personal information as required by law, when we believe disclosure is necessary to comply with a regulatory requirement, judicial proceeding, court order or legal process served on us, to protect the safety, rights or property of our customers, the public or Invesco or to enforce the Terms of Use.
If we sell or transfer a business unit (such as a subsidiary) or an asset (such as a website) to another company, we will share your personal information with such company. You will receive notice of such an event and the new entity will inform you of any changes to the practices in this Privacy Policy. If the new entity wishes to make additional use of your information, you have the right to decline such use at that time.
We occasionally disclose aggregate orde-identified data that is not personally identifiable with third parties.
Cookies and Other Tools
Invesco and its Providers collect information about you by using cookies, tracking pixels and other technologies. We use this information to better understand, customize and improve user experience with our websites, services and offerings as well as to manage our advertising. For example, we use web analytics services that use these technologies to gather information to help us understand how visitors engage with and navigate our Website, e.g., how and when pages in a site are visited and by how many visitors. We are also able to offer our visitors a more customized, relevant experience on our sites using these technologies by delivering content and functionality based on your preferences and interests.
Depending on their purpose, some cookies will only operate for the length of a single browsing session, while others have a longer life span to ensure that they fulfill their longer-term purposes. Your web browser can be set to allow you to control whether you will accept cookies or reject cookies, to notify you each time a cookie is sent to your browser, or to delete cookies that have already been set. If your browser is set to reject cookies, certain aspects of the Website that are cookie-enabled will not recognize you when you return to the website, and some Website functionality may be lost. The “Help” section of your browser may tell you how to prevent your browser from accepting cookies. To find out more about cookies, visitwww.aboutcookies.org.
158 INVESCO OPPENHEIMER INTERNATIONAL BOND FUND
Security
No data transmission over the internet can be 100% secure, so Invesco cannot ensure or warrant the security of any information you submit to us on this Website. However, Invesco seeks to protect your personal information from unauthorized access or use when you transact business on our Website using technical, administrative and procedural measures. Invesco makes no representation as to the reasonableness, efficacy, or appropriateness of the measures we use to safeguard such information.
Users are responsible for maintaining the secrecy of their own passwords. If you have reason to believe that your interaction with us is no longer secure (for example, if you feel that the security of any account you might have with us has been compromised), please immediately notify us by contacting us as specified below.
Transfer of Data to Other Countries
Any information you provide to Invesco through use of the Website may be stored and processed, transferred between and accessed from the United States, Canada and other countries which do not guarantee the same level of protection of personal information as the one in which you reside. However, Invesco will handle your personal information in accordance with this Privacy Policy regardless of where your personal information is stored/accessed.
Children’s Privacy
We are committed to protecting the privacy of children. We do not knowingly collect personal information from children under the age of 18. If you are under the age of 18, do not provide us with any personal information.
Contact Us
Please contact us if you have any questions or concerns about your personal information or require assistance in managing your choices.
Invesco Ltd.
1555 Peachtree St. NE
Atlanta, GA 30309
By phone:
(404)439-3236
By fax:
(404)962-8288
By email:
Anne.Gerry@invesco.com
Please update your account information by logging in or contact us by email or telephone as specified above to update your account information whenever such information ceases to be complete or accurate.
You may also contact us to:
159 INVESCO OPPENHEIMER INTERNATIONAL BOND FUND
| | |
| | INVESCO’S PRIVACY NOTICEContinued |
| | 🌑 | | Request that we amend, rectify, delete or update the personal data we hold about you; |
| | 🌑 | | Where possible (e.g. in relation to marketing) amend or update your choices around processing; |
| | 🌑 | | Request a copy of personal data held by us. |
Disclaimer
Where the Website contains links to third-party websites/content/services that are not owned or controlled by Invesco, Invesco is not responsible for how these properties operate or treat your personal information so we recommend that you read the privacy policies and terms associated with these third party properties carefully.
160 INVESCO OPPENHEIMER INTERNATIONAL BOND FUND
THIS PAGE INTENTIONALLY LEFT BLANK.
THIS PAGE INTENTIONALLY LEFT BLANK.
THIS PAGE INTENTIONALLY LEFT BLANK.
THIS PAGE INTENTIONALLY LEFT BLANK.
THIS PAGE INTENTIONALLY LEFT BLANK.
THIS PAGE INTENTIONALLY LEFT BLANK.
THIS PAGE INTENTIONALLY LEFT BLANK.
Explore High-Conviction Investing with Invesco

Go paperless with eDelivery
Visit invesco.com/edelivery to enjoy the convenience and security of anytime electronic access to your investment documents.
With eDelivery, you can elect to have any or all of the following materials delivered straight to your inbox to download, save and print from your own computer:
∎ Fund reports and prospectuses
∎ Quarterly statements
∎ Daily confirmations
∎ Tax forms
Invesco mailing information
Send general correspondence to Invesco Investment Services, Inc., P.O. Box 219078, Kansas City, MO 64121-9078.
| | | | | | | | |
| | | | 
| |
| | | |
| | Invesco Distributors, Inc. | | O-IBD-AR-1 | | | 11272019 | |
ITEM 2. CODE OF ETHICS.
There were no amendments to the Code of Ethics (the “Code”) that applies to the Registrant’s Principal Executive Officer (“PEO”) and Principal Financial Officer (“PFO”) during the period covered by the report. The Registrant did not grant any waivers, including implicit waivers, from any provisions of the Code to the PEO or PFO during the period covered by this report.
ITEM 3. AUDIT COMMITTEE FINANCIAL EXPERT.
The Board of Trustees has determined that the Registrant has at least one audit committee financial expert serving on its Audit Committee. The Audit Committee financial experts are David C. Arch, Bruce L. Crockett, Cynthia Hostetler, Elizabeth Krentzman, Anthony J. LaCava, Jr., Teresa M. Ressel, Raymond Stickel, Jr., Robert C. Troccoli and James Vaughn. David C. Arch, Bruce L. Crockett, Cynthia Hostetler, Elizabeth Krentzman, Anthony J. LaCava, Jr., Teresa M. Ressel, Raymond Stickel, Jr., Robert C. Troccoli and James Vaughn are “independent” within the meaning of that term as used in FormN-CSR.
ITEM 4. PRINCIPAL ACCOUNTANT FEES AND SERVICES.
During the reporting period, PricewaterhouseCoopers (“PwC”) advised the Audit Committee of the following matters for consideration under the SEC’s auditor independence rules. PwC advised the Audit Committee that a PwC Director, a PwC Manager and a PwC Senior Associate each held financial interests in investment companies within the Invesco Fund Complex that were inconsistent with the requirements of Rule2-01(c)(1) of RegulationS-X. PwC noted, among other things, that during the time of its audit, the engagement team was not aware of the investments, (or with respect to the PwC Senior Associate was not aware until after the investments were confirmed as SEC exceptions), the individuals were not in the chain of command of the audit or the audit partners of Invesco or the affiliate of the Registrant, the services each individual provided were not relied upon by the audit engagement team with respect to the audit of the Registrant or its affiliates (or with respect to the PwC Senior Associate, the services were performed by an individual who did not have decision-making responsibility for matters that materially affected the audit and were reviewed by team members at least two levels higher than the PwC Senior Associate), and the investments were not material to the net worth of each individual or their respective immediate family members which PwC considered in reaching its conclusion. PwC advised the Audit Committee that it believes its objectivity and impartiality had not been adversely affected by these matters as they related to the audit of the Registrant.
On May 24, 2019, certain investment advisor subsidiaries of Invesco Ltd. assumed management responsibility from Oppenheimer Funds, Inc. (“OFI”) for 83open-end mutual funds and 20 exchange-traded funds (collectively, the “Oppenheimer Funds”). Assumption of management responsibility for the Oppenheimer Funds was accomplished through the reorganization of each Oppenheimer Fund into a new Invesco shell fund (collectively, the “New Invesco Funds”) that did not havepre-existing assets (together, the “Reorganizations”). The Reorganizations were part of the acquisition by Invesco Ltd. (together with its subsidiaries, “Invesco”) of the asset management business of OFI (including the Oppenheimer Funds) from Massachusetts Mutual Life Insurance Company (“MassMutual”), which was also consummated on May 24, 2019 (the “Acquisition”). Subsequent to the Acquisition, MassMutual became a significant shareholder of Invesco, and the Invesco Ltd. board of directors expanded by one director with the addition of a director selected by MassMutual.
Prior to the consummation of the Acquisition and the Reorganizations on May 24, 2019, PwC completed an independence assessment to evaluate the services and relationships with OFI and its affiliates, which became affiliates of Invesco upon the closing of the Acquisition. The assessment identified the following relationship and services that are inconsistent with the auditor independence rules under Rule2-01 of RegulationS-X (“Rule2-01”) if provided to an affiliate of an audit client. A retired PwC partner who receives a benefit from PwC that is not fully funded, served
as a member of Audit Committee of the Boards of Trustees of certain Oppenheimer Funds prior to the Acquisition (the“Pre-Reorganization Relationship”). Additionally, PwC provided certainnon-audit services including, expert legal services to one Oppenheimer Fund, custody of client assets in connection with payroll services, anon-audit service performed pursuant to a success-based fee,non-audit services in which PwC acted as an advocate on behalf of a MassMutual foreign affiliate and certain employee activities undertaken in connection with the provision ofnon-audit services for MassMutual and certain MassMutual foreign affiliates (collectively, the“Pre-Reorganization Services”).
PwC and the Audit Committees of the New Invesco Funds each considered the impact that thePre-Reorganization Relationship and Services have on PwC’s independence with respect to the New Invesco Funds. On the basis of the nature of the relationship and services performed, and in particular the mitigating factors described below, PwC concluded that a reasonable investor, possessing knowledge of all the relevant facts and circumstances regarding thePre-Reorganization Relationship and Services, would conclude that thePre-Reorganization Relationship and Services do not impair PwC’s ability to exhibit the requisite objectivity and impartiality to report on the financial statements of the New Invesco Funds for the years ending May 31, 2019 – April 30, 2020 (“PwC’s Conclusion”).
The Audit Committees of the Boards of Trustees of the New Invesco Funds, based upon PwC’s Conclusion and the concurrence of Invesco, considered the relevant facts and circumstances including the mitigating factors described below and, after careful consideration, concluded that PwC is capable of exercising objective and impartial judgment in connection with its audits of the financial statements of the New Invesco Funds that the respective Boards of Trustees oversee.
Mitigating factors that PwC and the Audit Committees considered in reaching their respective conclusions included, among others, the following factors:
| • | | none of thePre-Reorganization Relationship or Services created a mutuality of interest between PwC and the New Invesco Funds; |
| • | | PwC will not act in a management or employee capacity for the New Invesco Funds or their affiliates during any portion of PwC’s professional engagement period; |
| • | | other than the expert legal services,Pre-Reorganization Services that have been provided to OFI, MassMutual and their affiliates do not have any impact on the financial statements of the New Invesco Funds; |
| • | | as it relates to the expert legal services, while the service provided by PwC related to litigation involving one Oppenheimer Fund, the impact of the litigation on the Oppenheimer Fund’s financial statements was based upon OFI’s decision, and OFI management represented that the PwC service was not considered a significant component of its decision; |
| • | | while certain employees of OFI who were involved in the financial reporting process of the Oppenheimer Funds will be employed by Invesco subsequent to the Reorganizations, existing officers of other Invesco Funds will serve as Principal Executive Officer and Principal Financial Officer or equivalent roles for the New Invesco Funds, and are ultimately responsible for the accuracy of all financial statement assertions for the entirety of the financial reporting periods for the New Invesco Funds; |
| • | | thePre-Reorganization Services giving rise to the lack of independence were provided to, or entered into with, OFI, MassMutual and their affiliates at a time when PwC had no independence restriction with respect to these entities; |
| • | | with the exception of the expert legal service provided to one Oppenheimer Fund, none of thePre-Reorganization Services affected the operations or financial reporting of the New Invesco Funds; |
| • | | thePre-Reorganization Services provided by PwC to OFI, MassMutual and their affiliates were performed by persons who were not, and will not be, part of the audit engagement team for the New Invesco Funds; and |
| • | | the fees associated with thePre-Reorganization Services were not material to MassMutual, Invesco or PwC. |
(a) to (d)
Fees Billed by PwC Related to the Registrant
PwC billed the series of the Registrant with a fiscal year end of October 31, 2019 and September 30, 2019, respectively (each a “Fund”) aggregate fees for services rendered to these Funds as shown in the following tables. Each Fund is newly organized and was created, respectively, for the purpose of acquiring the assets and liabilities of a corresponding predecessor fund (each, a “Reorganization”). Each Reorganization was consummated after the close of business on May 24, 2019, prior to which each Fund had not yet commenced operations. Accordingly, the information shown in the following tables has been provided for the periods since each Fund’s commencement of operations. The Audit Committeepre-approved all audit andnon-audit services provided to the Funds.
| | | | | | | | | | |
| | | Fees Billed for Services Rendered to the Registrant for fiscal year end October 31, 2019 | | Fees Billed for Services Rendered to the Registrant for fiscal year end September 30, 2019 |
Audit Fees | | | $ | 122,025 | | | | $ | 164,529 | |
Audit-Related Fees | | | $ | 0 | | | | $ | 0 | |
Tax Fees(1) | | | $ | 20,992 | | | | $ | 20,992 | |
All Other Fees | | | $ | 0 | | | | $ | 0 | |
| | | | | | | | | | |
Total Fees | | | $ | 143,017 | | | | $ | 185,521 | |
(g) PwC billed the Registrant aggregatenon-audit fees of $20,992 for the fiscal year ended October 31, 2019 and $20,992 for the fiscal year ended September 30, 2019.
| | (1) | Tax Fees for the fiscal years ended October 31, 2019 and September 30, 2019 include fees billed for reviewing tax returns and/or services related to tax compliance. |
Fees Billed by PwC Related to Invesco and Invesco Affiliates
PwC billed Invesco Advisers, Inc. (“Invesco”), each Fund’s adviser, and any entity controlling, controlled by or under common control with Invesco that provides ongoing services to each Fund (“Invesco Affiliates”) aggregate fees forpre-approvednon-audit services rendered to Invesco and Invesco Affiliates for the periods since each Fund’s commencement of operations as shown in the following tables. The Audit Committeepre-approved allnon-audit services provided to Invesco and Invesco Affiliates.
| | | | | | | | | | |
| | | Fees Billed for Non-Audit Services Rendered to Invesco and Affiliates for fiscal year end October 31, 2019 That Were Required to be Pre-Approved by the Registrant’s Audit Committee | | Fees Billed for Non-Audit Services Rendered to Invesco and Affiliates for fiscal year end September 30, 2019 That Were Required to be Pre-Approved by the Registrant’s Audit Committee |
| | |
Audit-Related Fees(1) | | | $ | 690,000 | | | | $ | 690,000 | |
Tax Fees | | | $ | 0 | | | | $ | 0 | |
All Other Fees | | | $ | 0 | | | | $ | 0 | |
| | | | | | | | | | |
Total Fees | | | $ | 690,000 | | | | $ | 690,000 | |
| | (1) | Audit-Related Fees for the fiscal years ended October 31, 2019 and September 30, 2019 include fees billed related to reviewing controls at a service organization. |
| (e)(2) | There were no amounts that werepre-approved by the Audit Committee pursuant to the de minimis exception under Rule2-01 of RegulationS-X. |
(f) Not applicable.
(g) Including the fees for services not required to bepre-approved by the registrant’s audit committee, PwC billed Invesco and Invesco Affiliates aggregatenon-audit fees of $3,984,000 for the fiscal year ended October 31, 2019 and $3,984,000 for the fiscal year ended September 30, 2019 fornon-audit services rendered to Invesco and Invesco Affiliates.
PwC provided audit services to the Investment Company complex of approximately $34 million.
(h) The Audit Committee also has considered whether the provision ofnon-audit services that were rendered to Invesco and Invesco Affiliates that were not required to bepre-approved pursuant to SEC regulations, if any, is compatible with maintaining PwC’s independence.
(e)(1)
PRE-APPROVAL OF AUDIT ANDNON-AUDIT SERVICES
POLICIES AND PROCEDURES
As adopted by the Audit Committees
of the Invesco Funds (the “Funds”)
Last Amended March 29, 2017
| | I. | Statement of Principles |
The Audit Committees (the “Audit Committee”) of the Boards of Trustees of the Funds (the “Board”) have adopted these policies and procedures (the “Procedures”) with respect to thepre-approval of audit andnon-audit services to be provided by the Funds’ independent auditor (the “Auditor”) to the Funds, and to the Funds’ investment adviser(s) and any entity controlling, controlled by, or under common control with the investment adviser(s) that provides ongoing services to the Funds (collectively, “Service Affiliates”).
Under Section 202 of the Sarbanes-Oxley Act of 2002, all audit andnon-audit services provided to the Funds by the Auditor must be preapproved by the Audit Committee. Rule2-01 of RegulationS-X requires that the Audit Committee alsopre-approve a Service Affiliate’s engagement of the Auditor fornon-audit services if the engagement relates directly to the operations and financial reporting of the Funds (a “Service Affiliate’s Covered Engagement”).
These Procedures set forth the procedures and the conditions pursuant to which the Audit Committee maypre-approve audit andnon-audit services for the Funds and a Service Affiliate’s Covered Engagement pursuant to rules and regulations of the Securities and Exchange Commission (“SEC”) and other organizations and regulatory bodies applicable to the Funds (“Applicable Rules”).1 They address both generalpre-approvals without consideration of specificcase-by-case services (“general pre-approvals”) and pre-approvals on acase-by-case basis (“specific pre-approvals”). Any services requiringpre-approval that are not within the scope of generalpre-approvals hereunder are subject to specificpre-approval. These Procedures also
1 Applicable Rules include, for example, New York Stock Exchange (“NYSE”) rules applicable to closed-end funds managed by Invesco and listed on NYSE.
address the delegation by the Audit Committee ofpre-approval authority to the Audit Committee Chair or Vice Chair.
| | II. | Pre-Approval of Fund Audit Services |
The annual Fund audit services engagement, including terms and fees, is subject to specificpre-approval by the Audit Committee. Audit services include the annual financial statement audit and other procedures required to be performed by an independent auditor to be able to form an opinion on the Funds’ financial statements. The Audit Committee will receive, review and consider sufficient information concerning a proposed Fund audit engagement to make a reasonable evaluation of the Auditor’s qualifications and independence. The Audit Committee will oversee the Fund audit services engagement as necessary, including approving any changes in terms, audit scope, conditions and fees.
In addition to approving the Fund audit services engagement at least annually and specifically approving any changes, the Audit Committee may generally or specificallypre-approve engagements for other audit services, which are those services that only an independent auditor reasonably can provide. Other audit services may include services associated with SEC registration statements, periodic reports and other documents filed with the SEC.
| | III. | General and SpecificPre-Approval ofNon-Audit Fund Services |
The Audit Committee will consider, at least annually, the list of GeneralPre-ApprovedNon-Audit Services which list may be terminated or modified at any time by the Audit Committee. To inform the Audit Committee’s review and approval of GeneralPre-ApprovedNon-Audit Services, the Funds’ Treasurer (or his or her designee) and Auditor shall provide such information regarding independence or other matters as the Audit Committee may request.
Any services or fee ranges that are not within the scope of GeneralPre-ApprovedNon-Audit Services have not received generalpre-approval and require specificpre-approval. Each request for specificpre-approval by the Audit Committee for services to be provided by the Auditor to the Funds must be submitted to the Audit Committee by the Funds’ Treasurer (or his or her designee)and must include detailed information about the services to be provided, the fees or fee ranges to be charged, and other relevant information sufficient to allow the Audit Committee to consider whether topre-approve such engagement, including evaluating whether the provision of such services will impair the independence of the Auditor and is otherwise consistent with Applicable Rules.
| | IV. | Non-Audit Service Types |
The Audit Committee may provide either general or specificpre-approval of audit-related, tax or other services, each as described in more detail below.
“Audit-related services” are assurance and related services that are reasonably related to the performance of the audit or review of the Fund’s financial statements or that are traditionally performed by an independent auditor. Audit-related services include, among others, accounting consultations related to accounting, financial reporting or disclosure matters not classified as “Audit services”; assistance with understanding and implementing new accounting and financial reporting guidance from rulemaking authorities; services related to mergers, acquisitions or
dispositions; compliance with ratings agency requirements and interfund lending activities; and assistance with internal control reporting requirements.
“Tax services” include, but are not limited to, the review and signing of the Funds’ federal tax returns, the review of required distributions by the Funds and consultations regarding tax matters such as the tax treatment of new investments or the impact of new regulations. The Audit Committee will not approve proposed services of the Auditor which the Audit Committee believes are to be provided in connection with a service or transaction initially recommended by the Auditor, the sole business purpose of which may be tax avoidance and the tax treatment of which may not be supported in the Internal Revenue Code and related regulations. The Audit Committee will consult with the Funds’ Treasurer (or his or her designee) and may consult with outside counsel or advisers as necessary to ensure the consistency of tax services rendered by the Auditor with the foregoing policy. The Auditor shall not represent any Fund or any Service Affiliate before a tax court, district court or federal court of claims.
Each request to provide tax services under either the general or specificpre-approval of the Audit Committee will include a description from the Auditor in writing of (i) the scope of the service, the fee structure for the engagement, and any side letter or other amendment to the engagement letter, or any other agreement (whether oral, written, or otherwise) between the Auditor and the Funds, relating to the service; and (ii) any compensation arrangement or other agreement, such as a referral agreement, a referral fee orfee-sharing arrangement, between the Auditor (or an affiliate of the Auditor) and any person (other than the Funds or Service Affiliates receiving the services) with respect to the promoting, marketing, or recommending of a transaction covered by the service. The Auditor will also discuss with the Audit Committee the potential effects of the services on the independence of the Auditor, and document the substance of its discussion with the Audit Committee.
The Audit Committee maypre-approve other non-audit services so long as the Audit Committee believes that the service will not impair the independence of the Auditor.Appendix I includes a list of services that the Auditor is prohibited from performing by the SEC rules.Appendix I also includes a list of services that would impair the Auditor’s independence unless the Audit Committee reasonably concludes that the results of the services will not be subject to audit procedures during an audit of the Funds’ financial statements.
| | V. | Pre-Approval of Service Affiliate’s Covered Engagements |
Rule2-01 of RegulationS-X requires that the Audit Committeepre-approve a Service Affiliate’s engagement of the Auditor fornon-audit services if the engagement relates directly to the operations and financial reporting of the Funds, defined above as a “Service Affiliate’s Covered Engagement”.
The Audit Committee may provide either general or specificpre-approval of any Service Affiliate’s Covered Engagement, including for audit-related, tax or other services, as described
above, if the Audit Committee believes that the provision of the services to a Service Affiliate will not impair the independence of the Auditor with respect to the Funds. Any Service Affiliate’s Covered Engagements that are not within the scope of GeneralPre-ApprovedNon-Audit Services have not received generalpre-approval and require specificpre-approval.
Each request for specificpre-approval by the Audit Committee of a Service Affiliate’s Covered Engagement must be submitted to the Audit Committee by the Funds’ Treasurer (or his or her designee)and must include detailed information about the services to be provided, the fees or fee ranges to be charged, a description of the current status of thepre-approval process involving other audit committees in the Invesco investment company complex (as defined in Rule2-201 of RegulationS-X) with respect to the proposed engagement, and other relevant information sufficient to allow the Audit Committee to consider whether the provision of such services will impair the independence of the Auditor from the Funds. Additionally, the Funds’ Treasurer (or his or her designee) and the Auditor will provide the Audit Committee with a statement that the proposed engagement requirespre-approval by the Audit Committee, the proposed engagement, in their view, will not impair the independence of the Auditor and is consistent with Applicable Rules, and the description of the proposed engagement provided to the Audit Committee is consistent with that presented to or approved by the Invesco audit committee.
Information about all Service Affiliate engagements of the Auditor fornon-audit services, whether or not subject topre-approval by the Audit Committee, shall be provided to the Audit Committee at least quarterly, to allow the Audit Committee to consider whether the provision of such services is compatible with maintaining the Auditor’s independence from the Funds. The Funds’ Treasurer and Auditor shall provide the Audit Committee with sufficiently detailed information about the scope of services provided and the fees for such services, to ensure that the Audit Committee can adequately consider whether the provision of such services is compatible with maintaining the Auditor’s independence from the Funds.
| | VI. | Pre-Approved Fee Levels or Established Amounts |
Pre-approved fee levels or ranges for audit andnon-audit services to be provided by the Auditor to the Funds, and for a Service Affiliate’s Covered Engagement, under generalpre-approval or specificpre-approval will be set periodically by the Audit Committee. Any proposed fees exceeding 110% of the maximumpre-approved fee levels or ranges for such services or engagements will be promptly presented to the Audit Committee and will require specificpre-approval by the Audit Committee before payment of any additional fees is made.
The Audit Committee hereby delegates, subject to the dollar limitations set forth below, specific authority to its Chair, or in his or her absence, Vice Chair, topre-approve audit andnon-audit services proposed to be provided by the Auditor to the Funds and/or a Service Affiliate’s Covered Engagement, between Audit Committee meetings. Such delegation does not preclude the Chair or Vice Chair from declining, on a case by case basis, to exercise his or her delegated authority
and instead convening the Audit Committee to consider andpre-approve any proposed services or engagements.
Notwithstanding the foregoing, the Audit Committee mustpre-approve: (a) anynon-audit services to be provided to the Funds for which the fees are estimated to exceed $500,000; (b) any Service Affiliate’s Covered Engagement for which the fees are estimated to exceed $500,000; or (c) any cost increase to any previously approved service or engagement that exceeds the greater of $250,000 or 50% of the previously approved fees up to a maximum increase of $500,000.
| | VIII. | Compliance with Procedures |
Notwithstanding anything herein to the contrary, failure topre-approve any services or engagements that are not required to bepre-approved pursuant to the de minimis exception provided for in Rule2-01(c)(7)(i)(C) of RegulationS-X shall not constitute a violation of these Procedures. The Audit Committee has designated the Funds’ Treasurer to ensure services and engagements arepre-approved in compliance with these Procedures. The Funds’ Treasurer will immediately report to the Chair of the Audit Committee, or the Vice Chair in his or her absence, any breach of these Procedures that comes to the attention of the Funds’ Treasurer or any services or engagements that are not required to bepre-approved pursuant to the de minimis exception provided for in Rule2-01(c)(7)(i)(C) of RegulationS-X.
On at least an annual basis, the Auditor will provide the Audit Committee with a summary of allnon-audit services provided to any entity in the investment company complex (as defined in section2-01(f)(14) of RegulationS-X, including the Funds and Service Affiliates) that were notpre-approved, including the nature of services provided and the associated fees.
| | IX. | Amendments to Procedures |
All material amendments to these Procedures must be approved in advance by the Audit Committee.Non-material amendments to these Procedures may be made by the Legal and Compliance Departments and will be reported to the Audit Committee at the next regularly scheduled meeting of the Audit Committee.
Appendix I
Non-Audit Services That May Impair the Auditor’s Independence
The Auditor is not independent if, at any point during the audit and professional engagement, the Auditor provides the followingnon-audit services:
| | • | | Broker-dealer, investment adviser, or investment banking services; |
| | • | | Expert services unrelated to the audit; |
| | • | | Any service or product provided for a contingent fee or a commission; |
| | • | | Services related to marketing, planning, or opining in favor of the tax treatment of confidential transactions or aggressive tax position transactions, a significant purpose of which is tax avoidance; |
| | • | | Tax services for persons in financial reporting oversight roles at the Fund; and |
| | • | | Any other service that the Public Company Oversight Board determines by regulation is impermissible. |
An Auditor is not independent if, at any point during the audit and professional engagement, the Auditor provides the followingnon-audit services unless it is reasonable to conclude that the results of the services will not be subject to audit procedures during an audit of the Funds’ financial statements:
| | • | | Bookkeeping or other services related to the accounting records or financial statements of the audit client; |
| | • | | Financial information systems design and implementation; |
| | • | | Appraisal or valuation services, fairness opinions, orcontribution-in-kind reports; |
| | • | | Actuarial services; and |
| | • | | Internal audit outsourcing services. |
| ITEM 5. | AUDIT COMMITTEE OF LISTED REGISTRANTS. |
Not applicable.
| ITEM 6. | SCHEDULE OF INVESTMENTS. |
Investments in securities of unaffiliated issuers is included as part of the reports to stockholders filed under Item 1 of this Form.
| ITEM 7. | DISCLOSURE OF PROXY VOTING POLICIES AND PROCEDURES FORCLOSED-END MANAGEMENT INVESTMENT COMPANIES. |
Not applicable.
| ITEM 8. | PORTFOLIO MANAGERS OFCLOSED-END MANAGEMENT COMPANIES. |
Not applicable.
| ITEM 9. | PURCHASES OF EQUITY SECURITIES BYCLOSED-END MANAGEMENT INVESTMENT COMPANY AND AFFILIATED PURCHASERS. |
Not applicable.
| ITEM 10. | SUBMISSION OF MATTERS TO A VOTE OF SECURITY HOLDERS. |
None
| ITEM 11. | CONTROLS AND PROCEDURES. |
| | (a) | As of December 9, 2019, an evaluation was performed under the supervision and with the participation of the officers of the Registrant, including the Principal Executive Officer (“PEO”) and Principal Financial Officer (“PFO”), to assess the effectiveness of the Registrant’s disclosure controls and procedures, as that term is defined in Rule30a-3(c) under the Investment Company Act of 1940 (“Act”), as amended. Based on that evaluation, the Registrant’s officers, including the PEO and PFO, concluded that, as of December 9, 2019, the Registrant’s disclosure controls and procedures were reasonably designed so as to ensure: (1) that information required to be disclosed by the Registrant on FormN-CSR is recorded, processed, summarized and reported within the time periods specified by the rules and forms of the Securities and Exchange Commission; and (2) that material information relating to the Registrant is made known to the PEO and PFO as appropriate to allow timely decisions regarding required disclosure. |
| | (b) | There have been no changes in the Registrant’s internal control over financial reporting (as defined in Rule30a-3(d) under the Act) that occurred during the period covered by this report that have materially affected, or are reasonably likely to materially affect, the Registrant’s internal control over financial reporting. |
| ITEM 12. | DISCLOSURE OF SECURITIES LENDING ACTIVITIES FORCLOSED-END MANAGEMENT INVESTMENT COMPANIES. |
Not applicable.
| | |
13(a) (1) | | Code of Ethics. |
| |
13(a) (2) | | Certifications of principal executive officer and principal financial officer as required by Rule30a-2(a) under the Investment Company Act of 1940. |
| |
13(a) (3) | | Not applicable. |
| |
13(a) (4) | | Registrant’s Independent Public Accountant, attached as Exhibit 99.ACCT |
| |
13(b) | | Certifications of principal executive officer and principal financial officer as required by Rule30a-2(b) under the Investment Company Act of 1940. |
SIGNATURES
Pursuant to the requirements of the Securities Exchange Act of 1934 and the Investment Company Act of 1940, the Registrant has duly caused this report to be signed on its behalf by the undersigned, thereunto duly authorized.
Registrant: AIM Investment Funds (Invesco Investment Funds)
| | |
| By: | | /s/ Sheri Morris |
| | Sheri Morris |
| | Principal Executive Officer |
| |
| Date: | | December 20, 2019 |
Pursuant to the requirements of the Securities and Exchange Act of 1934 and the Investment Company Act of 1940, this report has been signed below by the following persons on behalf of the Registrant and in the capacities and on the dates indicated.
| | |
| By: | | /s/ Sheri Morris |
| | Sheri Morris |
| | Principal Executive Officer |
| |
| Date: | | December 20, 2019 |
| |
| By: | | /s/ Kelli Gallegos |
| | Kelli Gallegos |
| | Principal Financial Officer |
| |
| Date: | | December 20, 2019 |