UNITED STATES
SECURITIES AND EXCHANGE COMMISSION
Washington, D.C. 20549
FORMN-CSR
CERTIFIED SHAREHOLDER REPORT OF REGISTERED
MANAGEMENT INVESTMENT COMPANIES
Investment Company Act file number 811-05426
AIM Investment Funds (Invesco Investment Funds)
(Exact name of registrant as specified in charter)
11 Greenway Plaza, Suite 1000 Houston, Texas 77046
(Address of principal executive offices) (Zip code)
Sheri Morris 11 Greenway Plaza, Suite 1000 Houston, Texas 77046
(Name and address of agent for service)
Registrant’s telephone number, including area code: (713)626-1919
Date of fiscal year end: 10/31
Date of reporting period: 10/31/19
The Registrant is filing this amendment to its FormN-CSR for the period ended October 31, 2019, originally filed with the Securities and Exchange Commission on January 3, 2020 (AccessionNo. 0001193125-20-001332). The sole purpose of this amendment is to amend the date of the Report of Independent Registered Public Accounting Firm in the “Item 1 ‘Report to Stockholders’” for Invesco Multi-Asset Income Fund. Except for such change, this amendment does not amend, update or change any other items or disclosures found in the original FormN-CSR filing nor does it reflect events occurring after the filing of the original FormN-CSR.
Items 1 (amended further herein) through 13(a)(1), and Item 13(a)(4) to this FormN-CSR are incorporated by reference to the FormN-CSR filed with the Securities and Exchange Commission on January 3, 2020 (AccessionNo. 0001193125-20-001332).”
| Item 1. | Reports to Stockholders. |
| | | | |
| | |
 | | Annual Report to Shareholders | | October 31, 2019 |
| | |
| | Invesco Multi-Asset Income Fund Nasdaq: A: PIAFX∎ C: PICFX∎ R: PIRFX∎ Y: PIYFX∎ R5: IPNFX∎ R6: PIFFX |

Letters to Shareholders
| | |

Andrew Schlossberg | | Dear Shareholders: This annual report includes information about your Fund, including performance data and a complete list of its investments as of the close of the reporting period. Inside is a discussion of how your Fund was managed and the factors that affected its performance during the reporting period. Despite marked market volatility along the way, most global equity markets produced solid gains for the reporting period. As the reporting period unfolded in the final months of 2018, global equities were reeling from a sharpsell-off. The catalyst for thesell-off was a combination of ongoing trade concerns between the US and China, fears of a global economic slowdown and lower oil prices from a supply glut. Gains posted earlier in 2018 for global equities were erased, while US Treasury bonds, along with government and municipal bonds, rallied as investors fled to “safe haven” assets. |
At the start of 2019, global equity markets rebounded strongly buoyed by more policy from central banks and optimism about a potentialUS-China trade deal. In May,US-China trade concerns and slowing global growth led to a global equitysell-off and rally in US Treasuries. Despite the Maysell-off, domestic equity markets rallied in June in anticipation of a US Federal Reserve (the Fed) interest rate cut and closed the second quarter with modest gains. ContinuedUS-China trade worries and signs of slowing global economic growth left global equity markets largely flat for the third quarter. As the reporting period came to a close in October 2019, a raft of upbeat positive corporate earnings results and a US interest rate cut buoyed domestic equity results with some domestic indices recording record highs.
The Fed, in fact, both raised and lowered the federal funds rate during the reporting period. Given signs of a strong economy, the Fed raised rates in December 2018. In 2019, however, the Fed altered its outlook on further rate hikes leaving rates unchanged for the first half of the year. In July, the Fed lowered interest rates for the first time in 11 years. It again lowered rates in September and once again in October. As the year continues to unfold, we’ll see how the interplay of interest rates, economic data, geopolitics and a host of other factors affect US and overseas equity and fixed income markets.
Investor uncertainty and market volatility, such as we witnessed during the reporting period, are unfortunate facts of life when it comes to investing. That’s why Invesco encourages investors to work with a professional financial adviser who can stress the importance of starting to save and invest early and the importance of adhering to a disciplined investment plan. A financial adviser who knows your unique financial situation, investment goals and risk tolerance can be an invaluable partner as you seek to achieve your financial goals. He or she can offer a long-term perspective when markets are volatile and timetested advice and guidance when your financial situation or investment goals change.
Visit our website for more information on your investments
Our website, invesco.com/us, offers a wide range of market insights and investment perspectives. On the website, you’ll find detailed information about our funds, including performance, holdings and portfolio manager commentaries. You can access information about your account by completing a simple, secure online registration. To do so, select “Log In” on the right side of the homepage, and then select “Register for Individual Account Access.”
In addition to the resources accessible on our website and through our mobile app, you can obtain timely updates to help you stay informed about the markets and the economy by connecting with Invesco on Twitter, LinkedIn or Facebook. You can access our blog at blog.invesco.us.com. Our goal is to provide you the information you want, when and where you want it.
Finally, I’m pleased to share with you Invesco’s commitment to both the Principles for Responsible Investment and to considering environmental, social and governance issues in our robust investment process. I invite you to learn more at invesco.com/esg.
Have questions?
For questions about your account, contact an Invesco client services representative at 800 959 4246.
All of us at Invesco look forward to serving your investment management needs. Thank you for investing with us.
Sincerely,

Andrew Schlossberg
Head of the Americas,
Senior Managing Director, Invesco Ltd.
|
| 2 Invesco Multi-Asset Income Fund |
| | |

Bruce Crockett | | Dear Shareholders: Among the many important lessons I’ve learned in more than 40 years in a variety of business endeavors is the value of a trusted advocate. As independent chair of the Invesco Funds Board, I can assure you that the members of the Board are strong advocates for the interests of investors in Invesco’s mutual funds. We work hard to represent your interests through oversight of the quality of the investment management services your funds receive and other matters important to your investment, including but not limited to: ∎ Ensuring that Invesco offers a diverse lineup of mutual funds that your financial adviser can use to strive to meet your financial needs as your investment goals change over time. ∎ Monitoring how the portfolio management teams of the Invesco funds are performing in light of changing economic and market conditions. |
∎ Assessing each portfolio management team’s investment performance within the context of the investment strategy described in the fund’s prospectus.
∎ Monitoring for potential conflicts of interests that may impact the nature of the services that your funds receive.
We believe one of the most important services we provide our fund shareholders is the annual review of the funds’ advisory andsub-advisory contracts with Invesco Advisers and its affiliates. This review is required by the Investment Company Act of 1940 and focuses on the nature and quality of the services Invesco provides as the adviser to the Invesco funds and the reasonableness of the fees that it charges for those services. Each year, we spend months carefully reviewing information received from Invesco and a variety of independent sources, such as performance and fee data prepared by Lipper, Inc. (a subsidiary of Broadridge Financial Solutions, Inc.), an independent, third-party firm widely recognized as a leader in its field. We also meet with our independent legal counsel and other independent advisers to review and help us assess the information that we have received. Our goal is to assure that you receive quality investment management services for a reasonable fee.
I trust the measures outlined above provide assurance that you have a worthy advocate when it comes to choosing the Invesco Funds.
On behalf of the Board, we look forward to continuing to represent your interests and serving your needs.
Sincerely,

Bruce L. Crockett
Independent Chair
Invesco Funds Board of Trustees
|
| 3 Invesco Multi-Asset Income Fund |
Management’s Discussion of Fund Performance
| | | | | |
Performance summary | |
For the fiscal year ended October 31, 2019, Class A shares of Invesco Multi-Asset Income Fund (the Fund), at net asset value (NAV), underperformed the Custom Invesco Multi-Asset Income Index, the Fund’s style-specific benchmark. Your Fund’s long-term performance appears later in this report. | |
Fund vs. Indexes | |
Total returns, October 31, 2018 to October 31, 2019, at net asset value (NAV). Performance shown does not include applicable contingent deferred sales charges (CDSC) orfront-end sales charges, which would have reduced performance. | |
| |
Class A Shares | | | | 13.18% | |
Class C Shares | | | | 12.35 | |
Class R Shares | | | | 12.90 | |
Class Y Shares | | | | 13.47 | |
Class R5 Shares | | | | 13.46 | |
Class R6 Shares | | | | 13.47 | |
Bloomberg Barclays U.S. Aggregate Bond Index▼(Broad Market Index) | | | | 11.51 | |
Custom Invesco Multi-Asset Income Index⬛(Style-Specific Index) | | | | 13.23 | |
Lipper Mixed-Asset Target Allocation Conservative Funds Index◆(Peer Group Index) | | | | 8.95 | |
|
Source(s):▼RIMES Technologies Corp.;⬛Invesco, RIMES Technologies Corp.;◆Lipper Inc. | |
Market conditions and your Fund
The fiscal year ended October 31, 2019, provided a strong environment for Invesco Multi-Asset Income Fund as it reported positive absolute performance with all seven strategic asset classes in which the Fund invests posting positive returns. The fiscal year began with a general deterioration in US and international economic sentiment, inciting the US Federal Reserve (the Fed) to take a more accommodative monetary stance in the first quarter of 2019. This resulted in a decline in US Treasury yields and fueled the largest quarterly equity market rally since 2009.1 The decrease in interest rates was the primary driver of performance for each of the Fund’s strategic asset classes for the fiscal year. Results were led by US preferred equity securities, emerging market debt, US high yield debt and US Treasuries. There were no detractors from the Fund’s performance
for the fiscal year, as the tactical overlay also contributed to performance.
Exposure to US preferred equity securities was the top contributor to the Fund’s performance for the fiscal year. The asset class started the fiscal year off strong, rebounding from losses in the previous months that had resulted from increases in the federal funds rate. The Fed raised interest rates in December 2018, then held steady before changing course and issuing a rate cut in July 2019.2 Two more rate cuts followed in September and October2, benefiting asset classes that are sensitive to interest rate changes. US Treasuries also contributed to the Fund’s performance for the fiscal year, having been positively impacted by lower rates.
During the fiscal year, emerging market debt exposure also contributed to the Fund’s performance. The asset class recovered from losses in the previous fiscal
year as low to negative yields across developed markets drove investors into riskier assets. Asset class performance is correlated to the strength of the US dollar, as a strengthening US dollar makes it more expensive for foreign governments to service US dollar-denominated debt. The lowering of interest rates helped cap further strengthening of the dollar. The asset class was challenged in the middle of the fiscal year, as results from the Argentinian elections suggested a return to a populist government, spooking investors. However, the gains outweighed the losses during the fiscal year.
Exposure to high yield securities also contributed to the Fund’s results for the fiscal year, largely due to yield spreads between high yield and US Treasuries widening from the Fed lowering interest rates. The asset class started the fiscal year on weak footing following a period of tightening financial conditions and global growth fears. It then bounced back at the beginning of 2019, following reports of strong corporate earnings, a rebound of the equity markets and oil prices, and easing China and US trade tensions. Positive performance in the asset class continued through the fiscal year as the Fed pivoted toward easier monetary policy.
Exposure to interest rate-sensitive US real estate investment trusts (REITs) – both mortgage and equity REITs – contributed to the Fund’s performance after beginning the fiscal year significantly lower. The fiscal year was plagued by trade uncertainty, slowing economic growth and geopolitical volatility coupled with a shift to an accommodative monetary policy. These conditions supported the performance of many income-oriented US REIT sectors over recent months and generally led US REITs to
| | |
Portfolio Composition |
By security type, based on Net Assets as of October 31, 2019 | | |
| |
U.S. Dollar Denominated Bonds & Notes | | 56.25% |
| Preferred Stocks | | 20.58 |
| Common Stocks & Other Equity Interests | | 7.23 |
| U.S. Treasury Securities | | 6.31 |
| Exchange-Traded Notes | | 1.79 |
| Exchange-Traded Funds | | 1.74 |
Security Types Each Less Than 1% of Portfolio | | 0.50 |
Money Market Funds Plus Other Assets Less Liabilities | | 5.60 |
| | |
Top Five Debt Issuers* |
| % of total net assets |
| |
1. U.S. Treasury | | 6.3% |
| |
2. GS Finance Corp. | | 4.0 |
| |
3. Royal Bank of Canada | | 3.8 |
| |
4. JPMorgan Chase Bank NA | | 2.4 |
| |
5. UBS AG | | 2.0 |
| | | | | |
Total Net Assets | | | $ | 769.5 million | |
| |
Total Number of Holdings* | | | | 753 | |
The Fund’s holdings are subject to change, and there is no assurance that the Fund will continue to hold any particular security.
The Fund’s holdings are subject to change, and there is no assurance that the Fund will continue to hold any particular security.
*Excluding money market fund holdings, if any.
Data presented here are as of October 31, 2019.
|
| 4 Invesco Multi-Asset Income Fund |
positive returns, broadly reflecting investor appetite for adding exposure to more defensive income-focused investments. Master Limited Partnerships (MLPs) also contributed to the Fund’s performance for the fiscal year due to rising energy prices and increased production coming out of the Permian basin.
The Fund’s tactical overlay, obtained through the use of futures, also contributed to results for the fiscal year. Overweight exposure to equities proved timely and outweighed gains from tactical bond exposure in aggregate during the fiscal year. The tactical overlay is designed to allow the Fund to adapt to short-term market dynamics by shifting the Fund’s sensitivity to equity (beta) or fixed income (duration) markets. The tactical process is implemented by buying or selling futures on six global equity markets (Europe, Hong Kong, UK, USlarge-cap and USsmall-cap) and three global government bond markets (UK, Germany and the US), which serve as proxies for equity and fixed income risk metrics, beta and duration. The benefit of a tactical overlay is that the Fund can adjust the beta and duration of the portfolio without adjusting the seven strategic assets and disrupting the income stream.
The landscape at the close of the fiscal year placed the upcoming Brexit deadline, geopolitical tensions in the Middle East, turmoil in Hong Kong and the lack of resolution to the US and China trade dispute at the forefront of catalysts for potential market volatility. Meanwhile, it is our view that shift in monetary policy during the fiscal year could lead to an expansion in total size of assets by central banks. The question that arises is whether these actions are going to achieve the intended effect of stimulating inflation, and if not, will fiscal stimulus be deployed.
Please note that our strategy utilizes derivative instruments that include futures and total return swaps. Therefore, some of the performance of the strategy, both positive and negative, can be attributed to these instruments. Derivatives can be a cost-effective way to gain exposure to asset classes. However, derivatives may amplify traditional investment risks through the creation of leverage and may be less liquid than traditional securities.
Thank you for your continued investment in Invesco Multi-Asset Income Fund.
1 Source: US Department of the Treasury
2 Source: US Federal Reserve
Portfolio Managers:
Mark Ahnrud
Chris Devine
Scott Hixon
Peter Hubbard
Christian Ulrich
Scott Wolle - Lead
The views and opinions expressed in management’s discussion of Fund performance are those of Invesco Advisers, Inc. These views and opinions are subject to change at any time based on factors such as market and economic conditions. These views and opinions may not be relied upon as investment advice or recommendations, or as an offer for a particular security. The information is not a complete analysis of every aspect of any market, country, industry, security or the Fund. Statements of fact are from sources considered reliable, but Invesco Advisers, Inc. makes no representation or warranty as to their completeness or accuracy. Although historical performance is no guarantee of future results, these insights may help you understand our investment management philosophy.
See important Fund and, if applicable, index disclosures later in this report.
|
| 5 Invesco Multi-Asset Income Fund |
Your Fund’s Long-Term Performance
Results of a $10,000 Investment – Oldest Share Class(es) since Inception
Fund and index data from 12/14/11
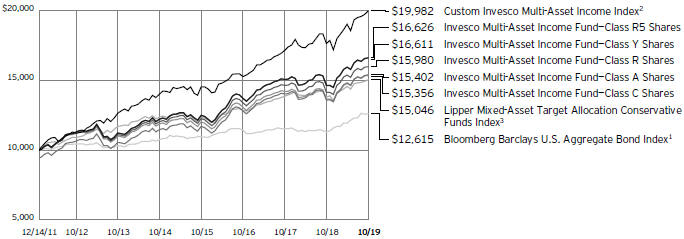
1 Source: RIMES Technologies Corp.
2 Sources: Invesco, RIMES Technologies Corp.
3 Source: Lipper Inc.
Past performance cannot guarantee comparable future results.
The data shown in the chart include reinvested distributions, applicable sales charges and Fund expenses including
management fees. Index results include reinvested dividends, but they do not reflect sales charges. Performance of the peer group, if applicable, reflects fund expenses and management fees; performance
of a market index does not. Performance shown in the chart does not reflect deduction of taxes a shareholder would pay on Fund distributions or sale of Fund shares.
|
| 6 Invesco Multi-Asset Income Fund |
| | | | | |
Average Annual Total Returns | |
As of 10/31/19, including maximum applicable sales charges | |
| |
Class A Shares | | | | | |
Inception (12/14/11) | | | | 5.63 | % |
5 Years | | | | 4.88 | |
1 Year | | | | 6.92 | |
| |
Class C Shares | | | | | |
Inception (12/14/11) | | | | 5.59 | % |
5 Years | | | | 5.27 | |
1 Year | | | | 11.35 | |
| |
Class R Shares | | | | | |
Inception (12/14/11) | | | | 6.13 | % |
5 Years | | | | 5.82 | |
1 Year | | | | 12.90 | |
| |
Class Y Shares | | | | | |
Inception (12/14/11) | | | | 6.65 | % |
5 Years | | | | 6.33 | |
1 Year | | | | 13.47 | |
| |
Class R5 Shares | | | | | |
Inception (12/14/11) | | | | 6.66 | % |
5 Years | | | | 6.35 | |
1 Year | | | | 13.46 | |
| |
Class R6 Shares | | | | | |
Inception | | | | 6.63 | % |
5 Years | | | | 6.33 | |
1 Year | | | | 13.47 | |
| | | | | |
Average Annual Total Returns | |
As of 9/30/19, the most recent calendar quarter end, including maximum applicable sales charges | |
| |
Class A Shares | | | | | |
Inception (12/14/11) | | | | 5.67 | % |
5 Years | | | | 5.11 | |
1 Year | | | | 1.87 | |
| |
Class C Shares | | | | | |
Inception (12/14/11) | | | | 5.63 | % |
5 Years | | | | 5.51 | |
1 Year | | | | 6.03 | |
| |
Class R Shares | | | | | |
Inception (12/14/11) | | | | 6.17 | % |
5 Years | | | | 6.06 | |
1 Year | | | | 7.56 | |
| |
Class Y Shares | | | | | |
Inception (12/14/11) | | | | 6.69 | % |
5 Years | | | | 6.58 | |
1 Year | | | | 8.10 | |
| |
Class R5 Shares | | | | | |
Inception (12/14/11) | | | | 6.70 | % |
5 Years | | | | 6.60 | |
1 Year | | | | 8.10 | |
| |
Class R6 Shares | | | | | |
Inception | | | | 6.67 | % |
5 Years | | | | 6.58 | |
1 Year | | | | 8.00 | |
Class R6 shares incepted on September 24, 2012. Performance shown prior to that date is that of Class A shares and includes the12b-1 fees applicable to Class A shares.
The performance data quoted represent past performance and cannot guarantee comparable future results; current performance may be lower or higher. Please visit invesco.com/ performance for the most recentmonth-end performance. Performance figures reflect reinvested distributions, changes in net asset value and the effect of the maximum sales charge unless otherwise stated. Performance figures do not reflect deduction of taxes a shareholder would pay on Fund distributions or sale of Fund shares. Investment return and principal value will fluctuate so that you may have a gain or loss when you sell shares.
The net annual Fund operating expense ratio set forth in the most recent Fund prospectus as of the date of this report for Class A, Class C, Class R, Class Y, Class R5 and Class R6 shares was 0.85%, 1.60%, 1.10%, 0.60%, 0.60% and 0.60%, respectively.1 The total annual Fund operating expense ratio set forth in the
most recent Fund prospectus as of the date of this report for Class A, Class C, Class R, Class Y, Class R5 and Class R6 shares was 1.01%, 1.76%, 1.26%, 0.76%, 0.70% and 0.64%, respectively. The expense ratios presented above may vary from the expense ratios presented in other sections of this report that are based on expenses incurred during the period covered by this report.
Class A share performance reflects the maximum 5.50% sales charge, and Class C share performance reflects the applicable contingent deferred sales charge (CDSC) for the period involved. The CDSC on Class C shares is 1% for the first year after purchase. Class R, Class Y, Class R5 and Class R6 shares do not have afront-end sales charge or a CDSC; therefore, performance is at net asset value.
The performance of the Fund’s share classes will differ primarily due to different sales charge structures and class expenses.
Fund performance reflects any applicable fee waivers and/or expense reimbursements. Had the adviser not waived fees and/or reimbursed expenses currently or in the past, returns
would have been lower. See current prospectus for more information.
| 1 | Total annual Fund operating expenses after any contractual fee waivers and/or expense reimbursements by the adviser in effect through at least February 28, 2021. See current prospectus for more information. |
|
| 7 Invesco Multi-Asset Income Fund |
Invesco Multi-Asset Income Fund’s investment objective is to provide current income.
| ∎ | | Unless otherwise stated, information presented in this report is as of October 31, 2019, and is based on total net assets. |
| ∎ | | Unless otherwise noted, all data provided by Invesco. |
| ∎ | | To access your Fund’s reports/prospectus, visit invesco.com/fundreports. |
About share classes
| ∎ | | Class R sharesare generally available only to employer sponsored retirement and benefit plans. Please see the prospectus for more information. |
| ∎ | | Class Y sharesare available only to certain investors. Please see the prospectus for more information. |
| ∎ | | Class R5 sharesandClass R6 sharesare available for use by retirement plans that meet certain standards and for institutional investors. Class R6 shares are also available through intermediaries that have established an agreement with Invesco Distributors, Inc. to make such shares available for use in retail omnibus accounts. Please see the prospectus for more information. |
Principal risks of investing in the Fund
| ∎ | | Bank loan risk.There are a number of risks associated with an investment in bank loans including credit risk, interest rate risk, liquidity risk and prepayment risk. Lack of an active trading market, restrictions on resale, irregular trading activity, wide bid/ask spreads and extended trade settlement periods may impair the Fund’s ability to sell bank loans within its desired time frame or at an acceptable price and its ability to accurately value existing and prospective investments. Extended trade settlement periods may result in cash not being immediately available to the Fund. As a result, the Fund may have to sell other investments or engage in borrowing transactions to raise cash to meet its obligations. The risk of holding bank loans is also directly tied to the risk of insolvency or bankruptcy of the issuing banks. These risks could cause the Fund to lose income or principal on a particular investment, which in turn could affect the Fund’s returns. The value of bank loans can be affected by and sensitive to changes in government regulation and to economic downturns in the United States and |
| | | abroad. Bank loans generally are floating rate loans, which are subject to interest rate risk as the interest paid on the floating rate loans adjusts periodically based on changes in widely accepted reference rates. |
| ∎ | | Changing fixed income market conditions risk.The current low interest rate environment was created in part by the Federal Reserve Board (FRB) and certain foreign central banks keeping the federal funds and equivalent foreign rates near historical lows. Increases in the federal funds and equivalent foreign rates may expose fixed income markets to heightened volatility and reduced liquidity for certain fixed income investments, particularly those with longer maturities. In addition, decreases in fixed income dealer market-making capacity may also potentially lead to heightened volatility and reduced liquidity in the fixed income markets. As a result, the value of the Fund’s investments and share price may decline. Changes in central bank policies could also result in higher than normal shareholder redemptions, which could potentially increase portfolio turnover and the Fund’s transaction costs. |
| ∎ | | Commodities tax risk.The tax treatment of commodity-linked derivative instruments may be adversely affected by changes in legislation, regulations or other legally binding authority. If, as a result of any such adverse action, the income of the Fund from certain commodity-linked derivatives was treated asnon-qualifying income, the Fund might fail to qualify as a regulated investment company and be subject to federal income tax at the Fund level. As a result of an announcement by the Internal Revenue Service (IRS), the Fund intends to invest in commodity-linked notes: (a) directly, relying on an opinion of counsel confirming that income from such investments should be qualifying income because such commodity-linked notes constitute securities under section 2(a)(36) of the 1940 Act or (b) |
|
This report must be accompanied or preceded by a currently effective Fund prospectus, which contains more complete information, including sales charges and expenses. Investors should read it carefully before investing. |
NOT FDIC INSURED | MAY LOSE VALUE | NO BANK GUARANTEE |
| | indirectly through the Subsidiary. Should the IRS issue further guidance, or Congress enact legislation, that adversely affects the tax treatment of the Fund’s use of commodity-linked notes or the Subsidiary (which guidance might be applied to the Fund retroactively), it could, among other consequences, limit the Fund’s ability to pursue its investment strategy. |
| ∎ | | Commodity risk.The Fund may have investment exposure to the commodities markets and/or a particular sector of the commodities markets, which may subject the Fund to greater volatility than investments in traditional securities, such as stocks and bonds. Volatility in the commodities markets may be caused by changes in overall market movements, domestic and foreign political and economic events and policies, war, acts of terrorism, changes in domestic or foreign interest rates and/or investor expectations concerning interest rates, domestic and foreign inflation rates, investment and trading activities of mutual funds, hedge funds and commodities funds, and factors such as drought, floods, weather, livestock disease, embargoes, tariffs and other regulatory developments or supply and demand disruptions. Because the Fund’s performance may be linked to the performance of volatile commodities, investors should be willing to assume the risks of potentially significant fluctuations in the value of the Fund’s shares. |
| ∎ | | Credit linked notes risk.Risks of credit linked notes include those risks associated with the underlying reference obligation including but not limited to market risk, interest rate risk, credit risk, default risk and, in some cases, foreign currency risk. An investor in a credit linked note bears counterparty risk or the risk that the issuer of the credit linked note will default or become bankrupt and not make timely payment of principal and interest of the structured security. Credit linked notes may be less liquid than other |
|
| 8 Invesco Multi-Asset Income Fund |
| | investments and therefore harder to dispose of at the desired time and price. In addition, credit linked notes may be leveraged and, as a result, small changes in the value of the underlying reference obligation may produce disproportionate losses to the Fund. |
| ∎ | | Debt securities risk.The prices of debt securities held by the Fund will be affected by changes in interest rates, the creditworthiness of the issuer and other factors. An increase in prevailing interest rates typically causes the value of existing debt securities to fall and often has a greater impact on longer-duration debt securities and higher quality debt securities. Falling interest rates will cause the Fund to reinvest the proceeds of debt securities that have been repaid by the issuer at lower interest rates. Falling interest rates may also reduce the Fund’s distributable income because interest payments on floating rate debt instruments held by the Fund will decline. The Fund could lose money on investments in debt securities if the issuer or borrower fails to meet its obligations to make interest payments and/or to repay principal in a timely manner. Changes in an issuer’s financial strength, the market’s perception of such strength or in the credit rating of the issuer or the security may affect the value of debt securities. The Adviser’s credit analysis may fail to anticipate such changes, which could result in buying a debt security at an inopportune time or failing to sell a debt security in advance of a price decline or other credit event. |
| ∎ | | Derivatives risk.The value of a derivative instrument depends largely on (and is derived from) the value of an underlying security, currency, commodity, interest rate, index or other asset (each referred to as an underlying asset). In addition to risks relating to the underlying assets, the use of derivatives may include other, possibly greater, risks, including counterparty, leverage and liquidity risks. Counterparty risk is the risk that the counterparty to the derivative contract will default on its obligation to pay the Fund the amount owed or otherwise perform under the derivative contract. Derivatives create leverage risk because they do not require payment up front equal to the economic exposure created by holding a position in the derivative. As a result, an adverse change in the value of the |
| | underlying asset could result in the Fund sustaining a loss that is substantially greater than the amount invested in the derivative or the anticipated value of the underlying asset, which may make the Fund’s returns more volatile and increase the risk of loss. Derivative instruments may also be less liquid than more traditional investments and the Fund may be unable to sell or close out its derivative positions at a desirable time or price. This risk may be more acute under adverse market conditions, during which the Fund may be most in need of liquidating its derivative positions. Derivatives may also be harder to value, less tax efficient and subject to changing government regulation that could impact the Fund’s ability to use certain derivatives or their cost. Derivatives strategies may not always be successful. For example, derivatives used for hedging or to gain or limit exposure to a particular market segment may not provide the expected benefits, particularly during adverse market conditions. These risks are greater for the Fund than mutual funds that do not use derivative instruments or that use derivative instruments to a lesser extent than the Fund to implement their investment strategies. |
| ∎ | | Dividend paying security risk.Securities that pay high dividends as a group can fall out of favor with the market, causing such companies to underperform companies that do not pay high dividends. Also, changes in the dividend policies of such companies and the capital resources available for such companies’ dividend payments may affect the Fund. |
| ∎ | | Emerging markets securities risk.Emerging markets (also referred to as developing markets) are generally subject to greater market volatility, political, social and economic instability, uncertain trading markets and more governmental limitations on foreign investment than more developed markets. In addition, companies operating in emerging markets may be subject to lower trading volume and greater price fluctuations than companies in more developed markets. Securities law and the enforcement of systems of taxation in many emerging market countries may change quickly and unpredictably. In addition, investments in emerging markets securities |
| | may be subject to additional transaction costs, delays in settlement procedures, and lack of timely information. |
| ∎ | | Equity linked notes risk.ELNs may not perform as anticipated and could cause the Fund to realize significant losses including its entire principal investment. Other risks include those of underlying securities, as well as counterparty risk, liquidity risk and imperfect correlation between ELNs and the underlying securities. |
| ∎ | | Exchange-traded funds risk.In addition to the risks associated with the underlying assets held by the exchange-traded fund, investments in exchange-traded funds are subject to the following additional risks: (1) an exchange-traded fund’s shares may trade above or below its net asset value; (2) an active trading market for the exchange-traded fund’s shares may not develop or be maintained; (3) trading an exchange-traded fund’s shares may be halted by the listing exchange; (4) a passively managed exchange-traded fund may not track the performance of the reference asset; and (5) a passively managed exchange-traded fund may hold troubled securities. Investment in exchange-traded funds may involve duplication of management fees and certain other expenses, as the Fund indirectly bears its proportionate share of any expenses paid by the exchange-traded funds in which it invests. Further, certain exchange-traded funds in which the Fund may invest are leveraged, which may result in economic leverage, permitting the Fund to gain exposure that is greater than would be the case in anun-levered instrument and potentially resulting in greater volatility. |
| ∎ | | Exchange-traded notes risk.Exchange-traded notes are subject to credit risk, counterparty risk, and the risk that the value of the exchange-traded note may drop due to a downgrade in the issuer’s credit rating. The value of an exchange-traded note may also be influenced by time to maturity, level of supply and demand for the exchange-traded note, volatility and lack of liquidity in the underlying market, changes in the applicable interest rates, and economic, legal, political, or geographic events that affect the referenced underlying market or assets. The Fund will bear its proportionate share of any fees and expenses borne by an exchange-traded note in which it invests. For certain exchange-traded |
|
| 9 Invesco Multi-Asset Income Fund |
| | notes, there may be restrictions on the Fund’s right to redeem its investment, which is meant to be held until maturity. |
| ∎ | | Financial services sector risk.The Fund may be susceptible to adverse economic or regulatory occurrences affecting the financial services sector. Financial services companies are subject to extensive government regulation and are disproportionately affected by unstable interest rates, each of which could adversely affect the profitability of such companies. Financial services companies may also have concentrated portfolios, which makes them especially vulnerable to unstable economic conditions. |
| ∎ | | Foreign currency tax risk. If the US Treasury Department were to exercise its authority to issue regulations that exclude from the definition of “qualifying income” foreign currency gains not directly related to the Fund’s business of investing in securities, the Fund may be unable to qualify as a regulated investment company for one or more years. In this event, the Fund’s Board of Trustees may authorize a significant change in investment strategy or other action. |
| ∎ | | Foreign government debt risk.Investments in foreign government debt securities (sometimes referred to as sovereign debt securities) involve certain risks in addition to those relating to foreign securities or debt securities generally. The issuer of the debt or the governmental authorities that control the repayment of the debt may be unable or unwilling to repay principal or interest when due in accordance with the terms of such debt, and the Fund may have limited recourse in the event of a default against the defaulting government. Without the approval of debt holders, some governmental debtors have in the past been able to reschedule or restructure their debt payments or declare moratoria on payments. |
| ∎ | | Foreign securities risk.The Fund’s foreign investments may be adversely affected by political and social instability, changes in economic or taxation policies, difficulty in enforcing obligations, decreased liquidity or increased volatility. Foreign investments also involve the risk of the possible seizure, nationalization or expropriation of the issuer or foreign deposits (in which the Fund could lose its entire investments in a certain market) and the possible adoption of foreign |
| | | governmental restrictions such as exchange controls. Unless the Fund has hedged its foreign securities risk, foreign securities risk also involves the risk of negative foreign currency rate fluctuations, which may cause the value of securities denominated in such foreign currency (or other instruments through which the Fund has exposure to foreign currencies) to decline in value. Currency exchange rates may fluctuate significantly over short periods of time. Currency hedging strategies, if used, are not always successful. |
| ∎ | | High yield debt securities (junk bond) risk.Investments in high yield debt securities (“junk bonds”) and other lower-rated securities will subject the Fund to substantial risk of loss. These securities are considered to be speculative with respect to the issuer’s ability to pay interest and principal when due, are more susceptible to default or decline in market value and are less liquid than investment grade debt securities. Prices of high yield debt securities tend to be very volatile. |
| ∎ | | Indexing risk.Certain portions of the Fund’s assets are managed pursuant to an indexing approach (Indexed Assets) and, therefore, the adverse performance of a particular security necessarily will not result in the elimination of the security from the Indexed Assets. Ordinarily, the Fund will not sell portfolio securities of the Indexed Assets except to reflect additions or deletions of the securities that comprise the index the Fund seeks to track with respect to the Indexed Assets (Underlying Index), or as may be necessary to raise cash to pay Fund shareholders who sell Fund shares. As such, the Indexed Assets, and therefore the Fund, will be negatively affected by declines in the securities represented by the Underlying Index. Also, there is no guarantee that the Fund will be able to correlate the performance of the Indexed Assets with that of the Underlying Index. |
| ∎ | | Investment companies risk.Investing in other investment companies could result in the duplication of certain fees, including management and administrative fees, and may expose the Fund to the risks of owning the underlying investments that the other investment company holds. |
| ∎ | | Liquidity risk.The Fund may be unable to sell illiquid investments at the time or price it desires and, as a result, could lose its entire investment in |
| | | such investments. Liquid securities can become illiquid during periods of market stress. If a significant amount of the Fund’s securities become illiquid, the Fund may not be able to timely pay redemption proceeds and may need to sell securities at significantly reduced prices. |
| ∎ | | Management risk.Certain portions of the Fund’s assets are actively managed and depend heavily on the Adviser’s judgment about markets, interest rates or the attractiveness, relative values, liquidity, or potential appreciation of particular investments made for the Fund’s portfolio. The Fund could experience losses if these judgments prove to be incorrect. Because the Fund’s investment process relies heavily on its asset allocation process, market movements that are counter to the portfolio managers’ expectations may have a significant adverse effect on the Fund’s net asset value. Additionally, legislative, regulatory, or tax developments may adversely affect management of the Fund and, therefore, the ability of the Fund to achieve its investment objective. |
| ∎ | | Market risk.The market values of the Fund’s investments, and therefore the value of the Fund’s shares, will go up and down, sometimes rapidly or unpredictably. Market risk may affect a single issuer, industry or section of the economy, or it may affect the market as a whole. Individual stock prices tend to go up and down more dramatically than those of certain other types of investments, such as bonds. During a general downturn in the financial markets, multiple asset classes may decline in value. When markets perform well, there can be no assurance that specific investments held by the Fund will rise in value. |
| ∎ | | MLP risk.The Fund invests in securities of MLPs, which are subject to the following risks: |
| | - | Limited partner risk. An MLP is a public limited partnership or limited liability company taxed as a partnership under the Internal Revenue Code of 1986, as amended (the Code). Although the characteristics of MLPs closely resemble a traditional limited partnership, a major difference is that MLPs may trade on a public exchange or in theover-the-counter market. The risks of investing in an MLP are similar to those of investing in a partnership, including more flexible governance |
|
| 10 Invesco Multi-Asset Income Fund |
| | structures, which could result in less protection for investors than investments in a corporation. Investors in an MLP normally would not be liable for the debts of the MLP beyond the amount that the investor has contributed but investors may not be shielded to the same extent that a shareholder of a corporation would be. In certain circumstances, creditors of an MLP would have the right to seek return of capital distributed to a limited partner, which right would continue after an investor sold its investment in the MLP. In addition, MLP distributions may be reduced by fees and other expenses incurred by the MLP. |
| | - | Liquidity risk.The ability to trade on a public exchange or in theover-the-counter market provides a certain amount of liquidity not found in many limited partnership investments. However, MLP interests may be less liquid than conventional publicly traded securities and, therefore, more difficult to trade at desirable times and/or prices. |
| | - | Interest rate risk.MLPs generally are considered interest-rate sensitive investments. During periods of interest rate volatility, these investments may not provide attractive returns. |
| | - | General partner risk.The holder of the general partner or managing member interest can be liable in certain circumstances for amounts greater than the amount of the holder’s investment in the general partner or managing member. |
Additionally, if the Fund were to invest more than 25% of its total assets in MLPs that are taxed as partnerships this could cause the Fund to lose its status as regulated investment company under Subchapter M of the Code.
| ∎ | | MLP tax risk.MLPs taxed as partnerships do not pay US federal income tax at the partnership level, subject to the application of certain partnership audit rules. A change in current tax law, or a change in the underlying business mix of a given MLP, however, could result in an MLP being classified as a corporation for US federal income tax purposes, which would have the effect of reducing the amount of cash available for distribution by the MLP and, as a result, could result in a reduction of the value of the Fund’s investment, and consequently your investment in the Fund |
| | | and lower income. Each year, the Fund will send you an annual tax statement (Form 1099) to assist you in completing your federal, state and local tax returns. If an MLP in which the Fund invests amends its partnership tax return, the Fund will, when necessary, send you a corrected Form 1099, which could, in turn, require you to amend your federal, state or local tax returns. |
| ∎ | | Mortgage- and asset-backed securities risk.Mortgage- and asset-backed securities, including collateralized debt obligations and collateralized mortgage obligations, are subject to prepayment or call risk, which is the risk that a borrower’s payments may be received earlier or later than expected due to changes in prepayment rates on underlying loans. This could result in the Fund reinvesting these early payments at lower interest rates, thereby reducing the Fund’s income. Mortgage- and asset-backed securities also are subject to extension risk, which is the risk that an unexpected rise in interest rates could reduce the rate of prepayments, causing the price of the mortgage- and asset-backed securities and the Fund’s share price to fall. An unexpectedly high rate of defaults on the mortgages held by a mortgage pool may adversely affect the value of mortgage-backed securities and could result in losses to the Fund. Privately-issued mortgage-backed securities and asset-backed securities may be less liquid than other types of securities and the Fund may be unable to sell these securities at the time or price it desires. During periods of market stress or high redemptions, the Fund may be forced to sell these securities at significantly reduced prices, resulting in losses. Liquid privately-issued mortgaged-backed securities and asset-backed securities can become illiquid during periods of market stress. The Fund may invest in mortgage pools that include subprime mortgages, which are loans made to borrowers with weakened credit histories or with lower capacity to make timely payments on their mortgages. Liquidity risk is even greater for mortgage pools that include subprime mortgages. Privately issued mortgage-related securities are not subject to the same underwriting requirements as those with government or government-sponsored entity guarantees and, therefore, mortgage loans |
| | | underlying privately issued mortgage-related securities may have less favorable collateral, credit risk, liquidity risk or other underwriting characteristics, and wider variances in interest rate, term, size, purpose and borrower characteristics. |
| ∎ | | Non-correlation risk.The return of the Fund’s assets managed pursuant to an indexing approach (Indexed Assets) may not match the return of the index the Fund seeks to track with respect to the Indexed Assets (Underlying Index) for a number of reasons. For example, the Fund incurs operating expenses not applicable to the Underlying Index, and incurs costs in buying and selling securities, especially when rebalancing securities holdings to reflect changes in the Underlying Index. In addition, the performance of the Indexed Assets and the Underlying Index may vary due to asset valuation differences and differences between the Indexed Assets and the Underlying Index resulting from legal restrictions, costs or liquidity constraints. |
| ∎ | | Preferred securities risk.Preferred securities are subject to issuer-specific and market risks applicable generally to equity securities. Preferred securities also may be subordinated to bonds or other debt instruments, subjecting them to a greater risk ofnon-payment, may be less liquid than many other securities, such as common stocks, and generally offer no voting rights with respect to the issuer. |
| ∎ | | REIT risk/real estate risk.Investments in real estate related instruments may be affected by economic, legal, cultural, environmental or technological factors that affect property values, rents or occupancies of real estate related to the Fund’s holdings. Shares of real estate related companies, which tend to be small- andmid-cap companies, may be more volatile and less liquid. |
| ∎ | | Sampling risk.The Fund’s use of a sampling methodology with respect to assets managed pursuant to an indexing approach (Indexed Assets) may result in the Indexed Assets including a smaller number of securities than are in the index the Fund seeks to track with respect to the Indexed Assets (Underlying Index), and in the Indexed Assets including securities that are not included in the Underlying Index. As a result, an adverse development to an issuer of securities |
|
| 11 Invesco Multi-Asset Income Fund |
| | included in the Indexed Assets could result in a greater decline in the Fund’s NAV than would be the case if all of the securities in the Underlying Index were included in the Indexed Assets. The Fund’s use of a sampling methodology may also include the risk that the Indexed Assets may not track the return of the Underlying Index as well as they would have if the Indexed Assets included all of the securities in the Underlying Index. To the extent the assets in the Indexed Assets are smaller, these risks will be greater. |
| ∎ | | Short position risk.Because the Fund’s potential loss on a short position arises from increases in the value of the asset sold short, the Fund will incur a loss on a short position, which is theoretically unlimited, if the price of the asset sold short increases from the short sale price. The counterparty to a short position or other market factors may prevent the Fund from closing out a short position at a desirable time or price and may reduce or eliminate any gain or result in a loss. In a rising market, the Fund’s short positions will cause the Fund to underperform the overall market and its peers that do not engage in shorting. If the Fund holds both long and short positions, and both positions decline simultaneously, the short positions will not provide any buffer (hedge) from declines in value of the Fund’s long positions. Certain types of short positions involve leverage, which may exaggerate any losses, potentially more than the actual cost of the investment, and will increase the volatility of the Fund’s returns. |
| ∎ | | Subsidiary risk.By investing in the Subsidiary, the Fund is indirectly exposed to risks associated with the Subsidiary’s investments. The Subsidiary is not registered under the Investment Company Act of 1940, as amended (1940 Act), and, except as otherwise noted in this prospectus, is not subject to the investor protections of the 1940 Act. Changes in the laws of the United States and/or the Cayman Islands, under which the Fund and the Subsidiary, respectively, are organized, could result in the inability of the Fund and/or the Subsidiary to operate as described in this prospectus and the SAI, and could negatively affect the Fund and its shareholders. |
| ∎ | | US government obligations risk.Obligations of US government agencies and authorities receive varying levels of support and may not be backed by |
| | | the full faith and credit of the US government, which could affect the Fund’s ability to recover should they default. No assurance can be given that the US government will provide financial support to its agencies and authorities if it is not obligated by law to do so. |
About indexes used in this report
| ∎ | | TheBloomberg Barclays U.S. Aggregate Indexis an unmanaged index considered representative of the US investment grade, fixed-rate bond market. |
| ∎ | | TheCustom Invesco Multi-Asset Income Indexis composed of the following indexes: S&P 500 Index and Bloomberg Barclays U.S. Universal Index. |
| ∎ | | TheLipper Mixed-Asset Target Allocation Conservative Funds Indexis an unmanaged index considered representative of mixed-asset target allocation conservative funds tracked by Lipper. |
| ∎ | | TheS&P 500® Indexis an unmanaged index considered representative of the US stock market. |
| ∎ | | TheBloomberg Barclays U.S. Universal Indexis composed of US dollar-denominated, taxable bonds that are rated investment grade or below investment grade. |
| ∎ | | The Fund is not managed to track the performance of any particular index, including the index(es) described here, and consequently, the performance of the Fund may deviate significantly from the performance of the index(es). |
| ∎ | | A direct investment cannot be made in an index. Unless otherwise indicated, index results include reinvested dividends, and they do not reflect sales charges. Performance of the peer group, if applicable, reflects fund expenses; performance of a market index does not. |
Other information
| ∎ | | The returns shown in management’s discussion of Fund performance are based on net asset values (NAVs) calculated for shareholder transactions. Generally accepted accounting principles require adjustments to be made to the net assets of the Fund at period end for financial reporting purposes, and as such, the NAVs for shareholder transactions and the returns based on those NAVs may differ from the NAVs and returns reported in the Financial Highlights. |
| ∎ | | Industry classifications used in this report are generally according to the Global Industry Classification Standard, which was developed by and is the exclusive property and a service mark of MSCI Inc. and Standard & Poor’s. |
|
| 12 Invesco Multi-Asset Income Fund |
Schedule of Investments(a)
October 31, 2019
| | | | | | | | |
| | | Principal
Amount | | | Value | |
U.S. Dollar Denominated Bonds & Notes-56.25% | |
| |
Aerospace & Defense-0.68% | | | | | |
| | |
Bombardier, Inc. (Canada), | | | | | | | | |
8.75%, 12/01/2021(b) | | $ | 138,000 | | | $ | 146,625 | |
5.75%, 03/15/2022(b) | | | 173,000 | | | | 170,405 | |
6.13%, 01/15/2023(b) | | | 516,000 | | | | 505,680 | |
7.50%, 03/15/2025(b) | | | 862,000 | | | | 827,520 | |
7.88%, 04/15/2027(b) | | | 253,000 | | | | 239,717 | |
TransDigm UK Holdings PLC, 6.88%, 05/15/2026 | | | 801,000 | | | | 857,070 | |
TransDigm, Inc., | | | | | | | | |
6.50%, 07/15/2024 | | | 245,000 | | | | 253,881 | |
6.50%, 05/15/2025 | | | 150,000 | | | | 156,188 | |
6.25%, 03/15/2026(b) | | | 833,000 | | | | 894,434 | |
Triumph Group, Inc., | | | | | | | | |
5.25%, 06/01/2022 | | | 350,000 | | | | 345,625 | |
7.75%, 08/15/2025 | | | 800,000 | | | | 802,000 | |
| | | | | | | | 5,199,145 | |
| |
Agricultural & Farm Machinery-0.12% | | | | | |
| | |
Titan International, Inc., 6.50%, 11/30/2023 | | | 1,100,000 | | | | 904,750 | |
| | |
Airlines-0.06% | | | | | | | | |
| | |
Air Canada (Canada), 7.75%, 04/15/2021(b) | | | 425,000 | | | | 457,406 | |
| | |
Alternative Carriers-0.28% | | | | | | | | |
| | |
CenturyLink, Inc., | | | | | | | | |
Series S, 6.45%, 06/15/2021 | | | 535,000 | | | | 564,425 | |
Series Y, 7.50%, 04/01/2024 | | | 677,000 | | | | 770,088 | |
Level 3 Financing, Inc.,
5.38%, 05/01/2025 | | | 496,000 | | | | 513,980 | |
5.25%, 03/15/2026 | | | 277,000 | | | | 289,811 | |
| | | | | | | | 2,138,304 | |
| |
Aluminum-0.04% | | | | | |
| | |
Novelis Corp., 6.25%, 08/15/2024(b) | | | 284,000 | | | | 298,200 | |
| | |
Apparel Retail-0.17% | | | | | | | | |
| | |
L Brands, Inc., | | | | | | | | |
| | |
5.63%, 02/15/2022 | | | 396,000 | | | | 418,275 | |
6.88%, 11/01/2035 | | | 270,000 | | | | 230,850 | |
6.75%, 07/01/2036 | | | 30,000 | | | | 25,050 | |
Michaels Stores, Inc., 8.00%, 07/15/2027(b) | | | 627,000 | | | | 621,326 | |
| | | | | | | | 1,295,501 | |
| |
Apparel, Accessories & Luxury Goods-0.09% | | | | | |
| | |
William Carter Co. (The), 5.63%, 03/15/2027(b) | | | 614,000 | | | | 656,980 | |
| | | | | | | | |
| | | Principal
Amount | | | Value | |
Asset Management & Custody Banks-0.12% | | | | | |
| | |
Prime Security Services Borrower, LLC/Prime Finance, Inc., | | | | | | | | |
9.25%, 05/15/2023(b) | | $ | 414,000 | | | $ | 436,304 | |
5.75%, 04/15/2026(b) | | | 198,000 | | | | 203,569 | |
RegionalCare Hospital Partners Holdings, Inc.,
8.25%, 05/01/2023(b) | | | 300,000 | | | | 320,437 | |
| | | | | | | | 960,310 | |
| |
Auto Parts & Equipment-0.10% | | | | | |
| | |
Dana, Inc., 5.50%, 12/15/2024 | | | 520,000 | | | | 536,250 | |
Flexi-Van Leasing, Inc., 10.00%, 02/15/2023(b) | | | 281,000 | | | | 268,355 | |
| | | | | | | | 804,605 | |
| |
Automobile Manufacturers-0.27% | | | | | |
| | |
Ford Motor Credit Co., LLC, | | | | | | | | |
5.60%, 01/07/2022 | | | 461,000 | | | | 486,076 | |
5.11%, 05/03/2029 | | | 479,000 | | | | 485,458 | |
J.B. Poindexter & Co., Inc., 7.13%, 04/15/2026(b) | | | 1,072,000 | | | | 1,122,920 | |
| | | | | | | | 2,094,454 | |
| |
Automotive Retail-0.40% | | | | | |
| | |
Capitol Investment Merger Sub 2 LLC, 10.00%, 08/01/2024(b) | | | 726,000 | | | | 749,595 | |
Lithia Motors, Inc., 5.25%, 08/01/2025(b) | | | 177,000 | | | | 186,071 | |
Murphy Oil USA, Inc., | | | | | | | | |
5.63%, 05/01/2027 | | | 590,000 | | | | 636,148 | |
4.75%, 09/15/2029 | | | 237,000 | | | | 247,961 | |
Penske Automotive Group, Inc., 5.50%, 05/15/2026 | | | 1,168,000 | | | | 1,224,940 | |
| | | | | | | | 3,044,715 | |
| |
Broadcasting-0.46% | | | | | |
| | |
AMC Networks, Inc., | | | | | | | | |
5.00%, 04/01/2024 | | | 404,000 | | | | 412,508 | |
4.75%, 08/01/2025 | | | 286,000 | | | | 289,933 | |
Clear Channel Worldwide Holdings, Inc.,
9.25%, 02/15/2024(b) | | | 1,013,000 | | | | 1,116,199 | |
Gray Television, Inc., 7.00%, 05/15/2027(b) | | | 449,000 | | | | 493,011 | |
iHeartCommunications, Inc., | | | | | | | | |
8.38%, 05/01/2027 | | | 515,000 | | | | 554,912 | |
5.25%, 08/15/2027(b) | | | 336,000 | | | | 347,491 | |
TV Azteca, S.A.B. de C.V. (Mexico), 8.25%, 08/09/2024(b) | | | 350,000 | | | | 329,879 | |
| | | | | | | | 3,543,933 | |
| | |
Building Products-0.06% | | | | | | | | |
| | |
Advanced Drainage Systems, Inc., 5.00%, 09/30/2027(b) | | | 84,000 | | | | 86,100 | |
See accompanying Notes to Financial Statements which are an integral part of the financial statements.
13 Invesco Multi-Asset Income Fund
| | | | | | | | |
| | | Principal
Amount | | | Value | |
Building Products-(continued) | | | | | |
| | |
Standard Industries, Inc., 6.00%, 10/15/2025(b) | | $ | 384,000 | | | $ | 405,120 | |
| | | | | | | | 491,220 | |
| |
Cable & Satellite-1.91% | | | | | |
| | |
Altice Financing S.A. (Luxembourg), | | | | | | | | |
6.63%, 02/15/2023(b) | | | 400,000 | | | | 411,880 | |
7.50%, 05/15/2026(b) | | | 600,000 | | | | 639,000 | |
Altice Luxembourg S.A. (Luxembourg),
10.50%, 05/15/2027(b) | | | 410,000 | | | | 464,838 | |
CCO Holdings LLC/CCO Holdings Capital Corp., | | | | | | | | |
5.75%, 09/01/2023 | | | 510,000 | | | | 521,475 | |
5.75%, 02/15/2026(b) | | | 2,155,000 | | | | 2,281,067 | |
CSC Holdings, LLC, | | | | | | | | |
7.75%, 07/15/2025(b) | | | 340,000 | | | | 365,500 | |
10.88%, 10/15/2025(b) | | | 700,000 | | | | 791,235 | |
5.50%, 05/15/2026(b) | | | 415,000 | | | | 438,344 | |
6.50%, 02/01/2029(b) | | | 927,000 | | | | 1,039,978 | |
DISH DBS Corp., | | | | | | | | |
5.88%, 11/15/2024 | | | 2,145,000 | | | | 2,158,406 | |
7.75%, 07/01/2026 | | | 164,000 | | | | 165,861 | |
Hughes Satellite Systems Corp., | | | | | | | | |
7.63%, 06/15/2021 | | | 357,000 | | | | 385,560 | |
5.25%, 08/01/2026 | | | 686,000 | | | | 737,450 | |
Intelsat Jackson Holdings S.A. (Luxembourg), | | | | | | | | |
5.50%, 08/01/2023 | | | 1,077,000 | | | | 1,012,380 | |
8.00%, 02/15/2024(b) | | | 175,000 | | | | 180,950 | |
8.50%, 10/15/2024(b) | | | 404,000 | | | | 407,915 | |
9.75%, 07/15/2025(b) | | | 235,000 | | | | 245,208 | |
Telenet Finance Luxembourg Notes S.a r.l. (Belgium), 5.50%, 03/01/2028(b) | | | 200,000 | | | | 213,700 | |
UPC Holding B.V. (Netherlands), 5.50%, 01/15/2028(b) | | | 200,000 | | | | 204,500 | |
UPCB Finance IV Ltd. (Netherlands), 5.38%, 01/15/2025(b) | | | 400,000 | | | | 414,500 | |
Virgin Media Finance PLC (United Kingdom), 6.00%, 10/15/2024(b) | | | 400,000 | | | | 414,000 | |
Virgin Media Secured Finance PLC (United Kingdom), 5.50%, 08/15/2026(b) | | | 200,000 | | | | 210,750 | |
VTR Finance B.V. (Chile), 6.88%, 01/15/2024(b) | | | 539,000 | | | | 553,823 | |
Ziggo B.V. (Netherlands), 5.50%, 01/15/2027(b) | | | 400,000 | | | | 422,492 | |
| | | | | | | | 14,680,812 | |
| | |
Casinos & Gaming-0.60% | | | | | | | | |
| | |
Boyd Gaming Corp., | | | | | | | | |
6.38%, 04/01/2026 | | | 278,000 | | | | 296,417 | |
6.00%, 08/15/2026 | | | 180,000 | | | | 191,475 | |
Cirsa Finance International S.a.r.l (Spain), 7.88%, 12/20/2023(b) | | | 200,000 | | | | 212,154 | |
Codere Finance 2 (Luxembourg) S.A. (Spain), 7.63%,
11/01/2021(b) | | | 200,000 | | | | 172,887 | |
| | | | | | | | |
| | | Principal
Amount | | | Value | |
Casinos & Gaming-(continued) | | | | | |
| | |
Melco Resorts Finance Ltd. (Hong Kong), 5.63%, 07/17/2027(b) | | $ | 256,000 | | | $ | 267,640 | |
MGM China Holdings Ltd. (Macau), 5.88%, 05/15/2026(b) | | | 206,000 | | | | 218,360 | |
MGM Resorts International, | | | | | | | | |
6.63%, 12/15/2021 | | | 45,000 | | | | 48,881 | |
7.75%, 03/15/2022 | | | 150,000 | | | | 168,375 | |
4.63%, 09/01/2026 | | | 1,242,000 | | | | 1,307,205 | |
Scientific Games International, Inc., 10.00%, 12/01/2022 | | | 383,000 | | | | 394,969 | |
Studio City Finance Ltd. (Macau), 7.25%, 02/11/2024(b) | | | 447,000 | | | | 476,055 | |
Wynn Las Vegas LLC/Wynn Las Vegas Capital Corp., | | | | | | | | |
5.50%, 03/01/2025(b) | | | 684,000 | | | | 728,460 | |
5.25%, 05/15/2027(b) | | | 150,000 | | | | 156,563 | |
| | | | | | | | 4,639,441 | |
| |
Coal & Consumable Fuels-0.12% | | | | | |
| | |
SunCoke Energy Partners L.P./SunCoke Energy Partners Finance Corp.,
7.50%, 06/15/2025(b) | | | 1,101,000 | | | | 941,355 | |
| |
Commodity Chemicals-0.17% | | | | | |
| | |
Koppers, Inc., 6.00%, 02/15/2025(b) | | | 506,000 | | | | 506,992 | |
Nufarm Australia Ltd./Nufarm Americas, Inc. (Australia), 5.75%, 04/30/2026(b) | | | 247,000 | | | | 249,470 | |
Olin Corp., 5.63%, 08/01/2029 | | | 521,000 | | | | 542,241 | |
| | | | | | | | 1,298,703 | |
| |
Communications Equipment-0.06% | | | | | |
| | |
CommScope Technologies LLC, 6.00%, 06/15/2025(b) | | | 503,000 | | | | 452,826 | |
| |
Construction & Engineering-0.09% | | | | | |
| | |
William Lyon Homes, Inc., | | | | | | | | |
6.00%, 09/01/2023 | | | 116,000 | | | | 120,640 | |
6.63%, 07/15/2027(b) | | | 533,000 | | | | 563,647 | |
| | | | | | | | 684,287 | |
| | |
Consumer Finance-0.47% | | | | | | | | |
| | |
Ally Financial, Inc., | | | | | | | | |
8.00%, 03/15/2020 | | | 280,000 | | | | 285,830 | |
5.13%, 09/30/2024 | | | 1,100,000 | | | | 1,211,331 | |
Navient Corp., | | | | | | | | |
8.00%, 03/25/2020 | | | 705,000 | | | | 721,744 | |
7.25%, 01/25/2022 | | | 230,000 | | | | 250,343 | |
7.25%, 09/25/2023 | | | 1,015,000 | | | | 1,112,673 | |
| | | | | | | | 3,581,921 | |
| | |
Copper-0.32% | | | | | | | | |
| | |
First Quantum Minerals Ltd. (Zambia), 7.50%, 04/01/2025(b) | | | 833,000 | | | | 838,206 | |
Freeport-McMoRan, Inc., 5.40%, 11/14/2034 | | | 1,010,000 | | | | 991,063 | |
See accompanying Notes to Financial Statements which are an integral part of the financial statements.
14 Invesco Multi-Asset Income Fund
| | | | | | | | |
| | | Principal
Amount | | | Value | |
Copper-(continued) | | | | | | | | |
Taseko Mines Ltd. (Canada), 8.75%, 06/15/2022(b) | | $ | 746,000 | | | $ | 660,210 | |
| | | | | | | | 2,489,479 | |
|
Data Processing & Outsourced Services-0.07% | |
| | |
Cardtronics Inc./Cardtronics USA, Inc., 5.50%, 05/01/2025(b) | | | 515,000 | | | | 534,313 | |
| | |
Distributors-0.14% | | | | | | | | |
| | |
Core & Main Holdings L.P., 9.38% PIK Rate, 8.63% Cash Rate, 09/15/2024(b)(c) | | | 1,081,000 | | | | 1,079,649 | |
| | |
Diversified Banks-14.31% | | | | | | | | |
| | |
Barclays Bank PLC (United Kingdom), 7.63%, 11/21/2022 | | | 200,000 | | | | 223,843 | |
BNP Paribas Issuance B.V. (France), 6.64%, 11/22/2019(b) | | | 14,900,000 | | | | 14,974,236 | |
Citigroup Global Markets Holdings, Inc., 17.87%, 12/06/2019(b) | | | 15,300,000 | | | | 15,157,326 | |
Credit Agricole S.A. (France), 8.13%(b)(d) | | | 447,000 | | | | 536,429 | |
JPMorgan Chase Bank, N.A., Series EMV3, 0.00%, 11/08/2019(e) | | | 19,000,000 | | | | 18,261,677 | |
Royal Bank of Canada (Canada), | | | | | | | | |
7.58%, 11/15/2019 | | | 14,800,000 | | | | 14,873,738 | |
1.73%, 11/20/2019(b) | | | 14,900,000 | | | | 14,741,366 | |
Royal Bank of Scotland Group PLC (The) (United Kingdom), 6.13%, 12/15/2022 | | | 285,000 | | | | 311,019 | |
Societe Generale S.A. (France), 7.38%(b)(d) | | | 246,000 | | | | 259,530 | |
Standard Chartered PLC (United Kingdom), 7.50%(b)(d) | | | 207,000 | | | | 220,196 | |
Toronto-Dominion Bank (The) (Canada), 6.08%, 12/02/2019 | | | 15,300,000 | | | | 15,235,620 | |
UBS AG (Switzerland), 16.70%, 12/09/2019(b) | | | 15,300,000 | | | | 15,300,000 | |
| | | | | | | | 110,094,980 | |
| |
Diversified Capital Markets-1.90% | | | | | |
| | |
Credit Suisse AG (Switzerland), 9.00%, 11/12/2019 | | | 14,550,000 | | | | 14,641,436 | |
| | |
Diversified Chemicals-0.17% | | | | | | | | |
| | |
Braskem Netherlands Finance B.V. (Brazil), | | | | | | | | |
4.50%, 01/31/2030(b) | | | 355,000 | | | | 352,337 | |
5.88%, 01/31/2050(b) | | | 410,000 | | | | 408,155 | |
Chemours Co. (The), 7.00%, 05/15/2025 | | | 220,000 | | | | 212,850 | |
Trinseo Materials Operating S.C.A./Trinseo Materials Finance, Inc., 5.38%, 09/01/2025(b) | | | 354,000 | | | | 343,380 | |
| | | | | | | | 1,316,722 | |
| |
Diversified Metals & Mining-0.18% | | | | | |
| | |
Hudbay Minerals, Inc. (Canada), 7.63%, 01/15/2025(b) | | | 587,000 | | | | 600,574 | |
| | | | | | | | |
| | | Principal
Amount | | | Value | |
Diversified Metals & Mining-(continued) | | | | | |
| | |
Teck Resources Ltd. (Canada), 6.13%, 10/01/2035 | | $ | 390,000 | | | $ | 439,102 | |
Vedanta Resources Ltd. (India), 6.38%, 07/30/2022(b) | | | 350,000 | | | | 347,375 | |
| | | | | | | | 1,387,051 | |
| | |
Diversified REITs-0.16% | | | | | | | | |
| | |
Colony Capital, Inc., Conv., | | | | | | | | |
3.88%, 01/15/2021 | | | 31,000 | | | | 30,535 | |
5.00%, 04/15/2023 | | | 258,000 | | | | 252,546 | |
iStar, Inc., 4.75%, 10/01/2024 | | | 926,000 | | | | 957,253 | |
| | | | | | | | 1,240,334 | |
|
Diversified Support Services-0.06% | |
| | |
IAA, Inc., 5.50%, 06/15/2027(b) | | | 431,000 | | | | 462,851 | |
|
Electric Utilities-0.18% | |
| | |
DPL, Inc., 4.35%, 04/15/2029(b) | | | 339,000 | | | | 338,915 | |
NextEra Energy Capital Holdings, Inc., Series K, Investment Units, 5.25%, 06/01/2076 | | | 38,200 | | | | 1,038,276 | |
| | | | | | | | 1,377,191 | |
| |
Electrical Components & Equipment-0.09% | | | | | |
| | |
EnerSys, 5.00%, 04/30/2023(b) | | | 693,000 | | | | 718,121 | |
| |
Electronic Equipment & Instruments-0.10% | | | | | |
| | |
Itron, Inc., 5.00%, 01/15/2026(b) | | | 443,000 | | | | 459,612 | |
MTS Systems Corp., 5.75%, 08/15/2027(b) | | | 290,000 | | | | 304,500 | |
| | | | | | | | 764,112 | |
| |
Environmental & Facilities Services-0.07% | | | | | |
| | |
GFL Environmental, Inc. (Canada), 7.00%, 06/01/2026(b) | | | 156,000 | | | | 165,750 | |
Waste Pro USA, Inc., 5.50%, 02/15/2026(b) | | | 381,000 | | | | 395,287 | |
| | | | | | | | 561,037 | |
| |
Fertilizers & Agricultural Chemicals-0.06% | | | | | |
| | |
OCI N.V. (Netherlands), 6.63%, 04/15/2023(b) | | | 460,000 | | | | 481,735 | |
| |
Financial Exchanges & Data-0.03% | | | | | |
| | |
MSCI, Inc., 5.25%, 11/15/2024(b) | | | 185,000 | | | | 191,013 | |
| | |
Food Distributors-0.08% | | | | | | | | |
| | |
US Foods, Inc.,
5.88%, 06/15/2024(b) | | | 568,000 | | | | 587,170 | |
| | |
Food Retail-0.25% | | | | | | | | |
| | |
Albertsons Cos. LLC/Safeway, Inc./New Albertson’s, Inc./Albertson’s LLC, | | | | | | | | |
6.63%, 06/15/2024 | | | 737,000 | | | | 776,614 | |
7.50%, 03/15/2026(b) | | | 306,000 | | | | 341,573 | |
5.88%, 02/15/2028(b) | | | 341,000 | | | | 367,001 | |
See accompanying Notes to Financial Statements which are an integral part of the financial statements.
15 Invesco Multi-Asset Income Fund
| | | | | | | | |
| | | Principal
Amount | | | Value | |
Food Retail-(continued) | | | | | |
| | |
Simmons Foods, Inc., 5.75%, 11/01/2024(b) | | $ | 419,000 | | | $ | 411,667 | |
| | | | | | | | 1,896,855 | |
| | |
Forest Products-0.06% | | | | | | | | |
| | |
Norbord, Inc. (Canada), 5.75%, 07/15/2027(b) | | | 425,000 | | | | 440,938 | |
| | |
Gas Utilities-0.22% | | | | | | | | |
| | |
AmeriGas Partners, L.P./AmeriGas Finance Corp., 5.88%, 08/20/2026 | | | 360,000 | | | | 400,500 | |
Suburban Propane Partners, L.P./Suburban Energy Finance Corp., 5.50%, 06/01/2024 | | | 1,222,000 | | | | 1,255,238 | |
| | | | | | | | 1,655,738 | |
| | |
Health Care Equipment-0.01% | | | | | | | | |
| | |
Teleflex, Inc., 4.88%, 06/01/2026 | | | 56,000 | | | | 58,993 | |
| | |
Health Care Facilities-0.87% | | | | | | | | |
| | |
Acadia Healthcare Co., Inc., 6.50%, 03/01/2024 | | | 575,000 | | | | 598,000 | |
Community Health Systems, Inc., | | | | | | | | |
6.25%, 03/31/2023 | | | 738,000 | | | | 721,856 | |
8.00%, 03/15/2026(b) | | | 373,000 | | | | 365,540 | |
HCA, Inc., | | | | | | | | |
7.50%, 02/15/2022 | | | 116,000 | | | | 128,992 | |
5.38%, 02/01/2025 | | | 270,000 | | | | 297,338 | |
5.25%, 04/15/2025 | | | 749,000 | | | | 836,454 | |
5.88%, 02/15/2026 | | | 790,000 | | | | 890,725 | |
5.38%, 09/01/2026 | | | 169,000 | | | | 184,633 | |
5.50%, 06/15/2047 | | | 878,000 | | | | 1,001,018 | |
Tenet Healthcare Corp., | | | | | | | | |
8.13%, 04/01/2022 | | | 350,000 | | | | 380,187 | |
6.75%, 06/15/2023 | | | 1,235,000 | | | | 1,313,731 | |
| | | | | | | | 6,718,474 | |
| | |
Health Care REITs-0.07% | | | | | | | | |
| | |
MPT Operating Partnership L.P./MPT Finance Corp., 5.00%, 10/15/2027 | | | 477,000 | | | | 504,428 | |
| | |
Health Care Services-0.47% | | | | | | | | |
| | |
Eagle Holding Co. II, LLC, 8.38% PIK Rate, 7.63% Cash Rate, 05/15/2022(b)(c) | | | 612,000 | | | | 618,885 | |
Envision Healthcare Corp., 8.75%, 10/15/2026(b) | | | 223,000 | | | | 126,553 | |
Hadrian Merger Sub, Inc., 8.50%, 05/01/2026(b) | | | 581,000 | | | | 573,011 | |
MPH Acquisition Holdings LLC, 7.13%, 06/01/2024(b) | | | 1,084,000 | | | | 1,016,250 | |
Polaris Intermediate Corp., 9.25% PIK Rate, 8.50% Cash Rate, 12/01/2022(b)(c) | | | 697,000 | | | | 588,965 | |
Surgery Center Holdings, Inc., 10.00%, 04/15/2027(b) | | | 365,000 | | | | 370,475 | |
| | | | | | | | |
| | | Principal
Amount | | | Value | |
Health Care Services-(continued) | | | | | |
| | |
Team Health Holdings, Inc., 6.38%, 02/01/2025(b) | | $ | 465,000 | | | $ | 302,250 | |
| | | | | | | | 3,596,389 | |
| | |
Home Improvement Retail-0.10% | | | | | | | | |
| | |
Hillman Group, Inc. (The), 6.38%, 07/15/2022(b) | | | 808,000 | | | | 747,400 | |
| | |
Homebuilding-0.46% | | | | | | | | |
| | |
Ashton Woods USA LLC/Ashton Woods Finance Co., 9.88%, 04/01/2027(b) | | | 472,000 | | | | 528,640 | |
Beazer Homes USA, Inc., 5.88%, 10/15/2027 | | | 72,000 | | | | 70,920 | |
KB Home, 8.00%, 03/15/2020 | | | 199,000 | | | | 203,537 | |
Lennar Corp., | | | | | | | | |
8.38%, 01/15/2021 | | | 50,000 | | | | 53,500 | |
5.38%, 10/01/2022 | | | 702,000 | | | | 753,772 | |
5.25%, 06/01/2026 | | | 255,000 | | | | 281,456 | |
Meritage Homes Corp., | | | | | | | | |
7.15%, 04/15/2020 | | | 65,000 | | | | 66,463 | |
6.00%, 06/01/2025 | | | 216,000 | | | | 242,460 | |
5.13%, 06/06/2027 | | | 250,000 | | | | 270,000 | |
PulteGroup, Inc., 6.38%, 05/15/2033 | | | 13,000 | | | | 14,853 | |
Taylor Morrison Communities, Inc., 5.75%, 01/15/2028(b) | | | 358,000 | | | | 396,932 | |
Taylor Morrison Communities, Inc./Taylor Morrison Holdings II, Inc., 5.88%, 04/15/2023(b) | | | 569,000 | | | | 617,365 | |
| | | | | | | | 3,499,898 | |
| | |
Household Products-0.36% | | | | | | | | |
| | |
Energizer Holdings, Inc., | | | | | | | | |
6.38%, 07/15/2026(b) | | | 85,000 | | | | 90,848 | |
7.75%, 01/15/2027(b) | | | 308,000 | | | | 341,880 | |
Reynolds Group Issuer, Inc./LLC, | | | | | | | | |
5.13%, 07/15/2023(b) | | | 41,000 | | | | 42,166 | |
7.00%, 07/15/2024(b) | | | 1,288,000 | | | | 1,335,495 | |
Spectrum Brands, Inc., 5.75%, 07/15/2025 | | | 935,000 | | | | 979,413 | |
| | | | | | | | 2,789,802 | |
|
Independent Power Producers & Energy Traders-0.28% | |
| | |
AES Corp. (The), 5.50%, 04/15/2025 | | | 279,000 | | | | 290,425 | |
Calpine Corp., | | | | | | | | |
5.38%, 01/15/2023 | | | 384,000 | | | | 391,181 | |
5.50%, 02/01/2024 | | | 400,000 | | | | 402,500 | |
NRG Energy, Inc., | | | | | | | | |
7.25%, 05/15/2026 | | | 200,000 | | | | 219,756 | |
6.63%, 01/15/2027 | | | 463,000 | | | | 503,512 | |
5.25%, 06/15/2029(b) | | | 340,000 | | | | 365,925 | |
| | | | | | | | 2,173,299 | |
| | |
Industrial Machinery-0.32% | | | | | | | | |
| | |
Cleaver-Brooks, Inc., 7.88%, 03/01/2023(b) | | | 963,000 | | | | 912,442 | |
EnPro Industries, Inc., 5.75%, 10/15/2026 | | | 737,000 | | | | 781,220 | |
See accompanying Notes to Financial Statements which are an integral part of the financial statements.
16 Invesco Multi-Asset Income Fund
| | | | | | | | |
| | | Principal
Amount | | | Value | |
Industrial Machinery-(continued) | | | | | |
| | |
Mueller Industries, Inc., 6.00%, 03/01/2027 | | $ | 780,000 | | | $ | 793,650 | |
| | | | | | | | 2,487,312 | |
|
Integrated Oil & Gas-0.11% | |
| | |
Petrobras Global Finance B.V. (Brazil), 5.75%, 02/01/2029 | | | 591,000 | | | | 658,728 | |
Petroleos Mexicanos (Mexico), 6.49%, 01/23/2027(b) | | | 197,000 | | | | 210,544 | |
| | | | | | | | 869,272 | |
|
Integrated Telecommunication Services-0.43% | |
| | |
Altice France S.A. (France), 7.38%, 05/01/2026(b) | | | 600,000 | | | | 644,007 | |
Cincinnati Bell, Inc., | | | | | | | | |
7.00%, 07/15/2024(b) | | | 502,000 | | | | 455,565 | |
8.00%, 10/15/2025(b) | | | 72,000 | | | | 64,620 | |
CommScope, Inc., | | | | | | | | |
6.00%, 03/01/2026(b) | | | 300,000 | | | | 309,750 | |
8.25%, 03/01/2027(b) | | | 443,000 | | | | 421,284 | |
Frontier Communications Corp., | | | | | | | | |
10.50%, 09/15/2022 | | | 1,653,000 | | | | 781,043 | |
11.00%, 09/15/2025 | | | 378,000 | | | | 178,605 | |
Telecom Italia Capital S.A. (Italy), | | | | | | | | |
6.38%, 11/15/2033 | | | 47,000 | | | | 52,039 | |
7.20%, 07/18/2036 | | | 355,000 | | | | 415,350 | |
| | | | | | | | 3,322,263 | |
| |
Interactive Media & Services-0.28% | | | | | |
| | |
Cable Onda S.A. (Panama), 4.50%, 01/30/2030(b) | | | 230,000 | | | | 233,512 | |
Cumulus Media New Holdings, Inc., 6.75%, 07/01/2026(b) | | | 481,000 | | | | 511,063 | |
Diamond Sports Group LLC/Diamond Sports Finance Co., | | | | | | | | |
5.38%, 08/15/2026(b) | | | 646,000 | | | | 675,878 | |
6.63%, 08/15/2027(b) | | | 687,000 | | | | 709,327 | |
| | | | | | | | 2,129,780 | |
| |
Investment Banking & Brokerage-3.91% | | | | | |
| | |
GS Finance Corp., | | | | | | | | |
21.69%, 11/25/2019(b) | | | 15,100,000 | | | | 14,995,381 | |
7.77%, 11/26/2019(b) | | | 15,150,000 | | | | 15,117,194 | |
| | | | | | | | 30,112,575 | |
| | |
Leisure Products-0.04% | | | | | | | | |
| | |
Mattel, Inc., 6.75%, 12/31/2025(b) | | | 286,000 | | | | 299,943 | |
| | |
Managed Health Care-0.18% | | | | | | | | |
| | |
Centene Corp., 5.38%, 06/01/2026(b) | | | 276,000 | | | | 292,836 | |
Molina Healthcare, Inc., 4.88%, 06/15/2025(b) | | | 392,000 | | | | 399,840 | |
WellCare Health Plans, Inc., | | | | | | | | |
5.25%, 04/01/2025 | | | 420,000 | | | | 441,131 | |
5.38%, 08/15/2026(b) | | | 238,000 | | | | 253,768 | |
| | | | | | | | 1,387,575 | |
| | | | | | | | |
| | | Principal
Amount | | | Value | |
Metal & Glass Containers-0.19% | | | | | | | | |
| | |
Ardagh Packaging Finance PLC/Ardagh Holdings USA, Inc. (Ireland), 6.00%, 02/15/2025(b) | | $ | 600,000 | | | $ | 631,500 | |
Flex Acquisition Co., Inc., 7.88%, 07/15/2026(b) | | | 405,000 | | | | 381,712 | |
Trivium Packaging Finance B.V. (Netherlands), | | | | | | | | |
5.50%, 08/15/2026(b) | | | 206,000 | | | | 216,558 | |
8.50%, 08/15/2027(b) | | | 204,000 | | | | 217,260 | |
| | | | | | | | 1,447,030 | |
| | |
Movies & Entertainment-0.32% | | | | | | | | |
| | |
AMC Entertainment Holdings, Inc., | | | | | | | | |
5.75%, 06/15/2025 | | | 935,000 | | | | 891,850 | |
6.13%, 05/15/2027 | | | 311,000 | | | | 282,816 | |
Netflix, Inc., | | | | | | | | |
5.75%, 03/01/2024 | | | 423,000 | | | | 467,219 | |
5.88%, 11/15/2028 | | | 722,000 | | | | 796,907 | |
| | | | | | | | 2,438,792 | |
| | |
Multi-Utilities-0.30% | | | | | | | | |
| | |
Dominion Energy, Inc., Series A, Investment Units, 5.25%, 07/30/2076 | | | 38,200 | | | | 992,436 | |
DTE Energy Co., | | | | | | | | |
Series B, Investment Units, 5.38%, 06/01/2076 | | | 20,300 | | | | 529,018 | |
Series F, Investment Units, 6.00%, 12/15/2076 | | | 15,100 | | | | 410,720 | |
Series E, Investment Units, 5.25%, 12/01/2077 | | | 14,100 | | | | 379,149 | |
| | | | | | | | 2,311,323 | |
| | |
Oil & Gas Drilling-0.30% | | | | | | | | |
| | |
Diamond Offshore Drilling, Inc., 4.88%, 11/01/2043 | | | 192,000 | | | | 98,640 | |
Ensign Drilling, Inc. (Canada), 9.25%, 04/15/2024(b) | | | 351,000 | | | | 299,228 | |
Noble Holding International Ltd., 7.75%, 01/15/2024 | | | 656,000 | | | | 396,880 | |
Plains All American Pipeline, L.P., Series B, 6.13%(d) | | | 351,000 | | | | 327,841 | |
Precision Drilling Corp. (Canada), | | | | | | | | |
6.50%, 12/15/2021 | | | 43,441 | | | | 43,333 | |
7.75%, 12/15/2023 | | | 25,000 | | | | 23,750 | |
5.25%, 11/15/2024 | | | 453,000 | | | | 383,917 | |
Transocean, Inc., 7.50%, 04/15/2031 | | | 647,000 | | | | 436,725 | |
Valaris PLC, 7.75%, 02/01/2026 | | | 608,000 | | | | 322,240 | |
| | | | | | | | 2,332,554 | |
| |
Oil & Gas Equipment & Services-0.07% | | | | | |
| | |
Calfrac Holdings L.P. (Canada), 8.50%, 06/15/2026(b) | | | 312,000 | | | | 135,424 | |
SESI, L.L.C., 7.13%, 12/15/2021 | | | 487,000 | | | | 371,337 | |
| | | | | | | | 506,761 | |
See accompanying Notes to Financial Statements which are an integral part of the financial statements.
17 Invesco Multi-Asset Income Fund
| | | | | | | | |
| | | Principal
Amount | | | Value | |
Oil & Gas Exploration & Production-1.24% | | | | | |
| | |
Ascent Resources Utica Holdings, LLC/ARU Finance Corp., 10.00%, 04/01/2022(b) | | $ | 614,000 | | | $ | 584,098 | |
Brazos Valley Longhorn LLC/Brazos Valley Longhorn Finance Corp., 6.88%, 02/01/2025 | | | 336,000 | | | | 265,440 | |
California Resources Corp., 8.00%, 12/15/2022(b) | | | 601,000 | | | | 177,295 | |
Callon Petroleum Co., | | | | | | | | |
6.13%, 10/01/2024 | | | 849,000 | | | | 810,795 | |
6.38%, 07/01/2026 | | | 189,000 | | | | 177,187 | |
Centennial Resource Production, LLC, 6.88%, 04/01/2027(b) | | | 557,000 | | | | 548,645 | |
Denbury Resources, Inc., | | | | | | | | |
9.00%, 05/15/2021(b) | | | 300,000 | | | | 264,000 | |
5.50%, 05/01/2022 | | | 198,000 | | | | 101,475 | |
EP Energy LLC/Everest Acquisition Finance, Inc., 8.00%, 11/29/2024(b) | | | 611,000 | | | | 253,565 | |
Genesis Energy L.P./Genesis Energy Finance Corp., 6.25%, 05/15/2026 | | | 728,000 | | | | 677,040 | |
Gulfport Energy Corp., | | | | | | | | |
6.63%, 05/01/2023 | | | 690,000 | | | | 519,225 | |
6.00%, 10/15/2024 | | | 616,000 | | | | 398,860 | |
NGL Energy Partners L.P./NGL Energy Finance Corp., 7.50%, 04/15/2026(b) | | | 563,000 | | | | 540,317 | |
Oasis Petroleum, Inc., 6.88%, 01/15/2023 | | | 723,000 | | | | 629,010 | |
QEP Resources, Inc., 5.63%, 03/01/2026 | | | 1,072,000 | | | | 970,160 | |
SM Energy Co., 6.63%, 01/15/2027 | | | 324,000 | | | | 273,780 | |
Southwestern Energy Co., | | | | | | | | |
7.50%, 04/01/2026 | | | 463,000 | | | | 408,639 | |
7.75%, 10/01/2027 | | | 327,000 | | | | 282,855 | |
Whiting Petroleum Corp., | | | | | | | | |
6.25%, 04/01/2023 | | | 710,000 | | | | 518,300 | |
6.63%, 01/15/2026 | | | 150,000 | | | | 93,750 | |
WPX Energy, Inc., | | | | | | | | |
5.25%, 09/15/2024 | | | 869,000 | | | | 882,035 | |
5.75%, 06/01/2026 | | | 150,000 | | | | 151,313 | |
| | | | | | | | 9,527,784 | |
| |
Oil & Gas Refining & Marketing-0.33% | | | | | |
| | |
Calumet Specialty Products Partners L.P./Calumet Finance Corp., 7.63%, 01/15/2022 | | | 613,000 | | | | 600,740 | |
NuStar Logistics L.P., 6.00%, 06/01/2026 | | | 648,000 | | | | 695,758 | |
Parkland Fuel Corp. (Canada), 6.00%, 04/01/2026(b) | | | 595,000 | | | | 631,265 | |
Sunoco L.P./Sunoco Finance Corp., | | | | | | | | |
4.88%, 01/15/2023 | | | 385,000 | | | | 396,069 | |
6.00%, 04/15/2027 | | | 200,000 | | | | 210,500 | |
| | | | | | | | 2,534,332 | |
| | | | | | | | |
| | | Principal
Amount | | | Value | |
Oil & Gas Storage & Transportation-0.36% | | | | | |
| | |
Antero Midstream Partners L.P./Antero Midstream Finance Corp., | | | | | | | | |
5.38%, 09/15/2024 | | $ | 350,000 | | | $ | 285,250 | |
5.75%, 01/15/2028(b) | | | 893,000 | | | | 667,517 | |
Energy Transfer Operating, L.P., Series A, 6.25%(d) | | | 242,000 | | | | 225,428 | |
SemGroup Corp., 6.38%, 03/15/2025 | | | 535,000 | | | | 557,069 | |
Targa Resources Partners L.P./Targa Resources Partners Finance Corp., | | | | | | | | |
5.13%, 02/01/2025 | | | 642,000 | | | | 661,273 | |
5.88%, 04/15/2026 | | | 377,000 | | | | 394,945 | |
| | | | | | | | 2,791,482 | |
| |
Other Diversified Financial Services-0.29% | | | | | |
| | |
eG Global Finance PLC (United Kingdom), | | | | | | | | |
6.75%, 02/07/2025(b) | | | 406,000 | | | | 407,522 | |
8.50%, 10/30/2025(b) | | | 233,000 | | | | 245,233 | |
Lions Gate Capital Holdings LLC, 6.38%, 02/01/2024(b) | | | 540,000 | | | | 520,209 | |
LPL Holdings, Inc., 5.75%, 09/15/2025(b) | | | 390,000 | | | | 405,600 | |
Tempo Acquisition LLC/Tempo Acquisition Finance Corp., 6.75%, 06/01/2025(b) | | | 632,000 | | | | 653,330 | |
| | | | | | | | 2,231,894 | |
| | |
Packaged Foods & Meats-0.37% | | | | | | | | |
| | |
B&G Foods, Inc., 5.25%, 04/01/2025 | | | 486,000 | | | | 498,150 | |
JBS USA LUX S.A./JBS USA Food Co./JBS USA Finance, Inc., 5.50%, 01/15/2030(b) | | | 689,000 | | | | 744,120 | |
Pilgrim’s Pride Corp., 5.88%, 09/30/2027(b) | | | 383,000 | | | | 411,828 | |
Post Holdings, Inc., | | | | | | | | |
5.75%, 03/01/2027(b) | | | 397,000 | | | | 424,643 | |
5.63%, 01/15/2028(b) | | | 397,000 | | | | 426,279 | |
TreeHouse Foods, Inc., 6.00%, 02/15/2024(b) | | | 357,000 | | | | 371,280 | |
| | | | | | | | 2,876,300 | |
| | |
Paper Products-0.20% | | | | | | | | |
| | |
Mercer International, Inc. (Germany), | | | | | | | | |
6.50%, 02/01/2024 | | | 476,000 | | | | 492,065 | |
5.50%, 01/15/2026 | | | 163,000 | | | | 156,998 | |
Schweitzer-Mauduit International, Inc., 6.88%, 10/01/2026(b) | | | 840,000 | | | | 898,800 | |
| | | | | | | | 1,547,863 | |
| | |
Pharmaceuticals-0.58% | | | | | | | | |
| | |
Bausch Health Americas, Inc., 9.25%, 04/01/2026(b) | | | 301,000 | | | | 341,265 | |
Bausch Health Cos., Inc., | | | | | | | | |
6.13%, 04/15/2025(b) | | | 500,000 | | | | 520,312 | |
5.50%, 11/01/2025(b) | | | 307,000 | | | | 321,969 | |
9.00%, 12/15/2025(b) | | | 1,329,000 | | | | 1,501,504 | |
5.75%, 08/15/2027(b) | | | 126,000 | | | | 137,143 | |
See accompanying Notes to Financial Statements which are an integral part of the financial statements.
18 Invesco Multi-Asset Income Fund
| | | | | | | | |
| | | Principal
Amount | | | Value | |
Pharmaceuticals-(continued) | | | | | |
| | |
Endo Dac/Endo Finance LLC/Endo Finco, Inc., 6.00%, 07/15/2023(b) | | $ | 750,000 | | | $ | 499,688 | |
HLF Financing S.a.r.l. LLC/Herbalife International, Inc., 7.25%, 08/15/2026(b) | | | 825,000 | | �� | | 863,156 | |
Par Pharmaceutical, Inc., 7.50%, 04/01/2027(b) | | | 325,000 | | | | 309,563 | |
| | | | | | | | 4,494,600 | |
| | |
Publishing-0.07% | | | | | | | | |
| | |
Meredith Corp., 6.88%, 02/01/2026 | | | 546,000 | | | | 565,509 | |
| | |
Railroads-0.14% | | | | | | | | |
| | |
Kenan Advantage Group, Inc. (The), 7.88%, 07/31/2023(b) | | | 1,157,000 | | | | 1,051,424 | |
| |
Research & Consulting Services-0.08% | | | | | |
| | |
Equinix, Inc., 5.88%, 01/15/2026 | | | 595,000 | | | | 633,496 | |
| |
Restaurants-0.20% | | | | | |
1011778 BC ULC/New Red Finance, Inc. (Canada), 5.00%, 10/15/2025(b) | | | 1,023,000 | | | | 1,056,247 | |
IRB Holding Corp., 6.75%, 02/15/2026(b) | | | 482,000 | | | | 491,640 | |
| | | | | | | | 1,547,887 | |
| | |
Security & Alarm Services-0.11% | | | | | | | | |
| | |
Brink’s Co. (The), 4.63%, 10/15/2027(b) | | | 572,000 | | | | 580,580 | |
GWB-CR Security Corp. (Canada), 9.50%, 11/01/2027(b) | | | 294,000 | | | | 302,820 | |
| | | | | | | | 883,400 | |
| | |
Sovereign Debt-16.39% | | | | | | | | |
| | |
Abu Dhabi Government International Bond (United Arab Emirates), | | | | | | | | |
3.13%, 10/11/2027(b) | | | 1,100,000 | | | | 1,150,297 | |
4.13%, 10/11/2047(b) | | | 1,100,000 | | | | 1,267,615 | |
Angolan Government International Bond (Angola), | | | | | | | | |
9.50%, 11/12/2025(b) | | | 1,000,000 | | | | 1,129,370 | |
8.25%, 05/09/2028(b) | | | 900,000 | | | | 942,332 | |
9.38%, 05/08/2048(b) | | | 900,000 | | | | 954,090 | |
Argentine Republic Government International Bond (Argentina), | | | | | | | | |
4.63%, 01/11/2023 | | | 1,100,000 | | | | 446,600 | |
7.50%, 04/22/2026 | | | 1,100,000 | | | | 470,261 | |
6.88%, 01/26/2027 | | | 1,100,000 | | | | 437,261 | |
Bahrain Government International Bond (Bahrain), | | | | | | | | |
6.75%, 09/20/2029(b) | | | 900,000 | | | | 1,028,232 | |
6.00%, 09/19/2044(b) | | | 1,200,000 | | | | 1,211,040 | |
7.50%, 09/20/2047(b) | | | 1,000,000 | | | | 1,173,750 | |
| | | | | | | | |
| | | Principal
Amount | | | Value | |
Sovereign Debt-(continued) | | | | | |
| | |
Brazilian Government International Bond (Brazil), | | | | | | | | |
8.25%, 01/20/2034 | | $ | 825,000 | | | $ | 1,143,664 | |
5.63%, 01/07/2041 | | | 1,000,000 | | | | 1,123,760 | |
5.63%, 02/21/2047 | | | 1,100,000 | | | | 1,240,398 | |
Chile Government International Bond (Chile), | | | | | | | | |
3.13%, 01/21/2026 | | | 1,650,000 | | | | 1,738,069 | |
3.86%, 06/21/2047 | | | 1,600,000 | | | | 1,837,616 | |
China Government International Bond (China), | | | | | | | | |
2.63%, 11/02/2027(b) | | | 1,000,000 | | | | 1,033,110 | |
3.50%, 10/19/2028(b) | | | 900,000 | | | | 993,707 | |
4.00%, 10/19/2048(b) | | | 1,000,000 | | | | 1,200,892 | |
Colombia Government International Bond (Colombia), | | | | | | | | |
7.38%, 09/18/2037 | | | 800,000 | | | | 1,136,008 | |
6.13%, 01/18/2041 | | | 900,000 | | | | 1,168,875 | |
5.63%, 02/26/2044 | | | 1,000,000 | | | | 1,245,260 | |
Costa Rica Government International Bond (Costa Rica), | | | | | | | | |
5.63%, 04/30/2043(b) | | | 1,100,000 | | | | 955,911 | |
7.00%, 04/04/2044(b) | | | 1,000,000 | | | | 990,010 | |
7.16%, 03/12/2045(b) | | | 1,000,000 | | | | 998,760 | |
Croatia Government International Bond (Croatia), | | | | | | | | |
5.50%, 04/04/2023(b) | | | 1,400,000 | | | | 1,549,187 | |
6.00%, 01/26/2024(b) | | | 1,300,000 | | | | 1,496,863 | |
Dominican Republic International Bond (Dominican Republic), | | | | | | | | |
7.45%, 04/30/2044(b) | | | 875,000 | | | | 1,051,102 | |
6.85%, 01/27/2045(b) | | | 950,000 | | | | 1,074,697 | |
6.50%, 02/15/2048(b) | | | 950,000 | | | | 1,039,072 | |
Ecuador Government International Bond (Ecuador), | | | | | | | | |
9.65%, 12/13/2026(b) | | | 1,000,000 | | | | 987,760 | |
9.63%, 06/02/2027(b) | | | 1,000,000 | | | | 975,635 | |
8.88%, 10/23/2027(b) | | | 1,000,000 | | | | 934,625 | |
Egypt Government International Bond (Egypt), | | | | | | | | |
8.50%, 01/31/2047(b) | | | 1,000,000 | | | | 1,055,376 | |
7.90%, 02/21/2048(b) | | | 1,000,000 | | | | 1,004,974 | |
8.70%, 03/01/2049(b) | | | 900,000 | | | | 967,036 | |
El Salvador Government International Bond (El Salvador), | | | | | | | | |
8.25%, 04/10/2032(b) | | | 897,000 | | | | 1,036,294 | |
7.65%, 06/15/2035(b) | | | 1,030,000 | | | | 1,124,373 | |
7.63%, 02/01/2041(b) | | | 950,000 | | | | 1,034,322 | |
Emirate of Dubai Government International Bonds (United Arab Emirates), 5.25%, 01/30/2043(b) | | | 1,000,000 | | | | 1,149,371 | |
Hungary Government International Bond (Hungary), | | | | | | | | |
5.75%, 11/22/2023 | | | 950,000 | | | | 1,075,121 | |
5.38%, 03/25/2024 | | | 910,000 | | | | 1,025,482 | |
7.63%, 03/29/2041 | | | 710,000 | | | | 1,169,531 | |
See accompanying Notes to Financial Statements which are an integral part of the financial statements.
19 Invesco Multi-Asset Income Fund
| | | | | | | | |
| | | Principal
Amount | | | Value | |
Sovereign Debt-(continued) | | | | | | | | |
| | |
Indonesia Government International Bond (Indonesia), | | | | | | | | |
8.50%, 10/12/2035(b) | | $ | 750,000 | | | $ | 1,173,811 | |
6.63%, 02/17/2037(b) | | | 900,000 | | | | 1,210,717 | |
7.75%, 01/17/2038(b) | | | 750,000 | | | | 1,119,439 | |
Jordan Government International Bond (Jordan), | | | | | | | | |
6.13%, 01/29/2026(b) | | | 1,000,000 | | | | 1,058,098 | |
5.75%, 01/31/2027(b) | | | 1,000,000 | | | | 1,036,565 | |
7.38%, 10/10/2047(b) | | | 1,000,000 | | | | 1,057,850 | |
Kazakhstan Government International Bond (Kazakhstan), | | | | | | | | |
5.13%, 07/21/2025(b) | | | 950,000 | | | | 1,078,944 | |
4.88%, 10/14/2044(b) | | | 1,050,000 | | | | 1,278,191 | |
6.50%, 07/21/2045(b) | | | 900,000 | | | | 1,309,396 | |
Kenya Government International Bond (Kenya), | | | | | | | | |
6.88%, 06/24/2024(b) | | | 900,000 | | | | 958,147 | |
7.25%, 02/28/2028(b) | | | 1,100,000 | | | | 1,164,032 | |
8.25%, 02/28/2048(b) | | | 1,100,000 | | | | 1,156,702 | |
Lebanon Government International Bond (Lebanon), | | | | | | | | |
6.10%, 10/04/2022(b) | | | 1,000,000 | | | | 598,930 | |
6.40%, 05/26/2023 | | | 1,100,000 | | | | 651,530 | |
6.65%, 04/22/2024(b) | | | 1,200,000 | | | | 687,300 | |
Mexico Government International Bond (Mexico), Series A, | | | | | | | | |
6.05%, 01/11/2040 | | | 912,000 | | | | 1,166,229 | |
4.60%, 01/23/2046 | | | 1,050,000 | | | | 1,122,723 | |
5.75%, 10/12/2110 | | | 1,050,000 | | | | 1,223,785 | |
Mongolia Government International Bond (Mongolia), | | | | | | | | |
5.13%, 12/05/2022(b) | | | 1,100,000 | | | | 1,117,008 | |
5.63%, 05/01/2023(b) | | | 928,000 | | | | 950,709 | |
8.75%, 03/09/2024(b) | | | 800,000 | | | | 904,767 | |
Nigeria Government International Bond (Nigeria), | | | | | | | | |
7.70%, 02/23/2038(b) | | | 1,000,000 | | | | 1,003,400 | |
7.63%, 11/28/2047(b) | | | 1,000,000 | | | | 978,760 | |
9.25%, 01/21/2049(b) | | | 900,000 | | | | 999,000 | |
Oman Government International Bond (Oman), | | | | | | | | |
5.63%, 01/17/2028(b) | | | 1,000,000 | | | | 991,975 | |
6.50%, 03/08/2047(b) | | | 1,200,000 | | | | 1,114,500 | |
6.75%, 01/17/2048(b) | | | 1,200,000 | | | | 1,129,380 | |
Pakistan Government International Bond (Pakistan), | | | | | | | | |
8.25%, 04/15/2024(b) | | | 1,000,000 | | | | 1,092,020 | |
8.25%, 09/30/2025(b) | | | 1,010,000 | | | | 1,105,095 | |
6.88%, 12/05/2027(b) | | | 1,000,000 | | | | 1,002,692 | |
Panama Government International Bond (Panama), | | | | | | | | |
7.13%, 01/29/2026 | | | 850,000 | | | | 1,069,946 | |
8.88%, 09/30/2027 | | | 769,000 | | | | 1,103,523 | |
3.88%, 03/17/2028 | | | 1,000,000 | | | | 1,089,385 | |
| | | | | | | | |
| | | Principal
Amount | | | Value | |
Sovereign Debt-(continued) | | | | | | | | |
| | |
Paraguay Government International Bond (Paraguay), | | | | | | | | |
5.00%, 04/15/2026(b) | | $ | 1,000,000 | | | $ | 1,103,760 | |
6.10%, 08/11/2044(b) | | | 1,000,000 | | | | 1,220,010 | |
5.60%, 03/13/2048(b) | | | 900,000 | | | | 1,039,509 | |
Peruvian Government International Bond (Peru), | | | | | | | | |
2.84%, 06/20/2030 | | | 1,000,000 | | | | 1,034,500 | |
8.75%, 11/21/2033 | | | 721,000 | | | | 1,191,460 | |
5.63%, 11/18/2050 | | | 802,000 | | | | 1,176,943 | |
Philippine Government International Bond (Philippines), | | | | | | | | |
7.75%, 01/14/2031 | | | 700,000 | | | | 1,039,346 | |
6.38%, 01/15/2032 | | | 840,000 | | | | 1,142,211 | |
6.38%, 10/23/2034 | | | 750,000 | | | | 1,061,036 | |
Qatar Government International Bond (Qatar), | | | | | | | | |
6.40%, 01/20/2040(b) | | | 800,000 | | | | 1,170,698 | |
5.10%, 04/23/2048(b) | | | 900,000 | | | | 1,149,552 | |
4.82%, 03/14/2049(b) | | | 900,000 | | | | 1,109,259 | |
Republic of Poland Government International Bond (Poland), | | | | | | | | |
3.00%, 03/17/2023 | | | 1,024,000 | | | | 1,057,654 | |
4.00%, 01/22/2024 | | | 995,000 | | | | 1,077,343 | |
3.25%, 04/06/2026 | | | 1,004,000 | | | | 1,072,117 | |
Republic of South Africa Government International Bond (South Africa), | | | | | | | | |
6.25%, 03/08/2041 | | | 1,000,000 | | | | 1,078,475 | |
5.38%, 07/24/2044 | | | 1,050,000 | | | | 1,010,331 | |
6.30%, 06/22/2048 | | | 900,000 | | | | 955,913 | |
Romanian Government International Bond (Romania), | | | | | | | | |
4.88%, 01/22/2024(b) | | | 952,000 | | | | 1,047,805 | |
6.13%, 01/22/2044(b) | | | 930,000 | | | | 1,211,994 | |
5.13%, 06/15/2048(b) | | | 1,050,000 | | | | 1,213,854 | |
Russian Foreign Bond (Russia), | | | | | | | | |
5.63%, 04/04/2042(b) | | | 1,000,000 | | | | 1,237,575 | |
5.88%, 09/16/2043(b) | | | 800,000 | | | | 1,022,588 | |
Russian Foreign Bond - Eurobond (Russia), 5.25%, 06/23/2047(b) | | | 1,000,000 | | | | 1,195,540 | |
Saudi Government International Bond (Saudi Arabia), | | | | | | | | |
4.50%, 10/26/2046(b) | | | 1,100,000 | | | | 1,212,717 | |
4.63%, 10/04/2047(b) | | | 1,000,000 | | | | 1,122,445 | |
5.00%, 04/17/2049(b) | | | 1,000,000 | | | | 1,187,095 | |
Slovenia Government International Bond (Slovenia), 5.25%, 02/18/2024(b) | | | 1,400,000 | | | | 1,589,316 | |
Sri Lanka Government International Bond (Sri Lanka), | | | | | | | | |
6.83%, 07/18/2026(b) | | | 1,050,000 | | | | 1,058,853 | |
7.85%, 03/14/2029(b) | | | 1,050,000 | | | | 1,089,241 | |
7.55%, 03/28/2030(b) | | | 950,000 | | | | 961,278 | |
Trinidad & Tobago Government International Bond (Trinidad), | | | | | | | | |
4.38%, 01/16/2024(b) | | | 1,400,000 | | | | 1,468,264 | |
4.50%, 08/04/2026(b) | | | 1,750,000 | | | | 1,822,205 | |
See accompanying Notes to Financial Statements which are an integral part of the financial statements.
20 Invesco Multi-Asset Income Fund
| | | | | | | | |
| | | Principal
Amount | | | Value | |
Sovereign Debt-(continued) | | | | | |
| | |
Turkey Government International Bond (Turkey), | | | | | | | | |
8.00%, 02/14/2034 | | $ | 910,000 | | | $ | 1,005,226 | |
6.88%, 03/17/2036 | | | 1,048,000 | | | | 1,034,988 | |
7.25%, 03/05/2038 | | | 1,000,000 | | | | 1,029,375 | |
Ukraine Government International Bond (Ukraine), | | | | | | | | |
7.75%, 09/01/2026(b) | | | 1,100,000 | | | | 1,184,688 | |
7.75%, 09/01/2027(b) | | | 1,100,000 | | | | 1,185,882 | |
9.75%, 11/01/2028(b) | | | 900,000 | | | | 1,072,930 | |
| | | | | | | | 126,116,234 | |
| |
Specialized Consumer Services-0.16% | | | | | |
| | |
ServiceMaster Co., LLC (The), | | | | | | | | |
5.13%, 11/15/2024(b) | | | 942,000 | | | | 978,502 | |
7.45%, 08/15/2027 | | | 254,000 | | | | 286,068 | |
| | | | | | | | 1,264,570 | |
| | |
Specialized REITs-0.27% | | | | | | | | |
| | |
Iron Mountain US Holdings, Inc., 5.38%, 06/01/2026(b) | | | 653,000 | | | | 680,752 | |
Iron Mountain, Inc., | | | | | | | | |
6.00%, 08/15/2023 | | | 203,000 | | | | 207,821 | |
5.75%, 08/15/2024 | | | 115,000 | | | | 116,294 | |
5.25%, 03/15/2028(b) | | | 173,000 | | | | 182,515 | |
Rayonier A.M. Products, Inc., 5.50%, 06/01/2024(b) | | | 611,000 | | | | 426,173 | |
SBA Communications Corp., | | | | | | | | |
4.88%, 07/15/2022 | | | 79,000 | | | | 80,037 | |
4.88%, 09/01/2024 | | | 400,000 | | | | 417,000 | |
| | | | | | | | 2,110,592 | |
| | |
Specialty Chemicals-0.12% | | | | | | | | |
| | |
Element Solutions, Inc., 5.88%, 12/01/2025(b) | | | 444,000 | | | | 465,715 | |
GCP Applied Technologies, Inc., 5.50%, 04/15/2026(b) | | | 458,000 | | | | 471,740 | |
| | | | | | | | 937,455 | |
| | |
Steel-0.03% | | | | | | | | |
| | |
AK Steel Corp., 7.63%, 10/01/2021 | | | 250,000 | | | | 245,830 | |
| | |
Systems Software-0.03% | | | | | | | | |
| | |
Camelot Finance S.A., 4.50%, 11/01/2026(b) | | | 190,000 | | | | 192,451 | |
|
Technology Hardware, Storage & Peripherals-0.09% | |
| | |
Dell International LLC/EMC Corp., 7.13%, 06/15/2024(b) | | | 620,000 | | | | 658,130 | |
| | |
Textiles-0.08% | | | | | | | | |
| | |
Eagle Intermediate Global Holding B.V./Ruyi US Finance LLC (China), 7.50%, 05/01/2025(b) | | | 739,000 | | | | 647,549 | |
| | | | | | | | |
| | | Principal
Amount | | | Value | |
Trading Companies & Distributors-0.36% | | | | | |
| | |
AerCap Global Aviation Trust (Ireland), 6.50% (3 mo. USD LIBOR + 4.30%), 06/15/2045(b)(f) | | $ | 400,000 | | | $ | 440,500 | |
BMC East, LLC, 5.50%,
10/01/2024(b) | | | 576,000 | | | | 601,200 | |
Herc Holdings, Inc., 5.50%, 07/15/2027(b) | | | 554,000 | | | | 576,160 | |
United Rentals North America, Inc., | | | | | | | | |
5.88%, 09/15/2026 | | | 400,000 | | | | 426,000 | |
6.50%, 12/15/2026 | | | 325,000 | | | | 353,031 | |
5.50%, 05/15/2027 | | | 85,000 | | | | 89,941 | |
5.25%, 01/15/2030 | | | 231,000 | | | | 243,705 | |
| | | | | | | | 2,730,537 | |
| | |
Trucking-0.07% | | | | | | | | |
| | |
Avis Budget Car Rental LLC/Avis Budget Finance, Inc., | | | | | | | | |
6.38%, 04/01/2024(b) | | | 200,000 | | | | 209,250 | |
5.25%, 03/15/2025(b) | | | 330,000 | | | | 337,837 | |
| | | | | | | | 547,087 | |
|
Wireless Telecommunication Services-0.89% | |
| | |
Digicel Group One Ltd. (Jamaica), 8.25%, 12/30/2022(b) | | | 207,000 | | | | 123,424 | |
Digicel Group Two Ltd. (Jamaica), 8.25%, 09/30/2022(b) | | | 196,000 | | | | 51,940 | |
Intelsat (Luxembourg) S.A. (Luxembourg), 7.75%, 06/01/2021 | | | 387,000 | | | | 368,618 | |
Intelsat Connect Finance S.A. (Luxembourg),
9.50%, 02/15/2023(b) | | | 267,000 | | | | 249,004 | |
Oztel Holdings SPC Ltd. (Oman), 5.63%, 10/24/2023(b) | | | 382,000 | | | | 399,929 | |
Sprint Corp., | | | | | | | | |
7.25%, 09/15/2021 | | | 1,104,000 | | | | 1,180,794 | |
11.50%, 11/15/2021 | | | 235,000 | | | | 272,894 | |
7.88%, 09/15/2023 | | | 1,808,000 | | | | 2,000,100 | |
7.63%, 02/15/2025 | | | 84,000 | | | | 92,505 | |
7.63%, 03/01/2026 | | | 211,000 | | | | 233,946 | |
T-Mobile USA, Inc., | | | | | | | | |
6.38%, 03/01/2025 | | | 350,000 | | | | 364,074 | |
6.50%, 01/15/2026 | | | 1,409,000 | | | | 1,511,293 | |
| | | | | | | | 6,848,521 | |
Total U.S. Dollar Denominated Bonds & Notes
(Cost $429,706,219) | | | | 432,808,383 | |
| | |
| | | Shares | | | | |
Preferred Stocks-20.58% | | | | | | | | |
| | |
Alternative Carriers-0.57% | | | | | | | | |
| | |
Qwest Corp., 6.50%, Pfd. | | | 47,700 | | | | 1,215,873 | |
Qwest Corp., 6.75%, Pfd. | | | 47,700 | | | | 1,255,941 | |
Qwest Corp., 6.13%, Pfd. | | | 26,800 | | | | 661,960 | |
Qwest Corp., 6.88%, Pfd. | | | 19,100 | | | | 497,364 | |
Qwest Corp., 6.63%, Pfd. | | | 28,600 | | | | 740,740 | |
| | | | | | | | 4,371,878 | |
See accompanying Notes to Financial Statements which are an integral part of the financial statements.
21 Invesco Multi-Asset Income Fund
| | | | | | | | |
| | | Shares | | | Value | |
Asset Management & Custody Banks-1.07% | | | | | |
| | |
Affiliated Managers Group, Inc., 5.88%, Pfd. | | | 13,100 | | | $ | 349,246 | |
Apollo Global Management, Inc., 6.38%, Series A, Pfd. | | | 12,000 | | | | 316,440 | |
Apollo Global Management, Inc., 6.38%, Series B, Pfd. | | | 13,100 | | | | 352,783 | |
Ares Management Corp., 7.00%, Series A, Pfd. | | | 13,600 | | | | 364,072 | |
Bank of New York Mellon Corp. (The), 5.20%, Pfd. | | | 27,800 | | | | 710,846 | |
Brightsphere Investment Group, Inc., 5.13%, Pfd. | | | 5,400 | | | | 134,406 | |
KKR & Co., Inc., 6.75%, Series A, Pfd. | | | 13,300 | | | | 358,701 | |
KKR & Co., Inc., 6.50%, Series B, Pfd. | | | 10,300 | | | | 277,997 | |
Legg Mason, Inc., 6.38%, Pfd. | | | 10,900 | | | | 298,006 | |
Legg Mason, Inc., 5.45%, Pfd. | | | 23,900 | | | | 624,507 | |
Northern Trust Corp., 5.85%, Series C, Pfd. | | | 18,200 | | | | 459,732 | |
Oaktree Capital Group, LLC, 6.63%, Series A, Pfd. | | | 8,000 | | | | 215,760 | |
Oaktree Capital Group, LLC, 6.55%, Series B, Pfd. | | | 10,300 | | | | 276,967 | |
Prospect Capital Corp., 6.25%, Pfd. | | | 9,500 | | | | 241,300 | |
State Street Corp., 5.35%, Series G, Pfd. | | | 31,000 | | | | 859,630 | |
State Street Corp., 5.25%, Series C, Pfd. | | | 13,200 | | | | 335,676 | |
State Street Corp., 5.90%, Series D, Pfd. | | | 29,900 | | | | 825,240 | |
State Street Corp., 6.00%, Series E, Pfd. | | | 47,700 | | | | 1,211,580 | |
| | | | | | | | 8,212,889 | |
| | |
Automobile Manufacturers-0.12% | | | | | | | | |
| | |
Ford Motor Co., 6.20%, Pfd. | | | 35,800 | | | | 952,280 | |
| | |
Consumer Finance-0.82% | | | | | | | | |
| | |
Capital One Financial Corp., 5.20%, Series G, Pfd. | | | 47,700 | | | | 1,221,597 | |
Capital One Financial Corp., 6.00%, Series H, Pfd. | | | 47,700 | | | | 1,295,055 | |
Capital One Financial Corp., 6.00%, Series B, Pfd. | | | 12,300 | | | | 315,003 | |
Capital One Financial Corp., 6.25%, Series C, Pfd. | | | 8,200 | | | | 207,706 | |
Capital One Financial Corp., 6.70%, Series D, Pfd. | | | 19,400 | | | | 491,984 | |
Capital One Financial Corp., 6.20%, Series F, Pfd. | | | 22,100 | | | | 577,694 | |
Capital One Financial Corp., 5.00%, Series I, Pfd. | | | 77,000 | | | | 1,935,010 | |
Navient Corp., 6.00%, Pfd. | | | 12,500 | | | | 296,125 | |
| | | | | | | | 6,340,174 | |
| | |
Diversified Banks-5.29% | | | | | | | | |
| | |
Bank of America Corp., 6.20%, Series CC, Pfd. | | | 58,500 | | | | 1,525,095 | |
Bank of America Corp., 6.00%, Series EE, Pfd. | | | 47,700 | | | | 1,251,648 | |
Bank of America Corp., 6.00%, Series GG, Pfd. | | | 62,100 | | | | 1,692,225 | |
| | | | | | | | |
| | | Shares | | | Value | |
Diversified Banks-(continued) | | | | | |
| | |
Bank of America Corp., 5.88%, Series HH, Pfd. | | | 53,700 | | | $ | 1,457,418 | |
Bank of America Corp., 6.50%, Series Y, Pfd. | | | 54,300 | | | | 1,387,908 | |
Bank of America Corp., 5.38%, Series KK, Pfd. | | | 83,500 | | | | 2,221,935 | |
Bank of America Corp., 5.00%, Series LL, Pfd. | | | 68,000 | | | | 1,764,600 | |
Citigroup, Inc., 6.30%, Series S, Pfd. | | | 45,200 | | | | 1,186,048 | |
Citigroup, Inc., 7.13%, Series J, Pfd. | | | 48,900 | | | | 1,410,765 | |
Citigroup, Inc., 6.88%, Series K, Pfd. | | | 69,200 | | | | 1,958,360 | |
JPMorgan Chase & Co., 5.45%, Series P, Pfd. | | | 4,100 | | | | 102,664 | |
JPMorgan Chase & Co., 6.13%, Series Y, Pfd. | | | 57,200 | | | | 1,447,732 | |
JPMorgan Chase & Co., 6.10%, Series AA, Pfd. | | | 76,400 | | | | 1,960,424 | |
JPMorgan Chase & Co., 6.15%, Series BB, Pfd. | | | 90,700 | | | | 2,331,897 | |
JPMorgan Chase & Co., 5.75%, Series DD, Pfd. | | | 94,300 | | | | 2,564,960 | |
JPMorgan Chase & Co., 6.00%, Series EE, Pfd. | | | 77,800 | | | | 2,216,522 | |
U.S. Bancorp, 5.50%, Series K, Pfd. | | | 27,900 | | | | 757,206 | |
U.S. Bancorp, 6.50%, Series F, Pfd. | | | 76,400 | | | | 2,090,304 | |
Wells Fargo & Co., 5.70%, Series W, Pfd. | | | 31,600 | | | | 819,072 | |
Wells Fargo & Co., 5.50%, Series X, Pfd. | | | 85,900 | | | | 2,232,541 | |
Wells Fargo & Co., 5.63%, Series Y, Pfd. | | | 45,300 | | | | 1,194,561 | |
Wells Fargo & Co., 5.20%, Pfd. | | | 60,600 | | | | 1,533,786 | |
Wells Fargo & Co., 5.13%, Series O, Pfd. | | | 53,000 | | | | 1,339,840 | |
Wells Fargo & Co., 5.25%, Series P, Pfd. | | | 16,400 | | | | 415,412 | |
Wells Fargo & Co., 5.85%, Series Q, Pfd. | | | 48,700 | | | | 1,311,491 | |
Wells Fargo & Co., 6.63%, Series R, Pfd. | | | 27,700 | | | | 799,699 | |
Wells Fargo & Co., 6.00%, Series T, Pfd. | | | 40,600 | | | | 1,033,270 | |
Wells Fargo & Co., 6.00%, Series V, Pfd. | | | 26,300 | | | | 685,378 | |
| | | | | | | | 40,692,761 | |
| | |
Diversified Capital Markets-0.35% | | | | | | | | |
| | |
Deutsche Bank Contingent Capital Trust II, 6.55%, Pfd. | | | 21,500 | | | | 547,175 | |
Deutsche Bank Contingent Capital Trust V, 8.05%, Pfd. | | | 83,600 | | | | 2,149,356 | |
| | | | | | | | 2,696,531 | |
| | |
Diversified REITs-0.30% | | | | | | | | |
| | |
PS Business Parks, Inc., 5.20%, Series W, Pfd. | | | 11,100 | | | | 284,049 | |
PS Business Parks, Inc., 5.25%, Series X, Pfd. | | | 10,100 | | | | 261,590 | |
PS Business Parks, Inc., 5.20%, Series Y, Pfd. | | | 11,700 | | | | 303,615 | |
PS Business Parks, Inc., 5.75%, Series U, Pfd. | | | 9,900 | | | | 250,470 | |
VEREIT, Inc., 6.70%, Series F, Pfd. | | | 46,388 | | | | 1,178,255 | |
| | | | | | | | 2,277,979 | |
See accompanying Notes to Financial Statements which are an integral part of the financial statements.
22 Invesco Multi-Asset Income Fund
| | | | | | | | |
| | | Shares | | | Value | |
Electric Utilities-1.64% | | | | | | | | |
| | |
Alabama Power Co., 5.00%, Series A, Pfd. | | | 14,300 | | | $ | 375,232 | |
Duke Energy Corp., 5.13%, Pfd. | | | 21,800 | | | | 552,630 | |
Duke Energy Corp., 5.63%, Pfd. | | | 21,800 | | | | 592,960 | |
Duke Energy Corp., 5.75%, Series A, Pfd. | | | 50,100 | | | | 1,397,790 | |
Entergy Arkansas LLC, 4.88%, Pfd. | | | 19,100 | | | | 506,341 | |
Entergy Arkansas LLC, 4.90%, Pfd. | | | 8,800 | | | | 235,840 | |
Entergy Louisiana, LLC, 4.88%, Pfd. | | | 20,300 | | | | 537,544 | |
Entergy Louisiana, LLC, 5.25%, Pfd. | | | 10,500 | | | | 272,370 | |
Entergy Mississippi, Inc., 4.90%, Pfd. | | | 15,100 | | | | 410,418 | |
Entergy Texas, Inc., 5.63%, Pfd. | | | 7,000 | | | | 197,750 | |
Georgia Power Co., 5.00%, Series 2017A, Pfd. | | | 14,300 | | | | 383,669 | |
Interstate Power & Light Co., 5.10%, Series D, Pfd. | | | 9,000 | | | | 234,540 | |
NextEra Energy Capital Holdings, Inc., 5.00%, Pfd. | | | 25,900 | | | | 649,572 | |
NextEra Energy Capital Holdings, Inc., 5.65%, Series N, Pfd. | | | 37,500 | | | | 1,041,375 | |
PPL Capital Funding, Inc., 5.90%, Series B, Pfd. | | | 21,500 | | | | 546,745 | |
SCE Trust III, 5.75%, Series H, Pfd. | | | 13,500 | | | | 322,245 | |
SCE Trust IV, 5.38%, Series J, Pfd. | | | 20,300 | | | | 472,584 | |
SCE Trust V, 5.45%, Series K, Pfd. | | | 17,500 | | | | 418,600 | |
SCE Trust VI, 5.00%, Pfd. | | | 32,300 | | | | 722,228 | |
Southern Co. (The), 5.25%, Pfd. | | | 43,000 | | | | 1,131,330 | |
Southern Co. (The), 5.25%, Pfd. | | | 23,900 | | | | 635,262 | |
Southern Co. (The), 6.25%, Pfd. | | | 36,600 | | | | 965,874 | |
| | | | | | | | 12,602,899 | |
| | |
Gas Utilities-0.07% | | | | | | | | |
| | |
South Jersey Industries, Inc., 5.63%, Pfd. | | | 8,800 | | | | 230,648 | |
Spire, Inc., 5.90%, Series A, Pfd. | | | 10,900 | | | | 294,954 | |
| | | | | | | | 525,602 | |
| | |
Health Care REITs-0.09% | | | | | | | | |
| | |
Senior Housing Properties Trust, 5.63%, Pfd. | | | 28,600 | | | | 697,840 | |
| | |
Industrial Machinery-0.12% | | | | | | | | |
| | |
Stanley Black & Decker, Inc., 5.75%, Investment Units | | | 35,800 | | | | 926,146 | |
|
Integrated Telecommunication Services-0.36% | |
| | |
AT&T, Inc., 5.35%, Pfd. | | | 63,100 | | | | 1,702,438 | |
AT&T, Inc., 5.63%, Pfd. | | | 39,400 | | | | 1,084,288 | |
| | | | | | | | 2,786,726 | |
| |
Internet & Direct Marketing Retail-0.12% | | | | | |
| | |
eBay, Inc., 6.00%, Pfd. | | | 35,800 | | | | 952,638 | |
| |
Investment Banking & Brokerage-1.44% | | | | | |
| | |
Charles Schwab Corp. (The), 5.95%, Series D, Pfd. | | | 39,400 | | | | 1,052,374 | |
Charles Schwab Corp. (The), 6.00%, Series C, Pfd. | | | 23,300 | | | | 627,702 | |
| | | | | | | | |
| | | Shares | | | Value | |
Investment Banking & Brokerage-(continued) | | | | | |
| | |
Goldman Sachs Group, Inc. (The), 6.30%, Series N, Pfd. | | | 23,900 | | | $ | 629,287 | |
Goldman Sachs Group, Inc. (The), 5.50%, Series J, Pfd. | | | 43,900 | | | | 1,191,446 | |
Goldman Sachs Group, Inc. (The), 6.38%, Series K, Pfd. | | | 45,300 | | | | 1,274,289 | |
Morgan Stanley, 5.85%, Series K, Pfd. | | | 62,100 | | | | 1,717,686 | |
Morgan Stanley, 7.13%, Series E, Pfd. | | | 19,000 | | | | 552,330 | |
Morgan Stanley, 6.88%, Series F, Pfd. | | | 32,700 | | | | 930,642 | |
Morgan Stanley, 6.63%, Series G, Pfd. | | | 15,900 | | | | 404,973 | |
Morgan Stanley, 6.38%, Series I, Pfd. | | | 71,600 | | | | 2,015,540 | |
Stifel Financial Corp., 6.25%, Series A, Pfd. | | | 6,500 | | | | 173,680 | |
Stifel Financial Corp., 5.20%, Pfd. | | | 9,300 | | | | 239,382 | |
Stifel Financial Corp., 6.25%, Series B, Pfd. | | | 8,700 | | | | 237,771 | |
| | | | | | | | 11,047,102 | |
| | |
Leisure Products-0.08% | | | | | | | | |
| | |
Brunswick Corp., 6.50%, Pfd. | | | 8,000 | | | | 213,920 | |
Brunswick Corp., 6.63%, Pfd. | | | 5,513 | | | | 151,938 | |
Brunswick Corp., 6.38%, Pfd. | | | 9,800 | | | | 267,344 | |
| | | | | | | | 633,202 | |
| | |
Life & Health Insurance-1.06% | | | | | | | | |
| | |
Aegon N.V., 6.38%, Pfd. | | | 31,600 | | | | 800,112 | |
Athene Holding Ltd., 6.35%, Series A, Pfd. | | | 41,200 | | | | 1,158,132 | |
Athene Holding Ltd., 5.63%, Series B, Pfd. | | | 16,000 | | | | 424,160 | |
Brighthouse Financial, Inc., 6.25%, Pfd. | | | 16,400 | | | | 440,668 | |
Brighthouse Financial, Inc., 6.60%, Series A, Pfd. | | | 20,300 | | | | 566,167 | |
Globe Life, Inc., 6.13%, Pfd. | | | 13,100 | | | | 357,237 | |
MetLife, Inc., 5.63%, Series E, Pfd. | | | 38,400 | | | | 1,036,800 | |
Prudential Financial, Inc., 5.63%, Pfd. | | | 29,300 | | | | 795,202 | |
Prudential Financial, Inc., 5.75%, Pfd. | | | 23,900 | | | | 619,966 | |
Prudential Financial, Inc., 5.70%, Pfd. | | | 33,900 | | | | 879,366 | |
Prudential PLC, 6.75%, Pfd. | | | 21,500 | | | | 575,770 | |
Prudential PLC, 6.50%, Pfd. | | | 6,300 | | | | 169,659 | |
Unum Group, 6.25%, Pfd. | | | 13,100 | | | | 359,464 | |
| | | | | | | | 8,182,703 | |
| | |
Mortgage REITs-0.05% | | | | | | | | |
| | |
Wells Fargo Real Estate Investment Corp., 6.38%, Series A, Pfd. | | | 14,300 | | | | 365,508 | |
| | |
Multi-line Insurance-0.31% | | | | | | | | |
| | |
American Financial Group, Inc., 6.00%, Pfd. | | | 12,900 | | | | 335,658 | |
American Financial Group, Inc., 5.88%, Pfd. | | | 6,000 | | | | 162,480 | |
American International Group, Inc., 5.85%, Series A, Pfd. | | | 23,900 | | | | 649,363 | |
Hartford Financial Services Group, Inc. (The), 7.88%, Pfd. | | | 29,800 | | | | 847,214 | |
See accompanying Notes to Financial Statements which are an integral part of the financial statements.
23 Invesco Multi-Asset Income Fund
| | | | | | | | |
| | | Shares | | | Value | |
Multi-line Insurance-(continued) | | | | | | | | |
| | |
Hartford Financial Services Group, Inc. (The), 6.00%, Series G, Pfd. | | | 15,100 | | | $ | 411,777 | |
| | | | | | | | 2,406,492 | |
| | |
Multi-Sector Holdings-0.10% | | | | | | | | |
| | |
PartnerRe Ltd., 7.25%, Series H, Pfd. | | | 27,300 | | | | 735,735 | |
| | |
Multi-Utilities-0.58% | | | | | | | | |
| | |
Algonquin Power & Utilities Corp., 6.88%, Pfd. | | | 12,600 | | | | 352,170 | |
Algonquin Power & Utilities Corp., 6.20%, Series19-A, Pfd. | | | 15,000 | | | | 416,550 | |
CMS Energy Corp., 5.63%, Pfd. | | | 8,600 | | | | 232,716 | |
CMS Energy Corp., 5.88%, Pfd. | | | 12,200 | | | | 335,012 | |
CMS Energy Corp., 5.88%, Pfd. | | | 30,500 | | | | 852,780 | |
DTE Energy Co., 5.25%, Pfd. | | | 5,000 | | | | 127,200 | |
Integrys Holding, Inc., 6.00%, Pfd. | | | 17,750 | | | | 492,563 | |
NiSource, Inc., 6.50%, Series B, Pfd. | | | 23,900 | | | | 662,269 | |
Sempra Energy, 5.75%, Pfd. | | | 36,130 | | | | 957,445 | |
| | | | | | | | 4,428,705 | |
| | |
Office REITs-0.25% | | | | | | | | |
| | |
Boston Properties, Inc., 5.25%, Series B, Pfd. | | | 9,000 | | | | 226,620 | |
Office Properties Income Trust, 5.88%, Pfd. | | | 13,600 | | | | 354,688 | |
SL Green Realty Corp., 6.50%, Series I, Pfd. | | | 9,900 | | | | 257,598 | |
Vornado Realty Trust, 5.40%, Series L, Pfd. | | | 43,900 | | | | 1,110,670 | |
| | | | | | | | 1,949,576 | |
| | |
Office Services & Supplies-0.05% | | | | | | | | |
| | |
Pitney Bowes, Inc., 6.70%, Pfd. | | | 20,300 | | | | 421,428 | |
| |
Oil & Gas Refining & Marketing-0.11% | | | | | |
| | |
NuStar Energy L.P., 8.50%, Series A, Pfd. | | | 21,800 | | | | 529,958 | |
NuStar Energy L.P., 9.00%, Series C, Pfd. | | | 7,700 | | | | 191,961 | |
NuStar Energy L.P., 7.63%, Series B, Pfd. | | | 5,000 | | | | 113,050 | |
| | | | | | | | 834,969 | |
| |
Oil & Gas Storage & Transportation-0.41% | | | | | |
| | |
DCP Midstream, L.P., 7.88%, Series B, Pfd. | | | 7,100 | | | | 174,447 | |
DCP Midstream, L.P., 7.95%, Series C, Pfd. | | | 4,800 | | | | 120,144 | |
Enbridge, Inc., 6.38%, Series B, Pfd. | | | 28,600 | | | | 785,356 | |
Energy Transfer Operating, L.P., 7.38%, Series C, Pfd. | | | 19,700 | | | | 477,134 | |
Energy Transfer Operating, L.P., 7.63%, Series D, Pfd. | | | 19,400 | | | | 478,792 | |
Energy Transfer Operating, L.P., 7.60%, Series E, Pfd. | | | 38,200 | | | | 965,696 | |
Targa Resources Partners L.P., 9.00%, Series A, Pfd. | | | 6,200 | | | | 170,066 | |
| | | | | | | | 3,171,635 | |
| | | | | | | | |
| | | Shares | | | Value | |
Other Diversified Financial Services-0.09% | | | | | |
| | |
National Rural Utilities Cooperative Finance Corp., 5.50%, Pfd. | | | 10,900 | | | $ | 300,840 | |
Voya Financial, Inc., 5.35%, Series B, Pfd. | | | 13,100 | | | | 355,141 | |
| | | | | | | | 655,981 | |
| |
Property & Casualty Insurance-1.05% | | | | | |
| | |
Allstate Corp. (The), 5.63%, Series G, Pfd. | | | 33,400 | | | | 903,804 | |
Allstate Corp. (The), 5.10%, Pfd. | | | 21,800 | | | | 575,956 | |
Allstate Corp. (The), 5.63%, Series A, Pfd. | | | 12,600 | | | | 332,766 | |
Allstate Corp. (The), 5.10%, Series H, Pfd. | | | 53,700 | | | | 1,408,551 | |
Arch Capital Group Ltd., 5.25%, Series E, Pfd. | | | 19,700 | | | | 502,350 | |
Arch Capital Group Ltd., 5.45%, Series F, Pfd. | | | 17,900 | | | | 464,505 | |
Argo Group U.S., Inc., 6.50%, Pfd. | | | 6,800 | | | | 176,256 | |
Aspen Insurance Holdings Ltd., 5.63%, Pfd. | | | 14,000 | | | | 364,560 | |
Aspen Insurance Holdings Ltd., 5.95%, Pfd. | | | 12,000 | | | | 323,520 | |
Aspen Insurance Holdings Ltd., 5.63%, Pfd. | | | 10,900 | | | | 285,798 | |
Assured Guaranty Municipal Holdings, Inc., 6.25%, Pfd. | | | 17,300 | | | | 453,260 | |
AXIS Capital Holdings Ltd., 5.50%, Series E, Pfd. | | | 37,000 | | | | 955,710 | |
Hanover Insurance Group, Inc. (The), 6.35%, Pfd. | | | 7,300 | | | | 187,975 | |
W. R. Berkley Corp., 5.75%, Pfd. | | | 21,500 | | | | 556,850 | |
W. R. Berkley Corp., 5.70%, Pfd. | | | 8,000 | | | | 211,360 | |
W. R. Berkley Corp., 5.63%, Pfd. | | | 13,600 | | | | 341,496 | |
| | | | | | | | 8,044,717 | |
| |
Real Estate Operating Companies-0.07% | | | | | |
| | |
Brookfield Property Partners L.P., 6.50%, SeriesA-1, Pfd. | | | 8,100 | | | | 216,351 | |
Brookfield Property Partners L.P., 6.38%, Series A2, Pfd. | | | 11,000 | | | | 301,730 | |
| | | | | | | | 518,081 | |
| | |
Regional Banks-1.91% | | | | | | | | |
| | |
Associated Banc-Corp., 5.88%, Series E, Pfd. | | | 4,300 | | | | 116,272 | |
BB&T Corp., 5.63%, Series H, Pfd. | | | 59,300 | | | | 1,577,973 | |
BB&T Corp., 5.20%, Series G, Pfd. | | | 11,300 | | | | 288,489 | |
BOK Financial Corp., 5.38%, Pfd. | | | 7,100 | | | | 184,174 | |
Citizens Financial Group, Inc., 6.35%, Series D, Pfd. | | | 13,400 | | | | 375,870 | |
Commerce Bancshares, Inc., 6.00%, Series B, Pfd. | | | 6,900 | | | | 181,470 | |
Cullen/Frost Bankers, Inc., 5.38%, Pfd. | | | 7,100 | | | | 184,529 | |
Fifth Third Bancorp, 6.63%, Series I, Pfd. | | | 19,700 | | | | 561,844 | |
Fifth Third Bancorp, 6.00%, Series A, Pfd. | | | 8,800 | | | | 241,648 | |
Fifth Third Bancorp, 4.95%, Series K, Pfd. | | | 11,900 | | | | 310,471 | |
First Horizon National Corp., 6.20%, Series A, Pfd. | | | 4,500 | | | | 115,425 | |
First Republic Bank, 5.50%, Series G, Pfd. | | | 6,600 | | | | 171,996 | |
See accompanying Notes to Financial Statements which are an integral part of the financial statements.
24 Invesco Multi-Asset Income Fund
| | | | | | | | |
| | | Shares | | | Value | |
Regional Banks-(continued) | | | | | |
| | |
First Republic Bank, 5.13%, Series H, Pfd. | | | 8,800 | | | $ | 229,240 | |
First Republic Bank, 5.50%, Series I, Pfd. | | | 13,100 | | | | 348,460 | |
First Republic Bank, 5.70%, Series F, Pfd. | | | 4,200 | | | | 108,570 | |
FNB Corp., 7.25%, Pfd. | | | 5,600 | | | | 166,880 | |
Hancock Whitney Corp., 5.95%, Pfd. | | | 6,200 | | | | 160,890 | |
Huntington Bancshares, Inc., 6.25%, Series D, Pfd. | | | 22,400 | | | | 587,104 | |
Huntington Bancshares, Inc., 5.88%, Series C, Pfd. | | | 8,200 | | | | 218,940 | |
IBERIABANK Corp., 6.10%, Series D, Pfd. | | | 4,400 | | | | 116,996 | |
KeyCorp, 6.13%, Series E, Pfd. | | | 23,800 | | | | 713,524 | |
KeyCorp, 5.65%, Series F, Pfd. | | | 20,300 | | | | 541,401 | |
KeyCorp, 5.63%, Series G, Pfd. | | | 19,700 | | | | 527,960 | |
People’s United Financial, Inc., 5.63%, Series A, Pfd. | | | 10,500 | | | | 282,765 | |
PNC Financial Services Group, Inc. (The), 6.13%, Series P, Pfd. | | | 78,800 | | | | 2,142,572 | |
PNC Financial Services Group, Inc. (The), 5.38%, Series Q, Pfd. | | | 14,600 | | | | 377,702 | |
Regions Financial Corp., 6.38%, Series A, Pfd. | | | 18,300 | | | | 471,957 | |
Regions Financial Corp., 6.38%, Series B, Pfd. | | | 28,600 | | | | 816,530 | |
Regions Financial Corp., 5.70%, Series C, Pfd. | | | 23,900 | | | | 654,860 | |
Synovus Financial Corp., 6.30%, Series D, Pfd. | | | 8,600 | | | | 228,072 | |
Synovus Financial Corp., 5.88%, Series E, Pfd. | | | 15,300 | | | | 404,532 | |
TCF Financial Corp., 5.70%, Series C, Pfd. | | | 7,900 | | | | 211,325 | |
Texas Capital Bancshares, Inc., 6.50%, Series A, Pfd. | | | 12,500 | | | | 328,625 | |
Valley National Bancorp, 5.50%, Series B, Pfd. | | | 4,400 | | | | 114,312 | |
Valley National Bancorp, 6.25%, Series A, Pfd. | | | 5,050 | | | | 148,571 | |
Webster Financial Corp., 5.25%, Series F, Pfd. | | | 6,300 | | | | 163,800 | |
Wintrust Financial Corp., 6.50%, Series D, Pfd. | | | 5,400 | | | | 157,842 | |
Zions Bancorp. N.A., 6.30%, Series G, Pfd. | | | 5,800 | | | | 161,124 | |
| | | | | | | | 14,694,715 | |
| | |
Reinsurance-0.32% | | | | | | | | |
| | |
Enstar Group Ltd., 7.00%, Series D, Pfd. | | | 17,500 | | | | 478,800 | |
Enstar Group Ltd., 7.00%, Series E, Pfd. | | | 4,800 | | | | 129,600 | |
Reinsurance Group of America, Inc., 5.75%, Pfd. | | | 23,900 | | | | 674,458 | |
Reinsurance Group of America, Inc., 6.20%, Pfd. | | | 15,600 | | | | 425,256 | |
RenaissanceRe Holdings Ltd., 5.75%, Series F, Pfd. | | | 11,800 | | | | 318,718 | |
RenaissanceRe Holdings Ltd., 5.38%, Series E, Pfd. | | | 17,100 | | | | 432,288 | |
| | | | | | | | 2,459,120 | |
| | | | | | | | |
| | | Shares | | | Value | |
Residential REITs-0.14% | | | | | |
| | |
American Homes 4 Rent, 5.88%, Series F, Pfd. | | | 8,300 | | | $ | 216,962 | |
American Homes 4 Rent, 5.88%, Series G, Pfd. | | | 4,500 | | | | 119,475 | |
American Homes 4 Rent, 6.50%, Series D, Pfd. | | | 12,100 | | | | 324,159 | |
American Homes 4 Rent, 6.35%, Series E, Pfd. | | | 10,600 | | | | 281,748 | |
American Homes 4 Rent, 6.25%, Series H, Pfd. | | | 4,000 | | | | 107,720 | |
| | | | | | | | 1,050,064 | |
| | |
Retail REITs-0.34% | | | | | | | | |
| | |
Federal Realty Investment Trust, 5.00%, Series C, Pfd. | | | 6,600 | | | | 169,620 | |
Kimco Realty Corp., 5.13%, Series L, Pfd. | | | 13,800 | | | | 350,520 | |
Kimco Realty Corp., 5.25%, Class M, Pfd. | | | 13,800 | | | | 357,972 | |
Kimco Realty Corp., 5.50%, Series J, Pfd. | | | 9,900 | | | | 251,064 | |
National Retail Properties, Inc., 5.20%, Series F, Pfd. | | | 19,100 | | | | 494,690 | |
SITE Centers Corp., 6.50%, Series J, Pfd. | | | 8,800 | | | | 221,144 | |
SITE Centers Corp., 6.38%, Series A, Pfd. | | | 11,600 | | | | 313,200 | |
SITE Centers Corp., 6.25%, Series K, Pfd. | | | 7,200 | | | | 184,824 | |
Spirit Realty Capital, Inc., 6.00%, Series A, Pfd. | | | 7,800 | | | | 203,814 | |
Washington Prime Group, Inc., 7.50%, Series H, Pfd. | | | 4,400 | | | | 100,320 | |
| | | | | | | | 2,647,168 | |
| | |
Specialized REITs-0.81% | | | | | | | | |
| | |
Digital Realty Trust, Inc., 5.25%, Series J, Pfd. | | | 15,600 | | | | 407,316 | |
Digital Realty Trust, Inc., 6.63%, Series C, Pfd. | | | 10,900 | | | | 290,267 | |
Digital Realty Trust, Inc., 5.88%, Series G, Pfd. | | | 10,600 | | | | 268,922 | |
Digital Realty Trust, Inc., 5.85%, Series K, Pfd. | | | 10,900 | | | | 297,897 | |
Digital Realty Trust, Inc., 5.20%, Series L, Pfd. | | | 14,300 | | | | 371,800 | |
EPR Properties, 5.75%, Series G, Pfd. | | | 6,300 | | | | 165,375 | |
Public Storage, 5.40%, Series B, Pfd. | | | 24,900 | | | | 644,910 | |
Public Storage, 5.13%, Series C, Pfd. | | | 22,600 | | | | 581,046 | |
Public Storage, 4.95%, Series D, Pfd. | | | 29,500 | | | | 753,725 | |
Public Storage, 4.90%, Series E, Pfd. | | | 35,800 | | | | 909,320 | |
Public Storage, 5.15%, Series F, Pfd. | | | 9,700 | | | | 254,528 | |
Public Storage, 5.05%, Series G, Pfd. | | | 11,600 | | | | 299,976 | |
Public Storage, 5.88%, Series A, Pfd. | | | 8,400 | | | | 212,268 | |
Public Storage, 5.20%, Series W, Pfd. | | | 7,700 | | | | 195,426 | |
Public Storage, 5.60%, Series H, Pfd. | | | 10,900 | | | | 301,603 | |
Public Storage, 4.88%, Series I, Pfd. | | | 12,000 | | | | 314,160 | |
| | | | | | | | 6,268,539 | |
| | |
Specialty Stores-0.03% | | | | | | | | |
| | |
QVC, Inc., 6.38%, Pfd. | | | 10,000 | | | | 265,000 | |
See accompanying Notes to Financial Statements which are an integral part of the financial statements.
25 Invesco Multi-Asset Income Fund
| | | | | | | | |
| | | Shares | | | Value | |
Thrifts & Mortgage Finance-0.09% | | | | | |
| | |
New York Community Bancorp, Inc., 6.38%, Series A, Pfd. | | | 24,600 | | | $ | 686,832 | |
| |
Trading Companies & Distributors-0.08% | | | | | |
| | |
Air Lease Corp., 6.15%, Series A, Pfd. | | | 10,900 | | | | 295,717 | |
GATX Corp., 5.63%, Pfd. | | | 6,800 | | | | 182,920 | |
Triton International Ltd., 8.00%, Pfd. | | | 6,300 | | | | 166,950 | |
| | | | | | | | 645,587 | |
|
Wireless Telecommunication Services-0.29% | |
| | |
Telephone & Data Systems, Inc., 7.00%, Pfd. | | | 19,100 | | | | 485,904 | |
Telephone & Data Systems, Inc., 5.88%, Pfd. | | | 13,100 | | | | 327,893 | |
Telephone & Data Systems, Inc., 6.88%, Pfd. | | | 10,300 | | | | 261,620 | |
United States Cellular Corp., 7.25%, Pfd. | | | 19,100 | | | | 520,857 | |
United States Cellular Corp., 6.95%, Pfd. | | | 9,300 | | | | 236,964 | |
United States Cellular Corp., 7.25%, Pfd. | | | 15,500 | | | | 405,325 | |
| | | | | | | | 2,238,563 | |
Total Preferred Stocks (Cost $153,391,681) | | | | 158,387,765 | |
|
Common Stocks & Other Equity Interests-7.23% | |
| | |
Industrial REITs-0.43% | | | | | | | | |
| | |
Hannon Armstrong Sustainable Infrastructure Capital, Inc. | | | 112,370 | | | | 3,355,368 | |
| | |
Mortgage REITs-6.80% | | | | | | | | |
| | |
AG Mortgage Investment Trust, Inc. | | | 58,672 | | | | 917,630 | |
AGNC Investment Corp. | | | 163,289 | | | | 2,784,077 | |
Annaly Capital Management, Inc. | | | 423,119 | | | | 3,799,609 | |
Anworth Mortgage Asset Corp. | | | 117,748 | | | | 402,698 | |
Apollo Commercial Real Estate Finance, Inc. | | | 146,691 | | | | 2,684,445 | |
Arbor Realty Trust, Inc. | | | 215,114 | | | | 2,938,457 | |
Ares Commercial Real Estate Corp. | | | 35,650 | | | | 552,575 | |
Blackstone Mortgage Trust, Inc., Class A | | | 88,842 | | | | 3,224,965 | |
Capstead Mortgage Corp. | | | 137,110 | | | | 1,059,860 | |
Cherry Hill Mortgage Investment Corp. | | | 28,078 | | | | 379,615 | |
Chimera Investment Corp. | | | 174,543 | | | | 3,536,241 | |
Dynex Capital, Inc. | | | 28,527 | | | | 460,996 | |
Ellington Residential Mortgage REIT | | | 47,818 | | | | 519,782 | |
Granite Point Mortgage Trust, Inc. | | | 55,020 | | | | 1,023,372 | |
KKR Real Estate Finance Trust, Inc. | | | 50,877 | | | | 1,020,084 | |
Ladder Capital Corp. | | | 168,274 | | | | 2,906,092 | |
MFA Financial, Inc. | | | 381,762 | | | | 2,897,574 | |
New Residential Investment Corp. | | | 213,944 | | | | 3,388,873 | |
New York Mortgage Trust, Inc. | | | 164,358 | | | | 1,028,881 | |
Orchid Island Capital, Inc. | | | 155,462 | | | | 865,923 | |
PennyMac Mortgage Investment Trust | | | 126,032 | | | | 2,884,873 | |
Ready Capital Corp. | | | 34,597 | | | | 547,671 | |
Redwood Trust, Inc. | | | 157,113 | | | | 2,567,226 | |
Starwood Property Trust, Inc. | | | 144,310 | | | | 3,550,026 | |
TPG RE Finance Trust, Inc. | | | 140,199 | | | | 2,836,226 | |
Two Harbors Investment Corp. | | | 217,547 | | | | 3,017,377 | |
| | | | | | | | |
| | | Shares | | | Value | |
| | |
Mortgage REITs-(continued) | | | | | | | | |
Western Asset Mortgage Capital Corp. | | | 50,627 | | | $ | 508,295 | |
| | | | | | | | 52,303,443 | |
Total Common Stocks & Other Equity Interests (Cost $51,473,425) | | | | 55,658,811 | |
| | |
| | | Principal | | | | |
| | | Amount | | | | |
|
U.S. Treasury Securities-6.31% | |
| | |
U.S. Treasury Bills-0.05% | | | | | | | | |
| | |
1.92% - 2.08%, 12/19/2019(g) | | $ | 390,000 | | | | 388,971 | |
| | |
U.S. Treasury Bonds-6.26% | | | | | | | | |
| | |
4.25%, 11/15/2040 | | | 35,100,000 | | | | 48,158,982 | |
Total U.S. Treasury Securities (Cost $46,702,299) | | | | | | | 48,547,953 | |
|
Exchange-Traded Notes-1.79% | |
| | |
ETRACS Alerian MLP Index ETN (linked to the Alerian MLP Index - 0.14%) , 8.60%, 11/01/2019 (Cost $ 14,550,000) | | | 14,550,000 | | | | 13,740,429 | |
| | |
| | | Shares | | | | |
|
Exchange-Traded Funds-1.74% | |
| | |
Vanguard Real Estate ETF | | | 91,000 | | | | 8,581,300 | |
Alerian MLP ETF | | | 560,000 | | | | 4,782,400 | |
Total Exchange-Traded Funds
(Cost $13,019,280) | | | | 13,363,700 | |
| | |
| | | Principal | | | | |
| | | Amount | | | | |
|
Asset-Backed Securities-0.37% | |
| | |
Apidos CLO XV, Series2013-15A, Class CRR, 3.82% (3 mo. USD LIBOR + 1.85%), 04/20/2031(b)(f) | | $ | 522,000 | | | | 494,479 | |
Bain Capital Credit CLO, Ltd. (Cayman Islands), | | | | | | | | |
Series2019-1A, Class C, 4.75% (3 mo. USD LIBOR + 2.75%), 04/18/2032(b)(f) | | | 485,000 | | | | 485,281 | |
Series2019-3A, Class C, 1.00% (3 mo. USD LIBOR + 2.85%), 10/21/2032(b)(f) | | | 344,000 | | | | 344,170 | |
Magnetite XXIII Ltd., Series2019-23A, Class C, 1.00% (3 mo. USD LIBOR + 2.40%), 10/25/2032(b)(f) | | | 524,000 | | | | 525,965 | |
Neuberger Berman Loan Advisers CLO 34 Ltd., Series2019-34A, Class C1, 1.00% (3 mo. USD LIBOR + 2.60%), 01/20/2033(b)(f) | | | 525,000 | | | | 525,262 | |
Octagon Investment Partners XVII Ltd., Series2013-1A, Class CR2, 3.64% (3 mo. USD LIBOR + 1.70%),
01/25/2031(b)(f) | | | 514,558 | | | | 482,101 | |
Total Asset-Backed Securities
(Cost $2,873,186) | | | | 2,857,258 | |
|
Non-U.S. Dollar Denominated Bonds & Notes-0.10%(h) | |
| | |
Diversified Banks-0.03% | | | | | | | | |
Erste Group Bank AG (Austria), 6.50%(b)(d) | | EUR | 200,000 | | | | 257,039 | |
See accompanying Notes to Financial Statements which are an integral part of the financial statements.
26 Invesco Multi-Asset Income Fund
| | | | | | | | | | |
| | | | | Principal Amount | | | Value | |
Food Retail-0.04% | | | | | | | | | | |
| | | |
Iceland Bondco PLC (United Kingdom), 4.63%, 03/15/2025(b) | | GBP | | | 250,000 | | | $ | 267,166 | |
| |
Other Diversified Financial Services–0.02% | | | | | |
| | | |
eG Global Finance PLC (United Kingdom), 6.25%, 10/30/2025(b) | | EUR | | | 100,000 | | | | 115,487 | |
| | | |
Textiles-0.01% | | | | | | | | | | |
| | | |
Eagle Intermediate Global Holding B.V./Ruyi US Finance LLC (China), 5.38%, 05/01/2023(b) | | EUR | | | 100,000 | | | | 94,800 | |
TotalNon-U.S. Dollar Denominated Bonds & Notes (Cost $816,593) | | | | | | | | | 734,492 | |
|
U.S. Government Sponsored Agency Mortgage-Backed Securities-0.01% | |
| | | |
Freddie Mac Multifamily Connecticut Avenue Securities Trust, Series2019-01, Class M10, 5.05% (1 mo. USD LIBOR + 3.25%), 10/15/2049(b)(f)(Cost $107,000) | | | | $ | 107,000 | | | | 107,000 | |
| | | | | | | | | | |
| | | | | Shares | | | Value | |
| |
Money Market Funds-7.77% | | | | | |
| | | |
Invesco Government & Agency Portfolio, Institutional Class, 1.71%(i) | | | | | 20,918,386 | | | $ | 20,918,386 | |
| |
Invesco Liquid Assets Portfolio, Institutional Class, 1.90%(i) | | | | | 14,943,818 | | | | 14,949,795 | |
| |
Invesco Treasury Portfolio, Institutional Class, 1.66%(i) | | | | | 23,906,727 | | | | 23,906,727 | |
| |
Total Money Market Funds
(Cost $59,773,514) | | | | 59,774,908 | |
| |
| | | |
Options Purchased-0.02% | | | | | | | | | | |
(Cost $142,800)(j) | | | | | | | | | 155,459 | |
| |
TOTAL INVESTMENTS IN SECURITIES-102.17%
(Cost $772,555,997) | | | | | | | | | 786,136,158 | |
| |
OTHER ASSETS LESS LIABILITIES-(2.17)% | | | | | | | | | (16,683,817 | ) |
| |
NET ASSETS-100.00% | | | | | | | | $ | 769,452,341 | |
| |
| | |
| Investment Abbreviations: |
| |
| CLO | | - Collateralized Loan Obligation |
| Conv. | | - Convertible |
| ETF | | - Exchange-Traded Fund |
| ETN | | - Exchange Traded Notes |
| EUR | | - Euro |
| GBP | | - British Pound Sterling |
| LIBOR - London Interbank Offered Rate |
| MLP | | - Master Limited Partnership |
| Pfd. | | - Preferred |
| PIK | | -Pay-in-Kind |
| REIT | | - Real Estate Investment Trust |
| USD | | - U.S. Dollar |
Notes to Schedule of Investments:
| (a) | Industry and/or sector classifications used in this report are generally according to the Global Industry Classification Standard, which was developed by and is the exclusive property and a service mark of MSCI Inc. and Standard & Poor’s. |
| (b) | Security purchased or received in a transaction exempt from registration under the Securities Act of 1933, as amended (the “1933 Act”). The security may be resold pursuant to an exemption from registration under the 1933 Act, typically to qualified institutional buyers. The aggregate value of these securities at October 31, 2019 was $260,374,731, which represented 33.84% of the Fund’s Net Assets. |
| (c) | All or a portion of this security isPay-in-Kind.Pay-in-Kind securities pay interest income in the form of securities. |
| (d) | Perpetual bond with no specified maturity date. |
| (e) | Zero coupon bond issued at a discount. The interest rate shown represents the yield to maturity at issue. |
| (f) | Interest or dividend rate is redetermined periodically. Rate shown is the rate in effect on October 31, 2019. |
| (g) | Security traded on a discount basis. The interest rate shown represents the discount rate at the time of purchase by the Fund. |
| (h) | Foreign denominated security. Principal amount is denominated in the currency indicated. |
| (i) | The money market fund and the Fund are affiliated by having the same investment adviser. The rate shown is the7-day SEC standardized yield as of October 31, 2019. |
| (j) | The table below details options purchased. |
| | | | | | | | | | | | | | | | | | | | | | | | | | | | | | | | | | |
| OpenOver-The-Counter Credit Default Swaptions Purchased | |
| Counterparty | | Type of
Contract | | | Exercise
Rate | | | Reference Entity | | (Pay)/
Receive
Fixed
Rate | | | Payment Frequency | | | Expiration
Date | | | Implied
Credit
Spread(a)
| | | Notional
Value | | | Value | |
Credit Risk | | | | | | | | | | | | | | | | | | | | | | | | | | | | | | | | | | |
Citibank N.A. | | | Put | | | | 106.00 | % | | Markit CDX North American High Yield Index, Series 33 | | | 5.00 | % | | | Quarterly | | | | 01/15/2020 | | | | 1.072 | % | | $ | 17,000,000 | | | $ | 155,459 | |
See accompanying Notes to Financial Statements which are an integral part of the financial statements.
27 Invesco Multi-Asset Income Fund
| (a) | Implied credit spreads represent the current level, as of October 31, 2019, at which protection could be bought or sold given the terms of the existing credit default swap agreement and serve as an indicator of the current status of the payment/performance risk of the credit default swap agreement. An implied credit spread that has widened or increased since entry into the initial agreement may indicate a deteriorating credit profile and increased risk of default for the reference entity. A declining or narrowing spread may indicate an improving credit profile or decreased risk of default for the reference entity. Alternatively, credit spreads may increase or decrease reflecting the general tolerance for risk in the credit markets generally. |
| | | | | | | | | | | | | | | | | | | | | | | | | | | | | | | | | | | | | | | | | | |
OpenOver-The-Counter Credit Default Swaptions Written | |
| | | | | | | | | | | (Pay)/ | | | | | | | | | | | | | | | | | | | | | | |
| | | | | | | | | | | Receive | | | | | | | | | Implied | | | | | | | | | | | | Unrealized | |
| | | Type of | | | Exercise | | | Reference | | Fixed | | | Payment | | | Expiration | | | Credit | | | Premiums | | | Notional | | | | | | Appreciation | |
| Counterparty | | Contract | | | Rate | | | Entity | | Rate | | | Frequency | | | Date | | | Spread(a) | | | Received | | | Value | | | Value | | | (Depreciation) | |
| Credit Risk | | | | | | | | | | | | | | | | | | | | | | | | | | | | | | | | | | | | | | | | | | |
| Citibank N.A. | | | Put | | | | 103.50 | % | | Markit CDX North American
High Yield Index, Series 33 | | | 5.00 | % | | | Quarterly | | | | 01/15/2020 | | |
| 1.072
| %
| | $ | (56,525 | ) | | $ | (17,000,000 | ) | | $ | (64,398 | ) | | $ | (7,873 | ) |
| (a) | Implied credit spreads represent the current level, as of October 31, 2019, at which protection could be bought or sold given the terms of the existing credit default swap agreement and serve as an indicator of the current status of the payment/performance risk of the credit default swap agreement. An implied credit spread that has widened or increased since entry into the initial agreement may indicate a deteriorating credit profile and increased risk of default for the reference entity. A declining or narrowing spread may indicate an improving credit profile or decreased risk of default for the reference entity. Alternatively, credit spreads may increase or decrease reflecting the general tolerance for risk in the credit markets generally. |
| | | | | | | | | | | | | | | | | | | | |
Open Futures Contracts(a) | |
| |
| | | | | | | | | | | | | | | Unrealized | |
| | | Number of | | | Expiration | | | Notional | | | | | | Appreciation | |
| Long Futures Contracts | | Contracts | | | Month | | | Value | | | Value | | | (Depreciation) | |
| |
Equity Risk | | | | | | | | | | | | | | | | | | | | |
| |
E-Mini Russell 2000 Index | | | 132 | | | | December-2019 | | | $ | 10,318,440 | | | $ | 206,530 | | | $ | 206,530 | |
| |
E-Mini S&P 500 Index | | | 219 | | | | December-2019 | | | | 33,242,010 | | | | 349,408 | | | | 349,408 | |
| |
EURO STOXX 50 Index | | | 877 | | | | December-2019 | | | | 35,300,272 | | | | 1,052,860 | | | | 1,052,860 | |
| |
FTSE 100 Index | | | 439 | | | | December-2019 | | | | 41,205,012 | | | | (409,635 | ) | | | (409,635 | ) |
| |
Hang Seng Index | | | 64 | | | | November-2019 | | | | 11,019,570 | | | | 64,307 | | | | 64,307 | |
| |
Tokyo Stock Price Index | | | 267 | | | | December-2019 | | | | 41,252,848 | | | | 2,961,217 | | | | 2,961,217 | |
| |
Subtotal | | | | | | | | | | | | | | | 4,224,687 | | | | 4,224,687 | |
| |
Interest Rate Risk | | | | | | | | | | | | | | | | | | | | |
| |
Long Gilt | | | 111 | | | | December-2019 | | | | 19,100,250 | | | | (253,234 | ) | | | (253,234 | ) |
| |
Subtotal-Long Futures Contracts | | | | | | | | | | | | | | | 3,971,453 | | | | 3,971,453 | |
| |
| | | | | |
Short Futures Contracts | | | | | | | | | | | | | | | | | | | | |
| |
Interest Rate Risk | | | | | | | | | | | | | | | | | | | | |
| |
Euro-Bund | | | 48 | | | | December-2019 | | | | (9,195,066 | ) | | | 91,874 | | | | 91,874 | |
| |
U.S. Treasury Long Bonds | | | 30 | | | | December-2019 | | | | (4,841,250 | ) | | | (19,671 | ) | | | (19,671 | ) |
| |
Subtotal-Short Futures Contracts | | | | | | | | | | | | | | | 72,203 | | | | 72,203 | |
| |
Total Futures Contracts | | | | | | | | | | | | | | $ | 4,043,656 | | | $ | 4,043,656 | |
| |
| (a) | Futures contracts collateralized by $9,700,000 cash held with Goldman Sachs & Co. LLC, the futures commission merchant. |
| | | | | | | | | | | | | | |
| Open Forward Foreign Currency Contracts | |
| | | | | | | | | | | Unrealized | |
| Settlement | | | | Contract to | | | Appreciation | |
| Date | | Counterparty | | Deliver | | | Receive | | | (Depreciation) | |
Currency Risk | | | | | | | | | | | | | | |
11/29/2019 | | Goldman Sachs International | | EUR | 1,115,981 | | | USD | 1,247,799 | | | $ | 1,136 | |
| | | | |
Currency Risk | | | | | | | | | | | | | | |
11/29/2019 | | Goldman Sachs International | | GBP | 164,512 | | | USD | 201,777 | | | | (11,489 | ) |
Total Forward Foreign Currency Contracts | | | $ | (10,353 | ) |
See accompanying Notes to Financial Statements which are an integral part of the financial statements.
28 Invesco Multi-Asset Income Fund
| | | | | | | | | | | | | | | | | | | | | | | | | | | | | | | | | | | | | | | | | | | | | | | | | | |
| OpenOver-The-Counter Total Return Swap Agreements(a) |
| | | | | | | | | | | | | | | | | Upfront | | | | |
| | | | | | | | | | | | | | | | | Payments | | | | |
| | | Pay/ | | | | Fixed | | Payment | | Number of | | | | | | Paid | | | | Unrealized |
| Counterparty | | Receive | | Reference Entity | | Rate | | Frequency | | Contracts | | Maturity Date | | Notional Value | | (Received) | | Value | | Appreciation |
Equity Risk | | | | | | | | | | | | | | | | | | | | | | | | | | | | | | | | | | | | | | | | | | | | | | | | | | |
Morgan Stanley & Co. International PLC | | | | Receive | | | |
| Markit iBoxx USD Liquid
Leveraged Loan Index |
| | | | 1.00 | % | | | | Quarterly | | | | | 8,958 | | | | | December-2019 | | | | $ | 1,560,000 | | | | $ | - | | | | $ | 660 | | | | $ | 660 | |
| (a) | The Fund receives or pays payments based on any positive or negative return on the Reference Entity, respectively. |
Abbreviations:
EUR –Euro
GBP –British Pound Sterling
USD –U.S. Dollar
See accompanying Notes to Financial Statements which are an integral part of the financial statements.
29 Invesco Multi-Asset Income Fund
Statement of Assets and Liabilities
October 31, 2019
| | | | | |
Assets: | |
| |
Investments in securities, at value
(Cost $712,782,483) | | | $ | 726,361,250 | |
Investments in affiliated money market funds, at value (Cost $59,773,514) | | | | 59,774,908 | |
Other investments: | | | | | |
Unrealized appreciation on swap agreements - OTC | | | | 660 | |
Unrealized appreciation on forward foreign
currency contracts outstanding | | | | 1,136 | |
Deposits with brokers: | | | | | |
Cash collateral - exchange-traded futures contracts | | | | 9,700,000 | |
Cash | | | | 9,504 | |
Foreign currencies, at value (Cost $948,616) | | | | 963,351 | |
Receivable for: | | | | | |
Interest | | | | 5,065,694 | |
Fund shares sold | | | | 1,624,040 | |
Dividends | | | | 576,202 | |
Investments sold | | | | 378,553 | |
Fund expenses absorbed | | | | 10,154 | |
Investment for trustee deferred compensation
and retirement plans | | | | 35,028 | |
Other assets | | | | 25,237 | |
Total assets | | | | 804,525,717 | |
|
Liabilities: | |
| |
Other investments: | | | | | |
Options written, at value (premiums received $56,525) | | | | 64,398 | |
Variation margin payable - futures contracts | | | | 299,028 | |
Unrealized depreciation on forward foreign
currency contracts outstanding | | | | 11,489 | |
Swaps payable - OTC | | | | 3,620 | |
Payable for: | | | | | |
Investments purchased | | | | 33,487,507 | |
Fund shares reacquired | | | | 435,924 | |
Accrued fees to affiliates | | | | 387,733 | |
Accrued trustees’ and officers’ fees and benefits | | | | 1,724 | |
Accrued other operating expenses | | | | 342,376 | |
Trustee deferred compensation and retirement plans | | | | 39,577 | |
Total liabilities | | | | 35,073,376 | |
Net assets applicable to shares outstanding | | | $ | 769,452,341 | |
| | | | |
Net assets consist of: | |
| |
Shares of beneficial interest | | $ | 776,564,385 | |
| |
Distributable earnings (loss) | | | (7,112,044 | ) |
| |
| | $ | 769,452,341 | |
| |
|
Net Assets: | |
| |
Class A | | $ | 188,655,220 | |
| |
Class C | | $ | 118,618,573 | |
| |
Class R | | $ | 5,202,258 | |
| |
Class Y | | $ | 397,302,834 | |
| |
Class R5 | | $ | 104,392 | |
| |
Class R6 | | $ | 59,569,064 | |
| |
|
Shares outstanding, no par value, with an unlimited number of shares authorized: | |
| |
Class A | | | 17,490,635 | |
| |
Class C | | | 11,007,293 | |
| |
Class R | | | 482,426 | |
| |
Class Y | | | 36,828,690 | |
| |
Class R5 | | | 9,672 | |
| |
Class R6 | | | 5,521,621 | |
| |
Class A: | | | | |
Net asset value per share | | $ | 10.79 | |
| |
Maximum offering price per share
(Net asset value of $10.79 ÷ 94.50%) | | $ | 11.42 | |
| |
Class C: | | | | |
| |
Net asset value and offering price per share | | $ | 10.78 | |
| |
Class R: | | | | |
Net asset value and offering price per share | | $ | 10.78 | |
| |
Class Y: | | | | |
Net asset value and offering price per share | | $ | 10.79 | |
| |
Class R5: | | | | |
Net asset value and offering price per share | | $ | 10.79 | |
| |
Class R6: | | | | |
Net asset value and offering price per share | | $ | 10.79 | |
| |
See accompanying Notes to Financial Statements which are an integral part of the financial statements.
30 Invesco Multi-Asset Income Fund
Statement of Operations
For the year ended October 31, 2019
| | | | |
Investment income: | | | | |
| |
Interest | | $ | 22,358,611 | |
| |
Dividends | | | 14,723,153 | |
| |
Dividends from affiliated money market funds | | | 702,307 | |
| |
Total investment income | | | 37,784,071 | |
| |
| |
Expenses: | | | | |
Advisory fees | | | 3,058,241 | |
| |
Administrative services fees | | | 100,487 | |
| |
Custodian fees | | | 23,675 | |
| |
Distribution fees: | | | | |
Class A | | | 373,104 | |
| |
Class C | | | 940,265 | |
| |
Class R | | | 15,491 | |
| |
Transfer agent fees – A, C, R and Y | | | 708,193 | |
| |
Transfer agent fees – R5 | | | 103 | |
| |
Transfer agent fees – R6 | | | 2,022 | |
| |
Trustees’ and officers’ fees and benefits | | | 26,441 | |
| |
Registration and filing fees | | | 105,444 | |
| |
Licensing fees | | | 244,983 | |
| |
Reports to shareholders | | | 61,801 | |
| |
Professional services fees | | | 66,716 | |
| |
Other | | | 34,374 | |
| |
Total expenses | | | 5,761,340 | |
| |
Less: Fees waived and/or expense offset arrangement(s) | | | (724,258 | ) |
| |
Net expenses | | | 5,037,082 | |
| |
Net investment income | | | 32,746,989 | |
| |
| |
Realized and unrealized gain (loss) from: | | | | |
| |
Net realized gain (loss) from: | | | | |
Investment securities | | | (4,060,440 | ) |
| |
Foreign currencies | | | (3,342 | ) |
| |
Forward foreign currency contracts | | | 135,771 | |
| |
Futures contracts | | | (4,419,407 | ) |
| |
Option contracts written | | | 43,591 | |
| |
Swap agreements | | | 73,029 | |
| |
| | | (8,230,798 | ) |
| |
Change in net unrealized appreciation (depreciation) of: | | | | |
Investment securities | | | 38,913,373 | |
| |
Foreign currencies | | | 35,436 | |
| |
Forward foreign currency contracts | | | (84,786 | ) |
| |
Futures contracts | | | 10,989,783 | |
| |
Option contracts written | | | (7,873 | ) |
| |
Swap agreements | | | 78,940 | |
| |
| | | 49,924,873 | |
| |
Net realized and unrealized gain | | | 41,694,075 | |
| |
Net increase in net assets resulting from operations | | $ | 74,441,064 | |
| |
See accompanying Notes to Financial Statements which are an integral part of the financial statements.
31 Invesco Multi-Asset Income Fund
Statement of Changes in Net Assets
For the years ended October 31, 2019 and 2018
| | | | | | | | |
| | | 2019 | | | 2018 | |
| |
Operations: | | | | | | | | |
Net investment income | | $ | 32,746,989 | | | $ | 30,272,833 | |
| |
Net realized gain (loss) | | | (8,230,798 | ) | | | (9,527,766 | ) |
| |
Change in net unrealized appreciation (depreciation) | | | 49,924,873 | | | | (40,573,906 | ) |
| |
Net increase (decrease) in net assets resulting from operations | | | 74,441,064 | | | | (19,828,839 | ) |
| |
| | |
Distributions to shareholders from distributable earnings: | | | | | | | | |
Class A | | | (8,046,699 | ) | | | (9,472,855 | ) |
| |
Class C | | | (4,404,348 | ) | | | (4,242,332 | ) |
| |
Class R | | | (158,155 | ) | | | (111,408 | ) |
| |
Class Y | | | (18,244,593 | ) | | | (19,669,652 | ) |
| |
Class R5 | | | (7,039 | ) | | | (4,901 | ) |
| |
Class R6 | | | (3,184,274 | ) | | | (3,632,822 | ) |
| |
Total distributions from distributable earnings | | | (34,045,108 | ) | | | (37,133,970 | ) |
| |
| | |
Share transactions–net: | | | | | | | | |
Class A | | | 47,016,424 | | | | (44,754,951 | ) |
| |
Class C | | | 27,173,051 | | | | 18,810,856 | |
| |
Class R | | | 2,790,424 | | | | 801,652 | |
| |
Class Y | | | 88,523,815 | | | | (11,409,554 | ) |
| |
Class R5 | | | (52,932 | ) | | | 126,787 | |
| |
Class R6 | | | 1,874,966 | | | | (2,001,854 | ) |
| |
Net increase (decrease) in net assets resulting from share transactions | | | 167,325,748 | | | | (38,427,064 | ) |
| |
Net increase (decrease) in net assets | | | 207,721,704 | | | | (95,389,873 | ) |
| |
| | |
Net assets: | | | | | | | | |
Beginning of year | | | 561,730,637 | | | | 657,120,510 | |
| |
End of year | | $ | 769,452,341 | | | $ | 561,730,637 | |
| |
See accompanying Notes to Financial Statements which are an integral part of the financial statements.
32 Invesco Multi-Asset Income Fund
Financial Highlights
The following schedule presents financial highlights for a share of the Fund outstanding throughout the periods indicated.
| | | | | | | | | | | | | | | | | | | | | | | | | | | | | | | | | | | | | | | | | | | | | | | | | | | | | | | | | | | | | | | | | | | |
| | | Net asset value,
beginning
of period | | Net
investment
income(a) | | Net gains
(losses) on securities
(both
realized and
unrealized) | | Total from
investment
operations | | Dividends
from net
investment
income | | Distributions
from net realized
gains | | Total distributions | | Net asset value, end of period | | Total
return(b) | | Net assets,
end of period
(000’s omitted) | | Ratio of
expenses
to average
net assets
with fee waivers
and/or expenses absorbed | | Ratio of
expenses
to average net
assets without
fee waivers and/or
expenses absorbed | | Ratio of net investment income to average
net assets | | Portfolio
turnover(c) |
| Class A | | | | | | | | | | | | | | | | | | | | | | | | | | | | | | | | | | | | | | | | | | | | | | | | | | | | | | | | | | | | | | | | | | | |
| Year ended 10/31/19 | | $10.07 | | | $ | 0.55 | | | | $ | 0.74 | | | | $ | 1.29 | | | | $ | (0.57 | ) | | | $ | - | | | | $ | (0.57 | ) | | | $ | 10.79 | | | | | 13.18 | % | | | $ | 188,655 | | | | | 0.84 | %(d) | | | | 0.97 | %(d) | | | | 5.21 | %(d) | | | | 76 | % |
| Year ended 10/31/18 | | 11.01 | | | | 0.51 | | | | | (0.84 | ) | | | | (0.33 | ) | | | | (0.52 | ) | | | | (0.09 | ) | | | | (0.61 | ) | | | | 10.07 | | | | | (3.13 | ) | | | | 131,971 | | | | | 0.85 | | | | | 1.00 | | | | | 4.76 | | | | | 59 | |
| Year ended 10/31/17 | | 10.51 | | | | 0.49 | | | | | 0.50 | | | | | 0.99 | | | | | (0.49 | ) | | | | - | | | | | (0.49 | ) | | | | 11.01 | | | | | 9.64 | | | | | 191,395 | | | | | 0.86 | | | | | 1.06 | | | | | 4.53 | | | | | 40 | |
| Year ended 10/31/16 | | 10.09 | | | | 0.47 | | | | | 0.45 | | | | | 0.92 | | | | | (0.50 | ) | | | | - | | | | | (0.50 | ) | | | | 10.51 | | | | | 9.44 | | | | | 91,585 | | | | | 1.04 | | | | | 1.28 | | | | | 4.60 | | | | | 101 | |
| Year ended 10/31/15 | | 10.37 | | | | 0.46 | | | | | (0.25 | ) | | | | 0.21 | | | | | (0.49 | ) | | | | - | | | | | (0.49 | ) | | | | 10.09 | | | | | 2.02 | | | | | 52,613 | | | | | 0.99 | | | | | 1.27 | | | | | 4.52 | | | | | 120 | |
| Class C | | | | | | | | | | | | | | | | | | | | | | | | | | | | | | | | | | | | | | | | | | | | | | | | | | | | | | | | | | | | | | | | | | | |
| Year ended 10/31/19 | | 10.06 | | | | 0.47 | | | | | 0.74 | | | | | 1.21 | | | | | (0.49 | ) | | | | - | | | | | (0.49 | ) | | | | 10.78 | | | | | 12.35 | | | | | 118,619 | | | | | 1.59 | (d) | | | | 1.72 | (d) | | | | 4.46 | (d) | | | | 76 | |
| Year ended 10/31/18 | | 11.00 | | | | 0.43 | | | | | (0.84 | ) | | | | (0.41 | ) | | | | (0.44 | ) | | | | (0.09 | ) | | | | (0.53 | ) | | | | 10.06 | | | | | (3.87 | ) | | | | 85,370 | | | | | 1.60 | | | | | 1.75 | | | | | 4.01 | | | | | 59 | |
| Year ended 10/31/17 | | 10.50 | | | | 0.41 | | | | | 0.50 | | | | | 0.91 | | | | | (0.41 | ) | | | | - | | | | | (0.41 | ) | | | | 11.00 | | | | | 8.83 | | | | | 74,211 | | | | | 1.61 | | | | | 1.81 | | | | | 3.78 | | | | | 40 | |
| Year ended 10/31/16 | | 10.08 | | | | 0.39 | | | | | 0.45 | | | | | 0.84 | | | | | (0.42 | ) | | | | - | | | | | (0.42 | ) | | | | 10.50 | | | | | 8.62 | | | | | 24,238 | | | | | 1.79 | | | | | 2.03 | | | | | 3.85 | | | | | 101 | |
| Year ended 10/31/15 | | 10.36 | | | | 0.39 | | | | | (0.26 | ) | | | | 0.13 | | | | | (0.41 | ) | | | | - | | | | | (0.41 | ) | | | | 10.08 | | | | | 1.26 | | | | | 17,133 | | | | | 1.74 | | | | | 2.02 | | | | | 3.77 | | | | | 120 | |
| Class R | | | | | | | | | | | | | | | | | | | | | | | | | | | | | | | | | | | | | | | | | | | | | | | | | | | | | | | | | | | | | | | | | | | |
| Year ended 10/31/19 | | 10.07 | | | | 0.52 | | | | | 0.74 | | | | | 1.26 | | | | | (0.55 | ) | | | | - | | | | | (0.55 | ) | | | | 10.78 | | | | | 12.80 | | | | | 5,202 | | | | | 1.09 | (d) | | | | 1.22 | (d) | | | | 4.96 | (d) | | | | 76 | |
| Year ended 10/31/18 | | 11.01 | | | | 0.48 | | | | | (0.84 | ) | | | | (0.36 | ) | | | | (0.49 | ) | | | | (0.09 | ) | | | | (0.58 | ) | | | | 10.07 | | | | | (3.38 | ) | | | | 2,220 | | | | | 1.10 | | | | | 1.25 | | | | | 4.51 | | | | | 59 | |
| Year ended 10/31/17 | | 10.51 | | | | 0.46 | | | | | 0.50 | | | | | 0.96 | | | | | (0.46 | ) | | | | - | | | | | (0.46 | ) | | | | 11.01 | | | | | 9.37 | | | | | 1,608 | | | | | 1.11 | | | | | 1.31 | | | | | 4.28 | | | | | 40 | |
| Year ended 10/31/16 | | 10.08 | | | | 0.44 | | | | | 0.46 | | | | | 0.90 | | | | | (0.47 | ) | | | | - | | | | | (0.47 | ) | | | | 10.51 | | | | | 9.28 | | | | | 538 | | | | | 1.29 | | | | | 1.53 | | | | | 4.35 | | | | | 101 | |
| Year ended 10/31/15 | | 10.36 | | | | 0.44 | | | | | (0.26 | ) | | | | 0.18 | | | | | (0.46 | ) | | | | - | | | | | (0.46 | ) | | | | 10.08 | | | | | 1.77 | | | | | 339 | | | | | 1.24 | | | | | 1.52 | | | | | 4.27 | | | | | 120 | |
| Class Y | | | | | | | | | | | | | | | | | | | | | | | | | | | | | | | | | | | | | | | | | | | | | | | | | | | | | | | | | | | | | | | | | | | |
| Year ended 10/31/19 | | 10.07 | | | | 0.57 | | | | | 0.75 | | | | | 1.32 | | | | | (0.60 | ) | | | | - | | | | | (0.60 | ) | | | | 10.79 | | | | | 13.47 | | | | | 397,303 | | | | | 0.59 | (d) | | | | 0.72 | (d) | | | | 5.46 | (d) | | | | 76 | |
| Year ended 10/31/18 | | 11.01 | | | | 0.53 | | | | | (0.83 | ) | | | | (0.30 | ) | | | | (0.55 | ) | | | | (0.09 | ) | | | | (0.64 | ) | | | | 10.07 | | | | | (2.89 | ) | | | | 288,116 | | | | | 0.60 | | | | | 0.75 | | | | | 5.01 | | | | | 59 | |
| Year ended 10/31/17 | | 10.51 | | | | 0.52 | | | | | 0.50 | | | | | 1.02 | | | | | (0.52 | ) | | | | - | | | | | (0.52 | ) | | | | 11.01 | | | | | 9.91 | | | | | 328,798 | | | | | 0.61 | | | | | 0.81 | | | | | 4.78 | | | | | 40 | |
| Year ended 10/31/16 | | 10.09 | | | | 0.50 | | | | | 0.44 | | | | | 0.94 | | | | | (0.52 | ) | | | | - | | | | | (0.52 | ) | | | | 10.51 | | | | | 9.71 | | | | | 31,049 | | | | | 0.79 | | | | | 1.03 | | | | | 4.85 | | | | | 101 | |
| Year ended 10/31/15 | | 10.37 | | | | 0.49 | | | | | (0.26 | ) | | | | 0.23 | | | | | (0.51 | ) | | | | - | | | | | (0.51 | ) | | | | 10.09 | | | | | 2.28 | | | | | 12,424 | | | | | 0.74 | | | | | 1.02 | | | | | 4.77 | | | | | 120 | |
| Class R5 | | | | | | | | | | | | | | | | | | | | | | | | | | | | | | | | | | | | | | | | | | | | | | | | | | | | | | | | | | | | | | | | | | | |
| Year ended 10/31/19 | | 10.08 | | | | 0.57 | | | | | 0.74 | | | | | 1.31 | | | | | (0.60 | ) | | | | - | | | | | (0.60 | ) | | | | 10.79 | | | | | 13.35 | | | | | 104 | | | | | 0.59 | (d) | | | | 0.68 | (d) | | | | 5.46 | (d) | | | | 76 | |
| Year ended 10/31/18 | | 11.01 | | | | 0.53 | | | | | (0.82 | ) | | | | (0.29 | ) | | | | (0.55 | ) | | | | (0.09 | ) | | | | (0.64 | ) | | | | 10.08 | | | | | (2.79 | ) | | | | 150 | | | | | 0.60 | | | | | 0.69 | | | | | 5.01 | | | | | 59 | |
| Year ended 10/31/17 | | 10.52 | | | | 0.52 | | | | | 0.49 | | | | | 1.01 | | | | | (0.52 | ) | | | | - | | | | | (0.52 | ) | | | | 11.01 | | | | | 9.81 | | | | | 30 | | | | | 0.61 | | | | | 0.72 | | | | | 4.78 | | | | | 40 | |
| Year ended 10/31/16 | | 10.09 | | | | 0.50 | | | | | 0.45 | | | | | 0.95 | | | | | (0.52 | ) | | | | - | | | | | (0.52 | ) | | | | 10.52 | | | | | 9.82 | | | | | 19 | | | | | 0.79 | | | | | 0.90 | | | | | 4.85 | | | | | 101 | |
| Year ended 10/31/15 | | 10.37 | | | | 0.49 | | | | | (0.26 | ) | | | | 0.23 | | | | | (0.51 | ) | | | | - | | | | | (0.51 | ) | | | | 10.09 | | | | | 2.28 | | | | | 10 | | | | | 0.74 | | | | | 0.89 | | | | | 4.77 | | | | | 120 | |
| Class R6 | | | | | | | | | | | | | | | | | | | | | | | | | | | | | | | | | | | | | | | | | | | | | | | | | | | | | | | | | | | | | | | | | | | |
| Year ended 10/31/19 | | 10.07 | | | | 0.57 | | | | | 0.75 | | | | | 1.32 | | | | | (0.60 | ) | | | | - | | | | | (0.60 | ) | | | | 10.79 | | | | | 13.47 | | | | | 59,569 | | | | | 0.59 | (d) | | | | 0.60 | (d) | | | | 5.46 | (d) | | | | 76 | |
| Year ended 10/31/18 | | 11.01 | | | | 0.53 | | | | | (0.83 | ) | | | | (0.30 | ) | | | | (0.55 | ) | | | | (0.09 | ) | | | | (0.64 | ) | | | | 10.07 | | | | | (2.89 | ) | | | | 53,904 | | | | | 0.60 | | | | | 0.63 | | | | | 5.01 | | | | | 59 | |
| Year ended 10/31/17 | | 10.51 | | | | 0.52 | | | | | 0.50 | | | | | 1.02 | | | | | (0.52 | ) | | | | - | | | | | (0.52 | ) | | | | 11.01 | | | | | 9.91 | | | | | 61,077 | | | | | 0.61 | | | | | 0.69 | | | | | 4.78 | | | | | 40 | |
| Year ended 10/31/16 | | 10.09 | | | | 0.49 | | | | | 0.45 | | | | | 0.94 | | | | | (0.52 | ) | | | | - | | | | | (0.52 | ) | | | | 10.51 | | | | | 9.71 | | | | | 49,388 | | | | | 0.79 | | | | | 0.90 | | | | | 4.85 | | | | | 101 | |
| Year ended 10/31/15 | | 10.37 | | | | 0.49 | | | | | (0.26 | ) | | | | 0.23 | | | | | (0.51 | ) | | | | - | | | | | (0.51 | ) | | | | 10.09 | | | | | 2.28 | | | | | 67,568 | | | | | 0.74 | | | | | 0.89 | | | | | 4.77 | | | | | 120 | |
| (a) | Calculated using average shares outstanding. |
| (b) | Includes adjustments in accordance with accounting principles generally accepted in the United States of America and as such, the net asset value for financial reporting purposes and the returns based upon those net asset values may differ from the net asset value and returns for shareholder transactions. Does not include sales charges and is not annualized for periods less than one year, if applicable. |
| (c) | Portfolio turnover is calculated at the fund level and is not annualized for periods less than one year, if applicable. |
| (d) | Ratios are based on average daily net assets (000’s omitted) of $149,242, $94,027, $3,098, $321,814, $119 and $55,754 for Class A, Class C, Class R, Class Y, Class R5 and Class R6 shares, respectively. |
See accompanying Notes to Financial Statements which are an integral part of the financial statements.
33 Invesco Multi-Asset Income Fund
Notes to Financial Statements
October 31, 2019
NOTE 1–Significant Accounting Policies
Invesco Multi-Asset Income Fund (the “Fund”) is a series portfolio of AIM Investment Funds (Invesco Investment Funds) (the “Trust”). The Trust is organized as a Delaware statutory trust and is registered under the Investment Company Act of 1940, as amended (the “1940 Act”), as anopen-end series management investment company authorized to issue an unlimited number of shares of beneficial interest. Information presented in these financial statements pertains only to the Fund. Matters affecting the Fund or each class will be voted on exclusively by the shareholders of the Fund or each class.
The Fund’s investment objective is to provide current income.
The Fund currently consists of six different classes of shares: Class A, Class C, Class R, Class Y, Class R5 and Class R6. Class Y shares are available only to certain investors. Class A shares are sold with afront-end sales charge unless certain waiver criteria are met. Under certain circumstances, load waived shares may be subject to contingent deferred sales charges (“CDSC”). Class C shares are sold with a CDSC. Class R, Class Y, Class R5 and Class R6 shares are sold at net asset value. Class C shares held for ten years after purchase are eligible for automatic conversion into Class A shares of the same Fund (the “Conversion Feature”). The automatic conversion pursuant to the Conversion Feature will generally occur at the end of the month following the tenth anniversary after a purchase of Class C shares.
The Fund is an investment company and accordingly follows the investment company accounting and reporting guidance in accordance with Financial Accounting Standards Board Accounting Standards Codification Topic 946,Financial Services – Investment Companies.
The following is a summary of the significant accounting policies followed by the Fund in the preparation of its financial statements.
| A. | Security Valuations- Securities, including restricted securities, are valued according to the following policy. |
A security listed or traded on an exchange (except convertible securities) is valued at its last sales price or official closing price as of the close of the customary trading session on the exchange where the security is principally traded, or lacking any sales or official closing price on a particular day, the security may be valued at the closing bid price on that day. Securities traded in theover-the-counter market are valued based on prices furnished by independent pricing services or market makers. When such securities are valued by an independent pricing service they may be considered fair valued. Futures contracts are valued at the final settlement price set by an exchange on which they are principally traded. Listed options are valued at the mean between the last bid and asked prices from the exchange on which they are principally traded. Options not listed on an exchange are valued by an independent source at the mean between the last bid and asked prices. For purposes of determining net asset value (“NAV”) per share, futures and option contracts generally are valued 15 minutes after the close of the customary trading session of the New York Stock Exchange (“NYSE”).
Investments inopen-end andclosed-end registered investment companies that do not trade on an exchange are valued at theend-of-day net asset value per share. Investments inopen-end andclosed-end registered investment companies that trade on an exchange are valued at the last sales price or official closing price as of the close of the customary trading session on the exchange where the security is principally traded.
Swap agreements are fair valued using an evaluated quote, if available, provided by an independent pricing service. Evaluated quotes provided by the pricing service are valued based on a model which may includeend-of-day net present values, spreads, ratings, industry, company performance and returns of referenced assets. Centrally cleared swap agreements are valued at the daily settlement price determined by the relevant exchange or clearinghouse.
Debt obligations (including convertible securities) and unlisted equities are fair valued using an evaluated quote provided by an independent pricing service. Evaluated quotes provided by the pricing service may be determined without exclusive reliance on quoted prices, and may reflect appropriate factors such asinstitution-size trading in similar groups of securities, developments related to specific securities, dividend rate (for unlisted equities), yield (for debt obligations), quality, type of issue, coupon rate (for debt obligations), maturity (for debt obligations), individual trading characteristics and other market data. Pricing services generally value debt obligations assuming orderly transactions of institutional round lot size, but a fund may hold or transact in the same securities in smaller, odd lot sizes. Odd lots often trade at lower prices than institutional round lots. Debt obligations are subject to interest rate and credit risks. In addition, all debt obligations involve some risk of default with respect to interest and/or principal payments.
Foreign securities’ (including foreign exchange contracts) prices are converted into U.S. dollar amounts using the applicable exchange rates as of the close of the NYSE. If market quotations are available and reliable for foreign exchange-traded equity securities, the securities will be valued at the market quotations. Because trading hours for certain foreign securities end before the close of the NYSE, closing market quotations may become unreliable. If between the time trading ends on a particular security and the close of the customary trading session on the NYSE, events occur that the investment adviser determines are significant and make the closing price unreliable, the Fund may fair value the security. If the event is likely to have affected the closing price of the security, the security will be valued at fair value in good faith using procedures approved by the Board of Trustees. Adjustments to closing prices to reflect fair value may also be based on a screening process of an independent pricing service to indicate the degree of certainty, based on historical data, that the closing price in the principal market where a foreign security trades is not the current value as of the close of the NYSE. Foreign securities’ prices meeting the approved degree of certainty that the price is not reflective of current value will be priced at the indication of fair value from the independent pricing service. Multiple factors may be considered by the independent pricing service in determining adjustments to reflect fair value and may include information relating to sector indices, American Depositary Receipts and domestic and foreign index futures. Foreign securities may have additional risks including exchange rate changes, potential for sharply devalued currencies and high inflation, political and economic upheaval, the relative lack of issuer information, relatively low market liquidity and the potential lack of strict financial and accounting controls and standards.
Securities for which market prices are not provided by any of the above methods may be valued based upon quotes furnished by independent sources. The last bid price may be used to value equity securities. The mean between the last bid and asked prices is used to value debt obligations, including corporate loans.
Securities for which market quotations are not readily available or became unreliable are valued at fair value as determined in good faith by or under the supervision of the Trust’s officers following procedures approved by the Board of Trustees. Issuer specific events, market trends,
34 Invesco Multi-Asset Income Fund
bid/asked quotes of brokers and information providers and other market data may be reviewed in the course of making a good faith determination of a security’s fair value.
The Fund may invest in securities that are subject to interest rate risk, meaning the risk that the prices will generally fall as interest rates rise and, conversely, the prices will generally rise as interest rates fall. Specific securities differ in their sensitivity to changes in interest rates depending on their individual characteristics. Changes in interest rates may result in increased market volatility, which may affect the value and/or liquidity of certain Fund investments.
Valuations change in response to many factors including the historical and prospective earnings of the issuer, the value of the issuer’s assets, general economic conditions, interest rates, investor perceptions and market liquidity. Because of the inherent uncertainties of valuation, the values reflected in the financial statements may materially differ from the value received upon actual sale of those investments.
| B. | Securities Transactions and Investment Income– Securities transactions are accounted for on a trade date basis. Realized gains or losses on sales are computed on the basis of specific identification of the securities sold. Interest income (net of withholding tax, if any) is recorded on the accrual basis from settlement date. Bond premiums and discounts are amortized and/or accreted over the lives of the respective securities.Pay-in-kind interest income andnon-cash dividend income received in the form of securitiesin-lieu of cash are recorded at the fair value of the securities received. Paydown gains and losses on mortgage and asset-backed securities are recorded as adjustments to interest income. Dividend income (net of withholding tax, if any) is recorded on theex-dividend date. |
The Fund may periodically participate in litigation related to Fund investments. As such, the Fund may receive proceeds from litigation settlements. Any proceeds received are included in the Statement of Operations as realized gain (loss) for investments no longer held and as unrealized gain (loss) for investments still held.
Brokerage commissions and mark ups are considered transaction costs and are recorded as an increase to the cost basis of securities purchased and/or a reduction of proceeds on a sale of securities. Such transaction costs are included in the determination of net realized and unrealized gain (loss) from investment securities reported in the Statement of Operations and the Statement of Changes in Net Assets and the net realized and unrealized gains (losses) on securities per share in the Financial Highlights. Transaction costs are included in the calculation of the Fund’s net asset value and, accordingly, they reduce the Fund’s total returns. These transaction costs are not considered operating expenses and are not reflected in net investment income reported in the Statement of Operations and the Statement of Changes in Net Assets, or the net investment income per share and the ratios of expenses and net investment income reported in the Financial Highlights, nor are they limited by any expense limitation arrangements between the Fund and the investment adviser.
The Fund allocates income and realized and unrealized capital gains and losses to a class based on the relative net assets of each class.
The Fund recharacterizes distributions received from REIT investments based on information provided by the REIT into the following categories: ordinary income, long-term and short-term capital gains, and return of capital. If information is not available on a timely basis from the REIT, the recharacterization will be based on available information which may include the previous year’s allocation. If new or additional information becomes available from the REIT at a later date, a recharacterization will be made in the following year. The Fund records as dividend income the amount recharacterized as ordinary income and as realized gain the amount recharacterized as capital gain in the Statement of Operations, and the amount recharacterized as return of capital as a reduction of the cost of the related investment. These recharacterizations are reflected in the accompanying financial statements.
| C. | Country Determination– For the purposes of making investment selection decisions and presentation in the Schedule of Investments, the investment adviser may determine the country in which an issuer is located and/or credit risk exposure based on various factors. These factors include the laws of the country under which the issuer is organized, where the issuer maintains a principal office, the country in which the issuer derives 50% or more of its total revenues and the country that has the primary market for the issuer’s securities, as well as other criteria. Among the other criteria that may be evaluated for making this determination are the country in which the issuer maintains 50% or more of its assets, the type of security, financial guarantees and enhancements, the nature of the collateral and the sponsor organization. Country of issuer and/or credit risk exposure has been determined to be the United States of America, unless otherwise noted. |
| D. | Distributions– Distributions from net investment income, if any, are declared and paid monthly. Distributions from net realized capital gain, if any, are generally declared and paid annually and recorded on theex-dividend date. The Fund may elect to treat a portion of the proceeds from redemptions as distributions for federal income tax purposes. |
| E. | Master Limited Partnerships– The Fund primarily invests in Master Limited Partnerships (“MLPs”). MLPs are publicly traded partnerships and limited liability companies taxed as partnerships under the Internal Revenue Code of 1986, as amended (the “Internal Revenue Code”). The Fund principally invests in MLPs that derive their revenue primarily from businesses involved in the gathering, transporting, processing, treating, storing, refining, distributing, mining or marketing of natural gas, natural gas liquids, crude oil, refined products or coal (“energy infrastructure MLPs”). The Fund is a partner in each MLP; accordingly, the Fund is required to take into account the Fund’s allocable share of income, gains, losses, deductions, expenses, and tax credits recognized by each MLP. |
The Fund isnon-diversified and will concentrate its investments in the energy sector. Energy infrastructure MLPs are subject to a variety of industry specific risk factors that may adversely affect their business or operations, including a decrease in production or reduced volumes of natural gas or other energy commodities available for transporting, processing, storing or distributing; changes in energy commodity prices; a sustained reduced demand for crude oil, natural gas and refined petroleum products; depletion of natural gas reserves or other commodities if not replaced; natural disasters, extreme weather and environmental hazards; rising interest rates, how facilities are constructed, maintained and operated, environmental and safety controls, and the prices they may charge for products and services. In addition, taxes, government regulation, international politics, price, and supply fluctuations, volatile interest rates and energy conservation may cause difficulties for energy infrastructure MLPs.
MLPs may be less liquid and subject to more abrupt or erratic price movements than conventional publicly traded securities.
| F. | Federal Income Taxes –The Fund intends to comply with the requirements of Subchapter M of the Internal Revenue Code of 1986, as amended (the “Internal Revenue Code”), necessary to qualify as a regulated investment company and to distribute substantially all of the Fund’s taxable earnings to shareholders. As such, the Fund will not be subject to federal income taxes on otherwise taxable income (including net realized capital gain) that is distributed to shareholders. Therefore, no provision for federal income taxes is recorded in the financial statements. |
The Fund recognizes the tax benefits of uncertain tax positions only when the position is more likely than not to be sustained. Management has analyzed the Fund’s uncertain tax positions and concluded that no liability for unrecognized tax benefits should be recorded related to uncertain
35 Invesco Multi-Asset Income Fund
tax positions. Management is not aware of any tax positions for which it is reasonably possible that the total amounts of unrecognized tax benefits will change materially in the next 12 months.
The Fund files tax returns in the U.S. Federal jurisdiction and certain other jurisdictions. Generally, the Fund is subject to examinations by such taxing authorities for up to three years after the filing of the return for the tax period.
| G. | Expenses –Fees provided for under the Rule12b-1 plan of a particular class of the Fund are charged to the operations of such class. Transfer agency fees and expenses and other shareholder recordkeeping fees and expenses attributable to Class R5 and Class R6 are allocated to each share class based on relative net assets.Sub-accounting fees attributable to Class R5 are charged to the operations of the class. Transfer agency fees and expenses and other shareholder recordkeeping fees and expenses relating to all other classes are allocated among those classes based on relative net assets. All other expenses are allocated among the classes based on relative net assets. |
| H. | Accounting Estimates –The preparation of financial statements in conformity with accounting principles generally accepted in the United States of America (“GAAP”) requires management to make estimates and assumptions that affect the reported amounts of assets and liabilities at the date of the financial statements and the reported amounts of revenues and expenses during the reporting period including estimates and assumptions related to taxation. Actual results could differ from those estimates by a significant amount. In addition, the Fund monitors for material events or transactions that may occur or become known after theperiod-end date and before the date the financial statements are released to print. |
| I. | Indemnifications– Under the Trust’s organizational documents, each Trustee, officer, employee or other agent of the Trust is indemnified against certain liabilities that may arise out of the performance of their duties to the Fund. Additionally, in the normal course of business, the Fund enters into contracts, including the Fund’s servicing agreements, that contain a variety of indemnification clauses. The Fund’s maximum exposure under these arrangements is unknown as this would involve future claims that may be made against the Fund that have not yet occurred. The risk of material loss as a result of such indemnification claims is considered remote. |
| J. | Exchange-traded Notes– The Fund may invest in exchange-traded notes (“ETNs”) which are senior, unsecured, unsubordinated debt securities whose returns are linked to the performance of a particular market benchmark or strategy, minus applicable fees. ETNs can be traded on an exchange and/or they can be held to maturity. At maturity, the issuer pays the investor a cash amount equal to the principal amount, subject to the day’s market benchmark or strategy factor. ETNs do not make periodic coupon payments or provide principal protection. The value of an ETN may be influenced by time to maturity, level of supply and demand for the ETN, volatility and lack of liquidity in underlying market, changes in the applicable interest rates, and economic legal, political, or geographic events that affect the referenced underlying market or assets. ETNs are subject to credit risk, including the credit risk of the issuer, and counterparty risk. |
| K. | Foreign Currency Translations– Foreign currency is valued at the close of the NYSE based on quotations posted by banks and major currency dealers. Portfolio securities and other assets and liabilities denominated in foreign currencies are translated into U.S. dollar amounts at the date of valuation. Purchases and sales of portfolio securities (net of foreign taxes withheld on disposition) and income items denominated in foreign currencies are translated into U.S. dollar amounts on the respective dates of such transactions. The Fund does not separately account for the portion of the results of operations resulting from changes in foreign exchange rates on investments and the fluctuations arising from changes in market prices of securities held. The combined results of changes in foreign exchange rates and the fluctuation of market prices on investments (net of estimated foreign tax withholding) are included with the net realized and unrealized gain or loss from investments in the Statement of Operations. Reported net realized foreign currency gains or losses arise from (1) sales of foreign currencies, (2) currency gains or losses realized between the trade and settlement dates on securities transactions, and (3) the difference between the amounts of dividends, interest, and foreign withholding taxes recorded on the Fund’s books and the U.S. dollar equivalent of the amounts actually received or paid. Net unrealized foreign currency gains and losses arise from changes in the fair values of assets and liabilities, other than investments in securities at fiscal period end, resulting from changes in exchange rates. |
The Fund may invest in foreign securities, which may be subject to foreign taxes on income, gains on investments or currency repatriation, a portion of which may be recoverable. Foreign taxes, if any, are recorded based on the tax regulations and rates that exist in the foreign markets in which the Fund invests and are shown in the Statement of Operations.
| L. | Forward Foreign Currency Contracts– The Fund may engage in foreign currency transactions either on a spot (i.e. for prompt delivery and settlement) basis, or through forward foreign currency contracts, to manage or minimize currency or exchange rate risk. |
The Fund may also enter into forward foreign currency contracts for the purchase or sale of a security denominated in a foreign currency in order to “lock in” the U.S. dollar price of that security, or the Fund may also enter into forward foreign currency contracts that do not provide for physical settlement of the two currencies, but instead are settled by a single cash payment calculated as the difference between the agreed upon exchange rate and the spot rate at settlement based upon an agreed upon notional amount(non-deliverable forwards). The Fund will set aside liquid assets in an amount equal to the dailymark-to-market obligation for forward foreign currency contracts.
A forward foreign currency contract is an obligation between two parties (“Counterparties”) to purchase or sell a specific currency for an agreed-upon price at a future date. The use of forward foreign currency contracts does not eliminate fluctuations in the price of the underlying securities the Fund owns or intends to acquire but establishes a rate of exchange in advance. Fluctuations in the value of these contracts are measured by the difference in the contract date and reporting date exchange rates and are recorded as unrealized appreciation (depreciation) until the contracts are closed. When the contracts are closed, realized gains (losses) are recorded. Realized and unrealized gains (losses) on the contracts are included in the Statement of Operations. The primary risks associated with forward foreign currency contracts include failure of the Counterparty to meet the terms of the contract and the value of the foreign currency changing unfavorably. These risks may be in excess of the amounts reflected in the Statement of Assets and Liabilities.
| M. | Futures Contracts– The Fund may enter into futures contracts to manage exposure to interest rate, equity and market price movements and/or currency risks. A futures contract is an agreement between two parties (“Counterparties”) to purchase or sell a specified underlying security, currency or commodity (or delivery of a cash settlement price, in the case of an index future) for a fixed price at a future date. The Fund currently invests only in exchange-traded futures and they are standardized as to maturity date and underlying financial instrument. Initial margin deposits required upon entering into futures contracts are satisfied by the segregation of specific securities or cash as collateral at the futures commission merchant (broker). During the period the futures contracts are open, changes in the value of the contracts are recognized as unrealized gains or losses by recalculating the value of the contracts on a daily basis. Subsequent or variation margin payments are received or made depending upon whether unrealized gains or losses are incurred. These amounts are reflected as receivables or payables on the Statement |
36 Invesco Multi-Asset Income Fund
| | of Assets and Liabilities. When the contracts are closed or expire, the Fund recognizes a realized gain or loss equal to the difference between the proceeds from, or cost of, the closing transaction and the Fund’s basis in the contract. The net realized gain (loss) and the change in unrealized gain (loss) on futures contracts held during the period is included on the Statement of Operations. The primary risks associated with futures contracts are market risk and the absence of a liquid secondary market. If the Fund were unable to liquidate a futures contract and/or enter into an offsetting closing transaction, the Fund would continue to be subject to market risk with respect to the value of the contracts and continue to be required to maintain the margin deposits on the futures contracts. Futures contracts have minimal Counterparty risk since the exchange’s clearinghouse, as Counterparty to all exchange-traded futures, guarantees the futures against default. Risks may exceed amounts recognized in the Statement of Assets and Liabilities. |
| N. | Call Options Purchased and Written– The Fund may write call options and/or buy call options. A covered call option gives the purchaser of such option the right to buy, and the writer the obligation to sell, the underlying security or foreign currency at the stated exercise price during the option period. An uncovered call option exists without the ownership of the underlying security. Options written by the Fund normally will have expiration dates between three and nine months from the date written. The exercise price of a call option may be below, equal to, or above the current market value of the underlying security at the time the option is written. |
Additionally, the Fund may enter into an option on a swap agreement, also called a “swaption”. A swaption is an option that gives the buyer the right, but not the obligation, to enter into a swap on a future date in exchange for paying a market-based premium. A receiver swaption gives the owner the right to receive the total return of a specified asset, reference rate or index. Swaptions also include options that allow an existing swap to be terminated or extended by one of the Counterparties.
When the Fund writes a covered call option, an amount equal to the premium received by the Fund is recorded as an asset and an equivalent liability in the Statement of Assets and Liabilities. The amount of the liability is subsequently“marked-to-market” to reflect the current market value of the option written. If a written covered call option expires on the stipulated expiration date, or if the Fund enters into a closing purchase transaction, the Fund realizes a gain (or a loss if the closing purchase transaction exceeds the premium received when the option was written) without regard to any unrealized gain or loss on the underlying security, and the liability related to such option is extinguished. If a written covered call option is exercised, the Fund realizes a gain or a loss from the sale of the underlying security and the proceeds of the sale are increased by the premium originally received. Realized and unrealized gains and losses on call options written are included in the Statement of Operations as Net realized gain (loss) from and Change in net unrealized appreciation (depreciation) of Option contracts written. A risk in writing a covered call option is that the Fund gives up the opportunity for profit if the market price of the security increases and the option is exercised. The risk in writing an uncovered call option is that the Fund may incur significant losses if the value of the written security exceeds the exercise price of the option.
When the Fund buys a call option, an amount equal to the premium paid by the Fund is recorded as an investment on the Statement of Assets and Liabilities. The amount of the investment is subsequently“marked-to-market” to reflect the current value of the option purchased. Realized and unrealized gains and losses on call options purchased are included in the Statement of Operations as Net realized gain (loss) from and Change in net unrealized appreciation (depreciation) of Investment securities. A risk in buying an option is that the Fund pays a premium whether or not the option is exercised. In addition, there can be no assurance that a liquid secondary market will exist for any option purchased.
| O. | Put Options Purchased and Written– The Fund may purchase and write put options including options on securities indexes, or foreign currency and/or futures contracts. By purchasing a put option, the Fund obtains the right (but not the obligation) to sell the option’s underlying instrument at a fixed strike price. In return for this right, the Fund pays an option premium. The option’s underlying instrument may be a security, securities index, or a futures contract. |
Additionally, the Fund may enter into an option on a swap agreement, also called a “swaption”. A swaption is an option that gives the buyer the right, but not the obligation, to enter into a swap on a future date in exchange for paying a market-based premium. A receiver swaption gives the owner the right to receive the total return of a specified asset, reference rate or index. Swaptions also include options that allow an existing swap to be terminated or extended by one of the Counterparties.
Put options may be used by the Fund to hedge securities it owns by locking in a minimum price at which the Fund can sell. If security prices fall, the put option could be exercised to offset all or a portion of the Fund’s resulting losses. At the same time, because the maximum the Fund has at risk is the cost of the option, purchasing put options does not eliminate the potential for the Fund to profit from an increase in the value of the underlying portfolio securities. The Fund may write put options to earn additional income in the form of option premiums if it expects the price of the underlying instrument to remain stable or rise during the option period so that the option will not be exercised. The risk in this strategy is that the price of the underlying securities may decline by an amount greater than the premium received. Put options written are reported as a liability in the Statement of Assets and Liabilities. Realized and unrealized gains and losses on put options purchased and put options written are included in the Statement of Operations as Net realized gain (loss) from and Change in net unrealized appreciation (depreciation) of Investment securities and Option contracts written, respectively. A risk in buying an option is that the Fund pays a premium whether or not the option is exercised. In addition, there can be no assurance that a liquid secondary market will exist for any option purchased.
| P. | Swap Agreements– The Fund may enter into various swap transactions, including interest rate, total return, index, currency and credit default swap contracts (“CDS”) for investment purposes or to manage interest rate, currency or credit risk. Such transactions are agreements between Counterparties. A swap agreement may be negotiated bilaterally and tradedover-the-counter (“OTC”) between two parties (“uncleared/ OTC”) or, in some instances, must be transacted through a future commission merchant (“FCM”) and cleared through a clearinghouse that serves as a central Counterparty (“centrally cleared swap”). These agreements may contain among other conditions, events of default and termination events, and various covenants and representations such as provisions that require the Fund to maintain apre-determined level of net assets, and/ or provide limits regarding the decline of the Fund’s NAV over specific periods of time. If the Fund were to trigger such provisions and have open derivative positions at that time, the Counterparty may be able to terminate such agreement and request immediate payment in an amount equal to the net liability positions, if any. |
Interest rate, total return, index, and currency swap agreements aretwo-party contracts entered into primarily to exchange the returns (or differentials in rates of returns) earned or realized on particular predetermined investments or instruments. The gross returns to be exchanged or “swapped” between the parties are calculated with respect to a notional amount, i.e., the return on or increase in value of a particular dollar amount invested at a particular interest rate or return of an underlying asset, in a particular foreign currency, or in a “basket” of securities representing a particular index.
37 Invesco Multi-Asset Income Fund
In a centrally cleared swap, the Fund’s ultimate Counterparty is a central clearinghouse. The Fund initially will enter into centrally cleared swaps through an executing broker. When a fund enters into a centrally cleared swap, it must deliver to the central Counterparty (via the FCM) an amount referred to as “initial margin.” Initial margin requirements are determined by the central Counterparty, but an FCM may require additional initial margin above the amount required by the central Counterparty. Initial margin deposits required upon entering into centrally cleared swaps are satisfied by cash or securities as collateral at the FCM. Securities deposited as initial margin are designated on the Schedule of Investments and cash deposited is recorded on the Statement of Assets and Liabilities. During the term of a cleared swap agreement, a “variation margin” amount may be required to be paid by the Fund or may be received by the Fund, based on the daily change in price of the underlying reference instrument subject to the swap agreement and is recorded as a receivable or payable for variation margin in the Statement of Assets and Liabilities until the centrally cleared swap is terminated at which time a realized gain or loss is recorded.
A CDS is an agreement between Counterparties to exchange the credit risk of an issuer. A buyer of a CDS is said to buy protection by paying a fixed payment over the life of the agreement and in some situations an upfront payment to the seller of the CDS. If a defined credit event occurs (such as payment default or bankruptcy), the Fund as a protection buyer would cease paying its fixed payment, the Fund would deliver eligible bonds issued by the reference entity to the seller, and the seller would pay the full notional value, or the “par value”, of the referenced obligation to the Fund. A seller of a CDS is said to sell protection and thus would receive a fixed payment over the life of the agreement and an upfront payment, if applicable. If a credit event occurs, the Fund as a protection seller would cease to receive the fixed payment stream, the Fund would pay the buyer “par value” or the full notional value of the referenced obligation, and the Fund would receive the eligible bonds issued by the reference entity. In turn, these bonds may be sold in order to realize a recovery value. Alternatively, the seller of the CDS and its Counterparty may agree to net the notional amount and the market value of the bonds and make a cash payment equal to the difference to the buyer of protection. If no credit event occurs, the Fund receives the fixed payment over the life of the agreement. As the seller, the Fund would effectively add leverage to its portfolio because, in addition to its total net assets, the Fund would be subject to investment exposure on the notional amount of the CDS. In connection with these agreements, cash and securities may be identified as collateral in accordance with the terms of the respective swap agreements to provide assets of value and recourse in the event of default under the swap agreement or bankruptcy/insolvency of a party to the swap agreement. If a Counterparty becomes bankrupt or otherwise fails to perform its obligations due to financial difficulties, the Fund may experience significant delays in obtaining any recovery in a bankruptcy or other reorganization proceeding. The Fund may obtain only limited recovery or may obtain no recovery in such circumstances. The Fund’s maximum risk of loss from Counterparty risk, either as the protection seller or as the protection buyer, is the value of the contract. The risk may be mitigated by having a master netting arrangement between the Fund and the Counterparty and by the designation of collateral by the Counterparty to cover the Fund’s exposure to the Counterparty.
Implied credit spreads represent the current level at which protection could be bought or sold given the terms of the existing CDS contract and serve as an indicator of the current status of the payment/performance risk of the CDS. An implied spread that has widened or increased since entry into the initial contract may indicate a deteriorating credit profile and increased risk of default for the reference entity. A declining or narrowing spread may indicate an improving credit profile or decreased risk of default for the reference entity. Alternatively, credit spreads may increase or decrease reflecting the general tolerance for risk in the credit markets.
An interest rate swap is an agreement between Counterparties pursuant to which the parties exchange a floating rate payment for a fixed rate payment based on a specified notional amount.
Changes in the value of centrally cleared and OTC swap agreements are recognized as unrealized gains (losses) in the Statement of Operations by “marking to market” on a daily basis to reflect the value of the swap agreement at the end of each trading day. Payments received or paid at the beginning of the agreement are reflected as such on the Statement of Assets and Liabilities and may be referred to as upfront payments. The Fund accrues for the fixed payment stream and amortizes upfront payments, if any, on swap agreements on a daily basis with the net amount, recorded as a component of realized gain (loss) on the Statement of Operations. A liquidation payment received or made at the termination of a swap agreement is recorded as realized gain (loss) on the Statement of Operations. The Fund segregates cash or liquid securities having a value at least equal to the amount of the potential obligation of a Fund under any swap transaction. Cash held as collateral is recorded as deposits with brokers on the Statement of Assets and Liabilities. Entering into these agreements involves, to varying degrees, lack of liquidity and elements of credit, market, and Counterparty risk in excess of amounts recognized on the Statement of Assets and Liabilities. Such risks involve the possibility that a swap is difficult to sell or liquidate; the Counterparty does not honor its obligations under the agreement and unfavorable interest rates and market fluctuations. It is possible that developments in the swaps market, including potential government regulation, could adversely affect the Fund’s ability to terminate existing swap agreements or to realize amounts to be received under such agreements. A short position in a security poses more risk than holding the same security long. As there is no limit on how much the price of the security can increase, the Fund’s exposure is unlimited.
Notional amounts of each individual credit default swap agreement outstanding as of October 31, 2019 for which the Fund is the seller of protection are disclosed in the open swap agreements table. These potential amounts would be partially offset by any recovery values of the respective referenced obligations, upfront payments received upon entering into the agreement, or net amounts received from the settlement of buy protection credit default swap agreements entered into by the Fund for the same referenced entity or entities.
| Q. | Other Risks- The Fund may invest in lower-quality debt securities, i.e., “junk bonds”. Investments in lower-rated securities or unrated securities of comparable quality tend to be more sensitive to economic conditions than higher rated securities. Junk bonds involve a greater risk of default by the issuer because such securities are generally unsecured and are often subordinated to other creditors’ claim. |
| R. | Leverage Risk– Leverage exists when the Fund can lose more than it originally invests because it purchases or sells an instrument or enters into a transaction without investing an amount equal to the full economic exposure of the instrument or transaction. |
| S. | Collateral– To the extent the Fund has designated or segregated a security as collateral and that security is subsequently sold, it is the Fund’s practice to replace such collateral no later than the next business day. |
38 Invesco Multi-Asset Income Fund
NOTE 2–Advisory Fees and Other Fees Paid to Affiliates
The Trust has entered into a master investment advisory agreement with Invesco Advisers, Inc. (the “Adviser” or “Invesco”). Under the terms of the investment advisory agreement, the Fund accrues daily and pays monthly an advisory fee to the Adviser based on the annual rate of the Fund’s average daily net assets as follows:
| | | | | |
| Average Daily Net Assets | | Rate |
First $ 500 million | | | | 0.500 | % |
Next $500 million | | | | 0.450 | % |
Next $500 million | | | | 0.400 | % |
Over $1.5 billion | | | | 0.390 | % |
For the year ended October 31, 2019, the effective advisory fee rate incurred by the Fund was 0.49%.
Under the terms of a mastersub-advisory agreement between the Adviser and each of Invesco Asset Management Deutschland GmbH, Invesco Asset Management Limited, Invesco Asset Management (Japan) Limited, Invesco Hong Kong Limited, Invesco Senior Secured Management, Inc. and Invesco Canada Ltd. and separatesub-advisory agreements with Invesco Capital Management LLC and Invesco Asset Management (India) Private Limited (collectively, the “AffiliatedSub-Advisers”) the Adviser, not the Fund, will pay 40% of the fees paid to the Adviser to any such AffiliatedSub-Adviser(s) that provide(s) discretionary investment management services to the Fund based on the percentage of assets allocated to such AffiliatedSub-Adviser(s).
The Adviser has contractually agreed, through at least February 28, 2021, to waive advisory fees and/or reimburse expenses of all shares to the extent necessary to limit total annual fund operating expenses after fee waiver and/or reimbursement (excluding certain items discussed below) of Class A, Class C, Class R, Class Y, Class R5 and Class R6 shares to 0.85%, 1.60%, 1.10%, 0.60%, 0.60% and 0.60%, respectively, of the Fund’s average daily net assets (the “expense limits”). In determining the Adviser’s obligation to waive advisory fees and/or reimburse expenses, the following expenses are not taken into account, and could cause the total annual fund operating expenses after fee waiver and/or reimbursement to exceed the numbers reflected above: (1) interest, facilities and maintenance fees; (2) taxes; (3) dividend expense on short sales; (4) extraordinary ornon-routine items, including litigation expenses; and (5) expenses that the Fund has incurred but did not actually pay because of an expense offset arrangement. Unless Invesco continues the fee waiver agreement, it will terminate on February 28, 2021. During its term, the fee waiver agreement cannot be terminated or amended to increase the expense limits or reduce the advisory fee waivers without approval of the Board of Trustees.
Further, the Adviser has contractually agreed, through at least June 30, 2021, to waive the advisory fee payable by the Fund in an amount equal to 100% of the net advisory fees the Adviser receives from the affiliated money market funds on investments by the Fund of uninvested cash in such affiliated money market funds.
For the year ended October 31, 2019, the Adviser waived advisory fees of $32,487 and reimbursed class level expenses of $181,017, $114,046, $3,758, $390,333, $100 and $1,042 of Class A, Class C, Class R, Class Y, Class R5 and Class R6 shares, respectively.
The Trust has entered into a master administrative services agreement with Invesco pursuant to which the Fund has agreed to pay Invesco for certain administrative costs incurred in providing accounting services to the Fund. For the year ended October 31, 2019, expenses incurred under the agreement are shown in the Statement of Operations asAdministrative services fees. Invesco has entered into asub-administration agreement whereby State Street Bank and Trust Company (“SSB”) serves as fund accountant and provides certain administrative services to the Fund. Pursuant to a custody agreement with the Trust on behalf of the Fund, SSB also serves as the Fund’s custodian.
The Trust has entered into a transfer agency and service agreement with Invesco Investment Services, Inc. (“IIS”) pursuant to which the Fund has agreed to pay IIS a fee for providing transfer agency and shareholder services to the Fund and reimburse IIS for certain expenses incurred by IIS in the course of providing such services. IIS may make payments to intermediaries that provide omnibus account services,sub-accounting services and/or networking services. All fees payable by IIS to intermediaries that provide omnibus account services orsub-accounting services are charged back to the Fund, subject to certain limitations approved by the Trust’s Board of Trustees. For the year ended October 31, 2019, expenses incurred under the agreement are shown in the Statement of Operations asTransfer agent fees.
The Trust has entered into master distribution agreements with Invesco Distributors, Inc. (“IDI”) to serve as the distributor for the Class A, Class C, Class R, Class Y, Class R5 and Class R6 shares of the Fund. The Trust has adopted plans pursuant to Rule12b-1 under the 1940 Act with respect to the Fund’s Class A, Class C and Class R shares (collectively, the “Plans”). The Fund, pursuant to the Plans, pays IDI compensation at the annual rate of 0.25% of the Fund’s average daily net assets of Class A shares, 1.00% of the average daily net assets of Class C shares and 0.50% of the average daily net assets of Class R shares. The fees are accrued daily and paid monthly. Of the Plan payments, up to 0.25% of the average daily net assets of each class of shares may be paid to furnish continuing personal shareholder services to customers who purchase and own shares of such classes. Any amounts not paid as a service fee under the Plans would constitute an asset-based sales charge. Rules of the Financial Industry Regulatory Authority (“FINRA”) impose a cap on the total sales charges, including asset-based sales charges, that may be paid by any class of shares of the Fund. For the year ended October 31, 2019, expenses incurred under the Plans are shown in the Statement of Operations asDistribution fees.
Front-end sales commissions and CDSC (collectively, the “sales charges”) are not recorded as expenses of the Fund.Front-end sales commissions are deducted from proceeds from the sales of Fund shares prior to investment in Class A shares of the Fund. CDSC are deducted from redemption proceeds prior to remittance to the shareholder. During the year ended October 31, 2019, IDI advised the Fund that IDI retained $126,007 infront-end sales commissions from the sale of Class A shares and $4,095 and $15,786 from Class A and Class C shares, respectively, for CDSC imposed upon redemptions by shareholders.
Certain officers and trustees of the Trust are officers and directors of Invesco.
NOTE 3–Additional Valuation Information
GAAP defines fair value as the price that would be received to sell an asset or paid to transfer a liability in an orderly transaction between market participants at the measurement date, under current market conditions. GAAP establishes a hierarchy that prioritizes the inputs to valuation methods, giving the highest priority to readily available unadjusted quoted prices in an active market for identical assets (Level 1) and the lowest priority to
39 Invesco Multi-Asset Income Fund
significant unobservable inputs (Level 3), generally when market prices are not readily available or are unreliable. Based on the valuation inputs, the securities or other investments are tiered into one of three levels. Changes in valuation methods may result in transfers in or out of an investment’s assigned level:
| | Level 1 - | Prices are determined using quoted prices in an active market for identical assets. |
| | Level 2 - | Prices are determined using other significant observable inputs. Observable inputs are inputs that other market participants may use in pricing a security. These may include quoted prices for similar securities, interest rates, prepayment speeds, credit risk, yield curves, loss severities, default rates, discount rates, volatilities and others. |
| | Level 3 - | Prices are determined using significant unobservable inputs. In situations where quoted prices or observable inputs are unavailable (for example, when there is little or no market activity for an investment at the end of the period), unobservable inputs may be used. Unobservable inputs reflect the Fund’s own assumptions about the factors market participants would use in determining fair value of the securities or instruments and would be based on the best available information. |
The following is a summary of the tiered valuation input levels, as of October 31, 2019. The level assigned to the securities valuations may not be an indication of the risk or liquidity associated with investing in those securities. Because of the inherent uncertainties of valuation, the values reflected in the financial statements may materially differ from the value received upon actual sale of those investments.
| | | | | | | | | | | | | | | | | | | | |
| | | Level 1 | | Level 2 | | Level 3 | | Total |
Investments in Securities | | | | | | | | | | | | | | | | | | | | |
U.S. Dollar Denominated Bonds & Notes | | | $ | 3,349,599 | | | | $ | 429,458,784 | | | | $ | – | | | | $ | 432,808,383 | |
Preferred Stocks | | | | 158,387,765 | | | | | – | | | | | – | | | | | 158,387,765 | |
Common Stocks & Other Equity Interests | | | | 55,658,811 | | | | | – | | | | | – | | | | | 55,658,811 | |
U.S. Treasury Securities | | | | – | | | | | 48,547,953 | | | | | – | | | | | 48,547,953 | |
Exchange-Traded Notes | | | | – | | | | | 13,740,429 | | | | | – | | | | | 13,740,429 | |
Exchange-Traded Funds | | | | 13,363,700 | | | | | – | | | | | – | | | | | 13,363,700 | |
Asset-Backed Securities | | | | – | | | | | 2,857,258 | | | | | – | | | | | 2,857,258 | |
Non-U.S. Dollar Denominated Bonds & Notes | | | | – | | | | | 734,492 | | | | | – | | | | | 734,492 | |
U.S. Government Sponsored Agency Mortgage-Backed Securities | | | | – | | | | | 107,000 | | | | | – | | | | | 107,000 | |
Money Market Funds | | | | 59,774,908 | | | | | – | | | | | – | | | | | 59,774,908 | |
Options Purchased | | | | – | | | | | 155,459 | | | | | – | | | | | 155,459 | |
Total Investments in Securities | | | | 290,534,783 | | | | | 495,601,375 | | | | | – | | | | | 786,136,158 | |
| | | | |
Other Investments - Assets* | | | | | | | | | | | | | | | | | | | | |
Futures Contracts | | | | 4,726,196 | | | | | – | | | | | – | | | | | 4,726,196 | |
Forward Foreign Currency Contracts | | | | – | | | | | 1,136 | | | | | – | | | | | 1,136 | |
Swap Agreements | | | | – | | | | | 660 | | | | | – | | | | | 660 | |
| | | | | 4,726,196 | | | | | 1,796 | | | | | – | | | | | 4,727,992 | |
| | | | |
Other Investments - Liabilities* | | | | | | | | | | | | | | | | | | | | |
Futures Contracts | | | | (682,540 | ) | | | | – | | | | | – | | | | | (682,540 | ) |
Forward Foreign Currency Contracts | | | | – | | | | | (11,489 | ) | | | | – | | | | | (11,489 | ) |
Options Written | | | | – | | | | | (64,398 | ) | | | | – | | | | | (64,398 | ) |
| | | | | (682,540 | ) | | | | (75,887 | ) | | | | – | | | | | (758,427 | ) |
Total Other Investments | | | | 4,043,656 | | | | | (74,091 | ) | | | | – | | | | | 3,969,565 | |
Total Investments | | | $ | 294,578,439 | | | | $ | 495,527,284 | | | | $ | – | | | | $ | 790,105,723 | |
| * | Forward foreign currency contracts, futures contracts and swap agreements are valued at unrealized appreciation (depreciation). Options written are shown at value. |
NOTE 4–Derivative Investments
The Fund may enter into an International Swaps and Derivatives Association Master Agreement (“ISDA Master Agreement”) under which a fund may trade OTC derivatives. An OTC transaction entered into under an ISDA Master Agreement typically involves a collateral posting arrangement, payment netting provisions andclose-out netting provisions. These netting provisions allow for reduction of credit risk through netting of contractual obligations. The enforceability of the netting provisions of the ISDA Master Agreement depends on the governing law of the ISDA Master Agreement, among other factors.
For financial reporting purposes, the Fund does not offset OTC derivative assets or liabilities that are subject to ISDA Master Agreements in the Statement of Assets and Liabilities.
40 Invesco Multi-Asset Income Fund
Value of Derivative Investments atPeriod-End
The table below summarizes the value of the Fund’s derivative investments, detailed by primary risk exposure, held as of October 31, 2019:
| | | | | | | | | | | | | | | | | | | | |
| | | Value |
| Derivative Assets | | Currency
Risk | | Equity Risk | | Interest
Rate Risk | | Total |
Unrealized appreciation on futures contracts – Exchange-Traded | | | $ | - | | | | $ | 4,634,322 | | | | $ | 91,874 | | | | $ | 4,726,196 | |
Unrealized appreciation on forward foreign currency contracts outstanding | | | | 1,136 | | | | | - | | | | | - | | | | | 1,136 | |
Unrealized appreciation on swap agreements – OTC | | | | - | | | | | 660 | | | | | - | | | | | 660 | |
Options purchased, at value – OTC | | | | - | | | | | - | | | | | 155,459 | | | | | 155,459 | |
Total Derivative Assets | | | | 1,136 | | | | | 4,634,982 | | | | | 247,333 | | | | | 4,883,451 | |
Derivatives not subject to master netting agreements | | | | - | | | | | (4,634,322 | ) | | | | (91,874 | ) | | | | (4,726,196 | ) |
Total Derivative Assets subject to master netting agreements | | | $ | 1,136 | | | | $ | 660 | | | | $ | 155,459 | | | | $ | 157,255 | |
| |
| | | Value |
| Derivative Liabilities | | Currency
Risk | | Equity Risk | | Interest
Rate Risk | | Total |
Unrealized depreciation on futures contracts – Exchange-Traded | | | $ | - | | | | $ | (409,635 | ) | | | $ | (272,905 | ) | | | $ | (682,540 | ) |
Unrealized depreciation on forward foreign currency contracts outstanding | | | | (11,489 | ) | | | | - | | | | | - | | | | | (11,489 | ) |
Options written, at value – OTC | | | | - | | | | | - | | | | | (64,398 | ) | | | | (64,398 | ) |
Total Derivative Liabilities | | | | (11,489 | ) | | | | (409,635 | ) | | | | (337,303 | ) | | | | (758,427 | ) |
Derivatives not subject to master netting agreements | | | | - | | | | | 409,635 | | | | | 272,905 | | | | | 682,540 | |
Total Derivative Liabilities subject to master netting agreements | | | $ | (11,489 | ) | | | $ | - | | | | $ | (64,398 | ) | | | $ | (75,887 | ) |
Offsetting Assets and Liabilities
The table below reflects the Fund’s exposure to Counterparties subject to either an ISDA Master Agreement or other agreement for OTC derivative transactions as of October 31, 2019.
| | | | | | | | | | | | | | | | | | | | | | | | | | | | | | | | | | | | | | | | | | | | | | | | | | | | | | | | | | | | |
| | | Financial Derivative Assets | | Financial Derivative Liabilities | | | | | | | | |
| | | Forward | | | | | | | | Forward | | | | | | | | | | | | | | |
| | | Foreign | | | | | | | | Foreign | | | | | | | | | | | | | | |
| | | Currency | | Options | | Swap | | Total | | Currency | | Options | | Swap | | Total | | Net Value of | | Collateral | | Net |
| Counterparty | | Contracts | | Purchased | | Agreements | | Assets | | Contracts | | Written | | Agreements | | Liabilities | | Derivatives | | (Received/Pledged) | | Amount |
| | | | | | | | | | | | | | | | | | | | | Non-Cash | | Cash | | |
| | | | | | | | | | | | | | | | | | | | | | | |
| Citibank N.A. | | | $ | – | | | | $ | 155,459 | | | | $ | – | | | | $ | 155,459 | | | | $ | – | | | | $ | (64,398 | ) | | | $ | – | | | | $ | (64,398 | ) | | | $ | 91,061 | | | | $ | – | | | | $ | – | | | | $ | 91,061 | |
| Goldman Sachs International | | | | 1,136 | | | | | – | | | | | – | | | | | 1,136 | | | | | (11,489 | ) | | | | – | | | | | – | | | | | (11,489 | ) | | | | (10,353 | ) | | | | – | | | | | – | | | | | (10,353 | ) |
| Morgan Stanley & Co. International PLC | | | | – | | | | | – | | | | | 660 | | | | | 660 | | | | | – | | | | | – | | | | | – | | | | | – | | | | | 660 | | | | | – | | | | | – | | | | | 660 | |
Total | | | $ | 1,136 | | | | $ | 155,459 | | | | $ | 660 | | | | $ | 157,255 | | | | $ | (11,489 | ) | | | $ | (64,398 | ) | | | $ | – | | | | $ | (75,887 | ) | | | $ | 81,368 | | | | $ | – | | | | $ | – | | | | $ | 81,368 | |
Effect of Derivative Investments for the year ended October 31, 2019
The table below summarizes the gains (losses) on derivative investments, detailed by primary risk exposure, recognized in earnings during the period:
| | | | | | | | | | | | | | | | | | | | | | | | | | | | | | |
| | | Location of Gain (Loss) on
Statement of Operations |
| | | Commodity | | Credit | | Currency | | Equity | | Interest | | |
| | | Risk | | Risk | | Risk | | Risk | | Rate Risk | | Total |
| Realized Gain (Loss): | | | | | | | | | | | | | | | | | | | | | | | | | | | | | | |
Forward foreign currency contracts | | | $ | - | | | | $ | - | | | | $ | 135,771 | | | | $ | - | | | | $ | - | | | | $ | 135,771 | |
Futures contracts | | | | - | | | | | - | | | | | - | | | | | (9,905,953 | ) | | | | 5,486,546 | | | | | (4,419,407 | ) |
Options purchased(a) | | | | - | | | | | - | | | | | (14,950 | ) | | | | - | | | | | (8,642 | ) | | | | (23,592 | ) |
Options written | | | | - | | | | | - | | | | | - | | | | | - | | | | | 43,591 | | | | | 43,591 | |
Swap agreements | | | | 9,580 | | | | | 64,360 | | | | | - | | | | | - | | | | | (911 | ) | | | | 73,029 | |
41 Invesco Multi-Asset Income Fund
| | | | | | | | | | | | | | | | | | | | | | | | |
| | | Location of Gain (Loss) on
Statement of Operations | |
| | | Commodity | | | Credit | | | Currency | | | Equity | | | Interest | | | | |
| | | Risk | | | Risk | | | Risk | | | Risk | | | Rate Risk | | | Total | |
| |
Change in Net Unrealized Appreciation (Depreciation): | | | | | | | | | | | | | | | | | | | | | | | | |
Forward foreign currency contracts | | $ | - | | | $ | - | | | $ | (84,786 | ) | | $ | - | | | $ | - | | | $ | (84,786 | ) |
| |
Futures contracts | | | - | | | | - | | | | - | | | | 10,900,329 | | | | 89,454 | | | | 10,989,783 | |
| |
Options purchased(a) | | | - | | | | 12,659 | | | | - | | | | - | | | | - | | | | 12,659 | |
| |
Options written | | | - | | | | (7,873 | ) | | | - | | | | - | | | | - | | | | (7,873 | ) |
| |
Swap agreements | | | - | | | | 78,280 | | | | - | | | | 660 | | | | - | | | | 78,940 | |
| |
Total | | $ | 9,580 | | | $ | 147,426 | | | $ | 36,035 | | | $ | 995,036 | | | $ | 5,610,038 | | | $ | 6,798,115 | |
| |
| (a) | Options purchased are included in the net realized gain (loss) from investment securities and the change in net unrealized appreciation (depreciation) of investment securities. |
The table below summarizes the average notional value of derivatives held during the period.
| | | | | | | | | | | | | | | | | | | | | | | | |
| | | Forward | | | | | | | | | | | | | | | | |
| | | Foreign Currency | | | Futures | | | Swaptions | | | Options | | | Swaptions | | | Swap | |
| | | Contracts | | | Contracts | | | Purchased | | | Purchased | | | Written | | | Agreements | |
| |
Average notional value | | | $1,708,969 | | | | $207,474,180 | | | | $13,483,333 | | | | $3,326,900 | | | | $11,775,000 | | | | $5,005,833 | |
| |
NOTE 5–Expense Offset Arrangement(s)
The expense offset arrangement is comprised of transfer agency credits which result from balances in demand deposit accounts used by the transfer agent for clearing shareholder transactions. For the year ended October 31, 2019, the Fund received credits from this arrangement, which resulted in the reduction of the Fund’s total expenses of $1,475.
NOTE 6–Trustees’ and Officers’ Fees and Benefits
Trustees’ and Officers’ Fees and Benefits include amounts accrued by the Fund to pay remuneration to certain Trustees and Officers of the Fund. Trustees have the option to defer compensation payable by the Fund, andTrustees’ and Officers’ Fees and Benefits also include amounts accrued by the Fund to fund such deferred compensation amounts. Those Trustees who defer compensation have the option to select various Invesco Funds in which their deferral accounts shall be deemed to be invested. Finally, certain current Trustees were eligible to participate in a retirement plan that provided for benefits to be paid upon retirement to Trustees over a period of time based on the number of years of service. The Fund may have certain former Trustees who also participate in a retirement plan and receive benefits under such plan.Trustees’ and Officers’ Fees and Benefits include amounts accrued by the Fund to fund such retirement benefits. Obligations under the deferred compensation and retirement plans represent unsecured claims against the general assets of the Fund.
NOTE 7–Cash Balances
The Fund is permitted to temporarily carry a negative or overdrawn balance in its account with State Street Bank and Trust Company, the custodian bank. Such balances, if any atperiod-end, are shown in the Statement of Assets and Liabilities under the payable caption Amount due custodian. To compensate the custodian bank for such overdrafts, the overdrawn Fund may either (1) leave funds as a compensating balance in the account so the custodian bank can be compensated by earning the additional interest; or (2) compensate by paying the custodian bank at a rate agreed upon by the custodian bank and Invesco, not to exceed the contractually agreed upon rate.
NOTE 8–Distributions to Shareholders and Tax Components of Net Assets
Tax Character of Distributions to Shareholders Paid During the Fiscal Years Ended October 31, 2019 and 2018
| | | | | | | | |
| | | 2019 | | | 2018 | |
| |
Ordinary income | | | $34,045,108 | | | | $32,572,785 | |
| |
Long-term capital gain | | | – | | | | 4,561,185 | |
| |
Total distributions | | | $34,045,108 | | | | $37,133,970 | |
| |
Tax Components of Net Assets atPeriod-End:
| | | | |
| | | 2019 | |
| |
Undistributed ordinary income | | $ | 2,646,200 | |
| |
Net unrealized appreciation – investments | | | 10,457,020 | |
| |
Net unrealized appreciation – foreign currencies | | | 44,679 | |
| |
Temporary book/tax differences | | | (32,362 | ) |
| |
Capital loss carryforward | | | (20,227,581 | ) |
| |
Shares of beneficial interest | | | 776,564,385 | |
| |
Total net assets | | $ | 769,452,341 | |
| |
42 Invesco Multi-Asset Income Fund
The difference between book-basis andtax-basis unrealized appreciation (depreciation) is due to differences in the timing of recognition of gains and losses on investments for tax and book purposes. The Fund’s net unrealized appreciation (depreciation) difference is attributable primarily to wash sales, futures contracts and bond premiums.
The temporary book/tax differences are a result of timing differences between book and tax recognition of income and/or expenses. The Fund’s temporary book/tax differences are the result of the trustee deferral of compensation and retirement plan benefits.
Capital loss carryforward is calculated and reported as of a specific date. Results of transactions and other activity after that date may affect the amount of capital loss carryforward actually available for the Fund to utilize. Capital losses generated in years beginning after December 22, 2010 can be carried forward for an unlimited period, whereas previous losses expire in eight tax years. Capital losses with an expiration period may not be used to offset capital gains until all net capital losses without an expiration date have been utilized. Capital loss carryforwards with no expiration date will retain their character as either short-term or long-term capital losses instead of as short-term capital losses as under prior law. The ability to utilize capital loss carryforwards in the future may be limited under the Internal Revenue Code and related regulations based on the results of future transactions.
The Fund has a capital loss carryforward as of October 31, 2019, as follows:
| | | | | | | | | | | | |
| Capital Loss Carryforward* | |
| |
| Expiration | | Short-Term | | | Long-Term | | | Total | |
| |
Not subject to expiration | | $ | 4,551,292 | | | $ | 15,676,289 | | | $ | 20,227,581 | |
| |
| * | Capital loss carryforwards as of the date listed above are reduced for limitations, if any, to the extent required by the Internal Revenue Code and may be further limited depending upon a variety of factors, including the realization of net unrealized gains or losses as of the date of any reorganization. |
NOTE 9–Investment Transactions
The aggregate amount of investment securities (other than short-term securities, U.S. Treasury obligations and money market funds, if any) purchased and sold by the Fund during the year ended October 31, 2019 was $361,522,805 and $390,524,390, respectively. During the same period, purchases and sales of U.S. Treasury obligations were $50,244,734 and $4,276,289, respectively. Cost of investments, including any derivatives, on a tax basis includes the adjustments for financial reporting purposes as of the most recently completed federal income tax reportingperiod-end.
| | | | |
| Unrealized Appreciation (Depreciation) of Investments on a Tax Basis | |
| |
Aggregate unrealized appreciation of investments | | $ | 24,544,587 | |
| |
Aggregate unrealized (depreciation) of investments | | | (14,087,567 | ) |
| |
Net unrealized appreciation of investments | | $ | 10,457,020 | |
| |
Cost of investments for tax purposes is $779,648,703.
NOTE 10–Reclassification of Permanent Differences
Primarily as a result of differing book/tax treatment of bond premium amortization, futures contracts and swap agreement income, on October 31, 2019, undistributed net investment income was increased by $1,238,190, undistributed net realized gain (loss) was decreased by $1,232,495 and shares of beneficial interest was decreased by $5,695. This reclassification had no effect on the net assets of the Fund.
NOTE 11–Share Information
| | | | | | | | | | | | | | | | | | |
| | | Summary of Share Activity | |
| |
| | | Years ended October 31, | |
| | | 2019(a) | | | | | 2018 | |
| | | Shares | | | Amount | | | | | Shares | | | Amount | |
| |
Sold: | | | | | | | | | | | | | | | | | | |
| | | | | |
Class A | | | 8,223,833 | | | $ | 87,125,025 | | | | | | 6,711,689 | | | $ | 72,173,241 | |
| |
Class C | | | 4,641,964 | | | | 49,080,633 | | | | | | 3,387,904 | | | | 36,193,139 | |
| |
Class R | | | 296,704 | | | | 3,159,273 | | | | | | 106,045 | | | | 1,135,961 | |
| |
Class Y | | | 20,007,093 | | | | 210,574,513 | | | | | | 17,453,638 | | | | 186,994,732 | |
| |
Class R5 | | | - | | | | - | | | | | | 12,597 | | | | 131,905 | |
| |
Class R6 | | | 313,437 | | | | 3,304,813 | | | | | | 901,885 | | | | 9,518,938 | |
| |
| | | | | |
Issued as reinvestment of dividends: | | | | | | | | | | | | | | | | | | |
| | | | | |
Class A | | | 595,188 | | | | 6,219,236 | | | | | | 800,753 | | | | 8,552,192 | |
| |
Class C | | | 280,127 | | | | 2,924,043 | | | | | | 289,651 | | | | 3,084,082 | |
| |
Class R | | | 15,040 | | | | 157,523 | | | | | | 10,392 | | | | 110,374 | |
| |
Class Y | | | 1,272,079 | | | | 13,304,500 | | | | | | 1,427,830 | | | | 15,212,966 | |
| |
Class R5 | | | 620 | | | | 6,439 | | | | | | 382 | | | | 4,023 | |
| |
Class R6 | | | 304,898 | | | | 3,182,818 | | | | | | 341,361 | | | | 3,632,071 | |
| |
43 Invesco Multi-Asset Income Fund
| | | | | | | | | | | | | | | | |
| | | Summary of Share Activity | |
| |
| | | Years ended October 31, | |
| | | 2019(a) | | | 2018 | |
| | | Shares | | | Amount | | | Shares | | | Amount | |
| |
| | |
Automatic conversion of Class C shares to Class A shares: | | | | | | | | | |
Class A | | | 326,563 | | | $ | 3,379,001 | | | | - | | | $ | - | |
| |
Class C | | | (326,877 | ) | | | (3,379,001 | ) | | | - | | | | - | |
| |
| | | | |
Reacquired: | | | | | | | | | | | | | | | | |
| | | | |
Class A | | | (4,758,793 | ) | | | (49,706,838 | ) | | | (11,796,159 | ) | | | (125,480,384 | ) |
| |
Class C | | | (2,072,188 | ) | | | (21,452,624 | ) | | | (1,940,964 | ) | | | (20,466,365 | ) |
| |
Class R | | | (49,757 | ) | | | (526,372 | ) | | | (42,138 | ) | | | (444,683 | ) |
| |
Class Y | | | (13,054,343 | ) | | | (135,355,198 | ) | | | (20,140,304 | ) | | | (213,617,252 | ) |
| |
Class R5 | | | (5,794 | ) | | | (59,371 | ) | | | (867 | ) | | | (9,141 | ) |
| |
Class R6 | | | (447,891 | ) | | | (4,612,665 | ) | | | (1,439,258 | ) | | | (15,152,863 | ) |
| |
Net increase (decrease) in share activity | | | 15,561,903 | | | $ | 167,325,748 | | | | (3,915,563 | ) | | $ | (38,427,064 | ) |
| |
| (a) | There are entities that are record owners of more than 5% of the outstanding shares of the Fund and in the aggregate own 61% of the outstanding shares of the Fund. IDI has an agreement with these entities to sell Fund shares. The Fund, Invesco and/or Invesco affiliates may make payments to these entities, which are considered to be related to the Fund, for providing services to the Fund, Invesco and/or Invesco affiliates including but not limited to services such as securities brokerage, distribution, third party record keeping and account servicing. The Fund has no knowledge as to whether all or any portion of the shares owned of record by these entities are also owned beneficially. |
In addition, 7% of the outstanding shares of the Fund are owned by the Adviser or an affiliate of the Adviser.
NOTE 12–Subsequent Event
The Board of Trustees of the Fund unanimously approved an Agreement and Plan of Reorganizations (the “Agreement”) pursuant to which the Fund would acquire all of the assets and liabilities of Invesco Oppenheimer Global Multi-Asset Income Fund and Invesco Oppenheimer Capital Income Fund (the “Target Funds”) in exchange for shares of the Fund.
The reorganization is expected to be consummated in or around April or May 2020. Upon closing of the reorganization, shareholders of each Target Fund will receive shares of the Fund in exchange for their shares of the corresponding Target Fund, and the Target Funds will liquidate and cease operations.
44 Invesco Multi-Asset Income Fund
Report of Independent Registered Public Accounting Firm
To the Board of Trustees of AIM Investment Funds (Invesco Investment Funds) and Shareholders of Invesco Multi-Asset Income Fund
Opinion on the Financial Statements
We have audited the accompanying statement of assets and liabilities, including the schedule of investments, of Invesco Multi-Asset Income Fund (one of the funds constituting AIM Investment Funds (Invesco Investment Funds), referred to hereafter as the “Fund”) as of October 31, 2019, the related statement of operations for the year ended October 31, 2019, the statement of changes in net assets for each of the two years in the period ended October 31, 2019, including the related notes, and the financial highlights for each of the five years in the period ended October 31, 2019 (collectively referred to as the “financial statements”). In our opinion, the financial statements present fairly, in all material respects, the financial position of the Fund as of October 31, 2019, the results of its operations for the year then ended, the changes in its net assets for each of the two years in the period ended October 31, 2019 and the financial highlights for each of the five years in the period ended October 31, 2019 in conformity with accounting principles generally accepted in the United States of America.
Basis for Opinion
These financial statements are the responsibility of the Fund’s management. Our responsibility is to express an opinion on the Fund’s financial statements based on our audits. We are a public accounting firm registered with the Public Company Accounting Oversight Board (United States) (PCAOB) and are required to be independent with respect to the Fund in accordance with the U.S. federal securities laws and the applicable rules and regulations of the Securities and Exchange Commission and the PCAOB.
We conducted our audits of these financial statements in accordance with the standards of the PCAOB. Those standards require that we plan and perform the audit to obtain reasonable assurance about whether the financial statements are free of material misstatement, whether due to error or fraud.
Our audits included performing procedures to assess the risks of material misstatement of the financial statements, whether due to error or fraud, and performing procedures that respond to those risks. Such procedures included examining, on a test basis, evidence regarding the amounts and disclosures in the financial statements. Our audits also included evaluating the accounting principles used and significant estimates made by management, as well as evaluating the overall presentation of the financial statements. Our procedures included confirmation of securities owned as of October 31, 2019 by correspondence with the custodian, transfer agent and brokers; when replies were not received from brokers, we performed other auditing procedures. We believe that our audits provide a reasonable basis for our opinion.
|
| /s/PricewaterhouseCoopers LLP |
Houston, Texas
December 27, 2019
We have served as the auditor of one or more of the investment companies in the Invesco group of investment companies since at least 1995. We have not been able to determine the specific year we began serving as auditor.
45 Invesco Multi-Asset Income Fund
Calculating your ongoing Fund expenses
Example
As a shareholder of the Fund, you incur two types of costs: (1) transaction costs, which may include sales charges (loads) on purchase payments or contingent deferred sales charges on redemptions, if any; and (2) ongoing costs, including management fees, distribution and/or service(12b-1) fees, and other Fund expenses. This example is intended to help you understand your ongoing costs (in dollars) of investing in the Fund and to compare these costs with ongoing costs of investing in other mutual funds. The example is based on an investment of $1,000 invested at the beginning of the period and held for the entire period May 1, 2019 through October 31, 2019.
Actual expenses
The table below provides information about actual account values and actual expenses. You may use the information in this table, together with the amount you invested, to estimate the expenses that you paid over the period. Simply divide your account value by $1,000 (for example, an $8,600 account value divided by $1,000 = 8.6), then multiply the result by the number in the table under the heading entitled “Actual Expenses Paid During Period” to estimate the expenses you paid on your account during this period.
Hypothetical example for comparison purposes
The table below also provides information about hypothetical account values and hypothetical expenses based on the Fund’s actual expense ratio and an assumed rate of return of 5% per year before expenses, which is not the Fund’s actual return.
The hypothetical account values and expenses may not be used to estimate the actual ending account balance or expenses you paid for the period. You may use this information to compare the ongoing costs of investing in the Fund and other funds. To do so, compare this 5% hypothetical example with the 5% hypothetical examples that appear in the shareholder reports of the other funds.
Please note that the expenses shown in the table are meant to highlight your ongoing costs only and do not reflect any transaction costs, such as sales charges (loads) on purchase payments or contingent deferred sales charges on redemptions, if any. Therefore, the hypothetical information is useful in comparing ongoing costs only, and will not help you determine the relative total costs of owning different funds. In addition, if these transaction costs were included, your costs would have been higher.
| | | | | | | | | | | | |
| | | | | | | | | HYPOTHETICAL | | |
| | | | | | | | | (5% annual return before | | |
| | | | | ACTUAL | | expenses) | | |
| | | Beginning | | Ending | | Expenses | | Ending | | Expenses | | Annualized |
| | | Account Value | | Account Value | | Paid During | | Account Value | | Paid During | | Expense |
| | | (05/01/19) | | (10/31/19)1 | | Period2 | | (10/31/19) | | Period2 | | Ratio |
Class A | | $1,000.00 | | $1,040.20 | | $4.32 | | $1,020.97 | | $4.28 | | 0.84% |
Class C | | 1,000.00 | | 1,035.40 | | 8.16 | | 1,017.19 | | 8.08 | | 1.59 |
Class R | | 1,000.00 | | 1,038.90 | | 5.60 | | 1,019.71 | | 5.55 | | 1.09 |
Class Y | | 1,000.00 | | 1,040.50 | | 3.03 | | 1,022.23 | | 3.01 | | 0.59 |
Class R5 | | 1,000.00 | | 1,041.50 | | 3.04 | | 1,022.23 | | 3.01 | | 0.59 |
Class R6 | | 1,000.00 | | 1,040.50 | | 3.03 | | 1,022.23 | | 3.01 | | 0.59 |
| 1 | The actual ending account value is based on the actual total return of the Fund for the period May 1, 2019 through October 31, 2019, after actual expenses and will differ from the hypothetical ending account value which is based on the Fund’s expense ratio and a hypothetical annual return of 5% before expenses. |
| 2 | Expenses are equal to the Fund’s annualized expense ratio as indicated above multiplied by the average account value over the period, multiplied by 184/365 to reflect the most recent fiscal half year. |
46 Invesco Multi-Asset Income Fund
Approval of Investment Advisory andSub-Advisory Contracts
At meetings held on June 10, 2019, the Board of Trustees (the Board or the Trustees) of AIM Investment Funds (Invesco Investment Funds) as a whole, and the independent Trustees, who comprise over 75% of the Board, voting separately, approved the continuance of the Invesco Multi-Asset Income Fund’s (the Fund) Master Investment Advisory Agreement with Invesco Advisers, Inc. (Invesco Advisers and the investment advisory agreement) and the Master IntergroupSub-Advisory Contract for Mutual Funds with Invesco Asset Management Deutschland GmbH, Invesco Asset Management Limited, Invesco Asset Management (Japan) Limited, Invesco Hong Kong Limited, Invesco Senior Secured Management, Inc. and Invesco Canada Ltd. and separatesub-advisory contracts with Invesco Capital Management LLC and Invesco Asset Management (India) Private Limited (collectively, the AffiliatedSub-Advisers and thesub-advisory contracts) for another year, effective July 1, 2019. After evaluating the factors discussed below, among others, the Board approved the renewal of the Fund’s investment advisory agreement and thesub-advisory contracts and determined that the compensation payable by the Fund to Invesco Advisers and by Invesco Advisers to the AffiliatedSub-Advisers is fair and reasonable.
The Board’s Evaluation Process
The Board’s Investments Committee has established threeSub-Committees, which meet throughout the year to review the performance of funds advised by Invesco Advisers (the Invesco Funds). As part of a regularly scheduled basis ofin-person Board meetings, theSub-Committees meet with portfolio managers for their assigned Invesco Funds and other members of management to review detailed information about investment performance and portfolio attributes of these funds. The Board took into account evaluations and reports that it received from the Investments Committee andSub-Committees, as well as the information provided to such committees and the Board throughout the year, in considering whether to approve each Invesco Fund’s investment advisory agreement andsub-advisory contracts.
As part of the contract renewal process, the Board reviews and considers information provided in response to detailed requests for information submitted to management by the independent Trustees with assistance from legal counsel to the independent Trustees. The Board receives comparative investment performance and fee data regarding the Invesco Funds prepared by Invesco Advisers and Broadridge Financial Solutions, Inc. (Broadridge), an independent mutual fund data provider. The Board also receives an independent written evaluation from the Senior Officer, an officer of
the Invesco Funds who reports directly to the independent Trustees. The Senior Officer’s evaluation is prepared as part of his responsibility to manage the process by which the Invesco Funds’ proposed management fees are negotiated during the annual contract renewal process to ensure they are negotiated in a manner that is at arms’ length and reasonable. In addition to meetings with Invesco Advisers and fund counsel throughout the year, the independent Trustees also discuss the continuance of the investment advisory agreement andsub-advisory contracts in separate sessions with the Senior Officer and with independent legal counsel.
The discussion below is a summary of the Senior Officer’s independent written evaluation with respect to the Fund’s investment advisory agreement, as well as a discussion of the material factors and related conclusions that formed the basis for the Board’s approval of the Fund’s investment advisory agreement andsub-advisory contracts. The Trustees’ review and conclusions are based on the comprehensive consideration of all information presented to them during the course of the year and in prior years and are not the result of any single determinative factor. Moreover, one Trustee may have weighed a particular piece of information or factor differently than another Trustee. This information is current as of June 10, 2019.
Factors and Conclusions and Summary of Independent Written Fee Evaluation
| A. | Nature, Extent and Quality of Services Provided by Invesco Advisers and the AffiliatedSub-Advisers |
The Board reviewed the nature, extent and quality of the advisory services provided to the Fund by Invesco Advisers under the Fund’s investment advisory agreement, and the credentials and experience of the officers and employees of Invesco Advisers who provide these services, including the Fund’s portfolio manager(s). The Board’s review included consideration of Invesco Advisers’ investment process oversight and structure, credit analysis and investment risk management. The Board also considerednon-advisory services that Invesco Advisers and its affiliates provide to the Invesco Funds such as various back office support functions, third party oversight, internal audit, valuation, portfolio trading and legal and compliance. The Board also received and reviewed information about Invesco Advisers’ role as administrator of the Invesco Funds’ liquidity risk management program. The Board also reviewed and considered the benefits to shareholders of investing in a fund that is part of the Invesco family of funds under the umbrella of Invesco Ltd., Invesco Advisers’
parent company, and noted Invesco Ltd.’s depth and experience in conducting an investment management business, as well as its commitment of financial and other resources to such business. The Board reviewed and considered information about the resources that Invesco Advisers intends to continue to commit to managing the Invesco family of funds following Invesco Ltd.’s acquisition of OppenheimerFunds, Inc. and its subsidiaries. The Board concluded that the nature, extent and quality of the services provided to the Fund by Invesco Advisers are appropriate and satisfactory.
The Board reviewed the services that may be provided by the AffiliatedSub-Advisers under thesub-advisory contracts and the credentials and experience of the officers and employees of the AffiliatedSub-Advisers who provide these services. The Board noted the AffiliatedSub-Advisers’ expertise with respect to certain asset classes and that the AffiliatedSub-Advisers have offices and personnel that are located in financial centers around the world. As a result, the Board noted that the AffiliatedSub-Advisers can provide research and investment analysis on the markets and economies of various countries in which the Fund may invest, make recommendations regarding securities and assist with security trades. The Board concluded that thesub-advisory contracts may benefit the Fund and its shareholders by permitting Invesco Advisers to use the resources and talents of the AffiliatedSub-Advisers in managing the Fund. The Board concluded that the nature, extent and quality of the services that may be provided by the AffiliatedSub-Advisers are appropriate and satisfactory.
| B. | Fund Investment Performance |
The Board considered Fund investment performance as a relevant factor in considering whether to approve the investment advisory agreement as well as thesub-advisory contracts for the Fund, as Invesco Capital Management LLC currently manages assets of the Fund.
The Board compared the Fund’s investment performance over multiple time periods ending December 31, 2018 to the performance of funds in the Broadridge performance universe and against the Lipper Mixed-Asset Target Allocation Conservative Funds Index. The Board noted that performance of Class A shares of the Fund was in the fourth quintile of its performance universe for the one year period and the first quintile for the three and five year periods (the first quintile being the best performing funds and the fifth quintile being the worst performing funds). The Board noted that performance of Class A shares of the Fund was
47 Invesco Multi-Asset Income Fund
below the performance of the Index for the one year period, and above the performance of the Index for the three and five year periods. The Board noted that the Fund’s asset allocation, including its overweight equity exposure and exposure to certain segments of the fixed income market, negatively impacted relative performance. The Trustees also reviewed more recent Fund performance and this review did not change their conclusions.
| C. | Advisory andSub-Advisory Fees and Fund Expenses |
The Board compared the Fund’s contractual management fee rate to the contractual management fee rates of funds in the Fund’s Broadridge expense group. The Board noted that the contractual management fee rate for Class A shares of the Fund was below the median contractual management fee rate of funds in its expense group. The Board noted that the term “contractual management fee” for funds in the expense group may include both advisory and certainnon-portfolio management administrative services fees, but that Broadridge does not provide information on a fund by fund basis as to what is included. The Board also reviewed the methodology used by Broadridge in providing expense group information, which includes using each fund’s contractual management fee schedule (including any applicable breakpoints) as reported in the most recent prospectus or statement of additional information for each fund in the expense group. The Board also considered comparative information regarding the Fund’s total expense ratio and its various components.
The Board noted that Invesco Advisers has contractually agreed to waive fees and/or limit expenses of the Fund for the term disclosed in the Fund’s registration statement in an amount necessary to limit total annual operating expenses to a specified percentage of average daily net assets for each class of the Fund.
The Board noted that Invesco Advisers and the AffiliatedSub-Advisers do not manage other mutual funds or client accounts with investment strategies comparable to those of the Fund.
The Board also considered the services that may be provided by the AffiliatedSub-Advisers pursuant to thesub-advisory contracts, as well as the fees payable by Invesco Advisers to the AffiliatedSub-Advisers pursuant to thesub-advisory contracts. The Board noted that Invesco Advisers retains overall responsibility for, and provides services to,sub-advised Invesco Funds, including oversight of the AffiliatedSub-Advisers as well as the additional services described herein other thanday-to-day portfolio management.
| D. | Economies of Scale and Breakpoints |
The Board considered the extent to which there may be economies of scale in the provision of advisory services to the Fund. The Board considered Invesco’s reinvestment in its business, including investments in business
infrastructure and cybersecurity. The Board also considered that the Fund benefits from economies of scale through contractual breakpoints in the Fund’s advisory fee schedule, which generally operate to reduce the Fund’s expense ratio as it grows in size. The Board noted that the Fund shares directly in economies of scale through lower fees charged by third party service providers based on the combined size of the Invesco Funds. The Board noted that the Fund may also benefit from economies of scale through initial fee setting, fee waivers and expense reimbursements.
| E. | Profitability and Financial Resources |
The Board reviewed information from Invesco Advisers concerning the costs of the advisory and other services that Invesco Advisers and its affiliates provide to the Fund and the Invesco Funds and the profitability of Invesco Advisers and its affiliates in providing these services. The Board considered the methodology used for calculating profitability and noted the periodic review of such methodology by an independent consultant. The Board noted that Invesco Advisers continues to operate at a net profit from services Invesco Advisers and its affiliates provide to the Invesco Funds and the Fund. The Board did not deem the level of profits realized by Invesco Advisers and its affiliates from providing services to the Fund to be excessive given the nature, extent and quality of the services provided. The Board received information from Invesco Advisers demonstrating that Invesco Advisers and the AffiliatedSub-Advisers are financially sound and have the resources necessary to perform their obligations under the investment advisory agreement andsub-advisory contracts.
| F. | Collateral Benefits to Invesco Advisers and its Affiliates |
The Board considered various other benefits received by Invesco Advisers and its affiliates from the relationship with the Fund, including the fees received for providing administrative, transfer agency and distribution services to the Fund. The Board considered comparative information regarding fees charged for these services, including information provided by Broadridge and other independent sources. The Board considered the performance of Invesco Advisers and its affiliates in providing these services and the organizational structure employed to provide these services. The Board also considered that these services are provided to the Fund pursuant to written contracts that are reviewed and approved on an annual basis by the Board; and that the services are required for the operation of the Fund.
The Board considered the benefits realized by Invesco Advisers and the AffiliatedSub-Advisers as a result of portfolio brokerage transactions executed through “soft dollar” arrangements. The Board noted that soft dollar arrangements may result in the Fund bearing costs to purchase research that may be used by Invesco Advisers or the AffiliatedSub-Advisers with other clients
and may reduce Invesco Advisers’ or the AffiliatedSub-Advisers’ expenses. The Board also considered that it receives periodic reports from Invesco representing that these arrangements are consistent with regulatory requirements. The Board did not deem the soft dollar arrangements to be inappropriate.
The Board considered that the Fund’s uninvested cash and cash collateral from any securities lending arrangements may be invested in money market funds advised by Invesco Advisers pursuant to procedures approved by the Board. The Board considered information regarding the returns of the affiliated money market funds relative to comparable overnight investments, as well as the costs to the Fund of such investments. The Board noted that Invesco Advisers receives advisory fees from these affiliated money market funds attributable to such investments, although Invesco Advisers has contractually agreed to waive through varying periods the advisory fees payable by the Invesco Funds with respect to certain investments in the affiliated money market funds. The waiver is in an amount equal to 100% of the net advisory fee Invesco Advisers receives from the affiliated money market funds with respect to the Fund’s investment in the affiliated money market funds of uninvested cash, but not cash collateral. The Board concluded that the amount of advisory fees received by Invesco Advisers from the Fund’s investment of cash collateral from any securities lending arrangements in the affiliated money market funds is fair and reasonable.
The Board also considered that an affiliated broker may receive commissions for executing certain trades for the Fund. Invesco Advisers and the AffiliatedSub-Advisers may use the affiliated broker to, among other things, control order routing and minimize information leakage, and the Board was advised that such trades are executed in compliance with rules under the federal securities laws and consistent with best execution obligations.
48 Invesco Multi-Asset Income Fund
Tax Information
Form1099-DIV, Form1042-S and otheryear-end tax information provide shareholders with actual calendar year amounts that should be included in their tax returns. Shareholders should consult their tax advisors.
The following distribution information is being provided as required by the Internal Revenue Code or to meet a specific state’s requirement.
The Funds designate the following amounts or, if subsequently determined to be different, the maximum amount allowable for their fiscal year ended October 31, 2019:
| | | | | | | |
| | | Federal and State Income Tax | | |
| | Qualified Dividend Income* | | | | 13.48 | % |
| | Corporate Dividends Received Deduction* | | | | 12.99 | % |
| | Qualified Business Income (199A)* | | | | 11.41 | % |
| | U.S. Treasury Obligations* | | | | 3.98 | % |
| | * | The above percentages are based on ordinary income dividends paid to shareholders during the Fund’s fiscal year. |
49 Invesco Multi-Asset Income Fund
Distribution Information
The following table sets forth on a per share basis the distribution that was paid in October 2019. Included in the table is a written statement of the sources of the distribution on a GAAP basis.
| | | | | | | | | | | | | | | | | | | | | | |
| | | | | | | Gain from | | | | |
| | | | | Net Income | | Sale of Securities | | Return of Principal | | Total Distribution |
10/17/19 | | Class A | | | $ | 0.0403 | | | | $ | 0.000 | | | | $ | 0.0034 | | | | $ | 0.0437 | |
10/17/19 | | Class C | | | $ | 0.0335 | | | | $ | 0.000 | | | | $ | 0.0034 | | | | $ | 0.0369 | |
10/17/19 | | Class R | | | $ | 0.0380 | | | | $ | 0.000 | | | | $ | 0.0034 | | | | $ | 0.0414 | |
10/17/19 | | Class Y | | | $ | 0.0425 | | | | $ | 0.000 | | | | $ | 0.0034 | | | | $ | 0.0459 | |
10/17/19 | | Class R5 | | | $ | 0.0426 | | | | $ | 0.000 | | | | $ | 0.0034 | | | | $ | 0.0460 | |
10/17/19 | | Class R6 | | | $ | 0.0426 | | | | $ | 0.000 | | | | $ | 0.0034 | | | | $ | 0.0460 | |
Please note that the information in the preceding chart is for financial accounting purposes only. Shareholders should be aware that the tax treatment of distributions likely differs from GAAP treatment. Form1099-DIV for the calendar year will report distributions for U.S. federal income tax purposes. This notice is sent to comply with certain U.S. Securities and Exchange Commission requirements.
50 Invesco Multi-Asset Income Fund
Trustees and Officers
The address of each trustee and officer is AIM Investment Funds (Invesco Investment Funds) (the “Trust”), 11 Greenway Plaza, Suite 1000, Houston, Texas 77046-1173. The trustees serve for the life of the Trust, subject to their earlier death, incapacitation, resignation, retirement or removal as more specifically provided in the Trust’s organizational documents. Each officer serves for a one year term or until their successors are elected and qualified. Column two below includes length of time served with predecessor entities, if any.
| | | | | | | | |
| | | | | | | Number of | | Other |
| | | Trustee | | | | Funds in | | Directorship(s) |
| Name, Year of Birth and | | and/or | | | | Fund Complex | | Held by Trustee |
| Position(s) | | Officer | | Principal Occupation(s) | | Overseen by | | During Past 5 |
| Held with the Trust | | Since | | During Past 5 Years | | Trustee | | Years |
| Interested Persons | | | | | | | | |
Martin L. Flanagan1 - 1960 Trustee and Vice Chair | | 2007 | | Executive Director, Chief Executive Officer and President, Invesco Ltd. (ultimate parent of Invesco and a global investment management firm); Trustee and Vice Chair, The Invesco Funds; Vice Chair, Investment Company Institute; and Member of Executive Board, SMU Cox School of Business Formerly: Advisor to the Board, Invesco Advisers, Inc. (formerly known as Invesco Institutional (N.A.), Inc.); Chairman and Chief Executive Officer, Invesco Advisers, Inc. (registered investment adviser); Director, Chairman, Chief Executive Officer and President, Invesco Holding Company (US), Inc. (formerly IVZ Inc.) (holding company), Invesco Group Services, Inc. (service provider) and Invesco North American Holdings, Inc. (holding company); Director, Chief Executive Officer and President, Invesco Holding Company Limited (parent of Invesco and a global investment management firm); Director, Invesco Ltd.; Chairman, Investment Company Institute and President,Co-Chief Executive Officer,Co-President, Chief Operating Officer and Chief Financial Officer, Franklin Resources, Inc. (global investment management organization) | | 229 | | None |
| Philip A. Taylor2- 1954 Trustee | | 2006 | | Vice Chair, Invesco Ltd.; Trustee, The Invesco Funds Formerly: Director, Invesco Canada Ltd. (formerly known as Invesco Trimark Ltd./Invesco Trimark Ltèe) (registered investment adviser and registered transfer agent); Head of the Americas and Senior Managing Director, Invesco Ltd.; Director, Invesco Advisers, Inc. (formerly known as Invesco Institutional (N.A.), Inc.) (registered investment adviser); Director and Chairman, Invesco Investment Services, Inc. (formerly known as Invesco AIM Investment Services, Inc.) (registered transfer agent); Chief Executive Officer, Invesco Corporate Class Inc. (corporate mutual fund company); Chairman and Chief Executive Officer, Invesco Canada Ltd. (formerly known as Invesco Trimark Ltd./Invesco Trimark Ltèe) (registered investment adviser and registered transfer agent); Senior Vice President, The Invesco Funds; Director, Invesco Investment Advisers LLC (formerly known as Van Kampen Asset Management); Director, Chairman, Chief Executive Officer and President, Invesco Management Group, Inc. (formerly known as Invesco AIM Management Group, Inc.) (financial services holding company);Co-Chairman,Co-President andCo-Chief Executive Officer, Invesco Advisers, Inc. (formerly known as Invesco Institutional (N.A.), Inc.) (registered investment adviser); Director, Chief Executive Officer and President, Van Kampen Exchange Corp; President and Principal Executive Officer, The Invesco Funds (other than AIM Treasurer’s Series Trust (Invesco Treasurer’s Series Trust), Short-Term Investments Trust and Invesco Management Trust); Executive Vice President, The Invesco Funds (AIM Treasurer’s Series Trust (Invesco Treasurer’s Series Trust), Short-Term Investments Trust and Invesco Management Trust only); Director and President, INVESCO Funds Group, Inc. (registered investment adviser and registered transfer agent); Director and Chairman, IVZ Distributors, Inc. (formerly known as INVESCO Distributors, Inc.) (registered broker dealer); Director, President and Chairman, Invesco Inc. (holding company), Invesco Canada Holdings Inc. (holding company), Trimark Investments Ltd./Placements Trimark Ltèe and Invesco Financial Services Ltd/Services Financiers Invesco Ltèe; Chief Executive Officer, Invesco Canada Fund Inc. (corporate mutual fund company); Director and Chairman, Van Kampen Investor Services Inc.; Director, Chief Executive Officer and President, 1371 Preferred Inc. (holding company) and Van Kampen Investments Inc.; Director and President, AIM GP Canada Inc. (general partner for limited partnerships) and Van Kampen Advisors, Inc.; Director and Chief Executive Officer, Invesco Trimark Dealer Inc. (registered broker dealer); Director, Invesco Distributors, Inc. (formerly known as Invesco AIM Distributors, Inc.) (registered broker dealer); Manager, Invesco Capital Management LLC; Director, Chief Executive Officer and President, Invesco Advisers, Inc.; Director, Chairman, Chief Executive Officer and President, Invesco AIM Capital Management, Inc.; President, Invesco Trimark Dealer Inc. and Invesco Trimark Ltd./Invesco Trimark Ltèe; Director and President, AIM Trimark Corporate Class Inc. and AIM Trimark Canada Fund Inc.; Senior Managing Director, Invesco Holding Company Limited; Director and Chairman, Fund Management Company (former registered broker dealer); President and Principal Executive Officer, The Invesco Funds (AIM Treasurer’s Series Trust (Invesco Treasurer’s Series Trust), and Short-Term Investments Trust only); President, AIM Trimark Global Fund Inc. and AIM Trimark Canada Fund Inc. | | 229 | | None |
| 1 | Mr. Flanagan is considered an interested person (within the meaning of Section 2(a)(19) of the 1940 Act) of the Trust because he is an officer of the Adviser to the Trust, and an officer and a director of Invesco Ltd., ultimate parent of the Adviser. |
| 2 | Mr. Taylor is considered an interested person (within the meaning of Section 2(a)(19) of the 1940 Act) of the Trust because he is an officer and a director of the Adviser. |
T-1 Invesco Multi-Asset Income Fund
Trustees and Officers–(continued)
| | | | | | | | |
| | | | | | | Number of | | Other Directorship(s) |
| | | Trustee | | | | Funds in |
| Name, Year of Birth and | | and/or | | | | Fund Complex | | Held by Trustee |
| Position(s) | | Officer | | Principal Occupation(s) | | Overseen by | | During Past 5 |
| Held with the Trust | | Since | | During Past 5 Years | | Trustee | | Years |
| Independent Trustees | | | | | | |
Bruce L. Crockett - 1944 Trustee and Chair | | 2001 | | Chairman, Crockett Technologies Associates (technology consulting company) Formerly: Director, Captaris (unified messaging provider); Director, President and Chief Executive Officer, COMSAT Corporation; Chairman, Board of Governors of INTELSAT (international communications company); ACE Limited (insurance company); Independent Directors Council and Investment Company Institute: Member of the Audit Committee, Investment Company Institute; Member of the Executive Committee and Chair of the Governance Committee, Independent Directors Council | | 229 | | Director and Chairman of the Audit Committee, ALPS (Attorneys Liability Protection Society) (insurance company); Director and Member of the Audit Committee and Compensation Committee, Ferroglobe PLC (metallurgical company) |
David C. Arch - 1945 Trustee | | 2010 | | Chairman of Blistex Inc. (consumer health care products manufacturer); Member, World Presidents’ Organization | | 229 | | Board member of the Illinois Manufacturers’ Association |
Beth Ann Brown - 1968 Trustee | | 2019 | | Independent Consultant Formerly: Head of Intermediary Distribution, Managing Director, Strategic Relations, Managing Director, Head of National Accounts, Senior Vice President, National Account Manager and Senior Vice President, Key Account Manager, Columbia Management Investment Advisers LLC; Vice President, Key Account Manager, Liberty Funds Distributor, Inc.; and Trustee of certain Oppenheimer Funds | | 229 | | Director, Board of Directors of Caron Engineering Inc.; President and Director, Acton Shapleigh Youth Conservation Corps (non - profit); and Vice President and Director of Grahamtastic Connection (non- profit) |
Jack M. Fields - 1952 Trustee | | 2001 | | Chief Executive Officer, Twenty First Century Group, Inc. (government affairs company); and Chairman, Discovery Learning Alliance(non-profit) Formerly: Owner and Chief Executive Officer, Dos Angeles Ranch L.P. (cattle, hunting, corporate entertainment); Director, Insperity, Inc. (formerly known as Administaff) (human resources provider); Chief Executive Officer, Texana Timber LP (sustainable forestry company); Director of Cross Timbers Quail Research Ranch(non-profit); and member of the U.S. House of Representatives | | 229 | | None |
Cynthia Hostetler - 1962 Trustee | | 2017 | | Non-Executive Director and Trustee of a number of public and private business corporations Formerly: Director, Aberdeen Investment Funds (4 portfolios); Head of Investment Funds and Private Equity, Overseas Private Investment Corporation; President, First Manhattan Bancorporation, Inc.; Attorney, Simpson Thacher & Bartlett LLP | | 229 | | Vulcan Materials Company (construction materials company); Trilinc Global Impact Fund; Genesee & Wyoming, Inc. (railroads); Artio Global Investment LLC (mutual fund complex); Edgen Group, Inc. (specialized energy and infrastructure products distributor); Investment Company Institute (professional organization); Independent Directors Council (professional organization) |
T-2 Invesco Multi-Asset Income Fund
Trustees and Officers–(continued)
| | | | | | | | |
| | | | | | | Number of | | Other |
| | | Trustee | | | | Funds in | | Directorship(s) |
| Name, Year of Birth and | | and/or | | | | Fund Complex | | Held by Trustee |
| Position(s) | | Officer | | Principal Occupation(s) | | Overseen by | | During Past 5 |
| Held with the Trust | | Since | | During Past 5 Years | | Trustee | | Years |
| Independent Trustees–(continued) | | | | | | |
Eli Jones - 1961 Trustee | | 2016 | | Professor and Dean, Mays Business School - Texas A&M University Formerly: Professor and Dean, Walton College of Business, University of Arkansas and E.J. Ourso College of Business, Louisiana State University; Director, Arvest Bank | | 229 | | Insperity, Inc. (formerly known as Administaff) (human resources provider) |
Elizabeth Krentzman - 1959 Trustee | | 2019 | | Formerly: Principal and Chief Regulatory Advisor for Asset Management Services and U.S. Mutual Fund Leader of Deloitte & Touche LLP; General Counsel of the Investment Company Institute (trade association); National Director of the Investment Management Regulatory Consulting Practice, Principal, Director and Senior Manager of Deloitte & Touche LLP; Assistant Director of the Division of Investment Management - Office of Disclosure and Investment Adviser Regulation of the U.S. Securities and Exchange Commission and various positions with the Division of Investment Management – Office of Regulatory Policy of the U.S. Securities and Exchange Commission; Associate at Ropes & Gray LLP; Advisory Board Member of the Securities and Exchange Commission Historical Society; and Trustee of certain Oppenheimer Funds | | 229 | | Trustee of the University of Florida National Board Foundation and Audit Committee Member; Member of the Cartica Funds Board of Directors (private investment funds); Member of the University of Florida Law Center Association, Inc. Board of Trustees and Audit Committee Member |
Anthony J. LaCava, Jr. - 1956 Trustee | | 2019 | | Formerly: Director and Member of the Audit Committee, Blue Hills Bank (publicly traded financial institution) and Managing Partner, KPMG LLP | | 229 | | Blue Hills Bank; Chairman, Bentley University; Member, Business School Advisory Council; and Nominating Committee KPMG LLP |
Prema Mathai-Davis - 1950 Trustee | | 2001 | | Retired Co-Owner & Partner of Quantalytics Research, LLC, (a FinTech Investment Research Platform for the Self-Directed Investor) | | 229 | | None |
Joel W. Motley - 1952 Trustee | | 2019 | | Director of Office of Finance, Federal Home Loan Bank; Member of the Vestry of Trinity Wall Street; Managing Director of Carmona Motley Inc. (privately held financial advisor); Member of the Finance and Budget Committee of the Council on Foreign Relations, Member of the Investment Committee and Board of Human Rights Watch and Member of the Investment Committee and Board of Historic Hudson Valley(non-profit cultural organization) Formerly: Managing Director of Public Capital Advisors, LLC (privately held financial advisor); Managing Director of Carmona Motley Hoffman, Inc. (privately held financial advisor); Trustee of certain Oppenheimer Funds; and Director of Columbia Equity Financial Corp. (privately held financial advisor) | | 229 | | Director of Greenwall Foundation (bioethics research foundation); Member of Board and Investment Committee of The Greenwall Foundation; Director of Southern Africa Legal Services Foundation; Board Member and Investment Committee Member of Pulizer Center for Crisis Reporting(non-profit journalism) |
Teresa M. Ressel - 1962 Trustee | | 2017 | | Non-executive director and trustee of a number of public and private business corporations Formerly: Chief Financial Officer, Olayan America, The Olayan Group (international investor/commercial/industrial); Chief Executive Officer, UBS Securities LLC; Group Chief Operating Officer, Americas, UBS AG; Assistant Secretary for Management & Budget and CFO, US Department of the Treasury | | 229 | | Atlantic Power Corporation (power generation company); ON Semiconductor Corp. (semiconductor supplier) |
T-3 Invesco Multi-Asset Income Fund
Trustees and Officers–(continued)
| | | | | | | | |
| | | | | | | Number of | | Other |
| | | Trustee | | | | Funds in | | Directorship(s) |
| Name, Year of Birth and | | and/or | | | | Fund Complex | | Held by Trustee |
| Position(s) | | Officer | | Principal Occupation(s) | | Overseen by | | During Past 5 |
| Held with the Trust | | Since | | During Past 5 Years | | Trustee | | Years |
| Independent Trustees–(continued) | | | | | | |
Ann Barnett Stern - 1957 Trustee | | 2017 | | President and Chief Executive Officer, Houston Endowment Inc. (private philanthropic institution) Formerly: Executive Vice President and General Counsel, Texas Children’s Hospital; Attorney, Beck, Redden and Secrest, LLP; Business Law Instructor, University of St. Thomas; Attorney, Andrews & Kurth LLP | | 229 | | Federal Reserve Bank of Dallas |
Raymond Stickel, Jr. - 1944 Trustee | | 2005 | | Retired Formerly: Director, Mainstay VP Series Funds, Inc. (25 portfolios); Partner, Deloitte & Touche | | 229 | | None |
Robert C. Troccoli - 1949 Trustee | | 2016 | | Retired Formerly: Adjunct Professor, University of Denver – Daniels College of Business; Senior Partner, KPMG LLP | | 229 | | None |
Daniel S. Vandivort - 1954 Trustee | | 2019 | | Treasurer, Chairman of the Audit and Finance Committee, and Trustee, Board of Trustees, Huntington Disease Foundation of America; and President, Flyway Advisory Services LLC (consulting and property management) Formerly: Trustee and Governance Chair, of certain Oppenheimer Funds | | 229 | | Chairman and Lead Independent Director, Chairman of the Audit Committee, and Director, Board of Directors, Value Line Funds |
James D. Vaughn - 1945 Trustee | | 2019 | | Retired Formerly: Managing Partner, Deloitte & Touche LLP; Trustee and Chairman of the Audit Committee, Schroder Funds; Board Member, Mile High United Way, Boys and Girls Clubs, Boy Scouts, Colorado Business Committee for the Arts, Economic Club of Colorado and Metro Denver Network (economic development corporation); and Trustee of certain Oppenheimer Funds | | 229 | | Board member and Chairman of Audit Committee of AMG National Trust Bank; Trustee and Investment Committee member, University of South Dakota Foundation; Board member, Audit Committee Member and past Board Chair, Junior Achievement(non-profit) |
Christopher L. WIlson - 1957 Trustee, Vice Chair and Chair Designate | | 2017 | | Retired Formerly: Director, TD Asset Management USA Inc. (mutual fund complex) (22 portfolios); Managing Partner, CT2, LLC (investing and consulting firm); President/Chief Executive Officer, Columbia Funds, Bank of America Corporation; President/Chief Executive Officer, CDC IXIS Asset Management Services, Inc.; Principal & Director of Operations, Scudder Funds, Scudder, Stevens & Clark, Inc.; Assistant Vice President, Fidelity Investments | | 229 | | ISO New England, Inc.(non-profit organization managing regional electricity market) |
T-4 Invesco Multi-Asset Income Fund
Trustees and Officers–(continued)
| | | | | | | | |
| | | | | | | Number of | | Other |
| | | Trustee | | | | Funds in | | Directorship(s) |
| Name, Year of Birth and | | and/or | | | | Fund Complex | | Held by Trustee |
| Position(s) | | Officer | | Principal Occupation(s) | | Overseen by | | During Past 5 |
| Held with the Trust | | Since | | During Past 5 Years | | Trustee | | Years |
| Other Officers | | | | | | |
Sheri Morris - 1964 President, Principal Executive Officer and Treasurer | | 1999 | | Head of Global Fund Services, Invesco Ltd.; President, Principal Executive Officer and Treasurer, The Invesco Funds; Vice President, Invesco Advisers, Inc. (formerly known as Invesco Institutional (N.A.), Inc.) (registered investment adviser); and Vice President, Invesco Exchange-Traded Fund Trust, Invesco Exchange-Traded Fund Trust II, Invesco India Exchange-Traded Fund Trust, Invesco Actively Managed Exchange-Traded Fund Trust, Invesco Actively Managed Exchange-Traded Commodity Fund Trust and Invesco Exchange-Traded Self-Indexed Fund Trust; and Vice President, OppenheimerFunds, Inc. Formerly: Vice President and Principal Financial Officer, The Invesco Funds; Vice President, Invesco AIM Advisers, Inc., Invesco AIM Capital Management, Inc. and Invesco AIM Private Asset Management, Inc.; Assistant Vice President and Assistant Treasurer, The Invesco Funds and Assistant Vice President, Invesco Advisers, Inc., Invesco AIM Capital Management, Inc. and Invesco AIM Private Asset Management, Inc.; and Treasurer, Invesco Exchange-Traded FundTrust, Invesco Exchange-Traded Fund Trust II, Invesco India Exchange-Traded Fund Trust and Invesco Actively Managed Exchange-Traded Fund Trust | | N/A | | N/A |
Russell C. Burk - 1958 Senior Vice President and Senior Officer | | 2005 | | Senior Vice President and Senior Officer, The Invesco Funds | | N/A | | N/A |
Jeffrey H. Kupor - 1968 Senior Vice President, Chief Legal Officer and Secretary | | 2018 | | Head of Legal of the Americas, Invesco Ltd.; Senior Vice President and Secretary, Invesco Advisers, Inc. (formerly known as Invesco Institutional (N.A.), Inc.) (registered investment adviser); Senior Vice President and Secretary, Invesco Distributors, Inc. (formerly known as Invesco AIM Distributors, Inc.); Vice President and Secretary, Invesco Investment Services, Inc. (formerly known as Invesco AIM Investment Services, Inc.) Senior Vice President, Chief Legal Officer and Secretary, The Invesco Funds; Secretary and General Counsel, Invesco Investment Advisers LLC (formerly known as Van Kampen Asset Management); Secretary and General Counsel, Invesco Capital Markets, Inc. (formerly known as Van Kampen Funds Inc.) and Chief Legal Officer, Invesco Exchange-Traded Fund Trust, Invesco Exchange-Traded Fund Trust II, Invesco India Exchange-Traded Fund Trust, Invesco Actively Managed Exchange-Traded Fund Trust, Invesco Actively Managed Exchange-Traded Commodity Fund Trust and Invesco Exchange-Traded Self-Indexed Fund Trust; Secretary, Invesco Indexing LLC; Secretary, W.L. Ross & Co., LLC Formerly: Secretary and Vice President, Jemstep, Inc.; Head of Legal, Worldwide Institutional, Invesco Ltd.; Secretary and General Counsel, INVESCO Private Capital Investments, Inc.; Senior Vice President, Secretary and General Counsel, Invesco Management Group, Inc. (formerly known as Invesco AIM Management Group, Inc.); Assistant Secretary, INVESCO Asset Management (Bermuda) Ltd.; Secretary and General Counsel, Invesco Private Capital, Inc.; Assistant Secretary and General Counsel, INVESCO Realty, Inc.; Secretary and General Counsel, Invesco Senior Secured Management, Inc.; and Secretary, Sovereign G./P. Holdings Inc. | | N/A | | N/A |
Andrew R. Schlossberg - 1974 Senior Vice President | | 2019 | | Head of the Americas and Senior Managing Director, Invesco Ltd.; Director and Senior Vice President, Invesco Advisers, Inc. (formerly known as Invesco Institutional (N.A.), Inc.) (registered investment adviser); Director and Chairman, Invesco Investment Services, Inc. (formerly known as Invesco AIM Investment Services, Inc.) (registered transfer agent); Senior Vice President, The Invesco Funds; Director, Invesco Investment Advisers LLC (formerly known as Van Kampen Asset Management); Director, President and Chairman, Invesco Insurance Agency, Inc. Formerly: Director, Invesco UK Limited; Director and Chief Executive, Invesco Asset Management Limited and Invesco Fund Managers Limited; Assistant Vice President, The Invesco Funds; Senior Vice President, Invesco Advisers, Inc. (formerly known as Invesco Institutional (N.A.), Inc.) (registered investment adviser); Director and Chief Executive, Invesco Administration Services Limited and Invesco Global Investment Funds Limited; Director, Invesco Distributors, Inc.; Head of EMEA, Invesco Ltd.; President, Invesco Actively Managed Exchange-Traded Commodity Fund Trust, Invesco Actively Managed Exchange-Traded Fund Trust, Invesco Exchange-Traded Fund Trust, Invesco Exchange-Traded Fund Trust II and Invesco India Exchange-Traded Fund Trust; Managing Director and Principal Executive Officer, Invesco Capital Management LLC | | N/A | | N/A |
T-5 Invesco Multi-Asset Income Fund
Trustees and Officers–(continued)
| | | | | | | | |
| | | | | | | Number of | | Other |
| | | Trustee | | | | Funds in | | Directorship(s) |
| Name, Year of Birth and | | and/or | | | | Fund Complex | | Held by Trustee |
| Position(s) | | Officer | | Principal Occupation(s) | | Overseen by | | During Past 5 |
| Held with the Trust | | Since | | During Past 5 Years | | Trustee | | Years |
| Other Officers–(continued) | | | | | | |
John M. Zerr - 1962 Senior Vice President | | 2006 | | Chief Operating Officer of the Americas; Senior Vice President, Invesco Advisers, Inc. (formerly known as Invesco Institutional (N.A.), Inc.) (registered investment adviser); Senior Vice President, Invesco Distributors, Inc. (formerly known as Invesco AIM Distributors, Inc.); Director and Vice President, Invesco Investment Services, Inc. (formerly known as Invesco AIM Investment Services, Inc.) Senior Vice President, The Invesco Funds; Managing Director, Invesco Capital Management LLC; Director, Invesco Investment Advisers LLC (formerly known as Van Kampen Asset Management); Senior Vice President, Invesco Capital Markets, Inc. (formerly known as Van Kampen Funds Inc.); Manager, Invesco Indexing LLC; Manager, Invesco Specialized Products, LLC; Director and Senior Vice President, Invesco Insurance Agency, Inc.; Member, Invesco Canada Funds Advisory Board; Director, President and Chief Executive Officer, Invesco Corporate Class Inc. (corporate mutual fund company); and Director, Chairman, President and Chief Executive Officer, Invesco Canada Ltd. (formerly known as Invesco Trimark Ltd./Invesco Trimark Ltèe) (registered investment adviser and registered transfer agent) Formerly: Director and Senior Vice President, Invesco Management Group, Inc. (formerly known as Invesco AIM Management Group, Inc.); Secretary and General Counsel, Invesco Management Group, Inc. (formerly known as Invesco AIM Management Group, Inc.); Secretary, Invesco Investment Services, Inc. (formerly known as Invesco AIM Investment Services, Inc.); Chief Legal Officer and Secretary, The Invesco Funds; Secretary and General Counsel, Invesco Investment Advisers LLC (formerly known as Van Kampen Asset Management); Secretary and General Counsel, Invesco Capital Markets, Inc. (formerly known as Van Kampen Funds Inc.); Chief Legal Officer, Invesco Exchange-Traded Fund Trust, Invesco Exchange-Traded Fund Trust II, Invesco India Exchange-Traded Fund Trust, Invesco Actively Managed Exchange-Traded Fund Trust, Invesco Actively Managed Exchange-Traded Commodity Fund Trust and Invesco Exchange-Traded Self-Indexed Fund Trust; Secretary, Invesco Indexing LLC; Director, Secretary, General Counsel and Senior Vice President, Van Kampen Exchange Corp.; Director, Vice President and Secretary, IVZ Distributors, Inc. (formerly known as INVESCO Distributors, Inc.); Director and Vice President, INVESCO Funds Group, Inc.; Director and Vice President, Van Kampen Advisors Inc.; Director, Vice President, Secretary and General Counsel, Van Kampen Investor Services Inc.; Director and Secretary, Invesco Distributors, Inc. (formerly known as Invesco AIM Distributors, Inc.); Director, Senior Vice President, General Counsel and Secretary, Invesco AIM Advisers, Inc. and Van Kampen Investments Inc.; Director, Vice President and Secretary, Fund Management Company; Director, Senior Vice President, Secretary, General Counsel and Vice President, Invesco AIM Capital Management, Inc.; Chief Operating Officer and General Counsel, Liberty Ridge Capital, Inc. (an investment adviser) | | N/A | | N/A |
Gregory G. McGreevey - 1962 Senior Vice President | | 2012 | | Senior Managing Director, Invesco Ltd.; Director, Chairman, President, and Chief Executive Officer, Invesco Advisers, Inc. (formerly known as Invesco Institutional (N.A.), Inc.) (registered investment adviser); Director, Invesco Mortgage Capital, Inc. and Invesco Senior Secured Management, Inc.; and Senior Vice President, The Invesco Funds; and President, SNW Asset Management Corporation Formerly: Senior Vice President, Invesco Management Group, Inc. and Invesco Advisers, Inc.; Assistant Vice President, The Invesco Funds | | N/A | | N/A |
Kelli Gallegos - 1970 Vice President, Principal Financial Officer and Assistant Treasurer | | 2008 | | Principal Financial and Accounting Officer – Investments Pool, Invesco Specialized Products, LLC; Vice President, Principal Financial Officer and Assistant Treasurer, The Invesco Funds; Principal Financial and Accounting Officer – Pooled Investments, Invesco Capital Management LLC; Vice President and Treasurer, Invesco Exchange-Traded Fund Trust, Invesco Exchange-Traded Fund Trust II, Invesco India Exchange-Traded Fund Trust, Invesco Actively Managed Exchange-Traded Fund Trust, Invesco Actively Managed Exchange-Traded Commodity Fund Trust and Invesco Exchange-Traded Self-Indexed Fund Trust Formerly: Assistant Treasurer, Invesco Specialized Products, LLC; Assistant Treasurer, Invesco Exchange-Traded Fund Trust, Invesco Exchange-Traded Fund Trust II, Invesco India Exchange-Traded Fund Trust, Invesco Actively Managed Exchange-Traded Fund Trust, Invesco Actively Managed Exchange-Traded Commodity Fund Trust and Invesco Exchange-Traded Self-Indexed Fund Trust; Assistant Treasurer, Invesco Capital Management LLC; Assistant Vice President, The Invesco Funds | | N/A | | N/A |
T-6 Invesco Multi-Asset Income Fund
Trustees and Officers–(continued)
| | | | | | | | |
| | | | | | | Number of | | Other |
| | | Trustee | | | | Funds in | | Directorship(s) |
| Name, Year of Birth and | | and/or | | | | Fund Complex | | Held by Trustee |
| Position(s) | | Officer | | Principal Occupation(s) | | Overseen by | | During Past 5 |
| Held with the Trust | | Since | | During Past 5 Years | | Trustee | | Years |
| Other Officers–(continued) | | | | | | |
Crissie M. Wisdom - 1969 Anti-Money Laundering Compliance Officer | | 2013 | | Anti-Money Laundering Compliance Officer, Invesco Advisers, Inc. (formerly known as Invesco Institutional (N.A.), Inc.) (registered investment adviser), Invesco Capital Markets, Inc. (formerly known as Van Kampen Funds Inc.), Invesco Distributors, Inc., Invesco Investment Services, Inc., The Invesco Funds, and Invesco Exchange-Traded Fund Trust, Invesco Exchange-Traded Fund Trust II, Invesco India Exchange-Traded Fund Trust, Invesco Actively Managed Exchange-Traded Fund Trust, Invesco Actively Managed Exchange-Traded Commodity Fund Trust and Invesco Exchange-Traded Self-Indexed Fund Trust; Anti-Money Laundering Compliance Officer and Bank Secrecy Act Officer, INVESCO National Trust Company and Invesco Trust Company; and Fraud Prevention Manager and Controls and Risk Analysis Manager for Invesco Investment Services, Inc. Formerly: Anti-Money Laundering Compliance Officer, Van Kampen Exchange Corp. and Invesco Management Group, Inc. | | N/A | | N/A |
Robert R. Leveille - 1969 Chief Compliance Officer | | 2016 | | Chief Compliance Officer, Invesco Advisers, Inc. (registered investment adviser); and Chief Compliance Officer, The Invesco Funds Formerly: Chief Compliance Officer, Putnam Investments and the Putnam Funds | | N/A | | N/A |
The Statement of Additional Information of the Trust includes additional information about the Fund’s Trustees and is available upon request, without charge, by calling 1.800.959.4246. Please refer to the Fund’s Statement of Additional Information for information on the Fund’ssub-advisers.
| | | | | | |
| Office of the Fund | | Investment Adviser | | Distributor | | Auditors |
| 11 Greenway Plaza, Suite 1000 | | Invesco Advisers, Inc. | | Invesco Distributors, Inc. | | PricewaterhouseCoopers LLP |
| Houston, TX 77046-1173 | | 1555 Peachtree Street, N.E. | | 11 Greenway Plaza, Suite 1000 | | 1000 Louisiana Street, Suite 5800 |
| | Atlanta, GA 30309 | | Houston, TX 77046-1173 | | Houston, TX 77002-5678 |
| | | |
| Counsel to the Fund | | Counsel to the Independent Trustees | | Transfer Agent | | Custodian |
| Stradley Ronon Stevens & Young, LLP | | Goodwin Procter LLP | | Invesco Investment Services, Inc. | | State Street Bank and Trust Company |
| 2005 Market Street, Suite 2600 | | 901 New York Avenue, N.W. | | 11 Greenway Plaza, Suite 1000 | | 225 Franklin Street |
| Philadelphia, PA 19103-7018 | | Washington, D.C. 20001 | | Houston, TX 77046-1173 | | Boston, MA 02110-2801 |
T-7 Invesco Multi-Asset Income Fund
(This page intentionally left blank)
(This page intentionally left blank)

Go paperless with eDelivery
Visit invesco.com/edelivery to enjoy the convenience and security of anytime electronic access to your investment documents.
With eDelivery, you can elect to have any or all of the following materials delivered straight to your inbox to download, save and print from your own computer:
∎ Fund reports and prospectuses
∎ Quarterly statements
∎ Daily confirmations
∎ Tax forms
Invesco mailing information
Send general correspondence to Invesco Investment Services, Inc., P.O. Box 219078, Kansas City, MO 64121-9078.
Important notice regarding delivery of security holder documents
To reduce Fund expenses, only one copy of most shareholder documents may be mailed to shareholders with multiple accounts at the same address (Householding). Mailing of your shareholder documents may be householded indefinitely unless you instruct us otherwise. If you do not want the mailing of these documents to be combined with those for other members of your household, please contact Invesco Investment Services, Inc. at 800 959 4246 or contact your financial institution. We will begin sending you individual copies for each account within 30 days after receiving your request.
Fund holdings and proxy voting information
The Fund provides a complete list of its holdings four times in each fiscal year, at the quarter-ends. For the second and fourth quarters, the list appears in the Fund’s semiannual and annual reports to shareholders. For the first and third quarters, the Fund files the lists with the Securities and Exchange Commission (SEC) as an exhibit to its reports on FormN-PORT. The most recent list of portfolio holdings is available at invesco.com/completeqtrholdings. Shareholders can also look up the Fund’s FormN-PORT filings on the SEC website, sec.gov. The SEC file numbers for the Fund are shown below.
A description of the policies and procedures that the Fund uses to determine how to vote proxies relating to portfolio securities is available without charge, upon request, from our Client Services department at 800 959 4246, or at invesco.com/ proxyguidelines. The information is also available on the SEC website, sec.gov.
| | |
Information regarding how the Fund voted proxies related to its portfolio securities during the most recent12-month period ended June 30 is available at invesco.com/proxysearch. This information is also available on the SEC website, sec.gov. Invesco Advisers, Inc. is an investment adviser; it provides investment advisory services to individual and institutional clients and does not sell securities. Invesco Distributors, Inc. is the US distributor for Invesco Ltd.’s retail mutual funds, exchange-traded funds and institutional money market funds. Both are wholly owned, indirect subsidiaries of Invesco Ltd. | | 
|
| | | | |
| | |
| SEC file numbers:811-05426 and033-19338 | | Invesco Distributors, Inc. | | MAIN-AR-1 |
SIGNATURES
Pursuant to the requirements of the Securities Exchange Act of 1934 and the Investment Company Act of 1940, the Registrant has duly caused this report to be signed on its behalf by the undersigned, thereunto duly authorized.
Registrant: AIM Investment Funds (Invesco Investment Funds)
| | |
| By: | | /s/ Sheri Morris |
| | Sheri Morris |
| | Principal Executive Officer |
| |
| Date: | | February 14, 2020 |
Pursuant to the requirements of the Securities and Exchange Act of 1934 and the Investment Company Act of 1940, this report has been signed below by the following persons on behalf of the Registrant and in the capacities and on the dates indicated.
| | |
| By: | | /s/ Sheri Morris |
| | Sheri Morris |
| | Principal Executive Officer |
| |
| Date: | | February 14, 2020 |
| | |
| By: | | /s/ Kelli Gallegos |
| | Kelli Gallegos |
| | Principal Financial Officer |
| |
| Date: | | February 14, 2020 |
| | |
| 13(a) (2) | | Certifications of principal executive officer and principal financial officer as required by Rule30a-2(a) under the Investment Company Act of 1940. |
| |
| 13(a) (3) | | Not applicable. |
| |
| 13(b) | | Certifications of principal executive officer and principal financial officer as required by Rule30a-2(b) under the Investment Company Act of 1940. |