UNITED STATES
SECURITIES AND EXCHANGE COMMISSION
Washington, D.C. 20549
FORMN-CSR
CERTIFIED SHAREHOLDER REPORT OF REGISTERED
MANAGEMENT INVESTMENT COMPANIES
| | |
Investment Company Act file number | | 811-05426 |
|
| AIM Investment Funds (Invesco Investment Funds) |
| (Exact name of registrant as specified in charter) |
|
| 11 Greenway Plaza, Suite 1000 Houston, Texas 77046 |
| (Address of principal executive offices) (Zip code) |
|
| Sheri Morris 11 Greenway Plaza, Suite 1000 Houston, Texas 77046 |
| (Name and address of agent for service) |
Registrant’s telephone number, including area code: (713)626-1919
Date of fiscal year end: October 31
Date of reporting period: 10/31/19
| Item 1. | Reports to Stockholders. |
| | |
 | | Shareholder Report for the Two Months Ended 10/31/2019 |
| | Invesco Oppenheimer Developing Markets Fund* Beginning on January 1, 2021, as permitted by regulations adopted by the Securities and Exchange Commission, paper copies of the Fund’s shareholder reports will no longer be sent by mail, unless you specifically request paper copies of the reports from the Fund or from your financial intermediary, such as a broker-dealer or bank. Instead, the reports will be made available on the Fund’s website, and you will be notified by mail each time a report is posted and provided with a website link to access the report. If you already elected to receive shareholder reports electronically, you will not be affected by this change and you need not take any action. You may elect to receive shareholder reports and other communications from the Fund electronically by contacting your financial intermediary (such as a broker-dealer or bank) or, if you are a direct investor, by enrolling at invesco. com/edelivery. You may elect to receive all future reports in paper free of charge. If you invest through a financial intermediary, you can contact your financial intermediary to request that you continue to receive paper copies of your shareholder reports. If you invest directly with the Fund, you can call 800 959 4246 to let the Fund know you wish to continue receiving paper copies of your shareholder reports. Your election to receive reports in paper will apply to all funds held with your financial intermediary or all funds held with the fund complex if you invest directly with the Fund. *Prior to the close of business on May 24, 2019, the Fund’s name was Oppenheimer Developing Markets Fund. See Important Update on the following page for more information. |
Important Update
On October 18, 2018, Massachusetts Mutual Life Insurance Company, an indirect corporate parent of OppenheimerFunds, Inc. and its subsidiaries OFI Global Asset Management, Inc., OFI SteelPath, Inc. and OFI Advisors, LLC, announced that it had entered into an agreement whereby Invesco Ltd., a global investment management company would acquire OppenheimerFunds and its subsidiaries (together, “OppenheimerFunds”). After the close of business on May 24, 2019 Invesco Ltd. completed the acquisition of OppenheimerFunds. This Fund was included in that acquisition and as of that date, became part of the Invesco family of funds. Please visit invesco.com for more information or call Invesco’s Client Services team at800-959-4246.
Table of Contents
Class A Shares
AVERAGE ANNUAL TOTAL RETURNS AT 10/31/19
| | | | | | | | | | | | | | | |
| | | Class A Shares of the Fund | | |
| | | Without Sales Charge | | With Sales Charge | | MSCI Emerging |
| | | Markets Index |
1-Year | | | | 17.95% | | | | | 11.47% | | | | | 11.86% | |
5-Year | | | | 2.94 | | | | | 1.78 | | | | | 2.93 | |
10-Year | | | | 6.05 | | | | | 5.45 | | | | | 3.78 | |
Performance quoted is past performance and cannot guarantee comparable future results; current performance may be lower or higher.Visit invesco.com for the most recentmonth-end performance. Performance figures reflect reinvested distributions and changes in net asset value (NAV). Investment return and principal value will vary so that you may have a gain or a loss when you sell shares. Fund returns include changes in share price, reinvested distributions and a 5.50% maximum applicable sales charge except where “without sales charge” is indicated. Returns for periods of less than one year are cumulative and not annualized. As the result of a reorganization after the close of business on May 24, 2019, the returns of the Fund for periods on or prior to May 24, 2019 reflect performance of the Oppenheimer predecessor fund. Share class returns will differ from those of the predecessor fund because they have different expenses. Returns do not consider capital gains or income taxes on an individual’s investment. See Fund prospectus and summary prospectus for more information on share classes, sales charges and new fee agreements, if any. Fund literature is available at invesco.com.
3 INVESCO OPPENHEIMER DEVELOPING MARKETS FUND
Fund Performance Discussion
MARKET OVERVIEW
Not surprisingly, for an asset class that covers close to 25 markets, there are several key controversies effecting emerging market equity performance. However, as the largest economy and equity market in EM by a wide margin, it should also come as little surprise that China is at the epicenter. The lingering trade dispute between the United States and China continues to dampen global growth and whipsaw Chinese indices and ADRs. The trade dispute is clearly about more than just trade and therefore will be challenging to fully resolve. China’s future growth trajectory also continues to create angst. Following an extended period of extremely rapid growth, China’s economy is undergoing a major structural transformation and moving onto a
more sustainable development track. We are cognizant this will not be a linear transition, but we believe that China’s circumstances are largely manageable. At a slower 5% pace of growth over the long term, China will still be the largest growth engine in the world accounting for30-40% of GDP growth. The global community is also monitoring how China handles the escalation of political turmoil in Hong Kong, which has brought the international business hub to a standstill.
FUND REVIEW
Top contributors to performance during this reporting period included Taiwan Semiconductor Manufacturing Co. (TSMC), Kering and Novatek.
COMPARISON OF CHANGE IN VALUE OF $10,000 HYPOTHETICAL INVESTMENTS IN:
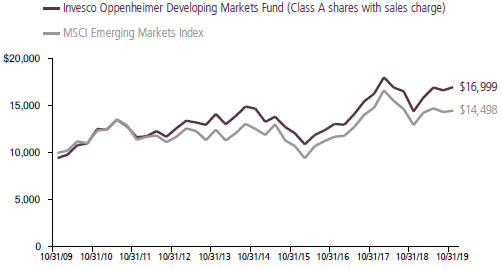
4 INVESCO OPPENHEIMER DEVELOPING MARKETS FUND
Taiwan Semiconductor Manufacturing Co. (TSMC) is the world’s preeminent semiconductor foundry. For the past 30 years, TSMC has made inhouse design and innovation a priority while placing a large emphasis on client service and trust, allowing them to capture 56% of the overall market share. The company continues to deliver solid revenue growth on the back of strong demand in themid-range smartphone segment, increased graphic chip demand for AI (artificial intelligence) and the HPC (high power computing) division.
Kering, domiciled in France, is the third largest luxury group in the world. The company controls iconic brands such as Gucci, Yves Saint Laurent, and Bottega Veneta. Kering has been successful in targeting a new customer base through the Gucci label, Asian consumers- who account for 42% of sales and Millennials- who now account for 56% of sales.
Novatek is a Russian energy company. It has always stood at the forefront of technological and business innovation, finding creative ways to add value to its constantly expanding natural gas and condensate resource base. We have watched Novatek evolve from a local independent gas player to a global LNG major. This is exemplified through the rapid succession of portfolio and strategy updates that the company continuously provides.
Detractors from performance included Zee Entertainment, Yum China and Yandex.
Zee Entertainment is a global media conglomerate with a presence in 173 countries that broadcasts entertainment in 19 languages and reached an audience of approximately 1.3 billion people. While Zee continues to expand and innovate, this has largely been overshadowed by media reports earlier in the year that the company’s promoter, Essel Group, was being investigated by the government over alleged fraud. The company has been actively looking for strategic investors to unwind the promoter’s stake in Zee, including selling a stake to Invesco Oppenheimer Developing Markets Fund.
Yum China operates a portfolio of Quick Serve Restaurants (QSR), including KFC and Pizza Hut. Volatility in commodity prices, particularly in poultry, have negatively impacted the overall industry in China. Yum China’s management team announced a strategy to mitigate losses- negotiations with long-term chicken suppliers, menu adjustments that may include a diversification of protein sources, and potentially raising the prices of certain menu items.
Yandex is the leading Russian internet search engine. Increasing internet penetration will support strong structural growth opportunities in internet advertising as ad budgets shift from traditional to new media. The company also has opportunities to expand into other online verticals.
5 INVESCO OPPENHEIMER DEVELOPING MARKETS FUND
STRATEGY & OUTLOOK
Our approach to investing and the positioning of the portfolio remain unchanged. We look to avoid short-term tactical positions and macroeconomic calls. We remind investors that the case for investing in emerging markets is not about superior economic growth. Investing in emerging markets equities is about identifying extraordinary businesses that have the capacity to generate above average earnings even in pedestrian macro environments. In slower growth economies- in both developed and emerging markets- there are two broad categories of companies that meet that criteria: globally competitive companies that are not entirely dependent on their domestic markets and domestic disruptors that gather market share in their own markets over time because of their significant efficiency advantages.
We continue to believe that EM should be an increasingly core allocation for global investors. EM now represents a meaningful portion of global GDP and is the largest contributor to global growth. Most investors are still under-allocated to the asset class and, especially for those who invest through passive vehicles, to the areas of EM that exhibit the most attractive growth characteristics.
Mark Ahnrud, Portfolio Manager
John Burrello, Portfolio Manager
Chris Devine, Portfolio Manager
Scott Hixon, Portfolio Manager
Christian Ulrich, Portfolio Manager
Scott Wolle, Portfolio Manager
6 INVESCO OPPENHEIMER DEVELOPING MARKETS FUND
Top Holdings and Allocations
TOP TEN COMMON STOCK HOLDINGS
| | | | |
Alibaba Group Holding Ltd., Sponsored ADR | | | 7.2% | |
Novatek PJSC, Sponsored GDR | | | 4.8 | |
Taiwan Semiconductor Manufacturing Co. Ltd. | | | 4.6 | |
Kering SA | | | 4.5 | |
Housing Development Finance Corp. Ltd. | | | 4.1 | |
AIA Group Ltd. | | | 3.4 | |
Tencent Holdings Ltd. | | | 3.1 | |
Kotak Mahindra Bank Ltd. | | | 3.0 | |
Huazhu Group Ltd., ADR | | | 2.6 | |
Jiangsu Hengrui Medicine Co. Ltd., Cl. A | | | 2.4 | |
Holdings and allocations are subject to change and are not buy/sell recommendations. Percentages are as of October 31, 2019, and are based on net assets.
REGIONAL ALLOCATION
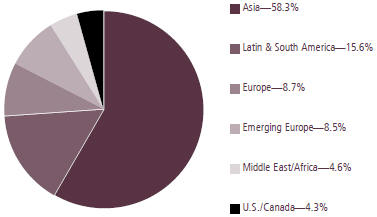
Holdings and allocations are subject to change and are not buy/sell recommendations. Percentages are as of October 31, 2019, and are based on the total market value of investments.
For more current Fund holdings, please visit invesco.com.
7 INVESCO OPPENHEIMER DEVELOPING MARKETS FUND
Share Class Performance
AVERAGE ANNUAL TOTAL RETURNS WITHOUT SALES CHARGE AS OF 10/31/19
| | | | | | | | | | |
| | | Inception Date | | | 1-Year | | 5-Year | | 10-Year |
Class A (ODMAX) | | | 11/18/96 | | | 17.95% | | 2.94% | | 6.05% |
Class C (ODVCX) | | | 11/18/96 | | | 17.10 | | 2.17 | | 5.28 |
Class R (ODVNX) | | | 3/1/01 | | | 17.67 | | 2.68 | | 5.73 |
Class Y (ODVYX) | | | 9/7/05 | | | 18.26 | | 3.19 | | 6.34 |
Class R5 (DVMFX)1 | | | 5/24/19 | | | 18.09 | | 2.96 | | 6.06 |
Class R6 (ODVIX)2 | | | 12/29/11 | | | 18.44 | | 3.38 | | 6.453 |
AVERAGE ANNUAL TOTAL RETURNS WITH SALES CHARGE AS OF 10/31/19 |
| | | Inception Date | | | 1-Year | | 5-Year | | 10-Year |
Class A (ODMAX) | | | 11/18/96 | | | 11.47% | | 1.78% | | 5.45% |
Class C (ODVCX) | | | 11/18/96 | | | 16.10 | | 2.17 | | 5.28 |
Class R (ODVNX) | | | 3/1/01 | | | 17.67 | | 2.68 | | 5.73 |
Class Y (ODVYX) | | | 9/7/05 | | | 18.26 | | 3.19 | | 6.34 |
Class R5 (DVMFX)1 | | | 5/24/19 | | | 18.09 | | 2.96 | | 6.06 |
Class R6 (ODVIX)2 | | | 12/29/11 | | | 18.44 | | 3.38 | | 6.453 |
1. Class R5 shares’ performance shown prior to the inception date is that of the predecessor fund’s Class A shares at net asset value (NAV) and includes the12b-1 fees applicable to Class A shares. Class A shares’ performance reflects any applicable fee waivers and/or expense reimbursements.
2. Pursuant to the closing of the transaction described in the Notes to Consolidated Financial Statements, after the close of business on May 24, 2019, Class I shares were reorganized as Class R6 shares.
3. Shows performance since inception.
Performance quoted is past performance and cannot guarantee comparable future results; current performance may be lower or higher.Visit invesco.com for the most recentmonth-end performance. Performance figures reflect reinvested distributions and changes in net asset value (NAV). Investment return and principal value will vary so that you may have a gain or a loss when you sell shares. Performance shown at NAV does not include the applicablefront-end sales charge, which would have reduced the performance. The current maximum initial sales charge for Class A shares is 5.50%, and the contingent deferred sales charge for Class C shares is 1% for the1-year period. Class R, Class Y, Class R5 and Class R6 shares have no sales charge; therefore, performance is at NAV. Effective after the close of business on May 24, 2019, Class A, Class C, Class R, Class Y, and Class I shares of the predecessor fund were reorganized into Class A, Class C, Class R, Class Y, and Class R6 shares, respectively, of the Fund. Class R5 shares’ performance shown prior to the inception date is that of the predecessor fund’s Class A shares at NAV and includes the12b-1 fees applicable to Class A shares. Class A shares’ performance reflects any applicable fee waivers and/or expense reimbursements. Returns shown for Class A, Class C, Class R, Class Y, Class R5, and Class R6 shares are blended returns of the predecessor fund and the Fund. Share class returns will differ from those of the predecessor fund because of different
8 INVESCO OPPENHEIMER DEVELOPING MARKETS FUND
expenses. See Fund prospectuses and summary prospectuses for more information on share classes, sales charges and new fee agreements, if any. Fund literature is available at invesco.com.
The Fund’s performance is compared to the performance of the MSCI Emerging Markets Index, which is designed to measure equity market performance of emerging markets. The Index isunmanaged and cannot be purchased directly by investors. While index comparisons may be useful to provide a benchmark for the Fund’s performance, it must be noted that the Fund’s investments are not limited to the investments comprising the Index. Index performance includes reinvestment of income, but does not reflect transaction costs, fees, expenses or taxes. Index performance is shown for illustrative purposes only as a benchmark for the Fund’s performance, and does not predict or depict performance of the Fund. The Fund’s performance reflects the effects of the Fund’s business and operating expenses.
The views and opinions expressed in management’s discussion of Fund performance are those of Invesco Advisers, Inc. These views and opinions are subject to change at any time based on factors such as market and economic conditions. These views and opinions may not be relied upon as investment advice or recommendations, or as an offer for a particular security. The information is not a complete analysis of every aspect of any market, country, industry, security or the Fund. Statements of fact are from sources considered reliable, but Invesco Advisers, Inc. makes no representation or warranty as to their completeness or accuracy. Although historical performance is no guarantee of future results, these insights may help you understand our investment management philosophy.
Before investing, investors should carefully read the prospectus and/or summary prospectus and carefully consider the investment objectives, risks, charges and expenses. For this and more complete information about the fund(s), investors should ask their advisors for a prospectus/summary prospectus or visit invesco. com/fundprospectus.
Shares of Invesco funds are not deposits or obligations of any bank, are not guaranteed by any bank, are not insured by the FDIC or any other agency, and involve investment risks, including the possible loss of the principal amount invested.
9 INVESCO OPPENHEIMER DEVELOPING MARKETS FUND
Fund Expenses
Fund Expenses. As a shareholder of the Fund, you incur two types of costs: (1) transaction costs, which may include sales charges (loads) on purchase payments and/or contingent deferred sales charges on redemptions; and (2) ongoing costs, including management fees; distribution and service fees; and other Fund expenses. These examples are intended to help you understand your ongoing costs (in dollars) of investing in the Fund and to compare these costs with the ongoing costs of investing in other mutual funds.
The examples are based on an investment of $1,000.00 invested at the beginning of the period and held for the entire6-month period ended October 31, 2019.
Actual Expenses. The first section of the table provides information about actual account values and actual expenses. You may use the information in this section for the class of shares you hold, together with the amount you invested, to estimate the expense that you paid over the period. Simply divide your account value by $1,000.00 (for example, an $8,600.00 account value divided by $1,000.00 = 8.60), then multiply the result by the number in the first section under the heading entitled “Expenses Paid During 6 Months Ended October 31, 2019” to estimate the expenses you paid on your account during this period.
Hypothetical Example for Comparison Purposes.The second section of the table provides information about hypothetical account values and hypothetical expenses based on the Fund’s actual expense ratio for each class of shares, and an assumed rate of return of 5% per year for each class before expenses, which is not the Fund’s actual return. The hypothetical account values and expenses may not be used to estimate the actual ending account balance or expenses you paid for the period. You may use this information to compare the ongoing costs of investing in the Fund and other funds. To do so, compare this 5% hypothetical example for the class of shares you hold with the 5% hypothetical examples that appear in the shareholder reports of the other funds.
Please note that the expenses shown in the table are meant to highlight your ongoing costs only and do not reflect any transactional costs, such asfront-end or contingent deferred sales charges (loads). Therefore, the “hypothetical” section of the table is useful in comparing ongoing costs only, and will not help you determine the relative total costs of owning different funds. In addition, if these transactional costs were included, your costs would have been higher.
10 INVESCO OPPENHEIMER DEVELOPING MARKETS FUND
| | | | | | | | | | | | |
| Actual | | Beginning
Account Value May 1, 2019 | | | | Ending Account Value October 31, 2019 | | | | Expenses
Paid During
6 Months Ended
October 31, 20191,2 | | |
Class A | | $ 1,000.00 | | | | $ 1,002.50 | | | | $ 6.28 | | |
Class C | | 1,000.00 | | | | 998.80 | | | | 10.13 | | |
Class R | | 1,000.00 | | | | 1,001.20 | | | | 7.59 | | |
Class Y | | 1,000.00 | | | | 1,003.70 | | | | 5.06 | | |
Class R5 | | 1,000.00 | | | | 1,003.60 | | | | 3.87 | | |
Class R6 | | 1,000.00 | | | | 1,004.40 | | | | 4.20 | | |
| | | | | | |
Hypothetical
(5% return before expenses) | | | | | | | | | | | | |
Class A | | 1,000.00 | | | | 1,018.95 | | | | 6.33 | | |
Class C | | 1,000.00 | | | | 1,015.12 | | | | 10.21 | | |
Class R | | 1,000.00 | | | | 1,017.64 | | | | 7.66 | | |
Class Y | | 1,000.00 | | | | 1,020.16 | | | | 5.10 | | |
Class R5 | | 1,000.00 | | | | 1,020.77 | | | | 4.49 | | |
Class R6 | | 1,000.00 | | | | 1,021.02 | | | | 4.24 | | |
1. Actual expenses paid for Class A, C, R, Y, and R6are equal to the Fund’s annualized expense ratio for that class, multiplied by the average account value over the period, multiplied by 184/365 (to reflect theone-half year period). Actual expenses paid for Class R5 are equal to the Fund’s annualized expense ratio for that class, multiplied by the average account value over the period, multiplied by 160/365to reflect the period from after the close of business on May 24, 2019 (inception of offering) to October 31, 2019.
2.Hypothetical expenses paid for all classes are equal to the Fund’s annualized expense ratio for that class, multiplied by the average account value over the period, multiplied by 184/365(to reflect theone-half year period).
Those annualized expense ratios, excluding indirect expenses from affiliated funds, based on the6-month period ended October 31, 2019 for Classes A, C, R, Y and R6and for the period from after the close of business on May 24, 2019 (inception of offering) to October 31, 2019 for Class R5 are as follows:
| | | | | | | | |
| Class | | Expense Ratios | | | | |
Class A | | | 1.24 | % | | | | |
Class C | | | 2.00 | | | | | |
Class R | | | 1.50 | | | | | |
Class Y | | | 1.00 | | | | | |
Class R5 | | | 0.88 | | | | | |
Class R6 | | | 0.83 | | | | | |
The expense ratios reflect voluntary and/or contractual waivers and/or reimbursements of expenses by the Fund’s Manager. Some of these undertakings may be modified or terminated at any time, as indicated in the Fund’s prospectus. The “Consolidated Financial Highlights”
11 INVESCO OPPENHEIMER DEVELOPING MARKETS FUND
tables in the Fund’s financial statements, included in this report, also show the gross expense ratios, without such waivers or reimbursements and reduction to custodian expenses, if applicable.
12 INVESCO OPPENHEIMER DEVELOPING MARKETS FUND
CONSOLIDATED
SCHEDULE OF INVESTMENTSOctober 31, 2019
| | | | | | | | |
| | | Shares | | | Value | |
| |
Common Stocks—93.2% | | | | | | | | |
| |
Consumer Discretionary—29.7% | |
| |
Entertainment—0.0% | |
| Tencent Music Entertainment Group, ADR1 | | | 8,537 | | | $ | 118,152 | |
| |
Hotels, Restaurants & Leisure—5.4% | | | | | |
Alsea SAB de CV1,2 | | | 72,433,347 | | | | 193,240,941 | |
| |
Huazhu Group Ltd., ADR2 | | | 29,530,806 | | | | 1,118,036,315 | |
| |
Yum China Holdings, Inc.2 | | | 23,227,290 | | | | 987,159,825 | |
| | | | | | | | |
| | | | | | | 2,298,437,081 | |
| | | | | | | | |
| |
Household Durables—0.0% | |
Steinhoff International Holdings NV1 | | | 114,467,311 | | | | 7,424,501 | |
| |
Interactive Media & Services—4.0% | |
Tencent Holdings Ltd. | | | 31,838,510 | | | | 1,298,298,031 | |
| |
Yandex NV, Cl. A1 | | | 11,573,544 | | | | 386,440,634 | |
| | | | | | | | |
| | | | | | | 1,684,738,665 | |
| |
Internet & Catalog Retail—9.6% | |
| Alibaba Group Holding Ltd., Sponsored ADR1 | | | 17,279,461 | | | | 3,052,762,375 | |
| |
| Baozun, Inc., Sponsored ADR1 | | | 5,539,494 | | | | 241,078,779 | |
| |
Meituan Dianping, Cl. B1 | | | 53,078,400 | | | | 634,175,883 | |
| |
MercadoLibre, Inc.1 | | | 220,920 | | | | 115,214,198 | |
| | | | | | | | |
| | | | | | | 4,043,231,235 | |
| |
Media—1.4% | | | | | |
Zee Entertainment Enterprises Ltd.2,3 | | | 157,919,210 | | | | 580,244,394 | |
| |
Multiline Retail—2.2% | |
| Lojas Americanas SA, Preference2 | | | 108,714,800 | | | | 541,879,779 | |
| |
SACI Falabella | | | 74,519,550 | | | | 378,447,532 | |
| | | | | | | | |
| | | | | | | 920,327,311 | |
| |
Textiles, Apparel & Luxury Goods—7.1% | |
Kering SA | | | 3,350,863 | | | | 1,908,408,182 | |
| |
| LVMH Moet Hennessy Louis Vuitton SE | | | 947,497 | | | | 404,506,290 | |
| |
Moncler SpA | | | 7,374,134 | | | | 284,857,804 | |
| | | | | | | | |
| | | Shares | | | Value | |
| |
Textiles, Apparel & Luxury Goods (Continued) | | | | | |
| |
PRADA SpA | | | 119,610,010 | | | $ | 410,883,888 | |
| | | | | | | | |
| | | | | | | 3,008,656,164 | |
| |
Consumer Staples—8.9% | | | | | | | | |
| |
Beverages—5.2% | | | | | | | | |
| Anadolu Efes Biracilik Ve Malt Sanayii AS2 | | | 38,338,430 | | | | 128,567,363 | |
| |
| Budweiser Brewing Co. APAC Ltd.1,4 | | | 218,870,200 | | | | 800,238,801 | |
| |
| Fomento Economico Mexicano SAB de CV | | | 113,759,877 | | | | 1,009,477,348 | |
| |
| Fomento Economico Mexicano SAB de CV, Sponsored ADR | | | 3,093,745 | | | | 275,405,180 | |
| | | | | | | | |
| | | | | | | 2,213,688,692 | |
| |
Food & Staples Retailing—1.7% | |
Atacadao SA | | | 67,305,900 | | | | 320,712,068 | |
| |
BIM Birlesik Magazalar AS | | | 13,241,290 | | | | 109,562,050 | |
| |
Shoprite Holdings Ltd. | | | 24,721,145 | | | | 221,464,043 | |
| |
Wal-Mart de Mexico SAB de CV | | | 22,910,703 | | | | 68,756,525 | |
| | | | | | | | |
| | | | | | | 720,494,686 | |
| |
Food Products—0.3% | | | | | | | | |
Vietnam Dairy Products JSC | | | 20,419,300 | | | | 114,096,409 | |
| |
Personal Products—1.7% | | | | | | | | |
Amorepacific Corp. | | | 1,449,666 | | | | 238,536,797 | |
| |
AMOREPACIFIC Group | | | 1,503,979 | | | | 109,134,016 | |
| |
| LG Household & Health Care Ltd. | | | 178,627 | | | | 192,830,615 | |
| |
Natura Cosmeticos SA | | | 19,897,438 | | | | 154,595,229 | |
| | | | | | | | |
| | | | | | | 695,096,657 | |
| |
Energy—5.7% | |
| |
Oil, Gas & Consumable Fuels—5.7% | |
LUKOIL PJSC, Sponsored ADR | | | 3,553,364 | | | | 327,263,059 | |
| |
| Novatek PJSC, Sponsored GDR | | | 9,391,646 | | | | 2,011,596,957 | |
| |
| Novatek PJSC, Sponsored GDR | | | 314,606 | | | | 66,696,472 | |
| | | | | | | | |
| | | | | | | 2,405,556,488 | |
13 INVESCO OPPENHEIMER DEVELOPING MARKETS FUND
CONSOLIDATED
SCHEDULE OF INVESTMENTSContinued
| | | | | | | | |
| | | Shares | | | Value | |
| |
Financials—26.2% | | | | | | | | |
| |
Capital Markets—2.9% | | | | | | | | |
B3SA-Brasil Bolsa Balcao | | | 37,962,548 | | | $ | 457,954,886 | |
| |
| China International Capital Corp. Ltd., Cl. H4 | | | 93,204,800 | | | | 168,948,445 | |
| |
| Hong Kong Exchanges & Clearing Ltd. | | | 19,599,456 | | | | 606,889,722 | |
| | | | | | | | |
| | | | | | | 1,233,793,053 | |
| |
Commercial Banks—10.1% | | | | | |
Akbank TAS1 | | | 236,617,980 | | | | 285,841,804 | |
| |
Bandhan Bank Ltd.4 | | | 8,959,566 | | | | 77,287,561 | |
| |
Bank Central Asia Tbk PT | | | 83,271,600 | | | | 186,183,301 | |
| |
| Commercial International Bank Egypt SAE | | | 45,861,035 | | | | 230,157,610 | |
| |
Credicorp Ltd. | | | 3,718,042 | | | | 795,809,710 | |
| |
| Grupo Aval Acciones y Valores SA, ADR2 | | | 27,098,977 | | | | 220,856,663 | |
| |
| Grupo Financiero Banorte SAB de CV, Cl. O | | | 27,770,194 | | | | 151,580,088 | |
| |
| Grupo Financiero Inbursa SAB de CV, Cl. O | | | 204,087,887 | | | | 253,564,864 | |
| |
| Itau Unibanco Holding SA, ADR | | | 20,632,810 | | | | 186,314,274 | |
| |
| Kotak Mahindra Bank Ltd. | | | 57,854,984 | | | | 1,284,290,613 | |
| |
| Sberbank of Russia PJSC | | | 117,880,109 | | | | 432,036,258 | |
| |
| Siam Commercial Bank PCL (The) | | | 43,316,800 | | | | 160,350,987 | |
| | | | | | | | |
| | | | | | | 4,264,273,733 | |
| |
Consumer Finance—0.4% | |
| Cholamandalam Investment & Finance Co. Ltd. | | | 34,621,005 | | | | 148,847,380 | |
| |
Diversified Financial Services—2.0% | |
FirstRand Ltd. | | | 197,607,420 | | | | 853,701,377 | |
| |
Insurance—5.1% | |
AIA Group Ltd. | | | 144,322,800 | | | | 1,432,036,705 | |
| | | | | | | | |
| | | Shares | | | Value | |
| |
Insurance (Continued) | |
| |
| Ping An Insurance Group Co. of China Ltd., Cl. A | | | 56,950,232 | | | $ | 706,512,766 | |
| | | | | | | | |
| | | | | | | 2,138,549,471 | |
| |
Real Estate Management & Development—1.6% | |
Ayala Land, Inc. | | | 317,887,100 | | | | 303,649,510 | |
| |
| Emaar Properties PJSC | | | 105,024,724 | | | | 122,066,110 | |
| |
Hang Lung Properties Ltd. | | | 24,548,000 | | | | 53,931,279 | |
| |
Oberoi Realty Ltd. | | | 15,128,917 | | | | 108,235,485 | |
| |
| SM Prime Holdings, Inc. | | | 129,521,839 | | | | 99,428,361 | |
| | | | | | | | |
| | | | | | | 687,310,745 | |
| |
Thrifts & Mortgage Finance—4.1% | |
| Housing Development Finance Corp. Ltd. | | | 58,223,845 | | | | 1,749,112,629 | |
| |
Health Care—6.2% | |
| |
Biotechnology—0.6% | |
Innovent Biologics, Inc.1,4 | | | 68,301,500 | | | | 208,160,993 | |
| |
| Shanghai Junshi Biosciences Co. Ltd., Cl. H1,2,4 | | | 7,084,800 | | | | 25,271,480 | |
| | | | | | | | |
| | | | | | | 233,432,473 | |
| |
Health Care Providers & Services—0.7% | |
Sinopharm Group Co. Ltd.,
Cl. H2 | | | 78,206,063 | | | | 279,213,655 | |
| |
Health Care Technology—0.0% | |
| Ping An Healthcare & Technology Co. Ltd.1,4 | | | 2,664,621 | | | | 18,215,828 | |
| |
Life Sciences Tools & Services—2.0% | |
Samsung Biologics Co. Ltd.1,4 | | | 1,552,036 | | | | 528,273,830 | |
| |
Wuxi Biologics Cayman, Inc.1,4 | | | 26,576,500 | | | | 312,653,659 | |
| | | | | | | | |
| | | | | | | 840,927,489 | |
| |
Pharmaceuticals—2.9% | |
| Hansoh Pharmaceutical Group Co. Ltd.1,4 | | | 35,376,000 | | | | 107,714,639 | |
| |
| Hutchison China MediTech Ltd., ADR1 | | | 3,230,910 | | | | 61,064,199 | |
14 INVESCO OPPENHEIMER DEVELOPING MARKETS FUND
| | | | | | | | |
| | | Shares | | | Value | |
| |
Pharmaceuticals (Continued) | |
| |
| Jiangsu Hengrui Medicine Co. Ltd., Cl. A5 | | | 3,663,844 | | | $ | 46,959,288 | |
| |
| Jiangsu Hengrui Medicine Co. Ltd., Cl. A3,5 | | | 78,695,271 | | | | 1,010,410,714 | |
| | | | | | | | |
| | | | | | | 1,226,148,840 | |
| |
Industrials—4.3% | |
| |
Air Freight & Couriers—1.4% | |
| ZTO Express Cayman, Inc., ADR | | | 27,859,787 | | | | 612,915,314 | |
| |
Industrial Conglomerates—2.4% | |
Ayala Corp. | | | 2,824,364 | | | | 47,774,675 | |
| |
| Jardine Strategic Holdings Ltd. | | | 13,467,948 | | | | 434,712,513 | |
| |
| SM Investments Corp. | | | 26,729,237 | | | | 541,248,846 | |
| | | | | | | | |
| | | | | | | 1,023,736,034 | |
| |
Transportation Infrastructure—0.5% | |
| Grupo Aeroportuario del Sureste SAB de CV, Cl. B | | | 12,082,161 | | | | 198,123,196 | |
| |
Information Technology—6.9% | |
| |
IT Services—2.1% | |
StoneCo Ltd., Cl. A1 | | | 4,796,210 | | | | 176,452,566 | |
| |
| Tata Consultancy Services Ltd. | | | 21,814,371 | | | | 698,250,547 | |
| | | | | | | | |
| | | | | | | 874,703,113 | |
| |
Semiconductors & Semiconductor Equipment—4.6% | |
| Taiwan Semiconductor Manufacturing Co. Ltd. | | | 200,756,429 | | | | 1,950,404,914 | |
| |
Technology Hardware, Storage & Peripherals—0.2% | |
| Samsung Electronics Co. Ltd. | | | 2,333,984 | | | | 100,877,362 | |
| |
Materials—5.3% | |
| |
Construction Materials—0.7% | |
Dalmia Bharat Ltd. | | | 3,039,014 | | | | 34,707,074 | |
| |
| Indocement Tunggal Prakarsa Tbk PT | | | 109,221,879 | | | | 154,661,978 | |
| |
| Semen Indonesia Persero Tbk PT | | | 98,230,000 | | | | 88,152,950 | |
| | | | | | | | |
| | | | | | | 277,522,002 | |
| | | | | | | | |
| | | Shares | | | Value | |
| |
Metals & Mining—4.6% | |
| Glencore plc1 | | | 202,648,435 | | | $ | 611,419,904 | |
| |
| Grupo Mexico SAB de CV | | | 232,901,184 | | | | 613,474,540 | |
| |
| MMC Norilsk Nickel PJSC | | | 312,740 | | | | 87,303,497 | |
| |
| MMC Norilsk Nickel PJSC, ADR | | | 7,489,663 | | | | 207,784,821 | |
| |
| Polyus PJSC, GDR4 | | | 1,319,684 | | | | 76,920,026 | |
| |
| Vale SA, Cl. B, Sponsored ADR1 | | | 30,107,670 | | | | 353,464,046 | |
| | | | | | | | |
| | | | | | | 1,950,366,834 | |
| | | | | | | | |
| | |
Total Common Stocks | | | | | | | | |
(Cost $28,779,781,408) | | | | 39,354,285,877 | |
| |
Preferred Stocks—2.2% | |
| |
| Grab Holdings, Inc., H Shares, Preference1,2,3,6 | | | 104,679,791 | | | | 645,131,084 | |
| |
| Xiaoju Kuaizhi, Inc., Series A, Preference1,2,3,6 | | | 2,615,945 | | | | 133,235,572 | |
| |
| Xiaoju Kuaizhi, Inc., Series A1, Preference1,2,3,6 | | | 2,083,333 | | | | 106,108,525 | |
| |
| Xiaoju Kuaizhi, Inc., Series B, Preference1,2,3,6 | | | 981,699 | | | | 49,999,992 | |
| |
| Zee Entertainment Enterprises Ltd., 6% Cum.Non-Cv.2 | | | 189,591,305 | | | | 13,498,561 | |
| | | | | | | | |
Total Preferred Stocks | | | | | | | | |
(Cost $895,131,051) | | | | | | | 947,973,734 | |
| |
Investment Company—3.6% | |
| |
Invesco Government | | | | | | | | |
& Agency Portfolio, | | | | | | | | |
Institutional Class, 1.71%7
(Cost $1,501,595,497) | | | 1,501,595,497 | | | | 1,501,595,497 | |
| |
| Total Investments, at Value (Cost $31,176,507,956) | | | 99.0% | | | | 41,803,855,108 | |
| |
Net Other Assets (Liabilities) | | | 1.0 | | | | 408,046,310 | |
| | | | |
Net Assets | | | 100.0% | | | $ | 42,211,901,418 | |
| | | | |
15 INVESCO OPPENHEIMER DEVELOPING MARKETS FUND
CONSOLIDATED
SCHEDULE OF INVESTMENTSContinued
Footnotes to Consolidated Schedule of Investments
1.Non-income producing security.
2. Is or was an affiliate, as defined in the Investment Company Act of 1940, as amended, at or during the reporting period, by virtue of the Fund owning at least 5% of the voting securities of the issuer or as a result of the Fund and the issuer having the same investment adviser. Transactions during the reporting period in which the issuer was an affiliate are as follows:
| | | | | | | | | | | | | | | | |
| | | Shares August 31, 2019 | | | Gross
Additions | | | Gross
Reductions | | | Shares October 31, 2019 | |
| |
Common Stock | | | | | | | | | | | | | | | | |
Beverages | | | | | | | | | | | | | | | | |
Anadolu Efes Biracilik Ve Malt Sanayii AS | | | 38,338,430 | | | | — | | | | — | | | | 38,338,430 | |
Biotechnology | | | | | | | | | | | | | | | | |
Shanghai Junshi Biosciences Co. Ltd., Cl. Ha | | | 11,821,000 | | | | — | | | | 4,736,200 | | | | 7,084,800 | |
Commercial Banks | | | | | | | | | | | | | | | | |
Grupo Aval Acciones y Valores SA, ADR | | | 27,098,977 | | | | — | | | | — | | | | 27,098,977 | |
Health Care Providers & Services | | | | | | | | | | | | | | | | |
Sinopharm Group Co. Ltd., Cl. H | | | 78,851,600 | | | | — | | | | 645,537 | | | | 78,206,063 | |
Hotels, Restaurants & Leisure | | | | | | | | | | | | | | | | |
Alsea SAB de CV | | | 72,433,347 | | | | — | | | | — | | | | 72,433,347 | |
Huazhu Group Ltd., ADR | | | 29,530,806 | | | | — | | | | — | | | | 29,530,806 | |
Yum China Holdings, Inc. | | | 23,227,290 | | | | — | | | | — | | | | 23,227,290 | |
Media | | | | | | | | | | | | | | | | |
Zee Entertainment Enterprises Ltd. | | | 74,318,476 | | | | 83,600,734 | | | | — | | | | 157,919,210 | |
Multiline Retail | | | | | | | | | | | | | | | | |
Lojas Americanas SA | | | 108,714,800 | | | | — | | | | — | | | | 108,714,800 | |
Preferred Stocks | | | | | | | | | | | | | | | | |
Grab Holdings, Inc., H Shares, Preference | | | 104,679,791 | | | | — | | | | — | | | | 104,679,791 | |
Xiaoju Kuaizhi, Inc., Series A, Preference | | | 2,615,945 | | | | — | | | | — | | | | 2,615,945 | |
Xiaoju Kuaizhi, Inc., Series A1, Preference | | | 2,083,333 | | | | — | | | | — | | | | 2,083,333 | |
Xiaoju Kuaizhi, Inc., Series B, Preference | | | 981,699 | | | | — | | | | — | | | | 981,699 | |
Zee Entertainment Enterprises Ltd., 6% Cum.Non-Cv. | | | 189,591,305 | | | | — | | | | — | | | | 189,591,305 | |
| | | | |
| | | Value | | | Income | | | Realized
Gain (Loss) | | | Change in
Unrealized Gain (Loss) | |
| |
Common Stock | | | | | | | | | | | | | | | | |
Beverages | | | | | | | | | | | | | | | | |
Anadolu Efes Biracilik Ve Malt Sanayii AS | | $ | 128,567,363 | | | $ | — | | | $ | — | | | $ | (39,833,965 | ) |
Biotechnology | | | | | | | | | | | | | | | | |
Shanghai Junshi Biosciences Co. Ltd., Cl. Ha | | | — | a | | | — | | | | 6,365,604 | | | | (8,881,158 | ) |
Commercial Banks | | | | | | | | | | | | | | | | |
Grupo Aval Acciones y Valores SA, ADR | | | 220,856,663 | | | | 1,516,038 | | | | — | | | | 22,221,162 | |
16 INVESCO OPPENHEIMER DEVELOPING MARKETS FUND
Footnotes to Consolidated Schedule of Investments(Continued)
| | | | | | | | | | | | | | | | |
| | | Value | | | Income | | | Realized
Gain (Loss) | | | Change in
Unrealized Gain (Loss) | |
| |
Health Care Providers & Services | | | | | | | | | | | | | | | | |
Sinopharm Group Co. Ltd., Cl. H | | $ | 279,213,655 | | | $ | — | | | $ | (499,145 | ) | | $ | (2,287,114) | |
Hotels, Restaurants & Leisure | | | | | | | | | | | | | | | | |
Alsea SAB de CV | | | 193,240,941 | | | | — | | | | — | | | | 38,771,403 | |
Huazhu Group Ltd., ADR | | | 1,118,036,315 | | | | — | | | | — | | | | 142,633,793 | |
Yum China Holdings, Inc. | | | 987,159,825 | | | | — | | | | — | | | | (68,055,960) | |
Media | | | | | | | | | | | | | | | | |
Zee Entertainment Enterprises Ltd. | | | 580,244,394 | | | | — | | | | — | | | | (275,192,987) | |
Multiline Retail | | | | | | | | | | | | | | | | |
Lojas Americanas SA | | | 541,879,779 | | | | — | | | | — | | | | 50,155,992 | |
Preferred Stocks | | | | | | | | | | | | | | | | |
Grab Holdings, Inc., H Shares, Preference | | | 645,131,084 | | | | — | | | | — | | | | — | |
Xiaoju Kuaizhi, Inc., Series A, Preference | | | 133,235,572 | | | | — | | | | — | | | | 7,696,371 | |
Xiaoju Kuaizhi, Inc., Series A1, Preference | | | 106,108,525 | | | | — | | | | — | | | | 6,129,374 | |
Xiaoju Kuaizhi, Inc., Series B, Preference | | | 49,999,992 | | | | — | | | | — | | | | 2,888,257 | |
Zee Entertainment Enterprises Ltd., 6% Cum.Non-Cv. | | | 13,498,561 | | | | — | | | | — | | | | (891,872) | |
| | | | |
Total | | $ | 4,997,172,669 | | | $ | 1,516,038 | | | $ | 5,866,459 | | | $ | (124,646,704) | |
| | | | |
a. The security is no longer an affiliate. Therefore, the value has been excluded from this table.
3. All or a portion of this security is owned by the subsidiary. See Note 1 of the accompanying Consolidated Notes.
4. Security purchased or received in a transaction exempt from registration under the Securities Act of 1933, as amended (the “1933 Act”). The security may be resold pursuant to an exemption from registration under the 1933 Act, typically to qualified institutional buyers. The aggregate value of these securities at October 31, 2019 was $2,323,685,262, which represented 5.50% of the Fund’s Net Assets.
5. The Fund holds securities which have been issued by the same entity and that trade on separate exchanges.
6. The value of this security was determined using significant unobservable inputs. See Note 3 of the accompanying Consolidated Notes.
7. The money market fund and the Fund are affiliated by having the same investment adviser. The rate shown is the7-day SEC standardized yield as of October 31, 2019.
Distribution of investments representing geographic holdings, as a percentage of total investments at value, is as follows:
| | | | | | | | | | | | |
| Geographic Holdings | | Value | | | Percent | | | | |
| |
China | | $ | 11,628,844,940 | | | | 27.8% | | | | | |
India | | | 4,694,474,245 | | | | 11.2 | | | | | |
Russia | | | 3,596,041,724 | | | | 8.6 | | | | | |
Mexico | | | 2,763,622,682 | | | | 6.6 | | | | | |
Hong Kong | | | 2,588,634,418 | | | | 6.2 | | | | | |
France | | | 2,312,914,472 | | | | 5.5 | | | | | |
Brazil | | | 2,191,372,849 | | | | 5.2 | | | | | |
Taiwan | | | 1,950,404,914 | | | | 4.7 | | | | | |
United States | | | 1,790,939,586 | | | | 4.3 | | | | | |
South Korea | | | 1,169,652,620 | | | | 2.8 | | | | | |
17 INVESCO OPPENHEIMER DEVELOPING MARKETS FUND
CONSOLIDATED
SCHEDULE OF INVESTMENTSContinued
Footnotes to Consolidated Schedule of Investments (continued)
| | | | | | | | | | | | |
| Geographic Holdings (Continued) | | Value | | | Percent | | | | |
| |
South Africa | | $ | 1,082,589,922 | | | | 2.6% | | | | | |
Philippines | | | 992,101,391 | | | | 2.4 | | | | | |
Peru | | | 795,809,710 | | | | 1.9 | | | | | |
Italy | | | 695,741,692 | | | | 1.7 | | | | | |
Singapore | | | 645,131,084 | | | | 1.5 | | | | | |
Switzerland | | | 611,419,904 | | | | 1.5 | | | | | |
Turkey | | | 523,971,216 | | | | 1.3 | | | | | |
Indonesia | | | 428,998,230 | | | | 1.0 | | | | | |
Chile | | | 378,447,532 | | | | 0.9 | | | | | |
Egypt | | | 230,157,611 | | | | 0.5 | | | | | |
Colombia | | | 220,856,662 | | | | 0.5 | | | | | |
Thailand | | | 160,350,987 | | | | 0.4 | | | | | |
United Arab Emirates | | | 122,066,110 | | | | 0.3 | | | | | |
Argentina | | | 115,214,198 | | | | 0.3 | | | | | |
Vietnam | | | 114,096,409 | | | | 0.3 | | | | | |
| | | | |
Total | | $ | 41,803,855,108 | | | | 100.0% | | | | | |
| | | | |
| | |
| Glossary: | | |
| |
| Definitions | | |
| ADR | | American Depositary Receipt |
| GDR | | Global Depositary Receipts |
See accompanying Notes to Consolidated Financial Statements.
18 INVESCO OPPENHEIMER DEVELOPING MARKETS FUND
CONSOLIDATED STATEMENT OF
ASSETS AND LIABILITIESOctober 31, 2019
| | | | |
Assets | | | | |
Investments, at value—see accompanying consolidated schedule of investments: | | | | |
Unaffiliated companies (cost $25,235,903,808) | | $ | 35,305,086,942 | |
Affiliated companies (cost $5,940,604,148) | | | 6,498,768,166 | |
| | | | |
| | | | 41,803,855,108 | |
Cash | | | 132,215,493 | |
Cash—foreign currencies (cost $291,245,812) | | | 285,095,458 | |
Receivables and other assets: | | | | |
Investments sold | | | 64,791,543 | |
Shares of beneficial interest sold | | | 47,500,577 | |
Dividends | | | 42,038,743 | |
Other | | | 1,445,106 | |
| | | | |
Total assets | | | 42,376,942,028 | |
Liabilities | | | | |
Payables and other liabilities: | | | | |
Foreign capital gains tax | | | 82,941,577 | |
Shares of beneficial interest redeemed | | | 46,286,732 | |
Transfer and shareholder servicing agent fees | | | 11,348,682 | |
Investments purchased | | | 8,401,379 | |
Shareholder communications | | | 1,794,581 | |
Trustees’ compensation | | | 1,699,151 | |
Distribution and service plan fees | | | 1,518,908 | |
Advisory fees | | | 874,993 | |
Administration fees | | | 16,646 | |
Other | | | 10,157,961 | |
| | | | |
Total liabilities | | | 165,040,610 | |
Net Assets | | $ | 42,211,901,418 | |
| | | | |
| | | | |
Composition of Net Assets | | | | |
Shares of beneficial interest | | $ | 30,721,459,712 | |
Total distributable earnings | | | 11,490,441,706 | |
| | | | |
Net Assets | | $ | 42,211,901,418 | |
| | | | |
19 INVESCO OPPENHEIMER DEVELOPING MARKETS FUND
CONSOLIDATED STATEMENT OF
ASSETS AND LIABILITIESContinued
| | | | |
Net Asset Value Per Share | | | | |
Class A Shares: | | | | |
| |
| Net asset value and redemption price per share (based on net assets of $4,881,007,905 and 110,227,980 shares of beneficial interest outstanding) | | | $44.28 | |
| |
Maximum offering price per share (net asset value plus sales charge of 5.50% of offering price) | | | $46.86 | |
| |
Class C Shares: | | | | |
| |
| Net asset value, redemption price (excludes applicable contingent deferred sales charge) and offering price per share (based on net assets of $403,026,575 and 9,840,148 shares of beneficial interest outstanding) | | | $40.96 | |
| |
Class R Shares: | | | | |
| |
| Net asset value, redemption price and offering price per share (based on net assets of $472,840,046 and 11,130,378 shares of beneficial interest outstanding) | | | $42.48 | |
| |
Class Y Shares: | | | | |
| |
| Net asset value, redemption price and offering price per share (based on net assets of $19,342,100,701 and 442,568,146 shares of beneficial interest outstanding) | | | $43.70 | |
| |
Class R5 Shares: | | | | |
| |
| Net asset value, redemption price and offering price per share (based on net assets of $6,005,563 and 135,460 shares of beneficial interest outstanding) | | | $44.33 | |
| |
Class R6 Shares: | | | | |
| |
| Net asset value, redemption price and offering price per share (based on net assets of $17,106,920,628 and 391,004,051 shares of beneficial interest outstanding) | | | $43.75 | |
See accompanying Notes to Consolidated Financial Statements.
20 INVESCO OPPENHEIMER DEVELOPING MARKETS FUND
CONSOLIDATED STATEMENT OF
OPERATIONS
| | | | | | | | |
| | | Two Months Ended
October 31, 2019 | | Year Ended August
31, 2019 |
Investment Income | | | | | | | | |
Interest | | $ | 268,488 | | | $ | 960,755 | |
Dividends: | | | | | | | | |
| Unaffiliated companies (net of foreign withholding taxes of $12,028,216 and $56,649,655, respectively) | | | 133,037,377 | | | | 549,718,040 | |
Affiliated companies (net of foreign withholding taxes of $15,424 and $1,591,874, respectively) | | | 6,716,862 | | | | 72,938,463 | |
| | | | |
Total investment income | | | 140,022,727 | | | | 623,617,258 | |
Expenses | | | | | | | | |
Advisory fees | | | 51,784,757 | | | | 298,769,275 | |
Administration fees | | | 985,173 | | | | 1,517,342 | |
Distribution and service plan fees: | | | | | | | | |
Class A | | | 1,941,715 | | | | 11,989,716 | |
Class C | | | 747,336 | | | | 6,981,281 | |
Class R | | | 393,350 | | | | 2,555,007 | |
Transfer and shareholder servicing agent fees: | | | | | | | | |
Class A | | | 1,318,293 | | | | 9,059,042 | |
Class C | | | 124,058 | | | | 1,317,708 | |
Class R | | | 130,592 | | | | 959,453 | |
Class Y | | | 5,225,038 | | | | 33,288,086 | |
Class R5 | | | 300 | | | | 1 | |
Class R6 | | | 82,693 | | | | 3,346,945 | |
Shareholder communications: | | | | | | | | |
Class A | | | 98,638 | | | | 146,774 | |
Class C | | | 8,968 | | | | 20,037 | |
Class R | | | 9,705 | | | | 12,750 | |
Class Y | | | 390,555 | | | | 545,350 | |
Class R5 | | | 82 | | | | — | |
Class R6 | | | 343,122 | | | | 443,771 | |
Custodian fees and expenses | | | 2,995,449 | | | | 15,631,423 | |
Trustees’ compensation | | | 57,580 | | | | 505,361 | |
Borrowing fees | | | — | | | | 794,564 | |
Other | | | 696,279 | | | | 6,538,128 | |
| | | | |
Total expenses | | | 67,333,683 | | | | 394,422,014 | |
Less waivers, reimbursements of expenses and expense offset arrangement(s) | | | (275,492 | ) | | | (1,788,778) | |
| | | | |
Net expenses | | | 67,058,191 | | | | 392,633,236 | |
Net Investment Income | | | 72,964,536 | | | | 230,984,022 | |
21 INVESCO OPPENHEIMER DEVELOPING MARKETS FUND
CONSOLIDATED STATEMENT OF
OPERATIONSContinued
| | | | | | | | |
| | | Two Months Ended
October 31, 2019 | | Year Ended August
31, 2019 | |
Realized and Unrealized Gain (Loss) | | | | | | | | |
Net realized gain (loss) on: | | | | | | | | |
Investment transactions in: | | | | | | | | |
Unaffiliated companies (net of foreign capital gains tax of $9,163,345 and $—, respectively) | | $ | 56,230,900 | | | $ | 1,276,561,933 | |
Affiliated companies | | | 5,866,459 | | | | (8,142,272) | |
Foreign currency transactions | | | (2,833,206 | ) | | | (34,227,728) | |
| | | | |
Net realized gain | | | 59,264,153 | | | | 1,234,191,933 | |
Net change in unrealized appreciation/(depreciation) on: | | | | | | | | |
Investment transactions in: | | | | | | | | |
Unaffiliated companies (net of foreign capital gains tax of $3,235,609 and $61,370,129, respectively) | | | 2,134,383,875 | | | | (1,184,844,127) | |
Affiliated companies | | | (124,666,758 | ) | | | (19,297,296) | |
Translation of assets and liabilities denominated in foreign currencies | | | 6,972,400 | | | | 4,628,390 | |
| | | | |
Net change in unrealized appreciation/(depreciation) | | | 2,016,689,517 | | | | (1,199,513,033) | |
Net Increase in Net Assets Resulting from Operations | | $ | 2,148,918,206 | | | $ | 265,662,922 | |
| | | | |
See accompanying Notes to Consolidated Financial Statements.
22 INVESCO OPPENHEIMER DEVELOPING MARKETS FUND
CONSOLIDATED STATEMENT OF CHANGES IN NET ASSETS
| | | | | | | | | | | | |
| | | Two Months Ended
October 31, 2019 | | Year Ended August 31, 2019 | | | Year Ended
August 31, 2018 | |
Operations | | | | | | | | | | | | |
Net investment income | | $ | 72,964,536 | | | $ | 230,984,022 | | | $ | 143,722,639 | |
Net realized gain (loss) | | | 59,264,153 | | | | 1,234,191,933 | | | | 2,682,724,173 | |
Net change in unrealized appreciation/(depreciation) | | | 2,016,689,517 | | | | (1,199,513,033 | ) | | | (2,198,636,821) | |
| | | | |
Net increase (decrease) in net assets resulting from operations | | | 2,148,918,206 | | | | 265,662,922 | | | | 627,809,991 | |
Dividends and/or Distributions to Shareholders1 | | | | | | | | | | | | |
Distributions to shareholders from distributable earnings: | | | | | | | | | | | | |
Class A | | | — | | | | (12,939,870 | ) | | | (18,919,405) | |
Class B2 | | | — | | | | — | | | | — | |
Class C | | | — | | | | — | | | | — | |
Class R | | | — | | | | — | | | | (743,812) | |
Class Y | | | — | | | | (100,145,148 | ) | | | (104,289,090) | |
Class R5 | | | — | | | | — | | | | — | |
Class R6 | | | — | | | | (107,242,383 | ) | | | (92,634,631) | |
| | | | |
Total distributions from distributable earnings | | | — | | | | (220,327,401 | ) | | | (216,586,938) | |
Beneficial Interest Transactions | | | | | | | | | | | | |
Net increase (decrease) in net assets resulting from beneficial interest transactions: | | | | | | | | | | | | |
Class A | | | (52,265,503 | ) | | | (574,327,685 | ) | | | (1,193,123,304) | |
Class B2 | | | — | | | | — | | | | (19,647,055) | |
Class C | | | (112,129,919 | ) | | | (335,015,124 | ) | | | (160,861,678) | |
Class R | | | (22,227,042 | ) | | | (112,086,207 | ) | | | (107,346,421) | |
Class Y | | | (169,911,527 | ) | | | 612,900,938 | | | | 188,006,405 | |
Class R5 | | | 5,798,094 | | | | 10,025 | | | | — | |
Class R6 | | | 13,512,830 | | | | 2,187,851,902 | | | | 2,377,253,137 | |
| | | | |
Total beneficial interest transactions | | | (337,223,067 | ) | | | 1,779,333,849 | | | | 1,084,281,084 | |
Net Assets | | | | | | | | | | | | |
Total increase | | | 1,811,695,139 | | | | 1,824,669,370 | | | | 1,495,504,137 | |
Beginning of period | | | 40,400,206,279 | | | | 38,575,536,909 | | | | 37,080,032,772 | |
| | | | |
End of period | | $ | 42,211,901,418 | | | $ | 40,400,206,279 | | | $ | 38,575,536,909 | |
| | | | |
1. The Securities Exchange Commission eliminated the requirement to disclose the distribution components separately, except for tax return of capital. For the year ended August 31, 2018, distributions to shareholders from distributable earnings consisted of distributions from net investment income.
2. Effective June 1, 2018, all Class B shares converted to Class A shares.
See accompanying Notes to Consolidated Financial Statements.
23 INVESCO OPPENHEIMER DEVELOPING MARKETS FUND
CONSOLIDATED FINANCIAL HIGHLIGHTS
| | | | | | | | | | | | |
| Class A | | Two Months
Ended
October 31,
2019 | | Year Ended
August 31,
2019 | | Year Ended
August 31,
2018 | | Year Ended
August 31,
2017 | | Year Ended
August 31,
2016 | | Year Ended
August 31,
2015 |
Per Share Operating Data | | | | | | | | | | | | |
Net asset value, beginning of period | | $42.05 | | $42.01 | | $41.49 | | $33.45 | | $30.06 | | $41.30 |
Income (loss) from investment operations: | | | | | | | | | | | | |
Net investment income1 | | 0.06 | | 0.14 | | 0.06 | | 0.13 | | 0.12 | | 0.17 |
Net realized and unrealized gain (loss) | | 2.17 | | 0.01 | | 0.59 | | 7.98 | | 3.40 | | (10.71) |
| | |
Total from investment operations | | 2.23 | | 0.15 | | 0.65 | | 8.11 | | 3.52 | | (10.54) |
Dividends and/or distributions to shareholders: | | | | | | | | | | | | |
Dividends from net investment income | | 0.00 | | (0.11) | | (0.13) | | (0.07) | | (0.13) | | (0.10) |
Distributions from net realized gain | | 0.00 | | 0.00 | | 0.00 | | 0.00 | | 0.00 | | (0.60) |
| | |
Total dividends and/or distributions to shareholders | | 0.00 | | (0.11) | | (0.13) | | (0.07) | | (0.13) | | (0.70) |
Net asset value, end of period | | $44.28 | | $42.05 | | $42.01 | | $41.49 | | $33.45 | | $30.06 |
| | |
| | | | | | | | | | | | | |
Total Return, at Net Asset Value2 | | 5.30% | | 0.34% | | 1.59% | | 24.32% | | 11.74% | | (25.84)% |
| | | | | | | | | | | | | |
Ratios/Supplemental Data | | | | | | | | | | | | |
Net assets, end of period (in thousands) | | $4,881,008 | | $4,686,134 | | $5,277,791 | | $6,350,957 | | $6,574,857 | | $7,679,026 |
Average net assets (in thousands) | | $4,767,974 | | $4,832,676 | | $6,132,474 | | $6,236,473 | | $6,903,922 | | $10,303,699 |
Ratios to average net assets:3 | | | | | | | | | | | | |
Net investment income | | 0.80% | | 0.34% | | 0.13% | | 0.37% | | 0.38% | | 0.47% |
Expenses excluding specific expenses listed below | | 1.24% | | 1.27% | | 1.29% | | 1.32% | | 1.32% | | 1.31% |
Interest and fees from borrowings | | 0.00% | | 0.00%4 | | 0.00%4 | | 0.00%4 | | 0.00%4 | | 0.00%4 |
| | |
Total expenses5 | | 1.24% | | 1.27% | | 1.29% | | 1.32% | | 1.32% | | 1.31% |
| Expenses after payments, waivers and/or reimbursements and reduction to custodian expenses | | 1.24%6 | | 1.27%6 | | 1.28% | | 1.31% | | 1.32%6 | | 1.30% |
Portfolio turnover rate7 | | 7% | | 28% | | 36% | | 33% | | 18% | | 36% |
24 INVESCO OPPENHEIMER DEVELOPING MARKETS FUND
1. Per share amounts calculated based on the average shares outstanding during the period.
2. Includes adjustments in accordance with accounting principles generally accepted in the United States of America and as such, the net asset value for financial reporting purposes and the returns based upon those net asset values may differ from the net asset value and returns for shareholder transactions. Does not include sales charges and is not annualized for periods less than one year, if applicable.
3. Annualized for periods less than one full year.
4. Less than 0.005%.
5. Total expenses including indirect expenses from affiliated fund fees and expenses were as follows:
| | | | | | |
Two Months Ended October 31, 2019 | | | 1.24 | % | | |
Year Ended August 31, 2019 | | | 1.27 | % | | |
Year Ended August 31, 2018 | | | 1.29 | % | | |
Year Ended August 31, 2017 | | | 1.32 | % | | |
Year Ended August 31, 2016 | | | 1.32 | % | | |
Year Ended August 31, 2015 | | | 1.31 | % | | |
6. Waiver was less than 0.005%.
7. Portfolio turnover is calculated at the fund level and is not annualized for periods less than one year, if applicable.
See accompanying Notes to Consolidated Financial Statements.
25 INVESCO OPPENHEIMER DEVELOPING MARKETS FUND
CONSOLIDATED FINANCIAL HIGHLIGHTSContinued
| | | | | | | | | | | | | | | | | | | | | | | | |
| Class C | | Two Months
Ended
October 31,
2019 | | | Year Ended
August 31,
2019 | | | Year Ended
August 31,
2018 | | | Year Ended
August 31,
2017 | | | Year Ended
August 31,
2016 | | | Year Ended
August 31,
2015 | |
| |
| Per Share Operating Data | | | | | | | | | | | | | | | | | | | | | | | | |
Net asset value, beginning of period | | | $38.95 | | | | $39.10 | | | | $38.79 | | | | $31.44 | | | | $28.35 | | | | $39.17 | |
| |
Income (loss) from investment operations: | | | | | | | | | | | | | | | | | | | | | | | | |
Net investment income (loss)1 | | | 0.002 | | | | (0.16) | | | | (0.25) | | | | (0.13) | | | | (0.11) | | | | (0.10) | |
Net realized and unrealized gain (loss) | | | 2.01 | | | | 0.01 | | | | 0.56 | | | | 7.48 | | | | 3.20 | | | | (10.12) | |
| | | | |
Total from investment operations | | | 2.01 | | | | (0.15) | | | | 0.31 | | | | 7.35 | | | | 3.09 | | | | (10.22) | |
| |
Dividends and/or distributions to shareholders: | | | | | | | | | | | | | | | | | | | | | | | | |
Dividends from net investment income | | | 0.00 | | | | 0.00 | | | | 0.00 | | | | 0.00 | | | | 0.00 | | | | 0.00 | |
Distributions from net realized gain | | | 0.00 | | | | 0.00 | | | | 0.00 | | | | 0.00 | | | | 0.00 | | | | (0.60) | |
| | | | |
Total dividends and/or distributions to shareholders | | | 0.00 | | | | 0.00 | | | | 0.00 | | | | 0.00 | | | | 0.00 | | | | (0.60) | |
| |
Net asset value, end of period | | | $40.96 | | | | $38.95 | | | | $39.10 | | | | $38.79 | | | | $31.44 | | | | $28.35 | |
| | | | |
|
| |
| Total Return, at Net Asset Value3 | | | 5.16% | | | | (0.41)% | | | | 0.80% | | | | 23.38% | | | | 10.90% | | | | (26.39)% | |
| | | | | | | | | | | | | | | | | | | | | | | | |
| |
| Ratios/Supplemental Data | | | | | | | | | | | | | | | | | | | | | | | | |
Net assets, end of period (in thousands) | | | $403,027 | | | | $493,169 | | | | $826,481 | | | | $973,031 | | | | $1,046,894 | | | | $1,311,171 | |
| |
Average net assets (in thousands) | | | $443,673 | | | | $697,567 | | | | $943,157 | | | | $964,547 | | | | $1,114,383 | | | | $1,785,113 | |
| |
Ratios to average net assets:4 | | | | | | | | | | | | | | | | | | | | | | | | |
Net investment income (loss) | | | 0.03% | | | | (0.42)% | | | | (0.62)% | | | | (0.39)% | | | | (0.39)% | | | | (0.29)% | |
Expenses excluding specific expenses listed below | | | 2.00% | | | | 2.02% | | | | 2.05% | | | | 2.07% | | | | 2.07% | | | | 2.06% | |
Interest and fees from borrowings | | | 0.00% | | | | 0.00%5 | | | | 0.00%5 | | | | 0.00%5 | | | | 0.00%5 | | | | 0.00%5 | |
| | | | |
Total expenses6 | | | 2.00% | | | | 2.02% | | | | 2.05% | | | | 2.07% | | | | 2.07% | | | | 2.06% | |
| Expenses after payments, waivers and/or reimbursements and reduction to custodian expenses | | | 2.00%7 | | | | 2.02%7 | | | | 2.04% | | | | 2.06% | | | | 2.07%7 | | | | 2.05% | |
| |
Portfolio turnover rate8 | | | 7% | | | | 28% | | | | 36% | | | | 33% | | | | 18% | | | | 36% | |
26 INVESCO OPPENHEIMER DEVELOPING MARKETS FUND
1. Per share amounts calculated based on the average shares outstanding during the period.
2. Less than $0.005 per share.
3. Includes adjustments in accordance with accounting principles generally accepted in the United States of America and as such, the net asset value for financial reporting purposes and the returns based upon those net asset values may differ from the net asset value and returns for shareholder transactions. Does not include sales charges and is not annualized for periods less than one year, if applicable.
4. Annualized for periods less than one full year.
5. Less than 0.005%.
6. Total expenses including indirect expenses from affiliated fund fees and expenses were as follows:
| | | | | | |
Two Months Ended October 31, 2019 | | | 2.00 | % | | |
Year Ended August 31, 2019 | | | 2.02 | % | | |
Year Ended August 31, 2018 | | | 2.05 | % | | |
Year Ended August 31, 2017 | | | 2.07 | % | | |
Year Ended August 31, 2016 | | | 2.07 | % | | |
Year Ended August 31, 2015 | | | 2.06 | % | | |
7. Waiver was less than 0.005%.
8. Portfolio turnover is calculated at the fund level and is not annualized for periods less than one year, if applicable.
See accompanying Notes to Consolidated Financial Statements.
27 INVESCO OPPENHEIMER DEVELOPING MARKETS FUND
CONSOLIDATED FINANCIAL HIGHLIGHTSContinued
| | | | | | | | | | | | | | | | | | | | | | | | |
| Class R | | Two Months
Ended
October 31,
2019 | | | Year Ended
August 31,
2019 | | | Year Ended
August 31,
2018 | | | Year Ended
August 31,
2017 | | | Year Ended
August 31,
2016 | | | Year Ended
August 31,
2015 | |
| |
| Per Share Operating Data | | | | | | | | | | | | | | | | | | | | | | | | |
Net asset value, beginning of period | | | $40.36 | | | | $40.32 | | | | $39.84 | | | | $32.13 | | | | $28.88 | | | | $39.74 | |
| |
Income (loss) from investment operations: | | | | | | | | | | | | | | | | | | | | | | | | |
Net investment income (loss)1 | | | 0.04 | | | | 0.03 | | | | (0.05) | | | | 0.05 | | | | 0.04 | | | | 0.08 | |
Net realized and unrealized gain (loss) | | | 2.08 | | | | 0.01 | | | | 0.58 | | | | 7.66 | | | | 3.27 | | | | (10.30) | |
| | | | |
Total from investment operations | | | 2.12 | | | | 0.04 | | | | 0.53 | | | | 7.71 | | | | 3.31 | | | | (10.22) | |
| |
Dividends and/or distributions to shareholders: | | | | | | | | | | | | | | | | | | | | | | | | |
Dividends from net investment income | | | 0.00 | | | | 0.00 | | | | (0.05) | | | | (0.00)2 | | | | (0.06) | | | | (0.04) | |
Distributions from net realized gain | | | 0.00 | | | | 0.00 | | | | 0.00 | | | | 0.00 | | | | 0.00 | | | | (0.60) | |
| | | | |
Total dividends and/or distributions to shareholders | | | 0.00 | | | | 0.00 | | | | (0.05) | | | | (0.00) | | | | (0.06) | | | | (0.64) | |
| |
Net asset value, end of period | | | $42.48 | | | | $40.36 | | | | $40.32 | | | | $39.84 | | | | $32.13 | | | | $28.88 | |
| | | | |
|
| |
| Total Return, at Net Asset Value3 | | | 5.25% | | | | 0.10% | | | | 1.32% | | | | 24.01% | | | | 11.47% | | | | (26.03)% | |
| | | | | | | | | | | | | | | | | | | | | | | | |
| |
| Ratios/Supplemental Data | | | | | | | | | | | | | | | | | | | | | | | | |
Net assets, end of period (in thousands) | | | $472,840 | | | | $471,206 | | | | $585,385 | | | | $680,861 | | | | $634,007 | | | | $657,581 | |
| |
Average net assets (in thousands) | | | $471,672 | | | | $510,935 | | | | $667,630 | | | | $626,788 | | | | $627,034 | | | | $832,613 | |
| |
Ratios to average net assets:4 | | | | | | | | | | | | | | | | | | | | | | | | |
Net investment income (loss) | | | 0.54% | | | | 0.08% | | | | (0.12)% | | | | 0.14% | | | | 0.14% | | | | 0.23% | |
Expenses excluding specific expenses listed below | | | 1.50% | | | | 1.52% | | | | 1.55% | | | | 1.57% | | | | 1.57% | | | | 1.56% | |
Interest and fees from borrowings | | | 0.00% | | | | 0.00%5 | | | | 0.00%5 | | | | 0.00%5 | | | | 0.00%5 | | | | 0.00%5 | |
| | | | |
Total expenses6 | | | 1.50% | | | | 1.52% | | | | 1.55% | | | | 1.57% | | | | 1.57% | | | | 1.56% | |
| Expenses after payments, waivers and/or reimbursements and reduction to custodian expenses | | | 1.50%7 | | | | 1.52%7 | | | | 1.54% | | | | 1.56% | | | | 1.57%7 | | | | 1.55% | |
| |
Portfolio turnover rate8 | | | 7% | | | | 28% | | | | 36% | | | | 33% | | | | 18% | | | | 36% | |
28 INVESCO OPPENHEIMER DEVELOPING MARKETS FUND
1. Per share amounts calculated based on the average shares outstanding during the period.
2. Less than $0.005 per share.
3. Includes adjustments in accordance with accounting principles generally accepted in the United States of America and as such, the net asset value for financial reporting purposes and the returns based upon those net asset values may differ from the net asset value and returns for shareholder transactions. Does not include sales charges and is not annualized for periods less than one year, if applicable.
4. Annualized for periods less than one full year.
5. Less than 0.005%.
6. Total expenses including indirect expenses from affiliated fund fees and expenses were as follows:
| | | | | | |
Two Months Ended October 31, 2019 | | | 1.50 | % | | |
Year Ended August 31, 2019 | | | 1.52 | % | | |
Year Ended August 31, 2018 | | | 1.55 | % | | |
Year Ended August 31, 2017 | | | 1.57 | % | | |
Year Ended August 31, 2016 | | | 1.57 | % | | |
Year Ended August 31, 2015 | | | 1.56 | % | | |
7. Waiver was less than 0.005%.
8. Portfolio turnover is calculated at the fund level and is not annualized for periods less than one year, if applicable.
See accompanying Notes to Consolidated Financial Statements.
29 INVESCO OPPENHEIMER DEVELOPING MARKETS FUND
CONSOLIDATED FINANCIAL HIGHLIGHTSContinued
| | | | | | | | | | | | | | | | | | | | | | | | |
| Class Y | | Two Months
Ended
October 31,
2019 | | | Year Ended
August 31,
2019 | | | Year Ended
August 31,
2018 | | | Year Ended
August 31,
2017 | | | Year Ended
August 31,
2016 | | | Year Ended
August 31,
2015 | |
| |
| Per Share Operating Data | | | | | | | | | | | | | | | | | | | | | | | | |
Net asset value, beginning of period | | | $41.49 | | | | $41.48 | | | | $40.98 | | | | $33.06 | | | | $29.73 | | | | $40.88 | |
| |
Income (loss) from investment operations: | | | | | | | | | | | | | | | | | | | | | | | | |
Net investment income1 | | | 0.07 | | | | 0.24 | | | | 0.16 | | | | 0.24 | | | | 0.19 | | | | 0.26 | |
Net realized and unrealized gain (loss) | | | 2.14 | | | | 0.002 | | | | 0.59 | | | | 7.85 | | | | 3.36 | | | | (10.59) | |
| | | | |
Total from investment operations | | | 2.21 | | | | 0.24 | | | | 0.75 | | | | 8.09 | | | | 3.55 | | | | (10.33) | |
| |
Dividends and/or distributions to shareholders: | | | | | | | | | | | | | | | | | | | | | | | | |
Dividends from net investment income | | | 0.00 | | | | (0.23) | | | | (0.25) | | | | (0.17) | | | | (0.22) | | | | (0.22) | |
Distributions from net realized gain | | | 0.00 | | | | 0.00 | | | | 0.00 | | | | 0.00 | | | | 0.00 | | | | (0.60) | |
| | | | |
Total dividends and/or distributions to shareholders | | | 0.00 | | | | (0.23) | | | | (0.25) | | | | (0.17) | | | | (0.22) | | | | (0.82) | |
| |
Net asset value, end of period | | | $43.70 | | | | $41.49 | | | | $41.48 | | | | $40.98 | | | | $33.06 | | | | $29.73 | |
| | | | |
|
| |
| Total Return, at Net Asset Value3 | | | 5.33% | | | | 0.61% | | | | 1.82% | | | | 24.61% | | | | 12.04% | | | | (25.66)% | |
| | | | | | | | | | | | | | | | | | | | | | | | |
| |
| Ratios/Supplemental Data | | | | | | | | | | | | | | | | | | | | | | | | |
Net assets, end of period (in thousands) | | | $19,342,101 | | | | $18,525,445 | | | | $17,898,340 | | | | $17,496,988 | | | | $13,551,480 | | | | $15,358,492 | |
| |
Average net assets (in thousands) | | | $18,887,742 | | | | $17,807,102 | | | | $18,317,515 | | | | $14,523,085 | | | | $13,507,017 | | | | $19,567,341 | |
| |
Ratios to average net assets:4 | | | | | | | | | | | | | | | | | | | | | | | | |
Net investment income | | | 1.04% | | | | 0.59% | | | | 0.38% | | | | 0.67% | | | | 0.62% | | | | 0.74% | |
Expenses excluding specific expenses listed below | | | 1.00% | | | | 1.02% | | | | 1.05% | | | | 1.07% | | | | 1.07% | | | | 1.06% | |
Interest and fees from borrowings | | | 0.00% | | | | 0.00%5 | | | | 0.00%5 | | | | 0.00%5 | | | | 0.00%5 | | | | 0.00%5 | |
| | | | |
Total expenses6 | | | 1.00% | | | | 1.02% | | | | 1.05% | | | | 1.07% | | | | 1.07% | | | | 1.06% | |
| Expenses after payments, waivers and/or reimbursements and reduction to custodian expenses | | | 1.00%7 | | | | 1.02%7 | | | | 1.04% | | | | 1.06% | | | | 1.07%7 | | | | 1.05% | |
| |
Portfolio turnover rate8 | | | 7% | | | | 28% | | | | 36% | | | | 33% | | | | 18% | | | | 36% | |
30 INVESCO OPPENHEIMER DEVELOPING MARKETS FUND
1. Per share amounts calculated based on the average shares outstanding during the period.
2. Less than $0.005 per share.
3. Includes adjustments in accordance with accounting principles generally accepted in the United States of America and as such, the net asset value for financial reporting purposes and the returns based upon those net asset values may differ from the net asset value and returns for shareholder transactions. Does not include sales charges and is not annualized for periods less than one year, if applicable.
4. Annualized for periods less than one full year.
5. Less than 0.005%.
6. Total expenses including indirect expenses from affiliated fund fees and expenses were as follows:
| | | | | | |
Two Months Ended October 31, 2019 | | | 1.00 | % | | |
Year Ended August 31, 2019 | | | 1.02 | % | | |
Year Ended August 31, 2018 | | | 1.05 | % | | |
Year Ended August 31, 2017 | | | 1.07 | % | | |
Year Ended August 31, 2016 | | | 1.07 | % | | |
Year Ended August 31, 2015 | | | 1.06 | % | | |
7. Waiver was less than 0.005%.
8. Portfolio turnover is calculated at the fund level and is not annualized for periods less than one year, if applicable.
See accompanying Notes to Consolidated Financial Statements.
31 INVESCO OPPENHEIMER DEVELOPING MARKETS FUND
CONSOLIDATED FINANCIAL HIGHLIGHTSContinued
| | | | |
| Class R5 | | Two Months
Ended
October 31,
2019 | | Period
Ended
August 31,
20191 |
| Per Share Operating Data |
| Net asset value, beginning of period | | $42.08 | | $41.26 |
| Income (loss) from investment operations: | | | | |
Net investment income2 | | 0.08 | | 0.09 |
Net realized and unrealized gain | | 2.17 | | 0.73 |
| | |
| Total from investment operations | | 2.25 | | 0.82 |
| Dividends and/or distributions to shareholders: | | | | |
| Dividends from net investment income | | 0.00 | | 0.00 |
| Distributions from net realized gain | | 0.00 | | 0.00 |
| | |
| Total dividends and/or distributions to shareholders | | 0.00 | | 0.00 |
Net asset value, end of period | | $44.33 | | $42.08 |
| | |
| | |
| | | | |
| Total Return, at Net Asset Value3 | | 5.35% | | 1.99% |
| | | | |
| Ratios/Supplemental Data | | | | |
| Net assets, end of period (in thousands) | | $6,006 | | $10 |
| Average net assets (in thousands) | | $3,490 | | $11 |
Ratios to average net assets:4 | | | | |
Net investment income | | 1.16% | | 0.74% |
| Expenses excluding specific expenses listed below | | 0.88% | | 0.87% |
Interest and fees from borrowings | | 0.00% | | 0.00% |
| | |
Total expenses5 | | 0.88% | | 0.87% |
| Expenses after payments, waivers and/or reimbursements and reduction to custodian expenses | | 0.88%6 | | 0.87%6 |
Portfolio turnover rate7 | | 7% | | 28% |
32 INVESCO OPPENHEIMER DEVELOPING MARKETS FUND
1. For the period from after the close of business on May 24, 2019 (inception of offering) to August 31, 2019.
2. Per share amounts calculated based on the average shares outstanding during the period.
3. Includes adjustments in accordance with accounting principles generally accepted in the United States of America and as such, the net asset value for financial reporting purposes and the returns based upon those net asset values may differ from the net asset value and returns for shareholder transactions. Does not include sales charges and is not annualized for periods less than one year, if applicable.
4. Annualized for periods less than one full year.
5. Total expenses including indirect expenses from affiliated fund fees and expenses were as follows:
| | | | | | |
Two Months Ended October 31, 2019 | | | 0.88 | % | | |
Period Ended August 31, 2019 | | | 0.87 | % | | |
6. Waiver was less than 0.005%.
7. Portfolio turnover is calculated at the fund level and is not annualized for periods less than one year, if applicable.
See accompanying Notes to Consolidated Financial Statements.
33 INVESCO OPPENHEIMER DEVELOPING MARKETS FUND
CONSOLIDATED FINANCIAL HIGHLIGHTSContinued
| | | | | | | | | | | | | | | | | | | | | | | | |
| Class R6 | | Two Months
Ended
October 31,
2019 | | | Year Ended
August 31,
2019 | | | Year Ended
August 31,
2018 | | | Year Ended
August 31,
2017 | | | Year Ended
August 31,
2016 | | | Year Ended
August 31,
2015 | |
| |
| Per Share Operating Data | | | | | | | | | | | | | | | | | | | | | | | | |
Net asset value, beginning of period | | | $41.52 | | | | $41.52 | | | | $41.01 | | | | $33.09 | | | | $29.77 | | | | $40.94 | |
| |
Income (loss) from investment operations: | | | | | | | | | | | | | | | | | | | | | | | | |
Net investment income1 | | | 0.09 | | | | 0.31 | | | | 0.23 | | | | 0.31 | | | | 0.26 | | | | 0.34 | |
Net realized and unrealized gain (loss) | | | 2.14 | | | | (0.01) | | | | 0.59 | | | | 7.84 | | | | 3.36 | | | | (10.61) | |
| | | | |
Total from investment operations | | | 2.23 | | | | 0.30 | | | | 0.82 | | | | 8.15 | | | | 3.62 | | | | (10.27) | |
| |
Dividends and/or distributions to shareholders: | | | | | | | | | | | | | | | | | | | | | | | | |
Dividends from net investment income | | | 0.00 | | | | (0.30) | | | | (0.31) | | | | (0.23) | | | | (0.30) | | | | (0.30) | |
Distributions from net realized gain | | | 0.00 | | | | 0.00 | | | | 0.00 | | | | 0.00 | | | | 0.00 | | | | (0.60) | |
| | | | |
Total dividends and/or distributions to shareholders | | | 0.00 | | | | (0.30) | | | | (0.31) | | | | (0.23) | | | | (0.30) | | | | (0.90) | |
| |
Net asset value, end of period | | | $43.75 | | | | $41.52 | | | | $41.52 | | | | $41.01 | | | | $33.09 | | | | $29.77 | |
| | | | |
|
| |
| Total Return, at Net Asset Value2 | | | 5.37% | | | | 0.77% | | | | 2.00% | | | | 24.84% | | | | 12.22% | | | | (25.50)% | |
| | | | | | | | | | | | | | | | | | | | | | | | |
| |
| Ratios/Supplemental Data | | | | | | | | | | | | | | | | | | | | | | | | |
Net assets, end of period (in thousands) | | | $17,106,921 | | | | $16,224,242 | | | | $13,987,540 | | | | $11,559,582 | | | | $7,861,500 | | | | $6,201,064 | |
| |
Average net assets (in thousands) | | | $16,548,066 | | | | $15,072,069 | | | | $13,484,000 | | | | $9,305,452 | | | | $6,593,711 | | | | $6,961,648 | |
| |
Ratios to average net assets:3 | | | | | | | | | | | | | | | | | | | | | | | | |
Net investment income | | | 1.21% | | | | 0.75% | | | | 0.55% | | | | 0.87% | | | | 0.87% | | | | 0.95% | |
Expenses excluding specific expenses listed below | | | 0.83% | | | | 0.86% | | | | 0.87% | | | | 0.88% | | | | 0.88% | | | | 0.87% | |
Interest and fees from borrowings | | | 0.00% | | | | 0.00%4 | | | | 0.00%4 | | | | 0.00%4 | | | | 0.00%4 | | | | 0.00%4 | |
| | | | |
Total expenses5 | | | 0.83% | | | | 0.86% | | | | 0.87% | | | | 0.88% | | | | 0.88% | | | | 0.87% | |
| Expenses after payments, waivers and/or reimbursements and reduction to custodian expenses | | | 0.83%6 | | | | 0.86%6 | | | | 0.87%6 | | | | 0.88%6 | | | | 0.88%6 | | | | 0.86% | |
| |
Portfolio turnover rate7 | | | 7% | | | | 28% | | | | 36% | | | | 33% | | | | 18% | | | | 36% | |
34 INVESCO OPPENHEIMER DEVELOPING MARKETS FUND
1. Per share amounts calculated based on the average shares outstanding during the period.
2. Includes adjustments in accordance with accounting principles generally accepted in the United States of America and as such, the net asset value for financial reporting purposes and the returns based upon those net asset values may differ from the net asset value and returns for shareholder transactions. Does not include sales charges and is not annualized for periods less than one year, if applicable.
3. Annualized for periods less than one full year.
4. Less than 0.005%.
5. Total expenses including indirect expenses from affiliated fund fees and expenses were as follows:
| | | | | | |
Two Months Ended October 31, 2019 | | | 0.83 | % | | |
Year Ended August 31, 2019 | | | 0.86 | % | | |
Year Ended August 31, 2018 | | | 0.87 | % | | |
Year Ended August 31, 2017 | | | 0.88 | % | | |
Year Ended August 31, 2016 | | | 0.88 | % | | |
Year Ended August 31, 2015 | | | 0.87 | % | | |
6. Waiver was less than 0.005%.
7. Portfolio turnover is calculated at the fund level and is not annualized for periods less than one year, if applicable.
See accompanying Notes to Consolidated Financial Statements.
35 INVESCO OPPENHEIMER DEVELOPING MARKETS FUND
NOTES TO
CONSOLIDATED FINANCIAL STATEMENTSOctober 31, 2019
Note 1 - Significant Accounting Policies
Invesco Oppenheimer Developing Markets Fund (the “Fund”) is a series portfolio of AIM Investment Funds (Invesco Investment Funds) (the “Trust”). The Trust is a Delaware statutory trust registered under the Investment Company Act of 1940, as amended (the “1940 Act”), as anopen-end series management investment company authorized to issue an unlimited number of shares of beneficial interest. Information presented in these consolidated financial statements pertains only to the Fund. Matters affecting the Fund or each class will be voted on exclusively by the shareholders of such Fund or each class.
Prior to the close of business on May 24, 2019, the Fund operated as Oppenheimer Developing Markets Fund(the “Acquired Fund” or “Predecessor Fund”). The Acquired Fund was reorganized after the close of business on May 24, 2019 (the “Reorganization Date”) through the transfer of all of its assets and liabilities to the Fund (the “Reorganization”).
Upon closing of the Reorganization, holders of the Acquired Fund’s Class A, Class C, Class R, and Class Y shares received the corresponding class of shares of the Fund and holders of the Acquired Fund’s Class I shares received Class R6 shares of the Fund. Information for the Acquired Fund’s Class I shares prior to the Reorganization is included with Class R6 shares throughout this report. Class R5 shares commenced operations on the Reorganization Date.
Effective October 31, 2019, the Fund’s fiscal year end changed from August 31 to October 31.
The Fund will seek long term capital appreciation by investing primarily in companies established or operating in the People’s Republic of China through investments in the China A Shares Fund (the “Subsidiary”), a wholly-owned and controlled subsidiary by the Fund organized under the laws of Delaware. The Fund may invest up to 10% of its total assets in the Subsidiary.
The Fund’s investment objective is to seek capital appreciation.
The Fund currently consists of six different classes of shares: Class A, Class C, Class R, Class Y, Class R5 and Class R6. Class Y shares are available only to certain investors. Class A shares are sold with afront-end sales charge unless certain waiver criteria are met and under certain circumstances load waived shares may be subject to contingent deferred sales charges (“CDSC”). Class C shares are sold with a CDSC. Class R, Class Y, Class R5 and Class R6 shares are sold at net asset value. Class C shares held for ten years after purchase are eligible for automatic conversion into Class A shares of the same Fund (the “Conversion Feature”). The automatic conversion pursuant to the Conversion Feature will generally occur at the end of the month following the tenth anniversary after a purchase of Class C shares.
The Fund is an investment company and accordingly follows the investment company accounting and reporting guidance in accordance with Financial Accounting Standards Board Accounting Standards Codification Topic 946, Financial Services – Investment Companies.
The following is a summary of the significant accounting policies followed by the Fund in the preparation of its consolidated financial statements.
A. Security Valuations– Securities, including restricted securities, are valued according to the following policy.
A security listed or traded on an exchange (except convertible securities) is valued at
36 INVESCO OPPENHEIMER DEVELOPING MARKETS FUND
its last sales price or official closing price as of the close of the customary trading session on the exchange where the security is principally traded, or lacking any sales or official closing price on a particular day, the security may be valued at the closing bid price on that day. Securities traded in theover-the-counter market are valued based on prices furnished by independent pricing services or market makers. When such securities are valued by an independent pricing service they may be considered fair valued. Futures contracts are valued at the final settlement price set by an exchange on which they are principally traded. Listed options are valued at the mean between the last bid and asked prices from the exchange on which they are principally traded. Options not listed on an exchange are valued by an independent source at the mean between the last bid and asked prices. For purposes of determining net asset value (“NAV”) per share, futures and option contracts generally are valued 15 minutes after the close of the customary trading session of the New York Stock Exchange (“NYSE”).
Investments inopen-end andclosed-end registered investment companies that do not trade on an exchange are valued at theend-of-day net asset value per share. Investments inopen-end andclosed-end registered investment companies that trade on an exchange are valued at the last sales price or official closing price as of the close of the customary trading session on the exchange where the security is principally traded.
Debt obligations (including convertible securities) and unlisted equities are fair valued using an evaluated quote provided by an independent pricing service. Evaluated quotes provided by the pricing service may be determined without exclusive reliance on quoted prices, and may reflect appropriate factors such asinstitution-size trading in similar groups of securities, developments related to specific securities, dividend rate (for unlisted equities), yield (for debt obligations), quality, type of issue, coupon rate (for debt obligations), maturity (for debt obligations), individual trading characteristics and other market data. Pricing services generally value debt obligations assuming orderly transactions of institutional round lot size, but a fund may hold or transact in the same securities in smaller, odd lot sizes. Odd lots often trade at lower prices than institutional round lots. Debt obligations are subject to interest rate and credit risks. In addition, all debt obligations involve some risk of default with respect to interest and/or principal payments.
Foreign securities’ (including foreign exchange contracts) prices are converted into U.S. dollar amounts using the applicable exchange rates as of the close of the NYSE. If market quotations are available and reliable for foreign exchange-traded equity securities, the securities will be valued at the market quotations. Because trading hours for certain foreign securities end before the close of the NYSE, closing market quotations may become unreliable. If between the time trading ends on a particular security and the close of the customary trading session on the NYSE, events occur that the investment adviser determines are significant and make the closing price unreliable, the Fund may fair value the security. If the event is likely to have affected the closing price of the security, the security will be valued at fair value in good faith using procedures approved by the Board of Trustees. Adjustments to closing prices to reflect fair value may also be based on a screening process of an independent pricing service to indicate the degree of certainty, based on historical data, that the closing price in the principal market where a foreign
37 INVESCO OPPENHEIMER DEVELOPING MARKETS FUND
NOTES TO
CONSOLIDATED FINANCIAL STATEMENTSContinued
security trades is not the current value as of the close of the NYSE. Foreign securities’ prices meeting the approved degree of certainty that the price is not reflective of current value will be priced at the indication of fair value from the independent pricing service. Multiple factors may be considered by the independent pricing service in determining adjustments to reflect fair value and may include information relating to sector indices, American Depositary Receipts and domestic and foreign index futures. Foreign securities may have additional risks including exchange rate changes, potential for sharply devalued currencies and high inflation, political and economic upheaval, the relative lack of issuer information, relatively low market liquidity and the potential lack of strict financial and accounting controls and standards.
Securities for which market prices are not provided by any of the above methods may be valued based upon quotes furnished by independent sources. The last bid price may be used to value equity securities. The mean between the last bid and asked prices is used to value debt obligations, including corporate loans.
Securities for which market quotations are not readily available or became unreliable are valued at fair value as determined in good faith by or under the supervision of the Trust’s officers following procedures approved by the Board of Trustees. Issuer specific events, market trends, bid/asked quotes of brokers and information providers and other market data may be reviewed in the course of making a good faith determination of a security’s fair value.
The Fund may invest in securities that are subject to interest rate risk, meaning the risk that the prices will generally fall as interest rates rise and, conversely, the prices will generally rise as interest rates fall. Specific securities differ in their sensitivity to changes in interest rates depending on their individual characteristics. Changes in interest rates may result in increased market volatility, which may affect the value and/or liquidity of certain Fund investments.
Valuations change in response to many factors including the historical and prospective earnings of the issuer, the value of the issuer’s assets, general economic conditions, interest rates, investor perceptions and market liquidity. Because of the inherent uncertainties of valuation, the values reflected in the consolidated financial statements may materially differ from the value received upon actual sale of those investments.
| B. | Securities Transactions and Investment Income -Securities transactions are accounted for on a trade date basis. Realized gains or losses on sales are computed on the basis of specific identification of the securities sold. Interest income (net of withholding tax, if any) is recorded on the accrual basis from settlement date. Dividend income (net of withholding tax, if any) is recorded on theex-dividend date. |
The Fund may periodically participate in litigation related to Fund investments. As such, the Fund may receive proceeds from litigation settlements. Any proceeds received are included in the Consolidated Statement of Operations as realized gain (loss) for investments no longer held and as unrealized gain (loss) for investments still held.
Brokerage commissions and mark ups are considered transaction costs and are recorded as an increase to the cost basis of securities purchased and/or a reduction of proceeds on a sale of securities. Such transaction costs are included in the determination of net realized
38 INVESCO OPPENHEIMER DEVELOPING MARKETS FUND
and unrealized gain (loss) from investment transactions reported in the Consolidated Statement of Operations and the Consolidated Statement of Changes in Net Assets and the net realized and unrealized gains (losses) on securities per share in the Consolidated Financial Highlights. Transaction costs are included in the calculation of the Fund’s net asset value and, accordingly, they reduce the Fund’s total returns. These transaction costs are not considered operating expenses and are not reflected in net investment income reported in the Consolidated Statement of Operations and the Consolidated Statement of Changes in Net Assets, or the net investment income per share and the ratios of expenses and net investment income reported in the Consolidated Financial Highlights, nor are they limited by any expense limitation arrangements between the Fund and the investment adviser.
The Fund allocates income and realized and unrealized capital gains and losses to a class based on the relative net assets of each class.
| C. | Country Determination- For the purposes of making investment selection decisions and presentation in the Consolidated Schedule of Investments, the investment adviser may determine the country in which an issuer is located and/or credit risk exposure based on various factors. These factors include the laws of the country under which the issuer is organized, where the issuer maintains a principal office, the country in which the issuer derives 50% or more of its total revenues and the country that has the primary market for the issuer’s securities, as well as other criteria. Among the other criteria that may be evaluated for making this determination are the country in which the issuer maintains 50% or more of its assets, the type of security, financial guarantees and enhancements, the nature of the collateral and the sponsor organization. |
| D. | Distributions -Dividends and distributions to shareholders, which are determined in accordance with income tax regulations and may differ from accounting principles generally accepted in the United States of America (“GAAP”), are recorded on theex-dividend date. Income and capital gain distributions, if any, are declared and paid annually or at other times as determined necessary by the Adviser. |
| E. | Federal Income Taxes -The Fund intends to comply with provisions of the Internal Revenue Code applicable to regulated investment companies and to distribute substantially all of its investment company taxable income, including any net realized gain on investments not offset by capital loss carryforwards, if any, to shareholders. Therefore, no federal income or excise tax provision is required. The Fund files income tax returns in U.S. federal and applicable state jurisdictions. The statute of limitations on the Fund’s tax return filings generally remains open for the three preceding fiscal reporting period ends. The Fund has analyzed its tax positions for the fiscal year ended October 31, 2019, including open tax years, and does not believe there are any uncertain tax positions requiring recognition in the Fund’s consolidated financial statements. |
The tax components of capital shown in the following table represent distribution requirements the Fund must satisfy under the income tax regulations, losses the Fund may be able to offset against income and gains realized in future years and unrealized appreciation or depreciation of securities and other investments for federal income tax purposes.
39 INVESCO OPPENHEIMER DEVELOPING MARKETS FUND
NOTES TO
CONSOLIDATED FINANCIAL STATEMENTSContinued
| | | | | | | | | | | | |
| | | | | | | | | Net Unrealized | |
| | | | | | | | | Appreciation | |
| | | | | | | | | Based on cost of | |
| | | | | | | | | Securities and | |
| Undistributed | | Undistributed | | | Accumulated | | | Other Investments | |
| Net Investment | | Long-Term | | | Loss | | | for Federal Income | |
| Income | | Gain | | | Carryforward1,2 | | | Tax Purposes | |
| |
$311,408,095 | | | $755,603,699 | | | | $— | | | | $10,425,105,589 | |
1. During the reporting period, the Fund did not utilize any capital loss carryforward.
2.During the previous reporting period, the Fund utilized $478,076,395 of capital loss carryforward to offset capital gains realized in that fiscal year.
Net investment income (loss) and net realized gain (loss) may differ for consolidated financial statement and tax purposes. The character of dividends and distributions made during the fiscal year from net investment income or net realized gains are determined in accordance with federal income tax requirements, which may differ from the character of net investment income or net realized gains presented in those consolidated financial statements in accordance with U.S. GAAP. Also, due to timing of dividends and distributions, the fiscal year in which amounts are distributed may differ from the fiscal year in which the income or net realized gain was recorded by the Fund.
The tax character of distributions paid during the reporting periods:
| | | | | | | | | | | | |
| | | Two Months Ended
October 31, 2019 | | | Year Ended
August 31, 2019 | | | Year Ended
August 31, 2018 | |
| |
Distributions paid from: | | | | | | | | | | | | |
| | | |
Ordinary income | | $ | — | | | $ | 220,327,401 | | | $ | 216,586,938 | |
The aggregate cost of securities and other investments and the composition of unrealized appreciation and depreciation of securities and other investments for federal income tax purposes at period end are noted in the following table. The primary difference between book and tax appreciation or depreciation of securities and other investments, if applicable, is attributable to the tax deferral of losses or tax realization of consolidated financial statement unrealized gain or loss.
| | | | |
Federal tax cost of securities | | $ | 31,289,748,362 | |
| |
Federal tax cost of other investments | | | 291,245,811 | |
| |
| | | | |
| |
Total federal tax cost | | $ | 31,580,994,173 | |
| |
| | | | |
| |
Gross unrealized appreciation | | $ | 13,684,301,759 | |
| |
Gross unrealized depreciation | | | (3,259,196,170 | ) |
| |
| | | | |
| |
Net unrealized appreciation | | $ | 10,425,105,589 | |
| | | | |
Certain foreign countries impose a tax on capital gains which is accrued by the Fund based on unrealized appreciation, if any, on affected securities. The tax is paid when the gain is realized.
| F. | Expenses -Fees provided for under the Rule12b-1 plan of a particular class of the Fund |
40 INVESCO OPPENHEIMER DEVELOPING MARKETS FUND
are charged to the operations of such class. Transfer agency fees and expenses and other shareholder recordkeeping fees and expenses attributable to Class R5 and Class R6 are allocated to each share class based on relative net assets.Sub-accounting fees attributable to Class R5 are charged to the operations of the class. Transfer agency fees and expenses and other shareholder recordkeeping fees and expenses relating to all other classes are allocated among those classes based on relative net assets. All other expenses are allocated among the classes based on relative net assets.
| G. | Accounting Estimates -The consolidated financial statements are prepared on a basis in conformity with GAAP, which requires management to make estimates and assumptions that affect the reported amounts of assets and liabilities at the date of the consolidated financial statements and the reported amounts of revenues and expenses during the reporting period including estimates and assumptions related to taxation. Actual results could differ from those estimates by a significant amount. The accompanying consolidated financial statements reflect the financial position of the Fund and its Subsidiary and the results of operations on a consolidated basis. All inter-company accounts and transactions have been eliminated in consolidation. In addition, the Fund monitors for material events or transactions that may occur or become known after theperiod-end date and before the date the consolidated financial statements are released to print. |
| H. | Indemnifications -Under the Trust’s organizational documents, each Trustee, officer, employee or other agent of the Trust, and under the Subsidiary’s organizational documents, the directors and officers of the Subsidiary, are indemnified against certain liabilities that may arise out of the performance of their duties to the Fund and/or the Subsidiary, respectively. Additionally, in the normal course of business, the Fund enters into contracts, including the Fund’s servicing agreements, that contain a variety of indemnification clauses. The Fund’s maximum exposure under these arrangements is unknown as this would involve future claims that may be made against the Fund that have not yet occurred. The risk of material loss as a result of such indemnification claims is considered remote. |
| I. | Foreign Currency Translations -Foreign currency is valued at the close of the NYSE based on quotations posted by banks and major currency dealers. Portfolio securities and other assets and liabilities denominated in foreign currencies are translated into U.S. dollar amounts at the date of valuation. Purchases and sales of portfolio securities (net of foreign taxes withheld on disposition) and income items denominated in foreign currencies are translated into U.S. dollar amounts on the respective dates of such transactions. The Fund does not separately account for the portion of the results of operations resulting from changes in foreign exchange rates on investments and the fluctuations arising from changes in market prices of securities held. The combined results of changes in foreign exchange rates and the fluctuation of market prices on investments (net of estimated foreign tax withholding) are included with the net realized and unrealized gain or loss from investments in the Consolidated Statement of Operations. Reported net realized foreign currency gains or losses arise from (1) sales of foreign currencies, (2) currency gains or losses realized between the trade and settlement dates on securities transactions, and (3) the difference between the amounts of dividends, interest, and foreign withholding taxes recorded on the Fund’s books and the U.S. dollar equivalent of the amounts actually |
41 INVESCO OPPENHEIMER DEVELOPING MARKETS FUND
NOTES TO
CONSOLIDATED FINANCIAL STATEMENTSContinued
received or paid. Net unrealized foreign currency gains and losses arise from changes in the fair values of assets and liabilities, other than investments in securities at fiscal period end, resulting from changes in exchange rates. The Fund may invest in foreign securities, which may be subject to foreign taxes on income, gains on investments or currency repatriation, a portion of which may be recoverable. Foreign taxes, if any, are recorded based on the tax regulations and rates that exist in the foreign markets in which the Fund invests and are shown in the Consolidated Statement of Operations.
| J. | Forward Foreign Currency Contracts - The Fund may engage in foreign currency transactions either on a spot (i.e. for prompt delivery and settlement) basis, or through forward foreign currency contracts, to manage or minimize currency or exchange rate risk. |
The Fund may also enter into forward foreign currency contracts for the purchase or sale of a security denominated in a foreign currency in order to “lock in” the U.S. dollar price of that security, or the Fund may also enter into forward foreign currency contracts that do not provide for physical settlement of the two currencies, but instead are settled by a single cash payment calculated as the difference between the agreed upon exchange rate and the spot rate at settlement based upon an agreed upon notional amount(non-deliverable forwards). The Fund will set aside liquid assets in an amount equal to the dailymark-to-market obligation for forward foreign currency contracts.
A forward foreign currency contract is an obligation between two parties (“Counterparties”) to purchase or sell a specific currency for an agreed-upon price at a future date. The use of forward foreign currency contracts does not eliminate fluctuations in the price of the underlying securities the Fund owns or intends to acquire but establishes a rate of exchange in advance. Fluctuations in the value of these contracts are measured by the difference in the contract date and reporting date exchange rates and are recorded as unrealized appreciation (depreciation) until the contracts are closed. When the contracts are closed, realized gains (losses) are recorded. Realized and unrealized gains (losses) on the contracts are included in the Consolidated Statement of Operations. The primary risks associated with forward foreign currency contracts include failure of the Counterparty to meet the terms of the contract and the value of the foreign currency changing unfavorably. These risks may be in excess of the amounts reflected in the Consolidated Statement of Assets and Liabilities.
Note 2 - Advisory Fees and Other Fees Paid to Affiliates
The Trust has entered into a master investment advisory agreement with Invesco Advisers, Inc. (the “Adviser” or “Invesco”). Under the terms of the investment advisory agreement, the Fund accrues daily and pays monthly an advisory fee to the Adviser based on the annual rate of the Fund’s average daily net assets as follows:
42 INVESCO OPPENHEIMER DEVELOPING MARKETS FUND
| | | | |
| Fee Schedule* | | | |
| |
Up to $250 million | | | 1.00% | |
Next $250 million | | | 0.95 | |
Next $500 million | | | 0.90 | |
Next $6 billion | | | 0.85 | |
Next $3 billion | | | 0.80 | |
Next $20 billion | | | 0.75 | |
Next $15 billion | | | 0.74 | |
Over $45 billion | | | 0.73 | |
*The advisory fee paid by the Fund shall be reduced by any amounts paid by the Fund under the administrative services agreement with the Adviser.
For the period ended October 31, 2019, the effective advisory fee incurred by the Fund was 0.75% annualized.
Under the terms of a mastersub-advisory agreement between the Adviser and each of Invesco Asset Management Deutschland GmbH, Invesco Asset Management Limited, Invesco Asset Management (Japan) Limited, Invesco Hong Kong Limited, Invesco Senior Secured Management, Inc. and Invesco Canada Ltd. and separatesub-advisory agreements with Invesco Capital Management LLC, and Invesco Asset Management (India) Private Limited (collectively, the “AffiliatedSub-Advisers”) the Adviser, not the Fund, will pay 40% of the fees paid to the Adviser to any such AffiliatedSub-Adviser(s) that provide(s) discretionary investment management services to the Fund based on the percentage of assets allocated to such AffiliatedSub-Adviser(s). Invesco has also entered into aSub-Advisory Agreement with OppenheimerFunds, Inc. to provide discretionary management services to the Funds.
Effective on the Reorganization Date, the Adviser has contractually agreed, through at least May 31, 2021, to waive advisory fees and/or reimburse expenses of all shares to the extent necessary to limit the total annual fund operating expenses after fee waiver and/ or expense reimbursement (excluding certain items discussed below) of Class A, Class C, Class R, Class Y, Class R5 and Class R6 shares to 1.29%, 2.05%, 1.55%, 1.05%, 0.92% and 0.87%, respectively, of the Fund’s average daily net assets (the “expense limits”). In determining the Adviser’s obligation to waive advisory fees and/or reimburse expenses, the following expenses are not taken into account, and could cause total annual fund operating expenses after fee waivers and/or expense reimbursement to exceed the numbers reflected above: (1) interest; (2) taxes; (3) dividend expenses on short sales; (4) extraordinary ornon-routine items, including litigation expenses; and (5) expenses that the Fund has incurred but did not actually pay because of an expense offset arrangement. Acquired Fund Fees and Expenses are not operating expenses of the Fund directly, but are fees and expenses, including management fees of the investment companies in which the Fund invests. As a result, the total annual fund operating expenses after expense reimbursement may exceed the expense limits above. Unless Invesco continues the fee waiver agreement, it will terminate May 31, 2021. During its term, the fee waiver agreement cannot be terminated or amended to increase the expense limits or reduce the advisory fee waiver without approval of the Board of Trustees.
Further, the Adviser has contractually agreed, through at least June 30, 2021, to waive the advisory fee payable by the Fund in an amount equal to 100% of the net advisory fees the Adviser receives from the affiliated money market funds on investments by the Fund of
43 INVESCO OPPENHEIMER DEVELOPING MARKETS FUND
NOTES TO
CONSOLIDATED FINANCIAL STATEMENTSContinued
uninvested cash in such affiliated money market funds.
For the periodended October 31, 2019, the Adviser waived advisory fees of $275,492.
The Trust has entered into a master administrative services agreement with Invesco pursuant to which the Fund has agreed to pay Invesco for certain administrative costs incurred in providing accounting services to the Fund. For the period ended October 31, 2019, expenses incurred under the agreement are shown in the Consolidated Statement of Operations as Administration fees. Additionally, Invesco has entered into service agreements whereby JPMorgan Chase Bankserves as custodian to the Fund. Prior to the Reorganization, the Acquired Fund paid administrative fees to OFI Global Asset Management, Inc.
The Trust has entered into a transfer agency and service agreement with Invesco Investment Services, Inc. (“IIS”) pursuant to which the Fund has agreed to pay IIS a fee for providing transfer agency and shareholder services to the Fund and reimburse IIS for certain expenses incurred by IIS in the course of providing such services. IIS may make payments to intermediaries that provide omnibus account services,sub-accounting services and/or networking services. All fees payable by IIS to intermediaries that provide omnibus account services orsub-accounting services are charged back to the Fund, subject to certain limitations approved by the Trust’s Board of Trustees. Prior to the Reorganization, the Acquired Fund paid transfer agent fees to OFI Global Asset Management, Inc. and Shareholder Services, Inc. For the period ended October 31, 2019, expenses incurred under these agreements are shown in the Consolidated Statement of Operations as Transfer and shareholder servicing agent fees.
The Trust has entered into master distribution agreements with Invesco Distributors, Inc. (“IDI”) to serve as the distributor for the Class A, Class C, Class R, Class Y, Class R5 and Class R6 shares of the Fund. The Trust has adopted plans pursuant to Rule12b-1 under the 1940 Act with respect to the Fund’s Class A, Class C and Class R shares (collectively the “Plan”). The Fund, pursuant to the Class A Plan, reimburses IDI in an amount up to an annual rate of 0.25% of the average daily net assets of Class A shares. The Fund pursuant to the Class C and Class R Plan, pays IDI compensation at the annual rate of 1.00% of the average daily net assets of Class C shares and 0.50% of the average daily net assets of Class R shares. The fees are accrued daily and paid monthly. Of the Plan payments, up to 0.25% of the average daily net assets of each class of shares may be paid to furnish continuing personal shareholder services to customers who purchase and own shares of such classes. Any amounts not paid as a service fee under the Plan would constitute an asset-based sales charge. Rules of the Financial Industry Regulatory Authority (“FINRA”) impose a cap on the total sales charges, including asset-based sales charges, that may be paid by any class of shares of the Fund plans. Prior to the Reorganization, the Acquired Fund paid distribution fees to OppenheimerFunds Distributor, Inc. For the period ended October 31, 2019, expenses incurred under the plans are shown in the Consolidated Statement of Operations as Distribution and service plan fees.
Front-end sales commissions and CDSC (collectively, the “sales charges”) are not recorded as expenses of the Fund.Front-end sales commissions are deducted from proceeds from the sales of Fund shares prior to investment in Class A shares of the Fund. CDSC are deducted from redemption proceeds prior to remittance to the shareholder. During the period ended October 31, 2019, IDI advised the Fund that IDI retained $11,878 infront-end sales commissions from the sale of Class A shares and $1,584 from Class C shares for CDSC
44 INVESCO OPPENHEIMER DEVELOPING MARKETS FUND
imposed on redemptions by shareholders.
Certain officers and trustees of the Trust are officers and directors of the Adviser, IIS and/or IDI.
Note 3 - Additional Valuation Information
GAAP defines fair value as the price that would be received to sell an asset or paid to transfer a liability in an orderly transaction between market participants at the measurement date, under current market conditions. GAAP establishes a hierarchy that prioritizes the inputs to valuation methods, giving the highest priority to readily available unadjusted quoted prices in an active market for identical assets (Level 1) and the lowest priority to significant unobservable inputs (Level 3), generally when market prices are not readily available or are unreliable. Based on the valuation inputs, the securities or other investments are tiered into one of three levels. Changes in valuation methods may result in transfers in or out of an investment’s assigned level:
Level 1 — Prices are determined using quoted prices in an active market for identical assets.
Level 2 — Prices are determined using other significant observable inputs. Observable inputs are inputs that other market participants may use in pricing a security. These may include quoted prices for similar securities, interest rates, prepayment speeds, credit risk, yield curves, loss severities, default rates, discount rates, volatilities and others.
Level 3 — Prices are determined using significant unobservable inputs. In situations where quoted prices or observable inputs are unavailable (for example, when there is little or no market activity for an investment at the end of the period), unobservable inputs may be used. Unobservable inputs reflect the Fund’s own assumptions about the factors market participants would use in determining fair value of the securities or instruments and would be based on the best available information.
The following is a summary of the tiered valuation input levels, as of October 31, 2019. The level assigned to the securities valuations may not be an indication of the risk or liquidity associated with investing in those securities. Because of the inherent uncertainties of valuation, the values reflected in the consolidated financial statements may materially differ from the value received upon actual sale of those investments.
| | | | | | | | | | | | | | | | |
| | | | | | | | | Level 3— | | | | |
| | | Level 1— | | | Level 2— | | | Significant | | | | |
| | | Unadjusted | | | Other Significant | | | Unobservable | | | | |
| | | Quoted Prices | | | Observable Inputs | | | Inputs | | | Value | |
| |
Assets Table | | | | | | | | | | | | | | | | |
Investments, at Value: | | | | | | | | | | | | | | | | |
Common Stocks | | | | | | | | | | | | | | | | |
Consumer Discretionary | | $ | 6,635,930,998 | | | $ | 5,907,246,505 | | | $ | — | | | $ | 12,543,177,503 | |
Consumer Staples | | | 1,760,189,825 | | | | 1,983,186,619 | | | | — | | | | 3,743,376,444 | |
Energy | | | 66,696,472 | | | | 2,338,860,016 | | | | — | | | | 2,405,556,488 | |
Financials | | | 2,200,512,843 | | | | 8,875,075,545 | | | | — | | | | 11,075,588,388 | |
Health Care | | | 61,064,199 | | | | 2,536,874,086 | | | | — | | | | 2,597,938,285 | |
45 INVESCO OPPENHEIMER DEVELOPING MARKETS FUND
NOTES TO
CONSOLIDATED FINANCIAL STATEMENTSContinued
| | | | | | | | | | | | | | | | |
| | | | | | | | | Level 3— | | | | |
| | | Level 1— | | | Level 2— | | | Significant | | | | |
| | | Unadjusted | | | Other Significant | | | Unobservable | | | | |
| | | Quoted Prices | | | Observable Inputs | | | Inputs | | | Value | |
Common Stocks (Continued) | | | | | | | | | | | | | | | | |
Industrials | | $ | 811,038,510 | | | $ | 1,023,736,034 | | | $ | — | | | $ | 1,834,774,544 | |
Information Technology | | | 176,452,566 | | | | 2,749,532,823 | | | | — | | | | 2,925,985,389 | |
Materials | | | 1,131,162,109 | | | | 1,096,726,727 | | | | — | | | | 2,227,888,836 | |
Preferred Stocks | | | 13,498,561 | | | | — | | | | 934,475,173 | | | | 947,973,734 | |
Investment Company | | | 1,501,595,497 | | | | — | | | | — | | | | 1,501,595,497 | |
| | | | |
Total Assets | | $ | 14,358,141,580 | | | $ | 26,511,238,355 | | | $ | 934,475,173 | | | $ | 41,803,855,108 | |
| | | | |
Forward currency exchange contracts and futures contracts, if any, are reported at their unrealized appreciation/depreciation at measurement date, which represents the change in the contract’s value from trade date. All additional assets and liabilities included in the above table are reported at their market value at measurement date.
The following is a reconciliation of assets in which significant unobservable inputs (level 3) were used in determining fair value:
| | | | | | | | | | | | | | | | | | | | |
| | | | | | | | | | | | Change in | | | Accretion/ | |
| | | | | | Value as of | | | | | | unrealized | | | (amortization) | |
| | | | | | August 31, | | | Realized gain | | | appreciation/ | | | of premium/ | |
| | | | | | 2019 | | | (loss) | | | depreciation | | | discounta | |
Assets Table | | | | | | | | | | | | | | | | | | | | |
Investments, at Value: | | | | | | | | | | | | | | | | | | | | |
Preferred Stocks | | | | | | $ | 917,761,171 | | | $ | — | | | $ | 16,714,002 | | | $ | — | |
| | | | | | | | |
Total Assets | | | | | | $ | 917,761,171 | | | $ | — | | | $ | 16,714,002 | | | $ | — | |
| | | | | | | | |
| | | | | |
| a. Included in net investment income. | | | | | | | | | | | | | | | | | | | | |
| | | | | |
| | | | | | | | | | | | | | | Value as of | |
| | | | | | | | | Transfers into | | | Transfers out | | | October 31, | |
| | | Purchases | | | Sales | | | Level 3 | | | of Level 3 | | | 2019 | |
Assets Table | | | | | | | | | | | | | | | | | | | | |
Investments, at Value: | | | | | | | | | | | | | | | | | | | | |
Preferred Stocks | | $ | — | | | $ | — | | | $ | — | | | $ | — | | | $ | 934,475,173 | |
| | | | |
Total Assets | | $ | — | | | $ | — | | | $ | — | | | $ | — | | | $ | 934,475,173 | |
| | | | |
The total change in unrealized appreciation/depreciation included in the Consolidated Statement of Operations attributable to Level 3 investments still held at period end:
| | | | |
| | | Change in | |
| | | unrealized | |
| | | appreciation/ | |
| | | depreciation | |
Assets Table | | | | |
Investments, at Value: | | | | |
Preferred Stocks | | $ | 16,714,002 | |
| | | | |
Total Assets | | $ | 16,714,002 | |
| | | | |
46 INVESCO OPPENHEIMER DEVELOPING MARKETS FUND
The following table summarizes the valuation techniques and significant unobservable inputs used in determining fair value measurements for those investments classified as Level 3 as of October 31, 2019:
| | | | | | | | | | | | | | | | | | | | |
| | | Value as of | | | | | | | | | Range of | | | | |
| | | October 31, | | | Valuation | | | Unobservable | | | Unobservable | | | Unobservable | |
| | | 2019 | | | Technique | | | Input | | | Inputs | | | Input Used | |
Assets Table | | | | | | | | | | | | | | | | | | | | |
Investments, at Value: | | | | | | | | | | | | | | | | | | | | |
Xiaoju Kuaizhi, Series A, A1, B | | $ | 289,344,089 | | |
| Recent Transaction
Price |
| |
| Recent Transaction
Price |
| | | N/A | | |
| $50.9321/
share (a) |
|
Grab Holdings Inc. | | | 645,131,084 | | |
| Recent Transaction
Price |
| |
| Recent Transaction
Price |
| | | N/A | | |
| $6.1629/share
(b) |
|
| | | | | | | | | | | | | | | | | | | | |
Total | | $ | 934,475,173 | | | | | | | | | | | | | | | | | |
| | | | | | | | | | | | | | | | | | | | |
(a) The Fund fair valued the holding noted above at the most recent transaction price occurring within the past four months. The Adviser periodically reviews the consolidated financial statements and monitors such investments for additional market information or the occurrence of a significant event which would warrant are-evaluation of the security’s fair valuation.
(b) The Fund fair valued the holding noted above at the most recent transaction price occurring within the past five months. The Adviser periodically reviews the consolidated financial statements and monitors such investments for additional market information or the occurrence of a significant event which would warrant are-evaluation of the security’s fair valuation.
Note 4 - Trustee and Officer Fees and Benefits
The Fund has adopted an unfunded retirement plan (the “Plan”) for the Fund’s Independent Trustees. Benefits are based on years of service and fees paid to each Trustee during their period of service. The Plan was frozen with respect to adding new participants effective December 31, 2006 (the “Freeze Date”) and existing Plan Participants as of the Freeze Date will continue to receive accrued benefits under the Plan. Active Independent Trustees as of the Freeze Date have each elected a distribution method with respect to their benefits under the Plan.
During the reporting period, the Fund’s projected benefit obligations, payments to retired Trustees and accumulated liability were as follows:
| | | | |
Projected Benefit Obligations Increased | | $ | — | |
Payments Made to Retired Trustees | | | — | |
Accumulated Liability as of October 31, 2019 | | | 362,032 | |
Certain trustees have executed a Deferred Compensation Agreement pursuant to which they have the option to elect to defer receipt of all or a portion of the annual compensation they are entitled to receive from the Fund. For purposes of determining the amount owed to the Trustee under the plan, deferred amounts are treated as though equal dollar amounts had been invested in shares of the Fund or in other Invesco and/or Invesco Oppenheimer funds selected by the Trustee. The Fund purchases shares of the funds selected for deferral by the
47 INVESCO OPPENHEIMER DEVELOPING MARKETS FUND
NOTES TO
CONSOLIDATED FINANCIAL STATEMENTSContinued
Trustee in amounts equal to his or her deemed investment, resulting in a Fund asset equal to the deferred compensation liability. Such assets are included as a component of “Other” within the asset section of the Consolidated Statement of Assets and Liabilities. Deferral of Trustees’ fees under the plan will not affect the net assets of the Fund and will not materially affect the Fund’s assets, liabilities or net investment income per share. Amounts will be deferred until distributed in accordance with the compensation deferral plan.
Note 5 - Cash Balances
The Fund is permitted to temporarily carry a negative or overdrawn balance in its account with JPMorgan Chase Bank, the custodian bank. Such balances, if any atperiod-end, are shown in the Consolidated Statement of Assets and Liabilities under the payable caption Amount due to custodian. To compensate the custodian bank for such overdrafts, the overdrawn Fund may either (1) leave funds as a compensating balance in the account so the custodian bank can be compensated by earning the additional interest; or (2) compensate by paying the custodian bank at a rate agreed upon by the custodian bank and Invesco, not to exceed the contractually agreed upon rate.
Note 6 - Investment Transactions
The aggregate amount of investment securities (other than short-term securities, U.S. Treasury obligations and money market funds, if any) purchased and sold by the Fund during theperiod ended October 31, 2019 was $3,422,350,232 and $2,902,821,475, respectively.
Note 7 - Share Information
Transactions in shares of beneficial interest were as follows:
| | | | | | | | | | | | | | | | | | | | | | | | |
| | | Two Months Ended October | | Year Ended August 31, | | | Year Ended August 31, | |
| | | | | 31, 20191 | | | | | | 20192 | | | | | | 2018 | |
| | | Shares | | Amount | | | Shares | | | Amount | | | Shares | | | Amount | |
Class A | | | | | | | | | | | | | | | | | | | | | | | | |
Sold | | | 1,825,541 | | | $ | 78,189,194 | | | | 19,826,241 | | | $ | 825,875,316 | | | | 21,273,170 | | | $ | 932,056,792 | |
| Automatic conversion Class C to Class A Shares | | | 2,227,969 | | | | 95,635,429 | | | | — | | | | — | | | | — | | | | — | |
Dividends and/or distributions reinvested | | | — | | | | — | | | | 298,774 | | | | 12,007,718 | | | | 416,997 | | | | 17,622,285 | |
Redeemed | | | (5,261,666 | ) | | | (226,090,126 | ) | | | (34,310,616 | ) | | | (1,412,210,719 | ) | | | (49,132,728 | ) | | | (2,142,802,381) | |
| | | | |
Net increase (decrease) | | | (1,208,156) | | | $ | (52,265,503 | ) | | | (14,185,601 | ) | | $ | (574,327,685 | ) | | | (27,442,561 | ) | | $ | (1,193,123,304) | |
| | | | |
48 INVESCO OPPENHEIMER DEVELOPING MARKETS FUND
| | | | | | | | | | | | | | | | | | | | | | | | |
| | | Two Months Ended October | | Year Ended August 31, | | | Year Ended August 31, | |
| | | | | 31, 20191 | | | | | | 20192 | | | | | | 2018 | |
| | | Shares | | Amount | | | Shares | | | Amount | | | Shares | | | Amount | |
Class B | | | | | | | | | | | | | | | | | | | | | | | | |
Sold | | | — | | | $ | — | | | | — | | | $ | — | | | | 254 | | | $ | 10,465 | |
Dividends and/or distributions reinvested | | | — | | | | — | | | | — | | | | — | | | | — | | | | — | |
Redeemed3 | | | — | | | | — | | | | — | | | | — | | | | (468,709 | ) | | | (19,657,520) | |
| | | | |
Net increase (decrease) | | | — | | | $ | — | | | | — | | | $ | — | | | | (468,455 | ) | | $ | (19,647,055) | |
| | | | |
| | | | | | | | | | | | | | | | | | |
Class C | | | | | | | | | | | | | | | | | | | | | | | | |
Sold | | | 42,339 | | | $ | 1,686,182 | | | | 427,864 | | | $ | 16,283,254 | | | | 710,658 | | | $ | 29,007,061 | |
Dividends and/or distributions reinvested | | | — | | | | — | | | | — | | | | — | | | | — | | | | — | |
| Automatic conversion Class C to Class A Shares | | | (2,407,197 | ) | | | (95,635,429 | ) | | | — | | | | — | | | | — | | | | — | |
Redeemed | | | (458,192 | ) | | | (18,180,672 | ) | | | (8,902,854 | ) | | | (351,298,378 | ) | | | (4,659,226 | ) | | | (189,868,739) | |
| | | | |
Net increase (decrease) | | | (2,823,050 | ) | | $ | (112,129,919 | ) | | | (8,474,990 | ) | | $ | (335,015,124 | ) | | | (3,948,568 | ) | | $ | (160,861,678) | |
| | | | |
| | | | | | | | | | | | | | | | | | |
Class R | | | | | | | | | | | | | | | | | | | | | | | | |
Sold | | | 165,097 | | | $ | 6,794,664 | | | | 1,255,509 | | | $ | 49,307,965 | | | | 2,098,902 | | | $ | 88,414,402 | |
Dividends and/or distributions reinvested | | | — | | | | — | | | | — | | | | — | | | | 17,434 | | | | 708,333 | |
Redeemed | | | (709,539 | ) | | | (29,021,706 | ) | | | (4,100,083 | ) | | | (161,394,172 | ) | | | (4,686,871 | ) | | | (196,469,156) | |
| | | | |
Net increase (decrease) | | | (544,442 | ) $ | | | (22,227,042 | ) | | | (2,844,574 | ) | | $ | (112,086,207 | ) | | | (2,570,535 | ) | | $ | (107,346,421) | |
| | | | |
| | | | | | | | | | | | | | | | | | |
Class Y | | | | | | | | | | | | | | | | | | | | | | | | |
Sold | | | 13,070,841 | | | $ | 554,206,095 | | | | 136,939,699 | | | $ | 5,519,609,533 | | | | 114,443,327 | | | $ | 4,936,574,257 | |
Dividends and/or distributions reinvested | | | — | | | | — | | | | 2,291,204 | | | | 90,685,856 | | | | 2,294,025 | | | | 95,523,194 | |
Redeemed | | | (17,041,075 | ) | | | (724,117,622 | ) | | | (124,202,065 | ) | | | (4,997,394,451 | ) | | | (112,216,228 | ) | | | (4,844,091,046) | |
| | | | |
Net increase (decrease) | | | (3,970,234 | ) | | $ | (169,911,527 | ) | | | 15,028,838 | | | $ | 612,900,938 | | | | 4,521,124 | | | $ | 188,006,405 | |
| | | | |
49 INVESCO OPPENHEIMER DEVELOPING MARKETS FUND
NOTES TO
CONSOLIDATED FINANCIAL STATEMENTSContinued
| | | | | | | | | | | | | | | | | | | | | | | | |
| | | Two Months Ended October | | Year Ended August 31, | | | Year Ended August 31, | |
| | | | | 31, 20191 | | | | | | 20192 | | | | | | 2018 | |
| | | Shares | | Amount | | | Shares | | | Amount | | | Shares | | | Amount | |
Class R54 | | | | | | | | | | | | | | | | | | | | | | | | |
Sold | | | 137,470 | | | $ | 5,894,681 | | | | 243 | | | $ | 10,025 | | | | — | | | $ | — | |
Dividends and/or distributions reinvested | | | — | | | | — | | | | — | | | | — | | | | — | | | | — | |
Redeemed | | | (2,253 | ) | | | (96,587 | ) | | | — | | | | — | | | | — | | | | — | |
| | | | |
Net increase (decrease) | | | 135,217 | | | $ | 5,798,094 | | | | 243 | | | $ | 10,025 | | | | — | | | $ | — | |
| | | | |
| | | | | | | | | | | | | | | | | | |
Class R6 | | | | | | | | | | | | | | | | | | | | | | | | |
Sold | | | 12,996,571 | | | $ | 553,795,087 | | | | 128,840,618 | | | $ | 5,206,191,344 | | | | 115,693,371 | | | $ | 4,997,186,819 | |
Dividends and/or distributions reinvested | | | — | | | | — | | | | 2,119,944 | | | | 83,865,017 | | | | 1,705,746 | | | | 71,010,204 | |
Redeemed | | | (12,741,196 | ) | | | (540,282,257 | ) | | | (77,134,317 | ) | | | (3,102,204,459 | ) | | | (62,345,405 | ) | | | (2,690,943,886) | |
| | | | |
Net increase (decrease) | | | 255,375 | | | $ | 13,512,830 | | | | 53,826,245 | | | $ | 2,187,851,902 | | | | 55,053,712 | | | $ | 2,377,253,137 | |
| | | | |
1.There are entities that are record owners of more than 5% of the outstanding shares of the Fund and own 25% of the outstanding shares of the Fund. IDI has an agreement with these entities to sell Fund shares. The Fund, Invesco and/or Invesco affiliates may make payments to these entities, which are considered to be related to the Fund, for providing services to the Fund, Invesco and/or Invesco affiliates, including but not limited to services such as securities brokerage, distribution, third party record keeping and account servicing. The Fund has no knowledge as to whether all or any portion of the shares owned of record by these entities are also owned beneficially.
2.There are entities that are record owners of more than 5% of the outstanding shares of the Fund and own 24% of the outstanding shares of the Fund. IDI has an agreement with these entities to sell Fund shares. The Fund, Invesco and/or Invesco affiliates may make payments to these entities, which are considered to be related to the Fund, for providing services to the Fund, Invesco and/or Invesco affiliates, including but not limited to services such as securities brokerage, distribution, third party record keeping and account servicing. The Fund has no knowledge as to whether all or any portion of the shares owned of record by these entities are also owned beneficially.
3.All outstanding Class B shares converted to Class A shares on June 1, 2018.
4. Commencement date after the close of business on May 24, 2019.
50 INVESCO OPPENHEIMER DEVELOPING MARKETS FUND
REPORT OF INDEPENDENT REGISTERED PUBLIC ACCOUNTING FIRM
To the Board of Trustees of AIM Investment Funds (Invesco Investment Funds) and Shareholders of Invesco Oppenheimer Developing Markets Fund
Opinion on the Financial Statements
We have audited the accompanying consolidated statement of assets and liabilities, including the consolidated schedule of investments, of Invesco Oppenheimer Developing Markets Fund and its subsidiary (one of the funds constituting AIM Investment Funds (Invesco Investment Funds), referred to hereafter as the “Fund”) as of October 31, 2019, the related consolidated statements of operations and of consolidated changes in net assets for each of the periods indicated in the table below, including the related notes, and the consolidated financial highlights for each of the periods indicated in the table below (collectively referred to as the “consolidated financial statements”). In our opinion, the consolidated financial statements present fairly, in all material respects, the financial position of the Fund as of October 31, 2019, the results of its operations, the changes in its net assets and the financial highlights for each of the periods indicated in the table below, in conformity with accounting principles generally accepted in the United States of America.
| | |
Consolidated Statement of Operations and Consolidated Statement of Changes in Net Assets | | Consolidated Financial Highlights |
| For the period from September 1, 2019 through October 31, 2019 and the year ended August 31, 2019 | | For the period from September 1, 2019 through October 31, 2019 and the year ended August 31, 2019 for Class A, Class C, Class R, Class Y and Class R6 |
| | |
| | | For the period from September 1, 2019 through October 31, 2019 and the period from May 24, 2019 (inception of offering) through August 31, 2019 for Class R5 |
The consolidated financial statements of Invesco Oppenheimer Developing Markets Fund (formerly known as Oppenheimer Developing Markets Fund) as of and for the year ended August 31, 2018 and the consolidated financial highlights for each of the periods ended on or prior to August 31, 2018 (not presented herein, other than the consolidated statement of changes in net assets and the consolidated financial highlights) were audited by other auditors whose report dated October 25, 2018 expressed an unqualified opinion on those consolidated financial statements and consolidated financial highlights.
Basis for Opinion
These consolidated financial statements are the responsibility of the Fund’s management. Our responsibility is to express an opinion on the Fund’s consolidated financial statements based on our audits. We are a public accounting firm registered with the Public Company Accounting Oversight Board (United States) (PCAOB) and are required to be independent with respect to the Fund in accordance with the U.S. federal securities laws and the applicable rules and regulations of the Securities and Exchange Commission and the PCAOB.
We conducted our audits of these consolidated financial statements in accordance with the standards
51 INVESCO OPPENHEIMER DEVELOPING MARKETS FUND
REPORT OF INDEPENDENT REGISTERED PUBLIC ACCOUNTING FIRM
of the PCAOB. Those standards require that we plan and perform the audit to obtain reasonable assurance about whether the consolidated financial statements are free of material misstatement, whether due to error or fraud.
Our audits included performing procedures to assess the risks of material misstatement of the consolidated financial statements, whether due to error or fraud, and performing procedures that respond to those risks. Such procedures included examining, on a test basis, evidence regarding the amounts and disclosures in the consolidated financial statements. Our audits also included evaluating the accounting principles used and significant estimates made by management, as well as evaluating the overall presentation of the consolidated financial statements. Our procedures included confirmation of securities owned as of October 31, 2019 by correspondence with the custodian, transfer agent and brokers; when replies were not received from brokers, we performed other auditing procedures. We believe that our audits provide a reasonable basis for our opinion.
/s/PricewaterhouseCoopers LLP
Houston, Texas
December 27, 2019
We have served as the auditor of one or more of the investment companies in the Invesco group of investment companies since at least 1995. We have not been able to determine the specific year we began serving as auditor.
52 INVESCO OPPENHEIMER DEVELOPING MARKETS FUND
FEDERAL INCOME TAX INFORMATIONUnaudited
In early 2019, if applicable, shareholders of record received information regarding all dividends and distributions paid to them by the Fund during calendar year 2018.
None of the dividends paid by the Fund during the reporting period are eligible for the corporate dividend-received deduction.
A portion, if any, of the dividends paid by the Fund during the reporting period which are not designated as capital gain distributions are eligible for lower individual income tax rates to the extent that the Fund has received qualified dividend income as stipulated by recent tax legislation. The maximum amount allowable but not less than $76,861,513 of the Fund’s fiscal year taxable income may be eligible for the lower individual income tax rates. In early
2019, shareholders of record received information regarding the percentage of distributions that are eligible for lower individual income tax rates.
Recent tax legislation allows a regulated investment company to designate distributions not designated as capital gain distributions, as either interest related dividends or short-term capital gain dividends, both of which are exempt from the U.S. withholding tax applicable to non U.S. taxpayers. For the reporting period, the maximum amount allowable but not less than $2,850,931 of the ordinary distributions to be paid by the Fund qualifies as an interest related dividend and the maximum amount allowable but not less than $71,260,705 of the short-term capital gain distribution to be paid by the Fund qualifies as a short-term capital gain dividend.
The Fund has elected the application of Section 853 of the Internal Revenue Code to permit shareholders to take a federal income tax credit or deduction, at their option, on a per share basis. The maximum amount allowable but not less than $16,131,091 of foreign income taxes were paid by the Fund during the reporting period. A separate notice will be mailed to each shareholder, which will reflect the proportionate share of such foreign taxes which must be treated by shareholders as gross income for federal income tax purposes.
Gross income of the maximum amount allowable but not less than $75,729,769 was derived from sources within foreign countries or possessions of the United States.
The foregoing information is presented to assist shareholders in reporting distributions received from the Fund to the Internal Revenue Service. Because of the complexity of the federal regulations which may affect your individual tax return and the many variations in state and local tax regulations, we recommend that you consult your tax advisor for specific guidance.
53 INVESCO OPPENHEIMER DEVELOPING MARKETS FUND
PORTFOLIO PROXY VOTING POLICIES AND GUIDELINES;
UPDATES TO SCHEDULE OF INVESTMENTSUnaudited
Go paperless with eDelivery
Visit invesco.com/edelivery to enjoy the convenience and security of anytime electronic access to your investment documents.
With eDelivery, you can elect to have any or all of the following materials delivered straight to your inbox to download, save and print from your own computer:
● Fund reports and prospectuses
● Quarterly statements
● Daily confirmations
● Tax forms
Invesco mailing information
Send general correspondence to Invesco Investment Services, Inc., P.O. Box 219078, Kansas City, MO 64121-9078.
Important notice regarding delivery of security holder documents
To reduce Fund expenses, only one copy of most shareholder documents may be mailed to shareholders with multiple accounts at the same address (Householding). Mailing of your shareholder documents may be householded indefinitely unless you instruct us otherwise. If you do not want the mailing of these documents to be combined with those for other members of your household, please contact Invesco Investment Services, Inc. at 800 959 4246 or contact your financial institution. We will begin sending you individual copies for each account within 30 days after receiving your request.
Fund holdings and proxy voting information
The Fund provides a complete list of its holdings four times in each fiscal year, at the quarter ends. For the second and fourth quarters, the lists appear in the Fund’s semiannual and annual reports to shareholders. For the first and third quarters, the Fund files the lists with the Securities and Exchange Commission (SEC) as an exhibit to its reports on FormN-PORT. The most recent list of portfolio holdings is available at invesco.com/completeqtrholdings. Shareholders can also look up the Fund’s FormsN-PORT on the SEC website at sec.gov.
A description of the policies and procedures that the Fund uses to determine how to vote proxies relating to portfolio securities is available without charge, upon request, from our Client Services department at 800 959 4246 or at invesco.com/proxyguidelines. The information is also available on the SEC website, sec.gov.
Information regarding how the Fund voted proxies related to its portfolio securities during the most recent12-month period ended June 30 is available at invesco.com/proxysearch. The information is also available on the SEC website, sec.gov.
Invesco Advisers, Inc. is an investment adviser; it provides investment advisory services to individual and institutional clients and does not sell securities. Invesco Distributors, Inc. is the US distributor for Invesco Ltd.’s retail mutual funds, exchange-traded funds and institutional money market funds. Both are wholly owned, indirect subsidiaries of Invesco Ltd.
54 INVESCO OPPENHEIMER DEVELOPING MARKETS FUND
TRUSTEES AND OFFICERSUnaudited
The address of each trustee and officer is AIM Investment Funds (Invesco Investment Funds) (the “Trust”), 11 Greenway Plaza, Suite 1000, Houston, Texas 77046-1173. The trustees serve for the life of the Trust, subject to their earlier death, incapacitation, resignation, retirement or removal as more specifically provided in the Trust’s organizational documents. Each officer serves for a one year term or until their successors are elected and qualified.
Column two below includes length of time served with predecessor entities, if any.
| | | | | | | | |
| | | | | |
Name, Year of Birth and Position(s) Held with the Trust | | Trustee
and/or
Officer
Since | | Principal Occupation(s) During Past 5 Years | | Number of Funds in Fund Complex
Overseen by Trustee | | Other Directorship(s)
Held by Trustee During Past 5 Years |
| | | | | |
INTERESTED PERSONS | | | | | | | | |
| | | | | |
Martin L. Flanagan1 — 1960 Trustee and Vice Chair | | 2007 | | Executive Director, Chief Executive Officer and President, Invesco Ltd. (ultimate parent of Invesco and a global investment management firm); Trustee and Vice Chair, The Invesco Funds; Vice Chair, Investment Company Institute; and Member of Executive Board, SMU Cox School of Business Formerly: Advisor to the Board, Invesco Advisers, Inc. (formerly known as Invesco Institutional (N.A.), Inc.); Chairman and Chief Executive Officer, Invesco Advisers, Inc. (registered investment adviser); Director, Chairman, Chief Executive Officer and President, Invesco Holding Company (US), Inc. (formerly IVZ Inc.) (holding company), Invesco Group Services, Inc. (service provider) and Invesco North American Holdings, Inc. (holding company); Director, Chief Executive Officer and President, Invesco Holding Company Limited (parent of Invesco and a global investment management firm); Director, Invesco Ltd.; Chairman, Investment Company Institute and President,Co-Chief Executive Officer,Co-President, Chief Operating Officer and Chief Financial Officer, Franklin Resources, Inc. (global investment management organization) | | 229 | | None |
| | | | | |
Philip A. Taylor2 — 1954 Trustee | | 2006 | | Vice Chair, Invesco Ltd.; Trustee, The Invesco Funds Formerly: Director, Invesco Canada Ltd. (formerly known as Invesco Trimark Ltd./Invesco Trimark Ltèe) (registered investment adviser and registered transfer agent); Head of the Americas and Senior Managing Director, Invesco Ltd.; Director, Invesco Advisers, Inc. (formerly known as Invesco Institutional (N.A.), Inc.) (registered investment adviser); | | 229 | | None |
| |
| 1 Mr. Flanagan is considered an interested person (within the meaning of Section 2(a)(19) of the 1940 Act) of the Trust because he is an officer of the Adviser to the Trust, and an officer and a director of Invesco Ltd., ultimate parent of the Adviser. |
| |
| 2 Mr. Taylor is considered an interested person (within the meaning of Section 2(a)(19) of the 1940 Act) of the Trust because he is an officer of Invesco Ltd., ultimate parent of the Adviser. |
55 INVESCO OPPENHEIMER DEVELOPING MARKETS FUND
TRUSTEES AND OFFICERSUnaudited / Continued
| | | | | | | | |
| | | | | |
Name, Year of Birth and Position(s) Held with the Trust | | Trustee
and/or
Officer
Since | | Principal Occupation(s) During Past 5 Years | | Number of Funds in Fund Complex
Overseen by Trustee | | Other Directorship(s)
Held by Trustee During Past 5 Years |
| | | | | |
INTERESTED PERSONS (CONTINUED) | | | | | | | | |
| | | | | |
| Philip A. Taylor (Continued) | | | | Director and Chairman, Invesco Investment Services, Inc. (formerly known as Invesco AIM Investment Services, Inc.) (registered transfer agent); Chief Executive Officer, Invesco Corporate Class Inc. (corporate mutual fund company); Chairman and Chief Executive Officer, Invesco Canada Ltd. (formerly known as Invesco Trimark Ltd./Invesco Trimark Ltèe) (registered investment adviser and registered transfer agent); Senior Vice President, The Invesco Funds; Director, Invesco Investment Advisers LLC (formerly known as Van Kampen Asset Management); Director, Chairman, Chief Executive Officer and President, Invesco Management Group, Inc. (formerly known as Invesco AIM Management Group, Inc.) (financial services holding company);Co-Chairman,Co-President andCo-Chief Executive Officer, Invesco Advisers, Inc. (formerly known as Invesco Institutional (N.A.), Inc.) (registered investment adviser); Director, Chief Executive Officer and President, Van Kampen Exchange Corp; President and Principal Executive Officer, The Invesco Funds (other than AIM Treasurer’s Series Trust (Invesco Treasurer’s Series Trust), Short-Term Investments Trust and Invesco Management Trust); Executive Vice President, The Invesco Funds (AIM Treasurer’s Series Trust (Invesco Treasurer’s Series Trust), Short-Term Investments Trust and Invesco Management Trust only); Director and President, INVESCO Funds Group, Inc. (registered investment adviser and registered transfer agent); Director and Chairman, IVZ Distributors, Inc. (formerly known as INVESCO Distributors, Inc.) (registered broker dealer); Director, President and Chairman, Invesco Inc. (holding company), Invesco Canada Holdings Inc. (holding company), Trimark Investments Ltd./Placements Trimark Ltèe and Invesco Financial Services Ltd/Services Financiers Invesco Ltèe; Chief Executive Officer, Invesco Canada Fund Inc. (corporate mutual fund company); Director and Chairman, Van Kampen Investor Services Inc.; Director, Chief Executive Officer and President, 1371 Preferred Inc. (holding | | | | |
56 INVESCO OPPENHEIMER DEVELOPING MARKETS FUND
| | | | | | | | |
| | | | | |
Name, Year of Birth and Position(s) Held with the Trust | | Trustee
and/or
Officer
Since | | Principal Occupation(s) During Past 5 Years | | Number of Funds in Fund Complex
Overseen by Trustee | | Other Directorship(s)
Held by Trustee During Past 5 Years |
| | | | | |
INTERESTED PERSONS (CONTINUED) | | | | | | | | |
| | | | | |
| Philip A. Taylor (Continued) | | | | company) and Van Kampen Investments Inc.; Director and President, AIM GP Canada Inc. (general partner for limited partnerships) and Van Kampen Advisors, Inc.; Director and Chief Executive Officer, Invesco Trimark Dealer Inc. (registered broker dealer); Director, Invesco Distributors, Inc. (formerly known as Invesco AIM Distributors, Inc.) (registered broker dealer); Manager, Invesco Capital Management LLC; Director, Chief Executive Officer and President, Invesco Advisers, Inc.; Director, Chairman, Chief Executive Officer and President, Invesco AIM Capital Management, Inc.; President, Invesco Trimark Dealer Inc. and Invesco Trimark Ltd./Invesco Trimark Ltèe; Director and President, AIM Trimark Corporate Class Inc. and AIM Trimark Canada Fund Inc.; Senior Managing Director, Invesco Holding Company Limited; Director and Chairman, Fund Management Company (former registered broker dealer); President and Principal Executive Officer, The Invesco Funds (AIM Treasurer’s Series Trust (Invesco Treasurer’s Series Trust), and Short-Term Investments Trust only); President, AIM Trimark Global Fund Inc. and AIM Trimark Canada Fund Inc. | | | | |
57 INVESCO OPPENHEIMER DEVELOPING MARKETS FUND
TRUSTEES AND OFFICERSUnaudited / Continued
| | | | | | | | |
| | | | | |
Name, Year of Birth and Position(s) Held with the Trust | | Trustee
and/or
Officer
Since | | Principal Occupation(s) During Past 5 Years | | Number of Funds in Fund Complex
Overseen by Trustee | | Other Directorship(s)
Held by Trustee During Past 5 Years |
| | | | | |
INDEPENDENT TRUSTEES | | | | | | | | |
| | | | | |
Bruce L. Crockett – 1944 Trustee and Chair | | 2003 | | Chairman, Crockett Technologies Associates (technology consulting company) Formerly: Director, Captaris (unified messaging provider); Director, President and Chief Executive Officer, COMSAT Corporation; Chairman, Board of Governors of INTELSAT (international communications company); ACE Limited (insurance company); Independent Directors Council and Investment Company Institute: Member of the Audit Committee, Investment Company Institute; Member of the Executive Committee and Chair of the Governance Committee, Independent Directors Council | | 229 | | Director and Chairman of the Audit Committee, ALPS (Attorneys Liability Protection Society) (insurance company); Director and Member of the Audit Committee and Compensation Committee, Ferroglobe PLC (metallurgical company) |
| | | | | |
David C. Arch – 1945 Trustee | | 2010 | | Chairman of Blistex Inc. (consumer health care products manufacturer); Member, World Presidents’ Organization | | 229 | | Board member of the Illinois Manufacturers’ Association |
| | | | | |
Beth Ann Brown – 1968 Trustee | | 2019 | | Independent Consultant Formerly: Head of Intermediary Distribution, Managing Director, Strategic Relations, Managing Director, Head of National Accounts, Senior Vice President, National Account Manager and Senior Vice President, Key Account Manager, Columbia Management Investment Advisers LLC; Vice President, Key Account Manager, Liberty Funds Distributor, Inc.; and Trustee of certain Oppenheimer Funds | | 229 | | Director, Board of Directors of Caron Engineering Inc.; Advisor, Board of Advisors of Caron Engineering Inc.; President and Director, of Acton Shapleigh Youth Conservation Corps (non-profit); and Vice President and Director of Grahamtastic Connection (non-profit) |
| | | | | |
Jack M. Fields – 1952 Trustee | | 2003 | | Chief Executive Officer, Twenty First Century Group, Inc. (government affairs company); and Chairman, Discovery Learning Alliance(non-profit) Formerly: Owner and Chief Executive Officer, Dos Angeles Ranch L.P. (cattle, hunting, corporate entertainment); Director, Insperity, Inc. (formerly known as Administaff) (human resources provider); Chief Executive Officer, Texana Timber LP (sustainable forestry company); Director of Cross Timbers Quail Research Ranch(non-profit); and member of the U.S. House of Representatives | | 229 | | None |
58 INVESCO OPPENHEIMER DEVELOPING MARKETS FUND
| | | | | | | | |
| | | | | |
Name, Year of Birth and Position(s) Held with the Trust | | Trustee
and/or
Officer
Since | | Principal Occupation(s) During Past 5 Years | | Number of Funds in Fund Complex
Overseen by Trustee | | Other Directorship(s)
Held by Trustee During Past 5 Years |
| | | | | |
INDEPENDENT TRUSTEES (CONTINUED) | | | | | | | | |
| | | | | |
Cynthia Hostetler —1962 Trustee | | 2017 | | Non-Executive Director and Trustee of a number of public and private business corporations Formerly: Director, Aberdeen Investment Funds (4 portfolios); Head of Investment Funds and Private Equity, Overseas Private Investment Corporation; President, First Manhattan Bancorporation, Inc.; Attorney, Simpson Thacher & Bartlett LLP | | 229 | | Vulcan Materials Company (construction materials company); Trilinc Global Impact Fund; Genesee & Wyoming, Inc. (railroads); Artio Global Investment LLC (mutual fund complex); Edgen Group, Inc. (specialized energy and infrastructure products distributor); Investment Company Institute (professional organization); Independent Directors Council (professional organization) |
| | | | | |
Eli Jones – 1961 Trustee | | 2016 | | Professor and Dean, Mays Business School - Texas A&M University Formerly: Professor and Dean, Walton College of Business, University of Arkansas and E.J. Ourso College of Business, Louisiana State University; Director, Arvest Bank | | 229 | | Insperity, Inc. (formerly known as Administaff) (human resources provider) |
| | | | | |
Elizabeth Krentzman – 1959 Trustee | | 2019 | | Formerly: Principal and Chief Regulatory Advisor for Asset Management Services and U.S. Mutual Fund Leader of Deloitte & Touche LLP; General Counsel of the Investment Company Institute (trade association); National Director of the Investment Management Regulatory Consulting Practice, Principal, Director and Senior Manager of Deloitte & Touche LLP; Assistant Director of the Division of Investment Management - Office of Disclosure and Investment Adviser Regulation of the U.S. Securities and Exchange Commission and various positions with the Division of Investment Management – Office of Regulatory Policy of the U.S. Securities and Exchange Commission; Associate at Ropes & Gray LLP.; Advisory Board Member of the Securities and Exchange Commission Historical Society; and Trustee of certain Oppenheimer Funds | | 229 | | Trustee of the University of Florida National Board Foundation and Audit Committee Member; Member of the Cartica Funds Board of Directors (private investment funds); Member of the University of Florida Law Center Association, Inc. Board of Trustees and Audit Committee Member |
59 INVESCO OPPENHEIMER DEVELOPING MARKETS FUND
TRUSTEES AND OFFICERSUnaudited / Continued
| | | | | | | | |
| | | | | |
Name, Year of Birth and Position(s) Held with the Trust | | Trustee
and/or
Officer
Since | | Principal Occupation(s) During Past 5 Years | | Number of Funds in Fund Complex
Overseen by Trustee | | Other Directorship(s)
Held by Trustee During Past 5 Years |
| | | | | |
INDEPENDENT TRUSTEES (CONTINUED) | | | | | | | | |
| | | | | |
Anthony J. LaCava, Jr. – 1956 Trustee | | 2019 | | Formerly: Director and Member of the Audit Committee, Blue Hills Bank (publicly traded financial institution) and Managing Partner, KPMG LLP | | 229 | | Blue Hills Bank; Chairman of Bentley University; Member, Business School Advisory Council; and Nominating Committee, KPMG LLP |
| | | | | |
Prema Mathai-Davis – 1950 Trustee | | 2003 | | Retired Co-Owner & Partner of Quantalytics Research, LLC, (a FinTech Investment Research Platform for the Self-Directed Investor) | | 229 | | None |
| | | | | |
Joel W. Motley – 1952 Trustee | | 2019 | | Director of Office of Finance, Federal Home Loan Bank; Member of the Vestry of Trinity Wall Street; Managing Director of Carmona Motley Hoffman, Inc. (privately held financial advisor); Member of the Finance and Budget Committee of the Council on Foreign Relations, Member of the Investment Committee and Board of Human Rights Watch and Member of the Investment Committee and Board of Historic Hudson Valley (non-profit cultural organization). Formerly: Managing Director of Public Capital Advisors, LLC (privately held financial advisor); Managing Director of Carmona Motley Hoffman, Inc. (privately held financial advisor); Trustee of certain Oppenheimer Funds; and Director of Columbia Equity Financial Corp. (privately held financial advisor) | | 229 | | Director of Greenwall Foundation (bioethics research foundation); Member of Board and Investment Committee of The Greenwall Foundation; Director of Southern Africa Legal Services Foundation; Board Member and Investment Committee Member of Pulitzer Center for Crisis Reporting(non-profit journalism) |
| | | | | |
Teresa M. Ressel — 1962 Trustee | | 2017 | | Non-executive director and trustee of a number of public and private business corporations Formerly: Chief Financial Officer, Olayan America, The Olayan Group (international investor/commercial/industrial); Chief Executive Officer, UBS Securities LLC; Group Chief Operating Officer, Americas, UBS AG; Assistant Secretary for Management & Budget and CFO, US Department of the Treasury | | 229 | | Atlantic Power Corporation (power generation company); ON Semiconductor Corp. (semiconductor supplier) |
| | | | | |
Ann Barnett Stern – 1957 Trustee | | 2017 | | President and Chief Executive Officer, Houston Endowment Inc. (private philanthropic institution) Formerly: Executive Vice President and General Counsel, Texas Children’s Hospital; | | 229 | | Federal Reserve Bank of Dallas |
60 INVESCO OPPENHEIMER DEVELOPING MARKETS FUND
| | | | | | | | |
| | | | | |
Name, Year of Birth and Position(s) Held with the Trust | | Trustee
and/or
Officer
Since | | Principal Occupation(s) During Past 5 Years | | Number of Funds in Fund Complex
Overseen by Trustee | | Other Directorship(s)
Held by Trustee During Past 5 Years |
| | | | | |
INDEPENDENT TRUSTEES (CONTINUED) | | | | | | | | |
| | | | | |
| Ann Barnett Stern (Continued) | | | | Attorney, Beck, Redden and Secrest, LLP; Business Law Instructor, University of St. Thomas; Attorney, Andrews & Kurth LLP | | | | |
| | | | | |
Raymond Stickel, Jr. – 1944 Trustee | | 2005 | | Retired Formerly: Director, Mainstay VP Series Funds, Inc. (25 portfolios); Partner, Deloitte & Touche | | 229 | | None |
| | | | | |
Robert C. Troccoli – 1949 Trustee | | 2016 | | Retired Formerly: Adjunct Professor, University of Denver – Daniels College of Business, Senior Partner, KPMG LLP | | 229 | | None |
| | | | | |
Daniel S. Vandivort – 1954 Trustee | | 2019 | | Treasurer, Chairman of the Audit and Finance Committee, and Trustee, Board of Trustees, Huntington Disease Foundation of America; and President, Flyway Advisory Services LLC (consulting and property management). Formerly: Trustee and Governance Chair, of certain Oppenheimer Funds | | 229 | | Chairman and Lead Independent Director, Chairman of the Audit Committee, and Director, Board of Directors, Value Line Funds |
| | | | | |
James D. Vaughn – 1945 Trustee | | 2019 | | Retired Formerly: Managing Partner, Deloitte & Touche LLP; Trustee and Chairman of the Audit Committee, Schroder Funds; Board Member, Mile High United Way, Boys and Girls Clubs, Boy Scouts, Colorado Business Committee for the Arts, Economic Club of Colorado and Metro Denver Network (economic development corporation); and Trustee of certain Oppenheimer Funds | | 229 | | Board member and Chairman of Audit Committee of AMG National Trust Bank; Trustee and Investment Committee member, University of South Dakota Foundation; Board member, Audit Committee Member and past Board Chair, Junior Achievement(non-profit) |
| | | | | |
Christopher L. Wilson – 1957 Trustee, Vice Chair and Chair Designate | | 2017 | | Retired Formerly: Director, TD Asset Management USA Inc. (mutual fund complex) (22 portfolios); Managing Partner, CT2, LLC (investing and consulting firm); President/Chief Executive Officer, Columbia Funds, Bank of America Corporation; President/Chief Executive Officer, CDC IXIS Asset Management Services, Inc.; Principal & Director of Operations, Scudder Funds, Scudder, Stevens & Clark, Inc.; Assistant Vice President, Fidelity Investments | | 229 | | ISO New England, Inc.(non-profit organization managing regional electricity market) |
61 INVESCO OPPENHEIMER DEVELOPING MARKETS FUND
TRUSTEES AND OFFICERSUnaudited / Continued
| | | | | | | | |
| | | | | |
Name, Year of Birth and Position(s) Held with the Trust | | Trustee
and/or
Officer
Since | | Principal Occupation(s) During Past 5 Years | | Number of Funds in Fund Complex
Overseen by Trustee | | Other Directorship(s)
Held by Trustee During Past 5 Years |
| | | | | |
OTHER OFFICERS | | | | | | | | |
| | | | | |
Sheri Morris — 1964 President, Principal Executive Officer and Treasurer | | 2003 | | Head of Global Fund Services, Invesco Ltd.; President, Principal Executive Officer and Treasurer, The Invesco Funds; Vice President, Invesco Advisers, Inc. (formerly known as Invesco Institutional (N.A.), Inc.) (registered investment adviser); and Vice President, Invesco Exchange-Traded Fund Trust, Invesco Exchange-Traded Fund Trust II, Invesco India Exchange-Traded Fund Trust, Invesco Actively Managed Exchange-Traded Fund Trust, Invesco Actively Managed Exchange-Traded Commodity Fund Trust and Invesco Exchange-Traded Self-Indexed Fund Trust, and Vice President, OppenheimerFunds, Inc. Formerly: Vice President and Principal Financial Officer, The Invesco Funds; Vice President, Invesco AIM Advisers, Inc., Invesco AIM Capital Management, Inc. and Invesco AIM Private Asset Management, Inc.; Assistant Vice President and Assistant Treasurer, The Invesco Funds and Assistant Vice President, Invesco Advisers, Inc., Invesco AIM Capital Management, Inc. and Invesco AIM Private Asset Management, Inc.; and Treasurer, Invesco Exchange-Traded Fund Trust, Invesco Exchange-Traded Fund Trust II, Invesco India Exchange-Traded Fund Trust and Invesco Actively Managed Exchange-Traded Fund Trust | | N/A | | N/A |
| | | | | |
Russell C. Burk — 1958 Senior Vice President and Senior Officer | | 2005 | | Senior Vice President and Senior Officer, The Invesco Funds | | N/A | | N/A |
| | | | | |
Jeffrey H. Kupor – 1968 Senior Vice President, Chief Legal Officer and Secretary | | 2018 | | Head of Legal of the Americas, Invesco Ltd.; Senior Vice President and Secretary, Invesco Advisers, Inc. (formerly known as Invesco Institutional (N.A.), Inc.) (registered investment adviser); Senior Vice President and Secretary, Invesco Distributors, Inc. (formerly known as Invesco AIM Distributors, Inc.); Vice President and Secretary, Invesco Investment Services, Inc. (formerly known as Invesco AIM Investment Services, Inc.) Senior Vice President, Chief Legal Officer and Secretary, The Invesco Funds; Secretary and General Counsel, Invesco Investment Advisers LLC (formerly known as Van Kampen Asset Management); Secretary and General Counsel, Invesco Capital Markets, Inc. (formerly known as Van Kampen Funds Inc.) and Chief Legal | | N/A | | N/A |
62 INVESCO OPPENHEIMER DEVELOPING MARKETS FUND
| | | | | | | | |
| | | | | |
Name, Year of Birth and Position(s) Held with the Trust | | Trustee
and/or
Officer
Since | | Principal Occupation(s) During Past 5 Years | | Number of Funds in Fund Complex
Overseen by Trustee | | Other Directorship(s)
Held by Trustee During Past 5 Years |
| | | | | |
| OTHER OFFICERS (CONTINUED) | | | | | | | | |
| | | | | |
| Jeffrey H. Kupor (Continued) | | | | Officer, Invesco Exchange-Traded Fund Trust, Invesco Exchange-Traded Fund Trust II, Invesco India Exchange-Traded Fund Trust, Invesco Actively Managed Exchange-Traded Fund Trust, Invesco Actively Managed Exchange-Traded Commodity Fund Trust and Invesco Exchange-Traded Self-Indexed Fund Trust; Secretary, Invesco Indexing LLC; Secretary, W.L. Ross & Co., LLC Formerly: Secretary and Vice President, Jemstep, Inc.; Head of Legal, Worldwide Institutional, Invesco Ltd.; Secretary and General Counsel, INVESCO Private Capital Investments, Inc.; Senior Vice President, Secretary and General Counsel, Invesco Management Group, Inc. (formerly known as Invesco AIM Management Group, Inc.); Assistant Secretary, INVESCO Asset Management (Bermuda) Ltd.; Secretary and General Counsel, Invesco Private Capital, Inc.; Assistant Secretary and General Counsel, INVESCO Realty, Inc.; Secretary and General Counsel, Invesco Senior Secured Management, Inc.; and Secretary, Sovereign G./P. Holdings Inc. | | | | |
| | | | | |
Andrew R. Schlossberg – 1974 Senior Vice President | | 2019 | | Head of the Americas and Senior Managing Director, Invesco Ltd.; Director and Senior Vice President, Invesco Advisers, Inc. (formerly known as Invesco Institutional (N.A.), Inc.) (registered investment adviser); Director and Chairman, Invesco Investment Services, Inc. (formerly known as Invesco AIM Investment Services, Inc.) (registered transfer agent); Senior Vice President, The Invesco Funds; Director, Invesco Investment Advisers LLC (formerly known as Van Kampen Asset Management); Director, President and Chairman, Invesco Insurance Agency, Inc. Formerly: Director, Invesco UK Limited; Director and Chief Executive, Invesco Asset Management Limited and Invesco Fund Managers Limited; Assistant Vice President, The Invesco Funds; Senior Vice President, Invesco Advisers, Inc. (formerly known as Invesco Institutional (N.A.), Inc.) (registered investment adviser); Director and Chief Executive, Invesco Administration Services | | N/A | | N/A |
63 INVESCO OPPENHEIMER DEVELOPING MARKETS FUND
TRUSTEES AND OFFICERSUnaudited / Continued
| | | | | | | | |
| | | | | |
Name, Year of Birth and Position(s) Held with the Trust | | Trustee
and/or
Officer
Since | | Principal Occupation(s) During Past 5 Years | | Number of Funds in Fund Complex
Overseen by Trustee | | Other Directorship(s)
Held by Trustee During Past 5 Years |
| | | | | |
| OTHER OFFICERS (CONTINUED) | | | | | | | | |
| | | | | |
| Andrew R. Schlossberg (Continued) | | | | Limited and Invesco Global Investment Funds Limited; Director, Invesco Distributors, Inc.; Head of EMEA, Invesco Ltd.; President, Invesco Actively Managed Exchange-Traded Commodity Fund Trust, Invesco Actively Managed Exchange-Traded Fund Trust, Invesco Exchange-Traded Fund Trust, Invesco Exchange-Traded Fund Trust II and Invesco India Exchange-Traded Fund Trust; Managing Director and Principal Executive Officer, Invesco Capital Management LLC | | | | |
| | | | | |
John M. Zerr — 1962 Senior Vice President | | 2006 | | Chief Operating Officer of the Americas; Senior Vice President, Invesco Advisers, Inc. (formerly known as Invesco Institutional (N.A.), Inc.) (registered investment adviser); Senior Vice President, Invesco Distributors, Inc. (formerly known as Invesco AIM Distributors, Inc.); Director and Vice President, Invesco Investment Services, Inc. (formerly known as Invesco AIM Investment Services, Inc.) Senior Vice President, The Invesco Funds; Managing Director, Invesco Capital Management LLC; Director, Invesco Investment Advisers LLC (formerly known as Van Kampen Asset Management); Senior Vice President, Invesco Capital Markets, Inc. (formerly known as Van Kampen Funds Inc.); Manager, Invesco Indexing LLC; Manager, Invesco Specialized Products, LLC; Director and Senior Vice President, Invesco Insurance Agency, Inc.; Member, Invesco Canada Funds Advisory Board; Director, President and Chief Executive Officer, Invesco Corporate Class Inc. (corporate mutual fund company); and Director, Chairman, President and Chief Executive Officer, Invesco Canada Ltd. (formerly known as Invesco Trimark Ltd./Invesco Trimark Ltèe) (registered investment adviser and registered transfer agent) Formerly: Director and Senior Vice President, Invesco Management Group, Inc. (formerly known as Invesco AIM Management Group, Inc.); Secretary and General Counsel, Invesco Management Group, Inc. (formerly known as Invesco AIM Management Group, Inc.); Secretary, Invesco Investment Services, Inc. (formerly known as Invesco AIM Investment Services, Inc.); Chief Legal Officer and | | N/A | | N/A |
64 INVESCO OPPENHEIMER DEVELOPING MARKETS FUND
| | | | | | | | |
| | | | | |
Name, Year of Birth and Position(s) Held with the Trust | | Trustee
and/or
Officer
Since | | Principal Occupation(s) During Past 5 Years | | Number of Funds in Fund Complex
Overseen by Trustee | | Other Directorship(s)
Held by Trustee During Past 5 Years |
| | | | | |
| OTHER OFFICERS (CONTINUED) | | | | | | | | |
| | | | | |
| John M. Zerr (Continued) | | | | Secretary, The Invesco Funds; Secretary and General Counsel, Invesco Investment Advisers LLC (formerly known as Van Kampen Asset Management); Secretary and General Counsel, Invesco Capital Markets, Inc. (formerly known as Van Kampen Funds Inc.); Chief Legal Officer, Invesco Exchange-Traded Fund Trust, Invesco Exchange-Traded Fund Trust II, Invesco India Exchange-Traded Fund Trust, Invesco Actively Managed Exchange-Traded Fund Trust, Invesco Actively Managed Exchange-Traded Commodity Fund Trust and Invesco Exchange-Traded Self-Indexed Fund Trust; Secretary, Invesco Indexing LLC; Director, Secretary, General Counsel and Senior Vice President, Van Kampen Exchange Corp.; Director, Vice President and Secretary, IVZ Distributors, Inc. (formerly known as INVESCO Distributors, Inc.); Director and Vice President, INVESCO Funds Group, Inc.; Director and Vice President, Van Kampen Advisors Inc.; Director, Vice President, Secretary and General Counsel, Van Kampen Investor Services Inc.; Director and Secretary, Invesco Distributors, Inc. (formerly known as Invesco AIM Distributors, Inc.); Director, Senior Vice President, General Counsel and Secretary, Invesco AIM Advisers, Inc. and Van Kampen Investments Inc.; Director, Vice President and Secretary, Fund Management Company; Director, Senior Vice President, Secretary, General Counsel and Vice President, Invesco AIM Capital Management, Inc.; Chief Operating Officer and General Counsel, Liberty Ridge Capital, Inc. (an investment adviser) | | | | |
| | | | | |
Gregory G. McGreevey - 1962 Senior Vice President | | 2012 | | Senior Managing Director, Invesco Ltd.; Director, Chairman, President, and Chief Executive Officer, Invesco Advisers, Inc. (formerly known as Invesco Institutional (N.A.), Inc.) (registered investment adviser); Director, Invesco Mortgage Capital, Inc. and Invesco Senior Secured Management, Inc.; and Senior Vice President, The Invesco Funds; and President, SNW Asset Management Corporation Formerly: Senior Vice President, Invesco | | N/A | | N/A |
65 INVESCO OPPENHEIMER DEVELOPING MARKETS FUND
TRUSTEES AND OFFICERSUnaudited / Continued
| | | | | | | | |
| | | | | |
Name, Year of Birth and Position(s) Held with the Trust | | Trustee
and/or
Officer
Since | | Principal Occupation(s) During Past 5 Years | | Number of Funds in Fund Complex
Overseen by Trustee | | Other Directorship(s)
Held by Trustee During Past 5 Years |
| | | | | |
| OTHER OFFICERS (CONTINUED) | | | | | | | | |
| | | | | |
| Gregory G. McGreevey (Continued) | | | | Management Group, Inc. and Invesco Advisers, Inc.; Assistant Vice President, The Invesco Funds | | | | |
| | | | | |
Kelli Gallegos – 1970 Vice President, Principal Financial Officer and Assistant Treasurer | | 2008 | | Principal Financial and Accounting Officer – Investments Pool, Invesco Specialized Products, LLC; Vice President, Principal Financial Officer and Assistant Treasurer, The Invesco Funds; Principal Financial and Accounting Officer – Pooled Investments, Invesco Capital Management LLC; Vice President and Treasurer, Invesco Exchange-Traded Fund Trust, Invesco Exchange-Traded Fund Trust II, Invesco India Exchange-Traded Fund Trust, Invesco Actively Managed Exchange-Traded Fund Trust, Invesco Actively Managed Exchange-Traded Commodity Fund Trust and Invesco Exchange-Traded Self-Indexed Fund Trust Formerly: Assistant Treasurer, Invesco Specialized Products, LLC; Assistant Treasurer, Invesco Exchange-Traded Fund Trust, Invesco Exchange-Traded Fund Trust II, Invesco India Exchange-Traded Fund Trust, Invesco Actively Managed Exchange-Traded Fund Trust, Invesco Actively Managed Exchange-Traded Commodity Fund Trust and Invesco Exchange-Traded Self-Indexed Fund Trust; Assistant Treasurer, Invesco Capital Management LLC; Assistant Vice President, The Invesco Funds | | N/A | | N/A |
| | | | | |
Crissie M. Wisdom – 1969 Anti-Money Laundering Compliance Officer | | 2013 | | Anti-Money Laundering Compliance Officer, Invesco Advisers, Inc. (formerly known as Invesco Institutional (N.A.), Inc.) (registered investment adviser), Invesco Capital Markets, Inc. (formerly known as Van Kampen Funds Inc.), Invesco Distributors, Inc., Invesco Investment Services, Inc., The Invesco Funds, and Invesco Exchange-Traded Fund Trust, Invesco Exchange-Traded Fund Trust II, Invesco India Exchange-Traded Fund Trust, Invesco Actively Managed Exchange-Traded Fund Trust, Invesco Actively Managed Exchange-Traded Commodity Fund Trust and Invesco Exchange-Traded Self-Indexed Fund Trust; Anti-Money Laundering Compliance Officer and Bank Secrecy Act Officer, INVESCO National Trust Company and Invesco Trust Company; and Fraud Prevention Manager and | | N/A | | N/A |
66 INVESCO OPPENHEIMER DEVELOPING MARKETS FUND
| | | | | | | | |
| | | | | |
Name, Year of Birth and Position(s) Held with the Trust | | Trustee
and/or
Officer
Since | | Principal Occupation(s) During Past 5 Years | | Number of Funds in Fund Complex
Overseen by Trustee | | Other Directorship(s)
Held by Trustee During Past 5 Years |
| | | | | |
| OTHER OFFICERS (CONTINUED) | | | | | | | | |
| | | | | |
Crissie M. Wisdom
(Continued) | | | | Controls and Risk Analysis Manager for Invesco Investment Services, Inc. Formerly: Anti-Money Laundering Compliance Officer, Van Kampen Exchange Corp. and Invesco Management Group, Inc. | | | | |
| | | | | |
Robert R. Leveille – 1969 Chief Compliance Officer | | 2016 | | Chief Compliance Officer, Invesco Advisers, Inc. (registered investment adviser); and Chief Compliance Officer, The Invesco Funds Formerly: Chief Compliance Officer, Putnam Investments and the Putnam Funds | | N/A | | N/A |
The Statement of Additional Information of the Trust includes additional information about the Fund’s Trustees and is available upon request, without charge, by calling 1.800.959.4246. Please refer to the Fund’s Statement of Additional Information for information on the Fund’ssub-advisers.
| | | | | | |
Office of the Fund 11 Greenway Plaza, Suite 1000 Houston, TX 77046-1173 Counsel to the Fund Stradley Ronon Stevens & Young,
LLP 2005 Market Street, Suite 2600 Philadelphia, PA 19103-7018 | | Investment Adviser Invesco Advisers, Inc. 1555 Peachtree Street, N.E. Atlanta, GA 30309 Counsel to the
Independent Trustees Goodwin Procter LLP 901 New York Avenue, N.W. Washington, D.C. 20001 | | Distributor Invesco Distributors, Inc. 11 Greenway Plaza, Suite 1000 Houston, TX 77046-1173 Transfer Agent Invesco Investment Services, Inc. 11 Greenway Plaza, Suite 1000 Houston, TX 77046-1173 | | Auditors PricewaterhouseCoopers
LLP 1000 Louisiana Street, Suite 5800 Houston, TX 77002-5021 Custodian JPMorgan Chase Bank 4 Chase Metro Tech Center Brooklyn, NY 11245 |
67 INVESCO OPPENHEIMER DEVELOPING MARKETS FUND
Invesco recognizes the importance of protecting your personal and financial information when you visit our website located atwww.invesco.com (the “Website”). The following information is designed to help you understand the information collection practices at this Website. We will not sell, share or rent your personally identifiable information to others in contravention of this Privacy Policy. When we refer to ourselves as “we” or “Invesco” in this Privacy Policy, we mean our entire company including our affiliates, such as subsidiaries.
By visiting this Website, you are accepting the practices described in this Privacy Policy. If you do not agree to this policy, you may not use this Website. This Privacy Policy is subject to change without notice, from time to time in our sole discretion. You acknowledge that by accessing the Website after we have posted changes to this Privacy Policy, you are agreeing to this Privacy Policy as modified. Please review the Terms of Use1 to learn of other terms and conditions applicable to your use of the Website.
Please note that this Privacy Policy is not an exclusive statement of our privacy principles across all products and services. Other privacy principles or policies may apply depending on the products or services you obtain from Invesco, or the jurisdiction in which you transact with Invesco.
This Privacy Policy was last updated on May 6, 2018.
Information We Collect and Use
We collect personal information you choose to submit to the Website in order to process transactions requested by you and meet our contractual obligations. For example, you can choose to provide your name, contact information, social security number, or tax identification number in connection with accessing your account, or you can choose to provide your personal information when you fill out a secure account question form. Any information collected about you from the Website can, from time to time, be associated with other identifying information we have about you.
In addition, we may gather information about you automatically through your use of the Website, e.g. your IP address, how you navigate the Website, the organization from which you are accessing the Website, and the websites that you access before and after you visit the Website.
When you access the Website, we may also collect information such as unique device identifiers, your screen resolution and other device settings, information about your location, and analytical information about how you use the device from which you are viewing the Website. Where applicable, we may ask your permission before collecting certain information, such as precise geolocation information.
From time to time, we use or augment the personal information we have about you with information obtained from third parties. For example, we use third party information to confirm contact or financial information or to better understand your interests by associating demographic information from third parties with the information you have provided.
How We Use Personal Information
We use your personal information to respond to your inquiries and provide the products and services you request. We also use your information from time to time to deliver the content and services we believe
1NTD
68 INVESCO OPPENHEIMER DEVELOPING MARKETS FUND
you will find the most relevant and to provide customer service and support.
We also use the information you provide to further develop and improve our products and services. We aggregate and/orde-identify data about visitors to the Website for various business purposes including product and service development and improvement activities.
How We Share Personal Information
We collaborate with other companies and individuals to perform services for us and on our behalf and we collaborate with our affiliates, other companies and individuals with respect to particular products or services (“Providers”). Examples of Providers include data analysis firms, customer service and support providers, email and SMS vendors, andweb-hosting and development companies. Some Providers collect information for us or on our behalf on our Website. These Providers can be provided with access to personal information needed to perform their functions.
We reserve the right to disclose your personal information as required by law, when we believe disclosure is necessary to comply with a regulatory requirement, judicial proceeding, court order or legal process served on us, to protect the safety, rights or property of our customers, the public or Invesco or to enforce the Terms of Use.
If we sell or transfer a business unit (such as a subsidiary) or an asset (such as a website) to another company, we will share your personal information with such company. You will receive notice of such an event and the new entity will inform you of any changes to the practices in this Privacy Policy. If the new entity wishes to make additional use of your information, you have the right to decline such use at that time.
We occasionally disclose aggregate orde-identified data that is not personally identifiable with third parties.
Cookies and Other Tools
Invesco and its Providers collect information about you by using cookies, tracking pixels and other technologies. We use this information to better understand, customize and improve user experience with our websites, services and offerings as well as to manage our advertising. For example, we use web analytics services that use these technologies to gather information to help us understand how visitors engage with and navigate our Website, e.g., how and when pages in a site are visited and by how many visitors. We are also able to offer our visitors a more customized, relevant experience on our sites using these technologies by delivering content and functionality based on your preferences and interests.
Depending on their purpose, some cookies will only operate for the length of a single browsing session, while others have a longer life span to ensure that they fulfill their longer-term purposes. Your web browser can be set to allow you to control whether you will accept cookies or reject cookies, to notify you each time a cookie is sent to your browser, or to delete cookies that have already been set. If your browser is set to reject cookies, certain aspects of the Website that are cookie-enabled will not recognize you when you return to the website, and some Website functionality may be lost. The “Help” section of your browser may tell you how to prevent your browser from accepting cookies. To find out more about cookies, visitwww.aboutcookies.org.
69 INVESCO OPPENHEIMER DEVELOPING MARKETS FUND
| | | | |
| | INVESCO’S PRIVACY NOTICE Continued | | |
| | |
Security
No data transmission over the internet can be 100% secure, so Invesco cannot ensure or warrant the security of any information you submit to us on this Website. However, Invesco seeks to protect your personal information from unauthorized access or use when you transact business on our Website using technical, administrative and procedural measures. Invesco makes no representation as to the reasonableness, efficacy, or appropriateness of the measures we use to safeguard such information.
Users are responsible for maintaining the secrecy of their own passwords. If you have reason to believe that your interaction with us is no longer secure (for example, if you feel that the security of any account you might have with us has been compromised), please immediately notify us by contacting us as specified below.
Transfer of Data to Other Countries
Any information you provide to Invesco through use of the Website may be stored and processed, transferred between and accessed from the United States, Canada and other countries which do not guarantee the same level of protection of personal information as the one in which you reside. However, Invesco will handle your personal information in accordance with this Privacy Policy regardless of where your personal information is stored/accessed.
Children’s Privacy
We are committed to protecting the privacy of children. We do not knowingly collect personal information from children under the age of 18. If you are under the age of 18, do not provide us with any personal information.
Contact Us
Please contact us if you have any questions or concerns about your personal information or require assistance in managing your choices.
Invesco Ltd.
1555 Peachtree St. NE
Atlanta, GA 30309
By phone:
(404)439-3236
By fax:
(404)962-8288
By email:
Anne.Gerry@invesco.com
Please update your account information by logging in or contact us by email or telephone as specified above to update your account information whenever such information ceases to be complete or accurate.
You may also contact us to:
70 INVESCO OPPENHEIMER DEVELOPING MARKETS FUND
● Request that we amend, rectify, delete or update the personal data we hold about you;
● Where possible (e.g. in relation to marketing) amend or update your choices around processing;
● Request a copy of personal data held by us.
Disclaimer
Where the Website contains links to third-party websites/content/services that are not owned or controlled by Invesco, Invesco is not responsible for how these properties operate or treat your personal information so we recommend that you read the privacy policies and terms associated with these third party properties carefully.
71 INVESCO OPPENHEIMER DEVELOPING MARKETS FUND
| | |
| |
| Explore High-Conviction Investing with Invesco | | |

| | |
| |
Go paperless with eDelivery Visit invesco.com/edelivery to enjoy the convenience and security of anytime electronic access to your investment documents. | | |
| |
| With eDelivery, you can elect to have any or all of the following materials delivered straight to your inbox to download, save and print from your own computer: | | |
| |
∎ Fund reports and prospectuses ∎ Quarterly statements ∎ Daily confirmations ∎ Tax forms | | |
| |
Invesco mailing information | | |
| |
| Send general correspondence to Invesco Investment Services, Inc., P.O. Box 219078, Kansas City, MO64121-9078. | | |
Invesco Distributors, Inc. | | 
O-DVM-AR-1 12272019 |
| | |
 | | Shareholder Report for the Two Months Ended 10/31/2019 |
| |
| | Invesco Oppenheimer Emerging Markets Innovators Fund* |
| |
| | Beginning on January 1, 2021, as permitted by regulations adopted by the Securities and Exchange Commission, paper copies of the Fund’s shareholder reports will no longer be sent by mail, unless you specifically request paper copies of the reports from the Fund or from your financial intermediary, such as a broker-dealer or bank. Instead, the reports will be made available on the Fund’s website, and you will be notified by mail each time a report is posted and provided with a website link to access the report. |
| |
| | If you already elected to receive shareholder reports electronically, you will not be affected by this change and you need not take any action. You may elect to receive shareholder reports and other communications from the Fund electronically by contacting your financial intermediary (such as a broker-dealer or bank) or, if you are a direct investor, by enrolling at invesco. com/edelivery. |
| |
| | You may elect to receive all future reports in paper free of charge. If you invest through a financial intermediary, you can contact your financial intermediary to request that you continue to receive paper copies of your shareholder reports. If you invest directly with the Fund, you can call 800 959 4246 to let the Fund know you wish to continue receiving paper copies of your shareholder reports. Your election to receive reports in paper will apply to all funds held with your financial intermediary or all funds held with the fund complex if you invest directly with the Fund. |
| |
| | *Prior to the close of business on May 24, 2019, the Fund’s name was Oppenheimer Emerging Markets Innovators Fund. See Important Update on the following page for more information. |
Important Update
On October 18, 2018, Massachusetts Mutual Life Insurance Company, an indirect corporate parent of OppenheimerFunds, Inc. and its subsidiaries OFI Global Asset Management, Inc., OFI SteelPath, Inc. and OFI Advisors, LLC, announced that it had entered into an agreement whereby Invesco Ltd., a global investment management company would acquire OppenheimerFunds and its subsidiaries (together, “OppenheimerFunds”). After the close of business on May 24, 2019 Invesco Ltd. completed the acquisition of OppenheimerFunds. This Fund was included in that acquisition and as of that date, became part of the Invesco family of funds. Please visit invesco.com for more information or call Invesco’s Client Services team at800-959-4246.
Class A Shares
AVERAGE ANNUAL TOTAL RETURNS AT 10/31/19
| | | | | | | | | | | | |
| | | Class A Shares of the Fund | | | | |
| | | Without Sales Charge | | | With Sales Charge | | | MSCI Emerging
Markets Mid Cap Index | |
1-Year | | | 17.49% | | | | 10.98% | | | | 11.08% | |
5-Year | | | 1.81 | | | | 0.66 | | | | 1.45 | |
Since Inception (6/30/14) | | | 0.82 | | | | -0.24 | | | | 0.74 | |
Performance quoted is past performance and cannot guarantee comparable future results; current performance may be lower or higher.Visit invesco.com for the most recentmonth-end performance. Performance figures reflect reinvested distributions and changes in net asset value (NAV). Investment return and principal value will vary so that you may have a gain or a loss when you sell shares. Fund returns include changes in share price, reinvested distributions and a 5.50% maximum applicable sales charge except where “without sales charge” is indicated. Returns for periods of less than one year are cumulative and not annualized. As the result of a reorganization after the close of business on May 24, 2019, the returns of the Fund for periods on or prior to May 24, 2019 reflect performance of the Oppenheimer predecessor fund. Share class returns will differ from those of the predecessor fund because they have different expenses. Returns do not consider capital gains or income taxes on an individual’s investment. See Fund prospectus and summary prospectus for more information on share classes, sales charges and new fee agreements, if any. Fund literature is available at invesco.com.
3 INVESCO OPPENHEIMER EMERGING MARKETS INNOVATORS FUND
Fund Performance Discussion
MARKET OVERVIEW
Not surprisingly, for an asset class that covers close to 25 markets, there are several key controversies effecting emerging market equity performance. However, as the largest economy and equity market in EM by a wide margin, it should also come as little surprise that China is at the epicenter. The lingering trade dispute between the United States and China continues to dampen global growth and whipsaw Chinese indices and ADRs. The trade dispute is clearly about more than just trade and therefore will be challenging to fully resolve. China’s future growth trajectory also continues to create angst. Following an extended period of extremely rapid growth, China’s economy is undergoing a major
structural transformation and moving onto a more sustainable development track. We are cognizant this will not be a linear transition, but we believe that China’s circumstances are largely manageable. At a slower 5% pace of growth over the long term, China will still be the largest growth engine in the world accounting for30-40% of GDP growth. The global community is also monitoring how China handles the escalation of political turmoil in Hong Kong, which has brought the international business hub to a standstill.
FUND REVIEW
Top contributors to performance during this reporting period included Samsung BioLogics, Capitec Bank and Silergy Corp.
COMPARISON OF CHANGE IN VALUE OF $10,000 HYPOTHETICAL INVESTMENTS IN:
4 INVESCO OPPENHEIMER EMERGING MARKETS INNOVATORS FUND
Samsung BioLogicsis a South Korean manufacturer ofbio-healthcare products, has evolved from a leading contract manufacturing organization (CMO) in the country to one of the fastest-growing in the world. Samsung Biologics owns a 50% stake in the biosimilar producer Samsung Bioepis with US biotech giant Biogen. This JV positions Samsung Biologics to benefit from the United States Food and Drug Administrations (FDA) guidelines on interchangeability, allowing customers to potentially switch to biosimilars at the drug store counter.
Capitec Bankis one of the largest retail banks in South Africa. Capitec has a healthy lending business that is supported by sound underwriting principles and conservative provisioning. Capitec has successfully built a strong transaction and deposit franchise by paying a higher deposit rate than big banks and charging a lower monthly fee. Capitec also maintains the largest branch network in South Africa and they open on Sundays. Future growth may be supported by growth in the underserved personal loan, credit card, insurance and investment product areas.
Silergy Corp.is a Taiwanese based fabless producer and a leader in the PMIC (power management integrated circuits) segment, which regulates power flow and adjusts voltage/currents of electricity in a multitude of products including mobile phones and portable media players. Silergy, a market leader, is expanding into more lucrative business segments, such as automotive
applications. The business is likely to continue to grow as more IoT (internet of things) devices, such as wireless chargers, wearables, and LED backlit devices proliferate the consumer landscape.
Detractors from performance includedPagSeguro Digital, OdontoPrev andLocaliza Rent A Car.
PagSeguro Digitalis an electronic payment processing company that caters to the micro merchant and small and medium size businesses in Brazil. PAGS offers these businesses affordable point of sale devices that enable merchants to accept credit and debit cards. PAGS introduced a significant product expansion this year, underscoring their rapid transformation into a full financial services company, which was timely given increased competition.
OdontoPrevis a Brazilian dental benefits company that works with corporate clients, labor unions, insurance companies and associations providing over 100 benefit structure plans. There is low dental insurance penetration in Brazil, which may underpin long-term growth opportunities for well positioned companies in this highly competitive insurance segment.
Localiza Rent A Caris a leading car rental company in Brazil that has delivered growth in revenue as well as profitability. Localiza has been able to outgrow the overall car rental market in Brazil by gaining market share from smaller companies and from its status as
5 INVESCO OPPENHEIMER EMERGING MARKETS INNOVATORS FUND
the preferred car supplier for Uber in Brazil. Heavy technological investments allowed Localiza to seamlessly integrate into Uber’s backend system, enabling direct payment deductions from drivers thus greatly reducing credit risk and increasing driver “stickiness.”
STRATEGY & OUTLOOK
Our approach to investing and the positioning of the portfolio remain unchanged. We look to avoid short-term tactical positions and macroeconomic calls. We remind investors that the case for investing in emerging markets is not about superior economic growth. Investing in emerging markets equities is about identifying extraordinary businesses that have the capacity to generate above average earnings even in pedestrian macro environments. In slower growth economies- in both developed and
emerging markets- there are two broad categories of companies that meet that criteria: globally competitive companies that are not entirely dependent on their domestic markets and domestic disruptors that gather market share in their own markets over time because of their significant efficiency advantages.
We continue to believe that EM should be an increasingly core allocation for global investors. EM now represents a meaningful portion of global GDP and is the largest contributor to global growth. Most investors are still under-allocated to the asset class and, especially for those who invest through passive vehicles, to the areas of EM that exhibit the most attractive growth characteristics.
Justin Leveranz, Portfolio Manager
6 INVESCO OPPENHEIMER EMERGING MARKETS INNOVATORS FUND
Top Holdings and Allocations
TOP TEN GEOGRAPHICAL HOLDINGS
| | | | |
China | | | 26.7% | |
Taiwan | | | 17.0 | |
India | | | 8.7 | |
South Korea | | | 8.3 | |
Brazil | | | 8.1 | |
United States | | | 6.1 | |
Mexico | | | 4.3 | |
Argentina | | | 3.2 | |
Russia | | | 3.1 | |
South Africa | | | 3.0 | |
Holdings and allocations are subject to change and are not buy/sell recommendations. Percentages are as of October 31, 2019 and are based on total market value of investments.
TOP TEN COMMON STOCK HOLDINGS
| | | | |
Samsung Biologics Co. Ltd. | | | 3.2% | |
Globant SA | | | 3.2 | |
Baozun, Inc., Sponsored ADR | | | 3.0 | |
Yandex NV, Cl. A | | | 2.8 | |
Chailease Holding Co. Ltd. | | | 2.8 | |
Huazhu Group Ltd., ADR | | | 2.7 | |
Yum China Holdings, Inc. | | | 2.6 | |
Wuxi Biologics Cayman, Inc. | | | 2.5 | |
ASMedia Technology, Inc. | | | 2.3 | |
Alsea SAB de CV | | | 2.3 | |
Holdings and allocations are subject to change and are not buy/sell recommendations. Percentages are as of October 31, 2019 and are based on net assets.
SECTOR ALLOCATION
Holdings and allocations are subject to change and are not buy/sell recommendation. Percentages are as of October 31, 2019, and are based on the total market value of common stocks.
For more current Fund holdings, please visit invesco.com.
7 INVESCO OPPENHEIMER EMERGING MARKETS INNOVATORS FUND
Share Class Performance
AVERAGE ANNUAL TOTAL RETURNS WITHOUT SALES CHARGE AS OF 10/31/19
| | | | | | | | | | | | | | | | |
| | | Inception | | | | | | | | | Since | |
| | | Date | | | 1-Year | | | 5-Year | | | Inception | |
Class A (EMIAX) | | | 6/30/14 | | | | 17.49 | % | | | 1.81 | % | | | 0.82% | |
Class C (EMVCX) | | | 6/30/14 | | | | 16.65 | | | | 1.04 | | | | 0.05 | |
Class R (EMIRX) | | | 6/30/14 | | | | 17.08 | | | | 1.53 | | | | 0.54 | |
Class Y (EMIYX) | | | 6/30/14 | | | | 17.81 | | | | 2.08 | | | | 1.07 | |
Class R5 (EMIMX)1 | | | 5/24/19 | | | | 17.61 | | | | 1.83 | | | | 0.84 | |
Class R6 (EMVIX)2 | | | 6/30/14 | | | | 17.89 | | | | 2.27 | | | | 1.27 | |
AVERAGE ANNUAL TOTAL RETURNS WITH SALES CHARGE AS OF 10/31/19 | |
| | | Inception | | | | | | | | | Since | |
| | | Date | | | 1-Year | | | 5-Year | | | Inception | |
Class A (EMIAX) | | | 6/30/14 | | | | 10.98 | % | | | 0.66 | % | | | -0.24% | |
Class C (EMVCX) | | | 6/30/14 | | | | 15.65 | | | | 1.04 | | | | 0.05 | |
Class R (EMIRX) | | | 6/30/14 | | | | 17.08 | | | | 1.53 | | | | 0.54 | |
Class Y (EMIYX) | | | 6/30/14 | | | | 17.81 | | | | 2.08 | | | | 1.07 | |
Class R5 (EMIMX)1 | | | 5/24/19 | | | | 17.61 | | | | 1.83 | | | | 0.84 | |
Class R6 (EMVIX)2 | | | 6/30/14 | | | | 17.89 | | | | 2.27 | | | | 1.27 | |
1. Class R5 shares’ performance shown prior to the inception date is that of the predecessor fund’s Class A shares at net asset value (NAV) and includes the12b-1 fees applicable to Class A shares. Class A shares’ performance reflects any applicable fee waivers and/or expense reimbursements.
2. Pursuant to the closing of the transaction described in the Notes to Financial Statements, after the close of business on May 24, 2019, Class I shares were reorganized as Class R6 shares.
Performance quoted is past performance and cannot guarantee comparable future results; current performance may be lower or higher.Visit invesco.com for the most recent month-end performance. Performance figures reflect reinvested distributions and changes in net asset value (NAV). Investment return and principal value will vary so that you may have a gain or a loss when you sell shares. Performance shown at NAV does not include the applicablefront-end sales charge, which would have reduced the performance. The current maximum initial sales charge for Class A shares is 5.50%, and the contingent deferred sales charge for Class C shares is 1% for the1-year period. Class R, Class Y, Class R5 and Class R6 shares have no sales charge; therefore, performance is at NAV. Effective after the close of business on May 24, 2019, Class A, Class C, Class R, Class Y, and Class I shares of the predecessor fund were reorganized into Class A, Class C, Class R, Class Y, and Class R6 shares, respectively, of the Fund. Class R5 shares’ performance shown prior to the inception date is that of the predecessor fund’s Class A shares at NAV and includes the12b-1 fees applicable to Class A shares. Class A shares’ performance reflects any applicable fee waivers and/or expense reimbursements. Returns shown for Class A, Class C, Class R, Class Y, Class R5, and Class R6 shares are blended returns of the predecessor fund and the Fund. Share class returns will differ from those of the predecessor fund because of different expenses. See Fund prospectuses and summary prospectuses for more information on share classes, sales charges and new fee agreements, if any. Fund literature is available at invesco.com.
8 INVESCO OPPENHEIMER EMERGING MARKETS INNOVATORS FUND
The Fund’s performance is compared to the performance of the MSCI Emerging Markets Mid Cap Index, which is designed to measure performance ofmid-capitalization, global emerging market equities. The Index isunmanaged and cannot be purchased directly by investors. While index comparisons may be useful to provide a benchmark for the Fund’s performance, it must be noted that the Fund’s investments are not limited to the investments comprising theIndex. Index performance includes reinvestment of income, but does not reflect transaction costs, fees, expenses or taxes. Index performance is shown for illustrative purposes only as a benchmark for the Fund’s performance, and does not predict or depict performance of the Fund. The Fund’s performance reflects the effects of the Fund’s business and operating expenses.
The views and opinions expressed in management’s discussion of Fund performance are those of Invesco Advisers, Inc. These views and opinions are subject to change at any time based on factors such as market and economic conditions. These views and opinions may not be relied upon as investment advice or recommendations, or as an offer for a particular security. The information is not a complete analysis of every aspect of any market, country, industry, security or the Fund. Statements of fact are from sources considered reliable, but Invesco Advisers, Inc. makes no representation or warranty as to their completeness or accuracy. Although historical performance is no guarantee of future results, these insights may help you understand our investment management philosophy.
Before investing, investors should carefully read the prospectus and/or summary prospectus and carefully consider the investment objectives, risks, charges and expenses. For this and more complete information about the fund(s), investors should ask their advisors for a prospectus/summary prospectus or visit invesco. com/fundprospectus.
Shares of Invesco funds are not deposits or obligations of any bank, are not guaranteed by any bank, are not insured by the FDIC or any other agency, and involve investment risks, including the possible loss of the principal amount invested.
9 INVESCO OPPENHEIMER EMERGING MARKETS INNOVATORS FUND
Fund Expenses
Fund Expenses. As a shareholder of the Fund, you incur two types of costs: (1) transaction costs, which may include sales charges (loads) on purchase payments and/or contingent deferred sales charges on redemptions; and (2) ongoing costs, including management fees; distribution and service fees; and other Fund expenses. These examples are intended to help you understand your ongoing costs (in dollars) of investing in the Fund and to compare these costs with the ongoing costs of investing in other mutual funds.
The examples are based on an investment of $1,000.00 invested at the beginning of the period and held for the entire6-month period ended October 31, 2019.
Actual Expenses. The first section of the table provides information about actual account values and actual expenses. You may use the information in this section for the class of shares you hold, together with the amount you invested, to estimate the expense that you paid over the period. Simply divide your account value by $1,000.00 (for example, an $8,600.00 account value divided by $1,000.00 = 8.60), then multiply the result by the number in the first section under the heading entitled “Expenses Paid During 6 Months Ended October 31, 2019” to estimate the expenses you paid on your account during this period.
Hypothetical Example for Comparison Purposes.The second section of the table provides information about hypothetical account values and hypothetical expenses based on the Fund’s actual expense ratio for each class of shares, and an assumed rate of return of 5% per year for each class before expenses, which is not the Fund’s actual return. The hypothetical account values and expenses may not be used to estimate the actual ending account balance or expenses you paid for the period. You may use this information to compare the ongoing costs of investing in the Fund and other funds. To do so, compare this 5% hypothetical example for the class of shares you hold with the 5% hypothetical examples that appear in the shareholder reports of the other funds.
Please note that the expenses shown in the table are meant to highlight your ongoing costs only and do not reflect any transactional costs, such asfront-end or contingent deferred sales charges (loads). Therefore, the “hypothetical” section of the table is useful in comparing ongoing costs only, and will not help you determine the relative total costs of owning different funds. In addition, if these transactional costs were included, your costs would have been higher.
10 INVESCO OPPENHEIMER EMERGING MARKETS INNOVATORS FUND
| | | | | | | | | | | | | | | | |
| | | Beginning | | | Ending | | | Expenses | | | | |
| | | Account | | | Account | | | Paid During | | | | |
| | | Value | | | Value | | | 6 Months Ended | | | | |
| Actual | | May 1, 2019 | | | October 31, 2019 | | | October 31, 20191,2 | | | | |
| |
Class A | | $ | 1,000.00 | | | $ | 1,015.60 | | | $ | 8.52 | | | | | |
| |
Class C | | | 1,000.00 | | | | 1,011.10 | | | | 12.39 | | | | | |
| |
Class R | | | 1,000.00 | | | | 1,013.80 | | | | 9.84 | | | | | |
| |
Class Y | | | 1,000.00 | | | | 1,016.40 | | | | 7.29 | | | | | |
| |
Class R5 | | | 1,000.00 | | | | 1,016.60 | | | | 5.76 | | | | | |
| |
Class R6 | | | 1,000.00 | | | | 1,017.30 | | | | 6.38 | | | | | |
| | | | |
| Hypothetical | | | | | | | | | | | | |
(5% return before expenses) | | | | | | | | | | | | | | | | |
| |
Class A | | | 1,000.00 | | | | 1,016.79 | | | | 8.52 | | | | | |
| |
Class C | | | 1,000.00 | | | | 1,012.96 | | | | 12.40 | | | | | |
| |
Class R | | | 1,000.00 | | | | 1,015.48 | | | | 9.85 | | | | | |
| |
Class Y | | | 1,000.00 | | | | 1,018.00 | | | | 7.30 | | | | | |
| |
Class R5 | | | 1,000.00 | | | | 1,018.65 | | | | 6.64 | | | | | |
| |
Class R6 | | | 1,000.00 | | | | 1,018.90 | | | | 6.38 | | | | | |
1. Actual expenses paid for Class A, C, R, Y, and R6are equal to the Fund’s annualized expense ratio for that class, multiplied by the average account value over the period, multiplied by 184/365 (to reflect theone-half year period). Actual expenses paid for Class R5 are equal to the Fund’s annualized expense ratio for that class, multiplied by the average account value over the period, multiplied by 160/365 to reflect the period from after the close of business on May 24, 2019 (inception of offering) to October 31, 2019.
2.Hypothetical expenses paid for all classes are equal to the Fund’s annualized expense ratio for that class, multiplied by the average account value over the period, multiplied by 184/365 (to reflect theone-half year period).
Those annualized expense ratios, excluding indirect expenses from affiliated funds, based on the6-month period ended October 31, 2019 for Classes A, C, R, Y and R6and for the period from after the close of business on May 24, 2019 (inception of offering) to October 31, 2019 for Class R5 are as follows:
| | | | | | | | |
| Class | | | Expense Ratios | | | | | |
| |
Class A | | | 1.67 | % | | | | |
| |
Class C | | | 2.43 | | | | | |
| |
Class R | | | 1.93 | | | | | |
| |
Class Y | | | 1.43 | | | | | |
| |
Class R5 | | | 1.30 | | | | | |
| |
Class R6 | | | 1.25 | | | | | |
The expense ratios reflect voluntary and/or contractual waivers and/or reimbursements of expenses by the Fund’s Manager. Some of these undertakings may be modified or terminated at any time, as indicated in the Fund’s prospectus. The “Financial Highlights” tables in the
11 INVESCO OPPENHEIMER EMERGING MARKETS INNOVATORS FUND
Fund’s financial statements, included in this report, also show the gross expense ratios, without such waivers or reimbursements and reduction to custodian expenses, if applicable.
12 INVESCO OPPENHEIMER EMERGING MARKETS INNOVATORS FUND
SCHEDULE OF INVESTMENTSOctober 31, 2019
| | | | | | | | |
| | | Shares | | | Value | |
| |
| Common Stocks—93.5% | | | | | | | | |
| |
| Consumer Discretionary—29.4% | | | | | |
| |
| Auto Components—2.9% | | | | | |
| Cub Elecparts, Inc. | | | 1,108,386 | | | $ | 9,265,226 | |
| |
| Minth Group Ltd. | | | 2,554,000 | | | | 9,015,968 | |
| | | | | | | | |
| | | | | | | 18,281,194 | |
| |
| Diversified Consumer Services—3.0% | | | | | |
| Fu Shou Yuan | | | | | | | | |
| International Group Ltd. | | | 6,375,000 | | | | 5,628,869 | |
| |
| New Oriental Education & Technology Group, Inc., Sponsored ADR1 | | | 42,886 | | | | 5,234,665 | |
| |
| TAL Education Group, ADR1 | | | 178,513 | | | | 7,642,142 | |
| | | | | | | | |
| | | | | | | 18,505,676 | |
| |
| Entertainment—1.3% | | | | | |
| NCSoft Corp. | | | 18,266 | | | | 8,098,858 | |
| |
| Hotels, Restaurants & Leisure—8.0% | | | | | |
| Alsea SAB de CV1 | | | 5,422,802 | | | | 14,467,195 | |
| |
| Hongkong & Shanghai Hotels Ltd. (The) | | | 2,166,500 | | | | 2,432,441 | |
| |
| Huazhu Group Ltd., ADR | | | 452,066 | | | | 17,115,219 | |
| |
| Yum China Holdings, Inc. | | | 382,732 | | | | 16,266,110 | |
| | | | | | | | |
| | | | | | | 50,280,965 | |
| |
| Interactive Media & Services—3.9% | | | | | |
| Kakao Corp. | | | 57,173 | | | | 6,939,151 | |
| |
| Yandex NV, Cl. A1 | | | 534,019 | | | | 17,830,894 | |
| | | | | | | | |
| | | | | | | 24,770,045 | |
| |
| Internet & Catalog Retail—3.0% | | | | | |
| Baozun, Inc., Sponsored ADR1 | | | 424,981 | | | | 18,495,173 | |
| |
| Multiline Retail—1.5% | | | | | |
| Lojas Americanas SA | | | 1,928,600 | | | | 9,612,945 | |
| |
| Specialty Retail—4.8% | | | | | |
| Ace Hardware Indonesia Tbk PT | | | 114,446,000 | | | | 13,767,236 | |
| |
| JUMBO SA | | | 399,735 | | | | 7,804,089 | |
| |
| Zhongsheng Group Holdings Ltd. | | | 2,646,500 | | | | 8,753,871 | |
| | | | | | | | |
| | | | | | | 30,325,196 | |
| | | | | | | | |
| | | Shares | | | Value | |
| |
| Textiles, Apparel & Luxury Goods—1.0% | |
| Fila Korea Ltd. | | | 123,114 | | | $ | 6,083,362 | |
| |
| HOSA International Ltd.1,2 | | | 6,382,000 | | | | 0 | |
| | | | | | | | |
| | | | | | | 6,083,362 | |
| |
| Consumer Staples—3.5% | | | | | |
| |
| Food & Staples Retailing—2.7% | | | | | |
| Clicks Group Ltd. | | | 394,177 | | | | 6,419,921 | |
| |
| Philippine Seven Corp. | | | 358,082 | | | | 1,052,909 | |
| |
| President Chain Store Corp. | | | 683,000 | | | | 6,804,611 | |
| |
| Raia Drogasil SA | | | 104,400 | | | | 2,863,484 | |
| | | | | | | | |
| | | | | | | 17,140,925 | |
| |
| Food Products—0.2% | | | | | |
| Vietnam Dairy Products JSC | | | 152,392 | | | | 851,517 | |
| |
| Personal Products—0.6% | | | | | |
| Natura Cosmeticos SA | | | 508,463 | | | | 3,950,556 | |
| |
| Financials—16.0% | | | | | | | | |
| |
| Commercial Banks—9.4% | | | | | |
| Banco Davivienda SA | | | 688,147 | | | | 8,795,252 | |
| |
| Bandhan Bank Ltd.3 | | | 137,251 | | | | 1,183,963 | |
| |
| Bank of the Philippine Islands | | | 3,611,240 | | | | 6,884,762 | |
| |
| Capitec Bank Holdings Ltd. | | | 138,056 | | | | 12,556,326 | |
| |
| Commercial International Bank Egypt SAE | | | 1,602,037 | | | | 8,039,963 | |
| |
| Credicorp Ltd. | | | 31,463 | | | | 6,734,340 | |
| |
| Equity Group Holdings plc | | | 16,472,854 | | | | 7,416,311 | |
| |
| Intercorp Financial Services, Inc.1 | | | 39,440 | | | | 1,645,831 | |
| |
| Regional SAB de CV | | | 699,630 | | | | 3,716,279 | |
| |
| TCS Group Holding plc, GDR | | | 94,578 | | | | 1,800,892 | |
| | | | | | | | |
| | | | | | | 58,773,919 | |
| |
| Consumer Finance—2.4% | | | | | |
| Cholamandalam Investment & Finance Co. Ltd. | | | 1,577,090 | | | | 6,780,442 | |
| |
| Gentera SAB de CV | | | 8,426,399 | | | | 8,349,084 | |
| | | | | | | | |
| | | | | | | 15,129,526 | |
13 INVESCO OPPENHEIMER EMERGING MARKETS INNOVATORS FUND
SCHEDULE OF INVESTMENTSContinued
| | | | | | | | |
| | | Shares | | | Value | |
| |
| Diversified Financial Services—2.8% | | | | | |
| Chailease Holding Co. Ltd. | | | 3,943,428 | | | $ | 17,698,623 | |
| |
| Real Estate Management & Development—1.4% | |
| Oberoi Realty Ltd. | | | 1,213,611 | | | | 8,682,431 | |
| |
| Health Care—12.1% | | | | | | | | |
| |
| Biotechnology—2.9% | | | | | | | | |
| Biocon Ltd. | | | 2,111,933 | | | | 7,324,213 | |
| |
| Innovent Biologics, Inc.1,3 | | | 3,154,500 | | | | 9,613,901 | |
| |
| Seegene, Inc.1 | | | 91,310 | | | | 1,663,770 | |
| | | | | | | | |
| | | | | | | 18,601,884 | |
| |
| Health Care Providers & Services—1.5% | |
| Odontoprev SA | | | 2,524,300 | | | | 9,309,163 | |
| |
| Life Sciences Tools & Services—6.6% | | | | | |
| Samsung Biologics Co. Ltd.1,3 | | | 58,791 | | | | 20,010,970 | |
| |
| Syngene International Ltd.3 | | | 1,231,172 | | | | 5,755,585 | |
| |
| Wuxi Biologics Cayman, Inc.1,3 | | | 1,323,500 | | | | 15,570,038 | |
| | | | | | | | |
| | | | | | | 41,336,593 | |
| |
| Pharmaceuticals—1.1% | | | | | |
| Caregen Co. Ltd.2 | | | 40,349 | | | | 2,122,445 | |
| |
| Hansoh Pharmaceutical Group Co. Ltd.1,3 | | | 1,500,000 | | | | 4,567,276 | |
| | | | | | | | |
| | | | | | | 6,689,721 | |
| |
| Industrials—13.2% | | | | | | | | |
| |
| Air Freight & Couriers—1.7% | | | | | |
| Kerry Logistics Network Ltd. | | | 6,614,000 | | | | 10,533,447 | |
| |
| Commercial Services & Supplies—1.1% | | | | | |
| Sunny Friend Environmental Technology Co. Ltd. | | | 805,000 | | | | 6,948,074 | |
| |
| Construction & Engineering—2.2% | | | | | |
| Voltas Ltd. | | | 1,372,218 | | | | 13,701,023 | |
| |
| Electrical Equipment—2.3% | | | | | |
| Havells India Ltd. | | | 378,673 | | | | 3,695,113 | |
| |
| Voltronic Power Technology Corp. | | | 490,778 | | | | 10,877,269 | |
| | | | | | | | |
| | | | | | | 14,572,382 | |
| |
| Machinery—2.2% | | | | | | | | |
| Airtac International Group | | | 778,093 | | | | 10,519,798 | |
| | | | | | | | |
| | | Shares | | | Value | |
| |
| Machinery (Continued) | | | | | | | | |
| |
| Estun Automation Co. Ltd., Cl. A | | | 2,618,636 | | | $ | 3,151,685 | |
| | | | | | | | |
| | | | | | | 13,671,483 | |
| |
| Marine—1.6% | | | | | | | | |
| SITC International Holdings Co. Ltd. | | | 9,159,000 | | | | 10,101,904 | |
| |
| Road & Rail—1.1% | | | | | | | | |
| Localiza Rent a Car SA | | | 655,275 | | | | 7,055,174 | |
| |
| Transportation Infrastructure—1.0% | | | | | |
| International Container Terminal Services, Inc. | | | 2,852,950 | | | | 6,647,876 | |
| |
| Information Technology—18.2% | | | | | |
| |
| Electronic Equipment, Instruments, & | | | | | |
| Components—3.5% | | | | | | | | |
| Largan Precision Co. Ltd. | | | 51,000 | | | | 7,458,414 | |
| |
| Sunny Optical Technology Group Co. Ltd. | | | 412,200 | | | | 6,538,441 | |
| |
| Taiwan Union Technology Corp. | | | 1,885,000 | | | | 8,268,834 | |
| | | | | | | | |
| | | | | | | 22,265,689 | |
| |
| IT Services—1.1% | | | | | | | | |
| Pagseguro Digital Ltd., Cl. A1 | | | 185,113 | | | | 6,863,990 | |
| |
| Semiconductors & Semiconductor Equipment—7.8% | | | | | |
| ASMedia Technology, Inc. | | | 906,000 | | | | 14,530,790 | |
| |
| ASPEED Technology, Inc. | | | 165,000 | | | | 4,295,953 | |
| |
| Koh Young Technology, Inc. | | | 86,203 | | | | 6,962,315 | |
| |
| LandMark Optoelectronics Corp. | | | 1,166,000 | | | | 9,834,006 | |
| |
| Silergy Corp. | | | 471,000 | | | | 13,168,972 | |
| | | | | | | | |
| | | | | | | 48,792,036 | |
| |
| Software—5.8% | | | | | | | | |
| Globant SA1 | | | 213,722 | | | | 19,931,714 | |
| |
| Kingdee International Software Group Co. Ltd. | | | 5,058,300 | | | | 5,506,203 | |
14 INVESCO OPPENHEIMER EMERGING MARKETS INNOVATORS FUND
| | | | | | | | |
| | | Shares | | | Value | |
| |
| Software (Continued) | | | | | | | | |
| |
| Linx SA | | | 1,246,140 | | | $ | 10,778,855 | |
| | | | | | | | |
| | | | | | | 36,216,772 | |
| |
| Materials—1.1% | | | | | | | | |
| |
| Construction Materials—1.1% | | | | | |
| Dalmia Bharat Ltd. | | | 306,894 | | | | 3,504,884 | |
| |
| Shree Cement Ltd. | | | 13,646 | | | | 3,826,641 | |
| | | | | | | | |
| | | | | | | 7,331,525 | |
| | | | | | | | |
Total Common Stocks (Cost $480,294,929) | | | | | | | 587,319,647 | |
| | | | | | | | |
| | | Shares | | | Value | |
| |
| Investment Company—6.1% | | | | | | | | |
| |
| Invesco Government & Agency Portfolio, Institutional Class, 1.71%4(Cost $38,085,651) | | | 38,085,651 | | | $ | 38,085,651 | |
| |
Total Investments, at Value
(Cost $518,380,580) | | | 99.6 | % | | | 625,405,298 | |
| |
| Net Other Assets | | | | | | | | |
(Liabilities) | | | 0.4 | | | | 2,214,205 | |
| | | | |
Net Assets | | | 100.0 | % | | $ | 627,619,503 | |
| | | | |
Footnotes to Schedule of Investments
1.Non-income producing security.
2. The value of this security was determined using significant unobservable inputs. See Note 3 of the accompanying Notes.
3. Security purchased or received in a transaction exempt from registration under the Securities Act of 1933, as amended (the “1933 Act”). The security may be resold pursuant to an exemption from registration under the 1933 Act, typically to qualified institutional buyers. The aggregate value of these securities at October 31, 2019 was $56,701,733, which represented 9.03% of the Fund’s Net Assets.
4. The money market fund and the Fund are affiliated by having the same investment adviser. The rate shown is the7-day SEC standardized yield as of October 31, 2019.
Distribution of investments representing geographic holdings, as a percentage of total investments at value, is as follows:
| | | | | | | | |
| Geographic Holdings | | Value | | | Percent | |
| |
| China | | $ | 166,903,885 | | | | 26.7% | |
| Taiwan | | | 106,501,598 | | | | 17.0 | |
| India | | | 54,454,294 | | | | 8.7 | |
| South Korea | | | 51,880,872 | | | | 8.3 | |
| Brazil | | | 50,434,166 | | | | 8.1 | |
| United States | | | 38,085,651 | | | | 6.1 | |
| Mexico | | | 26,532,558 | | | | 4.3 | |
| Argentina | | | 19,931,714 | | | | 3.2 | |
| Russia | | | 19,631,786 | | | | 3.1 | |
| South Africa | | | 18,976,247 | | | | 3.0 | |
| Philippines | | | 14,585,547 | | | | 2.3 | |
| Indonesia | | | 13,767,236 | | | | 2.2 | |
| Colombia | | | 8,795,251 | | | | 1.4 | |
| Peru | | | 8,380,172 | | | | 1.3 | |
| Egypt | | | 8,039,963 | | | | 1.3 | |
| Greece | | | 7,804,089 | | | | 1.3 | |
| Kenya | | | 7,416,311 | | | | 1.2 | |
| Hong Kong | | | 2,432,441 | | | | 0.4 | |
| Vietnam | | | 851,517 | | | | 0.1 | |
| | | | |
| Total | | $ | 625,405,298 | | | | 100.0% | |
| | | | |
15 INVESCO OPPENHEIMER EMERGING MARKETS INNOVATORS FUND
SCHEDULE OF INVESTMENTSContinued
| | |
| Glossary: | | |
| |
| Definitions | | |
| ADR | | American Depositary Receipt |
| GDR | | Global Depositary Receipts |
|
| See accompanying Notes to Financial Statements. |
16 INVESCO OPPENHEIMER EMERGING MARKETS INNOVATORS FUND
STATEMENT OF ASSETS AND LIABILITIESOctober 31, 2019
| | | | |
| |
| Assets | | | | |
| Investments, at value—see accompanying schedule of investments: | | | | |
| Unaffiliated companies (cost $480,294,929) | | $ | 587,319,647 | |
| Affiliated companies (cost $38,085,651) | | | 38,085,651 | |
| | | | |
| | | 625,405,298 | |
| |
| Cash—foreign currencies (cost $762,319) | | | 714,250 | |
| |
| Receivables and other assets: | | | | |
| Investments sold | | | 7,944,144 | |
| Dividends | | | 280,175 | |
| Shares of beneficial interest sold | | | 121,239 | |
| Other | | | 52,075 | |
| | | | |
| Total assets | | | 634,517,181 | |
| |
| Liabilities | | | | |
| Amount due to custodian | | | 275,157 | |
| |
| Payables and other liabilities: | | | | |
| Investments purchased | | | 3,882,751 | |
| Foreign capital gains tax | | | 1,741,969 | |
| Shares of beneficial interest redeemed | | | 472,078 | |
| Transfer and shareholder servicing agent fees | | | 124,372 | |
| Shareholder communications | | | 42,340 | |
| Distribution and service plan fees | | | 41,635 | |
| Advisory fees | | | 19,407 | |
| Due to advisor | | | 13,107 | |
| Trustees’ compensation | | | 7,230 | |
| Administration fees | | | 248 | |
| Other | | | 277,384 | |
| | | | |
| Total liabilities | | | 6,897,678 | |
| |
Net Assets | | $ | 627,619,503 | |
| | | | |
|
| |
| Composition of Net Assets | | | | |
| Shares of beneficial interest | | $ | 589,543,078 | |
| |
| Total distributable earnings | | | 38,076,425 | |
| | | | |
Net Assets | | $ | 627,619,503 | |
| | | | |
17 INVESCO OPPENHEIMER EMERGING MARKETS INNOVATORS FUND
STATEMENT OF ASSETS AND LIABILITIESContinued
| | | | |
| |
| Net Asset Value Per Share | | | | |
| Class A Shares: | | | | |
| |
| Net asset value and redemption price per share (based on net assets of $83,842,412 and 8,057,762 shares of beneficial interest outstanding) | | | $10.41 | |
| |
| Maximum offering price per share (net asset value plus sales charge of 5.50% of offering price) | | | $11.02 | |
| |
| |
| Class C Shares: | | | | |
| |
| Net asset value, redemption price (excludes applicable contingent deferred sales charge) and offering price per share (based on net assets of $26,427,048 and 2,637,917 shares of beneficial interest outstanding) | | | $10.02 | |
| |
| |
| Class R Shares: | | | | |
| |
| Net asset value, redemption price and offering price per share (based on net assets of $8,011,863 and 779,310 shares of beneficial interest outstanding) | | | $10.28 | |
| |
| |
| Class Y Shares: | | | | |
| |
| Net asset value, redemption price and offering price per share (based on net assets of $216,383,577 and 20,569,807 shares of beneficial interest outstanding) | | | $10.52 | |
| |
| |
| Class R5 Shares: | | | | |
| |
| Net asset value, redemption price and offering price per share (based on net assets of $10,933 and 1,049 shares of beneficial interest outstanding) | | | $10.42 | |
| |
| |
| Class R6 Shares: | | | | |
| |
| Net asset value, redemption price and offering price per share (based on net assets of $292,943,670 and 27,599,762 shares of beneficial interest outstanding) | | | $10.61 | |
See accompanying Notes to Financial Statements.
18 INVESCO OPPENHEIMER EMERGING MARKETS INNOVATORS FUND
STATEMENT
OF OPERATIONS
| | | | | | | | |
| | | Two Months Ended
October 31, 2019 | | | Year Ended August
31, 2019 | |
| |
| Investment Income | | | | | | | | |
| Dividends: | | | | | | | | |
| Unaffiliated companies (net of foreign withholding taxes of $84,788 and $838,990, respectively) | | $ | 923,404 | | | $ | 7,400,101 | |
| Affiliated companies | | | 135,378 | | | | 1,090,258 | |
| |
| Interest | | | — | | | | 43,473 | |
| | | | |
| Total investment income | | | 1,058,782 | | | | 8,533,832 | |
|
| |
| Expenses | | | | | | | | |
| Advisory fees | | | 1,150,829 | | | | 6,794,792 | |
| |
| Administration fees | | | 14,687 | | | | 7,190 | |
| |
| Distribution and service plan fees: | | | | | | | | |
| Class A | | | 32,509 | | | | 208,313 | |
| Class C | | | 43,959 | | | | 322,778 | |
| Class R | | | 6,432 | | | | 34,329 | |
| |
| Transfer and shareholder servicing agent fees: | | | | | | | | |
| Class A | | | 23,938 | | | | 161,617 | |
| Class C | | | 7,693 | | | | 61,495 | |
| Class R | | | 2,251 | | | | 13,063 | |
| Class Y | | | 62,035 | | | | 450,803 | |
| Class R5 | | | 1 | | | | 1 | |
| Class R6 | | | 473 | | | | 49,025 | |
| |
| Shareholder communications: | | | | | | | | |
| Class A | | | 2,563 | | | | 8,214 | |
| Class C | | | 819 | | | | 3,396 | |
| Class R | | | 242 | | | | 1,291 | |
| Class Y | | | 6,629 | | | | 17,001 | |
| Class R6 | | | 8,887 | | | | 11,909 | |
| |
| Custodian fees and expenses | | | 62,913 | | | | 368,649 | |
| |
| Trustees’ compensation | | | 3,400 | | | | 11,599 | |
| |
| Borrowing fees | | | — | | | | 11,492 | |
| |
| Other | | | 44,036 | | | | 245,920 | |
| | | | |
| Total expenses | | | 1,474,296 | | | | 8,782,877 | |
| Less waivers, reimbursements of expenses, and expense offset arrangement(s) | | | (11,157 | ) | | | (81,150) | |
| | | | |
| Net expenses | | | 1,463,139 | | | | 8,701,727 | |
|
| |
Net Investment Loss | | | (404,357 | ) | | | (167,895) | |
19 INVESCO OPPENHEIMER EMERGING MARKETS INNOVATORS FUND
STATEMENT
OF OPERATIONSContinued
| | | | | | | | |
| | | Two Months Ended
October 31, 2019 | | | Year Ended August
31, 2019 | |
| |
| Realized and Unrealized Gain (Loss) | | | | | | | | |
| Net realized gain (loss) on: | | | | | | | | |
| Investment transactions in unaffiliated companies (net of foreign capital gains tax of $(199) and $6,902, respectively) | | $ | 11,361,832 | | | $ | (56,763,821) | |
| Foreign currency transactions | | | (40,096 | ) | | | (225,835) | |
| | | | |
| Net realized gain (loss) | | | 11,321,736 | | | | (56,989,656) | |
| |
| Net change in unrealized appreciation/(depreciation) on: | | | | | | | | |
| Investment transactions in: | | | | | | | | |
Unaffiliated companies (net of foreign capital gains tax of $212,601 and $1,294,065, respectively) | | | 23,203,387 | | | | 41,797,572 | |
Affiliated companies | | | (503 | ) | | | 503 | |
| Translation of assets and liabilities denominated in foreign currencies | | | (7,315 | ) | | | (2,818) | |
| | | | |
| Net change in unrealized appreciation/(depreciation) | | | 23,195,569 | | | | 41,795,257 | |
|
| |
| Net Increase (Decrease) in Net Assets Resulting from Operations | | $ | 34,112,948 | | | $ | (15,362,294) | |
| | | | |
See accompanying Notes to Financial Statements.
20 INVESCO OPPENHEIMER EMERGING MARKETS INNOVATORS FUND
STATEMENT OF CHANGES IN NET ASSETS
| | | | | | | | | | | | |
| | | Two Months Ended
October 31, 2019 | | | Year Ended
August 31, 2019 | | Year Ended
August 31, 2018 | |
| |
| Operations | | | | | | | | | | | | |
| Net investment loss | | $ | (404,357 | ) | | $ | (167,895 | ) | | $ | (324,339) | |
| |
| Net realized gain (loss) | | | 11,321,736 | | | | (56,989,656 | ) | | | 11,347,777 | |
| |
| Net change in unrealized appreciation/(depreciation) | | | 23,195,569 | | | | 41,795,257 | | | | (41,182,070) | |
| | | | |
| Net increase (decrease) in net assets resulting from operations | | | 34,112,948 | | | | (15,362,294 | ) | | | (30,158,632) | |
|
| |
| Dividends and/or Distributions to Shareholders1 | | | | | | | | | | | | |
| Distributions to shareholders from distributable earnings: | | | | | | | | | | | | |
| Class A | | | — | | | | — | | | | (197,910) | |
| Class C | | | — | | | | — | | | | — | |
| Class R | | | — | | | | — | | | | (3,421) | |
| Class Y | | | — | | | | — | | | | (823,021) | |
| Class R5 | | | — | | | | — | | | | — | |
| Class R6 | | | — | | | | — | | | | (158,922) | |
| | | | |
| Total distributions from distributable earnings | | | — | | | | — | | | | (1,183,274) | |
|
| |
| Beneficial Interest Transactions | | | | | | | | | | | | |
| Net increase (decrease) in net assets resulting from beneficial interest transactions: | | | | | | | | | | | | |
| Class A | | | (1,176,936 | ) | | | (12,295,214 | ) | | | 18,406,177 | |
| Class C | | | (1,643,660 | ) | | | (9,155,459 | ) | | | 10,170,178 | |
| Class R | | | 73,076 | | | | 992,778 | | | | 3,736,385 | |
| Class Y | | | (7,955,725 | ) | | | (53,894,034 | ) | | | 104,621,163 | |
| Class R5 | | | — | | | | 10,000 | | | | — | |
| Class R6 | | | (994,222 | ) | | | 165,025,902 | | | | 89,051,985 | |
| | | | |
| Total beneficial interest transactions | | | (11,697,467 | ) | | | 90,683,973 | | | | 225,985,888 | |
|
| |
| Net Assets | | | | | | | | | | | | |
| Total increase | | | 22,415,481 | | | | 75,321,679 | | | | 194,643,982 | |
| |
| Beginning of period | | | 605,204,022 | | | | 529,882,343 | | | | 335,238,361 | |
| | | | |
| End of period | | $ | 627,619,503 | | | $ | 605,204,022 | | | $ | 529,882,343 | |
| | | | |
1. The Securities exchange Commission eliminated the requirement to disclose the distribution components separately, except for tax return of capital. For the year ended August 31, 2018, distributions to shareholders from distributable earnings consisted of distributions from net investment income.
See accompanying Notes to Financial Statements.
21 INVESCO OPPENHEIMER EMERGING MARKETS INNOVATORS FUND
FINANCIAL HIGHLIGHTS
| | | | | | | | | | | | | | | | | | | | | | | | |
| Class A | | Two Months
Ended
October 31,
2019 | | | Year Ended
August 31,
2019 | | | Year Ended
August 31,
2018 | | | Year Ended
August 31,
2017 | | | Year Ended
August 31,
2016 | | | Year Ended
August 31,
2015 | |
| |
| Per Share Operating Data | | | | | | | | | | | | | | | | | | | | | | | | |
| Net asset value, beginning of period | | | $9.85 | | | | $10.38 | | | | $10.67 | | | | $8.87 | | | | $8.22 | | | | $9.93 | |
| |
| Income (loss) from investment operations: | | | | | | | | | | | | | | | | | | | | | | | | |
| Net investment loss1 | | | (0.01) | | | | (0.02) | | | | (0.02) | | | | (0.03) | | | | (0.03) | | | | (0.02) | |
| Net realized and unrealized gain (loss) | | | 0.57 | | | | (0.51) | | | | (0.25) | | | | 1.83 | | | | 0.68 | | | | (1.67) | |
| | | | |
| Total from investment operations | | | 0.56 | | | | (0.53) | | | | (0.27) | | | | 1.80 | | | | 0.65 | | | | (1.69) | |
| |
| Dividends and/or distributions to shareholders: | | | | | | | | | | | | | | | | | | | | | | | | |
| Dividends from net investment income | | | 0.00 | | | | 0.00 | | | | (0.02) | | | | 0.00 | | | | 0.00 | | | | (0.01) | |
| Distributions from net realized gain | | | 0.00 | | | | 0.00 | | | | 0.00 | | | | 0.00 | | | | 0.00 | | | | (0.01) | |
| | | | |
| Total dividends and/or distributions to shareholders | | | 0.00 | | | | 0.00 | | | | (0.02) | | | | 0.00 | | | | 0.00 | | | | (0.02) | |
| |
| Net asset value, end of period | | | $10.41 | | | | $9.85 | | | | $10.38 | | | | $10.67 | | | | $8.87 | | | | $8.22 | |
| | | | |
|
| |
| Total Return, at Net Asset Value2 | | | 5.69% | | | | (5.11)% | | | | (2.52)% | | | | 20.29% | | | | 7.91% | | | | (17.10)% | |
|
| |
| Ratios/Supplemental Data | | | | | | | | | | | | | | | | | | | | | | | | |
| Net assets, end of period (in thousands) | | | $83,842 | | | | $80,454 | | | | $97,641 | | | | $84,324 | | | | $64,713 | | | | $41,993 | |
| |
| Average net assets (in thousands) | | | $82,113 | | | | $85,050 | | | | $111,837 | | | | $65,566 | | | | $55,666 | | | | $61,498 | |
| |
| Ratios to average net assets:3 | | | | | | | | | | | | | | | | | | | | | | | | |
| Net investment loss | | | (0.63)% | | | | (0.25)% | | | | (0.18)% | | | | (0.35)% | | | | (0.31)% | | | | (0.21)% | |
| Expenses excluding specific expenses listed below | | | 1.68% | | | | 1.71% | | | | 1.70% | | | | 1.77% | | | | 1.75% | | | | 1.71% | |
| Interest and fees from borrowings | | | 0.00% | | | | 0.00%4 | | | | 0.00%4 | | | | 0.00%4 | | | | 0.00%4 | | | | 0.00%4 | |
| | | | |
| Total expenses5 | | | 1.68% | | | | 1.71% | | | | 1.70% | | | | 1.77% | | | | 1.75% | | | | 1.71% | |
| Expenses after payments, waivers and/or reimbursements and reduction to custodian expenses | | | 1.67% | | | | 1.70% | | | | 1.69% | | | | 1.70% | | | | 1.71% | | | | 1.70% | |
| |
| Portfolio turnover rate6 | | | 20% | | | | 36% | | | | 24% | | | | 23% | | | | 26% | | | | 34% | |
22 INVESCO OPPENHEIMER EMERGING MARKETS INNOVATORS FUND
1. Per share amounts calculated based on the average shares outstanding during the period.
2. Includes adjustments in accordance with accounting principles generally accepted in the United States of America and as such, the net asset value for financial reporting purposes and the returns based upon those net asset values may differ from the net asset value and returns for shareholder transactions. Does not include sales charges and is not annualized for periods less than one year, if applicable.
3. Annualized for periods less than one full year.
4. Less than 0.005%.
5. Total expenses including indirect expenses from affiliated fund fees and expenses were as follows:
| | | | | | |
| | | | | | |
| | | | | | |
Two Months Ended October 31, 2019 | | | 1.69 | % |
Year Ended August 31, 2019 | | | 1.72 | % |
Year Ended August 31, 2018 | | | 1.71 | % |
Year Ended August 31, 2017 | | | 1.78 | % |
Year Ended August 31, 2016 | | | 1.76 | % |
Year Ended August 31, 2015 | | | 1.72 | % |
6. Portfolio turnover is calculated at the fund level and is not annualized for periods less than one year, if applicable.
See accompanying Notes to Financial Statements.
23 INVESCO OPPENHEIMER EMERGING MARKETS INNOVATORS FUND
FINANCIAL HIGHLIGHTSContinued
| | | | | | | | | | | | | | | | | | | | | | | | |
| Class C | | Two Months
Ended
October 31,
2019 | | | Year Ended
August 31,
2019 | | | Year Ended
August 31,
2018 | | | Year Ended
August 31,
2017 | | | Year Ended
August 31,
2016 | | | Year Ended
August 31,
2015 | |
| |
| Per Share Operating Data | | | | | | | | | | | | | | | | | | | | | | | | |
| Net asset value, beginning of period | | | $9.49 | | | | $10.09 | | | | $10.42 | | | | $8.74 | | | | $8.16 | | | | $9.92 | |
| |
| Income (loss) from investment operations: | | | | | | | | | | | | | | | | | | | | | | | | |
| Net investment loss1 | | | (0.02) | | | | (0.09) | | | | (0.10) | | | | (0.10) | | | | (0.09) | | | | (0.08) | |
| Net realized and unrealized gain (loss) | | | 0.55 | | | | (0.51) | | | | (0.23) | | | | 1.78 | | | | 0.67 | | | | (1.67) | |
| | | | |
| Total from investment operations | | | 0.53 | | | | (0.60) | | | | (0.33) | | | | 1.68 | | | | 0.58 | | | | (1.75) | |
| |
| Dividends and/or distributions to shareholders: | | | | | | | | | | | | | | | | | | | | | | | | |
| Dividends from net investment income | | | 0.00 | | | | 0.00 | | | | 0.00 | | | | 0.00 | | | | 0.00 | | | | 0.00 | |
| Distributions from net realized gain | | | 0.00 | | | | 0.00 | | | | 0.00 | | | | 0.00 | | | | 0.00 | | | | (0.01) | |
| | | | |
| Total dividends and/or distributions to shareholders | | | 0.00 | | | | 0.00 | | | | 0.00 | | | | 0.00 | | | | 0.00 | | | | (0.01) | |
| |
| Net asset value, end of period | | | $10.02 | | | | $9.49 | | | | $10.09 | | | | $10.42 | | | | $8.74 | | | | $8.16 | |
| | | | |
|
| |
| Total Return, at Net Asset Value2 | | | 5.58% | | | | (5.95)% | | | | (3.17)% | | | | 19.22% | | | | 7.24% | | | | (17.80)% | |
|
| |
| Ratios/Supplemental Data | | | | | | | | | | | | | | | | | | | | | | | | |
| Net assets, end of period (in thousands) | | | $26,427 | | | | $26,661 | | | | $38,156 | | | | $30,168 | | | | $19,616 | | | | $10,795 | |
| |
| Average net assets (in thousands) | | | $26,333 | | | | $32,285 | | | | $39,496 | | | | $22,635 | | | | $15,335 | | | | $7,615 | |
| |
| Ratios to average net assets:3 | | | | | | | | | | | | | | | | | | | | | | | | |
| Net investment loss | | | (1.40)% | | | | (1.01)% | | | | (0.94)% | | | | (1.11)% | | | | (1.10)% | | | | (0.88)% | |
| Expenses excluding specific expenses listed below | | | 2.44% | | | | 2.45% | | | | 2.46% | | | | 2.52% | | | | 2.50% | | | | 2.69% | |
| Interest and fees from borrowings | | | 0.00% | | | | 0.00%4 | | | | 0.00%4 | | | | 0.00%4 | | | | 0.00%4 | | | | 0.00%4 | |
| | | | |
| Total expenses5 | | | 2.44% | | | | 2.45% | | | | 2.46% | | | | 2.52% | | | | 2.50% | | | | 2.69% | |
| Expenses after payments, waivers and/or reimbursements and reduction to custodian expenses | | | 2.43% | | | | 2.44% | | | | 2.45% | | | | 2.50% | | | | 2.49% | | | | 2.50% | |
| |
| Portfolio turnover rate6 | | | 20% | | | | 36% | | | | 24% | | | | 23% | | | | 26% | | | | 34% | |
24 INVESCO OPPENHEIMER EMERGING MARKETS INNOVATORS FUND
1. Per share amounts calculated based on the average shares outstanding during the period.
2. Includes adjustments in accordance with accounting principles generally accepted in the United States of America and as such, the net asset value for financial reporting purposes and the returns based upon those net asset values may differ from the net asset value and returns for shareholder transactions. Does not include sales charges and is not annualized for periods less than one year, if applicable.
3. Annualized for periods less than one full year.
4. Less than 0.005%.
5. Total expenses including indirect expenses from affiliated fund fees and expenses were as follows:
| | | | | | |
| | | | | | |
Two Months Ended October 31, 2019 | | | 2.45 | % |
Year Ended August 31, 2019 | | | 2.46 | % |
Year Ended August 31, 2018 | | | 2.47 | % |
Year Ended August 31, 2017 | | | 2.53 | % |
Year Ended August 31, 2016 | | | 2.51 | % |
Year Ended August 31, 2015 | | | 2.70 | % |
6. Portfolio turnover is calculated at the fund level and is not annualized for periods less than one year, if applicable.
See accompanying Notes to Financial Statements.
25 INVESCO OPPENHEIMER EMERGING MARKETS INNOVATORS FUND
FINANCIAL HIGHLIGHTSContinued
| | | | | | | | | | | | | | | | | | | | | | | | |
| Class R | | Two Months
Ended
October 31,
2019 | | | Year Ended
August 31,
2019 | | | Year Ended
August 31,
2018 | | | Year Ended
August 31,
2017 | | | Year Ended
August 31,
2016 | | | Year Ended
August 31,
2015 | |
| |
| Per Share Operating Data | | | | | | | | | | | | | | | | | | | | | | | | |
| Net asset value, beginning of period | | | $9.73 | | | | $10.29 | | | | $10.59 | | | | $8.83 | | | | $8.20 | | | | $9.93 | |
| |
| Income (loss) from investment operations: | | | | | | | | | | | | | | | | | | | | | | | | |
| Net investment loss1 | | | (0.01) | | | | (0.05) | | | | (0.05) | | | | (0.05) | | | | (0.05) | | | | (0.03) | |
| Net realized and unrealized gain (loss) | | | 0.56 | | | | (0.51) | | | | (0.24) | | | | 1.81 | | | | 0.68 | | | | (1.69) | |
| | | | |
| Total from investment operations | | | 0.55 | | | | (0.56) | | | | (0.29) | | | | 1.76 | | | | 0.63 | | | | (1.72) | |
| |
| Dividends and/or distributions to shareholders: | | | | | | | | | | | | | | | | | | | | | | | | |
| Dividends from net investment income | | | 0.00 | | | | 0.00 | | | | (0.01) | | | | 0.00 | | | | 0.00 | | | | 0.00 | |
| Distributions from net realized gain | | | 0.00 | | | | 0.00 | | | | 0.00 | | | | 0.00 | | | | 0.00 | | | | (0.01) | |
| | | | |
| Total dividends and/or distributions to shareholders | | | 0.00 | | | | 0.00 | | | | (0.01) | | | | 0.00 | | | | 0.00 | | | | (0.01) | |
| |
| Net asset value, end of period | | | $10.28 | | | | $9.73 | | | | $10.29 | | | | $10.59 | | | | $8.83 | | | | $8.20 | |
| | | | |
|
| |
| Total Return, at Net Asset Value2 | | | 5.65% | | | | (5.44)% | | | | (2.77)% | | | | 19.93% | | | | 7.68% | | | | (17.38)% | |
|
| |
| Ratios/Supplemental Data | | | | | | | | | | | | | | | | | | | | | | | | |
| Net assets, end of period (in thousands) | | | $8,012 | | | | $7,516 | | | | $6,884 | | | | $3,606 | | | | $1,692 | | | | $966 | |
| |
| Average net assets (in thousands) | | | $7,725 | | | | $6,905 | | | | $6,023 | | | | $2,336 | | | | $1,253 | | | | $555 | |
| |
| Ratios to average net assets:3 | | | | | | | | | | | | | | | | | | | | | | | | |
| Net investment loss | | | (0.90)% | | | | (0.51)% | | | | (0.45)% | | | | (0.55)% | | | | (0.60)% | | | | (0.36)% | |
| Expenses excluding specific expenses listed below | | | 1.94% | | | | 1.95% | | | | 1.97% | | | | 2.03% | | | | 2.02% | | | | 2.24% | |
| Interest and fees from borrowings | | | 0.00% | | | | 0.00%4 | | | | 0.00%4 | | | | 0.00%4 | | | | 0.00%4 | | | | 0.00%4 | |
| | | | |
| Total expenses5 | | | 1.94% | | | | 1.95% | | | | 1.97% | | | | 2.03% | | | | 2.02% | | | | 2.24% | |
| Expenses after payments, waivers and/or reimbursements and reduction to custodian expenses | | | 1.93% | | | | 1.94% | | | | 1.96% | | | | 2.00% | | | | 2.00% | | | | 2.00% | |
| |
| Portfolio turnover rate6 | | | 20% | | | | 36% | | | | 24% | | | | 23% | | | | 26% | | | | 34% | |
26 INVESCO OPPENHEIMER EMERGING MARKETS INNOVATORS FUND
1. Per share amounts calculated based on the average shares outstanding during the period.
2. Includes adjustments in accordance with accounting principles generally accepted in the United States of America and as such, the net asset value for financial reporting purposes and the returns based upon those net asset values may differ from the net asset value and returns for shareholder transactions. Does not include sales charges and is not annualized for periods less than one year, if applicable.
3. Annualized for periods less than one full year.
4. Less than 0.005%.
5. Total expenses including indirect expenses from affiliated fund fees and expenses were as follows:
| | | | | | |
| | | | | | |
Two Months Ended October 31, 2019 | | | 1.95 | % |
Year Ended August 31, 2019 | | | 1.96 | % |
Year Ended August 31, 2018 | | | 1.98 | % |
Year Ended August 31, 2017 | | | 2.04 | % |
Year Ended August 31, 2016 | | | 2.03 | % |
Year Ended August 31, 2015 | | | 2.25 | % |
6.Portfolio turnover is calculated at the fund level and is not annualized for periods less than one year, if applicable.
See accompanying Notes to Financial Statements.
27 INVESCO OPPENHEIMER EMERGING MARKETS INNOVATORS FUND
FINANCIAL HIGHLIGHTSContinued
| | | | | | | | | | | | | | | | | | | | | | | | |
| Class Y | | Two Months
Ended
October 31,
2019 | | | Year Ended
August 31,
2019 | | | Year Ended
August 31,
2018 | | | Year Ended
August 31,
2017 | | | Year Ended
August 31,
2016 | | | Year Ended
August 31,
2015 | |
| |
| Per Share Operating Data | | | | | | | | | | | | | | | | | | | | | | | | |
| Net asset value, beginning of period | | | $9.95 | | | | $10.47 | | | | $10.75 | | | | $8.92 | | | | $8.24 | | | | $9.94 | |
| |
| Income (loss) from investment operations: | | | | | | | | | | | | | | | | | | | | | | | | |
| Net investment income (loss)1 | | | (0.01) | | | | (0.00)2 | | | | 0.01 | | | | (0.01) | | | | (0.00)2 | | | | 0.01 | |
| Net realized and unrealized gain (loss) | | | 0.58 | | | | (0.52) | | | | (0.25) | | | | 1.84 | | | | 0.68 | | | | (1.68) | |
| | | | |
| Total from investment operations | | | 0.57 | | | | (0.52) | | | | (0.24) | | | | 1.83 | | | | 0.68 | | | | (1.67) | |
| |
| Dividends and/or distributions to shareholders: | | | | | | | | | | | | | | | | | | | | | | | | |
| Dividends from net investment income | | | 0.00 | | | | 0.00 | | | | (0.04) | | | | 0.00 | | | | 0.00 | | | | (0.02) | |
| Distributions from net realized gain | | | 0.00 | | | | 0.00 | | | | 0.00 | | | | 0.00 | | | | 0.00 | | | | (0.01) | |
| | | | |
| Total dividends and/or distributions to shareholders | | | 0.00 | | | | 0.00 | | | | (0.04) | | | | 0.00 | | | | 0.00 | | | | (0.03) | |
| |
| Net asset value, end of period | | | $10.52 | | | | $9.95 | | | | $10.47 | | | | $10.75 | | | | $8.92 | | | | $8.24 | |
| | | | |
|
| |
| Total Return, at Net Asset Value3 | | | 5.73% | | | | (4.97)% | | | | (2.23)% | | | | 20.52% | | | | 8.25% | | | | (16.92)% | |
|
| |
| Ratios/Supplemental Data | | | | | | | | | | | | | | | | | | | | | | | | |
| Net assets, end of period (in thousands) | | | $216,384 | | | | $212,530 | | | | $281,465 | | | | $193,261 | | | | $162,599 | | | | $68,697 | |
| |
| Average net assets (in thousands) | | | $212,626 | | | | $237,068 | | | | $253,099 | | | | $153,808 | | | | $128,076 | | | | $38,619 | |
| |
| Ratios to average net assets:4 | | | | | | | | | | | | | | | | | | | | | | | | |
| Net investment income (loss) | | | (0.40)% | | | | (0.00)%5 | | | | 0.06% | | | | (0.10)% | | | | (0.03)% | | | | 0.14% | |
| Expenses excluding specific expenses listed below | | | 1.44% | | | | 1.46% | | | | 1.46% | | | | 1.52% | | | | 1.50% | | | | 1.72% | |
| Interest and fees from borrowings | | | 0.00% | | | | 0.00%5 | | | | 0.00%5 | | | | 0.00%5 | | | | 0.00%5 | | | | 0.00%5 | |
| | | | |
| Total expenses6 | | | 1.44% | | | | 1.46% | | | | 1.46% | | | | 1.52% | | | | 1.50% | | | | 1.72% | |
| Expenses after payments, waivers and/or reimbursements and reduction to custodian expenses | | | 1.43% | | | | 1.45% | | | | 1.45% | | | | 1.45% | | | | 1.45% | | | | 1.45% | |
| |
| Portfolio turnover rate7 | | | 20% | | | | 36% | | | | 24% | | | | 23% | | | | 26% | | | | 34% | |
28 INVESCO OPPENHEIMER EMERGING MARKETS INNOVATORS FUND
1. Per share amounts calculated based on the average shares outstanding during the period.
2. Less than $0.005 per share.
3. Includes adjustments in accordance with accounting principles generally accepted in the United States of America and as such, the net asset value for financial reporting purposes and the returns based upon those net asset values may differ from the net asset value and returns for shareholder transactions. Does not include sales charges and is not annualized for periods less than one year, if applicable.
4. Annualized for periods less than one full year.
5. Less than 0.005%.
6. Total expenses including indirect expenses from affiliated fund fees and expenses were as follows:
| | | | | | |
| | | | | | |
Two Months Ended October 31, 2019 | | | 1.45 | % |
Year Ended August 31, 2019 | | | 1.47 | % |
Year Ended August 31, 2018 | | | 1.47 | % |
Year Ended August 31, 2017 | | | 1.53 | % |
Year Ended August 31, 2016 | | | 1.51 | % |
Year Ended August 31, 2015 | | | 1.73 | % |
7.Portfolio turnover is calculated at the fund level and is not annualized for periods less than one year, if applicable.
See accompanying Notes to Financial Statements.
29 INVESCO OPPENHEIMER EMERGING MARKETS INNOVATORS FUND
FINANCIAL HIGHLIGHTSContinued
| | | | | | | | |
| Class R5 | | Two Months
Ended
October 31,
2019 | | | Period
Ended
August 31,
20191 | |
| |
| Per Share Operating Data | | | | | | | | |
| Net asset value, beginning of period | | | $9.86 | | | | $9.53 | |
| |
| Income (loss) from investment operations: | | | | | | | | |
| Net investment income (loss)2 | | | (0.00)3 | | | | 0.003 | |
| Net realized and unrealized gain | | | 0.56 | | | | 0.33 | |
| | | | |
| Total from investment operations | | | 0.56 | | | | 0.33 | |
| |
| Dividends and/or distributions to shareholders: | | | | | | | | |
| Dividends from net investment income | | | 0.00 | | | | 0.00 | |
| Distributions from net realized gain | | | 0.00 | | | | 0.00 | |
| | | | |
| Total dividends and/or distributions to shareholders | | | 0.00 | | | | 0.00 | |
| |
| Net asset value, end of period | | | $10.42 | | | | $9.86 | |
| | | | |
|
| |
| Total Return, at Net Asset Value4 | | | 5.68% | | | | 3.46% | |
|
| |
| Ratios/Supplemental Data | | | | | | | | |
| Net assets, end of period (in thousands) | | | $11 | | | | $10 | |
| |
| Average net assets (in thousands) | | | $11 | | | | $10 | |
| |
| Ratios to average net assets:5 | | | | | | | | |
| Net investment income (loss) | | | (0.26)% | | | | 0.15% | |
| Expenses excluding specific expenses listed below | | | 1.31% | | | | 1.28% | |
| Interest and fees from borrowings | | | 0.00% | | | | 0.00% | |
| | | | |
| Total expenses6 | | | 1.31% | | | | 1.28% | |
| Expenses after payments, waivers and/or reimbursements and reduction to custodian expenses | | | 1.30% | | | | 1.27% | |
| |
| Portfolio turnover rate7 | | | 20% | | | | 36% | |
1. For the period from after the close of business on May 24, 2019 (inception of offering) to August 31, 2019.
2. Per share amounts calculated based on the average shares outstanding during the period.
3. Less than $0.005 per share.
4. Includes adjustments in accordance with accounting principles generally accepted in the United States of America and as such, the net asset value for financial reporting purposes and the returns based upon those net asset values may differ from the net asset value and returns for shareholder transactions. Does not include sales charges and is not annualized for periods less than one year, if applicable.
5. Annualized for periods less than one full year.
6. Total expenses including indirect expenses from affiliated fund fees and expenses were as follows:
| | | | | | |
| | | | | | |
| Two Months Ended October 31, 2019 | | | 1.32 | % |
| Period Ended August 31, 2019 | | | 1.29 | % |
7.Portfolio turnover is calculated at the fund level and is not annualized for periods less than one year, if applicable.
See accompanying Notes to Financial Statements.
30 INVESCO OPPENHEIMER EMERGING MARKETS INNOVATORS FUND
| | | | | | | | | | | | | | | | | | | | | | | | |
| Class R6 | | Two Months
Ended
October 31,
2019 | | | Year Ended
August 31,
2019 | | | Year Ended
August 31,
2018 | | | Year Ended
August 31,
2017 | | | Year Ended
August 31,
2016 | | | Year Ended
August 31,
2015 | |
| |
| Per Share Operating Data | | | | | | | | | | | | | | | | | | | | | | | | |
| Net asset value, beginning of period | | | $10.04 | | | | $10.54 | | | | $10.82 | | | | $8.96 | | | | $8.26 | | | | $9.94 | |
| |
| Income (loss) from investment operations: | | | | | | | | | | | | | | | | | | | | | | | | |
| Net investment income (loss)1 | | | (0.00)2 | | | | 0.02 | | | | 0.03 | | | | 0.03 | | | | 0.06 | | | | 0.05 | |
| Net realized and unrealized gain (loss) | | | 0.57 | | | | (0.52) | | | | (0.25) | | | | 1.83 | | | | 0.64 | | | | (1.70) | |
| | | | |
| Total from investment operations | | | 0.57 | | | | (0.50) | | | | (0.22) | | | | 1.86 | | | | 0.70 | | | | (1.65) | |
| |
| Dividends and/or distributions to shareholders: | | | | | | | | | | | | | | | | | | | | | | | | |
| Dividends from net investment income | | | 0.00 | | | | 0.00 | | | | (0.06) | | | | 0.00 | | | | 0.00 | | | | (0.02) | |
| Distributions from net realized gain | | | 0.00 | | | | 0.00 | | | | 0.00 | | | | 0.00 | | | | 0.00 | | | | (0.01) | |
| | | | |
| Total dividends and/or distributions to shareholders | | | 0.00 | | | | 0.00 | | | | (0.06) | | | | 0.00 | | | | 0.00 | | | | (0.03) | |
| |
| Net asset value, end of period | | | $10.61 | | | | $10.04 | | | | $10.54 | | | | $10.82 | | | | $8.96 | | | | $8.26 | |
| | | | |
|
| |
| Total Return, at Net Asset Value3 | | | 5.68% | | | | (4.74)% | | | | (2.06)% | | | | 20.89% | | | | 8.35% | | | | (16.68)% | |
|
| |
| Ratios/Supplemental Data | | | | | | | | | | | | | | | | | | | | | | | | |
| Net assets, end of period (in thousands) | | | $292,944 | | | | $278,033 | | | | $105,736 | | | | $23,879 | | | | $7,332 | | | | $102 | |
| |
| Average net assets (in thousands) | | | $284,296 | | | | $234,650 | | | | $49,969 | | | | $11,916 | | | | $2,128 | | | | $64 | |
| |
| Ratios to average net assets:4 | | | | | | | | | | | | | | | | | | | | | | | | |
| Net investment income (loss) | | | (0.22)% | | | | 0.18% | | | | 0.26% | | | | 0.30% | | | | 0.65% | | | | 0.54% | |
| Expenses excluding specific expenses listed below | | | 1.27% | | | | 1.27% | | | | 1.29% | | | | 1.32% | | | | 1.33% | | | | 1.60% | |
| Interest and fees from borrowings | | | 0.00% | | | | 0.00%5 | | | | 0.00%5 | | | | 0.00%5 | | | | 0.00%5 | | | | 0.00%5 | |
| | | | |
| Total expenses6 | | | 1.27% | | | | 1.27% | | | | 1.29% | | | | 1.32% | | | | 1.33% | | | | 1.60% | |
| Expenses after payments, waivers and/or reimbursements and reduction to custodian expenses | | | 1.25% | | | | 1.25% | | | | 1.25% | | | | 1.25% | | | | 1.24% | | | | 1.25% | |
| |
| Portfolio turnover rate7 | | | 20% | | | | 36% | | | | 24% | | | | 23% | | | | 26% | | | | 34% | |
31 INVESCO OPPENHEIMER EMERGING MARKETS INNOVATORS FUND
FINANCIAL HIGHLIGHTSContinued
1. Per share amounts calculated based on the average shares outstanding during the period.
2. Less than $0.005 per share.
3. Includes adjustments in accordance with accounting principles generally accepted in the United States of America and as such, the net asset value for financial reporting purposes and the returns based upon those net asset values may differ from the net asset value and returns for shareholder transactions. Does not include sales charges and is not annualized for periods less than one year, if applicable.
4. Annualized for periods less than one full year.
5. Less than 0.005%.
6. Total expenses including indirect expenses from affiliated fund fees and expenses were as follows:
| | | | | | |
| | | | | | |
Two Months Ended October 31, 2019 | | | 1.28 | % |
Year Ended August 31, 2019 | | | 1.28 | % |
Year Ended August 31, 2018 | | | 1.30 | % |
Year Ended August 31, 2017 | | | 1.33 | % |
Year Ended August 31, 2016 | | | 1.34 | % |
Year Ended August 31, 2015 | | | 1.61 | % |
7.Portfolio turnover is calculated at the fund level and is not annualized for periods less than one year, if applicable.
See accompanying Notes to Financial Statements.
32 INVESCO OPPENHEIMER EMERGING MARKETS INNOVATORS FUND
NOTES TO FINANCIAL STATEMENTSOctober 31, 2019
Note 1 - Significant Accounting Policies
Invesco Oppenheimer Emerging Markets Innovators Fund (the “Fund”) is a series portfolio of AIM Investment Funds (Invesco Investment Funds) (the “Trust”). The Trust is a Delaware statutory trust registered under the Investment Company Act of 1940, as amended (the “1940 Act”), as anopen-end series management investment company authorized to issue an unlimited number of shares of beneficial interest. Information presented in these financial statements pertains only to the Fund. Matters affecting the Fund or each class will be voted on exclusively by the shareholders of such Fund or each class.
Prior to the close of business on May 24, 2019, the Fund operated as Oppenheimer Emerging Markets Innovators Fund (the “Acquired Fund” or “Predecessor Fund”). The Acquired Fund was reorganized after the close of business on May 24, 2019 (the “Reorganization Date”) through the transfer of all of its assets and liabilities to the Fund (the “Reorganization”).
Upon closing of the Reorganization, holders of the Acquired Fund’s Class A, Class C, Class R, and Class Y shares received the corresponding class of shares of the Fund and holders of the Acquired Fund’s Class I shares received Class R6 shares of the Fund. Information for the Acquired Fund’s Class I shares prior to the Reorganization is included with Class R6 shares throughout this report. Class R5 shares commenced operations on the Reorganization Date.
Effective October 31, 2019, the Fund’s fiscal year end changed from August 31 to October 31.
The Fund’s investment objective is to seek capital appreciation.
The Fund currently consists of six different classes of shares: Class A, Class C, Class R, Class Y, Class R5 and Class R6. Class Y shares are available only to certain investors. Class A shares are sold with afront-end sales charge unless certain waiver criteria are met and under certain circumstances load waived shares may be subject to contingent deferred sales charges (“CDSC”). Class C shares are sold with a CDSC. Class R, Class Y, Class R5 and Class R6 shares are sold at net asset value. Class C shares held for ten years after purchase are eligible for automatic conversion into Class A shares of the same Fund (the “Conversion Feature”). The automatic conversion pursuant to the Conversion Feature will generally occur at the end of the month following the tenth anniversary after a purchase of Class C shares.
The Fund is an investment company and accordingly follows the investment company accounting and reporting guidance in accordance with Financial Accounting Standards Board Accounting Standards Codification Topic 946, Financial Services – Investment Companies.
The following is a summary of the significant accounting policies followed by the Fund in the preparation of its financial statements.
A. Security Valuations– Securities, including restricted securities, are valued according to the following policy.
A security listed or traded on an exchange (except convertible securities) is valued at its last sales price or official closing price as of the close of the customary trading session on the exchange where the security is principally traded, or lacking any sales or official closing price on a particular day, the security may be valued at the closing bid price on that day. Securities traded in theover-the-counter market are valued based on prices furnished
33 INVESCO OPPENHEIMER EMERGING MARKETS INNOVATORS FUND
NOTES TO FINANCIAL STATEMENTSContinued
by independent pricing services or market makers. When such securities are valued by an independent pricing service they may be considered fair valued. Futures contracts are valued at the final settlement price set by an exchange on which they are principally traded. Listed options are valued at the mean between the last bid and asked prices from the exchange on which they are principally traded. Options not listed on an exchange are valued by an independent source at the mean between the last bid and asked prices. For purposes of determining net asset value (“NAV”) per share, futures and option contracts generally are valued 15 minutes after the close of the customary trading session of the New York Stock Exchange (“NYSE”).
Investments inopen-end andclosed-end registered investment companies that do not trade on an exchange are valued at theend-of-day net asset value per share. Investments inopen-end andclosed-end registered investment companies that trade on an exchange are valued at the last sales price or official closing price as of the close of the customary trading session on the exchange where the security is principally traded.
Debt obligations (including convertible securities) and unlisted equities are fair valued using an evaluated quote provided by an independent pricing service. Evaluated quotes provided by the pricing service may be determined without exclusive reliance on quoted prices, and may reflect appropriate factors such asinstitution-size trading in similar groups of securities, developments related to specific securities, dividend rate (for unlisted equities), yield (for debt obligations), quality, type of issue, coupon rate (for debt obligations), maturity (for debt obligations), individual trading characteristics and other market data. Pricing services generally value debt obligations assuming orderly transactions of institutional round lot size, but a fund may hold or transact in the same securities in smaller, odd lot sizes. Odd lots often trade at lower prices than institutional round lots. Debt obligations are subject to interest rate and credit risks. In addition, all debt obligations involve some risk of default with respect to interest and/or principal payments.
Foreign securities’ (including foreign exchange contracts) prices are converted into U.S. dollar amounts using the applicable exchange rates as of the close of the NYSE. If market quotations are available and reliable for foreign exchange-traded equity securities, the securities will be valued at the market quotations. Because trading hours for certain foreign securities end before the close of the NYSE, closing market quotations may become unreliable. If between the time trading ends on a particular security and the close of the customary trading session on the NYSE, events occur that the investment adviser determines are significant and make the closing price unreliable, the Fund may fair value the security. If the event is likely to have affected the closing price of the security, the security will be valued at fair value in good faith using procedures approved by the Board of Trustees. Adjustments to closing prices to reflect fair value may also be based on a screening process of an independent pricing service to indicate the degree of certainty, based on historical data, that the closing price in the principal market where a foreign security trades is not the current value as of the close of the NYSE. Foreign securities’ prices meeting the approved degree of certainty that the price is not reflective of current value will be priced at the indication of fair value from the independent pricing service. Multiple factors may be considered by the independent pricing service in determining adjustments
34 INVESCO OPPENHEIMER EMERGING MARKETS INNOVATORS FUND
to reflect fair value and may include information relating to sector indices, American Depositary Receipts and domestic and foreign index futures. Foreign securities may have additional risks including exchange rate changes, potential for sharply devalued currencies and high inflation, political and economic upheaval, the relative lack of issuer information, relatively low market liquidity and the potential lack of strict financial and accounting controls and standards.
Securities for which market prices are not provided by any of the above methods may be valued based upon quotes furnished by independent sources. The last bid price may be used to value equity securities. The mean between the last bid and asked prices is used to value debt obligations, including corporate loans.
Securities for which market quotations are not readily available or became unreliable are valued at fair value as determined in good faith by or under the supervision of the Trust’s officers following procedures approved by the Board of Trustees. Issuer specific events, market trends, bid/asked quotes of brokers and information providers and other market data may be reviewed in the course of making a good faith determination of a security’s fair value.
The Fund may invest in securities that are subject to interest rate risk, meaning the risk that the prices will generally fall as interest rates rise and, conversely, the prices will generally rise as interest rates fall. Specific securities differ in their sensitivity to changes in interest rates depending on their individual characteristics. Changes in interest rates may result in increased market volatility, which may affect the value and/or liquidity of certain Fund investments.
Valuations change in response to many factors including the historical and prospective earnings of the issuer, the value of the issuer’s assets, general economic conditions, interest rates, investor perceptions and market liquidity. Because of the inherent uncertainties of valuation, the values reflected in the financial statements may materially differ from the value received upon actual sale of those investments.
| B. | Securities Transactions and Investment Income -Securities transactions are accounted for on a trade date basis. Realized gains or losses on sales are computed on the basis of specific identification of the securities sold. Interest income (net of withholding tax, if any) is recorded on the accrual basis from settlement date. Dividend income (net of withholding tax, if any) is recorded on theex-dividend date. |
The Fund may periodically participate in litigation related to Fund investments. As such, the Fund may receive proceeds from litigation settlements. Any proceeds received are included in the Statement of Operations as realized gain (loss) for investments no longer held and as unrealized gain (loss) for investments still held.
Brokerage commissions and mark ups are considered transaction costs and are recorded as an increase to the cost basis of securities purchased and/or a reduction of proceeds on a sale of securities. Such transaction costs are included in the determination of net realized and unrealized gain (loss) from investment transactions reported in the Statement of Operations and the Statement of Changes in Net Assets and the net realized and unrealized gains (losses) on securities per share in the Financial Highlights. Transaction costs are included in the calculation of the Fund’s net asset value and, accordingly, they reduce the
35 INVESCO OPPENHEIMER EMERGING MARKETS INNOVATORS FUND
NOTES TO FINANCIAL STATEMENTSContinued
Fund’s total returns. These transaction costs are not considered operating expenses and are not reflected in net investment income reported in the Statement of Operations and the Statement of Changes in Net Assets, or the net investment income per share and the ratios of expenses and net investment income reported in the Financial Highlights, nor are they limited by any expense limitation arrangements between the Fund and the investment adviser.
The Fund allocates income and realized and unrealized capital gains and losses to a class based on the relative net assets of each class.
| C. | Country Determination- For the purposes of making investment selection decisions and presentation in the Schedule of Investments, the investment adviser may determine the country in which an issuer is located and/or credit risk exposure based on various factors. These factors include the laws of the country under which the issuer is organized, where the issuer maintains a principal office, the country in which the issuer derives 50% or more of its total revenues and the country that has the primary market for the issuer’s securities, as well as other criteria. Among the other criteria that may be evaluated for making this determination are the country in which the issuer maintains 50% or more of its assets, the type of security, financial guarantees and enhancements, the nature of the collateral and the sponsor organization. |
| D. | Distributions -Dividends and distributions to shareholders, which are determined in accordance with income tax regulations and may differ from accounting principles generally accepted in the United States of America (“GAAP”), are recorded on theex-dividend date. Income and capital gain distributions, if any, are declared and paid annually or at other times as determined necessary by the Adviser. |
| E. | Federal Income Taxes -The Fund intends to comply with provisions of the Internal Revenue Code applicable to regulated investment companies and to distribute substantially all of its investment company taxable income, including any net realized gain on investments not offset by capital loss carryforwards, if any, to shareholders. Therefore, no federal income or excise tax provision is required. The Fund files income tax returns in U.S. federal and applicable state jurisdictions. The statute of limitations on the Fund’s tax return filings generally remains open for the three preceding fiscal reporting period ends. The Fund has analyzed its tax positions for the fiscal year ended October 31, 2019, including open tax years, and does not believe there are any uncertain tax positions requiring recognition in the Fund’s financial statements. |
The tax components of capital shown in the following table represent distribution requirements the Fund must satisfy under the income tax regulations, losses the Fund may be able to offset against income and gains realized in future years and unrealized appreciation or depreciation of securities and other investments for federal income tax purposes.
36 INVESCO OPPENHEIMER EMERGING MARKETS INNOVATORS FUND
| | | | | | | | | | | | |
Undistributed Net Investment Income | | Undistributed
Long-Term
Gain | | | Accumulated
Loss
Carryforward1,2,3 | | | Net Unrealized
Appreciation
Based on cost of
Securities and
Other Investments
for Federal Income
Tax Purposes | |
| |
| $— | | | $— | | | | $65,369,315 | | | | $103,451,439 | |
1.At period end, the Fund had $65,369,315 of net capital loss carryforward available to offset future realized capital gains, if any, and thereby reduce future taxable gain distributions.
2.During the reporting period, the Fund utilized $11,297,245 of capital loss carryforward to offset capital gains realized in that fiscal year.
3.During the previous reporting period, the Fund did not utilize any capital loss carryforward.
Net investment income (loss) and net realized gain (loss) may differ for financial statement and tax purposes. The character of dividends and distributions made during the fiscal year from net investment income or net realized gains are determined in accordance with federal income tax requirements, which may differ from the character of net investment income or net realized gains presented in those financial statements in accordance with U.S. GAAP. Also, due to timing of dividends and distributions, the fiscal year in which amounts are distributed may differ from the fiscal year in which the income or net realized gain was recorded by the Fund.
Accordingly, the following amounts have been reclassified for the reporting period. Net assets of the Fund were unaffected by the reclassifications.
| | | | |
Reduction toPaid-in Capital | | Increase
to Accumulated Net
Earnings | |
| |
| $766,463 | | | $766,463 | |
The tax character of distributions paid during the reporting periods:
| | | | | | | | | | | | |
| | | Two Months Ended
October 31, 2019 | | | Year Ended
August 31, 2019 | | | Year Ended
August 31, 2018 | |
| |
Distributions paid from: | | | | | | | | | | | | |
Ordinary income | | $ | — | | | $ | — | | | $ | 1,183,274 | |
The aggregate cost of securities and other investments and the composition of unrealized appreciation and depreciation of securities and other investments for federal income tax purposes at period end are noted in the following table. The primary difference between book and tax appreciation or depreciation of securities and other investments, if applicable, is attributable to the tax deferral of losses or tax realization of financial statement unrealized gain or loss.
37 INVESCO OPPENHEIMER EMERGING MARKETS INNOVATORS FUND
NOTES TO FINANCIAL STATEMENTSContinued
| | | | |
Federal tax cost of securities | | $ | 520,165,211 | |
Federal tax cost of other investments | | | 762,319 | |
| | | | |
Total federal tax cost | | $ | 520,927,530 | |
| | | | |
Gross unrealized appreciation | | $ | 125,139,812 | |
Gross unrealized depreciation | | | (21,688,373 | ) |
| | | | |
Net unrealized appreciation | | $ | 103,451,439 | |
| | | | |
Certain foreign countries impose a tax on capital gains which is accrued by the Fund based on unrealized appreciation, if any, on affected securities. The tax is paid when the gain is realized.
| F. | Expenses -Fees provided for under the Rule12b-1 plan of a particular class of the Fund are charged to the operations of such class. Transfer agency fees and expenses and other shareholder recordkeeping fees and expenses attributable to Class R5 and Class R6 are allocated to each share class based on relative net assets.Sub-accounting fees attributable to Class R5 are charged to the operations of the class. Transfer agency fees and expenses and other shareholder recordkeeping fees and expenses relating to all other classes are allocated among those classes based on relative net assets. All other expenses are allocated among the classes based on relative net assets. |
| G. | Accounting Estimates -The financial statements are prepared on a basis in conformity with GAAP, which requires management to make estimates and assumptions that affect the reported amounts of assets and liabilities at the date of the financial statements and the reported amounts of revenues and expenses during the reporting period including estimates and assumptions related to taxation. Actual results could differ from those estimates by a significant amount. In addition, the Fund monitors for material events or transactions that may occur or become known after theperiod-end date and before the date the financial statements are released to print. |
| H. | Indemnifications -Under the Trust’s organizational documents, each Trustee, officer, employee or other agent of the Trust is indemnified against certain liabilities that may arise out of the performance of their duties to the Fund. Additionally, in the normal course of business, the Fund enters into contracts, including the Fund’s servicing agreements, that contain a variety of indemnification clauses. The Fund’s maximum exposure under these arrangements is unknown as this would involve future claims that may be made against the Fund that have not yet occurred. The risk of material loss as a result of such indemnification claims is considered remote. |
| I. | Foreign Currency Translations -Foreign currency is valued at the close of the NYSE based on quotations posted by banks and major currency dealers. Portfolio securities and other assets and liabilities denominated in foreign currencies are translated into U.S. dollar amounts at the date of valuation. Purchases and sales of portfolio securities (net of foreign taxes withheld on disposition) and income items denominated in foreign currencies are translated into U.S. dollar amounts on the respective dates of such transactions. The Fund does not separately account for the portion of the results of operations resulting from changes in foreign exchange rates on investments and the fluctuations arising from |
38 INVESCO OPPENHEIMER EMERGING MARKETS INNOVATORS FUND
| | changes in market prices of securities held. The combined results of changes in foreign exchange rates and the fluctuation of market prices on investments (net of estimated foreign tax withholding) are included with the net realized and unrealized gain or loss from investments in the Statement of Operations. Reported net realized foreign currency gains or losses arise from (1) sales of foreign currencies, (2) currency gains or losses realized between the trade and settlement dates on securities transactions, and (3) the difference between the amounts of dividends, interest, and foreign withholding taxes recorded on the Fund’s books and the U.S. dollar equivalent of the amounts actually received or paid. Net unrealized foreign currency gains and losses arise from changes in the fair values of assets and liabilities, other than investments in securities at fiscal period end, resulting from changes in exchange rates. The Fund may invest in foreign securities, which may be subject to foreign taxes on income, gains on investments or currency repatriation, a portion of which may be recoverable. Foreign taxes, if any, are recorded based on the tax regulations and rates that exist in the foreign markets in which the Fund invests and are shown in the Statement of Operations. |
| J. | Forward Foreign Currency Contracts - The Fund may engage in foreign currency transactions either on a spot (i.e. for prompt delivery and settlement) basis, or through forward foreign currency contracts, to manage or minimize currency or exchange rate risk. |
The Fund may also enter into forward foreign currency contracts for the purchase or sale of a security denominated in a foreign currency in order to “lock in” the U.S. dollar price of that security, or the Fund may also enter into forward foreign currency contracts that do not provide for physical settlement of the two currencies, but instead are settled by a single cash payment calculated as the difference between the agreed upon exchange rate and the spot rate at settlement based upon an agreed upon notional amount(non-deliverable forwards). The Fund will set aside liquid assets in an amount equal to the dailymark-to-market obligation for forward foreign currency contracts.
A forward foreign currency contract is an obligation between two parties (“Counterparties”) to purchase or sell a specific currency for an agreed-upon price at a future date. The use of forward foreign currency contracts does not eliminate fluctuations in the price of the underlying securities the Fund owns or intends to acquire but establishes a rate of exchange in advance. Fluctuations in the value of these contracts are measured by the difference in the contract date and reporting date exchange rates and are recorded as unrealized appreciation (depreciation) until the contracts are closed. When the contracts are closed, realized gains (losses) are recorded. Realized and unrealized gains (losses) on the contracts are included in the Statement of Operations. The primary risks associated with forward foreign currency contracts include failure of the Counterparty to meet the terms of the contract and the value of the foreign currency changing unfavorably. These risks may be in excess of the amounts reflected in the Statement of Assets and Liabilities.
Note 2 – Advisory Fees and Other Fees Paid to Affiliates
The Trust has entered into a master investment advisory agreement with Invesco Advisers,
39 INVESCO OPPENHEIMER EMERGING MARKETS INNOVATORS FUND
NOTES TO FINANCIAL STATEMENTSContinued
Inc. (the “Adviser” or “Invesco”). Under the terms of the investment advisory agreement, the Fund accrues daily and pays monthly an advisory fee to the Adviser based on the annual rate of the Fund’s average daily net assets as follows:
| | | | |
Fee Schedule* | |
Up to $500 million | | | 1.15% | |
Next $500 million | | | 1.10 | |
Next $4 billion | | | 1.05 | |
Over $5 billion | | | 1.00 | |
*The advisory fee paid by the Fund shall be reduced by any amounts paid by the Fund under the administrative services agreement with the Adviser.
For the period ended October 31, 2019, the effective advisory fee incurred by the Fund was 1.12% annualized.
Under the terms of a mastersub-advisory agreement between the Adviser and each of Invesco Asset Management Deutschland GmbH, Invesco Asset Management Limited, Invesco Asset Management (Japan) Limited, Invesco Hong Kong Limited, Invesco Senior Secured Management, Inc. and Invesco Canada Ltd. and separatesub-advisory agreements with Invesco Capital Management LLC, and Invesco Asset Management (India) Private Limited (collectively, the “AffiliatedSub-Advisers”) the Adviser, not the Fund, will pay 40% of the fees paid to the Adviser to any such AffiliatedSub-Adviser(s) that provide(s) discretionary investment management services to the Fund based on the percentage of assets allocated to such AffiliatedSub-Adviser(s). Invesco has also entered into aSub-Advisory Agreement with OppenheimerFunds, Inc. to provide discretionary management services to the Funds.
Effective on the Reorganization Date, the Adviser has contractually agreed, through at least May 31, 2021, to waive advisory fees and/or reimburse expenses of all shares to the extent necessary to limit the total annual fund operating expenses after fee waiver and/or expense reimbursement (excluding certain items discussed below) of Class A, Class C, Class R, Class Y, Class R5 and Class R6 shares to 1.70%, 2.46%, 1.98%, 1.45%, 1.30% and 1.25%, respectively, of the Fund’s average daily net assets (the “expense limits”). In determining the Adviser’s obligation to waive advisory fees and/or reimburse expenses, the following expenses are not taken into account, and could cause total annual fund operating expenses after fee waivers and/or expense reimbursement to exceed the numbers reflected above: (1) interest; (2) taxes; (3) dividend expenses on short sales; (4) extraordinary ornon-routine items, including litigation expenses; and (5) expenses that the Fund has incurred but did not actually pay because of an expense offset arrangement. Unless Invesco continues the fee waiver agreement, it will terminate May 31, 2021. During its term, the fee waiver agreement cannot be terminated or amended to increase the expense limits or reduce the advisory fee waiver without approval of the Board of Trustees.
Further, the Adviser has contractually agreed, through at least June 30, 2021, to waive the advisory fee payable by the Fund in an amount equal to 100% of the net advisory fees the Adviser receives from the affiliated money market funds on investments by the Fund of uninvested cash in such affiliated money market funds.
For the period ended October 31, 2019, the Adviser waived advisory fees of $7,614 and reimbursed fund expenses of $3,543 for Class R6.
40 INVESCO OPPENHEIMER EMERGING MARKETS INNOVATORS FUND
The Trust has entered into a master administrative services agreement with Invesco pursuant to which the Fund has agreed to pay Invesco for certain administrative costs incurred in providing accounting services to the Fund. For the period ended October 31, 2019, expenses incurred under the agreement are shown in the Statement of Operations as Administration fees. Additionally, Invesco has entered into service agreements whereby JPMorgan Chase Bank serves as custodian to the Fund. Prior to the Reorganization, the Acquired Fund paid administrative fees to OFI Global Asset Management, Inc.
The Trust has entered into a transfer agency and service agreement with Invesco Investment Services, Inc. (“IIS”) pursuant to which the Fund has agreed to pay IIS a fee for providing transfer agency and shareholder services to the Fund and reimburse IIS for certain expenses incurred by IIS in the course of providing such services. IIS may make payments to intermediaries that provide omnibus account services,sub-accounting services and/or networking services. All fees payable by IIS to intermediaries that provide omnibus account services orsub-accounting services are charged back to the Fund, subject to certain limitations approved by the Trust’s Board of Trustees. Prior to the Reorganization, the Acquired Fund paid transfer agent fees to OFI Global Asset Management, Inc. and Shareholder Services, Inc. For the periodended October 31, 2019, expenses incurred under these agreements are shown in the Statement of Operations as Transfer and shareholder servicing agent fees.
The Trust has entered into master distribution agreements with Invesco Distributors, Inc. (“IDI”) to serve as the distributor for the Class A, Class C, Class R, Class Y, Class R5 and Class R6 shares of the Fund. The Trust has adopted plans pursuant to Rule12b-1 under the 1940 Act with respect to the Fund’s Class A, Class C and Class R shares(collectively the “Plan”). The Fund, pursuant to the Class A Plan, reimburses IDI in an amount up to an annual rate of 0.25% of the average daily net assets of Class A shares. The Fund pursuant to the Class C and Class R Plan, pays IDI compensation at the annual rate of 1.00% of the average daily net assets of Class C shares and 0.50% of the average daily net assets of Class R shares. The fees are accrued daily and paid monthly. Of the Plan payments, up to 0.25% of the average daily net assets of each class of shares may be paid to furnish continuing personal shareholder services to customers who purchase and own shares of such classes. Any amounts not paid as a service fee under the Plan would constitute an asset-based sales charge. Rules of the Financial Industry Regulatory Authority (“FINRA”) impose a cap on the total sales charges, including asset-based sales charges, that may be paid by any class of shares of the Fund plans. Prior to the Reorganization, the Acquired Fund paid distribution fees to OppenheimerFunds Distributor, Inc. For the period ended October 31, 2019, expenses incurred under the plans are shown in the Statement of Operations as Distribution and service plan fees.
Front-end sales commissions and CDSC (collectively, the “sales charges”) are not recorded as expenses of the Fund.Front-end sales commissions are deducted from proceeds from the sales of Fund shares prior to investment in Class A shares of the Fund. CDSC are deducted from redemption proceeds prior to remittance to the shareholder. During the period ended October 31, 2019, IDI advised the Fund that IDI retained $5,771 infront-end sales commissions from the sale of Class A shares and $1,852 and $239 from Class A and Class C shares, respectively, for CDSC imposed on redemptions by shareholders.
Certain officers and trustees of the Trust are officers and directors of the Adviser, IIS and/or
41 INVESCO OPPENHEIMER EMERGING MARKETS INNOVATORS FUND
NOTES TO FINANCIAL STATEMENTSContinued
IDI.
Note 3 – Additional Valuation Information
GAAP defines fair value as the price that would be received to sell an asset or paid to transfer a liability in an orderly transaction between market participants at the measurement date, under current market conditions. GAAP establishes a hierarchy that prioritizes the inputs to valuation methods, giving the highest priority to readily available unadjusted quoted prices in an active market for identical assets (Level 1) and the lowest priority to significant unobservable inputs (Level 3), generally when market prices are not readily available or are unreliable. Based on the valuation inputs, the securities or other investments are tiered into one of three levels. Changes in valuation methods may result in transfers in or out of an investment’s assigned level:
Level 1 — Prices are determined using quoted prices in an active market for identical assets.
Level 2 — Prices are determined using other significant observable inputs. Observable inputs are inputs that other market participants may use in pricing a security. These may include quoted prices for similar securities, interest rates, prepayment speeds, credit risk, yield curves, loss severities, default rates, discount rates, volatilities and others.
Level 3 — Prices are determined using significant unobservable inputs. In situations where quoted prices or observable inputs are unavailable (for example, when there is little or no market activity for an investment at the end of the period), unobservable inputs may be used. Unobservable inputs reflect the Fund’s own assumptions about the factors market participants would use in determining fair value of the securities or instruments and would be based on the best available information.
The following is a summary of the tiered valuation input levels, as of October 31, 2019. The level assigned to the securities valuations may not be an indication of the risk or liquidity associated with investing in those securities. Because of the inherent uncertainties of valuation, the values reflected in the financial statements may materially differ from the value received upon actual sale of those investments.
| | | | | | | | | | | | | | | | |
| | | Level 1—
Unadjusted
Quoted Prices | | | Level 2— Other Significant
Observable Inputs | | | Level 3—
Significant
Unobservable
Inputs | | | Value |
| |
Assets Table | | | | | | | | | | | | | | | | |
Investments, at Value: | | | | | | | | | | | | | | | | |
Common Stocks | | | | | | | | | | | | | | | | |
Consumer Discretionary | | $ | 106,664,343 | | | $ | 77,789,071 | | | $ | 0 | | | $ | 184,453,414 | |
Consumer Staples | | | 6,814,040 | | | | 15,128,958 | | | | — | | | | 21,942,998 | |
Financials | | | 25,524,507 | | | | 74,759,992 | | | | — | | | | 100,284,499 | |
Health Care | | | 9,309,163 | | | | 64,505,753 | | | | 2,122,445 | | | | 75,937,361 | |
Industrials | | | 7,055,174 | | | | 76,176,189 | | | | — | | | | 83,231,363 | |
Information Technology | | | 37,574,559 | | | | 76,563,928 | | | | — | | | | 114,138,487 | |
Materials | | | — | | | | 7,331,525 | | | | — | | | | 7,331,525 | |
42 INVESCO OPPENHEIMER EMERGING MARKETS INNOVATORS FUND
| | | | | | | | | | | | | | | | |
| | | Level 1—
Unadjusted
Quoted Prices | | | Level 2— Other Significant
Observable Inputs | | | Level 3—
Significant
Unobservable
Inputs | | | Value |
| |
Common Stocks (Continued) | | | | | | | | | | | | | | | | |
Investment Company | | $ | 38,085,651 | | | $ | — | | | $ | — | | | $ | 38,085,651 | |
| | | | |
Total Assets | | $ | 231,027,437 | | | $ | 392,255,416 | | | $ | 2,122,445 | | | $ | 625,405,298 | |
| | | | |
Note 4 – Trustee and Officer Fees and Benefits
Certain Trustees have executed a Deferred Compensation Agreement pursuant to which they have the option to elect to defer receipt of all or a portion of the annual compensation they are entitled to receive from the Fund. For purposes of determining the amount owed to the Trustees under the plan, deferred amounts are treated as though equal dollar amounts had been invested in shares of the Fund or in other Invesco and/or Invesco Oppenheimer funds selected by the Trustees. The Fund purchases shares of the funds selected for deferral by the Trustees in amounts equal to his or her deemed investment, resulting in a Fund asset equal to the deferred compensation liability. Such assets are included as a component of “Other” within the asset section of the Statement of Assets and Liabilities. Deferral of Trustees’ fees under the plan will not affect the net assets of the Fund and will not materially affect the Fund’s assets, liabilities or net investment income per share. Amounts will be deferred until distributed in accordance with the compensation deferral plan.
Note 5 – Cash Balances
The Fund is permitted to temporarily carry a negative or overdrawn balance in its account with JPMorgan Chase Bank, the custodian bank. Such balances, if any atperiod-end, are shown in the Statement of Assets and Liabilities under the payable caption Amount due to custodian. To compensate the custodian bank for such overdrafts, the overdrawn Fund may either (1) leave funds as a compensating balance in the account so the custodian bank can be compensated by earning the additional interest; or (2) compensate by paying the custodian bank at a rate agreed upon by the custodian bank and Invesco, not to exceed the contractually agreed upon rate.
Note 6 – Investment Transactions
The aggregate amount of investment securities (other than short-term securities, U.S. Treasury obligations and money market funds, if any) purchased and sold by the Fund during the period ended October 31, 2019 was $115,817,976 and $123,039,182, respectively.
Note 7 – Share Information
Transactions in shares of beneficial interest were as follows:
43 INVESCO OPPENHEIMER EMERGING MARKETS INNOVATORS FUND
NOTES TO FINANCIAL STATEMENTSContinued
| | | | | | | | | | | | | | | | | | | | | | | | |
| | | Two Months Ended October | | | Year Ended August 31, | | | Year Ended August 31, | |
| | | Shares | | | 31, 20191
Amount | | | Shares | | | 20192 Amount | | | Shares | | | 2018 Amount | |
| |
Class A | | | | | | | | | | | | | | | | | | | | | | | | |
Sold | | | 215,833 | | | $ | 2,144,231 | | | | 2,831,685 | | | $ | 27,135,496 | | | | 6,491,611 | | | $ | 74,827,295 | |
Automatic conversion Class C to Class A Shares | | | 67,125 | | | | 671,440 | | | | — | | | | — | | | | — | | | | — | |
Dividends and/or distributions reinvested | | | — | | | | — | | | | — | | | | — | | | | 17,794 | | | | 197,154 | |
Redeemed | | | (394,543 | ) | | | (3,992,607 | ) | | | (4,065,625 | ) | | | (39,430,710 | ) | | | (5,008,718 | ) | | | (56,618,272) | |
| | | | |
Net increase (decrease) | | | (111,585 | ) | | $ | (1,176,936 | ) | | | (1,233,940 | ) | | $ | (12,295,214 | ) | | | 1,500,687 | | | $ | 18,406,177 | |
| | | | |
|
| |
Class C | | | | | | | | | | | | | | | | | | | | | | | | |
Sold | | | 37,728 | | | $ | 365,110 | | | | 675,184 | | | $ | 6,281,216 | | | | 1,727,382 | | | $ | 19,365,900 | |
Dividends and/or distributions reinvested | | | — | | | | — | | | | — | | | | — | | | | — | | | | — | |
Automatic conversion Class C to Class A Shares | | | (69,640 | ) | | | (671,440 | ) | | | — | | | | — | | | | — | | | | — | |
Redeemed | | | (138,315 | ) | | | (1,337,330 | ) | | | (1,649,989 | ) | | | (15,436,675 | ) | | | (839,009 | ) | | | (9,195,722) | |
| | | | |
Net increase (decrease) | | | (170,227 | ) | | $ | (1,643,660 | ) | | | (974,805 | ) | | $ | (9,155,459 | ) | | | 888,373 | | | $ | 10,170,178 | |
| | | | |
|
| |
Class R | | | | | | | | | | | | | | | | | | | | | | | | |
Sold | | | 26,562 | | | $ | 264,114 | | | | 298,488 | | | $ | 2,854,027 | | | | 449,968 | | | $ | 5,094,935 | |
Dividends and/or distributions reinvested | | | — | | | | — | | | | — | | | | — | | | | 310 | | | | 3,408 | |
Redeemed | | | (19,331 | ) | | | (191,038 | ) | | | (195,415 | ) | | | (1,861,249 | ) | | | (121,838 | ) | | | (1,361,958) | |
| | | | |
Net increase | | | 7,231 | | | $ | 73,076 | | | | 103,073 | | | $ | 992,778 | | | | 328,440 | | | $ | 3,736,385 | |
| | | | |
|
| |
Class Y | | | | | | | | | | | | | | | | | | | | | | | | |
Sold | | | 354,784 | | | $ | 3,603,679 | | | | 9,320,886 | | | $ | 88,483,577 | | | | 14,401,215 | | | $ | 166,676,312 | |
Dividends and/or distributions reinvested | | | — | | | | — | | | | — | | | | — | | | | 73,150 | | | | 814,890 | |
Redeemed | | | (1,139,324 | ) | | | (11,559,404 | ) | | | (14,855,717 | ) | | | (142,377,611 | ) | | | (5,562,480 | ) | | | (62,870,039) | |
| | | | |
Net increase (decrease) | | | (784,540 | ) | | $ | (7,955,725 | ) | | | (5,534,831 | ) | | $ | (53,894,034 | ) | | | 8,911,885 | | | $ | 104,621,163 | |
| | | | |
44 INVESCO OPPENHEIMER EMERGING MARKETS INNOVATORS FUND
| | | | | | | | | | | | | | | | | | | | | | | | |
| | | Two Months Ended October | | | Year Ended August 31, | | | Year Ended August 31, | |
| | | Shares | | | 31, 20191
Amount | | | Shares | | | 20192 Amount | | | Shares | | | 2018 Amount | |
| |
Class R53 | | | | | | | | | | | | | | | | | | | | | | | | |
Sold | | | — | | | $ | — | | | | 1,049 | | | $ | 10,000 | | | | — | | | $ | — | |
Dividends and/or distributions reinvested | | | — | | | | — | | | | — | | | | — | | | | — | | | | — | |
Redeemed | | | — | | | | — | | | | — | | | | — | | | | — | | | | — | |
| | | | |
Net increase | | | — | | | $ | — | | | | 1,049 | | | $ | 10,000 | | | | — | | | $ | — | |
| | | | |
|
| |
Class R6 | | | | | | | | | | | | | | | | | | | | | | | | |
Sold | | | 242,449 | | | $ | 2,459,925 | | | | 20,331,432 | | | $ | 191,144,970 | | | | 8,020,236 | | | $ | 91,304,613 | |
Dividends and/or distributions reinvested | | | — | | | | — | | | | — | | | | — | | | | 13,686 | | | | 153,282 | |
Redeemed | | | (338,100 | ) | | | (3,454,147 | ) | | | (2,667,474 | ) | | | (26,119,068 | ) | | | (209,593 | ) | | | (2,405,910) | |
| | | | |
Net increase (decrease) | | | (95,651 | ) | | $ | (994,222 | ) | | | 17,663,958 | | | $ | 165,025,902 | | | | 7,824,329 | | | $ | 89,051,985 | |
| | | | |
1.There are entities that are record owners of more than 5% of the outstanding shares of the Fund and own 31% of the outstanding shares of the Fund. IDI has an agreement with these entities to sell Fund shares. The Fund, Invesco and/or Invesco affiliates may make payments to these entities, which are considered to be related to the Fund, for providing services to the Fund, Invesco and/or Invesco affiliates, including but not limited to services such as securities brokerage, distribution, third party record keeping and account servicing. The Fund has no knowledge as to whether all or any portion of the shares owned of record by these entities are also owned beneficially.
In addition, 26% of the outstanding shares of the Fund are owned by the Adviser or an affiliate of the Adviser.
2.There are entities that are record owners of more than 5% of the outstanding shares of the Fund and own 31% of the outstanding shares of the Fund. IDI has an agreement with these entities to sell Fund shares. The Fund, Invesco and/or Invesco affiliates may make payments to these entities, which are considered to be related to the Fund, for providing services to the Fund, Invesco and/or Invesco affiliates, including but not limited to services such as securities brokerage, distribution, third party record keeping and account servicing. The Fund has no knowledge as to whether all or any portion of the shares owned of record by these entities are also owned beneficially.
In addition, 25% of the outstanding shares of the Fund are owned by the Adviser or an affiliate of the Adviser.
3. Commencement date after the close of business on May 24, 2019.
45 INVESCO OPPENHEIMER EMERGING MARKETS INNOVATORS FUND
REPORT OF INDEPENDENT REGISTERED PUBLIC ACCOUNTING FIRM
To the Board of Trustees of AIM Investment Funds (Invesco Investment Funds) and Shareholders of Invesco Oppenheimer Emerging Markets Innovators Fund
Opinion on the Financial Statements
We have audited the accompanying statement of assets and liabilities, including the schedule of investments, of Invesco Oppenheimer Emerging Markets Innovators Fund (one of the funds constituting AIM Investment Funds (Invesco Investment Funds), referred to hereafter as the “Fund”) as of October 31, 2019, the related statements of operations and of changes in net assets for each of the periods indicated in the table below, including the related notes, and the financial highlights for each of the periods indicated in the table below (collectively referred to as the “financial statements”). In our opinion, the financial statements present fairly, in all material respects, the financial position of the Fund as of October 31, 2019, the results of its operations, the changes in its net assets and the financial highlights for each of the periods indicated in the table below, in conformity with accounting principles generally accepted in the United States of America.
| | |
Statement of Operations and Statement of Changes in Net Assets | | Financial Highlights |
| For the period from September 1, 2019 through October 31, 2019 and the year ended August 31, 2019 | | For the period from September 1, 2019 through October 31, 2019 and the year ended August 31, 2019 for Class A, Class C, Class R, Class Y and Class R6 |
| | |
| | | For the period from September 1, 2019 through October 31, 2019 and the period from May 24, 2019 (inception of offering) through August 31, 2019 for Class R5 |
The financial statements of Invesco Oppenheimer Emerging Markets Innovators Fund (formerly known as Oppenheimer Emerging Markets Innovators Fund) as of and for the year ended August 31, 2018 and the financial highlights for each of the periods ended on or prior to August 31, 2018 (not presented herein, other than the statement of changes in net assets and the financial highlights) were audited by other auditors whose report dated October 25, 2018 expressed an unqualified opinion on those financial statements and financial highlights.
Basis for Opinion
These financial statements are the responsibility of the Fund’s management. Our responsibility is to express an opinion on the Fund’s financial statements based on our audits. We are a public accounting firm registered with the Public Company Accounting Oversight Board (United States) (PCAOB) and are required to be independent with respect to the Fund in accordance with the U.S. federal securities laws and the applicable rules and regulations of the Securities and Exchange Commission and the PCAOB.
We conducted our audits of these financial statements in accordance with the standards of the PCAOB. Those standards require that we plan and perform the audit to obtain reasonable assurance about whether the financial statements are free of material misstatement, whether due to error or fraud.
46 INVESCO OPPENHEIMER EMERGING MARKETS INNOVATORS FUND
Our audits included performing procedures to assess the risks of material misstatement of the financial statements, whether due to error or fraud, and performing procedures that respond to those risks. Such procedures included examining, on a test basis, evidence regarding the amounts and disclosures in the financial statements. Our audits also included evaluating the accounting principles used and significant estimates made by management, as well as evaluating the overall presentation of the financial statements. Our procedures included confirmation of securities owned as of October 31, 2019 by correspondence with the custodian, transfer agent and brokers; when replies were not received from brokers, we performed other auditing procedures. We believe that our audits provide a reasonable basis for our opinion.
/s/PricewaterhouseCoopers LLP
Houston, Texas
December 23, 2019
We have served as the auditor of one or more of the investment companies in the Invesco group of investment companies since at least 1995. We have not been able to determine the specific year we began serving as auditor.
47 INVESCO OPPENHEIMER EMERGING MARKETS INNOVATORS FUND
FEDERAL INCOME TAX INFORMATION
In early 2019, if applicable, shareholders of record received information regarding all dividends and distributions paid to them by the Fund during calendar year 2018.
None of the dividends paid by the Fund during the reporting period are eligible for the corporate dividend-received deduction.
Dividends, if any, paid by the Fund during the reporting period which are not designated as capital gain distributions, may be eligible for lower individual income tax rates to the extent that the Fund has received qualified dividend income as stipulated by recent tax legislation. In early 2019, shareholders of record received information regarding the percentage of distributions that are eligible for lower individual income tax rates. The amount will be the maximum amount allowed.
A portion, if any, of the dividends paid by the Fund during the reporting period which are not designated as capital gain distributions are eligible for lower individual income tax rates to the extent that the Fund has received qualified dividend income as stipulated by recent tax legislation. The maximum amount allowable but not less than $63,277 of the Fund’s fiscal year taxable income may be eligible for the lower individual income tax rates. In early 2019, shareholders of record received information regarding the percentage of distributions that are eligible for lower individual income tax rates.
The foregoing information is presented to assist shareholders in reporting distributions received from the Fund to the Internal Revenue Service. Because of the complexity of the federal regulations which may affect your individual tax return and the many variations in state and local tax regulations, we recommend that you consult your tax advisor for specific guidance.
48 INVESCO OPPENHEIMER EMERGING MARKETS INNOVATORS FUND
PORTFOLIO PROXY VOTING POLICIES AND GUIDELINES;
UPDATES TO SCHEDULE OF INVESTMENTS
Go paperless with eDelivery
Visit invesco.com/edelivery to enjoy the convenience and security of anytime electronic access to your investment documents.
With eDelivery, you can elect to have any or all of the following materials delivered straight to your inbox to download, save and print from your own computer:
● Fund reports and prospectuses
● Quarterly statements
● Daily confirmations
● Tax forms
Invesco mailing information
Send general correspondence to Invesco Investment Services, Inc., P.O. Box 219078, Kansas City, MO 64121-9078.
Important notice regarding delivery of security holder documents
To reduce Fund expenses, only one copy of most shareholder documents may be mailed to shareholders with multiple accounts at the same address (Householding). Mailing of your shareholder documents may be householded indefinitely unless you instruct us otherwise. If you do not want the mailing of these documents to be combined with those for other members of your household, please contact Invesco Investment Services, Inc. at 800 959 4246 or contact your financial institution. We will begin sending you individual copies for each account within 30 days after receiving your request.
Fund holdings and proxy voting information
The Fund provides a complete list of its holdings four times in each fiscal year, at the quarter ends. For the second and fourth quarters, the lists appear in the Fund’s semiannual and annual reports to shareholders. For the first and third quarters, the Fund files the lists with the Securities and Exchange Commission (SEC) as an exhibit to its reports on FormN-PORT. The most recent list of portfolio holdings is available at invesco.com/completeqtrholdings. Shareholders can also look up the Fund’s FormsN-PORT on the SEC website at sec.gov.
A description of the policies and procedures that the Fund uses to determine how to vote proxies relating to portfolio securities is available without charge, upon request, from our Client Services department at 800 959 4246 or at invesco.com/proxyguidelines. The information is also available on the SEC website, sec.gov.
Information regarding how the Fund voted proxies related to its portfolio securities during the most recent12-month period ended June 30 is available at invesco.com/proxysearch. The information is also available on the SEC website, sec.gov.
Invesco Advisers, Inc. is an investment adviser; it provides investment advisory services to individual and institutional clients and does not sell securities. Invesco Distributors, Inc. is the US distributor for Invesco Ltd.’s retail mutual funds, exchange-traded funds and institutional money market funds. Both are wholly owned, indirect subsidiaries of Invesco Ltd.
49 INVESCO OPPENHEIMER EMERGING MARKETS INNOVATORS FUND
TRUSTEES AND OFFICERS
The address of each trustee and officer is AIM Investments Funds (Invesco Investment Funds) (the “Trust”), 11 Greenway Plaza, Suite 1000, Houston, Texas 77046-1173. The trustees serve for the life of the Trust, subject to their earlier death, incapacitation, resignation, retirement or removal as more specifically provided in the Trust’s organizational documents. Each officer serves for a one year term or until their successors are elected and qualified. Column two below includes length of time served with predecessor entities, if any.
| | | | | | | | |
| | | | | |
Name, Year of Birth and Position(s) Held with the Trust | | Trustee
and/or
Officer
Since | | Principal Occupation(s) During Past 5 Years | | Number of Funds in Fund Complex
Overseen by Trustee | | Other Directorship(s)
Held by Trustee During Past 5 Years |
INTERESTED PERSONS | | | | | | | | |
| | | | | |
Martin L. Flanagan1— 1960 Trustee and Vice Chair | | 2007 | | Executive Director, Chief Executive Officer and President, Invesco Ltd. (ultimate parent of Invesco and a global investment management firm); Trustee and Vice Chair, The Invesco Funds; Vice Chair, Investment Company Institute; and Member of Executive Board, SMU Cox School of Business Formerly: Advisor to the Board, Invesco Advisers, Inc. (formerly known as Invesco Institutional (N.A.), Inc.); Chairman and Chief Executive Officer, Invesco Advisers, Inc. (registered investment adviser); Director, Chairman, Chief Executive Officer and President, Invesco Holding Company (US), Inc. (formerly IVZ Inc.) (holding company), Invesco Group Services, Inc. (service provider) and Invesco North American Holdings, Inc. (holding company); Director, Chief Executive Officer and President, Invesco Holding Company Limited (parent of Invesco and a global investment management firm); Director, Invesco Ltd.; Chairman, Investment Company Institute and President,Co-Chief Executive Officer,Co-President, Chief Operating Officer and Chief Financial Officer, Franklin Resources, Inc. (global investment management organization) | | 229 | | None |
| | | | | |
Philip A. Taylor2— 1954 Trustee | | 2006 | | Vice Chair, Invesco Ltd.; Trustee, The Invesco Funds | | 229 | | None |
| | | | Formerly: Director, Invesco Canada Ltd. (formerly known as Invesco Trimark Ltd./Invesco Trimark Ltèe) (registered investment adviser and registered transfer agent); Head of the Americas and Senior Managing Director, Invesco Ltd.; Director, Invesco Advisers, Inc. (formerly known as Invesco Institutional (N.A.), Inc.) (registered investment adviser); | | | | |
| |
1 Mr. Flanagan is considered an interested person (within the meaning of Section 2(a)(19) of the 1940 Act) of the Trust because he is an officer of the Adviser to the Trust, and an officer and a director of Invesco Ltd., ultimate parent of the Adviser. |
| |
2 Mr. Taylor is considered an interested person (within the meaning of Section 2(a)(19) of the 1940 Act) of the Trust because he is an officer of Invesco Ltd., ultimate parent of the Adviser. |
50 INVESCO OPPENHEIMER EMERGING MARKETS INNOVATORS FUND
| | | | | | | | |
Name, Year of Birth and Position(s) Held with the Trust | | Trustee
and/or
Officer
Since | | Principal Occupation(s) During Past 5 Years | | Number of Funds in Fund Complex
Overseen by Trustee | | Other Directorship(s)
Held by Trustee During Past 5 Years |
| | | | | |
| INTERESTED PERSONS (CONTINUED) | | | | | | | | |
| | | | | |
| Philip A. Taylor (Continued) | | | | Director and Chairman, Invesco Investment Services, Inc. (formerly known as Invesco AIM Investment Services, Inc.) (registered transfer agent); Chief Executive Officer, Invesco Corporate Class Inc. (corporate mutual fund company); Chairman and Chief Executive Officer, Invesco Canada Ltd. (formerly known as Invesco Trimark Ltd./Invesco Trimark Ltèe) (registered investment adviser and registered transfer agent); Senior Vice President, The Invesco Funds; Director, Invesco Investment Advisers LLC (formerly known as Van Kampen Asset Management); Director, Chairman, Chief Executive Officer and President, Invesco Management Group, Inc. (formerly known as Invesco AIM Management Group, Inc.) (financial services holding company);Co-Chairman,Co-President andCo-Chief Executive Officer, Invesco Advisers, Inc. (formerly known as Invesco Institutional (N.A.), Inc.) (registered investment adviser); Director, Chief Executive Officer and President, Van Kampen Exchange Corp; President and Principal Executive Officer, The Invesco Funds (other than AIM Treasurer’s Series Trust (Invesco Treasurer’s Series Trust), Short-Term Investments Trust and Invesco Management Trust); Executive Vice President, The Invesco Funds (AIM Treasurer’s Series Trust (Invesco Treasurer’s Series Trust), Short-Term Investments Trust and Invesco Management Trust only); Director and President, INVESCO Funds Group, Inc. (registered investment adviser and registered transfer agent); Director and Chairman, IVZ Distributors, Inc. (formerly known as INVESCO Distributors, Inc.) (registered broker dealer); Director, President and Chairman, Invesco Inc. (holding company), Invesco Canada Holdings Inc. (holding company), Trimark Investments Ltd./Placements Trimark Ltèe and Invesco Financial Services Ltd/Services Financiers Invesco Ltèe; Chief Executive Officer, Invesco Canada Fund Inc. (corporate mutual fund company); Director and Chairman, Van Kampen Investor Services Inc.; Director, Chief Executive Officer and President, 1371 Preferred Inc. (holding | | | | |
51 INVESCO OPPENHEIMER EMERGING MARKETS INNOVATORS FUND
TRUSTEES AND OFFICERSContinued
| | | | | | | | |
Name, Year of Birth and Position(s) Held with the Trust | | Trustee
and/or
Officer
Since | | Principal Occupation(s) During Past 5 Years | | Number of Funds in Fund Complex
Overseen by Trustee | | Other Directorship(s)
Held by Trustee During Past 5 Years |
| | | | | |
| INTERESTED PERSONS (CONTINUED) | | | | | | | | |
| | | | | |
| Philip A. Taylor (Continued) | | | | company) and Van Kampen Investments Inc.; Director and President, AIM GP Canada Inc. (general partner for limited partnerships) and Van Kampen Advisors, Inc.; Director and Chief Executive Officer, Invesco Trimark Dealer Inc. (registered broker dealer); Director, Invesco Distributors, Inc. (formerly known as Invesco AIM Distributors, Inc.) (registered broker dealer); Manager, Invesco Capital Management LLC; Director, Chief Executive Officer and President, Invesco Advisers, Inc.; Director, Chairman, Chief Executive Officer and President, Invesco AIM Capital Management, Inc.; President, Invesco Trimark Dealer Inc. and Invesco Trimark Ltd./Invesco Trimark Ltèe; Director and President, AIM Trimark Corporate Class Inc. and AIM Trimark Canada Fund Inc.; Senior Managing Director, Invesco Holding Company Limited; Director and Chairman, Fund Management Company (former registered broker dealer); President and Principal Executive Officer, The Invesco Funds (AIM Treasurer’s Series Trust (Invesco Treasurer’s Series Trust), and Short-Term Investments Trust only); President, AIM Trimark Global Fund Inc. and AIM Trimark Canada Fund Inc. | | | | |
52 INVESCO OPPENHEIMER EMERGING MARKETS INNOVATORS FUND
| | | | | | | | |
Name, Year of Birth and Position(s) Held with the Trust | | Trustee
and/or
Officer
Since | | Principal Occupation(s) During Past 5 Years | | Number of Funds in Fund Complex
Overseen by Trustee | | Other Directorship(s)
Held by Trustee During Past 5 Years |
INDEPENDENT TRUSTEES | | | | | | | | |
| | | | | |
Bruce L. Crockett – 1944 Trustee and Chair | | 2003 | | Chairman, Crockett Technologies Associates (technology consulting company) Formerly: Director, Captaris (unified messaging provider); Director, President and Chief Executive Officer, COMSAT Corporation; Chairman, Board of Governors of INTELSAT (international communications company); ACE Limited (insurance company); Independent Directors Council and Investment Company Institute: Member of the Audit Committee, Investment Company Institute; Member of the Executive Committee and Chair of the Governance Committee, Independent Directors Council | | 229 | | Director and Chairman of the Audit Committee, ALPS (Attorneys Liability Protection Society) (insurance company); Director and Member of the Audit Committee and Compensation Committee, Ferroglobe PLC (metallurgical company) |
| | | | | |
David C. Arch – 1945 Trustee | | 2010 | | Chairman of Blistex Inc. (consumer health care products manufacturer); Member, World Presidents’ Organization | | 229 | | Board member of the Illinois Manufacturers’ Association |
| | | | | |
Beth Ann Brown – 1968 Trustee | | 2019 | | Independent Consultant Formerly: Head of Intermediary Distribution, Managing Director, Strategic Relations, Managing Director, Head of National Accounts, Senior Vice President, National Account Manager and Senior Vice President, Key Account Manager, Columbia Management Investment Advisers LLC; Vice President, Key Account Manager, Liberty Funds Distributor, Inc.; and Trustee of certain Oppenheimer Funds | | 229 | | Director, Board of Directors of Caron Engineering Inc.; Advisor, Board of Advisors of Caron Engineering Inc.; President and Director, of Acton Shapleigh Youth Conservation Corps (non-profit); and Vice President and Director of Grahamtastic Connection (non-profit) |
| | | | | |
Jack M. Fields – 1952 Trustee | | 2003 | | Chief Executive Officer, Twenty First Century Group, Inc. (government affairs company); and Chairman, Discovery Learning Alliance(non-profit) Formerly: Owner and Chief Executive Officer, Dos Angeles Ranch L.P. (cattle, hunting, corporate entertainment); Director, Insperity, Inc. (formerly known as Administaff) (human resources provider); Chief Executive Officer, Texana Timber LP (sustainable forestry company); Director of Cross Timbers Quail Research Ranch(non-profit); and member of the U.S. House of Representatives | | 229 | | None |
53 INVESCO OPPENHEIMER EMERGING MARKETS INNOVATORS FUND
TRUSTEES AND OFFICERSContinued
| | | | | | | | |
Name, Year of Birth and Position(s) Held with the Trust | | Trustee
and/or
Officer
Since | | Principal Occupation(s) During Past 5 Years | | Number of Funds in Fund Complex
Overseen by Trustee | | Other Directorship(s)
Held by Trustee During Past 5 Years |
| | | | | |
| INDEPENDENT TRUSTEES (CONTINUED) | | | | | | | | |
| | | | | |
Cynthia Hostetler — 1962 Trustee | | 2017 | | Non-Executive Director and Trustee of a number of public and private business corporations Formerly: Director, Aberdeen Investment Funds (4 portfolios); Head of Investment Funds and Private Equity, Overseas Private Investment Corporation; President, First Manhattan Bancorporation, Inc.; Attorney, Simpson Thacher & Bartlett LLP | | 229 | | Vulcan Materials Company (construction materials company); Trilinc Global Impact Fund; Genesee & Wyoming, Inc. (railroads); Artio Global Investment LLC (mutual fund complex); Edgen Group, Inc. (specialized energy and infrastructure products distributor); Investment Company Institute (professional organization); Independent Directors Council (professional organization) |
| | | | | |
Eli Jones – 1961 Trustee | | 2016 | | Professor and Dean, Mays Business School - Texas A&M University Formerly: Professor and Dean, Walton College of Business, University of Arkansas and E.J. Ourso College of Business, Louisiana State University; Director, Arvest Bank | | 229 | | Insperity, Inc. (formerly known as Administaff) (human resources provider) |
| | | | | |
Elizabeth Krentzman – 1959 Trustee | | 2019 | | Formerly: Principal and Chief Regulatory Advisor for Asset Management Services and U.S. Mutual Fund Leader of Deloitte & Touche LLP; General Counsel of the Investment Company Institute (trade association); National Director of the Investment Management Regulatory Consulting Practice, Principal, Director and Senior Manager of Deloitte & Touche LLP; Assistant Director of the Division of Investment Management - Office of Disclosure and Investment Adviser Regulation of the U.S. Securities and Exchange Commission and various positions with the Division of Investment Management – Office of Regulatory Policy of the U.S. Securities and Exchange Commission; Associate at Ropes & Gray LLP.; Advisory Board Member of the Securities and Exchange Commission Historical Society; and Trustee of certain Oppenheimer Funds | | 229 | | Trustee of the University of Florida National Board Foundation and Audit Committee Member; Member of the Cartica Funds Board of Directors (private investment funds); Member of the University of Florida Law Center Association, Inc. Board of Trustees and Audit Committee Member |
54 INVESCO OPPENHEIMER EMERGING MARKETS INNOVATORS FUND
| | | | | | | | |
Name, Year of Birth and Position(s) Held with the Trust | | Trustee
and/or
Officer
Since | | Principal Occupation(s) During Past 5 Years | | Number of Funds in Fund Complex
Overseen by Trustee | | Other Directorship(s)
Held by Trustee During Past 5 Years |
| | | | | |
| INDEPENDENT TRUSTEES (CONTINUED) | | | | | | | | |
| | | | | |
Anthony J. LaCava, Jr. – 1956 Trustee | | 2019 | | Formerly: Director and Member of the Audit Committee, Blue Hills Bank (publicly traded financial institution) and Managing Partner, KPMG LLP | | 229 | | Blue Hills Bank; Chairman of Bentley University; Member, Business School Advisory Council; and Nominating Committee, KPMG LLP |
| | | | | |
Prema Mathai-Davis – 1950 Trustee | | 2003 | | Retired Co-Owner & Partner of Quantalytics Research, LLC, (a FinTech Investment Research Platform for the Self-Directed Investor) | | 229 | | None |
| | | | | |
Joel W. Motley – 1952 Trustee | | 2019 | | Director of Office of Finance, Federal Home Loan Bank; Member of the Vestry of Trinity Wall Street; Managing Director of Carmona Motley Hoffman, Inc. (privately held financial advisor); Member of the Finance and Budget Committee of the Council on Foreign Relations, Member of the Investment Committee and Board of Human Rights Watch and Member of the Investment Committee and Board of Historic Hudson Valley (non-profit cultural organization). Formerly: Managing Director of Public Capital Advisors, LLC (privately held financial advisor); Managing Director of Carmona Motley Hoffman, Inc. (privately held financial advisor); Trustee of certain Oppenheimer Funds; and Director of Columbia Equity Financial Corp. (privately held financial advisor) | | 229 | | Director of Greenwall Foundation (bioethics research foundation); Member of Board and Investment Committee of The Greenwall Foundation; Director of Southern Africa Legal Services Foundation; Board Member and Investment Committee Member of Pulitzer Center for Crisis Reporting(non-profit journalism) |
| | | | | |
Teresa M. Ressel — 1962 Trustee | | 2017 | | Non-executive director and trustee of a number of public and private business corporations Formerly: Chief Financial Officer, Olayan America, The Olayan Group (international investor/commercial/industrial); Chief Executive Officer, UBS Securities LLC; Group Chief Operating Officer, Americas, UBS AG; Assistant Secretary for Management & Budget and CFO, US Department of the Treasury | | 229 | | Atlantic Power Corporation (power generation company); ON Semiconductor Corp. (semiconductor supplier) |
| | | | | |
Ann Barnett Stern – 1957 Trustee | | 2017 | | President and Chief Executive Officer, Houston Endowment Inc. (private philanthropic institution) Formerly: Executive Vice President and General Counsel, Texas Children’s Hospital; | | 229 | | Federal Reserve Bank of Dallas |
55 INVESCO OPPENHEIMER EMERGING MARKETS INNOVATORS FUND
TRUSTEES AND OFFICERSContinued
| | | | | | | | |
Name, Year of Birth and Position(s) Held with the Trust | | Trustee
and/or
Officer
Since | | Principal Occupation(s) During Past 5 Years | | Number of Funds in Fund Complex
Overseen by Trustee | | Other Directorship(s)
Held by Trustee During Past 5 Years |
| | | | | |
| INDEPENDENT TRUSTEES (CONTINUED) | | | | | | | | |
| | | | | |
| Ann Barnett Stern (Continued) | | | | Attorney, Beck, Redden and Secrest, LLP; Business Law Instructor, University of St. Thomas; Attorney, Andrews & Kurth LLP | | | | |
| | | | | |
Raymond Stickel, Jr. – 1944 Trustee | | 2005 | | Retired Formerly: Director, Mainstay VP Series Funds, Inc. (25 portfolios); Partner, Deloitte & Touche | | 229 | | None |
| | | | | |
Robert C. Troccoli – 1949 Trustee | | 2016 | | Retired Formerly: Adjunct Professor, University of Denver – Daniels College of Business, Senior Partner, KPMG LLP | | 229 | | None |
| | | | | |
Daniel S. Vandivort – 1954 Trustee | | 2019 | | Treasurer, Chairman of the Audit and Finance Committee, and Trustee, Board of Trustees, Huntington Disease Foundation of America; and President, Flyway Advisory Services LLC (consulting and property management). Formerly: Trustee and Governance Chair, of certain Oppenheimer Funds | | 229 | | Chairman and Lead Independent Director, Chairman of the Audit Committee, and Director, Board of Directors, Value Line Funds |
| | | | | |
James D. Vaughn – 1945 Trustee | | 2019 | | Retired Formerly: Managing Partner, Deloitte & Touche LLP; Trustee and Chairman of the Audit Committee, Schroder Funds; Board Member, Mile High United Way, Boys and Girls Clubs, Boy Scouts, Colorado Business Committee for the Arts, Economic Club of Colorado and Metro Denver Network (economic development corporation); and Trustee of certain Oppenheimer Funds | | 229 | | Board member and Chairman of Audit Committee of AMG National Trust Bank; Trustee and Investment Committee member, University of South Dakota Foundation; Board member, Audit Committee Member and past Board Chair, Junior Achievement(non-profit) |
| | | | | |
Christopher L. Wilson – 1957 Trustee, Vice Chair and Chair Designate | | 2017 | | Retired Formerly: Director, TD Asset Management USA Inc. (mutual fund complex) (22 portfolios); Managing Partner, CT2, LLC (investing and consulting firm); President/Chief Executive Officer, Columbia Funds, Bank of America Corporation; President/Chief Executive Officer, CDC IXIS Asset Management Services, Inc.; Principal & Director of Operations, Scudder Funds, Scudder, Stevens & Clark, Inc.; Assistant Vice President, Fidelity Investments | | 229 | | ISO New England, Inc.(non-profit organization managing regional electricity market) |
56 INVESCO OPPENHEIMER EMERGING MARKETS INNOVATORS FUND
| | | | | | | | |
Name, Year of Birth and Position(s) Held with the Trust | | Trustee
and/or
Officer
Since | | Principal Occupation(s) During Past 5 Years | | Number of Funds in Fund Complex
Overseen by Trustee | | Other Directorship(s)
Held by Trustee During Past 5 Years |
| | | | | |
OTHER OFFICERS | | | | | | | | |
| | | | | |
Sheri Morris — 1964 President, Principal Executive Officer and Treasurer | | 2003 | | Head of Global Fund Services, Invesco Ltd.; President, Principal Executive Officer and Treasurer, The Invesco Funds; Vice President, Invesco Advisers, Inc. (formerly known as Invesco Institutional (N.A.), Inc.) (registered investment adviser); and Vice President, Invesco Exchange-Traded Fund Trust, Invesco Exchange-Traded Fund Trust II, Invesco India Exchange-Traded Fund Trust, Invesco Actively Managed Exchange-Traded Fund Trust, Invesco Actively Managed Exchange-Traded Commodity Fund Trust and Invesco Exchange-Traded Self-Indexed Fund Trust, and Vice President, OppenheimerFunds, Inc. | | N/A | | N/A |
| | | | | |
| | | | | Formerly: Vice President and Principal Financial Officer, The Invesco Funds; Vice President, Invesco AIM Advisers, Inc., Invesco AIM Capital Management, Inc. and Invesco AIM Private Asset Management, Inc.; Assistant Vice President and Assistant Treasurer, The Invesco Funds and Assistant Vice President, Invesco Advisers, Inc., Invesco AIM Capital Management, Inc. and Invesco AIM Private Asset Management, Inc.; and Treasurer, Invesco Exchange-Traded Fund Trust, Invesco Exchange-Traded Fund Trust II, Invesco India Exchange-Traded Fund Trust and Invesco Actively Managed Exchange-Traded Fund Trust | | | | |
| | | | | |
Russell C. Burk — 1958 Senior Vice President and Senior Officer | | 2005 | | Senior Vice President and Senior Officer, The Invesco Funds | | N/A | | N/A |
| | | | | |
Jeffrey H. Kupor – 1968 Senior Vice President, Chief Legal Officer and Secretary | | 2018 | | Head of Legal of the Americas, Invesco Ltd.; Senior Vice President and Secretary, Invesco Advisers, Inc. (formerly known as Invesco Institutional (N.A.), Inc.) (registered investment adviser); Senior Vice President and Secretary, Invesco Distributors, Inc. (formerly known as Invesco AIM Distributors, Inc.); Vice President and Secretary, Invesco Investment Services, Inc. (formerly known as Invesco AIM Investment Services, Inc.) Senior Vice President, Chief Legal Officer and Secretary, The Invesco Funds; Secretary and General Counsel, Invesco Investment Advisers LLC (formerly known as Van Kampen Asset Management); Secretary and General Counsel, Invesco Capital Markets, Inc. (formerly known as Van Kampen Funds Inc.) and Chief Legal | | N/A | | N/A |
57 ��INVESCO OPPENHEIMER EMERGING MARKETS INNOVATORS FUND
TRUSTEES AND OFFICERSContinued
| | | | | | | | |
Name, Year of Birth and Position(s) Held with the Trust | | Trustee
and/or
Officer
Since | | Principal Occupation(s) During Past 5 Years | | Number of Funds in Fund Complex
Overseen by Trustee | | Other Directorship(s)
Held by Trustee During Past 5 Years |
OTHER OFFICERS (CONTINUED) | | | | | | | | |
| | | | | |
| Jeffrey H. Kupor (Continued) | | | | Officer, Invesco Exchange-Traded Fund Trust, Invesco Exchange-Traded Fund Trust II, Invesco India Exchange-Traded Fund Trust, Invesco Actively Managed Exchange-Traded Fund Trust, Invesco Actively Managed Exchange-Traded Commodity Fund Trust and Invesco Exchange-Traded Self-Indexed Fund Trust; Secretary, Invesco Indexing LLC; Secretary, W.L. Ross & Co., LLC Formerly: Secretary and Vice President, Jemstep, Inc.; Head of Legal, Worldwide Institutional, Invesco Ltd.; Secretary and General Counsel, INVESCO Private Capital Investments, Inc.; Senior Vice President, Secretary and General Counsel, Invesco Management Group, Inc. (formerly known as Invesco AIM Management Group, Inc.); Assistant Secretary, INVESCO Asset Management (Bermuda) Ltd.; Secretary and General Counsel, Invesco Private Capital, Inc.; Assistant Secretary and General Counsel, INVESCO Realty, Inc.; Secretary and General Counsel, Invesco Senior Secured Management, Inc.; and Secretary, Sovereign G./P. Holdings Inc. | | | | |
| | | | | |
Andrew R. Schlossberg – 1974 Senior Vice President | | 2019 | | Head of the Americas and Senior Managing Director, Invesco Ltd.; Director and Senior Vice President, Invesco Advisers, Inc. (formerly known as Invesco Institutional (N.A.), Inc.) (registered investment adviser); Director and Chairman, Invesco Investment Services, Inc. (formerly known as Invesco AIM Investment Services, Inc.) (registered transfer agent); Senior Vice President, The Invesco Funds; Director, Invesco Investment Advisers LLC (formerly known as Van Kampen Asset Management); Director, President and Chairman, Invesco Insurance Agency, Inc. Formerly: Director, Invesco UK Limited; Director and Chief Executive, Invesco Asset Management Limited and Invesco Fund Managers Limited; Assistant Vice President, The Invesco Funds; Senior Vice President, Invesco Advisers, Inc. (formerly known as Invesco Institutional (N.A.), Inc.) (registered investment adviser); Director and Chief Executive, Invesco Administration Services | | N/A | | N/A |
58 INVESCO OPPENHEIMER EMERGING MARKETS INNOVATORS FUND
| | | | | | | | |
Name, Year of Birth and Position(s) Held with the Trust | | Trustee
and/or
Officer
Since | | Principal Occupation(s) During Past 5 Years | | Number of Funds in Fund Complex
Overseen by Trustee | | Other Directorship(s)
Held by Trustee During Past 5 Years |
| | | | | |
| OTHER OFFICERS (CONTINUED) | | | | | | | | |
| | | | | |
| Andrew R. Schlossberg (Continued) | | | | Limited and Invesco Global Investment Funds Limited; Director, Invesco Distributors, Inc.; Head of EMEA, Invesco Ltd.; President, Invesco Actively Managed Exchange-Traded Commodity Fund Trust, Invesco Actively Managed Exchange-Traded Fund Trust, Invesco Exchange-Traded Fund Trust, Invesco Exchange-Traded Fund Trust II and Invesco India Exchange-Traded Fund Trust; Managing Director and Principal Executive Officer, Invesco Capital Management LLC | | | | |
| | | | | |
John M. Zerr — 1962 Senior Vice President | | 2006 | | Chief Operating Officer of the Americas; Senior Vice President, Invesco Advisers, Inc. (formerly known as Invesco Institutional (N.A.), Inc.) (registered investment adviser); Senior Vice President, Invesco Distributors, Inc. (formerly known as Invesco AIM Distributors, Inc.); Director and Vice President, Invesco Investment Services, Inc. (formerly known as Invesco AIM Investment Services, Inc.) Senior Vice President, The Invesco Funds; Managing Director, Invesco Capital Management LLC; Director, Invesco Investment Advisers LLC (formerly known as Van Kampen Asset Management); Senior Vice President, Invesco Capital Markets, Inc. (formerly known as Van Kampen Funds Inc.); Manager, Invesco Indexing LLC; Manager, Invesco Specialized Products, LLC; Director and Senior Vice President, Invesco Insurance Agency, Inc.; Member, Invesco Canada Funds Advisory Board; Director, President and Chief Executive Officer, Invesco Corporate Class Inc. (corporate mutual fund company); and Director, Chairman, President and Chief Executive Officer, Invesco Canada Ltd. (formerly known as Invesco Trimark Ltd./Invesco Trimark Ltèe) (registered investment adviser and registered transfer agent) Formerly: Director and Senior Vice President, Invesco Management Group, Inc. (formerly known as Invesco AIM Management Group, Inc.); Secretary and General Counsel, Invesco Management Group, Inc. (formerly known as Invesco AIM Management Group, Inc.); Secretary, Invesco Investment Services, Inc. (formerly known as Invesco AIM Investment Services, Inc.); Chief Legal Officer and | | N/A | | N/A |
59 INVESCO OPPENHEIMER EMERGING MARKETS INNOVATORS FUND
TRUSTEES AND OFFICERSContinued
| | | | | | | | |
Name, Year of Birth and Position(s) Held with the Trust | | Trustee
and/or
Officer
Since | | Principal Occupation(s) During Past 5 Years | | Number of Funds in Fund Complex
Overseen by Trustee | | Other Directorship(s)
Held by Trustee During Past 5 Years |
| | | | | |
| OTHER OFFICERS (CONTINUED) | | | | | | | | |
| | | | | |
| John M. Zerr (Continued) | | | | Secretary, The Invesco Funds; Secretary and General Counsel, Invesco Investment Advisers LLC (formerly known as Van Kampen Asset Management); Secretary and General Counsel, Invesco Capital Markets, Inc. (formerly known as Van Kampen Funds Inc.); Chief Legal Officer, Invesco Exchange-Traded Fund Trust, Invesco Exchange-Traded Fund Trust II, Invesco India Exchange-Traded Fund Trust, Invesco Actively Managed Exchange-Traded Fund Trust, Invesco Actively Managed Exchange-Traded Commodity Fund Trust and Invesco Exchange-Traded Self-Indexed Fund Trust; Secretary, Invesco Indexing LLC; Director, Secretary, General Counsel and Senior Vice President, Van Kampen Exchange Corp.; Director, Vice President and Secretary, IVZ Distributors, Inc. (formerly known as INVESCO Distributors, Inc.); Director and Vice President, INVESCO Funds Group, Inc.; Director and Vice President, Van Kampen Advisors Inc.; Director, Vice President, Secretary and General Counsel, Van Kampen Investor Services Inc.; Director and Secretary, Invesco Distributors, Inc. (formerly known as Invesco AIM Distributors, Inc.); Director, Senior Vice President, General Counsel and Secretary, Invesco AIM Advisers, Inc. and Van Kampen Investments Inc.; Director, Vice President and Secretary, Fund Management Company; Director, Senior Vice President, Secretary, General Counsel and Vice President, Invesco AIM Capital Management, Inc.; Chief Operating Officer and General Counsel, Liberty Ridge Capital, Inc. (an investment adviser) | | | | |
| | | | | |
Gregory G. McGreevey - 1962 Senior Vice President | | 2012 | | Senior Managing Director, Invesco Ltd.; Director, Chairman, President, and Chief Executive Officer, Invesco Advisers, Inc. (formerly known as Invesco Institutional (N.A.), Inc.) (registered investment adviser); Director, Invesco Mortgage Capital, Inc. and Invesco Senior Secured Management, Inc.; and Senior Vice President, The Invesco Funds; and President, SNW Asset Management Corporation Formerly: Senior Vice President, Invesco | | N/A | | N/A |
60 INVESCO OPPENHEIMER EMERGING MARKETS INNOVATORS FUND
| | | | | | | | |
Name, Year of Birth and Position(s) Held with the Trust | | Trustee
and/or
Officer
Since | | Principal Occupation(s) During Past 5 Years | | Number of Funds in Fund Complex
Overseen by Trustee | | Other Directorship(s)
Held by Trustee During Past 5 Years |
| | | | | |
| OTHER OFFICERS (CONTINUED) | | | | | | | | |
| | | | | |
| Gregory G. McGreevey (Continued) | | | | Management Group, Inc. and Invesco Advisers, Inc.; Assistant Vice President, The Invesco Funds | | | | |
| | | | | |
Kelli Gallegos – 1970 Vice President, Principal Financial Officer and Assistant Treasurer | | 2008 | | Principal Financial and Accounting Officer – Investments Pool, Invesco Specialized Products, LLC; Vice President, Principal Financial Officer and Assistant Treasurer, The Invesco Funds; Principal Financial and Accounting Officer – Pooled Investments, Invesco Capital Management LLC; Vice President and Treasurer, Invesco Exchange-Traded Fund Trust, Invesco Exchange-Traded Fund Trust II, Invesco India Exchange-Traded Fund Trust, Invesco Actively Managed Exchange-Traded Fund Trust, Invesco Actively Managed Exchange-Traded Commodity Fund Trust and Invesco Exchange-Traded Self-Indexed Fund Trust Formerly: Assistant Treasurer, Invesco Specialized Products, LLC; Assistant Treasurer, Invesco Exchange-Traded Fund Trust, Invesco Exchange-Traded Fund Trust II, Invesco India Exchange-Traded Fund Trust, Invesco Actively Managed Exchange-Traded Fund Trust, Invesco Actively Managed Exchange-Traded Commodity Fund Trust and Invesco Exchange-Traded Self-Indexed Fund Trust; Assistant Treasurer, Invesco Capital Management LLC; Assistant Vice President, The Invesco Funds | | N/A | | N/A |
| | | | | |
Crissie M. Wisdom – 1969 Anti-Money Laundering Compliance Officer | | 2013 | | Anti-Money Laundering Compliance Officer, Invesco Advisers, Inc. (formerly known as Invesco Institutional (N.A.), Inc.) (registered investment adviser), Invesco Capital Markets, Inc. (formerly known as Van Kampen Funds Inc.), Invesco Distributors, Inc., Invesco Investment Services, Inc., The Invesco Funds, and Invesco Exchange-Traded Fund Trust, Invesco Exchange-Traded Fund Trust II, Invesco India Exchange-Traded Fund Trust, Invesco Actively Managed Exchange-Traded Fund Trust, Invesco Actively Managed Exchange-Traded Commodity Fund Trust and Invesco Exchange-Traded Self-Indexed Fund Trust; Anti-Money Laundering Compliance Officer and Bank Secrecy Act Officer, INVESCO National Trust Company and Invesco Trust Company; and Fraud Prevention Manager and | | N/A | | N/A |
61 INVESCO OPPENHEIMER EMERGING MARKETS INNOVATORS FUND
TRUSTEES AND OFFICERSContinued
| | | | | | | | |
Name, Year of Birth and Position(s) Held with the Trust | | Trustee
and/or
Officer
Since | | Principal Occupation(s) During Past 5 Years | | Number of Funds in Fund Complex
Overseen by Trustee | | Other Directorship(s)
Held by Trustee During Past 5 Years |
| | | | | |
| OTHER OFFICERS (CONTINUED) | | | | | | | | |
| | | | | |
Crissie M. Wisdom (Continued) | | | | Controls and Risk Analysis Manager for Invesco Investment Services, Inc. Formerly: Anti-Money Laundering Compliance Officer, Van Kampen Exchange Corp. and Invesco Management Group, Inc. | | | | |
| | | | | |
Robert R. Leveille – 1969 Chief Compliance Officer | | 2016 | | Chief Compliance Officer, Invesco Advisers, Inc. (registered investment adviser); and Chief Compliance Officer, The Invesco Funds Formerly: Chief Compliance Officer, Putnam Investments and the Putnam Funds | | N/A | | N/A |
The Statement of Additional Information of the Trust includes additional information about the Fund’s Trustees and is available upon request, without charge, by calling 1.800.959.4246. Please refer to the Fund’s Statement of Additional Information for information on the Fund’ssub-advisers.
| | | | | | |
| Office of the Fund | | Investment Adviser | | Distributor | | Auditors |
| 11 Greenway Plaza, | | Invesco Advisers, Inc. | | Invesco Distributors, Inc. | | PricewaterhouseCoopers |
| Suite 1000 | | 1555 Peachtree Street, N.E. | | 11 Greenway Plaza, | | LLP |
| Houston, TX 77046-1173 | | Atlanta, GA 30309 | | Suite 1000 | | 1000 Louisiana Street, |
| | | | Houston, TX | | Suite 5800 |
| | | | 77046-1173 | | Houston, TX 77002-5021 |
| Counsel to the Fund | | Counsel to the | | Transfer Agent | | Custodian |
| Stradley Ronon Stevens & Young, | | Independent Trustees | | Invesco Investment | | JPMorgan Chase Bank |
| LLP | | Goodwin Procter LLP | | Services, Inc. | | 4 Chase Metro Tech |
| 2005 Market Street, | | 901 New York Avenue, N.W. | | 11 Greenway Plaza, | | Center |
| Suite 2600 | | Washington, D.C. 20001 | | Suite 1000 | | Brooklyn, NY 11245 |
| Philadelphia, PA 19103-7018 | | | | Houston, TX | | |
| | | | 77046-1173 | | |
62 INVESCO OPPENHEIMER EMERGING MARKETS INNOVATORS FUND
Invesco recognizes the importance of protecting your personal and financial information when you visit our website located atwww.invesco.com (the “Website”). The following information is designed to help you understand the information collection practices at this Website. We will not sell, share or rent your personally identifiable information to others in contravention of this Privacy Policy. When we refer to ourselves as “we” or “Invesco” in this Privacy Policy, we mean our entire company including our affiliates, such as subsidiaries.
By visiting this Website, you are accepting the practices described in this Privacy Policy. If you do not agree to this policy, you may not use this Website. This Privacy Policy is subject to change without notice, from time to time in our sole discretion. You acknowledge that by accessing the Website after we have posted changes to this Privacy Policy, you are agreeing to this Privacy Policy as modified. Please review the Terms of Use1 to learn of other terms and conditions applicable to your use of the Website.
Please note that this Privacy Policy is not an exclusive statement of our privacy principles across all products and services. Other privacy principles or policies may apply depending on the products or services you obtain from Invesco, or the jurisdiction in which you transact with Invesco.
This Privacy Policy was last updated on May 6, 2018.
Information We Collect and Use
We collect personal information you choose to submit to the Website in order to process transactions requested by you and meet our contractual obligations. For example, you can choose to provide your name, contact information, social security number, or tax identification number in connection with accessing your account, or you can choose to provide your personal information when you fill out a secure account question form. Any information collected about you from the Website can, from time to time, be associated with other identifying information we have about you.
In addition, we may gather information about you automatically through your use of the Website, e.g. your IP address, how you navigate the Website, the organization from which you are accessing the Website, and the websites that you access before and after you visit the Website.
When you access the Website, we may also collect information such as unique device identifiers, your screen resolution and other device settings, information about your location, and analytical information about how you use the device from which you are viewing the Website. Where applicable, we may ask your permission before collecting certain information, such as precise geolocation information.
From time to time, we use or augment the personal information we have about you with information obtained from third parties. For example, we use third party information to confirm contact or financial information or to better understand your interests by associating demographic information from third parties with the information you have provided.
How We Use Personal Information
We use your personal information to respond to your inquiries and provide the products and services you request. We also use your information from time to time to deliver the content and services we believe
1NTD
63 INVESCO OPPENHEIMER EMERGING MARKETS INNOVATORS FUND
| | |
| | INVESCO’S PRIVACY NOTICEContinued |
you will find the most relevant and to provide customer service and support.
We also use the information you provide to further develop and improve our products and services. We aggregate and/orde-identify data about visitors to the Website for various business purposes including product and service development and improvement activities.
How We Share Personal Information
We collaborate with other companies and individuals to perform services for us and on our behalf and we collaborate with our affiliates, other companies and individuals with respect to particular products or services (“Providers”). Examples of Providers include data analysis firms, customer service and support providers, email and SMS vendors, andweb-hosting and development companies. Some Providers collect information for us or on our behalf on our Website. These Providers can be provided with access to personal information needed to perform their functions.
We reserve the right to disclose your personal information as required by law, when we believe disclosure is necessary to comply with a regulatory requirement, judicial proceeding, court order or legal process served on us, to protect the safety, rights or property of our customers, the public or Invesco or to enforce the Terms of Use.
If we sell or transfer a business unit (such as a subsidiary) or an asset (such as a website) to another company, we will share your personal information with such company. You will receive notice of such an event and the new entity will inform you of any changes to the practices in this Privacy Policy. If the new entity wishes to make additional use of your information, you have the right to decline such use at that time.
We occasionally disclose aggregate orde-identified data that is not personally identifiable with third parties.
Cookies and Other Tools
Invesco and its Providers collect information about you by using cookies, tracking pixels and other technologies. We use this information to better understand, customize and improve user experience with our websites, services and offerings as well as to manage our advertising. For example, we use web analytics services that use these technologies to gather information to help us understand how visitors engage with and navigate our Website, e.g., how and when pages in a site are visited and by how many visitors. We are also able to offer our visitors a more customized, relevant experience on our sites using these technologies by delivering content and functionality based on your preferences and interests.
Depending on their purpose, some cookies will only operate for the length of a single browsing session, while others have a longer life span to ensure that they fulfill their longer-term purposes. Your web browser can be set to allow you to control whether you will accept cookies or reject cookies, to notify you each time a cookie is sent to your browser, or to delete cookies that have already been set. If your browser is set to reject cookies, certain aspects of the Website that are cookie-enabled will not recognize you when you return to the website, and some Website functionality may be lost. The “Help” section of your browser may tell you how to prevent your browser from accepting cookies. To find out more about cookies, visitwww.aboutcookies.org.
64 INVESCO OPPENHEIMER EMERGING MARKETS INNOVATORS FUND
Security
No data transmission over the internet can be 100% secure, so Invesco cannot ensure or warrant the security of any information you submit to us on this Website. However, Invesco seeks to protect your personal information from unauthorized access or use when you transact business on our Website using technical, administrative and procedural measures. Invesco makes no representation as to the reasonableness, efficacy, or appropriateness of the measures we use to safeguard such information.
Users are responsible for maintaining the secrecy of their own passwords. If you have reason to believe that your interaction with us is no longer secure (for example, if you feel that the security of any account you might have with us has been compromised), please immediately notify us by contacting us as specified below.
Transfer of Data to Other Countries
Any information you provide to Invesco through use of the Website may be stored and processed, transferred between and accessed from the United States, Canada and other countries which do not guarantee the same level of protection of personal information as the one in which you reside. However, Invesco will handle your personal information in accordance with this Privacy Policy regardless of where your personal information is stored/accessed.
Children’s Privacy
We are committed to protecting the privacy of children. We do not knowingly collect personal information from children under the age of 18. If you are under the age of 18, do not provide us with any personal information.
Contact Us
Please contact us if you have any questions or concerns about your personal information or require assistance in managing your choices.
Invesco Ltd.
1555 Peachtree St. NE
Atlanta, GA 30309
By phone:
(404)439-3236
By fax:
(404)962-8288
By email:
Anne.Gerry@invesco.com
Please update your account information by logging in or contact us by email or telephone as specified above to update your account information whenever such information ceases to be complete or accurate.
You may also contact us to:
65 INVESCO OPPENHEIMER EMERGING MARKETS INNOVATORS FUND
| | |
| | INVESCO’S PRIVACY NOTICEContinued |
| | ● | | Request that we amend, rectify, delete or update the personal data we hold about you; |
| | ● | | Where possible (e.g. in relation to marketing) amend or update your choices around processing; |
| | ● | | Request a copy of personal data held by us. |
Disclaimer
Where the Website contains links to third-party websites/content/services that are not owned or controlled by Invesco, Invesco is not responsible for how these properties operate or treat your personal information so we recommend that you read the privacy policies and terms associated with these third party properties carefully.
66 INVESCO OPPENHEIMER EMERGING MARKETS INNOVATORS FUND
THIS PAGE INTENTIONALLY LEFT BLANK.
THIS PAGE INTENTIONALLY LEFT BLANK.
THIS PAGE INTENTIONALLY LEFT BLANK.
THIS PAGE INTENTIONALLY LEFT BLANK.
THIS PAGE INTENTIONALLY LEFT BLANK.
| | |
Explore High-Conviction Investing with Invesco | | |
| |
 | | |
| |
Go paperless with eDelivery Visit invesco.com/edelivery to enjoy the convenience and security of anytime electronic access to your investment documents. With eDelivery, you can elect to have any or all of the following materials delivered straight to your inbox to download, save and print from your own computer: | | |
| |
∎ Fund reports and prospectuses ∎ Quarterly statements ∎ Daily confirmations ∎ Tax forms | | |
| |
Invesco mailing information Send general correspondence to Invesco Investment Services, Inc., P.O. Box 219078, Kansas City, MO64121-9078. | | |
| |
| |  |
| |
Invesco Distributors, Inc. | | O-EMI-AR-1 12272019 |
There were no amendments to the Code of Ethics (the “Code”) that applies to the Registrant’s Principal Executive Officer (“PEO”) and Principal Financial Officer (“PFO”) during the period covered by the report. The Registrant did not grant any waivers, including implicit waivers, from any provisions of the Code to the PEO or PFO during the period covered by this report.
| ITEM 3. | AUDIT COMMITTEE FINANCIAL EXPERT. |
The Board of Trustees has determined that the Registrant has at least one audit committee financial expert serving on its Audit Committee. The Audit Committee financial experts are David C. Arch, Bruce L. Crockett, Cynthia Hostetler, Elizabeth Krentzman, Anthony J. LaCava, Jr., Teresa M. Ressel, Raymond Stickel, Jr., Robert C. Troccoli and James Vaughn. David C. Arch, Bruce L. Crockett, Cynthia Hostetler, Elizabeth Krentzman, Anthony J. LaCava, Jr., Teresa M. Ressel, Raymond Stickel, Jr., Robert C. Troccoli and James Vaughn are “independent” within the meaning of that term as used in FormN-CSR.
| ITEM 4. | PRINCIPAL ACCOUNTANT FEES AND SERVICES. |
During the reporting period, PricewaterhouseCoopers LLC (“PwC”) advised the Audit Committee of the following matters for consideration under the SEC’s auditor independence rules. PwC advised the Audit Committee that a PwC Senior Associate, a PwC Manager and a PwC Director each held financial interests in investment companies within the Invesco Fund Complex that were inconsistent with the requirements of Rule2-01(c)(1) of RegulationS-X. PwC noted, among other things, that during the time of its audit, the engagement team was not aware of the investments (or with respect to the PwC Senior Associate and one PwC Manager. was not aware until after the investments were confirmed as SEC exceptions), the individuals were not in the chain of command of the audit or the audit partners of Invesco or the affiliate of the Registrant, the services each individual provided were not relied upon by the audit engagement team with respect to the audit of the Registrant or its affiliates (or with respect to the PwC Senior Associate, the services were performed by an individual who did not have decision-making responsibilities for matters that materially affected the audit and were reviewed by team members at least two levels higher than the PwC Senior Associate), and the investments were not material to the net worth of each individual or their respective immediate family members which PwC considered in reaching its conclusion. PwC advised the Audit Committee that it believes its objectivity and impartiality had not been adversely affected by these matters as they related to the audit of the Registrant.
On May 24, 2019, certain investment advisor subsidiaries of Invesco Ltd. assumed management responsibility from Oppenheimer Funds, Inc. (“OFI”) for 83open-end mutual funds and 20 exchange-traded funds (collectively, the “Oppenheimer Funds”). Assumption of management responsibility for the Oppenheimer Funds was accomplished through the reorganization of each Oppenheimer Fund into a new Invesco shell fund (collectively, the “New Invesco Funds”) that did not havepre-existing assets (together, the “Reorganizations”). The Reorganizations were part of the acquisition by Invesco Ltd. (together with its subsidiaries, “Invesco”) of the asset management business of OFI (including the Oppenheimer Funds) from Massachusetts Mutual Life Insurance Company (“MassMutual”), which was also consummated on May 24, 2019 (the “Acquisition”). Subsequent to the Acquisition, MassMutual became a significant shareholder of Invesco, and the Invesco Ltd. board of directors expanded by one director with the addition of a director selected by MassMutual.
Prior to the consummation of the Acquisition and the Reorganizations on May 24, 2019, PwC completed an independence assessment to evaluate the services and relationships with OFI and its affiliates, which
became affiliates of Invesco upon the closing of the Acquisition. The assessment identified the following relationship and services that are inconsistent with the auditor independence rules under Rule2-01 of RegulationS-X (“Rule2-01”) if provided to an affiliate of an audit client. A retired PwC partner who receives a benefit from PwC that is not fully funded, served as a member of Audit Committee of the Boards of Trustees of certain Oppenheimer Funds prior to the Acquisition (the“Pre-Reorganization Relationship”). Additionally, PwC provided certainnon-audit services including, expert legal services to one Oppenheimer Fund, custody of client assets in connection with payroll services, anon-audit service performed pursuant to a success-based fee,non-audit services in which PwC acted as an advocate on behalf of a MassMutual foreign affiliate and certain employee activities undertaken in connection with the provision ofnon-audit services for MassMutual and certain MassMutual foreign affiliates (collectively, the“Pre-Reorganization Services”).
PwC and the Audit Committees of the New Invesco Funds each considered the impact that thePre-Reorganization Relationship and Services have on PwC’s independence with respect to the New Invesco Funds. On the basis of the nature of the relationship and services performed, and in particular the mitigating factors described below, PwC concluded that a reasonable investor, possessing knowledge of all the relevant facts and circumstances regarding thePre-Reorganization Relationship and Services, would conclude that thePre-Reorganization Relationship and Services do not impair PwC’s ability to exhibit the requisite objectivity and impartiality to report on the financial statements of the New Invesco Funds for the years ending May 31, 2019 – April 30, 2020 (“PwC’s Conclusion”).
The Audit Committees of the Boards of Trustees of the New Invesco Funds, based upon PwC’s Conclusion and the concurrence of Invesco, considered the relevant facts and circumstances including the mitigating factors described below and, after careful consideration, concluded that PwC is capable of exercising objective and impartial judgment in connection with its audits of the financial statements of the New Invesco Funds that the respective Boards of Trustees oversee.
Mitigating factors that PwC and the Audit Committees considered in reaching their respective conclusions included, among others, the following factors:
| ● | | none of thePre-Reorganization Relationship or Services created a mutuality of interest between PwC and the New Invesco Funds; |
| ● | | PwC will not act in a management or employee capacity for the New Invesco Funds or their affiliates during any portion of PwC’s professional engagement period; |
| ● | | other than the expert legal services,Pre-Reorganization Services that have been provided to OFI, MassMutual and their affiliates do not have any impact on the financial statements of the New Invesco Funds; |
| ● | | as it relates to the expert legal services, while the service provided by PwC related to litigation involving one Oppenheimer Fund, the impact of the litigation on the Oppenheimer Fund’s financial statements was based upon OFI’s decision, and OFI management represented that the PwC service was not considered a significant component of its decision; |
| ● | | while certain employees of OFI who were involved in the financial reporting process of the Oppenheimer Funds will be employed by Invesco subsequent to the Reorganizations, existing officers of other Invesco Funds will serve as Principal Executive Officer and Principal Financial Officer or equivalent roles for the New Invesco Funds, and are ultimately responsible for the accuracy of all financial statement assertions for the entirety of the financial reporting periods for the New Invesco Funds; |
| ● | | thePre-Reorganization Services giving rise to the lack of independence were provided to, or entered into with, OFI, MassMutual and their affiliates at a time when PwC had no independence restriction with respect to these entities; |
| ● | | with the exception of the expert legal service provided to one Oppenheimer Fund, none of thePre-Reorganization Services affected the operations or financial reporting of the New Invesco Funds; |
| ● | | thePre-Reorganization Services provided by PwC to OFI, MassMutual and their affiliates were performed by persons who were not, and will not be, part of the audit engagement team for the New Invesco Funds; and |
| ● | | the fees associated with thePre-Reorganization Services were not material to MassMutual, Invesco or PwC. |
(a) to (d)
Fees Billed by PwC Related to the Registrant
PwC billed the series of the Registrant with a fiscal year end of October 31, 2019 (each a “Fund”) aggregate fees for services rendered to these Funds as shown in the following table. Each Fund is newly organized and was created, respectively, for the purpose of acquiring the assets and liabilities of a corresponding predecessor fund (each, a “Reorganization”). Each Reorganization was consummated after the close of business on May 24, 2019, prior to which each Fund had not yet commenced operations. Accordingly, the information shown in the following table has been provided for the periods since each Fund’s commencement of operations. The Audit Committeepre-approved all audit andnon-audit services provided to the Funds.
| | | | | | | | | |
| | | Fees Billed for Services Rendered to
the Registrant for fiscal year end
2019 |
Audit Fees | | | | | $ | 53,954 | | | |
Audit-Related Fees | | | | | $ | 0 | | | |
Tax Fees(1) | | | | | $ | 11,480 | | | |
All Other Fees | | | | | $ | 0 | | | |
| | | | | | | | | |
Total Fees | | | | | $ | 65,434 | | | |
| | (1) | Tax Fees for the fiscal year ended October 31, 2019 include fees billed for reviewing tax returns and/or services related to tax compliance. |
Fees Billed by PwC Related to Invesco and Invesco Affiliates
PwC billed Invesco Advisers, Inc. (“Invesco”), each Fund’s adviser, and any entity controlling, controlled by or under common control with Invesco that provides ongoing services to each Fund (“Invesco Affiliates”) aggregate fees forpre-approvednon-audit services rendered to Invesco and Invesco Affiliates for the periods since each Fund’s commencement of operations as shown in the following table. The Audit Committeepre-approved allnon-audit services provided to Invesco and Invesco Affiliates.
| | | | | |
| | | Fees Billed for Non-Audit Services
Rendered to Invesco and Affiliates for
fiscal year end 2019 That Were Required to bePre-Approved by the Registrant’s Audit Committee |
Audit-Related Fees(1) | | | $ | 690,000 | |
Tax Fees | | | $ | 0 | |
All Other Fees | | | $ | 0 | |
| | | | | |
Total Fees | | | $ | 690,000 | |
| (1) | Audit-Related Fees for the fiscal year ended October 31, 2019 include fees billed related to reviewing controls at a service organization. |
(e)(2) There were no amounts that werepre-approved by the Audit Committee pursuant to the de minimis exception under Rule2-01 of RegulationS-X.
(f) Not applicable.
(g) Including the fees for services not required to bepre-approved by the registrant’s audit committee, PwC billed Invesco and Invesco Affiliates aggregatenon-audit fees of $3,984,000 for the fiscal year ended October 31, 2019 fornon-audit services rendered to Invesco and Invesco Affiliates.
PwC provided audit services to the Investment Company complex of approximately $34 million.
(h) The Audit Committee also has considered whether the provision ofnon-audit services that were rendered to Invesco and Invesco Affiliates that were not required to bepre-approved pursuant to SEC regulations, if any, is compatible with maintaining PwC’s independence.
(e)(1)
PRE-APPROVAL OF AUDIT ANDNON-AUDIT SERVICES
POLICIES AND PROCEDURES
As adopted by the Audit Committees
of the Invesco Funds (the “Funds”)
Last Amended March 29, 2017
| | I. | Statement of Principles |
The Audit Committees (the “Audit Committee”) of the Boards of Trustees of the Funds (the “Board”) have adopted these policies and procedures (the “Procedures”) with respect to thepre-approval of audit andnon-audit services to be provided by the Funds’ independent auditor (the “Auditor”) to the Funds, and to the Funds’ investment adviser(s) and any entity controlling, controlled by, or under common control with the investment adviser(s) that provides ongoing services to the Funds (collectively, “Service Affiliates”).
Under Section 202 of the Sarbanes-Oxley Act of 2002, all audit andnon-audit services provided to the Funds by the Auditor must be preapproved by the Audit Committee. Rule2-01 of RegulationS-X requires that the Audit Committee alsopre-approve a Service Affiliate’s engagement of the Auditor fornon-audit services if the engagement relates directly to the operations and financial reporting of the Funds (a “Service Affiliate’s Covered Engagement”).
These Procedures set forth the procedures and the conditions pursuant to which the Audit Committee maypre-approve audit andnon-audit services for the Funds and a Service Affiliate’s Covered Engagement pursuant to rules and regulations of the Securities and Exchange Commission (“SEC”) and other organizations and regulatory bodies applicable to the Funds (“Applicable Rules”).1 They address both generalpre-approvals without consideration of specific
| 1 | Applicable Rules include, for example, New York Stock Exchange (“NYSE”) rules applicable toclosed-end funds managed by Invesco and listed on NYSE. |
case-by-case services (“general pre-approvals”) and pre-approvals on acase-by-case basis (“specific pre-approvals”). Any services requiringpre-approval that are not within the scope of generalpre-approvals hereunder are subject to specificpre-approval. These Procedures also address the delegation by the Audit Committee ofpre-approval authority to the Audit Committee Chair or Vice Chair.
| | II. | Pre-Approval of Fund Audit Services |
The annual Fund audit services engagement, including terms and fees, is subject to specificpre-approval by the Audit Committee. Audit services include the annual financial statement audit and other procedures required to be performed by an independent auditor to be able to form an opinion on the Funds’ financial statements. The Audit Committee will receive, review and consider sufficient information concerning a proposed Fund audit engagement to make a reasonable evaluation of the Auditor’s qualifications and independence. The Audit Committee will oversee the Fund audit services engagement as necessary, including approving any changes in terms, audit scope, conditions and fees.
In addition to approving the Fund audit services engagement at least annually and specifically approving any changes, the Audit Committee may generally or specificallypre-approve engagements for other audit services, which are those services that only an independent auditor reasonably can provide. Other audit services may include services associated with SEC registration statements, periodic reports and other documents filed with the SEC.
| | III. | General and SpecificPre-Approval ofNon-Audit Fund Services |
The Audit Committee will consider, at least annually, the list of GeneralPre-ApprovedNon-Audit Services which list may be terminated or modified at any time by the Audit Committee. To inform the Audit Committee’s review and approval of GeneralPre-ApprovedNon-Audit Services, the Funds’ Treasurer (or his or her designee) and Auditor shall provide such information regarding independence or other matters as the Audit Committee may request.
Any services or fee ranges that are not within the scope of GeneralPre-ApprovedNon-Audit Services have not received generalpre-approval and require specificpre-approval. Each request for specificpre-approval by the Audit Committee for services to be provided by the Auditor to the Funds must be submitted to the Audit Committee by the Funds’ Treasurer (or his or her designee)and must include detailed information about the services to be provided, the fees or fee ranges to be charged, and other relevant information sufficient to allow the Audit Committee to consider whether topre-approve such engagement, including evaluating whether the provision of such services will impair the independence of the Auditor and is otherwise consistent with Applicable Rules.
| | IV. | Non-Audit Service Types |
The Audit Committee may provide either general or specificpre-approval of audit-related, tax or other services, each as described in more detail below.
“Audit-related services” are assurance and related services that are reasonably related to the performance of the audit or review of the Fund’s financial statements or that are traditionally performed by an independent auditor. Audit-related services include, among others, accounting
consultations related to accounting, financial reporting or disclosure matters not classified as “Audit services”; assistance with understanding and implementing new accounting and financial reporting guidance from rulemaking authorities; services related to mergers, acquisitions or dispositions; compliance with ratings agency requirements and interfund lending activities; and assistance with internal control reporting requirements.
“Tax services” include, but are not limited to, the review and signing of the Funds’ federal tax returns, the review of required distributions by the Funds and consultations regarding tax matters such as the tax treatment of new investments or the impact of new regulations. The Audit Committee will not approve proposed services of the Auditor which the Audit Committee believes are to be provided in connection with a service or transaction initially recommended by the Auditor, the sole business purpose of which may be tax avoidance and the tax treatment of which may not be supported in the Internal Revenue Code and related regulations. The Audit Committee will consult with the Funds’ Treasurer (or his or her designee) and may consult with outside counsel or advisers as necessary to ensure the consistency of tax services rendered by the Auditor with the foregoing policy. The Auditor shall not represent any Fund or any Service Affiliate before a tax court, district court or federal court of claims.
Each request to provide tax services under either the general or specificpre-approval of the Audit Committee will include a description from the Auditor in writing of (i) the scope of the service, the fee structure for the engagement, and any side letter or other amendment to the engagement letter, or any other agreement (whether oral, written, or otherwise) between the Auditor and the Funds, relating to the service; and (ii) any compensation arrangement or other agreement, such as a referral agreement, a referral fee orfee-sharing arrangement, between the Auditor (or an affiliate of the Auditor) and any person (other than the Funds or Service Affiliates receiving the services) with respect to the promoting, marketing, or recommending of a transaction covered by the service. The Auditor will also discuss with the Audit Committee the potential effects of the services on the independence of the Auditor, and document the substance of its discussion with the Audit Committee.
The Audit Committee maypre-approve other non-audit services so long as the Audit Committee believes that the service will not impair the independence of the Auditor.Appendix I includes a list of services that the Auditor is prohibited from performing by the SEC rules.Appendix I also includes a list of services that would impair the Auditor’s independence unless the Audit Committee reasonably concludes that the results of the services will not be subject to audit procedures during an audit of the Funds’ financial statements.
| | V. | Pre-Approval of Service Affiliate’s Covered Engagements |
Rule2-01 of RegulationS-X requires that the Audit Committeepre-approve a Service Affiliate’s engagement of the Auditor fornon-audit services if the engagement relates directly to the operations and financial reporting of the Funds, defined above as a “Service Affiliate’s Covered Engagement”.
The Audit Committee may provide either general or specificpre-approval of any Service Affiliate’s Covered Engagement, including for audit-related, tax or other services, as described above, if the Audit Committee believes that the provision of the services to a Service Affiliate will not impair the independence of the Auditor with respect to the Funds. Any Service Affiliate’s Covered Engagements that are not within the scope of GeneralPre-ApprovedNon-Audit Services have not received generalpre-approval and require specificpre-approval.
Each request for specificpre-approval by the Audit Committee of a Service Affiliate’s Covered Engagement must be submitted to the Audit Committee by the Funds’ Treasurer (or his or her designee)and must include detailed information about the services to be provided, the fees or fee ranges to be charged, a description of the current status of thepre-approval process involving other audit committees in the Invesco investment company complex (as defined in Rule2-201 of RegulationS-X) with respect to the proposed engagement, and other relevant information sufficient to allow the Audit Committee to consider whether the provision of such services will impair the independence of the Auditor from the Funds. Additionally, the Funds’ Treasurer (or his or her designee) and the Auditor will provide the Audit Committee with a statement that the proposed engagement requirespre-approval by the Audit Committee, the proposed engagement, in their view, will not impair the independence of the Auditor and is consistent with Applicable Rules, and the description of the proposed engagement provided to the Audit Committee is consistent with that presented to or approved by the Invesco audit committee.
Information about all Service Affiliate engagements of the Auditor fornon-audit services, whether or not subject topre-approval by the Audit Committee, shall be provided to the Audit Committee at least quarterly, to allow the Audit Committee to consider whether the provision of such services is compatible with maintaining the Auditor’s independence from the Funds. The Funds’ Treasurer and Auditor shall provide the Audit Committee with sufficiently detailed information about the scope of services provided and the fees for such services, to ensure that the Audit Committee can adequately consider whether the provision of such services is compatible with maintaining the Auditor’s independence from the Funds.
| | VI. | Pre-Approved Fee Levels or Established Amounts |
Pre-approved fee levels or ranges for audit andnon-audit services to be provided by the Auditor to the Funds, and for a Service Affiliate’s Covered Engagement, under generalpre-approval or specificpre-approval will be set periodically by the Audit Committee. Any proposed fees exceeding 110% of the maximumpre-approved fee levels or ranges for such services or engagements will be promptly presented to the Audit Committee and will require specificpre-approval by the Audit Committee before payment of any additional fees is made.
The Audit Committee hereby delegates, subject to the dollar limitations set forth below, specific authority to its Chair, or in his or her absence, Vice Chair, topre-approve audit andnon-audit services proposed to be provided by the Auditor to the Funds and/or a Service Affiliate’s Covered
Engagement, between Audit Committee meetings. Such delegation does not preclude the Chair or Vice Chair from declining, on a case by case basis, to exercise his or her delegated authority and instead convening the Audit Committee to consider andpre-approve any proposed services or engagements.
Notwithstanding the foregoing, the Audit Committee mustpre-approve: (a) anynon-audit services to be provided to the Funds for which the fees are estimated to exceed $500,000; (b) any Service Affiliate’s Covered Engagement for which the fees are estimated to exceed $500,000; or (c) any cost increase to any previously approved service or engagement that exceeds the greater of $250,000 or 50% of the previously approved fees up to a maximum increase of $500,000.
| | VIII. | Compliance with Procedures |
Notwithstanding anything herein to the contrary, failure topre-approve any services or engagements that are not required to bepre-approved pursuant to the de minimis exception provided for in Rule2-01(c)(7)(i)(C) of RegulationS-X shall not constitute a violation of these Procedures. The Audit Committee has designated the Funds’ Treasurer to ensure services and engagements arepre-approved in compliance with these Procedures. The Funds�� Treasurer will immediately report to the Chair of the Audit Committee, or the Vice Chair in his or her absence, any breach of these Procedures that comes to the attention of the Funds’ Treasurer or any services or engagements that are not required to bepre-approved pursuant to the de minimis exception provided for in Rule2-01(c)(7)(i)(C) of RegulationS-X.
On at least an annual basis, the Auditor will provide the Audit Committee with a summary of allnon-audit services provided to any entity in the investment company complex (as defined in section2-01(f)(14) of RegulationS-X, including the Funds and Service Affiliates) that were notpre-approved, including the nature of services provided and the associated fees.
| | IX. | Amendments to Procedures |
All material amendments to these Procedures must be approved in advance by the Audit Committee.Non-material amendments to these Procedures may be made by the Legal and Compliance Departments and will be reported to the Audit Committee at the next regularly scheduled meeting of the Audit Committee.
Appendix I
Non-Audit Services That May Impair the Auditor’s Independence
The Auditor is not independent if, at any point during the audit and professional engagement, the Auditor provides the followingnon-audit services:
| | • | | Broker-dealer, investment adviser, or investment banking services; |
| | • | | Expert services unrelated to the audit; |
| | • | | Any service or product provided for a contingent fee or a commission; |
| | • | | Services related to marketing, planning, or opining in favor of the tax treatment of confidential transactions or aggressive tax position transactions, a significant purpose of which is tax avoidance; |
| | • | | Tax services for persons in financial reporting oversight roles at the Fund; and |
| | • | | Any other service that the Public Company Oversight Board determines by regulation is impermissible. |
An Auditor is not independent if, at any point during the audit and professional engagement, the Auditor provides the followingnon-audit services unless it is reasonable to conclude that the results of the services will not be subject to audit procedures during an audit of the Funds’ financial statements:
| | • | | Bookkeeping or other services related to the accounting records or financial statements of the audit client; |
| | • | | Financial information systems design and implementation; |
| | • | | Appraisal or valuation services, fairness opinions, orcontribution-in-kind reports; |
| | • | | Actuarial services; and |
| | • | | Internal audit outsourcing services. |
| ITEM 5. | AUDIT COMMITTEE OF LISTED REGISTRANTS. |
Not applicable.
| ITEM 6. | SCHEDULE OF INVESTMENTS. |
Investments in securities of unaffiliated issuers is included as part of the reports to stockholders filed under Item 1 of this Form.
| ITEM 7. | DISCLOSURE OF PROXY VOTING POLICIES AND PROCEDURES FORCLOSED-END MANAGEMENT INVESTMENT COMPANIES. |
Not applicable.
| ITEM 8. | PORTFOLIO MANAGERS OFCLOSED-END MANAGEMENT COMPANIES. |
Not applicable.
| ITEM 9. | PURCHASES OF EQUITY SECURITIES BYCLOSED-END MANAGEMENT INVESTMENT COMPANY AND AFFILIATED PURCHASERS. |
Not applicable.
| ITEM 10. | SUBMISSION OF MATTERS TO A VOTE OF SECURITY HOLDERS. |
None
| ITEM 11. | CONTROLS AND PROCEDURES. |
| | (a) | As of December 18, 2019, an evaluation was performed under the supervision and with the participation of the officers of the Registrant, including the Principal Executive Officer (“PEO”) and Principal Financial Officer (“PFO”), to assess the effectiveness of the Registrant’s disclosure controls and procedures, as that term is defined in Rule30a-3(c) under the Investment Company Act of 1940 (“Act”), as amended. Based on that evaluation, the Registrant’s officers, including the PEO and PFO, concluded that, as of December 18, 2019, the Registrant’s disclosure controls and procedures were reasonably designed so as to ensure: (1) that information required to be disclosed by the Registrant on FormN-CSR is recorded, processed, summarized and reported within the time periods specified by the rules and forms of the Securities and Exchange Commission; and (2) that material information relating to the Registrant is made known to the PEO and PFO as appropriate to allow timely decisions regarding required disclosure. |
| | (b) | There have been no changes in the Registrant’s internal control over financial reporting (as defined in Rule30a-3(d) under the Act) that occurred during the period covered by this report that have materially affected, or are reasonably likely to materially affect, the Registrant’s internal control over financial reporting. |
| ITEM 12. | DISCLOSURE OF SECURITIES LENDING ACTIVITIES FORCLOSED-END MANAGEMENT INVESTMENT COMPANIES. |
Not applicable.
| 13(a) (2) | Certifications of principal executive officer and principal financial officer as required by Rule30a-2(a) under the Investment Company Act of 1940. |
| 13(b) | Certifications of principal executive officer and principal financial officer as required by Rule30a-2(b) under the Investment Company Act of 1940. |
SIGNATURES
Pursuant to the requirements of the Securities Exchange Act of 1934 and the Investment Company Act of 1940, the Registrant has duly caused this report to be signed on its behalf by the undersigned, thereunto duly authorized.
Registrant: AIM Investment Funds (Invesco Investment Funds)
| | |
| By: | | /s/ Sheri Morris |
| | Sheri Morris |
| | Principal Executive Officer |
| |
| Date: | | December 27, 2019 |
Pursuant to the requirements of the Securities and Exchange Act of 1934 and the Investment Company Act of 1940, this report has been signed below by the following persons on behalf of the Registrant and in the capacities and on the dates indicated.
| | |
| By: | | /s/ Sheri Morris |
| | Sheri Morris |
| | Principal Executive Officer |
| |
| Date: | | December 27, 2019 |
| |
| By: | | /s/ Kelli Gallegos |
| | Kelli Gallegos |
| | Principal Financial Officer |
| |
| Date: | | December 27, 2019 |