UNITED STATES
SECURITIES AND EXCHANGE COMMISSION
Washington, D.C. 20549
FORM N-CSR
CERTIFIED SHAREHOLDER REPORT OF REGISTERED
MANAGEMENT INVESTMENT COMPANIES
Investment Company Act file number: 811-05430
SSgA Funds
(Exact name of registrant as specified in charter)
One Lincoln Street, Boston, MA 02111
(Address of principal executive offices)(Zip code)
| | |
| (Name and Address of Agent for Service) | | Copy to: |
| |
David James, Vice President and Senior Managing Counsel State Street Bank and Trust Company 4 Copley Place, 5th Floor Boston, Massachusetts 02116 | | Philip Newman, Esq. Goodwin Proctor LLP Exchange Place Boston, MA 02109 |
Registrant’s telephone number, including area code: (617) 662-1742
Date of fiscal year end: August 31
Date of reporting period: September 1, 2012- August 31, 2013
Item 1: Shareholder Report

Dynamic Small Cap Fund
Clarion Real Estate Fund
(formerly Tuckerman Active REIT Fund)
IAM SHARES Fund
Enhanced Small Cap Fund
Emerging Markets Fund
Emerging Markets Fund — Select Class
International Stock Selection Fund
High Yield Bond Fund
Annual Report
August 31, 2013
SSgA Funds
Annual Report
August 31, 2013
Table of Contents
“SSgA” is a registered trademark of State Street Corporation and is licensed for use by the SSgA Funds.
This report is prepared from the books and records of the Funds and it is submitted for the general information of shareholders. This information is for distribution to prospective investors only when preceded or accompanied by a SSgA Funds Prospectus containing more complete information concerning the investment objectives and operations of the Funds, charges and expenses. The Prospectus should be read carefully before an investment is made.
Performance quoted represents past performance and past performance does not guarantee future results. Current performance may be higher or lower than the performance quoted. For the most recent month end performance information, visit www.ssgafunds.com. Investment in the Funds poses investment risks, including the possible loss of principal. The investment return and principal value of an investment will fluctuate so that shares, when redeemed, may be worth more or less than their original cost.
An investment in a money market fund is not insured or guaranteed by the Federal Deposit Insurance Corporation or another governmental agency. Although a money market fund seeks to preserve the value of your investment at $1.00 per share, it is possible to lose money by investing in a money market fund.
This page has been intentionally left blank.
SSgA Funds
Letter from the President of SSgA Funds Management, Inc.
Dear Shareholder:
We are pleased to provide you with the August 31, 2013 Annual Report for the SSgA Equity and Fixed Income Funds. The Annual Report provides information about the Funds, including a discussion of management, performance data and related financial statements.
Over the past 12 months, the U.S. economic recovery has gained traction, and even some steam. No longer nagged by the uncertainties of a presidential election year and sun-setting tax policies, U.S. equities posted solid performance and, along with the considerable recovery in the housing markets, fueled positive consumer sentiment. However, in a reminder that volatility may not be totally behind us, the Federal Reserve’s mere suggestion this spring that it would soon consider tapering its unprecedented bond-buying program ignited a week-long tumble for all major U.S. indexes. Nonetheless, with the market able to absorb the news of the impending policy shift, we believe that the economic recovery, although not robust by historical standards, finally can be categorized as sustainable.
Most recently, the market was tested by the political uncertainty resulting from the partial government shutdown and debt ceiling impasse in Washington D.C. At this writing, as Congress has negotiated only a temporary solution to end the stalemate and raise the debt limit, fiscal challenges remain here at home, as well as around the globe.
We hope that you find the enclosed information useful and thank you for the confidence that you have placed in the SSgA Funds.
Sincerely,

Ellen Needham
President
SSgA Funds
This page has been intentionally left blank.
SSgA
Dynamic Small Cap Fund
Portfolio Management Discussion and Analysis — August 31, 2013 (Unaudited)
Objective: The Fund seeks to maximize total return through investments in equity securities.
Invests in: At least 80% of the total assets will be invested in smaller capitalization equity securities.
Strategy: Equity securities will be selected for the Fund on the basis of proprietary analytical models. The Fund management team uses a quantative approach to investment management, designed to uncover equity securities which are undervalued, with superior growth potential. This quantative investment management approach involves a modeling process to evaluate vast amounts of financial data and corporate earnings forecast.
| | | | | | |
| Dynamic Small Cap Fund | |
| | |
Period Ended
08/31/13 | | | | Total
Return | |
1 Year | | | | | 32.20 | % |
5 Years | | | | | 7.72 | %+ |
10 Years | | | | | 6.37 | %+ |
| | | | | | |
| Russell 2000® Index† | |
| | |
Period Ended 08/31/13 | | | | Total
Return | |
1 Year | | | | | 26.27 | % |
5 Years | | | | | 7.98 | %+ |
10 Years | | | | | 8.76 | %+ |
Performance quoted represents past performance, which is no guarantee of future results. Investment return and principal value will fluctuate, so you may have a gain or loss when shares are sold. Current performance may be higher or lower than that quoted. Visit www.ssgafunds.com for most recent month-end performance. The returns do not reflect the deduction of taxes that a shareholder would pay on Fund distributions or on the redemption of Fund shares. The gross expense ratio for the Small Cap Fund as stated in the Fees and Expenses table of the prospectus dated December 14, 2012 is 3.52%.
Notes: The following notes relate to the Growth of $10,000 graph and tables.
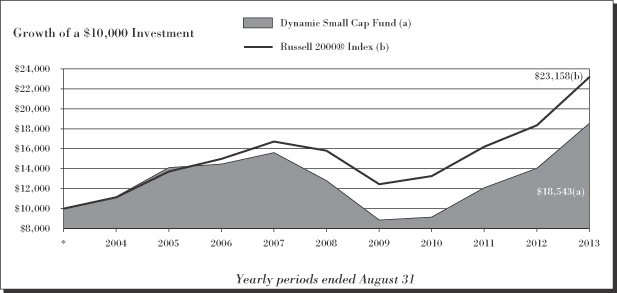
| * | Assumes initial investment on September 1, 2003. |
| † | The Russell 2000 Index measures the performance of the small-cap segment of the U.S. equity universe. The Russell 2000 is a subset of the Russell 3000® Index representing approximately 10% of the total market capitalization of that index. It includes approximately 2000 of the smallest securities based on a combination of their market cap and current index membership. |
| Small | company issues can be subject to increased volatility and considerable price fluctuation. |
| Performance | data reflects an expense limitation currently in effect, without which returns would have been lower. |
SSgA
Dynamic Small Cap Fund
Portfolio Management Discussion and Analysis, continued — August 31, 2013 (Unaudited)
SSgA Dynamic Small Cap Fund (the “Fund”) seeks to maximize the total return through investment in equity securities. The Fund is benchmarked to the Russell 2000 Index (the “Index”).
For the 12-month period ended August 31, 2013 (the “Reporting Period”), the total return for the Fund was 32.20%, and the total return for the Index was 26.27%. The Fund and Index returns reflect the reinvestment of dividends and other income. The Fund’s performance reflects the expenses of managing the Fund, including brokerage and advisory expenses. The Index is unmanaged and Index returns do not reflect fees and expenses of any kind, which would have a negative impact on returns.
During the Reporting Period, investor optimism rose, thanks in part to the eurozone’s stabilization and US economic improvement. Markets went up and down over the course of the Reporting Period, most notably coming under pressure at the close of September 2012. They rebounded in 2012’s fourth quarter, bolstered by positive political developments in the United States and Japan. These developments continued to benefit stocks in early 2013. Financials and economically sensitive sectors, such as the industrials and consumer discretionary sectors, performed well, most notably in the 2013 year-to-date period. More defensive sectors, such as utilities, underperformed. Commodities were also pressured through the first two quarters of 2013; gold and silver both fell sharply. The effects of these declines showed most clearly in the performance of the materials sector, which underperformed over the fiscal year. However, all sectors delivered positive returns for the Reporting Period.
The Fund outperformed the Index over the Reporting Period, driven by the strength of its dynamic stock selection model and systematic investment process. The model systematically assessed the macro-environment to determine the most desirable stock level exposures. Compared with the prior fiscal year, the Fund moved away from some of the higher-risk stocks that were beneficial in late 2011 and early 2012. The Fund responded to decreased market volatility as well as an increase in stock valuations from the relatively cheap levels of the prior fiscal year. As a result, the Fund tilted toward stocks with, in our view, strong earnings growth, positive price momentum, and reasonable valuations. This paid off as slower, more stable US growth prompted investors to reward traditional fundamentals. The Fund outperformed the Index during each of the four quarters within the Reporting Period.
On an individual security level, the top positive contributors to the Fund’s performance were Multimedia Games Holding Co. Inc., Conn’s, Inc., and Sinclair Broadcast Group, Inc. Gaming machine manufacturer Multimedia Games’ substantial return for the Reporting Period resulted from strong game sales and better-than-expected earnings. Strong earnings also helped retail and consumer finance company Conn’s post a substantial return for the period. Television broadcasting firm Sinclair Broadcast benefitted from solid financial results as well as the acquisition of Fisher Communications.
The top detractors from the Fund’s performance were Walter Investment Management Corp., ANN INC., and Louisiana-Pacific Corporation. Mortgage servicer and asset management company Walter Investment Management saw its share price decline by nearly a third after it released disappointing results for the fourth quarter. Shares of women’s apparel retailer ANN INC. were particularly volatile, falling by nearly a third in wake of lower earnings guidance before recovering most of that loss in a subsequent rebound. Shares of Louisiana-Pacific, which manufactures wood building materials, declined as lumber prices fell sharply in 2013’s second quarter.
The views expressed above reflect those of the Fund’s portfolio manager only through the Reporting Period, and do not necessarily represent the views of the Adviser as a whole. Any such views are subject to change at any time based upon market or other conditions and the Adviser disclaims any responsibility to update such views. These views may not be relied on as investment advice and, because investment decisions for a fund are based on numerous factors, may not be relied on as an indication of trading intent on behalf of any fund.
SSgA
Dynamic Small Cap Fund
Shareholder Expense Example — August 31, 2013 (Unaudited)
Fund Expenses
The following disclosure provides important information regarding each Fund’s Expense Example, which appears on each Fund’s individual page in this Annual Report. Please refer to this information when reviewing the Expense Example for a Fund.
Example
As a shareholder of the Fund, you incur two types of costs: (1) transaction costs, and (2) ongoing costs, including advisory and administrative fees; distribution (12b-1) and/or service fees; and other Fund expenses. The Example is intended to help you understand your ongoing costs (in dollars) of investing in the Fund and to compare these costs with the ongoing costs of investing in other mutual funds. The Example is based on an investment of $1,000 invested at the beginning of the period and held for the entire period indicated, which for this Fund is from March 1, 2013 to August 31, 2013.
Actual Expenses
The information in the table under the heading “Actual Performance” provides information about actual account values and actual expenses. You may use the information in this column, together with the amount you invested, to estimate the expenses that you paid over the period. Simply divide your account value by $1,000 (for example, an $8,600 account value divided by $1,000 = 8.6), then multiply the result by the number in the first column in the row entitled “Expenses Paid During Period” to estimate the expenses you paid on your account during this period.
Hypothetical Example for Comparison Purposes
The information in the table under the heading “Hypothetical Performance (5% return before expenses)” provides information about hypothetical account values and hypothetical expenses based on the Fund’s actual expense ratio and an assumed rate of return of 5% per year before expenses, which is not the Fund’s actual return. The hypothetical account values and expenses may not be used to estimate the actual ending account balance or expenses you paid for the period. You may use this information to compare the ongoing costs of investing in the Fund and other funds. To do so, compare this 5% hypothetical example with the 5% hypothetical examples that appear in the shareholder reports of other funds.
Please note that the expenses shown in the table are meant to highlight your ongoing costs only and do not reflect any transaction costs. Therefore, the information under the heading “Hypothetical Performance (5% return before expenses)” is useful in comparing ongoing costs only, and will not help you determine the relative total costs of owning different funds. In addition, if these transaction costs were included, your costs would have been higher.
| | | | | | | | |
| | | Actual
Performance | | | Hypothetical
Performance
(5% return
before expenses) | |
Beginning Account Value | | | | | | | | |
March 1, 2013 | | $ | 1,000.00 | | | $ | 1,000.00 | |
Ending Account Value | | | | | | | | |
August 31, 2013 | | $ | 1,141.60 | | | $ | 1,018.90 | |
Expenses Paid During Period* | | $ | 6.75 | | | $ | 6.36 | |
| * | Expenses are equal to the Fund’s annualized expense ratio of 1.25% (representing the six month period annualized), multiplied by the average account value over the period, multiplied by 184/365 (to reflect the one-half year period). Includes amounts waived and/or reimbursed. Without the waiver and/or reimbursement, expenses would have been higher. |
SSgA
Dynamic Small Cap Fund
Schedule of Investments — August 31, 2013
| | | | | | | | |
| | | Principal
Amount ($)
or Shares | | | Market
Value
$ | |
| | | | | | | | |
| Common Stocks - 99.5% | |
Consumer Discretionary - 18.7% | |
America’s Car-Mart, Inc. (a)(b) | | | 264 | | | | 10,824 | |
American Axle & Manufacturing Holdings, Inc. (a)(b) | | | 5,421 | | | | 104,246 | |
Asbury Automotive Group, Inc. (a)(b) | | | 2,501 | | | | 122,874 | |
Bassett Furniture Industries, Inc. | | | 962 | | | | 13,295 | |
Big 5 Sporting Goods Corp. (b) | | | 1,081 | | | | 18,085 | |
Bloomin’ Brands, Inc. (a)(b) | | | 984 | | | | 22,140 | |
Bridgepoint Education, Inc. (a)(b) | | | 769 | | | | 12,704 | |
Brown Shoe Co., Inc. | | | 4,259 | | | | 95,487 | |
Capella Education Co. (a)(b) | | | 348 | | | | 18,914 | |
Carriage Services, Inc. (b) | | | 683 | | | | 12,035 | |
CEC Entertainment, Inc. (b) | | | 2,314 | | | | 93,648 | |
Chuy’s Holdings, Inc. (a)(b) | | | 463 | | | | 16,645 | |
Conn’s, Inc. (a)(b) | | | 1,999 | | | | 133,153 | |
Core-Mark Holding Co., Inc. | | | 1,484 | | | | 93,640 | |
Cracker Barrel Old Country Store, Inc. (b) | | | 1,268 | | | | 124,797 | |
Crown Media Holdings, Inc. (Class A) (a) | | | 6,602 | | | | 20,268 | |
CSS Industries, Inc. | | | 629 | | | | 13,725 | |
Culp, Inc. | | | 904 | | | | 17,321 | |
Dana Holding Corp. | | | 6,763 | | | | 141,753 | |
Destination Maternity Corp. | | | 732 | | | | 20,328 | |
Drew Industries, Inc. | | | 1,237 | | | | 51,905 | |
Education Management Corp. (a)(b) | | | 1,405 | | | | 11,409 | |
Entravision Communications Corp. (Class A) (b) | | | 4,544 | | | | 23,765 | |
Express, Inc. (a)(b) | | | 3,118 | | | | 65,447 | |
Fiesta Restaurant Group, Inc. (a)(b) | | | 2,790 | | | | 91,149 | |
G-III Apparel Group, Ltd. (a)(b) | | | 2,231 | | | | 102,202 | |
Grand Canyon Education, Inc. (a)(b) | | | 3,797 | | | | 131,035 | |
Harte-Hanks, Inc. (b) | | | 1,468 | | | | 12,184 | |
Haverty Furniture Cos., Inc. | | | 894 | | | | 21,644 | |
Helen of Troy, Ltd. (a) | | | 2,596 | | | | 104,307 | |
hhgregg, Inc. (a)(b) | | | 1,303 | | | | 23,597 | |
Hooker Furniture Corp. (b) | | | 947 | | | | 13,627 | |
Iconix Brand Group, Inc. (a)(b) | | | 4,031 | | | | 132,297 | |
Jack in the Box, Inc. (a) | | | 2,904 | | | | 114,679 | |
Johnson Outdoors, Inc. (Class A) (a) | | | 603 | | | | 15,190 | |
Journal Communications, Inc. (Class A) (a)(b) | | | 2,415 | | | | 17,364 | |
Kirkland’s, Inc. (a) | | | 600 | | | | 11,706 | |
La-Z-Boy, Inc. (b) | | | 4,926 | | | | 104,727 | |
Libbey, Inc. (a) | | | 967 | | | | 22,937 | |
Lions Gate Entertainment Corp. (a)(b) | | | 3,268 | | | | 114,413 | |
Lithia Motors, Inc. (Class A) (b) | | | 1,935 | | | | 126,975 | |
Live Nation Entertainment, Inc. (a) | | | 670 | | | | 11,296 | |
| | | | | | | | |
| | | Principal
Amount ($)
or Shares | | | Market
Value
$ | |
Marriott Vacations Worldwide Corp. (a)(b) | | | 2,362 | | | | 102,983 | |
Mattress Firm Holding Corp. (a)(b) | | | 344 | | | | 14,138 | |
MDC Partners, Inc. (Class A) | | | 710 | | | | 15,890 | |
Meredith Corp. (b) | | | 2,537 | | | | 109,116 | |
Modine Manufacturing Co. (a) | | | 1,298 | | | | 16,913 | |
Monarch Casino & Resort, Inc. (a)(b) | | | 557 | | | | 10,472 | |
Multimedia Games Holding Co., Inc. (a) | | | 3,563 | | | | 139,812 | |
New York & Co., Inc. (a)(b) | | | 1,768 | | | | 8,663 | |
Nexstar Broadcasting Group, Inc. (Class A) (b) | | | 860 | | | | 28,870 | |
Orbitz Worldwide, Inc. (a) | | | 2,544 | | | | 24,193 | |
Overstock.com, Inc. (a) | | | 451 | | | | 12,687 | |
Papa John’s International, Inc. (a)(b) | | | 1,487 | | | | 101,309 | |
PetMed Express, Inc. (b) | | | 1,230 | | | | 18,782 | |
Pinnacle Entertainment, Inc. (a)(b) | | | 4,987 | | | | 118,092 | |
Red Robin Gourmet Burgers, Inc. (a) | | | 1,901 | | | | 123,299 | |
Restoration Hardware Holdings, Inc. (a)(b) | | | 393 | | | | 27,325 | |
Ruth’s Hospitality Group, Inc. (b) | | | 5,662 | | | | 66,925 | |
Saga Communications, Inc. (Class A) | | | 354 | | | | 17,403 | |
Salem Communications Corp. (Class A) | | | 1,625 | | | | 12,578 | |
Sinclair Broadcast Group, Inc. (Class A) (b) | | | 4,295 | | | | 102,736 | |
Skechers U.S.A., Inc. (Class A) (a)(b) | | | 4,169 | | | | 128,113 | |
Sonic Corp. (a)(b) | | | 6,854 | | | | 109,390 | |
Speedway Motorsports, Inc. (b) | | | 568 | | | | 10,042 | |
Standard Motor Products, Inc. (b) | | | 2,990 | | | | 91,673 | |
Stein Mart, Inc. (b) | | | 1,936 | | | | 23,522 | |
Steiner Leisure, Ltd. (a) | | | 1,724 | | | | 96,061 | |
Stoneridge, Inc. (a) | | | 1,050 | | | | 13,062 | |
Texas Roadhouse, Inc. (b) | | | 4,797 | | | | 119,205 | |
The Bon-Ton Stores, Inc. (b) | | | 510 | | | | 5,615 | |
The Buckle, Inc. (b) | | | 2,065 | | | | 106,926 | |
The E.W. Scripps Co. (Class A) (a)(b) | | | 918 | | | | 13,963 | |
Tower International, Inc. (a) | | | 550 | | | | 11,264 | |
Unifi, Inc. (a)(b) | | | 2,234 | | | | 50,600 | |
Universal Electronics, Inc. (a) | | | 517 | | | | 15,593 | |
Winnebago Industries, Inc. (a)(b) | | | 4,535 | | | | 100,994 | |
| | | | | | | | |
| | | | | | | 4,397,946 | |
| | | | | | | | |
Consumer Staples - 4.4% | | | | | | | | |
Arden Group, Inc. (Class A) (b) | | | 139 | | | | 18,445 | |
Chiquita Brands International, Inc. (a) | | | 1,338 | | | | 16,498 | |
SSgA
Dynamic Small Cap Fund
Schedule of Investments, continued — August 31, 2013
| | | | | | | | |
| | | Principal
Amount ($)
or Shares | | | Market
Value
$ | |
| | | | | | | | |
Ingles Markets, Inc. (Class A) (b) | | | 763 | | | | 19,068 | |
Inter Parfums, Inc. | | | 737 | | | | 19,582 | |
Inventure Foods, Inc. (a)(b) | | | 1,843 | | | | 16,624 | |
J&J Snack Foods Corp. | | | 1,226 | | | | 94,304 | |
John B Sanfilippo & Son, Inc. | | | 759 | | | | 16,432 | |
Lifeway Foods, Inc. (b) | | | 1,066 | | | | 15,105 | |
Medifast, Inc. (a)(b) | | | 460 | | | | 11,436 | |
National Beverage Corp. (b) | | | 609 | | | | 9,750 | |
Pilgrim’s Pride Corp. (a)(b) | | | 6,921 | | | | 106,099 | |
Prestige Brands Holdings, Inc. (a) | | | 3,705 | | | | 120,301 | |
Revlon, Inc. (Class A) (a) | | | 735 | | | | 16,449 | |
Rite Aid Corp. (a) | | | 37,046 | | | | 128,179 | |
Sanderson Farms, Inc. | | | 1,591 | | | | 104,179 | |
Spartan Stores, Inc. | | | 741 | | | | 15,235 | |
SUPERVALU, Inc. (a)(b) | | | 4,482 | | | | 32,136 | |
The Andersons, Inc. (b) | | | 1,729 | | | | 113,526 | |
The Chefs’ Warehouse, Inc. (a)(b) | | | 157 | | | | 3,625 | |
USANA Health Sciences, Inc. (a)(b) | | | 783 | | | | 59,469 | |
Village Super Market, Inc. (Class A) | | | 310 | | | | 10,847 | |
Weis Markets, Inc. (b) | | | 1,791 | | | | 84,141 | |
| | | | | | | | |
| | | | | | | 1,031,430 | |
| | | | | | | | |
| | |
Energy - 4.1% | | | | | | | | |
Adams Resources & Energy, Inc. (b) | | | 163 | | | | 9,912 | |
Carrizo Oil & Gas, Inc. (a)(b) | | | 2,193 | | | | 75,132 | |
CVR Energy, Inc. (b) | | | 1,815 | | | | 77,718 | |
Dawson Geophysical Co. (a) | | | 305 | | | | 10,949 | |
Diamondback Energy, Inc. (a)(b) | | | 2,124 | | | | 85,470 | |
EPL Oil & Gas, Inc. (a)(b) | | | 3,257 | | | | 110,217 | |
EXCO Resources, Inc. (b) | | | 7,919 | | | | 57,650 | |
Exterran Holdings, Inc. (a)(b) | | | 3,980 | | | | 109,171 | |
Green Plains Renewable Energy, Inc. (a)(b) | | | 863 | | | | 13,886 | |
Gulfmark Offshore, Inc. (Class A) | | | 1,974 | | | | 90,765 | |
Matrix Service Co. (a) | | | 759 | | | | 11,833 | |
Natural Gas Services Group, Inc. (a) | | | 836 | | | | 22,923 | |
Newpark Resources, Inc. (a)(b) | | | 9,993 | | | | 111,222 | |
Renewable Energy Group, Inc. (a) | | | 860 | | | | 13,287 | |
REX American Resources Corp. (a) | | | 292 | | | | 8,626 | |
Stone Energy Corp. (a)(b) | | | 4,402 | | | | 120,615 | |
Synergy Resources Corp. (a) | | | 2,381 | | | | 22,286 | |
TGC Industries, Inc. | | | 50 | | | | 397 | |
| | | | | | | | |
| | | | | | | 952,059 | |
| | | | | | | | |
Financials - 23.4% | | | | | | | | |
Access National Corp. (b) | | | 925 | | | | 12,580 | |
Allied World Assurance Company Holdings, Ltd. | | | 424 | | | | 38,894 | |
| | | | | | | | |
| | | Principal
Amount ($)
or Shares | | | Market
Value
$ | |
American Assets Trust, Inc. (b)(c) | | | 2,122 | | | | 62,832 | |
American Equity Investment Life Holding Co. (b) | | | 6,089 | | | | 120,623 | |
American National Bankshares, Inc. (b) | | | 328 | | | | 7,170 | |
American National Insurance Co. (b) | | | 479 | | | | 50,281 | |
Ameris Bancorp (a) | | | 3,058 | | | | 58,591 | |
AMERISAFE, Inc. | | | 2,474 | | | | 80,628 | |
Amtrust Financial Services, Inc. (b) | | | 1,752 | | | | 62,592 | |
Apollo Commercial Real Estate Finance, Inc. (c) | | | 1,185 | | | | 17,799 | |
Apollo Investment Corp. | | | 14,461 | | | | 114,097 | |
Argo Group International Holdings, Ltd. (b) | | | 1,816 | | | | 74,165 | |
Bancfirst Corp. (b) | | | 1,254 | | | | 64,054 | |
Banner Corp. (b) | | | 2,664 | | | | 91,269 | |
BofI Holding, Inc. (a)(b) | | | 519 | | | | 33,616 | |
Brandywine Realty Trust (c) | | | 2,747 | | | | 35,217 | |
Capital Southwest Corp. | | | 588 | | | | 19,386 | |
Capitol Federal Financial, Inc. (b) | | | 3,330 | | | | 40,759 | |
CapLease, Inc. (b)(c) | | | 2,064 | | | | 17,565 | |
Central Pacific Financial Corp. (b) | | | 725 | | | | 12,318 | |
Chesapeake Lodging Trust (b)(c) | | | 2,355 | | | | 51,834 | |
Citizens & Northern Corp. (b) | | | 1,847 | | | | 35,462 | |
CNO Financial Group, Inc. | | | 10,437 | | | | 141,839 | |
CoBiz Financial, Inc. | | | 2,101 | | | | 18,825 | |
Cousins Properties, Inc. (b)(c) | | | 8,591 | | | | 85,309 | |
Crawford & Co. (Class B) (b) | | | 1,981 | | | | 15,016 | |
Credit Acceptance Corp. (a)(b) | | | 446 | | | | 47,967 | |
Diamond Hill Investment Group, Inc. (b) | | | 200 | | | | 21,942 | |
Eagle Bancorp, Inc. (a) | | | 973 | | | | 24,792 | |
Eastern Insurance Holdings, Inc. (b) | | | 768 | | | | 15,368 | |
EMC Insurance Group, Inc. | | | 529 | | | | 14,759 | |
Encore Capital Group, Inc. (a)(b) | | | 2,910 | | | | 124,752 | |
Enstar Group, Ltd. (a)(b) | | | 596 | | | | 80,323 | |
Enterprise Financial Services Corp. | | | 725 | | | | 11,984 | |
FBL Financial Group, Inc. (Class A) | | | 2,286 | | | | 100,767 | |
FBR & Co. (a) | | | 781 | | | | 20,946 | |
Fidelity Southern Corp. (b) | | | 1,214 | | | | 17,445 | |
First American Financial Corp. (b) | | | 2,912 | | | | 60,861 | |
First Defiance Financial Corp. | | | 682 | | | | 16,716 | |
First Interstate Bancsystem, Inc. (b) | | | 898 | | | | 20,412 | |
First Merchants Corp. | | | 4,904 | | | | 83,760 | |
Franklin Street Properties Corp. (b)(c) | | | 4,697 | | | | 57,209 | |
FXCM, Inc. (Class A) (b) | | | 817 | | | | 15,515 | |
GAMCO Investors, Inc. (Class A) | | | 341 | | | | 19,601 | |
German American Bancorp, Inc. (b) | | | 487 | | | | 11,625 | |
SSgA
Dynamic Small Cap Fund
Schedule of Investments, continued — August 31, 2013
| | | | | | | | |
| | | Principal
Amount ($)
or Shares | | | Market
Value
$ | |
| | | | | | | | |
Getty Realty Corp. (c) | | | 743 | | | | 13,567 | |
Golub Capital BDC, Inc. (b) | | | 1,030 | | | | 17,798 | |
Gramercy Property Trust, Inc. (a)(b)(c) | | | 3,070 | | | | 12,556 | |
Green Dot Corp. (a)(b) | | | 1,121 | | | | 25,738 | |
Hanmi Financial Corp. (b) | | | 4,461 | | | | 72,848 | |
HCI Group, Inc. (b) | | | 357 | | | | 12,449 | |
Heartland Financial USA, Inc. (b) | | | 741 | | | | 20,133 | |
HFF, Inc. (Class A) | | | 2,812 | | | | 64,676 | |
Home BancShares, Inc. (b) | | | 2,330 | | | | 59,229 | |
Home Loan Servicing Solutions, Ltd. | | | 3,158 | | | | 72,002 | |
Horace Mann Educators Corp. | | | 3,768 | | | | 99,325 | |
Horizon Bancorp/IN (b) | | | 715 | | | | 15,501 | |
Investment Technology Group, Inc. (a) | | | 1,072 | | | | 18,224 | |
Lakeland Financial Corp. (b) | | | 492 | | | | 15,301 | |
Maiden Holdings, Ltd. (b) | | | 1,957 | | | | 25,598 | |
Manning & Napier, Inc. (b) | | | 586 | | | | 8,778 | |
MB Financial, Inc. | | | 4,087 | | | | 110,308 | |
MCG Capital Corp. | | | 2,598 | | | | 12,704 | |
Medallion Financial Corp. (b) | | | 1,213 | | | | 17,152 | |
Metro Bancorp, Inc. (a) | | | 974 | | | | 18,525 | |
Montpelier Re Holdings, Ltd. (b) | | | 3,635 | | | | 90,330 | |
National Western Life Insurance Co. (Class A) | | | 194 | | | | 38,420 | |
Nelnet, Inc. (Class A) | | | 2,621 | | | | 99,283 | |
New Mountain Finance Corp. (b) | | | 1,233 | | | | 18,100 | |
OMEGA Healthcare Investors, Inc. (c) | | | 2,680 | | | | 76,112 | |
Oritani Financial Corp. (b) | | | 1,462 | | | | 22,676 | |
Pinnacle Financial Partners, Inc. (a)(b) | | | 3,831 | | | | 107,076 | |
Platinum Underwriters Holdings, Ltd. | | | 1,866 | | | | 107,818 | |
Portfolio Recovery Associates, Inc. (a)(b) | | | 2,634 | | | | 139,707 | |
Potlatch Corp. (b)(c) | | | 820 | | | | 31,619 | |
Preferred Bank/Los Angeles CA (a) | | | 491 | | | | 7,895 | |
Primerica, Inc. | | | 1,856 | | | | 68,913 | |
PrivateBancorp, Inc. (b) | | | 2,649 | | | | 57,801 | |
Regional Management Corp. (a)(b) | | | 354 | | | | 9,728 | |
Renasant Corp. (b) | | | 3,758 | | | | 94,589 | |
Republic Bancorp, Inc. (Class A) (b) | | | 2,550 | | | | 67,346 | |
Resource Capital Corp. (b)(c) | | | 8,117 | | | | 47,241 | |
RLI Corp. (b) | | | 509 | | | | 39,748 | |
RLJ Lodging Trust (c) | | | 3,532 | | | | 81,165 | |
S&T Bancorp, Inc. (b) | | | 4,379 | | | | 98,440 | |
Safety Insurance Group, Inc. (b) | | | 1,810 | | | | 90,753 | |
Sandy Spring Bancorp, Inc. (b) | | | 697 | | | | 15,578 | |
Saul Centers, Inc. (c) | | | 452 | | | | 19,621 | |
| | | | | | | | |
| | | Principal
Amount ($)
or Shares | | | Market
Value
$ | |
Select Income REIT (b)(c) | | | 646 | | | | 15,717 | |
StanCorp Financial Group, Inc. (b) | | | 978 | | | | 51,169 | |
State Auto Financial Corp. | | | 600 | | | | 11,202 | |
Sterling Financial Corp. (b) | | | 1,896 | | | | 45,883 | |
Stewart Information Services Corp. (b) | | | 3,183 | | | | 97,368 | |
Susquehanna Bancshares, Inc. (b) | | | 9,217 | | | | 116,226 | |
Symetra Financial Corp. | | | 6,539 | | | | 112,929 | |
Territorial Bancorp, Inc. (b) | | | 704 | | | | 15,425 | |
The Geo Group, Inc. (b)(c) | | | 3,092 | | | | 96,501 | |
The Hanover Insurance Group, Inc. (b) | | | 848 | | | | 45,173 | |
The Navigators Group, Inc. (a) | | | 686 | | | | 37,545 | |
Tompkins Financial Corp. (b) | | | 267 | | | | 11,588 | |
Tree.com, Inc. | | | 405 | | | | 10,141 | |
Trico Bancshares | | | 581 | | | | 11,911 | |
Union First Market Bankshares Corp. (b) | | | 3,625 | | | | 77,539 | |
United Community Banks, Inc. (a) | | | 1,874 | | | | 27,323 | |
United Fire Group, Inc. | | | 993 | | | | 28,489 | |
Universal Insurance Holdings, Inc. (b) | | | 6,052 | | | | 44,664 | |
Virtus Investment Partners, Inc. (a)(b) | | | 501 | | | | 87,324 | |
Washington Trust Bancorp, Inc. (b) | | | 377 | | | | 11,314 | |
WesBanco, Inc. (b) | | | 3,660 | | | | 105,005 | |
Western Alliance Bancorp (a) | | | 6,665 | | | | 109,106 | |
Wintrust Financial Corp. (b) | | | 897 | | | | 35,557 | |
WSFS Financial Corp. | | | 251 | | | | 14,960 | |
| | | | | | | | |
| | | | | | | 5,491,895 | |
| | | | | | | | |
| | |
Health Care - 8.9% | | | | | | | | |
Acadia Healthcare Co., Inc. (a)(b) | | | 1,356 | | | | 51,975 | |
ACADIA Pharmaceuticals, Inc. (a)(b) | | | 851 | | | | 16,986 | |
Achillion Pharmaceuticals, Inc. (a)(b) | | | 526 | | | | 3,393 | |
Acorda Therapeutics, Inc. (a)(b) | | | 529 | | | | 17,875 | |
Aegerion Pharmaceuticals, Inc. (a)(b) | | | 432 | | | | 37,446 | |
Alnylam Pharmaceuticals, Inc. (a)(b) | | | 892 | | | | 46,206 | |
AMN Healthcare Services, Inc. (a) | | | 6,487 | | | | 88,223 | |
AmSurg Corp. (a) | | | 1,417 | | | | 52,840 | |
Anika Therapeutics, Inc. (a) | | | 516 | | | | 11,940 | |
Arena Pharmaceuticals, Inc. (a)(b) | | | 2,870 | | | | 18,397 | |
Array BioPharma, Inc. (a)(b) | | | 1,107 | | | | 6,210 | |
Astex Pharmaceuticals (a) | | | 2,145 | | | | 14,050 | |
Atrion Corp. | | | 59 | | | | 14,101 | |
Cambrex Corp. (a)(b) | | | 1,002 | | | | 13,657 | |
Celldex Therapeutics, Inc. (a)(b) | | | 1,085 | | | | 23,566 | |
| | |
| 10 | | Dynamic Small Cap Fund |
SSgA
Dynamic Small Cap Fund
Schedule of Investments, continued — August 31, 2013
| | | | | | | | |
| | | Principal
Amount ($)
or Shares | | | Market
Value
$ | |
| | | | | | | | |
Cepheid, Inc. (a)(b) | | | 947 | | | | 33,884 | |
Chemed Corp. (b) | | | 1,300 | | | | 90,532 | |
Clovis Oncology, Inc. (a) | | | 145 | | | | 9,353 | |
CONMED Corp. (b) | | | 2,820 | | | | 87,674 | |
Cornerstone Therapeutics, Inc. (a) | | | 1,863 | | | | 17,233 | |
Corvel Corp. (a) | | | 460 | | | | 15,152 | |
Dendreon Corp. (a)(b) | | | 1,650 | | | | 4,686 | |
Dyax Corp. (a)(b) | | | 398 | | | | 1,779 | |
Emergent Biosolutions, Inc. (a) | | | 90 | | | | 1,582 | |
Exact Sciences Corp. (a)(b) | | | 738 | | | | 8,539 | |
Exactech, Inc. (a) | | | 722 | | | | 13,747 | |
Exelixis, Inc. (a)(b) | | | 2,144 | | | | 10,741 | |
Genomic Health, Inc. (a)(b) | | | 94 | | | | 2,963 | |
Globus Medical, Inc. (Class A) (a)(b) | | | 987 | | | | 17,391 | |
Greatbatch, Inc. (a)(b) | | | 1,497 | | | | 50,853 | |
Halozyme Therapeutics, Inc. (a)(b) | | | 989 | | | | 8,219 | |
Idenix Pharmaceuticals, Inc. (a)(b) | | | 299 | | | | 1,429 | |
ImmunoGen, Inc. (a)(b) | | | 1,150 | | | | 18,400 | |
Infinity Pharmaceuticals, Inc. (a)(b) | | | 495 | | | | 9,162 | |
InterMune, Inc. (a)(b) | | | 872 | | | | 12,461 | |
Ironwood Pharmaceuticals, Inc. (a)(b) | | | 1,076 | | | | 12,535 | |
Isis Pharmaceuticals, Inc. (a)(b) | | | 1,647 | | | | 42,542 | |
Keryx Biopharmaceuticals, Inc. (a)(b) | | | 564 | | | | 4,811 | |
Kindred Healthcare, Inc. (b) | | | 6,584 | | | | 96,785 | |
Lannett Co., Inc. (a)(b) | | | 1,441 | | | | 19,108 | |
Lexicon Pharmaceuticals, Inc. (a)(b) | | | 1,262 | | | | 3,142 | |
Ligand Pharmaceuticals, Inc. (Class B) (a)(b) | | | 409 | | | | 19,669 | |
Magellan Health Services, Inc. (a) | | | 634 | | | | 35,637 | |
Medidata Solutions, Inc. (a) | | | 848 | | | | 75,845 | |
Merrimack Pharmaceuticals, Inc. (a)(b) | | | 327 | | | | 1,105 | |
MiMedx Group, Inc. (a)(b) | | | 543 | | | | 3,350 | |
Molina Healthcare, Inc. (a)(b) | | | 1,348 | | | | 45,010 | |
Momenta Pharmaceuticals, Inc. (a)(b) | | | 453 | | | | 6,383 | |
National Healthcare Corp. (b) | | | 328 | | | | 15,134 | |
Natus Medical, Inc. (a)(b) | | | 922 | | | | 12,124 | |
Neurocrine Biosciences, Inc. (a)(b) | | | 728 | | | | 10,607 | |
NPS Pharmaceuticals, Inc. (a)(b) | | | 1,522 | | | | 38,202 | |
NuVasive, Inc. (a)(b) | | | 4,235 | | | | 99,607 | |
Omnicell, Inc. (a) | | | 2,128 | | | | 46,263 | |
Opko Health, Inc. (a)(b) | | | 1,746 | | | | 16,133 | |
Orexigen Therapeutics, Inc. (a)(b) | | | 888 | | | | 6,092 | |
PAREXEL International Corp. (a)(b) | | | 2,166 | | | | 100,567 | |
PDL BioPharma, Inc. (b) | | �� | 1,654 | | | | 13,133 | |
PharMerica Corp. (a)(b) | | | 1,337 | | | | 16,445 | |
| | | | | | | | |
| | | Principal
Amount ($)
or Shares | | | Market
Value
$ | |
PhotoMedex, Inc. (a)(b) | | | 586 | | | | 9,575 | |
Puma Biotechnology, Inc. (a)(b) | | | 265 | | | | 13,420 | |
Raptor Pharmaceutical Corp. (a)(b) | | | 535 | | | | 7,244 | |
Repligen Corp. (a)(b) | | | 1,379 | | | | 13,459 | |
Rigel Pharmaceuticals, Inc. (a)(b) | | | 568 | | | | 1,789 | |
Rochester Medical Corp. (a)(b) | | | 999 | | | | 13,077 | |
Sangamo Biosciences, Inc. (a)(b) | | | 283 | | | | 2,793 | |
Santarus, Inc. (a)(b) | | | 5,047 | | | | 113,658 | |
Sarepta Therapeutics, Inc. (a)(b) | | | 385 | | | | 13,140 | |
Spectrum Pharmaceuticals, Inc. (b) | | | 353 | | | | 2,704 | |
Staar Surgical Co. (a)(b) | | | 1,290 | | | | 16,370 | |
STERIS Corp. | | | 2,448 | | | | 100,099 | |
SurModics, Inc. (a) | | | 643 | | | | 12,731 | |
Synageva BioPharma Corp. (a)(b) | | | 202 | | | | 9,476 | |
Synta Pharmaceuticals Corp. (a)(b) | | | 142 | | | | 838 | |
TESARO, Inc. (a)(b) | | | 42 | | | | 1,452 | |
The Ensign Group, Inc. (b) | | | 624 | | | | 24,118 | |
The Providence Service Corp. (a) | | | 442 | | | | 11,863 | |
Triple-S Management Corp. (Class B) (a)(b) | | | 627 | | | | 11,694 | |
US Physical Therapy, Inc. | | | 378 | | | | 10,406 | |
Utah Medical Products, Inc. (b) | | | 305 | | | | 15,403 | |
West Pharmaceutical Services, Inc. | | | 1,530 | | | | 113,144 | |
ZIOPHARM Oncology, Inc. (a)(b) | | | 279 | | | | 834 | |
| | | | | | | | |
| | | | | | | 2,092,161 | |
| | | | | | | | |
| | |
Industrials - 18.5% | | | | | | | | |
A.O. Smith Corp. (b) | | | 1,779 | | | | 74,807 | |
AAON, Inc. | | | 1,130 | | | | 26,352 | |
AAR Corp. | | | 4,084 | | | | 102,468 | |
ABM Industries, Inc. | | | 4,246 | | | | 102,541 | |
Air Transport Services Group, Inc. (a)(b) | | | 1,985 | | | | 12,724 | |
Alamo Group, Inc. | | | 393 | | | | 17,826 | |
Alaska Air Group, Inc. | | | 1,810 | | | | 102,482 | |
Alliant Techsystems, Inc. (b) | | | 580 | | | | 56,121 | |
Altra Holdings, Inc. (b) | | | 3,230 | | | | 80,265 | |
AMERCO, Inc. (b) | | | 646 | | | | 105,686 | |
American Woodmark Corp. (a)(b) | | | 526 | | | | 18,342 | |
Apogee Enterprises, Inc. (b) | | | 3,300 | | | | 92,070 | |
Arkansas Best Corp. (b) | | | 4,163 | | | | 103,575 | |
Astronics Corp. (a)(b) | | | 384 | | | | 17,867 | |
AT Cross Co. (Class A) (a) | | | 208 | | | | 4,435 | |
Barrett Business Services, Inc. | | | 841 | | | | 54,051 | |
CBIZ, Inc. (a)(b) | | | 628 | | | | 4,302 | |
Ceco Environmental Corp. (b) | | | 1,121 | | | | 14,932 | |
CIRCOR International, Inc. (b) | | | 919 | | | | 52,833 | |
Coleman Cable, Inc. (b) | | | 562 | | | | 10,700 | |
Columbus McKinnon Corp. (a) | | | 949 | | | | 20,309 | |
Comfort Systems USA, Inc. (b) | | | 5,886 | | | | 88,879 | |
Consolidated Graphics, Inc. (a) | | | 262 | | | | 14,017 | |
| | | | |
| Dynamic Small Cap Fund | | | 11 | |
SSgA
Dynamic Small Cap Fund
Schedule of Investments, continued — August 31, 2013
| | | | | | | | |
| | | Principal
Amount ($)
or Shares | | | Market
Value
$ | |
| | | | | | | | |
Courier Corp. (b) | | | 1,491 | | | | 23,260 | |
Curtiss-Wright Corp. (b) | | | 1,655 | | | | 69,113 | |
Deluxe Corp. (b) | | | 2,827 | | | | 111,242 | |
EnerSys (b) | | | 946 | | | | 48,511 | |
EnPro Industries, Inc. (a)(b) | | | 959 | | | | 54,644 | |
Federal Signal Corp. (a) | | | 1,730 | | | | 20,189 | |
Franklin Covey Co. (a) | | | 1,096 | | | | 17,218 | |
G&K Services, Inc. (Class A) (b) | | | 1,975 | | | | 101,594 | |
Generac Holdings, Inc. (b) | | | 2,455 | | | | 97,193 | |
Graham Corp. | | | 255 | | | | 8,800 | |
H&E Equipment Services, Inc. | | | 4,670 | | | | 112,454 | |
Hardinge, Inc. | | | 1,104 | | | | 15,997 | |
Huron Consulting Group, Inc. (a) | | | 1,128 | | | | 53,693 | |
Hyster-Yale Materials Handling, Inc. (b) | | | 1,514 | | | | 114,473 | |
ICF International, Inc. (a)(b) | | | 3,035 | | | | 99,821 | |
Insperity, Inc. | | | 517 | | | | 16,492 | |
Insteel Industries, Inc. | | | 1,082 | | | | 17,301 | |
John Bean Technologies Corp. (b) | | | 3,992 | | | | 87,465 | |
Kadant, Inc. | | | 415 | | | | 12,894 | |
Kelly Services, Inc. (Class A) (b) | | | 1,107 | | | | 20,147 | |
Korn/Ferry International (a) | | | 5,067 | | | | 89,737 | |
L.B. Foster Co. (Class A) (b) | | | 643 | | | | 27,276 | |
Marten Transport, Ltd. (b) | | | 798 | | | | 14,117 | |
MasTec, Inc. (a)(b) | | | 3,503 | | | | 111,395 | |
Mobile Mini, Inc. (a)(b) | | | 3,164 | | | | 96,122 | |
Moog, Inc. (Class A) (a)(b) | | | 978 | | | | 49,682 | |
Mueller Water Products, Inc. (Class A) | | | 10,443 | | | | 78,845 | |
Navigant Consulting, Inc. (a)(b) | | | 6,607 | | | | 90,185 | |
NN, Inc. | | | 827 | | | | 11,421 | |
Nortek, Inc. (a)(b) | | | 1,099 | | | | 73,578 | |
Orbital Sciences Corp. (a) | | | 5,599 | | | | 97,199 | |
Park-Ohio Holdings Corp. (a) | | | 2,694 | | | | 93,132 | |
Patrick Industries, Inc. (a) | | | 423 | | | | 11,455 | |
Pendrell Corp. (a) | | | 5,436 | | | | 10,437 | |
PGT, Inc. (a) | | | 2,142 | | | | 21,806 | |
Pike Electric Corp. | | | 1,140 | | | | 12,654 | |
Preformed Line Products Co. | | | 39 | | | | 2,688 | |
Primoris Services Corp. (b) | | | 3,807 | | | | 85,581 | |
Proto Labs, Inc. (a)(b) | | | 200 | | | | 14,208 | |
Quad Graphics, Inc. | | | 3,803 | | | | 119,186 | |
R.R. Donnelley & Sons Co. (b) | | | 3,469 | | | | 57,863 | |
Republic Airways Holdings, Inc. (a)(b) | | | 7,799 | | | | 87,115 | |
Roadrunner Transportation Systems, Inc. (a) | | | 762 | | | | 20,665 | |
RPX Corp. (a)(b) | | | 860 | | | | 13,493 | |
Saia, Inc. (a)(b) | | | 3,472 | | | | 104,195 | |
SkyWest, Inc. (b) | | | 6,662 | | | | 85,873 | |
Swift Transportation Co. (a)(b) | | | 6,478 | | | | 116,345 | |
Teledyne Technologies, Inc. (a) | | | 1,594 | | | | 123,009 | |
| | | | | | | | |
| | | Principal
Amount ($)
or Shares | | | Market
Value
$ | |
TrueBlue, Inc. (a) | | | 2,173 | | | | 52,847 | |
UniFirst Corp. | | | 1,110 | | | | 106,427 | |
United Stationers, Inc. (b) | | | 2,590 | | | | 102,927 | |
Universal Truckload Services, Inc. | | | 611 | | | | 15,397 | |
US Ecology, Inc. (b) | | | 763 | | | | 21,433 | |
VSE Corp. (b) | | | 258 | | | | 11,620 | |
WageWorks, Inc. (a) | | | 630 | | | | 26,296 | |
Wesco Aircraft Holdings, Inc. (a)(b) | | | 1,067 | | | | 20,412 | |
| | | | | | | | |
| | | | | | | 4,356,706 | |
| | | | | | | | |
|
Information Technology - 14.0% | |
Aeroflex Holding Corp. (a) | | | 1,131 | | | | 7,940 | |
Ambarella, Inc. (a)(b) | | | 508 | | | | 7,285 | |
AVG Technologies NV (a)(b) | | | 727 | | | | 15,754 | |
Belden, Inc. (b) | | | 912 | | | | 51,729 | |
Benchmark Electronics, Inc. (a)(b) | | | 1,393 | | | | 30,604 | |
CalAmp Corp. (a)(b) | | | 1,706 | | | | 27,961 | |
Calix, Inc. (a)(b) | | | 1,261 | | | | 16,204 | |
Cardtronics, Inc. (a)(b) | | | 1,149 | | | | 39,859 | |
Checkpoint Systems, Inc. (a)(b) | | | 6,001 | | | | 88,035 | |
CSG Systems International, Inc. (b) | | | 4,160 | | | | 97,926 | |
CTS Corp. | | | 1,152 | | | | 16,036 | |
Electro Rent Corp. (b) | | | 646 | | | | 10,982 | |
Electronics for Imaging, Inc. (a)(b) | | | 3,800 | | | | 111,264 | |
Envestnet, Inc. (a)(b) | | | 635 | | | | 17,545 | |
EPAM Systems, Inc. (a)(b) | | | 1,532 | | | | 48,993 | |
EPIQ Systems, Inc. | | | 1,327 | | | | 16,256 | |
ePlus, Inc. | | | 191 | | | | 9,923 | |
Euronet Worldwide, Inc. (a)(b) | | | 3,675 | | | | 126,236 | |
Fabrinet (a)(b) | | | 805 | | | | 11,238 | |
FleetMatics Group PLC (a)(b) | | | 353 | | | | 17,456 | |
Heartland Payment Systems, Inc. (b) | | | 2,876 | | | | 106,268 | |
iGate Corp. (a) | | | 895 | | | | 20,898 | |
Immersion Corp. (a)(b) | | | 990 | | | | 12,632 | |
Infoblox, Inc. (a)(b) | | | 1,177 | | | | 41,077 | |
IntraLinks Holdings, Inc. (a) | | | 1,486 | | | | 11,621 | |
IXYS Corp. | | | 975 | | | | 9,038 | |
j2 Global, Inc. (b) | | | 2,686 | | | | 132,259 | |
Lexmark International, Inc. (Class A) (b) | | | 1,425 | | | | 48,678 | |
Littelfuse, Inc. | | | 1,434 | | | | 105,786 | |
M/A-COM Technology Solutions Holdings, Inc. (a) | | | 658 | | | | 10,765 | |
Manhattan Associates, Inc. (a)(b) | | | 1,333 | | | | 116,638 | |
Marchex, Inc. | | | 1,506 | | | | 10,316 | |
Measurement Specialties, Inc. (a) | | | 2,057 | | | | 97,378 | |
Mentor Graphics Corp. (b) | | | 2,066 | | | | 45,783 | |
Methode Electronics, Inc. | | | 1,528 | | | | 36,504 | |
MoneyGram International, Inc. (a)(b) | | | 1,156 | | | | 23,421 | |
| | |
| 12 | | Dynamic Small Cap Fund |
SSgA
Dynamic Small Cap Fund
Schedule of Investments, continued — August 31, 2013
| | | | | | | | |
| | | Principal
Amount ($)
or Shares | | | Market
Value
$ | |
| | | | | | | | |
Monotype Imaging Holdings, Inc. (b) | | | 3,739 | | | | 96,279 | |
Move, Inc. (a) | | | 1,185 | | | | 17,183 | |
MTS Systems Corp. (b) | | | 1,577 | | | | 94,888 | |
PC Connection, Inc. | | | 881 | | | | 13,083 | |
PDF Solutions, Inc. (a) | | | 633 | | | | 12,565 | |
Pegasystems, Inc. (b) | | | 731 | | | | 26,937 | |
Perficient, Inc. (a) | | | 970 | | | | 15,646 | |
Photronics, Inc. (a)(b) | | | 1,770 | | | | 12,886 | |
Plexus Corp. (a) | | | 2,965 | | | | 97,074 | |
PMC - Sierra, Inc. (a)(b) | | | 12,719 | | | | 79,239 | |
Responsys, Inc. (a) | | | 1,066 | | | | 15,297 | |
Sanmina Corp. (a) | | | 7,166 | | | | 116,591 | |
Sapiens International Corp. NV | | | 2,502 | | | | 13,711 | |
ScanSource, Inc. (a) | | | 2,963 | | | | 91,794 | |
Seachange International, Inc. (a) | | | 1,496 | | | | 14,960 | |
Shutterstock, Inc. (a)(b) | | | 222 | | | | 11,020 | |
SS&C Technologies Holdings, Inc. (a)(b) | | | 3,408 | | | | 120,609 | |
Stamps.com, Inc. (a)(b) | | | 400 | | | | 16,752 | |
Sykes Enterprises, Inc. (a)(b) | | | 1,405 | | | | 23,927 | |
SYNNEX Corp. (a)(b) | | | 898 | | | | 42,664 | |
Syntel, Inc. (b) | | | 1,370 | | | | 98,462 | |
Take-Two Interactive Software, Inc. (a)(b) | | | 1,580 | | | | 29,009 | |
TeleTech Holdings, Inc. (a)(b) | | | 909 | | | | 22,243 | |
Tessco Technologies, Inc. (b) | | | 320 | | | | 10,099 | |
The Hackett Group, Inc. (b) | | | 1,574 | | | | 10,089 | |
Travelzoo, Inc. (a) | | | 347 | | | | 9,373 | |
Tyler Technologies, Inc. (a)(b) | | | 1,287 | | | | 95,096 | |
Ubiquiti Networks, Inc. (b) | | | 2,373 | | | | 83,197 | |
United Online, Inc. | | | 11,905 | | | | 93,454 | |
Virtusa Corp. (a)(b) | | | 557 | | | | 14,660 | |
Vishay Intertechnology, Inc. (a)(b) | | | 3,205 | | | | 39,261 | |
VistaPrint NV (a)(b) | | | 2,339 | | | | 124,528 | |
Web.com Group, Inc. (a)(b) | | | 4,118 | | | | 116,210 | |
XO Group, Inc. (a) | | | 1,011 | | | | 12,092 | |
| | | | | | | | |
| | | | | | | 3,289,166 | |
| | | | | | | | |
| | |
Materials - 4.1% | | | | | | | | |
AEP Industries, Inc. (a)(b) | | | 322 | | | | 25,193 | |
Chase Corp. (b) | | | 361 | | | | 10,729 | |
Ferro Corp. (a)(b) | | | 12,788 | | | | 93,992 | |
FutureFuel Corp. (b) | | | 1,316 | | | | 21,240 | |
Graphic Packaging Holding Co. (a) | | | 12,591 | | | | 104,631 | |
Innospec, Inc. | | | 2,120 | | | | 86,750 | |
KapStone Paper and Packaging Corp. | | | 3,175 | | | | 133,350 | |
KMG Chemicals, Inc. (b) | | | 461 | | | | 10,861 | |
Landec Corp. (a)(b) | | | 1,376 | | | | 18,163 | |
Neenah Paper, Inc. | | | 1,115 | | | | 40,809 | |
OM Group, Inc. (a)(b) | | | 3,376 | | | | 95,946 | |
| | | | | | | | |
| | | Principal
Amount ($)
or Shares | | | Market
Value
$ | |
P.H. Glatfelter Co. | | | 3,921 | | | | 100,456 | |
Quaker Chemical Corp. (b) | | | 1,468 | | | | 97,417 | |
United States Lime & Minerals, Inc. (a) | | | 152 | | | | 8,941 | |
US Silica Holdings, Inc. (b) | | | 418 | | | | 9,823 | |
Worthington Industries, Inc. | | | 3,367 | | | | 112,222 | |
| | | | | | | | |
| | | | | | | 970,523 | |
| | | | | | | | |
|
Telecommunication Services - 0.4% | |
Atlantic Tele-Network, Inc. (b) | | | 363 | | | | 17,148 | |
Hawaiian Telcom Holdco, Inc. (a)(b) | | | 695 | | | | 17,243 | |
IDT Corp. (Class B) (b) | | | 691 | | | | 11,484 | |
Inteliquent, Inc. | | | 1,598 | | | | 12,784 | |
Lumos Networks Corp. | | | 768 | | | | 12,096 | |
Straight Path Communications, Inc. (Class B) (a)(b) | | | 345 | | | | 1,773 | |
USA Mobility, Inc. (b) | | | 1,247 | | | | 17,608 | |
Vonage Holdings Corp. (a)(b) | | | 4,046 | | | | 12,624 | |
| | | | | | | | |
| | | | | | | 102,760 | |
| | | | | | | | |
| | |
Utilities - 3.0% | | | | | | | | |
ALLETE, Inc. | | | 870 | | | | 41,064 | |
American States Water Co. (b) | | | 1,635 | | | | 86,001 | |
Black Hills Corp. (b) | | | 2,416 | | | | 116,016 | |
Chesapeake Utilities Corp. (b) | | | 1,380 | | | | 72,050 | |
Empire District Electric Co. | | | 2,021 | | | | 42,785 | |
MGE Energy, Inc. (b) | | | 1,806 | | | | 94,111 | |
NorthWestern Corp. | | | 1,339 | | | | 53,788 | |
Otter Tail Corp. (b) | | | 3,011 | | | | 79,129 | |
Southwest Gas Corp. (b) | | | 1,380 | | | | 64,556 | |
UNS Energy Corp. | | | 1,250 | | | | 57,162 | |
| | | | | | | | |
| | | | | | | 706,662 | |
| | | | | | | | |
| | |
Total Common Stocks
(cost $21,056,393) | | | | | | | 23,391,308 | |
| | | | | | | | |
| Short-Term Investments - 25.8% | |
SSgA Prime Money Market Fund 0.19 (d)(e) | | | 72,340 | | | | 72,340 | |
State Street Navigator Securities Lending Prime Portfolio (d)(f) | | | 5,985,490 | | | | 5,985,490 | |
| | | | | | | | |
| |
Total Short-Term Investments
(cost $6,057,830) | | | | 6,057,830 | |
| | | | | | | | |
| |
Total Investments - 125.3%
(identified cost $27,114,223) | | | | 29,449,138 | |
| |
Other Assets and Liabilities,
Net - (25.3)% | | | | (5,940,205 | ) |
| | | | | | | | |
| | |
| Net Assets - 100.0% | | | | | | | 23,508,933 | |
| | | | | | | | |
| | | | |
| Dynamic Small Cap Fund | | | 13 | |
SSgA
Dynamic Small Cap Fund
Schedule of Investments, continued — August 31, 2013
Footnotes:
| (a) | Non-income producing security. |
| (b) | All or a portion of the shares of this security are on loan. |
| (c) | Real Estate Investment Trust (REIT). |
| (d) | Affiliated Fund managed by SSgA Funds Management, Inc. (Note 4). |
| (e) | The rate shown is the annualized seven-day yield at period end. |
| (f) | Investments of cash collateral for securities loaned. |
Abbreviations:
PLC - Public Limited Company
Presentation of Portfolio Holdings — August 31, 2013
| | | | | | | | | | | | | | | | | | | | |
| | | Market Value | | | % of
Net
Assets | |
| Categories | | Level 1 | | | Level 2 | | | Level 3 | | | Total | | |
Consumer Discretionary | | $ | 4,397,946 | | | $ | — | | | $ | — | | | $ | 4,397,946 | | | | 18.7 | |
Consumer Staples | | | 1,031,430 | | | | — | | | | — | | | | 1,031,430 | | | | 4.4 | |
Energy | | | 952,059 | | | | — | | | | — | | | | 952,059 | | | | 4.1 | |
Financials | | | 5,491,895 | | | | — | | | | — | | | | 5,491,895 | | | | 23.4 | |
Health Care | | | 2,092,161 | | | | — | | | | — | | | | 2,092,161 | | | | 8.9 | |
Industrials | | | 4,356,706 | | | | — | | | | — | | | | 4,356,706 | | | | 18.5 | |
Information Technology | | | 3,289,166 | | | | — | | | | — | | | | 3,289,166 | | | | 14.0 | |
Materials | | | 970,523 | | | | — | | | | — | | | | 970,523 | | | | 4.1 | |
Telecommunication Services | | | 102,760 | | | | — | | | | — | | | | 102,760 | | | | 0.4 | |
Utilities | | | 706,662 | | | | — | | | | — | | | | 706,662 | | | | 3.0 | |
Short-Term Investments | | | 72,340 | | | | 5,985,490 | | | | — | | | | 6,057,830 | | | | 25.8 | |
| | | | | | | | | | | | | | | | | | | | |
Total Investments | | $ | 23,463,648 | | | $ | 5,985,490 | | | $ | — | | | $ | 29,449,138 | | | | 125.3 | |
| | | | | | | | | | | | | | | | | | | | |
Other Assets and Liabilities, Net | | | | | | | | | | | | | | | | | | | (25.3 | ) |
| | | | | | | | | | | | | | | | | | | | |
| | | | | | | | | | | | | | | | | | | 100.0 | |
| | | | | | | | | | | | | | | | | | | | |
For a description of the levels see Note 2 in the Notes to Financial Statements.
There were no transfers in and out of Levels 1, 2 and 3 during the period ended August 31, 2013.
See accompanying notes which are an integral part of the financial statements.
| | |
| 14 | | Dynamic Small Cap Fund |
SSgA
Clarion Real Estate Fund
Portfolio Management Discussion and Analysis — August 31, 2013 (Unaudited)
Objective: The Fund seeks to provide income and capital growth by investing primarily in publicly traded securities of real estate companies. The Fund looks to identify companies with superior earnings growth, conservative balance sheets, and dividend security to target out-performance over a 2-3 year time horizon.
Invests in: Real Estate Investment Trust (REIT) securities, primarily from those securities in the Dow Jones U.S. Select REIT Index and across different types and regions based on the fundamental research of the Advisor.
Strategy: The Fund seeks to meet its objective by investing with a relatively long time horizon, favoring strong real estate fundamentals, and attempting to minimize turnover, while focusing on relative valuations, balance sheet strength and higher growth rates.
| | | | | | |
| Clarion Real Estate Fund | |
| | |
Period Ended
08/31/13 | | | | Total
Return | |
1 Year | | | | | (1.94 | )% |
5 Years | | | | | 1.90 | %+ |
10 Years | | | | | 8.57 | %+ |
| | | | | | |
| Dow Jones U.S. Select REIT® Index® Index# | |
| | |
Period Ended
08/31/13 | | | | Total
Return | |
1 Year | | | | | (0.43 | )% |
5 Years | | | | | 4.61 | %+ |
10 Years | | | | | 9.35 | %+ |
Performance quoted represents past performance, which is no guarantee of future results. Investment return and principal value will fluctuate, so you may have a gain or loss when shares are sold. Current performance may be higher or lower than that quoted. Visit www.ssgafunds.com for most recent month-end performance. The returns do not reflect the deduction of taxes that a shareholder would pay on Fund distributions or on the redemption of Fund shares. The gross expense ratio for the Clarion Real Estate Fund as stated in the Fees and Expenses table of the prospectus dated March 1, 2013 is 1.32%.
See related Notes on page 17.
| | | | |
| Clarion Real Estate Fund | | | 15 | |
SSgA
Clarion Real Estate Fund
Portfolio Management Discussion and Analysis, continued — August 31, 2013 (Unaudited)
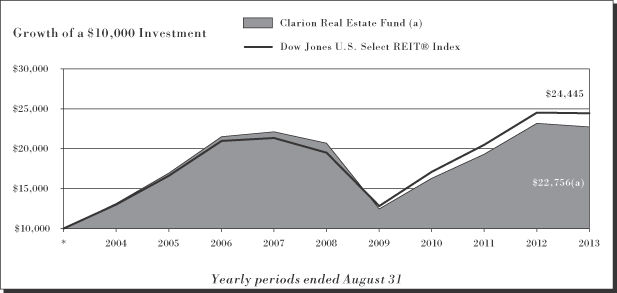
SSgA Clarion Real Estate Fund (the “Fund”) seeks to provide income and capital growth by investing primarily in publicly traded securities issued by real estate investment trusts (REITs). The Fund is benchmarked to the Dow Jones U.S. Select REIT Index (the “Index”).
For the 12-month period ended August 31, 2013, the total return for the Fund was -1.94%, and the total return for the Index was -0.43%. On January 1, 2013, CBRE Clarion Securities LLC began serving as the Fund’s sub-advisor. For the period from January 1 through August 31, 2013 (the “Reporting Period”), the total return for the Fund was -2.46%, and the total return for the Index was -1.99%. The Fund and Index returns reflect the reinvestment of dividends and other income. The Fund’s performance reflects the expenses of managing the Fund, including brokerage and advisory expenses. The Index is unmanaged and Index returns do not reflect fees and expenses of any kind, which would have a negative impact on returns.
Property stocks started the 2013 calendar year by generating solid positive total returns during the first quarter. They benefited from improving underlying property fundamentals, strengthening earnings, increasing dividends, rising transaction volumes, and continued access to attractively priced capital. However, the Fund’s first-quarter performance relative to the Index was hampered by investors’ quest for yield, which favored higher-yielding stocks. This hampered the effectiveness of strategies such as ours that focus on what we believe to be strong management, high quality property portfolios, financially sound balance sheets, improving earnings and net asset value growth, and underlying real estate fundamentals. The Fund’s negative stock selection was driven by picks in the apartment and hotel sectors, which more than offset strong picks in the mall sector. The Fund’s underweight to the outperforming health care and manufactured homes sectors, along with an overweight to the underperforming mall sector, hindered performance.
During the second quarter of 2013, property company shares declined in reaction to mixed economic news and statements from the US Federal Reserve (the “Fed”) that it may scale back its bond-buying program as early as fall 2013. This unsettled world financial markets. Bond yields moved sharply higher in response to the Fed’s comments. Many of the property sectors and companies that underperformed in 2013’s first quarter, outperformed during the second quarter, including apartment companies, which were the best performing sector. The Fund outperformed the Index during the second quarter of 2013, primarily due to stock selection, which was particularly strong in the office and hotel sectors.
Performance of equities “settled down” in July recovering from their decline during the second quarter following a spike in bond yields catalyzed by an eventual “tapering” of the Fed’s quantitative easing program. Returns for property stocks were positive in July, but lagged the robust gains of the broader stock market. Relative performance added value via favorable stock selection, continuing a trend started in the second quarter of 2013. Stock selection was strong in the office and shopping center sectors. Asset allocation was positive for the month as a result of an underweight to the underperforming health care sector and an overweight to the top performing hotel sector.
Performance of property stocks declined in August following their brief recovery in July. Relative performance was in-line with respect to the benchmark with few notable cross-currents. Stock selection was flat as a result of the outperformance of portfolio holdings in the apartments sector being offset by the negative selection within the health care and shopping center sectors. Asset allocation was flat as a result of an underweight to the underperforming shopping center sector and holding modest cash in a down market, which was offset by the negative effects of an underweight to an outperforming storage sector.
Overall, performance was modestly negative during the Reporting Period on both an absolute and relative basis. Unfavorable positioning in the storage, mall, and apartment sectors detracted from relative performance. The Fund benefited from strong stock selection in office and mall companies.
The top negative detractors from the Fund’s performance were Hospitality Properties Trust, LaSalle Hotel Properties, and Extra Space Storage. The Fund was underweight Hospitality Properties, as we remain cautious on bond-like business models because we believe they generally produce inferior organic growth and depend on acquisitions velocity and continuous access to capital markets to grow earnings. LaSalle Hotel Properties, the second largest hotel REIT with $4 billion in assets, is uniquely concentrated on independently branded hotels in urban gateway markets. We exited our position in April amid headwinds in
| | |
| 16 | | Clarion Real Estate Fund |
SSgA
Clarion Real Estate Fund
Portfolio Management Discussion and Analysis, continued — August 31, 2013 (Unaudited)
Washington, DC, and concerns about a massive redevelopment project. Extra Space Storage outperformed during the period, detracting from relative performance due to the Fund’s underweight position. We remain cautious on the storage sector due to its defensive characteristics.
The top positive contributors to the Fund’s performance were Digital Realty Trust, Inc, Host Hotels & Resorts, Inc., and SL Green Realty Corp. An underweight position to the underperforming Digital Realty Trust benefited the Fund. The shares underperformed amid concerns of decelerating fundamentals and diminishing external growth prospects within the data center sector. The Fund was overweight in outperforming Host Hotels & Resorts Inc, a leading hotel REIT, as we believe economically-sensitive property sectors, such as hotels, will benefit most from an improving economy. A key contributor to relative performance was strong stock selection in the office sector, especially an overweight to SL Green, which specializes in the midtown Manhattan market.
The views expressed above reflect those of the Fund’s portfolio manager only through the Reporting Period, and do not necessarily represent the views of the Adviser as a whole. Any such views are subject to change at any time based upon market or other conditions and the Adviser disclaims any responsibility to update such views. These views may not be relied on as investment advice and, because investment decisions for a fund are based on numerous factors, may not be relied on as an indication of trading intent on behalf of any fund.
Notes: The following notes relate to the Growth of $10,000 graph and tables on the preceding page.
| * | Assumes initial investment on September 1, 2003. |
| # | The Dow Jones U.S. Select REIT® Index is a subset of the Dow Jones Americas Select RESI and includes only REITs and REIT-like securities. |
REIT funds may be subject to a high degree of market risk due to lack of industry diversification. Furthermore, REIT funds may be subject to other risks including, but not limited to, declines in the value of real estate, risks related to general and economic conditions, changes in the value of the underlying property owned by the trust, and defaults by borrowers.
Performance data reflects an expense limitation currently in effect, without which returns would have been lower.
| | | | |
| Clarion Real Estate Fund | | | 17 | |
SSgA
Clarion Real Estate Fund
Shareholder Expense Example — August 31, 2013 (Unaudited)
Fund Expenses
The following disclosure provides important information regarding each Fund’s Expense Example, which appears on each Fund’s individual page in this Annual Report. Please refer to this information when reviewing the Expense Example for a Fund.
Example
As a shareholder of the Fund, you incur two types of costs: (1) transaction costs, and (2) ongoing costs, including advisory and administrative fees; distribution (12b-1) and/or service fees; and other Fund expenses. The Example is intended to help you understand your ongoing costs (in dollars) of investing in the Fund and to compare these costs with the ongoing costs of investing in other mutual funds. The Example is based on an investment of $1,000 invested at the beginning of the period and held for the entire period indicated, which for this Fund is from March 1, 2013 to August 31, 2013.
Actual Expenses
The information in the table under the heading “Actual Performance” provides information about actual account values and actual expenses. You may use the information in this column, together with the amount you invested, to estimate the expenses that you paid over the period. Simply divide your account value by $1,000 (for example, an $8,600 account value divided by $1,000 = 8.6), then multiply the result by the number in the first column in the row entitled “Expenses Paid During Period” to estimate the expenses you paid on your account during this period.
Hypothetical Example for Comparison Purposes
The information in the table under the heading “Hypothetical Performance (5% return before expenses)” provides information about hypothetical account values and hypothetical expenses based on the Fund’s actual expense ratio and an assumed rate of return of 5% per year before expenses, which is not the Fund’s actual return. The hypothetical account values and expenses may not be used to estimate the actual ending account balance or expenses you paid for the period. You may use this information to compare the ongoing costs of investing in the Fund and other funds. To do so, compare this 5% hypothetical example with the 5% hypothetical examples that appear in the shareholder reports of other funds.
Please note that the expenses shown in the table are meant to highlight your ongoing costs only and do not reflect any transaction costs. Therefore, the information under the heading “Hypothetical Performance (5% return before expenses)” is useful in comparing ongoing costs only, and will not help you determine the relative total costs of owning different funds. In addition, if these transaction costs were included, your costs would have been higher.
| | | | | | | | |
| | | Actual
Performance | | | Hypothetical
Performance
(5% return
before expenses) | |
Beginning Account Value | | | | | | | | |
March 1, 2013 | | $ | 1,000.00 | | | $ | 1,000.00 | |
Ending Account Value | | | | | | | | |
August 31, 2013 | | $ | 953.10 | | | $ | 1,020.16 | |
Expenses Paid During Period* | | $ | 4.92 | | | $ | 5.09 | |
| * | Expenses are equal to the Fund’s annualized expense ratio of 1.00% (representing the six month period annualized), multiplied by the average account value over the period, multiplied by 184/365 (to reflect the one-half year period). Includes amounts waived and/or reimbursed. Without the waiver and/or reimbursement, expenses would have been higher. |
| | |
| 18 | | Clarion Real Estate Fund |
SSgA
Clarion Real Estate Fund
Schedule of Investments — August 31, 2013
| | | | | | | | |
| | | Principal
Amount ($)
or Shares | | | Market
Value
$ | |
| | | | | | | | |
| Common Stocks - 99.2% | |
Diversified REITs - 6.8% | | | | | | | | |
Cousins Properties, Inc. (a) | | | 29,300 | | | | 290,949 | |
Liberty Property Trust (a) | | | 25,400 | | | | 878,840 | |
Vornado Realty Trust (a) | | | 18,988 | | | | 1,543,724 | |
| | | | | | | | |
| | | | | | | 2,713,513 | |
| | | | | | | | |
| | |
Industrial REITs - 5.3% | | | | | | | | |
DCT Industrial Trust, Inc. (a)(b) | | | 29,500 | | | | 197,355 | |
ProLogis (a) | | | 54,924 | | | | 1,935,522 | |
| | | | | | | | |
| | | | | | | 2,132,877 | |
| | | | | | | | |
| | |
Office REITs - 18.0% | | | | | | | | |
BioMed Realty Trust, Inc. (a) | | | 26,100 | | | | 480,501 | |
Boston Properties, Inc. (a) | | | 17,755 | | | | 1,819,887 | |
Brandywine Realty Trust (a) | | | 24,900 | | | | 319,218 | |
CommonWealth REIT (a) | | | 8,300 | | | | 203,765 | |
Digital Realty Trust, Inc. (a)(b) | | | 5,122 | | | | 284,783 | |
Douglas Emmett, Inc. (a) | | | 31,023 | | | | 716,631 | |
Duke Realty Corp. (a)(b) | | | 57,508 | | | | 839,042 | |
Highwoods Properties, Inc. (a) | | | 16,500 | | | | 557,370 | |
Kilroy Realty Corp. (a)(b) | | | 15,500 | | | | 756,245 | |
Lexington Realty Trust (a) | | | 6,800 | | | | 79,696 | |
SL Green Realty Corp. (a) | | | 12,908 | | | | 1,125,449 | |
| | | | | | | | |
| | | | | | | 7,182,587 | |
| | | | | | | | |
|
Residential REITs - 18.6% | |
American Residential Properties, Inc. (a)(c) | | | 4,800 | | | | 81,888 | |
Apartment Investment & Management Co. (Class A) (a) | | | 20,200 | | | | 556,106 | |
AvalonBay Communities, Inc. (a) | | | 12,598 | | | | 1,560,892 | |
BRE Properties, Inc. (a) | | | 16,600 | | | | 796,634 | |
Equity Residential (a) | | | 36,939 | | | | 1,916,765 | |
Essex Property Trust, Inc. (a) | | | 4,121 | | | | 590,580 | |
Post Properties, Inc. (a) | | | 13,200 | | | | 597,036 | |
Sun Communities, Inc. (a)(b) | | | 7,400 | | | | 317,978 | |
UDR, Inc. (a) | | | 44,162 | | | | 997,620 | |
| | | | | | | | |
| | | | | | | 7,415,499 | |
| | | | | | | | |
|
Retail REITs - 24.9% | |
CBL & Associates Properties, Inc. (a) | | | 4,121 | | | | 79,123 | |
DDR Corp. (a)(b) | | | 38,400 | | | | 595,968 | |
Federal Realty Investment Trust (a) | | | 2,063 | | | | 200,751 | |
General Growth Properties, Inc. (a) | | | 69,200 | | | | 1,327,256 | |
Kimco Realty Corp. (a)(b) | | | 59,929 | | | | 1,200,378 | |
Ramco-Gershenson Properties Trust (a)(b) | | | 13,900 | | | | 201,272 | |
Regency Centers Corp. (a)(b) | | | 9,100 | | | | 432,705 | |
Simon Property Group, Inc. (a) | | | 29,605 | | | | 4,311,376 | |
| | | | | | | | |
| | | Principal
Amount ($)
or Shares | | | Market
Value
$ | |
Tanger Factory Outlet Centers, Inc. (a) | | | 3,910 | | | | 120,624 | |
Taubman Centers, Inc. (a) | | | 6,449 | | | | 434,727 | |
The Macerich Co. (a) | | | 18,680 | | | | 1,051,310 | |
| | | | | | | | |
| | | | | | | 9,955,490 | |
| | | | | | | | |
|
Specialized REITs – 25.6% | |
CubeSmart (a)(b) | | | 21,300 | | | | 354,645 | |
HCP, Inc. (a) | | | 26,006 | | | | 1,059,224 | |
Health Care REIT, Inc. (a) | | | 26,195 | | | | 1,609,421 | |
Healthcare Realty Trust, Inc. (a) | | | 23,126 | | | | 520,104 | |
Healthcare Trust of America, Inc. (Class A) (a)(b) | | | 15,700 | | | | 161,710 | |
Host Hotels & Resorts, Inc. (a)(b) | | | 106,652 | | | | 1,816,284 | |
Pebblebrook Hotel Trust (a)(b) | | | 10,600 | | | | 271,360 | |
Public Storage (a) | | | 9,741 | | | | 1,487,158 | |
Senior Housing Properties Trust (a)(b) | | | 29,900 | | | | 680,225 | |
Starwood Hotels & Resorts Worldwide, Inc. | | | 3,200 | | | | 204,608 | |
Strategic Hotels & Resorts, Inc. (a)(c) | | | 24,800 | | | | 201,128 | |
Sunstone Hotel Investors, Inc. (a)(c) | | | 29,700 | | | | 357,291 | |
Ventas, Inc. (a) | | | 21,234 | | | | 1,322,029 | |
Weyerhaeuser Co. (a) | | | 7,400 | | | | 202,612 | |
| | | | | | | | |
| | | | | | | 10,247,799 | |
| | | | | | | | |
| |
Total Common Stocks
(cost $27,078,042) | | | | 39,647,765 | |
| | | | | | | | |
| Short-Term Investments - 7.1% | | | | | |
SSgA Prime Money Market Fund 0.19% (d)(e) | | | 201,242 | | | | 201,242 | |
State Street Navigator Securities Lending Prime Portfolio (d)(f) | | | 2,616,284 | | | | 2,616,284 | |
| | | | | | | | |
| |
Total Short-Term Investments
(cost $2,817,526) | | | | 2,817,526 | |
| | | | | | | | |
| |
Total Investments - 106.3%
(identified cost $29,895,568) | | | | 42,465,291 | |
| |
Other Assets and Liabilities,
Net - (6.3)% | | | | (2,509,686 | ) |
| | | | | | | | |
| | |
| Net Assets - 100.0% | | | | | | | 39,955,605 | |
| | | | | | | | |
| | | | |
| Clarion Real Estate Fund | | | 19 | |
SSgA
Clarion Real Estate Fund
Schedule of Investments, continued — August 31, 2013
Footnotes:
| (a) | Real Estate Investment Trust (REIT). |
| (b) | All or a portion of the shares of this security are on loan. |
| (c) | Non-income producing security. |
| (d) | Affiliated Fund managed by SSgA Funds Management, Inc. (Note 4). |
| (e) | The rate shown is the annualized seven-day yield at period end. |
| (f) | Investments of cash collateral for securities loaned. |
Presentation of Portfolio Holdings — August 31, 2013
| | | | | | | | | | | | | | | | | | | | |
| | | Market Value | | | % of
Net
Assets | |
| Categories | | Level 1 | | | Level 2 | | | Level 3 | | | Total | | |
Diversified REITs | | $ | 2,713,513 | | | $ | — | | | $ | — | | | $ | 2,713,513 | | | | 6.8 | |
Industrial REITs | | | 2,132,877 | | | | — | | | | — | | | | 2,132,877 | | | | 5.3 | |
Office REITs | | | 7,182,587 | | | | — | | | | — | | | | 7,182,587 | | | | 18.0 | |
Residential REITs | | | 7,415,499 | | | | — | | | | — | | | | 7,415,499 | | | | 18.6 | |
Retail REITs | | | 9,955,490 | | | | — | | | | — | | | | 9,955,490 | | | | 24.9 | |
Specialized REITs | | | 10,247,799 | | | | — | | | | — | | | | 10,247,799 | | | | 25.6 | |
Short-Term Investments | | | 201,242 | | | | 2,616,284 | | | | — | | | | 2,817,526 | | | | 7.1 | |
| | | | | | | | | | | | | | | | | | | | |
Total Investments | | $ | 39,849,007 | | | $ | 2,616,284 | | | $ | — | | | $ | 42,465,291 | | | | 106.3 | |
| | | | | | | | | | | | | | | | | | | | |
Other Assets and Liabilities, Net | | | | | | | | | | | | | | | | | | | (6.3 | ) |
| | | | | | | | | | | | | | | | | | | | |
| | | | | | | | | | | | | | | | | | | 100.0 | |
| | | | | | | | | | | | | | | | | | | | |
For a description of the levels see Note 2 in the Notes to Financial Statements.
There were no transfers in and out of Levels 1, 2 and 3 during the period ended August 31, 2013.
See accompanying notes which are an integral part of the financial statements.
| | |
| 20 | | Clarion Real Estate Fund |
SSgA
IAM SHARES Fund
Portfolio Management Discussion and Analysis — August 31, 2013 (Unaudited)
Objective: The Fund seeks to maximize total return by investing the majority of its net assets in equity securities of IAM companies.
Invests in: At least 80% of its total assets in equity securities of IAM companies. IAM companies are defined as companies that either have entered into collective bargaining agreements with the International Association of Machinists and Aerospace Workers (“IAMAW”) or affiliated labor unions, or are listed in the S&P 500® Index and have not been identified by IAMAW or affiliated labor unions as having non-union sentiment.
Strategy: The Fund’s investment strategy is driven by an investment process that manages portfolio exposure to fundamental attributes within a multifactor risk model environment. These attributes include industry allocations, size, style, growth expectations, and valuation ratios.
| | | | | | |
| IAM SHARES Fund | |
| | |
Period Ended
08/31/13 | | | | Total
Return | |
1 Year | | | | | 18.80 | % |
5 Years | | | | | 7.04 | %+ |
10 Years | | | | | 6.76 | %+ |
| | | | | | |
| Standard & Poor’s® 500 Composite Stock Index# | |
| | |
Period Ended 08/31/13 | | | | Total
Return | |
1 Year | | | | | 18.70 | % |
5 Years | | | | | 7.32 | %+ |
10 Years | | | | | 7.12 | %+ |
Performance quoted represents past performance, which is no guarantee of future results. Investment return and principal value will fluctuate, so you may have a gain or loss when shares are sold. Current performance may be higher or lower than that quoted. Visit www.ssgafunds.com for most recent month-end performance. The returns do not reflect the deduction of taxes that a shareholder would pay on Fund distributions or on the redemption of Fund shares. The gross expense ratio for the IAM SHARES Fund as stated in the Fees and Expenses table of the prospectus dated December 14, 2012 is 0.51%.
See related Notes on following page.
SSgA
IAM SHARES Fund
Portfolio Management Discussion and Analysis, continued — August 31, 2013 (Unaudited)
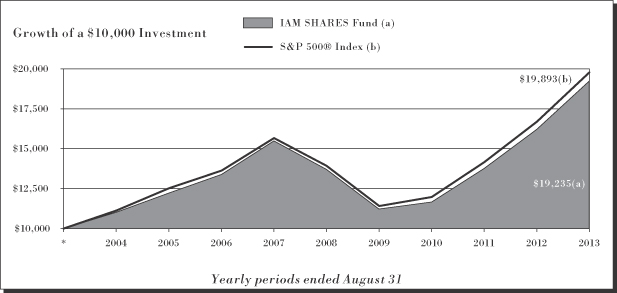
SSgA IAM SHARES Fund (the “Fund”) seeks to maximize total return primarily through investments in equity securities of companies that have entered into collective bargaining agreements with the International Association of Machinists and Aerospace Workers, or affiliated labor unions, or have not been identified as having non-union sentiment. The Fund is benchmarked to the S&P 500 Index (the “Index”).
For the 12-month period ended August 31, 2013 (the “Reporting Period”), the total return for the Fund was 18.80%, and the total return for the Index was 18.70%. The Fund and Index returns reflect the reinvestment of dividends and other income. The Fund’s performance reflects the expenses of managing the Fund, including brokerage and advisory expenses. The Index is unmanaged and Index returns do not reflect fees and expenses of any kind, which would have a negative impact on returns.
US stocks enjoyed a strong performance over the Reporting Period, despite challenges such as the impact of Hurricane Sandy, the debate over mandatory spending cuts and tax hikes, and banking turmoil in Cyprus. Improved financial stability in Europe and hints of perkier growth in Asia kept global stock returns largely positive. Enthusiasm for stocks faltered somewhat after US Federal Reserve (the “Fed”) Chairman Ben S. Bernanke suggested in May that asset purchases by the Fed might slow if economic conditions continued to improve. However, increased merger and acquisition activity and generally positive earnings from the largest US companies helped the S&P 500 reach new record highs in the summer. The Index later declined from its midsummer peaks due to concerns about military action in Syria and the Fed cutting back on its asset purchases.
The top positive contributors to the Fund’s performance were JPMorgan Chase & Co., Gilead Sciences Inc, and Johnson & Johnson. JPMorgan Chase & Co benefited from higher revenues in business lines such as investment banking and success implementing its longer-term, cost reduction-strategies. Both Gilead Sciences INC and Johnson & Johnson benefited from successful merger and acquisition activity as well as their strong drug pipelines.
The top negative contributors to the Fund’s performance were Apple Inc, Edwards Lifesciences Corp., and Intel Corp. Apple, Inc was hurt globally by strong smartphone and tablet competitors that caught up to Apple, Inc on technology and have delivered better pricing. Edwards Lifesciences Corp stock was hurt by missed sales targets and increased competition for its artificial heart valves. Meanwhile, Intel Corp., which was late to the mobile/tablet market, continued to suffer due to the rapid decline in the personal computer market.
The Fund invested in S&P 500 futures contracts to equitize the small amount of cash in the portfolio during the Reporting Period. The futures’ performance did not have a material impact on portfolio performance.
The views expressed above reflect those of the Fund’s portfolio manager only through the Reporting Period, and do not necessarily represent the views of the Adviser as a whole. Any such views are subject to change at any time based upon market or other conditions and the Adviser disclaims any responsibility to update such views. These views may not be relied on as investment advice and, because investment decisions for a fund are based on numerous factors, may not be relied on as an indication of trading intent on behalf of any fund.
Notes: The following notes relate to the Growth of $10,000 graph and tables on the preceding page.
| * | Assumes initial investment on September 1, 2003. |
| # | The Standard & Poor’s® 500 Composite Stock Index is composed of 500 common stocks which are chosen by Standard & Poor’s Corporation to best capture the price performance of a large cross-section of the US publicly traded stock market. The Index is structured to approximate the general distribution of industries in the US economy. |
SSgA
IAM SHARES Fund
Shareholder Expense Example — August 31, 2013 (Unaudited)
Fund Expenses
The following disclosure provides important information regarding each Fund’s Expense Example, which appears on each Fund’s individual page in this Annual Report. Please refer to this information when reviewing the Expense Example for a Fund.
Example
As a shareholder of the Fund, you incur two types of costs: (1) transaction costs, and (2) ongoing costs, including advisory and administrative fees; distribution (12b-1) and/or service fees; and other Fund expenses. The Example is intended to help you understand your ongoing costs (in dollars) of investing in the Fund and to compare these costs with the ongoing costs of investing in other mutual funds. The Example is based on an investment of $1,000 invested at the beginning of the period and held for the entire period indicated, which for this Fund is from March 1, 2013 to August 31, 2013.
Actual Expenses
The information in the table under the heading “Actual Performance” provides information about actual account values and actual expenses. You may use the information in this column, together with the amount you invested, to estimate the expenses that you paid over the period. Simply divide your account value by $1,000 (for example, an $8,600 account value divided by $1,000 = 8.6), then multiply the result by the number in the first column in the row entitled “Expenses Paid During Period” to estimate the expenses you paid on your account during this period.
Hypothetical Example for Comparison Purposes
The information in the table under the heading “Hypothetical Performance (5% return before expenses)” provides information about hypothetical account values and hypothetical expenses based on the Fund’s actual expense ratio and an assumed rate of return of 5% per year before expenses, which is not the Fund’s actual return. The hypothetical account values and expenses may not be used to estimate the actual ending account balance or expenses you paid for the period. You may use this information to compare the ongoing costs of investing in the Fund and other funds. To do so, compare this 5% hypothetical example with the 5% hypothetical examples that appear in the shareholder reports of other funds.
Please note that the expenses shown in the table are meant to highlight your ongoing costs only and do not reflect any transaction costs. Therefore, the information under the heading “Hypothetical Performance (5% return before expenses)” is useful in comparing ongoing costs only, and will not help you determine the relative total costs of owning different funds. In addition, if these transaction costs were included, your costs would have been higher.
| | | | | | | | |
| | | Actual
Performance | | | Hypothetical
Performance
(5% return
before expenses) | |
Beginning Account Value | | | | | | | | |
March 1, 2013 | | $ | 1,000.00 | | | $ | 1,000.00 | |
Ending Account Value | | | | | | | | |
August 31, 2013 | | $ | 1,087.10 | | | $ | 1,023.13 | |
Expenses Paid During Period* | | $ | 2.16 | | | $ | 2.09 | |
| * | Expenses are equal to the Fund’s annualized expense ratio of 0.41% (representing the six month period annualized), multiplied by the average account value over the period, multiplied by 184/365 (to reflect the one-half year period). Includes amounts waived and/or reimbursed. Without the waiver and/or reimbursement, expenses would have been higher. |
SSgA
IAM SHARES Fund
Schedule of Investments — August 31, 2013
| | | | | | | | |
| | | Principal
Amount ($)
or Shares | | | Market
Value
$ | |
| | | | | | | | |
| Common Stocks - 97.4% | |
Consumer Discretionary - 12.6% | |
Amazon.com, Inc. (a) | | | 4,600 | | | | 1,292,508 | |
AutoNation, Inc. (a)(b) | | | 7,300 | | | | 341,202 | |
AutoZone, Inc. (a) | | | 100 | | | | 41,994 | |
Bed Bath & Beyond, Inc. (a) | | | 3,200 | | | | 235,968 | |
Best Buy Co., Inc. | | | 3,925 | | | | 141,300 | |
BorgWarner, Inc. (b) | | | 1,700 | | | | 164,186 | |
Brunswick Corp. | | | 3,500 | | | | 127,260 | |
Cablevision Systems Corp. (Class A) (b) | | | 3,200 | | | | 56,736 | |
Carnival Corp. (b) | | | 4,300 | | | | 155,187 | |
CBS Corp. (Class B) | | | 8,701 | | | | 444,621 | |
Chipotle Mexican Grill, Inc. (a) | | | 100 | | | | 40,817 | |
Coach, Inc. (b) | | | 11,376 | | | | 600,767 | |
Comcast Corp. (Class A) | | | 42,966 | | | | 1,808,439 | |
CST Brands, Inc. (a) | | | 1 | | | | 29 | |
D.R. Horton, Inc. (b) | | | 3,900 | | | | 69,615 | |
Denny’s Corp. (a)(b) | | | 14,500 | | | | 81,490 | |
DIRECTV (a) | | | 9,211 | | | | 535,896 | |
Ethan Allen Interiors, Inc. (b) | | | 4,666 | | | | 121,643 | |
Family Dollar Stores, Inc. | | | 2,400 | | | | 170,856 | |
Ford Motor Co. | | | 53,743 | | | | 870,099 | |
Gannett Co., Inc. | | | 6,000 | | | | 144,540 | |
Genuine Parts Co. (b) | | | 2,800 | | | | 215,628 | |
H&R Block, Inc. | | | 3,700 | | | | 103,267 | |
Hanesbrands, Inc. (b) | | | 3,100 | | | | 184,388 | |
Harley-Davidson, Inc. | | | 7,200 | | | | 431,856 | |
J.C. Penney Co., Inc. (a)(b) | | | 2,500 | | | | 31,200 | |
JAKKS Pacific, Inc. (b) | | | 1,900 | | | | 9,861 | |
Johnson Controls, Inc. | | | 10,700 | | | | 433,671 | |
Kohl’s Corp. | | | 4,100 | | | | 210,371 | |
Leggett & Platt, Inc. (b) | | | 7,900 | | | | 228,468 | |
Liberty Global PLC (Class A) (a) | | | 3,900 | | | | 302,952 | |
Liberty Interactive Corp. (Class A) (a) | | | 7,298 | | | | 164,789 | |
Liberty Ventures (Series A) (a) | | | 486 | | | | 41,621 | |
Lowe’s Cos., Inc. | | | 16,600 | | | | 760,612 | |
Macy’s, Inc. | | | 6,768 | | | | 300,702 | |
Marriott International, Inc. (Class A) | | | 9,400 | | | | 375,906 | |
Matthews International Corp. (Class A) (b) | | | 3,793 | | | | 139,962 | |
McDonald’s Corp. | | | 14,730 | | | | 1,389,923 | |
Meredith Corp. (b) | | | 4,900 | | | | 210,749 | |
Netflix, Inc. (a) | | | 500 | | | | 141,955 | |
Newell Rubbermaid, Inc. | | | 10,100 | | | | 255,530 | |
News Corp. (Class A) (a) | | | 6,450 | | | | 101,265 | |
NIKE, Inc. (Class B) | | | 5,000 | | | | 314,100 | |
Nordstrom, Inc. (b) | | | 2,600 | | | | 144,898 | |
O’Reilly Automotive, Inc. (a) | | | 900 | | | | 110,439 | |
Omnicom Group, Inc. | | | 3,200 | | | | 194,080 | |
| | | | | | | | |
| | | Principal
Amount ($)
or Shares | | | Market
Value
$ | |
Penske Automotive Group, Inc. (b) | | | 1,100 | | | | 42,933 | |
priceline.com, Inc. (a) | | | 600 | | | | 563,118 | |
Ross Stores, Inc. | | | 400 | | | | 26,904 | |
Sears Holdings Corp. (a)(b) | | | 4,339 | | | | 191,957 | |
Sonic Automotive, Inc. (b) | | | 4,700 | | | | 102,413 | |
Staples, Inc. (b) | | | 8,400 | | | | 116,844 | |
Starbucks Corp. | | | 8,800 | | | | 620,576 | |
Starwood Hotels & Resorts Worldwide, Inc. | | | 4,300 | | | | 274,942 | |
Target Corp. | | | 10,900 | | | | 690,079 | |
The Gap, Inc. | | | 5,400 | | | | 218,376 | |
The Goodyear Tire & Rubber Co. (a) | | | 4,300 | | | | 86,516 | |
The Home Depot, Inc. | | | 22,400 | | | | 1,668,576 | |
The McClatchy Co. (Class A) (a)(b) | | | 15,070 | | | | 46,717 | |
The New York Times Co. (Class A) (a)(b) | | | 7,200 | | | | 80,280 | |
The Walt Disney Co. | | | 29,400 | | | | 1,788,402 | |
The Washington Post Co. (Class B) (b) | | | 321 | | | | 181,044 | |
Tiffany & Co. | | | 6,000 | | | | 462,660 | |
Time Warner Cable, Inc. | | | 3,963 | | | | 425,428 | |
Time Warner, Inc. | | | 13,983 | | | | 846,391 | |
TJX Cos., Inc. | | | 3,500 | | | | 184,520 | |
TripAdvisor, Inc. (a)(b) | | | 600 | | | | 44,382 | |
Twenty-First Century Fox, Inc. | | | 25,800 | | | | 808,314 | |
Viacom, Inc. (Class B) | | | 7,901 | | | | 628,603 | |
Whirlpool Corp. | | | 3,000 | | | | 385,950 | |
Wyndham Worldwide Corp. | | | 2,360 | | | | 140,090 | |
Yum! Brands, Inc. | | | 5,200 | | | | 364,104 | |
| | | | | | | | |
| | | | | | | 25,233,465 | |
| | | | | | | | |
|
Consumer Staples - 10.1% | |
Altria Group, Inc. | | | 34,585 | | | | 1,171,740 | |
Archer-Daniels-Midland Co. | | | 12,398 | | | | 436,533 | |
Arden Group, Inc. (Class A) (b) | | | 700 | | | | 92,890 | |
Avon Products, Inc. | | | 1,400 | | | | 27,678 | |
Campbell Soup Co. (b) | | | 8,490 | | | | 366,598 | |
Church & Dwight Co., Inc. | | | 3,200 | | | | 189,920 | |
Colgate-Palmolive Co. | | | 7,400 | | | | 427,498 | |
ConAgra Foods, Inc. | | | 9,900 | | | | 334,818 | |
Constellation Brands, Inc. (Class A) (a) | | | 300 | | | | 16,275 | |
Costco Wholesale Corp. | | | 5,900 | | | | 660,033 | |
CVS Caremark Corp. | | | 16,919 | | | | 982,148 | |
Dean Foods Co. (a) | | | 2,350 | | | | 45,026 | |
Energizer Holdings, Inc. | | | 400 | | | | 39,532 | |
General Mills, Inc. | | | 2,200 | | | | 108,504 | |
Katy Industries, Inc. (a) | | | 5,900 | | | | 944 | |
Kellogg Co. | | | 8,635 | | | | 524,231 | |
SSgA
IAM SHARES Fund
Schedule of Investments, continued — August 31, 2013
| | | | | | | | |
| | | Principal
Amount ($)
or Shares | | | Market
Value
$ | |
| | | | | | | | |
Kimberly-Clark Corp. | | | 8,188 | | | | 765,414 | |
Kraft Foods Group, Inc. | | | 8,236 | | | | 426,378 | |
Lorillard, Inc. (b) | | | 5,000 | | | | 211,500 | |
Mead Johnson Nutrition Co. | | | 2,522 | | | | 189,226 | |
Mondelez International, Inc. (Class A) | | | 24,709 | | | | 757,825 | |
Monster Beverage Corp. (a) | | | 1,100 | | | | 63,129 | |
PepsiCo, Inc. | | | 24,238 | | | | 1,932,496 | |
Philip Morris International, Inc. | | | 24,285 | | | | 2,026,340 | |
Rite Aid Corp. (a) | | | 25,600 | | | | 88,576 | |
Safeway, Inc. (b) | | | 11,100 | | | | 287,490 | |
SUPERVALU, Inc. (a) | | | 5,900 | | | | 42,303 | |
Sysco Corp. (b) | | | 15,100 | | | | 483,502 | |
The Coca-Cola Co. | | | 63,350 | | | | 2,418,703 | |
The Estee Lauder Cos., Inc. (Class A) | | | 200 | | | | 13,072 | |
The J.M. Smucker Co. | | | 4,007 | | | | 425,303 | |
The Kroger Co. | | | 15,300 | | | | 559,980 | |
The Procter & Gamble Co. | | | 41,621 | | | | 3,241,860 | |
TreeHouse Foods, Inc. (a) | | | 1,600 | | | | 104,048 | |
Tyson Foods, Inc. (Class A) (b) | | | 300 | | | | 8,685 | |
Walgreen Co. | | | 12,900 | | | | 620,103 | |
WhiteWave Foods Co. (Class A) (a) | | | 1,200 | | | | 22,944 | |
Whole Foods Market, Inc. | | | 1,800 | | | | 94,950 | |
| | | | | | | | |
| | | | | | | 20,208,195 | |
| | | | | | | | |
|
Energy - 10.9% | |
Alpha Natural Resources, Inc. (a)(b) | | | 900 | | | | 5,472 | |
Anadarko Petroleum Corp. | | | 6,400 | | | | 585,088 | |
Apache Corp. | | | 4,900 | | | | 419,832 | |
Baker Hughes, Inc. | | | 7,200 | | | | 334,728 | |
BP PLC ADR | | | 3,195 | | | | 131,954 | |
Cabot Oil & Gas Corp. | | | 4,000 | | | | 156,520 | |
Cameron International Corp. (a) | | | 4,400 | | | | 249,876 | |
Chesapeake Energy Corp. (b) | | | 8,300 | | | | 214,223 | |
Chevron Corp. | | | 29,829 | | | | 3,592,306 | |
ConocoPhillips | | | 23,777 | | | | 1,576,415 | |
CONSOL Energy, Inc. | | | 1,100 | | | | 34,353 | |
Devon Energy Corp. | | | 6,100 | | | | 348,249 | |
EOG Resources, Inc. | | | 3,200 | | | | 502,560 | |
Exxon Mobil Corp. | | | 74,780 | | | | 6,517,825 | |
Halliburton Co. (b) | | | 18,160 | | | | 871,680 | |
Hess Corp. | | | 6,700 | | | | 501,495 | |
Kinder Morgan, Inc. | | | 4,957 | | | | 188,019 | |
Marathon Oil Corp. | | | 8,200 | | | | 282,326 | |
Marathon Petroleum Corp. | | | 4,100 | | | | 297,291 | |
National Oilwell Varco, Inc. | | | 4,400 | | | | 326,920 | |
Newfield Exploration Co. (a) | | | 1,800 | | | | 42,876 | |
Noble Energy, Inc. | | | 400 | | | | 24,572 | |
| | | | | | | | |
| | | Principal
Amount ($)
or Shares | | | Market
Value
$ | |
Occidental Petroleum Corp. | | | 10,800 | | | | 952,668 | |
Peabody Energy Corp. (b) | | | 700 | | | | 12,040 | |
Phillips 66 | | | 9,388 | | | | 536,055 | |
Pioneer Natural Resources Co. | | | 1,100 | | | | 192,467 | |
Range Resources Corp. | | | 1,600 | | | | 119,968 | |
Schlumberger, Ltd. | | | 21,882 | | | | 1,771,129 | |
Southwestern Energy Co. (a) | | | 4,700 | | | | 179,540 | |
Spectra Energy Corp. | | | 8,398 | | | | 278,058 | |
The Williams Cos., Inc. | | | 7,800 | | | | 282,672 | |
Valero Energy Corp. | | | 7,200 | | | | 255,816 | |
WPX Energy, Inc. (a)(b) | | | 2,800 | | | | 52,248 | |
| | | | | | | | |
| | | | | | | 21,837,241 | |
| | | | | | | | |
|
Financials - 14.6% | |
Aegon NV | | | 8,631 | | | | 61,280 | |
Aflac, Inc. | | | 6,500 | | | | 375,635 | |
American Express Co. | | | 15,200 | | | | 1,093,032 | |
American Financial Group, Inc. | | | 15,521 | | | | 799,797 | |
American International Group, Inc. (a) | | | 19,803 | | | | 920,047 | |
American Tower Corp. (c) | | | 4,900 | | | | 340,501 | |
Ameriprise Financial, Inc. | | | 2,840 | | | | 244,666 | |
Aon PLC | | | 4,700 | | | | 311,986 | |
AvalonBay Communities, Inc. (c) | | | 600 | | | | 74,340 | |
Bank of America Corp. | | | 128,532 | | | | 1,814,872 | |
BB&T Corp. | | | 7,500 | | | | 254,700 | |
Berkshire Hathaway, Inc. (Class B) (a) | | | 20,800 | | | | 2,313,376 | |
BlackRock, Inc. | | | 800 | | | | 208,256 | |
Capital One Financial Corp. | | | 6,661 | | | | 429,968 | |
Citigroup, Inc. | | | 41,010 | | | | 1,982,013 | |
CME Group, Inc. | | | 4,800 | | | | 341,328 | |
Comerica, Inc. | | | 200 | | | | 8,168 | |
Discover Financial Services | | | 6,550 | | | | 309,487 | |
E*TRADE Financial Corp. (a) | | | 1,170 | | | | 16,427 | |
Equity Residential (c) | | | 2,100 | | | | 108,969 | |
Fifth Third Bancorp | | | 6,400 | | | | 117,056 | |
Franklin Resources, Inc. | | | 5,400 | | | | 249,264 | |
Genworth Financial, Inc. (Class A) (a) | | | 1,400 | | | | 16,520 | |
Hartford Financial Services Group, Inc. | | | 3,200 | | | | 94,720 | |
HCP, Inc. (c) | | | 1,400 | | | | 57,022 | |
Health Care REIT, Inc. (c) | | | 1,700 | | | | 104,448 | |
Host Hotels & Resorts, Inc. (c) | | | 28,417 | | | | 483,941 | |
HSBC Holdings PLC ADR | | | 10,103 | | | | 529,599 | |
Hudson City Bancorp, Inc. | | | 7,600 | | | | 69,844 | |
IntercontinentalExchange, Inc. (a)(b) | | | 1,100 | | | | 197,725 | |
Janus Capital Group, Inc. (b) | | | 14,987 | | | | 125,291 | |
JPMorgan Chase & Co. | | | 48,234 | | | | 2,437,264 | |
SSgA
IAM SHARES Fund
Schedule of Investments, continued — August 31, 2013
| | | | | | | | |
| | | Principal
Amount ($)
or Shares | | | Market
Value
$ | |
| | | | | | | | |
KeyCorp | | | 6,500 | | | | 75,855 | |
M&T Bank Corp. (b) | | | 1,600 | | | | 181,344 | |
Marsh & McLennan Cos., Inc. | | | 7,500 | | | | 309,225 | |
MetLife, Inc. | | | 11,099 | | | | 512,663 | |
Moody’s Corp. | | | 3,000 | | | | 190,680 | |
Morgan Stanley | | | 17,500 | | | | 450,800 | |
Northern Trust Corp. | | | 3,400 | | | | 186,558 | |
NYSE Euronext | | | 600 | | | | 25,080 | |
People’s United Financial, Inc. (b) | | | 5,700 | | | | 81,054 | |
Plum Creek Timber Co., Inc. (b)(c) | | | 2,000 | | | | 88,620 | |
PNC Financial Services Group, Inc. | | | 5,450 | | | | 393,871 | |
Potlatch Corp. (c) | | | 7,700 | | | | 296,912 | |
Principal Financial Group, Inc. (b) | | | 2,600 | | | | 106,392 | |
ProLogis, Inc. (c) | | | 5,828 | | | | 205,379 | |
Prudential Financial, Inc. | | | 6,400 | | | | 479,232 | |
Public Storage (c) | | | 1,700 | | | | 259,539 | |
Regions Financial Corp. | | | 9,142 | | | | 85,935 | |
Simon Property Group, Inc. (c) | | | 3,271 | | | | 476,356 | |
SLM Corp. | | | 6,300 | | | | 151,137 | |
SunTrust Banks, Inc. | | | 3,500 | | | | 112,070 | |
T. Rowe Price Group, Inc. | | | 1,000 | | | | 70,140 | |
The Allstate Corp. | | | 7,100 | | | | 340,232 | |
The Bank of New York Mellon Corp. | | | 14,798 | | | | 440,093 | |
The Charles Schwab Corp. | | | 13,300 | | | | 277,704 | |
The Chubb Corp. | | | 2,800 | | | | 232,876 | |
The Goldman Sachs Group, Inc. | | | 6,300 | | | | 958,419 | |
The Progressive Corp. | | | 8,100 | | | | 203,067 | |
The Travelers Cos., Inc. | | | 14,483 | | | | 1,157,192 | |
U.S. Bancorp | | | 22,812 | | | | 824,198 | |
Ventas, Inc. (c) | | | 3,633 | | | | 226,191 | |
Vornado Realty Trust (c) | | | 2,144 | | | | 174,307 | |
Wells Fargo & Co. | | | 64,235 | | | | 2,638,774 | |
Weyerhaeuser Co. (c) | | | 14,290 | | | | 391,260 | |
| | | | | | | | |
| | | | | | | 29,094,697 | |
| | | | | | | | |
|
Health Care - 11.9% | |
Abbott Laboratories | | | 20,100 | | | | 669,933 | |
AbbVie, Inc. | | | 20,100 | | | | 856,461 | |
Actavis, Inc. (a)(b) | | | 700 | | | | 94,626 | |
Aetna, Inc. | | | 6,515 | | | | 412,986 | |
Agilent Technologies, Inc. | | | 4,142 | | | | 193,183 | |
Alexion Pharmaceuticals, Inc. (a) | | | 2,000 | | | | 215,520 | |
Allergan, Inc. | | | 3,900 | | | | 344,682 | |
Allied Healthcare Products (a) | | | 2,744 | | | | 6,723 | |
AmerisourceBergen Corp. | | | 1,200 | | | | 68,304 | |
Amgen, Inc. | | | 7,961 | | | | 867,271 | |
Baxter International, Inc. | | | 11,136 | | | | 774,620 | |
| | | | | | | | |
| | | Principal
Amount ($)
or Shares | | | Market
Value
$ | |
Biogen Idec, Inc. (a) | | | 3,600 | | | | 766,872 | |
Boston Scientific Corp. (a) | | | 17,863 | | | | 188,991 | |
Bristol-Myers Squibb Co. | | | 20,688 | | | | 862,483 | |
Cardinal Health, Inc. | | | 4,000 | | | | 201,120 | |
CareFusion Corp. (a) | | | 2,000 | | | | 71,700 | |
Celgene Corp. (a) | | | 6,100 | | | | 853,878 | |
Cerner Corp. (a) | | | 3,900 | | | | 179,634 | |
Cigna Corp. | | | 3,800 | | | | 299,022 | |
Edwards Lifesciences Corp. (a)(b) | | | 4,466 | | | | 314,317 | |
Eli Lilly & Co. | | | 12,700 | | | | 652,780 | |
Express Scripts Holding Co. (a) | | | 12,485 | | | | 797,542 | |
Forest Laboratories, Inc. (a) | | | 3,800 | | | | 161,614 | |
Gilead Sciences, Inc. (a) | | | 21,800 | | | | 1,313,886 | |
Hospira, Inc. (a) | | | 900 | | | | 35,127 | |
Humana, Inc. | | | 2,000 | | | | 184,160 | |
Intuitive Surgical, Inc. (a) | | | 200 | | | | 77,304 | |
Johnson & Johnson | | | 36,000 | | | | 3,110,760 | |
Life Technologies Corp. (a) | | | 3,012 | | | | 224,123 | |
McKesson Corp. | | | 3,600 | | | | 437,076 | |
Medtronic, Inc. | | | 14,300 | | | | 740,025 | |
Merck & Co., Inc. | | | 43,515 | | | | 2,057,824 | |
PerkinElmer, Inc. | | | 4,700 | | | | 169,059 | |
Perrigo Co. | | | 600 | | | | 72,930 | |
Pfizer, Inc. | | | 94,054 | | | | 2,653,263 | |
St. Jude Medical, Inc. | | | 4,300 | | | | 216,763 | |
STERIS Corp. | | | 3,191 | | | | 130,480 | |
Stryker Corp. | | | 4,100 | | | | 274,249 | |
Thermo Fisher Scientific, Inc. | | | 5,800 | | | | 515,214 | |
UnitedHealth Group, Inc. | | | 14,700 | | | | 1,054,578 | |
WellPoint, Inc. | | | 5,800 | | | | 493,812 | |
Zimmer Holdings, Inc. | | | 2,570 | | | | 203,261 | |
Zoetis, Inc. | | | 2,295 | | | | 66,899 | |
| | | | | | | | |
| | | | | | | 23,885,055 | |
| | | | | | | | |
|
Industrials - 12.7% | |
3M Co. | | | 11,300 | | | | 1,283,454 | |
Actuant Corp. (Class A) (b) | | | 5,600 | | | | 200,032 | |
Alaska Air Group, Inc. | | | 1,600 | | | | 90,592 | |
AMETEK, Inc. | | | 7,200 | | | | 309,024 | |
Arkansas Best Corp. (b) | | | 1,600 | | | | 39,808 | |
Avis Budget Group, Inc. (a) | | | 1,800 | | | | 48,186 | |
AZZ, Inc. | | | 1,600 | | | | 60,064 | |
Caterpillar, Inc. | | | 10,421 | | | | 860,149 | |
CSX Corp. | | | 24,900 | | | | 612,789 | |
Cummins, Inc. | | | 4,200 | | | | 517,440 | |
Danaher Corp. | | | 11,600 | | | | 760,032 | |
Deere & Co. | | | 7,900 | | | | 660,756 | |
Dover Corp. (b) | | | 5,300 | | | | 450,765 | |
Eaton Corp. PLC | | | 8,142 | | | | 515,551 | |
Emerson Electric Co. | | | 12,600 | | | | 760,662 | |
FedEx Corp. | | | 3,100 | | | | 332,816 | |
SSgA
IAM SHARES Fund
Schedule of Investments, continued — August 31, 2013
| | | | | | | | |
| | | Principal
Amount ($)
or Shares | | | Market
Value
$ | |
| | | | | | | | |
General Dynamics Corp. | | | 5,710 | | | | 475,358 | |
General Electric Co. | | | 146,821 | | | | 3,397,438 | |
Hexcel Corp. (a) | | | 2,600 | | | | 92,482 | |
HNI Corp. (b) | | | 900 | | | | 30,132 | |
Honeywell International, Inc. | | | 11,462 | | | | 912,031 | |
Illinois Tool Works, Inc. | | | 9,308 | | | | 665,243 | |
Jacobs Engineering Group, Inc. (a) | | | 2,800 | | | | 163,184 | |
Kansas City Southern | | | 2,550 | | | | 268,821 | |
Koninklijke Philips Electronics NV | | | 1,264 | | | | 38,956 | |
L-3 Communications Holdings, Inc. | | | 2,500 | | | | 225,825 | |
Lockheed Martin Corp. | | | 4,819 | | | | 589,942 | |
Manpower, Inc. | | | 2,100 | | | | 136,185 | |
Masco Corp. | | | 14,300 | | | | 270,556 | |
Norfolk Southern Corp. | | | 7,200 | | | | 519,552 | |
Northrop Grumman Corp. | | | 4,796 | | | | 442,527 | |
PACCAR, Inc. | | | 7,875 | | | | 422,179 | |
Parker Hannifin Corp. | | | 3,000 | | | | 299,850 | |
Precision Castparts Corp. | | | 2,800 | | | | 591,472 | |
R.R. Donnelley & Sons Co. (b) | | | 5,700 | | | | 95,076 | |
Raytheon Co. | | | 5,800 | | | | 437,378 | |
Republic Services, Inc. | | | 4,080 | | | | 132,641 | |
Rockwell Automation, Inc. | | | 4,600 | | | | 447,258 | |
Rockwell Collins, Inc. | | | 1,800 | | | | 127,386 | |
Ryder System, Inc. | | | 4,800 | | | | 266,928 | |
Siemens AG ADR | | | 200 | | | | 21,232 | |
Snap-on, Inc. | | | 1,600 | | | | 149,760 | |
Southwest Airlines Co. | | | 12,825 | | | | 164,288 | |
Stanley Black & Decker, Inc. | | | 3,215 | | | | 274,111 | |
Tecumseh Products Co. (Class A) (a)(b) | | | 1,600 | | | | 15,472 | |
Terex Corp. (a) | | | 1,800 | | | | 52,200 | |
Textron, Inc. (b) | | | 5,600 | | | | 150,864 | |
The Boeing Co. | | | 10,400 | | | | 1,080,768 | |
The Manitowoc Co., Inc. (b) | | | 2,300 | | | | 45,954 | |
The Toro Co. | | | 4,600 | | | | 242,926 | |
Union Pacific Corp. | | | 8,500 | | | | 1,305,090 | |
United Continental Holdings, Inc. (a)(b) | | | 734 | | | | 20,890 | |
United Parcel Service, Inc. (Class B) | | | 15,714 | | | | 1,344,804 | |
United Technologies Corp. | | | 13,500 | | | | 1,351,350 | |
US Airways Group, Inc. (a) | | | 5,000 | | | | 80,800 | |
Valmont Industries, Inc. | | | 300 | | | | 40,488 | |
Waste Management, Inc. (b) | | | 10,218 | | | | 413,216 | |
Watts Water Technologies, Inc. (Class A) (b) | | | 400 | | | | 20,724 | |
| | | | | | | | |
| | | | | | | 25,325,457 | |
| | | | | | | | |
| | | | | | | | |
| | | Principal
Amount ($)
or Shares | | | Market
Value
$ | |
Information Technology - 16.3% | |
Accenture PLC (Class A) | | | 8,600 | | | | 621,350 | |
Adobe Systems, Inc. (a) | | | 6,800 | | | | 311,100 | |
Advanced Micro Devices, Inc. (a)(b) | | | 8,100 | | | | 26,487 | |
Akamai Technologies, Inc. (a)(b) | | | 400 | | | | 18,392 | |
Amphenol Corp. (Class A) | | | 5,200 | | | | 394,004 | |
Analog Devices, Inc. | | | 5,000 | | | | 231,400 | |
Apple, Inc. | | | 12,300 | | | | 5,990,715 | |
Applied Materials, Inc. | | | 17,300 | | | | 259,673 | |
Autodesk, Inc. (a) | | | 3,000 | | | | 110,250 | |
Automatic Data Processing, Inc. | | | 6,300 | | | | 448,308 | |
Broadcom Corp. (Class A) | | | 5,850 | | | | 147,771 | |
CA, Inc. | | | 4,400 | | | | 128,700 | |
Cisco Systems, Inc. | | | 70,500 | | | | 1,643,355 | |
Cognizant Technology Solutions Corp. (Class A) (a) | | | 700 | | | | 51,310 | |
Computer Sciences Corp. | | | 6,045 | | | | 303,157 | |
Corning, Inc. | | | 20,200 | | | | 283,608 | |
Dell, Inc. | | | 21,300 | | | | 293,301 | |
Diebold, Inc. (b) | | | 2,873 | | | | 81,248 | |
eBay, Inc. (a) | | | 14,700 | | | | 734,853 | |
Electronic Arts, Inc. (a) | | | 4,700 | | | | 125,208 | |
EMC Corp. | | | 27,100 | | | | 698,638 | |
Energy Conversion Devices, Inc. (a) | | | 36,400 | | | | — | |
F5 Networks, Inc. (a) | | | 1,100 | | | | 91,718 | |
Google, Inc. (Class A) (a) | | | 3,600 | | | | 3,048,840 | |
Hewlett-Packard Co. | | | 28,532 | | | | 637,405 | |
Intel Corp. | | | 66,700 | | | | 1,466,066 | |
International Business Machines Corp. | | | 16,700 | | | | 3,043,909 | |
Juniper Networks, Inc. (a) | | | 3,800 | | | | 71,820 | |
KLA-Tencor Corp. (b) | | | 2,100 | | | | 115,815 | |
Mastercard, Inc. (Class A) | | | 1,300 | | | | 787,904 | |
Micron Technology, Inc. (a) | | | 13,500 | | | | 183,195 | |
Microsoft Corp. | | | 95,800 | | | | 3,199,720 | |
Motorola Solutions, Inc. | | | 4,128 | | | | 231,209 | |
NetApp, Inc. (b) | | | 4,500 | | | | 186,930 | |
NVIDIA Corp. | | | 1,900 | | | | 28,025 | |
Oracle Corp. | | | 51,349 | | | | 1,635,979 | |
Paychex, Inc. (b) | | | 4,300 | | | | 166,324 | |
QUALCOMM, Inc. | | | 20,700 | | | | 1,371,996 | |
Quantum Corp. (a)(b) | | | 14,000 | | | | 20,160 | |
Red Hat, Inc. (a)(b) | | | 400 | | | | 20,208 | |
Salesforce.com, Inc. (a)(b) | | | 4,800 | | | | 235,824 | |
SanDisk Corp. | | | 100 | | | | 5,518 | |
Seagate Technology PLC (b) | | | 5,500 | | | | 210,760 | |
Symantec Corp. | | | 11,945 | | | | 305,912 | |
Teradata Corp. (a) | | | 200 | | | | 11,712 | |
Texas Instruments, Inc. | | | 16,700 | | | | 637,940 | |
The Western Union Co. (b) | | | 7,736 | | | | 135,612 | |
SSgA
IAM SHARES Fund
Schedule of Investments, continued — August 31, 2013
| | | | | | | | |
| | | Principal
Amount ($)
or Shares | | | Market
Value
$ | |
| | | | | | | | |
Total System Services, Inc. | | | 2,032 | | | | 56,225 | |
VeriSign, Inc. (a)(b) | | | 300 | | | | 14,397 | |
Visa, Inc. (Class A) | | | 4,600 | | | | 802,332 | |
Western Digital Corp. | | | 600 | | | | 37,200 | |
Xerox Corp. | | | 22,700 | | | | 226,546 | |
Xilinx, Inc. | | | 4,800 | | | | 208,416 | |
Yahoo!, Inc. (a) | | | 17,100 | | | | 463,752 | |
| | | | | | | | |
| | | | | | | 32,562,197 | |
| | | | | | | | |
|
Materials - 3.4% | |
Air Products & Chemicals, Inc. | | | 4,800 | | | | 490,272 | |
AK Steel Holding Corp. (a)(b) | | | 5,800 | | | | 19,488 | |
Alcoa, Inc. (b) | | | 20,300 | | | | 156,310 | |
Allegheny Technologies, Inc. (b) | | | 4,200 | | | | 112,182 | |
AngloGold Ashanti, Ltd. ADR (b) | | | 830 | | | | 11,097 | |
Ashland, Inc. | | | 1,204 | | | | 105,001 | |
Avery Dennison Corp. | | | 1,900 | | | | 81,244 | |
Ball Corp. | | | 3,400 | | | | 151,028 | |
Bemis Co., Inc. (b) | | | 3,500 | | | | 139,265 | |
CF Industries Holdings, Inc. | | | 400 | | | | 76,136 | |
Chemtura Corp. (a) | | | 18 | | | | 395 | |
Cliffs Natural Resources, Inc. (b) | | | 600 | | | | 12,522 | |
Crown Holdings, Inc. (a) | | | 3,400 | | | | 147,764 | |
E.I. du Pont de Nemours & Co. (b) | | | 9,700 | | | | 549,214 | |
Ecolab, Inc. | | | 4,100 | | | | 374,535 | |
FMC Corp. (b) | | | 2,900 | | | | 193,169 | |
Freeport-McMoRan Copper & Gold, Inc. | | | 9,552 | | | | 288,662 | |
International Paper Co. | | | 11,073 | | | | 522,756 | |
Martin Marietta Materials, Inc. (b) | | | 1,500 | | | | 144,075 | |
MeadWestvaco Corp. | | | 3,000 | | | | 107,550 | |
Monsanto Co. | | | 5,800 | | | | 567,762 | |
Newmont Mining Corp. (b) | | | 5,700 | | | | 181,089 | |
Owens-Illinois, Inc. (a) | | | 2,900 | | | | 82,331 | |
PPG Industries, Inc. | | | 2,900 | | | | 453,009 | |
Schnitzer Steel Industries, Inc. (Class A) (b) | | | 1,100 | | | | 27,775 | |
Sigma-Aldrich Corp. (b) | | | 2,300 | | | | 189,681 | |
The Dow Chemical Co. | | | 16,788 | | | | 627,871 | |
The Mosaic Co. | | | 3,600 | | | | 149,940 | |
The Sherwin-Williams Co. | | | 3,500 | | | | 603,400 | |
Vulcan Materials Co. (b) | | | 3,600 | | | | 172,080 | |
| | | | | | | | |
| | | | | | | 6,737,603 | |
| | | | | | | | |
|
Telecommunication Services - 2.5% | |
AT&T, Inc. | | | 81,781 | | | | 2,766,651 | |
CenturyLink, Inc. (b) | | | 7,665 | | | | 253,865 | |
Frontier Communications Corp. (b) | | | 10,506 | | | | 45,491 | |
T-Mobile US, Inc. (a) | | | 900 | | | | 21,015 | |
Verizon Communications, Inc. | | | 41,772 | | | | 1,979,157 | |
| | | | | | | | |
| | | | | | | 5,066,179 | |
| | | | | | | | |
| | | | | | | | |
| | | Principal
Amount ($)
or Shares | | | Market
Value
$ | |
Utilities - 2.4% | | | | | | | | |
Ameren Corp. | | | 3,000 | | | | 101,430 | |
American Electric Power Co., Inc. | | | 5,300 | | | | 226,840 | |
Consolidated Edison, Inc. (b) | | | 3,700 | | | | 208,051 | |
Dominion Resources, Inc. | | | 8,400 | | | | 490,140 | |
Duke Energy Corp. | | | 7,620 | | | | 499,872 | |
Edison International | | | 4,500 | | | | 206,505 | |
Entergy Corp. | | | 2,400 | | | | 151,752 | |
Exelon Corp. | | | 11,590 | | | | 353,379 | |
FirstEnergy Corp. | | | 4,200 | | | | 157,374 | |
NextEra Energy, Inc. | | | 5,600 | | | | 450,016 | |
Pepco Holdings, Inc. | | | 9,300 | | | | 176,142 | |
PG&E Corp. | | | 5,300 | | | | 219,208 | |
PPL Corp. (b) | | | 6,400 | | | | 196,480 | |
Public Service Enterprise Group, Inc. (b) | | | 7,000 | | | | 226,940 | |
Sempra Energy | | | 3,300 | | | | 278,586 | |
Southern Co. | | | 12,200 | | | | 507,764 | |
The AES Corp. | | | 8,800 | | | | 111,848 | |
Wisconsin Energy Corp. (b) | | | 3,500 | | | | 143,640 | |
Xcel Energy, Inc. | | | 4,000 | | | | 111,680 | |
| | | | | | | | |
| | | | | | | 4,817,647 | |
| | | | | | | | |
| |
Total Common Stocks
(cost $129,781,092) | | | | 194,767,736 | |
| | | | | | | | |
| Short-Term Investments - 5.6% | |
SSgA Prime Money Market Fund 0.19% (d)(e) | | | 4,615,850 | | | | 4,615,850 | |
State Street Navigator Securities Lending Prime Portfolio (d)(f) | | | 6,293,286 | | | | 6,293,286 | |
United States Treasury Bill 0.035%, due 09/12/13 (g)(h)(i) | | | 323,000 | | | | 322,997 | |
| | | | | | | | |
| |
Total Short-Term Investments
(cost $11,232,133) | | | | 11,232,133 | |
| | | | | | | | |
| |
Total Investments - 103.0%
(identified cost $141,013,225) | | | | 205,999,869 | |
| |
Other Assets and Liabilities,
Net - (3.0)% | | | | (6,020,284 | ) |
| | | | | | | | |
| | |
| Net Assets - 100.0% | | | | | | | 199,979,585 | |
| | | | | | | | |
SSgA
IAM SHARES Fund
Schedule of Investments, continued — August 31, 2013
Footnotes:
| (a) | Non-income producing security. |
| (b) | All or a portion of the shares of this security are on loan. |
| (c) | Real Estate Investment Trust (REIT). |
| (d) | Affiliated Fund managed by SSgA Funds Management, Inc. (Note 4). |
| (e) | The rate shown is the annualized seven-day yield at period end. |
| (f) | Investments of cash collateral for securities loaned. |
| (g) | Fair value is at amortized cost, which approximates market. |
| (h) | Rate noted is yield-to-maturity from date of acquisition. |
| (i) | All or a portion of the shares of this security are held as collateral in connection with futures contracts purchased (sold) by the Fund. |
Abbreviations:
ADR - American Depositary Receipt
PLC - Public Limited Company
| | | | | | | | | | | | | | | | | | |
| Futures Contracts | | Number of
Contracts | | | Notional
Amount | | | Expiration
Date | | | Unrealized
Appreciation
(Depreciation)
$ | |
| | | | | | | | | | | | | | | | | | |
Long Positions | | | | | | | | | | | | | | | | | | |
S&P 500 Index Futures | | | 12 | | | USD | | | 4,893,900 | | | | 09/13 | | | | 30,407 | |
| | | | | | | | | | | | | | | | | | |
Total Unrealized Appreciation (Depreciation) on Open Futures Contracts* | | | | | | | | | | | | | | | | | 30,407 | |
| | | | | | | | | | | | | | | | | | |
| * | | Cash collateral balances were held in connection with futures contracts purchased (sold) by the Fund. See Note 2 in the Notes to Financial Statements. |
Presentation of Portfolio Holdings — August 31, 2013
| | | | | | | | | | | | | | | | | | | | |
| | | Market Value | | | % of
Net
Assets | |
| Categories | | Level 1 | | | Level 2 | | | Level 3 | | | Total | | |
Consumer Discretionary | | $ | 25,233,465 | | | $ | — | | | $ | — | | | $ | 25,233,465 | | | | 12.6 | |
Consumer Staples | | | 20,208,195 | | | | — | | | | — | | | | 20,208,195 | | | | 10.1 | |
Energy | | | 21,837,241 | | | | — | | | | — | | | | 21,837,241 | | | | 10.9 | |
Financials | | | 29,094,697 | | | | — | | | | — | | | | 29,094,697 | | | | 14.6 | |
Health Care | | | 23,885,055 | | | | — | | | | — | | | | 23,885,055 | | | | 11.9 | |
Industrials | | | 25,325,457 | | | | — | | | | — | | | | 25,325,457 | | | | 12.7 | |
Information Technology | | | 32,562,197 | | | | — | * | | | — | | | | 32,562,197 | | | | 16.3 | |
Materials | | | 6,737,603 | | | | — | | | | — | | | | 6,737,603 | | | | 3.4 | |
Telecommunication Services | | | 5,066,179 | | | | — | | | | — | | | | 5,066,179 | | | | 2.5 | |
Utilities | | | 4,817,647 | | | | — | | | | — | | | | 4,817,647 | | | | 2.4 | |
Short-Term Investments | | | 4,615,850 | | | | 6,616,283 | | | | — | | | | 11,232,133 | | | | 5.6 | |
| | | | | | | | | | | | | | | | | | | | |
Total Investments | | | 199,383,586 | | | | 6,616,283 | | | | — | | | | 205,999,869 | | | | 103.0 | |
| | | | | | | | | | | | | | | | | | | | |
Other Assets and Liabilities, Net | | | | | | | | | | | | | | | | | | | (3.0 | ) |
| | | | | | | | | | | | | | | | | | | | |
| | | | | | | | | | | | | | | | | | | 100.0 | |
| | | | | | | | | | | | | | | | | | | | |
Other Financial Instruments** | | | | | | | | | | | | | | | | | | | | |
Futures Contracts | | $ | 30,407 | | | $ | — | | | $ | — | | | $ | 30,407 | | | | 0.0 | |
| | | | | | | | | | | | | | | | | | | | |
| * | | Fund held a Level 2 security that was valued at $0 at August 31, 2013. |
| ** | | Other financial instruments reflected in the Schedule of Investments, such as futures, forwards, and swap contracts which are valued at the unrealized appreciation (depreciation) on the instruments. |
For a description of the levels see Note 2 in the Notes to Financial Statements.
As of the year ended August 31, 2013, there were no transfers between levels. The transfers that did occur were the result of fair value pricing using significant observable inputs for Level 2 securities.
See accompanying notes which are an integral part of the financial statements.
SSgA
Enhanced Small Cap Fund
Portfolio Management Discussion and Analysis — August 31, 2013 (Unaudited)
Objective: The Fund seeks to maximize total return through investment primarily in small capitalization equity securities.
Invests in: At least 80% of total assets will be invested in small capitalization equity securities, such as common stocks, issued by companies with a market capitalization less than or equal to the largest capitalization stock in the Russell 2000® Index.
Strategy: The Fund attempts to create a portfolio with similar characteristics to the benchmark with potential to provide excess returns by allowing the fund to hold a portion, but not all of the securities in the Russell 2000 Index.
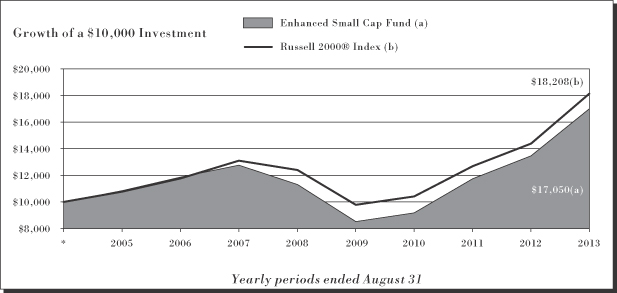
| | | | | | |
| Enhanced Small Cap Fund | |
| | |
Period Ended
08/31/13 | | | | Total
Return | |
1 Year | | | | | 26.45 | % |
5 Years | | | | | 8.57 | %+ |
Inception | | | | | 6.52 | %+ |
| | | | | | |
| Russell 2000® Index# | |
| | |
Period Ended 08/31/13 | | | | Total
Return | |
1 Year | | | | | 26.27 | % |
5 Years | | | | | 7.98 | %+ |
Inception | | | | | 7.36 | %+ |
Performance quoted represents past performance, which is no guarantee of future results. Investment return and principal value will fluctuate, so you may have a gain or loss when shares are sold. Current performance may be higher or lower than that quoted. Visit www.ssgafunds.com for most recent month-end performance. The returns do not reflect the deduction of taxes that a shareholder would pay on Fund distributions or on the redemption of Fund shares. The gross expense ratio for the Enhanced Small Cap Fund as stated in the Fees and Expenses table of the prospectus dated December 14, 2012 is 1.66%.
Notes: The following notes relate to the Growth of $10,000 graph and tables.
| * | The Fund commenced operations on March 22, 2005. Index comparison also began on March 22, 2005. |
| # | The Russell 2000 Index measures the performance of the small-cap segment of the U.S. equity universe. The Russell 2000 is a subset of the Russell 3000® Index representing approximately 10% of the total market capitalization of that index. It includes approximately 2000 of the smallest securities based on a combination of their market cap and current index membership. |
Performance data reflects an expense limitation currently in effect, without which returns would have been lower.
| | |
| 30 | | Enhanced Small Cap Fund |
SSgA
Enhanced Small Cap Fund
Portfolio Management Discussion and Analysis, continued — August 31, 2013 (Unaudited)
SSgA Enhanced Small Cap Fund (the “Fund”) seeks to maximize total return through investment primarily in small capitalization equity securities. The Fund is benchmarked to the Russell 2000 Index (the “Index”).
For the 12-month period ended August 31, 2013 (the “Reporting Period”), the total return for the Fund was 26.45%, and the total return for the Index was 26.27%. The Fund and Index returns reflect the reinvestment of dividends and other income. The Fund’s performance reflects the expenses of managing the Fund, including brokerage and advisory expenses. The Index is unmanaged and Index returns do not reflect fees and expenses of any kind, which would have a negative impact on returns.
Sector allocation does not contribute strongly to the Fund’s performance relative to the Russell 2000 Index because the Fund does not take meaningful active positions at the sector level. Instead, stock selection within sectors and across the Russell 2000 Index is the primary determinant of performance compared with the Index.
The Fund’s investment process favors stocks of higher quality companies with attractive growth characteristics that are viewed as reasonably valued with positive sentiment. During the Reporting Period, this stock selection technique successfully identified outperforming and underperforming stocks, which benefited the Fund. Over the Reporting Period, stock selection added value in most sectors, and was particularly effective in the industrials and consumer discretionary sectors. Meanwhile, stock selection was weakest within the information technology and health care sectors.
The top positive contributors to Fund performance were Rite Aid Corp., Multimedia Games Holding Co., Inc., and Office Depot, Inc. All three companies posted significant gains over the Reporting Period. The increase in Rite Aid’s share price benefited from strong earnings performance in the fiscal third and fourth quarters of 2012, thanks to the company repositioning itself as a health and wellness center and the start of its much anticipated debt refinancing. Gaming and casinos company Multimedia Games showcased better-than-expected results in 2013’s first quarter, with strong revenue and record game sales. That trend continued with favorable quarterly results and upward revisions to earnings guidance. Office Depot was up significantly over the Reporting Period, with the majority of the movement between September 2012 and February 2013. Strong financial results for the third quarter of 2012, and a February 2013 agreement to merge with OfficeMax contributed to its price movement.
The top negative contributors to Fund performance were MagicJack VocalTec, Ltd, Coeur Mining, Inc, and Crocs, Inc. Shares of MagicJack, a technology company focused on voice-over-Internet-protocol telephone services, fell over the Reporting Period. News of product delays in late 2012, and a negative research report in January 2013, drove shares lower. Silver and gold miner Coeur Mining was also down. Poor results in the third quarter of 2012 started its downtrend. Crocs’ decline over the Reporting Period was due to declining consumer demand in 2012’s third quarter and disappointing earnings in 2013’s second quarter.
The Fund only used index futures to equitize cash, which did not have a material impact on the Fund’s performance.
The views expressed above reflect those of the Fund’s portfolio manager only through the Reporting Period, and do not necessarily represent the views of the Adviser as a whole. Any such views are subject to change at any time based upon market or other conditions and the Adviser disclaims any responsibility to update such views. These views may not be relied on as investment advice and, because investment decisions for a fund are based on numerous factors, may not be relied on as an indication of trading intent on behalf of any fund.
| | | | |
| Enhanced Small Cap Fund | | | 31 | |
SSgA
Enhanced Small Cap Fund
Shareholder Expense Example — August 31, 2013 (Unaudited)
Fund Expenses
The following disclosure provides important information regarding each Fund’s Expense Example, which appears on each Fund’s individual page in this Annual Report. Please refer to this information when reviewing the Expense Example for a Fund.
Example
As a shareholder of the Fund, you incur two types of costs: (1) transaction costs, and (2) ongoing costs, including advisory and administrative fees; distribution (12b-1) and/or service fees; and other Fund expenses. The Example is intended to help you understand your ongoing costs (in dollars) of investing in the Fund and to compare these costs with the ongoing costs of investing in other mutual funds. The Example is based on an investment of $1,000 invested at the beginning of the period and held for the entire period indicated, which for this Fund is from March 1, 2013 to August 31, 2013.
Actual Expenses
The information in the table under the heading “Actual Performance” provides information about actual account values and actual expenses. You may use the information in this column, together with the amount you invested, to estimate the expenses that you paid over the period. Simply divide your account value by $1,000 (for example, an $8,600 account value divided by $1,000 = 8.6), then multiply the result by the number in the first column in the row entitled “Expenses Paid During Period” to estimate the expenses you paid on your account during this period.
Hypothetical Example for Comparison Purposes
The information in the table under the heading “Hypothetical Performance (5% return before expenses)” provides information about hypothetical account values and hypothetical expenses based on the Fund’s actual expense ratio and an assumed rate of return of 5% per year before expenses, which is not the Fund’s actual return. The hypothetical account values and expenses may not be used to estimate the actual ending account balance or expenses you paid for the period. You may use this information to compare the ongoing costs of investing in the Fund and other funds. To do so, compare this 5% hypothetical example with the 5% hypothetical examples that appear in the shareholder reports of other funds.
Please note that the expenses shown in the table are meant to highlight your ongoing costs only and do not reflect any transaction costs. Therefore, the information under the heading “Hypothetical Performance (5% return before expenses)” is useful in comparing ongoing costs only, and will not help you determine the relative total costs of owning different funds. In addition, if these transaction costs were included, your costs would have been higher.
| | | | | | | | |
| | | Actual
Performance | | | Hypothetical
Performance
(5% return
before expenses) | |
Beginning Account Value | | | | | | | | |
March 1, 2013 | | $ | 1,000.00 | | | $ | 1,000.00 | |
Ending Account Value | | | | | | | | |
August 31, 2013 | | $ | 1,113.30 | | | $ | 1,021.42 | |
Expenses Paid During Period* | | $ | 4.00 | | | $ | 3.82 | |
| * | Expenses are equal to the Fund’s annualized expense ratio of 0.75% (representing the six month period annualized), multiplied by the average account value over the period, multiplied by 184/365 (to reflect the one-half year period). Includes amounts waived and/or reimbursed. Without the waiver and/or reimbursement, expenses would have been higher. |
| | |
| 32 | | Enhanced Small Cap Fund |
SSgA
Enhanced Small Cap Fund
Schedule of Investments — August 31, 2013
| | | | | | | | |
| | | Principal
Amount ($)
or Shares | | | Market
Value
$ | |
| | | | | | | | |
| Common Stocks - 100.2% | | | | | |
Consumer Discretionary - 14.1% | | | | | |
1-800-FLOWERS.COM, Inc. (Class A) (a) | | | 11,157 | | | | 60,694 | |
Aeropostale, Inc. (a) | | | 940 | | | | 7,642 | |
American Public Education, Inc. (a) | | | 86 | | | | 3,442 | |
Arctic Cat, Inc. | | | 1,853 | | | | 99,469 | |
Ascent Media Corp. (Class A) (a) | | | 1,718 | | | | 126,857 | |
Big 5 Sporting Goods Corp. | | | 2,237 | | | | 37,425 | |
Biglari Holdings, Inc. (a) | | | 7 | | | | 2,922 | |
Blue Nile, Inc. (a) | | | 83 | | | | 3,003 | |
Bob Evans Farms, Inc. | | | 72 | | | | 3,530 | |
Brown Shoe Co., Inc. | | | 3,301 | | | | 74,008 | |
CEC Entertainment, Inc. | | | 598 | | | | 24,201 | |
Christopher & Banks Corp. (a) | | | 1,474 | | | | 8,166 | |
Cooper Tire & Rubber Co. | | | 1,929 | | | | 61,593 | |
Cracker Barrel Old Country Store, Inc. | | | 94 | | | | 9,251 | |
Crocs, Inc. (a) | | | 12,237 | | | | 164,710 | |
CSS Industries, Inc. | | | 1,402 | | | | 30,592 | |
Culp, Inc. | | | 2,233 | | | | 42,784 | |
Dana Holding Corp. | | | 9,255 | | | | 193,985 | |
Denny’s Corp. (a) | | | 26,414 | | | | 148,447 | |
Destination Maternity Corp. | | | 2,348 | | | | 65,204 | |
DineEquity, Inc. | | | 126 | | | | 8,350 | |
Einstein Noah Restaurant Group, Inc. | | | 1,718 | | | | 27,505 | |
Entravision Communications Corp. (Class A) | | | 7,400 | | | | 38,702 | |
Express, Inc. (a) | | | 8,576 | | | | 180,010 | |
Flexsteel Industries, Inc. | | | 200 | | | | 4,498 | |
Gerber Scientific, Inc. | | | 600 | | | | — | |
Harte-Hanks, Inc. | | | 7,427 | | | | 61,644 | |
hhgregg, Inc. (a) | | | 252 | | | | 4,564 | |
Hillenbrand, Inc. | | | 4,696 | | | | 116,273 | |
HSN, Inc. | | | 2,013 | | | | 108,420 | |
Iconix Brand Group, Inc. (a) | | | 1,618 | | | | 53,103 | |
Interval Leisure Group, Inc. | | | 3,385 | | | | 73,116 | |
Jack in the Box, Inc. (a) | | | 2,300 | | | | 90,827 | |
JAKKS Pacific, Inc. | | | 2 | | | | 10 | |
Journal Communications, Inc. (Class A) (a) | | | 3,418 | | | | 24,575 | |
K12, Inc. (a) | | | 2,907 | | | | 105,553 | |
KB Home | | | 332 | | | | 5,322 | |
Kirkland’s, Inc. (a) | | | 198 | | | | 3,863 | |
Krispy Kreme Doughnuts,
Inc. (a) | | | 3,522 | | | | 69,454 | |
La-Z-Boy, Inc. | | | 6,723 | | | | 142,931 | |
Leapfrog Enterprises, Inc. (a) | | | 5,397 | | | | 51,919 | |
Libbey, Inc. (a) | | | 436 | | | | 10,342 | |
Lifetime Brands, Inc. | | | 319 | | | | 4,412 | |
LIN Media LLC (Class A) (a) | | | 2,220 | | | | 37,296 | |
| | | | | | | | |
| | | Principal
Amount ($)
or Shares | | | Market
Value
$ | |
Live Nation Entertainment, Inc. (a) | | | 573 | | | | 9,661 | |
Lumber Liquidators Holdings, Inc. (a) | | | 100 | | | | 9,942 | |
Multimedia Games Holding Co., Inc. (a) | | | 4,307 | | | | 169,007 | |
NACCO Industries, Inc. (Class A) | | | 1,962 | | | | 109,048 | |
National CineMedia, Inc. | | | 262 | | | | 4,711 | |
New York & Co., Inc. (a) | | | 1,330 | | | | 6,517 | |
Nexstar Broadcasting Group, Inc. (Class A) | | | 738 | | | | 24,775 | |
Office Depot, Inc. (a) | | | 6,137 | | | | 25,714 | |
Orbitz Worldwide, Inc. (a) | | | 3,039 | | | | 28,901 | |
Outerwall, Inc. (a) | | | 51 | | | | 3,171 | |
Papa John’s International, Inc. (a) | | | 1,178 | | | | 80,257 | |
Perry Ellis International, Inc. | | | 300 | | | | 5,496 | |
Pier 1 Imports, Inc. | | | 7,470 | | | | 163,742 | |
Pool Corp. | | | 100 | | | | 5,209 | |
Red Robin Gourmet Burgers, Inc. (a) | | | 87 | | | | 5,643 | |
Rent-A-Center, Inc. | | | 4,137 | | | | 155,179 | |
RG Barry Corp. | | | 203 | | | | 3,234 | |
rue21, Inc. (a) | | | 148 | | | | 6,046 | |
Ruth’s Hospitality Group, Inc. | | | 3,846 | | | | 45,460 | |
Select Comfort Corp. (a) | | | 160 | | | | 3,952 | |
Sinclair Broadcast Group, Inc. (Class A) | | | 2,584 | | | | 61,809 | |
Sonic Corp. (a) | | | 3,381 | | | | 53,961 | |
Stage Stores, Inc. | | | 705 | | | | 13,134 | |
Standard Motor Products, Inc. | | | 3,048 | | | | 93,452 | |
Stein Mart, Inc. | | | 500 | | | | 6,075 | |
Steiner Leisure, Ltd. (a) | | | 100 | | | | 5,572 | |
Stoneridge, Inc. (a) | | | 2,600 | | | | 32,344 | |
Tenneco, Inc. (a) | | | 64 | | | | 2,952 | |
Texas Roadhouse, Inc. | | | 870 | | | | 21,619 | |
The Cato Corp. (Class A) | | | 343 | | | | 8,630 | |
The Cheesecake Factory, Inc. | | | 77 | | | | 3,216 | |
The Children’s Place Retail Stores, Inc. (a) | | | 59 | | | | 3,138 | |
The E.W. Scripps Co. (Class A) (a) | | | 3,711 | | | | 56,444 | |
The Finish Line, Inc.
(Class A) | | | 159 | | | | 3,333 | |
The Jones Group, Inc. | | | 1,769 | | | | 26,057 | |
The Men’s Wearhouse, Inc. | | | 87 | | | | 3,275 | |
The Wet Seal, Inc.
(Class A) (a) | | | 31,569 | | | | 115,227 | |
Tower International,
Inc. (a) | | | 2,896 | | | | 59,310 | |
Town Sports International Holdings, Inc. | | | 10,716 | | | | 124,413 | |
Unifi, Inc. (a) | | | 700 | | | | 15,855 | |
Universal Electronics,
Inc. (a) | | | 700 | | | | 21,112 | |
Vail Resorts, Inc. | | | 47 | | | | 3,196 | |
Valassis Communications, Inc. | | | 5,698 | | | | 156,980 | |
Zagg, Inc. (a) | | | 464 | | | | 2,065 | |
| | | | | | | | |
| | | | | | | 4,149,448 | |
| | | | | | | | |
| | | | |
| Enhanced Small Cap Fund | | | 33 | |
SSgA
Enhanced Small Cap Fund
Schedule of Investments, continued — August 31, 2013
| | | | | | | | |
| | | Principal
Amount ($)
or Shares | | | Market
Value
$ | |
| | | | | | | | |
Consumer Staples - 3.6% | | | | | |
B&G Foods, Inc. | | | 98 | | | | 3,319 | |
Cal-Maine Foods, Inc. | | | 501 | | | | 22,861 | |
Darling International, Inc. (a) | | | 5,805 | | | | 117,435 | |
Fresh Del Monte Produce, Inc. | | | 4,241 | | | | 122,395 | |
Inter Parfums, Inc. | | | 300 | | | | 7,971 | |
Inventure Foods, Inc. (a) | | | 2,303 | | | | 20,773 | |
J&J Snack Foods Corp. | | | 101 | | | | 7,769 | |
John B Sanfilippo & Son, Inc. | | | 1,711 | | | | 37,043 | |
Lancaster Colony Corp. | | | 39 | | | | 2,877 | |
Medifast, Inc. (a) | | | 3,102 | | | | 77,116 | |
Nutraceutical International Corp. | | | 3,255 | | | | 73,400 | |
Oil-Dri Corp. of America | | | 100 | | | | 3,101 | |
Omega Protein Corp. (a) | | | 400 | | | | 3,580 | |
Pilgrim’s Pride Corp. (a) | | | 265 | | | | 4,062 | |
Post Holdings, Inc. (a) | | | 1,505 | | | | 64,264 | |
Revlon, Inc. (Class A) (a) | | | 1,215 | | | | 27,192 | |
Rite Aid Corp. (a) | | | 54,217 | | | | 187,591 | |
Roundy’s, Inc. | | | 334 | | | | 2,819 | |
Sanderson Farms, Inc. | | | 245 | | | | 16,043 | |
Seaboard Corp. | | | 1 | | | | 2,680 | |
Seneca Foods Corp. (Class A) (a) | | | 701 | | | | 20,658 | |
Spartan Stores, Inc. | | | 220 | | | | 4,523 | |
Susser Holdings Corp. (a) | | | 1,766 | | | | 84,256 | |
The Pantry, Inc. (a) | | | 1,036 | | | | 11,821 | |
Tootsie Roll Industries, Inc. | | | 195 | | | | 5,848 | |
Universal Corp. | | | 2,270 | | | | 111,275 | |
USANA Health Sciences, Inc. (a) | | | 76 | | | | 5,772 | |
Village Super Market, Inc. (Class A) | | | 720 | | | | 25,193 | |
| | | | | | | | |
| | | | | | | 1,073,637 | |
| | | | | | | | |
| | |
Energy - 5.4% | | | | | | | | |
Abraxas Petroleum Corp. (a) | | | 2,322 | | | | 5,851 | |
Adams Resources & Energy, Inc. | | | 200 | | | | 12,162 | |
Bristow Group, Inc. | | | 2,250 | | | | 147,825 | |
Callon Petroleum Co. (a) | | | 1,002 | | | | 4,499 | |
Cloud Peak Energy, Inc. (a) | | | 2,585 | | | | 40,688 | |
Crimson Exploration, Inc. (a) | | | 2,459 | | | | 7,254 | |
Dawson Geophysical Co. (a) | | | 500 | | | | 17,950 | |
Delek US Holdings, Inc. | | | 5,631 | | | | 139,987 | |
Energy XXI Bermuda, Ltd. | | | 368 | | | | 9,778 | |
EPL Oil & Gas, Inc. (a) | | | 5,175 | | | | 175,122 | |
Global Geophysical Services, Inc. (a) | | | 2,703 | | | | 6,811 | |
Green Plains Renewable Energy, Inc. (a) | | | 3,780 | | | | 60,820 | |
Helix Energy Solutions Group, Inc. (a) | | | 6,565 | | | | 164,322 | |
ION Geophysical Corp. (a) | | | 489 | | | | 2,342 | |
Kodiak Oil & Gas Corp. (a) | | | 329 | | | | 3,287 | |
| | | | | | | | |
| | | Principal
Amount ($)
or Shares | | | Market
Value
$ | |
Matrix Service Co. (a) | | | 2,496 | | | | 38,913 | |
Natural Gas Services Group, Inc. (a) | | | 200 | | | | 5,484 | |
Newpark Resources, Inc. (a) | | | 324 | | | | 3,606 | |
Parker Drilling Co. (a) | | | 15,189 | | | | 87,185 | |
Pioneer Energy Services
Corp. (a) | | | 5,028 | | | | 33,989 | |
Quicksilver Resources, Inc. (a) | | | 1,961 | | | | 3,275 | |
Rentech, Inc. | | | 20,219 | | | | 39,023 | |
REX American Resources Corp. (a) | | | 4,089 | | | | 120,789 | |
Stone Energy Corp. (a) | | | 5,359 | | | | 146,837 | |
Targa Resources Corp. | | | 276 | | | | 18,793 | |
Tesco Corp. (a) | | | 700 | | | | 10,815 | |
TGC Industries, Inc. | | | 2,097 | | | | 16,650 | |
W&T Offshore, Inc. | | | 4,481 | | | | 69,231 | |
Warren Resources, Inc. (a) | | | 10,053 | | | | 28,751 | |
Western Refining, Inc. | | | 5,296 | | | | 155,332 | |
Willbros Group, Inc. (a) | | | 306 | | | | 2,788 | |
| | | | | | | | |
| | | | | | | 1,580,159 | |
| | | | | | | | |
| | |
Financials - 22.2% | | | | | | | | |
1st Source Corp. | | | 1,154 | | | | 29,727 | |
AG Mortgage Investment Trust, Inc. (b) | | | 3,536 | | | | 62,092 | |
American Assets Trust, Inc. (b) | | | 1,462 | | | | 43,290 | |
American Capital Mortgage Investment Corp. (b) | | | 572 | | | | 11,463 | |
American Realty Capital Properties, Inc. (b) | | | 219 | | | | 2,937 | |
Anworth Mortgage Asset Corp. (b) | | | 14,745 | | | | 65,320 | |
Apollo Commercial Real Estate Finance, Inc. (b) | | | 6,916 | | | | 103,878 | |
Apollo Investment Corp. | | | 17,722 | | | | 139,827 | |
Apollo Residential Mortgage, Inc. (b) | | | 3,592 | | | | 54,634 | |
Ares Commercial Real Estate Corp. (b) | | | 100 | | | | 1,277 | |
Argo Group International Holdings, Ltd. | | | 2,069 | | | | 84,498 | |
ARMOUR Residential REIT, Inc. (b) | | | 17,900 | | | | 74,822 | |
Ashford Hospitality Trust,
Inc. (b) | | | 275 | | | | 3,171 | |
Bancfirst Corp. | | | 58 | | | | 2,963 | |
Banco Latinoamericano de Comercio Exterior SA | | | 3,219 | | | | 77,514 | |
Bancorp, Inc. (a) | | | 531 | | | | 8,395 | |
Banner Corp. | | | 1,190 | | | | 40,769 | |
BBCN Bancorp, Inc. | | | 5,045 | | | | 67,401 | |
Berkshire Hills Bancorp, Inc. | | | 719 | | | | 17,867 | |
BlackRock Kelso Capital Corp. | | | 477 | | | | 4,675 | |
BNC Bancorp | | | 240 | | | | 3,125 | |
Capital Bank Financial
Corp. (a) | | | 2,322 | | | | 45,860 | |
| | |
| 34 | | Enhanced Small Cap Fund |
SSgA
Enhanced Small Cap Fund
Schedule of Investments, continued — August 31, 2013
| | | | | | | | |
| | | Principal
Amount ($)
or Shares | | | Market
Value
$ | |
| | | | | | | | |
Capitol Federal Financial, Inc. | | | 9,204 | | | | 112,657 | |
Capstead Mortgage
Corp. (b) | | | 13,853 | | | | 162,634 | |
Cardinal Financial Corp. | | | 184 | | | | 3,025 | |
Cash America International, Inc. | | | 144 | | | | 6,160 | |
Cathay General Bancorp | | | 1,946 | | | | 42,851 | |
Chatham Lodging Trust (b) | | | 200 | | | | 3,620 | |
Chemical Financial Corp. | | | 291 | | | | 7,927 | |
Clifton Savings Bancorp, Inc. | | | 253 | | | | 3,049 | |
CNO Financial Group, Inc. | | | 11,615 | | | | 157,848 | |
Colony Financial, Inc. (b) | | | 6,635 | | | | 131,174 | |
Community Trust Bancorp, Inc. | | | 78 | | | | 2,942 | |
CommunityOne
Bancorp (a) | | | 1,417 | | | | 12,030 | |
Cousins Properties, Inc. (b) | | | 6,710 | | | | 66,630 | |
Credit Acceptance
Corp. (a) | | | 950 | | | | 102,172 | |
CubeSmart (b) | | | 194 | | | | 3,230 | |
CyrusOne, Inc. (b) | | | 318 | | | | 6,061 | |
CYS Investments, Inc. (b) | | | 1,100 | | | | 8,448 | |
DiamondRock Hospitality Co. (b) | | | 246 | | | | 2,384 | |
Education Realty Trust, Inc. (b) | | | 338 | | | | 2,903 | |
Ellington Residential Mortgage REIT (b) | | | 8,645 | | | | 130,885 | |
EverBank Financial Corp. | | | 191 | | | | 2,685 | |
Ezcorp, Inc. (Class A) (a) | | | 169 | | | | 2,870 | |
F.N.B. Corp. | | | 5,375 | | | | 64,876 | |
FBL Financial Group, Inc. (Class A) | | | 500 | | | | 22,040 | |
FBR & Co. (a) | | | 1,275 | | | | 34,196 | |
FelCor Lodging Trust,
Inc. (a)(b) | | | 22,988 | | | | 126,664 | |
Fifth Street Finance Corp. | | | 410 | | | | 4,248 | |
Financial Institutions, Inc. | | | 153 | | | | 2,837 | |
First American Financial Corp. | | | 1,512 | | | | 31,601 | |
First Bancorp | | | 638 | | | | 8,970 | |
First Commonwealth Financial Corp. | | | 10,432 | | | | 76,467 | |
First Community Bancshares, Inc. | | | 1,061 | | | | 15,968 | |
First Financial Corp. | | | 96 | | | | 2,920 | |
First Financial Holdings, Inc. | | | 661 | | | | 35,582 | |
First Merchants Corp. | | | 1,000 | | | | 17,080 | |
First Midwest Bancorp, Inc. | | | 9,478 | | | | 142,454 | |
First NBC Bank Holding Co. (a) | | | 718 | | | | 16,880 | |
First Potomac Realty
Trust (b) | | | 408 | | | | 5,076 | |
First Security Group,
Inc. (a) | | | 4,262 | | | | 9,632 | |
FirstMerit Corp. | | | 2,722 | | | | 57,598 | |
Flushing Financial Corp. | | | 1,375 | | | | 24,613 | |
GFI Group, Inc. | | | 9,963 | | | | 39,952 | |
Gladstone Capital Corp. | | | 1,112 | | | | 9,096 | |
Glimcher Realty Trust (b) | | | 1,717 | | | | 16,998 | |
Golub Capital BDC, Inc. | | | 356 | | | | 6,152 | |
Gramercy Property Trust, Inc. (a)(b) | | | 2,638 | | | | 10,789 | |
Hanmi Financial Corp. | | | 539 | | | | 8,802 | |
Heritage Financial Corp. | | | 559 | | | | 8,452 | |
Heritage Oaks Bancorp (a) | | | 485 | | | | 3,031 | |
| | | | | | | | |
| | | Principal
Amount ($)
or Shares | | | Market
Value
$ | |
Hersha Hospitality
Trust (b) | | | 510 | | | | 2,672 | |
Home Loan Servicing Solutions, Ltd. | | | 2,683 | | | | 61,172 | |
Horace Mann Educators Corp. | | | 2,473 | | | | 65,188 | |
ICG Group, Inc. (a) | | | 249 | | | | 3,117 | |
International Bancshares Corp. | | | 1,708 | | | | 37,439 | |
Invesco Mortgage Capital, Inc. (b) | | | 8,682 | | | | 132,921 | |
Investment Technology Group, Inc. (a) | | | 8,579 | | | | 145,843 | |
JAVELIN Mortgage Investment Corp. (b) | | | 2,141 | | | | 26,698 | |
KCAP Financial, Inc. | | | 1,105 | | | | 9,227 | |
Kite Realty Group
Trust (b) | | | 1,100 | | | | 6,347 | |
Maiden Holdings, Ltd. | | | 7,565 | | | | 98,950 | |
MainSource Financial Group, Inc. | | | 2,420 | | | | 34,485 | |
Manning & Napier, Inc. | | | 155 | | | | 2,322 | |
MB Financial, Inc. | | | 742 | | | | 20,027 | |
MCG Capital Corp. | | | 25,801 | | | | 126,167 | |
Meadowbrook Insurance Group, Inc. | | | 6,830 | | | | 40,843 | |
Medley Capital Corp. | | | 4,946 | | | | 65,040 | |
Metro Bancorp, Inc. (a) | | | 1,190 | | | | 22,634 | |
MetroCorp Bancshares, Inc. | | | 600 | | | | 6,072 | |
MidWestOne Financial Group, Inc. | | | 219 | | | | 5,147 | |
Montpelier Re Holdings, Ltd. | | | 4,895 | | | | 121,641 | |
National Bank Holdings Corp. | | | 156 | | | | 3,050 | |
Nelnet, Inc. (Class A) | | | 3,038 | | | | 115,079 | |
New Residential Investment Corp. (b) | | | 1,329 | | | | 8,439 | |
New York Mortgage Trust, Inc. (b) | | | 860 | | | | 5,194 | |
NorthStar Realty Finance Corp. (b) | | | 11,282 | | | | 98,830 | |
Northwest Bancshares, Inc. | | | 6,723 | | | | 89,685 | |
OceanFirst Financial Corp. | | | 220 | | | | 3,588 | |
OFG Bancorp | | | 7,676 | | | | 131,874 | |
Old National Bancorp | | | 2,048 | | | | 26,911 | |
One Liberty Properties, Inc. (b) | | | 100 | | | | 2,137 | |
Oritani Financial Corp. | | | 1,564 | | | | 24,258 | |
Pacific Continental Corp. | | | 500 | | | | 6,285 | |
Parkway Properties,
Inc. (b) | | | 520 | | | | 8,502 | |
PennantPark Investment Corp. | | | 2,888 | | | | 32,028 | |
Pennsylvania Real Estate Investment Trust (b) | | | 200 | | | | 3,710 | |
PennyMac Financial Services, Inc.
(Class A) (a) | | | 158 | | | | 2,697 | |
PennyMac Mortgage Investment Trust (b) | | | 6,287 | | | | 132,341 | |
Peoples Bancorp, Inc. | | | 476 | | | | 9,977 | |
PHH Corp. (a) | | | 2,264 | | | | 47,250 | |
Platinum Underwriters Holdings, Ltd. | | | 2,382 | | | | 137,632 | |
Portfolio Recovery Associates, Inc. (a) | | | 51 | | | | 2,705 | |
| | | | |
| Enhanced Small Cap Fund | | | 35 | |
SSgA
Enhanced Small Cap Fund
Schedule of Investments, continued — August 31, 2013
| | | | | | | | |
| | | Principal
Amount ($)
or Shares | | | Market
Value
$ | |
| | | | | | | | |
Preferred Bank/Los Angeles CA (a) | | | 300 | | | | 4,824 | |
Primerica, Inc. | | | 2,154 | | | | 79,978 | |
PrivateBancorp, Inc. | | | 1,545 | | | | 33,712 | |
Prospect Capital Corp. | | | 636 | | | | 7,041 | |
Provident Financial Holdings, Inc. | | | 1,999 | | | | 35,522 | |
Provident Financial Services, Inc. | | | 536 | | | | 8,672 | |
RAIT Financial Trust (b) | | | 949 | | | | 5,865 | |
Ramco-Gershenson Properties Trust (b) | | | 764 | | | | 11,063 | |
Redwood Trust, Inc. (b) | | | 3,186 | | | | 56,679 | |
RLJ Lodging Trust (b) | | | 4,418 | | | | 101,526 | |
Rouse Properties, Inc. (b) | | | 313 | | | | 5,803 | |
Saul Centers, Inc. (b) | | | 100 | | | | 4,341 | |
Silver Bay Realty Trust Corp. (b) | | | 677 | | | | 10,676 | |
Solar Capital, Ltd. | | | 3,661 | | | | 80,359 | |
Southwest Bancorp, Inc. (a) | | | 2,992 | | | | 43,204 | |
StellarOne Corp. | | | 300 | | | | 6,144 | |
Sterling Bancorp | | | 300 | | | | 3,807 | |
Sterling Financial Corp. | | | 153 | | | | 3,703 | |
Strategic Hotels & Resorts, Inc. (a)(b) | | | 18,076 | | | | 146,596 | |
Suffolk Bancorp (a) | | | 449 | | | | 7,637 | |
Summit Hotel Properties, Inc. (b) | | | 557 | | | | 5,314 | |
Sunstone Hotel Investors, Inc. (a)(b) | | | 10,971 | | | | 131,981 | |
Susquehanna Bancshares, Inc. | | | 14,105 | | | | 177,864 | |
TCP Capital Corp. | | | 2,730 | | | | 42,533 | |
THL Credit, Inc. | | | 774 | | | | 12,152 | |
Umpqua Holdings Corp. | | | 9,751 | | | | 158,356 | |
Union First Market Bankshares Corp. | | | 700 | | | | 14,973 | |
Universal Health Realty Income Trust (b) | | | 1,241 | | | | 49,777 | |
Walter Investment Management Corp. (a) | | | 138 | | | | 5,063 | |
Washington Real Estate Investment Trust (b) | | | 436 | | | | 10,621 | |
Webster Financial Corp. | | | 3,822 | | | | 101,130 | |
WesBanco, Inc. | | | 345 | | | | 9,898 | |
Western Alliance
Bancorp (a) | | | 2,893 | | | | 47,358 | |
Western Asset Mortgage Capital Corp. (b) | | | 270 | | | | 4,215 | |
Wilshire Bancorp, Inc. | | | 16,770 | | | | 136,340 | |
Wintrust Financial Corp. | | | 100 | | | | 3,964 | |
WisdomTree Investments, Inc. (a) | | | 12,283 | | | | 137,570 | |
World Acceptance Corp. (a) | | | 1,692 | | | | 144,954 | |
| | | | | | | | |
| | | | | | | 6,500,003 | |
| | | | | | | | |
| | |
Health Care - 12.2% | | | | | | | | |
ACADIA Pharmaceuticals, Inc. (a) | | | 165 | | | | 3,293 | |
Acorda Therapeutics,
Inc. (a) | | | 189 | | | | 6,386 | |
| | | | | | | | |
| | | Principal
Amount ($)
or Shares | | | Market
Value
$ | |
Albany Molecular Research, Inc. (a) | | | 762 | | | | 8,390 | |
Alliance HealthCare Services, Inc. (a) | | | 5,511 | | | | 133,917 | |
Almost Family, Inc. | | | 154 | | | | 2,906 | |
Alnylam Pharmaceuticals, Inc. (a) | | | 244 | | | | 12,639 | |
Amedisys, Inc. (a) | | | 356 | | | | 5,799 | |
Anika Therapeutics,
Inc. (a) | | | 445 | | | | 10,297 | |
ArQule, Inc. (a) | | | 3,605 | | | | 10,058 | |
ArthroCare Corp. (a) | | | 2,784 | | | | 88,169 | |
Astex Pharmaceuticals (a) | | | 18,391 | | | | 120,461 | |
Cambrex Corp. (a) | | | 4,054 | | | | 55,256 | |
Cantel Medical Corp. | | | 2,577 | | | | 66,744 | |
Celldex Therapeutics,
Inc. (a) | | | 11 | | | | 239 | |
Chemed Corp. | | | 154 | | | | 10,725 | |
CONMED Corp. | | | 4,863 | | | | 151,191 | |
Cornerstone Therapeutics, Inc. (a) | | | 739 | | | | 6,836 | |
Corvel Corp. (a) | | | 118 | | | | 3,887 | |
CryoLife, Inc. | | | 17,151 | | | | 104,107 | |
Curis, Inc. (a) | | | 1,677 | | | | 7,345 | |
Cynosure, Inc.
(Class A) (a) | | | 128 | | | | 2,938 | |
Cytokinetics, Inc. (a) | | | 671 | | | | 7,025 | |
Emergent Biosolutions, Inc. (a) | | | 7,108 | | | | 124,959 | |
Emeritus Corp. (a) | | | 100 | | | | 2,181 | |
Endocyte, Inc. (a) | | | 915 | | | | 13,139 | |
Enzon Pharmaceuticals, Inc. | | | 23,439 | | | | 40,315 | |
Five Star Quality Care,
Inc. (a) | | | 2,900 | | | | 15,051 | |
Gentiva Health Services, Inc. (a) | | | 4,095 | | | | 46,970 | |
GTX, Inc. (a) | | | 3,130 | | | | 4,851 | |
Hanger, Inc. (a) | | | 1,428 | | | | 43,854 | |
HealthSouth Corp. (a) | | | 111 | | | | 3,492 | |
Invacare Corp. | | | 1,157 | | | | 17,367 | |
Isis Pharmaceuticals,
Inc. (a) | | | 1,111 | | | | 28,697 | |
Keryx Biopharmaceuticals, Inc. (a) | | | 1,700 | | | | 14,501 | |
Lannett Co., Inc. (a) | | | 271 | | | | 3,593 | |
LHC Group, Inc. (a) | | | 300 | | | | 6,789 | |
Ligand Pharmaceuticals, Inc. (Class B) (a) | | | 277 | | | | 13,321 | |
Magellan Health Services, Inc. (a) | | | 2,541 | | | | 142,830 | |
MedAssets, Inc. (a) | | | 7,085 | | | | 158,846 | |
Medical Action Industries, Inc. (a) | | | 327 | | | | 1,671 | |
MiMedx Group, Inc. (a) | | | 2,260 | | | | 13,944 | |
Molina Healthcare, Inc. (a) | | | 2,489 | | | | 83,108 | |
National Healthcare Corp. | | | 63 | | | | 2,907 | |
Natus Medical, Inc. (a) | | | 243 | | | | 3,195 | |
Neurocrine Biosciences, Inc. (a) | | | 244 | | | | 3,555 | |
NPS Pharmaceuticals,
Inc. (a) | | | 246 | | | | 6,175 | |
NuVasive, Inc. (a) | | | 2,649 | | | | 62,304 | |
Omnicell, Inc. (a) | | | 3,185 | | | | 69,242 | |
Orexigen Therapeutics, Inc. (a) | | | 3,802 | | | | 26,082 | |
Owens & Minor, Inc. | | | 91 | | | | 3,104 | |
PAREXEL International Corp. (a) | | | 83 | | | | 3,854 | |
| | |
| 36 | | Enhanced Small Cap Fund |
SSgA
Enhanced Small Cap Fund
Schedule of Investments, continued — August 31, 2013
| | | | | | | | |
| | | Principal
Amount ($)
or Shares | | | Market
Value
$ | |
| | | | | | | | |
PDL BioPharma, Inc. | | | 20,223 | | | | 160,571 | |
PharMerica Corp. (a) | | | 2,785 | | | | 34,255 | |
PhotoMedex, Inc. (a) | | | 374 | | | | 6,111 | |
Progenics Pharmaceuticals, Inc. (a) | | | 2,758 | | | | 15,334 | |
Questcor Pharmaceuticals, Inc. | | | 2,163 | | | | 144,229 | |
Repligen Corp. (a) | | | 3,635 | | | | 35,478 | |
RTI Biologics, Inc. (a) | | | 8,426 | | | | 28,059 | |
Sangamo Biosciences,
Inc. (a) | | | 5,748 | | | | 56,733 | |
Santarus, Inc. (a) | | | 5,953 | | | | 134,062 | |
Sarepta Therapeutics,
Inc. (a) | | | 669 | | | | 22,833 | |
Sciclone Pharmaceuticals, Inc. (a) | | | 8,774 | | | | 46,063 | |
Select Medical Holdings Corp. | | | 15,741 | | | | 133,326 | |
Spectranetics Corp. (a) | | | 501 | | | | 7,911 | |
Spectrum Pharmaceuticals, Inc. | | | 8,209 | | | | 62,881 | |
Stemline Therapeutics,
Inc. (a) | | | 1,969 | | | | 68,226 | |
STERIS Corp. | | | 2,517 | | | | 102,920 | |
SurModics, Inc. (a) | | | 3,923 | | | | 77,675 | |
Symmetry Medical, Inc. (a) | | | 800 | | | | 6,280 | |
Synergy Pharmaceuticals, Inc. (a) | | | 3,700 | | | | 16,428 | |
Team Health Holdings,
Inc. (a) | | | 85 | | | | 3,267 | |
TG Therapeutics, Inc. (a) | | | 700 | | | | 4,214 | |
The Medicines Co. (a) | | | 91 | | | | 2,877 | |
The Providence Service Corp. (a) | | | 2,730 | | | | 73,273 | |
Thoratec Corp. (a) | | | 4,922 | | | | 175,863 | |
Threshold Pharmaceuticals, Inc. (a) | | | 25,473 | | | | 110,808 | |
Triple-S Management Corp. (Class B) (a) | | | 5,031 | | | | 93,828 | |
US Physical Therapy, Inc. | | | 98 | | | | 2,698 | |
Vanda Pharmaceuticals, Inc. (a) | | | 594 | | | | 6,789 | |
Vascular Solutions, Inc. (a) | | | 920 | | | | 14,508 | |
Vical, Inc. (a) | | | 3,773 | | | | 4,867 | |
ViroPharma, Inc. (a) | | | 2,960 | | | | 89,244 | |
WellCare Health Plans,
Inc. (a) | | | 894 | | | | 56,921 | |
| | | | | | | | |
| | | | | | | 3,577,037 | |
| | | | | | | | |
| | |
Industrials - 14.7% | | | | | | | | |
AAON, Inc. | | | 159 | | | | 3,708 | |
AAR Corp. | | | 6,110 | | | | 153,300 | |
ABM Industries, Inc. | | | 357 | | | | 8,622 | |
Actuant Corp. (Class A) | | | 2,666 | | | | 95,230 | |
Air Transport Services Group, Inc. (a) | | | 2,538 | | | | 16,269 | |
Aircastle, Ltd. | | | 9,687 | | | | 157,898 | |
Alamo Group, Inc. | | | 463 | | | | 21,002 | |
Allegiant Travel Co. | | | 1,063 | | | | 100,464 | |
Altra Holdings, Inc. | | | 699 | | | | 17,370 | |
American Railcar Industries, Inc. | | | 83 | | | | 2,936 | |
Applied Industrial Technologies, Inc. | | | 1,532 | | | | 72,954 | |
Arkansas Best Corp. | | | 143 | | | | 3,558 | |
AT Cross Co. (Class A) (a) | | | 398 | | | | 8,485 | |
| | | | | | | | |
| | | Principal
Amount ($)
or Shares | | | Market
Value
$ | |
AZZ, Inc. | | | 82 | | | | 3,078 | |
Barnes Group, Inc. | | | 674 | | | | 21,076 | |
Barrett Business Services, Inc. | | | 284 | | | | 18,253 | |
Beacon Roofing Supply, Inc. (a) | | | 100 | | | | 3,633 | |
Brady Corp. (Class A) | | | 3,813 | | | | 125,829 | |
Briggs & Stratton Corp. | | | 834 | | | | 15,921 | |
Celadon Group, Inc. | | | 1,393 | | | | 25,269 | |
Cenveo, Inc. (a) | | | 3,984 | | | | 11,155 | |
CLARCOR, Inc. | | | 463 | | | | 24,798 | |
Coleman Cable, Inc. | | | 466 | �� | | | 8,873 | |
Columbus McKinnon Corp. (a) | | | 1,074 | | | | 22,984 | |
Comfort Systems USA, Inc. | | | 3,758 | | | | 56,746 | |
Consolidated Graphics, Inc. (a) | | | 2,587 | | | | 138,404 | |
Courier Corp. | | | 4,213 | | | | 65,723 | |
Deluxe Corp. | | | 4,235 | | | | 166,647 | |
Dycom Industries, Inc. (a) | | | 4,419 | | | | 112,287 | |
EMCOR Group, Inc. | | | 3,986 | | | | 149,834 | |
EnerSys | | | 3,570 | | | | 183,070 | |
Engility Holdings, Inc. (a) | | | 99 | | | | 3,332 | |
Esterline Technologies Corp. (a) | | | 159 | | | | 12,130 | |
Exponent, Inc. | | | 92 | | | | 5,992 | |
FTI Consulting, Inc. (a) | | | 255 | | | | 8,527 | |
Generac Holdings, Inc. | | | 515 | | | | 20,389 | |
Gibraltar Industries,
Inc. (a) | | | 199 | | | | 2,563 | |
Gorman-Rupp Co. (The) | | | 100 | | | | 3,497 | |
Griffon Corp. | | | 255 | | | | 2,813 | |
H&E Equipment Services, Inc. | | | 2,056 | | | | 49,508 | |
Heartland Express, Inc. | | | 3,125 | | | | 43,500 | |
Herman Miller, Inc. | | | 116 | | | | 2,955 | |
Huron Consulting Group, Inc. (a) | | | 71 | | | | 3,380 | |
Hyster-Yale Materials Handling, Inc. | | | 1,726 | | | | 130,503 | |
ICF International, Inc. (a) | | | 1,704 | | | | 56,045 | |
II-VI, Inc. (a) | | | 2,843 | | | | 54,813 | |
Insperity, Inc. | | | 2,928 | | | | 93,403 | |
Intersections, Inc. | | | 874 | | | | 7,997 | |
JetBlue Airways Corp. (a) | | | 1,845 | | | | 11,347 | |
John Bean Technologies Corp. | | | 5,123 | | | | 112,245 | |
Kadant, Inc. | | | 3,753 | | | | 116,606 | |
Kaydon Corp. | | | 700 | | | | 19,915 | |
Kforce, Inc. | | | 7,707 | | | | 125,393 | |
Kimball International, Inc. (Class B) | | | 370 | | | | 3,641 | |
Knoll, Inc. | | | 192 | | | | 2,924 | |
L.B. Foster Co. (Class A) | | | 1,060 | | | | 44,965 | |
Lydall, Inc. (a) | | | 3,848 | | | | 59,759 | |
Marten Transport, Ltd. | | | 3,012 | | | | 53,282 | |
MasTec, Inc. (a) | | | 154 | | | | 4,897 | |
Matson, Inc. | | | 6,084 | | | | 162,017 | |
Meritor, Inc. (a) | | | 15,221 | | | | 113,396 | |
Michael Baker Corp. | | | 117 | | | | 4,731 | |
Moog, Inc. (Class A) (a) | | | 955 | | | | 48,514 | |
| | | | |
| Enhanced Small Cap Fund | | | 37 | |
SSgA
Enhanced Small Cap Fund
Schedule of Investments, continued — August 31, 2013
| | | | | | | | |
| | | Principal
Amount ($)
or Shares | | | Market
Value
$ | |
| | | | | | | | |
Mueller Industries, Inc/TN | | | 225 | | | | 12,046 | |
Mueller Water Products, Inc. (Class A) | | | 3,410 | | | | 25,745 | |
MYR Group, Inc. (a) | | | 1,597 | | | | 35,006 | |
Navigant Consulting,
Inc. (a) | | | 211 | | | | 2,880 | |
NCI Building Systems,
Inc. (a) | | | 3,400 | | | | 40,732 | |
Nortek, Inc. (a) | | | 165 | | | | 11,047 | |
Orbital Sciences Corp. (a) | | | 3,957 | | | | 68,694 | |
Performant Financial
Corp. (a) | | | 291 | | | | 3,152 | |
PGT, Inc. (a) | | | 313 | | | | 3,186 | |
Pike Electric Corp. | | | 944 | | | | 10,478 | |
Primoris Services Corp. | | | 580 | | | | 13,038 | |
Resources Connection, Inc. | | | 11,036 | | | | 135,081 | |
Rexnord Corp. (a) | | | 168 | | | | 3,224 | |
RPX Corp. (a) | | | 1,228 | | | | 19,267 | |
Saia, Inc. (a) | | | 124 | | | | 3,721 | |
Spirit Airlines, Inc. (a) | | | 5,358 | | | | 167,009 | |
Steelcase, Inc. (Class A) | | | 10,908 | | | | 158,384 | |
Swift Transportation
Co. (a) | | | 575 | | | | 10,327 | |
TAL International Group, Inc. (a) | | | 272 | | | | 11,642 | |
Taser International, Inc. (a) | | | 12,674 | | | | 147,525 | |
Tetra Tech, Inc. (a) | | | 2,083 | | | | 47,451 | |
The Brink’s Co. | | | 769 | | | | 19,863 | |
TrueBlue, Inc. (a) | | | 2,688 | | | | 65,372 | |
Tutor Perini Corp. (a) | | | 133 | | | | 2,551 | |
US Airways Group, Inc. (a) | | | 3,149 | | | | 50,888 | |
Viad Corp. | | | 800 | | | | 18,056 | |
Werner Enterprises, Inc. | | | 678 | | | | 15,621 | |
Xerium Technologies,
Inc. (a) | | | 836 | | | | 9,029 | |
| | | | | | | | |
| | | | | | | 4,311,370 | |
| | | | | | | | |
|
Information Technology - 18.8% | |
Actuate Corp. (a) | | | 5,427 | | | | 37,718 | |
Acxiom Corp. (a) | | | 6,476 | | | | 161,123 | |
Advanced Energy Industries, Inc. (a) | | | 3,610 | | | | 65,810 | |
Aeroflex Holding Corp. (a) | | | 1,567 | | | | 11,000 | |
Alliance Fiber Optic Products, Inc. | | | 115 | | | | 4,258 | |
Amkor Technology, Inc. (a) | | | 7,509 | | | | 30,111 | |
Anaren, Inc. (a) | | | 784 | | | | 19,271 | |
Angie’s List, Inc. (a) | | | 132 | | | | 2,767 | |
Anixter International,
Inc. (a) | | | 301 | | | | 25,152 | |
ARRIS Group, Inc. (a) | | | 8,577 | | | | 134,402 | |
Aspen Technology, Inc. (a) | | | 6,378 | | | | 213,217 | |
AVG Technologies NV (a) | | | 2,968 | | | | 64,317 | |
Aviat Networks, Inc. (a) | | | 1,118 | | | | 2,840 | |
Belden, Inc. | | | 2,535 | | | | 143,785 | |
Benchmark Electronics, Inc. (a) | | | 7,170 | | | | 157,525 | |
Black Box Corp. | | | 2,596 | | | | 68,976 | |
Blucora, Inc. (a) | | | 6,781 | | | | 135,756 | |
Brooks Automation, Inc. | | | 617 | | | | 5,430 | |
| | | | | | | | |
| | | Principal
Amount ($)
or Shares | | | Market
Value
$ | |
Cabot Microelectronics Corp. (a) | | | 85 | | | | 3,070 | |
CACI International, Inc. (Class A) (a) | | | 47 | | | | 3,168 | |
CalAmp Corp. (a) | | | 184 | | | | 3,016 | |
Calix, Inc. (a) | | | 321 | | | | 4,125 | |
CEVA, Inc. (a) | | | 157 | | | | 2,846 | |
Checkpoint Systems,
Inc. (a) | | | 2,313 | | | | 33,932 | |
Cirrus Logic, Inc. (a) | | | 3,713 | | | | 83,542 | |
Coherent, Inc. | | | 1,310 | | | | 73,530 | |
CommVault Systems,
Inc. (a) | | | 555 | | | | 46,526 | |
Comtech Telecommunications Corp. | | | 2,145 | | | | 51,416 | |
Comverse, Inc. (a) | | | 4,910 | | | | 148,527 | |
Convergys Corp. | | | 2,149 | | | | 37,887 | |
CSG Systems International, Inc. | | | 1,621 | | | | 38,158 | |
CTS Corp. | | | 500 | | | | 6,960 | |
Daktronics, Inc. | | | 2,400 | | | | 25,656 | |
Dice Holdings, Inc. (a) | | | 12,459 | | | | 103,783 | |
Digimarc Corp. | | | 181 | | | | 3,441 | |
Digital River, Inc. (a) | | | 7,389 | | | | 127,682 | |
Diodes, Inc. (a) | | | 241 | | | | 6,001 | |
DSP Group, Inc. (a) | | | 1,668 | | | | 10,592 | |
EarthLink, Inc. | | | 15,758 | | | | 77,529 | |
Ebix, Inc. | | | 172 | | | | 1,956 | |
Electro Rent Corp. | | | 358 | | | | 6,086 | |
Electronics for Imaging, Inc. (a) | | | 5,474 | | | | 160,279 | |
Emulex Corp. (a) | | | 2 | | | | 14 | |
Entegris, Inc. (a) | | | 12,097 | | | | 113,712 | |
Entropic Communications, Inc. (a) | | | 981 | | | | 4,101 | |
ePlus, Inc. | | | 317 | | | | 16,468 | |
Euronet Worldwide,
Inc. (a) | | | 284 | | | | 9,755 | |
Fabrinet (a) | | | 4,591 | | | | 64,090 | |
Forrester Research, Inc. | | | 84 | | | | 2,770 | |
Global Cash Access Holdings, Inc. (a) | | | 15,723 | | | | 121,067 | |
GSI Group, Inc. (a) | | | 367 | | | | 3,094 | |
Harmonic, Inc. (a) | | | 15,494 | | | | 109,543 | |
Heartland Payment Systems, Inc. | | | 2,427 | | | | 89,678 | |
Insight Enterprises, Inc. (a) | | | 7,675 | | | | 146,669 | |
Integrated Silicon Solution, Inc. (a) | | | 11,207 | | | | 116,665 | |
Internap Network Services Corp. (a) | | | 446 | | | | 3,251 | |
IXYS Corp. | | | 2,589 | | | | 24,000 | |
j2 Global, Inc. | | | 56 | | | | 2,757 | |
Lattice Semiconductor Corp. (a) | | | 1,980 | | | | 9,425 | |
Littelfuse, Inc. | | | 40 | | | | 2,951 | |
Manhattan Associates,
Inc. (a) | | | 1,929 | | | | 168,787 | |
MAXIMUS, Inc. | | | 457 | | | | 17,142 | |
Microsemi Corp. (a) | | | 5,832 | | | | 150,116 | |
MKS Instruments, Inc. | | | 973 | | | | 24,374 | |
Monotype Imaging Holdings, Inc. | | | 4,924 | | | | 126,793 | |
Move, Inc. (a) | | | 285 | | | | 4,132 | |
Netscout Systems, Inc. (a) | | | 2,316 | | | | 57,529 | |
| | |
| 38 | | Enhanced Small Cap Fund |
SSgA
Enhanced Small Cap Fund
Schedule of Investments, continued — August 31, 2013
| | | | | | | | |
| | | Principal
Amount ($)
or Shares | | | Market
Value
$ | |
| | | | | | | | |
Newport Corp. (a) | | | 1,991 | | | | 30,542 | |
OmniVision Technologies, Inc. (a) | | | 182 | | | | 2,812 | |
Oplink Communications, Inc. (a) | | | 1,841 | | | | 34,224 | |
PC Connection, Inc. | | | 3,570 | | | | 53,014 | |
Perficient, Inc. (a) | | | 231 | | | | 3,726 | |
Pericom Semiconductor Corp. (a) | | | 2,688 | | | | 18,897 | |
Plantronics, Inc. | | | 2,206 | | | | 95,299 | |
Progress Software Corp. (a) | | | 2,735 | | | | 66,898 | |
PTC, Inc. (a) | | | 4,337 | | | | 113,066 | |
QAD, Inc. (Class A) | | | 2,293 | | | | 28,387 | |
RF Micro Devices, Inc. (a) | | | 16,900 | | | | 83,824 | |
Sanmina Corp. (a) | | | 3,071 | | | | 49,965 | |
Sapient Corp. (a) | | | 711 | | | | 10,629 | |
Silicon Graphics International Corp. (a) | | | 4,688 | | | | 69,101 | |
Silicon Image, Inc. (a) | | | 27,271 | | | | 147,809 | |
Spansion, Inc. (Class A) (a) | | | 12,697 | | | | 131,668 | |
SS&C Technologies Holdings, Inc. (a) | | | 168 | | | | 5,946 | |
support.com, Inc. (a) | | | 672 | | | | 3,454 | |
Sykes Enterprises, Inc. (a) | | | 2,848 | | | | 48,501 | |
Symmetricom, Inc. (a) | | | 3,695 | | | | 17,958 | |
Synaptics, Inc. (a) | | | 148 | | | | 5,722 | |
SYNNEX Corp. (a) | | | 1,019 | | | | 48,413 | |
TeleNav, Inc. (a) | | | 2,661 | | | | 14,423 | |
TeleTech Holdings, Inc. (a) | | | 2,579 | | | | 63,108 | |
Tellabs, Inc. | | | 18,200 | | | | 40,404 | |
TiVo, Inc. (a) | | | 7,137 | | | | 83,289 | |
TTM Technologies, Inc. (a) | | | 1,376 | | | | 13,127 | |
Unisys Corp. (a) | | | 6,272 | | | | 157,803 | |
United Online, Inc. | | | 9,585 | | | | 75,242 | |
ValueClick, Inc. (a) | | | 7,362 | | | | 155,780 | |
Verint Systems, Inc. (a) | | | 792 | | | | 26,255 | |
WebMD Health Corp. (a) | | | 101 | | | | 3,173 | |
XO Group, Inc. (a) | | | 5,387 | | | | 64,428 | |
Zix Corp. (a) | | | 1,370 | | | | 5,905 | |
| | | | | | | | |
| | | | | | | 5,504,841 | |
| | | | | | | | |
| | |
Materials - 5.5% | | | | | | | | |
A. Schulman, Inc. | | | 3,201 | | | | 86,299 | |
American Pacific Corp. (a) | | | 62 | | | | 3,037 | |
Axiall Corp. | | | 73 | | | | 2,922 | |
Boise, Inc. | | | 7,265 | | | | 62,116 | |
Chemtura Corp. (a) | | | 3,986 | | | | 87,373 | |
Coeur Mining, Inc. (a) | | | 1,192 | | | | 17,213 | |
Ferro Corp. (a) | | | 3,000 | | | | 22,050 | |
FutureFuel Corp. | | | 218 | | | | 3,519 | |
Graphic Packaging Holding Co. (a) | | | 20,802 | | | | 172,865 | |
Handy & Harman, Ltd. (a) | | | 206 | | | | 4,293 | |
Headwaters, Inc. (a) | | | 4,689 | | | | 40,138 | |
Innospec, Inc. | | | 3,571 | | | | 146,125 | |
Kaiser Aluminum Corp. | | | 343 | | | | 23,708 | |
| | | | | | | | |
| | | Principal
Amount ($)
or Shares | | | Market
Value
$ | |
KapStone Paper and Packaging Corp. | | | 105 | | | | 4,410 | |
Koppers Holdings, Inc. | | | 4,181 | | | | 162,097 | |
Landec Corp. (a) | | | 2,062 | | | | 27,218 | |
Louisiana-Pacific
Corp. (a) | | | 401 | | | | 5,999 | |
Materion Corp. | | | 411 | | | | 12,083 | |
Minerals Technologies, Inc. | | | 2,366 | | | | 105,050 | |
OM Group, Inc. (a) | | | 1,147 | | | | 32,598 | |
Omnova Solutions,
Inc. (a) | | | 13,148 | | | | 101,503 | |
P.H. Glatfelter Co. | | | 3,281 | | | | 84,059 | |
Schweitzer-Mauduit International, Inc. | | | 3,226 | | | | 184,753 | |
Stepan Co. | | | 50 | | | | 2,822 | |
SunCoke Energy, Inc. (a) | | | 8,696 | | | | 136,788 | |
Worthington Industries, Inc. | | | 2,242 | | | | 74,726 | |
| | | | | | | | |
| | | | | | | 1,605,764 | |
| | | | | | | | |
| |
Telecommunication Services - 1.1% | | | | | |
8x8, Inc. (a) | | | 651 | | | | 6,022 | |
IDT Corp. (Class B) | | | 2,242 | | | | 37,262 | |
magicJack VocalTec,
Ltd. (a) | | | 7,438 | | | | 104,429 | |
Premiere Global Services, Inc. (a) | | | 5,303 | | | | 51,333 | |
Straight Path Communications, Inc. (Class B) (a) | | | 221 | | | | 1,136 | |
USA Mobility, Inc. | | | 1,963 | | | | 27,718 | |
Vonage Holdings
Corp. (a) | | | 28,902 | | | | 90,174 | |
| | | | | | | | |
| | | | | | | 318,074 | |
| | | | | | | | |
| | |
Utilities - 2.6% | | | | | | | | |
Avista Corp. | | | 3,614 | | | | 94,940 | |
Black Hills Corp. | | | 212 | | | | 10,180 | |
Chesapeake Utilities Corp. | | | 600 | | | | 31,326 | |
Cleco Corp. | | | 1,302 | | | | 58,798 | |
El Paso Electric Co. | | | 3,130 | | | | 107,672 | |
Genie Energy, Ltd.
(Class B) (a) | | | 1,839 | | | | 15,668 | |
IDACORP, Inc. | | | 2,403 | | | | 115,032 | |
NorthWestern Corp. | | | 1,137 | | | | 45,673 | |
PNM Resources, Inc. | | | 5,697 | | | | 124,821 | |
Portland General Electric Co. | | | 574 | | | | 16,537 | |
South Jersey Industries, Inc. | | | 265 | | | | 15,307 | |
Southwest Gas Corp. | | | 1,690 | | | | 79,058 | |
The Laclede Group, Inc. | | | 639 | | | | 28,455 | |
UNS Energy Corp. | | | 515 | | | | 23,551 | |
| | | | | | | | |
| | | | | | | 767,018 | |
| | | | | | | | |
| | |
Total Common Stocks
(cost $23,237,347) | | | | | | | 29,387,351 | |
| | | | | | | | |
|
| Warrants & Rights - 0.0% (c) | |
Consumer Discretionary - 0.0% (c) | |
Biglari Holdings, Inc., expires 9/16/13 (a)
(cost $0) | | | 39 | | | | 1,154 | |
| | | | | | | | |
| | | | |
| Enhanced Small Cap Fund | | | 39 | |
SSgA
Enhanced Small Cap Fund
Schedule of Investments, continued — August 31, 2013
| | | | | | | | |
| | | Principal
Amount ($)
or Shares | | | Market
Value
$ | |
| | | | | | | | |
| Short-Term Investment - 0.3% | |
SSgA Prime Money Market Fund
0.19% (d)(e)
(cost $66,713) | | | 66,713 | | | | 66,713 | |
| | | | | | | | |
| |
Total Investments - 100.5%
(identified cost $23,304,060) | | | | 29,455,218 | |
| |
Other Assets and Liabilities,
Net - (0.5%) | | | | (134,192 | ) |
| | | | | | | | |
| | |
| Net Assets - 100.0% | | | | | | | 29,321,026 | |
| | | | | | | | |
Footnotes:
| (a) | Non-income producing security. |
| (b) | Real Estate Investment Trust (REIT). |
| (c) | Less than 0.05% of net assets. |
| (d) | Affiliated Fund managed by SSgA Funds Management, Inc. (Note 4). |
| (e) | The rate shown is the annualized seven-day yield at period end. |
Presentation of Portfolio Holdings — August 31, 2013
| | | | | | | | | | | | | | | | | | | | |
| | | Market Value | | | % of
Net
Assets | |
| Categories | | Level 1 | | | Level 2 | | | Level 3 | | | Total | | |
Consumer Discretionary | | $ | 4,149,448 | | | $ | — | * | | $ | — | | | $ | 4,149,448 | | | | 14.1 | |
Consumer Staples | | | 1,073,637 | | | | — | | | | — | | | | 1,073,637 | | | | 3.6 | |
Energy | | | 1,580,159 | | | | — | | | | — | | | | 1,580,159 | | | | 5.4 | |
Financials | | | 6,500,003 | | | | — | | | | — | | | | 6,500,003 | | | | 22.2 | |
Health Care | | | 3,577,037 | | | | — | | | | — | | | | 3,577,037 | | | | 12.2 | |
Industrials | | | 4,311,370 | | | | — | | | | — | | | | 4,311,370 | | | | 14.7 | |
Information Technology | | | 5,504,841 | | | | — | | | | — | | | | 5,504,841 | | | | 18.8 | |
Materials | | | 1,605,764 | | | | — | | | | — | | | | 1,605,764 | | | | 5.5 | |
Telecommunication Services | | | 318,074 | | | | — | | | | — | | | | 318,074 | | | | 1.1 | |
Utilities | | | 767,018 | | | | — | | | | — | | | | 767,018 | | | | 2.6 | |
Warrants & Rights | | | 1,154 | | | | — | | | | — | | | | 1,154 | | | | 0.0 | ** |
Short-Term Investment | | | 66,713 | | | | — | | | | — | | | | 66,713 | | | | 0.3 | |
| | | | | | | | | | | | | | | | | | | | |
Total Investments | | $ | 29,455,218 | | | $ | — | | | $ | — | | | $ | 29,455,218 | | | | 100.5 | |
| | | | | | | | | | | | | | | | | | | | |
Other Assets and Liabilities, Net | | | | | | | | | | | | | | | | | | | (0.5 | ) |
| | | | | | | | | | | | | | | | | | | | |
| | | | | | | | | | | | | | | | | | | 100.0 | |
| | | | | | | | | | | | | | | | | | | | |
| * | | Fund held a Level 2 security that was valued at $0 at August 31, 2013. |
| ** | | Less than 0.05% of net assets. |
For a description of the levels see Note 2 in the Notes to Financial Statements.
As of the year ended August 31, 2013, there were no transfers between levels. The transfers that did occur were the result of fair value pricing using significant observable inputs for Level 2 securities.
See accompanying notes which are an integral part of the financial statements.
| | |
| 40 | | Enhanced Small Cap Fund |
SSgA
Emerging Markets Fund
Portfolio Management Discussion and Analysis — August 31, 2013 (Unaudited)
Objective: The Fund seeks to provide maximum total return, primarily through capital appreciation, by investing primarily in securities of foreign issuers.
Invests in: Equity securities of foreign issuers domiciled, or having a substantial portion of their business, in countries having a developing or emerging economy or securities market.
Strategy: The Fund invests in securities of issuers located in emerging market countries. The Fund’s management team will evaluate the countries’ economic and political climates with prospects for sustained macro and micro economic growth.
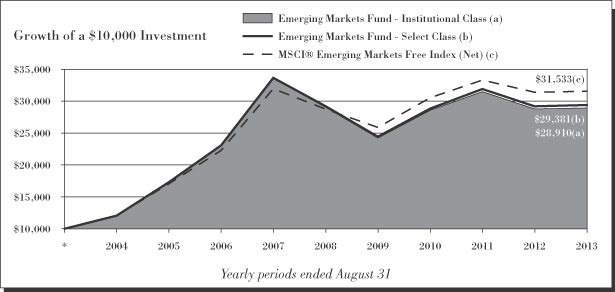
| | | | | | |
| Emerging Markets Fund — Institutional Class | |
| | |
Period Ended
08/31/13 | | | | Total
Return | |
1 Year | | | | | 0.45 | % |
5 Years | | | | | (0.06 | )%+ |
10 Years | | | | | 11.20 | %+ |
| | | | | | |
| Emerging Markets Fund — Select Class‡ | |
| | |
Period Ended
08/31/13 | | | | Total
Return | |
1 Year | | | | | 0.69 | % |
5 Years | | | | | 0.16 | %+ |
10 Years | | | | | 11.38 | %+ |
| | | | | | |
| MSCI Emerging Markets Free Index (Net)# | |
| | |
Period Ended
08/31/13 | | | | Total
Return | |
1 Year | | | | | 0.54 | % |
5 Years | | | | | 1.88 | %+ |
10 Years | | | | | 12.17 | %+ |
Performance quoted represents past performance, which is no guarantee of future results. Investment return and principal value will fluctuate, so you may have a gain or loss when shares are sold. Current performance may be higher or lower than that quoted. Visit www.ssgafunds.com for most recent month-end performance. The returns do not reflect the deduction of taxes that a shareholder would pay on Fund distributions or on the redemption of Fund shares. The gross expense ratio for the Emerging Markets Fund Institutional Class and Select Class as stated in the Fees and Expenses table of the prospectus dated December 14, 2012 are 1.28% and 1.05%, respectively.
See related Notes on page 43.
SSgA
Emerging Markets Fund
Portfolio Management Discussion and Analysis, continued — August 31, 2013 (Unaudited)
SSgA Emerging Markets Fund (the “Fund”) seeks to provide maximum total return, primarily through capital appreciation, by investing primarily in securities of foreign issuers. The Fund is benchmarked to the MSCI Emerging Markets Index (the “Index”).
For the 12-month period ended August 31, 2013 (the “Reporting Period”), the total returns for the Institutional Class and Select Class of the Fund were 0.45% and 0.69%, respectively, and the total return for the Index was 0.54%. The Fund and Index returns reflect the reinvestment of dividends and other income. The Fund’s performance reflects the expenses of managing the Fund, including brokerage and advisory expenses. The Index is unmanaged and Index returns do not reflect fees and expenses of any kind, which would have a negative impact on returns.
The Fund’s advisor employs a proprietary quantitative model to assist in country and stock selection for the Fund. For the Reporting Period, stock selection contributed to performance relative to the Index, while country allocation detracted slightly. On the positive side, the Fund’s overall position in South Korea contributed to performance relative to the Index. The Fund’s underweight position in Indonesia also helped relative performance since it limited exposure to a market that experienced a moderate decline over the period. On the negative side, Peru and South Africa were the two largest country detractors from relative performance. Being overweight to Peru and to various positions within the country’s financial and materials sectors detracted from performance. South Africa was a large detractor in terms of both country and stock selection. Contributing to the decline in the South African market over this period was its exposure to the materials sector as well as the depreciation of its currency, the rand.
At the level of individual stocks, the top positive contributors to the Fund’s performance relative to the Index were SK Telecom Co., Ltd, Turk Hava Yollari Anonim Ortakligi, and America Movil SAB de CV ADR. SK Telecom and Turk Hava Yollari were both large overweight positions, while America Movil was a substantial underweighting. SK Telecom benefited from strong earnings and the expansion of its LTE user base. Turk Hava Yollari, the Turkish airlines, also benefitted from strong first-quarter results as well as a plan to expand its fleet. An underweight position in American Movil helped performance relative to the Index, since the stock underperformed for the period. The stock was pressured early in 2013 by the passing of new regulatory reforms affecting the Mexican telecommunication industry and the firm’s announcement of first-quarter results that were slightly below consensus estimates.
The top negative contributors to the Fund’s performance were positions in Compania de Minas Buenaventura, KGHM Polska Miedz SA, and Naspers, Ltd. Two of top three detractors were mining and materials stocks — Buenaventura and KGHM Polska Miedz — in which the Fund held overweight positions. Mining and materials firms were hurt as the prices of nearly all major metals fell in 2013. An underweight position in Naspers detracted, as the South African consumer services firm posted moderate gains over the period on the announcement of solid fiscal year results.
The use of derivatives did not have a material impact on the Fund’s performance for the Reporting Period.
The views expressed above reflect those of the Fund’s portfolio manager only through the Reporting Period, and do not necessarily represent the views of the Adviser as a whole. Any such views are subject to change at any time based upon market or other conditions and the Adviser disclaims any responsibility to update such views. These views may not be relied on as investment advice and, because investment decisions for a fund are based on numerous factors, may not be relied on as an indication of trading intent on behalf of any fund.
SSgA
Emerging Markets Fund
Portfolio Management Discussion and Analysis, continued — August 31, 2013 (Unaudited)
Notes: The following notes relate to the Growth of $10,000 graph and table on the preceding page.
| * | Assumes initial investment on September 1, 2003. |
| # | The MSCI Emerging Markets Index is a free float-adjusted market capitalization index that is designed to measure equity market performance of emerging markets. The MSCI Emerging Markets Index consists of the following 21 emerging market country indices: Brazil, Chile, China, Colombia, Czech Republic, Egypt, Hungary, India, Indonesia, Korea, Malaysia, Mexico, Morocco, Peru, Philippines, Poland, Russia, South Africa, Taiwan, Thailand, and Turkey. |
| ‡ | Performance for the Emerging Markets Select Class before its inception (March 2, 2006) is derived from the historical performance of the institutional class. |
Performance data reflects an expense limitation currently in effect, without which returns would have been lower. Investments in emerging market countries involve exposure to economic structures that are generally less diverse and mature, and to political systems which can be expected to have less stability than those of more developed countries. Securities may be less liquid and more volatile than those in US or longer established international markets. The prospectus contains further information and details regarding these risks.
The Prospectus contains further information and details regarding these risks.
SSgA
Emerging Markets Fund
Shareholder Expense Example — August 31, 2013 (Unaudited)
Fund Expenses
The following disclosure provides important information regarding each Fund’s Expense Example, which appears on each Fund’s individual page in this Annual Report. Please refer to this information when reviewing the Expense Example for a Fund.
Example
As a shareholder of the Fund, you incur two types of costs: (1) transaction costs, and (2) ongoing costs, including advisory and administrative fees; distribution (12b-1) and/or service fees; and other Fund expenses. The Example is intended to help you understand your ongoing costs (in dollars) of investing in the Fund and to compare these costs with the ongoing costs of investing in other mutual funds. The Example is based on an investment of $1,000 invested at the beginning of the period and held for the entire period indicated, which for this Fund is from March 1, 2013 to August 31, 2013.
Actual Expenses
The information in the table under the heading “Actual Performance” provides information about actual account values and actual expenses. You may use the information in this column, together with the amount you invested, to estimate the expenses that you paid over the period. Simply divide your account value by $1,000 (for example, an $8,600 account value divided by $1,000 = 8.6), then multiply the result by the number in the first column in the row entitled “Expenses Paid During Period” to estimate the expenses you paid on your account during this period.
Hypothetical Example for Comparison Purposes
The information in the table under the heading “Hypothetical Performance (5% return before expenses)” provides information about hypothetical account values and hypothetical expenses based on the Fund’s actual expense ratio and an assumed rate of return of 5% per year before expenses, which is not the Fund’s actual return. The hypothetical account values and expenses may not be used to estimate the actual ending account balance or expenses you paid for the period. You may use this information to compare the ongoing costs of investing in the Fund and other funds. To do so, compare this 5% hypothetical example with the 5% hypothetical examples that appear in the shareholder reports of other funds.
Please note that the expenses shown in the table are meant to highlight your ongoing costs only and do not reflect any transaction costs. Therefore, the information under the heading “Hypothetical Performance (5% return before expenses)” is useful in comparing ongoing costs only, and will not help you determine the relative total costs of owning different funds. In addition, if these transaction costs were included, your costs would have been higher.
| | | | | | | | |
| Institutional Class | | Actual
Performance | | | Hypothetical
Performance
(5% return
before expenses) | |
Beginning Account Value | | | | | | | | |
March 1, 2013 | | $ | 1,000.00 | | | $ | 1,000.00 | |
Ending Account Value | | | | | | | | |
August 31, 2013 | | $ | 888.89 | | | $ | 1,018.90 | |
Expenses Paid During Period* | | $ | 5.95 | | | $ | 6.36 | |
| | |
Select Class | | | | | | |
Beginning Account Value | | | | | | | | |
March 1, 2013 | | $ | 1,000.00 | | | $ | 1,000.00 | |
Ending Account Value | | | | | | | | |
August 31, 2013 | | $ | 890.00 | | | $ | 1,020.06 | |
Expenses Paid During Period** | | $ | 4.86 | | | $ | 5.19 | |
| * | | Expenses are equal to the Fund’s annualized expense ratio of 1.25% (representing the six month period annualized), multiplied by the average account value over the period, multiplied by 184/365 (to reflect the one-half year period). Includes amounts waived, reimbursed and/or other credits. Without the waiver, reimbursement and/or other credits, expenses would have been higher. |
| ** | | Expenses are equal to the Fund’s annualized expense ratio of 1.02% (representing the six month period annualized), multiplied by the average account value over the period, multiplied by 184/365 (to reflect the one-half year period). Includes amounts waived, reimbursed and/or other credits. Without the waiver, reimbursement and/or other credits, expenses would have been higher. |
SSgA
Emerging Markets Fund
Schedule of Investments — August 31, 2013
| | | | | | | | |
| | | Principal
Amount ($)
or Shares | | | Market
Value
$ | |
| | | | | | | | |
| Common Stocks - 96.2% | | | | | |
Austria - 0.9% | | | | | | | | |
Erste Group Bank AG | | | 328,873 | | | | 10,542,557 | |
| | | | | | | | |
| | |
Bermuda - 1.8% | | | | | | | | |
COSCO Pacific, Ltd. | | | 3,968,000 | | | | 5,833,451 | |
Credicorp, Ltd. | | | 122,843 | | | | 14,893,485 | |
| | | | | | | | |
| | | | | | | 20,726,936 | |
| | | | | | | | |
| | |
Brazil - 8.2% | | | | | | | | |
Banco Bradesco SA ADR (a) | | | 470,793 | | | | 5,470,615 | |
Banco do Brasil SA | | | 757,705 | | | | 7,319,977 | |
BB Seguridade Participacoes SA | | | 1,306,183 | | | | 10,532,895 | |
Cia de Bebidas das Americas ADR | | | 251,962 | | | | 8,763,238 | |
Cia de Saneamento Basico do Estado de Sao Paulo ADR (a) | | | 181,422 | | | | 1,547,530 | |
Cielo SA | | | 98,300 | | | | 2,406,464 | |
Cosan SA Industria e Comercio | | | 325,300 | | | | 5,669,010 | |
Direcional Engenharia SA | | | 856,300 | | | | 4,331,835 | |
Ez Tec Empreendimentos e Participacoes SA | | | 456,900 | | | | 5,112,944 | |
Gafisa SA ADR (a)(b) | | | 673,924 | | | | 1,556,764 | |
Natura Cosmeticos SA | | | 250,300 | | | | 4,696,633 | |
Petroleo Brasileiro SA ADR (a) | | | 120,566 | | | | 1,630,052 | |
Petroleo Brasileiro SA ADR (Class A) (a) | | | 496,135 | | | | 7,074,885 | |
Telefonica Brasil SA ADR | | | 213,000 | | | | 4,202,490 | |
Vale SA ADR (a) | | | 1,591,577 | | | | 22,934,625 | |
| | | | | | | | |
| | | | | | | 93,249,957 | |
| | | | | | | | |
| | |
Cayman Islands - 2.4% | | | | | | | | |
ENN Energy Holdings, Ltd. (a) | | | 1,070,000 | | | | 5,312,433 | |
Evergrande Real Estate Group, Ltd. (a)(b) | | | 16,069,941 | | | | 6,838,758 | |
Shimao Property Holdings, Ltd. | | | 1,451,000 | | | | 3,697,459 | |
Tencent Holdings, Ltd. | | | 253,400 | | | | 11,881,725 | |
| | | | | | | | |
| | | | | | | 27,730,375 | |
| | | | | | | | |
| | |
China - 13.1% | | | | | | | | |
Bank of China, Ltd. (Class H) | | | 50,592,100 | | | | 21,269,110 | |
China Construction Bank Corp. (Class H) | | | 40,300,169 | | | | 29,519,174 | |
China Minsheng Banking Corp., Ltd. (Class H) (a) | | | 6,251,500 | | | | 6,723,560 | |
China National Building Material Co., Ltd. (Class H) (a) | | | 4,080,000 | | | | 3,751,446 | |
China Petroleum & Chemical Corp. (Class H) | | | 17,808,100 | | | | 12,837,439 | |
China Railway Construction Corp. (Class H) (a) | | | 8,387,000 | | | | 7,982,005 | |
| | | | | | | | |
| | | Principal
Amount ($)
or Shares | | | Market
Value
$ | |
Great Wall Motor Co., Ltd.
(Class H) (a) | | | 2,519,000 | | | | 12,831,406 | |
Guangzhou R&F Properties Co., Ltd. (Class H) (a) | | | 4,158,800 | | | | 6,789,702 | |
Huaneng Power International, Inc. (Class H) | | | 5,544,000 | | | | 5,526,520 | |
Industrial & Commercial Bank of China, Ltd. (Class H) | | | 27,537,000 | | | | 18,075,212 | |
Inner Mongolia Yitai Coal Co., Ltd. (Class B) | | | 1,970,426 | | | | 4,078,782 | |
PetroChina Co., Ltd. (Class H) | | | 5,020,000 | | | | 5,463,805 | |
PICC Property & Casualty Co., Ltd. (Class H) | | | 4,646,000 | | | | 6,470,710 | |
Sihuan Pharmaceutical Holdings Group, Ltd. | | | 3,083,000 | | | | 2,301,978 | |
Tsingtao Brewery Co., Ltd.
(Class H) (a) | | | 300,000 | | | | 2,222,595 | |
Zhejiang Expressway Co., Ltd.
(Class H) | | | 3,150,000 | | | | 2,636,357 | |
| | | | | | | | |
| | | | | | | 148,479,801 | |
| | | | | | | | |
| | |
Egypt - 0.0% | | | | | | | | |
Orascom Hotels & Development (b)(c) | | | 1 | | | | — | |
| | | | | | | | |
| | |
Hong Kong - 5.5% | | | | | | | | |
China Mobile, Ltd. | | | 2,922,200 | | | | 31,409,754 | |
CNOOC, Ltd. | | | 7,031,500 | | | | 13,964,253 | |
Fushan International Energy Group, Ltd. (a) | | | 12,572,000 | | | | 4,215,283 | |
Guangdong Investment, Ltd. (a) | | | 4,476,000 | | | | 3,705,733 | |
Huabao International Holdings, Ltd. (a) | | | 5,571,000 | | | | 2,478,570 | |
Shanghai Industrial Holdings, Ltd. | | | 978,000 | | | | 3,203,477 | |
Yuexiu Property Co., Ltd. | | | 11,660,000 | | | | 3,292,999 | |
| | | | | | | | |
| | | | | | | 62,270,069 | |
| | | | | | | | |
| | |
Hungary - 0.4% | | | | | | | | |
OTP Bank PLC | | | 250,521 | | | | 4,659,818 | |
| | | | | | | | |
| | |
India - 4.8% | | | | | | | | |
Dabur India, Ltd. | | | 1,014,350 | | | | 2,504,018 | |
HCL Technologies, Ltd. | | | 713,315 | | | | 11,233,065 | |
ITC, Ltd. | | | 1,959,912 | | | | 9,157,331 | |
Lupin, Ltd. | | | 151,106 | | | | 1,820,956 | |
Oil & Natural Gas Corp., Ltd. | | | 582,869 | | | | 2,197,999 | |
Power Finance Corp., Ltd. | | | 712,395 | | | | 1,176,363 | |
Reliance Industries, Ltd. | | | 491,582 | | | | 6,352,918 | |
Rural Electrification Corp., Ltd. | | | 1,046,305 | | | | 2,673,961 | |
Sterlite Industries India, Ltd. (c) | | | 1,185,331 | | | | 2,031,765 | |
SSgA
Emerging Markets Fund
Schedule of Investments, continued — August 31, 2013
| | | | | | | | |
| | | Principal
Amount ($)
or Shares | | | Market
Value
$ | |
| | | | | | | | |
Sun Pharmaceutical Industries, Ltd. | | | 546,202 | | | | 4,308,771 | |
Tata Consultancy Services, Ltd. | | | 263,072 | | | | 8,095,626 | |
Tata Motors, Ltd. | | | 747,174 | | | | 3,384,166 | |
| | | | | | | | |
| | | | | | | 54,936,939 | |
| | | | | | | | |
| | |
Malaysia - 2.0% | | | | | | | | |
Gamuda Bhd | | | 2,143,500 | | | | 2,916,948 | |
IJM Corp. Bhd | | | 1,835,700 | | | | 3,090,470 | |
Malayan Banking Bhd | | | 2,594,800 | | | | 7,899,536 | |
Tenaga Nasional Bhd | | | 3,071,500 | | | | 8,163,237 | |
| | | | | | | | |
| | | | | | | 22,070,191 | |
| | | | | | | | |
| | |
Mexico - 4.2% | | | | | | | | |
America Movil SAB de CV ADR (Series L) (a) | | | 415,062 | | | | 8,010,696 | |
Cemex SAB de CV ADR (a)(b) | | | 795,708 | | | | 8,943,758 | |
Grupo Financiero Banorte SAB de CV (Class O) | | | 1,297,970 | | | | 8,110,734 | |
Grupo Financiero Santander Mexico SAB de CV ADR (Class B) (a) | | | 465,600 | | | | 6,350,784 | |
Grupo Mexico SAB de CV (Series B) (a) | | | 909,868 | | | | 2,601,374 | |
Kimberly-Clark de Mexico SAB de CV (Class A) | | | 3,126,400 | | | | 8,859,030 | |
OHL Mexico S.A.B. de CV (a)(b) | | | 1,898,500 | | | | 4,937,720 | |
| | | | | | | | |
| | | | | | | 47,814,096 | |
| | | | | | | | |
| | |
Philippines - 1.8% | | | | | | | | |
Aboitiz Power Corp. | | | 2,783,900 | | | | 2,028,627 | |
Alliance Global Group, Inc. (b) | | | 4,414,400 | | | | 2,573,417 | |
Bank of the Philippine Islands | | | 1,683,828 | | | | 3,473,367 | |
DMCI Holdings, Inc. | | | 2,751,900 | | | | 2,977,112 | |
First Philippine Holdings Corp. | | | 823,640 | | | | 1,477,381 | |
Metropolitan Bank & Trust | | | 2,603,351 | | | | 4,757,244 | |
Philippine Long Distance Telephone Co. ADR | | | 23,931 | | | | 1,516,029 | |
SM Investments Corp. | | | 138,270 | | | | 2,077,150 | |
| | | | | | | | |
| | | | | | | 20,880,327 | |
| | | | | | | | |
| | |
Poland - 2.8% | | | | | | | | |
KGHM Polska Miedz SA | | | 57,429 | | | | 2,178,430 | |
PGE SA | | | 1,618,392 | | | | 8,507,443 | |
Polski Koncern Naftowy Orlen SA | | | 181,017 | | | | 2,519,749 | |
Polskie Gornictwo Naftowe i Gazownictwo SA | | | 1,599,852 | | | | 3,059,075 | |
Powszechny Zaklad Ubezpieczen SA | | | 114,388 | | | | 15,499,830 | |
| | | | | | | | |
| | | | | | | 31,764,527 | |
| | | | | | | | |
| | | | | | | | |
| | | Principal
Amount ($)
or Shares | | | Market
Value
$ | |
Russia - 8.0% | | | | | | | | |
Gazprom OAO ADR | | | 1,663,711 | | | | 13,076,769 | |
Lukoil OAO | | | 422,156 | | | | 24,362,822 | |
Magnit OJSC GDR | | | 316,387 | | | | 17,559,479 | |
MegaFon OAO GDR | | | 184,684 | | | | 6,242,319 | |
MMC Norilsk Nickel OJSC ADR | | | 295,080 | | | | 3,844,892 | |
Rosneft Oil Co. GDR | | | 779,746 | | | | 5,731,133 | |
Sberbank | | | 5,101,569 | | | | 13,497,609 | |
Surgutneftegas OAO | | | 7,726,747 | | | | 6,040,987 | |
| | | | | | | | |
| | | | | | | 90,356,010 | |
| | | | | | | | |
| | |
South Africa - 3.4% | | | | | | | | |
FirstRand, Ltd. | | | 363,238 | | | | 1,062,351 | |
Investec, Ltd. | | | 965,539 | | | | 6,239,402 | |
Liberty Holdings, Ltd. | | | 216,427 | | | | 2,420,766 | |
Mondi, Ltd. | | | 123,268 | | | | 1,882,680 | |
MTN Group, Ltd. (a) | | | 867,974 | | | | 15,858,475 | |
Naspers, Ltd. | | | 63,923 | | | | 5,274,557 | |
Sasol, Ltd. | | | 131,009 | | | | 6,139,578 | |
| | | | | | | | |
| | | | | | | 38,877,809 | |
| | | | | | | | |
| | |
South Korea - 18.1% | | | | | | | | |
Dongbu Insurance Co., Ltd. | | | 91,823 | | | | 3,896,098 | |
Hana Financial Group, Inc. | | | 121,515 | | | | 3,831,382 | |
Hanwha Corp. | | | 129,740 | | | | 3,810,210 | |
Hyundai Marine & Fire Insurance Co., Ltd. | | | 220,180 | | | | 5,871,202 | |
Hyundai Mobis | | | 6,744 | | | | 1,695,037 | |
Hyundai Motor Co. | | | 117,115 | | | | 26,270,560 | |
Industrial Bank of Korea | | | 613,490 | | | | 6,245,157 | |
Jahwa Electronics Co., Ltd. | | | 153,480 | | | | 2,827,500 | |
KCC Corp. | | | 9,805 | | | | 3,696,584 | |
Kia Motors Corp. | | | 303,454 | | | | 18,370,442 | |
KT&G Corp. | | | 144,320 | | | | 9,438,883 | |
Partron Co., Ltd. | | | 145,308 | | | | 2,382,420 | |
POSCO | | | 27,442 | | | | 7,972,654 | |
Samsung Electronics Co., Ltd. | | | 48,864 | | | | 60,218,866 | |
Samsung Heavy Industries Co., Ltd. | | | 229,000 | | | | 8,148,732 | |
SK Holdings Co., Ltd. | | | 82,516 | | | | 13,900,718 | |
SK Innovation Co., Ltd. | | | 28,063 | | | | 3,539,318 | |
SK Telecom Co., Ltd. | | | 61,455 | | | | 12,262,765 | |
Woori Finance Holdings Co., Ltd. | | | 1,098,780 | | | | 10,987,305 | |
| | | | | | | | |
| | | | | | | 205,365,833 | |
| | | | | | | | |
| | |
Taiwan - 11.8% | | | | | | | | |
Asia Cement Corp. | | | 4,038,127 | | | | 5,046,900 | |
Asustek Computer, Inc. | | | 480,000 | | | | 3,825,628 | |
Chinatrust Financial Holding Co., Ltd. | | | 15,154,171 | | | | 9,545,895 | |
SSgA
Emerging Markets Fund
Schedule of Investments, continued — August 31, 2013
| | | | | | | | |
| | | Principal
Amount ($)
or Shares | | | Market
Value
$ | |
| | | | | | | | |
Chipbond Technology Corp. | | | 2,248,000 | | | | 5,025,688 | |
Chong Hong Construction Co. | | | 818,000 | | | | 2,760,881 | |
Far Eastern New Century Corp. | | | 2,283,688 | | | | 2,453,527 | |
Farglory Land Development Co., Ltd. | | | 1,304,000 | | | | 2,357,480 | |
Fubon Financial Holding Co., Ltd. | | | 4,895,366 | | | | 6,707,213 | |
Highwealth Construction Corp. | | | 1,261,800 | | | | 2,804,047 | |
Hon Hai Precision Industry Co., Ltd. | | | 6,033,000 | | | | 16,370,519 | |
Inventec Corp. | | | 2,783,000 | | | | 2,264,567 | |
Lite-On Technology Corp. | | | 2,161,405 | | | | 3,661,990 | |
MediaTek, Inc. | | | 570,000 | | | | 6,990,593 | |
Mega Financial Holding Co., Ltd. | | | 4,746,742 | | | | 3,624,557 | |
Pou Chen Corp. | | | 3,871,630 | | | | 4,230,724 | |
Powertech Technology, Inc. | | | 6,139,000 | | | | 11,221,685 | |
Quanta Computer, Inc. | | | 3,213,000 | | | | 6,775,061 | |
Ruentex Development Co., Ltd. | | | 3,144,000 | | | | 6,209,307 | |
Taiwan Cement Corp. | | | 4,407,000 | | | | 5,817,190 | |
Taiwan Mobile Co., Ltd. | | | 966,382 | | | | 3,487,753 | |
Taiwan Semiconductor Manufacturing Co., Ltd. | | | 5,903,782 | | | | 19,827,569 | |
TSRC Corp. | | | 1,485,000 | | | | 2,520,944 | |
| | | | | | | | |
| | | | | | | 133,529,718 | |
| | | | | | | | |
| | |
Thailand - 3.5% | | | | | | | | |
Advanced Info Service PCL | | | 1,698,567 | | | | 12,664,060 | |
Bangkok Bank PCL ADR | | | 1,369,200 | | | | 7,613,756 | |
CP ALL PCL | | | 1,979,700 | | | | 2,014,140 | |
PTT Global Chemical PCL | | | 1,511,600 | | | | 3,240,149 | |
PTT PCL | | | 699,633 | | | | 7,107,176 | |
Sansiri PCL | | | 47,031,900 | | | | 3,009,808 | |
Thai Airways International PCL | | | 5,596,300 | | | | 2,816,404 | |
Thai Oil PCL | | | 693,600 | | | | 1,174,315 | |
| | | | | | | | |
| | | | | | | 39,639,808 | |
| | | | | | | | |
| | |
Turkey - 3.2% | | | | | | | | |
Emlak Konut Gayrimenkul Yatirim Ortakligi AS (d) | | | 2,218,194 | | | | 2,589,480 | |
Eregli Demir ve Celik Fabrikalari TAS | | | 3,238,655 | | | | 3,510,694 | |
Ford Otomotiv Sanayi AS | | | 163,775 | | | | 2,048,443 | |
Kardemir Karabuk Demir Celik Sanayi ve Ticaret AS (Class D) (b) | | | 5,863,287 | | | | 2,875,922 | |
TAV Havalimanlari Holding AS | | | 385,038 | | | | 2,086,901 | |
Turk Hava Yollari Anonim Ortakligi | | | 3,517,192 | | | | 10,903,080 | |
| | | | | | | | |
| | | Principal
Amount ($)
or Shares | | | Market
Value
$ | |
Turkiye Halk Bankasi AS | | | 426,476 | | | | 2,719,406 | |
Turkiye Is Bankasi (Class C) | | | 2,471,921 | | | | 5,795,601 | |
Turkiye Vakiflar Bankasi Tao (Class D) | | | 1,781,317 | | | | 3,494,920 | |
| | | | | | | | |
| | | | | | | 36,024,447 | |
| | | | | | | | |
|
United Kingdom - 0.3% | |
Old Mutual PLC | | | 1,137,623 | | | | 3,190,985 | |
| | | | | | | | |
| |
Total Common Stocks
(cost $830,830,049) | | | | 1,092,110,203 | |
| | | | | | | | |
| |
| Preferred Stocks - 2.9% | | | | | |
Brazil - 1.3% | | | | | | | | |
Itau Unibanco Holding SA | | | 318,530 | | | | 3,871,569 | |
Cia Energetica de Minas Gerais | | | 732,962 | | | | 5,713,906 | |
Cia Brasileira de Distribuicao Grupo Pao de Acucar | | | 131,099 | | | | 5,369,347 | |
| | | | | | | | |
| | | | | | | 14,954,822 | |
| | | | | | | | |
| | |
Russia - 0.7% | | | | | | | | |
AK Transneft OAO | | | 3,331 | | | | 7,641,497 | |
| | | | | | | | |
| | |
South Korea - 0.9% | | | | | | | | |
Samsung Electronics Co., Ltd. | | | 12,591 | | | | 10,423,971 | |
| | | | | | | | |
| |
Total Preferred Stocks
(cost $21,548,426) | | | | 33,020,290 | |
| | | | | | | | |
|
| Short-Term Investments - 6.4% | |
United States - 6.4% | | | | | | | | |
SSgA Prime Money Market Fund
0.19 (e)(f) | | | 4,394,439 | | | | 4,394,439 | |
State Street Navigator Securities Lending Prime Portfolio (e)(g) | | | 67,817,030 | | | | 67,817,030 | |
| | | | | | | | |
| |
Total Short-Term Investments
(cost $72,211,469) | | | | 72,211,469 | |
| | | | | | | | |
| |
Total Investments - 105.5%
(identified cost $924,589,944) | | | | 1,197,341,962 | |
| |
Other Assets and Liabilities,
Net - (5.5%) | | | | (62,106,736 | ) |
| | | | | | | | |
| | |
| Net Assets - 100.0% | | | | | | | 1,135,235,226 | |
| | | | | | | | |
SSgA
Emerging Markets Fund
Schedule of Investments, continued — August 31, 2013
Footnotes:
| (a) | All or a portion of the shares of this security are on loan. |
| (b) | Non-income producing security. |
| (c) | Security is valued at fair value as determined in good faith by the Trust in accordance with procedures approved by the Board of Trustees. Security value is determined based on Level 2 inputs. |
| (d) | Real Estate Investment Trust (REIT). |
| (e) | Affiliated Fund managed by SSgA Funds Management, Inc. (Note 4). |
| (f) | The rate shown is the annualized seven-day yield at period end. |
| (g) | Investments of cash collateral for securities loaned. |
Abbreviations:
ADR - American Depositary Receipt
GDR - Global Depositary Receipt
PCL - Public Company Limited
PLC - Public Limited Company
| | | | | | | | |
| Sector Exposure | | % of
Net
Assets | | | Market
Value
$ | |
Common Stocks | | | | | | | | |
Consumer Discretionary | | | 7.6 | | | | 85,106,878 | |
Consumer Staples | | | 5.8 | | | | 65,215,347 | |
Energy | | | 11.4 | | | | 132,020,065 | |
Financials | | | 28.6 | | | | 322,512,458 | |
Health Care | | | 0.8 | | | | 8,431,705 | |
Industrials | | | 7.2 | | | | 82,234,053 | |
Information Technology | | | 15.3 | | | | 175,008,966 | |
Materials | | | 7.9 | | | | 89,657,486 | |
Telecommunication Services | | | 8.5 | | | | 95,654,341 | |
Utilities | | | 3.1 | | | | 36,268,904 | |
Preferred Stocks | | | | | | | | |
Consumer Staples | | | 0.5 | | | | 5,369,347 | |
Energy | | | 0.7 | | | | 7,641,497 | |
Financials | | | 0.3 | | | | 3,871,569 | |
Information Technology | | | 0.9 | | | | 10,423,971 | |
Utilities | | | 0.5 | | | | 5,713,906 | |
Short-Term Investments | | | 6.4 | | | | 72,211,469 | |
| | | | | | | | |
Total Investments | | | 105.5 | | | | 1,197,341,962 | |
Other Assets & Liabilities | | | (5.5 | ) | | | (62,106,736 | ) |
| | | | | | | | |
| | | 100.0 | | | | 1,135,235,226 | |
| | | | | | | | |
| | | | | | | | | | | | | | | | | | |
| Futures Contracts | | Number of
Contracts | | | Notional
Amount | | | Expiration
Date | | | Unrealized
Appreciation
(Depreciation)
$ | |
| | | | | | | | | | | | | | | | | | |
Long Positions | | | | | | | | | | | | | | | | | | |
MSCI EAFE E-Mini Index Futures | | | 220 | | | USD | | | 10,090,300 | | | | 09/13 | | | | (218,190 | ) |
MSCI Taiwan Index Futures (Taiwan) | | | 212 | | | USD | | | 5,982,640 | | | | 09/13 | | | | 144,427 | |
| | | | | | | | | | | | | | | | | | |
| | | | | | | | | | | | | | | | | (73,763 | ) |
| | | | | | | | | | | | | | | | | | |
| | | | | |
Short Positions | | | | | | | | | | | | | | | | | | |
FTSE JSE Top 40 Africa Index Futures (South Africa) | | | 189 | | | ZAR | | | 71,717,940 | | | | 09/13 | | | | (285,823 | ) |
SGX CNX Nifty Index Futures (Singapore) | | | 324 | | | USD | | | 3,528,360 | | | | 09/13 | | | | (26,008 | ) |
| | | | | | | | | | | | | | | | | | |
| | | | | | | | | | | | | | | | | (311,831 | ) |
| | | | | | | | | | | | | | | | | | |
Total Unrealized Appreciation (Depreciation) on Open Futures Contracts* | | | | (385,594 | ) |
| | | | | | | | | | | | | | | | | | |
| * | Cash collateral balances were held in connection with futures contracts purchased (sold) by the Fund. See Note 2 in the Notes to Financial Statements. |
See accompanying notes which are an integral part of the financial statements.
SSgA
Emerging Markets Fund
Schedule of Investments, continued — August 31, 2013
| | | | | | | | | | | | | | | | | | | | |
| Foreign Currency Exchange Contracts | |
Counterparty | | Amount
Sold | | | Amount
Bought | | | Settlement
Date | | | Unrealized
Appreciation
(Depreciation)
$ | |
| | | | | | | | | | | | | | | | | | | | |
Barclays Bank PLC | | USD | | | 25,261,924 | | | CLP | | | 12,891,160,000 | | | | 09/23/13 | | | | (79,730 | ) |
Barclays Bank PLC | | USD | | | 14,795,422 | | | TWD | | | 438,832,200 | | | | 09/23/13 | | | | (126,895 | ) |
Barclays Bank PLC | | RUB | | | 387,853,100 | | | USD | | | 11,804,995 | | | | 09/23/13 | | | | 211,500 | |
Barclays Bank PLC | | TWD | | | 182,115,500 | | | USD | | | 6,100,000 | | | | 09/23/13 | | | | 12,557 | |
Barclays Bank PLC | | TWD | | | 178,800,000 | | | USD | | | 6,000,000 | | | | 09/23/13 | | | | 23,382 | |
Barclays Bank PLC | | TWD | | | 179,220,000 | | | USD | | | 6,000,000 | | | | 09/23/13 | | | | 9,343 | |
Citibank N.A. | | USD | | | 6,000,000 | | | PEN | | | 16,810,800 | | | | 09/23/13 | | | | (37,561 | ) |
Citibank N.A. | | CZK | | | 119,360,724 | | | USD | | | 6,000,000 | | | | 09/23/13 | | | | (129,288 | ) |
Citibank N.A. | | HKD | | | 149,833,556 | | | USD | | | 19,311,235 | | | | 09/23/13 | | | | (12,342 | ) |
Citibank N.A. | | USD | | | 24,984,045 | | | ZAR | | | 252,718,616 | | | | 09/23/13 | | | | (474,916 | ) |
Credit Suisse | | HUF | | | 1,353,955,530 | | | USD | | | 6,000,000 | | | | 09/23/13 | | | | 69,133 | |
Deutsche Bank AG | | USD | | | 1,281,022 | | | IDR | | | 13,085,000,000 | | | | 09/23/13 | | | | (86,192 | ) |
Deutsche Bank AG | | USD | | | 6,000,000 | | | IDR | | | 61,500,000,000 | | | | 09/23/13 | | | | (384,254 | ) |
Deutsche Bank AG | | USD | | | 32,495,971 | | | INR | | | 1,895,490,000 | | | | 09/23/13 | | | | (3,960,376 | ) |
Deutsche Bank AG | | USD | | | 12,000,000 | | | PLN | | | 39,882,330 | | | | 09/23/13 | | | | 325,486 | |
Deutsche Bank AG | | THB | | | 435,638,000 | | | USD | | | 14,076,451 | | | | 09/23/13 | | | | 557,879 | |
Goldman Sachs & Co. | | PLN | | | 94,470,130 | | | USD | | | 29,253,152 | | | | 09/23/13 | | | | 57,510 | |
JPMorgan Chase Bank NA | | KRW | | | 2,447,020,000 | | | USD | | | 2,170,884 | | | | 09/23/13 | | | | (30,776 | ) |
JPMorgan Chase Bank NA | | KRW | | | 5,329,000,000 | | | USD | | | 4,705,727 | | | | 09/23/13 | | | | (88,940 | ) |
JPMorgan Chase Bank NA | | KRW | | | 1,495,300,000 | | | USD | | | 1,316,749 | | | | 09/23/13 | | | | (28,619 | ) |
JPMorgan Chase Bank NA | | KRW | | | 838,855,000 | | | USD | | | 741,234 | | | | 09/23/13 | | | | (13,509 | ) |
JPMorgan Chase Bank NA | | PHP | | | 893,739,000 | | | USD | | | 20,994,574 | | | | 09/23/13 | | | | 957,080 | |
Royal Bank of Scotland PLC | | TRY | | | 13,870,000 | | | USD | | | 7,267,488 | | | | 09/23/13 | | | | 489,765 | |
Royal Bank of Scotland PLC | | USD | | | 2,723,710 | | | ZAR | | | 27,312,000 | | | | 09/23/13 | | | | (74,940 | ) |
Societe Generale | | USD | | | 7,143,004 | | | TRY | | | 13,870,000 | | | | 09/23/13 | | | | (365,281 | ) |
UBS AG | | USD | | | 9,456,916 | | | ZAR | | | 95,225,000 | | | | 09/23/13 | | | | (221,816 | ) |
| | | | | | | | | | | | | | | | | | | | |
Total Unrealized Appreciation (Depreciation) on Open Foreign Currency Exchange Contracts | | | | (3,401,800 | ) |
| | | | | | | | | | | | | | | | | | | | |
Foreign Currency Abbreviations:
CLP - Chilean Peso
CZK - Czech Koruna
HKD - Hong Kong Dollar
HUF - Hungarian Forint
IDR - Indonesian Rupiah
INR - Indian Rupee
KRW - South Korean Won
PEN - Peruvian Nuevo Sol
PHP - Philippine Peso
PLN - Polish Zloty
RUB - Russian Ruble
THB - Thai Baht
TRY - Turkish Lira
TWD - Taiwan Dollar
USD - United States Dollar
ZAR - South African Rand
See accompanying notes which are an integral part of the financial statements.
SSgA
Emerging Markets Fund
Presentation of Portfolio Holdings — August 31, 2013
| | | | | | | | | | | | | | | | | | | | |
| | | Market Value | | | % of
Net
Assets | |
| Categories | | Level 1 | | | Level 2 | | | Level 3 | | | Total | | |
Common Stocks | | | | | | | | | | | | | | | | | | | | |
Austria | | $ | 10,542,557 | | | $ | — | | | $ | — | | | $ | 10,542,557 | | | | 0.9 | |
Bermuda | | | 20,726,936 | | | | — | | | | — | | | | 20,726,936 | | | | 1.8 | |
Brazil | | | 93,249,957 | | | | — | | | | — | | | | 93,249,957 | | | | 8.2 | |
Cayman Islands | | | 27,730,375 | | | | — | | | | — | | | | 27,730,375 | | | | 2.4 | |
China | | | 148,479,801 | | | | — | | | | — | | | | 148,479,801 | | | | 13.1 | |
Egypt | | | — | | | | — | * | | | — | | | | — | | | | 0.0 | ** |
Hong Kong | | | 62,270,069 | | | | — | | | | — | | | | 62,270,069 | | | | 5.5 | |
Hungary | | | 4,659,818 | | | | — | | | | — | | | | 4,659,818 | | | | 0.4 | |
India | | | 52,905,174 | | | | 2,031,765 | | | | — | | | | 54,936,939 | | | | 4.8 | |
Malaysia | | | 22,070,191 | | | | — | | | | — | | | | 22,070,191 | | | | 2.0 | |
Mexico | | | 47,814,096 | | | | — | | | | — | | | | 47,814,096 | | | | 4.2 | |
Philippines | | | 20,880,327 | | | | — | | | | — | | | | 20,880,327 | | | | 1.8 | |
Poland | | | 31,764,527 | | | | — | | | | — | | | | 31,764,527 | | | | 2.8 | |
Russia | | | 90,356,010 | | | | — | | | | — | | | | 90,356,010 | | | | 8.0 | |
South Africa | | | 38,877,809 | | | | — | | | | — | | | | 38,877,809 | | | | 3.4 | |
South Korea | | | 205,365,833 | | | | — | | | | — | | | | 205,365,833 | | | | 18.1 | |
Taiwan | | | 133,529,718 | | | | — | | | | — | | | | 133,529,718 | | | | 11.8 | |
Thailand | | | 39,639,808 | | | | — | | | | — | | | | 39,639,808 | | | | 3.5 | |
Turkey | | | 36,024,447 | | | | — | | | | — | | | | 36,024,447 | | | | 3.2 | |
United Kingdom | | | 3,190,985 | | | | — | | | | — | | | | 3,190,985 | | | | 0.3 | |
Preferred Stocks | | | 33,020,290 | | | | — | | | | — | | | | 33,020,290 | | | | 2.9 | |
Short-Term Investments | | | 4,394,439 | | | | 67,817,030 | | | | — | | | | 72,211,469 | | | | 6.4 | |
| | | | | | | | | | | | | | | | | | | | |
Total Investments | | | 1,127,493,167 | | | | 69,848,795 | | | | — | | | | 1,197,341,962 | | | | 105.5 | |
| | | | | | | | | | | | | | | | | | | | |
Other Assets and Liabilities, Net | | | | | | | | | | | | | | | | | | | (5.5 | ) |
| | | | | | | | | | | | | | | | | | | | |
| | | | | | | | | | | | | | | | | | | 100.0 | |
| | | | | | | | | | | | | | | | | | | | |
Other Financial Instruments | | | | | | | | | | | | | | | | | | | | |
Futures Contracts | | | (385,594 | ) | | | — | | | | — | | | | (385,594 | ) | | | (— | )** |
Forward Foreign Currency Contracts | | | — | | | | (3,401,800 | ) | | | — | | | | (3,401,800 | ) | | | (0.3 | ) |
| | | | | | | | | | | | | | | | | | | | |
Total Other Financial Instruments*** | | $ | (385,594 | ) | | $ | (3,401,800 | ) | | $ | — | | | $ | (3,787,394 | ) | | | | |
| | | | | | | | | | | | | | | | | | | | |
| * | | Fund held a Level 2 security that was valued at $0 at August 31, 2013. |
| ** | | Less than 0.05% of net assets. |
| *** | | Other financial instruments reflected in the Schedule of Investments, such as futures, forwards, and swap contracts which are valued at the unrealized appreciation (depreciation) on the instruments. |
For a description of the levels see Note 2 in the Notes to Financial Statements.
As of the year ended August 31, 2013, there were no transfers between levels. The transfers that did occur were the result of fair value pricing using significant observable inputs for Level 2 securities.
See accompanying notes which are an integral part of the financial statements.
SSgA
International Stock Selection Fund
Portfolio Management Discussion and Analysis — August 31, 2013 (Unaudited)
Objective: The Fund seeks to provide long-term capital growth by investing primarily in securities of foreign issuers.
Invests In: Primarily equity securities of foreign issuers.
Strategy: The management team utilizes a proprietary bottom-up stock selection process that is based on a quantitative multi-factor model used to select the best securities within each underlying country in the MSCI EAFE Index. Portfolio construction focuses on strong risk controls relative to the benchmark, specifically controls for country and size exposures.
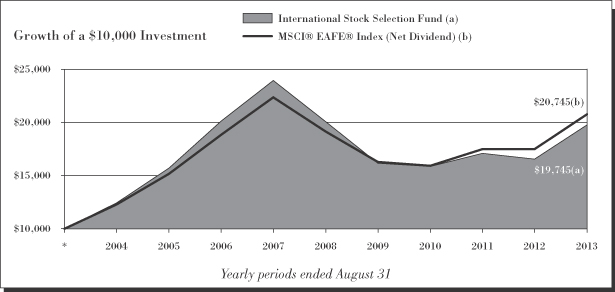
| | | | | | |
| International Stock Selection Fund | |
| | |
Period Ended
08/31/13 | | | | Total Return | |
1 Year | | | | | 19.45 | % |
5 Years | | | | | (0.32 | )%+ |
10 Years | | | | | 7.04 | %+ |
| | | | | | |
| MSCI® EAFE® Index (Net dividend)# | |
| | |
Period Ended
08/31/13 | | | | Total Return | |
1 Year | | | | | 18.66 | % |
5 Years | | | | | 1.62 | %+ |
10 Years | | | | | 7.57 | %+ |
Performance quoted represents past performance, which is no guarantee of future results. Investment return and principal value will fluctuate, so you may have a gain or loss when shares are sold. Current performance may be higher or lower than that quoted. Visit www.ssgafunds.com for most recent month-end performance. The returns do not reflect the deduction of taxes that a shareholder would pay on Fund distributions or on the redemption of Fund shares. The gross expense ratio for the International Stock Selection Fund Institutional Class as stated in the Fees and Expenses table of the prospectus dated December 14, 2012 is 1.21%.
| | | | |
| International Stock Selection Fund | | | 51 | |
See related Notes on page 53.
SSgA
International Stock Selection Fund
Portfolio Management Discussion and Analysis, continued — August 31, 2013 (Unaudited)
SSgA International Stock Selection Fund (the “Fund”) seeks to provide long-term capital growth by investing primarily in securities of foreign issuers. The Fund is benchmarked to the MSCI EAFE Net Dividend Index (the “Index”).
For the 12-month period ended August 31, 2013 (the “Reporting Period”), the total return for the Fund was 19.45%, and the total return for the Index was 18.66%. The Fund and Index returns reflect the reinvestment of dividends and other income. The Fund’s performance reflects the expenses of managing the Fund, including brokerage and advisory expenses. The Index is unmanaged and Index returns do not reflect fees and expenses of any kind, which would have a negative impact on returns.
During the Reporting Period, investor optimism rose, thanks in part to the eurozone’s stabilization and US economic improvement. Markets went up and down over the course of the Reporting Period, most notably coming under pressure at the close of September 2012. They rebounded in 2012’s fourth quarter, bolstered by positive political developments in the United States and Japan. These developments continued to benefit stocks in early 2013. Financials and economically sensitive sectors, such as the industrials and consumer discretionary sectors, performed well, most notably in the 2013 year-to-date period. More defensive sectors, such as utilities, underperformed. Commodities were also pressured through the first two quarters of 2013; gold and silver both fell sharply. The effects of these declines showed most clearly in the performance of the materials sector, which underperformed for the Reporting Period. However, all sectors delivered positive returns for the Reporting Period.
The Fund outperformed the Index over the Reporting Period, driven by the strength of the Fund’s longer-term and shorter-term dynamic stock selection models and its systematic investment process. The shorter-term dynamic model systematically assessed the macro-environment to determine the most desirable stock level exposures, allowing for a more agile and nimble approach that complemented our balanced longer-term model. Compared with the prior fiscal year, the Fund moved away from some of the higher-risk stocks that were beneficial in late 2011 and early 2012. The Fund’s dynamic model responded to decreased market volatility as well as an increase in stock valuations from the relatively cheap levels of the prior fiscal year. As a result, the Fund tilted toward stocks with, in our view, strong earnings growth, higher earnings quality, and reasonable valuations. This was driven by a positive correlation between our long-term and intermediate-term outlooks. Our shift paid off as slower, more stable global growth prompted investors to reward traditional fundamentals. This contrasted with the big swings in investors’ appetite for risk during most of 2012.
On an individual security level, the top positive contributors to the Fund’s performance were two financial companies: French insurer AXA SA and Japanese mega-bank Sumitomo Mitsui Financial Group Inc. AXA’s increase during the period was supported by stronger earnings numbers driven by strengths in its US-based business and the benefit of a rising interest-rate environment. Sumitomo Mitsui benefitted from an expansion of loan growth, improving margins, and positive sentiment about the Japanese market due to the Japanese government’s expansionary policies. Outside of financials, UK media company ITV PLC was also a strong contributor to Fund performance. An improving advertising environment and the potential for continued production of strong television content contributed to ITV’s strong performance during the period.
On the negative side, among top detractors to the Fund’s performance were oil exploration and production company StatoilHydro ASA and pharmaceutical company Novo Nordisk A/S. Disappointing near-term energy production and the need for higher levels of capital investment to grow production over the longer term contributed to Statoil’s underperformance. Novo Nordisk was pressured by delays in the launch of its diabetes treatment Tresiba and the potential of more competition for its current diabetes treatments.
The views expressed above reflect those of the Fund’s portfolio manager only through the Reporting Period, and do not necessarily represent the views of the Adviser as a whole. Any such views are subject to change at any time based upon market or other conditions and the Adviser disclaims any responsibility to update such views. These views may not be relied on as investment advice and, because investment decisions for a fund are based on numerous factors, may not be relied on as an indication of trading intent on behalf of any fund.
| | |
| 52 | | International Stock Selection Fund |
SSgA
International Stock Selection Fund
Portfolio Management Discussion and Analysis, continued — August 31, 2013 (Unaudited)
Notes: The following notes relate to the Growth of $10,000 graph and tables on the preceding page.
| * | Assumes initial investment on September 1, 2003. |
| # | The MSCI® EAFE® Index (Europe, Australasia, Far East) is a free float-adjusted market capitalization index that is designed to measure the equity market performance of developed markets, excluding the U.S. and Canada. The MSCI EAFE Index consists of the following 22 developed market country indices: Australia, Austria, Belgium, Denmark, Finland, France, Germany, Greece, Hong Kong, Ireland, Israel, Italy, Japan, the Netherlands, New Zealand, Norway, Portugal, Singapore, Spain, Sweden, Switzerland, and the United Kingdom. |
Performance data reflects an expense limitation currently in effect, without which returns would have been lower. Investments in securities of non-US issuers and foreign currencies involve investment risks different from those of US issuers. The Prospectus contains further information The Prospectus contains further information and details regarding these risks.
| | | | |
| International Stock Selection Fund | | | 53 | |
SSgA
International Stock Selection Fund
Shareholder Expense Example — August 31, 2013 (Unaudited)
Fund Expenses
The following disclosure provides important information regarding each Fund’s Expense Example, which appears on each Fund’s individual page in this Annual Report. Please refer to this information when reviewing the Expense Example for a Fund.
Example
As a shareholder of the Fund, you incur two types of costs: (1) transaction costs, and (2) ongoing costs, including advisory and administrative fees; distribution (12b-1) and/or service fees; and other Fund expenses. The Example is intended to help you understand your ongoing costs (in dollars) of investing in the Fund and to compare these costs with the ongoing costs of investing in other mutual funds. The Example is based on an investment of $1,000 invested at the beginning of the period and held for the entire period indicated, which for this Fund is from March 1, 2013 to August 31, 2013.
Actual Expenses
The information in the table under the heading “Actual Performance” provides information about actual account values and actual expenses. You may use the information in this column, together with the amount you invested, to estimate the expenses that you paid over the period. Simply divide your account value by $1,000 (for example, an $8,600 account value divided by $1,000 = 8.6), then multiply the result by the number in the first column in the row entitled “Expenses Paid During Period” to estimate the expenses you paid on your account during this period.
Hypothetical Example for Comparison Purposes
The information in the table under the heading “Hypothetical Performance (5% return before expenses)” provides information about hypothetical account values and hypothetical expenses based on the Fund’s actual expense ratio and an assumed rate of return of 5% per year before expenses, which is not the Fund’s actual return. The hypothetical account values and expenses may not be used to estimate the actual ending account balance or expenses you paid for the period. You may use this information to compare the ongoing costs of investing in the Fund and other funds. To do so, compare this 5% hypothetical example with the 5% hypothetical examples that appear in the shareholder reports of other funds.
Please note that the expenses shown in the table are meant to highlight your ongoing costs only and do not reflect any transaction costs. Therefore, the information under the heading “Hypothetical Performance (5% return before expenses)” is useful in comparing ongoing costs only, and will not help you determine the relative total costs of owning different funds. In addition, if these transaction costs were included, your costs would have been higher.
| | | | | | | | |
| | | Actual
Performance | | | Hypothetical
Performance
(5% return
before expenses) | |
Beginning Account Value | | | | | | | | |
March 1, 2013 | | $ | 1,000.00 | | | $ | 1,000.00 | |
Ending Account Value | | | | | | | | |
August 31, 2013 | | $ | 1,039.90 | | | $ | 1,020.16 | |
Expenses Paid During Period* | | $ | 5.14 | | | $ | 5.09 | |
| * | Expenses are equal to the Fund’s annualized expense ratio of 1.00% (representing the six month period annualized), multiplied by the average account value over the period, multiplied by 184/365 (to reflect the one-half year period). Includes amounts waived, reimbursed and/or other credits. Without the waiver, reimbursement and/or other credits, expenses would have been higher. |
| | |
| 54 | | International Stock Selection Fund |
SSgA
International Stock Selection Fund
Schedule of Investments — August 31, 2013
| | | | | | | | |
| | | Principal
Amount ($)
or Shares | | | Market
Value
$ | |
| | | | | | | | |
| Common Stocks - 98.9% | | | | | |
Australia - 5.9% | | | | | | | | |
Amcor, Ltd. | | | 284,297 | | | | 2,639,193 | |
CSL, Ltd. | | | 37,235 | | | | 2,253,258 | |
Dexus Property Group (a) | | | 1,420,210 | | | | 1,301,980 | |
Flight Centre, Ltd. (b) | | | 66,032 | | | | 2,762,275 | |
GPT Group (a) | | | 496,188 | | | | 1,567,795 | |
Incitec Pivot, Ltd. | | | 618,178 | | | | 1,425,043 | |
Shopping Centres Australasia Property Group (a) | | | 14,321 | | | | 19,884 | |
Sonic Healthcare, Ltd. | | | 67,735 | | | | 931,443 | |
Tatts Group, Ltd. (b) | | | 568,687 | | | | 1,624,774 | |
Telstra Corp., Ltd. | | | 871,387 | | | | 3,800,333 | |
Westpac Banking Corp. | | | 119,284 | | | | 3,332,637 | |
| | | | | | | | |
| | | | | | | 21,658,615 | |
| | | | | | | | |
| | |
Austria - 1.3% | | | | | | | | |
OMV AG | | | 107,367 | | | | 4,956,623 | |
| | | | | | | | |
| | |
Belgium - 2.5% | | | | | | | | |
Anheuser-Busch InBev NV | | | 58,499 | | | | 5,441,444 | |
Delhaize Group | | | 56,020 | | | | 3,574,224 | |
| | | | | | | | |
| | | | | | | 9,015,668 | |
| | | | | | | | |
| | |
Cayman Islands - 0.3% | | | | | | | | |
MGM China Holdings, Ltd. | | | 337,200 | | | | 1,006,671 | |
| | | | | | | | |
| | |
Denmark - 2.5% | | | | | | | | |
Carlsberg A/S (Class B) | | | 56,443 | | | | 5,475,049 | |
Novo Nordisk A/S
(Class B) | | | 22,608 | | | | 3,777,179 | |
| | | | | | | | |
| | | | | | | 9,252,228 | |
| | | | | | | | |
| | |
Finland - 1.3% | | | | | | | | |
UPM-Kymmene Oyj (b) | | | 411,378 | | | | 4,966,679 | |
| | | | | | | | |
| | |
France - 9.9% | | | | | | | | |
AXA SA | | | 365,848 | | | | 7,970,877 | |
BNP Paribas SA | | | 48,492 | | | | 3,038,801 | |
Cie Generale des Etablissements Michelin | | | 30,470 | | | | 2,915,194 | |
Credit Agricole SA (c) | | | 320,606 | | | | 3,239,408 | |
EDF SA | | | 46,297 | | | | 1,297,195 | |
L’Oreal SA | | | 5,157 | | | | 860,488 | |
Legrand SA | | | 55,114 | | | | 2,795,289 | |
Renault SA | | | 41,411 | | | | 2,959,844 | |
Safran SA | | | 21,054 | | | | 1,169,110 | |
Schneider Electric SA | | | 20,117 | | | | 1,539,424 | |
Societe Generale SA | | | 61,849 | | | | 2,706,910 | |
Total SA | | | 51,400 | | | | 2,847,404 | |
Vinci SA | | | 60,825 | | | | 3,140,812 | |
| | | | | | | | |
| | | | | | | 36,480,756 | |
| | | | | | | | |
| | | | | | | | |
| | | Principal
Amount ($)
or Shares | | | Market
Value
$ | |
Germany - 9.8% | | | | | | | | |
Allianz SE | | | 25,113 | | | | 3,597,861 | |
BASF SE | | | 78,501 | | | | 6,861,043 | |
Bayer AG | | | 41,802 | | | | 4,643,009 | |
Continental AG | | | 21,671 | | | | 3,270,857 | |
Deutsche Bank AG | | | 108,390 | | | | 4,692,989 | |
Freenet AG (c) | | | 71,317 | | | | 1,682,000 | |
Fresenius SE | | | 6,923 | | | | 832,996 | |
HeidelbergCement AG | | | 24,914 | | | | 1,730,345 | |
Merck KGaA | | | 15,050 | | | | 2,286,451 | |
ProSiebenSat.1 Media AG | | | 37,629 | | | | 1,595,166 | |
Siemens AG | | | 46,570 | | | | 4,929,478 | |
| | | | | | | | |
| | | | | | | 36,122,195 | |
| | | | | | | | |
| | |
Hong Kong - 2.3% | | | | | | | | |
Cathay Pacific Airways, Ltd. | | | 546,000 | | | | 936,469 | |
Cheung Kong Holdings, Ltd. | | | 271,000 | | | | 3,868,707 | |
Power Assets Holdings, Ltd. | | | 129,500 | | | | 1,116,401 | |
Wharf Holdings, Ltd. | | | 302,000 | | | | 2,482,768 | |
| | | | | | | | |
| | | | | | | 8,404,345 | |
| | | | | | | | |
| | |
Italy - 0.9% | | | | | | | | |
ENI SpA | | | 139,495 | | | | 3,185,802 | |
| | | | | | | | |
| | |
Japan - 23.2% | | | | | | | | |
Asahi Kasei Corp. | | | 181,000 | | | | 1,334,664 | |
Bridgestone Corp. (b) | | | 39,000 | | | | 1,282,986 | |
Central Japan Railway Co. | | | 31,400 | | | | 3,600,998 | |
Daicel Chemical Industries, Ltd. | | | 318,000 | | | | 2,759,444 | |
Daihatsu Motor Co., Ltd. | | | 54,000 | | | | 1,013,617 | |
Daiwa House Industry Co., Ltd. | | | 212,000 | | | | 3,821,765 | |
Fuji Electric Co., Ltd. | | | 561,000 | | | | 2,074,074 | |
FUJIFILM Holdings Corp. | | | 250,600 | | | | 5,487,498 | |
ITOCHU Corp. (b) | | | 210,000 | | | | 2,382,645 | |
JFE Holdings, Inc. | | | 59,400 | | | | 1,317,647 | |
KDDI Corp. | | | 69,400 | | | | 3,318,562 | |
Kirin Holdings Co., Ltd. | | | 101,000 | | | | 1,388,705 | |
Konica Minolta, Inc. | | | 310,000 | | | | 2,554,260 | |
Marubeni Corp. (b) | | | 195,000 | | | | 1,422,009 | |
Mitsubishi Chemical Holdings Corp. | | | 490,000 | | | | 2,315,629 | |
Mitsubishi Heavy Industries, Ltd. | | | 334,000 | | | | 1,833,539 | |
Mitsubishi UFJ Financial Group, Inc. | | | 975,100 | | | | 5,720,401 | |
Mizuho Financial Group, Inc. | | | 2,010,200 | | | | 4,094,719 | |
Namco Bandai Holdings, Inc. | | | 96,100 | | | | 1,534,703 | |
NEC Corp. | | | 590,000 | | | | 1,255,895 | |
Nippon Telegraph & Telephone Corp. | | | 61,700 | | | | 3,138,886 | |
Nissan Chemical Industries, Ltd. | | | 79,700 | | | | 1,095,840 | |
ORIX Corp. | | | 344,000 | | | | 4,743,861 | |
| | | | |
| International Stock Selection Fund | | | 55 | |
SSgA
International Stock Selection Fund
Schedule of Investments, continued — August 31, 2013
| | | | | | | | |
| | | Principal
Amount ($)
or Shares | | | Market
Value
$ | |
| | | | | | | | |
Otsuka Holdings Co., Ltd. | | | 47,300 | | | | 1,466,909 | |
Sekisui Chemical Co., Ltd. | | | 148,000 | | | | 1,362,652 | |
Shimamura Co., Ltd. | | | 5,900 | | | | 603,310 | |
Sumitomo Corp. | | | 276,000 | | | | 3,502,531 | |
Sumitomo Mitsui Financial Group, Inc. | | | 128,001 | | | | 5,670,972 | |
Sumitomo Rubber Industries, Ltd. | | | 85,600 | | | | 1,207,476 | |
Suzuki Motor Corp. | | | 36,500 | | | | 785,130 | |
Taiheiyo Cement Corp. | | | 1,020,000 | | | | 3,833,376 | |
Toppan Printing Co.,
Ltd. (b) | | | 268,000 | | | | 1,973,458 | |
Toyota Motor Corp. | | | 38,300 | | | | 2,317,075 | |
UNY Group Holdings Co.,
Ltd. (b) | | | 146,700 | | | | 938,306 | |
Yahoo Japan Corp. | | | 4,318 | | | | 2,141,739 | |
| | | | | | | | |
| | | | | | | 85,295,281 | |
| | | | | | | | |
| | |
Netherlands - 2.0% | | | | | | | | |
ING Groep NV (c) | | | 282,344 | | | | 3,065,509 | |
Koninklijke Ahold NV | | | 131,653 | | | | 2,097,560 | |
Koninklijke Philips NV | | | 76,134 | | | | 2,353,560 | |
| | | | | | | | |
| | | | | | | 7,516,629 | |
| | | | | | | | |
| | |
Norway - 0.7% | | | | | | | | |
StatoilHydro ASA | | | 125,217 | | | | 2,749,931 | |
| | | | | | | | |
| | |
Singapore - 1.0% | | | | | | | | |
DBS Group Holdings, Ltd. | | | 167,000 | | | | 2,068,517 | |
Hutchison Port Holdings Trust | | | 2,025,000 | | | | 1,498,500 | |
| | | | | | | | |
| | | | | | | 3,567,017 | |
| | | | | | | | |
| | |
Spain - 3.7% | | | | | | | | |
Amadeus IT Holding SA (Class A) (b) | | | 38,031 | | | | 1,228,444 | |
Enagas SA | | | 44,975 | | | | 1,021,200 | |
Gas Natural SDG SA | | | 274,201 | | | | 5,370,734 | |
Iberdrola SA | | | 490,569 | | | | 2,601,222 | |
Repsol SA | | | 150,888 | | | | 3,500,838 | |
| | | | | | | | |
| | | | | | | 13,722,438 | |
| | | | | | | | |
| | |
Sweden - 2.9% | | | | | | | | |
Skandinaviska Enskilda Banken AB (Class A) | | | 381,766 | | | | 3,919,994 | |
Swedbank AB (Class A) | | | 119,429 | | | | 2,703,094 | |
Trelleborg AB (Class B) | | | 243,136 | | | | 4,101,580 | |
| | | | | | | | |
| | | | | | | 10,724,668 | |
| | | | | | | | |
| | |
Switzerland - 9.2% | | | | | | | | |
Cie Financiere Richemont SA (Class A) | | | 30,273 | | | | 2,876,171 | |
Credit Suisse Group AG (c) | | | 107,728 | | | | 3,105,234 | |
| | | | | | | | |
| | | Principal
Amount ($)
or Shares | | | Market
Value
$ | |
Givaudan SA (c) | | | 680 | | | | 915,729 | |
Holcim, Ltd. (c) | | | 13,597 | | | | 922,834 | |
Nestle SA | | | 27,160 | | | | 1,782,060 | |
Novartis AG | | | 53,545 | | | | 3,904,593 | |
OC Oerlikon Corp. AG (c) | | | 196,217 | | | | 2,435,710 | |
Roche Holding AG | | | 52,142 | | | | 13,006,780 | |
Swiss Life Holding
AG (c) | | | 10,480 | | | | 1,963,205 | |
Swiss Re AG (c) | | | 38,509 | | | | 2,955,067 | |
| | | | | | | | |
| | | | | | | 33,867,383 | |
| | | | | | | | |
| |
United Kingdom - 19.5% | | | | | |
ARM Holdings PLC | | | 219,783 | | | | 2,980,231 | |
AstraZeneca PLC | | | 56,379 | | | | 2,776,637 | |
Aviva PLC | | | 321,115 | | | | 1,924,841 | |
Barclays PLC | | | 994,378 | | | | 4,366,390 | |
BP PLC | | | 156,443 | | | | 1,081,766 | |
British American Tobacco PLC | | | 59,487 | | | | 3,000,688 | |
BT Group PLC | | | 1,611,740 | | | | 8,125,064 | |
Capita PLC | | | 83,351 | | | | 1,231,627 | |
HSBC Holdings PLC | | | 606,605 | | | | 6,354,779 | |
IMI PLC | | | 99,853 | | | | 2,220,551 | |
ITV PLC | | | 1,292,435 | | | | 3,296,752 | |
Kingfisher PLC | | | 355,708 | | | | 2,122,277 | |
Legal & General Group PLC | | | 1,409,459 | | | | 4,080,159 | |
Next PLC | | | 12,925 | | | | 980,262 | |
Royal Dutch Shell PLC
(Class A) | | | 227,324 | | | | 7,353,931 | |
Royal Dutch Shell PLC
(Class B) | | | 152,980 | | | | 5,151,600 | |
Tate & Lyle PLC | | | 546,463 | | | | 6,817,174 | |
Unilever PLC | | | 78,736 | | | | 3,000,403 | |
Vodafone Group PLC | | | 1,527,324 | | | | 4,881,720 | |
| | | | | | | | |
| | | | | | | 71,746,852 | |
| | | | | | | | |
| | |
Total Common Stocks
(cost $308,036,526) | | | | | | | 364,239,781 | |
| | | | | | | | |
| | |
| Preferred Stock - 0.6% | | | | | | | | |
Germany - 0.6% | | | | | | | | |
Henkel AG & Co. KGaA
(cost $1,807,466) | | | 21,203 | | | | 2,054,082 | |
| | | | | | | | |
| |
| Warrants & Rights - 0.0% (d) | | | | | |
Hong Kong - 0.0% (d) | | | | | | | | |
New Hotel, expires 12/31/13 (c) (e)
(cost $0) | | | 7,525 | | | | — | |
| | | | | | | | |
|
| Short-Term Investments - 2.8% | |
United States - 2.8% | | | | | | | | |
SSgA Prime Money Market Fund 0.19 (f) (g) | | | 1,033,154 | | | | 1,033,154 | |
| | |
| 56 | | International Stock Selection Fund |
SSgA
International Stock Selection Fund
Schedule of Investments, continued — August 31, 2013
| | | | | | | | |
| | | Principal
Amount ($)
or Shares | | | Market
Value
$ | |
| | | | | | | | |
State Street Navigator Securities Lending Prime Portfolio (f) (h) | | | 9,152,529 | | | | 9,152,529 | |
| | | | | | | | |
| |
Total Short-Term Investments
(cost $10,185,683) | | | | 10,185,683 | |
| | | | | | | | |
| |
Total Investments - 102.3%
(identified cost $320,029,675) | | | | 376,479,546 | |
| |
Other Assets and Liabilities,
Net - (2.3%) | | | | (8,388,611 | ) |
| | | | | | | | |
| | |
| Net Assets - 100.0% | | | | | | | 368,090,935 | |
| | | | | | | | |
Footnotes:
| (a) | Real Estate Investment Trust (REIT). |
| (b) | All or a portion of the shares of this security are on loan. |
| (c) | Non-income producing security. |
| (d) | Less than 0.05% of net assets. |
| (e) | Security is valued at fair value as determined in good faith by the Trust in accordance with procedures approved by the Board of Trustees. Security value is determined based on Level 2 inputs. |
| (f) | Affiliated Fund managed by SSgA Funds Management, Inc. (Note 4). |
| (g) | The rate shown is the annualized seven-day yield at period end. |
| (h) | Investments of cash collateral for securities loaned. |
Abbreviations:
PLC - Public Limited Company
| | | | | | | | |
| Sector Exposure | | % of
Net
Assets | | | Market
Value
$ | |
Common Stocks | | | | | | | | |
Consumer Discretionary | | | 9.7 | | | | 35,517,192 | |
Consumer Staples | | | 9.5 | | | | 34,376,101 | |
Energy | | | 8.3 | | | | 30,827,895 | |
Financials | | | 26.6 | | | | 98,379,124 | |
Health Care | | | 9.8 | | | | 35,879,255 | |
Industrials | | | 12.3 | | | | 45,141,364 | |
Information Technology | | | 4.2 | | | | 15,648,067 | |
Materials | | | 8.7 | | | | 32,117,466 | |
Telecommunication Services | | | 6.7 | | | | 24,946,565 | |
Utilities | | | 3.1 | | | | 11,406,752 | |
Preferred Stocks | | | | | | | | |
Consumer Staples | | | 0.6 | | | | 2,054,082 | |
Short-Term Investments | | | 2.8 | | | | 10,185,683 | |
| | | | | | | | |
Total Investments | | | 102.3 | | | | 376,479,546 | |
Other Assets & Liabilities | | | (2.3 | ) | | | (8,388,611 | ) |
| | | | | | | | |
| | | 100.0 | | | | 368,090,935 | |
| | | | | | | | |
See accompanying notes which are an integral part of the financial statements.
| | | | |
| International Stock Selection Fund | | | 57 | |
SSgA
International Stock Selection Fund
Presentation of Portfolio Holdings — August 31, 2013
| | | | | | | | | | | | | | | | | | | | |
| | | Market Value | | | % of
Net
Assets | |
| Categories | | Level 1 | | | Level 2 | | | Level 3 | | | Total | | |
Australia | | $ | 21,658,615 | | | $ | — | | | $ | — | | | $ | 21,658,615 | | | | 5.9 | |
Austria | | | 4,956,623 | | | | — | | | | — | | | | 4,956,623 | | | | 1.3 | |
Belgium | | | 9,015,668 | | | | — | | | | — | | | | 9,015,668 | | | | 2.5 | |
Cayman Islands | | | 1,006,671 | | | | — | | | | — | | | | 1,006,671 | | | | 0.3 | |
Denmark | | | 9,252,228 | | | | — | | | | — | | | | 9,252,228 | | | | 2.5 | |
Finland | | | 4,966,679 | | | | — | | | | — | | | | 4,966,679 | | | | 1.3 | |
France | | | 36,480,756 | | | | — | | | | — | | | | 36,480,756 | | | | 9.9 | |
Germany | | | 36,122,195 | | | | — | | | | — | | | | 36,122,195 | | | | 9.8 | |
Hong Kong | | | 8,404,345 | | | | — | | | | — | | | | 8,404,345 | | | | 2.3 | |
Italy | | | 3,185,802 | | | | — | | | | — | | | | 3,185,802 | | | | 0.9 | |
Japan | | | 85,295,281 | | | | — | | | | — | | | | 85,295,281 | | | | 23.2 | |
Netherlands | | | 7,516,629 | | | | — | | | | — | | | | 7,516,629 | | | | 2.0 | |
Norway | | | 2,749,931 | | | | — | | | | — | | | | 2,749,931 | | | | 0.7 | |
Singapore | | | 3,567,017 | | | | — | | | | — | | | | 3,567,017 | | | | 1.0 | |
Spain | | | 13,722,438 | | | | — | | | | — | | | | 13,722,438 | | | | 3.7 | |
Sweden | | | 10,724,668 | | | | — | | | | — | | | | 10,724,668 | | | | 2.9 | |
Switzerland | | | 33,867,383 | | | | — | | | | — | | | | 33,867,383 | | | | 9.2 | |
United Kingdom | | | 71,746,852 | | | | — | | | | — | | | | 71,746,852 | | | | 19.5 | |
Preferred Stocks | | | 2,054,082 | | | | — | | | | — | | | | 2,054,082 | | | | 0.6 | |
Warrants & Rights | | | — | | | | — | * | | | — | | | | — | | | | 0.0 | ** |
Short-Term Investments | | | 1,033,154 | | | | 9,152,529 | | | | — | | | | 10,185,683 | | | | 2.8 | |
| | | | | | | | | | | | | | | | | | | | |
Total Investments | | $ | 367,327,017 | | | $ | 9,152,529 | | | $ | — | | | $ | 376,479,546 | | | | 102.3 | |
| | | | | | | | | | | | | | | | | | | | |
Other Assets and Liabilities, Net | | | | | | | | | | | | | | | | | | | (2.3 | ) |
| | | | | | | | | | | | | | | | | | | | |
| | | | | | | | | | | | | | | | | | | 100.0 | |
| | | | | | | | | | | | | | | | | | | | |
| * | | Fund held a Level 2 security that was valued at $0 at August 31, 2013. |
| ** | | Less than 0.05% of net assets. |
For a description of the levels see Note 2 in the Notes to Financial Statements.
As of the year ended August 31, 2013, there were no transfers between levels. The transfers that did occur were the result of fair value pricing using significant observable inputs for Level 2 securities.
See accompanying notes which are an integral part of the financial statements.
| | |
| 58 | | International Stock Selection Fund |
SSgA
High Yield Bond Fund
Portfolio Management Discussion and Analysis — August 31, 2013 (Unaudited)
Objective: The Fund seeks to maximize total return by investing primarily in fixed-income securities, including but not limited to those represented by the Barclays Capital U.S. Corporate High Yield Index.
Invests in: Primarily domestic, non-investment grade debt securities.
Strategy: Fund Managers make investment decisions that enable the Fund’s performance to seek excess returns over Barclays Capital U.S. High-Yield 2% Issuer Capped Index.
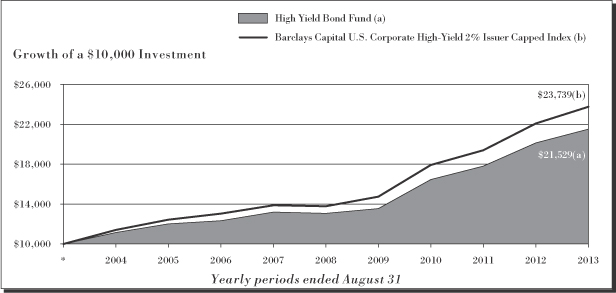
| | | | | | |
| High Yield Bond Fund | |
| | |
Period Ended
08/31/13 | | | | Total
Return | |
1 Year | | | | | 6.85 | % |
5 Years | | | | | 10.49 | %+ |
10 Years | | | | | 7.97 | %+ |
| | | | | | |
Barclays Capital U.S. Corporate High-Yield 2% Issuer
Capped Index# | |
| | |
Period Ended
08/31/13 | | | | Total
Return | |
1 Year | | | | | 7.56 | % |
5 Years | | | | | 11.49 | %+ |
10 Years | | | | | 9.03 | %+ |
Performance quoted represents past performance, which is no guarantee of future results. Investment return and principal value will fluctuate, so you may have a gain or loss when shares are sold. Current performance may be higher or lower than that quoted. Visit www.ssgafunds.com for most recent month-end performance. The returns do not reflect the deduction of taxes that a shareholder would pay on Fund distributions or on the redemption of Fund share. The gross expense ratio for the High Yield Bond Fund as stated in the Fees and Expenses table of the prospectus dated December 14, 2012 is 0.90%.
See related Notes on following page.
SSgA
High Yield Bond Fund
Portfolio Management Discussion and Analysis, continued — August 31, 2013 (Unaudited)
SSgA High Yield Bond Fund (the “Fund”) seeks to maximize total return by investing primarily in fixed-income securities, including, but not limited to, those represented by the Barclays U.S. High-Yield 2% Issuer Capped Bond Index (the “Index”).
For the 12-month period ended August 31, 2013 (the “Reporting Period”), the total return for the Fund was 6.85%, and the total return for the Index was 7.56%. The Fund and Index returns reflect the reinvestment of dividends and other income. The Fund’s performance reflects the expenses of managing the Fund, including brokerage and advisory expenses. The Index is unmanaged and Index returns do not reflect fees and expenses of any kind, which would have a negative impact on returns.
Absent June and August, the Fund operated in a “risk on” environment, meaning that investors favored investments perceived as riskier. As a result, the sectors most exposed to lower credit quality increased the most in value. Investors moved out of US Treasuries and other “safe-haven” assets into higher-yielding securities as a result of the unprecedented easing policies by central banks across the globe attempting to stimulate their economies. In the third quarter of 2012, both the US Federal Reserve (the “Fed”) and the European Central Bank announced bond-buying programs. Later, the Bank of Japan joined with its own asset purchase program. With the expectation that the central bank actions would keep benchmark rates low for the foreseeable future, investors sought out additional yield in investment grade and high yield corporate bonds.
Credit markets rallied steadily for most of the Reporting Period. However, a shift in investor sentiment cooled the rally after the markets reached highs in late May. Improving economic data in the United States and statements by Fed officials forced investors to envision an environment where the Fed would need to taper its current asset purchases. As a result, credit markets gave up some of their earlier gains. However, the earlier rally meant this had relatively little impact on the high yield sector’s return for the Reporting Period. The total return for this sector was a standout among fixed-income sectors for the Reporting Period. The Index significantly outperformed US Treasuries of similar duration.
For the Reporting Period, the Fund underperformed the Index. Much of the underperformance resulted from the fees and expenses of managing the Fund, but also came from the Fund’s security selection in the banking, finance, and energy sectors. On the other hand, the Fund’s security selection in capital goods and consumer cyclicals aided the performance of the Fund relative to the Index. Also driving positive Fund performance relative to the Index was our relatively higher allocation to securities rated CCC and B and our lower allocation to securities rated BB.
The views expressed above reflect those of the Fund’s portfolio manager only through the Reporting Period, and do not necessarily represent the views of the Adviser as a whole. Any such views are subject to change at any time based upon market or other conditions and the Adviser disclaims any responsibility to update such views. These views may not be relied on as investment advice and, because investment decisions for a fund are based on numerous factors, may not be relied on as an indication of trading intent on behalf of any fund.
Notes: The following notes relate to the Growth of $10,000 graph and tables on the preceding page.
| * | Assumes initial investment on September 1, 2003. |
| # | The Barclays Capital U.S. Corporate High-Yield 2% Issuer Capped Index is an issuer-constrained version of the U.S. Corporate High-Yield Index that covers the USD-denominated non-investment grade, fixed-rate, taxable corporate bonds. The U.S. High-Yield 2% Issuer Capped Index follows the same index construction rules as the uncapped index but limits issuer the exposure of each issuer to 2% of the total market value and redistributes the excess market value index-side on a pro-rata basis. |
Bond funds contain interest rate risk (as interest rates rise bond prices fall); the risk of issues default; and inflation risk.
SSgA
High Yield Bond Fund
Shareholder Expense Example — August 31, 2013 (Unaudited)
Fund Expenses
The following disclosure provides important information regarding each Fund’s Expense Example, which appears on each Fund’s individual page in this Annual Report. Please refer to this information when reviewing the Expense Example for a Fund.
Example
As a shareholder of the Fund, you incur two types of costs: (1) transaction costs, and (2) ongoing costs, including advisory and administrative fees; distribution (12b-1) and/or service fees; and other Fund expenses. The Example is intended to help you understand your ongoing costs (in dollars) of investing in the Fund and to compare these costs with the ongoing costs of investing in other mutual funds. The Example is based on an investment of $1,000 invested at the beginning of the period and held for the entire period indicated, which for this Fund is from March 1, 2013 to August 31, 2013.
Actual Expenses
The information in the table under the heading “Actual Performance” provides information about actual account values and actual expenses. You may use the information in this column, together with the amount you invested, to estimate the expenses that you paid over the period. Simply divide your account value by $1,000 (for example, an $8,600 account value divided by $1,000 = 8.6), then multiply the result by the number in the first column in the row entitled “Expenses Paid During Period” to estimate the expenses you paid on your account during this period.
Hypothetical Example for Comparison Purposes
The information in the table under the heading “Hypothetical Performance (5% return before expenses)” provides information about hypothetical account values and hypothetical expenses based on the Fund’s actual expense ratio and an assumed rate of return of 5% per year before expenses, which is not the Fund’s actual return. The hypothetical account values and expenses may not be used to estimate the actual ending account balance or expenses you paid for the period. You may use this information to compare the ongoing costs of investing in the Fund and other funds. To do so, compare this 5% hypothetical example with the 5% hypothetical examples that appear in the shareholder reports of other funds.
Please note that the expenses shown in the table are meant to highlight your ongoing costs only and do not reflect any transaction costs. Therefore, the information under the heading “Hypothetical Performance (5% return before expenses)” is useful in comparing ongoing costs only, and will not help you determine the relative total costs of owning different funds. In addition, if these transaction costs were included, your costs would have been higher.
| | | | | | | | |
| | | Actual
Performance | | | Hypothetical
Performance
(5% return
before expenses) | |
Beginning Account Value | | | | | | | | |
March 1, 2013 | | $ | 1,000.00 | | | $ | 1,000.00 | |
Ending Account Value | | | | | | | | |
August 31, 2013 | | $ | 1,001.60 | | | $ | 1,021.42 | |
Expenses Paid During Period* | | $ | 3.78 | | | $ | 3.82 | |
| * | Expenses are equal to the Fund’s annualized expense ratio of 0.75% (representing the six month period annualized), multiplied by the average account value over the period, multiplied by 184/365 (to reflect the one-half year period). Includes amounts waived, reimbursed and/or other credits. Without the waiver, reimbursement and/or other credits, expenses would have been higher. |
SSgA
High Yield Bond Fund
Schedule of Investments — August 31, 2013
| | | | | | | | |
| | | Principal
Amount ($)
or Shares | | | Market
Value
$ | |
| | | | | | | | |
| Long-Term Investments - 95.9% | |
Corporate Bonds and Notes - 84.8% | |
ACE Cash Express, Inc.
11.000%, due 02/01/19 (a) | | | 300,000 | | | | 285,750 | |
Ahern Rentals, Inc.
9.500%, due 06/15/18 (a) | | | 350,000 | | | | 358,750 | |
Alere, Inc.
6.500%, due 06/15/20 (a) | | | 400,000 | | | | 399,000 | |
Alliance One International, Inc.
9.875%, due 07/15/21 (a) | | | 550,000 | | | | 503,250 | |
Allison Transmission, Inc.
7.125%, due 05/15/19 (a) | | | 350,000 | | | | 368,375 | |
Antero Resources Finance Corp.
6.000%, due 12/01/20 | | | 615,000 | | | | 613,462 | |
ArcelorMittal
10.350%, due 06/01/19 | | | 1,350,000 | | | | 1,599,750 | |
Ashtead Capital, Inc.
6.500%, due 07/15/22 (a) | | | 525,000 | | | | 555,187 | |
Atlas Pipeline Partners LP/Atlas Pipeline Finance Corp.
6.625%, due 10/01/20 (a) | | | 550,000 | | | | 552,750 | |
Audatex North America, Inc.
6.000%, due 06/15/21 (a) | | | 176,000 | | | | 178,200 | |
Bank of America Corp.
Series U
5.200%, due 12/31/49 (b)(c) | | | 500,000 | | | | 443,750 | |
BC Mountain LLC/BC Mountain Finance, Inc.
7.000%, due 02/01/21 (a) | | | 550,000 | | | | 563,750 | |
BI-LO LLC/BI-LO Finance Corp.
9.250%, due 02/15/19 (a) | | | 550,000 | | | | 599,500 | |
Biomet, Inc.
6.500%, due 08/01/20 | | | 398,000 | | | | 407,950 | |
BMC Software Finance, Inc.
8.125%, due 07/15/21 (a) | | | 465,000 | | | | 470,813 | |
BOE Intermediate Holding Corp. PIK
9.000%, due 11/01/17 (a) | | | 500,000 | | | | 510,000 | |
BOE Merger Corp. PIK
9.500%, due 11/01/17 (a) | | | 550,000 | | | | 583,000 | |
Burlington Coat Factory Warehouse Corp.
10.000%, due 02/15/19 | | | 250,000 | | | | 278,750 | |
Burlington Holdings LLC/Burlington Holding Finance, Inc. PIK
9.000%, due 02/15/18 (a) | | | 600,000 | | | | 613,500 | |
Cablevision Systems Corp.
5.875%, due 09/15/22 | | | 550,000 | | | | 525,250 | |
Calumet Specialty Products Partners LP/Calumet Finance Corp.
9.625%, due 08/01/20 | | | 475,000 | | | | 521,906 | |
| | | | | | | | |
| | | Principal
Amount ($)
or Shares | | | Market
Value
$ | |
Capella Healthcare, Inc.
9.250%, due 07/01/17 | | | 200,000 | | | | 213,250 | |
Case New Holland, Inc.
7.875%, due 12/01/17 | | | 400,000 | | | | 460,000 | |
CCO Holdings LLC / CCO Holdings Capital Corp.
7.250%, due 10/30/17 | | | 750,000 | | | | 795,000 | |
CenturyLink, Inc.
Series V
5.625%, due 04/01/20 | | | 341,000 | | | | 334,180 | |
Cequel Communications Escrow 1 LLC/Cequel Communications Escrow Capital Corp.
6.375%, due 09/15/20 (a) | | | 550,000 | | | | 548,625 | |
Chaparral Energy, Inc.
9.875%, due 10/01/20 | | | 250,000 | | | | 280,000 | |
8.250%, due 09/01/21 | | | 125,000 | | | | 130,313 | |
Chesapeake Energy Corp.
5.375%, due 06/15/21 | | | 787,000 | | | | 781,097 | |
CHS/Community Health Systems, Inc.
5.125%, due 08/15/18 | | | — | | | | — | |
8.000%, due 11/15/19 | | | 500,000 | | | | 525,000 | |
CIT Group, Inc.
5.000%, due 05/15/17 | | | 550,000 | | | | 570,625 | |
5.250%, due 03/15/18 | | | 500,000 | | | | 516,250 | |
Citigroup, Inc.
Series D
5.350%, due 04/29/49 (b)(c) | | | 850,000 | | | | 754,375 | |
CityCenter Holdings LLC/CityCenter Finance Corp.
7.625%, due 01/15/16 | | | 675,000 | | | | 712,969 | |
Claire’s Stores, Inc.
6.125%, due 03/15/20 (a) | | | 882,000 | | | | 877,590 | |
Clear Channel Communications, Inc.
5.500%, due 09/15/14 | | | 250,000 | | | | 243,125 | |
Clear Channel Worldwide Holdings, Inc.
Series A
7.625%, due 03/15/20 | | | 125,000 | | | | 124,063 | |
Series B 7.625%, due 03/15/20 | | | 625,000 | | | | 626,562 | |
CNH Capital LLC
6.250%, due 11/01/16 | | | 350,000 | | | | 381,500 | |
Continental Resources, Inc.
5.000%, due 09/15/22 | | | 550,000 | | | | 555,500 | |
4.500%, due 04/15/23 | | | 160,000 | | | | 157,200 | |
Continental Rubber of America Corp.
4.500%, due 09/15/19 (a) | | | 153,000 | | | | 154,607 | |
SSgA
High Yield Bond Fund
Schedule of Investments, continued — August 31, 2013
| | | | | | | | |
| | | Principal
Amount ($)
or Shares | | | Market
Value
$ | |
| | | | | | | | |
CVR Refining LLC/Coffeyville Finance, Inc.
6.500%, due 11/01/22 (a) | | | 550,000 | | | | 528,000 | |
CyrusOne LP/CyrusOne Finance Corp.
6.375%, due 11/15/22 | | | 550,000 | | | | 552,750 | |
DAE Aviation Holdings, Inc.
11.250%, due 08/01/15 (a) | | | 185,000 | | | | 185,463 | |
DaVita HealthCare Partners, Inc.
5.750%, due 08/15/22 | | | 351,500 | | | | 347,985 | |
Delphi Corp.
6.125%, due 05/15/21 | | | 300,000 | | | | 327,750 | |
Delta Air Lines 2007-1 Class C Pass Through Trust
8.954%, due 08/10/14 | | | 185,508 | | | | 190,146 | |
Deluxe Corp.
7.000%, due 03/15/19 | | | 300,000 | | | | 318,750 | |
DISH DBS Corp.
5.125%, due 05/01/20 | | | 500,000 | | | | 483,750 | |
5.000%, due 03/15/23 | | | 291,000 | | | | 268,448 | |
DJO Finance LLC/DJO Finance Corp.
8.750%, due 03/15/18 | | | 750,000 | | | | 811,875 | |
Dynacast International LLC/Dynacast Finance, Inc.
9.250%, due 07/15/19 | | | 375,000 | | | | 408,750 | |
EnergySolutions, Inc./EnergySolutions LLC
10.750%, due 08/15/18 | | | 375,000 | | | | 405,000 | |
EP Energy LLC/EP Energy Finance, Inc.
9.375%, due 05/01/20 | | | 313,000 | | | | 344,300 | |
EP Energy LLC/Everest Acquisition Finance, Inc.
7.750%, due 09/01/22 | | | 275,000 | | | | 294,250 | |
EPE Holdings LLC/EP Energy Bond Co., Inc. PIK
8.125%, due 12/15/17 (a) | | | 1,042,895 | | | | 1,063,753 | |
Felcor Lodging LP
6.750%, due 06/01/19 | | | 505,000 | | | | 528,987 | |
5.625%, due 03/01/23 | | | 331,000 | | | | 307,830 | |
FGI Operating Co. LLC/FGI Finance, Inc.
7.875%, due 05/01/20 (a) | | | 500,000 | | | | 513,750 | |
First Data Corp.
11.250%, due 03/31/16 | | | 198,000 | | | | 197,505 | |
6.750%, due 11/01/20 (a) | | | 575,000 | | | | 587,937 | |
11.250%, due 01/15/21 (a) | | | 525,000 | | | | 538,125 | |
Flexi-Van Leasing, Inc.
7.875%, due 08/15/18 (a) | | | 350,000 | | | | 355,250 | |
FMG Resources August 2006 Pty Ltd.
6.875%, due 04/01/22 (a) | | | 500,000 | | | | 495,000 | |
| | | | | | | | |
| | | Principal
Amount ($)
or Shares | | | Market
Value
$ | |
Freescale Semiconductor, Inc.
Series 1
9.250%, due 04/15/18 (a) | | | 350,000 | | | | 378,000 | |
Fresenius Medical Care US Finance, Inc.
6.875%, due 07/15/17 | | | 130,000 | | | | 144,300 | |
6.500%, due 09/15/18 (a) | | | 325,000 | | | | 354,250 | |
Frontier Communications Corp.
9.250%, due 07/01/21 | | | 250,000 | | | | 283,750 | |
7.125%, due 01/15/23 | | | 550,000 | | | | 534,875 | |
General Motors Financial Co., Inc.
3.250%, due 05/15/18 (a) | | | 175,000 | | | | 168,000 | |
6.750%, due 06/01/18 | | | 275,000 | | | | 306,281 | |
Genworth Financial, Inc.
6.150%, due 11/15/66 (c) | | | 400,000 | | | | 348,000 | |
GWR Operating Partnership LLP
10.875%, due 04/01/17 | | | 200,000 | | | | 222,600 | |
GXS Worldwide, Inc.
9.750%, due 06/15/15 | | | 275,000 | | | | 282,906 | |
Halcon Resources Corp.
8.875%, due 05/15/21 | | | 830,000 | | | | 832,075 | |
Hawk Acquisition Sub, Inc.
4.250%, due 10/15/20 (a) | | | 50,000 | | | | 47,250 | |
HCA, Inc.
6.500%, due 02/15/20 | | | 1,350,000 | | | | 1,449,562 | |
HD Supply, Inc.
7.500%, due 07/15/20 (a) | | | 500,000 | | | | 522,500 | |
Healthcare Technology Intermediate, Inc. PIK
7.375%, due 09/01/18 (a) | | | 371,000 | | | | 376,565 | |
Hexion US Finance Corp.
6.625%, due 04/15/20 | | | 250,000 | | | | 246,875 | |
6.625%, due 04/15/20 (a) | | | 311,000 | | | | 307,113 | |
Interline Brands, Inc. PIK
10.000%, due 11/15/18 | | | 500,000 | | | | 538,750 | |
International Lease Finance Corp.
6.250%, due 05/15/19 | | | 275,000 | | | | 283,250 | |
8.250%, due 12/15/20 | | | 350,000 | | | | 389,375 | |
iPayment, Inc.
10.250%, due 05/15/18 | | | 325,000 | | | | 242,125 | |
j2 Global, Inc.
8.000%, due 08/01/20 | | | 500,000 | | | | 538,750 | |
Jefferies Finance LLC/JFIN Co-Issuer Corp.
7.375%, due 04/01/20 (a) | | | 473,000 | | | | 468,270 | |
Legacy Reserves LP/Legacy Reserves Finance Corp.
6.625%, due 12/01/21 (a) | | | 400,000 | | | | 380,000 | |
Level 3 Communications, Inc.
8.875%, due 06/01/19 | | | 250,000 | | | | 266,875 | |
Level 3 Financing, Inc.
8.625%, due 07/15/20 | | | 250,000 | | | | 267,500 | |
SSgA
High Yield Bond Fund
Schedule of Investments, continued — August 31, 2013
| | | | | | | | |
| | | Principal
Amount ($)
or Shares | | | Market
Value
$ | |
| | | | | | | | |
Linn Energy LLC/Linn Energy Finance Corp.
6.250%, due 11/01/19 (a) | | | 250,000 | | | | 230,000 | |
Magnachip Semiconductor Corp.
6.625%, due 07/15/21 (a) | | | 450,000 | | | | 436,500 | |
MarkWest Energy Partners LP/MarkWest Energy Finance Corp. | | | | | | | | |
6.250%, due 06/15/22 | | | 406,000 | | | | 424,270 | |
4.500%, due 07/15/23 | | | 286,000 | | | | 260,260 | |
McClatchy Co. (The)
9.000%, due 12/15/22 | | | 505,000 | | | | 532,775 | |
Mcron Finance Sub LLC/Mcron Finance Corp.
8.375%, due 05/15/19 (a) | | | 500,000 | | | | 537,500 | |
Memorial Production Partners LP/Memorial Production Finance Corp.
7.625%, due 05/01/21 | | | 334,000 | | | | 322,310 | |
MetroPCS Wireless, Inc.
6.250%, due 04/01/21 (a) | | | 365,000 | | | | 364,088 | |
MGM Resorts International
6.750%, due 10/01/20 | | | 550,000 | | | | 561,000 | |
6.625%, due 12/15/21 | | | 655,000 | | | | 664,825 | |
Michael Foods Group, Inc.
9.750%, due 07/15/18 | | | 250,000 | | | | 274,375 | |
Michaels FinCo Holdings LLC/Michaels FinCo, Inc. PIK
7.500%, due 08/01/18 (a) | | | 484,000 | | | | 484,000 | |
Monitronics International, Inc.
9.125%, due 04/01/20 | | | 500,000 | | | | 517,500 | |
Murray Energy Corp.
8.625%, due 06/15/21 (a) | | | 500,000 | | | | 497,500 | |
NAI Entertainment Holdings/NAI Entertainment Holdings Finance Corp.
5.000%, due 08/01/18 (a) | | | 375,000 | | | | 379,688 | |
NES Rentals Holdings, Inc.
7.875%, due 05/01/18 (a) | | | 325,000 | | | | 333,125 | |
Neuberger Berman Group LLC/Neuberger Berman Finance Corp.
5.875%, due 03/15/22 (a) | | | 550,000 | | | | 563,750 | |
Newfield Exploration Co.
5.750%, due 01/30/22 | | | 650,000 | | | | 646,750 | |
Northern Tier Energy LLC/Northern Tier Finance Corp.
7.125%, due 11/15/20 (a) | | | 550,000 | | | | 544,500 | |
NRG Energy, Inc.
7.625%, due 05/15/19 | | | 500,000 | | | | 528,750 | |
Nuveen Investments, Inc.
5.500%, due 09/15/15 | | | 375,000 | | | | 371,250 | |
| | | | | | | | |
| | | Principal
Amount ($)
or Shares | | | Market
Value
$ | |
9.125%, due 10/15/17 (a) | | | 250,000 | | | | 246,250 | |
Peabody Energy Corp.
6.000%, due 11/15/18 | | | 275,000 | | | | 273,625 | |
Pittsburgh Glass Works LLC
8.500%, due 04/15/16 (a) | | | 550,000 | | | | 567,875 | |
PolyOne Corp.
5.250%, due 03/15/23 (a) | | | 500,000 | | | | 478,750 | |
PQ Corp.
8.750%, due 05/01/18 (a) | | | 550,000 | | | | 577,500 | |
Provident Funding Associates LP/PFG Finance Corp.
6.750%, due 06/15/21 (a) | | | 233,000 | | | | 235,330 | |
Quiksilver, Inc./QS Wholesale, Inc.
7.875%, due 08/01/18 (a) | | | 300,000 | | | | 309,375 | |
Regions Bank
7.500%, due 05/15/18 | | | 500,000 | | | | 583,966 | |
Revlon Consumer Products Corp.
5.750%, due 02/15/21 (a) | | | 525,000 | | | | 500,062 | |
Reynolds Group Issuer, Inc./Reynolds Group Issuer LLC/Reynolds Group Issuer Lu
9.875%, due 08/15/19 | | | 920,000 | | | | 977,500 | |
6.875%, due 02/15/21 | | | 340,000 | | | | 358,700 | |
RHP Hotel Properties LP/RHP Finance Corp.
5.000%, due 04/15/21 (a) | | | 400,000 | | | | 372,000 | |
Rockwood Specialties Group, Inc.
4.625%, due 10/15/20 | | | 550,000 | | | | 540,375 | |
RR Donnelley & Sons Co.
7.875%, due 03/15/21 | | | 675,000 | | | | 723,937 | |
Ruby Tuesday, Inc.
7.625%, due 05/15/20 | | | 500,000 | | | | 500,000 | |
Sabre, Inc.
8.500%, due 05/15/19 (a) | | | 500,000 | | | | 538,750 | |
Samson Investment Co.
10.250%, due 02/15/20 (a) | | | 300,000 | | | | 313,500 | |
SandRidge Energy, Inc.
8.125%, due 10/15/22 | | | 500,000 | | | | 502,500 | |
SBA Communications Corp.
5.625%, due 10/01/19 | | | 275,000 | | | | 270,875 | |
Sealed Air Corp.
5.250%, due 04/01/23 (a) | | | 800,000 | | | | 762,000 | |
ServiceMaster Co.
7.000%, due 08/15/20 | | | 431,000 | | | | 394,365 | |
Sinclair Television Group, Inc.
5.375%, due 04/01/21 | | | 525,000 | | | | 497,437 | |
SLM Corp. MTN
8.000%, due 03/25/20 | | | 1,000,000 | | | | 1,087,500 | |
SPL Logistics Escrow LLC/SPL Logistics Finance Corp.
8.875%, due 08/01/20 (a) | | | 500,000 | | | | 525,000 | |
SSgA
High Yield Bond Fund
Schedule of Investments, continued — August 31, 2013
| | | | | | | | |
| | | Principal
Amount ($)
or Shares | | | Market
Value
$ | |
| | | | | | | | |
Sprint Nextel Corp.
7.000%, due 03/01/20 (a) | | | 550,000 | | | | 591,250 | |
6.000%, due 11/15/22 | | | 500,000 | | | | 467,500 | |
Steel Dynamics, Inc.
5.250%, due 04/15/23 (a) | | | 775,000 | | | | 740,125 | |
Sun Merger Sub, Inc.
5.250%, due 08/01/18 (a) | | | 700,000 | | | | 702,625 | |
SunGard Data Systems, Inc.
6.625%, due 11/01/19 | | | 550,000 | | | | 558,250 | |
SUPERVALU, Inc.
6.750%, due 06/01/21 (a) | | | 500,000 | | | | 479,375 | |
Surgical Care Affiliates, Inc.
10.000%, due 07/15/17 (a) | | | 275,000 | | | | 284,625 | |
T-Mobile USA, Inc.
5.250%, due 09/01/18 (a) | | | 385,000 | | | | 388,850 | |
Taminco Global Chemical Corp.
9.750%, due 03/31/20 (a) | | | 485,000 | | | | 544,412 | |
Tenet Healthcare Corp.
4.500%, due 04/01/21 (a) | | | 375,000 | | | | 345,000 | |
Tenneco, Inc.
7.750%, due 08/15/18 | | | 250,000 | | | | 268,125 | |
Terex Corp.
6.000%, due 05/15/21 | | | 276,000 | | | | 278,070 | |
Textron Financial Corp.
6.000%, due 02/15/67 (a) (c) | | | 350,000 | | | | 308,875 | |
The Goodyear Tire & Rubber Co.
6.500%, due 03/01/21 | | | 550,000 | | | | 558,250 | |
The Hertz Corp.
6.250%, due 10/15/22 | | | 275,000 | | | | 279,813 | |
The Sun Products Corp.
7.750%, due 03/15/21 (a) | | | 525,000 | | | | 514,500 | |
TRAC Intermodal LLC/TRAC Intermodal Corp.
11.000%, due 08/15/19 | | | 275,000 | | | | 308,000 | |
TransDigm, Inc.
7.750%, due 12/15/18 | | | 475,000 | | | | 508,250 | |
UCI International, Inc.
8.625%, due 02/15/19 | | | 250,000 | | | | 256,250 | |
United Rentals North America, Inc.
7.375%, due 05/15/20 | | | 200,000 | | | | 215,500 | |
8.375%, due 09/15/20 | | | 250,000 | | | | 273,750 | |
6.125%, due 06/15/23 | | | 440,000 | | | | 433,400 | |
US Coatings Acquisition, Inc./Flash Dutch 2 BV
7.375%, due 05/01/21 (a) | | | 856,000 | | | | 875,260 | |
Vanguard Natural Resources LLC/VNR Finance Corp.
7.875%, due 04/01/20 | | | 275,000 | | | | 278,438 | |
Viasystems, Inc.
7.875%, due 05/01/19 (a) | | | 750,000 | | | | 798,750 | |
| | | | | | | | |
| | | Principal
Amount ($)
or Shares | | | Market
Value
$ | |
Virgin Media Finance PLC
6.375%, due 04/15/23 (a) | | | 525,000 | | | | 521,062 | |
WideOpenWest Finance LLC/WideOpenWest Capital Corp.
10.250%, due 07/15/19 | | | 500,000 | | | | 536,250 | |
Wolverine World Wide, Inc.
6.125%, due 10/15/20 (a) | | | 300,000 | | | | 311,250 | |
Wyle Services Corp.
10.500%, due 04/01/18 (a) | | | 200,000 | | | | 201,500 | |
Zayo Group LLC/Zayo Capital, Inc.
8.125%, due 01/01/20 | | | 302,000 | | | | 327,670 | |
| | | | | | | | |
| | | | | | | 75,676,488 | |
| | | | | | | | |
|
International Debt - 11.1% | |
Ardagh Packaging Finance PLC
9.125%, due 10/15/20 (a) | | | 250,000 | | | | 266,875 | |
Ardagh Packaging Finance PLC/Ardagh MP Holdings USA, Inc.
7.000%, due 11/15/20 (a) | | | 200,000 | | | | 194,500 | |
4.875%, due 11/15/22 (a) | | | 625,000 | | | | 601,562 | |
CEVA Group PLC
8.375%, due 12/01/17 (a) | | | 500,000 | | | | 498,750 | |
FMG Resources August 2006 Pty Ltd.
8.250%, due 11/01/19 (a) | | | 350,000 | | | | 373,625 | |
HBOS PLC
6.750%, due 05/21/18 (a) | | | 500,000 | | | | 546,627 | |
INEOS Group Holdings SA
6.125%, due 08/15/18 (a) | | | 550,000 | | | | 532,125 | |
Intelsat Luxembourg SA
7.750%, due 06/01/21 (a) | | | 188,000 | | | | 193,640 | |
Kodiak Oil & Gas Corp.
5.500%, due 02/01/22 (a) | | | 650,000 | | | | 627,250 | |
Lightstream Resources Ltd.
8.625%, due 02/01/20 (a) | | | 545,000 | | | | 517,750 | |
NCL Corp., Ltd.
5.000%, due 02/15/18 (a) | | | 620,000 | | | | 612,250 | |
Rexel SA
6.125%, due 12/15/19 (a) | | | 500,000 | | | | 510,000 | |
Royal Bank of Scotland Group PLC Series U
7.640%, due 03/29/49 (b) (c) | | | 500,000 | | | | 445,000 | |
Sable International Finance, Ltd.
8.750%, due 02/01/20 (a) | | | 635,000 | | | | 698,500 | |
Schaeffler Finance BV
4.750%, due 05/15/21 (a) | | | 438,000 | | | | 411,720 | |
Schaeffler Holding Finance BV PIK
6.875%, due 08/15/18 (a) | | | 200,000 | | | | 208,000 | |
Seven Seas Cruises S de RL LLC
9.125%, due 05/15/19 | | | 225,000 | | | | 244,125 | |
SSgA
High Yield Bond Fund
Schedule of Investments, continued — August 31, 2013
| | | | | | | | |
| | | Principal
Amount ($)
or Shares | | | Market
Value
$ | |
| | | | | | | | |
Silver II Borrower/Silver II US Holdings LLC
7.750%, due 12/15/20 (a) | | | 375,000 | | | | 388,125 | |
Softbank Corp.
4.500%, due 04/15/20 (a) | | | 506,000 | | | | 478,393 | |
Trinseo Materials Operating SCA/Trinseo Materials Finance, Inc.
8.750%, due 02/01/19 (a) | | | 508,000 | | | | 496,570 | |
UPCB Finance VI Ltd.
6.875%, due 01/15/22 (a) | | | 500,000 | | | | 522,500 | |
VPII Escrow Corp.
6.750%, due 08/15/18 (a) | | | 500,000 | | | | 529,375 | |
| | | | | | | | |
| | | | | | | 9,897,262 | |
| | | | | | | | |
| | |
Total Long-Term Investments
(cost $84,712,684) | | | | | | | 85,573,750 | |
| | | | | | | | |
| Short-Term Investment - 0.5% | |
SSgA Prime Money Market Fund
0.19 % (d)(e) (cost $495,506) | | | 495,506 | | | | 495,506 | |
| | | | | | | | |
| |
Total Investments - 96.4%
(identified cost $85,208,190) | | | | 86,069,256 | |
| |
Other Assets and Liabilities,
Net - 3.6% | | | | 3,187,453 | |
| | | | | | | | |
| | |
| Net Assets - 100.0% | | | | | | | 89,256,709 | |
| | | | | | | | |
Footnotes:
| (a) | Restricted security Rule (144A) or Section 4 (2) commercial paper. Security may have contractual restrictions on resale, may have been offered in a private placement transaction, and may not be registered under the Securities Act of 1933. |
| (b) | Perpetual floating rate security. |
| (c) | Adjustable or floating rate security. Rate shown reflects rate in effect at period end. |
| (d) | Affiliated Fund managed by SSgA Funds Management, Inc. (Note 4). |
| (e) | The rate shown is the annualized seven-day yield at period end. |
Abbreviations:
PIK - Pay In Kind
PLC - Public Limited Company
Presentation of Portfolio Holdings — August 31, 2013
| | | | | | | | | | | | | | | | | | | | |
| | | Market Value | | | % of
Net
Assets | |
| Categories | | Level 1 | | | Level 2 | | | Level 3 | | | Total | | |
Corporate Bonds and Notes | | $ | — | | | $ | 75,676,488 | | | $ | — | | | $ | 75,676,488 | | | | 84.8 | |
International Debt | | | — | | | | 9,897,262 | | �� | | — | | | | 9,897,262 | | | | 11.1 | |
Short-Term Investment | | | 495,506 | | | | — | | | | — | | | | 495,506 | | | | 0.5 | |
| | | | | | | | | | | | | | | | | | | | |
Total Investments | | $ | 495,506 | | | $ | 85,573,750 | | | $ | — | | | $ | 86,069,256 | | | | 96.4 | |
| | | | | | | | | | | | | | | | | | | | |
Other Assets and Liabilities, Net | | | | | | | | | | | | | | | | | | | 3.6 | |
| | | | | | | | | | | | | | | | | | | | |
| | | | | | | | | | | | | | | | | | | 100.0 | |
| | | | | | | | | | | | | | | | | | | | |
For a description of the levels see Note 2 in the Notes to Financial Statements.
There were no transfers in and out of Levels 1, 2 and 3 during the period ended August 31, 2013.
See accompanying notes which are an integral part of the financial statements.
This page has been intentionally left blank.
SSgA Funds
Statements of Assets and Liabilities — August 31, 2013
| | | | | | | | | | | | |
| | |
Dynamic Small
Cap Fund | | | Clarion Real
Estate Fund | | | IAM
SHARES Fund | |
| | | | | | | | | | | | |
Assets | | | | | | | | | | | | |
Investments, at identified cost | | $ | 27,114,223 | | | $ | 29,895,568 | | | $ | 141,013,225 | |
Investments, at market*,** | | | 29,449,138 | | | | 42,465,291 | | | | 205,999,869 | |
Cash | | | — | | | | — | | | | — | |
Cash (restricted) | | | — | | | | — | | | | — | |
Foreign currency holdings*** | | | — | | | | — | | | | — | |
Foreign cash collateral for futures**** | | | — | | | | — | | | | — | |
Unrealized appreciation on foreign currency exchange contracts | | | — | | | | — | | | | — | |
Receivables: | | | | | | | | | | | | |
Dividends and interest | | | 18,531 | | | | 19,228 | | | | 477,116 | |
Dividends from affiliated money market funds | | | 2 | | | | — | | | | 53 | |
Investments sold | | | — | | | | 297,805 | | | | — | |
Fund shares sold | | | 268 | | | | 15,987 | | | | 1,207 | |
Foreign taxes recoverable | | | — | | | | — | | | | 141 | |
From adviser | | | 104,445 | | | | 51,725 | | | | 640 | |
Prepaid expenses | | | 313 | | | | 924 | | | | 4,152 | |
| | | | | | | | | | | | |
Total assets | | | 29,572,697 | | | | 42,850,960 | | | | 206,483,178 | |
| | | | | | | | | | | | |
| | | |
Liabilities | | | | | | | | | | | | |
Payables: | | | | | | | | | | | | |
Cash due to broker | | | — | | | | — | | | | — | |
Investments purchased | | | — | | | | 127,671 | | | | — | |
Fund shares redeemed | �� | | 376 | | | | 12,875 | | | | 159 | |
Accrued fees to affiliates and trustees | | | 55,675 | | | | 87,988 | | | | 133,790 | |
Other accrued expenses | | | 22,223 | | | | 50,537 | | | | 60,158 | |
Deferred tax liability | | | — | | | | — | | | | — | |
Daily variation margin on futures contracts | | | — | | | | — | | | | 16,200 | |
Unrealized depreciation on foreign currency exchange contracts | | | — | | | | — | | | | — | |
Payable upon return of securities loaned | | | 5,985,490 | | | | 2,616,284 | | | | 6,293,286 | |
| | | | | | | | | | | | |
Total liabilities | | | 6,063,764 | | | | 2,895,355 | | | | 6,503,593 | |
| | | | | | | | | | | | |
| | | | | | | | | | | | |
Net Assets | | $ | 23,508,933 | | | $ | 39,955,605 | | | $ | 199,979,585 | |
| | | | | | | | | | | | |
| | | |
Net Assets Consist of: | | | | | | | | | | | | |
Undistributed (overdistributed) net investment income | | $ | 78,032 | | | $ | 67,520 | | | $ | 814,749 | |
Accumulated net realized gain (loss) | | | (19,454,094 | ) | | | (10,826,318 | ) | | | (22,516,135 | ) |
Unrealized appreciation (depreciation) on: | | | | | | | | | | | | |
Investments (Emerging Markets Fund — net of deferred tax liability for foreign capital gains tax) | | | 2,334,915 | | | | 12,569,723 | | | | 64,986,644 | |
Futures contracts | | | — | | | | — | | | | 30,407 | |
Foreign currency-related transactions | | | — | | | | — | | | | — | |
Shares of beneficial interest | | | 740 | | | | 3,165 | | | | 15,821 | |
Additional paid-in-capital | | | 40,549,340 | | | | 38,141,515 | | | | 156,648,099 | |
| | | | | | | | | | | | |
Net Assets | | $ | 23,508,933 | | | $ | 39,955,605 | | | $ | 199,979,585 | |
| | | | | | | | | | | | |
See accompanying notes which are an integral part of the financial statements.
| | |
| 68 | | Statements of Assets and Liabilities |
| | | | | | | | | | | | | | |
Enhanced
Small Cap
Fund | | | Emerging
Markets
Fund | | | International
Stock Selection
Fund | | | High Yield
Bond Fund | |
| | | | | | | | | | | | | | |
| | | | | | | | | | | | | | |
| $ | 23,304,060 | | | $ | 924,589,944 | | | $ | 320,029,675 | | | $ | 85,208,190 | |
| | 29,455,218 | | | | 1,197,341,962 | | | | 376,479,546 | | | | 86,069,256 | |
| | 39 | | | | — | | | | — | | | | — | |
| | 9,600 | | | | 1,697,681 | | | | — | | | | — | |
| | — | | | | 3,774,733 | | | | 148,532 | | | | — | |
| | — | | | | 952,452 | | | | — | | | | — | |
| | — | | | | 2,713,635 | | | | — | | | | — | |
| | | | | | | | | | | | | | |
| | 25,105 | | | | 5,841,697 | | | | 821,153 | | | | 1,651,249 | |
| | 3 | | | | 65 | | | | — | | | | 13 | |
| | 255,106 | | | | 549,313 | | | | — | | | | 1,180,587 | |
| | 147,059 | | | | 2,635,177 | | | | 195,906 | | | | 459,553 | |
| | — | | | | — | | | | 181,278 | | | | 5,361 | |
| | 24,852 | | | | 418,114 | | | | 398,838 | | | | 35,818 | |
| | 614 | | | | 27,252 | | | | 8,020 | | | | 2,159 | |
| | | | | | | | | | | | | | |
| | 29,917,596 | | | | 1,215,952,081 | | | | 378,233,273 | | | | 89,403,996 | |
| | | | | | | | | | | | | | |
| | | |
| | | | | | | | | | | | | | |
| | | | | | | | | | | | | | |
| | 2,684 | | | | — | | | | — | | | | — | |
| | 236,679 | | | | 1,304,430 | | | | — | | | | — | |
| | 270,648 | | | | 2,198,204 | | | | 391,195 | | | | 8,278 | |
| | 42,298 | | | | 1,678,858 | | | | 559,473 | | | | 91,066 | |
| | 44,261 | | | | 78,889 | | | | 39,141 | | | | 47,943 | |
| | — | | | | 1,138,415 | | | | — | | | | — | |
| | — | | | | 385,594 | | | | — | | | | — | |
| | — | | | | 6,115,435 | | | | — | | | | — | |
| | — | | | | 67,817,030 | | | | 9,152,529 | | | | — | |
| | | | | | | | | | | | | | |
| | 596,570 | | | | 80,716,855 | | | | 10,142,338 | | | | 147,287 | |
| | | | | | | | | | | | | | |
| | | | | | | | | | | | | | |
| $ | 29,321,026 | | | $ | 1,135,235,226 | | | $ | 368,090,935 | | | $ | 89,256,709 | |
| | | | | | | | | | | | | | |
| | | |
| | | | | | | | | | | | | | |
| | 348,742 | | | | 15,306,352 | | | | 5,025,428 | | | | 426,185 | |
| | (1,736,465 | ) | | | 89,126,509 | | | | (636,332,083 | ) | | | 4,915,718 | |
| | | | | | | | | | | | | | |
|
6,151,158 |
| | | 271,662,938 | | | | 56,449,871 | | | | 861,066 | |
| | — | | | | (385,594 | ) | | | — | | | | — | |
| | — | | | | (3,563,518 | ) | | | (4,565 | ) | | | — | |
| | 2,031 | | | | 61,421 | | | | 37,172 | | | | 10,630 | |
| | 24,555,560 | | | | 763,027,118 | | | | 942,915,112 | | | | 83,043,110 | |
| | | | | | | | | | | | | | |
| $ | 29,321,026 | | | $ | 1,135,235,226 | | | $ | 368,090,935 | | | $ | 89,256,709 | |
| | | | | | | | | | | | | | |
See accompanying notes which are an integral part of the financial statements.
| | | | |
| Statements of Assets and Liabilities | | | 69 | |
SSgA Funds
Statements of Assets and Liabilities — August 31, 2013
| | | | | | | | | | | | |
| | |
Dynamic Small
Cap Fund | | | Clarion Real
Estate Fund | | | IAM
SHARES Fund | |
| | | | | | | | | | | | |
Net Asset Value, offering and redemption price per share: | | | | | |
Net asset value per share: (a) | | $ | 31.76 | | | $ | 12.63 | | | $ | 12.64 | |
Net assets | | $ | 23,508,933 | | | $ | 39,955,605 | | | $ | 199,979,585 | |
Shares outstanding ($0.001 par value) | | | 740,161 | | | | 3,164,604 | | | | 15,821,365 | |
Net asset value per share: Institutional Class (b) | | $ | — | | | $ | — | | | $ | — | |
Net assets | | $ | — | | | $ | — | | | $ | — | |
Shares outstanding ($0.001 par value) | | | — | | | | — | | | | — | |
Net asset value per share: Select Class (b) | | $ | — | | | $ | — | | | $ | — | |
Net assets | | $ | — | | | $ | — | | | $ | — | |
Shares outstanding ($0.001 par value) | | | — | | | | — | | | | — | |
| | | |
* Securities on loan included in investments | | $ | 5,887,049 | | | $ | 2,518,591 | | | $ | 6,187,120 | |
** Investments in affiliated issuers, SSgA Prime Money Market Fund and State Street Navigator Securities Lending Prime Portfolio | | $ | 6,057,830 | | | $ | 2,817,526 | | | $ | 10,909,136 | |
*** Foreign currency holdings — cost | | $ | — | | | $ | — | | | $ | — | |
**** Identified cost of cash collateral denominated in foreign currencies was $957,250. | |
(a) Net asset value per share equals net assets divided by shares of beneficial interest outstanding. | |
(b) Net asset value per share equals class level net assets divided by class level shares of beneficial interest outstanding. | |
See accompanying notes which are an integral part of the financial statements.
| | |
| 70 | | Statements of Assets and Liabilities |
| | | | | | | | | | | | | | |
Enhanced
Small Cap
Fund | | | Emerging
Markets
Fund | | | International
Stock Selection
Fund | | | High Yield
Bond Fund | |
| | | | | | | | | | | | | | |
| | | | | | | | | | | | | | |
| $ | 14.44 | | | $ | — | | | $ | — | | | $ | 8.40 | |
| $ | 29,321,026 | | | $ | — | | | $ | — | | | $ | 89,256,709 | |
| | 2,030,516 | | | | — | | | | — | | | | 10,629,777 | |
| $ | — | | | $ | 18.47 | | | $ | 9.90 | | | $ | — | |
| $ | — | | | $ | 938,194,751 | | | $ | 368,090,935 | | | $ | — | |
| | — | | | | 50,784,474 | | | | 37,171,828 | | | | — | |
| $ | — | | | $ | 18.53 | | | $ | — | | | $ | — | |
| $ | — | | | $ | 197,040,475 | | | $ | — | | | $ | — | |
| | — | | | | 10,636,189 | | | | — | | | | — | |
| | | |
| $ | — | | | $ | 64,544,846 | | | $ | 8,618,378 | | | $ | — | |
$ |
66,713 |
| | $ | 72,211,469 | | | $ | 10,185,683 | | | $ | 495,506 | |
| $ | — | | | $ | 4,770,744 | | | $ | 149,740 | | | $ | — | |
See accompanying notes which are an integral part of the financial statements.
| | | | |
| Statements of Assets and Liabilities | | | 71 | |
SSgA Funds
Statements of Operations — For the Period Ended August 31, 2013
| | | | | | | | | | | | |
| | |
Dynamic Small
Cap Fund | | | Clarion Real
Estate Fund | | | IAM SHARES
Fund | |
| | | | | | | | | | | | |
Investment Income | | | | | | | | | | | | |
Dividends (net of foreign taxes withheld of $408, $0, $176, $223, $5,835,099, $1,220,798, $2,509, respectively) | | $ | 245,331 | | | $ | 1,282,921 | | | $ | 4,215,922 | |
Dividends from affiliated money market funds | | | 119 | | | | — | | | | 3,183 | |
Interest | | | 3,671 | | | | — | | | | 247 | |
Securities lending income | | | 11,695 | | | | 10,156 | | | | 27,866 | |
| | | | | | | | | | | | |
Total investment income | | | 260,816 | | | | 1,293,077 | | | | 4,247,218 | |
| | | | | | | | | | | | |
| | | |
Expenses | | | | | | | | | | | | |
Advisory fees | | | 105,180 | | | | 323,481 | | | | 464,356 | |
Administrative fees | | | 43,286 | | | | 32,334 | | | | 68,783 | |
Custodian fees | | | 55,399 | | | | 35,646 | | | | 60,669 | |
Distribution fees | | | 27,426 | | | | 105,001 | | | | 40,236 | |
Transfer agent fees | | | 33,600 | | | | 54,606 | | | | 34,501 | |
Professional fees | | | 11,386 | | | | 48,591 | | | | 49,994 | |
Registration fees | | | 13,750 | | | | 20,059 | | | | 16,969 | |
Shareholder servicing fees | | | 3,952 | | | | 15,356 | | | | 48,767 | |
Shareholder servicing fees — Select Class | | | — | | | | — | | | | — | |
Trustees’ fees | | | 15,267 | | | | 16,467 | | | | 20,379 | |
Insurance fees | | | 365 | | | | 1,815 | | | | 5,573 | |
Printing fees | | | 6,653 | | | | 57,288 | | | | 14,250 | |
Miscellaneous | | | 3,461 | | | | 1,671 | | | | 11,780 | |
| | | | | | | | | | | | |
Expenses before reductions | | | 319,725 | | | | 712,315 | | | | 836,257 | |
Expense reductions | | | (144,425 | ) | | | (214,652 | ) | | | (6,403 | ) |
| | | | | | | | | | | | |
Net expenses | | | 175,300 | | | | 497,663 | | | | 829,854 | |
| | | | | | | | | | | | |
Net investment income (loss) | | | 85,516 | | | | 795,414 | | | | 3,417,364 | |
| | | | | | | | | | | | |
| | | |
Net Realized and Unrealized Gain (Loss) | | | | | | | | | | | | |
Net realized gain (loss) on: | | | | | | | | | | | | |
Investments (Emerging Markets Fund — net of deferred tax liability for foreign capital gains taxes) | | | 1,833,547 | | | | 14,931,043 | | | | 330,969 | |
Futures contracts | | | 25,169 | | | | — | | | | 1,092,422 | |
Credit default swap contracts | | | — | | | | — | | | | — | |
Foreign currency-related transactions | | | — | | | | — | | | | — | |
Net increase from payments by affiliates | | | — | | | | — | | | | — | |
| | | | | | | | | | | | |
Net realized gain (loss) | | | 1,858,716 | | | | 14,931,043 | | | | 1,423,391 | |
| | | | | | | | | | | | |
Net change in unrealized appreciation (depreciation) on: | | | | | | | | | | | | |
Investments (Emerging Markets Fund — net of deferred tax liability for foreign capital gains taxes) | | | 1,350,457 | | | | (16,690,653 | ) | | | 26,962,215 | |
Futures contracts | | | — | | | | — | | | | (260,304 | ) |
Foreign currency-related transactions | | | — | | | | — | | | | — | |
Credit default swap contracts | | | — | | | | — | | | | — | |
| | | | | | | | | | | | |
Net change in unrealized appreciation (depreciation) | | | 1,350,457 | | | | (16,690,653 | ) | | | 26,701,911 | |
| | | | | | | | | | | | |
| | | |
Net realized and unrealized gain (loss) | | | 3,209,173 | | | | (1,759,610 | ) | | | 28,125,302 | |
| | | | | | | | | | | | |
Net Increase (Decrease) in Net Assets from Operations | | $ | 3,294,689 | | | $ | (964,196 | ) | | $ | 31,542,666 | |
| | | | | | | | | | | | |
See accompanying notes which are an integral part of the financial statements.
| | |
| 72 | | Statements of Operations |
| | | | | | | | | | | | | | |
Enhanced Small
Cap Fund | | | Emerging
Markets Fund | | | International
Stock Selection
Fund | | | High Yield
Bond Fund | |
| | | | | | | | | | | | | | |
| | | | | | | | | | | | | | |
$ |
609,193 |
| | $ | 45,263,664 | | | $ | 12,878,310 | | | $ | 2,509 | |
| | 179 | | | | 9,264 | | | | — | | | | 5,968 | |
| | — | | | | 165,791 | | | | 47,383 | | | | 8,071,240 | |
| | — | | | | 790,974 | | | | 320,053 | | | | — | |
| | | | | | | | | | | | | | |
| | 609,372 | | | | 46,229,693 | | | | 13,245,746 | | | | 8,079,717 | |
| | | | | | | | | | | | | | |
| | | |
| | | | | | | | | | | | | | |
| | 130,352 | | | | 11,261,860 | | | | 2,917,384 | | | | 375,768 | |
| | 22,487 | | | | 488,514 | | | | 150,579 | | | | 42,807 | |
| | 66,599 | | | | 2,496,017 | | | | 221,922 | | | | 79,924 | |
| | 61,677 | | | | 2,364,909 | | | | 941,036 | | | | 289,369 | |
| | 34,229 | | | | 410,367 | | | | 229,745 | | | | 55,028 | |
| | 38,557 | | | | 58,697 | | | | 30,478 | | | | 48,872 | |
| | 14,957 | | | | 62,655 | | | | 17,545 | | | | 23,153 | |
| | 876 | | | | 584,670 | | | | 31,425 | | | | 23,771 | |
| | — | | | | 75,596 | | | | — | | | | — | |
| | 15,757 | | | | 55,095 | | | | 26,111 | | | | 18,718 | |
| | 877 | | | | 58,127 | | | | 16,682 | | | | 3,390 | |
| | 5,741 | | | | 249,305 | | | | 39,446 | | | | 28,699 | |
| | 1,337 | | | | 47,229 | | | | 10,693 | | | | 2,432 | |
| | | | | | | | | | | | | | |
| | 393,446 | | | | 18,213,041 | | | | 4,633,046 | | | | 991,931 | |
| | (176,192 | ) | | | (107,779 | ) | | | (743,138 | ) | | | (52,511 | ) |
| | | | | | | | | | | | | | |
| | 217,254 | | | | 18,105,262 | | | | 3,889,908 | | | | 939,420 | |
| | | | | | | | | | | | | | |
| | 392,118 | | | | 28,124,431 | | | | 9,355,838 | | | | 7,140,297 | |
| | | | | | | | | | | | | | |
| | | |
| | | | | | | | | | | | | | |
| | | | | | | | | | | | | | |
|
4,008,245 |
| | | 149,330,076 | | | | 16,557,716 | | | | 5,167,610 | |
| | 68,984 | | | | 1,353,949 | | | | 596,203 | | | | — | |
| | — | | | | — | | | | — | | | | 364,619 | |
| | — | | | | (5,176,253 | ) | | | (38,774 | ) | | | — | |
| | — | | | | 43,032 | | | | 1,184 | | | | — | |
| | | | | | | | | | | | | | |
| | 4,077,229 | | | | 145,550,804 | | | | 17,116,329 | | | | 5,532,229 | |
| | | | | | | | | | | | | | |
| | | | | | | | | | | | | | |
|
2,276,509 |
| | | (126,814,375 | ) | | | 42,695,541 | | | | (3,524,586 | ) |
| | (2,956 | ) | | | 521,398 | | | | 8,551 | | | | — | |
| | — | | | | (2,910,746 | ) | | | (11,113 | ) | | | — | |
| | — | | | | — | | | | — | | | | (121,666 | ) |
| | | | | | | | | | | | | | |
| | 2,273,553 | | | | (129,203,723 | ) | | | 42,692,979 | | | | (3,646,252 | ) |
| | | | | | | | | | | | | | |
| | | |
| | 6,350,782 | | | | 16,347,081 | | | | 59,809,308 | | | | 1,885,977 | |
| | | | | | | | | | | | | | |
| $ | 6,742,900 | | | $ | 44,471,512 | | | $ | 69,165,146 | | | $ | 9,026,274 | |
| | | | | | | | | | | | | | |
See accompanying notes which are an integral part of the financial statements.
| | | | |
| Statements of Operations | | | 73 | |
SSgA Funds
Statements of Changes in Net Assets
| | | | | | | | | | | | | | | | |
| | | Dynamic Small Cap Fund | | | Clarion Real Estate Fund | |
| | | Year Ended
August 31, 2013 | | | Year Ended
August 31, 2012 | | | Year Ended
August 31, 2013 | | | Year Ended
August 31, 2012 | |
| | | | | | | | | | | | | | | | |
Increase (Decrease) in Net Assets | | | | | | | | | | | | | | | | |
| | | | |
Operations | | | | | | | | | | | | | | | | |
Net investment income (loss) | | $ | 85,516 | | | $ | 108,639 | | | $ | 795,414 | | | $ | 1,026,445 | |
Net realized gain (loss) | | | 1,858,716 | | | | 739,317 | | | | 14,931,043 | | | | 4,609,881 | |
Net change in unrealized appreciation (depreciation) | | | 1,350,457 | | | | 610,615 | | | | (16,690,653 | ) | | | 5,059,375 | |
| | | | | | | | | | | | | | | | |
Net increase (decrease) in net assets from operations | | | 3,294,689 | | | | 1,458,571 | | | | (964,196 | ) | | | 10,695,701 | |
| | | | | | | | | | | | | | | | |
Voluntary contribution from Adviser | | | 89,037 | | | | — | | | | — | | | | — | |
| | | | | | | | | | | | | | | | |
| | | | |
Distributions | | | | | | | | | | | | | | | | |
From net investment income | | | (108,659 | ) | | | — | | | | (913,282 | ) | | | (849,986 | ) |
Institutional Class | | | — | | | | — | | | | — | | | | — | |
Select Class | | | — | | | | — | | | | — | | | | — | |
Class R | | | — | | | | — | | | | — | | | | — | |
From net realized gain | | | — | | | | — | | | | — | | | | — | |
| | | | | | | | | | | | | | | | |
Net decrease in net assets from distributions | | | (108,659 | ) | | | — | | | | (913,282 | ) | | | (849,986 | ) |
| | | | | | | | | | | | | | | | |
| | | | |
Share Transactions | | | | | | | | | | | | | | | | |
Net increase (decrease) in net assets from share transactions | | | 10,227,164 | | | | (1,209,319 | ) | | | (20,321,498 | ) | | | (5,826,072 | ) |
| | | | | | | | | | | | | | | | |
Total Net Increase (Decrease) in
Net Assets | | | 13,502,231 | | | | 249,252 | | | | (22,198,976 | ) | | | 4,019,643 | |
| | | | |
Net Assets | | | | | | | | | | | | | | | | |
Beginning of period | | | 10,006,702 | | | | 9,757,450 | | | | 62,154,581 | | | | 58,134,938 | |
| | | | | | | | | | | | | | | | |
| | | | |
End of period | | $ | 23,508,933 | | | $ | 10,006,702 | | | $ | 39,955,605 | | | $ | 62,154,581 | |
| | | | | | | | | | | | | | | | |
| | | | |
Undistributed (overdistributed) net investment
income included in net assets | | $ | 78,032 | | | $ | 108,639 | | | $ | 67,520 | | | $ | 185,388 | |
See accompanying notes which are an integral part of the financial statements.
| | |
| 74 | | Statements of Changes in Net Assets |
| | | | | | | | | | | | | | | | | | | | | | |
| IAM SHARES Fund | | | Enhanced Small Cap Fund | | | Emerging Markets Fund | |
Year Ended
August 31, 2013 | | | Year Ended
August 31, 2012 | | | Year Ended
August 31, 2013 | | | Year Ended
August 31, 2012 | | | Year Ended
August 31, 2013 | | | Year Ended
August 31, 2012 | |
| | | | | | | | | | | | | | | | | | | | | | |
| | | | | | | | | | | | | | | | | | | | | | |
| | | | | |
| | | | | | | | | | | | | | | | | | | | | | |
| $ | 3,417,364 | | | $ | 2,868,842 | | | $ | 392,118 | | | $ | 278,494 | | | $ | 28,124,431 | | | $ | 36,535,627 | |
| | 1,423,391 | | | | (447,725 | ) | | | 4,077,229 | | | | 2,037,819 | | | | 145,550,804 | | | | 40,797,685 | |
| | 26,701,911 | | | | 24,623,542 | | | | 2,273,553 | | | | 1,075,678 | | | | (129,203,723 | ) | | | (251,039,321 | ) |
| | | | | | | | | | | | | | | | | | | | | | |
| | 31,542,666 | | | | 27,044,659 | | | | 6,742,900 | | | | 3,391,991 | | | | 44,471,512 | | | | (173,706,009 | ) |
| | | | | | | | | | | | | | | | | | | | | | |
| | — | | | | — | | | | — | | | | — | | | | — | | | | — | |
| | | | | | | | | | | | | | | | | | | | | | |
| | | | | |
| | | | | | | | | | | | | | | | | | | | | | |
| | (3,333,585 | ) | | | (2,780,639 | ) | | | (283,671 | ) | | | (206,136 | ) | | | — | | | | — | |
| | — | | | | — | | | | — | | | | — | | | | (21,694,247 | ) | | | (22,434,463 | ) |
| | — | | | | — | | | | — | | | | — | | | | (8,728,385 | ) | | | — | |
| | — | | | | — | | | | — | | | | — | | | | — | | | | (11,369,950 | ) |
| | — | | | | — | | | | — | | | | — | | | | — | | | | — | |
| | | | | | | | | | | | | | | | | | | | | | |
| | (3,333,585 | ) | | | (2,780,639 | ) | | | (283,671 | ) | | | (206,136 | ) | | | (30,422,632 | ) | | | (33,804,413 | ) |
| | | | | | | | | | | | | | | | | | | | | | |
| | | | | |
| | | | | | | | | | | | | | | | | | | | | | |
| | 3,581,348 | | | | (8,417,646 | ) | | | (4,272,123 | ) | | | (3,363,138 | ) | | | (588,996,718 | ) | | | (249,444,634 | ) |
| | | | | | | | | | | | | | | | | | | | | | |
|
31,790,429 |
| | | 15,846,374 | | | | 2,187,106 | | | | (177,283 | ) | | | (574,947,838 | ) | | | (456,955,056 | ) |
| | | | | |
| | | | | | | | | | | | | | | | | | | | | | |
| | 168,189,156 | | | | 152,342,782 | | | | 27,133,920 | | | | 27,311,203 | | | | 1,710,183,064 | | | | 2,167,138,120 | |
| | | | | | | | | | | | | | | | | | | | | | |
| | | | | |
| $ | 199,979,585 | | | $ | 168,189,156 | | | $ | 29,321,026 | | | $ | 27,133,920 | | | $ | 1,135,235,226 | | | $ | 1,710,183,064 | |
| | | | | | | | | | | | | | | | | | | | | | |
| | | | | |
$ |
814,749 |
| | $ | 772,332 | | | $ | 348,742 | | | $ | 281,285 | | | $ | 15,306,352 | | | $ | 18,719,425 | |
See accompanying notes which are an integral part of the financial statements.
| | | | |
| Statements of Changes in Net Assets | | | 75 | |
SSgA Funds
Statements of Changes in Net Assets
| | | | | | | | | | | | | | | | |
| | | International Stock Selection Fund | | | High Yield Bond Fund | |
| | | Year Ended
August 31, 2013 | | | Year Ended
August 31, 2012 | | | Year Ended
August 31, 2013 | | | Year Ended
August 31, 2012 | |
| | | | | | | | | | | | | | | | |
Increase (Decrease) in Net Assets | | | | | | | | | | | | | | | | |
| | | | |
Operations | | | | | | | | | | | | | | | | |
Net investment income (loss) | | $ | 9,355,838 | | | $ | 15,250,971 | | | $ | 7,140,297 | | | $ | 6,204,080 | |
Net realized gain (loss) | | | 17,116,329 | | | | (65,751,077 | ) | | | 5,532,229 | | | | 450,267 | |
Net change in unrealized appreciation (depreciation) | | | 42,692,979 | | | | 23,114,092 | | | | (3,646,252 | ) | | | 5,422,582 | |
| | | | | | | | | | | | | | | | |
Net increase (decrease) in net assets from operations | | | 69,165,146 | | | | (27,386,014 | ) | | | 9,026,274 | | | | 12,076,929 | |
| | | | | | | | | | | | | | | | |
Voluntary contribution from Adviser | | | — | | | | — | | | | — | | | | — | |
| | | | | | | | | | | | | | | | |
| | | | |
Distributions | | | | | | | | | | | | | | | | |
From net investment income | | | — | | | | — | | | | — | | | | — | |
Institutional Class | | | (14,562,360 | ) | | | (26,997,642 | ) | | | (7,383,793 | ) | | | (6,364,757 | ) |
Select Class | | | — | | | | — | | | | — | | | | — | |
Class R | | | — | | | | (62,360 | ) | | | — | | | | — | |
From net realized gain | | | — | | | | — | | | | (298,638 | ) | | | — | |
| | | | | | | | | | | | | | | | |
Net decrease in net assets from distributions | | | (14,562,360 | ) | | | (27,060,002 | ) | | | (7,682,431 | ) | | | (6,364,757 | ) |
| | | | | | | | | | | | | | | | |
| | | | |
Share Transactions | | | | | | | | | | | | | | | | |
Net increase (decrease) in net assets from share transactions | | | (73,632,327 | ) | | | (326,455,301 | ) | | | (26,086,439 | ) | | | 29,661,221 | |
| | | | | | | | | | | | | | | | |
Total Net Increase (Decrease) in Net Assets | | | (19,029,541 | ) | | | (380,901,317 | ) | | | (24,742,596 | ) | | | 35,373,393 | |
| | | | |
Net Assets | | | | | | | | | | | | | | | | |
Beginning of period | | | 387,120,476 | | | | 768,021,793 | | | | 113,999,305 | | | | 78,625,912 | |
| | | | | | | | | | | | | | | | |
| | | | |
End of period | | $ | 368,090,935 | | | $ | 387,120,476 | | | $ | 89,256,709 | | | $ | 113,999,305 | |
| | | | | | | | | | | | | | | | |
| | | | |
Undistributed (overdistributed) net investment
income included in net assets | | $ | 5,025,428 | | | $ | 8,316,000 | | | $ | 426,185 | | | $ | 611,767 | |
See accompanying notes which are an integral part of the financial statements.
| | |
| 76 | | Statements of Changes in Net Assets |
This page has been intentionally left blank.
SSgA Funds
Financial Highlights — For the Periods Ended
For a Share Outstanding Throughout Each Period.
| | | | | | | | | | | | | | | | | | | | | | | | | | | | |
| | |
$
Net Asset Value,
Beginning of
Period | | | $
Net
Investment
Income (Loss)(a)(b) | | | $
Net Realized
and Unrealized
Gain (Loss) | | | $
Total from
Investment
Operations | | | $
Voluntary
Contribution
from Adviser | | | $
Distributions from
Net
Investment Income | | | $
Distributions
from Net
Realized Gain | |
Dynamic Small Cap Fund | |
August 31, 2013 | | | 24.28 | | | | 0.17 | | | | 7.56 | | | | 7.73 | | | | 0.01 | | | | (0.26 | ) | | | — | |
August 31, 2012 | | | 20.89 | | | | 0.25 | | | | 3.14 | | | | 3.39 | | | | — | | | | — | | | | — | |
August 31, 2011 | | | 15.80 | | | | (0.05 | ) | | | 5.14 | | | | 5.09 | | | | — | | | | — | | | | — | |
August 31, 2010 | | | 15.31 | | | | (0.02 | ) | | | 0.51 | | | | 0.49 | | | | — | | | | — | | | | — | |
August 31, 2009 | | | 22.14 | | | | (0.06 | ) | | | (6.77 | ) | | | (6.83 | ) | | | — | | | | — | | | | — | |
Clarion Real Estate Fund | |
August 31, 2013 | | | 13.11 | | | | 0.21 | | | | (0.46 | ) | | | (0.25 | ) | | | — | | | | (0.23 | ) | | | — | |
August 31, 2012 | | | 11.07 | | | | 0.21 | | | | 2.00 | | | | 2.21 | | | | — | | | | (0.17 | ) | | | — | |
August 31, 2011 | | | 9.49 | | | | 0.14 | | | | 1.60 | | | | 1.74 | | | | — | | | | (0.16 | ) | | | — | |
August 31, 2010 | | | 7.48 | | | | 0.21 | | | | 2.06 | | | | 2.27 | | | | — | | | | (0.26 | ) | | | — | |
August 31, 2009 | | | 14.00 | | | | 0.28 | | | | (5.80 | ) | | | (5.52 | ) | | | — | | | | (0.27 | ) | | | (0.73 | ) |
IAM SHARES Fund | |
August 31, 2013 | | | 10.84 | | | | 0.22 | | | | 1.79 | | | | 2.01 | | | | — | | | | (0.21 | ) | | | — | |
August 31, 2012 | | | 9.37 | | | | 0.18 | | | | 1.46 | | | | 1.64 | | | | — | | | | (0.17 | ) | | | — | |
August 31, 2011 | | | 8.07 | | | | 0.15 | | | | 1.30 | | | | 1.45 | | | | — | | | | (0.15 | ) | | | — | |
August 31, 2010 | | | 7.88 | | | | 0.14 | | | | 0.18 | | | | 0.32 | | | | — | | | | (0.13 | ) | | | — | |
August 31, 2009 | | | 9.89 | | | | 0.17 | | | | (1.99 | ) | | | (1.82 | ) | | | — | | | | (0.19 | ) | | | — | |
Enhanced Small Cap Fund | |
August 31, 2013 | | | 11.54 | | | | 0.18 | | | | 2.84 | | | | 3.02 | | | | — | | | | (0.12 | ) | | | — | |
August 31, 2012 | | | 10.14 | | | | 0.11 | | | | 1.37 | | | | 1.48 | | | | — | | | | (0.08 | ) | | | — | |
August 31, 2011 | | | 7.95 | | | | 0.07 | | | | 2.17 | | | | 2.24 | | | | — | | | | (0.05 | ) | | | — | |
August 31, 2010 | | | 7.42 | | | | 0.05 | | | | 0.54 | | | | 0.59 | | | | — | | | | (0.06 | ) | | | — | |
August 31, 2009 | | | 10.01 | | | | 0.06 | | | | (2.56 | ) | | | (2.50 | ) | | | — | | | | (0.09 | ) | | | — | |
| (a) | | Average daily shares outstanding were used for this calculation. |
| (b) | | May reflect amounts waived and/or reimbursed by the investment adviser and for certain funds, custody credit arrangements. The custody credit arrangements had an impact of less than 0.005%. |
| (c) | | If the Adviser had not made a one-time voluntary contribution during the period ended August 31, 2013, the total return would have been 31.70% for Dynamic Small Cap Fund. |
See accompanying notes which are an integral part of the financial statements.
| | | | | | | | | | | | | | | | | | | | | | | | | | | | | | |
$
Total
Distributions | | | $
Net Asset Value,
End of
Period | | | %
Total
Return | | | $
Net Assets,
End of Period
(000) | | | %
Ratio of Expenses
to Average
Net Assets,
Net(b) | | | %
Ratio of Expenses
to Average
Net Assets,
Gross | | | %
Ratio of Net
Investment Income
to Average
Net Assets(b) | | | %
Portfolio
Turnover Rate | |
| | | | | | | | | | | | | | | | | | | | | | | | | | | | | | |
| | (0.26 | ) | | | 31.76 | | | | 32.20 | (c) | | | 23,509 | | | | 1.25 | | | | 2.28 | | | | 0.61 | | | | 147 | |
| | — | | | | 24.28 | | | | 16.23 | | | | 10,007 | | | | 1.25 | | | | 3.51 | | | | 1.10 | | | | 160 | |
| | — | | | | 20.89 | | | | 32.22 | | | | 9,115 | | | | 1.25 | | | | 3.38 | | | | (0.24 | ) | | | 179 | |
| | — | | | | 15.80 | | | | 3.20 | | | | 8,562 | | | | 1.53 | | | | 3.36 | | | | (0.10 | ) | | | 240 | |
| | — | | | | 15.31 | | | | (30.85 | ) | | | 10,906 | | | | 1.81 | | | | 2.70 | | | | (0.39 | ) | | | 235 | |
| | | | | | | | | | | | | | | | | | | | | | | | | | | | | | |
| | (0.23 | ) | | | 12.63 | | | | (1.94 | ) | | | 39,956 | | | | 1.00 | | | | 1.43 | | | | 1.60 | | | | 58 | |
| | (0.17 | ) | | | 13.11 | | | | 20.22 | | | | 62,155 | | | | 1.00 | | | | 1.32 | | | | 1.76 | | | | 21 | |
| | (0.16 | ) | | | 11.07 | | | | 18.41 | | | | 58,135 | | | | 1.00 | | | | 1.26 | | | | 1.29 | | | | 12 | |
| | (0.26 | ) | | | 9.49 | | | | 30.77 | | | | 59,738 | | | | 1.00 | | | | 1.31 | | | | 2.46 | | | | 36 | |
| | (1.00 | ) | | | 7.48 | | | | (39.82 | ) | | | 75,511 | | | | 1.00 | | | | 1.29 | | | | 3.88 | | | | 55 | |
| | | | | | | | | | | | | | | | | | | | | | | | | | | | | | |
| | (0.21 | ) | | | 12.64 | | | | 18.80 | | | | 199,980 | | | | 0.45 | | | | 0.45 | | | | 1.84 | | | | — | |
| | (0.17 | ) | | | 10.84 | | | | 17.73 | | | | 168,189 | | | | 0.50 | | | | 0.51 | | | | 1.74 | | | | 3 | |
| | (0.15 | ) | | | 9.37 | | | | 17.99 | | | | 152,343 | | | | 0.48 | | | | 0.48 | | | | 1.54 | | | | — | |
| | (0.13 | ) | | | 8.07 | | | | 4.01 | | | | 128,928 | | | | 0.53 | | | | 0.53 | | | | 1.62 | | | | 2 | |
| | (0.19 | ) | | | 7.88 | | | | (18.15 | ) | | | 123,953 | | | | 0.54 | | | | 0.54 | | | | 2.39 | | | | 5 | |
| | | | | | | | | | | | | | | | | | | | | | | | | | | | | | |
| | (0.12 | ) | | | 14.44 | | | | 26.45 | | | | 29,321 | | | | 0.75 | | | | 1.36 | | | | 1.35 | | | | 57 | |
| | (0.08 | ) | | | 11.54 | | | | 14.76 | | | | 27,134 | | | | 0.75 | | | | 1.58 | | | | 1.06 | | | | 64 | |
| | (0.05 | ) | | | 10.14 | | | | 28.19 | | | | 27,311 | | | | 0.75 | | | | 1.44 | | | | 0.69 | | | | 57 | |
| | (0.06 | ) | | | 7.95 | | | | 8.01 | | | | 26,130 | | | | 0.75 | | | | 1.58 | | | | 0.62 | | | | 77 | |
| | (0.09 | ) | | | 7.42 | | | | (24.91 | ) | | | 27,314 | | | | 0.75 | | | | 1.48 | | | | 0.85 | | | | 101 | |
See accompanying notes which are an integral part of the financial statements.
SSgA Funds
Financial Highlights — For the Periods Ended
For a Share Outstanding Throughout Each Period.
| | | | | | | | | | | | | | | | | | | | | | | | |
| | |
$
Net Asset Value,
Beginning of
Period | | | $
Net
Investment
Income (Loss)(a)(b) | | | $
Net Realized
and Unrealized
Gain (Loss) | | | $
Total from
Investment
Operations | | | $
Distributions
from Net
Investment Income | | | $
Distributions
from Net
Realized Gain | |
Emerging Markets Fund Institutional Class | |
August 31, 2013 | | | 18.71 | | | | 0.37 | | | | (0.28 | ) | | | 0.09 | | | | (0.33 | ) | | | — | |
August 31, 2012 | | | 20.81 | | | | 0.34 | | | | (2.14 | ) | | | (1.80 | ) | | | (0.30 | ) | | | — | |
August 31, 2011 | | | 19.20 | | | | 0.29 | | | | 1.70 | | | | 1.99 | | | | (0.38 | ) | | | — | |
August 31, 2010 | | | 16.61 | | | | 0.17 | | | | 2.81 | | | | 2.98 | | | | (0.39 | ) | | | — | |
August 31, 2009 | | | 22.72 | | | | 0.27 | | | | (4.71 | ) | | | (4.44 | ) | | | — | | | | (1.67 | ) |
Select Class | |
August 31, 2013 | | | 18.79 | | | | 0.38 | | | | (0.23 | ) | | | 0.15 | | | | (0.41 | ) | | | — | |
August 31, 2012 | | | 20.90 | | | | 0.36 | | | | (2.13 | ) | | | (1.77 | ) | | | (0.34 | ) | | | — | |
August 31, 2011 | | | 19.28 | | | | 0.31 | | | | 1.73 | | | | 2.04 | | | | (0.42 | ) | | | — | |
August 31, 2010 | | | 16.67 | | | | 0.21 | | | | 2.82 | | | | 3.03 | | | | (0.42 | ) | | | — | |
August 31, 2009 | | | 22.75 | | | | 0.30 | | | | (4.71 | ) | | | (4.41 | ) | | | — | | | | (1.67 | ) |
International Stock Selection Fund | |
August 31, 2013 | | | 8.61 | | | | 0.23 | | | | 1.40 | | | | 1.63 | | | | (0.34 | ) | | | — | |
August 31, 2012 | | | 9.24 | | | | 0.23 | | | | (0.53 | ) | | | (0.30 | ) | | | (0.33 | ) | | | — | |
August 31, 2011 | | | 8.81 | | | | 0.23 | | | | 0.46 | | | | 0.69 | | | | (0.26 | ) | | | — | |
August 31, 2010 | | | 9.24 | | | | 0.18 | | | | (0.33 | ) | | | (0.15 | ) | | | (0.28 | ) | | | — | |
August 31, 2009 | | | 11.79 | | | | 0.24 | | | | (2.57 | ) | | | (2.33 | ) | | | (0.22 | ) | | | — | |
High Yield Bond Fund | |
August 31, 2013 | | | 8.36 | | | | 0.49 | | | | 0.08 | | | | 0.57 | | | | (0.51 | ) | | | (0.02 | ) |
August 31, 2012 | | | 7.90 | | | | 0.52 | | | | 0.48 | | | | 1.00 | | | | (0.54 | ) | | | — | |
August 31, 2011 | | | 7.84 | | | | 0.58 | | | | 0.06 | | | | 0.64 | | | | (0.58 | ) | | | — | |
August 31, 2010 | | | 7.12 | | | | 0.73 | | | | 0.74 | | | | 1.47 | | | | (0.75 | ) | | | — | |
August 31, 2009 | | | 7.60 | | | | 0.64 | | | | (0.48 | ) | | | 0.16 | | | | (0.64 | ) | | | — | |
| (a) | | May reflect amounts waived and/or reimbursed by the investment adviser and for certain funds, custody credit arrangements. The custody credit arrangements had an impact of less than 0.005%. |
| (b) | | Average daily shares outstanding were used for this calculation. |
| (c) | | If the Adviser had not made a contribution during the period ended August 31, 2013, the total return would have been 0.41% and 0.66% for the Institutional Class and Select Class of Emerging Markets Fund, respectively, and would have remained 19.45% for International Stock Selection Fund. |
See accompanying notes which are an integral part of the financial statements.
| | | | | | | | | | | | | | | | | | | | | | | | | | | | | | |
$
Total
Distributions | | | $
Net Asset Value,
End of
Period | | | %
Total
Return | | | $
Net Assets,
End of Period
(000) | | | %
Ratio of Expenses
to Average
Net Assets,
Net(a) | | | %
Ratio of Expenses
to Average
Net Assets,
Gross | | | %
Ratio of Net
Investment Income
to Average
Net Assets(a) | | | %
Portfolio
Turnover Rate | |
| | | | | | | | | | | | | | | | | | | | | | | | | | | | | | |
| | (0.33 | ) | | | 18.47 | | | | 0.45 | (c) | | | 938,195 | | | | 1.25 | | | | 1.26 | | | | 1.86 | | | | 56 | |
| | (0.30 | ) | | | 18.71 | | | | (8.63 | ) | | | 1,273,588 | | | | 1.25 | | | | 1.28 | | | | 1.80 | | | | 74 | |
| | (0.38 | ) | | | 20.81 | | | | 10.25 | | | | 1,451,810 | | | | 1.25 | | | | 1.26 | | | | 1.29 | | | | 50 | |
| | (0.39 | ) | | | 19.20 | | | | 17.98 | | | | 1,328,720 | | | | 1.24 | | | | 1.24 | | | | 0.87 | | | | 63 | |
| | (1.67 | ) | | | 16.61 | | | | (16.50 | ) | | | 1,453,575 | | | | 1.20 | | | | 1.21 | | | | 1.99 | | | | 61 | |
| | | | | | | | | | | | | | | | | | | | | | | | | | | | | | |
| | (0.41 | ) | | | 18.53 | | | | 0.69 | (c) | | | 197,040 | | | | 1.03 | | | | 1.04 | | | | 1.92 | | | | 56 | |
| | (0.34 | ) | | | 18.79 | | | | (8.42 | ) | | | 436,595 | | | | 1.02 | | | | 1.05 | | | | 1.90 | | | | 74 | |
| | (0.42 | ) | | | 20.90 | | | | 10.48 | | | | 715,328 | | | | 1.02 | | | | 1.04 | | | | 1.40 | | | | 50 | |
| | (0.42 | ) | | | 19.28 | | | | 18.24 | | | | 954,350 | | | | 1.01 | | | | 1.02 | | | | 1.09 | | | | 63 | |
| | (1.67 | ) | | | 16.67 | | | | (16.33 | ) | | | 1,082,478 | | | | 0.98 | | | | 0.99 | | | | 2.22 | | | | 61 | |
| | | | | | | | | | | | | | | | | | | | | | | | | | | | | | |
| | (0.34 | ) | | | 9.90 | | | | 19.45 | (c) | | | 368,091 | | | | 1.00 | | | | 1.19 | | | | 2.41 | | | | 54 | |
| | (0.33 | ) | | | 8.61 | | | | (3.16 | ) | | | 387,120 | | | | 1.00 | | | | 1.21 | | | | 2.65 | | | | 90 | |
| | (0.26 | ) | | | 9.24 | | | | 7.61 | | | | 766,126 | | | | 1.00 | | | | 1.19 | | | | 2.27 | | | | 77 | |
| | (0.28 | ) | | | 8.81 | | | | (1.85 | ) | | | 1,055,967 | | | | 1.00 | | | | 1.17 | | | | 1.95 | | | | 83 | |
| | (0.22 | ) | | | 9.24 | | | | (19.46 | ) | | | 1,525,020 | | | | 1.00 | | | | 1.16 | | | | 3.04 | | | | 122 | |
| | | | | | | | | | | | | | | | | | | | | | | | | | | | | | |
| | (0.53 | ) | | | 8.40 | | | | 6.85 | | | | 89,257 | | | | 0.75 | | | | 0.79 | | | | 5.70 | | | | 112 | |
| | (0.54 | ) | | | 8.36 | | | | 13.17 | | | | 113,999 | | | | 0.75 | | | | 0.88 | | | | 6.30 | | | | 196 | |
| | (0.58 | ) | | | 7.90 | | | | 8.16 | | | | 78,626 | | | | 0.75 | | | | 0.83 | | | | 7.02 | | | | 294 | |
| | (0.75 | ) | | | 7.84 | | | | 21.46 | | | | 51,398 | | | | 0.75 | | | | 1.01 | | | | 9.43 | | | | 294 | |
| | (0.64 | ) | | | 7.12 | | | | 3.65 | | | | 51,856 | | | | 0.75 | | | | 1.06 | | | | 10.20 | | | | 289 | |
See accompanying notes which are an integral part of the financial statements.
SSgA Funds
Notes to Financial Statements — August 31, 2013
The SSgA Funds (the “Investment Company”) is a series mutual fund, comprised of 12 investment portfolios that were in operation as of August 31, 2013. These financial statements report on seven funds: the SSgA Dynamic Small Cap Fund, SSgA Clarion Real Estate Fund, SSgA IAM SHARES Fund, SSgA Enhanced Small Cap Fund, SSgA Emerging Markets Fund, SSgA International Stock Selection Fund and SSgA High Yield Bond Fund (each a “Fund” and collectively referred to as the “Funds”), each of which has distinct investment objectives and strategies. Each Fund is an open-end management investment company, as defined in the Investment Company Act of 1940, as amended (the “1940 Act”). The Investment Company was organized as a Massachusetts business trust on October 3, 1987 and operates under a Second Amended and Restated Master Trust Agreement, dated May 15, 2012 (the “Agreement”). The Agreement permits the Board of Trustees (the “Board”) to issue an unlimited number of full and fractional shares of beneficial interest at a $.001 par value.
Select Class shares of the Emerging Markets Fund, which were first offered on November 28, 2005, may not be purchased by individuals directly, but must be purchased through a third party financial institution which is permitted by contract with the Investment Company or State Street Global Markets LLC to offer shares (“Select Intermediaries”). Select Intermediaries are advisers, securities brokers, banks and financial institutions or other industry professionals or organizations that have entered into a shareholder servicing agreement with the State Street Global Markets LLC with respect to investments of its accounts in the Select Class.
On August 29, 2013, the Bond Market Fund and Intermediate Fund were liquidated and closed.
| 2. | | Significant Accounting Policies |
The Funds’ financial statements are prepared in accordance with accounting principles generally accepted in the United States of America (“U.S. GAAP”), which require the use of management estimates and assumptions at the date of the financial statements. Actual results could differ from those estimates. The following is a summary of the significant accounting policies consistently followed by each Fund in the preparation of its financial statements.
Security Valuation
U.S. GAAP defines fair market value as the price that a Fund would receive to sell an asset or pay to transfer a liability in an orderly transaction between market participants at the measurement date. It establishes a fair value hierarchy that prioritizes inputs to valuation methods and requires a separate disclosure of the fair value hierarchy, for each major category of assets and liabilities that segregates fair value measurements into levels (Level 1, 2, and 3). In such cases, an investment’s level within the fair value hierarchy is based on the lowest level of input that is significant to the fair value measurement. The inputs or methodology used for valuing securities are not necessarily an indication of the risk associated with investing in those securities. Levels 1, 2 and 3 of the fair value hierarchy are defined as follows:
| | • | | Level 1 — Inputs using quoted prices (unadjusted) in active markets or exchanges for identical assets and liabilities. |
| | • | | Level 2 — Significant other observable inputs, which may include, but are not limited to, quoted prices for similar assets or liabilities in markets that are active, quoted prices for identical or similar assets or liabilities in markets that are non-active, inputs other than quoted prices that are observable for the assets or liabilities (such as interest rates, yield curves, volatilities, prepayment speeds, loss severities, credit risks and default rates) or other market corroborated inputs. |
| | • | | Level 3 — Significant unobservable inputs based on the best information available in the circumstances, to the extent observable inputs are not available, which may include assumptions made by the Board or persons acting at their direction that are used in determining the fair market value of investments. |
The valuation techniques and significant inputs used in determining the fair market values of financial instruments classified as Level 1 and Level 2 of the fair value hierarchy are as follows:
Common stocks, preferred stocks, exchange traded funds and derivatives that are traded on a national securities exchange are stated at the last reported sale or settlement price on the day of valuation. To the extent these securities are actively traded and valuation adjustments are not applied, they are categorized as Level 1 of the fair value hierarchy.
| | |
| 82 | | Notes to Financial Statements |
SSgA Funds
Notes to Financial Statements, continued — August 31, 2013
Fixed income securities including corporate, convertible and municipal bonds and notes, U.S. government agencies, U.S. Treasury obligations, sovereign issues, bank loans, bank notes and non-U.S. bonds are normally valued by pricing service providers that use broker-dealer quotations or valuation estimates from their internal pricing models. The service providers’ internal models use inputs that are observable, such as issuer details, interest rates, yield curves, prepayment speeds, credit risks/spreads and default rates. Securities that use similar valuation techniques and inputs as described above are categorized as Level 2 of the fair value hierarchy.
Fixed income securities purchased on a delayed-delivery basis are marked-to-market daily until settlement at the forward settlement date and are categorized as Level 2 of the fair value hierarchy.
Investments in privately held investment funds are valued based upon the Net Asset Value (“NAV”) of such investments and are categorized as Level 2 of the fair value hierarchy.
Short-term instruments purchased by the Funds and maturing within 60 days of the time of purchase are valued at “amortized cost” unless the Board determines that amortized cost does not represent fair value. These investments are categorized as Level 2 of the fair value hierarchy.
Financial over-the-counter derivative instruments are instruments such as foreign currency contracts, options contracts, or swap agreements that derive their value from underlying asset prices, indices, reference rates, and other inputs or a combination of these factors. These contracts are normally valued on the basis of broker-dealer quotations or pricing service providers. Depending on the product and the terms of the transaction, the value of the derivative contracts can be estimated by a pricing service provider using a series of techniques, including simulation pricing models. The pricing models use inputs that are observed from actively quoted markets such as issuer details, indices, spreads, interest rates, curves, dividends and exchange rates. Derivatives that use similar valuation techniques and inputs as described above are categorized as Level 2 of the fair value hierarchy.
Events or circumstances affecting the values of Fund securities that occur between the closing of the principal markets on which they trade and the time the NAV of Fund shares is determined may be reflected in the Investment Company’s calculation of NAVs for each applicable Fund when the Investment Company deems that the particular event or circumstance would materially affect such Fund’s NAV. Funds that invest primarily in frequently traded exchange-listed securities will use fair value pricing in limited circumstances since reliable market quotations will often be readily available. If market quotations are not readily available for a security or if subsequent events suggest that a market quotation is not reliable, the Funds will use the security’s fair value, as determined in accordance with Fair Value Procedures adopted by the Board. Funds that invest in foreign securities are likely to use fair value pricing more often since significant events may occur between the close of foreign markets and the time of pricing which would trigger fair value pricing of the foreign securities. Although there are observable inputs assigned on a security level, prices are derived from factors using proprietary models or matrix pricing. For this reason, significant events will cause movement between Levels 1 and 2. Funds that invest in low-rated debt securities are also likely to use fair value pricing more often since the markets in which such securities are traded are generally thinner, more limited and less active than those for higher rated securities. Examples of events that could trigger fair value pricing of one or more securities are: (1) market quotations are not readily available because a portfolio security is not traded in a public market or the principal market in which the security trades is closed; (2) trading in a portfolio security is suspended and not resumed prior to the time as of which the Funds calculate their NAV; (3) where a significant event affecting the value of a portfolio security is determined to have occurred between the time of the market quotation provided for a portfolio security and the time as of which the Funds calculate their NAV; (4) a security’s price has remained unchanged over an extended period of time (often referred to as a “stale price”), or (5) the Funds’ custodian or administrator determines that a market quotation is inaccurate.
Equities traded on inactive markets or valued by reference to similar instruments are also categorized as Level 2 of the fair value hierarchy.
The NAV of a Fund’s portfolio that includes foreign securities may change on days when shareholders will not be able to purchase or redeem Fund shares, since foreign securities can trade on non-business days.
| | | | |
| Notes to Financial Statements | | | 83 | |
SSgA Funds
Notes to Financial Statements, continued — August 31, 2013
Level 3 Trading Assets and Trading Liabilities, at Fair Value
The valuation techniques and significant inputs used in determining the fair values of financial instruments classified as Level 3 of the fair value hierarchy are as follows:
Securities and other assets for which market quotes are not readily available are valued at fair value as determined in good faith by the Board and are categorized as Level 3 of the fair value hierarchy. Market quotes are considered not readily available in circumstances where there is an absence of current or reliable market-based data (e.g., trade information or broker quotes).
When fair valuation methods are applied that use significant unobservable inputs to determine a Fund’s NAV, securities will not be priced on the basis of quotes from the primary market in which they are traded, but rather may be priced by another method that the Board or persons acting at their direction believe accurately reflects fair value and are categorized as Level 3 of the fair value hierarchy. Fair value pricing may require subjective determinations about the value of a security. While the securities valuation procedures are intended to result in a calculation of a Fund’s NAV that fairly reflects security values as of the time of pricing, the process cannot guarantee that fair values determined by the Board or persons acting at their direction would accurately reflect the price that a Fund could obtain for a security if it were to dispose of that security as of the time of pricing (for instance, in a forced or distressed sale). The prices used by a Fund may differ from the value that would be realized if the securities were sold.
For fair valuations using significant unobservable inputs, U.S. GAAP requires a reconciliation of the beginning to ending balances for reported market values that presents changes attributable to total realized and unrealized gains or losses, purchases and sales, and transfers in/out of the Level 3 category during the period. In accordance with the requirements of U.S. GAAP, a fair value hierarchy and Level 3 reconciliation, if any, have been included in the footnotes to the Schedule of Investments for each respective Fund.
The levels associated with valuing the Funds’ investments for the period ended August 31, 2013 are disclosed in the Presentation of Portfolio Holdings following the Schedules of Investments.
Securities Transactions
Securities transactions are recorded on a trade date basis. Realized gains and losses from securities transactions, if any, are recorded on the basis of identified cost which is the same basis used for federal income taxes.
Investment Income
Dividend income is recorded net of applicable withholding taxes on the ex-dividend date, except that certain dividends from foreign securities are recorded as soon thereafter as the Funds are informed of the ex-dividend date or as soon as practicable after the Fund determines the existence of a dividend declaration after exercising reasonable due diligence. Interest income is recorded daily on the accrual basis. All premiums and discounts, including original issue discounts, are amortized/accreted using the interest method. Withholding taxes on foreign dividend interest and capital gains have been provided for in accordance with the applicable country’s tax rules and rates.
Federal Income Taxes
Since the Investment Company is a Massachusetts business trust, each Fund is a separate corporate taxpayer and determines its net investment income and capital gains (losses) and the amounts to be distributed to each Fund’s shareholders without regard to the income and capital gains (losses) of the other Funds.
It is each Fund’s intention to qualify as a regulated investment company, as defined by the Internal Revenue Code of 1986 (the “Code”), as amended. This requires each Fund to distribute an amount sufficient to avoid any excise tax under Section 4982 of the Code. Therefore, for the period ended August 31, 2013, the Funds paid no federal income taxes and no federal income tax provision was required for the Funds.
Each Fund files a U.S. tax return. At August 31, 2013, the Funds had recorded no liabilities for net unrecognized tax benefits relating to uncertain income tax positions they have taken or expect to take in future tax returns. While the statute of
| | |
| 84 | | Notes to Financial Statements |
SSgA Funds
Notes to Financial Statements, continued — August 31, 2013
limitations remains open to examine the Funds’ U.S. tax returns filed for the fiscal years ended August 31, 2010 through August 31, 2012, no examinations are in progress or anticipated at this time. The Funds are not aware of any tax positions for which it is reasonably possible that the total amounts of unrecognized tax benefits will significantly change in the next twelve months.
At August 31, 2013, the following Funds had net tax basis capital loss carryforwards, which may be applied against any realized net taxable gains in each succeeding year or until their expiration dates, whichever occurs first:
| | | | | | | | | | | | | | | | | | | | | | | | | | | | |
| | | Expiration Year | |
| | | 8/31/2016 | | | 8/31/2017 | | | 8/31/2018 | | | 8/31/2019 | | | Non-Expiring
Short-Term | | | Non-Expiring
Long-Term | | | Total | |
Dynamic Small Cap Fund | | $ | — | | | $ | 12,950,987 | | | $ | 6,490,926 | | | $ | — | | | $ | — | | | $ | — | | | $ | 19,441,913 | |
Clarion Real Estate Fund | | $ | — | | | $ | — | | | $ | 10,726,973 | | | $ | — | | | $ | — | | | $ | — | | | $ | 10,726,973 | |
IAM SHARES Fund | | $ | 2,796,414 | | | $ | 1,248,239 | | | $ | 17,638,415 | | | $ | 413,777 | | | $ | — | | | $ | — | | | $ | 22,096,845 | |
Enhanced Small Cap Fund | | $ | — | | | $ | — | | | $ | 1,727,264 | | | $ | — | | | $ | — | | | $ | — | | | $ | 1,727,264 | |
Emerging Markets Fund | | $ | — | | | $ | — | | | $ | — | | | $ | — | | | $ | — | | | $ | — | | | $ | — | |
International Stock Selection Fund | | $ | — | | | $ | 153,873,846 | | | $ | 428,227,873 | | | $ | — | | | $ | 52,700,471 | | | $ | — | | | $ | 634,802,190 | |
High Yield Bond Fund | | $ | — | | | $ | — | | | $ | — | | | $ | — | | | $ | — | | | $ | — | | | $ | — | |
During the period ended August 31, 2013, the Funds utilized/expired capital loss carryforwards in the following amounts:
| | | | | | | | |
| | | Amount Utilized | | | Amount Expired | |
| | | | | | | | |
Dynamic Small Cap Fund | | $ | 1,868,125 | | | $ | — | |
Clarion Real Estate Fund | | | 14,917,782 | | | | — | |
IAM SHARES Fund | | | 822,292 | | | | 36,915 | |
Enhanced Small Cap Fund | | | 3,926,178 | | | | — | |
Emerging Markets Fund | | | — | | | | — | |
International Stock Selection Fund | | | — | | | | — | |
High Yield Bond Fund | | | 233,572 | | | | — | |
As of August 31, 2013, the Funds’ aggregate cost of investments and the comparison of unrealized appreciation and depreciation of investment securities for federal income tax purposes are as follows:
| | | | | | | | | | | | | | | | |
| | | Cost of
Investments for
Tax Purposes | | | Gross Tax
Unrealized
Appreciation | | | Gross Tax
Unrealized
Depreciation | | | Net Unrealized
Appreciation
(Depreciation) | |
| | | | | | | | | | | | | | | | |
Dynamic Small Cap Fund | | $ | 27,126,499 | | | $ | 2,742,661 | | | $ | 420,022 | | | $ | 2,322,639 | |
Clarion Real Estate Fund | | | 29,994,913 | | | | 12,956,885 | | | | 486,507 | | | | 12,470,378 | |
IAM SHARES Fund | | | 141,399,258 | | | | 78,909,242 | | | | 14,308,632 | | | | 64,600,610 | |
Enhanced Small Cap Fund | | | 23,335,299 | | | | 6,933,077 | | | | 813,158 | | | | 6,119,919 | |
Emerging Markets Fund | | | 933,510,415 | | | | 329,815,333 | | | | 65,983,786 | | | | 263,831,547 | |
International Stock Selection Fund | | | 324,531,225 | | | | 58,235,504 | | | | 6,287,183 | | | | 51,948,321 | |
High Yield Bond Fund | | | 85,208,190 | | | | 2,334,707 | | | | 1,473,641 | | | | 861,066 | |
| | | | | | | | | | | | | | | | | | | | |
| | | Components of Distributable Earnings | | | Tax Composition of Distributions | |
| | | Undistributed
Ordinary Income | | | Capital Loss
Carryforward | | | Undistributed
Capital Gains | | | Ordinary
Income | | | Long Term
Capital Gains | |
| | | | | | | | | | | | | | | | | | | | |
Dynamic Small Cap Fund | | $ | 78,128 | | | $ | (19,441,913 | ) | | $ | — | | | $ | 108,659 | | | $ | — | |
Clarion Real Estate Fund | | | 67,520 | | | | (10,726,973 | ) | | | — | | | | 913,282 | | | | — | |
IAM SHARES Fund | | | 811,899 | | | | (22,096,845 | ) | | | — | | | | 3,333,585 | | | | — | |
Enhanced Small Cap Fund | | | 370,780 | | | | (1,727,264 | ) | | | — | | | | 283,671 | | | | — | |
Emerging Markets Fund | | | 16,612,136 | | | | — | | | | 92,287,938 | | | | 30,422,632 | | | | — | |
International Stock Selection Fund | | | 7,997,085 | | | | (634,802,190 | ) | | | — | | | | 14,562,360 | | | | — | |
High Yield Bond Fund | | | 2,437,090 | | | | — | | | | 2,904,812 | | | | 7,629,340 | | | | 53,091 | |
As permitted by tax regulations, the Funds intend to defer long-term realized capital loss and short-term realized capital loss incurred from November 1, 2012 to August 31, 2013. During the period ended August 31, 2013, the Funds did not have any Post October Capital Loss Deferral or Late Year Ordinary Loss Deferral.
| | | | |
| Notes to Financial Statements | | | 85 | |
SSgA Funds
Notes to Financial Statements, continued — August 31, 2013
Dividends and Distributions to Shareholders
Income dividends and capital gain distributions, if any, are recorded on the ex-dividend date. Dividends are generally declared and paid on the following frequency:
| | | | |
Dynamic Small Cap Fund | | | Annually | |
Clarion Real Estate Fund | | | Monthly | |
IAM SHARES Fund | | | Quarterly | |
Enhanced Small Cap Fund | | | Annually | |
Emerging Markets Fund | | | Annually | |
International Stock Selection Fund | | | Annually | |
High Yield Bond Fund | | | Monthly | |
Capital gain distributions are generally declared and paid annually. An additional distribution may be paid by the Funds to avoid imposition of federal income tax on any remaining undistributed net investment income and capital gains. The amount and character of income and gains to be distributed are determined in accordance with federal tax regulations which may differ from net investment income and realized gains recognized for U.S. GAAP purposes. These differences relate primarily to investments in swaps, futures, forward contracts, passive foreign investment companies, foreign denominated investments, REITs, wash sales, partnerships, non-taxable dividends and investments in certain securities sold at a loss. Permanent differences between book and tax accounting are reclassified to paid-in capital. Accordingly, the Funds may periodically make reclassifications among certain of their capital accounts without impacting their net asset value.
Expenses
Most expenses can be directly attributed to a Fund. Expenses of the Investment Company which cannot be directly attributed to a Fund are allocated among all funds of the Investment Company based principally on their relative average net assets.
The Emerging Markets Fund offers Institutional Class and Select Class shares. All share classes have identical voting, dividend, liquidation and other rights and the same terms and conditions. The separate classes of shares differ principally in the applicable distribution fees and shareholder servicing fees. Shareholders of each class bear certain expenses that pertain to that particular class. Realized and unrealized gains (losses), net investment income, and expenses with the exception of class level expenses, are allocated daily to each class of shares based upon the relative proportion of net assets of each class.
Foreign Currency Translations
The books and records of the Funds are maintained in U.S. dollars. Foreign currency amounts and transactions of any Fund that holds securities denominated in non-U.S. dollars are translated into U.S. dollars on the following basis:
(a) Market value of investment securities, other assets and liabilities at the closing rate of exchange on the valuation date.
(b) Purchases and sales of investment securities and income at the closing rate of exchange prevailing on the respective trade dates of such transactions.
Reported net realized gains or losses from foreign currency-related transactions arise from sales and maturities of short-term securities; sales of foreign currencies; currency gains or losses realized between the trade and settlement dates on securities transactions; and the difference between the amounts of dividends, interest, and foreign withholding taxes recorded on the Funds’ books and the U.S. dollar equivalent of the amounts actually received or paid. Net unrealized gains (losses) from foreign currency-related transactions arise from changes in the value of assets and liabilities, other than investments in securities resulting from changes in the exchange rates.
These Funds do not isolate that portion of the results of operations of a Fund that arises as a result of changes in exchange rates from that portion that arises from changes in market prices of investments during the period. Such fluctuations are included with the net realized and unrealized gain or loss from investments. However, for federal income tax purposes the Funds do isolate the effects of changes in foreign exchange rates from the fluctuations arising from changes in market prices for realized gain (loss) on debt obligations.
| | |
| 86 | | Notes to Financial Statements |
SSgA Funds
Notes to Financial Statements, continued — August 31, 2013
Capital Gains Taxes
The Emerging Markets Fund may be subject to capital gains and repatriation taxes imposed by certain countries in which it invests. This Fund has recorded a deferred tax liability in respect of unrealized appreciation on foreign securities for potential capital gains and repatriation taxes at August 31, 2013. The accrual for capital gains and repatriation taxes is included in net unrealized appreciation (depreciation) on investments in the Statement of Assets and Liabilities for the Fund. The amounts related to capital gain taxes are included in net realized gain (loss) on investments in the Statement of Operations for the Fund.
| | | | | | | | |
| | | Deferred Tax Liability | | | Capital Gains Taxes | |
| | | | | | | | |
Emerging Markets Fund | | $ | 1,138,415 | | | $ | 1,534,465 | |
High Yield Securities
The High Yield Bond Fund may invest in high yield instruments that are subject to certain credit and market risks. The yields of high yield instruments reflect, among other things, perceived credit risk. The Fund’s investments in securities rated below investment grade typically involve risks not associated with higher rated securities including, among others, greater risk related to timely and ultimate payment of interest and principal, greater market price volatility and less liquid secondary market trading.
Loan Agreements
The High Yield Bond Fund may invest in direct debt instruments which are interests in amounts owed by corporate, governmental, or other borrowers to lenders or lending syndicates. These investments in loans may be in the form of participations in loans or assignments of all or a portion of loans from third parties. A loan is often administered by a bank or other financial institution (the “lender”) that acts as agent for all holders. The agent administers the terms of the loan, as specified in the loan agreement. When investing in a loan anticipation, the Fund has the right to receive payments of principal, interest and any fees to which it is entitled only from the lender selling the loan agreement and only upon receipt by the lender of payments from the borrower. A Fund generally has no right to enforce compliance with the terms of the loan agreement with the borrower. As a result, a Fund may be subject to the credit risk of both the borrower and the lender that is selling the loan agreement. When a Fund purchases assignments from lenders it acquires direct rights against the borrower on the loan.
Derivatives
To the extent permitted by the investment objective, restrictions and policies set forth in each Fund’s Prospectus and Statement of Additional Information, the Funds may invest in various derivative-based transactions. Derivative securities are instruments or agreements whose value is derived from an underlying security or index. The Funds’ use of derivatives includes exchange-traded futures and credit default swaps. These instruments offer unique characteristics and risks that assist the Funds in meeting their investment objectives.
The Funds typically use derivatives in three ways: cash equitization, hedging, and return enhancement. Cash equitization is a technique that may be used by the Funds through the use of options and futures to earn “market-like” returns with the Funds’ excess and liquidity reserve cash balances. Hedging is used by the Funds to limit or control risks, such as adverse movements in exchange rates and interest rates. Return enhancement can be accomplished through the use of derivatives in the Funds. By purchasing certain instruments, the Funds may more effectively achieve the desired portfolio characteristics that assist in meeting the Funds’ investment objectives. Depending on how the derivatives are structured and utilized, the risks associated with them may vary widely. These risks are generally categorized as market risk, liquidity risk, counterparty risk, interest rate risk and credit risk.
Investments in a derivative instrument could lose more than the principal amount invested. Compared to conventional securities, derivatives can be more sensitive to changes in interest rates or to sudden fluctuations in market prices and thus a Fund’s losses may be greater if it invests in derivatives than if it invests only in conventional securities. The use of derivative instruments involves risks different from, or possibly greater than, the risks associated with investing directly in equity or fixed income securities, currencies or other investments. Derivatives are subject to a number of risks such as liquidity risk, market risk, credit risk, default risk, counterparty risk and management risk. They also involve the risk of mispricing or improper valuation and the risk that changes in the value of the derivative may not correlate exactly with the change in the value of the underlying asset, rate or index.
| | | | |
| Notes to Financial Statements | | | 87 | |
SSgA Funds
Notes to Financial Statements, continued — August 31, 2013
The fair values of the Funds’ derivative instruments as shown on the Statements of Assets and Liabilities, categorized by risk exposure for the period ended August 31, 2013 were as follows:
| | | | | | | | | | | | |
| | | IAM Shares | | | Emerging Markets Fund | |
| | | Equity Contracts | | | Equity Contracts | | | Foreign Currency
Contracts* | |
| | | | | | | | | | | | |
Asset Derivatives(1) | | | | | | | | | | | | |
Futures Contracts | | $ | 30,407 | | | $ | — | | | $ | — | |
Foreign currency-related transactions | | | — | | | | — | | | | 2,713,635 | |
| | | |
| Liability Derivatives(1) | | | | | | | | | | | | |
Futures Contracts | | $ | — | | | $ | 385,594 | | | $ | — | |
Foreign currency-related transactions | | | — | | | | — | | | | 6,115,435 | |
| | * | Includes only forward foreign currency-related transactions. |
| | (1) | Portfolio of Investments: Cumulative unrealized appreciation/depreciation of futures contracts. Only unsettled receivable/payable for variation margin is reported within Statement of Assets and Liabilities. |
The effects of derivative instruments on the Statements of Operations, for the period ended August 31, 2013 were as follows:
| | | | | | | | | | | | | | | | | | | | | | | | | | | | | | | | |
| | | Dynamic Small
Cap Fund | | | IAM
Shares | | | Enhanced Small
Cap Fund | | | Emerging
Markets Fund | | | International Stock
Selection Fund | | | High Yield
Bond Fund | |
| | Equity
Contracts | | | Equity
Contracts | | | Equity
Contracts | | | Equity
Contracts | | | Foreign
Currency
Contracts* | | | Equity
Contracts | | | Foreign
Currency
Contracts* | | | Interest
Rate
Contracts | |
| | | | | | | | | | | | | | | | | | | | | | | | | | | | | | | | |
| Realized Gain (Loss)(2) | | | | | | | | | | | | | | | | | | | | | | | | | | | | | |
Futures contracts | | $ | 25,169 | | | $ | 1,092,422 | | | $ | 68,984 | | | $ | 1,353,949 | | | $ | — | | | $ | 596,203 | | | $ | — | | | $ | — | |
Foreign currency-related transactions | | | — | | | | — | | | | — | | | | — | | | | (5,176,253 | ) | | | — | | | | (38,774 | ) | | | — | |
Credit Default Swap Contracts | | | — | | | | — | | | | — | | | | — | | | | — | | | | — | | | | — | | | | 364,619 | |
| | | | | | |
| Change in Appreciation (Depreciation)(3) | | | | | | | | | | | | | | | | | | | | | | | | | |
Futures contracts | | $ | — | | | $ | (260,304 | ) | | $ | (2,956 | ) | | $ | 521,398 | | | $ | — | | | $ | 8,551 | | | $ | — | | | $ | — | |
Foreign currency-related transactions | | | — | | | | — | | | | — | | | | — | | | | (3,052,163 | ) | | | — | | | | (11,113 | ) | | | — | |
Credit Default Swap Contracts | | | — | | | | — | | | | — | | | | — | | | | — | | | | — | | | | — | | | | (121,666 | ) |
| | * | Includes only forward foreign currency-related transactions. |
| | (2) | Statement of Operations location: Net realized gain (loss) on: Futures contracts |
| | (3) | Statement of Operations location: Net change in unrealized appreciation (depreciation) on: Futures contracts |
Derivative balances at August 31, 2013 are representative of derivative use throughout the period.
| | |
| 88 | | Notes to Financial Statements |
SSgA Funds
Notes to Financial Statements, continued — August 31, 2013
For the period ended August 31, 2013, the Funds’ quarterly holdings of futures contracts were as follows:
| | | | | | | | | | | | | | | | | | | | | | | | |
| | | Number of Futures Contracts Outstanding | |
| Quarter Ended | | Dynamic
Small Cap
Fund | | | IAM
SHARES
Fund | | | Enhanced
Small Cap
Fund | | | Emerging
Markets
Fund | | | International
Stock Selection
Fund | | | High Yield
Bond
Fund | |
November 30, 2012 | | | — | | | | 14 | | | | 3 | | | | 7,897 | | | | — | | | | — | |
February 28, 2013 | | | — | | | | 14 | | | | 2 | | | | 419 | | | | 100 | | | | — | |
May 31, 2013 | | | 2 | | | | 12 | | | | 3 | | | | 1,241 | | | | 181 | | | | — | |
August 31, 2013 | | | — | | | | 12 | | | | — | | | | 945 | | | | — | | | | — | |
For the period ended August 31, 2013, the Funds’ quarterly holdings of swap contracts were as follows:
| | | | |
| | | Credit Default Swap Notional Amounts Outstanding | |
| Quarter Ended | | High Yield Bond Fund | |
November 30, 2012 | | | 4,200,000 | |
February 28, 2013 | | | — | |
May 31, 2013 | | | — | |
August 31, 2013 | | | — | |
Foreign Currency Exchange Contracts
In connection with portfolio purchases and sales of securities denominated in a foreign currency, certain funds may enter into foreign currency exchange spot contracts and forward foreign currency exchange contracts (“contracts”). Additionally, from time to time these Funds may enter into contracts to hedge certain foreign currency-denominated assets. Contracts are recorded at market value. Certain risks may arise upon entering into these contracts from the potential inability of counterparties to meet the terms of their contracts and are generally limited to the amount of unrealized gain on the contracts, if any, that are recognized in the accompanying Statements of Assets and Liabilities. Realized gains (losses) arising from such transactions are included in net realized gain (loss) from foreign currency-related transactions.
These Funds may engage in forward currency contracts to hedge against uncertainty in the level of future exchange rates or, to the extent permitted by the investment objective, restrictions and policies set forth in a Fund’s Prospectus and Statement of Additional Information, to effect investment transactions to generate returns consistent with the Fund’s investment objective and strategies. A forward contract involves an obligation to purchase or sell a specific currency. Forward currency contracts are subject to the risk that should forward prices increase, a loss will be incurred to the extent that the price of the currency agreed to be purchased exceeds the price of the currency agreed to be sold.
For the period ended August 31, 2013, the following Fund entered into forward foreign currency exchange contracts primarily for the strategy listed below:
| | |
| Fund | | Strategy |
Emerging Markets Fund | | Hedging duration |
Futures Contracts
A futures contract is an agreement to buy or sell a security, or deliver a cash settlement, in connection with an interest rate, an index, currency or other asset. The risk of loss in trading futures contracts in some strategies is potentially unlimited. The entire amount invested in futures contracts could be lost. There also is no assurance that a liquid secondary market will exist for futures contracts and options in which a Fund may invest. Participation in the futures markets, as well as the use of various forward contracts, involves investment risks and transaction costs to which the Fund would not be subject absent the use of these strategies. If the Fund’s predictions of movements in the direction of the securities, fixed income or currencies markets are inaccurate, the adverse consequences to the Fund may leave the Fund in a worse position than if such strategies were not used.
Certain Funds are currently utilizing exchange-traded futures contracts. The primary risks associated with the use of futures contracts are an imperfect correlation between the change in market value of the securities held by the Funds and the prices of futures contracts and the possibility of an illiquid market. Upon entering into a futures contract, the Funds are required to deposit with a broker an amount, termed the initial margin, which typically represents 5% of the purchase price indicated in the futures contract. Payments to and from the broker, known as the variation margin, are required to be made on a daily basis as the price of the futures contract fluctuates. Changes in initial settlement value are accounted for as unrealized appreciation (depreciation) until the contracts are terminated, at which time realized gains and losses are recognized.
| | | | |
| Notes to Financial Statements | | | 89 | |
SSgA Funds
Notes to Financial Statements, continued — August 31, 2013
As of August 31, 2013, the following Funds had cash collateral balances held in connection with futures contracts purchased (sold) as follows:
| | | | |
| | | Cash Collateral for Futures | |
| | | | |
IAM SHARES Fund | | $ | 322,997 | |
Enhanced Small Cap Fund | | | 9,600 | |
Emerging Markets Fund | | | 2,650,133 | |
For the period ended August 31, 2013, the following Funds entered into future contracts primarily for the strategies listed below:
| | |
| Funds | | Strategies |
IAM SHARES Fund | | Equitize cash and cash equivalents |
Enhanced Small Cap Fund | | Hedging duration |
Emerging Markets Fund | | Return enhancement, hedging and exposing cash reserves to markets |
International Stock Selection Fund | | Exposing cash reserves to markets |
High Yield Bond Fund | | Hedging duration |
Credit Default Swaps
The High Yield Bond Fund may enter into credit default swaps. A credit default swap can refer to corporate issues, asset-backed securities or an index of assets, each known as the reference entity or underlying asset. The Fund may act as either the buyer or the seller of a credit default swap involving one party making a stream of payments to another party in exchange for the right to receive a specified return in the event of a default or other credit event. Depending upon the terms of the contract, the credit default swap may be closed via physical settlement. However, due to the possible or potential instability in the market, there is a risk that the Fund may be unable to deliver the underlying debt security to the other party to the agreement. Additionally, the Fund may not receive the expected amount under the swap agreement if the other party to the agreement defaults or becomes bankrupt. In an unhedged credit default swap, the Fund enters into a credit default swap without owning the underlying asset or debt issued by the reference entity. Credit default swaps allow the Fund to acquire or reduce credit exposure to a particular issuer, asset or basket of assets.
Credit default swaps could result in losses if the Fund does not correctly evaluate the creditworthiness of the company or companies on which the credit default swap is based. Credit default swap agreements may involve greater risks than if the Fund had invested in the reference obligation directly since, in addition to risks relating to the reference obligation, credit default swaps are subject to illiquidity and counterparty risk. The Fund will generally incur a greater degree of risk when it sells a credit default swap than when it purchases a credit default swap. As a buyer of a credit default swap, the Fund may lose its upfront or periodic payments previously made and recover nothing should a credit event fail to occur and the swap is held to its termination date. As a seller of a credit default swap, if a credit event were to occur, the value of any deliverable obligation received by the Fund, coupled with the upfront or periodic payments previously received, may be less than what it pays to the buyer, resulting in a loss of value to the Fund. The maximum potential amount the Fund may pay should a negative credit event take place is defined under the terms of the agreement.
If the creditworthiness of a Fund’s swap counterparty declines, the risk that the counterparty may not perform could increase, potentially resulting in a loss to the Fund. To limit the counterparty risk involved in swap agreements, the Fund will only enter into swap agreements with counterparties that meet certain standards of creditworthiness. Although there can be no assurance that the Fund will be able to do so, the Fund may be able to reduce or eliminate its exposure under a swap agreement either by assignment or other disposition, or by entering into an offsetting swap agreement with the same party or another creditworthy party. The Fund may have limited ability to eliminate its exposure under a credit default swap if the credit of the reference entity or underlying asset has declined.
For the period ended August 31, 2013, the following Fund entered into credit default swaps primarily for the strategy listed below:
| | |
| Fund | | Strategy |
SSgA High Yield Bond Fund | | Market exposure |
| | |
| 90 | | Notes to Financial Statements |
SSgA Funds
Notes to Financial Statements, continued — August 31, 2013
Index Swaps
The Emerging Markets Fund may enter into index swap agreements in order to efficiently participate in certain foreign markets. Pursuant to these agreements, the Fund pays the swap counterparties based on the notional amount an agreed upon rate (e.g., the 12-month USD LIBOR BBA rate). During the terms of the agreements, changes in the underlying values of the swaps are recorded as unrealized gain (loss) and are based on changes in the value of the underlying index or security. The underlying index or security is valued at the published daily closing price. Accrued interest expense to be paid to the swap counterparties or accrued interest income to be paid to the Fund, at the agreed upon dates, are recognized as unrealized gain (loss). Amounts paid to and received from the swap counterparties representing capital appreciation (depreciation) on the underlying securities and accrued interest expense and interest income are recorded as net realized gain (loss). The Fund is exposed to credit and counterparty risk in the event of non-performance by the swap counterparties. The Fund minimizes this risk by entering into agreements only with counterparties that the Funds’ investment adviser deems creditworthy. This risk is also mitigated by investing the portfolio in assets generating cash flows complementary to the returns it is required to pay. The Fund segregates certain short-term investments (identified in the accompanying Schedule of Investments) as collateral for the notional amount under the index swap agreements. As of August 31, 2013, the Emerging Markets Fund held no swap contracts and therefore held no cash collateral in connection with swap contracts purchased (sold).
Participation Notes
The Emerging Markets Fund may purchase participation notes, also known as participation certificates or participation interest notes. Participation notes are issued by banks or broker-dealers that are designed to replicate the performance of foreign companies or foreign securities markets and can be used by the Fund as an alternative means to access the securities market of a frontier emerging market country. The performance results of participation notes will not replicate exactly the performance of the foreign companies or foreign securities markets that they seek to replicate due to transaction and other expenses. Investments in participation notes involve certain risks in addition to those associated with a direct investment in the underlying foreign companies or foreign securities markets whose return they seek to replicate. There can be no assurance that there will be a trading market or that the trading price of a participation note will equal the underlying value of the foreign company or foreign securities market that it seeks to replicate. The Fund relies on the creditworthiness of the counterparty issuing the participation note and has no rights against the issuer of the underlying security. The Fund minimizes this risk by entering into agreements only with counterparties that the Funds’ investment adviser deems creditworthy. Due to liquidity and transfer restrictions, the secondary markets on which the participation notes are traded may be less liquid than the markets for other securities, or may be completely illiquid.
Investment in Foreign Securities
The investments by the Funds in foreign securities may involve risks not present in domestic investments. Since securities may be denominated in foreign currencies and may require settlement in foreign currencies and pay interest or dividends in foreign currencies, changes in the relationship of these foreign currencies to the U.S. dollar can significantly affect the value of the investments and earnings of the Funds. Foreign investments may also subject the Funds to foreign government exchange restrictions, expropriation, taxation or other political, social or economic developments, all of which could affect the market and/or credit risk of the investments. In addition to the risks described above, risks may arise from forward foreign currency contracts with respect to the potential inability of counterparties to meet the terms of their contracts.
Investment in Emerging Markets
Investing in emerging markets may involve special risks and considerations not typically associated with investing in developed markets. These risks include revaluation of currencies, high rates of inflation, repatriation, restrictions on income and capital, and future adverse political and economic developments. Moreover, securities issued in these markets may be less liquid, subject to government ownership controls, delayed settlements, and their prices may be more volatile than those of comparable securities in the U.S.
| | | | |
| Notes to Financial Statements | | | 91 | |
SSgA Funds
Notes to Financial Statements, continued — August 31, 2013
Contractual Obligation/Indemnification
Under the Investment Company’s organizational documents, its officers and trustees are indemnified against certain liabilities arising out of the performance of their duties to the Trust. In the normal course of business, the Funds enter into contracts that contain a variety of representations and obligations, including general indemnifications. The Funds’ maximum exposure under these arrangements is unknown as this would involve future claims that may be made against the Funds that have not yet occurred. However, based on experience, the Funds expect the risk of loss to be remote.
| 3. | | Investment Transactions |
Securities
For the period ended August 31, 2013, purchases and sales of investment securities, excluding U.S. government and agency obligations, short-term investments and derivative contracts, aggregated to the following:
| | | | | | | | |
| | | Purchases | | | Sales | |
| | | | | | | | |
Dynamic Small Cap Fund | | $ | 30,854,419 | | | $ | 20,598,189 | |
Clarion Real Estate Fund | | | 28,558,145 | | | | 48,326,451 | |
IAM SHARES Fund | | | 5,108,426 | | | | 527,690 | |
Enhanced Small Cap Fund | | | 16,157,361 | | | | 19,579,277 | |
Emerging Markets Fund | | | 817,137,636 | | | | 1,396,837,576 | |
International Stock Selection Fund | | | 202,505,642 | | | | 279,657,928 | |
High Yield Bond Fund | | | 129,924,617 | | | | 145,492,201 | |
Securities Lending
The Investment Company participates in a securities lending program whereby each Fund can loan securities with a value up to 33 1/3% of its total assets. Each Fund receives cash (U.S. currency), U.S. Government, U.S. Government agency obligations or foreign government securities as collateral against the loaned securities. To the extent that a loan is secured by cash collateral, such collateral must be invested by State Street Bank and Trust Company, as the lending agent, in short-term instruments, money market mutual funds, and such other short-term investments, provided the investments meet certain quality and diversification requirements. Under the securities lending arrangement, the collateral received is recorded on a lending Fund’s Statement of Assets and Liabilities along with the related obligation to return the collateral. At year end, all such cash collateral was invested in the State Street Navigator Securities Lending Prime Portfolio, a money market fund affiliated with the Funds’ investment adviser.
Income generated from the investment of cash collateral, less negotiated rebate fees paid to participating brokers and transaction costs, is divided between the Fund and the lending agent and is recorded as securities lending income for the Funds. To the extent that a loan is secured by non-cash collateral, brokers pay the Fund negotiated lenders’ fees, which are divided between the Fund and the lending agent and are recorded as security lending income for the Fund. All collateral received will be in an amount at least equal to 102% (for loans of U.S. securities) or 105% (for non-U.S. securities) of the market value of the loaned securities at the inception of each loan. The market value of the loaned securities is determined at the close of business of the Funds, and any additional required collateral is delivered to the Funds the next day. Should the borrower of the securities fail financially, there is a risk of delay in recovery or loss of rights in the securities loaned or loss of rights in the collateral. Consequently, loans are made only to borrowers which are deemed to be of good financial standing.
As of August 31, 2013, the non-cash collateral received for the securities on loan was as follows:
| | | | | | |
| | | Non-Cash
Collateral Value | | | Non-Cash Collateral Holding |
| | | | | | |
Dynamic Small Cap Fund | | $ | 146,340 | | | Pool of U.S. Government Bonds |
IAM SHARES Fund | | $ | 60,900 | | | Pool of U.S. Government Bonds |
Emerging Markets Fund | | $ | 30 | | | Pool of U.S. and Foreign Government Bonds |
The Funds cannot repledge or sell non-cash collateral balances.
| | |
| 92 | | Notes to Financial Statements |
SSgA Funds
Notes to Financial Statements, continued — August 31, 2013
| 4. | | Related Party Transactions, Fees and Expenses |
Adviser and Affiliates
SSgA Funds Management, Inc. (the “Adviser”) manages the Funds pursuant to an Amended and Restated Investment Advisory Agreement dated April 11, 2012, between the Investment Company and the Adviser. The Adviser is a wholly-owned subsidiary of State Street Corporation, a publicly held bank holding company. The Tuckerman Group, LLC served as the investment sub-adviser (through December 31, 2013) and CBRE Clarion Securities LLC currently serves as the sub-adviser (effective January 1, 2013) for the Clarion Real Estate Fund. The Adviser provides reporting, operational compliance and general oversight services with respect to the investment advisory services of the sub-adviser. The Adviser and other advisory affiliates of State Street Corporation make up State Street Global Advisors, the investment management arm of State Street Corporation and its affiliated companies. The Adviser directs the investments of the Funds in accordance with their investment objectives, policies, and limitations. For these services, each Fund pays a fee to the Adviser, calculated daily and paid monthly, at the following annual rates of their average daily net assets:
| | | | |
| Funds | | % | |
Dynamic Small Cap Fund | | | 0.75 | |
Clarion Real Estate Fund | | | 0.65 | |
IAM SHARES Fund | | | 0.25 | |
Enhanced Small Cap Fund | | | 0.45 | |
Emerging Markets Fund | | | 0.75 | |
International Stock Selection Fund | | | 0.75 | |
High Yield Bond Fund | | | 0.30 | |
The Adviser is contractually obligated until December 31, 2013 to waive its management fee on the Dynamic Small Cap Fund and to reimburse the Fund for all expenses to the extent that total expenses (exclusive of non-recurring account fees, extraordinary expenses and acquired fund fees) exceed 1.25% of average daily net assets on an annual basis. The total amount of waiver for the period ended August 31, 2013 was $105,180. The total amount of reimbursement for the period ended August 31, 2013 was $39,245. The Adviser does not have the ability to recover these amounts waived or reimbursed under this contractual agreement.
The Adviser is contractually obligated until December 31, 2013 to waive its management fee on the Clarion Real Estate Fund and to reimburse the Fund for all expenses to the extent that total expenses (exclusive of non-recurring account fees, extraordinary expenses and acquired fund fees) exceed 1.00% of average daily net assets on an annual basis. The total amount of waiver for the period ended August 31, 2013 was $214,652. There was no reimbursement for the period ended August 31, 2013. The Adviser does not have the ability to recover these amounts waived or reimbursed under this contractual agreement.
The Adviser is contractually obligated until December 31, 2013 to waive its management fee on the IAM SHARES Fund and to reimburse the Fund for all expenses to the extent that total expenses (exclusive of non-recurring account fees, extraordinary expenses and acquired fund fees) exceed 0.65% of average daily net assets on an annual basis. There were no waivers or reimbursements for the period ended August 31, 2013.
The Adviser is contractually obligated until December 31, 2013 to waive its management fee on the Enhanced Small Cap Fund and to reimburse the Fund for all expenses to the extent that total expenses (exclusive of non-recurring account fees, extraordinary expenses and acquired fund fees) exceed 0.75% of average daily net assets on an annual basis. The total amount of waiver for the period ended August 31, 2013 was $130,352. The total amount of reimbursement for the period ended August 31, 2013 was $45,839. The Adviser does not have the ability to recover these amounts waived or reimbursed under this contractual agreement.
The Adviser is contractually obligated until December 31, 2013 to waive its management fee on the Emerging Markets Fund and to reimburse the Fund for all expenses to the extent that total expenses (exclusive of non-recurring account fees, extraordinary expenses and acquired fund fees) exceed 1.25% of average daily net assets on an annual basis. The total amount of waivers for the period ended August 31, 2013 was $85,789 for the Institutional Class and $21,727 for Select Class. There were no reimbursements for the Institutional Class or Select Class for the period ended August 31, 2013. The Adviser does not have the ability to recover these amounts waived or reimbursed under this contractual agreement.
| | | | |
| Notes to Financial Statements | | | 93 | |
SSgA Funds
Notes to Financial Statements, continued — August 31, 2013
The Adviser is contractually obligated until December 31, 2013 to waive its management fee on the International Stock Selection Fund and to reimburse the Fund for all expenses to the extent that total expenses (exclusive of non-recurring account fees, extraordinary expenses and acquired fund fees) exceed 1.00% of average daily net assets on an annual basis. The total amount of waivers for the period ended August 31, 2013 was $743,129. There were no reimbursements for the period ended August 31, 2013. The Adviser does not have the ability to recover these amounts waived or reimbursed under this contractual agreement.
The Adviser is contractually obligated until December 31, 2013 to waive its management fee on the High Yield Bond Fund and to reimburse the Fund for all expenses to the extent that total expenses (exclusive of non-recurring account fees, extraordinary expenses and acquired fund fees) exceed 0.75% of average daily net assets on an annual basis. The total amount of the waiver for the period ended August 31, 2013 was $52,474. There were no reimbursements for the period ended August 31, 2013. The Adviser does not have the ability to recover these amounts waived or reimbursed under this contractual agreement.
The Funds are permitted to invest their cash reserves (i.e., monies awaiting investment in portfolio securities suitable for the Funds’ objectives) in the SSgA Prime Money Market Fund (“Central Fund”) (a series of the Investment Company not presented herein). Shares of the Central Fund sold to and redeemed from any participating fund will not be subject to a redemption fee, distribution fee or service fee. If Central Fund shares sold to or redeemed from a participating fund are subject to any such distribution or service fee, the Adviser will waive its advisory fee for each participating fund in an amount that offsets the amount of such distribution and/or service fees incurred by the participating fund. Effective September 1, 2006, the Adviser has voluntarily agreed to waive a portion of any participating Fund’s advisory fee equal to the advisory fee paid by that participating Fund to the Central Fund. As of August 31, 2013, $10,879,244 of the Central Fund’s net assets represents investments by these Funds.
For the period ended August 31, 2013, the total advisory fees waived pursuant to the voluntary waiver agreement were as follows:
| | | | |
| | | Amount Waived | |
| | | | |
Dynamic Small Cap Fund | | $ | 407 | |
Clarion Real Estate Fund | | | 389 | |
IAM SHARES Fund | | | 6,401 | |
Enhanced Small Cap Fund | | | 344 | |
Emerging Markets Fund | | | 13,996 | |
International Stock Selection Fund | | | 5,881 | |
High Yield Bond Fund | | | 9,447 | |
Boston Financial Data Services, Inc. (“BFDS”) serves as the Funds’ transfer and dividend paying agent, pursuant to an agreement dated August 1, 2006, as amended. For these services, the Funds pay annual account services fees, activity based fees, charges related to compliance and regulatory services and a minimum fee of $200 for each Fund. BFDS is a joint venture of DST Systems, Inc., and State Street Corporation.
State Street Bank and Trust Company (“State Street”) provides custody and fund accounting services to the Funds pursuant to an Amended and Restated Custodian Agreement dated April 11, 2012. For these services, the Funds pay State Street asset based fees that vary according to the number of positions and transactions plus out-of-pocket expenses. State Street is a wholly-owned subsidiary of State Street Corporation.
In addition, the Funds have entered into arrangements with State Street whereby custody credits realized as a result of uninvested cash balances were used to reduce a portion of the Funds’ expenses. During the period, the Funds’ custodian fees were reduced by the following amounts under these arrangements:
| | | | |
| | | Amount Paid | |
| | | | |
Dynamic Small Cap Fund | | $ | — | |
Clarion Real Estate Fund | | | — | |
IAM SHARES Fund | | | 2 | |
Enhanced Small Cap Fund | | | 1 | |
Emerging Markets Fund | | | 263 | |
International Stock Selection Fund | | | 9 | |
High Yield Bond Fund | | | 37 | |
| | |
| 94 | | Notes to Financial Statements |
SSgA Funds
Notes to Financial Statements, continued — August 31, 2013
On December 26, 2012 the Adviser agreed to make a voluntary contribution of $43,032 to the Emerging Markets Fund and $1,184 to the International Stock Selection Fund in connection with a portfolio investment matter. As a result of the payment, the performance of each Fund for periods as of and after December 26, 2012, is expected to be impacted by the increase in the Fund’s NAV. If the voluntary payment had not been made, the total return for the period(s) indicated would have been lower.
A one-time voluntary payment was made by the Adviser on August 20, 2013 to the Dynamic Small Cap Fund. As a result of the payment, the performance of the Fund for periods as of and after August 20, 2013, is expected to be impacted by the increase in the Fund’s NAV. If the voluntary payment had not been made, the total return for the period(s) indicated would have been lower.
Securities Lending
State Street is authorized to act on behalf of the Investment Company as lending agent with respect to the lending of certain securities of the Investment Company held by State Street as custodian, pursuant to an amended and restated securities lending authorization agreement dated September 28, 2010. Proceeds collected by State Street on investment of cash collateral or any fee income is allocated at 85% payment to the fund, and 15% payable to State Street (after deduction of such other amounts payable to State Street under the terms of the securities lending agreement).
For the period September 1, 2012 through August 31, 2013, State Street earned securities lending agent fees as follows:
| | | | |
| | | Agent Fees Earned | |
| | | | |
Dynamic Small Cap Fund | | $ | 2,124 | |
Clarion Real Estate Fund | | | 1,523 | |
IAM SHARES Fund | | | 4,294 | |
Emerging Markets Fund | | | 122,020 | |
International Stock Selection Fund | | | 55,964 | |
Transactions with Affiliates
Each Fund may invest in the SSgA Prime Money Market Fund, a series of the Investment Company. All income distributions earned by the Funds from affiliated money market funds are recorded as dividends from affiliated money market funds on the Statements of Operations. In addition, cash collateral from lending activities is invested in the State Street Navigator Securities Lending Prime Portfolio, for which SSgA FM serves as the investment adviser.
Amounts related to investments in the SSgA Prime Money Market Fund and/or State Street Navigator Securities Lending Prime Portfolio at August 31, 2013 and for the period then ended are:
| | | | | | | | | | | | | | | | | | | | | | | | | | | | |
SSgA Prime Money
Market Fund | | Value at
8/31/2012 | | | Purchased
Cost | | | Purchases
Shares | | | Sold
Cost | | | Sold
Shares | | | Value at
8/31/2013 | | | Income | |
| | | | | | | | | | | | | | | | | | | | | | | | | | | | |
Dynamic Small Cap Fund | | $ | 82,538 | | | $ | 11,454,011 | | | | 11,454,011 | | | $ | 11,464,209 | | | | 11,464,209 | | | $ | 72,340 | | | $ | 119 | |
Clarion Real Estate Fund | | | 538,339 | | | | 10,644,599 | | | | 10,644,599 | | | | 10,981,696 | | | | 10,981,696 | | | | 201,242 | | | | 186 | |
IAM SHARES Fund | | | 4,568,189 | | | | 7,766,817 | | | | 7,766,817 | | | | 7,719,156 | | | | 7,719,156 | | | | 4,615,850 | | | | 3,183 | |
Enhanced Small Cap Fund | | | 234,162 | | | | 5,714,005 | | | | 5,714,005 | | | | 5,881,454 | | | | 5,881,454 | | | | 66,713 | | | | 178 | |
Emerging Markets Fund | | | 31,473,270 | | | | 439,765,406 | | | | 439,765,406 | | | | 466,844,237 | | | | 466,844,237 | | | | 4,394,439 | | | | 9,264 | |
International Stock Selection Fund | | | 724,934 | | | | 69,504,095 | | | | 69,504,095 | | | | 69,195,875 | | | | 69,195,875 | | | | 1,033,154 | | | | 1,869 | |
High Yield Bond Fund | | | 11,975,468 | | | | 110,157,731 | | | | 110,157,731 | | | | 121,637,693 | | | | 121,637,693 | | | | 495,506 | | | | 5,968 | |
| | | | | | | |
State Street Navigator
Securities Lending Prime
Portfolio | | Value at
8/31/2012 | | | Purchased
Cost | | | Purchases
Shares | | | Sold
Cost | | | Sold
Shares | | | Value at
8/31/2013 | | | Income | |
| | | | | | | | | | | | | | | | | | | | | | | | | | | | |
Dynamic Small Cap Fund | | $ | 2,558,697 | | | $ | 12,068,632 | | | | 12,068,632 | | | $ | 8,641,839 | | | | 8,641,839 | | | $ | 5,985,490 | | | $ | 12,250 | |
Clarion Real Estate Fund | | | 11,984,819 | | | | 52,363,673 | | | | 52,363,673 | | | | 61,732,208 | | | | 61,732,208 | | | | 2,616,284 | | | | 8,631 | |
IAM SHARES Fund | | | 15,153,582 | | | | 46,377,080 | | | | 46,377,080 | | | | 55,237,376 | | | | 55,237,376 | | | | 6,293,286 | | | | 24,076 | |
Emerging Markets Fund | | | 94,359,562 | | | | 289,681,325 | | | | 289,681,325 | | | | 316,223,857 | | | | 316,223,857 | | | | 67,817,030 | | | | 668,954 | |
International Stock Selection Fund | | | 20,549,710 | | | | 174,138,605 | | | | 174,138,605 | | | | 185,535,786 | | | | 185,535,786 | | | | 9,152,529 | | | | 314,499 | |
| | | | |
| Notes to Financial Statements | | | 95 | |
SSgA Funds
Notes to Financial Statements, continued — August 31, 2013
Administrator
State Street (the “Administrator”) serves as the Investment Company’s Administrator, pursuant to an administration agreement dated January 1, 2013 (the “Administration Agreement”). Under the Administration Agreement, the Administrator supervises certain administrative aspects of the Investment Company’s operations. The Investment Company pays the Administrator an annual fee, payable monthly on a pro rata basis. The annual fee is based on the following percentages of the average daily net assets of the Investment Company: $0 to $10 billion — 0.0175%; next $10 billion — 0.0125%; next $10 billion — 0.0075% and 0.0050% thereafter. In addition, the Investment Company pays additional fees to the Administrator for certain services and reimburses the Administrator for out-of-pocket expenses.
Prior to January 1, 2013, Russell Fund Services Company (“RFSC”) served as administrator at an annual fee based on the following percentages of the average daily net assets of the Dynamic Small Cap Fund, Clarion Real Estate Fund, IAM SHARES Fund and Enhanced Small Cap Fund: $0 to $2 billion — 0.0315%; over $2 billion — 0.029%: Prior to January 1, 2013, the fee structure for the Emerging Markets Fund and International Stock Selection Fund was: $0 to $1 billion — 0.07%; over $1 billion — 0.05%. Prior to January 1, 2013, the fee structure for the High Yield Bond Fund was: $0 to $1 billion — 0.0315%; over $1 billion — 0.029%. In addition, RFSC charged a flat fee of $30,000 per year per Fund with less than $500 million in assets under management.
Distributor and Shareholder Servicing
State Street Global Markets, LLC (the “Distributor” or “SSGM”) promotes and offers shares of the Investment Company pursuant to an Amended and Restated Distribution Agreement dated April 11, 2012. The Distributor may enter into agreements with other related and non-related parties which act as agents to offer and sell shares of the Funds. The amounts paid to the Distributor are included in the accompanying Statements of Operations. The Distributor is a wholly-owned subsidiary of State Street Corporation.
The Investment Company has adopted a distribution plan pursuant to Rule 12b-1 (the “Plan”) under the 1940 Act. Under the Plan, the Investment Company is authorized to make payments to the Distributor, or any shareholder servicing agent, as defined in the Plan, for providing distribution and marketing services, for furnishing assistance to investors on an ongoing basis, and for the reimbursement of direct out-of-pocket expenses charged by the Distributor in connection with the distribution and marketing of shares of the Investment Company and the servicing of investor accounts.
Institutional Class
Each Fund has a shareholder servicing agreement with State Street and the following entities related to State Street: SSGM, Fiduciary Investors Services Division of State Street (“Fiduciary Investors Services”) and High Net Worth Services Division of State Street (“High Net Worth Services”) (collectively, the “Agents”), as well as several unaffiliated services providers. For these services, each Institutional Class pays 0.025% to State Street and a maximum of 0.175% to each of the affiliated Agents, based upon the average daily value of all Institutional Class shares held by or for customers of these Agents. For the period ended August 31, 2013, each Institutional Class paid the following shareholder servicing expenses to the Agents:
| | | | | | | | |
| | | State Street | | | SSGM | |
| | | | | | | | |
Dynamic Small Cap Fund | | $ | 568 | | | $ | 363 | |
Clarion Real Estate Fund | | | 1,397 | | | | 173 | |
IAM SHARES Fund | | | 45,775 | | | | 6 | |
Enhanced Small Cap Fund | | | 16 | | | | — | |
Emerging Markets Fund | | | 43,399 | | | | 5,722 | |
International Stock Selection Fund | | | 7,696 | | | | 122 | |
High Yield Bond Fund | | | 4,743 | | | | 650 | |
The Fund(s) did not incur any expenses from Fiduciary Investors Services during the period.
The combined distribution and shareholder servicing payments shall not exceed 0.25% of the average daily value of net assets of the Institutional Class on an annual basis. The shareholder servicing payments shall not exceed 0.20% of the average daily value of net assets of the Institutional Class on an annual basis. Costs that exceed the maximum amount of allowable
| | |
| 96 | | Notes to Financial Statements |
SSgA Funds
Notes to Financial Statements, continued — August 31, 2013
reimbursement may be carried forward for two years following the year in which the expenditure was incurred so long as the Plan is in effect. The class’ responsibility for any such expenses carried forward shall terminate at the end of two years following the year in which the expenditure was incurred. The Board or a majority of the class’ shareholders have the right, however, to terminate the Plan and all payments thereunder at any time. The Institutional Class will not be obligated to reimburse the Distributor for carryover expenses subsequent to the Plan’s termination or discontinuation. As of August 31, 2013, the Funds had no carryover expenses.
Select Class
The Investment Company has entered into a distribution plan with respect to the Select Class pursuant to Rule 12b-1 (the “Select Plan”) under the 1940 Act. The Select Plan provides that the Select Class pay a service fee for the performance of certain administrative functions in connection with purchases and redemptions of shares of the Select Class and related services provided to Select Class shareholders by the Distributor. Payments to State Street for shareholder and administrative services are not permitted by the Select Plan to exceed 0.025% of each Fund’s average net asset value per year. Any payments that are required to be made to State Street that cannot be made because of the limitations contained in the Select Plan may be carried forward and paid in the following two fiscal years so long as the Select Plan is in effect. There were no carryover expenses as of August 31, 2013.
Under the Select Plan, the Emerging Markets Fund has entered into a distribution agreement with the Distributor. For these services, Select Class pays the Distributor 0.025% of the daily net asset value. For the period ended August 31, 2013, Emerging Markets Select Class paid $0 to Global Markets.
Board of Trustees
The Investment Company paid each trustee not affiliated with the Investment Company an annual retainer, plus specified amounts for Board and committee meetings attended. These expenses are allocated among all of the funds of the Investment Company based upon their relative net assets.
Accrued fees payable to affiliates and trustees as of August 31, 2013 were as follows:
| | | | | | | | | | | | | | | | | | | | | | | | | | | | |
| | | Dynamic
Small Cap
Fund | | | Clarion
Real Estate
Fund | | | IAM
SHARES
Fund | | | Enhanced Small Cap
Fund | | | Emerging
Markets
Fund | | | International
Stock Selection
Fund | | | High Yield
Bond
Fund | |
| | | | | | | | | | | | | | | | | | | | | | | | | | | | |
Advisory fees | | $ | 27,818 | | | $ | 47,927 | | | $ | 86,613 | | | $ | 23,565 | | | $ | 1,531,841 | | | $ | 497,880 | | | $ | 50,641 | |
Administrative fees | | | 9,886 | | | | 4,390 | | | | 12,616 | | | | — | | | | 10,927 | | | | 5,593 | | | | 3,981 | |
Custodian fees | | | 809 | | | | 3,702 | | | | 5,167 | | | | 3,163 | | | | 92,621 | | | | 12,753 | | | | 4,782 | |
Distribution fees | | | 5,187 | | | | 8,872 | | | | 14,368 | | | | 5,669 | | | | — | | | | — | | | | — | |
Shareholder servicing fees | | | 1,757 | | | | 4,225 | | | | 5,053 | | | | 865 | | | | 22,272 | | | | 5,022 | | | | 16,489 | |
Transfer agent fees | | | 7,139 | | | | 15,621 | | | | 5,920 | | | | 5,876 | | | | 16,498 | | | | 33,067 | | | | 11,489 | |
Trustees’ fees | | | 3,079 | | | | 3,251 | | | | 4,053 | | | | 3,160 | | | | 4,699 | | | | 5,158 | | | | 3,684 | |
| | | | | | | | | | | | | | | | | | | | | | | | | | | | |
| | $ | 55,675 | | | $ | 87,988 | | | $ | 133,790 | | | $ | 42,298 | | | $ | 1,678,858 | | | $ | 559,473 | | | $ | 91,066 | |
| | | | | | | | | | | | | | | | | | | | | | | | | | | | |
| | | | |
| Notes to Financial Statements | | | 97 | |
SSgA Funds
Notes to Financial Statements, continued — August 31, 2013
| 5. | | Fund Share Transactions |
| | | | | | | | | | | | | | | | |
| | | Year Ended
August 31, 2013 | | | Year Ended
August 31, 2012 | |
| Dynamic Small Cap Fund | | Shares | | | Dollars | | | Shares | | | Dollars | |
| | | | | | | | | | | | | | | | |
Institutional Class | | | | | | | | | | | | | | | | |
Proceeds from shares sold | | | 381,077 | | | $ | 11,794,409 | | | | 93,910 | | | $ | 2,221,361 | |
Proceeds from reinvestment of distributions | | | 4,147 | | | | 101,363 | | | | | | | | | |
Payments for shares redeemed | | | (57,127 | ) | | | (1,668,608 | ) | | | (118,128 | ) | | | (2,731,787 | ) |
| | | | | | | | | | | | | | | | |
| | | 328,097 | | | | 10,227,164 | | | | (24,218 | ) | | | (510,426 | ) |
| | | | | | | | | | | | | | | | |
Class R | | | | | | | | | | | | | | | | |
Proceeds from shares sold | | | — | | | | — | | | | 13,630 | | | | 314,892 | |
Payments for shares redeemed | | | — | | | | — | | | | (44,718 | ) | | | (1,013,785 | ) |
| | | | | | | | | | | | | | | | |
| | | — | | | | — | | | | (31,088 | ) | | | (698,893 | ) |
| | | | | | | | | | | | | | | | |
Total net increase (decrease) | | | 328,097 | | | $ | 10,227,164 | | | | (55,306 | ) | | $ | (1,209,319 | ) |
| | | | | | | | | | | | | | | | |
| | | | |
Clarion Real Estate Fund | | | | | | | | | | | | | | | | |
Proceeds from shares sold | | | 475,045 | | | $ | 6,333,423 | | | | 719,517 | | | $ | 8,640,572 | |
Proceeds from reinvestment of distributions | | | 68,641 | | | | 901,156 | | | | 73,775 | | | | 840,993 | |
Payments for shares redeemed | | | (2,118,918 | ) | | | (27,556,077 | ) | | | (1,305,739 | ) | | | (15,307,637 | ) |
| | | | | | | | | | | | | | | | |
Total net increase (decrease) | | | (1,575,232 | ) | | $ | (20,321,498 | ) | | | (512,447 | ) | | $ | (5,826,072 | ) |
| | | | | | | | | | | | | | | | |
| | | | |
IAM SHARES Fund | | | | | | | | | | | | | | | | |
Proceeds from shares sold | | | 69,306 | | | $ | 825,598 | | | | 75,071 | | | $ | 732,903 | |
Proceeds from reinvestment of distributions | | | 292,149 | | | | 3,332,502 | | | | 286,759 | | | | 2,779,856 | |
Payments for shares redeemed | | | (49,455 | ) | | | (576,752 | ) | | | (1,118,238 | ) | | | (11,930,405 | ) |
| | | | | | | | | | | | | | | | |
Total net increase (decrease) | | | 312,000 | | | $ | 3,581,348 | | | | (756,408 | ) | | $ | (8,417,646 | ) |
| | | | | | | | | | | | | | | | |
| | | | |
Enhanced Small Cap Fund | | | | | | | | | | | | | | | | |
Proceeds from shares sold | | | 346,831 | | | $ | 4,548,861 | | | | 261,606 | | | $ | 2,880,589 | |
Proceeds from reinvestment of distributions | | | 24,582 | | | | 283,672 | | | | 20,676 | | | | 206,136 | |
Payments for shares redeemed | | | (693,058 | ) | | | (9,104,656 | ) | | | (624,861 | ) | | | (6,449,863 | ) |
| | | | | | | | | | | | | | | | |
Total net increase (decrease) | | | (321,645 | ) | | $ | (4,272,123 | ) | | | (342,579 | ) | | $ | (3,363,138 | ) |
| | | | | | | | | | | | | | | | |
| | |
| 98 | | Notes to Financial Statements |
SSgA Funds
Notes to Financial Statements, continued — August 31, 2013
| | | | | | | | | | | | | | | | |
| | | Year Ended
August 31, 2013 | | | Year Ended
August 31, 2012 | |
| Emerging Markets Fund | | Shares | | | Dollars | | | Shares | | | Dollars | |
| | | | | | | | | | | | | | | | |
Institutional Class | | | | | | | | | | | | | | | | |
Proceeds from shares sold | | | 15,103,762 | | | $ | 297,991,912 | | | | 35,368,937 | | | $ | 665,688,642 | |
Proceeds from reinvestment of distributions | | | 1,109,563 | | | | 21,338,902 | | | | 1,200,506 | | | | 21,897,235 | |
Payments for shares redeemed | | | (33,504,017 | ) | | | (657,702,252 | ) | | | (38,257,950 | ) | | | (726,117,752 | ) |
| | | | | | | | | | | | | | | | |
| | | (17,290,692 | ) | | | (338,371,438 | ) | | | (1,688,507 | ) | | | (38,531,875 | ) |
| | | | | | | | | | | | | | | | |
Select Class | | | | | | | | | | | | | | | | |
Proceeds from shares sold | | | 821,369 | | | | 16,663,954 | | | | 1,485,127 | | | | 27,778,551 | |
Proceeds from reinvestment of distributions | | | 218,027 | | | | 4,215,053 | | | | 293,584 | | | | 5,370,647 | |
Payments for shares redeemed | | | (13,638,000 | ) | | | (271,504,287 | ) | | | (12,769,524 | ) | | | (244,061,957 | ) |
| | | | | | | | | | | | | | | | |
| | | (12,598,604 | ) | | | (250,625,280 | ) | | | (10,990,813 | ) | | | (210,912,759 | ) |
| | | | | | | | | | | | | | | | |
Total net increase (decrease) | | | (29,889,296 | ) | | $ | (588,996,718 | ) | | | (12,679,320 | ) | | $ | (249,444,634 | ) |
| | | | | | | | | | | | | | | | |
| | | | |
International Stock Selection Fund | | | | | | | | | | | | | | | | |
| | | | |
Institutional Class | | | | | | | | | | | | | | | | |
Proceeds from shares sold | | | 3,864,898 | | | $ | 36,947,571 | | | | 10,917,726 | | | $ | 92,742,099 | |
Proceeds from reinvestment of distributions | | | 1,636,372 | | | | 14,373,424 | | | | 3,127,224 | | | | 26,839,285 | |
Payments for shares redeemed | | | (13,274,260 | ) | | | (124,953,322 | ) | | | (51,992,690 | ) | | | (444,317,676 | ) |
| | | | | | | | | | | | | | | | |
| | | (7,772,990 | ) | | | (73,632,327 | ) | | | (37,947,740 | ) | | | (324,736,292 | ) |
| | | | | | | | | | | | | | | | |
Class R | | | | | | | | | | | | | | | | |
Proceeds from shares sold | | | — | | | | — | | | | 47,567 | | | | 403,173 | |
Proceeds from reinvestment of distributions | | | — | | | | — | | | | 7,263 | | | | 61,995 | |
Payments for shares redeemed | | | — | | | | — | | | | (261,776 | ) | | | (2,184,177 | ) |
| | | | | | | | | | | | | | | | |
| | | — | | | | — | | | | (206,946 | ) | | | (1,719,009 | ) |
| | | | | | | | | | | | | | | | |
Total net increase (decrease) | | | (7,772,990 | ) | | $ | (73,632,327 | ) | | | (38,154,686 | ) | | $ | (326,455,301 | ) |
| | | | | | | | | | | | | | | | |
| | | | |
High Yield Bond Fund | | | | | | | | | | | | | | | | |
Proceeds from shares sold | | | 12,331,867 | | | $ | 105,388,139 | | | | 16,941,138 | | | $ | 136,416,964 | |
Proceeds from reinvestment of distributions | | | 857,178 | | | | 7,315,934 | | | | 776,979 | | | | 6,231,844 | |
Payments for shares redeemed | | | (16,193,785 | ) | | | (138,790,512 | ) | | | (14,031,806 | ) | | | (112,987,587 | ) |
| | | | | | | | | | | | | | | | |
Total net increase (decrease) | | | (3,004,740 | ) | | $ | (26,086,439 | ) | | | 3,686,311 | | | $ | 29,661,221 | |
| | | | | | | | | | | | | | | | |
Beneficial Interest
As of August 31, 2013, one shareholder owned 99% of the issued and outstanding shares of the SSgA IAM SHARES Fund.
| 6. | | Interfund Lending Program |
The Funds participate in a joint lending and borrowing facility (the “Interfund Lending Program”). Funds of the Investment Company may borrow money from the SSgA Money Market Fund for temporary purposes. All such borrowing and lending will be subject to a participating fund’s fundamental investment limitations. The SSgA Money Market Fund will lend through the Interfund Lending Program only when the returns are higher than those available from an investment in repurchase agreements or short-term reserves. The Funds will borrow through the Interfund Lending Program only when the costs are equal to or lower than the cost of bank loans. Interfund loans and borrowings normally extend overnight, but can have a maximum duration of seven days. Loans may be called on one business day’s notice. A participating fund may have to borrow from a bank at a higher interest rate if an interfund loan is called or not renewed. Any delay in repayment to the SSgA Money Market Fund could result in additional borrowing costs. For the period ended August 31, 2013, the Funds did not utilize the Interfund Lending Program.
| | | | |
| Notes to Financial Statements | | | 99 | |
SSgA Funds
Notes to Financial Statements, continued — August 31, 2013
On September 3, 2013, the Funds declared the following dividends from net investment income payable on September 4, 2013 to shareholders of record September 9, 2013.
| | | | |
| | | Net Investment
Income | |
| | | | |
Clarion Real Estate Fund | | $ | 0.0238 | |
IAM SHARES Fund | | | 0.0565 | |
High Yield Bond Fund | | | 0.0462 | |
| 8. | | Market, Credit and Counterparty Risk |
In the normal course of business, the Funds invest in securities and enter into transactions where risks exist due to fluctuations in the market (market risk) or failure of the other party to a transaction to perform (counterparty risk). The value of securities held by each Fund may decline in response to certain events, including those directly involving the companies whose securities are owned by the Funds; conditions affecting the general economy; overall market changes; local, regional or global political, social or economic instability; and currency and interest rate and price fluctuations. Similar to credit risk, the Funds may be exposed to counterparty risk, or the risk that an entity with which the Funds have unsettled or open transactions may default. Financial assets, which potentially expose the Funds to credit and counterparty risks, consist principally of investments and cash due from counterparties. The extent of the Funds’ exposure to credit and counterparty risks in respect to these financial assets approximates their value as recorded in the Funds’ Statements of Assets and Liabilities.
| 9. | | Recent Accounting Pronouncements |
In December 2011, the Financial Accounting Standards Board (FASB) issued Accounting Standard Update No. 2011-11 (ASU 2011-11) “Disclosures about Offsetting Assets and Liabilities.” These disclosure requirements are intended to help investors and other financial statement users to better assess the effect or potential effect of offsetting arrangements on a portfolio’s financial position. They also improve transparency in the reporting of how companies mitigate credit risk, including disclosure of related collateral pledged or received. In addition, ASU 2011-11 facilitates comparison between those entities that prepare their financial statements on the basis of U.S. GAAP and those entities that prepare their financial statements on the basis of International Financial Reporting Standards. ASU 2011-11 requires entities to disclose both gross and net information about both instruments and transactions eligible for offset in the financial position; and disclose instruments and transactions subject to an agreement similar to a master netting agreement. ASU 2011-11 is effective for fiscal years beginning on or after January 1, 2013, and interim periods within those annual periods. Management is currently evaluating the implications of ASU 2011-11 and its impact on financial statement disclosures.
In January 2013, Accounting Standard Update 2013-01 (ASU 2013-01), Clarifying the Scope of Disclosures about Offsetting Assets and Liabilities, clarified Accounting Standards Update 2011-11 (ASU 2011-11), Disclosures about Offsetting Assets and Liabilities. ASU 2013-01 is effective for fiscal years beginning on or after January 1, 2013, and interim periods within those annual periods. As described above, ASU 2011-11 was intended to enhance disclosure requirements on the offsetting of financial assets and liabilities. The ASU 2013-01 limits the scope of the new balance sheet offsetting disclosures to derivatives, repurchase agreements, and securities lending transactions to the extent that they are (1) offset in the financial statements or (2) subject to an enforceable master netting arrangement or similar agreement. Management is currently evaluating the application of ASU 2013-01 and its impact on financial statement disclosures.
On November 1, 2010 a class action complaint was filed in Bankruptcy Court in the bankruptcy case of The Tribune Company (“Tribune”). The defendants in this action include mutual funds, individuals, institutional investors and others who owned shares in Tribune at the time of the 2007 leveraged buyout transaction (the “LBO”) and sold their shares for $34 per share in cash, including the SSgA IAM SHARES Fund. Thereafter, two additional and substantially similar class actions were filed and
| | |
| 100 | | Notes to Financial Statements |
SSgA
Notes to Financial Statements, continued — August 31, 2013
are pending in United States District Courts (with the Bankruptcy Court action, collectively referred to as the “Lawsuits”). The Lawsuits have been consolidated into a single Multidistrict Litigation action in federal court for pretrial proceedings. On September 23, 2013, the United States District Court dismissed one of the Lawsuits. On September 30, 2013 the plaintiffs appealed that dismissal. The Lawsuits seek to recover, for the benefit of Tribune’s bankruptcy estate or various creditors, payments to shareholders in the LBO. The Lawsuits allege that Tribune’s payment for those shares violated the rights of creditors, as set forth in the Bankruptcy Code’s and various states’ fraudulent transfer laws. However, the Lawsuits proceed on different legal theories: the Bankruptcy Court action pleads an intentionally fraudulent transfer; the District Court actions plead constructively fraudulent transfers. The Fund cannot predict the outcome of these proceedings or the effect, if any, on the Fund’s net asset value.
Management has evaluated events and transactions that may have occurred since August 31, 2013, through the date the financial statements were issued, that would merit recognition or additional disclosure in the financial statements. During this review nothing was discovered, other than referred to in Note 7, which would require disclosure within the financial statements.
| | | | |
| Notes to Financial Statements | | | 101 | |
SSgA Funds
Report of Independent Registered Public Accounting Firm
To the Board of Trustees of the SSgA Funds and Shareholders of the SSgA Dynamic Small Cap Fund, SSgA Clarion Real Estate Fund (formerly known as SSgA Tuckerman Active REIT Fund), SSgA IAM SHARES Fund, SSgA Enhanced Small Cap Fund, SSgA Emerging Markets Fund, SSgA International Stock Selection Fund and SSgA High Yield Bond Fund:
We have audited the accompanying statements of assets and liabilities, including the schedules of investments, of SSgA Dynamic Small Cap Fund, SSgA Clarion Real Estate Fund, SSgA IAM SHARES Fund, SSgA Enhanced Small Cap Fund, SSgA Emerging Markets Fund, SSgA International Stock Selection Fund and SSgA High Yield Bond Fund (the “Funds”) (seven of the funds comprising the SSgA Funds) as of August 31, 2013, and the related statements of operations for the year then ended, the statements of changes in net assets for each of the two years in the period then ended, and the financial highlights for each of the five years in the period then ended. These financial statements and financial highlights are the responsibility of the Funds’ management. Our responsibility is to express an opinion on these financial statements and financial highlights based on our audits.
We conducted our audits in accordance with the standards of the Public Company Accounting Oversight Board (United States). Those standards require that we plan and perform the audit to obtain reasonable assurance about whether the financial statements and financial highlights are free of material misstatement. The Funds are not required to have, nor were we engaged to perform, an audit of their internal control over financial reporting. Our audits included consideration of internal control over financial reporting as a basis for designing audit procedures that are appropriate in the circumstances, but not for the purpose of expressing an opinion on the effectiveness of the Funds’ internal control over financial reporting. Accordingly, we express no such opinion. An audit also includes examining, on a test basis, evidence supporting the amounts and disclosures in the financial statements, assessing the accounting principles used and significant estimates made by management, as well as evaluating the overall financial statement presentation. Our procedures included confirmation of securities owned as of August 31, 2013, by correspondence with the custodian and brokers; where replies were not received from brokers, we performed other auditing procedures. We believe that our audits provide a reasonable basis for our opinion.
In our opinion, the financial statements and financial highlights referred to above present fairly, in all material respects, the financial position of the Funds as of August 31, 2013, the results of their operations for the year then ended, the changes in their net assets for each of the two years in the period then ended, and the financial highlights for each of the five years in the period then ended, in conformity with accounting principles generally accepted in the United States of America.
DELOITTE & TOUCHE LLP
Boston, Massachusetts
October 30, 2013
| | |
| 102 | | Report of Independent Registered Public Accounting Firm |
SSgA Funds
Tax Information — August 31, 2013 (Unaudited)
Long term capital gains dividends of $53,091 were paid by the High Yield Bond Fund during the period ended August 31, 2013.
The Funds designate dividends during the fiscal year as qualifying for the dividends received deduction for corporate shareholders as follows:
| | | | |
Dynamic Small Cap Fund | | | 0.02 | % |
Clarion Real Estate Fund | | | 0.0 | % |
IAM SHARES Fund | | | 100.0 | % |
Enhanced Small Cap Fund | | | 100.0 | % |
Emerging Markets Fund | | | 0.0 | % |
International Stock Selection Fund | | | 0.0 | % |
High Yield Bond Fund | | | 0.0 | % |
For the tax year ended August 31, 2013, the Funds hereby designate the following percentage of their net taxable income as qualified dividends taxed at individual net capital gain rates:
| | | | |
Dynamic Small Cap Fund | | | 0.02 | % |
Clarion Real Estate Fund | | | 0.0 | % |
IAM SHARES Fund | | | 100.0 | % |
Enhanced Small Cap Fund | | | 100.0 | % |
Emerging Markets Fund | | | 100.0 | % |
International Stock Selection Fund | | | 100.0 | % |
High Yield Bond Fund | | | 0.0 | % |
Form 1099-DIV mailed to you in January 2014 will show the tax status of all distributions paid to your account in calendar year 2013.
Pursuant to Section 853 of the Internal Revenue Code, the Funds designate the following amounts as foreign taxes paid and gross income earned from foreign sources in the taxable year ended August 31, 2013:
| | | | | | | | | | | | | | | | |
| | | Foreign Taxes
Paid | | | Foreign Taxes
Paid Per Share | | | Foreign Source
Income | | | Foreign Source
Income Per Share | |
| | | | | | | | | | | | | | | | |
Emerging Markets Fund | | $ | 6,645,497 | | | $ | 0.1082 | | | $ | 50,808,148 | | | $ | 0.8272 | |
International Stock Selection Fund | | | 685,679 | | | | 0.0184 | | | | 14,098,424 | | | | 0.3793 | |
Please consult a tax adviser for questions about federal or state income tax laws.
SSgA Funds
Basis for Approval of Investment Advisory Contracts (Unaudited)
Trustee Considerations in Approving Continuation of Investment Advisory Agreements1
Overview of the Contract Review Process
Under the Investment Company Act of 1940, an investment advisory agreement between a mutual fund and its investment adviser or sub-adviser may continue in effect from year to year only if its continuance is approved at least annually by the fund’s board of trustees, including by a vote of a majority of those trustees who are not “interested persons” of the fund (commonly referred to as, the “Independent Trustees”) cast in person at a meeting called for the purpose of considering such approval.
Consistent with these requirements, the Board of Trustees (the “Board”) of the SSgA Funds (the “Trust”), including a majority of the Independent Trustees of the Trust, met on March 23, 2013 and on April 22 and 23, 2013 to consider a proposal to approve, with respect to each portfolio series of the Trust (each, a “Fund” and collectively, the “Funds”), the continuation of the investment advisory agreement (the “Advisory Agreement”) with SSgA Funds Management, Inc. (the “Adviser”). Prior to voting on the proposal, the Board reviewed information furnished by the Adviser and others reasonably necessary to permit the Board to evaluate the proposal fully. Such information included, among other things, the following:
Information about Performance, Expenses and Fees
| • | | A report prepared by an independent provider of investment company data, which includes for each Fund: |
| | ¡ | | Comparisons of the Fund’s performance over the past one-, three-, five- and ten-year periods ended December 31, 2012, as applicable, to the performance of an appropriate benchmark for the Fund and a universe of other mutual funds with similar investment objectives and policies; |
| | ¡ | | Comparisons of the Fund’s expense ratio (with detail of component expenses) to the expense ratios of a group of comparable mutual funds selected by the independent data provider; |
| | ¡ | | A chart showing the Fund’s historical average net assets relative to its total expenses, management fees, and non-management expenses over the past five years, as applicable; and |
| | ¡ | | Comparisons of the Fund’s contractual management fee to the contractual management fees of comparable mutual funds at different asset levels. |
| • | | Comparative information concerning fees charged by the Adviser for managing institutional accounts using investment strategies and techniques similar to those used in managing the Funds; and |
| • | | Profitability analyses for (a) the Adviser with respect to each Fund and (b) affiliates of the Adviser that provide services to the Funds (“Affiliated Service Providers”). |
Information about Portfolio Management
| • | | Descriptions of the investment management services provided by the Adviser, including their investment strategies and processes; |
| • | | Information concerning the allocation of brokerage and the benefits received by the Adviser as a result of brokerage allocation, including information concerning the acquisition of any research through “soft dollar” benefits received in connection with the Funds’ brokerage; and |
| 1 | Over the course of more than 20 years, the Independent Trustees have identified numerous relevant issues, factors and concerns (“issues, factors and concerns”) that they consider each year in connection with the proposed continuation of the advisory and sub-advisory agreements, the administration agreement, the distribution plans, the distribution agreement and various related-party service agreements (the “annual review process”). The statement of issues, factors and concerns and the related conclusions of the Independent Trustees may not change substantially from year to year. However, the information requested by, and provided to, the Independent Trustees with respect to the issues, factors and concerns and on which their conclusions are based is updated annually and, in some cases, may differ substantially from the previous year. The Independent Trustees schedule annually a separate in-person meeting that is dedicated to the annual review process (the “special meeting”). At the special meeting and throughout the annual review process, the Independent Trustees take a fresh look at each of the issues, factors and concerns in light of the latest available information and each year present one or more sets of comments and questions to management with respect to specific issues, factors and concerns. Management responds to such comments and questions to the satisfaction of the Independent Trustee before the annual review process is completed and prior to the Independent Trustees voting on proposals to approve continuation of the agreements and plans. |
| | |
| 104 | | Basis for Approval of Investment Advisory Contracts |
SSgA Funds
Basis for Approval of Investment Advisory Contracts (Unaudited), continued
| • | | Information regarding the procedures and processes used to value the assets of the Funds and the assistance provided to the administrator of the Funds by the Adviser in monitoring the effectiveness of such procedures and processes. |
Information about the Adviser
| • | | Reports detailing the financial results and condition of the Adviser and its affiliates; |
| • | | Descriptions of the qualifications, education and experience of the individual investment professionals responsible for managing the portfolios of the Funds; |
| • | | A copy of the Code of Ethics adopted by the Adviser, together with information relating to compliance with and the administration of such Code; |
| • | | A copy of the Adviser’s proxy voting policies and procedures; |
| • | | Information concerning the resources devoted by the Adviser to overseeing compliance by the Funds and their service providers, including the Adviser’s record of compliance with investment policies and restrictions and other operating policies of the Funds; and |
| • | | A description of the business continuity and disaster recovery plans of the Adviser. |
Other Relevant Information
| • | | Information concerning the nature, quality and cost of various non-investment management services provided to the Funds by affiliates of the Adviser, including the custodian, fund accountant, transfer agent and securities lending agent of the Funds, and the role of the Adviser in managing the Funds’ relationship with these service providers; |
| • | | Copies of the Advisory Agreement and agreements with other service providers of the Funds; |
| • | | Additional data requested from an independent provider of investment company data by the Independent Trustees on (a) the SSgA Funds money market portfolios to determine the magnitude to which the absolute difference in yields separated the better performing from the poorer performing funds; and (b) the SSgA Funds quantitative equity portfolios to determine how they performed in the larger universe; |
| • | | Draft responses to letters dated February 14, 2013 from Joseph P. Barri, LLC (counsel to the Independent Trustees), and reviewed prior to such date by Independent Counsel, requesting specific information, from each of: |
| | ¡ | | The Adviser, with respect to its operations relating to the Funds and its approximate profit margins before taxes from such operations for the Funds’ last fiscal year; and the relevant operations of other affiliated service providers to the Funds, together with their approximate profit margins from such relevant operations for the Funds’ last fiscal year; |
| | ¡ | | State Street Bank and Trust Company (“State Street”), the administrator, custodian, transfer agent, securities lending agent, and shareholder services for the Funds, with respect to its operations relating to the Funds; and |
| | ¡ | | State Street Global Markets, LLC, the principal underwriter and distributor of the shares of the Funds (the “Distributor”), with respect to its operations relating to the Funds, together with the Funds’ related distribution plans and arrangements under SEC Rule 12b-1; |
| • | | Excerpts from the Funds’ most recent Prospectuses, statements of Additional Information and Annual reports for the fiscal year ended August 31, 2012, including (i) the latest prospectus descriptions of each Fund’s investment objectives, strategies and authorized investment techniques and investments; and (ii) the latest Annual Shareholder Report for each Fund, including Portfolio Management Discussion of Performance, as prepared by its portfolio management team, together with a graphic comparison of the performance of each Fund with its benchmark index, for its fiscal year ended August 31, 2012; |
| • | | Lipper materials dated March 2013, obtained by an Independent Trustee and circulated to the other Independent Trustees and to Independent Counsel, with respect to the Funds for which such materials were then available; and |
| • | | A summary of the foregoing materials prepared by Independent Counsel. |
| | | | |
| Basis for Approval of Investment Advisory Contracts | | | 105 | |
SSgA Funds
Basis for Approval of Investment Advisory Contracts (Unaudited), continued
In addition to the information identified above, the Board considered information provided from time to time by the Adviser, and other service providers of the Funds throughout the year at meetings of the Board and its committees. At such meetings, the Trustees received, among other things, presentations by the portfolio managers and other investment professionals of the Adviser relating to the performance of the Funds and the investment strategies used in pursuing each Fund’s investment objective.
The Independent Trustees were assisted throughout the contract review process by their independent legal counsel. The Independent Trustees relied upon the advice of such counsel and their own business judgment in determining the material factors to be considered in evaluating the Advisory Agreement, and the weight to be given to each such factor. The conclusions reached with respect to the Advisory Agreement were based on a comprehensive evaluation of all the information provided and not any single factor. Moreover, each Trustee may have placed varying emphasis on particular factors in reaching conclusions with respect to each Fund.
Results of the Process
Based on a consideration of the foregoing and such other information as deemed relevant, including the factors and conclusions described below, on April 23, 2013 the Board, including a majority of the Independent Trustees, voted to approve the continuation of the Advisory Agreement effective May 1, 2013, for an additional year with respect to all Funds.
Nature, Extent and Quality of Services
In considering whether to approve the Advisory Agreement, the Board evaluated the nature, extent and quality of services provided to each Fund by the Adviser.
The Board considered the Adviser’s management capabilities and investment process with respect to the types of investments held by each Fund, including the education, experience and number of investment professionals and other personnel who provide portfolio management, investment research, and similar services to the Fund. The Board evaluated, where relevant, the abilities and experience of such investment personnel in analyzing particular markets, industries and specific issuers of securities in these markets and industries. The Board also considered the substantial expertise of the Adviser in developing and applying proprietary quantitative models for managing various Funds that invest primarily in equity securities. With respect to those Funds that invest primarily in fixed-income securities, the Board considered the extensive experience and resources committed by the Adviser to the evaluation of credit, interest-rate and currency risks. With respect to those Funds that operate as money market mutual funds, the Board considered the Adviser’s success in maintaining the constant dollar value of each Fund through extraordinary market conditions. The Board also took into account the compensation paid to recruit and retain investment personnel, and the time and attention devoted to the Funds by senior management.
The Board reviewed the compliance programs of the Adviser and various affiliated service providers. Among other things, the Board considered compliance and reporting matters relating to personal trading by investment personnel, selective disclosure of portfolio holdings, late trading, frequent trading, portfolio valuation, business continuity, the allocation of investment opportunities and the voting of proxies. The Board also considered the role of the Adviser in monitoring each Fund’s securities lending activities.
On the basis of the foregoing and other relevant information, the Board concluded that the Adviser can be expected to continue to provide, high quality investment management and related services for the Funds.
Fund Performance
The Board compared each Fund’s investment performance to the performance of an appropriate benchmark and universe of comparable mutual funds for various time periods ended December 31, 2012.
On the basis of the foregoing and other relevant information, the Board concluded that the performance of each Fund is satisfactory or better (a) by comparison to the performance of its peer group funds or (b) after considering steps taken by management to improve the performance of certain Funds.
Management Fees and Expenses
The Board reviewed the contractual investment advisory fee rates payable by each Fund and actual fees paid by each Fund, net of waivers. As part of its review, the Board considered each Fund’s management fee and total expense ratio (both before and after
| | |
| 106 | | Basis for Approval of Investment Advisory Contracts |
SSgA Funds
Basis for Approval of Investment Advisory Contracts (Unaudited), continued
giving effect to any expense caps), as compared to a group of similarly managed funds selected by an independent data provider. The Board also considered the comparability of the fees charged and the services provided to each Fund by the Adviser to the fees charged and services provided to other clients of the Adviser, including institutional accounts. In addition, the Board considered the willingness of the Adviser to provide undertakings from time to time to waive fees or pay expenses of various Funds to limit the total expenses borne by shareholders of such Funds.
On the basis of the foregoing and other relevant information, and in light of the nature, extent and quality of the services provided by the Adviser, the Board concluded that the fees and the expense ratio of each Fund compare favorably to the fees and expenses of similar mutual funds and are reasonable in relation to the services provided.
Profitability
The Board reviewed the level of profits realized by the Adviser and its affiliates in providing investment advisory and other services to each Fund and to all Funds as a group. The Board considered other direct and indirect benefits received by the Adviser and the Affiliated Service Providers in connection with their relationships with the Funds, including the benefits of research services that may be available to the Adviser as a result of securities transactions effected for the Funds and other investment advisory clients, together with the ranges of profitability of each of the Affiliated Service Providers with respect to their services to the Funds.
The Board concluded that the profitability of the Adviser with respect to each of the Funds, and the profitability range of each of the Affiliated Service Providers with respect to its services to the Funds, were reasonable in relation to the services provided.
Economies of Scale
In reviewing management fees and profitability, the Board also considered the extent to which the Adviser and its affiliates, on the one hand, and each Fund and all Funds as a group, on the other hand, can expect to realize benefits from economies of scale as the assets of the Funds increase. The Board acknowledged the difficulty in accurately measuring the benefits resulting from the economies of scale with respect to the management of any specific Fund or the Funds taken as a whole. The Board concluded that, in light of the current size of each Fund and all Funds as a group, the level of profitability of the Adviser and its affiliates with respect to each Fund and all Funds as a group over various time periods, and the comparatively low management fee and expense ratio of each Fund during these periods, it does not appear that the Adviser or its affiliates has realized benefits from economies of scale in managing the assets of the Funds to such an extent that previously agreed advisory fees should be reduced or that breakpoints in such fees should be implemented for any Fund at this time.
| | | | |
| Basis for Approval of Investment Advisory Contracts | | | 107 | |
SSgA Funds
Shareholder Requests for Additional Information — August 31, 2013
The Funds have adopted the proxy voting policies of the Adviser. A description of the policies and procedures that the Funds have adopted to determine how to vote proxies relating to portfolio securities are contained in the Funds’ Statement of Additional Information, which is available (i) without charge, upon request, by calling the Funds at (800) 647-7327, (ii) on the Funds’ website at www.ssgafunds.com, (iii) on the U.S. Securities and Exchange Commission’s website at www.sec.gov, or (iv) at the U.S. Securities and Exchange Commission’s public reference room.
The Funds will file their complete schedules of investments with the U.S. Securities and Exchange Commission for the first and third quarters of each fiscal year on Form N-Q. For the second and fourth quarters, the complete schedules of investments are available in the Funds’ semi-annual and annual financial statements. The Funds’ Form N-Q is available (i) without charge, upon request, by calling the Funds at (800) 647-7327, (ii) on the Funds’ website at www.ssgafunds.com, (iii) on the U.S. Securities and Exchange Commission’s website at www.sec.gov, or (iv) at the Securities and Exchange Commission’s public reference room.
| | |
| 108 | | Shareholder Requests for Additional Information |
SSgA Funds
Disclosure of Information about Fund Trustees and Officers — August 31, 2013 (Unaudited)
The table below includes information about the Trustees of the SSgA Funds, including their:
| • | | business addresses and ages; |
| • | | principal occupations during the past five years; and |
| • | | other directorships of publicly traded companies or funds. |
| | | | | | | | |
| Name, Address and Age | | Position(s) with SSgA Funds; Length of Time Served; Term of Office: Until successor is elected
and qualified | | Principal Occupation(s) During Past 5 Years; Other Relevant Experience,
Attributes and Skills1 | | Number of
Portfolios
in Fund
Complex
Overseen
by Trustee | | Other
Directorships
Held by
Trustee During
Past 5 Years |
INTERESTED TRUSTEE: | | | | | | |
Scott F. Powers State Street Financial Center One Lincoln Street Boston, MA 02111- 2900 YOB: 1959 | | • Trustee since 2013 | | • May 2008 to Present, President and Chief Executive Officer of State Street Global Advisors; • 2001 – 2008, Chief Executive Officer of Old Mutual Asset Management; • Board of Directors, United Way of Massachusetts Bay; • Board of Directors of Middlesex School; • Incorporator, Cardigan Mountain School | | 12 | | None. |
INDEPENDENT TRUSTEES: | | | | | | |
William L. Marshall State Street Financial Center One Lincoln Street Boston, MA 02111-2900 YOB: 1942 | | • Independent Trustee since 1988 • Chairman, Audit Committee • Member, Governance Committee • Member, Valuation Committee • Member, Qualified Legal and Compliance Committee (“QLCC”) | | • April 2011 to Present, Chairman (until April 2011, Chief Executive Officer and President), Wm. L. Marshall Associates, Inc., Wm. L. Marshall Companies, Inc. and the Marshall Financial Group, Inc. (a registered investment advisor and provider of financial and related consulting services); • Certified Financial Planner; • Member, Financial Planners Association; • Director, SPCA of Bucks County, PA; and • Director, The Ann Silverman Community Clinic of Doylestown, PA. | | 12 | | Director, Marshall Financial Group, Inc. |
| | | | | | | | | |
Patrick J. Riley State Street Financial Center One Lincoln Street Boston, MA 02111-2900 YOB: 1948 | | • Independent Trustee since 1988 • Independent Chairman of the Board since January 2009 • Member, Audit Committee • Member, Governance Committee • Member, Valuation Committee • Member, QLCC | | • 2002 to May 2010, Associate Justice of the Superior Court, Commonwealth of Massachusetts; • 1985 to 2002, Partner, Riley, Burke & Donahue, L.L.P. (law firm); • 1998 to Present, Independent Director, State Street Global Advisers Ireland, Ltd. (investment company); • 1998 to Present, Independent Director, SSgA Liquidity PLC (formerly, SSgA Cash Management Fund PLC); • January 2009 to Present, Independent Director, SSgA Fixed Income PLC; and • January 2009 to Present, Independent Director, SSgA Qualified Funds PLC. • 2011 to Present, Independent Director, SSgA SPDR ETFs Europe 1 PLC and (since 2012) Chairman. | | 12 | | Board Director and Chairman, SPDR Europe 1 PLC Board (2011 – Present); Board Director and Chairman, SPDR Europe II, PLC (2013 – Present). |
| | | | |
| Disclosure of Information about Fund Trustees and Officers | | | 109 | |
SSgA Funds
Disclosure of Information about Fund Trustees and Officers, continued — August 31, 2013 (Unaudited)
| | | | | | | | |
| Name, Address and Age | | Position(s) with SSgA Funds; Length of Time Served; Term of Office: Until successor is elected
and qualified | | Principal Occupation(s) During Past 5 Years; Other Relevant Experience,
Attributes and Skills1 | | Number of
Portfolios
in Fund
Complex
Overseen
by Trustee | | Other
Directorships
Held by
Trustee During
Past 5 Years |
INDEPENDENT TRUSTEES: (continued) | | | | | | |
Richard D. Shirk State Street Financial Center One Lincoln Street Boston, MA 02111-2900 YOB: 1945 | | • Independent Trustee since 1988 • Member, Audit Committee • Member, Governance Committee • Member, Valuation Committee • Chairman, QLCC | | • March 2001 to April 2002, Chairman (1996 to March 2001, President and Chief Executive Officer), Cerulean Companies, Inc. (holding company) (Retired); • 1992 to March 2001, President and Chief Executive Officer, Blue Cross Blue Shield of Georgia (health insurer, managed healthcare); • 1998 to December 2008, Chairman, Board Member and December 2008 to Present, Investment Committee Member, Healthcare Georgia Foundation (private foundation); • September 2002 to Present, Lead Director and Board Member, Amerigroup Corp. (managed health care); • 1999 to Present, Board Member and (since 2001) Investment Committee Member, Woodruff Arts Center; and • 2003 to 2009, Trustee, Gettysburg College. | | 12 | | None. |
| | | | | | | | | |
Bruce D. Taber State Street Financial Center One Lincoln Street Boston, MA 02111-2900 YOB: 1943 | | • Independent Trustee since 1991 • Member, Audit Committee • Chairman, Governance Committee • Chairman, Valuation Committee • Member, QLCC | | • 1999 to Present, Partner, Zenergy LLC (a technology company providing Computer Modeling and System Analysis to the General Electric Power Generation Division); • Until December 2008, Independent Director, SSgA Cash Management Fund PLC; • Until December 2008, Independent Director, State Street Global Advisers Ireland, Ltd. (investment companies); and • Until August 1994, President, Alonzo B. Reed, Inc., (a Boston architect-engineering firm). | | 12 | | None. |
| 1 | | The information reported includes the principal occupation during the last five years for each Trustee and other information relating to the professional experiences, attributes and skills relevant to each Trustee’s qualifications to serve as a Trustee. |
The table below includes information about the Officers of the SSgA Funds, including their:
| • | | business addresses and ages; and |
| • | | principal occupations during the past five years. |
| | | | |
Principal Officer Name, Address and Age | | Position(s) with SSgA Funds; Length of Time Served; Term of Office: Until successor is elected by Trustees | | Principal Occupation(s) During Past Five Years |
Ellen M. Needham SSgA Funds Management, Inc. State Street Financial Center One Lincoln Street Boston, MA 02111-2900 YOB: 1967 | | • President and Principal Executive Officer since October 2012 | | • June 2012 to Present, President and Director, SSgA Funds Management, Inc.; • May 2010 to June 2012, Chief Operating Officer, SSgA Funds Management, Inc.; • 1992 to 2012, Senior Managing Director, SSgA Funds Management, Inc. • 1992 to Present, Senior Managing Director, State Street Global Advisors |
| | |
| 110 | | Disclosure of Information about Fund Trustees and Officers |
SSgA Funds
Disclosure of Information about Fund Trustees and Officers, continued — August 31, 2013 (Unaudited)
| | | | |
Principal Officer Name, Address and Age | | Position(s) with SSgA Funds; Length of Time Served; Term of Office: Until successor is elected by Trustees | | Principal Occupation(s) During Past Five Years |
Ann M. Carpenter State Street Financial Center One Lincoln Street Boston, MA 02111-2900 YOB: 1966 | | • Vice President since October 2012 | | • March 2008 to Present, Vice President SSgA Funds Management, Inc. • November 2005 to Present, Vice President, State Street Global Advisors. |
| | | | | |
Jacqueline Angell State Street Financial Center One Lincoln Street Boston, MA 02111-2900 YOB: 1974 | | • Chief Compliance Officer since April 2011 | | • July 2012 to Present, Head of UK Compliance, State Street Bank and Trust Company • July 2008 to 2012, Vice President, SSgA Funds Management, Inc.; • July 2008 to 2012, Vice President, State Street Global Advisers; and |
| | | | | |
Laura F. Dell State Street Bank and Trust Company 4 Copley Place, 5th Floor Boston, MA 02116 YOB: 1964 | | • Treasurer and Principal Accounting Officer since January 2013 | | • 2002 to Present, Vice President of State Street Bank and Trust Company. |
| | | | | |
David K. James State Street Bank and Trust Company 4 Copley Place, 5th Floor Boston, MA 02116 YOB: 1970 | | • Secretary since April 2013 | | • 2009 to Present, Vice President and Managing Counsel, State Street Bank and Trust Company; • 2006 to 2009, Vice President and Counsel, PNC Global Investment Servicing (US), Inc. |
| | | | |
| Disclosure of Information about Fund Trustees and Officers | | | 111 | |
SSgA Funds
State Street Financial Center
One Lincoln Street
Boston, Massachusetts 02111-2900
(800) 647-7327
Trustees
William L. Marshall
Patrick J. Riley, Chairman
Richard D. Shirk
Bruce D. Taber
Officers
Ellen M. Needham, President, Chief Executive Officer and Principal Executive Officer
Laura F. Dell, Treasurer and Principal Accounting Officer
Ann M. Carpenter, Vice President
Jacqueline Angell, Chief Compliance Officer
David James, Secretary and Chief Legal Officer
Chad C. Hallett, Assistant Treasurer
Caroline Connolly, Assistant Treasurer
Investment Adviser
SSgA Funds Management, Inc.
State Street Financial Center,
One Lincoln Street
Boston, Massachusetts 02111-2900
Custodian and Office of Shareholder Inquiries
State Street Bank and Trust Company
1776 Heritage Drive
North Quincy, Massachusetts 02171
Transfer and Dividend Paying Agent
Boston Financial Data Services, Inc.
Two Heritage Drive
North Quincy, Massachusetts 02171
Distributor
State Street Global Markets, LLC
State Street Financial Center
One Lincoln Street
Boston, Massachusetts 02111-2900
Administrator
State Street Bank and Trust Company
State Street Financial Center
One Lincoln Street
Boston, Massachusetts 02111-2900
Legal Counsel
Goodwin Procter LLP
Exchange Place
Boston, Massachusetts 02109
Independent Registered Public Accounting Firm
Deloitte & Touche LLP
200 Berkeley Street
Boston, Massachusetts 02116
Distributor: State Street Global Markets, LLC, member FINRA, SIPC, a wholly owned subsidiary of State Street Corporation. References to State Street may include State Street Corporation and its affiliates. The SSgA Funds pay State Street Bank and Trust Company for its services as administrator, custodian, transfer agent and shareholder servicing agent and pays SSgA Funds Management, Inc. for investment advisory services.
This information must be preceded or accompanied by a current prospectus or summary prospectus. Read the prospectus carefully before you invest or send money.
| | |
| 112 | | Fund Management and Service Providers |
SSGACOMBFDAR

MONEY MARKET FUNDS
Money Market Fund
U.S. Government Money Market Fund
Annual Report
August 31, 2013
SSgA Funds
Money Market Funds
Annual Report
August 31, 2013
Table of Contents
“SSgA” is a registered trademark of State Street Corporation and is licensed for use by the SSgA Funds.
This report is prepared from the books and records of the Funds and it is submitted for the general information of shareholders. This information is for distribution to prospective investors only when preceded or accompanied by a SSgA Funds Prospectus containing more complete information concerning the investment objectives and operations of the Funds, charges and expenses. The Prospectus should be read carefully before an investment is made.
Performance quoted represents past performance and past performance does not guarantee future results. Current performance may be higher or lower than the performance quoted. For the most recent month end performance information, visit www.ssgafunds.com. Investment in the Funds poses investment risks, including the possible loss of principal. The investment return and principal value of an investment will fluctuate so that shares, when redeemed, may be worth more or less than their original cost.
An investment in a money market fund is not insured or guaranteed by the Federal Deposit Insurance Corporation or another governmental agency. Although a money market fund seeks to preserve the value of your investment at $1.00 per share, it is possible to lose money by investing in a money market fund.
This page has been intentionally left blank.
SSgA Funds
Letter from the President of SSgA Funds Management, Inc.
Dear Shareholder:
We are pleased to provide you with the August 31, 2013 Annual Report for the SSgA Money Market Funds. The Annual Report provides information about the Funds, including performance data and related financial statements.
Over the past 12 months, the U.S. economic recovery has gained traction, and even some steam. No longer nagged by the uncertainties of a presidential election year and sun-setting tax policies, U.S. equities posted solid performance and, along with the considerable recovery in the housing markets, fueled positive consumer sentiment. However, in a reminder that volatility may not be totally behind us, the Federal Reserve’s mere suggestion this spring that it would soon consider tapering its unprecedented bond-buying program ignited a week-long tumble for all major U.S. indexes. Nonetheless, with the market able to absorb the news of the impending policy shift, we believe that the economic recovery, although not robust by historical standards, finally can be categorized as sustainable.
Most recently, the market was tested by the political uncertainty resulting from the partial government shutdown and debt ceiling impasse in Washington D.C. At this writing, as Congress has negotiated only a temporary solution to end the stalemate and raise the debt limit, fiscal challenges remain here at home, as well as around the globe.
We hope that you find the enclosed information useful and thank you for the confidence that you have placed in the SSgA Funds.
Sincerely,

Ellen Needham
President
SSgA Funds
This page has been intentionally left blank.
SSgA
Money Market Fund
Shareholder Expense Example — August 31, 2013 (Unaudited)
Fund Expenses
The following disclosure provides important information regarding each Fund’s Expense Example, which appears on each Fund’s individual page in this Annual Report. Please refer to this information when reviewing the Expense Example for a Fund.
Example
As a shareholder of the Fund, you incur two types of costs: (1) transaction costs, and (2) ongoing costs, including advisory and administrative fees; distribution (12b-1) and/or service fees; and other Fund expenses. The Example is intended to help you understand your ongoing costs (in dollars) of investing in the Fund and to compare these costs with the ongoing costs of investing in other mutual funds. The Example is based on an investment of $1,000 invested at the beginning of the period and held for the entire period indicated, which for this Fund is from March 1, 2013 to August 31, 2013.
Actual Expenses
The information in the table under the heading “Actual Performance” provides information about actual account values and actual expenses. You may use the information in this column, together with the amount you invested, to estimate the expenses that you paid over the period. Simply divide your account value by $1,000 (for example, an $8,600 account value divided by $1,000 = 8.6), then multiply the result by the number in the first column in the row entitled “Expenses Paid During Period” to estimate the expenses you paid on your account during this period.
Hypothetical Example for Comparison Purposes
The information in the table under the heading “Hypothetical Performance (5% return before expenses)” provides information about hypothetical account values and hypothetical expenses based on the Fund’s actual expense ratio and an assumed rate of return of 5% per year before expenses, which is not the Fund’s actual return. The hypothetical account values and expenses may not be used to estimate the actual ending account balance or expenses you paid for the period. You may use this information to compare the ongoing costs of investing in the Fund and other funds. To do so, compare this 5% hypothetical example with the 5% hypothetical examples that appear in the shareholder reports of other funds.
Please note that the expenses shown in the table are meant to highlight your ongoing costs only and do not reflect any transaction costs. Therefore, the information under the heading “Hypothetical Performance (5% return before expenses)” is useful in comparing ongoing costs only, and will not help you determine the relative total costs of owning different funds. In addition, if these transaction costs were included, your costs would have been higher.
| | | | | | | | |
| | | Actual
Performance | | | Hypothetical
Performance
(5% return
before expenses) | |
Beginning Account Value March 1, 2013 | | $ | 1,000.00 | | | $ | 1,000.00 | |
Ending Account Value August 31, 2013 | | $ | 1,000.03 | | | $ | 1,024.14 | |
Expenses Paid During Period* | | $ | 1.06 | | | $ | 1.07 | |
| * | Expenses are equal to the Fund’s annualized expense ratio of 0.21% (representing the six month period annualized), multiplied by the average account value over the period, multiplied by 184/365 (to reflect the one-half year period). Includes amounts waived, reimbursed and/or other credits. Without the waiver, reimbursement and/or other credits, expenses would have been higher. |
SSgA
Money Market Fund
Schedule of Investments — August 31, 2013
| | | | | | | | | | | | | | | | |
| | | Principal
Amount ($)
or Shares | | | Rate
% (#) | | | Date
of
Maturity | | | Value
$ | |
| Asset Backed Commercial Paper - 2.4% | | | | | | | | | | | | | | | | |
Gemini Securitization Corp. LLC (a) | | | 25,000,000 | | | | 0.230 | | | | 11/26/13 | | | | 24,986,264 | |
Kells Funding LLC (a) | | | 25,000,000 | | | | 0.220 | | | | 09/25/13 | | | | 24,996,333 | |
Kells Funding LLC (a) | | | 25,000,000 | | | | 0.220 | | | | 10/11/13 | | | | 24,993,889 | |
Kells Funding LLC (a) | | | 40,000,000 | | | | 0.223 | | | | 10/11/13 | | | | 39,990,222 | |
Kells Funding LLC (a) | | | 15,000,000 | | | | 0.200 | | | | 11/04/13 | | | | 14,994,667 | |
| | | | | | | | | | | | | | | | |
| | | | |
Total Asset Backed Commercial Paper
(amortized cost $129,961,375) | | | | | | | | | | | | | | | 129,961,375 | |
| | | | | | | | | | | | | | | | |
| | | | |
| Certificates of Deposit - 46.8% | | | | | | | | | | | | | | | | |
Bank of Montreal | | | 50,000,000 | | | | 0.180 | | | | 09/05/13 | | | | 50,000,000 | |
Bank of Montreal | | | 100,000,000 | | | | 0.180 | | | | 09/23/13 | | | | 100,000,000 | |
Bank of Montreal | | | 50,000,000 | | | | 0.180 | | | | 11/05/13 | | | | 50,000,000 | |
Bank of Montreal (next reset date 09/18/13) (b) | | | 40,000,000 | | | | 0.264 | | | | 02/14/14 | | | | 40,000,000 | |
Bank of Nova Scotia (next reset date 09/09/13) (b) | | | 55,000,000 | | | | 0.256 | | | | 02/04/14 | | | | 55,000,000 | |
Bank of Tokyo - Mitsubishi | | | 25,000,000 | | | | 0.230 | | | | 10/15/13 | | | | 25,000,000 | |
Barclays Bank (next reset date 09/13/13) (b) | | | 100,000,000 | | | | 0.295 | | | | 12/13/13 | | | | 100,000,000 | |
BNP Paribas | | | 100,000,000 | | | | 0.290 | | | | 11/08/13 | | | | 100,000,000 | |
Branch Bank & Trust | | | 28,000,000 | | | | 0.190 | | | | 09/23/13 | | | | 28,000,000 | |
Branch Bank & Trust | | | 45,000,000 | | | | 0.190 | | | | 09/24/13 | | | | 45,000,000 | |
Credit Suisse | | | 150,000,000 | | | | 0.270 | | | | 10/11/13 | | | | 150,000,000 | |
Credit Suisse | | | 25,000,000 | | | | 0.270 | | | | 11/05/13 | | | | 25,000,000 | |
Deutsche Bank AG | | | 100,000,000 | | | | 0.255 | | | | 09/27/13 | | | | 100,000,000 | |
Deutsche Bank AG | | | 100,000,000 | | | | 0.280 | | | | 10/30/13 | | | | 100,000,000 | |
ING Bank NV | | | 125,000,000 | | | | 0.260 | | | | 10/09/13 | | | | 125,000,000 | |
ING Bank NV | | | 50,000,000 | | | | 0.260 | | | | 10/15/13 | | | | 50,000,000 | |
ING Bank NV | | | 50,000,000 | | | | 0.260 | | | | 12/02/13 | | | | 50,000,000 | |
Lloyds TSB Bank | | | 100,000,000 | | | | 0.200 | | | | 10/03/13 | | | | 100,000,000 | |
Lloyds TSB Bank | | | 75,000,000 | | | | 0.190 | | | | 11/08/13 | | | | 75,000,000 | |
National Australia Bank Ltd. | | | 65,000,000 | | | | 0.282 | | | | 09/30/13 | | | | 65,000,000 | |
National Australia Bank Ltd. | | | 60,000,000 | | | | 0.291 | | | | 09/30/13 | | | | 60,000,000 | |
Nordea Bank AB | | | 100,000,000 | | | | 0.190 | | | | 10/04/13 | | | | 99,999,542 | |
Nordea Bank AB (next reset date 10/17/13) (b) | | | 25,000,000 | | | | 0.268 | | | | 01/17/14 | | | | 25,000,000 | |
Norinchukin Bank | | | 50,000,000 | | | | 0.150 | | | | 09/27/13 | | | | 50,000,000 | |
Rabobank Nederland NV | | | 50,000,000 | | | | 0.300 | | | | 10/09/13 | | | | 50,000,000 | |
Rabobank Nederland NV (next reset date 09/06/13) (b) | | | 60,000,000 | | | | 0.334 | | | | 03/06/14 | | | | 60,000,000 | |
Royal Bank of Canada | | | 16,700,000 | | | | 0.324 | | | | 09/06/13 | | | | 16,700,000 | |
Royal Bank of Canada (next reset date 09/09/13) (b) | | | 31,000,000 | | | | 0.305 | | | | 04/09/14 | | | | 31,000,000 | |
Royal Bank of Canada (next reset date 09/16/13) (b) | | | 18,000,000 | | | | 0.304 | | | | 04/16/14 | | | | 18,000,000 | |
Skandinaviska Enskilda Banken AB (next reset date 09/04/13) (b) | | | 61,000,000 | | | | 0.311 | | | | 12/27/13 | | | | 61,000,000 | |
Sumitomo Mitsui Banking Corp. | | | 75,000,000 | | | | 0.230 | | | | 09/05/13 | | | | 75,000,000 | |
Sumitomo Mitsui Banking Corp. | | | 50,000,000 | | | | 0.230 | | | | 09/06/13 | | | | 50,000,000 | |
Sumitomo Mitsui Banking Corp. | | | 50,000,000 | | | | 0.240 | | | | 09/17/13 | | | | 50,000,000 | |
Sumitomo Mitsui Banking Corp. | | | 60,000,000 | | | | 0.220 | | | | 09/19/13 | | | | 60,000,000 | |
Svenska Handelsbanken AB | | | 30,000,000 | | | | 0.215 | | | | 11/05/13 | | | | 30,000,271 | |
Svenska Handelsbanken AB | | | 75,000,000 | | | | 0.215 | | | | 11/12/13 | | | | 75,000,749 | |
Svenska Handelsbanken AB | | | 75,000,000 | | | | 0.215 | | | | 11/15/13 | | | | 75,000,781 | |
Swedbank AB (next reset date 09/05/13) (b) | | | 48,000,000 | | | | 0.356 | | | | 11/05/13 | | | | 48,000,000 | |
Toronto Dominion Bank | | | 150,000,000 | | | | 0.170 | | | | 09/18/13 | | | | 150,000,000 | |
UBS AG (next reset date 09/30/13) (b) | | | 47,000,000 | | | | 0.262 | | | | 10/28/13 | | | | 47,000,000 | |
SSgA
Money Market Fund
Schedule of Investments, continued — August 31, 2013
| | | | | | | | | | | | | | | | |
| | | Principal
Amount ($)
or Shares | | | Rate
% (#) | | | Date
of
Maturity | | | Value
$ | |
Westpac Banking Corp. (next reset date 10/17/13) (b) | | | 10,000,000 | | | | 0.318 | | | | 01/17/14 | | | | 9,999,811 | |
| | | | | | | | | | | | | | | | |
| | | | |
Total Certificates of Deposit
(amortized cost $2,574,701,154) | | | | | | | | | | | | | | | 2,574,701,154 | |
| | | | | | | | | | | | | | | | |
| | | | |
| Financial Company Commercial Paper - 13.8% | | | | | | | | | | | | | | | | |
Bank of Tokyo - Mitsubishi | | | 50,000,000 | | | | 0.203 | | | | 09/04/13 | | | | 49,999,167 | |
Caisse des Depots et Consignations (a) | | | 20,000,000 | | | | 0.220 | | | | 09/03/13 | | | | 19,999,755 | |
Caisse des Depots et Consignations (a) | | | 35,000,000 | | | | 0.218 | | | | 09/06/13 | | | | 34,998,955 | |
Caisse des Depots et Consignations (a) | | | 25,000,000 | | | | 0.210 | | | | 10/01/13 | | | | 24,995,625 | |
Caisse des Depots et Consignations (a) | | | 50,000,000 | | | | 0.180 | | | | 11/04/13 | | | | 49,984,000 | |
Collateralized Commercial Paper Co. LLC | | | 44,000,000 | | | | 0.270 | | | | 11/14/13 | | | | 43,975,580 | |
Collateralized Commercial Paper Co. LLC (a) | | | 18,000,000 | | | | 0.274 | | | | 11/14/13 | | | | 17,990,010 | |
Collateralized Commercial Paper Co. LLC | | | 40,000,000 | | | | 0.274 | | | | 11/18/13 | | | | 39,976,600 | |
Collateralized Commercial Paper Co. LLC | | | 40,000,000 | | | | 0.315 | | | | 01/06/14 | | | | 39,956,255 | |
Commonwealth Bank of Australia (a) | | | 50,000,000 | | | | 0.180 | | | | 10/08/13 | | | | 49,990,750 | |
Commonwealth Bank of Australia (next reset date
10/11/13) (a)(b) | | | 49,000,000 | | | | 0.299 | | | | 07/03/14 | | | | 49,000,000 | |
DnB Bank ASA (a) | | | 100,000,000 | | | | 0.215 | | | | 11/13/13 | | | | 99,956,403 | |
HSBC Bank PLC (next reset date 11/05/13) (a)(b) | | | 12,000,000 | | | | 0.316 | | | | 02/05/14 | | | | 11,999,533 | |
HSBC Bank PLC (next reset date 11/07/13) (a)(b) | | | 8,000,000 | | | | 0.315 | | | | 02/07/14 | | | | 7,999,930 | |
Lloyds Bank PLC | | | 50,000,000 | | | | 0.203 | | | | 09/24/13 | | | | 49,993,611 | |
Nationwide Building Society (a) | | | 50,000,000 | | | | 0.223 | | | | 09/24/13 | | | | 49,992,972 | |
Nordea Bank AB (a) | | | 50,000,000 | | | | 0.175 | | | | 10/29/13 | | | | 49,985,903 | |
Toyota Motor Credit Corp. | | | 25,000,000 | | | | 0.170 | | | | 01/13/14 | | | | 24,984,181 | |
Westpac Banking Corp. (next reset date 10/21/13) (a)(b) | | | 20,000,000 | | | | 0.316 | | | | 01/21/14 | | | | 20,000,000 | |
Westpac Banking Corp. (next reset date 10/24/13) (a)(b) | | | 25,000,000 | | | | 0.315 | | | | 01/24/14 | | | | 25,000,000 | |
| | | | | | | | | | | | | | | | |
| | | | |
Total Financial Company Commercial Paper
(amortized cost $760,779,230) | | | | | | | | | | | | | | | 760,779,230 | |
| | | | | | | | | | | | | | | | |
| | | | |
| Other Notes - 7.7% | | | | | | | | | | | | | | | | |
Bank of America NA | | | 50,000,000 | | | | 0.260 | | | | 09/06/13 | | | | 50,000,000 | |
Bank of America NA | | | 55,000,000 | | | | 0.260 | | | | 09/27/13 | | | | 55,000,000 | |
Bank of America NA | | | 75,000,000 | | | | 0.260 | | | | 10/16/13 | | | | 75,000,000 | |
JPMorgan Chase Bank NA (next reset date 09/07/13) (b) | | | 40,000,000 | | | | 0.355 | | | | 09/07/14 | | | | 40,000,000 | |
JPMorgan Chase Bank NA (next reset date 10/22/13) (b) | | | 30,000,000 | | | | 0.346 | | | | 09/22/14 | | | | 30,000,000 | |
Natixis | | | 54,000,000 | | | | 0.100 | | | | 09/03/13 | | | | 54,000,000 | |
Societe Generale | | | 50,000,000 | | | | 0.080 | | | | 09/03/13 | | | | 50,000,000 | |
Svenska Handelsbanken AB (next reset date 09/27/13) (a)(b) | | | 25,000,000 | | | | 0.294 | | | | 02/27/14 | | | | 25,000,000 | |
Toyota Motor Credit Corp. | | | 9,600,000 | | | | 0.324 | | | | 09/09/13 | | | | 9,600,000 | |
Wells Fargo Bank NA (next reset date 09/20/13) (b) | | | 33,000,000 | | | | 0.324 | | | | 09/19/14 | | | | 33,000,000 | |
| | | | | | | | | | | | | | | | |
| | | | |
Total Other Notes
(amortized cost $421,600,000) | | | | | | | | | | | | | | | 421,600,000 | |
| | | | | | | | | | | | | | | | |
| | | | |
Total Investments - 70.7%
(amortized cost $3,887,041,759) | | | | | | | | | | | | | | | 3,887,041,759 | |
| | | | | | | | | | | | | | | | |
| | | | | | | | | | | | | | | | |
SSgA
Money Market Fund
Schedule of Investments, continued — August 31, 2013
| | | | | | | | | | |
| | | | | | | | |
Value
$ | |
| Repurchase Agreements - 29.3% | | | | | | | | | | |
| Government Agency Repurchase Agreements - 24.8% | | | | | | | | | | |
Agreement with Barclays Capital, Inc. and The Bank of New York Mellon Corp. (Tri-Party) of $137,000,000 dated August 30, 2013 at 0.050% to be repurchased at $137,000,761 on September 3, 2013, collateralized by: $138,236,300 par various United States Government Mortgage Agency Obligations valued at $139,740,078. | | | | | | | | | 137,000,000 | |
Agreement with BNP Paribas and The Bank of New York Mellon Corp. (Tri-Party) of $200,000,000 dated August 30, 2013 at 0.050% to be repurchased at $200,001,111 on September 3, 2013, collateralized by: $236,433,511 par various United States Government Mortgage Agency Obligations valued at $204,000,001. | | | | | | | | | 200,000,000 | |
Agreement with Calyon Financial, Inc. and The Bank of New York Mellon Corp. (Tri-Party) of $132,000,000 dated August 30, 2013 at 0.060% to be repurchased at $132,000,880 on September 3, 2013, collateralized by: $160,729,237 par various United States Government Mortgage Agency Obligations valued at $134,640,000. | | | | | | | | | 132,000,000 | |
Agreement with Calyon Financial, Inc. and The Bank of New York Mellon Corp. (Tri-Party) of $76,000,000 dated August 30, 2013 at 0.070% to be repurchased at $76,000,591 on September 3, 2013, collateralized by: $79,744,600 par various United States Government Mortgage Agency Obligations valued at $77,520,042. | | | | | | | | | 76,000,000 | |
Agreement with Citigroup Global Markets, Inc. and The Bank of New York Mellon Corp. (Tri-Party) of $40,000,000 dated August 30, 2013 at 0.060% to be repurchased at $40,000,267 on September 3, 2013, collateralized by: $75,656,465 par various United States Government Mortgage Agency Obligations valued at $40,881,816. | | | | | | | | | 40,000,000 | |
Agreement with Deutsche Bank AG and The Bank of New York Mellon Corp. (Tri-Party) of $22,000,000 dated August 30, 2013 at 0.060% to be repurchased at $22,000,147 on September 3, 2013, collateralized by: $22,529,000 par various United States Government Treasury Obligations valued at $22,491,037. | | | | | | | | | 22,000,000 | |
Agreement with Deutsche Bank AG and The Bank of New York Mellon Corp. (Tri-Party) of $35,000,000 dated August 30, 2013 at 0.070% to be repurchased at $35,000,272 on September 3, 2013, collateralized by: $65,947,382 par various United States Government Treasury Obligations valued at $35,700,001. | | | | | | | | | 35,000,000 | |
Agreement with Goldman Sachs & Co. and The Bank of New York Mellon Corp. (Tri-Party) of $100,000,000 dated August 30, 2013 at 0.040% to be repurchased at $100,000,556 on September 4, 2013, collateralized by: $115,454,223 par various United States Government Mortgage Agency Obligations valued at $102,000,000. | | | | | | | | | 100,000,000 | |
Agreement with Goldman Sachs & Co. and The Bank of New York Mellon Corp. (Tri-Party) of $275,000,000 dated August 30, 2013 at 0.050% to be repurchased at $275,001,528 on September 3, 2013, collateralized by: $872,665,942 par various United States Government Mortgage Agency Obligations valued at $280,500,000. | | | | | | | | | 275,000,000 | |
Agreement with Morgan Stanley and The Bank of New York Mellon Corp. (Tri-Party) of $58,000,000 dated August 30, 2013 at 0.060% to be repurchased at $58,000,387 on September 3, 2013, collateralized by: $60,759,125 par various United States Government Mortgage Agency Obligations valued at $59,378,087. | | | | | | | | | 58,000,000 | |
| | | | | | | | | | |
SSgA
Money Market Fund
Schedule of Investments, continued — August 31, 2013
| | | | | | | | | | |
| | | | | | | | |
Value
$ | |
Agreement with Societe Generale and The Bank of New York Mellon Corp. (Tri-Party) of $250,000,000 dated August 30, 2013 at 0.070% to be repurchased at $250,001,944 on September 3, 2013, collateralized by: $540,739,278 par various United States Government Mortgage Agency Obligations valued at $255,000,000. | | | | | | | | | 250,000,000 | |
Agreement with UBS Securities, LLC and The Bank of New York Mellon Corp. (Tri-Party) of $40,000,000 dated August 30, 2013 at 0.050% to be repurchased at $40,000,222 on September 3, 2013, collateralized by: $46,610,778 par various United States Government Treasury Obligations valued at $40,800,000. | | | | | | | | | 40,000,000 | |
| | | | | | | | | | |
| | | | |
Total Government Agency Repurchase Agreements
(identified cost $1,365,000,000) | | | | | | | | | 1,365,000,000 | |
| | | | | | | | | | |
| | | | |
| Treasury Repurchase Agreements - 4.5% | | | | | | | | | | |
Agreement with Barclays Capital, Inc. and The Bank of New York Mellon Corp. (Tri-Party) of $63,000,000 dated August 30, 2013 at 0.060% to be repurchased at $63,000,420 on September 3, 2013, collateralized by: $65,218,600 par various United States Government Treasury Obligations valued at $64,260,096. | | | | | | | | | 63,000,000 | |
Agreement with HSBC Securities USA, Inc. and JPMorgan Chase & Co. (Tri-Party) of $125,000,000 dated August 30, 2013 at 0.020% to be repurchased at $125,000,278 on September 3, 2013, collateralized by: $109,739,000 par various United States Government Treasury Obligations valued at $127,500,400. | | | | | | | | | 125,000,000 | |
Agreement with Merrill Lynch and The Bank of New York Mellon Corp. (Tri-Party) of $25,000,000 dated August 30, 2013 at 0.020% to be repurchased at $25,000,056 on September 3, 2013, collateralized by: $26,416,200 par various United States Government Treasury Obligations valued at $25,500,032. | | | | | | | | | 25,000,000 | |
Agreement with Merrill Lynch and The Bank of New York Mellon Corp. (Tri-Party) of $35,000,000 dated August 30, 2013 at 0.070% to be repurchased at $35,000,476 on September 6, 2013, collateralized by: $35,152,400 par various United States Government Treasury Obligations valued at $35,700,077. | | | | | | | | | 35,000,000 | |
| | | | | | | | | | |
| | | | |
Total Treasury Repurchase Agreements
(identified cost $248,000,000) | | | | | | | | | 248,000,000 | |
| | | | | | | | | | |
| | | | |
Total Repurchase Agreement
(identified cost $1,613,000,000) | | | | | | | | | 1,613,000,000 | |
| | | | | | | | | | |
| | | | |
Total Investments and Repurchase Agreements - 100.0% (c)
(cost $5,500,041,759) (d) | | | | | | | | | 5,500,041,759 | |
| | | | |
| Other Assets and Liabilities, Net - 0.0% (e) | | | | | | | | | 727,418 | |
| | | | | | | | | | |
| | | | |
| Net Assets - 100.0% | | | | | | | | | 5,500,769,177 | |
| | | | | | | | | | |
SSgA
Money Market Fund
Schedule of Investments, continued — August 31, 2013
Footnotes:
| # | For purposes of this report, for non-interest bearing Commercial Paper and Discount Notes, the discount rate at purchase is used to populate the coupon rate column. |
| (a) | Restricted security Rule (144A) or Section 4 (2) commercial paper. Security may have contractual restrictions on resale, may have been offered in a private placement transaction, and may not be registered under the Securities Act of 1933. |
| (b) | Adjustable or floating rate security. Rate shown reflects rate in effect at period end. |
| (c) | Unless otherwise indicated, the values of securities of the Fund are determined based on Level 2 inputs. (Note 2) |
| (d) | The identified cost for Federal income tax purposes. |
| (e) | Less than 0.05% of net assets. |
Presentation of Portfolio Holdings — August 31, 2013
| | | | |
| Categories | | % of
Net
Assets | |
| | | | |
Asset Backed Commercial Paper | | | 2.4 | |
Certificates of Deposit | | | 46.8 | |
Financial Company Commercial Paper | | | 13.8 | |
Other Notes | | | 7.7 | |
Repurchase Agreements | | | 29.3 | |
| | | | |
Total Investments and Repurchase Agreements | | | 100.0 | |
Other Assets and Liabilities, Net | | | — | * |
| | | | |
| |
| | | 100.0 | |
| | | | |
| * | Less than 0.05% of net assets. |
See accompanying notes which are an integral part of the financial statements.
SSgA
U.S. Government Money Market Fund
Shareholder Expense Example — August 31, 2013 (Unaudited)
Fund Expenses
The following disclosure provides important information regarding each Fund’s Expense Example, which appears on each Fund’s individual page in this Annual Report. Please refer to this information when reviewing the Expense Example for a Fund.
Example
As a shareholder of the Fund, you incur two types of costs: (1) transaction costs, and (2) ongoing costs, including advisory and administrative fees; distribution (12b-1) and/or service fees; and other Fund expenses. The Example is intended to help you understand your ongoing costs (in dollars) of investing in the Fund and to compare these costs with the ongoing costs of investing in other mutual funds. The Example is based on an investment of $1,000 invested at the beginning of the period and held for the entire period indicated, which for this Fund is from March 1, 2013 to August 31, 2013.
Actual Expenses
The information in the table under the heading “Actual Performance” provides information about actual account values and actual expenses. You may use the information in this column, together with the amount you invested, to estimate the expenses that you paid over the period. Simply divide your account value by $1,000 (for example, an $8,600 account value divided by $1,000 = 8.6), then multiply the result by the number in the first column in the row entitled “Expenses Paid During Period” to estimate the expenses you paid on your account during this period.
Hypothetical Example for Comparison Purposes
The information in the table under the heading “Hypothetical Performance (5% return before expenses)” provides information about hypothetical account values and hypothetical expenses based on the Fund’s actual expense ratio and an assumed rate of return of 5% per year before expenses, which is not the Fund’s actual return. The hypothetical account values and expenses may not be used to estimate the actual ending account balance or expenses you paid for the period. You may use this information to compare the ongoing costs of investing in the Fund and other funds. To do so, compare this 5% hypothetical example with the 5% hypothetical examples that appear in the shareholder reports of other funds.
Please note that the expenses shown in the table are meant to highlight your ongoing costs only and do not reflect any transaction costs. Therefore, the information under the heading “Hypothetical Performance (5% return before expenses)” is useful in comparing ongoing costs only, and will not help you determine the relative total costs of owning different funds. In addition, if these transaction costs were included, your costs would have been higher.
| | | | | | | | |
| | | Actual
Performance | | | Hypothetical
Performance
(5% return
before expenses) | |
Beginning Account Value | | | | | | | | |
March 1, 2013 | | $ | 1,000.00 | | | $ | 1,000.00 | |
Ending Account Value | | | | | | | | |
August 31, 2013 | | $ | 1,000.00 | | | $ | 1,024.70 | |
Expenses Paid During Period* | | $ | 0.50 | | | $ | 0.51 | |
| * | Expenses are equal to the Fund’s annualized expense ratio of 0.10% (representing the six month period annualized), multiplied by the average account value over the period, multiplied by 184/365 (to reflect the one-half year period). Includes amounts waived, reimbursed and/or other credits. Without the waiver, reimbursement and/or other credits, expenses would have been higher. |
| | | | |
| U.S. Government Money Market Fund | | | 11 | |
SSgA
U.S. Government Money Market Fund
Schedule of Investments — August 31, 2013
| | | | | | | | | | | | | | | | |
| | | Principal
Amount ($)
or Shares | | | Rate
% (#) | | | Date
of
Maturity | | | Value
$ | |
| | | | | | | | | | | | | | | | |
| Government Agency Debt - 52.1% | | | | | | | | | | | | | | | | |
Federal Home Loan Bank | | | 30,000,000 | | | | 0.140 | | | | 09/06/13 | | | | 29,999,417 | |
Federal Home Loan Bank | | | 17,000,000 | | | | 0.140 | | | | 09/11/13 | | | | 16,999,339 | |
Federal Home Loan Bank | | | 45,000,000 | | | | 0.090 | | | | 09/18/13 | | | | 44,998,087 | |
Federal Home Loan Bank | | | 54,000,000 | | | | 0.100 | | | | 09/18/13 | | | | 53,997,450 | |
Federal Home Loan Bank | | | 21,850,000 | | | | 0.133 | | | | 09/18/13 | | | | 21,848,633 | |
Federal Home Loan Bank | | | 30,000,000 | | | | 0.120 | | | | 09/25/13 | | | | 29,997,600 | |
Federal Home Loan Bank | | | 38,000,000 | | | | 0.129 | | | | 09/25/13 | | | | 37,996,732 | |
Federal Home Loan Bank | | | 17,000,000 | | | | 0.135 | | | | 09/25/13 | | | | 16,998,470 | |
Federal Home Loan Bank | | | 34,000,000 | | | | 0.115 | | | | 10/09/13 | | | | 33,995,873 | |
Federal Home Loan Bank | | | 30,000,000 | | | | 0.116 | | | | 10/09/13 | | | | 29,996,327 | |
Federal Home Loan Bank | | | 15,000,000 | | | | 0.110 | | | | 10/16/13 | | | | 14,997,938 | |
Federal Home Loan Bank | | | 25,000,000 | | | | 0.110 | | | | 10/18/13 | | | | 24,996,410 | |
Federal Home Loan Bank | | | 12,000,000 | | | | 0.100 | | | | 11/15/13 | | | | 11,997,500 | |
Federal Home Loan Bank | | | 25,800,000 | | | | 0.125 | | | | 01/02/14 | | | | 25,788,981 | |
Federal Home Loan Bank | | | 9,000,000 | | | | 0.115 | | | | 01/08/14 | | | | 8,996,291 | |
Federal Home Loan Bank | | | 100,000,000 | | | | 0.090 | | | | 01/15/14 | | | | 99,966,000 | |
Federal Home Loan Bank | | | 68,900,000 | | | | 0.095 | | | | 01/22/14 | | | | 68,874,000 | |
Federal Home Loan Bank | | | 36,000,000 | | | | 0.090 | | | | 01/24/14 | | | | 35,986,950 | |
Federal Home Loan Bank | | | 16,000,000 | | | | 0.090 | | | | 01/31/14 | | | | 15,993,920 | |
Federal Home Loan Bank | | | 8,000,000 | | | | 0.092 | | | | 01/31/14 | | | | 7,996,892 | |
Federal Home Loan Bank | | | 38,000,000 | | | | 0.095 | | | | 02/05/14 | | | | 37,984,256 | |
Federal Home Loan Bank | | | 100,000,000 | | | | 0.100 | | | | 02/05/14 | | | | 99,956,389 | |
Federal Home Loan Bank | | | 47,000,000 | | | | 0.095 | | | | 02/14/14 | | | | 46,979,411 | |
Federal Home Loan Bank (next reset date 09/18/13) (a) | | | 45,000,000 | | | | 0.114 | | | | 02/18/14 | | | | 44,999,663 | |
Federal Home Loan Bank | | | 35,000,000 | | | | 0.095 | | | | 02/19/14 | | | | 34,984,206 | |
Federal Home Loan Bank | | | 16,000,000 | | | | 0.100 | | | | 02/19/14 | | | | 15,992,400 | |
Federal Home Loan Bank | | | 30,000,000 | | | | 0.084 | | | | 02/28/14 | | | | 29,987,400 | |
Federal Home Loan Bank (next reset date 09/01/13) (a) | | | 71,000,000 | | | | 0.137 | | | | 04/01/14 | | | | 71,000,000 | |
Federal Home Loan Mortgage Corp. | | | 17,000,000 | | | | 0.143 | | | | 09/03/13 | | | | 16,999,865 | |
Federal Home Loan Mortgage Corp. | | | 60,725,000 | | | | 0.140 | | | | 09/09/13 | | | | 60,723,111 | |
Federal Home Loan Mortgage Corp. | | | 15,000,000 | | | | 0.080 | | | | 09/16/13 | | | | 14,999,500 | |
Federal Home Loan Mortgage Corp. | | | 10,000,000 | | | | 0.100 | | | | 09/16/13 | | | | 9,999,583 | |
Federal Home Loan Mortgage Corp. | | | 39,000,000 | | | | 0.130 | | | | 09/16/13 | | | | 38,997,888 | |
Federal Home Loan Mortgage Corp. | | | 16,000,000 | | | | 0.070 | | | | 09/17/13 | | | | 15,999,502 | |
Federal Home Loan Mortgage Corp. | | | 15,000,000 | | | | 0.110 | | | | 09/23/13 | | | | 14,998,992 | |
Federal Home Loan Mortgage Corp. | | | 11,000,000 | | | | 0.130 | | | | 09/23/13 | | | | 10,999,126 | |
Federal Home Loan Mortgage Corp. | | | 63,000,000 | | | | 0.114 | | | | 10/07/13 | | | | 62,992,818 | |
Federal Home Loan Mortgage Corp. | | | 66,000,000 | | | | 0.100 | | | | 10/21/13 | | | | 65,990,833 | |
Federal Home Loan Mortgage Corp. | | | 7,000,000 | | | | 0.100 | | | | 10/28/13 | | | | 6,998,892 | |
Federal Home Loan Mortgage Corp. | | | 16,000,000 | | | | 0.095 | | | | 11/04/13 | | | | 15,997,298 | |
Federal Home Loan Mortgage Corp. | | | 5,000,000 | | | | 0.100 | | | | 11/04/13 | | | | 4,999,111 | |
Federal Home Loan Mortgage Corp. | | | 27,000,000 | | | | 0.105 | | | | 11/05/13 | | | | 26,994,881 | |
Federal Home Loan Mortgage Corp. | | | 11,000,000 | | | | 0.100 | | | | 11/26/13 | | | | 10,997,372 | |
Federal Home Loan Mortgage Corp. | | | 13,000,000 | | | | 0.115 | | | | 01/06/14 | | | | 12,994,726 | |
Federal Home Loan Mortgage Corp. | | | 55,000,000 | | | | 0.120 | | | | 01/06/14 | | | | 54,976,717 | |
Federal Home Loan Mortgage Corp. | | | 30,000,000 | | | | 0.120 | | | | 01/07/14 | | | | 29,987,200 | |
Federal Home Loan Mortgage Corp. | | | 15,000,000 | | | | 0.120 | | | | 01/14/14 | | | | 14,993,250 | |
Federal Home Loan Mortgage Corp. | | | 20,000,000 | | | | 0.130 | | | | 01/14/14 | | | | 19,990,250 | |
Federal Home Loan Mortgage Corp. | | | 35,000,000 | | | | 0.090 | | | | 01/21/14 | | | | 34,987,575 | |
Federal Home Loan Mortgage Corp. | | | 33,000,000 | | | | 0.110 | | | | 01/21/14 | | | | 32,985,682 | |
Federal Home Loan Mortgage Corp. | | | 8,000,000 | | | | 0.095 | | | | 02/03/14 | | | | 7,996,728 | |
| | |
| 12 | | U.S. Government Money Market Fund |
SSgA
U.S. Government Money Market Fund
Schedule of Investments, continued — August 31, 2013
| | | | | | | | | | | | | | | | |
| | | Principal
Amount ($)
or Shares | | | Rate
% (#) | | | Date
of
Maturity | | | Value
$ | |
| | | | | | | | | | | | | | | | |
Federal Home Loan Mortgage Corp. | | | 80,000,000 | | | | 0.095 | | | | 02/10/14 | | | | 79,965,800 | |
Federal Home Loan Mortgage Corp. | | | 44,000,000 | | | | 0.083 | | | | 02/24/14 | | | | 43,982,146 | |
Federal National Mortgage Assoc. | | | 88,000,000 | | | | 0.150 | | | | 09/03/13 | | | | 87,999,267 | |
Federal National Mortgage Assoc. | | | 5,458,000 | | | | 0.140 | | | | 09/04/13 | | | | 5,457,936 | |
Federal National Mortgage Assoc. | | | 39,900,000 | | | | 0.140 | | | | 09/11/13 | | | | 39,898,448 | |
Federal National Mortgage Assoc. | | | 15,000,000 | | | | 0.120 | | | | 09/25/13 | | | | 14,998,800 | |
Federal National Mortgage Assoc. | | | 5,000,000 | | | | 0.115 | | | | 10/02/13 | | | | 4,999,505 | |
Federal National Mortgage Assoc. | | | 17,000,000 | | | | 0.100 | | | | 10/30/13 | | | | 16,997,214 | |
Federal National Mortgage Assoc. | | | 5,000,000 | | | | 0.095 | | | | 11/06/13 | | | | 4,999,129 | |
Federal National Mortgage Assoc. | | | 17,000,000 | | | | 0.095 | | | | 11/13/13 | | | | 16,996,725 | |
Federal National Mortgage Assoc. | | | 8,000,000 | | | | 0.100 | | | | 11/13/13 | | | | 7,998,378 | |
Federal National Mortgage Assoc. | | | 22,000,000 | | | | 0.100 | | | | 11/20/13 | | | | 21,995,111 | |
Federal National Mortgage Assoc. | | | 22,000,000 | | | | 0.100 | | | | 11/27/13 | | | | 21,994,683 | |
Federal National Mortgage Assoc. | | | 9,000,000 | | | | 0.112 | | | | 01/08/14 | | | | 8,996,388 | |
Federal National Mortgage Assoc. | | | 18,000,000 | | | | 0.113 | | | | 01/08/14 | | | | 17,992,712 | |
Federal National Mortgage Assoc. | | | 63,000,000 | | | | 0.100 | | | | 01/13/14 | | | | 62,976,550 | |
Federal National Mortgage Assoc. | | | 16,000,000 | | | | 0.100 | | | | 01/15/14 | | | | 15,993,956 | |
Federal National Mortgage Assoc. | | | 51,000,000 | | | | 0.090 | | | | 01/22/14 | | | | 50,981,767 | |
Federal National Mortgage Assoc. | | | 9,000,000 | | | | 0.090 | | | | 01/27/14 | | | | 8,996,670 | |
Federal National Mortgage Assoc. | | | 16,000,000 | | | | 0.100 | | | | 02/03/14 | | | | 15,993,111 | |
Federal National Mortgage Assoc. | | | 17,000,000 | | | | 0.095 | | | | 02/05/14 | | | | 16,992,957 | |
Federal National Mortgage Assoc. | | | 50,000,000 | | | | 0.100 | | | | 02/12/14 | | | | 49,977,222 | |
Federal National Mortgage Assoc. | | | 31,000,000 | | | | 0.082 | | | | 02/26/14 | | | | 30,987,431 | |
Federal National Mortgage Assoc. | | | 12,000,000 | | | | 0.083 | | | | 02/26/14 | | | | 11,995,075 | |
| | | | | | | | | | | | | | | | |
| | | | |
Total Government Agency Debt
(amortized cost $2,262,074,416) | | | | | | | | | | | | | | | 2,262,074,416 | |
| | | | | | | | | | | | | | | | |
| | | | |
| Treasury Debt - 0.7% | | | | | | | | | | | | | | | | |
U.S. Treasury Note | | | 13,000,000 | | | | 0.107 | | | | 01/31/14 | | | | 13,007,706 | |
U.S. Treasury Note | | | 10,000,000 | | | | 0.102 | | | | 01/15/14 | | | | 10,033,263 | |
U.S. Treasury Note | | | 9,000,000 | | | | 0.107 | | | | 01/31/14 | | | | 9,061,269 | |
| | | | | | | | | | | | | | | | |
| | | | |
Total Treasury Debt
(amortized cost $32,102,238) | | | | | | | | | | | | | | | 32,102,238 | |
| | | | | | | | | | | | | | | | |
| | | | |
Total Investments - 52.8%
(amortized cost $2,294,176,654) | | | | | | | | | | | | | | | 2,294,176,654 | |
| | | | | | | | | | | | | | | | |
| | | | |
| Repurchase Agreements - 34.5% | | | | | | | | | | | | | | | | |
| Government Agency Repurchase Agreements - 5.4% | | | | | | | | | | | | | | | | |
Agreement with Barclays Capital, Inc. and The Bank of New York Mellon Corp. (Tri-Party) of $150,000,000 dated August 30, 2013 at 0.030% to be repurchased at $150,000,625 on September 4, 2013, collateralized by: $154,597,000 par various United States Government Mortgage Agency Obligations valued at $153,000,040. | | | | | | | | | | | | | | | 150,000,000 | |
Agreement with Citigroup Global Markets, Inc. and The Bank of New York Mellon Corp. (Tri-Party) of $83,000,000 dated August 30, 2013 at 0.050% to be repurchased at $83,000,461 on September 3, 2013, collateralized by: $84,825,000 par various United States Government Mortgage Agency Obligations valued at $84,660,839. | | | | | | | | | | | | | | | 83,000,000 | |
| | | | | | | | | | | | | | | | |
| | | | |
Total Government Agency Repurchase Agreements
(identified cost $233,000,000) | | | | | | | | | | | | | | | 233,000,000 | |
| | | | | | | | | | | | | | | | |
| | | | |
| U.S. Government Money Market Fund | | | 13 | |
SSgA
U.S. Government Money Market Fund
Schedule of Investments, continued — August 31, 2013
| | | | | | | | | | |
| | | | | | | | |
Value
$ | |
| Treasury Repurchase Agreements - 29.1% | | | | | | | | | | |
Agreement with BNP Paribas and The Bank of New York Mellon Corp. (Tri-Party) of $150,000,000 dated August 30, 2013 at 0.040% to be repurchased at $150,000,667 on September 3, 2013, collateralized by: $152,942,300 par various United States Government Treasury Obligations valued at $153,000,092. | | | | | | | | | 150,000,000 | |
Agreement with Calyon Financial, Inc. and The Bank of New York Mellon Corp. (Tri-Party) of $406,000,000 dated August 30, 2013 at 0.050% to be repurchased at $406,002,256 on September 3, 2013, collateralized by: $288,438,300 par various United States Government Treasury Obligations valued at $414,120,025. | | | | | | | | | 406,000,000 | |
Agreement with Deutsche Bank AG and The Bank of New York Mellon Corp. (Tri-Party) of $16,000,000 dated August 30, 2013 at 0.050% to be repurchased at $16,000,089 on September 3, 2013, collateralized by: $16,474,800 par various United States Government Treasury Obligations valued at $16,320,011. | | | | | | | | | 16,000,000 | |
Agreement with HSBC Securities USA, Inc. and JP Morgan Chase & Co. (Tri-Party) of $200,000,000 dated August 30, 2013 at 0.020% to be repurchased at $200,000,444 on September 3, 2013, collateralized by: $190,742,400 par various United States Government Treasury Obligations valued at $204,000,956. | | | | | | | | | 200,000,000 | |
Agreement with Merrill Lynch and The Bank of New York Mellon Corp. (Tri-Party) of $25,000,000 dated August 30, 2013 at 0.070% to be repurchased at $25,000,340 on September 6, 2013, collateralized by: $26,416,200 par various United States Government Treasury Obligations valued at $25,500,032. | | | | | | | | | 25,000,000 | |
Agreement with Morgan Stanley and The Bank of New York Mellon Corp. (Tri-Party) of $145,000,000 dated August 30, 2013 at 0.040% to be repurchased at $145,000,644 on September 3, 2013, collateralized by: $144,837,800 par various United States Government Treasury Obligations valued at $147,900,023. | | | | | | | | | 145,000,000 | |
Agreement with RBC Capital Markets and The Bank of New York Mellon Corp. (Tri-Party) of $100,000,000 dated August 30, 2013 at 0.040% to be repurchased at $100,000,444 on September 3, 2013, collateralized by: $90,484,700 par various United States Government Treasury Obligations valued at $102,000,119. | | | | | | | | | 100,000,000 | |
Agreement with Societe Generale and The Bank of New York Mellon Corp. (Tri-Party) of $144,511,000 dated August 30, 2013 at 0.050% to be repurchased at $144,511,803 on September 3, 2013, collateralized by: $127,647,700 par various United States Government Treasury Obligations valued at $147,401,260. | | | | | | | | | 144,511,000 | |
Agreement with UBS Securities, LLC and The Bank of New York Mellon Corp. (Tri-Party) of $77,000,000 dated August 30, 2013 at 0.040% to be repurchased at $77,000,342 on September 3, 2013, collateralized by: $77,589,400 par various United States Government Treasury Obligations valued at $78,540,046. | | | | | | | | | 77,000,000 | |
| | | | | | | | | | |
| | | | |
Total Treasury Repurchase Agreements
(identified cost $1,263,511,000) | | | | | | | | | 1,263,511,000 | |
| | | | | | | | | | |
| | | | |
Total Repurchase Agreement
(identified cost $1,496,511,000) | | | | | | | | | 1,496,511,000 | |
| | | | | | | | | | |
| | | | |
Total Investments and Repurchase Agreements - 87.3% (b)
(cost $3,790,687,654) (c) | | | | | | | | | 3,790,687,654 | |
| | | | |
| Other Assets and Liabilities, Net - 12.7% | | | | | | | | | 553,397,386 | |
| | | | | | | | | | |
| | | | |
| Net Assets - 100.0% | | | | | | | | | 4,344,085,040 | |
| | | | | | | | | | |
| | |
| 14 | | U.S. Government Money Market Fund |
SSgA
U.S. Government Money Market Fund
Schedule of Investments, continued — August 31, 2013
Footnotes:
| # | For purposes of this report, for non-interest bearing Commercial Paper and Discount Notes, the discount rate at purchase is used to populate the coupon rate column. |
| (a) | Adjustable or floating rate security. Rate shown reflects rate in effect at period end. |
| (b) | Unless otherwise indicated, the values of securities of the Fund are determined based on Level 2 inputs. (Note 2) |
| (c) | The identified cost for Federal income tax purposes. |
Presentation of Portfolio Holdings — August 31, 2013
| | | | |
| Categories | | % of
Net
Assets | |
| | | | |
Government Agency Debt | | | 52.1 | |
Treasury Debt | | | 0.7 | |
Repurchase Agreements | | | 34.5 | |
| | | | |
Total Investments and Repurchase Agreements | | | 87.3 | |
Other Assets and Liabilities, Net | | | 12.7 | |
| | | | |
| |
| | | 100.0 | |
| | | | |
See accompanying notes which are an integral part of the financial statements.
| | | | |
| U.S. Government Money Market Fund | | | 15 | |
SSgA
Money Market Funds
Statements of Assets and Liabilities — August 31, 2013
| | | | | | | | |
| | | Money
Market Fund | | | U.S. Government
Money Market Fund | |
| | | | | | | | |
Assets | | | | | | | | |
Investments, at identified cost | | $ | 3,887,041,759 | | | $ | 2,294,176,654 | |
Investments at amortized cost which approximates value | | | 3,887,041,759 | | | | 2,294,176,654 | |
Repurchase agreements at cost which approximates value | | | 1,613,000,000 | | | | 1,496,511,000 | |
Cash | | | 462,040 | | | | 553,302,277 | |
Receivables: | | | | | | | | |
Dividends and interest | | | 1,244,533 | | | | 46,324 | |
Fund shares sold | | | 364,102 | | | | 187,447 | |
From adviser | | | 1,773,909 | | | | 1,910,408 | |
Prepaid expenses | | | 121,404 | | | | 65,061 | |
| | | | | | | | |
Total assets | | | 5,504,007,747 | | | | 4,346,199,171 | |
| | | | | | | | |
| | |
Liabilities | | | | | | | | |
Payables: | | | | | | | | |
Fund shares redeemed | | | 5,606 | | | | 12,952 | |
Accrued fees to affiliates and trustees | | | 3,156,855 | | | | 2,072,819 | |
Other accrued expenses | | | 60,882 | | | | 28,360 | |
Income distribution | | | 15,227 | | | | — | |
| | | | | | | | |
Total liabilities | | | 3,238,570 | | | | 2,114,131 | |
| | | | | | | | |
| | | | | | | | |
Net Assets | | $ | 5,500,769,177 | | | $ | 4,344,085,040 | |
| | | | | | | | |
| | |
Net Assets Consist of: | | | | | | | | |
Undistributed (overdistributed) net investment income | | $ | 190,893 | | | $ | 285 | |
Accumulated net realized gain (loss) | | | 100,997 | | | | (2,635 | ) |
Shares of beneficial interest | | | 5,500,498 | | | | 4,344,166 | |
Additional paid-in-capital | | | 5,494,976,789 | | | | 4,339,743,224 | |
| | | | | | | | |
Net Assets | | $ | 5,500,769,177 | | | $ | 4,344,085,040 | |
| | | | | | | | |
| | |
Net Asset Value, offering and redemption price per share: | | | | | | | | |
Net asset value per share: (a) | | $ | 1.00 | | | $ | 1.00 | |
Net assets | | $ | 5,500,769,177 | | | $ | 4,344,085,040 | |
Shares outstanding ($0.001 par value) | | | 5,500,496,092 | | | | 4,344,167,046 | |
| (a) | | Net asset value per share equals net assets divided by shares of beneficial interest outstanding. |
See accompanying notes which are an integral part of the financial statements.
| | |
| 16 | | Statements of Assets and Liabilities |
SSgA
Money Market Funds
Statements of Operations — For the Period Ended August 31, 2013
| | | | | | | | |
| | | Money
Market Fund | | | U.S. Government
Money Market Fund | |
| | | | | | | | |
Investment Income | | | | | | | | |
Interest | | $ | 12,717,879 | | | $ | 4,601,574 | |
| | | | | | | | |
Total investment income | | | 12,717,879 | | | | 4,601,574 | |
| | | | | | | | |
| | |
Expenses | | | | | | | | |
Advisory fees | | | 12,499,918 | | | | 9,125,982 | |
Administrative fees | | | 986,022 | | | | 746,966 | |
Custodian fees | | | 693,550 | | | | 568,135 | |
Distribution fees | | | 1,204,417 | | | | 781,904 | |
Transfer agent fees | | | 88,218 | | | | 60,388 | |
Professional fees | | | 79,636 | | | | 67,909 | |
Registration fees | | | 34,014 | | | | 16,185 | |
Shareholder servicing fees | | | 2,850,189 | | | | 2,277,184 | |
Trustees’ fees | | | 162,080 | | | | 121,613 | |
Insurance fees | | | 177,917 | | | | 109,058 | |
Printing fees | | | 71,904 | | | | 11,930 | |
Miscellaneous | | | 112,370 | | | | 84,545 | |
| | | | | | | | |
Expenses before reductions | | | 18,960,235 | | | | 13,971,799 | |
Expense reductions | | | (6,492,346 | ) | | | (9,370,225 | ) |
| | | | | | | | |
Net expenses | | | 12,467,889 | | | | 4,601,574 | |
| | | | | | | | |
Net investment income (loss) | | | 249,990 | | | | — | |
| | | | | | | | |
| | |
Net Realized Gain (Loss) | | | | | | | | |
Net realized gain (loss) on investments | | | 100,997 | | | | — | |
| | | | | | | | |
Net Increase (Decrease) in Net Assets from Operations | | $ | 350,987 | | | $ | — | |
| | | | | | | | |
See accompanying notes which are an integral part of the financial statements.
| | | | |
| Statements of Operations | | | 17 | |
SSgA
Money Market Funds
Statements of Changes in Net Assets
| | | | | | | | | | | | | | | | |
| | | Money Market Fund | | | U.S. Government
Money Market Fund | |
| | | Year Ended
August 31,
2013 | | | Year Ended
August 31,
2012 | | | Year Ended
August 31,
2013 | | | Year Ended
August 31,
2012 | |
| | | | | | | | | | | | | | | | |
Increase (Decrease) in Net Assets | | | | | | | | | | | | | | | | |
| | | | |
Operations | | | | | | | | | | | | | | | | |
Net investment income (loss) | | $ | 249,990 | | | $ | 425,738 | | | $ | — | | | $ | 23,079 | |
Net realized gain (loss) | | | 100,997 | | | | 51,659 | | | | — | | | | 4,173 | |
| | | | | | | | | | | | | | | | |
Net increase (decrease) in net assets from operations | | | 350,987 | | | | 477,397 | | | | — | | | | 27,252 | |
| | | | | | | | | | | | | | | | |
| | | | |
Distributions | | | | | | | | | | | | | | | | |
From net investment income | | | (249,990 | ) | | | (425,738 | ) | | | — | | | | (23,079 | ) |
| | | | | | | | | | | | | | | | |
Net decrease in net assets from distributions | | | (249,990 | ) | | | (425,738 | ) | | | — | | | | (23,079 | ) |
| | | | | | | | | | | | | | | | |
| | | | |
Share Transactions | | | | | | | | | | | | | | | | |
Net increase (decrease) in net assets from share transactions | | | (55,557,347 | ) | | | (1,079,011,455 | ) | | | 300,667,820 | | | | (426,127,837 | ) |
| | | | | | | | | | | | | | | | |
Total Net Increase (Decrease) in Net Assets | | | (55,456,350 | ) | | | (1,078,959,796 | ) | | | 300,667,820 | | | | (426,123,664 | ) |
| | | | |
Net Assets | | | | | | | | | | | | | | | | |
Beginning of period | | | 5,556,225,527 | | | | 6,635,185,323 | | | | 4,043,417,220 | | | | 4,469,540,884 | |
| | | | | | | | | | | | | | | | |
| | | | |
End of period | | $ | 5,500,769,177 | | | $ | 5,556,225,527 | | | $ | 4,344,085,040 | | | $ | 4,043,417,220 | |
| | | | | | | | | | | | | | | | |
| | | | |
Undistributed (overdistributed) net investment income included in net assets | | $ | 190,893 | | | $ | 126,975 | | | $ | 285 | | | $ | — | |
See accompanying notes which are an integral part of the financial statements.
| | |
| 18 | | Statements of Changes in Net Assets |
This page has been intentionally left blank.
SSgA
Money Market Funds
Financial Highlights — For the Periods Ended
For a Share Outstanding Throughout Each Period.
| | | | | | | | | | | | | | | | | | | | | | | | |
| | |
$
Net Asset Value,
Beginning of
Period | | | $
Net
Investment
Income (Loss)(a)(b) | | | $
Net Realized
and Unrealized
Gain (Loss) | | | $
Total from
Investment
Operations | | | $
Distributions
from Net
Investment Income | | | $
Distributions
from Net
Realized Gain | |
Money Market Fund | | | | | | | | | | | | | | | | | |
August 31, 2013 | | | 1.0000 | | | | 0.0001 | | | | — | (c) | | | 0.0001 | | | | (0.0001 | ) | | | — | |
August 31, 2012 | | | 1.0000 | | | | 0.0001 | | | | — | (c) | | | 0.0001 | | | | (0.0001 | ) | | | — | |
August 31, 2011 | | | 1.0000 | | | | 0.0001 | | | | — | (c) | | | 0.0001 | | | | (0.0001 | ) | | | — | |
August 31, 2010 | | | 1.0000 | | | | 0.0002 | | | | — | (c) | | | 0.0002 | | | | (0.0002 | ) | | | — | |
August 31, 2009 | | | 1.0000 | | | | 0.0080 | | | | 0.0006 | | | | 0.0086 | | | | (0.0084 | ) | | | (0.0002 | ) |
U.S. Government Money Market Fund | | | | | | | | | | | | | |
August 31, 2013 | | | 1.0000 | | | | — | | | | — | | | | — | | | | — | | | | — | |
August 31, 2012 | | | 1.0000 | | | | — | (c) | | | — | (c) | | | — | (c) | | | — | (c) | | | — | |
August 31, 2011 | | | 1.0000 | | | | — | | | | — | | | | — | | | | — | | | | — | |
August 31, 2010 | | | 1.0000 | | | | — | (c) | | | — | | | | — | (c) | | | — | (c) | | | — | |
August 31, 2009 | | | 1.0000 | | | | 0.0028 | | | | 0.0012 | | | | 0.0040 | | | | (0.0040 | ) | | | — | |
| (a) | | Average daily shares outstanding were used for this calculation. |
| (b) | | May reflect amounts waived and/or reimbursed by the investment adviser and for certain funds, custody credit arrangements. The custody credit arrangements had an impact of less than 0.005%. |
| (c) | | Less than $0.0001 per share. |
| (d) | | Includes expenses related to the U.S. Treasury Guarantee Program. |
| (f) | | Less than 0.005% of average net assets. |
See accompanying notes which are an integral part of the financial statements.
| | | | | | | | | | | | | | | | | | | | | | | | | | |
$
Total
Distributions | | | $
Net Asset Value,
End of
Period | | | %
Total
Return | | | $
Net Assets,
End of Period
(000) | | | %
Ratio of Expenses
to Average
Net Assets,
Net(b) | | | %
Ratio of Expenses
to Average
Net Assets,
Gross | | | %
Ratio of Net
Investment Income
to Average
Net Assets(b) | |
| | | | | | | | | | | | | | | | | | | | | | | | | | |
| | (0.0001 | ) | | | 1.0000 | | | | 0.01 | | | | 5,500,769 | | | | 0.25 | | | | 0.38 | | | | 0.01 | |
| | (0.0001 | ) | | | 1.0000 | | | | 0.01 | | | | 5,556,226 | | | | 0.29 | | | | 0.39 | | | | 0.01 | |
| | (0.0001 | ) | | | 1.0000 | | | | 0.01 | | | | 6,635,185 | | | | 0.31 | | | | 0.38 | | | | 0.01 | |
| | (0.0002 | ) | | | 1.0000 | | | | 0.02 | | | | 7,019,663 | | | | 0.32 | | | | 0.39 | | | | 0.02 | |
| | (0.0086 | ) | | | 1.0000 | | | | 0.86 | | | | 8,599,276 | | | | 0.41 | (d) | | | 0.41 | | | | 0.80 | |
| | | | | | | | | | | | | | | | | | | | | | | | | | |
| | — | | | | 1.0000 | | | | — | | | | 4,344,085 | | | | 0.13 | | | | 0.39 | | | | — | |
| | — | (c) | | | 1.0000 | | | | — | (e) | | | 4,043,417 | | | | 0.10 | | | | 0.39 | | | | — | (f) |
| | — | | | | 1.0000 | | | | — | | | | 4,469,541 | | | | 0.16 | | | | 0.39 | | | | — | |
| | — | (c) | | | 1.0000 | | | | — | | | | 3,491,968 | | | | 0.20 | | | | 0.37 | | | | — | (f) |
| | (0.0040 | ) | | | 1.0000 | | | | 0.40 | | | | 4,308,697 | | | | 0.35 | | | | 0.38 | | | | 0.28 | |
See accompanying notes which are an integral part of the financial statements.
SSgA
Money Market Funds
Notes to Financial Statements — August 31, 2013
The SSgA Funds (the “Investment Company”) is a series mutual fund, comprised of 12 investment portfolios that were in operation as of August 31, 2013. These financial statements report on two funds: the SSgA Money Market Fund and SSgA U.S. Government Money Market Fund (each a “Fund” and collectively referred to as the “Funds”), each of which has distinct investment objectives and strategies. Each Fund is an open-end management investment company, as defined in the Investment Company Act of 1940, as amended (the “1940 Act”). The Investment Company was organized as a Massachusetts business trust on October 3, 1987 and operates under a Second Amended and Restated Master Trust Agreement, dated May 15, 2012 (the “Agreement”). The Agreement permits the Board of Trustees (the “Board”) to issue an unlimited number of full and fractional shares of beneficial interest at a $.001 par value.
| 2. | | Significant Accounting Policies |
The Funds’ financial statements are prepared in accordance with accounting principles generally accepted in the United States of America (“U.S. GAAP”), which require the use of management estimates and assumptions at the date of the financial statements. Actual results could differ from those estimates. The following is a summary of the significant accounting policies consistently followed by each Fund in the preparation of its financial statements.
Security Valuation
As permitted in accordance with Rule 2a-7 of the 1940 Act, each Fund values portfolio investments using the amortized cost method which approximates fair market value. Under this method, each portfolio instrument is initially valued at cost, and thereafter assumes a constant accretion/amortization to maturity date or next reset date of any discount or premium.
U.S. GAAP defines fair market value as the price that a Fund would receive to sell an asset or pay to transfer a liability in an orderly transaction between market participants at the measurement date. It establishes a fair value hierarchy that prioritizes inputs to valuation methods and requires a separate disclosure of the fair value hierarchy, for each major category of assets and liabilities that segregates fair value measurements into levels (Level 1, 2, and 3). In such cases, an investment’s level within the fair value hierarchy is based on the lowest level of input that is significant to the fair value measurement. The inputs or methodology used for valuing securities are not necessarily an indication of the risk associated with investing in those securities. Levels 1, 2 and 3 of the fair value hierarchy are defined as follows:
| | • | | Level 1 — Inputs using quoted prices (unadjusted) in active markets or exchanges for identical assets and liabilities. |
| | • | | Level 2 — Significant other observable inputs, which may include, but are not limited to, quoted prices for similar assets or liabilities in markets that are active, quoted prices for identical or similar assets or liabilities in markets that are nonactive, inputs other than quoted prices that are observable for the assets or liabilities (such as interest rates, yield curves, volatilities, prepayment speeds, loss severities, credit risks and default rates) or other market corroborated inputs. |
| | • | | Level 3 — Significant unobservable inputs based on the best information available in the circumstances, to the extent observable inputs are not available, which may include assumptions made by the Board or persons acting at their direction that are used in determining the fair market value of investments. |
The valuation techniques and significant inputs used in determining the fair market values of financial instruments classified as Level 1 and Level 2 of the fair value hierarchy are as follows:
Short-term instruments purchased by the Funds and maturing within 60 days of the time of purchase are valued at “amortized cost” unless the Board determines that amortized cost does not represent fair value. These investments are categorized as Level 2 of the fair value hierarchy.
| | |
| 22 | | Notes to Financial Statements |
SSgA
Money Market Funds
Notes to Financial Statements, continued — August 31, 2013
Level 3 Trading Assets and Trading Liabilities, at Fair Value
The valuation techniques and significant inputs used in determining the fair values of financial instruments classified as Level 3 of the fair value hierarchy are as follows:
Securities and other assets for which market quotes are not readily available are valued at fair value as determined in good faith by the Board and are categorized as Level 3 of the fair value hierarchy. Market quotes are considered not readily available in circumstances where there is an absence of current or reliable market-based data (e.g., trade information or broker quotes).
When fair valuation methods are applied that use significant unobservable inputs to determine a Fund’s NAV, securities will not be priced on the basis of quotes from the primary market in which they are traded, but rather may be priced by another method that the Board or persons acting at their direction believe accurately reflects fair value and are categorized as Level 3 of the fair value hierarchy. Fair value pricing may require subjective determinations about the value of a security. While the securities valuation procedures are intended to result in a calculation of a Fund’s NAV that fairly reflects security values as of the time of pricing, the process cannot guarantee that fair values determined by the Board or persons acting at their direction would accurately reflect the price that a Fund could obtain for a security if it were to dispose of that security as of the time of pricing (for instance, in a forced or distressed sale). The prices used by a Fund may differ from the value that would be realized if the securities were sold.
For fair valuations using significant unobservable inputs, U.S. GAAP requires a reconciliation of the beginning to ending balances for reported market values that presents changes attributable to total realized and unrealized gains or losses, purchases and sales, and transfers in/out of the Level 3 category during the period. In accordance with the requirements of U.S. GAAP, a fair value hierarchy and Level 3 reconciliation, if any, have been included in the footnotes to the Schedule of Investments for each respective Fund.
As of the period ended August 31, 2013, there were no transfers between levels.
Securities Transactions
Securities transactions are recorded on a trade date basis, which in most instances is the same as the settlement date. Realized gains and losses from securities transactions, if any, are recorded on the basis of identified cost which is the same basis used for federal income taxes.
Investment Income
Interest income is recorded daily on an accrual basis and includes amortization of premium and accretion of discount on investments. Premium is amortized and discount is accreted using the straight line method. Distributions received on securities that represent a return on capital or capital gains are recorded as a reduction on cost of investments and/or as a realized gain.
Federal Income Taxes
Since the Investment Company is a Massachusetts business trust, each Fund is a separate corporate taxpayer and determines its net investment income and capital gains (or losses) and the amounts to be distributed to each Fund’s shareholders without regard to the income and capital gains (or losses) of the other Funds.
It is each Fund’s intention to qualify as a regulated investment company, as defined by the Internal Revenue Code of 1986 (the “Code”), as amended. This requires each Fund to distribute an amount sufficient to avoid any excise tax under Section 4982 of the Code. Therefore, for the period ended August 31, 2013, the Funds paid no federal income taxes and no federal income tax provision was required for the Funds.
Each Fund files a U.S. tax return. At August 31, 2013, the Funds had recorded no liabilities for net unrecognized tax benefits relating to uncertain income tax positions they have taken or expect to take in future tax returns. While the statute of limitations remains open to examine the Funds’ U.S. tax returns filed for the fiscal years ended August 31, 2010 through August 31, 2012, no examinations are in progress or anticipated at this time. The Funds are not aware of any tax positions for which it is reasonably possible that the total amounts of unrecognized tax benefits will significantly change in the next twelve months.
| | | | |
| Notes to Financial Statements | | | 23 | |
SSgA
Money Market Funds
Notes to Financial Statements, continued — August 31, 2013
At August 31, 2013, the following Fund had net tax basis capital loss carryforwards, which may be applied against any realized net taxable gains in each succeeding year or until their respective expiration dates, whichever occurs first, as follows:
| | | | | | | | | | | | | | | | | | | | | | | | | | | | | | | | |
| | | Expiration Year | |
| | | 8/31/2014 | | | 8/31/2015 | | | 8/31/2016 | | | 8/31/2017 | | | 8/31/2018 | | | Non-Expiring
Short Term | | | Non-Expiring
Long Term | | | Total | |
U.S. Government Money Market Fund | | $ | 2,635 | | | $ | — | | | $ | — | | | $ | — | | | $ | — | | | $ | — | | | $ | — | | | $ | 2,635 | |
During the period ended August 31, 2013, $8,920 of capital loss carryforward expired for U.S. Government Money Market Fund.
Under the Regulated Investment Company Modernization Act of 2010, the Funds will be permitted to carry forward capital losses incurred in taxable years beginning after December 22, 2010 for an unlimited period. However, any losses incurred during those future taxable years will be required to be utilized prior to the losses incurred in pre-enactment taxable years. As a result of this ordering rule, pre-enactment capital loss carryforwards may be more likely to expire unused. Additionally, post-enactment capital losses that are carried forward will retain their character as either short-term or long-term capital losses rather than being considered all short-term as under previous law.
For the period ended August 31, 2013, the Funds’ components of distributable earnings and tax composition of distributions for federal income tax purposes were as follows:
| | | | | | | | |
| | | Money
Market Fund | | | U.S. Government
Money Market Fund | |
| | | | | | | | |
Components of Distributable Earnings: | | | | | |
Undistributed Ordinary Income | | $ | 307,116 | | | $ | 285 | |
| | |
Tax Composition of Distributions: | | | | | | | | |
Ordinary Income | | $ | 249,990 | | | $ | — | |
Dividends and Distributions to Shareholders
The Funds declare and record dividends on net investment income daily and pay them monthly. Capital gain distributions, if any, are generally declared and paid annually. An additional distribution may be paid by the Funds to avoid imposition of federal income tax on any remaining undistributed net investment income and capital gains. Each Fund may periodically make reclassifications among certain of its capital accounts without impacting net asset value for differences between federal tax regulations and U.S. GAAP.
The amount and character of income and gains to be distributed are determined in accordance with federal income tax regulations which may differ from net investment income and realized gains recognized for U.S. GAAP purposes. These differences relate primarily to capital loss carryforwards.
Expenses
Most expenses can be directly attributed to a Fund. Expenses of the Investment Company which cannot be directly attributed to a Fund are allocated among all funds of the Investment Company based principally on their relative average net assets.
Repurchase Agreements
A repurchase agreement customarily obligates the seller at the time it sells securities to the Funds to repurchase the securities at a mutually agreed-upon price and time. The total amount received by the Funds on repurchase is calculated to exceed the price paid by the Funds, reflecting an agreed-upon market rate of interest for the period of time to the settlement date, and is not necessarily related to the interest rate on the underlying securities. The underlying securities are ordinarily United States Government securities. In most cases, repurchase transactions must be collateralized initially at a minimum of 102% of the repurchase price, but in no event less than 100% of the repurchase price. The use of repurchase agreements involves certain risks. For example, if the seller of securities under a repurchase agreement defaults on its obligation to repurchase the
| | |
| 24 | | Notes to Financial Statements |
SSgA
Money Market Funds
Notes to Financial Statements, continued — August 31, 2013
underlying securities (as a result of its bankruptcy or otherwise) the Funds will seek to dispose of such securities; this action could involve losses, costs or delays. The Funds may enter into repurchase agreements maturing within a specified date with domestic dealers, banks and other financial institutions deemed to be creditworthy by the Funds’ investment adviser.
Contractual Obligation/Indemnification
Under the Investment Company’s organizational documents, its officers and trustees are indemnified against certain liabilities arising out of the performance of their duties to the Trust. In the normal course of business, the Funds enter into contracts that contain a variety of representations and obligations, including general indemnifications. The Funds’ maximum exposure under these arrangements is unknown as this would involve future claims that may be made against the Funds that have not yet occurred. However, based on experience, the Funds expect the risk of loss to be remote.
| 3. | | Related Party Transactions, Fees and Expenses |
Adviser and Affiliates
SSgA Funds Management, Inc. (the “Adviser”), manages the Funds pursuant to an Amended and Restated Investment Advisory Agreement dated April 11, 2012, between the Investment Company and the Adviser. The Adviser is a wholly-owned subsidiary of State Street Corporation, a publicly held bank holding company. The Adviser and other advisory affiliates of State Street Corporation make up State Street Global Advisors, the investment management arm of State Street Corporation and its affiliated companies. The Adviser directs the investments of each Fund in accordance with its investment objectives, policies, and limitations. For these services, the Funds pay a fee to the Adviser, calculated daily and paid monthly at the annual rate of 0.25% of their daily net assets.
The Adviser is contractually obligated until December 31, 2013 to waive its management fee on the Money Market Fund and to reimburse the Fund for all expenses to the extent that total expenses (exclusive of non-recurring account fees, extraordinary expenses and acquired fund fees) exceed 0.40% of average daily net assets on an annual basis. For the period ended August 31, 2013, there were no contractual waivers or reimbursements for the Money Market Fund. The Adviser does not have the ability to recover these amounts waived or reimbursed under this contractual agreement.
The Adviser also may voluntarily reduce all or a portion of its fees and/or reimburse expenses to the extent necessary to maintain a minimum net yield for a Fund (the “Voluntary Reduction”) which may vary from time to time and from fund to fund in the Adviser’s sole discretion. Under an agreement with SSgA Funds relating to the Voluntary Reduction, the Money Market Fund and the U.S. Government Money Market Fund, respectively, have agreed to reimburse the Adviser for the full dollar amount of any Voluntary Reduction beginning on August 1, 2012, subject to certain limitations. A Fund will not be obligated to reimburse the Adviser: more than three years after the end of the fiscal year for the Fund in which the Adviser provided a Voluntary Reduction; in respect of any business day for which the net annualized one-day yield is less than 0.00%; to the extent that the amount of the reimbursement to the Adviser on any day exceeds fifty percent of the yield (net of all expenses, exclusive of the reimbursement) of the Fund on that day; to the extent that the amount of such reimbursement would cause the Fund’s net yield to fall below the Fund’s minimum net yield; or in respect of any fee waivers and/or expense reimbursements that are necessary to maintain a Fund’s contractual total expense limit which is effective at the time of such fee waivers and/or expense reimbursements. A reimbursement to the Adviser could negatively impact the Money Market Fund’s and the U.S. Government Money Market Fund’s future yield. There is no guarantee that either the Money Market Fund or the U.S. Government Money Market Fund will be able to avoid a negative yield. The Adviser may, in its sole discretion, irrevocably waive receipt of any or all reimbursement amounts due from a Fund, without limitation. Any such waiver or reimbursement would be voluntary and may be revised or cancelled at any time without notice. For the period ended August 31, 2013, the Adviser waived $6,490,477 of its fee and reimbursed $0 of expenses on the Money Market Fund and waived $9,125,982 of its fee and reimbursed $168,415 of expenses on the U.S. Government Money Market Fund. Voluntary reductions subject to potential recovery by year of expiration are as follows:
| | | | | | | | |
| Expiration | | Money Market Fund | | | U.S. Government
Money Market Fund | |
| | | | | | | | |
8/31/15 | | $ | 265,443 | | | $ | 695,151 | |
8/31/16 | | $ | 6,490,477 | | | $ | 9,294,397 | |
| | | | |
| Notes to Financial Statements | | | 25 | |
SSgA
Money Market Funds
Notes to Financial Statements, continued — August 31, 2013
Boston Financial Data Services, Inc. (“BFDS”) serves as the Funds’ transfer and dividend paying agent, pursuant to an agreement dated August 1, 2006, as amended. For these services, the Funds pay annual account services fees, activity based fees, charges related to compliance and regulatory services and a minimum fee of $200 for each Fund. BFDS is a joint venture of DST Systems, Inc., and State Street Corporation.
State Street Bank and Trust Company (“State Street”) provides custody and fund accounting services to the Funds pursuant to an Amended and Restated Custodian Contract dated April 11, 2012. For these services, the Funds pay State Street asset-based fees that vary according to the number of positions and transactions plus out-of-pocket expenses. State Street is a wholly-owned subsidiary of State Street Corporation. In addition, the Funds have entered into arrangements with State Street whereby custody credits realized as a result of uninvested cash balances were used to reduce a portion of the Funds’ expenses. The custody credits are included in the expense reductions in the Statements of Operations. For the period ended August 31, 2013, the Funds’ custodian fees were reduced by the following amounts under these arrangements:
| | | | |
| | | Amount Paid | |
| | | | |
Money Market Fund | | $ | 1,869 | |
U.S. Government Money Market Fund | | | 75,828 | |
Administrator
State Street (the “Administrator”) serves as the Investment Company’s Administrator, pursuant to an administration agreement dated January 1, 2013 (the “Administration Agreement”). Under the Administration Agreement, the Administrator supervises certain administrative aspects of the Investment Company’s operations. The Investment Company pays the Administrator an annual fee, payable monthly on a pro rata basis. The annual fee is based on the following percentages of the average daily net assets of the Investment Company: $0 to $10 billion — 0.0175%; next $10 billion — 0.0125%; next $10 billion — 0.0075% and 0.0050% thereafter. In addition, the Investment Company pays additional fees to the Administrator for certain services and reimburses the Administrator for out-of-pocket expenses. Prior to January 1, 2013, Russell Fund Services Company (“RFSC”) served as administrator at an annual fee based on the following percentages of the average daily net assets of all of the Investment Company’s money market portfolios: $0 to $15 billion — 0.0315%; over $15 billion — 0.029%. In addition, RFSC charged a flat fee of $30,000 per year per Fund with less than $500 million in assets under management.
Distributor and Shareholder Servicing
State Street Global Markets, LLC (the “Distributor” or “SSGM”) promotes and offers shares of the Investment Company pursuant to an Amended and Restated Distribution Agreement dated April 11, 2012. The Distributor may enter into agreements with other related and non-related parties which act as agents to offer and sell shares of the Funds. The amounts paid to the Distributor are included in the accompanying Statements of Operations. The Distributor is a wholly-owned subsidiary of State Street Corporation.
The Investment Company has adopted a distribution plan pursuant to Rule 12b-1 (the “Plan”) under the 1940 Act. Under this Plan, the Investment Company is authorized to make payments to the Distributor, or any shareholder servicing agent as defined in the Plan, for providing distribution and marketing services, for furnishing assistance to investors on an ongoing basis, and for the reimbursement of direct out-of-pocket expenses charged by the Distributor in connection with the distribution and marketing of shares of the Investment Company and the servicing of investor accounts.
Each Fund has shareholder service agreements with State Street and the following entities related to State Street: SSGM, Fiduciary Investors Services Division of State Street (“Fiduciary Investors Services”), High Net Worth Services Division of State Street (“High Net Worth Services”) and Wealth Management Systems (collectively, the “Agents”), as well as several unaffiliated service providers. For these services, each Institutional Class pays 0.025% to State Street and a maximum of 0.175% to each of the affiliated Agents, based on the average daily value of all Institutional Class shares held by or for customers of these Agents. For the period ended August 31, 2013, each Fund paid the following shareholder servicing expenses to the Agents:
| | |
| 26 | | Notes to Financial Statements |
SSgA
Money Market Funds
Notes to Financial Statements, continued — August 31, 2013
| | | | | | | | | | | | | | | | | | | | |
| | | State Street | | | SSGM | | | Fiduciary
Investor
Services | | | High Net
Worth
Services | | | Wealth
Management
Systems | |
| | | | | | | | | | | | | | | | | | | | |
Money Market Fund | | $ | 1,059,695 | | | $ | 948,155 | | | $ | — | | | $ | 146,520 | | | $ | 177,159 | |
U.S. Government Money Market Fund | | | 906,159 | | | | 89,410 | | | | — | | | | 1,054,215 | | | | 108,785 | |
The combined distribution and shareholder servicing payments shall not exceed 0.25% of the average daily value of net assets of a Fund on an annual basis. The shareholder servicing payments shall not exceed 0.20% of the average daily value of net assets of a Fund on an annual basis. Costs that exceed the maximum amount of allowable reimbursement may be carried forward for two years following the year in which the expenditure was incurred so long as the Plan is in effect. The Funds’ responsibility for any such expenses carried forward shall terminate at the end of two years following the year in which the expenditure was incurred. The Board or a majority of the Funds’ shareholders have the right, however, to terminate the Plan and all payments there under at any time. The Funds will not be obligated to reimburse the Distributor for carryover expenses subsequent to the Plan’s termination or discontinuation. As of August 31, 2013, the Money Market Fund and the U.S. Government Money Market Fund had no carryover expenses.
Board of Trustees
The Investment Company paid each trustee not affiliated with the Investment Company an annual retainer, plus specified amounts for Board and committee meetings attended. These expenses are allocated among all of the funds of the Investment Company based upon their relative net assets.
Accrued fees payable to affiliates and trustees as of August 31, 2013 were as follows:
| | | | | | | | |
| | | Money
Market Fund | | | U.S. Government
Money
Market Fund | |
| | | | | | | | |
Advisory fees | | $ | 2,378,093 | | | $ | 1,602,495 | |
Administrative fees | | | 178,440 | | | | 120,148 | |
Custodian fees | | | 62,670 | | | | 65,828 | |
Distribution fees | | | 146,147 | | | | 53,354 | |
Shareholder servicing fees | | | 339,166 | | | | 197,435 | |
Transfer agent fees | | | 19,548 | | | | 12,244 | |
Trustees’ fees | | | 32,791 | | | | 21,315 | |
| | | | | | | | |
| | $ | 3,156,855 | | | $ | 2,072,819 | |
| | | | | | | | |
| 4. | | Fund Share Transactions (On a Constant Dollar Basis) |
| | | | | | | | |
| | | Year Ended
August 31, 2013 | | | Year Ended
August 31, 2012 | |
| | | | | | | | |
Money Market Fund | | | | | | | | |
Proceeds from shares sold | | $ | 49,015,724,173 | | | $ | 45,666,000,327 | |
Proceeds from reinvestment of distributions | | | 100,866 | | | | 179,887 | |
Payments for shares redeemed | | | (49,071,382,386 | ) | | | (46,745,191,669 | ) |
| | | | | | | | |
Total net increase (decrease) | | $ | (55,557,347 | ) | | $ | (1,079,011,455 | ) |
| | | | | | | | |
| | |
U.S. Government Money Market Fund | | | | | | | | |
Proceeds from shares sold | | $ | 40,079,629,827 | | | $ | 40,291,047,092 | |
Proceeds from reinvestment of distributions | | | — | | | | 5,712 | |
Payments for shares redeemed | | | (39,778,962,007 | ) | | | (40,717,180,641 | ) |
| | | | | | | | |
Total net increase (decrease) | | $ | 300,667,820 | | | $ | (426,127,837 | ) |
| | | | | | | | |
| | | | |
| Notes to Financial Statements | | | 27 | |
SSgA
Money Market Funds
Notes to Financial Statements, continued — August 31, 2013
| 5. | | Interfund Lending Program |
The Funds participate in a joint lending and borrowing facility. Funds of the Investment Company may borrow money from the Money Market Fund for temporary purposes. All such borrowing and lending will be subject to a participating fund’s fundamental investment limitations. The Money Market Fund will lend through the program only when the returns are higher than those available from an investment in repurchase agreements or short-term reserves. The Funds will borrow through the program only when the costs are equal to or lower than the cost of bank loans. Interfund loans and borrowings normally extend overnight, but can have a maximum duration of seven days. Loans may be called on one business day’s notice. A participating fund may have to borrow from a bank at a higher interest rate if an interfund loan is called or not renewed. Any delay in repayment to the Money Market Fund could result in additional borrowing costs. For the period ended August 31, 2013, the Funds did not utilize the Interfund Lending Program.
| 6. | | Market, Credit and Counterparty Risk |
In the normal course of business, the Funds invest in securities and enter into transactions where risks exist due to fluctuations in the market (market risk) or failure of the other party to a transaction to perform (counterparty risk). The value of securities held by each Fund may decline in response to certain events, including those directly involving the companies whose securities are owned by the Funds; conditions affecting the general economy; overall market changes; local, regional or global political, social or economic instability; and currency and interest rate and price fluctuations. Similar to credit risk, the Funds may be exposed to counterparty risk, or the risk that an entity with which the Funds have unsettled or open transactions may default. Financial assets, which potentially expose the Funds to credit and counterparty risks, consist principally of investments and cash due from counterparties. The extent of the Funds’ exposure to credit and counterparty risks in respect to these financial assets approximates their value as recorded in the Funds’ Statements of Assets and Liabilities.
| 7. | | Recent Accounting Pronouncements |
In December 2011, the Financial Accounting Standards Board (FASB) issued Accounting Standard Update No. 2011-11 (ASU 2011-11) “Disclosures about Offsetting Assets and Liabilities.” These disclosure requirements are intended to help investors and other financial statement users to better assess the effect or potential effect of offsetting arrangements on a portfolio’s financial position. They also improve transparency in the reporting of how companies mitigate credit risk, including disclosure of related collateral pledged or received. In addition, ASU 2011-11 facilitates comparison between those entities that prepare their financial statements on the basis of U.S. GAAP and those entities that prepare their financial statements on the basis of International Financial Reporting Standards. ASU 2011-11 requires entities to disclose both gross and net information about both instruments and transactions eligible for offset in the financial position; and disclose instruments and transactions subject to an agreement similar to a master netting agreement. ASU 2011-11 is effective for fiscal years beginning on or after January 1, 2013, and interim periods within those annual periods. Management is currently evaluating the implications of ASU 2011-11 and its impact on financial statement disclosures.
In January 2013, Accounting Standard Update 2013-01 (ASU 2013-01), Clarifying the Scope of Disclosures about Offsetting Assets and Liabilities, clarified Accounting Standards Update 2011-11 (ASU 2011-11), Disclosures about Offsetting Assets and Liabilities. ASU 2013-01 is effective for fiscal years beginning on or after January 1, 2013, and interim periods within those annual periods. As described above, ASU 2011-11 was intended to enhance disclosure requirements on the offsetting of financial assets and liabilities. The ASU 2013-01 limits the scope of the new balance sheet offsetting disclosures to derivatives, repurchase agreements, and securities lending transactions to the extent that they are (1) offset in the financial statements or (2) subject to an enforceable master netting arrangement or similar agreement. Management is currently evaluating the implications of ASU 2013-01 and its impact on financial statement disclosures.
Management has evaluated events and transactions that may have occurred since August 31, 2013, through the date the financial statements were issued, that would merit recognition or additional disclosure in the financial statements. During this review nothing was discovered which would require disclosure within the financial statements.
| | |
| 28 | | Notes to Financial Statements |
SSgA
Money Market Funds
Report of Independent Registered Public Accounting Firm
To the Board of Trustees of the SSgA Funds and Shareholders of the SSgA Money Market Fund and SSgA U.S. Government Money Market Fund:
We have audited the accompanying statements of assets and liabilities, including the schedules of investments, of SSgA Money Market Fund and SSgA U.S. Government Money Market Fund (the “Funds”) (two of the funds comprising the SSgA Funds) as of August 31, 2013, and the related statements of operations for the year then ended, the statements of changes in net assets for each of the two years in the period then ended, and the financial highlights for each of the five years in the period then ended. These financial statements and financial highlights are the responsibility of the Funds’ management. Our responsibility is to express an opinion on these financial statements and financial highlights based on our audits.
We conducted our audits in accordance with the standards of the Public Company Accounting Oversight Board (United States). Those standards require that we plan and perform the audit to obtain reasonable assurance about whether the financial statements and financial highlights are free of material misstatement. The Funds are not required to have, nor were we engaged to perform, an audit of their internal control over financial reporting. Our audits included consideration of internal control over financial reporting as a basis for designing audit procedures that are appropriate in the circumstances, but not for the purpose of expressing an opinion on the effectiveness of the Funds’ internal control over financial reporting. Accordingly, we express no such opinion. An audit also includes examining, on a test basis, evidence supporting the amounts and disclosures in the financial statements, assessing the accounting principles used and significant estimates made by management, as well as evaluating the overall financial statement presentation. Our procedures included confirmation of securities owned as of August 31, 2013, by correspondence with the custodian and brokers; where replies were not received from brokers, we performed other auditing procedures. We believe that our audits provide a reasonable basis for our opinion.
In our opinion, the financial statements and financial highlights referred to above present fairly, in all material respects, the financial position of each of the Funds as of August 31, 2013, the results of their operations for the year then ended, the changes in their net assets for each of the two years in the period then ended, and the financial highlights for each of the five years in the period then ended, in conformity with accounting principles generally accepted in the United States of America.
DELOITTE & TOUCHE LLP
Boston, Massachusetts
October 30, 2013
| | | | |
| Report of Independent Registered Public Accounting Firm | | | 29 | |
SSgA
Money Market Funds
Tax Information — August 31, 2013 (Unaudited)
For the tax year ended August 31, 2013, the Money Market Fund hereby designates 98.82% or the maximum amount allowable, of its net taxable income as qualified interest income taxed at individual ordinary income rates.
For the tax year ended August 31, 2013, the U.S. Government Money Market Fund hereby designates 100% or the maximum amount allowable, of its net taxable income as qualified interest income taxed at individual ordinary income rates.
Form 1099-DIV mailed to you in January 2014 will show the tax status of all distributions paid to your account in calendar year 2013.
Please consult a tax adviser for questions about federal or state income tax laws.
SSgA
Money Market Funds
Basis for Approval of Investment Advisory Contracts (Unaudited)
Trustee Considerations in Approving Continuation of Investment Advisory Agreements1
Overview of the Contract Review Process
Under the Investment Company Act of 1940, an investment advisory agreement between a mutual fund and its investment adviser or sub-adviser may continue in effect from year to year only if its continuance is approved at least annually by the fund’s board of trustees, including by a vote of a majority of those trustees who are not “interested persons” of the fund (commonly referred to as, the “Independent Trustees”) cast in person at a meeting called for the purpose of considering such approval.
Consistent with these requirements, the Board of Trustees (the “Board”) of the SSgA Funds (the “Trust”), including a majority of the Independent Trustees of the Trust, met on March 23, 2013 and on April 22 and 23, 2013 to consider a proposal to approve, with respect to each portfolio series of the Trust (each, a “Fund” and collectively, the “Funds”), the continuation of the investment advisory agreement (the “Advisory Agreement”) with SSgA Funds Management, Inc. (the “Adviser”). Prior to voting on the proposal, the Board reviewed information furnished by the Adviser and others reasonably necessary to permit the Board to evaluate the proposal fully. Such information included, among other things, the following:
Information about Performance, Expenses and Fees
| • | | A report prepared by an independent provider of investment company data, which includes for each Fund: |
| | ¡ | | Comparisons of the Fund’s performance over the past one-, three-, five- and ten-year periods ended December 31, 2012, as applicable, to the performance of an appropriate benchmark for the Fund and a universe of other mutual funds with similar investment objectives and policies; |
| | ¡ | | Comparisons of the Fund’s expense ratio (with detail of component expenses) to the expense ratios of a group of comparable mutual funds selected by the independent data provider; |
| | ¡ | | A chart showing the Fund’s historical average net assets relative to its total expenses, management fees, and non-management expenses over the past five years, as applicable; and |
| | ¡ | | Comparisons of the Fund’s contractual management fee to the contractual management fees of comparable mutual funds at different asset levels. |
| • | | Comparative information concerning fees charged by the Adviser for managing institutional accounts using investment strategies and techniques similar to those used in managing the Funds; and |
| • | | Profitability analyses for (a) the Adviser with respect to each Fund and (b) affiliates of the Adviser that provide services to the Funds (“Affiliated Service Providers”). |
Information about Portfolio Management
| • | | Descriptions of the investment management services provided by the Adviser, including their investment strategies and processes; |
| • | | Information concerning the allocation of brokerage and the benefits received by the Adviser as a result of brokerage allocation, including information concerning the acquisition of any research through “soft dollar” benefits received in connection with the Funds’ brokerage; and |
| 1 | Over the course of more than 20 years, the Independent Trustees have identified numerous relevant issues, factors and concerns (“issues, factors and concerns”) that they consider each year in connection with the proposed continuation of the advisory and sub-advisory agreements, the administration agreement, the distribution plans, the distribution agreement and various related-party service agreements (the “annual review process”). The statement of issues, factors and concerns and the related conclusions of the Independent Trustees may not change substantially from year to year. However, the information requested by, and provided to, the Independent Trustees with respect to the issues, factors and concerns and on which their conclusions are based is updated annually and, in some cases, may differ substantially from the previous year. The Independent Trustees schedule annually a separate in-person meeting that is dedicated to the annual review process (the “special meeting”). At the special meeting and throughout the annual review process, the Independent Trustees take a fresh look at each of the issues, factors and concerns in light of the latest available information and each year present one or more sets of comments and questions to management with respect to specific issues, factors and concerns. Management responds to such comments and questions to the satisfaction of the Independent Trustee before the annual review process is completed and prior to the Independent Trustees voting on proposals to approve continuation of the agreements and plans. |
| | | | |
| Basis for Approval of Investment Advisory Contracts | | | 31 | |
SSgA
Money Market Funds
Basis for Approval of Investment Advisory Contracts (Unaudited), continued
| • | | Information regarding the procedures and processes used to value the assets of the Funds and the assistance provided to the administrator of the Funds by the Adviser in monitoring the effectiveness of such procedures and processes. |
Information about the Adviser
| • | | Reports detailing the financial results and condition of the Adviser and its affiliates; |
| • | | Descriptions of the qualifications, education and experience of the individual investment professionals responsible for managing the portfolios of the Funds; |
| • | | A copy of the Code of Ethics adopted by the Adviser, together with information relating to compliance with and the administration of such Code; |
| • | | A copy of the Adviser’s proxy voting policies and procedures; |
| • | | Information concerning the resources devoted by the Adviser to overseeing compliance by the Funds and their service providers, including the Adviser’s record of compliance with investment policies and restrictions and other operating policies of the Funds; and |
| • | | A description of the business continuity and disaster recovery plans of the Adviser. |
Other Relevant Information
| • | | Information concerning the nature, quality and cost of various non-investment management services provided to the Funds by affiliates of the Adviser, including the custodian, fund accountant, transfer agent and securities lending agent of the Funds, and the role of the Adviser in managing the Funds’ relationship with these service providers; |
| • | | Copies of the Advisory Agreement and agreements with other service providers of the Funds; |
| • | | Additional data requested from an independent provider of investment company data by the Independent Trustees on (a) the SSgA Funds money market portfolios to determine the magnitude to which the absolute difference in yields separated the better performing from the poorer performing funds; and (b) the SSgA Funds quantitative equity portfolios to determine how they performed in the larger universe; |
| • | | Draft responses to letters dated February 14, 2013 from Joseph P. Barri, LLC (counsel to the Independent Trustees), and reviewed prior to such date by Independent Counsel, requesting specific information, from each of: |
| | ¡ | | The Adviser, with respect to its operations relating to the Funds and its approximate profit margins before taxes from such operations for the Funds’ last fiscal year; and the relevant operations of other affiliated service providers to the Funds, together with their approximate profit margins from such relevant operations for the Funds’ last fiscal year; |
| | ¡ | | State Street Bank and Trust Company (“State Street”), the administrator, custodian, transfer agent, securities lending agent, and shareholder services for the Funds, with respect to its operations relating to the Funds; and |
| | ¡ | | State Street Global Markets, LLC, the principal underwriter and distributor of the shares of the Funds (the “Distributor”), with respect to its operations relating to the Funds, together with the Funds’ related distribution plans and arrangements under SEC Rule 12b-1; |
| • | | Excerpts from the Funds’ most recent Prospectuses, statements of Additional Information and Annual reports for the fiscal year ended August 31, 2012, including (i) the latest prospectus descriptions of each Fund’s investment objectives, strategies and authorized investment techniques and investments; and (ii) the latest Annual Shareholder Report for each Fund, including Portfolio Management Discussion of Performance, as prepared by its portfolio management team, together with a graphic comparison of the performance of each Fund with its benchmark index, for its fiscal year ended August 31, 2012; |
| • | | Lipper materials dated March 2013, obtained by an Independent Trustee and circulated to the other Independent Trustees and to Independent Counsel, with respect to the Funds for which such materials were then available; and |
| • | | A summary of the foregoing materials prepared by Independent Counsel. |
| | |
| 32 | | Basis for Approval of Investment Advisory Contracts |
SSgA
Money Market Funds
Basis for Approval of Investment Advisory Contracts (Unaudited), continued
In addition to the information identified above, the Board considered information provided from time to time by the Adviser, and other service providers of the Funds throughout the year at meetings of the Board and its committees. At such meetings, the Trustees received, among other things, presentations by the portfolio managers and other investment professionals of the Adviser relating to the performance of the Funds and the investment strategies used in pursuing each Fund’s investment objective.
The Independent Trustees were assisted throughout the contract review process by their independent legal counsel. The Independent Trustees relied upon the advice of such counsel and their own business judgment in determining the material factors to be considered in evaluating the Advisory Agreement, and the weight to be given to each such factor. The conclusions reached with respect to the Advisory Agreement were based on a comprehensive evaluation of all the information provided and not any single factor. Moreover, each Trustee may have placed varying emphasis on particular factors in reaching conclusions with respect to each Fund.
Results of the Process
Based on a consideration of the foregoing and such other information as deemed relevant, including the factors and conclusions described below, on April 23, 2013 the Board, including a majority of the Independent Trustees, voted to approve the continuation of the Advisory Agreement effective May 1, 2013, for an additional year with respect to all Funds.
Nature, Extent and Quality of Services
In considering whether to approve the Advisory Agreement, the Board evaluated the nature, extent and quality of services provided to each Fund by the Adviser.
The Board considered the Adviser’s management capabilities and investment process with respect to the types of investments held by each Fund, including the education, experience and number of investment professionals and other personnel who provide portfolio management, investment research, and similar services to the Fund. The Board evaluated, where relevant, the abilities and experience of such investment personnel in analyzing particular markets, industries and specific issuers of securities in these markets and industries. The Board also considered the substantial expertise of the Adviser in developing and applying proprietary quantitative models for managing various Funds that invest primarily in equity securities. With respect to those Funds that invest primarily in fixed-income securities, the Board considered the extensive experience and resources committed by the Adviser to the evaluation of credit, interest-rate and currency risks. With respect to those Funds that operate as money market mutual funds, the Board considered the Adviser’s success in maintaining the constant dollar value of each Fund through extraordinary market conditions. The Board also took into account the compensation paid to recruit and retain investment personnel, and the time and attention devoted to the Funds by senior management.
The Board reviewed the compliance programs of the Adviser and various affiliated service providers. Among other things, the Board considered compliance and reporting matters relating to personal trading by investment personnel, selective disclosure of portfolio holdings, late trading, frequent trading, portfolio valuation, business continuity, the allocation of investment opportunities and the voting of proxies. The Board also considered the role of the Adviser in monitoring each Fund’s securities lending activities.
On the basis of the foregoing and other relevant information, the Board concluded that the Adviser can be expected to continue to provide, high quality investment management and related services for the Funds.
Fund Performance
The Board compared each Fund’s investment performance to the performance of an appropriate benchmark and universe of comparable mutual funds for various time periods ended December 31, 2012.
On the basis of the foregoing and other relevant information, the Board concluded that the performance of each Fund is satisfactory or better (a) by comparison to the performance of its peer group funds or (b) after considering steps taken by management to improve the performance of certain Funds.
| | | | |
| Basis for Approval of Investment Advisory Contracts | | | 33 | |
SSgA
Money Market Funds
Basis for Approval of Investment Advisory Contracts (Unaudited), continued
Management Fees and Expenses
The Board reviewed the contractual investment advisory fee rates payable by each Fund and actual fees paid by each Fund, net of waivers. As part of its review, the Board considered each Fund’s management fee and total expense ratio (both before and after giving effect to any expense caps), as compared to a group of similarly managed funds selected by an independent data provider. The Board also considered the comparability of the fees charged and the services provided to each Fund by the Adviser to the fees charged and services provided to other clients of the Adviser, including institutional accounts. In addition, the Board considered the willingness of the Adviser to provide undertakings from time to time to waive fees or pay expenses of various Funds to limit the total expenses borne by shareholders of such Funds.
On the basis of the foregoing and other relevant information, and in light of the nature, extent and quality of the services provided by the Adviser, the Board concluded that the fees and the expense ratio of each Fund compare favorably to the fees and expenses of similar mutual funds and are reasonable in relation to the services provided.
Profitability
The Board reviewed the level of profits realized by the Adviser and its affiliates in providing investment advisory and other services to each Fund and to all Funds as a group. The Board considered other direct and indirect benefits received by the Adviser and the Affiliated Service Providers in connection with their relationships with the Funds, including the benefits of research services that may be available to the Adviser as a result of securities transactions effected for the Funds and other investment advisory clients, together with the ranges of profitability of each of the Affiliated Service Providers with respect to their services to the Funds.
The Board concluded that the profitability of the Adviser with respect to each of the Funds, and the profitability range of each of the Affiliated Service Providers with respect to its services to the Funds, were reasonable in relation to the services provided.
Economies of Scale
In reviewing management fees and profitability, the Board also considered the extent to which the Adviser and its affiliates, on the one hand, and each Fund and all Funds as a group, on the other hand, can expect to realize benefits from economies of scale as the assets of the Funds increase. The Board acknowledged the difficulty in accurately measuring the benefits resulting from the economies of scale with respect to the management of any specific Fund or the Funds taken as a whole. The Board concluded that, in light of the current size of each Fund and all Funds as a group, the level of profitability of the Adviser and its affiliates with respect to each Fund and all Funds as a group over various time periods, and the comparatively low management fee and expense ratio of each Fund during these periods, it does not appear that the Adviser or its affiliates has realized benefits from economies of scale in managing the assets of the Funds to such an extent that previously agreed advisory fees should be reduced or that breakpoints in such fees should be implemented for any Fund at this time.
| | |
| 34 | | Basis for Approval of Investment Advisory Contracts |
SSgA
Money Market Funds
Shareholder Requests for Additional Information — August 31, 2013
The Funds have adopted the proxy voting policies of the Adviser. A description of the policies and procedures that the Funds have adopted to determine how to vote proxies relating to portfolio securities are contained in the Funds’ Statement of Additional Information, which is available (i) without charge, upon request, by calling the Funds at (800) 647-7327, (ii) on the Funds’ website at www.ssgafunds.com, (iii) on the U.S. Securities and Exchange Commission’s website at www.sec.gov, or (iv) at the U.S. Securities and Exchange Commission’s public reference room.
The Funds will file their complete schedules of investments with the U.S. Securities and Exchange Commission for the first and third quarters of each fiscal year on Form N-Q. For the second and fourth quarters, the complete schedules of investments are available in the Funds’ semi-annual and annual financial statements. The Funds’ Form N-Q is available (i) without charge, upon request, by calling the Funds at (800) 647-7327, (ii) on the Funds’ website at www.ssgafunds.com, (iii) on the Securities and Exchange Commission’s website at www.sec.gov, or (iv) at the Securities and Exchange Commission’s public reference room.
| | | | |
| Shareholder Requests for Additional Information | | | 35 | |
SSgA
Money Market Funds
Disclosure of Information about Fund Trustees and Officers — August 31, 2013 (Unaudited)
The table below includes information about the Trustees of the SSgA Funds, including their:
| • | | business addresses and ages; |
| • | | principal occupations during the past five years; and |
| • | | other directorships of publicly traded companies or funds. |
| | | | | | | | |
| Name, Address and Age | | Position(s) with SSgA Funds; Length of Time Served;
Term of Office: Until
successor is elected
and qualified | | Principal Occupation(s) During Past 5 Years; Other Relevant Experience,
Attributes and Skills1 | | Number of
Portfolios
in Fund
Complex
Overseen
by Trustee | | Other
Directorships
Held by
Trustee During
Past 5 Years |
INTERESTED TRUSTEE: | | | | | | |
Scott F. Powers State Street Financial Center One Lincoln Street Boston, MA 02111-2900 YOB: 1959 | | • Trustee since 2013 | | • May 2008 to Present, • President and Chief Executive Officer of State Street Global Advisors; • 2001 – 2008, Chief Executive Officer of Old Mutual Asset Management; • Board of Directors, United Way of Massachusetts Bay; • Board of Directors of Middlesex School; • Incorporator, Cardigan Mountain School | | 12 | | None. |
INDEPENDENT TRUSTEES: | | | | | | |
William L. Marshall State Street Financial Center One Lincoln Street Boston, MA 02111-2900 YOB: 1942 | | • Independent Trustee since 1988 • Chairman, Audit Committee • Member, Governance Committee • Member, Valuation Committee • Member, Qualified Legal and Compliance Committee (“QLCC”) | | • April 2011 to Present, Chairman (until April 2011, Chief Executive Officer and President), Wm. L. Marshall Associates, Inc., Wm. L. Marshall Companies, Inc. and the Marshall Financial Group, Inc. (a registered investment advisor and provider of financial and related consulting services); • Certified Financial Planner; • Member, Financial Planners Association; • Director, SPCA of Bucks County, PA; and • Director, The Ann Silverman Community Clinic of Doylestown, PA. | | 12 | | Director, Marshall Financial Group, Inc. |
| | | | | | | | | |
Patrick J. Riley State Street Financial Center One Lincoln Street Boston, MA 02111-2900 YOB: 1948 | | • Independent Trustee since 1988 • Independent Chairman of the Board since January 2009 • Member, Audit Committee • Member, Governance Committee • Member, Valuation Committee • Member, QLCC | | • 2002 to May 2010, Associate Justice of the Superior Court, Commonwealth of Massachusetts; • 1985 to 2002, Partner, Riley, Burke & Donahue, L.L.P. (law firm); • 1998 to Present, Independent Director, State Street Global Advisers Ireland, Ltd. (investment company); • 1998 to Present, Independent Director, SSgA Liquidity PLC (formerly, SSgA Cash Management Fund PLC); • January 2009 to Present, Independent Director, SSgA Fixed Income PLC; and • January 2009 to Present, Independent Director, SSgA Qualified Funds PLC. • 2011 to Present, Independent Director, SSgA SPDR ETFs Europe 1 PLC and (since 2012) Chairman. | | 12 | | Board Director and Chairman, SPDR Europe 1 PLC Board (2011–Present); Board Director and Chairman, SPDR Europe II, PLC (2013–Present). |
| | |
| 36 | | Disclosure of Information about Fund Trustees and Officers |
SSgA
Money Market Funds
Disclosure of Information about Fund Trustees and Officers, continued — August 31, 2013 (Unaudited)
| | | | | | | | |
| Name, Address and Age | | Position(s) with SSgA Funds; Length of Time Served;
Term of Office: Until
successor is elected
and qualified | | Principal Occupation(s) During Past 5 Years; Other Relevant Experience,
Attributes and Skills1 | | Number of
Portfolios
in Fund
Complex
Overseen
by Trustee | | Other
Directorships
Held by
Trustee During
Past 5 Years |
INDEPENDENT TRUSTEES: (continued) | | | | | | |
Richard D. Shirk State Street Financial Center One Lincoln Street Boston, MA 02111-2900 YOB: 1945 | | • Independent Trustee since 1988 • Member, Audit Committee • Member, Governance Committee • Member, Valuation Committee • Chairman, QLCC | | • March 2001 to April 2002, Chairman (1996 to March 2001, President and Chief Executive Officer), Cerulean Companies, Inc. (holding company) (Retired); • 1992 to March 2001, President and Chief Executive Officer, Blue Cross Blue Shield of Georgia (health insurer, managed healthcare); • 1998 to December 2008, Chairman, Board Member and December 2008 to Present, Investment Committee Member, Healthcare Georgia Foundation (private foundation); • September 2002 to Present, Lead Director and Board Member, Amerigroup Corp. (managed health care); • 1999 to Present, Board Member and (since 2001) Investment Committee Member, Woodruff Arts Center; and • 2003 to 2009, Trustee, Gettysburg College. | | 12 | | None. |
| | | | | | | | | |
Bruce D. Taber State Street Financial Center One Lincoln Street Boston, MA 02111-2900 YOB: 1943 | | • Independent Trustee since 1991 • Member, Audit Committee • Chairman, Governance Committee • Chairman, Valuation Committee • Member, QLCC | | • 1999 to Present, Partner, Zenergy LLC (a technology company providing Computer Modeling and System Analysis to the General Electric Power Generation Division); • Until December 2008, Independent Director, SSgA Cash Management Fund PLC; • Until December 2008, Independent Director, State Street Global Advisers Ireland, Ltd. (investment companies); and • Until August 1994, President, Alonzo B. Reed, Inc., (a Boston architect-engineering firm). | | 12 | | None. |
| 1 | | The information reported includes the principal occupation during the last five years for each Trustee and other information relating to the professional experiences, attributes and skills relevant to each Trustee’s qualifications to serve as a Trustee. |
The table below includes information about the Officers of the SSgA Funds, including their:
| • | | business addresses and ages; and |
| • | | principal occupations during the past five years. |
| | | | |
Principal Officer Name, Address and Age | | Position(s) with SSgA Funds; Length of Time Served; Term of Office: Until successor is elected by Trustees | | Principal Occupation(s) During Past Five Years |
Ellen M. Needham SSgA Funds Management, Inc. State Street Financial Center One Lincoln Street Boston, MA 02111-2900 YOB: 1967 | | • President and Principal Executive Officer since October 2012 | | • June 2012 to Present, President and Director, SSgA Funds Management, Inc.; • May 2010 to June 2012, Chief Operating Officer, SSgA Funds Management, Inc.; • 1992 to 2012, Senior Managing Director, SSgA Funds Management, Inc. • 1992 to Present, Senior Managing Director, State Street Global Advisors |
| | | | |
| Disclosure of Information about Fund Trustees and Officers | | | 37 | |
SSgA
Money Market Funds
Disclosure of Information about Fund Trustees and Officers, continued — August 31, 2013 (Unaudited)
| | | | |
Principal Officer Name, Address and Age | | Position(s) with SSgA Funds; Length of Time Served; Term of Office: Until successor is elected by Trustees | | Principal Occupation(s) During Past Five Years |
Ann M. Carpenter State Street Financial Center One Lincoln Street Boston, MA 02111-2900 YOB: 1966 | | • Vice President since October 2012 | | • March 2008 to Present, Vice President SSgA Funds Management, Inc. • November 2005 to Present, Vice President, State Street Global Advisors. |
| | | | | |
Jacqueline Angell State Street Financial Center One Lincoln Street Boston, MA 02111-2900 YOB: 1974 | | • Chief Compliance Officer since April 2011 | | • July 2012 to Present, Head of UK Compliance, State Street Bank and Trust Company • July 2008 to 2012, Vice President, SSgA Funds Management, Inc.; • July 2008 to 2012, Vice President, State Street Global Advisers; and |
| | | | | |
Laura F. Dell State Street Bank and Trust Company 4 Copley Place, 5th Floor Boston, MA 02116 YOB: 1964 | | • Treasurer and Principal Accounting Officer since January 2013 | | • 2002 to Present, Vice President of State Street Bank and Trust Company. |
| | | | | |
David K. James State Street Bank and Trust Company 4 Copley Place, 5th Floor Boston, MA 02116 YOB: 1970 | | • Secretary since April 2013 | | • 2009 to Present, Vice President and Managing Counsel, State Street Bank and Trust Company; • 2006 to 2009, Vice President and Counsel, PNC Global Investment Servicing (US), Inc. |
| | |
| 38 | | Disclosure of Information about Fund Trustees and Officers |
SSgA
Money Market Funds
State Street Financial Center
One Lincoln Street
Boston, Massachusetts 02111-2900
(800) 647-7327
Trustees
William L. Marshall
Patrick J. Riley, Chairman
Richard D. Shirk
Bruce D. Taber
Officers
Ellen M. Needham, President, Chief Executive Officer and Principal Executive Officer
Laura F. Dell, Treasurer and Principal Accounting Officer
Ann M. Carpenter, Vice President
Jacqueline Angell, Chief Compliance Officer
David James, Secretary and Chief Legal Officer
Chad C. Hallett, Assistant Treasurer
Caroline Connolly, Assistant Treasurer
Investment Adviser
SSgA Funds Management, Inc.
State Street Financial Center,
One Lincoln Street
Boston, Massachusetts 02111-2900
Custodian and Office of Shareholder Inquiries
State Street Bank and Trust Company
1776 Heritage Drive
North Quincy, Massachusetts 02171
Transfer and Dividend Paying Agent
Boston Financial Data Services, Inc.
Two Heritage Drive
North Quincy, Massachusetts 02171
Distributor
State Street Global Markets, LLC
State Street Financial Center
One Lincoln Street
Boston, Massachusetts 02111-2900
Administrator
State Street Bank and Trust Company
State Street Financial Center
One Lincoln Street
Boston, Massachusetts 02111-2900
Legal Counsel
Goodwin Procter LLP
Exchange Place
Boston, Massachusetts 02109
Independent Registered Public Accounting Firm
Deloitte & Touche LLP
200 Berkeley Street
Boston, Massachusetts 02116
Distributor: State Street Global Markets, LLC, member FINRA, SIPC, a wholly owned subsidiary of State Street Corporation. References to State Street may include State Street Corporation and its affiliates. The SSgA Funds pay State Street Bank and Trust Company for its services as administrator, custodian, transfer agent and shareholder servicing agent and pays SSgA Funds Management, Inc. for investment advisory services.
This information must be preceded or accompanied by a current prospectus or summary prospectus. Read the prospectus carefully before you invest or send money.
| | | | |
| Fund Management and Service Providers | | | 39 | |
SSGAMMFDAR

INSTITUTIONAL MONEY MARKET FUNDS
U.S. Treasury Money Market Fund
Prime Money Market Fund
Annual Report
August 31, 2013
SSgA Funds
Institutional Money Market Funds
Annual Report
August 31, 2013
Table of Contents
“SSgA” is a registered trademark of State Street Corporation and is licensed for use by the SSgA Funds.
This report is prepared from the books and records of the Funds and it is submitted for the general information of shareholders. This information is for distribution to prospective investors only when preceded or accompanied by a SSgA Funds Prospectus containing more complete information concerning the investment objectives and operations of the Funds, charges and expenses. The Prospectus should be read carefully before an investment is made.
Performance quoted represents past performance and past performance does not guarantee future results. Current performance may be higher or lower than the performance quoted. For the most recent month end performance information, visit www.ssgafunds.com. Investment in the Funds poses investment risks, including the possible loss of principal. The investment return and principal value of an investment will fluctuate so that shares, when redeemed, may be worth more or less than their original cost.
An investment in a money market fund is not insured or guaranteed by the Federal Deposit Insurance Corporation or another governmental agency. Although a money market fund seeks to preserve the value of your investment at $1.00 per share, it is possible to lose money by investing in a money market fund.
This page has been intentionally left blank.
SSgA Funds
Letter from the President of SSgA Funds Management, Inc.
Dear Shareholder:
We are pleased to provide you with the August 31, 2013 Annual Report for the SSgA Institutional Money Market Funds. The Annual Report provides information about the Funds, including performance data and related financial statements.
Over the past 12 months, the U.S. economic recovery has gained traction, and even some steam. No longer nagged by the uncertainties of a presidential election year and sun-setting tax policies, U.S. equities posted solid performance and, along with the considerable recovery in the housing markets, fueled positive consumer sentiment. However, in a reminder that volatility may not be totally behind us, the Federal Reserve’s mere suggestion this spring that it would soon consider tapering its unprecedented bond-buying program ignited a week-long tumble for all major U.S. indexes. Nonetheless, with the market able to absorb the news of the impending policy shift, we believe that the economic recovery, although not robust by historical standards, finally can be categorized as sustainable.
Most recently, the market was tested by the political uncertainty resulting from the partial government shutdown and debt ceiling impasse in Washington D.C. At this writing, as Congress has negotiated only a temporary solution to end the stalemate and raise the debt limit, fiscal challenges remain here at home, as well as around the globe.
We hope that you find the enclosed information useful and thank you for the confidence that you have placed in the SSgA Funds.
Sincerely,

Ellen Needham
President
SSgA Funds
This page has been intentionally left blank.
SSgA
U.S. Treasury Money Market Fund
Shareholder Expense Example — August 31, 2013 (Unaudited)
Fund Expenses
The following disclosure provides important information regarding each Fund’s Expense Example, which appears on each Fund’s individual page in this Annual Report. Please refer to this information when reviewing the Expense Example for a Fund.
Example
As a shareholder of the Fund, you incur two types of costs: (1) transaction costs, and (2) ongoing costs, including advisory and administrative fees; distribution (12b-1) and/or service fees; and other Fund expenses. The Example is intended to help you understand your ongoing costs (in dollars) of investing in the Fund and to compare these costs with the ongoing costs of investing in other mutual funds. The Example is based on an investment of $1,000 invested at the beginning of the period and held for the entire period indicated, which for this Fund is from March 1, 2013 to August 31, 2013.
Actual Expenses
The information in the table under the heading “Actual Performance” provides information about actual account values and actual expenses. You may use the information in this column, together with the amount you invested, to estimate the expenses that you paid over the period. Simply divide your account value by $1,000 (for example, an $8,600 account value divided by $1,000 = 8.6), then multiply the result by the number in the first column in the row entitled “Expenses Paid During Period” to estimate the expenses you paid on your account during this period.
Hypothetical Example for Comparison Purposes
The information in the table under the heading “Hypothetical Performance (5% return before expenses)” provides information about hypothetical account values and hypothetical expenses based on the Fund’s actual expense ratio and an assumed rate of return of 5% per year before expenses, which is not the Fund’s actual return. The hypothetical account values and expenses may not be used to estimate the actual ending account balance or expenses you paid for the period. You may use this information to compare the ongoing costs of investing in the Fund and other funds. To do so, compare this 5% hypothetical example with the 5% hypothetical examples that appear in the shareholder reports of other funds.
Please note that the expenses shown in the table are meant to highlight your ongoing costs only and do not reflect any transaction costs. Therefore, the information under the heading “Hypothetical Performance (5% return before expenses)” is useful in comparing ongoing costs only, and will not help you determine the relative total costs of owning different funds. In addition, if these transaction costs were included, your costs would have been higher.
| | | | | | | | |
| | | Actual
Performance | | | Hypothetical
Performance
(5% return
before expenses) | |
Beginning Account Value | | | | | | | | |
March 1, 2013 | | $ | 1,000.00 | | | $ | 1,000.00 | |
Ending Account Value | | | | | | | | |
August 31, 2013 | | $ | 1,000.00 | | | $ | 1,024.85 | |
Expenses Paid During Period* | | $ | 0.35 | | | $ | 0.36 | |
| * | Expenses are equal to the Fund’s annualized expense ratio of 0.07% (representing the six month period annualized), multiplied by the average account value over the period, multiplied by 184/365 (to reflect the one-half year period). Includes amounts waived, reimbursed and/or other credits. Without the waiver, reimbursement and/or other credits, expenses would have been higher. |
| | | | |
| U.S. Treasury Money Market Fund | | | 5 | |
SSgA
U.S. Treasury Money Market Fund
Schedule of Investments — August 31, 2013
| | | | | | | | | | | | | | | | |
| | | Principal
Amount ($)
or Shares | | | Rate
% (#) | | | Date
of
Maturity | | | Value
$ | |
| Treasury Debt - 71.1% | | | | | | | | | | | | | | | | |
U.S. Treasury Bill | | | 72,000,000 | | | | 0.045 | | | | 09/05/13 | | | | 71,999,640 | |
U.S. Treasury Bill | | | 128,000,000 | | | | 0.048 | | | | 09/05/13 | | | | 127,999,324 | |
U.S. Treasury Bill | | | 75,000,000 | | | | 0.128 | | | | 09/05/13 | | | | 74,998,938 | |
U.S. Treasury Bill | | | 175,000,000 | | | | 0.050 | | | | 09/12/13 | | | | 174,997,326 | |
U.S. Treasury Bill | | | 100,000,000 | | | | 0.115 | | | | 09/12/13 | | | | 99,996,486 | |
U.S. Treasury Bill | | | 250,000,000 | | | | 0.048 | | | | 09/19/13 | | | | 249,994,063 | |
U.S. Treasury Bill | | | 100,000,000 | | | | 0.110 | | | | 09/19/13 | | | | 99,994,500 | |
U.S. Treasury Bill | | | 212,000,000 | | | | 0.038 | | | | 09/26/13 | | | | 211,994,479 | |
U.S. Treasury Bill | | | 88,000,000 | | | | 0.040 | | | | 09/26/13 | | | | 87,997,556 | |
U.S. Treasury Bill | | | 95,000,000 | | | | 0.058 | | | | 09/26/13 | | | | 94,996,207 | |
U.S. Treasury Bill | | | 107,000,000 | | | | 0.060 | | | | 09/26/13 | | | | 106,995,542 | |
U.S. Treasury Bill | | | 125,000,000 | | | | 0.110 | | | | 09/26/13 | | | | 124,990,451 | |
U.S. Treasury Bill | | | 175,000,000 | | | | 0.053 | | | | 10/03/13 | | | | 174,991,833 | |
U.S. Treasury Bill | | | 100,000,000 | | | | 0.108 | | | | 10/03/13 | | | | 99,990,444 | |
U.S. Treasury Bill | | | 100,000,000 | | | | 0.050 | | | | 10/10/13 | | | | 99,994,583 | |
U.S. Treasury Bill | | | 150,000,000 | | | | 0.100 | | | | 10/10/13 | | | | 149,983,750 | |
U.S. Treasury Bill | | | 225,000,000 | | | | 0.043 | | | | 10/17/13 | | | | 224,987,781 | |
U.S. Treasury Bill | | | 150,000,000 | | | | 0.090 | | | | 10/17/13 | | | | 149,982,750 | |
U.S. Treasury Bill | | | 200,000,000 | | | | 0.038 | | | | 10/24/13 | | | | 199,988,959 | |
U.S. Treasury Bill | | | 300,000,000 | | | | 0.085 | | | | 10/24/13 | | | | 299,962,458 | |
U.S. Treasury Bill | | | 75,000,000 | | | | 0.040 | | | | 11/07/13 | | | | 74,994,417 | |
U.S. Treasury Bill | | | 150,000,000 | | | | 0.085 | | | | 11/07/13 | | | | 149,976,271 | |
U.S. Treasury Bill | | | 75,000,000 | | | | 0.055 | | | | 11/14/13 | | | | 74,991,521 | |
U.S. Treasury Bill | | | 200,000,000 | | | | 0.053 | | | | 11/21/13 | | | | 199,976,375 | |
U.S. Treasury Bill | | | 100,000,000 | | | | 0.080 | | | | 12/05/13 | | | | 99,978,889 | |
U.S. Treasury Bill | | | 100,000,000 | | | | 0.093 | | | | 01/02/14 | | | | 99,968,396 | |
U.S. Treasury Bill | | | 100,000,000 | | | | 0.080 | | | | 01/09/14 | | | | 99,971,111 | |
U.S. Treasury Bill | | | 225,000,000 | | | | 0.073 | | | | 01/16/14 | | | | 224,937,921 | |
U.S. Treasury Bill | | | 100,000,000 | | | | 0.073 | | | | 01/23/14 | | | | 99,971,000 | |
U.S. Treasury Bill | | | 175,000,000 | | | | 0.065 | | | | 01/30/14 | | | | 174,952,288 | |
U.S. Treasury Bill | | | 91,000,000 | | | | 0.075 | | | | 02/06/14 | | | | 90,970,046 | |
U.S. Treasury Bill | | | 84,000,000 | | | | 0.078 | | | | 02/06/14 | | | | 83,971,428 | |
U.S. Treasury Bill | | | 75,000,000 | | | | 0.075 | | | | 02/13/14 | | | | 74,974,219 | |
U.S. Treasury Bill | | | 100,000,000 | | | | 0.078 | | | | 02/13/14 | | | | 99,964,479 | |
| | | | | | | | | | | | | | | | |
| | | | |
Total Treasury Debt
(amortized cost $4,576,435,431) | | | | | | | | | | | | | | | 4,576,435,431 | |
| | | | | | | | | | | | | | | | |
| | | | |
Total Investments - 71.1%
(amortized cost $4,576,435,431) | | | | | | | | | | | | | | | 4,576,435,431 | |
| | | | | | | | | | | | | | | | |
| | | | |
| Repurchase Agreements - 24.9% | | | | | | | | | | | | | | | | |
| Treasury Repurchase Agreements - 24.9% | | | | | | | | | | | | | | | | |
Agreement with Barclays Capital, Inc. and The Bank of New York Mellon Corp. (Tri-Party) of $50,000,000 dated August 30, 2013 at 0.020% to be repurchased at $50,000,111 on September 3, 2013, collateralized by: $50,813,400 par various United States Government Treasury Obligations valued at $51,001,100. | | | | | | | | | | | | | | | 50,000,000 | |
Agreement with BNP Paribas and The Bank of New York Mellon Corp. (Tri-Party) of $250,000,000 dated August 30, 2013 at 0.040% to be repurchased at $250,001,111 on September 3, 2013, collateralized by: $260,387,300 par various United States Government Treasury Obligations valued at $255,000,093. | | | | | | | | | | | | | | | 250,000,000 | |
| | | | | | | | | | | | | | | | |
| | |
| 6 | | U.S. Treasury Money Market Fund |
SSgA
U.S. Treasury Money Market Fund
Schedule of Investments, continued — August 31, 2013
| | | | | | | | | | |
| | | | | | | | | Value
$ | |
Agreement with Calyon Financial, Inc. and The Bank of New York Mellon Corp. (Tri-Party) of $136,000,000 dated August 30, 2013 at 0.050% to be repurchased at $136,000,756 on September 3, 2013, collateralized by: $133,120,000 par various United States Government Treasury Obligations valued at $138,720,004. | | | | | | | | | 136,000,000 | |
Agreement with Deutsche Bank AG and The Bank of New York Mellon Corp. (Tri-Party) of $100,000,000 dated August 30, 2013 at 0.030% to be repurchased at $100,000,417 on September 4, 2013, collateralized by: $100,066,500 par various United States Government Treasury Obligations valued at $102,000,109. | | | | | | | | | 100,000,000 | |
Agreement with HSBC Securities USA, Inc. and JPMorgan Chase & Co. (Tri-Party) of $125,000,000 dated August 30, 2013 at 0.020% to be repurchased at $125,000,278 on September 3, 2013, collateralized by: $112,285,500 par various United States Government Treasury Obligations valued at $127,501,414. | | | | | | | | | 125,000,000 | |
Agreement with HSBC Securities USA, Inc. and JPMorgan Chase & Co. (Tri-Party) of $200,000,000 dated August 30, 2013 at 0.020% to be repurchased at $200,000,556 on September 4, 2013, collateralized by: $202,591,400 par various United States Government Treasury Obligations valued at $204,000,539. | | | | | | | | | 200,000,000 | |
Agreement with Merrill Lynch and The Bank of New York Mellon Corp. (Tri-Party) of $35,000,000 dated August 30, 2013 at 0.070% to be repurchased at $35,000,272 on September 3, 2013, collateralized by: $35,152,400 par various United States Government Treasury Obligations valued at $35,700,077. | | | | | | | | | 35,000,000 | |
Agreement with Merrill Lynch and The Bank of New York Mellon Corp. (Tri-Party) of $50,000,000 dated August 30, 2013 at 0.020% to be repurchased at $50,000,111 on September 3, 2013, collateralized by: $45,806,400 par various United States Government Treasury Obligations valued at $51,000,080. | | | | | | | | | 50,000,000 | |
Agreement with Morgan Stanley and The Bank of New York Mellon Corp. (Tri-Party) of $24,000,000 dated August 30, 2013 at 0.040% to be repurchased at $24,000,107 on September 3, 2013, collateralized by: $23,914,500 par various United States Government Treasury Obligations valued at $24,480,055. | | | | | | | | | 24,000,000 | |
Agreement with RBC Capital Markets and The Bank of New York Mellon Corp. (Tri-Party) of $200,000,000 dated August 30, 2013 at 0.040% to be repurchased at $200,000,889 on September 3, 2013, collateralized by: $202,363,200 par various United States Government Treasury Obligations valued at $204,000,081. | | | | | | | | | 200,000,000 | |
Agreement with RBS Securities, Inc. and JPMorgan Chase & Co. (Tri-Party) of $100,000,000 dated August 30, 2013 at 0.040% to be repurchased at $100,000,444 on September 3, 2013, collateralized by: $102,315,000 par various United States Government Treasury Obligations valued at $102,001,675. | | | | | | | | | 100,000,000 | |
Agreement with Societe Generale and The Bank of New York Mellon Corp. (Tri-Party) of $180,000,000 dated August 30, 2013 at 0.050% to be repurchased at $180,001,000 on September 3, 2013, collateralized by: $169,168,900 par various United States Government Treasury Obligations valued at $183,600,014. | | | | | | | | | 180,000,000 | |
| | | | |
| U.S. Treasury Money Market Fund | | | 7 | |
SSgA
U.S. Treasury Money Market Fund
Schedule of Investments, continued — August 31, 2013
| | | | | | | | | | |
| | | | | | | | | Value
$ | |
Agreement with UBS Warburg and The Bank of New York Mellon Corp. (Tri-Party) of $156,000,000 dated August 30, 2013 at 0.040% to be repurchased at $156,000,693 on September 3, 2013, collateralized by: $157,705,900 par various United States Government Treasury Obligations valued at $159,120,063. | | | | | | | | | 156,000,000 | |
| | | | | | | | | | |
| | | | |
Total Treasury Repurchase Agreements
(identified cost $1,606,000,000) | | | | | | | | | 1,606,000,000 | |
| | | | | | | | | | |
| | | | |
Total Repurchase Agreement
(identified cost $1,606,000,000) | | | | | | | | | 1,606,000,000 | |
| | | | | | | | | | |
| | | | |
Total Investments and Repurchase Agreements - 96.0% (a)
(cost $6,182,435,431) (b) | | | | | | | | | 6,182,435,431 | |
| | | | |
| Other Assets and Liabilities, Net - 4.0% | | | | | | | | | 258,376,521 | |
| | | | | | | | | | |
| | | | |
| Net Assets - 100.0% | | | | | | | | | 6,440,811,952 | |
| | | | | | | | | | |
Footnotes:
| # | For purposes of this report, for non-interest bearing Commercial Paper and Discount Notes, the discount rate at purchase is used to populate the coupon rate column. |
| (a) | Unless otherwise indicated, the values of securities of the Fund are determined based on Level 2 inputs. (Note 2) |
| (b) | The identified cost for Federal income tax purposes. |
Presentation of Portfolio Holdings — August 31, 2013
| | | | |
| Categories | | % of
Net
Assets | |
| | | | |
Treasury Debt | | | 71.1 | |
Repurchase Agreements | | | 24.9 | |
| | | | |
Total Investments and Repurchase Agreements | | | 96.0 | |
Other Assets and Liabilities, Net | | | 4.0 | |
| | | | |
| | | 100.0 | |
| | | | |
See accompanying notes which are an integral part of the financial statements.
| | |
| 8 | | U.S. Treasury Money Market Fund |
SSgA
Prime Money Market Fund
Shareholder Expense Example — August 31, 2013 (Unaudited)
Fund Expenses
The following disclosure provides important information regarding each Fund’s Expense Example, which appears on each Fund’s individual page in this Annual Report. Please refer to this information when reviewing the Expense Example for a Fund.
Example
As a shareholder of the Fund, you incur two types of costs: (1) transaction costs, and (2) ongoing costs, including advisory and administrative fees; distribution (12b-1) and/or service fees; and other Fund expenses. The Example is intended to help you understand your ongoing costs (in dollars) of investing in the Fund and to compare these costs with the ongoing costs of investing in other mutual funds. The Example is based on an investment of $1,000 invested at the beginning of the period and held for the entire period indicated, which for this Fund is from March 1, 2013 to August 31, 2013.
Actual Expenses
The information in the table under the heading “Actual Performance” provides information about actual account values and actual expenses. You may use the information in this column, together with the amount you invested, to estimate the expenses that you paid over the period. Simply divide your account value by $1,000 (for example, an $8,600 account value divided by $1,000 = 8.6), then multiply the result by the number in the first column in the row entitled “Expenses Paid During Period” to estimate the expenses you paid on your account during this period.
Hypothetical Example for Comparison Purposes
The information in the table under the heading “Hypothetical Performance (5% return before expenses)” provides information about hypothetical account values and hypothetical expenses based on the Fund’s actual expense ratio and an assumed rate of return of 5% per year before expenses, which is not the Fund’s actual return. The hypothetical account values and expenses may not be used to estimate the actual ending account balance or expenses you paid for the period. You may use this information to compare the ongoing costs of investing in the Fund and other funds. To do so, compare this 5% hypothetical example with the 5% hypothetical examples that appear in the shareholder reports of other funds.
Please note that the expenses shown in the table are meant to highlight your ongoing costs only and do not reflect any transaction costs. Therefore, the information under the heading “Hypothetical Performance (5% return before expenses)” is useful in comparing ongoing costs only, and will not help you determine the relative total costs of owning different funds. In addition, if these transaction costs were included, your costs would have been higher.
| | | | | | | | |
| | | Actual
Performance | | | Hypothetical
Performance
(5% return
before expenses) | |
Beginning Account Value | | | | | | | | |
March 1, 2013 | | $ | 1,000.00 | | | $ | 1,000.00 | |
Ending Account Value | | | | | | | | |
August 31, 2013 | | $ | 1,000.10 | | | $ | 1,024.19 | |
Expenses Paid During Period* | | $ | 1.01 | | | $ | 1.02 | |
| * | Expenses are equal to the Fund’s annualized expense ratio of 0.20% (representing the six month period annualized), multiplied by the average account value over the period, multiplied by 184/365 (to reflect the one-half year period). Includes amounts waived, reimbursed and/or other credits. Without the waiver, reimbursement and/or other credits, expenses would have been higher. |
| | | | |
| Prime Money Market Fund | | | 9 | |
SSgA
Prime Money Market Fund
Schedule of Investments — August 31, 2013
| | | | | | | | | | | | | | | | |
| | | Principal
Amount ($)
or Shares | | | Rate
% (#) | | | Date
of
Maturity | | | Value
$ | |
| Asset Backed Commercial Paper - 4.3% | | | | | | | | | | | | | | | | |
Kells Funding LLC (a) | | | 50,000,000 | | | | 0.220 | | | | 09/05/13 | | | | 49,998,777 | |
Kells Funding LLC (a) | | | 50,000,000 | | | | 0.223 | | | | 09/23/13 | | | | 49,993,278 | |
Kells Funding LLC (a) | | | 25,000,000 | | | | 0.200 | | | | 10/17/13 | | | | 24,993,611 | |
Kells Funding LLC (a) | | | 25,000,000 | | | | 0.210 | | | | 10/25/13 | | | | 24,992,125 | |
Kells Funding LLC (a) | | | 50,000,000 | | | | 0.220 | | | | 11/07/13 | | | | 49,979,528 | |
Northern Pines Funding LLC (a) | | | 135,000,000 | | | | 0.243 | | | | 09/10/13 | | | | 134,991,900 | |
| | | | | | | | | | | | | | | | |
| | | | |
Total Asset Backed Commercial Paper
(amortized cost $334,949,219) | | | | | | | | | | | | | | | 334,949,219 | |
| | | | | | | | | | | | | | | | |
| | | | |
| Certificates of Deposit - 47.2% | | | | | | | | | | | | | | | | |
Bank of Montreal | | | 95,000,000 | | | | 0.180 | | | | 09/05/13 | | | | 95,000,000 | |
Bank of Montreal (next reset date 09/18/13) (b) | | | 100,000,000 | | | | 0.264 | | | | 02/14/14 | | | | 100,000,000 | |
Bank of Nova Scotia (next reset date 09/09/13) (b) | | | 130,000,000 | | | | 0.256 | | | | 02/04/14 | | | | 130,000,000 | |
Bank of Tokyo - Mitsubishi | | | 335,000,000 | | | | 0.230 | | | | 10/23/13 | | | | 335,000,000 | |
Barclays Bank | | | 175,000,000 | | | | 0.396 | | | | 09/03/13 | | | | 175,000,000 | |
Barclays Bank | | | 50,000,000 | | | | 0.270 | | | | 01/06/14 | | | | 50,000,000 | |
Barclays Bank (next reset date 09/13/13) (b) | | | 100,000,000 | | | | 0.295 | | | | 12/13/13 | | | | 100,000,000 | |
BNP Paribas | | | 125,000,000 | | | | 0.290 | | | | 11/08/13 | | | | 125,000,000 | |
Branch Bank & Trust | | | 37,000,000 | | | | 0.190 | | | | 09/23/13 | | | | 37,000,000 | |
Branch Bank & Trust | | | 55,000,000 | | | | 0.190 | | | | 09/24/13 | | | | 55,000,000 | |
Canadian Imperial Bank of Commerce (next reset date 09/05/13) (b) | | | 75,000,000 | | | | 0.286 | | | | 02/03/14 | | | | 75,000,000 | |
Deutsche Bank AG | | | 200,000,000 | | | | 0.255 | | | | 09/27/13 | | | | 200,000,000 | |
ING Bank NV | | | 300,000,000 | | | | 0.250 | | | | 12/20/13 | | | | 300,000,000 | |
Lloyds TSB Bank | | | 50,000,000 | | | | 0.190 | | | | 10/23/13 | | | | 50,000,000 | |
National Australia Bank Ltd. | | | 100,000,000 | | | | 0.282 | | | | 09/30/13 | | | | 100,000,000 | |
National Australia Bank Ltd. | | | 100,000,000 | | | | 0.291 | | | | 09/30/13 | | | | 100,000,000 | |
Norinchukin Bank | | | 200,000,000 | | | | 0.150 | | | | 09/19/13 | | | | 200,000,000 | |
Norinchukin Bank | | | 50,000,000 | | | | 0.150 | | | | 09/25/13 | | | | 50,000,000 | |
Norinchukin Bank | | | 75,000,000 | | | | 0.150 | | | | 09/27/13 | | | | 75,000,000 | |
Rabobank Nederland NV | | | 200,000,000 | | | | 0.300 | | | | 10/09/13 | | | | 200,000,000 | |
Royal Bank of Canada | | | 36,300,000 | | | | 0.324 | | | | 09/06/13 | | | | 36,300,000 | |
Royal Bank of Canada (next reset date 09/09/13) (b) | | | 44,000,000 | | | | 0.305 | | | | 04/09/14 | | | | 44,000,000 | |
Royal Bank of Canada (next reset date 09/16/13) (b) | | | 24,000,000 | | | | 0.304 | | | | 04/16/14 | | | | 24,000,000 | |
Skandinaviska Enskilda Banken AB | | | 32,000,000 | | | | 0.250 | | | | 01/31/14 | | | | 32,000,000 | |
Skandinaviska Enskilda Banken AB (next reset date 09/04/13) (b) | | | 190,000,000 | | | | 0.311 | | | | 12/27/13 | | | | 190,000,000 | |
Standard Chartered Bank | | | 13,000,000 | | | | 0.220 | | | | 11/22/13 | | | | 13,000,000 | |
Sumitomo Mitsui Banking Corp. | | | 200,000,000 | | | | 0.230 | | | | 09/06/13 | | | | 200,000,000 | |
Sumitomo Mitsui Banking Corp. | | | 130,000,000 | | | | 0.220 | | | | 09/19/13 | | | | 130,000,000 | |
Svenska Handelsbanken AB | | | 120,000,000 | | | | 0.215 | | | | 11/05/13 | | | | 120,001,083 | |
Swedbank AB (next reset date 09/05/13) (b) | | | 101,000,000 | | | | 0.356 | | | | 11/05/13 | | | | 101,000,000 | |
UBS AG (next reset date 09/30/13) (b) | | | 174,838,000 | | | | 0.262 | | | | 10/28/13 | | | | 174,838,000 | |
Westpac Banking Corp. (next reset date 10/17/13) (b) | | | 45,000,000 | | | | 0.318 | | | | 01/17/14 | | | | 44,999,149 | |
| | | | | | | | | | | | | | | | |
| | | | |
Total Certificates of Deposit
(amortized cost $3,662,138,232) | | | | | | | | | | | | | | | 3,662,138,232 | |
| | | | | | | | | | | | | | | | |
| | | | |
| Financial Company Commercial Paper - 13.1% | | | | | | | | | | | | | | | | |
Caisse des Depots et Consignations (a) | | | 31,000,000 | | | | 0.220 | | | | 09/03/13 | | | | 30,999,621 | |
Caisse des Depots et Consignations (a) | | | 60,000,000 | | | | 0.218 | | | | 09/06/13 | | | | 59,998,208 | |
Caisse des Depots et Consignations (a) | | | 50,000,000 | | | | 0.205 | | | | 11/20/13 | | | | 49,977,222 | |
Collateralized Commercial Paper Co. LLC (a) | | | 100,000,000 | | | | 0.315 | | | | 01/06/14 | | | | 99,890,639 | |
| | |
| 10 | | Prime Money Market Fund |
SSgA
Prime Money Market Fund
Schedule of Investments, continued — August 31, 2013
| | | | | | | | | | | | | | | | |
| | | Principal
Amount ($)
or Shares | | | Rate
% (#) | | | Date
of
Maturity | | | Value
$ | |
Collateralized Commercial Paper Co. LLC | | | 85,000,000 | | | | 0.270 | | | | 01/07/14 | | | | 84,918,400 | |
Commonwealth Bank of Australia (next reset date 10/11/13) (a)(b) | | | 64,000,000 | | | | 0.299 | | | | 07/03/14 | | | | 64,000,000 | |
DnB Bank ASA (a) | | | 200,000,000 | | | | 0.215 | | | | 11/13/13 | | | | 199,912,806 | |
HSBC Bank PLC (next reset date 11/05/13) (a)(b) | | | 24,000,000 | | | | 0.316 | | | | 02/05/14 | | | | 23,999,066 | |
HSBC Bank PLC (next reset date 11/07/13) (a)(b) | | | 16,000,000 | | | | 0.315 | | | | 02/07/14 | | | | 15,999,861 | |
Lloyds Bank PLC | | | 50,000,000 | | | | 0.203 | | | | 09/24/13 | | | | 49,993,611 | |
Nationwide Building Society | | | 17,000,000 | | | | 0.233 | | | | 10/03/13 | | | | 16,996,524 | |
Nordea Bank AB (a) | | | 190,000,000 | | | | 0.175 | | | | 10/29/13 | | | | 189,946,431 | |
Skandinaviska Enskilda Banken AB (a) | | | 43,000,000 | | | | 0.250 | | | | 01/23/14 | | | | 42,957,000 | |
Toyota Motor Credit Corp. | | | 50,000,000 | | | | 0.170 | | | | 01/13/14 | | | | 49,968,361 | |
Westpac Banking Corp. (next reset date 10/21/13) (a)(b) | | | 40,000,000 | | | | 0.316 | | | | 01/21/14 | | | | 40,000,000 | |
| | | | | | | | | | | | | | | | |
| | | | |
Total Financial Company Commercial Paper
(amortized cost $1,019,557,750) | | | | | | | | | | | | | | | 1,019,557,750 | |
| | | | | | | | | | | | | | | | |
| | | | |
| Other Notes - 9.5% | | | | | | | | | | | | | | | | |
Bank of America NA | | | 75,000,000 | | | | 0.260 | | | | 11/20/13 | | | | 75,000,000 | |
Bank of America NA | | | 50,000,000 | | | | 0.260 | | | | 10/16/13 | | | | 50,000,000 | |
Bank of America NA | | | 75,000,000 | | | | 0.260 | | | | 09/27/13 | | | | 75,000,000 | |
JPMorgan Chase Bank NA (next reset date 09/07/13) (b) | | | 60,000,000 | | | | 0.355 | | | | 09/07/14 | | | | 60,000,000 | |
JPMorgan Chase Bank NA (next reset date 10/22/13) (b) | | | 35,000,000 | | | | 0.346 | | | | 09/22/14 | | | | 35,000,000 | |
Natixis | | | 50,000,000 | | | | 0.100 | | | | 09/03/13 | | | | 50,000,000 | |
Societe Generale | | | 276,000,000 | | | | 0.080 | | | | 09/03/13 | | | | 276,000,000 | |
Svenska Handelsbanken AB (next reset date 09/27/13) (a)(b) | | | 40,000,000 | | | | 0.294 | | | | 02/27/14 | | | | 40,000,000 | |
Toyota Motor Credit Corp. | | | 21,070,000 | | | | 0.324 | | | | 09/09/13 | | | | 21,070,000 | |
Wells Fargo Bank NA (next reset date 09/20/13) (b) | | | 58,000,000 | | | | 0.324 | | | | 09/19/14 | | | | 58,000,000 | |
| | | | | | | | | | | | | | | | |
| | | | |
Total Other Notes
(amortized cost $740,070,000) | | | | | | | | | | | | | | | 740,070,000 | |
| | | | | | | | | | | | | | | | |
| | | | |
Total Investments - 74.1%
(amortized cost $5,756,715,201) | | | | | | | | | | | | | | | 5,756,715,201 | |
| | | | | | | | | | | | | | | | |
| | | | |
| Repurchase Agreements - 25.9% | | | | | | | | | | | | | | | | |
| Government Agency Repurchase Agreements - 15.2% | | | | | | | | | | | | | | | | |
Agreement with BNP Paribas and The Bank of New York Mellon Corp. (Tri-Party) of $325,000,000 dated August 30, 2013 at 0.050% to be repurchased at $325,001,806 on September 3, 2013, collateralized by: $709,760,887 par various United States Government Mortgage Agency Obligations valued at $331,500,001. | | | | | | | | | | | | | | | 325,000,000 | |
Agreement with Goldman Sachs & Co. and The Bank of New York Mellon Corp. (Tri-Party) of $150,000,000 dated August 30, 2013 at 0.040% to be repurchased at $150,000,833 on September 4, 2013, collateralized by: $749,632,344 par various United States Government Mortgage Agency Obligations valued at $153,000,000. | | | | | | | | | | | | | | | 150,000,000 | |
Agreement with HSBC Securities USA, Inc. and JPMorgan Chase & Co. (Tri-Party) of $76,000,000 dated August 30, 2013 at 0.060% to be repurchased at $76,000,507 on September 3, 2013, collateralized by: $92,626,872 par various United States Government Mortgage Agency Obligations valued at $77,523,031. | | | | | | | | | | | | | | | 76,000,000 | |
| | | | |
| Prime Money Market Fund | | | 11 | |
SSgA
Prime Money Market Fund
Schedule of Investments, continued — August 31, 2013
| | | | | | | | | | |
| | | | | | | | | Value
$ | |
Agreement with Merrill Lynch and The Bank of New York Mellon Corp. (Tri-Party) of $50,000,000 dated August 30, 2013 at 0.060% to be repurchased at $50,000,333 on September 3, 2013, collateralized by: $51,167,900 par various United States Government Mortgage Agency Obligations valued at $51,000,005. | | | | | | | | | 50,000,000 | |
Agreement with RBS Securities, Inc. and JPMorgan Chase & Co. (Tri-Party) of $175,000,000 dated August 30, 2013 at 0.050% to be repurchased at $175,000,972 on September 3, 2013, collateralized by: $166,602,000 par various United States Government Mortgage Agency Obligations valued at $178,504,716. | | | | | | | | | 175,000,000 | |
Agreement with Societe Generale and The Bank of New York Mellon Corp. (Tri-Party) of $350,000,000 dated August 30, 2013 at 0.070% to be repurchased at $350,002,722 on September 3, 2013, collateralized by: $579,762,789 par various United States Government Mortgage Agency Obligations valued at $357,000,000. | | | | | | | | | 350,000,000 | |
Agreement with UBS Warburg and The Bank of New York Mellon Corp. (Tri-Party) of $60,000,000 dated August 30, 2013 at 0.050% to be repurchased at $60,000,333 on September 3, 2013, collateralized by: $149,494,414 par various United States Government Mortgage Agency Obligations valued at $61,200,000. | | | | | | | | | 60,000,000 | |
| | | | | | | | | | |
| | | | |
Total Government Agency Repurchase Agreements
(identified cost $1,186,000,000) | | | | | | | | | 1,186,000,000 | |
| | | | | | | | | | |
| | | | |
| Treasury Repurchase Agreements - 10.7% | | | | | | | | | | |
Agreement with Barclays Capital, Inc. and The Bank of New York Mellon Corp. (Tri-Party) of $243,000,000 dated August 30, 2013 at 0.040% to be repurchased at $243,001,080 on September 3, 2013, collateralized by: $248,093,400 par various United States Government Treasury Obligations valued at $247,860,089. | | | | | | | | | 243,000,000 | |
Agreement with Deutsche Bank AG and The Bank of New York Mellon Corp. (Tri-Party) of $255,000,000 dated August 30, 2013 at 0.020% to be repurchased at $255,000,567 on September 3, 2013, collateralized by: $258,152,800 par various United States Government Treasury Obligations valued at $260,100,077. | | | | | | | | | 255,000,000 | |
Agreement with HSBC Securities USA, Inc. and JPMorgan Chase & Co. (Tri-Party) of $150,000,000 dated August 30, 2013 at 0.020% to be repurchased at $150,000,333 on September 3, 2013, collateralized by: $156,656,178 par various United States Government Treasury Obligations valued at $153,001,720. | | | | | | | | | 150,000,000 | |
Agreement with Merrill Lynch and The Bank of New York Mellon Corp. (Tri-Party) of $50,000,000 dated August 30, 2013 at 0.020% to be repurchased at $50,000,111 on September 3, 2013, collateralized by: $50,217,700 par various United States Government Treasury Obligations valued at $51,000,096. | | | | | | | | | 50,000,000 | |
Agreement with Merrill Lynch and The Bank of New York Mellon Corp. (Tri-Party) of $50,000,000 dated August 30, 2013 at 0.070% to be repurchased at $50,000,681 on September 6, 2013, collateralized by: $45,567,900 par various United States Government Treasury Obligations valued at $51,000,069. | | | | | | | | | 50,000,000 | |
| | |
| 12 | | Prime Money Market Fund |
SSgA
Prime Money Market Fund
Schedule of Investments, continued — August 31, 2013
| | | | | | | | | | |
| | | | | | | | | Value
$ | |
Agreement with RBS Securities, Inc. and JPMorgan Chase & Co. (Tri-Party) of $81,000,000 dated August 30, 2013 at 0.040% to be repurchased at $81,000,360 on September 3, 2013, collateralized by: $83,860,000 par various United States Government Treasury Obligations valued at $82,622,825. | | | | | | | | | 81,000,000 | |
| | | | | | | | | | |
| | | | |
Total Treasury Repurchase Agreements
(identified cost $829,000,000) | | | | | | | | | 829,000,000 | |
| | | | | | | | | | |
| | | | |
Total Repurchase Agreement
(identified cost $2,015,000,000) | | | | | | | | | 2,015,000,000 | |
| | | | | | | | | | |
| | | | |
Total Investments and Repurchase Agreements - 100.0% (c)
(cost $7,771,715,201) (d) | | | | | | | | | 7,771,715,201 | |
| | | | |
| Other Assets and Liabilities, Net - 0.0% (e) | | | | | | | | | (249,792 | ) |
| | | | | | | | | | |
| | | | |
| Net Assets - 100.0% | | | | | | | | | 7,771,465,409 | |
| | | | | | | | | | |
Footnotes:
| # | For purposes of this report, for non-interest bearing Commercial Paper and Discount Notes, the discount rate at purchase is used to populate the coupon rate column. |
| (a) | Restricted security Rule (144A) or Section 4 (2) commercial paper. Security may have contractual restrictions on resale, may have been offered in a private placement transaction, and may not be registered under the Securities Act of 1933. |
| (b) | Adjustable or floating rate security. Rate shown reflects rate in effect at period end. |
| (c) | Unless otherwise indicated, the values of securities of the Fund are determined based on Level 2 inputs. (Note 2) |
| (d) | The identified cost for Federal income tax purposes. |
| (e) | Less than 0.05% of net assets. |
Presentation of Portfolio Holdings — August 31, 2013
| | | | |
| Categories | | % of
Net
Assets | |
| | | | |
Asset Backed Commercial Paper | | | 4.3 | |
Certificates of Deposit | | | 47.2 | |
Financial Company Commercial Paper | | | 13.1 | |
Other Notes | | | 9.5 | |
Repurchase Agreements | | | 25.9 | |
| | | | |
Total Investments and Repurchase Agreements | | | 100.0 | |
Other Assets and Liabilities, Net | | | (— | )* |
| | | | |
| | | 100.0 | |
| | | | |
| * | Less than 0.05% of net assets. |
See accompanying notes which are an integral part of the financial statements.
| | | | |
| Prime Money Market Fund | | | 13 | |
SSgA
Institutional Money Market Funds
Statements of Assets and Liabilities — August 31, 2013
| | | | | | | | |
| | | U.S. Treasury Money
Market Fund | | | Prime Money
Market Fund | |
| | | | | | | | |
Assets | | | | | | | | |
Investments, at identified cost | | $ | 4,576,435,431 | | | $ | 5,756,715,201 | |
Investments at amortized cost which approximates value | | | 4,576,435,431 | | | | 5,756,715,201 | |
Repurchase agreements at cost which approximates value | | | 1,606,000,000 | | | | 2,015,000,000 | |
Cash | | | 258,543,928 | | | | 241,197 | |
Receivables: | | | | | | | | |
Dividends and interest | | | 7,374 | | | | 1,287,522 | |
Fund shares sold | | | 150,000 | | | | — | |
From adviser | | | 2,000,068 | | | | 607,210 | |
Prepaid expenses | | | 131,527 | | | | 162,981 | |
| | | | | | | | |
Total assets | | | 6,443,268,328 | | | | 7,774,014,111 | |
| | | | | | | | |
| | |
Liabilities | | | | | | | | |
Payables: | | | | | | | | |
Fund shares redeemed | | | 297,790 | | | | 77,414 | |
Accrued fees to affiliates and trustees | | | 2,131,304 | | | | 2,403,483 | |
Other accrued expenses | | | 27,282 | | | | 63,336 | |
Income distribution | | | — | | | | 4,469 | |
| | | | | | | | |
Total liabilities | | | 2,456,376 | | | | 2,548,702 | |
| | | | | | | | |
| | | | | | | | |
Net Assets | | $ | 6,440,811,952 | | | $ | 7,771,465,409 | |
| | | | | | | | |
| | |
Net Assets Consist of: | | | | | | | | |
Undistributed (overdistributed) net investment income | | $ | 1,411 | | | $ | 204,727 | |
Accumulated net realized gain (loss) | | | 12,945 | | | | 197,989 | |
Shares of beneficial interest | | | 6,440,857 | | | | 7,771,101 | |
Additional paid-in -capital | | | 6,434,356,739 | | | | 7,763,291,592 | |
| | | | | | | | |
Net Assets | | $ | 6,440,811,952 | | | $ | 7,771,465,409 | |
| | | | | | | | |
| | |
Net Asset Value, offering and redemption price per share: | | | | | | | | |
Net asset value per share: (a) | | $ | 1.00 | | | $ | 1.00 | |
Net assets | | $ | 6,440,811,952 | | | $ | 7,771,465,409 | |
Shares outstanding ($0.001 par value) | | | 6,440,857,448 | | | | 7,771,129,365 | |
(a) Net asset value per share equals net assets divided by shares of beneficial interest outstanding. | | | | | | | | |
See accompanying notes which are an integral part of the financial statements.
| | |
| 14 | | Statements of Assets and Liabilities |
SSgA
Institutional Money Market Funds
Statements of Operations — For the Period Ended August 31, 2013
| | | | | | | | |
| | | U.S. Treasury Money
Market Fund | | | Prime Money
Market Fund | |
| | | | | | | | |
Investment Income | | | | | | | | |
Interest | | $ | 5,011,317 | | | $ | 23,639,131 | |
| | | | | | | | |
Total investment income | | | 5,011,317 | | | | 23,639,131 | |
| | | | | | | | |
| | |
Expenses | | | | | | | | |
Advisory fees | | | 8,138,145 | | | | 13,106,974 | |
Administrative fees | | | 1,044,291 | | | | 1,863,577 | |
Custodian fees | | | 750,559 | | | | 1,125,005 | |
Distribution fees | | | 872,033 | | | | 2,221,719 | |
Transfer agent fees | | | 53,908 | | | | 68,389 | |
Professional fees | | | 88,424 | | | | 173,394 | |
Registration fees | | | 18,313 | | | | 20,284 | |
Shareholder servicing fees | | | 1,336,434 | | | | 2,182,857 | |
Trustees’ fees | | | 184,797 | | | | 287,485 | |
Insurance fees | | | 151,218 | | | | 348,143 | |
Printing fees | | | 20,524 | | | | 43,188 | |
Miscellaneous | | | 98,660 | | | | 169,076 | |
| | | | | | | | |
Expenses before reductions | | | 12,757,306 | | | | 21,610,091 | |
Expense reductions | | | (7,745,989 | ) | | | (4,373,130 | ) |
| | | | | | | | |
Net expenses | | | 5,011,317 | | | | 17,236,961 | |
| | | | | | | | |
Net investment income (loss) | | | — | | | | 6,402,170 | |
| | | | | | | | |
| | |
Net Realized Gain (Loss) | | | | | | | | |
Net realized gain (loss) on investments | | | 12,945 | | | | 197,989 | |
| | | | | | | | |
Net Increase (Decrease) in Net Assets from Operations | | $ | 12,945 | | | $ | 6,600,159 | |
| | | | | | | | |
See accompanying notes which are an integral part of the financial statements.
| | | | |
| Statements of Operations | | | 15 | |
SSgA
Institutional Money Market Funds
Statements of Changes in Net Assets — For the Periods Ended August 31,
| | | | | | | | | | | | | | | | |
| | | U.S. Treasury Money
Market Fund | | | Prime Money Market Fund | |
| | | 2013 | | | 2012 | | | 2013 | | | 2012 | |
| | | | | | | | | | | | | | | | |
Increase (Decrease) in Net Assets | | | | | | | | | | | | | | | | |
| | | | |
Operations | | | | | | | | | | | | | | | | |
Net investment income (loss) | | $ | — | | | $ | — | | | $ | 6,402,170 | | | $ | 10,776,548 | |
Net realized gain (loss) | | | 12,945 | | | | 679 | | | | 197,989 | | | | 62,503 | |
| | | | | | | | | | | | | | | | |
Net increase (decrease) in net assets from operations | | | 12,945 | | | | 679 | | | | 6,600,159 | | | | 10,839,051 | |
| | | | | | | | | | | | | | | | |
| | | | |
Distributions | | | | | | | | | | | | | | | | |
From net investment income | | | — | | | | — | | | | (6,402,170 | ) | | | (10,776,548 | ) |
From net realized gain | | | — | | | | (21,914 | ) | | | — | | | | — | |
| | | | | | | | | | | | | | | | |
Net decrease in net assets from distributions | | | — | | | | (21,914 | ) | | | (6,402,170 | ) | | | (10,776,548 | ) |
| | | | | | | | | | | | | | | | |
| | | | |
Share Transactions | | | | | | | | | | | | | | | | |
Net increase (decrease) in net assets from share transactions | | | 2,052,836,894 | | | | (22,182,473 | ) | | | (4,301,364,826 | ) | | | 2,137,809,217 | |
| | | | | | | | | | | | | | | | |
Total Net Increase (Decrease) in Net Assets | | | 2,052,849,839 | | | | (22,203,708 | ) | | | (4,301,166,837 | ) | | | 2,137,871,720 | |
| | | | |
Net Assets | | | | | | | | | | | | | | | | |
Beginning of period | | | 4,387,962,113 | | | | 4,410,165,821 | | | | 12,072,632,246 | | | | 9,934,760,526 | |
| | | | | | | | | | | | | | | | |
| | | | |
End of period | | $ | 6,440,811,952 | | | $ | 4,387,962,113 | | | $ | 7,771,465,409 | | | $ | 12,072,632,246 | |
| | | | | | | | | | | | | | | | |
| | | | |
Undistributed (overdistributed) net investment income included in net assets | | $ | 1,411 | | | $ | 1,363 | | | $ | 204,727 | | | $ | 137,842 | |
See accompanying notes which are an integral part of the financial statements.
| | |
| 16 | | Statements of Changes in Net Assets |
This page has been intentionally left blank.
SSgA
Institutional Money Market Funds
Financial Highlights — For the Periods Ended
For a Share Outstanding Throughout Each Period.
| | | | | | | | | | | | | | | | | | | | | | | | |
| | | $
Net Asset Value,
Beginning of
Period | | | $
Net
Investment
Income (Loss)(a)(b) | | | $
Net Realized
and Unrealized
Gain (Loss) | | | $
Total from
Investment
Operations | | | $
Distributions from Net Investment Income | | | $
Distributions
from Net
Realized Gain | |
U.S. Treasury Money Market Fund | | | | | | | | | | | | | | | | | |
August 31, 2013 | | | 1.0000 | | | | — | | | | — | (c) | | | — | (c) | | | — | | | | — | |
August 31, 2012 | | | 1.0000 | | | | — | | | | — | (c) | | | — | (c) | | | — | | | | — | (c) |
August 31, 2011 | | | 1.0000 | | | | — | (c) | | | — | (c) | | | — | (c) | | | — | (c) | | | — | (c) |
August 31, 2010 | | | 1.0000 | | | | — | (c) | | | — | (c) | | | — | (c) | | | — | (c) | | | — | |
August 31, 2009 | | | 1.0000 | | | | 0.0011 | | | | 0.0001 | | | | 0.0012 | | | | (0.0007 | ) | | | (0.0005 | ) |
Prime Money Market Fund | | | | | | | | | | | | | | | | | |
August 31, 2013 | | | 1.0000 | | | | 0.0007 | | | | — | (c) | | | 0.0007 | | | | (0.0007 | ) | | | — | |
August 31, 2012 | | | 1.0000 | | | | 0.0010 | | | | — | (c) | | | 0.0010 | | | | (0.0010 | ) | | | — | |
August 31, 2011 | | | 1.0000 | | | | 0.0012 | | | | — | (c) | | | 0.0012 | | | | (0.0012 | ) | | | — | |
August 31, 2010 | | | 1.0000 | | | | 0.0013 | | | | — | (c) | | | 0.0013 | | | | (0.0013 | ) | | | — | (c) |
August 31, 2009 | | | 1.0000 | | | | 0.0094 | | | | 0.0010 | | | | 0.0104 | | | | (0.0104 | ) | | | — | (c) |
| (a) | | Average daily shares outstanding were used for this calculation. |
| (b) | | May reflect amounts waived and/or reimbursed by the investment adviser and for certain funds, custody credit arrangements. The custody credit arrangements had an impact of less than 0.005%. |
| (c) | | Less than $0.0001 per share. |
| (d) | | Less than 0.005% of average net assets. |
| (e) | | Includes expenses related to the U.S. Treasury Guarantee Program. |
See accompanying notes which are an integral part of the financial statements.
| | | | | | | | | | | | | | | | | | | | | | | | | | |
$
Total
Distributions | | | $
Net Asset Value,
End of
Period | | | %
Total
Return | | | $
Net Assets,
End of Period
(000) | | | %
Ratio of Expenses
to Average
Net Assets,
Net(b) | | | %
Ratio of Expenses
to Average
Net Assets,
Gross | | | %
Ratio of Net
Investment Income
to Average
Net Assets(b) | |
| | | | | | | | | | | | | | | | | | | | | | | | | | |
| | — | | | | 1.0000 | | | | — | | | | 6,440,812 | | | | 0.09 | | | | 0.24 | | | | — | |
| | — | (c) | | | 1.0000 | | | | — | (d) | | | 4,387,962 | | | | 0.08 | | | | 0.25 | | | | — | |
| | — | (c) | | | 1.0000 | | | | — | (d) | | | 4,410,166 | | | | 0.11 | | | | 0.25 | | | | — | (d) |
| | — | (c) | | | 1.0000 | | | | — | (d) | | | 4,215,084 | | | | 0.13 | | | | 0.25 | | | | — | (d) |
| | (0.0012 | ) | | | 1.0000 | | | | 0.12 | | | | 4,120,408 | | | | 0.16 | | | | 0.25 | | | | 0.11 | |
| | | | | | | | | | | | | | | | | | | | | | | | | | |
| | (0.0007 | ) | | | 1.0000 | | | | 0.07 | | | | 7,771,465 | | | | 0.20 | | | | 0.25 | | | | 0.07 | |
| | (0.0010 | ) | | | 1.0000 | | | | 0.10 | | | | 12,072,632 | | | | 0.20 | | | | 0.25 | | | | 0.10 | |
| | (0.0012 | ) | | | 1.0000 | | | | 0.12 | | | | 9,934,761 | | | | 0.20 | | | | 0.25 | | | | 0.12 | |
| | (0.0013 | ) | | | 1.0000 | | | | 0.13 | | | | 12,043,331 | | | | 0.20 | | | | 0.26 | | | | 0.13 | |
| | (0.0104 | ) | | | 1.0000 | | | | 1.04 | | | | 18,404,141 | | | | 0.23 | (e) | | | 0.28 | | | | 0.94 | |
See accompanying notes which are an integral part of the financial statements.
SSgA
Institutional Money Market Funds
Notes to Financial Statements — August 31, 2013
The SSgA Funds (the “Investment Company”) is a series mutual fund, comprised of 12 investment portfolios that were in operation as of August 31, 2013. These financial statements report on two funds: the SSgA U.S. Treasury Money Market Fund and SSgA Prime Money Market Fund (each a “Fund” and collectively referred to as the “Funds”), each of which has distinct investment objectives and strategies. Each Fund is an open-end management investment company, as defined in the Investment Company Act of 1940, as amended (the “1940 Act”). The Investment Company was organized as a Massachusetts business trust on October 3, 1987 and operates under a Second Amended and Restated Master Trust Agreement, dated May 15, 2012 (the “Agreement”). The Agreement permits the Board of Trustees (the “Board”) to issue an unlimited number of full and fractional shares of beneficial interest at a $.001 par value.
| 2. | | Significant Accounting Policies |
The Funds’ financial statements are prepared in accordance with accounting principles generally accepted in the United States of America (“U.S. GAAP”), which require the use of management estimates and assumptions at the date of the financial statements. Actual results could differ from those estimates. The following is a summary of the significant accounting policies consistently followed by each Fund in the preparation of its financial statements.
Security Valuation
As permitted in accordance with Rule 2a-7 of the 1940 Act, each Fund values portfolio investments using the amortized cost method which approximates fair market value. Under this method, each portfolio instrument is initially valued at cost, and thereafter assumes a constant accretion/amortization to maturity date or next reset date of any discount or premium.
U.S. GAAP defines fair market value as the price that a Fund would receive to sell an asset or pay to transfer a liability in an orderly transaction between market participants at the measurement date. It establishes a fair value hierarchy that prioritizes inputs to valuation methods and requires a separate disclosure of the fair value hierarchy, for each major category of assets and liabilities that segregates fair value measurements into levels (Level 1, 2, and 3). In such cases, an investment’s level within the fair value hierarchy is based on the lowest level of input that is significant to the fair value measurement. The inputs or methodology used for valuing securities are not necessarily an indication of the risk associated with investing in those securities. Levels 1, 2 and 3 of the fair value hierarchy are defined as follows:
| | • | | Level 1 — Inputs using quoted prices (unadjusted) in active markets or exchanges for identical assets and liabilities. |
| | • | | Level 2 — Significant other observable inputs, which may include, but are not limited to, quoted prices for similar assets or liabilities in markets that are active, quoted prices for identical or similar assets or liabilities in markets that are nonactive, inputs other than quoted prices that are observable for the assets or liabilities (such as interest rates, yield curves, volatilities, prepayment speeds, loss severities, credit risks and default rates) or other market corroborated inputs. |
| | • | | Level 3 — Significant unobservable inputs based on the best information available in the circumstances, to the extent observable inputs are not available, which may include assumptions made by the Board or persons acting at their direction that are used in determining the fair market value of investments. |
The valuation techniques and significant inputs used in determining the fair market values of financial instruments classified as Level 1 and Level 2 of the fair value hierarchy are as follows:
Short-term instruments purchased by the Funds and maturing within 60 days of the time of purchase are valued at “amortized cost” unless the Board determines that amortized cost does not represent fair value. These investments are categorized as Level 2 of the fair value hierarchy.
| | |
| 20 | | Notes to Financial Statements |
SSgA
Institutional Money Market Funds
Notes to Financial Statements, continued — August 31, 2013
Level 3 Trading Assets and Trading Liabilities, at Fair Value
The valuation techniques and significant inputs used in determining the fair values of financial instruments classified as Level 3 of the fair value hierarchy are as follows:
Securities and other assets for which market quotes are not readily available are valued at fair value as determined in good faith by the Board and are categorized as Level 3 of the fair value hierarchy. Market quotes are considered not readily available in circumstances where there is an absence of current or reliable market-based data (e.g., trade information or broker quotes).
When fair valuation methods are applied that use significant unobservable inputs to determine a Fund’s NAV, securities will not be priced on the basis of quotes from the primary market in which they are traded, but rather may be priced by another method that the Board or persons acting at their direction believe accurately reflects fair value and are categorized as Level 3 of the fair value hierarchy. Fair value pricing may require subjective determinations about the value of a security. While the securities valuation procedures are intended to result in a calculation of a Fund’s NAV that fairly reflects security values as of the time of pricing, the process cannot guarantee that fair values determined by the Board or persons acting at their direction would accurately reflect the price that a Fund could obtain for a security if it were to dispose of that security as of the time of pricing (for instance, in a forced or distressed sale). The prices used by a Fund may differ from the value that would be realized if the securities were sold.
For fair valuations using significant unobservable inputs, U.S. GAAP requires a reconciliation of the beginning to ending balances for reported market values that presents changes attributable to total realized and unrealized gains or losses, purchases and sales, and transfers in/out of the Level 3 category during the period. In accordance with the requirements of U.S. GAAP, a fair value hierarchy and Level 3 reconciliation, if any, have been included in the footnotes to the Schedule of Investments for each respective Fund.
As of the period ended August 31, 2013, there were no transfers between levels.
Securities Transactions
Securities transactions are recorded on a trade date basis, which in most instances is the same as the settlement date. Realized gains and losses from securities transactions, if any, are recorded on the basis of identified cost which is the same basis used for federal income taxes.
Investment Income
Interest income is recorded daily on an accrual basis and includes amortization of premium and accretion of discount on investments. Premium is amortized and discount is accreted using the straight line method. Distributions received on securities that represent a return on capital or capital gains are recorded as a reduction on cost of investments and/or as a realized gain.
Federal Income Taxes
Since the Investment Company is a Massachusetts business trust, each Fund is a separate corporate taxpayer and determines its net investment income and capital gains (or losses) and the amounts to be distributed to each Fund’s shareholders without regard to the income and capital gains (or losses) of the other Funds.
It is each Fund’s intention to qualify as a regulated investment company, as defined by the Internal Revenue Code of 1986 (the “Code”), as amended. This requires each Fund to distribute an amount sufficient to avoid any excise tax under Section 4982 of the Code. Therefore, for the period ended August 31, 2013, the Funds paid no federal income taxes and no federal income tax provision was required for the Funds.
Each Fund files a U.S. tax return. At August 31, 2013, the Funds had recorded no liabilities for net unrecognized tax benefits relating to uncertain income tax positions they have taken or expect to take in future tax returns. While the statute of limitations remains open to examine the Funds’ U.S. tax returns filed for the fiscal years ended August 31, 2010 through August 31, 2012, no
| | | | |
| Notes to Financial Statements | | | 21 | |
SSgA
Institutional Money Market Funds
Notes to Financial Statements, continued — August 31, 2013
examinations are in progress or anticipated at this time. The Funds are not aware of any tax positions for which it is reasonably possible that the total amounts of unrecognized tax benefits will significantly change in the next twelve months.
The Funds may have net tax basis capital loss carryforwards which may be applied against any realized net taxable gains in each succeeding year or until their respective expiration dates, whichever occurs first. At August 31, 2013, the Funds had no net tax basis capital loss carryforwards.
For the period ended August 31, 2013, the Funds’ components of distributable earnings and tax composition of distributions for federal income tax purposes were as follows:
| | | | | | | | |
| | | U.S. Treasury Money
Market Fund | | | Prime Money
Market Fund | |
| | | | | | | | |
Components of Distributable Earnings: | | | | | |
Undistributed Ordinary Income | | $ | 14,356 | | | $ | 407,185 | |
| | |
Tax Composition of Distributions: | | | | | | | | |
Ordinary Income | | $ | — | | | $ | 6,402,170 | |
Dividends and Distributions to Shareholders
The Funds declare and record dividends on net investment income daily and pay them monthly. Capital gain distributions, if any, are generally declared and paid annually. An additional distribution may be paid by the Funds to avoid imposition of federal income tax on any remaining undistributed net investment income and capital gains. Each Fund may periodically make reclassifications among certain of its capital accounts without impacting net asset value for differences between federal tax regulations and U.S. GAAP.
The amount and character of income and gains to be distributed are determined in accordance with federal income tax regulations which may differ from net investment income and realized gains recognized for U.S. GAAP purposes. These differences relate primarily to capital loss carryforwards.
Expenses
Most expenses can be directly attributed to a Fund. Expenses of the Investment Company which cannot be directly attributed to a Fund are allocated among all funds of the Investment Company based principally on their relative average net assets.
Repurchase Agreements
A repurchase agreement customarily obligates the seller at the time it sells securities to the Funds to repurchase the securities at a mutually agreed-upon price and time. The total amount received by the Funds on repurchase is calculated to exceed the price paid by the Funds, reflecting an agreed-upon market rate of interest for the period of time to the settlement date, and is not necessarily related to the interest rate on the underlying securities. The underlying securities are ordinarily United States Government securities. In most cases, repurchase transactions must be collateralized initially at a minimum of 102% of the repurchase price, but in no event less than 100% of the repurchase price. The use of repurchase agreements involves certain risks. For example, if the seller of securities under a repurchase agreement defaults on its obligation to repurchase the underlying securities (as a result of its bankruptcy or otherwise) the Funds will seek to dispose of such securities; this action could involve losses, costs or delays. The Funds may enter into repurchase agreements maturing within a specified date with domestic dealers, banks and other financial institutions deemed to be creditworthy by the Funds’ investment adviser.
Contractual Obligation/Indemnification
Under the Investment Company’s organizational documents, its officers and trustees are indemnified against certain liabilities arising out of the performance of their duties to the Trust. In the normal course of business, the Funds enter into contracts that contain a variety of representations and obligations, including general indemnifications. The Funds’ maximum exposure under these arrangements is unknown as this would involve future claims that may be made against the Funds that have not yet occurred. However, based on experience, the Funds expect the risk of loss to be remote.
| | |
| 22 | | Notes to Financial Statements |
SSgA
Institutional Money Market Funds
Notes to Financial Statements, continued — August 31, 2013
| 3. | | Related Party Transactions, Fees and Expenses |
Adviser and Affiliates
SSgA Funds Management, Inc. (the “Adviser”) manages the Funds pursuant to an Amended and Restated Investment Advisory Agreement dated April 11, 2012, between the Investment Company and the Adviser. The Adviser is a wholly-owned subsidiary of State Street Corporation, a publicly held bank holding company. The Adviser and other advisory affiliates of State Street Corporation make up State Street Global Advisors, the investment management arm of State Street Corporation and its affiliated companies. The Adviser directs the investments of each Fund in accordance with their investment objectives, policies, and limitations. For these services, the Funds pay a fee to the Adviser, calculated daily and paid monthly at the annual rate of 0.15% of its daily average net assets.
The Adviser is contractually obligated until December 31, 2013 to waive 0.05% of its 0.15% management fee on the U.S. Treasury Money Market Fund. Additionally, the Adviser is further contractually obligated until December 31, 2013 to waive its management fee and to reimburse the Fund for all expenses to the extent that total expenses (exclusive of non-recurring account fees, extraordinary expenses and acquired fund fees) exceed 0.20% of average daily net assets on an annual basis. The total amounts of the waiver and reimbursement for the period ended August 31, 2013 were $2,712,388 and $0, respectively. The Adviser does not have the ability to recover these amounts waived or reimbursed under this contractual agreement.
The Adviser is contractually obligated until December 31, 2013 to waive 0.05% of its 0.15% management fee on the Prime Money Market Fund. Additionally, the Adviser is further contractually obligated until December 31, 2013 to waive its management fee and to reimburse the Fund for all expenses to the extent that total expenses (exclusive of non-recurring account fees, extraordinary expenses and acquired fund fees) exceed 0.20% of average daily net assets on an annual basis. The total amounts of the waiver and reimbursement for the period ended August 31, 2013 were $4,368,985 and $0, respectively. The Adviser does not have the ability to recover these amounts waived or reimbursed from prior periods.
The Adviser also may voluntarily reduce all or a portion of its fees and/or reimburse expenses to the extent necessary to maintain a minimum net yield for a Fund (the “Voluntary Reduction”) which may vary from time to time and from fund to fund in the Adviser’s sole discretion. Under an agreement with SSgA Funds relating to the Voluntary Reduction, the U.S. Treasury Money Market Fund and the Prime Money Market Fund, respectively, have agreed to reimburse the Adviser for the full dollar amount of any Voluntary Reduction beginning on August 1, 2012, subject to certain limitations. A Fund will not be obligated to reimburse the Adviser: more than three years after the end of the fiscal year for the Fund in which the Adviser provided a Voluntary Reduction; in respect of any business day for which the net annualized one-day yield is less than 0.00%; to the extent that the amount of the reimbursement to the Adviser on any day exceeds fifty percent of the yield (net of all expenses, exclusive of the reimbursement) of the Fund on that day; to the extent that the amount of such reimbursement would cause the Fund’s net yield to fall below the Fund’s minimum net yield; or in respect of any fee waivers and/or expense reimbursements that are necessary to maintain a Fund’s contractual total expense limit which is effective at the time of such fee waivers and/or expense reimbursements. A reimbursement to the Adviser could negatively impact the U.S. Treasury Money Market Fund’s and the Prime Money Market Fund’s future yield. There is no guarantee that either the U.S. Treasury Money Market Fund or the Prime Money Market Fund will be able to avoid a negative yield. The Adviser may, in its sole discretion, irrevocably waive receipt of any or all reimbursement amounts due from a Fund, without limitation. Any such waiver or reimbursement would be voluntary and may be revised or cancelled at any time without notice. For the period ended August 31, 2013, the Adviser waived $4,941,980 of its fee and reimbursed $0 of expenses on the U.S. Treasury Money Market Fund and waived $0 of its fee and reimbursed $0 of expenses on the Prime Money Market Fund. Voluntary reductions subject to potential recovery by year of expiration are as follows:
| | | | | | | | |
| Expiration | | U.S. Treasury Money
Market Fund | | | Prime Money
Market Fund | |
| | | | | | | | |
8/31/2015 | | $ | 226,572 | | | $ | — | |
8/31/2016 | | $ | 4,941,980 | | | $ | — | |
| | | | |
| Notes to Financial Statements | | | 23 | |
SSgA
Institutional Money Market Funds
Notes to Financial Statements, continued — August 31, 2013
The SSgA Funds are permitted to invest their cash reserves (i.e., monies awaiting investment in portfolio securities suitable for the Funds’ objectives) in the Prime Money Market Fund. As of August 31, 2013, $10,879,244 represents the investments of other Investment Company funds not presented herein.
Boston Financial Data Services, Inc. (“BFDS”) serves as the Funds’ transfer and dividend paying agent, pursuant to an agreement dated August 1, 2006, as amended. For these services, the Funds pay annual account services fees, activity based fees, charges related to compliance and regulatory services and a minimum fee of $200 for each Fund. BFDS is a joint venture of DST Systems, Inc., and State Street Corporation.
State Street Bank and Trust Company (“State Street”) provides custody and fund accounting services to the Funds pursuant to an Amended and Restated Custodian Contract dated April 11, 2012. For these services, the Funds pay State Street asset-based fees that vary according to the number of positions and transactions plus out-of-pocket expenses. State Street is a wholly-owned subsidiary of State Street Corporation. In addition, the Funds have entered into arrangements with State Street whereby custody credits realized as a result of uninvested cash balances were used to reduce a portion of the Funds’ expenses. The custody credits are included in the expense reductions in the Statements of Operations. For the period ended August 31, 2013, the Funds’ custodian fees were reduced by the following amounts under these arrangements:
| | | | |
| | | Amount Paid | |
| | | | |
U.S. Treasury Money Market Fund | | $ | 91,621 | |
Prime Money Market Fund | | | 4,145 | |
Administrator
State Street (the “Administrator”) serves as the Investment Company’s Administrator, pursuant to an administration agreement dated January 1, 2013 (the “Administration Agreement”). Under the Administration Agreement, the Administrator supervises certain administrative aspects of the Investment Company’s operations. The Investment Company pays the Administrator an annual fee, payable monthly on a pro rata basis. The annual fee is based on the following percentages of the average daily net assets of the Investment Company: $0 to $10 billion — 0.0175%; next $10 billion — 0.0125%; next $10 billion — 0.0075% and 0.0050% thereafter. In addition, the Investment Company pays additional fees to the Administrator for certain services and reimburses the Administrator for out-of-pocket expenses. Prior to January 1, 2013, Russell Fund Services Company (“RFSC”) served as administrator at an annual fee based on the following percentages of the average daily net assets of all of the Investment Company’s money market portfolios: $0 to $15 billion — 0.0315%; over $15 billion — 0.029%. In addition, RFSC charged a flat fee of $30,000 per year per Fund with less than $500 million in assets under management.
Distributor and Shareholder Servicing
State Street Global Markets, LLC (the “Distributor” or “SSGM”) promotes and offers shares of the Investment Company pursuant to an Amended and Restated Distribution Agreement dated April 11, 2012. The Distributor may enter into agreements with other related and non-related parties which act as agents to offer and sell shares of the Funds. The amounts paid to the Distributor are included in the accompanying Statements of Operations. The Distributor is a wholly-owned subsidiary of State Street Corporation.
The Investment Company has entered into a distribution plan pursuant to Rule 12b-1 (the “Plan”) under the 1940 Act. Under this Plan, the Investment Company is authorized to make payments to the Distributor, or any shareholder servicing agent, as defined in the Plan, for providing distribution and marketing services, for furnishing assistance to investors on an ongoing basis, and for the reimbursement of direct out-of-pocket expenses charged by the Distributor in connection with the distribution and marketing of shares of the Investment Company and the servicing of investor accounts.
Each Fund has a shareholder servicing agreement with State Street and Wealth Management Systems, an entity related to State Street. For these services, each Fund pays a maximum of 0.025% to State Street, and 0.05% to Wealth Management Systems,
| | |
| 24 | | Notes to Financial Statements |
SSgA
Institutional Money Market Funds
Notes to Financial Statements, continued — August 31, 2013
based on the average daily value of all Institutional Class shares held by their clients. For the period ended August 31, 2013, the Funds paid the following shareholder servicing expenses to the Agents:
| | | | | | | | |
| | | State Street | | | Wealth
Management
Systems | |
| | | | | | | | |
U.S. Treasury Money Market Fund | | $ | 1,356,138 | | | $ | 77,957 | |
Prime Money Market Fund | | | 2,029,290 | | | | 182,215 | |
The combined distribution and shareholder servicing payments shall not exceed 0.25% of the average daily value of net assets of a Fund on an annual basis. The shareholder servicing payments shall not exceed 0.20% of the average daily value of net assets of a Fund on an annual basis. Costs that exceed the maximum amount of allowable reimbursement may be carried forward for two years following the year in which the expenditure was incurred so long as the Plan is in effect. The Funds’ responsibility for any such expenses carried forward shall terminate at the end of two years following the year in which the expenditure was incurred. The Board or a majority of the Funds’ shareholders have the right, however, to terminate the Plan and all payments thereunder at any time. The Funds will not be obligated to reimburse the Distributor for carryover expenses subsequent to the Plan’s termination or discontinuance. As of August 31, 2013, the U.S. Treasury Money Market Fund and the Prime Money Market Fund had no carryover expenses.
Board of Trustees
The Investment Company paid each trustee not affiliated with the Investment Company an annual retainer, plus specified amounts for Board and committee meetings attended. These expenses are allocated among all of the funds of the Investment Company based upon their relative net assets.
Accrued fees payable to affiliates and trustees as of August 31, 2013 were as follows:
| | | | | | | | |
| | | U.S. Treasury Money
Market Fund | | | Prime Money
Market Fund | |
| | | | | | | | |
Advisory fees | | $ | 1,752,488 | | | $ | 1,872,181 | |
Administrative fees | | | 198,650 | | | | 256,374 | |
Custodian fees | | | 52,375 | | | | 81,561 | |
Distribution fees | | | 11,804 | | | | 18,843 | |
Shareholder servicing fees | | | 50,536 | | | | 114,271 | |
Transfer agent fees | | | 11,977 | | | | 14,223 | |
Trustees’ fees | | | 53,474 | | | | 46,030 | |
| | | | | | | | |
| | $ | 2,131,304 | | | $ | 2,403,483 | |
| | | | | | | | |
| 4. | | Fund Share Transactions (On a Constant Dollar Basis) |
| | | | | | | | |
| | | Years Ended August 31, | |
| | | 2013 | | | 2012 | |
| | | | | | | | |
U.S. Treasury Money Market Fund | | | | | | | | |
Proceeds from shares sold | | $ | 30,459,523,197 | | | $ | 47,963,371,212 | |
Proceeds from reinvestment of distributions | | | — | | | | 32,739 | |
Payments for shares redeemed | | | (28,406,686,303 | ) | | | (47,985,586,424 | ) |
| | | | | | | | |
Total net increase (decrease) | | $ | 2,052,836,894 | | | $ | (22,182,473 | ) |
| | | | | | | | |
| | | | |
| Notes to Financial Statements | | | 25 | |
SSgA
Institutional Money Market Funds
Notes to Financial Statements, continued — August 31, 2013
| | | | | | | | |
| | | Years Ended August 31, | |
| | | 2013 | | | 2012 | |
| | |
Prime Money Market Fund | | | | | | | | |
Proceeds from shares sold | | $ | 67,356,334,716 | | | $ | 101,227,618,713 | |
Proceeds from reinvestment of distributions | | | 7,235,088 | | | | 9,401,147 | |
Payments for shares redeemed | | | (71,664,934,630 | ) | | | (99,099,210,643 | ) |
| | | | | | | | |
Total net increase (decrease) | | $ | (4,301,364,826 | ) | | $ | 2,137,809,217 | |
| | | | | | | | |
| 5. | | Market, Credit and Counterparty Risk |
In the normal course of business, the Funds invest in securities and enter into transactions where risks exist due to fluctuations in the market (market risk) or failure of the other party to a transaction to perform (counterparty risk). The value of securities held by each Fund may decline in response to certain events, including those directly involving the companies whose securities are owned by the Funds; conditions affecting the general economy; overall market changes; local, regional or global political, social or economic instability; and currency and interest rate and price fluctuations. Similar to credit risk, the Funds may be exposed to counterparty risk, or the risk that an entity with which the Funds have unsettled or open transactions may default. Financial assets, which potentially expose the Funds to credit and counterparty risks, consist principally of investments and cash due from counterparties. The extent of the Funds’ exposure to credit and counterparty risks in respect to these financial assets approximates their value as recorded in the Funds’ Statements of Assets and Liabilities.
| 6. | | Recent Accounting Pronouncements |
In December 2011, the Financial Accounting Standards Board (FASB) issued Accounting Standard Update No. 2011-11 (ASU 2011-11) “Disclosures about Offsetting Assets and Liabilities.” These disclosure requirements are intended to help investors and other financial statement users to better assess the effect or potential effect of offsetting arrangements on a portfolio’s financial position. They also improve transparency in the reporting of how companies mitigate credit risk, including disclosure of related collateral pledged or received. In addition, ASU 2011-11 facilitates comparison between those entities that prepare their financial statements on the basis of U.S. GAAP and those entities that prepare their financial statements on the basis of International Financial Reporting Standards. ASU 2011-11 requires entities to disclose both gross and net information about both instruments and transactions eligible for offset in the financial position; and disclose instruments and transactions subject to an agreement similar to a master netting agreement. ASU 2011-11 is effective for fiscal years beginning on or after January 1, 2013, and interim periods within those annual periods. Management is currently evaluating the implications of ASU 2011-11 and its impact on financial statement disclosures.
In January 2013, Accounting Standard Update 2013-01 (ASU 2013-01), Clarifying the Scope of Disclosures about Offsetting Assets and Liabilities, clarified Accounting Standards Update 2011-11 (ASU 2011-11), Disclosures about Offsetting Assets and Liabilities. ASU 2013-01 is effective for fiscal years beginning on or after January 1, 2013, and interim periods within those annual periods. As described above, ASU 2011-11 was intended to enhance disclosure requirements on the offsetting of financial assets and liabilities. The ASU 2013-01 limits the scope of the new balance sheet offsetting disclosures to derivatives, repurchase agreements, and securities lending transactions to the extent that they are (1) offset in the financial statements or (2) subject to an enforceable master netting arrangement or similar agreement. Management is currently evaluating the implications of ASU 2013-01 and its impact on financial statement disclosures.
Management has evaluated events and transactions that may have occurred since August 31, 2013, through the date the financial statements were issued, that would merit recognition or additional disclosure in the financial statements. During this review nothing was discovered which would require disclosure within the financial statements.
| | |
| 26 | | Notes to Financial Statements |
SSgA
Institutional Money Market Funds
Report of Independent Registered Public Accounting Firm
To the Board of Trustees of the SSgA Funds and Shareholders of the SSgA U.S. Treasury Money Market Fund and SSgA Prime Money Market Fund:
We have audited the accompanying statements of assets and liabilities, including the schedules of investments, of SSgA U.S. Treasury Money Market Fund and SSgA Prime Money Market Fund (the “Funds”) (two of the funds comprising the SSgA Funds) as of August 31, 2013, and the related statements of operations for the year then ended, the statements of changes in net assets for each of the two years in the period then ended, and the financial highlights for each of the five years in the period then ended. These financial statements and financial highlights are the responsibility of the Funds’ management. Our responsibility is to express an opinion on these financial statements and financial highlights based on our audits.
We conducted our audits in accordance with the standards of the Public Company Accounting Oversight Board (United States). Those standards require that we plan and perform the audit to obtain reasonable assurance about whether the financial statements and financial highlights are free of material misstatement. The Funds are not required to have, nor were we engaged to perform, an audit of their internal control over financial reporting. Our audits included consideration of internal control over financial reporting as a basis for designing audit procedures that are appropriate in the circumstances, but not for the purpose of expressing an opinion on the effectiveness of the Funds’ internal control over financial reporting. Accordingly, we express no such opinion. An audit also includes examining, on a test basis, evidence supporting the amounts and disclosures in the financial statements, assessing the accounting principles used and significant estimates made by management, as well as evaluating the overall financial statement presentation. Our procedures included confirmation of securities owned as of August 31, 2013, by correspondence with the custodian and brokers; where replies were not received from brokers, we performed other auditing procedures. We believe that our audits provide a reasonable basis for our opinion.
In our opinion, the financial statements and financial highlights referred to above present fairly, in all material respects, the financial position of each of the Funds as of August 31, 2013, the results of their operations for the year then ended, the changes in their net assets for each of the two years in the period then ended, and their financial highlights for each of the five years in the period then ended, in conformity with accounting principles generally accepted in the United States of America.
DELOITTE & TOUCHE LLP
Boston, Massachusetts
October 30, 2013
| | | | |
| Report of Independent Registered Public Accounting Firm | | | 27 | |
SSgA
Institutional Money Market Funds
Tax Information — August 31, 2013 (Unaudited)
For the tax year ended August 31, 2013, the U.S. Treasury Money Market Fund hereby designates 100% or the maximum amount allowable, of its net taxable income as qualified interest income taxed at individual ordinary income rates.
For the tax year ended August 31, 2013, the Prime Money Market Fund hereby designates 98.74% or the maximum amount allowable of its net taxable income as qualified interest income taxed at individual ordinary income rates.
Form 1099-DIV mailed to you in January 2014 will show the tax status of all distributions paid to your account in calendar year 2013.
Please consult a tax adviser for questions about federal or state income tax laws.
SSgA
Institutional Money Market Funds
Basis for Approval of Investment Advisory Contracts (Unaudited)
Trustee Considerations in Approving Continuation of Investment Advisory Agreements1
Overview of the Contract Review Process
Under the Investment Company Act of 1940, an investment advisory agreement between a mutual fund and its investment adviser or sub-adviser may continue in effect from year to year only if its continuance is approved at least annually by the fund’s board of trustees, including by a vote of a majority of those trustees who are not “interested persons” of the fund (commonly referred to as, the “Independent Trustees”) cast in person at a meeting called for the purpose of considering such approval.
Consistent with these requirements, the Board of Trustees (the “Board”) of the SSgA Funds (the “Trust”), including a majority of the Independent Trustees of the Trust, met on March 23, 2013 and on April 22 and 23, 2013 to consider a proposal to approve, with respect to each portfolio series of the Trust (each, a “Fund” and collectively, the “Funds”), the continuation of the investment advisory agreement (the “Advisory Agreement”) with SSgA Funds Management, Inc. (the “Adviser”). Prior to voting on the proposal, the Board reviewed information furnished by the Adviser and others reasonably necessary to permit the Board to evaluate the proposal fully. Such information included, among other things, the following:
Information about Performance, Expenses and Fees
| • | | A report prepared by an independent provider of investment company data, which includes for each Fund: |
| | ¡ | | Comparisons of the Fund’s performance over the past one-, three-, five- and ten-year periods ended December 31, 2012, as applicable, to the performance of an appropriate benchmark for the Fund and a universe of other mutual funds with similar investment objectives and policies; |
| | ¡ | | Comparisons of the Fund’s expense ratio (with detail of component expenses) to the expense ratios of a group of comparable mutual funds selected by the independent data provider; |
| | ¡ | | A chart showing the Fund’s historical average net assets relative to its total expenses, management fees, and non-management expenses over the past five years, as applicable; and |
| | ¡ | | Comparisons of the Fund’s contractual management fee to the contractual management fees of comparable mutual funds at different asset levels. |
| • | | Comparative information concerning fees charged by the Adviser for managing institutional accounts using investment strategies and techniques similar to those used in managing the Funds; and |
| • | | Profitability analyses for (a) the Adviser with respect to each Fund and (b) affiliates of the Adviser that provide services to the Funds (“Affiliated Service Providers”). |
Information about Portfolio Management
| • | | Descriptions of the investment management services provided by the Adviser, including their investment strategies and processes; |
| • | | Information concerning the allocation of brokerage and the benefits received by the Adviser as a result of brokerage allocation, including information concerning the acquisition of any research through “soft dollar” benefits received in connection with the Funds’ brokerage; and |
| 1 | Over the course of more than 20 years, the Independent Trustees have identified numerous relevant issues, factors and concerns (“issues, factors and concerns”) that they consider each year in connection with the proposed continuation of the advisory and sub-advisory agreements, the administration agreement, the distribution plans, the distribution agreement and various related-party service agreements (the “annual review process”). The statement of issues, factors and concerns and the related conclusions of the Independent Trustees may not change substantially from year to year. However, the information requested by, and provided to, the Independent Trustees with respect to the issues, factors and concerns and on which their conclusions are based is updated annually and, in some cases, may differ substantially from the previous year. The Independent Trustees schedule annually a separate in-person meeting that is dedicated to the annual review process (the “special meeting”). At the special meeting and throughout the annual review process, the Independent Trustees take a fresh look at each of the issues, factors and concerns in light of the latest available information and each year present one or more sets of comments and questions to management with respect to specific issues, factors and concerns. Management responds to such comments and questions to the satisfaction of the Independent Trustee before the annual review process is completed and prior to the Independent Trustees voting on proposals to approve continuation of the agreements and plans. |
| | | | |
| Basis for Approval of Investment Advisory Contracts | | | 29 | |
SSgA
Institutional Money Market Funds
Basis for Approval of Investment Advisory Contracts (Unaudited), continued
| • | | Information regarding the procedures and processes used to value the assets of the Funds and the assistance provided to the administrator of the Funds by the Adviser in monitoring the effectiveness of such procedures and processes. |
Information about the Adviser
| • | | Reports detailing the financial results and condition of the Adviser and its affiliates; |
| • | | Descriptions of the qualifications, education and experience of the individual investment professionals responsible for managing the portfolios of the Funds; |
| • | | A copy of the Code of Ethics adopted by the Adviser, together with information relating to compliance with and the administration of such Code; |
| • | | A copy of the Adviser’s proxy voting policies and procedures; |
| • | | Information concerning the resources devoted by the Adviser to overseeing compliance by the Funds and their service providers, including the Adviser’s record of compliance with investment policies and restrictions and other operating policies of the Funds; and |
| • | | A description of the business continuity and disaster recovery plans of the Adviser. |
Other Relevant Information
| • | | Information concerning the nature, quality and cost of various non-investment management services provided to the Funds by affiliates of the Adviser, including the custodian, fund accountant, transfer agent and securities lending agent of the Funds, and the role of the Adviser in managing the Funds’ relationship with these service providers; |
| • | | Copies of the Advisory Agreement and agreements with other service providers of the Funds; |
| • | | Additional data requested from an independent provider of investment company data by the Independent Trustees on (a) the SSgA Funds money market portfolios to determine the magnitude to which the absolute difference in yields separated the better performing from the poorer performing funds; and (b) the SSgA Funds quantitative equity portfolios to determine how they performed in the larger universe; |
| • | | Draft responses to letters dated February 14, 2013 from Joseph P. Barri, LLC (counsel to the Independent Trustees), and reviewed prior to such date by Independent Counsel, requesting specific information, from each of: |
| | ¡ | | The Adviser, with respect to its operations relating to the Funds and its approximate profit margins before taxes from such operations for the Funds’ last fiscal year; and the relevant operations of other affiliated service providers to the Funds, together with their approximate profit margins from such relevant operations for the Funds’ last fiscal year; |
| | ¡ | | State Street Bank and Trust Company (“State Street”), the administrator, custodian, transfer agent, securities lending agent, and shareholder services for the Funds, with respect to its operations relating to the Funds; and |
| | ¡ | | State Street Global Markets, LLC, the principal underwriter and distributor of the shares of the Funds (the “Distributor”), with respect to its operations relating to the Funds, together with the Funds’ related distribution plans and arrangements under SEC Rule 12b-1; |
| • | | Excerpts from the Funds’ most recent Prospectuses, statements of Additional Information and Annual reports for the fiscal year ended August 31, 2012, including (i) the latest prospectus descriptions of each Fund’s investment objectives, strategies and authorized investment techniques and investments; and (ii) the latest Annual Shareholder Report for each Fund, including Portfolio Management Discussion of Performance, as prepared by its portfolio management team, together with a graphic comparison of the performance of each Fund with its benchmark index, for its fiscal year ended August 31, 2012; |
| • | | Lipper materials dated March 2013, obtained by an Independent Trustee and circulated to the other Independent Trustees and to Independent Counsel, with respect to the Funds for which such materials were then available; and |
| • | | A summary of the foregoing materials prepared by Independent Counsel. |
| | |
| 30 | | Basis for Approval of Investment Advisory Contracts |
SSgA
Institutional Money Market Funds
Basis for Approval of Investment Advisory Contracts (Unaudited), continued
In addition to the information identified above, the Board considered information provided from time to time by the Adviser, and other service providers of the Funds throughout the year at meetings of the Board and its committees. At such meetings, the Trustees received, among other things, presentations by the portfolio managers and other investment professionals of the Adviser relating to the performance of the Funds and the investment strategies used in pursuing each Fund’s investment objective.
The Independent Trustees were assisted throughout the contract review process by their independent legal counsel. The Independent Trustees relied upon the advice of such counsel and their own business judgment in determining the material factors to be considered in evaluating the Advisory Agreement, and the weight to be given to each such factor. The conclusions reached with respect to the Advisory Agreement were based on a comprehensive evaluation of all the information provided and not any single factor. Moreover, each Trustee may have placed varying emphasis on particular factors in reaching conclusions with respect to each Fund.
Results of the Process
Based on a consideration of the foregoing and such other information as deemed relevant, including the factors and conclusions described below, on April 23, 2013 the Board, including a majority of the Independent Trustees, voted to approve the continuation of the Advisory Agreement effective May 1, 2013, for an additional year with respect to all Funds.
Nature, Extent and Quality of Services
In considering whether to approve the Advisory Agreement, the Board evaluated the nature, extent and quality of services provided to each Fund by the Adviser.
The Board considered the Adviser’s management capabilities and investment process with respect to the types of investments held by each Fund, including the education, experience and number of investment professionals and other personnel who provide portfolio management, investment research, and similar services to the Fund. The Board evaluated, where relevant, the abilities and experience of such investment personnel in analyzing particular markets, industries and specific issuers of securities in these markets and industries. The Board also considered the substantial expertise of the Adviser in developing and applying proprietary quantitative models for managing various Funds that invest primarily in equity securities. With respect to those Funds that invest primarily in fixed-income securities, the Board considered the extensive experience and resources committed by the Adviser to the evaluation of credit, interest-rate and currency risks. With respect to those Funds that operate as money market mutual funds, the Board considered the Adviser’s success in maintaining the constant dollar value of each Fund through extraordinary market conditions. The Board also took into account the compensation paid to recruit and retain investment personnel, and the time and attention devoted to the Funds by senior management.
The Board reviewed the compliance programs of the Adviser and various affiliated service providers. Among other things, the Board considered compliance and reporting matters relating to personal trading by investment personnel, selective disclosure of portfolio holdings, late trading, frequent trading, portfolio valuation, business continuity, the allocation of investment opportunities and the voting of proxies. The Board also considered the role of the Adviser in monitoring each Fund’s securities lending activities.
On the basis of the foregoing and other relevant information, the Board concluded that the Adviser can be expected to continue to provide, high quality investment management and related services for the Funds.
Fund Performance
The Board compared each Fund’s investment performance to the performance of an appropriate benchmark and universe of comparable mutual funds for various time periods ended December 31, 2012.
On the basis of the foregoing and other relevant information, the Board concluded that the performance of each Fund is satisfactory or better (a) by comparison to the performance of its peer group funds or (b) after considering steps taken by management to improve the performance of certain Funds.
| | | | |
| Basis for Approval of Investment Advisory Contracts | | | 31 | |
SSgA
Institutional Money Market Funds
Basis for Approval of Investment Advisory Contracts (Unaudited), continued
Management Fees and Expenses
The Board reviewed the contractual investment advisory fee rates payable by each Fund and actual fees paid by each Fund, net of waivers. As part of its review, the Board considered each Fund’s management fee and total expense ratio (both before and after giving effect to any expense caps), as compared to a group of similarly managed funds selected by an independent data provider. The Board also considered the comparability of the fees charged and the services provided to each Fund by the Adviser to the fees charged and services provided to other clients of the Adviser, including institutional accounts. In addition, the Board considered the willingness of the Adviser to provide undertakings from time to time to waive fees or pay expenses of various Funds to limit the total expenses borne by shareholders of such Funds.
On the basis of the foregoing and other relevant information, and in light of the nature, extent and quality of the services provided by the Adviser, the Board concluded that the fees and the expense ratio of each Fund compare favorably to the fees and expenses of similar mutual funds and are reasonable in relation to the services provided.
Profitability
The Board reviewed the level of profits realized by the Adviser and its affiliates in providing investment advisory and other services to each Fund and to all Funds as a group. The Board considered other direct and indirect benefits received by the Adviser and the Affiliated Service Providers in connection with their relationships with the Funds, including the benefits of research services that may be available to the Adviser as a result of securities transactions effected for the Funds and other investment advisory clients, together with the ranges of profitability of each of the Affiliated Service Providers with respect to their services to the Funds.
The Board concluded that the profitability of the Adviser with respect to each of the Funds, and the profitability range of each of the Affiliated Service Providers with respect to its services to the Funds, were reasonable in relation to the services provided.
Economies of Scale
In reviewing management fees and profitability, the Board also considered the extent to which the Adviser and its affiliates, on the one hand, and each Fund and all Funds as a group, on the other hand, can expect to realize benefits from economies of scale as the assets of the Funds increase. The Board acknowledged the difficulty in accurately measuring the benefits resulting from the economies of scale with respect to the management of any specific Fund or the Funds taken as a whole. The Board concluded that, in light of the current size of each Fund and all Funds as a group, the level of profitability of the Adviser and its affiliates with respect to each Fund and all Funds as a group over various time periods, and the comparatively low management fee and expense ratio of each Fund during these periods, it does not appear that the Adviser or its affiliates has realized benefits from economies of scale in managing the assets of the Funds to such an extent that previously agreed advisory fees should be reduced or that breakpoints in such fees should be implemented for any Fund at this time.
| | |
| 32 | | Basis for Approval of Investment Advisory Contracts |
SSgA
Institutional Money Market Funds
Shareholder Requests for Additional Information — August 31, 2013
The Funds have adopted the proxy voting policies of the Adviser. A description of the policies and procedures that the Funds have adopted to determine how to vote proxies relating to portfolio securities are contained in the Funds’ Statement of Additional Information, which is available (i) without charge, upon request, by calling the Funds at (800) 647-7327, (ii) on the Funds’ website at www.ssgafunds.com, (iii) on the U.S. Securities and Exchange Commission’s website at www.sec.gov, or (iv) at the U.S. Securities and Exchange Commission’s public reference room.
The Funds will file their complete schedules of investments with the U.S. Securities and Exchange Commission for the first and third quarters of each fiscal year on Form N-Q. For the second and fourth quarters, the complete schedules of investments are available in the Funds’ semi-annual and annual financial statements. The Funds’ Form N-Q is available (i) without charge, upon request, by calling the Funds at (800) 647-7327, (ii) on the Funds’ website at www.ssgafunds.com, (iii) on the Securities and Exchange Commission’s website at www.sec.gov, or (iv) at the Securities and Exchange Commission’s public reference room.
| | | | |
| Shareholder Requests for Additional Information | | | 33 | |
SSgA
Institutional Money Market Funds
Disclosure of Information about Fund Trustees and Officers — August 31, 2013 (Unaudited)
The table below includes information about the Trustees of the SSgA Funds, including their:
• business addresses and ages;
• principal occupations during the past five years; and
• other directorships of publicly traded companies or funds.
| | | | | | | | |
| Name, Address and Age | | Position(s) with SSgA Funds;
Length of Time Served;
Term of Office: Until
successor is elected
and qualified | | Principal Occupation(s)
During Past 5 Years;
Other Relevant Experience,
Attributes and Skills1 | | Number of
Portfolios
in Fund
Complex
Overseen
by Trustee | | Other
Directorships
Held by
Trustee During
Past 5 Years |
INTERESTED TRUSTEE: | | | | | | |
Scott F. Powers State Street Financial Center One Lincoln Street Boston, MA 02111-2900 YOB: 1959 | | • Trustee since 2013 | | • May 2008 to Present, President and Chief Executive Officer of State Street Global Advisors; • 2001 – 2008, Chief Executive Officer of Old Mutual Asset Management; • Board of Directors, United Way of Massachusetts Bay; • Board of Directors of Middlesex School; • Incorporator, Cardigan Mountain School | | 12 | | None. |
INDEPENDENT TRUSTEES: | | | | | | |
William L. Marshall State Street Financial Center One Lincoln Street Boston, MA 02111-2900 YOB: 1942 | | • Independent Trustee since 1988 • Chairman, Audit Committee • Member, Governance Committee • Member, Valuation Committee • Member, Qualified Legal and Compliance Committee (“QLCC”) | | • April 2011 to Present, Chairman (until April 2011, Chief Executive Officer and President), Wm. L. Marshall Associates, Inc., Wm. L. Marshall Companies, Inc. and the Marshall Financial Group, Inc. (a registered investment advisor and provider of financial and related consulting services); • Certified Financial Planner; • Member, Financial Planners Association; • Director, SPCA of Bucks County, PA; and • Director, The Ann Silverman Community Clinic of Doylestown, PA. | | 12 | | Director, Marshall Financial Group, Inc. |
| | | | | | | | | |
Patrick J. Riley State Street Financial Center One Lincoln Street Boston, MA 02111-2900 YOB: 1948 | | • Independent Trustee since 1988 • Independent Chairman of the Board since January 2009 • Member, Audit Committee • Member, Governance Committee • Member, Valuation Committee • Member, QLCC | | • 2002 to May 2010, Associate Justice of the Superior Court, Commonwealth of Massachusetts; • 1985 to 2002, Partner, Riley, Burke & Donahue, L.L.P. (law firm); • 1998 to Present, Independent Director, State Street Global Advisers Ireland, Ltd. (investment company); • 1998 to Present, Independent Director, SSgA Liquidity PLC (formerly, SSgA Cash Management Fund PLC); • January 2009 to Present, Independent Director, SSgA Fixed Income PLC; and • January 2009 to Present, Independent Director, SSgA Qualified Funds PLC. • 2011 to Present, Independent Director, SSgA SPDR ETFs Europe 1 PLC and (since 2012) Chairman. | | 12 | | Board Director and Chairman, SPDR Europe 1 PLC Board (2011 – Present); Board Director and Chairman, SPDR Europe II, PLC (2013 – Present). |
| | |
| 34 | | Disclosure of Information about Fund Trustees and Officers |
SSgA
Institutional Money Market Funds
Disclosure of Information about Fund Trustees and Officers, continued — August 31, 2013 (Unaudited)
| | | | | | | | |
| Name, Address and Age | | Position(s) with SSgA Funds;
Length of Time Served;
Term of Office: Until
successor is elected
and qualified | | Principal Occupation(s)
During Past 5 Years;
Other Relevant Experience,
Attributes and Skills1 | | Number of
Portfolios
in Fund
Complex
Overseen
by Trustee | | Other
Directorships
Held by
Trustee During
Past 5 Years |
INDEPENDENT TRUSTEES: (continued) | | | | | | |
Richard D. Shirk State Street Financial Center One Lincoln Street Boston, MA 02111-2900 YOB: 1945 | | • Independent Trustee since 1988 • Member, Audit Committee • Member, Governance Committee • Member, Valuation Committee • Chairman, QLCC | | • March 2001 to April 2002, Chairman (1996 to March 2001, President and Chief Executive Officer), Cerulean Companies, Inc. (holding company) (Retired); • 1992 to March 2001, President and Chief Executive Officer, Blue Cross Blue Shield of Georgia (health insurer, managed healthcare); • 1998 to December 2008, Chairman, Board Member and December 2008 to Present, Investment Committee Member, Healthcare Georgia Foundation (private foundation); • September 2002 to Present, Lead Director and Board Member, Amerigroup Corp. (managed health care); • 1999 to Present, Board Member and (since 2001) Investment Committee Member, Woodruff Arts Center; and • 2003 to 2009, Trustee, Gettysburg College. | | 12 | | None. |
| | | | | | | | | |
Bruce D. Taber State Street Financial Center One Lincoln Street Boston, MA 02111-2900 YOB: 1943 | | • Independent Trustee since 1991 • Member, Audit Committee • Chairman, Governance Committee • Chairman, Valuation Committee • Member, QLCC | | • 1999 to Present, Partner, Zenergy LLC (a technology company providing Computer Modeling and System Analysis to the General Electric Power Generation Division); • Until December 2008, Independent Director, SSgA Cash Management Fund PLC; • Until December 2008, Independent Director, State Street Global Advisers Ireland, Ltd. (investment companies); and • Until August 1994, President, Alonzo B. Reed, Inc., (a Boston architect-engineering firm). | | 12 | | None. |
| 1 | | The information reported includes the principal occupation during the last five years for each Trustee and other information relating to the professional experiences, attributes and skills relevant to each Trustee’s qualifications to serve as a Trustee. |
The table below includes information about the Officers of the SSgA Funds, including their:
| • | | business addresses and ages; and |
| • | | principal occupations during the past five years. |
| | | | |
Principal Officer
Name, Address and Age | | Position(s) with SSgA Funds;
Length of Time Served;
Term of Office: Until successor is
elected by Trustees | | Principal Occupation(s) During Past Five Years |
Ellen M. Needham SSgA Funds Management, Inc. State Street Financial Center One Lincoln Street Boston, MA 02111-2900 YOB: 1967 | | • President and Principal Executive Officer since October 2012 | | • June 2012 to Present, President and Director, SSgA Funds Management, Inc.; • May 2010 to June 2012, Chief Operating Officer, SSgA Funds Management, Inc.; • 1992 to 2012, Senior Managing Director, SSgA Funds Management, Inc. • 1992 to Present, Senior Managing Director, State Street Global Advisors |
| | | | |
| Disclosure of Information about Fund Trustees and Officers | | | 35 | |
SSgA
Institutional Money Market Funds
Disclosure of Information about Fund Trustees and Officers, continued — August 31, 2013 (Unaudited)
| | | | |
Principal Officer
Name, Address and Age | | Position(s) with SSgA Funds;
Length of Time Served;
Term of Office: Until successor is
elected by Trustees | | Principal Occupation(s) During Past Five Years |
Ann M. Carpenter State Street Financial Center One Lincoln Street Boston, MA 02111-2900 YOB: 1966 | | • Vice President since October 2012 | | • March 2008 to Present, Vice President SSgA Funds Management, Inc. • November 2005 to Present, Vice President, State Street Global Advisors. |
| | | | | |
Jacqueline Angell State Street Financial Center One Lincoln Street Boston, MA 02111-2900 YOB: 1974 | | • Chief Compliance Officer since April 2011 | | • July 2012 to Present, Head of UK Compliance, State Street Bank and Trust Company • July 2008 to 2012, Vice President, SSgA Funds Management, Inc.; • July 2008 to 2012, Vice President, State Street Global Advisers; and |
| | | | | |
Laura F. Dell State Street Bank and Trust Company 4 Copley Place, 5th Floor Boston, MA 02116 YOB: 1964 | | • Treasurer and Principal Accounting Officer since January 2013 | | • 2002 to Present, Vice President of State Street Bank and Trust Company. |
| | | | | |
David K. James State Street Bank and Trust Company 4 Copley Place, 5th Floor Boston, MA 02116 YOB: 1970 | | • Secretary since April 2013 | | • 2009 to Present, Vice President and Managing Counsel, State Street Bank and Trust Company; • 2006 to 2009, Vice President and Counsel, PNC Global Investment Servicing (US), Inc. |
| | |
| 36 | | Disclosure of Information about Fund Trustees and Officers |
SSgA
Institutional Money Market Funds
State Street Financial Center
One Lincoln Street
Boston, Massachusetts 02111-2900
(800) 647-7327
Trustees
William L. Marshall
Patrick J. Riley, Chairman
Richard D. Shirk
Bruce D. Taber
Officers
Ellen M. Needham, President, Chief Executive Officer and Principal Executive Officer
Laura F. Dell, Treasurer and Principal Accounting Officer
Ann M. Carpenter, Vice President
Jacqueline Angell, Chief Compliance Officer
David James, Secretary and Chief Legal Officer
Chad C. Hallett, Assistant Treasurer
Caroline Connolly, Assistant Treasurer
Investment Adviser
SSgA Funds Management, Inc.
State Street Financial Center,
One Lincoln Street
Boston, Massachusetts 02111-2900
Custodian and Office of Shareholder Inquiries
State Street Bank and Trust Company
1776 Heritage Drive
North Quincy, Massachusetts 02171
Transfer and Dividend Paying Agent
Boston Financial Data Services, Inc.
Two Heritage Drive
North Quincy, Massachusetts 02171
Distributor
State Street Global Markets, LLC
State Street Financial Center
One Lincoln Street
Boston, Massachusetts 02111-2900
Administrator
State Street Bank and Trust Company
State Street Financial Center
One Lincoln Street
Boston, Massachusetts 02111-2900
Legal Counsel
Goodwin Procter LLP
Exchange Place
Boston, Massachusetts 02109
Independent Registered Public Accounting Firm
Deloitte & Touche LLP
200 Berkeley Street
Boston, Massachusetts 02116
Distributor: State Street Global Markets, LLC, member FINRA, SIPC, a wholly owned subsidiary of State Street Corporation. References to State Street may include State Street Corporation and its affiliates. The SSgA Funds pay State Street Bank and Trust Company for its services as administrator, custodian, transfer agent and shareholder servicing agent and pays SSgA Funds Management, Inc. for investment advisory services.
This information must be preceded or accompanied by a current prospectus or summary prospectus. Read the prospectus carefully before you invest or send money.
| | | | |
| Fund Management and Service Providers | | | 37 | |
SSGAIMMFDAR

S&P 500 Index Fund
Annual Report
August 31, 2013
SSgA Funds
S&P 500 Index Fund
Annual Report
August 31, 2013
Table of Contents
“SSgA” is a registered trademark of State Street Corporation and is licensed for use by the SSgA Funds.
This report is prepared from the books and records of the Funds and it is submitted for the general information of shareholders. This information is for distribution to prospective investors only when preceded or accompanied by a SSgA Funds Prospectus containing more complete information concerning the investment objectives and operations of the Funds, charges and expenses. The Prospectus should be read carefully before an investment is made.
Performance quoted represents past performance and past performance does not guarantee future results. Current performance may be higher or lower than the performance quoted. For the most recent month end performance information, visit www.ssgafunds.com. Investment in the Funds poses investment risks, including the possible loss of principal. The investment return and principal value of an investment will fluctuate so that shares, when redeemed, may be worth more or less than their original cost.
This page has been intentionally left blank.
SSgA Funds
Letter from the President of SSgA Funds Management, Inc.
Dear Shareholder:
We are pleased to provide you with the August 31, 2013 Annual Report for the SSgA S&P 500 Index Fund. The Annual Report provides information about the Fund, including a discussion of management, performance data and related financial statements.
Over the past 12 months, the U.S. economic recovery has gained traction, and even some steam. No longer nagged by the uncertainties of a presidential election year and sun-setting tax policies, U.S. equities posted solid performance and, along with the considerable recovery in the housing markets, fueled positive consumer sentiment. However, in a reminder that volatility may not be totally behind us, the Federal Reserve’s mere suggestion this spring that it would soon consider tapering its unprecedented bond-buying program ignited a week-long tumble for all major U.S. indexes. Nonetheless, with the market able to absorb the news of the impending policy shift, we believe that the economic recovery, although not robust by historical standards, finally can be categorized as sustainable.
Most recently, the market was tested by the political uncertainty resulting from the partial government shutdown and debt ceiling impasse in Washington D.C. At this writing, as Congress has negotiated only a temporary solution to end the stalemate and raise the debt limit, fiscal challenges remain here at home, as well as around the globe.
We hope that you find the enclosed information useful and thank you for the confidence that you have placed in the SSgA Funds.
Sincerely,

Ellen Needham
President
SSgA Funds
SSgA
S&P 500 Index Fund
Portfolio Management Discussion and Analysis — August 31, 2013 (Unaudited)
Objective: The Fund seeks to replicate the total return of the S&P 500® Index.
Invests in: Shares of the State Street Equity 500 Index Portfolio.
Strategy: The Portfolio’s holdings are comprised of the 500 stocks in the S&P 500® Index. The Index is designed to capture the price performance of a large cross-section of the US publicly traded stock market.
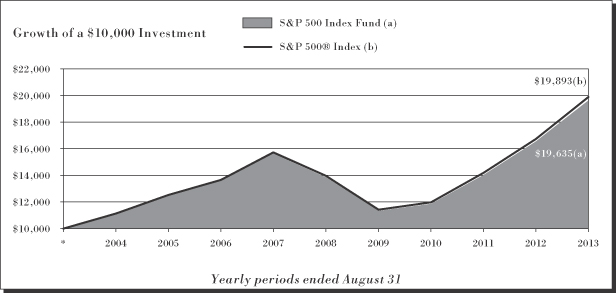
| | | | | | |
| S&P 500 Index Fund | |
Period Ended
08/31/13 | | | | Total
Return | |
| | |
| 1 Year | | | | | 18.54 | % |
| 5 Years | | | | | 7.21 | %+ |
| 10 Years | | | | | 6.98 | %+ |
| | | | | | |
| Standard & Poor’s® 500 Composite Stock Price Index# | |
Period Ended 08/31/13 | | | | Total
Return | |
| | |
| 1 Year | | | | | 18.70 | % |
| 5 Years | | | | | 7.32 | %+ |
| 10 Years | | | | | 7.12 | %+ |
Performance quoted represents past performance, which is no guarantee of future results. Investment return and principal value will fluctuate, so you may have a gain or loss when shares are sold. Current performance may be higher or lower than that quoted. Visit www.ssgafunds.com for most recent month-end performance. The returns do not reflect the deduction of taxes that a shareholder would pay on Fund distributions or on the redemption of Fund shares. The gross expense ratio for the S&P 500 Index Fund as stated in the Fees and Expenses table of the prospectus dated December 14, 2012 is 0.19%.
See related Notes on following page.
SSgA
S&P 500 Index Fund
Portfolio Management Discussion and Analysis — August 31, 2013 (Unaudited)
SSgA S&P 500 Index Fund (the “Fund”) seeks to replicate as closely as possible, before expenses, the performance of the Standard & Poor’s® 500 Index (the “Index”).
For the 12-month period ended August 31, 2013 (the “Reporting Period”), the total return for the Fund was 18.54%, and the total return for the Index was 18.70%. The Fund and Index returns reflect the reinvestment of dividends and other income. The Fund’s performance reflects the expenses of managing the Fund, including brokerage and advisory expenses. The Index is unmanaged and Index returns do not reflect fees and expenses of any kind, which would have a negative impact on returns.
The Fund’s performance relative to the Index during the Reporting Period was within expectations.
US stocks enjoyed a strong performance over the Reporting Period, despite challenges such as Hurricane Sandy, the debate over mandatory spending cuts and tax hikes, and banking turmoil in Cyprus. Improved financial stability in Europe and hints of perkier growth in Asia kept global stock returns largely positive. Enthusiasm for stocks faltered somewhat after US Federal Reserve (the “Fed”) Chairman Ben S. Bernanke suggested in May that asset purchases by the Fed might slow if economic conditions continued to improve. However, increased merger and acquisition activity and generally positive earnings from the largest US companies helped the S&P 500 reach new record highs in the summer. The Index later declined from its midsummer peaks due to concerns about military action in Syria and the Fed cutting back on its asset purchases.
The top positive contributors to the Fund’s performance were Bank of America Corp., Johnson & Johnson, and JPMorgan Chase & Co. Both Bank of America and JPMorgan Chase benefited from higher revenues in business lines such as investment banking and success implementing longer-term, cost-reduction strategies. Johnson & Johnson benefited from successful merger and acquisition activity as well as its strong drug pipeline.
The top negative contributors to the Fund’s performance were Apple, Inc, Intel Corp., and Newmont Mining Corp. Apple was hurt globally by strong smartphone and tablet competitors that caught up to Apple on technology and delivered better pricing. Meanwhile, Intel Corp., which was late to the mobile/tablet market, continued to suffer from the rapid decline in the personal computer market. Like other gold-mining companies, Newmont Mining was pressured by falling gold prices and rising production costs.
The Fund invested in S&P 500 futures contracts to equitize the small amount of cash in the portfolio during the Reporting Period. The futures’ performance did not have a material impact on portfolio performance.
The views expressed above reflect those of the Fund’s portfolio manager only through the Reporting Period, and do not necessarily represent the views of the Adviser as a whole. Any such views are subject to change at any time based upon market or other conditions and the Adviser disclaims any responsibility to update such views. These views may not be relied on as investment advice and, because investment decisions for a fund are based on numerous factors, may not be relied on as an indication of trading intent on behalf of any fund.
Notes: The following notes relate to the Growth of $10,000 graph and tables on the preceding page.
| | * | Assumes initial investment on September 1, 2003. |
| | # | The Standard & Poor’s® 500 Composite Stock Index is composed of 500 common stocks which are chosen by Standard & Poor’s Corporation to best capture the price performance of a large cross-section of the US publicly traded stock market. The Index is structured to approximate the general distribution of industries in the US economy. |
| | | “Standard & Poor’s®”, “S&P®”, “S&P 500®”, “Standard & Poor’s 500” and “500” are trademarks of Standard & Poor’s Corporation and have been licensed for use by The SSgA Fund. The Product is not sponsored, endorsed, sold or promoted by Standard & Poor’s, and Standard & Poor’s makes no representation regarding the advisability of investing in the Product. |
| | | Performance data reflects an expense limitation currently in effect, without which returns would have been lower. |
SSgA
S&P 500 Index Fund
Shareholder Expense Example — August 31, 2013 (Unaudited)
Fund Expenses
The following disclosure provides important information regarding each Fund’s Expense Example, which appears on each Fund’s individual page in this Annual Report. Please refer to this information when reviewing the Expense Example for a Fund.
Example
As a shareholder of the Fund, you incur two types of costs: (1) transaction costs, and (2) ongoing costs, including advisory and administrative fees; distribution (12b-1) and/or service fees; and other Fund expenses. The Example is intended to help you understand your ongoing costs (in dollars) of investing in the Fund and to compare these costs with the ongoing costs of investing in other mutual funds. The Example is based on an investment of $1,000 invested at the beginning of the period and held for the entire period indicated, which for this Fund is from March 1, 2013 to August 31, 2013.
Actual Expenses
The information in the table under the heading “Actual Performance” provides information about actual account values and actual expenses. You may use the information in this column, together with the amount you invested, to estimate the expenses that you paid over the period. Simply divide your account value by $1,000 (for example, an $8,600 account value divided by $1,000 = 8.6), then multiply the result by the number in the first column in the row entitled “Expenses Paid During Period” to estimate the expenses you paid on your account during this period.
Hypothetical Example for Comparison Purposes
The information in the table under the heading “Hypothetical Performance (5% return before expenses)” provides information about hypothetical account values and hypothetical expenses based on the Fund’s actual expense ratio and an assumed rate of return of 5% per year before expenses, which is not the Fund’s actual return. The hypothetical account values and expenses may not be used to estimate the actual ending account balance or expenses you paid for the period. You may use this information to compare the ongoing costs of investing in the Fund and other funds. To do so, compare this 5% hypothetical example with the 5% hypothetical examples that appear in the shareholder reports of other funds.
Please note that the expenses shown in the table are meant to highlight your ongoing costs only and do not reflect any transaction costs. Therefore, the information under the heading “Hypothetical Performance (5% return before expenses)” is useful in comparing ongoing costs only, and will not help you determine the relative total costs of owning different funds. In addition, if these transaction costs were included, your costs would have been higher.
| | | | | | | | |
| | | Actual
Performance | | | Hypothetical
Performance
(5% return
before expenses) | |
Beginning Account Value | | | | | | | | |
March 1, 2013 | | $ | 1,000.00 | | | $ | 1,000.00 | |
Ending Account Value | | | | | | | | |
August 31, 2013 | | $ | 1,088.50 | | | $ | 1,024.39 | |
Expenses Paid During Period* | | $ | 0.84 | | | $ | 0.82 | |
| * | Expenses are equal to the Fund’s annualized expense ratio of 0.16% (representing the six month period annualized), multiplied by the average account value over the period, multiplied by 184/365 (to reflect the one-half year period). Includes amounts waived and/or reimbursed. Without the waiver and/or reimbursement, expenses would have been higher. |
SSgA
S&P 500 Index Fund
Presentation of Master Portfolio Holdings — August 31, 2013 (Unaudited)
| | | | |
| Categories | | % of
Master
Portfolio
Net
Assets | |
| | | | |
Common Stock | | | | |
Consumer Discretionary | | | 12.6 | |
Consumer Staples | | | 9.8 | |
Energy | | | 10.3 | |
Financials | | | 16.7 | |
Health Care | | | 12.2 | |
Industrials | | | 10.2 | |
Information Technology | | | 16.0 | |
Materials | | | 3.5 | |
Telecommunication Services | | | 2.5 | |
Utilities | | | 3.1 | |
U.S. Government Securities | | | 0.2 | |
Money Market Fund | | | 2.7 | |
| | | | |
Total Investments | | | 99.8 | |
Other Assets and Liabilities, Net | | | 0.2 | |
| | | | |
| | | 100.0 | |
| | | | |
Futures Contracts | | | 0.0 | * |
| * | Less than 0.05% of net assets. |
SSgA
S&P 500 Index Fund
Statement of Assets and Liabilities — August 31, 2013
| | | | |
| | | | |
| | | | |
Assets | | | | |
Investments in Master Portfolio, at value | | $ | 1,222,742,497 | |
Receivables: | | | | |
Fund shares sold | | | 914,171 | |
Prepaid expenses | | | 25,661 | |
| | | | |
Total assets | | | 1,223,682,329 | |
| | | | |
| |
Liabilities | | | | |
Payables: | | | | |
Fund shares redeemed | | | 1,555,256 | |
Accrued fees to affiliates and trustees | | | 157,640 | |
Other accrued expenses | | | 41,622 | |
| | | | |
Total liabilities | | | 1,754,518 | |
| | | | |
| | | | |
Net Assets | | $ | 1,221,927,811 | |
| | | | |
| |
Net Assets Consist of: | | | | |
Undistributed (overdistributed) net investment income | | $ | 5,955,997 | |
Accumulated net realized gain (loss) allocated from Master Portfolio | | | (99,720,281 | ) |
Unrealized appreciation (depreciation) allocated from Master Portfolio on: | | | | |
Investments | | | 763,089,692 | |
Futures contracts | | | 457,561 | |
Shares of beneficial interest | | | 45,997 | |
Additional paid-in -capital | | | 552,098,845 | |
| | | | |
Net Assets | | $ | 1,221,927,811 | |
| | | | |
| |
Net Asset Value, offering and redemption price per share: | | | | |
Net asset value per share: (a) | | $ | 26.57 | |
Net assets | | $ | 1,221,927,811 | |
Shares of beneficial interest outstanding ($0.001 par value) | | | 45,996,683 | |
| (a) | | Net asset value per share equals net assets divided by shares of beneficial interest outstanding. |
See accompanying notes which are an integral part of the financial statements.
| | |
| 8 | | Statement of Assets and Liabilities |
SSgA
S&P 500 Index Fund
Statement of Operations — For the Period Ended August 31, 2013
| | | | |
| | | | |
| | | | |
Investment Income Allocated From Master Portfolio | | | | |
Dividends (net of foreign taxes withheld of $67,567) | | $ | 26,340,449 | |
Interest | | | 30,723 | |
Expenses | | | (525,659 | ) |
| | | | |
Total investment income allocated from Master Portfolio | | | 25,845,513 | |
| | | | |
| |
Fund Level Expenses | | | | |
Administrative fees | | | 231,499 | |
Custodian fees | | | 19,479 | |
Distribution fees | | | 495,343 | |
Transfer agent fees | | | 233,347 | |
Professional fees | | | 33,939 | |
Registration fees | | | 46,465 | |
Shareholder servicing fees | | | 227,447 | |
Trustees’ fees | | | 49,146 | |
Insurance fees | | | 36,464 | |
Printing fees | | | 99,516 | |
Miscellaneous | | | 17,835 | |
| | | | |
Net Fund Level expenses | | | 1,490,480 | |
| | | | |
Net investment income (loss) | | | 24,355,033 | |
| | | | |
| |
Net Realized and Unrealized Gain (Loss) Allocated From Master Portfolio | | | | |
Net realized gain (loss) on: | | | | |
Investments | | | 10,498,931 | |
Futures contracts | | | 5,303,928 | |
| | | | |
Net realized gain (loss) | | | 15,802,859 | |
| | | | |
Net change in unrealized appreciation (depreciation) on: | | | | |
Investments | | | 159,271,215 | |
Futures contracts | | | (1,578,986 | ) |
| | | | |
Net change in unrealized appreciation (depreciation) | | | 157,692,229 | |
| | | | |
Net realized and unrealized gain (loss) | | | 173,495,088 | |
| | | | |
Net Increase (Decrease) in Net Assets from Operations | | $ | 197,850,121 | |
| | | | |
See accompanying notes which are an integral part of the financial statements.
| | | | |
| Statement of Operations | | | 9 | |
SSgA
S&P 500 Index Fund
Statements of Changes in Net Assets
| | | | | | | | |
| | | Year Ended
August 31, 2013 | | | Year Ended
August 31, 2012 | |
| | | | | | | | |
Increase (Decrease) in Net Assets | | | | | | | | |
| | |
Operations | | | | | | | | |
Net investment income (loss) | | $ | 24,355,033 | | | $ | 24,772,334 | |
Net realized gain (loss) | | | 15,802,859 | | | | 47,243,375 | |
Net change in unrealized appreciation (depreciation) | | | 157,692,229 | | | | 116,261,564 | |
| | | | | | | | |
Net increase (decrease) in net assets from operations | | | 197,850,121 | | | | 188,277,273 | |
| | | | | | | | |
| | |
Distributions | | | | | | | | |
From net investment income | | | (23,702,540 | ) | | | (24,475,274 | ) |
From net realized gain | | | (14,123,147 | ) | | | — | |
| | | | | | | | |
Net decrease in net assets from distributions | | | (37,825,687 | ) | | | (24,475,274 | ) |
| | | | | | | | |
| | |
Share Transactions | | | | | | | | |
Net increase (decrease) in net assets from share transactions | | | (69,358,165 | ) | | | (159,025,216 | ) |
| | | | | | | | |
Total Net Increase (Decrease) in Net Assets | | | 90,666,269 | | | | 4,776,783 | |
| | |
Net Assets | | | | | | | | |
Beginning of period | | | 1,131,261,542 | | | | 1,126,484,759 | |
| | | | | | | | |
| | |
End of period | | $ | 1,221,927,811 | | | $ | 1,131,261,542 | |
| | | | | | | | |
| | |
Undistributed (overdistributed) net investment income included in net assets | | $ | 5,955,997 | | | $ | 5,401,087 | |
See accompanying notes which are an integral part of the financial statements.
| | |
| 10 | | Statements of Changes in Net Assets |
SSgA
S&P 500 Index Fund
Financial Highlights — For the Periods Ended
For a Share Outstanding Throughout Each Period.
| | | | | | | | | | | | | | | | | | | | | | | | |
| | |
$
Net Asset Value,
Beginning of
Period | | | $
Net
Investment
Income (Loss)(a)(b) | | | $
Net Realized
and Unrealized
Gain (Loss) | | | $
Total from
Investment
Operations | | | $
Distributions
from Net
Investment Income | | | $
Distributions
from Net
Realized Gain | |
S&P 500 Index Fund | | | | | | | | | | | | | | | | | | | | | | | | |
August 31, 2013 | | | 23.18 | | | | 0.52 | | | | 3.67 | | | | 4.19 | | | | (0.50 | ) | | | (0.30 | ) |
August 31, 2012 | | | 20.09 | | | | 0.47 | | | | 3.09 | | | | 3.56 | | | | (0.47 | ) | | | — | |
August 31, 2011 | | | 17.31 | | | | 0.38 | | | | 2.78 | | | | 3.16 | | | | (0.38 | ) | | | — | |
August 31, 2010 | | | 16.83 | | | | 0.33 | | | | 0.48 | | | | 0.81 | | | | (0.33 | ) | | | — | |
August 31, 2009 | | | 21.17 | | | | 0.37 | | | | (4.30 | ) | | | (3.93 | ) | | | (0.41 | ) | | | — | |
| (a) | | Average daily shares outstanding were used for this calculation. |
| (b) | | May reflect amounts waived and/or reimbursed by the investment adviser and for certain funds, custody credit arrangements. The custody credit arrangements had an impact of less than 0.005%. |
| (c) | | Expense ratios include the Fund’s share of the Master Portfolio’s allocated expenses. |
See accompanying notes which are an integral part of the financial statements.
| | | | | | | | | | | | | | | | | | | | | | | | | | | | | | |
$
Total
Distributions | | | $
Net Asset Value,
End of
Period | | | %
Total
Return | | | $
Net Assets,
End of Period
(000) | | | %
Ratio of Expenses
to Average
Net Assets,
Net(b)(c) | | | %
Ratio of Expenses
to Average
Net Assets,
Gross(c) | | | %
Ratio of Net
Investment Income
to Average
Net Assets(b) | | | %
Portfolio
Turnover Rate
of the Master
Portfolio(d) | |
| | | | | | | | | | | | | | | | | | | | | | | | | | | | | | |
| | (0.80 | ) | | | 26.57 | | | | 18.54 | | | | 1,221,928 | | | | 0.17 | | | | 0.17 | | | | 2.08 | | | | 2 | |
| | (0.47 | ) | | | 23.18 | | | | 18.00 | | | | 1,131,262 | | | | 0.18 | | | | 0.19 | | | | 2.21 | | | | 19 | |
| | (0.38 | ) | | | 20.09 | | | | 18.26 | | | | 1,126,485 | | | | 0.18 | | | | 0.19 | | | | 1.82 | | | | 2 | |
| | (0.33 | ) | | | 17.31 | | | | 4.77 | | | | 1,246,140 | | | | 0.18 | | | | 0.19 | | | | 1.84 | | | | 13 | |
| | (0.41 | ) | | | 16.83 | | | | (18.29 | ) | | | 1,375,449 | | | | 0.18 | | | | 0.20 | | | | 2.45 | | | | 8 | |
See accompanying notes which are an integral part of the financial statements.
SSgA
S&P 500 Index Fund
Notes to Financial Statements — August 31, 2013
The SSgA Funds (the “Investment Company”) is a series mutual fund, comprised of 12 investment portfolios that were in operation as of August 31, 2013. These financial statements report on the SSgA S&P 500 Index Fund (the “Fund”). The Investment Company is an open-end management investment company, as defined in the Investment Company Act of 1940, as amended (the “1940 Act”). The Investment Company was organized as a Massachusetts business trust on October 3, 1987 and operates under a Second Amended and Restated Master Trust Agreement, dated May 15, 2012 (the “Agreement”). The Agreement permits the Board of Trustees (the “Board”) to issue an unlimited number of full and fractional shares of beneficial interest at $.001 par value.
The Fund invests substantially all of its investable assets in interests of the State Street Equity 500 Index Portfolio (the “Master Portfolio”). The Fund has the same investment objective as the Master Portfolio and investment policies that are substantially similar to those of the Master Portfolio in which it invests. The value of the Fund’s investment in the Master Portfolio reflects the Fund’s proportionate interest in the net assets of the Master Portfolio (approximately 50.84% at August 31, 2013). The performance of the Fund is directly affected by the performance of the Master Portfolio. The financial statements of the Master Portfolio, including the Portfolio of Investments, are included elsewhere in this report and should be read in conjunction with the Fund’s financial statements.
| 2. | | Significant Accounting Policies |
The Fund’s financial statements are prepared in accordance with accounting principles generally accepted in the United States of America (“U.S. GAAP”), which require the use of management estimates and assumptions at the date of the financial statements. Actual results could differ from those estimates. The following is a summary of the significant accounting policies consistently followed by the Fund in the preparation of its financial statements.
Security Valuation
The Fund records its investments in the Master Portfolio at fair value. Valuation of securities held by the Master Portfolio is discussed in Note 2 of the Master Portfolio’s Notes to Financial Statements, which are included elsewhere in this report.
U.S. GAAP defines fair market value as the price that a Fund would receive to sell an asset or pay to transfer a liability in an orderly transaction between market participants at the measurement date. It establishes a fair value hierarchy that prioritizes inputs to valuation methods and requires a separate disclosure of the fair value hierarchy, for each major category of assets and liabilities that segregates fair value measurements into levels (Level 1, 2, and 3). In such cases, an investment’s level within the fair value hierarchy is based on the lowest level of input that is significant to the fair value measurement. The inputs or methodology used for valuing securities are not necessarily an indication of the risk associated with investing in those securities. Levels 1, 2 and 3 of the fair value hierarchy are defined as follows:
| | • | | Level 1 — Inputs using quoted prices (unadjusted) in active markets or exchanges for identical assets and liabilities. |
| | • | | Level 2 — Significant other observable inputs, which may include, but are not limited to, quoted prices for similar assets or liabilities in markets that are active, quoted prices for identical or similar assets or liabilities in markets that are non-active, inputs other than quoted prices that are observable for the assets or liabilities (such as interest rates, yield curves, volatilities, prepayment speeds, loss severities, credit risks and default rates) or other market corroborated inputs. |
| | • | | Level 3 — Significant unobservable inputs based on the best information available in the circumstances, to the extent observable inputs are not available, which may include assumptions made by the Board or persons acting at their direction that are used in determining the fair market value of investments. |
The valuation techniques and significant inputs used in determining the fair market values of financial instruments classified as Level 1 and Level 2 of the fair value hierarchy are as follows:
Common stocks, preferred stocks, exchange traded funds and derivatives that are traded on a national securities exchange are stated at the last reported sale or settlement price on the day of valuation. To the extent these securities are actively traded and valuation adjustments are not applied, they are categorized as Level 1 of the fair value hierarchy.
| | | | |
| Notes to Financial Statements | | | 13 | |
SSgA
S&P 500 Index Fund
Notes to Financial Statements, continued — August 31, 2013
Fixed income securities including corporate, convertible and municipal bonds and notes, U.S. government agencies, U.S. Treasury obligations, sovereign issues, bank loans, bank notes and non-U.S. bonds are normally valued by pricing service providers that use broker-dealer quotations or valuation estimates from their internal pricing models. The service providers’ internal models use inputs that are observable, such as issuer details, interest rates, yield curves, prepayment speeds, credit risks/spreads and default rates. Securities that use similar valuation techniques and inputs as described above are categorized as Level 2 of the fair value hierarchy.
Fixed income securities purchased on a delayed-delivery basis are marked-to-market daily until settlement at the forward settlement date and are categorized as Level 2 of the fair value hierarchy.
Mortgage and asset-backed securities are usually issued as separate tranches, or classes, of securities within each deal. These securities are also normally valued by pricing service providers that use broker-dealer quotations or valuation estimates from their internal pricing models. The pricing models for these securities usually consider tranche-level attributes, estimated cash flows of each tranche, market-based yield spreads for each tranche, current market data and incorporates deal collateral performance, as available. Mortgage and asset-backed securities that use similar valuation techniques and inputs as described above are categorized as Level 2 of the fair value hierarchy.
Investments in privately held investment funds are valued based upon the Net Asset Value (“NAV”) of such investments and are categorized as Level 2 of the fair value hierarchy.
Short-term instruments purchased by the Fund and maturing within 60 days of the time of purchase are valued at “amortized cost” unless the Board determines that amortized cost does not represent fair value. These investments are categorized as Level 2 of the fair value hierarchy.
Level 3 Trading Assets and Trading Liabilities, at Fair Value
The valuation techniques and significant inputs used in determining the fair values of financial instruments classified as Level 3 of the fair value hierarchy are as follows:
Securities and other assets for which market quotes are not readily available are valued at fair value as determined in good faith by the Board and are categorized as Level 3 of the fair value hierarchy. Market quotes are considered not readily available in circumstances where there is an absence of current or reliable market-based data (e.g., trade information or broker quotes).
When fair valuation methods are applied that use significant unobservable inputs to determine a Fund’s NAV, securities will not be priced on the basis of quotes from the primary market in which they are traded, but rather may be priced by another method that the Board or persons acting at their direction believe accurately reflects fair value and are categorized as Level 3 of the fair value hierarchy. Fair value pricing may require subjective determinations about the value of a security. While the securities valuation procedures are intended to result in a calculation of a Fund’s NAV that fairly reflects security values as of the time of pricing, the process cannot guarantee that fair values determined by the Board or persons acting at their direction would accurately reflect the price that a Fund could obtain for a security if it were to dispose of that security as of the time of pricing (for instance, in a forced or distressed sale). The prices used by a Fund may differ from the value that would be realized if the securities were sold.
For fair valuations using significant unobservable inputs, U.S. GAAP requires a reconciliation of the beginning to ending balances for reported market values that presents changes attributable to total realized and unrealized gains or losses, purchases and sales, and transfers in/out of the Level 3 category during the period. In accordance with the requirements of U.S. GAAP, a fair value hierarchy and Level 3 reconciliation, if any, have been included in the footnotes to the Schedule of Investments for the Fund.
The level associated with valuing the Fund’s investments for the period ended August 31, 2013 was Level 1 for the Fund.
Investment Income
The Fund records daily its proportionate share of the Master Portfolio’s income, expenses and realized and unrealized gains and losses.
| | |
| 14 | | Notes to Financial Statements |
SSgA
S&P 500 Index Fund
Notes to Financial Statements, continued — August 31, 2013
Federal Income Taxes
Since the Investment Company is a Massachusetts business trust, the Fund is a separate corporate taxpayer and determines its net investment income and capital gains (or losses) and the amounts to be distributed to the Fund’s shareholders without regard to the income and capital gains (or losses) of the other funds of the Investment Company.
It is the Fund’s intention to qualify as a regulated investment company, as defined by the Internal Revenue Code of 1986 (the “Code”), as amended. This requires the Fund to distribute an amount sufficient to avoid any excise tax under Section 4982 of the Code. Therefore, for the period ended August 31, 2013 the Fund paid no federal income taxes and no federal income tax provision was required.
The Fund files a U.S. tax return. At August 31, 2013, the Fund had recorded no liabilities for net unrecognized tax benefits relating to uncertain income tax positions it had taken or expects to take in future tax returns. While the statute of limitations remains open to examine the Fund’s U.S. tax returns filed for the fiscal years ended August 31, 2010 through August 31, 2012, no examinations are in progress or anticipated at this time.
Capital Loss Carryovers
At August 31, 2013, the Fund had no tax basis capital loss carryforwards.
Under the Regulated Investment Company Modernization Act of 2010, the Fund will be permitted to carry forward capital losses incurred in taxable years beginning after December 22, 2010 for an unlimited period. However, any losses incurred during those future taxable years will be required to be utilized prior to the losses incurred in pre-enactment taxable years. As a result of this ordering rule, pre-enactment capital loss carryforwards may be more likely to expire unused. Additionally, post-enactment capital losses that are carried forward will retain their character as either short-term or long-term capital losses rather than being considered all short-term as under previous law.
For the period ended August 31, 2013, the Fund’s components of distributable earnings and tax composition of distributions for federal income tax purposes were as follows:
| | | | |
| | | S&P 500
Index Fund | |
| | | | |
Components of Distributable Earnings: | | | | |
Undistributed Ordinary Income | | $ | 8,934,669 | |
Accumulated Undistributed Capital Gains | | $ | 11,776,425 | |
| |
Tax Composition of Distributions: | | | | |
Ordinary Income | | $ | 23,702,540 | |
Undistributed Capital Gains | | $ | 14,123,147 | |
Dividends and Distributions to Shareholders
Income dividends and capital gain distributions, if any, are recorded on the ex-dividend date. The Fund declares and pays dividends quarterly. Capital gain distributions, if any, are generally declared and paid annually. An additional distribution may be paid by the Fund to avoid imposition of federal income tax on any remaining undistributed net investment income and capital gains.
The amount and character of income and gains to be distributed are determined in accordance with federal tax regulations which may differ from net investment income and realized gains recognized for U.S. GAAP purposes. These differences relate primarily to investments in futures, options, losses deferred due to wash sales and straddles, and capital loss carry forwards. Permanent differences between book and tax accounting are reclassified to paid-in capital.
Expenses
Expenses allocated from the Master Portfolio are recorded and identified separately in the Statement of Operations. The Fund also pays certain other expenses which can be directly attributed to the Fund. Expenses of the Investment Company which cannot be directly attributed will be allocated among all funds of the Investment Company based principally on their relative net assets.
| | | | |
| Notes to Financial Statements | | | 15 | |
SSgA
S&P 500 Index Fund
Notes to Financial Statements, continued — August 31, 2013
Contractual Obligation/Indemnification
Under the Investment Company’s organizational documents, its officers and trustees are indemnified against certain liabilities arising out of the performance of their duties to the Trust. In the normal course of business, the Fund enters into contracts that contain a variety of representations and obligations, including general indemnifications. The Fund’s maximum exposure under these arrangements is unknown as this would involve future claims that may be made against the Fund that have not yet occurred. However, based on experience, the Fund expects the risk of loss to be remote.
| 3. | | Investment Transactions |
Securities
Net daily increases and decreases in the Fund’s investment in the Master Portfolio aggregated to the following, for the period ended August 31, 2013:
| | | | | | | | |
| | | Increases | | | Decreases | |
| | | | | | | | |
S&P 500 Index Fund | | $ | 111,851,941 | | | $ | 225,333,902 | |
| 4. | | Related Party Transactions, Fees and Expenses |
Adviser and Affiliates
The Fund is allocated a charge for a management fee from the Master Portfolio, calculated daily at an annual rate of 0.045% of average daily net assets. This fee relates to the advisory, custody and administrative services fees provided by the Master Portfolio on behalf of its investors. SSgA Funds Management, Inc. (the “Adviser”) manages the Fund pursuant to an Amended and Restated Investment Advisory Agreement dated April 11, 2012, between the Investment Company and the Adviser. The Adviser is a wholly-owned subsidiary of State Street Corporation, a publicly held bank holding company. The Adviser and other advisory affiliates of State Street Corporation make up State Street Global Advisors, the investment management arms of State Street Corporation and its affiliated companies. The Adviser directs the investments of the Fund in accordance with its investment objectives, policies, and limitations.
The Adviser is contractually obligated until December 31, 2013 to waive its management fee and to reimburse the Fund for all expenses to the extent that total expenses (exclusive of non-recurring account fees, extraordinary expenses and acquired fund fees) exceed 0.18% of average daily net assets on an annual basis. The total amount of the reimbursement for the period ended August 31, 2013 was $0. The Adviser does not have the ability to recover these amounts waived or reimbursed under this contractual agreement.
Boston Financial Data Services, Inc. (“BFDS”) serves as the Fund’s transfer and dividend paying agent, pursuant to an agreement dated August 1, 2006, as amended. For these services, the Fund pays annual account services fees, activity based fees, charges related to compliance and regulatory services and a minimum fee of $200 for the Fund. BFDS is a joint venture of DST Systems, Inc., and State Street Corporation.
State Street Bank and Trust Company (“State Street”) provides custody and fund accounting services to the Fund pursuant to an Amended and Restated Custodian Contract dated April 11, 2012. For these services, the Fund pays State Street asset-based fees that vary according to the number of positions and transactions plus out-of-pocket expenses. State Street is a wholly-owned subsidiary of State Street Corporation.
Administrator
State Street (the “Administrator”) serves as the Investment Company’s Administrator, pursuant to an administration agreement dated January 1, 2013 (the “Administration Agreement”). Under the Administration Agreement, the Administrator supervises certain administrative aspects of the Investment Company’s operations. The Investment Company pays the Administrator an annual fee, payable monthly on a pro rata basis. The annual fee is based on the following percentages of the average daily net
| | |
| 16 | | Notes to Financial Statements |
SSgA
S&P 500 Index Fund
Notes to Financial Statements, continued — August 31, 2013
assets of the Investment Company: $0 to $10 billion — 0.0175%; next $10 billion — 0.0125%; next $10 billion — 0.0075% and 0.0050% thereafter. In addition, the Investment Company pays additional fees to the Administrator for certain services and reimburses the Administrator for out-of-pocket expenses. Prior to January 1, 2013, Russell Fund Services Company (“RFSC”) served as administrator at an annual fee based on the following percentages of the average daily net assets of the Funds: $0 to $1 billion — 0.0315%; over $1 billion — 0.01%. In addition, RFSC charged a flat fee of $30,000 per year to the Fund if it had less than $500 million in assets under management.
Distributor and Shareholder Servicing
State Street Global Markets, LLC (the “Distributor” or “SSGM”) promotes and offers shares of the Investment Company pursuant to an Amended and Restated Distribution Agreement dated April 11, 2012. The Distributor may enter into agreements with other related and non-related parties which act as agents to offer and sell shares of the Fund. The amounts paid to the Distributor are included in the accompanying Statements of Operations. The Distributor is a wholly-owned subsidiary of State Street Corporation. The Investment Company has entered into a distribution plan pursuant to Rule 12b-1 (the “Plan”) under the 1940 Act. Under the Plan, the Investment Company is authorized to make payments to the Distributor, or any shareholder servicing agent, as defined in the Plan, for providing distribution and marketing services, for furnishing assistance to investors on an ongoing basis, and for the reimbursement of direct out-of-pocket expenses charged by the Distributor in connection with the distribution and marketing of shares of the Investment Company and the servicing of investor accounts.
The Investment Company has adopted a shareholder service agreement with State Street, and the following entities related to State Street: SSGM, Fiduciary Investors Services Division of State Street (“Fiduciary Investors Services”) and High Net Worth Services Division of State Street (“High Net Worth Services”) (collectively, the “Agents”), as well as several unaffiliated services providers. For these services, the Fund pays 0.025% to State Street, and a fee to each of the Agents, based upon the average daily value of all Fund shares held by or for customers of these Agents subject to the maximum of 0.05%.
For the period ended August 31, 2013, the Fund paid the following shareholder servicing expenses to the Agents:
| | | | |
| | | State Street | |
| | | | |
S&P 500 Index Fund | | $ | 35,752 | |
The Fund did not make any payments to SSGM, Fiduciary Investors Services or High Net Worth Services during the period.
Total shareholder servicing payments shall not exceed 0.20% of the average daily net assets of the Fund on an annual basis. The combined distribution and shareholder servicing payments shall not exceed 0.25% of the average daily value of net assets of the Fund on an annual basis. Costs that exceed the maximum amount of allowable reimbursement may be carried forward for two years following the year in which the expenditure was incurred so long as the Plan is in effect. The Fund’s responsibility for any such expenses carried forward shall terminate at the end of two years following the year in which the expenditure was incurred. The Board or a majority of the Fund’s shareholders have the right, however, to terminate the Plan and all payments thereunder at any time. The Fund will not be obligated to reimburse the Distributor for carryover expenses subsequent to the Plan’s termination or discontinuation. As of August 31, 2013, the S&P 500 Index Fund had no carryover expenses.
Board of Trustees
The Investment Company paid each trustee not affiliated with the Investment Company an annual retainer, plus specified amounts for Board and committee meetings attended. These expenses are allocated among all of the funds of the Investment Company based upon their relative net assets.
| | | | |
| Notes to Financial Statements | | | 17 | |
SSgA
S&P 500 Index Fund
Notes to Financial Statements, continued — August 31, 2013
Accrued fees payable to affiliates and trustees as of August 31, 2013 were as follows:
| | | | |
| | | S&P 500
Index Fund | |
| | | | |
Administrative fees | | $ | 42,371 | |
Custodian fees | | | 2,006 | |
Distribution fees | | | 29,030 | |
Shareholder servicing fees | | | 20,449 | |
Transfer agent fees | | | 54,060 | |
Trustees’ fees | | | 9,724 | |
| | | | |
| | $ | 157,640 | |
| | | | |
| 5. | | Fund Share Transactions |
| | | | | | | | | | | | | | | | |
| | | Year Ended
August 31, 2013 | | | Year Ended
August 31, 2012 | |
| | | Shares | | | Dollars | | | Shares | | | Dollars | |
| | | | | | | | | | | | | | | | |
| | | | |
S&P 500 Index Fund | | | | | | | | | | | | | | | | |
Proceeds from shares sold | | | 11,696,984 | | | $ | 292,081,370 | | | | 11,319,847 | | | $ | 237,659,797 | |
Proceeds from reinvestment of distributions | | | 1,512,714 | | | | 35,797,392 | | | | 1,115,234 | | | | 23,129,418 | |
Payments for shares redeemed | | | (16,012,092 | ) | | | (397,236,927 | ) | | | (19,721,255 | ) | | | (419,814,431 | ) |
| | | | | | | | | | | | | | | | |
Total net increase (decrease) | | | (2,802,394 | ) | | $ | (69,358,165 | ) | | | (7,286,174 | ) | | $ | (159,025,216 | ) |
| | | | | | | | | | | | | | | | |
| 6. | | Interfund Lending Program |
The Fund participates in a joint lending and borrowing facility (the “Interfund Lending Program”). Portfolios of the Fund may borrow money from the SSgA Money Market Fund for temporary purposes. All such borrowing and lending will be subject to a participating fund’s fundamental investment limitations. The SSgA Money Market Fund will lend through the Interfund Lending Program only when the returns are higher than those available from an investment in repurchase agreements or short-term reserves. The Fund will borrow through the Interfund Lending Program only when the costs are equal to or lower than the cost of bank loans. Interfund loans and borrowings normally extend overnight, but can have a maximum duration of seven days. Loans may be called on one business day’s notice. A participating fund may have to borrow from a bank at a higher interest rate if an interfund loan is called or not renewed. Any delay in repayment to the SSgA Money Market Fund could result in additional borrowing costs. For the period ended August 31, 2013, the Fund did not utilize the Interfund Lending Program.
On September 3, 2013, the Fund declared the following dividends from net investment income payable on September 9, 2013 to shareholders of record on September 4, 2013.
| | | | |
| | | Net Investment
Income | |
| | | | |
S&P 500 Index Fund | | $ | 0.1302 | |
| 8. | | Market, Credit and Counterparty Risk |
In the normal course of business, the Fund invests in securities and enters into transactions where risks exist due to fluctuations in the market (market risk) or failure of the other party to a transaction to perform (counterparty risk). The value of securities held by the Fund may decline in response to certain events, including those directly involving the companies whose securities are owned by the Fund; conditions affecting the general economy; overall market changes; local, regional or global political, social or economic instability; and currency and interest rate and price fluctuations. Similar to credit risk, the Fund
| | |
| 18 | | Notes to Financial Statements |
SSgA
S&P 500 Index Fund
Notes to Financial Statements, continued — August 31, 2013
may be exposed to counterparty risk, or the risk that an entity with which the Fund has unsettled or open transactions may default. Financial assets, which potentially expose the Fund to credit and counterparty risks, consist principally of investments and cash due from counterparties. The extent of the Fund’s exposure to credit and counterparty risks in respect to these financial assets approximates their value as recorded in the Fund’s Statement of Assets and Liabilities.
| 9. | | Recent Accounting Pronouncements |
In December 2011, the Financial Accounting Standards Board (FASB) issued Accounting Standard Update No. 2011-11 (ASU 2011-11) “Disclosures about Offsetting Assets and Liabilities.” These disclosure requirements are intended to help investors and other financial statement users to better assess the effect or potential effect of offsetting arrangements on a portfolio’s financial position. They also improve transparency in the reporting of how companies mitigate credit risk, including disclosure of related collateral pledged or received. In addition, ASU 2011-11 facilitates comparison between those entities that prepare their financial statements on the basis of U.S. GAAP and those entities that prepare their financial statements on the basis of International Financial Reporting Standards. ASU 2011-11 requires entities to disclose both gross and net information about both instruments and transactions eligible for offset in the financial position; and disclose instruments and transactions subject to an agreement similar to a master netting agreement. ASU 2011-11 is effective for fiscal years beginning on or after January 1, 2013, and interim periods within those annual periods. Management is currently evaluating the implications of ASU 2011-11 and its impact on financial statement disclosures.
In January 2013, Accounting Standard Update 2013-01 (ASU 2013-01), Clarifying the Scope of Disclosures about Offsetting Assets and Liabilities, clarified Accounting Standards Update 2011-11 (ASU 2011-11), Disclosures about Offsetting Assets and Liabilities. ASU 2013-01 is effective for fiscal years beginning on or after January 1, 2013, and interim periods within those annual periods. As described above, ASU 2011-11 was intended to enhance disclosure requirements on the offsetting of financial assets and liabilities. The ASU 2013-01 limits the scope of the new balance sheet offsetting disclosures to derivatives, repurchase agreements, and securities lending transactions to the extent that they are (1) offset in the financial statements or (2) subject to an enforceable master netting arrangement or similar agreement. Management is currently evaluating the implications of ASU 2013-01 and its impact on financial statement disclosures.
On November 1, 2010 a class action complaint was filed in Bankruptcy Court in the bankruptcy case of The Tribune Company (“Tribune”). The defendants in this action include mutual funds, individuals, institutional investors and others who owned shares in Tribune at the time of the 2007 leveraged buyout transaction (the “LBO”) and sold their shares for $34 per share in cash, including the SSgA S&P 500 Index Fund. Thereafter, two additional and substantially similar class actions were filed and are pending in United States District Courts (with the Bankruptcy Court action, collectively referred to as the “Lawsuits”). The Lawsuits have been consolidated into a single Multidistrict Litigation action in federal court for pretrial proceedings. On September 23, 2013, the United States District Court dismissed one of the Lawsuits. On September 30, 2013 the plaintiffs appealed that dismissal. The Lawsuits seek to recover, for the benefit of Tribune’s bankruptcy estate or various creditors, payments to shareholders in the LBO. The Lawsuits allege that Tribune’s payment for those shares violated the rights of creditors, as set forth in the Bankruptcy Code’s and various states’ fraudulent transfer laws. However, the Lawsuits proceed on different legal theories: the Bankruptcy Court action pleads an intentionally fraudulent transfer; the District Court actions plead constructively fraudulent transfers. The Fund cannot predict the outcome of these proceedings or the effect, if any, on the Fund’s net asset value.
Management has evaluated events and transactions that may have occurred since August 31, 2013, through the date the financial statements were issued, that would merit recognition or additional disclosure in the financial statements. During this review nothing was discovered, other than referred to in Note 7, which would require disclosure within the financial statements.
| | | | |
| Notes to Financial Statements | | | 19 | |
SSgA
S&P 500 Index Fund
Report of Independent Registered Public Accounting Firm
To the Board of Trustees of the SSgA Funds and Shareholders of the SSgA S&P 500 Index Fund:
We have audited the accompanying statement of assets and liabilities of SSgA S&P 500 Index Fund (the “Fund”) (one of the funds comprising the SSgA Funds) as of August 31, 2013, and the related statement of operations for the year then ended, the statements of changes in net assets for each of the two years in the period then ended, and the financial highlights for each of the five years in the period then ended. These financial statements and financial highlights are the responsibility of the Fund’s management. Our responsibility is to express an opinion on these financial statements and financial highlights based on our audits.
We conducted our audits in accordance with the standards of the Public Company Accounting Oversight Board (United States). Those standards require that we plan and perform the audit to obtain reasonable assurance about whether the financial statements and financial highlights are free of material misstatement. The Fund is not required to have, nor were we engaged to perform, an audit of its internal control over financial reporting. Our audits included consideration of internal control over financial reporting as a basis for designing audit procedures that are appropriate in the circumstances, but not for the purpose of expressing an opinion on the effectiveness of the Fund’s internal control over financial reporting. Accordingly, we express no such opinion. An audit also includes examining, on a test basis, evidence supporting the amounts and disclosures in the financial statements, assessing the accounting principles used and significant estimates made by management, as well as evaluating the overall financial statement presentation. We believe that our audits provide a reasonable basis for our opinion.
In our opinion, the financial statements and financial highlights referred to above present fairly, in all material respects, the financial position of SSgA S&P 500 Index Fund as of August 31, 2013, the results of its operations for the year then ended, the changes in its net assets for each of the two years in the period then ended, and the financial highlights for each of the five years in the period then ended, in conformity with accounting principles generally accepted in the United States of America.
DELOITTE & TOUCHE LLP
Boston, Massachusetts
October 30, 2013
| | |
| 20 | | Report of Independent Registered Public Accounting Firm |
SSgA
S&P 500 Index Fund
Tax Information — August 31, 2013 (Unaudited)
Long term capital gains dividends of $14,123,147 were paid by the Fund during the period ended August 31, 2013.
The Form 1099 mailed to you in January 2014 will show the tax status of all distributions paid to your account in calendar year 2013.
Please consult a tax adviser for questions about federal or state income tax laws.
SSgA
S&P 500 Index Fund
Basis for Approval of Investment Advisory Contracts (Unaudited)
Trustee Considerations in Approving Continuation of Investment Advisory Agreements1
Overview of the Contract Review Process
Under the Investment Company Act of 1940, an investment advisory agreement between a mutual fund and its investment adviser or sub-adviser may continue in effect from year to year only if its continuance is approved at least annually by the fund’s board of trustees, including by a vote of a majority of those trustees who are not “interested persons” of the fund (commonly referred to as, the “Independent Trustees”) cast in person at a meeting called for the purpose of considering such approval.
Consistent with these requirements, the Board of Trustees (the “Board”) of the SSgA Funds (the “Trust”), including a majority of the Independent Trustees of the Trust, met on March 23, 2013 and on April 22 and 23, 2013 to consider a proposal to approve, with respect to each portfolio series of the Trust (each, a “Fund” and collectively, the “Funds”), the continuation of the investment advisory agreement (the “Advisory Agreement”) with SSgA Funds Management, Inc. (the “Adviser”). Prior to voting on the proposal, the Board reviewed information furnished by the Adviser and others reasonably necessary to permit the Board to evaluate the proposal fully. Such information included, among other things, the following:
Information about Performance, Expenses and Fees
| • | | A report prepared by an independent provider of investment company data, which includes for each Fund: |
| | ¡ | | Comparisons of the Fund’s performance over the past one-, three-, five- and ten-year periods ended December 31, 2012, as applicable, to the performance of an appropriate benchmark for the Fund and a universe of other mutual funds with similar investment objectives and policies; |
| | ¡ | | Comparisons of the Fund’s expense ratio (with detail of component expenses) to the expense ratios of a group of comparable mutual funds selected by the independent data provider; |
| | ¡ | | A chart showing the Fund’s historical average net assets relative to its total expenses, management fees, and non-management expenses over the past five years, as applicable; and |
| | ¡ | | Comparisons of the Fund’s contractual management fee to the contractual management fees of comparable mutual funds at different asset levels. |
| • | | Comparative information concerning fees charged by the Adviser for managing institutional accounts using investment strategies and techniques similar to those used in managing the Funds; and |
| • | | Profitability analyses for (a) the Adviser with respect to each Fund and (b) affiliates of the Adviser that provide services to the Funds (“Affiliated Service Providers”). |
Information about Portfolio Management
| • | | Descriptions of the investment management services provided by the Adviser, including their investment strategies and processes; |
| • | | Information concerning the allocation of brokerage and the benefits received by the Adviser as a result of brokerage allocation, including information concerning the acquisition of any research through “soft dollar” benefits received in connection with the Funds’ brokerage; and |
| 1 | Over the course of more than 20 years, the Independent Trustees have identified numerous relevant issues, factors and concerns (“issues, factors and concerns”) that they consider each year in connection with the proposed continuation of the advisory and sub-advisory agreements, the administration agreement, the distribution plans, the distribution agreement and various related-party service agreements (the “annual review process”). The statement of issues, factors and concerns and the related conclusions of the Independent Trustees may not change substantially from year to year. However, the information requested by, and provided to, the Independent Trustees with respect to the issues, factors and concerns and on which their conclusions are based is updated annually and, in some cases, may differ substantially from the previous year. The Independent Trustees schedule annually a separate in-person meeting that is dedicated to the annual review process (the “special meeting”). At the special meeting and throughout the annual review process, the Independent Trustees take a fresh look at each of the issues, factors and concerns in light of the latest available information and each year present one or more sets of comments and questions to management with respect to specific issues, factors and concerns. Management responds to such comments and questions to the satisfaction of the Independent Trustee before the annual review process is completed and prior to the Independent Trustees voting on proposals to approve continuation of the agreements and plans. |
| | |
| 22 | | Basis for Approval of Investment Advisory Contracts |
SSgA
S&P 500 Index Fund
Basis for Approval of Investment Advisory Contracts (Unaudited), continued
| • | | Information regarding the procedures and processes used to value the assets of the Funds and the assistance provided to the administrator of the Funds by the Adviser in monitoring the effectiveness of such procedures and processes. |
Information about the Adviser
| • | | Reports detailing the financial results and condition of the Adviser and its affiliates; |
| • | | Descriptions of the qualifications, education and experience of the individual investment professionals responsible for managing the portfolios of the Funds; |
| • | | A copy of the Code of Ethics adopted by the Adviser, together with information relating to compliance with and the administration of such Code; |
| • | | A copy of the Adviser’s proxy voting policies and procedures; |
| • | | Information concerning the resources devoted by the Adviser to overseeing compliance by the Funds and their service providers, including the Adviser’s record of compliance with investment policies and restrictions and other operating policies of the Funds; and |
| • | | A description of the business continuity and disaster recovery plans of the Adviser. |
Other Relevant Information
| • | | Information concerning the nature, quality and cost of various non-investment management services provided to the Funds by affiliates of the Adviser, including the custodian, fund accountant, transfer agent and securities lending agent of the Funds, and the role of the Adviser in managing the Funds’ relationship with these service providers; |
| • | | Copies of the Advisory Agreement and agreements with other service providers of the Funds; |
| • | | Additional data requested from an independent provider of investment company data by the Independent Trustees on (a) the SSgA Funds money market portfolios to determine the magnitude to which the absolute difference in yields separated the better performing from the poorer performing funds; and (b) the SSgA Funds quantitative equity portfolios to determine how they performed in the larger universe; |
| • | | Draft responses to letters dated February 14, 2013 from Joseph P. Barri, LLC (counsel to the Independent Trustees), and reviewed prior to such date by Independent Counsel, requesting specific information, from each of: |
| | ¡ | | The Adviser, with respect to its operations relating to the Funds and its approximate profit margins before taxes from such operations for the Funds’ last fiscal year; and the relevant operations of other affiliated service providers to the Funds, together with their approximate profit margins from such relevant operations for the Funds’ last fiscal year; |
| | ¡ | | State Street Bank and Trust Company (“State Street”), the administrator, custodian, transfer agent, securities lending agent, and shareholder services for the Funds, with respect to its operations relating to the Funds; and |
| | ¡ | | State Street Global Markets, LLC, the principal underwriter and distributor of the shares of the Funds (the “Distributor”), with respect to its operations relating to the Funds, together with the Funds’ related distribution plans and arrangements under SEC Rule 12b-1; |
| • | | Excerpts from the Funds’ most recent Prospectuses, statements of Additional Information and Annual reports for the fiscal year ended August 31, 2012, including (i) the latest prospectus descriptions of each Fund’s investment objectives, strategies and authorized investment techniques and investments; and (ii) the latest Annual Shareholder Report for each Fund, including Portfolio Management Discussion of Performance, as prepared by its portfolio management team, together with a graphic comparison of the performance of each Fund with its benchmark index, for its fiscal year ended August 31, 2012; |
| • | | Lipper materials dated March 2013, obtained by an Independent Trustee and circulated to the other Independent Trustees and to Independent Counsel, with respect to the Funds for which such materials were then available; and |
| • | | A summary of the foregoing materials prepared by Independent Counsel. |
| | | | |
| Basis for Approval of Investment Advisory Contracts | | | 23 | |
SSgA
S&P 500 Index Fund
Basis for Approval of Investment Advisory Contracts (Unaudited), continued
In addition to the information identified above, the Board considered information provided from time to time by the Adviser, and other service providers of the Funds throughout the year at meetings of the Board and its committees. At such meetings, the Trustees received, among other things, presentations by the portfolio managers and other investment professionals of the Adviser relating to the performance of the Funds and the investment strategies used in pursuing each Fund’s investment objective.
The Independent Trustees were assisted throughout the contract review process by their independent legal counsel. The Independent Trustees relied upon the advice of such counsel and their own business judgment in determining the material factors to be considered in evaluating the Advisory Agreement, and the weight to be given to each such factor. The conclusions reached with respect to the Advisory Agreement were based on a comprehensive evaluation of all the information provided and not any single factor. Moreover, each Trustee may have placed varying emphasis on particular factors in reaching conclusions with respect to each Fund.
Results of the Process
Based on a consideration of the foregoing and such other information as deemed relevant, including the factors and conclusions described below, on April 23, 2013 the Board, including a majority of the Independent Trustees, voted to approve the continuation of the Advisory Agreement effective May 1, 2013, for an additional year with respect to all Funds.
Nature, Extent and Quality of Services
In considering whether to approve the Advisory Agreement, the Board evaluated the nature, extent and quality of services provided to each Fund by the Adviser.
The Board considered the Adviser’s management capabilities and investment process with respect to the types of investments held by each Fund, including the education, experience and number of investment professionals and other personnel who provide portfolio management, investment research, and similar services to the Fund. The Board evaluated, where relevant, the abilities and experience of such investment personnel in analyzing particular markets, industries and specific issuers of securities in these markets and industries. The Board also considered the substantial expertise of the Adviser in developing and applying proprietary quantitative models for managing various Funds that invest primarily in equity securities. With respect to those Funds that invest primarily in fixed-income securities, the Board considered the extensive experience and resources committed by the Adviser to the evaluation of credit, interest-rate and currency risks. With respect to those Funds that operate as money market mutual funds, the Board considered the Adviser’s success in maintaining the constant dollar value of each Fund through extraordinary market conditions. The Board also took into account the compensation paid to recruit and retain investment personnel, and the time and attention devoted to the Funds by senior management.
The Board reviewed the compliance programs of the Adviser and various affiliated service providers. Among other things, the Board considered compliance and reporting matters relating to personal trading by investment personnel, selective disclosure of portfolio holdings, late trading, frequent trading, portfolio valuation, business continuity, the allocation of investment opportunities and the voting of proxies. The Board also considered the role of the Adviser in monitoring each Fund’s securities lending activities.
On the basis of the foregoing and other relevant information, the Board concluded that the Adviser can be expected to continue to provide, high quality investment management and related services for the Funds.
Fund Performance
The Board compared each Fund’s investment performance to the performance of an appropriate benchmark and universe of comparable mutual funds for various time periods ended December 31, 2012.
On the basis of the foregoing and other relevant information, the Board concluded that the performance of each Fund is satisfactory or better (a) by comparison to the performance of its peer group funds or (b) after considering steps taken by management to improve the performance of certain Funds.
| | |
| 24 | | Basis for Approval of Investment Advisory Contracts |
SSgA
S&P 500 Index Fund
Basis for Approval of Investment Advisory Contracts (Unaudited), continued
Management Fees and Expenses
The Board reviewed the contractual investment advisory fee rates payable by each Fund and actual fees paid by each Fund, net of waivers. As part of its review, the Board considered each Fund’s management fee and total expense ratio (both before and after giving effect to any expense caps), as compared to a group of similarly managed funds selected by an independent data provider. The Board also considered the comparability of the fees charged and the services provided to each Fund by the Adviser to the fees charged and services provided to other clients of the Adviser, including institutional accounts. In addition, the Board considered the willingness of the Adviser to provide undertakings from time to time to waive fees or pay expenses of various Funds to limit the total expenses borne by shareholders of such Funds.
On the basis of the foregoing and other relevant information, and in light of the nature, extent and quality of the services provided by the Adviser, the Board concluded that the fees and the expense ratio of each Fund compare favorably to the fees and expenses of similar mutual funds and are reasonable in relation to the services provided.
Profitability
The Board reviewed the level of profits realized by the Adviser and its affiliates in providing investment advisory and other services to each Fund and to all Funds as a group. The Board considered other direct and indirect benefits received by the Adviser and the Affiliated Service Providers in connection with their relationships with the Funds, including the benefits of research services that may be available to the Adviser as a result of securities transactions effected for the Funds and other investment advisory clients, together with the ranges of profitability of each of the Affiliated Service Providers with respect to their services to the Funds.
The Board concluded that the profitability of the Adviser with respect to each of the Funds, and the profitability range of each of the Affiliated Service Providers with respect to its services to the Funds, were reasonable in relation to the services provided.
Economies of Scale
In reviewing management fees and profitability, the Board also considered the extent to which the Adviser and its affiliates, on the one hand, and each Fund and all Funds as a group, on the other hand, can expect to realize benefits from economies of scale as the assets of the Funds increase. The Board acknowledged the difficulty in accurately measuring the benefits resulting from the economies of scale with respect to the management of any specific Fund or the Funds taken as a whole. The Board concluded that, in light of the current size of each Fund and all Funds as a group, the level of profitability of the Adviser and its affiliates with respect to each Fund and all Funds as a group over various time periods, and the comparatively low management fee and expense ratio of each Fund during these periods, it does not appear that the Adviser or its affiliates has realized benefits from economies of scale in managing the assets of the Funds to such an extent that previously agreed advisory fees should be reduced or that breakpoints in such fees should be implemented for any Fund at this time.
| | | | |
| Basis for Approval of Investment Advisory Contracts | | | 25 | |
SSgA
S&P 500 Index Fund
Shareholder Requests for Additional Information — August 31, 2013
The Fund has adopted the proxy voting policies of the Adviser. A description of the policies and procedures that the Fund has adopted to determine how to vote proxies relating to portfolio securities are contained in the Fund’s Statement of Additional Information, which is available (i) without charge, upon request, by calling the Fund at (800) 647-7327, (ii) on the Fund’s website at www.ssgafunds.com, (iii) on the U.S. Securities and Exchange Commission’s website at www.sec.gov, or (iv) at the Securities and Exchange Commission’s public reference room.
The Fund will file its complete schedule of investments with the U.S. Securities and Exchange Commission for the first and third quarters of each fiscal year on Form N-Q. For the second and fourth quarters, the complete schedule of investments is available in the Fund’s semi-annual and annual financial statements. The Fund’s Form N-Q is available (i) without charge, upon request, by calling the Fund at (800) 647-7327, (ii) on the Fund’s website at www.ssgafunds.com, (iii) on the Securities and Exchange Commission’s website at www.sec.gov, or (iv) at the Securities and Exchange Commission’s public reference room.
| | |
| 26 | | Shareholder Requests for Additional Information |
SSgA
S&P 500 Index Fund
Disclosure of Information about Fund Trustees and Officers —
August 31, 2013 (Unaudited)
The table below includes information about the Trustees of the SSgA Funds, including their:
| • | | business addresses and ages; |
| • | | principal occupations during the past five years; and |
| • | | other directorships of publicly traded companies or funds. |
| | | | | | | | |
| Name, Address and Age | | Position(s) with SSgA Funds; Length of Time Served;
Term of Office: Until
successor is elected
and qualified | | Principal Occupation(s) During Past 5 Years; Other Relevant Experience,
Attributes and Skills1 | | Number of
Portfolios
in Fund
Complex
Overseen
by Trustee | | Other
Directorships
Held by
Trustee During
Past 5 Years |
INTERESTED TRUSTEE: | | | | | | |
Scott F. Powers State Street Financial Center One Lincoln Street Boston, MA 02111-2900 YOB: 1959 | | • Trustee since 2013 | | • May 2008 to Present, President and Chief Executive Officer of State Street Global Advisors; • 2001 – 2008, Chief Executive Officer of Old Mutual Asset Management; • Board of Directors, United Way of Massachusetts Bay; • Board of Directors of Middlesex School; • Incorporator, Cardigan Mountain School | | 12 | | None. |
INDEPENDENT TRUSTEES: | | | | | | |
William L. Marshall State Street Financial Center One Lincoln Street Boston, MA 02111-2900 YOB: 1942 | | • Independent Trustee since 1988 • Chairman, Audit Committee • Member, Governance Committee • Member, Valuation Committee • Member, Qualified Legal and Compliance Committee (“QLCC”) | | • April 2011 to Present, Chairman (until April 2011, Chief Executive Officer and President), Wm. L. Marshall Associates, Inc., Wm. L. Marshall Companies, Inc. and the Marshall Financial Group, Inc. (a registered investment advisor and provider of financial and related consulting services); • Certified Financial Planner; • Member, Financial Planners Association; • Director, SPCA of Bucks County, PA; and • Director, The Ann Silverman Community Clinic of Doylestown, PA. | | 12 | | Director, Marshall Financial Group, Inc. |
| | | | | | | | | |
Patrick J. Riley State Street Financial Center One Lincoln Street Boston, MA 02111-2900 YOB: 1948 | | • Independent Trustee since 1988 • Independent Chairman of the Board since January 2009 • Member, Audit Committee • Member, Governance Committee • Member, Valuation Committee • Member, QLCC | | • 2002 to May 2010, Associate Justice of the Superior Court, Commonwealth of Massachusetts; • 1985 to 2002, Partner, Riley, Burke & Donahue, L.L.P. (law firm); • 1998 to Present, Independent Director, State Street Global Advisers Ireland, Ltd. (investment company); • 1998 to Present, Independent Director, SSgA Liquidity PLC (formerly, SSgA Cash Management Fund PLC); • January 2009 to Present, Independent Director, SSgA Fixed Income PLC; and • January 2009 to Present, Independent Director, SSgA Qualified Funds PLC. • 2011 to Present, Independent Director, SSgA SPDR ETFs Europe 1 PLC and (since 2012) Chairman. | | 12 | | Board Director and Chairman, SPDR Europe 1 PLC Board (2011 – Present); Board Director and Chairman, SPDR Europe II, PLC (2013 – Present). |
| | | | |
| Disclosure of Information about Fund Trustees and Officers | | | 27 | |
SSgA
S&P 500 Index Fund
Disclosure of Information about Fund Trustees and Officers, continued — August 31, 2013 (Unaudited)
| | | | | | | | |
| Name, Address and Age | | Position(s) with SSgA Funds; Length of Time Served;
Term of Office: Until
successor is elected
and qualified | | Principal Occupation(s) During Past 5 Years; Other Relevant Experience,
Attributes and Skills1 | | Number of
Portfolios
in Fund
Complex
Overseen
by Trustee | | Other
Directorships
Held by
Trustee During
Past 5 Years |
INDEPENDENT TRUSTEES: (continued) | | | | | | |
Richard D. Shirk State Street Financial Center One Lincoln Street Boston, MA 02111-2900 YOB: 1945 | | • Independent Trustee since 1988 • Member, Audit Committee • Member, Governance Committee • Member, Valuation Committee • Chairman, QLCC | | • March 2001 to April 2002, Chairman (1996 to March 2001, President and Chief Executive Officer), Cerulean Companies, Inc. (holding company) (Retired); • 1992 to March 2001, President and Chief Executive Officer, Blue Cross Blue Shield of Georgia (health insurer, managed healthcare); • 1998 to December 2008, Chairman, Board Member and December 2008 to Present, Investment Committee Member, Healthcare Georgia Foundation (private foundation); • September 2002 to Present, Lead Director and Board Member, Amerigroup Corp. (managed health care); • 1999 to Present, Board Member and (since 2001) Investment Committee Member, Woodruff Arts Center; and • 2003 to 2009, Trustee, Gettysburg College. | | 12 | | None. |
| | | | | | | | | |
Bruce D. Taber State Street Financial Center One Lincoln Street Boston, MA 02111-2900 YOB: 1943 | | • Independent Trustee since 1991 • Member, Audit Committee • Chairman, Governance Committee • Chairman, Valuation Committee • Member, QLCC | | • 1999 to Present, Partner, Zenergy LLC (a technology company providing Computer Modeling and System Analysis to the General Electric Power Generation Division); • Until December 2008, Independent Director, SSgA Cash Management Fund PLC; • Until December 2008, Independent Director, State Street Global Advisers Ireland, Ltd. (investment companies); and • Until August 1994, President, Alonzo B. Reed, Inc., (a Boston architect-engineering firm). | | 12 | | None. |
| 1 | | The information reported includes the principal occupation during the last five years for each Trustee and other information relating to the professional experiences, attributes and skills relevant to each Trustee’s qualifications to serve as a Trustee. |
The table below includes information about the Officers of the SSgA Funds, including their:
| • | | business addresses and ages; and |
| • | | principal occupations during the past five years. |
| | | | |
Principal Officer Name, Address and Age | | Position(s) with SSgA Funds; Length of Time Served; Term of Office: Until successor is elected by Trustees | | Principal Occupation(s) During Past Five Years |
Ellen M. Needham SSgA Funds Management, Inc. State Street Financial Center One Lincoln Street Boston, MA 02111-2900 YOB: 1967 | | • President and Principal Executive Officer since October 2012 | | • June 2012 to Present, President and Director, SSgA Funds Management, Inc.; • May 2010 to June 2012, Chief Operating Officer, SSgA Funds Management, Inc.; • 1992 to 2012, Senior Managing Director, SSgA Funds Management, Inc. • 1992 to Present, Senior Managing Director, State Street Global Advisors |
| | |
| 28 | | Disclosure of Information about Fund Trustees and Officers |
SSgA
S&P 500 Index Fund
Disclosure of Information about Fund Trustees and Officers, continued — August 31, 2013 (Unaudited)
| | | | |
Principal Officer Name, Address and Age | | Position(s) with SSgA Funds; Length of Time Served; Term of Office: Until successor is elected by Trustees | | Principal Occupation(s) During Past Five Years |
Ann M. Carpenter State Street Financial Center One Lincoln Street Boston, MA 02111-2900 YOB: 1966 | | • Vice President since October 2012 | | • March 2008 to Present, Vice President SSgA Funds Management, Inc. • November 2005 to Present, Vice President, State Street Global Advisors. |
| | | | | |
Jacqueline Angell State Street Financial Center One Lincoln Street Boston, MA 02111-2900 YOB: 1974 | | • Chief Compliance Officer since April 2011 | | • July 2012 to Present, Head of UK Compliance, State Street Bank and Trust Company • July 2008 to 2012, Vice President, SSgA Funds Management, Inc.; • July 2008 to 2012, Vice President, State Street Global Advisers; and |
| | | | | |
Laura F. Dell State Street Bank and Trust Company 4 Copley Place, 5th Floor Boston, MA 02116 YOB: 1964 | | • Treasurer and Principal Accounting Officer since January 2013 | | • 2002 to Present, Vice President of State Street Bank and Trust Company. |
| | | | | |
David K. James State Street Bank and Trust Company 4 Copley Place, 5th Floor Boston, MA 02116 YOB: 1970 | | • Secretary since April 2013 | | • 2009 to Present, Vice President and Managing Counsel, State Street Bank and Trust Company; • 2006 to 2009, Vice President and Counsel, PNC Global Investment Servicing (US), Inc. |
| | | | |
| Disclosure of Information about Fund Trustees and Officers | | | 29 | |
SSgA
S&P 500 Index Fund
State Street Financial Center
One Lincoln Street
Boston, Massachusetts 02111-2900
(800) 647-7327
Trustees
William L. Marshall
Patrick J. Riley, Chairman
Richard D. Shirk
Bruce D. Taber
Officers
Ellen M. Needham, President, Chief Executive Officer and Principal Executive Officer
Laura F. Dell, Treasurer and Principal Accounting Officer
Ann M. Carpenter, Vice President
Jacqueline Angell, Chief Compliance Officer
David James, Secretary and Chief Legal Officer
Chad C. Hallett, Assistant Treasurer
Caroline Connolly, Assistant Treasurer
Investment Adviser
SSgA Funds Management, Inc.
State Street Financial Center,
One Lincoln Street
Boston, Massachusetts 02111-2900
Custodian and Office of Shareholder Inquiries
State Street Bank and Trust Company
1776 Heritage Drive
North Quincy, Massachusetts 02171
Transfer and Dividend Paying Agent
Boston Financial Data Services, Inc.
Two Heritage Drive
North Quincy, Massachusetts 02171
Distributor
State Street Global Markets, LLC
State Street Financial Center
One Lincoln Street
Boston, Massachusetts 02111-2900
Administrator
State Street Bank and Trust Company
State Street Financial Center
One Lincoln Street
Boston, Massachusetts 02111-2900
Legal Counsel
Goodwin Procter LLP
Exchange Place
Boston, Massachusetts 02109
Independent Registered Public Accounting Firm
Deloitte & Touche LLP
200 Berkeley Street
Boston, Massachusetts 02116
Distributor: State Street Global Markets, LLC, member FINRA, SIPC, a wholly owned subsidiary of State Street Corporation. References to State Street may include State Street Corporation and its affiliates. The SSgA Funds pay State Street Bank and Trust Company for its services as administrator, custodian, transfer agent and shareholder servicing agent and pays SSgA Funds Management, Inc. for investment advisory services.
This information must be preceded or accompanied by a current prospectus or summary prospectus. Read the prospectus carefully before you invest or send money.
| | |
| 30 | | Fund Management and Service Providers |
State Street Equity 500 Index Portfolio
Portfolio of Investments — August 31, 2013 (Unaudited)
| | | | | | | | |
| | | Shares | | | Market
Value | |
| | | | | | | | |
| | | | | | | | |
| Common Stocks - 96.9% | | | | | | | | |
Consumer Discretionary - 12.6% | |
Abercrombie & Fitch Co. Class A | | | 13,046 | | | $ | 460,654 | |
Amazon.com, Inc. (a) | | | 58,792 | | | | 16,519,376 | |
AutoNation, Inc. (a) | | | 6,363 | | | | 297,407 | |
AutoZone, Inc. (a) | | | 5,764 | | | | 2,420,534 | |
Bed Bath & Beyond, Inc. (a) | | | 36,545 | | | | 2,694,828 | |
Best Buy Co., Inc. | | | 42,119 | | | | 1,516,284 | |
BorgWarner, Inc. | | | 18,500 | | | | 1,786,730 | |
Cablevision Systems Corp. | | | 35,600 | | | | 631,188 | |
CarMax, Inc. (a) | | | 37,200 | | | | 1,769,232 | |
Carnival Corp. | | | 70,650 | | | | 2,549,758 | |
CBS Corp. Class B | | | 91,203 | | | | 4,660,473 | |
Chipotle Mexican Grill, Inc. (a) | | | 5,100 | | | | 2,081,667 | |
Coach, Inc. | | | 44,828 | | | | 2,367,367 | |
Comcast Corp. Class A | | | 420,448 | | | | 17,696,656 | |
D.R. Horton, Inc. | | | 46,076 | | | | 822,457 | |
Darden Restaurants, Inc. | | | 20,588 | | | | 951,371 | |
Delphi Automotive PLC | | | 45,500 | | | | 2,503,410 | |
DIRECTV (a) | | | 91,377 | | | | 5,316,314 | |
Discovery Communications, Inc. Class A (a) | | | 40,700 | | | | 3,154,657 | |
Dollar General Corp. (a) | | | 48,200 | | | | 2,601,354 | |
Dollar Tree, Inc. (a) | | | 36,600 | | | | 1,928,820 | |
eBay, Inc. (a) | | | 186,803 | | | | 9,338,282 | |
Expedia, Inc. | | | 14,357 | | | | 671,333 | |
Family Dollar Stores, Inc. | | | 15,558 | | | | 1,107,574 | |
Ford Motor Co. | | | 630,098 | | | | 10,201,287 | |
Fossil Group, Inc. (a) | | | 8,800 | | | | 1,022,032 | |
GameStop Corp. Class A | | | 19,500 | | | | 979,095 | |
Gannett Co., Inc. | | | 39,574 | | | | 953,338 | |
Gap, Inc. | | | 48,098 | | | | 1,945,083 | |
Garmin Ltd. | | | 17,300 | | | | 705,321 | |
General Motors Co. (a) | | | 123,300 | | | | 4,202,064 | |
Genuine Parts Co. | | | 25,209 | | | | 1,941,345 | |
Goodyear Tire & Rubber Co. (a) | | | 39,357 | | | | 791,863 | |
H&R Block, Inc. | | | 43,615 | | | | 1,217,295 | |
Harley-Davidson, Inc. | | | 35,801 | | | | 2,147,344 | |
Harman International Industries, Inc. | | | 12,021 | | | | 769,584 | |
Hasbro, Inc. | | | 17,825 | | | | 812,463 | |
Home Depot, Inc. | | | 234,912 | | | | 17,498,595 | |
Host Hotels & Resorts, Inc. | | | 118,721 | | | | 2,021,819 | |
International Game Technology | | | 39,819 | | | | 752,181 | |
Interpublic Group of Cos., Inc. | | | 71,894 | | | | 1,130,174 | |
JC Penney Co., Inc. (a) | | | 21,810 | | | | 272,189 | |
Johnson Controls, Inc. | | | 109,586 | | | | 4,441,521 | |
Kohl’s Corp. | | | 34,533 | | | | 1,771,888 | |
L Brands, Inc. | | | 38,167 | | | | 2,189,259 | |
Lennar Corp. Class A | | | 25,931 | | | | 824,865 | |
Lowe’s Cos., Inc. | | | 171,762 | | | | 7,870,135 | |
Macy’s, Inc. | | | 61,423 | | | | 2,729,024 | |
Marriott International, Inc. Class A | | | 39,050 | | | | 1,561,609 | |
Mattel, Inc. | | | 55,276 | | | | 2,238,678 | |
| | | | | | | | |
| | | Shares | | | Market
Value | |
| | | | | | | | |
McDonald’s Corp. | | | 160,625 | | | $ | 15,156,575 | |
McGraw-Hill Cos., Inc. | | | 45,766 | | | | 2,671,361 | |
NetFlix, Inc. (a) | | | 8,900 | | | | 2,526,799 | |
Newell Rubbermaid, Inc. | | | 47,893 | | | | 1,211,693 | |
News Corp. Class A (a) | | | 80,202 | | | | 1,259,171 | |
NIKE, Inc. Class B | | | 115,004 | | | | 7,224,551 | |
Nordstrom, Inc. | | | 23,633 | | | | 1,317,067 | |
O’Reilly Automotive, Inc. (a) | | | 17,700 | | | | 2,171,967 | |
Omnicom Group, Inc. | | | 40,441 | | | | 2,452,747 | |
PetSmart, Inc. | | | 17,300 | | | | 1,218,439 | |
Priceline.com, Inc. (a) | | | 8,290 | | | | 7,780,414 | |
PulteGroup, Inc. | | | 54,705 | | | | 841,910 | |
PVH Corp. | | | 13,000 | | | | 1,673,750 | |
Ralph Lauren Corp. | | | 9,515 | | | | 1,573,876 | |
Ross Stores, Inc. | | | 35,900 | | | | 2,414,634 | |
Scripps Networks Interactive, Inc. Class A | | | 13,535 | | | | 995,229 | |
Snap-on, Inc. | | | 9,212 | | | | 862,243 | |
Stanley Black & Decker, Inc. | | | 25,707 | | | | 2,191,779 | |
Staples, Inc. | | | 110,033 | | | | 1,530,559 | |
Starbucks Corp. | | | 119,961 | | | | 8,459,650 | |
Starwood Hotels & Resorts Worldwide, Inc. | | | 31,247 | | | | 1,997,933 | |
Target Corp. | | | 102,816 | | | | 6,509,281 | |
Tiffany & Co. | | | 19,880 | | | | 1,532,947 | |
Time Warner Cable, Inc. | | | 46,071 | | | | 4,945,722 | |
Time Warner, Inc. | | | 150,191 | | | | 9,091,061 | |
TJX Cos., Inc. | | | 115,312 | | | | 6,079,249 | |
TripAdvisor, Inc. (a) | | | 16,857 | | | | 1,246,912 | |
Twenty-First Century Fox, Inc. | | | 320,809 | | | | 10,050,946 | |
Urban Outfitters, Inc. (a) | | | 18,300 | | | | 767,319 | |
V.F. Corp. | | | 14,393 | | | | 2,694,514 | |
Viacom, Inc. Class B | | | 72,422 | | | | 5,761,894 | |
Walt Disney Co. | | | 287,545 | | | | 17,491,362 | |
Washington Post Co. Class B | | | 660 | | | | 372,240 | |
Whirlpool Corp. | | | 12,661 | | | | 1,628,838 | |
Wyndham Worldwide Corp. | | | 22,699 | | | | 1,347,413 | |
Wynn Resorts, Ltd. | | | 12,700 | | | | 1,791,208 | |
Yum! Brands, Inc. | | | 72,292 | | | | 5,061,886 | |
| | | | | | | | |
| | | | | | | 302,742,916 | |
| | | | | | | | |
|
Consumer Staples - 9.8% | |
Altria Group, Inc. | | | 321,299 | | | | 10,885,610 | |
Archer-Daniels-Midland Co. | | | 104,724 | | | | 3,687,332 | |
Avon Products, Inc. | | | 67,660 | | | | 1,337,638 | |
Beam, Inc. | | | 25,045 | | | | 1,569,069 | |
Brown-Forman Corp. Class B | | | 23,482 | | | | 1,573,059 | |
Campbell Soup Co. | | | 28,865 | | | | 1,246,391 | |
Clorox Co. | | | 20,543 | | | | 1,698,906 | |
Coca-Cola Co. | | | 615,022 | | | | 23,481,540 | |
Coca-Cola Enterprises, Inc. | | | 40,801 | | | | 1,525,957 | |
Colgate-Palmolive Co. | | | 140,402 | | | | 8,111,024 | |
ConAgra Foods, Inc. | | | 65,375 | | | | 2,210,983 | |
Constellation Brands, Inc. Class A (a) | | | 25,426 | | | | 1,379,361 | |
| | | | |
| State Street Equity 500 Index Portfolio | | | 31 | |
State Street Equity 500 Index Portfolio
Portfolio of Investments, continued — August 31, 2013 (Unaudited)
| | | | | | | | |
| | | Shares | | | Market
Value | |
| | | | | | | | |
| | | | | | | | |
Costco Wholesale Corp. | | | 69,989 | | | $ | 7,829,669 | |
CVS Caremark Corp. | | | 196,832 | | | | 11,426,098 | |
Dr Pepper Snapple Group, Inc. | | | 32,700 | | | | 1,463,652 | |
Estee Lauder Cos., Inc. Class A | | | 38,504 | | | | 2,516,621 | |
General Mills, Inc. | | | 103,664 | | | | 5,112,708 | |
Hormel Foods Corp. | | | 21,200 | | | | 878,316 | |
Kellogg Co. | | | 40,335 | | | | 2,448,738 | |
Kimberly-Clark Corp. | | | 61,800 | | | | 5,777,064 | |
Kraft Foods Group, Inc. | | | 94,769 | | | | 4,906,191 | |
Kroger Co. | | | 81,676 | | | | 2,989,342 | |
Lorillard, Inc. | | | 61,383 | | | | 2,596,501 | |
McCormick & Co., Inc. | | | 20,753 | | | | 1,403,940 | |
Molson Coors Brewing Co. Class B | | | 25,162 | | | | 1,227,654 | |
Mondelez International, Inc. Class A | | | 285,809 | | | | 8,765,762 | |
Monster Beverage Corp. (a) | | | 24,300 | | | | 1,394,577 | |
PepsiCo, Inc. | | | 248,554 | | | | 19,817,210 | |
Philip Morris International, Inc. | | | 263,399 | | | | 21,978,013 | |
Procter & Gamble Co. | | | 440,619 | | | | 34,319,814 | |
Reynolds American, Inc. | | | 52,074 | | | | 2,480,285 | |
Safeway, Inc. | | | 37,164 | | | | 962,548 | |
Sysco Corp. | | | 93,209 | | | | 2,984,552 | |
The Hershey Co. | | | 23,482 | | | | 2,159,170 | |
The J.M. Smucker Co. | | | 17,160 | | | | 1,821,362 | |
Tyson Foods, Inc. Class A | | | 44,235 | | | | 1,280,603 | |
Wal-Mart Stores, Inc. | | | 263,302 | | | | 19,215,780 | |
Walgreen Co. | | | 137,218 | | | | 6,596,069 | |
Whole Foods Market, Inc. | | | 55,066 | | | | 2,904,732 | |
| | | | | | | | |
| | | | | | | 235,963,841 | |
| | | | | | | | |
|
Energy - 10.3% | |
Anadarko Petroleum Corp. | | | 81,626 | | | | 7,462,249 | |
Apache Corp. | | | 62,125 | | | | 5,322,870 | |
Baker Hughes, Inc. | | | 69,973 | | | | 3,253,045 | |
Cabot Oil & Gas Corp. | | | 67,500 | | | | 2,641,275 | |
Cameron International Corp. (a) | | | 39,700 | | | | 2,254,563 | |
Chesapeake Energy Corp. | | | 83,182 | | | | 2,146,927 | |
Chevron Corp. | | | 311,646 | | | | 37,531,528 | |
ConocoPhillips | | | 195,130 | | | | 12,937,119 | |
Consol Energy, Inc. | | | 34,973 | | | | 1,092,207 | |
Denbury Resources, Inc. (a) | | | 61,500 | | | | 1,063,335 | |
Devon Energy Corp. | | | 60,151 | | | | 3,434,021 | |
Diamond Offshore Drilling, Inc. | | | 11,500 | | | | 736,345 | |
Ensco PLC Class A | | | 36,500 | | | | 2,027,940 | |
EOG Resources, Inc. | | | 43,617 | | | | 6,850,050 | |
EQT Corp. | | | 24,100 | | | | 2,065,852 | |
ExxonMobil Corp. | | | 711,747 | | | | 62,035,868 | |
FMC Technologies, Inc. (a) | | | 38,600 | | | | 2,070,118 | |
Halliburton Co. | | | 126,694 | | | | 6,081,312 | |
Helmerich & Payne, Inc. | | | 16,300 | | | | 1,027,552 | |
Hess Corp. | | | 47,801 | | | | 3,577,905 | |
Kinder Morgan, Inc. | | | 101,326 | | | | 3,843,295 | |
Marathon Oil Corp. | | | 111,777 | | | | 3,848,482 | |
Marathon Petroleum Corp. | | | 51,688 | | | | 3,747,897 | |
| | | | | | | | |
| | | Shares | | | Market
Value | |
| | | | | | | | |
Murphy Oil Corp. | | | 28,841 | | | $ | 1,944,460 | |
Nabors Industries, Ltd. | | | 48,204 | | | | 742,342 | |
National Oilwell Varco, Inc. | | | 67,757 | | | | 5,034,345 | |
Newfield Exploration Co. (a) | | | 20,600 | | | | 490,692 | |
Noble Corp. | | | 39,400 | | | | 1,465,680 | |
Noble Energy, Inc. | | | 57,920 | | | | 3,558,026 | |
Occidental Petroleum Corp. | | | 130,444 | | | | 11,506,465 | |
Peabody Energy Corp. | | | 44,124 | | | | 758,933 | |
Phillips 66 | | | 99,165 | | | | 5,662,321 | |
Pioneer Natural Resources Co. | | | 21,700 | | | | 3,796,849 | |
QEP Resources, Inc. | | | 27,068 | | | | 739,498 | |
Range Resources Corp. | | | 25,500 | | | | 1,911,990 | |
Rowan Cos. PLC Class A (a) | | | 19,620 | | | | 694,940 | |
Schlumberger, Ltd. | | | 213,858 | | | | 17,309,666 | |
Southwestern Energy Co. (a) | | | 56,300 | | | | 2,150,660 | |
Spectra Energy Corp. | | | 107,798 | | | | 3,569,192 | |
Tesoro Corp. | | | 23,165 | | | | 1,067,675 | |
Valero Energy Corp. | | | 87,909 | | | | 3,123,407 | |
Williams Cos., Inc. | | | 108,468 | | | | 3,930,880 | |
WPX Energy, Inc. (a) | | | 30,856 | | | | 575,773 | |
| | | | | | | | |
| | | | | | | 247,085,549 | |
| | | | | | | | |
|
Financials - 16.7% | |
ACE, Ltd. | | | 54,100 | | | | 4,745,652 | |
AFLAC, Inc. | | | 73,990 | | | | 4,275,882 | |
Allstate Corp. | | | 76,406 | | | | 3,661,376 | |
American Express Co. | | | 153,764 | | | | 11,057,169 | |
American International Group, Inc. (a) | | | 239,033 | | | | 11,105,473 | |
American Tower Corp. REIT | | | 62,800 | | | | 4,363,972 | |
Ameriprise Financial, Inc. | | | 32,307 | | | | 2,783,248 | |
Aon PLC | | | 49,547 | | | | 3,288,930 | |
Apartment Investment & Management Co. Class A | | | 22,952 | | | | 631,869 | |
Assurant, Inc. | | | 14,131 | | | | 749,508 | |
AvalonBay Communities, Inc. | | | 19,298 | | | | 2,391,022 | |
Bank of America Corp. | | | 1,730,771 | | | | 24,438,487 | |
BB&T Corp. | | | 111,970 | | | | 3,802,501 | |
Berkshire Hathaway, Inc. Class B (a) | | | 292,503 | | | | 32,532,184 | |
BlackRock, Inc. | | | 20,434 | | | | 5,319,379 | |
Boston Properties, Inc. | | | 23,867 | | | | 2,446,368 | |
Capital One Financial Corp. | | | 92,963 | | | | 6,000,762 | |
CBRE Group, Inc. (a) | | | 49,575 | | | | 1,084,205 | |
Charles Schwab Corp. | | | 175,293 | | | | 3,660,118 | |
Chubb Corp. | | | 41,475 | | | | 3,449,476 | |
Cincinnati Financial Corp. | | | 23,114 | | | | 1,055,848 | |
Citigroup, Inc. | | | 488,520 | | | | 23,610,172 | |
CME Group, Inc. | | | 48,955 | | | | 3,481,190 | |
Comerica, Inc. | | | 29,944 | | | | 1,222,913 | |
DDR Corp. REIT | | | 1,532 | | | | 23,777 | |
Discover Financial Services | | | 79,005 | | | | 3,732,986 | |
E*Trade Financial Corp. (a) | | | 44,931 | | | | 630,831 | |
Equity Residential | | | 51,157 | | | | 2,654,537 | |
Fifth Third Bancorp | | | 141,716 | | | | 2,591,986 | |
| | |
| 32 | | State Street Equity 500 Index Portfolio |
State Street Equity 500 Index Portfolio
Portfolio of Investments, continued — August 31, 2013 (Unaudited)
| | | | | | | | |
| | | Shares | | | Market
Value | |
| | | | | | | | |
| | | | | | | | |
Franklin Resources, Inc. | | | 68,940 | | | $ | 3,182,270 | |
Genworth Financial, Inc. Class A (a) | | | 82,251 | | | | 970,562 | |
Goldman Sachs Group, Inc. | | | 69,034 | | | | 10,502,142 | |
Hartford Financial Services Group, Inc. | | | 74,097 | | | | 2,193,271 | |
HCP, Inc. | | | 73,400 | | | | 2,989,582 | |
Health Care REIT, Inc. | | | 46,100 | | | | 2,832,384 | |
Hudson City Bancorp, Inc. | | | 76,692 | | | | 704,799 | |
Huntington Bancshares, Inc. | | | 141,956 | | | | 1,169,717 | |
IntercontinentalExchange, Inc. (a) | | | 11,980 | | | | 2,153,405 | |
Invesco Ltd. | | | 72,200 | | | | 2,191,992 | |
J.P. Morgan Chase & Co. | | | 606,115 | | | | 30,626,991 | |
KeyCorp | | | 148,675 | | | | 1,735,037 | |
Kimco Realty Corp. | | | 62,669 | | | | 1,255,260 | |
Legg Mason, Inc. | | | 18,042 | | | | 586,726 | |
Leucadia National Corp. | | | 46,736 | | | | 1,165,128 | |
Lincoln National Corp. | | | 42,992 | | | | 1,807,384 | |
Loews Corp. | | | 49,231 | | | | 2,188,810 | |
M&T Bank Corp. | | | 19,437 | | | | 2,202,990 | |
Marsh & McLennan Cos., Inc. | | | 88,553 | | | | 3,651,040 | |
Mastercard, Inc. Class A | | | 16,900 | | | | 10,242,752 | |
MetLife, Inc. | | | 174,396 | | | | 8,055,351 | |
Moody’s Corp. | | | 30,266 | | | | 1,923,707 | |
Morgan Stanley | | | 218,030 | | | | 5,616,453 | |
NASDAQ OMX Group, Inc. | | | 18,400 | | | | 549,424 | |
Northern Trust Corp. | | | 34,306 | | | | 1,882,370 | |
NYSE Euronext | | | 40,200 | | | | 1,680,360 | |
Paychex, Inc. | | | 50,738 | | | | 1,962,546 | |
People’s United Financial, Inc. | | | 57,000 | | | | 810,540 | |
PNC Financial Services Group, Inc. | | | 84,117 | | | | 6,079,136 | |
Principal Financial Group, Inc. | | | 43,391 | | �� | | 1,775,560 | |
Progressive Corp. | | | 88,101 | | | | 2,208,692 | |
ProLogis, Inc. | | | 78,999 | | | | 2,783,925 | |
Prudential Financial, Inc. | | | 74,339 | | | | 5,566,504 | |
Public Storage, Inc. | | | 23,087 | | | | 3,524,692 | |
Regions Financial Corp. | | | 226,389 | | | | 2,128,057 | |
Simon Property Group, Inc. | | | 49,415 | | | | 7,196,306 | |
SLM Corp. | | | 69,254 | | | | 1,661,403 | |
State Street Corp. (b) | | | 72,725 | | | | 4,852,212 | |
SunTrust Banks, Inc. | | | 86,518 | | | | 2,770,306 | |
T. Rowe Price Group, Inc. | | | 41,175 | | | | 2,888,014 | |
The Bank of New York Mellon Corp. | | | 184,485 | | | | 5,486,584 | |
The Macerich Co. REIT | | | 21,800 | | | | 1,226,904 | |
Torchmark Corp. | | | 14,931 | | | | 1,028,597 | |
Total System Services, Inc. | | | 26,575 | | | | 735,330 | |
Travelers Cos., Inc. | | | 60,504 | | | | 4,834,270 | |
U.S. Bancorp | | | 299,052 | | | | 10,804,749 | |
Unum Group | | | 40,929 | | | | 1,208,633 | |
Ventas, Inc. | | | 46,600 | | | | 2,901,316 | |
Visa, Inc. Class A | | | 81,900 | | | | 14,284,998 | |
Vornado Realty Trust | | | 26,714 | | | | 2,171,848 | |
Wells Fargo & Co. | | | 789,749 | | | | 32,442,889 | |
| | | | | | | | |
| | | Shares | | | Market
Value | |
| | | | | | | | |
Western Union Co. | | | 86,585 | | | $ | 1,517,835 | |
XL Group PLC | | | 44,968 | | | | 1,329,254 | |
Zions Bancorp. | | | 30,453 | | | | 851,770 | |
| | | | | | | | |
| | | | | | | 401,884,598 | |
| | | | | | | | |
|
Health Care - 12.2% | |
Abbott Laboratories | | | 252,406 | | | | 8,412,692 | |
AbbVie, Inc. | | | 252,906 | | | | 10,776,325 | |
Actavis, Inc. (a) | | | 20,946 | | | | 2,831,480 | |
Aetna, Inc. | | | 60,559 | | | | 3,838,835 | |
Alexion Pharmaceuticals, Inc. (a) | | | 32,400 | | | | 3,491,424 | |
Allergan, Inc. | | | 49,192 | | | | 4,347,589 | |
AmerisourceBergen Corp. | | | 36,686 | | | | 2,088,167 | |
Amgen, Inc. | | | 120,145 | | | | 13,088,596 | |
Baxter International, Inc. | | | 88,461 | | | | 6,153,347 | |
Becton Dickinson and Co. | | | 31,397 | | | | 3,057,440 | |
Biogen Idec, Inc. (a) | | | 38,031 | | | | 8,101,364 | |
Boston Scientific Corp. (a) | | | 219,034 | | | | 2,317,380 | |
Bristol-Myers Squibb Co. | | | 262,516 | | | | 10,944,292 | |
C.R. Bard, Inc. | | | 11,997 | | | | 1,378,095 | |
Cardinal Health, Inc. | | | 53,957 | | | | 2,712,958 | |
CareFusion Corp. (a) | | | 33,878 | | | | 1,214,526 | |
Celgene Corp. (a) | | | 66,818 | | | | 9,353,184 | |
Cerner Corp. (a) | | | 46,000 | | | | 2,118,760 | |
CIGNA Corp. | | | 45,996 | | | | 3,619,425 | |
Covidien PLC | | | 77,100 | | | | 4,579,740 | |
DaVita, Inc. (a) | | | 13,300 | | | | 1,429,883 | |
Dentsply International, Inc. | | | 23,300 | | | | 978,367 | |
Edwards Lifesciences Corp. (a) | | | 19,000 | | | | 1,337,220 | |
Eli Lilly & Co. | | | 160,675 | | | | 8,258,695 | |
Express Scripts Holding Co. (a) | | | 129,914 | | | | 8,298,906 | |
Forest Laboratories, Inc. (a) | | | 37,402 | | | | 1,590,707 | |
Gilead Sciences, Inc. (a) | | | 244,298 | | | | 14,723,840 | |
Hospira, Inc. (a) | | | 25,303 | | | | 987,576 | |
Humana, Inc. | | | 25,207 | | | | 2,321,061 | |
Intuitive Surgical, Inc. (a) | | | 6,300 | | | | 2,435,076 | |
Johnson & Johnson | | | 450,049 | | | | 38,888,734 | |
Laboratory Corp. of America Holdings (a) | | | 15,422 | | | | 1,476,194 | |
Life Technologies Corp. (a) | | | 27,887 | | | | 2,075,072 | |
McKesson Corp. | | | 37,255 | | | | 4,523,130 | |
Mead Johnson Nutrition Co. | | | 32,618 | | | | 2,447,329 | |
Medtronic, Inc. | | | 163,778 | | | | 8,475,511 | |
Merck & Co., Inc. | | | 484,970 | | | | 22,934,231 | |
Mylan, Inc. (a) | | | 63,209 | | | | 2,233,806 | |
Patterson Cos., Inc. | | | 12,894 | | | | 514,213 | |
Perrigo Co. | | | 14,400 | | | | 1,750,320 | |
Pfizer, Inc. | | | 1,073,781 | | | | 30,291,362 | |
Quest Diagnostics, Inc. | | | 25,600 | | | | 1,500,672 | |
Regeneron Pharmaceuticals, Inc. (a) | | | 12,100 | | | | 2,931,951 | |
St. Jude Medical, Inc. | | | 45,126 | | | | 2,274,802 | |
Stryker Corp. | | | 46,289 | | | | 3,096,271 | |
Tenet Healthcare Corp. (a) | | | 15,542 | | | | 606,915 | |
UnitedHealth Group, Inc. | | | 165,096 | | | | 11,843,987 | |
| | | | |
| State Street Equity 500 Index Portfolio | | | 33 | |
State Street Equity 500 Index Portfolio
Portfolio of Investments, continued — August 31, 2013 (Unaudited)
| | | | | | | | |
| | | Shares | | | Market
Value | |
| | | | | | | | |
| | | | | | | | |
Varian Medical Systems, Inc. (a) | | | 18,060 | | | $ | 1,272,327 | |
WellPoint, Inc. | | | 47,738 | | | | 4,064,413 | |
Zimmer Holdings, Inc. | | | 26,952 | | | | 2,131,634 | |
Zoetis, Inc. | | | 79,448 | | | | 2,315,909 | |
| | | | | | | | |
| | | | | | | 294,435,733 | |
| | | | | | | | |
|
Industrials - 10.2% | |
3M Co. | | | 101,772 | | | | 11,559,264 | |
ADT Corp. (a) | | | 36,250 | | | | 1,443,837 | |
Amphenol Corp. Class A | | | 26,100 | | | | 1,977,597 | |
Avery Dennison Corp. | | | 15,388 | | | | 657,991 | |
Boeing Co. | | | 108,988 | | | | 11,326,033 | |
Caterpillar, Inc. | | | 105,179 | | | | 8,681,475 | |
CH Robinson Worldwide, Inc. | | | 25,861 | | | | 1,470,715 | |
Cintas Corp. | | | 17,588 | | | | 840,003 | |
CSX Corp. | | | 162,814 | | | | 4,006,852 | |
Cummins, Inc. | | | 28,358 | | | | 3,493,705 | |
Danaher Corp. | | | 92,472 | | | | 6,058,765 | |
Deere & Co. | | | 62,337 | | | | 5,213,867 | |
Dover Corp. | | | 27,895 | | | | 2,372,470 | |
Eaton Corp. PLC | | | 75,124 | | | | 4,756,852 | |
Emerson Electric Co. | | | 115,248 | | | | 6,957,522 | |
Equifax, Inc. | | | 19,983 | | | | 1,180,795 | |
Expeditors International of Washington, Inc. | | | 34,020 | | | | 1,379,851 | |
Fastenal Co. | | | 42,500 | | | | 1,869,575 | |
FedEx Corp. | | | 46,800 | | | | 5,024,448 | |
First Solar, Inc. (a) | | | 10,570 | | | | 388,130 | |
Flir Systems, Inc. | | | 23,500 | | | | 735,080 | |
Flowserve Corp. | | | 21,900 | | | | 1,221,801 | |
Fluor Corp. | | | 26,060 | | | | 1,652,986 | |
Fortune Brands Home & Security, Inc. | | | 1,145 | | | | 42,182 | |
General Dynamics Corp. | | | 53,161 | | | | 4,425,653 | |
General Electric Co. | | | 1,657,133 | | | | 38,346,057 | |
Honeywell International, Inc. | | | 125,781 | | | | 10,008,394 | |
Illinois Tool Works, Inc. | | | 66,271 | | | | 4,736,388 | |
Ingersoll-Rand PLC | | | 44,500 | | | | 2,631,730 | |
Iron Mountain, Inc. | | | 26,910 | | | | 694,278 | |
Jacobs Engineering Group, Inc. (a) | | | 20,400 | | | | 1,188,912 | |
Joy Global, Inc. | | | 17,200 | | | | 844,864 | |
Kansas City Southern | | | 17,500 | | | | 1,844,850 | |
L-3 Communications Holdings, Inc. | | | 14,403 | | | | 1,301,023 | |
Leggett & Platt, Inc. | | | 24,198 | | | | 699,806 | |
Lockheed Martin Corp. | | | 43,552 | | | | 5,331,636 | |
Masco Corp. | | | 57,123 | | | | 1,080,767 | |
Nielsen Holdings NV | | | 33,300 | | | | 1,148,850 | |
Norfolk Southern Corp. | | | 50,055 | | | | 3,611,969 | |
Northrop Grumman Corp. | | | 38,911 | | | | 3,590,318 | |
PACCAR, Inc. | | | 56,774 | | | | 3,043,654 | |
Pall Corp. | | | 18,609 | | | | 1,286,626 | |
Parker Hannifin Corp. | | | 23,903 | | | | 2,389,105 | |
| | | | | | | | |
| | | Shares | | | Market
Value | |
| | | | | | | | |
Pentair, Ltd. | | | 33,495 | | | $ | 2,013,384 | |
Pitney Bowes, Inc. | | | 29,727 | | | | 485,145 | |
Precision Castparts Corp. | | | 24,007 | | | | 5,071,239 | |
Quanta Services, Inc. (a) | | | 35,000 | | | | 914,900 | |
Raytheon Co. | | | 52,382 | | | | 3,950,127 | |
Republic Services, Inc. | | | 47,503 | | | | 1,544,322 | |
Robert Half International, Inc. | | | 23,540 | | | | 830,256 | |
Rockwell Automation, Inc. | | | 22,505 | | | | 2,188,161 | |
Rockwell Collins, Inc. | | | 22,531 | | | | 1,594,519 | |
Roper Industries, Inc. | | | 16,100 | | | | 1,991,570 | |
Ryder System, Inc. | | | 7,921 | | | | 440,487 | |
Southwest Airlines Co. | | | 114,186 | | | | 1,462,723 | |
Stericycle, Inc. (a) | | | 14,100 | | | | 1,587,096 | |
Textron, Inc. | | | 44,839 | | | | 1,207,963 | |
Thermo Fisher Scientific, Inc. | | | 57,024 | | | | 5,065,442 | |
Tyco International Ltd. | | | 74,300 | | | | 2,454,872 | |
Union Pacific Corp. | | | 74,768 | | | | 11,479,879 | |
United Parcel Service, Inc. Class B | | | 115,246 | | | | 9,862,753 | |
United Technologies Corp. | | | 135,478 | | | | 13,561,348 | |
W.W. Grainger, Inc. | | | 9,669 | | | | 2,391,627 | |
Waste Management, Inc. | | | 73,139 | | | | 2,957,741 | |
Xylem, Inc. | | | 28,692 | | | | 710,988 | |
| | | | | | | | |
| | | | | | | 246,283,218 | |
| | | | | | | | |
|
Information Technology - 16.0% | |
Accenture PLC Class A | | | 104,100 | | | | 7,521,225 | |
Adobe Systems, Inc. (a) | | | 79,757 | | | | 3,648,883 | |
Advanced Micro Devices, Inc. (a) | | | 84,086 | | | | 274,961 | |
Agilent Technologies, Inc. | | | 54,968 | | | | 2,563,708 | |
Akamai Technologies, Inc. (a) | | | 27,324 | | | | 1,256,358 | |
Altera Corp. | | | 50,554 | | | | 1,777,984 | |
Analog Devices, Inc. | | | 50,069 | | | | 2,317,193 | |
AOL, Inc. (a) | | | 1 | | | | 33 | |
Apple, Inc. | | | 150,284 | | | | 73,195,822 | |
Applied Materials, Inc. | | | 194,207 | | | | 2,915,047 | |
Autodesk, Inc. (a) | | | 36,476 | | | | 1,340,493 | |
Automatic Data Processing, Inc. | | | 78,417 | | | | 5,580,154 | |
BMC Software, Inc. (a) | | | 22,421 | | | | 1,031,366 | |
Broadcom Corp. Class A | | | 82,359 | | | | 2,080,388 | |
CA, Inc. | | | 53,099 | | | | 1,553,146 | |
Cisco Systems, Inc. | | | 858,519 | | | | 20,012,078 | |
Citrix Systems, Inc. (a) | | | 29,667 | | | | 2,099,534 | |
Cognizant Technology Solutions Corp. Class A (a) | | | 47,784 | | | | 3,502,567 | |
Computer Sciences Corp. | | | 23,144 | | | | 1,160,672 | |
Corning, Inc. | | | 234,476 | | | | 3,292,043 | |
Dell, Inc. | | | 233,250 | | | | 3,211,853 | |
Dun & Bradstreet Corp. | | | 7,100 | | | | 706,308 | |
Electronic Arts, Inc. (a) | | | 50,400 | | | | 1,342,656 | |
EMC Corp. | | | 334,284 | | | | 8,617,842 | |
F5 Networks, Inc. (a) | | | 12,200 | | | | 1,017,236 | |
Fidelity National Information Services, Inc. | | | 46,777 | | | | 2,079,705 | |
Fiserv, Inc. (a) | | | 21,052 | | | | 2,026,676 | |
| | |
| 34 | | State Street Equity 500 Index Portfolio |
State Street Equity 500 Index Portfolio
Portfolio of Investments, continued — August 31, 2013 (Unaudited)
| | | | | | | | |
| | | Shares | | | Market
Value | |
| | | | | | | | |
Google, Inc. Class A (a) | | | 43,090 | | | $ | 36,492,921 | |
Harris Corp. | | | 18,600 | | | | 1,053,318 | |
Hewlett-Packard Co. | | | 313,416 | | | | 7,001,713 | |
Intel Corp. | | | 799,556 | | | | 17,574,241 | |
International Business Machines Corp. | | | 166,742 | | | | 30,392,064 | |
Intuit, Inc. | | | 43,863 | | | | 2,786,616 | |
Jabil Circuit, Inc. | | | 27,551 | | | | 628,714 | |
Juniper Networks, Inc. (a) | | | 84,393 | | | | 1,595,028 | |
KLA-Tencor Corp. | | | 27,005 | | | | 1,489,326 | |
Lam Research Corp. (a) | | | 25,858 | | | | 1,206,793 | |
Linear Technology Corp. | | | 37,363 | | | | 1,432,124 | |
LSI Corp. (a) | | | 89,162 | | | | 660,690 | |
Microchip Technology, Inc. | | | 32,589 | | | | 1,264,779 | |
Micron Technology, Inc. (a) | | | 160,962 | | | | 2,184,254 | |
Microsoft Corp. | | | 1,207,935 | | | | 40,345,029 | |
Molex, Inc. | | | 23,205 | | | | 673,409 | |
Motorola Solutions, Inc. | | | 42,752 | | | | 2,394,540 | |
NetApp, Inc. | | | 57,357 | | | | 2,382,610 | |
NVIDIA Corp. | | | 99,956 | | | | 1,474,351 | |
Oracle Corp. | | | 587,962 | | | | 18,732,469 | |
PerkinElmer, Inc. | | | 19,218 | | | | 691,271 | |
QUALCOMM, Inc. | | | 277,911 | | | | 18,419,941 | |
Red Hat, Inc. (a) | | | 29,800 | | | | 1,505,496 | |
SAIC, Inc. | | | 42,900 | | | | 646,503 | |
Salesforce.com, Inc. (a) | | | 89,700 | | | | 4,406,961 | |
SanDisk Corp. | | | 38,367 | | | | 2,117,091 | |
Seagate Technology PLC | | | 51,800 | | | | 1,984,976 | |
Symantec Corp. | | | 109,963 | | | | 2,816,152 | |
TE Connectivity, Ltd. | | | 67,300 | | | | 3,297,700 | |
Teradata Corp. (a) | | | 25,320 | | | | 1,482,739 | |
Teradyne, Inc. (a) | | | 28,149 | | | | 432,087 | |
Texas Instruments, Inc. | | | 176,199 | | | | 6,730,802 | |
VeriSign, Inc. (a) | | | 24,721 | | | | 1,186,361 | |
Waters Corp. (a) | | | 13,765 | | | | 1,360,670 | |
Western Digital Corp. | | | 36,200 | | | | 2,244,400 | |
Xerox Corp. | | | 208,201 | | | | 2,077,846 | |
Xilinx, Inc. | | | 42,502 | | | | 1,845,437 | |
Yahoo!, Inc. (a) | | | 154,519 | | | | 4,190,555 | |
| | | | | | | | |
| | | | | | | 385,327,908 | |
| | | | | | | | |
| | |
Materials - 3.5% | | | | | | | | |
Air Products & Chemicals, Inc. | | | 33,209 | | | | 3,391,967 | |
Airgas, Inc. | | | 11,600 | | | | 1,179,140 | |
Alcoa, Inc. | | | 169,749 | | | | 1,307,067 | |
Allegheny Technologies, Inc. | | | 17,228 | | | | 460,160 | |
Ball Corp. | | | 25,024 | | | | 1,111,566 | |
Bemis Co., Inc. | | | 17,462 | | | | 694,813 | |
CF Industries Holdings, Inc. | | | 10,550 | | | | 2,008,087 | |
Cliffs Natural Resources, Inc. | | | 22,200 | | | | 463,314 | |
Dow Chemical Co. | | | 192,228 | | | | 7,189,327 | |
E.I. du Pont de Nemours & Co. | | | 148,112 | | | | 8,386,102 | |
Eastman Chemical Co. | | | 24,808 | | | | 1,885,408 | |
| | | | | | | | |
| | | Shares | | | Market
Value | |
| | | | | | | | |
Ecolab, Inc. | | | 42,166 | | | $ | 3,851,864 | |
FMC Corp. | | | 21,400 | | | | 1,425,454 | |
Freeport-McMoRan Copper & Gold, Inc. Class B | | | 165,004 | | | | 4,986,421 | |
International Flavors & Fragrances, Inc. | | | 13,031 | | | | 1,029,579 | |
International Paper Co. | | | 71,411 | | | | 3,371,313 | |
LyondellBasell Industries NV | | | 62,600 | | | | 4,391,390 | |
MeadWestvaco Corp. | | | 26,720 | | | | 957,912 | |
Monsanto Co. | | | 86,055 | | | | 8,423,924 | |
Mosaic Co. | | | 43,600 | | | | 1,815,940 | |
Newmont Mining Corp. | | | 78,406 | | | | 2,490,959 | |
Nucor Corp. | | | 49,654 | | | | 2,258,761 | |
Owens-Illinois, Inc. (a) | | | 26,300 | | | | 746,657 | |
Plum Creek Timber Co., Inc. | | | 25,311 | | | | 1,121,531 | |
PPG Industries, Inc. | | | 22,771 | | | | 3,557,058 | |
Praxair, Inc. | | | 48,411 | | | | 5,683,451 | |
Sealed Air Corp. | | | 31,392 | | | | 891,533 | |
Sherwin-Williams Co. | | | 13,696 | | | | 2,361,190 | |
Sigma-Aldrich Corp. | | | 19,134 | | | | 1,577,981 | |
United States Steel Corp. | | | 21,478 | | | | 384,456 | |
Vulcan Materials Co. | | | 21,361 | | | | 1,021,056 | |
Weyerhaeuser Co. | | | 91,674 | | | | 2,510,034 | |
| | | | | | | | |
| | | | | | | 82,935,415 | |
| | | | | | | | |
|
Telecommunication Services - 2.5% | |
AT&T, Inc. | | | 863,050 | | | | 29,196,981 | |
CenturyLink, Inc. | | | 99,565 | | | | 3,297,593 | |
Crown Castle International Corp. (a) | | | 46,900 | | | | 3,255,798 | |
Frontier Communications Corp. | | | 165,844 | | | | 718,105 | |
JDS Uniphase Corp. (a) | | | 37,923 | | | | 486,552 | |
Verizon Communications, Inc. | | | 459,566 | | | | 21,774,237 | |
Windstream Corp. | | | 99,213 | | | | 800,649 | |
| | | | | | | | |
| | | | | | | 59,529,915 | |
| | | | | | | | |
|
Utilities - 3.1% | |
AES Corp. | | | 103,195 | | | | 1,311,608 | |
AGL Resources, Inc. | | | 18,100 | | | | 795,495 | |
Ameren Corp. | | | 37,560 | | | | 1,269,904 | |
American Electric Power Co., Inc. | | | 76,652 | | | | 3,280,706 | |
CenterPoint Energy, Inc. | | | 66,311 | | | | 1,520,511 | |
CMS Energy Corp. | | | 42,056 | | | | 1,115,746 | |
Consolidated Edison, Inc. | | | 47,252 | | | | 2,656,980 | |
Dominion Resources, Inc. | | | 94,562 | | | | 5,517,693 | |
DTE Energy Co. | | | 27,484 | | | | 1,837,855 | |
Duke Energy Corp. | | | 112,183 | | | | 7,359,205 | |
Edison International | | | 52,219 | | | | 2,396,330 | |
Entergy Corp. | | | 27,698 | | | | 1,751,345 | |
Exelon Corp. | | | 136,543 | | | | 4,163,196 | |
FirstEnergy Corp. | | | 67,022 | | | | 2,511,314 | |
Integrys Energy Group, Inc. | | | 11,616 | | | | 649,567 | |
NextEra Energy, Inc. | | | 67,721 | | | | 5,442,060 | |
NiSource, Inc. | | | 50,582 | | | | 1,480,029 | |
| | | | |
| State Street Equity 500 Index Portfolio | | | 35 | |
State Street Equity 500 Index Portfolio
Portfolio of Investments, continued — August 31, 2013 (Unaudited)
| | | | | | | | |
| | | Shares | | | Market
Value | |
| | | | | | | | |
| | | | | | | | |
Northeast Utilities | | | 50,060 | | | $ | 2,050,958 | |
NRG Energy, Inc. | | | 51,700 | | | | 1,357,125 | |
Oneok, Inc. | | | 32,200 | | | | 1,656,368 | |
Pepco Holdings, Inc. | | | 41,200 | | | | 780,328 | |
PG&E Corp. | | | 70,826 | | | | 2,929,363 | |
Pinnacle West Capital Corp. | | | 17,860 | | | | 969,262 | |
PPL Corp. | | | 100,475 | | | | 3,084,582 | |
Public Service Enterprise Group, Inc. | | | 80,924 | | | | 2,623,556 | |
SCANA Corp. | | | 22,300 | | | | 1,073,076 | |
Sempra Energy | | | 36,086 | | | | 3,046,380 | |
Southern Co. | | | 138,343 | | | | 5,757,836 | |
TECO Energy, Inc. | | | 34,951 | | | | 577,740 | |
Wisconsin Energy Corp. | | | 38,100 | | | | 1,563,624 | |
Xcel Energy, Inc. | | | 79,051 | | | | 2,207,104 | |
| | | | | | | | |
| | | | | | | 74,736,846 | |
| | | | | | | | |
| |
Total Common Stocks
(cost: $1,208,425,619) | | | | 2,330,925,939 | |
| | | | | | | | |
| | |
| | | Par
Amount | | | | |
| | | | | | | | |
| U.S. Government Securities - 0.2% | |
U.S. Treasury Bill (c)(d)(e)
0% due 09/12/2013 | | $ | 1,150,000 | | | | 1,149,988 | |
U.S. Treasury Bill (c)(d)(e)
0% due 10/03/2013 | | | 400,000 | | | | 399,989 | |
U.S. Treasury Bill (c)(d)(e)
0% due 11/07/2013 | | | 1,610,000 | | | | 1,609,910 | |
| | | | | | | | |
| |
Total U.S. Government Securities
(cost: $3,159,887) | | | | 3,159,887 | |
| | | | | | | | |
| | |
| | | Shares | | | | |
| | | | | | | | |
| Money Market Fund - 2.7% | | | | | |
State Street Institutional Liquid Reserves Fund (b)(f) | | | 66,118,130 | | | | 66,118,130 | |
| | | | | | | | |
| |
Total Money Market Fund
(cost: $66,118,130) | | | | 66,118,130 | |
| | | | | | | | |
| |
Total Investments (g) - 99.8%
(cost $1,277,703,636 (h)†) | | | | 2,400,203,956 | |
| |
Other Assets in Excess of
Liabilities - 0.2% | | | | 5,620,159 | |
| | | | | | | | |
| | |
| Net Assets - 100.0% | | | | | | $ | 2,405,824,115 | |
| | | | | | | | |
| (a) | Non-income producing security. |
| (b) | Affiliated issuer. See table that follows for more information. |
| (c) | All or part of this security has been designated as collateral for futures contracts. |
| (d) | Rate represents annualized yield at date of purchase. |
| (e) | Value determined based on Level 2 inputs established by provisions surrounding fair value measurements and disclosures. |
| (f) | The rate shown is the annualized seven-day yield at period end. |
| (g) | Unless otherwise indicated, the values of the Securities of the Portfolio are determined based on Level 1 instablished by provisions surrounding fair value measurements and disclosures. |
| (h) | Cost of investments shown approximates cost for federal income tax purposes. Gross unrealized appreciation and gross unrealized depreciation of investments at August 31, 2013 was $1,145,614,567 and $23,114,247, respectively, resulting in net unrealized appreciation of investments of $1,122,500,320. |
| † | Security valuation: The Portfolio’s investments are valued each business day by independent pricing services. Equity securities for which market quotations are available are valued at the last sale price or official closing price (closing bid price if no sale has occurred) on the primary market or exchange on which they trade. Investments in other mutual funds are valued at the net asset value per share. Fixed-income securities and options are valued on the basis of the closing bid price. Futures contracts are valued on the basis of the last sale price. Money market instruments maturing within 60 days of the valuation date are valued at amortized cost, a method by which each money market instrument is initially valued at cost, and thereafter a constant accretion or amortization of any discount or premium is recorded until maturity of the security. The Portfolio may value securities for which market quotations are not readily available at “fair value,” as determined in good faith pursuant to procedures established by the Board of Trustees. |
| PLC | Public Limited Company |
| REIT | Real Estate Investment Trust |
See notes to financial statements.
| | |
| 36 | | State Street Equity 500 Index Portfolio |
State Street Equity 500 Index Portfolio
Portfolio of Investments, continued — August 31, 2013 (Unaudited)
The Portfolio adopted provisions surrounding fair value measurements and disclosures that define fair value, establish a framework for measuring fair value in generally accepted accounting principles and expand disclosures about fair value measurements. These provisions apply to fair value measurements that are already required or permitted by other accounting standards and are intended to increase the consistency of those measurements and apply broadly to securities and other types of assets and liabilities. In accordance with these provisions, fair value is defined as the price that the Portfolio would receive upon selling an investment in a timely transaction to an independent buyer in the principal or most advantageous market of the investment. Various inputs are used in determining the value of the Portfolio’s investments.
The three tier hierarchy of inputs is summarized below:
| • | | Level 1 — quoted prices in active markets for identical securities |
| • | | Level 2 — other significant observable inputs (including quoted prices for similar securities, interest rates, prepayment speeds, credit risk, etc.) |
| • | | Level 3 — significant unobservable inputs (including the Portfolio’s own assumptions in determining the fair value of investments) |
The inputs or methodology used for valuing securities are not an indication of the risk associated with investing in those securities.
The following is a summary of the inputs used, as of August 31, 2013, in valuing the Portfolio’s assets carried at fair value:
| | | | | | | | | | | | | | | | |
| Description | | Quoted Prices in Active Markets for Identical Assets (Level 1) | | | Significant Other Observable Inputs (Level 2) | | | Significant Unobservable Inputs (Level 3) | | | Total | |
| | | | | | | | | | | | | | | | |
Assets: | | | | | | | | | | | | | | | | |
| | | | |
Investments: | | | | | | | | | | | | | | | | |
Common Stocks | | $ | 2,330,925,939 | | | $ | — | | | $ | — | | | $ | 2,330,925,939 | |
U.S. Government Securities | | | — | | | | 3,159,887 | | | | — | | | | 3,159,887 | |
Money Market Fund | | | 66,118,130 | | | | — | | | | — | | | | 66,118,130 | |
| | | | | | | | | | | | | | | | |
Total Investments | | | 2,397,044,069 | | | | 3,159,887 | | | | — | | | | 2,400,203,956 | |
| | | | |
Liabilities: | | | | | | | | | | | | | | | | |
Futures contracts | | | (577,428 | ) | | | — | | | | — | | | | (577,428 | ) |
| | | | | | | | | | | | | | | | |
Total | | $ | 2,396,466,641 | | | $ | 3,159,887 | | | $ | — | | | $ | 2,399,626,528 | |
| | | | | | | | | | | | | | | | |
The type of inputs used to value each security under the provisions surrounding fair value measurements and disclosures is identified in the Portfolio of Investments, which also includes a breakdown of the Portfolio’s investments by category.
For the eight months ended August 31, 2013, there were no transfers between levels.
Derivatives
Futures: The Portfolio may enter into financial futures contracts as part of its strategy to track the performance of the S&P 500® Index. Upon entering into a futures contract, the Portfolio is required to deposit with the broker cash or securities in an amount equal to a certain percentage of the contract amount. Variation margin payments are made or received by the Portfolio each day, depending on the daily fluctuations in the value of the underlying security or index, and are recorded for financial statement purposes as unrealized gains or losses by the Portfolio, which is recorded on the Statement of Asset and Liabilities. The Portfolio recognizes a realized gain or loss when the contract is closed. The Portfolio voluntarily segregates securities in an amount equal to the outstanding value of the open futures contracts in accordance with Securities and Exchange Commission requirements.
| | | | | | | | | | | | |
| Schedule of Futures Contracts | | Number of
Contracts | | | Notional
Value | | | Unrealized
Depreciation
$ | |
| | | | | | | | | | | | |
S&P 500 Financial Futures Contracts (long) Expiration Date 09/2013 | | | 872 | | | $ | 71,124,680 | | | | (577,428 | ) |
| | | | | | | | | | | | |
Total unrealized depreciation on open futures contracts purchased | | | | | | | | | | | (577,428 | ) |
| | | | | | | | | | | | |
See notes to financial statements.
| | | | |
| State Street Equity 500 Index Portfolio | | | 37 | |
State Street Equity 500 Index Portfolio
Portfolio of Investments, continued — August 30, 2013 (Unaudited)
The Portfolio adopted provisions surrounding Derivatives and Hedging which requires qualitative disclosures about objectives and strategies for using derivatives, quantitative disclosures about fair value amounts of gains and losses on derivative instruments, and disclosures about credit-risk-related contingent features in derivative agreements.
The primary risks associated with the use of futures contracts are an imperfect correlation between the change in market value of the securities held by the Portfolio and the prices of futures contracts and the possibility of an illiquid market. To the extent permitted by the investment objective, restrictions and policies set forth in the Portfolio’s Prospectus and Statement of Additional Information, the Portfolio may participate in various derivative-based transactions. Derivative securities are instruments or agreements whose value is derived from an underlying security or index. The Portfolio’s use of derivatives includes futures. These instruments offer unique characteristics and risks that assist the Portfolio in meeting its investment objective. The Portfolio typically uses derivatives in two ways: cash equitization and return enhancement. Cash equitization is a technique that may be used by the Portfolio through the use of options and futures to earn “market-like” returns with the Portfolio’s excess and liquidity reserve cash balances and receivables. Return enhancement can be accomplished through the use of derivatives in the Portfolio. By purchasing certain instruments, the Portfolio may more effectively achieve the desired portfolio characteristics that assist in meeting the Portfolio’s investment objectives. Depending on how the derivatives are structured and utilized, the risks associated with them may vary widely. These risks are generally categorized as market risk, liquidity risk and counterparty or credit risk.
The following table, grouped into appropriate risk categories, discloses the amounts related to the Portfolio’s use of derivative instruments and hedging activities at August 31, 2013:
Asset Derivatives(1)
| | | | | | | | |
| | | Equity
Contracts Risk | | | Total | |
| | | | | | | | |
Futures Contracts | | $ | (577,428 | ) | | $ | (577,428 | ) |
| (1) | | Portfolio of Investments: Unrealized depreciation of futures contracts. Only unsettled receivable/payable for variation margin is reported within the Statement of Assets and Liabilities. |
The average notional value of futures outstanding during the period ended August 31, 2013, was $50,183,432.
Affiliates Table
Certain investments made by the Portfolio were made in securities affiliated with State Street and SSgA FM. Investments in State Street Corp., the holding company of State Street, were made according to its representative portion of the S&P 500® Index. The Portfolio also invested in the State Street Institutional Liquid Reserves Fund. Transactions in all affiliates for the period ending August 31, 2013 were as follows:
| | | | | | | | | | | | | | | | | | | | | | | | | | | | |
Security
Description | | Number of shares Held at
12/31/12 | | | Shares Purchased for the Eight Months
Ended 08/31/13 | | | Shares Sold for the Eight Months
Ended 08/31/13 | | | Number of shares Held at
08/31/13 | | | Value at
08/31/13 | | | Income
Earned for the Eight Months
Ended 08/31/13 | | | Realized Loss on Shares Sold | |
State Street Corp. | | | 72,725 | | | | — | | | | — | | | | 72,725 | | | $ | 4,852,212 | | | $ | 37,817 | | | $ | — | |
State Street Institutional Liquid Reserves Fund | | | 25,053,183 | | | | 215,437,690 | | | | 174,372,743 | | | | 66,118,130 | | | | 66,118,130 | | | | 33,998 | | | | — | |
See notes to financial statements.
| | |
| 38 | | State Street Equity 500 Index Portfolio |
State Street Equity 500 Index Portfolio
Statement of Assets and Liabilities — August 31, 2013 (Unaudited)
| | | | |
| | | | |
| | | | |
Assets | | | | |
Investments in unaffiliated issuers at market value (identified cost $1,209,195,732) | | $ | 2,329,233,614 | |
Investments in non-controlled affiliates at market value (identified cost $68,507,904) | | | 70,970,342 | |
| | | | |
Total investments at market value (identified cost $1,277,703,636) | | | 2,400,203,956 | |
Receivable for fund shares sold | | | 623,179 | |
Daily variation margin on futures contracts | | | 341,987 | |
Dividends and interest receivable | | | 5,285,626 | |
| | | | |
Total assets | | | 2,406,454,748 | |
| | | | |
| |
Liabilities | | | | |
Management fees payable | | | 53,205 | |
Daily variation margin on futures contracts | | | 577,428 | |
| | | | |
Total liabilities | | | 630,633 | |
| | | | |
| | | | |
Net Assets | | $ | 2,405,824,115 | |
| | | | |
See notes to financial statements.
| | | | |
| State Street Equity 500 Index Portfolio | | | 39 | |
State Street Equity 500 Index Portfolio
Portfolio of Investments — December 31, 2012
| | | | | | | | |
| | | Shares | | | Market
Value (000) | |
| | | | | | | | |
| | | | | | | | |
| Common Stocks - 98.5% | |
Consumer Discretionary - 12.0% | |
Abercrombie & Fitch Co. Class A | | | 13,046 | | | $ | 626 | |
Amazon.com, Inc. (a) | | | 57,092 | | | | 14,338 | |
Apollo Group, Inc. Class A (a) | | | 18,029 | | | | 377 | |
AutoNation, Inc. (a) | | | 6,363 | | | | 253 | |
AutoZone, Inc. (a) | | | 5,964 | | | | 2,114 | |
Bed Bath & Beyond, Inc. (a) | | | 36,545 | | | | 2,043 | |
Best Buy Co., Inc. | | | 42,119 | | | | 499 | |
Big Lots, Inc. (a) | | | 9,227 | | | | 263 | |
BorgWarner, Inc. (a) | | | 18,500 | | | | 1,325 | |
Cablevision Systems Corp. | | | 35,600 | | | | 532 | |
CarMax, Inc. (a) | | | 37,200 | | | | 1,396 | |
Carnival Corp. | | | 70,650 | | | | 2,598 | |
CBS Corp. Class B | | | 95,403 | | | | 3,630 | |
Chipotle Mexican Grill, Inc. (a) | | | 5,100 | | | | 1,517 | |
Coach, Inc. | | | 44,828 | | | | 2,488 | |
Comcast Corp. Class A | | | 420,748 | | | | 15,728 | |
D.R. Horton, Inc. | | | 46,076 | | | | 911 | |
Darden Restaurants, Inc. | | | 20,588 | | | | 928 | |
Delphi Automotive PLC (a) | | | 45,500 | | | | 1,740 | |
DIRECTV (a) | | | 94,977 | | | | 4,764 | |
Discovery Communications, Inc. Class A (a) | | | 39,900 | | | | 2,533 | |
Dollar General Corp. (a) | | | 42,500 | | | | 1,874 | |
Dollar Tree, Inc. (a) | | | 36,600 | | | | 1,485 | |
eBay, Inc. (a) | | | 182,503 | | | | 9,311 | |
Expedia, Inc. | | | 14,357 | | | | 882 | |
Family Dollar Stores, Inc. | | | 15,558 | | | | 987 | |
Ford Motor Co. | | | 604,598 | | | | 7,830 | |
Fossil, Inc. (a) | | | 8,800 | | | | 819 | |
GameStop Corp. Class A | | | 19,500 | | | | 489 | |
Gannett Co., Inc. | | | 39,574 | | | | 713 | |
Gap, Inc. | | | 44,198 | | | | 1,372 | |
Garmin Ltd. | | | 17,300 | | | | 706 | |
Genuine Parts Co. | | | 25,209 | | | | 1,603 | |
Goodyear Tire & Rubber Co. (a) | | | 34,957 | | | | 483 | |
H&R Block, Inc. | | | 47,115 | | | | 875 | |
Harley-Davidson, Inc. | | | 35,801 | | | | 1,749 | |
Harman International Industries, Inc. | | | 12,021 | | | | 537 | |
Hasbro, Inc. | | | 17,825 | | | | 640 | |
Home Depot, Inc. | | | 236,712 | | | | 14,641 | |
Host Hotels & Resorts, Inc. | | | 118,721 | | | | 1,860 | |
International Game Technology | | | 39,819 | | | | 564 | |
Interpublic Group of Cos., Inc. | | | 71,894 | | | | 792 | |
JC Penney Co., Inc. | | | 21,810 | | | | 430 | |
Johnson Controls, Inc. | | | 109,586 | | | | 3,364 | |
Kohl’s Corp. | | | 34,533 | | | | 1,484 | |
Lennar Corp. Class A | | | 25,931 | | | | 1,003 | |
Limited Brands, Inc. | | | 38,167 | | | | 1,796 | |
Lowe’s Cos., Inc. | | | 180,762 | | | | 6,421 | |
Macy’s, Inc. | | | 61,423 | | | | 2,397 | |
Marriott International, Inc. Class A | | | 39,050 | | | | 1,455 | |
Mattel, Inc. | | | 53,776 | | | | 1,969 | |
| | | | | | | | |
| | | Shares | | | Market
Value (000) | |
| | | | | | | | |
McDonald’s Corp. | | | 160,325 | | | $ | 14,142 | |
McGraw-Hill Cos., Inc. | | | 45,766 | | | | 2,502 | |
NetFlix, Inc. (a) | | | 7,700 | | | | 714 | |
Newell Rubbermaid, Inc. | | | 47,893 | | | | 1,067 | |
News Corp. Class A | | | 320,809 | | | | 8,193 | |
NIKE, Inc. Class B | | | 116,504 | | | | 6,012 | |
Nordstrom, Inc. | | | 23,633 | | | | 1,264 | |
O’Reilly Automotive, Inc. (a) | | | 19,400 | | | | 1,735 | |
Omnicom Group, Inc. | | | 43,541 | | | | 2,175 | |
PetSmart, Inc. | | | 17,300 | | | | 1,182 | |
Priceline.com, Inc. (a) | | | 7,990 | | | | 4,963 | |
PulteGroup, Inc. (a) | | | 54,705 | | | | 993 | |
Ralph Lauren Corp. | | | 9,515 | | | | 1,426 | |
Ross Stores, Inc. | | | 35,900 | | | | 1,944 | |
Scripps Networks Interactive, Inc. Class A | | | 12,035 | | | | 697 | |
Snap-on, Inc. | | | 9,212 | | | | 728 | |
Stanley Black & Decker, Inc. | | | 27,007 | | | | 1,998 | |
Staples, Inc. | | | 110,033 | | | | 1,254 | |
Starbucks Corp. | | | 120,461 | | | | 6,459 | |
Starwood Hotels & Resorts Worldwide, Inc. | | | 31,247 | | | | 1,792 | |
Target Corp. | | | 104,216 | | | | 6,166 | |
Tiffany & Co. | | | 19,880 | | | | 1,140 | |
Time Warner Cable, Inc. | | | 48,471 | | | | 4,711 | |
Time Warner, Inc. | | | 151,091 | | | | 7,227 | |
TJX Cos., Inc. | | | 117,212 | | | | 4,976 | |
TripAdvisor, Inc. (a) | | | 16,857 | | | | 707 | |
Urban Outfitters, Inc. (a) | | | 18,300 | | | | 720 | |
V.F. Corp. | | | 14,393 | | | | 2,173 | |
Viacom, Inc. Class B | | | 72,422 | | | | 3,820 | |
Walt Disney Co. | | | 283,245 | | | | 14,103 | |
Washington Post Co. Class B | | | 660 | | | | 241 | |
Whirlpool Corp. | | | 12,661 | | | | 1,288 | |
Wyndham Worldwide Corp. | | | 22,699 | | | | 1,208 | |
Wynn Resorts, Ltd. | | | 12,700 | | | | 1,429 | |
Yum! Brands, Inc. | | | 73,292 | | | | 4,867 | |
| | | | | | | | |
| | | | | | | 247,150 | |
| | | | | | | | |
|
Consumer Staples - 10.4% | |
Altria Group, Inc. | | | 320,199 | | | | 10,061 | |
Archer-Daniels-Midland Co. | | | 107,324 | | | | 2,940 | |
Avon Products, Inc. | | | 67,660 | | | | 972 | |
Beam, Inc. | | | 25,045 | | | | 1,530 | |
Brown-Forman Corp. Class B | | | 23,482 | | | | 1,485 | |
Campbell Soup Co. | | | 28,865 | | | | 1,007 | |
Clorox Co. | | | 20,543 | | | | 1,504 | |
Coca-Cola Co. | | | 610,822 | | | | 22,142 | |
Coca-Cola Enterprises, Inc. | | | 40,801 | | | | 1,295 | |
Colgate-Palmolive Co. | | | 71,401 | | | | 7,464 | |
ConAgra Foods, Inc. | | | 65,375 | | | | 1,929 | |
Constellation Brands, Inc. Class A (a) | | | 23,026 | | | | 815 | |
Costco Wholesale Corp. | | | 68,589 | | | | 6,775 | |
CVS Caremark Corp. | | | 199,532 | | | | 9,647 | |
| | |
| 40 | | State Street Equity 500 Index Portfolio |
State Street Equity 500 Index Portfolio
Portfolio of Investments, continued — December 31, 2012
| | | | | | | | |
| | | Shares | | | Market
Value (000) | |
| | | | | | | | |
| | | | | | | | |
Dean Foods Co. (a) | | | 31,858 | | | $ | 526 | |
Dr Pepper Snapple Group, Inc. | | | 34,100 | | | | 1,507 | |
Estee Lauder Cos., Inc. Class A | | | 38,504 | | | | 2,305 | |
General Mills, Inc. | | | 103,664 | | | | 4,189 | |
H.J. Heinz Co. | | | 52,069 | | | | 3,003 | |
Hormel Foods Corp. | | | 21,200 | | | | 662 | |
Kellogg Co. | | | 39,035 | | | | 2,180 | |
Kimberly-Clark Corp. | | | 63,300 | | | | 5,344 | |
Kraft Foods Group, Inc. | | | 94,769 | | | | 4,309 | |
Kroger Co. | | | 77,576 | | | | 2,019 | |
Lorillard, Inc. | | | 20,461 | | | | 2,387 | |
McCormick & Co., Inc. | | | 20,753 | | | | 1,318 | |
Molson Coors Brewing Co. Class B | | | 25,162 | | | | 1,077 | |
Mondelez International, Inc. Class A | | | 284,309 | | | | 7,241 | |
Monster Beverage Corp. (a) | | | 24,300 | | | | 1,285 | |
PepsiCo, Inc. | | | 247,554 | | | | 16,940 | |
Philip Morris International, Inc. | | | 265,999 | | | | 22,248 | |
Procter & Gamble Co. | | | 433,619 | | | | 29,438 | |
Reynolds American, Inc. | | | 52,074 | | | | 2,157 | |
Safeway, Inc. | | | 37,164 | | | | 672 | |
Sysco Corp. | | | 93,209 | | | | 2,951 | |
The Hershey Co. | | | 23,482 | | | | 1,696 | |
The J.M. Smucker Co. | | | 18,060 | | | | 1,558 | |
Tyson Foods, Inc. Class A | | | 44,235 | | | | 858 | |
Wal-Mart Stores, Inc. | | | 267,402 | | | | 18,245 | |
Walgreen Co. | | | 137,218 | | | | 5,078 | |
Whole Foods Market, Inc. | | | 27,533 | | | | 2,515 | |
| | | | | | | | |
| | | | | | | 213,274 | |
| | | | | | | | |
| | |
Energy - 10.8% | | | | | | | | |
Anadarko Petroleum Corp. | | | 79,126 | | | | 5,880 | |
Apache Corp. | | | 62,125 | | | | 4,877 | |
Baker Hughes, Inc. | | | 69,973 | | | | 2,858 | |
Cabot Oil & Gas Corp. | | | 32,600 | | | | 1,622 | |
Cameron International Corp. (a) | | | 38,500 | | | | 2,174 | |
Chesapeake Energy Corp. | | | 83,182 | | | | 1,382 | |
Chevron Corp. (b) | | | 311,046 | | | | 33,636 | |
ConocoPhillips | | | 191,330 | | | | 11,095 | |
Consol Energy, Inc. | | | 34,973 | | | | 1,123 | |
Denbury Resources, Inc. (a) | | | 61,500 | | | | 996 | |
Devon Energy Corp. | | | 60,151 | | | | 3,130 | |
Diamond Offshore Drilling, Inc. | | | 11,500 | | | | 782 | |
Ensco PLC Class A | | | 36,500 | | | | 2,164 | |
EOG Resources, Inc. | | | 42,717 | | | | 5,160 | |
EQT Corp. | | | 23,300 | | | | 1,374 | |
ExxonMobil Corp. (b) | | | 723,747 | | | | 62,640 | |
FMC Technologies, Inc. (a) | | | 38,600 | | | | 1,653 | |
Halliburton Co. | | | 148,634 | | | | 5,156 | |
Helmerich & Payne, Inc. | | | 16,300 | | | | 913 | |
Hess Corp. | | | 47,801 | | | | 2,532 | |
Kinder Morgan, Inc. | | | 101,326 | | | | 3,580 | |
Marathon Oil Corp. | | | 111,777 | | | | 3,427 | |
Marathon Petroleum Corp. | | | 54,288 | | | | 3,420 | |
Murphy Oil Corp. | | | 27,441 | | | | 1,634 | |
| | | | | | | | |
| | | Shares | | | Market
Value (000) | |
| | | | | | | | |
Nabors Industries, Ltd. (a) | | | 48,204 | | | $ | 697 | |
National Oilwell Varco, Inc. | | | 67,757 | | | | 4,631 | |
Newfield Exploration Co. (a) | | | 20,600 | | | | 552 | |
Noble Corp. | | | 39,400 | | | | 1,372 | |
Noble Energy, Inc. | | | 27,910 | | | | 2,840 | |
Occidental Petroleum Corp. | | | 127,044 | | | | 9,733 | |
Peabody Energy Corp. | | | 44,124 | | | | 1,174 | |
Phillips 66 | | | 99,165 | | | | 5,266 | |
Pioneer Natural Resources Co. | | | 19,400 | | | | 2,068 | |
QEP Resources, Inc. | | | 27,068 | | | | 819 | |
Range Resources Corp. | | | 25,500 | | | | 1,602 | |
Rowan Cos. PLC Class A (a) | | | 19,620 | | | | 614 | |
Schlumberger, Ltd. | | | 209,558 | | | | 14,520 | |
Southwestern Energy Co. (a) | | | 54,600 | | | | 1,824 | |
Spectra Energy Corp. | | | 104,398 | | | | 2,858 | |
Tesoro Corp. | | | 23,165 | | | | 1,020 | |
Valero Energy Corp. | | | 87,909 | | | | 2,999 | |
Williams Cos., Inc. | | | 105,468 | | | | 3,453 | |
WPX Energy, Inc. (a) | | | 30,856 | | | | 459 | |
| | | | | | | | |
| | | | | | | 221,709 | |
| | | | | | | | |
| | |
Financials - 16.3% | | | | | | | | |
ACE, Ltd. | | | 52,700 | | | | 4,205 | |
AFLAC, Inc. | | | 73,990 | | | | 3,930 | |
Allstate Corp. | | | 76,406 | | | | 3,069 | |
American Express Co. | | | 156,564 | | | | 8,999 | |
American International Group, Inc. (a) | | | 234,433 | | | | 8,276 | |
American Tower Corp. REIT | | | 62,800 | | | | 4,853 | |
Ameriprise Financial, Inc. | | | 34,007 | | | | 2,130 | |
AonPLC | | | 51,247 | | | | 2,849 | |
Apartment Investment & Management Co. Class A | | | 22,952 | | | | 621 | |
Assurant, Inc. | | | 14,131 | | | | 490 | |
AvalonBay Communities, Inc. | | | 17,798 | | | | 2,413 | |
Bank of America Corp. | | | 1,714,371 | | | | 19,887 | |
BB&T Corp. | | | 111,970 | | | | 3,259 | |
Berkshire Hathaway, Inc. Class B (a) | | | 289,503 | | | | 25,968 | |
BlackRock, Inc. | | | 20,434 | | | | 4,224 | |
Boston Properties, Inc. | | | 23,867 | | | | 2,525 | |
Capital One Financial Corp. | | | 92,963 | | | | 5,385 | |
CBRE Group, Inc. (a) | | | 49,575 | | | | 987 | |
Charles Schwab Corp. | | | 175,293 | | | | 2,517 | |
Chubb Corp. | | | 43,175 | | | | 3,252 | |
Cincinnati Financial Corp. | | | 20,814 | | | | 815 | |
Citigroup, Inc. | | | 463,320 | | | | 18,329 | |
CME Group, Inc. | | | 48,955 | | | | 2,483 | |
Comerica, Inc. | | | 32,144 | | | | 975 | |
DDR Corp. REIT | | | 1,532 | | | | 24 | |
Discover Financial Services | | | 83,105 | | | | 3,204 | |
E*Trade Financial Corp. (a) | | | 35,531 | | | | 318 | |
Equity Residential | | | 51,157 | | | | 2,899 | |
Fifth Third Bancorp | | | 147,916 | | | | 2,247 | |
First Horizon National Corp. | | | 43,755 | | | | 434 | |
| | | | |
| State Street Equity 500 Index Portfolio | | | 41 | |
State Street Equity 500 Index Portfolio
Portfolio of Investments, continued — December 31, 2012
| | | | | | | | |
| | | Shares | | | Market
Value (000) | |
| | | | | | | | |
| | | | | | | | |
Franklin Resources, Inc. | | | 22,380 | | | $ | 2,813 | |
Genworth Financial, Inc. Class A (a) | | | 72,151 | | | | 542 | |
Goldman Sachs Group, Inc. | | | 70,534 | | | | 8,997 | |
Hartford Financial Services Group, Inc. | | | 70,197 | | | | 1,575 | |
HCP, Inc. | | | 73,400 | | | | 3,316 | |
Health Care REIT, Inc. | | | 40,700 | | | | 2,495 | |
Hudson City Bancorp, Inc. | | | 76,692 | | | | 624 | |
Huntington Bancshares, Inc. | | | 141,956 | | | | 907 | |
IntercontinentalExchange, Inc. (a) | | | 11,980 | | | | 1,483 | |
Invesco, Ltd. | | | 72,200 | | | | 1,884 | |
J.P. Morgan Chase & Co. | | | 604,015 | | | | 26,559 | |
KeyCorp | | | 148,675 | | | | 1,252 | |
Kimco Realty Corp. | | | 62,669 | | | | 1,211 | |
Legg Mason, Inc. | | | 18,042 | | | | 464 | |
Leucadia National Corp. | | | 29,736 | | | | 707 | |
Lincoln National Corp. | | | 46,592 | | | | 1,207 | |
Loews Corp. | | | 51,131 | | | | 2,084 | |
M & T Bank Corp. | | | 18,737 | | | | 1,845 | |
Marsh & McLennan Cos., Inc. | | | 88,553 | | | | 3,052 | |
Mastercard, Inc. Class A | | | 16,800 | | | | 8,254 | |
MetLife, Inc. | | | 168,196 | | | | 5,540 | |
Moody’s Corp. | | | 30,266 | | | | 1,523 | |
Morgan Stanley | | | 221,530 | | | | 4,236 | |
NASDAQ OMX Group, Inc. | | | 18,400 | | | | 460 | |
Northern Trust Corp. | | | 32,506 | | | | 1,631 | |
NYSE Euronext | | | 40,200 | | | | 1,268 | |
Paychex, Inc. | | | 50,738 | | | | 1,580 | |
People’s United Financial, Inc. | | | 57,000 | | | | 689 | |
PNC Financial Services Group, Inc. | | | 84,717 | | | | 4,940 | |
Principal Financial Group, Inc. | | | 39,991 | | | | 1,141 | |
Progressive Corp. | | | 84,501 | | | | 1,783 | |
ProLogis, Inc. | | | 72,299 | | | | 2,638 | |
Prudential Financial, Inc. | | | 74,339 | | | | 3,965 | |
Public Storage, Inc. | | | 23,087 | | | | 3,347 | |
Regions Financial Corp. | | | 218,789 | | | | 1,558 | |
Simon Property Group, Inc. | | | 48,815 | | | | 7,717 | |
SLM Corp. | | | 77,454 | | | | 1,327 | |
State Street Corp. (c) | | | 72,725 | | | | 3,419 | |
SunTrust Banks, Inc. | | | 86,518 | | | | 2,453 | |
T. Rowe Price Group, Inc. | | | 40,075 | | | | 2,610 | |
The Bank of New York Mellon Corp. | | | 188,685 | | | | 4,849 | |
Torchmark Corp. | | | 14,931 | | | | 771 | |
Total System Services, Inc. | | | 26,575 | | | | 569 | |
Travelers Cos., Inc. | | | 61,604 | | | | 4,424 | |
U.S. Bancorp | | | 300,952 | | | | 9,612 | |
Unum Group | | | 46,829 | | | | 975 | |
Ventas, Inc. | | | 47,300 | | | | 3,061 | |
Visa, Inc. Class A | | | 82,400 | | | | 12,490 | |
Vornado Realty Trust | | | 25,514 | | | | 2,043 | |
Wells Fargo & Co. | | | 775,449 | | | | 26,505 | |
Western Union Co. | | | 98,485 | | | | 1,340 | |
XL Group PLC | | | 50,268 | | | | 1,260 | |
Zions Bancorp. | | | 30,453 | | | | 652 | |
| | | | | | | | |
| | | | | | | 335,214 | |
| | | | | | | | |
| | | | | | | | |
| | | Shares | | | Market
Value (000) | |
| | | | | | | | |
Health Care - 11.6% | | | | | | | | |
Abbott Laboratories | | | 251,206 | | | $ | 16,454 | |
Aetna, Inc. | | | 54,750 | | | | 2,535 | |
Alexion Pharmaceuticals, Inc. (a) | | | 30,400 | | | | 2,852 | |
Allergan, Inc. | | | 49,192 | | | | 4,512 | |
AmerisourceBergen Corp. | | | 34,986 | | | | 1,511 | |
Amgen, Inc. | | | 121,445 | | | | 10,483 | |
Baxter International, Inc. | | | 87,561 | | | | 5,837 | |
Becton Dickinson and Co. | | | 31,997 | | | | 2,502 | |
Biogen Idec, Inc. (a) | | | 37,731 | | | | 5,534 | |
Boston Scientific Corp. (a) | | | 219,034 | | | | 1,255 | |
Bristol-Myers Squibb Co. | | | 263,016 | | | | 8,572 | |
C.R. Bard, Inc. | | | 11,997 | | | | 1,173 | |
Cardinal Health, Inc. | | | 53,957 | | | | 2,222 | |
CareFusion Corp. (a) | | | 33,878 | | | | 968 | |
Celgene Corp. (a) | | | 67,118 | | | | 5,284 | |
Cerner Corp. (a) | | | 23,000 | | | | 1,786 | |
CIGNA Corp. | | | 45,996 | | | | 2,459 | |
Coventry Health Care, Inc. | | | 21,903 | | | | 982 | |
Covidien PLC | | | 76,800 | | | | 4,434 | |
DaVita, Inc. (a) | | | 12,300 | | | | 1,359 | |
Dentsply International, Inc. | | | 23,300 | | | | 923 | |
Edwards Lifesciences Corp. (a) | | | 19,000 | | | | 1,713 | |
Eli Lilly & Co. | | | 159,675 | | | | 7,875 | |
Express Scripts Holding Co. (a) | | | 129,914 | | | | 7,015 | |
Forest Laboratories, Inc. (a) | | | 37,402 | | | | 1,321 | |
Gilead Sciences, Inc. (a) | | | 120,999 | | | | 8,887 | |
Hospira, Inc. (a) | | | 25,303 | | | | 790 | |
Humana, Inc. | | | 26,207 | | | | 1,799 | |
Intuitive Surgical, Inc. (a) | | | 6,300 | | | | 3,089 | |
Johnson & Johnson | | | 439,549 | | | | 30,812 | |
Laboratory Corp. of America Holdings (a) | | | 15,422 | | | | 1,336 | |
Life Technologies Corp. (a) | | | 27,887 | | | | 1,369 | |
McKesson Corp. | | | 37,255 | | | | 3,612 | |
Mead Johnson Nutrition Co. | | | 32,618 | | | | 2,149 | |
Medtronic, Inc. | | | 159,778 | | | | 6,554 | |
Merck & Co., Inc. | | | 480,370 | | | | 19,666 | |
Mylan, Inc. (a) | | | 63,209 | | | | 1,737 | |
Patterson Cos., Inc. | | | 12,894 | | | | 441 | |
Perrigo Co. | | | 14,400 | | | | 1,498 | |
Pfizer, Inc. | | | 1,167,611 | | | | 29,284 | |
Quest Diagnostics, Inc. | | | 25,600 | | | | 1,492 | |
St. Jude Medical, Inc. | | | 50,326 | | | | 1,819 | |
Stryker Corp. | | | 46,289 | | | | 2,538 | |
Tenet Healthcare Corp. (a) | | | 18,342 | | | | 596 | |
UnitedHealth Group, Inc. | | | 161,796 | | | | 8,776 | |
Varian Medical Systems, Inc. (a) | | | 18,060 | | | | 1,269 | |
Watson Pharmaceuticals, Inc. (a) | | | 20,946 | | | | 1,801 | |
WellPoint, Inc. | | | 47,738 | | | | 2,908 | |
Zimmer Holdings, Inc. | | | 28,252 | | | | 1,883 | |
| | | | | | | | |
| | | | | | | 237,666 | |
| | | | | | | | |
| | |
| 42 | | State Street Equity 500 Index Portfolio |
State Street Equity 500 Index Portfolio
Portfolio of Investments, continued — December 31, 2012
| | | | | | | | |
| | | Shares | | | Market
Value (000) | |
| | | | | | | | |
| | | | | | | | |
| | | | | | | | |
Industrials - 10.1% | | | | | | | | |
3M Co. | | | 99,672 | | | $ | 9,255 | |
ADT Corp. | | | 36,250 | | | | 1,685 | |
Amphenol Corp. Class A | | | 26,100 | | | | 1,689 | |
Avery Dennison Corp. | | | 15,388 | | | | 537 | |
Boeing Co. | | | 105,888 | | | | 7,980 | |
Caterpillar, Inc. | | | 103,679 | | | | 9,288 | |
CH Robinson Worldwide, Inc. | | | 25,861 | | | | 1,635 | |
Cintas Corp. | | | 17,588 | | | | 719 | |
CSX Corp. | | | 168,914 | | | | 3,333 | |
Cummins, Inc. | | | 28,358 | | | | 3,073 | |
Danaher Corp. | | | 93,572 | | | | 5,231 | |
Deere & Co. | | | 62,737 | | | | 5,422 | |
Dover Corp. | | | 29,995 | | | | 1,971 | |
Eaton Corp. PLC | | | 71,424 | | | | 3,871 | |
Emerson Electric Co. | | | 115,548 | | | | 6,119 | |
Equifax, Inc. | | | 19,983 | | | | 1,081 | |
Expeditors International Washington, Inc. | | | 34,020 | | | | 1,345 | |
Fastenal Co. | | | 40,300 | | | | 1,882 | |
FedEx Corp. | | | 46,800 | | | | 4,293 | |
First Solar, Inc. (a) | | | 8,070 | | | | 249 | |
Flir Systems, Inc. | | | 23,500 | | | | 524 | |
Flowserve Corp. | | | 8,400 | | | | 1,233 | |
Fluor Corp. | | | 26,960 | | | | 1,584 | |
Fortune Brands Home & Security, Inc. (a) | | | 1,145 | | | | 33 | |
General Dynamics Corp. | | | 53,161 | | | | 3,682 | |
General Electric Co. | | | 1,663,433 | | | | 34,915 | |
Honeywell International, Inc. | | | 122,081 | | | | 7,748 | |
Illinois Tool Works, Inc. | | | 69,071 | | | | 4,200 | |
Ingersoll-Rand PLC | | | 43,300 | | | | 2,077 | |
Iron Mountain, Inc. | | | 24,010 | | | | 746 | |
Jacobs Engineering Group, Inc. (a) | | | 20,400 | | | | 868 | |
Joy Global, Inc. | | | 17,200 | | | | 1,097 | |
L-3 Communications Holdings, Inc. | | | 15,703 | | | | 1,203 | |
Leggett & Platt, Inc. | | | 20,398 | | | | 555 | |
Lockheed Martin Corp. | | | 43,152 | | | | 3,983 | |
Masco Corp. | | | 57,123 | | | | 952 | |
Norfolk Southern Corp. | | | 50,855 | | | | 3,145 | |
Northrop Grumman Corp. | | | 39,511 | | | | 2,670 | |
PACCAR, Inc. | | | 56,774 | | | | 2,567 | |
Pall Corp. | | | 18,609 | | | | 1,121 | |
Parker Hannifin Corp. | | | 23,903 | | | | 2,033 | |
Pentair, Ltd. | | | 33,495 | | | | 1,646 | |
Pitney Bowes, Inc. | | | 29,727 | | | | 316 | |
Precision Castparts Corp. | | | 23,007 | | | | 4,358 | |
Quanta Services, Inc. (a) | | | 35,000 | | | | 955 | |
Raytheon Co. | | | 52,982 | | | | 3,050 | |
Republic Services, Inc. | | | 50,103 | | | | 1,470 | |
Robert Half International, Inc. | | | 23,540 | | | | 749 | |
Rockwell Automation, Inc. | | | 22,505 | | | | 1,890 | |
Rockwell Collins, Inc. | | | 22,531 | | | | 1,311 | |
Roper Industries, Inc. | | | 16,100 | | | | 1,795 | |
| | | | | | | | |
| | | Shares | | | Market
Value (000) | |
| | | | | | | | |
Ryder System, Inc. | | | 7,921 | | | $ | 395 | |
Southwest Airlines Co. | | | 114,186 | | | | 1,169 | |
Stericycle, Inc. (a) | | | 14,100 | | | | 1,315 | |
Textron, Inc. | | | 44,839 | | | | 1,112 | |
Thermo Fisher Scientific, Inc. | | | 58,124 | | | | 3,707 | |
Tyco International, Ltd. | | | 72,500 | | | | 2,121 | |
Union Pacific Corp. | | | 74,268 | | | | 9,337 | |
United Parcel Service, Inc. Class B | | | 112,546 | | | | 8,298 | |
United Technologies Corp. | | | 132,078 | | | | 10,832 | |
W.W. Grainger, Inc. | | | 9,669 | | | | 1,957 | |
Waste Management, Inc. | | | 68,239 | | | | 2,302 | |
Xylem, Inc. | | | 28,692 | | | | 778 | |
| | | | | | | | |
| | | | | | | 208,457 | |
| | | | | | | | |
|
Information Technology - 17.2% | |
Accenture PLC Class A | | | 101,500 | | | | 6,750 | |
Adobe Systems, Inc. (a) | | | 77,957 | | | | 2,937 | |
Advanced Micro Devices, Inc. (a) | | | 84,086 | | | | 202 | |
Agilent Technologies, Inc. | | | 54,968 | | | | 2,250 | |
Akamai Technologies, Inc. (a) | | | 27,324 | | | | 1,118 | |
Altera Corp. | | | 50,554 | | | | 1,741 | |
Analog Devices, Inc. | | | 47,269 | | | | 1,988 | |
AOL, Inc. (a)(d) | | | 1 | | | | — | |
Apple, Inc. | | | 149,384 | | | | 79,626 | |
Applied Materials, Inc. | | | 185,707 | | | | 2,125 | |
Autodesk, Inc. (a) | | | 36,476 | | | | 1,289 | |
Automatic Data Processing, Inc. | | | 75,317 | | | | 4,294 | |
BMC Software, Inc. (a) | | | 22,421 | | | | 889 | |
Broadcom Corp. Class A (a) | | | 82,359 | | | | 2,735 | |
CA, Inc. | | | 56,999 | | | | 1,253 | |
Cisco Systems, Inc. | | | 835,919 | | | | 16,426 | |
Citrix Systems, Inc. (a) | | | 29,667 | | | | 1,951 | |
Cognizant Technology Solutions Corp. Class A (a) | | | 47,784 | | | | 3,538 | |
Computer Sciences Corp. | | | 23,144 | | | | 927 | |
Corning, Inc. | | | 238,976 | | | | 3,016 | |
Dell, Inc. | | | 236,250 | | | | 2,393 | |
Dun & Bradstreet Corp. | | | 7,100 | | | | 558 | |
Electronic Arts, Inc. (a) | | | 50,400 | | | | 732 | |
EMC Corp. (a) | | | 334,284 | | | | 8,457 | |
F5 Networks, Inc. (a) | | | 12,200 | | | | 1,185 | |
Fidelity National Information Services, Inc. | | | 41,377 | | | | 1,440 | |
Fiserv, Inc. (a) | | | 21,052 | | | | 1,664 | |
Google, Inc. Class A (a) | | | 42,190 | | | | 29,928 | |
Harris Corp. | | | 18,600 | | | | 911 | |
Hewlett-Packard Co. | | | 312,916 | | | | 4,459 | |
Intel Corp. | | | 795,756 | | | | 16,417 | |
International Business Machines Corp. | | | 168,442 | | | | 32,265 | |
Intuit, Inc. | | | 42,163 | | | | 2,509 | |
Jabil Circuit, Inc. | | | 27,551 | | | | 532 | |
Juniper Networks, Inc. (a) | | | 84,393 | | | | 1,660 | |
KLA-Tencor Corp. | | | 27,005 | | | | 1,290 | |
Lam Research Corp. (a) | | | 25,858 | | | | 934 | |
| | | | |
| State Street Equity 500 Index Portfolio | | | 43 | |
State Street Equity 500 Index Portfolio
Portfolio of Investments, continued — December 31, 2012
| | | | | | | | |
| | | Shares | | | Market
Value
(000) | |
| | | | | | | | |
| | | | | | | | |
Linear Technology Corp. | | | 35,263 | | | $ | 1,210 | |
LSI Corp. (a) | | | 89,162 | | | | 631 | |
Microchip Technology, Inc. | | | 29,389 | | | | 958 | |
Micron Technology, Inc. (a) | | | 160,962 | | | | 1,022 | |
Microsoft Corp. (b) | | | 1,201,435 | | | | 32,114 | |
Molex, Inc. | | | 23,205 | | | | 634 | |
Motorola Solutions, Inc. | | | 45,952 | | | | 2,559 | |
NetApp, Inc. (a) | | | 57,357 | | | | 1,924 | |
NVIDIA Corp. | | | 99,956 | | | | 1,229 | |
Oracle Corp. | | | 595,662 | | | | 19,848 | |
PerkinElmer, Inc. | | | 19,218 | | | | 610 | |
QUALCOMM, Inc. | | | 271,011 | | | | 16,808 | |
Red Hat, Inc. (a) | | | 29,800 | | | | 1,578 | |
SAIC, Inc. | | | 42,900 | | | | 486 | |
Salesforce.com, Inc. (a) | | | 20,500 | | | | 3,446 | |
SanDisk Corp. (a) | | | 38,367 | | | | 1,671 | |
Seagate Technology PLC | | | 54,800 | | | | 1,670 | |
Symantec Corp. (a) | | | 109,963 | | | | 2,068 | |
TE Connectivity, Ltd. | | | 67,300 | | | | 2,498 | |
Teradata Corp. (a) | | | 27,720 | | | | 1,716 | |
Teradyne, Inc. (a) | | | 28,149 | | | | 475 | |
Texas Instruments, Inc. | | | 181,899 | | | | 5,628 | |
VeriSign, Inc. (a) | | | 24,721 | | | | 960 | |
Waters Corp. (a) | | | 13,765 | | | | 1,199 | |
Western Digital Corp. | | | 32,400 | | | | 1,377 | |
Xerox Corp. | | | 209,101 | | | | 1,426 | |
Xilinx, Inc. | | | 42,502 | | | | 1,526 | |
Yahoo!, Inc. (a) | | | 167,019 | | | | 3,324 | |
| | | | | | | | |
| �� | | | | | | 352,984 | |
| | | | | | | | |
|
Materials - 3.7% | |
Air Products & Chemicals, Inc. | | | 33,209 | | | | 2,790 | |
Airgas, Inc. | | | 11,600 | | | | 1,059 | |
Alcoa, Inc. | | | 169,749 | | | | 1,473 | |
Allegheny Technologies, Inc. | | | 17,228 | | | | 523 | |
Ball Corp. | | | 25,024 | | | | 1,120 | |
Bemis Co., Inc. | | | 17,462 | | | | 584 | |
CF Industries Holdings, Inc. | | | 9,450 | | | | 1,920 | |
Cliffs Natural Resources, Inc. | | | 22,200 | | | | 856 | |
Dow Chemical Co. | | | 189,628 | | | | 6,129 | |
E.I. du Pont de Nemours & Co. | | | 148,112 | | | | 6,661 | |
Eastman Chemical Co. | | | 23,708 | | | | 1,613 | |
Ecolab, Inc. | | | 42,166 | | | | 3,032 | |
FMC Corp. | | | 21,400 | | | | 1,252 | |
Freeport-McMoRan Copper & Gold, Inc. Class B | | | 152,104 | | | | 5,202 | |
International Flavors & Fragrances, Inc. | | | 13,031 | | | | 867 | |
International Paper Co. | | | 71,411 | | | | 2,845 | |
LyondellBasell Industries NV | | | 59,400 | | | | 3,391 | |
MeadWestvaco Corp. | | | 26,720 | | | | 852 | |
Monsanto Co. | | | 85,355 | | | | 8,079 | |
Mosaic Co. | | | 41,900 | | | | 2,373 | |
Newmont Mining Corp. | | | 78,406 | | | | 3,641 | |
| | | | | | | | |
| | | Shares | | | Market
Value
(000) | |
| | | | | | | | |
Nucor Corp. | | | 49,654 | | | $ | 2,144 | |
Owens-Illinois, Inc. (a) | | | 24,000 | | | | 510 | |
Plum Creek Timber Co., Inc. | | | 25,311 | | | | 1,123 | |
PPG Industries, Inc. | | | 24,271 | | | | 3,285 | |
Praxair, Inc. | | | 46,511 | | | | 5,091 | |
Sealed Air Corp. | | | 28,792 | | | | 504 | |
Sherwin-Williams Co. | | | 13,696 | | | | 2,107 | |
Sigma-Aldrich Corp. | | | 19,134 | | | | 1,408 | |
United States Steel Corp. | | | 21,478 | | | | 513 | |
Vulcan Materials Co. | | | 21,361 | | | | 1,112 | |
Weyerhaeuser Co. | | | 87,474 | | | | 2,433 | |
| | | | | | | | |
| | | | | | | 76,492 | |
| | | | | | | | |
|
Telecommunication Services - 3.0% | |
AT&T, Inc. | | | 900,850 | | | | 30,368 | |
CenturyLink, Inc. | | | 99,565 | | | | 3,895 | |
Crown Castle International Corp. (a) | | | 46,900 | | | | 3,384 | |
Frontier Communications Corp. | | | 165,844 | | | | 710 | |
JDS Uniphase Corp. (a) | | | 32,523 | | | | 440 | |
MetroPCS Communications, Inc. (a) | | | 52,500 | | | | 522 | |
Sprint Nextel Corp. (a) | | | 479,365 | | | | 2,718 | |
Verizon Communications, Inc. | | | 449,166 | | | | 19,435 | |
Windstream Corp. | | | 99,213 | | | | 822 | |
| | | | | | | | |
| | | | | | | 62,294 | |
| | | | | | | | |
|
Utilities - 3.4% | |
AES Corp. | | | 103,195 | | | | 1,104 | |
AGL Resources, Inc. | | | 18,100 | | | | 723 | |
Ameren Corp. | | | 37,560 | | | | 1,154 | |
American Electric Power Co., Inc. | | | 76,652 | | | | 3,272 | |
CenterPoint Energy, Inc. | | | 66,311 | | | | 1,276 | |
CMS Energy Corp. | | | 42,056 | | | | 1,025 | |
Consolidated Edison, Inc. | | | 47,252 | | | | 2,624 | |
Dominion Resources, Inc. | | | 90,862 | | | | 4,707 | |
DTE Energy Co. | | | 27,484 | | | | 1,650 | |
Duke Energy Corp. | | | 112,783 | | | | 7,196 | |
Edison International | | | 53,219 | | | | 2,405 | |
Entergy Corp. | | | 27,698 | | | | 1,766 | |
Exelon Corp. | | | 136,543 | | | | 4,061 | |
FirstEnergy Corp. | | | 68,122 | | | | 2,845 | |
Integrys Energy Group, Inc. | | | 11,616 | | | | 607 | |
NextEra Energy, Inc. | | | 67,721 | | | | 4,686 | |
NiSource, Inc. | | | 45,982 | | | | 1,144 | |
Northeast Utilities | | | 50,060 | | | | 1,956 | |
NRG Energy, Inc. | | | 49,000 | | | | 1,127 | |
Oneok, Inc. | | | 32,200 | | | | 1,377 | |
Pepco Holdings, Inc. | | | 34,700 | | | | 680 | |
PG&E Corp. | | | 66,926 | | | | 2,689 | |
Pinnacle West Capital Corp. | | | 17,860 | | | | 910 | |
PPL Corp. | | | 92,275 | | | | 2,642 | |
Public Service Enterprise Group, Inc. | | | 80,924 | | | | 2,476 | |
SCANA Corp. | | | 21,000 | | | | 958 | |
Sempra Energy | | | 35,286 | | | | 2,503 | |
Southern Co. | | | 139,943 | | | | 5,991 | |
| | |
| 44 | | State Street Equity 500 Index Portfolio |
State Street Equity 500 Index Portfolio
Portfolio of Investments, continued — December 31, 2012
| | | | | | | | |
| | | Shares | | | Market
Value
(000) | |
| | | | | | | | |
| | | | | | | | |
TECO Energy, Inc. | | | 34,951 | | | $ | 586 | |
Wisconsin Energy Corp. | | | 38,100 | | | | 1,404 | |
Xcel Energy, Inc. | | | 75,951 | | | | 2,029 | |
| | | | | | | | |
| | | | | | | 69,573 | |
| | | | | | | | |
| |
Total Common Stocks
(cost $1,184,487) | | | | 2,024,813 | |
| | | | | | | | |
| | |
| | | Par
Amount | | | | |
| | | | | | | | |
| U.S. Government Securities - 0.1% | | | | | |
U.S. Treasury Bill (b)(e)(f)
0.08% due 01/03/13 | | $ | 400,000 | | | | 400 | |
U.S. Treasury Bill (b)(e)(f)
0.09% due 02/07/13 | | | 610,000 | | | | 610 | |
U.S. Treasury Bill (b)(e)(f)
0.01% due 03/07/13 | | | 1,150,000 | | | | 1,150 | |
| | | | | | | | |
| |
Total U.S. Government Securities
(cost $2,160) | | | | 2,160 | |
| | | | | | | | |
| | |
| | | Shares | | | | |
| | | | | | | | |
| Money Market Fund - 1.2% | | | | | |
State Street Institutional Liquid Reserves Fund 0.17% (c)(g) | | | 25,053,183 | | | | 25,053 | |
| | | | | | | | |
| |
Total Money Market Fund
(cost $25,053) | | | | 25,053 | |
| | | | | | | | |
| |
Total Investments (h) - 99.8%
(cost $1,211,700) | | | | 2,052,026 | |
| |
Other Assets in Excess of
Liabilities - 0.2% | | | | 3,215 | |
| | | | | | | | |
| | |
| Net Assets - 100.0% | | | | | | $ | 2,055,241 | |
| | | | | | | | |
| (a) | Non-income producing security. |
| (b) | All or part of this security has been designated as collateral for futures contracts. |
| (c) | Affiliated issuer. See table that follows for more information. |
| (d) | Amount is less than $1,000. |
| (e) | Rate represents annualized yield at date of purchase. |
| (f) | Value determined based on Level 2 inputs. (Note 2) |
| (g) | The rate shown is the annualized seven-day yield at period end. |
| (h) | Unless otherwise indicated, the values of the securities of the Portfolio are determined based on Level 1 inputs. (Note 2) |
| PLC = | Public Limited Company |
| REIT = | Real Estate Investment Trust |
| | | | | | | | | | | | |
Schedule of Futures
Contracts | | Number of
Contracts | | | Notional
Value
(000) | | | Unrealized
Appreciation
(000) | |
| | | | | | | | | | | | |
S&P 500 Financial Futures Contracts (long) Expiration Date 03/2013 | | | 399 | | | $ | 28,262 | | | $ | 69 | |
| | | | | | | | | | | | |
Total unrealized appreciation on open futures contracts purchased | | | | | | | | | | $ | 69 | |
| | | | | | | | | | | | |
| | | | |
| State Street Equity 500 Index Portfolio | | | 45 | |
State Street Equity 500 Index Portfolio
Portfolio of Investments, continued — December 31, 2012
Affiliates Table
Certain investments made by the Portfolio were made in securities affiliated with State Street and SSgA FM. Investments in State Street Corp., the holding company of State Street, were made according to its representative portion of the S&P 500® Index. The Portfolio also invested in the State Street Institutional Liquid Reserves Fund. Transactions in all affiliates for the year ending December 31, 2012 were as follows:
| | | | | | | | | | | | | | | | | | | | | | | | | | | | |
Security
Description | | Number of shares
held at 12/31/11 | | | Shares Purchased
for the year
ended 12/31/12 | | | Shares sold for
the year ended
12/31/12 | | | Number of shares
held at 12/31/12 | | | Value at
12/31/12
(000) | | | Income Earned
for the year
ended
12/31/12
(000) | | | Realized gain
on shares sold
(000) | |
| | | | | | | | | | | | | | | | | | | | | | | | | | | | |
State Street Corp. | | | 79,225 | | | | 5,700 | | | | 12,200 | | | | 72,725 | | | $ | 3,419 | | | $ | 71 | | | $ | 19 | |
State Street Institutional Liquid Reserves Fund | | | — | | | | 262,860,342 | | | | 237,807,159 | | | | 25,053,183 | | | | 25,053 | | | | 46 | | | | — | |
See notes to financial statements.
| | |
| 46 | | State Street Equity 500 Index Portfolio |
State Street Equity 500 Index Portfolio
Statement of Assets and Liabilities — December 31, 2012
| | | | |
| (Amounts in thousands) | | | |
| | | | |
Assets | | | | |
Investments in unaffiliated issuers at market value (identified cost $1,184,257) | | $ | 2,023,554 | |
Investments in non-controlled affiliates at market value (identified cost $27,443) (Note 4) | | | 28,472 | |
| | | | |
Total investments at market value (identified cost $1,211,700) | | | 2,052,026 | |
Receivable for investment securities sold | | | 301 | |
Daily variation margin on futures contracts | | | 720 | |
Dividends and interest receivable | | | 2,245 | |
| | | | |
Total assets | | | 2,055,292 | |
| |
Liabilities | | | | |
Management fees payable (Note 4) | | | 51 | |
| | | | |
Total liabilities | | | 51 | |
| | | | |
| | | | |
Net Assets | | $ | 2,055,241 | |
| | | | |
See notes to financial statements.
| | | | |
| State Street Equity 500 Index Portfolio | | | 47 | |
State Street Equity 500 Index Portfolio
Statement of Operations — Year Ended December 31, 2012
| | | | |
| (Amounts in thousands) | | | |
| | | | |
Investment Income | | | | |
Dividend income — unaffiliated issuers (net of foreign taxes withheld of $103) | | $ | 44,960 | |
Dividend income — non-controlled affiliated issuer | | | 117 | |
Interest | | | 62 | |
| | | | |
Total investment income | | | 45,139 | |
| | | | |
| |
Expenses | | | | |
Management fees (Note 4) | | | 881 | |
| | | | |
Total expenses | | | 881 | |
| | | | |
Net Investment Income | | | 44,258 | |
| | | | |
| |
Realized and Unrealized Gain (Loss) | | | | |
Net realized gain on: | | | | |
Investments — unaffiliated issuers | | | 54,491 | |
Investments — non-controlled affiliated issuer | | | 19 | |
Futures contracts | | | 5,272 | |
| | | | |
| | | 59,782 | |
| | | | |
Net change in net unrealized appreciation (depreciation) on: | | | | |
Investments | | | 177,781 | |
Futures contracts | | | (70 | ) |
| | | | |
| | | 177,711 | |
| | | | |
Net realized and unrealized gain | | | 237,493 | |
| | | | |
Net Increase in Net Assets Resulting from Operations | | $ | 281,751 | |
| | | | |
.See notes to financial statements.
| | |
| 48 | | State Street Equity 500 Index Portfolio |
State Street Equity 500 Index Portfolio
Statements of Changes in Net Assets
| | | | | | | | |
| (Amounts in thousands) | | For the Year Ended
December 31, 2012 | | | For the Year Ended
December 31, 2011 | |
| | | | | | | | |
Increase (Decrease) in Net Assets From Operations: | | | | | | | | |
Net investment income | | $ | 44,258 | | | $ | 38,015 | |
Net realized gain on investments and futures contracts | | | 59,782 | | | | 68,236 | |
Net change in net unrealized appreciation (depreciation) on investments and futures contracts | | | 177,711 | | | | (60,650 | ) |
| | | | | | | | |
Net increase in net assets from operations | | | 281,751 | | | | 45,601 | |
| | | | | | | | |
| | |
Capital Transactions | | | | | | | | |
Contributions | | | 262,982 | | | | 279,791 | |
Withdrawals | | | (315,020 | ) | | | (598,001 | ) |
| | | | | | | | |
Net decrease in net assets from capital transactions | | | (52,038 | ) | | | (318,210 | ) |
| | | | | | | | |
Net Increase (Decrease) in Net Assets | | | 229,713 | | | | (272,609 | ) |
| | |
Net Assets | | | | | | | | |
Beginning of year | | | 1,825,528 | | | | 2,098,137 | |
| | | | | | | | |
End of year | | $ | 2,055,241 | | | $ | 1,825,528 | |
| | | | | | | | |
See notes to financial statements.
| | | | |
| State Street Equity 500 Index Portfolio | | | 49 | |
State Street Equity 500 Index Portfolio
Financial Highlights
The following table includes selected supplemental data and ratios to average net assets:
| | | | | | | | | | | | | | | | | | | | |
| | | Year Ended
12/31/12 | | | Year Ended
12/31/11 | | | Year Ended
12/31/10 | | | Year Ended
12/31/09 | | | Year Ended
12/31/08 | |
Supplemental Data and Ratios: | | | | | | | | | | | | | | | | | | | | |
Net assets, end of period (in thousands) | | $ | 2,055,241 | | | $ | 1,825,528 | | | $ | 2,098,137 | | | $ | 1,893,386 | | | $ | 1,522,208 | |
Ratios to average net assets: | | | | | | | | | | | | | | | | | | | | |
Operating expenses | | | 0.045 | % | | | 0.045 | % | | | 0.045 | % | | | 0.045 | % | | | 0.045 | % |
Net investment income | | | 2.26 | % | | | 2.04 | % | | | 1.99 | % | | | 2.28 | % | | | 2.30 | % |
Portfolio turnover rate (a) | | | 9 | % | | | 15 | % | | | 12 | % | | | 19 | % | | | 14 | % |
Total return (b) | | | 15.97 | % | | | 2.03 | % | | | 15.08 | % | | | 26.50 | % | | | (37.02 | )% |
| (a) | | The portfolio turnover rate excludes in-kind security transactions. |
| (b) | | Results represent past performance and are not indicative of future results. |
See notes to financial statements.
| | |
| 50 | | State Street Equity 500 Index Portfolio |
State Street Equity 500 Index Portfolio
Notes to Financial Statements — December 31, 2012
State Street Master Funds (the “Trust”) is registered under the Investment Company Act of 1940, as amended (the “1940 Act”), as an open-end management investment company, and was organized as a business trust under the laws of the Commonwealth of Massachusetts on July 27, 1999. The Trust comprises ten investment portfolios: the State Street Equity 500 Index Portfolio, the State Street Equity 400 Index Portfolio, the State Street Equity 2000 Index Portfolio, the State Street Aggregate Bond Index Portfolio, the State Street Money Market Portfolio, the State Street Tax Free Money Market Portfolio, the State Street Limited Duration Bond Portfolio, the State Street Treasury Money Market Portfolio, the State Street Treasury Plus Money Market Portfolio and the State Street U.S. Government Money Market Portfolio. Information presented in these financial statements pertains only to the State Street Equity 500 Index Portfolio (the “Portfolio”).
At December 31, 2012, the following Portfolios were operational: the Portfolio, the State Street Money Market Portfolio, the State Street Tax Free Money Market Portfolio, the State Street U.S. Government Money Market Portfolio, the State Street Treasury Money Market Portfolio and the State Street Treasury Plus Money Market Portfolio. The Portfolio is authorized to issue an unlimited number of non-transferable beneficial interests.
The Portfolio’s investment objective is to replicate, as closely as possible, before expenses, the performance of the Standard & Poor’s 500 Composite Stock Price Index (the “S&P 500® Index”). The Portfolio uses a passive management strategy designed to track the performance of the S&P 500® Index. The S&P 500® Index is a well-known, unmanaged, stock index that includes common stocks of 500 companies from several industrial sectors representing a significant portion of the market value of all stocks publicly traded in the United States. There is no assurance that the Portfolio will achieve its objective.
| 2. | | Significant Accounting Policies |
The following is a summary of the significant accounting policies consistently followed by the Portfolio in the preparation of its financial statements.
Security valuation — The Portfolio’s investments are valued each business day by independent pricing services. Equity securities for which market quotations are available are valued at the last sale price or official closing price (closing bid price if no sale has occurred) on the primary market or exchange on which they trade. Investments in other mutual funds are valued at the net asset value per share. Fixed income securities and options are valued on the basis of the closing bid price. Futures contracts are valued on the basis of the last sale price. Money market instruments maturing within 60 days of the valuation date are valued at amortized cost, a method by which each money market instrument is initially valued at cost, and thereafter a constant accretion or amortization of any discount or premium is recorded until maturity of the security. The Portfolio may value securities for which market quotations are not readily available at “fair value,” as determined in good faith pursuant to procedures established by the Board of Trustees.
The Portfolio adopted provisions surrounding fair value measurements and disclosures that define fair value, establish a framework for measuring fair value in generally accepted accounting principles and expand disclosures about fair value measurements. These provisions apply to fair value measurements that are already required or permitted by other accounting standards and are intended to increase the consistency of those measurements and apply broadly to securities and other types of assets and liabilities. In accordance with these provisions, fair value is defined as the price that the Portfolio would receive upon selling an investment in a timely transaction to an independent buyer in the principal or most advantageous market of the investment. Various inputs are used in determining the value of the Portfolio’s investments.
The three tier hierarchy of inputs is summarized below:
| | • | | Level 1 — quoted prices in active markets for identical securities |
| | • | | Level 2 — other significant observable inputs (including quoted prices for similar securities, interest rates, prepayment speeds, credit risk, etc.) |
| | • | | Level 3 — significant unobservable inputs (including the Portfolio’s own assumptions in determining the fair value of investments) |
| | | | |
| Notes to Financial Statements | | | 51 | |
State Street Equity 500 Index Portfolio
Notes to Financial Statements, continued — December 31, 2012
The inputs or methodology used for valuing securities are not an indication of the risk associated with investing in those securities.
The following is a summary of the inputs used, as of December 31, 2012, in valuing the Portfolio’s assets carried at fair value (amounts in thousands):
| | | | | | | | | | | | | | | | |
| Description | | Quoted Prices in Active Markets for Identical Assets (Level 1) | | | Significant Other Observable Inputs (Level 2) | | | Significant Unobservable Inputs (Level 3) | | | Total | |
| | | | | | | | | | | | | | | | |
Assets: | | | | | | | | | | | | | | | | |
| | | | |
Investments: | | | | | | | | | | | | | | | | |
Common Stocks | | $ | 2,024,813 | | | $ | — | | | $ | — | | | $ | 2,024,813 | |
U.S. Government Securities | | | — | | | | 2,160 | | | | — | | | | 2,160 | |
Money Market Fund | | | 25,053 | | | | — | | | | — | | | | 25,053 | |
| | | | | | | | | | | | | | | | |
Total Investments | | | 2,049,866 | | | | 2,160 | | | | — | | | | 2,052,026 | |
| | | | |
Other Assets: | | | | | | | | | | | | | | | | |
Futures contracts | | | 69 | | | | — | | | | — | | | | 69 | |
| | | | | | | | | | | | | | | | |
Total Assets | | $ | 2,049,935 | | | $ | 2,160 | | | $ | — | | | $ | 2,052,095 | |
| | | | | | | | | | | | | | | | |
The type of inputs used to value each security under the provisions surrounding fair value measurements and disclosures is identified in the Portfolio of Investments, which also includes a breakdown of the Portfolio’s investments by category.
For the year ended December 31, 2012, there were no transfers between levels.
Securities transactions, investment income and expenses — Securities transactions are recorded on a trade date basis. Dividend income is recorded on the ex-dividend date. Interest income is recorded daily on the accrual basis and includes amortization of premium and accretion of discount on investments. Realized gains and losses from securities transactions are recorded on the basis of identified cost. Expenses are accrued daily based on average daily net assets. The effects of changes in foreign currency exchange rates on portfolio investments are included in the net realized and unrealized gains and losses on investments and foreign currency transactions on the Statement of Operations.
All of the net investment income and realized and unrealized gains and losses from the security transactions of the Portfolio are allocated pro rata among the partners in the Portfolio on a daily basis based on each partner’s daily ownership percentage.
Federal income taxes — The Portfolio is not required to pay federal income taxes on its net investment income and net capital gains because it is treated as a partnership for federal income tax purposes. All interest, dividends, gains and losses of the Portfolio are deemed to have been “passed through” to the Portfolio’s partners in proportion to their holdings in the Portfolio, regardless of whether such items have been distributed by the Portfolio. Each partner is responsible for tax liability based on its distributive share; therefore, no provision has been made for federal income taxes.
The Portfolio has reviewed the tax positions for open years as of and during the year ended December 31, 2012, and determined it did not have a liability for any unrecognized tax expenses. The Portfolio recognizes interest and penalties, if any, related to tax liabilities as income tax expense in the Statement of Operations. As of December 31, 2012, tax years 2009 through 2012 remain subject to examination by the Portfolio’s major tax jurisdictions, which include the United States of America and the Commonwealth of Massachusetts.
At December 31, 2012, the tax cost of investments was $1,211,700,264 on a federal tax basis. The aggregate gross unrealized appreciation and gross unrealized depreciation was $877,545,005 and $37,219,452 respectively, resulting in net appreciation of $840,325,553 for all securities as computed on a federal income tax basis.
Futures — The Portfolio may enter into financial futures contracts as part of its strategy to track the performance of the S&P 500® Index. Upon entering into a futures contract, the Portfolio is required to deposit with the broker cash or securities in an amount equal to a certain percentage of the contract amount. Variation margin payments are made or received by the Portfolio each day, depending on the daily fluctuations in the value of the underlying security or index, and are recorded for financial statement purposes as unrealized gains or losses by the Portfolio, which is recorded on the Statement of Assets and Liabilities.
| | |
| 52 | | Notes to Financial Statements |
State Street Equity 500 Index Portfolio
Notes to Financial Statements, continued — December 31, 2012
The Portfolio recognizes a realized gain or loss when the contract is closed, which is recorded on the Statement of Operations. The Portfolio voluntarily segregates securities in an amount equal to the outstanding value of the open futures contracts in accordance with Securities and Exchange Commission requirements.
The Portfolio adopted provisions surrounding Derivatives and Hedging which requires qualitative disclosures about objectives and strategies for using derivatives, quantitative disclosures about fair value amounts of gains and losses on derivative instruments, and disclosures about credit-risk-related contingent features in derivative agreements.
The primary risks associated with the use of futures contracts are an imperfect correlation between the change in market value of the securities held by the Portfolio and the prices of futures contracts and the possibility of an illiquid market. To the extent permitted by the investment objective, restrictions and policies set forth in the Portfolio’s Prospectus and Statement of Additional Information, the Portfolio may participate in various derivative-based transactions. Derivative securities are instruments or agreements whose value is derived from an underlying security or index. The Portfolio’s use of derivatives includes futures. These instruments offer unique characteristics and risks that assist the Portfolio in meeting its investment objective. The Portfolio typically uses derivatives in two ways: cash equitization and return enhancement. Cash equitization is a technique that may be used by the Portfolio through the use of options and futures to earn “market-like” returns with the Portfolio’s excess and liquidity reserve cash balances and receivables. Return enhancement can be accomplished through the use of derivatives in the Portfolio. By purchasing certain instruments, the Portfolio may more effectively achieve the desired portfolio characteristics that assist in meeting the Portfolio’s investment objectives. Depending on how the derivatives are structured and utilized, the risks associated with them may vary widely. These risks are generally categorized as market risk, liquidity risk and counterparty or credit risk.
The following table, grouped into appropriate risk categories, discloses the amounts related to the Portfolio’s use of derivative instruments and hedging activities at December 31, 2012:
Asset Derivatives(1) (amounts in thousands)
| | | | | | | | |
| | | Equity Contracts Risk | | | Total | |
| | | | | | | | |
Futures Contracts | | $ | 69 | | | $ | 69 | |
| | (1) | Portfolio of Investments: Unrealized appreciation of futures contracts. Only unsettled receivable/payable for variation margin is reported within Statement of Assets and Liabilities. |
Transactions in derivative instruments during the year ended December 31, 2012, were as follows:
Realized Gain (Loss)(2) (amounts in thousands)
| | | | | | | | |
| | | Equity Contracts Risk | | | Total | |
| | | | | | | | |
Futures Contracts | | $ | 5,272 | | | $ | 5,272 | |
Change in Appreciation (Depreciation)(3) (amounts in thousands)
| | | | | | | | |
| | | Equity Contracts Risk | | | Total | |
| | | | | | | | |
Futures Contracts | | $ | (70 | ) | | $ | (70 | ) |
| | (2) | Statement of Operations location: Net realized gain (loss) on: Futures contracts |
| | (3) | Statement of Operations location: Net change in unrealized appreciation (depreciation) on: Futures contracts |
The average notional value of futures contracts outstanding during the year ended December 31, 2012, was $39,836,418.
Use of estimates — The Portfolio’s financial statements are prepared in accordance with U.S. generally accepted accounting principles, which require the use of management estimates. Actual results could differ from those estimates. It is reasonably possible that these differences could be material.
Subsequent Events — Management has determined that there are no subsequent events or transactions that would have materially impacted the Portfolio’s financial statements as presented.
| | | | |
| Notes to Financial Statements | | | 53 | |
State Street Equity 500 Index Portfolio
Notes to Financial Statements, continued — December 31, 2012
| 3. | | Securities Transactions |
For the year ended December 31, 2012, purchases and sales of investment securities, excluding short-term investments and futures contracts, aggregated to $198,682,282 and $173,603,446, respectively.
| 4. | | Related Party Fees and Transactions |
The Portfolio has entered into an investment advisory agreement with SSgA Funds Management, Inc. (“SSgA FM” or the “Adviser”), a subsidiary of State Street Corporation and an affiliate of State Street Bank and Trust Company (“State Street”), under which SSgA FM directs the investments of the Portfolio in accordance with its investment objective, policies, and limitations. The Trust has contracted with State Street to provide custody, administration and transfer agent services to the Portfolio. In compensation for SSgA FM’s services as investment adviser and for State Street’s services as administrator, custodian and transfer agent (and for assuming ordinary operating expenses of the Portfolio, including ordinary legal, audit and trustees expense), State Street receives a unitary fee, calculated daily, at the annual rate of 0.045% of the Portfolio’s average daily net assets.
Certain investments made by the Portfolio were made in securities affiliated with State Street and SSgA FM. Investments in State Street Corporation, the holding company of State Street, were made according to its representative portion of the S&P 500® Index. The market value of this investment at December 31, 2012 is listed in the Portfolio of Investments.
Each Independent Trustee receives for his or her services a $100,000 retainer in addition to $5,000 for each in-person meeting and $1,250 for each telephonic meeting from the Trust. The Chairman receives an additional $30,000 annual retainer and the Audit Committee Chair receives an additional $10,000 annual retainer.
The Trust’s organizational documents provide that its officers and trustees are indemnified against certain liabilities arising out of the performance of their duties to the Trust. In addition, both in some of its principal service contracts and in the normal course of its business, the Trust enters into contracts that provide indemnifications to other parties for certain types of losses or liabilities. The Trust’s maximum exposure under these arrangements is unknown as this could involve future claims against the Trust. Management does not expect any significant claims.
| 7. | | New Accounting Pronouncement |
In December 2011, FASB issued ASU No. 2011-11 “Disclosures about Offsetting Assets and Liabilities.” These disclosure requirements are intended to help investors and other financial statement users to better assess the effect or potential effect of offsetting arrangements on a portfolio’s financial position. They also improve transparency in the reporting of how companies mitigate credit risk, including disclosure of related collateral pledged or received. In addition, ASU 2011-11 facilitates comparison between those entities that prepare their financial statements on the basis of U.S. GAAP and those entities that prepare their financial statements on the basis of International Financial Reporting Standards. ASU 2011-11 requires entities to disclose both gross and net information about both instruments and transactions eligible for offset in the financial position; and disclose instruments and transactions subject to an agreement similar to a master netting agreement. ASU 2011-11 is effective for fiscal years beginning on or after January 1, 2013, and interim periods within those annual periods. Management is currently evaluating the implications of ASU 2011-11 and its impact on financial statement disclosures.
In this reporting period the Trust adopted FASB Accounting Standards Update 2011-04, Fair Value Measurement (ASC 820) – Amendments to Achieve Common Fair Value Measurement and Disclosure Requirements in U.S. GAAP and IFRSs (“ASU 2011-04”). ASU 2011-04 seeks to improve the comparability of fair value measurements as presented and disclosed in the financial statements prepared in accordance with U.S. GAAP and International Financial Reporting Standards (IFRS) by providing common requirements for fair value measurement and disclosure. The guidance clarified that a reporting entity should disclose quantitative information from the observable inputs used in fair value measurement that is categorized within Level 3 of
| | |
| 54 | | Notes to Financial Statements |
State Street Equity 500 Index Portfolio
Notes to Financial Statements, continued — December 31, 2012
the fair value hierarchy and also required additional disclosure regarding the valuation processes used by the reporting entity. The guidance was effective for annual reporting periods beginning after December 15, 2011. The Trust adopted this guidance for the fiscal year ended December 31, 2012 and determined that the adoption did not have a material impact on its financial statements. Please see note 2 for additional information.
| | | | |
| Notes to Financial Statements | | | 55 | |
State Street Equity 500 Index Portfolio
Report of Independent Registered Public Accounting Firm
To the Board of Trustees of State Street Master Funds and Owners of Beneficial Interest of State Street Equity 500 Index Portfolio:
We have audited the accompanying statement of assets and liabilities of State Street Equity 500 Index Portfolio (the “Portfolio”) (one of the portfolios constituting State Street Master Funds), including the portfolio of investments, as of December 31, 2012, and the related statement of operations for the year then ended, the statements of changes in net assets for each of the two years in the period then ended and the financial highlights for each of the five years in the period then ended. These financial statements and financial highlights are the responsibility of the Portfolio’s management. Our responsibility is to express an opinion on these financial statements and financial highlights based on our audits.
We conducted our audits in accordance with the standards of the Public Company Accounting Oversight Board (United States). Those standards require that we plan and perform the audit to obtain reasonable assurance about whether the financial statements and financial highlights are free of material misstatement. We were not engaged to perform an audit of the Portfolio’s internal control over financial reporting. Our audits included consideration of internal control over financial reporting as a basis for designing audit procedures that are appropriate in the circumstances, but not for the purpose of expressing an opinion on the effectiveness of the Portfolio’s internal control over financial reporting. Accordingly, we express no such opinion. An audit also includes examining, on a test basis, evidence supporting the amounts and disclosures in the financial statements and financial highlights, assessing the accounting principles used and significant estimates made by management, and evaluating the overall financial statement presentation. Our procedures included confirmation of securities owned as of December 31, 2012 by correspondence with the custodian and brokers. We believe that our audits provide a reasonable basis for our opinion.
In our opinion, the financial statements and financial highlights referred to above present fairly, in all material respects, the financial position of State Street Equity 500 Index Portfolio, a portfolio of State Street Master Funds, at December 31, 2012, the results of its operations for the year then ended, the changes in its net assets for each of the two years in the period then ended and the financial highlights for each of the five years in the period then ended, in conformity with U.S. generally accepted accounting principles.

Boston, Massachusetts
February 22, 2013
| | |
| 56 | | Report of Independent Registered Public Accounting Firm |
State Street Equity 500 Index Portfolio
General Information — December 31, 2012 (Unaudited)
Proxy Voting Policies and Procedures and Record
The Trust has adopted proxy voting procedures relating to portfolio securities held by the Portfolio. A description of the policies and procedures are available without charge, upon request, (i) by calling (877) 521-4083 or (ii) on the website of the Securities and Exchange Commission (the “SEC”) at www.sec.gov. Information on how the Portfolio voted proxies relating to portfolio securities during the most recent 12-month period ended June 30 is available by August 31 without charge, upon request, (i) by calling (877) 521-4083 or (ii) on the SEC’s website at www.sec.gov.
Quarterly Portfolio Schedule
The Trust files a complete schedule of portfolio holdings with the SEC for the first and third quarters of its fiscal year (as of March and September of each year) on Form N-Q. The Trust’s Forms N-Q are available on the SEC’s website at www.sec.gov. The Trust’s Forms N-Q may be reviewed and copied at the SEC’s Public Reference Room in Washington, D.C. and information on the operation of the Public Reference Room may be obtained by calling 1-800-SEC-0330. The most recent Form N-Q is available without charge, upon request, by calling (877) 521-4083.
Advisory Agreement Renewal
The Board of Trustees of the Trust met on November 15, 2012 (the “November Meeting” or “Meeting”) to consider the renewal of the investment advisory agreement for the Portfolio (the “Advisory Agreement”). In preparation for considering renewal of the Advisory Agreement at the November Meeting, the Independent Trustees convened a special telephonic meeting on October 18, 2012 (the “Preliminary Meeting”), at which they reviewed renewal materials provided by the Adviser, which they had requested through independent counsel, and discussed the materials with counsel and representatives of the Adviser. In the course of the Preliminary Meeting they requested additional materials from the Adviser and State Street, which were subsequently provided in advance of the November Meeting along with updates of certain of the original materials. At the November Meeting, in deciding whether to renew the Advisory Agreement, the Trustees considered various factors, including (i) the nature, extent and quality of the services provided by the Adviser under the Advisory Agreement, (ii) the investment performance of the Portfolio, (iii) the costs to the Adviser of its services and the profits realized by the Adviser and its affiliates from their relationship with the Trust, (iv) the extent to which economies of scale would be realized if and as the Trust grows and whether the fee levels in the Advisory Agreement reflect these economies of scale, and (v) any additional benefits to the Adviser from its relationship with the Trust.
In considering the nature, extent and quality of the services provided by the Adviser, the Trustees relied on their prior direct experience as Trustees of the Trust as well as on the materials provided in advance of the November Meeting. The Trustees reviewed the Adviser’s responsibilities under the Advisory Agreement and noted the experience and expertise that would be appropriate to expect of an adviser to the Portfolio, which is an index fund. The Trustees reviewed the background and experience of the Adviser’s senior management, including those individuals responsible for the investment and compliance operations relating to the investments of the Portfolio, and the responsibilities of the latter with respect to the Portfolio. They also considered the resources, operational structures and practices of the Adviser in managing the Portfolio’s investments, in monitoring and securing the Portfolio’s compliance with its investment objective and investment policies and with applicable laws and regulations, and in seeking best execution of portfolio transactions. The Trustees also considered information about the Adviser’s overall investment management business, noting that the Adviser manages assets for a variety of institutional investors and that the Adviser and its affiliates had over $1.95 trillion in assets under management at August 31, 2012, including over $259 billion managed by the Adviser. They reviewed information regarding State Street’s business continuity and disaster recovery program. Drawing upon the materials provided and their general knowledge of the business of the Adviser, the Trustees determined that the experience, resources and strength of the Adviser in the management of a variety of index products are exceptional. As discussed more fully below, they also determined that the advisory fee paid by the Portfolio was fair and reasonable and that the Portfolio’s performance and expense ratio were acceptable. On the basis of this review, the Trustees determined that the nature and extent of the services provided by the Adviser to the Portfolio were appropriate and had been of good quality.
The Trustees determined, in view of the investment objective of the Portfolio and after review and discussion of the available data and of a memorandum discussing the recent performance of the Portfolio supplied by the Adviser at the Independent Trustees’ request, that the investment performance was acceptable. The Trustees noted that the performance of the Portfolio in absolute terms was not of the importance that normally attaches to that of actively-managed funds. Of more importance to the Trustees was the extent to which the Portfolio achieved its objective of replicating, before expenses, the total return of the S&P 500 Index. Drawing
State Street Equity 500 Index Portfolio
General Information — December 31, 2012 (Unaudited), continued
upon information provided at the Meeting and upon reports provided to the Trustees by the Adviser throughout the preceding year, they determined that the Portfolio had in fact tracked the index within an acceptable range of tracking error. They concluded that performance of the Portfolio was satisfactory.
The Trustees considered the profitability to the Adviser and its affiliate, State Street, of the advisory relationships with the Trust. (They noted at the outset that the issue of profitability would not arise with respect to SSGM, also an affiliate of the Adviser, because of the fact that SSGM receives no compensation from the feeder fund and, by implication, the Portfolio.) The Trustees had been provided with data regarding the profitability to the Adviser and State Street with respect to the Portfolio individually, and on an aggregate basis with the other feeder funds and master portfolios overseen by the Trustees (together, the “Funds and Portfolios”), for the year ended June 30, 2012, and for the four prior years. Having discussed with representatives of the Adviser the methodologies used in computing the costs that formed the bases of the profitability calculations, they concluded that these methodologies appeared reasonable and turned to the data provided. After discussion and analysis they concluded that, to the extent that the Adviser’s and State Street’s relationships with the Trust had been profitable to either or both of those entities during the period for which information had been provided, the profitability was in no case such as to render the advisory fee excessive, especially in light of the competitive levels of the fees paid to the Adviser and State Street by the Trust. They noted that the levels of profitability had tended to increase in recent periods as a number of the Funds and Portfolios had experienced significant growth, and they determined to reconsider again the profitability of these relationships to the Adviser and State Street at the next year’s renewal meeting.
In order better to evaluate the Portfolio’s advisory fee, the Trustees had requested comparative information from Lipper Inc. with respect to fees paid by, and expense ratios of, similar funds not managed by the Adviser. The Trustees found that the Portfolio’s advisory fee and total expense ratio were all lower than the average for its Lipper peer group; after discussion, they concluded that the data available provided confirmation of the reasonableness of the Adviser’s fee.
In addition, the Trustees considered other advisory fees paid to the Adviser and its affiliate, State Street Global Advisors (“SSgA”). They noted that as a general matter fees paid to the Adviser by other, closely similar mutual funds sponsored by State Street tended to be higher than the fees paid by the Portfolio, with some exceptions, whereas fees paid by mutual funds for which the Adviser acted as sub-adviser and by institutional accounts managed by SSgA tended to be lower than those paid by the Portfolio, again with some exceptions; in considering these fees, the Trustees reviewed and discussed a memorandum prepared by the Adviser discussing the differences between the services provided to the Portfolio by the Adviser and those provided to sub-advised funds and other types of institutional clients. The Trustees determined that, in light of these significant differences, the fees paid by sub-advised funds and other types of clients were of doubtful utility for purposes of comparison with those of the Portfolio, but that to the extent that meaningful comparison was practicable the differences in services satisfactorily accounted for differences in the fees. The Trustees determined that the Adviser’s fee was fair and reasonable.
In considering whether the Adviser benefits in other ways from its relationship with the Trust, the Trustees also considered whether the Adviser’s affiliates may benefit from the Trust’s relationship with State Street as fund administrator, custodian and transfer agent and with SSGM, a wholly-owned subsidiary of State Street, as principal underwriter for the Trust. They noted, among other things, that the Adviser utilizes no soft-dollar arrangements in connection with the Portfolio’s brokerage transactions to obtain third-party (non-proprietary research) services. The Trustees concluded that, to the extent that the Adviser or its affiliates derive other benefits from their relationships with the Trust, those benefits are not so significant as to render the Adviser’s fee excessive.
The Trustees also considered the extent to which economies of scale may be realized by the Portfolio as assets grow and whether the Portfolio’s fee levels reflect such economies of scale, if any, for the benefit of investors. In considering the matter, the Trustees determined that, to the extent that economies of scale were in fact being realized, such economies of scale were shared with the Portfolio by virtue of an advisory fee of a comparatively low level that subsumed economies of scale in the fee itself. The Trustees also recognized, however, that should sustained, substantial asset growth be realized in the future, it might be appropriate to consider additional measures.
On the basis of the foregoing discussions and determinations, without any one factor being dispositive, the Trustees decided to approve the continuance of the Advisory Agreement.
Trustees and Executive Officers (Unaudited)
The table below includes information about the Trustees and Executive Officers of the State Street Master Funds, including their:
| | • | | business addresses and ages; |
| | • | | principal occupations during the past five years; and |
| | • | | other directorships of publicly traded companies or funds. |
| | | | | | | | | | | | |
Name, Address,
and Year of Birth
(“YOB”) | | Position(s) Held
with Trust | | Term of Office
and Length of
Time Served | | Principal Occupation
During Past Five Years | | Number of
Funds
in Fund
Complex
Overseen
by Trustee* | | | Other
Directorships
Held by
Trustee |
INDEPENDENT TRUSTEES |
Michael F. Holland
Holland & Company, LLC 375 Park Avenue New York, NY 10152 YOB: 1944 | | Trustee and Chairman of the Board | | Term: Indefinite Elected: 7/99 | | Chairman, Holland & Company L.L.C. (investment adviser) (1995 – present). | | | 20 | | | Trustee, State Street Institutional Investment Trust; Director, the Holland Series Fund, Inc.; Director, The China Fund, Inc.; Director, The Taiwan Fund, Inc.; Director, Reaves Utility Income Fund, Inc.; and Director, Blackstone/GSO Loan Funds. |
| | | | | | | | | | | | | |
William L. Boyan
State Street Master Funds P.O. Box 5049 Boston, MA 02206 YOB: 1937 | | Trustee | | Term: Indefinite Elected: 7/99 | | President and Chief Operations Officer, John Hancock Financial Services (1959 – 1999) Mr. Boyan retired in 1999. Chairman Emeritus, Children’s Hospital, Boston, MA (1984 – 2011); Former Trustee of Old Mutual South Africa Master Trust (investments) (1995 – 2008); Former Chairman, Boston Plan For Excellence, Boston Public Schools (1995 – 2010). | | | 20 | | | Trustee, State Street Institutional Investment Trust; Former Trustee of Old Mutual South Africa Master Trust; Trustee, Children’s Hospital, Boston, MA; and Trustee, Florida Stage. |
| | | | | | | | | | | | | |
Rina K. Spence State Street Master Funds P.O. Box 5049 Boston, MA 02206 YOB: 1948 | | Trustee | | Term: Indefinite Elected: 7/99 | | President of SpenceCare International LLC (international healthcare consulting) (1999 – present); Chief Executive Officer, IEmily.com (health internet company) (2000 – 2001); Chief Executive Officer of Consensus Pharmaceutical, Inc. (1998 – 1999); Founder, President and Chief Executive Officer of Spence Center for Women’s Health (1994 – 1998); President and CEO Emerson Hospital (1984 – 1994); Trustee, Eastern Enterprise (utilities) (1988 – 2000). | | | 20 | | | Trustee, State Street Institutional Investment Trust; Director, Berkshire Life Insurance Company of America (1993 – 2009); Director, IEmily.com, Inc. (2000 – 2010); and Trustee, National Osteoporosis Foundation (2005 – 2008). |
| | | | |
| Trustees and Executive Officers | | | 59 | |
Trustees and Executive Officers (Unaudited) — continued
| | | | | | | | | | | | |
Name, Address,
and Year of Birth
(“YOB”) | | Position(s) Held
with Trust | | Term of Office
and Length of
Time Served | | Principal Occupation
During Past Five Years | | Number of
Funds
in Fund
Complex
Overseen
by Trustee* | | | Other
Directorships
Held by
Trustee |
INDEPENDENT TRUSTEES (continued) | | | | | | | | |
Douglas T. Williams
State Street Master Funds P.O. Box 5049 Boston, MA 02206 YOB: 1940 | | Trustee | | Term: Indefinite Elected: 7/99 | | Executive Vice President of Chase Manhattan Bank (1987 –1999). Mr. Williams retired in 1999. | | | 20 | | | Trustee, State Street Institutional Investment Trust; Treasurer, Nantucket Educational Trust (2002 – 2007). |
| * | The “Fund Complex” consists of ten series of the Trust and ten series of State Street Institutional Investment Trust. |
| | | | | | | | | | | | |
INTERESTED TRUSTEE** | | | | | | | | |
James E. Ross SSgA Funds
Management, Inc. State Street Financial Center One Lincoln Street Boston, MA 02111-2900 YOB: 1965 | | Interested Trustee | | Term: Indefinite Elected Trustee: 2/07 | | Chairman and Director, SSgA Funds Management, Inc. (2005 – present); President, SSgA Funds Management, Inc. (2005 – 2012); Senior Managing Director, State Street Global Advisors (2006 – present); Principal, State Street Global Advisors (2006 – present). | | | 170 | | | Trustee, State Street Institutional Investment Trust; Trustee, SPDR Series Trust; Trustee, SPDR Index Shares Funds; Trustee, The Select Sector SPDR Trust; Trustee, SSgA Active ETF Trust; and Trustee, SSgA Master Trust. |
| * | | The “Fund Complex” consists of ten series of the Trust and ten series of State Street Institutional Investment Trust. |
| ** | | Mr. Ross is an Interested Trustee because of his employment by SSgA Funds Management, Inc., an affiliate of the Trust. |
| | |
| 60 | | Trustees and Executive Officers |
Trustees and Executive Officers (Unaudited) — continued
| | | | | | |
Name, Address,
and Year of Birth
(“YOB”) | | Position(s) Held
with Trust | | Term of Office
and Length of
Time Served | | Principal Occupation
During Past Five Years |
OFFICERS: | | | | | | |
Ellen M. Needham SSgA Funds Management, Inc. State Street Financial Center
One Lincoln Street Boston, MA 02111-2900 YOB: 1967 | | President | | Term: Indefinite Elected: 10/12 | | President and Director, SSgA Funds Management Inc. (June 2012 – present); Chief Operating Officer, SSgA Funds Management, Inc. (May 2010 – June 2012); Senior Managing Director, SSgA Funds Management, Inc. (1992 – 2012); Senior Managing Director, State Street Global Advisors (1992 – present).* |
| | | | | | | |
Ann M. Carpenter SSgA Funds Management, Inc. State Street Financial Center
One Lincoln Street Boston,
MA 02111-2900 YOB: 1966 | | Vice President | | Term: Indefinite Elected: 10/12 | | Vice President, SSgA Funds Management, Inc. (2008 – present); Principal, State Street Global Advisors (2005 – 2008 – present).* |
| | | | | | | |
Laura F. Dell State Street Bank and
Trust Company 4 Copley Place 5th floor
Boston, MA 02116 YOB: 1964 | | Treasurer Assistant Treasurer | | Term: Indefinite Elected: 11/10 11/08-11/10 | | Vice President, State Street Bank and Trust Company (2002 – present).* |
| | | | | | | |
Chad C. Hallett State Street Bank and Trust Company 4 Copley Place 5th floor Boston, MA 02116 YOB: 1969 | | Assistant Treasurer | | Term: Indefinite Elected: 09/11 | | Vice President, State Street Bank and Trust Company (2001 – present).* |
| | | | | | | |
Caroline Connolly State Street Bank and Trust Company 4 Copley Place 5th floor Boston, MA 02116 YOB: 1975 | | Assistant Treasurer | | Term: Indefinite Elected: 09/11 | | Assistant Vice President, State Street Bank and Trust Company (2007 – present) |
| | | | | | | |
Jacqueline Angell State Street Bank and Trust
Company
20 Churchill Place
London E14 5HJ YOB: 1974 | | Chief Compliance Officer | | Term: Indefinite Elected: 04/11 | | Head of UK Compliance, State Street Bank and Trust Company (July 2012 – present); Vice President, State Street Global Advisors and SSgA Funds Management, Inc. (2008 – June 2012); Director of Investment Adviser Oversight, Fidelity Investments (2006 – 2008). |
| | | | |
| Trustees and Executive Officers | | | 61 | |
Trustees and Executive Officers (Unaudited) — continued
| | | | | | |
Name, Address,
and Year of Birth
(“YOB”) | | Position(s) Held
with Trust | | Term of Office
and Length of
Time Served | | Principal Occupation
During Past Five Years |
OFFICERS: (continued) | | |
Ryan M. Louvar State Street Bank and Trust Company 4 Copley Place, 5th Floor Boston, MA 02116 YOB: 1972 | | Secretary | | Term: Indefinite Elected: 2/12 | | Vice President and Senior Managing Counsel, State Street Bank and Trust Company (2005 – present).* |
| | | | | | | |
Mark E. Tuttle State Street Bank and Trust Company 4 Copley Place, 5th Floor Boston, MA 02116 YOB: 1970 | | Assistant Secretary | | Term: Indefinite Elected: 2/12 | | Vice President and Counsel, State Street Bank and Trust Company (2007 – present).* |
| | | | | | | |
Scott E. Habeeb State Street Bank and Trust Company 4 Copley Place, 5th Floor Boston, MA 02116 YOB: 1968 | | Assistant Secretary | | Term: Indefinite Elected: 2/12 | | Vice President and Counsel, State Street Bank and Trust Company (2007 – present).* |
| * | | Served in various capacities and/or with various affiliated entities during noted time period. |
The Statement of Additional Information includes additional information about the Trustees and is available, without charge, upon request, by calling (toll free) 877-521-4083.
| | |
| 62 | | Trustees and Executive Officers |
Trustees
Michael F. Holland
William L. Boyan
Rina K. Spence
Douglas T. Williams
James E. Ross
Investment Adviser
SSgA Funds Management, Inc.
State Street Financial Center
One Lincoln Street
Boston, MA 02111
Administrator, Custodian and Transfer Agent
State Street Bank and Trust Company
State Street Financial Center
One Lincoln Street
Boston, MA 02111
Independent Registered Public Accounting Firm
Ernst & Young LLP
200 Clarendon Street
Boston, MA 02116
Legal Counsel
Ropes & Gray LLP 800
Boylston Street
Boston, MA 02119
This report is for shareholder information. This is not a prospectus intended for use in the purchase or sale of shares of beneficial interest.
State Street Equity 500 Index Portfolio
State Street Bank and Trust Company
P.O. Box 5049
Boston, MA 02206
SSGASP500FDAR
Item 2. Code of Ethics.
| (a) | As of the end of the period covered by the report, the Registrant has adopted a code of ethics that applies to the Registrant’s principal executive officer and principal financial officer (“Code”). |
| (b) | That Code comprises written standards that are reasonably designed to deter wrongdoing and to promote: |
| | 1) | honest and ethical conduct, including the ethical handling of actual or apparent conflicts of interest between personal and professional relationships; |
| | 2) | full, fair, accurate, timely and understandable disclosure in reports and documents that a Registrant files with, or submits to, the Securities Exchange Commission (“SEC”) and in other public communications made by a Registrant; |
| | 3) | compliance with applicable laws and governmental rules and regulations; |
| | 4) | the prompt internal reporting to an appropriate person or persons identified in the Code of violations of the Code; and |
| | 5) | accountability for adherence to the Code. |
| (c) | As of the end of the period covered by the report, there have been no amendments to the Code that applies to the Registrant’s principal executive officer and principal financial officer. |
| (d) | As of the end of the period covered by the report, there have been no waivers granted from a provision of the Code that applies to the Registrant’s principal executive officer and principal financial officer. |
| (f) | The Registrant has filed with the Commission, pursuant to Item 12(a), a copy of the Code that applies to the Registrant’s principal executive officer, principal financial officer, principal accounting officer or controller, or persons performing similar functions, as an exhibit to its annual report on this Form N-CSR. |
Item 3. Audit Committee Financial Expert.
Registrant’s board of trustees has determined that the Registrant has at least one audit committee financial expert serving on its audit committee. Richard D. Shirk qualifies as an Audit Committee Financial Expert and is “independent” for purposes of Item 3, paragraph (a)(2)(i) and (ii) of Form N-CSR. Mr. Shirk’s relevant experience includes his positions as former Chairman, President and Chief Executive Officer, Cerulean Companies, Inc.; former President and Chief Executive Officer, Blue Cross/Blue Shield of Georgia; former Chairman, Board Member and Investment Committee Member, Healthcare Georgia Foundation; and Lead Director and Board Member, Amerigroup Corp.
Item 4. Principal Accountant Fees and Services.
Audit Fees
(a) The aggregate fees billed for each of the last two fiscal years for professional services rendered by the principal accountant for the audit of the Registrant’s annual financial statements or services that are normally provided by the accountant in connection with statutory and regulatory filings or engagements for those fiscal years were as follows:
| | | | |
2012 | | $ | 496,100 | |
2013 | | $ | 411,767 | |
Audit-Related Fees
(b) The aggregate fees billed in each of the last two fiscal years for assurance and related services by the principal accountant that are reasonably related to the performance of the audit of the Registrant’s financial statements and are not reported under paragraph (a) of this Item and the nature of the services comprising those fees were as follows:
Tax Fees
(c) The aggregate fees billed in each of the last two fiscal years for professional services rendered by the principal accountant for tax compliance, tax advice, and tax planning and the nature of the services comprising the fees were as follows:
| | | | | | |
| | | Fees | | | Nature of Services |
| | |
2012 | | $ | 130,100 | | | Tax services |
2013 | | $ | 98,600 | | | Tax services |
All Other Fees
(d) The aggregate fees billed in each of the last two fiscal years for products and services provided by the principal accountant, other than the services reported in paragraphs (a) through (c) were as follows:
| | | | | | |
| | | Fees | | | Nature of Services |
| | |
2012 | | $ | 0 | | | None |
2013 | | $ | 0 | | | None |
(e) (1) Registrant’s audit committee has adopted the following pre-approval policies and procedures for certain services provided by Registrant’s accountants:
For the period ended August 31, 2013
SSgA Funds
Audit and Non-Audit Services Pre-Approval Policy
I. Statement of Purpose.
This Policy is designed to apply to any and all engagements by the SSgA Funds (“Funds”) of the firm that is the independent auditor to the Funds for audit, non-audit, tax or other services to the Funds. In addition, this Policy is designed to apply to any engagements by the advisor to the Funds or to any affiliate of the advisor to the Funds of the firm that is the independent auditor to the Funds for audit, non-audit, tax or other services that affect the operations of the Funds. Except as specifically set forth herein, this Policy does not delegate to management the responsibilities set forth herein for the pre-approval of services performed by the independent auditor to the Funds. This Policy does not apply to the engagement of a firm of certified public accountants by the advisor to the Funds or to any affiliate of the advisor to the Funds.
II. Statement of Principles.
Under the Sarbanes-Oxley Act of 2002 (the “Act”), the audit committee of the SSgA Funds (“Audit Committee”) is charged with responsibility to oversee the work of the firms that provide independent auditing services to the Funds. As part of these responsibilities, the Audit Committee is required to pre-approve the audit and non-audit services performed by the independent auditor for the Funds to assure that the independence of the auditor is not in any way compromised or impaired. In determining whether an auditor is independent, there are three guiding principles under the Act that must be considered. In general, the independence of the auditor would be deemed impaired if the auditor provides a service whereby it:
| | • | | Functions in the role of management of the Funds, the advisor of the Funds or any other affiliate1 of the Funds; |
| | • | | Is in the position of auditing its own work; or |
| | • | | Serves in an advocacy role for the Funds, the advisor of the Funds or any other affiliate of the Funds. |
Accordingly, it is the policy of the Funds that the independent auditor for the Funds must not be engaged to perform any service that contravenes any of the three guidelines set forth above, or which in any way could be deemed to impair or compromise the independence of the auditor for the Funds. This Policy is designed to accomplish those requirements and will henceforth be applied to all engagements by the Funds of its independent auditor, whether for audit, audit-related, tax, or other non-audit services.
| 1 | For purposes of this Policy, if the engagement of the independent auditor relates directly to the operations and financial reporting of the Funds, an affiliate of the Funds is defined as the Funds’ principal investment advisor (but not a sub-advisor whose role is primarily portfolio management and whose activities are overseen by the principal investment advisor), and any entity controlling, controlled by, or under common control with the principal investment advisor that provides regular and ongoing services to the Funds. |
Rules adopted by the United States Securities and Exchange Commission (the “SEC”) establish two separate approaches to the pre-approval of services by the Audit Committee. The proposed services may either receive general pre-approval through adoption by the Audit Committee of a list of authorized services for the Funds, together with a budget of expected costs for those services (“general pre-approval”) or specific pre-approval by the Audit Committee of all services provided to the Funds on a case-by-case basis (“specific pre-approval”). The appendices to this Policy list the audit, audit-related, tax and other services that have the general pre-approval of the Audit Committee. These appendices refer to Schedules A-E, representative forms of which are attached to this Policy. As set forth in this Policy, unless a particular service has received general pre-approval, those services will require specific pre-approval by the Audit Committee, before any such services can be provided by the independent auditor. Any proposed service that exceeds the pre-approved budget for those services will also require specific pre-approval by the Audit Committee.
III. Delegation
As provided in the Act and in the SEC’s rules, the Audit Committee may delegate either general or specific pre-approval authority to one or more of its members. The member to whom such authority is delegated must report, for informational purposes only, any pre-approval decisions to the Audit Committee at its next scheduled meeting. The Audit Committee has delegated general pre-approval authority to the Chairman and Alternate Chairman of the Audit Committee.
IV. Audit Services
The annual engagement terms and fees for the Funds independent auditor will be subject to the specific pre-approval of the Audit Committee. The audit services to be provided by that engagement include the annual financial statement audit and other procedures required by the independent auditor to be performed in order to be able to form an opinion on the financial statements for each of the Funds for that year. These other procedures include reviews of information systems, procedural reviews and testing performed in order to understand and rely on the Funds’ systems of internal control, and consultations relating to the audit or any quarterly reviews that may be required. Audit services also include the attestation engagement for the independent auditor’s report on the report from management on financial reporting internal controls.
In addition to the pre-approval by the Audit Committee of the engagement of the independent auditor to perform annual audit services, the Audit Committee may grant general pre-approval to other audit services, which are those services that only the independent auditor reasonably can provide. These may include services associated with statements, reports and other documents filed by the Funds with the SEC or the securities, banking or other financial services authorities with jurisdiction over the operations of the Funds.
The Audit Committee will pre-approve the audit services set forth in Schedule A to Appendix 1, “Fees and Expenses Incurred Under Pre-Approval and Communications,” which is incorporated herein by reference. All other audit services not listed in Schedule A must be specifically pre-approved by the Audit Committee.
V. Audit-Related Services
Audit-related services are assurance and related services that are reasonably related to the performance of the audit or review of the financial statements for the Funds, or the separate financial statements for certain of the Funds that are traditionally performed by the independent auditor. Because the Audit Committee believes that the provision of audit-related services does not compromise or impair the independence of the auditor and is consistent with the SEC’s rules on auditor independence, the Audit Committee will pre-approve the audit-related services set forth in Schedule B to “Fees and Expenses Incurred Under Pre-Approval and Communications,” which is incorporated herein by reference. All other audit-related services not listed in Schedule B must be specifically pre-approved by the Audit Committee.
VI. Tax Services
The Audit Committee believes that the independent auditor can provide tax services to the Funds, such as tax compliance, tax planning and tax advice, without impairing the auditor’s independence. In addition, the Audit Committee should also scrutinize carefully the retention of an independent auditor in a transaction initially recommended by the independent auditor, the sole business purpose of which may be tax avoidance and the tax treatment of which may not be supported in the Internal Revenue Code and related regulations. The Audit Committee will pre-approve the tax services set forth in Schedule C to “Fees and Expenses Incurred Under Pre-Approval and Communications,” which is incorporated herein by reference. All other tax services not listed in Schedule C must be specifically pre-approved by the Audit Committee.
VII. All Other Services
The Audit Committee may grant general pre-approval to those permissible non-audit services classified as “all other” services that the Audit Committee believes are routine and recurring services, provided that the Audit Committee reasonably believes that the provision of those services would not impair or compromise the independence of the auditor and the services are consistent with the SEC’s rules (or other applicable rules) governing auditor independence.
The Audit Committee will pre-approve the permissible “all other services” set forth in Schedule D to “Fees and Expenses Incurred Under Pre-Approval and Communications,” which is incorporated herein by reference. Those permissible all other services not listed in Schedule D must be specifically pre-approved by the Audit Committee. The Audit Committee determined that any member of the Audit Committee may approve expenditures of not more than $25,000 for permissible non-audit services not already itemized in Schedule D.
A list of the SEC’s prohibited non-audit services is attached to this Policy as Appendix 2. The SEC’s rules and relevant official interpretations and guidance should be consulted to determine the scope of these prohibited services and the applicability of any of the listed exceptions. Under no circumstance may an executive, manager or associate of the Funds, or of any advisor to the Funds, authorize the independent auditor for the Funds to provide prohibited non-audit services.
VIII. Procedures
All requests or applications for services to be provided by the independent auditor that do not require specific pre-approval by the Audit Committee will be submitted to the Clearance
Committee2 and must include a detailed description of the services to be rendered and the estimated costs of those services. The Clearance Committee will determine whether such services are included within the list of services that have received general pre-approval by the Audit Committee. The Audit Committee will be informed periodically by the Clearance Committee of any such services rendered by the independent auditor. In the event the Clearance Committee determines that a service is not included in the group of pre-approved services, the Clearance Committee shall treat this as a request to provide services requiring pre-approval.
Requests or applications to provide services that require specific pre-approval by the Audit Committee will be submitted first to the Clearance Committee. After review by the Clearance Committee, the request or application will be submitted by both the independent auditor and the Clearance Committee to the Audit Committee, and must be accompanied by a statement from each as to whether, in their view, the request or application is consistent with the SEC’s rules (or other applicable rules) governing auditor independence.
The Audit Committee has delegated to the Clearance Committee the responsibility to monitor the performance of all services to be provided by the independent auditor and to determine whether such services are in compliance with this Policy. The Clearance Committee will report to the Audit Committee on a periodic basis on the results of its monitoring activities. The Clearance Committee will report immediately to the Chairman of the Audit Committee any breach of this Policy that comes to the attention of the Clearance Committee.
IX. Additional Requirements
The Audit Committee has determined to take additional measures on an annual basis to meet its responsibility to oversee the work performed by the independent auditor and to assure the internal auditor’s continuing independence from affiliates of the Funds, including State Street Holding Corporation (“State Street”). Such efforts will include, but not be limited to, reviewing a formal written statement from the independent auditor delineating all relationships between the independent auditor and State Street and its subsidiaries and affiliates, consistent with Independence Standards Board Standard No. 1, and discussing with the independent auditor its methods and procedures for ensuring independence.
| | |
| Adopted: | | July 14, 2003 |
| Revised: | | February 3, 2009 |
| Reviewed: | | July 13, 2010 |
| 2 | The Clearance Committee shall be comprised of the Funds’ Treasurer and Principal Financial Officer, and President and Principal Executive Officer. A member of the Legal Department of the Funds’ administrator shall serve as an advisory member to the Clearance Committee. The Clearance Committee may act together or individually in the event one of the members is unavailable should consultation be necessary. |
(e) (2) The percentage of services described in each of paragraphs (b) through (d) of this Item that were approved by the audit committee pursuant to paragraph (c)(7)(i)(C) of Rule 2-01 of Regulation S-X is as follows
| | | | |
Audit Fees | | | 100 | % |
Audit-Related Fees | | | 100 | % |
Tax Fees | | | 100 | % |
All Other Fees | | | 100 | % |
(f) For services, 50 percent or more of which were pre-approved, the percentage of hours expended on the principal accountant’s engagement to audit the Registrant’s financial statements for the most recent fiscal year that were attributed to work performed by persons other than the principal accountant’s full-time, permanent employees was 0%.
(g) The aggregate non-audit fees billed by Registrant’s accountant for services rendered to the Registrant, and rendered to the Registrant’s investment adviser (not including any sub-adviser whose role is primarily portfolio management and is subcontracted with or overseen by another investment adviser), and any entity controlling, controlled by, or under common control with the adviser that provides ongoing services to the Registrant for each of the last two fiscal years of the Registrant were as follows:
(h) The Registrant’s audit committee of the board of trustees has considered whether the provision of non-audit services that were rendered to the Registrant’s investment adviser (not including any sub-adviser whose role is primarily portfolio management and is subcontracted with or overseen by another investment adviser), and any entity controlling, controlled by, or under common control with the investment adviser that provides ongoing services to the Registrant that were not pre-approved pursuant to paragraph (c)(7)(ii) of Rule 2-01 of Regulation S-X is compatible with maintaining the principal accountant’s independence.
Item 5. Audit Committees of Listed Registrants.
Not applicable to the Registrant.
Item 6. Schedule of Investments.
(a) Schedules of Investments are included as part of the reports to shareholders filed under Item 1 of this Form N-CSR.
(b) Not applicable to the Registrant.
Item 7. Disclosure of Proxy Voting Policies and Procedures for Closed-End Management Investment Companies.
Not applicable to the Registrant.
Item 8. Portfolio Managers of Closed-End Management Investment Companies.
Not applicable to the Registrant.
Item 9. Purchases of Equity Securities by Closed-End Management Investment Company and Affiliated Purchasers.
Not applicable to the Registrant.
Item 10. Submission of Matters to a Vote of Security Holders.
The Board of Trustees approved an Amended and Restated Nominating Committee Charter (the “Charter”) at their September 26, 2013 Board Meeting. The Charter contains new procedures related to how shareholders are to submit recommendations for Trustee candidates to the Trust. Those new procedures are as follows:
SSgA Funds
Nominating sub-Committee Charter
September 26, 2013
Mission Statement
The Board of Trustees (the “Board”) of SSgA Funds (the “Trust”) has adopted this charter to govern the activities of the Nominating Sub-Committee of the Governance Committee of the Board (the “Nominating Sub-Committee”).
The Nominating Sub-Committee is a sub-committee of the Governance Committee of the Board created to assist the Board in fulfilling its duty to fill vacancies in the Board. The Nominating Sub-Committee of the Board is responsible for evaluating and recommending the nomination of candidates for election as independent trustees of the Trust.
The scope of the Nominating Sub-Committee’s responsibilities and its structure, process and membership requirements are set forth in this charter (the “Charter”).
Organization
The membership of the Nominating Sub-Committee shall consist entirely of those trustees who are not “interested persons,” within the meaning of the Investment Company Act of 1940, as amended (“Independent Trustees”), of the Trust; however, the Nominating Sub-Committee need not be comprised of all of the Independent Trustees.
The Nominating Sub-Committee may designate one or more members to serve as Chair or Co-Chair of the Nominating Sub-Committee, as the case may be, but need not make such a designation.
The Nominating Sub-Committee shall report to the Governance Committee and/or the Board of Trustees as to the results of its meetings and activities.
Authority and Responsibilities
The Nominating Sub-Committee, in discharging its responsibilities under this Charter, may, in addition to other actions it deems appropriate, consider taking one or more of the actions described below:
| | 1. | To make nominations for Independent Trustee membership on the Board. A potential nominee must have a college degree or equivalent business experience. The Nominating Sub-Committee may take into account a wide variety of factors in considering potential nominees, including (but not limited to): (i) availability and commitment of a candidate to attend meetings and perform his or her responsibilities on the Board, (ii) relevant industry and related experience, (iii) educational background, (iv) financial expertise, (v) ability, judgment and expertise and (vi) overall diversity of the Board’s composition. |
| | 2. | When identifying potential nominees for the Board, the Nominating Sub-Committee may consider candidates recommended by the following sources: (i) a Trust’s current Trustees; (ii) the Trust’s officers; (iii) the Trust’s investment adviser, sub-advisers or administrator; (iv) shareholders of the Trust (see below); or (v) any other source the Nominating Sub-Committee deems to be appropriate. The Nominating Sub-Committee may, but is not required to, retain a third party search firm at the Trust’s expense to identify potential candidates. |
| | 3. | To consider nominee candidates properly submitted in accordance with Appendix A by shareholders of the Trust on the same basis as it considers and evaluates candidates recommended by other sources. |
| | 4. | To review Nominating Sub-Committee Chair or Co-Chair assignments and Nominating Sub-Committee assignments periodically. |
| | 5. | To consider the structure, operations and effectiveness of the Nominating Sub-Committee and review this Charter periodically. |
| | 6. | To meet as frequently and at such times as circumstances dictate. |
| | 7. | To hire (and compensate) from time to time independent counsel and any other expert deemed necessary by the Nominating Sub-Committee to perform its duties. |
The Nominating Sub-Committee shall have the resources to discharge all of its responsibilities, including but not limited to the authority to select, retain, terminate and approve the fees and other retention terms of special or independent counsel or any other advisers determined to be necessary or appropriate without seeking approval of management of the Trust. Costs incurred by the Nominating Sub-Committee in performing its functions under this Charter shall be borne by the Trust.
Adopted by SSgA Funds
Board of Trustees on September 26, 2013
Appendix A
Procedures for Shareholders to Submit Nominee Candidates
(As of September 26, 2013)
A shareholder of the Trust, or of any series thereof, if applicable, must follow the following procedures in order to submit properly a nominee recommendation for the Nominating Sub-Committee’s consideration.
| | 1. | The shareholder must submit any such recommendation (a “Shareholder Recommendation”) in writing to the Trust, to the attention of the Trust’s Secretary, at the address of the principal executive offices of the Trust. |
| | 2. | The Shareholder Recommendation must be delivered to, or mailed and received at, the principal executive offices of the Trust not less than sixty (60) calendar days nor more than ninety (90) calendar days prior to the date of the Board or shareholder meeting at which the nominee candidate would be considered for election. Shareholder Recommendations will be kept on file for two years after receipt of the Shareholder Recommendation. A Shareholder Recommendation considered by the Nominating Sub-Committee in connection with the Nominating Sub-Committee’s nomination of any candidate(s) for appointment or election as an independent Trustee need not be considered again by the Nominating Sub-Committee in connection with any subsequent nomination(s). |
| | 3. | The Shareholder Recommendation must include: (i) a statement in writing setting forth (A) the name, age, date of birth, business address, residence address and nationality of the person recommended by the shareholder (the “candidate”), and the names and addresses of at least three professional references; (B) the number of all shares of the Trust (including the series and class, if applicable) owned of record or beneficially by the candidate, the date such shares were acquired and the investment intent of such acquisition(s), as reported to such shareholder by the candidate; (C) any other information regarding the candidate called for with respect to director nominees by paragraphs (a), (d), (e) and (f) of Item 401 of Regulation S-K or paragraph (b) of Item 22 of Rule 14a-101 (Schedule 14A) under the Securities Exchange Act of 1934, as amended (the “Exchange Act”), adopted by the Securities and Exchange Commission (or the corresponding provisions of any applicable regulation or rule subsequently adopted by the Securities and Exchange Commission or any successor agency with jurisdiction related to the Trust); (D) any other information regarding the candidate that would be required to be disclosed if the candidate were a nominee in a proxy statement or other filing required to be made in connection with solicitation of proxies for election of directors pursuant to Section 14 of the Exchange Act and the rules and regulations promulgated thereunder or any other applicable law or regulation; and (E) whether the |
| | recommending shareholder believes that the candidate is or will be an “interested person” of the Trust (as defined in the Investment Company Act of 1940, as amended) and, if not an “interested person,” information regarding the candidate that will be sufficient, in the discretion of the Board or the Nominating Sub-Committee, for the Trust to make such determination; (ii) the written and signed consent of the candidate to be named as a nominee and to serve as a Trustee if elected; (iii) the recommending shareholder’s name as it appears on the Trust’s books; (iv) the number of all shares of the Trust (including the series and class, if applicable) owned beneficially and of record by the recommending shareholder; (v) a complete description of all arrangements or understandings between the recommending shareholder and the candidate and any other person or persons (including their names) pursuant to which the recommendation is being made by the recommending shareholder including, without limitation, all direct and indirect compensation and other material monetary agreements, arrangements and understandings between the candidate and recommending shareholder during the past three years; and (vi) a brief description of the candidate’s relevant background and experience for membership on the Board, such as qualification as an audit committee financial expert. |
| | 4. | The Nominating Sub-Committee may require the recommending shareholder to furnish such other information as it may reasonably require or deem necessary to verify any information furnished pursuant to paragraph 3 above or to determine the eligibility of the candidate to serve as a Trustee of the Trust or to satisfy applicable law. If the recommending shareholder fails to provide such other information in writing within seven days of receipt of a written request from the Nominating Sub-Committee, the recommendation of such candidate as a nominee will be deemed not properly submitted for consideration, and the Nominating Sub-Committee will not be required to consider such candidate. |
Item 11. Controls and Procedures.
(a) Registrant’s principal executive officer and principal financial officer have concluded that Registrant’s disclosure controls and procedures (as defined in Rule 30a-2(c) under the Investment Company Act of 1940 (the “Act”)) are effective, based on their evaluation of these controls and procedures as of a date within 90 days of the date this report is filed with the Securities and Exchange Commission.
(b) There were no significant changes in Registrant’s internal control over financial reporting that occurred during the period covered by this report that has materially affected or is likely to materially affect Registrant’s internal control over financial reporting.
Item 12. Exhibits.
(a)(1) Code of Ethics pursuant to Item 2 of Form N-CSR is attached hereto.
(a)(2) Certifications of principal executive officer and principal financial officer of the Trust as required by Rule 30a-2(a) under the 1940 Act, as amended, are attached hereto.
(a)(3) Not applicable to the Registrant.
(b) Certifications of principal executive officer and principal financial officer of the Trust as required by Rule 30a-2(b) under the 1940 Act, as amended, and Section 906 of the Sarbanes-Oxley Act of 2002 are attached hereto.
SIGNATURES
Pursuant to the requirements of the Securities Exchange Act of 1934 and the Investment Company Act of 1940, the Registrant has duly caused this report to be signed on its behalf by the undersigned, thereunto duly authorized.
| | |
| SSgA FUNDS |
| |
| By: | | /s/ Ellen M. Needham |
| | Ellen M. Needham |
| | President and Principal Executive Officer |
| |
| Date: | | November 8, 2013 |
Pursuant to the requirements of the Securities Exchange Act of 1934 and the Investment Company Act of 1940, this report has been signed below by the following persons on behalf of the Registrant and in the capacities and on the dates indicated.
| | |
| By: | | /s/ Ellen M. Needham |
| | Ellen M. Needham |
| | President and Principal Executive Officer |
| |
| Date: | | November 8, 2013 |
| | |
| By: | | /s/ Laura F. Dell |
| | Laura F. Dell |
| | Principal Financial Officer, |
| | Principal Accounting Officer |
| | and Treasurer |
| |
| Date: | | November 8, 2013 |