UNITED STATES
SECURITIES AND EXCHANGE COMMISSION
Washington, D.C. 20549
FORM N-CSR
CERTIFIED SHAREHOLDER REPORT OF REGISTERED
MANAGEMENT INVESTMENT COMPANIES
Investment Company Act file number: 811-05430
SSGA FUNDS
(Exact name of registrant as specified in charter)
One Lincoln Street
Boston, Massachusetts 02111
(Address of principal executive offices)(Zip code)
| | |
| (Name and Address of Agent for Service) | | Copy to: |
| |
David James, Managing Director and Managing Counsel State Street Bank and Trust Company 2 Copley Place, 3rd Floor Boston, Massachusetts 02116 | | Timothy W. Diggins, Esq. Ropes & Gray 800 Boylston Street Boston, Massachusetts 02110-2624 |
Registrant’s telephone number, including area code: (617) 662-1742
Date of fiscal year end: August 31
Date of reporting period: August 31, 2015
Item 1. Shareholder Report.
Annual Report
31 August 2015
SSGA Funds
Money Market Funds
SSGA Money Market Fund
SSGA U.S. Government Money Market Fund

SSGA Funds
Money Market Funds
Annual Report
August 31, 2015
Table of Contents
“SSGA” is a registered trademark of State Street Corporation and is licensed for use by the SSGA Funds.
This report is prepared from the books and records of the Funds and it is submitted for the general information of shareholders. This information is for distribution to prospective investors only when preceded or accompanied by a SSGA Funds Prospectus containing more complete information concerning the investment objectives and operations of the Funds, charges and expenses. The Prospectus should be read carefully before an investment is made.
Performance quoted represents past performance and past performance does not guarantee future results. Current performance may be higher or lower than the performance quoted. For the most recent month end performance information, visit www.ssgafunds.com. Investment in the Funds poses investment risks, including the possible loss of principal. The investment return and principal value of an investment will fluctuate so that shares, when redeemed, may be worth more or less than their original cost.
An investment in a money market fund is not insured or guaranteed by the Federal Deposit Insurance Corporation or any other government agency. Although a money market fund seeks to preserve the value of your investment at $1.00 per share, it is possible to lose money by investing in a money market fund.
SSGA Money Market Fund
Shareholder Expense Example — August 31, 2015 (Unaudited)
Fund Expenses
The following disclosure provides important information regarding the Fund’s Expense Example, which appears on the Fund’s individual page in this Annual Report. Please refer to this information when reviewing the Expense Example for a Fund.
Example
As a shareholder of the Fund, you incur two types of costs: (1) transaction costs, and (2) ongoing costs, including advisory and administration fees; distribution (12b-1) and/or service fees; and other Fund expenses. The Example is intended to help you understand your ongoing costs (in dollars) of investing in the Fund and to compare these costs with the ongoing costs of investing in other mutual funds. The Example is based on an investment of $1,000 invested at the beginning of the period and held for the entire period indicated, which for this Fund is from March 1, 2015 to August 31, 2015.
Actual Expenses
The information in the table under the heading “Actual Performance” provides information about actual account values and actual expenses. You may use the information in this column, together with the amount you invested, to estimate the expenses that you paid over the period. Simply divide your account value by $1,000 (for example, an $8,600 account value divided by $1,000 = 8.6), then multiply the result by the number in the first column in the row entitled “Expenses Paid During Period” to estimate the expenses you paid on your account during this period.
Hypothetical Example for Comparison Purposes
The information in the table under the heading “Hypothetical Performance (5% return before expenses)” provides information about hypothetical account values and hypothetical expenses based on the Fund’s actual expense ratio and an assumed rate of return of 5% per year before expenses, which is not the Fund’s actual return. The hypothetical account values and expenses may not be used to estimate the actual ending account balance or expenses you paid for the period. You may use this information to compare the ongoing costs of investing in the Fund and other funds. To do so, compare this 5% hypothetical example with the 5% hypothetical examples that appear in the shareholder reports of other funds.
Please note that the expenses shown in the table are meant to highlight your ongoing costs only and do not reflect any transaction costs. Therefore, the information under the heading “Hypothetical Performance (5% return before expenses)” is useful in comparing ongoing costs only, and will not help you determine the relative total costs of owning different funds. In addition, if these transaction costs were included, your costs would have been higher.
| | | | | | | | |
| | | Actual
Performance | | | Hypothetical
Performance
(5% return
before expenses) | |
Beginning Account Value | | | | | | | | |
March 1, 2015 | | $ | 1,000.00 | | | $ | 1,000.00 | |
Ending Account Value | | | | | | | | |
August 31, 2015 | | $ | 1,000.00 | | | $ | 1,024.09 | |
Expenses Paid During Period* | | $ | 1.11 | | | $ | 1.12 | |
| * | Expenses are equal to the Fund’s annualized expense ratio of 0.22% (representing the six month period annualized), multiplied by the average account value over the period, multiplied by 184/365 (to reflect the one-half year period). Includes amounts waived, reimbursed and/or other credits. Without the waiver, reimbursement and/or other credits, expenses would have been higher. |
SSGA Money Market Fund
Schedule of Investments — August 31, 2015
| | | | | | | | | | | | | | | | |
| | | Principal
Amount ($)
or Shares | | | Rate
% (#) | | | Date
of
Maturity | | | Value
$ | |
| | | | | | | | | | | | | | | | |
| | | | | | | | | | | | | | | | |
| Certificates of Deposit - 30.9% | | | | | | | | | | | | | | | | |
Bank of Montreal (next reset date 09/15/15) (a) | | | 25,000,000 | | | | 0.318 | | | | 01/15/16 | | | | 25,000,000 | |
Bank of Montreal (next reset date 09/18/15) (a) | | | 40,000,000 | | | | 0.360 | | | | 01/15/16 | | | | 40,000,000 | |
Bank of Montreal (next reset date 09/22/15) (a) | | | 12,000,000 | | | | 0.365 | | | | 01/22/16 | | | | 11,999,771 | |
Bank of Nova Scotia (next reset date 09/08/15) (a) | | | 24,000,000 | | | | 0.291 | | | | 11/05/15 | | | | 24,000,000 | |
Bank of Nova Scotia (next reset date 09/08/15) (a) | | | 55,000,000 | | | | 0.344 | | | | 11/06/15 | | | | 55,000,000 | |
Bank of Nova Scotia (next reset date 09/10/15) (a) | | | 35,000,000 | | | | 0.292 | | | | 02/05/16 | | | | 35,000,000 | |
Bank of Tokyo - Mitsubishi | | | 35,000,000 | | | | 0.260 | | | | 09/18/15 | | | | 35,000,000 | |
Bank of Tokyo - Mitsubishi | | | 30,000,000 | | | | 0.270 | | | | 10/14/15 | | | | 30,000,000 | |
BNP Paribas | | | 35,000,000 | | | | 0.260 | | | | 09/10/15 | | | | 35,000,000 | |
BNP Paribas | | | 40,000,000 | | | | 0.350 | | | | 12/04/15 | | | | 40,000,000 | |
Canadian Imperial Bank of Commerce (next reset date 09/16/15) (a) | | | 20,000,000 | | | | 0.318 | | | | 02/16/16 | | | | 20,000,000 | |
Citibank NA | | | 23,000,000 | | | | 0.180 | | | | 09/08/15 | | | | 23,000,000 | |
Citibank NA | | | 30,000,000 | | | | 0.250 | | | | 11/03/15 | | | | 30,000,000 | |
Credit Agricole Corporate & Investment Bank | | | 65,000,000 | | | | 0.270 | | | | 09/09/15 | | | | 65,000,000 | |
ING Bank NV | | | 75,000,000 | | | | 0.285 | | | | 10/01/15 | | | | 75,000,000 | |
ING Bank NV | | | 20,000,000 | | | | 0.330 | | | | 10/19/15 | | | | 20,000,000 | |
ING Bank NV | | | 25,000,000 | | | | 0.390 | | | | 12/14/15 | | | | 25,000,000 | |
Rabobank Nederland NV | | | 25,000,000 | | | | 0.259 | | | | 09/11/15 | | | | 25,000,000 | |
Rabobank Nederland NV | | | 13,000,000 | | | | 0.240 | | | | 09/18/15 | | | | 13,000,000 | |
Rabobank Nederland NV | | | 30,000,000 | | | | 0.240 | | | | 09/18/15 | | | | 30,000,000 | |
Royal Bank of Canada (next reset date 09/08/15) (a) | | | 40,000,000 | | | | 0.344 | | | | 01/07/16 | | | | 40,000,000 | |
Societe Generale | | | 25,000,000 | | | | 0.290 | | | | 09/04/15 | | | | 25,000,000 | |
Sumitomo Mitsui Banking Corp. | | | 25,000,000 | | | | 0.290 | | | | 10/26/15 | | | | 25,000,000 | |
Svenska Handelsbanken AB | | | 50,000,000 | | | | 0.210 | | | | 09/02/15 | | | | 50,000,007 | |
Svenska Handelsbanken AB | | | 20,000,000 | | | | 0.235 | | | | 09/21/15 | | | | 20,000,056 | |
Svenska Handelsbanken AB | | | 27,000,000 | | | | 0.260 | | | | 10/26/15 | | | | 26,999,999 | |
Svenska Handelsbanken AB (next reset date 09/15/15) (a) | | | 15,000,000 | | | | 0.348 | | | | 01/15/16 | | | | 15,000,000 | |
Toronto Dominion Bank (next reset date 09/14/15) (a) | | | 25,000,000 | | | | 0.363 | | | | 02/12/16 | | | | 25,000,000 | |
Toronto Dominion Bank (next reset date 09/28/15) (a) | | | 35,000,000 | | | | 0.349 | | | | 05/26/16 | | | | 35,000,000 | |
Toronto Dominion Bank (next reset date 10/02/15) (a) | | | 23,000,000 | | | | 0.313 | | | | 04/04/16 | | | | 23,000,000 | |
UBS AG | | | 40,000,000 | | | | 0.320 | | | | 11/17/15 | | | | 40,000,000 | |
Wells Fargo Bank NA (next reset date 09/08/15) (a) | | | 30,000,000 | | | | 0.319 | | | | 03/07/16 | | | | 30,000,000 | |
Wells Fargo Bank NA (next reset date 09/09/15) (a) | | | 30,000,000 | | | | 0.302 | | | | 01/11/16 | | | | 30,000,000 | |
Westpac Banking Corp. (next reset date 09/25/15) (a) | | | 14,000,000 | | | | 0.319 | | | | 04/25/16 | | | | 14,000,000 | |
| | | | | | | | | | | | | | | | |
| | | | |
Total Certificates of Deposit
(cost $1,055,999,833) | | | | | | | | | | | | | | | 1,055,999,833 | |
| | | | | | | | | | | | | | | | |
| | | | |
| Financial Company Commercial Paper - 30.3% | | | | | | | | | | | | | | | | |
Australia & New Zealand Banking Group Ltd. (next reset date 09/04/15) (a)(b) | | | 11,000,000 | | | | 0.302 | | | | 05/04/16 | | | | 10,999,614 | |
Australia & New Zealand Banking Group Ltd. (next reset date 09/15/15) (a)(b) | | | 10,500,000 | | | | 0.298 | | | | 10/15/15 | | | | 10,500,000 | |
Australia & New Zealand Banking Group Ltd. (next reset date 09/15/15) (a)(b) | | | 10,500,000 | | | | 0.298 | | | | 10/15/15 | | | | 10,500,000 | |
Australia & New Zealand Banking Group Ltd. (next reset date 09/21/15) (a)(b) | | | 6,000,000 | | | | 0.345 | | | | 01/19/16 | | | | 6,000,000 | |
Caisse des Depots et Consignations (b) | | | 20,000,000 | | | | 0.240 | | | | 10/07/15 | | | | 19,995,200 | |
Caisse des Depots et Consignations (b) | | | 25,000,000 | | | | 0.230 | | | | 10/22/15 | | | | 24,991,854 | |
Caisse des Depots et Consignations (b) | | | 30,000,000 | | | | 0.260 | | | | 11/02/15 | | | | 29,986,567 | |
Commonwealth Bank of Australia (b) | | | 25,000,000 | | | | 0.210 | | | | 09/15/15 | | | | 24,997,958 | |
DBS Bank Ltd. (b) | | | 25,000,000 | | | | 0.220 | | | | 09/08/15 | | | | 24,998,930 | |
DBS Bank Ltd. (b) | | | 25,000,000 | | | | 0.230 | | | | 09/10/15 | | | | 24,998,562 | |
SSGA Money Market Fund
Schedule of Investments, continued — August 31, 2015
| | | | | | | | | | | | | | | | |
| | | Principal
Amount ($)
or Shares | | | Rate
% (#) | | | Date
of
Maturity | | | Value
$ | |
| | | | | | | | | | | | | | | | |
DBS Bank Ltd. (b) | | | 25,000,000 | | | | 0.250 | | | | 09/23/15 | | | | 24,996,181 | |
DnB Bank ASA (b) | | | 50,000,000 | | | | 0.240 | | | | 09/25/15 | | | | 49,992,000 | |
DnB Bank ASA (b) | | | 35,000,000 | | | | 0.359 | | | | 11/23/15 | | | | 35,000,000 | |
Erste Abwicklungsanstalt (b) | | | 25,000,000 | | | | 0.240 | | | | 09/22/15 | | | | 24,996,500 | |
Erste Abwicklungsanstalt (b) | | | 25,000,000 | | | | 0.210 | | | | 10/01/15 | | | | 24,995,625 | |
Erste Abwicklungsanstalt (b) | | | 25,000,000 | | | | 0.210 | | | | 10/05/15 | | | | 24,995,042 | |
Erste Abwicklungsanstalt (b) | | | 25,000,000 | | | | 0.320 | | | | 11/30/15 | | | | 24,980,000 | |
General Electric Capital Corp. | | | 5,000,000 | | | | 0.252 | | | | 09/03/15 | | | | 5,000,000 | |
General Electric Capital Corp. | | | 25,000,000 | | | | 0.200 | | | | 09/15/15 | | | | 24,998,056 | |
General Electric Capital Corp. (next reset date 09/04/15) (a) | | | 5,000,000 | | | | 0.282 | | | | 10/30/15 | | | | 5,000,000 | |
HSBC Bank PLC (next reset date 09/21/15) (a)(b) | | | 18,000,000 | | | | 0.321 | | | | 12/21/15 | | | | 18,000,000 | |
HSBC Bank PLC (next reset date 09/23/15) (a)(b) | | | 20,000,000 | | | | 0.330 | | | | 11/23/15 | | | | 20,000,000 | |
Nordea Bank AB (b) | | | 50,000,000 | | | | 0.210 | | | | 09/10/15 | | | | 49,997,375 | |
Nordea Bank AB (b) | | | 50,000,000 | | | | 0.245 | | | | 09/23/15 | | | | 49,992,514 | |
Nordea Bank AB (b) | | | 25,000,000 | | | | 0.260 | | | | 10/26/15 | | | | 24,990,069 | |
NRW.Bank (b) | | | 50,000,000 | | | | 0.190 | | | | 09/21/15 | | | | 49,994,722 | |
NRW.Bank (b) | | | 50,000,000 | | | | 0.185 | | | | 10/02/15 | | | | 49,992,035 | |
Skandinaviska Enskilda Banken AB (b) | | | 35,000,000 | | | | 0.240 | | | | 09/09/15 | | | | 34,998,133 | |
Skandinaviska Enskilda Banken AB (b) | | | 20,000,000 | | | | 0.250 | | | | 09/15/15 | | | | 19,998,056 | |
Skandinaviska Enskilda Banken AB (b) | | | 16,400,000 | | | | 0.260 | | | | 09/15/15 | | | | 16,398,342 | |
Skandinaviska Enskilda Banken AB (b) | | | 15,000,000 | | | | 0.250 | | | | 09/16/15 | | | | 14,998,437 | |
Skandinaviska Enskilda Banken AB (b) | | | 32,730,000 | | | | 0.250 | | | | 10/15/15 | | | | 32,719,999 | |
Societe Generale (b) | | | 45,000,000 | | | | 0.290 | | | | 11/02/15 | | | | 44,977,525 | |
Standard Chartered Bank (b) | | | 40,000,000 | | | | 0.260 | | | | 09/09/15 | | | | 39,997,689 | |
Standard Chartered Bank (b) | | | 20,000,000 | | | | 0.260 | | | | 09/21/15 | | | | 19,997,111 | |
Standard Chartered Bank (b) | | | 25,000,000 | | | | 0.270 | | | | 10/23/15 | | | | 24,990,250 | |
Swedbank AB | | | 50,000,000 | | | | 0.310 | | | | 11/27/15 | | | | 49,962,542 | |
Toyota Motor Credit Corp. (next reset date 09/08/15) (a) | | | 15,000,000 | | | | 0.292 | | | | 01/13/16 | | | | 15,000,000 | |
Westpac Banking Corp. (next reset date 09/11/15) (a)(b) | | | 11,000,000 | | | | 0.301 | | | | 03/11/16 | | | | 11,000,000 | |
Westpac Banking Corp. (next reset date 09/28/15) (a)(b) | | | 16,500,000 | | | | 0.299 | | | | 10/26/15 | | | | 16,500,000 | |
| | | | | | | | | | | | | | | | |
| | | | |
Total Financial Company Commercial Paper
(cost $1,037,426,888) | | | | | | | | | | | | | | | 1,037,426,888 | |
| | | | | | | | | | | | | | | | |
| | | | |
| Government Agency Debt - 3.2% | | | | | | | | | | | | | | | | |
Federal Home Loan Bank | | | 28,000,000 | | | | 0.092 | | | | 10/07/15 | | | | 27,997,480 | |
Federal Home Loan Bank | | | 29,000,000 | | | | 0.122 | | | | 10/09/15 | | | | 28,996,327 | |
Federal Home Loan Bank | | | 23,000,000 | | | | 0.173 | | | | 10/16/15 | | | | 22,995,113 | |
Federal Home Loan Bank | | | 9,000,000 | | | | 0.162 | | | | 10/16/15 | | | | 8,998,211 | |
Federal Home Loan Bank | | | 22,000,000 | | | | 0.148 | | | | 10/21/15 | | | | 21,995,569 | |
| | | | | | | | | | | | | | | | |
| | | | |
Total Government Agency Debt
(cost $110,982,700) | | | | | | | | | | | | | | | 110,982,700 | |
| | | | | | | | | | | | | | | | |
| | | | |
| Other Notes - 12.7% | | | | | | | | | | | | | | | | |
Bank of America NA | | | 31,000,000 | | | | 0.280 | | | | 10/05/15 | | | | 31,000,000 | |
JPMorgan Chase Bank NA (next reset date 09/08/15) (a) | | | 44,500,000 | | | | 0.439 | | | | 08/05/16 | | | | 44,500,000 | |
JPMorgan Chase Bank NA (next reset date 10/22/15) (a) | | | 30,000,000 | | | | 0.455 | | | | 08/22/16 | | | | 30,000,000 | |
Lloyds Bank PLC | | | 100,000,000 | | | | 0.060 | | | | 09/01/15 | | | | 100,000,000 | |
Natixis | | | 108,321,000 | | | | 0.070 | | | | 09/01/15 | | | | 108,321,000 | |
Royal Bank of Canada (next reset date 09/16/15) (a) | | | 12,000,000 | | | | 0.506 | | | | 12/16/15 | | | | 12,006,935 | |
Royal Bank of Canada (next reset date 10/07/15) (a)(b) | | | 25,000,000 | | | | 0.374 | | | | 08/08/16 | | | | 25,000,000 | |
Svenska Handelsbanken AB (next reset date 09/28/15) (a)(b) | | | 25,000,000 | | | | 0.388 | | | | 01/27/16 | | | | 25,000,000 | |
SSGA Money Market Fund
Schedule of Investments, continued — August 31, 2015
| | | | | | | | | | | | | | | | |
| | | Principal
Amount ($)
or Shares | | | Rate
% (#) | | | Date
of
Maturity | | | Value
$ | |
| | | | | | | | | | | | | | | | |
Wells Fargo Bank NA (next reset date 09/10/15) (a) | | | 25,000,000 | | | | 0.372 | | | | 08/09/16 | | | | 25,000,000 | |
Wells Fargo Bank NA (next reset date 09/21/15) (a) | | | 33,000,000 | | | | 0.403 | | | | 08/19/16 | | | | 33,000,000 | |
| | | | | | | | | | | | | | | | |
| | | | |
Total Other Notes
(cost $433,827,935) | | | | | | | | | | | | | | | 433,827,935 | |
| | | | | | | | | | | | | | | | |
| | | | |
| Treasury Debt - 0.7% | | | | | | | | | | | | | | | | |
U.S. Treasury Bill (cost $23,999,580) | | | 24,000,000 | | | | 0.025 | | | | 10/01/15 | | | | 23,999,580 | |
| | | | | | | | | | | | | | | | |
| | | | |
Total Investments - 77.8%
(cost $2,662,236,936) | | | | | | | | | | | | | | | 2,662,236,936 | |
| | | | | | | | | | | | | | | | |
| | | | |
| Repurchase Agreements - 22.9% | | | | | | | | | | | | | | | | |
| Treasury Repurchase Agreements - 20.9% | | | | | | | | | | | | | | | | |
Agreement with Credit Suisse Securities (USA) LLC and JP Morgan Chase & Co. (Tri-Party) of $10,000,000 dated August 31, 2015 at 0.470% to be repurchased at $10,000,131 on October 2, 2015, collateralized by: $10,041,000 par various United States Government Treasury Obligations valued at $10,203,073. (c) | | | | | | | | | | | | | | | 10,000,000 | |
Agreement with Federal Reserve Bank and Bank of New York Mellon Corp. (Tri-Party) of $680,000,000 dated August 31, 2015 at 0.050% to be repurchased at $680,000,944 on September 1, 2015, collateralized by: $676,040,400 par various United States Government Treasury Obligations valued at $680,000,964. | | | | | | | | | | | | | | | 680,000,000 | |
Agreement with Goldman Sachs & Co. and Bank of New York Mellon Corp. (Tri-Party) of $25,000,000 dated August 31, 2015 at 0.350% to be repurchased at $25,000,243 on November 18, 2015, collateralized by: $24,741,900 par various United States Government Treasury Obligations valued at $25,500,068. (c) | | | | | | | | | | | | | | | 25,000,000 | |
| | | | | | | | | | | | | | | | |
| | | | |
Total Treasury Repurchase Agreements
(cost $715,000,000) | | | | | | | | | | | | | | | 715,000,000 | |
| | | | | | | | | | | | | | | | |
| | | | |
| Other Repurchase Agreements - 2.0% | | | | | | | | | | | | | | | | |
Agreement with Citigroup Global Markets, Inc. and Bank of New York Mellon Corp. (Tri-Party) of $20,000,000 dated August 31, 2015 at 0.550% to be repurchased at $20,000,306 on November 19, 2015, collateralized by: $19,917,958 par various Corporate Bonds and United States Government National Mortgage Association valued at $20,457,144. (c) | | | | | | | | | | | | | | | 20,000,000 | |
Agreement with Goldman Sachs & Co. and Bank of New York Mellon Corp. (Tri-Party) of $25,000,000 dated August 31, 2015 at 0.410% to be repurchased at $25,000,285 on December 24, 2015, collateralized by: $10,164,931 par various Common Stocks and United States Government Treasury Obligations valued at $25,850,819. (c) | | | | | | | | | | | | | | | 25,000,000 | |
SSGA Money Market Fund
Schedule of Investments, continued — August 31, 2015
| | | | | | | | | | |
| | | | | | | | | Value
$ | |
| | | | | | | | | | |
Agreement with JPM Chase and JP Morgan Chase & Co. (Tri-Party) of $25,000,000 dated August 31, 2015 at 0.394% to be repurchased at $25,001,093 on December 3, 2015, collateralized by: $27,653,801 par various Corporate Bonds valued at $27,001,591. (c) | | | | | | | | | 25,000,000 | |
| | | | | | | | | | |
| | | | |
Total Other Repurchase Agreements
(cost $70,000,000) | | | | | | | | | 70,000,000 | |
| | | | | | | | | | |
| | | | |
Total Repurchase Agreements
(cost $785,000,000) | | | | | | | | | 785,000,000 | |
| | | | | | | | | | |
| | | | |
Total Investments and Repurchase Agreements - 100.7% (d)
(cost $3,447,236,936) (e) | | | | | | | | | 3,447,236,936 | |
| | | | |
| Other Assets and Liabilities, Net - (0.7%) | | | | | | | | | (25,139,119 | ) |
| | | | | | | | | | |
| | | | |
| Net Assets - 100.0% | | | | | | | | | 3,422,097,817 | |
| | | | | | | | | | |
Footnotes:
| # | For purposes of this report, for non-interest bearing Commercial Paper and Discount Notes, the discount rate at purchase is used to populate the rate column. |
| (a) | Adjustable or floating rate security. Rate shown reflects rate in effect at period end. |
| (b) | Rule 144A, Section 4(2) or other security, which is restricted to resale to institutional investors. The Fund’s investment manager has deemed this security to be liquid based upon procedures approved by the Board of Trustees. These securities represent $987,466,290 or 28.9% of net assets as of August 31, 2015. |
| (d) | Unless otherwise indicated, the values of securities of the Fund are determined based on Level 2 inputs (Note 2). |
| (e) | The cost of securities for federal income tax purposes is substantially the same for financial reporting purposes. |
Presentation of Portfolio Holdings — August 31, 2015
| | | | |
| Categories | | % of
Net
Assets | |
| | | | |
Certificates of Deposit | | | 30.9 | |
Financial Company Commercial Paper | | | 30.3 | |
Government Agency Debt | | | 3.2 | |
Other Notes | | | 12.7 | |
Treasury Debt | | | 0.7 | |
Repurchase Agreements | | | 22.9 | |
| | | | |
Total Investments and Repurchase Agreements | | | 100.7 | |
Other Assets and Liabilities, Net | | | (0.7 | ) |
| | | | |
| | | 100.0 | |
| | | | |
Abbreviations:
LLC Limited Liability Company
PLC Public Limited Company
See accompanying notes which are an integral part of the financial statements.
SSGA U.S. Government Money Market Fund
Shareholder Expense Example — August 31, 2015 (Unaudited)
Fund Expenses
The following disclosure provides important information regarding the Fund’s Expense Example, which appears on the Fund’s individual page in this Annual Report. Please refer to this information when reviewing the Expense Example for a Fund.
Example
As a shareholder of the Fund, you incur two types of costs: (1) transaction costs, and (2) ongoing costs, including advisory and administration fees; distribution (12b-1) and/or service fees; and other Fund expenses. The Example is intended to help you understand your ongoing costs (in dollars) of investing in the Fund and to compare these costs with the ongoing costs of investing in other mutual funds. The Example is based on an investment of $1,000 invested at the beginning of the period and held for the entire period indicated, which for this Fund is from March 1, 2015 to August 31, 2015.
Actual Expenses
The information in the table under the heading “Actual Performance” provides information about actual account values and actual expenses. You may use the information in this column, together with the amount you invested, to estimate the expenses that you paid over the period. Simply divide your account value by $1,000 (for example, an $8,600 account value divided by $1,000 = 8.6), then multiply the result by the number in the first column in the row entitled “Expenses Paid During Period” to estimate the expenses you paid on your account during this period.
Hypothetical Example for Comparison Purposes
The information in the table under the heading “Hypothetical Performance (5% return before expenses)” provides information about hypothetical account values and hypothetical expenses based on the Fund’s actual expense ratio and an assumed rate of return of 5% per year before expenses, which is not the Fund’s actual return. The hypothetical account values and expenses may not be used to estimate the actual ending account balance or expenses you paid for the period. You may use this information to compare the ongoing costs of investing in the Fund and other funds. To do so, compare this 5% hypothetical example with the 5% hypothetical examples that appear in the shareholder reports of other funds.
Please note that the expenses shown in the table are meant to highlight your ongoing costs only and do not reflect any transaction costs. Therefore, the information under the heading “Hypothetical Performance (5% return before expenses)” is useful in comparing ongoing costs only, and will not help you determine the relative total costs of owning different funds. In addition, if these transaction costs were included, your costs would have been higher.
| | | | | | | | |
| | | Actual
Performance | | | Hypothetical
Performance
(5% return
before expenses) | |
Beginning Account Value | | | | | | | | |
March 1, 2015 | | $ | 1,000.00 | | | $ | 1,000.00 | |
Ending Account Value | | | | | | | | |
August 31, 2015 | | $ | 1,000.00 | | | $ | 1,024.75 | |
Expenses Paid During Period* | | $ | 0.45 | | | $ | 0.46 | |
| * | Expenses are equal to the Fund’s annualized expense ratio of 0.09% (representing the six month period annualized), multiplied by the average account value over the period, multiplied by 184/365 (to reflect the one-half year period). Includes amounts waived, reimbursed and/or other credits. Without the waiver, reimbursement and/or other credits, expenses would have been higher. |
| | | | |
| SSGA U.S. Government Money Market Fund | | | 7 | |
SSGA U.S. Government Money Market Fund
Schedule of Investments — August 31, 2015
| | | | | | | | | | | | | | | | |
| | | Principal
Amount ($)
or Shares | | | Rate
% (#) | | | Date
of
Maturity | | | Value
$ | |
| | | | | | | | | | | | | | | | |
| | | | | | | | | | | | | | | | |
| Government Agency Debt - 70.3% | | | | | | | | | | | | | | | | |
Federal Farm Credit Bank | | | 9,000,000 | | | | 0.082 | | | | 09/04/15 | | | | 8,999,940 | |
Federal Farm Credit Bank (next reset date 09/07/15) (a) | | | 20,000,000 | | | | 0.161 | | | | 01/05/16 | | | | 20,000,000 | |
Federal Farm Credit Bank (next reset date 09/09/15) (a) | | | 14,400,000 | | | | 0.162 | | | | 12/09/15 | | | | 14,400,000 | |
Federal Farm Credit Bank (next reset date 09/11/15) (a) | | | 19,000,000 | | | | 0.161 | | | | 01/11/16 | | | | 19,000,000 | |
Federal Farm Credit Bank (next reset date 09/18/15) (a) | | | 24,000,000 | | | | 0.160 | | | | 02/18/16 | | | | 23,999,013 | |
Federal Home Loan Bank | | | 25,000,000 | | | | 0.118 | | | | 09/04/15 | | | | 24,999,943 | |
Federal Home Loan Bank | | | 80,000,000 | | | | 0.092 | | | | 09/09/15 | | | | 79,998,400 | |
Federal Home Loan Bank | | | 50,000,000 | | | | 0.095 | | | | 09/11/15 | | | | 49,998,708 | |
Federal Home Loan Bank | | | 55,000,000 | | | | 0.094 | | | | 09/16/15 | | | | 54,997,892 | |
Federal Home Loan Bank | | | 50,000,000 | | | | 0.092 | | | | 09/18/15 | | | | 49,997,875 | |
Federal Home Loan Bank | | | 75,000,000 | | | | 0.097 | | | | 10/02/15 | | | | 74,993,865 | |
Federal Home Loan Bank | | | 31,000,000 | | | | 0.760 | | | | 10/02/15 | | | | 30,997,998 | |
Federal Home Loan Bank | | | 35,000,000 | | | | 0.097 | | | | 10/07/15 | | | | 34,996,675 | |
Federal Home Loan Bank | | | 65,000,000 | | | | 0.095 | | | | 10/14/15 | | | | 64,992,780 | |
Federal Home Loan Bank | | | 30,000,000 | | | | 0.092 | | | | 10/16/15 | | | | 29,996,625 | |
Federal Home Loan Bank | | | 65,000,000 | | | | 0.101 | | | | 10/23/15 | | | | 64,990,705 | |
Federal Home Loan Bank | | | 36,000,000 | | | | 0.164 | | | | 11/06/15 | | | | 35,989,440 | |
Federal Home Loan Bank | | | 25,000,000 | | | | 0.178 | | | | 11/12/15 | | | | 24,991,300 | |
Federal Home Loan Bank (next reset date 09/08/15) (a) | | | 25,000,000 | | | | 0.142 | | | | 07/08/16 | | | | 25,000,000 | |
Federal Home Loan Bank (next reset date 09/14/15) (a) | | | 48,000,000 | | | | 0.138 | | | | 08/12/16 | | | | 48,000,000 | |
Federal Home Loan Bank (next reset date 09/15/15) (a) | | | 43,000,000 | | | | 0.148 | | | | 10/15/15 | | | | 43,000,000 | |
Federal Home Loan Bank (next reset date 09/15/15) (a) | | | 40,000,000 | | | | 0.148 | | | | 07/15/16 | | | | 40,000,000 | |
Federal Home Loan Bank (next reset date 09/24/15) (a) | | | 30,000,000 | | | | 0.150 | | | | 06/24/16 | | | | 30,000,000 | |
Federal Home Loan Bank (next reset date 09/25/15) (a) | | | 28,000,000 | | | | 0.179 | | | | 01/25/16 | | | | 28,000,000 | |
Federal Home Loan Mortgage Corp. | | | 55,000,000 | | | | 0.082 | | | | 09/08/15 | | | | 54,999,144 | |
Federal Home Loan Mortgage Corp. | | | 48,500,000 | | | | 0.061 | | | | 09/14/15 | | | | 48,498,949 | |
Federal Home Loan Mortgage Corp. | | | 95,000,000 | | | | 0.058 | | | | 09/16/15 | | | | 94,997,744 | |
Federal Home Loan Mortgage Corp. | | | 2,500,000 | | | | 0.077 | | | | 09/28/15 | | | | 2,499,859 | |
Federal Home Loan Mortgage Corp. | | | 27,000,000 | | | | 0.102 | | | | 10/02/15 | | | | 26,997,675 | |
Federal Home Loan Mortgage Corp. | | | 27,000,000 | | | | 0.122 | | | | 10/13/15 | | | | 26,996,220 | |
Federal Home Loan Mortgage Corp. | | | 41,000,000 | | | | 0.133 | | | | 10/14/15 | | | | 40,993,634 | |
Federal Home Loan Mortgage Corp. | | | 43,000,000 | | | | 0.072 | | | | 10/15/15 | | | | 42,996,321 | |
Federal Home Loan Mortgage Corp. | | | 12,000,000 | | | | 0.077 | | | | 10/15/15 | | | | 11,998,900 | |
Federal Home Loan Mortgage Corp. | | | 46,000,000 | | | | 0.072 | | | | 10/23/15 | | | | 45,995,349 | |
Federal Home Loan Mortgage Corp. | | | 19,000,000 | | | | 0.096 | | | | 10/23/15 | | | | 18,997,393 | |
Federal Home Loan Mortgage Corp. | | | 37,000,000 | | | | 0.131 | | | | 10/26/15 | | | | 36,992,708 | |
Federal Home Loan Mortgage Corp. | | | 14,000,000 | | | | 0.077 | | | | 10/28/15 | | | | 13,998,337 | |
Federal Home Loan Mortgage Corp. | | | 19,000,000 | | | | 0.096 | | | | 10/28/15 | | | | 18,997,142 | |
Federal Home Loan Mortgage Corp. | | | 22,325,000 | | | | 0.082 | | | | 10/29/15 | | | | 22,322,123 | |
Federal Home Loan Mortgage Corp. | | | 19,000,000 | | | | 0.102 | | | | 11/05/15 | | | | 18,996,569 | |
Federal Home Loan Mortgage Corp. | | | 39,000,000 | | | | 0.102 | | | | 12/02/15 | | | | 38,990,033 | |
Federal Home Loan Mortgage Corp. (next reset date 09/17/15) (a) | | | 26,000,000 | | | | 0.143 | | | | 08/17/16 | | | | 26,000,000 | |
Federal Home Loan Mortgage Corp. (next reset date 09/24/15) (a) | | | 27,500,000 | | | | 0.155 | | | | 08/24/16 | | | | 27,500,000 | |
Federal National Mortgage Assoc. | | | 4,800,000 | | | | 0.077 | | | | 09/02/15 | | | | 4,799,990 | |
Federal National Mortgage Assoc. | | | 30,000,000 | | | | 0.133 | | | | 09/02/15 | | | | 29,999,892 | |
Federal National Mortgage Assoc. | | | 30,000,000 | | | | 0.056 | | | | 09/09/15 | | | | 29,999,633 | |
Federal National Mortgage Assoc. | | | 27,500,000 | | | | 0.133 | | | | 09/14/15 | | | | 27,498,709 | |
Federal National Mortgage Assoc. | | | 2,000,000 | | | | 0.059 | | | | 09/16/15 | | | | 1,999,952 | |
Federal National Mortgage Assoc. | | | 52,000,000 | | | | 0.082 | | | | 09/18/15 | | | | 51,998,036 | |
Federal National Mortgage Assoc. | | | 3,000,000 | | | | 0.077 | | | | 09/30/15 | | | | 2,999,819 | |
Federal National Mortgage Assoc. | | | 2,450,000 | | | | 0.072 | | | | 10/14/15 | | | | 2,449,780 | |
Federal National Mortgage Assoc. | | | 2,450,000 | | | | 0.077 | | | | 10/14/15 | | | | 2,449,795 | |
Federal National Mortgage Assoc. | | | 11,000,000 | | | | 0.112 | | | | 10/19/15 | | | | 10,998,093 | |
| | |
| 8 | | SSGA U.S. Government Money Market Fund |
SSGA U.S. Government Money Market Fund
Schedule of Investments, continued — August 31, 2015
| | | | | | | | | | | | | | | | |
| | | Principal
Amount ($)
or Shares | | | Rate
% (#) | | | Date
of
Maturity | | | Value
$ | |
| | | | | | | | | | | | | | | | |
Federal National Mortgage Assoc. | | | 24,775,000 | | | | 0.112 | | | | 10/19/15 | | | | 24,771,366 | |
Federal National Mortgage Assoc. | | | 39,000,000 | | | | 0.117 | | | | 11/02/15 | | | | 38,992,276 | |
Federal National Mortgage Assoc. | | | 27,000,000 | | | | 0.164 | | | | 11/03/15 | | | | 26,992,440 | |
Federal National Mortgage Assoc. | | | 54,000,000 | | | | 0.154 | | | | 11/04/15 | | | | 53,985,600 | |
Federal National Mortgage Assoc. | | | 25,000,000 | | | | 0.161 | | | | 11/12/15 | | | | 24,992,150 | |
Federal National Mortgage Assoc. | | | 71,000,000 | | | | 0.112 | | | | 11/16/15 | | | | 70,983,512 | |
Federal National Mortgage Assoc. | | | 29,000,000 | | | | 0.153 | | | | 11/17/15 | | | | 28,990,696 | |
Federal National Mortgage Assoc. | | | 30,000,000 | | | | 0.184 | | | | 11/18/15 | | | | 29,988,300 | |
Federal National Mortgage Assoc. | | | 37,000,000 | | | | 0.163 | | | | 11/25/15 | | | | 36,986,110 | |
| | | | | | | | | | | | | | | | |
| | | | |
Total Government Agency Debt
(cost $2,043,985,408) | | | | | | | | | | | | | | | 2,043,985,408 | |
| | | | | | | | | | | | | | | | |
| | | | |
| Treasury Debt - 7.8% | | | | | | | | | | | | | | | | |
U.S. Treasury Bill | | | 19,900,000 | | | | 0.020 | | | | 10/01/15 | | | | 19,899,652 | |
U.S. Treasury Note | | | 66,000,000 | | | | 0.061 | | | | 10/15/15 | | | | 66,014,991 | |
U.S. Treasury Note | | | 14,000,000 | | | | 0.081 | | | | 10/15/15 | | | | 14,002,837 | |
U.S. Treasury Note | | | 3,000,000 | | | | 0.102 | | | | 10/15/15 | | | | 3,000,535 | |
U.S. Treasury Note | | | 22,000,000 | | | | 0.071 | | | | 10/15/15 | | | | 22,004,728 | |
U.S. Treasury Note (next reset date 09/01/15) (a) | | | 11,000,000 | | | | 0.174 | | | | 04/30/16 | | | | 11,000,111 | |
U.S. Treasury Note (next reset date 09/01/15) (a) | | | 8,000,000 | | | | 0.127 | | | | 07/31/17 | | | | 8,000,000 | |
U.S. Treasury Note (next reset date 09/01/15) (a) | | | 10,000,000 | | | | 0.158 | | | | 10/31/16 | | | | 9,993,265 | |
U.S. Treasury Note (next reset date 09/01/15) (a) | | | 45,000,000 | | | | 0.150 | | | | 01/31/16 | | | | 44,995,486 | |
U.S. Treasury Note (next reset date 09/01/15) (a) | | | 29,000,000 | | | | 0.094 | | | | 04/30/17 | | | | 29,000,168 | |
| | | | | | | | | | | | | | | | |
| | | | |
Total Treasury Debt
(cost $227,911,773) | | | | | | | | | | | | | | | 227,911,773 | |
| | | | | | | | | | | | | | | | |
| | | | |
Total Investments - 78.1%
(cost $2,271,897,181) | | | | | | | | | | | | | | | 2,271,897,181 | |
| | | | | | | | | | | | | | | | |
| | | | |
| Repurchase Agreements - 14.1% | | | | | | | | | | | | | | | | |
| Government Agency Repurchase Agreements - 4.7% | | | | | | | | | | | | | | | | |
Agreement with Citigroup Global Markets, Inc. and Bank of New York Mellon Corp. (Tri-Party) of $69,000,000 dated August 31, 2015 at 0.140% to be repurchased at $69,000,268 on September 1, 2015, collateralized by: $70,312,000 par various United States Government Mortgage Obligations valued at $70,381,840. | | | | | | | | | | | | | | | 69,000,000 | |
Agreement with Societe Generale and Bank of New York Mellon Corp. (Tri-Party) of $68,000,000 dated August 31, 2015 at 0.140% to be repurchased at $68,000,264 on September 1, 2015, collateralized by: $62,917,502 par various United States Government Mortgage Obligations valued at $69,360,027. | | | | | | | | | | | | | | | 68,000,000 | |
| | | | | | | | | | | | | | | | |
| | | | |
Total Government Agency Repurchase Agreements
(cost $137,000,000) | | | | | | | | | | | | | | | 137,000,000 | |
| | | | | | | | | | | | | | | | |
| | | | |
| SSGA U.S. Government Money Market Fund | | | 9 | |
SSGA U.S. Government Money Market Fund
Schedule of Investments, continued — August 31, 2015
| | | | | | | | | | |
| | | | | | | | |
Value
$ | |
| Treasury Repurchase Agreements - 9.4% | | | | | | | | | | |
Agreement with BNP Paribas and Bank of New York Mellon Corp. (Tri-Party) of $80,000,000 dated August 31, 2015 at 0.130% to be repurchased at $80,000,289 on September 1, 2015, collateralized by: $75,166,100 par various United States Government Treasury Obligations valued at $81,600,000. | | | | | | | | | 80,000,000 | |
Agreement with Calyon Financial, Inc. and Bank of New York Mellon Corp. (Tri-Party) of $31,000,000 dated August 31, 2015 at 0.140% to be repurchased at $31,000,121 on September 1, 2015, collateralized by: $30,674,800 par various United States Government Treasury Obligations valued at $31,620,040. | | | | | | | | | 31,000,000 | |
Agreement with Calyon Financial, Inc. and Bank of New York Mellon Corp. (Tri-Party) of $37,000,000 dated August 31, 2015 at 0.130% to be repurchased at $37,000,134 on September 1, 2015, collateralized by: $36,066,600 par various United States Government Treasury Obligations valued at $37,740,088. | | | | | | | | | 37,000,000 | |
Agreement with Morgan Stanley and Bank of New York Mellon Corp. (Tri-Party) of $25,000,000 dated August 31, 2015 at 0.120% to be repurchased at $25,000,083 on September 1, 2015, collateralized by: $19,673,264 par various United States Government Treasury Obligations valued at $25,500,003. | | | | | | | | | 25,000,000 | |
Agreement with TD Securities (USA) LLC and Bank of New York Mellon Corp. (Tri-Party) of $100,000,000 dated August 31, 2015 at 0.120% to be repurchased at $100,000,333 on September 1, 2015, collateralized by: $94,079,300 par various United States Government Treasury Obligations valued at $102,000,401. | | | | | | | | | 100,000,000 | |
| | | | | | | | | | |
| | | | |
Total Treasury Repurchase Agreements
(cost $273,000,000) | | | | | | | | | 273,000,000 | |
| | | | | | | | | | |
| | | | |
Total Repurchase Agreement
(cost $410,000,000) | | | | | | | | | 410,000,000 | |
| | | | | | | | | | |
| | | | |
Total Investments and Repurchase Agreements - 92.2% (b)
(cost $2,681,897,181) (c) | | | | | | | | | 2,681,897,181 | |
| | | | |
| Other Assets and Liabilities, Net - 7.8% | | | | | | | | | 226,893,188 | |
| | | | | | | | | | |
| | | | |
| Net Assets - 100.0% | | | | | | | | | 2,908,790,369 | |
| | | | | | | | | | |
Footnotes:
| # | For purposes of this report, for non-interest bearing Commercial Paper and Discount Notes, the discount rate at purchase is used to populate the rate column. |
| (a) | Adjustable or floating rate security. Rate shown reflects rate in effect at period end. |
| (b) | Unless otherwise indicated, the values of securities of the Fund are determined based on Level 2 inputs (Note 2). |
| (c) | The cost of securities for federal income tax purposes is substantially the same for financial reporting purposes. |
See accompanying notes which are an integral part of the financial statements.
| | |
| 10 | | SSGA U.S. Government Money Market Fund |
SSGA U.S. Government Money Market Fund
Presentation of Portfolio Holdings — August 31, 2015
| | | | |
| Categories | | % of
Net
Assets | |
| | | | |
Government Agency Debt | | | 70.3 | |
Treasury Debt | | | 7.8 | |
Repurchase Agreements | | | 14.1 | |
| | | | |
Total Investments and Repurchase Agreements | | | 92.2 | |
Other Assets and Liabilities, Net | | | 7.8 | |
| | | | |
| |
| | | 100.0 | |
| | | | |
See accompanying notes which are an integral part of the financial statements.
| | | | |
| SSGA U.S. Government Money Market Fund | | | 11 | |
SSGA Money Market Funds
Statements of Assets and Liabilities — August 31, 2015
| | | | | | | | |
| | | SSGA
Money
Market Fund | | | SSGA
U.S. Government
Money
Market Fund | |
| | | | | | | | |
Assets | | | | | | | | |
Investments at amortized cost which approximates value | | $ | 2,662,236,936 | | | $ | 2,271,897,181 | |
Repurchase agreements at cost which approximates value | | | 785,000,000 | | | | 410,000,000 | |
Cash | | | 1,888 | | | | 247,115,776 | |
Receivables: | | | | | | | | |
Interest | | | 566,717 | | | | 145,069 | |
Fund shares sold | | | 435,879 | | | | 9,925 | |
From adviser | | | 475,888 | | | | 646,856 | |
Prepaid expenses | | | 28,245 | | | | 25,260 | |
| | | | | | | | |
Total assets | | | 3,448,745,553 | | | | 2,929,840,067 | |
| | | | | | | | |
| | |
Liabilities | | | | | | | | |
Payables: | | | | | | | | |
Investments purchased | | | 23,999,580 | | | | 19,899,652 | |
Fund shares redeemed | | | 1,319,484 | | | | — | |
Accrued fees to affiliates and trustees | | | 1,182,104 | | | | 1,061,377 | |
Other accrued expenses | | | 146,568 | | | | 88,669 | |
| | | | | | | | |
Total liabilities | | | 26,647,736 | | | | 21,049,698 | |
| | | | | | | | |
| | | | | | | | |
Net Assets | | $ | 3,422,097,817 | | | $ | 2,908,790,369 | |
| | | | | | | | |
| | |
Net Assets Consist of: | | | | | | | | |
Undistributed net investment income | | $ | — | | | $ | — | |
Accumulated net realized gain (loss) | | | (316 | ) | | | 4,662 | |
Paid in capital | | | 3,422,098,133 | | | | 2,908,785,707 | |
| | | | | | | | |
Net Assets | | $ | 3,422,097,817 | | | $ | 2,908,790,369 | |
| | | | | | | | |
| | |
Net Asset Value, offering and redemption price per share: | | | | | | | | |
Net asset value per share: | | $ | 1.00 | | | $ | 1.00 | |
Net assets | | $ | 3,422,097,817 | | | $ | 2,908,790,369 | |
Shares outstanding ($0.001 par value) | | | 3,422,098,136 | | | | 2,908,869,130 | |
See accompanying notes which are an integral part of the financial statements.
| | |
| 12 | | Statements of Assets and Liabilities |
SSGA Money Market Funds
Statements of Operations — For the Year Ended August 31, 2015
| | | | | | | | |
| | | SSGA
Money
Market Fund | | | SSGA
U.S. Government
Money
Market Fund | |
| | | | | | | | |
Investment Income | | | | | | | | |
Interest | | $ | 7,320,361 | | | $ | 2,800,274 | |
| | | | | | | | |
Total investment income | | | 7,320,361 | | | | 2,800,274 | |
| | | | | | | | |
| | |
Expenses | | | | | | | | |
Advisory fees | | | 8,735,211 | | | | 8,407,743 | |
Administration fees | | | 807,892 | | | | 725,248 | |
Custodian fees | | | 493,138 | | | | 590,796 | |
Distribution fees | | | 1,921,746 | | | | 1,849,704 | |
Transfer agent fees | | | 80,629 | | | | 68,830 | |
Professional fees | | | 96,783 | | | | 94,765 | |
Registration fees | | | 27,728 | | | | 23,668 | |
Shareholder servicing fees | | | 663,268 | | | | 715,100 | |
Trustees’ fees | | | 57,335 | | | | 61,239 | |
Insurance fees | | | 68,335 | | | | 60,786 | |
Printing fees | | | 117,554 | | | | 52,623 | |
Miscellaneous | | | 57,134 | | | | 60,313 | |
| | | | | | | | |
Expenses before reductions | | | 13,126,753 | | | | 12,710,815 | |
Expense reductions | | | (5,806,392 | ) | | | (9,910,541 | ) |
| | | | | | | | |
Net expenses | | | 7,320,361 | | | | 2,800,274 | |
| | | | | | | | |
Net investment income (loss) | | | — | | | | — | |
| | | | | | | | |
| | |
Net Realized Gain (Loss) | | | | | | | | |
Net realized gain (loss) on investments | | | 26,825 | | | | 13,782 | |
| | | | | | | | |
Net Increase (Decrease) in Net Assets from Operations | | $ | 26,825 | | | $ | 13,782 | |
| | | | | | | | |
See accompanying notes which are an integral part of the financial statements.
| | | | |
| Statements of Operations | | | 13 | |
SSGA Money Market Funds
Statements of Changes in Net Assets
| | | | | | | | | | | | | | | | |
| | | SSGA Money Market Fund | | | SSGA U.S. Government
Money Market Fund | |
| | | Year Ended
August 31, 2015 | | | Year Ended
August 31, 2014 | | | Year Ended
August 31, 2015 | | | Year Ended
August 31, 2014 | |
| | | | | | | | | | | | | | | | |
Increase (Decrease) in Net Assets | | | | | | | | | | | | | | | | |
| | | | |
Operations | | | | | | | | | | | | | | | | |
Net investment income | | $ | — | | | $ | 35,749 | | | $ | — | | | $ | — | |
Net realized gain (loss) | | | 26,825 | | | | 27,394 | | | | 13,782 | | | | (3,338 | ) |
| | | | | | | | | | | | | | | | |
Net increase (decrease) in net assets from operations | | | 26,825 | | | | 63,143 | | | | 13,782 | | | | (3,338 | ) |
| | | | | | | | | | | | | | | | |
| | | | |
Distributions | | | | | | | | | | | | | | | | |
From net investment income | | | — | | | | (230,129 | ) | | | — | | | | (4,051 | ) |
From net realized gains | | | (26,778 | ) | | | (106,465 | ) | | | — | | | | (3,148 | ) |
| | | | | | | | | | | | | | | | |
Net decrease in net assets from distributions | | | (26,778 | ) | | | (336,594 | ) | | | — | | | | (7,199 | ) |
| | | | | | | | | | | | | | | | |
| | | | |
Share Transactions | | | | | | | | | | | | | | | | |
Net decrease in net assets from share transactions (Note 4) | | | (10,982,375 | ) | | | (2,067,415,581 | ) | | | (1,232,738,913 | ) | | | (202,559,003 | ) |
| | | | | | | | | | | | | | | | |
Total Net Decrease in Net Assets | | | (10,982,328 | ) | | | (2,067,689,032 | ) | | | (1,232,725,131 | ) | | | (202,569,540 | ) |
| | | | |
Net Assets | | | | | | | | | | | | | | | | |
Beginning of year | | | 3,433,080,145 | | | | 5,500,769,177 | | | | 4,141,515,500 | | | | 4,344,085,040 | |
| | | | | | | | | | | | | | | | |
| | | | |
End of year | | $ | 3,422,097,817 | | | $ | 3,433,080,145 | | | $ | 2,908,790,369 | | | $ | 4,141,515,500 | |
| | | | | | | | | | | | | | | | |
| | | | |
Undistributed net investment income included in net assets | | $ | — | | | $ | — | | | $ | — | | | $ | — | |
See accompanying notes which are an integral part of the financial statements.
| | |
| 14 | | Statements of Changes in Net Assets |
This page has been intentionally left blank.
SSGA Money Market Funds
Financial Highlights
Selected data for a share of beneficial interest outstanding throughout each year is presented below.
| | | | | | | | | | | | | | | | | | | | | | | | |
| | |
$
Net Asset Value,
Beginning of
Year | | | $
Net
Investment
Income (Loss)(a)(b) | | | $
Net Realized
and Unrealized
Gain (Loss) | | | $
Total from
Investment
Operations | | | $
Distributions
from Net
Investment Income | | | $
Distributions
from Net
Realized Gain | |
SSGA Money Market Fund | |
August 31, 2015 | | | 1.0000 | | | | — | | | | — | (c) | | | — | (c) | | | — | | | | — | (c) |
August 31, 2014 | | | 1.0000 | | | | 0.0001 | (d) | | | — | (c) | | | 0.0001 | (d) | | | (0.0001 | ) | | | — | (c) |
August 31, 2013 | | | 1.0000 | | | | 0.0001 | | | | — | (c) | | | 0.0001 | | | | (0.0001 | ) | | | — | |
August 31, 2012 | | | 1.0000 | | | | 0.0001 | | | | — | (c) | | | 0.0001 | | | | (0.0001 | ) | | | — | |
August 31, 2011 | | | 1.0000 | | | | 0.0001 | | | | — | (c) | | | 0.0001 | | | | (0.0001 | ) | | | — | |
SSGA U.S. Government Money Market Fund | |
August 31, 2015 | | | 1.0000 | | | | — | | | | — | (c) | | | — | (c) | | | — | | | | — | |
August 31, 2014 | | | 1.0000 | | | | — | | | | — | (c) | | | — | (c) | | | — | (c) | | | — | (c) |
August 31, 2013 | | | 1.0000 | | | | — | | | | — | | | | — | | | | — | | | | — | |
August 31, 2012 | | | 1.0000 | | | | — | (c) | | | — | (c) | | | — | (c) | | | — | (c) | | | — | |
August 31, 2011 | | | 1.0000 | | | | — | | | | — | | | | — | | | | — | | | | — | |
| (a) | | Average daily shares outstanding were used for this calculation. |
| (b) | | Reflects amounts waived and/or reimbursed by the investment adviser and for certain funds, custody credit arrangements. |
| (c) | | Less than $0.0001 per share. |
| (d) | | Amount previously presented has been restated by $0.0001. |
| (f) | | Less than 0.005% of average net assets. |
See accompanying notes which are an integral part of the financial statements.
| | | | | | | | | | | | | | | | | | | | | | | | | | |
$
Total
Distributions | | | $
Net Asset Value,
End of
Year | | | %
Total
Return | | | $
Net Assets,
End of Year
(000) | | | %
Ratio of Expenses
to Average
Net Assets,
Net(b) | | | %
Ratio of Expenses
to Average
Net Assets,
Gross | | | %
Ratio of Net
Investment Income
to Average
Net Assets(b) | |
| | | | | | | | | | | | | | | | | | | | | | | | | | |
| | — | (c) | | | 1.0000 | | | | — | (e) | | | 3,422,098 | | | | 0.21 | | | | 0.38 | | | | — | |
| | (0.0001 | ) | | | 1.0000 | | | | 0.01 | | | | 3,433,080 | | | | 0.19 | | | | 0.37 | | | | — | (f) |
| | (0.0001 | ) | | | 1.0000 | | | | 0.01 | | | | 5,500,769 | | | | 0.25 | | | | 0.38 | | | | 0.01 | |
| | (0.0001 | ) | | | 1.0000 | | | | 0.01 | | | | 5,556,226 | | | | 0.29 | | | | 0.39 | | | | 0.01 | |
| | (0.0001 | ) | | | 1.0000 | | | | 0.01 | | | | 6,635,185 | | | | 0.31 | | | | 0.38 | | | | 0.01 | |
| | | | | | | | | | | | | | | | | | | | | | | | | | |
| | — | | | | 1.0000 | | | | — | | | | 2,908,790 | | | | 0.08 | | | | 0.38 | | | | — | |
| | — | (c) | | | 1.0000 | | | | — | (e) | | | 4,141,516 | | | | 0.08 | | | | 0.37 | | | | — | |
| | — | | | | 1.0000 | | | | — | | | | 4,344,085 | | | | 0.13 | | | | 0.39 | | | | — | |
| | — | (c) | | | 1.0000 | | | | — | (e) | | | 4,043,417 | | | | 0.10 | | | | 0.39 | | | | — | (f) |
| | — | | | | 1.0000 | | | | — | | | | 4,469,541 | | | | 0.16 | | | | 0.39 | | | | — | |
See accompanying notes which are an integral part of the financial statements.
SSGA Money Market Funds
Notes to Financial Statements — August 31, 2015
The SSGA Funds (the “Trust”) is registered under the Investment Company Act of 1940, as amended (the “1940 Act”), as an open-end management investment company, and was organized as a Massachusetts business trust on October 3, 1987. The Trust operates under a Second Amended and Restated Master Trust Agreement, dated May 15, 2012 (the “Agreement”).
As of August 31, 2015, the Trust consisted of eleven (11) series and corresponding classes each of which have the same rights and privileges, including voting rights. The Declaration of Trust permits the Board of Trustees of the Trust (the “Board”) to authorize the issuance of unlimited number of shares of beneficial interest at a $.001 par value. The financial statements herein relate to the following series (each a “Fund” and, collectively, the “Funds”):
| | | | |
| Fund | | Classes | | Commencement of Operations: |
SSGA Money Market Fund (diversified) | | Class N | | May 2, 1998 |
| | |
SSGA U.S. Government Money Market Fund (diversified) | | Class N | | March 1, 1991 |
The financial statements of the remaining 9 series are presented in separate reports.
The SSGA Money Market Fund and SSGA U.S. Government Money Market Fund are considered to be money market funds pursuant to Rule 2a-7 under the Investment Company Act of 1940, as amended (the “1940 Act”). It is the policy of the Funds to maintain a stable net asset value per share of $1.00. However, there is no assurance the Funds will be able to maintain a stable net asset value per share.
An investment in the Funds is not insured or guaranteed by the Federal Deposit Insurance Corporation or any other government agency. Although the Funds seek to preserve the value of shareholders’ investment at $1.00 per share, it is possible to lose money by investing in the Funds.
Under the Trust’s organizational documents, its officers and trustees are indemnified against certain liabilities arising out of the performance of their duties to the Trust. Additionally, in the normal course of business, the Trust enters into contracts with service providers that contain general indemnification clauses. The Trust’s maximum exposure under these arrangements is unknown as this could involve future claims that may be made against the Trust that have not yet occurred.
Deloitte & Touche LLP (“Deloitte & Touche”) served as independent registered certified public accounting firm through November 19, 2014. On November 19, 2014, upon recommendation by the Audit Committee of the Fund, the Fund’s Board of Trustees selected Ernst & Young LLP to replace Deloitte & Touche as the independent public accountant for the fiscal year ending August 31, 2015.
The reports of Deloitte & Touche on the financial statements for the past two fiscal years contained no adverse opinion or disclaimer of opinion and were not qualified or modified as to uncertainty, audit scope or accounting principles.
During the two most recent fiscal years and through November 19, 2014, there have been no disagreements with Deloitte & Touche on any matter of accounting principles or practices, financial statement disclosure, or auditing scope or procedure, which disagreements if not resolved to the satisfaction of Deloitte & Touche would have caused them to make reference thereto in their reports on the financial statements for such years.
During the two most recent fiscal years and through, there have been no reportable events (as defined in Item 304(a)(1)(v) of Regulation S-K). The Fund requested and Deloitte & Touche furnished a letter addressed to the Securities and Exchange Commission stating whether or not it agreed with the above statements. A copy of such letter was filed as Exhibit 77 to Form N-SAR for the period.
| 2. | | Summary of Significant Accounting Policies |
The following is a summary of significant accounting policies followed by the Trust in the preparation of its financial statements:
The preparation of financial statements in accordance with U.S. generally accepted accounting principles (“U.S. GAAP”) which requires management to make estimates and assumptions that affect the reported amounts and disclosures in the
| | |
| 18 | | Notes to Financial Statements |
SSGA Money Market Funds
Notes to Financial Statements, continued — August 31, 2015
financial statements. Actual results could differ from those estimates. Each Fund is an investment company under U.S. GAAP and follows the accounting and reporting guidance applicable to investment companies in Financial Accounting Standards Board (“FASB”) Accounting Standards Codification (“ASC”) 946, Financial Services Investment Companies (“ASC 946”).
Security Valuation
The Funds’ securities are recorded on the basis of amortized cost which approximates fair value as permitted by Rule 2a-7 under the 1940 Act. This method values a security at its cost on the date of purchase and, thereafter, assumes a constant amortization to maturity of any premiums or accretion of any discounts. These securities are generally included in Level 2 of the fair value hierarchy.
Because of the inherent uncertainties of valuation and under certain market conditions, the values reflected in the financial statements may differ from the value received upon actual sale of those investments and it is possible that the differences could be material.
These inputs are categorized into a fair value hierarchy consisting of three broad levels for financial reporting purposes. The Funds value their assets and liabilities at fair value using a hierarchy that prioritizes the inputs to valuation techniques giving the highest priority to readily available unadjusted quoted prices in active markets for identical assets or liabilities (Level 1 measurements) and the lowest priority to unobservable inputs (Level 3 measurements) when market prices are not readily available or reliable. The categorization of a value determined for an investment within the hierarchy is based upon the pricing transparency of the investment and is not necessarily an indication of the risk associated with investing in it.
The three levels of the fair value hierarchy are as follows:
| | • | | Level 1 — Unadjusted quoted prices in active markets for identical assets or liabilities; |
| | • | | Level 2 — Inputs other than quoted prices included within Level 1 that are observable for the asset or liability either directly or indirectly, including quoted prices for similar assets or liabilities in active markets, quoted prices for identical or similar assets or liabilities in markets that are not considered to be active, inputs other than quoted prices that are observable for the asset or liability (such as exchange rates, financing terms, interest rates, yield curves, volatilities, prepayment speeds, loss severities, credit risks and default rates) or other market-corroborated inputs; and |
| | • | | Level 3 — Unobservable inputs for the asset or liability, including the Committee’s assumptions used in determining the fair value of investments. |
Changes in valuation techniques may result in transfers in or out of an assigned level within the fair value hierarchy. Transfers between different levels of the fair value hierarchy are recognized at the end of the reporting period. The Funds had no transfers between levels for year ended August 31, 2015.
The following is a summary of the inputs used, as of August 31, 2015, in valuing the Funds’ assets carried at fair value:
| | | | | | | | |
| | | Investments in Securities | |
| Valuation Inputs | | SSGA
Money
Market Fund | | | SSGA
U.S. Government
Money
Market Fund | |
| | | | | | | | |
Level 1 — Quoted Prices | | $ | — | | | $ | — | |
Level 2 — Other Significant Observable Inputs | | $ | 3,447,236,936 | | | $ | 2,681,897,181 | |
Level 3 — Significant Unobservable Inputs | | $ | — | | | $ | — | |
| | | | | | | | |
Total | | $ | 3,447,236,936 | | | $ | 2,681,897,181 | |
Investment Transactions and Income Recognition
Investment transactions are accounted for on trade date for financial reporting purposes. Interest income is recorded daily on an accrual basis and includes amortization of premium and accretion of discount on investments. Realized gains and losses from the sale of disposition of investments are determined using the identified cost method.
| | | | |
| Notes to Financial Statements | | | 19 | |
SSGA Money Market Funds
Notes to Financial Statements, continued — August 31, 2015
Dividends and Distributions
Net investment income is declared daily and is payable as of the last business day of each month. Net realized capital gains, if any, are distributed annually, unless additional distributions are required for compliance with applicable tax regulations. The amount and character of income and gains to be distributed are determined in accordance with federal tax regulations which may differ from net investment income and realized gains recognized for U.S. GAAP purposes.
Expenses
Certain expenses, which are directly identifiable to a specific Fund, are applied to that Fund within the Trust. Other expenses which cannot be attributed to a specific Fund are allocated in such a manner as deemed equitable, taking into consideration the nature and type of expense and the relative net assets of the Funds within the Trust.
Repurchase Agreements
The Funds may enter into repurchase agreements under the terms of a Master Repurchase Agreement. A repurchase agreement customarily obligates the seller at the time it sells securities to the Funds to repurchase the securities at a mutually agreed-upon price and time. The total amount received by the Funds on repurchase is calculated to exceed the price paid by the Funds, reflecting an agreed-upon market rate of interest for the period of time to the settlement date, and is not necessarily related to the interest rate on the underlying securities. The underlying securities are ordinarily United States Government or Government Agency securities, but the underlying securities on the SSGA Money Market Fund may consist of other securities such as Corporate Bonds in limited circumstances. The value of the underlying securities, at the time of purchase and each subsequent business day, is required to be maintained at such a level that the value is equal to at least the principal amount of the repurchase price plus accrued interest. The use of repurchase agreements involves certain risks. Upon an event of default under the Master Repurchase Agreement, if the seller of securities under a repurchase agreement defaults on its obligation to repurchase the underlying securities (as a result of its bankruptcy or otherwise) the Funds will seek to dispose of such securities; this action could involve losses, costs or delays. In addition, the proceeds of any such disposition may be less than the amount each Fund is owed under the repurchase agreement. The Funds may enter into repurchase agreements maturing within a specified date with domestic dealers, banks and other financial institutions deemed to be creditworthy by SSGA Funds Management, Inc. (“SSGA FM” or the “Adviser”), a subsidiary of State Street Corporation and an affiliate of State Street Bank and Trust Company (“State Street”).
Federal Income Taxes
Each Fund has qualified and intends to continue to qualify for and elect treatment as a regulated investment company under Subchapter M of the Internal Revenue Code of 1986, as amended. By so qualifying and electing, the Funds will not be subject to federal income taxes to the extent they distribute their taxable income, including any net realized capital gains, for each fiscal year. In addition, by distributing during each calendar year substantially all of their net taxable income and capital gains, if any, the Funds will not be subject to federal excise tax. Income and capital gain distributions if any, are determined in accordance with income tax regulation which may differ from U.S. GAAP. The book tax differences were primarily attributable to equalization.
Management has reviewed the Funds tax positions for the open tax years as of August 31, 2015 and has determined that no provision for income tax is required in the Funds’ financial statements. The Funds’ federal tax returns for the prior three fiscal years remain subject to examination by the Funds’ major tax jurisdictions, which include the United States of America and the Commonwealth of Massachusetts. The Funds recognize interest and penalties, if any, related to tax liabilities as income tax expense in the Statements of Operations.
No income tax returns are currently under examination. Management has analyzed tax laws and regulations and their applications to the Funds’ facts and circumstances and does not believe there are any uncertain tax positions that require recognition of tax liability.
| | |
| 20 | | Notes to Financial Statements |
SSGA Money Market Funds
Notes to Financial Statements, continued — August 31, 2015
For the year ended August 31, 2015, the Funds’ components of distributable earnings and tax composition of distributions for federal income tax purposes were as follows:
| | | | | | | | | | | | | | | | | | | | |
| | | Components of Distributable Earnings: | | | Tax Composition of Distributions: | |
| | | Undistributed
Ordinary Income | | | Undistributed Long-Term Capital Gains | | | Ordinary
Income | | | Long-Term Capital Gains | | | Tax Return
of Capital | |
SSGA Money Market Fund | | $ | — | | | $ | — | | | $ | 26,778 | | | $ | — | | | $ | — | |
SSGA U.S. Government Money Market Fund | | $ | 4,662 | | | $ | — | | | $ | — | | | $ | — | | | $ | — | |
For the year ended August 31, 2014, the Funds’ tax composition of distributions for federal income tax purposes were as follows:
| | | | | | | | | | | | |
| | | Tax Composition of Distributions: | |
| | | Ordinary
Income | | | Long-Term
Capital Gains | | | Tax Return
of Capital | |
SSGA Money Market Fund | | $ | 336,594 | | | $ | — | | | $ | — | |
SSGA U.S. Government Money Market Fund | | $ | 7,199 | | | $ | — | | | $ | — | |
| 3. | | Fees and Compensation paid to Affiliates and other Related Party Transactions |
Adviser and Affiliates
The Adviser manages the Funds pursuant to an Amended and Restated Investment Advisory Agreement dated April 11, 2012, between the Trust and the Adviser. The Adviser and other advisory affiliates of State Street Corporation make up State Street Global Advisors, the investment management arm of State Street Corporation and its affiliated companies. The Adviser directs the investments of each Fund in accordance with their investment objectives, policies, and limitations. For these services, each Fund pays a fee to the Adviser, calculated daily and paid monthly at the annual rate of 0.25% of their daily net assets.
The Adviser is contractually obligated until December 31, 2015 to waive its management fee on the SSGA Money Market Fund and/or to reimburse the Fund for expenses to the extent that total expenses (exclusive of non-recurring account fees, extraordinary expenses, acquired fund fees and distribution, shareholder servicing, and sub-transfer agency fees) exceed 0.32% of average daily net assets on an annual basis. This waiver and/or reimbursement may not be terminated prior to December 31, 2015 except with the approval of the Board. The total amounts of the waiver and reimbursement for the year ended August 31, 2015 were $7,171 and $0, respectively. The Adviser does not have the ability to recover these amounts waived or reimbursed under this contractual agreement.
The Adviser is contractually obligated until December 31, 2015 to waive its management fee on the SSGA U.S. Government Money Market Fund and/or to reimburse the Fund for expenses to the extent that total expenses (exclusive of nonrecurring account fees, extraordinary expenses, acquired fund fees and distribution, shareholder servicing, and sub-transfer agency fees) exceed 0.32% of average daily net assets on an annual basis. This waiver and/or reimbursement may not be terminated prior to December 31, 2015 except with the approval of the Board. The total amounts of the waiver and reimbursement for the year ended August 31, 2015 were $7,004 and $0, respectively. The Adviser does not have the ability to recover these amounts waived or reimbursed under this contractual agreement.
The Adviser also may voluntarily reduce all or a portion of its fees and/or reimburse expenses to the extent necessary to avoid a negative yield (the “Voluntary Reduction”) which may vary from time to time and from fund to fund in the Adviser’s sole discretion. Under an agreement with the Trust relating to the Voluntary Reduction, the Funds have agreed to reimburse the Adviser for the full dollar amount of any Voluntary Reduction beginning on August 1, 2012, subject to certain limitations. A Fund will not be obligated to reimburse the Adviser more than three years after the end of the fiscal year for the Fund in which the Adviser provided a Voluntary Reduction; in respect of any business day for which the net annualized one-day yield is less than 0.00%; to the extent that the amount of the reimbursement to the Adviser on any day exceeds fifty percent of the yield (net of all expenses, exclusive of the reimbursement) of the Fund on that day; to the extent that the amount of such reimbursement would cause the Fund’s net yield to fall below the Fund’s minimum net yield as determined by the Adviser in its sole discretion; or in respect of any fee waivers and/or expense reimbursements that are necessary to maintain a Fund’s contractual total expense limit which is effective at the time of such fee waivers and/or expense reimbursements. A reimbursement to the Adviser would increase fund expenses and negatively impact the SSGA Money Market Fund’s and the SSGA U.S. Government
| | | | |
| Notes to Financial Statements | | | 21 | |
SSGA Money Market Funds
Notes to Financial Statements, continued — August 31, 2015
Money Market Fund’s future yield. There is no guarantee that the Voluntary Reduction will be in effect at any given time or that either the SSGA Money Market Fund or the SSGA U.S. Government Money Market Fund will be able to avoid a negative yield. Reimbursement payments by a fund to the Adviser in connection with the Voluntary Reduction are considered extraordinary. For the year ended August 31, 2015, the Adviser waived $5,711,610 of its fee and reimbursed $0 of expenses on the SSGA Money Market Fund and waived $8,400,739 of its fee and reimbursed $1,432,989 of expenses on the SSGA U.S. Government Money Market Fund. Voluntary reductions subject to potential recovery by year of expiration are as follows:
| | | | | | | | |
| Expiration | | SSGA
Money
Market Fund | | | SSGA
U.S. Government
Money
Market Fund | |
| | | | | | | | |
8/31/2016 | | $ | 6,490,477 | | | $ | 9,294,397 | |
8/31/2017 | | $ | 7,368,968 | | | $ | 9,815,855 | |
8/31/2018 | | $ | 5,711,610 | | | $ | 8,400,739 | |
Boston Financial Data Services, Inc. (“BFDS”), a joint venture of DST Systems, Inc. and State Street Corporation, serves as the Funds’ transfer and dividend paying agent, pursuant to an agreement dated August 1, 2006, as amended. For these services, the Funds pay annual account services fees, activity based fees, charges related to compliance and regulatory services.
State Street provides custody and fund accounting services to the Funds pursuant to an Amended and Restated Custodian Contract dated April 11, 2012. For these services, the Funds pay State Street asset-based fees that vary according to the number of positions and transactions plus out-of-pocket expenses. State Street is a wholly-owned subsidiary of State Street Corporation.
Administrator and Sub-Administrator
Effective June 1, 2015, SSGA FM serves as Administrator and State Street serves as Sub-Administrator. Pursuant to the Administration Agreement between the Trust on behalf of the Funds and SSGA FM, each Fund pays a fee at an annual rate of 0.05% of the Fund’s net assets. SSGA FM has contractually agreed to waive 0.01% of its administration fee. For the year ended, August 31, 2015, SSGA FM waived fees in the amount of $87,611 and $69,809 for the SSGA Money Market Fund and SSGA U.S. Government Money Market Fund, respectively. This waiver may not be terminated or modified except with the approval of the Board.
Prior to June 1, 2015, State Street served as the Administrator of the Funds. For its services as Administrator, the Trust paid State Street an annual fee, payable monthly on a pro rata basis. The annual fee was based on the following percentages of the average daily net assets of the Trust: $0 to $10 billion — 0.0175%; next $10 billion — 0.0125%; next $10 billion — 0.0075% and 0.0050% thereafter. In addition, the Trust paid additional fees to the Administrator for certain services and reimbursed the Administrator for out-of-pocket expenses.
Distributor and Shareholder Servicing
State Street Global Markets, LLC (the “Distributor” or “SSGM”) promotes and offers shares of the Trust pursuant to an Amended and Restated Distribution Agreement dated April 14, 2014. The Distributor may enter into agreements with other related and non-related parties which act as agents to offer and sell shares of the Funds. The amounts paid to the Distributor are included in the accompanying Statements of Operations. The Distributor is a wholly-owned subsidiary of State Street Corporation.
To compensate the Distributor for the services it provides and for the expenses it bears in connection with the distribution of shares of the Funds, each Fund may make payments from the assets attributable to certain classes of its shares to the Distributor under a distribution plan adopted pursuant to Rule 12b-1 under the 1940 Act (the “Plan”). The Plan is a compensation plan that provides for payments at annual rates (based on average daily net assets) described below.
The Plan will continue in effect with respect to a class of shares of a Fund only if such continuance is specifically approved at least annually by a vote of both a majority of the Board and a majority of the Trustees of the Trust who are not “interested persons” of the Trust (the “Independent Trustees”) and have no direct or indirect financial interest in the Plan or in any agreements related thereto (the “Qualified Distribution Plan Trustees”). The Plan may not be amended to increase materially the amount of a Fund’s permitted expenses thereunder without the approval of a majority of the outstanding shares of the affected share class and may not be materially amended in any case without a vote of the majority of both the Trustees and the Qualified Distribution Plan Trustees. At the time of adoption, none of the Independent Trustees of the Trust had a direct or
| | |
| 22 | | Notes to Financial Statements |
SSGA Money Market Funds
Notes to Financial Statements, continued — August 31, 2015
indirect financial interest in the operation of the Plan. The Plan calls for payments at an annual rate (based on average net assets) of 0.25%.
Additionally, the Board approved the following limits on the amount of Rule 12b-1 fees paid to the Distributor:
| | | | |
| | | 12b-1 Fee Limit | |
SSGA Money Market Fund | | | 0.08 | % |
SSGA U.S. Government Money Market Fund | | | 0.08 | % |
The Plan may benefit the Funds by increasing sales of shares and reducing redemptions of shares, resulting potentially, for example, in economies of scale and more predictable flows of cash into and out of the Funds. Because Rule 12b-1 fees are paid out of a Fund’s assets, all shareholders share in that expense; however, because shareholders hold their shares through varying arrangements (for example, directly or through financial intermediaries), they may not share equally in the benefits of the Plan.
Financial intermediaries are firms that, for compensation, sell shares of mutual funds, including the Funds, and/or provide certain administrative and account maintenance services to mutual fund shareholders. Financial intermediaries may include, among others, brokers, financial planners or advisors, banks, and insurance companies.
In some cases, a financial intermediary may hold its clients’ Fund shares in nominee or street name. Shareholder services provided by a financial intermediary may (though they will not necessarily) include, among other things: processing and mailing trade confirmations, periodic statements, prospectuses, annual reports, semi-annual reports, shareholder notices, and other SEC-required communications; capturing and processing tax data; issuing and mailing dividend checks to shareholders who have selected cash distributions; preparing record date shareholder lists for proxy solicitations; collecting and posting distributions to shareholder accounts; and establishing and maintaining systematic withdrawals and automated investment plans and shareholder account registrations.
The compensation paid by the Distributor to a financial intermediary may be paid continually over time, during the period when the intermediary’s clients hold investments in the Funds. The compensation to financial intermediaries includes asset-based fees and account-based fees. The amount of continuing compensation paid by the Distributor to different financial intermediaries varies. Some portion of the Distributor’s payments to financial intermediaries will be made out of amounts received by the Distributor under the Funds’ Plans. In addition, certain of the Funds may reimburse the Distributor for payments the Distributor makes to financial intermediaries that provide certain recordkeeping, administrative and account maintenance services. The amount of the reimbursement is calculated in a manner approved by the Trustees and is reviewed by the Trustees periodically. A Fund may pay distribution fees, service fees and other amounts described above at a time when shares of the Fund are not being actively promoted to new investors generally, or when shares of that Fund are unavailable for purchase.
Each Fund listed in the table below has shareholder service agreements during the reporting period with State Street and the following entities related to State Street: SSGM, Fiduciary Investors Services Division of State Street (“Fiduciary Investors Services”), High Net Worth Services Division of State Street (“High Net Worth Services”) and Wealth Management Systems, as well as unaffiliated service providers (collectively, the “Agents”). For these services, Class N shares paid 0.025% to State Street and a maximum of 0.175% to each of the affiliated Agents, based on the average daily value of all Class N shares held by or for customers of these Agents. Effective June 1, 2015, the shareholder service agreement between the Trust and State Street was terminated. For the year ended August 31, 2015, each Fund paid the following shareholder servicing expenses to the Agents:
| | | | | | | | | | | | | | | | |
| | | State Street | | | SSGM | | | High Net
Worth
Services | | | Wealth
Management
Systems | |
| | | | | | | | | | | | | | | | |
SSGA Money Market Fund | | $ | 608,056 | | | $ | 216,967 | | | $ | 3,028 | | | $ | 95,466 | |
SSGA U.S. Government Money Market Fund | | | 638,400 | | | | — | | | | 1,137,520 | | | | 111,121 | |
The Fund(s) did not incur any expenses from Fiduciary Investors Services during the year.
Board of Trustees
Independent Trustees are compensated on a calendar year basis. Any Trustee who is deemed to be an “interested person” (as defined in the 1940 Act) of the Funds does not receive compensation from the Funds for his or her service as a Trustee.
| | | | |
| Notes to Financial Statements | | | 23 | |
SSGA Money Market Funds
Notes to Financial Statements, continued — August 31, 2015
Each Independent Trustee receives for his or her services to the State Street Master Funds, State Street Institutional Investment Trust and SSGA Funds, a $141,500 annual base retainer in addition to $18,000 for each in-person meeting and $2,000 for each telephonic meeting from the Trust. Trustees’ fees and expenses are allocated among the Trusts and Funds overseen by the Trustees in a manner deemed equitable taking into consideration the relative net assets of the Funds, subject to a $15,000 minimum per Fund. The Co-Chairmen each receive an additional $44,000 annual retainer. The Independent Trustees are reimbursed for travel and other out-of-pocket expenses in connection with meeting attendance. Trustee fees are allocated among the Trusts and each of their respective series in such a manner as deemed equitable, taking into consideration the relative net assets of the series. As of the date of this Shareholder Report, the Trustees were not paid pension or retirement benefits as part of SSGA Funds’ expenses. However, the SSGA Funds have, pursuant to an exemptive order from the SEC, implemented an optional deferred compensation plan by which the Independent Trustees may defer receipt of compensation and receive a return on the deferred amount determined with reference to the performance of shares of specified SSGA Funds. As of the fiscal year ended August 31, 2015, none of the Independent Trustees participated in the optional deferred compensation program.
The Trust’s officers are compensated by the Adviser and its affiliates.
Accrued fees payable to affiliates and trustees as of August 31, 2015 were as follows:
| | | | | | | | |
| | | SSGA
Money
Market Fund | | | SSGA
U.S. Government
Money
Market Fund | |
| | | | | | | | |
Advisory fees | | $ | 750,017 | | | $ | 589,022 | |
Administration fees | | | 143,443 | | | | 116,786 | |
Custodian fees | | | 121,800 | | | | 243,117 | |
Distribution fees | | | 88,949 | | | | 9,086 | |
Shareholder servicing fees | | | 59,256 | | | | 88,604 | |
Transfer agent fees | | | 15,971 | | | | 14,099 | |
Trustees’ fees | | | 2,668 | | | | 663 | |
| | | | | | | | |
| | $ | 1,182,104 | | | $ | 1,061,377 | |
| | | | | | | | |
| 4. | | Fund Share Transactions |
| | | | | | | | |
| | | Year Ended
August 31, 2015 | | | Year Ended
August 31, 2014 | |
| | | | | | | | |
SSGA Money Market Fund | | | | | | | | |
Proceeds from shares sold | | $ | 32,953,000,509 | | | $ | 39,918,886,419 | |
Proceeds from reinvestment of distributions | | | 10,040 | | | | 111,117 | |
Payments for shares redeemed | | | (32,963,992,924 | ) | | | (41,986,413,117 | ) |
| | | | | | | | |
Net decrease | | $ | (10,982,375 | ) | | $ | (2,067,415,581 | ) |
| | | | | | | | |
| | | | | | | | |
| | |
SSGA U.S. Government Money Market Fund | | | | | | | | |
Proceeds from shares sold | | $ | 42,703,008,926 | | | $ | 49,706,658,546 | |
Proceeds from reinvestment of distributions | | | — | | | | 915 | |
Payments for shares redeemed | | | (43,935,747,839 | ) | | | (49,909,218,464 | ) |
| | | | | | | | |
Net decrease | | $ | (1,232,738,913 | ) | | $ | (202,559,003 | ) |
| | | | | | | | |
The number of shares sold, reinvested and redeemed corresponds to the net proceeds from the sale of shares, reinvestment of all distributions and cost of shares redeemed, respectively, since shares are sold and redeemed at $1.00 per share.
| | |
| 24 | | Notes to Financial Statements |
SSGA Money Market Funds
Notes to Financial Statements, continued — August 31, 2015
| 5. | | Market, Credit and Counterparty Risk |
In the normal course of business, the Funds invest in securities and enter into transactions where risks exist due to fluctuations in the market (market risk) or failure of the other party to a transaction to perform (counterparty risk). The value of securities held by each Fund may decline in response to certain events, including those directly involving the companies whose securities are owned by the Funds; conditions affecting the general economy; overall market changes; local, regional or global political, social or economic instability; and currency and interest rate and price fluctuations (credit risk). Similar to credit risk, the Funds may be exposed to counterparty risk, or the risk that an entity with which the Funds have unsettled or open transactions may default. Financial assets, which potentially expose the Funds to credit and counterparty risks, consist principally of investments and cash due from counterparties. The extent of the Funds’ exposure to credit and counterparty risks in respect to these financial assets approximates their value as recorded in the Funds’ Schedules of Investments.
| 6. | | Rule Issuance and Recent Accounting Pronouncements |
On July 23, 2014, the U.S. Securities and Exchange Commission (the “SEC”) adopted amendments to the governing rules for money market funds. The amendments require that, following a two-year implementation timeframe, institutional prime and institutional tax exempt money market funds adopt a floating net asset value. The rule changes also allow for certain liquidity-based redemption fees and gate, and include enhanced requirements for disclosure and stress testing. The degree to which a money market fund will be impacted by the rule amendments will depend upon the type of fund and type of investors (retail or institutional). At this time, management is evaluating the implications of these amendments and their impact to the Funds’ financial statements and related disclosure.
In June 2014, the Financial Accounting Standards Board issued Accounting Standards Update 2014-11, Transfers and Servicing (Topic 860) — Repurchase-to-Maturity Transactions, Repurchase Financings, and Disclosures (“ASU 2014-11”). ASU 2014-11 changes the accounting for repurchase-to-maturity transactions and enhances the required disclosures for repurchase agreements, reverse repurchase agreements and other similar transactions accounted for as secured borrowings, including securities lending. Management is evaluating the impact, if any, of this standard on the Funds’ financial statements and related disclosures, which would first be effective for annual and interim reporting periods beginning after December 15, 2014.
Management has evaluated the impact of all subsequent events on the Funds through the date the financial statements were available to be issued and has determined that there were no subsequent events requiring adjustment or disclosure in the financial statements.
| | | | |
| Notes to Financial Statements | | | 25 | |
SSGA Money Market Funds
Report of Independent Registered Public Accounting Firm
To the Shareholders and Board of Trustees of SSGA Funds:
We have audited the accompanying statements of assets and liabilities, including the schedules of investments, of SSGA Money Market Fund and SSGA U.S. Government Money Market Fund (collectively, the “Funds”) (two of the portfolios constituting SSGA Funds) as of August 31, 2015, and the related statements of operations, statements of changes in net assets, and the financial highlights for the year then ended. These financial statements and financial highlights are the responsibility of the Funds’ management. Our responsibility is to express an opinion on these financial statements and financial highlights based on our audit. The statements of changes in net assets for the year ended August 31, 2014 and the financial highlights for periods ended prior to September 1, 2014 were audited by another independent registered public accounting firm whose report, dated October 30, 2014, expressed an unqualified opinion on those statements of changes in net assets and those financial highlights.
We conducted our audit in accordance with the standards of the Public Company Accounting Oversight Board (United States). Those standards require that we plan and perform the audits to obtain reasonable assurance about whether the financial statements and financial highlights are free of material misstatement. We were not engaged to perform an audit of the Funds’ internal control over financial reporting. Our audits included consideration of internal controls over financial reporting as a basis for designing audit procedures that are appropriate in the circumstances, but not for the purpose of expressing an opinion on the effectiveness of the Funds’ internal controls over financial reporting. Accordingly, we express no such opinion. An audit also includes examining, on a test basis, evidence supporting the amounts and disclosures in the financial statements and financial highlights, assessing the accounting principles used and significant estimates made by management, and evaluating the overall financial statement presentation. Our procedures included confirmation of securities owned as of August 31, 2015, by correspondence with the custodian and others or by other appropriate auditing procedures where replies from others were not received. We believe that our audit provides a reasonable basis for our opinion.
In our opinion, the financial statements and financial highlights referred to above present fairly, in all material respects, the financial position of each of the above mentioned Funds of SSGA Funds at August 31, 2015, and the results of their operations, the changes in their net assets, and the financial highlights for the year then ended, in conformity with U.S. generally accepted accounting principles.

Boston, Massachusetts
October 30, 2015
| | |
| 26 | | Report of Independent Registered Public Accounting Firm |
SSGA Money Market Funds
Tax Information — August 31, 2015 (Unaudited)
For the tax year ended August 31, 2015, the Money Market Fund hereby designates 97% or the maximum amount allowable, of its net taxable income as qualified interest income taxed at individual ordinary income rates.
For the tax year ended August 31, 2015, the U.S. Government Money Market Fund hereby designates 100% or the maximum amount allowable, of its net taxable income as qualified interest income taxed at individual ordinary income rates.
Short term capital gains dividends of $26,778 were paid by the Money Market Fund during the year ended August 31, 2015.
The Form 1099-DIV mailed to you in January 2016 will show the tax status of all distributions paid to your account in calendar year 2015.
Please consult a tax advisor for questions about federal or state income tax laws.
SSGA Money Market Funds
Basis for Approval of Investment Advisory Contracts (Unaudited)
Trustee Considerations in Approving Continuation of Investment Advisory Agreement1
Overview of the Contract Review Process
Under the Investment Company Act of 1940, an investment advisory agreement between a mutual fund and its investment adviser may continue in effect from year to year only if its continuance is approved at least annually by the fund’s board of trustees, including by a vote of a majority of those trustees who are not “interested persons” of the fund (commonly referred to as, the “Independent Trustees”) cast in person at a meeting called for the purpose of considering such approval.
Consistent with these requirements, the Independent Trustees on the Board of Trustees (the “Board”) of the SSGA Funds (the “Trust”), met in Executive Sessions on April 12-13, 2015, and May 18-19, 2015 to consider a proposal to approve, with respect to each portfolio series of the Trust (each, a “Fund” and collectively, the “Funds”), the continuation of the investment advisory agreement (the “Advisory Agreement”) with SSGA Funds Management, Inc. (the “Adviser”). Prior to voting on the proposal, the Independent Trustees, as well as the Trustees who are “interested persons” of the Adviser, reviewed information furnished by the Adviser and others reasonably necessary to permit the Board to evaluate the proposal fully. The Independent Trustees were separately represented by co-counsel that is independent of the Adviser in connection with their consideration of approval of the Advisory Agreement. Following the April 12-13, 2015 meeting, the Independent Trustees submitted questions and requests for additional information to management, and considered management’s responses thereto prior to and at the May 18-19, 2015 meeting. The Independent Trustees considered, among other things, the following:
Information about Performance, Expenses and Fees
| • | | A report prepared by an independent third-party provider of investment company data, which includes for each Fund: |
| | ¡ | | Comparisons of the Fund’s performance over the past one-, three-, five- and ten-year periods ended December 31, 2014, as applicable, to the performance of an appropriate benchmark for the Fund and a universe of other mutual funds with similar investment objectives and policies; |
| | ¡ | | Comparisons of the Fund’s expense ratio (with detail of component expenses) to the expense ratios of a group of comparable mutual funds selected by the independent third-party data provider; |
| | ¡ | | A chart showing the Fund’s historical average net assets relative to its total expenses, management fees, and non-management expenses over the past five years, as applicable; and |
| | ¡ | | Comparisons of the Fund’s contractual management fee to the contractual management fees of comparable mutual funds at different asset levels. |
| • | | Comparative information concerning fees charged by the Adviser for managing institutional accounts using investment strategies and techniques similar to those used in managing the Funds, as applicable; and |
| • | | Profitability analyses for (a) the Adviser with respect to each Fund and (b) affiliates of the Adviser that provide services to the Funds (“Affiliated Service Providers”). |
| 1 | Over the course of more than 20 years, the Independent Trustees have identified numerous relevant issues, factors and concerns (“issues, factors and concerns”) that they consider each year in connection with the proposed continuation of the advisory agreement, the administration agreement, the distribution plans, the distribution agreement and various related-party service agreements (the “annual review process”). The statement of issues, factors and concerns and the related conclusions of the Independent Trustees may not change substantially from year to year. However, the information requested by, and provided to, the Independent Trustees with respect to the issues, factors and concerns and on which their conclusions are based is updated annually and, in some cases, may differ substantially from the previous year. The Independent Trustees schedule annually a separate in-person meeting that is dedicated to the annual review process (the “special meeting”). At the special meeting and throughout the annual review process, the Independent Trustees take a fresh look at each of the issues, factors and concerns in light of the latest available information and each year present one or more sets of comments and questions to management with respect to specific issues, factors and concerns. Management responds to such comments and questions to the satisfaction of the Independent Trustee before the annual review process is completed and prior to the Independent Trustees voting on proposals to approve continuation of the agreements and plans. |
| | |
| 28 | | Basis for Approval of Investment Advisory Contracts |
SSGA Money Market Funds
Basis for Approval of Investment Advisory Contracts (Unaudited), continued
Information about Portfolio Management
| • | | Descriptions of the investment management services provided by the Adviser, including its investment strategies and processes; |
| • | | Information concerning the allocation of brokerage and the benefits received by the Adviser as a result of brokerage allocation, including information concerning the acquisition of any research through “soft dollar” benefits received in connection with the Funds’ brokerage; and |
| • | | Information regarding the procedures and processes used to value the assets of the Funds and the assistance provided to the administrator of the Funds by the Adviser in monitoring the effectiveness of such procedures and processes. |
Information about the Adviser
| • | | Reports detailing the financial results and condition of the Adviser and its affiliates; |
| • | | Descriptions of the qualifications, education and experience of the individual investment professionals responsible for managing the portfolios of the Funds; |
| • | | A copy of each Code of Ethics adopted by the Adviser, together with information relating to compliance with and the administration of such Codes; |
| • | | A copy of the Adviser’s proxy voting policies and procedures; |
| • | | Information concerning the resources devoted by the Adviser to overseeing compliance by the Funds and their service providers, including the Adviser’s record of compliance with investment policies and restrictions and other operating policies of the Funds; |
| • | | A description of the business continuity and disaster recovery plans of the Adviser; and |
| • | | Information regarding the Adviser’s risk management processes. |
Other Relevant Information
| • | | Information concerning the nature, quality and cost of various non-investment management services provided to the Funds by affiliates of the Adviser, including the custodian, administrator, fund accountant, transfer agent and securities lending agent of the Funds, and the role of the Adviser in managing the Funds’ relationship with these service providers; |
| • | | Copies of the Advisory Agreement and agreements with other service providers of the Funds; |
| • | | Draft responses to the letter dated March 11, 2015 from Joseph P. Barri, LLC, co-counsel along with the law firm of Sullivan & Worcester LLP (together, “Independent Counsel”), to the Independent Trustees, and reviewed prior to such date by Independent Counsel, requesting specific information, from each of: |
| | ¡ | | The Adviser, with respect to its operations relating to the Funds and its approximate profit margins before taxes from such operations for the Funds’ last fiscal year; and the relevant operations of other affiliated service providers to the Funds, together with their approximate profit margins from such relevant operations for the Funds’ last fiscal year; |
| | ¡ | | State Street Bank and Trust Company (“State Street”), the sub-administrator, administrator, custodian, transfer agent, securities lending agent, and/or shareholder services, as applicable, for the Funds, with respect to its operations relating to the Funds; and |
| | ¡ | | State Street Global Markets, LLC, the principal underwriter and distributor of the shares of the Funds (the “Distributor”), with respect to its operations relating to the Funds, together with the Funds’ related distribution plans and arrangements under SEC Rule 12b-1; |
| • | | Information from the Adviser, State Street and the Distributor providing any material changes to the previous information supplied in response to the letter dated March 11, 2015 from Joseph P. Barri, LLC prior to the Executive Sessions of the Board on May 18-19, 2015. |
| | | | |
| Basis for Approval of Investment Advisory Contracts | | | 29 | |
SSGA Money Market Funds
Basis for Approval of Investment Advisory Contracts (Unaudited), continued
| • | | Excerpts from the Funds’ most recent Prospectuses, Statements of Additional Information and Annual Reports for the fiscal year ended August 31, 2014, including (i) the latest prospectus descriptions of each Fund’s investment objectives, strategies and authorized investment techniques and investments; and (ii) the latest Annual Shareholder Report for each Fund, including Portfolio Management Discussion of Performance, as prepared by its portfolio management team, together with a graphic comparison of the performance of each Fund with its benchmark index, for its fiscal year ended August 31, 2014; |
| • | | Lipper materials dated March 2015, circulated to the Independent Trustees and to Independent Counsel, with respect to the Funds for which such materials were then available; and |
| • | | A summary of the foregoing materials prepared by Independent Counsel. |
In addition to the information identified above, the Board considered information provided from time to time by the Adviser, and other service providers of the Funds throughout the year at meetings of the Board and its committees. At such meetings, the Trustees received, among other things, presentations by the portfolio managers and other investment professionals of the Adviser relating to the performance of the Funds and the investment strategies used in pursuing each Fund’s investment objective.
The Independent Trustees were assisted throughout the contract review process by their independent legal counsel. The Independent Trustees relied upon the advice of such counsel and their own business judgment in determining the material factors to be considered in evaluating the Advisory Agreement, and the weight to be given to each such factor. The conclusions reached with respect to the Advisory Agreement were based on a comprehensive evaluation of all the information provided and not any single factor. Moreover, each Trustee may have placed varying emphasis on particular factors in reaching conclusions with respect to each Fund.
Results of the Process
Based on a consideration of the foregoing and such other information as deemed relevant, including the factors and conclusions described below, on May 18-19, 2015 the Board, including a majority of the Independent Trustees, voted to approve continuation of the Advisory Agreement effective June 1, 2015, for an additional year with respect to all Funds.
Nature, Extent and Quality of Services
In considering whether to approve the Advisory Agreement, the Board evaluated the nature, extent and quality of services provided to each Fund by the Adviser.
The Board considered the Adviser’s management capabilities and investment process with respect to the types of investments held by each Fund, including the education, experience and number of investment professionals and other personnel who provide portfolio management, investment research, and similar services to the Fund. The Board evaluated, where relevant, the abilities and experience of such investment personnel in analyzing particular markets, industries and specific issuers of securities in these markets and industries. The Board also considered the substantial expertise of the Adviser in developing and applying proprietary quantitative models for managing various Funds that invest primarily in equity securities. With respect to those Funds that invest primarily in fixed-income securities, the Board considered the extensive experience and resources committed by the Adviser to the evaluation of credit, interest-rate and currency risks. The Board also considered the Adviser’s success in maintaining the constant dollar value of each Fund through extraordinary market conditions. The Board also took into account the compensation paid to recruit and retain investment personnel, and the time and attention devoted to the Funds by senior management.
The Board reviewed the compliance programs of the Adviser and various affiliated service providers. Among other things, the Board considered compliance and reporting matters relating to personal trading by investment personnel, selective disclosure of portfolio holdings, late trading, frequent trading, portfolio valuation, business continuity, the allocation of investment opportunities and the voting of proxies. The Board also considered the role of the Adviser in monitoring each Fund’s securities lending activities.
On the basis of the foregoing and other relevant information, the Board concluded that the Adviser can be expected to continue to provide, high quality investment management and related services for the Funds.
| | |
| 30 | | Basis for Approval of Investment Advisory Contracts |
SSGA Money Market Funds
Basis for Approval of Investment Advisory Contracts (Unaudited), continued
Fund Performance
The Board compared each Fund’s investment performance to the performance of an appropriate benchmark and universe of comparable mutual funds for various time periods ended December 31, 2014. The Board noted the relatively narrow range of returns in each Fund’s Performance Group and Performance Universe. The Board also observed that several basis points of performance, whether from yield on portfolio investments or fees waived by service providers, accounted for substantial differences in performance relative to other funds in such Group and Universe during periods when preservation of capital and net asset value were generally considered by stockholders to have been more important than several basis points of yield. Among other information, the Board considered the following performance information in its evaluation of your Fund(s):
SSGA Money Market Fund. The Board considered that: (a) the Fund underperformed the medians of its Performance Group and Performance Universe for the 1-year period, equaled the medians of its Performance Group and Performance Universe for the 3- and 5-year periods, and outperformed the medians of its Performance Group and Performance Universe for the 10-year period; and (b) the Fund underperformed its Lipper Index for the 1- and 5- year periods, equaled its Lipper Index for the 3-year period, and outperformed its Lipper Index for the 10-year period. The Board took into account management’s discussion of the Fund’s performance.
SSGA U.S. Government Money Market Fund. The Board considered that the Fund underperformed the medians of its Performance Group and Performance Universe and its Lipper Index for the 1-, 3- and 5-year periods, equaled the median of its Performance Group for the 10-year period and outperformed the median of its Performance Universe and Lipper Index for the 10-year period. The Board took into account management’s discussion of the Fund’s performance.
On the basis of the foregoing and other relevant information, the Board concluded that the performance of each Fund is satisfactory or better (a) by comparison to the performance of its peer group funds or (b) after considering steps taken by management to improve the performance of certain Funds.
Management Fees and Expenses
The Board reviewed the contractual investment advisory fee rates payable by each Fund and actual fees paid by each Fund, net of waivers. As part of its review, the Board considered each Fund’s management fee and total expense ratio (both before and after giving effect to any expense caps), as compared to a group of similarly managed funds selected by an independent data provider. The Board also considered the comparability of the fees charged and the services provided to each Fund by the Adviser to the fees charged and services provided to other clients of the Adviser, including institutional accounts. In addition, the Board considered the willingness of the Adviser to provide undertakings from time to time to waive fees or pay expenses of various Funds to limit the total expenses borne by shareholders of such Funds. Among other information, the Board considered the following expense information in its evaluation of your Fund(s):
SSGA Money Market Fund. The Board considered that the Fund’s actual management fee was slightly above the median of its Expense Group and equal to the median of its Expense Universe. The Board also considered that the Fund’s total expenses were slightly above the median of its Expense Group and equal to the median of the Fund’s Expense Universe. The Board took into account management’s discussion of the Fund’s expenses.
SSGA U.S. Government Money Market Fund. The Board considered that the Fund’s actual management fee was below the medians of its Expense Group and Expense Universe. The Board also considered that the Fund’s total expenses were below the medians of its Expense Group and Expense Universe.
On the basis of the foregoing and other relevant information, and in light of the nature, extent and quality of the services provided by the Adviser, the Board concluded that the fees and the expense ratio of each Fund compare favorably to the fees and expenses of similar mutual funds and are reasonable in relation to the services provided.
Profitability
The Board reviewed the level of profits realized by the Adviser and its affiliates in providing investment advisory and other services to each Fund and to all Funds as a group. The Board considered other direct and indirect benefits received by the Adviser and the Affiliated Service Providers in connection with their relationships with the Funds, including the benefits of research services that
| | | | |
| Basis for Approval of Investment Advisory Contracts | | | 31 | |
SSGA Money Market Funds
Basis for Approval of Investment Advisory Contracts (Unaudited), continued
may be available to the Adviser as a result of securities transactions effected for the Funds and other investment advisory clients, together with the ranges of profitability of each of the Affiliated Service Providers with respect to their services to the Funds.
The Board concluded that the profitability of the Adviser with respect to each of the Funds, and the profitability range of each of the Affiliated Service Providers with respect to its services to the Funds, were reasonable in relation to the services provided.
Economies of Scale
In reviewing management fees and profitability, the Board also considered the extent to which the Adviser and its affiliates, on the one hand, and each Fund and all Funds as a group, on the other hand, can expect to realize benefits from economies of scale as the assets of the Funds increase. The Board acknowledged the difficulty in accurately measuring the benefits resulting from the economies of scale with respect to the management of any specific Fund or the Funds taken as a whole. The Board concluded that, in light of the current size of each Fund and all Funds as a group, the level of profitability of the Adviser and its affiliates with respect to each Fund and all Funds as a group over various time periods, and the comparatively low management fee and expense ratio of each Fund during these periods, it does not appear that the Adviser or its affiliates has realized benefits from economies of scale in managing the assets of the Funds to such an extent that previously agreed advisory fees should be reduced or that breakpoints in such fees should be implemented for any Fund at this time.
Conclusions
In reaching its decision to approve the Advisory Agreement, the Board did not identify any single factor as being controlling, but based its recommendation on each of the factors it considered. Each Trustee may have contributed different weight to the various factors. Based upon the materials reviewed, the representations made and the considerations described above, and as part of its deliberations, the Board, including the Independent Trustees, concluded that the Adviser possesses the capability and resources to perform the duties required of it under the Advisory Agreement.
Further, based upon its review of the Advisory Agreement, the materials provided, and the considerations described above, the Board, including the Independent Trustees, concluded that (1) the terms of the Advisory Agreement are reasonable, fair, and in the best interests of each Fund and its respective shareholders, and (2) the rates payable under the Advisory Agreement are fair and reasonable in light of the usual and customary charges made for services of the same nature and quality.
| | |
| 32 | | Basis for Approval of Investment Advisory Contracts |
SSGA Money Market Funds
Shareholder Requests for Additional Information — August 31, 2015 (Unaudited)
Proxy Voting Policies and Procedures and Record
The Funds have adopted the proxy voting policies of the Adviser. A description of the policies and procedures that the Funds have adopted to determine how to vote proxies relating to portfolio securities are contained in the Funds’ Statement of Additional Information, which is available (i) without charge, upon request, by calling the Funds at (800) 647-7327, (ii) on the Funds’ website at www.SSGAfunds.com, (iii) on the U.S. Securities and Exchange Commission’s website at www.sec.gov, or (iv) at the U.S. Securities and Exchange Commission’s public reference room. Information on the operation of the public reference room may be obtained by calling 1-800-SEC-0330. Information regarding how the Funds voted proxies, if any, during the most recent 12-month period ended June 30 is available by August 31 of each year without charge (1) by calling 1-800-997-7327 (toll free), or (2) on the website of the Securities and Exchange Commission (“SEC”) at www.sec.gov.
Quarterly Portfolio Schedule
The Funds will file their complete schedules of investments with the U.S. Securities and Exchange Commission for the first and third quarters of each fiscal year on Form N-Q. For the second and fourth quarters, the complete schedules of investments are available in the Funds’ semi-annual and annual financial statements. The Funds’ Form N-Q is available (i) without charge, upon request, by calling the Funds at (800) 647-7327, (ii) on the Funds’ website at www.SSGAfunds.com, (iii) on the Securities and Exchange Commission’s website at www.sec.gov, or (iv) at the Securities and Exchange Commission’s public reference room. Information on the operation of the public reference room may be obtained by calling 1-800-SEC-0330.
Monthly Portfolio Schedule
The Funds file their monthly portfolio holdings with the U.S. Securities and Exchange Commission on Form N-MFP. The SEC delays the public availability of the information filed on Form N-MFP for 60 days after the end of the reporting period included in the filing. The Funds’ Form N-MFP is available (i) on the U.S. Securities and Exchange Commission’s website at www.sec.gov, or ii) at the Securities and Exchange Commission’s public reference room.
| | | | |
| Shareholder Requests for Additional Information | | | 33 | |
SSGA Money Market Funds
Disclosure of Information about Fund Trustees and Officers — August 31, 2015 (Unaudited)
| | | | | | | | | | | | |
Name,
Address, and
Year of Birth(1) | |
Position(s) Held
with Trust(1) | |
Term of
Office and Length of
Time Served(1) | | Principal Occupation
During Past Five Years(1) | | Number of Funds in Fund Complex Overseen
by Trustee(1) | | | Other Directorships Held by
Trustee During
Past Five Years(1) |
INDEPENDENT TRUSTEES | | | | | | | | | | |
Michael F. Holland State Street Bank and Trust Company 100 Huntington Avenue, CPH 0326 Boston, MA 02116 YOB: 1944 | | Trustee and Co-Chairman of the Board | | Term: Indefinite Elected: 1/14 | | • Chairman, Holland & Company L.L.C. (investment adviser) (1995 – present). | | | 71 | | | Trustee and Co-Chairman, State Street Master Funds; Trustee and Co-Chairman, State Street Institutional Investment Trust; Director, the Holland Series Fund, Inc.; Director, The China Fund, Inc.; Director, The Taiwan Fund, Inc.; Director, Reaves Utility Income Fund, Inc.; and Director, Blackstone/GSO Loan Funds. |
| | | | | | | | | | | | | |
Patrick J. Riley State Street Bank and Trust Company 100 Huntington Avenue, CPH 0326 Boston, MA 02116 YOB: 1948 | | Trustee and Co-Chairman of the Board | | Term: Indefinite Elected: 1988 | | • 2002 to May 2010, Associate Justice of the Superior Court, Commonwealth of Massachusetts; 1985 to 2002, Partner, Riley, Burke & Donahue, L.L.P. (law firm); 1998 to Present, Independent Director, State Street Global Advisers Ireland, Ltd. (investment company); 1998 to Present, Independent Director, SSGA Liquidity plc (formerly, SSGA Cash Management Fund plc); January 2009 to Present, Independent Director, SSGA Fixed Income plc; and January 2009 to Present, Independent Director, SSGA Qualified Funds PLC. | | | 71 | | | Trustee and Co-Chairman, State Street Master Funds; Trustee and Co-Chairman, State Street Institutional Investment Trust; Board Director and Chairman, SPDR Europe 1 PLC Board (2011 – Present); Board Director and Chairman, SPDR Europe II, PLC (2013 – Present). |
| | | | | | | | | | | | | |
William L. Boyan State Street Bank and Trust Company 100 Huntington Avenue, CPH 0326 Boston, MA 02116 YOB: 1937 | | Trustee and Co-Chairman of the Valuation Committee | | Term: Indefinite Elected: 1/14 | | • President and Chief Operations Officer, John Hancock Financial Services (1959 – 1999). Mr. Boyan retired in 1999. Chairman Emeritus, Children’s Hospital, Boston, MA (1984 – 2011); Former Trustee of Old Mutual South Africa Master Trust (investments) (1995 – 2008); Former Chairman, Boston Plan For Excellence, Boston Public Schools (1995 – 2010); Member of Advisory Board of Florida Atlantic University Lifelong Learning Society; Trustee, Children’s Hospital, Boston, MA. | | | 71 | | | Trustee, State Street Master Funds; Trustee, State Street Institutional Investment Trust; Former Trustee of Old Mutual South Africa Master Trust. |
| | |
| 34 | | Disclosure of Information about Fund Trustees and Officers |
SSGA Money Market Funds
Disclosure of Information about Fund Trustees and Officers, continued — August 31, 2015 (Unaudited)
| | | | | | | | | | | | |
Name,
Address, and
Year of Birth(1) | |
Position(s) Held
with Trust(1) | |
Term of
Office and Length of
Time Served(1) | | Principal Occupation
During Past Five Years(1) | | Number of Funds in Fund Complex Overseen
by Trustee(1) | | | Other Directorships Held by
Trustee During
Past Five Years(1) |
INDEPENDENT TRUSTEES (continued) | | | | | | | | | | |
William L. Marshall State Street Bank and Trust Company 100 Huntington Avenue, CPH 0326 Boston, MA 02116 YOB: 1942 | | Trustee and Co-Chairman of the Audit Committee | | Term: Indefinite Elected: 1988 | | • April 2011 to Present, Chairman (until April 2011, Chief Executive Officer and President), Wm. L. Marshall Associates, Inc., Wm. L. Marshall Companies, Inc. and the Marshall Financial Group, Inc. (a registered investment adviser and provider of financial and related consulting services); Certified Financial Planner; Member, Financial Planners Association; Director, (2008 – 2014) Doylestown Health Foundation Board; and the Ann Silverman Community Clinic of Doylestown, PA. | | | 71 | | | Trustee, State Street Master Funds; Trustee, State Street Institutional Investment Trust; Director, Marshall Financial Group, Inc. |
| | | | | | | | | | | | | |
Richard D. Shirk State Street Bank and Trust Company 100 Huntington Avenue, CPH 0326 Boston, MA 02116 YOB: 1945 | | Trustee and Co-Chairman of the Qualified Legal and Compliance Committee | | Term: Indefinite Elected: 1988 | | • March 2001 to April 2002, Chairman (1996 to March 2001, President and Chief Executive Officer), Cerulean Companies, Inc. (holding company) (Retired); 1992 to March 2001, President and Chief Executive Officer, Blue Cross Blue Shield of Georgia (health insurer, managed healthcare); 1998 to December 2008, Chairman, Board Member and December 2008 to Present, Investment Committee Member, Healthcare Georgia Foundation (private foundation); September 2002 to 2012, Lead Director and Board Member, Amerigroup Corp. (managed health care); 1999 to 2013: Board Member and (since 2001) Investment Committee Member, Woodruff Arts Center; and 2003 to 2009, Trustee, Gettysburg College. | | | 71 | | | Trustee, State Street Master Funds; Trustee, State Street Institutional Investment Trust; Board member, AeroCare Holdings (privately held healthcare services company) (February 2003 – Present); Board member, Regenesis Biomedical (health care services) (April 2012 – Present). |
| | | | | | | | | | | | | |
Rina K. Spence State Street Bank and Trust Company 100 Huntington Avenue, CPH 0326 Boston, MA 02116 YOB: 1948 | | Trustee and Co-Chairman of the Qualified Legal and Compliance Committee and Co-Chairman of the Governance Committee | | Term: Indefinite Elected: 1/14 | | • President of SpenceCare International LLC (international healthcare consulting) (1999 – present); Chief Executive Officer, IEmily.com (health internet company) (2000 – 2001); Chief Executive Officer of Consensus Pharmaceutical, Inc. (1998 – 1999); Founder, President and Chief Executive Officer of Spence Center for Women’s Health (1994 – 1998); President and CEO Emerson Hospital (1984 – 1994); Trustee, Eastern Enterprise (utilities) (1988 – 2000); Director, Berkshire Life Insurance Company of America (1993 – 2009); Director, IEmily.com, Inc. (2000 – 2010); and Trustee, National Osteoporosis Foundation (2005 – 2008). | | | 71 | | | Trustee, State Street Master Funds; Trustee, State Street Institutional Investment Trust. |
| | | | |
| Disclosure of Information about Fund Trustees and Officers | | | 35 | |
SSGA Money Market Funds
Disclosure of Information about Fund Trustees and Officers, continued — August 31, 2015 (Unaudited)
| | | | | | | | | | | | |
Name,
Address, and
Year of Birth(1) | |
Position(s) Held
with Trust(1) | |
Term of
Office and Length of
Time Served(1) | | Principal Occupation
During Past Five Years(1) | | Number of Funds in Fund Complex Overseen
by Trustee(1) | | | Other Directorships Held by
Trustee During
Past Five Years(1) |
INDEPENDENT TRUSTEES (continued) | | | | | | | | | | |
Bruce D. Taber State Street Bank and Trust Company 100 Huntington Avenue, CPH 0326 Boston, MA 02116 YOB: 1943 | | Trustee and Co-Chairman of the Valuation Committee and Co-Chairman of the Governance Committee | | Term: Indefinite Elected: 1991 | | • 1999 to Present, Partner, Zenergy LLC (a technology company providing Computer Modeling and System Analysis to the General Electric Power Generation Division); Until December 2008, Independent Director, SSGA Cash Management Fund plc; Until December 2008, Independent Director, State Street Global Advisers Ireland, Ltd. (investment companies); and Until August 1994, President, Alonzo B. Reed, Inc. (a Boston architect-engineering firm). | | | 71 | | | Trustee, State Street Master Funds; Trustee, State Street Institutional Investment Trust. |
| | | | | | | | | | | | | |
Douglas T. Williams State Street Bank and Trust Company 100 Huntington Avenue, CPH 0326 Boston, MA 02116 YOB: 1940 | | Trustee and Co-Chairman of the Audit Committee | | Term: Indefinite Elected: 1/14 | | • President, Oakmont Homeowners Association; President, Mariner Sands Chapel; Executive Vice President and member of Executive Committee, Chase Manhattan Bank (1987 – 1999); President, Boston Stock Exchange Depository Trust Company, 1981 – 1982; Treasurer, Nantucket Educational Trust (2002 – 2007). | | | 71 | | | Trustee, State Street Master Funds; Trustee, State Street Institutional Investment Trust. |
INTERESTED TRUSTEES(2) | | | | | | | | | | |
Gregory A. Ehret SSGA Funds Management, Inc. State Street Financial Center One Lincoln Street Boston, MA 02111-2900 YOB: 1969 | | Trustee | | Term: Indefinite Elected Trustee: 8/15 | | • President and Global Chief Operating Officer State Street Global Advisors (2012 – Present); Head of Europe, the Middle East, and Africa, State Street Global Advisors (2008 – 2012); Head of Sales and Distribution in Europe, the Middle East, and Africa, State Street Global Advisors (2007 – 2008). | | | 71 | | | Trustee, State Street Master Funds; Trustee, State Street Institutional Investment Trust. |
| | | | | | | | | | | | | |
James E. Ross SSGA Funds Management, Inc. State Street Financial Center One Lincoln Street Boston, MA 02111-2900 YOB: 1965 | | Trustee | | Term: Indefinite Elected Trustee: 1/14 | | • Chairman and Director, SSGA Funds Management, Inc. (2012 – present); President, SSGA Funds Management, Inc. (2005 – 2012); Executive Vice President and Senior Managing Director, State Street Global Advisors (2006 – present); and Principal, State Street Global Advisors (2006 – present). | | | 268 | | | Trustee, State Street Master Funds; Trustee, State Street Institutional Investment Trust; Trustee, SPDR Series Trust; Trustee, SPDR Index Shares Funds; Trustee, Select Sector SPDR Trust; Trustee, SSGA Active Trust; and Trustee, SSGA Master Trust. |
| (1) | | As of October 12, 2015. |
| (2) | | Mr. Ehret and Mr. Ross are Interested Trustees because of their employment by SSGA Funds Management, Inc., an affiliate of the Trust. |
| | |
| 36 | | Disclosure of Information about Fund Trustees and Officers |
SSGA Money Market Funds
Disclosure of Information about Fund Trustees and Officers, continued — August 31, 2015 (Unaudited)
The following lists the principal officers for SSGA Funds and the State Street Master Funds, as well as their mailing addresses and ages, positions with the Trusts and length of time served, and present and principal occupations:
| | | | | | |
Name,
Address, and
Year of Birth | | Position(s) Held
with Trust | | Term of Office and Length of Time Served | | Principal Occupation During Past Five Years |
OFFICERS: | | | | | | |
Ellen M. Needham SSGA Funds Management, Inc. State Street Financial Center One Lincoln Street Boston, MA 02111-2900 YOB: 1967 | | President | | Term: Indefinite Elected: 10/12 | | • President and Director, SSGA Funds Management, Inc. (June 2012 – present); Chief Operating Officer, SSGA Funds Management, Inc. (May 2010 – June 2012); Senior Managing Director, SSGA Funds Management, Inc. (1992 – 2012) and Senior Managing Director, State Street Global Advisors (1992 – present).* |
| | | | | | | |
Ann M. Carpenter SSGA Funds Management, Inc. State Street Financial Center One Lincoln Street Boston, MA 02111-2900 YOB: 1966 | | Vice President Assistant Treasurer | | Term: Indefinite Elected: 10/12 Term: Indefinite Elected: 4/15 | | • Chief Operating Officer, SSGA Funds Management, Inc. (April 2014 – present); Vice President, SSGA Funds Management, Inc. (2008 – present); Principal, State Street Global Advisors (2005 – 2008 – present).* |
| | | | | | | |
Chad C. Hallett SSGA Funds Management, Inc. State Street Financial Center One Lincoln Street Boston, MA 02111 YOB: 1969 | | Treasurer | | Term: Indefinite Elected: 4/15 | | • Vice President, State Street Global Advisors and SSGA Funds Management, Inc. (November 2014 – present); Vice President, State Street Bank and Trust Company (2001 – November 2014).* |
| | | | | | | |
Brian Harris SSGA Funds Management, Inc. State Street Financial Center One Lincoln Street Boston, MA 02111 YOB: 1973 | | Chief Compliance Officer | | Term: Indefinite Elected: 11/13 | | • Vice President, State Street Global Advisors and SSGA Funds Management, Inc. ( June 2013 – Present); Senior Vice President and Global Head of Investment Compliance, BofA Global Capital Management (September 2010 to May 2013); Director of Compliance, AARP Financial Inc. (July 2008 to August 2010). |
| | | | | | | |
Joshua A. Weinberg SSGA Funds Management, Inc. State Street Financial Center One Lincoln Street Boston, MA 02111-2900 YOB: 1978 | | Chief Legal Officer | | Term: Indefinite Elected: 2/15 | | • Vice President and Managing Counsel, State Street Global Advisors (2011 – present); Clerk, SSGA Funds Management, Inc. (2013 – present); Associate, Financial Services Group, Dechert LLP (2006 – 2011). |
| | | | | | | |
David K. James State Street Bank and Trust Company 100 Huntington Avenue, 3rd Floor Boston, MA 02116 YOB: 1970 | | Secretary | | Term: Indefinite Elected: 4/13 | | • Managing Director and Managing Counsel, State Street Bank and Trust Company (2009 – present); Vice President and Counsel, PNC Global Investment Servicing (US), Inc. (2006 – 2009). |
| | | | |
| Disclosure of Information about Fund Trustees and Officers | | | 37 | |
SSGA Money Market Funds
Disclosure of Information about Fund Trustees and Officers, continued — August 31, 2015 (Unaudited)
| | | | | | |
Name,
Address, and
Year of Birth | | Position(s) Held
with Trust | | Term of Office and Length of Time Served | | Principal Occupation During Past Five Years |
OFFICERS (continued) | | | | |
Kristin Schantz State Street Bank and Trust Company 100 Huntington Avenue, 3rd Floor Boston, MA 02116 YOB: 1979 | | Assistant Secretary | | Term: Indefinite Elected: 2/14 | | • Vice President and Senior Counsel, State Street Bank and Trust Company (2013 – present); Vice President, Citi Fund Services Ohio, Inc. (2008 – 2013). |
| * | Served in various capacities and/or with various affiliated entities during noted time period. |
The Statement of Additional Information includes additional information about the Trustees and is available, without charge, upon request, by calling (toll free) 800-997-7327.
| | |
| 38 | | Disclosure of Information about Fund Trustees and Officers |
SSGA Money Market Funds
State Street Financial Center
One Lincoln Street
Boston, Massachusetts 02111-2900
(800) 647-7327
Trustees
William L. Boyan
Gregory A. Ehret
Michael F. Holland
William L. Marshall
Patrick J. Riley
James E. Ross
Richard D. Shirk
Rina K. Spence
Bruce D. Taber
Douglas T. Williams
Officers
Ellen M. Needham, President and Principal Executive Officer
Chad C. Hallett, Treasurer and Principal Accounting Officer
Ann M. Carpenter, Vice President and Assistant Treasurer
Brian Harris, Chief Compliance Officer
David James, Secretary
Joshua A. Weinberg, Chief Legal Officer
Kristin M. Schantz, Assistant Secretary
Investment Adviser and Administrator
SSGA Funds Management, Inc.
State Street Financial Center,
One Lincoln Street
Boston, Massachusetts 02111-2900
Custodian and Office of Shareholder Inquiries
State Street Bank and Trust Company
1776 Heritage Drive
North Quincy, Massachusetts 02171
Transfer and Dividend Paying Agent
Boston Financial Data Services, Inc.
2000 Crown Colony Drive
Quincy, Massachusetts 02169
Distributor
State Street Global Markets, LLC
State Street Financial Center
One Lincoln Street
Boston, Massachusetts 02111-2900
Sub-Administrator
State Street Bank and Trust Company
State Street Financial Center
One Lincoln Street
Boston, Massachusetts 02111-2900
Legal Counsel
Ropes & Gray LLP
800 Boylston Street
Boston, Massachusetts 02199
Independent Registered Public Accounting Firm
Ernst & Young LLP
200 Clarendon Street
Boston, Massachusetts 02116
Distributor: State Street Global Markets, LLC, member FINRA, SIPC, a wholly owned subsidiary of State Street Corporation. References to State Street may include State Street Corporation and its affiliates. The SSGA Funds pay State Street Bank and Trust Company for its services as sub-administrator, custodian, transfer agent and shareholder servicing agent and pays SSGA Funds Management, Inc. for investment advisory and administrator services.
This information must be preceded or accompanied by a current prospectus or summary prospectus. Read the prospectus carefully before you invest or send money.
| | | | |
| Fund Management and Service Providers | | | 39 | |
Annual Report
31 August 2015
SSGA Funds
Institutional Money Market Funds
SSGA U.S. Treasury Money Market Fund
SSGA Prime Money Market Fund

SSGA Funds
Institutional Money Market Funds
Annual Report
August 31, 2015
Table of Contents
“SSGA” is a registered trademark of State Street Corporation and is licensed for use by the SSGA Funds.
This report is prepared from the books and records of the Funds and it is submitted for the general information of shareholders. This information is for distribution to prospective investors only when preceded or accompanied by a SSGA Funds Prospectus containing more complete information concerning the investment objectives and operations of the Funds, charges and expenses. The Prospectus should be read carefully before an investment is made.
Performance quoted represents past performance and past performance does not guarantee future results. Current performance may be higher or lower than the performance quoted. For the most recent month end performance information, visit www.ssgafunds.com. Investment in the Funds poses investment risks, including the possible loss of principal. The investment return and principal value of an investment will fluctuate so that shares, when redeemed, may be worth more or less than their original cost.
An investment in a money market fund is not insured or guaranteed by the Federal Deposit Insurance Corporation or any other government agency. Although a money market fund seeks to preserve the value of your investment at $1.00 per share, it is possible to lose money by investing in a money market fund.
SSGA U.S. Treasury Money Market Fund
Shareholder Expense Example — August 31, 2015 (Unaudited)
Fund Expenses
The following disclosure provides important information regarding the Fund’s Expense Example, which appears on the Fund’s individual page in this Annual Report. Please refer to this information when reviewing the Expense Example for a Fund.
Example
As a shareholder of the Fund, you incur two types of costs: (1) transaction costs, and (2) ongoing costs, including advisory and administration fees; distribution (12b-1) and/or service fees; and other Fund expenses. The Example is intended to help you understand your ongoing costs (in dollars) of investing in the Fund and to compare these costs with the ongoing costs of investing in other mutual funds. The Example is based on an investment of $1,000 invested at the beginning of the period and held for the entire period indicated, which for this Fund is from March 1, 2015 to August 31, 2015.
Actual Expenses
The information in the table under the heading “Actual Performance” provides information about actual account values and actual expenses. You may use the information in this column, together with the amount you invested, to estimate the expenses that you paid over the period. Simply divide your account value by $1,000 (for example, an $8,600 account value divided by $1,000 = 8.6), then multiply the result by the number in the first column in the row entitled “Expenses Paid During Period” to estimate the expenses you paid on your account during this period.
Hypothetical Example for Comparison Purposes
The information in the table under the heading “Hypothetical Performance (5% return before expenses)” provides information about hypothetical account values and hypothetical expenses based on the Fund’s actual expense ratio and an assumed rate of return of 5% per year before expenses, which is not the Fund’s actual return. The hypothetical account values and expenses may not be used to estimate the actual ending account balance or expenses you paid for the period. You may use this information to compare the ongoing costs of investing in the Fund and other funds. To do so, compare this 5% hypothetical example with the 5% hypothetical examples that appear in the shareholder reports of other funds.
Please note that the expenses shown in the table are meant to highlight your ongoing costs only and do not reflect any transaction costs. Therefore, the information under the heading “Hypothetical Performance (5% return before expenses)” is useful in comparing ongoing costs only, and will not help you determine the relative total costs of owning different funds. In addition, if these transaction costs were included, your costs would have been higher.
| | | | | | | | |
| | | Actual
Performance | | | Hypothetical
Performance
(5% return
before expenses) | |
Beginning Account Value | | | | | | | | |
March 1, 2015 | | $ | 1,000.00 | | | $ | 1,000.00 | |
Ending Account Value | | | | | | | | |
August 31, 2015 | | $ | 1,000.00 | | | $ | 1,025.00 | |
Expenses Paid During Period* | | $ | 0.20 | | | $ | 0.20 | |
| * | Expenses are equal to the Fund’s annualized expense ratio of 0.04% (representing the six month period annualized), multiplied by the average account value over the period, multiplied by 184/365 (to reflect the one-half year period). Includes amounts waived, reimbursed and/or other credits. Without the waiver, reimbursement and/or other credits, expenses would have been higher. |
| | |
| 2 | | SSGA U.S. Treasury Money Market Fund |
SSGA U.S. Treasury Money Market Fund
Schedule of Investments — August 31, 2015
| | | | | | | | | | | | | | | | |
| | | Principal
Amount ($)
or Shares | | | Rate
% (#) | | | Date
of
Maturity | | | Value
$ | |
| | | | | | | | | | | | | | | | |
| Treasury Debt - 66.4% | | | | | | | | | | | | | | | | |
U.S. Treasury Bill | | | 120,000,000 | | | | 0.013 | | | | 09/03/15 | | | | 119,999,917 | |
U.S. Treasury Bill | | | 400,000,000 | | | | 0.050 | | | | 09/03/15 | | | | 399,998,889 | |
U.S. Treasury Bill | | | 175,000,000 | | | | 0.018 | | | | 09/10/15 | | | | 174,999,234 | |
U.S. Treasury Bill | | | 157,000,000 | | | | 0.050 | | | | 09/10/15 | | | | 156,998,037 | |
U.S. Treasury Bill | | | 62,000,000 | | | | 0.013 | | | | 09/17/15 | | | | 61,999,656 | |
U.S. Treasury Bill | | | 138,000,000 | | | | 0.015 | | | | 09/17/15 | | | | 137,999,080 | |
U.S. Treasury Bill | | | 450,000,000 | �� | | | 0.045 | | | | 09/17/15 | | | | 449,991,000 | |
U.S. Treasury Bill | | | 50,000,000 | | | | 0.155 | | | | 09/17/15 | | | | 49,996,544 | |
U.S. Treasury Bill | | | 425,000,000 | | | | 0.045 | | | | 09/24/15 | | | | 424,987,781 | |
U.S. Treasury Bill | | | 79,000,000 | | | | 0.001 | | | | 10/01/15 | | | | 78,999,934 | |
U.S. Treasury Bill | | | 126,000,000 | | | | 0.005 | | | | 10/01/15 | | | | 125,999,475 | |
U.S. Treasury Bill | | | 28,000,000 | | | | 0.010 | | | | 10/01/15 | | | | 27,999,767 | |
U.S. Treasury Bill | | | 261,000,000 | | | | 0.020 | | | | 10/01/15 | | | | 260,995,940 | |
U.S. Treasury Bill | | | 45,500,000 | | | | 0.023 | | | | 10/01/15 | | | | 45,499,204 | |
U.S. Treasury Bill | | | 147,000,000 | | | | 0.025 | | | | 10/01/15 | | | | 146,997,142 | |
U.S. Treasury Bill | | | 45,500,000 | | | | 0.027 | | | | 10/01/15 | | | | 45,499,027 | |
U.S. Treasury Bill | | | 13,000,000 | | | | 0.005 | | | | 10/08/15 | | | | 12,999,933 | |
U.S. Treasury Bill | | | 328,000,000 | | | | 0.010 | | | | 10/08/15 | | | | 327,996,629 | |
U.S. Treasury Bill | | | 126,000,000 | | | | 0.015 | | | | 10/08/15 | | | | 125,998,057 | |
U.S. Treasury Bill | | | 8,100,000 | | | | 0.005 | | | | 10/15/15 | | | | 8,099,951 | |
U.S. Treasury Bill | | | 66,000,000 | | | | 0.012 | | | | 10/15/15 | | | | 65,998,992 | |
U.S. Treasury Bill | | | 300,000,000 | | | | 0.017 | | | | 10/15/15 | | | | 299,993,583 | |
U.S. Treasury Bill | | | 28,000,000 | | | | 0.020 | | | | 10/15/15 | | | | 27,999,316 | |
U.S. Treasury Bill | | | 27,000,000 | | | | 0.025 | | | | 10/15/15 | | | | 26,999,175 | |
U.S. Treasury Bill | | | 33,000,000 | | | | 0.010 | | | | 10/22/15 | | | | 32,999,532 | |
U.S. Treasury Bill | | | 200,000,000 | | | | 0.030 | | | | 10/22/15 | | | | 199,991,500 | |
U.S. Treasury Bill | | | 86,000,000 | | | | 0.005 | | | | 10/29/15 | | | | 85,999,307 | |
U.S. Treasury Bill | | | 49,000,000 | | | | 0.010 | | | | 10/29/15 | | | | 48,999,211 | |
U.S. Treasury Bill | | | 183,000,000 | | | | 0.046 | | | | 10/29/15 | | | | 182,986,438 | |
U.S. Treasury Bill | | | 67,000,000 | | | | 0.050 | | | | 10/29/15 | | | | 66,994,603 | |
U.S. Treasury Bill | | | 200,000,000 | | | | 0.075 | | | | 11/05/15 | | | | 199,972,917 | |
U.S. Treasury Bill | | | 39,000,000 | | | | 0.125 | | | | 11/12/15 | | | | 38,990,250 | |
U.S. Treasury Bill | | | 131,000,000 | | | | 0.045 | | | | 11/27/15 | | | | 130,985,754 | |
U.S. Treasury Bill | | | 90,000,000 | | | | 0.048 | | | | 11/27/15 | | | | 89,989,669 | |
U.S. Treasury Note | | | 218,000,000 | | | | 0.061 | | | | 10/15/15 | | | | 218,049,514 | |
U.S. Treasury Note | | | 52,000,000 | | | | 0.071 | | | | 10/15/15 | | | | 52,011,174 | |
U.S. Treasury Note | | | 33,000,000 | | | | 0.081 | | | | 10/15/15 | | | | 33,006,688 | |
U.S. Treasury Note | | | 7,000,000 | | | | 0.102 | | | | 10/15/15 | | | | 7,001,247 | |
U.S. Treasury Note | | | 27,000,000 | | | | 0.097 | | | | 11/30/15 | | | | 27,084,836 | |
U.S. Treasury Note | | | 85,000,000 | | | | 0.097 | | | | 11/30/15 | | | | 85,032,046 | |
U.S. Treasury Note (next reset date 09/01/15) (a) | | | 92,000,000 | | | | 0.150 | | | | 01/31/16 | | | | 91,990,647 | |
U.S. Treasury Note (next reset date 09/01/15) (a) | | | 17,000,000 | | | | 0.174 | | | | 04/30/16 | | | | 17,000,171 | |
U.S. Treasury Note (next reset date 09/01/15) (a) | | | 18,000,000 | | | | 0.158 | | | | 10/31/16 | | | | 17,987,877 | |
U.S. Treasury Note (next reset date 09/01/15) (a) | | | 71,000,000 | | | | 0.094 | | | | 04/30/17 | | | | 71,000,447 | |
U.S. Treasury Note (next reset date 09/01/15) (a) | | | 20,000,000 | | | | 0.127 | | | | 07/31/17 | | | | 20,000,000 | |
| | | | | | | | | | | | | | | | |
| | | | |
Total Treasury Debt
(cost $5,323,120,091) | | | | | | | | | | | | | | | 5,323,120,091 | |
| | | | | | | | | | | | | | | | |
| | | | |
Total Investments - 66.4%
(cost $5,323,120,091) | | | | | | | | | | | | | | | 5,323,120,091 | |
| | | | | | | | | | | | | | | | |
| | | | |
| SSGA U.S. Treasury Money Market Fund | | | 3 | |
SSGA U.S. Treasury Money Market Fund
Schedule of Investments, continued — August 31, 2015
| | | | | | | | | | |
| | | | | | | | |
Value
$ | |
| | | | | | | | | | |
| Repurchase Agreements - 36.0% | | | | | | | | | | |
| Treasury Repurchase Agreements - 36.0% | | | | | | | | | | |
Agreement with Federal Reserve Bank and Bank of New York Mellon Corp. (Tri-Party) of $2,540,000,000 dated August 31, 2015 at 0.050% to be repurchased at $2,540,003,528 on September 1, 2015, collateralized by: $2,477,656,400 par various United States Government Treasury Obligations valued at $2,540,003,582. | | | | | | | | | 2,540,000,000 | |
Agreement with Societe Generale and Bank of New York Mellon Corp. (Tri-Party) of $175,000,000 dated August 31, 2015 at 0.110% to be repurchased at $175,001,069 on September 2, 2015, collateralized by: $170,627,400 par various United States Government Treasury Obligations valued at $178,500,007. | | | | | | | | | 175,000,000 | |
Agreement with Societe Generale and Bank of New York Mellon Corp. (Tri-Party) of $29,022,000 dated August 31, 2015 at 0.130% to be repurchased at $29,022,105 on September 1, 2015, collateralized by: $28,761,900 par United States Government Treasury Obligation valued at $29,602,482. | | | | | | | | | 29,022,000 | |
Agreement with TD Securities (USA) LLC and Bank of New York Mellon Corp. (Tri-Party) of $143,000,000 dated August 31, 2015 at 0.120% to be repurchased at $143,000,477 on September 1, 2015, collateralized by: $92,749,600 par various United States Government Treasury Obligations valued at $145,860,550. | | | | | | | | | 143,000,000 | |
| | | | | | | | | | |
| | | | |
Total Treasury Repurchase Agreements
(cost $2,887,022,000) | | | | | | | | | 2,887,022,000 | |
| | | | | | | | | | |
| | | | |
Total Investments and Repurchase Agreements - 102.4% (b)
(cost $8,210,142,091) (c) | | | | | | | | | 8,210,142,091 | |
| | | | |
| Other Assets and Liabilities, Net - (2.4)% | | | | | | | | | (191,432,336 | ) |
| | | | | | | | | | |
| | | | |
| Net Assets - 100.0% | | | | | | | | | 8,018,709,755 | |
| | | | | | | | | | |
Footnotes:
| # | For purposes of this report, for non-interest bearing Commercial Paper and Discount Notes, the discount rate at purchase is used to populate the rate column. |
| (a) | Adjustable or floating rate security. Rate shown reflects rate in effect at period end. |
| (b) | Unless otherwise indicated, the values of securities of the Fund are determined based on Level 2 inputs (Note 2). |
| (c) | The cost of securities for federal income tax purposes is substantially the same for financial reporting purposes. |
Presentation of Portfolio Holdings — August 31, 2015
| | | | |
| Categories | | % of
Net
Assets | |
| | | | |
Treasury Debt | | | 66.4 | |
Repurchase Agreements | | | 36.0 | |
| | | | |
Total Investments and Repurchase Agreements | | | 102.4 | |
Other Assets and Liabilities, Net | | | (2.4 | ) |
| | | | |
| | | 100.0 | |
| | | | |
See accompanying notes which are an integral part of the financial statements.
| | |
| 4 | | SSGA U.S. Treasury Money Market Fund |
SSGA Prime Money Market Fund
Shareholder Expense Example — August 31, 2015 (Unaudited)
Fund Expenses
The following disclosure provides important information regarding the Fund’s Expense Example, which appears on the Fund’s individual page in this Annual Report. Please refer to this information when reviewing the Expense Example for a Fund.
Example
As a shareholder of the Fund, you incur two types of costs: (1) transaction costs, and (2) ongoing costs, including advisory and administration fees; distribution (12b-1) and/or service fees; and other Fund expenses. The Example is intended to help you understand your ongoing costs (in dollars) of investing in the Fund and to compare these costs with the ongoing costs of investing in other mutual funds. The Example is based on an investment of $1,000 invested at the beginning of the period and held for the entire period indicated, which for this Fund is from March 1, 2015 to August 31, 2015.
Actual Expenses
The information in the table under the heading “Actual Performance” provides information about actual account values and actual expenses. You may use the information in this column, together with the amount you invested, to estimate the expenses that you paid over the period. Simply divide your account value by $1,000 (for example, an $8,600 account value divided by $1,000 = 8.6), then multiply the result by the number in the first column in the row entitled “Expenses Paid During Period” to estimate the expenses you paid on your account during this period.
Hypothetical Example for Comparison Purposes
The information in the table under the heading “Hypothetical Performance (5% return before expenses)” provides information about hypothetical account values and hypothetical expenses based on the Fund’s actual expense ratio and an assumed rate of return of 5% per year before expenses, which is not the Fund’s actual return. The hypothetical account values and expenses may not be used to estimate the actual ending account balance or expenses you paid for the period. You may use this information to compare the ongoing costs of investing in the Fund and other funds. To do so, compare this 5% hypothetical example with the 5% hypothetical examples that appear in the shareholder reports of other funds.
Please note that the expenses shown in the table are meant to highlight your ongoing costs only and do not reflect any transaction costs. Therefore, the information under the heading “Hypothetical Performance (5% return before expenses)” is useful in comparing ongoing costs only, and will not help you determine the relative total costs of owning different funds. In addition, if these transaction costs were included, your costs would have been higher.
| | | | | | | | |
| | | Actual
Performance | | | Hypothetical
Performance
(5% return
before expenses) | |
Beginning Account Value | | | | | | | | |
March 1, 2015 | | $ | 1,000.00 | | | $ | 1,000.00 | |
Ending Account Value | | | | | | | | |
August 31, 2015 | | $ | 1,000.20 | | | $ | 1,024.29 | |
Expenses Paid During Period* | | $ | 0.91 | | | $ | 0.92 | |
| * | Expenses are equal to the Fund’s annualized expense ratio of 0.18% (representing the six month period annualized), multiplied by the average account value over the period, multiplied by 184/365 (to reflect the one-half year period). Includes amounts waived, reimbursed and/or other credits. Without the waiver, reimbursement and/or other credits, expenses would have been higher. |
| | | | |
| SSGA Prime Money Market Fund | | | 5 | |
SSGA Prime Money Market Fund
Schedule of Investments — August 31, 2015
| | | | | | | | | | | | | | | | |
| | | Principal
Amount ($)
or Shares | | | Rate
% (#) | | | Date
of
Maturity | | | Value
$ | |
| | | | | | | | | | | | | | | | |
| Asset Backed Commercial Paper - 0.6% | | | | | | | | | | | | | | | | |
Collateralized Commercial Paper Co. LLC (next reset date 09/25/15) (a) (cost $35,000,000) | | | 35,000,000 | | | | 0.389 | | | | 01/25/16 | | | | 35,000,000 | |
| | | | | | | | | | | | | | | | |
| | | | |
| Certificates of Deposit - 38.8% | | | | | | | | | | | | | | | | |
Bank of Montreal | | | 50,000,000 | | | | 0.300 | | | | 11/13/15 | | | | 50,000,000 | |
Bank of Montreal (next reset date 09/18/15) (a) | | | 100,000,000 | | | | 0.360 | | | | 01/15/16 | | | | 100,000,000 | |
Bank of Montreal (next reset date 09/22/15) (a) | | | 22,000,000 | | | | 0.320 | | | | 01/22/16 | | | | 21,999,581 | |
Bank of Nova Scotia (next reset date 09/08/15) (a) | | | 48,000,000 | | | | 0.291 | | | | 11/05/15 | | | | 48,000,000 | |
Bank of Nova Scotia (next reset date 09/08/15) (a) | | | 130,000,000 | | | | 0.344 | | | | 11/06/15 | | | | 130,000,000 | |
Bank of Nova Scotia (next reset date 09/10/15) (a) | | | 50,000,000 | | | | 0.292 | | | | 02/05/16 | | | | 50,000,000 | |
Bank of Tokyo - Mitsubishi | | | 30,000,000 | | | | 0.260 | | | | 09/03/15 | | | | 30,000,000 | |
Bank of Tokyo - Mitsubishi | | | 50,000,000 | | | | 0.270 | | | | 10/14/15 | | | | 50,000,000 | |
BNP Paribas | | | 60,000,000 | | | | 0.290 | | | | 09/01/15 | | | | 60,000,000 | |
BNP Paribas | | | 30,000,000 | | | | 0.320 | | | | 11/18/15 | | | | 30,000,000 | |
Canadian Imperial Bank of Commerce (next reset date 09/08/15) (a) | | | 75,000,000 | | | | 0.371 | | | | 12/07/15 | | | | 75,000,000 | |
Canadian Imperial Bank of Commerce (next reset date 09/08/15) (a) | | | 40,000,000 | | | | 0.342 | | | | 01/08/16 | | | | 40,000,000 | |
Canadian Imperial Bank of Commerce (next reset date 09/16/15) (a) | | | 39,000,000 | | | | 0.318 | | | | 02/16/16 | | | | 39,000,000 | |
Chase Bank USA NA (next reset date 09/21/15) (a) | | | 33,000,000 | | | | 0.362 | | | | 04/21/16 | | | | 33,000,000 | |
Citibank NA | | | 35,000,000 | | | | 0.200 | | | | 09/21/15 | | | | 35,000,000 | |
Credit Agricole Corporate & Investment Bank | | | 50,000,000 | | | | 0.290 | | | | 09/08/15 | | | | 50,000,000 | |
Credit Agricole Corporate & Investment Bank | | | 75,000,000 | | | | 0.270 | | | | 09/09/15 | | | | 75,000,000 | |
Credit Agricole Corporate & Investment Bank | | | 18,000,000 | | | | 0.270 | | | | 10/07/15 | | | | 18,000,000 | |
Credit Agricole Corporate & Investment Bank | | | 17,000,000 | | | | 0.340 | | | | 11/04/15 | | | | 17,000,000 | |
ING Bank NV | | | 50,000,000 | | | | 0.285 | | | | 10/01/15 | | | | 50,000,000 | |
ING Bank NV | | | 80,000,000 | | | | 0.330 | | | | 10/02/15 | | | | 80,000,000 | |
ING Bank NV | | | 35,000,000 | | | | 0.285 | | | | 10/05/15 | | | | 35,000,000 | |
ING Bank NV | | | 50,000,000 | | | | 0.330 | | | | 10/19/15 | | | | 50,000,000 | |
Rabobank Nederland NV | | | 50,000,000 | | | | 0.259 | | | | 09/11/15 | | | | 50,000,000 | |
Rabobank Nederland NV | | | 65,000,000 | | | | 0.240 | | | | 09/18/15 | | | | 65,000,000 | |
Rabobank Nederland NV | | | 20,000,000 | | | | 0.260 | | | | 10/08/15 | | | | 20,000,000 | |
Royal Bank of Canada (next reset date 09/08/15) (a) | | | 66,000,000 | | | | 0.344 | | | | 01/07/16 | | | | 66,000,000 | |
Societe Generale | | | 75,000,000 | | | | 0.290 | | | | 09/04/15 | | | | 75,000,000 | |
Standard Chartered Bank | | | 45,000,000 | | | | 0.270 | | | | 10/21/15 | | | | 45,000,000 | |
Standard Chartered Bank | | | 50,000,000 | | | | 0.270 | | | | 10/23/15 | | | | 50,000,000 | |
Sumitomo Mitsui Banking Corp. | | | 75,000,000 | | | | 0.280 | | | | 10/01/15 | | | | 75,000,000 | |
Sumitomo Mitsui Banking Corp. | | | 35,000,000 | | | | 0.300 | | | | 10/01/15 | | | | 35,000,000 | |
Sumitomo Mitsui Banking Corp. | | | 35,000,000 | | | | 0.290 | | | | 10/26/15 | | | | 35,000,000 | |
Svenska Handelsbanken AB | | | 55,250,000 | | | | 0.260 | | | | 10/26/15 | | | | 55,249,999 | |
Svenska Handelsbanken AB (next reset date 09/15/15) (a) | | | 50,000,000 | | | | 0.348 | | | | 01/15/16 | | | | 50,000,000 | |
Toronto Dominion Bank | | | 35,000,000 | | | | 0.380 | | | | 12/21/15 | | | | 35,000,000 | |
Toronto Dominion Bank (next reset date 09/28/15) (a) | | | 61,000,000 | | | | 0.349 | | | | 05/26/16 | | | | 61,000,000 | |
Toronto Dominion Bank (next reset date 10/02/15) (a) | | | 44,000,000 | | | | 0.313 | | | | 04/04/16 | | | | 44,000,000 | |
Toronto Dominion Bank (next reset date 10/15/15) (a) | | | 16,000,000 | | | | 0.319 | | | | 04/15/16 | | | | 16,000,000 | |
UBS AG | | | 65,000,000 | | | | 0.350 | | | | 11/17/15 | | | | 65,000,000 | |
Wells Fargo Bank NA | | | 50,000,000 | | | | 0.322 | | | | 11/09/15 | | | | 50,001,630 | |
Wells Fargo Bank NA (next reset date 09/08/15) (a) | | | 50,000,000 | | | | 0.319 | | | | 03/07/16 | | | | 50,000,000 | |
Wells Fargo Bank NA (next reset date 09/09/15) (a) | | | 35,000,000 | | | | 0.302 | | | | 01/11/16 | | | | 35,000,000 | |
Westpac Banking Corp. (next reset date 09/25/15) (a) | | | 19,000,000 | | | | 0.319 | | | | 04/25/16 | | | | 19,000,000 | |
| | | | | | | | | | | | | | | | |
| | | | |
Total Certificates of Deposit
(cost $2,163,251,210) | | | | | | | | | | | | | | | 2,163,251,210 | |
| | | | | | | | | | | | | | | | |
| | |
| 6 | | SSGA Prime Money Market Fund |
SSGA Prime Money Market Fund
Schedule of Investments, continued — August 31, 2015
| | | | | | | | | | | | | | | | |
| | | Principal
Amount ($)
or Shares | | | Rate
% (#) | | | Date
of
Maturity | | | Value
$ | |
| | | | | | | | | | | | | | | | |
| Financial Company Commercial Paper - 26.0% | | | | | | | | | | | | | | | | |
Australia & New Zealand Banking Group Ltd. (next reset date 09/04/15) (a)(b) | | | 20,000,000 | | | | 0.302 | | | | 05/04/16 | | | | 19,999,298 | |
Australia & New Zealand Banking Group Ltd. (next reset date 09/15/15) (a)(b) | | | 19,500,000 | | | | 0.298 | | | | 10/15/15 | | | | 19,500,000 | |
Australia & New Zealand Banking Group Ltd. (next reset date 09/15/15) (a)(b) | | | 19,500,000 | | | | 0.298 | | | | 10/15/15 | | | | 19,500,000 | |
Australia & New Zealand Banking Group Ltd. (next reset date 09/21/15) (a)(b) | | | 12,000,000 | | | | 0.345 | | | | 01/19/16 | | | | 12,000,000 | |
Caisse des Depots et Consignations (c) | | | 75,000,000 | | | | 0.240 | | | | 10/07/15 | | | | 74,982,000 | |
Caisse des Depots et Consignations (c) | | | 75,000,000 | | | | 0.250 | | | | 10/29/15 | | | | 74,969,792 | |
Commonwealth Bank of Australia (b) | | | 50,000,000 | | | | 0.210 | | | | 09/15/15 | | | | 49,995,917 | |
Commonwealth Bank of Australia (next reset date 09/11/15) (a)(b) | | | 14,000,000 | | | | 0.331 | | | | 01/11/16 | | | | 14,000,000 | |
DBS Bank Ltd. (b) | | | 25,000,000 | | | | 0.230 | | | | 09/10/15 | | | | 24,998,562 | |
DnB Bank ASA (b) | | | 50,000,000 | | | | 0.240 | | | | 09/10/15 | | | | 49,997,000 | |
DnB Bank ASA (b) | | | 40,000,000 | | | | 0.359 | | | | 11/23/15 | | | | 40,000,000 | |
Erste Abwicklungsanstalt (b) | | | 45,000,000 | | | | 0.210 | | | | 10/05/15 | | | | 44,991,075 | |
Erste Abwicklungsanstalt (b) | | | 45,000,000 | | | | 0.265 | | | | 10/08/15 | | | | 44,987,744 | |
Erste Abwicklungsanstalt (b) | | | 75,000,000 | | | | 0.320 | | | | 11/30/15 | | | | 74,940,000 | |
General Electric Capital Corp. | | | 7,500,000 | | | | 0.252 | | | | 09/03/15 | | | | 7,500,000 | |
General Electric Capital Corp. (next reset date 09/04/15) (a) | | | 7,500,000 | | | | 0.282 | | | | 10/30/15 | | | | 7,500,000 | |
HSBC Bank PLC (next reset date 09/21/15) (a)(b) | | | 35,000,000 | | | | 0.321 | | | | 12/21/15 | | | | 35,000,000 | |
HSBC Bank PLC (next reset date 09/23/15) (a)(b) | | | 65,000,000 | | | | 0.330 | | | | 11/23/15 | | | | 65,000,000 | |
National Australia Bank Ltd. (next reset date 09/09/15) (a)(b) | | | 10,000,000 | | | | 0.333 | | | | 01/12/16 | | | | 10,000,000 | |
Nederlandse Waterschapsbank NV (b) | | | 50,000,000 | | | | 0.275 | | | | 10/29/15 | | | | 49,977,847 | |
Nordea Bank AB (b) | | | 75,000,000 | | | | 0.210 | | | | 09/10/15 | | | | 74,996,062 | |
Nordea Bank AB (b) | | | 45,700,000 | | | | 0.250 | | | | 09/21/15 | | | | 45,693,653 | |
Nordea Bank AB (b) | | | 20,000,000 | | | | 0.260 | | | | 10/22/15 | | | | 19,992,633 | |
Nordea Bank AB (b) | | | 60,000,000 | | | | 0.300 | | | | 10/27/15 | | | | 59,972,000 | |
NRW.Bank (b) | | | 75,000,000 | | | | 0.185 | | | | 10/02/15 | | | | 74,988,052 | |
Skandinaviska Enskilda Banken AB (b) | | | 30,000,000 | | | | 0.250 | | | | 10/14/15 | | | | 29,991,042 | |
Skandinaviska Enskilda Banken AB (b) | | | 95,000,000 | | | | 0.250 | | | | 10/15/15 | | | | 94,970,972 | |
Standard Chartered Bank (b) | | | 60,000,000 | | | | 0.260 | | | | 09/09/15 | | | | 59,996,533 | |
Swedbank AB | | | 75,000,000 | | | | 0.250 | | | | 10/07/15 | | | | 74,981,250 | |
Swedbank AB | | | 50,000,000 | | | | 0.310 | | | | 11/27/15 | | | | 49,962,542 | |
Toyota Motor Credit Corp. (next reset date 09/08/15) (a) | | | 21,500,000 | | | | 0.294 | | | | 01/15/16 | | | | 21,500,000 | |
Toyota Motor Credit Corp. (next reset date 09/10/15) (a) | | | 21,500,000 | | | | 0.291 | | | | 01/06/16 | | | | 21,500,000 | |
Westpac Banking Corp. (next reset date 09/11/15) (a)(b) | | | 22,000,000 | | | | 0.301 | | | | 03/11/16 | | | | 22,000,000 | |
Westpac Banking Corp. (next reset date 09/25/15) (a)(b) | | | 8,500,000 | | | | 0.309 | | | | 02/25/16 | | | | 8,500,000 | |
Westpac Banking Corp. (next reset date 09/28/15) (a)(b) | | | 41,000,000 | | | | 0.299 | | | | 10/26/15 | | | | 41,000,000 | |
Westpac Banking Corp. (next reset date 09/28/15) (a)(b) | | | 8,500,000 | | | | 0.309 | | | | 02/26/16 | | | | 8,500,000 | |
| | | | | | | | | | | | | | | | |
| | | | |
Total Financial Company Commercial Paper
(cost $1,448,383,974) | | | | | | | | | | | | | | | 1,448,383,974 | |
| | | | | | | | | | | | | | | | |
| | | | |
| Government Agency Debt - 3.2% | | | | | | | | | | | | | | | | |
Federal Home Loan Bank | | | 45,000,000 | | | | 0.092 | | | | 10/07/15 | | | | 44,995,950 | |
Federal Home Loan Bank | | | 47,000,000 | | | | 0.122 | | | | 10/09/15 | | | | 46,994,046 | |
Federal Home Loan Bank | | | 38,000,000 | | | | 0.173 | | | | 10/16/15 | | | | 37,991,925 | |
Federal Home Loan Bank | | | 15,000,000 | | | | 0.162 | | | | 10/16/15 | | | | 14,997,019 | |
Federal Home Loan Bank | | | 36,000,000 | | | | 0.148 | | | | 10/21/15 | | | | 35,992,750 | |
| | | | | | | | | | | | | | | | |
| | | | |
Total Government Agency Debt
(cost $180,971,690) | | | | | | | | | | | | | | | 180,971,690 | |
| | | | | | | | | | | | | | | | |
| | | | |
| SSGA Prime Money Market Fund | | | 7 | |
SSGA Prime Money Market Fund
Schedule of Investments, continued — August 31, 2015
| | | | | | | | | | | | | | | | |
| | | Principal
Amount ($)
or Shares | | | Rate
% (#) | | | Date
of
Maturity | | | Value
$ | |
| | | | | | | | | | | | | | | | |
| Other Notes - 7.9% | | | | | | | | | | | | | | | | |
Bank of America NA | | | 8,000,000 | | | | 0.280 | | | | 10/09/15 | | | | 8,000,000 | |
Bank of America NA | | | 7,000,000 | | | | 0.280 | | | | 10/14/15 | | | | 7,000,000 | |
Bank of America NA | | | 10,000,000 | | | | 0.250 | | | | 10/15/15 | | | | 10,000,000 | |
Bank of America NA | | | 20,000,000 | | | | 0.300 | | | | 11/05/15 | | | | 20,000,000 | |
Bank of America NA (next reset date 09/01/15) (a) | | | 40,000,000 | | | | 0.368 | | | | 02/01/16 | | | | 40,000,000 | |
Bank of America NA (next reset date 09/15/15) (a) | | | 50,000,000 | | | | 0.358 | | | | 01/15/16 | | | | 50,000,000 | |
JPMorgan Chase Bank NA (next reset date 09/08/15) (a) | | | 60,000,000 | | | | 0.439 | | | | 08/05/16 | | | | 60,000,000 | |
JPMorgan Chase Bank NA (next reset date 10/22/15) (a) | | | 35,000,000 | | | | 0.455 | | | | 08/22/16 | | | | 35,000,000 | |
Natixis | | | 8,868,000 | | | | 0.070 | | | | 09/01/15 | | | | 8,868,000 | |
Royal Bank of Canada (next reset date 09/16/15) (a) | | | 25,000,000 | | | | 0.506 | | | | 12/16/15 | | | | 25,014,447 | |
Royal Bank of Canada (next reset date 10/07/15) (a)(c) | | | 35,000,000 | | | | 0.374 | | | | 08/08/16 | | | | 35,000,000 | |
Svenska Handelsbanken AB (next reset date 09/28/15) (a)(b) | | | 40,000,000 | | | | 0.388 | | | | 01/27/16 | | | | 40,000,000 | |
Toyota Motor Credit Corp. | | | 11,000,000 | | | | 0.434 | | | | 10/07/15 | | | | 11,002,327 | |
Wells Fargo Bank NA (next reset date 09/10/15) (a) | | | 35,000,000 | | | | 0.372 | | | | 08/09/16 | | | | 35,000,000 | |
Wells Fargo Bank NA (next reset date 09/21/15) (a) | | | 58,000,000 | | | | 0.403 | | | | 08/19/16 | | | | 58,000,000 | |
| | | | | | | | | | | | | | | | |
| | | | |
Total Other Notes
(cost $442,884,774) | | | | | | | | | | | | | | | 442,884,774 | |
| | | | | | | | | | | | | | | | |
| | | | |
| Treasury Debt - 0.8% | | | | | | | | | | | | | | | | |
U.S. Treasury Bill (cost $41,999,265) | | | 42,000,000 | | | | 0.020 | | | | 10/01/15 | | | | 41,999,265 | |
| | | | | | | | | | | | | | | | |
| | | | |
Total Investments - 77.3%
(cost $4,312,490,913) | | | | | | | | | | | | | | | 4,312,490,913 | |
| | | | | | | | | | | | | | | | |
| | | | |
| Repurchase Agreements - 23.4% | | | | | | | | | | | | | | | | |
| Treasury Repurchase Agreements - 23.0% | | | | | | | | | | | | | | | | |
Agreement with Credit Suisse Securities (USA) LLC and JP Morgan Chase & Co. (Tri-Party) of $50,000,000 dated August 31, 2015 at 0.620% to be repurchased at $50,000,861 on December 4, 2015, collateralized by: $51,560,000 par various United States Government Treasury Obligations valued at $51,004,980. (d) | | | | | | | | | | | | | | | 50,000,000 | |
Agreement with Federal Reserve Bank and Bank of New York Mellon Corp. (Tri-Party) of $1,235,000,000 dated August 31, 2015 at 0.050% to be repurchased at $1,235,001,715 on September 1, 2015, collateralized by: $1,201,981,900 par various United States Government Treasury Obligations valued at $1,235,001,740. | | | | | | | | | | | | | | | 1,235,000,000 | |
| | | | | | | | | | | | | | | | |
| | | | |
Total Treasury Repurchase Agreements
(cost $1,285,000,000) | | | | | | | | | | | | | | | 1,285,000,000 | |
| | | | | | | | | | | | | | | | |
| | | | |
| Other Repurchase Agreements - 0.4% | | | | | | | | | | | | | | | | |
Agreement with JPM Chase and JP Morgan Chase & Co. (Tri-Party) of $25,000,000 dated August 31, 2015 at 0.394% to be repurchased at $25,001,094 on December 3, 2015, collateralized by: $150,299,405 par various Asset-Backed/Mortgage Backed Securities valued at $27,003,112. (d) (cost $25,000,000) | | | | | | | | | | | | | | | 25,000,000 | |
| | | | | | | | | | | | | | | | |
| | | | |
Total Repurchase Agreements
(cost $1,310,000,000) | | | | | | | | | | | | | | | 1,310,000,000 | |
| | | | | | | | | | | | | | | | |
| | | | |
Total Investments and Repurchase
Agreements - 100.7% (e)
(cost $5,622,490,913) (f) | | | | | | | | | | | | | | | 5,622,490,913 | |
| | | | |
| Other Assets and Liabilities, Net - (0.7)% | | | | | | | | | | | | | | | (41,784,822 | ) |
| | | | | | | | | | | | | | | | |
| | | | |
| Net Assets - 100.0% | | | | | | | | | | | | | | | 5,580,706,091 | |
| | | | | | | | | | | | | | | | |
| | |
| 8 | | SSGA Prime Money Market Fund |
SSGA Prime Money Market Fund
Schedule of Investments, continued — August 31, 2015
Footnotes:
| # | For purposes of this report, for non-interest bearing Commercial Paper and Discount Notes, the discount rate at purchase is used to populate the rate column. |
| (a) | Adjustable or floating rate security. Rate shown reflects rate in effect at period end. |
| (b) | Rule 144A, Section 4(2) or other security, which is restricted to resale to institutional investors. The Fund’s investment manager has deemed this security to be liquid based upon procedures approved by the Board of Trustees. These securities represent $1,155,488,390 or 20.7% of net assets as of August 31, 2015. |
| (c) | Security exempt from registration under Rule 144A. These securities, which represent 3.31% of net assets as of August 31, 2015, are considered liquid and may be resold in transactions exempt from registration, normally to qualified institutional buyers. |
| (e) | Unless otherwise indicated, the values of securities of the Fund are determined based on Level 2 inputs (Note 2). |
| (f) | The cost of securities for federal income tax purposes is substantially the same for financial reporting purposes. |
Legend
LLC Limited Liability Company
PLC Public Limited Company
Presentation of Portfolio Holdings — August 31, 2015
| | | | |
| Categories | | % of
Net
Assets | |
| | | | |
Asset Backed Commercial Paper | | | 0.6 | |
Certificates of Deposit | | | 38.8 | |
Financial Company Commercial Paper | | | 26.0 | |
Government Agency Debt | | | 3.2 | |
Other Notes | | | 7.9 | |
Treasury Debt | | | 0.8 | |
Repurchase Agreements | | | 23.4 | |
| | | | |
Total Investments and Repurchase Agreements | | | 100.7 | |
Other Assets and Liabilities, Net | | | (0.7 | ) |
| | | | |
| | | 100.0 | |
| | | | |
See accompanying notes which are an integral part of the financial statements.
| | | | |
| SSGA Prime Money Market Fund | | | 9 | |
SSGA Institutional Money Market Funds
Statements of Assets and Liabilities — August 31, 2015
| | | | | | | | |
| | | SSGA U.S.
Treasury
Money
Market Fund | | | SSGA Prime
Money
Market Fund | |
| | | | | | | | |
Assets | | | | | | | | |
Investments at amortized cost which approximates value | | $ | 5,323,120,091 | | | $ | 4,312,490,913 | |
Repurchase agreements at cost which approximates value | | | 2,887,022,000 | | | | 1,310,000,000 | |
Cash | | | 308,057,100 | | | | 734 | |
Receivables: | | | | | | | | |
Interest | | | 477,851 | | | | 1,147,844 | |
Fund shares sold | | | 222 | | | | 28,034 | |
From adviser | | | 1,719,442 | | | | 366,830 | |
Prepaid expenses | | | 54,813 | | | | 94,272 | |
| | | | | | | | |
Total assets | | | 8,520,451,519 | | | | 5,624,128,627 | |
| | | | | | | | |
| | |
Liabilities | | | | | | | | |
Payables: | | | | | | | | |
Investments purchased | | | 498,991,312 | | | | 41,999,265 | |
Fund shares redeemed | | | 798,223 | | | | 16,201 | |
Accrued fees to affiliates and trustees | | | 1,845,155 | | | | 1,276,064 | |
Other accrued expenses | | | 107,074 | | | | 113,705 | |
Distribution payable | | | — | | | | 17,301 | |
| | | | | | | | |
Total liabilities | | | 501,741,764 | | | | 43,422,536 | |
| | | | | | | | |
| | | | | | | | |
Net Assets | | $ | 8,018,709,755 | | | $ | 5,580,706,091 | |
| | | | | | | | |
| | |
Net Assets Consist of: | | | | | | | | |
Distributions in excess of net investment income | | $ | — | | | $ | (6,498 | ) |
Accumulated net realized gain | | | 3,482 | | | | 34,690 | |
Paid in capital | | | 8,018,706,273 | | | | 5,580,677,899 | |
| | | | | | | | |
Net Assets | | $ | 8,018,709,755 | | | $ | 5,580,706,091 | |
| | | | | | | | |
| | |
Net Asset Value, offering and redemption price per share: | | | | | | | | |
Net asset value per share: | | $ | 1.00 | | | $ | 1.00 | |
Net assets | | $ | 8,018,709,755 | | | $ | 5,580,706,091 | |
Shares outstanding ($0.001 par value) | | | 8,018,773,213 | | | | 5,580,688,547 | |
See accompanying notes which are an integral part of the financial statements.
| | |
| 10 | | Statements of Assets and Liabilities |
SSGA Institutional Money Market Funds
Statements of Operations — For the Year Ended August 31, 2015
| | | | | | | | |
| | | SSGA U.S.
Treasury
Money
Market Fund | | | SSGA Prime
Money
Market Fund | |
| | | | | | | | |
Investment Income | | | | | | | | |
Interest | | $ | 2,887,618 | | | $ | 12,689,209 | |
| | | | | | | | |
Total investment income | | | 2,887,618 | | | | 12,689,209 | |
| | | | | | | | |
| | |
Expenses | | | | | | | | |
Advisory fees | | | 10,260,954 | | | | 9,239,530 | |
Administration fees | | | 1,602,791 | | | | 1,434,284 | |
Custodian fees | | | 844,240 | | | | 837,069 | |
Distribution fees | | | 1,501,630 | | | | 1,539,922 | |
Transfer agent fees | | | 65,135 | | | | 57,740 | |
Professional fees | | | 131,543 | | | | 126,287 | |
Registration fees | | | 26,484 | | | | 26,606 | |
Shareholder servicing fees | | | 1,334,248 | | | | 1,177,851 | |
Trustees’ fees | | | 112,645 | | | | 100,842 | |
Insurance fees | | | 122,360 | | | | 47,004 | |
Printing fees | | | 60,039 | | | | 59,266 | |
Miscellaneous | | | 109,116 | | | | 68,304 | |
| | | | | | | | |
Expenses before reductions | | | 16,171,185 | | | | 14,714,705 | |
Expense reductions | | | (13,283,567 | ) | | | (3,462,734 | ) |
| | | | | | | | |
Net expenses | | | 2,887,618 | | | | 11,251,971 | |
| | | | | | | | |
Net investment income | | | — | | | | 1,437,238 | |
| | | | | | | | |
| | |
Net Realized Gain (Loss) | | | | | | | | |
Net realized gain (loss) on investments | | | 3,482 | | | | 95,533 | |
| | | | | | | | |
Net Increase in Net Assets from Operations | | $ | 3,482 | | | $ | 1,532,771 | |
| | | | | | | | |
See accompanying notes which are an integral part of the financial statements.
| | | | |
| Statements of Operations | | | 11 | |
SSGA Institutional Money Market Funds
Statements of Changes in Net Assets
| | | | | | | | | | | | | | | | |
| | | SSGA U.S. Treasury Money
Market Fund | | | SSGA Prime Money Market Fund | |
| | | Year Ended
August 31, 2015 | | | Year Ended
August 31, 2014 | | | Year Ended
August 31, 2015 | | | Year Ended
August 31, 2014 | |
Increase (Decrease) in Net Assets | | | | | | | | | | | | | | | | |
| | | | |
Operations | | | | | | | | | | | | | | | | |
Net investment income | | $ | — | | | $ | — | | | $ | 1,437,238 | | | $ | 641,716 | |
Net realized gain | | | 3,482 | | | | — | | | | 95,533 | | | | 163,433 | |
| | | | | | | | | | | | | | | | |
Net increase in net assets from operations | | | 3,482 | | | | — | | | | 1,532,771 | | | | 805,149 | |
| | | | | | | | | | | | | | | | |
| | | | |
Distributions | | | | | | | | | | | | | | | | |
From net investment income | | | — | | | | (8,496 | ) | | | (1,437,238 | ) | | | (889,158 | ) |
From net realized gains | | | — | | | | (12,948 | ) | | | (126,963 | ) | | | (203,061 | ) |
| | | | | | | | | | | | | | | | |
Net decrease in net assets from distributions | | | — | | | | (21,444 | ) | | | (1,564,201 | ) | | | (1,092,219 | ) |
| | | | | | | | | | | | | | | | |
| | | | |
Share Transactions | | | | | | | | | | | | | | | | |
Net increase (decrease) in net assets from share transactions (Note 4) | | | (55,002,360 | ) | | | 1,632,918,125 | | | | 120,725,006 | | | | (2,311,165,824 | ) |
| | | | | | | | | | | | | | | | |
Total Net Increase (Decrease) in Net Assets | | | (54,998,878 | ) | | | 1,632,896,681 | | | | 120,693,576 | | | | (2,311,452,894 | ) |
| | | | |
Net Assets | | | | | | | | | | | | | | | | |
Beginning of year | | | 8,073,708,633 | | | | 6,440,811,952 | | | | 5,460,012,515 | | | | 7,771,465,409 | |
| | | | | | | | | | | | | | | | |
| | | | |
End of year | | $ | 8,018,709,755 | | | $ | 8,073,708,633 | | | $ | 5,580,706,091 | | | $ | 5,460,012,515 | |
| | | | | | | | | | | | | | | | |
| | | | |
Distributions in excess of net investment income included in net assets | | $ | — | | | $ | — | | | $ | (6,498 | ) | | $ | (6,498 | ) |
See accompanying notes which are an integral part of the financial statements.
| | |
| 12 | | Statements of Changes in Net Assets |
This page has been intentionally left blank.
SSGA Institutional Money Market Funds
Financial Highlights
Selected data for a share of beneficial interest outstanding throughout each year is presented below.
| | | | | | | | | | | | | | | | | | | | | | | | |
| | |
$
Net Asset Value,
Beginning of
Year | | | $
Net
Investment
Income (Loss)(a)(b) | | | $
Net Realized
and Unrealized
Gain (Loss) | | | $
Total from
Investment
Operations | | | $
Distributions
from Net
Investment Income | | | $
Distributions
from Net
Realized Gain | |
SSGA U.S. Treasury Money Market Fund | | | | | | | | | | | | | |
August 31, 2015 | | | 1.0000 | | | | — | | | | — | (c) | | | — | (c) | | | — | | | | — | |
August 31, 2014 | | | 1.0000 | | | | — | | | | — | | | | — | | | | — | (c) | | | — | (c) |
August 31, 2013 | | | 1.0000 | | | | — | | | | — | (c) | | | — | (c) | | | — | | | | — | |
August 31, 2012 | | | 1.0000 | | | | — | | | | — | (c) | | | — | (c) | | | — | | | | — | (c) |
August 31, 2011 | | | 1.0000 | | | | — | (c) | | | — | (c) | | | — | (c) | | | — | (c) | | | — | (c) |
SSGA Prime Money Market Fund | | | | | | | | | | | | | |
August 31, 2015 | | | 1.0000 | | | | 0.0003 | | | | — | (c) | | | 0.0003 | | | | (0.0003 | ) | | | — | (c) |
August 31, 2014 | | | 1.0000 | | | | 0.0001 | | | | — | (c) | | | 0.0001 | | | | (0.0001 | ) | | | — | (c) |
August 31, 2013 | | | 1.0000 | | | | 0.0007 | | | | — | (c) | | | 0.0007 | | | | (0.0007 | ) | | | — | |
August 31, 2012 | | | 1.0000 | | | | 0.0010 | | | | — | (c) | | | 0.0010 | | | | (0.0010 | ) | | | — | |
August 31, 2011 | | | 1.0000 | | | | 0.0012 | | | | — | (c) | | | 0.0012 | | | | (0.0012 | ) | | | — | |
| (a) | | Average daily shares outstanding were used for this calculation. |
| (b) | | Reflects amounts waived and/or reimbursed by the adviser and for certain funds, custody credit arrangements. |
| (c) | | Less than $0.0001 per share. |
| (e) | | Less than 0.005% of average net assets. |
See accompanying notes which are an integral part of the financial statements.
| | | | | | | | | | | | | | | | | | | | | | | | | | |
$
Total
Distributions | | | $
Net Asset Value,
End of
Year | | | %
Total
Return | | | $
Net Assets,
End of Year
(000) | | | %
Ratio of Expenses
to Average
Net Assets,
Net | | | %
Ratio of Expenses
to Average
Net Assets,
Gross | | | %
Ratio of Net
Investment Income
to Average
Net Assets | |
| | | | | | | | | | | | | | | | | | | | | | | | | | |
| | — | | | | 1.0000 | | | | — | | | | 8,018,710 | | | | 0.04 | | | | 0.24 | | | | — | |
| | — | (c) | | | 1.0000 | | | | — | (d) | | | 8,073,709 | | | | 0.06 | | | | 0.23 | | | | — | |
| | — | | | | 1.0000 | | | | — | | | | 6,440,812 | | | | 0.09 | | | | 0.24 | | | | — | |
| | — | (c) | | | 1.0000 | | | | — | (d) | | | 4,387,962 | | | | 0.08 | | | | 0.25 | | | | — | |
| | — | (c) | | | 1.0000 | | | | — | (d) | | | 4,410,166 | | | | 0.11 | | | | 0.25 | | | | — | (e) |
| | | | | | | | | | | | | | | | | | | | | | | | | | |
| | (0.0003 | ) | | | 1.0000 | | | | 0.03 | | | | 5,580,706 | | | | 0.18 | | | | 0.24 | | | | 0.02 | |
| | (0.0001 | ) | | | 1.0000 | | | | 0.01 | | | | 5,460,013 | | | | 0.18 | | | | 0.24 | | | | 0.01 | |
| | (0.0007 | ) | | | 1.0000 | | | | 0.07 | | | | 7,771,465 | | | | 0.20 | | | | 0.25 | | | | 0.07 | |
| | (0.0010 | ) | | | 1.0000 | | | | 0.10 | | | | 12,072,632 | | | | 0.20 | | | | 0.25 | | | | 0.10 | |
| | (0.0012 | ) | | | 1.0000 | | | | 0.12 | | | | 9,934,761 | | | | 0.20 | | | | 0.25 | | | | 0.12 | |
See accompanying notes which are an integral part of the financial statements.
SSGA Institutional Money Market Funds
Notes to Financial Statements — August 31, 2015
The SSGA Funds (the “Trust”) is registered under the Investment Company Act of 1940, as amended (the “1940 Act”), as an open-end management investment company, and was organized as a Massachusetts business trust on October 3, 1987. The Trust operates under a Second Amended and Restated Master Trust Agreement, dated May 15, 2012 (the “Agreement”).
As of August 31, 2015, the Trust consisted of eleven (11) series and corresponding classes each of which have the same rights and privileges, including voting rights. The Declaration of Trust permits the Board of Trustees of the Trust (the “Board”) to authorize the issuance of unlimited number of shares of beneficial interest at a $.001 par value. The financial statements herein relate to the following series (each a “Fund” and, collectively, the “Funds”):
| | | | |
| Fund | | Classes | | Commencement of Operations: |
SSGA U.S. Treasury Money Market Fund (diversified) | | Class N | | December 1, 1993 |
| | |
SSGA Prime Money Market Fund (diversified) | | Class N | | February 22, 1994 |
The financial statements of the remaining 9 series are presented in separate reports.
The SSGA U.S. Treasury Money Market Fund and SSGA Prime Money Market Fund are considered to be money market funds pursuant to Rule 2a-7 under the Investment Company Act of 1940, as amended (the “1940 Act”). It is the policy of the Funds to maintain a stable net asset value per share of $1.00. However, there is no assurance the Funds will be able to maintain a stable net asset value per share.
An investment in the Funds is not insured or guaranteed by the Federal Deposit Insurance Corporation or any other government agency. Although the Funds seek to preserve the value of shareholders’ investment at $1.00 per share, it is possible to lose money by investing in the Funds.
Under the Trust’s organizational documents, its officers and trustees are indemnified against certain liabilities arising out of the performance of their duties to the Trust. Additionally, in the normal course of business, the Trust enters into contracts with service providers that contain general indemnification clauses. The Trust’s maximum exposure under these arrangements is unknown as this could involve future claims that may be made against the Trust that have not yet occurred.
Deloitte & Touche LLP (“Deloitte & Touche”) served as independent registered certified public accounting firm through November 19, 2014. On November 19, 2014, upon recommendation by the Audit Committee of the Funds, the Funds’ Board of Trustees selected Ernst & Young LLP to replace Deloitte & Touche as the independent public accountant for the fiscal year ending August 31, 2015.
The reports of Deloitte & Touche on the financial statements for the past two fiscal years contained no adverse opinion or disclaimer of opinion and were not qualified or modified as to uncertainty, audit scope or accounting principles.
During the two most recent fiscal years and through November 19, 2014, there have been no disagreements with Deloitte & Touche on any matter of accounting principles or practices, financial statement disclosure, or auditing scope or procedure, which disagreements if not resolved to the satisfaction of Deloitte & Touche would have caused them to make reference thereto in their reports on the financial statements for such years.
During the two most recent fiscal years and through, there have been no reportable events (as defined in Item 304(a)(1)(v) of Regulation S-K). The Funds requested and Deloitte & Touche furnished a letter addressed to the Securities and Exchange Commission stating whether or not it agreed with the above statements. A copy of such letter was filed as Exhibit 77 to Form N-SAR for the period.
| | |
| 16 | | Notes to Financial Statements |
SSGA Institutional Money Market Funds
Notes to Financial Statements, continued — August 31, 2015
| 2. | | Summary of Significant Accounting Policies |
The following is a summary of significant accounting policies followed by the Trust in the preparation of its financial statements:
The preparation of financial statements in accordance with U.S. generally accepted accounting principles (“U.S. GAAP”) which requires management to make estimates and assumptions that affect the reported amounts and disclosures in the financial statements. Actual results could differ from those estimates. Each Fund is an investment company under U.S. GAAP and follows the accounting and reporting guidance applicable to investment companies in Financial Accounting Standards Board (“FASB”) Accounting Standards Codification (“ASC”) 946, Financial Services Investment Companies (“ASC 946”).
Security Valuation
The Funds’ securities are recorded on the basis of amortized cost which approximates fair value as permitted by Rule 2a-7 under the 1940 Act. This method values a security at its cost on the date of purchase and, thereafter, assumes a constant amortization to maturity of any premiums or accretion of any discounts. These securities are generally included in Level 2 of the fair value hierarchy.
Because of the inherent uncertainties of valuation and under certain market conditions, the values reflected in the financial statements may differ from the value received upon actual sale of those investments and it is possible that the differences could be material.
These inputs are categorized into a fair value hierarchy consisting of three broad levels for financial reporting purposes. The Funds value their assets and liabilities at fair value using a hierarchy that prioritizes the inputs to valuation techniques giving the highest priority to readily available unadjusted quoted prices in active markets for identical assets or liabilities (Level 1 measurements) and the lowest priority to unobservable inputs (Level 3 measurements) when market prices are not readily available or reliable. The categorization of a value determined for an investment within the hierarchy is based upon the pricing transparency of the investment and is not necessarily an indication of the risk associated with investing in it.
The three levels of the fair value hierarchy are as follows:
| | • | | Level 1 — Unadjusted quoted prices in active markets for identical assets or liabilities; |
| | • | | Level 2 — Inputs other than quoted prices included within Level 1 that are observable for the asset or liability either directly or indirectly, including quoted prices for similar assets or liabilities in active markets, quoted prices for identical or similar assets or liabilities in markets that are not considered to be active, inputs other than quoted prices that are observable for the asset or liability (such as exchange rates, financing terms, interest rates, yield curves, volatilities, prepayment speeds, loss severities, credit risks and default rates) or other market-corroborated inputs; and |
| | • | | Level 3 — Unobservable inputs for the asset or liability, including the Committee’s assumptions used in determining the fair value of investments. |
Changes in valuation techniques may result in transfers in or out of an assigned level within the fair value hierarchy. Transfers between different levels of the fair value hierarchy are recognized at the end of the reporting period. The Funds had no transfers between levels for year ended August 31, 2015.
The following is a summary of the inputs used, as of August 31, 2015, in valuing the Funds’ assets carried at fair value:
| | | | | | | | |
| | | Investments in Securities | |
| Valuation Inputs | | SSGA U.S. Treasury
Money Market Fund | | | SSGA Prime
Money Market Fund | |
Level 1 — Quoted Prices | | $ | — | | | $ | — | |
Level 2 — Other Significant Observable Inputs | | $ | 8,210,142,091 | | | $ | 5,622,490,913 | |
Level 3 — Significant Unobservable Inputs | | $ | — | | | $ | — | |
| | | | | | | | |
Total | | $ | 8,210,142,091 | | | $ | 5,622,490,913 | |
| | | | |
| Notes to Financial Statements | | | 17 | |
SSGA Institutional Money Market Funds
Notes to Financial Statements, continued — August 31, 2015
Investment Transactions and Income Recognition
Investment transactions are accounted for on trade date for financial reporting purposes. Interest income is recorded daily on an accrual basis and includes amortization of premium and accretion of discount on investments. Realized gains and losses from the sale of disposition of investments are determined using the identified cost method.
Dividends and Distributions
Net investment income is declared daily and is payable as of the last business day of each month. Net realized capital gains, if any, are distributed annually, unless additional distributions are required for compliance with applicable tax regulations. The amount and character of income and gains to be distributed are determined in accordance with federal tax regulations which may differ from net investment income and realized gains recognized for U.S. GAAP purposes.
Expenses
Certain expenses, which are directly identifiable to a specific Fund, are applied to that Fund within the Trust. Other expenses which cannot be attributed to a specific Fund are allocated in such a manner as deemed equitable, taking into consideration the nature and type of expense and the relative net assets of the Funds within the Trust.
Repurchase Agreements
The Funds may enter into repurchase agreements under the terms of a Master Repurchase Agreement. A repurchase agreement customarily obligates the seller at the time it sells securities to the Funds to repurchase the securities at a mutually agreed-upon price and time. The total amount received by the Funds on repurchase is calculated to exceed the price paid by the Funds, reflecting an agreed-upon market rate of interest for the period of time to the settlement date, and is not necessarily related to the interest rate on the underlying securities. The underlying securities are ordinarily United States Government or Government Agency securities, but the underlying securities on the SSGA Prime Money Market Fund may consist of other securities such as Corporate Bonds in limited circumstances. The value of the underlying securities, at the time of purchase and each subsequent business day, is required to be maintained at such a level that the value is equal to at least the principal amount of the repurchase price plus accrued interest. The use of repurchase agreements involves certain risks. Upon an event of default under the Master Repurchase Agreement, if the seller of securities under a repurchase agreement defaults on its obligation to repurchase the underlying securities (as a result of its bankruptcy or otherwise) the Funds will seek to dispose of such securities; this action could involve losses, costs or delays. In addition, the proceeds of any such disposition may be less than the amount each Fund is owed under the repurchase agreement. The Funds may enter into repurchase agreements maturing within a specified date with domestic dealers, banks and other financial institutions deemed to be creditworthy by SSGA Funds Management, Inc. (“SSGA FM” or the “Adviser”), a subsidiary of State Street Corporation and an affiliate of State Street Bank and Trust Company (“State Street”).
Federal Income Taxes
Each Fund has qualified and intends to continue to qualify for and elect treatment as a regulated investment company under Subchapter M of the Internal Revenue Code of 1986, as amended. By so qualifying and electing, the Funds will not be subject to federal income taxes to the extent they distribute their taxable income, including any net realized capital gains, for each fiscal year. In addition, by distributing during each calendar year substantially all of their net taxable income and capital gains, if any, the Funds will not be subject to federal excise tax. Income and capital gain distributions if any, are determined in accordance with income tax regulation which may differ from U.S. GAAP. The book tax differences were primarily attributable to equalization.
Management has reviewed the Funds’ tax positions for the open tax years as of August 31, 2015 and has determined that no provision for income tax is required in the Funds’ financial statements. The Funds’ federal tax returns for the prior three fiscal years remain subject to examination by the Funds’ major tax jurisdictions, which include the United States of America and the Commonwealth of Massachusetts. The Funds recognize interest and penalties, if any, related to tax liabilities as income tax expense in the Statements of Operations.
| | |
| 18 | | Notes to Financial Statements |
SSGA Institutional Money Market Funds
Notes to Financial Statements, continued — August 31, 2015
No income tax returns are currently under examination. Management has analyzed tax laws and regulations and their applications to the Funds’ facts and circumstances and does not believe there are any uncertain tax positions that require recognition of tax liability.
For the year ended August 31, 2015, the Funds’ components of distributable earnings and tax composition of distributions for federal income tax purposes were as follows:
| | | | | | | | | | | | | | | | | | | | |
| | | Components of Distributable Earnings: | | | Tax Composition of Distributions: | |
| | | Undistributed
Ordinary Income | | | Undistributed Long-Term Capital Gains | | | Ordinary
Income | | | Long-Term Capital Gains | | | Tax Return of Capital | |
| | | | | | | | | | | | | | | | | | | | |
SSGA U.S. Treasury Money Market Fund | | $ | 3,482 | | | $ | — | | | $ | — | | | $ | — | | | $ | — | |
SSGA Prime Money Market Fund | | $ | 45,493 | | | $ | — | | | $ | 1,564,201 | | | $ | — | | | $ | — | |
For the year ended August 31, 2014, the Funds’ tax composition of distributions for federal income tax purposes were as follows:
| | | | | | | | | | | | |
| | | Tax Composition of Distributions: | |
| | | Ordinary
Income | | | Long-Term Capital Gains | | | Tax Return of Capital | |
| | | | | | | | | | | | |
SSGA U.S. Treasury Money Market Fund | | $ | 21,444 | | | $ | — | | | $ | — | |
SSGA Prime Money Market Fund | | $ | 1,092,219 | | | $ | — | | | $ | — | |
| 3. | | Fees and Compensation paid to Affiliates and other Related Party Transactions |
Adviser and Affiliates
The Adviser manages the Funds pursuant to an Amended and Restated Investment Advisory Agreement dated April 11, 2012, between the Trust and the Adviser. The Adviser and other advisory affiliates of State Street Corporation make up State Street Global Advisors, the investment management arm of State Street Corporation and its affiliated companies. The Adviser directs the investments of each Fund in accordance with their investment objectives, policies, and limitations. For these services, each Fund pays a fee to the Adviser, calculated daily and paid monthly at the annual rate of 0.15% of its daily average net assets.
The Adviser is contractually obligated until December 31, 2015 to waive 0.05% of its 0.15% management fee on the SSGA U.S. Treasury Money Market Fund. Additionally, the Adviser is further contractually obligated until December 31, 2015 to waive its management fee and/or to reimburse the Fund for expenses to the extent that total expenses (exclusive of non-recurring account fees, extraordinary expenses, acquired fund fees and distribution, shareholder servicing, and sub-transfer agency fees) exceed 0.16% of average daily net assets on an annual basis. This waiver and/or reimbursement may not be terminated prior to December 31, 2015 except with the approval of the Fund’s Board of Trustees. The total amounts of the waiver and reimbursement for the year ended August 31, 2015 were $3,430,755 and $0, respectively. The Adviser does not have the ability to recover these amounts waived or reimbursed under this contractual agreement.
The Adviser is contractually obligated until December 31, 2015 to waive 0.05% of its 0.15% management fee on the SSGA Prime Money Market Fund. Additionally, the Adviser is further contractually obligated until December 31, 2015 to waive its management fee and/or to reimburse the Fund for expenses to the extent that total expenses (exclusive of non-recurring account fees, extraordinary expenses, acquired fund fees and distribution, shareholder servicing, and sub-transfer agency fees) exceed 0.15% of average daily net assets on an annual basis. This waiver and/or reimbursement may not be terminated prior to December 31, 2015 except with the approval of the Fund’s Board of Trustees. The total amounts of the waiver and reimbursement for the year ended August 31, 2015 were $3,305,155 and $0, respectively. The Adviser does not have the ability to recover these amounts waived or reimbursed from prior years.
The Adviser also may voluntarily reduce all or a portion of its fees and/or reimburse expenses to the extent necessary to avoid a negative yield (the “Voluntary Reduction”) which may vary from time to time and from fund to fund in the Adviser’s sole discretion. Under an agreement with the Trust relating to the Voluntary Reduction, the Funds have agreed to reimburse the Adviser for the full dollar amount of any Voluntary Reduction beginning on August 1, 2012, subject to certain limitations. A
| | | | |
| Notes to Financial Statements | | | 19 | |
SSGA Institutional Money Market Funds
Notes to Financial Statements, continued — August 31, 2015
Fund will not be obligated to reimburse the Adviser more than three years after the end of the fiscal year for the Fund in which the Adviser provided a Voluntary Reduction; in respect of any business day for which the net annualized one-day yield is less than 0.00%; to the extent that the amount of the reimbursement to the Adviser on any day exceeds fifty percent of the yield (net of all expenses, exclusive of the reimbursement) of the Fund on that day; to the extent that the amount of such reimbursement would cause the Fund’s net yield to fall below the Fund’s minimum net yield as determined by the Adviser in its sole discretion; or in respect of any fee waivers and/or expense reimbursements that are necessary to maintain a Fund’s contractual total expense limit which is effective at the time of such fee waivers and/or expense reimbursements. A reimbursement to the Adviser would increase fund expenses and negatively impact the SSGA U.S. Treasury Money Market Fund’s and the SSGA Prime Money Market Fund’s future yield. There is no guarantee that the Voluntary Reduction will be in effect at any given time or that either the SSGA U.S. Treasury Money Market Fund or the SSGA Prime Money Market Fund will be able to avoid a negative yield. Reimbursement payments by a fund to the Adviser in connection with the Voluntary Reduction are considered extraordinary. For the year ended August 31, 2015, the Adviser voluntarily waived $6,830,199 of its fee and reimbursed $2,845,864 of expenses on the SSGA U.S. Treasury Money Market Fund and voluntarily waived $0 of its fee and reimbursed $0 of expenses on the SSGA Prime Money Market Fund. Voluntary reductions subject to potential recovery by year of expiration are as follows:
| | | | | | | | |
| Expiration | | SSGA U.S. Treasury
Money Market Fund | | | SSGA Prime Money
Market Fund | |
8/31/2016 | | $ | 4,941,980 | | | $ | — | |
8/31/2017 | | $ | 8,075,743 | | | $ | 181,137 | |
8/31/2018 | | $ | 6,830,199 | | | $ | — | |
The SSGA Funds, except the money market funds, are permitted to invest their cash reserves (i.e., monies awaiting investment in portfolio securities suitable for the Funds’ objectives) in the SSGA Prime Money Market Fund. As of August 31, 2015, $8,250,622 or 0.15% of the shares outstanding represents the investments of other funds not presented herein.
Boston Financial Data Services, Inc. (“BFDS”), a joint venture of DST Systems, Inc. and State Street Corporation, serves as the Funds’ transfer and dividend paying agent, pursuant to an agreement dated August 1, 2006, as amended. For these services, the Funds pay annual account services fees, activity based fees, charges related to compliance and regulatory services.
State Street provides custody and fund accounting services to the Funds pursuant to an Amended and Restated Custodian Contract dated April 11, 2012. For these services, the Funds pay State Street asset-based fees that vary according to the number of positions and transactions plus out-of-pocket expenses. State Street is a wholly-owned subsidiary of State Street Corporation.
Administrator and Sub-Administrator
Effective June 1, 2015, SSGA FM serves as Administrator and State Street serves as Sub-Administrator. Pursuant to the Administration Agreement between the Trust on behalf of the Funds and SSGA FM, each Fund pays a fee at an annual rate of 0.05% of the Fund’s net assets. SSGA FM has contractually agreed to waive 0.01% of its administration fee. For the year ended, August 31, 2015, SSGA FM waived fees in the amount of $176,749 and $157,579 for the SSGA U.S. Treasury Money Market Fund and SSGA Prime Money Market Fund, respectively. This waiver may not be terminated or modified except with the approval of the Board.
Prior to June 1, 2015, State Street served as the Administrator of the Funds. For its services as Administrator, the Trust paid State Street an annual fee, payable monthly on a pro rata basis. The annual fee was based on the following percentages of the average daily net assets of the Trust: $0 to $10 billion — 0.0175%; next $10 billion — 0.0125%; next $10 billion — 0.0075% and 0.0050% thereafter. In addition, the Trust paid additional fees to the Administrator for certain services and reimbursed the Administrator for out-of-pocket expenses.
Distributor and Shareholder Servicing
State Street Global Markets, LLC (the “Distributor” or “SSGM”) promotes and offers shares of the Trust pursuant to an Amended and Restated Distribution Agreement dated April 14, 2014. The Distributor may enter into agreements with other related and non-related parties which act as agents to offer and sell shares of the Funds. The amounts paid to the Distributor are included in the accompanying Statements of Operations. The Distributor is a wholly-owned subsidiary of State Street Corporation.
| | |
| 20 | | Notes to Financial Statements |
SSGA Institutional Money Market Funds
Notes to Financial Statements, continued — August 31, 2015
With respect to the SSGA Prime Money Market Fund, the Trust has adopted a distribution plan pursuant to Rule 12b-1 (the “Historical Class N Plan”) under the 1940 Act. Under the Historical Class N Plan, the Trust is authorized to make payments to the Distributor, or any shareholder servicing agent, as defined in the Historical Class N Plan, for providing distribution and marketing services, for furnishing assistance to investors on an ongoing basis, and for the reimbursement of direct out-of-pocket expenses charged by the Distributor in connection with the distribution and marketing of shares of the Trust and the servicing of investor accounts. Payments to the Distributor for the sale and distribution of Class N shares are not permitted by the Historical 12b-1 Plan to exceed 0.25% of the SSGA Prime Money Market Fund’s average net asset value per year.
Additionally, the Board approved the following limits on the amount of Rule 12b-1 fees the Distributor is reimbursed pursuant to the Historical 12b-1 Plan:
| | | | |
| | | 12b-1 Fee Limit | |
SSGA Prime Money Market Fund | | | 0.05 | % |
With respect to the SSGA U.S. Treasury Money Market Fund, to compensate the Distributor for the services it provides and for the expenses it bears in connection with the distribution of shares of the Fund, the Fund may make payments from the assets attributable to certain classes of its shares to the Distributor under a distribution plan adopted pursuant to Rule 12b-1 under the 1940 Act (the “Plan”). The Plan is a compensation plan that provides for payments at annual rates (based on average daily net assets) described below.
The Plan will continue in effect with respect to a class of shares of a Fund only if such continuance is specifically approved at least annually by a vote of both a majority of the Board and a majority of the Trustees of the Trust who are not “interested persons” of the Trust (the “Independent Trustees”) and have no direct or indirect financial interest in the Plan or in any agreements related thereto (the “Qualified Distribution Plan Trustees”). The Plan may not be amended to increase materially the amount of a Fund’s permitted expenses thereunder without the approval of a majority of the outstanding shares of the affected share class and may not be materially amended in any case without a vote of the majority of both the Trustees and the Qualified Distribution Plan Trustees. At the time of adoption, none of the Independent Trustees of the Trust had a direct or indirect financial interest in the operation of the Plan. The Plan calls for payments at an annual rate (based on average net assets) of 0.25%.
Additionally, the Board approved the following limits on the amount of Rule 12b-1 fees paid to the Distributor:
| | | | |
| | | 12b-1 Fee Limit | |
SSGA U.S. Treasury Money Market Fund | | | 0.04 | % |
The Plan may benefit the Funds by increasing sales of shares and reducing redemptions of shares, resulting potentially, for example, in economies of scale and more predictable flows of cash into and out of the Funds. Because Rule 12b-1 fees are paid out of a Fund’s assets, all shareholders share in that expense; however, because shareholders hold their shares through varying arrangements (for example, directly or through financial intermediaries), they may not share equally in the benefits of the Plan.
Financial intermediaries are firms that, for compensation, sell shares of mutual funds, including the Funds, and/or provide certain administrative and account maintenance services to mutual fund shareholders. Financial intermediaries may include, among others, brokers, financial planners or advisors, banks, and insurance companies.
In some cases, a financial intermediary may hold its clients’ Fund shares in nominee or street name. Shareholder services provided by a financial intermediary may (though they will not necessarily) include, among other things: processing and mailing trade confirmations, periodic statements, prospectuses, annual reports, semi-annual reports, shareholder notices, and other SEC-required communications; capturing and processing tax data; issuing and mailing dividend checks to shareholders who have selected cash distributions; preparing record date shareholder lists for proxy solicitations; collecting and posting distributions to shareholder accounts; and establishing and maintaining systematic withdrawals and automated investment plans and shareholder account registrations.
The compensation paid by the Distributor to a financial intermediary may be paid continually over time, during the period when the intermediary’s clients hold investments in the Funds. The compensation to financial intermediaries includes
| | | | |
| Notes to Financial Statements | | | 21 | |
SSGA Institutional Money Market Funds
Notes to Financial Statements, continued — August 31, 2015
asset-based fees and account-based fees. The amount of continuing compensation paid by the Distributor to different financial intermediaries varies. Some portion of the Distributor’s payments to financial intermediaries will be made out of amounts received by the Distributor under the Funds’ Plans. In addition, certain of the Funds may reimburse the Distributor for payments the Distributor makes to financial intermediaries that provide certain recordkeeping, administrative and account maintenance services. The amount of the reimbursement is calculated in a manner approved by the Trustees and is reviewed by the Trustees periodically. A Fund may pay distribution fees, service fees and other amounts described above at a time when shares of the Fund are not being actively promoted to new investors generally, or when shares of that Fund are unavailable for purchase.
Each Fund listed in the table below has a shareholder servicing agreement during the reporting period with State Street and Wealth Management Systems, an entity related to State Street. For these services, Class N shares paid a maximum of 0.025% to State Street, and 0.05% to Wealth Management Systems, based on the average daily value of all Class N shares held by their clients. Effective June 1, 2015, the shareholder servicing agreement between the Trust and State Street was terminated. For the year ended August 31, 2015, the Funds paid the following shareholder servicing expenses to the agents:
| | | | | | | | |
| | | State Street | | | Wealth
Management
Systems | |
| | | | | | | | |
SSGA U.S. Treasury Money Market Fund | | $ | 1,267,156 | | | $ | 166,186 | |
SSGA Prime Money Market Fund | | | 1,108,779 | | | | 170,149 | |
Board of Trustees
Independent Trustees are compensated on a calendar year basis. Any Trustee who is deemed to be an “interested person” (as defined in the 1940 Act) of the Funds does not receive compensation from the Funds for his or her service as a Trustee.
Each Independent Trustee receives for his or her services to the State Street Master Funds, State Street Institutional Investment Trust and SSGA Funds, a $141,500 annual base retainer in addition to $18,000 for each in-person meeting and $2,000 for each telephonic meeting from the Trust. Trustees’ fees and expenses are allocated among the Trusts and Funds overseen by the Trustees in a manner deemed equitable taking into consideration the relative net assets of the Funds, subject to a $15,000 minimum per Fund. The Co-Chairmen each receive an additional $44,000 annual retainer. The Independent Trustees are reimbursed for travel and other out-of-pocket expenses in connection with meeting attendance. Trustee fees are allocated among the Trusts and each of their respective series in such a manner as deemed equitable, taking into consideration the relative net assets of the series. As of the date of this Shareholder Report, the Trustees were not paid pension or retirement benefits as part of SSGA Funds’ expenses. However, the SSGA Funds have, pursuant to an exemptive order from the SEC, implemented an optional deferred compensation plan by which the Independent Trustees may defer receipt of compensation and receive a return on the deferred amount determined with reference to the performance of shares of specified SSGA Funds. As of the fiscal year ended August 31, 2015, none of the Independent Trustees participated in the optional deferred compensation program.
The Trust’s officers are compensated by the Adviser and its affiliates.
Accrued fees payable to affiliates and trustees as of August 31, 2015 were as follows:
| | | | | | | | |
| | | SSGA U.S. Treasury
Money Market Fund | | | SSGA Prime
Money Market Fund | |
| | | | | | | | |
Advisory fees | | $ | 985,018 | | | $ | 757,338 | |
Administration fees | | | 372,432 | | | | 251,464 | |
Custodian fees | | | 204,520 | | | | 219,803 | |
Distribution fees | | | 248,657 | | | | 8,007 | |
Shareholder servicing fees | | | 14,015 | | | | 13,606 | |
Transfer agent fees | | | 20,513 | | | | 16,916 | |
Trustees’ fees | | | — | | | | 8,930 | |
| | | | | | | | |
| | $ | 1,845,155 | | | $ | 1,276,064 | |
| | | | | | | | |
| | |
| 22 | | Notes to Financial Statements |
SSGA Institutional Money Market Funds
Notes to Financial Statements, continued — August 31, 2015
| 4. | | Fund Share Transactions |
| | | | | | | | |
| | | Year Ended
August 31, 2015 | | | Year Ended
August 31, 2014 | |
| | | | | | | | |
SSGA U.S. Treasury Money Market Fund | | | | | | | | |
Proceeds from shares sold | | $ | 15,991,574,686 | | | $ | 19,722,021,328 | |
Proceeds from reinvestment of distributions | | | — | | | | 20,561 | |
Payments for shares redeemed | | | (16,046,577,046 | ) | | | (18,089,123,764 | ) |
| | | | | | | | |
Total net increase (decrease) | | $ | (55,002,360 | ) | | $ | 1,632,918,125 | |
| | | | | | | | |
| | |
SSGA Prime Money Market Fund | | | | | | | | |
Proceeds from shares sold | | $ | 21,279,216,081 | | | $ | 20,834,820,548 | |
Proceeds from reinvestment of distributions | | | 1,470,184 | | | | 1,016,638 | |
Payments for shares redeemed | | | (21,159,961,259 | ) | | | (23,147,003,010 | ) |
| | | | | | | | |
Total net increase (decrease) | | $ | 120,725,006 | | | $ | (2,311,165,824 | ) |
| | | | | | | | |
The number of shares sold, reinvested and redeemed corresponds to the net proceeds from the sale of shares, reinvestment of all distributions and cost of shares redeemed, respectively, since shares are sold and redeemed at $1.00 per share.
| 5. | | Market, Credit and Counterparty Risk |
In the normal course of business, the Funds invest in securities and enter into transactions where risks exist due to fluctuations in the market (market risk) or failure of the other party to a transaction to perform (counterparty risk). The value of securities held by each Fund may decline in response to certain events, including those directly involving the companies whose securities are owned by the Funds; conditions affecting the general economy; overall market changes; local, regional or global political, social or economic instability; and currency and interest rate and price fluctuations (credit risk). Similar to credit risk, the Funds may be exposed to counterparty risk, or the risk that an entity with which the Funds have unsettled or open transactions may default. Financial assets, which potentially expose the Funds to credit and counterparty risks, consist principally of investments and cash due from counterparties. The extent of the Funds’ exposure to credit and counterparty risks in respect to these financial assets approximates their value as recorded in the Funds’ Schedules of Investments.
| 6. | | Rule Issuance and Recent Accounting Pronouncements |
On July 23, 2014, the U.S. Securities and Exchange Commission (the “SEC”) adopted amendments to the governing rules for money market funds. The amendments require that, following a two-year implementation timeframe, institutional prime and institutional tax exempt money market funds adopt a floating net asset value. The rule changes also allow for certain liquidity-based redemption fees and gate, and include enhanced requirements for disclosure and stress testing. The degree to which a money market fund will be impacted by the rule amendments will depend upon the type of fund and type of investors (retail or institutional). At this time, management is evaluating the implications of these amendments and their impact to the Funds’ financial statements and related disclosure.
In June 2014, the Financial Accounting Standards Board issued Accounting Standards Update 2014-11, Transfers and Servicing (Topic 860) — Repurchase-to-Maturity Transactions, Repurchase Financings, and Disclosures (“ASU 2014-11”). ASU 2014-11 changes the accounting for repurchase-to-maturity transactions and enhances the required disclosures for repurchase agreements, reverse repurchase agreements and other similar transactions accounted for as secured borrowings, including securities lending. Management is evaluating the impact, if any, of this standard on the Funds’ financial statements and related disclosures, which would first be effective for annual and interim reporting periods beginning after December 15, 2014.
| | | | |
| Notes to Financial Statements | | | 23 | |
SSGA Institutional Money Market Funds
Notes to Financial Statements, continued — August 31, 2015
Management has evaluated the impact of all subsequent events on the Funds through the date the financial statements were available to be issued and has determined that there were no subsequent events requiring adjustment or disclosure in the financial statements.
| | |
| 24 | | Notes to Financial Statements |
SSGA Institutional Money Market Funds
Report of Independent Registered Public Accounting Firm
To the Shareholders and Board of Trustees of SSGA Funds:
We have audited the accompanying statements of assets and liabilities, including the schedules of investments, of SSGA U.S. Treasury Money Market Fund and SSGA Prime Money Market Fund (collectively, the “Funds”) (two of the portfolios constituting SSGA Funds) as of August 31, 2015, and the related statements of operations, statements of changes in net assets, and the financial highlights for the year then ended. These financial statements and financial highlights are the responsibility of the Funds’ management. Our responsibility is to express an opinion on these financial statements and financial highlights based on our audit. The statements of changes in net assets for the year ended August 31, 2014 and the financial highlights for periods ended prior to September 1, 2014 were audited by another independent registered public accounting firm whose report, dated October 30, 2014, expressed an unqualified opinion on those statements of changes in net assets and those financial highlights.
We conducted our audit in accordance with the standards of the Public Company Accounting Oversight Board (United States). Those standards require that we plan and perform the audit to obtain reasonable assurance about whether the financial statements and financial highlights are free of material misstatement. We were not engaged to perform an audit of the Funds’ internal control over financial reporting. Our audit included consideration of internal control over financial reporting as a basis for designing audit procedures that are appropriate in the circumstances, but not for the purpose of expressing an opinion on the effectiveness of the Funds’ internal control over financial reporting. Accordingly, we express no such opinion. An audit also includes examining, on a test basis, evidence supporting the amounts and disclosures in the financial statements and financial highlights, assessing the accounting principles used and significant estimates made by management, and evaluating the overall financial statement presentation. Our procedures included confirmation of securities owned as of August 31, 2015, by correspondence with the custodian and others or by other appropriate auditing procedures where replies from others were not received. We believe that our audit provides a reasonable basis for our opinion.
In our opinion, the financial statements and financial highlights referred to above present fairly, in all material respects, the financial position of each of the above mentioned Funds of SSGA Funds at August 31, 2015, the results of their operations, changes in their net assets, and the financial highlights for the year then ended, in conformity with U.S. generally accepted accounting principles.

Boston, Massachusetts
October 30, 2015
| | | | |
| Report of Independent Registered Public Accounting Firm | | | 25 | |
SSGA Institutional Money Market Funds
Tax Information — August 31, 2015 (Unaudited)
For the tax year ended August 31, 2015, the SSGA U.S. Treasury Money Market Fund did not designate any of its net taxable income as qualified interest income taxed at individual ordinary income rates.
For the tax year ended August 31, 2015, the SSGA Prime Money Market Fund hereby designates 98% or the maximum amount allowable, of its net taxable income as qualified interest income taxed at individual ordinary income rates.
Short term capital gains dividends of $126,963 were paid by the SSGA Prime Money Market Fund during the year ended August 31, 2015.
The Form 1099-DIV mailed to you in January 2016 will show the tax status of all distributions paid to your account in calendar year 2015.
Please consult a tax advisor for questions about federal or state income tax laws.
SSGA Institutional Money Market Funds
Basis for Approval of Investment Advisory Contracts (Unaudited)
Trustee Considerations in Approving Continuation of Investment Advisory Agreement1
Overview of the Contract Review Process
Under the Investment Company Act of 1940, an investment advisory agreement between a mutual fund and its investment adviser may continue in effect from year to year only if its continuance is approved at least annually by the fund’s board of trustees, including by a vote of a majority of those trustees who are not “interested persons” of the fund (commonly referred to as, the “Independent Trustees”) cast in person at a meeting called for the purpose of considering such approval.
Consistent with these requirements, the Independent Trustees on the Board of Trustees (the “Board”) of the SSGA Funds (the “Trust”), met in Executive Sessions on April 12-13, 2015, and May 18-19, 2015 to consider a proposal to approve, with respect to each portfolio series of the Trust (each, a “Fund” and collectively, the “Funds”), the continuation of the investment advisory agreement (the “Advisory Agreement”) with SSGA Funds Management, Inc. (the “Adviser”). Prior to voting on the proposal, the Independent Trustees, as well as the Trustees who are “interested persons” of the Adviser, reviewed information furnished by the Adviser and others reasonably necessary to permit the Board to evaluate the proposal fully. The Independent Trustees were separately represented by co-counsel that is independent of the Adviser in connection with their consideration of approval of the Advisory Agreement. Following the April 12-13, 2015 meeting, the Independent Trustees submitted questions and requests for additional information to management, and considered management’s responses thereto prior to and at the May 18-19, 2015 meeting. The Independent Trustees considered, among other things, the following:
Information about Performance, Expenses and Fees
| • | | A report prepared by an independent third-party provider of investment company data, which includes for each Fund: |
| | ¡ | | Comparisons of the Fund’s performance over the past one-, three-, five- and ten-year periods ended December 31, 2014, as applicable, to the performance of an appropriate benchmark for the Fund and a universe of other mutual funds with similar investment objectives and policies; |
| | ¡ | | Comparisons of the Fund’s expense ratio (with detail of component expenses) to the expense ratios of a group of comparable mutual funds selected by the independent third-party data provider; |
| | ¡ | | A chart showing the Fund’s historical average net assets relative to its total expenses, management fees, and non-management expenses over the past five years, as applicable; and |
| | ¡ | | Comparisons of the Fund’s contractual management fee to the contractual management fees of comparable mutual funds at different asset levels. |
| • | | Comparative information concerning fees charged by the Adviser for managing institutional accounts using investment strategies and techniques similar to those used in managing the Funds, as applicable; and |
| • | | Profitability analyses for (a) the Adviser with respect to each Fund and (b) affiliates of the Adviser that provide services to the Funds (“Affiliated Service Providers”). |
| 1 | Over the course of more than 20 years, the Independent Trustees have identified numerous relevant issues, factors and concerns (“issues, factors and concerns”) that they consider each year in connection with the proposed continuation of the advisory agreement, the administration agreement, the distribution plans, the distribution agreement and various related-party service agreements (the “annual review process”). The statement of issues, factors and concerns and the related conclusions of the Independent Trustees may not change substantially from year to year. However, the information requested by, and provided to, the Independent Trustees with respect to the issues, factors and concerns and on which their conclusions are based is updated annually and, in some cases, may differ substantially from the previous year. The Independent Trustees schedule annually a separate in-person meeting that is dedicated to the annual review process (the “special meeting”). At the special meeting and throughout the annual review process, the Independent Trustees take a fresh look at each of the issues, factors and concerns in light of the latest available information and each year present one or more sets of comments and questions to management with respect to specific issues, factors and concerns. Management responds to such comments and questions to the satisfaction of the Independent Trustee before the annual review process is completed and prior to the Independent Trustees voting on proposals to approve continuation of the agreements and plans. |
| | | | |
| Basis for Approval of Investment Advisory Contracts | | | 27 | |
SSGA Institutional Money Market Funds
Basis for Approval of Investment Advisory Contracts (Unaudited), continued
Information about Portfolio Management
| • | | Descriptions of the investment management services provided by the Adviser, including its investment strategies and processes; |
| • | | Information concerning the allocation of brokerage and the benefits received by the Adviser as a result of brokerage allocation, including information concerning the acquisition of any research through “soft dollar” benefits received in connection with the Funds’ brokerage; and |
| • | | Information regarding the procedures and processes used to value the assets of the Funds and the assistance provided to the administrator of the Funds by the Adviser in monitoring the effectiveness of such procedures and processes. |
Information about the Adviser
| • | | Reports detailing the financial results and condition of the Adviser and its affiliates; |
| • | | Descriptions of the qualifications, education and experience of the individual investment professionals responsible for managing the portfolios of the Funds; |
| • | | A copy of each Code of Ethics adopted by the Adviser, together with information relating to compliance with and the administration of such Codes; |
| • | | A copy of the Adviser’s proxy voting policies and procedures; |
| • | | Information concerning the resources devoted by the Adviser to overseeing compliance by the Funds and their service providers, including the Adviser’s record of compliance with investment policies and restrictions and other operating policies of the Funds; |
| • | | A description of the business continuity and disaster recovery plans of the Adviser; and |
| • | | Information regarding the Adviser’s risk management processes. |
Other Relevant Information
| • | | Information concerning the nature, quality and cost of various non-investment management services provided to the Funds by affiliates of the Adviser, including the custodian, administrator, fund accountant, transfer agent and securities lending agent of the Funds, and the role of the Adviser in managing the Funds’ relationship with these service providers; |
| • | | Copies of the Advisory Agreement and agreements with other service providers of the Funds; |
| • | | Draft responses to the letter dated March 11, 2015 from Joseph P. Barri, LLC, co-counsel along with the law firm of Sullivan & Worcester LLP (together, “Independent Counsel”), to the Independent Trustees, and reviewed prior to such date by Independent Counsel, requesting specific information, from each of: |
| | ¡ | | The Adviser, with respect to its operations relating to the Funds and its approximate profit margins before taxes from such operations for the Funds’ last fiscal year; and the relevant operations of other affiliated service providers to the Funds, together with their approximate profit margins from such relevant operations for the Funds’ last fiscal year; |
| | ¡ | | State Street Bank and Trust Company (“State Street”), the sub-administrator, administrator, custodian, transfer agent, securities lending agent, and/or shareholder services, as applicable, for the Funds, with respect to its operations relating to the Funds; and |
| | ¡ | | State Street Global Markets, LLC, the principal underwriter and distributor of the shares of the Funds (the “Distributor”), with respect to its operations relating to the Funds, together with the Funds’ related distribution plans and arrangements under SEC Rule 12b-1; |
| • | | Information from the Adviser, State Street and the Distributor providing any material changes to the previous information supplied in response to the letter dated March 11, 2015 from Joseph P. Barri, LLC prior to the Executive Sessions of the Board on May 18-19, 2015. |
| | |
| 28 | | Basis for Approval of Investment Advisory Contracts |
SSGA Institutional Money Market Funds
Basis for Approval of Investment Advisory Contracts (Unaudited), continued
| • | | Excerpts from the Funds’ most recent Prospectuses, Statements of Additional Information and Annual Reports for the fiscal year ended August 31, 2014, including (i) the latest prospectus descriptions of each Fund’s investment objectives, strategies and authorized investment techniques and investments; and (ii) the latest Annual Shareholder Report for each Fund, including Portfolio Management Discussion of Performance, as prepared by its portfolio management team, together with a graphic comparison of the performance of each Fund with its benchmark index, for its fiscal year ended August 31, 2014; |
| • | | Lipper materials dated March 2015, circulated to the Independent Trustees and to Independent Counsel, with respect to the Funds for which such materials were then available; and |
| • | | A summary of the foregoing materials prepared by Independent Counsel. |
In addition to the information identified above, the Board considered information provided from time to time by the Adviser, and other service providers of the Funds throughout the year at meetings of the Board and its committees. At such meetings, the Trustees received, among other things, presentations by the portfolio managers and other investment professionals of the Adviser relating to the performance of the Funds and the investment strategies used in pursuing each Fund’s investment objective.
The Independent Trustees were assisted throughout the contract review process by their independent legal counsel. The Independent Trustees relied upon the advice of such counsel and their own business judgment in determining the material factors to be considered in evaluating the Advisory Agreement, and the weight to be given to each such factor. The conclusions reached with respect to the Advisory Agreement were based on a comprehensive evaluation of all the information provided and not any single factor. Moreover, each Trustee may have placed varying emphasis on particular factors in reaching conclusions with respect to each Fund.
Results of the Process
Based on a consideration of the foregoing and such other information as deemed relevant, including the factors and conclusions described below, on May 18-19, 2015 the Board, including a majority of the Independent Trustees, voted to approve continuation of the Advisory Agreement effective June 1, 2015, for an additional year with respect to all Funds.
Nature, Extent and Quality of Services
In considering whether to approve the Advisory Agreement, the Board evaluated the nature, extent and quality of services provided to each Fund by the Adviser.
The Board considered the Adviser’s management capabilities and investment process with respect to the types of investments held by each Fund, including the education, experience and number of investment professionals and other personnel who provide portfolio management, investment research, and similar services to the Fund. The Board evaluated, where relevant, the abilities and experience of such investment personnel in analyzing particular markets, industries and specific issuers of securities in these markets and industries. The Board also considered the substantial expertise of the Adviser in developing and applying proprietary quantitative models for managing various Funds that invest primarily in equity securities. With respect to those Funds that invest primarily in fixed-income securities, the Board considered the extensive experience and resources committed by the Adviser to the evaluation of credit, interest-rate and currency risks. The Board also considered the Adviser’s success in maintaining the constant dollar value of each Fund through extraordinary market conditions. The Board also took into account the compensation paid to recruit and retain investment personnel, and the time and attention devoted to the Funds by senior management.
The Board reviewed the compliance programs of the Adviser and various affiliated service providers. Among other things, the Board considered compliance and reporting matters relating to personal trading by investment personnel, selective disclosure of portfolio holdings, late trading, frequent trading, portfolio valuation, business continuity, the allocation of investment opportunities and the voting of proxies. The Board also considered the role of the Adviser in monitoring each Fund’s securities lending activities.
On the basis of the foregoing and other relevant information, the Board concluded that the Adviser can be expected to continue to provide, high quality investment management and related services for the Funds.
| | | | |
| Basis for Approval of Investment Advisory Contracts | | | 29 | |
SSGA Institutional Money Market Funds
Basis for Approval of Investment Advisory Contracts (Unaudited), continued
Fund Performance
The Board compared each Fund’s investment performance to the performance of an appropriate benchmark and universe of comparable mutual funds for various time periods ended December 31, 2014. The Board noted the relatively narrow range of returns in each Fund’s Performance Group and Performance Universe. The Board also observed that several basis points of performance, whether from yield on portfolio investments or fees waived by service providers, accounted for substantial differences in performance relative to other funds in such Group and Universe during periods when preservation of capital and net asset value were generally considered by stockholders to have been more important than several basis points of yield. Among other information, the Board considered the following performance information in its evaluation of your Fund(s):
SSGA U.S. Treasury Money Market Fund. The Board considered that: (a) the Fund equaled the median of its Performance Group for the 1-, 3- and 5-year periods and outperformed the median of its Performance Group for the 10-year period; and (b) the Fund underperformed the median of its Performance Universe and its Lipper Index for the 1-, 3- and 5-year periods and outperformed the median of its Performance Universe and its Lipper Index for the 10-year period. The Board took into account management’s discussion of the Fund’s performance.
SSGA Prime Money Market Fund. The Board considered that: (a) the Fund equaled the medians of its Performance Group and Performance Universe for the 1-year period and outperformed the medians of its Performance Group and Performance Universe for the 3-, 5- and 10-year periods; and (b) the Fund underperformed its Lipper Index for the 1-, 3-, 5- and 10-year periods. The Board took into account management’s discussion of the Fund’s performance.
On the basis of the foregoing and other relevant information, the Board concluded that the performance of each Fund is satisfactory or better (a) by comparison to the performance of its peer group funds or (b) after considering steps taken by management to improve the performance of certain Funds.
Management Fees and Expenses
The Board reviewed the contractual investment advisory fee rates payable by each Fund and actual fees paid by each Fund, net of waivers. As part of its review, the Board considered each Fund’s management fee and total expense ratio (both before and after giving effect to any expense caps), as compared to a group of similarly managed funds selected by an independent data provider. The Board also considered the comparability of the fees charged and the services provided to each Fund by the Adviser to the fees charged and services provided to other clients of the Adviser, including institutional accounts. In addition, the Board considered the willingness of the Adviser to provide undertakings from time to time to waive fees or pay expenses of various Funds to limit the total expenses borne by shareholders of such Funds. Among other information, the Board considered the following expense information in its evaluation of your Fund(s):
SSGA U.S. Treasury Money Market Fund. The Board considered that the Fund’s actual management fee equaled the median of its Expense Group and was below the median of its Expense Universe. The Board also considered that the Fund’s total expenses were below the medians of its Expense Group and Expense Universe.
SSGA Prime Money Market Fund. The Board considered that the Fund’s actual management fee was below the medians of its Expense Group and Expense Universe. The Board also considered that the Fund’s total expenses were below the medians of its Expense Group and Expense Universe.
On the basis of the foregoing and other relevant information, and in light of the nature, extent and quality of the services provided by the Adviser, the Board concluded that the fees and the expense ratio of each Fund compare favorably to the fees and expenses of similar mutual funds and are reasonable in relation to the services provided.
Profitability
The Board reviewed the level of profits realized by the Adviser and its affiliates in providing investment advisory and other services to each Fund and to all Funds as a group. The Board considered other direct and indirect benefits received by the Adviser and the Affiliated Service Providers in connection with their relationships with the Funds, including the benefits of research services that may be available to the Adviser as a result of securities transactions effected for the Funds and other investment advisory clients, together with the ranges of profitability of each of the Affiliated Service Providers with respect to their services to the Funds.
| | |
| 30 | | Basis for Approval of Investment Advisory Contracts |
SSGA Institutional Money Market Funds
Basis for Approval of Investment Advisory Contracts (Unaudited), continued
The Board concluded that the profitability of the Adviser with respect to each of the Funds, and the profitability range of each of the Affiliated Service Providers with respect to its services to the Funds, were reasonable in relation to the services provided.
Economies of Scale
In reviewing management fees and profitability, the Board also considered the extent to which the Adviser and its affiliates, on the one hand, and each Fund and all Funds as a group, on the other hand, can expect to realize benefits from economies of scale as the assets of the Funds increase. The Board acknowledged the difficulty in accurately measuring the benefits resulting from the economies of scale with respect to the management of any specific Fund or the Funds taken as a whole. The Board concluded that, in light of the current size of each Fund and all Funds as a group, the level of profitability of the Adviser and its affiliates with respect to each Fund and all Funds as a group over various time periods, and the comparatively low management fee and expense ratio of each Fund during these periods, it does not appear that the Adviser or its affiliates has realized benefits from economies of scale in managing the assets of the Funds to such an extent that previously agreed advisory fees should be reduced or that breakpoints in such fees should be implemented for any Fund at this time.
Conclusions
In reaching its decision to approve the Advisory Agreement, the Board did not identify any single factor as being controlling, but based its recommendation on each of the factors it considered. Each Trustee may have contributed different weight to the various factors. Based upon the materials reviewed, the representations made and the considerations described above, and as part of its deliberations, the Board, including the Independent Trustees, concluded that the Adviser possesses the capability and resources to perform the duties required of it under the Advisory Agreement.
Further, based upon its review of the Advisory Agreement, the materials provided, and the considerations described above, the Board, including the Independent Trustees, concluded that (1) the terms of the Advisory Agreement are reasonable, fair, and in the best interests of each Fund and its respective shareholders, and (2) the rates payable under the Advisory Agreement are fair and reasonable in light of the usual and customary charges made for services of the same nature and quality.
| | | | |
| Basis for Approval of Investment Advisory Contracts | | | 31 | |
SSGA Institutional Money Market Funds
Shareholder Requests for Additional Information — August 31, 2015 (Unaudited)
Proxy Voting Policies and Procedures and Record
The Funds have adopted the proxy voting policies of the Adviser. A description of the policies and procedures that the Funds have adopted to determine how to vote proxies relating to portfolio securities are contained in the Funds’ Statement of Additional Information, which is available (i) without charge, upon request, by calling the Funds at (800) 647-7327, (ii) on the Funds’ website at www.SSGAfunds.com, (iii) on the U.S. Securities and Exchange Commission’s website at www.sec.gov, or (iv) at the U.S. Securities and Exchange Commission’s public reference room. Information on the operation of the public reference room may be obtained by calling 1-800-SEC-0330. Information regarding how the Funds voted proxies, if any, during the most recent 12-month period ended June 30 is available by August 31 of each year without charge (1) by calling 1-800-997-7327 (toll free), or (2) on the website of the Securities and Exchange Commission (“SEC”) at www.sec.gov.
Quarterly Portfolio Schedule
The Funds will file their complete schedules of investments with the U.S. Securities and Exchange Commission for the first and third quarters of each fiscal year on Form N-Q. For the second and fourth quarters, the complete schedules of investments are available in the Funds’ semi-annual and annual financial statements. The Funds’ Form N-Q is available (i) without charge, upon request, by calling the Funds at (800) 647-7327, (ii) on the Funds’ website at www.SSGAfunds.com, (iii) on the Securities and Exchange Commission’s website at www.sec.gov, or (iv) at the Securities and Exchange Commission’s public reference room. Information on the operation of the public reference room may be obtained by calling 1-800-SEC-0330.
Monthly Portfolio Schedule
The Funds file their monthly portfolio holdings with the U.S. Securities and Exchange Commission on Form N-MFP. The SEC delays the public availability of the information filed on Form N-MFP for 60 days after the end of the reporting period included in the filing. The Funds’ Form N-MFP is available (i) on the U.S. Securities and Exchange Commission’s website at www.sec.gov, or ii) at the Securities and Exchange Commission’s public reference room.
| | |
| 32 | | Shareholder Requests for Additional Information |
SSGA Institutional Money Market Funds
Disclosure of Information about Fund Trustees and Officers — August 31, 2015 (Unaudited)
| | | | | | | | | | | | |
Name,
Address,
and Year of Birth(1) | | Position(s) Held
with Trust(1) | | Term of Office
and Length of
Time Served(1) | | Principal Occupation
During Past Five Years(1) | | Number of
Funds
in Fund
Complex
Overseen
by Trustee(1) | | | Other
Directorships
Held by
Trustee During
Past Five Years(1) |
INDEPENDENT TRUSTEES | | | | | | | | | | |
Michael F. Holland State Street Bank and Trust Company 100 Huntington Avenue, CPH 0326 Boston, MA 02116 YOB: 1944 | | Trustee and Co-Chairman of the Board | | Term: Indefinite Elected: 1/14 | | Chairman, Holland & Company L.L.C. (investment adviser) (1995 – present). | | | 71 | | | Trustee and Co-Chairman, State Street Master Funds; Trustee and Co-Chairman, State Street Institutional Investment Trust; Director, the Holland Series Fund, Inc.; Director, The China Fund, Inc.; Director, The Taiwan Fund, Inc.; Director, Reaves Utility Income Fund, Inc.; and Director, Blackstone/GSO Loan Funds. |
| | | | | | | | | | | | | |
Patrick J. Riley State Street Bank and Trust Company 100 Huntington Avenue, CPH 0326 Boston, MA 02116 YOB: 1948 | | Trustee and Co-Chairman of the Board | | Term: Indefinite Elected: 1988 | | 2002 to May 2010, Associate Justice of the Superior Court, Commonwealth of Massachusetts; 1985 to 2002, Partner, Riley, Burke & Donahue, L.L.P. (law firm); 1998 to Present, Independent Director, State Street Global Advisers Ireland, Ltd. (investment company); 1998 to Present, Independent Director, SSGA Liquidity plc (formerly, SSGA Cash Management Fund plc); January 2009 to Present, Independent Director, SSGA Fixed Income plc; and January 2009 to Present, Independent Director, SSGA Qualified Funds PLC. | | | 71 | | | Trustee and Co-Chairman, State Street Master Funds; Trustee and Co-Chairman, State Street Institutional Investment Trust; Board Director and Chairman, SPDR Europe 1PLC Board (2011 – Present); Board Director and Chairman, SPDR Europe II, PLC (2013 – Present). |
| | | | | | | | | | | | | |
William L. Boyan State Street Bank and Trust Company 100 Huntington Avenue, CPH 0326 Boston, MA 02116 YOB: 1937 | | Trustee and Co-Chairman of the Valuation Committee | | Term: Indefinite Elected: 1/14 | | President and Chief Operations Officer, John Hancock Financial Services (1959 – 1999). Mr. Boyan retired in 1999. Chairman Emeritus, Children’s Hospital, Boston, MA (1984 – 2011); Former Trustee of Old Mutual South Africa Master Trust (investments) (1995 – 2008); Former Chairman, Boston Plan For Excellence, Boston Public Schools (1995 – 2010); Member of Advisory Board of Florida Atlantic University Lifelong Learning Society; Trustee, Children’s Hospital, Boston, MA. | | | 71 | | | Trustee, State Street Master Funds; Trustee, State Street Institutional Investment Trust; Former Trustee of Old Mutual South Africa Master Trust. |
| | | | |
| Disclosure of Information about Fund Trustees and Officers | | | 33 | |
SSGA Institutional Money Market Funds
Disclosure of Information about Fund Trustees and Officers, continued — August 31, 2015 (Unaudited)
| | | | | | | | | | | | |
Name,
Address,
and Year of Birth(1) | | Position(s) Held
with Trust(1) | | Term of Office
and Length of
Time Served(1) | | Principal Occupation
During Past Five Years(1) | | Number of
Funds
in Fund
Complex
Overseen
by Trustee(1) | | | Other
Directorships
Held by
Trustee During
Past Five Years(1) |
William L. Marshall State Street Bank and Trust Company 100 Huntington Avenue, CPH 0326 Boston, MA 02116 YOB: 1942 | | Trustee and Co-Chairman of the Audit Committee | | Term: Indefinite Elected: 1988 | | April 2011 to Present, Chairman (until April 2011, Chief Executive Officer and President), Wm. L. Marshall Associates, Inc., Wm. L. Marshall Companies, Inc. and the Marshall Financial Group, Inc. (a registered investment adviser and provider of financial and related consulting services); Certified Financial Planner; Member, Financial Planners Association; Director, (2008 – 2014) Doylestown Health Foundation Board; and the Ann Silverman Community Clinic of Doylestown, PA. | | | 71 | | | Trustee, State Street Master Funds; Trustee, State Street Institutional Investment Trust; Director, Marshall Financial Group, Inc. |
| | | | | | | | | | | | | |
Richard D. Shirk State Street Bank and Trust Company 100 Huntington Avenue, CPH 0326 Boston, MA 02116 YOB: 1945 | | Trustee and Co-Chairman of the Qualified Legal and Compliance Committee | | Term: Indefinite Elected: 1988 | | March 2001 to April 2002, Chairman (1996 to March 2001, President and Chief Executive Officer), Cerulean Companies, Inc. (holding company) (Retired); 1992 to March 2001, President and Chief Executive Officer, Blue Cross Blue Shield of Georgia (health insurer, managed healthcare); 1998 to December 2008, Chairman, Board Member and December 2008 to Present, Investment Committee Member, Healthcare Georgia Foundation (private foundation); September 2002 to 2012, Lead Director and Board Member, Amerigroup Corp. (managed health care); 1999 to 2013: Board Member and (since 2001) Investment Committee Member, Woodruff Arts Center; and 2003 to 2009, Trustee, Gettysburg College. | | | 71 | | | Trustee, State Street Master Funds; Trustee, State Street Institutional Investment Trust; Board member, AeroCare Holdings (privately held healthcare services company) (February 2003 – Present); Board member, Regenesis Biomedical (health care services) (April 2012 – Present). |
| | | | | | | | | | | | | |
Rina K. Spence State Street Bank and Trust Company 100 Huntington Avenue, CPH 0326 Boston, MA 02116 YOB: 1948 | | Trustee and Co-Chairman of the Qualified Legal and Compliance Committee and Co-Chairman of the Governance Committee | | Term: Indefinite Elected: 1/14 | | President of SpenceCare International LLC (international healthcare consulting) (1999 – present); Chief Executive Officer, IEmily.com (health internet company) (2000 – 2001); Chief Executive Officer of Consensus Pharmaceutical, Inc. (1998 – 1999); Founder, President and Chief Executive Officer of Spence Center for Women’s Health (1994 – 1998); President and CEO Emerson Hospital (1984 – 1994); Trustee, Eastern Enterprise (utilities) (1988 – 2000); Director, Berkshire Life Insurance Company of America (1993 – 2009); Director, IEmily.com, Inc. (2000 – 2010); and Trustee, National Osteoporosis Foundation (2005 – 2008). | | | 71 | | | Trustee, State Street Master Funds; Trustee, State Street Institutional Investment Trust. |
| | |
| 34 | | Disclosure of Information about Fund Trustees and Officers |
SSGA Institutional Money Market Funds
Disclosure of Information about Fund Trustees and Officers, continued — August 31, 2015 (Unaudited)
| | | | | | | | | | | | |
Name,
Address,
and Year of Birth(1) | | Position(s) Held
with Trust(1) | | Term of Office
and Length of
Time Served(1) | | Principal Occupation
During Past Five Years(1) | | Number of
Funds
in Fund
Complex
Overseen
by Trustee(1) | | | Other
Directorships
Held by
Trustee During
Past Five Years(1) |
Bruce D. Taber State Street Bank and Trust Company 100 Huntington Avenue, CPH 0326 Boston, MA 02116 YOB: 1943 | | Trustee and Co-Chairman of the Valuation Committee and Co-Chairman of the Governance Committee | | Term: Indefinite Elected: 1991 | | 1999 to Present, Partner, Zenergy LLC (a technology company providing Computer Modeling and System Analysis to the General Electric Power Generation Division); Until December 2008, Independent Director, SSGA Cash Management Fund plc; Until December 2008, Independent Director, State Street Global Advisers Ireland, Ltd. (investment companies); and Until August 1994, President, Alonzo B. Reed, Inc., (a Boston architect-engineering firm). | | | 71 | | | Trustee, State Street Master Funds; Trustee, State Street Institutional Investment Trust. |
| | | | | | | | | | | | | |
Douglas T. Williams State Street Bank and Trust Company 100 Huntington Avenue, CPH 0326 Boston, MA 02116 YOB: 1940 | | Trustee and Co-Chairman of the Audit Committee | | Term: Indefinite Elected: 1/14 | | President, Oakmont Homeowners Association; President, Mariner Sands Chapel; Executive Vice President and member of Executive Committee, Chase Manhattan Bank (1987 – 1999); President, Boston Stock Exchange Depository Trust Company, 1981 – 1982; Treasurer, Nantucket Educational Trust, (2002 – 2007). | | | 71 | | | Trustee, State Street Master Funds; Trustee, State Street Institutional Investment Trust. |
INTERESTED TRUSTEES(2) | | | | | | | | | | |
Gregory A. Ehret SSGA Funds Management, Inc. State Street Financial Center One Lincoln Street Boston, MA 02111-2900 YOB: 1969 | | Trustee | | Term: Indefinite Elected Trustee: 8/15 | | President and Global Chief Operating Officer State Street Global Advisors (2012 – Present); Head of Europe, the Middle East, and Africa, State Street Global Advisors (2008 – 2012); Head of Sales and Distribution in Europe, the Middle East, and Africa, State Street Global Advisors (2007 – 2008). | | | 71 | | | Trustee, State Street Master Funds; Trustee, State Street Institutional Investment Trust. |
| | | | | | | | | | | | | |
James E. Ross SSGA Funds Management, Inc. State Street Financial Center One Lincoln Street Boston, MA 02111-2900 YOB: 1965 | | Trustee | | Term: Indefinite Elected Trustee: 1/14 | | Chairman and Director, SSGA Funds Management, Inc. (2012 – present); President, SSGA Funds Management, Inc. (2005 – 2012); Executive Vice President and Senior Managing Director, State Street Global Advisors (2006 – present); and Principal, State Street Global Advisors (2006 – present). | | | 268 | | | Trustee, State Street Master Funds; Trustee, State Street Institutional Investment Trust; Trustee, SPDR Series Trust; Trustee, SPDR Index Shares Funds; Trustee, Select Sector SPDR Trust; Trustee, SSGA Active Trust; and Trustee, SSGA Master Trust. |
| (1) | | As of October 12, 2015. |
| (2) | | Mr. Ehret and Mr. Ross are Interested Trustees because of their employment by SSGA Funds Management, Inc., an affiliate of the Trust. |
| | | | |
| Disclosure of Information about Fund Trustees and Officers | | | 35 | |
SSGA Institutional Money Market Funds
Disclosure of Information about Fund Trustees and Officers, continued — August 31, 2015 (Unaudited)
The following lists the principal officers for SSGA Funds and the State Street Master Funds, as well as their mailing addresses and ages, positions with the Trusts and length of time served, and present and principal occupations:
| | | | | | |
Name,
Address, and Year of Birth | | Position(s)
Held with Trust | | Term of Office
and Length of Time Served | | Principal
Occupation During
Past Five Years |
OFFICERS: | | | | | | |
Ellen M. Needham SSGA Funds Management, Inc. State Street Financial Center One Lincoln Street Boston, MA 02111-2900 YOB: 1967 | | President | | Term: Indefinite Elected: 10/12 | | President and Director, SSGA Funds Management, Inc. (June 2012 – present); Chief Operating Officer, SSGA Funds Management, Inc. (May 2010 – June 2012); Senior Managing Director, SSGA Funds Management, Inc. (1992 – 2012) and Senior Managing Director, State Street Global Advisors (1992 – present).* |
| | | | | | | |
Ann M. Carpenter SSGA Funds Management, Inc. State Street Financial Center One Lincoln Street Boston, MA 02111-2900 YOB: 1966 | | Vice President Assistant Treasurer | | Term: Indefinite Elected: 10/12 Term: Indefinite Elected: 4/15 | | Chief Operating Officer, SSGA Funds Management, Inc. (April 2014 – present); Vice President, SSGA Funds Management, Inc. (2008 – present); Principal, State Street Global Advisors (2005 – 2008 – present).* |
| | | | | | | |
Chad C. Hallett SSGA Funds Management, Inc. State Street Financial Center One Lincoln Street Boston, MA 02111 YOB: 1969 | | Treasurer | | Term: Indefinite Elected: 4/15 | | Vice President, State Street Global Advisors and SSGA Funds Management, Inc. (November 2014 – present); Vice President, State Street Bank and Trust Company (2001 – November 2014).* |
| | | | | | | |
Brian Harris SSGA Funds Management, Inc. State Street Financial Center One Lincoln Street Boston, MA 02111 YOB: 1973 | | Chief Compliance Officer | | Term: Indefinite Elected: 11/13 | | Vice President, State Street Global Advisors and SSGA Funds Management, Inc. (June 2013 – present); Senior Vice President and Global Head of Investment Compliance, BofA Global Capital Management (September 2010 to May 2013); Director of Compliance, AARP Financial Inc. (July 2008 to August 2010). |
| | | | | | | |
Joshua A. Weinberg SSGA Funds Management, Inc. State Street Financial Center One Lincoln Street Boston, MA 02111-2900 YOB: 1978 | | Chief Legal Officer | | Term: Indefinite Elected: 2/15 | | Vice President and Managing Counsel, State Street Global Advisors (2011 – present); Clerk, SSGA Funds Management, Inc. (2013 – present); Associate, Financial Services Group, Dechert LLP (2006 – 2011). |
| | | | | | | |
David K. James State Street Bank and Trust Company 100 Huntington Avenue, 3rd Floor Boston, MA 02116 YOB: 1970 | | Secretary | | Term: Indefinite Elected: 4/13 | | Managing Director and Managing Counsel, State Street Bank and Trust Company (2009 – present); Vice President and Counsel, PNC Global Investment Servicing (US), Inc. (2006 – 2009). |
| | |
| 36 | | Disclosure of Information about Fund Trustees and Officers |
SSGA Institutional Money Market Funds
Disclosure of Information about Fund Trustees and Officers, continued — August 31, 2015 (Unaudited)
| | | | | | |
Name,
Address, and Year of Birth | | Position(s)
Held with Trust | | Term of Office
and Length of Time Served | | Principal
Occupation During
Past Five Years |
Kristin Schantz State Street Bank and Trust Company 100 Huntington Avenue, 3rd Floor Boston, MA 02116 YOB: 1979 | | Assistant Secretary | | Term: Indefinite Elected: 2/14 | | Vice President and Senior Counsel, State Street Bank and Trust Company (2013 – present); Vice President, Citi Fund Services Ohio, Inc. (2008 – 2013). |
| * | Served in various capacities and/or with various affiliated entities during noted time period. |
The Statement of Additional Information includes additional information about the Trustees and is available, without charge, upon request, by calling (toll free) 800-997-7327.
| | | | |
| Disclosure of Information about Fund Trustees and Officers | | | 37 | |
SSGA Institutional Money Market Funds
State Street Financial Center
One Lincoln Street
Boston, Massachusetts 02111-2900
(800) 647-7327
Trustees
William L. Boyan
Gregory A. Ehret
Michael F. Holland
William L. Marshall
Patrick J. Riley
James E. Ross
Richard D. Shirk
Rina K. Spence
Bruce D. Taber
Douglas T. Williams
Officers
Ellen M. Needham, President and Principal Executive Officer
Chad C. Hallett, Treasurer and Principal Accounting Officer
Ann M. Carpenter, Vice President and Assistant Treasurer
Brian Harris, Chief Compliance Officer
David James, Secretary
Joshua A. Weinberg, Chief Legal Officer
Kristin M. Schantz, Assistant Secretary
Investment Adviser and Administrator
SSGA Funds Management, Inc.
State Street Financial Center,
One Lincoln Street
Boston, Massachusetts 02111-2900
Custodian and Office of Shareholder Inquiries
State Street Bank and Trust Company
1776 Heritage Drive
North Quincy, Massachusetts 02171
Transfer and Dividend Paying Agent
Boston Financial Data Services, Inc.
2000 Crown Colony Drive
Quincy, Massachusetts 02169
Distributor
State Street Global Markets, LLC
State Street Financial Center
One Lincoln Street
Boston, Massachusetts 02111-2900
Sub-Administrator
State Street Bank and Trust Company
State Street Financial Center
One Lincoln Street
Boston, Massachusetts 02111-2900
Legal Counsel
Ropes & Gray LLP
800 Boylston Street
Boston, Massachusetts 02199
Independent Registered Public Accounting Firm
Ernst & Young LLP
200 Clarendon Street
Boston, Massachusetts 02116
Distributor: State Street Global Markets, LLC, member FINRA, SIPC, a wholly owned subsidiary of State Street Corporation. References to State Street may include State Street Corporation and its affiliates. The SSGA Funds pay State Street Bank and Trust Company for its services as sub-administrator, custodian, transfer agent and shareholder servicing agent and pays SSGA Funds Management, Inc. for investment advisory and administrator services.
This information must be preceded or accompanied by a current prospectus or summary prospectus. Read the prospectus carefully before you invest or send money.
| | |
| 38 | | Fund Management and Service Providers |
Annual Report
31 August 2015
SSGA Funds
SSGA Dynamic Small Cap Fund
SSGA Clarion Real Estate Fund
SSGA Enhanced Small Cap Fund
SSGA Emerging Markets Fund
SSGA International Stock Selection Fund
SSGA High Yield Bond Fund

SSGA Funds
Annual Report
August 31, 2015
Table of Contents
“SSGA” is a registered trademark of State Street Corporation and is licensed for use by the SSGA Funds.
This report is prepared from the books and records of the Funds and it is submitted for the general information of shareholders. This information is for distribution to prospective investors only when preceded or accompanied by a SSGA Funds Prospectus containing more complete information concerning the investment objectives and operations of the Funds, charges and expenses. The Prospectus should be read carefully before an investment is made.
Performance quoted represents past performance and past performance does not guarantee future results. Current performance may be higher or lower than the performance quoted. For the most recent month end performance information, visit www.ssgafunds.com. Investment in the Funds poses investment risks, including the possible loss of principal. The investment return and principal value of an investment will fluctuate so that shares, when redeemed, may be worth more or less than their original cost.
SSGA Dynamic Small Cap Fund
Portfolio Management Discussion and Analysis — August 31, 2015 (Unaudited)
Objective: The Fund seeks to maximize total return through investments in equity securities.
Invests in: At least 80% of total assets will be invested in smaller capitalization equity securities.
Strategy: Equity securities will be selected for the Fund on the basis of proprietary analytical models. The Fund management team uses a quantitative approach to investment management, designed to uncover equity securities which are undervalued, with superior growth potential. This quantative investment management approach involves a modeling process to evaluate vast amounts of financial data and corporate earnings forecast.
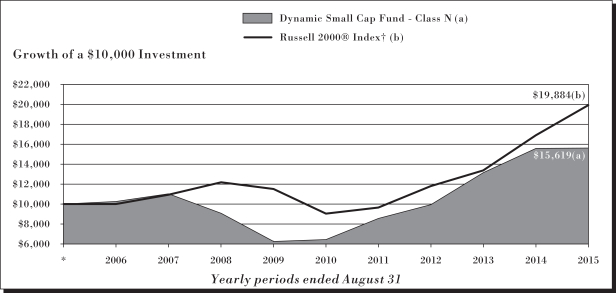
The growth of $10,000 is cumulative. The performance of other shares classes will vary based on the sales charges and the fee structure of those classes.
Index returns do not reflect any fees or expenses and it is not possible to invest directly into an index.
| * | Assumes initial investment on September 1, 2005. |
| † | The Russell 2000 Index measures the performance of the small-cap segment of the U.S. equity universe. The Russell 2000 Index is a subset of the Russell 3000® Index representing approximately 10% of the total market capitalization of that index. It includes approximately 2,000 of the smallest securities based on a combination of their market cap and current index membership. |
See related Notes on following page.
SSGA Dynamic Small Cap Fund
Portfolio Management Discussion and Analysis, continued — August 31, 2015 (Unaudited)
Performance Summary
Average Annual Total Returns as of 8/31/2015
| | | | | | | | | | | | |
| Class N | | 1 Year | | | 5 Year | | | 10 Year | |
Unadjusted for Sales Charge | | | 0.33 | % | | | 19.27 | % | | | 4.56 | % |
Russell 2000 Index† | | | 0.03 | % | | | 15.55 | % | | | 7.12 | % |
| Class A | | 1 Year | | | 5 Year | | | 10 Year | |
Unadjusted for Sales Charge | | | 0.15 | % | | | 19.18 | % | | | 4.48 | % |
Adjusted for the Maximum Sale Charge (Max 5.25% load) | | | -5.11 | % | | | 17.89 | % | | | 3.92 | % |
Russell 2000 Index† | | | 0.03 | % | | | 15.55 | % | | | 7.12 | % |
| Class C | | 1 Year | | | 5 Year | | | 10 Year | |
Unadjusted for Sales Charge | | | -0.57 | %* | | | 18.30 | % | | | 3.79 | % |
Adjusted for the Maximum Sale Charge (Max 1.00% CDSC) | | | -1.56 | %* | | | 18.30 | % | | | 3.79 | % |
Russell 2000 Index† | | | 0.03 | % | | | 15.55 | % | | | 7.12 | % |
| Class I | | 1 Year | | | 5 Year | | | 10 Year | |
Unadjusted for Sales Charge | | | 0.40 | % | | | 19.29 | % | | | 4.57 | % |
Russell 2000 Index† | | | 0.03 | % | | | 15.55 | % | | | 7.12 | % |
| Class K | | 1 Year | | | 5 Year | | | 10 Year | |
Unadjusted for Sales Charge | | | 0.61 | % | | | 19.34 | % | | | 4.59 | % |
Russell 2000 Index† | | | 0.03 | % | | | 15.55 | % | | | 7.12 | % |
The maximum sales charge for Class A shares is 5.25%. A contingent deferred sales charge (“CDSC”) of 1.00% may be assessed on redemptions of Class A shares made within 18 months after purchase where no initial sales charge was paid at the time of purchase as part of an investment of $1,000,000 or more. There is no CDSC on Class C shares redeemed more than one year after purchase. A 1.00% CDSC may be assessed on redemptions of Class C shares during the first year only. Class N, Class I, and Class K are not subject to a sales charge.
Adjusted Performance shown for the periods prior to the inception of Classes A and C shares on July 7, 2014 reflect the historical performance of the Fund’s Class N shares adjusted to reflect the higher expenses of Classes A and C shares, estimated for their first year of operations, including applicable 12b-1 fees and the maximum sales load of Classes A and C. Unadjusted Performance shown for the periods prior to the inception of Classes A and C shares on July 7, 2014 reflects the historical performance of the Fund’s Class N shares adjusted to reflect the higher expenses of Classes A and C shares, estimated for their first year of operations, including applicable 12b-1 fees. Unadjusted returns do not reflect sales charges and would have been lower if they had. Performance shown for the periods prior to the inception of Class I and K shares on July 7, 2014, reflect the historical performance of the Fund’s Class N shares. Had the Fund’s Class I and K fees been reflected, the returns shown for those periods would have been higher.
Performance quoted represents past performance, which is no guarantee of future results. Investment return and principal value will fluctuate, so you may have a gain or loss when shares are sold. Current performance may be higher or lower than that quoted. Visit www.ssgafunds.com for most recent month-end performance. The returns do not reflect the deduction of taxes that a shareholder would pay on Fund distributions or on the redemption of Fund shares. Performance includes reinvestment of all distributions. The gross expense ratio for the Dynamic Small Cap Fund as stated in the Fees and Expenses table of the prospectus dated December 18, 2014 is 2.02%, 2.22%, 2.97%, 1.97% and 1.77% for Class N, A, C, I and K, respectively, and may differ from the expense ratios disclosed in the Financial Highlights tables in this report.
| † | The Russell 2000 Index measures the performance of the small-cap segment of the U.S. equity universe. The Russell 2000 Index is a subset of the Russell 3000® Index representing approximately 10% of the total market capitalization of that index. It includes approximately 2,000 of the smallest securities based on a combination of their market cap and current index membership. |
| * | Performance results do not include adjustments made for financial reporting purposes in accordance with U.S. generally accepted accounting principles and may differ from amounts reported in the financial highlights. |
Performance data reflects an expense limitation currently in effect, without which returns would have been lower.
SSGA Dynamic Small Cap Fund
Management’s Discussion of Fund Performance, continued — August 31, 2015 (Unaudited)
SSGA Dynamic Small Cap Fund (the “Fund”) seeks to maximize the total return through investment in equity securities. The Fund’s benchmark is the Russell 2000® Index (the “Index”).
For the 12-month period ended August 31, 2015 (the “Reporting Period”), the total return for Class N shares of the Fund was 0.33%, and the total return for the Index was 0.03%. The Fund and Index returns reflect the reinvestment of dividends and other income. The Fund’s performance reflects the expenses of managing the Fund, including brokerage and advisory expenses. The Index is unmanaged and Index returns do not reflect fees and expenses of any kind, which would have a negative impact on returns.
Both US and non-US stocks began the Reporting Period relatively weakly. They improved through the close of 2014 and first half of 2015, although they declined in August 2015. Overall, during the Reporting Period economic activity in the US improved from 2014, despite a fairly weak close to the Reporting Period. The European Central Bank opened 2015 by unveiling a one trillion euro bond-buying program, which helped to facilitate investment across developed markets. The Fund’s systematic investment process focused on identifying stocks that would benefit from attractive valuations, strong investor sentiment, and continued economic recovery. This was most effective with respect to industrial and energy issuers through the Reporting Period, while security selection within the technology and financial sectors was least successful.
At the level of individual stocks, significant contributors to relative performance through the Reporting Period were overweight positions in Skechers, JetBlue, and AMN Healthcare Services. The Fund’s position in Skechers made the largest contribution, as the California-based footwear company returned over 140% through the Reporting Period. It was notably strong in the second quarter, following the release of impressive first-quarter results, which included record-high sales. The Fund benefited from its position in JetBlue. The company widely outperformed the Index through the Reporting Period. It was exceptionally strong in 2014’s fourth quarter, following the release of favorable third-quarter results, which included record-high operating revenues. Rounding out the top contributors, an overweighting to AMN Healthcare Services made a comparable contribution to relative performance, as the company also widely outperformed the Index, with particular strength in 2015’s second quarter.
On the negative side, the most significant stock detractors to the Fund’s performance relative to the Index over the Reporting Period resulted from active positions within the energy service and industrial sectors. An overweighting to Maryland-based commercial silica producer U.S. Silica Holdings detracted from relative performance during the Reporting Period. The company underperformed the Index, particularly following the fourth quarter 2014 news that OPEC would not cut oil production in November 2014. The Fund’s overweighting to ethanol fuel producer Green Plains also detracted from relative performance, with underperformance also largely concentrated in the fourth quarter, as the company was negatively affected by the same OPEC decision. Rounding out the largest detractors was an overweighting to Pioneer Energy Services, as the energy services provider widely underperformed the Index through the Reporting Period.
The views expressed above reflect those of the Fund’s portfolio manager only through the Reporting Period, and do not necessarily represent the views of the Adviser as a whole. Any such views are subject to change at any time based upon market or other conditions and the Adviser disclaims any responsibility to update such views. These views may not be relied on as investment advice and, because investment decisions for a fund are based on numerous factors, may not be relied on as an indication of trading intent on behalf of any fund.
SSGA Dynamic Small Cap Fund
Shareholder Expense Example — August 31, 2015 (Unaudited)
Fund Expenses
The following disclosure provides important information regarding the Fund’s Expense Example, which appears on the Fund’s individual page in this Annual Report. Please refer to this information when reviewing the Expense Example for a Fund.
Example
As a shareholder of the Fund, you incur two types of costs: (1) transaction costs, and (2) ongoing costs, including advisory and administration fees; distribution (12b-1) and/or service fees; and other Fund expenses. The Example is intended to help you understand your ongoing costs (in dollars) of investing in the Fund and to compare these costs with the ongoing costs of investing in other mutual funds. The Example is based on an investment of $1,000 invested at the beginning of the period and held for the entire period indicated, which for this Fund is from March 1, 2015 to August 31, 2015.
Actual Expenses
The information in the table under the heading “Actual Performance” provides information about actual account values and actual expenses. You may use the information in this column, together with the amount you invested, to estimate the expenses that you paid over the period. Simply divide your account value by $1,000 (for example, an $8,600 account value divided by $1,000 = 8.6), then multiply the result by the number in the first column in the row entitled “Expenses Paid During Period” to estimate the expenses you paid on your account during this period.
Hypothetical Example for Comparison Purposes
The information in the table under the heading “Hypothetical Performance (5% return before expenses)” provides information about hypothetical account values and hypothetical expenses based on the Fund’s actual expense ratio and an assumed rate of return of 5% per year before expenses, which is not the Fund’s actual return. The hypothetical account values and expenses may not be used to estimate the actual ending account balance or expenses you paid for the period. You may use this information to compare the ongoing costs of investing in the Fund and other funds. To do so, compare this 5% hypothetical example with the 5% hypothetical examples that appear in the shareholder reports of other funds.
Please note that the expenses shown in the table are meant to highlight your ongoing costs only and do not reflect any transaction costs. Therefore, the information under the heading “Hypothetical Performance (5% return before expenses)” is useful in comparing ongoing costs only, and will not help you determine the relative total costs of owning different funds. In addition, if these transaction costs were included, your costs would have been higher.
| | | | | | | | | | | | |
Class N | | Annualized
Expense Ratio | | | Actual
Performance | | | Hypothetical
Performance
(5% return
before expenses) | |
Beginning Account Value March 1, 2015 | | | 1.10 | % | | $ | 1,000.00 | | | $ | 1,000.00 | |
Ending Account Value August 31, 2015 | �� | | | | | $ | 965.30 | | | $ | 1,019.65 | |
Expenses Paid During Period* | | | | | | $ | 5.45 | | | $ | 5.60 | |
Class A | | | | | | | | | |
Beginning Account Value March 1, 2015 | | | 1.31 | % | | $ | 1,000.00 | | | $ | 1,000.00 | |
Ending Account Value August 31, 2015 | | | | | | $ | 964.50 | | | $ | 1,018.60 | |
Expenses Paid During Period* | | | | | | $ | 6.49 | | | $ | 6.67 | |
Class C | | | | | | | | | |
Beginning Account Value March 1, 2015 | | | 2.08 | % | | $ | 1,000.00 | | | $ | 1,000.00 | |
Ending Account Value August 31, 2015 | | | | | | $ | 960.80 | | | $ | 1,014.71 | |
Expenses Paid During Period* | | | | | | $ | 10.28 | | | $ | 10.56 | |
Class I | | | | | | | | | |
Beginning Account Value March 1, 2015 | | | 1.05 | % | | $ | 1,000.00 | | | $ | 1,000.00 | |
Ending Account Value August 31, 2015 | | | | | | $ | 965.80 | | | $ | 1,019.91 | |
Expenses Paid During Period* | | | | | | $ | 5.20 | | | $ | 5.35 | |
Class K | | | | | | | | | |
Beginning Account Value March 1, 2015 | | | 0.85 | % | | $ | 1,000.00 | | | $ | 1,000.00 | |
Ending Account Value August 31, 2015 | | | | | | $ | 966.60 | | | $ | 1,020.92 | |
Expenses Paid During Period* | | | | | | $ | 4.21 | | | $ | 4.33 | |
| * | Expenses are equal to the Fund’s annualized expense ratio (representing the six month period annualized), multiplied by the average account value over the period, multiplied by 184/365 (to reflect the one-half year period). Includes amounts waived, reimbursed and/or other credits. Without the waiver, reimbursement and/or other credits, expenses would have been higher. |
SSGA Dynamic Small Cap Fund
Schedule of Investments — August 31, 2015
| | | | | | | | |
| | | Principal
Amount ($)
or Shares | | | Value
$ | |
| | | | | | | | |
| Common Stocks - 99.0% | | | | | | | | |
Consumer Discretionary - 15.2% | |
AMC Entertainment Holdings, Inc.
(Class A) (a) | | | 536 | | | | 15,533 | |
Asbury Automotive Group, Inc. (a)(b) | | | 1,674 | | | | 134,874 | |
Barnes & Noble Education, Inc. (a)(b) | | | 531 | | | | 6,850 | |
Barnes & Noble, Inc. (a) | | | 841 | | | | 13,128 | |
Biglari Holdings, Inc. (b) | | | 156 | | | | 58,229 | |
BJ’s Restaurants, Inc. (a)(b) | | | 2,150 | | | | 92,429 | |
Bob Evans Farms, Inc. | | | 564 | | | | 25,487 | |
Bright Horizons Family Solutions, Inc. (b) | | | 1,916 | | | | 117,106 | |
Caleres, Inc. (a) | | | 3,881 | | | | 129,237 | |
Cato Corp. (Class A) (a) | | | 2,588 | | | | 90,916 | |
Children’s Place, Inc. (a) | | | 1,671 | | | | 100,126 | |
Churchill Downs, Inc. | | | 1,016 | | | | 134,996 | |
Columbia Sportswear Co. (a) | | | 1,859 | | | | 114,087 | |
Cooper-Standard Holding, Inc. (a)(b) | | | 661 | | | | 37,955 | |
Cracker Barrel Old Country Store, Inc. (a) | | | 923 | | | | 133,078 | |
Denny’s Corp. (b) | | | 9,217 | | | | 103,507 | |
Diamond Resorts International, Inc. (a)(b) | | | 3,910 | | | | 99,275 | |
DineEquity, Inc. (a) | | | 1,208 | | | | 115,364 | |
Drew Industries, Inc. | | | 1,132 | | | | 62,554 | |
Group 1 Automotive, Inc. | | | 1,400 | | | | 122,360 | |
Haverty Furniture Cos., Inc. (a) | | | 317 | | | | 7,326 | |
Helen of Troy, Ltd. (b) | | | 1,328 | | | | 113,066 | |
International Speedway Corp. (Class A) | | | 2,806 | | | | 90,045 | |
Isle of Capri Casinos,
Inc. (a)(b) | | | 1,050 | | | | 19,383 | |
Jack in the Box, Inc. (a) | | | 1,958 | | | | 153,076 | |
Libbey, Inc. | | | 2,467 | | | | 86,937 | |
Marcus Corp. (a) | | | 1,259 | | | | 24,437 | |
MarineMax, Inc. (a)(b) | | | 654 | | | | 10,660 | |
Marriott Vacations Worldwide Corp. | | | 1,826 | | | | 129,664 | |
Meredith Corp. (a) | | | 731 | | | | 34,518 | |
Metaldyne Performance Group, Inc. | | | 2,279 | | | | 43,028 | |
National CineMedia, Inc. | | | 6,251 | | | | 82,201 | |
Nautilus, Inc. (a)(b) | | | 1,008 | | | | 15,402 | |
Nutrisystem, Inc. | | | 1,034 | | | | 28,931 | |
Outerwall, Inc. (a) | | | 933 | | | | 57,473 | |
Oxford Industries, Inc. | | | 1,216 | | | | 102,339 | |
Papa John’s International, Inc. (a) | | | 1,814 | | | | 121,992 | |
Pinnacle Entertainment,
Inc. (b) | | | 3,211 | | | | 121,280 | |
Popeyes Louisiana Kitchen, Inc. (a)(b) | | | 1,741 | | | | 96,834 | |
Ruth’s Hospitality Group, Inc. | | | 4,503 | | | | 72,408 | |
Shoe Carnival, Inc. | | | 659 | | | | 17,068 | |
Skechers U.S.A., Inc.
(Class A) (b) | | | 1,076 | | | | 151,436 | |
Sonic Corp. | | | 3,490 | | | | 94,230 | |
Speedway Motorsports,
Inc. (a) | | | 901 | | | | 17,434 | |
Texas Roadhouse, Inc. (a) | | | 1,322 | | | | 47,579 | |
Tilly’s, Inc. (Class A) (a)(b) | | | 1,178 | | | | 9,436 | |
| | | | | | | | |
| | | Principal
Amount ($)
or Shares | | | Value
$ | |
Tower International, Inc. (b) | | | 3,144 | | | | 76,871 | |
Unifi, Inc. (b) | | | 448 | | | | 13,005 | |
Vail Resorts, Inc. (a) | | | 635 | | | | 68,523 | |
| | | | | | | | |
| | | | | | | 3,613,673 | |
| | | | | | | | |
Consumer Staples - 2.9% | | | | | | | | |
Cal-Maine Foods, Inc. (a) | | | 2,089 | | | | 110,968 | |
Casey’s General Stores, Inc. (a) | | | 1,502 | | | | 159,002 | |
Coca-Cola Hellenic Bottling Co. (a) | | | 246 | | | | 37,940 | |
Fresh Del Monte Produce, Inc. (a) | | | 2,717 | | | | 107,566 | |
HRG Group, Inc. (a)(b) | | | 2,719 | | | | 35,021 | |
Ingles Markets, Inc. (Class A) | | | 708 | | | | 35,187 | |
Medifast, Inc. (b) | | | 657 | | | | 18,245 | |
Omega Protein Corp. (b) | | | 1,982 | | | | 33,833 | |
Revlon, Inc. (Class A) (b) | | | 729 | | | | 24,305 | |
SpartanNash Co. (a) | | | 3,323 | | | | 94,041 | |
USANA Health Sciences, Inc. (a)(b) | | | 276 | | | | 40,431 | |
| | | | | | | | |
| | | | | | | 696,539 | |
| | | | | | | | |
|
Energy - 1.0% | |
Adams Resources & Energy, Inc. (a) | | | 168 | | | | 7,663 | |
Nordic American Tankers, Ltd. (a) | | | 7,542 | | | | 102,797 | |
REX American Resources Corp. (a)(b) | | | 406 | | | | 21,770 | |
Ship Finance International, Ltd. (a) | | | 5,903 | | | | 99,170 | |
Teekay Tankers, Ltd. (Class A) | | | 3,143 | | | | 18,481 | |
| | | | | | | | |
| | | | | | | 249,881 | |
| | | | | | | | |
|
Financials - 29.8% | |
Acadia Realty Trust (c) | | | 3,390 | | | | 100,175 | |
AG Mortgage Investment Trust, Inc. (a)(c) | | | 1,465 | | | | 24,216 | |
Alexander’s, Inc. (a)(c) | | | 106 | | | | 38,478 | |
American Assets Trust, Inc. (c) | | | 2,541 | | | | 97,879 | |
AMERISAFE, Inc. | | | 1,418 | | | | 66,277 | |
Amtrust Financial Services, Inc. (a) | | | 1,971 | | | | 114,614 | |
Apollo Commercial Real Estate Finance,
Inc. (a)(c) | | | 2,375 | | | | 38,879 | |
Apollo Residential Mortgage, Inc. (c) | | | 1,212 | | | | 16,920 | |
Argo Group International Holdings, Ltd. | | | 2,338 | | | | 130,881 | |
BancFirst Corp. (a) | | | 339 | | | | 20,499 | |
Banco Latinoamericano de Comercio Exterior
SA (a) | | | 1,333 | | | | 32,858 | |
Banner Corp. | | | 1,712 | | | | 76,030 | |
Berkshire Hills Bancorp, Inc. | | | 849 | | | | 23,755 | |
BGC Partners, Inc.
(Class A) (a) | | | 15,137 | | | | 132,752 | |
Brookline Bancorp, Inc. | | | 6,741 | | | | 71,118 | |
Calamos Asset Management, Inc. (Class A) (a) | | | 962 | | | | 10,159 | |
Capitol Federal Financial, Inc. | | | 2,956 | | | | 35,620 | |
Cardinal Financial Corp. (a) | | | 1,059 | | | | 23,626 | |
Central Pacific Financial Corp. (a) | | | 1,161 | | | | 24,079 | |
Chemical Financial Corp. | | | 1,903 | | | | 60,782 | |
SSGA Dynamic Small Cap Fund
Schedule of Investments, continued — August 31, 2015
| | | | | | | | |
| | | Principal
Amount ($)
or Shares | | | Value
$ | |
| | | | | | | | |
Chesapeake Lodging Trust (a)(c) | | | 1,671 | | | | 48,309 | |
City Holding Co. | | | 926 | | | | 44,096 | |
Colony Capital, Inc.
(Class A) (c) | | | 5,816 | | | | 126,265 | |
Community Trust Bancorp, Inc. | | | 803 | | | | 28,185 | |
Coresite Realty Corp. (c) | | | 2,094 | | | | 101,957 | |
CubeSmart (c) | | | 5,899 | | | | 149,186 | |
CyrusOne, Inc. (c) | | | 3,634 | | | | 115,052 | |
Dynex Capital, Inc. (a)(c) | | | 2,389 | | | | 16,006 | |
Eagle Bancorp, Inc. (a)(b) | | | 2,438 | | | | 102,177 | |
Employers Holdings, Inc. | | | 3,967 | | | | 87,472 | |
Enstar Group, Ltd. (a)(b) | | | 281 | | | | 41,057 | |
Enterprise Financial Services Corp. (a) | | | 825 | | | | 19,726 | |
EPR Properties (a)(c) | | | 1,020 | | | | 51,908 | |
Equity One, Inc. (a)(c) | | | 4,095 | | | | 96,273 | |
FBL Financial Group, Inc. (Class A) | | | 1,799 | | | | 102,615 | |
FelCor Lodging Trust,
Inc. (a)(c) | | | 10,901 | | | | 87,971 | |
Fidelity & Guaranty Life | | | 4,136 | | | | 101,994 | |
First American Financial Corp. (a) | | | 4,833 | | | | 187,810 | |
First Busey Corp. (a) | | | 2,630 | | | | 16,832 | |
First Citizens BancShares, Inc. (Class A) | | | 337 | | | | 79,930 | |
First Commonwealth Financial Corp. (a) | | | 918 | | | | 8,124 | |
First Defiance Financial Corp. | | | 442 | | | | 16,659 | |
First Financial Corp. (a) | | | 478 | | | | 15,721 | |
First Interstate Bancsystem, Inc. (a) | | | 1,026 | | | | 27,374 | |
First Merchants Corp. (a) | | | 3,851 | | | | 100,203 | |
First Midwest Bancorp, Inc. | | | 6,286 | | | | 110,885 | |
First NBC Bank Holding
Co. (a)(b) | | | 403 | | | | 14,105 | |
Franklin Street Properties Corp. (a)(c) | | | 7,199 | | | | 74,942 | |
Geo Group, Inc. (c) | | | 3,537 | | | | 106,216 | |
German American Bancorp, Inc. (a) | | | 361 | | | | 10,462 | |
Great Southern Bancorp, Inc. (a) | | | 462 | | | | 18,605 | |
Hanover Insurance Group, Inc. | | | 610 | | | | 48,129 | |
Hatteras Financial Corp. (c) | | | 2,288 | | | | 37,134 | |
HCI Group, Inc. (a) | | | 674 | | | | 26,792 | |
Healthcare Realty Trust, Inc. (c) | | | 4,360 | | | | 99,844 | |
Hilltop Holdings, Inc. (b) | | | 4,840 | | | | 99,946 | |
Horace Mann Educators Corp. | | | 1,284 | | | | 42,654 | |
Horizon Bancorp | | | 715 | | | | 16,895 | |
Hudson Pacific Properties, Inc. (c) | | | 4,405 | | | | 125,058 | |
Infinity Property & Casualty Corp. (a) | | | 332 | | | | 25,657 | |
INTL. FCStone, Inc. (b) | | | 473 | | | | 12,516 | |
Investment Technology Group, Inc. | | | 3,564 | | | | 58,521 | |
Investors Bancorp, Inc. | | | 6,221 | | | | 73,283 | |
Kansas City Life Insurance Co. (a) | | | 387 | | | | 17,903 | |
KCG Holdings, Inc. (Class A) (a)(b) | | | 9,407 | | | | 108,181 | |
Kennedy-Wilson Holdings, Inc. (a) | | | 1,770 | | | | 42,409 | |
Lakeland Financial Corp. (a) | | | 630 | | | | 25,887 | |
Maiden Holdings, Ltd. (a) | | | 5,386 | | | | 77,181 | |
MainSource Financial Group, Inc. | | | 1,384 | | | | 28,663 | |
Marcus & Millichap,
Inc. (a)(b) | | | 833 | | | | 35,369 | |
| | | | | | | | |
| | | Principal
Amount ($)
or Shares | | | Value
$ | |
MarketAxess Holdings,
Inc. (a) | | | 1,624 | | | | 146,842 | |
National General Holdings Corp. | | | 1,231 | | | | 22,564 | |
National Western Life Insurance Co. (Class A) (a) | | | 168 | | | | 38,207 | |
Navigators Group, Inc. (b) | | | 864 | | | | 65,707 | |
Northfield Bancorp, Inc. (a) | | | 3,921 | | | | 58,697 | |
NorthStar Realty Finance Corp. (c) | | | 4,223 | | | | 59,333 | |
Northwest Bancshares, Inc. | | | 8,421 | | | | 108,126 | |
Pebblebrook Hotel Trust (c) | | | 3,447 | | | | 131,193 | |
PennyMac Mortgage Investment Trust (a)(c) | | | 5,005 | | | | 75,425 | |
Peoples Bancorp, Inc. (a) | | | 389 | | | | 8,550 | |
PHH Corp. (a)(b) | | | 1,222 | | | | 19,796 | |
Pinnacle Financial Partners, Inc. | | | 1,306 | | | | 61,931 | |
Preferred Bank/Los Angeles CA | | | 895 | | | | 27,432 | |
PrivateBancorp, Inc. (a) | | | 3,822 | | | | 144,663 | |
Pzena Investment Management, Inc. (Class A) | | | 834 | | | | 8,432 | |
RLJ Lodging Trust (c) | | | 4,415 | | | | 121,589 | |
S&T Bancorp, Inc. (a) | | | 1,809 | | | | 54,125 | |
Safety Insurance Group, Inc. (a) | | | 1,471 | | | | 77,345 | |
Saul Centers, Inc. (c) | | | 465 | | | | 22,943 | |
Selective Insurance Group, Inc. | | | 2,179 | | | | 66,067 | |
Simmons First National Corp. (Class A) (a) | | | 699 | | | | 30,665 | |
South State Corp. (a) | | | 1,507 | | | | 113,251 | |
Sovran Self Storage, Inc. (c) | | | 1,394 | | | | 125,084 | |
Springleaf Holdings, Inc. (b) | | | 2,575 | | | | 115,257 | |
State Auto Financial Corp. (a) | | | 876 | | | | 19,184 | |
State Bank Financial Corp. (a) | | | 2,768 | | | | 55,914 | |
Strategic Hotels & Resorts, Inc. (a)(b)(c) | | | 5,139 | | | | 69,325 | |
Summit Hotel Properties,
Inc. (c) | | | 8,250 | | | | 100,073 | |
Sun Communities, Inc. (c) | | | 1,963 | | | | 128,007 | |
Sunstone Hotel Investors, Inc. (c) | | | 7,861 | | | | 108,718 | |
Symetra Financial Corp. | | | 4,368 | | | | 137,461 | |
Territorial Bancorp, Inc. | | | 591 | | | | 15,342 | |
Third Point Reinsurance, Ltd. (a)(b) | | | 866 | | | | 12,115 | |
Tompkins Financial Corp. (a) | | | 679 | | | | 35,641 | |
United Community Banks, Inc. | | | 5,067 | | | | 99,161 | |
United Fire Group, Inc. (a) | | | 1,744 | | | | 57,901 | |
Universal Insurance Holdings, Inc. (a) | | | 3,791 | | | | 93,372 | |
Walker & Dunlop, Inc. (b) | | | 1,067 | | | | 25,960 | |
West Bancorp., Inc. (a) | | | 500 | | | | 9,015 | |
Westwood Holdings Group, Inc. | | | 274 | | | | 15,210 | |
Wintrust Financial Corp. | | | 2,318 | | | | 118,218 | |
World Acceptance Corp. (a)(b) | | | 1,152 | | | | 43,292 | |
| | | | | | | | |
| | | | | | | 7,096,869 | |
| | | | | | | | |
| | |
Health Care - 15.4% | | | | | | | | |
ACADIA Pharmaceuticals, Inc. (a)(b) | | | 1,006 | | | | 36,850 | |
Acceleron Pharma, Inc. (b) | | | 293 | | | | 8,491 | |
SSGA Dynamic Small Cap Fund
Schedule of Investments, continued — August 31, 2015
| | | | | | | | |
| | | Principal
Amount ($)
or Shares | | | Value
$ | |
| | | | | | | | |
Achillion Pharmaceuticals, Inc. (a)(b) | | | 1,727 | | | | 12,763 | |
Acorda Therapeutics, Inc. (a)(b) | | | 579 | | | | 18,511 | |
Aegerion Pharmaceuticals, Inc. (a)(b) | | | 434 | | | | 7,677 | |
Agenus, Inc. (a)(b) | | | 1,174 | | | | 8,347 | |
Agios Pharmaceuticals,
Inc. (a)(b) | | | 244 | | | | 21,082 | |
Akebia Therapeutics, Inc. (b) | | | 110 | | | | 766 | |
Alder Biopharmaceuticals, Inc. (a)(b) | | | 156 | | | | 6,045 | |
Amedisys, Inc. (a)(b) | | | 2,768 | | | | 106,956 | |
Amicus Therapeutics, Inc. (a)(b) | | | 2,845 | | | | 40,911 | |
AMN Healthcare Services, Inc. (b) | | | 4,697 | | | | 157,819 | |
Anacor Pharmaceuticals,
Inc. (a)(b) | | | 812 | | | | 105,893 | |
Arena Pharmaceuticals,
Inc. (a)(b) | | | 3,507 | | | | 9,504 | |
ARIAD Pharmaceuticals,
Inc. (a)(b) | | | 1,672 | | | | 15,784 | |
Array BioPharma, Inc. (a)(b) | | | 1,140 | | | | 6,726 | |
Asterias Biotherapeutics,
Inc. (a)(b) | | | 90 | | | | 427 | |
Atara Biotherapeutics, Inc. (b) | | | 131 | | | | 5,309 | |
BioCryst Pharmaceuticals,
Inc. (b) | | | 640 | | | | 7,450 | |
Bluebird Bio, Inc. (a)(b) | | | 362 | | | | 48,171 | |
Cambrex Corp. (b) | | | 2,486 | | | | 118,856 | |
Cantel Medical Corp. (a) | | | 2,132 | | | | 105,811 | |
Celldex Therapeutics, Inc. (a)(b) | | | 1,373 | | | | 20,375 | |
Cepheid, Inc. (a)(b) | | | 930 | | | | 45,328 | |
Chemed Corp. (a) | | | 1,156 | | | | 157,621 | |
Chimerix, Inc. (a)(b) | | | 503 | | | | 24,617 | |
Clovis Oncology, Inc. (b) | | | 257 | | | | 20,010 | |
Coherus Biosciences, Inc. (a)(b) | | | 214 | | | | 5,906 | |
CONMED Corp. | | | 1,916 | | | | 101,663 | |
CTI BioPharma Corp. (a)(b) | | | 1,926 | | | | 3,043 | |
CytRx Corp. (a)(b) | | | 780 | | | | 1,919 | |
Diplomat Pharmacy, Inc. (a)(b) | | | 1,554 | | | | 61,367 | |
Dyax Corp. (b) | | | 1,775 | | | | 40,860 | |
Dynavax Technologies Corp. (b) | | | 189 | | | | 5,360 | |
Eagle Pharmaceuticals, Inc. (b) | | | 58 | | | | 4,556 | |
Emergent Biosolutions,
Inc. (a)(b) | | | 299 | | | | 9,954 | |
Enanta Pharmaceuticals,
Inc. (a)(b) | | | 200 | | | | 7,808 | |
Ensign Group, Inc. (a) | | | 2,151 | | | | 100,989 | |
Epizyme, Inc. (a)(b) | | | 184 | | | | 3,680 | |
Esperion Therapeutics,
Inc. (a)(b) | | | 132 | | | | 6,329 | |
Exact Sciences Corp. (a)(b) | | | 1,003 | | | | 22,176 | |
Exelixis, Inc. (a)(b) | | | 1,387 | | | | 8,253 | |
FibroGen, Inc. (b) | | | 450 | | | | 11,025 | |
Five Prime Therapeutics,
Inc. (a)(b) | | | 348 | | | | 6,636 | |
Foundation Medicine, Inc. (a)(b) | | | 36 | | | | 847 | |
Galectin Therapeutics, Inc. (a)(b) | | | 250 | | | | 552 | |
Galena Biopharma, Inc. (a)(b) | | | 1,665 | | | | 2,631 | |
Geron Corp. (a)(b) | | | 921 | | | | 2,791 | |
Halozyme Therapeutics, Inc. (b) | | | 1,183 | | | | 20,655 | |
Heron Therapeutics, Inc. (a)(b) | | | 1,087 | | | | 41,806 | |
Heska Corp. (b) | | | 525 | | | | 17,719 | |
ImmunoGen, Inc. (b) | | | 1,249 | | | | 16,812 | |
Immunomedics, Inc. (a)(b) | | | 1,150 | | | | 2,484 | |
INC Research Holdings, Inc. (Class A) (b) | | | 484 | | | | 19,849 | |
Inovio Pharmaceuticals,
Inc. (a)(b) | | | 1,187 | | | | 8,891 | |
| | | | | | | | |
| | | Principal
Amount ($)
or Shares | | | Value
$ | |
Insmed, Inc. (a)(b) | | | 673 | | | | 16,448 | |
Insys Therapeutics, Inc. (a)(b) | | | 170 | | | | 5,511 | |
Integra LifeSciences Holdings Corp. (b) | | | 1,677 | | | | 100,586 | |
Intrexon Corp. (a)(b) | | | 507 | | | | 22,561 | |
Ironwood Pharmaceuticals, Inc. (a)(b) | | | 1,304 | | | | 14,344 | |
Karyopharm Therapeutics, Inc. (a)(b) | | | 182 | | | | 2,523 | |
Keryx Biopharmaceuticals, Inc. (a)(b) | | | 1,251 | | | | 7,731 | |
Kite Pharma, Inc. (a)(b) | | | 321 | | | | 17,068 | |
Lexicon Pharmaceuticals,
Inc. (a)(b) | | | 466 | | | | 5,564 | |
LHC Group, Inc. (b) | | | 573 | | | | 24,811 | |
Ligand Pharmaceuticals, Inc. (Class B) (a)(b) | | | 198 | | | | 18,204 | |
MacroGenics, Inc. (b) | | | 365 | | | | 9,618 | |
MannKind Corp. (a)(b) | | | 2,490 | | | | 9,437 | |
Masimo Corp. (b) | | | 2,932 | | | | 119,127 | |
Merit Medical Systems, Inc. (b) | | | 4,730 | | | | 107,607 | |
Merrimack Pharmaceuticals, Inc. (a)(b) | | | 979 | | | | 9,878 | |
MiMedx Group, Inc. (a)(b) | | | 1,104 | | | | 10,720 | |
Molina Healthcare, Inc. (a)(b) | | | 202 | | | | 15,067 | |
Momenta Pharmaceuticals, Inc. (a)(b) | | | 1,830 | | | | 35,703 | |
Myriad Genetics, Inc. (a)(b) | | | 819 | | | | 30,762 | |
National Healthcare Corp. (a) | | | 344 | | | | 20,764 | |
Natus Medical, Inc. (a)(b) | | | 3,256 | | | | 132,454 | |
Navidea Biopharmaceuticals, Inc. (a)(b) | | | 2,203 | | | | 4,142 | |
Neurocrine Biosciences, Inc. (b) | | | 1,076 | | | | 49,905 | |
NewLink Genetics Corp. (a)(b) | | | 213 | | | | 9,566 | |
Northwest Biotherapeutics, Inc. (a)(b) | | | 738 | | | | 5,683 | |
Novavax, Inc. (a)(b) | | | 3,149 | | | | 33,915 | |
NuVasive, Inc. (b) | | | 2,496 | | | | 131,589 | |
Omeros Corp. (a)(b) | | | 190 | | | | 2,677 | |
Omnicell, Inc. (b) | | | 2,831 | | | | 96,197 | |
OncoMed Pharmaceuticals, Inc. (b) | | | 173 | | | | 3,389 | |
Oncothyreon, Inc. (a)(b) | | | 1,039 | | | | 3,533 | |
Ophthotech Corp. (a)(b) | | | 240 | | | | 10,567 | |
Opko Health, Inc. (a)(b) | | | 2,963 | | | | 32,060 | |
Orexigen Therapeutics,
Inc. (a)(b) | | | 888 | | | | 2,460 | |
Organovo Holdings, Inc. (a)(b) | | | 867 | | | | 2,367 | |
Orthofix International NV (a)(b) | | | 624 | | | | 23,388 | |
OvaScience, Inc. (a)(b) | | | 176 | | | | 3,421 | |
Pacira Pharmaceuticals,
Inc. (a)(b) | | | 406 | | | | 23,365 | |
PAREXEL International
Corp. (a)(b) | | | 661 | | | | 43,441 | |
PDL BioPharma, Inc. (a) | | | 1,628 | | | | 9,198 | |
Peregrine Pharmaceuticals, Inc. (a)(b) | | | 2,439 | | | | 2,805 | |
PharMerica Corp. (b) | | | 3,807 | | | | 124,565 | |
Phibro Animal Health Corp. (Class A) (a) | | | 615 | | | | 21,709 | |
SSGA Dynamic Small Cap Fund
Schedule of Investments, continued — August 31, 2015
| | | | | | | | |
| | | Principal
Amount ($)
or Shares | | | Value
$ | |
| | | | | | | | |
Portola Pharmaceuticals,
Inc. (a)(b) | | | 625 | | | | 29,475 | |
PRA Health Sciences, Inc. (a)(b) | | | 924 | | | | 34,770 | |
Prothena Corp. PLC (a)(b) | | | 318 | | | | 18,295 | |
Providence Service Corp. (a)(b) | | | 506 | | | | 22,684 | |
PTC Therapeutics, Inc. (a)(b) | | | 405 | | | | 15,467 | |
Radius Health, Inc. (b) | | | 324 | | | | 19,719 | |
RadNet, Inc. (a)(b) | | | 2,766 | | | | 16,983 | |
Raptor Pharmaceutical Corp. (b) | | | 835 | | | | 10,129 | |
Repligen Corp. (a)(b) | | | 468 | | | | 15,949 | |
Retrophin, Inc. (b) | | | 376 | | | | 10,310 | |
Rigel Pharmaceuticals,
Inc. (a)(b) | | | 1,601 | | | | 4,803 | |
Sage Therapeutics, Inc. (a)(b) | | | 137 | | | | 7,399 | |
Sagent Pharmaceuticals,
Inc. (a)(b) | | | 289 | | | | 5,774 | |
Sangamo Biosciences, Inc. (a)(b) | | | 382 | | | | 2,888 | |
Sarepta Therapeutics, Inc. (b) | | | 479 | | | | 17,100 | |
SeaSpine Holdings Corp. (b) | | | 559 | | | | 7,899 | |
Select Medical Holdings Corp. | | | 4,842 | | | | 62,462 | |
Sorrento Therapeutics, Inc. (a)(b) | | | 220 | | | | 2,790 | |
Sucampo Pharmaceuticals, Inc. (Class A) (a)(b) | | | 940 | | | | 25,248 | |
Supernus Pharmaceuticals, Inc. (a)(b) | | | 1,166 | | | | 21,163 | |
Synergy Pharmaceuticals, Inc. (a)(b) | | | 727 | | | | 5,089 | |
Synta Pharmaceuticals Corp. (b) | | | 823 | | | | 1,646 | |
TESARO, Inc. (a)(b) | | | 241 | | | | 12,407 | |
Tetraphase Pharmaceuticals, Inc. (a)(b) | | | 1,056 | | | | 45,841 | |
TG Therapeutics, Inc. (a)(b) | | | 473 | | | | 5,808 | |
Threshold Pharmaceuticals, Inc. (b) | | | 737 | | | | 3,095 | |
Tornier NV (b) | | | 3,507 | | | | 77,996 | |
Triple-S Management Corp. (Class B) (a)(b) | | | 1,156 | | | | 24,322 | |
Ultragenyx Pharmaceutical, Inc. (a)(b) | | | 447 | | | | 49,894 | |
US Physical Therapy, Inc. | | | 541 | | | | 24,859 | |
Vanda Pharmaceuticals,
Inc. (a)(b) | | | 705 | | | | 8,312 | |
Verastem, Inc. (a)(b) | | | 294 | | | | 1,790 | |
Versartis, Inc. (a)(b) | | | 98 | | | | 1,271 | |
Xencor, Inc. (a)(b) | | | 213 | | | | 3,572 | |
XOMA Corp. (a)(b) | | | 1,737 | | | | 1,443 | |
ZIOPHARM Oncology,
Inc. (a)(b) | | | 1,373 | | | | 11,959 | |
| | | | | | | | |
| | | | | | | 3,661,702 | |
| | | | | | | | |
| | |
Industrials - 13.9% | | | | | | | | |
ABM Industries, Inc. | | | 3,472 | | | | 111,139 | |
Air Transport Services Group, Inc. (a)(b) | | | 2,546 | | | | 23,143 | |
Aircastle, Ltd. (a) | | | 4,782 | | | | 99,370 | |
AMERCO, Inc. | | | 232 | | | | 86,898 | |
American Railcar Industries,
Inc. (a) | | | 429 | | | | 17,786 | |
Apogee Enterprises, Inc. | | | 2,317 | | | | 120,832 | |
Argan, Inc. (a) | | | 1,198 | | | | 46,902 | |
Atlas Air Worldwide Holdings, Inc. (b) | | | 2,697 | | | | 111,413 | |
| | | | | | | | |
| | | Principal
Amount ($)
or Shares | | | Value
$ | |
Comfort Systems USA, Inc. | | | 4,398 | | | | 121,913 | |
Deluxe Corp. (a) | | | 2,530 | | | | 146,765 | |
Dycom Industries, Inc. (b) | | | 1,971 | | | | 140,118 | |
Echo Global Logistics, Inc. (b) | | | 3,208 | | | | 74,618 | |
EMCOR Group, Inc. | | | 637 | | | | 29,359 | |
ESCO Technologies, Inc. (a) | | | 1,744 | | | | 62,976 | |
Federal Signal Corp. | | | 6,675 | | | | 94,451 | |
G&K Services, Inc. (Class A) (a) | | | 1,615 | | | | 109,190 | |
General Cable Corp. (a) | | | 3,395 | | | | 49,397 | |
Hillenbrand, Inc. | | | 1,520 | | | | 40,979 | |
Insperity, Inc. (a) | | | 2,044 | | | | 90,733 | |
Interface, Inc. | | | 4,569 | | | | 110,753 | |
JetBlue Airways Corp. (a)(b) | | | 5,670 | | | | 126,554 | |
John Bean Technologies Corp. | | | 2,479 | | | | 82,105 | |
Kadant, Inc. | | | 441 | | | | 19,620 | |
Kaman Corp. (a) | | | 694 | | | | 26,948 | |
Knoll, Inc. | | | 5,802 | | | | 138,784 | |
Korn/Ferry International | | | 3,814 | | | | 129,943 | |
L.B. Foster Co. (Class A) | | | 418 | | | | 7,495 | |
Lydall, Inc. (b) | | | 953 | | | | 25,883 | |
Masonite International
Corp. (a)(b) | | | 1,719 | | | | 113,540 | |
Matson, Inc. (a) | | | 3,150 | | | | 118,692 | |
Matthews International Corp. (Class A) (a) | | | 661 | | | | 33,566 | |
Multi-Color Corp. (a) | | | 1,506 | | | | 99,230 | |
MYR Group, Inc. (b) | | | 948 | | | | 27,198 | |
On Assignment, Inc. (b) | | | 2,970 | | | | 106,861 | |
PAM Transportation Services, Inc. (a)(b) | | | 200 | | | | 7,726 | |
Park-Ohio Holdings Corp. | | | 2,030 | | | | 73,202 | |
Patrick Industries, Inc. (b) | | | 1,342 | | | | 50,714 | |
Quad Graphics, Inc. (a) | | | 1,065 | | | | 15,379 | |
SkyWest, Inc. | | | 6,488 | | | | 103,159 | |
TriNet Group, Inc. (a)(b) | | | 550 | | | | 9,262 | |
TrueBlue, Inc. (b) | | | 3,511 | | | | 84,264 | |
Universal Forest Products, Inc. | | | 1,162 | | | | 69,790 | |
Viad Corp. | | | 820 | | | | 22,419 | |
VSE Corp. (a) | | | 373 | | | | 15,435 | |
Wabash National Corp. (a)(b) | | | 4,471 | | | | 54,680 | |
West Corp. (a) | | | 2,701 | | | | 65,742 | |
| | | | | | | | |
| | | | | | | 3,316,926 | |
| | | | | | | | |
|
Information Technology - 12.3% | |
Advanced Energy Industries,
Inc. (b) | | | 2,584 | | | | 62,714 | |
Badger Meter, Inc. (a) | | | 448 | | | | 26,114 | |
Bel Fuse, Inc. (Class B) | | | 619 | | | | 10,931 | |
Blackbaud, Inc. | | | 935 | | | | 53,426 | |
Blackhawk Network Holdings, Inc. (b) | | | 3,119 | | | | 123,232 | |
BroadSoft, Inc. (b) | | | 1,917 | | | | 60,500 | |
CACI International, Inc. (Class A) (b) | | | 483 | | | | 37,877 | |
Cimpress NV (a)(b) | | | 1,507 | | | | 105,460 | |
comScore, Inc. (b) | | | 1,320 | | | | 68,917 | |
SSGA Dynamic Small Cap Fund
Schedule of Investments, continued — August 31, 2015
| | | | | | | | |
| | | Principal
Amount ($)
or Shares | | | Value
$ | |
| | | | | | | | |
Comtech Telecommunications Corp. (a) | | | 626 | | | | 16,702 | |
Convergys Corp. | | | 3,495 | | | | 78,987 | |
CSG Systems International, Inc. (a) | | | 2,157 | | | | 66,673 | |
Cypress Semiconductor Corp. (a)(b) | | | 10,611 | | | | 106,110 | |
Ebix, Inc. (a) | | | 3,042 | | | | 86,362 | |
Ellie Mae, Inc. (b) | | | 1,709 | | | | 123,783 | |
EPAM Systems, Inc. (a)(b) | | | 1,358 | | | | 95,888 | |
ePlus, Inc. (a)(b) | | | 530 | | | | 40,132 | |
Euronet Worldwide, Inc. (b) | | | 1,104 | | | | 71,175 | |
Everi Holdings, Inc. (a)(b) | | | 8,795 | | | | 45,470 | |
Fair Isaac Corp. | | | 1,515 | | | | 129,639 | |
GSI Group, Inc. (b) | | | 1,655 | | | | 21,498 | |
Hackett Group, Inc. | | | 1,768 | | | | 24,911 | |
II-VI, Inc. (b) | | | 4,972 | | | | 83,977 | |
Imperva, Inc. (b) | | | 1,705 | | | | 101,584 | |
Infoblox, Inc. (b) | | | 4,990 | | | | 96,008 | |
LogMeIn, Inc. (b) | | | 663 | | | | 41,331 | |
Mantech International Corp. (Class A) (a) | | | 756 | | | | 20,707 | |
MAXIMUS, Inc. | | | 1,179 | | | | 71,388 | |
MicroStrategy, Inc. (Class A) (b) | | | 672 | | | | 133,526 | |
MKS Instruments, Inc. (a) | | | 2,192 | | | | 73,870 | |
MoneyGram International, Inc. (a)(b) | | | 454 | | | | 3,968 | |
Multi-Fineline Electronix, Inc. (b) | | | 673 | | | | 10,748 | |
OSI Systems, Inc. (a)(b) | | | 471 | | | | 34,402 | |
PC Connection, Inc. (a) | | | 1,069 | | | | 22,524 | |
PMC - Sierra, Inc. (a)(b) | | | 3,935 | | | | 24,751 | |
Qorvo, Inc. (b) | | | 1,407 | | | | 78,103 | |
Science Applications International Corp. (a) | | | 2,159 | | | | 105,294 | |
SS&C Technologies Holdings, Inc. | | | 2,002 | | | | 135,615 | |
Stamps.com, Inc. (b) | | | 1,719 | | | | 141,542 | |
Sykes Enterprises, Inc. (b) | | | 5,191 | | | | 130,554 | |
TeleTech Holdings, Inc. | | | 931 | | | | 25,184 | |
Tessera Technologies, Inc. | | | 1,099 | | | | 35,981 | |
VASCO Data Security International, Inc. (a)(b) | | | 1,805 | | | | 30,180 | |
Web.com Group, Inc. (b) | | | 2,924 | | | | 62,954 | |
| | | | | | | | |
| | | | | | | 2,920,692 | |
| | | | | | | | |
|
Materials - 3.0% | |
Berry Plastics Group, Inc. (b) | | | 1,625 | | | | 48,100 | |
Chase Corp. (a) | | | 716 | | | | 28,282 | |
Clearwater Paper Corp. (b) | | | 1,854 | | | | 103,935 | |
Ferro Corp. (a) (b) | | | 6,494 | | | | 79,876 | |
Graphic Packaging Holding Co. | | | 8,909 | | | | 125,617 | |
Hawkins, Inc. (a) | | | 442 | | | | 16,818 | |
Kaiser Aluminum Corp. (a) | | | 1,320 | | | | 110,326 | |
Neenah Paper, Inc. (a) | | | 1,775 | | | | 102,453 | |
Stepan Co. (a) | | | 1,405 | | | | 63,267 | |
US Concrete, Inc. (a)(b) | | | 516 | | | | 26,719 | |
| | | | | | | | |
| | | | | | | 705,393 | |
| | | | | | | | |
| | | | | | | | |
| | | Principal
Amount ($)
or Shares | | | Value
$ | |
Telecommunication Services - 0.7% | |
Inteliquent, Inc. (a) | | | 1,366 | | | | 25,025 | |
Premiere Global Services, Inc. (b) | | | 2,070 | | | | 22,314 | |
Vonage Holdings Corp. (b) | | | 21,307 | | | | 118,254 | |
| | | | | | | | |
| | | | | | | 165,593 | |
| | | | | | | | |
|
Utilities - 4.8% | |
American States Water Co. (a) | | | 3,086 | | | | 116,496 | |
Avista Corp. | | | 3,656 | | | | 114,762 | |
Chesapeake Utilities Corp. (a) | | | 814 | | | | 40,106 | |
Connecticut Water Service, Inc. (a) | | | 487 | | | | 16,923 | |
IDACORP, Inc. (a) | | | 2,530 | | | | 150,206 | |
Laclede Group, Inc. (a) | | | 852 | | | | 45,105 | |
MGE Energy, Inc. (a) | | | 1,629 | | | | 62,651 | |
New Jersey Resources Corp. | | | 4,612 | | | | 130,381 | |
ONE Gas, Inc. (a) | | | 1,202 | | | | 51,650 | |
Ormat Technologies, Inc. (a) | | | 2,803 | | | | 98,666 | |
Piedmont Natural Gas Co., Inc. | | | 1,710 | | | | 65,972 | |
Portland General Electric Co. | | | 1,613 | | | | 55,713 | |
Southwest Gas Corp. | | | 1,054 | | | | 58,065 | |
Unitil Corp. | | | 584 | | | | 21,030 | |
WGL Holdings, Inc. (a) | | | 2,372 | | | | 128,562 | |
| | | | | | | | |
| | | | | | | 1,156,288 | |
| | | | | | | | |
| |
Total Common Stocks
(cost $21,737,841) | | | | 23,583,556 | |
| | | | | | | | |
|
| Rights - 0.0% (d) | |
Health Care - 0.0% (d) | |
Durata Therapeutics, Inc. (CVR)
(expiring 12/31/18) (b)(e) (cost $0) | | | 224 | | | | 186 | |
| | | | | | | | |
|
| Warrant - 0.0% (d) | |
Health Care - 0.0% (d) | |
BIOTIME, Inc.
(expiring 10/01/18) (a)(b)
(cost $109) | | | 110 | | | | 85 | |
| | | | | | | | |
|
| Short-Term Investments - 23.6% | |
SSGA Prime Money Market Fund
0.24% (f)(g) | | | 248,619 | | | | 248,619 | |
State Street Navigator Securities Lending Prime Portfolio (g)(h) | | | 5,375,144 | | | | 5,375,144 | |
| | | | | | | | |
| |
Total Short-Term Investments
(cost $5,623,763) | | | | 5,623,763 | |
| | | | | | | | |
| |
Total Investments - 122.6%
(cost $27,361,713) | | | | 29,207,590 | |
| |
Other Assets and Liabilities,
Net - (22.6)% | | | | (5,387,123 | ) |
| | | | | | | | |
| | |
| Net Assets - 100.0% | | | | | | | 23,820,467 | |
| | | | | | | | |
| | |
| 10 | | Dynamic Small Cap Fund |
SSGA Dynamic Small Cap Fund
Schedule of Investments, continued — August 31, 2015
Footnotes:
| (a) | All or a portion of the shares of this security are on loan. |
| (b) | Non-income producing security |
| (c) | Real Estate Investment Trust (REIT) |
| (d) | Less than 0.05% of net assets |
| (e) | Security is valued at fair value as determined in good faith by the Trust’s Oversight Committee in accordance with procedures approved by the Board of Trustees. Security value is determined based on Level 2 inputs. Represents $186 or less than 0.1% of net assets. (Note 2) |
| (f) | The rate shown is the annualized seven-day yield at period end. |
| (g) | Affiliated Fund managed by SSGA Funds Management, Inc. (Note 4). |
| (h) | Investments of cash collateral for securities loaned |
Abbreviations:
CVR Contingent Value Rights
PLC Public Limited Company
Presentation of Portfolio Holdings — August 31, 2015
| | | | | | | | | | | | | | | | | | | | |
| | | Value* | | | % of
Net
Assets | |
| Categories | | Level 1 | | | Level 2 | | | Level 3 | | | Total | | |
Common Stocks | | | | | | | | | | | | | | | | | | | | |
Consumer Discretionary | | $ | 3,613,673 | | | $ | — | | | $ | — | | | $ | 3,613,673 | | | | 15.2 | |
Consumer Staples | | | 696,539 | | | | — | | | | — | | | | 696,539 | | | | 2.9 | |
Energy | | | 249,881 | | | | — | | | | — | | | | 249,881 | | | | 1.0 | |
Financials | | | 7,096,869 | | | | — | | | | — | | | | 7,096,869 | | | | 29.8 | |
Health Care | | | 3,661,702 | | | | — | | | | — | | | | 3,661,702 | | | | 15.4 | |
Industrials | | | 3,316,926 | | | | — | | | | — | | | | 3,316,926 | | | | 13.9 | |
Information Technology | | | 2,920,692 | | | | — | | | | — | | | | 2,920,692 | | | | 12.3 | |
Materials | | | 705,393 | | | | — | | | | — | | | | 705,393 | | | | 3.0 | |
Telecommunication Services | | | 165,593 | | | | — | | | | — | | | | 165,593 | | | | 0.7 | |
Utilities | | | 1,156,288 | | | | — | | | | — | | | | 1,156,288 | | | | 4.8 | |
Rights | | | | | | | | | | | | | | | | | | | | |
Health Care | | | — | | | | 186 | | | | — | | | | 186 | | | | 0.0 | ** |
Warrants | | | | | | | | | | | | | | | | | | | | |
Health Care | | | 85 | | | | — | | | | — | | | | 85 | | | | 0.0 | ** |
Short-Term Investments | | | 5,623,763 | | | | — | | | | — | | | | 5,623,763 | | | | 23.6 | |
| | | | | | | | | | | | | | | | | | | | |
Total Investments | | $ | 29,207,404 | | | $ | 186 | | | $ | — | | | $ | 29,207,590 | | | | 122.6 | |
| | | | | | | | | | | | | | | | | | | | |
Other Assets & Liabilities, Net | | | | | | | | | | | | | | | | | | | (22.6 | ) |
| | | | | | | | | | | | | | | | | | | | |
| | | | | | | | | | | | | | | | | | | 100.0 | |
| | | | | | | | | | | | | | | | | | | | |
| * | | For a description of the levels, see Note 2 in the Notes to Financial Statements. During the year ended August 31, 2015, there were no material transfers between levels. The transfers that did occur were the result of fair value pricing using significant observable inputs. |
| ** | | Less than 0.05% of net assets. |
See accompanying notes which are an integral part of the financial statements.
| | | | |
| Dynamic Small Cap Fund | | | 11 | |
SSGA Clarion Real Estate Fund
Portfolio Management Discussion and Analysis — August 31, 2015 (Unaudited)
Objective: The Fund seeks to provide income and capital growth by investing primarily in publicly traded securities issued by real estate investment trusts.
Invests in: Real Estate Investment Trust (REIT) securities, primarily from those securities in the Dow Jones U.S. Select REIT Index and across different industry types and regions based on the fundamental research of the Fund’s sub-adviser.
Strategy: The Fund seeks to meet its objective by investing with a relatively long time horizon, favoring strong real estate fundamentals, and attempting to minimize turnover, while focusing on relative valuations, balance sheet strength and higher growth rates.
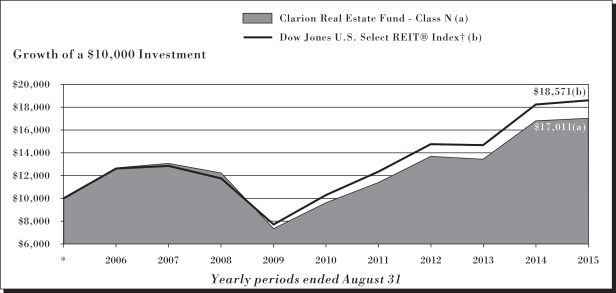
The growth of $10,000 is cumulative. The performance of other shares classes will vary based on the sales charges and the fee structure of those classes.
Index returns do not reflect any fees or expenses and it is not possible to invest directly into an index.
| * | Assumes initial investment on September 1, 2005. |
| † | The Dow Jones U.S. Select REIT® Index is a subset of the Dow Jones Americas Select RESI and includes only REITs and REIT like securities. |
See related Notes on following page.
| | |
| 12 | | Clarion Real Estate Fund |
SSGA Clarion Real Estate Fund
Portfolio Management Discussion and Analysis, continued — August 31, 2015 (Unaudited)
Performance Summary
Average Annual Total Returns as of 8/31/2015
| | | | | | | | | | | | |
| Class N | | 1 Year | | | 5 Year | | | 10 Year | |
Unadjusted for Sales Charge | | | 1.33 | % | | | 12.09 | % | | | 5.46 | % |
Dow Jones U.S. Select REIT Index† | | | 1.87 | % | | | 12.53 | % | | | 6.39 | % |
| Class A | | 1 Year | | | 5 Year | | | 10 Year | |
Unadjusted for Sales Charge | | | 1.14 | % | | | 11.88 | % | | | 5.25 | % |
Adjusted for the Maximum Sale Charge (Max 5.25% load) | | | -4.16 | % | | | 10.67 | % | | | 4.69 | % |
Dow Jones U.S. Select REIT Index† | | | 1.87 | % | | | 12.53 | % | | | 6.39 | % |
| Class C | | 1 Year | | | 5 Year | | | 10 Year | |
Unadjusted for Sales Charge | | | 0.40 | %* | | | 11.06 | % | | | 4.47 | % |
Adjusted for the Maximum Sale Charge (Max 1.00% CDSC) | | | -0.60 | %* | | | 11.06 | % | | | 4.47 | % |
Dow Jones U.S. Select REIT Index† | | | 1.87 | % | | | 12.53 | % | | | 6.39 | % |
| Class I | | 1 Year | | | 5 Year | | | 10 Year | |
Unadjusted for Sales Charge | | | 1.35 | % | | | 12.11 | % | | | 5.47 | % |
Dow Jones U.S. Select REIT Index† | | | 1.87 | % | | | 12.53 | % | | | 6.39 | % |
| Class K | | 1 Year | | | 5 Year | | | 10 Year | |
Unadjusted for Sales Charge | | | 1.62 | % | | | 12.18 | % | | | 5.50 | % |
Dow Jones U.S. Select REIT Index† | | | 1.87 | % | | | 12.53 | % | | | 6.39 | % |
The maximum sales charge for Class A shares is 5.25%. A contingent deferred sales charge (“CDSC”) of 1.00% may be assessed on redemptions of Class A shares made within 18 months after purchase where no initial sales charge was paid at the time of purchase as part of an investment of $1,000,000 or more. There is no CDSC on Class C shares redeemed more than one year after purchase. A 1.00% CDSC may be assessed on redemptions of Class C shares during the first year only. Class N, Class I, and Class K are not subject to a sales charge.
Adjusted Performance shown for the periods prior to the inception of Classes A and C shares on July 7, 2014 reflect the historical performance of the fund’s Class N shares adjusted to reflect the higher expenses of Classes A and C shares, estimated for their first year of operations, including applicable 12b-1 fees and the maximum sales load of Classes A and C. Unadjusted Performance shown for the periods prior to the inception of Classes A and C shares on July 7, 2014 reflects the historical performance of the fund’s Class N shares adjusted to reflect the higher expenses of Classes A and C shares, estimated for their first year of operations, including applicable 12b-1 fees. Unadjusted returns do not reflect sales charges and would have been lower if they had. Performance shown for the periods prior to the inception of Class I and K shares on July 7, 2014, reflect the historical performance of the fund’s Class N shares. Had the fund’s Class I and K fees been reflected, the returns shown for those periods would have been higher.
Performance quoted represents past performance, which is no guarantee of future results. Investment return and principal value will fluctuate, so you may have a gain or loss when shares are sold. Current performance may be higher or lower than that quoted. Visit www.ssgafunds.com for most recent month-end performance. The returns do not reflect the deduction of taxes that a shareholder would pay on Fund distributions or on the redemption of Fund shares. Performance includes reinvestment of all distributions. The gross expense ratio for the Clarion Real Estate Fund as stated in the Fees and Expenses table of the prospectus dated December 18, 2014 is 1.41%, 1.61%, 2.36%, 1.36% and 1.16% for Class N, A, C, I and K, respectively, and may differ from the expense ratios disclosed in the Financial Highlights tables in this report.
| † | The Dow Jones U.S. Select REIT® Index is a subset of the Dow Jones Americas Select RESI and includes only REITs and REIT like securities. |
| * | Performance results do not include adjustments made for financial reporting purposes in accordance with U.S. generally accepted accounting principles and may differ from amounts reported in the financial highlights. |
Performance data reflects an expense limitation currently in effect, without which returns would have been lower.
| | | | |
| Clarion Real Estate Fund | | | 13 | |
SSGA Clarion Real Estate Fund
Management’s Discussion of Fund Performance, continued — August 31, 2015 (Unaudited)
SSGA Clarion Real Estate Fund (the “Fund”) seeks to provide income and capital growth by investing primarily in publicly traded securities issued by real estate investment trusts (“REITs”). The Fund’s benchmark is the Dow Jones U.S. Select REIT Index (the “Index”).
For the 12-month period ended August 31, 2015 (the “Reporting Period”), the total return for Class N shares of the Fund was 1.33%, and the total return for the Index was 1.87%. The Fund and Index returns reflect the reinvestment of dividends and other income. The Fund’s performance reflects the expenses of managing the Fund, including brokerage and advisory expenses. The Index is unmanaged and Index returns do not reflect fees and expenses of any kind, which would have a negative impact on returns.
US REITs generated a positive total return during the Reporting Period, but performance during the two halves of the Reporting Period diverged. During the first half of the Reporting Period, REIT returns were strong for reasons we believe included attractive and rising dividends, strong earnings growth through both organic as well as external growth, discounted valuations, and a continued rise in underlying real estate values. Interest rates and inflationary pressures remained lower than what was expected at the beginning of the Reporting Period. However, the second half of the Reporting Period erased most of the first half’s gains, despite real estate operating fundamentals remaining strong, in our view, and significant capital flows supporting private market real estate valuations. We believe the decline in the second half of the Reporting Period resulted from investor fears over the impact of higher interest rates, the economic implications of problems in resolving Greece’s continuing financial difficulties, investor concerns about potentially lower-than-projected Chinese economic growth, and a growing sense among investors that the Chinese government’s influence over its economy was weaker than was previously believed.
Overall, the Fund’s performance was positive during the Reporting Period. The Fund benefited from strong stock selection in nearly all sectors, led by picks in the healthcare, technology (data centers), industrial, and office sectors. Stock selection was also positive in the apartment, malls, and hotel sectors. Asset allocation detracted from relative return, primarily as a result of underweight positioning (relative to the Index) in the outperforming self-storage sector, coupled with overweight allocations to underperforming office and net leased sectors. Asset allocations that contributed positively to performance included an underweight position in the underperforming healthcare sector and an overweight to the outperforming apartment sector.
The top positive contributors to the Fund’s performance during the Reporting Period were CubeSmart, Senior Housing Properties Trust, and QTS Realty Trust. An overweight position to outperforming CubeSmart (a company in the storage sector) benefited the Fund. Our position in CubeSmart, one of the best-performing REITs in the Index during the Reporting Period, was the largest positive contributor to the Fund’s performance, relative to the size of the position. Another key contributor to performance was strong stock selection and positioning in the healthcare sector, especially an underweight position in Senior Housing Properties Trust and the overall healthcare sector. The underweight position in the healthcare sector resulted from portfolio positioning emphasizing property types that typically benefit the most from improving economic conditions, while remaining cautious on the more bond-like healthcare sector. A position in QTS Realty Trust, a small-cap REIT not included in the Index, also contributed to positive results. Given the sharp underperformance in the technology sector, despite strong demand drivers, combined with an opportunity to buy a position in a fundamentally sound company in a discounted secondary equity offering, we added small cap QTS Realty Trust to the portfolio in February.
The top negative contributors to the Fund’s performance were Extra Space Storage, Host Hotels, and VEREIT. The Fund was underweight in Extra Space Storage, the second-largest owner of self-storage real estate. The firm traded at a hefty premium to its peers, which we felt was unwarranted given what we saw as the market’s overly optimistic growth prospects. An overweight to underperforming Host Hotels, a $23 billion hotel REIT concentrated in branded full-service assets, also detracted from results, although overall stock selection in the hotel sector helped returns. VEREIT, the lone net lease holding in the Fund, underperformed despite new management that has undertaken steps to move the company in what we believe to be the right direction. The Fund liquidated its position in VEREIT in April 2015 on concerns that management’s plan of action will take longer than initially anticipated.
The views expressed above reflect those of the Fund’s portfolio manager only through the Reporting Period, and do not necessarily represent the views of the Adviser as a whole. Any such views are subject to change at any time based upon market or other conditions and the Adviser disclaims any responsibility to update such views. These views may not be relied on as investment advice and, because investment decisions for a fund are based on numerous factors, may not be relied on as an indication of trading intent on behalf of any fund.
| | |
| 14 | | Clarion Real Estate Fund |
SSGA Clarion Real Estate Fund
Shareholder Expense Example — August 31, 2015 (Unaudited)
Fund Expenses
The following disclosure provides important information regarding the Fund’s Expense Example, which appears on the Fund’s individual page in this Annual Report. Please refer to this information when reviewing the Expense Example for a Fund.
Example
As a shareholder of the Fund, you incur two types of costs: (1) transaction costs, and (2) ongoing costs, including advisory and administration fees; distribution (12b-1) and/or service fees; and other Fund expenses. The Example is intended to help you understand your ongoing costs (in dollars) of investing in the Fund and to compare these costs with the ongoing costs of investing in other mutual funds. The Example is based on an investment of $1,000 invested at the beginning of the period and held for the entire period indicated, which for this Fund is from March 1, 2015 to August 31, 2015.
Actual Expenses
The information in the table under the heading “Actual Performance” provides information about actual account values and actual expenses. You may use the information in this column, together with the amount you invested, to estimate the expenses that you paid over the period. Simply divide your account value by $1,000 (for example, an $8,600 account value divided by $1,000 = 8.6), then multiply the result by the number in the first column in the row entitled “Expenses Paid During Period” to estimate the expenses you paid on your account during this period.
Hypothetical Example for Comparison Purposes
The information in the table under the heading “Hypothetical Performance (5% return before expenses)” provides information about hypothetical account values and hypothetical expenses based on the Fund’s actual expense ratio and an assumed rate of return of 5% per year before expenses, which is not the Fund’s actual return. The hypothetical account values and expenses may not be used to estimate the actual ending account balance or expenses you paid for the period. You may use this information to compare the ongoing costs of investing in the Fund and other funds. To do so, compare this 5% hypothetical example with the 5% hypothetical examples that appear in the shareholder reports of other funds.
Please note that the expenses shown in the table are meant to highlight your ongoing costs only and do not reflect any transaction costs. Therefore, the information under the heading “Hypothetical Performance (5% return before expenses)” is useful in comparing ongoing costs only, and will not help you determine the relative total costs of owning different funds. In addition, if these transaction costs were included, your costs would have been higher.
| | | | | | | | | | | | |
Class N | | Annualized
Expense Ratio | | | Actual
Performance | | | Hypothetical
Performance
(5% return
before expenses) | |
Beginning Account Value March 1, 2015 | | | 0.99 | % | | $ | 1,000.00 | | | $ | 1,000.00 | |
Ending Account Value August 31, 2015 | | | | | | $ | 908.90 | | | $ | 1,020.21 | |
Expenses Paid During Period* | | | | | | $ | 4.76 | | | $ | 5.04 | |
Class A | | | | | | | | | |
Beginning Account Value March 1, 2015 | | | 1.20 | % | | $ | 1,000.00 | | | $ | 1,000.00 | |
Ending Account Value August 31, 2015 | | | | | | $ | 907.90 | | | $ | 1,019.15 | |
Expenses Paid During Period* | | | | | | $ | 5.77 | | | $ | 6.11 | |
Class C | | | | | | | | | |
Beginning Account Value March 1, 2015 | | | 1.95 | % | | $ | 1,000.00 | | | $ | 1,000.00 | |
Ending Account Value August 31, 2015 | | | | | | $ | 905.20 | | | $ | 1,015.37 | |
Expenses Paid During Period* | | | | | | $ | 9.36 | | | $ | 9.91 | |
Class I | | | | | | | | | |
Beginning Account Value March 1, 2015 | | | 0.95 | % | | $ | 1,000.00 | | | $ | 1,000.00 | |
Ending Account Value August 31, 2015 | | | | | | $ | 909.50 | | | $ | 1,020.41 | |
Expenses Paid During Period* | | | | | | $ | 4.57 | | | $ | 4.84 | |
Class K | | | | | | | | | |
Beginning Account Value March 1, 2015 | | | 0.75 | % | | $ | 1,000.00 | | | $ | 1,000.00 | |
Ending Account Value August 31, 2015 | | | | | | $ | 910.20 | | | $ | 1,021.42 | |
Expenses Paid During Period* | | | | | | $ | 3.61 | | | $ | 3.82 | |
| * | Expenses are equal to the Fund’s annualized expense ratio (representing the six month period annualized), multiplied by the average account value over the period, multiplied by 184/365 (to reflect the one-half year period). Includes amounts waived, reimbursed and/or other credits. Without the waiver, reimbursement and/or other credits, expenses would have been higher. |
| | | | |
| Clarion Real Estate Fund | | | 15 | |
SSGA Clarion Real Estate Fund
Schedule of Investments — August 31, 2015
| | | | | | | | |
| | | Principal
Amount ($)
or Shares | | | Value
$ | |
| | | | | | | | |
| Common Stocks - 100.1% | | | | | | | | |
Diversified REITs - 3.8% | | | | | | | | |
Liberty Property Trust | | | 7,300 | | | | 224,402 | |
Vornado Realty Trust | | | 17,338 | | | | 1,511,700 | |
| | | | | | | | |
| | | | | | | 1,736,102 | |
| | | | | | | | |
| | |
Health Care REITs - 0.0% (a) | | | | | | | | |
Care Capital Properties, Inc. (b) | | | 1 | | | | 16 | |
| | | | | | | | |
| | |
Industrial REITs - 6.3% | | | | | | | | |
DCT Industrial Trust, Inc. | | | 22,975 | | | | 737,727 | |
ProLogis | | | 57,224 | | | | 2,174,512 | |
| | | | | | | | |
| | | | | | | 2,912,239 | |
| | | | | | | | |
| | |
Office REITs - 20.0% | | | | | | | | |
Alexandria Real Estate Equities, Inc. (c) | | | 10,600 | | | | 911,494 | |
Boston Properties, Inc. | | | 17,255 | | | | 1,956,372 | |
Brandywine Realty Trust | | | 21,800 | | | | 264,216 | |
Digital Realty Trust, Inc. (c) | | | 15,722 | | | | 995,517 | |
Douglas Emmett, Inc. | | | 17,923 | | | | 495,213 | |
Duke Realty Corp. | | | 39,908 | | | | 720,738 | |
Highwoods Properties, Inc. (c) | | | 13,200 | | | | 500,808 | |
Kilroy Realty Corp. (c) | | | 15,100 | | | | 979,386 | |
Paramount Group, Inc. | | | 25,100 | | | | 412,644 | |
QTS Realty Trust, Inc.
(Class A) (c) | | | 11,713 | | | | 470,745 | |
SL Green Realty Corp. | | | 14,398 | | | | 1,490,337 | |
| | | | | | | | |
| | | | | | | 9,197,470 | |
| | | | | | | | |
|
Real Estate Operating Companies - 0.5% | |
Forest City Enterprises, Inc. (Class A) (b) | | | 10,900 | | | | 234,677 | |
| | | | | | | | |
| | |
Residential REITs - 21.6% | | | | | | | | |
American Residential Properties, Inc. (c) | | | 11,300 | | | | 191,535 | |
AvalonBay Communities, Inc. | | | 13,208 | | | | 2,180,112 | |
Equity Residential | | | 51,139 | | | | 3,643,654 | |
Essex Property Trust, Inc. (c) | | | 6,737 | | | | 1,445,895 | |
Post Properties, Inc. | | | 10,000 | | | | 553,600 | |
Sun Communities, Inc. (c) | | | 6,900 | | | | 449,949 | |
UDR, Inc. (c) | | | 44,662 | | | | 1,442,583 | |
| | | | | | | | |
| | | | | | | 9,907,328 | |
| | | | | | | | |
| | |
Retail REITs - 26.2% | | | | | | | | |
DDR Corp. | | | 53,900 | | | | 824,131 | |
General Growth Properties, Inc. | | | 95,600 | | | | 2,426,328 | |
Kimco Realty Corp. (c) | | | 45,529 | | | | 1,049,444 | |
Kite Realty Group Trust | | | 15,300 | | | | 359,703 | |
Macerich Co. | | | 6,780 | | | | 516,500 | |
Pennsylvania Real Estate Investment Trust (c) | | | 18,700 | | | | 371,008 | |
Ramco-Gershenson Properties Trust (c) | | | 26,800 | | | | 415,400 | |
Regency Centers Corp. | | | 14,900 | | | | 883,719 | |
| | | | | | | | |
| | | Principal
Amount ($)
or Shares | | | Value
$ | |
Simon Property Group, Inc. | | | 29,125 | | | | 5,222,695 | |
| | | | | | | | |
| | | | | | | 12,068,928 | |
| | | | | | | | |
| | |
Specialized REITs - 21.7% | | | | | | | | |
CubeSmart (c) | | | 32,100 | | | | 811,809 | |
Equinix, Inc. (c) | | | 800 | | | | 215,816 | |
Health Care REIT, Inc. | | | 37,095 | | | | 2,349,968 | |
Healthcare Realty Trust, Inc. | | | 24,226 | | | | 554,776 | |
Host Hotels & Resorts, Inc. (c) | | | 91,052 | | | | 1,614,352 | |
Pebblebrook Hotel Trust (c) | | | 10,100 | | | | 384,406 | |
Public Storage | | | 11,741 | | | | 2,363,111 | |
RLJ Lodging Trust | | | 13,900 | | | | 382,806 | |
Strategic Hotels & Resorts, Inc. (b)(c) | | | 55,100 | | | | 743,299 | |
Sunstone Hotel Investors, Inc. | | | 41,386 | | | | 572,368 | |
| | | | | | | | |
| | | | | | | 9,992,711 | |
| | | | | | | | |
| |
Total Common Stocks
(cost $33,504,257) | | | | 46,049,471 | |
| | | | | | | | |
|
| Short-Term Investments - 10.1% | |
SSGA Prime Money Market Fund
0.24% (d)(e) | | | 203,411 | | | | 203,411 | |
State Street Navigator Securities Lending Prime Portfolio (e)(f) | | | 4,470,984 | | | | 4,470,984 | |
| | | | | | | | |
| |
Total Short-Term Investments
(cost $4,674,395) | | | | 4,674,395 | |
| | | | | | | | |
| |
Total Investments - 110.2%
(cost $38,178,652) | | | | 50,723,866 | |
| |
Other Assets and Liabilities,
Net - (10.2)% | | | | (4,706,858 | ) |
| | | | | | | | |
| | |
| Net Assets - 100.0% | | | | | | | 46,017,008 | |
| | | | | | | | |
Footnotes:
| (a) | Less than 0.05% of net assets |
| (b) | Non-income producing security |
| (c) | All or a portion of the shares of this security are on loan. |
| (d) | The rate shown is the annualized seven-day yield at period end. |
| (e) | Affiliated Fund managed by SSGA Funds Management, Inc. (Note 4). |
| (f) | Investments of cash collateral for securities loaned |
Abbreviation:
REIT - Real Estate Investment Trust
See accompanying notes which are an integral part of the financial statements.
| | |
| 16 | | Clarion Real Estate Fund |
SSGA Clarion Real Estate Fund
Schedule of Investments, continued
Presentation of Portfolio Holdings — August 31, 2015
| | | | | | | | | | | | | | | | | | | | |
| | | Value* | | | % of
Net
Assets | |
| Categories | | Level 1 | | | Level 2 | | | Level 3 | | | Total | | |
Common Stocks | | | | | | | | | | | | | | | | | | | | |
Diversified REITs | | $ | 1,736,102 | | | $ | — | | | $ | — | | | $ | 1,736,102 | | | | 3.8 | |
Health Care REITs | | | 16 | | | | — | | | | — | | | | 16 | | | | 0.0 | |
Industrial REITs | | | 2,912,239 | �� | | | — | | | | — | | | | 2,912,239 | | | | 6.3 | |
Office REITs | | | 9,197,470 | | | | — | | | | — | | | | 9,197,470 | | | | 20.0 | |
Real Estate Operating Companies | | | 234,677 | | | | — | | | | — | | | | 234,677 | | | | 0.5 | |
Residential REITs | | | 9,907,328 | | | | — | | | | — | | | | 9,907,328 | | | | 21.6 | |
Retail REITs | | | 12,068,928 | | | | — | | | | — | | | | 12,068,928 | | | | 26.2 | |
Specialized REITs | | | 9,992,711 | | | | — | | | | — | | | | 9,992,711 | | | | 21.7 | |
Short-Term Investments | | | 4,674,395 | | | | — | | | | — | | | | 4,674,395 | | | | 10.1 | |
| | | | | | | | | | | | | | | | | | | | |
Total Investments | | $ | 50,723,866 | | | $ | — | | | $ | — | | | $ | 50,723,866 | | | | 110.2 | |
| | | | | | | | | | | | | | | | | | | | |
Other Assets and Liabilities, Net | | | | | | | | | | | | | | | | | | | (10.2 | ) |
| | | | | | | | | | | | | | | | | | | | |
| | | | | | | | | | | | | | | | | | | 100.0 | |
| | | | | | | | | | | | | | | | | | | | |
| * | For a description of the levels, see Note 2 in the Notes to Financial Statements. During the year ended August 31, 2015, there were no material transfers between levels. The transfers that did occur were the result of fair value pricing using significant observable inputs. |
See accompanying notes which are an integral part of the financial statements.
| | | | |
| Clarion Real Estate Fund | | | 17 | |
SSGA Enhanced Small Cap Fund
Portfolio Management Discussion and Analysis — August 31, 2015 (Unaudited)
Objective: The Fund seeks to maximize total return through investment primarily in small capitalization equity securities.
Invests in: At least 80% of total assets will be invested in small capitalization equity securities, such as common stocks, issued by companies with a market capitalization less than or equal to the largest capitalization stock in the Russell 2000® Index.
Strategy: The Fund attempts to create a portfolio with similar characteristics to the benchmark with potential to provide excess returns by allowing the Fund to hold a portion, but not all of the securities in the Russell 2000 Index.

The growth of $10,000 is cumulative. The performance of other shares classes will vary based on the sales charges and the fee structure of those classes.
Index returns do not reflect any fees or expenses and it is not possible to invest directly into an index.
| * | Assumes initial investment on September 1, 2005. |
| † | The Russell 2000 Index measures the performance of the small-cap segment of the U.S. equity universe. The Russell 2000 Index is a subset of the Russell 3000® Index representing approximately 10% of the total market capitalization of that index. It includes approximately 2,000 of the smallest securities based on a combination of their market cap and current index membership. |
See related Notes on following page.
| | |
| 18 | | Enhanced Small Cap Fund |
SSGA Enhanced Small Cap Fund
Portfolio Management Discussion and Analysis, continued — August 31, 2015 (Unaudited)
Performance Summary
Average Annual Total Returns as of 8/31/2015
| | | | | | | | | | | | |
| Class N | | 1 Year | | | 5 Year | | | 10 Year | |
Unadjusted for Sales Charge | | | 1.74 | % | | | 17.97 | % | | | 6.80 | % |
Russell 2000 Index† | | | 0.03 | % | | | 15.55 | % | | | 7.12 | % |
| Class A | | 1 Year | | | 5 Year | | | 10 Year | |
Unadjusted for Sales Charge | | | 1.51 | % | | | 17.72 | % | | | 6.58 | % |
Adjusted for the Maximum Sale Charge (Max 5.25% load) | | | -3.83 | % | | | 16.46 | % | | | 6.01 | % |
Russell 2000 Index† | | | 0.03 | % | | | 15.55 | % | | | 7.12 | % |
| Class C | | 1 Year | �� | | 5 Year | | | 10 Year | |
Unadjusted for Sales Charge | | | 0.70 | % | | | 16.86 | % | | | 5.78 | % |
Adjusted for the Maximum Sale Charge (Max 1.00% CDSC) | | | -0.16 | % | | | 16.86 | % | | | 5.78 | % |
Russell 2000 Index† | | | 0.03 | % | | | 15.55 | % | | | 7.12 | % |
| Class I | | 1 Year | | | 5 Year | | | 10 Year | |
Unadjusted for Sales Charge | | | 1.76 | % | | | 17.97 | % | | | 6.80 | % |
Russell 2000 Index† | | | 0.03 | % | | | 15.55 | % | | | 7.12 | % |
| Class K | | 1 Year | | | 5 Year | | | 10 Year | |
Unadjusted for Sales Charge | | | 1.93 | % | | | 18.02 | % | | | 6.82 | % |
Russell 2000 Index† | | | 0.03 | % | | | 15.55 | % | | | 7.12 | % |
The maximum sales charge for Class A shares is 5.25%. A contingent deferred sales charge (“CDSC”) of 1.00% may be assessed on redemptions of Class A shares made within 18 months after purchase where no initial sales charge was paid at the time of purchase as part of an investment of $1,000,000 or more. There is no CDSC on Class C shares redeemed more than one year after purchase. A 1.00% CDSC may be assessed on redemptions of Class C shares during the first year only. Class N, Class I, and Class K are not subject to a sales charge.
Adjusted Performance shown for the periods prior to the inception of Classes A and C shares on July 7, 2014 reflect the historical performance of the Fund’s Class N shares adjusted to reflect the higher expenses of Classes A and C shares, estimated for their first year of operations, including applicable 12b-1 fees and the maximum sales load of Classes A and C. Unadjusted Performance shown for the periods prior to the inception of Classes A and C shares on July 7, 2014 reflects the historical performance of the Fund’s Class N shares adjusted to reflect the higher expenses of Classes A and C shares, estimated for their first year of operations, including applicable 12b-1 fees. Unadjusted returns do not reflect sales charges and would have been lower if they had. Performance shown for the periods prior to the inception of Class I and K shares on July 7, 2014, reflect the historical performance of the Fund’s Class N shares. Had the Fund’s Class I and K fees been reflected, the returns shown for those periods would have been higher.
Performance quoted represents past performance, which is no guarantee of future results. Investment return and principal value will fluctuate, so you may have a gain or loss when shares are sold. Current performance may be higher or lower than that quoted. Visit www.ssgafunds.com for most recent month-end performance. The returns do not reflect the deduction of taxes that a shareholder would pay on Fund distributions or on the redemption of Fund shares. Performance includes reinvestment of all distributions. The gross expense ratio for the Enhanced Small Cap Fund as stated in the Fees and Expenses table of the prospectus dated December 18, 2014 is 1.44%, 1.64%, 2.39%, 1.39% and 1.19% for Class N, A, C, I and K, respectively, and may differ from the expense ratios disclosed in the Financial Highlights tables in this report.
| † | The Russell 2000 Index measures the performance of the small-cap segment of the U.S. equity universe. The Russell 2000 Index is a subset of the Russell 3000® Index representing approximately 10% of the total market capitalization of that index. It includes approximately 2,000 of the smallest securities based on a combination of their market cap and current index membership. |
Performance data reflects an expense limitation currently in effect, without which returns would have been lower.
| | | | |
| Enhanced Small Cap Fund | | | 19 | |
SSGA Enhanced Small Cap Fund
Management’s Discussion of Fund Performance, continued — August 31, 2015 (Unaudited)
SSGA Enhanced Small Cap Fund (the “Fund”) seeks to maximize total return through investment primarily in small capitalization equity securities. The Fund’s benchmark is the Russell 2000® Index (the “Index”).
For the 12-month period ended August 31, 2015 (the “Reporting Period”), the total return for Class N shares of the Fund was 1.74%, and the total return for the Index was 0.03%. The Fund and Index returns reflect the reinvestment of dividends and other income. The Fund’s performance reflects the expenses of managing the Fund, including brokerage and advisory expenses. The Index is unmanaged and Index returns do not reflect fees and expenses of any kind, which would have a negative impact on returns.
At the start of the period, the most defensive sectors in the U.S. small cap universe, such as consumer staples, and healthcare, outperformed riskier, more cyclical sectors such as materials, industrials, and energy. This theme persisted throughout most of the Fund’s fiscal year, and against this backdrop the Fund’s diversified stock selection model performed well.
Over the entire reporting period, trending-based, growth and quality oriented stock selection methods proved to be especially effective, as investors shunned the cheapest stocks in favor of relatively more expensive, safer, and less volatile names. The model’s short-interest factor, which favors stocks with low levels of shorting activity, was the model’s most successful factor over the entire reporting period, while valuation was generally the least successful.
As 2015 began, our balanced view of fundamentals paid off, as most components of the model proved to be effective at stock selection. However, the model underperformed during 2015’s second quarter, even though valuation strategies posted one of their strongest months of performance in April as relatively cheap and low quality energy stocks rallied on the back of a surge in oil prices. However, it was short-lived as valuation strongly reversed in May over continuing concerns on economic growth and global market uncertainty. Ultimately valuation was the most significant performance detractor of the second quarter and towards the end of the second and beginning of the third quarter, the familiar defensive themes of quality and growth were back in vogue. Finally, in August valuation-based stock selection themes staged another comeback and the Fund’s diversified factor model, including familiar quality themes, added significant value in the final month of the fiscal year.
The views expressed above reflect those of the Fund’s portfolio manager only through the Reporting Period, and do not necessarily represent the views of the Adviser as a whole. Any such views are subject to change at any time based upon market or other conditions and the Adviser disclaims any responsibility to update such views. These views may not be relied on as investment advice and, because investment decisions for a fund are based on numerous factors, may not be relied on as an indication of trading intent on behalf of any fund.
| | |
| 20 | | Enhanced Small Cap Fund |
SSGA Enhanced Small Cap Fund
Shareholder Expense Example — August 31, 2015 (Unaudited)
Fund Expenses
The following disclosure provides important information regarding the Fund’s Expense Example, which appears on the Fund’s individual page in this Annual Report. Please refer to this information when reviewing the Expense Example for a Fund.
Example
As a shareholder of the Fund, you incur two types of costs: (1) transaction costs, and (2) ongoing costs, including advisory and administration fees; distribution (12b-1) and/or service fees; and other Fund expenses. The Example is intended to help you understand your ongoing costs (in dollars) of investing in the Fund and to compare these costs with the ongoing costs of investing in other mutual funds. The Example is based on an investment of $1,000 invested at the beginning of the period and held for the entire period indicated, which for this Fund is from March 1, 2015 to August 31, 2015.
Actual Expenses
The information in the table under the heading “Actual Performance” provides information about actual account values and actual expenses. You may use the information in this column, together with the amount you invested, to estimate the expenses that you paid over the period. Simply divide your account value by $1,000 (for example, an $8,600 account value divided by $1,000 = 8.6), then multiply the result by the number in the first column in the row entitled “Expenses Paid During Period” to estimate the expenses you paid on your account during this period.
Hypothetical Example for Comparison Purposes
The information in the table under the heading “Hypothetical Performance (5% return before expenses)” provides information about hypothetical account values and hypothetical expenses based on the Fund’s actual expense ratio and an assumed rate of return of 5% per year before expenses, which is not the Fund’s actual return. The hypothetical account values and expenses may not be used to estimate the actual ending account balance or expenses you paid for the period. You may use this information to compare the ongoing costs of investing in the Fund and other funds. To do so, compare this 5% hypothetical example with the 5% hypothetical examples that appear in the shareholder reports of other funds.
Please note that the expenses shown in the table are meant to highlight your ongoing costs only and do not reflect any transaction costs. Therefore, the information under the heading “Hypothetical Performance (5% return before expenses)” is useful in comparing ongoing costs only, and will not help you determine the relative total costs of owning different funds. In addition, if these transaction costs were included, your costs would have been higher.
| | | | | | | | | | | | |
Class N | | Annualized
Expense Ratio | | | Actual
Performance | | | Hypothetical
Performance
(5% return
before expenses) | |
Beginning Account Value March 1, 2015 | | | 0.75 | % | | $ | 1,000.00 | | | $ | 1,000.00 | |
Ending Account Value August 31, 2015 | | | | | | $ | 948.80 | | | $ | 1,021.42 | |
Expenses Paid During Period* | | | | | | $ | 3.68 | | | $ | 3.82 | |
Class A | | | | | | | | | |
Beginning Account Value March 1, 2015 | | | 0.95 | % | | $ | 1,000.00 | | | $ | 1,000.00 | |
Ending Account Value August 31, 2015 | | | | | | $ | 947.40 | | | $ | 1,020.41 | |
Expenses Paid During Period* | | | | | | $ | 4.66 | | | $ | 4.84 | |
Class C | | | | | | | | | |
Beginning Account Value March 1, 2015 | | | 1.70 | % | | $ | 1,000.00 | | | $ | 1,000.00 | |
Ending Account Value August 31, 2015 | | | | | | $ | 943.50 | | | $ | 1,016.63 | |
Expenses Paid During Period* | | | | | | $ | 8.33 | | | $ | 8.64 | |
Class I | | | | | | | | | |
Beginning Account Value March 1, 2015 | | | 0.70 | % | | $ | 1,000.00 | | | $ | 1,000.00 | |
Ending Account Value August 31, 2015 | | | | | | $ | 948.80 | | | $ | 1,021.67 | |
Expenses Paid During Period* | | | | | | $ | 3.44 | | | $ | 3.57 | |
Class K | | | | | | | | | |
Beginning Account Value March 1, 2015 | | | 0.49 | % | | $ | 1,000.00 | | | $ | 1,000.00 | |
Ending Account Value August 31, 2015 | | | | | | $ | 949.40 | | | $ | 1,022.73 | |
Expenses Paid During Period* | | | | | | $ | 2.41 | | | $ | 2.50 | |
| * | Expenses are equal to the Fund’s annualized expense ratio (representing the six month period annualized), multiplied by the average account value over the period, multiplied by 184/365 (to reflect the one-half year period). Includes amounts waived, reimbursed and/or other credits. Without the waiver, reimbursement and/or other credits, expenses would have been higher. |
| | | | |
| Enhanced Small Cap Fund | | | 21 | |
SSGA Enhanced Small Cap Fund
Schedule of Investments — August 31, 2015
| | | | | | | | |
| | | Principal
Amount ($)
or Shares | | | Value
$ | |
| | | | | | | | |
| Common Stocks - 96.9% | |
Consumer Discretionary - 14.0% | |
American Axle & Manufacturing Holdings, Inc. (a) | | | 486 | | | | 9,817 | |
Apollo Education Group, Inc. (a) | | | 331 | | | | 3,677 | |
Ascena Retail Group, Inc. (a) | | | 1,583 | | | | 19,112 | |
Bloomin’ Brands, Inc. | | | 4,196 | | | | 86,857 | |
Bravo Brio Restaurant Group, Inc. (a) | | | 2,085 | | | | 26,584 | |
Build-A-Bear Workshop, Inc. (a) | | | 3,722 | | | | 72,951 | |
Caleres, Inc. | | | 5,449 | | | | 181,452 | |
Capella Education Co. | | | 1,890 | | | | 92,137 | |
Carmike Cinemas, Inc. (a) | | | 289 | | | | 6,893 | |
Carrols Restaurant Group, Inc. (a) | | | 759 | | | | 9,601 | |
Cato Corp. (Class A) | | | 3,267 | | | | 114,770 | |
Cherokee, Inc. (a) | | | 147 | | | | 3,769 | |
Chico’s FAS, Inc. | | | 9,903 | | | | 147,654 | |
Citi Trends, Inc. | | | 201 | | | | 5,308 | |
ClubCorp Holdings, Inc. | | | 329 | | | | 7,406 | |
Cooper Tire & Rubber Co. | | | 3,881 | | | | 149,807 | |
CSS Industries, Inc. | | | 184 | | | | 4,872 | |
Culp, Inc. | | | 3,694 | | | | 113,590 | |
Dana Holding Corp. | | | 8,502 | | | | 149,125 | |
Dave & Buster’s Entertainment, Inc. (a) | | | 4,381 | | | | 150,882 | |
Denny’s Corp. (a) | | | 13,396 | | | | 150,437 | |
Diamond Resorts International, Inc. (a) | | | 293 | | | | 7,439 | |
DineEquity, Inc. | | | 140 | | | | 13,370 | |
Entravision Communications Corp. (Class A) | | | 969 | | | | 7,800 | |
Eros International PLC (a) | �� | | 717 | | | | 23,747 | |
Express, Inc. (a) | | | 5,464 | | | | 111,466 | |
Finish Line, Inc. (Class A) | | | 2,632 | | | | 69,406 | |
Gerber Scientific, Inc. (a)(b) | | | 600 | | | | — | |
Grand Canyon Education, Inc. (a) | | | 3,529 | | | | 130,432 | |
Gray Television, Inc. (a) | | | 11,511 | | | | 133,412 | |
Guess?, Inc. | | | 240 | | | | 5,306 | |
Harte-Hanks, Inc. | | | 9,215 | | | | 35,478 | |
Haverty Furniture Cos., Inc. | | | 2,570 | | | | 59,393 | |
Helen of Troy, Ltd. (a) | | | 2,164 | | | | 184,243 | |
Hooker Furniture Corp. | | | 115 | | | | 2,744 | |
HSN, Inc. | | | 2,578 | | | | 156,768 | |
Iconix Brand Group, Inc. (a) | | | 448 | | | | 6,223 | |
Interval Leisure Group, Inc. | | | 487 | | | | 9,769 | |
Intrawest Resorts Holdings, Inc. (a) | | | 7,837 | | | | 70,455 | |
Isle of Capri Casinos, Inc. (a) | | | 3,719 | | | | 68,653 | |
Jack in the Box, Inc. | | | 2,255 | | | | 176,296 | |
K12, Inc. (a) | | | 6,725 | | | | 88,904 | |
Kirkland’s, Inc. | | | 5,520 | | | | 123,206 | |
La Quinta Holdings, Inc. (a) | | | 7,745 | | | | 145,993 | |
La-Z-Boy, Inc. | | | 6,417 | | | | 177,173 | |
Malibu Boats, Inc. (Class A) (a) | | | 8,378 | | | | 144,688 | |
Monarch Casino & Resort, Inc. (a) | | | 1,853 | | | | 32,520 | |
| | | | | | | | |
| | | Principal
Amount ($)
or Shares | | | Value
$ | |
Motorcar Parts of America, Inc. (a) | | | 129 | | | | 4,114 | |
National CineMedia, Inc. | | | 7,025 | | | | 92,379 | |
Nautilus, Inc. (a) | | | 720 | | | | 11,002 | |
New Media Investment Group, Inc. | | | 426 | | | | 6,356 | |
New York Times Co. (Class A) | | | 509 | | | | 6,189 | |
Nexstar Broadcasting Group, Inc. (Class A) | | | 134 | | | | 6,228 | |
Nutrisystem, Inc. | | | 1,025 | | | | 28,679 | |
Outerwall, Inc. | | | 62 | | | | 3,819 | |
Oxford Industries, Inc. | | | 282 | | | | 23,733 | |
Pinnacle Entertainment, Inc. (a) | | | 1,143 | | | | 43,171 | |
Reading International, Inc. (Class A) (a) | | | 318 | | | | 4,080 | |
Red Robin Gourmet Burgers, Inc. (a) | | | 92 | | | | 7,249 | |
Regis Corp. (a) | | | 609 | | | | 6,602 | |
Ruby Tuesday, Inc. (a) | | | 3,275 | | | | 21,550 | |
Ruth’s Hospitality Group, Inc. | | | 9,892 | | | | 159,063 | |
Scholastic Corp. | | | 105 | | | | 4,537 | |
Shoe Carnival, Inc. | | | 2,236 | | | | 57,912 | |
Smith & Wesson Holding Corp. (a) | | | 573 | | | | 10,360 | |
Stein Mart, Inc. | | | 5,966 | | | | 64,075 | |
Steiner Leisure, Ltd. (a) | | | 2,875 | | | | 183,051 | |
Steven Madden, Ltd. (a) | | | 87 | | | | 3,555 | |
Stoneridge, Inc. (a) | | | 6,138 | | | | 74,945 | |
Tenneco, Inc. (a) | | | 299 | | | | 14,068 | |
Tilly’s, Inc. (Class A) (a) | | | 6,366 | | | | 50,992 | |
Time, Inc. | | | 1,658 | | | | 34,437 | |
Tower International, Inc. (a) | | | 4,048 | | | | 98,974 | |
Townsquare Media, Inc. (Class A) (a) | | | 889 | | | | 10,215 | |
TRI Pointe Group, Inc. (a) | | | 2,772 | | | | 38,475 | |
Unifi, Inc. (a) | | | 925 | | | | 26,853 | |
Weight Watchers International, Inc. (a) | | | 512 | | | | 3,149 | |
Wolverine World Wide, Inc. | | | 706 | | | | 19,027 | |
| | | | | | | | |
| | | | | | | 4,610,424 | |
| | | | | | | | |
|
Consumer Staples - 2.9% | |
Andersons, Inc. | | | 269 | | | | 9,517 | |
Cal-Maine Foods, Inc. | | | 279 | | | | 14,820 | |
Central Garden & Pet Co. (Class A) (a) | | | 2,432 | | | | 30,765 | |
Darling International, Inc. (a) | | | 5,952 | | | | 76,424 | |
Dean Foods Co. | | | 6,378 | | | | 104,982 | |
Fresh Del Monte Produce, Inc. | | | 3,158 | | | | 125,025 | |
Fresh Market, Inc. (a) | | | 187 | | | | 4,026 | |
Ingles Markets, Inc. (Class A) | | | 1,102 | | | | 54,769 | |
J&J Snack Foods Corp. | | | 28 | | | | 3,191 | |
John B Sanfilippo & Son, Inc. | | | 146 | | | | 7,547 | |
Lancaster Colony Corp. | | | 220 | | | | 20,863 | |
Medifast, Inc. (a) | | | 2,522 | | | | 70,036 | |
Nutraceutical International Corp. (a) | | | 2,197 | | | | 53,255 | |
| | |
| 22 | | Enhanced Small Cap Fund |
SSGA Enhanced Small Cap Fund
Schedule of Investments, continued — August 31, 2015
| | | | | | | | |
| | | Principal
Amount ($)
or Shares | | | Value
$ | |
| | | | | | | | |
Omega Protein Corp. (a) | | | 261 | | | | 4,455 | |
PriceSmart, Inc. | | | 62 | | | | 5,271 | |
Sanderson Farms, Inc. | | | 977 | | | | 67,452 | |
Seaboard Corp. (a) | | | 22 | | | | 73,045 | |
SpartanNash Co. | | | 1,616 | | | | 45,733 | |
SUPERVALU, Inc. (a) | | | 21,299 | | | | 175,504 | |
Village Super Market, Inc. (Class A) | | | 796 | | | | 22,121 | |
Weis Markets, Inc. | | | 87 | | | | 3,536 | |
| | | | | | | | |
| | | | | | | 972,337 | |
| | | | | | | | |
|
Energy - 3.4% | |
Adams Resources & Energy, Inc. | | | 616 | | | | 28,096 | |
Alon USA Energy, Inc. | | | 7,446 | | | | 138,049 | |
Atwood Oceanics, Inc. | | | 294 | | | | 5,618 | |
Basic Energy Services, Inc. (a) | | | 1,112 | | | | 5,794 | |
Callon Petroleum Co. (a) | | | 9,268 | | | | 84,988 | |
Carrizo Oil & Gas, Inc. (a) | | | 922 | | | | 33,588 | |
DHT Holdings, Inc. | | | 1,009 | | | | 7,214 | |
Exterran Holdings, Inc. | | | 489 | | | | 10,915 | |
Fairmount Santrol Holdings, Inc. (a) | | | 894 | | | | 4,479 | |
Forum Energy Technologies, Inc. (a) | | | 8,138 | | | | 127,929 | |
Frontline, Ltd. (a) | | | 2,915 | | | | 7,754 | |
Gastar Exploration, Inc. (a) | | | 3,380 | | | | 5,577 | |
Matador Resources Co. (a) | | | 230 | | | | 5,269 | |
Matrix Service Co. (a) | | | 2,988 | | | | 59,760 | |
McDermott International, Inc. (a) | | | 1,339 | | | | 6,802 | |
Natural Gas Services Group, Inc. (a) | | | 406 | | | | 8,806 | |
Navios Maritime Acquisition Corp. | | | 15,207 | | | | 52,464 | |
Newpark Resources, Inc. (a) | | | 1,238 | | | | 9,075 | |
Northern Oil and Gas, Inc. (a) | | | 3,611 | | | | 21,774 | |
Oil States International, Inc. (a) | | | 1,617 | | | | 45,874 | |
Pacific Ethanol, Inc. (a) | | | 6,909 | | | | 48,916 | |
Parker Drilling Co. (a) | | | 18,599 | | | | 62,679 | |
Pioneer Energy Services Corp. (a) | | | 28,611 | | | | 94,702 | |
REX American Resources Corp. (a) | | | 1,177 | | | | 63,111 | |
W&T Offshore, Inc. | | | 2,036 | | | | 7,269 | |
Western Refining, Inc. | | | 4,320 | | | | 185,846 | |
| | | | | | | | |
| | | | | | | 1,132,348 | |
| | | | | | | | |
| | |
Financials - 23.6% | | | | | | | | |
1st Source Corp. | | | 309 | | | | 9,251 | |
AG Mortgage Investment Trust, Inc. (c) | | | 2,735 | | | | 45,210 | |
Alexander’s, Inc. (c) | | | 15 | | | | 5,445 | |
Altisource Portfolio Solutions SA (a) | | | 558 | | | | 15,016 | |
Altisource Residential Corp. (c) | | | 436 | | | | 6,658 | |
American Capital Mortgage Investment Corp. (c) | | | 9,216 | | | | 140,728 | |
Ameris Bancorp | | | 485 | | | | 13,226 | |
Anworth Mortgage Asset Corp. (c) | | | 29,932 | | | | 150,558 | |
Apollo Commercial Real Estate Finance, Inc. (c) | | | 8,905 | | | | 145,775 | |
| | | | | | | | |
| | | Principal
Amount ($)
or Shares | | | Value
$ | |
Apollo Residential Mortgage, Inc. (c) | | | 11,101 | | | | 154,970 | |
Ares Commercial Real Estate Corp. (c) | | | 1,597 | | | | 19,994 | |
Argo Group International Holdings, Ltd. | | | 1,836 | | | | 102,779 | |
Armada Hoffler Properties, Inc. (c) | | | 2,793 | | | | 27,874 | |
ARMOUR Residential REIT, Inc. (c) | | | 7,297 | | | | 155,937 | |
Ashford Hospitality Trust, Inc. (c) | | | 1,419 | | | | 10,983 | |
Banc of California, Inc. | | | 584 | | | | 7,236 | |
Banner Corp. | | | 165 | | | | 7,328 | |
BBCN Bancorp, Inc. | | | 4,974 | | | | 72,372 | |
Berkshire Hills Bancorp, Inc. | | | 5,883 | | | | 164,606 | |
BGC Partners, Inc. (Class A) | | | 19,607 | | | | 171,953 | |
BNC Bancorp | | | 850 | | | | 17,561 | |
Brookline Bancorp, Inc. | | | 450 | | | | 4,748 | |
Capitol Federal Financial, Inc. | | | 9,886 | | | | 119,126 | |
Capstead Mortgage Corp. (c) | | | 11,932 | | | | 124,331 | |
CatchMark Timber Trust, Inc. (Class A) (c) | | | 363 | | | | 3,655 | |
Cathay General Bancorp | | | 2,479 | | | | 73,453 | |
CenterState Banks, Inc. | | | 995 | | | | 13,751 | |
Central Pacific Financial Corp. | | | 1,386 | | | | 28,746 | |
Chatham Lodging Trust (c) | | | 137 | | | | 3,144 | |
Chemical Financial Corp. | | | 404 | | | | 12,904 | |
CNO Financial Group, Inc. (d) | | | 11,794 | | | | 210,995 | |
Colony Capital, Inc. (Class A) (c) | | | 6,862 | | | | 148,974 | |
Columbia Banking System, Inc. | | | 118 | | | | 3,577 | |
Cousins Properties, Inc. (c) | | | 7,019 | | | | 64,364 | |
Cowen Group, Inc. (Class A) (a) | | | 13,914 | | | | 73,605 | |
CubeSmart (c) | | | 229 | | | | 5,791 | |
Customers Bancorp, Inc. (a) | | | 165 | | | | 4,044 | |
CyrusOne, Inc. (c)(d) | | | 5,681 | | | | 179,860 | |
CYS Investments, Inc. (c) | | | 17,650 | | | | 137,847 | |
DiamondRock Hospitality Co. (c) | | | 1,107 | | | | 13,018 | |
Dynex Capital, Inc. (c) | | | 888 | | | | 5,950 | |
F.N.B. Corp. | | | 5,557 | | | | 69,796 | |
Federated National Holding Co. | | | 174 | | | | 3,812 | |
FelCor Lodging Trust, Inc. (c) | | | 13,863 | | | | 111,874 | |
Fidelity Southern Corp. | | | 207 | | | | 3,994 | |
Fifth Street Asset Management, Inc. | | | 793 | | | | 6,558 | |
First American Financial Corp. | | | 130 | | | | 5,052 | |
First Bancorp | | | 1,553 | | | | 26,432 | |
First Commonwealth Financial Corp. | | | 16,338 | | | | 144,591 | |
First Community Bancshares, Inc. | | | 1,435 | | | | 25,414 | |
First Defiance Financial Corp. | | | 1,128 | | | | 42,514 | |
First Financial Bancorp | | | 511 | | | | 9,423 | |
First Financial Corp. | | | 348 | | | | 11,446 | |
First Merchants Corp. | | | 1,098 | | | | 28,570 | |
First Midwest Bancorp, Inc. | | | 9,523 | | | | 167,986 | |
First NBC Bank Holding Co. (a) | | | 3,955 | | | | 138,425 | |
FirstMerit Corp. | | | 6,066 | | | | 108,945 | |
Flushing Financial Corp. | | | 2,873 | | | | 57,316 | |
Fulton Financial Corp. | | | 13,882 | | | | 168,805 | |
| | | | |
| Enhanced Small Cap Fund | | | 23 | |
SSGA Enhanced Small Cap Fund
Schedule of Investments, continued — August 31, 2015
| | | | | | | | |
| | | Principal
Amount ($)
or Shares | | | Value
$ | |
| | | | | | | | |
Gain Capital Holdings, Inc. | | | 3,065 | | | | 25,317 | |
German American Bancorp, Inc. | | | 422 | | | | 12,230 | |
Gramercy Property Trust, Inc. (c) | | | 133 | | | | 2,941 | |
Great Western Bancorp, Inc. | | | 6,304 | | | | 158,672 | |
Hancock Holding Co. | | | 465 | | | | 13,057 | |
Hanmi Financial Corp. | | | 148 | | | | 3,588 | |
Hatteras Financial Corp. (c) | | | 10,274 | | | | 166,747 | |
HCI Group, Inc. | | | 269 | | | | 10,693 | |
Heartland Financial USA, Inc. | | | 776 | | | | 28,223 | |
Heritage Financial Corp. | | | 758 | | | | 13,432 | |
Heritage Insurance Holdings, Inc. (a) | | | 1,145 | | | | 20,118 | |
Heritage Oaks Bancorp | | | 485 | | | | 3,768 | |
HFF, Inc. (Class A) | | | 3,871 | | | | 140,633 | |
Hilltop Holdings, Inc. (a) | | | 8,471 | | | | 174,926 | |
HomeStreet, Inc. (a) | | | 344 | | | | 7,657 | |
HomeTrust Bancshares, Inc. (a) | | | 275 | | | | 5,002 | |
Horace Mann Educators Corp. | | | 1,922 | | | | 63,849 | |
Horizon Bancorp | | | 183 | | | | 4,324 | |
Independent Bank Corp. | | | 349 | | | | 4,910 | |
International Bancshares Corp. | | | 804 | | | | 20,623 | |
Invesco Mortgage Capital, Inc. (c) | | | 13,159 | | | | 178,962 | |
James River Group Holdings, Ltd. | | | 1,309 | | | | 36,128 | |
KCG Holdings, Inc. (Class A) (a) | | | 2,514 | | | | 28,911 | |
Kite Realty Group Trust (c) | | | 217 | | | | 5,102 | |
Ladder Capital Corp. (c) | | | 2,052 | | | | 31,970 | |
Lakeland Bancorp, Inc. | | | 1,329 | | | | 14,699 | |
Mack-Cali Realty Corp. (c) | | | 377 | | | | 7,061 | |
Maiden Holdings, Ltd. | | | 5,068 | | | | 72,624 | |
MainSource Financial Group, Inc. | | | 1,925 | | | | 39,867 | |
Marcus & Millichap, Inc. (a) | | | 248 | | | | 10,530 | |
MB Financial, Inc. | | | 1,261 | | | | 41,537 | |
Medical Properties Trust, Inc. (c) | | | 291 | | | | 3,396 | |
Mercantile Bank Corp. | | | 424 | | | | 8,607 | |
Meta Financial Group, Inc. | | | 222 | | | | 9,639 | |
MGIC Investment Corp. (a)(d) | | | 19,516 | | | | 206,089 | |
MidWestOne Financial Group, Inc. | | | 240 | | | | 7,001 | |
Moelis & Co. (Class A) | | | 230 | | | | 6,274 | |
National General Holdings Corp. | | | 184 | | | | 3,373 | |
Nelnet, Inc. (Class A) | | | 2,326 | | | | 87,574 | |
New Residential Investment
Corp. (c)(d) | | | 13,956 | | | | 197,617 | |
New York Mortgage Trust, Inc. (c) | | | 508 | | | | 3,322 | |
NewBridge Bancorp | | | 1,012 | | | | 8,450 | |
OceanFirst Financial Corp. | | | 463 | | | | 8,528 | |
Old National Bancorp | | | 2,030 | | | | 28,014 | |
OM Asset Management PLC | | | 8,772 | | | | 144,913 | |
Orchid Island Capital, Inc. (c) | | | 463 | | | | 4,209 | |
Pacific Premier Bancorp, Inc. (a) | | | 450 | | | | 8,442 | |
Parkway Properties, Inc. (c) | | | 4,486 | | | | 71,058 | |
Patriot National, Inc. (a) | | | 214 | | | | 3,480 | |
PennyMac Mortgage Investment Trust (c) | | | 9,498 | | | | 143,135 | |
| | | | | | | | |
| | | Principal
Amount ($)
or Shares | | | Value
$ | |
Peoples Bancorp, Inc. | | | 476 | | | | 10,463 | |
PHH Corp. (a) | | | 4,038 | | | | 65,416 | |
Pinnacle Financial Partners, Inc. | | | 152 | | | | 7,208 | |
Piper Jaffray Cos. (a) | | | 731 | | | | 30,600 | |
Preferred Bank/Los Angeles CA | | | 1,345 | | | | 41,224 | |
PrivateBancorp, Inc. | | | 1,875 | | | | 70,969 | |
Provident Financial Services, Inc. | | | 2,503 | | | | 47,407 | |
QCR Holdings, Inc. | | | 131 | | | | 2,844 | |
RLJ Lodging Trust (c) | | | 4,591 | | | | 126,436 | |
Saul Centers, Inc. (c) | | | 894 | | | | 44,110 | |
Selective Insurance Group, Inc. | | | 3,054 | | | | 92,597 | |
Silver Bay Realty Trust Corp. (c) | | | 543 | | | | 8,503 | |
Simmons First National Corp. (Class A) | | | 920 | | | | 40,360 | |
Southwest Bancorp, Inc. | | | 3,320 | | | | 55,378 | |
State Bank Financial Corp. | | | 188 | | | | 3,798 | |
Stewart Information Services Corp. | | | 159 | | | | 6,160 | |
Strategic Hotels & Resorts, Inc. (a)(c) | | | 812 | | | | 10,954 | |
Summit Hotel Properties, Inc. (c) | | | 919 | | | | 11,147 | |
Sunstone Hotel Investors, Inc. (c) | | | 12,087 | | | | 167,163 | |
Third Point Reinsurance, Ltd. (a) | | | 2,736 | | | | 38,277 | |
Trico Bancshares | | | 193 | | | | 4,582 | |
Triumph Bancorp, Inc. (a) | | | 359 | | | | 5,195 | |
Umpqua Holdings Corp. (d) | | | 12,613 | | | | 210,763 | |
Union Bankshares Corp. | | | 2,419 | | | | 57,088 | |
United Community Banks, Inc. | | | 652 | | | | 12,760 | |
United Community Financial Corp. | | | 1,919 | | | | 9,576 | |
United Financial Bancorp, Inc. | | | 695 | | | | 8,722 | |
Universal Insurance Holdings, Inc. | | | 3,869 | | | | 95,294 | |
Univest Corp. of Pennsylvania | | | 528 | | | | 10,217 | |
Walker & Dunlop, Inc. (a) | | | 2,081 | | | | 50,631 | |
Webster Financial Corp. | | | 3,663 | | | | 129,597 | |
Western Alliance Bancorp (a) | | | 3,269 | | | | 99,770 | |
Western Asset Mortgage Capital Corp. (c) | | | 797 | | | | 10,186 | |
Wilshire Bancorp, Inc. | | | 9,967 | | | | 106,448 | |
| | | | | | | | |
| | | | | | | 7,801,361 | |
| | | | | | | | |
| | |
Health Care - 15.7% | | | | | | | | |
Adamas Pharmaceuticals, Inc. (a) | | | 705 | | | | 14,142 | |
Alder Biopharmaceuticals, Inc. (a) | | | 706 | | | | 27,358 | |
Alliance HealthCare Services, Inc. (a) | | | 1,088 | | | | 15,580 | |
AMAG Pharmaceuticals, Inc. (a) | | | 155 | | | | 9,694 | |
Amicus Therapeutics, Inc. (a) | | | 228 | | | | 3,279 | |
AmSurg Corp. (a) | | | 77 | | | | 6,038 | |
Anacor Pharmaceuticals, Inc. (a) | | | 1,275 | | | | 166,273 | |
Anika Therapeutics, Inc. (a) | | | 2,632 | | | | 93,199 | |
Anthera Pharmaceuticals, Inc. (a) | | | 866 | | | | 5,915 | |
ARIAD Pharmaceuticals, Inc. (a) | | | 17,307 | | | | 163,378 | |
Array BioPharma, Inc. (a) | | | 6,618 | | | | 39,046 | |
Atrion Corp. | | | 6 | | | | 2,322 | |
BioCryst Pharmaceuticals, Inc. (a) | | | 5,352 | | | | 62,297 | |
| | |
| 24 | | Enhanced Small Cap Fund |
SSGA Enhanced Small Cap Fund
Schedule of Investments, continued — August 31, 2015
| | | | | | | | |
| | | Principal
Amount ($)
or Shares | | | Value
$ | |
| | | | | | | | |
BioSpecifics Technologies Corp. (a) | | | 444 | | | | 22,049 | |
Cambrex Corp. (a) | | | 3,681 | | | | 175,989 | |
Cara Therapeutics, Inc. (a) | | | 1,293 | | | | 24,515 | |
Catalent, Inc. (a) | | | 5,747 | | | | 182,697 | |
Celldex Therapeutics, Inc. (a) | | | 311 | | | | 4,615 | |
Civitas Solutions, Inc. (a) | | | 1,720 | | | | 41,727 | |
CONMED Corp. | | | 494 | | | | 26,212 | |
Corvel Corp. (a) | | | 121 | | | | 3,634 | |
Cross Country Healthcare, Inc. (a) | | | 896 | | | | 12,445 | |
CTI BioPharma Corp. (a) | | | 2,604 | | | | 4,114 | |
Cynosure, Inc. (Class A) (a) | | | 1,657 | | | | 52,428 | |
Depomed, Inc. (a) | | | 173 | | | | 4,659 | |
Dyax Corp. (a) | | | 7,026 | | | | 161,739 | |
Eagle Pharmaceuticals, Inc. (a) | | | 704 | | | | 55,299 | |
Emergent Biosolutions, Inc. (a) | | | 4,950 | | | | 164,786 | |
Enanta Pharmaceuticals, Inc. (a) | | | 2,059 | | | | 80,383 | |
Ensign Group, Inc. | | | 3,372 | | | | 158,315 | |
Exelixis, Inc. (a) | | | 4,791 | | | | 28,506 | |
Five Prime Therapeutics, Inc. (a) | | | 391 | | | | 7,456 | |
Five Star Quality Care, Inc. (a) | | | 10,873 | | | | 36,751 | |
Geron Corp. (a) | | | 24,169 | | | | 73,232 | |
Globus Medical, Inc. (Class A) (a) | | | 198 | | | | 4,835 | |
Greatbatch, Inc. (a) | | | 1,520 | | | | 86,366 | |
Halozyme Therapeutics, Inc. (a) | | | 311 | | | | 5,430 | |
HealthSouth Corp. | | | 242 | | | | 10,333 | |
Heron Therapeutics, Inc. (a) | | | 240 | | | | 9,230 | |
ICU Medical, Inc. (a) | | | 85 | | | | 9,649 | |
ImmunoGen, Inc. (a) | | | 541 | | | | 7,282 | |
INC Research Holdings, Inc. (Class A) (a) | | | 2,996 | | | | 122,866 | |
Infinity Pharmaceuticals, Inc. (a) | | | 10,598 | | | | 93,474 | |
Inogen, Inc. (a) | | | 178 | | | | 8,774 | |
Insys Therapeutics, Inc. (a) | | | 205 | | | | 6,646 | |
Lannett Co., Inc. (a) | | | 571 | | | | 27,379 | |
LeMaitre Vascular, Inc. | | | 7,031 | | | | 92,950 | |
LHC Group, Inc. (a) | | | 123 | | | | 5,326 | |
Lion Biotechnologies, Inc. (a) | | | 856 | | | | 6,086 | |
MacroGenics, Inc. (a) | | | 4,620 | | | | 121,737 | |
Magellan Health, Inc. (a) | | | 2,976 | | | | 166,656 | |
MannKind Corp. (a) | | | 1,364 | | | | 5,170 | |
MedAssets, Inc. (a) | | | 5,092 | | | | 107,543 | |
Merge Healthcare, Inc. (a) | | | 10,089 | | | | 71,531 | |
Merit Medical Systems, Inc. (a) | | | 6,931 | | | | 157,680 | |
MiMedx Group, Inc. (a) | | | 623 | | | | 6,049 | |
Molina Healthcare, Inc. (a) | | | 2,378 | | | | 177,375 | |
Natus Medical, Inc. (a) | | | 327 | | | | 13,302 | |
Nektar Therapeutics (a) | | | 4,467 | | | | 49,360 | |
Neurocrine Biosciences, Inc. (a) | | | 4,102 | | | | 190,251 | |
NewLink Genetics Corp. (a) | | | 2,806 | | | | 126,018 | |
Novavax, Inc. (a) | | | 2,687 | | | | 28,939 | |
NuVasive, Inc. (a) | | | 2,590 | | | | 136,545 | |
Omnicell, Inc. (a) | | | 3,031 | | | | 102,993 | |
Oncothyreon, Inc. (a) | | | 17,540 | | | | 59,636 | |
Owens & Minor, Inc. | | | 106 | | | | 3,603 | |
| | | | | | | | |
| | | Principal
Amount ($)
or Shares | | | Value
$ | |
Pacira Pharmaceuticals, Inc. (a) | | | 758 | | | | 43,623 | |
PAREXEL International Corp. (a) | | | 627 | | | | 41,206 | |
PDL BioPharma, Inc. | | | 22,159 | | | | 125,198 | |
PharMerica Corp. (a) | | | 3,350 | | | | 109,612 | |
Phibro Animal Health Corp. (Class A) | | | 2,618 | | | | 92,415 | |
Prothena Corp. PLC (a) | | | 903 | | | | 51,950 | |
Quality Systems, Inc. | | | 579 | | | | 7,869 | |
Radius Health, Inc. (a) | | | 67 | | | | 4,078 | |
RadNet, Inc. (a) | | | 7,313 | | | | 44,902 | |
Repligen Corp. (a) | | | 107 | | | | 3,647 | |
Rigel Pharmaceuticals, Inc. (a) | | | 2,512 | | | | 7,536 | |
RTI Surgical, Inc. (a) | | | 1,977 | | | | 12,613 | |
Select Medical Holdings Corp. | | | 2,624 | | | | 33,850 | |
Sucampo Pharmaceuticals, Inc. (Class A) (a) | | | 1,777 | | | | 47,730 | |
Supernus Pharmaceuticals, Inc. (a) | | | 1,092 | | | | 19,820 | |
Surgical Care Affiliates, Inc. (a) | | | 2,089 | | | | 76,353 | |
SurModics, Inc. (a) | | | 2,471 | | | | 56,215 | |
Synergy Pharmaceuticals, Inc. (a) | | | 3,519 | | | | 24,633 | |
Threshold Pharmaceuticals, Inc. (a) | | | 1,418 | | | | 5,956 | |
Tobira Therapeutics, Inc. (a) | | | 417 | | | | 5,025 | |
Triple-S Management Corp. (Class B) (a) | | | 1,630 | | | | 34,295 | |
Ultragenyx Pharmaceutical, Inc. (a) | | | 240 | | | | 26,789 | |
WellCare Health Plans, Inc. (a) | | | 46 | | | | 4,171 | |
West Pharmaceutical Services, Inc. | | | 2,397 | | | | 133,873 | |
Xencor, Inc. (a) | | | 208 | | | | 3,488 | |
XenoPort, Inc. (a) | | | 3,513 | | | | 23,713 | |
Zeltiq Aesthetics, Inc. (a) | | | 4,774 | | | | 154,057 | |
ZIOPHARM Oncology, Inc. (a) | | | 3,243 | | | | 28,247 | |
Zogenix, Inc. (a) | | | 314 | | | | 6,035 | |
| | | | | | | | |
| | | | | | | 5,179,985 | |
| | | | | | | | |
| | |
Industrials - 12.6% | | | | | | | | |
ABM Industries, Inc. | | | 1,642 | | | | 52,560 | |
ACCO Brands Corp. (a) | | | 21,872 | | | | 166,227 | |
Accuride Corp. (a) | | | 1,046 | | | | 3,546 | |
Aegion Corp. (a) | | | 196 | | | | 3,606 | |
Aerojet Rocketdyne Holdings, Inc. (a) | | | 165 | | | | 3,394 | |
Air Transport Services Group, Inc. (a) | | | 4,844 | | | | 44,032 | |
Allied Motion Technologies, Inc. | | | 354 | | | | 6,733 | |
American Woodmark Corp. (a) | | | 2,189 | | | | 145,087 | |
Applied Industrial Technologies, Inc. | | | 815 | | | | 34,507 | |
ARC Document Solutions, Inc. (a) | | | 1,142 | | | | 7,583 | |
ArcBest Corp. | | | 922 | | | | 26,627 | |
Argan, Inc. | | | 2,167 | | | | 84,838 | |
Astronics Corp. (a) | | | 2,443 | | | | 126,205 | |
Barnes Group, Inc. | | | 3,235 | | | | 124,968 | |
Celadon Group, Inc. | | | 548 | | | | 10,461 | |
Chart Industries, Inc. (a) | | | 168 | | | | 4,294 | |
| | | | |
| Enhanced Small Cap Fund | | | 25 | |
SSGA Enhanced Small Cap Fund
Schedule of Investments, continued — August 31, 2015
| | | | | | | | |
| | | Principal
Amount ($)
or Shares | | | Value
$ | |
| | | | | | | | |
Columbus McKinnon Corp. | | | 300 | | | | 5,703 | |
Comfort Systems USA, Inc. | | | 3,119 | | | | 86,459 | |
Continental Building Products, Inc. (a) | | | 7,468 | | | | 149,285 | |
Covenant Transportation Group, Inc. (Class A) (a) | | | 291 | | | | 6,865 | |
Cubic Corp. | | | 3,413 | | | | 143,756 | |
Curtiss-Wright Corp. | | | 2,955 | | | | 194,173 | |
Deluxe Corp. | | | 194 | | | | 11,254 | |
DXP Enterprises, Inc. (a) | | | 153 | | | | 4,552 | |
Dycom Industries, Inc. (a) | | | 1,016 | | | | 72,227 | |
EMCOR Group, Inc. | | | 2,788 | | | | 128,499 | |
EnerSys | | | 2,307 | | | | 123,355 | |
Ennis, Inc. | | | 5,119 | | | | 83,593 | |
Federal Signal Corp. | | | 10,405 | | | | 147,231 | |
General Cable Corp. | | | 1,709 | | | | 24,866 | |
Global Brass & Copper Holdings, Inc. | | | 6,318 | | | | 124,086 | |
H&E Equipment Services, Inc. | | | 316 | | | | 6,544 | |
Herman Miller, Inc. | | | 1,686 | | | | 45,707 | |
Hillenbrand, Inc. | | | 5,094 | | | | 137,334 | |
Hurco Cos., Inc. | | | 1,001 | | | | 30,871 | |
Hyster-Yale Materials Handling, Inc. | | | 86 | | | | 5,225 | |
Insperity, Inc. | | | 153 | | | | 6,792 | |
Interface, Inc. | | | 6,808 | | | | 165,026 | |
Kadant, Inc. | | | 2,798 | | | | 124,483 | |
Kforce, Inc. | | | 4,877 | | | | 130,655 | |
Knoll, Inc. | | | 152 | | | | 3,636 | |
Korn/Ferry International | | | 2,976 | | | | 101,392 | |
Lydall, Inc. (a) | | | 2,983 | | | | 81,018 | |
Marten Transport, Ltd. | | | 2,082 | | | | 38,538 | |
Matson, Inc. | | | 4,284 | | | | 161,421 | |
Meritor, Inc. (a) | | | 13,171 | | | | 166,613 | |
Moog, Inc. (Class A) (a) | | | 165 | | | | 10,412 | |
MRC Global, Inc. (a) | | | 204 | | | | 2,650 | |
Mueller Industries, Inc. | | | 226 | | | | 7,189 | |
Mueller Water Products, Inc. (Class A) | | | 1,302 | | | | 11,653 | |
MYR Group, Inc. (a) | | | 720 | | | | 20,657 | |
Navigant Consulting, Inc. (a) | | | 722 | | | | 11,400 | |
PAM Transportation Services, Inc. (a) | | | 2,601 | | | | 100,477 | |
Patrick Industries, Inc. (a) | | | 1,344 | | | | 50,790 | |
Quanex Building Products Corp. | | | 203 | | | | 3,644 | |
Resources Connection, Inc. | | | 9,058 | | | | 142,120 | |
RPX Corp. (a) | | | 9,461 | | | | 130,278 | |
Saia, Inc. (a) | | | 220 | | | | 8,261 | |
SkyWest, Inc. | | | 1,587 | | | | 25,233 | |
SP Plus Corp. (a) | | | 343 | | | | 7,879 | |
Steelcase, Inc. (Class A) | | | 435 | | | | 7,669 | |
Swift Transportation Co. (a) | | | 2,052 | | | | 39,994 | |
TRC Cos., Inc. (a) | | | 1,106 | | | | 9,866 | |
TrueBlue, Inc. (a) | | | 2,464 | | | | 59,136 | |
| | | | | | | | |
| | | Principal
Amount ($)
or Shares | | | Value
$ | |
Universal Forest Products, Inc. | | | 441 | | | | 26,486 | |
USA Truck, Inc. (a) | | | 1,450 | | | | 28,638 | |
Viad Corp. | | | 1,803 | | | | 49,294 | |
Wabash National Corp. (a) | | | 908 | | | | 11,105 | |
Werner Enterprises, Inc. | | | 283 | | | | 7,497 | |
West Corp. | | | 412 | | | | 10,028 | |
YRC Worldwide, Inc. (a) | | | 582 | | | | 9,725 | |
| | | | | | | | |
| | | | | | | 4,147,908 | |
| | | | | | | | |
| |
Information Technology - 16.4% | | | | | |
ACI Worldwide, Inc. (a) | | | 163 | | | | 3,477 | |
Acxiom Corp. (a) | | | 325 | | | | 6,812 | |
Advanced Energy Industries, Inc. (a) | | | 264 | | | | 6,407 | |
Amkor Technology, Inc. (a) | | | 5,617 | | | | 30,332 | |
Aspen Technology, Inc. (a) | | | 4,893 | | | | 185,298 | |
AVG Technologies NV (a) | | | 1,366 | | | | 31,596 | |
Barracuda Networks, Inc. (a) | | | 605 | | | | 15,905 | |
Benchmark Electronics, Inc. (a) | | | 7,744 | | | | 165,489 | |
Black Box Corp. | | | 1,870 | | | | 28,798 | |
Blucora, Inc. (a) | | | 3,771 | | | | 52,643 | |
Cabot Microelectronics Corp. (a) | | | 3,570 | | | | 154,867 | |
Callidus Software, Inc. (a) | | | 787 | | | | 12,411 | |
Cascade Microtech, Inc. (a) | | | 512 | | | | 7,895 | |
Ciena Corp. (a) | | | 319 | | | | 7,133 | |
Cohu, Inc. | | | 3,835 | | | | 37,199 | |
Comtech Telecommunications Corp. | | | 2,716 | | | | 72,463 | |
Constant Contact, Inc. (a) | | | 2,251 | | | | 55,735 | |
Convergys Corp. | | | 2,852 | | | | 64,455 | |
CTS Corp. | | | 1,498 | | | | 28,237 | |
DHI Group, Inc. (a) | | | 17,167 | | | | 133,903 | |
Diodes, Inc. (a) | | | 4,003 | | | | 78,819 | |
EarthLink Holdings Corp. | | | 18,363 | | | | 154,066 | |
Entegris, Inc. (a) | | | 263 | | | | 3,611 | |
ePlus, Inc. (a) | | | 2,035 | | | | 154,090 | |
Euronet Worldwide, Inc. (a) | | | 910 | | | | 58,668 | |
ExlService Holdings, Inc. (a) | | | 105 | | | | 3,799 | |
Formfactor, Inc. (a) | | | 11,784 | | | | 78,364 | |
Gigamon, Inc. (a) | | | 3,000 | | | | 68,340 | |
Globant SA (a) | | | 236 | | | | 6,419 | |
GrubHub, Inc. (a) | | | 109 | | | | 2,883 | |
Hackett Group, Inc. | | | 1,589 | | | | 22,389 | |
Harmonic, Inc. (a) | | | 20,968 | | | | 120,985 | |
Imperva, Inc. (a) | | | 237 | | | | 14,120 | |
Infinera Corp. (a) | | | 170 | | | | 3,709 | |
Insight Enterprises, Inc. (a) | | | 4,920 | | | | 124,525 | |
Integrated Device Technology, Inc. (a) | | | 790 | | | | 15,002 | |
Ixia (a) | | | 235 | | | | 3,635 | |
IXYS Corp. | | | 2,020 | | | | 23,816 | |
Jive Software, Inc. (a) | | | 1,615 | | | | 7,284 | |
Lionbridge Technologies, Inc. (a) | | | 3,894 | | | | 20,755 | |
| | |
| 26 | | Enhanced Small Cap Fund |
SSGA Enhanced Small Cap Fund
Schedule of Investments, continued — August 31, 2015
| | | | | | | | |
| | | Principal
Amount ($)
or Shares | | | Value
$ | |
| | | | | | | | |
Liquidity Services, Inc. (a) | | | 1,008 | | | | 7,560 | |
LogMeIn, Inc. (a) | | | 61 | | | | 3,803 | |
Manhattan Associates, Inc. (a)(d) | | | 3,680 | | | | 215,206 | |
Marchex, Inc. (Class B) | | | 5,922 | | | | 23,510 | |
Methode Electronics, Inc. | | | 3,968 | | | | 105,430 | |
Microsemi Corp. (a) | | | 4,912 | | | | 156,005 | |
MicroStrategy, Inc. (Class A) (a) | | | 851 | | | | 169,094 | |
Monotype Imaging Holdings, Inc. | | | 826 | | | | 17,495 | |
Monster Worldwide, Inc. (a) | | | 8,537 | | | | 62,064 | |
Multi-Fineline Electronix, Inc. (a) | | | 346 | | | | 5,526 | |
Netscout Systems, Inc. (a) | | | 221 | | | | 8,078 | |
NeuStar, Inc. (Class A) (a) | | | 131 | | | | 3,661 | |
Newport Corp. (a) | | | 4,537 | | | | 69,416 | |
OSI Systems, Inc. (a) | | | 2,506 | | | | 183,038 | |
PC Connection, Inc. | | | 930 | | | | 19,595 | |
Perficient, Inc. (a) | | | 8,073 | | | | 133,689 | |
Pericom Semiconductor Corp. | | | 7,776 | | | | 94,712 | |
Photronics, Inc. (a) | | | 2,031 | | | | 18,502 | |
Plantronics, Inc. | | | 428 | | | | 22,752 | |
Plexus Corp. (a) | | | 2,979 | | | | 113,411 | |
PMC - Sierra, Inc. (a) | | | 13,534 | | | | 85,129 | |
Polycom, Inc. (a) | | | 15,912 | | | | 171,213 | |
Progress Software Corp. (a) | | | 950 | | | | 25,735 | |
Proofpoint, Inc. (a) | | | 1,191 | | | | 67,101 | |
QAD, Inc. (Class A) | | | 3,089 | | | | 77,750 | |
QLogic Corp. (a) | | | 13,656 | | | | 141,203 | |
Rubicon Project, Inc. (a) | | | 1,700 | | | | 24,480 | |
Sanmina Corp. (a) | | | 6,178 | | | | 118,865 | |
Science Applications International Corp. | | | 3,483 | | | | 169,866 | |
ShoreTel, Inc. (a) | | | 7,820 | | | | 58,181 | |
Super Micro Computer, Inc. (a) | | | 148 | | | | 4,048 | |
Sykes Enterprises, Inc. (a) | | | 6,952 | | | | 174,843 | |
TeleCommunication Systems, Inc. (Class A) (a) | | | 1,397 | | | | 4,889 | |
TeleTech Holdings, Inc. | | | 142 | | | | 3,841 | |
Tessera Technologies, Inc. | | | 5,221 | | | | 170,936 | |
TiVo, Inc. (a) | | | 5,245 | | | | 47,729 | |
TTM Technologies, Inc. (a) | | | 785 | | | | 5,354 | |
Tyler Technologies, Inc. (a) | | | 112 | | | | 15,460 | |
United Online, Inc. (a) | | | 9,449 | | | | 102,900 | |
Verint Systems, Inc. (a) | | | 2,317 | | | | 123,566 | |
Web.com Group, Inc. (a) | | | 6,120 | | | | 131,764 | |
Xcerra Corp. (a) | | | 25,618 | | | | 160,369 | |
XO Group, Inc. (a) | | | 251 | | | | 3,677 | |
Zix Corp. (a) | | | 1,561 | | | | 6,837 | |
| | | | | | | | |
| | | | | | | 5,394,617 | |
| | | | | | | | |
| | |
Materials - 4.2% | | | | | | | | |
AEP Industries, Inc. (a) | | | 504 | | | | 27,443 | |
Berry Plastics Group, Inc. (a)(d) | | | 6,556 | | | | 194,058 | |
| | | | | | | | |
| | | Principal
Amount ($)
or Shares | | | Value
$ | |
Boise Cascade Co. (a) | | | 5,045 | | | | 163,710 | |
Calgon Carbon Corp. | | | 6,950 | | | | 113,007 | |
Century Aluminum Co. (a) | | | 1,687 | | | | 9,447 | |
Chase Corp. | | | 99 | | | | 3,911 | |
Commercial Metals Co. | | | 6,622 | | | | 103,965 | |
FutureFuel Corp. | | | 3,300 | | | | 33,264 | |
Globe Specialty Metals, Inc. | | | 4,845 | | | | 66,570 | |
Handy & Harman, Ltd. (a) | | | 1,021 | | | | 25,750 | |
Headwaters, Inc. (a) | | | 1,460 | | | | 29,463 | |
Innophos Holdings, Inc. | | | 2,139 | | | | 102,822 | |
Innospec, Inc. | | | 313 | | | | 15,368 | |
Intrepid Potash, Inc. (a) | | | 745 | | | | 5,893 | |
KapStone Paper and Packaging Corp. | | | 330 | | | | 7,191 | |
KMG Chemicals, Inc. | | | 360 | | | | 7,272 | |
Materion Corp. | | | 765 | | | | 23,684 | |
Minerals Technologies, Inc. | | | 256 | | | | 13,770 | |
OM Group, Inc. | | | 1,396 | | | | 46,766 | |
P.H. Glatfelter Co. | | | 3,553 | | | | 64,167 | |
Schweitzer-Mauduit International, Inc. | | | 2,487 | | | | 87,866 | |
Stepan Co. | | | 2,629 | | | | 118,384 | |
SunCoke Energy, Inc. | | | 8,011 | | | | 91,966 | |
Worthington Industries, Inc. | | | 612 | | | | 15,661 | |
| | | | | | | | |
| | | | | | | 1,371,398 | |
| | | | | | | | |
| |
Telecommunication Services - 1.2% | | | | | |
Cincinnati Bell, Inc. (a) | | | 14,641 | | | | 50,219 | |
IDT Corp. (Class B) | | | 1,385 | | | | 21,634 | |
Inteliquent, Inc. | | | 6,338 | | | | 116,112 | |
NTELOS Holdings Corp. (a) | | | 1,452 | | | | 13,315 | |
Shenandoah Telecommunications Co. | | | 140 | | | | 5,416 | |
Spok Holdings, Inc. | | | 1,762 | | | | 29,091 | |
Vonage Holdings Corp. (a) | | | 27,402 | | | | 152,081 | |
| | | | | | | | |
| | | | | | | 387,868 | |
| | | | | | | | |
Utilities - 2.9% | | | | | | | | |
Atlantic Power Corp. | | | 2,379 | | | | 5,591 | |
Avista Corp. | | | 3,614 | | | | 113,443 | |
Chesapeake Utilities Corp. | | | 760 | | | | 37,445 | |
Cleco Corp. | | | 2,416 | | | | 129,449 | |
Dynegy, Inc. (a) | | | 1,837 | | | | 47,303 | |
El Paso Electric Co. | | | 1,887 | | | | 66,800 | |
IDACORP, Inc. | | | 2,275 | | | | 135,067 | |
Laclede Group, Inc. | | | 668 | | | | 35,364 | |
MGE Energy, Inc. | | | 264 | | | | 10,153 | |
NRG Yield, Inc. (Class A) | | | 513 | | | | 8,070 | |
ONE Gas, Inc. | | | 81 | | | | 3,481 | |
PNM Resources, Inc. | | | 5,371 | | | | 137,551 | |
Portland General Electric Co. | | | 313 | | | | 10,811 | |
Southwest Gas Corp. | | | 3,483 | | | | 191,878 | |
| | | | |
| Enhanced Small Cap Fund | | | 27 | |
SSGA Enhanced Small Cap Fund
Schedule of Investments, continued — August 31, 2015
| | | | | | | | |
| | | Principal
Amount ($)
or Shares | | | Value
$ | |
Spark Energy, Inc. (Class A) | | | 336 | | | | 5,208 | |
Talen Energy Corp. (a) | | | 984 | | | | 14,022 | |
Unitil Corp. | | | 420 | | | | 15,125 | |
| | | | | | | | |
| | | | | | | 966,761 | |
| | | | | | | | |
| |
Total Common Stocks
(cost $28,505,753) | | | | 31,965,007 | |
| | | | | | | | |
| |
| Short-Term Investment - 3.0% | | | | | |
SSGA Prime Money Market Fund 0.24% (d)(e)(f)
(cost $992,460) | | | 992,460 | | | | 992,460 | |
| | | | | | | | |
| |
Total Investments - 99.9%
(cost $29,498,213) | | | | 32,957,467 | |
| | |
Other Assets and Liabilities,
Net - 0.1% | | | | | | | 26,103 | |
| | | | | | | | |
| |
| Net Assets - 100.0% | | | | 32,983,570 | |
| | | | | | | | |
Footnotes:
| (a) | Non-income producing security |
| (b) | Security is valued at fair value as determined in good faith by the Trust’s Oversight Committee in accordance with procedures approved by the Board of Trustees. Security value is determined based on Level 3 inputs. Represents $0 or 0.0% of net assets. (Note 2) |
| (c) | Real Estate Investment Trust (REIT) |
| (d) | All or a portion of the shares of these securities are held as collateral for futures contracts purchased by the Fund. |
| (e) | The rate shown is the annualized seven-day yield at period end. |
| (f) | Affiliated Fund managed by SSGA Funds Management, Inc. (Note 4). |
| | | | | | | | | | | | | | | | | | |
| Futures Contracts | | Number of
Contracts | | | Notional
Amount | | | Expiration
Date | | | Unrealized
Depreciation
$ | |
| | | | | | | | | | | | | | | | | | |
Long Positions | | | | | | | | | | | | | | | | | | |
Russell 2000 Mini Index Futures | | | 8 | | | USD | | | 926,000 | | | | 09/15 | | | | (55,687 | ) |
| | | | | | | | | | | | | | | | | | |
Total Unrealized Appreciation (Depreciation) on Open Futures Contracts | | | | | | | | | | | | | | | | | (55,687 | ) |
| | | | | | | | | | | | | | | | | | |
During the year ended August 31, 2015, average notional value related to futures contracts was $749,542 or 2.3% of net assets.
See accompanying notes which are an integral part of the financial statements.
| | |
| 28 | | Enhanced Small Cap Fund |
SSGA Enhanced Small Cap Fund
Schedule of Investments, continued
Presentation of Portfolio Holdings — August 31, 2015
| | | | | | | | | | | | | | | | | | | | |
| | | Value* | | | % of
Net
Assets | |
| Categories | | Level 1 | | | Level 2 | | | Level 3 | | | Total | | |
Common Stocks | | | | | | | | | | | | | | | | | | | | |
Consumer Discretionary | | $ | 4,610,424 | | | $ | — | | | $ | — | ** | | $ | 4,610,424 | | | | 14.0 | |
Consumer Staples | | | 972,337 | | | | — | | | | — | | | | 972,337 | | | | 2.9 | |
Energy | | | 1,132,348 | | | | — | | | | — | | | | 1,132,348 | | | | 3.4 | |
Financials | | | 7,801,361 | | | | — | | | | — | | | | 7,801,361 | | | | 23.6 | |
Health Care | | | 5,179,985 | | | | — | | | | — | | | | 5,179,985 | | | | 15.7 | |
Industrials | | | 4,147,908 | | | | — | | | | — | | | | 4,147,908 | | | | 12.6 | |
Information Technology | | | 5,394,617 | | | | — | | | | — | | | | 5,394,617 | | | | 16.4 | |
Materials | | | 1,371,398 | | | | — | | | | — | | | | 1,371,398 | | | | 4.2 | |
Telecommunication Services | | | 387,868 | | | | — | | | | — | | | | 387,868 | | | | 1.2 | |
Utilities | | | 966,761 | | | | — | | | | — | | | | 966,761 | | | | 2.9 | |
Short-Term Investment | | | 992,460 | | | | — | | | | — | | | | 992,460 | | | | 3.0 | |
| | | | | | | | | | | | | | | | | | | | |
Total Investments | | $ | 32,957,467 | | | $ | — | | | $ | — | | | $ | 32,957,467 | | | | 99.9 | |
| | | | | | | | | | | | | | | | | | | | |
Other Assets and Liabilities, Net | | | | | | | | | | | | | | | | | | | 0.1 | |
| | | | | | | | | | | | | | | | | | | | |
| | | | | | | | | | | | | | | | | | | 100.0 | |
| | | | | | | | | | | | | | | | | | | | |
Liabilities: | | | | | | | | | | | | | | | | | | | | |
Other Financial Instruments*** | | | | | | | | | | | | | | | | | | | | |
Future Contracts | | $ | (55,687 | ) | | $ | — | | | $ | — | | | $ | (55,687 | ) | | | (0.2 | ) |
| | | | | | | | | | | | | | | | | | | | |
Total Other Financial Instruments | | $ | (55,687 | ) | | $ | — | | | $ | — | | | $ | (55,687 | ) | | | (0.2 | ) |
| | | | | | | | | | | | | | | | | | | | |
| * | | For a description of the levels, see Note 2 in the Notes to Financial Statements. During the year ended August 31, 2015, there were no material transfers between levels. The transfers that did occur were the result of fair value pricing using significant observable inputs. |
| ** | | Fund held a level 3 security that was valued at $0 at August 31, 2015. |
| *** | | Other financial instruments reflected in the Schedule of Investments, such as futures, which are valued at the unrealized appreciation (depreciation) on the instruments. |
See accompanying notes which are an integral part of the financial statements.
| | | | |
| Enhanced Small Cap Fund | | | 29 | |
SSGA Emerging Markets Fund
Portfolio Management Discussion and Analysis — August 31, 2015 (Unaudited)
Objective: The Fund seeks to provide maximum total return, primarily through capital appreciation, by investing primarily in securities of foreign issuers.
Invests in: Equity securities of foreign issuers domiciled, or having a substantial portion of their business, in countries having a developing or emerging economy or securities market.
Strategy: The Fund invests in securities of issuers located in emerging market countries. The Fund’s management team will evaluate the countries’ economic and political climates with prospects for sustained macro and micro economic growth.
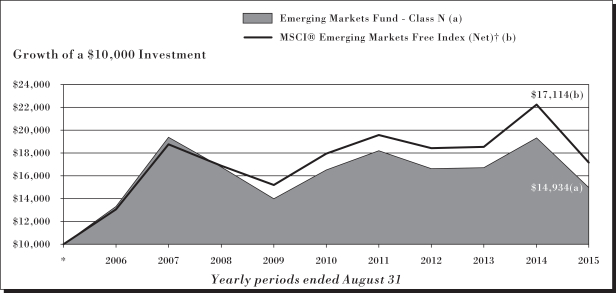
The growth of $10,000 is cumulative. The performance of other shares classes will vary based on the sales charges and the fee structure of those classes.
Index returns do not reflect any fees or expenses and it is not possible to invest directly into an index.
| * | Assumes initial investment on September 1, 2005. |
| † | The MSCI Emerging Markets Index is a free float-adjusted market capitalization index that is designed to measure equity market performance of emerging markets. The MSCI Emerging Markets Index consists of the following 23 emerging market country indices: Brazil, Chile, China, Colombia, Czech Republic, Egypt, Greece, Hungary, India, Indonesia, Korea, Malaysia, Mexico, Peru, Philippines, Poland, Qatar, Russia, South Africa, Taiwan, Thailand, Turkey and United Arab Emirates. |
See related Notes on following page.
SSGA Emerging Markets Fund
Portfolio Management Discussion and Analysis, continued — August 31, 2015 (unaudited)
Performance Summary
Average Annual Total Returns as of 8/31/2015
| | | | | | | | | | | | |
| Class N | | 1 Year | | | 5 Year | | | 10 Year | |
Unadjusted for Sales Charge | | | -22.67 | % | | | -1.97 | % | | | 4.09 | % |
MSCI Emerging Markets Free Index (Net)† | | | -22.95 | % | | | -0.92 | % | | | 5.52 | % |
| Select Class | | 1 Year | | | 5 Year | | | 10 Year | |
Unadjusted for Sales Charge | | | -22.40 | % | | | -1.73 | % | | | 4.32 | % |
MSCI Emerging Markets Free Index (Net)† | | | -22.95 | % | | | -0.92 | % | | | 5.52 | % |
| Class A | | 1 Year | | | 5 Year | | | 10 Year | |
Unadjusted for Sales Charge | | | -22.73 | % | | | -2.08 | % | | | 3.97 | % |
Adjusted for the Maximum Sale Charge (Max 5.25% load) | | | -26.77 | % | | | -3.12 | % | | | 3.41 | % |
MSCI Emerging Markets Free Index (Net)† | | | -22.95 | % | | | -0.92 | % | | | 5.52 | % |
| Class C | | 1 Year | | | 5 Year | | | 10 Year | |
Unadjusted for Sales Charge | | | -23.43 | % | | | -2.89 | % | | | 3.15 | % |
Adjusted for the Maximum Sale Charge (Max 1.00% CDSC) | | | -23.91 | % | | | -2.89 | % | | | 3.15 | % |
MSCI Emerging Markets Free Index (Net)† | | | -22.95 | % | | | -0.92 | % | | | 5.52 | % |
| Class I | | 1 Year | | | 5 Year | | | 10 Year | |
Unadjusted for Sales Charge | | | -22.56 | % | | | -1.93 | % | | | 4.11 | % |
MSCI Emerging Markets Free Index (Net)† | | | -22.95 | % | | | -0.92 | % | | | 5.52 | % |
| Class K | | 1 Year | | | 5 Year | | | 10 Year | |
Unadjusted for Sales Charge | | | -22.49 | % | | | -1.92 | % | | | 4.12 | % |
MSCI Emerging Markets Free Index (Net)† | | | -22.95 | % | | | -0.92 | % | | | 5.52 | % |
The maximum sales charge for Class A shares is 5.25%. A contingent deferred sales charge (“CDSC”) of 1.00% may be assessed on redemptions of Class A shares made within 18 months after purchase where no initial sales charge was paid at the time of purchase as part of an investment of $1,000,000 or more. There is no CDSC on Class C shares redeemed more than one year after purchase. A 1.00% CDSC may be assessed on redemptions of Class C shares during the first year only. Class N, Class I, and Class K are not subject to a sales charge.
Adjusted Performance shown for the periods prior to the inception of Classes A and C shares on July 7, 2014 reflect the historical performance of the Fund’s Class N shares adjusted to reflect the higher expenses of Classes A and C shares, estimated for their first year of operations, including applicable 12b-1 fees and the maximum sales load of Classes A and C. Unadjusted Performance shown for the periods prior to the inception of Classes A and C shares on July 7, 2014 reflects the historical performance of the Fund’s Class N shares adjusted to reflect the higher expenses of Classes A and C shares, estimated for their first year of operations, including applicable 12b-1 fees. Unadjusted returns do not reflect sales charges and would have been lower if they had. Performance shown for the periods prior to the inception of Select Class, Class I and K shares on July 7, 2014, reflect the historical performance of the Fund’s Class N shares. Had the Fund’s Select Class, Class I and K fees been reflected, the returns shown for those periods would have been higher.
Performance quoted represents past performance, which is no guarantee of future results. Investment return and principal value will fluctuate, so you may have a gain or loss when shares are sold. Current performance may be higher or lower than that quoted. Visit www.ssgafunds.com for most recent month-end performance. The returns do not reflect the deduction of taxes that a shareholder would pay on Fund distributions or on the redemption of Fund shares. Performance includes reinvestment of all distributions. The gross expense ratio for the Emerging Markets Fund as stated in the Fees and Expenses table of the prospectus dated December 18, 2014 is 1.33%, 1.11%, 1.53%, 2.28%, 1.28% and 1.08% for Class N, Select Class, A, C, I and K, respectively, and may differ from the expense ratios disclosed in the Financial Highlights tables in this report.
| † | The MSCI Emerging Markets Index is a free float-adjusted market capitalization index that is designed to measure equity market performance of emerging markets. The MSCI Emerging Markets Index consists of the following 21 emerging market country indices: Brazil, Chile, China, Colombia, Czech Republic, Egypt, Hungary, India, Indonesia, Korea, Malaysia, Mexico, Morocco, Peru, Philippines, Poland, Russia, South Africa, Taiwan, Thailand, and Turkey. |
Performance data reflects an expense limitation currently in effect, without which returns would have been lower.
SSGA Emerging Markets Fund
Management’s Discussion of Fund Performance, continued — August 31, 2015 (Unaudited)
SSGA Emerging Markets Fund (the “Fund”) seeks to provide maximum total return, primarily through capital appreciation, by investing primarily in securities of foreign issuers. The Fund is benchmarked to the MSCI Emerging Markets Index (the “Index”).
For the 12-month period ended August 31, 2015 (the “Reporting Period”), the total return for Class N shares of the Fund was -22.67%, and the total return for the Index was -22.95%. The Fund and Index returns reflect the reinvestment of dividends and other income. The Fund’s performance reflects the expenses of managing the Fund, including brokerage and advisory expenses. The Index is unmanaged and Index returns do not reflect fees and expenses of any kind, which would have a negative impact on returns.
The Fund uses a country selection and a stock selection model in its investment approach. For the Reporting Period, security selection as well as country allocation aided performance relative to the Index. At the level of individual stocks, the significant contributors to the Fund’s relative performance were overweight positions relative to the Index to China CNR Corporation (China), Britannia Industries (India), and BGF Retail (Korea). The largest contributor, China CNR Corporation, is in the manufacturing industry. The Beijing-based rail transport manufacturer widely outperformed the Index through the Reporting Period. This included returning 42% in 2015’s second quarter, as the company benefited from the announcement of government approval to merge with competitor CSR Corporation. Two of the Fund’s top three contributors were in consumer retail. BGF Retail’s notable contribution included returning more than 40% in the second quarter of 2015. The retail-store operator benefited from the release of strong first quarter 2015 financial results, including an operating profit increase of over 200%, related to its CVS chain stores. The Fund’s overweighting to Britannia Industries also contributed to performance relative to the Index, as the company’s performance was particularly strong in the second quarter of 2015, following the release of first quarter financial results that outpaced expectations.
On the negative side, notable detractors to security selection included active positions within the Brazilian and Chinese financial sectors. In Brazil, an overweighting to Banco do Brasil detracted from relative performance, as the company widely underperformed the Index through the Reporting Period. The company’s share price fell more than 18% in 2015’s first quarter, following the announcement that both its chief executive officer and its chief financial officer were resigning. Also in Brazil, an overweight position to Banco Estado do Rio Grande do Sul detracted comparably to Banco do Brasil. The company’s stock experienced downward pressure in the first quarter of 2015, following the release of relatively weak fourth quarter 2014 financial results that showed earnings falling year over year. Within Chinese financials, underweighting to China Life Insurance reduced relative performance, as the company widely outperformed the Index, returning 40% during the 2014’s fourth quarter. From a country perspective, active positions across Brazil and Colombia positively impacted country allocation, while positions across Turkey and Thailand detracted from relative performance.
The views expressed above reflect those of the Fund’s portfolio manager only through the Reporting Period, and do not necessarily represent the views of the Adviser as a whole. Any such views are subject to change at any time based upon market or other conditions and the Adviser disclaims any responsibility to update such views. These views may not be relied on as investment advice and, because investment decisions for a fund are based on numerous factors, may not be relied on as an indication of trading intent on behalf of any fund.
SSGA Emerging Markets Fund
Shareholder Expense Example — August 31, 2015 (Unaudited)
Fund Expenses
The following disclosure provides important information regarding the Fund’s Expense Example, which appears on the Fund’s individual page in this Annual Report. Please refer to this information when reviewing the Expense Example for a Fund.
Example
As a shareholder of the Fund, you incur two types of costs: (1) transaction costs, and (2) ongoing costs, including advisory and administration fees; distribution (12b-1) and/or service fees; and other Fund expenses. The Example is intended to help you understand your ongoing costs (in dollars) of investing in the Fund and to compare these costs with the ongoing costs of investing in other mutual funds. The Example is based on an investment of $1,000 invested at the beginning of the period and held for the entire period indicated, which for this Fund is from March 1, 2015 to August 31, 2015.
Actual Expenses
The information in the table under the heading “Actual Performance” provides information about actual account values and actual expenses. You may use the information in this column, together with the amount you invested, to estimate the expenses that you paid over the period. Simply divide your account value by $1,000 (for example, an $8,600 account value divided by $1,000 = 8.6), then multiply the result by the number in the first column in the row entitled “Expenses Paid During Period” to estimate the expenses you paid on your account during this period.
Hypothetical Example for Comparison Purposes
The information in the table under the heading “Hypothetical Performance (5% return before expenses)” provides information about hypothetical account values and hypothetical expenses based on the Fund’s actual expense ratio and an assumed rate of return of 5% per year before expenses, which is not the Fund’s actual return. The hypothetical account values and expenses may not be used to estimate the actual ending account balance or expenses you paid for the period. You may use this information to compare the ongoing costs of investing in the Fund and other funds. To do so, compare this 5% hypothetical example with the 5% hypothetical examples that appear in the shareholder reports of other funds.
Please note that the expenses shown in the table are meant to highlight your ongoing costs only and do not reflect any transaction costs. Therefore, the information under the heading “Hypothetical Performance (5% return before expenses)” is useful in comparing ongoing costs only, and will not help you determine the relative total costs of owning different funds. In addition, if these transaction costs were included, your costs would have been higher.
| | | | | | | | | | | | |
Class N | | Annualized
Expense Ratio | | | Actual
Performance | | | Hypothetical
Performance
(5% return
before expenses) | |
Beginning Account Value March 1, 2015 | | | 1.25 | % | | $ | 1,000.00 | | | $ | 1,000.00 | |
Ending Account Value August 31, 2015 | | | | | | $ | 852.40 | | | $ | 1,018.90 | |
Expenses Paid During Period* | | | | | | $ | 5.84 | | | $ | 6.36 | |
Select Class | | | | | | | | | |
Beginning Account Value March 1, 2015 | | | 1.09 | % | | $ | 1,000.00 | | | $ | 1,000.00 | |
Ending Account Value August 31, 2015 | | | | | | $ | 854.40 | | | $ | 1,019.71 | |
Expenses Paid During Period* | | | | | | $ | 5.09 | | | $ | 5.55 | |
Class A | | | | | | | | | |
Beginning Account Value March 1, 2015 | | | 1.45 | % | | $ | 1,000.00 | | | $ | 1,000.00 | |
Ending Account Value August 31, 2015 | | | | | | $ | 853.20 | | | $ | 1,017.89 | |
Expenses Paid During Period* | | | | | | $ | 6.77 | | | $ | 7.38 | |
Class C | | | | | | | | | |
Beginning Account Value March 1, 2015 | | | 2.20 | % | | $ | 1,000.00 | | | $ | 1,000.00 | |
Ending Account Value August 31, 2015 | | | | | | $ | 848.50 | | | $ | 1,014.11 | |
Expenses Paid During Period* | | | | | | $ | 10.25 | | | $ | 11.17 | |
Class I | | | | | | | | | |
Beginning Account Value March 1, 2015 | | | 1.20 | % | | $ | 1,000.00 | | | $ | 1,000.00 | |
Ending Account Value August 31, 2015 | | | | | | $ | 854.00 | | | $ | 1,019.15 | |
Expenses Paid During Period* | | | | | | $ | 5.61 | | | $ | 6.11 | |
Class K | | | | | | | | | |
Beginning Account Value March 1, 2015 | | | 0.96 | % | | $ | 1,000.00 | | | $ | 1,000.00 | |
Ending Account Value August 31, 2015 | | | | | | $ | 854.10 | | | $ | 1,020.36 | |
Expenses Paid During Period* | | | | | | $ | 4.49 | | | $ | 4.89 | |
| * | Expenses are equal to the Fund’s annualized expense ratio (representing the six month period annualized), multiplied by the average account value over the period, multiplied by 184/365 (to reflect the one-half year period). Includes amounts waived, reimbursed and/or other credits. Without the waiver, reimbursement and/or other credits, expenses would have been higher. |
SSGA Emerging Markets Fund
Schedule of Investments — August 31, 2015
| | | | | | | | |
| | | Principal
Amount ($)
or Shares | | | Value
$ | |
| | | | | | | | |
| Common Stocks - 93.6% | |
Brazil - 4.1% | | | | | | | | |
Banco ABC Brasil SA (a)(b) | | | 9,353 | | | | 23,417 | |
Banco Bradesco SA | | | 87,960 | | | | 610,468 | |
Banco do Brasil SA | | | 148,105 | | | | 728,141 | |
BB Seguridade Participacoes SA | | | 105,083 | | | | 831,589 | |
Cielo SA | | | 68,280 | | | | 722,026 | |
Fibria Celulose SA | | | 26,000 | | | | 367,204 | |
JBS SA | | | 168,000 | | | | 655,481 | |
Light SA | | | 108,300 | | | | 349,090 | |
Multiplus SA | | | 30,600 | | | | 318,348 | |
Petroleo Brasileiro SA
ADR (a)(c) | | | 43,766 | | | | 256,469 | |
Raia Drogasil SA | | | 26,600 | | | | 291,183 | |
Smiles SA | | | 38,800 | | | | 511,820 | |
Transmissora Alianca de Energia Eletrica SA | | | 111,600 | | | | 569,286 | |
Ultrapar Participacoes SA | | | 37,700 | | | | 659,788 | |
Vale SA ADR (c) | | | 43,977 | | | | 217,686 | |
Valid Solucoes e Servicos de Seguranca em Meios de Pagamento e Identificacao SA | | | 35,000 | | | | 453,104 | |
| | | | | | | | |
| | | | | | | 7,565,100 | |
| | | | | | | | |
| | |
Canada - 0.1% | | | | | | | | |
Pacific Exploration and Production Corp. | | | 54,100 | | | | 183,404 | |
| | | | | | | | |
| |
Cayman Islands - 2.7% | | | | | |
ENN Energy Holdings, Ltd. | | | 22,000 | | | | 112,270 | |
Evergrande Real Estate Group, Ltd. | | | 1 | | | | 1 | |
Tencent Holdings, Ltd. | | | 284,500 | | | | 4,838,304 | |
| | | | | | | | |
| | | | | | | 4,950,575 | |
| | | | | | | | |
| |
China - 13.4% | | | | | |
Anhui Expressway Co., Ltd. (Class H) | | | 702,000 | | | | 537,140 | |
Bank of China, Ltd. (Class H) | | | 6,426,100 | | | | 2,935,258 | |
Bank of Chongqing Co., Ltd. (Class H) | | | 920,500 | | | | 677,008 | |
Beijing Capital Land, Ltd. (Class H) | | | 1,222,000 | | | | 488,797 | |
China Construction Bank Corp. (Class H) | | | 5,486,169 | | | | 3,857,991 | |
China Dongxiang Group Co., Ltd. | | | 2,438,000 | | | | 607,137 | |
China Life Insurance Co., Ltd. (Class H) | | | 344,000 | | | | 1,189,566 | |
China Lilang, Ltd. (c) | | | 728,000 | | | | 626,546 | |
China Merchants Bank Co., Ltd. (Class H) | | | 317,000 | | | | 755,069 | |
China Petroleum & Chemical Corp. (Class H) | | | 1,232,100 | | | | 820,335 | |
Chongqing Rural Commercial Bank (Class H) | | | 2,380,000 | | | | 1,391,139 | |
| | | | | | | | |
| | | Principal
Amount ($)
or Shares | | | Value
$ | |
Cosmo Lady China Holdings Co., Ltd. (d) | | | 494,000 | | | | 530,329 | |
Dongpeng Holdings Co., Ltd. | | | 587,000 | | | | 240,858 | |
Fufeng Group, Ltd. | | | 505,000 | | | | 224,805 | |
Huadian Power International Corp., Ltd. (Class H) | | | 586,000 | | | | 477,114 | |
Huaneng Power International, Inc. (Class H) | | | 332,000 | | | | 382,547 | |
Industrial & Commercial Bank of China, Ltd. (Class H) | | | 1,459,000 | | | | 862,216 | |
KWG Property Holding, Ltd. | | | 1,744,000 | | | | 1,102,651 | |
Logan Property Holdings Co., Ltd. | | | 1,222,000 | | | | 521,909 | |
Peak Sport Products Co., Ltd. | | | 1,475,000 | | | | 353,998 | |
PetroChina Co., Ltd. (Class H) | | | 468,000 | | | | 388,890 | |
Ping An Insurance Group Co of China, Ltd. (Class H) | | | 446,000 | | | | 2,183,947 | |
Powerlong Real Estate Holdings, Ltd. | | | 1,627,000 | | | | 289,709 | |
Shandong Chenming Paper Holdings, Ltd. (Class B) | | | 1,049,400 | | | | 552,455 | |
Shanghai Mechanical and Electrical Industry Co., Ltd. (Class B) | | | 211,917 | | | | 471,303 | |
Sino-Ocean Land Holdings, Ltd. | | | 1,342,500 | | | | 701,560 | |
Wuxi Little Swan Co., Ltd. (Class B) | | | 261,050 | | | | 529,844 | |
Zhejiang Expressway Co., Ltd. (Class H) | | | 882,000 | | | | 946,864 | |
| | | | | | | | |
| | | | | | | 24,646,985 | |
| | | | | | | | |
| |
Egypt - 0.4% | | | | | |
Commercial International Bank Egypt SAE | | | 108,705 | | | | 695,819 | |
| | | | | | | | |
| |
Hong Kong - 6.0% | | | | | |
C C Land Holdings, Ltd. | | | 1,586,000 | | | | 378,591 | |
China Everbright, Ltd. | | | 38,000 | | | | 79,432 | |
China Mobile, Ltd. | | | 396,200 | | | | 4,800,379 | |
China Power International Development, Ltd. | | | 1,862,000 | | | | 1,239,724 | |
CNOOC, Ltd. | | | 1,006,500 | | | | 1,248,052 | |
Hopewell Highway Infrastructure, Ltd. | | | 1,067,000 | | | | 510,780 | |
Sino Biopharmaceutical, Ltd. | | | 616,000 | | | | 731,247 | |
Skyworth Digital Holdings, Ltd. | | | 980,000 | | | | 565,235 | |
Tongda Group Holdings, Ltd. | | | 3,300,000 | | | | 510,965 | |
Vinda International Holdings, Ltd. | | | 228,000 | | | | 439,522 | |
Yuexiu Transport Infrastructure, Ltd. | | | 800,000 | | | | 477,932 | |
| | | | | | | | |
| | | | | | | 10,981,859 | |
| | | | | | | | |
| |
Hungary - 0.2% | | | | | |
OTP Bank PLC | | | 24,707 | | | | 476,463 | |
| | | | | | | | |
SSGA Emerging Markets Fund
Schedule of Investments, continued — August 31, 2015
| | | | | | | | |
| | | Principal
Amount ($)
or Shares | | | Value
$ | |
| | | | | | | | |
India - 9.5% | | | | | |
Amara Raja Batteries, Ltd. | | | 20,148 | | | | 305,531 | |
Ashok Leyland, Ltd. | | | 528,414 | | | | 717,800 | |
Aurobindo Pharma, Ltd. | | | 103,123 | | | | 1,168,133 | |
Bajaj Auto, Ltd. | | | 18,805 | | | | 631,605 | |
Bajaj Finance, Ltd. | | | 10,151 | | | | 766,757 | |
Bayer CropScience, Ltd. | | | 5,201 | | | | 301,674 | |
Bharat Petroleum Corp., Ltd. | | | 71,816 | | | | 954,162 | |
Britannia Industries, Ltd. | | | 35,001 | | | | 1,542,703 | |
Ceat, Ltd. | | | 19,110 | | | | 315,505 | |
Coal India, Ltd. | | | 30,646 | | | | 168,893 | |
Great Eastern Shipping Co., Ltd. | | | 69,147 | | | | 382,740 | |
HCL Technologies, Ltd. | | | 52,237 | | | | 763,065 | |
Hindustan Unilever, Ltd. | | | 72,346 | | | | 936,934 | |
Indiabulls Housing Finance, Ltd. | | | 63,348 | | | | 719,532 | |
Infosys, Ltd. | | | 114,212 | | | | 1,880,310 | |
Jagran Prakashan, Ltd. | | | 22,980 | | | | 47,153 | |
Lupin, Ltd. | | | 24,908 | | | | 725,245 | |
Mindtree, Ltd. | | | 27,261 | | | | 572,430 | |
MRF, Ltd. | | | 1,060 | | | | 644,088 | |
Oil & Natural Gas Corp., Ltd. | | | 15,974 | | | | 57,504 | |
Power Finance Corp., Ltd. | | | 123,937 | | | | 417,909 | |
Reliance Industries, Ltd. | | | 41,687 | | | | 536,742 | |
Rural Electrification Corp., Ltd. | | | 54,123 | | | | 206,192 | |
Siemens, Ltd. | | | 20,502 | | | | 390,101 | |
Tata Motors, Ltd. (a) | | | 54,414 | | | | 278,434 | |
Torrent Pharmaceuticals, Ltd. | | | 51,841 | | | | 1,253,230 | |
Vardhman Textiles, Ltd. | | | 22,506 | | | | 308,042 | |
Welspun India, Ltd. | | | 33,856 | | | | 393,106 | |
| | | | | | | | |
| | | | | | | 17,385,520 | |
| | | | | | | | |
| | |
Indonesia - 2.5% | | | | | | | | |
Bank Negara Indonesia Persero Tbk PT | | | 1,108,300 | | | | 390,469 | |
Bank Rakyat Indonesia Persero Tbk PT | | | 854,000 | | | | 645,818 | |
Bank Tabungan Negara Persero Tbk PT | | | 12,290,500 | | | | 931,628 | |
Telekomunikasi Indonesia Persero Tbk PT | | | 9,145,300 | | | | 1,868,115 | |
United Tractors Tbk PT | | | 533,700 | | | | 726,478 | |
| | | | | | | | |
| | | | | | | 4,562,508 | |
| | | | | | | | |
| |
Malaysia - 1.8% | | | | | |
IGB Real Estate Investment Trust (e) | | | 1,592,200 | | | | 496,615 | |
IJM Corp. Bhd | | | 271,500 | | | | 407,250 | |
Malaysian Pacific Industries Bhd | | | 499,500 | | | | 786,118 | |
MISC Bhd | | | 441,600 | | | | 851,657 | |
Top Glove Corp. Bhd | | | 215,200 | | | | 395,558 | |
YTL Power International Bhd | | | 1,152,500 | | | | 425,327 | |
| | | | | | | | |
| | | | | | | 3,362,525 | |
| | | | | | | | |
| | | | | | | | |
| | | Principal
Amount ($)
or Shares | | | Value
$ | |
Mexico - 4.6% | | | | | | | | |
America Movil SAB de CV ADR (Series L) | | | 82,362 | | | | 1,507,225 | |
Controladora Vuela Cia de Aviacion S.A.B. de C.V. (Class A) (a) | | | 430,400 | | | | 570,853 | |
Credito Real S.A.B. de C.V. | | | 252,502 | | | | 494,191 | |
El Puerto de Liverpool S.A.B. de C.V. | | | 46,700 | | | | 558,687 | |
Fibra Uno Administracion S.A. de C.V. (e) | | | 228,100 | | | | 489,983 | |
Gruma S.A.B. de C.V. (Class B) | | | 55,600 | | | | 749,154 | |
Grupo Aeroportuario del Centro Norte S.A.B. de C.V. (a)(c) | | | 161,200 | | | | 846,727 | |
Grupo Aeroportuario del Pacifico S.A.B. de C.V. (Class B) | | | 46,200 | | | | 388,176 | |
Grupo Herdez S.A.B. de C.V. | | | 137,700 | | | | 337,744 | |
Grupo Mexico SAB de CV (Series B) | | | 296,968 | | | | 754,518 | |
Industrias Bachoco S.A.B. de C.V. (Series B) | | | 202,300 | | | | 960,176 | |
Wal-Mart de Mexico S.A.B. de C.V. | | | 328,000 | | | | 787,816 | |
| | | | | | | | |
| | | | | | | 8,445,250 | |
| | | | | | | | |
| | |
Oman - 0.2% | | | | | | | | |
Bank Muscat SAOG | | | 330,194 | | | | 432,030 | |
| | | | | | | | |
| | |
Philippines - 2.2% | | | | | | | | |
BDO Unibank, Inc. | | | 186,180 | | | | 392,356 | |
Cebu Air, Inc. | | | 274,700 | | | | 525,715 | |
D&L Industries, Inc. | | | 1,931,400 | | | | 471,073 | |
Filinvest Land, Inc. | | | 17,880,000 | | | | 684,750 | |
Globe Telecom, Inc. | | | 34,925 | | | | 1,924,835 | |
| | | | | | | | |
| | | | | | | 3,998,729 | |
| | | | | | | | |
| | |
Poland - 1.7% | | | | | | | | |
Asseco Poland SA | | | 39,588 | | | | 549,270 | |
Ciech SA (a) | | | 41,948 | | | | 804,977 | |
Polski Koncern Naftowy Orlen SA | | | 72,838 | | | | 1,424,179 | |
Powszechny Zaklad Ubezpieczen SA | | | 3,413 | | | | 389,391 | |
| | | | | | | | |
| | | | | | | 3,167,817 | |
| | | | | | | | |
| | |
Qatar - 0.9% | | | | | | | | |
Barwa Real Estate Co. | | | 38,713 | | | | 467,818 | |
Qatar Electricity & Water Co. QSC | | | 10,545 | | | | 634,247 | |
Qatar National Bank SAQ | | | 11,384 | | | | 559,648 | |
| | | | | | | | |
| | | | | | | 1,661,713 | |
| | | | | | | | |
| | |
Russia - 3.8% | | | | | | | | |
Aeroflot - Russian Airlines OJSC (a) | | | 310,423 | | | | 192,364 | |
Alrosa AO (a) | | | 561,308 | | | | 573,284 | |
Gazprom PAO ADR | | | 155,599 | | | | 686,192 | |
Lukoil PJSC (a) | | | 26,047 | | | | 1,025,086 | |
Magnit OJSC (a) | | | 4,167 | | | | 797,253 | |
SSGA Emerging Markets Fund
Schedule of Investments, continued — August 31, 2015
| | | | | | | | |
| | | Principal
Amount ($)
or Shares | | | Value
$ | |
| | | | | | | | |
MMC Norilsk Nickel PJSC ADR | | | 72,312 | | | | 1,145,061 | |
Moscow Exchange MICEX-RTS PJSC | | | 784,163 | | | | 901,281 | |
Severstal PAO GDR | | | 61,591 | | | | 655,944 | |
Surgutneftegas OAO (a) | | | 822,479 | | | | 514,930 | |
Yandex NV (Class A) (a) | | | 39,100 | | | | 477,020 | |
| | | | | | | | |
| | | | | | | 6,968,415 | |
| | | | | | | | |
| | |
Singapore - 1.0% | | | | | | | | |
Yangzijiang Shipbuilding Holdings, Ltd. (c) | | | 2,345,400 | | | | 1,828,383 | |
| | | | | | | | |
| | |
South Africa - 7.5% | | | | | | | | |
Astral Foods, Ltd. | | | 33,417 | | | | 448,453 | |
Barclays Africa Group, Ltd. (c) | | | 19,291 | | | | 252,788 | |
Bidvest Group, Ltd. (c) | | | 21,704 | | | | 521,970 | |
Cashbuild, Ltd. | | | 49,043 | | | | 1,156,899 | |
Clicks Group, Ltd. | | | 65,444 | | | | 451,786 | |
DataTec, Ltd. | | | 123,470 | | | | 698,352 | |
Emira Property Fund, Ltd. (e) | | | 487,777 | | | | 646,683 | |
FirstRand, Ltd. | | | 235,799 | | | | 940,874 | |
Hyprop Investments, Ltd. (e) | | | 83,520 | | | | 781,023 | |
Lewis Group, Ltd. (c) | | | 90,586 | | | | 427,307 | |
Mondi, Ltd. | | | 22,266 | | | | 516,361 | |
MTN Group, Ltd. (c) | | | 41,220 | | | | 550,122 | |
Naspers, Ltd. | | | 11,823 | | | | 1,532,693 | |
Sasol, Ltd. | | | 31,553 | | | | 1,011,088 | |
Standard Bank Group, Ltd. | | | 121,132 | | | | 1,334,812 | |
Steinhoff International Holdings, Ltd. (c) | | | 255,700 | | | | 1,532,254 | |
Truworths International, Ltd. (c) | | | 63,616 | | | | 421,607 | |
Vodacom Group, Ltd. | | | 56,934 | | | | 607,504 | |
| | | | | | | | |
| | | | | | | 13,832,576 | |
| | | | | | | | |
|
South Korea - 13.1% | |
BGF retail Co., Ltd. | | | 4,063 | | | | 692,196 | |
Dongsuh Cos., Inc. | | | 8,060 | | | | 305,295 | |
Dongwon Development Co., Ltd. | | | 6,586 | | | | 304,590 | |
Hana Financial Group, Inc. | | | 5 | | | | 115 | |
Hana Tour Service, Inc. | | | 3,867 | | | | 514,946 | |
Hanwha Life Insurance Co., Ltd. | | | 74,998 | | | | 504,108 | |
Hyosung Corp. | | | 3,801 | | | | 411,353 | |
Hyundai Marine & Fire Insurance Co., Ltd. | | | 22,277 | | | | 527,378 | |
Hyundai Motor Co. | | | 3,906 | | | | 492,068 | |
Industrial Bank of Korea | | | 56,564 | | | | 631,279 | |
KB Financial Group, Inc. | | | 25,488 | | | | 771,482 | |
Kia Motors Corp. | | | 16,634 | | | | 684,909 | |
Korea Electric Power Corp. | | | 41,609 | | | | 1,688,634 | |
Korea Electric Terminal Co., Ltd. | | | 4,919 | | | | 422,134 | |
Korea Zinc Co., Ltd. | | | 1,104 | | | | 478,843 | |
Korean Reinsurance Co. | | | 54,431 | | | | 639,688 | |
KT&G Corp. | | | 14,836 | | | | 1,386,073 | |
| | | | | | | | |
| | | Principal
Amount ($)
or Shares | | | Value
$ | |
LG Chem, Ltd. | | | 5,047 | | | | 998,519 | |
LG Display Co., Ltd. | | | 25,217 | | | | 491,441 | |
Lotte Chemical Corp. | | | 1,976 | | | | 412,659 | |
OCI Materials Co., Ltd. | | | 4,552 | | | | 422,198 | |
POSCO | | | 225 | | | | 36,144 | |
S&T Motiv Co., Ltd. | | | 17,666 | | | | 966,384 | |
S-Oil Corp. | | | 8,831 | | | | 447,990 | |
Samsung Electronics Co., Ltd. | | | 6,289 | | | | 5,790,506 | |
Seah Besteel Corp. | | | 18,662 | | | | 503,333 | |
Silicon Works Co., Ltd. | | | 11,680 | | | | 349,091 | |
SK Hynix, Inc. | | | 19,824 | | | | 600,042 | |
SK Telecom Co., Ltd. | | | 3,188 | | | | 657,681 | |
Soulbrain Co., Ltd. | | | 14,820 | | | | 543,181 | |
Tongyang Life Insurance | | | 51,022 | | | | 647,077 | |
Woori Bank | | | 92,435 | | | | 712,752 | |
| | | | | | | | |
| | | | | | | 24,034,089 | |
| | | | | | | | |
|
Taiwan - 12.3% | |
China Development Financial Holding Corp. | | | 2,158,000 | | | | 622,806 | |
Chunghwa Telecom Co., Ltd. | | | 514,000 | | | | 1,560,831 | |
Compeq Manufacturing Co., Ltd. | | | 1,298,000 | | | | 863,711 | |
CTBC Financial Holding Co., Ltd. | | | 682,568 | | | | 411,186 | |
Elite Material Co., Ltd. | | | 161,000 | | | | 351,334 | |
Far EasTone Telecommunications Co., Ltd. | | | 256,000 | | | | 561,790 | |
FLEXium Interconnect, Inc. | | | 192,285 | | | | 547,849 | |
Foxconn Technology Co., Ltd. | | | 402,430 | | | | 1,131,742 | |
Fubon Financial Holding Co., Ltd. | | | 675,366 | | | | 1,160,344 | |
Grand Pacific Petrochemical | | | 1,460,000 | | | | 735,923 | |
Highwealth Construction Corp. (a) | | | 434,000 | | | | 670,955 | |
Hon Hai Precision Industry Co., Ltd. | | | 942,296 | | | | 2,678,952 | |
Innolux Corp. | | | 1,158,235 | | | | 409,383 | |
Mega Financial Holding Co., Ltd. | | | 833,000 | | | | 624,699 | |
Pegatron Corp. | | | 568,000 | | | | 1,469,929 | |
Powertech Technology, Inc. | | | 388,000 | | | | 667,814 | |
Shin Zu Shing Co., Ltd. | | | 153,000 | | | | 363,032 | |
Taichung Commercial Bank Co., Ltd. | | | 1,488,753 | | | | 432,405 | |
Taishin Financial Holding Co., Ltd. | | | 1,240,852 | | | | 434,771 | |
Taiwan Semiconductor Manufacturing Co., Ltd. | | | 1,109,782 | | | | 4,400,107 | |
Uni-President Enterprises Corp. | | | 567,960 | | | | 1,012,469 | |
Wisdom Marine Lines Co., Ltd. (a) | | | 927,000 | | | | 1,057,035 | |
Wistron NeWeb Corp. | | | 7,624 | | | | 14,317 | |
Zhen Ding Technology Holding, Ltd. | | | 130,000 | | | | 368,791 | |
| | | | | | | | |
| | | | | | | 22,552,175 | |
| | | | | | | | |
|
Thailand - 2.4% | |
Advanced Info Service PCL (b) | | | 127,000 | | | | 843,242 | |
SSGA Emerging Markets Fund
Schedule of Investments, continued — August 31, 2015
| | | | | | | | |
| | | Principal
Amount ($)
or Shares | | | Value
$ | |
| | | | | | | | |
Airports of Thailand PCL (b) | | | 59,900 | | | | 461,219 | |
Hana Microelectronics PCL | | | 610,700 | | | | 434,450 | |
Kasikornbank PCL NVDR | | | 67,300 | | | | 338,894 | |
Krungthai Card PCL (b) | | | 133,400 | | | | 327,499 | |
Major Cineplex Group PCL (b) | | | 543,100 | | | | 492,419 | |
PTT Global Chemical PCL NVDR | | | 179,200 | | | | 299,958 | |
Srisawad Power 1979 PCL (b)(c) | | | 400,800 | | | | 410,919 | |
Thai Vegetable Oil PCL NVDR | | | 547,600 | | | | 420,114 | |
Thanachart Capital PCL (b) | | | 499,400 | | | | 411,000 | |
| | | | | | | | |
| | | | | | | 4,439,714 | |
| | | | | | | | |
|
Turkey - 1.7% | |
Adana Cimento Sanayii TAS (Class A) | | | 66,246 | | | | 146,364 | |
Dogus Otomotiv Servis ve Ticaret AS | | | 206,799 | | | | 888,220 | |
TAV Havalimanlari Holding AS | | | 121,777 | | | | 983,321 | |
Tofas Turk Otomobil Fabrikasi AS | | | 76,831 | | | | 476,514 | |
Turk Hava Yollari AO (a) | | | 224,796 | | | | 621,794 | |
| | | | | | | | |
| | | | | | | 3,116,213 | |
| | | | | | | | |
|
United Arab Emirates - 0.9% | |
Abu Dhabi Commercial Bank PJSC | | | 319,763 | | | | 696,462 | |
Al Waha Capital PJSC | | | 344,862 | | | | 214,071 | |
First Gulf Bank PJSC | | | 192,674 | | | | 752,756 | |
| | | | | | | | |
| | | | | | | 1,663,289 | |
| | | | | | | | |
|
United Kingdom - 0.6% | |
Gem Diamonds, Ltd. | | | 277,992 | | | | 554,552 | |
Old Mutual PLC | | | 160,366 | | | | 480,488 | |
| | | | | | | | |
| | | | | | | 1,035,040 | |
| | | | | | | | |
| | |
Total Common Stocks
(cost $151,455,994) | | | | | | | 171,986,191 | |
| | | | | | | | |
|
| Convertible Foreign Bond - 0.0% (f) | |
Oman - 0.0% (f) | |
Bank Muscat SAOG
3.500%, due 03/19/18
(cost $0) | | | 46,703 | | | | 12,125 | |
| | | | | | | | |
|
| Preferred Stocks - 2.3% | |
Brazil - 1.5% | |
Banco ABC Brasil SA | | | 220,634 | | | | 552,399 | |
Banco do Estado do Rio Grande do Sul SA (Class B) | | | 259,414 | | | | 552,926 | |
| | | | | | | | |
| | | Principal
Amount ($)
or Shares | | | Value
$ | |
Centrais Eletricas Brasileiras SA (Class B) | | | 148,496 | | | | 307,503 | |
Itau Unibanco Holding SA | | | 101,095 | | | | 740,097 | |
Petroleo Brasileiro SA (a) | | | 39,662 | | | | 100,504 | |
Suzano Papel e Celulose SA (Class A) | | | 95,100 | | | | 460,992 | |
Vale SA | | | 24,937 | | | | 97,296 | |
| | | | | | | | |
| | | | | | | 2,811,717 | |
| | | | | | | | |
|
South Korea - 0.8% | |
Samsung Electronics Co., Ltd. | | | 2,007 | | | | 1,476,297 | |
| | | | | | | | |
| |
Total Preferred Stocks
(cost $4,657,931) | | | | 4,288,014 | |
| | | | | | | | |
|
| Equity-Linked Securities - 1.7% | |
Saudi Arabia - 1.7% | |
HSBC Bank PLC, Dallah Healthcare Holding Company (expiring 12/24/15) (b) | | | 19,801 | | | | 538,472 | |
HSBC Bank PLC, Samba Financial Group
(expiring 6/29/17) (b) | | | 111,400 | | | | 692,017 | |
HSBC Bank PLC, Saudi Basic Industries Corp.
(expiring 10/31/16) (b) | | | 56,214 | | | | 1,206,470 | |
HSBC Bank PLC, Yanbu National Petrochemical Co.
(expiring 7/31/17) (b) | | | 56,000 | | | | 673,350 | |
| | | | | | | | |
| |
Total Equity-Linked Securities
(cost $3,812,289) | | | | 3,110,309 | |
| | | | | | | | |
|
| Short-Term Investments - 2.7% | |
United States - 2.7% | |
SSGA Prime Money Market Fund
0.24% (g)(h) | | | 327,928 | | | | 327,928 | |
State Street Navigator Securities Lending Prime Portfolio (h)(i) | | | 4,543,293 | | | | 4,543,293 | |
| | | | | | | | |
| |
Total Short-Term Investments
(cost $4,871,221) | | | | 4,871,221 | |
| | | | | | | | |
| |
Total Investments - 100.3% (j)
(cost $164,797,435) | | | | 184,267,860 | |
| |
Other Assets and Liabilities,
Net - (0.3)% | | | | (602,449 | ) |
| | | | | | | | |
| | |
| Net Assets - 100.0% | | | | | | | 183,665,411 | |
| | | | | | | | |
See accompanying notes which are an integral part of the financial statements.
SSGA Emerging Markets Fund
Schedule of Investments, continued — August 31, 2015
Footnotes:
| (a) | Non-income producing security |
| (b) | Security is valued at fair value as determined in good faith by the Trust’s Oversight Committee in accordance with procedures approved by the Board of Trustees. Security value is determined based on Level 2 inputs. Represents $6,080,024 or 3.3% of net assets. (Note 2) |
| (c) | All or a portion of the shares of this security are on loan. |
| (d) | Restricted security Rule (144A) or Section 4 (2) commercial paper. Security may have contractual restrictions on resale or may have been offered in a private placement transaction. Securities sold within terms of a private placement memorandum, exempt from registration under Section 144A of the Securities Act of 1933, as amended, and may be sold only to dealers in that program or other accredited investors. These securities have been determined to be liquid under guidelines established by the Board of Trustees. |
| (e) | Real Estate Investment Trust (REIT) |
| (f) | Less than 0.05% of net assets |
| (g) | The rate shown is the annualized seven-day yield at period end. |
| (h) | Affiliated Fund managed by SSGA Funds Management, Inc. (Note 4). |
| (i) | Investments of cash collateral for securities loaned |
| (j) | All or a portion of the shares of these securities are held as collateral in connection with futures contracts and forward foreign currency contracts purchased by the Fund. |
Abbreviations:
ADR - American Depositary Receipt
GDR - Global Depositary Receipt
NVDR - Non-Voting Depository Receipt
OJSC - Open Joint Stock Company
PCL - Public Company Limited
PJSC - Public Joint Stock Company
PLC - Public Limited Company
| | | | | | | | |
| Sector Exposure | | % of
Net
Assets | | | Value
$ | |
Common Stocks | | | | | | | | |
Consumer Discretionary | | | 9.2 | | | | 16,806,097 | |
Consumer Staples | | | 6.6 | | | | 12,214,352 | |
Energy | | | 5.9 | | | | 10,766,444 | |
Financials | | | 25.5 | | | | 46,851,013 | |
Health Care | | | 2.3 | | | | 4,273,413 | |
Industrials | | | 8.5 | | | | 15,578,663 | |
Information Technology | | | 17.6 | | | | 32,367,319 | |
Materials | | | 6.7 | | | | 12,368,927 | |
Telecommunication Services | | | 8.1 | | | | 14,881,724 | |
Utilities | | | 3.2 | | | | 5,878,239 | |
Convertible Foreign Bonds | | | | | | | | |
Financials | | | 0.0 | | | | 12,125 | |
Preferred Stocks | | | | | | | | |
Energy | | | 0.0 | | | | 100,504 | |
Financials | | | 1.0 | | | | 1,845,422 | |
Information Technology | | | 0.8 | | | | 1,476,297 | |
Materials | | | 0.3 | | | | 558,288 | |
Utilities | | | 0.2 | | | | 307,503 | |
Equity-Linked Securities | | | | | | | | |
Financials | | | 0.4 | | | | 692,017 | |
Health Care | | | 0.3 | | | | 538,472 | |
Materials | | | 1.0 | | | | 1,879,820 | |
Short Term Investments | | | 2.7 | | | | 4,871,221 | |
| | | | | | | | |
Total Investments | | | 100.3 | | | | 184,267,860 | |
Other Assets & Liabilities | | | (0.3 | ) | | | (602,449 | ) |
| | | | | | | | |
| | | 100.0 | | | | 183,665,411 | |
| | | | | | | | |
| | | | | | | | | | | | | | | | | | |
| Futures Contracts | | Number of
Contracts | | | Notional
Amount | | | Expiration
Date | | | Unrealized
Depreciation $ | |
| | | | | | | | | | | | | | | | | | |
Long Positions | | | | | | | | | | | | | | | | | | |
Mini MSCI Emerging Market Futures | | | 82 | | | USD | | | 3,351,750 | | | | 09/15 | | | | (327,943 | ) |
| | | | | | | | | | | | | | | | | | |
Total Unrealized Appreciation (Depreciation) on Open Futures Contracts | | | | | | | | | | | | | | | | | (327,943 | ) |
| | | | | | | | | | | | | | | | | | |
During the year ended August 31, 2015, average notional value related to futures contracts was $6,457,068 or 3.5% of net assets.
| | | | | | | | | | | | | | | | | | | | |
| Foreign Currency Exchange Contracts | | | | | | | |
Counterparty | | Amount
Sold | | | Amount
Bought | | | Settlement
Date | | | Unrealized
Appreciation
(Depreciation)
$ | |
Bank of America N.A. | | USD | | | 1,017,021 | | | TRY | | | 2,989,000 | | | | 09/15/15 | | | | 5,689 | |
Barclays Capital | | USD | | | 1,836,766 | | | BRL | | | 5,828,243 | | | | 09/15/15 | | | | (237,452 | ) |
Barclays Capital | | USD | | | 1,072,908 | | | TWD | | | 35,127,000 | | | | 09/15/15 | | | | 6,839 | |
Barclays Capital | | USD | | | 160,031 | | | TWD | | | 5,000,000 | | | | 09/15/15 | | | | (6,339 | ) |
Barclays Capital | | BRL | | | 875,000 | | | USD | | | 261,311 | | | | 09/15/15 | | | | 21,204 | |
See accompanying notes which are an integral part of the financial statements.
SSGA Emerging Markets Fund
Schedule of Investments, continued — August 31, 2015
| | | | | | | | | | | | | | | | | | | | |
| Foreign Currency Exchange Contracts, continued | | | | | | | |
Counterparty | | Amount
Sold | | | Amount
Bought | | | Settlement
Date | | | Unrealized
Appreciation
(Depreciation)
$ | |
Barclays Capital | | BRL | | | 500,000 | | | USD | | | 139,579 | | | | 09/15/15 | | | | 2,375 | |
Barclays Capital | | TWD | | | 33,350,125 | | | USD | | | 1,088,628 | | | | 09/15/15 | | | | 63,499 | |
Barclays Capital | | TWD | | | 700,000 | | | USD | | | 21,652 | | | | 09/15/15 | | | | 136 | |
Citibank N.A. | | USD | | | 1,891,985 | | | HKD | | | 14,665,000 | | | | 09/15/15 | | | | 219 | |
Citibank N.A. | | USD | | | 625,000 | | | PEN | | | 2,071,875 | | | | 09/15/15 | | | | 11,710 | |
Citibank N.A. | | USD | | | 1,834,028 | | | PEN | | | 5,871,090 | | | | 09/15/15 | | | | (29,777 | ) |
Citibank N.A. | | HKD | | | 73,326,574 | | | USD | | | 9,458,735 | | | | 09/15/15 | | | | (2,484 | ) |
Citibank N.A. | | PEN | | | 1,175,000 | | | USD | | | 365,474 | | | | 09/15/15 | | | | 4,384 | |
Citibank N.A. | | PEN | | | 700,000 | | | USD | | | 213,415 | | | | 09/15/15 | | | | (1,703 | ) |
Citibank N.A. | | ZAR | | | 9,600,000 | | | USD | | | 764,149 | | | | 09/15/15 | | | | 41,796 | |
Citibank N.A. | | USD | | | 3,892,625 | | | ZAR | | | 48,054,455 | | | | 09/15/15 | | | | (276,763 | ) |
Credit Suisse International | | USD | | | 23,991 | | | PLN | | | 90,000 | | | | 09/15/15 | | | | (166 | ) |
Credit Suisse International | | PLN | | | 574,055 | | | USD | | | 155,208 | | | | 09/15/15 | | | | 3,242 | |
Deutsche Bank AG | | USD | | | 1,313,626 | | | IDR | | | 17,806,204,000 | | | | 09/15/15 | | | | (49,898 | ) |
Deutsche Bank AG | | USD | | | 1,372,072 | | | INR | | | 88,307,928 | | | | 09/15/15 | | | | (46,789 | ) |
Deutsche Bank AG | | USD | | | 6,165,430 | | | MYR | | | 23,198,047 | | | | 09/15/15 | | | | (647,806 | ) |
Deutsche Bank AG | | USD | | | 278,940 | | | THB | | | 10,000,000 | | | | 09/15/15 | | | | (135 | ) |
Deutsche Bank AG | | USD | | | 664,854 | | | THB | | | 23,230,000 | | | | 09/15/15 | | | | (17,190 | ) |
Deutsche Bank AG | | IDR | | | 3,561,240,000 | | | USD | | | 260,897 | | | | 09/15/15 | | | | 8,151 | |
Deutsche Bank AG | | IDR | | | 1,500,000,000 | | | USD | | | 106,458 | | | | 09/15/15 | | | | 2 | |
Deutsche Bank AG | | INR | | | 17,650,000 | | | USD | | | 273,983 | | | | 09/15/15 | | | | 9,101 | |
Deutsche Bank AG | | INR | | | 7,200,000 | | | USD | | | 108,515 | | | | 09/15/15 | | | | 461 | |
Deutsche Bank AG | | MXN | | | 2,500,000 | | | USD | | | 149,066 | | | | 09/15/15 | | | | (423 | ) |
Deutsche Bank AG | | MYR | | | 2,000,000 | | | USD | | | 480,480 | | | | 09/15/15 | | | | 4,783 | |
Deutsche Bank AG | | MYR | | | 4,640,000 | | | USD | | | 1,206,605 | | | | 09/15/15 | | | | 102,987 | |
Deutsche Bank AG | | THB | | | 116,157,164 | | | USD | | | 3,427,173 | | | | 09/15/15 | | | | 188,654 | |
Deutsche Bank AG | | TRY | | | 600,000 | | | USD | | | 205,029 | | | | 09/15/15 | | | | (266 | ) |
Goldman Sachs Capital Markets L.P. | | USD | | | 774,177 | | | HKD | | | 6,000,000 | | | | 09/15/15 | | | | (6 | ) |
Goldman Sachs Capital Markets L.P. | | USD | | | 13,278 | | | PLN | | | 50,000 | | | | 09/15/15 | | | | (42 | ) |
Goldman Sachs Capital Markets L.P. | | USD | | | 1,175,407 | | | TRY | | | 3,248,943 | | | | 09/15/15 | | | | (63,755 | ) |
Goldman Sachs Capital Markets L.P. | | EUR | | | 75,000 | | | USD | | | 84,173 | | | | 09/15/15 | | | | (4 | ) |
Goldman Sachs Capital Markets L.P. | | TRY | | | 490,000 | | | USD | | | 176,532 | | | | 09/15/15 | | | | 8,875 | |
Goldman Sachs Capital Markets L.P. | | ZAR | | | 3,000,000 | | | USD | | | 226,180 | | | | 09/15/15 | | | | 444 | |
JP Morgan Chase Bank, N.A. | | USD | | | 314,532 | | | KRW | | | 370,000,000 | | | | 09/15/15 | | | | (1,840 | ) |
JP Morgan Chase Bank, N.A. | | USD | | | 271,779 | | | KRW | | | 316,025,000 | | | | 09/15/15 | | | | (4,702 | ) |
JP Morgan Chase Bank, N.A. | | USD | | | 291,374 | | | PHP | | | 13,275,000 | | | | 09/15/15 | | | | (7,559 | ) |
JP Morgan Chase Bank, N.A. | | USD | | | 171,149 | | | PHP | | | 8,000,000 | | | | 09/15/15 | | | | (112 | ) |
JP Morgan Chase Bank, N.A. | | USD | | | 211,772 | | | RUB | | | 11,817,938 | | | | 09/15/15 | | | | (28,462 | ) |
JP Morgan Chase Bank, N.A. | | KRW | | | 1,732,500,000 | | | USD | | | 1,447,368 | | | | 09/15/15 | | | | (16,792 | ) |
JP Morgan Chase Bank, N.A. | | KRW | | | 2,106,822,650 | | | USD | | | 1,905,334 | | | | 09/15/15 | | | | 124,827 | |
JP Morgan Chase Bank, N.A. | | PHP | | | 88,518,830 | | | USD | | | 1,957,515 | | | | 09/15/15 | | | | 65,015 | |
JP Morgan Chase Bank, N.A. | | RUB | | | 1,775,000 | | | USD | | | 30,095 | | | | 09/15/15 | | | | 2,563 | |
JP Morgan Chase Bank, N.A. | | RUB | | | 1,100,000 | | | USD | | | 16,658 | | | | 09/15/15 | | | | (404 | ) |
JP Morgan Chase Bank, N.A. | | ZAR | | | 11,243,000 | | | USD | | | 853,269 | | | | 09/15/15 | | | | 7,289 | |
| | | | | | | | | | | | | | | | | | | | |
| | | | | | | | | | | | | | | | | | | | |
Standard Chartered Bank | | USD | | | 981,620 | | | EUR | | | 865,408 | | | | 09/15/15 | | | | (10,320 | ) |
Standard Chartered Bank | | EUR | | | 130,000 | | | USD | | | 143,092 | | | | 09/15/15 | | | | (2,815 | ) |
Toronto Dominion Bank | | USD | | | 1,849,872 | | | MXN | | | 28,539,834 | | | | 09/15/15 | | | | (143,323 | ) |
Toronto Dominion Bank | | MXN | | | 4,280,000 | | | USD | | | 263,323 | | | | 09/15/15 | | | | 7,399 | |
| | | | | | | | | | | | | | | | | | | | |
Total Unrealized Appreciation (Depreciation) on Open Foreign Currency Exchange Contracts | | | | (905,683 | ) |
| | | | | | | | | | | | | | | | | | | | |
During the year ended August 31, 2015, average notional value related to foreign currency exchange contracts was $70,739,530 or 38.5% of net assets.
See accompanying notes which are an integral part of the financial statements.
SSGA Emerging Markets Fund
Schedule of Investments, continued — August 31, 2015
Foreign Currency Abbreviations:
BRL - Brazilian Real
EUR - Euro Currency
HKD - Hong Kong Dollar
IDR - Indonesian Rupiah
INR - Indian Rupee
KRW - South Korean Won
MXN - Mexican Peso
MYR - Malaysian Ringgit
PEN - Peruvian Nuevo Sol
PHP - Philippine Peso
PLN - Polish Zloty
RUB - Russian Ruble
THB - Thai Baht
TRY - Turkish Lira
TWD - Taiwan Dollar
USD - United States Dollar
ZAR - South African Rand
See accompanying notes which are an integral part of the financial statements.
SSGA Emerging Markets Fund
Schedule of Investments, continued
Presentation of Portfolio Holdings — August 31, 2015
| | | | | | | | | | | | | | | | | | | | |
| | | Value* | | | % of
Net
Assets | |
| Categories | | Level 1 | | | Level 2 | | | Level 3 | | | Total | | |
Common Stocks | | | | | | | | | | | | | | | | | | | | |
Brazil | | $ | 7,541,683 | | | $ | 23,417 | | | $ | — | | | $ | 7,565,100 | | | | 4.1 | |
Canada | | | 183,404 | | | | — | | | | — | | | | 183,404 | | | | 0.1 | |
Cayman Islands | | | 4,950,575 | | | | — | | | | — | | | | 4,950,575 | | | | 2.7 | |
China | | | 24,646,985 | | | | — | | | | — | | | | 24,646,985 | | | | 13.4 | |
Egypt | | | 695,819 | | | | — | | | | — | | | | 695,819 | | | | 0.4 | |
Hong Kong | | | 10,981,859 | | | | — | | | | — | | | | 10,981,859 | | | | 6.0 | |
Hungary | | | 476,463 | | | | — | | | | — | | | | 476,463 | | | | 0.2 | |
India | | | 17,385,520 | | | | — | | | | — | | | | 17,385,520 | | | | 9.5 | |
Indonesia | | | 4,562,508 | | | | — | | | | — | | | | 4,562,508 | | | | 2.5 | |
Malaysia | | | 3,362,525 | | | | — | | | | — | | | | 3,362,525 | | | | 1.8 | |
Mexico | | | 8,445,250 | | | | — | | | | — | | | | 8,445,250 | | | | 4.6 | |
Oman | | | 432,030 | | | | — | | | | — | | | | 432,030 | | | | 0.2 | |
Philippines | | | 3,998,729 | | | | — | | | | — | | | | 3,998,729 | | | | 2.2 | |
Poland | | | 3,167,817 | | | | — | | | | — | | | | 3,167,817 | | | | 1.7 | |
Qatar | | | 1,661,713 | | | | — | | | | — | | | | 1,661,713 | | | | 0.9 | |
Russia | | | 6,968,415 | | | | — | | | | — | | | | 6,968,415 | | | | 3.8 | |
Singapore | | | 1,828,383 | | | | — | | | | — | | | | 1,828,383 | | | | 1.0 | |
South Africa | | | 13,832,576 | | �� | | — | | | | — | | | | 13,832,576 | | | | 7.5 | |
South Korea | | | 24,034,089 | | | | — | | | | — | | | | 24,034,089 | | | | 13.1 | |
Taiwan | | | 22,552,175 | | | | — | | | | — | | | | 22,552,175 | | | | 12.3 | |
Thailand | | | 1,493,416 | | | | 2,946,298 | | | | — | | | | 4,439,714 | | | | 2.4 | |
Turkey | | | 3,116,213 | | | | — | | | | — | | | | 3,116,213 | | | | 1.7 | |
United Arab Emirates | | | 1,663,289 | | | | — | | | | — | | | | 1,663,289 | | | | 0.9 | |
United Kingdom | | | 1,035,040 | | | | — | | | | — | | | | 1,035,040 | | | | 0.6 | |
Convertible Foreign Bond | | | | | | | | | | | | | | | | | | | | |
Oman | | | — | | | | 12,125 | | | | — | | | | 12,125 | | | | 0.0 | ** |
Preferred Stocks | | | | | | | | | | | | | | | | | | | | |
Brazil | | | 2,811,717 | | | | — | | | | — | | | | 2,811,717 | | | | 1.5 | |
South Korea | | | 1,476,297 | | | | — | | | | — | | | | 1,476,297 | | | | 0.8 | |
Equity-Linked Securities | | | | | | | | | | | | | | | | | | | | |
Saudi Arabia | | | — | | | | 3,110,309 | | | | — | | | | 3,110,309 | | | | 1.7 | |
Short-Term Investments | | | | | | | | | | | | | | | | | | | | |
United States | | | 4,871,221 | | | | — | | | | — | | | | 4,871,221 | | | | 2.7 | |
| | | | | | | | | | | | | | | | | | | | |
Total Investments | | $ | 178,175,711 | | | $ | 6,092,149 | | | $ | — | | | $ | 184,267,860 | | | | 100.3 | |
| | | | | | | | | | | | | | | | | | | | |
Other Assets and Liabilities, Net | | | | | | | | | | | | | | | | | | | (0.3 | ) |
| | | | | | | | | | | | | | | | | | | | |
| | | | | | | | | | | | | | | | | | | 100.0 | |
| | | | | | | | | | | | | | | | | | | | |
Assets: | | | | | | | | | | | | | | | | | | | | |
Other Financial Instruments*** | | | | | | | | | | | | | | | | | | | | |
Foreign Currency Exchange Contracts | | $ | — | | | $ | 691,644 | | | $ | — | | | $ | 691,644 | | | | 0.4 | |
| | | | | | | | | | | | | | | | | | | | |
Total Other Financial Instruments | | $ | — | | | $ | 691,644 | | | $ | — | | | $ | 691,644 | | | | 0.4 | |
| | | | | | | | | | | | | | | | | | | | |
Liabilities: | | | | | | | | | | | | | | | | | | | | |
Other Financial Instruments*** | | | | | | | | | | | | | | | | | | | | |
Foreign Currency Exchange Contracts | | $ | — | | | $ | (1,597,327 | ) | | $ | — | | | $ | (1,597,327 | ) | | | (0.9 | ) |
Futures Contracts | | | (327,943 | ) | | | — | | | | — | | | | (327,943 | ) | | | (0.2 | ) |
| | | | | | | | | | | | | | | | | | | | |
Total Other Financial Instruments | | $ | (327,943 | ) | | $ | (1,597,327 | ) | | $ | — | | | $ | (1,925,270 | ) | | | (1.1 | ) |
| | | | | | | | | | | | | | | | | | | | |
| * | | For a description of the levels, see Note 2 in the Notes to Financial Statements. During the year ended August 31, 2015, there were no material transfers between levels. |
| ** | | Less than 0.05% of net assets. |
| *** | | Other financial instruments reflected in the Schedule of Investments, such as futures and forwards, which are valued at the unrealized appreciation (depreciation) on the instruments. |
See accompanying notes which are an integral part of the financial statements.
SSGA International Stock Selection Fund
Portfolio Management Discussion and Analysis — August 31, 2015 (Unaudited)
Objective: The Fund seeks to provide long-term capital growth by investing primarily in securities of foreign issuers.
Invests In: Primarily equity securities of foreign issuers.
Strategy: The management team utilizes a proprietary bottom-up stock selection process that is based on a quantitative multi- factor model used to select the best securities within each underlying country in the MSCI EAFE Index. Portfolio construction focuses on strong risk controls relative to the benchmark, specifically controls for country and size exposures.
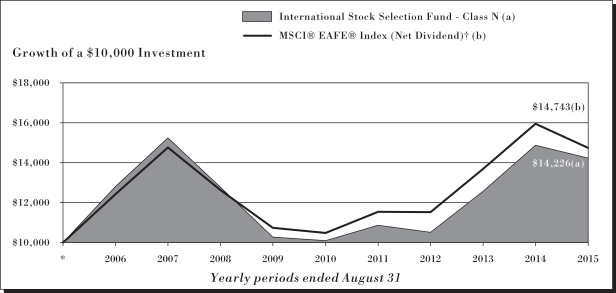
The growth of $10,000 is cumulative. The performance of other shares classes will vary based on the sales charges and the fee structure of those classes.
Index returns do not reflect any fees or expenses and it is not possible to invest directly into an index.
| * | Assumes initial investment on September 1, 2005. |
| † | The MSCI® EAFE® Index (Europe, Australasia, Far East) is a free float-adjusted market capitalization index that is designed to measure the equity market performance of developed markets, excluding the U.S. and Canada. The MSCI EAFE Index consists of the following 21 developed market country indices: Australia, Austria, Belgium, Denmark, Finland, France, Germany, Hong Kong, Ireland, Israel, Italy, Japan, the Netherlands, New Zealand, Norway, Portugal, Singapore, Spain, Sweden, Switzerland, and the United Kingdom. |
See related Notes on following page.
| | |
| 42 | | International Stock Selection Fund |
SSGA International Stock Selection Fund
Portfolio Management Discussion and Analysis, continued — August 31, 2015 (Unaudited)
Performance Summary
Average Annual Total Returns as of 8/31/2015
| | | | | | | | | | | | |
| Class N | | 1 Year | | | 5 Year | | | 10 Year | |
Unadjusted for Sales Charge | | | -4.31 | % | | | 7.10 | % | | | 3.59 | % |
MSCI EAFE Index (Net dividend)† | | | -7.47 | % | | | 7.05 | % | | | 3.96 | % |
| Class A | | 1 Year | | | 5 Year | | | 10 Year | |
Unadjusted for Sales Charge | | | -4.39 | % | | | 6.90 | % | | | 3.39 | % |
Adjusted for the Maximum Sale Charge (Max 5.25% load) | | | -9.39 | % | | | 5.75 | % | | | 2.83 | % |
MSCI EAFE Index (Net dividend)† | | | -7.47 | % | | | 7.05 | % | | | 3.96 | % |
| Class C | | 1 Year | | | 5 Year | | | 10 Year | |
Unadjusted for Sales Charge | | | -5.18 | % | | | 6.10 | % | | | 2.61 | % |
Adjusted for the Maximum Sale Charge (Max 1.00% CDSC) | | | -6.12 | % | | | 6.10 | % | | | 2.61 | % |
MSCI EAFE Index (Net dividend)† | | | -7.47 | % | | | 7.05 | % | | | 3.96 | % |
| Class I | | 1 Year | | | 5 Year | | | 10 Year | |
Unadjusted for Sales Charge | | | -4.21 | % | | | 7.12 | % | | | 3.60 | % |
MSCI EAFE Index (Net dividend)† | | | -7.47 | % | | | 7.05 | % | | | 3.96 | % |
| Class K | | 1 Year | | | 5 Year | | | 10 Year | |
Unadjusted for Sales Charge | | | -4.01 | % | | | 7.17 | % | | | 3.62 | % |
MSCI EAFE Index (Net dividend)† | | | -7.47 | % | | | 7.05 | % | | | 3.96 | % |
The maximum sales charge for Class A shares is 5.25%. A contingent deferred sales charge (“CDSC”) of 1.00% may be assessed on redemptions of Class A shares made within 18 months after purchase where no initial sales charge was paid at the time of purchase as part of an investment of $1,000,000 or more. There is no CDSC on Class C shares redeemed more than one year after purchase. A 1.00% CDSC may be assessed on redemptions of Class C shares during the first year only. Class N, Class I, and Class K are not subject to a sales charge.
Adjusted Performance shown for the periods prior to the inception of Classes A and C shares on July 7, 2014 reflect the historical performance of the Fund’s Class N shares adjusted to reflect the higher expenses of Classes A and C shares, estimated for their first year of operations, including applicable 12b-1 fees and the maximum sales load of Classes A and C. Unadjusted Performance shown for the periods prior to the inception of Classes A and C shares on July 7, 2014 reflects the historical performance of the Fund’s Class N shares adjusted to reflect the higher expenses of Classes A and C shares, estimated for their first year of operations, including applicable 12b-1 fees. Unadjusted returns do not reflect sales charges and would have been lower if they had. Performance shown for the periods prior to the inception of Class I and K shares on July 7, 2014, reflect the historical performance of the Fund’s Class N shares. Had the Fund’s Class I and K fees been reflected, the returns shown for those periods would have been higher.
Performance quoted represents past performance, which is no guarantee of future results. Investment return and principal value will fluctuate, so you may have a gain or loss when shares are sold. Current performance may be higher or lower than that quoted. Visit www.ssgafunds.com for most recent month-end performance. The returns do not reflect the deduction of taxes that a shareholder would pay on Fund distributions or on the redemption of Fund shares. Performance includes reinvestment of all distributions. The gross expense ratio for the International Stock Selection Fund as stated in the Fees and Expenses table of the prospectus dated December 18, 2014 is 1.26%, 1.46%, 2.21%, 1.21% and 1.01% for Class N, A, C, I and K, respectively, and may differ from the expense ratios disclosed in the Financial Highlights tables in this report.
| † | The MSCI® EAFE® Index (Europe, Australasia, Far East) is a free float-adjusted market capitalization index that is designed to measure the equity market performance of developed markets, excluding the U.S. and Canada. The MSCI EAFE Index consists of the following 21 developed market country indices: Australia, Austria, Belgium, Denmark, Finland, France, Germany, Hong Kong, Ireland, Israel, Italy, Japan, the Netherlands, New Zealand, Norway, Portugal, Singapore, Spain, Sweden, Switzerland, and the United Kingdom. |
Performance data reflects an expense limitation currently in effect, without which returns would have been lower.
| | | | |
| International Stock Selection Fund | | | 43 | |
SSGA International Stock Selection Fund
Management’s Discussion of Fund Performance, continued — August 31, 2015 (Unaudited)
SSGA International Stock Selection Fund (the “Fund”) seeks to provide long-term capital growth by investing primarily in securities of foreign issuers. The Fund is benchmarked to the MSCI EAFE Index (the “Index”).
For the 12-month period ended August 31, 2015 (the “Reporting Period”), the total return for Class N shares of the Fund was -4.31%, and the total return for the Index was -7.47%. The Fund and Index returns reflect the reinvestment of dividends and other income. The Fund’s performance reflects the expenses of managing the Fund, including brokerage and advisory expenses. The Index is unmanaged and Index returns do not reflect fees and expenses of any kind, which would have a negative impact on returns.
Both US and non-US stocks began the Reporting Period relatively flat. They improved through the close of 2014 and first half of 2015, but subsequently declined in August 2015. Economic activity in the US improved from 2014, despite a fairly weak close to the Reporting Period. The European Central Bank opened 2015 by unveiling a one trillion euro bond-buying program, which helped to facilitate investment across developed markets. The Fund’s systematic investment process focused on identifying stocks that would benefit from what we consider to be attractive valuations, strong investor sentiment, and continued global economic recovery. This strategy was most effective in Europe across consumer discretionary and financial stocks, while in Japan the Fund was most successful in consumer discretionary and technology stocks.
On an individual security level, the top contributors to the Fund’s performance relative to the Index were overweight positions in three Japanese companies: Fujifilm Holdings Corporation (“Fujifilm”), Fuji Heavy Industries, and Central Japan Railway. Fujifilm (Information Technology) widely outperformed the Index through the Reporting Period. The company was notably positive in July and August, benefiting from strong second quarter financial results, with operating profits outpacing consensus estimates. Fuji Heavy Industries (Consumer Discretionary) outperformed comparably through the period, with particular strength in 2014’s third quarter. The engine parts manufacturer posted exceptional sales and revenue results, opening the third quarter with a nearly 30% improvement in auto sales revenues. The Fund also benefited from an overweighting to Central Japan Railway (Industrials), as the company also outperformed through the period, with particular strength in 2015’s first quarter.
On the downside, the largest detractors to the Fund’s performance relative to the Index over the Reporting Period were in the consumer service and industrial sectors. Overweight positions to Sands China, Downer EDI, and Sembcorp Industries detracted. An overweighting relative to the Index to Sands China negatively affected returns, as the company widely underperformed through the Reporting Period. The company’s stock price was notably pressured downward in 2015’s first quarter, declining more than 10% on news that revenues derived from Macau gambling districts were considerably lower in the preceding quarter. Overweightings to Downer EDI and Sembcorp Industries also reduced relative performance over the Reporting Period as both companies widely underperformed the Index.
The views expressed above reflect those of the Fund’s portfolio manager only through the Reporting Period, and do not necessarily represent the views of the Adviser as a whole. Any such views are subject to change at any time based upon market or other conditions and the Adviser disclaims any responsibility to update such views. These views may not be relied on as investment advice and, because investment decisions for a fund are based on numerous factors, may not be relied on as an indication of trading intent on behalf of any fund.
| | |
| 44 | | International Stock Selection Fund |
SSGA International Stock Selection Fund
Shareholder Expense Example — August 31, 2015 (Unaudited)
Fund Expenses
The following disclosure provides important information regarding the Fund’s Expense Example, which appears on the Fund’s individual page in this Annual Report. Please refer to this information when reviewing the Expense Example for a Fund.
Example
As a shareholder of the Fund, you incur two types of costs: (1) transaction costs, and (2) ongoing costs, including advisory and administration fees; distribution (12b-1) and/or service fees; and other Fund expenses. The Example is intended to help you understand your ongoing costs (in dollars) of investing in the Fund and to compare these costs with the ongoing costs of investing in other mutual funds. The Example is based on an investment of $1,000 invested at the beginning of the period and held for the entire period indicated, which for this Fund is from March 1, 2015 to August 31, 2015.
Actual Expenses
The information in the table under the heading “Actual Performance” provides information about actual account values and actual expenses. You may use the information in this column, together with the amount you invested, to estimate the expenses that you paid over the period. Simply divide your account value by $1,000 (for example, an $8,600 account value divided by $1,000 = 8.6), then multiply the result by the number in the first column in the row entitled “Expenses Paid During Period” to estimate the expenses you paid on your account during this period.
Hypothetical Example for Comparison Purposes
The information in the table under the heading “Hypothetical Performance (5% return before expenses)” provides information about hypothetical account values and hypothetical expenses based on the Fund’s actual expense ratio and an assumed rate of return of 5% per year before expenses, which is not the Fund’s actual return. The hypothetical account values and expenses may not be used to estimate the actual ending account balance or expenses you paid for the period. You may use this information to compare the ongoing costs of investing in the Fund and other funds. To do so, compare this 5% hypothetical example with the 5% hypothetical examples that appear in the shareholder reports of other funds.
Please note that the expenses shown in the table are meant to highlight your ongoing costs only and do not reflect any transaction costs. Therefore, the information under the heading “Hypothetical Performance (5% return before expenses)” is useful in comparing ongoing costs only, and will not help you determine the relative total costs of owning different funds. In addition, if these transaction costs were included, your costs would have been higher.
| | | | | | | | | | | | |
Class N | | Annualized
Expense Ratio | | | Actual
Performance | | | Hypothetical
Performance
(5% return
before expenses) | |
Beginning Account Value March 1, 2015 | | | 1.00 | % | | $ | 1,000.00 | | | $ | 1,000.00 | |
Ending Account Value August 31, 2015 | | | | | | $ | 953.40 | | | $ | 1,020.16 | |
Expenses Paid During Period* | | | | | | $ | 4.92 | | | $ | 5.09 | |
Class A | | | | | | | | | |
Beginning Account Value March 1, 2015 | | | 1.20 | % | | $ | 1,000.00 | | | $ | 1,000.00 | |
Ending Account Value August 31, 2015 | | | | | | $ | 952.60 | | | $ | 1,019.15 | |
Expenses Paid During Period* | | | | | | $ | 5.91 | | | $ | 6.11 | |
Class C | | | | | | | | | |
Beginning Account Value March 1, 2015 | | | 1.94 | % | | $ | 1,000.00 | | | $ | 1,000.00 | |
Ending Account Value August 31, 2015 | | | | | | $ | 948.90 | | | $ | 1,015.42 | |
Expenses Paid During Period* | | | | | | $ | 9.53 | | | $ | 9.86 | |
Class I | | | | | | | | | |
Beginning Account Value March 1, 2015 | | | 0.95 | % | | $ | 1,000.00 | | | $ | 1,000.00 | |
Ending Account Value August 31, 2015 | | | | | | $ | 953.40 | | | $ | 1,020.41 | |
Expenses Paid During Period* | | | | | | $ | 4.68 | | | $ | 4.84 | |
Class K | | | | | | | | | |
Beginning Account Value March 1, 2015 | | | 0.74 | % | | $ | 1,000.00 | | | $ | 1,000.00 | |
Ending Account Value August 31, 2015 | | | | | | $ | 954.40 | | | $ | 1,021.47 | |
Expenses Paid During Period* | | | | | | $ | 3.65 | | | $ | 3.77 | |
| * | Expenses are equal to the Fund’s annualized expense ratio (representing the six month period annualized), multiplied by the average account value over the period, multiplied by 184/365 (to reflect the one-half year period). Includes amounts waived, reimbursed and/or other credits. Without the waiver, reimbursement and/or other credits, expenses would have been higher. |
| | | | |
| International Stock Selection Fund | | | 45 | |
SSGA International Stock Selection Fund
Schedule of Investments — August 31, 2015
| | | | | | | | |
| | | Principal
Amount ($)
or Shares | | | Value
$ | |
| | | | | | | | |
| Common Stocks - 97.9% | | | | | | | | |
Australia - 5.4% | | | | | | | | |
Beach Energy, Ltd. (a) | | | 2,597,614 | | | | 1,238,557 | |
BHP Billiton, Ltd. | | | 133,368 | | | | 2,389,868 | |
GPT Group (b) | | | 1,051,957 | | | | 3,361,327 | |
Primary Health Care, Ltd. (a) | | | 969,023 | | | | 2,854,966 | |
Wesfarmers, Ltd. | | | 52,839 | | | | 1,528,933 | |
Woodside Petroleum, Ltd. | | | 208,125 | | | | 4,778,099 | |
Woolworths, Ltd. (a) | | | 79,263 | | | | 1,489,158 | |
| | | | | | | | |
| | | | | | | 17,640,908 | |
| | | | | | | | |
| | |
Denmark - 4.5% | | | | | | | | |
AP Moeller - Maersk A/S (Class A) | | | 844 | | | | 1,409,765 | |
AP Moeller - Maersk A/S (Class B) | | | 1,323 | | | | 2,253,616 | |
Danske Bank A/S | | | 115,842 | | | | 3,587,761 | |
Novo Nordisk A/S (Class B) | | | 34,115 | | | | 1,893,639 | |
Vestas Wind Systems A/S | | | 106,086 | | | | 5,670,063 | |
| | | | | | | | |
| | | | | | | 14,814,844 | |
| | | | | | | | |
| | |
France - 11.7% | | | | | | | | |
Atos | | | 53,639 | | | | 4,076,739 | |
AXA SA | | | 80,691 | | | | 2,035,054 | |
BNP Paribas SA | | | 91,644 | | | | 5,786,715 | |
Cap Gemini SA | | | 34,054 | | | | 3,061,683 | |
Cie Generale des Etablissements Michelin | | | 13,302 | | | | 1,288,038 | |
CNP Assurances | | | 142,925 | | | | 2,205,271 | |
Engie | | | 232,838 | | | | 4,176,550 | |
Sanofi | | | 85,977 | | | | 8,506,566 | |
Total SA | | | 53,149 | | | | 2,433,658 | |
Valeo SA | | | 37,860 | | | | 4,758,277 | |
| | | | | | | | |
| | | | | | | 38,328,551 | |
| | | | | | | | |
| | |
Germany - 11.0% | | | | | | | | |
Continental AG | | | 22,371 | | | | 4,755,883 | |
Deutsche Bank AG | | | 135,891 | | | | 4,006,679 | |
Deutsche Telekom AG | | | 393,381 | | | | 6,729,642 | |
Deutz AG | | | 250,378 | | | | 1,466,621 | |
E.ON SE | | | 145,081 | | | | 1,645,121 | |
Infineon Technologies AG | | | 436,834 | | | | 4,781,348 | |
Merck KGaA | | | 21,505 | | | | 2,057,723 | |
METRO AG (a) | | | 201,604 | | | | 5,888,768 | |
OSRAM Licht AG | | | 85,382 | | | | 4,518,468 | |
| | | | | | | | |
| | | | | | | 35,850,253 | |
| | | | | | | | |
| | |
Hong Kong - 1.1% | | | | | | | | |
CK Hutchison Holdings, Ltd. | | | 178,500 | | | | 2,379,217 | |
Sands China, Ltd. | | | 312,800 | | | | 1,085,712 | |
| | | | | | | | |
| | | | | | | 3,464,929 | |
| | | | | | | | |
| | | | | | | | |
| | | Principal
Amount ($)
or Shares | | | Value
$ | |
Italy - 2.4% | | | | | | | | |
ENI SpA | | | 248,802 | | | | 4,084,598 | |
Mediaset SpA | | | 784,362 | | | | 3,760,096 | |
| | | | | | | | |
| | | | | | | 7,844,694 | |
| | | | | | | | |
| | |
Japan - 22.4% | | | | | | | | |
Canon, Inc. | | | 136,500 | | | | 4,173,758 | |
Central Japan Railway Co. | | | 35,300 | | | | 5,789,916 | |
Fuji Heavy Industries, Ltd. | | | 190,700 | | | | 6,717,403 | |
FUJIFILM Holdings Corp. | | | 182,400 | | | | 7,506,030 | |
Hankyu Hanshin Holdings, Inc. | | | 386,000 | | | | 2,317,879 | |
Iida Group Holdings Co., Ltd. | | | 197,300 | | | | 3,495,693 | |
Kirin Holdings Co., Ltd. | | | 99,100 | | | | 1,456,644 | |
Mirait Holdings Corp. | | | 100,200 | | | | 938,897 | |
Mitsubishi Electric Corp. | | | 517,000 | | | | 5,164,243 | |
Mitsubishi Materials Corp. | | | 835,000 | | | | 2,686,105 | |
Mitsubishi UFJ Financial Group, Inc. | | | 711,000 | | | | 4,692,301 | |
Mizuho Financial Group, Inc. | | | 3,219,600 | | | | 6,604,648 | |
Nippon Steel & Sumitomo Metal Corp. | | | 2,125,000 | | | | 4,376,727 | |
Nippon Telegraph & Telephone Corp. | | | 157,700 | | | | 6,021,959 | |
Otsuka Holdings Co., Ltd. | | | 114,600 | | | | 3,909,171 | |
Panasonic Corp. | | | 448,700 | | | | 4,950,190 | |
Sumitomo Mitsui Financial Group, Inc. | | | 21,501 | | | | 880,364 | |
Toyota Motor Corp. | | | 23,800 | | | | 1,411,883 | |
| | | | | | | | |
| | | | | | | 73,093,811 | |
| | | | | | | | |
| | |
Netherlands - 6.0% | | | | | | | | |
Heineken Holding NV | | | 66,405 | | | | 4,634,921 | |
ING Groep NV | | | 487,512 | | | | 7,464,659 | |
Koninklijke Ahold NV | | | 188,503 | | | | 3,726,079 | |
NN Group NV | | | 120,460 | | | | 3,680,119 | |
| | | | | | | | |
| | | | | | | 19,505,778 | |
| | | | | | | | |
| | |
New Zealand - 0.8% | | | | | | | | |
Spark New Zealand, Ltd. | | | 1,303,903 | | | | 2,793,278 | |
| | | | | | | | |
| | |
Singapore - 1.8% | | | | | | | | |
ComfortDelGro Corp., Ltd. | | | 2,218,200 | | | | 4,417,379 | |
Singapore Airlines, Ltd. | | | 188,200 | | | | 1,323,088 | |
| | | | | | | | |
| | | | | | | 5,740,467 | |
| | | | | | | | |
| | |
Spain - 1.4% | | | | | | | | |
Amadeus IT Holding SA (Class A) | | | 35,820 | | | | 1,499,691 | |
Banco Santander SA | | | 484,362 | | | | 2,967,658 | |
| | | | | | | | |
| | | | | | | 4,467,349 | |
| | | | | | | | |
| | |
| 46 | | International Stock Selection Fund |
SSGA International Stock Selection Fund
Schedule of Investments, continued — August 31, 2015
| | | | | | | | |
| | | Principal
Amount ($)
or Shares | | | Value
$ | |
| | | | | | | | |
Sweden - 0.4% | | | | | | | | |
Nordea Bank AB | | | 112,231 | | | | 1,328,319 | |
| | | | | | | | |
| | |
Switzerland - 9.5% | | | | | | | | |
Lonza Group AG | | | 31,338 | | | | 4,298,783 | |
Nestle SA | | | 12,134 | | | | 895,003 | |
Novartis AG | | | 111,979 | | | | 10,970,270 | |
Roche Holding AG | | | 33,225 | | | | 9,074,018 | |
Swiss Re AG | | | 66,292 | | | | 5,695,495 | |
| | | | | | | | |
| | | | | | | 30,933,569 | |
| | | | | | | | |
| | |
United Kingdom - 19.5% | | | | | | | | |
AstraZeneca PLC (c) | | | 12,836 | | | | 811,510 | |
Barclays PLC (c) | | | 1,986,202 | | | | 7,968,544 | |
Berendsen PLC (c) | | | 255,315 | | | | 3,909,973 | |
BHP Billiton PLC (c) | | | 287,042 | | | | 4,986,075 | |
BP PLC (c) | | | 772,458 | | | | 4,273,140 | |
BT Group PLC (c) | | | 960,183 | | | | 6,443,919 | |
Direct Line Insurance Group PLC (c) | | | 1,140,543 | | | | 6,179,827 | |
HSBC Holdings PLC (c) | | | 175,405 | | | | 1,396,128 | |
Imperial Tobacco Group PLC (c) | | | 153,539 | | | | 7,442,782 | |
Lloyds Banking Group PLC (c) | | | 4,747,730 | | | | 5,637,437 | |
Man Group PLC (c) | | | 1,023,953 | | | | 2,531,293 | |
Rio Tinto PLC (c) | | | 127,994 | | | | 4,690,195 | |
Royal Dutch Shell PLC (Class A) (c) | | | 175,404 | | | | 4,562,219 | |
Royal Dutch Shell PLC (Class B) (c) | | | 109,715 | | | | 2,873,024 | |
| | | | | | | | |
| | | | | | | 63,706,066 | |
| | | | | | | | |
| | |
Total Common Stocks
(cost $318,663,334) | | | | | | | 319,512,816 | |
| | | | | | | | |
|
| Short-Term Investments - 2.1% | |
United States - 2.1% | | | | | | | | |
SSGA Prime Money Market Fund
0.24% (d)(e) | | | 3,492,482 | | | | 3,492,482 | |
State Street Navigator Securities Lending Prime Portfolio (d)(f) | | | 3,247,773 | | | | 3,247,773 | |
| | | | | | | | |
| |
Total Short-Term Investments
(cost $6,740,255) | | | | 6,740,255 | |
| | | | | | | | |
| |
Total Investments - 100.0%
(cost $325,403,589) | | | | 326,253,071 | |
| |
Other Assets and Liabilities,
Net - (0.0)% (g) | | | | (81,977 | ) |
| | | | | | | | |
| | |
| Net Assets - 100.0% | | | | | | | 326,171,094 | |
| | | | | | | | |
Footnotes:
| (a) | All or a portion of the shares of this security are on loan. |
| (b) | Real Estate Investment Trust (REIT) |
| (c) | Security is valued at fair value as determined in good faith by the Trust’s Oversight Committee in accordance with procedures approved by the Board of Trustees. Security value is determined based on Level 2 inputs. Represents $63,706,066 or 19.5% of net assets (Note 2) |
| (d) | Affiliated Fund managed by SSGA Funds Management, Inc. (Note 4). |
| (e) | The rate shown is the annualized seven-day yield at period end. |
| (f) | Investments of cash collateral for securities loaned |
| (g) | Less than 0.05% of net assets |
Abbreviation:
PLC - Public Limited Company
| | | | | | | | |
| Sector Exposure | | % of
Net
Assets | | | Value
$ | |
Common Stocks | | | | | | | | |
Consumer Discretionary | | | 9.9 | | | | 32,223,175 | |
Consumer Staples | | | 8.3 | | | | 27,062,288 | |
Energy | | | 7.4 | | | | 24,243,295 | |
Financials | | | 23.9 | | | | 78,009,599 | |
Health Care | | | 13.6 | | | | 44,376,646 | |
Industrials | | | 12.7 | | | | 41,559,125 | |
Information Technology | | | 7.7 | | | | 25,099,249 | |
Materials | | | 5.9 | | | | 19,128,970 | |
Telecommunication Services | | | 6.7 | | | | 21,988,798 | |
Utilities | | | 1.8 | | | | 5,821,671 | |
Short-Term Investments | | | 2.1 | | | | 6,740,255 | |
| | | | | | | | |
Total Investments | | | 100.0 | | | | 326,253,071 | |
Other Assets & Liabilities, Net | | | (0.0 | )* | | | (81,977 | ) |
| | | | | | | | |
| | | 100.0 | | | | 326,171,094 | |
| | | | | | | | |
| * | Less than 0.05% of net assets. |
See accompanying notes which are an integral part of the financial statements.
| | | | |
| International Stock Selection Fund | | | 47 | |
SSGA International Stock Selection Fund
Schedule of Investments, continued
Presentation of Portfolio Holdings — August 31, 2015
| | | | | | | | | | | | | | | | | | | | |
| | | Value* | | | % of
Net
Assets | |
| Categories | | Level 1 | | | Level 2 | | | Level 3 | | | Total | | |
Common Stocks | | | | | | | | | | | | | | | | | | | | |
Australia | | $ | 17,640,908 | | | $ | — | | | $ | — | | | $ | 17,640,908 | | | | 5.4 | |
Denmark | | | 14,814,844 | | | | — | | | | — | | | | 14,814,844 | | | | 4.5 | |
France | | | 38,328,551 | | | | — | | | | — | | | | 38,328,551 | | | | 11.7 | |
Germany | | | 35,850,253 | | | | — | | | | — | | | | 35,850,253 | | | | 11.0 | |
Hong Kong | | | 3,464,929 | | | | — | | | | — | | | | 3,464,929 | | | | 1.1 | |
Italy | | | 7,844,694 | | | | — | | | | — | | | | 7,844,694 | | | | 2.4 | |
Japan | | | 73,093,811 | | | | — | | | | — | | | | 73,093,811 | | | | 22.4 | |
Netherlands | | | 19,505,778 | | | | — | | | | — | | | | 19,505,778 | | | | 6.0 | |
New Zealand | | | 2,793,278 | | | | — | | | | — | | | | 2,793,278 | | | | 0.8 | |
Singapore | | | 5,740,467 | | | | — | | | | — | | | | 5,740,467 | | | | 1.8 | |
Spain | | | 4,467,349 | | | | — | | | | — | | | | 4,467,349 | | | | 1.4 | |
Sweden | | | 1,328,319 | | | | — | | | | — | | | | 1,328,319 | | | | 0.4 | |
Switzerland | | | 30,933,569 | | | | — | | | | — | | | | 30,933,569 | | | | 9.5 | |
United Kingdom | | | — | | | | 63,706,066 | | | | — | | | | 63,706,066 | | | | 19.5 | |
Short-Term Investments | | | | | | | | | | | | | | | | | | | | |
United States | | | 6,740,255 | | | | — | | | | — | | | | 6,740,255 | | | | 2.1 | |
| | | | | | | | | | | | | | | | | | | | |
Total Investments | | $ | 262,547,005 | | | $ | 63,706,066 | | | $ | — | | | $ | 326,253,071 | | | | 100.0 | |
| | | | | | | | | | | | | | | | | | | | |
Other Assets and Liabilities, Net | | | | | | | | | | | | | | | | | | | (0.0 | )** |
| | | | | | | | | | | | | | | | | | | | |
| | | | | | | | | | | | | | | | | | | 100.0 | |
| | | | | | | | | | | | | | | | | | | | |
| * | | For a description of the levels, see Note 2 in the Notes to Financial Statements. During the year ended August 31, 2015, there were transfers in the amount of $40,644,198 from Level 1 to Level 2 due to a market closure in observance of a holiday. At August 31, 2015, these investments were valued at prior day exchange closing prices in accordance with the Fund’s valuation policies. |
| ** | | Less than 0.05% of net assets. |
See accompanying notes which are an integral part of the financial statements.
| | |
| 48 | | International Stock Selection Fund |
SSGA High Yield Bond Fund
Portfolio Management Discussion and Analysis — August 31, 2015 (Unaudited)
Objective: The Fund seeks to maximize total return by investing primarily in fixed-income securities, including but not limited to those represented by the Barclays U.S. Corporate High-Yield Bond Index.
Invests in: Primarily domestic, high yield (non-investment grade bonds).
Strategy: Fund Managers make investment decisions that enable the Fund’s performance to seek excess returns over Barclays U.S. High-Yield 2% Issuer Capped Index.
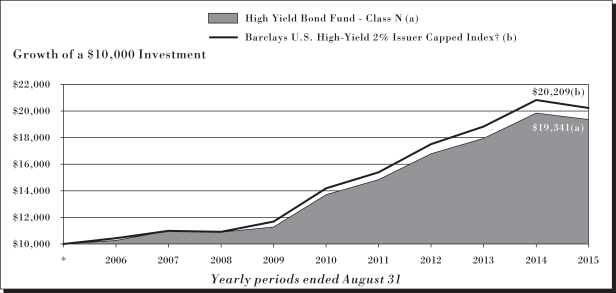
The growth of $10,000 is cumulative. The performance of other shares classes will vary based on the sales charges and the fee structure of those classes.
Index returns do not reflect any fees or expenses and it is not possible to invest directly into an index.
| * | Assumes initial investment on September 1, 2005. |
| † | The Barclays U.S. High-Yield 2% Issuer Capped Index is an issuer-constrained version Corporate High-Yield Index that covers the USD-denominated non-investment grade, fixed-rate, taxable corporate U.S. High-Yield 2% Issuer Capped Index follows the same index construction rules as the uncapped index but limits exposure of each issuer to 2% of the total market value and redistributes the excess market value index-side on basis. |
See related Notes on following page.
SSGA High Yield Bond Fund
Portfolio Management Discussion and Analysis, continued — August 31, 2015 (Unaudited)
Performance Summary
Average Annual Total Returns as of 8/31/2015
| | | | | | | | | | | | |
| Class N | | 1 Year | | | 5 Year | | | 10 Year | |
Unadjusted for Sales Charge | | | -2.38 | % | | | 7.12 | % | | | 6.82 | % |
Barclays U.S. High-Yield 2% Issuer Capped Index† | | | -2.93 | % | | | 7.32 | % | | | 7.29 | % |
| Class A | | 1 Year | | | 5 Year | | | 10 Year | |
Unadjusted for Sales Charge | | | -2.57 | % | | | 6.92 | % | | | 6.61 | % |
Adjusted for the Maximum Sale Charge (Max 3.75% load) | | | -6.27 | % | | | 6.09 | % | | | 6.21 | % |
Barclays U.S. High-Yield 2% Issuer Capped Index† | | | -2.93 | % | | | 7.32 | % | | | 7.29 | % |
| Class C | | 1 Year | | | 5 Year | | | 10 Year | |
Unadjusted for Sales Charge | | | -3.28 | % | | | 6.14 | % | | | 5.82 | % |
Adjusted for the Maximum Sale Charge (Max 1.00% CDSC) | | | -4.18 | % | | | 6.14 | % | | | 5.82 | % |
Barclays U.S. High-Yield 2% Issuer Capped Index† | | | -2.93 | % | | | 7.32 | % | | | 7.29 | % |
| Class I | | 1 Year | | | 5 Year | | | 10 Year | |
Unadjusted for Sales Charge | | | -2.22 | % | | | 7.16 | % | | | 6.84 | % |
Barclays U.S. High-Yield 2% Issuer Capped Index† | | | -2.93 | % | | | 7.32 | % | | | 7.29 | % |
| Class K | | 1 Year | | | 5 Year | | | 10 Year | |
Unadjusted for Sales Charge | | | -2.03 | %* | | | 7.21 | % | | | 6.86 | % |
Barclays U.S. High-Yield 2% Issuer Capped Index† | | | -2.93 | % | | | 7.32 | % | | | 7.29 | % |
The maximum sales charge for Class A shares is 3.75%. A contingent deferred sales charge (“CDSC”) of 1.00% may be assessed on redemptions of Class A shares made within 18 months after purchase where no initial sales charge was paid at the time of purchase as part of an investment of $1,000,000 or more. There is no CDSC on Class C shares redeemed more than one year after purchase. A 1.00% CDSC may be assessed on redemptions of Class C shares during the first year only. Class N, Class I, and Class K are not subject to a sales charge.
Adjusted Performance shown for the periods prior to the inception of Classes A and C shares on July 7, 2014 reflect the historical performance of the Fund’s Class N shares adjusted to reflect the higher expenses of Classes A and C shares, estimated for their first year of operations, including applicable 12b-1 fees and the maximum sales load of Classes A and C. Unadjusted Performance shown for the periods prior to the inception of Classes A and C shares on July 7, 2014 reflects the historical performance of the Fund’s Class N shares adjusted to reflect the higher expenses of Classes A and C shares, estimated for their first year of operations, including applicable 12b-1 fees. Unadjusted returns do not reflect sales charges and would have been lower if they had. Performance shown for the periods prior to the inception of Class I and K shares on July 7, 2014, reflect the historical performance of the Fund’s Class N shares. Had the Fund’s Class I and K fees been reflected, the returns shown for those periods would have been higher.
Performance quoted represents past performance, which is no guarantee of future results. Investment return and principal value will fluctuate, so you may have a gain or loss when shares are sold. Current performance may be higher or lower than that quoted. Visit www.ssgafunds.com for most recent month-end performance. The returns do not reflect the deduction of taxes that a shareholder would pay on Fund distributions or on the redemption of Fund shares. Performance includes reinvestment of all distributions. The gross expense ratio for the High Yield Bond Fund as stated in the Fees and Expenses table of the prospectus dated December 18, 2014 is 0.86%, 1.06%, 1.81%, 0.81% and 0.61% for Class N, A, C, I and K, respectively, and may differ from the expense ratios disclosed in the Financial Highlights tables in this report.
| † | The Barclays U.S. High-Yield 2% Issuer Capped Index is an issuer-constrained version Corporate High-Yield Index that covers the USD-denominated non-investment grade, fixed-rate, taxable corporate U.S. High-Yield 2% Issuer Capped Index follows the same index construction rules as the uncapped index but limits exposure of each issuer to 2% of the total market value and redistributes the excess market value index-side on basis. |
| * | Performance results do not include adjustments made for financial reporting purposes in accordance with U.S. generally accepted accounting principles and may differ from amounts reported in the financial highlights. |
Performance data reflects an expense limitation currently in effect, without which returns would have been lower.
SSGA High Yield Bond Fund
Management’s Discussion of Fund Performance, continued — August 31, 2015 (Unaudited)
SSGA High Yield Bond Fund (the “Fund”) seeks to maximize total return by investing primarily in fixed-income securities, including, but not limited to, those represented by the Barclays U.S. High-Yield 2% Issuer Capped Index (the “Index”).
For the 12-month period ended August 31, 2015 (the “Reporting Period”), the total return for Class N shares of the Fund was -2.38%, and the total return for the Index was -2.93%. The Fund and Index returns reflect the reinvestment of dividends and other income. The Fund’s performance reflects the expenses of managing the Fund, including brokerage and advisory expenses. The Index is unmanaged and Index returns do not reflect fees and expenses of any kind, which would have a negative impact on returns.
In contrast with the previous reporting period, ended August 31, 2014, which favored riskier products over “safe-haven” assets, this year’s Reporting Period ended with mixed support at both ends of the risk spectrum. However, credit-exposed products — including high-yield bonds — considerably underperformed comparable duration-matched Treasuries over the Reporting Period, as US Treasuries rallied well into January 2015.
In October 2014, the Federal Reserve (the “Fed”) concluded its bond-purchasing program, as it had promised over the summer. Volatility returned, as US fixed-income markets adjusted to losing the large purchases made by the central bank since 2008. At the beginning of 2015, a deteriorating global growth outlook spurred investors to seek out “safe-haven” assets and abandon riskier instruments, as global stock markets and oil prices plummeted and fears of deflation emerged across the globe. As investors considered the outlook for a Fed interest rate hike, they saw signs of health in the US labor market, as a string of strong job statistics ended 2014. However, the absence of wage growth in the US seemed as if it could stall a Fed rate hike. As stock and oil prices began to show signs of stability in April and May of 2015, investors shed US fixed-income assets at the fastest pace since the 2013 “taper tantrum” that followed the Fed’s warning that it would taper off its bond-buying program. This supported demand for risky assets, such as high-yield bonds. The high-yield sector’s option-adjusted spread, a measure of how much more return investors demand for investing in riskier assets, narrowed as a result.
International issues began to overshadow the US outlook in June, as talks between Greece and its creditors broke down mid-month, leading Greek Prime Minister Tsipras to call for a referendum. Although the contagion effects of an uncertain Greek vote was contained within Greek and surrounding periphery bonds, investors sought safety. This allowed for a small rally in assets perceived as risk-free, such as US Treasuries, through the end of July 2015. August 2015 brought a fresh round of uncertainty, as lackluster growth and unexpected currency devaluation in China sent waves of panic throughout equity and commodity markets and may have contributed to a sharp decline in oil prices. These events, coupled with the uncertainty of a September interest rate increase by the Fed, may have contributed to investors shying away from the high-yield sector. As a result, spreads widened to their highest level for the Reporting Period.
For the Reporting Period, the Fund outperformed the Index. The Fund’s security selection in the industrial sector and its smaller allocation to lower-rated securities (securities rated Ca by Moody’s, or the equivalent, and below) aided the performance of the Fund relative to the Index over the Reporting Period.
The views expressed above reflect those of the Fund’s portfolio manager only through the Reporting Period, and do not necessarily represent the views of the Adviser as a whole. Any such views are subject to change at any time based upon market or other conditions and the Adviser disclaims any responsibility to update such views. These views may not be relied on as investment advice and, because investment decisions for a fund are based on numerous factors, may not be relied on as an indication of trading intent on behalf of any fund.
SSGA High Yield Bond Fund
Shareholder Expense Example — August 31, 2015 (Unaudited)
Fund Expenses
The following disclosure provides important information regarding the Fund’s Expense Example, which appears on the Fund’s individual page in this Annual Report. Please refer to this information when reviewing the Expense Example for a Fund.
Example
As a shareholder of the Fund, you incur two types of costs: (1) transaction costs, and (2) ongoing costs, including advisory and administration fees; distribution (12b-1) and/or service fees; and other Fund expenses. The Example is intended to help you understand your ongoing costs (in dollars) of investing in the Fund and to compare these costs with the ongoing costs of investing in other mutual funds. The Example is based on an investment of $1,000 invested at the beginning of the period and held for the entire period indicated, which for this Fund is from March 1, 2015 to August 31, 2015.
Actual Expenses
The information in the table under the heading “Actual Performance” provides information about actual account values and actual expenses. You may use the information in this column, together with the amount you invested, to estimate the expenses that you paid over the period. Simply divide your account value by $1,000 (for example, an $8,600 account value divided by $1,000 = 8.6), then multiply the result by the number in the first column in the row entitled “Expenses Paid During Period” to estimate the expenses you paid on your account during this period.
Hypothetical Example for Comparison Purposes
The information in the table under the heading “Hypothetical Performance (5% return before expenses)” provides information about hypothetical account values and hypothetical expenses based on the Fund’s actual expense ratio and an assumed rate of return of 5% per year before expenses, which is not the Fund’s actual return. The hypothetical account values and expenses may not be used to estimate the actual ending account balance or expenses you paid for the period. You may use this information to compare the ongoing costs of investing in the Fund and other funds. To do so, compare this 5% hypothetical example with the 5% hypothetical examples that appear in the shareholder reports of other funds.
Please note that the expenses shown in the table are meant to highlight your ongoing costs only and do not reflect any transaction costs. Therefore, the information under the heading “Hypothetical Performance (5% return before expenses)” is useful in comparing ongoing costs only, and will not help you determine the relative total costs of owning different funds. In addition, if these transaction costs were included, your costs would have been higher.
| | | | | | | | | | | | |
Class N | | Annualized
Expense Ratio | | | Actual
Performance | | | Hypothetical
Performance
(5% return
before expenses) | |
Beginning Account Value March 1, 2015 | | | 0.75 | % | | $ | 1,000.00 | | | $ | 1,000.00 | |
Ending Account Value August 31, 2015 | | | | | | $ | 982.70 | | | $ | 1,021.42 | |
Expenses Paid During Period* | | | | | | $ | 3.75 | | | $ | 3.82 | |
Class A | | | | | | | | | |
Beginning Account Value March 1, 2015 | | | 0.94 | % | | $ | 1,000.00 | | | $ | 1,000.00 | |
Ending Account Value August 31, 2015 | | | | | | $ | 981.80 | | | $ | 1,020.46 | |
Expenses Paid During Period* | | | | | | $ | 4.70 | | | $ | 4.79 | |
Class C | | | | | | | | | |
Beginning Account Value March 1, 2015 | | | 1.70 | % | | $ | 1,000.00 | | | $ | 1,000.00 | |
Ending Account Value August 31, 2015 | | | | | | $ | 978.10 | | | $ | 1,016.63 | |
Expenses Paid During Period* | | | | | | $ | 8.48 | | | $ | 8.64 | |
Class I | | | | | | | | | |
Beginning Account Value March 1, 2015 | | | 0.70 | % | | $ | 1,000.00 | | | $ | 1,000.00 | |
Ending Account Value August 31, 2015 | | | | | | $ | 982.90 | | | $ | 1,021.67 | |
Expenses Paid During Period* | | | | | | $ | 3.50 | | | $ | 3.57 | |
Class K | | | | | | | | | |
Beginning Account Value March 1, 2015 | | | 0.50 | % | | $ | 1,000.00 | | | $ | 1,000.00 | |
Ending Account Value August 31, 2015 | | | | | | $ | 983.90 | | | $ | 1,022.68 | |
Expenses Paid During Period* | | | | | | $ | 2.50 | | | $ | 2.55 | |
| * | Expenses are equal to the Fund’s annualized expense ratio (representing the six month period annualized), multiplied by the average account value over the period, multiplied by 184/365 (to reflect the one-half year period). Includes amounts waived, reimbursed and/or other credits. Without the waiver, reimbursement and/or other credits, expenses would have been higher. |
SSGA High Yield Bond Fund
Schedule of Investments — August 31, 2015
| | | | | | | | |
| | | Principal
Amount ($)
or Shares | | | Value
$ | |
| | | | | | | | |
| Long-Term Investments - 94.6% | |
Corporate Bonds and Notes - 78.4% | |
24 Hour Holdings III LLC
8.000%, due 06/01/22 (a) | | | 450,000 | | | | 357,750 | |
ACE Cash Express, Inc.
11.000%, due 02/01/19 (a) | | | 300,000 | | | | 117,000 | |
ADT Corp.
3.500%, due 07/15/22 | | | 500,000 | | | | 447,650 | |
AECOM
5.875%, due 10/15/24 (a) | | | 259,000 | | | | 260,943 | |
AES Corp. | | | | | | | | |
3.324%, due 06/01/19 (b) | | | 350,000 | | | | 346,500 | |
4.875%, due 05/15/23 | | | 150,000 | | | | 139,500 | |
Ahern Rentals, Inc.
7.375%, due 05/15/23 (a) | | | 150,000 | | | | 131,250 | |
Air Medical Merger Sub Corp.
6.375%, due 05/15/23 (a) | | | 250,000 | | | | 232,500 | |
AK Steel Corp.
7.625%, due 10/01/21 | | | 300,000 | | | | 188,250 | |
Alcatel-Lucent USA, Inc.
6.750%, due 11/15/20 (a) | | | 250,000 | | | | 266,875 | |
Alcoa, Inc. | | | | | | | | |
6.150%, due 08/15/20 | | | 375,000 | | | | 398,437 | |
5.125%, due 10/01/24 | | | 175,000 | | | | 171,500 | |
5.950%, due 02/01/37 | | | 250,000 | | | | 242,813 | |
Alere, Inc.
6.375%, due 07/01/23 (a) | | | 133,000 | | | | 136,325 | |
Ally Financial, Inc. | | | | | | | | |
3.600%, due 05/21/18 | | | 100,000 | | | | 100,000 | |
4.750%, due 09/10/18 | | | 300,000 | | | | 309,375 | |
3.750%, due 11/18/19 | | | 200,000 | | | | 199,500 | |
4.125%, due 02/13/22 | | | 200,000 | | | | 195,500 | |
5.125%, due 09/30/24 | | | 350,000 | | | | 353,500 | |
4.625%, due 03/30/25 | | | 150,000 | | | | 144,750 | |
8.000%, due 11/01/31 | | | 250,000 | | | | 295,992 | |
Alphabet Holding Co., Inc. PIK
7.750%, due 11/01/17 | | | 333,000 | | | | 332,167 | |
American Axle & Manufacturing, Inc.
5.125%, due 02/15/19 | | | 250,000 | | | | 253,125 | |
Amsurg Corp.
5.625%, due 11/30/20 | | | 200,000 | | | | 205,000 | |
Antero Resources Corp.
5.625%, due 06/01/23 (a) | | | 617,000 | | | | 561,470 | |
ARC Properties Operating Partnership LP
4.600%, due 02/06/24 | | | 450,000 | | | | 429,750 | |
ArcelorMittal
10.600%, due 06/01/19 | | | 600,000 | | | | 699,000 | |
Argos Merger Sub, Inc.
7.125%, due 03/15/23 (a) | | | 478,000 | | | | 500,705 | |
Artesyn Escrow, Inc.
9.750%, due 10/15/20 (a) | | | 125,000 | | | | 123,125 | |
| | | | | | | | |
| | | Principal
Amount ($)
or Shares | | | Value
$ | |
Asbury Automotive Group, Inc.
6.000%, due 12/15/24 | | | 250,000 | | | | 260,625 | |
Ashtead Capital, Inc.
5.625%, due 10/01/24 (a) | | | 225,000 | | | | 223,454 | |
Audatex North America, Inc.
6.000%, due 06/15/21 (a) | | | 315,000 | | | | 307,585 | |
Bank of America Corp.
Series Z
6.500%, due
10/23/24 (b)(c) | | | 175,000 | | | | 180,250 | |
BI-LO LLC/BI-LO Finance Corp.
9.250%, due 02/15/19 (a) | | | 300,000 | | | | 305,250 | |
Blackboard, Inc.
7.750%, due 11/15/19 (a) | | | 425,000 | | | | 380,375 | |
Blue Racer Midstream LLC/Blue Racer Finance Corp.
6.125%, due 11/15/22 (a) | | | 175,000 | | | | 171,500 | |
BlueLine Rental Finance Corp.
7.000%, due 02/01/19 (a) | | | 250,000 | | | | 236,250 | |
Builders FirstSource, Inc.
10.750%, due 08/15/23 (a) | | | 211,000 | | | | 214,165 | |
BWAY Holding Co.
9.125%, due 08/15/21 (a) | | | 375,000 | | | | 380,625 | |
C&S Group Enterprises LLC
5.375%, due 07/15/22 (a) | | | 200,000 | | | | 185,000 | |
California Resources Corp.
6.000%, due 11/15/24 | | | 350,000 | | | | 259,525 | |
Calpine Corp.
5.375%, due 01/15/23 | | | 635,000 | | | | 612,584 | |
Calumet Specialty Products Partners LP/Calumet Finance Corp.
7.625%, due 01/15/22 | | | 200,000 | | | | 195,000 | |
Carlson Travel Holdings, Inc. PIK
7.500%, due 08/15/19 (a) | | | 330,000 | | | | 334,125 | |
CCO Holdings LLC/CCO Holdings Capital Corp.
5.125%, due 05/01/23 (a) | | | 300,000 | | | | 300,000 | |
Century Intermediate Holding Co. 2 PIK
9.750%, due 02/15/19 (a) | | | 190,000 | | | | 197,125 | |
CenturyLink, Inc.
Series W
6.750%, due 12/01/23 | | | 390,000 | | | | 379,275 | |
Cequel Communications Escrow 1 LLC/Cequel Communications Escrow Capital Corp.
6.375%, due 09/15/20 (a) | | | 300,000 | | | | 294,525 | |
Chesapeake Energy Corp. | | | | | | | | |
5.375%, due 06/15/21 | | | 287,000 | | | | 210,228 | |
4.875%, due 04/15/22 | | | 200,000 | | | | 145,000 | |
Churchill Downs, Inc.
5.375%, due 12/15/21 | | | 300,000 | | | | 306,000 | |
SSGA High Yield Bond Fund
Schedule of Investments, continued — August 31, 2015
| | | | | | | | |
| | | Principal
Amount ($)
or Shares | | | Value
$ | |
| | | | | | | | |
CIT Group, Inc. | | | | | | | | |
5.250%, due 03/15/18 | | | 400,000 | | | | 415,500 | |
3.875%, due 02/19/19 | | | 530,000 | | | | 530,000 | |
Claire’s Stores, Inc.
9.000%, due 03/15/19 (a) | | | 325,000 | | | | 275,437 | |
Constellation Brands, Inc.
6.000%, due 05/01/22 | | | 300,000 | | | | 330,750 | |
Crestwood Midstream Partners LP/Crestwood Midstream Finance Corp.
6.250%, due 04/01/23 (a) | | | 370,000 | | | | 334,850 | |
DaVita HealthCare Partners, Inc.
5.000%, due 05/01/25 | | | 295,000 | | | | 289,100 | |
Dean Foods Co.
6.500%, due 03/15/23 (a) | | | 290,000 | | | | 292,900 | |
Denbury Resources, Inc.
5.500%, due 05/01/22 | | | 500,000 | | | | 356,250 | |
DISH DBS Corp.
5.875%, due 11/15/24 | | | 460,000 | | | | 419,175 | |
DJO Finco, Inc./DJO Finance LLC/DJO Finance Corp.
8.125%, due 06/15/21 (a) | | | 354,000 | | | | 366,213 | |
DR Horton, Inc.
4.000%, due 02/15/20 | | | 252,000 | | | | 253,260 | |
Dynegy, Inc. | | | | | | | | |
7.375%, due 11/01/22 | | | 200,000 | | | | 207,000 | |
7.625%, due 11/01/24 | | | 360,000 | | | | 374,688 | |
Eldorado Resorts, Inc.
7.000%, due 08/01/23 (a) | | | 181,000 | | | | 179,643 | |
EP Energy LLC/EP Energy Finance, Inc.
9.375%, due 05/01/20 | | | 425,000 | | | | 411,612 | |
EP Energy LLC/Everest Acquisition Finance, Inc.
6.375%, due 06/15/23 | | | 114,000 | | | | 96,900 | |
Equinix, Inc.
5.375%, due 01/01/22 | | | 400,000 | | | | 404,000 | |
ExamWorks Group, Inc.
5.625%, due 04/15/23 | | | 140,000 | | | | 143,325 | |
First Data Corp.
6.750%, due 11/01/20 (a) | | | 224,000 | | | | 235,760 | |
Florida East Coast Holdings Corp.
9.750%, due 05/01/20 (a) | | | 450,000 | | | | 405,000 | |
Fresenius Medical Care US Finance II, Inc.
4.125%, due 10/15/20 (a) | | | 265,000 | | | | 269,637 | |
Frontier Communications Corp. | | | | | | | | |
9.250%, due 07/01/21 | | | 250,000 | | | | 256,875 | |
7.125%, due 01/15/23 | | | 300,000 | | | | 270,900 | |
Gates Global LLC/Gates Global Co.
6.000%, due 07/15/22 (a) | | | 295,000 | | | | 240,455 | |
Genworth Financial, Inc.
6.150%, due 11/15/66 (b) | | | 600,000 | | | | 302,580 | |
| | | | | | | | |
| | | Principal
Amount ($)
or Shares | | | Value
$ | |
Group 1 Automotive, Inc.
5.000%, due 06/01/22 | | | 450,000 | | | | 446,625 | |
Halcon Resources Corp.
8.625%, due 02/01/20 (a) | | | 247,000 | | | | 216,743 | |
HCA Holdings, Inc.
6.250%, due 02/15/21 | | | 1,000,000 | | | | 1,085,000 | |
HCA, Inc.
4.250%, due 10/15/19 | | | 500,000 | | | | 510,000 | |
HD Supply, Inc.
11.500%, due 07/15/20 | | | 500,000 | | | | 572,500 | |
Hexion, Inc.
6.625%, due 04/15/20 | | | 500,000 | | | | 466,250 | |
Hill-Rom Holdings, Inc.
5.750%, due 09/01/23 (a) | | | 200,000 | | | | 203,500 | |
International Lease Finance Corp. | | | | | | | | |
6.250%, due 05/15/19 | | | 525,000 | | | | 565,687 | |
8.250%, due 12/15/20 | | | 350,000 | | | | 414,750 | |
j2 Global, Inc.
8.000%, due 08/01/20 | | | 500,000 | | | | 536,250 | |
Jack Cooper Holdings Corp.
10.250%, due 06/01/20 (a) | | | 200,000 | | | | 182,000 | |
Jaguar Holding Co. II/Pharmaceutical Product Development LLC
6.375%, due 08/01/23 (a) | | | 340,000 | | | | 336,940 | |
Lennar Corp. | | | | | | | | |
4.500%, due 06/15/19 | | | 50,000 | | | | 51,100 | |
4.500%, due 11/15/19 | | | 250,000 | | | | 256,125 | |
Level 3 Financing, Inc. | | | | | | | | |
8.625%, due 07/15/20 | | | 250,000 | | | | 264,875 | |
5.125%, due 05/01/23 (a) | | | 400,000 | | | | 390,000 | |
Linn Energy LLC/Linn Energy Finance Corp. | | | | | | | | |
8.625%, due 04/15/20 (d) | | | 175,000 | | | | 70,438 | |
6.500%, due 09/15/21 | | | 285,000 | | | | 109,013 | |
Live Nation Entertainment, Inc.
5.375%, due 06/15/22 (a) | | | 250,000 | | | | 250,625 | |
LMI Aerospace, Inc.
7.375%, due 07/15/19 | | | 325,000 | | | | 313,625 | |
MarkWest Energy Partners LP/MarkWest Energy Finance Corp. | | | | | | | | |
4.500%, due 07/15/23 | | | 100,000 | | | | 92,500 | |
4.875%, due 12/01/24 | | | 250,000 | | | | 231,875 | |
4.875%, due 06/01/25 | | | 399,000 | | | | 369,075 | |
Memorial Resource Development Corp.
5.875%, due 07/01/22 | | | 450,000 | | | | 409,500 | |
Men’s Wearhouse, Inc.
7.000%, due 07/01/22 | | | 250,000 | | | | 263,750 | |
MGM Resorts International | | | | | | | | |
6.750%, due 10/01/20 | | | 450,000 | | | | 479,250 | |
6.625%, due 12/15/21 | | | 300,000 | | | | 318,750 | |
SSGA High Yield Bond Fund
Schedule of Investments, continued — August 31, 2015
| | | | | | | | |
| | | Principal
Amount ($)
or Shares | | | Value
$ | |
| | | | | | | | |
Micron Technology, Inc.
5.250%, due 08/01/23 (a) | | | 328,000 | | | | 305,860 | |
Midcontinent Communications & Midcontinent Finance Corp.
6.875%, due 08/15/23 (a) | | | 100,000 | | | | 100,750 | |
Monitronics International, Inc.
9.125%, due 04/01/20 | | | 250,000 | | | | 233,750 | |
MPG Holdco I, Inc.
7.375%, due 10/15/22 | | | 255,000 | | | | 267,750 | |
MPH Acquisition Holdings LLC
6.625%, due 04/01/22 (a) | | | 410,000 | | | | 421,275 | |
MPT Operating Partnership LP/MPT Finance Corp.
5.500%, due 05/01/24 | | | 300,000 | | | | 309,000 | |
MSCI, Inc.
5.250%, due 11/15/24 (a) | | | 250,000 | | | | 254,375 | |
Navient Corp.
5.000%, due 10/26/20 | | | 100,000 | | | | 89,000 | |
5.875%, due 03/25/21 | | | 200,000 | | | | 179,500 | |
Navient Corp. MTN
8.000%, due 03/25/20 | | | 350,000 | | | | 354,375 | |
Navistar International Corp.
8.250%, due 11/01/21 | | | 250,000 | | | | 216,250 | |
NCR Corp.
5.875%, due 12/15/21 | | | 300,000 | | | | 305,250 | |
NES Rentals Holdings, Inc.
7.875%, due 05/01/18 (a) | | | 250,000 | | | | 248,125 | |
Netflix, Inc.
5.500%, due 02/15/22 (a) | | | 183,000 | | | | 187,575 | |
5.750%, due 03/01/24 | | | 150,000 | | | | 156,563 | |
Newfield Exploration Co.
5.750%, due 01/30/22 | | | 400,000 | | | | 394,500 | |
Nexstar Broadcasting, Inc.
6.875%, due 11/15/20 | | | 131,000 | | | | 137,550 | |
6.125%, due 02/15/22 (a) | | | 300,000 | | | | 302,250 | |
NRG Energy, Inc.
6.250%, due 07/15/22 | | | 250,000 | | | | 243,750 | |
OneMain Financial Holdings, Inc.
7.250%, due 12/15/21 (a) | | | 500,000 | | | | 517,500 | |
OPE KAG Finance Sub, Inc.
7.875%, due 07/31/23 (a) | | | 200,000 | | | | 204,000 | |
Outfront Media Capital LLC/
Outfront Media Capital Corp.
5.625%, due 02/15/24 | | | 300,000 | | | | 307,125 | |
5.875%, due 03/15/25 | | | 125,000 | | | | 127,500 | |
Owens-Brockway Glass Container, Inc.
5.875%, due 08/15/23 (a) | | | 100,000 | | | | 101,750 | |
Parsley Energy LLC/
Parsley Finance Corp.
7.500%, due 02/15/22 (a) | | | 303,000 | | | | 296,940 | |
Party City Holdings, Inc.
6.125%, due 08/15/23 (a) | | | 319,000 | | | | 321,193 | |
| | | | | | | | |
| | | Principal
Amount ($)
or Shares | | | Value
$ | |
Penn National Gaming, Inc.
5.875%, due 11/01/21 | | | 300,000 | | | | 304,500 | |
Penske Automotive Group, Inc.
5.750%, due 10/01/22 | | | 200,000 | | | | 206,000 | |
5.375%, due 12/01/24 | | | 300,000 | | | | 300,750 | |
PF Chang’s China Bistro, Inc.
10.250%, due 06/30/20 (a) | | | 300,000 | | | | 300,000 | |
Pittsburgh Glass Works LLC
8.000%, due 11/15/18 (a) | | | 226,000 | | | | 235,040 | |
Plantronics, Inc.
5.500%, due 05/31/23 (a) | | | 192,000 | | | | 192,960 | |
Plastipak Holdings, Inc.
6.500%, due 10/01/21 (a) | | | 200,000 | | | | 196,000 | |
Platform Specialty Products Corp.
6.500%, due 02/01/22 (a) | | | 332,000 | | | | 321,486 | |
Post Holdings, Inc.
7.750%, due 03/15/24 (a) | | | 145,000 | | | | 149,713 | |
Provident Funding Associates LP/PFG Finance Corp.
6.750%, due 06/15/21 (a) | | | 233,000 | | | | 221,350 | |
Qualitytech LP/QTS Finance Corp.
5.875%, due 08/01/22 | | | 400,000 | | | | 404,000 | |
Regal Entertainment Group
5.750%, due 02/01/25 | | | 350,000 | | | | 339,500 | |
Revlon Consumer Products Corp.
5.750%, due 02/15/21 | | | 140,000 | | | | 138,600 | |
Reynolds Group Issuer, Inc./Reynolds Group Issuer LLC/Reynolds Group Issuer Lu
9.875%, due 08/15/19 | | | 275,000 | | | | 289,094 | |
6.875%, due 02/15/21 | | | 340,000 | | | | 356,150 | |
Rice Energy, Inc.
6.250%, due 05/01/22 | | | 310,000 | | | | 275,900 | |
7.250%, due 05/01/23 (a) | | | 50,000 | | | | 46,500 | |
Rose Rock Midstream LP/
Rose Rock Finance Corp.
5.625%, due 07/15/22 | | | 400,000 | | | | 364,000 | |
Roundy’s Supermarkets, Inc.
10.250%, due 12/15/20 (a) | | | 350,000 | | | | 273,000 | |
RR Donnelley & Sons Co.
7.875%, due 03/15/21 | | | 350,000 | | | | 367,500 | |
RSP Permian, Inc.
6.625%, due 10/01/22 (a) | | | 265,000 | | | | 259,700 | |
Sabre GLBL, Inc.
5.375%, due 04/15/23 (a) | | | 187,000 | | | | 183,260 | |
Sanchez Energy Corp.
7.750%, due 06/15/21 | | | 300,000 | | | | 253,500 | |
Sanchez Energy Corp.
Series WI
6.125%, due 01/15/23 | | | 135,000 | | | | 101,250 | |
SandRidge Energy, Inc.
8.750%, due 06/01/20 (a) | | | 357,000 | | | | 242,760 | |
SSGA High Yield Bond Fund
Schedule of Investments, continued — August 31, 2015
| | | | | | | | |
| | | Principal
Amount ($)
or Shares | | | Value
$ | |
| | | | | | | | |
SBA Communications Corp.
5.625%, due 10/01/19 | | | 275,000 | | | | 288,578 | |
Scientific Games International, Inc.
7.000%, due 01/01/22 (a) | | | 700,000 | | | | 715,750 | |
Shea Homes LP/
Shea Homes Funding Corp.
5.875%, due 04/01/23 (a) | | | 320,000 | | | | 327,200 | |
Signode Industrial Group Lux SA/Signode Industrial Group US, Inc.
6.375%, due 05/01/22 (a) | | | 500,000 | | | | 482,500 | |
Sinclair Television Group, Inc.
6.375%, due 11/01/21 | | | 325,000 | | | | 331,500 | |
Sirius XM Radio, Inc.
6.000%, due 07/15/24 (a) | | | 575,000 | | | | 592,250 | |
Spectrum Brands, Inc.
6.625%, due 11/15/22 | | | 100,000 | | | | 107,373 | |
SPL Logistics Escrow LLC/
SPL Logistics Finance Corp.
8.875%, due 08/01/20 (a) | | | 250,000 | | | | 266,250 | |
Sprint Corp.
7.250%, due 09/15/21 | | | 1,125,000 | | | | 1,094,062 | |
Sprint Nextel Corp.
7.000%, due 03/01/20 (a) | | | 250,000 | | | | 265,550 | |
StandardAero Aviation Holdings, Inc.
10.000%, due 07/15/23 | | | 150,000 | | | | 147,375 | |
Steel Dynamics, Inc.
5.125%, due 10/01/21 | | | 330,000 | | | | 323,565 | |
Summit Midstream Holdings LLC/Summit Midstream Finance Corp.
5.500%, due 08/15/22 | | | 325,000 | | | | 287,625 | |
Sunoco LP/Sunoco Finance Corp.
6.375%, due 04/01/23 (a) | | | 346,000 | | | | 347,730 | |
T-Mobile USA, Inc.
6.633%, due 04/28/21 | | | 533,000 | | | | 556,985 | |
6.000%, due 03/01/23 | | | 175,000 | | | | 178,411 | |
Talen Energy Supply LLC
4.625%, due 07/15/19 (a) | | | 200,000 | | | | 189,000 | |
6.500%, due 06/01/25 (a) | | | 56,000 | | | | 51,940 | |
Targa Resources Partners LP/Targa Resources Partners Finance Corp.
5.000%, due 01/15/18 (a) | | | 175,000 | | | | 173,250 | |
4.125%, due 11/15/19 (a) | | | 450,000 | | | | 424,125 | |
Taylor Morrison Communities, Inc./Monarch Communities, Inc.
5.875%, due 04/15/23 (a) | | | 300,000 | | | | 300,750 | |
5.625%, due 03/01/24 (a) | | | 50,000 | | | | 48,750 | |
Tenet Healthcare Corp.
5.000%, due 03/01/19 | | | 600,000 | | | | 598,944 | |
6.875%, due 11/15/31 | | | 300,000 | | | | 277,500 | |
Tenneco, Inc.
5.375%, due 12/15/24 | | | 300,000 | | | | 309,750 | |
| | | | | | | | |
| | | Principal
Amount ($)
or Shares | | | Value
$ | |
Tesoro Logistics LP/
Tesoro Logistics Finance Corp.
5.875%, due 10/01/20 | | | 100,000 | | | | 100,250 | |
6.250%, due 10/15/22 (a) | | | 300,000 | | | | 300,000 | |
Tops Holding LLC/
Tops Markets II Corp.
8.000%, due 06/15/22 (a) | | | 219,000 | | | | 217,905 | |
TRAC Intermodal LLC/
TRAC Intermodal Corp.
11.000%, due 08/15/19 | | | 153,000 | | | | 166,005 | |
TRI Pointe Holdings, Inc.
4.375%, due 06/15/19 | | | 300,000 | | | | 297,375 | |
Tribune Media Co.
5.875%, due 07/15/22 (a) | | | 225,000 | | | | 226,688 | |
United Rentals North America, Inc.
6.125%, due 06/15/23 | | | 250,000 | | | | 255,000 | |
5.500%, due 07/15/25 | | | 250,000 | | | | 241,250 | |
Univar USA, Inc.
6.750%, due 07/15/23 (a) | | | 150,000 | | | | 149,250 | |
US Coatings Acquisition, Inc./Flash Dutch 2 BV
7.375%, due 05/01/21 (a) | | | 256,000 | | | | 273,894 | |
Valeant Pharmaceuticals International
6.375%, due 10/15/20 (a) | | | 1,050,000 | | | | 1,094,625 | |
VeriSign, Inc.
5.250%, due 04/01/25 | | | 150,000 | | | | 151,125 | |
Virgin Media Finance PLC
6.375%, due 04/15/23 (a) | | | 525,000 | | | | 545,669 | |
WCI Communities, Inc.
6.875%, due 08/15/21 | | | 345,000 | | | | 361,387 | |
WESCO Distribution, Inc.
5.375%, due 12/15/21 | | | 56,000 | | | | 54,460 | |
Whiting Petroleum Corp.
5.750%, due 03/15/21 | | | 400,000 | | | | 358,000 | |
6.250%, due 04/01/23 | | | 50,000 | | | | 44,000 | |
WideOpenWest Finance LLC/WideOpenWest Capital Corp.
10.250%, due 07/15/19 | | | 400,000 | | | | 414,000 | |
XPO Logistics, Inc.
6.500%, due 06/15/22 (a) | | | 450,000 | | | | 443,250 | |
York Risk Services Holding Corp.
8.500%, due 10/01/22 (a) | | | 405,000 | | | | 340,200 | |
Zebra Technologies Corp.
7.250%, due 10/15/22 (a) | | | 480,000 | | | | 513,600 | |
ZF North America Capital, Inc.
4.750%, due 04/29/25 (a) | | | 300,000 | | | | 284,250 | |
| | | | | | | | |
| | | | | | | 59,712,139 | |
| | | | | | | | |
SSGA High Yield Bond Fund
Schedule of Investments, continued — August 31, 2015
| | | | | | | | |
| | | Principal
Amount ($)
or Shares | | | Value
$ | |
| | | | | | | | |
International Debt - 16.2% | |
AerCap Ireland Capital, Ltd./AerCap Global Aviation Trust
2.750%, due 05/15/17 | | | 150,000 | | | | 148,500 | |
Altice Financing SA
6.500%, due 01/15/22 (a) | | | 100,000 | | | | 100,250 | |
6.625%, due 02/15/23 (a) | | | 250,000 | | | | 248,750 | |
Altice Finco SA
8.125%, due 01/15/24 (a) | | | 350,000 | | | | 353,500 | |
Altice Luxembourg SA
7.750%, due 05/15/22 (a) | | | 425,000 | | | | 414,375 | |
7.625%, due 02/15/25 (a) | | | 200,000 | | | | 190,000 | |
ArcelorMittal
5.125%, due 06/01/20 | | | 40,000 | | | | 39,500 | |
Ardagh Finance Holdings SA PIK
8.625%, due 06/15/19 (a) | | | 164,767 | | | | 173,829 | |
Ardagh Packaging Finance PLC/Ardagh Holdings USA, Inc.
3.286%, due 12/15/19 (a)(b) | | | 350,000 | | | | 343,000 | |
Ardagh Packaging Finance PLC/Ardagh MP Holdings USA, Inc.
7.000%, due
11/15/20 (a) | | | 35,294 | | | | 35,647 | |
ATS Automation Tooling Systems, Inc.
6.500%, due 06/15/23 (a) | | | 150,000 | | | | 151,125 | |
Bombardier, Inc.
7.750%, due 03/15/20 (a) | | | 150,000 | | | | 125,250 | |
Capsugel SA PIK
7.000%, due 05/15/19 (a) | | | 350,000 | | | | 352,625 | |
CEVA Group PLC
7.000%, due 03/01/21 (a) | | | 285,000 | | | | 263,625 | |
Columbus International, Inc.
7.375%, due 03/30/21 (a) | | | 300,000 | | | | 315,750 | |
Commerzbank AG
8.125%, due 09/19/23 (a) | | | 200,000 | | | | 234,250 | |
Constellium NV
5.750%, due 05/15/24 (a) | | | 400,000 | | | | 308,000 | |
Coveris Holdings SA
7.875%, due 11/01/19 (a) | | | 500,000 | | | | 485,000 | |
Digicel Group, Ltd.
8.250%, due 09/30/20 (a) | | | 300,000 | | | | 277,500 | |
DPx Holdings BV
7.500%, due 02/01/22 (a) | | | 360,000 | | | | 375,300 | |
Endo, Ltd./Endo Finance LLC/
Endo Finco, Inc.
6.000%, due 07/15/23 (a) | | | 200,000 | | | | 208,000 | |
Fly Leasing, Ltd.
6.750%, due 12/15/20 | | | 350,000 | | | | 360,500 | |
FMG Resources August 2006 Pty Ltd.
9.750%, due 03/01/22 (a) | | | 245,000 | | | | 223,869 | |
Global Ship Lease, Inc.
10.000%, due
04/01/19 (a) | | | 325,000 | | | | 331,500 | |
| | | | | | | | |
| | | Principal
Amount ($)
or Shares | | | Value
$ | |
INEOS Group Holdings SA
6.125%, due 08/15/18 (a) | | | 300,000 | | | | 300,375 | |
5.875%, due 02/15/19 (a) | | | 160,000 | | | | 158,600 | |
Intelsat Jackson Holdings SA
7.500%, due 04/01/21 | | | 325,000 | | | | 314,844 | |
MEG Energy Corp.
6.375%, due 01/30/23 (a) | | | 400,000 | | | | 322,000 | |
New Red Finance, Inc.
6.000%, due 04/01/22 (a) | | | 450,000 | | | | 463,500 | |
NOVA Chemicals Corp.
5.000%, due 05/01/25 (a) | | | 400,000 | | | | 400,000 | |
Perstorp Holding AB
11.000%, due
08/15/17 (a) | | | 350,000 | | | | 362,250 | |
Royal Bank of Scotland Group PLC
6.125%, due 12/15/22 | | | 250,000 | | | | 269,533 | |
Royal Bank of Scotland Group PLC
Series U
7.640%, due
09/30/17 (b)(c) | | | 400,000 | | | | 423,500 | |
Sable International Finance, Ltd.
8.750%, due 02/01/20 (a) | | | 185,000 | | | | 196,331 | |
Schaeffler Finance BV
4.750%, due 05/15/23 (a) | | | 300,000 | | | | 288,750 | |
Schaeffler Holding Finance BV PIK
6.875%, due 08/15/18 (a) | | | 200,000 | | | | 206,400 | |
6.750%, due 11/15/22 (a) | | | 200,000 | | | | 213,500 | |
Sensata Technologies BV
5.000%, due 10/01/25 (a) | | | 400,000 | | | | 388,000 | |
Silver II Borrower/Silver II US Holdings LLC
7.750%, due 12/15/20 (a) | | | 300,000 | | | | 261,000 | |
Transocean, Inc.
6.500%, due 11/15/20 | | | 250,000 | | | | 205,938 | |
UPCB Finance IV Ltd.
5.375%, due 01/15/25 (a) | | | 300,000 | | | | 291,000 | |
UPCB Finance VI Ltd.
6.875%, due 01/15/22 (a) | | | 450,000 | | | | 478,687 | |
Valeant Pharmaceuticals International, Inc.
5.500%, due 03/01/23 (a) | | | 430,000 | | | | 435,912 | |
Virgin Media Secured Finance PLC
5.250%, due 01/15/26 (a) | | | 100,000 | | | | 97,000 | |
VTR Finance BV
6.875%, due 01/15/24 (a) | | | 250,000 | | | | 246,250 | |
| | | | | | | | |
| | | | | | | 12,383,015 | |
| | | | | | | | |
| | |
Total Long-Term Investments
(cost $74,367,298) | | | | | | | 72,095,154 | |
| | | | | | | | |
SSGA High Yield Bond Fund
Schedule of Investments, continued — August 31, 2015
| | | | | | | | |
| | | Principal
Amount ($)
or Shares | | | Value
$ | |
| | | | | | | | |
| Short-Term Investment - 3.9% | | | | | |
SSGA Prime Money Market Fund 0.24% (e)(f)
(cost $2,985,722) | | | 2,985,722 | | | | 2,985,722 | |
| | | | | | | | |
| |
Total Investments - 98.5%
(cost $77,353,020) | | | | 75,080,876 | |
| | |
Other Assets and Liabilities,
Net - 1.5% | | | | | | | 1,125,690 | |
| | | | | | | | |
| |
| Net Assets - 100.0% | | | | 76,206,566 | |
| | | | | | | | |
Footnotes:
| (a) | Restricted security Rule (144A) or Section 4 (2) commercial paper. Security may have contractual restrictions on resale or may have been offered in a private placement transaction. Securities sold within terms of a private placement memorandum, exempt from registration under Section 144A of the Securities Act of 1933, as amended, and may be sold only to dealers in that program or other accredited investors. These securities have been determined to be liquid under guidelines established by the Board of Trustees. |
| (b) | Adjustable or floating rate security. Rate shown reflects rate in effect at period end. |
| (c) | Perpetual floating rate security. Date shown reflects the next reset date. |
| (d) | All or a portion of the shares of these securities are held as collateral in connection with swap contracts purchased by the Fund. |
| (e) | Affiliated Fund managed by SSGA Funds Management, Inc. (Note 4). |
| (f) | The rate shown is the annualized seven-day yield at period end. |
Abbreviations:
MTN - Medium Term Notes
PIK - Pay In Kind
PLC - Public Limited Company
| | | | | | | | | | | | | | | | | | | | | | |
| Centrally-Cleared Credit Default Swap Contracts | |
| Credit Indices | | | | | | | | | | | | | | | | | | |
| | | | | | |
Reference Entity | | Notional
Amount* | | Fund
(Pays)/
Receives
Fixed
Rate | | Termination
Date | | | Value
$ | | | Upfront
Premiums
Received/
(Paid)
$ | | | Unrealized
Appreciation/
(Depreciation)
$ | |
| | | | | | | | | | | | | | | | | | | | | | |
Protection Sold: | | | | | | | | | | | | | | | | | | | | | | |
Markit CDX North American High Yield Index | | USD | | 990,000 | | 5.00% | | | 6/20/2020 | | | | 44,728 | | | | (66,677 | ) | | | (21,949 | ) |
Markit CDX North American High Yield Index | | USD | | 990,000 | | 5.00% | | | 6/20/2020 | | | | 44,728 | | | | (70,884 | ) | | | (26,156 | ) |
| | | | | | | | | | | | | | | | | | | | | | |
Total | | | | | | | | | | | | | | | | | | | | | (48,105 | ) |
| | | | | | | | | | | | | | | | | | | | | | |
| * | | The maximum potential amount the Fund may pay should a negative credit event take place as defined under the terms of the agreement. |
During the year ended August 31, 2015, average notional value related to swap contracts was $1,630,467 or 2.1% of net assets.
See accompanying notes which are an integral part of the financial statements.
SSGA High Yield Bond Fund
Schedule of Investments, continued
Presentation of Portfolio Holdings — August 31, 2015
| | | | | | | | | | | | | | | | | | | | |
| | | Value* | | | % of
Net
Assets | |
| Categories | | Level 1 | | | Level 2 | | | Level 3 | | | Total | | |
Corporate Bonds and Notes | | $ | — | | | $ | 59,712,139 | | | $ | — | | | $ | 59,712,139 | | | | 78.4 | |
International Debt | | | — | | | | 12,383,015 | | | | — | | | | 12,383,015 | | | | 16.2 | |
Short-Term Investment | | | 2,985,722 | | | | — | | | | — | | | | 2,985,722 | | | | 3.9 | |
| | | | | | | | | | | | | | | | | | | | |
Total Investments | | $ | 2,985,722 | | | $ | 72,095,154 | | | $ | — | | | $ | 75,080,876 | | | | 98.5 | |
| | | | | | | | | | | | | | | | | | | | |
Other Assets and Liabilities, Net | | | | | | | | | | | | | | | | | | | 1.5 | |
| | | | | | | | | | | | | | | | | | | | |
| | | | | | | | | | | | | | | | | | | 100.00 | |
| | | | | | | | | | | | | | | | | | | | |
Liabilities: | | | | | | | | | | | | | | | | | | | | |
Other Financial Instruments** | | | | | | | | | | | | | | | | | | | | |
Credit Default Swap Contracts | | $ | — | | | $ | (48,105 | ) | | $ | — | | | $ | (48,105 | ) | | | (0.1 | ) |
| | | | | | | | | | | | | | | | | | | | |
Total Other Financial Instruments | | $ | — | | | $ | (48,105 | ) | | $ | — | | | $ | (48,105 | ) | | | (0.1 | ) |
| | | | | | | | | | | | | | | | | | | | |
| * | | For a description of the levels, see Note 2 in the Notes to Financial Statements. During the year ended August 31, 2015, there were no material transfers between levels. The transfers that did occur were the result of fair value pricing using significant observable inputs. |
| ** | | Other financial instruments reflected in the Schedule of Investments include credit default swap contracts which are valued at the unrealized appreciation (depreciation) on the instruments. |
See accompanying notes which are an integral part of the financial statements.
SSGA Funds
Statements of Assets and Liabilities — August 31, 2015
| | | | | | | | | | | | |
| | |
SSGA
Dynamic Small
Cap Fund | | | SSGA
Clarion Real
Estate Fund | | | SSGA
Enhanced
Small Cap
Fund | |
| | | | | | | | | | | | |
Assets | | | | | | | | | | | | |
Investments, at cost | | $ | 27,361,713 | | | $ | 38,178,652 | | | $ | 29,498,213 | |
Investments, at value (a)(b) | | | 29,207,590 | | | | 50,723,866 | | | | 32,957,467 | |
Cash | | | — | | | | — | | | | — | |
Due from broker | | | — | | | | — | | | | 43,200 | |
Foreign currency holdings (c) | | | — | | | | — | | | | — | |
Unrealized appreciation on forward currency contracts | | | — | | | | — | | | | — | |
Daily variation margin on futures contracts | | | — | | | | — | | | | — | |
Receivables: | | | | | | | | | | | | |
Dividends and interest | | | 17,834 | | | | 22,189 | | | | 29,720 | |
Dividends from affiliated money market funds | | | 12 | | | | 9 | | | | 42 | |
Investments sold | | | — | | | | 273,067 | | | | 8,390 | |
Fund shares sold | | | 532 | | | | 731 | | | | 17,905 | |
Foreign taxes recoverable | | | — | | | | — | | | | — | |
From adviser | | | 42,842 | | | | 34,149 | | | | 37,661 | |
Prepaid expenses | | | 256 | | | | 551 | | | | 381 | |
| | | | | | | | | | | | |
Total assets | | | 29,269,066 | | | | 51,054,562 | | | | 33,094,766 | |
| | | | | | | | | | | | |
| | | |
Liabilities | | | | | | | | | | | | |
Payables: | | | | | | | | | | | | |
Due to custodian | | | — | | | | — | | | | 8,390 | |
Investments purchased | | | — | | | | 328,908 | | | | — | |
Fund shares redeemed | | | 2,392 | | | | 122,653 | | | | 432 | |
Accrued fees to affiliates and trustees | | | 35,622 | | | | 74,841 | | | | 49,404 | |
Other accrued expenses | | | 35,441 | | | | 40,168 | | | | 36,483 | |
Deferred tax liability | | | — | | | | — | | | | — | |
Daily variation margin on futures contracts | | | — | | | | — | | | | 16,487 | |
Daily variation margin on credit default swaps | | | — | | | | — | | | | — | |
Unrealized depreciation on forward currency contracts | | | — | | | | — | | | | — | |
Payable upon return of securities loaned | | | 5,375,144 | | | | 4,470,984 | | | | — | |
Notes payable (Note 10) | | | — | | | | — | | | | — | |
| | | | | | | | | | | | |
Total liabilities | | | 5,448,599 | | | | 5,037,554 | | | | 111,196 | |
| | | | | | | | | | | | |
| | | | | | | | | | | | |
Net Assets | | $ | 23,820,467 | | | $ | 46,017,008 | | | $ | 32,983,570 | |
| | | | | | | | | | | | |
| | | |
Net Assets Consist of: | | | | | | | | | | | | |
Undistributed (Distributions in excess of) net investment income | | $ | 82,426 | | | $ | 190,652 | | | $ | 150,785 | |
Accumulated net realized gain (loss) | | | (15,499,949 | ) | | | (1,816,710 | ) | | | 2,047,584 | |
Unrealized appreciation (depreciation) on: | | | | | | | | | | | | |
Investments (Emerging Markets Fund — net of deferred tax liability for foreign capital gains tax) | | | 1,845,877 | | | | 12,545,214 | | | | 3,459,254 | |
Futures contracts | | | — | | | | — | | | | (55,687 | ) |
Credit default swap contracts | | | — | | | | — | | | | — | |
Foreign currency-related transactions | | | — | | | | — | | | | — | |
Paid in capital | | | 37,392,113 | | | | 35,097,852 | | | | 27,381,634 | |
| | | | | | | | | | | | |
Net Assets | | $ | 23,820,467 | | | $ | 46,017,008 | | | $ | 32,983,570 | |
| | | | | | | | | | | | |
See accompanying notes which are an integral part of the financial statements.
| | |
| 60 | | Statements of Assets and Liabilities |
| | | | | | | | | | |
SSGA
Emerging
Markets
Fund | | | SSGA
International
Stock Selection
Fund | | | SSGA
High Yield
Bond Fund | |
| | | | | | | | | | |
| | | | | | | | | | |
| $ | 164,797,435 | | | $ | 325,403,589 | | | $ | 77,353,020 | |
| | 184,267,860 | | | | 326,253,071 | | | | 75,080,876 | |
| | 127,000 | | | | — | | | | — | |
| | 151,700 | | | | 384,897 | | | | 107,274 | |
| | 1,474,229 | | | | 623,856 | | | | — | |
| | 691,644 | | | | — | | | | — | |
| | 150,395 | | | | — | | | | — | |
| | | | | | | | | | |
| | 362,918 | | | | 1,134,060 | | | | 1,279,271 | |
| | 321 | | | | 108 | | | | 145 | |
| | 13,361,836 | | | | 1,627,443 | | | | 87,493 | |
| | 13,974 | | | | 64,710 | | | | 5,113 | |
| | 324,388 | | | | 637,432 | | | | 243 | |
| | 525,519 | | | | 383,273 | | | | 26,911 | |
| | 3,359 | | | | 3,651 | | | | 952 | |
| | | | | | | | | | |
| | 201,455,143 | | | | 331,112,501 | | | | 76,588,278 | |
| | | | | | | | | | |
| | |
| | | | | | | | | | |
| | | | | | | | | | |
| | — | | | | — | | | | — | |
| | 195,703 | | | | — | | | | 200,000 | |
| | 325,509 | | | | 1,242,978 | | | | 33,482 | |
| | 1,057,546 | | | | 396,725 | | | | 91,636 | |
| | 196,605 | | | | 53,931 | | | | 51,543 | |
| | 673,749 | | | | — | | | | — | |
| | — | | | | — | | | | — | |
| | — | | | | — | | | | 5,051 | |
| | 1,597,327 | | | | — | | | | — | |
| | 4,543,293 | | | | 3,247,773 | | | | — | |
| | 9,200,000 | | | | — | | | | — | |
| | | | | | | | | | |
| | 17,789,732 | | | | 4,941,407 | | | | 381,712 | |
| | | | | | | | | | |
| | | | | | | | | | |
| $ | 183,665,411 | | | $ | 326,171,094 | | | $ | 76,206,566 | |
| | | | | | | | | | |
| | |
| | | | | | | | | | |
| $ | (463,309 | ) | | $ | 6,889,254 | | | $ | 121,140 | |
| | 35,592,846 | | | | (554,089,392 | ) | | | (1,509,757 | ) |
| | | | | | | | | | |
|
18,808,569 |
| | | 849,482 | | | | (2,272,144 | ) |
| | (327,943 | ) | | | — | | | | — | |
| | — | | | | — | | | | (48,105 | ) |
| | (985,917 | ) | | | (34,548 | ) | | | — | |
| | 131,041,165 | | | | 872,556,298 | | | | 79,915,432 | |
| | | | | | | | | | |
| $ | 183,665,411 | | | $ | 326,171,094 | | | $ | 76,206,566 | |
| | | | | | | | | | |
See accompanying notes which are an integral part of the financial statements.
| | | | |
| Statements of Assets and Liabilities | | | 61 | |
SSGA Funds
Statements of Assets and Liabilities — August 31, 2015
| | | | | | | | | | | | |
| | | SSGA
Dynamic Small
Cap Fund | | | SSGA
Clarion Real
Estate Fund | | | SSGA
Enhanced
Small Cap
Fund | |
| | | | | | | | | | | | |
Net Asset Value: | | | | | | | | | | | | |
Net asset value, offering and redemption price per share: Class N | | $ | 37.26 | | | $ | 15.53 | | | $ | 14.81 | |
Net assets | | $ | 22,508,298 | | | $ | 45,451,964 | | | $ | 32,432,038 | |
Shares outstanding ($0.001 par value) | | | 604,020 | | | | 2,925,967 | | | | 2,190,560 | |
Net asset value and redemption price per share: Class A | | $ | 37.21 | | | $ | 15.52 | | | $ | 14.78 | |
Net assets | | $ | 9,954 | | | $ | 102,721 | | | $ | 179,381 | |
Shares outstanding ($0.001 par value) | | | 268 | | | | 6,618 | | | | 12,134 | |
Maximum Sales Charge | | | 5.25 | % | | | 5.25 | % | | | 5.25 | % |
Maximum offering price per share | | $ | 39.27 | | | $ | 16.38 | | | $ | 15.60 | |
Net asset value, offering and redemption price per share: Class C | | $ | 37.01 | | | $ | 15.45 | | | $ | 14.70 | |
Net assets | | $ | 9,900 | | | $ | 118,058 | | | $ | 147,113 | |
Shares outstanding ($0.001 par value) | | | 268 | | | | 7,640 | | | | 10,006 | |
Net asset value, offering and redemption price per share: Class I | | $ | 37.25 | | | $ | 15.54 | | | $ | 14.81 | |
Net assets | | $ | 1,282,328 | | | $ | 241,324 | | | $ | 90,156 | |
Shares outstanding ($0.001 par value) | | | 34,422 | | | | 15,531 | | | | 6,088 | |
Net asset value, offering and redemption price per share: Class K | | $ | 37.33 | | | $ | 15.55 | | | $ | 14.83 | |
Net assets | | $ | 9,987 | | | $ | 102,941 | | | $ | 134,882 | |
Shares outstanding ($0.001 par value) | | | 268 | | | | 6,618 | | | | 9,093 | |
Net asset value, offering and redemption price per share: Select Class | | $ | — | | | $ | — | | | $ | — | |
Net assets | | $ | — | | | $ | — | | | $ | — | |
Shares outstanding ($0.001 par value) | | | — | | | | — | | | | — | |
| | | |
(a) Securities on loan included in investments | | $ | 5,712,651 | | | $ | 6,157,410 | | | $ | — | |
(b) Investments in affiliated issuers, SSGA Prime Money Market Fund and State Street Navigator Securities Lending Prime Portfolio | | $ | 5,623,763 | | | $ | 4,674,395 | | | $ | 992,460 | |
(c) Foreign currency holdings — cost | | $ | — | | | $ | — | | | $ | — | |
See accompanying notes which are an integral part of the financial statements.
| | |
| 62 | | Statements of Assets and Liabilities |
| | | | | | | | | | |
SSGA
Emerging
Markets
Fund | | | SSGA
International
Stock Selection
Fund | | | SSGA
High Yield
Bond Fund | |
| | | | | | | | | | |
| | | | | | | | | | |
| $ | 9.30 | | | $ | 10.65 | | | $ | 7.55 | |
| $ | 171,885,312 | | | $ | 325,555,597 | | | $ | 75,631,734 | |
| | 18,480,524 | | | | 30,559,095 | | | | 10,013,928 | |
| $ | 9.29 | | | $ | 10.64 | | | $ | 7.55 | |
| $ | 19,195 | | | $ | 15,908 | | | $ | 8,981 | |
| | 2,066 | | | | 1,494 | | | | 1,189 | |
| | 5.25 | % | | | 5.25 | % | | | 3.75 | % |
| $ | 9.80 | | | $ | 11.23 | | | $ | 7.84 | |
| $ | 9.24 | | | $ | 10.58 | | | $ | 7.55 | |
| $ | 49,481 | | | $ | 91,709 | | | $ | 89,735 | |
| | 5,353 | | | | 8,666 | | | | 11,891 | |
| $ | 9.30 | | | $ | 10.65 | | | $ | 7.56 | |
| $ | 1,447,438 | | | $ | 498,632 | | | $ | 467,128 | |
| | 155,690 | | | | 46,810 | | | | 61,803 | |
| $ | 9.31 | | | $ | 10.67 | | | $ | 7.56 | |
| $ | 4,985 | | | $ | 9,248 | | | $ | 8,988 | |
| | 535 | | | | 867 | | | | 1,189 | |
| $ | 9.32 | | | $ | — | | | $ | — | |
| $ | 10,259,000 | | | $ | — | | | $ | — | |
| | 1,100,443 | | | | — | | | | — | |
| | |
| $ | 4,972,708 | | | $ | 3,033,762 | | | $ | — | |
$ |
4,871,221 |
| | $ | 6,740,255 | | | $ | 2,985,722 | |
| $ | 1,477,322 | | | $ | 625,411 | | | $ | — | |
See accompanying notes which are an integral part of the financial statements.
| | | | |
| Statements of Assets and Liabilities | | | 63 | |
SSGA Funds
Statements of Operations — For the Year Ended August 31, 2015
| | | | | | | | | | | | |
| | |
SSGA
Dynamic Small
Cap Fund | | | SSGA
Clarion Real
Estate Fund | | | SSGA
Enhanced Small
Cap Fund | |
| | | | | | | | | | | | |
Investment Income | | | | | | | | | | | | |
Dividends (net of foreign taxes withheld of $0, $0, $350, $1,112,142, $851,291, $0, respectively) | | $ | 417,243 | | | $ | 1,340,310 | | | $ | 708,992 | |
Dividends from affiliated money market funds | | | 87 | | | | 7,294 | | | | 275 | |
Interest | | | — | | | | — | | | | — | |
Securities lending income | | | 32,424 | | | | 7,025 | | | | — | |
| | | | | | | | | | | | |
Total investment income | | | 449,754 | | | | 1,354,629 | | | | 709,267 | |
| | | | | | | | | | | | |
| | | |
Expenses | | | | | | | | | | | | |
Advisory fees | | | 186,047 | | | | 338,938 | | | | 161,873 | |
Administration fees | | | 13,802 | | | | 20,312 | | | | 16,966 | |
Custodian fees | | | 31,200 | | | | 26,860 | | | | 46,356 | |
Distribution fees — Class N | | | 54,739 | | | | 115,994 | | | | 80,100 | |
Distribution fees — Class A | | | 25 | | | | 272 | | | | 359 | |
Distribution fees — Class C | | | 101 | | | | 1,173 | | | | 1,034 | |
Distribution fees — Select Class | | | — | | | | — | | | | — | |
Transfer agent fees | | | 93,474 | | | | 102,807 | | | | 85,320 | |
Professional fees | | | 36,894 | | | | 37,095 | | | | 36,942 | |
Registration fees | | | 60,896 | | | | 63,614 | | | | 62,468 | |
Shareholder servicing fees — Class N | | | 5,897 | | | | 12,764 | | | | 8,900 | |
Shareholder servicing fees — Class A | | | 21 | | | | 218 | | | | 287 | |
Shareholder servicing fees — Class C | | | 21 | | | | 234 | | | | 207 | |
Shareholder servicing fees — Class I | | | 894 | | | | 513 | | | | 189 | |
Shareholder servicing fees — Select Class | | | — | | | | — | | | | — | |
Trustees’ fees | | | 14,829 | | | | 14,822 | | | | 14,826 | |
Insurance fees | | | 314 | | | | 633 | | | | 475 | |
Printing fees | | | 6,747 | | | | 19,162 | | | | 8,284 | |
Miscellaneous | | | 9,368 | | | | 6,383 | | | | 4,867 | |
| | | | | | | | | | | | |
Expenses before reductions | | | 515,269 | | | | 761,794 | | | | 529,453 | |
Expense reductions | | | (242,584 | ) | | | (239,304 | ) | | | (258,328 | ) |
| | | | | | | | | | | | |
Net expenses | | | 272,685 | | | | 522,490 | | | | 271,125 | |
| | | | | | | | | | | | |
Net investment income | | | 177,069 | | | | 832,139 | | | | 438,142 | |
| | | | | | | | | | | | |
| | | |
Net Realized and Unrealized Gain (Loss) | | | | | | | | | | | | |
Net realized gain/(loss) on: | | | | | | | | | | | | |
Investments (Net of foreign capital gains taxes of $0, $0, $0, $739,228, $0 and $0, respectively) | | | 1,040,954 | | | | 6,959,886 | | | | 2,498,242 | |
Futures contracts | | | 39,220 | | | | — | | | | (5,868 | ) |
Credit default swap contracts | | | — | | | | — | | | | — | |
Foreign currency-related transactions | | | — | | | | — | | | | — | |
| | | | | | | | | | | | |
Net realized gain (loss) | | | 1,080,174 | | | | 6,959,886 | | | | 2,492,374 | |
| | | | | | | | | | | | |
Net change in unrealized appreciation/depreciation on: | | | | | | | | | | | | |
Investments (Net of foreign capital gains taxes of $0, $0, $0, $661,856, $0 and $0, respectively) | | | (1,069,468 | ) | | | (7,207,706 | ) | | | (2,605,125 | ) |
Futures contracts | | | — | | | | — | | | | (77,899 | ) |
Foreign currency-related transactions | | | — | | | | — | | | | — | |
Credit default swap contracts | | | — | | | | — | | | | — | |
| | | | | | | | | | | | |
Net change in unrealized appreciation/depreciation | | | (1,069,468 | ) | | | (7,207,706 | ) | | | (2,683,024 | ) |
| | | | | | | | | | | | |
| | | |
Net realized and unrealized loss | | | 10,706 | | | | (247,820 | ) | | | (190,650 | ) |
| | | | | | | | | | | | |
Net Increase (Decrease) in Net Assets from Operations | | $ | 187,775 | | | $ | 584,319 | | | $ | 247,492 | |
| | | | | | | | | | | | |
See accompanying notes which are an integral part of the financial statements.
| | |
| 64 | | Statements of Operations |
| | | | | | | | | | |
SSGA
Emerging
Markets Fund | | | SSGA
International
Stock Selection
Fund | | | SSGA
High Yield
Bond Fund | |
| | | | | | | | | | |
| | | | | | | | | | |
$ |
9,541,555 |
| | $ | 11,614,907 | | | $ | — | |
| | 733 | | | | 803 | | | | 930 | |
| | 34,651 | | | | 433 | | | | 5,522,878 | |
| | 52,041 | | | | 117,612 | | | | — | |
| | | | | | | | | | |
| | 9,628,980 | | | | 11,733,755 | | | | 5,523,808 | |
| | | | | | | | | | |
| | |
| | | | | | | | | | |
| | 2,666,040 | | | | 2,695,982 | | | | 270,287 | |
| | 92,511 | | | | 101,226 | | | | 29,079 | |
| | 661,503 | | | | 193,798 | | | | 50,598 | |
| | 693,691 | | | | 807,942 | | | | 201,588 | |
| | 33 | | | | 26 | | | | 23 | |
| | 689 | | | | 952 | | | | 936 | |
| | 210 | | | | — | | | | — | |
| | 258,017 | | | | 183,622 | | | | 98,104 | |
| | 76,638 | | | | 43,592 | | | | 52,655 | |
| | 86,353 | | | | 64,647 | | | | 62,231 | |
| | 76,493 | | | | 88,107 | | | | 21,292 | |
| | 26 | | | | 20 | | | | 18 | |
| | 138 | | | | 190 | | | | 187 | |
| | 1,927 | | | | 528 | | | | 777 | |
| | 11,556 | | | | — | | | | — | |
| | 14,502 | | | | 14,717 | | | | 14,805 | |
| | 673 | | | | 5,549 | | | | 1,434 | |
| | 171,755 | | | | 55,016 | | | | 14,166 | |
| | 79,711 | | | | 57,210 | | | | 7,167 | |
| | | | | | | | | | |
| | 4,892,466 | | | | 4,313,124 | | | | 825,347 | |
| | (523,309 | ) | | | (716,452 | ) | | | (149,646 | ) |
| | | | | | | | | | |
| | 4,369,157 | | | | 3,596,672 | | | | 675,701 | |
| | | | | | | | | | |
| | 5,259,823 | | | | 8,137,083 | | | | 4,848,107 | |
| | | | | | | | | | |
| | |
| | | | | | | | | | |
| | | | | | | | | | |
|
63,121,226 |
| | | 26,428,452 | | | | (1,441,330 | ) |
| | (1,399,388 | ) | | | (648,846 | ) | | | — | |
| | — | | | | — | | | | 27,024 | |
| | (3,222,291 | ) | | | (379,842 | ) | | | — | |
| | | | | | | | | | |
| | 58,499,547 | | | | 25,399,764 | | | | (1,414,306 | ) |
| | | | | | | | | | |
| | | | | | | | | | |
| (161,956,662 | ) | | | (50,448,291 | ) | | | (5,732,719 | ) |
| | (383,100 | ) | | | — | | | | — | |
| | (831,747 | ) | | | 11,783 | | | | — | |
| | — | | | | — | | | | (48,105 | ) |
| | | | | | | | | | |
| | (163,171,509 | ) | | | (50,436,508 | ) | | | (5,780,824 | ) |
| | | | | | | | | | |
| | |
| | (104,671,962 | ) | | | (25,036,744 | ) | | | (7,195,130 | ) |
| | | | | | | | | | |
| $ | (99,412,139 | ) | | $ | (16,899,661 | ) | | $ | (2,347,023 | ) |
| | | | | | | | | | |
See accompanying notes which are an integral part of the financial statements.
| | | | |
| Statements of Operations | | | 65 | |
SSGA Funds
Statements of Changes in Net Assets
| | | | | | | | | | | | | | | | |
| | | SSGA Dynamic Small Cap Fund | | | SSGA Clarion Real Estate Fund | |
| | | Year Ended
August 31, 2015 | | | Year Ended
August 31, 2014 | | | Year Ended
August 31, 2015 | | | Year Ended
August 31, 2014 | |
| | | | | | | | | | | | | | | | |
Increase (Decrease) in Net Assets | | | | | | | | | | | | | | | | |
| | | | |
Operations | | | | | | | | | | | | | | | | |
Net investment income | | $ | 177,069 | | | $ | 101,795 | | | $ | 832,139 | | | $ | 717,192 | |
Net realized gain (loss) | | | 1,080,174 | | | | 2,875,886 | | | | 6,959,886 | | | | 2,046,472 | |
Net change in unrealized appreciation (depreciation) | | | (1,069,468 | ) | | | 580,430 | | | | (7,207,706 | ) | | | 7,183,197 | |
| | | | | | | | | | | | | | | | |
Net increase (decrease) in net assets from operations | | | 187,775 | | | | 3,558,111 | | | | 584,319 | | | | 9,946,861 | |
| | | | | | | | | | | | | | | | |
Voluntary contribution from Adviser | | | — | | | | — | | | | — | | | | — | |
| | | | | | | | | | | | | | | | |
| | | | |
Distributions | | | | | | | | | | | | | | | | |
From net investment income | | | | | | | | | | | | | | | | |
Class N | | | (128,641 | ) | | | (155,550 | ) | | | (705,477 | ) | | | (711,125 | ) |
Class A | | | (45 | ) | | | — | | | | (1,347 | ) | | | (5 | ) |
Class C | | | (13 | ) | | | — | | | | (906 | ) | | | — | |
Class I | | | (2,289 | ) | | | — | | | | (2,393 | ) | | | (21 | ) |
Class K | | | (64 | ) | | | — | | | | (1,641 | ) | | | (34 | ) |
Select Class | | | — | | | | — | | | | — | | | | — | |
From net realized gains | | | | | | | | | | | | | | | | |
Class N | | | — | | | | — | | | | — | | | | — | |
Class A | | | — | | | | — | | | | — | | | | — | |
Class C | | | — | | | | — | | | | — | | | | — | |
Class I | | | — | | | | — | | | | — | | | | — | |
Class K | | | — | | | | — | | | | — | | | | — | |
Select Class | | | — | | | | — | | | | — | | | | — | |
| | | | | | | | | | | | | | | | |
Net decrease in net assets from distributions | | | (131,052 | ) | | | (155,550 | ) | | | (711,764 | ) | | | (711,185 | ) |
| | | | | | | | | | | | | | | | |
| | | | |
Share Transactions | | | | | | | | | | | | | | | | |
Net increase (decrease) in net assets from share transactions (Note 6) | | | (412,340 | ) | | | (2,735,410 | ) | | | (6,785,069 | ) | | | 3,738,241 | |
| | | | | | | | | | | | | | | | |
Total Net Increase (Decrease) in Net Assets | | | (355,617 | ) | | | 667,151 | | | | (6,912,514 | ) | | | 12,973,917 | |
| | | | |
Net Assets | | | | | | | | | | | | | | | | |
Beginning of year | | | 24,176,084 | | | | 23,508,933 | | | | 52,929,522 | | | | 39,955,605 | |
| | | | | | | | | | | | | | | | |
| | | | |
End of year | | $ | 23,820,467 | | | $ | 24,176,084 | | | $ | 46,017,008 | | | $ | 52,929,522 | |
| | | | | | | | | | | | | | | | |
| | | | |
Undistributed (overdistributed) net investment income included in net assets | | $ | 82,426 | | | $ | 21,771 | | | $ | 190,652 | | | $ | 73,527 | |
See accompanying notes which are an integral part of the financial statements.
| | |
| 66 | | Statements of Changes in Net Assets |
| | | | | | | | | | | | | | | | | | | | | | |
| SSGA Enhanced Small Cap Fund | | | SSGA Emerging Markets Fund | | | SSGA International Stock Selection Fund | |
Year Ended
August 31, 2015 | | | Year Ended
August 31, 2014 | | | Year Ended
August 31, 2015 | | | Year Ended
August 31, 2014 | | | Year Ended
August 31, 2015 | | | Year Ended
August 31, 2014 | |
| | | | | | | | | | | | | | | | | | | | | | |
| | | | | | | | | | | | | | | | | | | | | | |
| | | | | |
| | | | | | | | | | | | | | | | | | | | | | |
| $ | 438,142 | | | $ | 252,192 | | | $ | 5,259,823 | | | $ | 13,832,401 | | | $ | 8,137,083 | | | $ | 9,674,540 | |
| | 2,492,374 | | | | 5,762,262 | | | | 58,499,547 | | | | 200,687,930 | | | | 25,399,764 | | | | 60,733,635 | |
| | (2,683,024 | ) | | | (64,567 | ) | | | (163,171,509 | ) | | | (87,047,608 | ) | | | (50,436,508 | ) | | | (5,193,864 | ) |
| | | | | | | | | | | | | | | | | | | | | | |
| | 247,492 | | | | 5,949,887 | | | | (99,412,139 | ) | | | 127,472,723 | | | | (16,899,661 | ) | | | 65,214,311 | |
| | | | | | | | | | | | | | | | | | | | | | |
| | — | | | | — | | | | — | | | | 252,840 | | | | — | | | | — | |
| | | | | | | | | | | | | | | | | | | | | | |
| | | | | |
| | | | | | | | | | | | | | | | | | | | | | |
| | | | | | | | | | | | | | | | | | | | | | |
| | (292,624 | ) | | | (585,136 | ) | | | (7,083,502 | ) | | | (19,817,580 | ) | | | (3,460,820 | ) | | | (16,373,374 | ) |
| | (817 | ) | | | — | | | | (181 | ) | | | — | | | | (83 | ) | | | — | |
| | (320 | ) | | | — | | | | (1,521 | ) | | | — | | | | (510 | ) | | | — | |
| | (982 | ) | | | — | | | | (30,496 | ) | | | — | | | | (3,618 | ) | | | — | |
| | (112 | ) | | | — | | | | (198 | ) | | | — | | | | (102 | ) | | | — | |
| | — | | | | — | | | | (1,977,714 | ) | | | (6,564,308 | ) | | | — | | | | — | |
| | | | | | | | | | | | | | | | | | | | | | |
| | (4,434,304 | ) | | | — | | | | (119,649,881 | ) | | | (76,697,086 | ) | | | — | | | | — | |
| | (14,347 | ) | | | — | | | | (3,149 | ) | | | — | | | | — | | | | — | |
| | (14,519 | ) | | | — | | | | (31,451 | ) | | | — | | | | — | | | | — | |
| | (14,290 | ) | | | — | | | | (488,564 | ) | | | — | | | | — | | | | — | |
| | (1,425 | ) | | | — | | | | (3,151 | ) | | | — | | | | — | | | | — | |
| | — | | | | — | | | | (31,676,855 | ) | | | (21,345,545 | ) | | | — | | | | — | |
| | | | | | | | | | | | | | | | | | | | | | |
| | (4,773,740 | ) | | | (585,136 | ) | | | (160,946,663 | ) | | | (124,424,519 | ) | | | (3,465,133 | ) | | | (16,373,374 | ) |
| | | | | | | | | | | | | | | | | | | | | | |
| | | | | |
| | | | | | | | | | | | | | | | | | | | | | |
| 5,495,643 | | | | (2,671,602 | ) | | | (215,844,066 | ) | | | (478,667,991 | ) | | | (39,248,360 | ) | | | (31,147,624 | ) |
| | | | | | | | | | | | | | | | | | | | | | |
| 969,395 | | | | 2,693,149 | | | | (476,202,868 | ) | | | (475,366,947 | ) | | | (59,613,154 | ) | | | 17,693,313 | |
| | | | | |
| | | | | | | | | | | | | | | | | | | | | | |
| | 32,014,175 | | | | 29,321,026 | | | | 659,868,279 | | | | 1,135,235,226 | | | | 385,784,248 | | | | 368,090,935 | |
| | | | | | | | | | | | | | | | | | | | | | |
| | | | | |
| $ | 32,983,570 | | | $ | 32,014,175 | | | $ | 183,665,411 | | | $ | 659,868,279 | | | $ | 326,171,094 | | | $ | 385,784,248 | |
| | | | | | | | | | | | | | | | | | | | | | |
| | | | | |
$ | 150,785 | | | $ | 31,633 | | | $ | (463,309 | ) | | $ | 4,740,561 | | | $ | 6,889,254 | | | $ | 965,925 | |
See accompanying notes which are an integral part of the financial statements.
| | | | |
| Statements of Changes in Net Assets | | | 67 | |
SSGA Funds
Statements of Changes in Net Assets
| | | | | | | | |
| | | SSGA High Yield Bond Fund | |
| | | Year Ended
August 31, 2015 | | | Year Ended
August 31, 2014 | |
| | | | | | | | |
Increase (Decrease) in Net Assets | | | | | | | | |
| | |
Operations | | | | | | | | |
Net investment income | | $ | 4,848,107 | | | $ | 5,619,460 | |
Net realized gain (loss) | | | (1,414,306 | ) | | | 1,552,254 | |
Net change in unrealized appreciation (depreciation) | | | (5,780,824 | ) | | | 2,599,509 | |
| | | | | | | | |
Net increase (decrease) in net assets from operations | | | (2,347,023 | ) | | | 9,771,223 | |
| | | | | | | | |
Voluntary contribution from Adviser | | | — | | | | — | |
| | | | | | | | |
| | |
Distributions | | | | | | | | |
From net investment income | | | | | | | | |
Class N | | | (5,177,842 | ) | | | (5,650,162 | ) |
Class A | | | (526 | ) | | | (54 | ) |
Class C | | | (4,569 | ) | | | (491 | ) |
Class I | | | (23,798 | ) | | | (55 | ) |
Class K | | | (566 | ) | | | (57 | ) |
Select Class | | | — | | | | — | |
From net realized gains | | | | | | | | |
Class N | | | (1,544,310 | ) | | | (4,914,908 | ) |
Class A | | | (184 | ) | | | — | |
Class C | | | (1,839 | ) | | | — | |
Class I | | | (16,490 | ) | | | — | |
Class K | | | (184 | ) | | | — | |
Select Class | | | — | | | | — | |
| | | | | | | | |
Net decrease in net assets from distributions | | | (6,770,308 | ) | | | (10,565,727 | ) |
| | | | | | | | |
| | |
Share Transactions | | | | | | | | |
Net increase (decrease) in net assets from share transactions (Note 6) | | | (3,702,872 | ) | | | 564,564 | |
| | | | | | | | |
Total Net Increase (Decrease) in Net Assets | | | (12,820,203 | ) | | | (229,940 | ) |
| | |
Net Assets | | | | | | | | |
Beginning of year | | | 89,026,769 | | | | 89,256,709 | |
| | | | | | | | |
| | |
End of year | | $ | 76,206,566 | | | $ | 89,026,769 | |
| | | | | | | | |
| | |
Undistributed (overdistributed) net investment income included in net assets | | $ | 121,140 | | | $ | 413,087 | |
See accompanying notes which are an integral part of the financial statements.
| | |
| 68 | | Statements of Changes in Net Assets |
This page has been intentionally left blank.
SSGA Funds
Financial Highlights
Selected data for a share of beneficial interest outstanding throughout each period is presented below.
| | | | | | | | | | | | | | | | | | | | | | | | |
| | |
$
Net Asset Value,
Beginning of
Period | | | $
Net
Investment
Income (Loss)(a)(b) | | | $
Net Realized
and Unrealized
Gain (Loss) | | | $
Total from
Investment
Operations | | | $
Voluntary
Contribution
from Adviser | | | $
Distributions
from Net
Investment Income | |
SSGA Dynamic Small Cap Fund | |
Class N | |
August 31, 2015 | | | 37.33 | | | | 0.27 | | | | (0.14 | ) | | | 0.13 | | | | — | | | | (0.20 | ) |
August 31, 2014 | | | 31.76 | | | | 0.17 | | | | 5.67 | | | | 5.84 | | | | — | | | | (0.27 | ) |
August 31, 2013 | | | 24.28 | | | | 0.17 | | | | 7.56 | | | | 7.73 | | | | 0.01 | | | | (0.26 | ) |
August 31, 2012 | | | 20.89 | | | | 0.25 | | | | 3.14 | | | | 3.39 | | | | — | | | | — | |
August 31, 2011 | | | 15.80 | | | | (0.05 | ) | | | 5.14 | | | | 5.09 | | | | — | | | | — | |
Class A | | | | | | | | | | | | | | | | | | | | | | | | |
August 31, 2015 | | | 37.32 | | | | 0.19 | | | | (0.13 | ) | | | 0.06 | | | | — | | | | (0.17 | ) |
August 31, 2014* | | | 37.38 | | | | (0.01 | ) | | | (0.05 | ) | | | (0.06 | ) | | | — | | | | — | |
Class C | | | | | | | | | | | | | | | | | | | | | | | | |
August 31, 2015 | | | 37.28 | | | | (0.10 | ) | | | (0.12 | ) | | | (0.22 | ) | | | — | | | | (0.05 | ) |
August 31, 2014* | | | 37.38 | | | | (0.05 | ) | | | (0.05 | ) | | | (0.10 | ) | | | — | | | | — | |
Class I | | | | | | | | | | | | | | | | | | | | | | | | |
August 31, 2015 | | | 37.33 | | | | 0.25 | | | | (0.10 | ) | | | 0.15 | | | | — | | | | (0.23 | ) |
August 31, 2014* | | | 37.38 | | | | 0.00 | (f) | | | (0.05 | ) | | | (0.05 | ) | | | — | | | | — | |
Class K | | | | | | | | | | | | | | | | | | | | | | | | |
August 31, 2015 | | | 37.34 | | | | 0.36 | | | | (0.13 | ) | | | 0.23 | | | | — | | | | (0.24 | ) |
August 31, 2014* | | | 37.38 | | | | 0.01 | | | | (0.05 | ) | | | (0.04 | ) | | | — | | | | — | |
SSGA Clarion Real Estate Fund | |
Class N | | | | | | | | | | | | | | | | | | | | | | | | |
August 31, 2015 | | | 15.54 | | | | 0.26 | | | | (0.05 | ) | | | 0.21 | | | | — | | | | (0.22 | ) |
August 31, 2014 | | | 12.63 | | | | 0.23 | | | | 2.91 | | | | 3.14 | | | | — | | | | (0.23 | ) |
August 31, 2013 | | | 13.11 | | | | 0.21 | | | | (0.46 | ) | | | (0.25 | ) | | | — | | | | (0.23 | ) |
August 31, 2012 | | | 11.07 | | | | 0.21 | | | | 2.00 | | | | 2.21 | | | | — | | | | (0.17 | ) |
August 31, 2011 | | | 9.49 | | | | 0.14 | | | | 1.60 | | | | 1.74 | | | | — | | | | (0.16 | ) |
Class A | | | | | | | | | | | | | | | | | | | | | | | | |
August 31, 2015 | | | 15.54 | | | | 0.23 | | | | (0.05 | ) | | | 0.18 | | | | — | | | | (0.20 | ) |
August 31, 2014* | | | 15.11 | | | | (0.11 | ) | | | 0.54 | | | | 0.43 | | | | — | | | | 0.00 | (f) |
Class C | | | | | | | | | | | | | | | | | | | | | | | | |
August 31, 2015 | | | 15.53 | | | | 0.10 | | | | (0.04 | ) | | | 0.06 | | | | — | | | | (0.14 | ) |
August 31, 2014* | | | 15.11 | | | | (0.12 | ) | | | 0.54 | | | | 0.42 | | | | — | | | | — | |
Class I | | | | | | | | | | | | | | | | | | | | | | | | |
August 31, 2015 | | | 15.55 | | | | 0.23 | | | | (0.01 | ) | | | 0.22 | | | | — | | | | (0.23 | ) |
August 31, 2014* | | | 15.11 | | | | (0.10 | ) | | | 0.54 | | | | 0.44 | | | | — | | | | 0.00 | (f) |
Class K | | | | | | | | | | | | | | | | | | | | | | | | |
August 31, 2015 | | | 15.55 | | | | 0.30 | | | | (0.05 | ) | | | 0.25 | | | | — | | | | (0.25 | ) |
August 31, 2014* | | | 15.11 | | | | (0.10 | ) | | | 0.55 | | | | 0.45 | | | | — | | | | (0.01 | ) |
| * | | For the period July 7, 2014 (commencement of operations) to August 31, 2014. |
| (a) | | Average daily shares outstanding were used for this calculation. |
| (b) | | May reflect amounts waived and/or reimbursed by the investment adviser and for certain funds, custody credit arrangements. |
| (c) | | Periods less than one year are not annualized. |
| (d) | | The ratios for periods less than one year are annualized. |
| (e) | | If the Adviser had not made a one-time voluntary contribution during the period ended August 31, 2013, the total return would have been 31.70%. |
| (f) | | Less than $0.005 per share. |
See accompanying notes which are an integral part of the financial statements.
| | | | | | | | | | | | | | | | | | | | | | | | | | | | | | |
$
Total
Distributions | | | $
Net Asset Value,
End of
Period | | | %
Total
Return(c) | | | $
Net Assets,
End of Period
(000) | | | %
Ratio of Expenses
to Average
Net Assets,
Net(b)(d) | | | %
Ratio of Expenses
to Average
Net Assets,
Gross(b)(d) | | | %
Ratio of Net
Investment Income
to Average
Net Assets(b)(d) | | | %
Portfolio
Turnover Rate(c) | |
| | | | | | | | | | | | | | | | | | | | | | | | | | | | | | |
| | | | | | | | | | | | | | | | | | | | | | | | | | | | | | |
| | (0.20 | ) | | | 37.26 | | | | 0.33 | | | | 22,508 | | | | 1.10 | | | | 2.08 | | | | 0.72 | | | | 73 | |
| | (0.27 | ) | | | 37.33 | | | | 18.42 | | | | 24,136 | | | | 1.20 | | | | 1.82 | | | | 0.46 | | | | 189 | |
| | (0.26 | ) | | | 31.76 | | | | 32.20 | (e) | | | 23,509 | | | | 1.25 | | | | 2.28 | | | | 0.61 | | | | 147 | |
| | — | | | | 24.28 | | | | 16.23 | | | | 10,007 | | | | 1.25 | | | | 3.51 | | | | 1.10 | | | | 160 | |
| | — | | | | 20.89 | | | | 32.22 | | | | 9,115 | | | | 1.25 | | | | 3.38 | | | | (0.24 | ) | | | 179 | |
| | | | | | | | | | | | | | | | | | | | | | | | | | | | | | |
| | (0.17 | ) | | | 37.21 | | | | 0.15 | | | | 10 | | | | 1.30 | | | | 2.28 | | | | 0.49 | | | | 73 | |
| | — | | | | 37.32 | | | | (0.16 | ) | | | 10 | | | | 1.20 | | | | 3.04 | | | | (0.17 | ) | | | 189 | |
| | | | | | | | | | | | | | | | | | | | | | | | | | | | | | |
| | (0.05 | ) | | | 37.01 | | | | (0.60 | ) | | | 10 | | | | 2.05 | | | | 3.03 | | | | (0.26 | ) | | | 73 | |
| | — | | | | 37.28 | | | | (0.29 | ) | | | 10 | | | | 1.93 | | | | 3.77 | | | | (0.91 | ) | | | 189 | |
| | | | | | | | | | | | | | | | | | | | | | | | | | | | | | |
| | (0.23 | ) | | | 37.25 | | | | 0.40 | | | | 1,282 | | | | 1.05 | | | | 2.03 | | | | 0.65 | | | | 73 | |
| | — | | | | 37.33 | | | | (0.13 | ) | | | 10 | | | | 0.95 | | | | 2.79 | | | | 0.08 | | | | 189 | |
| | | | | | | | | | | | | | | | | | | | | | | | | | | | | | |
| | (0.24 | ) | | | 37.33 | | | | 0.61 | | | | 10 | | | | 0.85 | | | | 1.83 | | | | 0.94 | | | | 73 | |
| | — | | | | 37.34 | | | | (0.11 | ) | | | 10 | | | | 0.76 | | �� | | 2.62 | | | | 0.26 | | | | 189 | |
| | | | | | | | | | | | | | | | | | | | | | | | | | | | | | |
| | | | | | | | | | | | | | | | | | | | | | | | | | | | | | |
| | (0.22 | ) | | | 15.53 | | | | 1.33 | | | | 45,452 | | | | 1.00 | | | | 1.46 | | | | 1.60 | | | | 38 | |
| | (0.23 | ) | | | 15.54 | | | | 25.11 | | | | 52,518 | | | | 1.00 | | | | 1.36 | | | | 1.62 | | | | 32 | |
| | (0.23 | ) | | | 12.63 | | | | (1.94 | ) | | | 39,956 | | | | 1.00 | | | | 1.43 | | | | 1.60 | | | | 58 | |
| | (0.17 | ) | | | 13.11 | | | | 20.22 | | | | 62,155 | | | | 1.00 | | | | 1.32 | | | | 1.76 | | | | 21 | |
| | (0.16 | ) | | | 11.07 | | | | 18.41 | | | | 58,135 | | | | 1.00 | | | | 1.26 | | | | 1.29 | | | | 12 | |
| | | | | | | | | | | | | | | | | | | | | | | | | | | | | | |
| | (0.20 | ) | | | 15.52 | | | | 1.14 | | | | 103 | | | | 1.20 | | | | 1.66 | | | | 1.39 | | | | 38 | |
| | 0.00 | (f) | | | 15.54 | | | | 2.85 | | | | 103 | | | | 1.18 | | | | 1.53 | | | | (4.51 | ) | | | 32 | |
| | | | | | | | | | | | | | | | | | | | | | | | | | | | | | |
| | (0.14 | ) | | | 15.45 | | | | 0.33 | | | | 118 | | | | 1.95 | | | | 2.41 | | | | 0.62 | | | | 38 | |
| | — | | | | 15.53 | | | | 2.78 | | | | 103 | | | | 1.91 | | | | 2.27 | | | | (5.25 | ) | | | 32 | |
| | | | | | | | | | | | | | | | | | | | | | | | | | | | | | |
| | (0.23 | ) | | | 15.54 | | | | 1.35 | | | | 241 | | | | 0.95 | | | | 1.41 | | | | 1.38 | | | | 38 | |
| | 0.00 | (f) | | | 15.55 | | | | 2.93 | | | | 103 | | | | 0.93 | | | | 1.29 | | | | (4.27 | ) | | | 32 | |
| | | | | | | | | | | | | | | | | | | | | | | | | | | | | | |
| | (0.25 | ) | | | 15.55 | | | | 1.62 | | | | 103 | | | | 0.75 | | | | 1.21 | | | | 1.84 | | | | 38 | |
| | (0.01 | ) | | | 15.55 | | | | 2.95 | | | | 103 | | | | 0.74 | | | | 1.08 | | | | (4.07 | ) | | | 32 | |
See accompanying notes which are an integral part of the financial statements.
SSGA Funds
Financial Highlights
Selected data for a share of beneficial interest outstanding throughout each period is presented below.
| | | | | | | | | | | | | | | | | | | | | | | | | | | | |
| | |
$
Net Asset Value,
Beginning of
Period | | | $
Net
Investment
Income (Loss)(a)(b) | | | $
Net Realized
and Unrealized
Gain (Loss) | | | $
Total from
Investment
Operations | | | $
Voluntary
Contribution
from Adviser | | | $
Distributions
from Net
Investment Income | | | $
Distributions
from Net
Realized Gain | |
SSGA Enhanced Small Cap Fund | |
Class N | | | | | | | | | | | | | | | | | | | | | | | | | | | | |
August 31, 2015 | | | 17.12 | | | | 0.19 | | | | 0.13 | | | | 0.32 | | | | — | | | | (0.11 | ) | | | (2.52 | ) |
August 31, 2014 | | | 14.44 | | | | 0.13 | | | | 2.84 | | | | 2.97 | | | | — | | | | (0.29 | ) | | | — | |
August 31, 2013 | | | 11.54 | | | | 0.18 | | | | 2.84 | | | | 3.02 | | | | — | | | | (0.12 | ) | | | — | |
August 31, 2012 | | | 10.14 | | | | 0.11 | | | | 1.37 | | | | 1.48 | | | | — | | | | (0.08 | ) | | | — | |
August 31, 2011 | | | 7.95 | | | | 0.07 | | | | 2.17 | | | | 2.24 | | | | — | | | | (0.05 | ) | | | — | |
Class A | | | | | | | | | | | | | | | | | | | | | | | | | | | | |
August 31, 2015 | | | 17.11 | | | | 0.17 | | | | 0.11 | | | | 0.28 | | | | — | | | | (0.09 | ) | | | (2.52 | ) |
August 31, 2014* | | | 17.23 | | | | (0.02 | ) | | | (0.10 | ) | | | (0.12 | ) | | | — | | | | — | | | | — | |
Class C | | | | | | | | | | | | | | | | | | | | | | | | | | | | |
August 31, 2015 | | | 17.10 | | | | 0.05 | | | | 0.11 | | | | 0.16 | | | | — | | | | (0.04 | ) | | | (2.52 | ) |
August 31, 2014* | | | 17.23 | | | | (0.04 | ) | | | (0.09 | ) | | | (0.13 | ) | | | — | | | | — | | | | — | |
Class I | | | | | | | | | | | | | | | | | | | | | | | | | | | | |
August 31, 2015 | | | 17.12 | | | | 0.20 | | | | 0.12 | | | | 0.32 | | | | — | | | | (0.11 | ) | | | (2.52 | ) |
August 31, 2014* | | | 17.23 | | | | (0.01 | ) | | | (0.10 | ) | | | (0.11 | ) | | | — | | | | — | | | | — | |
Class K | | | | | | | | | | | | | | | | | | | | | | | | | | | | |
August 31, 2015 | | | 17.13 | | | | 0.21 | | | | 0.14 | | | | 0.35 | | | | — | | | | (0.13 | ) | | | (2.52 | ) |
August 31, 2014* | | | 17.23 | | | | (0.01 | ) | | | (0.09 | ) | | | (0.10 | ) | | | — | | | | — | | | | — | |
SSGA Emerging Markets Fund | |
Class N | | | | | | | | | | | | | | | | | | | | | | | | | | | | |
August 31, 2015 | | | 19.22 | | | | 0.20 | | | | (3.89 | ) | | | (3.69 | ) | | | — | | | | (0.39 | ) | | | (5.84 | ) |
August 31, 2014 | | | 18.47 | | | | 0.26 | | | | 2.53 | | | | 2.79 | | | | 0.01 | | | | (0.44 | ) | | | (1.61 | ) |
August 31, 2013 | | | 18.71 | | | | 0.37 | | | | (0.28 | ) | | | 0.09 | | | | — | | | | (0.33 | ) | | | — | |
August 31, 2012 | | | 20.81 | | | | 0.34 | | | | (2.14 | ) | | | (1.80 | ) | | | — | | | | (0.30 | ) | | | — | |
August 31, 2011 | | | 19.20 | | | | 0.29 | | | | 1.70 | | | | 1.99 | | | | — | | | | (0.38 | ) | | | — | |
Class A | | | | | | | | | | | | | | | | | | | | | | | | | | | | |
August 31, 2015 | | | 19.22 | | | | 0.26 | | | | (3.97 | ) | | | (3.71 | ) | | | — | | | | (0.38 | ) | | | (5.84 | ) |
August 31, 2014* | | | 18.68 | | | | 0.07 | | | | 0.46 | (g) | | | 0.53 | (g) | | | 0.01 | | | | — | | | | — | |
Class C | | | | | | | | | | | | | | | | | | | | | | | | | | | | |
August 31, 2015 | | | 19.20 | | | | 0.07 | | | | (3.87 | ) | | | (3.80 | ) | | | — | | | | (0.32 | ) | | | (5.84 | ) |
August 31, 2014* | | | 18.68 | | | | 0.04 | | | | 0.47 | (g) | | | 0.51 | (g) | | | 0.01 | | | | — | | | | — | |
Class I | | | | | | | | | | | | | | | | | | | | | | | | | | | | |
August 31, 2015 | | | 19.23 | | | | 0.20 | | | | (3.88 | ) | | | (3.68 | ) | | | — | | | | (0.41 | ) | | | (5.84 | ) |
August 31, 2014* | | | 18.68 | | | | 0.07 | | | | 0.47 | (g) | | | 0.54 | (g) | | | 0.01 | | | | — | | | | — | |
Class K | | | | | | | | | | | | | | | | | | | | | | | | | | | | |
August 31, 2015 | | | 19.23 | | | | 0.23 | | | | (3.89 | ) | | | (3.66 | ) | | | — | | | | (0.42 | ) | | | (5.84 | ) |
August 31, 2014* | | | 18.68 | | | | 0.08 | | | | 0.46 | (g) | | | 0.54 | (g) | | | 0.01 | | | | — | | | | — | |
Select Class | | | | | | | | | | | | | | | | | | | | | | | | | | | | |
August 31, 2015 | | | 19.24 | | | | 0.16 | | | | (3.83 | ) | | | (3.67 | ) | | | — | | | | (0.41 | ) | | | (5.84 | ) |
August 31, 2014 | | | 18.53 | | | | 0.31 | | | | 2.52 | | | | 2.83 | | | | 0.01 | | | | (0.52 | ) | | | (1.61 | ) |
August 31, 2013 | | | 18.79 | | | | 0.38 | | | | (0.23 | ) | | | 0.15 | | | | — | | | | (0.41 | ) | | | — | |
August 31, 2012 | | | 20.90 | | | | 0.36 | | | | (2.13 | ) | | | (1.77 | ) | | | — | | | | (0.34 | ) | | | — | |
August 31, 2011 | | | 19.28 | | | | 0.31 | | | | 1.73 | | | | 2.04 | | | | — | | | | (0.42 | ) | | | — | |
| * | | For the period July 7, 2014 (commencement of operations) to August 31, 2014. |
| (a) | | Average daily shares outstanding were used for this calculation. |
| (b) | | May reflect amounts waived and/or reimbursed by the investment adviser and for certain funds, custody credit arrangements. |
| (c) | | Periods less than one year are not annualized. |
| (d) | | The ratios for periods less than one year are annualized. |
| (e) | | If the Adviser had not made a contribution during the period ended August 31, 2014, the total return would have been 15.62% for Class N, 15.94% for Select Class, 2.84% for Class A, 2.73% for Class C, 2.89% for Class I, and 2.89% for Class K of SSGA Emerging Markets Fund. |
| (f) | | If the Adviser had not made a contribution during the period ended August 31, 2013, the total return would have been 0.41% and 0.66% for the Class N shares and Select Class of SSGA Emerging Markets Fund, respectively. |
| (g) | | Amount previously presented has been restated by $0.01. |
See accompanying notes which are an integral part of the financial statements.
| | | | | | | | | | | | | | | | | | | | | | | | | | | | | | |
$
Total
Distributions | | | $
Net Asset Value,
End of
Period | | | %
Total
Return(c) | | | $
Net Assets,
End of Period
(000) | | | %
Ratio of Expenses
to Average
Net Assets,
Net(b)(d) | | | %
Ratio of Expenses
to Average
Net Assets,
Gross(b)(d) | | | %
Ratio of Net
Investment Income
to Average
Net Assets(b)(d) | | | %
Portfolio
Turnover Rate(c) | |
| | | | | | | | | | | | | | | | | | | | | | | | | | | | | | |
| | | | | | | | | | | | | | | | | | | | | | | | | | | | | | |
| | (2.63 | ) | | | 14.81 | | | | 1.74 | | | | 32,432 | | | | 0.75 | | | | 1.47 | | | | 1.22 | | | | 90 | |
| | (0.29 | ) | | | 17.12 | | | | 20.71 | | | | 31,706 | | | | 0.75 | | | | 1.28 | | | | 0.78 | | | | 71 | |
| | (0.12 | ) | | | 14.44 | | | | 26.45 | | | | 29,321 | | | | 0.75 | | | | 1.36 | | | | 1.35 | | | | 57 | |
| | (0.08 | ) | | | 11.54 | | | | 14.76 | | | | 27,134 | | | | 0.75 | | | | 1.58 | | | | 1.06 | | | | 64 | |
| | (0.05 | ) | | | 10.14 | | | | 28.19 | | | | 27,311 | | | | 0.75 | | | | 1.44 | | | | 0.69 | | | | 57 | |
| | | | | | | | | | | | | | | | | | | | | | | | | | | | | | |
| | (2.61 | ) | | | 14.78 | | | | 1.51 | | | | 179 | | | | 0.95 | | | | 1.67 | | | | 1.09 | | | | 90 | |
| | — | | | | 17.11 | | | | (0.70 | ) | | | 99 | | | | 0.93 | | | | 1.98 | | | | (0.77 | ) | | | 71 | |
| | | | | | | | | | | | | | | | | | | | | | | | | | | | | | |
| | (2.56 | ) | | | 14.70 | | | | 0.70 | | | | 147 | | | | 1.70 | | | | 2.42 | | | | 0.31 | | | | 90 | |
| | — | | | | 17.10 | | | | (0.75 | ) | | | 99 | | | | 1.67 | | | | 2.72 | | | | (1.51 | ) | | | 71 | |
| | | | | | | | | | | | | | | | | | | | | | | | | | | | | | |
| | (2.63 | ) | | | 14.81 | | | | 1.76 | | | | 90 | | | | 0.70 | | | | 1.42 | | | | 1.26 | | | | 90 | |
| | — | | | | 17.12 | | | | (0.64 | ) | | | 99 | | | | 0.69 | | | | 1.73 | | | | (0.52 | ) | | | 71 | |
| | | | | | | | | | | | | | | | | | | | | | | | | | | | | | |
| | (2.65 | ) | | | 14.83 | | | | 1.93 | | | | 135 | | | | 0.50 | | | | 1.21 | | | | 1.39 | | | | 90 | |
| | — | | | | 17.13 | | | | (0.58 | ) | | | 10 | | | | 0.49 | | | | 1.50 | | | | (0.32 | ) | | | 71 | |
| | | | | | | | | | | | | | | | | | | | | | | | | | | | | | |
| | | | | | | | | | | | | | | | | | | | | | | | | | | | | | |
| | (6.23 | ) | | | 9.30 | | | | (22.67 | ) | | | 171,885 | | | | 1.25 | | | | 1.40 | | | | 1.54 | | | | 78 | |
| | (2.05 | ) | | | 19.22 | | | | 15.68 | (e) | | | 495,509 | | | | 1.20 | | | | 1.24 | | | | 1.44 | | | | 89 | |
| | (0.33 | ) | | | 18.47 | | | | 0.45 | (f) | | | 938,195 | | | | 1.25 | | | | 1.26 | | | | 1.86 | | | | 56 | |
| | (0.30 | ) | | | 18.71 | | | | (8.63 | ) | | | 1,273,588 | | | | 1.25 | | | | 1.28 | | | | 1.80 | | | | 74 | |
| | (0.38 | ) | | | 20.81 | | | | 10.25 | | | | 1,451,810 | | | | 1.25 | | | | 1.26 | | | | 1.29 | | | | 50 | |
| | | | | | | | | | | | | | | | | | | | | | | | | | | | | | |
| | (6.22 | ) | | | 9.29 | | | | (22.73 | ) | | | 19 | | | | 1.45 | | | | 1.59 | | | | 2.19 | | | | 78 | |
| | — | | | | 19.22 | | | | 2.89 | (e) | | | 10 | | | | 1.36 | | | | 1.77 | | | | 2.27 | | | | 89 | |
| | | | | | | | | | | | | | | | | | | | | | | | | | | | | | |
| | (6.16 | ) | | | 9.24 | | | | (23.43 | ) | | | 49 | | | | 2.20 | | | | 2.34 | | | | 0.56 | | | | 78 | |
| | — | | | | 19.20 | | | | 2.78 | (e) | | | 103 | | | | 2.11 | | | | 2.52 | | | | 1.51 | | | | 89 | |
| | | | | | | | | | | | | | | | | | | | | | | | | | | | | | |
| | (6.25 | ) | | | 9.30 | | | | (22.56 | ) | | | 1,447 | | | | 1.20 | | | | 1.34 | | | | 1.83 | | | | 78 | |
| | — | | | | 19.23 | | | | 2.94 | (e) | | | 10 | | | | 1.12 | | | | 1.52 | | | | 2.52 | | | | 89 | |
| | | | | | | | | | | | | | | | | | | | | | | | | | | | | | |
| | (6.26 | ) | | | 9.31 | | | | (22.49 | ) | | | 5 | | | | 1.01 | | | | 1.15 | | | | 1.78 | | | | 78 | |
| | — | | | | 19.23 | | | | 2.94 | (e) | | | 10 | | | | 0.97 | | | | 1.42 | | | | 2.65 | | | | 89 | |
| | | | | | | | | | | | | | | | | | | | | | | | | | | | | | |
| | (6.25 | ) | | | 9.32 | | | | (22.40 | ) | | | 10,259 | | | | 1.03 | | | | 1.17 | | | | 1.05 | | | | 78 | |
| | (2.13 | ) | | | 19.24 | | | | 15.95 | (e) | | | 164,226 | | | | 0.98 | | | | 1.03 | | | | 1.68 | | | | 89 | |
| | (0.41 | ) | | | 18.53 | | | | 0.69 | (f) | | | 197,040 | | | | 1.03 | | | | 1.04 | | | | 1.92 | | | | 56 | |
| | (0.34 | ) | | | 18.79 | | | | (8.42 | ) | | | 436,595 | | | | 1.02 | | | | 1.05 | | | | 1.90 | | | | 74 | |
| | (0.42 | ) | | | 20.90 | | | | 10.48 | | | | 715,328 | | | | 1.02 | | | | 1.04 | | | | 1.40 | | | | 50 | |
See accompanying notes which are an integral part of the financial statements.
SSGA Funds
Financial Highlights
Selected data for a share of beneficial interest outstanding throughout each period is presented below.
| | | | | | | | | | | | | | | | | | | | | | | | |
| | |
$
Net Asset Value,
Beginning of
Period | | | $
Net
Investment
Income (Loss)(a)(b) | | | $
Net Realized
and Unrealized
Gain (Loss) | | | $
Total from
Investment
Operations | | | $
Distributions from Net
Investment Income | | | $
Distributions
from Net
Realized Gain | |
SSGA International Stock Selection Fund | | | | | | | | | | | | | |
Class N | | | | | | | | | | | | | | | | | | | | | | | | |
August 31, 2015 | | | 11.24 | | | | 0.25 | | | | (0.74 | ) | | | (0.49 | ) | | | (0.10 | ) | | | — | |
August 31, 2014 | | | 9.90 | | | | 0.27 | | | | 1.53 | | | | 1.80 | | | | (0.46 | ) | | | — | |
August 31, 2013 | | | 8.61 | | | | 0.23 | | | | 1.40 | | | | 1.63 | | | | (0.34 | ) | | | — | |
August 31, 2012 | | | 9.24 | | | | 0.23 | | | | (0.53 | ) | | | (0.30 | ) | | | (0.33 | ) | | | — | |
August 31, 2011 | | | 8.81 | | | | 0.23 | | | | 0.46 | | | | 0.69 | | | | (0.26 | ) | | | — | |
Class A | | | | | | | | | | | | | | | | | | | | | | | | |
August 31, 2015 | | | 11.23 | | | | 0.24 | | | | (0.73 | ) | | | (0.49 | ) | | | (0.10 | ) | | | — | |
August 31, 2014* | | | 11.54 | | | | 0.03 | | | | (0.34 | ) | | | (0.31 | ) | | | — | | | | — | |
Class C | | | | | | | | | | | | | | | | | | | | | | | | |
August 31, 2015 | | | 11.22 | | | | 0.15 | | | | (0.73 | ) | | | (0.58 | ) | | | (0.06 | ) | | | — | |
August 31, 2014* | | | 11.54 | | | | 0.02 | | | | (0.34 | ) | | | (0.32 | ) | | | — | | | | — | |
Class I | | | | | | | | | | | | | | | | | | | | | | | | |
August 31, 2015 | | | 11.24 | | | | 0.29 | | | | (0.76 | ) | | | (0.47 | ) | | | (0.12 | ) | | | — | |
August 31, 2014* | | | 11.54 | | | | 0.03 | | | | (0.33 | ) | | | (0.30 | ) | | | — | | | | — | |
Class K | | | | | | | | | | | | | | | | | | | | | | | | |
August 31, 2015 | | | 11.24 | | | | 0.28 | | | | (0.73 | ) | | | (0.45 | ) | | | (0.12 | ) | | | — | |
August 31, 2014* | | | 11.54 | | | | 0.04 | | | | (0.34 | ) | | | (0.30 | ) | | | — | | | | — | |
SSGA High Yield Bond Fund | | | | | | | | | | | | | |
Class N | | | | | | | | | | | | | | | | | | | | | | | | |
August 31, 2015 | | | 8.36 | | | | 0.42 | | | | (0.62 | ) | | | (0.20 | ) | | | (0.46 | ) | | | (0.15 | ) |
August 31, 2014 | | | 8.40 | | | | 0.47 | | | | 0.36 | | | | 0.83 | | | | (0.47 | ) | | | (0.40 | ) |
August 31, 2013 | | | 8.36 | | | | 0.49 | | | | 0.08 | | | | 0.57 | | | | (0.51 | ) | | | (0.02 | ) |
August 31, 2012 | | | 7.90 | | | | 0.52 | | | | 0.48 | | | | 1.00 | | | | (0.54 | ) | | | — | |
August 31, 2011 | | | 7.84 | | | | 0.58 | | | | 0.06 | | | | 0.64 | | | | (0.58 | ) | | | — | |
Class A | | | | | | | | | | | | | | | | | | | | | | | | |
August 31, 2015 | | | 8.36 | | | | 0.41 | | | | (0.63 | ) | | | (0.22 | ) | | | (0.44 | ) | | | (0.15 | ) |
August 31, 2014* | | | 8.41 | | | | 0.07 | | | | (0.07 | ) | | | — | | | | (0.05 | ) | | | — | |
Class C | | | | | | | | | | | | | | | | | | | | | | | | |
August 31, 2015 | | | 8.36 | | | | 0.35 | | | | (0.63 | ) | | | (0.28 | ) | | | (0.38 | ) | | | (0.15 | ) |
August 31, 2014* | | | 8.41 | | | | 0.06 | | | | (0.07 | ) | | | (0.01 | ) | | | (0.04 | ) | | | — | |
Class I | | | | | | | | | | | | | | | | | | | | | | | | |
August 31, 2015 | | | 8.36 | | | | 0.42 | | | | (0.61 | ) | | | (0.19 | ) | | | (0.46 | ) | | | (0.15 | ) |
August 31, 2014* | | | 8.41 | | | | 0.07 | | | | (0.07 | ) | | | — | | | | (0.05 | ) | | | — | |
Class K | | | | | | | | | | | | | | | | | | | | | | | | |
August 31, 2015 | | | 8.36 | | | | 0.45 | | | | (0.62 | ) | | | (0.17 | ) | | | (0.48 | ) | | | (0.15 | ) |
August 31, 2014* | | | 8.41 | | | | 0.07 | | | | (0.07 | ) | | | — | | | | (0.05 | ) | | | — | |
| * | | For the period July 7, 2014 (commencement of operations) to August 31, 2014. |
| (a) | | Average daily shares outstanding were used for this calculation. |
| (b) | | May reflect amounts waived and/or reimbursed by the investment adviser and for certain funds, custody credit arrangements. |
| (c) | | Periods less than one year are not annualized. |
| (d) | | The ratios for periods less than one year are annualized. |
| (e) | | If the Adviser had not made a contribution during the period ended August 31, 2013, the total return would have been 0.41% and 0.66% for the Class N shares and Select Class of SSGA Emerging Markets Fund, respectively. |
See accompanying notes which are an integral part of the financial statements.
| | | | | | | | | | | | | | | | | | | | | | | | | | | | | | |
$
Total
Distributions | | | $
Net Asset Value,
End of
Period | | | %
Total
Return(c) | | | $
Net Assets,
End of Period
(000) | | | %
Ratio of Expenses
to Average
Net Assets,
Net(b)(d) | | | %
Ratio of Expenses
to Average
Net Assets,
Gross(b)(d) | | | %
Ratio of Net
Investment Income
to Average
Net Assets(b)(d) | | | %
Portfolio
Turnover Rate(c) | |
| | | | | | | | | | | | | | | | | | | | | | | | | | | | | | |
| | | | | | | | | | | | | | | | | | | | | | | | | | | | | | |
| | (0.10 | ) | | | 10.65 | | | | (4.31 | ) | | | 325,556 | | | | 1.00 | | | | 1.20 | | | | 2.26 | | | | 60 | |
| | (0.46 | ) | | | 11.24 | | | | 18.31 | | | | 385,784 | | | | 1.02 | | | | 1.19 | | | | 2.46 | | | | 74 | |
| | (0.34 | ) | | | 9.90 | | | | 19.45 | (e) | | | 368,091 | | | | 1.00 | | | | 1.19 | | | | 2.41 | | | | 54 | |
| | (0.33 | ) | | | 8.61 | | | | (3.16 | ) | | | 387,120 | | | | 1.00 | | | | 1.21 | | | | 2.65 | | | | 90 | |
| | (0.26 | ) | | | 9.24 | | | | 7.61 | | | | 766,126 | | | | 1.00 | | | | 1.19 | | | | 2.27 | | | | 77 | |
| | | | | | | | | | | | | | | | | | | | | | | | | | | | | | |
| | (0.10 | ) | | | 10.64 | | | | (4.39 | ) | | | 16 | | | | 1.20 | | | | 1.40 | | | | 2.16 | | | | 60 | |
| | — | | | | 11.23 | | | | (2.69 | ) | | | 10 | | | | 1.17 | | | | 1.50 | | | | 1.65 | | | | 74 | |
| | | | | | | | | | | | | | | | | | | | | | | | | | | | | | |
| | (0.06 | ) | | | 10.58 | | | | (5.18 | ) | | | 92 | | | | 1.95 | | | | 2.15 | | | | 1.34 | | | | 60 | |
| | — | | | | 11.22 | | | | (2.77 | ) | | | 97 | | | | 1.91 | | | | 2.25 | | | | 0.91 | | | | 74 | |
| | | | | | | | | | | | | | | | | | | | | | | | | | | | | | |
| | (0.12 | ) | | | 10.65 | | | | (4.21 | ) | | | 499 | | | | 0.95 | | | | 1.16 | | | | 2.61 | | | | 60 | |
| | — | | | | 11.24 | | | | (2.60 | ) | | | 10 | | | | 0.92 | | | | 1.24 | | | | 1.90 | | | | 74 | |
| | | | | | | | | | | | | | | | | | | | | | | | | | | | | | |
| | (0.12 | ) | | | 10.67 | | | | (4.01 | ) | | | 9 | | | | 0.75 | | | | 0.96 | | | | 2.54 | | | | 60 | |
| | — | | | | 11.24 | | | | (2.60 | ) | | | 10 | | | | 0.73 | | | | 1.11 | | | | 2.09 | | | | 74 | |
| | | | | | | | | | | | | | | | | | | | | | | | | | | | | | |
| | | | | | | | | | | | | | | | | | | | | | | | | | | | | | |
| | (0.61 | ) | | | 7.55 | | | | (2.38 | ) | | | 75,632 | | | | 0.75 | | | | 0.92 | | | | 5.38 | | | | 100 | |
| | (0.87 | ) | | | 8.36 | | | | 10.49 | | | | 89,027 | | | | 0.73 | | | | 0.78 | | | | 5.61 | | | | 79 | |
| | (0.53 | ) | | | 8.40 | | | | 6.85 | | | | 89,257 | | | | 0.75 | | | | 0.79 | | | | 5.70 | | | | 112 | |
| | (0.54 | ) | | | 8.36 | | | | 13.17 | | | | 113,999 | | | | 0.75 | | | | 0.88 | | | | 6.30 | | | | 196 | |
| | (0.58 | ) | | | 7.90 | | | | 8.16 | | | | 78,626 | | | | 0.75 | | | | 0.83 | | | | 7.02 | | | | 294 | |
| | | | | | | | | | | | | | | | | | | | | | | | | | | | | | |
| | (0.59 | ) | | | 7.55 | | | | (2.57 | ) | | | 9 | | | | 0.94 | | | | 1.11 | | | | 5.21 | | | | 100 | |
| | (0.05 | ) | | | 8.36 | | | | (0.05 | ) | | | 10 | | | | 0.93 | | | | 1.19 | | | | 5.18 | | | | 79 | |
| | | | | | | | | | | | | | | | | | | | | | | | | | | | | | |
| | (0.53 | ) | | | 7.55 | | | | (3.28 | ) | | | 90 | | | | 1.70 | | | | 1.87 | | | | 4.45 | | | | 100 | |
| | (0.04 | ) | | | 8.36 | | | | (0.09 | ) | | | 99 | | | | 1.67 | | | | 1.95 | | | | 4.45 | | | | 79 | |
| | | | | | | | | | | | | | | | | | | | | | | | | | | | | | |
| | (0.61 | ) | | | 7.56 | | | | (2.22 | ) | | | 467 | | | | 0.70 | | | | 0.87 | | | | 5.42 | | | | 100 | |
| | (0.05 | ) | | | 8.36 | | | | (0.03 | ) | | | 10 | | | | 0.68 | | | | 0.94 | | | | 5.43 | | | | 79 | |
| | | | | | | | | | | | | | | | | | | | | | | | | | | | | | |
| | (0.63 | ) | | | 7.56 | | | | (2.16 | ) | | | 9 | | | | 0.50 | | | | 0.67 | | | | 5.66 | | | | 100 | |
| | (0.05 | ) | | | 8.36 | | | | (0.02 | ) | | | 10 | | | | 0.50 | | | | 0.81 | | | | 5.63 | | | | 79 | |
See accompanying notes which are an integral part of the financial statements.
SSGA Funds
Notes to Financial Statements — August 31, 2015
The SSGA Funds (the “Trust”) is registered under the Investment Company Act of 1940, as amended (the “1940 Act”), as an open-end management investment company, and was organized as a Massachusetts business trust on October 3, 1987 and operates under a Second Amended and Restated Master Trust Agreement, dated May 15, 2012 (the “Agreement”).
As of August 31, 2015, the Trust consisted of eleven (11) series and corresponding classes, each of which have the same rights and privileges, including voting rights. The Declaration of Trust permits the Board of Trustees of the Trust (the “Board”) to authorize the issuance of an unlimited number of shares of beneficial interest at a $.001 par value. The financial statements herein relate to the following series (each a “Fund” and, collectively, the “Funds”):
| | | | |
| Fund | | Classes | | Commencement of
Operations: |
SSGA Dynamic Small Cap Fund (diversified) | | Class N Class A Class C Class I Class K | | July 1, 1992 July 7, 2014 July 7, 2014 July 7, 2014 July 7, 2014 |
SSGA Clarion Real Estate Fund (non-diversified) | | Class N Class A Class C Class I Class K | | April 29, 1998 July 7, 2014 July 7, 2014 July 7, 2014 July 7, 2014 |
SSGA Enhanced Small Cap Fund (diversified) | | Class N Class A Class C Class I Class K | | March 22, 2005 July 7, 2014 July 7, 2014 July 7, 2014 July 7, 2014 |
SSGA Emerging Markets Fund (diversified) | | Class N Select Class1 Class A Class C Class I Class K | | March 1, 1994 November 28, 2005 July 7, 2014 July 7, 2014 July 7, 2014 July 7, 2014 |
SSGA International Stock Selection Fund (diversified) | | Class N Class A Class C Class I Class K | | March 7, 1995 July 7, 2014 July 7, 2014 July 7, 2014 July 7, 2014 |
SSGA High Yield Bond Fund (diversified) | | Class N Class A Class C Class I Class K | | May 4, 1998 July 7, 2014 July 7, 2014 July 7, 2014 July 7, 2014 |
The financial statements of the remaining 5 series are presented in separate reports.
Under the Trust’s organizational documents, its officers and trustees are indemnified against certain liabilities arising out of the performance of their duties to the Trust. Additionally, in the normal course of business, the Trust enters into contracts with service providers that contain general indemnification clauses. The Trust’s maximum exposure under these arrangements is unknown as this could involve future claims that may be made against the Trust that have not yet occurred.
| | 1 | Select Class shares of the SSGA Emerging Markets Fund may not be purchased by individuals directly, but must be purchased through a third party financial institution which is permitted by contract with the Investment Company or State Street Global Markets LLC to offer shares (“Select Intermediaries”). Select Intermediaries are advisors, securities brokers, banks and financial institutions or other industry professionals or organizations that have entered into a shareholder servicing agreement with the State Street Global Markets LLC with respect to investments of its accounts in the Select Class. |
| | |
| 76 | | Notes to Financial Statements |
SSGA Funds
Notes to Financial Statements, continued — August 31, 2015
Deloitte & Touche LLP (“Deloitte & Touche”) served as independent registered certified public accounting firm through November 19, 2014. On November 19, 2014, upon recommendation by the Audit Committee of the Funds, the Funds’ Board of Trustees selected Ernst & Young LLP to replace Deloitte & Touche as the independent public accountant for the fiscal year ending August 31, 2015.
The reports of Deloitte & Touche on the financial statements for the past two fiscal years contained no adverse opinion or disclaimer of opinion and were not qualified or modified as to uncertainty, audit scope or accounting principles.
During the two most recent fiscal years and through November 19, 2014, there have been no disagreements with Deloitte & Touche on any matter of accounting principles or practices, financial statement disclosure, or auditing scope or procedure, which disagreements if not resolved to the satisfaction of Deloitte & Touche would have caused them to make reference thereto in their reports on the financial statements for such years.
During the two most recent fiscal years and through, there have been no reportable events (as defined in Item 304(a)(1)(v) of Regulation S-K). The Funds requested and Deloitte & Touche furnished a letter addressed to the Securities and Exchange Commission stating whether or not it agreed with the above statements. A copy of such letter was filed as Exhibit 77 to Form N-SAR for the period.
| 2. | | Significant Accounting Policies |
The following is a summary of significant accounting policies followed by the Trust in the preparation of its financial statements:
The preparation of financial statements in accordance with U.S. generally accepted accounting principles (“U.S. GAAP”) requires management to make estimates and assumptions that affect the reported amounts and disclosures in the financial statements. Actual results could differ from those estimates. Each Fund is an investment company under U.S. GAAP and follows the accounting and reporting guidance applicable to investment companies in Financial Accounting Standards Board (“FASB”) Accounting Standards Codification (“ASC”) 946, Financial Services Investment Companies (“ASC 946”).
Security Valuation
Each Fund’s investments are valued at fair value each day that the Fund’s listing exchange is open and, for financial reporting purposes, as of the report date should the reporting period end on a day that the Fund’s listing exchange is not open. Fair value is generally defined as the price a fund would receive to sell an asset or pay to transfer a liability in an orderly transaction between market participants at the measurement date. By its nature, a fair value price is a good faith estimate of the valuation in a current sale and may not reflect an actual market price. The investments of each Fund are valued pursuant to policies and procedures developed by the Oversight Committee (the “Committee”) and approved by the Board. The Committee provides oversight of the valuation of investments for the Funds. The Board has responsibility for determining the fair value of investments. The members of the Committee are approved by the Board. Valuation techniques used to value each Fund’s investments by major category are as follows:
| | • | | Equity investments (including preferred stock and registered investment companies that are exchange-traded funds) traded on a recognized securities exchange for which market quotations are readily available are valued at the last sale price or official closing price, as applicable, on the primary market or exchange on which they trade. Equity investments traded on a recognized exchange for which there were no sales on that day are valued at the last published sale price or at fair value. |
| | • | | Rights and warrants are valued at the last reported sale price obtained from independent pricing services or brokers on the valuation date. If no prices are obtained from the pricing services or brokers, valuation will be based upon the intrinsic value. |
| | • | | Investments in registered investment companies (including money market funds) or other unitized pooled investment vehicles that are not traded on an exchange are valued at that day’s published net asset value per share or unit. Money market funds generally value portfolio investments using the amortized cost method as set forth in Rule 2a-7 under the 1940 Act and in accordance with funds’ procedures to stabilize net asset value. |
| | • | | Debt obligations (both governmental and non-governmental) purchased with greater than sixty days to maturity and not investment grade are valued at last reported evaluated bid prices obtained from independent pricing services or brokers. In |
| | | | |
| Notes to Financial Statements | | | 77 | |
SSGA Funds
Notes to Financial Statements, continued — August 31, 2015
| | determining the value of a fixed income investment, pricing services may use certain information with respect to transactions in such investments, quotations from dealers, pricing matrixes, market transactions in comparable investments, various relationships observed in the market between investments, and calculated yield measures. |
| | • | | Exchange-traded futures contracts are valued at the settlement price on the primary market on which they are traded most extensively. Exchange-traded futures contracts traded on a recognized exchange for which there were no sales on that day are valued at the last reported sale price obtained from independent pricing services or brokers or at fair value. |
| | • | | Forward foreign currency contracts are valued based on that day’s prevailing forward exchange rate for the underlying currencies. The rates are obtained from independent pricing services in accordance with valuation policy and procedures approved by the Board. |
| | • | | Swap agreements are valued daily based upon prices supplied by Board approved pricing vendors or through brokers. Depending on the product and terms of transaction, the value of agreements is determined using a series of techniques including valuation models that incorporate a number of market data factors, such as discounted cash flows, yields, curves, trades and values of the underlying reference instruments. In the event the advisor is unable to obtain an independent, third–party valuation on the settlement date of the swap agreements, the agreements will be fair valued. |
| | • | | Equity-Linked Securities are valued at the last reported sale or settlement price of the linked referenced equity. Foreign exchange adjustments, if any, are applied to the last reported price to convert the linked equity’s trading currency to the contract’s settling currency. |
In the event prices or quotations are not readily available or that application of these methods of valuation results in a price for an investment which is deemed not to be representative of the fair value of such investment, fair value will be determined in good faith by the Committee, in accordance with valuation policies and procedures approved by the Board.
Fair value pricing could result in a difference between the prices used to calculate a Funds’ net asset value and the prices used by the Funds’ benchmark indices, which in turn could result in a difference between the Funds’ performance and the performance of the Funds’ benchmark indices. Various inputs are used in determining the value of Funds’ investments. These inputs are categorized into a fair value hierarchy consisting of three broad levels for financial reporting purposes. The Funds value its assets and liabilities at fair value using a hierarchy that prioritizes the inputs to valuation techniques giving the highest priority to readily available unadjusted quoted prices in active markets for identical assets or liabilities (Level 1 measurements) and the lowest priority to unobservable inputs (Level 3 measurements) when market prices are not readily available or reliable. The categorization of a value determined for an investment within the hierarchy is based upon the pricing transparency of the investment and is not necessarily an indication of the risk associated with investing in it.
The three levels of the fair value hierarchy are as follows:
| | • | | Level 1 — Unadjusted quoted prices in active markets for identical assets or liabilities; |
| | • | | Level 2 — Inputs other than quoted prices included within Level 1 that are observable for the asset or liability either directly or indirectly, including quoted prices for similar assets or liabilities in active markets, quoted prices for identical or similar assets or liabilities in markets that are not considered to be active, inputs other than quoted prices that are observable for the asset or liability (such as exchange rates, financing terms, interest rates, yield curves, volatilities, prepayment speeds, loss severities, credit risks and default rates) or other market-corroborated inputs; and |
| | • | | Level 3 — Unobservable inputs for the asset or liability, including the Committee’s assumptions used in determining the fair value of investments. |
Changes in valuation techniques may result in transfers in or out of an assigned level within the fair value hierarchy. Transfers between different levels of the fair value hierarchy are recognized at the end of the reporting period. During the year ended August 31, 2015, there were no material transfers between levels except for the International Stock Selection Fund which had $40,644,198 transferred from Level 1 to Level 2 due to a market closure in observance of a holiday.
Investment Transactions and Income Recognition
Investment transactions are accounted for on trade date for financial reporting purposes. Dividend income and capital gain distributions, if any, are recognized daily on the ex-dividend date, net of any foreign taxes withheld at the source, if any. Interest income, if any, is recorded daily on an accrual basis. All premiums and discounts are amortized / accreted for financial
| | |
| 78 | | Notes to Financial Statements |
SSGA Funds
Notes to Financial Statements, continued — August 31, 2015
reporting purposes using the interest method. Non-cash dividends received in the form of stock, if any, are recorded as dividend income at fair value. Distributions received by the Funds may include a return of capital that is estimated by management. Such amounts, if any, are recorded as a reduction of the cost of investments or reclassified to capital gains. Certain Funds invest in Real Estate Investment Trusts (REITs). REITs determine the tax character of their distributions annually and may characterize a portion of their distributions as income, return of capital, or capital gain. The Funds’ policy is to record all REIT distributions initially as dividend income and re-designate to return of capital or capital gain distributions at year end based on information provided by the REIT and management’s estimates of such re-designations for which actual information has not yet been reported. Realized gains and losses from the sale or disposition of investments and foreign exchange transactions are determined using the identified cost method.
Expenses
Certain expenses, which are directly identifiable to a specific Fund are applied to that Fund. Other expenses which cannot be attributed to a specific Fund are allocated in such a manner as deemed equitable, taking into consideration the nature and type of expense and the relative net assets of the Funds within the Trust.
Investment income, realized and unrealized gains and losses, certain fund level expenses and expense reductions, if any, are borne pro rata on the basis of relative net assets by the holders of all classes of shares, except that each class bears certain expenses unique to that class such as distribution and shareholder servicing fees. Differences in class specific level expenses may result in payment of different per share dividends by class.
Foreign Currency Translation
The accounting records of the Funds are maintained in U.S. dollars. Foreign currencies as well as investment securities and other assets and liabilities denominated in a foreign currency are translated to U.S. dollars using exchange rates deemed appropriate pursuant to the valuation policies and procedures at period end. Purchases and sales of securities, income receipts and expense payments are translated into U.S. dollars on the respective dates of transactions. The Funds do not isolate the effect of fluctuations in foreign exchange from the effect of fluctuations in the market price of securities. Such fluctuations are reflected by the Funds as a component of realized and unrealized gains and losses from investments for financial reporting purposes.
High Yield Securities
The SSGA High Yield Bond Fund may invest in high yield instruments that are subject to certain credit and market risks. The yields of high yield instruments reflect, among other things, perceived credit risk. The Fund’s investments in securities rated below investment grade typically involve risks not associated with higher rated securities including, among others, greater risk related to timely and ultimate payment of interest and principal, greater market price volatility and less liquid secondary market trading.
Loan Agreements
The SSGA High Yield Bond Fund may invest in direct debt instruments which are interests in amounts owed by corporate, governmental, or other borrowers to lenders or lending syndicates. These investments in loans may be in the form of participations in loans or assignments of all or a portion of loans from third parties. A loan is often administered by a bank or other financial institution (the “lender”) that acts as agent for all holders. The agent administers the terms of the loan, as specified in the loan agreement. When investing in a loan participation, the Fund has the right to receive payments of principal, interest and any fees to which it is entitled only from the lender selling the loan agreement and only upon receipt by the lender of payments from the borrower. The Fund generally has no right to enforce compliance with the terms of the loan agreement with the borrower. As a result, the Fund may be subject to the credit risk of both the borrower and the lender that is selling the loan agreement. When the Fund purchases assignments from lenders it acquires direct rights against the borrower on the loan.
Forward Foreign Currency Contracts
Certain Funds may engage in forward foreign currency contracts to acquire exposure to foreign currencies or to hedge the Fund’s investments against currency fluctuations. A forward foreign currency contract is a commitment to purchase or sell a foreign currency at the settlement date at a negotiated rate. Forward foreign currency contracts are valued based on that day’s
| | | | |
| Notes to Financial Statements | | | 79 | |
SSGA Funds
Notes to Financial Statements, continued — August 31, 2015
prevailing forward exchange rate for the underlying currencies and are marked-to-market daily. The change in market value is recorded by a Fund as an unrealized gain or loss. When the contract is closed, a Fund recognizes a realized gain or loss equal to the difference between the value of the contract at the time it was opened and the value at the time it was closed.
Certain risks may arise upon entering into forward foreign currency contracts from the potential inability of counterparties to meet the terms of their contracts and are generally limited to the amount of unrealized gains on appreciated contracts, if any. Additionally, when utilizing forward foreign currency contracts to hedge, the Fund gives up the opportunity to profit from favorable exchange rate movements during the term of the contract.
For the year ended August 31, 2015, the Emerging Markets Fund entered into forward foreign currency exchange contracts.
Futures Contracts
Certain Funds may enter into future contracts to meet the Funds’ objectives. A Future contract is a standardized, exchange-traded agreement to buy and sell a financial instrument at a set price on a future date. Upon entering into a futures contract, the Funds are required to deposit with the broker, cash or securities in an amount equal to a certain percentage of the contract amount. Variation margin payments are made or received by the Funds each day, depending on the daily fluctuations in the value of the underlying security or index, and are recorded for financial statement purposes as unrealized gains or losses by the Funds, which is recorded on the Statement of Assets and Liabilities. The Funds recognize a realized gain or loss when the contract is closed, which is recorded on the Statement of Operations. The risk of loss in trading futures contracts in some strategies is potentially unlimited. Losses may arise if the value of futures contract decreases due to unfavorable change in the market rates or values of the underlying instrument during the term of the contract or if the counterparty does not perform under the contract. The use of future contracts also involves the risk of an imperfect correlation in the movements in the price of the future contracts and the assets underlying such contracts.
For the year ended August 31, 2015, the following Funds entered into future contracts primarily for the strategies listed below:
| | |
| Funds | | Strategies |
SSGA Enhanced Small Cap Fund | | Exposing cash reserves to markets |
SSGA Emerging Markets Fund | | Return enhancement, hedging and exposing cash reserves to markets |
SSGA International Stock Selection Fund | | Exposing cash reserves to markets |
SSGA High Yield Bond Fund | | Hedging duration |
Swaps:
Certain funds may enter into swap agreements, in which a Fund and counterparty agree either to make periodic net payments on a specified notional amount or a net payment upon termination. Swap agreements are privately negotiated in the OTC market and may be entered into as a bilateral contract (“BL OTC”) or centrally cleared (“centrally cleared swaps”). Swaps are marked-to-market daily and changes in value are recorded as unrealized appreciation (depreciation).
A BL OTC swap is a transaction between a fund and dealer counterparty where cash flows are exchanged between the two parties for the life of the swap. For BL OTC swaps, any upfront premiums paid are recorded as assets and any upfront fees received are recorded as liabilities and are shown as credit default swap contracts premiums paid and credit default swap contracts premiums received, respectively, in the Statements of Assets and Liabilities and amortized to realized gain/loss ratably over the term of the BL OTC swap. Payments received or made by the Fund for BL OTC swaps are recorded in the Statements of Operations as realized gains or losses, respectively. When a BL OTC swap is terminated, a Fund will record a realized gain or loss equal to the difference between the proceeds from (or cost of) the closing transaction and the Fund’s basis in the contract, if any. Generally, the basis of the contracts is the premium received or paid.
A centrally cleared OTC swap is a transaction executed between a fund and a dealer counterparty, then cleared by a futures commission merchant (FCM) through a clearinghouse. Once cleared, the clearinghouse serves as a central counterparty (“CCP”), with whom a fund exchanges cash flows for the life of the transaction, similar to transactions in futures contracts.
A Fund is required to interface with the CCP through a broker. Upon entering into a centrally cleared swap, the Fund is required to deposit initial margin with the broker in the form of cash or securities in an amount that varies depending on the size and risk profile of the particular swap. Securities deposited as initial margin if any, are designated on the Schedule of
| | |
| 80 | | Notes to Financial Statements |
SSGA Funds
Notes to Financial Statements, continued — August 31, 2015
Investments and cash deposited is segregated and recorded on the Statements of Assets and Liabilities as Due from broker. The daily change in valuation of centrally cleared swaps is recorded as a receivable or payable for variation margin in the Statements of Assets and Liabilities. Payments received from (paid to) the counterparty, including at termination, are recorded as realized gain (loss) in the Statements of Operations. For both bi-lateral and centrally cleared OTC swaps, payments are exchanged at specified intervals, accrued daily commencing with the effective date of the contract and recorded as realized gain or (loss). Some swaps may be terminated prior to the effective date and realize a gain or loss upon termination.
Credit default swaps
The SSGA High Yield Bond Fund may enter into a credit default swap or a total return swap for hedging purposes or to seek to increase total return of the Fund. Credit default swap contracts may be entered into OTC or may be executed through a clearinghouse (“cleared credit default swap”). The Fund enters into these transactions primarily to preserve a return or spread on a particular investment or portion of its portfolio or to protect against any increase in the price of securities it anticipates purchasing at a later date. These transactions are intended to be used as a hedge and not as a speculative investment. Accordingly, the Fund does not follow hedge accounting, even for derivatives employed as economic hedges.
Credit default swaps are typically governed by the standard terms and conditions of an International Swaps and Derivatives Association (“ISDA”) Master Agreement or similar agreement (“Master Agreements”). A credit default swap involves a protection buyer and a protection seller. A Fund may be either a protection buyer or seller. Credit default swaps enable the Fund to buy or sell protection against specified credit events on a single-name issuer or a traded credit index. Under the terms of a credit default swap the buyer of protection (buyer) receives credit protection in exchange for making periodic payments to the seller of protection (seller) based on a fixed percentage applied to a notional principal amount. In return for these payments, the seller will be required to make a payment upon the occurrence of one or more specified credit events. The Fund enters into credit default swaps as a seller to gain credit exposure to an issuer and/or as a buyer to obtain a measure of protection against defaults of an issuer. Periodic payments are made over the life of the contract by the buyer provided that no credit event occurs. For credit default swaps on most corporate and sovereign issuers, credit events include bankruptcy, failure to pay or repudiation/moratorium. For credit default swaps on corporate or sovereign issuers, the obligation that may be put to the seller is not limited to the specific reference obligation described in the Schedule of Investments. For credit default swaps on asset-backed securities, a credit event may be triggered by events such as failure to pay principal, maturity extension, rating downgrade or write-down. For credit default swaps on asset-backed securities, the reference obligation described represents the security that may be put to the seller. For credit default swaps on a traded credit index, a specified credit event may affect all or individual underlying securities included in the index.
As a seller, if an underlying credit event occurs, the Fund will pay a net settlement amount of cash equal to the notional amount of the swap less the recovery value of the reference obligation or underlying securities comprising an index. Only in the event of the industry’s inability to value the underlying asset will the Fund be required to take delivery of the reference obligation or underlying securities comprising an index and pay an amount equal to the notional amount of the swap.
As a buyer, if an underlying credit event occurs, the Fund will receive a net settlement amount of cash equal to the notional amount of the swap less the recovery value of the reference obligation or underlying securities comprising an index. Only in the event of the industry’s inability to value the underlying asset will the Fund be required to deliver the reference obligation or underlying securities comprising an index in exchange for payment of an amount equal to the notional amount of the swap.
Typically, the value of each credit default swap and credit rating disclosed for each reference obligation in the Schedule of Investments, where the Fund is the seller, can be used as measures of the current payment/performance risk of the swap. As the value of the swap changes as a positive or negative percentage of the total notional amount, the payment/performance risk may decrease or increase, respectively. In addition to these measures, the investment adviser monitors a variety of factors including cash flow assumptions, market activity and market sentiment as part of its ongoing process of assessing payment/performance risk.
Entering into a swap contract involves, to varying degrees, elements of credit, market and/or interest rate risk in excess of the amounts reported in the Statement of Assets and Liabilities. Such risks involve the possibility that there will be no liquid market for these agreements, that the counterparty to the agreements may default on its obligation to perform or disagree as to the meaning of the contractual terms in the agreements, and that there may be unfavorable changes in interest rates and/or market values associated with these transactions.
| | | | |
| Notes to Financial Statements | | | 81 | |
SSGA Funds
Notes to Financial Statements, continued — August 31, 2015
Credit default swap agreements are considered to have credit-risk-related contingent features since they trigger payment by the protection seller to the protection buyer upon the occurrence of a defined credit event. The aggregate fair value of credit default swap agreements in a net liability position as of August 31, 2015 is disclosed in the footnotes to the Schedule of Investments. The maximum amount of future, undiscounted payments that the fund, as protection seller, could be required to make is equal to the swap agreement’s notional amount. The protection seller’s payment obligation would be offset to the extent of the value of the agreement’s deliverable obligation. If a defined credit event had occurred as of August 31, 2015, the swap agreement’s credit-risk-related contingent features would have been triggered and, for those swap agreements in a net liability position for which the fund is the protection seller, the fund in order to settle these swap agreements would have been required to either (1) pay the swap agreement’s notional value of $1,980,000 less the value of the agreements’ related deliverable obligations as decided through an ISDA auction or (2) pay the notional value of the swap agreements in return for physical receipt of the deliverable obligations. The fund’s maximum risk of loss from counterparty risk, either as the protection seller or as the protection buyer, is the fair value of the agreement.
The aggregate value of the collateral of the credit default swaps held as of August 31, 2015, was $107,274.
Risks associated with Derivatives
Derivative transactions can create investment leverage and may be highly volatile. Use of derivatives other than for hedging purposes may be considered speculative. When the Fund invests in a derivative instrument, the future exposure is potentially unlimited. The value of a derivative instrument will depend on the ability and the willingness of the Funds’ derivative counterparty to perform its obligations under the transaction. A liquid secondary market may not always exist for the Funds’ derivative positions at any time and may impact the Funds’ ability to establish fair market value of a derivative transaction and close out derivative positions. Although the use of derivatives is intended to complement the Funds’ performance, it may instead reduce returns and increase volatility. The measurement of the risks associated with derivative instruments is meaningful only when all related and offsetting transactions are considered. The Funds must set aside liquid assets or engage in other appropriate measures to cover its obligations under these derivative instruments.
Regulations recently adopted or proposed by regulators in the U.S. and other countries may substantially affect the markets in which derivatives are traded, including requiring central clearing and reporting of transactions that may not have been previously required to be reported or cleared. These regulations may require, among other things, that the Funds post greater amounts of collateral or margin than the amounts currently posted by the Funds on a bilateral basis with its derivatives counterparties or with derivatives clearing organizations. In addition, the regulations may make certain types of derivatives uneconomical or unavailable to the Funds, and they may substantially reduce the liquidity for some derivatives. The full extent of the new regulations and their effects on the derivatives markets are not known at this time.
Certain derivatives, including forward foreign currency contracts and some swap contracts, as applicable, are entered into OTC under the terms and conditions of an ISDA Master Agreement, which are separately negotiated with each counterparty.
An ISDA Master Agreement is a bilateral agreement between each Fund and a counterparty that governs certain OTC derivatives and typically contains, among other things, collateral posting terms and netting provisions in the event of a default and/or termination event. Under an ISDA Master Agreement, each Fund may, under certain circumstances, offset with the counterparty certain derivative financial instruments’ payables and/or receivables with collateral held and/or posted and create one single net payment. The provisions of the ISDA Master Agreement typically permit a single net payment in the event of default including the bankruptcy or insolvency of the counterparty. Bankruptcy or insolvency laws of a particular jurisdiction may restrict or prohibit the right of offset in bankruptcy, insolvency or other events. In addition, certain ISDA Master Agreements allow counterparties to terminate derivative contracts prior to maturity in the event a Fund’s net assets decline by a stated percentage or the Fund fails to meet the terms of its ISDA Master Agreements. The result would cause the Fund to accelerate payment of any net liability owed to the counterparty.
For derivatives traded under an ISDA Master Agreement, the collateral requirements are typically calculated by netting the mark-to-market amount for each transaction under such agreement and comparing that amount to the value of any collateral currently pledged by the Funds and the counterparty. Cash collateral that has been pledged to cover obligations of a Fund and cash collateral received from the counterparty, if any, is reported separately on the Statements of Assets and Liabilities as cash pledged as collateral and cash received as collateral, respectively. Non-cash collateral pledged by the Funds, if any, is noted in the Schedule of Investments.
| | |
| 82 | | Notes to Financial Statements |
SSGA Funds
Notes to Financial Statements, continued — August 31, 2015
Notional principal amounts are one component used to calculate the amount of exposure to the underlying instrument, but is not the amount delivered under the contract. Accordingly, credit risk is limited to any amounts receivable from the counterparty. To reduce credit risk from potential counterparty default, the Fund enters into swap contracts with counterparties whose creditworthiness has been approved by the Trustee. The Fund bears the market risk arising from any change in index or security values or interest rates.
The fair values of the Funds’ derivative instruments as shown on the Statements of Assets and Liabilities, categorized by risk exposure for the year ended August 31, 2015 were as follows:
| | | | | | | | | | | | | | | | | | | | |
| Asset Derivatives | | | | | | | | | | | | | | | | | | |
| | | | | Interest Rate
Contracts
Risk | | Foreign
Exchange
Contracts
Risk | | | Credit
Contracts
Risk | | Equity
Contracts
Risk | | Commodity
Contracts
Risk | | Other
Contracts
Risk | | Total | |
| | | | | | | | | | | | | | | | | | | | |
SSGA Emerging Markets Fund | | Forward Contract(a) | | $— | | $ | 691,644 | | | $— | | $— | | $— | | $— | | $ | 691,644 | |
| | Futures Contract(b) | | — | | | — | | | — | | 150,395 | | — | | — | | | 150,395 | |
| | (a) | Unrealized appreciation on forward foreign currency contracts |
| | (b) Daily | variation margin on futures contracts |
| | | | | | | | | | | | | | | | | | | | | | | | |
| Liability Derivatives | | | | | | | | | | | | | | | | | | | | |
| | | | | Interest Rate
Contracts
Risk | | Foreign
Exchange
Contracts
Risk | | | Credit
Contracts
Risk | | | Equity
Contracts
Risk | | | Commodity
Contracts
Risk | | Other
Contracts
Risk | | Total | |
| | | | | | | | | | | | | | | | | | | | | | | | |
SSGA Enhanced Small Cap Fund | | Futures Contract(a) | | $— | | $ | — | | | $ | — | | | $ | (16,487 | ) | | $— | | $— | | $ | (16,487 | ) |
SSGA Emerging Markets Fund | | Forward Contract(b) | | — | | | (1,597,327 | ) | | | — | | | | — | | | — | | — | | | (1,597,327 | ) |
SSGA High Yield Bond Fund | | Credit Default Swap Contracts(c) | | — | | | — | | | | (48,105 | ) | | | — | | | — | | — | | | (48,105 | ) |
| | (a) | Daily variation margin on futures contracts |
| | (b) | Unrealized depreciation on forward foreign currency contracts |
| | (c) | Amount represent the cumulative appreciation/(depreciation) as reported in the Schedule of Investments. The Statements of Assets and Liabilities only reflects the current day’s net variation margin. |
| | | | | | | | | | | | | | | | | | | | | | | | |
| Net Realized Gain (Loss) | | | | | | | | | | | | | | | | | | | | |
| | | | | Interest Rate
Contracts
Risk | | Foreign
Exchange
Contracts
Risk | | | Credit
Contracts
Risk | | | Equity
Contracts
Risk | | | Commodity
Contracts
Risk | | Other
Contracts
Risk | | Total | |
| | | | | | | | | | | | | | | | | | | | | | | | |
SSGA Dynamic Small Cap Fund | | Futures Contract(a) | | $— | | $ | — | | | $ | — | | | $ | 39,220 | | | $— | | $— | | $ | 39,220 | |
SSGA Enhanced Small Cap Fund | | Futures Contract(a) | | — | | | — | | | | — | | | | (5,868 | ) | | — | | — | | | (5,868 | ) |
SSGA Emerging Markets Fund | | Forward Contract(b) | | — | | | (2,283,651 | ) | | | — | | | | — | | | — | | — | | | (2,283,651 | ) |
| | Futures Contract(a) | | — | | | — | | | | — | | | | (1,399,388 | ) | | — | | — | | | (1,399,388 | ) |
SSGA International Stock Selection Fund | | Futures Contract(a) | | — | | | — | | | | — | | | | (648,846 | ) | | — | | — | | | (648,846 | ) |
SSGA High Yield Bond Fund | | Credit Default
Swap Contracts(c) | | — | | | — | | | | 27,024 | | | | — | | | — | | — | | | 27,024 | |
| | (a) | Net realized gain (loss) on futures contracts |
| | (b) | Net realized gain (loss) on foreign currency-related transactions* |
| | (c) Net | realized gain (loss) on credit default swap contracts |
| | * | Includes only forward foreign currency-related transactions |
| | | | |
| Notes to Financial Statements | | | 83 | |
SSGA Funds
Notes to Financial Statements, continued — August 31, 2015
| | | | | | | | | | | | | | | | | | | | | | | | | | | | | | |
| Net Change In Unrealized Appreciation (Depreciation) | | | | | | | | | | | | | | | | | | | | | |
| | | | | Interest Rate
Contracts
Risk | | | Foreign
Exchange
Contracts
Risk | | | Credit
Contracts
Risk | | | Equity
Contracts
Risk | | | Commodity
Contracts
Risk | | | Other
Contracts
Risk | | | Total | |
| | | | | | | | | | | | | | | | | | | | | | | | | | | | | | |
SSGA Enhanced Small Cap Fund | | Futures Contract(a) | | | $— | | | $ | — | | | $ | — | | | $ | (77,899 | ) | | | $— | | | | $— | | | $ | (77,899 | ) |
SSGA Emerging Markets Fund | | Forward Contract(b) | | | — | | | | (765,274 | ) | | | — | | | | — | | | | — | | | | — | | | | (765,274 | ) |
| | Futures Contract(a) | | | — | | | | — | | | | — | | | | (383,100 | ) | | | — | | | | — | | | | (383,100 | ) |
SSGA High Yield Bond Fund | | Credit Default
Swap Contracts(c) | | | — | | | | — | | | | (48,105 | ) | | | — | | | | — | | | | — | | | | (48,105 | ) |
| | (a) Net | change in unrealized appreciation (depreciation) on futures contracts |
| | (b) | Net change in unrealized appreciation (depreciation) on foreign currency-related transactions* |
| | (c) Net | change in unrealized appreciation (depreciation) on credit default swap contracts |
| | * | Includes only forward foreign currency-related transactions |
Average notional related to derivatives is included in the Schedules of Investments. SSGA Dynamic Small Cap Fund and SSGA International Stock Selection Fund had no open derivatives at August 31, 2015. During the year ended August 31, 2015, average notional value related to futures contracts was $61,683 or 0.3% of net assets for the SSGA Dynamic Small Cap Fund. During the year ended August 31, 2015, average notional value related to futures contracts was $10,866,834 or 3.3% of net assets for the SSGA International Stock Selection Fund.
For financial reporting purposes, the Fund does not offset derivative assets or liabilities, including those that may be subject to an enforceable Foreign Exchange Master Agreement that allows for net settlement between counterparties, on the Statement of Assets and Liabilities. The following tables set forth the Fund’s net exposure to derivative assets and liabilities available for offset and net of collateral at August 31, 2015.
| | | | | | | | | | | | | | | | | | | | |
| Offsetting of Financial Assets and Derivative Assets | |
| Emerging Markets Fund — Foreign Currency Exchange Contracts | |
| Counterparty | | Gross Amounts of Recognized Assets | | | Gross Amounts Offset in Statements of Assets and Liabilities | | | Net Amounts of Assets presented in Statements of Assets and
Liabilities | | | Gross Amounts Not Offset in the Statements of Assets and Liabilities Collateral Received(a) | | | Net Amount
of Derivative Assets(b) | |
Bank of America | | | 5,689 | | | | — | | | | 5,689 | | | | — | | | | 5,689 | |
Barclays Bank PLC | | | 94,053 | | | | — | | | | 94,053 | | | | 94,053 | | | | — | |
Citibank N.A. | | | 58,109 | | | | — | | | | 58,109 | | | | 58,109 | | | | — | |
Credit Suisse International | | | 3,242 | | | | — | | | | 3,242 | | | | 166 | | | | 3,076 | |
Deutsche Bank AG | | | 314,139 | | | | — | | | | 314,139 | | | | 314,139 | | | | — | |
Goldman Sachs & Co. | | | 9,319 | | | | — | | | | 9,319 | | | | 9,319 | | | | — | |
JPMorgan Chase Bank NA | | | 199,694 | | | | — | | | | 199,694 | | | | 59,871 | | | | 139,823 | |
Toronto Dominion Bank | | | 7,399 | | | | — | | | | 7,399 | | | | 7,399 | | | | — | |
| | | | | | | | | | | | | | | | | | | | |
| | | 691,644 | | | | — | | | | 691,644 | | | | 543,056 | | | | 148,588 | |
| | | | | | | | | | | | | | | | | | | | |
| | |
| 84 | | Notes to Financial Statements |
SSGA Funds
Notes to Financial Statements, continued — August 31, 2015
| | | | | | | | | | | | | | | | | | | | |
|
| Offsetting of Financial Liabilities and Derivative Liabilities | |
| Emerging Markets Fund — Foreign Currency Exchange Contracts | |
| Counterparty | | Gross
Amounts of Recognized Liabilities | | | Gross Amounts Offset in Statements of Assets and Liabilities | | | Net Amounts of Assets presented in Statements of Assets and Liabilities | | | Gross Amounts Not Offset in the Statements of Assets and Liabilities Collateral Pledged(a) | | | Net Amount of Derivative Liabilities(b) | |
Barclays Bank PLC | | | 243,791 | | | | — | | | | 243,791 | | | | 94,053 | | | | 149,738 | |
Citibank N.A. | | | 310,727 | | | | — | | | | 310,727 | | | | 58,109 | | | | 252,618 | |
Credit Suisse International | | | 166 | | | | — | | | | 166 | | | | 166 | | | | — | |
Deutsche Bank AG | | | 762,507 | | | | — | | | | 762,507 | | | | 314,139 | | | | 448,368 | |
Goldman Sachs & Co. | | | 63,807 | | | | — | | | | 63,807 | | | | 9,319 | | | | 54,488 | |
JPMorgan Chase Bank NA | | | 59,871 | | | | — | | | | 59,871 | | | | 59,871 | | | | — | |
Standard Chartered Bank | | | 13,135 | | | | — | | | | 13,135 | | | | — | | | | 13,135 | |
Toronto Dominion Bank | | | 143,323 | | | | | | | | 143,323 | | | | 7,399 | | | | 135,924 | |
| | | | | | | | | | | | | | | | | | | | |
| | | 1,597,327 | | | | — | | | | 1,597,327 | | | | 543,056 | | | | 1,054,271 | |
| | | | | | | | | | | | | | | | | | | | |
| | (a) | The actual collateral received and/or pledged may be more than the amount shown. |
| | (b) | Net amount represents the net amount due from, or payable to, the counterparty in the event of default. |
Equity Linked Securities
The SSGA Emerging Markets Fund may purchase equity-linked securities also known as participation notes. These securities are issued by banks or broker-dealers that are designed to replicate the performance of foreign companies or foreign securities markets and can be used by the Fund as an alternative means to access the securities market of a frontier emerging market country.
A Fund deposits cash with its custodian (or broker, if legally permitted) in an amount near or equal to the selling price of the underlying security in an exchange for equity linked security. Upon sale, a Fund receives cash from broker or custodian equal to the value of the underlying security.
The performance results of equity linked securities will not replicate exactly the performance of the foreign companies or foreign securities markets that they seek to replicate due to transaction and other expenses. Investments in equity linked securities involve certain risks in addition to those associated with a direct investment in the underlying foreign companies or foreign securities markets whose return they seek to replicate.
There can be no assurance that there will be a trading market or that the trading price of a these securities will equal the underlying value of the foreign company or foreign securities market that it seeks to replicate. The Fund relies on the creditworthiness of the counterparty issuing equity-linked securities and has no rights against the issuer of the underlying security. The Fund minimizes this risk by entering into agreements only with counterparties that the Funds’ investment adviser deems creditworthy. Due to liquidity and transfer restrictions, the secondary markets on which the participation notes are traded may be less liquid than the markets for other securities, or may be completely illiquid. As of August 31, 2015, the SSGA Emerging Markets Fund held four (4) Equity-Linked Notes which are identified on the Schedule of Investments.
Federal Income Taxes
The Funds have qualified and intends to continue to qualify for and elect treatment as a regulated investment company under Subchapter M of the Internal Revenue Code of 1986, as amended. By so qualifying and electing, the Funds will not be subject to federal income taxes to the extent they distribute their taxable income, including any net realized capital gains, for each fiscal year. In addition, by distributing during each calendar year substantially all of their net taxable income and capital gains, if any, the Funds will not be subject to federal excise tax. Income and capital gain distributions are determined in accordance with income tax regulations which may differ from U.S. GAAP. The book tax differences were attributable primarily due to timing and recognition of wash sales, Non-REIT return of capital adjustments, futures contracts, forward contracts, foreign currency transactions, foreign capital gains tax, tax equalization, passive foreign investment companies, real estate investment trusts, and credit default swaps.
| | | | |
| Notes to Financial Statements | | | 85 | |
SSGA Funds
Notes to Financial Statements, continued — August 31, 2015
The Funds have reviewed the tax positions for the open tax years as of August 31, 2015 and have determined that no provision for income tax is required in the Funds’ Financial Statements. The Funds’ federal tax returns for the prior three fiscal years remain subject to examination by the Funds’ major tax jurisdictions, which include the United States of America and the Commonwealth of Massachusetts. The Funds recognize interest and penalties, if any, related to tax liabilities as income tax expense in the Statements of Operations. No income tax returns are currently under examination. Management has analyzed tax laws and regulations and their applications to the Funds’ facts and circumstances and does not believe there are any uncertain tax provisions that require recognition of tax liability.
At August 31, 2015, the following Funds had net tax basis capital loss carryforwards, which may be applied against any realized net taxable gains in each succeeding year or until their expiration dates, whichever occurs first:
| | | | | | | | | | | | | | | | | | | | | | | | | | | | |
| | | Expiration Year | |
| | | 8/31/2016 | | | 8/31/2017 | | | 8/31/2018 | | | 8/31/2019 | | | Non-Expiring
Short Term | | | Non-Expiring
Long Term | | | Total | |
SSGA Dynamic Small Cap Fund | | $ | — | | | $ | 8,793,937 | | | $ | 6,490,926 | | | $ | — | | | $ | — | | | $ | — | | | $ | 15,284,863 | |
SSGA Clarion Real Estate Fund | | | — | | | | — | | | | 1,769,688 | | | | — | | | | — | | | | — | | | | 1,769,688 | |
SSGA Enhanced Small Cap Fund | | | — | | | | — | | | | — | | | | — | | | | — | | | | — | | | | — | |
SSGA Emerging Markets Fund | | | — | | | | — | | | | — | | | | — | | | | — | | | | — | | | | — | |
SSGA International Stock Selection Fund | | | — | | | | 122,388,997 | | | | 428,227,873 | | | | — | | | | — | | | | — | | | | 550,616,870 | |
SSGA High Yield Bond Fund | | | — | | | | — | | | | — | | | | — | | | | — | | | | — | | | | — | |
During the year ended August 31, 2015, the Funds utilized/expired capital loss carryforwards in the following amounts:
| | | | | | | | |
| | | Amount Utilized | | | Amount Expired | |
| | | | | | | | |
SSGA Dynamic Small Cap Fund | | $ | 1,264,358 | | | | $ — | |
SSGA Clarion Real Estate Fund | | | 6,902,964 | | | | — | |
SSGA Enhanced Small Cap Fund | | | — | | | | — | |
SSGA Emerging Markets Fund | | | — | | | | — | |
SSGA International Stock Selection Fund | | | 27,978,520 | | | | — | |
SSGA High Yield Bond Fund | | | — | | | | — | |
As of August 31, 2015, the Funds’ components of distributable earnings and tax composition of distributions for federal income tax purposes were as follows:
| | | | | | | | | | | | | | | | |
| | | Components of Distributable Earnings | |
| | | Undistributed
Ordinary Income | | | Capital Loss
Carryforward | | | Undistributed
Long-term
Capital Gains | | | Post October
Capital Loss
Deferrals | |
| | | | | | | | | | | | | | | | |
SSGA Dynamic Small Cap Fund | | $ | 82,426 | | | $ | (15,284,863 | ) | | $ | — | | | $ | (202,882 | ) |
SSGA Clarion Real Estate Fund | | | 190,652 | | | | (1,769,688 | ) | | | — | | | | — | |
SSGA Enhanced Small Cap Fund | | | 150,785 | | | | — | | | | 2,233,974 | | | | — | |
SSGA Emerging Markets Fund | | | — | | | | — | | | | 35,682,091 | | | | — | |
SSGA International Stock Selection Fund | | | 6,897,654 | | | | (550,616,870 | ) | | | — | | | | (3,097,742 | ) |
SSGA High Yield Bond Fund | | | 95,285 | | | | — | | | | — | | | | (1,505,884 | ) |
For the years ended August 31, 2015 and August 31, 2014, the Funds��� tax composition of distributions for federal income tax purposes were as follows:
| | | | | | | | | | | | | | | | |
| | | August 31, 2015 | | | August 31, 2014 | |
| Tax Composition of Distributions | | Ordinary
Income | | | Long Term
Capital Gains | | | Ordinary
Income | | | Long Term
Capital Gains | |
| | | | | | | | | | | | | | | | |
SSGA Dynamic Small Cap Fund | | $ | 131,052 | | | $ | — | | | $ | 155,550 | | | $ | — | |
SSGA Clarion Real Estate Fund | | | 711,764 | | | | — | | | | 711,185 | | | | — | |
SSGA Enhanced Small Cap Fund | | | 294,855 | | | | 4,478,885 | | | | 585,136 | | | | — | |
SSGA Emerging Markets Fund | | | 9,093,612 | | | | 151,853,051 | | | | 26,381,888 | | | | 98,042,631 | |
SSGA International Stock Selection Fund | | | 3,465,133 | | | | — | | | | 16,373,374 | | | | — | |
SSGA High Yield Bond Fund | | | 5,353,201 | | | | 1,417,107 | | | | 7,660,915 | | | | 2,904,812 | |
| | |
| 86 | | Notes to Financial Statements |
SSGA Funds
Notes to Financial Statements, continued — August 31, 2015
Foreign Taxes
The Funds may be subject to foreign taxes ( a portion of which may be reclaimable) on income, stock dividends, capital gains on investments or certain foreign currency transactions. All foreign taxes are recorded in accordance with applicable foreign tax regulations and rates that exist in the foreign jurisdictions in which the Funds invest. These foreign taxes, if any, are paid by the Funds and are reflected in their statement of operations. Foreign taxes payable or deferred as of August 31, 2015 if any, are disclosed in the Funds’ statement of assets and liabilities.
The Emerging Markets Fund may be subject to capital gains and repatriation taxes imposed by certain countries in which it invests. The Fund has recorded a deferred tax liability in respect of unrealized appreciation on foreign securities for potential capital gains and repatriation taxes at August 31, 2015. The accrual for unrealized capital gains and repatriation taxes is included in net unrealized appreciation (depreciation) on investments in the Statement of Assets and Liabilities for the Fund. The amounts related to capital gain taxes are included in net realized gain (loss) on investments in the Statement of Operations for the Fund.
| | | | | | | | |
| | | Deferred Tax Liability | | | Capital Gains Taxes | |
| | | | | | | | |
Emerging Markets Fund | | $ | 673,749 | | | $ | 739,228 | |
Dividends and Distributions
All Funds except SSGA Clarion Real Estate and SSGA High Yield Bond Funds declare and distribute dividends from net investment income, if any, to its shareholders annually. SSGA Clarion Real Estate Fund declares and distributes dividends from its net investment income to its shareholders quarterly and SSGA High Yield Bond Fund declares and distributes dividends from its net investment income to its shareholders monthly.
Net realized capital gains, if any, are distributed annually, unless additional distributions are required for compliance with applicable tax regulations. The amount and character of income and gains to be distributed are determined in accordance with federal tax regulations which may differ from net investment income and realized gains recognized for U.S. GAAP purposes.
| 3. | | Investment Transactions |
Securities
For the year ended August 31, 2015, purchases and sales of investment securities (excluding U.S. government and agency obligations, short-term investments and derivative contracts) aggregated to the following:
| | | | | | | | |
| | | Purchases | | | Sales | |
| | | | | | | | |
SSGA Dynamic Small Cap Fund | | $ | 17,753,892 | | | $ | 17,921,062 | |
SSGA Clarion Real Estate Fund | | | 19,556,133 | | | | 25,398,643 | |
SSGA Enhanced Small Cap Fund | | | 31,745,996 | | | | 30,972,904 | |
SSGA Emerging Markets Fund | | | 274,616,612 | | | | 649,567,359 | |
SSGA International Stock Selection Fund | | | 209,476,442 | | | | 244,334,007 | |
SSGA High Yield Bond Fund | | | 85,489,849 | | | | 88,655,130 | |
Securities Lending
The Trust participates in a securities lending program whereby each Fund can loan securities with a value up to 33 1/3% of its total assets. Each Fund receives cash (U.S. currency), U.S. government, U.S. government agency obligations or foreign government securities as collateral against the loaned securities. To the extent that a loan is secured by cash collateral, such collateral must be invested by State Street Bank and Trust Company (“State Street”), a wholly-owned subsidiary of State Street Corporation, as the lending agent, in short-term instruments, money market mutual funds, and such other short-term investments, provided the investments meet certain quality and diversification requirements. Under the securities lending arrangement, the collateral received is recorded by a lending Fund along with the related obligation to return the collateral. As of August 31, 2015, all such cash collateral was invested in the State Street Navigator Securities Lending Prime Portfolio, a money market fund affiliated with the Funds’ investment adviser.
Income generated from the investment of cash collateral, less negotiated rebate fees paid to participating brokers and transaction costs, is divided between each Fund and the lending agent and is recorded as securities lending income for the
| | | | |
| Notes to Financial Statements | | | 87 | |
SSGA Funds
Notes to Financial Statements, continued — August 31, 2015
Funds. To the extent that a loan is secured by non-cash collateral, brokers pay each Fund negotiated lenders’ fees, which are divided between each Fund and the lending agent and are recorded as security lending income for each Fund. All collateral received will be in an amount at least equal to 102% (for loans of U.S. securities) or 105% (for non-U.S. securities) of the market value of the loaned securities at the inception of each loan. The market value of the loaned securities is determined at the close of business of the Funds, and any additional required collateral is delivered to the Funds the next day. Should the borrower of the securities fail financially, there is a risk of delay in recovery or loss of rights in the securities loaned or loss of rights in the collateral. Consequently, loans are made only to borrowers which are deemed to be of good financial standing.
The following table is a summary of each Fund’s securities lending agreements and related cash and non-cash collateral received as of August 31, 2015:
| | | | | | | | | | | | | | | | |
| Fund | | Market Value
of Securities
on Loan | | | Cash
Collateral
Received | | | Non-Cash
Collateral
Received* | | | Total
Collateral
Received | |
| | | | | | | | | | | | | | | | |
SSGA Dynamic Small Cap Fund | | $ | 5,712,651 | | | $ | 5,375,144 | | | $ | 520,102 | | | $ | 5,895,246 | |
SSGA Clarion Real Estate Fund | | | 6,157,410 | | | | 4,470,984 | | | | 1,986,466 | | | | 6,457,450 | |
SSGA Emerging Markets Fund | | | 4,972,708 | | | | 4,543,293 | | | | 705,228 | | | | 5,248,521 | |
SSGA International Stock Selection Fund | | | 3,033,762 | | | | 3,247,773 | | | | — | | | | 3,247,773 | |
| | * | The non-cash collateral includes US Treasuries and US Government Agency securities. |
| 4. | | Related Party Transactions, Fees and Expenses |
Adviser and Affiliates
SSGA Funds Management, Inc. (the “Adviser” or “SSGA FM”) manages the Funds pursuant to an Amended and Restated Investment Advisory Agreement dated April 11, 2012, between the Trust and the Adviser. The Adviser is a wholly-owned subsidiary of State Street Corporation, a publicly held bank holding company. CBRE Clarion Securities LLC serves as the sub-adviser for the SSGA Clarion Real Estate Fund. The Adviser provides reporting, operational compliance and general oversight services with respect to the investment advisory services of the sub-adviser. The Adviser and other advisory affiliates of State Street Corporation make up State Street Global Advisors, the investment management arm of State Street Corporation and its affiliated companies. The Adviser directs the investments of the Funds in accordance with their investment objectives, policies, and limitations. For these services, each Fund pays a fee to the Adviser, calculated daily and paid monthly, at the following annual rates of their average daily net assets:
| | | | |
| Funds | | % | |
SSGA Dynamic Small Cap Fund | | | 0.75 | |
SSGA Clarion Real Estate Fund | | | 0.65 | |
SSGA Enhanced Small Cap Fund | | | 0.45 | |
SSGA Emerging Markets Fund | | | 0.75 | |
SSGA International Stock Selection Fund | | | 0.75 | |
SSGA High Yield Bond Fund | | | 0.30 | |
The Adviser is contractually obligated until December 31, 2015 to waive its management fee and/or to reimburse the Fund for expenses to the extent that total expenses (exclusive of non-recurring account fees, extraordinary expenses, acquired fund fees and distribution, shareholder servicing, and sub-transfer agency fees) exceed the following percent of average daily net assets on an annual basis as follows:
| | | | | | |
| SSGA Fund Name | | Expense Limitation | | | Expiration Date |
SSGA Dynamic Small Cap Fund | | | 0.85 | % | | December 31, 2015 |
SSGA Clarion Real Estate Fund | | | 0.75 | % | | December 31, 2015 |
SSGA Enhanced Small Cap Fund | | | 0.50 | % | | December 31, 2015 |
SSGA Emerging Markets Fund | | | 1.00 | % | | December 31, 2015 |
SSGA International Stock Selection Fund | | | 0.75 | % | | December 31, 2015 |
SSGA High Yield Bond Fund | | | 0.50 | % | | December 31, 2015 |
| | |
| 88 | | Notes to Financial Statements |
SSGA Funds
Notes to Financial Statements, continued — August 31, 2015
Prior to December 31, 2015, this contract may not be terminated with respect to a Fund without the approval of the Board. The contract supersedes any prior voluntary waiver or reimbursement arrangements for the Funds specifically named above and may, at the Adviser’s option, continue after the dates designated above.
The total amount of waivers and reimbursements for the year ended August 31, 2015 is detailed in the following table. The Adviser does not have the ability to recover these amounts waived or reimbursed under this contractual agreement.
| | | | |
| SSGA Fund Name | | Amount Waived or Reimbursed | |
| | | | |
SSGA Dynamic Small Cap Fund | | $ | 241,438 | |
SSGA Clarion Real Estate Fund | | | 237,604 | |
SSGA Enhanced Small Cap Fund | | | 255,589 | |
SSGA Emerging Markets Fund | | | 512,864 | |
SSGA International Stock Selection Fund | | | 702,919 | |
SSGA High Yield Bond Fund | | | 141,437 | |
The Funds are permitted to invest their cash reserves (i.e., monies awaiting investment in portfolio securities suitable for the Funds’ objectives) in the SSGA Prime Money Market Fund (“Central Fund”) (a series of the Trust not presented herein). Shares of the Central Fund sold to and redeemed from any participating fund will not be subject to a redemption fee, distribution fee or service fee. If the Central Fund shares sold to or redeemed from a participating fund are subject to any such distribution or service fee, the Adviser will waive its advisory fee for each participating fund in an amount that offsets the amount of such distribution or service fees incurred by the participating fund. The Adviser has voluntarily agreed to waive a portion of any participating Fund’s advisory fee equal to the advisory fee paid by that participating Fund to the Central Fund. As of August 31, 2015, $8,250,622 or 0.15% of the Central Fund’s net assets represents investments by these Funds.
For the year ended August 31, 2015, the total advisory fees waived pursuant to the voluntary waiver agreement were as follows:
| | | | |
| | | Amount Waived | |
| | | | |
SSGA Dynamic Small Cap Fund | | $ | 509 | |
SSGA Clarion Real Estate Fund | | | 444 | |
SSGA Enhanced Small Cap Fund | | | 1,737 | |
SSGA Emerging Markets Fund | | | 4,255 | |
SSGA International Stock Selection Fund | | | 4,415 | |
SSGA High Yield Bond Fund | | | 5,985 | |
Boston Financial Data Services, Inc. (“BFDS”) serves as the Funds’ transfer and dividend paying agent, pursuant to an agreement dated August 1, 2006, as amended. For these services, the Funds pay annual account services fees, activity based fees and charges related to compliance and regulatory services. BFDS is a joint venture of DST Systems, Inc., and State Street Corporation.
State Street provides custody and fund accounting services to the Funds pursuant to an Amended and Restated Custodian Agreement dated April 11, 2013. For these services, the Funds pay State Street asset based fees that vary according to the number of positions and transactions plus out-of-pocket expenses.
On August 19, 2014, the Custodian made a contribution of $252,840 to the SSGA Emerging Markets Fund to correct a processing error. This amount is included in the Statement of Changes.
Administrator and Sub-Administrator
Effective June 1, 2015, SSGA FM serves as Administrator and State Street serves as Sub-Administrator. Pursuant to the Administration Agreement between the Trust on behalf of the Funds and SSGA FM, each Fund pays a fee at an annual rate of 0.05% of the Funds’ net assets. SSGA FM has contractually agreed to waive 0.01% of its administration fee. This waiver may not be terminated or modified except with the approval of the Board. Prior to June 1, 2015, State Street served as the Administrator of the Funds. For its services as Administrator, the Trust paid State Street an annual fee, payable monthly on a pro rata basis. The annual fee was based on the following percentages of the average daily net assets of the Trust: $0 to $10 billion — 0.0175%; next $10 billion — 0.0125%; next $10 billion — 0.0075% and 0.0050% thereafter. In addition, the Trust paid additional fees to the Administrator for certain services and reimbursed the Administrator for out-of-pocket expenses.
| | | | |
| Notes to Financial Statements | | | 89 | |
SSGA Funds
Notes to Financial Statements, continued — August 31, 2015
For the year ended August 31, 2015, the total administration fees waived pursuant to the voluntary waiver agreement were as follows:
| | | | |
| | | Amount Waived | |
| | | | |
SSGA Dynamic Small Cap Fund | | $ | 637 | |
SSGA Clarion Real Estate Fund | | | 1,256 | |
SSGA Enhanced Small Cap Fund | | | 1,002 | |
SSGA Emerging Markets Fund | | | 6,190 | |
SSGA International Stock Selection Fund | | | 9,118 | |
SSGA High Yield Bond Fund | | | 2,224 | |
Securities Lending
State Street is authorized to act on behalf of the Trust as lending agent with respect to the lending of certain securities of the Trust held by State Street as custodian, pursuant to an amended and restated securities lending authorization agreement dated September 28, 2010. Proceeds collected by State Street on investment of cash collateral or any fee income is allocated at 85% payment to the fund, and 15% payable to State Street (after deduction of such other amounts payable to State Street under the terms of the securities lending arrangement).
For the year September 1, 2014 through August 31, 2015, State Street earned securities lending agent fees as follows:
| | | | |
| | | Agent Fees Earned | |
| | | | |
SSGA Dynamic Small Cap Fund | | $ | 5,651 | |
SSGA Clarion Real Estate Fund | | | 1,240 | |
SSGA Emerging Markets Fund | | | 9,185 | |
SSGA International Stock Selection Fund | | | 20,754 | |
Transactions with Affiliates
Each Fund may invest in the SSGA Prime Money Market Fund, a series of the Trust. All income distributions earned by the Funds from affiliated money market funds are recorded as dividends from affiliated money market funds on the Statements of Operations. In addition, cash collateral from lending activities is invested in the State Street Navigator Securities Lending Prime Portfolio, a series of State Street Navigator Securities Lending Trust, for which SSGA FM serves as the investment adviser.
Amounts related to investments in the SSGA Prime Money Market Fund and/or State Street Navigator Securities Lending Prime Portfolio at August 31, 2015 and for the year then ended are:
| | | | | | | | | | | | | | | | | | | | | | | | | | | | |
SSGA Prime Money
Market Fund | | Value at
8/31/2014 | | | Purchased
Cost | | | Purchased
Shares | | | Sold
Proceeds | | | Sold
Shares | | | Value at
8/31/2015 | | | Income | |
| | | | | | | | | | | | | | | | | | | | | | | | | | | | |
SSGA Dynamic Small Cap Fund | | $ | 255,049 | | | $ | 4,268,150 | | | | 4,268,150 | | | $ | 4,274,580 | | | | 4,274,580 | | | $ | 248,619 | | | $ | 87 | |
SSGA Clarion Real Estate Fund | | | 621,712 | | | | 12,210,835 | | | | 12,210,835 | | | | 12,629,136 | | | | 12,629,136 | | | | 203,411 | | | | 74 | |
SSGA Enhanced Small Cap Fund | | | 519,323 | | | | 21,375,930 | | | | 21,375,930 | | | | 20,902,793 | | | | 20,902,793 | | | | 992,460 | | | | 305 | |
SSGA Emerging Markets Fund | | | 100 | | | | 145,274,860 | | | | 145,274,860 | | | | 144,947,032 | | | | 144,947,032 | | | | 327,928 | | | | 733 | |
SSGA International Stock Selection Fund | | | 815,887 | | | | 65,560,813 | | | | 65,560,813 | | | | 62,884,218 | | | | 62,884,218 | | | | 3,492,482 | | | | 803 | |
SSGA High Yield Bond Fund | | | 3,725,780 | | | | 91,571,451 | | | | 91,571,451 | | | | 92,311,509 | | | | 92,311,509 | | | | 2,985,722 | | | | 930 | |
| | | | | | | |
State Street Navigator Securities
Lending Prime Portfolio | | Value at
8/31/2014 | | | Purchased
Cost | | | Purchased
Shares | | | Sold
Cost | | | Sold
Shares | | | Value at
8/31/2015 | | | Income | |
| | | | | | | | | | | | | | | | | | | | | | | | | | | | |
SSGA Dynamic Small Cap Fund | | $ | 5,684,575 | | | $ | 9,298,368 | | | | 9,298,368 | | | $ | 9,607,799 | | | | 9,607,799 | | | $ | 5,375,144 | | | $ | 31,979 | |
SSGA Clarion Real Estate Fund | | | 3,796,807 | | | | 74,232,304 | | | | 74,232,304 | | | | 73,558,127 | | | | 73,558,127 | | | | 4,470,984 | | | | 6,038 | |
SSGA Emerging Markets Fund | | | 19,318,868 | | | | 46,833,556 | | | | 46,833,556 | | | | 61,609,131 | | | | 61,609,131 | | | | 4,543,293 | | | | 47,666 | |
SSGA International Stock Selection Fund | | | 9,985,733 | | | | 148,408,201 | | | | 148,408,201 | | | | 155,146,161 | | | | 155,146,161 | | | | 3,247,773 | | | | 113,787 | |
| | |
| 90 | | Notes to Financial Statements |
SSGA Funds
Notes to Financial Statements, continued — August 31, 2015
Distributor and Shareholder Servicing
State Street Global Markets, LLC (the “Distributor” or “SSGM”) promotes and offers shares of the Trust pursuant to an Amended and Restated Distribution Agreement dated April 14, 2014. The Distributor may enter into agreements with other related and non-related parties which act as agents to offer and sell shares of the Funds. The amounts paid to the Distributor are included in the accompanying Statements of Operations. The Distributor is a wholly-owned subsidiary of State Street Corporation.
With respect to the Class N shares of the SSGA Emerging Markets Fund, the Trust has adopted a distribution plan pursuant to Rule 12b-1 (the “Historical Class N Plan”) under the 1940 Act. Under the Historical Class N Plan, the Trust is authorized to make payments to the Distributor, or any shareholder servicing agent, as defined in the Historical Class N Plan, for providing distribution and marketing services, for furnishing assistance to investors on an ongoing basis, and for the reimbursement of direct out-of pocket expenses charged by the Distributor in connection with the distribution and marketing of shares of the Trust and the servicing of investor accounts. Payments to the Distributor for the sale and distribution of Class N shares are not permitted by the Historical 12b-1 Plan to exceed 0.25% of the SSGA Emerging Markets Fund’s average net asset value per year.
The Trust, with the exception of the SSGA Emerging Markets Class N shares, adopted a distribution plan pursuant to Rule 12b-1 (the “Plan”) under the 1940 Act. Under the Plan, the Trust is authorized to make payments to the Distributor, or any shareholder servicing agent, as defined in the Plan, for providing distribution and marketing services, for furnishing assistance to investors on an ongoing basis, and for the reimbursement of direct out-of-pocket expenses charged by the Distributor in connection with the distribution and marketing of shares of the Trust and the servicing of investor accounts.
To compensate the Distributor for the services it provides and for the expenses it bears in connection with the distribution of shares of the Funds, each Fund may make payments from the assets attributable to certain classes of its shares to the Distributor under the Plan. The Plan is a compensation plan that provides for payments at annual rates (based on average daily net assets) described below.
The Adviser, on behalf of the Distributor, will reimburse the SSGA Dynamic Small Cap Fund, SSGA Emerging Markets Fund and SSGA International Stock Selection Fund in the amount of $11,204, $541,314, and $332,287, respectively, in connection with excess expense payments made from the Funds to the Distributor in prior years. These amounts are contained within Receivable from Adviser on the Statements of Assets and Liabilities. The Adviser will also pay interest on the amounts for the time period the Distributor had use of the funds.
The Plan will continue in effect with respect to a class of shares of a Fund only if such continuance is specifically approved at least annually by a vote of both a majority of the Board and a majority of the Trustees of the Trust who are not “interested persons” of the Trust (the “Independent Trustees”) and have no direct or indirect financial interest in the Plan or in any agreements related thereto (the “Qualified Distribution Plan Trustees”). The Plan may not be amended to increase materially the amount of a Fund’s permitted expenses thereunder without the approval of a majority of the outstanding shares of the affected share class and may not be materially amended in any case without a vote of the majority of both the Trustees and the Qualified Distribution Plan Trustees. At the time of adoption, none of the Independent Trustees of the Trust had a direct or indirect financial interest in the operation of the Plan. The Plan calls for payments at an annual rate (based on average net assets) as follows:
| | | | |
| | | Annual 12b-1 Fee | |
| | | | |
Class N | | | 0.25 | % |
Select Class | | | 0.03 | % |
Class A | | | 0.25 | % |
Class C | | | 1.00 | % |
Class I | | | 0.00 | % |
Class K | | | 0.00 | % |
The Plan may benefit the Funds by increasing sales of shares and reducing redemptions of shares, resulting potentially, for example, in economies of scale and more predictable flows of cash into and out of the Funds. Because Rule 12b-1 fees are paid out of a Fund’s assets, all shareholders share in that expense; however, because shareholders hold their shares through varying arrangements (for example, directly or through financial intermediaries), they may not share equally in the benefits of the Plan.
| | | | |
| Notes to Financial Statements | | | 91 | |
SSGA Funds
Notes to Financial Statements, continued — August 31, 2015
Financial intermediaries are firms that, for compensation, sell shares of mutual funds, including the Funds, and/or provide certain administrative and account maintenance services to mutual fund shareholders. Financial intermediaries may include, among others, brokers, financial planners or advisors, banks, and insurance companies.
In some cases, a financial intermediary may hold its clients’ Fund shares in nominee or street name. Shareholder services provided by a financial intermediary may (though they will not necessarily) include, among other things: processing and mailing trade confirmations, periodic statements, prospectuses, annual reports, semi-annual reports, shareholder notices, and other SEC-required communications; capturing and processing tax data; issuing and mailing dividend checks to shareholders who have selected cash distributions; preparing record date shareholder lists for proxy solicitations; collecting and posting distributions to shareholder accounts; and establishing and maintaining systematic withdrawals and automated investment plans and shareholder account registrations.
The compensation paid by the Distributor to a financial intermediary may be paid continually over time, during the period when the intermediary’s clients hold investments in the Funds. The compensation to financial intermediaries includes asset-based fees and account-based fees. The amount of continuing compensation paid by the Distributor to different financial intermediaries varies.
Some portion of the Distributor’s payments to financial intermediaries will be made out of amounts received by the Distributor under the Funds’ Plans. In addition, certain of the Funds may reimburse the Distributor for payments the Distributor makes to financial intermediaries that provide certain recordkeeping, administrative and account maintenance services. The amount of the reimbursement is calculated in a manner approved by the Trustees and is reviewed by the Trustees periodically.
Each Fund listed in the table below has a shareholder servicing agreement with State Street and the following entities related to State Street: SSGM, Fiduciary Investors Services Division of State Street (“Fiduciary Investors Services”) and High Net Worth Services Division of State Street (“High Net Worth Services”), as well as unaffiliated services providers (collectively, the “Agents”). For these services, each Class N shares paid 0.025% to State Street and a maximum of 0.175% to each of the affiliated Agents, based upon the average daily value of all Class N shares held by or for customers of these Agents. Effective June 1, 2015, the shareholder service agreement between the Trust and State Street was terminated. For the year ended August 31, 2015, Class N shares paid the following shareholder servicing expenses:
| | | | | | | | |
| | | State Street | | | SSGM | |
| | | | | | | | |
SSGA Dynamic Small Cap Fund | | $ | 500 | | | $ | 326 | |
SSGA Clarion Real Estate Fund | | | 911 | | | | 36 | |
SSGA Enhanced Small Cap Fund | | | 18 | | | | — | |
SSGA Emerging Markets Fund | | | 2,365 | | | | 2,194 | |
SSGA International Stock Selection Fund | | | 6,983 | | | | 2 | |
SSGA High Yield Bond Fund | | | 3,396 | | | | 30 | |
The Funds did not incur any expenses from Fiduciary Investors Services during the year.
Board of Trustees
Independent Trustees are compensated on a calendar year basis. Any Trustee who is deemed to be an “interested person” (as defined in the 1940 Act) of the Funds does not receive compensation from the Funds for his or her service as a Trustee.
Each Independent Trustee receives for his or her services to the State Street Master Funds, State Street Institutional Investment Trust and SSGA Funds, a $141,500 annual base retainer in addition to $18,000 for each in-person meeting and $2,000 for each telephonic meeting from the Trust. Trustees’ fees and expenses are allocated among the Trusts and Funds overseen by the Trustees in a manner deemed equitable taking into consideration the relative net assets of the Funds, subject to a $15,000 minimum per Fund. The Co-Chairmen each receive an additional $44,000 annual retainer. The Independent Trustees are reimbursed for travel and other out-of-pocket expenses in connection with meeting attendance. Each Trust will bear a pro-rata allocation based on the Trust’s average monthly assets. As of the date of this Shareholder Report, the Trustees were not paid pension or retirement benefits as part of SSGA Funds’ expenses. However, the SSGA Funds have, pursuant to an exemptive order from the SEC, implemented an optional deferred compensation plan by which the Independent Trustees may defer receipt of compensation and receive a return on the deferred amount determined with reference to the performance of shares of specified SSGA Funds. As of the year ended August 31, 2015, none of the Independent Trustees participated in the optional deferred compensation program.
| | |
| 92 | | Notes to Financial Statements |
SSGA Funds
Notes to Financial Statements, continued — August 31, 2015
The Trust’s officers are compensated by the Adviser and its affiliates.
Accrued fees payable to affiliates and trustees as of August 31, 2015 were as follows:
| | | | | | | | | | | | | | | | | | | | | | | | |
| | | SSGA
Dynamic
Small Cap
Fund | | | SSGA
Clarion
Real Estate
Fund | | | SSGA
Enhanced
Small Cap
Fund | | | SSGA
Emerging
Markets Fund | | | SSGA
International
Stock Selection
Fund | | | SSGA
High Yield
Bond
Fund | |
| | | | | | | | | | | | | | | | | | | | | | | | |
Advisory fees | | $ | 15,789 | | | $ | 27,200 | | | $ | 14,312 | | | $ | 670,310 | | | $ | 224,185 | | | $ | 20,754 | |
Administration Fees | | | 1,092 | | | | 2,123 | | | | 1,661 | | | | 10,603 | | | | 15,264 | | | | 3,762 | |
Custodian Fees | | | 6,785 | | | | 6,446 | | | | 13,763 | | | | 239,772 | | | | 50,275 | | | | 14,435 | |
Distribution fees | | | 1,982 | | | | 18,508 | | | | 4,704 | | | | 46,091 | | | | 26,652 | | | | 4,094 | |
Shareholder servicing fees | | | 5,032 | | | | 14,474 | | | | 10,830 | | | | 28,711 | | | | 47,008 | | | | 42,718 | |
Transfer agent fees | | | 4,942 | | | | 6,090 | | | | 4,134 | | | | 62,059 | | | | 33,341 | | | | 5,873 | |
Trustees’ fees | | | — | | | | — | | | | — | | | | — | | | | — | | | | — | |
| | | | | | | | | | | | | | | | | | | | | | | | |
| | $ | 35,622 | | | $ | 74,841 | | | $ | 49,404 | | | $ | 1,057,546 | | | $ | 396,725 | | | $ | 91,636 | |
| | | | | | | | | | | | | | | | | | | | | | | | |
| 5. | | Aggregate Unrealized Appreciation and Depreciation |
As of August 31, 2015, gross unrealized appreciation and gross unrealized depreciation based on cost for federal income tax purposes were as follows:
| | | | | | | | | | | | | | | | |
| | | Tax Cost | | | Unrealized
Appreciation | | | Unrealized
Depreciation | | | Net Unrealized
Appreciation
(Depreciation) | |
| | | | | | | | | | | | | | | | |
SSGA Dynamic Small Cap Fund | | $ | 27,373,917 | | | $ | 3,098,704 | | | $ | 1,265,031 | | | $ | 1,833,673 | |
SSGA Clarion Real Estate Fund | | $ | 38,225,674 | | | $ | 12,584,292 | | | $ | 86,100 | | | $ | 12,498,192 | |
SSGA Enhanced Small Cap Fund | | $ | 29,740,290 | | | $ | 5,173,162 | | | $ | 1,955,985 | | | $ | 3,217,177 | |
SSGA Emerging Markets Fund | | $ | 166,276,349 | | | $ | 36,923,702 | | | $ | 18,932,191 | | | $ | 17,991,511 | |
SSGA International Stock Selection Fund | | $ | 325,778,369 | | | $ | 31,211,113 | | | $ | 30,736,411 | | | $ | 474,702 | |
SSGA High Yield Bond Fund | | $ | 77,356,893 | | | $ | 945,052 | | | $ | 3,221,069 | | | $ | (2,276,017 | ) |
| 6. | | Fund Share Transactions |
| | | | | | | | | | | | | | | | |
| | | Year Ended
August 31, 2015 | | | Year Ended
August 31, 2014* | |
| SSGA Dynamic Small Cap Fund | | Shares | | | Dollars | | | Shares | | | Dollars | |
| | | | | | | | | | | | | | | | |
Class N | | | | | | | | | �� | | | | | | | |
Proceeds from shares sold | | | 100,484 | | | $ | 3,690,512 | | | | 321,133 | | | $ | 11,524,788 | |
Proceeds from reinvestment of distributions | | | 3,025 | | | | 113,371 | | | | 3,894 | | | | 141,238 | |
Payments for shares redeemed | | | (146,127 | ) | | | (5,533,110 | ) | | | (418,552 | ) | | | (14,441,436 | ) |
| | | | | | | | | | | | | | | | |
Total net increase (decrease) | | | (42,618 | ) | | $ | (1,729,227 | ) | | | (93,525 | ) | | $ | (2,775,410 | ) |
| | | | | | | | | | | | | | | | |
Class A | | | | | | | | | | | | | | | | |
Proceeds from shares sold | | | — | | | $ | — | | | | 268 | | | $ | 10,000 | |
| | | | | | | | | | | | | | | | |
Total net increase (decrease) | | | — | | | $ | — | | | | 268 | | | $ | 10,000 | |
| | | | | | | | | | | | | | | | |
Class C | | | | | | | | | | | | | | | | |
Proceeds from shares sold | | | — | | | $ | — | | | | 268 | | | $ | 10,000 | |
| | | | | | | | | | | | | | | | |
Total net increase (decrease) | | | — | | | $ | — | | | | 268 | | | $ | 10,000 | |
| | | | | | | | | | | | | | | | |
Class I | | | | | | | | | | | | | | | | |
Proceeds from shares sold | | | 34,766 | | | $ | 1,340,848 | | | | 268 | | | $ | 10,000 | |
Proceeds from reinvestment of distributions | | | 57 | | | | 2,135 | | | | — | | | | — | |
Payments for shares redeemed | | | (669 | ) | | | (26,096 | ) | | | — | | | | — | |
| | | | | | | | | | | | | | | | |
Total net increase (decrease) | | | 34,154 | | | $ | 1,316,887 | | | | 268 | | | $ | 10,000 | |
| | | | | | | | | | | | | | | | |
Class K | | | | | | | | | | | | | | | | |
Proceeds from shares sold | | | — | | | $ | — | | | | 268 | | | $ | 10,000 | |
| | | | | | | | | | | | | | | | |
Total net increase (decrease) | | | — | | | $ | — | | | | 268 | | | $ | 10,000 | |
| | | | | | | | | | | | | | | | |
Total net increase (decrease) | | | (8,464 | ) | | $ | (412,340 | ) | | | (92,453 | ) | | $ | (2,735,410 | ) |
| | | | | | | | | | | | | | | | |
| | | | |
| Notes to Financial Statements | | | 93 | |
SSGA Funds
Notes to Financial Statements, continued — August 31, 2015
| | | | | | | | | | | | | | | | |
| | | Year Ended
August 31, 2015 | | | Year Ended
August 31, 2014* | �� |
| SSGA Clarion Real Estate Fund | | Shares | | | Dollars | | | Shares | | | Dollars | |
| | | | | | | | | | | | | | | | |
Class N | | | | | | | | | | | | | | | | |
Proceeds from shares sold | | | 455,564 | | | $ | 7,648,326 | | | | 712,149 | | | $ | 10,230,602 | |
Proceeds from reinvestment of distributions | | | 42,565 | | | | 683,409 | | | | 51,265 | | | | 693,736 | |
Payments for shares redeemed | | | (950,872 | ) | | | (15,305,682 | ) | | | (549,308 | ) | | | (7,586,097 | ) |
| | | | | | | | | | | | | | | | |
Total net increase (decrease) | | | (452,743 | ) | | $ | (6,973,947 | ) | | | 214,106 | | | $ | 3,338,241 | |
| | | | | | | | | | | | | | | | |
Class A | | | | | | | | | | | | | | | | |
Proceeds from shares sold | | | — | | | $ | — | | | | 6,618 | | | $ | 100,000 | |
| | | | | | | | | | | | | | | | |
Total net increase (decrease) | | | — | | | $ | — | | | | 6,618 | | | $ | 100,000 | |
| | | | | | | | | | | | | | | | |
Class C | | | | | | | | | | | | | | | | |
Proceeds from shares sold | | | 1,022 | | | $ | 17,501 | | | | 6,618 | | | $ | 100,000 | |
Proceeds from reinvestment of distributions | | | — | | | | — | | | | — | | | | — | |
| | | | | | | | | | | | | | | | |
Total net increase (decrease) | | | 1,022 | | | $ | 17,501 | | | | 6,618 | | | $ | 100,000 | |
| | | | | | | | | | | | | | | | |
Class I | | | | | | | | | | | | | | | | |
Proceeds from shares sold | | | 25,605 | | | $ | 444,756 | | | | 6,618 | | | $ | 100,000 | |
Proceeds from reinvestment of distributions | | | 22 | | | | 357 | | | | — | | | | — | |
Payments for shares redeemed | | | (16,714 | ) | | | (273,736 | ) | | | — | | | | — | |
| | | | | | | | | | | | | | | | |
Total net increase (decrease) | | | 8,913 | | | $ | 171,377 | | | | 6,618 | | | $ | 100,000 | |
| | | | | | | | | | | | | | | | |
Class K | | | | | | | | | | | | | | | | |
Proceeds from shares sold | | | — | | | $ | — | | | | 6,618 | | | $ | 100,000 | |
| | | | | | | | | | | | | | | | |
Total net increase (decrease) | | | — | | | $ | — | | | | 6,618 | | | $ | 100,000 | |
| | | | | | | | | | | | | | | | |
Total net increase (decrease) | | | (442,808 | ) | | $ | (6,785,069 | ) | | | 240,578 | | | $ | 3,738,241 | |
| | | | | | | | | | | | | | | | |
| | | | |
SSGA Enhanced Small Cap Fund | | | | | | | | | | | | | | | | |
Class N | | | | | | | | | | | | | | | | |
Proceeds from shares sold | | | 911,394 | | | $ | 14,231,626 | | | | 287,118 | | | $ | 4,652,143 | |
Proceeds from reinvestment of distributions | | | 316,500 | | | | 4,722,182 | | | | 36,301 | | | | 585,011 | |
Payments for shares redeemed | | | (889,338 | ) | | | (13,760,442 | ) | | | (501,931 | ) | | | (8,218,756 | ) |
| | | | | | | | | | | | | | | | |
Total net increase (decrease) | | | 338,556 | | | $ | 5,193,366 | | | | (178,512 | ) | | $ | (2,981,602 | ) |
| | | | | | | | | | | | | | | | |
Class A | | | | | | | | | | | | | | | | |
Proceeds from shares sold | | | 6,330 | | | $ | 98,334 | | | | 5,804 | | | $ | 100,000 | |
| | | | | | | | | | | | | | | | |
Total net increase (decrease) | | | 6,330 | | | $ | 98,334 | | | | 5,804 | | | $ | 100,000 | |
| | | | | | | | | | | | | | | | |
Class C | | | | | | | | | | | | | | | | |
Proceeds from shares sold | | | 4,202 | | | $ | 65,000 | | | | 5,804 | | | $ | 100,000 | |
| | | | | | | | | | | | | | | | |
Total net increase (decrease) | | | 4,202 | | | $ | 65,000 | | | | 5,804 | | | $ | 100,000 | |
| | | | | | | | | | | | | | | | |
Class I | | | | | | | | | | | | | | | | |
Proceeds from shares sold | | | 284 | | | $ | 4,352 | | | | 5,804 | | | $ | 100,000 | |
| | | | | | | | | | | | | | | | |
Total net increase (decrease) | | | 284 | | | $ | 4,352 | | | | 5,804 | | | $ | 100,000 | |
| | | | | | | | | | | | | | | | |
Class K | | | | | | | | | | | | | | | | |
Proceeds from shares sold | | | 8,513 | | | $ | 134,591 | | | | 580 | | | $ | 10,000 | |
| | | | | | | | | | | | | | | | |
Total net increase (decrease) | | | 8,513 | | | $ | 134,591 | | | | 580 | | | $ | 10,000 | |
| | | | | | | | | | | | | | | | |
Total net increase (decrease) | | | 357,885 | | | $ | 5,495,643 | | | | (160,520 | ) | | $ | (2,671,602 | ) |
| | | | | | | | | | | | | | | | |
| | |
| 94 | | Notes to Financial Statements |
SSGA Funds
Notes to Financial Statements, continued — August 31, 2015
| | | | | | | | | | | | | | | | |
| | | Year Ended
August 31, 2015 | | | Year Ended
August 31, 2014* | |
| SSGA Emerging Markets Fund | | Shares | | | Dollars | | | Shares | | | Dollars | |
| | | | | | | | | | | | | | | | |
Class N | | | | | | | | | | | | | | | | |
Proceeds from shares sold | | | 5,278,723 | | | $ | 64,140,257 | | | | 10,903,514 | | | $ | 198,700,280 | |
Proceeds from reinvestment of distributions | | | 11,777,523 | | | | 122,721,786 | | | | 5,045,074 | | | | 93,083,628 | |
Payments for shares redeemed | | | (24,353,604 | ) | | | (301,194,133 | ) | | | (40,955,179 | ) | | | (743,452,840 | ) |
| | | | | | | | | | | | | | | | |
Total net increase (decrease) | | | (7,297,358 | ) | | $ | (114,332,090 | ) | | | (25,006,591 | ) | | $ | (451,668,932 | ) |
| | | | | | | | | | | | | | | | |
Class A | | | | | | | | | | | | | | | | |
Proceeds from shares sold | | | 1,531 | | | $ | 17,500 | | | | 535 | | | $ | 10,000 | |
| | | | | | | | | | | | | | | | |
Total net increase (decrease) | | | 1,531 | | | $ | 17,500 | | | | 535 | | | $ | 10,000 | |
| | | | | | | | | | | | | | | | |
Class C | | | | | | | | | | | | | | | | |
Proceeds from shares sold | | | — | | | $ | — | | | | 5,353 | | | $ | 100,000 | |
| | | | | | | | | | | | | | | | |
Total net increase (decrease) | | | — | | | $ | — | | | | 5,353 | | | $ | 100,000 | |
| | | | | | | | | | | | | | | | |
Class I | | | | | | | | | | | | | | | | |
Proceeds from shares sold | | | 714,604 | | | $ | 7,831,896 | | | | 535 | | | $ | 10,000 | |
Proceeds from reinvestment of distributions | | | 35,640 | | | | 370,658 | | | | | | | | | |
Payments for shares redeemed | | | (595,089 | ) | | | (6,054,402 | ) | | | | | | | | |
| | | | | | | | | | | | | | | | |
Total net increase (decrease) | | | 155,155 | | | $ | 2,148,152 | | | | 535 | | | $ | 10,000 | |
| | | | | | | | | | | | | | | | |
Class K | | | | | | | | | | | | | | | | |
Proceeds from shares sold | | | — | | | $ | — | | | | 535 | | | $ | 10,000 | |
| | | | | | | | | | | | | | | | |
Total net increase (decrease) | | | — | | | $ | — | | | | 535 | | | $ | 10,000 | |
| | | | | | | | | | | | | | | | |
Select Class | | | | | | | | | | | | | | | | |
Proceeds from shares sold | | | 423,337 | | | $ | 6,821,160 | | | | 4,204,315 | | | $ | 83,742,567 | |
Proceeds from reinvestment of distributions | | | 2,763,883 | | | | 28,799,663 | | | | 961,567 | | | | 17,755,377 | |
Payments for shares redeemed | | | (10,620,895 | ) | | | (139,298,451 | ) | | | (7,267,953 | ) | | | (128,627,003 | ) |
| | | | | | | | | | | | | | | | |
Total net increase (decrease) | | | (7,433,675 | ) | | $ | (103,677,628 | ) | | | (2,102,071 | ) | | $ | (27,129,059 | ) |
| | | | | | | | | | | | | | | | |
Total net increase (decrease) | | | (14,574,347 | ) | | $ | (215,844,066 | ) | | | (27,101,704 | ) | | $ | (478,667,991 | ) |
| | | | | | | | | | | | | | | | |
| | | | |
| Notes to Financial Statements | | | 95 | |
SSGA Funds
Notes to Financial Statements, continued — August 31, 2015
| | | | | | | | | | | | | | | | |
| | | Year Ended
August 31, 2015 | | | Year Ended
August 31, 2014* | |
| SSGA International Stock Selection Fund | | Shares | | | Dollars | | | Shares | | | Dollars | |
| | | | | | | | | | | | | | | | |
Class N | | | | | | | | | | | | | | | | |
Proceeds from shares sold | | | 3,765,663 | | | $ | 42,173,893 | | | | 2,386,982 | | | $ | 26,345,285 | |
Proceeds from reinvestment of distributions | | | 325,333 | | | | 3,425,748 | | | | 1,464,645 | | | | 16,159,709 | |
Payments for shares redeemed | | | (7,851,715 | ) | | | (85,356,738 | ) | | | (6,703,641 | ) | | | (73,782,618 | ) |
| | | | | | | | | | | | | | | | |
Total net increase (decrease) | | | (3,760,719 | ) | | $ | (39,757,097 | ) | | | (2,852,014 | ) | | $ | (31,277,624 | ) |
| | | | | | | | | | | | | | | | |
Class A | | | | | | | | | | | | | | | | |
Proceeds from shares sold | | | 627 | | | $ | 7,000 | | | | 867 | | | $ | 10,000 | |
| | | | | | | | | | | | | | | | |
Total net increase (decrease) | | | 627 | | | $ | 7,000 | | | | 867 | | | $ | 10,000 | |
| | | | | | | | | | | | | | | | |
Class C | | | | | | | | | | | | | | | | |
Proceeds from shares sold | | | — | | | $ | | | | | 8,666 | | | $ | 100,000 | |
| | | | | | | | | | | | | | | | |
Total net increase (decrease) | | | — | | | $ | | | | | 8,666 | | | $ | 100,000 | |
| | | | | | | | | | | | | | | | |
Class I | | | | | | | | | | | | | | | | |
Proceeds from shares sold | | | 53,618 | | | $ | 587,661 | | | | 867 | | | $ | 10,000 | |
Proceeds from reinvestment of distributions | | | 331 | | | | 3,481 | | | | — | | | | — | |
Payments for shares redeemed | | | (8,006 | ) | | | (89,405 | ) | | | — | | | | — | |
| | | | | | | | | | | | | | | | |
Total net increase (decrease) | | | 45,943 | | | $ | 501,737 | | | | 867 | | | $ | 10,000 | |
| | | | | | | | | | | | | | | | |
Class K | | | | | | | | | | | | | | | | |
Proceeds from shares sold | | | — | | | $ | — | | | | 867 | | | $ | 10,000 | |
| | | | | | | | | | | | | | | | |
Total net increase (decrease) | | | — | | | $ | — | | | | 867 | | | $ | 10,000 | |
| | | | | | | | | | | | | | | | |
Total net increase (decrease) | | | (3,714,149 | ) | | $ | (39,248,360 | ) | | | (2,840,747 | ) | | $ | (31,147,624 | ) |
| | | | | | | | | | | | | | | | |
| | | | |
SSGA High Yield Bond Fund | | | | | | | | | | | | | | | | |
Class N | | | | | | | | | | | | | | | | |
Proceeds from shares sold | | | 10,797,255 | | | $ | 85,520,467 | | | | 9,658,270 | | | $ | 80,713,840 | |
Proceeds from reinvestment of distributions | | | 810,758 | | | | 6,340,786 | | | | 1,234,272 | | | | 10,197,119 | |
Payments for shares redeemed | | | (12,228,937 | ) | | | (96,072,295 | ) | | | (10,887,467 | ) | | | (90,476,395 | ) |
| | | | | | | | | | | | | | | | |
Total net increase (decrease) | | | (620,924 | ) | | $ | (4,211,042 | ) | | | 5,075 | | | $ | 434,564 | |
| | | | | | | | | | | | | | | | |
Class A | | | | | | | | | | | | | | | | |
Proceeds from shares sold | | | — | | | $ | — | | | | 1,189 | | | $ | 10,000 | |
| | | | | | | | | | | | | | | | |
Total net increase (decrease) | | | — | | | $ | — | | | | 1,189 | | | $ | 10,000 | |
| | | | | | | | | | | | | | | | |
Class C | | | | | | | | | | | | | | | | |
Proceeds from shares sold | | | — | | | $ | — | | | | 11,891 | | | $ | 100,000 | |
| | | | | | | | | | | | | | | | |
Total net increase (decrease) | | | — | | | $ | — | | | | 11,891 | | | $ | 100,000 | |
| | | | | | | | | | | | | | | | |
Class I | | | | | | | | | | | | | | | | |
Proceeds from shares sold | | | 172,074 | | | $ | 1,375,265 | | | | 1,189 | | | $ | 10,000 | |
Proceeds from reinvestment of distributions | | | 4,165 | | | | 32,167 | | | | — | | | | — | |
Payments for shares redeemed | | | (115,625 | ) | | | (899,262 | ) | | | — | | | | — | |
| | | | | | | | | | | | | | | | |
Total net increase (decrease) | | | 60,614 | | | $ | 508,170 | | | | 1,189 | | | $ | 10,000 | |
| | | | | | | | | | | | | | | | |
Class K | | | | | | | | | | | | | | | | |
Proceeds from shares sold | | | — | | | $ | — | | | | 1,189 | | | $ | 10,000 | |
| | | | | | | | | | | | | | | | |
Total net increase (decrease) | | | — | | | $ | — | | | | 1,189 | | | $ | 10,000 | |
| | | | | | | | | | | | | | | | |
Total net increase (decrease) | | | (560,310 | ) | | $ | (3,702,872 | ) | | | 20,533 | | | $ | 564,564 | |
| | | | | | | | | | | | | | | | |
| | * | For the period July 7, 2014 (commencement of operations) to August 31, 2014. |
| | |
| 96 | | Notes to Financial Statements |
SSGA Funds
Notes to Financial Statements, continued — August 31, 2015
The Funds’ assets may be concentrated in a particular state or geographic area, or in a particular industry, group of industries or sector. Because each Fund will generally concentrate its investments to approximately the same extent that its index is so concentrated, a Fund may be adversely affected by the performance of bonds of a particular state or geographic area, or in a particular industry, group of industries or sector, and its shares may be subject to increased price volatility. In addition, if a Fund concentrates in a single industry, group of industries or type of instrument, it may be more susceptible to any single economic, market, political or regulatory occurrence affecting that industry, group of industries or type of instrument.
| 8. | | Foreign Investment Risks |
Investing in securities of foreign companies and foreign governments involves special risks and considerations not typically associated with investing in U.S. companies and securities of the U.S. government. These risks include revaluation of currencies and the risk of expropriation. Moreover, the markets for securities of many foreign companies and foreign governments may be less liquid and the prices of such securities may be more volatile than those of comparable U.S. companies and the U.S. government.
Some foreign markets in which the Funds invest are considered emerging markets. Investment in these emerging markets subjects a Fund to a greater risk of loss than investments in a developed market. This is due to, among other things, greater market volatility, lower trading volume, political and economic instability, higher levels of inflation, deflation or currency devaluation, greater risk of market shut down, and more governmental limitations on foreign investment policy than those typically found in a developed market.
Interest rate risk is the risk that changes in interest rates will affect the value of the Fund’s investments in fixed-income debt securities such as bonds or notes. Increases in interest rates may cause the value of the Fund’s investments to decline.
Each Fund together with certain other affiliated funds (each a “Participant” and, collectively, the “Participants”) participate in a $300 million revolving credit facility provided by a syndication of banks. The Participants may borrow for the purpose of meeting shareholder redemption requests that otherwise might require the untimely disposition of securities. The Participants are charged an annual commitment fee which is calculated based on the unused portion of the shared credit line. Commitment fees are allocated among each of the Participants based on net assets. Commitment fees are ordinary fund operating expenses and are paid by the Adviser. A Participant incurs and pays the interest expense related to its borrowing. Interest is calculated at a rate per annum equal to the sum of the Federal Funds Rate plus 1%. The Funds may borrow up to a maximum of approximately 33 percent of its assets or a lower amount as may be set forth in the Funds’ prospectus.
During the year ended August 31, 2015, the following funds had a daily average balance on the line of credit (for those days on which there were borrowings):
| | | | | | | | | | | | |
| | | Weighted Average
Loan Balance | | | Weighted Average
borrowing cost | | | Number of days | |
| | | | | | | | | | | | |
SSGA Emerging Markets Fund | | $ | 8,110,000 | | | | 1.18 | % | | | 95 | |
SSGA International Stock Selection Fund | | | 9,190,000 | | | | 1.18 | | | | 9 | |
SSGA Enhanced Small Cap Fund | | | 3,200,000 | | | | 1.20 | | | | 5 | |
As of August 31, 2015, SSGA International Stock Selection and SSGA Enhanced Small Cap Funds had no borrowings under this agreement. As of August 31, 2015, SSGA Emerging Markets had an outstanding balance of $9,200,000, recorded as Notes payable on the Statements of Assets and Liabilities.
The Funds may incur interest expense on cash overdrafts at the custodian or from the use of the line of credit. For the year ended August 31, 2015, SSGA Emerging Markets Fund had interest expense of $22,077 and SSGA International Stock Selection Fund had interest expense of $773.
| | | | |
| Notes to Financial Statements | | | 97 | |
SSGA Funds
Notes to Financial Statements, continued — August 31, 2015
| 12. | | Recent Accounting Pronouncements |
In June 2014, the Financial Accounting Standards Board issued Accounting Standards Update 2014-11, Transfers and Servicing (Topic 860) — Repurchase-to-Maturity Transactions, Repurchase Financings, and Disclosures (“ASU 2014-11”). ASU 2014-11 changes the accounting for repurchase-to-maturity transactions and enhances the required disclosures for repurchase agreements, reverse repurchase agreements and other similar transactions accounted for as secured borrowings, including securities lending. Management is evaluating the impact, if any, of this standard on the Funds’ financial statements and related disclosures, which would first be for effective annual and interim reporting periods beginning after December 15, 2014.
Management has evaluated the impact of all subsequent events on the Funds through the date the financial statements were available to be issued and has determined that there were no subsequent events requiring adjustment or disclosure in the financial statements other than below.
The Board of Trustees of SSGA Funds has approved changing the name of SSGA Emerging Markets Fund (the “Fund”), as well as changing the Fund’s Principal Investment Strategy. Effective on or about December 18, 2015, all references to SSGA Emerging Markets Fund in the Prospectus, Summary Prospectus and Statement of Additional Information shall be replaced by references to State Street Disciplined Emerging Markets Equity Fund.
| | |
| 98 | | Notes to Financial Statements |
SSGA Funds
Report of Independent Registered Public Accounting Firm
To the Shareholders and Board of Trustees of SSGA Funds:
We have audited the accompanying statements of assets and liabilities, including the schedules of investments, of SSGA Dynamic Small Cap Fund, SSGA Clarion Real Estate Fund, SSGA Enhanced Small Cap Fund, SSGA Emerging Markets Fund, SSGA International Stock Selection Fund and SSGA High Yield Bond Fund (collectively, the “Funds”) (six of the portfolios constituting SSGA Funds) as of August 31, 2015, and the related statements of operations, statements of changes in net assets, and the financial highlights for the year then ended. These financial statements and financial highlights are the responsibility of the Funds’ management. Our responsibility is to express an opinion on these financial statements and financial highlights based on our audits. The statements of changes in net assets for the year ended August 31, 2014 and the financial highlights for periods ended prior to September 1, 2014 were audited by another independent registered public accounting firm whose report, dated October 30, 2014, expressed an unqualified opinion on those statements of changes in net assets and those financial highlights.
We conducted our audits in accordance with the standards of the Public Company Accounting Oversight Board (United States). Those standards require that we plan and perform the audit to obtain reasonable assurance about whether the financial statements and financial highlights are free of material misstatement. We were not engaged to perform an audit of the Funds’ internal control over financial reporting. Our audits included consideration of internal control over financial reporting as a basis for designing audit procedures that are appropriate in the circumstances, but not for the purpose of expressing an opinion on the effectiveness of the Funds’ internal control over financial reporting. Accordingly, we express no such opinion. An audit also includes examining, on a test basis, evidence supporting the amounts and disclosures in the financial statements and financial highlights, assessing the accounting principles used and significant estimates made by management, and evaluating the overall financial statement presentation. Our procedures included confirmation of securities owned as of August 31, 2015, by correspondence with the custodian and others or by other appropriate auditing procedures where replies from others were not received. We believe that our audits provides a reasonable basis for our opinion.
In our opinion, the financial statements and financial highlights referred to above present fairly, in all material respects, the financial position of each of the above mentioned Funds of SSGA Funds at August 31, 2015, and the results of their operations, the changes in their net assets, and the financial highlights for the year then ended, in conformity with U.S. generally accepted accounting principles.

Boston, Massachusetts
October 30, 2015
| | | | |
| Report of Independent Registered Public Accounting Firm | | | 99 | |
SSGA Funds
Tax Information — August 31, 2015 (Unaudited)
Long term capital gains dividends of $4,478,885 were paid by the SSGA Enhanced Small Cap Fund during the year ended August 31, 2015.
Long term capital gains dividends of $151,853,051 were paid by the SSGA Emerging Markets Fund during the year ended August 31, 2015.
Long term capital gains dividends of $1,417,107 were paid by the SSGA High Yield Bond Fund during the year ended August 31, 2015. Short term capital gains dividends of $145,900 were paid by the SSGA High Yield Bond Fund during the year ended August 31, 2015.
The Funds designate dividends during the fiscal year as qualifying for the dividends received deduction for corporate shareholders as follows:
| | | | |
SSGA Dynamic Small Cap Fund | | | 89.18 | % |
SSGA Clarion Real Estate Fund | | | 0.36 | % |
SSGA Enhanced Small Cap Fund | | | 95.56 | % |
SSGA Emerging Markets Fund | | | N/A | |
SSGA International Stock Selection Fund | | | 0.00 | % |
SSGA High Yield Bond Fund | | | 0.00 | % |
For the tax year ended August 31, 2015, the Funds hereby designate the following percentage of their net taxable income as qualified dividends taxed at individual net capital gain rates:
| | | | |
SSGA Dynamic Small Cap Fund | | | 89.34 | % |
SSGA Clarion Real Estate Fund | | | 0.30 | % |
SSGA Enhanced Small Cap Fund | | | 95.86 | % |
SSGA Emerging Markets Fund | | | 90.88 | % |
SSGA International Stock Selection Fund | | | 91.11 | % |
SSGA High Yield Bond Fund | | | N/A | |
Form 1099-DIV mailed to you in January 2016 will show the tax status of all distributions paid to your account in calendar year 2015.
Pursuant to Section 853 of the Internal Revenue Code, the Funds designate the following amounts as foreign taxes paid and gross income earned from foreign sources in the taxable year ended August 31, 2015:
| | | | | | | | | | | | | | | | |
| | | Foreign Taxes
Paid | | | Foreign Taxes Paid per Share | | | Foreign Source Income | | | Foreign Source Income per Share | |
| | | | | | | | | | | | | | | | |
| | | | | | | | | | | | | | | | |
SSGA Emerging Markets Fund | | $ | 1,620,873 | | | $ | 0.0821 | | | $ | 10,651,994 | | | $ | 0.5395 | |
SSGA International Stock Selection Fund | | $ | 564,514 | | | $ | 0.0184 | | | $ | 10,670,715 | | | $ | 0.3485 | |
Please consult a tax adviser for questions about federal or state income tax laws.
SSGA Funds
Basis for Approval of Investment Advisory Contracts (Unaudited)
Trustee Considerations in Approving Continuation of Investment Advisory and Sub-Advisory Agreements1
Overview of the Contract Review Process
Under the Investment Company Act of 1940, an investment advisory agreement between a mutual fund and its investment adviser or sub-adviser may continue in effect from year to year only if its continuance is approved at least annually by the fund’s board of trustees, including by a vote of a majority of those trustees who are not “interested persons” of the fund (commonly referred to as, the “Independent Trustees”) cast in person at a meeting called for the purpose of considering such approval.
Consistent with these requirements, the Independent Trustees on the Board of Trustees (the “Board”) of the SSGA Funds (the “Trust”), met in Executive Sessions on April 12-13, 2015, and May 18-19, 2015 to consider a proposal to approve, with respect to each portfolio series of the Trust (each, a “Fund” and collectively, the “Funds”), the continuation of the investment advisory agreement (the “Advisory Agreement”) with SSGA Funds Management, Inc. (the “Adviser”), and, with respect to SSGA Clarion Real Estate Fund, the sub-advisory agreement (the “Sub-Advisory Agreement,” and together with the Advisory Agreement, the “Advisory Agreements”) between the Adviser and CBRE Clarion Securities, LLC (the “Sub-Adviser”). Prior to voting on the proposal, the Independent Trustees, as well as the Trustees who are “interested persons” of the Adviser, reviewed information furnished by the Adviser and Sub-Adviser and others reasonably necessary to permit the Board to evaluate the proposal fully. The Independent Trustees were separately represented by co-counsel that is independent of the Adviser in connection with their consideration of approval of the Advisory Agreements. Following the April 12-13, 2015 meeting, the Independent Trustees submitted questions and requests for additional information to management, and considered management’s responses thereto prior to and at the May 18-19, 2015 meeting. The Independent Trustees considered, among other things, the following:
Information about Performance, Expenses and Fees
| • | | A report prepared by an independent third-party provider of investment company data, which includes for each Fund: |
| | ¡ | | Comparisons of the Fund’s performance over the past one-, three-, five- and ten-year periods ended December 31, 2014, as applicable, to the performance of an appropriate benchmark for the Fund and a universe of other mutual funds with similar investment objectives and policies; |
| | ¡ | | Comparisons of the Fund’s expense ratio (with detail of component expenses) to the expense ratios of a group of comparable mutual funds selected by the independent third-party data provider; |
| | ¡ | | A chart showing the Fund’s historical average net assets relative to its total expenses, management fees, and non-management expenses over the past five years, as applicable; and |
| | ¡ | | Comparisons of the Fund’s contractual management fee to the contractual management fees of comparable mutual funds at different asset levels. |
| • | | Comparative information concerning fees charged by the Adviser for managing institutional accounts using investment strategies and techniques similar to those used in managing the Funds, as applicable; and |
| • | | Profitability analyses for (a) the Adviser with respect to each Fund and (b) affiliates of the Adviser that provide services to the Funds (“Affiliated Service Providers”). |
| 1 | Over the course of more than 20 years, the Independent Trustees have identified numerous relevant issues, factors and concerns (“issues, factors and concerns”) that they consider each year in connection with the proposed continuation of the advisory and sub-advisory agreements, the administration agreement, the distribution plans, the distribution agreement and various related-party service agreements (the “annual review process”). The statement of issues, factors and concerns and the related conclusions of the Independent Trustees may not change substantially from year to year. However, the information requested by, and provided to, the Independent Trustees with respect to the issues, factors and concerns and on which their conclusions are based is updated annually and, in some cases, may differ substantially from the previous year. The Independent Trustees schedule annually a separate in-person meeting that is dedicated to the annual review process (the “special meeting”). At the special meeting and throughout the annual review process, the Independent Trustees take a fresh look at each of the issues, factors and concerns in light of the latest available information and each year present one or more sets of comments and questions to management with respect to specific issues, factors and concerns. Management responds to such comments and questions to the satisfaction of the Independent Trustee before the annual review process is completed and prior to the Independent Trustees voting on proposals to approve continuation of the agreements and plans. |
| | | | |
| Basis for Approval of Investment Advisory Contracts | | | 101 | |
SSGA Funds
Basis for Approval of Investment Advisory Contracts (Unaudited), continued
Information about Portfolio Management
| • | | Descriptions of the investment management services provided by the Adviser and Sub-Adviser, as applicable, including their investment strategies and processes; |
| • | | Information concerning the allocation of brokerage and the benefits received by the Adviser and Sub-Adviser, as applicable, as a result of brokerage allocation, including information concerning the acquisition of any research through “soft dollar” benefits received in connection with the Funds’ brokerage; and |
| • | | Information regarding the procedures and processes used to value the assets of the Funds and the assistance provided to the administrator of the Funds by the Adviser in monitoring the effectiveness of such procedures and processes. |
Information about the Adviser
| • | | Reports detailing the financial results and condition of the Adviser, the Sub-Adviser, and their affiliates; |
| • | | Descriptions of the qualifications, education and experience of the individual investment professionals responsible for managing the portfolios of the Funds; |
| • | | A copy of each Code of Ethics adopted by the Adviser and Sub-Adviser, together with information relating to compliance with and the administration of such Codes; |
| • | | A copy of the Adviser’s proxy voting policies and procedures; |
| • | | Information concerning the resources devoted by the Adviser to overseeing compliance by the Funds and their service providers, including the Adviser’s record of compliance with investment policies and restrictions and other operating policies of the Funds; |
| • | | A description of the business continuity and disaster recovery plans of the Adviser and Sub-Adviser; and |
| • | | Information regarding the Adviser’s and the Sub-Adviser’s risk management processes. |
Other Relevant Information
| • | | Information concerning the nature, quality and cost of various non-investment management services provided to the Funds by affiliates of the Adviser, including the custodian, administrator, fund accountant, transfer agent and securities lending agent of the Funds, and the role of the Adviser in managing the Funds’ relationship with these service providers; |
| • | | Copies of the Advisory Agreements, Sub-Advisory Agreement and agreements with other service providers of the Funds; |
| • | | Draft responses to the letter dated March 11, 2015 from Joseph P. Barri, LLC, co-counsel along with the law firm of Sullivan & Worcester LLP (together, “Independent Counsel”), to the Independent Trustees, and reviewed prior to such date by Independent Counsel, requesting specific information, from each of: |
| | ¡ | | The Adviser, with respect to its operations relating to the Funds and its approximate profit margins before taxes from such operations for the Funds’ last fiscal year; and the relevant operations of other affiliated service providers to the Funds, together with their approximate profit margins from such relevant operations for the Funds’ last fiscal year; |
| | ¡ | | State Street Bank and Trust Company (“State Street”), the sub-administrator, administrator, custodian, transfer agent, securities lending agent, and/or shareholder services, as applicable, for the Funds, with respect to its operations relating to the Funds; and |
| | ¡ | | State Street Global Markets, LLC, the principal underwriter and distributor of the shares of the Funds (the “Distributor”), with respect to its operations relating to the Funds, together with the Funds’ related distribution plans and arrangements under SEC Rule 12b-1; |
| • | | Information from the Adviser, State Street and the Distributor providing any material changes to the previous information supplied in response to the letter dated March 11, 2015 from Joseph P. Barri, LLC prior to the Executive Sessions of the Board on May 18-19, 2015. |
| • | | Excerpts from the Funds’ most recent Prospectuses, Statements of Additional Information and Annual Reports for the fiscal year ended August 31, 2014, including (i) the latest prospectus descriptions of each Fund’s investment objectives, strategies and authorized investment techniques and investments; and (ii) the latest Annual Shareholder Report for each Fund, including |
| | |
| 102 | | Basis for Approval of Investment Advisory Contracts |
SSGA Funds
Basis for Approval of Investment Advisory Contracts (Unaudited), continued
| | Portfolio Management Discussion of Performance, as prepared by its portfolio management team, together with a graphic comparison of the performance of each Fund with its benchmark index, for its fiscal year ended August 31, 2014; |
| • | | Lipper materials dated March 2015, circulated to the Independent Trustees and to Independent Counsel, with respect to the Funds for which such materials were then available; and |
| • | | A summary of the foregoing materials prepared by Independent Counsel. |
In addition to the information identified above, the Board considered information provided from time to time by the Adviser, and other service providers of the Funds throughout the year at meetings of the Board and its committees. At such meetings, the Trustees received, among other things, presentations by the portfolio managers and other investment professionals of the Adviser relating to the performance of the Funds and the investment strategies used in pursuing each Fund’s investment objective.
The Independent Trustees were assisted throughout the contract review process by their independent legal counsel. The Independent Trustees relied upon the advice of such counsel and their own business judgment in determining the material factors to be considered in evaluating the Advisory Agreement, and the weight to be given to each such factor. The conclusions reached with respect to the Advisory Agreement were based on a comprehensive evaluation of all the information provided and not any single factor. Moreover, each Trustee may have placed varying emphasis on particular factors in reaching conclusions with respect to each Fund.
Results of the Process
Based on a consideration of the foregoing and such other information as deemed relevant, including the factors and conclusions described below, on May 18-19, 2015 the Board, including a majority of the Independent Trustees, voted to approve continuation of the Advisory Agreements and Sub-Advisory Agreement effective June 1, 2015, for an additional year with respect to all Funds.
Nature, Extent and Quality of Services
In considering whether to approve the Advisory Agreement and Sub-Advisory Agreement, the Board evaluated the nature, extent and quality of services provided to each Fund by the Adviser and Sub-Adviser, as applicable.
The Board considered the Adviser’s and Sub-Adviser’s, as applicable, management capabilities and investment process with respect to the types of investments held by each Fund, including the education, experience and number of investment professionals and other personnel who provide portfolio management, investment research, and similar services to the Fund. The Board evaluated, where relevant, the abilities and experience of such investment personnel in analyzing particular markets, industries and specific issuers of securities in these markets and industries. The Board also considered the substantial expertise of the Adviser and Sub-Adviser, as applicable, in developing and applying proprietary quantitative models for managing various Funds that invest primarily in equity securities. With respect to those Funds that invest primarily in fixed-income securities, the Board considered the extensive experience and resources committed by the Adviser to the evaluation of credit, interest-rate and currency risks. The Board also took into account the compensation paid to recruit and retain investment personnel, and the time and attention devoted to the Funds by senior management.
The Board reviewed the compliance programs of the Adviser, Sub-Adviser and various affiliated service providers. Among other things, the Board considered compliance and reporting matters relating to personal trading by investment personnel, selective disclosure of portfolio holdings, late trading, frequent trading, portfolio valuation, business continuity, the allocation of investment opportunities and the voting of proxies. The Board also considered the role of the Adviser in monitoring each Fund’s securities lending activities.
On the basis of the foregoing and other relevant information, the Board concluded that the Adviser and Sub-Adviser, as applicable, can be expected to continue to provide, high quality investment management and related services for the Funds.
Fund Performance
The Board compared each Fund’s investment performance to the performance of an appropriate benchmark and universe of comparable mutual funds for various time periods ended December 31, 2014. Among other information, the Board considered the following performance information in its evaluation of your Fund(s):
SSGA High Yield Bond Fund. The Board considered that: (a) the Fund underperformed the median of its Performance Group for the 1-year period and outperformed the median of its Performance Group for the 3-, 5- and 10-year periods; (b) the Fund outperformed
| | | | |
| Basis for Approval of Investment Advisory Contracts | | | 103 | |
SSGA Funds
Basis for Approval of Investment Advisory Contracts (Unaudited), continued
the median of its Performance Universe for the 1-, 3-, 5- and 10-year periods; and (c) the Fund underperformed its Lipper Index for the 1-, 3- and 5-year periods and outperformed its Lipper Index for the 10-year period.
SSGA Clarion Real Estate Fund. The Board considered that: (a) the Fund outperformed the median of its Performance Group for the 1- year period, equaled the median of its Performance Group for the 5- year period, and underperformed the median of its Performance Group for the 3- and 10-year periods; and (b) outperformed the median of its Performance Universe and Lipper Index for the 1-, 3- and 5-year periods and underperformed the median of its Performance Universe and Lipper Index for the 10-year period.
SSGA Enhanced Small Cap Fund. The Board considered that the Fund outperformed the medians of its Performance Group and Performance Universe and Lipper Index for the 1-, 3- and 5-year periods.
SSGA Dynamic Small Cap Fund. The Board considered that: (a) the Fund outperformed the median of its Performance Group for the 1-, 3- and 5-year periods and underperformed the median of its Performance Group for the 10-year period; and (b) the Fund underperformed the median of its Performance Universe and Lipper Index for the 1- and 10-year periods and outperformed the median of its Performance Universe and Lipper Index for the 3- and 5-year periods.
SSGA Emerging Markets Fund. The Board considered that the Fund underperformed the medians of its Performance Group and Performance Universe and Lipper Index for the 1-, 3-, 5- and 10-year periods. The Board took into account management’s discussion of the Fund’s performance.
SSGA International Stock Selection Fund. The Board considered that: (a) the Fund outperformed the medians of its Performance Group and Performance Universe for the 1-, 3-, 5- and 10-year periods; and (b) the Fund outperformed its Lipper Index for the 1- and 3-year periods and underperformed its Lipper Index for the 5- and 10-year periods.
On the basis of the foregoing and other relevant information, the Board concluded that the performance of each Fund is satisfactory or better (a) by comparison to the performance of its peer group funds or (b) after considering steps taken by management to improve the performance of certain Funds.
Management Fees and Expenses
The Board reviewed the contractual investment advisory fee rates payable by each Fund and actual fees paid by each Fund, net of waivers. As part of its review, the Board considered each Fund’s management fee and total expense ratio (both before and after giving effect to any expense caps), as compared to a group of similarly managed funds selected by an independent data provider. The Board also considered the comparability of the fees charged and the services provided to each Fund by the Adviser to the fees charged and services provided to other clients of the Adviser, including institutional accounts. In addition, the Board considered the willingness of the Adviser to provide undertakings from time to time to waive fees or pay expenses of various Funds to limit the total expenses borne by shareholders of such Funds. The Board also considered the fees that Adviser pays to the Sub-Adviser for its services to the applicable Funds and noted that such fees were negotiated at arm’s length. Among other information, the Board considered the following expense information in its evaluation of your Fund(s):
SSGA High Yield Bond Fund. The Board considered that the Fund’s actual management fee was below the medians of its Expense Group and Expense Universe. The Board also considered that the Fund’s total expenses were below the medians of its Expense Group and Expense Universe.
SSGA Clarion Real Estate Fund. The Board considered that the Fund’s actual management fee was below the medians of its Expense Group and Expense Universe. The Board also considered that the Fund’s total expenses were below the medians of its Expense Group and Expense Universe.
SSGA Enhanced Small Cap Fund. The Board considered that the Fund’s actual management fee was below the medians of its Expense Group and Expense Universe. The Board also considered that the Fund’s total expenses were below the medians of its Expense Group and Expense Universe.
SSGA Dynamic Small Cap Fund. The Board considered that the Fund’s actual management fee was below the medians of its Expense Group and Expense Universe. The Board also considered that the Fund’s total expenses were below the medians of its Expense Group and Expense Universe.
| | |
| 104 | | Basis for Approval of Investment Advisory Contracts |
SSGA Funds
Basis for Approval of Investment Advisory Contracts (Unaudited), continued
SSGA Emerging Markets Fund. The Board considered that the Fund’s actual management fee was below the medians of its Expense Group and Expense Universe. The Board also considered that the Fund’s total expenses were below the medians of its Expense Group and Expense Universe.
SSGA International Stock Selection Fund. The Board considered that the Fund’s actual management fee was below the medians of its Expense Group and Expense Universe. The Board also considered that the Fund’s total expenses were below the medians of its Expense Group and Expense Universe.
On the basis of the foregoing and other relevant information, and in light of the nature, extent and quality of the services provided by the Adviser, the Board concluded that the fees and the expense ratio of each Fund compare favorably to the fees and expenses of similar mutual funds and are reasonable in relation to the services provided.
Profitability
The Board reviewed the level of profits realized by the Adviser and its affiliates in providing investment advisory and other services to each Fund and to all Funds as a group. The Board considered other direct and indirect benefits received by the Adviser and the Affiliated Service Providers in connection with their relationships with the Funds, including the benefits of research services that may be available to the Adviser as a result of securities transactions effected for the Funds and other investment advisory clients, together with the ranges of profitability of each of the Affiliated Service Providers with respect to their services to the Funds.
The Board concluded that the profitability of the Adviser with respect to each of the Funds, and the profitability range of each of the Affiliated Service Providers with respect to its services to the Funds, were reasonable in relation to the services provided.
In considering the profitability to the Sub-Adviser in connection with its relationship to the applicable Fund, the Board noted that the fees under the Sub-Advisory Agreement are paid by the Adviser out of the advisory fees that the Adviser receives under the Advisory Agreement. The Board also relied on the ability of the Adviser to negotiate the Sub-Advisory Agreement and the fees thereunder at arm’s length. For these reasons, the Board determined that the profitability to the Sub-Adviser from its relationship with the applicable Fund was not a material factor in their deliberations with respect to consideration of approval of the Sub-Advisory Agreement.
Economies of Scale
In reviewing management fees and profitability, the Board also considered the extent to which the Adviser and its affiliates, on the one hand, and each Fund and all Funds as a group, on the other hand, can expect to realize benefits from economies of scale as the assets of the Funds increase. The Board acknowledged the difficulty in accurately measuring the benefits resulting from the economies of scale with respect to the management of any specific Fund or the Funds taken as a whole. The Board concluded that, in light of the current size of each Fund and all Funds as a group, the level of profitability of the Adviser and its affiliates with respect to each Fund and all Funds as a group over various time periods, and the comparatively low management fee and expense ratio of each Fund during these periods, it does not appear that the Adviser or its affiliates has realized benefits from economies of scale in managing the assets of the Funds to such an extent that previously agreed advisory fees should be reduced or that breakpoints in such fees should be implemented for any Fund at this time. For similar reasons as stated above with respect to the Sub-Adviser’s profitability, the Board concluded that the potential for economies of scale in the Sub-Adviser’s management of the applicable Fund is not a material factor to the approval of the Sub-Advisory Agreement.
Conclusions
In reaching its decision to approve the Advisory Agreements, the Board did not identify any single factor as being controlling, but based its recommendation on each of the factors it considered. Each Trustee may have contributed different weight to the various factors. Based upon the materials reviewed, the representations made and the considerations described above, and as part of its deliberations, the Board, including the Independent Trustees, concluded that the Adviser and the Sub-Adviser possess the capability and resources to perform the duties required of them under the respective Advisory Agreements.
Further, based upon its review of the Advisory Agreements, the materials provided, and the considerations described above, the Board, including the Independent Trustees, concluded that (1) the terms of the Advisory Agreements are reasonable, fair, and in the best interests of each Fund and its respective shareholders, and (2) the rates payable under the Advisory Agreements are fair and reasonable in light of the usual and customary charges made for services of the same nature and quality.
| | | | |
| Basis for Approval of Investment Advisory Contracts | | | 105 | |
SSGA Funds
Shareholder Requests for Additional Information — August 31, 2015 (Unaudited)
Proxy Voting Policies and Procedures and Record
The Funds have adopted the proxy voting policies of the Adviser. A description of the policies and procedures that the Funds have adopted to determine how to vote proxies relating to portfolio securities are contained in the Funds’ Statement of Additional Information, which is available (i) without charge, upon request, by calling the Funds at (800) 647-7327, (ii) on the Funds’ website at www.SSGAfunds.com, (iii) on the U.S. Securities and Exchange Commission’s website at www.sec.gov, or (iv) at the U.S. Securities and Exchange Commission’s public reference room. Information on the operation of the public reference room may be obtained by calling 1-800-SEC-0330. Information regarding how the Funds voted proxies, if any, during the most recent 12-month period ended June 30 is available by August 31 of each year without charge (1) by calling 1-800-997-7327 (toll free), or (2) on the website of the Securities and Exchange Commission (“SEC”) at www.sec.gov.
Quarterly Portfolio Schedule
The Funds will file their complete schedules of investments with the U.S. Securities and Exchange Commission for the first and third quarters of each fiscal year on Form N-Q. For the second and fourth quarters, the complete schedules of investments are available in the Funds’ semi-annual and annual financial statements. The Funds’ Form N-Q is available (i) without charge, upon request, by calling the Funds at (800) 647-7327, (ii) on the Funds’ website at www.SSGAfunds.com, (iii) on the Securities and Exchange Commission’s website at www.sec.gov, or (iv) at the Securities and Exchange Commission’s public reference room. Information on the operation of the public reference room may be obtained by calling 1-800-SEC-0330.
| | |
| 106 | | Shareholder Requests for Additional Information |
SSGA Funds
Disclosure of Information about Fund Trustees and Officers —
August 31, 2015 (Unaudited)
| | | | | | | | | | | | |
Name, Address, and Year of Birth(1) | | Position(s) Held with Trust(1) | | Term of Office and Length of Time Served(1) | | Principal Occupation During Past Five Years(1) | | Number of Funds
in Fund Complex Overseen by Trustee(1) | | | Other Directorships Held by Trustee During Past Five Years(1) |
INDEPENDENT TRUSTEES |
Michael F. Holland State Street Bank and Trust Company 100 Huntington Avenue, CPH 0326 Boston, MA 02116 YOB: 1944 | | Trustee and Co-Chairman of the Board | | Term: Indefinite Elected: 1/14 | | Chairman, Holland & Company L.L.C. (investment adviser) (1995 – present). | | | 71 | | | Trustee and Co-Chairman, State Street Master Funds; Trustee and Co-Chairman, State Street Institutional Investment Trust; Director, the Holland Series Fund, Inc.; Director, The China Fund, Inc.; Director, The Taiwan Fund, Inc.; Director, Reaves Utility Income Fund, Inc.; and Director, Blackstone/GSO Loan Funds. |
| | | | | | | | | | | | | |
Patrick J. Riley State Street Bank and Trust Company 100 Huntington Avenue, CPH 0326 Boston, MA 02116 YOB: 1948 | | Trustee and Co-Chairman of the Board | | Term: Indefinite Elected: 1988 | | 2002 to May 2010, Associate Justice of the Superior Court, Commonwealth of Massachusetts; 1985 to 2002, Partner, Riley, Burke & Donahue, L.L.P. (law firm); 1998 to Present, Independent Director, State Street Global Advisers Ireland, Ltd. (investment company); 1998 to Present, Independent Director, SSGA Liquidity plc (formerly, SSGA Cash Management Fund plc); January 2009 to Present, Independent Director, SSGA Fixed Income plc; and January 2009 to Present, Independent Director, SSGA Qualified Funds PLC. | | | 71 | | | Trustee and Co-Chairman, State Street Master Funds; Trustee and Co-Chairman, State Street Institutional Investment Trust; Board Director and Chairman, SPDR Europe 1PLC Board (2011 – Present); Board Director and Chairman, SPDR Europe II, PLC (2013- Present). |
| | | | | | | | | | | | | |
William L. Boyan State Street Bank and Trust Company 100 Huntington Avenue, CPH 0326 Boston, MA 02116 YOB: 1937 | | Trustee and Co-Chairman of the Valuation Committee | | Term: Indefinite Elected: 1/14 | | President and Chief Operations Officer, John Hancock Financial Services (1959 – 1999). Mr. Boyan retired in 1999. Chairman Emeritus, Children’s Hospital, Boston, MA (1984 – 2011); Former Trustee of Old Mutual South Africa Master Trust (investments) (1995 – 2008); Former Chairman, Boston Plan For Excellence, Boston Public Schools (1995 – 2010); Member of Advisory Board of Florida Atlantic University Lifelong Learning Society; Trustee, Children’s Hospital, Boston, MA. | | | 71 | | | Trustee, State Street Master Funds; Trustee, State Street Institutional Investment Trust; Former Trustee of Old Mutual South Africa Master Trust. |
| | | | |
| Disclosure of Information about Fund Trustees and Officers | | | 107 | |
SSGA Funds
Disclosure of Information about Fund Trustees and Officers, continued —
August 31, 2015 (Unaudited)
| | | | | | | | | | | | |
Name, Address, and Year of Birth(1) | | Position(s) Held with Trust(1) | | Term of Office and Length of Time Served(1) | | Principal Occupation During Past Five Years(1) | | Number of Funds
in Fund Complex Overseen by Trustee(1) | | | Other Directorships Held by Trustee During Past Five Years(1) |
INDEPENDENT TRUSTEES (continued) | | | | | | | | |
William L. Marshall State Street Bank and Trust Company 100 Huntington Avenue, CPH 0326 Boston, MA 02116 YOB: 1942 | | Trustee and Co-Chairman of the Audit Committee | | Term: Indefinite Elected: 1988 | | April 2011 to Present, Chairman (until April 2011, Chief Executive Officer and President), Wm. L. Marshall Associates, Inc., Wm. L. Marshall Companies, Inc. and the Marshall Financial Group, Inc. (a registered investment adviser and provider of financial and related consulting services); Certified Financial Planner; Member, Financial Planners Association; Director, (2008-2014) Doylestown Health Foundation Board; and the Ann Silverman Community Clinic of Doylestown, PA. | | | 71 | | | Trustee, State Street Master Funds; Trustee, State Street Institutional Investment Trust; Director, Marshall Financial Group, Inc. |
| | | | | | | | | | | | | |
Richard D. Shirk State Street Bank and Trust Company 100 Huntington Avenue, CPH 0326 Boston, MA 02116 YOB: 1945 | | Trustee and Co-Chairman of the Qualified Legal and Compliance Committee | | Term: Indefinite Elected: 1988 | | March 2001 to April 2002, Chairman (1996 to March 2001, President and Chief Executive Officer), Cerulean Companies, Inc. (holding company) (Retired); 1992 to March 2001, President and Chief Executive Officer, Blue Cross Blue Shield of Georgia (health insurer, managed healthcare); 1998 to December 2008, Chairman, Board Member and December 2008 to Present, Investment Committee Member, Healthcare Georgia Foundation (private foundation); September 2002 to 2012, Lead Director and Board Member, Amerigroup Corp. (managed health care); 1999 to 2013: Board Member and (since 2001) Investment Committee Member, Woodruff Arts Center; and 2003 to 2009, Trustee, Gettysburg College. | | | 71 | | | Trustee, State Street Master Funds; Trustee, State Street Institutional Investment Trust; Board member, AeroCare Holdings (privately held healthcare services company) (February 2003 – Present); Board member, Regenesis Biomedical (health care services) (April 2012 – Present). |
| | | | | | | | | | | | | |
Rina K. Spence State Street Bank and Trust Company 100 Huntington Avenue, CPH 0326 Boston, MA 02116 YOB: 1948 | | Trustee and Co-Chairman of the Qualified Legal and Compliance Committee and Co-Chairman of the Governance Committee | | Term: Indefinite Elected: 1/14 | | President of SpenceCare International LLC (international healthcare consulting) (1999 – present); Chief Executive Officer, IEmily.com (health internet company) (2000 – 2001); Chief Executive Officer of Consensus Pharmaceutical, Inc. (1998 – 1999); Founder, President and Chief Executive Officer of Spence Center for Women’s Health (1994 – 1998); President and CEO Emerson Hospital (1984 – 1994); Trustee, Eastern Enterprise (utilities) (1988 – 2000); Director, Berkshire Life Insurance Company of America (1993 – 2009); Director, IEmily.com, Inc. (2000 – 2010); and Trustee, National Osteoporosis Foundation (2005 – 2008). | | | 71 | | | Trustee, State Street Master Funds; Trustee, State Street Institutional Investment Trust. |
| | |
| 108 | | Disclosure of Information about Fund Trustees and Officers |
SSGA Funds
Disclosure of Information about Fund Trustees and Officers, continued —
August 31, 2015 (Unaudited)
| | | | | | | | | | | | |
Name, Address, and Year of Birth(1) | | Position(s) Held with Trust(1) | | Term of Office and Length of Time Served(1) | | Principal Occupation During Past Five Years(1) | | Number of Funds
in Fund Complex Overseen by Trustee(1) | | | Other Directorships Held by Trustee During Past Five Years(1) |
INDEPENDENT TRUSTEES (continued) | | | | | | | | |
Bruce D. Taber State Street Bank and Trust Company 100 Huntington Avenue, CPH 0326 Boston, MA 02116 YOB: 1943 | | Trustee and Co-Chairman of the Valuation Committee and Co-Chairman of the Governance Committee | | Term: Indefinite Elected: 1991 | | 1999 to Present, Partner, Zenergy LLC (a technology company providing Computer Modeling and System Analysis to the General Electric Power Generation Division); Until December 2008, Independent Director, SSGA Cash Management Fund plc; Until December 2008, Independent Director, State Street Global Advisers Ireland, Ltd. (investment companies); and Until August 1994, President, Alonzo B. Reed, Inc., (a Boston architect-engineering firm). | | | 71 | | | Trustee, State Street Master Funds; Trustee, State Street Institutional Investment Trust. |
| | | | | | | | | | | | | |
Douglas T. Williams State Street Bank and Trust Company 100 Huntington Avenue, CPH 0326 Boston, MA 02116 YOB: 1940 | | Trustee and Co-Chairman of the Audit Committee | | Term: Indefinite Elected: 1/14 | | President, Oakmont Homeowners Association; President, Mariner Sands Chapel; Executive Vice President and member of Executive Committee, Chase Manhattan Bank (1987 – 1999); President, Boston Stock Exchange Depository Trust Company, 1981 – 1982; Treasurer, Nantucket Educational Trust, (2002 – 2007). | | | 71 | | | Trustee, State Street Master Funds; Trustee, State Street Institutional Investment Trust. |
INTERESTED TRUSTEES(2) |
Gregory A. Ehret SSGA Funds Management, Inc. State Street Financial Center One Lincoln Street Boston, MA 02111-2900 YOB: 1969 | | Trustee | | Term: Indefinite Elected Trustee: 8/15 | | President and Global Chief Operating Officer State Street Global Advisors (2012 – Present); Head of Europe, the Middle East, and Africa, State Street Global Advisors (2008 – 2012); Head of Sales and Distribution in Europe, the Middle East, and Africa, State Street Global Advisors (2007 – 2008). | | | 71 | | | Trustee, State Street Master Funds; Trustee, State Street Institutional Investment Trust. |
| | | | | | | | | | | | | |
James E. Ross SSGA Funds Management, Inc. State Street Financial Center One Lincoln Street Boston, MA 02111-2900 YOB: 1965 | | Trustee | | Term: Indefinite Elected Trustee: 1/14 | | Chairman and Director, SSGA Funds Management, Inc. (2012 – present); President, SSGA Funds Management, Inc. (2005 – 2012); Executive Vice President and Senior Managing Director, State Street Global Advisors (2006 – present); and Principal, State Street Global Advisors (2006 – present). | | | 268 | | | Trustee, State Street Master Funds; Trustee, State Street Institutional Investment Trust; Trustee, SPDR Series Trust; Trustee, SPDR Index Shares Funds; Trustee, Select Sector SPDR Trust; Trustee, SSGA Active Trust; and Trustee, SSGA Master Trust. |
| (1) | | As of October 12, 2015. |
| (2) | | Mr. Ehret and Mr. Ross are Interested Trustees because of their employment by SSGA Funds Management, Inc., an affiliate of the Trust. |
| | | | |
| Disclosure of Information about Fund Trustees and Officers | | | 109 | |
SSGA Funds
Disclosure of Information about Fund Trustees and Officers, continued —
August 31, 2015 (Unaudited)
The following lists the principal officers for SSGA Funds and the State Street Master Funds, as well as their mailing addresses and ages, positions with the Trusts and length of time served, and present and principal occupations:
| | | | | | |
Name, Address, and Year of Birth | | Position(s)
Held with Trust | | Term of Office
and Length of Time Served | | Principal
Occupation During
Past Five Years |
OFFICERS: | | | | | | |
Ellen M. Needham SSGA Funds Management, Inc. State Street Financial Center One Lincoln Street Boston, MA 02111-2900 YOB: 1967 | | President | | Term: Indefinite Elected: 10/12 | | President and Director, SSGA Funds Management, Inc. (June 2012 – present); Chief Operating Officer, SSGA Funds Management, Inc. (May 2010 – June 2012); Senior Managing Director, SSGA Funds Management, Inc. (1992 – 2012) and Senior Managing Director, State Street Global Advisors (1992 – present).* |
| | | | | | | |
Ann M. Carpenter SSGA Funds Management, Inc. State Street Financial Center One Lincoln Street Boston, MA 02111-2900 YOB: 1966 | | Vice President Assistant Treasurer | | Term: Indefinite Elected: 10/12 Term: Indefinite Elected: 4/15 | | Chief Operating Officer, SSGA Funds Management, Inc. (April 2014 – present); Vice President, SSGA Funds Management, Inc. (2008 – present); Principal, State Street Global Advisors (2005 – 2008 – present).* |
| | | | | | | |
Chad C. Hallett SSGA Funds Management, Inc. State Street Financial Center One Lincoln Street Boston, MA 02111 YOB: 1969 | | Treasurer | | Term: Indefinite Elected: 4/15 | | Vice President, State Street Global Advisors and SSGA Funds Management, Inc. (November 2014 – present); Vice President, State Street Bank and Trust Company (2001 – November 2014).* |
| | | | | | | |
Brian Harris SSGA Funds Management, Inc. State Street Financial Center One Lincoln Street Boston, MA 02111 YOB: 1973 | | Chief Compliance Officer | | Term: Indefinite Elected: 11/13 | | Vice President, State Street Global Advisors and SSGA Funds Management, Inc. ( June 2013 – Present); Senior Vice President and Global Head of Investment Compliance, BofA Global Capital Management (September 2010 to May 2013); Director of Compliance, AARP Financial Inc. (July 2008 to August 2010). |
| | | | | | | |
Joshua A. Weinberg SSGA Funds Management, Inc. State Street Financial Center One Lincoln Street Boston, MA 02111-2900 YOB: 1978 | | Chief Legal Officer | | Term: Indefinite Elected: 2/15 | | Vice President and Managing Counsel, State Street Global Advisors (2011 – present); Clerk, SSGA Funds Management, Inc. (2013 – present); Associate, Financial Services Group, Dechert LLP (2006 – 2011). |
| | | | | | | |
David K. James State Street Bank and Trust Company 100 Huntington Avenue, 3rd Floor Boston, MA 02116 YOB: 1970 | | Secretary | | Term: Indefinite Elected: 4/13 | | Managing Director and Managing Counsel, State Street Bank and Trust Company (2009 – present); Vice President and Counsel, PNC Global Investment Servicing (US), Inc. (2006 – 2009). |
| | | | | | | |
Kristin Schantz State Street Bank and Trust Company 100 Huntington Avenue, 3rd Floor Boston, MA 02116 YOB: 1979 | | Assistant Secretary | | Term: Indefinite Elected: 2/14 | | Vice President and Senior Counsel, State Street Bank and Trust Company (2013 – present); Vice President, Citi Fund Services Ohio, Inc. (2008 – 2013). |
| * | Served in various capacities and/or with various affiliated entities during noted time period. |
The Statement of Additional Information includes additional information about the Trustees and is available, without charge, upon request, by calling (toll free) 800-977-7327.
| | |
| 110 | | Disclosure of Information about Fund Trustees and Officers |
SSGA Funds
State Street Financial Center
One Lincoln Street
Boston, Massachusetts 02111-2900
(800) 647-7327
Trustees
William L. Boyan
Gregory A. Ehret
Michael F. Holland
William L. Marshall
Patrick J. Riley
James E. Ross
Richard D. Shirk
Rina K. Spence
Bruce D. Taber
Douglas T. Williams
Officers
Ellen M. Needham, President and Principal Executive Officer
Chad C. Hallett, Treasurer and Principal Accounting Officer
Ann M. Carpenter, Vice President and Assistant Treasurer
Brian Harris, Chief Compliance Officer
David James, Secretary
Joshua A. Weinberg, Chief Legal Officer
Kristin M. Schantz, Assistant Secretary
Investment Adviser and Administrator
SSGA Funds Management, Inc.
State Street Financial Center
One Lincoln Street
Boston, Massachusetts 02111-2900
Investment Sub-Adviser
CBRE Clarion Securities, LLC
201 King of Prussia Road, Suite 600
Radnor, Pennsylvania 19087
Custodian and Office of Shareholder Inquiries
State Street Bank and Trust Company
1776 Heritage Drive
North Quincy, Massachusetts 02171
Transfer and Dividend Paying Agent
Boston Financial Data Services, Inc.
2000 Crown Colony Drive
Quincy, Massachusetts 02169
Distributor
State Street Global Markets, LLC
State Street Financial Center
One Lincoln Street
Boston, Massachusetts 02111-2900
Sub-Administrator
State Street Bank and Trust Company
State Street Financial Center
One Lincoln Street
Boston, Massachusetts 02111-2900
Legal Counsel
Ropes & Gray LLP
800 Boylston Street
Boston, Massachusetts 02199
Independent Registered Public Accounting Firm
Ernst & Young LLP
200 Clarendon Street
Boston, Massachusetts 02116
Distributor: State Street Global Markets, LLC, member FINRA, SIPC, a wholly owned subsidiary of State Street Corporation. References to State Street may include State Street Corporation and its affiliates. The SSGA Funds pay State Street Bank and Trust Company for its services as sub-administrator, custodian, transfer agent and shareholder servicing agent and pays SSGA Funds Management, Inc. for investment advisory and administrator services.
This information must be preceded or accompanied by a current prospectus or summary prospectus. Read the prospectus carefully before you invest or send money.
| | | | |
| Fund Management and Service Providers | | | 111 | |
Annual Report
31 August 2015
SSGA Funds
SSGA S&P 500 Index Fund

SSGA Funds
SSGA S&P 500 Index Fund
Annual Report
August 31, 2015
Table of Contents
“SSGA” is a registered trademark of State Street Corporation and is licensed for use by the SSGA Funds.
This report is prepared from the books and records of the Funds and it is submitted for the general information of shareholders. This information is for distribution to prospective investors only when preceded or accompanied by a SSGA Funds Prospectus containing more complete information concerning the investment objectives and operations of the Funds, charges and expenses. The Prospectus should be read carefully before an investment is made.
Performance quoted represents past performance and past performance does not guarantee future results. Current performance may be higher or lower than the performance quoted. For the most recent month end performance information, visit www.ssgafunds.com. Investment in the Funds poses investment risks, including the possible loss of principal. The investment return and principal value of an investment will fluctuate so that shares, when redeemed, may be worth more or less than their original cost.
SSGA S&P 500 Index Fund
Portfolio Management Discussion and Analysis — August 31, 2015 (Unaudited)
Objective: The Fund seeks to replicate as closely as possible, before expenses, the performance of the Standard & Poor’s® 500 Index.
Invests in: State Street Equity 500 Index Portfolio (the “Portfolio”).
Strategy: The Portfolio’s holdings are generally comprised of the 500 stocks in the S&P 500® Index. The Index is designed to capture the price performance of a large cross-section of the US publicly traded stock market.
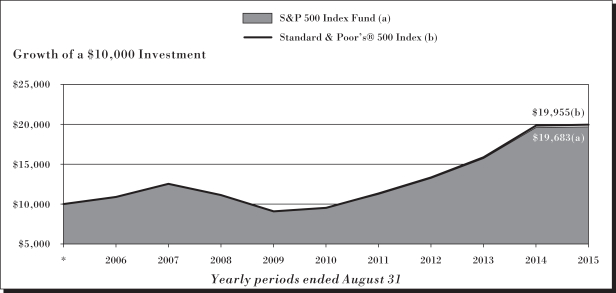
| | | | | | |
| S&P 500 Index Fund | |
| | |
Period Ended
08/31/2015 | | | | Total
Return | |
1 Year | | | | | 0.36 | % |
5 Years | | | | | 15.72 | %+ |
10 Years | | | | | 7.01 | %+ |
| | | | | | |
| Standard & Poor’s® 500 Index# | |
| | |
Period Ended
08/31/2015 | | | | Total
Return | |
1 Year | | | | | 0.48 | % |
5 Years | | | | | 15.87 | %+ |
10 Years | | | | | 7.15 | %+ |
Performance quoted represents past performance, which is no guarantee of future results. Investment return and principal value will fluctuate, so you may have a gain or loss when shares are sold. Current performance may be higher or lower than that quoted. Visit www.ssgafunds.com for most recent month-end performance. The returns do not reflect the deduction of taxes that a shareholder would pay on Fund distributions or on the redemption of Fund shares. The gross expense ratio for the S&P 500 Index Fund as stated in the Fees and Expenses table of the prospectus dated December 18, 2014 (as amended September 4, 2015) is 0.157%.
See related Notes on following page.
| | |
| 2 | | SSGA S&P 500 Index Fund |
SSGA S&P 500 Index Fund
Portfolio Management Discussion and Analysis, continued — August 31, 2015 (Unaudited)
SSGA S&P 500 Index Fund (the “Fund”) seeks to replicate as closely as possible, before expenses, the performance of the Standard & Poor’s® 500 Index (the “Index”).
For the 12-month period ended August 31, 2015 (the “Reporting Period”), the total return for the Fund was 0.36%, and the total return for the Index was 0.48%. The Fund and Index returns reflect the reinvestment of dividends and other income. The Fund’s performance reflects the expenses of managing the Fund, including brokerage and advisory expenses. The Index is unmanaged and Index returns do not reflect fees and expenses of any kind, which would have a negative impact on returns.
The Fund’s performance relative to the Index during the Reporting Period was within expectations. The Fund lagged behind the performance of the Index, due to management fees and expenses, as well as a small cash drag and transaction costs from participant cash flows.
With marked periods of volatility throughout the Reporting Period, the Fund posted a slightly positive return for the Reporting Period. Performance started strongly in the summer of 2014. The Dow Jones Industrial Average exceeded 17,000 for the first time, as stocks responded favorably to July’s strong US non-farm payroll report. However, the optimism was short-lived, due to the resumption of fighting in Gaza between the Israeli army and Hamas, and renewed fears about the banking sector in Europe, particularly in Greece. Positive earnings news from the US provided some relief from the gloom, as did Fed Chair Janet Yellen’s upbeat view on the economy in testimony before the US Senate. The year 2015 began with a flurry of global central bank policy moves in response to an uneven global growth outlook, rapidly declining global inflation, and a major anticipated expansion of quantitative easing by the European Central Bank. With oil prices weak, many started to wonder if the Federal Reserve was really prepared to start raising interest rates. However, as widely expected, the Fed removed the word “patient” from its March 18 post-meeting statement, which many observers believed set the stage for a potential hike in rates. The Fed was also careful to say that a lack of “patience” did not mean that a rate hike was imminent. While stock markets rallied on this news, shares experienced pressure again in August 2015, as concerns over the Chinese economy weighed heavily on global markets.
The Fund invested in S&P 500 futures contracts to equitize the small amount of cash in the portfolio during the Reporting Period. Futures performance did not have a material impact on portfolio performance.
On an individual security level, the top positive contributors to the Fund’s performance were Apple, Inc., Amazon.com, Inc., and Visa, Inc. The top negative contributors to the Fund’s performance were Exxon Mobil Corp., Chevron Corp., and IBM Corp.
The views expressed above reflect those of the Fund’s portfolio manager only through the Reporting Period, and do not necessarily represent the views of the Adviser as a whole. Any such views are subject to change at any time based upon market or other conditions and the Adviser disclaims any responsibility to update such views. These views may not be relied on as investment advice and, because investment decisions for a fund are based on numerous factors, may not be relied on as an indication of trading intent on behalf of any fund.
Notes: The following notes relate to the Growth of $10,000 graph and tables on the preceding page.
| * | Assumes initial investment on September 1, 2005. |
| # | The Standard & Poor’s® 500 Composite Stock Index is composed of 500 common stocks which are chosen by Standard & Poor’s Corporation to best capture the price performance of a large cross-section of the US publicly traded stock market. The Index is structured to approximate the general distribution of industries in the US economy. |
“Standard & Poor’s®”, “S&P®”, “S&P 500®”, “Standard & Poor’s 500” and “500” are trademarks of Standard & Poor’s Corporation and have been licensed for use by The SSGA Fund. The Product is not sponsored, endorsed, sold or promoted by Standard & Poor’s, and Standard & Poor’s makes no representation regarding the advisability of investing in the Product.
Performance data reflects an expense limitation currently in effect, without which returns would have been lower.
| | | | |
| SSGA S&P 500 Index Fund | | | 3 | |
SSGA S&P 500 Index Fund
Shareholder Expense Example — August 31, 2015 (Unaudited)
Fund Expenses
The following disclosure provides important information regarding the Fund’s Expense Example. Please refer to this information when reviewing the Expense Example of the Fund.
Example
As a shareholder of the Fund, you incur two types of costs: (1) transaction costs, and (2) ongoing costs, including advisory and administration fees; distribution (12b-1) and/or service fees; and other Fund expenses. The Example is intended to help you understand your ongoing costs (in dollars) of investing in the Fund and to compare these costs with the ongoing costs of investing in other mutual funds. The Example is based on an investment of $1,000 invested at the beginning of the period and held for the entire period indicated, which for this Fund is from March 1, 2015 to August 31, 2015.
Actual Expenses
The information in the table under the heading “Actual Performance” provides information about actual account values and actual expenses. You may use the information in this column, together with the amount you invested, to estimate the expenses that you paid over the period. Simply divide your account value by $1,000 (for example, an $8,600 account value divided by $1,000 = 8.6), then multiply the result by the number in the first column in the row entitled “Expenses Paid During Period” to estimate the expenses you paid on your account during this period.
Hypothetical Example for Comparison Purposes
The information in the table under the heading “Hypothetical Performance (5% return before expenses)” provides information about hypothetical account values and hypothetical expenses based on the Fund’s actual expense ratio and an assumed rate of return of 5% per year before expenses, which is not the Fund’s actual return. The hypothetical account values and expenses may not be used to estimate the actual ending account balance or expenses you paid for the period. You may use this information to compare the ongoing costs of investing in the Fund and other funds. To do so, compare this 5% hypothetical example with the 5% hypothetical examples that appear in the shareholder reports of other funds.
Please note that the expenses shown in the table are meant to highlight your ongoing costs only and do not reflect any transaction costs. Therefore, the information under the heading “Hypothetical Performance (5% return before expenses)” is useful in comparing ongoing costs only, and will not help you determine the relative total costs of owning different funds. In addition, if these transaction costs were included, your costs would have been higher.
| | | | | | | | |
| | | Actual
Performance | | | Hypothetical
Performance
(5% return
before expenses)* | |
Beginning Account Value | | | | | | | | |
March 1, 2015 | | $ | 1,000.00 | | | $ | 1,000.00 | |
Ending Account Value | | | | | | | | |
August 31, 2015 | | $ | 946.40 | | | $ | 1,024.39 | |
Expenses Paid During Period | | $ | 0.78 | | | $ | 0.82 | |
| * | Expenses are equal to the Fund’s annualized expense ratio of 0.16% (representing the six month period annualized), multiplied by the average account value over the period, multiplied by 184/365 (to reflect the one-half year period). Includes amounts waived, reimbursed and/or other credits and the Fund’s proportionate share of the expenses of the Portfolio. Without the waiver, reimbursement and/or other credits, expenses would have been higher. |
| | |
| 4 | | SSGA S&P 500 Index Fund |
SSGA S&P 500 Index Fund
Presentation of Portfolio Holdings — August 31, 2015 (Unaudited)
| | | | |
| Categories | | % of
Master
Portfolio
Net
Assets | |
| | | | |
Common Stock | | | | |
Consumer Discretionary | | | 12.6 | |
Consumer Staples | | | 9.5 | |
Energy | | | 7.1 | |
Financials | | | 16.1 | |
Health Care | | | 14.9 | |
Industrials | | | 9.8 | |
Information Technology | | | 19.7 | |
Materials | | | 2.9 | |
Telecommunication Services | | | 2.4 | |
Utilities | | | 2.9 | |
U.S. Government Securities | | | 0.2 | |
Money Market Fund | | | 1.4 | |
| | | | |
Total Investments | | | 99.5 | |
Other Assets and Liabilities, Net | | | 0.5 | |
| | | | |
| | | 100.0 | |
| | | | |
Futures Contracts | | | (0.9 | ) |
See accompanying notes which are an integral part of the financial statements.
| | | | |
| SSGA S&P 500 Index Fund | | | 5 | |
SSGA S&P 500 Index Fund
Statement of Assets and Liabilities — August 31, 2015
| | | | |
| | | | |
| | | | |
Assets | | | | |
Investment in Portfolio, at value | | $ | 1,535,107,019 | |
Receivables: | | | | |
Fund shares sold | | | 2,640,377 | |
From adviser | | | 13,775 | |
Prepaid expenses | | | 16,395 | |
| | | | |
Total assets | | | 1,537,777,566 | |
| | | | |
| |
Liabilities | | | | |
Payables: | | | | |
Fund shares redeemed | | | 5,513,109 | |
Accrued fees to affiliates and trustees | | | 161,882 | |
Other accrued expenses | | | 53,205 | |
| | | | |
Total liabilities | | | 5,278,196 | |
| | | | |
| | | | |
Net Assets | | $ | 1,532,049,370 | |
| | | | |
| |
Net Assets Consist of: | | | | |
Undistributed net investment income | | $ | 6,944,457 | |
Accumulated net realized loss allocated from Master Portfolio | | | (49,591,204 | ) |
Unrealized appreciation (depreciation) allocated from Master Portfolio on: | | | | |
Investments | | | 978,538,320 | |
Futures contracts | | | (628,395 | ) |
Paid in capital | | | 596,786,192 | |
| | | | |
Net Assets | | $ | 1,532,049,370 | |
| | | | |
| |
Net Asset Value, offering and redemption price per share: | | | | |
Net asset value per share: | | $ | 31.40 | |
Net assets | | $ | 1,532,049,370 | |
Shares of beneficial interest outstanding ($0.001 par value) | | | 48,792,105 | |
See accompanying notes which are an integral part of the financial statements.
| | |
| 6 | | Statement of Assets and Liabilities |
SSGA S&P 500 Index Fund
Statement of Operations — For the Year Ended August 31, 2015
| | | | |
| | | | |
| | | | |
Investment Income Allocated From Master Portfolio | | | | |
Dividends (net of foreign taxes withheld of $92,609) | | $ | 32,230,452 | |
Interest | | | 33,994 | |
Expenses | | | (719,327 | ) |
| | | | |
Total investment income allocated from Master Portfolio | | | 31,545,119 | |
| | | | |
| |
Fund Level Expenses | | | | |
Administration fees | | | 371,202 | |
Custodian fees | | | 27,686 | |
Distribution fees | | | 585,745 | |
Transfer agent fees | | | 265,102 | |
Professional fees | | | 44,183 | |
Registration fees | | | 30,962 | |
Shareholder servicing fees | | | 391,530 | |
Trustees’ fees | | | 14,444 | |
Insurance fees | | | 19,810 | |
Printing fees | | | 84,166 | |
Miscellaneous | | | 14,147 | |
| | | | |
Expenses before reductions | | | 1,848,977 | |
Expense reductions | | | (41,097 | ) |
| | | | |
Net Fund Level expenses | | | 1,807,880 | |
| | | | |
Net investment income | | | 29,737,239 | |
| | | | |
| |
Net Realized and Unrealized Gain (Loss) Allocated From Master Portfolio | | | | |
Net realized gain on: | | | | |
Investments | | | 21,843,421 | |
Futures contracts | | | 2,690,169 | |
| | | | |
Net realized gain | | | 24,533,590 | |
| | | | |
Net change in unrealized depreciation on: | | | | |
Investments | | | (48,335,522 | ) |
Futures contracts | | | (2,743,406 | ) |
| | | | |
Net change in unrealized depreciation | | | (51,078,928 | ) |
| | | | |
Net realized and unrealized loss | | | (26,545,338 | ) |
| | | | |
Net Increase in Net Assets from Operations | | $ | 3,191,901 | |
| | | | |
See accompanying notes which are an integral part of the financial statements.
| | | | |
| Statement of Operations | | | 7 | |
SSGA S&P 500 Index Fund
Statements of Changes in Net Assets
| | | | | | | | |
| | | Year Ended
August 31, 2015 | | | Year Ended
August 31, 2014 | |
| | | | | | | | |
Increase (Decrease) in Net Assets | | | | | | | | |
| | |
Operations | | | | | | | | |
Net investment income | | $ | 29,737,239 | | | $ | 25,768,660 | |
Net realized gain | | | 24,533,590 | | | | 11,027,149 | |
Net change in unrealized appreciation (depreciation) | | | (51,078,928 | ) | | | 265,441,600 | |
| | | | | | | | |
Net increase in net assets from operations | | | 3,191,901 | | | | 302,237,409 | |
| | | | | | | | |
| | |
Distributions | | | | | | | | |
From net investment income | | | (28,788,517 | ) | | | (25,005,413 | ) |
From net realized gains | | | (17,743,354 | ) | | | (14,759,296 | ) |
| | | | | | | | |
Net decrease in net assets from distributions | | | (46,531,871 | ) | | | (39,764,709 | ) |
| | | | | | | | |
| | |
Share Transactions | | | | | | | | |
Net increase in net assets from share transactions (Note 4) | | | 66,815,858 | | | | 24,172,971 | |
| | | | | | | | |
Net Increase in Net Assets | | | 23,475,888 | | | | 286,645,671 | |
| | |
Net Assets | | | | | | | | |
Beginning of year | | | 1,508,573,482 | | | | 1,221,927,811 | |
| | | | | | | | |
| | |
End of year | | $ | 1,532,049,370 | | | $ | 1,508,573,482 | |
| | | | | | | | |
| | |
Undistributed net investment income included in net assets | | $ | 6,944,457 | | | $ | 6,464,047 | |
See accompanying notes which are an integral part of the financial statements.
| | |
| 8 | | Statements of Changes in Net Assets |
This page has been intentionally left blank.
SSGA S&P 500 Index Fund
Financial Highlights
Selected data for a share of beneficial interest outstanding throughout each year is presented below. The per share amounts and percentages include the Fund’s proportionate share of income and expenses of the Portfolio.
| | | | | | | | | | | | | | | | | | | | | | | | |
| | |
$
Net Asset Value,
Beginning of
Year | | | $
Net
Investment
Income (Loss)(a) | | | $
Net Realized
and Unrealized
Gain (Loss) | | | $
Total from
Investment
Operations | | | $
Distributions
from Net
Investment Income | | | $
Distributions
from Net
Realized Gains | |
August 31, 2015 | | | 32.23 | | | | 0.61 | (b) | | | (0.46 | ) | | | 0.15 | | | | (0.60 | ) | | | (0.38 | ) |
August 31, 2014 | | | 26.57 | | | | 0.56 | | | | 5.96 | | | | 6.52 | | | | (0.54 | ) | | | (0.32 | ) |
August 31, 2013 | | | 23.18 | | | | 0.52 | | | | 3.67 | | | | 4.19 | | | | (0.50 | ) | | | (0.30 | ) |
August 31, 2012 | | | 20.09 | | | | 0.47 | (c) | | | 3.09 | | | | 3.56 | | | | (0.47 | ) | | | — | |
August 31, 2011 | | | 17.31 | | | | 0.38 | (c) | | | 2.78 | | | | 3.16 | | | | (0.38 | ) | | | — | |
| (a) | | Average daily shares outstanding were used for this calculation. |
| (b) | | Reflects amounts waived by the administrator. |
| (c) | | Reflects amounts waived and/or reimbursed by the investment adviser. |
See accompanying notes which are an integral part of the financial statements.
| | | | | | | | | | | | | | | | | | | | | | | | | | | | | | |
$
Total
Distributions | | | $
Net Asset Value,
End of
Year | | | %
Total
Return | | | $
Net Assets,
End of Year
(000) | | | %
Ratio of Expenses
to Average
Net Assets,
Net | | | %
Ratio of Expenses
to Average
Net Assets,
Gross | | | %
Ratio of Net
Investment Income
to Average
Net Assets | | | %
Portfolio
Turnover Rate
of the Master
Portfolio(d) | |
| | (0.98 | ) | | | 31.40 | | | | 0.36 | | | | 1,532,049 | | | | 0.16 | (b) | | | 0.16 | | | | 1.88 | (b) | | | 2 | |
| | (0.86 | ) | | | 32.23 | | | | 24.98 | | | | 1,508,573 | | | | 0.15 | | | | 0.15 | | | | 1.88 | | | | 2 | |
| | (0.80 | ) | | | 26.57 | | | | 18.54 | | | | 1,221,928 | | | | 0.17 | | | | 0.17 | | | | 2.08 | | | | 2 | |
| | (0.47 | ) | | | 23.18 | | | | 18.00 | | | | 1,131,262 | | | | 0.18 | (c) | | | 0.19 | | | | 2.21 | (c) | | | 19 | |
| | (0.38 | ) | | | 20.09 | | | | 18.26 | | | | 1,126,485 | | | | 0.18 | (c) | | | 0.19 | | | | 1.82 | (c) | | | 2 | |
See accompanying notes which are an integral part of the financial statements.
SSGA S&P 500 Index Fund
Notes to Financial Statements — August 31, 2015
The SSGA Funds (the “Trust”) is registered under the Investment Company Act of 1940, as amended (the “1940 Act”), as an open-end management investment company, and was organized as a Massachusetts business trust on October 3, 1987. The Trust operates under a Second Amended and Restated Master Trust Agreement, dated May 15, 2012 (the “Agreement”).
As of August 31, 2015, the Trust consisted of eleven (11) series, and corresponding classes each of which have the same rights and privileges, including voting rights. The Declaration of Trust permits the Board of Trustees of the Trust (the “Board”) to authorize the issuance of an unlimited number of shares of beneficial interest at a $.001 par value. The financial statements herein relate to the following “diversified” Fund (the “Fund”):
| | | | |
| Fund | | Classes | | Commencement of Operations: |
| | | | |
SSGA S&P 500 Index Fund | | Class N | | December 30, 1992 |
The financial statements of the remaining (10) series are presented in separate reports.
The Fund seeks to achieve its investment objective by investing all of its assets in State Street Equity 500 Index Portfolio (the “Portfolio”), a separate series of the State Street Master Funds. The value of the Fund’s investment in the Portfolio, reflects the Fund’s proportionate interest in net assets of the Portfolio (54.86% at August 31, 2015). The Fund invests as part of a “master-feeder” structure and has the same or substantially similar investment objective as the Portfolio. The performance of the Fund is directly affected by the performance of the Portfolio. The financial statements of the Portfolio, including its Portfolio of Investments, are attached to this report and should be read in conjunction with the Fund’s financial statements.
Under the Trust’s organizational documents, its officers and trustees are indemnified against certain liabilities arising out of the performance of their duties to the Trust. Additionally, in the normal course of business, the Trust enters into contracts with service providers that contain general indemnification clauses. The Trust’s maximum exposure under these arrangements is unknown as this could involve future claims that may be made against the Trust that have not yet occurred.
Deloitte & Touche LLP (“Deloitte & Touche”) served as independent registered certified public accounting firm through November 19, 2014. On November 19, 2014, upon recommendation by the Audit Committee of the Fund, the Fund’s Board of Trustees selected Ernst & Young LLP to replace Deloitte & Touche as the independent public accountant for the fiscal year ending August 31, 2015.
The reports of Deloitte & Touche on the financial statements for the past two fiscal years contained no adverse opinion or disclaimer of opinion and were not qualified or modified as to uncertainty, audit scope or accounting principles.
During the two most recent fiscal years and through November 19, 2014, there have been no disagreements with Deloitte & Touche on any matter of accounting principles or practices, financial statement disclosure, or auditing scope or procedure, which disagreements if not resolved to the satisfaction of Deloitte & Touche would have caused them to make reference thereto in their reports on the financial statements for such years.
During the two most recent fiscal years and through, there have been no reportable events (as defined in Item 304(a)(1)(v) of Regulation S-K). The Fund requested and Deloitte & Touche furnished a letter addressed to the Securities and Exchange Commission stating whether or not it agreed with the above statements. A copy of such letter was filed as Exhibit 77 to Form N-SAR for the period.
| 2. | | Significant Accounting Policies |
The following is a summary of significant accounting policies followed by the Trust in the preparation of its financial statements:
The preparation of financial statements in accordance with U.S. generally accepted accounting principles (“U.S. GAAP”) which requires management to make estimates and assumptions that affect the reported amounts and disclosures in the financial statements. Actual results could differ from those estimates. The Fund is an investment company under U.S. GAAP and follows the accounting and reporting guidance applicable to investment companies in Financial Accounting Standards Board (“FASB”) Accounting Standards Codification (“ASC”) 946, Financial Services Investment Companies (“ASC 946”).
| | |
| 12 | | Notes to Financial Statements |
SSGA S&P 500 Index Fund
Notes to Financial Statements, continued — August 31, 2015
Security Valuation
The Fund records its investment in the Portfolio at fair value based on the Fund’s proportionate interest in the net assets of the Portfolio. The valuation policies of the Portfolio are discussed in Note 2 of the Portfolio’s Notes to Financial Statements, which are attached to this report.
Investment Transactions and Income Recognition
Investment transactions (contributions to and withdrawals from the Portfolio) are accounted for on trade date for financial reporting purposes. The Fund records daily its proportionate share of the Portfolio’s income, expenses and realized and unrealized gains and losses.
Expenses
Certain expenses, which are directly identifiable to a specific Fund, are applied to that Fund within the Trust. Other expenses which cannot be attributed to a specific Fund are allocated in such a manner as deemed equitable, taking into consideration the nature and type of expense and the relative net assets of the Funds in the Trust.
Distributions
Dividends and capital gain distributions, if any, are recorded on ex-date. The Fund declares and distributes dividends from net investment income, if any, quarterly. Capital gain distributions, if any, are generally declared and paid annually.
The amount and character of income and gains to be distributed are determined in accordance with federal tax regulations which may differ from net investment income and realized gains recognized for U.S. GAAP purposes.
Federal Income Taxes
The Fund has qualified and intends to continue to qualify for and elect treatment as a regulated investment company under Subchapter M of the Internal Revenue Code of 1986, as amended. By so qualifying and electing, the Fund will not be subject to federal income taxes to the extent it distributes its taxable income, including any net realized capital gains, for each fiscal year. In addition, by distributing during each calendar year substantially all of their net taxable income and capital gains, if any, the Fund will not be subject to federal excise tax. Income and capital gain distributions are determined in accordance with income tax regulations which may differ from U.S. GAAP.
At August 31, 2015, the cost of investments for U.S. federal income tax purposes was $633,953,667. Gross unrealized appreciation was $901,153,352 and gross unrealized depreciation was $0, resulting in net unrealized appreciation of $901,153,352.
The Fund has reviewed the tax positions for the open tax years as of August 31, 2015 and has determined that no provision for income tax is required in the Fund’s Financial Statements. The Fund’s federal tax returns for the prior three fiscal years remain subject to examination by the Fund’s major tax jurisdictions, which include the United States of America and the Commonwealth of Massachusetts. The Fund recognizes interest and penalties, if any, related to tax liabilities as income tax expense in the Statements of Operations.
No income tax returns are currently under examination. Management has analyzed tax laws and regulations and their applications to the Fund’s facts and circumstances and does not believe there are any uncertain tax positions that require recognition of tax liability.
Capital Loss Carryovers
At August 31, 2015, the Fund had no tax basis capital loss carryforwards.
| | | | |
| Notes to Financial Statements | | | 13 | |
SSGA S&P 500 Index Fund
Notes to Financial Statements, continued — August 31, 2015
For the year ended August 31, 2015, the Fund’s components of distributable earnings and tax composition of distributions for federal income tax purposes were as follows:
| | | | |
| | | S&P 500
Index Fund | |
| | | | |
Components of Distributable Earnings: | | | | |
Undistributed Ordinary Income | | $ | 6,944,457 | |
Accumulated Undistributed Long-Term Capital Gains | | $ | 26,377,699 | |
Post October Capital Loss Deferrals | | $ | (395,549 | ) |
| |
Tax Composition of Distributions: | | | | |
Ordinary Income | | $ | 33,156,505 | |
Long-Term Capital Gains | | $ | 13,375,366 | |
For the year ended August 31, 2014, the Fund’s tax composition of distributions for federal income tax purposes were as follows:
| | | | |
| | | S&P 500
Index Fund | |
| | | | |
| | | | |
Tax Composition of Distributions: | | | | |
Ordinary Income | | $ | 27,146,288 | |
Long-Term Capital Gains | | $ | 12,618,421 | |
| 3. | | Fees and Compensation paid to Affiliates and other Related Party Transactions |
Adviser and Affiliates
The Fund pays no fee directly to SSGA Funds Management, Inc. (the “Adviser” or “SSGA FM”) for so long as assets of the Fund are invested in the Portfolio. The Portfolio makes payments to the Adviser for the Adviser’s advisory and administration services and for State Street Bank and Trust Company’s custody and transfer agency services in the amount of 0.045% of average daily net assets on an annual basis, calculated daily and paid monthly. SSGA FM manages the Fund pursuant to an Amended and Restated Investment Advisory Agreement dated April 11, 2012, between the Trust and the Adviser. The Adviser is a wholly-owned subsidiary of State Street Corporation, a publicly held bank holding company. The Adviser and other advisory affiliates of State Street Corporation make up State Street Global Advisors, the investment management arm of State Street Corporation and its affiliated companies. The Adviser directs the investments of the Fund in accordance with its investment objectives, policies, and limitations.
The Adviser is contractually obligated until December 31, 2015 to waive its management fee and/or to reimburse the Fund for expenses to the extent that total expenses (exclusive of non-recurring account fees, extraordinary expenses, acquired fund fees and distribution, shareholder servicing, and sub-transfer agency fees) exceed 0.13% of average daily net assets on an annual basis. This waiver and/or reimbursement may not be terminated during the relevant period except with the approval of the Fund’s Board of Trustees. The Adviser did not reimburse the Fund for the period ended August 31, 2015. The Adviser does not have the ability to recover these amounts waived or reimbursed under this contractual agreement.
Boston Financial Data Services, Inc. (“BFDS”), a joint venture of DST Systems, Inc. and State Street Corporation, serves as the Fund’s transfer and dividend paying agent, pursuant to an agreement dated August 1, 2006, as amended. For these services, the Fund pays annual account services fees, activity based fees, charges related to compliance and regulatory services.
State Street Bank and Trust Company (“State Street”) provides custody and fund accounting services to the Fund pursuant to an Amended and Restated Custodian Contract dated April 11, 2012. For these services, the Fund pays State Street asset-based fees that vary according to the number of positions and transactions plus out-of-pocket expenses. State Street is a wholly-owned subsidiary of State Street Corporation.
Administrator and Sub-Administrator
Effective June 1, 2015, SSGA FM serves as Administrator and State Street serves as Sub-Administrator. Pursuant to the Administration Agreement between the Trust on behalf of the Fund and SSGA FM, the Fund pays a fee at an annual rate of 0.05% of the Fund’s net assets. SSGA FM has contractually agreed to waive 0.01% of its administration fee. The waiver may
| | |
| 14 | | Notes to Financial Statements |
SSGA S&P 500 Index Fund
Notes to Financial Statements, continued — August 31, 2015
not be terminated or modified except with the approval of the Board. For the year ended August 31, 2015, SSGA FM waived fees in the amount of $41,097.
Prior to June 1, 2015, State Street served as the Administrator of the Fund. For its services as Administrator, the Trust paid State Street an annual fee, payable monthly on a pro rata basis. The annual fee was based on the following percentages of the average daily net assets of the Trust: $0 to $10 billion — 0.0175%; next $10 billion — 0.0125%; next $10 billion — 0.0075% and 0.0050% thereafter. In addition, the Trust paid additional fees to the Administrator for certain services and reimbursed the Administrator for out-of-pocket expenses.
Distributor and Shareholder Servicing
State Street Global Markets, LLC (the “Distributor” or “SSGM”) promotes and offers shares of the Trust pursuant to an Amended and Restated Distribution Agreement dated April 14, 2014. The Distributor may enter into agreements with other related and non-related parties which act as agents to offer and sell shares of the Fund. The amounts paid to the Distributor are included in the accompanying Statement of Operations. The Distributor is a wholly-owned subsidiary of State Street Corporation.
The Trust has adopted a shareholder service agreement with State Street, and the following entities related to State Street: SSGM, Fiduciary Investors Services Division of State Street (“Fiduciary Investors Services”) and High Net Worth Services Division of State Street (“High Net Worth Services”), as well as unaffiliated service providers (collectively, the “Agents”). For these services, the Fund paid 0.025% to State Street, and a fee to each of the Agents, based upon the average daily value of all Fund shares held by or for customers of these Agents subject to the maximum of 0.05%. Effective June 1, 2015, the shareholder service agreement between the Trust and State Street was terminated.
To compensate the Distributor for the services it provides and for the expenses it bears in connection with the distribution of shares of the Fund, the Fund may make payments to the Distributor under a distribution plan adopted pursuant to Rule 12b-1 under the 1940 Act (the “Plan”). The Plan is a compensation plan that provides for payments at annual rates (based on average daily net assets) described below.
The Plan will continue in effect only if such continuance is specifically approved at least annually by a vote of both a majority of the Board and a majority of the Trustees of the Trust who are not “interested persons” of the Trust (the “Independent Trustees”) and have no direct or indirect financial interest in the Plan or in any agreements related thereto (the “Qualified Distribution Plan Trustees”). The Plan may not be amended to increase materially the amount of a Fund’s permitted expenses thereunder without the approval of a majority of the outstanding shares of the affected share class and may not be materially amended in any case without a vote of the majority of both the Trustees and the Qualified Distribution Plan Trustees. At the time of adoption, none of the Independent Trustees of the Trust had a direct or indirect financial interest in the operation of the Plan. The Plan calls for payments at an annual rate (based on average net assets) of 0.25%.
Additionally, the Board approved a limit of 0.062% on the amount of Rule 12b-1 fees paid to the Distributor.
The Plan may benefit the Fund by increasing sales of shares and reducing redemptions of shares, resulting potentially, for example, in economies of scale and more predictable flows of cash into and out of the Fund. Because Rule 12b-1 fees are paid out of a Fund’s assets, all shareholders share in that expense; however, because shareholders hold their shares through varying arrangements (for example, directly or through financial intermediaries), they may not share equally in the benefits of the Plan.
Financial intermediaries are firms that, for compensation, sell shares of mutual funds, including the Fund, and/or provide certain administrative and account maintenance services to mutual fund shareholders. Financial intermediaries may include, among others, brokers, financial planners or advisors, banks, and insurance companies.
In some cases, a financial intermediary may hold its clients’ Fund shares in nominee or street name. Shareholder services provided by a financial intermediary may (though they will not necessarily) include, among other things: processing and mailing trade confirmations, periodic statements, prospectuses, annual reports, semi-annual reports, shareholder notices, and other SEC-required communications; capturing and processing tax data; issuing and mailing dividend checks to shareholders who have selected cash distributions; preparing record date shareholder lists for proxy solicitations; collecting and posting distributions to shareholder accounts; and establishing and maintaining systematic withdrawals and automated investment plans and shareholder account registrations.
| | | | |
| Notes to Financial Statements | | | 15 | |
SSGA S&P 500 Index Fund
Notes to Financial Statements, continued — August 31, 2015
The compensation paid by the Distributor to a financial intermediary may be paid continually over time, during the period when the intermediary’s clients hold investments in the Fund. The compensation to financial intermediaries includes asset-based fees and account-based fees. The amount of continuing compensation paid by the Distributor to different financial intermediaries varies.
Some portion of the Distributor’s payments to financial intermediaries will be made out of amounts received by the Distributor under the Fund’s Plan. In addition, the Fund may reimburse the Distributor for payments the Distributor makes to financial intermediaries that provide certain recordkeeping, administrative and account maintenance services. The amount of the reimbursement is calculated in a manner approved by the Trustees and is reviewed by the Trustees periodically.
The Fund may pay distribution fees, service fees and other amounts described above at a time when shares of the Fund are not being actively promoted to new investors generally, or when shares of the Fund are unavailable for purchase.
For the year ended August 31, 2015, the Fund paid the following shareholder servicing expenses:
| | | | |
| | | State Street | |
| | | | |
S&P 500 Index Fund | | $ | 20,722 | |
The Fund did not make any payments to SSGM, Fiduciary Investors Services or High Net Worth Services during the year ended August 31, 2015.
Trustees’ Fees
Independent Trustees are compensated on a calendar year basis. Any Trustee who is deemed to be an “interested person” (as defined in the 1940 Act) of the Fund does not receive compensation from the Fund for his or her service as a Trustee.
Each Independent Trustee receives for his or her services to the State Street Master Funds, State Street Institutional Investment Trust and SSGA Funds, a $141,500 annual base retainer in addition to $18,000 for each in-person meeting and $2,000 for each telephonic meeting from the Trust. Trustees’ fees and expenses are allocated among the Trusts and Funds overseen by the Trustees in a manner deemed equitable taking into consideration the relative net assets of the Funds, subject to a $15,000 minimum per Fund. The Co-Chairmen each receive an additional $44,000 annual retainer. The Independent Trustees are reimbursed for travel and other out-of-pocket expenses in connection with meeting attendance. Trustee fees are allocated among the Trusts and each of their respective series in such a manner as deemed equitable, taking into consideration the relative net assets of the series. As of the date of this Shareholder Report, the Trustees were not paid pension or retirement benefits as part of SSGA Funds’ expenses. However, the SSGA Funds have, pursuant to an exemptive order from the SEC, implemented an optional deferred compensation plan by which the Independent Trustees may defer receipt of compensation and receive a return on the deferred amount determined with reference to the performance of shares of specified SSGA Funds. As of the fiscal year ended August 31, 2015, none of the Independent Trustees participated in the optional deferred compensation program.
The Trust’s officers are compensated by the Adviser and its affiliates.
Accrued fees payable to affiliates and trustees as of August 31, 2015 were as follows:
| | | | |
| | | S&P 500
Index Fund | |
| | | | |
Administration fees | | $ | 61,272 | |
Custodian fees | | | 7,678 | |
Distribution and Shareholder servicing fees | | | 37,919 | |
Transfer agent fees | | | 55,013 | |
| | | | |
| | $ | 161,882 | |
| | | | |
| | |
| 16 | | Notes to Financial Statements |
SSGA S&P 500 Index Fund
Notes to Financial Statements, continued — August 31, 2015
| 4. | | Fund Share Transactions |
| | | | | | | | | | | | | | | | |
| | | Year Ended
August 31, 2015 | | | Year Ended
August 31, 2014 | |
| | | Shares | | | Dollars | | | Shares | | | Dollars | |
| | | | | | | | | | | | | | | | |
Proceeds from shares sold | | | 12,837,688 | | | $ | 418,680,658 | | | | 10,723,266 | | | $ | 318,481,325 | |
Proceeds from reinvestment of distributions | | | 1,349,631 | | | | 44,324,122 | | | | 1,300,945 | | | | 37,393,975 | |
Payments for shares redeemed | | | (12,201,700 | ) | | | (396,188,922 | ) | | | (11,214,408 | ) | | | (331,702,329 | ) |
| | | | | | | | | | | | | | | | |
Total net increase (decrease) | | | 1,985,619 | | | $ | 66,815,858 | | | | 809,803 | | | $ | 24,172,971 | |
| | | | | | | | | | | | | | | | |
Management has evaluated the impact of all subsequent events on the Fund through the date the financial statements were available to be issued and has determined that there were no subsequent events requiring adjustment or disclosure in the financial statements.
| | | | |
| Notes to Financial Statements | | | 17 | |
SSGA S&P 500 Index Fund
Report of Independent Registered Public Accounting Firm
To the Board of Trustees of the SSGA Funds and Shareholders of the SSGA S&P 500 Index Fund:
We have audited the accompanying statement of assets and liabilities of SSGA S&P 500 Index Fund (the “Fund”) (one of the Funds constituting the SSGA Funds (the “Trust”)) as of August 31, 2015, and the related statement of operations, statement of changes in net assets, and the financial highlights for the year then ended. These financial statements and financial highlights are the responsibility of the Fund’s management. Our responsibility is to express an opinion on these financial statements and financial highlights based on our audit. The statement of changes in net assets for the year ended August 31, 2014 and the financial highlights for periods ended prior to September 1, 2014 were audited by another independent registered public accounting firm whose report, dated October 30, 2014, expressed an unqualified opinion on that statement of changes in net assets and those financial highlights.
We conducted our audit in accordance with the standards of the Public Company Accounting Oversight Board (United States). Those standards require that we plan and perform the audit to obtain reasonable assurance about whether the financial statements and financial highlights are free of material misstatement. We were not engaged to perform an audit of the Trust’s internal control over financial reporting. Our audit included consideration of internal control over financial reporting as a basis for designing audit procedures that are appropriate in the circumstances, but not for the purpose of expressing an opinion on the effectiveness of the Trust’s internal control over financial reporting. Accordingly, we express no such opinion. An audit also includes examining, on a test basis, evidence supporting the amounts and disclosures in the financial statements and financial highlights, assessing the accounting principles used and significant estimates made by management, and evaluating the overall financial statement presentation. Our procedures included confirmation of securities owned as of August 31, 2015, by correspondence with the custodian. We believe that our audit provides a reasonable basis for our opinion.
In our opinion, the financial statements and financial highlights referred to above present fairly, in all material respects, the financial position of SSGA S&P 500 Index Fund (one of the Funds constituting the SSGA Funds) at August 31, 2015, and the results of its operations, changes in its net assets and the financial highlights for the year then ended, in conformity with U.S. generally accepted accounting principles.

Boston, Massachusetts
October 30, 2015
| | |
| 18 | | Report of Independent Registered Public Accounting Firm |
SSGA S&P 500 Index Fund
Tax Information — August 31, 2015 (Unaudited)
Long term capital gains dividends of $13,375,366 were paid by the Fund during the year ended August 31, 2015.
Short term capital gains dividends of $4,367,988 were paid by the Fund during the year ended August 31, 2015.
The Form 1099-DIV mailed to you in January 2016 will show the tax status of all distributions paid to your account in calendar year 2015.
Please consult a tax advisor for questions about federal or state income tax laws.
��
SSGA S&P 500 Index Fund
Basis for Approval of Investment Advisory Contracts (Unaudited)
Trustee Considerations in Approving Continuation of Investment Advisory Agreement1
Overview of the Contract Review Process
Under the Investment Company Act of 1940, an investment advisory agreement between a mutual fund and its investment adviser may continue in effect from year to year only if its continuance is approved at least annually by the fund’s board of trustees, including by a vote of a majority of those trustees who are not “interested persons” of the fund (commonly referred to as, the “Independent Trustees”) cast in person at a meeting called for the purpose of considering such approval.
Consistent with these requirements, the Independent Trustees on the Board of Trustees (the “Board”) of the SSGA Funds (the “Trust”), met in Executive Sessions on April 12-13, 2015, and May 18-19, 2015 to consider a proposal to approve, with respect to each portfolio series of the Trust (each, a “Fund” and collectively, the “Funds”), the continuation of the investment advisory agreement (the “Advisory Agreement”) with SSGA Funds Management, Inc. (the “Adviser”). Prior to voting on the proposal, the Independent Trustees, as well as the Trustees who are “interested persons” of the Adviser, reviewed information furnished by the Adviser and others reasonably necessary to permit the Board to evaluate the proposal fully. The Independent Trustees were separately represented by co-counsel that is independent of the Adviser in connection with their consideration of approval of the Advisory Agreement. Following the April 12-13, 2015 meeting, the Independent Trustees submitted questions and requests for additional information to management, and considered management’s responses thereto prior to and at the May 18-19, 2015 meeting. The Independent Trustees considered, among other things, the following:
Information about Performance, Expenses and Fees
| • | | A report prepared by an independent third-party provider of investment company data, which includes for the Fund: |
| | ¡ | | Comparisons of the Fund’s performance over the past one-, three-, five- and ten-year periods ended December 31, 2014, as applicable, to the performance of an appropriate benchmark for the Fund and a universe of other mutual funds with similar investment objectives and policies; |
| | ¡ | | Comparisons of the Fund’s expense ratio (with detail of component expenses) to the expense ratios of a group of comparable mutual funds selected by the independent third-party data provider; |
| | ¡ | | A chart showing the Fund’s historical average net assets relative to its total expenses, management fees, and non-management expenses over the past five years, as applicable; and |
| | ¡ | | Comparisons of the Fund’s contractual management fee to the contractual management fees of comparable mutual funds at different asset levels. |
| • | | Comparative information concerning fees charged by the Adviser for managing institutional accounts using investment strategies and techniques similar to those used in managing the Funds, as applicable; and |
| • | | Profitability analyses for (a) the Adviser with respect to the Fund and (b) affiliates of the Adviser that provide services to the Funds (“Affiliated Service Providers”). |
Information about Portfolio Management
| • | | Descriptions of the investment management services provided by the Adviser, including its investment strategies and processes; |
| 1 | Over the course of more than 20 years, the Independent Trustees have identified numerous relevant issues, factors and concerns (“issues, factors and concerns”) that they consider each year in connection with the proposed continuation of the advisory agreement, the administration agreement, the distribution plans, the distribution agreement and various related-party service agreements (the “annual review process”). The statement of issues, factors and concerns and the related conclusions of the Independent Trustees may not change substantially from year to year. However, the information requested by, and provided to, the Independent Trustees with respect to the issues, factors and concerns and on which their conclusions are based is updated annually and, in some cases, may differ substantially from the previous year. The Independent Trustees schedule annually a separate in-person meeting that is dedicated to the annual review process (the “special meeting”). At the special meeting and throughout the annual review process, the Independent Trustees take a fresh look at each of the issues, factors and concerns in light of the latest available information and each year present one or more sets of comments and questions to management with respect to specific issues, factors and concerns. Management responds to such comments and questions to the satisfaction of the Independent Trustee before the annual review process is completed and prior to the Independent Trustees voting on proposals to approve continuation of the agreements and plans. |
| | |
| 20 | | Basis for Approval of Investment Advisory Contracts |
SSGA S&P 500 Index Fund
Basis for Approval of Investment Advisory Contracts (Unaudited), continued
| • | | Information concerning the allocation of brokerage and the benefits received by the Adviser as a result of brokerage allocation, including information concerning the acquisition of any research through “soft dollar” benefits received in connection with the Funds’ brokerage; and |
| • | | Information regarding the procedures and processes used to value the assets of the Funds and the assistance provided to the administrator of the Funds by the Adviser in monitoring the effectiveness of such procedures and processes. |
Information about the Adviser
| • | | Reports detailing the financial results and condition of the Adviser and its affiliates; |
| • | | Descriptions of the qualifications, education and experience of the individual investment professionals responsible for managing the portfolios of the Funds; |
| • | | A copy of each Code of Ethics adopted by the Adviser, together with information relating to compliance with and the administration of such Codes; |
| • | | A copy of the Adviser’s proxy voting policies and procedures; |
| • | | Information concerning the resources devoted by the Adviser to overseeing compliance by the Funds and their service providers, including the Adviser’s record of compliance with investment policies and restrictions and other operating policies of the Funds; |
| • | | A description of the business continuity and disaster recovery plans of the Adviser; and |
| • | | Information regarding the Adviser’s risk management processes. |
Other Relevant Information
| • | | Information concerning the nature, quality and cost of various non-investment management services provided to the Funds by affiliates of the Adviser, including the custodian, administrator, fund accountant, transfer agent and securities lending agent of the Funds, and the role of the Adviser in managing the Funds’ relationship with these service providers; |
| • | | Copies of the Advisory Agreement and agreements with other service providers of the Funds; |
| • | | Draft responses to the letter dated March 11, 2015 from Joseph P. Barri, LLC, co-counsel along with the law firm of Sullivan & Worcester LLP (together, “Independent Counsel”), to the Independent Trustees), and reviewed prior to such date by Independent Counsel, requesting specific information, from each of: |
| | ¡ | | The Adviser, with respect to its operations relating to the Funds and its approximate profit margins before taxes from such operations for the Funds’ last fiscal year; and the relevant operations of other affiliated service providers to the Funds, together with their approximate profit margins from such relevant operations for the Funds’ last fiscal year; |
| | ¡ | | State Street Bank and Trust Company (“State Street”), the sub-administrator, administrator, custodian, transfer agent, securities lending agent, and/or shareholder services, as applicable, for the Funds, with respect to its operations relating to the Funds; and |
| | ¡ | | State Street Global Markets, LLC, the principal underwriter and distributor of the shares of the Funds (the “Distributor”), with respect to its operations relating to the Funds, together with the Funds’ related distribution plans and arrangements under SEC Rule 12b-1; |
| • | | Information from the Adviser, State Street and the Distributor providing any material changes to the previous information supplied in response to the letter dated March 11, 2015 from Joseph P. Barri, LLC prior to the Executive Sessions of the Board on May 18-19, 2015. |
| • | | Excerpts from the Funds’ most recent Prospectuses, Statements of Additional Information and Annual Reports for the fiscal year ended August 31, 2014, including (i) the latest prospectus descriptions of the Fund’s investment objectives, strategies and authorized investment techniques and investments; and (ii) the latest Annual Shareholder Report for the Fund, including |
| | | | |
| Basis for Approval of Investment Advisory Contracts | | | 21 | |
SSGA S&P 500 Index Fund
Basis for Approval of Investment Advisory Contracts (Unaudited), continued
| | Portfolio Management Discussion of Performance, as prepared by its portfolio management team, together with a graphic comparison of the performance of the Fund with its benchmark index, for its fiscal year ended August 31, 2014; |
| • | | Lipper materials dated March 2015, circulated to the Independent Trustees and to Independent Counsel, with respect to the Funds for which such materials were then available; and |
| • | | A summary of the foregoing materials prepared by Independent Counsel. |
In addition to the information identified above, the Board considered information provided from time to time by the Adviser, and other service providers of the Funds throughout the year at meetings of the Board and its committees. At such meetings, the Trustees received, among other things, presentations by the portfolio managers and other investment professionals of the Adviser relating to the performance of the Funds and the investment strategies used in pursuing the Fund’s investment objective.
The Independent Trustees were assisted throughout the contract review process by their independent legal counsel. The Independent Trustees relied upon the advice of such counsel and their own business judgment in determining the material factors to be considered in evaluating the Advisory Agreement, and the weight to be given to each such factor. The conclusions reached with respect to the Advisory Agreement were based on a comprehensive evaluation of all the information provided and not any single factor. Moreover, each Trustee may have placed varying emphasis on particular factors in reaching conclusions with respect to the Fund.
Results of the Process
Based on a consideration of the foregoing and such other information as deemed relevant, including the factors and conclusions described below, on May 18-19, 2015 the Board, including a majority of the Independent Trustees, voted to approve continuation of the Advisory Agreement effective June 1, 2015, for an additional year with respect to all Funds.
Nature, Extent and Quality of Services
In considering whether to approve the Advisory Agreement, the Board evaluated the nature, extent and quality of services provided to the Fund by the Adviser.
The Board considered the Adviser’s management capabilities and investment process with respect to the types of investments held by the Fund, including the education, experience and number of investment professionals and other personnel who provide portfolio management, investment research, and similar services to the Fund. The Board evaluated, where relevant, the abilities and experience of such investment personnel in analyzing particular markets, industries and specific issuers of securities in these markets and industries. The Board also considered the substantial expertise of the Adviser in developing and applying proprietary quantitative models for managing various Funds that invest primarily in equity securities. With respect to those Funds that invest primarily in fixed-income securities, the Board considered the extensive experience and resources committed by the Adviser to the evaluation of credit, interest-rate and currency risks. The Board also took into account the compensation paid to recruit and retain investment personnel, and the time and attention devoted to the Funds by senior management.
The Board reviewed the compliance programs of the Adviser and various affiliated service providers. Among other things, the Board considered compliance and reporting matters relating to personal trading by investment personnel, selective disclosure of portfolio holdings, late trading, frequent trading, portfolio valuation, business continuity, the allocation of investment opportunities and the voting of proxies. The Board also considered the role of the Adviser in monitoring the Fund’s securities lending activities.
On the basis of the foregoing and other relevant information, the Board concluded that the Adviser can be expected to continue to provide, high quality investment management and related services for the Funds.
Fund Performance
The Board compared the Fund’s investment performance to the performance of an appropriate benchmark and universe of comparable mutual funds for various time periods ended December 31, 2014. Among other information, the Board considered that the Fund outperformed the medians of its Performance Group and Performance Universe and its Lipper Index for the 1-, 3-, 5- and 10-year periods.
| | |
| 22 | | Basis for Approval of Investment Advisory Contracts |
SSGA S&P 500 Index Fund
Basis for Approval of Investment Advisory Contracts (Unaudited), continued
On the basis of the foregoing and other relevant information, the Board concluded that the performance of the Fund is satisfactory or better (a) by comparison to the performance of its peer group funds or (b) after considering steps taken by management to improve the performance of certain Funds.
Management Fees and Expenses
The Board reviewed the contractual investment advisory fee rates payable by the Fund and actual fees paid by the Fund, net of waivers. As part of its review, the Board considered the Fund’s management fee and total expense ratio (both before and after giving effect to any expense caps), as compared to a group of similarly managed funds selected by an independent data provider. The Board also considered the comparability of the fees charged and the services provided to the Fund by the Adviser to the fees charged and services provided to other clients of the Adviser, including institutional accounts. In addition, the Board considered the willingness of the Adviser to provide undertakings from time to time to waive fees or pay expenses of various Funds to limit the total expenses borne by shareholders of such Funds.
Among other information, the Board considered that the Fund’s actual management fee was below the medians of its Expense Group and Expense Universe. The Board also considered that the Fund’s total expenses were below the medians of its Expense Group and Expense Universe.
On the basis of the foregoing and other relevant information, and in light of the nature, extent and quality of the services provided by the Adviser, the Board concluded that the fees and the expense ratio of the Fund compare favorably to the fees and expenses of similar mutual funds and are reasonable in relation to the services provided.
Profitability
The Board reviewed the level of profits realized by the Adviser and its affiliates in providing investment advisory and other services to the Fund and to all Funds as a group. The Board considered other direct and indirect benefits received by the Adviser and the Affiliated Service Providers in connection with their relationships with the Funds, including the benefits of research services that may be available to the Adviser as a result of securities transactions effected for the Funds and other investment advisory clients, together with the ranges of profitability of each of the Affiliated Service Providers with respect to their services to the Funds.
The Board concluded that the profitability of the Adviser with respect to the Funds and the profitability range of each of the Affiliated Service Providers with respect to its services to the Fund, were reasonable in relation to the services provided.
Economies of Scale
In reviewing management fees and profitability, the Board also considered the extent to which the Adviser and its affiliates, on the one hand, and the Fund and all Funds as a group, on the other hand, can expect to realize benefits from economies of scale as the assets of the Funds increase. The Board acknowledged the difficulty in accurately measuring the benefits resulting from the economies of scale with respect to the management of any specific Fund or the Funds taken as a whole. The Board concluded that, in light of the current size of the Fund and all Funds as a group, the level of profitability of the Adviser and its affiliates with respect to the Fund and all Funds as a group over various time periods, and the comparatively low management fee and expense ratio of the Fund during these periods, it does not appear that the Adviser or its affiliates has realized benefits from economies of scale in managing the assets of the Funds to such an extent that previously agreed advisory fees should be reduced or that breakpoints in such fees should be implemented for any Fund at this time.
Conclusions
In reaching its decision to approve the Advisory Agreement, the Board did not identify any single factor as being controlling, but based its recommendation on each of the factors it considered. Each Trustee may have contributed different weight to the various factors. Based upon the materials reviewed, the representations made and the considerations described above, and as part of its deliberations, the Board, including the Independent Trustees, concluded that the Adviser possesses the capability and resources to perform the duties required of it under the Advisory Agreement.
Further, based upon its review of the Advisory Agreement, the materials provided, and the considerations described above, the Board, including the Independent Trustees, concluded that (1) the terms of the Advisory Agreement are reasonable, fair, and in the best interests of the Fund and its respective shareholders, and (2) the rates payable under the Advisory Agreement are fair and reasonable in light of the usual and customary charges made for services of the same nature and quality.
| | | | |
| Basis for Approval of Investment Advisory Contracts | | | 23 | |
SSGA S&P 500 Index Fund
Shareholder Requests for Additional Information (Unaudited)
Proxy Voting Policies and Procedures and Record
The Fund has adopted the proxy voting policies of the Adviser. A description of the policies and procedures that the Fund has adopted to determine how to vote proxies relating to portfolio securities are contained in the Fund’s Statement of Additional Information, which is available (i) without charge, upon request, by calling the Fund at (800) 647-7327, (ii) on the Fund’s website at www.SSGAfunds.com, (iii) on the U.S. Securities and Exchange Commission’s website at www.sec.gov, or (iv) at the U.S. Securities and Exchange Commission’s public reference room. Information on the operation of the public reference room may be obtained by calling 1-800-SEC-0330. Information regarding how the Fund voted proxies, if any, during the most recent 12-month period ended June 30 is available by August 31 of each year without charge (1) by calling 1-800-997-7327 (toll free), or (2) on the website of the Securities and Exchange Commission (“SEC”) at www.sec.gov.
Quarterly Portfolio Schedule
The Fund will file its complete schedule of investments with the U.S. Securities and Exchange Commission for the first and third quarters of each fiscal year on Form N-Q. For the second and fourth quarters, the complete schedule of investments is available in the Fund’s semi-annual and annual financial statements. The Fund’s Form N-Q is available (i) without charge, upon request, by calling the Fund at (800) 647-7327, (ii) on the Fund’s website at www.SSGAfunds.com, (iii) on the U.S. Securities and Exchange Commission’s website at www.sec.gov, or (iv) at the U.S. Securities and Exchange Commission’s public reference room. Information on the operation of the public reference room may be obtained by calling 1-800-SEC-0330.
| | |
| 24 | | Shareholder Requests for Additional Information |
SSGA S&P 500 Index Fund
Disclosure of Information about Fund Trustees and Officers — August 31, 2015 (Unaudited)
| | | | | | | | | | | | |
Name,
Address, and
Year of Birth(1)
| | Position(s) Held
with Trust(1) | | Term of
Office and
Length of
Time Served(1) | | Principal Occupation
During Past Five Years(1) | | Number of
Funds in
Fund
Complex
Overseen
by Trustee(1) | | | Other
Directorships
Held by
Trustee During
Past Five Years(1) |
INDEPENDENT TRUSTEES | | | | | | |
Michael F. Holland State Street Bank and Trust Company 100 Huntington Avenue, CPH 0326 Boston, MA 02116 YOB: 1944 | | Trustee and Co-Chairman of the Board | | Term: Indefinite Elected: 1/14 | | Chairman, Holland & Company L.L.C. (investment adviser) (1995 – present). | | | 71 | | | Trustee and Co-Chairman, State Street Master Funds; Trustee and Co-Chairman, State Street Institutional Investment Trust; Director, the Holland Series Fund, Inc.; Director, The China Fund, Inc.; Director, The Taiwan Fund, Inc.; Director, Reaves Utility Income Fund, Inc.; and Director, Blackstone/GSO Loan Funds. |
| | | | | | | | | | | | | |
Patrick J. Riley State Street Bank and Trust Company 100 Huntington Avenue, CPH 0326 Boston, MA 02116 YOB: 1948 | | Trustee and Co-Chairman of the Board | | Term: Indefinite Elected: 1988 | | 2002 to May 2010, Associate Justice of the Superior Court, Commonwealth of Massachusetts; 1985 to 2002, Partner, Riley, Burke & Donahue, L.L.P. (law firm); 1998 to Present, Independent Director, State Street Global Advisers Ireland, Ltd. (investment company); 1998 to Present, Independent Director, SSGA Liquidity plc (formerly, SSGA Cash Management Fund plc); January 2009 to Present, Independent Director, SSGA Fixed Income plc; and January 2009 to Present, Independent Director, SSGA Qualified Funds PLC. | | | 71 | | | Trustee and Co-Chairman, State Street Master Funds; Trustee and Co-Chairman, State Street Institutional Investment Trust; Board Director and Chairman, SPDR Europe 1PLC Board (2011 – Present); Board Director and Chairman, SPDR Europe II, PLC (2013- Present). |
| | | | |
| Disclosure of Information about Fund Trustees and Officers | | | 25 | |
SSGA S&P 500 Index Fund
Disclosure of Information about Fund Trustees and Officers, continued — August 31, 2015 (Unaudited)
| | | | | | | | | | | | |
Name,
Address, and
Year of Birth(1)
| | Position(s) Held
with Trust(1) | | Term of
Office and
Length of
Time Served(1) | | Principal Occupation
During Past Five Years(1) | | Number of
Funds in
Fund
Complex
Overseen
by Trustee(1) | | | Other
Directorships
Held by
Trustee During
Past Five Years(1) |
INDEPENDENT TRUSTEES (continued) | | | | | | |
William L. Boyan State Street Bank and Trust Company 100 Huntington Avenue, CPH 0326 Boston, MA 02116 YOB: 1937 | | Trustee and Co-Chairman of the Valuation Committee | | Term: Indefinite Elected: 1/14 | | President and Chief Operations Officer, John Hancock Financial Services (1959 – 1999). Mr. Boyan retired in 1999. Chairman Emeritus, Children’s Hospital, Boston, MA (1984 – 2011); Former Trustee of Old Mutual South Africa Master Trust (investments) (1995 – 2008); Former Chairman, Boston Plan For Excellence, Boston Public Schools (1995 – 2010); Member of Advisory Board of Florida Atlantic University Lifelong Learning Society; Trustee, Children’s Hospital, Boston, MA. | | | 71 | | | Trustee, State Street Master Funds; Trustee, State Street Institutional Investment Trust; Former Trustee of Old Mutual South Africa Master Trust. |
| | | | | | | | | | | | | |
William L. Marshall State Street Bank and Trust Company 100 Huntington Avenue, CPH 0326 Boston, MA 02116 YOB: 1942 | | Trustee and Co-Chairman of the Audit Committee | | Term: Indefinite Elected: 1988 | | April 2011 to Present, Chairman (until April 2011, Chief Executive Officer and President), Wm. L. Marshall Associates, Inc., Wm. L. Marshall Companies, Inc. and the Marshall Financial Group, Inc. (a registered investment adviser and provider of financial and related consulting services); Certified Financial Planner; Member, Financial Planners Association; Director, (2008 – 2014) Doylestown Health Foundation Board; and the Ann Silverman Community Clinic of Doylestown, PA. | | | 71 | | | Trustee, State Street Master Funds; Trustee, State Street Institutional Investment Trust; Director, Marshall Financial Group, Inc. |
| | | | | | | | | | | | | |
Richard D. Shirk State Street Bank and Trust Company 100 Huntington Avenue, CPH 0326 Boston, MA 02116 YOB: 1945 | | Trustee and Co-Chairman of the Qualified Legal and Compliance Committee | | Term: Indefinite Elected: 1988 | | March 2001 to April 2002, Chairman (1996 to March 2001, President and Chief Executive Officer), Cerulean Companies, Inc. (holding company) (Retired); 1992 to March 2001, President and Chief Executive Officer, Blue Cross Blue Shield of Georgia (health insurer, managed healthcare); 1998 to December 2008, Chairman, Board Member and December 2008 to Present, Investment Committee Member, Healthcare Georgia Foundation (private foundation); September 2002 to 2012, Lead Director and Board Member, Amerigroup Corp. (managed health care); 1999 to 2013: Board Member and (since 2001) Investment Committee Member, Woodruff Arts Center; and 2003 to 2009, Trustee, Gettysburg College. | | | 71 | | | Trustee, State Street Master Funds; Trustee, State Street Institutional Investment Trust; Board member, AeroCare Holdings (privately held healthcare services company) (February 2003 – Present); Board member, Regenesis Biomedical (health care services) (April 2012 – Present). |
| | |
| 26 | | Disclosure of Information about Fund Trustees and Officers |
SSGA S&P 500 Index Fund
Disclosure of Information about Fund Trustees and Officers, continued — August 31, 2015 (Unaudited)
| | | | | | | | | | | | |
Name,
Address, and
Year of Birth(1)
| | Position(s) Held
with Trust(1) | | Term of
Office and
Length of
Time Served(1) | | Principal Occupation
During Past Five Years(1) | | Number of
Funds in
Fund
Complex
Overseen
by Trustee(1) | | | Other
Directorships
Held by
Trustee During
Past Five Years(1) |
INDEPENDENT TRUSTEES (continued) | | | | | | |
Rina K. Spence State Street Bank and Trust Company 100 Huntington Avenue, CPH 0326 Boston, MA 02116 YOB: 1948 | | Trustee and Co-Chairman of the Qualified Legal and Compliance Committee and Co-Chairman of the Governance Committee | | Term: Indefinite Elected: 1/14 | | President of SpenceCare International LLC (international healthcare consulting) (1999 – present); Chief Executive Officer, IEmily.com (health internet company) (2000 – 2001); Chief Executive Officer of Consensus Pharmaceutical, Inc. (1998 – 1999); Founder, President and Chief Executive Officer of Spence Center for Women’s Health (1994 – 1998); President and CEO Emerson Hospital (1984 – 1994); Trustee, Eastern Enterprise (utilities) (1988 – 2000); Director, Berkshire Life Insurance Company of America (1993 – 2009); Director, IEmily.com, Inc. (2000 – 2010); and Trustee, National Osteoporosis Foundation (2005 – 2008). | | | 71 | | | Trustee, State Street Master Funds; Trustee, State Street Institutional Investment Trust. |
| | | | | | | | | | | | | |
Bruce D. Taber State Street Bank and Trust Company 100 Huntington Avenue, CPH 0326 Boston, MA 02116 YOB: 1943 | | Trustee and Co-Chairman of the Valuation Committee and Co-Chairman of the Governance Committee | | Term: Indefinite Elected: 1991 | | 1999 to Present, Partner, Zenergy LLC (a technology company providing Computer Modeling and System Analysis to the General Electric Power Generation Division); Until December 2008, Independent Director, SSGA Cash Management Fund plc; Until December 2008, Independent Director, State Street Global Advisers Ireland, Ltd. (investment companies); and Until August 1994, President, Alonzo B. Reed, Inc., (a Boston architect-engineering firm). | | | 71 | | | Trustee, State Street Master Funds; Trustee, State Street Institutional Investment Trust. |
| | | | | | | | | | | | | |
Douglas T. Williams State Street Bank and Trust Company 100 Huntington Avenue, CPH 0326 Boston, MA 02116 YOB: 1940 | | Trustee and Co-Chairman of the Audit Committee | | Term: Indefinite Elected: 1/14 | | President, Oakmont Homeowners Association; President, Mariner Sands Chapel; Executive Vice President and member of Executive Committee, Chase Manhattan Bank (1987 – 1999); President, Boston Stock Exchange Depository Trust Company, 1981 – 1982; Treasurer, Nantucket Educational Trust, (2002 – 2007). | | | 71 | | | Trustee, State Street Master Funds; Trustee, State Street Institutional Investment Trust. |
| | | | |
| Disclosure of Information about Fund Trustees and Officers | | | 27 | |
SSGA S&P 500 Index Fund
Disclosure of Information about Fund Trustees and Officers, continued — August 31, 2015 (Unaudited)
| | | | | | | | | | | | |
Name,
Address, and
Year of Birth(1)
| | Position(s) Held
with Trust(1) | | Term of
Office and
Length of
Time Served(1) | | Principal Occupation
During Past Five Years(1) | | Number of
Funds in
Fund
Complex
Overseen
by Trustee(1) | | | Other
Directorships
Held by
Trustee During
Past Five Years(1) |
INTERESTED TRUSTEES(2) |
Gregory A. Ehret SSGA Funds Management, Inc. State Street Financial Center One Lincoln Street Boston, MA 02111-2900 YOB: 1969 | | Trustee | | Term: Indefinite Elected Trustee: 8/15 | | President and Global Chief Operating Officer State Street Global Advisors (2012 – Present); Head of Europe, the Middle East, and Africa, State Street Global Advisors (2008 – 2012); Head of Sales and Distribution in Europe, the Middle East, and Africa, State Street Global Advisors (2007 – 2008). | | | 71 | | | Trustee, State Street Master Funds; Trustee, State Street Institutional Investment Trust. |
| | | | | | | | | | | | | |
James E. Ross SSGA Funds Management, Inc. State Street Financial Center One Lincoln Street Boston, MA 02111-2900 YOB: 1965 | | Trustee | | Term: Indefinite Elected Trustee: 1/14 | | Chairman and Director, SSGA Funds Management, Inc. (2012 – present); President, SSGA Funds Management, Inc. (2005 – 2012); Executive Vice President and Senior Managing Director, State Street Global Advisors (2006 – present); and Principal, State Street Global Advisors (2006 – present). | | | 268 | | | Trustee, State Street Master Funds; Trustee, State Street Institutional Investment Trust; Trustee, SPDR Series Trust; Trustee, SPDR Index Shares Funds; Trustee, Select Sector SPDR Trust; Trustee, SSGA Active Trust; and Trustee, SSGA Master Trust. |
| (1) | | As of October 12, 2015. |
| (2) | | Mr. Ehret and Mr. Ross are Interested Trustees because of their employment by SSGA Funds Management, Inc., an affiliate of the Trust. |
| | |
| 28 | | Disclosure of Information about Fund Trustees and Officers |
SSGA S&P 500 Index Fund
Disclosure of Information about Fund Trustees and Officers, continued — August 31, 2015 (Unaudited)
The following lists the principal officers for SSGA Funds and the State Street Master Funds, as well as their mailing addresses and ages, positions with the Trusts and length of time served, and present and principal occupations:
| | | | | | |
Name,
Address, and
Year of Birth | | Position(s) Held
with Trust | | Term of
Office and
Length of
Time Served | | Principal Occupation
During Past Five Years |
OFFICERS: | | | | | | |
Ellen M. Needham SSGA Funds Management, Inc. State Street Financial Center One Lincoln Street Boston, MA 02111-2900 YOB: 1967 | | President | | Term: Indefinite Elected: 10/12 | | President and Director, SSGA Funds Management, Inc. (June 2012 – present); Chief Operating Officer, SSGA Funds Management, Inc. (May 2010 – June 2012); Senior Managing Director, SSGA Funds Management, Inc. (1992-2012) and Senior Managing Director, State Street Global Advisors (1992-present).* |
| | | | | | | |
Ann M. Carpenter SSGA Funds Management, Inc. State Street Financial Center One Lincoln Street Boston, MA 02111-2900 YOB: 1966 | | Vice President Assistant Treasurer | | Term: Indefinite Elected: 10/12 Term: Indefinite Elected: 4/15 | | Chief Operating Officer, SSGA Funds Management, Inc. (April 2014 – present); Vice President, SSGA Funds Management, Inc. (2008 – present); Principal, State Street Global Advisors (2005 – 2008 – present).* |
| | | | | | | |
Chad C. Hallett SSGA Funds Management, Inc. State Street Financial Center One Lincoln Street Boston, MA 02111 YOB: 1969 | | Treasurer | | Term: Indefinite Elected: 4/15 | | Vice President, State Street Global Advisors and SSGA Funds Management, Inc. (November 2014 – present); Vice President, State Street Bank and Trust Company (2001-November 2014).* |
| | | | | | | |
Brian Harris SSGA Funds Management, Inc. State Street Financial Center One Lincoln Street Boston, MA 02111 YOB: 1973 | | Chief Compliance Officer | | Term: Indefinite Elected: 11/13 | | Vice President, State Street Global Advisors and SSGA Funds Management, Inc. (June 2013 – Present); Senior Vice President and Global Head of Investment Compliance, BofA Global Capital Management (September 2010 to May 2013); Director of Compliance, AARP Financial Inc. (July 2008 to August 2010). |
| | | | | | | |
Joshua A. Weinberg SSGA Funds Management, Inc. State Street Financial Center One Lincoln Street Boston, MA 02111-2900 YOB: 1978 | | Chief Legal Officer | | Term: Indefinite Elected: 2/15 | | Vice President and Managing Counsel, State Street Global Advisors (2011 – present); Clerk, SSGA Funds Management, Inc. (2013 – present); Associate, Financial Services Group, Dechert LLP (2006 – 2011). |
| | | | | | | |
David K. James State Street Bank and Trust Company 100 Huntington Avenue, 3rd Floor Boston, MA 02116 YOB: 1970 | | Secretary | | Term: Indefinite Elected: 4/13 | | Managing Director and Managing Counsel, State Street Bank and Trust Company (2009 – present); Vice President and Counsel, PNC Global Investment Servicing (US), Inc. (2006–2009). |
| | | | | | | |
Kristin Schantz State Street Bank and Trust Company 100 Huntington Avenue, 3rd Floor Boston, MA 02116 YOB: 1979 | | Assistant Secretary | | Term: Indefinite Elected: 2/14 | | Vice President and Senior Counsel, State Street Bank and Trust Company (2013 – present); Vice President, Citi Fund Services Ohio, Inc. (2008 – 2013). |
| * | Served in various capacities and/or with various affiliated entities during noted time period. |
The Statement of Additional Information includes additional information about the Trustees and is available, without charge, upon request, by calling (toll free) 800-997-7327.
| | | | |
| Disclosure of Information about Fund Trustees and Officers | | | 29 | |
SSGA S&P 500 Index Fund
State Street Financial Center
One Lincoln Street
Boston, Massachusetts 02111-2900
(800) 647-7327
Trustees
William L. Boyan
Gregory A. Ehret
Michael F. Holland
William L. Marshall
Patrick J. Riley
James E. Ross
Richard D. Shirk
Rina K. Spence
Bruce D. Taber
Douglas T. Williams
Officers
Ellen M. Needham, President and Principal Executive Officer
Chad C. Hallett, Treasurer and Principal Accounting Officer
Ann M. Carpenter, Vice President and Assistant Treasurer
Brian Harris, Chief Compliance Officer
David James, Secretary
Joshua A. Weinberg, Chief Legal Officer
Kristin M. Schantz, Assistant Secretary
Investment Adviser and Administrator
SSGA Funds Management, Inc.
State Street Financial Center,
One Lincoln Street
Boston, Massachusetts 02111-2900
Custodian and Office of Shareholder Inquiries
State Street Bank and Trust Company
1776 Heritage Drive
North Quincy, Massachusetts 02171
Transfer and Dividend Paying Agent
Boston Financial Data Services, Inc.
2000 Crown Colony Drive
Quincy, Massachusetts 02169
Distributor
State Street Global Markets, LLC
State Street Financial Center
One Lincoln Street
Boston, Massachusetts 02111-2900
Sub-Administrator
State Street Bank and Trust Company
State Street Financial Center
One Lincoln Street
Boston, Massachusetts 02111-2900
Legal Counsel
Ropes & Gray LLP
800 Boylston Street
Boston, Massachusetts 02199
Independent Registered Public Accounting Firm
Ernst & Young LLP
200 Clarendon Street
Boston, Massachusetts 02116
Distributor: State Street Global Markets, LLC, member FINRA, SIPC, a wholly owned subsidiary of State Street Corporation. References to State Street may include State Street Corporation and its affiliates. The SSGA Funds pay State Street Bank and Trust Company for its services as sub-administrator, custodian, transfer agent and shareholder servicing agent and pays SSGA Funds Management, Inc. for investment advisory and administrator services.
This information must be preceded or accompanied by a current prospectus or summary prospectus. Read the prospectus carefully before you invest or send money.
| | |
| 30 | | Fund Management and Service Providers |
31 August 2015
State Street Master Funds
State Street Equity 500 Index Portfolio
This page has been intentionally left blank.
State Street Equity 500 Index Portfolio
Portfolio of Investments — August 31, 2015 (Unaudited)
| | | | | | | | |
| | |
Shares | | | Value | |
| | | | | | | | |
| | | | | | | | |
| Common Stocks - 97.9% | | | | | |
Consumer Discretionary - 12.6% | | | | | |
Advance Auto Parts, Inc. | | | 11,500 | | | $ | 2,015,375 | |
Amazon.com, Inc. (a) | | | 59,802 | | | | 30,671,848 | |
AutoNation, Inc. (a) | | | 12,469 | | | | 746,145 | |
AutoZone, Inc. (a) | | | 4,988 | | | | 3,571,358 | |
Bed Bath & Beyond, Inc. (a) | | | 25,130 | | | | 1,560,824 | |
Best Buy Co., Inc. | | | 44,213 | | | | 1,624,386 | |
BorgWarner, Inc. | | | 36,423 | | | | 1,589,500 | |
Cablevision Systems Corp. (Class A) | | | 30,812 | | | | 775,538 | |
CarMax, Inc. (a) | | | 32,197 | | | | 1,964,017 | |
Carnival Corp. | | | 69,149 | | | | 3,404,205 | |
CBS Corp. (Class B) | | | 72,993 | | | | 3,302,203 | |
Chipotle Mexican Grill, Inc. (a) | | | 5,014 | | | | 3,559,990 | |
Coach, Inc. | | | 45,800 | | | | 1,385,450 | |
Comcast Corp. (Class A) | | | 395,665 | | | | 22,287,809 | |
D.R. Horton, Inc. | | | 50,179 | | | | 1,523,936 | |
Darden Restaurants, Inc. | | | 20,917 | | | | 1,422,565 | |
Delphi Automotive PLC | | | 47,381 | | | | 3,578,213 | |
Discovery Communications, Inc. (Class A) (a) | | | 21,597 | | | | 574,480 | |
Discovery Communications, Inc. (Class C) (a) | | | 39,797 | | | | 1,009,252 | |
Dollar General Corp. | | | 48,287 | | | | 3,596,899 | |
Dollar Tree, Inc. (a) | | | 33,282 | | | | 2,538,085 | |
Expedia, Inc. | | | 15,023 | | | | 1,727,495 | |
Ford Motor Co. | | | 637,860 | | | | 8,847,118 | |
Fossil Group, Inc. (a) | | | 7,617 | | | | 469,055 | |
GameStop Corp. (Class A) | | | 16,878 | | | | 716,977 | |
Gap, Inc. | | | 44,764 | | | | 1,468,707 | |
Garmin Ltd. | | | 19,560 | | | | 735,652 | |
General Motors Co. | | | 214,477 | | | | 6,314,203 | |
Genuine Parts Co. | | | 24,420 | | | | 2,038,826 | |
Goodyear Tire & Rubber Co. | | | 40,813 | | | | 1,215,003 | |
H&R Block, Inc. | | | 45,551 | | | | 1,549,645 | |
Hanesbrands, Inc. | | | 62,600 | | | | 1,884,886 | |
Harley-Davidson, Inc. | | | 33,585 | | | | 1,882,439 | |
Harman International Industries, Inc. | | | 10,405 | | | | 1,016,985 | |
Hasbro, Inc. | | | 19,928 | | | | 1,486,430 | |
Home Depot, Inc. | | | 203,310 | | | | 23,677,483 | |
Interpublic Group of Cos., Inc. | | | 62,228 | | | | 1,174,865 | |
Johnson Controls, Inc. | | | 102,206 | | | | 4,204,755 | |
Kohl’s Corp. | | | 33,588 | | | | 1,713,996 | |
L Brands, Inc. | | | 39,546 | | | | 3,317,909 | |
Leggett & Platt, Inc. | | | 20,944 | | | | 930,332 | |
Lennar Corp. (Class A) | | | 26,425 | | | | 1,345,032 | |
Lowe’s Cos., Inc. | | | 144,712 | | | | 10,009,729 | |
Macy’s, Inc. | | | 53,161 | | | | 3,115,766 | |
Marriott International, Inc. (Class A) | | | 33,797 | | | | 2,388,096 | |
Mattel, Inc. | | | 56,543 | | | | 1,324,802 | |
McDonald’s Corp. | | | 149,715 | | | | 14,225,919 | |
| | | | | | | | |
| | |
Shares | | | Value | |
| | | | | | | | |
Michael Kors Holdings, Ltd. (a) | | | 33,686 | | | $ | 1,463,994 | |
Mohawk Industries, Inc. (a) | | | 9,669 | | | | 1,904,503 | |
Netflix, Inc. (a) | | | 67,396 | | | | 7,752,562 | |
Newell Rubbermaid, Inc. | | | 41,451 | | | | 1,746,331 | |
News Corp. (Class A) (a) | | | 86,114 | | | | 1,173,734 | |
NIKE, Inc. (Class B) | | | 110,751 | | | | 12,376,424 | |
Nordstrom, Inc. | | | 23,856 | | | | 1,738,625 | |
O’Reilly Automotive, Inc. (a) | | | 15,320 | | | | 3,677,872 | |
Omnicom Group, Inc. | | | 38,550 | | | | 2,582,079 | |
Priceline Group, Inc. (a) | | | 8,108 | | | | 10,123,973 | |
PulteGroup, Inc. | | | 47,343 | | | | 979,527 | |
PVH Corp. | | | 12,451 | | | | 1,481,420 | |
Ralph Lauren Corp. | | | 9,236 | | | | 1,026,951 | |
Ross Stores, Inc. | | | 67,544 | | | | 3,283,989 | |
Royal Caribbean Cruises, Ltd. | | | 25,100 | | | | 2,212,816 | |
Scripps Networks Interactive, Inc. (Class A) | | | 15,263 | | | | 810,313 | |
Signet Jewelers, Ltd. | | | 12,600 | | | | 1,738,800 | |
Staples, Inc. | | | 95,234 | | | | 1,353,275 | |
Starbucks Corp. | | | 235,092 | | | | 12,861,883 | |
Starwood Hotels & Resorts Worldwide, Inc. | | | 25,244 | | | | 1,804,189 | |
Target Corp. | | | 99,044 | | | | 7,696,709 | |
TEGNA, Inc. | | | 34,252 | | | | 814,855 | |
Tiffany & Co. | | | 18,581 | | | | 1,528,287 | |
Time Warner Cable, Inc. | | | 44,474 | | | | 8,273,053 | |
Time Warner, Inc. | | | 130,780 | | | | 9,298,458 | |
TJX Cos., Inc. | | | 109,375 | | | | 7,691,250 | |
Tractor Supply Co. | | | 22,674 | | | | 1,934,319 | |
TripAdvisor, Inc. (a) | | | 19,015 | | | | 1,329,149 | |
Twenty-First Century Fox, Inc. (Class A) | | | 283,409 | | | | 7,762,573 | |
Under Armour, Inc. (Class A) (a) | | | 25,076 | | | | 2,395,510 | |
Urban Outfitters, Inc. (a) | | | 15,839 | | | | 488,792 | |
V.F. Corp. | | | 53,528 | | | | 3,877,033 | |
Viacom, Inc. (Class B) | | | 57,541 | | | | 2,345,947 | |
Walt Disney Co. | | | 245,593 | | | | 25,021,015 | |
Whirlpool Corp. | | | 12,459 | | | | 2,094,358 | |
Wyndham Worldwide Corp. | | | 19,646 | | | | 1,502,526 | |
Wynn Resorts, Ltd. | | | 11,859 | | | | 890,018 | |
Yum! Brands, Inc. | | | 67,990 | | | | 5,423,562 | |
| | | | | | | | |
| | | | | | | 353,944,857 | |
| �� | | | | | | | |
|
Consumer Staples - 9.5% | |
Altria Group, Inc. | | | 309,070 | | | | 16,559,971 | |
Archer-Daniels-Midland Co. | | | 94,592 | | | | 4,255,694 | |
Brown-Forman Corp. (Class B) | | | 24,161 | | | | 2,370,194 | |
Campbell Soup Co. | | | 30,583 | | | | 1,467,678 | |
Clorox Co. | | | 19,379 | | | | 2,154,363 | |
Coca-Cola Co. | | | 614,722 | | | | 24,170,869 | |
Coca-Cola Enterprises, Inc. | | | 35,313 | | | | 1,818,266 | |
Colgate-Palmolive Co. | | | 134,579 | | | | 8,452,907 | |
ConAgra Foods, Inc. | | | 66,051 | | | | 2,753,006 | |
| | | | |
| State Street Equity 500 Index Portfolio | | | 33 | |
State Street Equity 500 Index Portfolio
Portfolio of Investments, continued — August 31, 2015 (Unaudited)
| | | | | | | | |
| | |
Shares | | | Value | |
| | | | | | | | |
| | | | | | | | |
Constellation Brands, Inc. (Class A) | | | 27,076 | | | $ | 3,465,728 | |
Costco Wholesale Corp. | | | 68,834 | | | | 9,640,202 | |
CVS Health Corp. | | | 179,527 | | | | 18,383,565 | |
Dr. Pepper Snapple Group, Inc. | | | 31,703 | | | | 2,432,571 | |
Estee Lauder Cos., Inc. (Class A) | | | 36,263 | | | | 2,892,700 | |
General Mills, Inc. | | | 94,522 | | | | 5,365,069 | |
Hershey Co. | | | 23,615 | | | | 2,114,015 | |
Hormel Foods Corp. | | | 23,349 | | | | 1,426,624 | |
J.M. Smucker Co. | | | 14,855 | | | | 1,748,731 | |
Kellogg Co. | | | 40,207 | | | | 2,664,920 | |
Keurig Green Mountain, Inc. | | | 18,089 | | | | 1,023,837 | |
Kimberly-Clark Corp. | | | 57,473 | | | | 6,122,599 | |
Kraft Heinz Co. | | | 90,751 | | | | 6,593,968 | |
Kroger Co. | | | 153,910 | | | | 5,309,895 | |
McCormick & Co., Inc. | | | 20,261 | | | | 1,606,292 | |
Mead Johnson Nutrition Co. | | | 30,568 | | | | 2,394,697 | |
Molson Coors Brewing Co. (Class B) | | | 23,509 | | | | 1,600,728 | |
Mondelez International, Inc. (Class A) | | | 255,994 | | | | 10,843,906 | |
Monster Beverage Corp. (a) | | | 23,647 | | | | 3,274,164 | |
PepsiCo, Inc. | | | 231,738 | | | | 21,535,412 | |
Philip Morris International, Inc. | | | 245,087 | | | | 19,557,943 | |
Procter & Gamble Co. | | | 425,161 | | | | 30,046,128 | |
Reynolds American, Inc. | | | 65,846 | | | | 5,514,602 | |
Sysco Corp. | | | 93,735 | | | | 3,737,214 | |
Tyson Foods, Inc. (Class A) | | | 44,691 | | | | 1,889,535 | |
Wal-Mart Stores, Inc. | | | 248,299 | | | | 16,072,394 | |
Walgreens Boots Alliance, Inc. | | | 137,213 | | | | 11,875,785 | |
Whole Foods Market, Inc. | | | 55,587 | | | | 1,821,030 | |
| | | | | | | | |
| | | | | | | 264,957,202 | |
| | | | | | | | |
|
Energy - 7.1% | |
Anadarko Petroleum Corp. | | | 81,044 | | | | 5,801,130 | |
Apache Corp. | | | 60,570 | | | | 2,740,187 | |
Baker Hughes, Inc. | | | 69,094 | | | | 3,869,264 | |
Cabot Oil & Gas Corp. | | | 65,622 | | | | 1,553,273 | |
Cameron International Corp. (a) | | | 30,467 | | | | 2,033,977 | |
Chesapeake Energy Corp. | | | 78,594 | | | | 613,819 | |
Chevron Corp. | | | 294,834 | | | | 23,878,606 | |
Cimarex Energy Co. | | | 13,242 | | | | 1,463,373 | |
Columbia Pipeline Group, Inc. | | | 47,478 | | | | 1,204,042 | |
ConocoPhillips | | | 191,303 | | | | 9,402,542 | |
CONSOL Energy, Inc. | | | 32,173 | | | | 489,995 | |
Devon Energy Corp. | | | 59,550 | | | | 2,540,403 | |
Diamond Offshore Drilling, Inc. | | | 9,954 | | | | 236,009 | |
Ensco PLC (Class A) | | | 32,889 | | | | 595,620 | |
EOG Resources, Inc. | | | 86,263 | | | | 6,755,256 | |
| | | | | | | | |
| | |
Shares | | | Value | |
| | | | | | | | |
EQT Corp. | | | 22,243 | | | $ | 1,730,950 | |
Exxon Mobil Corp. | | | 656,372 | | | | 49,385,429 | |
FMC Technologies, Inc. (a) | | | 39,709 | | | | 1,381,079 | |
Halliburton Co. | | | 130,167 | | | | 5,122,071 | |
Helmerich & Payne, Inc. | | | 18,874 | | | | 1,113,755 | |
Hess Corp. | | | 38,344 | | | | 2,279,551 | |
Kinder Morgan, Inc. | | | 272,976 | | | | 8,847,152 | |
Marathon Oil Corp. | | | 109,289 | | | | 1,889,607 | |
Marathon Petroleum Corp. | | | 87,602 | | | | 4,144,451 | |
Murphy Oil Corp. | | | 24,962 | | | | 773,822 | |
National Oilwell Varco, Inc. | | | 57,941 | | | | 2,452,643 | |
Newfield Exploration Co. (a) | | | 29,185 | | | | 972,152 | |
Noble Energy, Inc. | | | 62,595 | | | | 2,091,299 | |
Occidental Petroleum Corp. | | | 121,135 | | | | 8,844,066 | |
ONEOK, Inc. | | | 31,504 | | | | 1,134,459 | |
Phillips 66 | | | 85,692 | | | | 6,775,666 | |
Pioneer Natural Resources Co. | | | 23,524 | | | | 2,894,863 | |
Range Resources Corp. | | | 24,841 | | | | 959,359 | |
Schlumberger, Ltd. | | | 202,072 | | | | 15,634,311 | |
Southwestern Energy Co. (a) | | | 63,944 | | | | 1,038,451 | |
Spectra Energy Corp. | | | 104,141 | | | | 3,027,379 | |
Tesoro Corp. | | | 20,049 | | | | 1,844,708 | |
Transocean, Ltd. | | | 47,690 | | | | 678,629 | |
Valero Energy Corp. | | | 83,386 | | | | 4,948,125 | |
Williams Cos., Inc. | | | 108,410 | | | | 5,225,362 | |
| | | | | | | | |
| | | | | | | 198,366,835 | |
| | | | | | | | |
|
Financials - 16.1% | |
ACE, Ltd. | | | 52,067 | | | | 5,319,165 | |
Affiliated Managers Group, Inc. (a) | | | 8,476 | | | | 1,580,265 | |
Aflac, Inc. | | | 69,737 | | | | 4,086,588 | |
Allstate Corp. | | | 63,967 | | | | 3,727,997 | |
American Express Co. | | | 139,752 | | | | 10,721,773 | |
American International Group, Inc. | | | 207,632 | | | | 12,528,515 | |
American Tower Corp. REIT | | | 66,982 | | | | 6,175,071 | |
Ameriprise Financial, Inc. | | | 29,963 | | | | 3,375,931 | |
Aon PLC | | | 45,682 | | | | 4,268,526 | |
Apartment Investment & Management Co. (Class A) REIT | | | 27,165 | | | | 978,755 | |
Assurant, Inc. | | | 10,846 | | | | 806,400 | |
AvalonBay Communities, Inc. REIT | | | 21,029 | | | | 3,471,047 | |
Bank of America Corp. | | | 1,655,566 | | | | 27,051,948 | |
Bank of New York Mellon Corp. | | | 180,491 | | | | 7,183,542 | |
BB&T Corp. | | | 116,439 | | | | 4,298,928 | |
Berkshire Hathaway, Inc. (Class B) (a) | | | 287,519 | | | | 38,539,047 | |
BlackRock, Inc. | | | 20,118 | | | | 6,085,091 | |
Boston Properties, Inc. REIT | | | 24,821 | | | | 2,814,205 | |
Capital One Financial Corp. | | | 84,268 | | | | 6,551,837 | |
| | |
| 34 | | State Street Equity 500 Index Portfolio |
State Street Equity 500 Index Portfolio
Portfolio of Investments, continued — August 31, 2015 (Unaudited)
| | | | | | | | |
| | |
Shares | | | Value | |
| | | | | | | | |
| | | | | | | | |
Care Capital Properties, Inc. REIT (a) | | | 1 | | | $ | 24 | |
CBRE Group, Inc. (a) | | | 42,908 | | | | 1,373,914 | |
Charles Schwab Corp. | | | 181,489 | | | | 5,513,636 | |
Chubb Corp. | | | 35,896 | | | | 4,336,596 | |
Cincinnati Financial Corp. | | | 23,305 | | | | 1,219,551 | |
Citigroup, Inc. | | | 475,093 | | | | 25,407,974 | |
CME Group, Inc. | | | 49,092 | | | | 4,636,248 | |
Comerica, Inc. | | | 25,917 | | | | 1,140,348 | |
Crown Castle International Corp. REIT | | | 51,842 | | | | 4,323,104 | |
Discover Financial Services | | | 72,977 | | | | 3,921,054 | |
E*TRADE Financial Corp. (a) | | | 43,889 | | | | 1,153,842 | |
Equity Residential REIT | | | 56,238 | | | | 4,006,958 | |
Essex Property Trust, Inc. REIT | | | 9,555 | | | | 2,050,694 | |
Fifth Third Bancorp | | | 136,554 | | | | 2,720,156 | |
Franklin Resources, Inc. | | | 62,651 | | | | 2,542,378 | |
General Growth Properties, Inc. REIT | | | 100,542 | | | | 2,551,756 | |
Genworth Financial, Inc. (Class A) (a) | | | 71,189 | | | | 368,759 | |
Goldman Sachs Group, Inc. | | | 63,688 | | | | 12,011,557 | |
Hartford Financial Services Group, Inc. | | | 63,130 | | | | 2,900,824 | |
HCP, Inc. REIT | | | 69,777 | | | | 2,585,936 | |
Health Care REIT, Inc. | | | 55,581 | | | | 3,521,056 | |
Host Hotels & Resorts, Inc. REIT | | | 113,659 | | | | 2,015,174 | |
Hudson City Bancorp, Inc. | | | 66,376 | | | | 617,297 | |
Huntington Bancshares, Inc. | | | 122,865 | | | | 1,340,457 | |
Intercontinental Exchange, Inc. | | | 17,525 | | | | 4,002,885 | |
Invesco Ltd. | | | 65,489 | | | | 2,233,830 | |
Iron Mountain, Inc. REIT | | | 33,274 | | | | 942,985 | |
JPMorgan Chase & Co. | | | 582,072 | | | | 37,310,815 | |
KeyCorp | | | 128,679 | | | | 1,768,049 | |
Kimco Realty Corp. REIT | | | 64,016 | | | | 1,475,569 | |
Legg Mason, Inc. | | | 15,615 | | | | 692,213 | |
Leucadia National Corp. | | | 47,809 | | | | 1,025,981 | |
Lincoln National Corp. | | | 40,310 | | | | 2,047,345 | |
Loews Corp. | | | 48,012 | | | | 1,750,037 | |
M&T Bank Corp. | | | 21,534 | | | | 2,546,180 | |
Macerich Co. REIT | | | 20,945 | | | | 1,595,590 | |
Marsh & McLennan Cos., Inc. | | | 82,934 | | | | 4,456,044 | |
McGraw Hill Financial, Inc. | | | 43,298 | | | | 4,199,473 | |
MetLife, Inc. | | | 175,626 | | | | 8,798,863 | |
Moody’s Corp. | | | 26,634 | | | | 2,724,925 | |
Morgan Stanley | | | 239,155 | | | | 8,238,890 | |
NASDAQ OMX Group, Inc. | | | 21,225 | | | | 1,086,508 | |
Navient Corp. | | | 59,941 | | | | 766,645 | |
Northern Trust Corp. | | | 35,310 | | | | 2,466,050 | |
People’s United Financial, Inc. | | | 49,334 | | | | 764,677 | |
| | | | | | | | |
| | |
Shares | | | Value | |
| | | | | | | | |
Plum Creek Timber Co., Inc. REIT | | | 27,186 | | | $ | 1,046,389 | |
PNC Financial Services Group, Inc. | | | 82,842 | | | | 7,548,563 | |
Principal Financial Group, Inc. | | | 45,626 | | | | 2,297,269 | |
Progressive Corp. | | | 85,852 | | | | 2,572,126 | |
ProLogis, Inc. REIT | | | 80,147 | | | | 3,045,586 | |
Prudential Financial, Inc. | | | 73,437 | | | | 5,926,366 | |
Public Storage, Inc. REIT | | | 22,852 | | | | 4,599,422 | |
Realty Income Corp. REIT | | | 35,500 | | | | 1,586,495 | |
Regions Financial Corp. | | | 213,143 | | | | 2,044,041 | |
Simon Property Group, Inc. REIT | | | 48,935 | | | | 8,775,024 | |
State Street Corp. (b) | | | 66,647 | | | | 4,793,252 | |
SunTrust Banks, Inc. | | | 78,882 | | | | 3,184,466 | |
T. Rowe Price Group, Inc. | | | 41,420 | | | | 2,977,270 | |
Torchmark Corp. | | | 19,384 | | | | 1,133,189 | |
Travelers Cos., Inc. | | | 51,098 | | | | 5,086,806 | |
U.S. Bancorp | | | 278,230 | | | | 11,783,040 | |
Unum Group | | | 43,424 | | | | 1,456,441 | |
Ventas, Inc. REIT | | | 51,003 | | | | 2,806,185 | |
Vornado Realty Trust REIT | | | 27,746 | | | | 2,419,174 | |
Wells Fargo & Co. | | | 735,046 | | | | 39,200,003 | |
Weyerhaeuser Co. REIT | | | 81,681 | | | | 2,282,167 | |
XL Group PLC | | | 48,220 | | | | 1,798,124 | |
Zions Bancorporation | | | 31,258 | | | | 906,482 | |
| | | | | | | | |
| | | | | | | 451,985,358 | |
| | | | | | | | |
|
Health Care - 14.9% | |
Abbott Laboratories | | | 233,759 | | | | 10,586,945 | |
AbbVie, Inc. | | | 270,563 | | | | 16,885,837 | |
Aetna, Inc. | | | 55,415 | | | | 6,346,126 | |
Agilent Technologies, Inc. | | | 52,075 | | | | 1,890,843 | |
Alexion Pharmaceuticals, Inc. (a) | | | 35,227 | | | | 6,065,737 | |
Allergan PLC (a) | | | 61,526 | | | | 18,687,907 | |
AmerisourceBergen Corp. | | | 33,552 | | | | 3,356,542 | |
Amgen, Inc. | | | 119,991 | | | | 18,212,234 | |
Anthem, Inc. | | | 42,119 | | | | 5,940,885 | |
Baxalta, Inc. (a) | | | 86,645 | | | | 3,045,572 | |
Baxter International, Inc. | | | 86,645 | | | | 3,331,500 | |
Becton Dickinson and Co. | | | 33,504 | | | | 4,724,734 | |
Biogen, Inc. (a) | | | 37,347 | | | | 11,103,263 | |
Boston Scientific Corp. (a) | | | 208,377 | | | | 3,488,231 | |
Bristol-Myers Squibb Co. | | | 261,112 | | | | 15,528,331 | |
C.R. Bard, Inc. | | | 11,162 | | | | 2,163,084 | |
Cardinal Health, Inc. | | | 52,424 | | | | 4,312,923 | |
Celgene Corp. (a) | | | 125,265 | | | | 14,791,291 | |
Cerner Corp. (a) | | | 47,263 | | | | 2,918,963 | |
CIGNA Corp. | | | 39,511 | | | | 5,562,754 | |
DaVita HealthCare Partners, Inc. (a) | | | 26,572 | | | | 2,009,906 | |
DENTSPLY International, Inc. | | | 20,166 | | | | 1,056,900 | |
| | | | |
| State Street Equity 500 Index Portfolio | | | 35 | |
State Street Equity 500 Index Portfolio
Portfolio of Investments, continued — August 31, 2015 (Unaudited)
| | | | | | | | |
| | |
Shares | | | Value | |
| | | | | | | | |
| | | | | | | | |
Edwards Lifesciences Corp. (a) | | | 16,445 | | | $ | 2,316,772 | |
Eli Lilly & Co. | | | 152,857 | | | | 12,587,774 | |
Endo International PLC (a) | | | 31,900 | | | | 2,456,300 | |
Express Scripts Holding Co. (a) | | | 106,747 | | | | 8,924,049 | |
Gilead Sciences, Inc. | | | 232,946 | | | | 24,475,636 | |
HCA Holdings, Inc. (a) | | | 46,800 | | | | 4,053,816 | |
Henry Schein, Inc. (a) | | | 13,100 | | | | 1,792,211 | |
Hospira, Inc. (a) | | | 28,117 | | | | 2,529,687 | |
Humana, Inc. | | | 22,717 | | | | 4,152,440 | |
Intuitive Surgical, Inc. (a) | | | 5,452 | | | | 2,785,699 | |
Johnson & Johnson (c) | | | 437,341 | | | | 41,101,307 | |
Laboratory Corp. of America Holdings (a) | | | 16,747 | | | | 1,972,964 | |
Mallinckrodt PLC (a) | | | 17,700 | | | | 1,526,448 | |
McKesson Corp. | | | 36,031 | | | | 7,119,005 | |
Medtronic PLC | | | 227,004 | | | | 16,410,119 | |
Merck & Co., Inc. | | | 445,198 | | | | 23,973,912 | |
Mylan NV (a) | | | 64,807 | | | | 3,213,779 | |
Patterson Cos., Inc. | | | 11,159 | | | | 511,417 | |
PerkinElmer, Inc. | | | 16,632 | | | | 809,646 | |
Perrigo Co. PLC | | | 22,414 | | | | 4,101,090 | |
Pfizer, Inc. | | | 965,148 | | | | 31,097,069 | |
Quest Diagnostics, Inc. | | | 22,158 | | | | 1,502,312 | |
Regeneron Pharmaceuticals, Inc. (a) | | | 12,158 | | | | 6,243,133 | |
St. Jude Medical, Inc. | | | 44,053 | | | | 3,119,393 | |
Stryker Corp. | | | 45,595 | | | | 4,497,947 | |
Tenet Healthcare Corp. (a) | | | 13,452 | | | | 662,242 | |
Thermo Fisher Scientific, Inc. | | | 62,512 | | | | 7,837,129 | |
UnitedHealth Group, Inc. | | | 151,622 | | | | 17,542,665 | |
Universal Health Services, Inc. | | | 13,300 | | | | 1,823,962 | |
Varian Medical Systems, Inc. (a) | | | 15,631 | | | | 1,270,019 | |
Vertex Pharmaceuticals, Inc. (a) | | | 38,748 | | | | 4,941,145 | |
Waters Corp. (a) | | | 14,215 | | | | 1,725,417 | |
Zimmer Biomet Holdings, Inc. | | | 25,727 | | | | 2,664,288 | |
Zoetis, Inc. | | | 76,228 | | | | 3,420,350 | |
| | | | | | | | |
| | | | | | | 417,171,650 | |
| | | | | | | | |
|
Industrials - 9.8% | |
3M Co. | | | 99,043 | | | | 14,077,972 | |
ADT Corp. | | | 25,056 | | | | 821,336 | |
Allegion PLC | | | 17,437 | | | | 1,039,420 | |
American Airlines Group, Inc. | | | 112,000 | | | | 4,365,760 | |
AMETEK, Inc. | | | 37,101 | | | | 1,996,776 | |
Boeing Co. | | | 102,124 | | | | 13,345,564 | |
C.H. Robinson Worldwide, Inc. | | | 22,382 | | | | 1,509,218 | |
Caterpillar, Inc. | | | 93,855 | | | | 7,174,276 | |
Cintas Corp. | | | 15,222 | | | | 1,293,718 | |
CSX Corp. | | | 155,859 | | | | 4,267,419 | |
| | | | | | | | |
| | |
Shares | | | Value | |
| | | | | | | | |
Cummins, Inc. | | | 26,444 | | | $ | 3,219,557 | |
Danaher Corp. | | | 96,478 | | | | 8,395,516 | |
Deere & Co. | | | 53,554 | | | | 4,379,646 | |
Delta Air Lines, Inc. | | | 130,566 | | | | 5,716,179 | |
Dover Corp. | | | 27,945 | | | | 1,731,193 | |
Dun & Bradstreet Corp. | | | 6,145 | | | | 651,186 | |
Eaton Corp. PLC | | | 76,199 | | | | 4,347,915 | |
Emerson Electric Co. | | | 102,369 | | | | 4,885,049 | |
Equifax, Inc. | | | 20,295 | | | | 1,986,880 | |
Expeditors International of Washington, Inc. | | | 29,444 | | | | 1,441,873 | |
Fastenal Co. | | | 44,042 | | | | 1,697,379 | |
FedEx Corp. | | | 41,950 | | | | 6,318,089 | |
Flowserve Corp. | | | 23,555 | | | | 1,063,037 | |
Fluor Corp. | | | 22,556 | | | | 1,029,005 | |
General Dynamics Corp. | | | 48,689 | | | | 6,915,299 | |
General Electric Co. | | | 1,586,963 | | | | 39,388,422 | |
Honeywell International, Inc. | | | 123,603 | | | | 12,270,070 | |
Illinois Tool Works, Inc. | | | 51,671 | | | | 4,367,750 | |
Ingersoll-Rand PLC | | | 41,116 | | | | 2,273,304 | |
Jacobs Engineering Group, Inc. (a) | | | 20,157 | | | | 814,544 | |
JB Hunt Transport Services, Inc. | | | 14,500 | | | | 1,055,310 | |
Joy Global, Inc. | | | 14,887 | | | | 360,563 | |
Kansas City Southern | | | 16,704 | | | | 1,549,129 | |
L-3 Communications Holdings, Inc. | | | 12,465 | | | | 1,314,684 | |
Lockheed Martin Corp. | | | 42,749 | | | | 8,600,244 | |
Masco Corp. | | | 54,139 | | | | 1,420,066 | |
Nielsen Holding PLC | | | 61,375 | | | | 2,775,991 | |
Norfolk Southern Corp. | | | 49,768 | | | | 3,877,425 | |
Northrop Grumman Corp. | | | 31,686 | | | | 5,188,266 | |
PACCAR, Inc. | | | 54,235 | | | | 3,198,238 | |
Parker-Hannifin Corp. | | | 20,514 | | | | 2,208,537 | |
Pentair PLC | | | 28,991 | | | | 1,602,912 | |
Pitney Bowes, Inc. | | | 30,921 | | | | 612,545 | |
Precision Castparts Corp. | | | 21,978 | | | | 5,060,434 | |
Quanta Services, Inc. (a) | | | 30,293 | | | | 734,302 | |
Raytheon Co. | | | 47,736 | | | | 4,895,804 | |
Republic Services, Inc. | | | 41,114 | | | | 1,684,852 | |
Robert Half International, Inc. | | | 20,374 | | | | 1,039,685 | |
Rockwell Automation, Inc. | | | 21,779 | | | | 2,435,546 | |
Rockwell Collins, Inc. | | | 22,300 | | | | 1,825,255 | |
Roper Technologies, Inc. | | | 16,535 | | | | 2,680,158 | |
Ryder System, Inc. | | | 9,755 | | | | 799,617 | |
Snap-on, Inc. | | | 8,872 | | | | 1,417,479 | |
Southwest Airlines Co. | | | 105,927 | | | | 3,887,521 | |
Stanley Black & Decker, Inc. | | | 24,950 | | | | 2,532,924 | |
Stericycle, Inc. (a) | | | 14,104 | | | | 1,990,639 | |
Textron, Inc. | | | 44,906 | | | | 1,742,353 | |
Tyco International PLC | | | 67,336 | | | | 2,443,623 | |
Union Pacific Corp. | | | 140,038 | | | | 12,006,858 | |
United Parcel Service, Inc. (Class B) | | | 109,455 | | | | 10,688,281 | |
| | |
| 36 | | State Street Equity 500 Index Portfolio |
State Street Equity 500 Index Portfolio
Portfolio of Investments, continued — August 31, 2015 (Unaudited)
| | | | | | | | |
| | |
Shares | | | Value | |
| | | | | | | | |
| | | | | | | | |
United Rentals, Inc. (a) | | | 15,200 | | | $ | 1,053,816 | |
United Technologies Corp. | | | 128,827 | | | | 11,801,841 | |
W.W. Grainger, Inc. | | | 9,412 | | | | 2,103,017 | |
Waste Management, Inc. | | | 68,204 | | | | 3,414,292 | |
Xylem, Inc. | | | 32,634 | | | | 1,058,973 | |
| | | | | | | | |
| | | | | | | 273,844,532 | |
| | | | | | | | |
|
Information Technology - 19.7% | |
Accenture PLC (Class A) | | | 99,282 | | | | 9,359,314 | |
Activision Blizzard, Inc. | | | 79,200 | | | | 2,267,496 | |
Adobe Systems, Inc. (a) | | | 73,813 | | | | 5,799,487 | |
Akamai Technologies, Inc. (a) | | | 27,734 | | | | 1,977,712 | |
Alliance Data Systems Corp. (a) | | | 10,204 | | | | 2,624,367 | |
Altera Corp. | | | 44,454 | | | | 2,158,242 | |
Amphenol Corp. (Class A) | | | 49,980 | | | | 2,616,953 | |
Analog Devices, Inc. | | | 50,818 | | | | 2,838,694 | |
Apple, Inc. | | | 905,664 | | | | 102,122,673 | |
Applied Materials, Inc. | | | 190,653 | | | | 3,066,654 | |
Autodesk, Inc. (a) | | | 34,170 | | | | 1,597,448 | |
Automatic Data Processing, Inc. | | | 76,465 | | | | 5,912,274 | |
Avago Technologies, Ltd. | | | 41,718 | | | | 5,255,216 | |
Broadcom Corp. (Class A) | | | 87,635 | | | | 4,528,100 | |
CA, Inc. | | | 54,159 | | | | 1,477,999 | |
Cisco Systems, Inc. | | | 803,029 | | | | 20,782,391 | |
Citrix Systems, Inc. (a) | | | 25,678 | | | | 1,748,929 | |
Cognizant Technology Solutions Corp. (Class A) (a) | | | 93,627 | | | | 5,892,883 | |
Computer Sciences Corp. | | | 22,732 | | | | 1,409,157 | |
Corning, Inc. | | | 203,350 | | | | 3,499,654 | |
eBay, Inc. (a) | | | 170,458 | | | | 4,621,116 | |
Electronic Arts, Inc. (a) | | | 50,121 | | | | 3,315,504 | |
EMC Corp. | | | 305,674 | | | | 7,602,112 | |
Equinix, Inc. REIT | | | 8,800 | | | | 2,373,976 | |
F5 Networks, Inc. (a) | | | 10,559 | | | | 1,281,968 | |
Facebook, Inc. (Class A) (a) | | | 331,507 | | | | 29,646,671 | |
Fidelity National Information Services, Inc. | | | 44,886 | | | | 3,099,827 | |
First Solar, Inc. (a) | | | 11,749 | | | | 562,072 | |
Fiserv, Inc. (a) | | | 35,642 | | | | 3,039,193 | |
FLIR Systems, Inc. | | | 20,339 | | | | 582,306 | |
Google, Inc. (Class A) (a) | | | 45,023 | | | | 29,166,800 | |
Google, Inc. (Class C) (a) | | | 44,945 | | | | 27,787,246 | |
Harris Corp. | | | 21,298 | | | | 1,636,112 | |
Hewlett-Packard Co. | | | 289,363 | | | | 8,119,526 | |
Intel Corp. | | | 741,920 | | | | 21,174,397 | |
International Business Machines Corp. | | | 143,647 | | | | 21,243,955 | |
Intuit, Inc. | | | 42,026 | | | | 3,603,730 | |
Juniper Networks, Inc. | | | 58,444 | | | | 1,502,595 | |
KLA-Tencor Corp. | | | 26,573 | | | | 1,331,573 | |
Lam Research Corp. | | | 24,281 | | | | 1,766,928 | |
Linear Technology Corp. | | | 35,021 | | | | 1,410,646 | |
Mastercard, Inc. (Class A) | | | 151,149 | | | | 13,961,633 | |
Microchip Technology, Inc. | | | 34,006 | | | | 1,445,255 | |
| | | | | | | | |
| | |
Shares | | | Value | |
| | | | | | | | |
Micron Technology, Inc. (a) | | | 173,328 | | | $ | 2,844,313 | |
Microsoft Corp. (c) | | | 1,270,377 | | | | 55,286,807 | |
Motorola Solutions, Inc. | | | 33,022 | | | | 2,140,486 | |
NetApp, Inc. | | | 49,643 | | | | 1,586,590 | |
NVIDIA Corp. | | | 87,012 | | | | 1,956,030 | |
Oracle Corp. | | | 507,070 | | | | 18,807,226 | |
Paychex, Inc. | | | 49,131 | | | | 2,194,190 | |
PayPal Holdings, Inc. (a) | | | 170,458 | | | | 5,966,030 | |
Qorvo, Inc. (a) | | | 23,300 | | | | 1,293,383 | |
QUALCOMM, Inc. | | | 258,985 | | | | 14,653,371 | |
Red Hat, Inc. (a) | | | 28,130 | | | | 2,031,267 | |
Salesforce.com, Inc. (a) | | | 93,805 | | | | 6,506,315 | |
SanDisk Corp. | | | 33,206 | | | | 1,811,719 | |
Seagate Technology PLC | | | 49,776 | | | | 2,558,486 | |
Skyworks Solutions, Inc. | | | 29,700 | | | | 2,594,295 | |
SL Green Realty Corp. REIT | | | 15,400 | | | | 1,594,054 | |
Symantec Corp. | | | 108,203 | | | | 2,217,079 | |
TE Connectivity, Ltd. | | | 64,849 | | | | 3,844,897 | |
Teradata Corp. (a) | | | 21,913 | | | | 640,517 | |
Texas Instruments, Inc. | | | 163,806 | | | | 7,836,479 | |
Total System Services, Inc. | | | 22,999 | | | | 1,054,044 | |
VeriSign, Inc. (a) | | | 19,320 | | | | 1,331,921 | |
Visa, Inc. (Class A) | | | 304,440 | | | | 21,706,572 | |
Western Digital Corp. | | | 33,647 | | | | 2,757,708 | |
Western Union Co. | | | 89,340 | | | | 1,647,430 | |
Xerox Corp. | | | 161,592 | | | | 1,643,391 | |
Xilinx, Inc. | | | 39,642 | | | | 1,660,603 | |
Yahoo!, Inc. (a)(c) | | | 137,637 | | | | 4,437,417 | |
| | | | | | | | |
| | | | | | | 551,813,404 | |
| | | | | | | | |
|
Materials - 2.9% | |
Air Products & Chemicals, Inc. | | | 29,807 | | | | 4,158,971 | |
Airgas, Inc. | | | 10,040 | | | | 969,061 | |
Alcoa, Inc. | | | 221,689 | | | | 2,094,961 | |
Avery Dennison Corp. | | | 13,318 | | | | 773,509 | |
Ball Corp. | | | 21,658 | | | | 1,427,479 | |
C.F. Industries Holdings, Inc. | | | 40,030 | | | | 2,296,921 | |
Dow Chemical Co. | | | 173,790 | | | | 7,605,050 | |
E.I. du Pont de Nemours & Co. | | | 142,594 | | | | 7,343,591 | |
Eastman Chemical Co. | | | 25,372 | | | | 1,838,455 | |
Ecolab, Inc. | | | 41,565 | | | | 4,536,404 | |
FMC Corp. | | | 22,922 | | | | 969,830 | |
Freeport-McMoRan, Inc. | | | 157,964 | | | | 1,680,737 | |
International Flavors & Fragrances, Inc. | | | 13,780 | | | | 1,509,599 | |
International Paper Co. | | | 66,808 | | | | 2,882,097 | |
LyondellBasell Industries NV (Class A) | | | 62,452 | | | | 5,332,152 | |
Martin Marietta Materials, Inc. | | | 10,555 | | | | 1,771,129 | |
Monsanto Co. | | | 75,094 | | | | 7,332,929 | |
Mosaic Co. | | | 47,516 | | | | 1,940,078 | |
Newmont Mining Corp. | | | 73,573 | | | | 1,255,891 | |
Nucor Corp. | | | 53,006 | | | | 2,294,630 | |
Owens-Illinois, Inc. (a) | | | 22,763 | | | | 474,609 | |
| | | | |
| State Street Equity 500 Index Portfolio | | | 37 | |
State Street Equity 500 Index Portfolio
Portfolio of Investments, continued — August 31, 2015 (Unaudited)
| | | | | | | | |
| | |
Shares | | | Value | |
| | | | | | | | |
| | | | | | | | |
PPG Industries, Inc. | | | 42,888 | | | $ | 4,086,798 | |
Praxair, Inc. | | | 45,000 | | | | 4,758,750 | |
Sealed Air Corp. | | | 32,469 | | | | 1,670,530 | |
Sherwin-Williams Co. | | | 11,887 | | | | 3,040,813 | |
Sigma-Aldrich Corp. | | | 19,661 | | | | 2,740,940 | |
Vulcan Materials Co. | | | 22,290 | | | | 2,086,790 | |
WestRock Co. | | | 41,048 | | | | 2,436,199 | |
| | | | | | | | |
| | | | | | | 81,308,903 | |
| | | | | | | | |
|
Telecommunication Services - 2.4% | |
AT&T, Inc. | | | 967,318 | | | | 32,114,958 | |
CenturyLink, Inc. | | | 86,173 | | | | 2,330,118 | |
Frontier Communications Corp. | | | 143,538 | | | | 727,738 | |
Level 3 Communications, Inc. (a) | | | 49,300 | | | | 2,205,189 | |
Verizon Communications, Inc. | | | 639,051 | | | | 29,402,736 | |
| | | | | | | | |
| | | | | | | 66,780,739 | |
| | | | | | | | |
|
Utilities - 2.9% | |
AES Corp. | | | 98,059 | | | | 1,176,708 | |
AGL Resources, Inc. | | | 18,002 | | | | 1,097,942 | |
Ameren Corp. | | | 36,056 | | | | 1,452,696 | |
American Electric Power Co., Inc. | | | 75,043 | | | | 4,074,085 | |
CenterPoint Energy, Inc. | | | 65,335 | | | | 1,216,538 | |
CMS Energy Corp. | | | 42,001 | | | | 1,376,793 | |
Consolidated Edison, Inc. | | | 47,100 | | | | 2,963,061 | |
Dominion Resources, Inc. | | | 91,268 | | | | 6,365,943 | |
DTE Energy Co. | | | 29,539 | | | | 2,305,814 | |
Duke Energy Corp. | | | 110,491 | | | | 7,834,917 | |
Edison International | | | 49,505 | | | | 2,895,052 | |
Entergy Corp. | | | 27,000 | | | | 1,763,910 | |
Eversource Energy | | | 51,243 | | | | 2,420,719 | |
Exelon Corp. | | | 131,659 | | | | 4,049,831 | |
FirstEnergy Corp. | | | 68,129 | | | | 2,177,403 | |
NextEra Energy, Inc. | | | 69,057 | | | | 6,795,899 | |
NiSource, Inc. | | | 47,478 | | | | 797,156 | |
NRG Energy, Inc. | | | 51,498 | | | | 1,025,840 | |
Pepco Holdings, Inc. | | | 35,659 | | | | 819,444 | |
PG&E Corp. | | | 77,112 | | | | 3,823,213 | |
Pinnacle West Capital Corp. | | | 18,956 | | | | 1,128,451 | |
PPL Corp. | | | 105,756 | | | | 3,277,378 | |
Public Service Enterprise Group, Inc. | | | 76,936 | | | | 3,096,674 | |
SCANA Corp. | | | 23,801 | | | | 1,258,835 | |
Sempra Energy | | | 35,624 | | | | 3,378,936 | |
Southern Co. | | | 139,484 | | | | 6,055,000 | |
TECO Energy, Inc. | | | 42,650 | | | | 898,636 | |
WEC Energy Group, Inc. | | | 45,587 | | | | 2,172,221 | |
Xcel Energy, Inc. | | | 80,800 | | | | 2,725,384 | |
| | | | | | | | |
| | | | | | | 80,424,479 | |
| | | | | | | | |
| |
Total Common Stocks
(cost $1,398,454,456) | | | | 2,740,597,959 | |
| | | | | | | | |
| | | | | | | | |
| | | Par
Amount | | | Value | |
| | | | | | | | |
| | | | | | | | |
| U.S. Government Securities - 0.2% | |
U.S. Treasury Bill (c)(d)(e) 0.01% due 10/01/2015 | | $ | 3,760,000 | | | $ | 3,760,000 | |
U.S. Treasury Bill (c)(d)(e) 0.01% due 10/01/2015 | | | 100,000 | | | | 99,998 | |
| | | | | | | | |
| |
Total U.S. Government Securities
(cost $3,859,998) | | | | 3,859,998 | |
| | | | | | | | |
| | |
| | | Shares | | | | |
| | | | | | | | |
| Short Term Investment - 1.4% | |
Money Market Fund - 1.4% | |
State Street Institutional Liquid Reserve Fund, Premier Class 0.12% (b)(f) | | | | | | | | |
(cost $39,469,325) | | | 39,469,325 | | | | 39,469,325 | |
| | | | | | | | |
| |
Total Investments - 99.5% (g)
(cost $1,441,783,779) (h) | | | | 2,783,927,282 | |
| |
Other Assets in Excess of
Liabilities - 0.5% | | | | 14,516,946 | |
| | | | | | | | |
| |
| Net Assets - 100.0% | | | $ | 2,798,444,228 | |
| | | | | | | | |
| (a) | Non-income producing security. |
| (b) | Affiliated issuer. See table that follows for more information. |
| (c) | All or part of this security has been designated as collateral for futures contracts. |
| (d) | Rate represents annualized yield at date of purchase. |
| (e) | Securities are valued in accordance with procedures approved by the Board of Trustees. Securities’ values are determined based on Level 2 inputs. |
| (f) | The rate shown is the annualized seven-day yield at period end. |
| (g) | Unless otherwise indicated, the values of the securities of the Portfolio are determined based on Level 1 inputs established by provisions surrounding fair value measurements and disclosures. |
| (h) | Cost of investments shown approximates cost for federal income tax purposes. Gross unrealized appreciation and gross unrealized depreciation of investments at August 31, 2015 was $1,373,606,029 and $31,462,526, respectively, resulting in net unrealized appreciation of investments of $1,342,143,503. |
| PLC | Public Limited Company |
| REIT | Real Estate Investment Trust |
See accompanying notes which are an integral part of the financial statements.
| | |
| 38 | | State Street Equity 500 Index Portfolio |
State Street Equity 500 Index Portfolio
Portfolio of Investments, continued — August 31, 2015 (Unaudited)
Security valuation — The Portfolio’s investments are valued at fair value each day that the Portfolio’s listing exchange is open and, for financial reporting purposes, as of the report date should the reporting period end on a day that the Portfolio’s listing exchange is not open. Fair value is generally defined as the price a fund would receive to sell an asset or pay to transfer a liability in an orderly transaction between market participants at the measurement date. By its nature, a fair value price is a good faith estimate of the valuation in a current sale and may not reflect an actual market price. The investments of the Portfolio are valued pursuant to policies and procedures developed by the Oversight Committee (the “Committee”) and approved by the Board of Trustees of the Trust (the “Board”). The Committee provides oversight of the valuation of investments for the Portfolio. The Board has responsibility for determining the fair value of investments. The members of the Committee are approved by the Board. Valuation techniques used to value the Portfolio’s investments by major category are as follows:
| • | | Equity investments (including registered investment companies that are exchange-traded funds) traded on a recognized securities exchange for which market quotations are readily available are valued at the last sale price or official closing price, as applicable, on the primary market or exchange on which they trade. Equity investments traded on a recognized exchange for which there were no sales on that day are valued at the last published sale price or at fair value. |
| • | | Investments in registered investment companies (including money market funds) or other unitized pooled investment vehicles that are not traded on an exchange are valued at that day’s published net asset value per share or unit. Money market funds generally value portfolio investments using the amortized cost method as set forth in Rule 2a-7 under the 1940 Act and in accordance with Fund procedures to stabilize net asset value. |
| • | | Exchange-traded futures contracts are valued at the settlement price on the primary market on which, they are traded most extensively. Exchange-traded futures contracts traded on a recognized exchange for which there were no sales on that day are valued at the last reported sale price obtained from independent pricing services or brokers or at fair value. |
In the event prices or quotations are not readily available or that application of these methods of valuation results in a price for an investment which is deemed not to be representative of the fair value of such investment, fair value will be determined in good faith by the Committee, in accordance with valuation policies and procedures approved by the Board.
Various inputs are used in determining the value of the Portfolio’s investments. These inputs are categorized into a hierarchy consisting of three broad levels for financial reporting purposes. The Portfolio values its assets and liabilities at fair value using a hierarchy that prioritizes the inputs to valuation techniques giving the highest priority to readily available unadjusted quoted prices in active markets for identical assets or liabilities (Level 1 measurements) and the lowest priority to unobservable inputs (Level 3 measurements) when market prices are not readily available or reliable. The categorization of a value determined for an investment within the hierarchy is based upon the pricing transparency of the investment and is not necessarily an indication of the risk associated with investing in it.
The three tier hierarchy of inputs is summarized below:
| | • | | Level 1 — Unadjusted quoted prices in active markets for identical assets and liabilities; |
| | • | | Level 2 — Inputs other than quoted prices included within Level 1 that are observable for the asset or liability either directly or indirectly, including quoted prices for similar assets or liabilities in active markets, quoted prices for identical or similar assets or liabilities in markets that are not considered to be active, inputs other than quoted prices that are observable for the asset or liability (such as exchange rates, financing terms, interest rates, yield curves, volatilities, prepayment speeds, loss severities, credit risks and default rates) or other market-corroborated inputs; and |
| | • | | Level 3 — Unobservable inputs for the asset or liability, including the Committee’s assumptions used in determining the fair value of investments. |
The inputs or methodology used for valuing securities are not an indication of the risk associated with investing in those securities.
See accompanying notes which are an integral part of the financial statements.
| | | | |
| State Street Equity 500 Index Portfolio | | | 39 | |
State Street Equity 500 Index Portfolio
Portfolio of Investments, continued — August 31, 2015 (Unaudited)
The following is a summary of the inputs used, as of August 31, 2015, in valuing the Portfolio’s assets carried at fair value:
| | | | | | | | | | | | | | | | |
| Description | | Quoted Prices in
Active Markets for
Identical Assets (Level 1) | | | Significant Other Observable Inputs (Level 2) | | | Significant Unobservable Inputs (Level 3) | | | Total | |
| | | | | | | | | | | | | | | | |
Assets: | | | | | | | | | | | | | | | | |
| | | | |
Investments: | | | | | | | | | | | | | | | | |
Common Stocks | | $ | 2,740,597,959 | | | $ | — | | | $ | — | | | $ | 2,740,597,959 | |
U.S. Government Securities | | | — | | | | 3,859,998 | | | | — | | | | 3,859,998 | |
Money Market Fund | | | 39,469,325 | | | | — | | | | — | | | | 39,469,325 | |
| | | | | | | | | | | | | | | | |
Total Investments | | | 2,780,067,284 | | | | 3,859,998 | | | | — | | | | 2,783,927,282 | |
| | | | |
Liabilities: | | | | | | | | | | | | | | | | |
| | | | |
Other Financial Instruments: | | | | | | | | | | | | | | | | |
Futures contracts | | | (2,632,420 | ) | | | — | | | | — | | | | (2,632,420 | ) |
| | | | | | | | | | | | | | | | |
Total | | $ | 2,777,434,864 | | | $ | 3,859,998 | | | $ | — | | | $ | 2,781,294,862 | |
| | | | | | | | | | | | | | | | |
The type of inputs used to value each security under the provisions surrounding fair value measurements and disclosures is identified in the Portfolio of Investments, which also includes a breakdown of the Portfolio’s investments by category.
For the eight months ended August 31, 2015, there were no transfers between levels.
Derivatives
Futures: The Portfolio may enter into financial futures contracts as part of its strategy to track the performance of the S&P 500® Index. Upon entering into a futures contract, the Portfolio is required to deposit with the broker cash or securities in an amount equal to a certain percentage of the contract amount. Variation margin payments are made or received by the Portfolio each day, depending on the daily fluctuations in the value of the underlying security or index, and are recorded for financial statement purposes as unrealized gains or losses by the Portfolio. The Portfolio recognizes a realized gain or loss when the contract is closed. The Portfolio voluntarily segregates securities in an amount equal to the outstanding value of the open futures contracts in accordance with Securities and Exchange Commission requirements.
| | | | | | | | | | |
| Schedule of Futures Contracts | | Number of
Contracts | | | Notional
Value | | Unrealized
Depreciation | |
| | | | | | | | | | |
S&P 500 Financial Futures Contracts (long) Expiration Date 09/2015 | | | 505 | | | $49,722,300 | | $ | (2,632,420 | ) |
| | | | | | | | | | |
Total unrealized depreciation on open futures contracts purchased | | | | | | | | $ | (2,632,420 | ) |
| | | | | | | | | | |
The Portfolio adopted provisions surrounding Derivatives and Hedging which requires qualitative disclosures about objectives and strategies for using derivatives, quantitative disclosures about fair value amounts of gains and losses on derivative instruments, and disclosures about credit-risk-related contingent features in derivative agreements.
The primary risks associated with the use of futures contracts are an imperfect correlation between the change in market value of the benchmark and the prices of futures contracts and the possibility of an illiquid market. To the extent permitted by the investment objective, restrictions and policies set forth in the Portfolio’s Prospectus and Statement of Additional Information, the Portfolio may participate in various derivative-based transactions. Derivative securities are instruments or agreements whose value is derived from an underlying security or index. The Portfolio’s use of derivatives includes futures. These instruments offer unique characteristics and risks that assist the Portfolio in meeting its investment objective. The Portfolio typically uses derivatives through cash equitization. Cash equitization is a technique that may be used by the Portfolio through the use of options and futures to earn “market-like” returns with the Portfolio’s excess and liquidity reserve cash balances and receivables. By purchasing certain instruments, the Portfolio may more effectively achieve the desired portfolio characteristics that assist in meeting the Portfolio’s investment objectives. Depending on how the derivatives are structured and utilized, the risks associated with them may vary widely. These risks are generally categorized as market risk, liquidity risk and counterparty or credit risk.
See accompanying notes which are an integral part of the financial statements.
| | |
| 40 | | State Street Equity 500 Index Portfolio |
State Street Equity 500 Index Portfolio
Portfolio of Investments, continued — August 31, 2015 (Unaudited)
The following table discloses the amounts related to the Portfolio’s use of derivative instruments and hedging activities at August 31, 2015:
Asset Derivatives(1)
| | | | | | | | |
| | | Equity
Contracts
Risk | | | Total | |
| | | | | | | | |
Futures Contracts | | $ | (2,632,420 | ) | | $ | (2,632,420 | ) |
| | (1) | Portfolio of Investments: Unrealized depreciation of futures contracts. Only unsettled receivable/payable for variation margin is reported with the Statement of Assets and Liabilities. |
The average notional value of futures outstanding during the eight months ended August 31, 2015, was $57,626,954.
Affiliates Table
Certain investments made by the Portfolio were made in securities affiliated with State Street and SSGA Funds Management, Inc. Investments in State Street Corp., the holding company of State Street, were made according to its representative portion of the S&P 500® Index. The Portfolio also invested in the State Street Institutional Liquid Reserves Fund. Transactions in all affiliates for the eight months ending August 31, 2015 were as follows:
| | | | | | | | | | | | | | | | | | | | | | | | | | | | |
Security Description | | Number
of Shares
Held at
12/31/14 | | | Shares
Purchased for
the Eight Months
Ended 08/31/15 | | | Shares
Sold for
the Eight Months
Ended 08/31/15 | | | Number
of Shares
Held at
08/31/15 | | | Value at
08/31/15 | | | Income
Earned for
the Eight Months
Ended 08/31/15 | | | Realized
Gain/Loss on
Shares Sold | |
| | | | | | | | | | | | | | | | | | | | | | | | | | | | |
State Street Corp. | | | 62,947 | | | | 3,700 | | | | — | | | | 66,647 | | | $ | 4,793,252 | | | $ | 42,654 | | | $ | — | |
State Street Institutional Liquid Reserves Fund, Premier Class | | | 91,116,189 | | | | 208,209,116 | | | | 259,855,980 | | | | 39,469,325 | | | | 39,469,325 | | | | 42,828 | | | | — | |
See accompanying notes which are an integral part of the financial statements.
| | | | |
| State Street Equity 500 Index Portfolio | | | 41 | |
State Street Equity 500 Index Portfolio
Statement of Assets and Liabilities — August 31, 2015 (Unaudited)
| | | | |
| | | | |
| | | | |
Assets | | | | |
Investments in unaffiliated issuers at market value (identified cost $1,399,963,253) | | $ | 2,739,664,705 | |
Investments in non-controlled affiliates at market value (identified cost $41,820,526) (Note 4) | | | 44,262,577 | |
| | | | |
Total investments at market value (identified cost $1,441,783,779) | | | 2,783,927,282 | |
Receivable for investment securities sold | | | 11,438,121 | |
Dividends and interest receivable | | | 6,170,956 | |
Dividends receivable from non-controlled affiliates | | | 6,964 | |
| | | | |
Total assets | | | 2,801,543,323 | |
| | | | |
| |
Liabilities | | | | |
Investment securities purchased | | | 2,315,554 | |
Daily variation margin on futures contracts | | | 517,625 | |
Management fees payable (Note 4) | | | 265,916 | |
| | | | |
Total liabilities | | | 3,099,095 | |
| | | | |
| | | | |
Net Assets | | $ | 2,798,444,228 | |
| | | | |
See accompanying notes which are an integral part of the financial statements.
| | |
| 42 | | Statement of Assets and Liabilities |
31 December 2014
State Street Master Funds
State Street Equity 500 Index Portfolio
This page has been intentionally left blank.
State Street Equity 500 Index Portfolio
Portfolio of Investments — December 31, 2014
| | | | | | | | |
| | | Shares | | | Market
Value | |
| | | | | | | | |
| | | | | | | | |
| Common Stocks - 96.9% | | | | | |
Consumer Discretionary - 11.7% | | | | | |
Amazon.com, Inc. (a) | | | 58,102 | | | $ | 18,031,956 | |
AutoNation, Inc. (a) | | | 12,469 | | | | 753,252 | |
AutoZone, Inc. (a) | | | 4,988 | | | | 3,088,121 | |
Bed Bath & Beyond, Inc. (a) | | | 31,630 | | | | 2,409,257 | |
Best Buy Co., Inc. | | | 44,213 | | | | 1,723,423 | |
BorgWarner, Inc. | | | 36,423 | | | | 2,001,444 | |
Cablevision Systems Corp. Class A | | | 30,812 | | | | 635,960 | |
CarMax, Inc. (a) | | | 32,197 | | | | 2,143,676 | |
Carnival Corp. | | | 69,149 | | | | 3,134,524 | |
CBS Corp. Class B | | | 72,993 | | | | 4,039,433 | |
Chipotle Mexican Grill, Inc. (a) | | | 4,614 | | | | 3,158,329 | |
Coach, Inc. | | | 38,800 | | | | 1,457,328 | |
Comcast Corp. Class A | | | 391,565 | | | | 22,714,686 | |
D.R. Horton, Inc. | | | 50,179 | | | | 1,269,027 | |
Darden Restaurants, Inc. | | | 20,917 | | | | 1,226,364 | |
Delphi Automotive PLC | | | 43,681 | | | | 3,176,482 | |
DIRECTV (a) | | | 76,375 | | | | 6,621,712 | |
Discovery Communications, Inc. Class A (a) | | | 21,597 | | | | 744,017 | |
Discovery Communications, Inc. Class C (a) | | | 39,797 | | | | 1,341,955 | |
Dollar General Corp. (a) | | | 44,487 | | | | 3,145,231 | |
Dollar Tree, Inc. (a) | | | 30,293 | | | | 2,132,021 | |
Expedia, Inc. | | | 15,023 | | | | 1,282,363 | |
Family Dollar Stores, Inc. | | | 13,465 | | | | 1,066,563 | |
Ford Motor Co. | | | 589,560 | | | | 9,138,180 | |
Fossil Group, Inc. (a) | | | 7,617 | | | | 843,506 | |
GameStop Corp. Class A | | | 16,878 | | | | 570,476 | |
Gannett Co., Inc. | | | 34,252 | | | | 1,093,666 | |
Gap, Inc. | | | 44,764 | | | | 1,885,012 | |
Garmin Ltd. | | | 19,560 | | | | 1,033,355 | |
General Motors Co. | | | 206,677 | | | | 7,215,094 | |
Genuine Parts Co. | | | 24,420 | | | | 2,602,439 | |
Goodyear Tire & Rubber Co. | | | 40,813 | | | | 1,166,027 | |
H&R Block, Inc. | | | 45,551 | | | | 1,534,158 | |
Harley-Davidson, Inc. | | | 33,585 | | | | 2,213,587 | |
Harman International Industries, Inc. | | | 10,405 | | | | 1,110,317 | |
Hasbro, Inc. | | | 15,428 | | | | 848,386 | |
Home Depot, Inc. | | | 201,910 | | | | 21,194,493 | |
Interpublic Group of Cos., Inc. | | | 62,228 | | | | 1,292,475 | |
Johnson Controls, Inc. | | | 102,206 | | | | 4,940,638 | |
Kohl’s Corp. | | | 29,888 | | | | 1,824,363 | |
L Brands, Inc. | | | 36,546 | | | | 3,163,056 | |
Leggett & Platt, Inc. | | | 20,944 | | | | 892,424 | |
Lennar Corp. Class A | | | 26,425 | | | | 1,184,104 | |
Lowe’s Cos., Inc. | | | 150,012 | | | | 10,320,826 | |
Macy’s, Inc. | | | 53,161 | | | | 3,495,336 | |
Marriott International, Inc. Class A | | | 33,797 | | | | 2,637,180 | |
Mattel, Inc. | | | 47,843 | | | | 1,480,502 | |
| | | | | | | | |
| | | Shares | | | Market
Value | |
| | | | | | | | |
McDonald’s Corp. | | | 147,715 | | | $ | 13,840,895 | |
Michael Kors Holdings, Ltd. (a) | | | 29,886 | | | | 2,244,439 | |
Mohawk Industries, Inc. (a) | | | 9,669 | | | | 1,502,176 | |
Netflix, Inc. (a) | | | 8,828 | | | | 3,015,733 | |
Newell Rubbermaid, Inc. | | | 41,451 | | | | 1,578,869 | |
News Corp. Class A (a) | | | 69,414 | | | | 1,089,106 | |
NIKE, Inc. Class B | | | 105,051 | | | | 10,100,654 | |
Nordstrom, Inc. | | | 20,456 | | | | 1,624,002 | |
O’Reilly Automotive, Inc. (a) | | | 15,320 | | | | 2,950,938 | |
Omnicom Group, Inc. | | | 38,550 | | | | 2,986,468 | |
PetSmart, Inc. | | | 14,973 | | | | 1,217,230 | |
Priceline Group, Inc. (a) | | | 7,908 | | | | 9,016,781 | |
PulteGroup, Inc. | | | 47,343 | | | | 1,015,981 | |
PVH Corp. | | | 12,451 | | | | 1,595,845 | |
Ralph Lauren Corp. | | | 9,236 | | | | 1,710,138 | |
Ross Stores, Inc. | | | 31,072 | | | | 2,928,847 | |
Royal Caribbean Cruises, Ltd. | | | 25,100 | | | | 2,068,993 | |
Scripps Networks Interactive, Inc. Class A | | | 15,263 | | | | 1,148,846 | |
Staples, Inc. | | | 95,234 | | | | 1,725,640 | |
Starbucks Corp. | | | 114,546 | | | | 9,398,499 | |
Starwood Hotels & Resorts Worldwide, Inc. | | | 29,944 | | | | 2,427,560 | |
Target Corp. | | | 95,444 | | | | 7,245,154 | |
Tiffany & Co. | | | 16,081 | | | | 1,718,416 | |
Time Warner Cable, Inc. | | | 42,574 | | | | 6,473,802 | |
Time Warner, Inc. | | | 127,580 | | | | 10,897,884 | |
TJX Cos., Inc. | | | 105,275 | | | | 7,219,759 | |
Tractor Supply Co. | | | 19,474 | | | | 1,534,941 | |
TripAdvisor, Inc. (a) | | | 15,715 | | | | 1,173,282 | |
Twenty-First Century Fox, Inc. Class A | | | 285,609 | | | | 10,968,814 | |
Under Armour, Inc. Class A (a) | | | 25,076 | | | | 1,702,660 | |
Urban Outfitters, Inc. (a) | | | 15,839 | | | | 556,424 | |
V.F. Corp. | | | 53,528 | | | | 4,009,247 | |
Viacom, Inc. Class B | | | 57,541 | | | | 4,329,960 | |
Walt Disney Co. | | | 236,793 | | | | 22,303,533 | |
Whirlpool Corp. | | | 12,459 | | | | 2,413,807 | |
Wyndham Worldwide Corp. | | | 19,646 | | | | 1,684,841 | |
Wynn Resorts, Ltd. | | | 11,859 | | | | 1,764,145 | |
Yum! Brands, Inc. | | | 67,990 | | | | 4,953,071 | |
| | | | | | | | |
| | | | | | | 337,114,104 | |
| | | | | | | | |
|
Consumer Staples - 9.5% | |
Altria Group, Inc. | | | 303,870 | | | | 14,971,675 | |
Archer-Daniels-Midland Co. | | | 97,392 | | | | 5,064,384 | |
Avon Products, Inc. | | | 58,558 | | | | 549,860 | |
Brown-Forman Corp. Class B | | | 24,161 | | | | 2,122,302 | |
Campbell Soup Co. | | | 24,983 | | | | 1,099,252 | |
Clorox Co. | | | 19,379 | | | | 2,019,486 | |
Coca-Cola Co. | | | 599,122 | | | | 25,294,931 | |
Coca-Cola Enterprises, Inc. | | | 35,313 | | | | 1,561,541 | |
Colgate-Palmolive Co. | | | 130,379 | | | | 9,020,923 | |
| | | | |
| State Street Equity 500 Index Portfolio | | | 45 | |
State Street Equity 500 Index Portfolio
Portfolio of Investments, continued — December 31, 2014
| | | | | | | | |
| | | Shares | | | Market
Value | |
| | | | | | | | |
| | | | | | | | |
ConAgra Foods, Inc. | | | 66,051 | | | $ | 2,396,330 | |
Constellation Brands, Inc. Class A (a) | | | 24,776 | | | | 2,432,260 | |
Costco Wholesale Corp. | | | 66,834 | | | | 9,473,719 | |
CVS Health Corp. | | | 174,027 | | | | 16,760,540 | |
Dr. Pepper Snapple Group, Inc. | | | 28,303 | | | | 2,028,759 | |
Estee Lauder Cos., Inc. Class A | | | 32,763 | | | | 2,496,541 | |
General Mills, Inc. | | | 94,522 | | | | 5,040,858 | |
Hershey Co. | | | 23,615 | | | | 2,454,307 | |
Hormel Foods Corp. | | | 18,349 | | | | 955,983 | |
J.M. Smucker Co. | | | 14,855 | | | | 1,500,058 | |
Kellogg Co. | | | 40,207 | | | | 2,631,146 | |
Keurig Green Mountain, Inc. | | | 18,089 | | | | 2,394,893 | |
Kimberly-Clark Corp. | | | 57,473 | | | | 6,640,430 | |
Kraft Foods Group, Inc. | | | 90,751 | | | | 5,686,458 | |
Kroger Co. | | | 76,955 | | | | 4,941,281 | |
Lorillard, Inc. | | | 53,128 | | | | 3,343,876 | |
McCormick & Co., Inc. | | | 20,261 | | | | 1,505,392 | |
Mead Johnson Nutrition Co. | | | 30,568 | | | | 3,073,307 | |
Molson Coors Brewing Co. Class B | | | 23,509 | | | | 1,751,891 | |
Mondelez International, Inc. Class A | | | 255,894 | | | | 9,295,350 | |
Monster Beverage Corp. (a) | | | 21,547 | | | | 2,334,617 | |
PepsiCo, Inc. | | | 226,738 | | | | 21,440,345 | |
Philip Morris International, Inc. | | | 237,687 | | | | 19,359,606 | |
Procter & Gamble Co. | | | 411,961 | | | | 37,525,527 | |
Reynolds American, Inc. | | | 45,070 | | | | 2,896,649 | |
Safeway, Inc. | | | 32,165 | | | | 1,129,635 | |
Sysco Corp. | | | 87,335 | | | | 3,466,326 | |
Tyson Foods, Inc. Class A | | | 44,691 | | | | 1,791,662 | |
Wal-Mart Stores, Inc. | | | 241,499 | | | | 20,739,934 | |
Walgreens Boots Alliance, Inc. | | | 133,713 | | | | 10,188,931 | |
Whole Foods Market, Inc. | | | 55,587 | | | | 2,802,697 | |
| | | | | | | | |
| | | | | | | 272,183,662 | |
| | | | | | | | |
| | |
Energy - 8.2% | | | | | | | | |
Anadarko Petroleum Corp. | | | 77,544 | | | | 6,397,380 | |
Apache Corp. | | | 56,370 | | | | 3,532,708 | |
Baker Hughes, Inc. | | | 64,694 | | | | 3,627,393 | |
Cabot Oil & Gas Corp. | | | 65,622 | | | | 1,943,067 | |
Cameron International Corp. (a) | | | 30,467 | | | | 1,521,827 | |
Chesapeake Energy Corp. | | | 78,594 | | | | 1,538,085 | |
Chevron Corp. (b) | | | 287,334 | | | | 32,233,128 | |
Cimarex Energy Co. | | | 13,242 | | | | 1,403,652 | |
ConocoPhillips | | | 187,103 | | | | 12,921,333 | |
CONSOL Energy, Inc. | | | 32,173 | | | | 1,087,769 | |
Denbury Resources, Inc. | | | 53,229 | | | | 432,752 | |
Devon Energy Corp. | | | 59,550 | | | | 3,645,056 | |
| | | | | | | | |
| | | Shares | | | Market
Value | |
| | | | | | | | |
Diamond Offshore Drilling, Inc. | | | 9,954 | | | $ | 365,411 | |
Ensco PLC Class A | | | 32,889 | | | | 985,026 | |
EOG Resources, Inc. | | | 83,263 | | | | 7,666,024 | |
EQT Corp. | | | 22,243 | | | | 1,683,795 | |
ExxonMobil Corp. (b) | | | 644,672 | | | | 59,599,926 | |
FMC Technologies, Inc. (a) | | | 33,409 | | | | 1,564,878 | |
Halliburton Co. | | | 130,167 | | | | 5,119,468 | |
Helmerich & Payne, Inc. | | | 14,974 | | | | 1,009,547 | |
Hess Corp. | | | 38,344 | | | | 2,830,554 | |
Kinder Morgan, Inc. | | | 258,176 | | | | 10,923,427 | |
Marathon Oil Corp. | | | 99,689 | | | | 2,820,202 | |
Marathon Petroleum Corp. | | | 43,801 | | | | 3,953,478 | |
Murphy Oil Corp. | | | 24,962 | | | | 1,261,080 | |
Nabors Industries, Ltd. | | | 41,720 | | | | 541,526 | |
National Oilwell Varco, Inc. | | | 66,641 | | | | 4,366,985 | |
Newfield Exploration Co. (a) | | | 20,685 | | | | 560,977 | |
Noble Corp. PLC | | | 37,996 | | | | 629,594 | |
Noble Energy, Inc. | | | 54,795 | | | | 2,598,927 | |
Occidental Petroleum Corp. | | | 117,635 | | | | 9,482,557 | |
ONEOK, Inc. | | | 31,504 | | | | 1,568,584 | |
Phillips 66 | | | 85,692 | | | | 6,144,116 | |
Pioneer Natural Resources Co. | | | 23,524 | | | | 3,501,547 | |
QEP Resources, Inc. | | | 27,323 | | | | 552,471 | |
Range Resources Corp. | | | 24,841 | | | | 1,327,751 | |
Schlumberger, Ltd. | | | 195,272 | | | | 16,678,182 | |
Southwestern Energy Co. (a) | | | 51,844 | | | | 1,414,823 | |
Spectra Energy Corp. | | | 104,141 | | | | 3,780,318 | |
Tesoro Corp. | | | 20,049 | | | | 1,490,643 | |
Transocean, Ltd. | | | 47,690 | | | | 874,158 | |
Valero Energy Corp. | | | 78,586 | | | | 3,890,007 | |
Williams Cos., Inc. (The) | | | 102,610 | | | | 4,611,293 | |
| | | | | | | | |
| | | | | | | 234,081,425 | |
| | | | | | | | |
| | |
Financials - 16.1% | | | | | | | | |
ACE, Ltd. | | | 49,767 | | | | 5,717,233 | |
Affiliated Managers Group, Inc. (a) | | | 8,476 | | | | 1,798,946 | |
Aflac, Inc. | | | 69,737 | | | | 4,260,233 | |
Allstate Corp. | | | 63,967 | | | | 4,493,682 | |
American Express Co. | | | 136,052 | | | | 12,658,278 | |
American International Group, Inc. | | | 215,932 | | | | 12,094,351 | |
American Tower Corp. REIT | | | 59,682 | | | | 5,899,566 | |
Ameriprise Financial, Inc. | | | 27,963 | | | | 3,698,107 | |
Aon PLC | | | 42,882 | | | | 4,066,500 | |
Apartment Investment & Management Co. Class A REIT | | | 19,865 | | | | 737,985 | |
Assurant, Inc. | | | 10,846 | | | | 742,192 | |
AvalonBay Communities, Inc. REIT | | | 19,529 | | | | 3,190,843 | |
Bank of America Corp. | | | 1,598,166 | | | | 28,591,190 | |
Bank of New York Mellon Corp. | | | 172,691 | | | | 7,006,074 | |
| | |
| 46 | | State Street Equity 500 Index Portfolio |
State Street Equity 500 Index Portfolio
Portfolio of Investments, continued — December 31, 2014
| | | | | | | | |
| | | Shares | | | Market
Value | |
| | | | | | | | |
| | | | | | | | |
BB&T Corp. | | | 109,439 | | | $ | 4,256,083 | |
Berkshire Hathaway, Inc. Class B (a) | | | 277,919 | | | | 41,729,538 | |
BlackRock, Inc. | | | 19,418 | | | | 6,943,100 | |
Boston Properties, Inc. REIT | | | 22,821 | | | | 2,936,835 | |
Capital One Financial Corp. | | | 85,268 | | | | 7,038,873 | |
CBRE Group, Inc. (a) | | | 42,908 | | | | 1,469,599 | |
Charles Schwab Corp. | | | 172,289 | | | | 5,201,405 | |
Chubb Corp. | | | 35,896 | | | | 3,714,159 | |
Cincinnati Financial Corp. | | | 23,305 | | | | 1,207,898 | |
Citigroup, Inc. | | | 462,693 | | | | 25,036,318 | |
CME Group, Inc. | | | 49,092 | | | | 4,352,006 | |
Comerica, Inc. | | | 25,917 | | | | 1,213,952 | |
Crown Castle International Corp. REIT | | | 51,842 | | | | 4,079,965 | |
Discover Financial Services | | | 68,377 | | | | 4,478,010 | |
E*TRADE Financial Corp. (a) | | | 43,889 | | | | 1,064,528 | |
Equity Residential REIT | | | 56,238 | | | | 4,040,138 | |
Essex Property Trust, Inc. REIT | | | 9,555 | | | | 1,974,063 | |
Fifth Third Bancorp | | | 122,654 | | | | 2,499,075 | |
Franklin Resources, Inc. | | | 57,851 | | | | 3,203,210 | |
General Growth Properties, Inc. REIT | | | 91,342 | | | | 2,569,450 | |
Genworth Financial, Inc. Class A (a) | | | 71,189 | | | | 605,107 | |
Goldman Sachs Group, Inc. | | | 62,188 | | | | 12,053,900 | |
Hartford Financial Services Group, Inc. | | | 70,630 | | | | 2,944,565 | |
HCP, Inc. REIT | | | 69,777 | | | | 3,072,281 | |
Health Care REIT, Inc. | | | 49,581 | | | | 3,751,794 | |
Host Hotels & Resorts, Inc. REIT | | | 113,659 | | | | 2,701,674 | |
Hudson City Bancorp, Inc. | | | 66,376 | | | | 671,725 | |
Huntington Bancshares, Inc. | | | 122,865 | | | | 1,292,540 | |
Intercontinental Exchange, Inc. | | | 17,525 | | | | 3,843,057 | |
Invesco Ltd. | | | 65,489 | | | | 2,588,125 | |
Iron Mountain, Inc. REIT | | | 33,274 | | | | 1,286,373 | |
J.P. Morgan Chase & Co. | | | 571,672 | | | | 35,775,234 | |
KeyCorp | | | 128,679 | | | | 1,788,638 | |
Kimco Realty Corp. REIT | | | 64,016 | | | | 1,609,362 | |
Legg Mason, Inc. | | | 15,615 | | | | 833,373 | |
Leucadia National Corp. | | | 47,809 | | | | 1,071,878 | |
Lincoln National Corp. | | | 40,310 | | | | 2,324,678 | |
Loews Corp. | | | 48,012 | | | | 2,017,464 | |
M&T Bank Corp. | | | 19,334 | | | | 2,428,737 | |
Marsh & McLennan Cos., Inc. | | | 82,934 | | | | 4,747,142 | |
McGraw Hill Financial, Inc. | | | 40,298 | | | | 3,585,716 | |
MetLife, Inc. | | | 175,626 | | | | 9,499,610 | |
Moody’s Corp. | | | 27,234 | | | | 2,609,290 | |
Morgan Stanley | | | 231,955 | | | | 8,999,854 | |
NASDAQ OMX Group, Inc. | | | 15,925 | | | | 763,763 | |
Navient Corp. | | | 59,941 | | | | 1,295,325 | |
Northern Trust Corp. | | | 35,310 | | | | 2,379,894 | |
| | | | | | | | |
| | | Shares | | | Market
Value | |
| | | | | | | | |
People’s United Financial, Inc. | | | 49,334 | | | $ | 748,890 | |
Plum Creek Timber Co., Inc. REIT | | | 27,186 | | | | 1,163,289 | |
PNC Financial Services Group, Inc. | | | 82,842 | | | | 7,557,676 | |
Principal Financial Group, Inc. | | | 40,326 | | | | 2,094,532 | |
Progressive Corp. | | | 85,852 | | | | 2,317,146 | |
ProLogis, Inc. REIT | | | 74,347 | | | | 3,199,151 | |
Prudential Financial, Inc. | | | 70,037 | | | | 6,335,547 | |
Public Storage, Inc. REIT | | | 21,452 | | | | 3,965,402 | |
Regions Financial Corp. | | | 213,143 | | | | 2,250,790 | |
Simon Property Group, Inc. REIT | | | 47,435 | | | | 8,638,388 | |
State Street Corp. (c) | | | 62,947 | | | | 4,941,340 | |
SunTrust Banks, Inc. | | | 78,882 | | | | 3,305,156 | |
T. Rowe Price Group, Inc. | | | 38,320 | | | | 3,290,155 | |
The Macerich Co. REIT | | | 20,945 | | | | 1,747,022 | |
Torchmark Corp. | | | 19,384 | | | | 1,050,031 | |
Travelers Cos., Inc. | | | 51,098 | | | | 5,408,723 | |
U.S. Bancorp | | | 271,630 | | | | 12,209,769 | |
Unum Group | | | 35,424 | | | | 1,235,589 | |
Ventas, Inc. REIT | | | 44,703 | | | | 3,205,205 | |
Vornado Realty Trust REIT | | | 27,746 | | | | 3,265,982 | |
Wells Fargo & Co. | | | 721,646 | | | | 39,560,634 | |
Weyerhaeuser Co. REIT | | | 81,681 | | | | 2,931,531 | |
XL Group PLC | | | 38,920 | | | | 1,337,680 | |
Zions Bancorporation | | | 31,258 | | | | 891,166 | |
| | | | | | | | |
| | | | | | | 463,155,278 | |
| | | | | | | | |
| | |
Health Care - 13.8% | | | | | | | | |
Abbott Laboratories | | | 227,959 | | | | 10,262,714 | |
AbbVie, Inc. | | | 241,063 | | | | 15,775,163 | |
Actavis PLC (a) | | | 40,969 | | | | 10,545,830 | |
Aetna, Inc. | | | 52,415 | | | | 4,656,024 | |
Agilent Technologies, Inc. | | | 52,075 | | | | 2,131,951 | |
Alexion Pharmaceuticals, Inc. (a) | | | 30,127 | | | | 5,574,399 | |
Allergan, Inc. | | | 45,014 | | | | 9,569,526 | |
AmerisourceBergen Corp. | | | 33,552 | | | | 3,025,048 | |
Amgen, Inc. | | | 116,391 | | | | 18,539,922 | |
Anthem, Inc. | | | 42,119 | | | | 5,293,095 | |
Baxter International, Inc. | | | 82,545 | | | | 6,049,723 | |
Becton Dickinson and Co. | | | 28,992 | | | | 4,034,527 | |
Biogen Idec, Inc. (a) | | | 35,847 | | | | 12,168,264 | |
Boston Scientific Corp. (a) | | | 208,377 | | | | 2,760,995 | |
Bristol-Myers Squibb Co. | | | 251,212 | | | | 14,829,044 | |
C.R. Bard, Inc. | | | 11,162 | | | | 1,859,812 | |
Cardinal Health, Inc. | | | 52,424 | | | | 4,232,190 | |
CareFusion Corp. (a) | | | 29,322 | | | | 1,739,968 | |
Celgene Corp. (a) | | | 122,865 | | | | 13,743,679 | |
Cerner Corp. (a) | | | 47,263 | | | | 3,056,026 | |
CIGNA Corp. | | | 39,811 | | | | 4,096,950 | |
Covidien PLC | | | 68,613 | | | | 7,017,738 | |
| | | | |
| State Street Equity 500 Index Portfolio | | | 47 | |
State Street Equity 500 Index Portfolio
Portfolio of Investments, continued — December 31, 2014
| | | | | | | | |
| | | Shares | | | Market
Value | |
| | | | | | | | |
| | | | | | | | |
DaVita HealthCare Partners, Inc. (a) | | | 26,572 | | | $ | 2,012,563 | |
DENTSPLY International, Inc. | | | 20,166 | | | | 1,074,243 | |
Edwards Lifesciences Corp. (a) | | | 16,445 | | | | 2,094,764 | |
Eli Lilly & Co. | | | 149,057 | | | | 10,283,442 | |
Express Scripts Holding Co. (a) | | | 111,647 | | | | 9,453,152 | |
Gilead Sciences, Inc. (a) | | | 228,746 | | | | 21,561,598 | |
Hospira, Inc. (a) | | | 25,017 | | | | 1,532,291 | |
Humana, Inc. | | | 22,917 | | | | 3,291,569 | |
Intuitive Surgical, Inc. (a) | | | 5,452 | | | | 2,883,781 | |
Johnson & Johnson | | | 427,741 | | | | 44,728,876 | |
Laboratory Corp. of America Holdings (a) | | | 13,347 | | | | 1,440,141 | |
Mallinckrodt PLC (a) | | | 17,700 | | | | 1,752,831 | |
McKesson Corp. | | | 36,031 | | | | 7,479,315 | |
Medtronic, Inc. | | | 148,410 | | | | 10,715,202 | |
Merck & Co., Inc. | | | 435,198 | | | | 24,714,894 | |
Mylan, Inc. (a) | | | 56,907 | | | | 3,207,848 | |
Patterson Cos., Inc. | | | 11,159 | | | | 536,748 | |
PerkinElmer, Inc. | | | 16,632 | | | | 727,317 | |
Perrigo Co. PLC | | | 20,814 | | | | 3,479,268 | |
Pfizer, Inc. | | | 958,648 | | | | 29,861,885 | |
Quest Diagnostics, Inc. | | | 22,158 | | | | 1,485,915 | |
Regeneron Pharmaceuticals, Inc. (a) | | | 11,458 | | | | 4,700,645 | |
St. Jude Medical, Inc. | | | 44,053 | | | | 2,864,767 | |
Stryker Corp. | | | 45,595 | | | | 4,300,976 | |
Tenet Healthcare Corp. (a) | | | 13,452 | | | | 681,613 | |
Thermo Fisher Scientific, Inc. | | | 60,512 | | | | 7,581,549 | |
UnitedHealth Group, Inc. | | | 146,122 | | | | 14,771,473 | |
Universal Health Services, Inc. | | | 13,300 | | | | 1,479,758 | |
Varian Medical Systems, Inc. (a) | | | 15,631 | | | | 1,352,238 | |
Vertex Pharmaceuticals, Inc. (a) | | | 36,648 | | | | 4,353,782 | |
Waters Corp. (a) | | | 11,915 | | | | 1,343,059 | |
Zimmer Holdings, Inc. | | | 25,727 | | | | 2,917,956 | |
Zoetis, Inc. | | | 76,228 | | | | 3,280,091 | |
| | | | | | | | |
| | | | | | | 394,908,138 | |
| | | | | | | | |
| | |
Industrials - 10.1% | | | | | | | | |
3M Co. | | | 97,443 | | | | 16,011,834 | |
ADT Corp. | | | 25,056 | | | | 907,779 | |
Allegion PLC | | | 12,837 | | | | 711,940 | |
AMETEK, Inc. | | | 37,101 | | | | 1,952,626 | |
Boeing Co. | | | 100,924 | | | | 13,118,102 | |
C.H. Robinson Worldwide, Inc. | | | 22,382 | | | | 1,676,188 | |
Caterpillar, Inc. | | | 93,855 | | | | 8,590,548 | |
Cintas Corp. | | | 15,222 | | | | 1,194,014 | |
CSX Corp. | | | 148,359 | | | | 5,375,047 | |
Cummins, Inc. | | | 26,444 | | | | 3,812,431 | |
| | | | | | | | |
| | | Shares | | | Market
Value | |
| | | | | | | | |
Danaher Corp. | | | 93,178 | | | $ | 7,986,286 | |
Deere & Co. | | | 53,954 | | | | 4,773,310 | |
Delta Air Lines, Inc. | | | 125,066 | | | | 6,151,997 | |
Dover Corp. | | | 24,145 | | | | 1,731,679 | |
Dun & Bradstreet Corp. | | | 6,145 | | | | 743,299 | |
Eaton Corp. PLC | | | 72,099 | | | | 4,899,848 | |
Emerson Electric Co. | | | 105,369 | | | | 6,504,428 | |
Equifax, Inc. | | | 17,295 | | | | 1,398,647 | |
Expeditors International of Washington, Inc. | | | 29,444 | | | | 1,313,497 | |
Fastenal Co. | | | 44,042 | | | | 2,094,638 | |
FedEx Corp. | | | 40,350 | | | | 7,007,181 | |
Flowserve Corp. | | | 18,955 | | | | 1,134,078 | |
Fluor Corp. | | | 22,556 | | | | 1,367,570 | |
General Dynamics Corp. | | | 48,689 | | | | 6,700,580 | |
General Electric Co. | | | 1,530,863 | | | | 38,684,908 | |
Honeywell International, Inc. | | | 120,603 | | | | 12,050,652 | |
Illinois Tool Works, Inc. | | | 56,071 | | | | 5,309,924 | |
Ingersoll-Rand PLC | | | 41,116 | | | | 2,606,343 | |
Jacobs Engineering Group, Inc. (a) | | | 20,157 | | | | 900,816 | |
Joy Global, Inc. | | | 14,887 | | | | 692,543 | |
Kansas City Southern | | | 16,704 | | | | 2,038,389 | |
L-3 Communications Holdings, Inc. | | | 12,465 | | | | 1,573,208 | |
Lockheed Martin Corp. | | | 41,249 | | | | 7,943,320 | |
Masco Corp. | | | 54,139 | | | | 1,364,303 | |
Nielsen NV | | | 52,275 | | | | 2,338,261 | |
Norfolk Southern Corp. | | | 47,268 | | | | 5,181,045 | |
Northrop Grumman Corp. | | | 31,686 | | | | 4,670,200 | |
PACCAR, Inc. | | | 54,235 | | | | 3,688,522 | |
Pall Corp. | | | 16,107 | | | | 1,630,189 | |
Parker-Hannifin Corp. | | | 21,814 | | | | 2,812,915 | |
Pentair PLC | | | 28,991 | | | | 1,925,582 | |
Pitney Bowes, Inc. | | | 30,921 | | | | 753,545 | |
Precision Castparts Corp. | | | 21,978 | | | | 5,294,061 | |
Quanta Services, Inc. (a) | | | 30,293 | | | | 860,018 | |
Raytheon Co. | | | 47,736 | | | | 5,163,603 | |
Republic Services, Inc. | | | 41,114 | | | | 1,654,839 | |
Robert Half International, Inc. | | | 20,374 | | | | 1,189,434 | |
Rockwell Automation, Inc. | | | 21,779 | | | | 2,421,825 | |
Rockwell Collins, Inc. | | | 19,500 | | | | 1,647,360 | |
Roper Industries, Inc. | | | 14,835 | | | | 2,319,452 | |
Ryder System, Inc. | | | 6,855 | | | | 636,487 | |
Snap-on, Inc. | | | 8,872 | | | | 1,213,157 | |
Southwest Airlines Co. | | | 105,927 | | | | 4,482,831 | |
Stanley Black & Decker, Inc. | | | 24,950 | | | | 2,397,196 | |
Stericycle, Inc. (a) | | | 12,204 | | | | 1,599,700 | |
Textron, Inc. | | | 44,906 | | | | 1,890,992 | |
Tyco International PLC | | | 67,336 | | | | 2,953,357 | |
Union Pacific Corp. | | | 134,838 | | | | 16,063,251 | |
United Parcel Service, Inc. Class B | | | 106,455 | | | | 11,834,602 | |
United Rentals, Inc. (a) | | | 15,200 | | | | 1,550,552 | |
United Technologies Corp. | | | 130,327 | | | | 14,987,605 | |
| | |
| 48 | | State Street Equity 500 Index Portfolio |
State Street Equity 500 Index Portfolio
Portfolio of Investments, continued — December 31, 2014
| | | | | | | | |
| | | Shares | | | Market
Value | |
| | | | | | | | |
| | | | | | | | |
W.W. Grainger, Inc. | | | 9,412 | | | $ | 2,399,025 | |
Waste Management, Inc. | | | 63,304 | | | | 3,248,761 | |
Xylem, Inc. | | | 24,834 | | | | 945,430 | |
| | | | | | | | |
| | | | | | | 290,075,750 | |
| | | | | | | | |
| |
Information Technology - 19.1% | | | | | |
Accenture PLC Class A | | | 96,082 | | | | 8,581,083 | |
Adobe Systems, Inc. (a) | | | 73,813 | | | | 5,366,205 | |
Akamai Technologies, Inc. (a) | | | 27,734 | | | | 1,746,133 | |
Alliance Data Systems Corp. (a) | | | 10,204 | | | | 2,918,854 | |
Altera Corp. | | | 43,754 | | | | 1,616,273 | |
Amphenol Corp. Class A | | | 45,180 | | | | 2,431,136 | |
Analog Devices, Inc. | | | 46,018 | | | | 2,554,919 | |
Apple, Inc. | | | 894,664 | | | | 98,753,012 | |
Applied Materials, Inc. | | | 190,653 | | | | 4,751,073 | |
Autodesk, Inc. (a) | | | 34,170 | | | | 2,052,250 | |
Automatic Data Processing, Inc. | | | 73,365 | | | | 6,116,440 | |
Avago Technologies, Ltd. | | | 38,718 | | | | 3,894,644 | |
Broadcom Corp. Class A | | | 81,235 | | | | 3,519,913 | |
CA, Inc. | | | 45,959 | | | | 1,399,452 | |
Cisco Systems, Inc. | | | 781,729 | | | | 21,743,792 | |
Citrix Systems, Inc. (a) | | | 25,678 | | | | 1,638,256 | |
Cognizant Technology Solutions Corp. Class A (a) | | | 93,627 | | | | 4,930,398 | |
Computer Sciences Corp. | | | 22,732 | | | | 1,433,253 | |
Corning, Inc. | | | 191,950 | | | | 4,401,413 | |
eBay, Inc. (a) | | | 172,158 | | | | 9,661,507 | |
Electronic Arts, Inc. (a) | | | 50,121 | | | | 2,356,439 | |
EMC Corp. | | | 306,874 | | | | 9,126,433 | |
F5 Networks, Inc. (a) | | | 10,559 | | | | 1,377,580 | |
Facebook, Inc. Class A (a) | | | 319,407 | | | | 24,920,134 | |
Fidelity National Information Services, Inc. | | | 44,886 | | | | 2,791,909 | |
First Solar, Inc. (a) | | | 11,749 | | | | 523,947 | |
Fiserv, Inc. (a) | | | 36,442 | | | | 2,586,289 | |
FLIR Systems, Inc. | | | 20,339 | | | | 657,153 | |
Google, Inc. Class A (a) | | | 43,323 | | | | 22,989,783 | |
Google, Inc. Class C (a) | | | 43,523 | | | | 22,910,507 | |
Harris Corp. | | | 16,098 | | | | 1,156,158 | |
Hewlett-Packard Co. | | | 282,863 | | | | 11,351,292 | |
Intel Corp. | | | 746,920 | | | | 27,105,727 | |
International Business Machines Corp. | | | 139,847 | | | | 22,437,053 | |
Intuit, Inc. | | | 43,326 | | | | 3,994,224 | |
Juniper Networks, Inc. | | | 58,444 | | | | 1,304,470 | |
KLA-Tencor Corp. | | | 26,573 | | | | 1,868,613 | |
Lam Research Corp. | | | 24,281 | | | | 1,926,454 | |
Linear Technology Corp. | | | 35,021 | | | | 1,596,958 | |
Mastercard, Inc. Class A | | | 148,349 | | | | 12,781,750 | |
Microchip Technology, Inc. | | | 28,206 | | | | 1,272,373 | |
Micron Technology, Inc. (a) | | | 163,528 | | | | 5,725,115 | |
Microsoft Corp. (b) | | | 1,254,977 | | | | 58,293,682 | |
Motorola Solutions, Inc. | | | 33,022 | | | | 2,215,116 | |
| | | | | | | | |
| | | Shares | | | Market
Value | |
| | | | | | | | |
NetApp, Inc. | | | 49,643 | | | $ | 2,057,702 | |
NVIDIA Corp. | | | 75,012 | | | | 1,503,991 | |
Oracle Corp. | | | 493,470 | | | | 22,191,346 | |
Paychex, Inc. | | | 49,131 | | | | 2,268,378 | |
QUALCOMM, Inc. | | | 255,185 | | | | 18,967,901 | |
Red Hat, Inc. (a) | | | 28,130 | | | | 1,944,908 | |
Salesforce.com, Inc. (a) | | | 89,205 | | | | 5,290,749 | |
SanDisk Corp. | | | 33,206 | | | | 3,253,524 | |
Seagate Technology PLC | | | 49,776 | | | | 3,310,104 | |
Symantec Corp. | | | 108,203 | | | | 2,775,948 | |
TE Connectivity, Ltd. | | | 60,849 | | | | 3,848,699 | |
Teradata Corp. (a) | | | 21,913 | | | | 957,160 | |
Texas Instruments, Inc. | | | 158,906 | | | | 8,495,909 | |
Total System Services, Inc. | | | 22,999 | | | | 781,046 | |
VeriSign, Inc. (a) | | | 19,320 | | | | 1,101,240 | |
Visa, Inc. Class A | | | 74,910 | | | | 19,641,402 | |
Western Digital Corp. | | | 33,647 | | | | 3,724,723 | |
Western Union Co. | | | 74,940 | | | | 1,342,175 | |
Xerox Corp. | | | 161,592 | | | | 2,239,665 | |
Xilinx, Inc. | | | 39,642 | | | | 1,716,102 | |
Yahoo!, Inc. (a) | | | 137,637 | | | | 6,952,045 | |
| | | | | | | | |
| | | | | | | 547,143,882 | |
| | | | | | | | |
| | |
Materials - 3.1% | | | | | | | | |
Air Products & Chemicals, Inc. | | | 29,807 | | | | 4,299,064 | |
Airgas, Inc. | | | 10,040 | | | | 1,156,407 | |
Alcoa, Inc. | | | 183,889 | | | | 2,903,607 | |
Allegheny Technologies, Inc. | | | 14,911 | | | | 518,455 | |
Avery Dennison Corp. | | | 13,318 | | | | 690,938 | |
Ball Corp. | | | 21,658 | | | | 1,476,426 | |
C.F. Industries Holdings, Inc. | | | 8,006 | | | | 2,181,955 | |
Dow Chemical Co. | | | 168,090 | | | | 7,666,585 | |
E.I. du Pont de Nemours & Co. | | | 138,794 | | | | 10,262,428 | |
Eastman Chemical Co. | | | 21,472 | | | | 1,628,866 | |
Ecolab, Inc. | | | 41,565 | | | | 4,344,374 | |
FMC Corp. | | | 18,522 | | | | 1,056,310 | |
Freeport-McMoRan, Inc. | | | 157,964 | | | | 3,690,039 | |
International Flavors & Fragrances, Inc. | | | 11,280 | | | | 1,143,341 | |
International Paper Co. | | | 66,808 | | | | 3,579,573 | |
LyondellBasell Industries NV Class A | | | 62,952 | | | | 4,997,759 | |
Martin Marietta Materials, Inc. | | | 8,655 | | | | 954,820 | |
MeadWestvaco Corp. | | | 24,943 | | | | 1,107,220 | |
Monsanto Co. | | | 72,794 | | | | 8,696,699 | |
Mosaic Co. | | | 47,516 | | | | 2,169,105 | |
Newmont Mining Corp. | | | 73,573 | | | | 1,390,530 | |
Nucor Corp. | | | 47,306 | | | | 2,320,359 | |
Owens-Illinois, Inc. (a) | | | 22,763 | | | | 614,373 | |
PPG Industries, Inc. | | | 21,444 | | | | 4,956,781 | |
Praxair, Inc. | | | 45,000 | | | | 5,830,200 | |
Sealed Air Corp. | | | 32,469 | | | | 1,377,660 | |
Sherwin-Williams Co. | | | 12,287 | | | | 3,231,972 | |
Sigma-Aldrich Corp. | | | 17,761 | | | | 2,438,052 | |
| | | | |
| State Street Equity 500 Index Portfolio | | | 49 | |
State Street Equity 500 Index Portfolio
Portfolio of Investments, continued — December 31, 2014
| | | | | | | | |
| | | Shares | | | Market
Value | |
| | | | | | | | |
| | | | | | | | |
Vulcan Materials Co. | | | 18,490 | | | $ | 1,215,348 | |
| | | | | | | | |
| | | | | | | 87,899,246 | |
| | | | | | | | |
|
Telecommunication Services - 2.2% | |
AT&T, Inc. | | | 788,273 | | | | 26,478,090 | |
CenturyLink, Inc. | | | 86,173 | | | | 3,410,727 | |
Frontier Communications Corp. | | | 143,538 | | | | 957,399 | |
Level 3 Communications, Inc. (a) | | | 41,500 | | | | 2,049,270 | |
Verizon Communications, Inc. | | | 633,251 | | | | 29,623,482 | |
Windstream Holdings, Inc. | | | 85,867 | | | | 707,544 | |
| | | | | | | | |
| | | | | | | 63,226,512 | |
| | | | | | | | |
| | |
Utilities - 3.1% | | | | | | | | |
AES Corp. | | | 98,059 | | | | 1,350,272 | |
AGL Resources, Inc. | | | 18,002 | | | | 981,289 | |
Ameren Corp. | | | 36,056 | | | | 1,663,263 | |
American Electric Power Co., Inc. | | | 75,043 | | | | 4,556,611 | |
CenterPoint Energy, Inc. | | | 65,335 | | | | 1,530,799 | |
CMS Energy Corp. | | | 42,001 | | | | 1,459,535 | |
Consolidated Edison, Inc. | | | 43,500 | | | | 2,871,435 | |
Dominion Resources, Inc. | | | 87,668 | | | | 6,741,669 | |
DTE Energy Co. | | | 26,039 | | | | 2,248,988 | |
Duke Energy Corp. | | | 107,391 | | | | 8,971,444 | |
Edison International | | | 49,505 | | | | 3,241,587 | |
Entergy Corp. | | | 27,000 | | | | 2,361,960 | |
Exelon Corp. | | | 131,659 | | | | 4,881,916 | |
FirstEnergy Corp. | | | 61,729 | | | | 2,406,814 | |
Integrys Energy Group, Inc. | | | 11,180 | | | | 870,363 | |
NextEra Energy, Inc. | | | 66,357 | | | | 7,053,086 | |
NiSource, Inc. | | | 47,478 | | | | 2,014,017 | |
Northeast Utilities | | | 46,443 | | | | 2,485,629 | |
NRG Energy, Inc. | | | 51,498 | | | | 1,387,871 | |
Pepco Holdings, Inc. | | | 35,659 | | | | 960,297 | |
PG&E Corp. | | | 72,012 | | | | 3,833,919 | |
Pinnacle West Capital Corp. | | | 15,456 | | | | 1,055,799 | |
PPL Corp. | | | 98,256 | | | | 3,569,641 | |
Public Service Enterprise Group, Inc. | | | 76,936 | | | | 3,185,920 | |
SCANA Corp. | | | 23,801 | | | | 1,437,580 | |
Sempra Energy | | | 35,624 | | | | 3,967,089 | |
Southern Co. | | | 139,484 | | | | 6,850,059 | |
TECO Energy, Inc. | | | 30,250 | | | | 619,823 | |
Wisconsin Energy Corp. | | | 32,976 | | | | 1,739,154 | |
Xcel Energy, Inc. | | | 80,800 | | | | 2,902,336 | |
| | | | | | | | |
| | | | | | | 89,200,165 | |
| | | | | | | | |
| |
Total Common Stocks
(cost: $1,279,834,253) | | | | 2,778,988,162 | |
| | | | | | | | |
| | | | | | | | |
| | | Par
Amount | | | Market
Value | |
| | | | | | | | |
| | | | | | | | |
| U.S. Government Securities - 0.2% | |
U.S. Treasury Bill (b)(d)(e)
0.01% due 01/15/2015 | | $ | 2,000,000 | | | $ | 1,999,992 | |
U.S. Treasury Bill (b)(d)(e)
0.00% due 01/29/2015 | | | 3,760,000 | | | | 3,760,000 | |
U.S. Treasury Bill (b)(d)(e)
0.00% due 03/12/2015 | | | 400,000 | | | | 400,000 | |
| | | | | | | | |
| |
Total U.S. Government Securities
(cost: $6,159,992) | | | | 6,159,992 | |
| | | | | | | | |
| | |
| | | Shares | | | | |
| | | | | | | | |
| Money Market Fund - 3.2% | |
State Street Institutional Liquid Reserves Fund, Premier Class 0.07% (c)(f) | | | 91,116,189 | | | | 91,116,189 | |
| | | | | | | | |
| |
Total Money Market Fund
(cost: $91,116,189) | | | | 91,116,189 | |
| | | | | | | | |
| |
Total Investments - 100.3%
(cost $1,377,110,434) | | | | 2,876,264,343 | |
| |
Liabilities in Excess of
Other Assets - (0.3)% | | | | (6,941,471 | ) |
| | | | | | | | |
| |
| Net Assets - 100.0% | | | $ | 2,869,322,872 | |
| | | | | | | | |
| (a) | Non-income producing security |
| (b) | All or part of this security has been designated as collateral for futures contracts |
| (c) | Affiliated issuer. See table that follows for more information. |
| (d) | Rate represents annualized yield at date of purchase |
| (e) | Securities are valued in accordance with procedures approved by the Board of Trustees. Securities’ values are determined based on Level 2 inputs. |
| (f) | The rate shown is the annualized seven-day yield at period end. |
| PLC | Public Limited Company |
| REIT | Real Estate Investment Trust |
See accompanying notes which are an integral part of the financial statements.
| | |
| 50 | | State Street Equity 500 Index Portfolio |
State Street Equity 500 Index Portfolio
Portfolio of Investments, continued — December 31, 2014
| | | | | | | | | | |
| Schedule of Futures Contracts | | Number of
Contracts | | | Notional
Value | | Unrealized
Appreciation | |
| | | | | | | | | | |
S&P 500 Financial Futures Contracts (long) Expiration Date 03/2015 | | | 875 | | | $89,792,500 | | $ | 2,382,058 | |
| | | | | | | | | | |
Total unrealized appreciation on open futures contracts purchased | | | | | | | | $ | 2,382,058 | |
| | | | | | | | | | |
Affiliates Table
Certain investments made by the Portfolio were made in securities affiliated with State Street and SSGA FM. Investments in State Street Corp., the holding company of State Street, were made according to its representative portion of the S&P 500® Index. The Portfolio also invested in the State Street Institutional Liquid Reserves Fund. Transactions in all affiliates for the period ending December 31, 2014 were as follows:
| | | | | | | | | | | | | | | | | | | | | | | | | | | | |
Security Description | | Number
of Shares
Held at
12/31/13 | | | Shares
Purchased for
the Year
Ended 12/31/14 | | | Shares
Sold for
the Year
Ended 12/31/14 | | | Number
of Shares
Held at
12/31/14 | | | Value at
12/31/14 | | | Income
Earned for
the Year
Ended 12/31/14 | | | Realized
Gain/Loss on
Shares Sold | |
| | | | | | | | | | | | | | | | | | | | | | | | | | | | |
State Street Corp. | | | 72,725 | | | | — | | | | 9,778 | * | | | 62,947 | | | $ | 4,941,340 | | | $ | 78,494 | | | $ | — | |
State Street Institutional Liquid Reserves Fund, Premier Class | | | 41,178,491 | | | | 407,287,719 | | | | 357,350,021 | | | | 91,116,189 | | | | 91,116,189 | | | | 45,460 | | | | — | |
| * | Shares of State Street Corp. were disposed of in a tax-free redemption in-kind (Note 7). |
See accompanying notes which are an integral part of the financial statements.
| | | | |
| State Street Equity 500 Index Portfolio | | | 51 | |
State Street Equity 500 Index Portfolio
Statement of Assets and Liabilities — December 31, 2014
| | | | |
| | | | |
| | | | |
Assets | | | | |
Investments in unaffiliated issuers at market value (identified cost $1,283,925,771) | | $ | 2,780,206,814 | |
Investments in non-controlled affiliates at market value (identified cost $93,184,663) (Note 4) | | | 96,057,529 | |
| | | | |
Total investments at market value (identified cost $1,377,110,434) | | | 2,876,264,343 | |
Dividends and interest receivable | | | 3,680,254 | |
Dividend receivable from non-controlled affiliates (Note 4) | | | 18,884 | |
| | | | |
Total assets | | | 2,879,963,481 | |
| | | | |
| |
Liabilities | | | | |
Investment securities purchased | | | 4,649,775 | |
Due to custodian | | | 4,769,756 | |
Daily variation margin on futures contracts | | | 1,063,125 | |
Management fees payable (Note 4) | | | 157,953 | |
| | | | |
Total liabilities | | | 10,640,609 | |
| | | | |
| | | | |
Net Assets | | $ | 2,869,322,872 | |
| | | | |
See accompanying notes which are an integral part of the financial statements.
| | |
| 52 | | Statement of Assets and Liabilities |
State Street Equity 500 Index Portfolio
Statement of Operations — Year Ended December 31, 2014
| | | | |
| | | | |
| | | | |
Investment Income | | | | |
Dividend income — unaffiliated issuers (net of foreign taxes withheld of $132,666) | | $ | 55,933,764 | |
Dividend income — non-controlled affiliated issuer | | | 123,954 | |
Interest | | | 46,355 | |
| | | | |
Total investment income | | | 56,104,073 | |
| | | | |
| |
Expenses | | | | |
Management fees (Note 4) | | | 1,246,586 | |
Other expenses | | | 12,081 | |
| | | | |
Total expenses | | | 1,258,667 | |
| | | | |
Net investment income | | | 54,845,406 | |
| | | | |
| |
Realized and Unrealized Gain (Loss) | | | | |
Net realized gain (loss) on: | | | | |
Investments — unaffiliated issuers | | | 10,063,213 | |
Futures contracts | | | 7,781,141 | |
| | | | |
| | | 17,844,354 | |
| | | | |
Net change in net unrealized appreciation (depreciation) on: | | | | |
Investments | | | 278,443,408 | |
Futures contracts | | | 664,091 | |
| | | | |
| | | 279,107,499 | |
| | | | |
Net realized and unrealized gain | | | 296,951,853 | |
| | | | |
Net Increase in Net Assets Resulting from Operations | | $ | 351,797,259 | |
| | | | |
See accompanying notes which are an integral part of the financial statements.
| | | | |
| Statement of Operations | | | 53 | |
State Street Equity 500 Index Portfolio
Statements of Changes in Net Assets
| | | | | | | | |
| | | Year Ended
December 31, 2014 | | | Year Ended
December 31, 2013 | |
| | | | | | | | |
Increase (Decrease) in Net Assets From Operations: | | | | | | | | |
Net investment income | | $ | 54,845,406 | | | $ | 49,096,073 | |
Net realized gain on investments and futures contracts | | | 17,844,354 | | | | 26,611,003 | |
Net change in net unrealized appreciation on investments and futures contracts | | | 279,107,499 | | | | 590,532,985 | |
| | | | | | | | |
Net increase in net assets from operations | | | 351,797,259 | | | | 666,240,061 | |
| | | | | | | | |
| | |
Capital Transactions: | | | | | | | | |
Contributions | | | 353,779,321 | | | | 235,748,437 | |
Withdrawals | | | (185,039,609 | ) | | | (217,635,806 | ) |
In-kind redemptions (Note 7) | | | (390,808,177 | ) | | | — | |
| | | | | | | | |
Net increase (decrease) in net assets from capital transactions | | | (222,068,465 | ) | | | 18,112,631 | |
| | | | | | | | |
Net Increase in Net Assets | | | 129,728,794 | | | | 684,352,692 | |
| | |
Net Assets | | | | | | | | |
Beginning of year | | | 2,739,594,078 | | | | 2,055,241,386 | |
| | | | | | | | |
| | |
End of year | | $ | 2,869,322,872 | | | $ | 2,739,594,078 | |
| | | | | | | | |
See accompanying notes which are an integral part of the financial statements.
| | |
| 54 | | Statements of Changes in Net Assets |
State Street Equity 500 Index Portfolio
Financial Highlights
The following table includes selected supplemental data and ratios to average net assets:
| | | | | | | | | | | | | | | | | | | | |
| | | Year Ended
12/31/14 | | | Year Ended
12/31/13 | | | Year Ended
12/31/12 | | | Year Ended
12/31/11 | | | Year Ended
12/31/10 | |
Supplemental Data and Ratios: | | | | | | | | | | | | | | | | | | | | |
Net assets, end of period (in thousands) | | $ | 2,869,323 | | | $ | 2,739,594 | | | $ | 2,055,241 | | | $ | 1,825,528 | | | $ | 2,098,137 | |
Ratios to average net assets: | | | | | | | | | | | | | | | | | | | | |
Expenses | | | 0.045 | % | | | 0.045 | % | | | 0.045 | % | | | 0.045 | % | | | 0.045 | % |
Net investment income | | | 1.98 | % | | | 2.05 | % | | | 2.26 | % | | | 2.04 | % | | | 1.99 | % |
Portfolio turnover rate (a) | | | 2 | % | | | 4 | % | | | 9 | % | | | 15 | % | | | 12 | % |
Total return (b) | | | 13.62 | % | | | 32.30 | % | | | 15.97 | % | | | 2.03 | % | | | 15.08 | % |
| (a) | | The portfolio turnover rate excludes in-kind security transactions (Note 7). |
| (b) | | Results represent past performance and are not indicative of future results. |
See accompanying notes which are an integral part of the financial statements.
State Street Equity 500 Index Portfolio
Notes to Financial Statements — December 31, 2014
State Street Master Funds (the “Trust”) is registered under the Investment Company Act of 1940, as amended (the “1940 Act”), as an open-end management investment company, and was organized as a business trust under the laws of the Commonwealth of Massachusetts on July 27, 1999. The Trust consists of ten investment portfolios: State Street Equity 500 Index Portfolio, State Street Equity 400 Index Portfolio, State Street Equity 2000 Index Portfolio, State Street Aggregate Bond Index Portfolio, State Street Money Market Portfolio, State Street Tax Free Money Market Portfolio, State Street Limited Duration Bond Portfolio, State Street Treasury Money Market Portfolio, State Street Treasury Plus Money Market Portfolio and State Street U.S. Government Money Market Portfolio. Information presented in these financial statements pertains only to the State Street Equity 500 Index Portfolio (the “Portfolio”).
At December 31, 2014, the following Portfolios were operational: State Street Money Market Portfolio, State Street Tax Free Money Market Portfolio, State Street U.S. Government Money Market Portfolio, State Street Treasury Money Market Portfolio and State Street Treasury Plus Money Market Portfolio. The Portfolio is authorized to issue an unlimited number of non-transferable beneficial interests.
The Portfolio’s investment objective is to replicate, as closely as possible, before expenses, the performance of the Standard & Poor’s 500 Index (the “S&P 500® Index”). The Portfolio uses a passive management strategy designed to track the performance of the S&P 500® Index. The S&P 500® Index is a well-known, unmanaged, stock index that includes common stocks of 500 companies from several industrial sectors representing a significant portion of the market value of all stocks publicly traded in the U.S. There is no assurance that the Portfolio will achieve its objective.
The Portfolio is an investment company and accordingly follows the investment company accounting and reporting guidance of the Financial Accounting Standards Board (“FASB”) Accounting Standards Codification Topic 946 Financial Services — Investment Companies.
| 2. | | Significant Accounting Policies |
The following is a summary of the significant accounting policies consistently followed by the Portfolio in the preparation of its financial statements.
Security valuation — The Portfolio’s investments are valued each business day by independent pricing services. Equity securities for which market quotations are available are valued at the last sale price or official closing price (closing bid price if no sale has occurred) on the primary market or exchange on which they trade. Investments in other mutual funds are valued at the net asset value per share. Fixed income securities and options are valued on the basis of the closing bid price. Futures contracts are valued at the quoted daily settlement price at the end of each day on the exchange upon which they are traded. Money market instruments maturing within 60 days of the valuation date are valued at amortized cost, a method by which each money market instrument is initially valued at cost, and thereafter a constant accretion or amortization of any discount or premium is recorded until maturity of the security. Investments in other mutual funds are valued at the net asset value per share. The Portfolio may value securities for which market quotations are not readily available at “fair value,” as determined in good faith pursuant to procedures established by the Board of Trustees.
The Portfolio adopted provisions surrounding fair value measurements and disclosures that define fair value, establish a framework for measuring fair value in generally accepted accounting principles and expand disclosures about fair value measurements. This applies to fair value measurements that are already required or permitted by other accounting standards and is intended to increase consistency of those measurements and apply broadly to securities and other types of assets and liabilities. In accordance with these provisions, fair value is defined as the price that the Portfolio would receive upon selling an investment in a timely transaction to an independent buyer in the principal or most advantageous market of the investment. Various inputs are used in determining the value of the Portfolio’s investments.
The three tier hierarchy of inputs is summarized below:
| | • | | Level 1 — quoted prices in active markets for identical securities |
| | • | | Level 2 — other significant observable inputs (including quoted prices for similar securities, interest rates, prepayment speeds, credit risk, etc.) |
| | |
| 56 | | Notes to Financial Statements |
State Street Equity 500 Index Portfolio
Notes to Financial Statements, continued — December 31, 2014
| | • | | Level 3 — significant unobservable inputs (including the Portfolio’s own assumptions in determining the fair value of investments) |
The inputs or methodology used for valuing securities are not an indication of the risk associated with investing in those securities.
The following is a summary of the inputs used, as of December 31, 2014, in valuing the Portfolio’s assets carried at fair value:
| | | | | | | | | | | | | | | | |
| Description | | Quoted Prices in Active Markets for Identical Assets (Level 1) | | | Significant Other Observable Inputs (Level 2) | | | Significant Unobservable Inputs (Level 3) | | | Total | |
| | | | | | | | | | | | | | | | |
Assets: | | | | | | | | | | | | | | | | |
| | | | |
Investments: | | | | | | | | | | | | | | | | |
Common Stocks | | $ | 2,778,988,162 | | | $ | — | | | $ | — | | | $ | 2,778,988,162 | |
U.S. Government Securities | | | — | | | | 6,159,992 | | | | — | | | | 6,159,992 | |
Money Market Fund | | | 91,116,189 | | | | — | | | | — | | | | 91,116,189 | |
| | | | | | | | | | | | | | | | |
Total Investments | | | 2,870,104,351 | | | | 6,159,992 | | | | — | | | | 2,876,264,343 | |
| | | | |
Other Assets: | | | | | | | | | | | | | | | | |
Futures contracts* | | | 2,382,058 | | | | — | | | | — | | | | 2,382,058 | |
| | | | | | | | | | | | | | | | |
Total Assets | | $ | 2,872,486,409 | | | $ | 6,159,992 | | | $ | — | | | $ | 2,878,646,401 | |
| | | | | | | | | | | | | | | | |
| | * | Only unsettled receivable/payable for variation margin is reported within Statement of Assets and Liabilities. |
For the year ended December 31, 2014, there were no transfers between levels.
Securities transactions, investment income and expenses — Securities transactions are recorded on a trade date basis. Dividend income is recorded on the ex-dividend date. Interest income is recorded daily on the accrual basis and includes amortization of premium and accretion of discount on investments. Realized gains and losses from securities transactions are recorded on the basis of identified cost. Expenses are accrued daily based on average daily net assets.
All of the net investment income and realized and unrealized gains and losses from the security transactions of the Portfolio are allocated pro rata among the partners in the Portfolio on a daily basis based on each partner’s daily ownership percentage.
Federal income taxes — The Portfolio is not required to pay federal income taxes on its net investment income and net capital gains because it is treated as a partnership for federal income tax purposes. All interest, dividends, gains and losses of the Portfolio are deemed to have been “passed through” to the Portfolio’s partners in proportion to their holdings in the Portfolio, regardless of whether such items have been distributed by the Portfolio. Each partner is responsible for tax liability based on its distributive share; therefore, no provision has been made for federal income taxes.
The Portfolio has reviewed the tax positions for open years as of and during the year ended December 31, 2014, and determined it did not have a liability for any unrecognized tax expenses. The Portfolio recognizes interest and penalties, if any, related to tax liabilities as income tax expense in the Statement of Operations. As of December 31, 2014, tax years 2011 through 2013 remain subject to examination by the Portfolio’s major tax jurisdictions, which include the United States of America and the Commonwealth of Massachusetts.
At December 31, 2014, the tax cost of investments was $1,377,110,434 on a federal tax basis. The aggregate gross unrealized appreciation and gross unrealized depreciation was $1,513,888,774 and $14,734,865, respectively, resulting in net appreciation of $1,499,153,909 for all securities as computed on a federal income tax basis.
Futures — The Portfolio may enter into financial futures contracts as part of its strategy to track the performance of the S&P 500® Index. Upon entering into a futures contract, the Portfolio is required to deposit with the broker cash or securities in an amount equal to a certain percentage of the contract amount. Variation margin payments are made or received by the Portfolio each day, depending on the daily fluctuations in the value of the underlying security or index, and are recorded for financial statement purposes as unrealized gains or losses by the Portfolio, which is recorded on the Statement of Assets and Liabilities. The Portfolio recognizes a realized gain or loss when the contract is closed, which is recorded on the Statement of Operations.
| | | | |
| Notes to Financial Statements | | | 57 | |
State Street Equity 500 Index Portfolio
Notes to Financial Statements, continued — December 31, 2014
The Portfolio voluntarily segregates securities in an amount equal to the outstanding value of the open futures contracts in accordance with Securities and Exchange Commission requirements.
The primary risks associated with the use of futures contracts are an imperfect correlation between the change in market value of the benchmark and the prices of futures contracts and the possibility of an illiquid market. To the extent permitted by the investment objective, restrictions and policies set forth in the Portfolio’s Prospectus and Statement of Additional Information, the Portfolio may participate in various derivative-based transactions. Derivative securities are instruments or agreements whose value is derived from an underlying security or index. The Portfolio’s use of derivatives includes futures. These instruments offer unique characteristics and risks that assist the Portfolio in meeting its investment objective. The Portfolio typically uses derivatives in two ways: cash equitization and return enhancement. Cash equitization is a technique that may be used by the Portfolio through the use of options and futures to earn “market-like” returns with the Portfolio’s excess and liquidity reserve cash balances and receivables. Return enhancement can be accomplished through the use of derivatives in the Portfolio. By purchasing certain instruments, the Portfolio may more effectively achieve the desired portfolio characteristics that assist in meeting the Portfolio’s investment objectives. Depending on how the derivatives are structured and utilized, the risks associated with them may vary widely. These risks are generally categorized as market risk, liquidity risk and counterparty or credit risk.
The following table, grouped into appropriate risk categories, discloses the amounts related to the Portfolio’s use of derivative instruments and hedging activities at December 31, 2014:
Asset Derivatives(1)
| | | | | | | | |
| | | Equity Contracts
Risk | | | Total | |
| | | | | | | | |
Futures Contracts | | $ | 2,382,058 | | | $ | 2,382,058 | |
Transactions in derivative instruments during the year ended December 31, 2014, were as follows:
Realized Gain (Loss)(2)
| | | | | | | | |
| | | Equity Contracts
Risk | | | Total | |
| | | | | | | | |
Futures Contracts | | $ | 7,781,141 | | | $ | 7,781,141 | |
Change in Appreciation (Depreciation)(3)
| | | | | | | | |
| | | Equity Contracts
Risk | | | Total | |
| | | | | | | | |
Futures Contracts | | $ | 664,091 | | | $ | 664,091 | |
| | (1) | Portfolio of Investments: Unrealized appreciation of futures contracts. Only unsettled receivable/payable for variation margin is reported within Statement of Assets and Liabilities. |
| | (2) | Statement of Operations location: Net realized gain (loss) on: Futures contracts |
| | (3) | Statement of Operations location: Net change in unrealized appreciation (depreciation) on: Futures contracts |
The average notional of futures outstanding during the year ended December 31, 2014 was $66,568,250.
Use of estimates — The Portfolio’s financial statements are prepared in accordance with U.S. generally accepted accounting principles, which require the use of management estimates. Actual results could differ from those estimates. It is reasonably possible that these differences could be material.
| 3. | | Securities Transactions |
For the year ended December 31, 2014, purchases and sales of investment securities, excluding short-term investments, and futures contracts, aggregated to $253,957,017 and $65,856,635, respectively.
| | |
| 58 | | Notes to Financial Statements |
State Street Equity 500 Index Portfolio
Notes to Financial Statements, continued — December 31, 2014
| 4. | | Related Party Fees and Transactions |
The Portfolio has entered into an investment advisory agreement with SSGA Funds Management, Inc. (“SSGA FM” or the “Adviser”), a subsidiary of State Street Corporation and an affiliate of State Street Bank and Trust Company (“State Street”), under which SSGA FM directs the investments of the Portfolio in accordance with its investment objective, policies, and limitations. The Trust has contracted with State Street to provide custody, administration and transfer agent services to the Portfolio. In compensation for SSGA FM’s services as investment adviser and for State Street’s services as administrator, custodian and transfer agent (and for assuming ordinary operating expenses of the Portfolio, including ordinary legal, audit and trustees expense), State Street receives a unitary fee, calculated daily, at the annual rate of 0.045% of the Portfolio’s average daily net assets.
Certain investments made by the Portfolio were made in securities affiliated with State Street and SSGA FM. Investments in State Street Corporation, the holding company of State Street, were made according to its representative portion of the S&P 500® Index. The market value of this investment at December 31, 2014 is listed in the Portfolio of Investments.
Independent Trustees are compensated on a calendar year basis. Any Trustee who is deemed to be an “interested person” (as defined in the 1940 Act) of the Funds does not receive compensation from the Funds for his or her service as a Trustee.
Each Independent Trustee receives for his or her services to the State Street Master Funds, State Street Institutional Investment Trust and SSGA Funds, a $141,500 annual base retainer in addition to $18,000 for each in-person meeting and $2,000 for each telephonic meeting from the Trust. The Trust will bear a pro rata allocation based on the Trust’s average monthly assets. The Co-Chairmen each receive an additional $44,000 annual retainer. The Independent Trustees are reimbursed for travel and other out-of-pocket expenses in connection with meeting attendance. As of the date of this Report, the Trustees were not paid pension or retirement benefits as part of the Trust’s expenses.
The Trust’s officers are compensated by the Adviser and its affiliates.
The Trust’s organizational documents provide that its officers and trustees are indemnified against certain liabilities arising out of the performance of their duties to the Trust. In addition, both in some of its principal service contracts and in the normal course of its business, the Trust enters into contracts that provide indemnifications to other parties for certain types of losses or liabilities. The Trust’s maximum exposure under these arrangements is unknown as this could involve future claims against the Trust. Management does not expect any significant claims.
On August 11, 2014, the State Street Equity 500 Index Fund redeemed its interest in the Portfolio in connection with a transfer of net assets to the State Street Equity 500 Index II Portfolio, a series of State Street Institutional Investment Trust. The transfer consisted of five hundred and three (503) securities totaling $387,955,841 at market value or 13% of the Portfolio and $2,852,336 in cash, and is disclosed in the Statement of Changes in Net Assets.
The Portfolio and other affiliated funds (each a “Participant” and, collectively, the “Participants”) share in a $300 million revolving credit facility provided by a syndication of banks. The Participants may borrow for the purpose of meeting shareholder redemption requests that otherwise might require the untimely disposition of securities. The Participants are charged an annual commitment fee which is calculated based on the unused portion of the shared credit line. Commitment fees are allocated among each of the Participants based on net assets. Commitment fees are ordinary fund operating expenses and are paid by the Adviser. A Participant incurs and pays the interest expense related to its borrowing. Interest is calculated at a rate per annum equal to the sum of the Federal Funds Rate plus 1%. The Portfolio may borrow up to a maximum of 33 percent of its assets. The Portfolio had no outstanding loans during the period ended December 31, 2014.
| | | | |
| Notes to Financial Statements | | | 59 | |
State Street Equity 500 Index Portfolio
Report of Independent Registered Public Accounting Firm
To the Board of Trustees and Owners of Beneficial Interest of State Street Master Funds:
We have audited the accompanying statement of assets and liabilities, including the portfolio of investments, of State Street Equity 500 Index Portfolio (one of the portfolios constituting State Street Master Funds) (the “Portfolio”) as of December 31, 2014, and the related statement of operations for the year then ended, the statements of changes in net assets for each of the two years in the period then ended, and the financial highlights for each of the five years in the period then ended. These financial statements and financial highlights are the responsibility of the Portfolio’s management. Our responsibility is to express an opinion on these financial statements and financial highlights based on our audits.
We conducted our audits in accordance with the standards of the Public Company Accounting Oversight Board (United States). Those standards require that we plan and perform the audit to obtain reasonable assurance about whether the financial statements and financial highlights are free of material misstatement. We were not engaged to perform an audit of the Portfolio’s internal control over financial reporting. Our audits included consideration of internal control over financial reporting as a basis for designing audit procedures that are appropriate in the circumstances, but not for the purpose of expressing an opinion on the effectiveness of the Portfolio’s internal control over financial reporting. Accordingly, we express no such opinion. An audit also includes examining, on a test basis, evidence supporting the amounts and disclosures in the financial statements and financial highlights, assessing the accounting principles used and significant estimates made by management, and evaluating the overall financial statement presentation. Our procedures included confirmation of securities owned as of December 31, 2014, by correspondence with the custodian and others or by other appropriate auditing procedures where replies from others were not received. We believe that our audits provide a reasonable basis for our opinion.
In our opinion, the financial statements and financial highlights referred to above present fairly, in all material respects, the financial position of State Street Equity 500 Index Portfolio (one of the portfolios constituting State Street Master Funds) at December 31, 2014, the results of its operations for the year then ended, the changes in its net assets for each of the two years in the period then ended, and the financial highlights for each of the five years in the period then ended, in conformity with U.S. generally accepted accounting principles.
Boston, Massachusetts
February 27, 2015
| | |
| 60 | | Report of Independent Registered Public Accounting Firm |
State Street Equity 500 Index Portfolio
General Information — December 31, 2014
Proxy Voting Policies and Procedures
Information regarding the Fund’s proxy voting policies and procedures, as well as information regarding how the Fund voted proxies, if any, during the most recent 12-month period ended June 30 is available by August 31 of each year without charge (1) by calling
1-877-521-4083 (toll free), or (2) on the website of the Securities and Exchange Commission (“SEC”) at www.sec.gov.
Quarterly Portfolio Schedule
The Fund files a complete schedule of portfolio holdings with the SEC for the first and third quarters of each fiscal year on
Form N-Q. The Fund’s Forms N-Q are available on the SEC’s website at www.sec.gov and may be reviewed and copied at the SEC’s Public Reference Room in Washington, DC. Information on the operation of the Public Reference Room may be obtained by calling
1-800-SEC-0330. The information on Form N-Q is available upon request, without charge, by calling 1-877-521-4083 (toll-free).
State Street Equity 500 Index Portfolio
Trustees and Officers Information — December 31, 2014
| | | | | | | | | | | | |
Name,
Address, and
Year of Birth
| | Position(s) Held
with Trust | | Term of
Office and
Length of
Time Served | | Principal Occupation
During Past Five Years | | Number of
Funds in
Fund
Complex
Overseen
by Trustee | | | Other
Directorships
Held by
Trustee During
Past Five Years |
INDEPENDENT TRUSTEES | | | | | | | | | | |
Michael F. Holland State Street Financial Center One Lincoln Street Boston, MA 02111-2900 YOB: 1944 | | Trustee and Co-Chairman of the Board | | Term: Indefinite Elected: 7/99 | | Chairman, Holland & Company L.L.C. (investment adviser) (1995 – present). | | | 59 | | | Trustee, State Street Institutional Investment Trust; Trustee SSGA Funds; Director, the Holland Series Fund, Inc.; Director, The China Fund, Inc.; Director, The Taiwan Fund, Inc.; Director, Reaves Utility Income Fund, Inc.; and Director, Blackstone/GSO Loan Funds. |
| | | | | | | | | | | | | |
Patrick J. Riley State Street Financial Center One Lincoln Street Boston, MA 02111-2900 YOB: 1948 | | Trustee and Co-Chairman of the Board | | Term: Indefinite Elected: 1/14 | | 2002 to May 2010, Associate Justice of the Superior Court, Commonwealth of Massachusetts; 1985 to 2002, Partner, Riley, Burke & Donahue, L.L.P. (law firm); 1998 to Present, Independent Director, State Street Global Advisers Ireland, Ltd. (investment company); 1998 to Present, Independent Director, SSGA Liquidity plc (formerly, SSGA Cash Management Fund plc); January 2009 to Present, Independent Director, SSGA Fixed Income plc; and January 2009 to Present, Independent Director, SSGA Qualified Funds PLC. | | | 59 | | | Trustee, State Street Institutional Investment Trust; Trustee SSGA Funds; Board Director and Chairman, SPDR Europe 1PLC Board (2011 – Present); Board Director and Chairman, SPDR Europe II, PLC (2013 – Present). |
| | | | | | | | | | | | | |
William L. Boyan State Street Financial Center One Lincoln Street Boston, MA 02111-2900 YOB: 1937 | | Trustee and Co-Chairman of the Valuation Committee | | Term: Indefinite Elected: 7/99 | | President and Chief Operations Officer, John Hancock Financial Services (1959 – 1999). Mr. Boyan retired in 1999. Chairman Emeritus, Children’s Hospital, Boston, MA (1984 – 2011); Former Chairman, Boston Plan For Excellence, Boston Public Schools (1995 – 2010); Member of Advisory Board of Florida Atlantic University Lifelong Learning Society. | | | 59 | | | Trustee, State Street Institutional Investment Trust; Trustee SSGA Funds; Former Trustee of Old Mutual South Africa Master Trust; Trustee, Children’s Hospital, Boston, MA. |
| | |
| 62 | | Trustees and Officers Information |
State Street Equity 500 Index Portfolio
Trustees and Officers Information, continued — December 31, 2014
| | | | | | | | | | | | |
Name,
Address, and
Year of Birth
| | Position(s) Held
with Trust | | Term of
Office and
Length of
Time Served | | Principal Occupation
During Past Five Years | | Number of
Funds in
Fund
Complex
Overseen
by Trustee | | | Other
Directorships
Held by
Trustee During
Past Five Years |
INDEPENDENT TRUSTEES (continued) |
William L. Marshall State Street Financial Center One Lincoln Street Boston, MA 02111-2900 YOB: 1942 | | Trustee and Co-Chairman of the Audit Committee | | Term: Indefinite Elected: 1/14 | | April 2011 to Present, Chairman (until April 2011, Chief Executive Officer and President), Wm. L. Marshall Associates, Inc., Wm. L. Marshall Companies, Inc. and the Marshall Financial Group, Inc. (a registered investment adviser and provider of financial and related consulting services); Certified Financial Planner; Member, Financial Planners Association; Director, (2008 – 2014) Doylestown Health Foundation Board; and the Ann Silverman Community Clinic of Doylestown, PA. | | | 59 | | | Trustee, State Street Institutional Investment Trust; Trustee SSGA Funds; Director, Marshall Financial Group, Inc. |
| | | | | | | | | | | | | |
Richard D. Shirk State Street Financial Center One Lincoln Street Boston, MA 02111-2900 YOB: 1945 | | Trustee and Co-Chairman of the Qualified Legal and Compliance Committee | | Term: Indefinite Elected: 1/14 | | March 2001 to April 2002, Chairman (1996 to March 2001, President and Chief Executive Officer), Cerulean Companies, Inc. (holding company) (Retired); 1992 to March 2001, President and Chief Executive Officer, Blue Cross Blue Shield of Georgia (health insurer, managed healthcare); 1998 to December 2008, Chairman, Board Member and December 2008 to Present, Investment Committee Member, Healthcare Georgia Foundation (private foundation); September 2002 to Present, Lead Director and Board Member, Amerigroup Corp. (managed health care); 1999 to Present, Board Member and (since 2001) Investment Committee Member, Woodruff Arts Center; and 2003 to 2009, Trustee, Gettysburg College. | | | 59 | | | Trustee, State Street Institutional Investment Trust; Trustee SSGA Funds; Board member, AeroCare Holdings (privately held healthcare services company) (February 2003 – Present); Board member, Regenesis Biomedical (health care services) (April 2012 – Present). |
| | | | | | | | | | | | | |
Rina K. Spence State Street Financial Center One Lincoln Street Boston, MA 02111-2900 YOB: 1948 | | Trustee and Co-Chairman of the Qualified Legal and Compliance Committee and Co-Chairman of the Governance Committee | | Term: Indefinite Elected: 7/99 | | President of SpenceCare International LLC (international healthcare consulting) (1999 – present); Chief Executive Officer, IEmily.com (health internet company) (2000 – 2001); Chief Executive Officer of Consensus Pharmaceutical, Inc. (1998 – 1999); Founder, President and Chief Executive Officer of Spence Center for Women’s Health (1994 – 1998); President and CEO Emerson Hospital (1984 – 1994); Trustee, Eastern Enterprise (utilities) (1988 – 2000). | | | 59 | | | Trustee, State Street Institutional Investment Trust; Trustee SSGA Funds; Director, Berkshire Life Insurance Company of America (1993 – 2009); Director, IEmily.com, Inc. (2000 – 2010); and Trustee, National Osteoporosis Foundation (2005 – 2008). |
| | | | |
| Trustees and Officers Information | | | 63 | |
State Street Equity 500 Index Portfolio
Trustees and Officers Information, continued — December 31, 2014
| | | | | | | | | | | | |
Name,
Address, and
Year of Birth
| | Position(s) Held
with Trust | | Term of
Office and
Length of
Time Served | | Principal Occupation
During Past Five Years | | Number of
Funds in
Fund
Complex
Overseen
by Trustee | | | Other
Directorships
Held by
Trustee During
Past Five Years |
INDEPENDENT TRUSTEES (continued) |
Bruce D. Taber State Street Financial Center One Lincoln Street Boston, MA 02111-2900 YOB: 1943 | | Trustee and Co-Chairman of the Valuation Committee and Co-Chairman of the Governance Committee | | Term: Indefinite Elected: 1/14 | | 1999 to Present, Partner, Zenergy LLC (a technology company providing Computer Modeling and System Analysis to the General Electric Power Generation Division); Until December 2008, Independent Director, SSGA Cash Management Fund plc; Until December 2008, Independent Director, State Street Global Advisers Ireland, Ltd. (investment companies); and Until August 1994, President, Alonzo B. Reed, Inc., (a Boston architect-engineering firm). | | | 59 | | | Trustee, State Street Institutional Trust; Trustee SSGA Funds. |
| | | | | | | | | | | | | |
Douglas T. Williams State Street Financial Center One Lincoln Street Boston, MA 02111-2900 YOB: 1940 | | Trustee and Co-Chairman of the Audit Committee | | Term: Indefinite Elected: 7/99 | | President, Oakmont Homeowners Association (2012 – 2013); President, Mariner Sands Chapel; Executive Vice President and member of Executive Committee, Chase Manhattan Bank (1987 –1999); President, Boston Stock Exchange Depository Trust Company, 1981 –1982. | | | 59 | | | Trustee, State Street Institutional Investment Trust; Trustee SSGA Funds; Treasurer, Nantucket Educational Trust, (2002 – 2007). |
Interested Trustees(1) |
Scott F. Powers State Street Financial Center One Lincoln Street Boston, MA 02111-2900 YOB: 1959 | | Trustee | | Term: Indefinite Elected Trustee: 1/14 | | May 2008 to Present, President and Chief Executive Officer of State Street Global Advisors; 2001 – 2008, Chief Executive Officer of Old Mutual Asset Management; Board of Directors, United Way of Massachusetts Bay; Board of Directors of Middlesex School; Incorporator, Cardigan Mountain School | | | 59 | | | |
| | | | | | | | | | | | | |
James E. Ross SSGA Funds Management, Inc. State Street Financial Center One Lincoln Street Boston, MA 02111-2900 YOB: 1965 | | Trustee | | Term: Indefinite Elected Trustee: 2/07 | | Chairman and Director, SSGA Funds Management, Inc. (2012 – present); President, SSGA Funds Management, Inc. (2005 – 2012); Executive Vice President and Senior Managing Director, State Street Global Advisors (2006 – present); and Principal, State Street Global Advisors (2006 – present). | | | 254 | | | |
| (1) | | Mr. Powers and Mr. Ross are Interested Trustees because of their employment by SSGA Funds Management, Inc., an affiliate of the Trust. |
| | |
| 64 | | Trustees and Officers Information |
State Street Equity 500 Index Portfolio
Trustees and Officers Information, continued — December 31, 2014
| | | | | | |
Name,
Address, and
Year of Birth | | Position(s) Held
with Trust | | Term of
Office and
Length of Time Served | | Principal Occupation During Past Five Years |
OFFICERS: | | | | | | |
Ellen M. Needham SSGA Funds Management, Inc. State Street Financial Center One Lincoln Street Boston, MA 02111-2900 YOB: 1967 | | President | | Term: Indefinite
Elected: 10/12 | | President and Director, SSGA Funds Management, Inc.
(June 2012 – present); Chief Operating Officer, SSGA Funds Management, Inc. (May 2010 – June 2012); Senior Managing Director, SSGA Funds Management, Inc. (1992 – 2012) and Senior Managing Director, State Street Global Advisors (1992 – present).* |
| | | | | | | |
Ann M. Carpenter SSGA Funds Management, Inc. State Street Financial Center One Lincoln Street Boston, MA 02111-2900 YOB: 1966 | | Vice President | | Term: Indefinite Elected: 10/12 | | Chief Operating Officer, SSGA Funds Management, Inc.
(April 2014 – present); Vice President, SSGA Funds Management, Inc. (2008 –present); Principal, State Street Global Advisors
(2005 – 2008 – present).* |
| | | | | | | |
Laura F. Dell State Street Bank and Trust Company 100 Huntington Avenue Boston, MA 02116 YOB: 1964 | | Treasurer | | Term: Indefinite Elected: 11/10 | | Vice President, State Street Bank and Trust Company (2002 – present).* |
| | | | | | | |
Chad C. Hallett SSGA Funds Management, Inc. State Street Financial Center One Lincoln Street Boston, MA 02111-2900 YOB: 1969 | | Assistant Treasurer | | Term: Indefinite Elected: 09/11 | | Vice President, State Street Global Advisors and SSGA Funds Management, Inc. (November 2014 – present); Vice President, State Street Bank and Trust Company (2001 – November 2014).* |
| | | | | | | |
Caroline M. Connolly State Street Bank and Trust Company 100 Huntington Avenue Boston, MA 02116 YOB: 1975 | | Assistant Treasurer | | Term: Indefinite Elected: 09/11 | | Assistant Vice President, State Street Bank and Trust Company
(2007 – present). |
| | | | | | | |
Brian Harris SSGA Funds Management, Inc. State Street Financial Center One Lincoln Street Boston, MA 02111 YOB: 1973 | | Chief Compliance Officer | | Term: Indefinite Elected: 11/13 | | Vice President, State Street Global Advisors and SSGA Funds Management, Inc. (June 2013 – Present); Senior Vice President and Global Head of Investment Compliance, BofA Global Capital Management (September 2010 to May 2013); Director of Compliance, AARP Financial Inc. (July 2008 to August 2010). |
| | | | |
| Trustees and Officers Information | | | 65 | |
State Street Equity 500 Index Portfolio
Trustees and Officers Information, continued — December 31, 2014
| | | | | | |
Name,
Address, and
Year of Birth | | Position(s) Held
with Trust | | Term of
Office and
Length of Time Served | | Principal Occupation During Past Five Years |
David K. James State Street Bank and Trust Company 100 Huntington Avenue Boston, MA 02116 YOB: 1970 | | Secretary | | Term: Indefinite Elected: 4/13 | | Managing Director and Managing Counsel, State Street Bank and Trust Company (2009 – present); Vice President and Counsel, PNC Global Investment Servicing (US), Inc. (2006 – 2009). |
| | | | | | | |
Kristin Schantz State Street Bank and Trust Company 100 Huntington Avenue Boston, MA 02116 YOB: 1979 | | Assistant Secretary | | Term: Indefinite Elected: 2/14 | | Vice President and Counsel, State Street Bank and Trust Company (2013 – present); Vice President, Citi Fund Services Ohio, Inc.
(2008 – 2013). |
| * | Served in various capacities and/or with various affiliated entities during noted time period. |
The Statement of Additional Information includes additional information about the Trustees and is available, without charge, upon request, by calling (toll free) 877-521-4083.
Trustees
William L. Boyan
Michael F. Holland
William L. Marshall
Scott F. Powers
Patrick J. Riley
James E. Ross
Richard D. Shirk
Rina K. Spence
Bruce D. Taber
Douglas T. Williams
Investment Adviser
SSGA Funds Management, Inc.
State Street Financial Center
One Lincoln Street
Boston, MA 02111
Administrator, Custodian and Transfer Agent
State Street Bank and Trust Company
State Street Financial Center
One Lincoln Street
Boston, MA 02111
Independent Registered Public Accounting Firm
Ernst & Young LLP
200 Clarendon Street
Boston, MA 02116
Legal Counsel
Ropes & Gray LLP
800 Boylston Street
Boston, MA 02119
This report is for shareholder information. This is not a prospectus intended for use in the purchase or sale of shares of beneficial interest.
State Street Equity 500 Index Portfolio
State Street Bank and Trust Company
P.O. Box 5049
Boston, MA 02206
IBG-14272
Item 2. Code of Ethics.
As of the end of the period covered by this report, SSGA Funds (the “Registrant”) has adopted a code of ethics, as defined in Item 2(b) of Form N-CSR, that applies to the Registrant’s principal executive officer, principal financial officer, principal accounting officer or controller, or persons performing similar functions, regardless of whether these individuals are employed by the registrant or a third party (the “Code”). That Code comprises written standards that are reasonably designed to deter wrongdoing and to promote: (1) honest and ethical conduct, including the ethical handling of actual or apparent conflicts of interest between personal and professional relationships; (2) full, fair, accurate, timely and understandable disclosure in reports and documents that a Registrant files with, or submits to, the U.S. Securities Exchange Commission (the “SEC”) and in other public communications made by a Registrant; (3) compliance with applicable laws and governmental rules and regulations; (4) the prompt internal reporting to an appropriate person or persons identified in the Code of violations of the Code; and accountability for adherence to the Code. As of the end of the period covered by the report, the Code was combined with other mutual funds advised by SSGA Funds Management, Inc. (“SSGA FM”). The Registrant has not granted any waivers from any provisions of the Code during the covered period. A copy of the Registrant’s Code is filed as Exhibit 12(a)(1) to this Form N-CSR.
Item 3. Audit Committee Financial Expert.
The Registrant’s Board of Trustees (the “Board”) has determined that the Registrant has the following “audit committee financial experts” as defined in Item 3(b) of Form N-CSR serving on its Audit Committee: Messrs. Michael F. Holland, William L. Boyan and Mr. Richard D. Shirk. The audit committee financial experts are “independent” as that term is defined in Item 3(a)(2) of Form N-CSR.
An “audit committee financial expert” is not an “expert” for any purpose, including for purposes of Section 11 of the Securities Act of 1933, as a result of being designated as an “audit committee financial expert.” Further, the designation of a person as an “audit committee financial expert” does not mean that the person has any greater duties, obligations, or liability than those imposed on the person without the “audit committee financial expert” designation. Similarly, the designation of a person as an “audit committee financial expert” does not affect the duties, obligations, or liability of any other member of the Audit Committee or Board of Trustees.
Item 4. Principal Accountant Fees and Services.
For the fiscal year ended August 31, 2015, the aggregate audit fees billed for professional services rendered by Ernst & Young LLP (“E&Y”), the Registrant’s principal accountant, for the audit of the Registrant’s annual financial statements or services normally provided by E&Y in connection with the Registrant’s
statutory and regulatory filings and engagements was $307,600. For the fiscal year ended August 31, 2014, the aggregate audit fees billed for professional services rendered by the Registrant’s previous principal accountant, for the audit of the Registrant’s annual financial statements or services normally provided in connection with the Registrant’s statutory and regulatory filings and engagements was $430,700.
For the fiscal years ended August 31, 2014 and August 31, 2015, there were no fees for assurance and related services by the Registrant’s principal accountant reasonably related to the performance of the audit of the Registrant’s financial statements that were not reported under paragraph (a) of this Item.
The aggregate tax fees billed for professional services rendered by E&Y for tax compliance, tax advice, and tax planning in the form of preparation of excise filings and income tax returns for the fiscal year ended August 31, 2015 was $92,000. The aggregate tax fees billed for professional services rendered by the Registrant’s principal accountant for tax compliance, tax advice, and tax planning in the form of preparation of excise filings and income tax returns for the fiscal year ended August 31, 2014 was $77,640.
For the fiscal year ended August 31, 2015, the aggregate fees for professional services rendered by E&Y for products and services provided by E&Y to SSGA Funds Management, Inc. (the “Adviser”) and any entity controlling, controlled by, or under common control with the Adviser that provides ongoing services to the Registrant that (i) relate directly to the operations and financial reporting of the Registrant and (ii) were pre-approved by the Registrant’s audit committee was approximately $7,638,332. For the fiscal year ended August 31, 2014, the aggregate fees for professional services rendered by the Registrant’s principal accountant for products and services provided to SSGA Funds Management, Inc. (the “Adviser”) and any entity controlling, controlled by, or under common control with the Adviser that provides ongoing services to the Registrant that (i) relate directly to the operations and financial reporting of the Registrant and (ii) were pre-approved by the Registrant’s audit committee was approximately $4,701,109.
| | | | |
| | (e)(1) | | Audit Committee Pre-Approval Policies and Procedures |
The Trust’s Audit Committee Charter states the following with respect to pre-approval procedures:
Pre-Approval Requirements. Before the independent accountants are engaged by the Trust to render audit or non-audit services, either:
| | 1. | The Audit Committee shall pre-approve all auditing services and permissible non-audit services (e.g., tax services) provided to the Trust. The Audit Committee may delegate to one or more of its members the authority to grant pre-approvals. Any decision of any member to whom authority is delegated under this section shall be presented to the full Audit Committee at its next regularly scheduled meeting; or |
| | 2. | The engagement to render the auditing service or permissible non-audit service is entered into pursuant to pre-approval policies and procedures established by the Audit Committee. Any such policies and procedures must (1) be detailed as to the particular service and (2) not involve any delegation of the Audit Committee’s responsibilities to the investment adviser. The Audit Committee must be informed of each service entered into pursuant to the policies and procedures. A copy of any such policies and procedures shall be attached as an exhibit to the Audit Committee Charter. |
De Minimis Exceptions to Pre-Approval Requirements. Pre-Approval for a service provided to the Trust other than audit, review or attest services is not required if: (1) the aggregate amount of all such non-audit services provided to the Trust constitutes not more than 5 percent of the total amount of revenues paid by the Trust to the independent accountants during the fiscal year in which the non-audit services are provided; (2) such services were not recognized by the Trust at the time of the engagement to be non-audit services; and (3) such services are promptly brought to the attention of the Audit Committee and are approved by the Audit Committee or by one or more members of the Audit Committee to whom authority to grant such approvals has been delegated by the Audit Committee prior to the completion of the audit.
Pre-Approval of Non-Audit Services Provided to the Adviser and Certain Control Persons. The Audit Committee shall pre-approve any non-audit services proposed to be provided by the independent accountants to (a) the investment adviser and (b) any entity controlling, controlled by, or under common control with the investment adviser that provides ongoing services to the Trust, if the independent accountants’ engagement with the investment adviser or any such control persons relates directly to the operations and financial reporting of the Trust. It shall be the responsibility of the independent accountants to notify the Audit Committee of any non-audit services that need to be pre-approved.
Application of De Minimis Exception: The De Minimis exception set forth above applies to pre-approvals under this Section as well, except that the
“total amount of revenues” calculation is based on the total amount of revenues paid to the independent accountants by the Trust and any other entity that has its services approved under this Section (i.e., the investment adviser or any control person).”
| | | | |
| | (e)(2) | | Percentages of Services |
The percentage of services described in each of paragraphs (b) through (d) of this Item that were approved by the audit committee pursuant to paragraph (c)(7)(i)(C) of Rule 2-01 of Regulation S-X is as follows
| | | | |
Audit Fees | | | 100 | % |
Audit-Related Fees | | | 100 | % |
Tax Fees | | | 100 | % |
All Other Fees | | | 100 | % |
| | (g) | Total Fees Paid By Adviser and Certain Affiliates |
For the corporate year ended December 31, 2012, the aggregate non-audit fees billed by E&Y for services rendered to the Registrant and the Adviser and any entity controlling, controlled by, or under common control with the Adviser that provided ongoing services to the Registrant was approximately $22,779,805. For the fiscal year ended August 31, 2014, the aggregate non-audit fees billed by the Registrant’s principal accountant for services rendered to the Registrant and the Adviser and any entity controlling, controlled by, or under common control with the Adviser that provided ongoing services to the Registrant was approximately $4,800,849.
| | (h) | E&Y notified the Registrant’s Audit Committee of all non-audit services that were rendered by E&Y to the Adviser and any entity controlling, controlled by, or under common control with the Adviser that provides services to the Registrant, which services were not required to be pre-approved pursuant to paragraph (c)(7)(ii) of Rule 2-01 of Regulation S-X, allowing the Registrant’s Audit Committee to consider whether such services were compatible with maintaining E&Y’s independence. |
Item 5. Audit Committees of Listed Registrants.
Not applicable to the Registrant.
Item 6. Schedule of Investments.
| (a) | Schedules of Investments are included as part of the reports to shareholders filed under Item 1 of this Form N-CSR. |
| (b) | Not applicable to the Registrant. |
Item 7. Disclosure of Proxy Voting Policies and Procedures for Closed-End Management Investment Companies.
Not applicable to the Registrant.
Item 8. Portfolio Managers of Closed-End Management Investment Companies.
Not applicable to the Registrant.
Item 9. Purchases of Equity Securities by Closed-End Management Investment Company and Affiliated Purchasers.
Not applicable to the Registrant.
Item 10. Submission of Matters to a Vote of Security Holders.
The Board of Trustees approved an Amended and Restated Nominating Committee Charter (the “Charter”) at their February 13, 2014 Board Meeting. The Charter contains new procedures related to how shareholders are to submit recommendations for Trustee candidates to the Trust. Those new procedures are as follows:
Procedures for Shareholders to Submit Nominee Candidates
(As of February 13, 2014)
A shareholder of the Trust, or of any series thereof, if applicable, must follow the following procedures in order to submit properly a nominee recommendation for the Nominating Committee’s consideration.
| | 1. | The shareholder must submit any such recommendation (a “Shareholder Recommendation”) in writing to the Trust, to the attention of the Trust’s Secretary, at the address of the principal executive offices of the Trust. |
| | 2. | The Shareholder Recommendation must be delivered to, or mailed and received at, the principal executive offices of the Trust not less than sixty (60) calendar days nor more than ninety (90) calendar days prior to the date of the Board or shareholder meeting at which the nominee candidate would be considered for election. Shareholder Recommendations will be kept on file for two years after receipt of the Shareholder Recommendation. A Shareholder Recommendation considered by the Nominating Committee in connection with the Nominating Committee’s nomination of any candidate(s) for appointment or election as an independent Trustee need not be considered again by the Nominating Committee in connection with any subsequent nomination(s). |
| | 3. | The Shareholder Recommendation must include: (i) a statement in writing setting forth (A) the name, age, date of birth, business address, residence address and nationality of the person recommended by the shareholder (the “candidate”), and the names and addresses of at least three professional references; (B) the number of all shares of the Trust (including the series and class, if applicable) owned of record or beneficially by the candidate, the date such shares were acquired and the investment intent of such acquisition(s), as reported to such shareholder by the candidate; (C) any other information regarding the candidate called for with respect to director nominees by paragraphs (a), (d), (e) and (f) of Item 401 of Regulation S-K or paragraph (b) of Item 22 of Rule 14a-101 (Schedule 14A) under the Securities Exchange Act of 1934, as amended (the “Exchange Act”), adopted by the Securities and Exchange Commission (or the corresponding provisions of any applicable regulation or rule subsequently adopted by the Securities and Exchange Commission or any successor agency with jurisdiction related to the Trust); (D) any other information regarding the candidate that would be required to be disclosed if the candidate were a nominee in a proxy statement or other filing required to be made in connection with solicitation of proxies for election of directors pursuant to Section 14 of the Exchange Act and the rules and regulations promulgated thereunder or any other applicable law or regulation; and (E) whether the recommending shareholder believes that the candidate is or will be an “interested person” of the Trust (as defined in the Investment Company Act of 1940, as amended) and, if not an “interested person,” information regarding the candidate that will be sufficient, in the discretion of the Board or the Nominating Committee, for the Trust to make such determination; (ii) the written and signed consent of the candidate to be named as a nominee and to serve as a Trustee if elected; (iii) the recommending shareholder’s name as it appears on the Trust’s books; (iv) the number of all shares of the Trust (including the series and class, if applicable) owned beneficially and of record by the recommending shareholder; (v) a complete description of all arrangements or understandings between the recommending shareholder and the candidate and any other person or persons (including their names) pursuant to which the recommendation is being made by the recommending shareholder including, without limitation, all direct and indirect compensation and other material monetary agreements, arrangements and understandings between the candidate and recommending shareholder during the past three years, and (vi) a brief description of the candidate’s relevant background and experience for membership on the Board, such as qualification as an audit committee financial expert. |
| | 4. | The Nominating Committee may require the recommending shareholder to furnish such other information as it may reasonably require or deem necessary to verify any information furnished pursuant to paragraph 3 above or to determine the eligibility of the candidate to serve as a Trustee of the Trust or to satisfy applicable law. If the recommending shareholder fails to provide such other information in writing within seven days of receipt of a written request from the Nominating Committee, the recommendation of such candidate as a nominee will be deemed not properly submitted for consideration, and the Nominating Committee will not be required to consider such candidate. |
Item 11. Controls and Procedures.
(a) The Registrant’s principal executive officer and principal financial officer have concluded that the Registrant’s disclosure controls and procedures (as defined in Rule 30a-3(c) under the Investment Company Act of 1940, as amended (the “1940 Act”)) are effective to provide reasonable assurance that information required to be disclosed by the registrant on Form N-CSR is recorded, processed, summarized and reported as of a date within 90 days of the filing date of this report, that includes the disclosure required by this paragraph, based on their evaluation of these controls and procedures required by Rule 30a-3(b) under the 1940 Act and Rules 13a-15(b) or 15d-15(b) under the Securities Exchange Act of 1934.
(b) There were no changes in the Registrant’s internal control over financial reporting (as defined in Rule 30a-3(d) under the 1940 Act) that occurred during the Registrant’s second fiscal quarter of the period covered by this Form N-CSR filing that has materially affected, or is reasonably likely to materially affect, the Registrant’s internal control over financial reporting.
Item 12. Exhibits.
(a)(1) Code of Ethics pursuant to Item 2 of Form N-CSR is attached hereto.
(a)(2) Certifications of principal executive officer and principal financial and accounting officer of the Registrant as required by Rule 30a-2(a) under the 1940 Act are attached hereto.
(a)(3) Not applicable to the Registrant.
(b) Certifications of principal executive officer and principal financial and accounting officer of the Registrant as required by Rule 30a-2(b) under the 1940 Act and Section 906 of the Sarbanes-Oxley Act of 2002 are attached hereto.
SIGNATURES
Pursuant to the requirements of the Securities Exchange Act of 1934 and the Investment Company Act of 1940, as amended, the Registrant has duly caused this report to be signed on its behalf by the undersigned, thereunto duly authorized.
SSGA FUNDS
| | |
| By: | | /s/ Ellen M. Needham |
| | Ellen M. Needham |
| | President and Principal Executive Officer |
| |
| Date: | | November 9, 2015 |
Pursuant to the requirements of the Securities Exchange Act of 1934 and the Investment Company Act of 1940, as amended, this report has been signed below by the following persons on behalf of the Registrant and in the capacities and on the dates indicated.
| | |
| By: | | /s/ Ellen M. Needham |
| | Ellen M. Needham |
| | President and Principal Executive Officer |
| |
| Date: | | November 9, 2015 |
| |
| By: | | /s/ Chad C. Hallett |
| | Chad C. Hallett |
| | Principal Financial Officer, |
| | Principal Accounting Officer and Treasurer |
| |
| Date: | | November 9, 2015 |