UNITED STATES
SECURITIES AND EXCHANGE COMMISSION
Washington, D.C. 20549
FORM N-CSR
CERTIFIED SHAREHOLDER REPORT OF REGISTERED
MANAGEMENT INVESTMENT COMPANIES
| INVESTMENT COMPANY ACT FILE NUMBER: | 811-05443 |
| | |
| EXACT NAME OF REGISTRANT AS SPECIFIED IN CHARTER: | Calamos Investment Trust |
| | |
| ADDRESS OF PRINCIPAL EXECUTIVE OFFICES: | 2020 Calamos Court, Naperville |
| | Illinois 60563-2787 |
| | |
| | |
| NAME AND ADDRESS OF AGENT FOR SERVICE: | John P Calamos, Sr., Founder, Chairman and |
| | Global Chief Investment Officer |
| | Calamos Advisors LLC |
| | 2020 Calamos Court, |
| | Naperville, Illinois |
| | 60563-2787 |
| REGISTRANT’S TELEPHONE NUMBER, INCLUDING AREA CODE: | (630) 245-7200 |
| DATE OF FISCAL YEAR END: | October 31, 2023 |
| DATE OF REPORTING PERIOD: | November 1, 2022 through October 31, 2023 |
ITEM 1. REPORT TO SHAREHOLDERS.

TIMELY INFORMATION INSIDE


Visit www.calamos.com/paperless to enroll. You can view shareholder communications, including fund prospectuses, annual reports and other shareholder materials online long before the printed publications arrive by traditional mail.
Family of Funds
ANNUAL REPORT OCTOBER 31, 2023
Alternative
Calamos Market Neutral Income Fund
Calamos Hedged Equity Fund
Calamos Phineus Long/Short Fund
Calamos Merger Arbitrage Fund
Convertible
Calamos Convertible Fund
Calamos Global Convertible Fund
US Equity
Calamos Timpani Small Cap Growth Fund
Calamos Timpani SMID Growth Fund
Calamos Growth Fund
Calamos Growth and Income Fund
Calamos Dividend Growth Fund
Calamos Select Fund
Global Equity
Calamos International Growth Fund
Calamos Evolving World Growth Fund
Calamos Global Equity Fund
Calamos Global Opportunities Fund
Calamos International Small Cap Growth Fund
Fixed Income
Calamos Total Return Bond Fund
Calamos High Income Opportunities Fund
Calamos Short-Term Bond Fund

Experience and Foresight
About Calamos Investments
For over 40 years, we have helped investors like you manage and build wealth to meet long-term objectives. Because investors have different time horizons, risk tolerances and goals, we offer funds to suit a variety of asset allocation needs. Our 20 mutual funds include equity, fixed income, convertible and alternative funds. We offer US funds as well as global and international choices.
We are dedicated to helping our clients build and protect wealth. We understand when you entrust us with your assets, you also entrust us with your achievements, goals and aspirations. We believe we best honor this trust by making investment decisions guided by integrity, discipline and our conscientious research.
We believe an active, risk-conscious approach is essential for wealth creation. In our early years, we pioneered the use of convertible securities as a means to control risk in volatile markets. We followed with strategies that combine convertibles and stocks, with the aim of participating in equity market upside with potentially less volatility than an all-stock portfolio. In 1990, we introduced our first stock fund, which invests in growth companies both large and small. Across our funds, our investment process seeks to manage risk at multiple levels and draws upon our experience investing through many market cycles. In a rapidly changing environment, we believe that this active management is essential.
We are global in our perspective. We believe globalization offers tremendous opportunities for countries and companies all over the world. In our US, global and international portfolios, we are seeking to capitalize on the potential growth of the global economy.
We believe there are opportunities in all markets. Our history traces back to the 1970s, a period of significant volatility and economic concerns. Since then, we have invested through the ebb and flow of multiple markets, each with its own set of challenges. Out of this experience comes our belief that the flipside of volatility is opportunity.
TABLE OF CONTENTS
Letter to Shareholders | | | 1 | | |
The Funds | |
Calamos Market Neutral Income Fund | | | 4 | | |
Calamos Hedged Equity Fund | | | 8 | | |
Calamos Phineus Long/Short Fund | | | 11 | | |
Calamos Merger Arbitrage Fund | | | 18 | | |
Calamos Convertible Fund | | | 20 | | |
Calamos Global Convertible Fund | | | 24 | | |
Calamos Timpani Small Cap
Growth Fund | | | 27 | | |
Calamos Timpani SMID Growth Fund | | | 31 | | |
Calamos Growth Fund | | | 35 | | |
Calamos Growth and Income Fund | | | 39 | | |
Calamos Dividend Growth Fund | | | 43 | | |
Calamos Select Fund | | | 47 | | |
Calamos International Growth Fund | | | 51 | | |
Calamos Evolving World Growth Fund | | | 55 | | |
Calamos Global Equity Fund | | | 59 | | |
Calamos Global Opportunities Fund | | | 64 | | |
Calamos International Small Cap
Growth Fund | | | 68 | | |
Calamos Total Return Bond Fund | | | 71 | | |
Calamos High Income
Opportunities Fund | | | 76 | | |
Calamos Short-Term Bond Fund | | | 81 | | |
Expense Overview | | | 85 | | |
Schedules of Investments | | | 89 | | |
Statements of Assets and Liabilities | | | 181 | | |
Statements of Operations | | | 186 | | |
Statements of Changes In Net Assets | | | 190 | | |
Notes to Financial Statements | | | 197 | | |
Financial Highlights | | | 235 | | |
Report of Independent Registered
Public Accounting Firm | | | 300 | | |
Trustee Approval of Management
Agreement | | | 302 | | |
Trustees and Officers | | | 309 | | |
Tax Information | | | 313 | | |

JOHN P. CALAMOS, SR.
Founder, Chairman, and Global Chief Investment Officer
Dear Fellow Shareholder:
Welcome to your annual report for the 12 months ending October 31, 2023. In this report, you will find commentary from our portfolio management teams, a listing of portfolio holdings, financial statements and highlights, and detailed information about the performance and positioning of the Calamos Funds.
Market Review
The reporting period was remarkable for its many ups and downs, which included leadership rotations, sell-offs, and rallies. Market turmoil reflected ongoing uncertainty and shifting sentiment around interest rates and Federal Reserve policy, energy prices, and inflation. Investors also grappled with waves of anxiety due to a wide variety of events, including the failures of Silicon Valley Bank and Signature Bank, an autoworkers strike, and contentious debt ceiling negotiations in a polarized US Congress. Emerging secular themes—most notably advances in artificial intelligence and weight loss drugs—disrupted the markets as investors considered which companies and industries were positioned to win or lose.
The final months of the reporting period proved particularly difficult as investors grappled with deepening concerns about the sustainability of corporate earnings, the health of the consumer, and the trajectory of economic growth. Although the Federal Reserve paused its rate tightening in September, the central bank dashed hopes of imminent rate cuts by reinforcing prior guidance that rates would be higher for longer. The yield of the US 10-Year Treasury Bond reached multi-decade highs, while the onset of the Israel-Hamas war intensified geopolitical uncertainty.
Although broad stock market benchmarks posted healthy advances for the period, these returns often fall short of capturing the crosscurrents buffeting the markets. The market capitalization weighted S&P 500 Index gained more than 10% overall, but the S&P 500 Equal Weighted Index ended up in negative territory with a loss of -0.75%. In other words, there were a handful of strong performers that anchored the performance in the broad index, while the average stock was down slightly on the year.
Meanwhile, in the bond market, high yield securities and shorter-duration bonds outperformed the broader investment-grade market, which was more vulnerable to fears about inflation and higher interest rates. Convertible securities, which combine attributes of stocks and bonds, also encountered headwinds, reflecting the challenges in the stock and traditional bond markets.
www.calamos.com
1
Outlook
We see many signs pointing to slower economic growth and increasing risks across sectors. Higher interest rates will take time to work through the economy, with far-reaching consequences for businesses and consumers. Global manufacturing data is trending down, and fuel prices are putting significant pressure on many companies and households. Meanwhile, retailers will likely struggle as consumer nest eggs amassed during the pandemic dwindle and student loan repayments resume. Fiscal policy uncertainty, already elevated, will intensify as the US presidential election approaches. We expect geopolitical crosscurrents will take a toll on individual markets, sectors, and industries. Monetary policy will also remain a focal point for the markets, as investors contemplate the Federal Reserve's next moves. Against this backdrop, we expect saw-toothed and volatile markets to continue.
In an economic and market environment with a lot going on "under the hood," we believe we are well positioned to serve our shareholders. My 50+ years experience in the markets supports my belief that although markets may be volatile in the short term, fundamentals ultimately win. We are confident that our teams have the long-term perspective and experience required to navigate an environment where discipline, individual security selection, and risk management matter.
Asset Allocation Considerations
In periods of heightened uncertainty and elevated volatility, it's especially important to remember that there are opportunities in all economic environments. However, there is typically a lot of noise in the headlines, which means that the emotion in the markets may not align with the long-term opportunities.
When global financial markets are as turbulent as they have been over recent months, investors may be tempted to retreat to the sidelines. However, as we've noted in the past, jumping in and out of the market is a dangerous strategy—investors tend to capture the downturns and miss the upturns. Instead, a far better course is to establish an asset allocation that aligns with your needs and risk tolerance.
I believe that a well-diversified blend of equity and fixed income funds provides a sound asset allocation foundation. I also encourage you to take a closer look at liquid alternative funds, which can employ a wider array of strategies than traditional funds. As a result, alternative investments can help investors optimize asset allocations and provide additional ballast during volatile markets.
Since we launched our first alternative fund in 1990, we've been committed to providing investors with these important asset allocation tools. Today, our alternative suite includes equity alternatives Calamos Phineus Long/Short Fund and Calamos Hedged Equity Fund. Our flagship alternative fund, Calamos Market Neutral Income Fund, focuses on providing consistent performance through an approach that is less vulnerable to interest rates than traditional fixed income approaches are. Finally, we're pleased to announce our newest fund, Calamos Merger Arbitrage Fund, which we launched earlier this year.
CALAMOS OPEN-END FAMILY OF FUNDS ANNUAL REPORT
2
In Closing
Since the founding of Calamos Investments in the difficult financial markets of the 1970s, our firm has dedicated itself to helping investors achieve their long-term goals. I continue to believe that our disciplined, research-driven approaches will allow us to turn volatility into long-term opportunity for the shareholders of the Calamos Funds. In the commentaries that follow, you'll read about the many ways our teams are pursuing returns and managing risks in the current environment on your behalf.
As always, thank you for your continued trust. All of us at Calamos Investments are honored that you have chosen us to help you achieve your asset allocation goals.
Sincerely,

John P. Calamos, Sr.
Founder, Chairman and Global Chief Investment Officer
Before investing, carefully consider a fund's investment objectives, risks, charges and expenses. Please see the prospectus containing this and other information or call 800-582-6959. Please read the prospectus carefully. Performance data represents past performance, which is no guarantee of future results. Current performance may be lower or higher than the performance quoted.
Diversification and asset allocation do not guarantee a profit or protection against a loss. Investments in alternative strategies may not be suitable for all investors.
* Returns for the 12 months ended October 31, 2023: The S&P 500 Index, a market-capitalization-weighted measure of the US stock market, returned 10.14%. The S&P 500 Equal Weighted Index, a non-market-capitalization-weighted measure of the US stock market returned -0.75%. The MSCI All Country World Index, a measure of global stock market performance, returned 11.06%. The MSCI Emerging Market Index, a measure of emerging market equity performance, returned 11.26%. The Bloomberg US High Yield 2% Issuer Capped Index, a measure of the performance of high-yield corporate bonds with a maximum allocation of 2% to any one issuer, returned 6.23%. The Bloomberg US Aggregate Bond Index, a measure of the US investment-grade bond market, returned 0.36%, the Bloomberg US Government/Credit 1-3 Year Index, a measure of US short-term bond performance, returned 3.23%. The ICE BofA All US Convertibles Index, a measure of the US convertible market, returned -0.48%.
Source: Calamos Advisors LLC.
Unmanaged index returns assume reinvestment of any and all distributions and, unlike fund returns, do not reflect fees, expenses or sales charges. Investors cannot invest directly in an index. Returns are in US dollar terms.
Investments in overseas markets pose special risks, including currency fluctuation and political risks. These risks are generally intensified for investments in emerging markets. Countries, regions, and sectors mentioned are presented to illustrate countries, regions, and sectors in which a fund may invest. There are certain risks involved with investing in convertible securities in addition to market risk, such as call risk, dividend risk, liquidity risk and default risk, which should be carefully considered prior to investing.
Investments in alternative strategies may not be suitable for all investors.
Fund holdings are subject to change daily. The Funds are actively managed. The information contained herein is based on internal research derived from various sources and does not purport to be statements of all material facts relating to the securities mentioned. The information contained herein, while not guaranteed as to accuracy or completeness, has been obtained from sources we believe to be reliable.
Opinions are as of the publication date, subject to change and may not come to pass.
This information is being provided for informational purposes only and should not be considered investment advice or an offer to buy or sell any security in the portfolio.
www.calamos.com
3
Calamos Market Neutral Income Fund (Unaudited)
OVERVIEW
The Fund combines two complementary strategies with different responses to volatility: arbitrage seeks alpha and uncorrelated returns, while hedged equity provides income from options writing and upside participation.
KEY FEATURES
◼ Generates returns not dependent on interest rates, a key differentiator from traditional bond strategies.
◼ Employs an absolute-return strategy with historically lower beta to fixed income and equity markets as well as lower volatility and limited drawdowns.
◼ As one of the first alternative mutual funds, capitalizes on more than four decades of experience in the convertible space.
PORTFOLIO FIT
The Fund may provide potential diversification, with its low correlation to bonds and stability versus equities.
FUND NASDAQ SYMBOLS
A Shares | | CVSIX | |
C Shares | | CVSCX | |
I Shares | | CMNIX | |
R6 Shares | | CVSOX | |
FUND CUSIP NUMBERS
A Shares | | | 128119203 | | |
C Shares | | | 128119849 | | |
I Shares | | | 128119880 | | |
R6 Shares | | | 128120342 | | |
CALAMOS MARKET NEUTRAL INCOME FUND
INVESTMENT TEAM DISCUSSION
Please discuss the Fund's strategy and role within an asset allocation.
Launched more than 30 years ago, Calamos Market Neutral Income Fund represents one of the first liquid alternative mutual funds and blends two main strategies—arbitrage and hedged equity—with the aim of monetizing volatility. Calamos Market Neutral Income Fund is designed to do the following:
◼ Potentially enhance an investor's fixed-income allocation.
◼ Actively pursue equity market upside while hedging downside risk.
◼ Provide consistent absolute total return over varying market cycles.
In addition to seeking an attractive historical risk/reward profile, the Fund may enhance long-term portfolio diversification potential, a vital benefit given recent bouts of elevated equity volatility.
How has the Fund performed?
For the 12 months ended October 31, 2023 ("annual period"), Calamos Market Neutral Income Fund returned 8.07% (Class I Shares at net asset value), strongly outperforming the 0.74% return of the Bloomberg US Government/Credit Bond Index and the 4.89% return of the Bloomberg Short Treasury 1-3 Month Index.
What factors influenced performance during the reporting period?
During the annual period, investors notably focused on the Federal Reserve's response to persistent inflation and the potential for a recession. Geopolitical concerns, regional bank deposit stress, rising fuel prices, and potential impacts from the United Auto Workers strike also dominated headlines. Despite these headwinds, the equity market recovered from 2022's lows as the S&P 500 Index advanced 10.14% during the annual period. However, as measured by the Bloomberg US Government/Credit Index, the bond market rose just 0.74%, reflecting concerns that interest rates might stay persistently higher for longer.
As the Federal Reserve raised its fed funds target from 3.00%–3.25% to 5.25%–5.50%, the overall bond market experienced rising interest rates with the Bloomberg US Aggregate Bond Index yield to maturity increasing 64 basis points to 5.65%. Credit spreads declined slightly as the Bloomberg US Corporate High Yield Index average spread narrowed 38 basis points to 445 basis points over Treasuries.
The interest rate environment was supportive of the Fund's strategies. Regarding convertible arbitrage, the higher overnight interest rate meant a higher short interest rebate (the interest earned on the cash received from shorting the convertible's underlying stock). Additionally, new convertible issues have offered more favorable terms, including higher coupons and lower conversion premiums. Higher interest rates also have flowed through to the hedged equity strategy in the form of higher call prices and lower put prices, making our collar strategy more attractive. Finally, the Fund's special purpose acquisition company (SPAC) arbitrage strategy also benefited because higher short-term interest rates meant that the Fund earned more interest on the SPAC's cash in trust.
CALAMOS OPEN-END FAMILY OF FUNDS ANNUAL REPORT
4
Calamos Market Neutral Income Fund (Unaudited)
While volatility was below average during the annual period, there was significant "volatility in volatility." Realized volatility, as measured by the Cboe Volatility Index (VIX), averaged 18.36 over the one-year period, below the VIX long-term average of 19.53. The VIX began the period at 20.58, rose to 26.52 in March, fell to 12.82 in September before finishing the period at 18.14. These moves proved beneficial as the Fund's strategies actively benefit from trade rebalancing during changing volatility.
The advancing equity market, represented by the 10.14% gain of the S&P 500 Index, rewarded the Fund's hedged equity strategy because the equity basket rose toward the index's call option strike price. The option environment also provided an attractive opportunity to utilize call and put spreads, which allowed the Fund to sell deep out-of-the-money puts and buy closer-to-the-money puts to improve the Fund's downside risk mitigation. This approach meant that we did not need as heavy a call write, which provided additional runway to the upside.
The Fund's merger arbitrage sleeve also contributed positively to the annual result. The merger arbitrage holdings provide a complementary risk profile to the Fund, with a beta to S&P 500 somewhere between the convertible arbitrage and hedged equity strategies.
How is the Fund positioned?
We actively manage allocations to the strategies based on our view of market conditions and relative opportunities. At the end of the annual period, the Fund had 50.9% in its hedged equity strategy and 49.1% in its arbitrage strategies. The arbitrage strategies included 43.4% in convertible arbitrage, 1.8% in SPAC arbitrage, and 4.0% in merger arbitrage. At the beginning of the annual period, the Fund's allocation to the arbitrage strategy was 50.3% with 49.7% allocated to the hedged equity strategy.
Within the arbitrage strategy, we have the flexibility to utilize different strategies, including convertible arbitrage, merger arbitrage and SPAC arbitrage. We continue to like the opportunity in convertible arbitrage most, and the Fund's allocation to convertible arbitrage rose from 38.1% at the start of the annual period to 43.4% at the period end. We expect to continue adding to convertible arbitrage, particularly if we see the attractive new convertible issuance that we anticipate.
A principal driver for growing convertible arbitrage is heightened return expectations with the rise in overnight interest rates. Convertible arbitrage returns have historically been correlated with overnight rates because the rebate the Fund receives on its short stock positions is directly tied to the fed funds rate. Although returns don't necessarily go up tick-for-tick with rates, we expect a meaningful tailwind going forward.
The market environment for SPAC arbitrage has been waning as few SPAC IPOs have come to market, and the number of merger announcements has declined. The yield to expiration in SPACs has been attractive, but the allocation in SPAC arbitrage has decreased from 9.6% to 1.8% as SPACs reached expiration. Unless the environment changes, we expect the SPAC arbitrage allocation to continue to decline in favor of convertible arbitrage. It also bears mentioning that the allocation to merger arbitrage increased slightly from 2.6% to 4.0%.
SECTOR WEIGHTINGS
Information Technology | | | 30.6 | % | |
Consumer Discretionary | | | 12.9 | | |
Health Care | | | 11.1 | | |
Financials | | | 7.7 | | |
Communication Services | | | 7.6 | | |
Industrials | | | 6.1 | | |
Energy | | | 4.4 | | |
Consumer Staples | | | 4.1 | | |
Other | | | 4.6 | | |
Utilities | | | 3.4 | | |
Real Estate | | | 1.4 | | |
Materials | | | 1.4 | | |
Sector weightings are subject to change daily and are calculated as a percentage of net assets. The table excludes cash or cash equivalents, any government/sovereign bonds or broad based index hedging securities the Fund may hold.
www.calamos.com
5
Calamos Market Neutral Income Fund (Unaudited)
What closing thoughts do you have for Fund shareholders?
As an alternative investment, we believe that Calamos Market Neutral Income Fund continues to provide an attractive role in asset allocation, especially when viewed within the fixed-income portion of an investment portfolio. As interest rates have moved higher, bonds have looked increasingly attractive to investors, given their higher income. Equally important, the same factors making bonds more attractive in the higher-interest-rate environment have also benefited Calamos Market Neutral Income Fund. As mentioned, the convertible arbitrage strategy, hedged equity strategy, and SPAC arbitrage holdings are all reaping rewards from the higher-rate environment. The potential for elevated volatility in the markets creates more trade rebalancing opportunities, which we also expect to add value to the Fund. Finally, the Fund has had a historically low correlation to traditional fixed income, providing attractive diversification benefits within a fixed-income allocation.
ANNUALIZED RETURN: SINCE INCEPTION (5/10/00) THROUGH 10/31/23

Performance data quoted represents past performance, which is no guarantee of future results. Current performance may be lower or higher than the performance quoted.
The principal value and investment return of an investment will fluctuate so that your shares, when redeemed, may be worth more or less than their original cost. You can obtain performance data current to the most recent month end by visiting www.calamos.com. Average annual total return measures net investment income and capital gain or loss from portfolio investments as an annualized average. All performance shown assumes reinvestment of dividends and capital gains distributions. Performance is for the Fund's Class I shares at net asset value. The Fund also offers Class A, Class C and Class R6 shares, the performance of which may vary. Source: State Street Corporation and Morningstar Direct.
* Annual returns for Class I shares are provided because Class I shares represent the largest percentage of assets in the Calamos Family of Funds.
CALAMOS OPEN-END FAMILY OF FUNDS ANNUAL REPORT
6
Calamos Market Neutral Income Fund (Unaudited)
GROWTH OF $1,000,000: FOR THE 10-YEAR PERIOD ENDED 10/31/23

AVERAGE ANNUAL TOTAL RETURN† AS OF 10/31/23
| | | 1
YEAR | | 5
YEARS | | 10
YEARS OR
^SINCE
INCEPTION | |
Class A Shares – Inception 9/4/90 | |
Without Sales Charge | | | 7.76 | % | | | 3.25 | % | | | 3.28 | % | |
With Sales Charge | | | 5.33 | | | | 2.79 | | | | 2.78 | | |
Class C Shares – Inception 2/16/00 | |
Without Sales Charge | | | 6.93 | | | | 2.47 | | | | 2.50 | | |
With Sales Charge | | | 5.93 | | | | 2.47 | | | | 2.50 | | |
Class I Shares – Inception 5/10/00 | | | 8.07 | | | | 3.52 | | | | 3.53 | | |
Class R6 Shares – Inception 6/23/20^ | | | 8.08 | | | | — | | | | 3.46 | | |
Performance data quoted represents past performance, which is no guarantee of future results. Current performance may be lower or higher than the performance quoted. The principal value and investment return of an investment will fluctuate so that your shares, when redeemed, may be worth more or less than their original cost.
As of the prospectus dated 3/1/23, the Fund's gross expense ratio for Class A shares is 1.18%, Class C shares is 1.93%, Class I shares is 0.93% and Class R6 shares is 0.88%. The expense ratios shown above may differ from the more recent expense ratios reported in the Financial Highlights section of this report.
† Average annual total return measures net investment income and capital gain or loss from portfolio investments as an annualized average assuming reinvestment of dividends and capital gains distributions. Load-adjusted returns are adjusted for the maximum front-end sales load of 2.75% for Class A shares and returns for Class C shares have been adjusted for the contingent deferred sales charge (CDSC).
NOTES:
The graphs do not reflect the income taxes that you would pay on fund distributions or the redemption of fund shares. Fund performance includes reinvestment of dividends. The performance of other classes will vary from the performance of the class shown based on the difference in sales charges and fees paid by shareholders investing in different share classes.
The Bloomberg US Government/Credit Index is comprised of long-term government and investment-grade corporate debt securities and is generally considered representative of the performance of the broad US bond market. The Bloomberg Short Treasury 1-3 Month Index is generally considered representative of the performance of short-term money market investments and is provided to show how the Fund's performance compares to public obligations of the US Treasury with maturities of 1-3 months.
The S&P 500 Index is an unmanaged index generally considered representative of the US stock market.
The Bloomberg US Aggregate Bond Index is considered generally representative of the investment grade bond market. The Bloomberg US Corporate High Yield Bond Index measures the USD-denominated, high yield, fixed-rate corporate bond market. Securities are classified as high yield if the middle rating of Moody's, Fitch and S&P is Ba1/BB+/BB+ or below.
The Cboe Volatility Index (VIX) is a leading measure of market expectations of near-term volatility conveyed by S&P 500 Index (SPX) option prices.
Index returns assume reinvestment of dividends and do not reflect deduction of fees and expenses. It is not possible to invest directly in an index.
The Fund's use of derivative instruments involves investment risks and transaction costs to which the Fund would not be subject absent the use of these instruments and, accordingly, may result in losses greater than if they had not been used. Derivative instruments can be illiquid, may disproportionately increase losses and may have a potentially large impact on Fund performance.
www.calamos.com
7
Calamos Hedged Equity Fund (Unaudited)
OVERVIEW
The Fund blends a core long-equity portfolio with an actively managed option overlay. Tactical management creates opportunities to add alpha from option market dynamics and equity market volatility.
KEY FEATURES
◼ Our investment approach is highly responsive to dynamic market conditions, unlike many less-active option-based strategies.
◼ The investment team seeks to take advantage of opportunities the market presents, with a focus on being favorably positioned for as many outcomes as possible.
PORTFOLIO FIT
The Fund's options-based risk-management strategy can provide upside participation in equity markets while limiting downside exposure, thereby improving the quality of the ride.
FUND NASDAQ SYMBOLS
A Shares | | CAHEX | |
C Shares | | CCHEX | |
I Shares | | CIHEX | |
FUND CUSIP NUMBERS
A Shares | | | 128120698 | | |
C Shares | | | 128120680 | | |
I Shares | | | 128120672 | | |
CALAMOS HEDGED EQUITY FUND
INVESTMENT TEAM DISCUSSION
The Fund's Strategic Approach and Role in a Portfolio
Calamos Hedged Equity Fund's investment approach, which blends a core long-equity portfolio with an actively managed options overlay, can be highly responsive to dynamic market conditions and serve as a portfolio diversifier. The Fund is often considered alongside more systematic or defined outcome peers. Defined outcome products are designed to capture a certain amount of downside or upside each quarter, depending on where the market moves. However, there are disadvantages to not being nimble in these turbulent markets; a significant drawback is a capped upside that cannot cover successive losses to the downside.
Compared to our mechanistic peers, the Calamos tactical management approach creates opportunities to generate alpha via option market dynamics and equity market volatility. The Fund seeks to exploit these opportunities by being favorably positioned for many outcomes.
How has the Fund performed?
For the 12 months ended October 31, 2023 ("annual period"), Calamos Hedged Equity Fund returned 8.41% (Class I shares at net asset value), capturing most of the S&P 500 Index's 10.14% return. In reference to bonds, the Bloomberg Aggregate Bond Index returned 0.36% for the annual period. At the end of the annual period, the markets faced higher for longer rates and crumbling volatility, which is a recipe for risk assets to underperform as risk-free yields potentially continue to increase. Let's be clear: trading markets still don't care about our opinion of yields and whether the Fed may be overshooting; the price is the price, and there is no denying that yields present a speed bump for stocks and bonds. Higher yields pressure equity prices because they create a higher discount rate and a higher cost of capital, and they pressure bond prices, which must mathematically reprice to the downside. In other words, the market backdrop is rate-driven, with equities and bonds being highly correlated.
The yield surge over the third quarter was spurred on by "higher for longer" Fed rhetoric regarding the future fed funds rate policy. We will continue to position out into 2024, taking advantage of the high-interest-rate environment. With the more prolonged higher-for-longer rate environment, the Fund can capture a high level of equity market upside, 83% for the annual period, while limiting drawdown to 35% or less. While the Fund maintained a since-inception beta of 0.50 through the end of October 2023, we are opportunistic, pursuing a significantly higher upside beta budget in line with the historically lower beta on the downside.
What factors influenced performance during the reporting period?
Higher moving yields have been a challenge for our equity basket. The collapse in volatility to near pre-pandemic levels has made calls cheaper and put spreads less attractive in the short term. Maybe yields have overshot, but there is no denying that yields present an impediment to stocks and bonds in the short term. The Cboe Volatility Index (VIX), aka the fear index, is trading around 18.14%, off its mean of 20.5% and well off the Covid mean of 23.5%. Although volatility has been depressed recently, off the year-to-date low on the VIX at 12.68%, it still requires monitoring because we're still firmly amid a market that could be subject to additional volatility.
CALAMOS OPEN-END FAMILY OF FUNDS ANNUAL REPORT
8
Calamos Hedged Equity Fund (Unaudited)
How is the Fund positioned?
We expect the market to be challenging, especially with the current volatility, which is even more settled than in the third quarter of 2023. The team is taking advantage of higher rates and lower volatility by structuring the option overlay out longer in time to capture more of the upside and less of the down. The interest rate and volatility landscape has allowed us to structure our hedges to emphasize better performance on the tails, i.e., 35 beta or less on the down and 65 beta or more on the up and further out in time. The repositioning provides additional mitigation over and above our average 40% to 50% put notional minimum while also adding upside participation potential. Lower volatility (with the VIX at 17) and relatively flat option skew made our "North Star" baseline trade more appealing through the end of the period. We used rallies to replace some of our protection with outright long puts, which appear attractive. At the end of the period, the Fund's net short put position was 53%, with an average strike of 4368.
Our call positioning included a call write of -34% and gross long calls of 15%, ending the year with net -18% short calls as of October 31, 2023. At the end of the annual period and relative to the S&P 500 Index, our sector positioning was slightly overweight in the consumer discretionary and information technology sectors. In contrast, we had underweight positions in the materials, financials, consumer staples, real estate, and materials sectors. Relative to the S&P 500 Index, the Fund's market-cap positioning maintained a heavier relative weight to larger-capitalization (>$25 billion) holdings and a lighter weight to small- and mid-capitalization ($1 to $25 billion) holdings.
What closing thoughts do you have for Fund shareholders?
The effect of rising rates on option prices has made participation rates for long-leaning option strategies like Calamos Hedged Equity Fund appealing. For risk-averse clients worried about economic and macro risks, hedged equity strategies like the Fund can be an excellent fit for investors looking to reduce risk but stay invested in long-term equity markets.
In the short term, challenges are apparent for risk assets, but longer-term investors are being presented with good opportunities in portfolios using hedging strategies around their stocks; these are performing well this year as higher rates and volatility play to strategy strengths. Well-run hedging strategies such as that can to capture a high level of equity market upside while limiting drawdown.
SECTOR WEIGHTINGS
Information Technology | | | 26.4 | % | |
Health Care | | | 13.3 | | |
Financials | | | 12.3 | | |
Consumer Discretionary | | | 10.3 | | |
Communication Services | | | 8.3 | | |
Industrials | | | 7.8 | | |
Consumer Staples | | | 6.5 | | |
Other | | | 6.3 | | |
Energy | | | 4.6 | | |
Materials | | | 2.2 | | |
Utilities | | | 2.1 | | |
Real Estate | | | 1.8 | | |
Sector weightings are subject to change daily and are calculated as a percentage of net assets. The table excludes cash or cash equivalents, any government/sovereign bonds or broad based index hedging securities the Fund may hold.
www.calamos.com
9
Calamos Hedged Equity Fund (Unaudited)
GROWTH OF $1,000,000: SINCE INCEPTION (12/31/14) THROUGH 10/31/23

AVERAGE ANNUAL TOTAL RETURN† AS OF 10/31/23
| | | 1
YEAR | | 5
YEARS | | SINCE
INCEPTION | |
Class A Shares – Inception 12/31/2014 | |
Without Sales Charge | | | 8.10 | % | | | 5.23 | % | | | 5.01 | % | |
With Sales Charge | | | 2.98 | | | | 4.21 | | | | 4.43 | | |
Class C Shares – Inception 12/31/2014 | |
Without Sales Charge | | | 7.28 | | | | 4.48 | | | | 4.26 | | |
With Sales Charge | | | 6.28 | | | | 4.48 | | | | 4.26 | | |
Class I Shares – Inception 12/31/2014 | | | 8.41 | | | | 5.51 | | | | 5.29 | | |
Performance data quoted represents past performance, which is no guarantee of future results. Current performance may be lower or higher than the performance quoted. The principal value and investment return of an investment will fluctuate so that your shares, when redeemed, may be worth more or less than their original cost.
As of the prospectus dated 3/1/23, the Fund's gross expense ratio for Class A shares is 1.17%, Class C shares is 1.92% and Class I shares is 0.92%.
† Average annual total return measures net investment income and capital gain or loss from portfolio investments as an annualized average assuming reinvestment of dividends and capital gains distributions. Performance shown includes the effects of an expense reimbursement that improved results and was in effect until March 31, 2021. Load-adjusted returns are adjusted for the maximum frontend sales load of 4.75% for Class A shares and returns for Class C shares have been adjusted for the contingent deferred sales charge (CDSC).
NOTES:
The S&P 500 Index is an unmanaged index generally considered representative of the US stock market.
The Bloomberg US Aggregate Bond Index is considered generally representative of the investment-grade bond market.
The Cboe Volatility Index (VIX) is a leading measure of market expectations of near-term volatility conveyed by S&P 500 Index (SPX) option prices.
Index returns assume reinvestment of dividends and do not reflect deduction of fees and expenses. It is not possible to invest directly in an index.
The Fund's use of derivative instruments involves investment risks and transaction costs to which the Fund would not be subject absent the use of these instruments and, accordingly, may result in losses greater than if they had not been used. Derivative instruments can be illiquid, may disproportionately increase losses and may have a potentially large impact on Fund performance.
CALAMOS OPEN-END FAMILY OF FUNDS ANNUAL REPORT
10
Calamos Phineus Long/Short Fund (Unaudited)
CALAMOS PHINEUS LONG/SHORT FUND
INVESTMENT TEAM DISCUSSION
What is the essence of the investment approach?
Through a global long/short structure, the Fund invests in publicly listed equity securities. Components of the strategy include:
◼ A fundamental global approach blends top-down and bottom-up considerations. Company analysis integrates industry, thematic, and macro research.
◼ An inclusive framework identifies potential returns and associated risks. The framework accounts for company, industry, style, country, and market factors.
◼ Flexible capital allocation allows for all investment styles, market caps, and geographic regions. The investment universe is global, liquid, and scalable. Exposure levels and investment styles depend upon market conditions and the economic cycle.
How has the Fund performed?
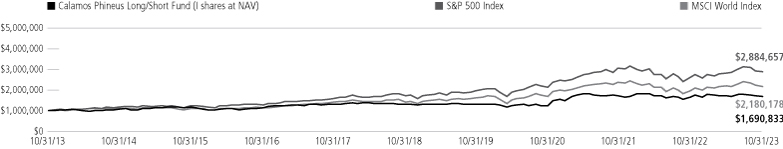
For the 12 months ended October 31, 2023 ("annual period"), Calamos Phineus Long/Short Fund returned 2.40% (Class I shares at net asset value), underperforming the S&P 500 Index's 10.14% return and the MSCI World Index's 11.05% return.
Since its inception on May 1, 2002, the Fund has returned 9.56% on an annualized basis (Class I shares at net asset value), markedly outperforming both the S&P 500 Index and MSCI World Index, which returned 8.64% and 7.58%, respectively.
What factors influenced performance during the reporting period?
The Fund's relative performance primarily reflected reduced net exposure, the narrowness of the market rally, underweights to select technology and health care names, and weakness in select defense and transport names. The Fund concluded the period with an average net equity delta-adjusted exposure of 41.95%, which compares to its average net equity exposure of approximately 28% (on a cash basis)† since its inception in 2002. It also represents a decline in exposure over the period, as the delta-adjusted exposure on October 31, 2022, was 59.89%.
The annual period was extraordinary by most standards, marked by both a European war and a more recent war in the Middle East. Despite calls for a recession, a healthy US job market, firm housing prices, and consumer spending all thwarted that expectation. Fed activity continued over the period from 2022 marked by six additional rate increases of 225 basis points through July, settling at a fed funds rate of 5.25%–5.50%, a 22-year high. While many expected interest rate cuts to be on the table earlier in the period for 2024, this timing appears to be unlikely, even though inflationary pressures appear to be abating.
The ebullient mood earlier in the year was fueled by the promise of AI, strong summer travel, and further disinflation amid a resilient economy and healthy earnings releases. The consensus capitulated to this optimism, and we concluded that the controlling narrative of disinflation momentum had run its course and would give way to a more ambiguous outlook.
† When the portfolio management team evaluates the Fund's exposures and related risks, it includes calculations based on a delta-adjusted basis that measures the price sensitivity of an option or portfolio to changes in the price of an underlying security. Delta-adjusted basis exposure is calculated by Calamos Advisors LLC and is specific only to that point in time since a security's delta changes continuously with market activity. The investment team began calculating the Fund's exposure on a delta-adjusted basis in August 2008.
OVERVIEW
The Fund seeks strong risk-adjusted and absolute returns across the global equity universe. The Fund uses a global long/short strategy to invest in publicly listed equity securities.
KEY FEATURES
◼ Fundamental global approach blends top-down and bottom-up considerations.
◼ Flexible asset allocation allows for all investment styles, market caps and geographic regions depending on the market environment.
◼ Comprehensive approach assesses stock, industry, style, country and market factors.
◼ Knowledge-based industry concentration includes technology, communications, media, financials and health care.
PORTFOLIO FIT
The Fund seeks to provide strong risk-adjusted returns via an alternative solution that complements and diversifies a global or US equity allocation.
FUND NASDAQ SYMBOLS
A Shares | | | CPLSX | | |
C Shares | | | CPCLX | | |
I Shares | | | CPLIX | | |
FUND CUSIP NUMBERS
A Shares | | | 128120656 | | |
C Shares | | | 128120649 | | |
I Shares | | | 128120631 | | |
www.calamos.com
11
Calamos Phineus Long/Short Fund (Unaudited)
SECTOR WEIGHTINGS
Industrials | | | 26.7 | % | |
Information Technology | | | 16.4 | | |
Health Care | | | 14.4 | | |
Consumer Discretionary | | | 11.6 | | |
Financials | | | 10.3 | | |
Communication Services | | | 5.3 | | |
Other | | | 5.0 | | |
Consumer Staples | | | 2.6 | | |
Materials | | | 1.0 | | |
Sector weightings are subject to change daily and are calculated as a percentage of net assets. The table excludes cash or cash equivalents, any government/sovereign bonds or broad based index hedging securities the Fund may hold.
The key feature of the Q3 correction has been its controlled character, particularly in the context of the dramatic move higher in US interest rates. Our hesitation to turn bearish outright reflects our judgment that the US will remain in a disinflation rather than deflation setting through 2024. The impressive GDP releases for Q3 (+8.6% nominal) underline this momentum of US economic activity, which implies the challenge for equities is a question of "price" rather than fundamentals.
Positive real interest rates imply a new emphasis on the time value of money. In 2023, the market rewarded high free cash flows that compete with higher bond yields, high-quality balance sheets, and secular thematic growth. Other pockets of sectors and styles have been punished depending upon their sensitivity to higher rates. In 2022, higher rates primarily impacted the fast-growing technology and concept names. In Q3 of 2022, the less profitable and higher-leveraged names were punished regardless of sector and style.
Finally, 2023 has highlighted how powerful secular themes can overcome traditional sector and style behavior. In a later-cycle environment where the rate of change for corporate fundamentals grinds to less exciting levels, investors can overly discount the perceived winners and losers. This overshooting is likely true for AI and obesity (GLP-1) drugs. We anticipate much of this fever pitch to reverse in 2024.
What helped and hurt performance over the reporting period?
We maintained a focus on cyclicals that we believed offered compelling valuations and were still poised to outperform due to pent-up demand post-pandemic. Examples included airlines, hotels, gaming, transportation, and defensive stocks. We remain underweight in the poorest quality compartment of long-duration technology and high-multiple consumer staples but have maintained or increased exposure to mega-cap growth (quality GARP). Our exposure throughout the period was primarily focused on US positions, given that we believed there were far less favorable opportunities abroad.
Given the overall positive market returns for the period, our hedges on US equity markets have not been helpful over the period.
The Fund's long position in communication services, consumer discretionary, and information technology, as well as short positions on a market index later in the period, were the largest contributors. Conversely, short positions in information technology, and long positions in industrials, financials, and health care companies hindered performance. Both our long and short positions in the consumer staples sector hindered performance over the period.
Notable contributors during the period included a long position on Alphabet Inc. +5.12% average over the period (communication services), long positions on Microsoft Corp. +4.75% average over the period (information technology), and Amazon.com Inc. +4.70% average over the period (consumer discretionary). Notable detractors during the period included short positions on SPDR S&P 500 ETF Trust -22.46% average over the period (Stock Market Hedge), a long position on United Airlines Holdings Inc. +2.43% average over the period (consumer discretionary), and a long position on L3 Harris Technologies Inc. +3.96% average over the period (industrials).
How is the Fund positioned in the context of the global economic cycle?
Net equity exposure (delta-adjusted) ended the annual period at 41.9% versus 59.9% at the start of the period. This compares with the average net equity exposure of approximately 28% (cash basis) since inception in 2002. The Fund
CALAMOS OPEN-END FAMILY OF FUNDS ANNUAL REPORT
12
Calamos Phineus Long/Short Fund (Unaudited)
leaned modestly out of equity risk throughout the year as markets were unsettled by higher interest rates, rapid inflation, interpretation of Fed policy, the continuing war in Ukraine, a new war in the Middle East, energy concerns in Europe, and increasing economic challenges in China.
The two major themes within technology have been slowing cloud services and further excitement around potential applications for artificial intelligence (AI) following the launch of ChatGPT. The major cloud providers dominate both themes, and we are positioned accordingly. Investors began 2023 concerned about slowing demand for such companies, yet attention quickly shifted to which ones stand to benefit most by incorporating AI into existing and new product offerings.
The Fund has avoided the high-multiple, long-duration software names in the past year, and this sidestep feels correct in a "higher for longer" rate setting. While the group's sensitivity to rates is diminishing, many names are merely controversial rather than crowded, and profitability is scarce if one factors in stock compensation. In our view, it will take years before cash flows can credibly support current valuations. We believe today's "time value of money" implies investors will be slow to re-embrace "growth at any price."
Outside technology, the Fund favors names that will benefit from a sustained economic expansion into 2024, with our largest exposure in industrials at the end of the period. The broadest exposure here is diversified industrials and transports. These rallied impressively in H1 2023 but retreated sharply in Q3.
Exposure to selective airlines remains intact. The pricing outlook for airfares should remain constructive for longer than expected due to structural changes on the capacity front. Higher financing costs, pilot shortages, and equipment delays have made it difficult for the lowest-cost players to add capacity. Meanwhile, the recovery in corporate and international travel has gained steam. The post-pandemic inflation surge implies the existing fleets of the legacy carriers cannot be replaced anywhere near their embedded costs, with positive implications for future returns.
In consumer discretionary, also a large sector position, the Fund is biased away from goods in favor of services, including core long positions in large hotel enterprises that stand to benefit from corporate and international travel as well as sustained revenue per available room (RevPAR) strength. We maintain select leisure-oriented names within the sector.
Health care is the one defensive sector to which the Fund has been adding exposure. We like its diversified growth theme, given the cyclicality of other parts of the portfolio, and its credible valuations versus other defensives. Although health care has underperformed in 2023, it is showing relative strength against broader defensives.
Energy remains problematic. The key swing factor will be China, which has been the primary source of consumption growth in recent decades. The setup for higher crude prices was ideal in 2022, yet the inability of markets to benefit from the war-related shortage fears points to a new dynamic in global oil markets.
Financials have been controversial, and banks have struggled to garner support in the wake of the March collapses. Higher rates, tepid loan demand and reduced capital returns in the face of heightened regulatory requirements have all weighed on banks. We reduced long exposures over the period.
www.calamos.com
13
Calamos Phineus Long/Short Fund (Unaudited)
Finally, global investors have discovered the Chinese economic recovery from a disastrous 2022 is underwhelming. There is hope for policy stimulus later in 2023, but this overlooks China's structural problems. The trouble starts with an abrupt downshift in economic potential due to the country's overcommitment to a centralized investment-led growth model, which is susceptible to downturns in return on invested capital.
This points to the necessity for far-reaching structural reforms, but these are inherently political. The ability of the system to adapt is hindered by the reality that the entire system—interest rates, access to credit, tax policy, operating licenses, and so forth—is geared to this model. We await the response of Chinese leadership in late autumn, whose success or failure to regenerate economic vibrancy holds implications for global interest rates in 2024. The Fund has avoided China and had little exposure to other global markets throughout the period.
What is your macro perspective heading into 2024?
Headwinds to Growth, Not Recession
◼ Disinflation momentum was the key narrative in Q1 2023. Since July, markets have struggled to price the risks of a more normalized "higher for longer" rate environment.
◼ The good news is that rates are rising because they can. Recession risk has remained remarkably low in 2023 and may remain low through much of 2024.
◼ Nonetheless, unwinding the legacy of unnaturally low interest rates is a transition, and investors should consider how a normalized 5% 10-year yield changes the contours of our industry.
◼ The Fund's long positioning is balanced between select quality GARP1 opportunities and cyclicals that appear "too cheap" given our bias that a US recession arrives later than many expect. A more tactical approach to equity allocation, style mix and security selection is appropriate.
Unprecedented low interest rates and central bank distortions have been the hallmark of the post-2008 era. The past quarter was notable for the gathering sense that this landscape is giving way to something very different, with real interest rates attaining their highest levels in more than two decades. Investors are grappling with the implications of this latest "new normal."
The short explanation for the rise in rates is the resiliency of the US economy and consumer incomes. Recession risk has remained remarkably low in 2023 and may remain low through 2024. This recession deferred may be why the equity correction has been orderly despite the headwinds of the spring 2023 banking crisis, the housing recession, and the acute pause in technology spending.
Put another way, yields are rising because they can and may signal the sustainability of today's economic expansion. Rather than fueling waves of asset-price distortion, positive real rates channel capital into productive uses and thus to higher real wages and returns. Not surprisingly, unwinding the legacy of unnaturally low interest rates is a transition, and markets are pricing this risk.
One consequence is a less favorable liquidity backdrop for financial asset prices. However, the economic implications are more nuanced because absolute levels
1 Growth at a reasonable price (GARP): firms with superior top-line growth that are not excessively valued on earnings.
CALAMOS OPEN-END FAMILY OF FUNDS ANNUAL REPORT
14
Calamos Phineus Long/Short Fund (Unaudited)
of economic liquidity appear abundant. The prima facie evidence is the pristine condition of private sector balance sheets. In effect, liquidity is being drawn from the financial system and into the economy: good news for Main Street, less good for Wall Street.
What closing thoughts do you have for Fund shareholders?
It is important to note that the rate sensitivity of the US economy is an echo of prior decades. Both consumers and corporates refinanced their debt obligations through the pandemic, and the rise in rates has, therefore, had minor effects on spending. For example, net debt servicing costs for US corporates have declined in 2023 because of the weighty share of firms with net cash positions.2
"Something" that undermines the business sector will likely be the catalyst of an eventual downturn. Yet this is hard to conceive given today's healthy profitability and balance sheets of larger corporates.3 While fixed investment has been an important tailwind in 2023, this spending has not been financed by increased leverage. The "financing gap"4 for the corporate sector remains at historically low levels.
There is a remarkable absence of the late-cycle excesses that would normally be the ingredients for a cyclical downturn. Of course, these aggregates do not capture the reality that rate pressures are troublesome for some parts of the economy. We view these pressures as more chronic than acute for the business cycle in 2024.
Housing is an example of this dichotomy. Housing sales and affordability have collapsed to the deep recessionary levels of the 2009 era, yet home prices and housing starts have proven resilient. Underlying demand relative to supply appears favorable, with positive implications for when rates pressures ease.
All of this contrasts with the vulnerabilities of an aged or mature expansion. A tight labor market is often associated with late-cycle risk, yet the usual spending or borrowing excesses are absent. In prior cycles, these included overspending on housing and autos, rising leverage across households and corporates, and downward pressure on profit margins. So far, little of this is apparent.
This aggregate data hides the harsher truth that parts of the economy are under duress due to normalized interest rates. This contrast between the broader economy and its interest-sensitive parts may provide insight into how the remaining years of this expansion unfold. These stresses can moderate activity, which is our forecast for 2024. Yet, it is difficult to conceive how they might cascade into recession-like conditions.
Inflation dynamics are an essential part of this outlook. The stunning disinflation of the past year has turned a potential crisis for the business cycle into a mild irritant. Chairman Powell is unlikely to declare victory anytime soon, which implies policy will continue to lean against economic growth. Nonetheless, the Federal Reserve can respond to any financial or economic breakage when it appears.
2 Firms with more cash than debt have benefited from higher interest income that has offset higher interest expense. For US consumers, the embedded mortgage servicing cost of 3.6% is about half the current mortgage rate of 7% plus.
3 With its predominance of fixed-rate debt, larger-cap companies have a circumscribed exposure to higher rates; more than 40% of their fixed-rate debt matures beyond 2030. Less than 20% of debt for S&P 500 companies is rate sensitive versus about 35% for small-cap stocks.
4 The degree to which private non-residential capital investment is funded by savings versus borrowings.
www.calamos.com
15
Calamos Phineus Long/Short Fund (Unaudited)
The timing of the next recession is hard to predict because so much of today's landscape is "different this time." Higher lending rates and tighter bank standards have been blunted by healthy balance sheets and robust corporate earnings. Recession may come later than many expect as the drag of higher rates is offset by fading supply shocks, the legacy of pandemic savings, and pro-cyclical fiscal support.
If the adage that "Bond Markets Never Lie" is true, what are they telling us?
Real interest rates have risen more than 100 basis points in 2023, with much of this move occurring since June. While equities have struggled in the past quarter, the pullback has been orderly and, for the major equity benchmarks, underwhelming given the sizable move in rates. Either investors do not believe this rate move will prove long-lasting, or markets are telling us there is a new resiliency to the economic outlook.
Bond markets rarely lie. The US 10-year yield has explained almost two-thirds of the cross-equity return distributions5 in 2023—one of the highest readings in six decades.6 This implies that rate pressures are becoming acute in parts of the economy regardless of its supportive features. These pressures need to culminate soon in a manner that moderates economic activity and eases financial conditions into 2024.
ANNUALIZED RETURN: SINCE INCEPTION (5/1/02) THROUGH 10/31/23

Performance data quoted represents past performance, which is no guarantee of future results. Current performance may be lower or higher than the performance quoted.
The principal value and investment return of an investment will fluctuate so that your shares, when redeemed, may be worth more or less than their original cost. You can obtain performance data current to the most recent month end by visiting www.calamos.com. Average annual total return measures net investment income and capital gain or loss from portfolio investments as an annualized average. All performance shown assumes reinvestment of dividends and capital gains distributions. Performance is for the Fund's Class I shares at net asset value. The Fund also offers Class A and Class C shares, the performance of which may vary. Source: State Street Corporation and Morningstar Direct.
The performance shown for periods prior to April 6, 2016 is the performance of a predecessor investment vehicle (the "Predecessor Fund"). The Predecessor Fund was reorganized into the Fund on April 6, 2016, the date upon which the Fund commenced operations. On October 1, 2015, the parent company of Calamos Advisors, purchased Phineus Partners LP, the prior investment adviser to the Predecessor Fund ("Phineus"), and Calamos Advisors served as the Predecessor Fund's investment adviser between October 1, 2015 until it was reorganized into the Fund. Phineus and Calamos Advisors managed the Predecessor Fund using investment policies, objectives, guidelines and restrictions that were in all material respects equivalent to those of the Fund. Phineus and Calamos Advisors managed the Predecessor Fund in this manner either directly or indirectly by investing all of the Predecessor Fund's assets in a master fund structure. The Predecessor Fund performance information has been adjusted to reflect Class A, Class C and Class I shares, expenses. However, the Predecessor Fund was not a registered mutual fund and thus was not subject to the same investment and tax restrictions as the Fund. If it had been, the Predecessor Fund's performance may have been lower.
* Annual returns for Class I shares are provided because Class I shares represent the largest percentage of assets in the Calamos Family of Funds.
5 The aggregate of individual stock deviations of performance versus the equity benchmark and the degree to which these deviations are correlated (or explained) by movements in the US 10-year yield.
6 Today's result ranks in the top 15 readings of the past 70 years and more than 4X the average of that period.
CALAMOS OPEN-END FAMILY OF FUNDS ANNUAL REPORT
16
Calamos Phineus Long/Short Fund (Unaudited)
GROWTH OF $1,000,000: FOR THE 10-YEAR PERIOD ENDED 10/31/23
AVERAGE ANNUAL TOTAL RETURN† AS OF 10/31/23
| | | 1
YEAR | | 5
YEARS | | 10
YEARS | |
Class A Shares (With Predecessor) – Inception 5/1/2002 | |
Without Sales Charge | | | 2.12 | % | | | 5.04 | % | | | 5.13 | % | |
With Sales Charge | | | -2.74 | | | | 4.01 | | | | 4.62 | | |
Class C Shares (With Predecessor) – Inception 5/1/2002 | |
Without Sales Charge | | | 1.37 | | | | 4.25 | | | | 4.34 | | |
With Sales Charge | | | 0.37 | | | | 4.25 | | | | 4.34 | | |
Class I Shares (With Predecessor) – Inception 5/1/2002 | | | 2.40 | | | | 5.29 | | | | 5.39 | | |
Performance data quoted represents past performance, which is no guarantee of future results. Current performance may be lower or higher than the performance quoted. The principal value and investment return of an investment will fluctuate so that your shares, when redeemed, may be worth more or less than their original cost.
As of the prospectus dated 3/1/23, the Fund's gross expense ratio for Class A shares is 2.39%, Class C shares is 3.13% and Class I shares is 2.15%. The expense ratios shown above may differ from the more recent expense ratios reported in the Financial Highlights section of this report.
† Average annual total return measures net investment income and capital gain or loss from portfolio investments as an annualized average assuming reinvestment of dividends and capital gains distributions. Load-adjusted returns are adjusted for the maximum front-end sales load of 4.75% for Class A shares. Returns for Class C shares have been adjusted for the contingent deferred sales charge (CDSC).
NOTES:
The graph does not reflect the income taxes that you would pay on fund distributions or the redemption of fund shares. Fund performance includes reinvestment of dividends. The performance of other classes will vary from the performance of the class shown based on the difference in sales charges and fees paid by shareholders investing in different share classes.
The S&P 500 Index is an unmanaged index generally considered representative of the US stock market.
The MSCI World Index (US Dollars) is a market-capitalization weighted index composed of companies representative of the market structure of developed market countries in North America, Europe and the Asia/Pacific region.
Index returns assume reinvestment of dividends and do not reflect deduction of fees and expenses. It is not possible to invest directly in an index.
The Fund's use of derivative instruments involves investment risks and transaction costs to which the Fund would not be subject absent the use of these instruments and, accordingly, may result in losses greater than if they had not been used. Derivative instruments can be illiquid, may disproportionately increase losses and may have a potentially large impact on Fund performance.
www.calamos.com
17
Calamos Merger Arbitrage Fund (Unaudited)
OVERVIEW
The Calamos Merger Arbitrage Fund's investment process seeks to capture the completion risk premium—the price difference between the stock price of a company being acquired and the announced acquisition price.
KEY FEATURES
◼ A powerful equity market diversifier that can mitigate drawdowns in volatile stock markets.
◼ A core alternative allocation seeking positive returns over long time horizons in most market environments.
◼ An interest rate hedge with correlation to short-term interest rates.
PORTFOLIO FIT
Seeks to deliver absolute returns uncorrelated to equity and fixed income markets.
FUND NASDAQ SYMBOLS
A Shares | | CMRAX | |
C Shares | | CMRCX | |
I Shares | | CMRGX | |
FUND CUSIP NUMBERS
A Shares | | | 128120219 | | |
C Shares | | | 128120193 | | |
I Shares | | | 128120185 | | |
CALAMOS MERGER ARBITRAGE FUND
INVESTMENT TEAM DISCUSSION
How has the Fund performed?
The recently launched Calamos Merger Arbitrage Fund provides investors a diversification opportunity that focuses on absolute returns largely uncorrelated to equity and fixed-income markets. Specifically, the Fund pursues an event-driven strategy, investing in companies involved in potential merger deals and other corporate transactions. The Fund seeks to take advantage of the dislocation between the price of a company's stock when a deal is announced versus its price when the deal is completed. For the period from September 29, 2023 (the Fund's inception), through October 31, 2023, Calamos Merger Arbitrage Fund returned -2.70% (Class I Shares at net asset value), while the ICE BofA 3-Month US Treasury Bill Index returned 0.45%.
What factors influenced performance during the reporting period?
Over the very limited time frame of the current reporting period, one of the main factors that influenced performance was weak earnings and guidance reports across multiple sectors and industries where consolidation is occurring. On top of that, the antitrust and regulatory environment remains volatile as this administration has taken a more holistic approach to identifying harms. Regarding two recent well-known deals involving popular brands, the Federal Trade Commission made second requests for more information from the companies involved, and the Department of Justice recently sued to block an acquisition in the airline industry.
How is the Fund positioned?
At the close of the reporting period, the Fund held securities associated with 32 deals or potential deals and, in our view, is well positioned to take advantage of the current merger landscape. Convertible bonds and high-yield debt comprise 30% of the Fund's current market value.
What are your closing thoughts for Fund shareholders?
Our merger arbitrage team also manages the convertible arbitrage and hedged equity strategies. We believe this experience gives us an edge in corporate transactions where we can utilize convertible bonds, liquid options, or other securities within a target company's capital structure, allowing us to pursue optimal risk-reward through the trade structure.
CALAMOS OPEN-END FAMILY OF FUNDS ANNUAL REPORT
18
Calamos Merger Arbitrage Fund (Unaudited)
AVERAGE ANNUAL TOTAL RETURN† AS OF 10/31/23
| | SINCE
INCEPTION | |
Class A Shares – Inception 9/29/2023 | |
Without Sales Charge | | | -2.70 | % | |
With Sales Charge | | | -5.35 | | |
Class C Shares – Inception 9/29/2023 | |
Without Sales Charge | | | -2.80 | | |
With Sales Charge | | | -3.77 | | |
Class I Shares – Inception 9/29/2023 | | | -2.70 | | |
Performance data quoted represents past performance, which is no guarantee of future results. Current performance may be lower or higher than the performance quoted. The principal value and investment return of an investment will fluctuate so that your shares, when redeemed, may be worth more or less than their original cost.
As of the prospectus dated 9/28/23, the Fund's gross expense ratio for Class A shares is 2.12%, Class C shares is 2.87% and Class I shares is 1.87%. The Fund's investment advisor has contractually agreed to reimburse Fund expenses through October 31, 2026 to the extent necessary so that Total Annual Fund Operating Expenses of Class A shares, Class C shares and Class I shares are limited to 1.50%, 2.25% and 1.25% of average net assets, respectively. For purposes of these expense limitations, operating expenses do not include taxes, interest, short interest, short dividend expenses, brokerage commissions, acquired fund fees and expenses, foreign tax reclaim expenses, and extraordinary expenses (as determined in the discretion of Calamos Advisors LLC ("Calamos Advisors")), such as litigation costs. Calamos Advisors may recapture previously waived expense amounts within the same fiscal year for any day where the respective share class's expense ratio falls below the contractual expense limit up to the expense limit for that day. This undertaking is binding on Calamos Advisors and any of its successors and assigns. This agreement is not terminable by either party. The expense ratios shown above may differ from the more recent expense ratios reported in the Financial Highlights section of this report.
† Average annual total return measures net investment income and capital gain or loss from portfolio investments as an annualized average assuming reinvestment of dividends and capital gains distributions. Load-adjusted returns are adjusted for the maximum front-end sales load of 4.75% for Class A shares. Returns for Class C shares have been adjusted for the contingent deferred sales charge (CDSC).
NOTES:
The ICE BofA 3-Month US Treasury Bill Index is an unmanaged index that measures the performance of a single US Treasury issue with approximately three months to final maturity. The issue is purchased at the beginning of each month and held for one full month. At the end of the month, that issue is sold and rolled into a newly selected issue.
Index returns assume reinvestment of dividends and do not reflect deduction of fees and expenses. It is not possible to invest directly in an index.
SECTOR WEIGHTINGS
Information Technology | | | 28.3 | % | |
Health Care | | | 20.5 | | |
Energy | | | 9.5 | | |
Consumer Staples | | | 8.4 | | |
Consumer Discretionary | | | 7.3 | | |
Utilities | | | 6.8 | | |
Communication Services | | | 6.0 | | |
Industrials | | | 3.7 | | |
Other | | | 1.8 | | |
Sector weightings are subject to change daily and are calculated as a percentage of net assets. The table excludes cash or cash equivalents, any government/sovereign bonds or broad based index hedging securities the Fund may hold.
www.calamos.com
19
Calamos Convertible Fund (Unaudited)
OVERVIEW
The Fund invests primarily in convertible securities of US companies that are diversified across market sectors and credit quality.
KEY FEATURES
◼ Leverages more than four decades of research and experience in convertible security investing.
◼ Provides diversification across market sectors and credit quality, emphasizing midsize companies with higher-quality balance sheets.
◼ Seeks to provide upside participation in equity markets with less exposure to downside than an equity-only portfolio over a full market cycle.
◼ Takes environmental, social and governance (ESG) factors into account, evaluating whether they impact a company's cash flow, risk profile and long-term returns.
PORTFOLIO FIT
When used in conjunction with an equity allocation, the Fund offers a potential way to manage risk by employing securities that engage in upside equity movements with limited downside participation.
FUND NASDAQ SYMBOLS
A Shares | | CCVIX | |
C Shares | | CCVCX | |
I Shares | | CICVX | |
FUND CUSIP NUMBERS
A Shares | | | 128119401 | | |
C Shares | | | 128119823 | | |
I Shares | | | 128119864 | | |
CALAMOS CONVERTIBLE FUND
INVESTMENT TEAM DISCUSSION
How has the Fund performed?
For the 12 months ended October 31, 2023 ("annual period"), Calamos Convertible Fund declined -1.04% (Class I shares at net asset value), modestly trailing the ICE BofA All US Convertibles Index (VXA0) -0.48% decrease.
Since the Class I shares inception on June 25, 1997, the Fund has returned 7.45% on an annualized basis, in line with an annualized gain of 7.63% for the ICE BofA All US Convertibles Index (VXA0) and slightly trailing the 8.06% annualized return of the S&P 500 Index.
What factors influenced performance during the reporting period?
During the annual period, investors focused on the Federal Reserve's response to persistent inflation and the potential for a recession. Geopolitical concerns, regional bank stress, rising fuel prices, and potential impacts of the United Auto Workers strike also made headlines and induced volatility. Despite these headwinds, the equity market began to recover from 2022's lows, and the S&P 500 Index returned 10.14% over the period. The higher-for-longer interest rate environment continued to stoke volatility in the bond market as the Bloomberg US Aggregate Bond Index rose just 0.36%.
The convertible market is well represented by small and mid-sized growth issuers, which lagged the broader equity market as evidenced by the Russell 2500 Growth Index's -4.80% return. More than half of the convertible market was priced below par on average during the annual period, and convertibles (-0.48%) held up much better than their underlying stocks (-8.2%).
From an economic sector perspective, the Fund benefited from its overweight position and favorable selection in the information technology and industrials sectors. In information technology, the Fund saw solid relative performance from its holdings in the data processing & outsourced services and semiconductors industries. In industrials, the Fund benefited from selection in the industrial machinery & supplies & components and aerospace & defense industries.
Lagging selection in the financials and energy sectors detracted from the Fund's results. In financials, the portfolio names within the transaction & payment processing services industry trailed, and the portfolio lacked an allocation to the relatively strong-performing mortgage REITs industry. In energy, the Fund's holdings in the oil & gas drilling industry notably lagged.
How is the Fund positioned?
We focus on actively managing the risk/reward trade-offs within the Fund's portfolio. The characteristics of convertible securities vary: some convertibles are more bond-like, some are more equity-like, and others offer balance. We have maintained a preference for the balanced portion of the convertible market to take advantage of recent equity-valuation resets. Balanced convertibles provide a favorable asymmetric payoff profile by offering an attractive level of upside equity participation with less exposure to downside moves. We also see opportunities in the bond-like segment of the convertible market in issues that can benefit from spread compression while offering attractive yields and sound structural risk mitigation during equity market weakness. Within this segment of the convertible
CALAMOS OPEN-END FAMILY OF FUNDS ANNUAL REPORT
20
Calamos Convertible Fund (Unaudited)
market, most issuers retain strong cash balances along with minimal near-term refinancing risk. We are selective in the group's most distressed names.
Technology and health care remain the largest sector allocations in the Fund's portfolio. Reflecting our strong focus on bottom-up company analysis, we favor companies that are executing well despite macro uncertainties, are, in our view, best-in-class, and are long-term winners benefiting from lasting secular themes such as cybersecurity, automation and productivity enhancements. These long-term themes serve as a beacon in turbulent times, such as now, and help us identify innovative firms whose valuations will most likely be rewarded over time. Many of these are growth firms that have shifted their focus from growth-at-all-costs to improving margins, generating free cash flow, and increasing profitability. Holding these names should prove advantageous as higher-quality growth becomes scarce with the end of the era of free money. Financials and real estate are the most significant underweight positions in the portfolio. In our view, the risk/reward characteristics in this space are generally unfavorable, and many issuers are susceptible to the negative impact of higher rates.
What closing thoughts do you have for Fund shareholders?
Looking forward, we are cautiously optimistic but see multiple positives and negatives pushing and pulling the market. We believe additional Fed moves will be data-dependent, likely generating heightened uncertainty. However, volatility has historically created opportunity in the convertible asset class. Any stabilization of the macro backdrop could shift narrow, larger-cap-driven S&P 500 leadership into broader strength, which we believe would benefit convertibles since many issuers lean toward more mid-cap, growth-oriented companies. The Calamos Convertible Fund remains positioned to participate in an attractive portion of the equity market's upside. Should the market continue to prove challenging, convertibles are situated near their bond floor and would be expected to provide defensive attributes.
Convertible new issuance was subdued in 2022 but has improved in 2023 with higher coupons and lower conversion premiums that are more favorable to investors. So far in 2023, global convertible issuance totaled $65.1 billion, far surpassing the $39.6 billion in 2022. We've also been encouraged to see more investment-grade companies issue convertibles. We remain optimistic about issuance prospects and believe the pace will continue to be strong as companies increasingly recognize the lower-borrowing-cost benefits of issuing convertibles in lieu of traditional bonds. The combination of a sizable amount of debt maturing in 2025 across bond markets and the Fed's higher-for-longer interest rate stance could be an accelerant for near-term issuance. Increased issuance should broaden the convertible market landscape and the number of investable opportunities.
SECTOR WEIGHTINGS
Information Technology | | | 31.8 | % | |
Health Care | | | 18.6 | | |
Consumer Discretionary | | | 16.3 | | |
Communication Services | | | 7.6 | | |
Industrials | | | 6.5 | | |
Energy | | | 3.7 | | |
Utilities | | | 3.6 | | |
Financials | | | 3.2 | | |
Materials | | | 2.6 | | |
Consumer Staples | | | 1.3 | | |
Real Estate | | | 0.5 | | |
Sector weightings are subject to change daily and are calculated as a percentage of net assets. The table excludes cash or cash equivalents, any government/sovereign bonds or broad based index hedging securities the Fund may hold.
www.calamos.com
21
Calamos Convertible Fund (Unaudited)
ANNUALIZED RETURN: SINCE INCEPTION (6/25/97) THROUGH 10/31/23

Performance data quoted represents past performance, which is no guarantee of future results. Current performance may be lower or higher than the performance quoted.
The principal value and investment return of an investment will fluctuate so that your shares, when redeemed, may be worth more or less than their original cost. You can obtain performance data current to the most recent month end by visiting www.calamos.com. Average annual total return measures net investment income and capital gain or loss from portfolio investments as an annualized average. All performance shown assumes reinvestment of dividends and capital gains distributions. Performance is for the Fund's Class I shares at net asset value. The Fund also offers Class A and Class C shares, the performance of which may vary. Source: State Street Corporation and Morningstar Direct.
* Annual returns for Class I shares are provided because Class I shares represent the largest percentage of assets in the Calamos Family of Funds.
CALAMOS OPEN-END FAMILY OF FUNDS ANNUAL REPORT
22
Calamos Convertible Fund (Unaudited)
GROWTH OF $1,000,000: FOR THE 10-YEAR PERIOD ENDED 10/31/23

AVERAGE ANNUAL TOTAL RETURN† AS OF 10/31/23
| | | 1
YEAR | | 5
YEARS | | 10
YEARS | |
Class A Shares – Inception 6/21/85 | |
Without Sales Charge | | | -1.26 | % | | | 7.14 | % | | | 6.16 | % | |
With Sales Charge | | | -3.49 | | | | 6.65 | | | | 5.65 | | |
Class C Shares – Inception 7/5/96 | |
Without Sales Charge | | | -2.01 | | | | 6.34 | | | | 5.37 | | |
With Sales Charge | | | -2.98 | | | | 6.34 | | | | 5.37 | | |
Class I Shares – Inception 6/25/97 | | | -1.04 | | | | 7.41 | | | | 6.43 | | |
Performance data quoted represents past performance, which is no guarantee of future results. Current performance may be lower or higher than the performance quoted. The principal value and investment return of an investment will fluctuate so that your shares, when redeemed, may be worth more or less than their original cost.
As of the prospectus dated 3/1/23, the Fund's gross expense ratio for Class A shares is 1.10%, Class C shares is 1.85% and Class I shares is 0.85%. The expense ratios shown above may differ from the more recent expense ratios reported in the Financial Highlights section of this report.
† Average annual total return measures net investment income and capital gain or loss from portfolio investments as an annualized average assuming reinvestment of dividends and capital gains distributions. Load-adjusted returns are adjusted for the maximum front-end sales load of 2.25% for Class A shares and returns for Class C shares have been adjusted for the contingent deferred sales charge (CDSC).
NOTES:
The graphs do not reflect the income of taxes that you would pay on fund distributions or the redemption of fund shares. Fund performance includes reinvestment of dividends. The performance of other classes will vary from the performance of the class shown based on the difference in sales charges and fees paid by shareholders investing in different share classes.
The ICE BofA All US Convertibles Index is comprised of approximately 700 issues of only convertible bonds and preferreds of all qualities. Since inception data for the index is shown from 6/30/97, since data is only available for full monthly periods.
The S&P 500 Index is an unmanaged index generally considered representative of the US stock market.
The Russell 2500 Growth Index measures the performance of the small to mid-cap growth segment of the US equity universe. It includes those Russell 2500 companies with higher growth earning potential. The Russell 2500 Growth Index is published and maintained by FTSE Russell.
Index returns assume reinvestment of dividends and do not reflect deduction of fees and expenses. It is not possible to invest directly in an index.
www.calamos.com
23
Calamos Global Convertible Fund (Unaudited)
OVERVIEW
The Fund invests in global convertible securities, striving to balance risk/reward while providing growth and income.
KEY FEATURES
◼ Provides broadly diversified exposure to the global convertible bond universe.
◼ Leverages more than 40 years of research in convertible security investing.
◼ Seeks to provide upside participation in equity markets with less exposure to downside than an equity-only portfolio over a full market cycle.
◼ Blends global investment themes and fundamental research via active management.
◼ Takes environmental, social and governance (ESG) factors into account, evaluating whether they impact a company's cash flow, risk profile and long-term returns.
PORTFOLIO FIT
Consisting of convertible securities that can participate in upside equity movements with potentially limited downside exposure, the Fund can provide a means to manage risk in conjunction with an equity allocation. The Fund can also serve a role within a fixed-income allocation, as convertibles have performed well during periods of rising interest rates and inflation.
FUND NASDAQ SYMBOLS
A Shares | | CAGCX | |
C Shares | | CCGCX | |
I Shares | | CXGCX | |
FUND CUSIP NUMBERS
A Shares | | | 128120748 | | |
C Shares | | | 128120730 | | |
I Shares | | | 128120722 | | |
CALAMOS GLOBAL CONVERTIBLE FUND
INVESTMENT TEAM DISCUSSION
How has the Fund performed?
Despite persistent inflation, geopolitical concerns, deposit risk in the banking sector, and interest-rate uncertainty, the convertible and equity markets posted positive returns during the annual period. The global convertible market, represented by the Refinitv Global Convertible Bond Index, advanced 4.33% and participated in the broader equity market's upside as represented by the MSCI World Index's 11.05% gain. The Calamos Global Convertible Fund returned 5.00% (Class I shares at net asset value), outperforming the convertible benchmark index.
What factors influenced performance during the reporting period?
For the 12 months ended October 31, 2023 ("annual period"), we saw volatility as investors focused on global central banks' response to persistent inflation, the potential for slowing growth, and the specter of higher-for-longer interest rates. Geopolitical concerns, regional bank stress, rising fuel prices, and potential impacts of the United Auto Workers strike added to investor concerns. Despite these headwinds, the equity market saw some recovery from 2022's lows, and the MSCI World Index returned 11.05% over the period. The higher-for-longer interest rate continued to stoke volatility in the bond market as the Bloomberg Global Aggregate Bond Index rose just 1.72%.
From an economic sector perspective, the Fund benefited most from security selection in the real estate and communication services sectors, where the portfolio's holdings in real estate services and real estate operating companies outperformed. In the communication services sector, holdings in the interactive home entertainment and cable & satellite industries outpaced the index's names. An underweight position and security selection in materials, along with an overweight position and lagging selection in health care, held back the portfolio's results. In materials, holdings in the specialty chemicals and steel industry lagged, and the holdings in the biotechnology and pharmaceuticals industries disappointed in health care.
From a geographic perspective, the Fund benefitted from its favorable selection in the United States and Emerging Europe & South Africa, as well as an underweight position and security selection in Europe. A relative overweight position and security selection in Canada, as well as lagging selection in Japan and Emerging Latin America held back the annual period performance.
How is the Fund positioned?
We focus on achieving the best risk/reward profile through bottom-up security selection. We continue to position the portfolio to participate in upside equity rallies while also seeking to manage the downside if the market pulls back. The global convertible market saw healthy issuance during the annual period, and we have been active in the new issuance market.
From a sector standpoint, information technology, consumer discretionary, and health care sectors represent the largest allocations, while materials, real estate, and consumer staples comprise the lightest exposures. Relative to the Refinitiv Global Convertible index, the largest overweight positions are in health care,
CALAMOS OPEN-END FAMILY OF FUNDS ANNUAL REPORT
24
Calamos Global Convertible Fund (Unaudited)
information technology, and energy. Conversely, communication services, materials, and industrials constitute the most significant underweights.
From a regional perspective on an absolute basis, the portfolio has its heaviest allocation in the United States, Europe, and Emerging Latin America and lightest allocations in Canada, Japan, and Emerging Europe & South Africa. On a relative basis, the portfolio is overweight to Emerging Europe & South Africa, the United States, Emerging Asia, and Canada. Europe and Japan represent relative underweights. The war in Ukraine, inflation, and the possibility of recession in Europe are macro factors that continue to influence our current underweight allocation to the region.
What closing thoughts do you have for Fund shareholders?
The equity, bond, and convertible markets delivered positive returns despite increasing geopolitical concern, rising interest rates and oil prices, banking stresses, and political and central bank uncertainty. We expect these challenges will also lead to greater uncertainty and bouts of volatility.
We believe that the US Federal Reserve is mostly done raising rates, but the market's obsession with the Fed continues, with investors now fixated on when the Fed will start cutting rates again. But with the economy holding up quite well, it's hard to see why the central bank would cut rates unless inflation falls below its 2% goal. With oil prices flirting with triple digits, that final drop in inflation may get pushed out further on the horizon, and that's before considering we have a big election next year. It's hard to see the Fed wanting to get in the middle of that potential mess.
All of this adds up to a questionable outlook for growth in 2024. This is a good point to remind our investors that we're not macro traders, just convertible managers. We will stick to our fundamental process and work to get the best risk/reward profile possible. We continue to position Calamos Global Convertible Fund to participate in upside equity rallies while also seeking to manage the downside if the market pulls back. The Fund remains overweight to the US and the technology sector and underweight Europe.
Convertible new issuance was subdued in 2022 but improved in 2023, with higher coupons and lower conversion premiums that have been more favorable to investors. So far in 2023, global convertible issuance totaled $65.1 billion, surpassing the $39.5 billion for all of 2022. We are optimistic about issuance prospects going forward as a large maturity wall looms across the credit markets beginning in 2025. As companies begin to address their refinancing needs, we maintain our belief that convertibles will be a popular choice for issuers, providing increased attractive investment opportunities.
SECTOR WEIGHTINGS
Information Technology | | | 29.3 | % | |
Consumer Discretionary | | | 18.3 | | |
Health Care | | | 13.8 | | |
Financials | | | 9.0 | | |
Industrials | | | 7.2 | | |
Communication Services | | | 7.0 | | |
Energy | | | 3.9 | | |
Utilities | | | 3.5 | | |
Materials | | | 2.6 | | |
Real Estate | | | 2.0 | | |
Consumer Staples | | | 1.3 | | |
Other | | | 0.7 | | |
Sector weightings are subject to change daily and are calculated as a percentage of net assets. The table excludes cash or cash equivalents, any government/sovereign bonds or broad based index hedging securities the Fund may hold.
www.calamos.com
25
Calamos Global Convertible Fund (Unaudited)
GROWTH OF $1,000,000: SINCE INCEPTION (12/31/14) THROUGH 10/31/23

AVERAGE ANNUAL TOTAL RETURN† AS OF 10/31/23
| | | 1
YEAR | | 5
YEARS | | SINCE
INCEPTION | |
Class A Shares – Inception 12/31/2014 | |
Without Sales Charge | | | 4.78 | % | | | 4.26 | % | | | 4.15 | % | |
With Sales Charge | | | 2.43 | | | | 3.79 | | | | 3.57 | | |
Class C Shares – Inception 12/31/2014 | |
Without Sales Charge | | | 4.01 | | | | 3.48 | | | | 3.38 | | |
With Sales Charge | | | 3.01 | | | | 3.48 | | | | 3.38 | | |
Class I Shares – Inception 12/31/2014 | | | 5.00 | | | | 4.51 | | | | 4.41 | | |
Performance data quoted represents past performance, which is no guarantee of future results. Current performance may be lower or higher than the performance quoted. The principal value and investment return of an investment will fluctuate so that your shares, when redeemed, may be worth more or less than their original cost.
As of the prospectus dated 3/1/23, the Fund's gross expense ratio for Class A shares is 1.28%, Class C shares is 2.03% and Class I shares is 1.03%. The Fund's Investment Adviser has contractually agreed to reimburse Fund expenses through 3/1/23 to the extent necessary so that Total Annual Fund Operating Expenses (excluding taxes, interest, short interest, short dividend expenses, brokerage commissions, acquired fund fees and expenses and extraordinary expenses, if any) of Class A, Class C and Class I shares are limited to 1.35%, 2.10%, 1.10% of average net assets, respectively. Calamos Advisors may recapture previously waived expense amounts within the same fiscal year for any day where the respective Fund's expense ratio falls below the contractual expense limit up to the expense limit for that day. This undertaking is binding on Calamos Advisors and any of its successors and assigns. This agreement is not terminable by either party. The expense ratios shown above may differ from the more recent expense ratios reported in the Financial Highlights section of this report.
† Average annual total return measures net investment income and capital gain or loss from portfolio investments as an annualized average assuming reinvestment of dividends and capital gains distributions. Performance shown includes the effects of an expense reimbursement that improved results. Load-adjusted returns are adjusted for the maximum frontend sales load of 2.25% for Class A shares and returns for Class C shares have been adjusted for the contingent deferred sales charge (CDSC).
NOTES:
The Refinitiv Global Convertible Bond Index (USD) is designed to represent the global convertible market.
The MSCI World Index (US Dollars) is a market-capitalization weighted index composed of companies representative of the market structure of developed market countries in North America, Europe and the Asia/Pacific region.
The Bloomberg Global Aggregate Index is a measure of global investment grade debt from twenty-five local currency markets.
Unmanaged index returns assume reinvestment of any and all distributions and, unlike fund returns, do not reflect fees, expenses or sales charges. Investors cannot invest directly in an index.
CALAMOS OPEN-END FAMILY OF FUNDS ANNUAL REPORT
26
Calamos Timpani Small Cap Growth Fund (Unaudited)
CALAMOS TIMPANI SMALL CAP
GROWTH FUND
INVESTMENT TEAM DISCUSSION
How has the Fund performed?
For the 12 months ended October 31, 2023 ("annual period"), Calamos Timpani Small Cap Growth Fund posted a return of -15.53% (Class I Shares at net asset value), underperforming the loss of -7.63% for the Russell 2000 Growth Index.
Since Class I shares inception on March 23, 2011, the Fund has returned 8.32% on an annualized basis, while the Russell 2000 Growth Index returned 7.15% over the same period. We believe this comparison demonstrates the Fund's ability to outdistance its benchmark over full market cycles.
What factors influenced performance during the reporting period?
Equity markets rallied over the course of the period, lifting off lows from the market sell-off that began in late 2021 when the Fed and central bankers around the world began raising interest rates in an effort to tackle inflation. The Fed hiked the fed funds rate in historically short order (300 basis points in approximately six months), and the broad market, not surprisingly, did not react favorably, falling by -24% from late December 2021 through early October 2022. At the onset of this annual period, data suggested that inflation had likely peaked, which many believed would allow the Fed to slow down its furious pace of interest rate hikes.
Cyclical stocks and beleaguered value stocks led the market in the initial months of the annual period, but that leadership was short-lived as the Fed continued to promote a hawkish narrative. During these 12 months, the Fed would raise rates an additional 225 basis points. In March 2023, two of the largest bank failures in history, Silicon Valley Bank and Credit Suisse, sent investors flocking to the large-cap growth stocks of companies with significant balance sheets and ties to AI (artificial intelligence). Toward the end of the period, investors continued to grapple with questions of whether the Fed could induce a soft-landing for the US economy while reining in inflation or whether a recession would result from the significant change in the cost of capital. Geopolitical risks increased with the onset of conflict between Hamas and Israel in October 2023. Those cumulative concerns weighed on the markets, with the S&P 500 Index, a measure of the US equity market, declining by -10% toward the end of the period.
For the annual period, the US equity market, as represented by the S&P 500 Index, gained 10.14%, although it should be noted that an equal-weighted S&P 500 Index went nowhere on the year, with a total return of -0.75%. Small-cap stocks, represented by the Russell 2000 Index, dropped -8.57% for the annual period, and mid-cap stocks, as measured by the Russell Midcap Index, also struggled with a -1.01% return. Mega-cap growth stocks performed best and carried the bulk of the overall S&P 500 Index's return, particularly those tied to AI with strong balance sheets (and perhaps less concerned about borrowing from banks or raising capital in a higher-interest-rate environment). The top eight names in the S&P 500 Index by market cap represented approximately 26% of the index's market cap, are primarily tech-related, have stronger-balance-sheets, and accounted for 85% of the market's gain over the period.
OVERVIEW
The Fund invests in the equity securities of small-capitalization companies with high, sustainable growth potential, which may exceed market expectations.
KEY FEATURES
◼ Combines fundamental research with the analysis of market estimates to identify the underestimated growth differential between a company's business strength and market expectations of that strength.
◼ Pursues active management in a less-followed investment space.
◼ Analyzes secular trends to uncover exploitable investment opportunities specific to small-cap companies.
PORTFOLIO FIT
Investing in small-cap companies is an important component of a diversified investment strategy. Smaller companies tend to experience greater growth and outperform larger companies.
FUND NASDAQ SYMBOLS
A Shares | | CTASX | |
C Shares | | CTCSX | |
I Shares | | CTSIX | |
R6 Shares | | CTSOX | |
FUND CUSIP NUMBERS
A Shares | | | 128120417 | | |
C Shares | | | 128120318 | | |
I Shares | | | 128120391 | | |
R6 Shares | | | 128120383 | | |
www.calamos.com
27
Calamos Timpani Small Cap Growth Fund (Unaudited)
SECTOR WEIGHTINGS
Industrials | | | 30.6 | % | |
Information Technology | | | 20.5 | | |
Health Care | | | 12.2 | | |
Consumer Discretionary | | | 10.9 | | |
Energy | | | 10.4 | | |
Consumer Staples | | | 6.6 | | |
Financials | | | 6.3 | | |
Materials | | | 1.4 | | |
Communication Services | | | 0.5 | | |
Sector weightings are subject to change daily and are calculated as a percentage of net assets. The table excludes cash or cash equivalents, any government/sovereign bonds or broad based index hedging securities the Fund may hold.
Within the Russell 2000 Growth Index, consumer staples (+9%) and industrials (+0.3%) were the only two sectors to finish in positive territory for the annual period. Energy (-0.1%), information technology (-2%), financials (-7%) outperformed the index, whereas consumer discretionary (-8%), communication services (-8%), real estate (-11%), materials (-13%), utilities (-18%), and health care (-18%) all lagged.
While the Fund lagged the Russell 2000 Growth Index for the annual period, the underperformance occurred at the beginning of the period when cyclical stocks rallied as investors prematurely celebrated a potential end to rate hikes. After that surge in cyclical stocks that culminated in early February, the Fund was able to outperform the Russell 2000 Growth Index by 2.72%. As seasoned investors, we are aware that our style and approach will not always be in favor, but after a period of difficult relative and absolute performance, we are pleased to see that focusing on companies with strong fundamental momentum is again being recognized by the market.
For the full annual period, performance lagged due to issue selection rather than sector allocations. While sector allocations didn't significantly drive relative performance, an underweight to energy and an overweight to health care were the bigger drags on performance. An overweight to consumer staples and an underweight to materials proved additive. Security selection in information technology within application software and communications equipment hindered performance. Selection within heath care also lagged, most notably in health care equipment and pharmaceuticals. A theme that gained traction during the period related to a specific group of weight loss drugs known as GLP-1s (short for glucagon-like peptide 1 agonists). Clinical data continues to be released, but investors are encouraged by the potential for these drugs to improve patient aesthetics and overall health. However, this excitement does have a downside for other industries, as some investors suspect a healthier society may result in lower demand for certain medical devices and procedures. Strong issue selection among industrials was additive to absolute and relative performance. Holdings in construction & engineering and electrical components & equipment saw strong gains with revenues related to AI and electronic infrastructure initiatives. Consumer staples holdings also performed well, particularly in beverages and personal care products.
How is the Fund positioned?
The Fund made some notable changes from the beginning of the annual period. An underweight to the industrials sector increased to a significant overweight by the end of the annual period, with additions to commercial services & supplies and construction & engineering. Conversely, a significant reduction occurred in the health care sector, largely associated with decreasing the health care equipment & supplies industry. As discussed, support for weight loss drugs has had negative consequences for businesses associated with curing or treating ailments that may, in part, be due to an overweight condition. It remains to be seen whether those treatments will decline as much as anticipated, but we made the move in order to pursue better opportunities elsewhere.
As of the end of the period, the Fund held a significant overweight to industrials, with overweights also in energy and consumer staples. The most significant underweight at period end was to health care, with an underweight in materials as well.
CALAMOS OPEN-END FAMILY OF FUNDS ANNUAL REPORT
28
Calamos Timpani Small Cap Growth Fund (Unaudited)
What closing thoughts do you have for Fund shareholders?
We believe the portfolio is well positioned, tilted toward stocks that we believe offer above-average growth prospects and very visible fundamental strength. Stocks with those characteristics were out of favor for most of 2022 as valuation multiples compressed, but since early February 2023, many of these stocks are back on track with the market.
In other words, we believe we are in the early stages of a new upcycle for our particular investment style. This belief, combined with the potential to see a recovery in the overall small-cap asset class, has us feeling upbeat on an intermediate-to-long-term basis. Admittedly, the short term is murky, with many macro sources of concern. This murkiness is causing performance to have many stops, starts, and rotations. We're focused on finding stocks that have company-specific secular growth, and are theoretically less vulnerable to some of that macro murkiness. We believe this approach makes the most sense, especially in this environment.
Although small caps have underperformed during the quarter and year to date, the outlook for small caps looks compelling. Small caps are relatively inexpensive and have tended to do well in periods after a bear market. Small caps are also entering what historically has been a seasonally strong period running from October through April. Regarding valuation, small caps look extremely stretched to the downside relative to large caps. Looking back at more than 90 years of data, research by Jefferies shows that the most significant dislocations have historically tended to be a positive indicator for future small-cap performance.
ANNUALIZED RETURN: SINCE INCEPTION (3/23/11) THROUGH 10/31/23
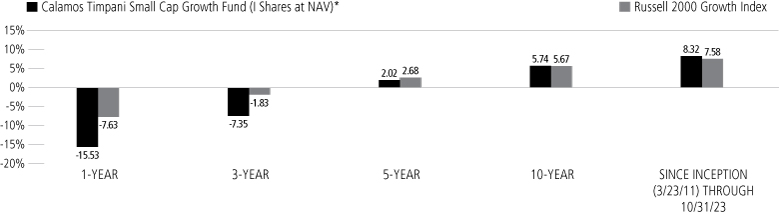
Performance data quoted represents past performance, which is no guarantee of future results. Current performance may be lower or higher than the performance quoted.
The principal value and investment return of an investment will fluctuate so that your shares, when redeemed, may be worth more or less than their original cost. You can obtain performance data current to the most recent month end by visiting www.calamos.com. Average annual total return measures net investment income and capital gain or loss from portfolio investments as an annualized average. All performance shown assumes reinvestment of dividends and capital gains distributions. Performance is for the Fund's Class I shares at net asset value. The Fund also offers Class A, Class C and Class R6 shares, the performance of which may vary. Source: State Street Corporation and Morningstar Direct.
* Annual returns for Class I shares are provided because Class I shares represent the largest percentage of assets in the Calamos Family of Funds.
www.calamos.com
29
Calamos Timpani Small Cap Growth Fund (Unaudited)
GROWTH OF $1,000,000: SINCE INCEPTION (3/23/11) THROUGH 10/31/23

AVERAGE ANNUAL TOTAL RETURN† AS OF 10/31/23
| | | 1
YEAR | | 5
YEARS | | 10
YEARS OR
^SINCE
INCEPTION | |
Class A Shares (With Predecessor) – Inception 1/6/14^ | |
Without Sales Charge | | | -15.75 | % | | | 1.75 | % | | | 4.83 | % | |
With Sales Charge | | | -19.74 | | | | 0.76 | | | | 4.31 | | |
Class C Shares – Inception 6/28/21^ | |
Without Sales Charge | | | -16.37 | | | | — | | | | -23.33 | | |
With Sales Charge | | | -17.21 | | | | — | | | | -23.33 | | |
Class I Shares (With Predecessor) – Inception 3/23/11 | |
Without Sales Charge | | | -15.53 | | | | 2.02 | | | | 5.74 | | |
Class R6 Shares – Inception 6/1/19^ | | | -15.41 | | | | — | | | | 2.04 | | |
Performance data quoted represents past performance, which is no guarantee of future results. Current performance may be lower or higher than the performance quoted. The principal value and investment return of an investment will fluctuate so that your shares, when redeemed, may be worth more or less than their original cost.
As of the prospectus dated 3/1/23, the Fund's gross expense ratio for Class A shares is 1.37%, Class C shares is 2.12%, Class I shares is 1.12% and Class R6 shares is 1.00%. The Fund's investment adviser has contractually agreed to reimburse Fund expenses through March 1, 2024, to the extent necessary so that Total Annual Fund Operating Expenses of Class A, Class C and Class I shares are limited to 1.30%, 2.05%, 1.05% of average net assets, respectively. The Fund's investment adviser has contractually agreed to limit the Fund's annual ordinary operating expenses for Class R6 shares (as a percentage of average net assets) to 1.05% less the Fund's annual sub-transfer agency ratio (the aggregate subtransfer agency fees of the Fund's other share classes divided by the aggregate average annual net assets of the Fund's other share classes). For purposes of these expense limitations, operating expenses do not include taxes, interest, short interest, short dividend expenses, brokerage commissions, acquired fund fees and expenses, and extraordinary expenses, if any. Calamos Advisors may recapture previously waived expense amounts within the same fiscal year for any day where the respective share class's expense ratio falls below the contractual expense limit up to the expense limit for that day. This undertaking is binding on Calamos Advisors and any of its successors and assigns. This agreement is not terminable by either party. The expense ratios shown above may differ from the more recent expense ratios reported in the Financial Highlights section of this report.
† Average annual total return measures net investment income and capital gain or loss from portfolio investments as an annualized average assuming reinvestment of dividends and capital gains distributions. Performance shown reflects the effects of an expense reimbursement that improved results. Load-adjusted returns are adjusted for the maximum front-end sales load of 4.75% for Class A shares and returns for Class C shares have been adjusted for the contingent deferred sales charge (CDSC).
NOTES:
Effective as of the close of business on May 31, 2019, the Fund acquired all of the assets, subject to the liabilities, of the Timpani Small Cap Growth Fund (the "Predecessor Fund") through a tax-free reorganization (the "Reorganization"). Pursuant to the Reorganization of the Predecessor Fund into the Fund, Class Y shareholders of the Predecessor Fund received Class A shares of the Fund, and Service Class and Institutional Class shareholders of the Predecessor Fund each received Class I shares of the Fund. As a result of the Reorganization, the Fund adopted the performance and financial history of the Predecessor Fund. Accordingly, the performance shown in the average annual total return table above for periods prior to the commencement of the Fund's operations on June 1, 2019 is the performance of the Predecessor Fund. The Fund has the same investment objective, strategy and portfolio manager as the Predecessor Fund. As a result, the performance of the Fund would have been substantially similar to that of the Predecessor Fund.
The graphs do not reflect the income taxes that you would pay on fund distributions or the redemption of fund shares. Fund performance includes reinvestment of dividends and adjustment for the maximum sales charge for Class A shares. The performance of other classes will vary from the performance of the class shown based on the difference in sales charges and fees paid by shareholders investing in different share classes.
The Russell 2000 Growth Index is a composite of small-cap companies located in the US that also exhibit a growth probability.
The S&P 500 Index is an unmanaged index generally considered representative of the US stock market.
The Russell 2000® Index measures the performance of the small-cap segment of the US equity universe. The Russell Midcap® Index measures the performance of companies whose average market capitalization is approximately $4.2 billion.
Index returns assume reinvestment of dividends and do not reflect deduction of fees and expenses. It is not possible to invest directly in an index.
CALAMOS OPEN-END FAMILY OF FUNDS ANNUAL REPORT
30
Calamos Timpani SMID Growth Fund (Unaudited)
CALAMOS TIMPANI SMID GROWTH FUND
INVESTMENT TEAM DISCUSSION
How has the Fund performed?
For the 12 months ended October 31, 2023 ("annual period"), Calamos Timpani SMID Growth Fund posted a return of -10.07% (Class I Shares at net asset value), trailing the -4.80% loss of the Russell 2500 Growth Index.
What factors influenced performance during the reporting period?
Equity markets rallied over the course of the period, lifting off lows from the market sell-off that began in late 2021 when the Fed and central bankers around the world began raising interest rates in an effort to tackle inflation. The Fed hiked the fed funds rate in historically short order (300 basis points in approximately six months), and the broad market, not surprisingly, did not react favorably, falling by -24% from late December 2021 through early October 2022. At the onset of this annual period, investors were pleased to see data suggesting that inflation had likely peaked, which many believed would allow the Fed to slow down its furious pace of interest rate hikes.
Cyclical stocks and beleaguered value stocks led the market in the initial months of the annual period, but that leadership was short-lived as the Fed continued to promote a hawkish narrative. During these 12 months, the Fed would raise rates an additional 225 basis points. In March 2023, two of the largest bank failures in history, Silicon Valley Bank and Credit Suisse, sent investors flocking to the large-cap growth stocks of companies with significant balance sheets and ties to AI (artificial intelligence). Toward the end of the period, investors continued to grapple with questions of whether the Fed could induce a soft-landing for the US economy while reining in inflation, or whether a recession would result from the significant change in the cost of capital. Geopolitical risks increased with the onset of conflict between Hamas and Israel in October 2023. Those cumulative concerns weighed on the markets, with the S&P 500 Index, a measure of the US equity market, declining by -10% toward the end of the period.
For the annual period, the US equity market, as represented by the S&P 500 Index, gained 10.14%, although it should be noted that an equal-weighted S&P 500 Index went nowhere on the year, with a total return of -0.75%. Small-cap stocks, represented by the Russell 2000 Index, dropped -8.57% for the annual period, and mid-cap stocks, as measured by the Russell Midcap Index, also struggled with a -1.01% return. Mega-cap growth stocks performed best and carried the bulk of the overall S&P 500 Index's return, particularly those tied to AI with strong balance sheets (and perhaps less concerned about borrowing from banks or raising capital in a higher-interest-rate environment). The top eight names in the S&P 500 Index by market cap represented approximately 26% of the index's market cap, are primarily tech-related, have stronger-balance-sheets, and accounted for 85% of the market's gain over the period.
Within the Russell 2500 Growth Index, consumer staples (+10%), information technology (+4%), consumer discretionary (+2%), and industrials (+2%) were the only sectors to finish in positive territory for the annual period. Energy (-4%) slightly outperformed the index while real estate (-5%), materials (-8%), financials (-8%), utilities (-10%), communication services (-16%), and health care (-19%) all lagged.
OVERVIEW
The Fund invests in the equity securities of small- and mid-capitalization (SMID) companies with high, sustainable growth potential, which may exceed market expectations.
KEY FEATURES
◼ Combines fundamental research with the analysis of market estimates to identify the underestimated growth differential between a company's business strength and market expectations of that strength.
◼ Pursues active management in a less-followed investment space.
◼ Analyzes secular trends to uncover exploitable investment opportunities specific to small- and mid-cap companies.
PORTFOLIO FIT
Investing in SMID companies is an important component of a diversified investment strategy. Small-to-midsize companies tend to experience greater growth and outperform larger companies, yet this greater potential also raises the potential for greater volatility—which is why we believe active management is crucial.
FUND NASDAQ SYMBOLS
A Shares | | CTAGX | |
I Shares | | CTIGX | |
R6 Shares | | CTOGX | |
FUND CUSIP NUMBERS
A Shares | | | 128120375 | | |
I Shares | | | 128120367 | | |
R6 Shares | | | 128120359 | | |
www.calamos.com
31
Calamos Timpani SMID Growth Fund (Unaudited)
SECTOR WEIGHTINGS
Industrials | | | 30.6 | % | |
Information Technology | | | 22.5 | | |
Consumer Discretionary | | | 14.4 | | |
Energy | | | 9.6 | | |
Health Care | | | 9.2 | | |
Financials | | | 6.4 | | |
Consumer Staples | | | 6.1 | | |
Materials | | | 1.0 | | |
Sector weightings are subject to change daily and are calculated as a percentage of net assets. The table excludes cash or cash equivalents, any government/sovereign bonds or broad based index hedging securities the Fund may hold.
While the Fund lagged the Russell 2500 Growth Index for the annual period, the underperformance occurred at the beginning of the period when cyclical stocks rallied as investors prematurely celebrated a potential end to rate hikes. After that surge in cyclical stocks that culminated in early February, the Fund was able to outperform the Russell 2500 Growth Index by 4.86%. As seasoned investors, we are aware that our style and approach will not always be in favor, but after a period of difficult relative and absolute performance, we are pleased to see that focusing on companies with strong fundamental momentum is again being recognized by the market.
For the annual period, performance lagged due to issue selection rather than sector allocations. Sector allocations were moderately additive but didn't significantly drive relative performance. An underweight to health care and an overweight to consumer staples proved additive. An underweight to energy and information technology early in the period dragged on performance. Security selection in information technology within application software and communications equipment hindered performance. Selection within heath care also lagged, most notably in health care equipment and health care supplies. A theme that gained traction during the period related to a specific group of weight loss drugs known as GLP-1s (short for glucagon-like peptide 1 agonists). Clinical data continues to be released, but investors are encouraged by the potential for these drugs to improve patient aesthetics and overall health. However, this excitement does have a downside for other industries, as some investors suspect a healthier society may result in lower demand for certain medical devices and procedures. Strong issue selection among industrials was additive to absolute and relative performance. Holdings in electrical components & equipment and construction & engineering saw strong gains with revenues related to AI and electronic infrastructure initiatives. Consumer staples holdings also performed well, particularly in beverages and personal care products.
How is the Fund positioned?
The Fund made some notable changes from the beginning of the annual period. A modest overweight to the industrials sector was increased to a significant overweight by the end of the annual period, with additions to commercial services & supplies and select transportation businesses. The allocation to the information technology sector also increased, bringing the initial underweight to an overweight at the end of the period. Conversely, the allocation to health care was significantly reduced, largely through decreases in the biotechnology and health care equipment & supplies industries. As discussed, support for weight loss drugs has had negative consequence to businesses associated with curing or treating ailments that may, in part, be due to an overweight condition. It remains to be seen whether those treatments will decline as much as anticipated, but we made the move in order to pursue better opportunities elsewhere.
As of the end of the period, the Fund held a significant overweight to industrials, with overweights also in energy and consumer staples. The most significant underweight at period end was to health care, with an underweight in materials and financials as well.
CALAMOS OPEN-END FAMILY OF FUNDS ANNUAL REPORT
32
Calamos Timpani SMID Growth Fund (Unaudited)
What closing thoughts do you have for Fund shareholders?
We believe the portfolio is well positioned, tilted toward stocks that offer above-average growth prospects and visible fundamental strength. Stocks with those characteristics were out of favor for most of 2022 as valuation multiples compressed, but since early February 2023, many of these stocks are back on track with the market.
In other words, we believe we are in the early stages of a new upcycle for our particular investment style. This belief, combined with the potential to see a recovery in the overall small-to-mid cap asset class, has us feeling upbeat on an intermediate-to-long-term basis. Admittedly, the short-term is murky, with many macro sources of concern. This murkiness is causing performance to have many stops, starts, and rotations. We're focused on finding stocks that have company-specific secular growth, and thus are theoretically less vulnerable to some of that macro murkiness. We believe this approach makes the most sense, especially in this environment.
Although small-to-mid caps have underperformed during the quarter and year to date, the outlook for small-to-mid caps looks compelling. Small-to-mid caps are relatively inexpensive, in our view, and have tended to do well in periods after a bear market. Small-to-mid caps are also entering what historically has been a seasonally strong period running from October through April. Regarding valuation, small-to-mid caps look extremely stretched to the downside relative to large caps. Looking back at more than 90 years of data, research by Jefferies shows that the most significant dislocations have historically tended to be a positive indicator for future small-to-mid cap performance.
www.calamos.com
33
Calamos Timpani SMID Growth Fund (Unaudited)
GROWTH OF $1,000,000: SINCE INCEPTION (7/31/19) THROUGH 10/31/23

AVERAGE ANNUAL TOTAL RETURN† AS OF 10/31/23
| | | 1
YEAR | | SINCE
INCEPTION | |
Class A Shares – Inception 7/31/19 | |
Without Sales Charge | | | -10.36 | % | | | 0.57 | % | |
With Sales Charge | | | -14.65 | | | | -0.58 | | |
Class I Shares – Inception 7/31/19 | |
Without Sales Charge | | | -10.07 | | | | 0.84 | | |
Class R6 Shares – Inception 7/31/19 | | | -9.97 | | | | 0.86 | | |
Performance data quoted represents past performance, which is no guarantee of future results. Current performance may be lower or higher than the performance quoted. The principal value and investment return of an investment will fluctuate so that your shares, when redeemed, may be worth more or less than their original cost.
As of the prospectus dated 3/1/23, the Fund's gross expense ratio for Class A shares is 1.93%, Class I shares is 1.65% and Class R6 shares is 1.63%. The Fund's investment adviser has contractually agreed to reimburse Fund expenses through March 1, 2024 to the extent necessary so that Total Annual Fund Operating Expenses of Class A shares and Class I shares are limited to 1.35% and 1.10% of average net assets, respectively. The Fund's investment adviser has contractually agreed to limit the Fund's annual ordinary operating expenses for Class R6 shares (as a percentage of average net assets) to 1.10% less the Fund's annual sub-transfer agency ratio (the aggregate subtransfer agency fees of the Fund's other share classes divided by the aggregate average annual net assets of the Fund's other share classes). For purposes of these expense limitations, operating expenses do not include taxes, interest, short interest, short dividend expenses, brokerage commissions, acquired fund fees and expenses, and extraordinary expenses, if any. Calamos Advisors may recapture previously waived expense amounts within the same fiscal year for any day where the respective share class's expense ratio falls below the contractual expense limit up to the expense limit for that day. This undertaking is binding on Calamos Advisors and any of its successors and assigns. This agreement is not terminable by either party. The expense ratios shown above may differ from the more recent expense ratios reported in the Financial Highlights section of this report.
† Average annual total return measures net investment income and capital gain or loss from portfolio investments as an annualized average assuming reinvestment of dividends and capital gains distributions. Performance shown reflects the effects of an expense reimbursement that improved results. Load-adjusted returns are adjusted for the maximum front-end sales load of 4.75% for Class A shares.
NOTES:
The graphs do not reflect the income taxes that you would pay on fund distributions or the redemption of fund shares. Fund performance includes reinvestment of dividends and adjustment for the maximum sales charge for Class A shares. The performance of other classes will vary from the performance of the class shown based on the difference in sales charges and fees paid by shareholders investing in different share classes.
The Russell 2500 Growth Index measures the performance of the small to mid-cap growth segment of the US equity universe. It includes those Russell 2500 companies with higher growth earning potential. The Russell 2500 Growth Index is published and maintained by FTSE Russell.
The S&P 500 Index is an unmanaged index generally considered representative of the US stock market.
The Russell Midcap® Index measures the performance of companies whose average market capitalization is approximately $4.2 billion.
Index returns assume reinvestment of dividends and do not reflect deduction of fees and expenses. It is not possible to invest directly in an index.
CALAMOS OPEN-END FAMILY OF FUNDS ANNUAL REPORT
34
Calamos Growth Fund (Unaudited)
CALAMOS GROWTH FUND
INVESTMENT TEAM DISCUSSION
How has the Fund performed?
For the 12 months ended October 31, 2023 ("annual period"), Calamos Growth Fund returned 15.27% (Class I Shares at net asset value), outperforming the S&P 1500 Growth Index return of 10.86%.
Since Class I shares inception on September 18, 1997, the Fund has returned 10.54% on an annualized basis. The S&P 1500 Growth Index, the primary benchmark, returned 8.31% over the same period, and the S&P 500 Index returned 7.84%. We believe these comparisons demonstrate the Fund's ability to outdistance the growth and broad indices over full market cycles.
What factors influenced performance during the reporting period?
Equity markets rallied over the course of the annual period, lifting off lows from the rate-hikes-induced market sell-off that began in late 2021. Just prior to this annual period, the Fed had raised rates 300 basis points in just six months in an effort to curb inflation. At the onset of this annual period, data suggested that inflation had likely peaked, which many believed would allow the Fed to slow down its furious pace of interest rate hikes. Cyclical stocks and beleaguered value stocks led the market in the initial months of the annual period, but that leadership was short-lived as the Fed continued to promote a hawkish narrative. During these 12 months, the Fed would, in fact, raise rates an additional 225 basis points. In March 2023, two of the largest bank failures in history, Silicon Valley Bank and Credit Suisse, sent investors flocking to the large-cap growth stocks of companies with significant balance sheets and ties to AI (artificial intelligence). Toward the end of the period, investors continued to grapple with questions of whether the Fed could induce a soft-landing for the US economy while reining in inflation, or whether a recession would result from the significant change in the cost of capital. Geopolitical risks increased with the onset of conflict between Hamas and Israel in October 2023. Those cumulative concerns weighed on the markets, with the S&P 500 Index, a measure of the US equity market, declining -10% toward the end of the annual period.
For the full annual period, the US equity market, as represented by the S&P 500 Index, gained 10.14%, although it should be noted that an equal-weighted S&P 500 Index went nowhere on the year, with a total return of -0.75%. Small-cap stocks, represented by the Russell 2000 Index, dropped -8.57% for the annual period. Large-cap growth stocks, particularly those tied to AI with strong balance sheets (and perhaps less concerned about needing to borrow from banks or raise capital in a higher-interest-rate environment), performed best. The top eight names in the S&P 500 Index by market cap represented approximately 26% of the index's market cap, are primarily tech-related, have stronger balance sheets, and accounted for 85% of the market's gain over the period.
Over the course of the period, inflation has declined dramatically. US GDP registered robust 4.9% real growth for 3Q 2023, and employment was strong, with employment cost pressures abating and quarterly earnings turning toward positive growth. That said, the cost of capital has increased dramatically in short order, monetary policy is restrictive at current levels, and the US is running a significant deficit.
OVERVIEW
A broad, flexible strategy enables the Fund to invest in the equities of US companies across all market capitalizations and sectors in order to attain the best potential for long-term capital growth.
KEY FEATURES
◼ Seeks to provide attractive returns through an emphasis on higher-growth US companies spanning the full range of market capitalizations and sectors. Draws on more than three decades of experience in growth investing.
◼ The portfolio reflects top-down, secular thematic views along with high-conviction, fundamentally researched stocks of companies with advantaged business models, high returns on capital, solid free-cash-flow generation, and stewardship-minded management.
◼ Combines secular and cyclical growth to help manage the dynamics of the economy.
PORTFOLIO FIT
May be an attractive option for investors seeking higher growth and diversification that spans all caps of US companies across sectors and industries.
FUND NASDAQ SYMBOLS
A Shares | | CVGRX | |
C Shares | | CVGCX | |
I Shares | | CGRIX | |
FUND CUSIP NUMBERS
A Shares | | | 128119302 | | |
C Shares | | | 128119856 | | |
I Shares | | | 128119807 | | |
www.calamos.com
35
Calamos Growth Fund (Unaudited)
SECTOR WEIGHTINGS
Information Technology | | | 38.5 | % | |
Consumer Discretionary | | | 14.6 | | |
Communication Services | | | 12.1 | | |
Health Care | | | 11.6 | | |
Industrials | | | 7.6 | | |
Financials | | | 7.1 | | |
Consumer Staples | | | 2.3 | | |
Energy | | | 1.6 | | |
Materials | | | 1.3 | | |
Sector weightings are subject to change daily and are calculated as a percentage of net assets. The table excludes cash or cash equivalents, any government/sovereign bonds or broad based index hedging securities the Fund may hold.
Within the growth equity market, as represented by the S&P 1500 Growth Index, communication services (+34%) and information technology (+32%) were significant outperformers led by mega-cap growth names, as discussed previously. Industrials (+7%) and consumer discretionary (+5%) sectors delivered positive returns, but all other sectors finished in negative territory for the annual period. Materials (-1%), financials (-1%), health care (-4%), consumer staples (-7%), energy (-8%), real estate (-11%) and utilities (-19%) rounded out performance by sector.
The Fund outperformed the S&P 1500 Growth Index through a combination of sector allocations and individual stock selection. In each case, sector and selection were additive in 9 of the 11 sectors. An underweight to the lagging health care sector was additive because defensives such as health care broadly struggled, and a slight overweight to information technology also lifted performance. An overweight to industrials slightly dragged on relative performance, with commercial and consumer transportation holdings lagging. Individual security selection was notably strong within consumer discretionary, where holdings in retail, restaurants, and apparel added the most relative performance. Holdings in information technology were also significant contributors, with strong balance sheet companies in AI-related areas adding the most value to the portfolio. Individual selection among financials detracted from relative performance as names in investment banking & brokerage and diversified banks struggled over the period. Holdings in industrials related to aerospace & defense and airlines also detracted from relative performance.
How is the Fund positioned?
In an environment where growth may prove increasingly scarce, we believe asset-light companies with the flexibility and financial strength to continue funding their growth initiatives—regardless of the economic backdrop—should outperform. As a result, we continue to favor quality growth companies with stellar balance sheets and attractive free cash flows. We believe these companies are better positioned to capitalize on the opportunities that volatile markets provide, as seen in the largest companies' first-mover advantage with AI. On the other end of the spectrum, we are increasingly cautious about the outlook for unprofitable technology companies.
Although some of the AI stocks euphoria has abated recently, the Fund has maintained considerable exposure to this investment theme through our positioning in semiconductor, cloud infrastructure, and software stocks. Undoubtedly, investor enthusiasm around AI will ebb and flow over time, but we remain confident this technology will bring new applications and widespread benefits to a range of businesses beyond the technology sector. As always, we remain committed to a selective and thoughtful approach as we sort through what lies ahead for this exciting innovation.
What closing thoughts do you have for Fund shareholders?
The economy continues to flash mixed signals. We believe the current trend of positive but tepid growth will likely continue for the next couple of quarters. However, a surprising number of factors are pointing toward the potential for further softening, including the inverted yield curve, tighter lending standards, higher energy costs, increasing labor costs, and higher financing costs. These all add up to growing profit pressures on the private sector. In addition, the rest of the world remains weaker than the United States and, therefore, unlikely to boost
CALAMOS OPEN-END FAMILY OF FUNDS ANNUAL REPORT
36
Calamos Growth Fund (Unaudited)
domestic growth. Given this backdrop, we believe the market may continue to display volatility but may also continue to reward the best-in-class businesses with the characteristics discussed earlier. It's often said that the market is willing to pay for what is scarce. Commonly, when the broad economy lacks robust growth, the market tends to reward those companies offering growth.
ANNUALIZED RETURN: SINCE INCEPTION (9/18/97) THROUGH 10/31/23

Performance data quoted represents past performance, which is no guarantee of future results. Current performance may be lower or higher than the performance quoted.
The principal value and investment return of an investment will fluctuate so that your shares, when redeemed, may be worth more or less than their original cost. You can obtain performance data current to the most recent month end by visiting www.calamos.com. Average annual total return measures net investment income and capital gain or loss from portfolio investments as an annualized average. All performance shown assumes reinvestment of dividends and capital gains distributions. Performance is for the Fund's Class I shares at net asset value. The Fund also offers Class A and Class C shares, the performance of which may vary. Source: State Street Corporation and Morningstar Direct.
* Annual returns for Class I shares are provided because Class I shares represent the largest percentage of assets in the Calamos Family of Funds.
www.calamos.com
37
Calamos Growth Fund (Unaudited)
GROWTH OF $1,000,000: FOR THE 10-YEAR PERIOD ENDED 10/31/23

AVERAGE ANNUAL TOTAL RETURN† AS OF 10/31/23
| | | 1
YEAR | | 5
YEARS | | 10
YEARS | |
Class A Shares – Inception 9/4/90 | |
Without Sales Charge | | | 14.98 | % | | | 9.61 | % | | | 9.06 | % | |
With Sales Charge | | | 9.51 | | | | 8.55 | | | | 8.54 | | |
Class C Shares – Inception 9/3/96 | |
Without Sales Charge | | | 14.14 | | | | 8.80 | | | | 8.26 | | |
With Sales Charge | | | 13.14 | | | | 8.80 | | | | 8.26 | | |
Class I Shares – Inception 9/18/97 | | | 15.27 | | | | 9.88 | | | | 9.34 | | |
Performance data quoted represents past performance, which is no guarantee of future results. Current performance may be lower or higher than the performance quoted. The principal value and investment return of an investment will fluctuate so that your shares, when redeemed, may be worth more or less than their original cost.
Performance results do not include adjustments made for financial reporting purposes in accordance with US generally accepted accounting principles and may differ from amounts reported in the financial highlights.
As of the prospectus dated 3/1/23, the Fund's gross expense ratio for Class A shares is 1.30%, Class C shares is 2.05% and Class I shares is 1.05%. The expense ratios shown above may differ from the more recent expense ratios reported in the Financial Highlights section of this report.
† Average annual total return measures net investment income and capital gain or loss from portfolio investments as an annualized average assuming reinvestment of dividends and capital gains distributions. Load-adjusted returns are adjusted for the maximum front-end sales load of 4.75% for Class A shares and returns for Class C shares have been adjusted for the contingent deferred sales charge (CDSC).
NOTES:
The graphs do not reflect the income taxes that you would pay on fund distributions or the redemption of fund shares. Fund performance includes reinvestment of dividends. The performance of other classes will vary from the performance of the class shown based on the difference in sales charges and fees paid by shareholders investing in different share classes.
The S&P 1500 Growth Index consists of the growth segment of the securities found in the S&P 1500 Index. The S&P 1500 combines the S&P 500, S&P MidCap 400 and the S&P SmallCap 600.
The Russell 2000® Index measures the performance of the small-cap segment of the US equity universe.
The S&P 500 Index is an unmanaged index generally considered representative of the US stock market.
Index returns assume reinvestment of dividends and do not reflect deduction of fees and expenses. It is not possible to invest directly in an index.
CALAMOS OPEN-END FAMILY OF FUNDS ANNUAL REPORT
38
Calamos Growth and Income Fund (Unaudited)
CALAMOS GROWTH AND INCOME FUND
INVESTMENT TEAM DISCUSSION
How has the Fund performed?
For the 12 months ended October 31, 2023 ("annual period"), Calamos Growth and Income Fund returned 7.12% (Class I Shares at net asset value). In comparison, the S&P 500 Index returned 10.14% for the period, and the ICE BofA All US Convertibles ex Mandatory Index registered a loss of -0.08%. We manage the Fund intending to achieve upside equity participation and potential downside risk mitigation over full market cycles. For the annual period, Calamos Growth and Income Fund captured 86% of the all-equity index's returns. Since its Class I shares inception on September 18, 1997, the Fund returned 9.29% on an annualized basis versus a 7.84% gain for the S&P 500 Index and 7.71% return for the ICE BofA All US Convertibles ex Mandatory Index.
Please discuss the Fund's lower-volatility characteristics.
We believe the Fund's historical lower-volatility characteristics are a byproduct of our investment style and focus on participating in equity market upside with less volatility than the market. Beta is one popular statistic for measuring volatility. Beta considers a fund's historic volatility versus the market, which is assigned a beta of 1.0. A fund with half the volatility of the market would have a beta of 0.5, while a fund with a beta of 2.0 would have been twice as volatile as the market. Since its inception, the Fund has had a beta of 0.76 (Class I shares) versus the S&P 500 Index. The Fund, therefore, outperformed the broader equity market, as measured by the S&P 500 Index, with less volatility than the equity market. Please note that past performance does not indicate future results and that beta is one of many risk measures.
What factors influenced performance during the reporting period?
Equity markets rallied over the course of the period, lifting off lows from the market sell-off that began in late 2021 when the Fed and central bankers around the world began raising interest rates in an effort to tackle inflation. The Fed hiked the fed funds rate in historically short order (300 basis points in approximately six months), and the broad market, not surprisingly, did not react favorably, falling by -24% from late December 2021 through early October 2022. At the onset of this annual period, data suggested that inflation had likely peaked, which many believed would allow the Fed to slow down its furious pace of interest rate hikes.
Cyclical stocks and beleaguered value stocks led the market in the initial months of the annual period, but that leadership was short-lived as the Fed continued to promote a hawkish narrative. During these 12 months, the Fed would, in fact, raise rates an additional 225 basis points. In March 2023, two of the largest bank failures in history, Silicon Valley Bank and Credit Suisse, sent investors flocking to the large-cap growth stocks of companies with significant balance sheets and ties to AI (artificial intelligence). Toward the end of the period, investors continued to grapple with questions of whether the Fed could induce a soft landing for the US economy while reining in inflation, or whether a recession would result from the significant change in the cost of capital. Geopolitical risks increased with the onset of conflict between Hamas and Israel in October 2023. Those cumulative concerns weighed on the markets, with the S&P 500 Index, a measure of the US equity market, declining by -10% toward the end of the annual period.
For the full annual period, the US equity market, as represented by the S&P 500 Index, gained 10.14%, although it should be noted that an equal-weighted S&P 500 Index went nowhere on the year, with a total return of -0.75%. Small-cap stocks, represented by the Russell 2000 Index, dropped -8.57% for the annual
OVERVIEW
The Fund invests primarily in US equity and convertible securities in an attempt to balance risk/reward while providing growth and income.
KEY FEATURES
◼ Leverages more than four decades of research experience combining equities and convertible holdings to provide equity-like participation.
◼ Provides a core holding option that aims to maintain a consistent risk posture throughout the market cycle.
◼ Research-driven approach identifies opportunities by combining top-down analysis with a focus on key growth characteristics.
PORTFOLIO FIT
The Fund can provide a long-term core equity allocation, which exhibits potentially lower volatility and delivers attractive income.
FUND NASDAQ SYMBOLS
A Shares | | CVTRX | |
C Shares | | CVTCX | |
I Shares | | CGIIX | |
R6 Shares | | CGIOX | |
FUND CUSIP NUMBERS
A Shares | | | 128119104 | | |
C Shares | | | 128119831 | | |
I Shares | | | 128119872 | | |
R6 Shares | | | 128120326 | | |
www.calamos.com
39
Calamos Growth and Income Fund (Unaudited)
SECTOR WEIGHTINGS
Information Technology | | | 24.9 | % | |
Health Care | | | 11.8 | | |
Financials | | | 10.8 | | |
Consumer Discretionary | | | 10.4 | | |
Communication Services | | | 9.3 | | |
Industrials | | | 7.3 | | |
Consumer Staples | | | 4.9 | | |
Energy | | | 4.5 | | |
Utilities | | | 2.6 | | |
Materials | | | 2.5 | | |
Real Estate | | | 1.7 | | |
Other | | | 0.1 | | |
Sector weightings are subject to change daily and are calculated as a percentage of net assets. The table excludes cash or cash equivalents, any government/sovereign bonds or broad based index hedging securities the Fund may hold.
period, and mid-cap stocks, as measured by the Russell Midcap Index, also struggled with a -1.01% return. Mega cap growth stocks performed best and carried the bulk of the overall S&P 500 Index's return, particularly those tied to AI with strong balance sheets (and perhaps less concerned about borrowing from banks or raising capital in a higher-interest-rate environment). The top eight names in the S&P 500 Index by market cap represented approximately 26% of the index's market cap, are primarily tech-related, have stronger-balance-sheets, and accounted for 85% of the market's gain over the period.
Within the S&P 500 Index, communication services (+36%) and information technology (+31%) were significant outperformers led by mega-cap growth names and were the only two sectors to beat the overall market. Consumer discretionary (+8%), industrials (+6%), and materials (+5%) delivered positive returns, but all other sectors finished in negative territory for the annual period. Energy (-2%), financials (-3%), consumer staples (-3%), health care (-5%), real estate (-7%), and utilities (-8%) rounded out performance by sector.
The Fund generated positive results yet trailed the all-equity S&P 500 Index for the annual period largely due to issue selection rather than sector allocation. Within issue selection, the Fund's use of convertible bonds, Treasuries, and options to help reduce the portfolio's overall volatility was a drag on performance for the period. As described above, market performance was narrowly focused on a small subset of names within the S&P 500 Index, and asset classes other than large-cap growth significantly lagged the S&P 500 Index's gain for the period. The Fund was well represented by the largest eight names within the S&P 500 Index and had a bias toward growth stocks for the annual period, which benefited the portfolio's common stock allocation performance. Individual security selection lagged within industrials, notably within aerospace & defense and industrial conglomerates. Selection in communication services also trailed the S&P 500 Index, almost exclusively due to an underweight exposure to Meta Platforms over the course of the reporting period. Selection within consumer staples outperformed the S&P 500 Index with notable contributions from consumer staples merchandise retailers and packaged foods & meats.
How is the Fund positioned?
At the beginning of 2023, we outlined the case for increasing the risk of the Fund, focusing on selective areas of the economy that we believed should show improving economic growth in 2023 and 2024, in addition to companies that could improve returns on capital during that time. Our premise to selectively add risk was based on several factors, including our convictions about long-term US economic growth trajectory, positive policy changes, and improvement in certain parts of the economy, despite opposing forces slowing growth down in other economic sectors. The events of the first three quarters of 2023 (the slowing of central bank rate increases, moderate slowing of inflation and economic growth, corporate cost-cutting measures, and the acceleration of spending in AI-related areas) have, in aggregate, supported that risk profile. Risk-asset returns were positive during this time, although there was a significant dispersion of returns across sectors and industries.
We believe the best positioning for this environment is a more neutral or defensive risk posture, with risk in specific areas that have real growth tailwinds, in companies with improving returns on capital in 2024, and in equities and fixed income with valuations at favorable expected risk-adjusted returns. We see compelling prospects for companies that have exposure to new products and geographic growth opportunities (examples can be found in health care, electric vehicles, and AI-related infrastructure and software), specific infrastructure
CALAMOS OPEN-END FAMILY OF FUNDS ANNUAL REPORT
40
Calamos Growth and Income Fund (Unaudited)
spending areas (in materials and industrials), and the normalization of supply chains and parts of the service economy.
We are still favoring higher-credit-quality companies with improving free cash flow. We selectively use options and convertible bonds to gain exposure to higher-risk industries. From an asset-class perspective, cash and short-term Treasuries remain useful tools to lower volatility in a multi-asset-class portfolio, given their yields.
What closing thoughts do you have for Fund shareholders?
As we look toward the end of 2023 and into 2024, the growth outlook appears more muted than at the beginning of 2023. Opposing economic forces have become more balanced as policy shifts (the elimination of some government policies and a cost-cutting agenda in the US Congress) are offsetting positive end-demand trends at the consumer and corporate levels. We continue to see slowing but positive economic growth over the next year, but the timing for a reacceleration in growth is more difficult to predict. In addition to this more balanced growth view, the growth outlook for many parts of the US economy continues to shift (for example, due to rising energy prices in recent months versus a decline in the first part of the year and a slowing of travel consumption from the fast pace over the summer). Therefore, we remain vigilant in identifying short-term cyclical investment themes. We continue to assess the investment opportunities within this environment, further focusing on real growth and return improvement areas. Finally, we continue to monitor security and asset-class valuations to target appropriate returns in this volatile environment.
We remain confident that the positive long-term growth trajectory of the US economy and the cash-flow-generation capabilities of US companies are intact. The ability of management teams to identify emerging short and long-term trends and the adaptability of business models and cost structures are central to our long-term favorable view. We see attractive long-term upside in the US equity market from current market levels, which we believe are at fair value for a majority of US companies.
ANNUALIZED RETURN: SINCE INCEPTION (9/18/97) THROUGH 10/31/23

Performance data quoted represents past performance, which is no guarantee of future results. Current performance may be lower or higher than the performance quoted.
The principal value and investment return of an investment will fluctuate so that your shares, when redeemed, may be worth more or less than their original cost. You can obtain performance data current to the most recent month end by visiting www.calamos.com. Average annual total return measures net investment income and capital gain or loss from portfolio investments as an annualized average. All performance shown assumes reinvestment of dividends and capital gains distributions. Performance is for the Fund's Class I shares at net asset value. The Fund also offers Class A, Class C and Class R6 shares, the performance of which may vary. Source: State Street Corporation and Morningstar Direct.
* Annual returns for Class I shares are provided because Class I shares represent the largest percentage of assets in the Calamos Family of Funds.
www.calamos.com
41
Calamos Growth and Income Fund (Unaudited)
GROWTH OF $1,000,000: FOR THE 10-YEAR PERIOD ENDED 10/31/23

AVERAGE ANNUAL TOTAL RETURN† AS OF 10/31/23
| | | 1
YEAR | | 5
YEARS | | 10
YEARS OR
^SINCE
INCEPTION | |
Class A Shares – Inception 9/22/88 | |
Without Sales Charge | | | 6.86 | % | | | 9.06 | % | | | 8.32 | % | |
With Sales Charge | | | 1.79 | | | | 8.00 | | | | 7.80 | | |
Class C Shares – Inception 8/5/96 | |
Without Sales Charge | | | 6.08 | | | | 8.24 | | | | 7.51 | | |
With Sales Charge | | | 5.08 | | | | 8.24 | | | | 7.51 | | |
Class I Shares – Inception 9/18/97 | | | 7.12 | | | | 9.33 | | | | 8.59 | | |
Class R6 Shares – Inception 6/23/20^ | | | 7.21 | | | | | | 8.13 | | |
Performance data quoted represents past performance, which is no guarantee of future results. Current performance may be lower or higher than the performance quoted. The principal value and investment return of an investment will fluctuate so that your shares, when redeemed, may be worth more or less than their original cost.
As of the prospectus dated 3/1/23, the Fund's gross expense ratio for Class A shares is 1.05%, Class C shares is 1.80%, Class I shares is 0.80% and Class R6 shares is 0.73%. The expense ratios shown above may differ from the more recent expense ratios reported in the Financial Highlights section of this report.
† Average annual total return measures net investment income and capital gain or loss from portfolio investments as an annualized average assuming reinvestment of dividends and capital gains distributions. Performance shown reflects the effects of an expense reimbursement that improved results. Load-adjusted returns are adjusted for the maximum frontend sales load of 4.75% for Class A shares. Returns for Class C shares have been adjusted for the contingent deferred sales charge (CDSC).
NOTES:
The graphs do not reflect the income taxes that you would pay on fund distributions or the redemption of fund shares. Fund performance includes reinvestment of dividends. The performance of other classes will vary from the performance of the class shown based on the difference in sales charges and fees paid by shareholders investing in different share classes.
The S&P 500 Index is an unmanaged index generally considered representative of the US stock market.
The ICE BofA All US Convertibles ex Mandatory Index represents the US convertibles securities market excluding mandatory convertibles.
The Russell 2000® Index measures the performance of the small-cap segment of the US equity universe. The Russell Midcap® Index measures the performance of companies whose average market capitalization is approximately $4.2 billion. The Russell indexes are published and maintained by FTSE Russell.
Index returns assume reinvestment of dividends and do not reflect deduction of fees and expenses. It is not possible to invest directly in an index.
The Fund's use of derivative instruments involves investment risks and transaction costs to which the Fund would not be subject absent the use of these instruments and, accordingly, may result in losses greater than if they had not been used. Derivative instruments can be illiquid, may disproportionately increase losses and may have a potentially large impact on Fund performance.
CALAMOS OPEN-END FAMILY OF FUNDS ANNUAL REPORT
42
Calamos Dividend Growth Fund (Unaudited)
CALAMOS DIVIDEND GROWTH FUND
INVESTMENT TEAM DISCUSSION
How has the Fund performed?
For the 12 months ended October 31, 2023 ("annual period"), Calamos Dividend Growth Fund returned 8.88% (Class I shares at net asset value), lagging the S&P 500 Index return of 10.14%.
What factors influenced performance during the reporting period?
Equity markets rallied over the course of the period, lifting off lows from the market sell-off that began in late 2021 when the Fed and central bankers around the world began raising interest rates in an effort to tackle inflation. The Fed hiked the fed funds rate in historically short order (300 basis points in approximately six months), and the broad market, not surprisingly, did not react favorably, falling by -24% from late December 2021 through early October 2022. At the onset of this annual period, data suggested that inflation had likely peaked, which many believed would allow the Fed to slow down its furious pace of interest rate hikes.
Cyclical stocks and beleaguered value stocks led the market in the initial months of the annual period, but that leadership was short-lived as the Fed continued to promote a hawkish narrative. During these 12 months, the Fed would raise rates an additional 225 basis points. In March 2023, two of the largest bank failures in history, Silicon Valley Bank and Credit Suisse, sent investors flocking to the large-cap growth stocks of companies with significant balance sheets and ties to AI (artificial intelligence). Toward the end of the period, investors continued to grapple with questions of whether the Fed could induce a soft-landing for the US economy while reining in inflation or whether a recession would result from the significant change in the cost of capital. Geopolitical risks increased with the onset of conflict between Hamas and Israel in October 2023. Those cumulative concerns weighed on the markets, with the S&P 500 Index, a measure of the US equity market, declining by -10% toward the end of the period.
For the annual period, the US equity market, as represented by the S&P 500 Index, gained 10.14%, although it should be noted that an equal-weighted S&P 500 Index went nowhere on the year, with a total return of -0.75%. Small-cap stocks, represented by the Russell 2000 Index, dropped -8.57% for the annual period, and mid-cap stocks, as measured by the Russell Midcap Index, also struggled with a -1.01% return. Mega-cap growth stocks performed best and carried the bulk of the overall S&P 500 Index's return, particularly those tied to AI with strong balance sheets (and perhaps less concerned about borrowing from banks or raising capital in a higher-interest-rate environment). The top eight names in the S&P 500 Index by market cap represented approximately 26% of the index's market cap, are primarily tech-related, have stronger balance sheets, and accounted for 85% of the market's gain over the period.
Within the equity market, as represented by the S&P 500 Index, communication services (+36%) and information technology (+31%) were significant outperformers led by mega-cap growth names and were the only two sectors to beat the overall market. Consumer discretionary (+8%), industrials (+6%), and materials (+5%) delivered positive returns, but all other sectors finished in negative territory for the annual period. Energy (-2%), financials (-3%), consumer staples (-3%), health care (-5%), real estate (-7%), and utilities (-8%) rounded out performance by sector.
OVERVIEW
The Fund invests in companies that we believe have the ability to increase dividends over time, either through increasing profits or more efficient use of capital.
KEY FEATURES
◼ Employs bottom-up stock picking and a benchmark-agnostic approach.
◼ Focuses on good businesses with solid cash flows and value prices.
PORTFOLIO FIT
The Fund may be suitable for investors seeking a regular stream of income and dividend-paying equity investments that tend to be less volatile than non-dividend payers.
FUND NASDAQ SYMBOLS
A Shares | | CADVX | |
C Shares | | CCDVX | |
I Shares | | CIDVX | |
FUND CUSIP NUMBERS
A Shares | | | 128120839 | | |
C Shares | | | 128120821 | | |
I Shares | | | 128120813 | | |
www.calamos.com
43
Calamos Dividend Growth Fund (Unaudited)
SECTOR WEIGHTINGS
Information Technology | | | 28.3 | % | |
Financials | | | 13.2 | | |
Health Care | | | 13.1 | | |
Consumer Discretionary | | | 11.9 | | |
Communication Services | | | 8.7 | | |
Consumer Staples | | | 6.3 | | |
Industrials | | | 5.7 | | |
Energy | | | 5.1 | | |
Materials | | | 2.7 | | |
Utilities | | | 2.1 | | |
Real Estate | | | 0.9 | | |
Other | | | 0.7 | | |
Sector weightings are subject to change daily and are calculated as a percentage of net assets. The table excludes cash or cash equivalents, any government/sovereign bonds or broad based index hedging securities the Fund may hold.
The Fund's focus on securities exhibiting higher cash flows was beneficial over the period as the market favored higher-quality businesses. Higher-dividend-yielding securities were not in favor, and the Fund has a slight bias toward dividend yield relative to the S&P 500 Index. The Fund was underweight the poorly performing real estate sector, boosting relative performance. Conversely, an underweight to the index-leading communication services sector detracted from performance. Selection in industrials hindered relative performance as names within industrial conglomerates and aerospace & defense lagged. Selection in information technology outperformed relative to the index, with notable contributions from application software and semiconductor names that offered an attractive combination of growth and solid balance sheets.
How is the Fund positioned?
The Fund remains broadly diversified by sector, favoring investments in dividend-paying equities and focusing on high cash-generating businesses. Allocations to consumer discretionary and financials rose slightly during the period, whereas investments in health care were reduced slightly. At the end of the annual period, the Fund held an underweight to industrials and real estate, with an overweight to consumer discretionary names. We continue to seek higher-quality businesses with dividends or dividend-growth potential, which in our view should serve investors well in an uncertain market environment.
What closing thoughts do you have for Fund shareholders?
As we look toward the end of 2023 and into 2024, the growth outlook appears more muted than at the beginning of 2023. Opposing economic forces have become more balanced as policy shifts (the elimination of some government policies and a cost-cutting agenda in the US Congress) and are offsetting positive end-demand trends at the consumer and corporate levels. We continue to see slowing but positive economic growth over the next year, but the timing for a reacceleration in growth is more difficult to predict. In addition to this more balanced growth view, the growth outlook for many parts of the US economy continues to shift (for example, due to rising energy prices in recent months versus a decline in the first part of the year and a slowing of travel consumption from the fast pace over the summer). Therefore, we remain vigilant in identifying short-term cyclical investment themes. We continue to assess the investment opportunities within this environment, further focusing on real growth and return-improvement areas. Finally, we continue to monitor security and asset-class valuations to target appropriate returns in this volatile environment.
We remain confident that the positive long-term growth trajectory of the US economy and the cash-flow-generation capabilities of US companies are intact. The ability of management teams to identify emerging short and long-term trends and the adaptability of business models and cost structures are central to our long-term favorable view. We see attractive long-term upside in the US equity market from current market levels, which we believe are at fair value for a majority of US companies.
CALAMOS OPEN-END FAMILY OF FUNDS ANNUAL REPORT
44
Calamos Dividend Growth Fund (Unaudited)
ANNUALIZED RETURN: SINCE INCEPTION (8/5/13) THROUGH 10/31/23

Performance data quoted represents past performance, which is no guarantee of future results. Current performance may be lower or higher than the performance quoted.
The principal value and investment return of an investment will fluctuate so that your shares, when redeemed, may be worth more or less than their original cost. You can obtain performance data current to the most recent month end by visiting www.calamos.com. Average annual total return measures net investment income and capital gain or loss from portfolio investments as an annualized average. All performance shown assumes reinvestment of dividends and capital gains distributions. Performance is for the Fund's Class I shares at net asset value. The Fund also offers Class A and Class C shares, the performance of which may vary. Source: State Street Corporation and Morningstar Direct.
* Annual returns for Class I shares are provided because Class I shares represent the largest percentage of assets in the Calamos Family of Funds.
www.calamos.com
45
Calamos Dividend Growth Fund (Unaudited)
GROWTH OF $1,000,000: FOR THE 10-YEAR PERIOD ENDED 10/31/23

AVERAGE ANNUAL TOTAL RETURN† AS OF 10/31/23
| | | 1
YEAR | | 5
YEARS | | 10
YEARS | |
Class A Shares – Inception 8/5/2013 | |
Without Sales Charge | | | 8.61 | % | | | 10.28 | % | | | 8.68 | % | |
With Sales Charge | | | 3.44 | | | | 9.21 | | | | 8.15 | | |
Class C Shares – Inception 8/5/2013 | |
Without Sales Charge | | | 7.82 | | | | 9.45 | | | | 7.87 | | |
With Sales Charge | | | 6.82 | | | | 9.45 | | | | 7.87 | | |
Class I Shares – Inception 8/5/2013 | | | 8.88 | | | | 10.56 | | | | 8.95 | | |
Performance data quoted represents past performance, which is no guarantee of future results. Current performance may be lower or higher than the performance quoted. The principal value and investment return of an investment will fluctuate so that your shares, when redeemed, may be worth more or less than their original cost.
As of the prospectus dated 3/1/23, the Fund's gross expense ratio for Class A shares is 2.03%, Class C shares is 2.78% and Class I shares is 1.78%. The Fund's Investment Adviser has contractually agreed to reimburse Fund expenses through March 1, 2024 to the extent necessary so that Total Annual Fund Operating Expenses (excluding taxes, interest, short interest, short dividend expenses, brokerage commissions, acquired fund fees and expenses and extraordinary expenses, if any) of Class A, Class C and Class I shares are limited to 1.35%, 2.10%,1.10% of average net assets, respectively. Calamos Advisors may recapture previously waived expense amounts within the same fiscal year for any day where the respective Fund's expense ratio falls below the contractual expense limit up to the expense limit for that day. This undertaking is binding on Calamos Advisors and any of its successors and assigns. This agreement is not terminable by either party. The expense ratios shown above may differ from the more recent expense ratios reported in the Financial Highlights section of this report.
† Average annual total return measures net investment income and capital gain or loss from portfolio investments as an annualized average assuming reinvestment of dividends and capital gains distributions. Performance shown reflects the effects of an expense reimbursement that improved results. Load-adjusted returns are adjusted for the maximum frontend sales load of 4.75% for Class A shares. Returns for Class C shares have been adjusted for the contingent deferred sales charge (CDSC).
NOTES:
The graph does not reflect the income taxes that you would pay on fund distributions or the redemption of fund shares. Fund performance includes reinvestment of dividends and adjustment for the maximum sales charge for Class A shares. The performance of other classes will vary from the performance of the class shown based on the difference in sales charges and fees paid by shareholders investing in different share classes.
The S&P 500 Index is an unmanaged index generally considered representative of the US stock market.
The Russell 2000® Index measures the performance of the small-cap segment of the US equity universe. The Russell Midcap® Index measures the performance of companies whose average market capitalization is approximately $4.2 billion. The Russell indexes are published and maintained by FTSE Russell.
Index returns assume reinvestment of dividends and do not reflect deduction of fees and expenses. It is not possible to invest directly in an index.
CALAMOS OPEN-END FAMILY OF FUNDS ANNUAL REPORT
46
Calamos Select Fund (Unaudited)
CALAMOS SELECT FUND
INVESTMENT TEAM DISCUSSION
How has the Fund performed?
For the 12 months ended October 31, 2023 ("annual period"), Calamos Select Fund returned 8.84% (Class I shares at net asset value), trailing the S&P 500 Index return of 10.14%.
What factors influenced performance over the reporting period?
Equity markets rallied over the course of the period, lifting off lows from the rate-hikes-induced market sell-off that began in late 2021. Just prior to this annual period, the Fed had raised rates 300 basis points in just six months in an effort to curb inflation. At the onset of this annual period, data suggested that inflation had likely peaked, which many believed would allow the Fed to slow down its furious pace of interest rate hikes.
Cyclical stocks and beleaguered value stocks led the market in the initial months of the annual period, but that leadership was short-lived as the Fed continued to promote a hawkish narrative. During these 12 months, the Fed would, in fact, raise rates an additional 225 basis points. In March 2023, two of the largest bank failures in history, Silicon Valley Bank and Credit Suisse, sent investors flocking to the large-cap growth stocks of companies with significant balance sheets and ties to AI (artificial intelligence). Toward the end of the period, investors continued to grapple with questions of whether the Fed could induce a soft landing for the US economy while reining in inflation or whether a recession would result from the significant change in the cost of capital. Geopolitical risks increased with the onset of conflict between Hamas and Israel in October 2023. Those cumulative concerns weighed on the markets, with the S&P 500 Index, a measure of the US equity market, declining by -10% toward the end of the annual period.
For the full period, the US equity market, as represented by the S&P 500 Index, gained 10.14%, although it should be noted that an equal-weighted S&P 500 Index went nowhere on the year, with a total return of -0.75%. Small-cap stocks, represented by the Russell 2000 Index, dropped -8.57% for the annual period. Large-cap growth stocks performed best, particularly those tied to AI with strong balance sheets (and perhaps less concerned about needing to borrow from banks or raise capital in a higher-interest-rate environment). The top eight names in the S&P 500 Index by market cap represented approximately 26% of the index's market cap, are primarily tech-related, have stronger balance sheets, and accounted for 85% of the market's gain over the period.
Over the course of the period, inflation has declined dramatically. US GDP registered robust 4.9% real growth for 3Q 2023, and employment was strong, with employment cost pressures abating and quarterly earnings turning toward positive growth. That said, the cost of capital has increased dramatically in short order, monetary policy is restrictive at current levels, and the US is running a significant deficit.
Within the S&P 500 Index, communication services (+36%) and information technology (+31%) significantly outperformed, led by mega-cap growth names. The consumer discretionary (+8%), industrials (+6%), and materials (+5%) sectors delivered positive returns, with all other sectors finishing in negative territory for the annual period. Energy (-2%), financials (-3%), consumer staples (-3%), health care (-5%), real estate (-7%), and utilities (-8%) rounded out performance by
OVERVIEW
The Fund primarily invests in a concentrated portfolio of large-cap US equities with broad representation across sectors and industries. In addition, the Fund can invest across investment styles in the US equity market.
KEY FEATURES
◼ Security selection is based mainly on Calamos analysts' highest conviction ideas. We leverage the collective expertise of the firm's research analysts, who average 15+ years of experience in their areas of expertise.
◼ The investment process is driven by rigorous fundamental and sector-specific research. The goal is to maximize exposure to opportunities the team believes are compelling.
◼ Quantitative tools help minimize systematic risks across both sectors and factors. We use quantitative tools to minimize unintended bets and maximize the impact of security selection.
PORTFOLIO FIT
Because the Fund pairs a high-conviction approach with a broad investment universe, we believe it is an attractive choice for investors seeking a long-term core equity allocation to US stocks.
FUND NASDAQ SYMBOLS
A Shares | | CVAAX | |
C Shares | | CVACX | |
I Shares | | CVAIX | |
FUND CUSIP NUMBERS
A Shares | | | 128119666 | | |
C Shares | | | 128119641 | | |
I Shares | | | 128119633 | | |
www.calamos.com
47
Calamos Select Fund (Unaudited)
SECTOR WEIGHTINGS
Information Technology | | | 27.6 | % | |
Health Care | | | 15.0 | | |
Consumer Discretionary | | | 12.1 | | |
Financials | | | 11.6 | | |
Industrials | | | 8.9 | | |
Communication Services | | | 8.2 | | |
Consumer Staples | | | 6.5 | | |
Energy | | | 3.1 | | |
Utilities | | | 2.0 | | |
Materials | | | 1.8 | | |
Sector weightings are subject to change daily and are calculated as a percentage of net assets. The table excludes cash or cash equivalents, any government/sovereign bonds or broad based index hedging securities the Fund may hold.
sector. Growth was more in favor than value, with the S&P 500 Growth Index's 11.9% gain outpacing the S&P 500 Value Index's 7.7% gain for the annual period.
How is the Fund positioned?
Portfolio performance benefited from a bias toward growth during much of the annual period, and individual selection was broadly in line with the market, but sector allocation and cash holdings were a net drag to relative performance. An underweight to information technology proved to be the biggest detractor from a sector-allocation perspective, although the Fund's weight to information technology did increase over the course of the annual period. Being overweight to the defensive-oriented consumer staple sector also proved to be a drag on relative performance. Conversely, a steady underweight to the real estate sector and a modest overweight to consumer discretionary names proved beneficial. Strong individual security selection within information technology was additive to performance owing to notable gains from semiconductor names and systems software holdings. Issue selection also contributed to consumer discretionary, highlighted by strength among various retailers. Individual security selection in communication services lost ground, owing almost exclusively to not owning Meta Platforms (Facebook), yet other names in interactive media & services performed very well. Selection within industrials also lagged as aerospace & defense names and passenger airlines struggled.
In an environment where growth may prove increasingly scarce, we believe asset-light companies with the flexibility and financial strength to continue funding their growth initiatives—regardless of the economic backdrop—should outperform. As a result, we continue to favor quality growth companies with stellar balance sheets and attractive free cash flows. We believe these companies are better positioned to capitalize on the opportunities that volatile markets provide, as seen in the largest companies' first-mover advantage with AI. By contrast, we are increasingly cautious about the outlook for unprofitable technology companies. In all, the portfolio is biased to growth-style stocks over value counterparts.
Over the course of the annual period, we actively adjusted individual positions. In aggregate, the portfolio reduced the total number of holdings and brought sector positioning more in line with the S&P 500 Index. Most notably, the Fund increased the allocation to information technology, taking the portfolio from a significant underweight at the beginning of the period to mostly in line with the market weight at the end, favoring growth businesses in semiconductors and system software. To a lesser extent, the portfolio's weight to consumer staples decreased, bringing an overweight position at the start of the period to a market weight at the end of the period.
What closing thoughts do you have for Fund shareholders?
The economy continues to flash mixed signals. The current trend of positive-but-tepid growth will likely continue for the next several quarters. However, a surprising number of factors are pointing toward the potential for further softening, including the inverted yield curve, tighter lending standards, higher energy costs, increasing labor costs, and higher financing costs. These all add up to growing profit pressures on the private sector. In addition, the rest of the world remains weaker than the United States and, therefore, unlikely to boost domestic growth. Given this backdrop, we believe the market may continue to display volatility but may also reward the best-in-class businesses with the characteristics discussed earlier. It's often said that the market is willing to pay for what is scarce. Commonly, when the broad economy lacks robust growth, the market tends to reward those companies offering growth.
CALAMOS OPEN-END FAMILY OF FUNDS ANNUAL REPORT
48
Calamos Select Fund (Unaudited)
ANNUALIZED RETURN: SINCE INCEPTION (3/1/02) THROUGH 10/31/23

Performance data quoted represents past performance, which is no guarantee of future results. Current performance may be lower or higher than the performance quoted.
The principal value and investment return of an investment will fluctuate so that your shares, when redeemed, may be worth more or less than their original cost. You can obtain performance data current to the most recent month end by visiting www.calamos.com. Average annual total return measures net investment income and capital gain or loss from portfolio investments as an annualized average. All performance shown assumes reinvestment of dividends and capital gains distributions. Performance is for the Fund's Class I shares at net asset value. The Fund also offers Class A and Class C shares, the performance of which may vary. Performance shown reflects an expense reimbursement that improved results. Source: State Street Corporation and Morningstar Direct.
* Annual returns for Class I shares are provided because Class I shares represent the largest percentage of assets in the Calamos Family of Funds.
www.calamos.com
49
Calamos Select Fund (Unaudited)
GROWTH OF $1,000,000: FOR THE 10-YEAR PERIOD ENDED 10/31/23
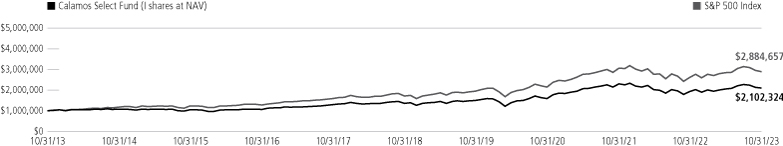
AVERAGE ANNUAL TOTAL RETURN† AS OF 10/31/23
| | | 1
YEAR | | 5
YEARS | | 10
YEARS | |
Class A Shares – Inception 1/2/02 | |
Without Sales Charge | | | 8.60 | % | | | 8.80 | % | | | 7.46 | % | |
With Sales Charge | | | 3.44 | | | | 7.74 | | | | 6.93 | | |
Class C Shares – Inception 1/2/02 | |
Without Sales Charge | | | 7.76 | | | | 7.98 | | | | 6.65 | | |
With Sales Charge | | | 6.76 | | | | 7.98 | | | | 6.65 | | |
Class I Shares – Inception 3/1/02 | | | 8.84 | | | | 9.06 | | | | 7.71 | | |
Performance data quoted represents past performance, which is no guarantee of future results. Current performance may be lower or higher than the performance quoted. The principal value and investment return of an investment will fluctuate so that your shares, when redeemed, may be worth more or less than their original cost.
As of the prospectus dated 3/1/23, the Fund's gross expense ratio for Class A shares is 1.57%, Class C shares is 2.33% and Class I shares is 1.32%. The Fund's investment adviser has contractually agreed to reimburse Fund expenses through March 1, 2024, to the extent necessary so that Total Annual Fund Operating Expenses (excluding taxes, interest, short interest, short dividend expenses, brokerage commissions, acquired fund fees and expenses, and extraordinary expenses, if any) of Class A, Class C, and Class I are limited to 1.15%, 1.91%, and 0.90% of average net assets, respectively. Calamos Advisors may recapture previously waived expense amounts within the same fiscal year for any day where the respective Fund's expense ratio falls below the contractual expense limit up to the expense limit for that day. This undertaking is binding on Calamos Advisors and any of its successors and assigns. This agreement is not terminable by either party. The expense ratios shown above may differ from the more recent expense ratios reported in the Financial Highlights section of this report.
† Average annual total return measures net investment income and capital gain or loss from portfolio investments as an annualized average assuming reinvestment of dividends and capital gains distributions. Performance shown reflects the effects of an expense reimbursement that improved results. Load-adjusted returns are adjusted for the maximum front-end sales load of 4.75% for Class A shares and returns for Class C shares have been adjusted for the contingent deferred sales charge (CDSC).
NOTES:
The graphs do not reflect the income taxes that you would pay on fund distributions or the redemption of fund shares. Fund performance includes reinvestment of dividends. The performance of other classes will vary from the performance of the class shown based on the difference in sales charges and fees paid by shareholders investing in different share classes.
The Russell 2000® Index measures the performance of the small-cap segment of the US equity universe. The Russell 2000® Index is published and maintained by FTSE Russell.
The S&P 500 Index is an unmanaged index generally considered representative of the US stock market.
The S&P 500 Value Index includes constituents of the S&P 500 Index designated as Value based the ratios of book value, earnings and sales to price.
Index returns assume reinvestment of dividends and do not reflect deduction of fees and expenses. It is not possible to invest directly in an index.
CALAMOS OPEN-END FAMILY OF FUNDS ANNUAL REPORT
50
Calamos International Growth Fund (Unaudited)
CALAMOS INTERNATIONAL GROWTH FUND
INVESTMENT TEAM DISCUSSION
How has the Fund performed?
For the 12 months ended October 31, 2023 ("annual period"), Calamos International Growth Fund returned 5.59% (Class I shares at net asset value) compared with an 11.16% return for the MSCI EAFE Growth Index and 12.66% return for the MSCI ACWI ex USA Index for the period. The Fund's return landed within the 79th percentile of the Morningstar Foreign Large Growth category during this period.*
Since its inception on March 17, 2005, the Fund has returned 6.09% on an annualized basis (Class I shares at net asset value), finishing in the top decile of its Morningstar peer category* and ahead of the MSCI EAFE Growth Index's 5.03% return and MSCI ACWI ex USA Index's 4.57% return. We believe this comparison demonstrates the Fund's ability to generate long-term excess returns over complete market cycles.
What factors influenced performance during the reporting period?
International stocks experienced periods of significant volatility and rotation but pushed higher and ultimately delivered positive returns over the period. Investors navigated an environment of tighter monetary policy and higher interest rates, but also moderating inflation and resilient corporate earnings.
The Fund generated positive returns over the period but trailed the index due to relative security selection. Select Fund holdings in companies with cyclical and secular growth characteristics underperformed amid markets that rewarded more defensive and value-oriented companies during the period. From a geographic perspective, Fund holdings in Japan and Emerging Asia trailed the benchmark and detracted value. In contrast, holdings in Canada and an overweight position in Europe contributed positively to Fund returns.
Positive Influences on Performance
Industrials. The Fund benefited from favorable security selection in industrials, where diversified support services was a leading contributor. In addition, our lack of exposure to environmental & facilities services assisted return.
Health Care. Security selection and an average underweight position in health care added to the portfolio's performance. Holdings in pharmaceuticals helped relative performance, as did our lack of exposure to biotechnology.
Negative Influences on Performance
Information Technology. Over the period, security selection within the information technology sector held back performance. Semiconductor materials & equipment lagged, as did internet services & infrastructure.
Materials. Security selection and an average underweight stance within the materials sector underperformed. Specifically, construction materials and our lack of exposure to specialty chemicals trailed on a relative basis.
* Data is as of 10/31/23. Morningstar category percentile rankings are based on annualized total returns. Calamos International Growth Fund Class I shares were in the 79th, 69th, 31st, 43rd and 6th percentiles of 421, 394, 373, 312, and 187 funds for the 1-year, 3-year, 5-year, 10-year, and since inception periods, respectively, for the Morningstar Foreign Large Growth category.
OVERVIEW
The Fund offers a dynamic approach to accessing international growth opportunities. We apply our active investment approach to build a portfolio of companies with superior growth and quality attributes across developed and emerging market.
KEY FEATURES
◼ Identifies companies with compelling growth, competitive advantages and financial strength.
◼ Identifies durable secular themes that provide a tailwind for sustainable growth and a franchise premium.
◼ Investment universe spans geographies and market caps, providing a wide breadth of opportunities.
◼ Takes environmental, social and governance (ESG) factors into account, evaluating the effects on a company's risk profile, cash flow and long-term returns.
PORTFOLIO FIT
As an active, true growth offering with a differentiated return profile, the Fund can potentially help investors optimize capital appreciation within their international allocation.
FUND NASDAQ SYMBOLS
A Shares | | CIGRX | |
C Shares | | CIGCX | |
I Shares | | CIGIX | |
R6 Shares | | CIGOX | |
FUND CUSIP NUMBERS
A Shares | | | 128119575 | | |
C Shares | | | 128119559 | | |
I Shares | | | 128119542 | | |
R6 Shares | | | 128120425 | | |
www.calamos.com
51
Calamos International Growth Fund (Unaudited)
SECTOR WEIGHTINGS
Information Technology | | | 21.3 | % | |
Industrials | | | 21.0 | | |
Consumer Discretionary | | | 18.1 | | |
Health Care | | | 12.3 | | |
Financials | | | 10.8 | | |
Energy | | | 7.7 | | |
Materials | | | 2.3 | | |
Consumer Staples | | | 2.3 | | |
Real Estate | | | 2.0 | | |
Other | | | 0.1 | | |
Sector weightings are subject to change daily and are calculated as a percentage of net assets. The table excludes cash or cash equivalents, any government/sovereign bonds or broad based index hedging securities the Fund may hold.
Geographic Performance
The portfolio benefited from leading security selection in Europe. Holdings in Denmark and Italy performed well in particular. Similarly, the portfolio benefitted from leading security selection and an average underweight allocation in the United States.
In contrast, the portfolio's position in Canada lagged on a relative basis. Similarly, security selection in EMEA underperformed. In particular, our holdings in Israel and Greece represented major detractors.
How is the Fund positioned?
The Fund's regional and country positioning reflects the combined inputs from our top-down global framework and our bottom-up security analysis. Our investment team evaluates macroeconomic factors and growth opportunities, actively integrating them into the investment decision-making process.
◼ We have positioned the Fund in secular growth, cyclicals, select defensives, and reopening opportunities.
◼ Technology, industrials, consumer discretionary, and health care are the largest sector weights. The Fund holds key industry positions in semiconductors, software, pharmaceuticals, autos, broadline retail, and aerospace & defense.
◼ The Fund owns select energy and materials companies positioned to benefit from supply-and-demand dynamics and increased capital efficiencies.
◼ The Fund holds underweights in defensive and interest-rate-sensitive areas, such as utilities, real estate, consumer staples, and traditional telecoms.
From a geographic perspective, The Fund holds a broadly diversified position in Europe, with a blend of secular growth, select cyclicals, and higher-quality defensives. We continue to evaluate the inflation and growth backdrop, given monetary tightening, global trade linkages, and geopolitical conflicts. The Fund holds a larger weight in Japanese companies benefiting from secular demand trends, regulatory reforms, global trade, and attractive valuations. The Fund owns a range of holdings in emerging markets where our positioning reflects our view of evolving trade dynamics, moderating inflation, and attractive valuations. The Fund owns industry positions within semiconductors, interactive media, and higher-quality financials.
What closing thoughts do you have for Fund shareholders?
International stocks continue to navigate a set of complex conditions. We are analyzing many important market drivers, including central bank policy, the inflationary backdrop, corporate earnings, and geopolitical tensions. Considering the global economy and evolving monetary policy, the financial markets remain uncertain, and we expect volatility to continue until these risks are resolved. Given this backdrop, we continue to identify ways to capitalize on volatility, including a range of opportunities at the thematic, regional, and market-cap levels.
Regarding Fund positioning, we emphasize companies with higher earnings growth, pricing power, cash flow, and supportive valuations. From a sector perspective, we see opportunities in information technology, industrials, consumer discretionary, health care, and energy with leading fundamentals. We believe our active investment approach and long-term perspective position us to take advantage of the volatility and opportunities in international markets.
CALAMOS OPEN-END FAMILY OF FUNDS ANNUAL REPORT
52
Calamos International Growth Fund (Unaudited)
ANNUALIZED RETURN: SINCE INCEPTION (3/16/05) THROUGH 10/31/23
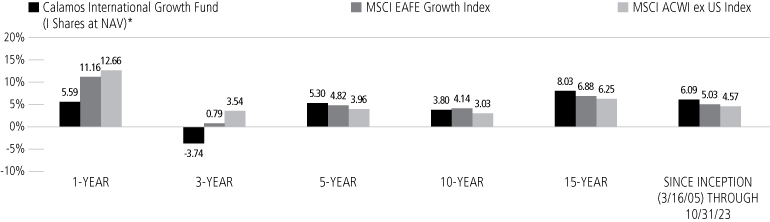
Performance data quoted represents past performance, which is no guarantee of future results. Current performance may be lower or higher than the performance quoted.
The principal value and investment return of an investment will fluctuate so that your shares, when redeemed, may be worth more or less than their original cost. You can obtain performance data current to the most recent month end by visiting www.calamos.com. Average annual total return measures net investment income and capital gain or loss from portfolio investments as an annualized average. All performance shown assumes reinvestment of dividends and capital gains distributions. Performance is for the Fund's Class I shares at net asset value. The Fund also offers Class A, Class C and Class R6 shares, the performance of which may vary. Source: State Street Corporation and Morningstar Direct.
* Annual returns for Class I shares are provided because Class I shares represent the largest percentage of assets in the Calamos Family of Funds.
www.calamos.com
53
Calamos International Growth Fund (Unaudited)
GROWTH OF $1,000,000: FOR THE 10-YEAR PERIOD ENDED 10/31/23
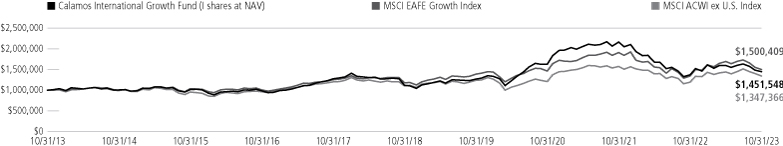
AVERAGE ANNUAL TOTAL RETURN† AS OF 10/31/23
| | | 1
YEAR | | 5
YEARS | | 10
YEARS OR
^SINCE
INCEPTION | |
Class A Shares – Inception 3/16/05 | |
Without Sales Charge | | | 5.31 | % | | | 5.04 | % | | | 3.54 | % | |
With Sales Charge | | | 0.31 | | | | 4.03 | | | | 3.04 | | |
Class C Shares – Inception 3/16/05 | |
Without Sales Charge | | | 4.51 | | | | 4.25 | | | | 2.76 | | �� |
With Sales Charge | | | 3.51 | | | | 4.25 | | | | 2.76 | | |
Class I Shares – Inception 3/16/05 | | | 5.59 | | | | 5.30 | | | | 3.80 | | |
AVERAGE ANNUAL TOTAL RETURN† AS OF 10/31/22 | | | 5.71 | | | | — | | | | 2.98 | | |
Performance data quoted represents past performance, which is no guarantee of future results. Current performance may be lower or higher than the performance quoted. The principal value and investment return of an investment will fluctuate so that your shares, when redeemed, may be worth more or less than their original cost.
As of the prospectus dated 3/1/23, the Fund's gross expense ratio for Class A shares is 1.64%, Class C shares is 2.39%, Class I shares is 1.39% and Class R6 shares is 1.28%. The Fund's investment adviser has contractually agreed to reimburse Fund expenses through March 1, 2024 to the extent necessary so that Total Annual Fund Operating Expenses (excluding taxes, interest, short interest, short dividend expenses, brokerage commissions, acquired fund fees and expenses, and extraordinary expenses, if any) of Class A, Class C, and Class I are limited to 1.20%, 1.95%, and 0.95% of average net assets, respectively. The Fund's investment adviser has contractually agreed to limit the Fund's annual ordinary operating expenses for Class R6 shares (as a percentage of average net assets) to 0.95% less the annual sub-transfer agency ratio for the Fund. The annual sub-transfer agency ratio is equal to the aggregate sub-transfer agency expenses common to the other share classes of the Fund divided by the aggregate average annual net assets of the Fund's other share classes. For purposes of these expense limitations, operating expenses do not include taxes, interest, short interest, short dividend expenses, all commissions and other normal charges incident to the purchase and sale of portfolio securities, and extraordinary expenses, if any. Calamos Advisors may recapture previously waived expense amounts within the same fiscal year for any day where the respective Fund's expense ratio falls below the contractual expense limit up to the expense limit for that day. This undertaking is binding on Calamos Advisors and any of its successors and assigns. This agreement is not terminable by either party. The expense ratios shown above may differ from the more recent expense ratios reported in the Financial Highlights section of this report.
† Average annual total return measures net investment income and capital gain or loss from portfolio investments as an annualized average assuming reinvestment of dividends and capital gains distributions. Performance shown reflects the effects of an expense reimbursement that improved results. Load-adjusted returns are adjusted for the maximum front-end sales load of 4.75% for Class A shares and returns for Class C shares have been adjusted for the contingent deferred sales charge (CDSC).
NOTES:
The graphs do not reflect the income taxes that you would pay on fund distributions or the redemption of fund shares. Fund performance includes reinvestment of dividends and adjustment for the maximum sales charge for Class A shares. The performance of other classes will vary from the performance of the class shown based on the difference in sales charges and fees paid by shareholders investing in different share classes.
The MSCI EAFE Growth Index measures developed market growth equity performance (excluding the US and Canada).
The MSCI ACWI ex USA Index represents the performance of large- and mid-cap stocks across developed and emerging markets excluding the United States. The MSCI ACWI ex USA Index is provided to show how the Fund's performance compares with the returns of an index of securities similar to those in which the Fund invests.
Index returns assume reinvestment of dividends and do not reflect deduction of fees and expenses. It is not possible to invest directly in an index.
The Fund's use of derivative instruments involves investment risks and transaction costs to which the Fund would not be subject absent the use of these instruments and, accordingly, may result in losses greater than if they had not been used. Derivative instruments can be illiquid, may disproportionately increase losses and may have a potentially large impact on Fund performance.
CALAMOS OPEN-END FAMILY OF FUNDS ANNUAL REPORT
54
Calamos Evolving World Growth Fund (Unaudited)
CALAMOS EVOLVING WORLD GROWTH FUND
INVESTMENT TEAM DISCUSSION
How has the Fund performed?
For the 12 months ended October 31, 2023 ("annual period"), Calamos Evolving World Growth Fund returned 3.44% (Class I shares at net asset value) versus an 11.26% return for the MSCI Emerging Markets Index. Emerging markets experienced multiple crosscurrents over the period, including tighter global monetary policy, a strong US dollar, evolving global trade dynamics, and geopolitical tension.
We believe the Fund's compelling medium and long-term performance record demonstrates the Fund's ability to generate excess returns over complete market cycles and varied investment environments. Since its inception on August 15, 2008, the Fund has returned 3.52% on an annualized basis (Class I shares at net asset value) compared to the 2.31% return of the MSCI Emerging Markets Index. The Fund's return is in the 15th percentile of its Morningstar peer category over the since-inception period.* We believe this exhibits the Fund's ability to access emerging market opportunities and deliver leading returns while pursuing our risk-managed investment approach.
What factors influenced performance during the reporting period?
Emerging market equities experienced significant dispersion in sector and country returns, reflecting a range of macro conditions, corporate earnings, and capital flows. Pursuant to our objective, Calamos Evolving World Growth Fund navigated the volatile global markets while employing an active blend of positions across a wide investment universe. The Fund's return trailed the index over the annual period due primarily to relative security selection. Our holdings in companies with secular and cyclical growth characteristics trailed the more defensive and value-oriented market areas that performed relatively well within emerging markets over the period.
Positive Influences on Performance
Information Technology. The Fund benefited from the information technology sector, as holdings in semiconductors and IT consulting & other services helped drive relative results.
Materials. Favorable security selection and an average underweight position in materials added to the results. Our construction materials position was a leading contributor, and our lack of exposure to commodity chemicals assisted relative returns.
Negative Influences on Performance
Financials. Over the period, security selection and an average underweight allocation in the financials sector detracted from performance, specifically holdings in the diversified banks and financial exchanges & data industries.
* Data is as of 10/31/23. The Morningstar category percentile rankings are based on annualized total returns. Calamos Evolving World Growth Fund Class I Shares were in the 92nd, 87th, 18th, 38th, and 15th percentiles of 810, 721, 651, 393, and 299 funds for the 1-year, 3-year, 5-year, 10-year, and since inception periods, respectively, for the Morningstar Diversified Emerging Markets category.
OVERVIEW
The Fund offers an active, risk-managed strategy to access growth opportunities in emerging markets. The Fund invests in emerging market-domiciled and developed market-domiciled companies with significant revenue exposures attributable to emerging markets.
KEY FEATURES
◼ Focuses on higher-quality companies with compelling growth attributes.
◼ Conducts research across the capital structure and utilizes Calamos' experience in convertible securities to dynamically manage the risk profile.
◼ Emphasizes countries enacting structural reforms and improving economic freedoms, which we believe enhances growth prospects and mitigates risk.
◼ Identifies durable secular themes that provide a tailwind for sustainable growth and a franchise premium.
PORTFOLIO FIT
Because of its focus on risk management, the fund can serve as a long-term emerging-market allocation.
FUND NASDAQ SYMBOLS
A Shares | | CNWGX | |
C Shares | | CNWDX | |
I Shares | | CNWIX | |
FUND CUSIP NUMBERS
A Shares | | | 128119161 | | |
C Shares | | | 128119146 | | |
I Shares | | | 128119138 | | |
www.calamos.com
55
Calamos Evolving World Growth Fund (Unaudited)
SECTOR WEIGHTINGS
Consumer Discretionary | | | 26.2 | % | |
Information Technology | | | 24.2 | | |
Financials | | | 11.5 | | |
Energy | | | 8.2 | | |
Industrials | | | 7.2 | | |
Real Estate | | | 6.3 | | |
Communication Services | | | 5.6 | | |
Consumer Staples | | | 5.4 | | |
Health Care | | | 3.9 | | |
Materials | | | 1.4 | | |
Other | | | 0.7 | | |
Sector weightings are subject to change daily and are calculated as a percentage of net assets. The table excludes cash or cash equivalents, any government/sovereign bonds or broad based index hedging securities the Fund may hold.
Industrials. Security selection and an average overweight stance within the electrical components & equipment and industrial machinery & supplies & components industries of the industrials sector lost ground on a relative basis.
Geographic Performance
The Fund's security selection in the United States boosted relative returns. Similarly, the Fund benefitted from favorable security selection in Europe, where holdings in the United Kingdom and France performed well.
Conversely, security selection and an average underweight stance in Emerging Asia negatively impacted performance. Specifically, our holdings in China and Indonesia represented major detractors. Similarly, security selection and an average overweight stance in Emerging Latin America underperformed. In particular, Brazil was a leading detractor.
How is the Fund positioned?
Our Fund positioning favors a blend of secular growth and cyclical companies, in addition to select reopening opportunities and defensives. From a sector perspective, the Fund holds significant weights in consumer discretionary, technology, industrials, higher-quality financials, and energy. The Fund owns holdings within key industries, including semiconductors, broadline retail, interactive media & services, autos, and diversified banks. The Fund has an underweight stance in utilities, materials, financials, and traditional telecoms, reflecting our view of lesser opportunities in these areas. From a geographic perspective, we favor investments in India, Brazil, Mexico, China, Taiwan, Korea, and Indonesia.
What closing thoughts do you have for Fund shareholders?
We see increased opportunities ahead for investors in emerging markets. We are analyzing multiple forces including evolving global monetary policy, the path of the US dollar, corporate earnings, and the geopolitical backdrop. Considering the global economy and evolving monetary policy, the financial markets remain uncertain, and we expect volatility will continue until these risks are resolved. Against this backdrop, we continue to identify ways to capitalize on volatility, including a range of opportunities across sectors, themes, and geographic regions.
Regarding Fund positioning, we favor companies with advantaged business models, relative pricing power, and higher-quality balance sheets. From a sector perspective, we see opportunities in consumer discretionary, technology, energy, industrials, and higher-quality financials with attractive fundamentals. We believe our active investment approach and long-term perspective position us to take advantage of the volatility and opportunities in emerging markets.
CALAMOS OPEN-END FAMILY OF FUNDS ANNUAL REPORT
56
Calamos Evolving World Growth Fund (Unaudited)
ANNUALIZED RETURN: SINCE INCEPTION (8/15/08) THROUGH 10/31/23

Performance data quoted represents past performance, which is no guarantee of future results. Current performance may be lower or higher than the performance quoted.
The principal value and investment return of an investment will fluctuate so that your shares, when redeemed, may be worth more or less than their original cost. You can obtain performance data current to the most recent month end by visiting www.calamos.com. Average annual total return measures net investment income and capital gain or loss from portfolio investments as an annualized average. All performance shown assumes reinvestment of dividends and capital gains distributions. Performance is for the Fund's Class I shares at net asset value. The Fund also offers Class A and Class C shares, the performance of which may vary. Source: State Street Corporation and Morningstar Direct.
* Annual returns for Class I shares are provided because Class I shares represent the largest percentage of assets in the Calamos Family of Funds.
www.calamos.com
57
Calamos Evolving World Growth Fund (Unaudited)
GROWTH OF $1,000,000: FOR THE 10-YEAR PERIOD ENDED 10/31/23

AVERAGE ANNUAL TOTAL RETURN† AS OF 10/31/23
| | | 1
YEAR | | 5
YEARS | | 10
YEARS | |
Class A Shares – Inception 8/15/08 | |
Without Sales Charge | | | 3.19 | % | | | 4.26 | % | | | 1.37 | % | |
With Sales Charge | | | -1.68 | | | | 3.24 | | | | 0.87 | | |
Class C Shares – Inception 8/15/08 | |
Without Sales Charge | | | 2.40 | | | | 3.48 | | | | 0.61 | | |
With Sales Charge | | | 1.40 | | | | 3.48 | | | | 0.61 | | |
Class I Shares – Inception 8/15/08 | | | 3.44 | | | | 4.53 | | | | 1.62 | | |
Performance data quoted represents past performance, which is no guarantee of future results. Current performance may be lower or higher than the performance quoted. The principal value and investment return of an investment will fluctuate so that your shares, when redeemed, may be worth more or less than their original cost.
As of the prospectus dated 3/1/23, the Fund's gross expense ratio for Class A shares is 1.63%, Class C shares is 2.39% and Class I shares is 1.38%. The Fund's investment adviser has contractually agreed to reimburse Fund expenses through March 1, 2024 to the extent necessary so that Total Annual Fund Operating Expenses (excluding taxes, interest, short interest, short dividend expenses, brokerage commissions, acquired fund fees and expenses, and extraordinary expenses, if any) of Class A, Class C, and Class I are limited to 1.30%, 2.05%, and 1.05% of average net assets, respectively. Calamos Advisors may recapture previously waived expense amounts within the same fiscal year for any day where the respective Fund's expense ratio falls below the contractual expense limit up to the expense limit for that day. This undertaking is binding on Calamos Advisors and any of its successors and assigns. This agreement is not terminable by either party. The expense ratios shown above may differ from the more recent expense ratios reported in the Financial Highlights section of this report.
† Average annual total return measures net investment income and capital gain or loss from portfolio investments as an annualized average assuming reinvestment of dividends and capital gains distributions. Performance shown reflects the effects of an expense reimbursement that improved results. Load-adjusted returns are adjusted for the maximum front-end sales load of 4.75% for Class A shares and returns for Class C shares have been adjusted for the contingent deferred sales charge (CDSC).
NOTES:
The graph does not reflect the income taxes that you would pay on fund distributions or the redemption of fund shares. Fund performance includes reinvestment of dividends. The performance of other classes will vary from the performance of the class shown based on the difference in sales charges and fees paid by shareholders investing in different share classes.
The MSCI Emerging Markets Index is a free float-adjusted market capitalization index considered broadly representative of emerging market equity performance. The index represents companies within the constituent emerging markets that are available to investors worldwide. The index is calculated on a total return basis, which includes reinvestment of gross dividends before deduction of withholding taxes.
Index returns assume reinvestment of dividends and do not reflect deduction of fees and expenses. It is not possible to invest directly in an index.
The Fund's use of derivative instruments involves investment risks and transaction costs to which the Fund would not be subject absent the use of these instruments and, accordingly, may result in losses greater than if they had not been used. Derivative instruments can be illiquid, may disproportionately increase losses and may have a potentially large impact on Fund performance.
CALAMOS OPEN-END FAMILY OF FUNDS ANNUAL REPORT
58
Calamos Global Equity Fund (Unaudited)
CALAMOS GLOBAL EQUITY FUND
INVESTMENT TEAM DISCUSSION
How has the Fund performed?
For the 12 months ended October 31, 2023 ("annual period"), Calamos Global Equity Fund returned 9.98% (Class I shares at net asset value), versus the 11.05% return for the MSCI World Index and 11.06% return for the MSCI ACWI Index over the period. The Fund's return was ahead of its category peer average in the period, landing in the 47th percentile of the Morningstar Global Large-Stock Growth category.*
We believe the Fund's compelling long-term performance record demonstrates its ability to generate excess returns over complete market cycles and varied investment environments. Since its inception on March 1, 2007, the Fund has returned 7.80% on an annualized basis (Class I shares at net asset value) compared with the 6.41% return of the MSCI World Index and 5.98% return of the MSCI ACWI Index.
What factors influenced performance during the reporting period?
Global stocks experienced periods of significant volatility and rotation but pushed higher and delivered positive returns over the period. Investors navigated an environment characterized by tighter monetary policy and higher interest rates but also moderating inflation and resilient corporate earnings.
The Fund generated near double-digit returns over the period but trailed the index due to relative security selection. Select Fund holdings in companies with cyclical and secular growth characteristics trailed amid the narrow global market leadership. From a geographic perspective, Fund holdings in Europe and emerging markets outperformed those in the MSCI World Index, whereas our selection in Japan underperformed the benchmark as growth-oriented names trailed in that market.
Positive Influences on Performance
Health Care. The Fund benefited from security selection and an average underweight stance in health care. Specifically, pharmaceuticals and our lack of exposure to health care services promoted relative returns.
Real Estate. An average underweight position in real estate added to the portfolio's performance. Our lack of representation in telecom tower REITs and other specialized REITs helped buoy relative performance.
Negative Influences on Performance
Energy. Over the period, security selection and an average overweight position within the energy sector detracted from performance. Specifically, positions in the oil & gas exploration & production and the integrated oil & gas industries lagged.
* Data is as of 10/31/23. The Morningstar category percentile rankings are based on annualized total returns. Calamos Global Equity Fund Class I Shares were in the 48th, 38th, 16th, and 32nd percentiles of 358, 323, 278, and 189 funds for the 1-year, 3-year, 5-year, and 10-year periods, respectively, for the Morningstar Global Large-Stock Growth category.
OVERVIEW
The Fund invests in equities of companies around the globe. We seek firms demonstrating what we believe to be key growth characteristics, including increasing profit margins and high returns on invested capital.
KEY FEATURES
◼ Flexibly seeks growth globally, searching for the best risk/reward opportunities across countries, market capitalizations and sectors.
◼ Seeks global growth companies that may benefit from long-term secular themes, including a burgeoning global middle class and increasing demand for information and entertainment.
PORTFOLIO FIT
The Fund can serve as a growth-oriented addition to a strategic global equity allocation and may complement or provide an alternative to value or blended styles.
FUND NASDAQ SYMBOLS
A Shares | | CAGEX | |
C Shares | | CCGEX | |
I Shares | | CIGEX | |
R6 Shares | | CGEOX | |
FUND CUSIP NUMBERS
A Shares | | | 128119484 | | |
C Shares | | | 128119468 | | |
I Shares | | | 128119450 | | |
R6 Shares | | | 128120334 | | |
www.calamos.com
59
Calamos Global Equity Fund (Unaudited)
SECTOR WEIGHTINGS
Information Technology | | | 28.7 | % | |
Industrials | | | 17.7 | | |
Health Care | | | 12.0 | | |
Consumer Discretionary | | | 9.8 | | |
Financials | | | 8.6 | | |
Energy | | | 7.0 | | |
Communication Services | | | 4.8 | | |
Consumer Staples | | | 3.2 | | |
Materials | | | 2.3 | | |
Real Estate | | | 1.0 | | |
Sector weightings are subject to change daily and are calculated as a percentage of net assets. The table excludes cash or cash equivalents, any government/sovereign bonds or broad based index hedging securities the Fund may hold.
Consumer Discretionary. Security selection in consumer discretionary, specifically in the internet & direct marketing retail and automotive parts & equipment industries, lost ground on a relative basis.
Geographic Performance
The portfolio's favorable security selection and an average overweight stance in Europe boosted relative returns. Particularly, Denmark and the United Kingdom contributed. Similarly, the portfolio benefited from favorable security selection and an average overweight position in Emerging Latin America, specifically holdings in Brazil and Mexico.
Conversely, security selection and an average underweight stance in Japan negatively impacted the portfolio's performance. Moreover, an average underweight allocation in the United States set back performance.
How is the Fund positioned?
We positioned the portfolio with a combination of secular growth, cyclicals, select defensives, and reopening opportunities. Technology, industrials, and health care are the largest sector weights in the Fund. The Fund holds key industry positions in semiconductors, systems software, pharmaceuticals, interactive media, construction & engineering, and aerospace & defense. The Fund owns select energy companies positioned to benefit from supply-and-demand dynamics and attractive capital efficiency. We are underweighted in more defensive and interest-rate-sensitive areas, including utilities, real estate, consumer staples, and traditional telecoms.
Through a geographic lens, the Fund owns a diversified and underweight position in the US. We see a range of attractive bottom-up opportunities across secular growth, cyclicals, and select defensives, reflecting our emphasis on advantaged business models and resilient earnings. The Fund has a moderate overweight position in Europe, comprising a blend of secular growth, select cyclicals, and higher-quality defensives. We continue to evaluate the inflation and growth backdrop given monetary tightening, global trade linkages, and geopolitical conflict. The Fund owns a range of holdings in emerging markets. Positioning reflects our view of evolving trade dynamics, moderating inflation, and attractive valuations. The Fund owns positions within industries, including semiconductors, interactive media, and higher-quality financials. In Japan, the Fund holds companies benefiting from secular demand trends, regulatory reforms, global trade dynamics, and attractive valuations.
What closing thoughts do you have for Fund shareholders?
Global stocks continue to navigate a set of complex conditions. We are analyzing many important market drivers, including central bank policy, the inflationary backdrop, corporate earnings, and geopolitical tensions. Considering the global economy and evolving monetary policy, the financial markets remain uncertain, and we expect volatility to continue until these risks are resolved. Given this backdrop, we continue to identify ways to capitalize on volatility, including a range of opportunities at the thematic, regional, and market-cap levels.
In terms of Fund positioning, we emphasize companies with attractive earnings, pricing power, cash flow, and supportive valuations. From a sector perspective, we see opportunities in technology, industrials, health care, consumer discretionary, and energy with leading fundamentals. We believe our active investment approach and long-term perspective position us to take advantage of the volatility and opportunities in global markets.
CALAMOS OPEN-END FAMILY OF FUNDS ANNUAL REPORT
60
Calamos Global Equity Fund (Unaudited)
ANNUALIZED RETURN: SINCE INCEPTION (3/1/07) THROUGH 10/31/23

Performance data quoted represents past performance, which is no guarantee of future results. Current performance may be lower or higher than the performance quoted.
The principal value and investment return of an investment will fluctuate so that your shares, when redeemed, may be worth more or less than their original cost. You can obtain performance data current to the most recent month end by visiting www.calamos.com. Average annual total return measures net investment income and capital gain or loss from portfolio investments as an annualized average. All performance shown assumes reinvestment of dividends and capital gains distributions. Performance is for the Fund's Class I shares at net asset value. The Fund also offers Class A, Class C and Class R6 shares, the performance of which may vary. Source: State Street Corporation and Morningstar Direct.
* Annual returns for Class I shares are provided because Class I shares represent the largest percentage of assets in the Calamos Family of Funds.
www.calamos.com
61
Calamos Global Equity Fund (Unaudited)
GROWTH OF $1,000,000: FOR THE 10-YEAR PERIOD ENDED 10/31/23

AVERAGE ANNUAL TOTAL RETURN† AS OF 10/31/23
| | | 1
YEAR | | 5
YEARS | | 10
YEARS OR
^SINCE
INCEPTION | |
Class A Shares – Inception 3/1/07 | |
Without Sales Charge | | | 9.68 | % | | | 9.23 | % | | | 7.80 | % | |
With Sales Charge | | | 4.50 | | | | 8.17 | | | | 7.28 | | |
Class C Shares – Inception 3/1/07 | |
Without Sales Charge | | | 8.99 | | | | 8.42 | | | | 7.00 | | |
With Sales Charge | | | 7.99 | | | | 8.42 | | | | 7.00 | | |
Class I Shares – Inception 3/1/07 | | | 9.98 | | | | 9.51 | | | | 8.08 | | |
Class R6 Shares – Inception 6/23/20^ | | | 10.04 | | | | — | | | | 5.84 | | |
Performance data quoted represents past performance, which is no guarantee of future results. Current performance may be lower or higher than the performance quoted. The principal value and investment return of an investment will fluctuate so that your shares, when redeemed, may be worth more or less than their original cost.
As of the prospectus dated 3/1/23, the Fund's gross expense ratio for Class A shares is 1.61%, Class C shares is 2.37%, Class I shares is 1.36% and Class R6 shares 1.35%. The Fund's investment adviser has contractually agreed to reimburse Fund expenses through March 1, 2024 to the extent necessary so that Total Annual Fund Operating Expenses (excluding taxes, interest, short interest, short dividend expenses, brokerage commissions, acquired fund fees and expenses, and extraordinary expenses, if any) of Class A, Class C, and Class I are limited to 1.40%, 2.15%, and 1.15% of average net assets, respectively. The Fund's investment advisor has contractually agreed to limit the Fund's annual ordinary operating expenses for Class R6 shares (as a percentage of average net assets) to 1.15% less the annual sub-transfer agency ratio for the Fund. The annual sub-transfer agency ratio is equal to the aggregate sub-transfer agency expenses common to the other share classes of the Fund divided by the aggregate average annual net assets of the Fund's other share classes. For purposes of this expense limitation, operating expenses do not include taxes, interest, short interest, short dividend expenses, brokerage commissions, acquired fund fees and expenses, and extraordinary expenses, if any. Calamos Advisors may recapture previously waived expense amounts within the same fiscal year for any day where the respective Fund's expense ratio falls below the contractual expense limit up to the expense limit for that day. This undertaking is binding on Calamos Advisors and any of its successors and assigns. This agreement is not terminable by either party. The expense ratios shown above may differ from the more recent expense ratios reported in the Financial Highlights section of this report.
† Average annual total return measures net investment income and capital gain or loss from portfolio investments as an annualized average assuming reinvestment of dividends and capital gains distributions. Performance shown reflects the effects of an expense reimbursement that improved results. Load-adjusted returns are adjusted for the maximum front-end sales load of 4.75% for Class A shares and returns for Class C shares have been adjusted for the contingent deferred sales charge (CDSC).
NOTES:
The graph does not reflect the income taxes that you would pay on fund distributions or the redemption of fund shares. Fund performance includes reinvestment of dividends. The performance of other classes will vary from the performance of the class shown based on the difference in sales charges and fees paid by shareholders investing in different share classes.
CALAMOS OPEN-END FAMILY OF FUNDS ANNUAL REPORT
62
Calamos Global Equity Fund (Unaudited)
The MSCI World Index (USD) is a free float-adjusted market-capitalization-weighted index composed of companies representative of the market structure of developed market countries in North America, Europe and the Asia/Pacific region.
The MSCI ACWI Index (USD) is a free float-adjusted market-capitalization-weighted index that is designed to measure the equity market performance of companies in developed and emerging markets. The MSCI ACWI Index is provided to show how the Fund's performance compares with the returns of an index of securities similar to those in which the Fund invests.
Index returns assume reinvestment of dividends and do not reflect deduction of fees and expenses. It is not possible to invest directly in an index.
www.calamos.com
63
Calamos Global Opportunities Fund (Unaudited)
OVERVIEW
The Fund invests primarily in global equity and convertible securities with an aim to balance risk/reward while providing growth and income.
KEY FEATURES
◼ Combines equity and convertible holdings in order to limit downside risk while potentially capturing upside equity participation.
◼ Provides a core holding option that strives to maintain a consistent risk posture throughout the market cycle.
◼ Seeks to participate in the upside movements of the global equity market while lessening the impact of down periods.
PORTFOLIO FIT
The Fund can provide a long-term core allocation to global equities with the potential for lower volatility over full market cycles.
FUND NASDAQ SYMBOLS
A Shares | | CVLOX | |
C Shares | | CVLCX | |
I Shares | | CGCIX | |
FUND CUSIP NUMBERS
A Shares | | | 128119500 | | |
C Shares | | | 128119708 | | |
I Shares | | | 128119609 | | |
CALAMOS GLOBAL OPPORTUNITIES FUND
INVESTMENT TEAM DISCUSSION
How has the Fund performed?
For the 12 months ended October 31, 2023 ("annual period"), Calamos Global Opportunities Fund returned 5.21% (Class I shares at net asset value) versus the 11.06% return for the MSCI ACWI Index and 11.05% return for the MSCI World Index. We believe the Fund's compelling long-term performance record demonstrates its ability to generate excess returns over complete market cycles and varied investment environments.
Since its inception on September 18, 1997, the Fund has returned 6.92% on an annualized basis (Class I shares at net asset value) compared with the 6.48% return of the MSCI ACWI Index and 6.72% return of the MSCI World Index. We manage the Fund intending to achieve upside equity participation and potential downside risk mitigation over complete market cycles. We believe these figures demonstrate the Fund's ability to generate attractive long-term returns while pursuing a risk-managed investment approach.
What factors influenced performance during the reporting period?
Global stocks experienced periods of significant volatility and rotation but pushed higher and delivered positive returns over the annual period. Investors navigated an environment characterized by tighter monetary policy and higher interest rates but also moderating inflation and resilient corporate earnings.
Pursuant to our risk-managed equity objective, Calamos Global Opportunities Fund navigated volatile markets while employing an active blend of common stocks, convertibles, and options. The Fund's performance over the period reflected the challenging return environment across each of these asset classes. Select Fund holdings in companies with cyclical and secular growth characteristics trailed behind the narrow band of global market leaders. From a geographic perspective, Fund holdings in Europe outperformed those of the MSCI ACWI Index, whereas the Fund's selection in the US and Japan underperformed the benchmark.
Positive Influences on Performance
Health Care. The Fund benefited from security selection and an average underweight stance in health care, as holdings in pharmaceuticals and biotechnology boosted relative returns.
Real Estate. A lack of representation in real estate added to the Fund's performance.
Negative Influences on Performance
Consumer Discretionary. Over the period, security selection within the consumer discretionary sector weakened returns. In particular, holdings in the internet & direct marketing retail and the automobile manufacturers industries lagged.
CALAMOS OPEN-END FAMILY OF FUNDS ANNUAL REPORT
64
Calamos Global Opportunities Fund (Unaudited)
Communication Services. Security selection and an average underweight position in communication services lost ground on a relative basis, specifically in the interactive media & services and interactive home entertainment industries.
Geographic Performance
Leading security selection in Europe contributed to relative performance, especially in Denmark and the Netherlands. Also, security selection in Canada supported relative returns.
Conversely, security selection and an average underweight position in the United States negatively impacted performance, as did selection in Japan.
How is the Fund positioned?
We positioned the Fund's portfolio with a combination of secular growth, cyclicals, select defensives, and reopening opportunities. Technology, industrials, and health care are the largest sector weights in the Fund. The Fund holds key industry positions in semiconductors, systems software, pharmaceuticals, and aerospace & defense. The Fund owns select energy companies positioned to benefit from supply-and-demand dynamics and attractive capital efficiency. The Fund is underweight in the defensive and interest-rate-sensitive areas, including utilities, real estate, and traditional telecoms.
Through a geographic lens, the fund owns a diversified and underweight position in the US. We see a range of attractive bottom-up opportunities across secular growth, cyclicals, and select defensives, reflecting our emphasis on advantaged business models and resilient earnings. The Fund has a moderate overweight position in Europe, comprising a blend of secular growth, select cyclicals, and higher-quality defensives. We continue to evaluate the inflation and growth backdrop given monetary tightening, global trade linkages, and geopolitical conflict. We own a range of holdings in emerging markets. Positioning reflects our view of evolving trade dynamics, moderating inflation, and attractive valuations. The Fund owns positions within semiconductors, interactive media, and higher-quality financials. In Japan, the Fund holds companies benefiting from regulatory reforms, global trade dynamics, and attractive valuations.
What closing thoughts do you have for Fund shareholders?
Global markets continue to navigate a set of complex conditions. We are analyzing many market drivers, including central bank policy, the inflationary backdrop, corporate earnings, and geopolitical tensions. Considering the global economy and evolving monetary policy, the financial markets remain uncertain, and we expect volatility to continue until these risks are resolved. Given this backdrop, we continue to identify ways to capitalize on volatility, including a range of opportunities at the thematic, regional, and market-cap levels.
In terms of Fund positioning, we emphasize companies with attractive earnings, pricing power, cash flow, and supportive valuations. From a sector perspective, we see opportunities in technology, industrials, health care, consumer, and energy with leading fundamentals. We believe our active, risk-managed investment approach and long-term perspective position us to take advantage of the volatility and opportunities in global markets.
SECTOR WEIGHTINGS
Information Technology | | | 27.1 | % | |
Industrials | | | 14.5 | | |
Health Care | | | 11.1 | | |
Financials | | | 10.3 | | |
Energy | | | 8.6 | | |
Consumer Staples | | | 5.7 | | |
Consumer Discretionary | | | 5.3 | | |
Communication Services | | | 4.4 | | |
Materials | | | 2.8 | | |
Real Estate | | | 1.5 | | |
Other | | | 1.1 | | |
Sector weightings are subject to change daily and are calculated as a percentage of net assets. The table excludes cash or cash equivalents, any government/sovereign bonds or broad based index hedging securities the Fund may hold.
www.calamos.com
65
Calamos Global Opportunities Fund (Unaudited)
ANNUALIZED RETURN: SINCE INCEPTION (9/18/97) THROUGH 10/31/23

Performance data quoted represents past performance, which is no guarantee of future results. Current performance may be lower or higher than the performance quoted.
The principal value and investment return of an investment will fluctuate so that your shares, when redeemed, may be worth more or less than their original cost. You can obtain performance data current to the most recent month end by visiting www.calamos.com. Average annual total return measures net investment income and capital gain or loss from portfolio investments as an annualized average. All performance shown assumes reinvestment of dividends and capital gains distributions. Performance is for the Fund's Class I shares at net asset value. The Fund also offers Class A and Class C shares, the performance of which may vary. Source: State Street Corporation and Morningstar Direct.
* Annual returns for Class I shares are provided because Class I shares represent the largest percentage of assets in the Calamos Family of Funds.
CALAMOS OPEN-END FAMILY OF FUNDS ANNUAL REPORT
66
Calamos Global Opportunities Fund (Unaudited)
GROWTH OF $1,000,000: FOR THE 10-YEAR PERIOD ENDED 10/31/23

AVERAGE ANNUAL TOTAL RETURN† AS OF 10/31/23
| | | 1
YEAR | | 5
YEARS | | 10
YEARS | |
Class A Shares – Inception 9/9/96 | |
Without Sales Charge | | | 4.97 | % | | | 6.46 | % | | | 5.15 | % | |
With Sales Charge | | | -0.06 | | | | 5.43 | | | | 4.64 | | |
Class C Shares – Inception 9/24/96 | |
Without Sales Charge | | | 4.22 | | | | 5.69 | | | | 4.38 | | |
With Sales Charge | | | 3.22 | | | | 5.69 | | | | 4.38 | | |
Class I Shares – Inception 9/18/97 | | | 5.21 | | | | 6.74 | | | | 5.42 | | |
Performance data quoted represents past performance, which is no guarantee of future results. Current performance may be lower or higher than the performance quoted. The principal value and investment return of an investment will fluctuate so that your shares, when redeemed, may be worth more or less than their original cost.
As of the prospectus dated 3/1/23, the Fund's gross expense ratio for Class A shares is 1.46%, Class C shares is 2.21% and Class I shares is 1.21%. The Fund's investment adviser has contractually agreed to reimburse Fund expenses through March 1, 2024 to the extent necessary so that Total Annual Fund Operating Expenses (excluding taxes, interest, short interest, short dividend expenses, brokerage commissions, acquired fund fees and expenses, and extraordinary expenses, if any) of Class A, Class C, and Class I are limited to 1.22%, 1.97%, and 0.97% of average net assets, respectively. Calamos Advisors may recapture previously waived expense amounts within the same fiscal year for any day where the respective Fund's expense ratio falls below the contractual expense limit up to the expense limit for that day. This undertaking is binding on Calamos Advisors and any of its successors and assigns. This agreement is not terminable by either party. The expense ratios shown above may differ from the more recent expense ratios reported in the Financial Highlights section of this report.
† Average annual total return measures net investment income and capital gain or loss from portfolio investments as an annualized average assuming reinvestment of dividends and capital gains distributions. Performance shown reflects the effects of an expense reimbursement that improved results. Load-adjusted returns are adjusted for the maximum front-end sales load of 4.75% for Class A shares and returns for Class C shares have been adjusted for the contingent deferred sales charge (CDSC).
NOTES:
The graphs do not reflect the income taxes that you would pay on fund distributions or the redemption of fund shares. Fund performance includes reinvestment of dividends. The performance of other classes will vary from the performance of the class shown based on the difference in sales charges and fees paid by shareholders investing in different share classes.
The MSCI ACWI Index is a free float-adjusted market-capitalization-weighted index that is designed to measure the equity market performance of developed and emerging markets.
The MSCI World Index (US Dollars) is a market-capitalization-weighted index composed of companies representative of the market structure of developed market countries in North America, Europe and the Asia/Pacific region. Since inception data for the index is shown from 9/30/97 since data is only available for full monthly periods.
Index returns assume reinvestment of dividends and do not reflect deduction of fees and expenses. It is not possible to invest directly in an index.
www.calamos.com
67
Calamos International Small Cap Growth Fund (Unaudited)
OVERVIEW
The Fund seeks long-term capital appreciation by investing in compelling international small capitalization companies with superior earnings growth potential coupled with financial strength and flexibility.
KEY FEATURES
◼ Provides access to an expansive opportunity set of small cap investments outside the United States, including businesses in emerging and frontier markets.
◼ Our long-tenured Investment team has experience managing portfolios across multiple market cycles.
PORTFOLIO FIT
The Fund can provide an attractive asset-allocation building block often under-represented in US investors' portfolios. By diversifying into this less correlated asset class, investors may be able to offset declines in the overall market and reduce their portfolio's volatility with the potential for significant equity upside.
FUND NASDAQ SYMBOLS
A Shares | | CAISX | |
C Shares | | CCISX | |
I Shares | | CSGIX | |
R6 Shares | | CISOX | |
FUND CUSIP NUMBERS
A Shares | | | 128120250 | | |
C Shares | | | 128120243 | | |
I Shares | | | 128120235 | | |
R6 Shares | | | 128120227 | | |
CALAMOS INTERNATIONAL SMALL CAP GROWTH FUND
INVESTMENT TEAM DISCUSSION
How has the Fund performed?
For the 12 months ended October 31, 2023 ("annual period"), Calamos International Growth Fund returned -0.48% (Class I shares at net asset value) versus the 8.82% return for the MSCI ACWI ex USA Small Cap Index. The Fund's return landed within the 72nd percentile of the Morningstar Foreign Small/Mid Growth category during this period.
We launched the Fund in March 2022. The Fund seeks long-term capital appreciation by investing in international small equities, utilizing the combined resources of our long-tenured investment team, global perspective, and rigorous investment approach.
What factors influenced performance during the reporting period?
International small caps experienced periods of significant volatility and rotation but ultimately advanced over the annual period. Investors navigated an environment characterized by tighter monetary policy and higher interest rates but also moderating inflation and resilient corporate earnings. The Fund underperformed the index over the annual period due to trailing relative security selection. Select Fund holdings in companies with higher-growth characteristics underperformed amid markets that rewarded more defensive and value-oriented small-to-mid cap companies during the period.
Positive Influences on Performance
Real Estate. The Fund's average underweight position in real estate helped buoy relative performance. Holdings in real estate operating companies helped relative performance, and our lack of representation in diversified REITs assisted return.
Energy. Favorable security selection in energy, specifically in the oil & gas equipment & services and oil & gas exploration & production industries, contributed to performance.
Negative Influences on Performance
Information Technology. Over the period, security selection within the information technology sector weakened return. Specifically, holdings in application software and IT consulting & other services lagged.
Health Care. Security selection and an average overweight position in health care, specifically in the pharmaceuticals and health care equipment industries, trailed on a relative basis.
CALAMOS OPEN-END FAMILY OF FUNDS ANNUAL REPORT
68
Calamos International Small Cap Growth Fund (Unaudited)
Geographic Performance
The Fund's security selection and an average underweight position in EMEA boosted relative returns. Positions in Israel helped relative performance. Additionally, our lack of exposure to South Africa boosted relative returns. Also, security selection in Canada supported relative returns.
By contrast, the Fund's security selection in Japan curbed relative returns. Moreover, security selection and an average overweight position in Emerging Latin America dampened relative results. Positions in Brazil notably hurt performance.
How is the Fund positioned?
From a sector perspective, the largest portfolio weights reside in industrials and information technology on an absolute basis. Conversely, communication services and materials represent the smallest absolute sector weights with holdings. The Fund's portfolio had no exposure to the utilities sector. We maintain relative overweight positions in industrials and information technology, with aerospace & defense (in industrials) and semiconductor materials & equipment (in information technology) among the overweight industries. Industrial machinery & supplies & components (in industrials) and diversified banks (in financials) constitute the most significant underweight industries.
Allocations to industrials and real estate rose during the period, with increased weights in construction & engineering and real estate operating companies. By contrast, allocations to health care and materials decreased, with reductions to health care supplies.
Regionally, Europe and Emerging Asia represent the largest absolute weights. The smallest positions are found in the United States and Emerging Latin America. We maintain overweight allocations to Europe and Japan, whereas Emerging Asia and Canada represent underweights relative to the index. The allocation to Japan rose during the period, while the allocation to Canada decreased.
What closing thoughts do you have for Fund shareholders?
International stocks continue to navigate complex conditions. We analyze many important market drivers, including central bank policy, the inflationary backdrop, corporate earnings, and geopolitical tensions. Considering the global economy and evolving monetary policy, the financial markets remain uncertain, and we expect volatility will continue until these risks are resolved. Against this backdrop, we continue to identify ways to capitalize on volatility, including a range of opportunities at the thematic, regional, and market-cap levels.
In terms of Fund positioning, we emphasize companies with higher earnings growth, pricing power, cash flow, and supportive valuations. From a sector perspective, we see opportunities in technology, industrials, consumer discretionary, health care, and energy with leading fundamentals. We believe our active investment approach and global perspective position us to take advantage of the volatility and opportunities in international small-cap equities.
SECTOR WEIGHTINGS
Industrials | | | 33.0 | % | |
Information Technology | | | 17.8 | | |
Consumer Discretionary | | | 14.2 | | |
Health Care | | | 6.4 | | |
Energy | | | 6.4 | | |
Real Estate | | | 5.8 | | |
Financials | | | 5.3 | | |
Consumer Staples | | | 4.6 | | |
Materials | | | 2.2 | | |
Communication Services | | | 0.7 | | |
Other | | | 0.3 | | |
Sector weightings are subject to change daily and are calculated as a percentage of net assets. The table excludes cash or cash equivalents, any government/sovereign bonds or broad based index hedging securities the Fund may hold.
www.calamos.com
69
Calamos International Small Cap Growth Fund (Unaudited)
GROWTH OF $1,000,000: FOR THE 10-YEAR PERIOD ENDED 10/31/23

AVERAGE ANNUAL TOTAL RETURN† AS OF 10/31/23
| | | 1
YEAR | | SINCE
INCEPTION | |
Class A Shares – Inception 3/31/22 | |
Without Sales Charge | | | -0.87 | % | | | -16.00 | % | |
With Sales Charge | | | -5.56 | | | | -18.55 | | |
Class C Shares – Inception 3/31/22 | |
Without Sales Charge | | | -1.62 | | | | -16.61 | | |
With Sales Charge | | | -2.60 | | | | -16.61 | | |
Class I Shares – Inception 3/31/22 | | | -0.48 | | | | -15.73 | | |
Class R6 Shares – Inception 3/31/22 | | | -0.48 | | | | -15.73 | | |
Performance data quoted represents past performance, which is no guarantee of future results. Current performance may be lower or higher than the performance quoted. The principal value and investment return of an investment will fluctuate so that your shares, when redeemed, may be worth more or less than their original cost.
As of the prospectus dated 3/1/23, the Fund's gross expense ratio for Class A shares is 1.36%, Class C shares is 2.11%, Class I shares is 1.11% and Class R6 shares is 1.11%. The Fund's investment advisor has contractually agreed to reimburse Fund expenses through March 31, 2025 to the extent necessary so that Total Annual Fund Operating Expenses of Class A shares, Class C shares and Class I shares are limited to 1.35%, 2.10% and 1.10% of average net assets, respectively. The Fund's investment advisor has contractually agreed to limit the Fund's annual ordinary operating expenses through March 31, 2025 for Class R6 shares (as a percentage of average net assets) to 1.10% less the Fund's annual sub-transfer agency ratio (the aggregate sub-transfer agency fees of the Fund's other share classes divided by the aggregate average annual net assets of the Fund's other share classes). For purposes of these expense limitations, operating expenses do not include taxes, interest, short interest, short dividend expenses, brokerage commissions, acquired fund fees and expenses, and extraordinary expenses, if any. Calamos Advisors LLC ("Calamos Advisors") may recapture previously waived expense amounts within the same fiscal year for any day where the respective share class's expense ratio falls below the contractual expense limit up to the expense limit for that day. This undertaking is binding on Calamos Advisors and any of its successors and assigns. This agreement is not terminable by either party. The expense ratios shown above may differ from the more recent expense ratios reported in the Financial Highlights section of this report.
† Average annual total return measures net investment income and capital gain or loss from portfolio investments as an annualized average assuming reinvestment of dividends and capital gains distributions. Performance shown reflects the effects of an expense reimbursement that improved results. Load-adjusted returns are adjusted for the maximum front-end sales load of 4.75% for Class A shares and returns for Class C shares have been adjusted for the contingent deferred sales charge (CDSC).
NOTES:
The graph does not reflect the income taxes that you would pay on fund distributions or the redemption of fund shares. Fund performance includes reinvestment of dividends. The performance of other classes will vary from the performance of the class shown based on the difference in sales charges and fees paid by shareholders investing in different share classes.
The benchmark MSCI ACWI ex USA Small Cap Index captures small cap representation across 22 of 23 Developed Markets (DM) countries (excluding the US) and 25 Emerging Markets (EM) countries.
Index returns assume reinvestment of dividends and do not reflect deduction of fees and expenses. It is not possible to invest directly in an index.
CALAMOS OPEN-END FAMILY OF FUNDS ANNUAL REPORT
70
Calamos Total Return Bond Fund (Unaudited)
CALAMOS TOTAL RETURN BOND FUND
INVESTMENT TEAM DISCUSSION
How has the Fund performed?
For the 12 months ended October 31, 2023 ("annual period"), Calamos Total Return Bond Fund returned 0.55% (Class I shares at net asset value), in line with the 0.36% return of the Bloomberg US Aggregate Bond Index.
Since its inception on June 27, 2007, the Fund gained 2.73% on an annualized basis (Class I shares at net asset value) compared with a 2.63% return for the Bloomberg US Aggregate Bond Index.
What factors influenced performance during the reporting period?
Recent economic data has generally exceeded economists' estimates, and some downtrodden areas continued to bounce back from the lows struck in the first half of 2023. Manufacturing surveys showed activity contracting, although measures improved slightly during the final months of the period. Consumer confidence—shaken by inflation, bank failures, higher interest expenses, and the resumption of student loan payments—is declining, but remains well above its level from the middle of 2022. These developments occurred against a backdrop of falling inflation and stable employment conditions.
Despite improved data, there are some areas of concern. Leading economic indicators (LEI) contracted every month of the annual period, extending the streak of negative measures to 17 consecutive months. Historically, prolonged periods of weakness in LEI have preceded a recession. Given the way that strength in the housing sector has propelled economic growth in past cycles, it is concerning that housing activity is so depressed. The unemployment rate ticked up to 3.8%, driven by increased labor participation.
The Fed reacted to the mixed indicators with composure, adopting a more measured pace of adjusting policy with back-to-back pauses that allow additional data to inform their next move. Given the magnitude of past policy shifts and the variable lags of policy implementation, we welcome the Fed's more flexible approach. The Fed's research indicates that 9 to 12-month lags are typical before policy action affects economic imbalances, with longer time lags needed for the full impact. To keep it simple, the effective fed funds rate 12 months ago was 3.12%, and more than 200 basis points of additional tightening (at a minimum) has yet to impact the real economy.
Risk markets are reflecting less confidence in conditions. Equities retreated across market capitalizations in the last three months of the period: the S&P 500 Index lost -8.3%, the Russell 2000 Index returned -16.7%, and leveraged finance markets returned -2.1%. The move to higher market rates had an impact on the latter during the annual period. In our view, equity returns these last few months reflect growing doubts that earnings momentum can continue unimpeded. Results were also more mixed at the sector level, as company fundamentals and themes have exerted greater influence, and the Fed's activity became less forceful.
OVERVIEW
Through its multi-sector fixed-income strategy, the Fund invests predominantly in US issuers with the goal of generating a high level of both current income and total return in excess of the benchmark over full market cycles.
KEY FEATURES
◼ Employs bond-by-bond portfolio construction with a focus on being well compensated for risks taken. We believe a disciplined process, grounded in fundamental research, enables us to achieve higher total returns with less volatility.
◼ Draws on a broader investable universe to enhance portfolio construction and risk management. The inclusion of high-yield bonds, bank loans and preferreds provides additional opportunities.
◼ Utilizes robust, independent credit research. Our fixed-income investment process unites quantitative and qualitative analyses into historical and forward-looking models. The result is a credit rating reflective of where a company is heading.
◼ Applies a macro overlay to capitalize on misunderstood industries and sectors. The overlay acts as a risk control that also considers the business cycle, geopolitical factors, inflation and real-rate expectations.
PORTFOLIO FIT
The Fund may be suitable as the cornerstone of a fixed-income allocation, with investments diversified across the major sectors of the US bond market. Allocations to specialized fixed-income strategies seek to enhance return potential and better manage risk.
FUND NASDAQ SYMBOLS
A Shares | | CTRAX | |
C Shares | | CTRCX | |
I Shares | | CTRIX | |
www.calamos.com
71
Calamos Total Return Bond Fund (Unaudited)
FUND CUSIP NUMBERS
A Shares | | | 128119310 | | |
C Shares | | | 128119286 | | |
I Shares | | | 128119278 | | |
ASSET ALLOCATION
U.S. Government and
Agency Securities | | | 43.4 | % | |
Corporate Bonds | | | 41.5 | | |
Asset Backed Securities | | | 6.3 | | |
Bank Loans | | | 5.1 | | |
Investment of Cash
Collateral For Securities
Loaned | | | 2.3 | | |
Residential Mortgage
Backed Securities | | | 1.7 | | |
Cash and Receivables/
Payables | | | (0.3 | ) | |
Asset Allocation weightings are subject to change daily and are calculated as a percentage of net assets. The table excludes cash or cash equivalents, any government/sovereign bonds or broad based index hedging securities the Fund may hold.
High yield spreads were modestly tighter, closing at 437 basis points on an option-adjusted basis, down from 464 in the prior year. Despite the perceived stability, the trading range for spreads during the period was 150 basis points wide, reflecting the volatility across markets. After increasing for most of the year, trailing 12-month defaults came in at 2.6% on a par-weighted basis. We expect this measure to climb and close the 2023 calendar year near the 3.0% average of the post-GFC era. The investment-grade universe was a bit more stable, trading in a roughly 50 basis points range and closing the period tighter by 29 basis points at 129 over like-maturity Treasuries.
The Treasury yield curve unwound some of its heavy inversion, representing expectations that the zero interest rate policy of the post-GFC period was an outlier and the resilience of the domestic consumer would push out the need for rate cuts mostly into the back half of 2024. Short-maturities of three and six-month bills rose by 141 and 103 basis points, respectively, tracking policy moves in the short term. All Treasury notes with maturities of two years and longer also moved to higher yields, as market pricing reflects greater balance between the continuing normalization of inflation and the possibility of recession. The Treasury sell-off was offset by healthy starting income levels and tighter spreads, which combined to deliver slightly positive returns during the annual period, with the Bloomberg US Aggregate Bond Index returning 0.4%. The corporate component of the Bloomberg US Aggregate Bond Index led with 2.8% returns, government-related sectors returned 2.2%, while Treasuries and securitized products trailed, returning -0.6%.
The Fund held an overweight allocation in corporate debt over the annual period. While the overweight positions to financial and industrial sector corporate debt added to performance, security selection among financial issuers detracted from performance. Security selection among Treasury positions also weighed on performance. The team materially decreased the corporate bond allocation during the annual period, adding to both mortgage-backed securities and Treasury positions. Over a full market cycle, we continue to favor an overweight to corporate bonds and asset-backed securities in the Fund, as the additional yield has shown historically to generate superior long-term returns.
How is the Fund positioned?
The Fund's duration is 6.1 years, which is equal to the duration of the Bloomberg US Aggregate Bond Index. The Fund continues to hold an overweight in corporate bonds in both the investment-grade and out-of-benchmark high-yield ratings categories. These overweights lead to a lower overall credit quality of A- compared to the benchmark's AA-quality. The move higher in Treasury rates coupled with modest spread moves in risk assets led to slightly positive returns during the annual period, with the Fund's return beating its benchmark but trailing peers modestly. The Fund continues to hold overweight positions in corporate and asset-backed securities and underweight positions in Treasuries and mortgages following the year's activity. Within the corporate bond allocation, our largest overweight allocations reside in the consumer cyclical and consumer non-cyclical sectors.
Positioning Implications
The market's reaction to the November Fed meeting has driven Treasury yields further from the Fed's expectations for its forward rate path. However, Powell noted multiple times that the dot plots released quarterly should be viewed as a snapshot in time that loses applicability with each incoming data point. Futures markets now indicate four rate cuts will occur in 2024, down from the five cuts the market had priced in at the midyear point. We have been gradually increasing
CALAMOS OPEN-END FAMILY OF FUNDS ANNUAL REPORT
72
Calamos Total Return Bond Fund (Unaudited)
portfolio durations in expectation of peak-Fed policy rates and a greater likelihood that the next rate move will be a cut. This positioning leaves us neutral to benchmark duration in Calamos Total Return Bond Fund. This shift has also led to selective reductions of our leveraged loan positions, though we maintain a significant loan allocation across mandates based on relative value and seniority considerations.
In our estimation, credit spreads reflect an outlook that is too sanguine. We are beginning to see a deterioration in fundamentals within the leveraged finance space. Although it is too early to determine if this is a wobble or a new trend forming, we are actively reducing exposure to credits we evaluate to be more exposed to a downturn in cyclical activity, those with weak contingent liquidity, or exposure to a rapid deterioration of asset value. Based on our fundamentally driven investment philosophy, we believe there are select high-yield issuers who are compensating investors well for associated risks, and we are maintaining allocations in those areas.
What closing thoughts do you have for Fund shareholders?
Progress on inflation and surprisingly resilient economic growth allowed the Federal Reserve to pause its rate-hiking campaign at its September and November meetings. The extended pause allows the committee to evaluate incoming data another six-weeks. It's clear the Fed is looking for continued improvement in PCE Core Services (ex-housing). However, the message between the September and November meetings changed. A recession is still not the base case for the Fed, as they aim for a soft landing. But apart from inflation, they have broadened the variables they are watching closely to determine whether an adequate level of restrictive policy has been met. Specifically, they are monitoring more balance in the labor market and a broader set of financial conditions driven by markets.
We agree that monetary policy is restrictive at current levels, as evidenced by trailing 12-month inflation (core PCE) below the fed funds' effective rate and real yields on Treasury Inflation Protected Securities well above 2% across the maturity spectrum. We expect future months and quarters to show a drop in consumer and business investment as a reduction in disposable income through higher borrowing costs rolls into more areas of economic activity. We are squarely in the "impatiently waiting" phase, looking to ascertain how much economic momentum will be lost from past policy changes. There is still a high level of uncertainty concerning potential economic outcomes, and a recession cannot be dismissed.
We've seen fundamentals weaken modestly in levered credit. The traditional high-yield market experienced year-over-year declines in both revenue and EBITDA* through the end of the second calendar quarter of 2023 for the first time since 2020. Recall that prior quarter results looked healthier, with 7.5% year-over-year growth in EBITDA, but the aggregate results relied heavily on significant strength within the leisure, energy, and transportation industries. Although the direction of progress may have changed, aggregate leverage and interest coverage continue to look healthy in our evaluation. We will monitor the situation closely to determine if a new trend toward weakness is emerging or if results are becoming more volatile as the instability in input prices, labor costs, and consumer behavior
* EBITDA stands for earnings before interest, taxes, depreciation, and amortization. It is a measure of a company's profitability that excludes the effects of its capital structure, tax strategy, and depreciation methods.
www.calamos.com
73
Calamos Total Return Bond Fund (Unaudited)
impact outcomes. Credit spreads in both the investment-grade and high-yield markets have widened slightly as strong balance sheets and technicals have offset the growing suspicion that results in coming quarters will be weaker.
Regarding capital access, we believe developing private credit markets have ample capital available to fill the liquidity gap when banks and other traditional capital sources pull back. These new capital sources and low-cost, fixed-rate Covid-era debt are likely to extend the transmission lag that occurs before the Fed's monetary policy affects economic activity. Nevertheless, a recession is still a possibility as liquidity conditions recede.
ANNUALIZED RETURN: SINCE INCEPTION (6/27/07) THROUGH 10/31/23
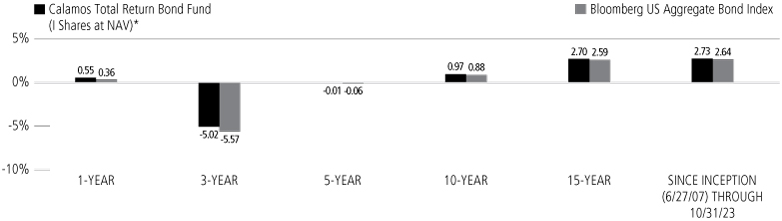
Performance data quoted represents past performance, which is no guarantee of future results. Current performance may be lower or higher than the performance quoted.
The principal value and investment return of an investment will fluctuate so that your shares, when redeemed, may be worth more or less than their original cost. You can obtain performance data current to the most recent month end by visiting www.calamos.com. Average annual total return measure net investment income and capital gain or loss from portfolio investments as an annualized average. All performance shown assumes reinvestment of dividends and capital gains distributions. Performance is for the Fund's Class I shares at net asset value. The Fund also offers Class A and Class C shares, the performance of which may vary. Source: State Street Corporation and Morningstar Direct.
Duration is useful in measuring a bond fund's sensitivity to changes in interest rates. The longer the duration, the more a bond fund's price will fluctuate when interest rates change.
* Annual returns for Class I shares are provided because Class I shares represent the largest percentage of assets in the Calamos Family of Funds.
CALAMOS OPEN-END FAMILY OF FUNDS ANNUAL REPORT
74
Calamos Total Return Bond Fund (Unaudited)
GROWTH OF $1,000,000: FOR THE 10-YEAR PERIOD ENDED 10/31/23

AVERAGE ANNUAL TOTAL RETURN† AS OF 10/31/23
| | | 1
YEAR | | 5
YEARS | | 10
YEARS | |
Class A Shares – Inception 6/27/07 | |
Without Sales Charge | | | 0.18 | % | | | -0.28 | % | | | 0.71 | % | |
With Sales Charge | | | -2.08 | | | | -0.74 | | | | 0.33 | | |
Class C Shares – Inception 6/27/07 | |
Without Sales Charge | | | -0.57 | | | | -1.03 | | | | -0.04 | | |
With Sales Charge | | | -1.54 | | | | -1.03 | | | | -0.04 | | |
Class I Shares – Inception 6/27/07 | | | 0.55 | | | | -0.01 | | | | 0.97 | | |
Performance data quoted represents past performance, which is no guarantee of future results. Current performance may be lower or higher than the performance quoted. The principal value and investment return of an investment will fluctuate so that your shares, when redeemed, may be worth more or less than their original cost.
As of the prospectus dated 3/1/23, the Fund's gross expense ratio for Class A shares is 1.15%, Class C shares is 1.90% and Class I shares is 0.88%. The Fund's investment adviser has contractually agreed to reimburse Fund expenses through March 1, 2024 to the extent necessary so that Total Annual Fund Operating Expenses (excluding taxes, interest, short interest, short dividend expenses, brokerage commissions, acquired fund fees and expenses, and extraordinary expenses, if any) of Class A, Class C, and Class I are limited to 0.90%, 1.65%, and 0.65% of average net assets, respectively. Calamos Advisors may recapture previously waived expense amounts within the same fiscal year for any day where the respective Fund's expense ratio falls below the contractual expense limit up to the expense limit for that day. This undertaking is binding on Calamos Advisors and any of its successors and assigns. This agreement is not terminable by either party. The expense ratios shown above may differ from the more recent expense ratios reported in the Financial Highlights section of this report.
† Average annual total return measures net investment income and capital gain or loss from portfolio investments as an annualized average assuming reinvestment of dividends and capital gains distributions. Performance shown reflects the effects of an expense reimbursement that improved results. Load-adjusted returns are adjusted for the maximum front-end sales load of 2.25% for Class A shares and returns for Class C shares have been adjusted for the contingent deferred sales charge (CDSC).
NOTES:
The graph does not reflect the income taxes that you would pay on fund distributions or the redemption of fund shares. Fund performance includes reinvestment of dividends. The performance of other classes will vary from the performance of the class shown based on the difference in sales charges and fees paid by shareholders investing in different share classes.
The Bloomberg US Aggregate Bond Index is considered generally representative of the investment-grade bond market.
The S&P 500 Index is an unmanaged index generally considered representative of the US stock market.
Index returns assume reinvestment of dividends and do not reflect deduction of fees and expenses. It is not possible to invest directly in an index.
www.calamos.com
75
Calamos High Income Opportunities Fund (Unaudited)
OVERVIEW
Through its multi-sector fixed-income strategy, the Fund invests mainly in high-yield securities from US issuers with the goal of generating a high level of current income and total return in excess of the benchmark index over full market cycles.
KEY FEATURES
◼ Employs bond-by-bond portfolio construction with a focus on being well compensated for risks taken. We believe a disciplined process, grounded in fundamental research, enables us to achieve higher total returns with less volatility.
◼ Draws on broader investable universe to enhance portfolio construction and risk management. Expanding the universe to include bank loans and preferred securities provides additional opportunities.
◼ Utilizes robust, independent credit research. Our fixed-income investment process unites quantitative and qualitative analyses into historical and forward-looking models. The result is a credit rating that reflects where a company is heading.
◼ Applies a macro overlay to capitalize on opportunities in misunderstood industries and sectors. The overlay acts as a risk control that also considers the business cycle, geopolitics, inflation and real rate expectations.
PORTFOLIO FIT
The Fund can complement investment-grade credit exposure, providing attractive income and total return potential for more risk-tolerant investors.
FUND NASDAQ SYMBOLS
A Shares | | CHYDX | |
C Shares | | CCHYX | |
I Shares | | CIHYX | |
CALAMOS HIGH INCOME OPPORTUNITIES FUND
INVESTMENT TEAM DISCUSSION
How has the Fund performed?
For the 12 months ended October 31, 2023 ("annual period"), Calamos High Income Opportunities Fund returned 5.48% (Class I shares at net asset value) compared to a gain of 6.23% for the Bloomberg US High Yield 2% Issuer Capped Index.
Since its inception on June 27, 2007, the Fund gained 5.53% on an annualized basis (Class I shares at net asset value) versus a 6.93% return for the Bloomberg US High Yield 2% Issuer Capped Index.
What factors influenced performance during the reporting period?
Recent economic data has generally exceeded economists' estimates, and some downtrodden areas continued to bounce back from the lows struck in the first half of 2023. Manufacturing surveys showed activity contracting, although measures improved slightly during the final months of the period. Consumer confidence—shaken by inflation, bank failures, higher interest expenses, and the resumption of student loan payments—is declining, but remains well above its level from the middle of 2022. These developments occurred against a backdrop of falling inflation and stable employment conditions.
Despite improved data, there are some areas of concern. Leading economic indicators (LEI) contracted every month of the annual period, extending the streak of negative measures to 17 consecutive months. Historically, prolonged periods of weakness in LEI have preceded a recession. Given the way that strength in the housing sector has propelled economic growth in past cycles, it is concerning that housing activity is so depressed. The unemployment rate ticked up to 3.8%, driven by increased labor participation.
The Fed reacted to the mixed indicators with composure, adopting a more measured pace of adjusting policy with back-to-back pauses that allow for additional data to inform their next move. Given the magnitude of past policy shifts and the variable lags of policy implementation, we welcome the Fed's more flexible approach. The Fed's research indicates that 9 to 12-month lags are typical before policy action affects economic imbalances, with longer time lags needed for the full impact. To keep it simple, the effective fed funds rate 12 months ago was 3.12%, and more than 200 basis points of additional tightening (at a minimum) has yet to impact the real economy.
Risk markets are reflecting less confidence in conditions. Equities retreated across market capitalizations in the period's last three months of the period: the S&P 500 Index lost -8.3%, the Russell 2000 Index returned -16.7%, and leveraged finance markets returned -2.1%. The latter were impacted by the move to higher market rates during the annual period. In our view, equity returns these last few months reflect growing doubts that earnings momentum can continue unimpeded. Results were also more mixed at the sector level, as company fundamentals and themes have exerted greater influence, and the Fed's activity became less forceful.
CALAMOS OPEN-END FAMILY OF FUNDS ANNUAL REPORT
76
Calamos High Income Opportunities Fund (Unaudited)
High yield spreads were modestly tighter, closing at 437 basis points on an option-adjusted basis, down from 464 in the prior year. Despite the perceived stability, the trading range for spreads during the period was 150 basis points wide, reflecting the volatility across markets. Lower quality outperformed as CCCs returned 7.4%, B-rated paper returned 6.8%, and more rate-sensitive BBs returned 5.3%. After increasing for most of the year, trailing 12-month defaults came in at 2.6% on a par-weighted basis. We expect this measure to climb and close the 2023 calendar year near the 3.0% average of the post-GFC era. The best-performing sectors in the Bloomberg US High Yield 2% Issuer Capped Index were finance companies (+10.9%), consumer cyclicals (+10.2%), and brokers and asset managers (+3.5), whereas communications (+0.8%), electric utilities (+3.1%), and transportation (+3.3%) represented the most significant laggards.
From a sector perspective, security selection in the energy and insurance sectors contributed to returns. Conversely, selection in consumer cyclicals weighed on performance, as did the Fund's underweight to the sector.
How is the Fund positioned?
The Fund is currently overweight retailers, airlines, and property and casualty insurance. Several of our retail positions are secured by real estate portfolios with what we believe are conservative valuations. The Fund's airline positions are mostly secured by planes and loyalty programs. The property and casualty insurance overweight is based on strong cash-flow metrics, pricing power, and consolidation in the industry. Consumer cyclical services, electric utilities, and technology industries comprise the Fund's largest underweights. The consumer cyclical services industry underweight is largely the result of relative value decisions in favor of higher-income opportunities in other industries.
From a credit-quality perspective, the Fund is relatively underweight in below-investment-grade rating categories, and has a corresponding out-of-benchmark allocation to BBB-rated debt. The Fund is positioned short (3.2 years) compared to the option-adjusted duration of the Bloomberg US High Yield 2% Issuer Capped Index (3.5 years).
Over the annual period, the team has added to positions in the energy sector, primarily through new positions in independent producers and midstream companies. New holdings in the leisure and automotive industries drove an increase in consumer cyclical exposure. Also, we reduced the Fund's exposure to the other financial sector. This reduction was primarily related to eliminating a commercial property management company.
Positioning Implications
The market's reaction to the November Fed meeting has driven Treasury yields further from the Fed's expectations for its forward rate path. However, Powell noted multiple times that the dot plots released quarterly should only be viewed as a snapshot in time that loses applicability with each incoming data point. Futures markets now indicate four rate cuts will occur in 2024, down from the five cuts the market had priced in at the midyear point. We have been gradually increasing portfolio durations in expectation of peak-Fed policy rates and a greater likelihood that the next rate move will be a cut. However, the duration of Calamos High Income Opportunities Fund remains below its benchmark duration, as interest-rate sensitivity in the high-yield market is a smaller driver of risk and return. Anticipation of the Fed's next move has also led us to selectively reduce our leveraged loan positions, although we maintain a significant loan allocation across mandates based on relative value and seniority considerations.
FUND CUSIP NUMBERS
A Shares | | | 128119815 | | |
C Shares | | | 128119799 | | |
I Shares | | | 128119781 | | |
SECTOR WEIGHTINGS
Consumer Discretionary | | | 20.6 | % | |
Financials | | | 15.1 | | |
Industrials | | | 15.6 | | |
Energy | | | 13.2 | | |
Communication Services | | | 10.1 | | |
Health Care | | | 7.1 | | |
Information Technology | | | 5.0 | | |
Materials | | | 4.6 | | |
Consumer Staples | | | 4.0 | | |
Real Estate | | | 0.8 | | |
Other | | | 1.5 | | |
Utilities | | | 0.3 | | |
Sector weightings are subject to change daily and are calculated as a percentage of net assets. The table excludes cash or cash equivalents, any government/sovereign bonds or broad based index hedging securities the Fund may hold.
www.calamos.com
77
Calamos High Income Opportunities Fund (Unaudited)
In our estimation, credit spreads reflect an outlook that is too sanguine. We are beginning to see a deterioration in fundamentals within the leveraged finance space. Although it is too early to determine if this is a wobble or a new trend forming, we are actively reducing exposure to credits we evaluate to be more exposed to a downturn in cyclical activity, those with weak contingent liquidity, or exposure to a rapid deterioration of asset value. Based on our fundamentally driven investment philosophy, we believe there are select high-yield issuers who are compensating investors well for associated risks, and we are maintaining allocations in those areas.
What closing thoughts do you have for Fund shareholders?
Progress on inflation and surprisingly resilient economic growth allowed the Federal Reserve to pause its rate-hiking campaign at its September and November meetings. The extended pause allows the committee to evaluate incoming data another six-weeks. It's clear the Fed is looking for continued improvement in PCE Core Services (ex-housing). However, the message between the September and November meetings changed. A recession is still not the base case for the Fed, as they aim for a soft landing. But apart from inflation, they have broadened the variables they are watching closely to determine whether an adequate level of restrictive policy has been met. Specifically, they are monitoring more balance in the labor market and a broader set of financial conditions driven by markets.
We agree that monetary policy is restrictive at current levels, as evidenced by trailing 12-month inflation (core PCE) below the fed funds' effective rate and real yields on Treasury Inflation Protected Securities well above 2% across the maturity spectrum. We expect future months and quarters to show a drop in consumer and business investment as a reduction in disposable income through higher borrowing costs rolls into more areas of economic activity. We are squarely in the "impatiently waiting" phase, looking to ascertain how much economic momentum will be lost from past policy changes. There is still a high level of uncertainty concerning potential economic outcomes, and a recession cannot be dismissed.
We've seen fundamentals weaken modestly in levered credit. The traditional high-yield market experienced year-over-year declines in both revenue and EBITDA* through the end of the second calendar quarter of 2023 for the first time since 2020. Recall that prior quarter results looked healthier, with 7.5% year-over-year growth in EBITDA, but the aggregate results relied heavily on significant strength within the leisure, energy, and transportation industries. Although the direction of progress may have changed, aggregate leverage and interest coverage continue to look healthy in our evaluation. We will monitor the situation closely to determine if a new trend toward weakness is emerging or if results are becoming more volatile as the instability in input prices, labor costs, and consumer behavior impact outcomes. Credit spreads in both the investment-grade and high-yield markets have widened slightly as strong balance sheets and technicals have offset the growing suspicion that results in coming quarters will be weaker.
Regarding capital access, we believe developing private credit markets have ample capital available to fill the liquidity gap when banks and other traditional capital sources pull back. These new capital sources and low-cost, fixed-rate Covid-era
* EBITDA stands for earnings before interest, taxes, depreciation, and amortization. It is a measure of a company's profitability that excludes the effects of its capital structure, tax strategy, and depreciation methods.
CALAMOS OPEN-END FAMILY OF FUNDS ANNUAL REPORT
78
Calamos High Income Opportunities Fund (Unaudited)
debt are likely to extend the transmission lag that occurs before the Fed's monetary policy affects economic activity. Nevertheless, a recession is still a possibility as liquidity conditions continue receding.
ANNUALIZED RETURN: SINCE INCEPTION (3/1/02) THROUGH 10/31/23
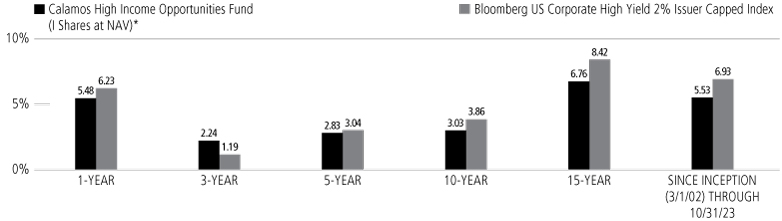
Performance data quoted represents past performance, which is no guarantee of future results. Current performance may be lower or higher than the performance quoted.
The principal value and investment return of an investment will fluctuate so that your shares, when redeemed, may be worth more or less than their original cost. You can obtain performance data current to the most recent month end by visiting www.calamos.com. Average annual total return measures net investment income and capital gain or loss from portfolio investments as an annualized average. All performance shown assumes reinvestment of dividends and capital gains distributions. Performance is for the Fund's Class I shares at net asset value. The Fund also offers Class A and Class C shares, the performance of which may vary. Source: State Street Corporation and Morningstar Direct.
* Annual returns for Class I shares are provided because Class I shares represent the largest percentage of assets in the Calamos Family of Funds.
www.calamos.com
79
Calamos High Income Opportunities Fund (Unaudited)
GROWTH OF $1,000,000: FOR THE 10-YEAR PERIOD ENDED 10/31/23

AVERAGE ANNUAL TOTAL RETURN† AS OF 10/31/23
| | | 1
YEAR | | 5
YEARS | | 10
YEARS | |
Class A Shares – Inception 8/2/99 | |
Without Sales Charge | | | 5.22 | % | | | 2.58 | % | | | 2.77 | % | |
With Sales Charge | | | 2.82 | | | | 2.12 | | | | 2.27 | | |
Class C Shares – Inception 12/21/00 | |
Without Sales Charge | | | 4.35 | | | | 1.80 | | | | 1.99 | | |
With Sales Charge | | | 3.36 | | | | 1.80 | | | | 1.99 | | |
Class I Shares – Inception 3/1/02 | | | 5.48 | | | | 2.83 | | | | 3.03 | | |
Performance data quoted represents past performance, which is no guarantee of future results. Current performance may be lower or higher than the performance quoted. The principal value and investment return of an investment will fluctuate so that your shares, when redeemed, may be worth more or less than their original cost.
As of the prospectus dated 3/1/23, the Fund's gross expense ratio for Class A shares is 1.40%, Class C shares is 2.15% and Class I shares is 1.15%. The Fund's investment adviser has contractually agreed to reimburse Fund expenses through March 1, 2024, to the extent necessary so that Total Annual Fund Operating Expenses (excluding taxes, interest, short interest, short dividend expenses, brokerage commissions, acquired fund fees and expenses, and extraordinary expenses, if any) of Class A, Class C, and Class I are limited to 1.00%, 1.75%, and 0.75% of average net assets, respectively. Calamos Advisors may recapture previously waived expense amounts within the same fiscal year for any day where the respective Fund's expense ratio falls below the contractual expenses limit up to the expense limit for that day. This undertaking is binding on Calamos Advisors and any of its successors and assigns. This agreement is not terminable by either party. The expense ratios shown above may differ from the more recent expense ratios reported in the Financial Highlights section of this report.
† Average annual total return measures net investment income and capital gain or loss from portfolio investments as an annualized average assuming reinvestment of dividends and capital gains distributions. Performance shown reflects the effects of an expense reimbursement that improved results. Load-adjusted returns are adjusted for the maximum front-end sales load of 2.25% for Class A shares and returns for Class C shares have been adjusted for the contingent deferred sales charge (CDSC).
NOTES:
The graphs do not reflect the income taxes that you would pay on fund distributions or the redemption of fund shares. Fund performance includes reinvestment of dividends. The performance of other classes will vary from the performance of the class shown based on the difference in sales charges and fees paid by shareholders investing in different share classes.
The Bloomberg US Corporate High Yield 2% Issuer Capped Index measures the performance of high-yield corporate bonds with a maximum allocation of 2% to any one issuer.
The S&P 500 Index is an unmanaged index generally considered representative of the US stock market.
The Russell 2000® Index measures the performance of the small-cap growth segment of the US equity universe. The Russell 2000® Index is published and maintained by FTSE Russell.
Index returns assume reinvestment of dividends and do not reflect deduction of fees and expenses. It is not possible to invest directly in an index.
CALAMOS OPEN-END FAMILY OF FUNDS ANNUAL REPORT
80
Calamos Short-Term Bond Fund (Unaudited)
CALAMOS SHORT-TERM BOND FUND
INVESTMENT TEAM DISCUSSION
How has the Fund performed?
For the 12 months ended October 31, 2023 ("annual period"), Calamos Short-Term Bond Fund returned 3.93% (Class I shares at net asset value), outperforming the 3.23% return of the Bloomberg 1-3 Year Government/Credit Bond Index.
Since its inception on September 19, 2018, the Fund gained 1.70% on an annualized basis (class I shares at net asset value) versus a 1.25% return for the Bloomberg 1-3 Year Government/Credit Index.
What factors influenced performance?
Recent economic data has generally exceeded economists' estimates, and some downtrodden areas continued to bounce back from the lows struck in the first half of 2023. Manufacturing surveys showed activity contracting, although measures improved slightly during the final months of the period. Consumer confidence—shaken by inflation, bank failures, higher interest expenses, and the resumption of student loan payments—is declining but remains well above its level from the middle of 2022. These developments occurred against a backdrop of falling inflation and stable employment conditions.
Despite improved data, there are some areas of concern. Leading economic indicators (LEI) contracted every month of the annual period, extending the streak of negative measures to 17 consecutive months. Historically, prolonged periods of weakness in LEI have preceded a recession. Given the way that strength in the housing sector has propelled economic growth in past cycles, it is concerning that housing activity is so depressed. The unemployment rate ticked up to 3.8%, driven by increased labor participation.
The Fed reacted to the mixed indicators with composure, adopting a more measured pace of adjusting policy with back-to-back pauses that allow additional data to inform their next move. Given the magnitude of past policy shifts and the variable lags of policy implementation, we welcome the Fed's more flexible approach. The Fed's research indicates that 9 to 12-month lags are typical before policy action affects economic imbalances, with longer time lags needed for the full impact. To keep it simple, the effective fed funds rate 12 months ago was 3.12%, and more than 200 basis points of additional tightening (at a minimum) has yet to impact the real economy.
Risk markets are reflecting less confidence in conditions. Equities retreated across market capitalizations in the last three months of the period: the S&P 500 Index lost -8.3%, the Russell 2000 Index returned -16.7%, and leveraged finance markets returned -2.1%. The move to higher market rates had an impact on the latter during the annual period. In our view, equity returns these last few months reflect growing doubts that earnings momentum can continue unimpeded. Results were also more mixed at the sector level, as company fundamentals and themes have exerted greater influence, and the Fed's activity became less forceful.
High yield spreads were modestly tighter, closing at 437 basis points on an option-adjusted basis, down from 464 in the prior year. Despite the perceived stability, the trading range for spreads during the period was 150 basis points wide, reflecting the volatility across markets. After increasing for most of the year, trailing 12-month defaults came in at 2.6% on a par-weighted basis. We expect this
OVERVIEW
Through its multi-sector fixed-income strategy, the fund invests predominantly in US issuers with the goal of generating a high level of current income and total return in excess of the benchmark over full market cycles.
KEY FEATURES
◼ Employs bond-by-bond portfolio construction with a focus on being well compensated for risks taken. We believe a disciplined process, grounded in fundamental research, enables us to achieve higher total returns with less volatility.
◼ Draws on a broader investable universe to enhance portfolio construction and risk management. Expanding the universe to include high-yield bonds, bank loans and preferreds provides additional opportunities.
◼ Utilizes robust, independent credit research. Our fixed-income investment process unites quantitative and qualitative analyses into historical and forward-looking models. The result is a credit rating reflective of where a company is heading.
◼ Applies a macro overlay to capitalize on misunderstood industries and sectors. The overlay acts as a risk control that also considers the business cycle, geopolitics, inflation and real rate expectations.
PORTFOLIO FIT
The Fund may be suitable for investors seeking current income accompanied by lower volatility over a one-year to two-year time horizon.
FUND NASDAQ SYMBOLS
A Shares | | CSTBX | |
I Shares | | CSTIX | |
www.calamos.com
81
Calamos Short-Term Bond Fund (Unaudited)
FUND CUSIP NUMBERS
A Shares | | | 128120441 | | |
I Shares | | | 128120433 | | |
ASSET ALLOCATION
Corporate Bonds | | | 57.2 | % | |
Asset Backed Securities | | | 19.4 | | |
Bank Loans | | | 7.8 | | |
U.S. Government and
Agency Securities | | | 7.6 | | |
Municipal Obligations | | | 4.6 | | |
Sovereign Bonds | | | 1.8 | | |
Asset Allocation weightings are subject to change daily and are calculated as a percentage of net assets. The table excludes cash or cash equivalents, any government/sovereign bonds or broad based index hedging securities the Fund may hold.
measure to climb and close the 2023 calendar year near the 3.0% average of the post-GFC era. The short-duration investment-grade universe was more stable, trading in a roughly 70 basis points range and closing the tighter period by 5 basis points at 96 over like-maturity Treasuries.
The Treasury yield curve unwound some of its heavy inversion, representing expectations that the zero interest rate policy of the post-GFC period was an outlier and that the resilience of the domestic consumer would push out the need for rate cuts mainly into the back half of 2024. Short-maturities of three and six-month bills rose by 141 and 103 basis points, respectively, tracking policy moves in the short term. All Treasury notes with maturities of two years and longer also moved to higher yields, as market pricing reflects a greater balance between the continuing normalization of inflation and the possibility of a recession. The Treasury sell-off was offset by healthy starting income levels and tighter spreads, which combined to deliver modestly positive returns during the annual period, with the Bloomberg 1-3 Year Government/Credit Index returning 3.2%.
The corporate component of the Bloomberg 1-3 Year Government/Credit Index led sectors with 4.2% returns, government-related securities returned 3.3%, and Treasuries trailed at 2.9%. The Fund held an overweight in corporate debt over the reporting period. As a result, higher returns among corporate bonds supported performance, as did security selection among non-financial issuers. Security selection among Treasury positions detracted from performance. Over the long term, we continue to favor an overweight to corporate bonds, asset-backed securities, and taxable municipal bonds in the Fund, as the additional yield in short-duration securities has historically generated superior long-term returns.
How is the Fund positioned?
The Fund has a duration of 2.0 years versus the 1.8-year duration of the Bloomberg 1-3 Year Government/Credit Index. The Fund continues to hold an overweight in corporate bonds in both the investment-grade and out-of-benchmark high-yield ratings categories. These overweights have resulted in a lower overall credit quality of A- compared to the AA- quality of the benchmark. Strong starting yields, and a move to higher Treasury rates and slightly tighter spreads, led to positive, below-carry returns. The rotation of Treasury yields in short-dated maturities, coupled with the tightening of credit spreads in risk assets, led to positive Fund returns, ahead of the benchmark and in line with the peer group average return. Although the Fund remains overweight corporate bonds and asset-backed securities, the weighting of corporate bonds was decreased over the annual period in favor of increasing the allocation to asset-backed securities. The corporate bond reductions largely occurred in financial sectors. The term loan positions are floating rate, which has helped mitigate exposure to increases in short-term interest rates. The Fund continues to hold underweight positions in both Treasuries and Agencies. Within the corporate bond allocation, our largest overweights reside in the consumer cyclical and technology sectors.
Positioning Implications
The market's reaction to the November Fed meeting has driven Treasury yields further from the Fed's expectations for its forward rate path. However, Powell noted multiple times that the dot plots released quarterly should be viewed as a snapshot in time that loses applicability with each incoming data point. Futures markets now indicate four rate cuts will occur in 2024, down from the five cuts the market had priced in at the midyear point. We have been gradually increasing portfolio durations in expectation of peak-Fed policy rates and a greater likelihood that the next rate move will be a cut. This positioning leaves us modestly long the benchmark duration
CALAMOS OPEN-END FAMILY OF FUNDS ANNUAL REPORT
82
Calamos Short-Term Bond Fund (Unaudited)
in Calamos Short-Term Bond Fund. This shift has also led to selective reductions of our leveraged loan positions, although we maintain a significant loan allocation across mandates based on relative value and seniority considerations.
In our estimation, credit spreads reflect an outlook that is too sanguine. We are beginning to see a deterioration in fundamentals within the leveraged finance space. Although it is too early to determine if this is a wobble or a new trend forming, we are actively reducing exposure to credits we evaluate to be more exposed to a downturn in cyclical activity, those with weak contingent liquidity, or exposure to a rapid deterioration of asset value. Based on our fundamentally driven investment philosophy, we believe there are select high-yield issuers who are compensating investors well for associated risks, and we are maintaining allocations in those areas.
What closing thoughts do you have for Fund shareholders?
Progress on inflation and surprisingly resilient economic growth allowed the Federal Reserve to pause its rate-hiking campaign at its September and November meetings. The extended pause allows the committee to evaluate incoming data for another six-weeks. It's clear the Fed is looking for continued improvement in PCE Core Services (ex-housing). However, the message between the September and November meetings changed. A recession is still not the base case for the Fed, as they aim for a soft landing. But apart from inflation, they have broadened the variables they are watching closely to determine whether an adequate level of restrictive policy has been met. Specifically, they are monitoring more balance in the labor market and a broader set of financial conditions driven by markets.
We agree that monetary policy is currently restrictive, as evidenced by trailing 12-month inflation (core PCE) below the fed funds' effective rate and real yields on Treasury Inflation Protected Securities well above 2% across the maturity spectrum. We expect future months and quarters to show a drop in consumer and business investment as a reduction in disposable income through higher borrowing costs rolls into more areas of economic activity. We are squarely in the "impatiently waiting" phase, looking to ascertain how much economic momentum will be lost from past policy changes. There is still a high level of uncertainty concerning potential economic outcomes, and a recession cannot be dismissed.
We've seen fundamentals weaken modestly in levered credit. The traditional high-yield market experienced year-over-year declines in both revenue and EBITDA* through the end of the second calendar quarter of 2023 for the first time since 2020. Recall that prior quarter results looked healthier, with 7.5% year-over-year growth in EBITDA, but the aggregate results relied heavily on significant strength within the leisure, energy, and transportation industries. Although the direction of progress may have changed, aggregate leverage and interest coverage continue to look healthy in our evaluation. We will monitor the situation closely to determine if a new trend toward weakness is emerging or results are becoming more volatile as the instability in input prices, labor costs, and consumer behavior impact outcomes. Credit spreads in both the investment-grade and high-yield markets have widened slightly as strong balance sheets and technicals have offset the growing suspicion that results in coming quarters will be weaker.
Regarding capital access, we believe developing private credit markets have ample capital available to fill the liquidity gap when banks and other traditional capital
* EBITDA stands for earnings before interest, taxes, depreciation, and amortization. It is a measure of a company's profitability that excludes the effects of its capital structure, tax strategy, and depreciation methods.
www.calamos.com
83
Calamos Short-Term Bond Fund (Unaudited)
sources pull back. These new capital sources and low-cost, fixed-rate Covid-era debt are likely to extend the transmission lag before the Fed's monetary policy affects economic activity. Nevertheless, a recession is still a possibility as liquidity conditions continue receding.
GROWTH OF $1,000,000: SINCE INCEPTION (9/18/18) THROUGH 10/31/23

AVERAGE ANNUAL TOTAL RETURN† AS OF 10/31/23
| | | 1
YEAR | | 5
YEARS | | SINCE
INCEPTION | |
Class A Shares – Inception 9/19/18 | |
Without Sales Charge | | | 3.79 | % | | | 1.48 | % | | | 1.47 | % | |
With Sales Charge | | | 1.50 | | | | 1.02 | | | | 1.02 | | |
Class I Shares – Inception 9/19/18 | | | 3.93 | | | | 1.71 | | | | 1.70 | | |
Performance data quoted represents past performance, which is no guarantee of future results. Current performance may be lower or higher than the performance quoted. The principal value and investment return of an investment will fluctuate so that your shares, when redeemed, may be worth more or less than their original cost.
As of the prospectus dated 3/1/23, the Fund's gross expense ratio for Class A shares is 0.63%, and Class I shares is 0.38%. The expense ratios shown above may differ from the more recent expense ratios reported in the Financial Highlights section of this report.
† Average annual total return measures net investment income and capital gain or loss from portfolio investments as an annualized average assuming reinvestment of dividends and capital gains distributions. Performance shown reflects the effects of an expense reimbursement that improved results. Load-adjusted returns are adjusted for the maximum frontend sales load of 2.25% for Class A shares.
NOTES:
The graph does not reflect the income taxes that you would pay on fund distributions or the redemption of fund shares. Fund performance includes reinvestment of dividends. The performance of other classes will vary from the performance of the class shown based on the difference in sales charges and fees paid by shareholders investing in different share classes.
The Bloomberg 1-3 Year Government/Credit Index includes all medium and larger issues of US government, investment-grade corporate, and investment-grade international dollar-denominated bonds that have maturities of between 1 and 3 years and are publicly issued.
The Bloomberg US 1-3 Year Credit Index measures the investment-grade, US dollar-denominated, fixed-rate, taxable corporate and government-related bond markets. It is composed of the US Corporate Index and a non-corporate component that includes foreign agencies, sovereigns, supranationals and local authorities that have maturities of between 1 and 3 years.
The S&P 500 Index is an unmanaged index generally considered representative of the US stock market.
The Russell 2000® Index measures the performance of the small-cap growth segment of the US equity universe. The Russell 2000® Index is published and maintained by FTSE Russell.
Index returns assume reinvestment of dividends and do not reflect deduction of fees and expenses. It is not possible to invest directly in an index.
CALAMOS OPEN-END FAMILY OF FUNDS ANNUAL REPORT
84
EXPENSE OVERVIEW
As a shareholder of a mutual fund, you incur two types of costs. You incur:
1) Transaction costs, including sales charges, or loads, on purchase payment and redemption fees.
2) Ongoing costs, including management fees, distribution and/or service (12b-1) fees and other fund expenses.
The examples in this report are based on an investment of $1,000 made at the beginning of the period and held for the entire period from May 1, 2023 to October 31, 2023. It is intended to help you understand the ongoing costs associated with investing in each mutual fund and to compare these costs with the ongoing costs of investing in other mutual funds.
There are two parts of each Fund's chart:
Actual
In this part of the chart, you'll see the actual expenses you would have paid on a $1,000 investment made at the beginning of the period and held for the entire period in each fund from May 1, 2023 to October 31, 2023, the period covered by this report. This chart also shows the actual returns, after expenses, you would have earned during that time. This chart can help you estimate your own expenses. For example, if you invested $8,600 in Class A shares of the fund, simply divide $8,600 by $1,000, then multiply that result by the figure in the Actual Expenses per $1,000 row. In this example, you would multiply 8.6 times the figure.
Hypothetical
In this part of the chart, you'll see the hypothetical expenses you would have paid on a $1,000 investment from May 1, 2023 to October 31, 2023, and the hypothetical returns, after expenses, you would have earned during that time. The Securities and Exchange Commission (SEC) has established the guidelines for this chart, including the assumed 5% annual rate of return before expenses, which is what you'll see in the chart. Note that this chart will not help you determine your own expenses, but will help you compare expenses of the fund you own to the expenses of another fund since the information for that fund should be calculated using the same assumptions.
Please note that the expenses shown in the chart are meant to highlight your ongoing costs only and do not include any transactional costs, such as sales charges (loads), redemption fees or exchange fees. Therefore, the second line of the chart is useful in comparing ongoing costs only and will not help you determine the relative total costs of owning different funds. In addition, if these transaction costs were included, your costs would have been higher.
www.calamos.com
85
The actual and hypothetical examples shown assume a $1,000 investment at the beginning of the period, May 1, 2023 and held through October 31, 2023.
| | CLASS A
SHARES | | CLASS C
SHARES | | CLASS I
SHARES | | CLASS R6
SHARES | |
CALAMOS MARKET NEUTRAL INCOME FUND | |
Actual Expenses per $1,000* | | $ | 6.02 | | | $ | 9.83 | | | $ | 4.75 | | | $ | 4.34 | | |
Actual – Ending Balance | | $ | 1,025.40 | | | $ | 1,021.30 | | | $ | 1,026.30 | | | $ | 1,026.00 | | |
Hypothetical Expenses per $1,000* | | $ | 6.01 | | | $ | 9.80 | | | $ | 4.74 | | | $ | 4.33 | | |
Hypothetical – Ending Value | | $ | 1,019.26 | | | $ | 1,015.48 | | | $ | 1,020.52 | | | $ | 1,020.92 | | |
Annualized expense ratio(1),(2) | | | 1.18 | % | | | 1.93 | % | | | 0.93 | % | | | 0.85 | % | |
CALAMOS HEDGED EQUITY FUND | |
Actual Expenses per $1,000** | | $ | 5.94 | | | $ | 9.73 | | | $ | 4.67 | | | $ | — | | |
Actual – Ending Balance | | $ | 1,015.20 | | | $ | 1,011.10 | | | $ | 1,015.70 | | | $ | — | | |
Hypothetical Expenses per $1,000** | | $ | 5.96 | | | $ | 9.75 | | | $ | 4.69 | | | $ | — | | |
Hypothetical – Ending Value | | $ | 1,019.31 | | | $ | 1,015.53 | | | $ | 1,020.57 | | | $ | — | | |
Annualized expense ratio | | | 1.17 | % | | | 1.92 | % | | | 0.92 | % | | | — | | |
CALAMOS PHINEUS LONG/SHORT FUND | |
Actual Expenses per $1,000** | | $ | 11.92 | | | $ | 15.63 | | | $ | 10.68 | | | $ | — | | |
Actual – Ending Balance | | $ | 979.00 | | | $ | 975.10 | | | $ | 980.00 | | | $ | — | | |
Hypothetical Expenses per $1,000** | | $ | 12.13 | | | $ | 15.90 | | | $ | 10.87 | | | $ | — | | |
Hypothetical – Ending Value | | $ | 1,013.16 | | | $ | 1,009.38 | | | $ | 1,014.42 | | | $ | — | | |
Annualized expense ratio(2) | | | 2.39 | % | | | 3.14 | % | | | 2.14 | % | | | — | | |
CALAMOS MERGER ARBITRAGE FUND(a) | |
Actual Expenses per $1,000 | | $ | 1.30 | | | $ | 1.94 | | | $ | 1.08 | | | $ | — | | |
Actual – Ending Balance | | $ | 973.00 | | | $ | 972.00 | | | $ | 973.00 | | | $ | — | | |
Hypothetical Expenses per $1,000 | | $ | 1.32 | | | $ | 1.97 | | | $ | 1.10 | | | $ | — | | |
Hypothetical – Ending Value | | $ | 1,003.07 | | | $ | 1,002.41 | | | $ | 1,003.29 | | | $ | — | | |
Annualized expense ratio(3) | | | 1.50 | % | | | 2.25 | % | | | 1.25 | % | | | — | | |
CALAMOS CONVERTIBLE FUND | |
Actual Expenses per $1,000** | | $ | 5.64 | | | $ | 9.36 | | | $ | 4.34 | | | $ | — | | |
Actual – Ending Balance | | $ | 979.30 | | | $ | 975.60 | | | $ | 980.50 | | | $ | — | | |
Hypothetical Expenses per $1,000** | | $ | 5.75 | | | $ | 9.55 | | | $ | 4.43 | | | $ | — | | |
Hypothetical – Ending Value | | $ | 1,019.51 | | | $ | 1,015.73 | | | $ | 1,020.82 | | | $ | — | | |
Annualized expense ratio | | | 1.13 | % | | | 1.88 | % | | | 0.87 | % | | | — | | |
CALAMOS GLOBAL CONVERTIBLE FUND | |
Actual Expenses per $1,000** | | $ | 6.67 | | | $ | 10.46 | | | $ | 5.42 | | | $ | — | | |
Actual – Ending Balance | | $ | 989.90 | | | $ | 985.60 | | | $ | 990.20 | | | $ | — | | |
Hypothetical Expenses per $1,000** | | $ | 6.77 | | | $ | 10.61 | | | $ | 5.50 | | | $ | — | | |
Hypothetical – Ending Value | | $ | 1,018.50 | | | $ | 1,014.67 | | | $ | 1,019.76 | | | $ | — | | |
Annualized expense ratio(3) | | | 1.33 | % | | | 2.09 | % | | | 1.08 | % | | | — | | |
CALAMOS TIMPANI SMALL CAP GROWTH FUND | |
Actual Expenses per $1,000* | | $ | 6.24 | | | $ | 9.82 | | | $ | 5.04 | | | $ | 4.46 | | |
Actual – Ending Balance | | $ | 903.20 | | | $ | 899.60 | | | $ | 904.10 | | | $ | 904.50 | | |
Hypothetical Expenses per $1,000* | | $ | 6.61 | | | $ | 10.41 | | | $ | 5.35 | | | $ | 4.74 | | |
Hypothetical – Ending Value | | $ | 1,018.65 | | | $ | 1,014.87 | | | $ | 1,019.91 | | | $ | 1,020.52 | | |
Annualized expense ratio(3) | | | 1.30 | % | | | 2.05 | % | | | 1.05 | % | | | 0.93 | % | |
* Expenses for all Fund Classes A, C, I, and R6, are equal to the Fund's annualized expense ratio, multiplied by the average account value over the period, multiplied by 184/365.
** Expenses for all Fund Classes A, C, and I are equal to the Fund's annualized expense ratio, multiplied by the average account value over the period, multiplied by 184/365.
(a) September 29, 2023 (commencement of operations) through October 31, 2023. Expenses for all Fund Classes of the Calamos Merger Arbitrage Fund are equal to the Fund's annualized expense ratio, multiplied by the average account value from inception to period end, multiplied by 32/365.
(1) Annualized Expense Ratios for Market Neutral Income Fund are adjusted to reflect fee waiver related to its investment in an affiliated fund.
(2) Includes 0.17% and 0.74% related to dividend expense on short positions for Market Neutral Income Fund and Phineus Long/Short Fund, respectively.
(3) Annualized Expense Ratios for Merger Arbitrage Fund, Global Convertible Fund, Timpani Small Cap Growth Fund are adjusted to reflect an expense limitation agreement.
CALAMOS OPEN-END FAMILY OF FUNDS ANNUAL REPORT
86
The actual and hypothetical examples shown assume a $1,000 investment at the beginning of the period, May 1, 2023 and held through October 31, 2023.
| | CLASS A
SHARES | | CLASS C
SHARES | | CLASS I
SHARES | | CLASS R6
SHARES | |
CALAMOS TIMPANI SMID GROWTH | |
Actual Expenses per $1,000*** | | $ | 6.58 | | | $ | — | | | $ | 5.36 | | | $ | 5.22 | | |
Actual – Ending Balance | | $ | 934.20 | | | $ | — | | | $ | 935.00 | | | $ | 936.00 | | |
Hypothetical Expenses per $1,000*** | | $ | 6.87 | | | $ | — | | | $ | 5.60 | | | $ | 5.45 | | |
Hypothetical – Ending Value | | $ | 1,018.40 | | | $ | — | | | $ | 1,019.66 | | | $ | 1,019.81 | | |
Annualized expense ratio(4) | | | 1.35 | % | | | — | | | | 1.10 | % | | | 1.07 | % | |
CALAMOS GROWTH FUND | |
Actual Expenses per $1,000** | | $ | 6.77 | | | $ | 10.62 | | | $ | 5.48 | | | $ | — | | |
Actual – Ending Balance | | $ | 1,049.80 | | | $ | 1,045.70 | | | $ | 1,050.90 | | | $ | — | | |
Hypothetical Expenses per $1,000** | | $ | 6.67 | | | $ | 10.46 | | | $ | 5.40 | | | $ | — | | |
Hypothetical – Ending Value | | $ | 1,018.60 | | | $ | 1,014.82 | | | $ | 1,019.86 | | | $ | — | | |
Annualized expense ratio | | | 1.31 | % | | | 2.06 | % | | | 1.06 | % | | | — | | |
CALAMOS GROWTH AND INCOME FUND | |
Actual Expenses per $1,000* | | $ | 8.13 | | | $ | 11.94 | | | $ | 6.82 | | | $ | 5.86 | | |
Actual – Ending Balance | | $ | 1,003.20 | | | $ | 999.50 | | | $ | 1,004.70 | | | $ | 1,005.10 | | |
Hypothetical Expenses per $1,000* | | $ | 8.19 | | | $ | 12.03 | | | $ | 6.87 | | | $ | 5.90 | | |
Hypothetical – Ending Value | | $ | 1,017.09 | | | $ | 1,013.26 | | | $ | 1,018.40 | | | $ | 1,019.36 | | |
Annualized expense ratio | | | 1.61 | % | | | 2.37 | % | | | 1.35 | % | | | 1.16 | % | |
CALAMOS DIVIDEND GROWTH FUND | |
Actual Expenses per $1,000** | | $ | 6.82 | | | $ | 10.53 | | | $ | 5.56 | | | $ | — | | |
Actual – Ending Balance | | $ | 1,002.80 | | | $ | 999.30 | | | $ | 1,004.80 | | | $ | — | | |
Hypothetical Expenses per $1,000** | | $ | 6.87 | | | $ | 10.61 | | | $ | 5.60 | | | $ | — | | |
Hypothetical – Ending Value | | $ | 1,018.40 | | | $ | 1,014.67 | | | $ | 1,019.66 | | | $ | — | | |
Annualized expense ratio(4) | | | 1.35 | % | | | 2.09 | % | | | 1.10 | % | | | — | | |
CALAMOS SELECT FUND | |
Actual Expenses per $1,000** | | $ | 5.85 | | | $ | 9.64 | | | $ | 4.58 | | | $ | — | | |
Actual – Ending Balance | | $ | 1,017.60 | | | $ | 1,013.20 | | | $ | 1,018.10 | | | $ | — | | |
Hypothetical Expenses per $1,000** | | $ | 5.85 | | | $ | 9.65 | | | $ | 4.58 | | | $ | — | | |
Hypothetical – Ending Value | | $ | 1,019.41 | | | $ | 1,015.63 | | | $ | 1,020.67 | | | $ | — | | |
Annualized expense ratio(4) | | | 1.15 | % | | | 1.90 | % | | | 0.90 | % | | | — | | |
CALAMOS INTERNATIONAL GROWTH FUND | |
Actual Expenses per $1,000* | | $ | 5.76 | | | $ | 9.35 | | | $ | 4.57 | | | $ | 3.99 | | |
Actual – Ending Balance | | $ | 905.80 | | | $ | 902.00 | | | $ | 906.70 | | | $ | 907.20 | | |
Hypothetical Expenses per $1,000* | | $ | 6.11 | | | $ | 9.91 | | | $ | 4.84 | | | $ | 4.23 | | |
Hypothetical – Ending Value | | $ | 1,019.16 | | | $ | 1,015.38 | | | $ | 1,020.42 | | | $ | 1,021.02 | | |
Annualized expense ratio(4) | | | 1.20 | % | | | 1.95 | % | | | 0.95 | % | | | 0.83 | % | |
CALAMOS EVOLVING WORLD GROWTH FUND | |
Actual Expenses per $1,000** | | $ | 6.25 | | | $ | 9.89 | | | $ | 5.03 | | | $ | — | | |
Actual – Ending Balance | | $ | 937.00 | | | $ | 933.10 | | | $ | 938.20 | | | $ | — | | |
Hypothetical Expenses per $1,000** | | $ | 6.51 | | | $ | 10.31 | | | $ | 5.24 | | | $ | — | | |
Hypothetical – Ending Value | | $ | 1,018.75 | | | $ | 1,014.97 | | | $ | 1,020.01 | | | $ | — | | |
Annualized expense ratio(4) | | | 1.28 | % | | | 2.03 | % | | | 1.03 | % | | | — | | |
* Expenses for all Fund Classes A, C, I, and R6, are equal to the Fund's annualized expense ratio, multiplied by the average account value over the period, multiplied by 184/365.
** Expenses for all Fund Classes A, C, and I are equal to the Fund's annualized expense ratio, multiplied by the average account value over the period, multiplied by 184/365.
*** Expenses for all Fund Classes A, I, and R6 are equal to the Fund's annualized expense ratio, multiplied by the average account value over the period, multiplied by 184/365.
(4) Annualized Expense Ratios for Timpani SMID Growth Fund, Dividend Growth Fund, Select Fund, International Growth Fund and Evolving World Growth Fund are adjusted to reflect an expense limitation agreement.
www.calamos.com
87
The actual and hypothetical examples shown assume a $1,000 investment at the beginning of the period, May 1, 2023 and held through October 31, 2023.
| | CLASS A
SHARES | | CLASS C
SHARES | | CLASS I
SHARES | | CLASS R6
SHARES | |
CALAMOS GLOBAL EQUITY FUND | |
Actual Expenses per $1,000* | | $ | 7.11 | | | $ | 10.91 | | | $ | 5.72 | | | $ | 5.31 | | |
Actual – Ending Balance | | $ | 987.70 | | | $ | 984.70 | | | $ | 989.10 | | | $ | 989.10 | | |
Hypothetical Expenses per $1,000* | | $ | 7.22 | | | $ | 11.07 | | | $ | 5.80 | | | $ | 5.40 | | |
Hypothetical – Ending Value | | $ | 1,018.05 | | | $ | 1,014.22 | | | $ | 1,019.46 | | | $ | 1,019.86 | | |
Annualized expense ratio(5) | | | 1.42 | % | | | 2.18 | % | | | 1.14 | % | | | 1.06 | % | |
CALAMOS GLOBAL OPPORTUNITIES FUND | |
Actual Expenses per $1,000** | | $ | 6.05 | | | $ | 9.75 | | | $ | 4.81 | | | $ | — | | |
Actual – Ending Balance | | $ | 966.30 | | | $ | 963.70 | | | $ | 967.80 | | | $ | — | | |
Hypothetical Expenses per $1,000** | | $ | 6.21 | | | $ | 10.01 | | | $ | 4.94 | | | $ | — | | |
Hypothetical – Ending Value | | $ | 1,019.06 | | | $ | 1,015.27 | | | $ | 1,020.32 | | | $ | — | | |
Annualized expense ratio(5) | | | 1.22 | % | | | 1.97 | % | | | 0.97 | % | | | — | | |
CALAMOS INTERNATIONAL SMALL CAP GROWTH FUND | |
Actual Expenses per $1,000* | | $ | 6.63 | | | $ | 9.92 | | | $ | 5.37 | | | $ | 5.12 | | |
Actual – Ending Balance | | $ | 933.20 | | | $ | 930.20 | | | $ | 935.70 | | | $ | 935.70 | | |
Hypothetical Expenses per $1,000* | | $ | 6.92 | | | $ | 10.36 | | | $ | 5.60 | | | $ | 5.35 | | |
Hypothetical – Ending Value | | $ | 1,018.35 | | | $ | 1,014.92 | | | $ | 1,019.66 | | | $ | 1,019.91 | | |
Annualized expense ratio(5) | | | 1.36 | % | | | 2.04 | % | | | 1.10 | % | | | 1.05 | % | |
CALAMOS TOTAL RETURN BOND FUND | |
Actual Expenses per $1,000** | | $ | 4.40 | | | $ | 8.06 | | | $ | 3.18 | | | $ | — | | |
Actual – Ending Balance | | $ | 941.10 | | | $ | 938.60 | | | $ | 943.40 | | | $ | — | | |
Hypothetical Expenses per $1,000** | | $ | 4.58 | | | $ | 8.39 | | | $ | 3.31 | | | $ | — | | |
Hypothetical – Ending Value | | $ | 1,020.67 | | | $ | 1,016.89 | | | $ | 1,021.93 | | | $ | — | | |
Annualized expense ratio(5) | | | 0.90 | % | | | 1.65 | % | | | 0.65 | % | | | — | | |
CALAMOS HIGH INCOME OPPORTUNITIES FUND | |
Actual Expenses per $1,000** | | $ | 5.05 | | | $ | 8.82 | | | $ | 3.79 | | | $ | — | | |
Actual – Ending Balance | | $ | 1,003.90 | | | $ | 999.70 | | | $ | 1,003.80 | | | $ | — | | |
Hypothetical Expenses per $1,000** | | $ | 5.09 | | | $ | 8.89 | | | $ | 3.82 | | | $ | — | | |
Hypothetical – Ending Value | | $ | 1,020.16 | | | $ | 1,016.38 | | | $ | 1,021.42 | | | $ | — | | |
Annualized expense ratio(5) | | | 1.00 | % | | | 1.75 | % | | | 0.75 | % | | | — | | |
CALAMOS SHORT-TERM BOND FUND | |
Actual Expenses per $1,000**** | | $ | 3.23 | | | $ | — | | | $ | 1.97 | | | $ | — | | |
Actual – Ending Balance | | $ | 1,002.20 | | | $ | — | | | $ | 1,003.50 | | | $ | — | | |
Hypothetical Expenses per $1,000**** | | $ | 3.26 | | | $ | — | | | $ | 1.99 | | | $ | — | | |
Hypothetical – Ending Value | | $ | 1,021.98 | | | $ | — | | | $ | 1,023.24 | | | $ | — | | |
Annualized expense ratio(5) | | | 0.64 | % | | | — | | | | 0.39 | % | | | — | | |
* Expenses for all Fund Classes A, C, I, and R6, are equal to the Fund's annualized expense ratio, multiplied by the average account value over the period, multiplied by 184/365.
** Expenses for all Fund Classes A, C, and I are equal to the Fund's annualized expense ratio, multiplied by the average account value over the period, multiplied by 184/365.
**** Expenses for all Fund Classes A and I are equal to the Fund's annualized expense ratio, multiplied by the average account value over the period, multiplied by 184/365.
(5) Annualized Expense Ratios for Global Equity Fund, Global Opportunities Fund, International Small Cap Growth Fund, Total Return Bond Fund, High Income Opportunities Fund and Short-Term Bond Fund are adjusted to reflect fee waiver.
CALAMOS OPEN-END FAMILY OF FUNDS ANNUAL REPORT
88
Market Neutral Income Fund Schedule of Investments October 31, 2023
PRINCIPAL
AMOUNT | | | | VALUE | |
CONVERTIBLE BONDS (37.6%) | | | |
| | | Communication Services (3.1%) | |
| | 50,000,000 | EUR | | America Movil, BV
0.000%, 03/02/24 | | $ | 54,766,742 | | |
| | 7,500,000 | | | Bandwidth, Inc.
0.500%, 04/01/28~ | | | 4,603,275 | | |
| | 3,000,000 | | | 0.250%, 03/01/26 | | | 2,352,120 | | |
| | 12,000,000 | | | Bilibili, Inc.~
1.375%, 04/01/26 | | | 11,877,240 | | |
| | 10,000,000 | EUR | | Cellnex Telecom, SA
0.750%, 11/20/31 | | | 7,810,791 | | |
| | 1,000,000,000 | JPY | | CyberAgent, Inc.
0.000%, 02/19/25 | | | 6,529,573 | | |
| | 10,000,000 | | | JOYY, Inc.~
1.375%, 06/15/26 | | | 9,549,700 | | |
| | 15,000,000 | | | Live Nation Entertainment,
Inc.~*^
3.125%, 01/15/29 | | | 15,114,900 | | |
| | 20,000,000 | | | Lyft, Inc.~
1.500%, 05/15/25 | | | 18,324,000 | | |
| | 15,000,000 | | | Match Group Financeco 2,
Inc.~*
0.875%, 06/15/26 | | | 12,904,050 | | |
| | 15,000,000 | | | Match Group Financeco 3,
Inc.~*
2.000%, 01/15/30 | | | 12,190,050 | | |
| | 7,707,000 | | | Perficient, Inc.
0.125%, 11/15/26 | | | 6,169,376 | | |
| | 80,040,000 | | | Sea, Ltd.~
0.250%, 09/15/26 | | | 63,646,207 | | |
| | 9,614,000 | | | 1.000%, 12/01/24 | | | 10,506,660 | | |
| | 70,897,000 | | | Snap, Inc.
0.000%, 05/01/27~ | | | 52,807,630 | | |
| | 40,000,000 | | | 0.125%, 03/01/28 | | | 27,447,600 | | |
| | 14,970,000 | | | 0.750%, 08/01/26~ | | | 13,215,815 | | |
| | 10,000,000 | | | 0.250%, 05/01/25~ | | | 9,378,200 | | |
| | 20,000,000 | | | TechTarget, Inc.
0.000%, 12/15/26 | | | 15,912,600 | | |
| | 15,000,000 | | | TripAdvisor, Inc.~
0.250%, 04/01/26 | | | 12,773,100 | | |
| | 4,153,000 | | | World Wrestling Entertainment,
Inc.
3.375%, 12/15/23 | | | 13,632,472 | | |
| | 20,000,000 | | | Ziff Davis, Inc.^
1.750%, 11/01/26 | | | 18,116,400 | | |
| | 18,000,000 | | | Zillow Group, Inc.~
0.750%, 09/01/24 | | | 18,640,440 | | |
| | 15,000,000 | | | 1.375%, 09/01/26 | | | 15,756,300 | | |
| | | | 434,025,241 | | |
| | | Consumer Discretionary (7.6%) | |
| | 91,893,000 | | | Airbnb, Inc.~
0.000%, 03/15/26 | | | 79,616,095 | | |
| | 2,800,000 | | | Booking Holdings, Inc.^
0.750%, 05/01/25 | | | 4,269,748 | | |
PRINCIPAL
AMOUNT | | | | VALUE | |
| | 22,500,000 | | | Carnival Corp.~
5.750%, 10/01/24 | | $ | 29,124,000 | | |
| | 20,000,000 | | | 5.750%, 12/01/27*^ | | | 23,696,400 | | |
| | 3,009,000 | | | Cheesecake Factory, Inc.~
0.375%, 06/15/26 | | | 2,500,449 | | |
| | 13,457,000 | | | Chegg, Inc.~
0.125%, 03/15/25 | | | 12,019,793 | | |
| | 7,500,000 | | | Cracker Barrel Old Country
Store, Inc.~
0.625%, 06/15/26 | | | 6,217,350 | | |
| | 35,000,000 | EUR | | Delivery Hero, SE
1.500%, 01/15/28 | | | 26,029,003 | | |
| | 30,000,000 | | | DISH Network Corp.
0.000%, 12/15/25 | | | 18,406,200 | | |
| | 75,956,000 | | | DraftKings Holdings, Inc.~
0.000%, 03/15/28 | | | 56,378,341 | | |
| | 60,000,000 | | | Etsy, Inc.~
0.250%, 06/15/28 | | | 44,374,200 | | |
| | 30,000,000 | | | 0.125%, 10/01/26 | | | 29,873,100 | | |
| | 18,500,000 | | | Farfetch, Ltd.~
3.750%, 05/01/27 | | | 9,036,140 | | |
| | 30,000,000 | | | Fiverr International, Ltd.~
0.000%, 11/01/25 | | | 25,853,100 | | |
| | 10,000,000 | | | Ford Motor Company~^
0.000%, 03/15/26 | | | 9,128,100 | | |
| | 6,500,000 | | | Groupon, Inc.~
1.125%, 03/15/26 | | | 3,323,450 | | |
| | 15,000,000 | | | Guess?, Inc.~*
3.750%, 04/15/28 | | | 15,655,050 | | |
| | 15,000,000 | | | Li Auto, Inc.~
0.250%, 05/01/28 | | | 20,373,900 | | |
| | 10,000,000 | | | Liberty Broadband Corp.~*
3.125%, 03/31/53 | | | 9,920,500 | | |
| | 50,000,000 | | | Lucid Group, Inc.~*
1.250%, 12/15/26 | | | 27,558,000 | | |
| | 13,000,000 | | | Luminar Technologies, Inc.~*
1.250%, 12/15/26 | | | 7,579,520 | | |
| | 10,000,000 | | | Marriott Vacations Worldwide
Corp.~
3.250%, 12/15/27*^ | | | 8,478,700 | | |
| | 7,000,000 | | | 0.000%, 01/15/26 | | | 6,034,210 | | |
| | 20,000,000 | | | Meituan
0.000%, 04/27/27 | | | 17,905,000 | | |
| | 15,000,000 | | | NIO, Inc.
4.625%, 10/15/30* | | | 13,418,250 | | |
| | 15,000,000 | | | 3.875%, 10/15/29* | | | 13,423,650 | | |
| | 10,199,000 | | | 0.500%, 02/01/27~ | | | 8,871,396 | | |
| | 10,000,000 | | | 0.000%, 02/01/26~ | | | 9,742,000 | | |
| | 20,000,000 | GBP | | Ocado Group, PLC
0.750%, 01/18/27 | | | 17,218,055 | | |
| | 17,000,000 | | | PDD Holdings, Inc.~
0.000%, 12/01/25^ | | | 16,869,440 | | |
| | 6,750,000 | | | 0.000%, 10/01/24 | | | 16,100,370 | | |
| | 47,500,000 | | | Peloton Interactive, Inc.~^
0.000%, 02/15/26 | | | 35,071,625 | | |
See accompanying Notes to Schedule of Investments
www.calamos.com
89
Market Neutral Income Fund Schedule of Investments October 31, 2023
PRINCIPAL
AMOUNT | | | | VALUE | |
| | 5,000,000 | | | Porch Group, Inc.~*
0.750%, 09/15/26 | | $ | 723,350 | | |
| | 37,500,000 | | | Rivian Automotive, Inc.*
4.625%, 03/15/29~^ | | | 39,531,750 | | |
| | 35,000,000 | | | 3.625%, 10/15/30 | | | 31,796,450 | | |
| | 30,000,000 | | | Royal Caribbean Cruises, Ltd.
6.000%, 08/15/25 | | | 54,858,600 | | |
| | 10,245,000 | | | Shake Shack, Inc.~
0.000%, 03/01/28 | | | 7,576,382 | | |
| | 10,833,000 | | | Stride, Inc.~^
1.125%, 09/01/27 | | | 12,846,421 | | |
| | 16,822,000 | | | Tesla, Inc.~
2.000%, 05/15/24 | | | 163,850,486 | | |
| | 7,500,000 | | | Vail Resorts, Inc.^
0.000%, 01/01/26 | | | 6,566,550 | | |
| | 11,632,000 | | | Vroom, Inc.~
0.750%, 07/01/26 | | | 6,132,390 | | |
| | 45,000,000 | | | Wayfair, Inc.
3.500%, 11/15/28~* | | | 52,285,050 | | |
| | 25,000,000 | | | 1.000%, 08/15/26^ | | | 18,874,750 | | |
| | 23,055,000 | | | 3.250%, 09/15/27 | | | 22,216,720 | | |
| | 12,590,000 | | | 0.625%, 10/01/25 | | | 10,709,180 | | |
| | 7,029,000 | | | Wynn Macau, Ltd.~*
4.500%, 03/07/29 | | | 7,170,424 | | |
| | | | 1,059,203,638 | | |
| | | Consumer Staples (0.4%) | |
| | 11,500,000 | | | Beauty Health Company~*
1.250%, 10/01/26 | | | 8,624,425 | | |
| | 36,755,000 | | | Beyond Meat, Inc.~
0.000%, 03/15/27 | | | 7,395,473 | | |
| | 5,500,000 | | | Enovis Corp.*^
3.875%, 10/15/28 | | | 5,746,125 | | |
| | 8,000,000 | | | Freshpet, Inc.~*
3.000%, 04/01/28 | | | 8,578,080 | | |
| | 15,000,000 | | | Post Holdings, Inc.
2.500%, 08/15/27 | | | 14,318,550 | | |
| | 610,000,000 | JPY | | Yaoko Company, Ltd.
0.000%, 06/20/24 | | | 5,199,337 | | |
| | | | 49,861,990 | | |
| | | Energy (1.4%) | |
| | 15,000,000 | | | Chesapeake Energy Corp.
0.000%, 09/15/26 | | | 337,500 | | |
| | 5,000,000 | | | Northern Oil & Gas, Inc.^
3.625%, 04/15/29 | | | 5,905,350 | | |
| | 71,500,000 | | | Pioneer Natural Resources
Company~
0.250%, 05/15/25 | | | 182,465,855 | | |
| | 6,000,000 | | | World Kinect Corp.*
3.250%, 07/01/28 | | | 5,376,600 | | |
| | | | 194,085,305 | | |
| | | Financials (0.7%) | |
| | 50,000,000 | | | Coinbase Global, Inc.~
0.500%, 06/01/26 | | | 37,943,500 | | |
PRINCIPAL
AMOUNT | | | | VALUE | |
| | 20,000,000 | | | JPMorgan Chase Bank NA
0.000%, 12/28/23 | | $ | 19,806,000 | | |
| | 75,000,000 | HKD | | Link CB, Ltd.
4.500%, 12/12/27 | | | 9,409,444 | | |
| | 10,000,000 | | | SoFi Technologies, Inc.~*
0.000%, 10/15/26 | | | 7,575,500 | | |
| | 5,000,000 | | | Starwood Property Trust, Inc.
6.750%, 07/15/27 | | | 4,834,900 | | |
| | 15,000,000 | | | Ventas Realty, LP~*
3.750%, 06/01/26 | | | 14,775,150 | | |
| | | | 94,344,494 | | |
| | | Health Care (3.5%) | |
| | 30,000,000 | | | Alnylam Pharmaceuticals, Inc.^
1.000%, 09/15/27 | | | 26,035,800 | | |
| | 10,000,000 | | | Amphastar Pharmaceuticals,
Inc.*
2.000%, 03/15/29 | | | 9,811,600 | | |
| | 8,500,000 | | | Ascendis Pharma, A/S~
2.250%, 04/01/28 | | | 7,571,630 | | |
| | 10,000,000 | | | Bridgebio Pharma, Inc.~
2.500%, 03/15/27 | | | 9,497,900 | | |
| | 10,000,000 | | | 2.250%, 02/01/29 | | | 7,359,500 | | |
| | 3,759,000 | | | Coherus Biosciences, Inc.
1.500%, 04/15/26 | | | 2,099,627 | | |
| | 25,000,000 | | �� | CONMED Corp.~
2.250%, 06/15/27 | | | 23,403,750 | | |
| | 3,188,000 | | | CryoPort, Inc.~*
0.750%, 12/01/26 | | | 2,522,824 | | |
| | 40,000,000 | | | Dexcom, Inc.~
0.375%, 05/15/28* | | | 35,282,400 | | |
| | 30,000,000 | | | 0.750%, 12/01/23 | | | 64,689,000 | | |
| | 9,000,000 | | | Envista Holdings Corp.*
1.750%, 08/15/28 | | | 7,787,160 | | |
| | 37,000,000 | | | Halozyme Therapeutics, Inc.
1.000%, 08/15/28 | | | 32,553,710 | | |
| | 10,000,000 | | | Innoviva, Inc.
2.125%, 03/15/28 | | | 8,157,400 | | |
| | 5,000,000 | | | 2.500%, 08/15/25~ | | | 4,889,200 | | |
| | 9,000,000 | | | Insmed, Inc.~
0.750%, 06/01/28 | | | 8,747,820 | | |
| | 27,500,000 | | | Insulet Corp.~
0.375%, 09/01/26 | | | 25,474,625 | | |
| | 8,501,000 | | | Integer Holdings Corp.~*
2.125%, 02/15/28 | | | 9,357,731 | | |
| | 5,000,000 | | | Intercept Pharmaceuticals, Inc.
2.000%, 05/15/26 | | | 4,938,750 | | |
| | 17,366,000 | | | Ionis Pharmaceuticals, Inc.~*
1.750%, 06/15/28 | | | 17,940,120 | | |
| | 9,500,000 | | | Ironwood Pharmaceuticals, Inc.
1.500%, 06/15/26~ | | | 9,148,310 | | |
| | 5,000,000 | | | 0.750%, 06/15/24 | | | 4,912,800 | | |
| | 19,500,000 | | | Jazz Investments I, Ltd.~
2.000%, 06/15/26 | | | 19,796,985 | | |
See accompanying Notes to Schedule of Investments
CALAMOS OPEN-END FAMILY OF FUNDS ANNUAL REPORT
90
Market Neutral Income Fund Schedule of Investments October 31, 2023
PRINCIPAL
AMOUNT | | | | VALUE | |
| | 5,000,000 | | | Lantheus Holdings, Inc.~*
2.625%, 12/15/27 | | $ | 5,547,600 | | |
| | 7,250,000 | | | Livongo Health, Inc.~
0.875%, 06/01/25 | | | 6,626,355 | | |
| | 5,000,000 | | | Mesa Laboratories, Inc.~
1.375%, 08/15/25 | | | 4,448,750 | | |
| | 10,000,000 | | | Natera, Inc.~
2.250%, 05/01/27 | | | 12,190,800 | | |
| | 10,000,000 | | | NeoGenomics, Inc.
0.250%, 01/15/28 | | | 7,226,700 | | |
| | 12,910,000 | | | NextGen Healthcare, Inc.*
3.750%, 11/15/27 | | | 14,521,813 | | |
| | 12,500,000 | | | Omnicell, Inc.~
0.250%, 09/15/25 | | | 11,112,125 | | |
| | 4,000,000 | | | Revance Therapeutics, Inc.~
1.750%, 02/15/27 | | | 3,007,080 | | |
| | 45,000,000 | | | Sarepta Therapeutics, Inc.^
1.250%, 09/15/27 | | | 38,319,750 | | |
| | 8,000,000 | | | Shockwave Medical, Inc.*
1.000%, 08/15/28 | | | 7,756,880 | | |
| | 12,500,000 | | | SmileDirectClub, Inc.*@
0.000%, 02/01/26 | | | 202,625 | | |
| | 5,000,000 | | | Tabula Rasa HealthCare, Inc.~
1.750%, 02/15/26 | | | 4,948,550 | | |
| | 16,250,000 | | | Teladoc Health, Inc.~
1.250%, 06/01/27 | | | 12,686,863 | | |
| | 5,000,000 | | | TransMedics Group, Inc.~*^
1.500%, 06/01/28 | | | 3,870,000 | | |
| | 10,500,000 | | | Veradigm, Inc.~
0.875%, 01/01/27 | | | 11,862,900 | | |
| | | | 486,307,433 | | |
| | | Industrials (1.6%) | |
| | 5,000,000 | | | Advanced Energy Industries,
Inc.*^
2.500%, 09/15/28 | | | 4,621,500 | | |
| | 5,000,000 | | | Air Transport Services Group,
Inc.*
3.875%, 08/15/29 | | | 4,617,450 | | |
| | 17,500,000 | | | American Airlines Group,
Inc.~^
6.500%, 07/01/25 | | | 17,714,900 | | |
| | 10,000,000 | | | Axon Enterprise, Inc.~*^
0.500%, 12/15/27 | | | 10,788,100 | | |
| | 11,000,000 | | | Bloom Energy Corp.~*
3.000%, 06/01/28 | | | 9,505,760 | | |
| | 15,000,000 | | | Chart Industries, Inc.~
1.000%, 11/15/24 | | | 30,286,500 | | |
| | 17,500,000 | | | Fluor Corp.*^
1.125%, 08/15/29 | | | 16,894,325 | | |
| | 7,000,000 | | | Granite Construction, Inc.~*
3.750%, 05/15/28 | | | 7,547,330 | | |
| | 6,600,000 | | | Greenbrier Companies, Inc.~
2.875%, 04/15/28 | | | 5,724,312 | | |
PRINCIPAL
AMOUNT | | | | VALUE | |
| | 20,000,000 | | | John Bean Technologies Corp.~
0.250%, 05/15/26 | | $ | 17,998,200 | | |
| | 16,467,000 | | | Middleby Corp.~^
1.000%, 09/01/25 | | | 17,104,438 | | |
| | 15,000,000 | EUR | | Safran, SA
0.875%, 05/15/27 | | | 24,226,740 | | |
| | 20,000,000 | SGD | | Singapore Airlines, Ltd.
1.625%, 12/03/25 | | | 17,338,202 | | |
| | 4,000,000 | | | Stem, Inc.~*
0.500%, 12/01/28 | | | 2,105,960 | | |
| | 7,500,000 | | | Tetra Tech, Inc.*^
2.250%, 08/15/28 | | | 7,265,175 | | |
| | 35,000,000 | | | Upwork, Inc.~
0.250%, 08/15/26 | | | 28,764,400 | | |
| | 15,000,000 | | | Virgin Galactic Holdings, Inc.~*
2.500%, 02/01/27 | | | 5,314,350 | | |
| | | | 227,817,642 | | |
| | | Information Technology (16.6%) | |
| | 20,000,000 | | | 3D Systems Corp.
0.000%, 11/15/26 | | | 13,755,400 | | |
| | 30,056,000 | | | Affirm Holdings, Inc.
0.000%, 11/15/26 | | | 21,663,764 | | |
| | 83,500,000 | | | Akamai Technologies, Inc.
0.375%, 09/01/27~^ | | | 85,058,945 | | |
| | 55,000,000 | | | 0.125%, 05/01/25~ | | | 63,663,600 | | |
| | 20,000,000 | | | 1.125%, 02/15/29* | | | 19,690,200 | | |
| | 10,000,000 | | | Altair Engineering, Inc.
1.750%, 06/15/27 | | | 10,515,700 | | |
| | 10,000,000 | | | Alteryx, Inc.~
1.000%, 08/01/26 | | | 8,817,100 | | |
| | 10,000,000 | | | 0.500%, 08/01/24 | | | 9,571,100 | | |
| | 16,398,000 | | | Bentley Systems, Inc.~
0.125%, 01/15/26 | | | 15,651,727 | | |
| | 15,000,000 | | | BigCommerce Holdings, Inc.
0.250%, 10/01/26 | | | 11,810,250 | | |
| | 50,000,000 | | | BILL Holdings, Inc.
0.000%, 12/01/25~ | | | 47,523,000 | | |
| | 20,000,000 | | | 0.000%, 04/01/27^ | | | 15,872,600 | | |
| | 50,000,000 | | | Blackline, Inc.~
0.000%, 03/15/26 | | | 42,725,000 | | |
| | 24,000,000 | | | 0.125%, 08/01/24 | | | 23,275,680 | | |
| | 60,000,000 | | | Block, Inc.
0.125%, 03/01/25~^ | | | 55,376,400 | | |
| | 20,000,000 | | | 0.250%, 11/01/27^ | | | 14,982,600 | | |
| | 17,000,000 | | | 0.000%, 05/01/26~ | | | 14,104,390 | | |
| | 25,000,000 | | | Box, Inc.~
0.000%, 01/15/26 | | | 27,416,750 | | |
| | 20,000,000 | | | Ceridian HCM Holding, Inc.~
0.250%, 03/15/26 | | | 17,408,400 | | |
| | 60,000,000 | | | Cloudflare, Inc.~
0.000%, 08/15/26 | | | 50,425,200 | | |
| | 59,700,000 | | | Confluent, Inc.~
0.000%, 01/15/27 | | | 48,185,064 | | |
See accompanying Notes to Schedule of Investments
www.calamos.com
91
Market Neutral Income Fund Schedule of Investments October 31, 2023
PRINCIPAL
AMOUNT | | | | VALUE | |
| | 10,000,000 | | | CSG Systems International,
Inc.*
3.875%, 09/15/28 | | $ | 9,326,000 | | |
| | 15,000,000 | | | CyberArk Software, Ltd.~^
0.000%, 11/15/24 | | | 17,172,000 | | |
| | 20,000,000 | | | Datadog, Inc.~
0.125%, 06/15/25 | | | 22,024,800 | | |
| | 62,500,000 | | | DigitalOcean Holdings, Inc.~
0.000%, 12/01/26 | | | 47,028,750 | | |
| | 27,750,000 | | | Dropbox, Inc.~^
0.000%, 03/01/28 | | | 25,741,455 | | |
| | 23,000,000 | | | 0.000%, 03/01/26 | | | 21,509,830 | | |
| | 16,000,000 | | | Enphase Energy, Inc.~
0.000%, 03/01/28^ | | | 11,870,880 | | |
| | 10,000,000 | | | 0.000%, 03/01/26 | | | 8,528,300 | | |
| | 10,000,000 | | | Envestnet, Inc.~
2.625%, 12/01/27* | | | 8,580,600 | | |
| | 6,000,000 | | | 0.750%, 08/15/25 | | | 5,457,120 | | |
| | 8,000,000 | | | Everbridge, Inc.~
0.000%, 03/15/26 | | | 6,742,960 | | |
| | 50,000,000 | | | Fastly, Inc.~
0.000%, 03/15/26 | | | 42,077,000 | | |
| | 15,000,000 | | | Five9, Inc.~
0.500%, 06/01/25 | | | 13,726,650 | | |
| | 20,000,000 | | | Guidewire Software, Inc.~
1.250%, 03/15/25 | | | 20,330,400 | | |
| | 5,000,000 | | | Impinj, Inc.~
1.125%, 05/15/27 | | | 4,603,450 | | |
| | 15,000,000 | | | Infinera Corp.
3.750%, 08/01/28* | | | 12,151,950 | | |
| | 6,000,000 | | | 3.750%, 08/01/28 | | | 4,694,700 | | |
| | 13,000,000 | | | Insight Enterprises, Inc.~
0.750%, 02/15/25 | | | 27,339,000 | | |
| | 10,000,000 | | | Interdigital, Inc.~
3.500%, 06/01/27 | | | 11,217,000 | | |
| | 15,000,000 | | | Itron, Inc.~
0.000%, 03/15/26 | | | 12,715,200 | | |
| | 15,000,000 | | | Jamf Holding Corp.
0.125%, 09/01/26 | | | 12,443,700 | | |
| | 8,000,000 | | | Lenovo Group, Ltd.
3.375%, 01/24/24 | | | 11,618,480 | | |
| | 8,000,000 | | | 2.500%, 08/26/29 | | | 9,599,040 | | |
| | 17,500,000 | | | LivePerson, Inc.~
0.000%, 12/15/26 | | | 11,409,475 | | |
| | 50,500,000 | | | Lumentum Holdings, Inc.
0.500%, 12/15/26~ | | | 41,204,465 | | |
| | 12,500,000 | | | 0.500%, 06/15/28 | | | 8,771,125 | | |
| | 10,000,000 | | | 1.500%, 12/15/29~* | | | 8,295,300 | | |
| | 10,000,000 | | | 0.250%, 03/15/24 | | | 9,785,400 | | |
| | 10,000,000 | | | Marathon Digital Holdings, Inc.
1.000%, 12/01/26 | | | 7,214,400 | | |
| | 29,523,000 | | | MicroStrategy, Inc.~
0.000%, 02/15/27 | | | 21,409,785 | | |
| | 7,000,000 | | | Model N, Inc.~*
1.875%, 03/15/28 | | | 6,233,080 | | |
PRINCIPAL
AMOUNT | | | | VALUE | |
| | 65,500,000 | | | MongoDB, Inc.~
0.250%, 01/15/26 | | $ | 111,762,650 | | |
| | 40,000,000 | | | NCL Corp., Ltd.
1.125%, 02/15/27 | | | 31,021,600 | | |
| | 20,000,000 | | | Nice Systems, Inc.~
1.250%, 01/15/24 | | | 36,903,800 | | |
| | 10,000,000 | | | Nova, Ltd.~
0.000%, 10/15/25 | | | 13,267,800 | | |
| | 14,984,000 | | | Nutanix, Inc.
0.250%, 10/01/27 | | | 13,508,675 | | |
| | 38,500,000 | | | Okta, Inc.~
0.375%, 06/15/26 | | | 33,018,755 | | |
| | 22,500,000 | | | 0.125%, 09/01/25 | | | 20,144,700 | | |
| | 70,000,000 | | | ON Semiconductor Corp.~
0.000%, 05/01/27 | | | 91,641,900 | | |
| | 35,000,000 | | | 0.500%, 03/01/29*^ | | | 30,769,900 | | |
| | 10,000,000 | | | PagerDuty, Inc.*
1.500%, 10/15/28 | | | 9,821,800 | | |
| | 100,000,000 | | | Palo Alto Networks, Inc.~
0.375%, 06/01/25 | | | 244,202,000 | | |
| | 22,500,000 | | | Pegasystems, Inc.~
0.750%, 03/01/25 | | | 20,691,450 | | |
| | 12,500,000 | | | Progress Software Corp.~
1.000%, 04/15/26 | | | 12,712,125 | | |
| | 2,000,000 | | | PROS Holdings, Inc.~
2.250%, 09/15/27 | | | 1,983,740 | | |
| | 30,625,000 | | | Q2 Holdings, Inc.~
0.125%, 11/15/25 | | | 26,851,388 | | |
| | 19,500,000 | | | Rapid7, Inc.
0.250%, 03/15/27~ | | | 16,718,910 | | |
| | 10,000,000 | | | 1.250%, 03/15/29* | | | 9,674,200 | | |
| | 7,500,000 | | | Repay Holdings Corp.~*
0.000%, 02/01/26 | | | 6,002,625 | | |
| | 41,100,000 | | | RingCentral, Inc.~
0.000%, 03/15/26 | | | 34,241,232 | | |
| | 2,353,000 | | | 0.000%, 03/01/25 | | | 2,152,242 | | |
| | 20,000,000 | | | Seagate HDD Cayman*
3.500%, 06/01/28 | | | 20,746,800 | | |
| | 17,500,000 | | | Shift4 Payments, Inc.~
0.500%, 08/01/27 | | | 13,792,800 | | |
| | 15,000,000 | | | 0.000%, 12/15/25^ | | | 13,660,500 | | |
| | 15,000,000 | | | Shopify, Inc.~
0.125%, 11/01/25 | | | 13,226,400 | | |
| | 39,500,000 | | | Splunk, Inc.
1.125%, 09/15/25~ | | | 42,465,265 | | |
| | 35,000,000 | | | 1.125%, 06/15/27 | | | 33,085,150 | | |
| | 75,000,000 | | | Spotify USA, Inc.~
0.000%, 03/15/26 | | | 64,215,000 | | |
| | 15,000,000 | | | Teradyne, Inc.~
1.250%, 12/15/23 | | | 39,552,900 | | |
| | 85,074,000 | | | Unity Software, Inc.
0.000%, 11/15/26 | | | 66,670,792 | | |
| | 10,000,000 | | | Varonis Systems, Inc.~
1.250%, 08/15/25 | | | 12,347,500 | | |
See accompanying Notes to Schedule of Investments
CALAMOS OPEN-END FAMILY OF FUNDS ANNUAL REPORT
92
Market Neutral Income Fund Schedule of Investments October 31, 2023
PRINCIPAL
AMOUNT | | | | VALUE | |
| | 10,000,000 | | | Verint Systems, Inc.~
0.250%, 04/15/26 | | $ | 8,440,000 | | |
| | 5,000,000 | | | Veritone, Inc.
1.750%, 11/15/26 | | | 1,751,850 | | |
| | 10,000,000 | | | Vishay Intertechnology, Inc.*
2.250%, 09/15/30 | | | 9,155,200 | | |
| | 26,500,000 | | | Western Digital Corp.~
1.500%, 02/01/24 | | | 26,197,105 | | |
| | 12,466,000 | | | Wix.com, Ltd.
0.000%, 08/15/25 | | | 11,054,350 | | |
| | 20,000,000 | | | Wolfspeed, Inc.
1.875%, 12/01/29*^ | | | 11,946,400 | | |
| | 17,500,000 | | | 1.750%, 05/01/26~ | | | 17,504,025 | | |
| | 15,000,000 | | | 0.250%, 02/15/28^ | | | 9,249,600 | | |
| | 17,862,000 | | | Workiva, Inc.
1.250%, 08/15/28*^ | | | 16,224,412 | | |
| | 7,516,000 | | | 1.125%, 08/15/26 | | | 9,286,168 | | |
| | | | 2,305,978,874 | | |
| | | Materials (0.2%) | |
| | 14,304,000 | | | Amyris, Inc.@
1.500%, 11/15/26 | | | 1,530,957 | | |
| | 10,000,000 | | | ATI, Inc.~
3.500%, 06/15/25 | | | 24,741,600 | | |
| | 3,124,000 | | | Lithium Americas Argentina
Corp.
1.750%, 01/15/27 | | | 2,109,012 | | |
| | | | 28,381,569 | | |
| | | Other (0.1%) | |
| | 10,000,000 | | | QIAGEN, NV
0.000%, 12/17/27 | | | 8,874,200 | | |
| | 10,000,000 | | | Upstart Holdings, Inc.
0.250%, 08/15/26 | | | 6,371,500 | | |
| | | | 15,245,700 | | |
| | | Real Estate (0.5%) | |
| | 20,000,000 | EUR | | ANLLIAN Capital, Ltd.
0.000%, 02/05/25 | | | 22,676,782 | | |
| | 12,500,000 | | | Opendoor Technologies, Inc.~*
0.250%, 08/15/26 | | | 8,094,375 | | |
| | 35,000,000 | | | Redfin Corp.~
0.500%, 04/01/27 | | | 19,988,850 | | |
| | 25,000,000 | | | Welltower OP, LLC~*
2.750%, 05/15/28 | | | 25,683,250 | | |
| | | | 76,443,257 | | |
| | | Utilities (1.9%) | |
| | 25,000,000 | | | Alliant Energy Corp.*
3.875%, 03/15/26 | | | 24,435,750 | | |
| | 39,542,000 | | | American Water Capital
Corp.~*^
3.625%, 06/15/26 | | | 38,069,851 | | |
| | 25,000,000 | | | CenterPoint Energy, Inc.*
4.250%, 08/15/26 | | | 24,465,500 | | |
| | 15,040,000 | | | CMS Energy Corp.~*
3.375%, 05/01/28 | | | 14,240,474 | | |
PRINCIPAL
AMOUNT | | | | VALUE | |
| | 40,000,000 | | | Duke Energy Corp.~*^
4.125%, 04/15/26 | | $ | 38,959,600 | | |
| | 30,000,000 | | | Firstenergy Corp.~*
4.000%, 05/01/26 | | | 29,176,800 | | |
| | 12,500,000 | | | NextEra Energy Partners, LP~*
0.000%, 06/15/24 | | | 11,929,125 | | |
| | 5,000,000 | | | NRG Energy, Inc.
2.750%, 06/01/48 | | | 5,612,250 | | |
| | 21,922,000 | | | PPL Capital Funding, Inc.~*^
2.875%, 03/15/28 | | | 20,104,228 | | |
| | 60,000,000 | | | Southern Company~*^
3.875%, 12/15/25 | | | 58,948,800 | | |
| | 8,000,000 | | | Sunnova Energy International,
Inc.
2.625%, 02/15/28 | | | 3,840,320 | | |
| | | | 269,782,698 | | |
| | | TOTAL CONVERTIBLE
BONDS
(Cost $5,429,729,442) | | | 5,241,477,841 | | |
CORPORATE BONDS (1.7%) | | | |
| | | Airlines (0.0%) | |
| | 2,248,512 | | | Mileage Plus Holdings, LLC /
Mileage Plus Intellectual
Property Assets, Ltd.~*
6.500%, 06/20/27 | | | 2,222,654 | | |
| | | Communication Services (0.1%) | |
| | 3,257,000 | | | Comcast Corp.~
3.375%, 08/15/25 | | | 3,136,198 | | |
| | 3,000,000 | | | 5.250%, 11/07/25 | | | 2,985,960 | | |
| | 3,214,000 | | | Netflix, Inc.~*
3.625%, 06/15/25 | | | 3,101,767 | | |
| | 2,500,000 | | | Verizon Communications,
Inc.~^
1.450%, 03/20/26 | | | 2,261,400 | | |
| | | | 11,485,325 | | |
| | | Consumer Discretionary (0.2%) | |
| | 5,000,000 | | | American Honda Finance
Corp.~
4.750%, 01/12/26 | | | 4,914,150 | | |
| | 5,000,000 | | | AutoZone, Inc.
5.050%, 07/15/26 | | | 4,918,700 | | |
| | 4,000,000 | | | BorgWarner, Inc.*
5.000%, 10/01/25 | | | 3,916,560 | | |
| | 5,000,000 | | | Cargill, Inc.~*
4.875%, 10/10/25 | | | 4,950,300 | | |
| | 5,000,000 | | | General Motors Financial
Company, Inc.
1.250%, 01/08/26 | | | 4,482,450 | | |
| | 5,000,000 | | | Lowe's Companies, Inc.~^
4.400%, 09/08/25 | | | 4,890,650 | | |
| | 1,859,000 | | | VF Corp.~
2.400%, 04/23/25 | | | 1,750,825 | | |
| | | | 29,823,635 | | |
See accompanying Notes to Schedule of Investments
www.calamos.com
93
Market Neutral Income Fund Schedule of Investments October 31, 2023
PRINCIPAL
AMOUNT | | | | VALUE | |
| | | Consumer Staples (0.1%) | |
| | 5,000,000 | | | Dollar General Corp.~
4.150%, 11/01/25 | | $ | 4,820,800 | | |
| | 5,000,000 | | | General Mills, Inc.~^
5.241%, 11/18/25 | | | 4,948,650 | | |
| | | | 9,769,450 | | |
| | | Energy (0.2%) | |
| | 5,000,000 | | | Enterprise Products Operating,
LLC~
5.050%, 01/10/26 | | | 4,942,450 | | |
| | 5,000,000 | | | MPLX, LP~
4.875%, 06/01/25 | | | 4,904,350 | | |
| | 9,000,000 | | | PDC Energy, Inc.
5.750%, 05/15/26 | | | 8,970,750 | | |
| | 3,000,000 | | | Williams Companies, Inc.~
5.400%, 03/02/26 | | | 2,965,920 | | |
| | | | 21,783,470 | | |
| | | Financials (0.5%) | |
| | 5,000,000 | | | Bank of America Corp.~‡
1.530%, 12/06/25
SOFR + 0.65% | | | 4,724,300 | | |
| | 5,000,000 | | | Bank of Montreal
4.250%, 09/14/24~ | | | 4,923,550 | | |
| | 1,000,000 | | | 5.200%, 12/12/24 | | | 991,660 | | |
| | 5,000,000 | | | Bank of NY Mellon Corp.~‡
4.414%, 07/24/26
SOFR + 1.35% | | | 4,856,900 | | |
| | 3,500,000 | | | Citizens Bank NA~‡
6.064%, 10/24/25
SOFR + 1.45% | | | 3,354,260 | | |
| | 5,000,000 | | | Huntington National Bank~‡
5.699%, 11/18/25
SOFR + 1.22% | | | 4,858,600 | | |
| | 2,000,000 | | | Intercontinental Exchange,
Inc.~
3.650%, 05/23/25 | | | 1,934,560 | | |
| | 5,000,000 | | | JPMorgan Chase & Company~‡
2.595%, 02/24/26
SOFR + 0.92% | | | 4,766,700 | | |
| | 5,000,000 | | | Mondelez International
Holdings Netherlands, BV~*
4.250%, 09/15/25 | | | 4,862,800 | | |
| | 208,000 | | | Nasdaq, Inc.
5.650%, 06/28/25 | | | 207,324 | | |
| | 5,000,000 | | | PayPal Holdings, Inc.~
2.650%, 10/01/26 | | | 4,606,350 | | |
| | 5,000,000 | | | PNC Financial Services Group,
Inc.~‡
5.671%, 10/28/25
SOFR + 1.09% | | | 4,950,050 | | |
| | 5,000,000 | | | State Street Corp.‡
5.751%, 11/04/26
SOFR + 1.35% | | | 4,971,850 | | |
PRINCIPAL
AMOUNT | | | | VALUE | |
| | 5,000,000 | | | Toronto-Dominion Bank~
3.766%, 06/06/25 | | $ | 4,833,900 | | |
| | 5,000,000 | | | Toyota Motor Credit Corp.~
3.950%, 06/30/25 | | | 4,875,900 | | |
| | 5,000,000 | | | Truist Financial Corp.~^‡
5.900%, 10/28/26
SOFR + 1.63% | | | 4,904,650 | | |
| | 5,000,000 | | | US Bancorp~‡
5.727%, 10/21/26
SOFR + 1.43% | | | 4,927,450 | | |
| | | | 69,550,804 | | |
| | | Health Care (0.2%) | |
| | 5,000,000 | | | Amgen, Inc.~
5.250%, 03/02/25 | | | 4,961,950 | | |
| | 4,860,000 | | | Baxter International, Inc.~
1.322%, 11/29/24 | | | 4,621,666 | | |
| | 5,000,000 | | | CVS Health Corp.~
5.000%, 02/20/26 | | | 4,905,100 | | |
| | 5,000,000 | | | Elevance Health, Inc.~
5.350%, 10/15/25 | | | 4,963,150 | | |
| | 4,283,000 | | | Gilead Sciences, Inc.~
3.500%, 02/01/25 | | | 4,162,819 | | |
| | 5,000,000 | | | UnitedHealth Group, Inc.~
5.150%, 10/15/25 | | | 4,983,000 | | |
| | 5,000,000 | | | Zoetis, Inc.~
5.400%, 11/14/25 | | | 4,965,900 | | |
| | | | 33,563,585 | | |
| | | Industrials (0.1%) | |
| | 2,500,000 | | | Lockheed Martin Corp.~
4.950%, 10/15/25 | | | 2,482,900 | | |
| | 1,750,000 | | | Roper Technologies, Inc.~
2.350%, 09/15/24 | | | 1,697,150 | | |
| | 3,830,000 | | | RTX Corp.~
3.950%, 08/16/25 | | | 3,706,636 | | |
| | 5,000,000 | | | Siemens
Financieringsmaatschappij, NV*
3.250%, 05/27/25 | | | 4,824,150 | | |
| | | | 12,710,836 | | |
| | | Information Technology (0.1%) | |
| | 3,500,000 | | | Broadridge Financial Solutions,
Inc.~
3.400%, 06/27/26 | | | 3,274,495 | | |
| | 3,000,000 | | | Mercedes-Benz Finance
North America, LLC~*
5.375%, 11/26/25 | | | 2,984,400 | | |
| | 5,500,000 | | | Playtika Holding Corp.*
4.250%, 03/15/29 | | | 4,440,370 | | |
| | 5,000,000 | | | Take-Two Interactive Software,
Inc.
5.000%, 03/28/26 | | | 4,896,450 | | |
| | | | 15,595,715 | | |
See accompanying Notes to Schedule of Investments
CALAMOS OPEN-END FAMILY OF FUNDS ANNUAL REPORT
94
Market Neutral Income Fund Schedule of Investments October 31, 2023
PRINCIPAL
AMOUNT | | | | VALUE | |
| | | Materials (0.0%) | |
| | 3,417,000 | | | Sherwin-Williams Company~
4.050%, 08/08/24 | | $ | 3,366,462 | | |
| | | Other (0.1%) | |
| | 5,000,000 | | | Diageo Capital, PLC~
5.200%, 10/24/25 | | | 4,980,700 | | |
| | 1,457,000 | | | Schlumberger Holdings Corp.~*
3.750%, 05/01/24 | | | 1,441,935 | | |
| | | | 6,422,635 | | |
| | | Utilities (0.1%) | |
| | 5,000,000 | | | National Rural Utilities
Cooperative Finance Corp.~
5.450%, 10/30/25 | | | 4,995,100 | | |
| | 5,000,000 | | | Southern Company~
5.150%, 10/06/25 | | | 4,945,250 | | |
| | 5,000,000 | | | WEC Energy Group, Inc.~
5.000%, 09/27/25 | | | 4,930,150 | | |
| | | | 14,870,500 | | |
| | | TOTAL CORPORATE BONDS
(Cost $233,640,400) | | | 231,165,071 | | |
NUMBER OF
SHARES | |
| | VALUE | |
CONVERTIBLE PREFERRED STOCKS (0.5%) | | | |
| | | Financials (0.2%) | |
| | 599,428 | | | Apollo Global Management,
Inc.~^
6.750%, 07/31/26 | | | 28,838,481 | | |
| | | Industrials (0.2%) | |
| | 246,461 | | | Chart Industries, Inc.~
6.750%, 12/15/25 | | | 12,116,023 | | |
| | 178,572 | | | Clarivate, PLC~
5.250%, 06/01/24 | | | 4,987,516 | | |
| | 47,143 | | | RBC Bearings, Inc.~^
5.000%, 10/15/24 | | | 4,958,972 | | |
| | | | 22,062,511 | | |
| | | Utilities (0.1%) | |
| | 400,000 | | | NextEra Energy, Inc.~^
6.926%, 09/01/25 | | | 15,016,000 | | |
| | | TOTAL CONVERTIBLE
PREFERRED STOCKS
(Cost $84,408,600) | | | 65,916,992 | | |
COMMON STOCKS (51.9%) | | | |
| | | Communication Services (4.4%) | |
| | 1,009,651 | | | Alphabet, Inc. - Class A~# | | | 125,277,496 | | |
| | 1,168,601 | | | Alphabet, Inc. - Class C~# | | | 146,425,705 | | |
| | 1,097,717 | | | AT&T, Inc. | | | 16,904,842 | | |
| | 899,938 | | | Comcast Corp. - Class A~ | | | 37,158,440 | | |
| | 345,637 | | | EchoStar Corp. - Class A# | | | 4,790,529 | | |
| | 162,671 | | | Fox Corp. - Class A^ | | | 4,943,572 | | |
NUMBER OF
SHARES | |
| | VALUE | |
| | 202,676 | | | Match Group, Inc.# | | $ | 7,012,590 | | |
| | 449,902 | | | Meta Platforms, Inc. -
Class A~# | | | 135,541,975 | | |
| | 90,551 | | | Netflix, Inc.# | | | 37,278,941 | | |
| | 144,959 | | | T-Mobile U.S., Inc.# | | | 20,853,802 | | |
| | 500,000 | | | TEGNA, Inc.~ | | | 7,255,000 | | |
| | 837,685 | | | Verizon Communications, Inc.~ | | | 29,427,874 | | |
| | 406,307 | | | Walt Disney Company~# | | | 33,150,588 | | |
| | | | 606,021,354 | | |
| | | Consumer Discretionary (5.0%) | |
| | 1,741,364 | | | Amazon.com, Inc.# | | | 231,758,135 | | |
| | 155,038 | | | Aptiv, PLC# | | | 13,519,314 | | |
| | 7,543 | | | Booking Holdings, Inc.~# | | | 21,041,651 | | |
| | 205,248 | | | Caesars Entertainment, Inc.# | | | 8,187,343 | | |
| | 484,724 | | | Capri Holdings, Ltd.~# | | | 24,808,174 | | |
| | 650,042 | | | Carnival Corp.^# | | | 7,449,481 | | |
| | 9,579 | | | Chipotle Mexican Grill, Inc.# | | | 18,604,334 | | |
| | 57,506 | | | Darden Restaurants, Inc.~ | | | 8,368,848 | | |
| | 174,697 | | | DR Horton, Inc.~ | | | 18,238,367 | | |
| | 163,821 | | | eBay, Inc. | | | 6,426,698 | | |
| | 836,378 | | | Ford Motor Company~ | | | 8,154,685 | | |
| | 314,009 | | | General Motors Company | | | 8,855,054 | | |
| | 217,483 | | | Home Depot, Inc.~ | | | 61,915,235 | | |
| | 343,719 | | | iRobot Corp.~# | | | 11,318,667 | | |
| | 186,875 | | | Las Vegas Sands Corp. | | | 8,869,087 | | |
| | 175,942 | | | Lowe's Companies, Inc.~ | | | 33,529,267 | | |
| | 17,014 | | | Lululemon Athletica, Inc.# | | | 6,694,669 | | |
| | 138,936 | | | McDonald's Corp. | | | 36,424,851 | | |
| | 190,815 | | | MGM Resorts International# | | | 6,663,260 | | |
| | 26,250 | | | Next.e.GO, NV# | | | 22,081 | | |
| | 294,770 | | | NIKE, Inc. - Class B~ | | | 30,293,513 | | |
| | 446,904 | | | Norwegian Cruise Line
Holdings, Ltd.^# | | | 6,077,894 | | |
| | 17,562 | | | O'Reilly Automotive, Inc.# | | | 16,340,387 | | |
| | 99,301 | | | Ross Stores, Inc.~ | | | 11,515,937 | | |
| | 241,173 | | | Starbucks Corp.~ | | | 22,245,798 | | |
| | 138,720 | | | Tesla, Inc.# | | | 27,860,525 | | |
| | 272,903 | | | TJX Cos., Inc.~ | | | 24,034,567 | | |
| | 30,020 | | | Ulta Beauty, Inc.# | | | 11,446,926 | | |
| | | | 690,664,748 | | |
| | | Consumer Staples (3.6%) | |
| | 1,310,362 | | | Albertsons Companies, Inc. -
Class A~ | | | 28,434,855 | | |
| | 404,258 | | | Altria Group, Inc.~ | | | 16,239,044 | | |
| | 164,436 | | | Archer-Daniels-Midland
Company~ | | | 11,768,685 | | |
| | 105,675 | | | Church & Dwight Company,
Inc. | | | 9,610,084 | | |
See accompanying Notes to Schedule of Investments
www.calamos.com
95
Market Neutral Income Fund Schedule of Investments October 31, 2023
NUMBER OF
SHARES | |
| | VALUE | |
| | 701,163 | | | Coca-Cola Company | | $ | 39,608,698 | | |
| | 162,938 | | | Colgate-Palmolive Company~ | | | 12,239,903 | | |
| | 81,673 | | | Constellation Brands, Inc. -
Class A | | | 19,123,733 | | |
| | 64,710 | | | Costco Wholesale Corp.~ | | | 35,748,392 | | |
| | 49,881 | | | Dollar General Corp.~ | | | 5,937,834 | | |
| | 90,104 | | | Dollar Tree, Inc.^# | | | 10,009,653 | | |
| | 61,996 | | | Estee Lauder Companies, Inc. -
Class A | | | 7,989,425 | | |
| | 178,221 | | | General Mills, Inc. | | | 11,627,138 | | |
| | 131,359 | | | Kellanova | | | 6,629,689 | | |
| | 97,902 | | | Kimberly-Clark Corp. | | | 11,712,995 | | |
| | 226,414 | | | Kraft Heinz Company | | | 7,122,984 | | |
| | 234,671 | | | Kroger Company | | | 10,647,023 | | |
| | 462,179 | | | Mondelez International, Inc. -
Class A | | | 30,600,872 | | |
| | 203,462 | | | Monster Beverage Corp.# | | | 10,396,908 | | |
| | 215,599 | | | PepsiCo, Inc.~ | | | 35,203,005 | | |
| | 386,218 | | | Philip Morris International,
Inc.~ | | | 34,435,197 | | |
| | 379,317 | | | Procter & Gamble Company | | | 56,908,930 | | |
| | 480,952 | | | Sovos Brands, Inc.# | | | 10,441,468 | | |
| | 176,311 | | | Sysco Corp. | | | 11,722,918 | | |
| | 109,102 | | | Target Corp.~ | | | 12,087,411 | | |
| | 358,764 | | | Walmart, Inc.~ | | | 58,625,625 | | |
| | | | 504,872,469 | | |
| | | Energy (2.8%) | |
| | 419,453 | | | Chevron Corp.~ | | | 61,126,886 | | |
| | 269,217 | | | ConocoPhillips~ | | | 31,982,980 | | |
| | 265,179 | | | Denbury, Inc.# | | | 23,571,761 | | |
| | 80,576 | | | EOG Resources, Inc.~ | | | 10,172,720 | | |
| | 494,378 | | | Exxon Mobil Corp.~ | | | 52,329,911 | | |
| | 224,133 | | | Hess Corp. | | | 32,364,805 | | |
| | 557,652 | | | Kinder Morgan, Inc. | | | 9,033,962 | | |
| | 293,729 | | | Marathon Petroleum Corp. | | | 44,426,511 | | |
| | 173,076 | | | Occidental Petroleum Corp. | | | 10,697,828 | | |
| | 111,787 | | | ONEOK, Inc. | | | 7,288,512 | | |
| | 78,461 | | | Phillips 66~ | | | 8,950,046 | | |
| | 258,224 | | | Pioneer Natural Resources
Company | | | 61,715,536 | | |
| | 248,731 | | | Schlumberger, NV | | | 13,844,368 | | |
| | 75,908 | | | Valero Energy Corp.~ | | | 9,640,316 | | |
| | 281,371 | | | Williams Companies, Inc. | | | 9,679,163 | | |
| | | | 386,825,305 | | |
| | | Financials (6.3%) | |
| | 138,608 | | | Aflac, Inc.~ | | | 10,826,671 | | |
| | 108,137 | | | Allstate Corp.~ | | | 13,855,594 | | |
| | 190,792 | | | American Express Company~ | | | 27,861,356 | | |
NUMBER OF
SHARES | |
| | VALUE | |
| | 395,390 | | | American International Group,
Inc.~ | | $ | 24,241,361 | | |
| | 54,183 | | | Ameriprise Financial, Inc. | | | 17,044,346 | | |
| | 96,664 | | | Arthur J Gallagher & Company | | | 22,763,405 | | |
| | 81,273 | | | Assurant, Inc. | | | 12,101,550 | | |
| | 2,197,564 | | | Bank of America Corp.~ | | | 57,883,836 | | |
| | 201,797 | | | Bank of New York Mellon Corp. | | | 8,576,372 | | |
| | 291,723 | | | Berkshire Hathaway, Inc. -
Class B~# | | | 99,573,812 | | |
| | 20,937 | | | BlackRock, Inc.~ | | | 12,819,306 | | |
| | 96,086 | | | Cboe Global Markets, Inc. | | | 15,747,534 | | |
| | 379,243 | | | Charles Schwab Corp.~ | | | 19,735,806 | | |
| | 124,587 | | | Chubb, Ltd.~ | | | 26,738,862 | | |
| | 305,816 | | | Citigroup, Inc.~ | | | 12,076,674 | | |
| | 43,545 | | | CME Group, Inc. | | | 9,295,116 | | |
| | 122,472 | | | Discover Financial Services | | | 10,052,502 | | |
| | 128,466 | | | Fiserv, Inc.# | | | 14,613,007 | | |
| | 72,817 | | | Global Payments, Inc. | | | 7,734,622 | | |
| | 117,378 | | | Goldman Sachs Group, Inc.~ | | | 35,637,135 | | |
| | 458,935 | | | Huntington Bancshares, Inc. | | | 4,428,723 | | |
| | 48,544 | | | Jack Henry & Associates, Inc. | | | 6,844,218 | | |
| | 530,936 | | | JPMorgan Chase & Company~ | | | 73,831,960 | | |
| | 53,861 | | | M&T Bank Corp. | | | 6,072,828 | | |
| | 149,428 | | | Marsh & McLennan Cos., Inc. | | | 28,339,020 | | |
| | 183,850 | | | Mastercard, Inc. - Class A | | | 69,191,947 | | |
| | 162,812 | | | MetLife, Inc.~ | | | 9,770,348 | | |
| | 274,860 | | | Morgan Stanley~ | | | 19,465,585 | | |
| | 86,273 | | | Northern Trust Corp. | | | 5,686,253 | | |
| | 147,077 | | | PayPal Holdings, Inc.# | | | 7,618,589 | | |
| | 64,835 | | | Prudential Financial, Inc.~ | | | 5,928,512 | | |
| | 56,279 | | | S&P Global, Inc. | | | 19,658,817 | | |
| | 81,482 | | | State Street Corp.~ | | | 5,266,182 | | |
| | 72,270 | | | Travelers Companies, Inc.~ | | | 12,100,889 | | |
| | 164,777 | | | US Bancorp | | | 5,253,091 | | |
| | 394,739 | | | Visa, Inc. - Class A~^ | | | 92,803,139 | | |
| | 1,024,792 | | | Wells Fargo & Company~ | | | 40,755,978 | | |
| | 260,056 | | | Zions Bancorp NA | | | 8,022,728 | | |
| | | | 880,217,674 | | |
| | | Health Care (7.4%) | |
| | 280,374 | | | Abbott Laboratories | | | 26,509,362 | | |
| | 351,701 | | | AbbVie, Inc.~ | | | 49,653,147 | | |
| | 873,713 | | | Abcam, PLC (ADR)# | | | 20,025,502 | | |
| | 185,629 | | | Agilent Technologies, Inc. | | | 19,188,470 | | |
| | 191,840 | | | Amedisys, Inc.# | | | 17,551,442 | | |
| | 78,837 | | | Amgen, Inc.~ | | | 20,158,621 | | |
| | 207,488 | | | Baxter International, Inc. | | | 6,728,836 | | |
| | 67,384 | | | Becton Dickinson & Co | | | 17,033,327 | | |
| | 40,318 | | | Biogen, Inc.~# | | | 9,577,138 | | |
See accompanying Notes to Schedule of Investments
CALAMOS OPEN-END FAMILY OF FUNDS ANNUAL REPORT
96
Market Neutral Income Fund Schedule of Investments October 31, 2023
NUMBER OF
SHARES | |
| | VALUE | |
| | 631,894 | | | Boston Scientific Corp.# | | $ | 32,346,654 | | |
| | 570,172 | | | Bristol-Myers Squibb
Company~ | | | 29,380,963 | | |
| | 127,665 | | | Centene Corp.# | | | 8,806,332 | | |
| | 54,327 | | | Cigna Group | | | 16,797,908 | | |
| | 239,980 | | | CVS Health Corp.~ | | | 16,561,020 | | |
| | 162,857 | | | Danaher Corp. | | | 31,271,801 | | |
| | 110,102 | | | Dexcom, Inc.# | | | 9,780,361 | | |
| | 184,268 | | | Edwards Lifesciences Corp.~# | | | 11,741,557 | | |
| | 198,964 | | | Eli Lilly & Company | | | 110,212,128 | | |
| | 69,593 | | | GE Healthcare, Inc. | | | 4,632,806 | | |
| | 254,896 | | | Gilead Sciences, Inc. | | | 20,019,532 | | |
| | 54,895 | | | HCA Healthcare, Inc. | | | 12,413,955 | | |
| | 33,297 | | | Humana, Inc. | | | 17,437,306 | | |
| | 91,788 | | | Intuitive Surgical, Inc.# | | | 24,068,649 | | |
| | 55,910 | | | IQVIA Holdings, Inc.# | | | 10,110,205 | | |
| | 441,602 | | | Johnson & Johnson | | | 65,507,241 | | |
| | 49,385 | | | Laboratory Corp. of America
Holdings~ | | | 9,863,666 | | |
| | 34,596 | | | McKesson Corp. | | | 15,753,635 | | |
| | 293,450 | | | Medtronic, PLC | | | 20,705,832 | | |
| | 488,267 | | | Merck & Company, Inc. | | | 50,145,021 | | |
| | 271,814 | | | Mirati Therapeutics, Inc.# | | | 15,093,831 | | |
| | 1,064,516 | | | Pfizer, Inc.~ | | | 32,531,609 | | |
| | 65,880 | | | Quest Diagnostics, Inc.~ | | | 8,570,988 | | |
| | 13,384 | | | Regeneron Pharmaceuticals,
Inc.~# | | | 10,438,048 | | |
| | 136,000 | | | Seagen, Inc.~# | | | 28,942,160 | | |
| | 47,731 | | | Stryker Corp.~ | | | 12,897,871 | �� | |
| | 95,641 | | | Thermo Fisher Scientific, Inc.~ | | | 42,538,248 | | |
| | 230,704 | | | UnitedHealth Group, Inc.~ | | | 123,555,834 | | |
| | 69,958 | | | Vertex Pharmaceuticals, Inc.# | | | 25,332,491 | | |
| | 51,610 | | | Zimmer Biomet Holdings, Inc. | | | 5,388,600 | | |
| | 132,094 | | | Zoetis, Inc. | | | 20,738,758 | | |
| | | | 1,030,010,855 | | |
| | | Industrials (4.2%) | |
| | 81,230 | | | 3M Company | | | 7,387,868 | | |
| | 57,027 | | | Allegion, PLC | | | 5,609,176 | | |
| | 108,748 | | | Automatic Data Processing,
Inc. | | | 23,730,988 | | |
| | 80,189 | | | Boeing Company~# | | | 14,980,909 | | |
| | 312,891 | | | Carrier Global Corp.^ | | | 14,912,385 | | |
| | 156,203 | | | Caterpillar, Inc.~ | | | 35,309,688 | | |
| | 820,109 | | | CSX Corp.~ | | | 24,480,254 | | |
| | 56,347 | | | Deere & Company | | | 20,586,940 | | |
| | 189,371 | | | Delta Air Lines, Inc.~ | | | 5,917,844 | | |
| | 82,970 | | | Eaton Corp., PLC | | | 17,250,293 | | |
| | 219,911 | | | Emerson Electric Company~ | | | 19,565,482 | | |
NUMBER OF
SHARES | |
| | VALUE | |
| | 59,978 | | | Generac Holdings, Inc.^# | | $ | 5,042,350 | | |
| | 48,333 | | | General Dynamics Corp. | | | 11,663,236 | | |
| | 208,779 | | | General Electric Company | | | 22,679,663 | | |
| | 182,969 | | | Honeywell International, Inc. | | | 33,530,899 | | |
| | 9,398 | | | Hubbell, Inc. | | | 2,538,400 | | |
| | 68,956 | | | Illinois Tool Works, Inc.~ | | | 15,454,419 | | |
| | 189,332 | | | Johnson Controls International,
PLC | | | 9,281,055 | | |
| | 72,797 | | | L3Harris Technologies, Inc. | | | 13,060,510 | | |
| | 39,515 | | | Lockheed Martin Corp. | | | 17,965,100 | | |
| | 162,849 | | | Masco Corp. | | | 8,482,804 | | |
| | 43,377 | | | Norfolk Southern Corp. | | | 8,275,898 | | |
| | 39,277 | | | Northrop Grumman Corp. | | | 18,516,356 | | |
| | 72,775 | | | Otis Worldwide Corp. | | | 5,618,958 | | |
| | 171,745 | | | PACCAR, Inc. | | | 14,174,115 | | |
| | 102,066 | | | Paychex, Inc. | | | 11,334,429 | | |
| | 40,729 | | | Paycom Software, Inc. | | | 9,977,383 | | |
| | 185,056 | | | Pentair, PLC | | | 10,755,455 | | |
| | 390,641 | | | RTX Corp.~^ | | | 31,794,271 | | |
| | 360,923 | | | Southwest Airlines Company~ | | | 8,023,318 | | |
| | 1,795,664 | | | Spirit Airlines, Inc.~ | | | 20,614,223 | | |
| | 206,970 | | | Union Pacific Corp.~ | | | 42,969,042 | | |
| | 198,523 | | | United Airlines Holdings, Inc.# | | | 6,950,290 | | |
| | 131,273 | | | United Parcel Service, Inc. -
Class B | | | 18,542,311 | | |
| | 64,196 | | | Verisk Analytics, Inc. | | | 14,595,602 | | |
| | 122,656 | | | Waste Management, Inc. | | | 20,156,060 | | |
| | 90,311 | | | Xylem, Inc. | | | 8,447,691 | | |
| | | | 580,175,665 | | |
| | | Information Technology (13.9%) | |
| | 108,194 | | | Accenture, PLC - Class A~ | | | 32,143,355 | | |
| | 84,644 | | | Adobe, Inc.# | | | 45,035,687 | | |
| | 386,247 | | | Advanced Micro Devices, Inc.# | | | 38,045,330 | | |
| | 167,189 | | | Amphenol Corp. - Class A~ | | | 13,467,074 | | |
| | 137,032 | | | Analog Devices, Inc. | | | 21,559,245 | | |
| | 2,884,222 | | | Apple, Inc.~ | | | 492,538,591 | | |
| | 175,208 | | | Applied Materials, Inc.~ | | | 23,188,779 | | |
| | 49,099 | | | Autodesk, Inc.# | | | 9,703,435 | | |
| | 27,111 | | | Blackbaud, Inc.# | | | 1,773,059 | | |
| | 86,209 | | | Broadcom, Inc. | | | 72,533,666 | | |
| | 1,028,231 | | | Cisco Systems, Inc.~ | | | 53,601,682 | | |
| | 141,418 | | | Cognizant Technology
Solutions Corp. - Class A~ | | | 9,117,218 | | |
| | 29,550 | | | Enphase Energy, Inc.# | | | 2,351,589 | | |
| | 47,756 | | | Gartner, Inc.# | | | 15,856,902 | | |
| | 275,201 | | | HP, Inc. | | | 7,246,042 | | |
| | 580,399 | | | Intel Corp.~ | | | 21,184,564 | | |
See accompanying Notes to Schedule of Investments
www.calamos.com
97
Market Neutral Income Fund Schedule of Investments October 31, 2023
NUMBER OF
SHARES | |
| | VALUE | |
| | 130,727 | | | International Business
Machines Corp. | | $ | 18,908,353 | | |
| | 71,407 | | | Intuit, Inc. | | | 35,342,895 | | |
| | 330,315 | | | Micron Technology, Inc.~ | | | 22,088,164 | | |
| | 1,450,499 | | | Microsoft Corp.~ | | | 490,428,217 | | |
| | 26,104 | | | Monolithic Power Systems, Inc. | | | 11,531,181 | | |
| | 78,516 | | | NetApp, Inc. | | | 5,714,394 | | |
| | 482,453 | | | NVIDIA Corp.~†† | | | 196,744,333 | | |
| | 77,461 | | | NXP Semiconductors, NV | | | 13,356,600 | | |
| | 121,122 | | | ON Semiconductor Corp.# | | | 7,587,082 | | |
| | 359,396 | | | Oracle Corp. | | | 37,161,546 | | |
| | 87,680 | | | Palo Alto Networks, Inc.# | | | 21,307,994 | | |
| | 70,794 | | | PTC, Inc.# | | | 9,940,894 | | |
| | 93,559 | | | Qorvo, Inc.# | | | 8,178,928 | | |
| | 235,426 | | | QUALCOMM, Inc. | | | 25,659,080 | | |
| | 223,599 | | | Salesforce, Inc.# | | | 44,905,387 | | |
| | 49,737 | | | ServiceNow, Inc.# | | | 28,939,473 | | |
| | 110,404 | | | Skyworks Solutions, Inc. | | | 9,576,443 | | |
| | 26,100 | | | SolarEdge Technologies, Inc.^# | | | 1,982,295 | | |
| | 70,869 | | | TE Connectivity, Ltd. | | | 8,351,912 | | |
| | 111,306 | | | Teradyne, Inc. | | | 9,268,451 | | |
| | 127,350 | | | Texas Instruments, Inc.~ | | | 18,084,974 | | |
| | 32,096 | | | Tyler Technologies, Inc.# | | | 11,968,598 | | |
| | 270,000 | | | VMware, Inc. - Class A#‡‡‡ | | | 41,310,000 | | |
| | | | 1,937,683,412 | | |
| | | Materials (1.1%) | |
| | 64,841 | | | Air Products & Chemicals,
Inc.~ | | | 18,313,692 | | |
| | 52,863 | | | Avery Dennison Corp. | | | 9,201,863 | | |
| | 69,869 | | | Celanese Corp.^ | | | 8,000,699 | | |
| | 184,274 | | | Corteva, Inc. | | | 8,870,950 | | |
| | 184,274 | | | Dow, Inc. | | | 8,907,805 | | |
| | 165,937 | | | DuPont de Nemours, Inc. | | | 12,093,489 | | |
| | 504,936 | | | Freeport-McMoRan, Inc. | | | 17,056,738 | | |
| | 141,651 | | | Linde, PLC | | | 54,133,346 | | |
| | 79,620 | | | PPG Industries, Inc. | | | 9,774,947 | | |
| | 47,691 | | | Sherwin-Williams Company | | | 11,360,473 | | |
| | | | 157,714,002 | | |
| | | Real Estate (0.9%) | |
| | 55,224 | | | Alexandria Real Estate Equities,
Inc. | | | 5,143,011 | | |
| | 76,197 | | | American Tower Corp.~ | | | 13,577,544 | | |
| | 50,804 | | | AvalonBay Communities, Inc.~ | | | 8,420,255 | | |
| | 70,395 | | | Crown Castle, Inc. | | | 6,545,327 | | |
| | 82,829 | | | Digital Realty Trust, Inc. | | | 10,300,615 | | |
| | 14,599 | | | Equinix, Inc. | | | 10,652,014 | | |
| | 65,834 | | | Mid-America Apartment
Communities, Inc. | | | 7,778,287 | | |
NUMBER OF
SHARES | |
| | VALUE | |
| | 217,777 | | | Prologis, Inc.~ | | $ | 21,941,033 | | |
| | 36,254 | | | Public Storage~ | | | 8,654,192 | | |
| | 125,687 | | | Realty Income Corp. | | | 5,955,050 | | |
| | 102,516 | | | Regency Centers Corp. | | | 6,177,614 | | |
| | 159,491 | | | UDR, Inc. | | | 5,073,409 | | |
| | 128,984 | | | Welltower, Inc. | | | 10,784,352 | | |
| | 246,345 | | | Weyerhaeuser Company | | | 7,067,638 | | |
| | | | 128,070,341 | | |
| | | Special Purpose Acquisition Companies (1.0%)# | |
| | 20,000 | | | 99 Acquisition Group, Inc. | | | 206,000 | | |
| | 50,000 | | | Alchemy Investments
Acquisition Corp. 1 | | | 547,750 | | |
| | 750,000 | | | Alpha Partners Technology
Merger Corp. - Class A | | | 7,972,500 | | |
| | 1,500,000 | | | CARTESIAN GROWTH Corp. II -
Class A | | | 16,297,500 | | |
| | 140,000 | | | Cetus Capital Acquisition Corp. | | | 1,472,800 | | |
| | 700,000 | | | Chenghe Acquisition
Company - Class A | | | 7,623,000 | | |
| | 350,000 | | | Denali Capital Acquisition
Corp. - Class A | | | 3,832,500 | | |
| | 1,250,000 | | | Everest Consolidator
Acquisition Corp. | | | 13,600,000 | | |
| | 500,000 | | | Evergreen Corp. - Class A | | | 5,517,500 | | |
| | 60,000 | | | Four Leaf Acquisition Corp. | | | 664,500 | | |
| | 500,000 | | | FutureTech II Acquisition
Corp. - Class A | | | 5,475,000 | | |
| | 500,000 | | | Generation Asia I Acquisition,
Ltd. - Class A | | | 5,400,000 | | |
| | 100,000 | | | Haymaker Acquisition Corp. 4 | | | 1,037,000 | | |
| | 500,000 | | | Investcorp Europe Acquisition
Corp. I - Class A | | | 5,465,000 | | |
| | 30,000 | | | Israel Acquisitions Corp. | | | 319,800 | | |
| | 100,000 | | | Keen Vision Acquisition Corp. | | | 1,028,500 | | |
| | 825,000 | | | Learn CW Investment Corp. -
Class A | | | 8,860,500 | | |
| | 100,000 | | | Nabors Energy Transition
Corp. II | | | 1,027,000 | | |
| | 55,000 | | | Oak Woods Acquisition Corp. | | | 616,825 | | |
| | 218,489 | | | OPY Acquisition Corp. I -
Class A | | | 2,285,395 | | |
| | 1,000,000 | | | Pearl Holdings Acquisition
Corp. - Class A | | | 10,750,000 | | |
| | 255,000 | | | Pono Capital Three, Inc. | | | 2,742,525 | | |
| | 14,770 | | | Quetta Acquisition Corp. | | | 149,473 | | |
| | 1,500,000 | | | Rigel Resource Acquisition
Corp. - Class A | | | 16,395,000 | | |
| | 800,000 | | | SDCL EDGE Acquisition Corp. -
Class A | | | 8,560,000 | | |
| | 250,000 | | | Silverbox Corp. III | | | 2,628,750 | | |
| | 24,769 | | | Spark I Acquisition Corp. | | | 250,662 | | |
See accompanying Notes to Schedule of Investments
CALAMOS OPEN-END FAMILY OF FUNDS ANNUAL REPORT
98
Market Neutral Income Fund Schedule of Investments October 31, 2023
NUMBER OF
SHARES | |
| | VALUE | |
| | 500,000 | | | TortoiseEcofin Acquisition
Corp. III - Class A | | $ | 5,265,000 | | |
| | 900,000 | | | Tristar Acquisition I Corp. -
Class A | | | 9,684,000 | | |
| | | | 145,674,480 | | |
| | | Utilities (1.3%) | |
| | 392,399 | | | AES Corp.~ | | | 5,846,745 | | |
| | 153,452 | | | American Electric Power
Company, Inc. | | | 11,591,764 | | |
| | 142,474 | | | CMS Energy Corp.~ | | | 7,742,037 | | |
| | 119,289 | | | Consolidated Edison, Inc. | | | 10,472,381 | | |
| | 140,999 | | | Dominion Energy, Inc.~ | | | 5,685,080 | | |
| | 194,840 | | | Duke Energy Corp.~ | | | 17,319,328 | | |
| | 93,652 | | | Edison International | | | 5,905,695 | | |
| | 87,227 | | | Entergy Corp. | | | 8,338,029 | | |
| | 131,126 | | | Exelon Corp. | | | 5,106,046 | | |
| | 197,458 | | | FirstEnergy Corp.~ | | | 7,029,505 | | |
| | 321,995 | | | NextEra Energy, Inc. | | | 18,772,309 | | |
| | 241,677 | | | NiSource, Inc. | | | 6,080,593 | | |
| | 815,027 | | | PNM Resources, Inc.~ | | | 34,443,041 | | |
| | 151,712 | | | Public Service Enterprise
Group, Inc.~ | | | 9,353,045 | | |
| | 216,864 | | | Southern Company | | | 14,594,947 | | |
| | 54,285 | | | Veralto Corp.# | | | 3,745,665 | | |
| | 173,581 | | | Xcel Energy, Inc. | | | 10,288,146 | | |
| | | | 182,314,356 | | |
| | | TOTAL COMMON STOCKS
(Cost $5,835,415,184) | | | 7,230,244,661 | | |
INVESTMENT IN AFFILIATED FUND (2.3%) | | | |
| | | Other (2.3%) | |
| | 35,117,150 | | | Calamos Short-Term Bond Fund
(Cost $350,000,000) | | | 326,238,322 | | |
WARRANTS (0.0%)# | | | |
| | | Communication Services (0.0%) | |
| | 200,000 | | | PSQ Holdings, Inc.
06/19/28, Strike $11.50 | | | 176,020 | | |
| | | Consumer Discretionary (0.0%) | |
| | 22,968 | | | Allurion Technologies, Inc.
08/02/30, Strike $8.10 | | | 19,523 | | |
| | 156,250 | | | American Oncology Network,
Inc.
09/20/28, Strike $11.50 | | | 25,000 | | |
| | 25,000 | | | ECARX Holdings, Inc.
12/21/27, Strike $11.50 | | | 800 | | |
| | 20,000 | | | Grove Collaborative Holdings
06/16/27, Strike $11.50 | | | 386 | | |
| | 35,000 | | | Lanvin Group Holdings, Ltd.
12/14/27, Strike $11.50 | | | 5,764 | | |
NUMBER OF
SHARES | |
| | VALUE | |
| | 200,000 | | | Nogin, Inc.
08/26/27, Strike $11.50 | | $ | 2,360 | | |
| | 81,526 | | | Spectral AI, Inc.
09/11/28, Strike $11.50 | | | 11,251 | | |
| | 25,000 | | | United Homes Group, Inc.
01/28/28, Strike $11.50 | | | 20,095 | | |
| | | | 85,179 | | |
| | | Financials (0.0%) | |
| | 187,500 | | | Beneficient - Class A
03/14/28, Strike $11.50 | | | 2,531 | | |
| | | Health Care (0.0%) | |
| | 83,333 | | | AEON Biopharma, Inc.
06/06/28, Strike $11.50 | | | 5,167 | | |
| | 100,000 | | | Envoy Medical, Inc.
12/31/27, Strike $11.50 | | | 1,620 | | |
| | 62,500 | | | Ocean Biomedical, Inc.
07/19/26, Strike $11.50 | | | 5,916 | | |
| | 33,333 | | | Oculis Holding, AG
03/03/30, Strike $11.50 | | | 37,834 | | |
| | 200,000 | | | Omniab, Inc.
11/01/27, Strike $11.50 | | | 150,020 | | |
| | 200,000 | | | Prenetics Global, Ltd.
05/17/27, Strike $8.91 | | | 3,260 | | |
| | 146,040 | | | YS Biopharma Company, Ltd.
03/15/28, Strike $11.50 | | | 5,192 | | |
| | 200,000 | | | Zura Bio, Ltd.
06/15/26, Strike $11.50 | | | 100,000 | | |
| | | | 309,009 | | |
| | | Industrials (0.0%) | |
| | 285,000 | | | AERWINS Technology, Inc.
06/16/26, Strike $11.50 | | | 5,757 | | |
| | 1,000,000 | | | Bitcoin Depot, Inc.
07/22/27, Strike $11.50 | | | 150,000 | | |
| | 25,000 | | | Bridger Aerospace Group
Holdings, Inc.
01/25/28, Strike $11.50 | | | 5,057 | | |
| | 42,500 | | | Complete Solaria, Inc.
12/31/27, Strike $11.50 | | | 646 | | |
| | 200,000 | | | Electriq Power Holdings, Inc.
01/28/26, Strike $11.50 | | | 4,890 | | |
| | 10,000 | | | Falcon's Beyond Global, Inc.
09/01/27, Strike $11.50 | | | 5,400 | | |
| | 500,000 | | | Intuitive Machines, Inc.
02/13/28, Strike $11.50 | | | 127,750 | | |
| | 300,000 | | | LanzaTech Global, Inc.
01/01/28, Strike $11.50 | | | 150,000 | | |
| | 100,000 | | | Marti Technologies, Inc.
12/31/28, Strike $11.50 | | | 3,005 | | |
| | 750,000 | | | Southland Holdings, Inc.
09/01/26, Strike $11.50 | | | 345,000 | | |
| | 116,666 | | | Terran Orbital Corp.
03/09/28, Strike $11.50 | | | 12,600 | | |
| | | | 810,105 | | |
See accompanying Notes to Schedule of Investments
www.calamos.com
99
Market Neutral Income Fund Schedule of Investments October 31, 2023
NUMBER OF
SHARES | |
| | VALUE | |
| | | Information Technology (0.0%) | |
| | 166,666 | | | MariaDB, PLC
12/16/27, Strike $11.50 | | $ | 15,217 | | |
| | 125,000 | | | Nvni Group, Ltd.
11/01/28, Strike $11.50 | | | 5,000 | | |
| | 625,000 | | | Roadzen, Inc.
11/30/28, Strike $11.50 | | | 21,875 | | |
| | 350,000 | | | Rubicon Technologies, Inc.
04/19/28, Strike $11.50 | | | 2,350 | | |
| | 100,000 | | | Smx Security Matters, PLC
03/07/28, Strike $11.50 | | | 1,705 | | |
| | 192,245 | | | Spectaire Holdings, Inc.
12/31/28, Strike $11.50 | | | 9,343 | | |
| | 250,000 | | | SpringBig Holdings, Inc.&
06/14/27, Strike $11.50 | | | 275 | | |
| | | | 55,765 | | |
| | | Materials (0.0%) | |
| | 500,000 | | | Lifezone Metals, Ltd.
07/07/28, Strike $11.50 | | | 392,750 | | |
| | 166,666 | | | Metals Acquisition, Ltd.
06/16/28, Strike $11.50 | | | 329,999 | | |
| | 177,835 | | | Niocorp Developments, Ltd.
03/17/28, Strike $0.89 | | | 88,917 | | |
| | | | 811,666 | | |
| | | Special Purpose Acquisition Companies (0.0%) | |
| | 83,333 | | | 10X Capital Venture Acquisition
Corp. II
12/31/27, Strike $11.50 | | | 7,358 | | |
| | 312,972 | | | 10X Capital Venture Acquisition
Corp. III
06/30/28, Strike $11.50 | | | 26,603 | | |
| | 80,000 | | | Accretion Acquisition Corp.
03/01/28, Strike $11.50 | | | 2,272 | | |
| | 205,467 | | | Acropolis Infrastructure
Acquisition Corp.
03/31/26, Strike $11.50 | | | 8,999 | | |
| | 500,000 | | | Aetherium Acquisition Corp.
01/21/28, Strike $11.50 | | | 33,000 | | |
| | 250,000 | | | Alpha Partners Technology
Merger Corp.
03/31/28, Strike $11.50 | | | 18,875 | | |
| | 500,000 | | | ALSP Orchid Acquisition Corp. I
11/30/28, Strike $11.50 | | | 14,850 | | |
| | 750,000 | | | Altenergy Acquisition Corp.
11/02/28, Strike $11.50 | | | 43,012 | | |
| | 500,000 | | | Andretti Acquisition Corp.
03/23/28, Strike $11.50 | | | 134,500 | | |
| | 50,000 | | | AP Acquisition Corp.
12/07/26, Strike $11.50 | | | 1,750 | | |
| | 2,000 | | | Apollo Strategic Growth
Capital II
12/31/27, Strike $11.50 | | | 160 | | |
NUMBER OF
SHARES | |
| | VALUE | |
| | 500,000 | | | APx Acquisition Corp. I
08/19/28, Strike $11.50 | | $ | 15,250 | | |
| | 20,000 | | | Ares Acquisition Corp.
12/31/27, Strike $11.50 | | | 2 | | |
| | 50,000 | | | Arrowroot Acquisition Corp.
03/02/26, Strike $11.50 | | | 7,000 | | |
| | 250,000 | | | Athena Technology Acquisition
Corp. II
10/17/28, Strike $11.50 | | | 10,250 | | |
| | 80,000 | | | Atlantic Coastal Acquisition
Corp.
12/31/27, Strike $11.50 | | | 528 | | |
| | 625,000 | | | Atlantic Coastal Acquisition
Corp. II
06/02/28, Strike $11.50 | | | 43,750 | | |
| | 500,000 | | | Aura FAT Projects Acquisition
Corp.
06/02/27, Strike $11.50 | | | 11,050 | | |
| | 500,000 | | | Banyan Acquisition Corp.
09/30/28, Strike $11.50 | | | 67,500 | | |
| | 750,000 | | | Battery Future Acquisition Corp.
05/26/28, Strike $11.50 | | | 28,125 | | |
| | 271,216 | | | Beard Energy Transition
Acquisition Corp.
12/31/27, Strike $11.50 | | | 5,424 | | |
| | 250,000 | | | Berenson Acquisition Corp. I
08/01/26, Strike $11.50 | | | 1,775 | | |
| | 169,125 | | | Black Mountain Acquisition
Corp.
10/15/27, Strike $11.50 | | | 4,651 | | |
| | 377,552 | | | Blockchain Coinvestors
Acquisition Corp. I
11/01/28, Strike $11.50 | | | 11,440 | | |
| | 625,000 | | | Blue Ocean Acquisition Corp.
10/21/28, Strike $11.50 | | | 12,562 | | |
| | 33,333 | | | BlueRiver Acquisition Corp.
01/04/26, Strike $11.50 | | | 1,660 | | |
| | 1,000,000 | | | BurTech Acquisition Corp.
12/18/26, Strike $11.50 | | | 25,000 | | |
| | 250,000 | | | byNordic Acquisition Corp.
02/09/27, Strike $11.50 | | | 12,612 | | |
| | 250,000 | | | Byte Acquisition Corp.
12/31/28, Strike $11.50 | | | 21,762 | | |
| | 375,000 | | | Cactus Acquisition Corp. 1, Ltd.
10/29/26, Strike $11.50 | | | 11,831 | | |
| | 400,000 | | | Canna-Global Acquisition Corp.
02/09/28, Strike $11.50 | | | 2,560 | | |
| | 500,000 | | | CARTESIAN GROWTH Corp. II
07/12/28, Strike $11.50 | | | 65,000 | | |
| | 134,701 | | | Cartica Acquisition Corp.
04/30/28, Strike $11.50 | | | 7,543 | | |
| | 25,000 | | | Catcha Investment Corp.
12/31/27, Strike $11.50 | | | 525 | | |
See accompanying Notes to Schedule of Investments
CALAMOS OPEN-END FAMILY OF FUNDS ANNUAL REPORT
100
Market Neutral Income Fund Schedule of Investments October 31, 2023
NUMBER OF
SHARES | |
| | VALUE | |
| | 140,000 | | | Cetus Capital Acquisition Corp.
03/24/28, Strike $11.50 | | $ | 3,507 | | |
| | 159,466 | | | CF Acquisition Corp. VII
03/15/26, Strike $11.50 | | | 8,133 | | |
| | 750,000 | | | Chain Bridge I
12/31/28, Strike $11.50 | | | 2,175 | | |
| | 350,000 | | | Chenghe Acquisition Company
04/28/27, Strike $11.50 | | | 35 | | |
| | 166,666 | | | Coliseum Acquisition Corp.
12/31/28, Strike $11.50 | | | 15,267 | | |
| | 166,666 | | | Compass Digital Acquisition
Corp.
10/15/28, Strike $11.50 | | | 20,833 | | |
| | 92,316 | | | Concord Acquisition Corp. II
12/31/28, Strike $11.50 | | | 10,621 | | |
| | 225,000 | | | Concord Acquisition Corp. III
12/31/28, Strike $11.50 | | | 23,895 | | |
| | 6,666 | | | Constellation Acquisition
Corp. I
12/31/27, Strike $11.50 | | | 296 | | |
| | 41,666 | | | Corner Growth Acquisition
Corp. 2
06/17/26, Strike $11.50 | | | 2,712 | | |
| | 750,000 | | | Crescera Capital Acquisition
Corp.
11/19/28, Strike $11.50 | | | 3,375 | | |
| | 133,333 | | | Crown PropTech Acquisitions
12/31/27, Strike $11.50 | | | 1,373 | | |
| | 375,000 | | | CSLM Acquisition Corp.
06/01/27, Strike $11.50 | | | 16,425 | | |
| | 350,000 | | | Denali Capital Acquisition Corp.
04/07/27, Strike $11.50 | | | 24,325 | | |
| | 166,666 | | | DHC Acquisition Corp.
12/31/27, Strike $11.50 | | | 9,975 | | |
| | 166,666 | | | Disruptive Acquisition Corp. I
03/06/26, Strike $11.50 | | | 7,125 | | |
| | 750,000 | | | DP Cap Acquisition Corp. I
11/09/26, Strike $11.50 | | | 23,887 | | |
| | 50,000 | | | Edify Acquisition Corp.
12/31/27, Strike $11.50 | | | 1,000 | | |
| | 75,000 | | | EG Acquisition Corp.
05/28/28, Strike $11.50 | | | 7,500 | | |
| | 125,000 | | | Energem Corp.
11/16/26, Strike $11.50 | | | 4,375 | | |
| | 625,000 | | | Enphys Acquisition Corp.
07/15/24, Strike $11.50 | | | 51,219 | | |
| | 87,500 | | | ESGEN Acquisition Corp.
10/20/26, Strike $11.50 | | | 7,438 | | |
| | 500,000 | | | EVe Mobility Acquisition Corp.
12/31/28, Strike $11.50 | | | 30,000 | | |
| | 625,000 | | | Everest Consolidator
Acquisition Corp.
07/19/28, Strike $11.50 | | | 137,500 | | |
NUMBER OF
SHARES | |
| | VALUE | |
| | 500,000 | | | Evergreen Corp.
02/15/27, Strike $11.50 | | $ | 18,000 | | |
| | 500,000 | | | ExcelFin Acquisition Corp.
10/21/26, Strike $11.50 | | | 24,100 | | |
| | 183,737 | | | Finnovate Acquisition Corp.
09/30/26, Strike $11.50 | | | 4,061 | | |
| | 3,750 | | | FinServ Acquisition Corp. II
02/17/26, Strike $11.50 | | | 146 | | |
| | 75,000 | | | Fintech Ecosystem
Development Corp.
12/31/28, Strike $11.50 | | | 2,888 | | |
| | 525,800 | | | Focus Impact Acquisition Corp.
10/28/26, Strike $11.50 | | | 13,671 | | |
| | 250,000 | | | Forbion European Acquisition
Corp.
05/23/28, Strike $11.50 | | | 205,725 | | |
| | 4,000 | | | Forest Road Acquisition Corp. II
01/15/26, Strike $11.50 | | | 100 | | |
| | 266,666 | | | Frontier Investment Corp.
12/31/26, Strike $11.50 | | | 17,347 | | |
| | 8,600 | | | FTAC Emerald Acquisition Corp.
08/22/28, Strike $11.50 | | | 462 | | |
| | 141,666 | | | Fusion Acquisition Corp. II
12/31/27, Strike $11.50 | | | 5,667 | | |
| | 200,000 | | | Future Health ESG Corp.
09/09/26, Strike $11.50 | | | 3,520 | | |
| | 500,000 | | | FutureTech II Acquisition Corp.
02/16/27, Strike $11.50 | | | 30,100 | | |
| | 250,000 | | | Generation Asia I Acquisition,
Ltd.
07/24/28, Strike $11.50 | | | 11,162 | | |
| | 500,000 | | | Genesis Growth Tech
Acquisition Corp.
05/19/28, Strike $11.50 | | | 90,000 | | |
| | 425,000 | | | GigCapital5, Inc.
12/31/28, Strike $11.50 | | | 17,000 | | |
| | 200,000 | | | Global Systems Dynamics Inc.
12/31/27, Strike $11.50 | | | 2,000 | | |
| | 25,000 | | | Global Technology Acquisition
Corp. I
07/13/26, Strike $11.50 | | | 1,248 | | |
| | 126,666 | | | Golden Arrow Merger Corp.
07/31/26, Strike $11.50 | | | 17,936 | | |
| | 625,000 | | | HCM ACQUISITION Corp.
12/31/27, Strike $11.50 | | | 13,875 | | |
| | 500,000 | | | Healthcare AI Acquisition Corp.
12/14/26, Strike $11.50 | | | 20,900 | | |
| | 256,033 | | | Healthwell Acquisition Corp. I
08/05/28, Strike $11.50 | | | 10,369 | | |
| | 375,000 | | | Industrial Tech Acquisitions II,
Inc.
12/31/28, Strike $11.50 | | | 8,813 | | |
| | 750,000 | | | Infinite Acquisition Corp.
11/23/28, Strike $11.50 | | | 39,450 | | |
See accompanying Notes to Schedule of Investments
www.calamos.com
101
Market Neutral Income Fund Schedule of Investments October 31, 2023
NUMBER OF
SHARES | |
| | VALUE | |
| | 438,223 | | | InFinT Acquisition Corp.
05/19/27, Strike $11.50 | | $ | 7,187 | | |
| | 200,000 | | | Innovative International
Acquisition Corp.
07/01/28, Strike $11.50 | | | 8,690 | | |
| | 350,000 | | | Insight Acquisition Corp.
08/26/26, Strike $11.50 | | | 1,995 | | |
| | 125,000 | | | Integral Acquisition Corp.1
12/14/28, Strike $11.50 | | | 12,500 | | |
| | 154,135 | | | Integrated Wellness Acquisition
Corp.
10/31/28, Strike $11.50 | | | 19,421 | | |
| | 750,000 | | | Investcorp Europe Acquisition
Corp. I
11/23/28, Strike $11.50 | | | 135,225 | | |
| | 6,250 | | | Iris Acquisition Corp.
03/05/26, Strike $11.50 | | | 195 | | |
| | 250,000 | | | IX Acquisition Corp.
11/24/26, Strike $11.50 | | | 9,638 | | |
| | 43,750 | | | Jaws Mustang Acquisition
Corp.
01/30/26, Strike $11.50 | | | 1,297 | | |
| | 222,150 | | | Kensington Capital Acquisition
Corp. V
08/13/28, Strike $11.50 | | | 25,103 | | |
| | 25,060 | | | Kernel Group Holdings, Inc.
01/31/27, Strike $11.50 | | | 1,256 | | |
| | 250,000 | | | Keyarch Acquisition Corp.
07/25/28, Strike $11.50 | | | 7,513 | | |
| | 500,000 | | | KnightSwan Acquisition Corp.
07/21/28, Strike $11.50 | | | 22,725 | | |
| | 33,333 | | | L Catterton Asia Acquisition
Corp.
03/08/26, Strike $11.50 | | | 16,333 | | |
| | 750,000 | | | LAMF Global Ventures Corp. I
11/11/26, Strike $11.50 | | | 46,912 | | |
| | 4,564 | | | Landcadia Holdings IV, Inc.
03/29/28, Strike $11.50 | | | 296 | | |
| | 250,000 | | | LatAmGrowth SPAC
01/25/28, Strike $11.50 | | | 12,500 | | |
| | 412,500 | | | Learn CW Investment Corp.
12/31/28, Strike $11.50 | | | 22,254 | | |
| | 150,000 | | | Liberty Resources Acquisition
Corp.
10/31/28, Strike $11.50 | | | 5,250 | | |
| | 375,000 | | | LIV Capital Acquisition Corp. II
02/16/27, Strike $11.50 | | | 10,612 | | |
| | 6,962 | | | Live Oak Crestview Climate
Acquisition Corp.
03/12/26, Strike $11.50 | | | 464 | | |
| | 228,160 | | | Marblegate Acquisition Corp.
08/31/28, Strike $11.50 | | | 8,237 | | |
NUMBER OF
SHARES | |
| | VALUE | |
| | 675,350 | | | Mountain & Company I
Acquisition Corp.
09/30/26, Strike $11.50 | | $ | 54,028 | | |
| | 200,000 | | | Nabors Energy Transition Corp.
11/17/26, Strike $11.50 | | | 30,000 | | |
| | 500,000 | | | New Providence Acquisition
Corp. II
12/31/27, Strike $11.50 | | | 23,375 | | |
| | 500,000 | | | Newcourt Acquisition Corp.
04/12/28, Strike $11.50 | | | 9,625 | | |
| | 3,333 | | | Northern Star Investment
Corp. III
02/25/28, Strike $11.50 | | | 42 | | |
| | 3,333 | | | Northern Star Investment
Corp. IV
12/31/27, Strike $11.50 | | | 200 | | |
| | 250,000 | | | Nubia Brand International Corp.
11/16/26, Strike $11.50 | | | 22,500 | | |
| | 100,000 | | | OceanTech Acquisitions I Corp.
05/10/26, Strike $11.50 | | | 2,000 | | |
| | 250,000 | | | Omnilit Acquisition Corp.
11/08/26, Strike $11.50 | | | 19,475 | | |
| | 750,000 | | | Onyx Acquisition Company I
11/30/28, Strike $11.50 | | | 19,500 | | |
| | 242,744 | | | OPY Acquisition Corp. I
09/22/27, Strike $11.50 | | | 6,700 | | |
| | 375,000 | | | Osiris Acquisition Corp.
05/01/28, Strike $11.50 | | | 13,444 | | |
| | 625,000 | | | Papaya Growth Opportunity
Corp. I
12/31/28, Strike $11.50 | | | 17,312 | | |
| | 150,000 | | | Patria Latin American
Opportunity Acquisition Corp.
03/10/27, Strike $11.50 | | | 5,475 | | |
| | 500,000 | | | Pearl Holdings Acquisition Corp.
12/15/26, Strike $11.50 | | | 12,950 | | |
| | 459,150 | | | Pegasus Digital Mobility
Acquisition Corp.
12/28/26, Strike $11.50 | | | 11,433 | | |
| | 350,000 | | | PepperLime Health Acquisition
Corp.
10/01/26, Strike $11.50 | | | 11,515 | | |
| | 144,093 | | | Perception Capital Corp. III
07/08/26, Strike $11.50 | | | 10,231 | | |
| | 12,500 | | | Phoenix Biotech Acquisition
Corp.
09/01/26, Strike $11.50 | | | 375 | | |
| | 20,000 | | | Plum Acquisition Corp. I
03/18/26, Strike $11.50 | | | 1,200 | | |
| | 50,000 | | | Power & Digital Infrastructure
Acquisition II Corp.
12/14/28, Strike $11.50 | | | 4,490 | | |
| | 250,000 | | | Project Energy Reimagined
Acquisition Corp.
12/31/28, Strike $11.50 | | | 15,550 | | |
See accompanying Notes to Schedule of Investments
CALAMOS OPEN-END FAMILY OF FUNDS ANNUAL REPORT
102
Market Neutral Income Fund Schedule of Investments October 31, 2023
NUMBER OF
SHARES | |
| | VALUE | |
| | 750,000 | | | PROOF Acquisition Corp. I
12/03/28, Strike $11.50 | | $ | 46,050 | | |
| | 50,000 | | | Pyrophyte Acquisition Corp.
12/17/23, Strike $11.50 | | | 3,625 | | |
| | 166,666 | | | Quadro Acquisition One Corp.
12/31/27, Strike $11.50 | | | 8,333 | | |
| | 686,522 | | | RCF Acquisition Corp.
11/10/26, Strike $11.50 | | | 61,718 | | |
| | 1,000,000 | | | Rigel Resource Acquisition Corp.
11/05/26, Strike $11.50 | | | 135,450 | | |
| | 40,000 | | | RMG Acquisition Corp. III
12/31/27, Strike $11.50 | | | 1,786 | | |
| | 115,402 | | | Rose Hill Acquisition Corp.
03/15/23, Strike $11.50 | | | 1,846 | | |
| | 133,333 | | | Ross Acquisition Corp. II
02/12/26, Strike $11.50 | | | 6,500 | | |
| | 250,000 | | | Roth CH Acquisition V
Company
12/10/26, Strike $11.50 | | | 9,988 | | |
| | 400,000 | | | SDCL EDGE Acquisition Corp.
03/23/26, Strike $11.50 | | | 48,000 | | |
| | 75,000 | | | Seaport Global Acquisition II
Corp.
11/17/26, Strike $11.50 | | | 3,368 | | |
| | 1,000,000 | | | Semper Paratus Acquisition
Corp.
11/04/26, Strike $11.50 | | | 47,500 | | |
| | 250,000 | | | SEP Acquisition Corp.
07/27/26, Strike $11.50 | | | 32,637 | | |
| | 1,000,000 | | | ShoulderUp Technology
Acquisition Corp.
11/17/26, Strike $11.50 | | | 27,000 | | |
| | 250,000 | | | SHUAA Partners Acquisition
Corp. I
03/02/27, Strike $11.50 | | | 14,387 | | |
| | 500,000 | | | Sizzle Acquisition Corp.
03/12/26, Strike $11.50 | | | 40,500 | | |
| | 7,500 | | | Slam Corp.
12/31/27, Strike $11.50 | | | 980 | | |
| | 2,500 | | | Social Leverage Acquisition
Corp. I
02/17/28, Strike $11.50 | | | 149 | | |
| | 500,000 | | | Southport Acquisition Corp.
05/24/28, Strike $11.50 | | | 19,500 | | |
| | 75,000 | | | SportsMap Tech Acquisition
Corp.
09/01/27, Strike $11.50 | | | 3,593 | | |
| | 250,000 | | | Spree Acquisition Corp. 1, Ltd.
12/22/28, Strike $11.50 | | | 3,300 | | |
| | 300,286 | | | Springwater Special Situations
Corp.
04/12/26, Strike $11.50 | | | 25,825 | | |
| | 250,000 | | | StoneBridge Acquisition Corp.
07/16/28, Strike $11.50 | | | 4,888 | | |
NUMBER OF
SHARES | |
| | VALUE | |
| | 250,000 | | | Swiftmerge Acquisition Corp.
06/17/28, Strike $11.50 | | $ | 13,412 | | |
| | 333,333 | | | Target Global Acquisition I Corp.
12/31/27, Strike $11.50 | | | 10,200 | | |
| | 20,000 | | | Thunder Bridge Capital
Partners III, Inc.
02/15/28, Strike $11.50 | | | 1,400 | | |
| | 100,000 | | | Thunder Bridge Capital
Partners IV, Inc.
04/30/28, Strike $11.50 | | | 10,840 | | |
| | 150,000 | | | TKB Critical Technologies 1
10/29/28, Strike $11.50 | | | 10,275 | | |
| | 328,694 | | | Tlgy Acquisition Corp.
01/14/28, Strike $11.50 | | | 11,702 | | |
| | 125,000 | | | TortoiseEcofin Acquisition
Corp. III
07/22/28, Strike $11.50 | | | 13,162 | | |
| | 250,000 | | | Trajectory Alpha Acquisition
Corp.
12/31/27, Strike $11.50 | | | 35,675 | | |
| | 450,000 | | | Tristar Acquisition I Corp.
12/31/28, Strike $11.50 | | | 11,250 | | |
| | 179,109 | | | Twelve Seas Investment
Company II
03/02/28, Strike $11.50 | | | 6,287 | | |
| | 83,333 | | | Twin Ridge Capital Acquisition
Corp.
12/31/28, Strike $11.50 | | | 4,075 | | |
| | 289,507 | | | Worldwide Webb Acquisition
Corp.
10/20/26, Strike $11.50 | | | 43,397 | | |
| | 266,666 | | | Zalatoris II Acquisition Corp.
05/13/27, Strike $11.50 | | | 18,547 | | |
| | | | 3,034,878 | | |
| | | TOTAL WARRANTS
(Cost $5,758,119) | | | 5,285,153 | | |
RIGHTS (0.0%)# | | | |
| | | Special Purpose Acquisition Companies (0.0%) | |
| | 160,000 | | | Accretion Acquisition Corp.,
(Expires 3/1/28) | | | 16,000 | | |
| | 140,000 | | | Cetus Capital Acquisition Corp.,
(Expires 3/31/24) | | | 25,207 | | |
| | 750,000 | | | CSLM Acquisition Corp.,
(Expires 7/1/23) | | | 105,000 | | |
| | 150,000 | | | Fintech Ecosystem
Development Corp.,
(Expires 4/1/26) | | | 15,780 | | |
| | 500,000 | | | Keyarch Acquisition Corp.,
(Expires 1/31/24) | | | 44,500 | | |
| | | TOTAL RIGHTS
(Cost $144,766) | | | 206,487 | | |
See accompanying Notes to Schedule of Investments
www.calamos.com
103
Market Neutral Income Fund Schedule of Investments October 31, 2023
NUMBER OF
CONTRACTS/
NOTIONAL
AMOUNT | | | | VALUE | |
PURCHASED OPTIONS (1.3%)# | | | |
| | | Communication Services (0.0%) | | | |
| | | | | CyberAgent, Inc. | | | | | |
| | 90 | JPY | | | | | | | | | |
| | 4,491,000,000 | | | Call, 11/16/29, Strike 88.81 | | $ | 537,620 | | |
| | 50 | JPY | | | | | | | | | |
| | 2,495,000,000 | | | Call, 11/16/29, Strike 89.46 | | | 274,967 | | |
| | 30 | JPY | | Cyberagent, Inc. | | | | | |
| | 1,497,000,000 | | | Call, 02/19/25, Strike 93.40 | | | 112,441 | | |
| | 165 | JPY | | Koei Tecmo Holdings Company, | | | | | |
| | 3,240,600,000,000 | | | Ltd. | | | | | |
| | | | | Call, 12/20/24, Strike 97.97 | | | 302,045 | | |
| | | | 1,227,073 | | |
| | | Consumer Discretionary (0.1%) | | | |
| | 5,000 | | | DISH Network Corp. | | | | | |
| | 2,450,000 | | | Put, 12/19/25, Strike $5.00 | | | 1,005,000 | | |
| | | | | EDION Corp. | | | | | |
| | 50 | JPY | | | | | | | | | |
| | 7,530,000,000 | | | Call, 06/19/25, Strike 94.30 | | | 1,361,067 | | |
| | 60 | JPY | | | | | | | | | |
| | 903,600,000,000 | | | Call, 06/19/25, Strike 99.51 | | | 1,489,164 | | |
| | 50 | JPY | | | | | | | | | |
| | 753,000,000,000 | | | Call, 06/19/25, Strike 95.45 | | | 1,323,132 | | |
| | 100 | JPY | | H.I.S. Company, Ltd. | | | | | |
| | 1,698,000,000,000 | | | Call, 11/15/24, Strike 96.54 | | | — | | |
| | 204 | | | iRobot Corp. | | | | | |
| | 671,772 | | | Call, 01/19/24, Strike $50.00 | | | 4,590 | | |
| | | | | Kyoritsu Maintenance
Company, Ltd. | | | | | |
| | 100 | JPY | | | | | | | | | |
| | 5,757,000,000,000 | | | Call, 01/29/26, Strike 94.89 | | | 2,283,469 | | |
| | 20 | JPY | | | | | | | | | |
| | 1,151,400,000,000 | | | Call, 01/29/26, Strike 96.66 | | | 433,361 | | |
| | 5 | JPY | | | | | | | | | |
| | 287,850,000,000 | | | Call, 01/29/26, Strike 95.73 | | | 111,390 | | |
| | 200 | JPY | | Takashimaya Company, Ltd. | | | | | |
| | 40,860,000,000 | | | Call, 12/06/28, Strike 94.40 | | | 3,211,232 | | |
| | | | 11,222,405 | | |
| | | Consumer Staples (0.0%) | | | |
| | 5,500 | | | Beyond Meat, Inc. | | | | | |
| | 3,283,500 | | | Put, 01/19/24, Strike $10.00 | | | 2,557,500 | | |
| | | | | Ezaki Glico Company, Ltd. | | | | | |
| | 100 | JPY | | | | | | | | | |
| | 43,860,000,000 | | | Call, 01/30/24, Strike 97.57 | | | 162,760 | | |
| | 50 | JPY | | | | | | | | | |
| | 21,930,000,000 | | | Call, 01/30/24, Strike 96.89 | | | 104,145 | | |
| | 50 | JPY | | | | | | | | | |
| | 1,149,500,000,000 | | | Nippn Corp. | | | | | |
| | | | | Call, 06/20/25, Strike 98.27 | | | 327,293 | | |
| | | | 3,151,698 | | |
NUMBER OF
CONTRACTS/
NOTIONAL
AMOUNT | | | | VALUE | |
| | | | | Health Care (0.0%) | | | |
| | | | | Ship Healthcare Holdings, Inc. | | | | | |
| | 72 | JPY | | | | | | | | | |
| | 1,674,000,000,000 | | | Call, 12/13/23, Strike 97.95 | | $ | 98,936 | | |
| | 50 | JPY | | | | | | | | | |
| | 1,162,500,000,000 | | | Call, 12/13/23, Strike 97.68 | | | 77,631 | | |
| | 25 | JPY | | | | | | | | | |
| | 581,250,000,000 | | | Call, 12/13/23, Strike 98.32 | | | 28,232 | | |
| | | | 204,799 | | |
| | | | | Industrials (0.0%) | | | |
| | | | | ANA Holdings, Inc. | | | | | |
| | 100 | JPY | | | | | | | | | |
| | 3,940,000,000 | | | Call, 12/08/28, Strike 86.09 | | | 2,436,350 | | |
| | 100 | JPY | | | | | | | | | |
| | 39,400,000 | | | Call, 09/19/24, Strike 96.53 | | | 244,180 | | |
| | 100 | | | Asashi Refining US, Inc. | | | | | |
| | 346,100,000 | | | Call, 03/16/26, Strike $88.78 | | | 25,000 | | |
| | 160 | JPY | | Seino Holdings Company, Ltd. | | | | | |
| | 3,504,000,000,000 | | | Call, 03/31/26, Strike 97.31 | | | 1,921,336 | | |
| | | | 4,626,866 | | |
| | | | | Information Technology (0.0%) | | | |
| | 2,000 | | | Palo Alto Networks, Inc. | | | | | |
| | 48,604,000 | | | Put, 11/03/23, Strike $260.00 | | | 3,430,000 | | |
| | 500 | | | Silicon Motion Technology Corp. | | | | | |
| | 2,679,000 | | | Call, 12/15/23, Strike $60.00 | | | 50,000 | | |
| | | | 3,480,000 | | |
| | | | | Materials (0.1%) | | | |
| | 45 | JPY | | | | | | | | | |
| | 1,315,350,000,000 | | | Maeda Kosen Company, Ltd.
Call, 04/18/24, Strike 99.90 | | | 45,433 | | |
| | | | | Nippon Steel Corp. | | | | | |
| | 100 | JPY | | | | | | | | | |
| | 7,220,000,000 | | | Call, 10/04/24, Strike 98.59 | | | 2,475,592 | | |
| | 50 | JPY | | | | | | | | | |
| | 3,610,000,000 | | | Call, 10/05/26, Strike 96.93 | | | 1,315,236 | | |
| | 34 | JPY | | | | | | | | | |
| | 2,454,800,000 | | | Call, 10/05/26, Strike 97.61 | | | 875,888 | | |
| | | | 4,712,149 | | |
| | | | | Other (1.1%) | | | |
| | 14,500 | | | S&P 500 Index | | | | | |
| | 6,081,010,000 | | | Put, 12/29/23, Strike $4,200.00 | | | 148,407,500 | | |
| | | | 148,407,500 | | |
| | | | | Real Estate (0.0%) | | | |
| | 100 | JPY | | Relo Group, Inc. | | | | | |
| | 1,487,000,000,000 | | | Call, 12/17/27, Strike 92.68 | | | 629,750 | | |
| | | | | TOTAL PURCHASED
OPTIONS
(Cost $103,099,310) | | | 177,662,240 | | |
See accompanying Notes to Schedule of Investments
CALAMOS OPEN-END FAMILY OF FUNDS ANNUAL REPORT
104
Market Neutral Income Fund Schedule of Investments October 31, 2023
NUMBER OF
SHARES/
PRINCIPAL
AMOUNT | | | | VALUE | |
INVESTMENT OF CASH COLLATERAL FOR SECURITIES
LOANED (0.9%) | | | |
| | 130,372,948 | | | State Street Navigator
Securities Lending Government
Money Market Portfolio,
5.358%†***
(Cost $130,372,948) | | $ | 130,372,948 | | |
| | | | | TOTAL INVESTMENTS (96.2%)
(Cost $12,172,568,769) | | | 13,408,569,715 | | |
PAYABLE UPON RETURN OF SECURITIES ON LOAN (-0.9%) | | | (130,372,948 | ) | |
OTHER ASSETS, LESS LIABILITIES (4.7%) | | | 656,289,955 | | |
NET ASSETS (100.0%) | | $ | 13,934,486,722 | | |
NUMBER OF
SHARES | | | | VALUE | |
COMMON STOCKS SOLD SHORT (-15.7%)# | | | |
| | | Communication Services (-0.7%) | |
| | (130,848 | ) | | Bilibili, Inc. (ADR) | | | (1,757,289 | ) | |
| | (10,500 | ) | | Charter Communications, Inc. -
Class A | | | (4,229,400 | ) | |
| | (400,000 | ) JPY | | CyberAgent, Inc. | | | (2,083,985 | ) | |
| | (985,065 | ) | | DISH Network Corp. - Class A | | | (4,826,818 | ) | |
| | (69,800 | ) | | JOYY, Inc. (ADR) | | | (2,716,616 | ) | |
| | (246,200 | ) JPY | | Koei Tecmo Holdings Company,
Ltd. | | | (3,190,083 | ) | |
| | (8,884,169 | ) EUR | | Koninklijke KPN, NV | | | (29,846,085 | ) | |
| | (103,913 | ) | | Live Nation Entertainment, Inc. | | | (8,315,118 | ) | |
| | (71,000 | ) | | Lyft, Inc. - Class A | | | (651,070 | ) | |
| | (169,347 | ) | | Match Group, Inc. | | | (5,859,406 | ) | |
| | (4,500 | ) | | Perficient, Inc. | | | (261,855 | ) | |
| | (113,988 | ) | | Sea, Ltd. (ADR) | | | (4,753,300 | ) | |
| | (661,267 | ) | | Snap, Inc. - Class A | | | (6,619,283 | ) | |
| | (45,992 | ) | | TechTarget, Inc. | | | (1,158,078 | ) | |
| | (166,701 | ) | | TKO Group Holdings, Inc. | | | (13,666,148 | ) | |
| | (32,170 | ) | | TripAdvisor, Inc. | | | (474,829 | ) | |
| | (94,929 | ) | | Ziff Davis, Inc. | | | (5,739,407 | ) | |
| | | | (96,148,770 | ) | |
| | | Consumer Discretionary (-3.0%) | |
| | (79,000 | ) | | Airbnb, Inc. - Class A | | | (9,344,910 | ) | |
| | (936,400 | ) HKD | | ANTA Sports Products, Ltd. | | | (10,572,306 | ) | |
| | (1,400 | ) | | Booking Holdings, Inc. | | | (3,905,384 | ) | |
| | (2,121,000 | ) | | Carnival Corp. | | | (24,306,660 | ) | |
| | (17,000 | ) | | Cheesecake Factory, Inc. | | | (528,190 | ) | |
| | (11,323 | ) | | Cracker Barrel Old Country
Store, Inc. | | | (751,394 | ) | |
| | (49,178 | ) EUR | | Delivery Hero, SE* | | | (1,247,285 | ) | |
NUMBER OF
SHARES | | | | VALUE | |
| | (192,300 | ) | | DraftKings, Inc. - Class A | | $ | (5,311,326 | ) | |
| | (1,285,100 | ) JPY | | EDION Corp. | | | (12,768,337 | ) | |
| | (299,959 | ) | | Etsy, Inc. | | | (18,687,446 | ) | |
| | (310,000 | ) | | Ford Motor Company | | | (3,022,500 | ) | |
| | (409,736 | ) | | Guess?, Inc. | | | (8,809,324 | ) | |
| | (206,500 | ) JPY | | Kyoritsu Maintenance
Company, Ltd. | | | (7,839,030 | ) | |
| | (444,400 | ) | | Li Auto, Inc. (ADR) | | | (15,025,164 | ) | |
| | (44,901 | ) | | Luminar Technologies, Inc. | | | (142,336 | ) | |
| | (38,217 | ) | | Marriott Vacations Worldwide
Corp. | | | (3,434,180 | ) | |
| | (20,000 | ) HKD | | Meituan - Class B* | | | (282,675 | ) | |
| | (1,974,400 | ) | | NIO, Inc. (ADR) | | | (14,413,120 | ) | |
| | (622,200 | ) | | Norwegian Cruise Line
Holdings, Ltd. | | | (8,461,920 | ) | |
| | (157,550 | ) | | PDD Holdings, Inc. | | | (15,978,721 | ) | |
| | (2,781,800 | ) | | Rivian Automotive, Inc. -
Class A | | | (45,120,796 | ) | |
| | (567,832 | ) | | Royal Caribbean Cruises, Ltd. | | | (48,112,405 | ) | |
| | (23,700 | ) | | Shake Shack, Inc. - Class A | | | (1,328,148 | ) | |
| | (150,355 | ) | | Stride, Inc. | | | (8,266,518 | ) | |
| | (515,800 | ) JPY | | Takashimaya Company, Ltd. | | | (6,952,198 | ) | |
| | (416,358 | ) | | Tesla, Inc. | | | (83,621,341 | ) | |
| | (6,600 | ) | | Vail Resorts, Inc. | | | (1,400,850 | ) | |
| | (1,221,902 | ) | | Wayfair, Inc. - Class A | | | (52,065,244 | ) | |
| | (3,380,000 | ) HKD | | Wynn Macau, Ltd. | | | (2,984,671 | ) | |
| | | | (414,684,379 | ) | |
| | | Consumer Staples (-0.1%) | |
| | (113,100 | ) | | Beauty Health Company | | | (458,055 | ) | |
| | (83,589 | ) | | Freshpet, Inc. | | | (4,798,009 | ) | |
| | (96,000 | ) JPY | | Nippn Corp. | | | (1,456,071 | ) | |
| | (84,900 | ) | | Post Holdings, Inc. | | | (6,815,772 | ) | |
| | (93,400 | ) JPY | | Yaoko Company, Ltd. | | | (4,776,140 | ) | |
| | | | (18,304,047 | ) | |
| | | Energy (-1.8%) | |
| | (36,774 | ) | | Chevron Corp. | | | (5,359,075 | ) | |
| | (559,643 | ) | | Exxon Mobil Corp. | | | (59,238,212 | ) | |
| | (101,968 | ) | | Northern Oil & Gas, Inc. | | | (3,909,453 | ) | |
| | (767,759 | ) | | Pioneer Natural Resources
Company | | | (183,494,401 | ) | |
| | (125,200 | ) | | World Kinect Corp. | | | (2,316,200 | ) | |
| | | | (254,317,341 | ) | |
| | | Financials (-0.2%) | |
| | (282,500 | ) | | Apollo Global Management,
Inc. | | | (21,876,800 | ) | |
| | (29,500 | ) | | Coinbase Global, Inc. - Class A | | | (2,275,040 | ) | |
| | (177,000 | ) | | SoFi Technologies, Inc. | | | (1,336,350 | ) | |
| | | | (25,488,190 | ) | |
See accompanying Notes to Schedule of Investments
www.calamos.com
105
Market Neutral Income Fund Schedule of Investments October 31, 2023
NUMBER OF
SHARES | | | | VALUE | |
| | | Health Care (-1.5%) | |
| | (61,000 | ) | | Alnylam Pharmaceuticals, Inc. | | $ | (9,259,800 | ) | |
| | (108,580 | ) | | Amphastar Pharmaceuticals,
Inc. | | | (4,915,417) | | |
| | (30,400 | ) | | Ascendis Pharma, A/S (ADR) | | | (2,715,024 | ) | |
| | (210,066 | ) | | Bridgebio Pharma, Inc. | | | (5,470,119 | ) | |
| | (57,790 | ) | | Coherus Biosciences, Inc. | | | (193,597 | ) | |
| | (112,619 | ) | | CONMED Corp. | | | (10,975,848 | ) | |
| | (749,380 | ) | | Dexcom, Inc. | | | (66,567,425 | ) | |
| | (94,406 | ) | | Envista Holdings Corp. | | | (2,196,828 | ) | |
| | (400,224 | ) | | Halozyme Therapeutics, Inc. | | | (13,555,587 | ) | |
| | (406,600 | ) | | Innoviva, Inc. | | | (5,045,906 | ) | |
| | (170,531 | ) | | Insmed, Inc. | | | (4,273,507 | ) | |
| | (74,881 | ) | | Insulet Corp. | | | (9,926,974 | ) | |
| | (70,500 | ) | | Integer Holdings Corp. | | | (5,722,485 | ) | |
| | (244,000 | ) | | Ionis Pharmaceuticals, Inc. | | | (10,801,880 | ) | |
| | (567,630 | ) | | Ironwood Pharmaceuticals, Inc. | | | (5,091,641 | ) | |
| | (83,420 | ) | | Jazz Pharmaceuticals, PLC | | | (10,596,008 | ) | |
| | (43,580 | ) | | Lantheus Holdings, Inc. | | | (2,815,268 | ) | |
| | (7,000 | ) | | Mesa Laboratories, Inc. | | | (656,810 | ) | |
| | (212,500 | ) | | Natera, Inc. | | | (8,387,375 | ) | |
| | (25,000 | ) | | NeoGenomics, Inc. | | | (350,500 | ) | |
| | (40,000 | ) | | Omnicell, Inc. | | | (1,421,600 | ) | |
| | (49,000 | ) | | Revance Therapeutics, Inc. | | | (386,610 | ) | |
| | (173,511 | ) | | Sarepta Therapeutics, Inc. | | | (11,679,025 | ) | |
| | (600 | ) JPY | | Ship Healthcare Holdings, Inc. | | | (9,203 | ) | |
| | (16,462 | ) | | Shockwave Medical, Inc. | | | (3,395,452 | ) | |
| | (23,700 | ) | | TransMedics Group, Inc. | | | (888,276 | ) | |
| | (642,149 | ) | | Veradigm, Inc. | | | (8,469,945 | ) | |
| | | | (205,768,110 | ) | |
| | | Industrials (-1.0%) | |
| | (21,800 | ) | | Advanced Energy Industries, Inc. | | | (1,902,268 | ) | |
| | (100,200 | ) | | Air Transport Services Group,
Inc. | | | (1,960,914) | | |
| | (602,400 | ) | | American Airlines Group, Inc. | | | (6,716,760 | ) | |
| | (238,100 | ) JPY | | ANA Holdings, Inc. | | | (4,637,118 | ) | |
| | (32,955 | ) | | Axon Enterprise, Inc. | | | (6,738,968 | ) | |
| | (382,400 | ) | | Bloom Energy Corp. - Class A | | | (3,976,960 | ) | |
| | (315,700 | ) | | Chart Industries, Inc. | | | (36,693,811 | ) | |
| | (513,000 | ) | | Clarivate, PLC | | | (3,272,940 | ) | |
| | (242,933 | ) | | Fluor Corp. | | | (8,087,240 | ) | |
| | (91,056 | ) | | Granite Construction, Inc. | | | (3,685,947 | ) | |
| | (54,380 | ) | | Greenbrier Companies, Inc. | | | (1,881,004 | ) | |
| | (49,800 | ) | | John Bean Technologies Corp. | | | (5,180,196 | ) | |
| | (92,200 | ) | | Middleby Corp. | | | (10,406,614 | ) | |
| | (19,000 | ) | | RBC Bearings, Inc. | | | (4,176,960 | ) | |
| | (129,000 | ) EUR | | Safran, SA | | | (20,067,486 | ) | |
| | (415,200 | ) JPY | | Seino Holdings Company, Ltd. | | | (5,997,562 | ) | |
NUMBER OF
SHARES | | | | VALUE | |
| | (3,374,000 | ) SGD | | Singapore Airlines, Ltd. | | $ | (15,056,889 | ) | |
| | (57,600 | ) | | Stem, Inc. | | | (194,688 | ) | |
| | (22,494 | ) | | Tetra Tech, Inc. | | | (3,394,569 | ) | |
| | (130,305 | ) | | Upwork, Inc. | | | (1,361,687 | ) | |
| | (340,000 | ) | | Virgin Galactic Holdings, Inc. | | | (503,200 | ) | |
| | | | (145,893,781 | ) | |
| | | Information Technology (-6.3%) | |
| | (106,345 | ) | | 3D Systems Corp. | | | (396,667 | ) | |
| | (1,020,900 | ) | | Akamai Technologies, Inc. | | | (105,489,597 | ) | |
| | (100,182 | ) | | Altair Engineering, Inc. - Class A | | | (6,223,306 | ) | |
| | (119,700 | ) | | Bentley Systems, Inc. - Class B | | | (5,822,208 | ) | |
| | (122,759 | ) | | BILL Holdings, Inc. | | | (11,206,669 | ) | |
| | (187,841 | ) | | Blackline, Inc. | | | (9,222,993 | ) | |
| | (78,000 | ) | | Block, Inc. | | | (3,139,500 | ) | |
| | (690,000 | ) | | Box, Inc. - Class A | | | (17,153,400 | ) | |
| | (34,020 | ) | | Broadcom, Inc. | | | (28,623,407 | ) | |
| | (27,900 | ) | | Ceridian HCM Holding, Inc. | | | (1,785,879 | ) | |
| | (73,594 | ) | | Cloudflare, Inc. - Class A | | | (4,172,044 | ) | |
| | (131,800 | ) | | Confluent, Inc. - Class A | | | (3,810,338 | ) | |
| | (84,439 | ) | | CSG Systems International, Inc. | | | (3,956,812 | ) | |
| | (65,900 | ) | | CyberArk Software, Ltd. | | | (10,783,876 | ) | |
| | (156,600 | ) | | Datadog, Inc. - Class A | | | (12,758,202 | ) | |
| | (32,050 | ) | | DigitalOcean Holdings, Inc. | | | (655,743 | ) | |
| | (742,200 | ) | | Dropbox, Inc. - Class A | | | (19,519,860 | ) | |
| | (22,734 | ) | | Enphase Energy, Inc. | | | (1,809,172 | ) | |
| | (78,200 | ) | | Envestnet, Inc. | | | (2,893,400 | ) | |
| | (42,000 | ) | | Five9, Inc. | | | (2,430,540 | ) | |
| | (69,833 | ) | | Guidewire Software, Inc. | | | (6,294,048 | ) | |
| | (23,000 | ) | | Impinj, Inc. | | | (1,486,030 | ) | |
| | (2,113,399 | ) | | Infinera Corp. | | | (6,192,259 | ) | |
| | (190,288 | ) | | Insight Enterprises, Inc. | | | (27,268,270 | ) | |
| | (95,973 | ) | | InterDigital, Inc. | | | (7,221,968 | ) | |
| | (47,916 | ) | | Itron, Inc. | | | (2,744,628 | ) | |
| | (115,000 | ) | | Jamf Holding Corp. | | | (1,846,900 | ) | |
| | (12,707,000 | ) HKD | | Lenovo Group, Ltd. | | | (14,776,998 | ) | |
| | (357,323 | ) | | Lumentum Holdings, Inc. | | | (14,010,635 | ) | |
| | (6,753 | ) | | MicroStrategy, Inc. - Class A | | | (2,859,153 | ) | |
| | (98,800 | ) | | Model N, Inc. | | | (2,381,080 | ) | |
| | (275,779 | ) | | MongoDB, Inc. | | | (95,030,686 | ) | |
| | (192,860 | ) | | Nice, Ltd. (ADR) | | | (29,767,941 | ) | |
| | (118,350 | ) | | Nova, Ltd. | | | (11,239,699 | ) | |
| | (79,587 | ) | | Nutanix, Inc. - Class A | | | (2,880,254 | ) | |
| | (35,662 | ) | | Okta, Inc. | | | (2,403,975 | ) | |
| | (1,280,700 | ) | | ON Semiconductor Corp. | | | (80,223,048 | ) | |
| | (807,986 | ) | | Palo Alto Networks, Inc. | | | (196,356,758 | ) | |
| | (30,500 | ) | | Pegasystems, Inc. | | | (1,303,570 | ) | |
| | (124,000 | ) | | Progress Software Corp. | | | (6,371,120 | ) | |
See accompanying Notes to Schedule of Investments
CALAMOS OPEN-END FAMILY OF FUNDS ANNUAL REPORT
106
Market Neutral Income Fund Schedule of Investments October 31, 2023
NUMBER OF
SHARES | | | | VALUE | |
| | (36,500 | ) | | PROS Holdings, Inc. | | $ | (1,136,975 | ) | |
| | (156,800 | ) | | Rapid7, Inc. | | | (7,289,632 | ) | |
| | (134,400 | ) | | Seagate Technology Holdings,
PLC | | | (9,172,800) | | |
| | (126,300 | ) | | Shift4 Payments, Inc. - Class A | | | (5,622,876 | ) | |
| | (127,498 | ) | | Splunk, Inc. | | | (18,762,606 | ) | |
| | (431,268 | ) | | Teradyne, Inc. | | | (35,911,686 | ) | |
| | (240,000 | ) | | Varonis Systems, Inc. | | | (8,073,600 | ) | |
| | (33,300 | ) | | Verint Systems, Inc. | | | (626,373 | ) | |
| | (216,646 | ) | | Vishay Intertechnology, Inc. | | | (4,818,207 | ) | |
| | (350,700 | ) | | Wolfspeed, Inc. | | | (11,867,688 | ) | |
| | (163,100 | ) | | Workiva, Inc. | | | (14,204,379 | ) | |
| | | | (881,999,455 | ) | |
| | | Materials (-0.3%) | |
| | (25,000 | ) JPY | | ARE Holdings, Inc. | | | (315,026 | ) | |
| | (642,997 | ) | | ATI, Inc. | | | (24,285,997 | ) | |
| | (73,870 | ) | | Lithium Americas Argentina
Corp. | | | (408,501) | | |
| | (51,200 | ) JPY | | Maeda Kosen Company, Ltd. | | | (987,350 | ) | |
| | (678,100 | ) JPY | | Nippon Steel Corp. | | | (14,458,975 | ) | |
| | | | (40,455,849 | ) | |
| | | Real Estate (-0.3%) | |
| | (605,000 | ) HKD | | Link REIT | | | (2,775,566 | ) | |
| | (88,000 | ) JPY | | Relo Group, Inc. | | | (863,309 | ) | |
| | (82,500 | ) | | Ventas, Inc. | | | (3,502,950 | ) | |
| | (144,500 | ) | | Welltower, Inc. | | | (12,081,645 | ) | |
| | (497,000 | ) | | Zillow Group, Inc. - Class C | | | (18,016,250 | ) | |
| | | | (37,239,720 | ) | |
| | | Utilities (-0.5%) | |
| | (77,700 | ) | | Alliant Energy Corp. | | | (3,790,983 | ) | |
| | (58,500 | ) | | American Water Works
Company, Inc. | | | (6,882,525) | | |
| | (163,000 | ) | | CenterPoint Energy, Inc. | | | (4,381,440 | ) | |
| | (60,500 | ) | | CMS Energy Corp. | | | (3,287,570 | ) | |
| | (71,500 | ) | | Duke Energy Corp. | | | (6,355,635 | ) | |
| | (160,000 | ) | | FirstEnergy Corp. | | | (5,696,000 | ) | |
| | (180,000 | ) | | NextEra Energy, Inc. | | | (10,494,000 | ) | |
| | (235,000 | ) | | PPL Corp. | | | (5,773,950 | ) | |
| | (226,600 | ) | | Southern Company | | | (15,250,180 | ) | |
| | (161,900 | ) | | Sunnova Energy International,
Inc. | | | (1,478,147) | | |
| | | | (63,390,430 | ) | |
| | | TOTAL COMMON STOCKS
SOLD SHORT
(Proceeds $2,260,175,982) | | | (2,183,690,072 | ) | |
| | | TOTAL SECURITIES SOLD SHORT
(Proceeds $2,260,175,982) | | | (2,183,690,072 | ) | |
NUMBER OF
CONTRACTS/
NOTIONAL
AMOUNT | | | | VALUE | |
WRITTEN OPTIONS (-0.7%)# | | | |
| | | Consumer Discretionary (0.0%) | | | |
| | 11,000 | | | Carnival Corp. | | | | | |
| | 12,606,000 | | | Call, 06/21/24, Strike $10.00 | | $ | (3,223,000 | ) | |
| | 68 | | | iRobot Corp. | | | | | |
| | 223,924 | | | Call, 01/19/24, Strike $35.00 | | | (21,420 | ) | |
| | | | (3,244,420 | ) | |
| | | Information Technology (0.0%) | | | |
| | 2,000 | | | Palo Alto Networks, Inc. | | | | | |
| | 48,604,000 | | | Call, 11/03/23, Strike $260.00 | | | (38,000 | ) | |
| | | Other (-0.7%) | | | |
| | | | | S&P 500 Index | | | | | |
| | 1,000 | | | | | | | | |
| | 419,380,000 | | | Call, 12/29/23, Strike $4,200.00 | | | (11,690,000 | ) | |
| | 1,000 | | | | | | | | | | |
| | 419,380,000 | | | Call, 12/29/23, Strike $4,000.00 | | | (25,975,000 | ) | |
| | | | | S&P 500 Index | | | | | |
| | 8,750 | | | | | | | | | | |
| | 3,669,575,000 | | | Call, 12/29/23, Strike $4,300.00 | | | (56,218,750 | ) | |
| | 5,000 | | | | | | | | | | |
| | 2,096,900,000 | | | Put, 12/29/23, Strike $3,500.00 | | | (3,550,000 | ) | |
| | | | (97,433,750 | ) | |
| | | | | TOTAL WRITTEN OPTIONS
(Premium $219,352,018) | | | (100,716,170 | ) | |
FORWARD FOREIGN CURRENCY CONTRACTS
COUNTERPARTY | | LONG
CONTRACTS | | SETTLEMENT
DATE | | LOCAL
CURRENCY | | CURRENT
VALUE | | UNREALIZED
GAIN/LOSS | |
Bank of New York | | Singapore Dollar | | 01/19/24 | | | 1,283,000 | | | $ | 940,368 | | | $ | 1,247 | | |
| | | $ | 1,247 | | |
COUNTERPARTY | | SHORT
CONTRACTS | | SETTLEMENT
DATE | | LOCAL
CURRENCY | | CURRENT
VALUE | | UNREALIZED
GAIN/LOSS | |
State Street Bank and
Trust | | British
Pound Sterling | | 01/19/24 | | | 14,001,000 | | | $ | 17,028,527 | | | $ | 17,018 | | |
State Street Bank and
Trust | | Singapore Dollar | | 01/19/24 | | | 24,025,000 | | | | 17,608,989 | | | | 6,524 | | |
State Street Bank and
Trust | | Japanese Yen | | 01/19/24 | | | 3,109,342,000 | | | | 20,782,545 | | | | 309,873 | | |
State Street Bank and
Trust | | European Monetary
Unit | | 01/19/24 | | | 102,255,000 | | | | 108,601,683 | | | | (405,382 | ) | |
| | | $ | (71,967 | ) | |
See accompanying Notes to Schedule of Investments
www.calamos.com
107
Market Neutral Income Fund Schedule of Investments October 31, 2023
NOTES TO SCHEDULE OF INVESTMENTS
~ Security, or portion of security, is segregated as collateral (or collateral for potential future transactions) for written options and securities sold short. The aggregate value of such securities is $3,774,357,766.
* Securities issued and sold pursuant to a Rule 144A transaction are exempted from the registration requirement of the Securities Act of 1933, as amended. These securities may only be sold to qualified institutional buyers ("QIBs"), such as the Fund. Any resale of these securities must generally be effected through a sale that is registered under the Act or otherwise exempted from such registration requirements.
^ Security, or portion of security, is on loan.
@ In default status and considered non-income producing.
‡ Variable rate security. The rate shown is the rate in effect at October 31, 2023.
# Non-income producing security.
†† Security or a portion of the security purchased on a delayed delivery or when-issued basis.
‡‡‡ Security fair valued using significant unobservable inputs and classified as a Level 3 security.
& Illiquid security.
† Represents investment of cash collateral received from securities on loan as of October 31, 2023.
*** The rate disclosed is the 7 day net yield as of October 31, 2023.
FOREIGN CURRENCY ABBREVIATION
EUR European Monetary Unit
GBP British Pound Sterling
HKD Hong Kong Dollar
JPY Japanese Yen
SGD Singapore Dollar
Note: Value for securities denominated in foreign currencies is shown in U.S. dollars. The principal amount for such securities is shown in the respective foreign currency. The date on options represents the expiration date of the option contract. The option contract may be exercised at any date on or before the date shown. For purchased options denominated in JPY, the strike price shown is a percentage of the par value of the underlying.
TOTAL RETURN SWAPS
COUNTERPARTY | | UNDERLYING
REFERENCE
INSTRUMENT | | FIXED RATE
(FUND PAYS) | | FLOATING RATE
(FUND RECEIVES) | | TERMINATION
DATE | | PERIODIC
PAYMENT
FREQUENCY | | NOTIONAL
AMOUNT | | UPFRONT
PAYMENTS
(PAID)/
RECEIVED | | MARKET
VALUE | | UNREALIZED
APPRECIATION/
(DEPRECIATION) | |
JPMorgan Chase
Bank N.A. | | PagerDuty, Inc. | | Equity returns on 227,709 shares of
PagerDuty, Inc. | | 1 mo. OBFR Plus 1.000% | | 11/15/23 | | Monthly | | $ | 4,884,358 | | | $ | — | | | $ | 291,468 | | | $ | 291,468 | | |
JPMorgan Chase
Bank N.A. | | Enovis Corp. | | Equity returns on 60,200 shares of
Enovis Corp. | | 1 mo. OBFR Plus 1.000% | | 11/22/23 | | Monthly | | | 2,700,572 | | | | — | | | | (62,608 | ) | | | (62,608 | ) | |
| | | $ | — | | | $ | 228,860 | | | $ | 228,860 | | |
See accompanying Notes to Schedule of Investments
CALAMOS OPEN-END FAMILY OF FUNDS ANNUAL REPORT
108
Hedged Equity Fund Schedule of Investments October 31, 2023
NUMBER OF
SHARES | | | | VALUE | |
COMMON STOCKS (94.5%) | | | |
| | | Communication Services (8.3%) | |
| | 81,811 | | | Alphabet, Inc. - Class A~# | | $ | 10,151,109 | | |
| | 91,737 | | | Alphabet, Inc. - Class C~# | | | 11,494,646 | | |
| | 82,036 | | | AT&T, Inc.~ | | | 1,263,354 | | |
| | 70,810 | | | Comcast Corp. - Class A | | | 2,923,745 | | |
| | 13,095 | | | Fox Corp. - Class A | | | 397,957 | | |
| | 15,143 | | | Match Group, Inc.# | | | 523,948 | | |
| | 35,178 | | | Meta Platforms, Inc. - Class A# | | | 10,598,076 | | |
| | 6,768 | | | Netflix, Inc.~# | | | 2,786,318 | | |
| | 10,830 | | | T-Mobile U.S., Inc.# | | | 1,558,004 | | |
| | 67,586 | | | Verizon Communications, Inc.~ | | | 2,374,296 | | |
| | 32,834 | | | Walt Disney Company~# | | | 2,678,926 | | |
| | | | 46,750,379 | | |
| | | Consumer Discretionary (9.2%) | |
| | 136,362 | | | Amazon.com, Inc.~# | | | 18,148,418 | | |
| | 11,586 | | | Aptiv, PLC# | | | 1,010,299 | | |
| | 584 | | | Booking Holdings, Inc.~# | | | 1,629,103 | | |
| | 15,339 | | | Caesars Entertainment, Inc.# | | | 611,873 | | |
| | 52,243 | | | Carnival Corp.# | | | 598,705 | | |
| | 701 | | | Chipotle Mexican Grill, Inc.# | | | 1,361,482 | | |
| | 4,530 | | | Darden Restaurants, Inc. | | | 659,251 | | |
| | 14,075 | | | DR Horton, Inc. | | | 1,469,430 | | |
| | 12,279 | | | eBay, Inc. | | | 481,705 | | |
| | 62,497 | | | Ford Motor Company | | | 609,346 | | |
| | 23,464 | | | General Motors Company | | | 661,685 | | |
| | 17,230 | | | Home Depot, Inc.~ | | | 4,905,209 | | |
| | 14,561 | | | Las Vegas Sands Corp. | | | 691,065 | | |
| | 14,068 | | | Lowe's Companies, Inc. | | | 2,680,939 | | |
| | 1,370 | | | Lululemon Athletica, Inc.# | | | 539,068 | | |
| | 10,904 | | | McDonald's Corp.~ | | | 2,858,702 | | |
| | 15,726 | | | MGM Resorts International# | | | 549,152 | | |
| | 22,026 | | | NIKE, Inc. - Class B~ | | | 2,263,612 | | |
| | 33,393 | | | Norwegian Cruise Line Holdings, Ltd.#^ | | | 454,145 | | |
| | 1,359 | | | O'Reilly Automotive, Inc.# | | | 1,264,468 | | |
| | 7,807 | | | Ross Stores, Inc. | | | 905,378 | | |
| | 18,926 | | | Starbucks Corp.~ | | | 1,745,734 | | |
| | 11,785 | | | Tesla, Inc.# | | | 2,366,899 | | |
| | 21,818 | | | TJX Cos., Inc.~ | | | 1,921,511 | | |
| | 2,401 | | | Ulta Beauty, Inc.# | | | 915,525 | | |
| | | | 51,302,704 | | |
| | | Consumer Staples (6.5%) | |
| | 30,078 | | | Altria Group, Inc.~ | | | 1,208,233 | | |
| | 13,261 | | | Archer-Daniels-Midland Company | | | 949,090 | | |
| | 8,504 | | | Church & Dwight Company, Inc. | | | 773,354 | | |
| | 55,002 | | | Coca-Cola Company~ | | | 3,107,063 | | |
NUMBER OF
SHARES | | | | VALUE | |
| | 12,810 | | | Colgate-Palmolive Company | | $ | 962,287 | | |
| | 6,044 | | | Constellation Brands, Inc. - Class A | | | 1,415,203 | | |
| | 5,230 | | | Costco Wholesale Corp.~ | | | 2,889,261 | | |
| | 4,093 | | | Dollar General Corp. | | | 487,231 | | |
| | 7,051 | | | Dollar Tree, Inc.# | | | 783,295 | | |
| | 4,633 | | | Estee Lauder Companies, Inc. - Class A | | | 597,055 | | |
| | 13,991 | | | General Mills, Inc. | | | 912,773 | | |
| | 10,613 | | | Kellanova | | | 535,638 | | |
| | 7,910 | | | Kimberly-Clark Corp. | | | 946,352 | | |
| | 18,278 | | | Kraft Heinz Company | | | 575,026 | | |
| | 18,412 | | | Kroger Company | | | 835,352 | | |
| | 36,953 | | | Mondelez International, Inc. - Class A~ | | | 2,446,658 | | |
| | 15,977 | | | Monster Beverage Corp.# | | | 816,425 | | |
| | 16,870 | | | PepsiCo, Inc.~ | | | 2,754,533 | | |
| | 30,879 | | | Philip Morris International, Inc.~ | | | 2,753,172 | | |
| | 30,327 | | | Procter & Gamble Company | | | 4,549,960 | | |
| | 13,781 | | | Sysco Corp. | | | 916,299 | | |
| | 8,722 | | | Target Corp. | | | 966,310 | | |
| | 26,015 | | | Walmart, Inc.~ | | | 4,251,111 | | |
| | | | 36,431,681 | | |
| | | Energy (4.6%) | |
| | 34,059 | | | Chevron Corp.~ | | | 4,963,418 | | |
| | 23,111 | | | ConocoPhillips~ | | | 2,745,587 | | |
| | 6,517 | | | EOG Resources, Inc. | | | 822,771 | | |
| | 39,644 | | | Exxon Mobil Corp. | | | 4,196,318 | | |
| | 15,001 | | | Hess Corp. | | | 2,166,144 | | |
| | 43,843 | | | Kinder Morgan, Inc. | | | 710,257 | | |
| | 23,211 | | | Marathon Petroleum Corp. | | | 3,510,664 | | |
| | 13,019 | | | Occidental Petroleum Corp. | | | 804,704 | | |
| | 8,789 | | | ONEOK, Inc. | | | 573,043 | | |
| | 6,156 | | | Phillips 66 | | | 702,215 | | |
| | 8,740 | | | Pioneer Natural Resources Company | | | 2,088,860 | | |
| | 18,547 | | | Schlumberger, NV | | | 1,032,326 | | |
| | 6,127 | | | Valero Energy Corp. | | | 778,129 | | |
| | 22,126 | | | Williams Companies, Inc. | | | 761,134 | | |
| | | | 25,855,570 | | |
| | | Financials (12.3%) | |
| | 9,088 | | | Aflac, Inc.~ | | | 709,864 | | |
| | 6,980 | | | Allstate Corp.~ | | | 894,347 | | |
| | 15,603 | | | American Express Company~ | | | 2,278,506 | | |
| | 31,070 | | | American International Group, Inc.~ | | | 1,904,902 | | |
| | 4,276 | | | Ameriprise Financial, Inc. | | | 1,345,101 | | |
| | 7,784 | | | Arthur J Gallagher & Company | | | 1,833,054 | | |
| | 6,419 | | | Assurant, Inc.~ | | | 955,789 | | |
| | 172,602 | | | Bank of America Corp.~ | | | 4,546,337 | | |
| | 15,841 | | | Bank of New York Mellon Corp. | | | 673,242 | | |
See accompanying Notes to Schedule of Investments
www.calamos.com
109
Hedged Equity Fund Schedule of Investments October 31, 2023
NUMBER OF
SHARES | | | | VALUE | |
| | 23,527 | | | Berkshire Hathaway, Inc. - Class B# | | $ | 8,030,471 | | |
| | 1,644 | | | BlackRock, Inc. | | | 1,006,588 | | |
| | 7,232 | | | Cboe Global Markets, Inc.~ | | | 1,185,252 | | |
| | 30,340 | | | Charles Schwab Corp. | | | 1,578,894 | | |
| | 9,665 | | | Chubb, Ltd. | | | 2,074,302 | | |
| | 22,853 | | | Citigroup, Inc.~ | | | 902,465 | | |
| | 3,420 | | | CME Group, Inc. | | | 730,033 | | |
| | 9,283 | | | Discover Financial Services | | | 761,949 | | |
| | 10,374 | | | Fiserv, Inc.~# | | | 1,180,042 | | |
| | 5,745 | | | Global Payments, Inc. | | | 610,234 | | |
| | 9,223 | | | Goldman Sachs Group, Inc.~ | | | 2,800,195 | | |
| | 34,292 | | | Huntington Bancshares, Inc. | | | 330,918 | | |
| | 3,921 | | | Jack Henry & Associates, Inc. | | | 552,822 | | |
| | 41,751 | | | JPMorgan Chase & Company~ | | | 5,805,894 | | |
| | 4,247 | | | M&T Bank Corp. | | | 478,849 | | |
| | 12,072 | | | Marsh & McLennan Cos., Inc.~ | | | 2,289,455 | | |
| | 13,739 | | | Mastercard, Inc. - Class A~ | | | 5,170,673 | | |
| | 13,163 | | | MetLife, Inc. | | | 789,912 | | |
| | 21,398 | | | Morgan Stanley | | | 1,515,406 | | |
| | 6,806 | | | Northern Trust Corp. | | | 448,583 | | |
| | 10,990 | | | PayPal Holdings, Inc.# | | | 569,282 | | |
| | 5,099 | | | Prudential Financial, Inc. | | | 466,253 | | |
| | 4,422 | | | S&P Global, Inc.~ | | | 1,544,649 | | |
| | 5,998 | | | State Street Corp. | | | 387,651 | | |
| | 5,680 | | | Travelers Companies, Inc. | | | 951,059 | | |
| | 15,712 | | | US Bancorp~ | | | 500,899 | | |
| | 31,172 | | | Visa, Inc. - Class A^ | | | 7,328,537 | | |
| | 80,783 | | | Wells Fargo & Company~ | | | 3,212,740 | | |
| | 20,400 | | | Zions Bancorp NA | | | 629,340 | | |
| | | | 68,974,489 | | |
| | | Health Care (13.3%) | |
| | 22,556 | | | Abbott Laboratories~ | | | 2,132,670 | | |
| | 28,019 | | | AbbVie, Inc. | | | 3,955,723 | | |
| | 14,461 | | | Agilent Technologies, Inc.~ | | | 1,494,834 | | |
| | 6,346 | | | Amgen, Inc.~ | | | 1,622,672 | | |
| | 15,835 | | | Baxter International, Inc.~ | | | 513,529 | | |
| | 5,297 | | | Becton Dickinson & Co | | | 1,338,976 | | |
| | 3,300 | | | Biogen, Inc.# | | | 783,882 | | |
| | 46,720 | | | Boston Scientific Corp.# | | | 2,391,597 | | |
| | 44,580 | | | Bristol-Myers Squibb Company~ | | | 2,297,207 | | |
| | 10,303 | | | Centene Corp.# | | | 710,701 | | |
| | 4,377 | | | Cigna Group | | | 1,353,368 | | |
| | 19,357 | | | CVS Health Corp.~ | | | 1,335,827 | | |
| | 12,641 | | | Danaher Corp. | | | 2,427,325 | | |
| | 8,227 | | | Dexcom, Inc.# | | | 730,804 | | |
| | 14,742 | | | Edwards Lifesciences Corp.~# | | | 939,360 | | |
| | 14,972 | | | Eli Lilly & Company | | | 8,293,440 | | |
NUMBER OF
SHARES | | | | VALUE | |
| | 5,427 | | | GE Healthcare, Inc. | | $ | 361,275 | | |
| | 20,620 | | | Gilead Sciences, Inc.~ | | | 1,619,495 | | |
| | 4,318 | | | HCA Healthcare, Inc. | | | 976,473 | | |
| | 2,789 | | | Humana, Inc.~ | | | 1,460,571 | | |
| | 7,388 | | | Intuitive Surgical, Inc.~# | | | 1,937,281 | | |
| | 4,179 | | | IQVIA Holdings, Inc.# | | | 755,689 | | |
| | 35,670 | | | Johnson & Johnson | | | 5,291,288 | | |
| | 4,088 | | | Laboratory Corp. of America Holdings | | | 816,496 | | |
| | 2,692 | | | McKesson Corp. | | | 1,225,829 | | |
| | 21,870 | | | Medtronic, PLC | | | 1,543,147 | | |
| | 38,353 | | | Merck & Company, Inc.~ | | | 3,938,853 | | |
| | 86,481 | | | Pfizer, Inc.~ | | | 2,642,859 | | |
| | 4,933 | | | Quest Diagnostics, Inc. | | | 641,783 | | |
| | 1,052 | | | Regeneron Pharmaceuticals, Inc.# | | | 820,444 | | |
| | 3,852 | | | Stryker Corp. | | | 1,040,888 | | |
| | 7,551 | | | Thermo Fisher Scientific, Inc.~ | | | 3,358,458 | | |
| | 18,231 | | | UnitedHealth Group, Inc. | | | 9,763,794 | | |
| | 5,482 | | | Vertex Pharmaceuticals, Inc.~# | | | 1,985,087 | | |
| | 3,831 | | | Zimmer Biomet Holdings, Inc. | | | 399,995 | | |
| | 10,255 | | | Zoetis, Inc. | | | 1,610,035 | | |
| | | | 74,511,655 | | |
| | | Industrials (7.8%) | |
| | 6,070 | | | 3M Company | | | 552,067 | | |
| | 4,593 | | | Allegion, PLC | | | 451,767 | | |
| | 8,751 | | | Automatic Data Processing, Inc.~ | | | 1,909,643 | | |
| | 5,994 | | | Boeing Company~# | | | 1,119,799 | | |
| | 23,944 | | | Carrier Global Corp. | | | 1,141,171 | | |
| | 12,197 | | | Caterpillar, Inc.~ | | | 2,757,132 | | |
| | 64,755 | | | CSX Corp.~ | | | 1,932,937 | | |
| | 4,403 | | | Deere & Company~ | | | 1,608,680 | | |
| | 15,140 | | | Delta Air Lines, Inc.~ | | | 473,125 | | |
| | 6,042 | | | Eaton Corp., PLC | | | 1,256,192 | | |
| | 17,282 | | | Emerson Electric Company~ | | | 1,537,580 | | |
| | 4,481 | | | Generac Holdings, Inc.# | | | 376,718 | | |
| | 3,822 | | | General Dynamics Corp. | | | 922,287 | | |
| | 16,285 | | | General Electric Company | | | 1,769,040 | | |
| | 14,639 | | | Honeywell International, Inc.~ | | | 2,682,743 | | |
| | 757 | | | Hubbell, Inc. | | | 204,466 | | |
| | 5,445 | | | Illinois Tool Works, Inc. | | | 1,220,333 | | |
| | 14,045 | | | Johnson Controls International, PLC | | | 688,486 | | |
| | 6,083 | | | L3Harris Technologies, Inc. | | | 1,091,351 | | |
| | 3,067 | | | Lockheed Martin Corp.~ | | | 1,394,381 | | |
| | 12,849 | | | Masco Corp. | | | 669,304 | | |
| | 3,493 | | | Norfolk Southern Corp. | | | 666,429 | | |
| | 3,141 | | | Northrop Grumman Corp.~ | | | 1,480,762 | | |
| | 5,751 | | | Otis Worldwide Corp. | | | 444,035 | | |
| | 13,482 | | | PACCAR, Inc. | | | 1,112,669 | | |
See accompanying Notes to Schedule of Investments
CALAMOS OPEN-END FAMILY OF FUNDS ANNUAL REPORT
110
Hedged Equity Fund Schedule of Investments October 31, 2023
NUMBER OF
SHARES | | | | VALUE | |
| | 8,226 | | | Paychex, Inc. | | $ | 913,497 | | |
| | 2,952 | | | Paycom Software, Inc. | | | 723,151 | | |
| | 13,826 | | | Pentair, PLC | | | 803,567 | | |
| | 31,233 | | | RTX Corp.~ | | | 2,542,054 | | |
| | 27,603 | | | Southwest Airlines Company | | | 613,615 | | |
| | 16,157 | | | Union Pacific Corp.~ | | | 3,354,355 | | |
| | 15,942 | | | United Airlines Holdings, Inc.# | | | 558,129 | | |
| | 10,304 | | | United Parcel Service, Inc. - Class B~ | | | 1,455,440 | | |
| | 5,171 | | | Verisk Analytics, Inc. | | | 1,175,679 | | |
| | 9,897 | | | Waste Management, Inc.~ | | | 1,626,374 | | |
| | 7,109 | | | Xylem, Inc.~ | | | 664,976 | | |
| | | | 43,893,934 | | |
| | | Information Technology (26.4%) | |
| | 8,650 | | | Accenture, PLC - Class A | | | 2,569,828 | | |
| | 6,326 | | | Adobe, Inc.# | | | 3,365,812 | | |
| | 28,867 | | | Advanced Micro Devices, Inc.~# | | | 2,843,399 | | |
| | 13,434 | | | Amphenol Corp. - Class A | | | 1,082,109 | | |
| | 10,726 | | | Analog Devices, Inc. | | | 1,687,522 | | |
| | 225,907 | | | Apple, Inc.~ | | | 38,578,138 | | |
| | 13,094 | | | Applied Materials, Inc. | | | 1,732,991 | | |
| | 3,739 | | | Autodesk, Inc.# | | | 738,939 | | |
| | 6,910 | | | Broadcom, Inc.~ | | | 5,813,867 | | |
| | 82,206 | | | Cisco Systems, Inc.~ | | | 4,285,399 | | |
| | 10,488 | | | Cognizant Technology Solutions
Corp. - Class A | | | 676,161 | | |
| | 2,208 | | | Enphase Energy, Inc.# | | | 175,713 | | |
| | 3,865 | | | Gartner, Inc.# | | | 1,283,335 | | |
| | 21,561 | | | HP, Inc. | | | 567,701 | | |
| | 44,897 | | | Intel Corp.~ | | | 1,638,741 | | |
| | 10,549 | | | International Business Machines Corp. | | | 1,525,807 | | |
| | 5,533 | | | Intuit, Inc.~ | | | 2,738,558 | | |
| | 25,558 | | | Micron Technology, Inc.~ | | | 1,709,063 | | |
| | 113,629 | | | Microsoft Corp.~ | | | 38,419,101 | | |
| | 1,951 | | | Monolithic Power Systems, Inc. | | | 861,835 | | |
| | 5,808 | | | NetApp, Inc. | | | 422,706 | | |
| | 37,718 | | | NVIDIA Corp.~†† | | | 15,381,400 | | |
| | 5,786 | | | NXP Semiconductors, NV | | | 997,680 | | |
| | 9,050 | | | ON Semiconductor Corp.# | | | 566,892 | | |
| | 28,103 | | | Oracle Corp.~ | | | 2,905,850 | | |
| | 6,846 | | | Palo Alto Networks, Inc.# | | | 1,663,715 | | |
| | 5,543 | | | PTC, Inc.# | | | 778,348 | | |
| | 6,990 | | | Qorvo, Inc.# | | | 611,066 | | |
| | 18,469 | | | QUALCOMM, Inc.~ | | | 2,012,936 | | |
| | 17,481 | | | Salesforce, Inc.~# | | | 3,510,709 | | |
| | 3,715 | | | ServiceNow, Inc.# | | | 2,161,573 | | |
| | 8,249 | | | Skyworks Solutions, Inc. | | | 715,518 | | |
| | 1,951 | | | SolarEdge Technologies, Inc.# | | | 148,178 | | |
NUMBER OF
SHARES | | | | VALUE | |
| | 5,608 | | | TE Connectivity, Ltd. | | $ | 660,903 | | |
| | 8,317 | | | Teradyne, Inc. | | | 692,557 | | |
| | 10,284 | | | Texas Instruments, Inc.~ | | | 1,460,431 | | |
| | 2,524 | | | Tyler Technologies, Inc.# | | | 941,200 | | |
| | | | 147,925,681 | | |
| | | Materials (2.2%) | |
| | 5,076 | | | Air Products & Chemicals, Inc.~ | | | 1,433,665 | | |
| | 4,149 | | | Avery Dennison Corp. | | | 722,216 | | |
| | 5,221 | | | Celanese Corp.^ | | | 597,857 | | |
| | 14,468 | | | Corteva, Inc. | | | 696,490 | | |
| | 14,465 | | | Dow, Inc. | | | 699,238 | | |
| | 13,005 | | | DuPont de Nemours, Inc. | | | 947,804 | | |
| | 40,784 | | | Freeport-McMoRan, Inc. | | | 1,377,684 | | |
| | 11,344 | | | Linde, PLC | | | 4,335,223 | | |
| | 6,431 | | | PPG Industries, Inc. | | | 789,534 | | |
| | 3,937 | | | Sherwin-Williams Company | | | 937,833 | | |
| | | | 12,537,544 | | |
| | | Real Estate (1.8%) | |
| | 4,421 | | | Alexandria Real Estate Equities, Inc. | | | 411,728 | | |
| | 5,557 | | | American Tower Corp. | | | 990,202 | | |
| | 4,065 | | | AvalonBay Communities, Inc. | | | 673,733 | | |
| | 5,516 | | | Crown Castle, Inc. | | | 512,878 | | |
| | 6,190 | | | Digital Realty Trust, Inc. | | | 769,788 | | |
| | 1,017 | | | Equinix, Inc. | | | 742,044 | | |
| | 5,289 | | | Mid-America Apartment Communities, Inc. | | | 624,895 | | |
| | 16,272 | | | Prologis, Inc. | | | 1,639,404 | | |
| | 2,913 | | | Public Storage | | | 695,362 | | |
| | 10,118 | | | Realty Income Corp. | | | 479,391 | | |
| | 8,249 | | | Regency Centers Corp. | | | 497,085 | | |
| | 12,808 | | | UDR, Inc. | | | 407,423 | | |
| | 10,361 | | | Welltower, Inc. | | | 866,283 | | |
| | 19,283 | | | Weyerhaeuser Company | | | 553,229 | | |
| | | | 9,863,445 | | |
| | | Utilities (2.1%) | |
| | 31,559 | | | AES Corp.~ | | | 470,229 | | |
| | 12,356 | | | American Electric Power Company, Inc.~ | | | 933,372 | | |
| | 11,494 | | | CMS Energy Corp. | | | 624,584 | | |
| | 9,624 | | | Consolidated Edison, Inc. | | | 844,891 | | |
| | 11,379 | | | Dominion Energy, Inc. | | | 458,801 | | |
| | 15,737 | | | Duke Energy Corp.~ | | | 1,398,862 | | |
| | 6,963 | | | Edison International | | | 439,087 | | |
| | 7,045 | | | Entergy Corp. | | | 673,432 | | |
| | 9,708 | | | Exelon Corp. | | | 378,030 | | |
| | 15,940 | | | FirstEnergy Corp. | | | 567,464 | | |
| | 25,314 | | | NextEra Energy, Inc.~ | | | 1,475,806 | | |
| | 19,476 | | | NiSource, Inc. | | | 490,016 | | |
See accompanying Notes to Schedule of Investments
www.calamos.com
111
Hedged Equity Fund Schedule of Investments October 31, 2023
NUMBER OF
SHARES | | | | VALUE | |
| | 12,239 | | | Public Service Enterprise Group, Inc. | | $ | 754,534 | | |
| | 17,471 | | | Southern Company | | | 1,175,798 | | |
| | 4,213 | | | Veralto Corp.# | | | 290,697 | | |
| | 14,026 | | | Xcel Energy, Inc. | | | 831,321 | | |
| | | | 11,806,924 | | |
| | | | | TOTAL COMMON STOCKS
(Cost $428,510,111) | | | 529,854,006 | | |
EXCHANGE-TRADED FUND (1.8%) | | | |
| | | Other (1.8%) | |
| | 24,852 | | | SPDR S&P 500 ETF Trust^
(Cost $10,650,584) | | | 10,393,107 | | |
PRINCIPAL
AMOUNT | | | | VALUE | |
CONVERTIBLE BOND (1.1%) | | | |
| | | Consumer Discretionary (1.1%) | |
| | 616,000 | | | Tesla, Inc.
2.000%, 05/15/24
(Cost $6,587,300) | | | 5,999,994 | | |
NUMBER OF
CONTRACTS/
NOTIONAL
AMOUNT | | | | VALUE | |
PURCHASED OPTIONS (4.5%)# | | | |
| | | Other (4.5%) | |
| | | | | S&P 500 Index | | | | | |
| | 530 | | | | | | | | |
| | 222,271,400 | | | Put, 12/20/24, Strike $4,350.00 | | | 15,823,150 | | |
| | 300 | | | | | | | | |
| | 125,814,000 | | | Put, 12/20/24, Strike $4,400.00 | | | 9,528,000 | | |
| | | | | TOTAL PURCHASED OPTIONS
(Cost $19,899,902) | | | 25,351,150 | | |
NUMBER OF
SHARES/
PRINCIPAL
AMOUNT | | | | VALUE | |
INVESTMENT OF CASH COLLATERAL FOR SECURITIES
LOANED (1.1%) | | | |
| | 6,187,314 | | | State Street Navigator Securities
Lending Government Money Market
Portfolio, 5.358%†***
(Cost $6,187,314) | | | 6,187,314 | | |
| | | | | TOTAL INVESTMENTS (103.0%)
(Cost $471,835,211) | | | 577,785,571 | | |
PAYABLE UPON RETURN OF SECURITIES ON LOAN (-1.1%) | | | (6,187,314 | ) | |
LIABILITIES, LESS OTHER ASSETS (-1.9%) | | | (10,717,684 | ) | |
NET ASSETS (100.0%) | | $ | 560,880,573 | | |
NUMBER OF
CONTRACTS/
NOTIONAL
AMOUNT | | | | VALUE | |
WRITTEN OPTIONS (-2.7%)# | | | |
| | | Other (-2.7%) | |
| | | | | S&P 500 Index | | | | | |
| | 345 | | | | | | | | |
| | 144,686,100 | | | Call, 12/20/24, Strike $4,350.00 | | $ | (11,459,175 | ) | |
| | 100 | | | | | | | | |
| | 41,938,000 | | | Put, 12/20/24, Strike $3,450.00 | | | (879,500 | ) | |
| | 90 | | | | | | | | |
| | 37,744,200 | | | Call, 12/20/24, Strike $4,400.00 | | | (2,737,800 | ) | |
| | | | | TOTAL WRITTEN OPTIONS
(Premium $20,949,358) | | $ | (15,076,475 | ) | |
NOTES TO SCHEDULE OF INVESTMENTS
~ Security, or portion of security, is segregated as collateral (or collateral for potential future transactions) for written options. The aggregate value of such securities is $132,857,105.
# Non-income producing security.
^ Security, or portion of security, is on loan.
†† Security or a portion of the security purchased on a delayed delivery or when-issued basis.
† Represents investment of cash collateral received from securities on loan as of October 31, 2023.
*** The rate disclosed is the 7 day net yield as of October 31, 2023.
Note: The date on options represents the expiration date of the option contract. The option contract may be exercised at any date on or before the date shown.
See accompanying Notes to Schedule of Investments
CALAMOS OPEN-END FAMILY OF FUNDS ANNUAL REPORT
112
Phineus Long/Short Fund Schedule of Investments October 31, 2023
NUMBER OF
SHARES | | | | VALUE | |
COMMON STOCKS (87.9%) | | | |
| | | Communication Services (4.9%) | |
| | 368,500 | | | Alphabet, Inc. - Class A#~ | | $ | 45,723,480 | | |
| | | Consumer Discretionary (11.6%) | |
| | 386,000 | | | Amazon.com, Inc.#~ | | | 51,372,740 | | |
| | 272,000 | | | Caesars Entertainment, Inc.#~ | | | 10,850,080 | | |
| | 234,000 | | | Hyatt Hotels Corp. - Class A~^ | | | 23,970,960 | | |
| | 120,000 | | | Marriott International, Inc. - Class A | | | 22,627,200 | | |
| | | | 108,820,980 | | |
| | | Consumer Staples (2.6%) | |
| | 367,000 | | | Sysco Corp.~ | | | 24,401,830 | | |
| | | Financials (10.2%) | |
| | 369,000 | | | Morgan Stanley~ | | | 26,132,580 | | |
| | 153,500 | | | Visa, Inc. - Class A~ | | | 36,087,850 | | |
| | 828,000 | | | Wells Fargo & Company | | | 32,929,560 | | |
| | | | 95,149,990 | | |
| | | Health Care (14.4%) | |
| | 95,000 | | | Abbott Laboratories | | | 8,982,250 | | |
| | 206,000 | | | Danaher Corp.~ | | | 39,556,120 | | |
| | 285,000 | | | Medtronic, PLC~ | | | 20,109,600 | | |
| | 325,500 | | | Merck & Company, Inc.~ | | | 33,428,850 | | |
| | 314,000 | | | Zimmer Biomet Holdings, Inc.~ | | | 32,784,740 | | |
| | | | 134,861,560 | | |
| | | Industrials (26.7%) | |
| | 658,000 | | | Air Lease Corp.~ | | | 22,786,540 | | |
| | 1,671,000 | | | American Airlines Group, Inc.#^ | | | 18,631,650 | | |
| | 47,000 | | | Automatic Data Processing, Inc. | | | 10,256,340 | | |
| | 705,500 | | | CSX Corp.~ | | | 21,059,175 | | |
| | 151,000 | | | Honeywell International, Inc.~ | | | 27,672,260 | | |
| | 269,000 | | | L3Harris Technologies, Inc. | | | 48,261,290 | | |
| | 95,500 | | | Paycom Software, Inc.#~ | | | 23,394,635 | | |
| | 149,000 | | | Union Pacific Corp.~ | | | 30,933,890 | | |
| | 1,344,000 | | | United Airlines Holdings, Inc.#~ | | | 47,053,440 | | |
| | | | 250,049,220 | | |
| | | Information Technology (16.2%) | |
| | 226,000 | | | Advanced Micro Devices, Inc.#~ | | | 22,261,000 | | |
| | 52,500 | | | Analog Devices, Inc.~ | | | 8,259,825 | | |
| | 395,000 | | | Intel Corp.~ | | | 14,417,500 | | |
| | 161,500 | | | Microsoft Corp.~ | | | 54,604,765 | | |
| | 269,500 | | | Oracle Corp.~ | | | 27,866,300 | | |
| | 286,000 | | | Taiwan Semiconductor Manufacturing
Company, Ltd. (ADR)~ | | | 24,684,660 | | |
| | | | 152,094,050 | | |
NUMBER OF
SHARES | | | | VALUE | |
| | | Materials (1.0%) | |
| | 25,000 | | | Linde, PLC~ | | $ | 9,554,000 | | |
| | | Utilities (0.3%) | |
| | 29,499 | | | Veralto Corp. | | | 2,035,431 | | |
| | | | | TOTAL COMMON STOCKS
(Cost $813,070,453) | | | 822,690,541 | | |
EXCHANGE-TRADED FUND (4.6%) | | | |
| | | Other (4.6%) | |
| | 510,000 | | | iShares 20+ Year Treasury Bond ETF^
(Cost $45,649,372) | | | 42,625,800 | | |
NUMBER OF
CONTRACTS/
NOTIONAL
AMOUNT | | | | VALUE | |
PURCHASED OPTIONS (1.1%)# | | | |
| | | Communication Services (0.4%) | |
| | 2,450 | | | Alphabet, Inc. | | | | | |
| | 30,399,600 | | | Put, 11/03/23, Strike $138.00 | | | 3,442,250 | | |
| | | Consumer Discretionary (0.0%) | |
| | 2,365 | | | Amazon.com, Inc. | | | | | |
| | 31,475,785 | | | Put, 11/03/23, Strike $118.00 | | | 5,913 | | |
| | | Financials (0.1%) | |
| | 5,400 | | | PayPal Holdings, Inc. | | | | | |
| | 27,972,000 | | | Call, 11/03/23, Strike $55.00 | | | 599,400 | | |
| | | Health Care (0.0%) | |
| | 3,255 | | | Merck & Company, Inc. | | | | | |
| | 33,428,850 | | | Put, 11/03/23, Strike $103.00 | | | 320,617 | | |
| | | Industrials (0.0%) | |
| | 17,490 | | | Delta Air Lines, Inc. | | | | | |
| | 54,656,250 | | | Call, 11/17/23, Strike $37.00 | | | 43,725 | | |
| | | Information Technology (0.1%) | |
| | | | | Advanced Micro Devices, Inc. | | | | | |
| | 2,260 | | | | | | | | |
| | 22,261,000 | | | Put, 11/10/23, Strike $95.00 | | | 642,970 | | |
| | 910 | | | | | | | | |
| | 8,963,500 | | | Call, 11/17/23, Strike $115.00 | | | 56,420 | | |
| | 1,400 | | | Apple, Inc. | | | | | |
| | 23,907,800 | | | Put, 11/17/23, Strike $165.00 | | | 356,300 | | |
| | 860 | | | Microsoft Corp. | | | | | |
| | 29,077,460 | | | Put, 11/03/23, Strike $327.50 | | | 56,760 | | |
| | 180 | | | ServiceNow, Inc. | | | | | |
| | 10,473,300 | | | Put, 11/10/23, Strike $510.00 | | | 6,750 | | |
| | 1,535 | | | Visa, Inc. | | | | | |
| | 36,087,850 | | | Put, 11/03/23, Strike $235.00 | | | 260,950 | | |
| | | | 1,380,150 | | |
See accompanying Notes to Schedule of Investments
www.calamos.com
113
Phineus Long/Short Fund Schedule of Investments October 31, 2023
NUMBER OF
CONTRACTS/
NOTIONAL
AMOUNT | | | | VALUE | |
| | | Other (0.5%) | |
| | 15,300 | | | iShares 20+ Year Treasury Bond ETF | | | | | |
| | 127,877,400 | | | Call, 11/03/23, Strike $85.00 | | $ | 428,400 | | |
| | 4,500 | | | SPDR S&P 500 ETF Trust | | | | | |
| | 188,190,000 | | | Put, 11/01/23, Strike $416.00 | | | 531,000 | | |
| | 9,300 | | | SPDR S&P Regional Banking ETF | | | | | |
| | 36,893,100 | | | Put, 11/17/23, Strike $41.00 | | | 1,739,100 | | |
| | 31,000 | | | U.S. Global Jets ETF | | | | | |
| | 46,252,000 | | | Call, 12/01/23, Strike $15.00 | | | 1,627,500 | | |
| | | | 4,326,000 | | |
| | | | | TOTAL PURCHASED OPTIONS
(Cost $12,968,795) | | | 10,118,055 | | |
NUMBER OF
SHARES/
PRINCIPAL
AMOUNT | | | | VALUE | |
INVESTMENT OF CASH COLLATERAL FOR SECURITIES
LOANED (1.3%) | | | |
| | 11,890,737 | | | State Street Navigator Securities
Lending Government Money Market
Portfolio, 5.358%†***
(Cost $11,890,737) | | | 11,890,737 | | |
| | | TOTAL INVESTMENTS (94.9%)
(Cost $883,579,357) | | | 887,325,133 | | |
PAYABLE UPON RETURN OF SECURITIES ON LOAN (-1.3%) | | | (11,890,737 | ) | |
OTHER ASSETS, LESS LIABILITIES (6.4%) | | | 60,461,883 | | |
NET ASSETS (100.0%) | | $ | 935,896,279 | | |
NUMBER OF
SHARES | | | | VALUE | |
COMMON STOCKS SOLD SHORT (-10.9%)# | | | |
| | | Consumer Discretionary (-1.6%) | |
| | (73,000 | ) | | Tesla, Inc. | | | (14,661,320 | ) | |
| | | Consumer Staples (-2.9%) | |
| | (166,000 | ) | | Walmart, Inc. | | | (27,126,060 | ) | |
| | | Financials (-1.5%) | |
| | (543,000 | ) | | Bank of America Corp. | | | (14,302,620 | ) | |
| | | Information Technology (-4.1%) | |
| | (53,000 | ) | | KLA Corp. | | | (24,894,100 | ) | |
| | (68,500 | ) | | Salesforce, Inc. | | | (13,756,855 | ) | |
| | | | (38,650,955 | ) | |
| | | Real Estate (-0.5%) | |
| | (38,000 | ) | | Digital Realty Trust, Inc. | | | (4,725,680 | ) | |
NUMBER OF
SHARES | | | | VALUE | |
| | | Utilities (-0.3%) | |
| | (29,499 | ) | | Veralto Corp. | | $ | (2,035,431 | ) | |
| | | TOTAL COMMON STOCKS
SOLD SHORT
(Proceeds $105,747,267) | | | (101,502,066 | ) | |
EXCHANGE-TRADED FUNDS SOLD SHORT (-60.7%)# | | | |
| | | Other (-60.7%) | |
| | (381,500 | ) | | Industrial Select Sector SPDR Fund | | | (37,524,340 | ) | |
| | (759,500 | ) | | SPDR S&P 500 ETF Trust | | | (317,622,900 | ) | |
| | (553,600 | ) | | Vanguard S&P 500 ETF | | | (212,676,512 | ) | |
| | | TOTAL EXCHANGE-TRADED FUNDS
SOLD SHORT
(Proceeds $596,754,352) | | | (567,823,752 | ) | |
| | | TOTAL SECURITIES SOLD SHORT
(Proceeds $702,501,619) | | | (669,325,818 | ) | |
NUMBER OF
CONTRACTS/
NOTIONAL
AMOUNT | | | | VALUE | |
WRITTEN OPTIONS (-1.2%)# | | | |
| | | Communication Services (-0.2%) | |
| | | | | Alphabet, Inc. | | | | | |
| | 2,450 | | | | | | | | |
| | 30,399,600 | | | Put, 11/17/23, Strike $130.00 | | | (1,586,375 | ) | |
| | 1,500 | | | | | | | | |
| | 18,612,000 | | | Put, 12/15/23, Strike $110.00 | | | (125,250 | ) | |
| | | | (1,711,625 | ) | |
| | | Consumer Discretionary (-0.2%) | |
| | | | | Amazon.com, Inc. | | | | | |
| | 1,750 | | | | | | | | |
| | 23,290,750 | | | Put, 12/15/23, Strike $105.00 | | | (64,750 | ) | |
| | 1,185 | | | | | | | | |
| | 15,771,165 | | | Call, 12/15/23, Strike $135.00 | | | (639,900 | ) | |
| | 730 | | | Tesla, Inc. | | | | | |
| | 14,661,320 | | | Put, 12/15/23, Strike $190.00 | | | (664,300 | ) | |
| | | | (1,368,950 | ) | |
| | | Financials (-0.1%) | |
| | 5,430 | | | Bank of America Corp. | | | | | |
| | 14,302,620 | | | Put, 12/15/23, Strike $24.00 | | | (198,195 | ) | |
| | 1,800 | | | PayPal Holdings, Inc. | | | | | |
| | 9,324,000 | | | Put, 11/17/23, Strike $52.00 | | | (513,000 | ) | |
| | | | (711,195 | ) | |
| | | Health Care (0.0%) | |
| | 3,255 | | | Merck & Company, Inc. | | | | | |
| | 33,428,850 | | | Put, 12/15/23, Strike $95.00 | | | (247,380 | ) | |
See accompanying Notes to Schedule of Investments
CALAMOS OPEN-END FAMILY OF FUNDS ANNUAL REPORT
114
Phineus Long/Short Fund Schedule of Investments October 31, 2023
NUMBER OF
CONTRACTS/
NOTIONAL
AMOUNT | | | | VALUE | |
| | | Industrials (-0.1%) | |
| | 8,745 | | | Delta Air Lines, Inc. | | | | | |
| | 27,328,125 | | | Call, 11/17/23, Strike $35.00 | | $ | (65,588 | ) | |
| | 7,600 | | | United Airlines Holdings, Inc. | | | | | |
| | 26,607,600 | | | Put, 11/17/23, Strike $36.00 | | | (1,269,200 | ) | |
| | | | (1,334,788 | ) | |
| | | Information Technology (-0.1%) | |
| | | | | Advanced Micro Devices, Inc. | | | | | |
| | 2,260 | | | | | | | | |
| | 22,261,000 | | | Put, 11/10/23, Strike $85.00 | | | (132,210 | ) | |
| | 2,260 | | | | | | | | |
| | 22,261,000 | | | Put, 12/15/23, Strike $85.00 | | | (454,260 | ) | |
| | 1,400 | | | Apple, Inc. | | | | | |
| | 23,907,800 | | | Put, 12/15/23, Strike $150.00 | | | (152,600 | ) | |
| | | | | Microsoft Corp. | | | | | |
| | 860 | | | | | | | | |
| | 29,077,460 | | | Put, 11/03/23, Strike $317.50 | | | (13,330 | ) | |
| | 645 | | | | | | | | |
| | 21,808,095 | | | Put, 12/15/23, Strike $300.00 | | | (133,192 | ) | |
| | 180 | | | ServiceNow, Inc. | | | | | |
| | 10,473,300 | | | Put, 12/15/23, Strike $440.00 | | | (30,150 | ) | |
| | | | | Visa, Inc. | | | | | |
| | 1,535 | | | | | | | | |
| | 36,087,850 | | | Call, 12/15/23, Strike $250.00 | | | (191,875 | ) | |
| | 1,535 | | | | | | | | |
| | 36,087,850 | | | Put, 12/15/23, Strike $205.00 | | | (112,055 | ) | |
| | | | (1,219,672 | ) | |
| | | Other (-0.5%) | |
| | 4,750 | | | Industrial Select Sector SPDR | | | | | |
| | 46,721,000 | | | Put, 11/17/23, Strike $96.00 | | | (353,875 | ) | |
| | 5,100 | | | iShares 20+ Year Treasury Bond ETF | | | | | |
| | 42,625,800 | | | Call, 11/03/23, Strike $83.00 | | | (543,150 | ) | |
| | 3,300 | | | SPDR S&P 500 ETF Trust | | | | | |
| | 138,006,000 | | | Put, 01/19/24, Strike $360.00 | | | (561,000 | ) | |
| | | | | SPDR S&P 500 ETF Trust | | | | | |
| | 9,800 | | | | | | | | |
| | 409,836,000 | | | Put, 12/15/23, Strike $370.00 | | | (1,024,100 | ) | |
| | 3,300 | | | | | | | | |
| | 138,006,000 | | | Put, 12/15/23, Strike $380.00 | | | (536,250 | ) | |
| | 9,300 | | | SPDR S&P Regional Banking ETF | | | | | |
| | 36,893,100 | | | Put, 12/15/23, Strike $35.00 | | | (497,550 | ) | |
| | 31,000 | | | U.S. Global Jets ETF | | | | | |
| | 46,252,000 | | | Put, 12/01/23, Strike $14.50 | | | (992,000 | ) | |
| | | | (4,507,925 | ) | |
| | | | | TOTAL WRITTEN OPTIONS
(Premium $12,343,738) | | $ | (11,101,535 | ) | |
NOTES TO SCHEDULE OF INVESTMENTS
# Non-income producing security.
~ Security, or portion of security, is segregated as collateral (or collateral for potential future transactions) for written options and securities sold short. The aggregate value of such securities is $444,859,313.
^ Security, or portion of security, is on loan.
† Represents investment of cash collateral received from securities on loan as of October 31, 2023.
*** The rate disclosed is the 7 day net yield as of October 31, 2023.
Note: The date on options represents the expiration date of the option contract. The option contract may be exercised at any date on or before the date shown.
See accompanying Notes to Schedule of Investments
www.calamos.com
115
Merger Arbitrage Fund Schedule of Investments October 31, 2023
PRINCIPAL
AMOUNT | | | | VALUE | |
CONVERTIBLE BONDS (25.9%) | | | |
| | | Communication Services (3.8%) | |
| | 100,000 | EUR | | Cellnex Telecom, SA
0.750%, 11/20/31 | | $ | 78,108 | | |
| | | Health Care (3.8%) | |
| | 15,000 | | | Intercept Pharmaceuticals, Inc.
2.000%, 05/15/26 | | | 14,816 | | |
| | 57,000 | | | NextGen Healthcare, Inc.*
3.750%, 11/15/27 | | | 64,117 | | |
| | | | 78,933 | | |
| | | Information Technology (18.3%) | |
| | 26,000 | | | Nutanix, Inc.
0.250%, 10/01/27 | | | 23,440 | | |
| | 55,000 | | | Rapid7, Inc.
0.250%, 03/15/27 | | | 47,156 | | |
| | 143,000 | | | Splunk, Inc.
1.125%, 06/15/27 | | | 135,176 | | |
| | 75,000 | | | 1.125%, 09/15/25 | | | 80,630 | | |
| | 36,000 | | | Unity Software, Inc.
0.000%, 11/15/26 | | | 28,213 | | |
| | 70,000 | | | Wix.com, Ltd.
0.000%, 08/15/25 | | | 62,073 | | |
| | | | 376,688 | | |
| | | | | TOTAL CONVERTIBLE BONDS
(Cost $535,385) | | | 533,729 | | |
CORPORATE BONDS (3.8%) | | | |
| | | Energy (2.6%) | |
| | 53,000 | | | PDC Energy, Inc.
5.750%, 05/15/26 | | | 52,828 | | |
| | | Information Technology (1.2%) | |
| | 32,000 | | | Playtika Holding Corp.
4.250%, 03/15/29 | | | 25,835 | | |
| | | | | TOTAL CORPORATE BONDS
(Cost $79,259) | | | 78,663 | | |
NUMBER OF
SHARES | | | | VALUE | |
COMMON STOCKS (62.6%) | | | |
| | | Communication Services (2.2%) | |
| | 2,000 | | | EchoStar Corp. - Class A# | | | 27,720 | | |
| | 1,181 | | | TEGNA, Inc. | | | 17,136 | | |
| | | | 44,856 | | |
| | | Consumer Discretionary (7.3%) | |
| | 1,831 | | | Capri Holdings, Ltd.#~ | | | 93,711 | | |
| | 1,709 | | | iRobot Corp.#~ | | | 56,277 | | |
| | | | 149,988 | | |
| | | Consumer Staples (8.4%) | |
| | 6,031 | | | Albertsons Companies, Inc. - Class A~ | | | 130,873 | | |
NUMBER OF
SHARES | | | | VALUE | |
| | 1,912 | | | Sovos Brands, Inc.# | | $ | 41,509 | | |
| | | | 172,382 | | |
| | | Energy (6.9%) | |
| | 130 | | | Hess Corp. | | | 18,772 | | |
| | 513 | | | Pioneer Natural Resources Company~ | | | 122,607 | | |
| | | | 141,379 | | |
| | | Health Care (16.7%) | |
| | 4,226 | | | Abcam, PLC (ADR)# | | | 96,860 | | |
| | 788 | | | Amedisys, Inc.#~ | | | 72,094 | | |
| | 1,078 | | | Mirati Therapeutics, Inc.#~ | | | 59,861 | | |
| | 540 | | | Seagen, Inc.#~ | | | 114,918 | | |
| | | | 343,733 | | |
| | | Industrials (3.7%) | |
| | 6,680 | | | Spirit Airlines, Inc. | | | 76,686 | | |
| | | Information Technology (8.8%) | |
| | 100 | | | Blackbaud, Inc.# | | | 6,540 | | |
| | 385 | | | Silicon Motion Technology Corp. (ADR)# | | | 20,628 | | |
| | 1,010 | | | VMware, Inc. - Class A#‡‡‡ | | | 154,530 | | |
| | | | 181,698 | | |
| | | Special Purpose Acquisition Companies (1.8%) | |
| | 1,500 | | | Four Leaf Acquisition Corp. - Class A | | | 15,750 | | |
| | 1,510 | | | OPY Acquisition Corp. I - Class A# | | | 15,794 | | |
| | 230 | | | Quetta Acquisition Corp. | | | 2,328 | | |
| | 231 | | | Spark I Acquisition Corp. | | | 2,338 | | |
| | | | 36,210 | | |
| | | Utilities (6.8%) | |
| | 3,325 | | | PNM Resources, Inc.~ | | | 140,515 | | |
| | | TOTAL COMMON STOCKS
(Cost $1,354,873) | | | 1,287,447 | | |
| | | TOTAL INVESTMENTS (92.3%)
(Cost $1,969,517) | | | 1,899,839 | | |
OTHER ASSETS, LESS LIABILITIES (7.7%) | | | 158,805 | | |
NET ASSETS (100.0%) | | $ | 2,058,644 | | |
COMMON STOCKS SOLD SHORT (-13.6%)# | | | |
| | | Communication Services (-1.3%) | |
| | (5,700 | ) | | DISH Network Corp. - Class A | | | (27,930 | ) | |
| | | Energy (-7.1%) | |
| | (134 | ) | | Chevron Corp. | | | (19,528 | ) | |
| | (1,191 | ) | | Exxon Mobil Corp. | | | (126,067 | ) | |
| | | | (145,595 | ) | |
| | | Information Technology (-5.2%) | |
| | (127 | ) | | Broadcom, Inc. | | | (106,854 | ) | |
| | | TOTAL COMMON STOCKS SOLD SHORT
(Proceeds $293,832) | | | (280,379 | ) | |
See accompanying Notes to Schedule of Investments
CALAMOS OPEN-END FAMILY OF FUNDS ANNUAL REPORT
116
Merger Arbitrage Fund Schedule of Investments October 31, 2023
NOTES TO SCHEDULE OF INVESTMENTS
* Securities issued and sold pursuant to a Rule 144A transaction are exempted from the registration requirement of the Securities Act of 1933, as amended. These securities may only be sold to qualified institutional buyers ("QIBs"), such as the Fund. Any resale of these securities must generally be effected through a sale that is registered under the Act or otherwise exempted from such registration requirements.
# Non-income producing security.
~ Security, or portion of security, is segregated as collateral (or collateral for potential future transactions) for written options. The aggregate value of such securities is $332,234.
‡‡‡ Security fair valued using significant unobservable inputs and classified as a Level 3 security.
FOREIGN CURRENCY ABBREVIATION
EUR European Monetary Unit
ABBREVIATION
ADR American Depositary Receipt
Note: Value for securities denominated in foreign currencies is shown in U.S. dollars. The principal amount for such securities is shown in the respective foreign currency.
See accompanying Notes to Schedule of Investments
www.calamos.com
117
Convertible Fund Schedule of Investments October 31, 2023
PRINCIPAL
AMOUNT | | | | VALUE | |
CONVERTIBLE BONDS (92.1%) | | | |
| | | Communication Services (7.6%) | |
| | 9,750,000 | | | Liberty Media Corp.*
3.750%, 03/15/28 | | $ | 10,744,792 | | |
| | 9,250,000 | | | 2.375%, 09/30/53 | | | 8,969,263 | | |
| | 11,250,000 | | | Liberty Media Corp.-Liberty
Formula One^
2.250%, 08/15/27 | | | 11,213,212 | | |
| | 7,750,000 | | | Match Group Financeco 3, Inc.*^
2.000%, 01/15/30 | | | 6,298,193 | | |
| | 8,500,000 | | | Perficient, Inc.
0.125%, 11/15/26 | | | 6,804,165 | | |
| | 20,500,000 | | | Snap, Inc.
0.000%, 05/01/27 | | | 15,269,425 | | |
| | 4,000,000 | | | Zillow Group, Inc.
1.375%, 09/01/26 | | | 4,201,680 | | |
| | | | 63,500,730 | | |
| | | Consumer Discretionary (16.2%) | |
| | 4,750,000 | | | Airbnb, Inc.
0.000%, 03/15/26 | | | 4,115,400 | | |
| | 6,750,000 | | | Booking Holdings, Inc.
0.750%, 05/01/25 | | | 10,293,142 | | |
| | 5,000,000 | | | Carnival Corp.*
5.750%, 12/01/27 | | | 5,924,100 | | |
| | 15,500,000 | | | DISH Network Corp.
0.000%, 12/15/25 | | | 9,509,870 | | |
| | 10,750,000 | | | DraftKings Holdings, Inc.^
0.000%, 03/15/28 | | | 7,979,188 | | |
| | 9,000,000 | | | Etsy, Inc.
0.125%, 10/01/26 | | | 8,961,930 | | |
| | 20,250,000 | | | Ford Motor Company
0.000%, 03/15/26 | | | 18,484,402 | | |
| | 9,500,000 | | | Liberty Broadband Corp.*
3.125%, 03/31/53 | | | 9,424,475 | | |
| | 2,695,000 | | | Lucid Group, Inc.*
1.250%, 12/15/26 | | | 1,485,376 | | |
| | 5,250,000 | | | Marriott Vacations Worldwide Corp.*^
3.250%, 12/15/27 | | | 4,451,318 | | |
| | 11,000,000 | | | Rivian Automotive, Inc.*
4.625%, 03/15/29 | | | 11,595,980 | | |
| | 5,250,000 | | | Royal Caribbean Cruises, Ltd.
6.000%, 08/15/25 | | | 9,600,255 | | |
| | 7,750,000 | | | Shake Shack, Inc.
0.000%, 03/01/28 | | | 5,731,280 | | |
| | 12,500,000 | | | Vail Resorts, Inc.
0.000%, 01/01/26 | | | 10,944,250 | | |
| | 7,500,000 | | | Wayfair, Inc.
3.500%, 11/15/28* | | | 8,714,175 | | |
| | 3,600,000 | | | 3.250%, 09/15/27 | | | 3,469,104 | | |
| | 4,750,000 | | | Wynn Macau, Ltd.*
4.500%, 03/07/29 | | | 4,845,570 | | |
| | | | 135,529,815 | | |
PRINCIPAL
AMOUNT | | | | VALUE | |
| | | Consumer Staples (1.3%) | |
| | 3,067,000 | | | Enovis Corp.*
3.875%, 10/15/28 | | $ | 3,204,248 | | |
| | 8,000,000 | | | Post Holdings, Inc.
2.500%, 08/15/27 | | | 7,636,560 | | |
| | | | 10,840,808 | | |
| | | Energy (3.7%) | |
| | 3,000,000 | | | EQT Corp.~
1.750%, 05/01/26 | | | 8,722,200 | | |
| | 5,410,000 | | | Nabors Industries, Inc.*
1.750%, 06/15/29 | | | 4,053,821 | | |
| | 5,000,000 | | | Northern Oil & Gas, Inc.
3.625%, 04/15/29 | | | 5,905,350 | | |
| | 4,750,000 | | | Pioneer Natural Resources Company
0.250%, 05/15/25 | | | 12,121,858 | | |
| | | | 30,803,229 | | |
| | | Financials (1.2%) | |
| | 10,250,000 | | | Morgan Stanley Finance, LLC
1.000%, 11/23/27 | | | 10,391,450 | | |
| | | Health Care (18.6%) | |
| | 5,500,000 | | | Alnylam Pharmaceuticals, Inc.^
1.000%, 09/15/27 | | | 4,773,230 | | |
| | 7,750,000 | | | Alphatec Holdings, Inc.
0.750%, 08/01/26 | | | 6,620,903 | | |
| | 6,969,000 | | | BioMarin Pharmaceutical, Inc.
0.599%, 08/01/24 | | | 6,720,276 | | |
| | 6,000,000 | | | CONMED Corp.
2.250%, 06/15/27 | | | 5,616,900 | | |
| | 7,000,000 | | | CryoPort, Inc.*
0.750%, 12/01/26 | | | 5,539,450 | | |
| | 35,000,000 | | | Dexcom, Inc.*
0.375%, 05/15/28 | | | 30,872,100 | | |
| | 4,750,000 | | | Envista Holdings Corp.*^
1.750%, 08/15/28 | | | 4,109,890 | | |
| | 10,750,000 | | | Exact Sciences Corp.^
0.375%, 03/01/28 | | | 8,925,080 | | |
| | 8,250,000 | | | Halozyme Therapeutics, Inc.
1.000%, 08/15/28 | | | 7,258,597 | | |
| | 5,500,000 | | | Insmed, Inc.
0.750%, 06/01/28 | | | 5,345,890 | | |
| | 5,750,000 | | | Insulet Corp.
0.375%, 09/01/26 | | | 5,326,513 | | |
| | 10,375,000 | | | Integer Holdings Corp.*
2.125%, 02/15/28 | | | 11,420,592 | | |
| | 5,500,000 | | | Ionis Pharmaceuticals, Inc.
0.000%, 04/01/26 | | | 5,326,475 | | |
| | 12,250,000 | | | Jazz Investments I, Ltd.
2.000%, 06/15/26 | | | 12,436,567 | | |
| | 4,359,000 | | | Lantheus Holdings, Inc.*
2.625%, 12/15/27 | | | 4,836,398 | | |
| | 10,000,000 | | | NeoGenomics, Inc.
0.250%, 01/15/28 | | | 7,226,700 | | |
See accompanying Notes to Schedule of Investments
CALAMOS OPEN-END FAMILY OF FUNDS ANNUAL REPORT
118
Convertible Fund Schedule of Investments October 31, 2023
PRINCIPAL
AMOUNT | | | | VALUE | |
| | 5,000,000 | | | NextGen Healthcare, Inc.*
3.750%, 11/15/27 | | $ | 5,624,250 | | |
| | 5,000,000 | | | Pacira BioSciences, Inc.
0.750%, 08/01/25 | | | 4,498,000 | | |
| | 4,250,000 | | | Sarepta Therapeutics, Inc.^
1.250%, 09/15/27 | | | 3,619,088 | | |
| | 9,500,000 | | | Shockwave Medical, Inc.*
1.000%, 08/15/28 | | | 9,211,295 | | |
| | | | 155,308,194 | | |
| | | Industrials (6.0%) | |
| | 4,750,000 | | | Advanced Energy Industries, Inc.*^
2.500%, 09/15/28 | | | 4,390,425 | | |
| | 5,000,000 | | | Axon Enterprise, Inc.*^
0.500%, 12/15/27 | | | 5,394,050 | | |
| | 4,750,000 | | | Fluor Corp.*^
1.125%, 08/15/29 | | | 4,585,603 | | |
| | 7,500,000 | | | John Bean Technologies Corp.
0.250%, 05/15/26 | | | 6,749,325 | | |
| | 5,500,000 | | | Middleby Corp.^
1.000%, 09/01/25 | | | 5,712,905 | | |
| | 3,500,000 | | | Parsons Corp.
0.250%, 08/15/25 | | | 4,591,440 | | |
| | 8,000,000 | | | Southwest Airlines Company^
1.250%, 05/01/25 | | | 7,624,000 | | |
| | 4,750,000 | | | Tetra Tech, Inc.*
2.250%, 08/15/28 | | | 4,601,277 | | |
| | 6,750,000 | | | Uber Technologies, Inc.^
0.000%, 12/15/25 | | | 6,170,850 | | |
| | | | 49,819,875 | | |
| | | Information Technology (31.7%) | |
| | 9,500,000 | | | Akamai Technologies, Inc.
1.125%, 02/15/29* | | | 9,352,845 | | |
| | 9,500,000 | | | 0.125%, 05/01/25 | | | 10,996,440 | | |
| | 11,500,000 | | | Bentley Systems, Inc.
0.125%, 01/15/26 | | | 10,976,635 | | |
| | 15,750,000 | | | BILL Holdings, Inc.
0.000%, 12/01/25 | | | 14,969,745 | | |
| | 3,750,000 | | | Camtek, Ltd.*
0.000%, 12/01/26 | | | 4,047,075 | | |
| | 8,000,000 | | | Confluent, Inc.
0.000%, 01/15/27 | | | 6,456,960 | | |
| | 8,750,000 | | | CyberArk Software, Ltd.^
0.000%, 11/15/24 | | | 10,017,000 | | |
| | 7,250,000 | | | Datadog, Inc.
0.125%, 06/15/25 | | | 7,983,990 | | |
| | 8,500,000 | | | DigitalOcean Holdings, Inc.
0.000%, 12/01/26 | | | 6,395,910 | | |
| | 6,750,000 | | | Enphase Energy, Inc.^
0.000%, 03/01/26 | | | 5,756,602 | | |
| | 4,125,000 | | | Microchip Technology, Inc.^
0.125%, 11/15/24 | | | 4,153,916 | | |
| | 2,500,000 | | | MongoDB, Inc.
0.250%, 01/15/26 | | | 4,265,750 | | |
PRINCIPAL
AMOUNT | | | | VALUE | |
| | | | | NCL Corp., Ltd. | | | | | |
| | 5,250,000 | | | 2.500%, 02/15/27 | | $ | 4,212,180 | | |
| | 3,500,000 | | | 5.375%, 08/01/25 | | | 3,715,180 | | |
| | 4,750,000 | | | Okta, Inc.
0.375%, 06/15/26 | | | 4,073,743 | | |
| | 19,250,000 | | | ON Semiconductor Corp.*
0.500%, 03/01/29 | | | 16,923,445 | | |
| | 6,250,000 | | | Palo Alto Networks, Inc.
0.375%, 06/01/25 | | | 15,262,625 | | |
| | 4,750,000 | | | Rapid7, Inc.*
1.250%, 03/15/29 | | | 4,595,245 | | |
| | 11,500,000 | | | Repay Holdings Corp.*
0.000%, 02/01/26 | | | 9,204,025 | | |
| | 8,250,000 | | | Seagate HDD Cayman*
3.500%, 06/01/28 | | | 8,558,055 | | |
| | 21,750,000 | | | Shift4 Payments, Inc.^
0.000%, 12/15/25 | | | 19,807,725 | | |
| | 7,600,000 | | | SK Hynix, Inc.
1.750%, 04/11/30 | | | 9,195,696 | | |
| | 20,000,000 | | | Splunk, Inc.
1.125%, 06/15/27 | | | 18,905,800 | | |
| | 13,750,000 | | | Tyler Technologies, Inc.^
0.250%, 03/15/26 | | | 13,074,875 | | |
| | 17,000,000 | | | Unity Software, Inc.
0.000%, 11/15/26 | | | 13,322,560 | | |
| | 7,500,000 | | | Wix.com, Ltd.
0.000%, 08/15/25 | | | 6,650,700 | | |
| | 10,250,000 | | | Wolfspeed, Inc.^
0.250%, 02/15/28 | | | 6,320,560 | | |
| | 4,750,000 | | | Workiva, Inc.*
1.250%, 08/15/28 | | | 4,314,520 | | |
| | 9,500,000 | | | Zscaler, Inc.
0.125%, 07/01/25 | | | 11,598,930 | | |
| | | | 265,108,732 | | |
| | | Materials (2.6%) | |
| | 2,125,000 | | | ATI, Inc.~
3.500%, 06/15/25 | | | 5,257,590 | | |
| | 4,500,000 | | | Ivanhoe Mines, Ltd.*
2.500%, 04/15/26 | | | 5,174,595 | | |
| | 6,655,000 | | | Lithium Americas Corp.
1.750%, 01/15/27 | | | 4,492,791 | | |
| | 8,241,000 | | | MP Materials Corp.*
0.250%, 04/01/26 | | | 6,790,254 | | |
| | | | 21,715,230 | | |
| | | Real Estate (0.5%) | |
| | 5,250,000 | | | Pebblebrook Hotel Trust
1.750%, 12/15/26 | | | 4,174,958 | | |
| | | Utilities (2.7%) | |
| | 4,375,000 | | | Alliant Energy Corp.*
3.875%, 03/15/26 | | | 4,276,256 | | |
| | 4,750,000 | | | CMS Energy Corp.*
3.375%, 05/01/28 | | | 4,497,490 | | |
See accompanying Notes to Schedule of Investments
www.calamos.com
119
Convertible Fund Schedule of Investments October 31, 2023
PRINCIPAL
AMOUNT | | | | VALUE | |
| | 9,500,000 | | | PPL Capital Funding, Inc.*
2.875%, 03/15/28 | | $ | 8,712,260 | | |
| | 4,750,000 | | | Southern Company*^
3.875%, 12/15/25 | | | 4,666,780 | | |
| | | | 22,152,786 | | |
| | | | | TOTAL CONVERTIBLE BONDS
(Cost $800,203,327) | | | 769,345,807 | | |
NUMBER OF
SHARES | | | | VALUE | |
CONVERTIBLE PREFERRED STOCKS (3.4%) | | | |
| | | Financials (2.0%) | |
| | 127,810 | | | Apollo Global Management, Inc.
6.750%, 07/31/26 | | | 6,148,939 | | |
| | 10,300 | | | Bank of America Corp.~‡‡
7.250% | | | 10,847,960 | | |
| | | | 16,996,899 | | |
| | | Industrials (0.5%) | |
| | 86,940 | | | Chart Industries, Inc.
6.750%, 12/15/25 | | | 4,273,971 | | |
| | | Utilities (0.9%) | |
| | 187,200 | | | NextEra Energy, Inc.~
6.926%, 09/01/25 | | | 7,027,488 | | |
| | | TOTAL CONVERTIBLE PREFERRED
STOCKS
(Cost $32,846,094) | | | 28,298,358 | | |
PRINCIPAL
AMOUNT | | | | VALUE | |
U.S. GOVERNMENT AND AGENCY SECURITY (1.1%) | | | |
| | | Other (1.1%) | |
| | 9,250,000 | | | United States Treasury Bill
0.000%, 11/24/23
(Cost $9,219,388) | | | 9,218,780 | | |
NUMBER OF
CONTRACTS/
NOTIONAL
AMOUNT | | | | VALUE | |
PURCHASED OPTIONS (0.2%)# | | | |
| | | Consumer Discretionary (0.1%) | |
| | 670 | | | Amazon.com, Inc. | | | | | |
| | 8,917,030 | | | Call, 01/19/24, Strike $127.50 | | | 814,050 | | |
| | | Information Technology (0.1%) | |
| | 300 | | | Palo Alto Networks, Inc. | | | | | |
| | 7,290,600 | | | Call, 01/19/24, Strike $250.00 | | | 471,000 | | |
| | | | | TOTAL PURCHASED OPTIONS
(Cost $1,704,930) | | | 1,285,050 | | |
NUMBER OF
SHARES/
PRINCIPAL
AMOUNT | | | | VALUE | |
INVESTMENT OF CASH COLLATERAL FOR SECURITIES
LOANED (4.4%) | |
| | 36,784,235 | | | State Street Navigator Securities
Lending Government Money
Market Portfolio, 5.358%†***
(Cost $36,784,235) | | $ | 36,784,235 | | |
| | | TOTAL INVESTMENTS (101.2%)
(Cost $880,757,974) | | | 844,932,230 | | |
PAYABLE UPON RETURN OF SECURITIES ON LOAN (-4.4%) | | | (36,784,235 | ) | |
OTHER ASSETS, LESS LIABILITIES (3.2%) | | | 27,047,301 | | |
NET ASSETS (100.0%) | | $ | 835,195,296 | | |
FORWARD FOREIGN CURRENCY CONTRACTS
COUNTERPARTY | | LONG
CONTRACTS | | SETTLEMENT
DATE | | LOCAL
CURRENCY | | CURRENT
VALUE | | UNREALIZED
GAIN/LOSS | |
State Street Bank
and Trust | | Canadian Dollar | | 01/19/24 | | | 804,000 | | | $ | 580,595 | | | $ | (1,864 | ) | |
Bank of New York | | Hong Kong Dollar | | 01/19/24 | | | 3,191,000 | | | | 408,283 | | | | (199 | ) | |
| | | $ | (2,063 | ) | |
COUNTERPARTY | | SHORT
CONTRACTS | | SETTLEMENT
DATE | | LOCAL
CURRENCY | | CURRENT
VALUE | | UNREALIZED
GAIN/LOSS | |
State Street Bank
and Trust | | South Korean Won | | 01/19/24 | | | 1,431,936,000 | | | $ | 1,065,150 | | | $ | (6,495 | ) | |
Bank of New York | | Hong Kong Dollar | | 01/19/24 | | | 26,405,000 | | | | 3,378,477 | | | | 3,114 | | |
State Street Bank
and Trust | | Canadian Dollar | | 01/19/24 | | | 6,330,000 | | | | 4,571,100 | | | | 84,028 | | |
State Street Bank
and Trust | | South Korean Won | | 01/19/24 | | | 9,456,713,000 | | | | 7,034,404 | | | | (7,832 | ) | |
| | | $ | 72,815 | | |
NOTES TO SCHEDULE OF INVESTMENTS
* Securities issued and sold pursuant to a Rule 144A transaction are exempted from the registration requirement of the Securities Act of 1933, as amended. These securities may only be sold to qualified institutional buyers ("QIBs"), such as the Fund. Any resale of these securities must generally be effected through a sale that is registered under the Act or otherwise exempted from such registration requirements.
^ Security, or portion of security, is on loan.
~ Security, or portion of security, is segregated as collateral (or collateral for potential future transactions) for written options. The aggregate value of such securities is $17,133,249.
‡‡ Perpetual maturity.
† Represents investment of cash collateral received from securities on loan as of October 31, 2023.
*** The rate disclosed is the 7 day net yield as of October 31, 2023.
Note: The date on options represents the expiration date of the option contract. The option contract may be exercised at any date on or before the date shown.
See accompanying Notes to Schedule of Investments
CALAMOS OPEN-END FAMILY OF FUNDS ANNUAL REPORT
120
Global Convertible Fund Schedule of Investments October 31, 2023
PRINCIPAL
AMOUNT | | | | VALUE | |
CONVERTIBLE BONDS (92.9%) | | | |
| | | Communication Services (7.0%) | |
| | 1,100,000 | EUR | | America Movil, BV
0.000%, 03/02/24 | | $ | 1,204,868 | | |
| | 863,000 | | | Bharti Airtel, Ltd.*
1.500%, 02/17/25 | | | 1,294,250 | | |
| | 50,000,000 | JPY | | CyberAgent, Inc.
0.000%, 02/19/25 | | | 326,479 | | |
| | 3,546,000 | | | Sea, Ltd.
0.250%, 09/15/26 | | | 2,819,708 | | |
| | 1,400,000 | | | Snap, Inc.
0.000%, 05/01/27 | | | 1,042,790 | | |
| | 1,000,000 | | | Xiaomi Best Time International, Ltd.
0.000%, 12/17/27 | | | 866,080 | | |
| | 808,000 | | | Zillow Group, Inc.
1.375%, 09/01/26 | | | 848,739 | | |
| | | | 8,402,914 | | |
| | | Consumer Discretionary (18.3%) | |
| | 607,000 | | | Booking Holdings, Inc.
0.750%, 05/01/25 | | | 925,620 | | |
| | 1,189,000 | | | DISH Network Corp.
0.000%, 12/15/25 | | | 729,499 | | |
| | 2,719,000 | | | DraftKings Holdings, Inc.
0.000%, 03/15/28 | | | 2,018,178 | | |
| | 772,000 | | | Etsy, Inc.
0.125%, 10/01/26 | | | 768,735 | | |
| | 1,329,000 | | | Farfetch, Ltd.
3.750%, 05/01/27 | | | 649,137 | | |
| | 1,400,000 | AUD | | Flight Centre Travel Group, Ltd.
1.625%, 11/01/28 | | | 809,680 | | |
| | 657,000 | | | Liberty Broadband Corp.*
3.125%, 03/31/53 | | | 651,777 | | |
| | 1,330,000 | | | Lucid Group, Inc.*
1.250%, 12/15/26 | | | 733,043 | | |
| | 1,458,000 | | | MakeMyTrip, Ltd.
0.000%, 02/15/28 | | | 1,660,633 | | |
| | 2,300,000 | | | Meituan
0.000%, 04/27/28 | | | 1,920,316 | | |
| | 646,000 | | | NIO, Inc.*
4.625%, 10/15/30 | | | 577,879 | | |
| | 900,000 | GBP | | Ocado Group, PLC
0.750%, 01/18/27 | | | 774,813 | | |
| | 800,000 | GBP | | 0.875%, 12/09/25 | | | 816,344 | | |
| | 1,197,000 | | | PDD Holdings, Inc.
0.000%, 12/01/25 | | | 1,187,807 | | |
| | 645,000 | | | Rivian Automotive, Inc.*^
4.625%, 03/15/29 | | | 679,946 | | |
| | 889,000 | | | Royal Caribbean Cruises, Ltd.
6.000%, 08/15/25 | | | 1,625,643 | | |
| | 700,000 | EUR | | Shop Apotheke Europe, NV
0.000%, 01/21/28 | | | 647,494 | | |
PRINCIPAL
AMOUNT | | | | VALUE | |
| | 980,000 | | | Stride, Inc.
1.125%, 09/01/27 | | $ | 1,162,143 | | |
| | 1,398,000 | | | Wayfair, Inc.
3.500%, 11/15/28* | | | 1,624,322 | | |
| | 977,000 | | | 1.000%, 08/15/26^ | | | 737,625 | | |
| | 1,283,000 | | | Wynn Macau, Ltd.*
4.500%, 03/07/29 | | | 1,308,814 | | |
| | | | 22,009,448 | | |
| | | Consumer Staples (1.3%) | |
| | 451,000 | | | Enovis Corp.*
3.875%, 10/15/28 | | | 471,182 | | |
| | 1,000,000 | EUR | | Fomento Economico Mexicano SAB
de CV
2.625%, 02/24/26 | | | 1,036,230 | | |
| | | | 1,507,412 | | |
| | | Energy (3.6%) | |
| | 1,100,000 | EUR | | Eni S.p.A
2.950%, 09/14/30 | | | 1,189,842 | | |
| | 670,000 | | | Nabors Industries, Inc.*
1.750%, 06/15/29 | | | 502,044 | | |
| | 1,341,000 | | | Northern Oil & Gas, Inc.
3.625%, 04/15/29 | | | 1,583,815 | | |
| | 409,000 | | | Pioneer Natural Resources Company
0.250%, 05/15/25 | | | 1,043,756 | | |
| | | | 4,319,457 | | |
| | | Financials (4.8%) | |
| | 841,000 | | | Coinbase Global, Inc.
0.500%, 06/01/26 | | | 638,210 | | |
| | 302,478 | EUR | | Corestate Capital Holding, SA&
8.000%, 12/31/26 | | | 161,998 | | |
| | 1,000,000 | GBP | | Cornwall Jersey, Ltd.
0.750%, 04/16/26 | | | 772,126 | | |
| | 600,000 | EUR | | JPMorgan Chase Bank NA
0.000%, 02/18/24 | | | 627,566 | | |
| | 900,000 | EUR | | JPMorgan Chase Financial
Company, LLC§
0.000%, 01/14/25 | | | 952,033 | | |
| | 1,299,000 | | | Morgan Stanley Finance, LLC
1.000%, 11/23/27 | | | 1,316,926 | | |
| | 1,300,000 | EUR | | Oliver Capital Sarl
0.000%, 12/29/23 | | | 1,364,980 | | |
| | | | 5,833,839 | | |
| | | Health Care (13.8%) | |
| | 761,000 | | | Alnylam Pharmaceuticals, Inc.
1.000%, 09/15/27 | | | 660,441 | | |
| | 725,000 | | | BioMarin Pharmaceutical, Inc.
0.599%, 08/01/24 | | | 699,125 | | |
| | 650,000 | | | Coherus Biosciences, Inc.
1.500%, 04/15/26 | | | 363,064 | | |
| | 841,000 | | | CONMED Corp.
2.250%, 06/15/27 | | | 787,302 | | |
See accompanying Notes to Schedule of Investments
www.calamos.com
121
Global Convertible Fund Schedule of Investments October 31, 2023
PRINCIPAL
AMOUNT | | | | VALUE | |
| | 1,140,000 | | | Dexcom, Inc.
0.250%, 11/15/25 | | $ | 1,082,168 | | |
| | 623,000 | | | 0.375%, 05/15/28* | | | 549,523 | | |
| | 661,000 | | | Envista Holdings Corp.*
1.750%, 08/15/28 | | | 571,924 | | |
| | 785,000 | | | Halozyme Therapeutics, Inc.
1.000%, 08/15/28 | | | 690,667 | | |
| | 622,000 | | | 0.250%, 03/01/27 | | | 508,784 | | |
| | 502,000 | | | Innoviva, Inc.
2.500%, 08/15/25 | | | 490,876 | | |
| | 732,000 | | | Insmed, Inc.
0.750%, 06/01/28 | | | 711,489 | | |
| | 658,000 | | | Integer Holdings Corp.*
2.125%, 02/15/28 | | | 724,313 | | |
| | 788,000 | | | Integra LifeSciences Holdings Corp.
0.500%, 08/15/25 | | | 710,863 | | |
| | 753,000 | | | Ionis Pharmaceuticals, Inc.
0.000%, 04/01/26 | | | 729,243 | | |
| | 1,295,000 | | | Jazz Investments I, Ltd.
2.000%, 06/15/26 | | | 1,314,723 | | |
| | 415,000 | | | Lantheus Holdings, Inc.*
2.625%, 12/15/27 | | | 460,451 | | |
| | 941,000 | | | NeoGenomics, Inc.
0.250%, 01/15/28 | | | 680,032 | | |
| | 600,000 | | | Omnicell, Inc.^
0.250%, 09/15/25 | | | 533,382 | | |
| | 620,000 | | | Pacira BioSciences, Inc.
0.750%, 08/01/25 | | | 557,752 | | |
| | 759,000 | | | Sarepta Therapeutics, Inc.
1.250%, 09/15/27 | | | 646,326 | | |
| | 130,000,000 | JPY | | Ship Healthcare Holdings, Inc.
0.000%, 12/13/23 | | | 857,395 | | |
| | 988,000 | | | Shockwave Medical, Inc.*
1.000%, 08/15/28 | | | 957,975 | | |
| | 910,000 | | | Tandem Diabetes Care, Inc.*
1.500%, 05/01/25 | | | 859,158 | | |
| | 618,000 | | | TransMedics Group, Inc.*^
1.500%, 06/01/28 | | | 478,332 | | |
| | | | 16,625,308 | | |
| | | Industrials (7.2%) | |
| | 180,000,000 | JPY | | Daifuku Co., Ltd.
0.000%, 09/13/30 | | | 1,232,004 | | |
| | 600,000 | EUR | | Duerr, AG
0.750%, 01/15/26 | | | 563,857 | | |
| | 981,000 | | | John Bean Technologies Corp.
0.250%, 05/15/26 | | | 882,812 | | |
| | 700,000 | | | L&F Company Ltd.
2.500%, 04/26/30 | | | 465,143 | | |
| | 652,000 | | | Middleby Corp.
1.000%, 09/01/25 | | | 677,239 | | |
| | 600,000 | EUR | | Prysmian S.p.A
0.000%, 02/02/26 | | | 652,382 | | |
PRINCIPAL
AMOUNT | | | | VALUE | |
| | 600,000 | EUR | | Rheinmetall, AG
2.250%, 02/07/30 | | $ | 684,182 | | |
| | 651,100 | EUR | | Schneider Electric, SE
0.000%, 06/15/26 | | | 1,232,749 | | |
| | 573,000 | | | Southwest Airlines Company
1.250%, 05/01/25 | | | 546,069 | | |
| | 600,000 | EUR | | SPIE, SA
2.000%, 01/17/28 | | | 613,707 | | |
| | 1,674,000 | | | Sunrun, Inc.
0.000%, 02/01/26 | | | 1,150,892 | | |
| | | | 8,701,036 | | |
| | | Information Technology (29.3%) | |
| | 888,000 | | | Affirm Holdings, Inc.
0.000%, 11/15/26 | | | 640,053 | | |
| | 978,000 | | | Akamai Technologies, Inc.
1.125%, 02/15/29* | | | 962,851 | | |
| | 610,000 | | | 0.125%, 05/01/25 | | | 706,087 | | |
| | 691,000 | | | BILL Holdings, Inc.
0.000%, 04/01/27 | | | 548,398 | | |
| | 873,000 | | | Block, Inc.^
0.125%, 03/01/25 | | | 805,727 | | |
| | 920,000 | | | Confluent, Inc.
0.000%, 01/15/27 | | | 742,550 | | |
| | 973,000 | | | CyberArk Software, Ltd.
0.000%, 11/15/24 | | | 1,113,890 | | |
| | 496,000 | | | Datadog, Inc.
0.125%, 06/15/25 | | | 546,215 | | |
| | 2,203,000 | | | DigitalOcean Holdings, Inc.
0.000%, 12/01/26 | | | 1,657,669 | | |
| | 1,374,000 | | | Dropbox, Inc.
0.000%, 03/01/28 | | | 1,274,550 | | |
| | 1,777,000 | CAD | | Dye & Durham, Ltd.*
3.750%, 03/01/26 | | | 954,653 | | |
| | 1,840,000 | | | Fastly, Inc.
0.000%, 03/15/26 | | | 1,548,434 | | |
| | 1,676,000 | | | Five9, Inc.
0.500%, 06/01/25 | | | 1,533,724 | | |
| | 600,000 | | | Gigabyte Technology Company, Ltd.
0.000%, 07/27/28 | | | 574,500 | | |
| | 663,000 | | | LivePerson, Inc.
0.000%, 12/15/26 | | | 432,256 | | |
| | 1,367,000 | | | Microchip Technology, Inc.^
0.125%, 11/15/24 | | | 1,376,583 | | |
| | 2,264,000 | | | MicroStrategy, Inc.
0.000%, 02/15/27 | | | 1,641,830 | | |
| | 2,783,000 | | | NCL Corp., Ltd.
1.125%, 02/15/27 | | | 2,158,328 | | |
| | 1,500,000 | EUR | | Nexi S.p.A
0.000%, 02/24/28 | | | 1,282,910 | | |
| | 569,000 | | | Nice, Ltd.
0.000%, 09/15/25 | | | 507,474 | | |
See accompanying Notes to Schedule of Investments
CALAMOS OPEN-END FAMILY OF FUNDS ANNUAL REPORT
122
Global Convertible Fund Schedule of Investments October 31, 2023
PRINCIPAL
AMOUNT | | | | VALUE | |
| | 1,301,000 | | | ON Semiconductor Corp.
0.500%, 03/01/29* | | $ | 1,143,761 | | |
| | 824,000 | | | 0.000%, 05/01/27 | | | 1,078,756 | | |
| | 520,000 | | | Palo Alto Networks, Inc.
0.375%, 06/01/25 | | | 1,269,850 | | |
| | 729,000 | | | Pegasystems, Inc.
0.750%, 03/01/25 | | | 670,403 | | |
| | 190,000,000 | JPY | | SCREEN Holdings Company, Ltd.
0.000%, 06/11/25 | | | 1,526,731 | | |
| | 1,291,000 | | | Seagate HDD Cayman*
3.500%, 06/01/28 | | | 1,339,206 | | |
| | 929,000 | | | Shift4 Payments, Inc.
0.000%, 12/15/25 | | | 846,040 | | |
| | 600,000 | | | SK Hynix, Inc.
1.750%, 04/11/30 | | | 725,976 | | |
| | 708,200 | EUR | | SOITEC
0.000%, 10/01/25 | | | 1,328,030 | | |
| | 796,000 | | | Tyler Technologies, Inc.^
0.250%, 03/15/26 | | | 756,916 | | |
| | 992,000 | | | Unity Software, Inc.
0.000%, 11/15/26 | | | 777,411 | | |
| | 977,000 | | | Workiva, Inc.
1.250%, 08/15/28* | | | 887,429 | | |
| | 120,000 | | | 1.125%, 08/15/26 | | | 148,262 | | |
| | 1,335,000 | | | Xero Investments, Ltd.
0.000%, 12/02/25 | | | 1,164,881 | | |
| | 490,000 | | | Zscaler, Inc.
0.125%, 07/01/25 | | | 598,261 | | |
| | | | 35,270,595 | | |
| | | Materials (2.6%) | |
| | 1,448,000 | | | Amyris, Inc.@
1.500%, 11/15/26 | | | 154,979 | | |
| | 1,300,000 | | | LG Chem, Ltd.
1.250%, 07/18/28 | | | 1,221,883 | | |
| | 1,675,000 | | | Lithium Americas Argentina Corp.
1.750%, 01/15/27 | | | 1,130,793 | | |
| | 70,000,000 | JPY | | Nippon Steel Corp.
0.000%, 10/05/26 | | | 616,600 | | |
| | | | 3,124,255 | | |
| | | Real Estate (2.0%) | |
| | 400,000 | EUR | | ANLLIAN Capital, Ltd.
0.000%, 02/05/25 | | | 453,535 | | |
| | 1,235,000 | | | Redfin Corp.
0.000%, 10/15/25 | | | 998,399 | | |
| | 1,000,000 | | | Vingroup, JSC
3.000%, 04/20/26 | | | 925,930 | | |
| | | | 2,377,864 | | |
| | | Utilities (3.0%) | |
| | 1,282,000 | | | American Water Capital Corp.*
3.625%, 06/15/26 | | | 1,234,271 | | |
| | 624,000 | | | CMS Energy Corp.*
3.375%, 05/01/28 | | | 590,828 | | |
PRINCIPAL
AMOUNT | | | | VALUE | |
| | 1,307,000 | | | PPL Capital Funding, Inc.*
2.875%, 03/15/28 | | $ | 1,198,624 | | |
| | 651,000 | | | Southern Company*
3.875%, 12/15/25 | | | 639,595 | | |
| | | | 3,663,318 | | |
| | | | | TOTAL CONVERTIBLE BONDS
(Cost $126,226,465) | | | 111,835,446 | | |
NUMBER OF
SHARES | | | | VALUE | |
CONVERTIBLE PREFERRED STOCKS (4.7%) | | | |
| | | Financials (4.2%) | |
| | 32,723 | | | Apollo Global Management, Inc.
6.750%, 07/31/26 | | | 1,574,304 | | |
| | 1,687 | | | Bank of America Corp.‡‡~
7.250% | | | 1,776,748 | | |
| | 1,580 | | | Wells Fargo & Company - Class A‡‡
7.500% | | | 1,668,954 | | |
| | | | 5,020,006 | | |
| | | Utilities (0.5%) | |
| | 15,361 | | | NextEra Energy, Inc.^
6.926%, 09/01/25 | | | 576,652 | | |
| | | | | TOTAL CONVERTIBLE PREFERRED
STOCKS
(Cost $6,629,206) | | | 5,596,658 | | |
PRINCIPAL
AMOUNT | | | | VALUE | |
U.S. GOVERNMENT AND AGENCY SECURITY (0.8%) | | | |
| | | Other (0.8%) | |
| | 1,016,000 | | | United States Treasury Note^
2.250%, 03/31/24
(Cost $1,014,957) | | | 1,002,784 | | |
NUMBER OF
CONTRACTS/
NOTIONAL
AMOUNT | | | | VALUE | |
PURCHASED OPTIONS (1.0%)# | | | |
| | | Energy (0.3%) | |
| | 379 | EUR | | TotalEnergies, SE | | | | | |
| | 2,574,623 | | | Call, 12/15/23, Strike 55.05 | | | 353,820 | | |
| | | Other (0.7%) | |
| | 82 | | | S&P 500 Index | | | | | |
| | 34,389,160 | | | Put, 12/29/23, Strike $4,200.00 | | | 839,270 | | |
| | | | 839,270 | | |
| | | | | TOTAL PURCHASED OPTIONS
(Cost $654,527) | | | 1,193,090 | | |
See accompanying Notes to Schedule of Investments
www.calamos.com
123
Global Convertible Fund Schedule of Investments October 31, 2023
NUMBER OF
SHARES/
PRINCIPAL
AMOUNT | | | | VALUE | |
INVESTMENT OF CASH COLLATERAL FOR SECURITIES LOANED (4.6%) | | | |
| | 5,551,209 | | | State Street Navigator Securities
Lending Government Money
Market Portfolio, 5.358%†***
(Cost $5,551,209) | | $ | 5,551,209 | | |
| | | TOTAL INVESTMENTS (104.0%)
(Cost $140,076,364) | | | 125,179,187 | | |
PAYABLE UPON RETURN OF SECURITIES ON LOAN (-4.6%) | | | (5,551,209 | ) | |
OTHER ASSETS, LESS LIABILITIES (0.6%) | | | 760,452 | | |
NET ASSETS (100.0%) | | $ | 120,388,430 | | |
NUMBER OF
CONTRACTS/
NOTIONAL
AMOUNT | | | | VALUE | |
WRITTEN OPTION (0.0%)# | | | |
| | | Other (0.0%) | |
| | 82 | | | S&P 500 Index | | | | | |
| | 34,389,160 | | | Put, 12/29/23, Strike $3,500.00
(Premium $139,955) | | $ | (58,220 | ) | |
NOTES TO SCHEDULE OF INVESTMENTS
* Securities issued and sold pursuant to a Rule 144A transaction are exempted from the registration requirement of the Securities Act of 1933, as amended. These securities may only be sold to qualified institutional buyers ("QIBs"), such as the Fund. Any resale of these securities must generally be effected through a sale that is registered under the Act or otherwise exempted from such registration requirements.
^ Security, or portion of security, is on loan.
& Illiquid security.
§ Securities exchangeable or convertible into securities of one or more entities that are different than the issuer. Each entity is identified in the parenthetical.
@ In default status and considered non-income producing.
‡‡ Perpetual maturity.
~ Security, or portion of security, is segregated as collateral (or collateral for potential future transactions) for written options. The aggregate value of such securities is $389,684.
† Represents investment of cash collateral received from securities on loan as of October 31, 2023.
*** The rate disclosed is the 7 day net yield as of October 31, 2023.
FOREIGN CURRENCY ABBREVIATIONS
AUD Australian Dollar
CAD Canadian Dollar
EUR European Monetary Unit
GBP British Pound Sterling
JPY Japanese Yen
Note: Value for securities denominated in foreign currencies is shown in U.S. dollars. The principal amount for such securities is shown in the respective foreign currency. The date on options represents the expiration date of the option contract. The option contract may be exercised at any date on or before the date shown.
CURRENCY EXPOSURE
OCTOBER 31, 2023
| | | VALUE | | % OF TOTAL
INVESTMENTS | |
US Dollar | | $ | 102,083,959 | | | | 81.6 | % | |
European Monetary Unit | | | 14,350,183 | | | | 11.5 | % | |
Japanese Yen | | | 4,559,209 | | | | 3.6 | % | |
British Pound Sterling | | | 2,363,283 | | | | 1.9 | % | |
Canadian Dollar | | | 954,653 | | | | 0.8 | % | |
Australian Dollar | | | 809,680 | | | | 0.6 | % | |
Total Investments | | $ | 125,120,967 | | | | 100.0 | % | |
Currency exposure may vary over time.
See accompanying Notes to Schedule of Investments
CALAMOS OPEN-END FAMILY OF FUNDS ANNUAL REPORT
124
Timpani Small Cap Growth Fund Schedule of Investments October 31, 2023
NUMBER OF
SHARES | | | | VALUE | |
COMMON STOCKS (99.4%) | | | |
| | | Communication Services (0.5%) | |
| | 93,477 | | | Gambling.com Group, Ltd.# | | $ | 1,211,462 | | |
| | | Consumer Discretionary (10.9%) | |
| | 15,309 | | | Boot Barn Holdings, Inc.# | | | 1,063,976 | | |
| | 11,791 | | | Duolingo, Inc.# | | | 1,722,076 | | |
| | 22,043 | | | Grand Canyon Education, Inc.# | | | 2,608,348 | | |
| | 117,391 | | | Modine Manufacturing Company# | | | 4,636,945 | | |
| | 82,713 | | | Ollie's Bargain Outlet Holdings, Inc.# | | | 6,388,752 | | |
| | 31,457 | | | On Holding, AG - Class A# | | | 807,501 | | |
| | 78,077 | | | Stride, Inc.# | | | 4,292,673 | | |
| | 5,057 | | | TopBuild Corp.# | | | 1,156,839 | | |
| | 8,242 | | | Wingstop, Inc. | | | 1,506,390 | | |
| | 43,638 | | | YETI Holdings, Inc.# | | | 1,855,488 | | |
| | | | 26,038,988 | | |
| | | Consumer Staples (6.6%) | |
| | 60,651 | | | Celsius Holdings, Inc.# | | | 9,224,410 | | |
| | 62,272 | | | elf Beauty, Inc.# | | | 5,768,255 | | |
| | 125,689 | | | Mama's Creations, Inc.# | | | 424,829 | | |
| | 178,043 | | | Real Good Food Company, Inc.# | | | 416,621 | | |
| | | | 15,834,115 | | |
| | | Energy (10.4%) | |
| | 112,884 | | | Antero Resources Corp.# | | | 3,323,305 | | |
| | 81,188 | | | Matador Resources Company | | | 5,008,488 | | |
| | 56,070 | | | Noble Corp., PLC | | | 2,617,908 | | |
| | 80,871 | | | Range Resources Corp. | | | 2,898,416 | | |
| | 148,258 | | | TechnipFMC, PLC | | | 3,190,512 | | |
| | 76,771 | | | Tidewater, Inc.# | | | 5,247,298 | | |
| | 26,596 | | | Weatherford International, PLC# | | | 2,475,822 | | |
| | | | 24,761,749 | | |
| | | Financials (6.3%) | |
| | 6,591 | | | FirstCash Holdings, Inc. | | | 717,892 | | |
| | 25,431 | | | Goosehead Insurance, Inc. - Class A# | | | 1,649,709 | | |
| | 9,964 | | | Kinsale Capital Group, Inc. | | | 3,327,079 | | |
| | 190,203 | | | Remitly Global, Inc.# | | | 5,122,167 | | |
| | 151,056 | | | Skyward Specialty Insurance Group, Inc.# | | | 4,252,226 | | |
| | | | 15,069,073 | | |
| | | Health Care (12.2%) | |
| | 293,339 | | | ADMA Biologics, Inc.# | | | 991,486 | | |
| | 99,558 | | | Avita Medical, Inc.# | | | 926,885 | | |
| | 17,656 | | | HealthEquity, Inc.# | | | 1,265,582 | | |
| | 93,366 | | | iRadimed Corp. | | | 3,803,731 | | |
| | 35,787 | | | Krystal Biotech, Inc.# | | | 4,182,427 | | |
| | 185,418 | | | PetIQ, Inc.# | | | 3,480,296 | | |
| | 88,344 | | | RadNet, Inc.# | | | 2,381,754 | | |
NUMBER OF
SHARES | | | | VALUE | |
| | 167,280 | | | RxSight, Inc.# | | $ | 3,703,579 | | |
| | 42,096 | | | Stevanato Group S.p.A | | | 1,176,583 | | |
| | 45,442 | | | UFP Technologies, Inc.# | | | 7,085,317 | | |
| | | | 28,997,640 | | |
| | | Industrials (30.6%) | |
| | 24,221 | | | Applied Industrial Technologies, Inc. | | | 3,718,166 | | |
| | 23,309 | | | Axon Enterprise, Inc.# | | | 4,766,457 | | |
| | 49,002 | | | AZEK Company, Inc.# | | | 1,283,852 | | |
| | 57,858 | | | CBIZ, Inc.# | | | 3,006,302 | | |
| | 340,050 | | | CECO Environmental Corp.# | | | 5,502,009 | | |
| | 19,137 | | | Clean Harbors, Inc.# | | | 2,940,783 | | |
| | 6,062 | | | Comfort Systems USA, Inc. | | | 1,102,375 | | |
| | 145,245 | | | Construction Partners, Inc. - Class A# | | | 5,584,670 | | |
| | 198,632 | | | FTAI Aviation, Ltd. | | | 7,470,549 | | |
| | 57,215 | | | Gibraltar Industries, Inc.# | | | 3,482,105 | | |
| | 17,572 | | | Huron Consulting Group, Inc.# | | | 1,745,954 | | |
| | 76,631 | | | Karat Packaging, Inc. | | | 1,580,898 | | |
| | 47,018 | | | Kirby Corp.# | | | 3,512,245 | | |
| | 17,464 | | | OSI Systems, Inc.# | | | 1,820,971 | | |
| | 10,121 | | | Saia, Inc.# | | | 3,628,277 | | |
| | 5,196 | | | SiteOne Landscape Supply, Inc.# | | | 715,853 | | |
| | 88,002 | | | Sterling Infrastructure, Inc.# | | | 6,410,946 | | |
| | 58,109 | | | Symbotic, Inc.# | | | 1,977,449 | | |
| | 93,475 | | | Tecnoglass, Inc. | | | 3,054,763 | | |
| | 16,394 | | | Transcat, Inc.# | | | 1,475,788 | | |
| | 170,260 | | | Vertiv Holdings Company | | | 6,686,110 | | |
| | 14,416 | | | VSE Corp. | | | 775,581 | | |
| | 36,933 | | | Willdan Group, Inc.# | | | 651,498 | | |
| | | | 72,893,601 | | |
| | | Information Technology (20.5%) | |
| | 235,421 | | | ACM Research, Inc. - Class A# | | | 3,201,726 | | |
| | 21,955 | | | Appfolio, Inc. - Class A# | | | 4,118,099 | | |
| | 93,394 | | | Applied Digital Corp.# | | | 455,763 | | |
| | 257,216 | | | AvePoint, Inc.# | | | 1,926,548 | | |
| | 75,542 | | | Blackbaud, Inc.# | | | 4,940,447 | | |
| | 40,034 | | | Braze, Inc. - Class A# | | | 1,704,648 | | |
| | 143,862 | | | Celestica, Inc.# | | | 3,359,178 | | |
| | 176,814 | | | Credo Technology Group Holding, Ltd.# | | | 2,514,295 | | |
| | 10,281 | | | CyberArk Software, Ltd.# | | | 1,682,383 | | |
| | 323,511 | | | Evolv Technologies Holdings, Inc.# | | | 1,374,922 | | |
| | 50,315 | | | Freshworks Inc - Class A# | | | 902,651 | | |
| | 79,118 | | | Intapp, Inc.# | | | 2,705,836 | | |
| | 35,061 | | | Onto Innovation, Inc.# | | | 3,939,804 | | |
| | 7,990 | | | Qualys, Inc.# | | | 1,222,070 | | |
| | 72,273 | | | Sprinklr, Inc. - Class A# | | | 982,190 | | |
| | 7,822 | | | SPS Commerce, Inc.# | | | 1,254,179 | | |
See accompanying Notes to Schedule of Investments
www.calamos.com
125
Timpani Small Cap Growth Fund Schedule of Investments October 31, 2023
NUMBER OF
SHARES | | | | VALUE | |
| | 30,312 | | | Super Micro Computer, Inc.# | | $ | 7,258,815 | | |
| | 61,324 | | | Varonis Systems, Inc.# | | | 2,062,939 | | |
| | 130,281 | | | Vertex, Inc. - Class A# | | | 3,154,103 | | |
| | | | 48,760,596 | | |
| | | Materials (1.4%) | |
| | 51,963 | | | Carpenter Technology Corp. | | | 3,259,119 | | |
| | | TOTAL COMMON STOCKS
(Cost $211,567,972) | | | 236,826,343 | | |
| | | TOTAL INVESTMENTS (99.4%)
(Cost $211,567,972) | | | 236,826,343 | | |
OTHER ASSETS, LESS LIABILITIES (0.6%) | | | 1,434,382 | | |
NET ASSETS (100.0%) | | $ | 238,260,725 | | |
NOTES TO SCHEDULE OF INVESTMENTS
# Non-income producing security.
See accompanying Notes to Schedule of Investments
CALAMOS OPEN-END FAMILY OF FUNDS ANNUAL REPORT
126
Timpani SMID Growth Fund Schedule of Investments October 31, 2023
NUMBER OF
SHARES | | | | VALUE | |
COMMON STOCKS (99.8%) | | | |
| | | Consumer Discretionary (14.4%) | |
| | 662 | | | Deckers Outdoor Corp.# | | $ | 395,254 | | |
| | 9,587 | | | DraftKings, Inc. - Class A# | | | 264,793 | | |
| | 562 | | | Duolingo, Inc.# | | | 82,080 | | |
| | 1,495 | | | Grand Canyon Education, Inc.# | | | 176,903 | | |
| | 7,056 | | | Modine Manufacturing Company# | | | 278,712 | | |
| | 5,608 | | | Ollie's Bargain Outlet Holdings, Inc.# | | | 433,162 | | |
| | 3,486 | | | On Holding, AG - Class A# | | | 89,486 | | |
| | 4,063 | | | Stride, Inc.# | | | 223,384 | | |
| | 469 | | | TopBuild Corp.# | | | 107,288 | | |
| | 729 | | | Wingstop, Inc. | | | 133,239 | | |
| | 3,257 | | | YETI Holdings, Inc.# | | | 138,488 | | |
| | | | 2,322,789 | | |
| | | Consumer Staples (6.1%) | |
| | 4,201 | | | Celsius Holdings, Inc.# | | | 638,930 | | |
| | 3,756 | | | elf Beauty, Inc.# | | | 347,918 | | |
| | | | 986,848 | | |
| | | Energy (9.6%) | |
| | 7,654 | | | Antero Resources Corp.# | | | 225,334 | | |
| | 4,570 | | | Matador Resources Company | | | 281,923 | | |
| | 3,030 | | | Noble Corp., PLC | | | 141,471 | | |
| | 5,483 | | | Range Resources Corp. | | | 196,511 | | |
| | 14,458 | | | TechnipFMC, PLC | | | 311,136 | | |
| | 4,310 | | | Tidewater, Inc.# | | | 294,589 | | |
| | 1,060 | | | Weatherford International, PLC# | | | 98,675 | | |
| | | | 1,549,639 | | |
| | | Financials (6.4%) | |
| | 292 | | | FirstCash Holdings, Inc. | | | 31,805 | | |
| | 1,182 | | | Goosehead Insurance, Inc. - Class A# | | | 76,676 | | |
| | 895 | | | Kinsale Capital Group, Inc. | | | 298,849 | | |
| | 11,457 | | | Remitly Global, Inc.# | | | 308,537 | | |
| | 8,786 | | | Skyward Specialty Insurance Group, Inc.# | | | 247,326 | | |
| | 439 | | | WEX, Inc.# | | | 73,085 | | |
| | | | 1,036,278 | | |
| | | Health Care (9.2%) | |
| | 4,133 | | | Avita Medical, Inc.# | | | 38,478 | | |
| | 6,084 | | | Exelixis, Inc.# | | | 125,270 | | |
| | 816 | | | HealthEquity, Inc.# | | | 58,491 | | |
| | 2,167 | | | Krystal Biotech, Inc.# | | | 253,257 | | |
| | 9,993 | | | PetIQ, Inc.# | | | 187,569 | | |
| | 4,766 | | | RadNet, Inc.# | | | 128,491 | | |
| | 7,398 | | | RxSight, Inc.# | | | 163,792 | | |
| | 4,524 | | | Stevanato Group S.p.A | | | 126,446 | | |
| | 2,582 | | | UFP Technologies, Inc.# | | | 402,585 | | |
| | | | 1,484,379 | | |
NUMBER OF
SHARES | | | | VALUE | |
| | | Industrials (30.6%) | |
| | 733 | | | Advanced Drainage Systems, Inc. | | $ | 78,306 | | |
| | 856 | | | Applied Industrial Technologies, Inc. | | | 131,405 | | |
| | 2,092 | | | Axon Enterprise, Inc.# | | | 427,793 | | |
| | 3,182 | | | AZEK Company, Inc.# | | | 83,368 | | |
| | 662 | | | BWX Technologies, Inc. | | | 49,173 | | |
| | 2,995 | | | CBIZ, Inc.# | | | 155,620 | | |
| | 16,707 | | | CECO Environmental Corp.# | | | 270,319 | | |
| | 2,615 | | | Clean Harbors, Inc.# | | | 401,847 | | |
| | 249 | | | Comfort Systems USA, Inc. | | | 45,281 | | |
| | 8,311 | | | Construction Partners, Inc. - Class A# | | | 319,558 | | |
| | 417 | | | EMCOR Group, Inc. | | | 86,173 | | |
| | 12,346 | | | FTAI Aviation, Ltd. | | | 464,333 | | |
| | 3,265 | | | Gibraltar Industries, Inc.# | | | 198,708 | | |
| | 575 | | | Huron Consulting Group, Inc.# | | | 57,132 | | |
| | 374 | | | Jabil, Inc. | | | 45,927 | | |
| | 3,122 | | | Kirby Corp.# | | | 233,214 | | |
| | 712 | | | OSI Systems, Inc.# | | | 74,240 | | |
| | 909 | | | Saia, Inc.# | | | 325,868 | | |
| | 460 | | | SiteOne Landscape Supply, Inc.# | | | 63,374 | | |
| | 5,577 | | | Sterling Infrastructure, Inc.# | | | 406,285 | | |
| | 3,751 | | | Symbotic, Inc.# | | | 127,647 | | |
| | 5,191 | | | Tecnoglass, Inc. | | | 169,642 | | |
| | 704 | | | Transcat, Inc.# | | | 63,374 | | |
| | 11,986 | | | Vertiv Holdings Company | | | 470,690 | | |
| | 2,663 | | | XPO, Inc.# | | | 201,882 | | |
| | | | 4,951,159 | | |
| | | Information Technology (22.5%) | |
| | 1,209 | | | Appfolio, Inc. - Class A# | | | 226,772 | | |
| | 4,881 | | | Applied Digital Corp.# | | | 23,819 | | |
| | 4,686 | | | Blackbaud, Inc.# | | | 306,464 | | |
| | 2,263 | | | Braze, Inc. - Class A# | | | 96,359 | | |
| | 7,355 | | | Celestica, Inc.# | | | 171,739 | | |
| | 8,202 | | | Credo Technology Group Holding, Ltd.# | | | 116,632 | | |
| | 681 | | | CyberArk Software, Ltd.# | | | 111,439 | | |
| | 2,175 | | | Dynatrace, Inc.# | | | 97,244 | | |
| | 12,901 | | | Evolv Technologies Holdings, Inc.# | | | 54,829 | | |
| | 484 | | | Fair Isaac Corp.# | | | 409,401 | | |
| | 2,190 | | | Flex, Ltd.# | | | 56,327 | | |
| | 2,056 | | | Freshworks Inc - Class A# | | | 36,885 | | |
| | 3,668 | | | Intapp, Inc.# | | | 125,446 | | |
| | 1,849 | | | Manhattan Associates, Inc.# | | | 360,518 | | |
| | 489 | | | MongoDB, Inc.# | | | 168,504 | | |
| | 2,112 | | | Onto Innovation, Inc.# | | | 237,325 | | |
| | 2,313 | | | Pure Storage, Inc. - Class A# | | | 78,203 | | |
| | 320 | | | Qualys, Inc.# | | | 48,944 | | |
| | 5,868 | | | Samsara Inc. - Class A# | | | 135,375 | | |
See accompanying Notes to Schedule of Investments
www.calamos.com
127
Timpani SMID Growth Fund Schedule of Investments October 31, 2023
NUMBER OF
SHARES | | | | VALUE | |
| | 3,542 | | | Sprinklr, Inc. - Class A# | | $ | 48,136 | | |
| | 307 | | | SPS Commerce, Inc.# | | | 49,224 | | |
| | 1,665 | | | Super Micro Computer, Inc.# | | | 398,718 | | |
| | 259 | | | Tyler Technologies, Inc.# | | | 96,581 | | |
| | 7,447 | | | Vertex, Inc. - Class A# | | | 180,292 | | |
| | | | 3,635,176 | | |
| | | Materials (1.0%) | |
| | 2,602 | | | Carpenter Technology Corp. | | | 163,197 | | |
| | | TOTAL COMMON STOCKS
(Cost $14,458,444) | | | 16,129,465 | | |
| | | TOTAL INVESTMENTS (99.8%)
(Cost $14,458,444) | | | 16,129,465 | | |
OTHER ASSETS, LESS LIABILITIES (0.2%) | | | 26,224 | | |
NET ASSETS (100.0%) | | $ | 16,155,689 | | |
NOTES TO SCHEDULE OF INVESTMENTS
# Non-income producing security.
See accompanying Notes to Schedule of Investments
CALAMOS OPEN-END FAMILY OF FUNDS ANNUAL REPORT
128
Growth Fund Schedule of Investments October 31, 2023
NUMBER OF
SHARES | | | | VALUE | |
COMMON STOCKS (96.7%) | | | |
| | | Communication Services (12.1%) | |
| | 744,000 | | | Alphabet, Inc. - Class A#~ | | $ | 92,315,520 | | |
| | 7,451 | | | Match Group, Inc.# | | | 257,805 | | |
| | 92,875 | | | Meta Platforms, Inc. - Class A# | | | 27,980,451 | | |
| | 25,149 | | | Netflix, Inc.# | | | 10,353,592 | | |
| | 17,500 | | | Pinterest, Inc. - Class A# | | | 522,900 | | |
| | 90,543 | | | T-Mobile U.S., Inc.# | | | 13,025,516 | | |
| | | | 144,455,784 | | |
| | | Consumer Discretionary (14.6%) | |
| | 634,340 | | | Amazon.com, Inc.#~ | | | 84,424,311 | | |
| | 1,860 | | | Booking Holdings, Inc.# | | | 5,188,582 | | |
| | 7,900 | | | Chipotle Mexican Grill, Inc.#~ | | | 15,343,380 | | |
| | 3,636 | | | Deckers Outdoor Corp.# | | | 2,170,910 | | |
| | 52,559 | | | DraftKings, Inc. - Class A# | | | 1,451,679 | | |
| | 3,094 | | | Duolingo, Inc.# | | | 451,879 | | |
| | 8,233 | | | Grand Canyon Education, Inc.# | | | 974,211 | | |
| | 62,557 | | | Lowe's Companies, Inc. | | | 11,921,487 | | |
| | 33,200 | | | Lululemon Athletica, Inc.# | | | 13,063,536 | | |
| | 38,603 | | | Modine Manufacturing Company# | | | 1,524,818 | | |
| | 92,117 | | | NIKE, Inc. - Class B | | | 9,466,864 | | |
| | 30,876 | | | Ollie's Bargain Outlet Holdings, Inc.# | | | 2,384,862 | | |
| | 19,080 | | | On Holding, AG - Class A#^ | | | 489,784 | | |
| | 22,360 | | | Stride, Inc.#^ | | | 1,229,353 | | |
| | 111,500 | | | Tesla, Inc.# | | | 22,393,660 | | |
| | 2,576 | | | TopBuild Corp.# | | | 589,286 | | |
| | 4,012 | | | Wingstop, Inc. | | | 733,273 | | |
| | 17,881 | | | YETI Holdings, Inc.# | | | 760,300 | | |
| | | | 174,562,175 | | |
| | | Consumer Staples (2.3%) | |
| | 23,063 | | | Celsius Holdings, Inc.# | | | 3,507,652 | | |
| | 46,100 | | | Constellation Brands, Inc. - Class A | | | 10,794,315 | | |
| | 20,559 | | | elf Beauty, Inc.# | | | 1,904,380 | | |
| | 70,500 | | | Walmart, Inc. | | | 11,520,405 | | |
| | | | 27,726,752 | | |
| | | Energy (1.6%) | |
| | 42,139 | | | Antero Resources Corp.# | | | 1,240,572 | | |
| | 38,333 | | | Hess Corp. | | | 5,535,285 | | |
| | 25,153 | | | Matador Resources Company | | | 1,551,689 | | |
| | 16,626 | | | Noble Corp., PLC | | | 776,268 | | |
| | 92,500 | | | Occidental Petroleum Corp. | | | 5,717,425 | | |
| | 30,189 | | | Range Resources Corp.^ | | | 1,081,974 | | |
| | 79,567 | | | TechnipFMC, PLC | | | 1,712,282 | | |
| | 23,649 | | | Tidewater, Inc.# | | | 1,616,409 | | |
| | 5,805 | | | Weatherford International, PLC# | | | 540,387 | | |
| | | | 19,772,291 | | |
NUMBER OF
SHARES | | | | VALUE | |
| | | Financials (7.1%) | |
| | 38,418 | | | American Express Company | | $ | 5,610,181 | | |
| | 62,000 | | | Blackstone, Inc. | | | 5,725,700 | | |
| | 1,610 | | | FirstCash Holdings, Inc. | | | 175,361 | | |
| | 6,503 | | | Goosehead Insurance, Inc. - Class A# | | | 421,850 | | |
| | 4,930 | | | Kinsale Capital Group, Inc. | | | 1,646,176 | | |
| | 53,500 | | | Marsh & McLennan Cos., Inc. | | | 10,146,275 | | |
| | 24,100 | | | Mastercard, Inc. - Class A | | | 9,070,035 | | |
| | 63,056 | | | Remitly Global, Inc.#^ | | | 1,698,098 | | |
| | 17,085 | | | S&P Global, Inc. | | | 5,967,961 | | |
| | 48,179 | | | Skyward Specialty Insurance Group, Inc.# | | | 1,356,239 | | |
| | 155,000 | | | Visa, Inc. - Class A^ | | | 36,440,500 | | |
| | 169,000 | | | Wells Fargo & Company | | | 6,721,130 | | |
| | 2,415 | | | WEX, Inc.# | | | 402,049 | | |
| | | | 85,381,555 | | |
| | | Health Care (11.6%) | |
| | 22,749 | | | Avita Medical, Inc.#^ | | | 211,793 | | |
| | 202,000 | | | Boston Scientific Corp.# | | | 10,340,380 | | |
| | 42,000 | | | Danaher Corp. | | | 8,064,840 | | |
| | 66,700 | | | Dexcom, Inc.# | | | 5,924,961 | | |
| | 50,000 | | | Eli Lilly & Company | | | 27,696,500 | | |
| | 33,301 | | | Exelixis, Inc.# | | | 685,667 | | |
| | 4,476 | | | HealthEquity, Inc.# | | | 320,840 | | |
| | 21,700 | | | Humana, Inc. | | | 11,364,073 | | |
| | 30,000 | | | Intuitive Surgical, Inc.# | | | 7,866,600 | | |
| | 11,872 | | | Krystal Biotech, Inc.#^ | | | 1,387,481 | | |
| | 112,600 | | | Merck & Company, Inc. | | | 11,564,020 | | |
| | 54,839 | | | PetIQ, Inc.#^ | | | 1,029,328 | | |
| | 26,232 | | | RadNet, Inc.# | | | 707,215 | | |
| | 40,716 | | | RxSight, Inc.# | | | 901,452 | | |
| | 24,900 | | | Stevanato Group S.p.A^ | | | 695,955 | | |
| | 22,300 | | | Stryker Corp. | | | 6,025,906 | | |
| | 14,208 | | | UFP Technologies, Inc.#^ | | | 2,215,311 | | |
| | 57,000 | | | UnitedHealth Group, Inc. | | | 30,526,920 | | |
| | 69,900 | | | Zoetis, Inc. | | | 10,974,300 | | |
| | | | 138,503,542 | | |
| | | Industrials (7.6%) | |
| | 4,013 | | | Advanced Drainage Systems, Inc. | | | 428,709 | | |
| | 972,000 | | | American Airlines Group, Inc.# | | | 10,837,800 | | |
| | 4,699 | | | Applied Industrial Technologies, Inc. | | | 721,344 | | |
| | 11,514 | | | Axon Enterprise, Inc.# | | | 2,354,498 | | |
| | 17,574 | | | AZEK Company, Inc.# | | | 460,439 | | |
| | 58,000 | | | Boeing Company# | | | 10,835,560 | | |
| | 3,620 | | | BWX Technologies, Inc. | | | 268,894 | | |
| | 16,405 | | | CBIZ, Inc.# | | | 852,404 | | |
| | 91,719 | | | CECO Environmental Corp.# | | | 1,484,013 | | |
See accompanying Notes to Schedule of Investments
www.calamos.com
129
Growth Fund Schedule of Investments October 31, 2023
NUMBER OF
SHARES | | | | VALUE | |
| | 14,339 | | | Clean Harbors, Inc.# | | $ | 2,203,474 | | |
| | 1,366 | | | Comfort Systems USA, Inc. | | | 248,407 | | |
| | 45,488 | | | Construction Partners, Inc. - Class A# | | | 1,749,014 | | |
| | 354,000 | | | CSX Corp. | | | 10,566,900 | | |
| | 2,279 | | | EMCOR Group, Inc. | | | 470,955 | | |
| | 67,778 | | | FTAI Aviation, Ltd.^ | | | 2,549,131 | | |
| | 17,919 | | | Gibraltar Industries, Inc.# | | | 1,090,550 | | |
| | 21,334 | | | Honeywell International, Inc. | | | 3,909,669 | | |
| | 3,153 | | | Huron Consulting Group, Inc.# | | | 313,282 | | |
| | 2,047 | | | Jabil, Inc. | | | 251,372 | | |
| | 17,139 | | | Kirby Corp.# | | | 1,280,283 | | |
| | 12,600 | | | Lockheed Martin Corp. | | | 5,728,464 | | |
| | 3,916 | | | OSI Systems, Inc.# | | | 408,321 | | |
| | 5,005 | | | Saia, Inc.# | | | 1,794,242 | | |
| | 2,521 | | | SiteOne Landscape Supply, Inc.# | | | 347,318 | | |
| | 30,569 | | | Sterling Infrastructure, Inc.# | | | 2,226,952 | | |
| | 20,548 | | | Symbotic, Inc.#^ | | | 699,248 | | |
| | 28,568 | | | Tecnoglass, Inc. | | | 933,602 | | |
| | 3,864 | | | Transcat, Inc.# | | | 347,837 | | |
| | 514,400 | | | Uber Technologies, Inc.# | | | 22,263,232 | | |
| | 65,967 | | | Vertiv Holdings Company | | | 2,590,524 | | |
| | 14,576 | | | XPO, Inc.#^ | | | 1,105,007 | | |
| | | | 91,321,445 | | |
| | | Information Technology (38.5%) | |
| | 25,000 | | | Adobe, Inc.# | | | 13,301,500 | | |
| | 143,000 | | | Advanced Micro Devices, Inc.# | | | 14,085,500 | | |
| | 7,999 | | | Amdocs, Ltd. | | | 641,200 | | |
| | 3,129 | | | Analog Devices, Inc. | | | 492,286 | | |
| | 6,656 | | | Appfolio, Inc. - Class A# | | | 1,248,466 | | |
| | 563,520 | | | Apple, Inc. | | | 96,232,310 | | |
| | 26,739 | | | Applied Digital Corp.#^ | | | 130,486 | | |
| | 36,300 | | | BILL Holdings, Inc.#^ | | | 3,313,827 | | |
| | 25,689 | | | Blackbaud, Inc.# | | | 1,680,061 | | |
| | 12,416 | | | Braze, Inc. - Class A# | | | 528,673 | | |
| | 21,060 | | | Broadcom, Inc.~ | | | 17,719,252 | | |
| | 33,900 | | | Cadence Design Systems, Inc.# | | | 8,130,915 | | |
| | 40,479 | | | Celestica, Inc.#^ | | | 945,185 | | |
| | 10,561 | | | Ciena Corp.# | | | 445,674 | | |
| | 45,034 | | | Credo Technology Group Holding, Ltd.# | | | 640,384 | | |
| | 2,390 | | | Crowdstrike Holdings, Inc. - Class A# | | | 422,480 | | |
| | 3,726 | | | CyberArk Software, Ltd.# | | | 609,723 | | |
| | 98,845 | | | Datadog, Inc. - Class A# | | | 8,052,902 | | |
| | 25,300 | | | DoubleVerify Holdings, Inc.#^ | | | 704,099 | | |
| | 11,969 | | | Dynatrace, Inc.# | | | 535,134 | | |
NUMBER OF
SHARES | | | | VALUE | |
| | 70,580 | | | Evolv Technologies Holdings, Inc.# | | $ | 299,965 | | |
| | 2,655 | | | Fair Isaac Corp.# | | | 2,245,785 | | |
| | 38,504 | | | Flex, Ltd.# | | | 990,323 | | |
| | 11,281 | | | Freshworks Inc - Class A# | | | 202,381 | | |
| | 22,544 | | | HashiCorp Inc. - Class A# | | | 443,891 | | |
| | 20,136 | | | Intapp, Inc.#^ | | | 688,651 | | |
| | 20,133 | | | Intuit, Inc. | | | 9,964,828 | | |
| | 10,122 | | | Manhattan Associates, Inc.# | | | 1,973,588 | | |
| | 127,799 | | | Micron Technology, Inc. | | | 8,545,919 | | |
| | 372,690 | | | Microsoft Corp. | | | 126,010,216 | | |
| | 2,681 | | | MongoDB, Inc.# | | | 923,846 | | |
| | 147,980 | | | NVIDIA Corp.†† | | | 60,346,244 | | |
| | 11,552 | | | Onto Innovation, Inc.# | | | 1,298,098 | | |
| | 183,090 | | | Oracle Corp. | | | 18,931,506 | | |
| | 47,240 | | | Palo Alto Networks, Inc.# | | | 11,480,265 | | |
| | 69,290 | | | PTC, Inc.# | | | 9,729,702 | | |
| | 25,789 | | | Pure Storage, Inc. - Class A# | | | 871,926 | | |
| | 3,752 | | | Qorvo, Inc.# | | | 328,000 | | |
| | 1,751 | | | Qualys, Inc.# | | | 267,815 | | |
| | 32,295 | | | Samsara Inc. - Class A# | | | 745,046 | | |
| | 31,000 | | | ServiceNow, Inc.# | | | 18,037,350 | | |
| | 19,435 | | | Sprinklr, Inc. - Class A# | | | 264,122 | | |
| | 1,680 | | | SPS Commerce, Inc.# | | | 269,371 | | |
| | 9,134 | | | Super Micro Computer, Inc.# | | | 2,187,319 | | |
| | 140,500 | | | Taiwan Semiconductor Manufacturing
Company, Ltd. (ADR) | | | 12,126,555 | | |
| | 15,700 | | | Teradata Corp.# | | | 670,704 | | |
| | 1,427 | | | Tyler Technologies, Inc.# | | | 532,128 | | |
| | 40,758 | | | Vertex, Inc. - Class A#^ | | | 986,751 | | |
| | | | 461,222,352 | | |
| | | Materials (1.3%) | |
| | 14,284 | | | Carpenter Technology Corp. | | | 895,893 | | |
| | 38,200 | | | Linde, PLC | | | 14,598,512 | | |
| | | | 15,494,405 | | |
| | | TOTAL COMMON STOCKS
(Cost $755,030,724) | | | 1,158,440,301 | | |
NUMBER OF
CONTRACTS/
NOTIONAL
AMOUNT | | | | VALUE | |
PURCHASED OPTION (0.0%)# | | | |
| | | Information Technology (0.0%) | |
| | 360 | | | Advanced Micro Devices, Inc. | | | | | |
| | 3,546,000 | | | Put, 11/10/23, Strike $95.00
(Cost $102,650) | | | 102,420 | | |
See accompanying Notes to Schedule of Investments
CALAMOS OPEN-END FAMILY OF FUNDS ANNUAL REPORT
130
Growth Fund Schedule of Investments October 31, 2023
NUMBER OF
SHARES/
PRINCIPAL
AMOUNT | | | | VALUE | |
INVESTMENT OF CASH COLLATERAL FOR SECURITIES
LOANED (0.2%) | | | |
| | 1,717,018 | | | State Street Navigator Securities
Lending Government Money Market
Portfolio, 5.358%†***
(Cost $1,717,018) | | $ | 1,717,018 | | |
| | | TOTAL INVESTMENTS (96.9%)
(Cost $756,850,392) | | | 1,160,259,739 | | |
PAYABLE UPON RETURN OF SECURITIES ON LOAN (-0.1%) | | | (1,717,018 | ) | |
OTHER ASSETS, LESS LIABILITIES (3.2%) | | | 39,139,532 | | |
NET ASSETS (100.0%) | | $ | 1,197,682,253 | | |
NUMBER OF
CONTRACTS/
NOTIONAL
AMOUNT | | | | VALUE | |
WRITTEN OPTIONS (0.0%)# | | | |
| | | Information Technology (0.0%) | |
| | | | | Advanced Micro Devices, Inc. | | | | | |
| | 360 | | | | | | | | |
| | 3,546,000 | | | Put, 11/10/23, Strike $85.00 | | $ | (21,060 | ) | |
| | 360 | | | | | | | | |
| | 3,546,000 | | | Put, 12/01/23, Strike $85.00 | | | (51,660 | ) | |
| | | TOTAL WRITTEN OPTIONS
(Premium $69,698) | | $ | (72,720 | ) | |
NOTES TO SCHEDULE OF INVESTMENTS
# Non-income producing security.
~ Security, or portion of security, is segregated as collateral (or potential collateral for future transactions) for written options. The aggregate value of such securities is $39,459,620.
^ Security, or portion of security, is on loan.
†† Security or a portion of the security purchased on a delayed delivery or when-issued basis.
† Represents investment of cash collateral received from securities on loan as of October 31, 2023.
*** The rate disclosed is the 7 day net yield as of October 31, 2023.
Note: The date on options represents the expiration date of the option contract. The option contract may be exercised at any date on or before the date shown.
FUTURES CONTRACTS
NUMBER OF
CONTRACTS | | DESCRIPTION | | EXPIRATION
DATE | | NOTIONAL
VALUE | | MARKET VALUE/
UNREALIZED
APPRECIATION
(DEPRECIATION) | |
Sales | |
| | 36,000 | | | Chicago Board Options
Exchange VIX Futures | | Nov 2023 | | $ | 652,565 | | | $ | (96,363 | ) | |
| | 21,000 | | | Chicago Board Options
Exchange VIX Futures | | Dec 2023 | | | 390,613 | | | | (49,552 | ) | |
| | | | | | | | | $ | (145,915 | ) | |
See accompanying Notes to Schedule of Investments
www.calamos.com
131
Growth and Income Fund Schedule of Investments October 31, 2023
PRINCIPAL
AMOUNT | | | | VALUE | |
CONVERTIBLE BONDS (16.3%) | | | |
| | | Communication Services (1.4%) | |
| | 5,635,000 | | | Liberty Media Corp.*
3.750%, 03/15/28 | | | $6,209,939 | | |
| | 4,845,000 | | | 2.375%, 09/30/53 | | | 4,697,954 | | |
| | 7,315,000 | | | Liberty Media Corp. - Liberty
Formula One^
2.250%, 08/15/27 | | | 7,291,080 | | |
| | 13,805,000 | | | Live Nation Entertainment, Inc.
2.000%, 02/15/25 | | | 13,893,628 | | |
| | | | | | | | 32,092,601 | | |
| | | Consumer Discretionary (2.3%) | |
| | 7,640,000 | | | Booking Holdings, Inc.^
0.750%, 05/01/25 | | | 11,650,313 | | |
| | 4,760,000 | | | DISH Network Corp.
3.375%, 08/15/26 | | | 2,436,120 | | |
| | 9,310,000 | | | Ford Motor Company^
0.000%, 03/15/26 | | | 8,498,261 | | |
| | 7,235,000 | | | Marriott Vacations Worldwide Corp.
0.000%, 01/15/26 | | | 6,236,787 | | |
| | 4,375,000 | | | Rivian Automotive, Inc.*
4.625%, 03/15/29 | | | 4,612,038 | | |
| | 1,150,000 | | | Royal Caribbean Cruises, Ltd.
6.000%, 08/15/25 | | | 2,102,913 | | |
| | 325,000 | | | Tesla, Inc.
2.000%, 05/15/24 | | | 3,165,581 | | |
| | 4,600,000 | | | Vail Resorts, Inc.
0.000%, 01/01/26 | | | 4,027,484 | | |
| | 8,900,000 | | | Wynn Macau, Ltd.*
4.500%, 03/07/29 | | | 9,079,068 | | |
| | | | | | | | 51,808,565 | | |
| | | Energy (0.7%) | |
| | 1,490,000 | | | EQT Corp.
1.750%, 05/01/26 | | | 4,332,026 | | |
| | 5,835,000 | | | Nabors Industries, Inc.*
1.750%, 06/15/29 | | | 4,372,282 | | |
| | 5,425,000 | | | Northern Oil & Gas, Inc.
3.625%, 04/15/29 | | | 6,407,305 | | |
| | �� | | | | | | 15,111,613 | | |
| | | Financials (0.8%) | |
| | 3,950,000 | | | Ares Capital Corp.
4.625%, 03/01/24 | | | 3,984,681 | | |
| | 4,500,000 | EUR | | JPMorgan Chase Bank NA
0.000%, 06/10/24 | | | 4,792,401 | | |
| | 9,225,000 | | | Morgan Stanley Finance, LLC
1.000%, 11/23/27 | | | 9,352,305 | | |
| | | | | | | | 18,129,387 | | |
| | | Health Care (1.9%) | |
| | 7,225,000 | | | Alnylam Pharmaceuticals, Inc.
1.000%, 09/15/27 | | | 6,270,289 | | |
PRINCIPAL
AMOUNT | | | | VALUE | |
| | 10,810,000 | | | Dexcom, Inc.
0.250%, 11/15/25 | | | $10,261,609 | | |
| | 2,885,000 | | | Envista Holdings Corp.*^
1.750%, 08/15/28 | | | 2,496,217 | | |
| | 6,375,000 | | | Integer Holdings Corp.*
2.125%, 02/15/28 | | | 7,017,472 | | |
| | 6,205,000 | | | Jazz Investments I, Ltd.
2.000%, 06/15/26 | | | 6,299,502 | | |
| | 9,355,000 | | | Pacira BioSciences, Inc.
0.750%, 08/01/25 | | | 8,415,758 | | |
| | 2,305,000 | | | Shockwave Medical, Inc.*
1.000%, 08/15/28 | | | 2,234,951 | | |
| | | | | | | | 42,995,798 | | |
| | | Industrials (2.7%) | |
| | 4,790,000 | | | Advanced Energy Industries, Inc.*
2.500%, 09/15/28 | | | 4,427,397 | | |
| | 4,585,000 | | | Axon Enterprise, Inc.*^
0.500%, 12/15/27 | | | 4,946,344 | | |
| | 7,260,000 | | | Fluor Corp.*^
1.125%, 08/15/29 | | | 7,008,732 | | |
| | 4,570,000 | | | Granite Construction, Inc.*
3.750%, 05/15/28 | | | 4,927,328 | | |
| | 14,230,000 | | | John Bean Technologies Corp.^
0.250%, 05/15/26 | | | 12,805,719 | | |
| | 13,785,000 | | | Middleby Corp.
1.000%, 09/01/25 | | | 14,318,617 | | |
| | 4,365,000 | | | Southwest Airlines Company^
1.250%, 05/01/25 | | | 4,159,845 | | |
| | 8,330,000 | | | Tetra Tech, Inc.*
2.250%, 08/15/28 | | | 8,069,188 | | |
| | | | | | | | 60,663,170 | | |
| | | Information Technology (3.7%) | |
| | 8,405,000 | | | Akamai Technologies, Inc.
1.125%, 02/15/29* | | | 8,274,807 | | |
| | 3,400,000 | | | 0.375%, 09/01/27^ | | | 3,463,478 | | |
| | 3,860,000 | | | BILL Holdings, Inc.
0.000%, 12/01/25 | | | 3,668,776 | | |
| | 13,910,000 | | | CyberArk Software, Ltd.^
0.000%, 11/15/24 | | | 15,924,168 | | |
| | 4,990,000 | | | Enphase Energy, Inc.
0.000%, 03/01/28 | | | 3,702,231 | | |
| | 4,104,000 | | | 0.000%, 03/01/26^ | | | 3,500,014 | | |
| | 13,845,000 | | | ON Semiconductor Corp.*
0.500%, 03/01/29 | | | 12,171,693 | | |
| | 2,030,000 | | | Palo Alto Networks, Inc.
0.375%, 06/01/25 | | | 4,957,301 | | |
| | 4,840,000 | | | Rapid7, Inc.*
1.250%, 03/15/29 | | | 4,682,313 | | |
| | 7,645,000 | | | Seagate HDD Cayman*
3.500%, 06/01/28 | | | 7,930,464 | | |
| | 6,800,000 | | | SK Hynix, Inc.
1.750%, 04/11/30 | | | 8,227,728 | | |
See accompanying Notes to Schedule of Investments
CALAMOS OPEN-END FAMILY OF FUNDS ANNUAL REPORT
132
Growth and Income Fund Schedule of Investments October 31, 2023
PRINCIPAL
AMOUNT | | | | VALUE | |
| | 4,725,000 | | | Tyler Technologies, Inc.^
0.250%, 03/15/26 | | | $4,493,002 | | |
| | 4,820,000 | | | Workiva, Inc.*^
1.250%, 08/15/28 | | | 4,378,102 | | |
| | | | | | | | 85,374,077 | | |
| | | Materials (0.2%) | |
| | 4,800,000 | | | Glencore Funding, LLC
0.000%, 03/27/25 | | | 5,034,768 | | |
| | | Real Estate (1.1%) | |
| | 5,200,000 | EUR | | ANLLIAN Capital, Ltd.
0.000%, 02/05/25 | | | 5,895,964 | | |
| | 8,975,000 | | | Pebblebrook Hotel Trust
1.750%, 12/15/26 | | | 7,137,189 | | |
| | 11,425,000 | | | Welltower OP, LLC*
2.750%, 05/15/28 | | | 11,737,245 | | |
| | | | | | | | 24,770,398 | | |
| | | Utilities (1.5%) | |
| | 5,885,000 | | | Alliant Energy Corp.*
3.875%, 03/15/26 | | | 5,752,175 | | |
| | 13,340,000 | | | CMS Energy Corp.*
3.375%, 05/01/28 | | | 12,630,846 | | |
| | 16,315,000 | | | PPL Capital Funding, Inc.*
2.875%, 03/15/28 | | | 14,962,160 | | |
| | | | | | | | 33,345,181 | | |
| | | TOTAL CONVERTIBLE BONDS
(Cost $387,471,117) | | | 369,325,558 | | |
NUMBER OF
SHARES | | | | VALUE | |
CONVERTIBLE PREFERRED STOCKS (1.3%) | | | |
| | | Financials (0.7%) | |
| | 80,250 | | | AMG Capital Trust II
5.150%, 10/15/37 | | | 3,823,190 | | |
| | 242,245 | | | Apollo Global Management, Inc.
6.750%, 07/31/26 | | | 11,654,407 | | |
| | | | | | | | 15,477,597 | | |
| | | Industrials (0.1%) | |
| | 56,341 | | | Chart Industries, Inc.
6.750%, 12/15/25 | | | 2,769,724 | | |
| | | Utilities (0.5%) | |
| | 80,675 | | | CenterPoint Energy, Inc. (Warner
Media, LLC, Charter Communications
Time, Inc.)#§**
3.369%, 09/15/29 | | | 3,087,755 | | |
| | 215,000 | | | NextEra Energy, Inc.^
6.926%, 09/01/25 | | | 8,071,100 | | |
| | | | | | | | 11,158,855 | | |
| | | TOTAL CONVERTIBLE PREFERRED
STOCKS
(Cost $32,076,934) | | | 29,406,176 | | |
NUMBER OF
SHARES | | | | VALUE | |
COMMON STOCKS (73.1%) | | | |
| | | Communication Services (7.9%) | |
| | 756,405 | | | Alphabet, Inc. - Class A# | | $ | 93,854,732 | | |
| | 321,635 | | | Comcast Corp. - Class A | | | 13,280,309 | | |
| | 119,745 | | | Meta Platforms, Inc. - Class A# | | | 36,075,576 | | |
| | 27,710 | | | Netflix, Inc.# | | | 11,407,930 | | |
| | 108,795 | | | T-Mobile U.S., Inc.# | | | 15,651,249 | | |
| | 108,500 | | | Walt Disney Company# | | | 8,852,515 | | |
| | | | | | | | 179,122,311 | | |
| | | Consumer Discretionary (8.1%) | |
| | 589,450 | | | Amazon.com, Inc.# | | | 78,449,901 | | |
| | 131,714 | | | Aptiv, PLC# | | | 11,485,461 | | |
| | 50,445 | | | Home Depot, Inc. | | | 14,361,187 | | |
| | 238,925 | | | Las Vegas Sands Corp. | | | 11,339,381 | | |
| | 44,130 | | | Lowe's Companies, Inc. | | | 8,409,854 | | |
| | 47,685 | | | McDonald's Corp. | | | 12,501,576 | | |
| | 100,640 | | | NIKE, Inc. - Class B | | | 10,342,773 | | |
| | 91,035 | | | Starbucks Corp. | | | 8,397,068 | | |
| | 105,835 | | | Tesla, Inc.# | | | 21,255,901 | | |
| | 76,340 | | | TJX Cos., Inc. | | | 6,723,264 | | |
| | | | | | | | 183,266,366 | | |
| | | Consumer Staples (4.9%) | |
| | 267,985 | | | Coca-Cola Company | | | 15,138,473 | | |
| | 29,260 | | | Costco Wholesale Corp. | | | 16,164,394 | | |
| | 124,501 | | | Kenvue, Inc. | | | 2,315,719 | | |
| | 90,855 | | | Mondelez International, Inc. - Class A | | | 6,015,509 | | |
| | 121,700 | | | Monster Beverage Corp.# | | | 6,218,870 | | |
| | 72,640 | | | PepsiCo, Inc. | | | 11,860,659 | | |
| | 155,005 | | | Philip Morris International, Inc. | | | 13,820,246 | | |
| | 152,560 | | | Procter & Gamble Company | | | 22,888,577 | | |
| | 98,230 | | | Walmart, Inc. | | | 16,051,764 | | |
| | | | | | | | 110,474,211 | | |
| | | Energy (3.8%) | |
| | 110,650 | | | Chevron Corp. | | | 16,125,024 | | |
| | 82,820 | | | ConocoPhillips | | | 9,839,016 | | |
| | 238,365 | | | Exxon Mobil Corp. | | | 25,230,935 | | |
| | 60,150 | | | Hess Corp. | | | 8,685,660 | | |
| | 70,550 | | | Marathon Petroleum Corp.~ | | | 10,670,688 | | |
| | 25,285 | | | Pioneer Natural Resources Company | | | 6,043,115 | | |
| | 195,675 | | | Schlumberger, NV | | | 10,891,271 | | |
| | | | | | | | 87,485,709 | | |
| | | Financials (9.3%) | |
| | 39,170 | | | American Express Company | | | 5,719,995 | | |
| | 99,710 | | | American International Group, Inc. | | | 6,113,220 | | |
| | 43,888 | | | Assurant, Inc. | | | 6,534,923 | | |
| | 541,560 | | | Bank of America Corp. | | | 14,264,690 | | |
See accompanying Notes to Schedule of Investments
www.calamos.com
133
Growth and Income Fund Schedule of Investments October 31, 2023
NUMBER OF
SHARES | | | | VALUE | |
| | 9,110 | | | BlackRock, Inc. | | $ | 5,577,871 | | |
| | 76,160 | | | Chubb, Ltd. | | | 16,345,459 | | |
| | 58,455 | | | Citigroup, Inc. | | | 2,308,388 | | |
| | 21,995 | | | Goldman Sachs Group, Inc. | | | 6,677,902 | | |
| | 173,430 | | | JPMorgan Chase & Company | | | 24,117,176 | | |
| | 97,121 | | | KKR & Company, Inc. | | | 5,380,503 | | |
| | 97,830 | | | Marsh & McLennan Cos., Inc. | | | 18,553,460 | | |
| | 68,530 | | | Mastercard, Inc. - Class A | | | 25,791,266 | | |
| | 236,405 | | | Morgan Stanley | | | 16,742,202 | | |
| | 12,385 | | | S&P Global, Inc. | | | 4,326,204 | | |
| | 168,980 | | | Visa, Inc. - Class A^ | | | 39,727,198 | | |
| | 320,775 | | | Wells Fargo & Company~ | | | 12,757,222 | | |
| | | | | | | | 210,937,679 | | |
| | | Health Care (9.9%) | |
| | 66,215 | | | Abbott Laboratories | | | 6,260,628 | | |
| | 76,365 | | | AbbVie, Inc. | | | 10,781,211 | | |
| | 99,305 | | | Alcon, Inc.^ | | | 7,082,433 | | |
| | 278,393 | | | Boston Scientific Corp.# | | | 14,250,938 | | |
| | 102,455 | | | Bristol-Myers Squibb Company | | | 5,279,506 | | |
| | 36,535 | | | Danaher Corp. | | | 7,015,451 | | |
| | 28,435 | | | Dexcom, Inc.# | | | 2,525,881 | | |
| | 19,290 | | | Elevance Health, Inc. | | | 8,682,236 | | |
| | 42,885 | | | Eli Lilly & Company | | | 23,755,288 | | |
| | 8,905 | | | Humana, Inc. | | | 4,663,459 | | |
| | 161,825 | | | Johnson & Johnson | | | 24,005,120 | | |
| | 28,585 | | | McKesson Corp. | | | 13,016,466 | | |
| | 190,735 | | | Medtronic, PLC | | | 13,458,262 | | |
| | 179,870 | | | Merck & Company, Inc. | | | 18,472,649 | | |
| | 206,135 | | | Pfizer, Inc. | | | 6,299,486 | | |
| | 17,665 | | | Stryker Corp. | | | 4,773,436 | | |
| | 26,215 | | | Thermo Fisher Scientific, Inc. | | | 11,659,645 | | |
| | 62,660 | | | UnitedHealth Group, Inc. | | | 33,558,190 | | |
| | 90,405 | | | Zimmer Biomet Holdings, Inc. | | | 9,439,186 | | |
| | | | | | | | 224,979,471 | | |
| | | Industrials (4.5%) | |
| | 696,840 | | | CSX Corp. | | | 20,800,674 | | |
| | 120,840 | | | Honeywell International, Inc. | | | 22,145,138 | | |
| | 64,255 | | | JB Hunt Transport Services, Inc. | | | 11,043,507 | | |
| | 25,300 | | | Northrop Grumman Corp. | | | 11,927,179 | | |
| | 47,545 | | | Parker-Hannifin Corp. | | | 17,539,826 | | |
| | 218,185 | | | RTX Corp. | | | 17,758,077 | | |
| | | | | | | | 101,214,401 | | |
NUMBER OF
SHARES | | | | VALUE | |
| | | Information Technology (21.2%) | |
| | 57,015 | | | Accenture, PLC - Class A | | $ | 16,938,586 | | |
| | 18,515 | | | Adobe, Inc.# | | | 9,851,091 | | |
| | 55,395 | | | Advanced Micro Devices, Inc.# | | | 5,456,408 | | |
| | 938,700 | | | Apple, Inc. | | | 160,301,799 | | |
| | 29,104 | | | Broadcom, Inc. | | | 24,487,232 | | |
| | 185,485 | | | Cisco Systems, Inc. | | | 9,669,333 | | |
| | 8,450 | | | Intuit, Inc. | | | 4,182,328 | | |
| | 13,650 | | | Lam Research Corp. | | | 8,029,203 | | |
| | 78,250 | | | Micron Technology, Inc. | | | 5,232,578 | | |
| | 462,645 | | | Microsoft Corp.~ | | | 156,424,901 | | |
| | 129,020 | | | NVIDIA Corp.††† | | | 52,614,356 | | |
| | 66,560 | | | Oracle Corp. | | | 6,882,304 | | |
| | 49,060 | | | Salesforce, Inc.# | | | 9,852,720 | | |
| | 18,370 | | | ServiceNow, Inc.# | | | 10,688,584 | | |
| | | | | | | | 480,611,423 | | |
| | | Materials (2.3%) | |
| | 308,640 | | | Freeport-McMoRan, Inc. | | | 10,425,859 | | |
| | 63,970 | | | Linde, PLC | | | 24,446,775 | | |
| | 101,590 | | | PPG Industries, Inc. | | | 12,472,204 | | |
| | 29,320 | | | Vulcan Materials Company | | | 5,761,087 | | |
| | | | | | | | 53,105,925 | | |
| | | Real Estate (0.6%) | |
| | 60,195 | | | American Tower Corp. | | | 10,726,147 | | |
| | 117,530 | | | Invitation Homes, Inc. | | | 3,489,466 | | |
| | | | | | | | 14,215,613 | | |
| | | Utilities (0.6%) | |
| | 83,800 | | | CMS Energy Corp. | | | 4,553,692 | | |
| | 94,415 | | | DTE Energy Company | | | 9,099,718 | | |
| | 12,178 | | | Veralto Corp.# | | | 840,282 | | |
| | | | | | | | 14,493,692 | | |
| | | | | TOTAL COMMON STOCKS
(Cost $804,744,911) | | | 1,659,906,801 | | |
PRINCIPAL
AMOUNT | | | | VALUE | |
U.S. GOVERNMENT AND AGENCY SECURITIES (2.2%) | | | |
| | 25,160,000 | | | United States Treasury Note
4.375%, 10/31/24 | | | 24,898,080 | | |
| | 24,335,000 | | | 2.250%, 03/31/24^ | | | 24,018,455 | | |
| | | | | TOTAL U.S. GOVERNMENT
AND AGENCY SECURITIES
(Cost $49,436,611) | | | 48,916,535 | | |
See accompanying Notes to Schedule of Investments
CALAMOS OPEN-END FAMILY OF FUNDS ANNUAL REPORT
134
Growth and Income Fund Schedule of Investments October 31, 2023
NUMBER OF
CONTRACTS/
NOTIONAL
AMOUNT | | | | VALUE | |
PURCHASED OPTION (0.1%)# | | | |
| | | Other (0.1%) | |
| | 1,925 | | | SPDR S&P 500 ETF Trust | | | | | |
| | 80,503,500 | | | Put, 12/15/23, Strike $420.00
(Cost $2,025,305) | | $ | 1,932,700 | | |
NUMBER OF
SHARES/
PRINCIPAL
AMOUNT | | | | VALUE | |
INVESTMENT OF CASH COLLATERAL FOR SECURITIES
LOANED (2.3%) | | | |
| | 52,088,275 | | | State Street Navigator Securities
Lending Government Money Market
Portfolio, 5.358%†*** | | | 52,088,275 | | |
| | | | | TOTAL INVESTMENT OF CASH
COLLATERAL FOR SECURITIES
LOANED
(Cost $52,088,275) | | | 52,088,275 | | |
| | | TOTAL INVESTMENTS (95.3%)
(Cost $1,327,843,153) | | | 2,161,576,045 | | |
PAYABLE UPON RETURN OF SECURITIES ON LOAN (-2.3%) | | | (52,088,275 | ) | |
OTHER ASSETS, LESS LIABILITIES (7.0%) | | | 159,622,933 | | |
NET ASSETS (100.0%) | | $ | 2,269,110,703 | | |
NOTES TO SCHEDULE OF INVESTMENTS
* Securities issued and sold pursuant to a Rule 144A transaction are exempted from the registration requirement of the Securities Act of 1933, as amended. These securities may only be sold to qualified institutional buyers ("QIBs"), such as the Fund. Any resale of these securities must generally be effected through a sale that is registered under the Act or otherwise exempted from such registration requirements.
^ Security, or portion of security, is on loan.
# Non-income producing security.
§ Securities exchangeable or convertible into securities of one or more entities that are different than the issuer. Each entity is identified in the parenthetical.
** Step coupon security. Coupon changes periodically based upon a predetermined schedule. The rate shown is the rate in effect at October 31, 2023.
~ Security, or portion of security, is segregated as collateral (or collateral for potential future transactions) for written options. The aggregate value of such securities is $12,459,281.
†† Security or a portion of the security purchased on a delayed delivery or when-issued basis.
† Represents investment of cash collateral received from securities on loan as of October 31, 2023.
*** The rate disclosed is the 7 day net yield as of October 31, 2023.
FOREIGN CURRENCY ABBREVIATION
EUR European Monetary Unit
Note: Value for securities denominated in foreign currencies is shown in U.S. dollars. The principal amount for such securities is shown in the respective foreign currency. The date on options represents the expiration date of the option contract. The option contract may be exercised at any date on or before the date shown.
See accompanying Notes to Schedule of Investments
www.calamos.com
135
Dividend Growth Fund Schedule of Investments October 31, 2023
NUMBER OF
SHARES | | | | VALUE | |
COMMON STOCKS (98.0%) | | | |
| | | Communication Services (8.7%) | |
| | 5,315 | | | Alphabet, Inc. - Class C# | | $ | 665,970 | | |
| | 3,250 | | | Comcast Corp. - Class A | | | 134,193 | | |
| | 340 | | | Live Nation Entertainment, Inc.# | | | 27,207 | | |
| | 835 | | | Meta Platforms, Inc. - Class A# | | | 251,560 | | |
| | 185 | | | Netflix, Inc.# | | | 76,163 | | |
| | 755 | | | T-Mobile U.S., Inc.# | | | 108,614 | | |
| | 755 | | | Walt Disney Company# | | | 61,600 | | |
| | | | 1,325,307 | | |
| | | Consumer Discretionary (11.9%) | |
| | 3,920 | | | Amazon.com, Inc.# | | | 521,713 | | |
| | 780 | | | Aptiv, PLC# | | | 68,016 | | |
| | 44 | | | Booking Holdings, Inc.# | | | 122,741 | | |
| | 2,545 | | | Ford Motor Company | | | 24,814 | | |
| | 400 | | | Home Depot, Inc. | | | 113,876 | | |
| | 1,680 | | | Las Vegas Sands Corp. | | | 79,733 | | |
| | 545 | | | Lowe's Companies, Inc. | | | 103,861 | | |
| | 625 | | | McDonald's Corp. | | | 163,856 | | |
| | 1,550 | | | MGM Resorts International# | | | 54,126 | | |
| | 1,235 | | | NIKE, Inc. - Class B | | | 126,921 | | |
| | 160 | | | Royal Caribbean Cruises, Ltd.# | | | 13,557 | | |
| | 1,305 | | | Starbucks Corp. | | | 120,373 | | |
| | 940 | | | Tesla, Inc.# | | | 188,789 | | |
| | 1,190 | | | TJX Cos., Inc. | | | 104,803 | | |
| | | | 1,807,179 | | |
| | | Consumer Staples (6.3%) | |
| | 2,085 | | | Coca-Cola Company | | | 117,782 | | |
| | 305 | | | Costco Wholesale Corp. | | | 168,494 | | |
| | 820 | | | Kenvue, Inc. | | | 15,252 | | |
| | 630 | | | Mondelez International, Inc. - Class A | | | 41,712 | | |
| | 1,270 | | | Monster Beverage Corp.# | | | 64,897 | | |
| | 680 | | | PepsiCo, Inc. | | | 111,030 | | |
| | 1,350 | | | Philip Morris International, Inc. | | | 120,366 | | |
| | 1,060 | | | Procter & Gamble Company | | | 159,032 | | |
| | 965 | | | Walmart, Inc. | | | 157,691 | | |
| | | | 956,256 | | |
| | | Energy (5.1%) | |
| | 795 | | | Chevron Corp. | | | 115,855 | | |
| | 850 | | | ConocoPhillips | | | 100,980 | | |
| | 2,100 | | | Exxon Mobil Corp. | | | 222,285 | | |
| | 515 | | | Hess Corp. | | | 74,366 | | |
| | 880 | | | Marathon Petroleum Corp. | | | 133,100 | | |
| | 180 | | | Pioneer Natural Resources Company | | | 43,020 | | |
| | 1,645 | | | Schlumberger, NV | | | 91,561 | | |
| | | | 781,167 | | |
NUMBER OF
SHARES | | | | VALUE | |
| | | Financials (13.2%) | |
| | 600 | | | American Express Company | | $ | 87,618 | | |
| | 355 | | | American International Group, Inc. | | | 21,765 | | |
| | 460 | | | Assurant, Inc.^ | | | 68,494 | | |
| | 6,015 | | | Bank of America Corp. | | | 158,435 | | |
| | 440 | | | Berkshire Hathaway, Inc. - Class B# | | | 150,185 | | |
| | 60 | | | BlackRock, Inc. | | | 36,737 | | |
| | 745 | | | Chubb, Ltd. | | | 159,892 | | |
| | 670 | | | Citigroup, Inc. | | | 26,458 | | |
| | 235 | | | Goldman Sachs Group, Inc. | | | 71,348 | | |
| | 1,785 | | | JPMorgan Chase & Company | | | 248,222 | | |
| | 570 | | | Marsh & McLennan Cos., Inc. | | | 108,101 | | |
| | 640 | | | Mastercard, Inc. - Class A | | | 240,864 | | |
| | 1,765 | | | Morgan Stanley | | | 124,997 | | |
| | 130 | | | PNC Financial Services Group, Inc. | | | 14,881 | | |
| | 255 | | | S&P Global, Inc. | | | 89,074 | | |
| | 1,100 | | | Visa, Inc. - Class A^ | | | 258,610 | | |
| | 3,715 | | | Wells Fargo & Company | | | 147,746 | | |
| | | | 2,013,427 | | |
| | | Health Care (13.1%) | |
| | 915 | | | Abbott Laboratories | | | 86,513 | | |
| | 840 | | | AbbVie, Inc. | | | 118,591 | | |
| | 660 | | | Alcon, Inc.^ | | | 47,071 | | |
| | 1,815 | | | Boston Scientific Corp.# | | | 92,910 | | |
| | 920 | | | Bristol-Myers Squibb Company | | | 47,408 | | |
| | 305 | | | Danaher Corp. | | | 58,566 | | |
| | 535 | | | Dexcom, Inc.# | | | 47,524 | | |
| | 165 | | | Elevance Health, Inc. | | | 74,265 | | |
| | 480 | | | Eli Lilly & Company | | | 265,886 | | |
| | 60 | | | Humana, Inc. | | | 31,421 | | |
| | 1,195 | | | Johnson & Johnson | | | 177,266 | | |
| | 200 | | | McKesson Corp. | | | 91,072 | | |
| | 1,295 | | | Medtronic, PLC | | | 91,375 | | |
| | 2,000 | | | Merck & Company, Inc. | | | 205,400 | | |
| | 1,660 | | | Pfizer, Inc. | | | 50,730 | | |
| | 215 | | | Stryker Corp. | | | 58,097 | | |
| | 215 | | | Thermo Fisher Scientific, Inc. | | | 95,626 | | |
| | 485 | | | UnitedHealth Group, Inc. | | | 259,747 | | |
| | 865 | | | Zimmer Biomet Holdings, Inc. | | | 90,315 | | |
| | | | 1,989,783 | | |
| | | Industrials (5.7%) | |
| | 5,535 | | | CSX Corp. | | | 165,220 | | |
| | 775 | | | Fortive Corp. | | | 50,592 | | |
| | 1,015 | | | Honeywell International, Inc. | | | 186,009 | | |
| | 445 | | | JB Hunt Transport Services, Inc. | | | 76,482 | | |
| | 190 | | | Northrop Grumman Corp. | | | 89,572 | | |
See accompanying Notes to Schedule of Investments
CALAMOS OPEN-END FAMILY OF FUNDS ANNUAL REPORT
136
Dividend Growth Fund Schedule of Investments October 31, 2023
NUMBER OF
SHARES | | | | VALUE | |
| | 445 | | | Parker-Hannifin Corp. | | $ | 164,165 | | |
| | 1,460 | | | RTX Corp. | | | 118,829 | | |
| | 935 | | | Southwest Airlines Company | | | 20,785 | | |
| | | | 871,654 | | |
| | | Information Technology (28.3%) | |
| | 580 | | | Accenture, PLC - Class A | | | 172,312 | | |
| | 105 | | | Adobe, Inc.# | | | 55,866 | | |
| | 380 | | | Advanced Micro Devices, Inc.# | | | 37,430 | | |
| | 7,185 | | | Apple, Inc. | | | 1,226,982 | | |
| | 460 | | | Applied Materials, Inc. | | | 60,881 | | |
| | 270 | | | Broadcom, Inc. | | | 227,170 | | |
| | 1,925 | | | Cisco Systems, Inc. | | | 100,350 | | |
| | 350 | | | Intuit, Inc. | | | 173,233 | | |
| | 95 | | | Lam Research Corp. | | | 55,881 | | |
| | 815 | | | Microchip Technology, Inc. | | | 58,101 | | |
| | 425 | | | Micron Technology, Inc. | | | 28,420 | | |
| | 3,660 | | | Microsoft Corp. | | | 1,237,483 | | |
| | 1,075 | | | NVIDIA Corp. | | | 438,385 | | |
| | 1,580 | | | Oracle Corp. | | | 163,372 | | |
| | 255 | | | Palo Alto Networks, Inc.# | | | 61,970 | | |
| | 345 | | | Salesforce, Inc.# | | | 69,286 | | |
| | 160 | | | ServiceNow, Inc.# | | | 93,096 | | |
| | 400 | | | Texas Instruments, Inc. | | | 56,804 | | |
| | | | 4,317,022 | | |
| | | Materials (2.7%) | |
| | 2,075 | | | Freeport-McMoRan, Inc. | | | 70,093 | | |
| | 430 | | | Linde, PLC | | | 164,329 | | |
| | 675 | | | PPG Industries, Inc. | | | 82,870 | | |
| | 75 | | | Sherwin-Williams Company | | | 17,866 | | |
| | 400 | | | Vulcan Materials Company | | | 78,596 | | |
| | | | 413,754 | | |
| | | Real Estate (0.9%) | |
| | 280 | | | American Tower Corp. | | | 49,893 | | |
| | 970 | | | Welltower, Inc. | | | 81,102 | | |
| | | | 130,995 | | |
| | | Utilities (2.1%) | |
| | 465 | | | Alliant Energy Corp. | | | 22,687 | | |
| | 1,685 | | | CMS Energy Corp. | | | 91,563 | | |
| | 630 | | | DTE Energy Company | | | 60,719 | | |
| | 800 | | | NextEra Energy, Inc. | | | 46,640 | | |
| | 3,970 | | | PPL Corp. | | | 97,543 | | |
| | 100 | | | Veralto Corp.# | | | 6,900 | | |
| | | | 326,052 | | |
| | | TOTAL COMMON STOCKS
(Cost $9,201,051) | | | 14,932,596 | | |
NUMBER OF
SHARES | | | | VALUE | |
EXCHANGE-TRADED FUND (0.7%) | |
| | | Other (0.7%) | |
| | 1,040 | | | Vanguard Communication Services ETF
(Cost $92,908) | | $ | 107,661 | | |
NUMBER OF
SHARES/
PRINCIPAL
AMOUNT | | | | VALUE | |
INVESTMENT OF CASH COLLATERAL FOR SECURITIES
LOANED (0.5%) | |
| | 66,806 | | | State Street Navigator Securities
Lending Government Money
Market Portfolio, 5.358%†***
(Cost $66,806) | | | 66,806 | | |
| | | TOTAL INVESTMENTS (99.2%)
(Cost $9,360,765) | | | 15,107,063 | | |
PAYABLE UPON RETURN OF SECURITIES ON LOAN (-0.4%) | | | (66,806 | ) | |
OTHER ASSETS, LESS LIABILITIES (1.2%) | | | 191,426 | | |
NET ASSETS (100.0%) | | $ | 15,231,683 | | |
NOTES TO SCHEDULE OF INVESTMENTS
# Non-income producing security.
^ Security, or portion of security, is on loan.
† Represents investment of cash collateral received from securities on loan as of October 31, 2023.
*** The rate disclosed is the 7 day net yield as of October 31, 2023.
See accompanying Notes to Schedule of Investments
www.calamos.com
137
Select Fund Schedule of Investments October 31, 2023
NUMBER OF
SHARES | | | | VALUE | |
COMMON STOCKS (96.8%) | | | |
| | | Communication Services (8.2%) | |
| | 19,929 | | | Alphabet, Inc. - Class A# | | $ | 2,472,790 | | |
| | 1,090 | | | Netflix, Inc.# | | | 448,742 | | |
| | 4,486 | | | T-Mobile U.S., Inc.# | | | 645,356 | | |
| | | | 3,566,888 | | |
| | | Consumer Discretionary (12.1%) | |
| | 17,988 | | | Amazon.com, Inc.# | | | 2,394,023 | | |
| | 5,810 | | | Aptiv, PLC# | | | 506,632 | | |
| | 2,521 | | | Home Depot, Inc. | | | 717,703 | | |
| | 1,150 | | | Lululemon Athletica, Inc.# | | | 452,502 | | |
| | 4,616 | | | NIKE, Inc. - Class B | | | 474,386 | | |
| | 7,894 | | | TJX Cos., Inc. | | | 695,225 | | |
| | | | 5,240,471 | | |
| | | Consumer Staples (6.5%) | |
| | 2,670 | | | Constellation Brands, Inc. - Class A | | | 625,181 | | |
| | 4,141 | | | Dollar Tree, Inc.# | | | 460,024 | | |
| | 10,482 | | | Mondelez International, Inc. - Class A | | | 694,013 | | |
| | 6,427 | | | Walmart, Inc. | | | 1,050,236 | | |
| | | | 2,829,454 | | |
| | | Energy (3.1%) | |
| | 2,840 | | | Chevron Corp. | | | 413,873 | | |
| | 3,192 | | | Hess Corp. | | | 460,925 | | |
| | 7,340 | | | Occidental Petroleum Corp. | | | 453,686 | | |
| | | | 1,328,484 | | |
| | | Financials (11.6%) | |
| | 4,486 | | | American Express Company | | | 655,091 | | |
| | 3,639 | | | Chubb, Ltd. | | | 781,002 | | |
| | 4,012 | | | Marsh & McLennan Cos., Inc. | | | 760,876 | | |
| | 7,500 | | | Morgan Stanley | | | 531,150 | | |
| | 1,245 | | | S&P Global, Inc. | | | 434,891 | | |
| | 4,659 | | | Visa, Inc. - Class A^ | | | 1,095,331 | | |
| | 19,200 | | | Wells Fargo & Company | | | 763,584 | | |
| | | | 5,021,925 | | |
| | | Health Care (15.0%) | |
| | 10,612 | | | Boston Scientific Corp.# | | | 543,228 | | |
| | 3,010 | | | Danaher Corp. | | | 577,980 | | |
| | 5,880 | | | Dexcom, Inc.# | | | 522,320 | | |
| | 1,960 | | | Eli Lilly & Company | | | 1,085,703 | | |
| | 2,631 | | | IQVIA Holdings, Inc.# | | | 475,764 | | |
| | 8,862 | | | Merck & Company, Inc. | | | 910,128 | | |
| | 2,329 | | | UnitedHealth Group, Inc. | | | 1,247,319 | | |
| | 4,800 | | | Zimmer Biomet Holdings, Inc. | | | 501,168 | | |
| | 4,055 | | | Zoetis, Inc. | | | 636,635 | | |
| | | | 6,500,245 | | |
NUMBER OF
SHARES | | | | VALUE | |
| | | Industrials (8.9%) | |
| | 3,544 | | | Boeing Company# | | $ | 662,090 | | |
| | 26,531 | | | CSX Corp. | | | 791,950 | | |
| | 13,750 | | | Delta Air Lines, Inc. | | | 429,688 | | |
| | 3,400 | | | Honeywell International, Inc. | | | 623,084 | | |
| | 15,400 | | | Uber Technologies, Inc.# | | | 666,512 | | |
| | 4,222 | | | Waste Management, Inc. | | | 693,801 | | |
| | | | 3,867,125 | | |
| | | Information Technology (27.6%) | |
| | 6,910 | | | Advanced Micro Devices, Inc.# | | | 680,635 | | |
| | 2,416 | | | Analog Devices, Inc. | | | 380,109 | | |
| | 18,204 | | | Apple, Inc. | | | 3,108,697 | | |
| | 940 | | | Broadcom, Inc. | | | 790,888 | | |
| | 1,430 | | | Intuit, Inc. | | | 707,778 | | |
| | 9,145 | | | Microsoft Corp. | | | 3,092,016 | | |
| | 4,042 | | | NVIDIA Corp.†† | | | 1,648,328 | | |
| | 7,486 | | | Oracle Corp. | | | 774,052 | | |
| | 1,295 | | | ServiceNow, Inc.# | | | 753,496 | | |
| | | | 11,935,999 | | |
| | | Materials (1.8%) | |
| | 2,071 | | | Linde, PLC | | | 791,453 | | |
| | | Utilities (2.0%) | |
| | 12,500 | | | Southern Company | | | 841,250 | | |
| | | TOTAL COMMON STOCKS
(Cost $30,780,978) | | | 41,923,294 | | |
| | | TOTAL INVESTMENTS (96.8%)
(Cost $30,780,978) | | | 41,923,294 | | |
OTHER ASSETS, LESS LIABILITIES (3.2%) | | | 1,392,840 | | |
NET ASSETS (100.0%) | | $ | 43,316,134 | | |
NOTES TO SCHEDULE OF INVESTMENTS
# Non-income producing security.
^ Security, or portion of security, is on loan.
†† Security or a portion of the security purchased on a delayed delivery or when-issued basis.
See accompanying Notes to Schedule of Investments
CALAMOS OPEN-END FAMILY OF FUNDS ANNUAL REPORT
138
International Growth Fund Schedule of Investments October 31, 2023
NUMBER OF
SHARES | | | | VALUE | |
COMMON STOCKS (97.7%) | | | |
| | | Consumer Discretionary (17.9%) | |
| | 174,200 | HKD | | Alibaba Group Holding, Ltd.# | | $ | 1,793,402 | | |
| | 56,500 | AUD | | Aristocrat Leisure, Ltd. | | | 1,388,775 | | |
| | 26,900 | INR | | Dixon Technologies India, Ltd. | | | 1,651,060 | | |
| | 9,450 | EUR | | Ferrari, NV | | | 2,860,552 | | |
| | 795 | EUR | | Hermes International | | | 1,483,331 | | |
| | 457,600 | INR | | Kalyan Jewellers India, Ltd. | | | 1,590,110 | | |
| | 68,840 | | | Li Auto, Inc. (ADR)#^ | | | 2,327,480 | | |
| | 90,800 | INR | | Mahindra & Mahindra, Ltd. | | | 1,597,186 | | |
| | 70,524 | | | MakeMyTrip, Ltd.# | | | 2,731,394 | | |
| | 2,456 | | | MercadoLibre, Inc.# | | | 3,047,257 | | |
| | 31,600 | JPY | | Oriental Land Company, Ltd. | | | 1,022,113 | | |
| | 14,500 | DKK | | Pandora, A/S | | | 1,644,597 | | |
| | 64,995 | EUR | | Prosus, NV | | | 1,817,624 | | |
| | 466,400 | HKD | | Sands China, Ltd.# | | | 1,255,572 | | |
| | 36,700 | JPY | | Sony Group Corp. | | | 3,051,196 | | |
| | 83,100 | JPY | | Toyota Boshoku Corp. | | | 1,445,185 | | |
| | 136,600 | JPY | | Toyota Motor Corp. | | | 2,389,645 | | |
| | 712,900 | INR | | Zomato, Ltd.# | | | 898,690 | | |
| | | | 33,995,169 | | |
| | | Consumer Staples (2.3%) | |
| | 783,600 | CHF | | Aryzta, AG# | | | 1,436,188 | | |
| | 3,540 | EUR | | L'Oreal, SA | | | 1,487,970 | | |
| | 68,200 | JPY | | Yamazaki Baking Company, Ltd. | | | 1,442,065 | | |
| | | | 4,366,223 | | |
| | | Energy (7.7%) | |
| | 101,600 | CAD | | ARC Resources, Ltd.^ | | | 1,634,538 | | |
| | 408,400 | GBP | | BP, PLC | | | 2,493,696 | | |
| | 59,455 | CAD | | Canadian Natural Resources, Ltd. | | | 3,775,452 | | |
| | 110,200 | JPY | | Inpex Corp. | | | 1,599,097 | | |
| | 1,261,590 | EUR | | Saipem S.p.A# | | | 1,922,444 | | |
| | 148,100 | | | TechnipFMC, PLC | | | 3,187,112 | | |
| | | | 14,612,339 | | |
| | | Financials (10.8%) | |
| | 215,000 | HKD | | AIA Group, Ltd. | | | 1,867,018 | | |
| | 5,000 | | | Aon, PLC - Class A | | | 1,547,000 | | |
| | 7,561,200 | IDR | | Bank Mandiri Persero, Tbk PT | | | 2,701,254 | | |
| | 457,200 | CNY | | CITIC Securities Company, Ltd. - Class A | | | 1,357,128 | | |
| | 76,200 | INR | | HDFC Bank, Ltd. | | | 1,350,760 | | |
| | 313,000 | GBP | | HSBC Holdings, PLC | | | 2,259,990 | | |
| | 85,800 | | | ICICI Bank, Ltd. (ADR) | | | 1,903,902 | | |
| | 97,300 | JPY | | Japan Exchange Group, Inc. | | | 1,924,087 | | |
| | 24,950 | GBP | | London Stock Exchange Group, PLC | | | 2,517,331 | | |
NUMBER OF
SHARES | | | | VALUE | |
| | 144,000 | | | Sumitomo Mitsui Financial Group,
Inc. (ADR) | | $ | 1,392,480 | | |
| | 63,500 | EUR | | UniCredit, S.p.A. | | | 1,591,920 | | |
| | | | 20,412,870 | | |
| | | Health Care (12.3%) | |
| | 38,530 | GBP | | AstraZeneca, PLC | | | 4,824,095 | | |
| | 51,700 | EUR | | Gerresheimer, AG | | | 4,822,225 | | |
| | 123,036 | DKK | | Novo Nordisk, A/S - Class B | | | 11,870,047 | | |
| | 289,000 | HKD | | Wuxi Biologics Cayman, Inc.#* | | | 1,796,926 | | |
| | | | 23,313,293 | | |
| | | Industrials (21.0%) | |
| | 25,704 | GBP | | Ashtead Technology Holdings, PLC^ | | | 150,248 | | |
| | 25,550 | CAD | | Canadian Pacific Kansas City, Ltd. | | | 1,814,064 | | |
| | 59,000 | JPY | | Central Japan Railway Company | | | 1,327,995 | | |
| | 22,100 | EUR | | DO & CO, AG | | | 2,581,595 | | |
| | 125,640 | INR | | Hindustan Aeronautics, Ltd. | | | 2,752,540 | | |
| | 64,000 | JPY | | Hitachi, Ltd. | | | 4,056,741 | | |
| | 256,600 | JPY | | INFRONEER Holdings, Inc. | | | 2,706,837 | | |
| | 62,900 | JPY | | Komatsu, Ltd. | | | 1,445,215 | | |
| | 339,900 | GBP | | Melrose Industries, PLC | | | 1,935,313 | | |
| | 261,001 | SEK | | Munters Group, AB*~ | | | 3,186,485 | | |
| | 41,400 | EUR | | Prysmian S.p.A | | | 1,550,306 | | |
| | 2,433,200 | GBP | | Rolls-Royce Holdings, PLC# | | | 6,404,726 | | |
| | 12,025 | EUR | | Schneider Electric, SE | | | 1,850,134 | | |
| | 34,200 | INR | | Siemens, Ltd. | | | 1,372,479 | | |
| | 45,700 | CAD | | Stantec, Inc.^ | | | 2,796,211 | | |
| | 17,650 | EUR | | Thales, SA | | | 2,604,744 | | |
| | 730,000 | CNY | | Weichai Power Company, Ltd. - Class A | | | 1,387,350 | | |
| | | | 39,922,983 | | |
| | | Information Technology (21.3%) | |
| | 96,800 | TWD | | Accton Technology Corp. | | | 1,499,844 | | |
| | 184,000 | JPY | | Advantest Corp. | | | 4,739,586 | | |
| | 34,100 | TWD | | Alchip Technologies, Ltd. | | | 2,796,759 | | |
| | 8,425 | EUR | | ASML Holding, NV | | | 5,064,440 | | |
| | 1,260 | CAD | | Constellation Software, Inc.^ | | | 2,525,915 | | |
| | 8,300 | | | Fabrinet# | | | 1,286,500 | | |
| | 9,800 | JPY | | Keyence Corp. | | | 3,793,761 | | |
| | 131,780 | INR | | KPIT Technologies, Ltd. | | | 1,939,672 | | |
| | 8,800 | JPY | | Lasertec Corp. | | | 1,453,586 | | |
| | 28,460 | EUR | | SAP, SE | | | 3,817,406 | | |
| | 8,500 | JPY | | SHIFT, Inc.#^ | | | 1,542,236 | | |
| | 59,900 | CAD | | Shopify, Inc. - Class A# | | | 2,828,809 | | |
| | 26,450 | KRW | | SK Hynix, Inc. | | | 2,296,973 | | |
| | 291,000 | TWD | | Taiwan Semiconductor Manufacturing
Company, Ltd. | | | 4,752,759 | | |
| | | | 40,338,246 | | |
See accompanying Notes to Schedule of Investments
www.calamos.com
139
International Growth Fund Schedule of Investments October 31, 2023
NUMBER OF
SHARES | | | | VALUE | |
| | | Materials (2.3%) | |
| | 268,200 | GBP | | Glencore, PLC | | $ | 1,420,608 | | |
| | 7,795 | | | Linde, PLC | | | 2,978,937 | | |
| | | | 4,399,545 | | |
| | | Real Estate (2.1%) | |
| | 788,800 | MXN | | Corp. Inmobiliaria Vesta SAB de CV^ | | | 2,473,723 | | |
| | 152,700 | INR | | Macrotech Developers, Ltd.* | | | 1,442,474 | | |
| | | | 3,916,197 | | |
| | | TOTAL COMMON STOCKS
(Cost $166,586,158) | | | 185,276,865 | | |
WARRANTS (0.0%)# | | | |
| | | Information Technology (0.0%) | |
| | 1,260 | | | Constellation Software, Inc.^
03/31/40, Strike $1.00
(Cost $—) | | | — | | |
NUMBER OF
CONTRACTS/
NOTIONAL
AMOUNT | | | | VALUE | |
PURCHASED OPTIONS (0.2%)# | | | |
| | | Communication Services (0.0%) | |
| | 290 | | | Baidu, Inc. | | | | | |
| | 3,045,000 | | | Call, 11/17/23, Strike $150.00 | | | 1,015 | | |
| | | Consumer Discretionary (0.1%) | |
| | 500 | | | Alibaba Group Holding, Ltd. | | | | | |
| | 4,127,000 | | | Call, 11/17/23, Strike $90.00 | | | 34,250 | | |
| | 353 | | | PDD Holdings, Inc. | | | | | |
| | 3,580,126 | | | Call, 01/19/24, Strike $120.00 | | | 141,200 | | |
| | | | 175,450 | | |
| | | Other (0.1%) | |
| | 2,235 | | | iShares MSCI India ETF | | | | | |
| | 9,664,140 | | | Put, 12/15/23, Strike $44.00 | | | 245,850 | | |
| | | TOTAL PURCHASED OPTIONS
(Cost $1,290,565) | | | 422,315 | | |
NUMBER OF
SHARES/
PRINCIPAL
AMOUNT | | | | VALUE | |
INVESTMENT OF CASH COLLATERAL FOR SECURITIES
LOANED (2.7%) | | | |
| | 5,053,942 | | | State Street Navigator Securities
Lending Government Money
Market Portfolio, 5.358%†***
(Cost $5,053,942) | | | 5,053,942 | | |
| | | TOTAL INVESTMENTS (100.6%)
(Cost $172,930,665) | | | 190,753,122 | | |
PAYABLE UPON RETURN OF SECURITIES ON LOAN (-2.7%) | | | (5,053,942 | ) | |
OTHER ASSETS, LESS LIABILITIES (2.1%) | | | 3,882,133 | | |
NET ASSETS (100.0%) | | $ | 189,581,313 | | |
FORWARD FOREIGN CURRENCY CONTRACTS
COUNTERPARTY | | LONG
CONTRACTS | | SETTLEMENT
DATE | | LOCAL
CURRENCY | | CURRENT
VALUE | | UNREALIZED
GAIN/LOSS | |
State Street Bank and
Trust | | Swiss Franc | | 12/29/23 | | | 4,550,000 | | | $ | 5,034,701 | | | $ | (2,268 | ) | |
State Street Bank and
Trust | | Brazilian Real | | 12/29/23 | | | 14,335,000 | | | | 2,825,108 | | | | (25,472 | ) | |
State Street Bank and
Trust | | Swiss Franc | | 12/29/23 | | | 2,300,000 | | | | 2,545,014 | | | | (1,146 | ) | |
State Street Bank and
Trust | | Brazilian Real | | 12/29/23 | | | 6,760,000 | | | | 1,332,245 | | | | (12,012 | ) | |
| | | $ | (40,898 | ) | |
NOTES TO SCHEDULE OF INVESTMENTS
# Non-income producing security.
^ Security, or portion of security, is on loan.
* Securities issued and sold pursuant to a Rule 144A transaction are exempted from the registration requirement of the Securities Act of 1933, as amended. These securities may only be sold to qualified institutional buyers ("QIBs"), such as the Fund. Any resale of these securities must generally be effected through a sale that is registered under the Act or otherwise exempted from such registration requirements.
~ Security, or portion of security, is segregated as collateral (or collateral for potential future transactions) for written options. The aggregate value of such securities is $1,220,871.
† Represents investment of cash collateral received from securities on loan as of October 31, 2023.
*** The rate disclosed is the 7 day net yield as of October 31, 2023.
FOREIGN CURRENCY ABBREVIATIONS
AUD Australian Dollar
CAD Canadian Dollar
CHF Swiss Franc
CNY Chinese Yuan Renminbi
DKK Danish Krone
EUR European Monetary Unit
GBP British Pound Sterling
HKD Hong Kong Dollar
IDR Indonesian Rupiah
INR Indian Rupee
JPY Japanese Yen
KRW South Korean Won
MXN Mexican Peso
SEK Swedish Krona
TWD New Taiwan Dollar
Note: Value for securities denominated in foreign currencies is shown in U.S. dollars. The date on options represents the expiration date of the option contract. The option contract may be exercised at any date on or before the date shown.
See accompanying Notes to Schedule of Investments
CALAMOS OPEN-END FAMILY OF FUNDS ANNUAL REPORT
140
International Growth Fund Schedule of Investments October 31, 2023
CURRENCY EXPOSURE
OCTOBER 31, 2023
| | | VALUE | | % OF TOTAL
INVESTMENTS | |
Japanese Yen | | $ | 33,939,345 | | | | 17.8 | % | |
European Monetary Unit | | | 33,454,691 | | | | 17.5 | % | |
US Dollar | | | 25,878,319 | | | | 13.6 | % | |
British Pound Sterling | | | 22,006,007 | | | | 11.5 | % | |
Canadian Dollar | | | 15,374,989 | | | | 8.1 | % | |
Indian Rupee | | | 14,594,971 | | | | 7.7 | % | |
Danish Krone | | | 13,514,644 | | | | 7.1 | % | |
New Taiwan Dollar | | | 9,049,362 | | | | 4.7 | % | |
Hong Kong Dollar | | | 6,712,918 | | | | 3.5 | % | |
Swedish Krona | | | 3,186,485 | | | | 1.7 | % | |
Chinese Yuan Renminbi | | | 2,744,478 | | | | 1.4 | % | |
Indonesian Rupiah | | | 2,701,254 | | | | 1.4 | % | |
Mexican Peso | | | 2,473,723 | | | | 1.3 | % | |
South Korean Won | | | 2,296,973 | | | | 1.2 | % | |
Swiss Franc | | | 1,436,188 | | | | 0.8 | % | |
Australian Dollar | | | 1,388,775 | | | | 0.7 | % | |
Total Investments | | $ | 190,753,122 | | | | 100.0 | % | |
Currency exposure may vary over time.
See accompanying Notes to Schedule of Investments
www.calamos.com
141
Evolving World Growth Fund Schedule of Investments October 31, 2023
PRINCIPAL
AMOUNT | | | | VALUE | |
CONVERTIBLE BONDS (18.3%) | | | |
| | | Consumer Discretionary (8.1%) | |
| | 6,857,000 | | | Li Auto, Inc.
0.250%, 05/01/28 | | $ | 9,313,589 | | |
| | 11,077,000 | | | MakeMyTrip, Ltd.
0.000%, 02/15/28 | | | 12,616,481 | | |
| | 7,308,000 | | | Wynn Macau, Ltd.*
4.500%, 03/07/29 | | | 7,455,037 | | |
| | | | 29,385,107 | | |
| | | Energy (2.0%) | |
| | 3,400,000 | EUR | | Eni S.p.A
2.950%, 09/14/30 | | | 3,677,694 | | |
| | 3,300,000 | EUR | | Saipem S.p.A
2.875%, 09/11/29 | | | 3,578,396 | | |
| | | | 7,256,090 | | |
| | | Information Technology (6.6%) | |
| | 32,000,000 | HKD | | Kingsoft Corp, Ltd.
0.625%, 04/29/25 | | | 4,232,412 | | |
| | 16,400,000 | | | SK Hynix, Inc.
1.750%, 04/11/30 | | | 19,843,344 | | |
| | | | 24,075,756 | | |
| | | Real Estate (1.6%) | |
| | 5,000,000 | EUR | | ANLLIAN Capital, Ltd.
0.000%, 02/05/25 | | | 5,669,196 | | |
| | | | | TOTAL CONVERTIBLE BONDS
(Cost $65,202,669) | | | 66,386,149 | | |
NUMBER OF
SHARES | | | | VALUE | |
COMMON STOCKS (80.1%) | | | |
| | | Communication Services (5.6%) | |
| | 259,750 | HKD | | Baidu, Inc. - Class A# | | | 3,410,206 | | |
| | 26,670 | | | NetEase, Inc. (ADR) | | | 2,851,556 | | |
| | 375,300 | HKD | | Tencent Holdings, Ltd. | | | 13,889,377 | | |
| | | | 20,151,139 | | |
| | | Consumer Discretionary (17.6%) | |
| | 763,900 | HKD | | Alibaba Group Holding, Ltd.# | | | 7,864,406 | | |
| | 912,120 | MXN | | Alsea, SAB de CV# | | | 3,027,415 | | |
| | 54,500 | INR | | Amber Enterprises India, Ltd.# | | | 1,917,456 | | |
| | 21,100 | CNY | | Beijing Roborock Technology
Company, Ltd. - Class A | | | 912,077 | | |
| | 13,712,100 | PHP | | Bloomberry Resorts Corp.# | | | 2,201,573 | | |
| | 75,948 | INR | | Dixon Technologies India, Ltd. | | | 4,661,513 | | |
| | 967,000 | HKD | | Hisense Home Appliances Group
Company, Ltd. - Class H | | | 2,661,745 | | |
| | 592,870 | INR | | Indian Hotels Company, Ltd. | | | 2,734,178 | | |
| | 1,710,000 | INR | | Kalyan Jewellers India, Ltd. | | | 5,942,062 | | |
NUMBER OF
SHARES | | | | VALUE | |
| | 53,440 | KRW | | Kia Corp. | | $ | 3,053,103 | | |
| | 231,550 | INR | | Mahindra & Mahindra, Ltd. | | | 4,073,000 | | |
| | 21,847,100 | IDR | | Map Aktif Adiperkasa PT | | | 1,024,620 | | |
| | 6,265 | | | MercadoLibre, Inc.# | | | 7,773,236 | | |
| | 34,500 | | | MINISO Group Holding, Ltd. (ADR) | | | 873,195 | | |
| | 17,078,400 | IDR | | Mitra Adiperkasa Tbk PT | | | 1,865,895 | | |
| | 568,000 | INR | | Tata Motors, Ltd. | | | 4,295,911 | | |
| | 521,300 | INR | | Welspun India, Ltd. | | | 943,023 | | |
| | 79,200 | HKD | | Yum China Holdings, Inc. | | | 4,150,242 | | |
| | 2,786,920 | INR | | Zomato, Ltd.# | | | 3,513,225 | | |
| | | | 63,487,875 | | |
| | | Consumer Staples (5.4%) | |
| | 35,100 | CNY | | Eastroc Beverage Group Company,
Ltd. - Class A | | | 921,557 | | |
| | 368,050 | MXN | | Fomento Economico Mexicano,
SAB de CV^ | | | 4,161,257 | | |
| | 594,930 | INR | | ITC, Ltd. | | | 3,062,784 | | |
| | 17,700 | CNY | | Kweichow Moutai Company,
Ltd. - Class A | | | 4,076,375 | | |
| | 15,170 | INR | | Nestlé India, Ltd. | | | 4,420,582 | | |
| | 598,440 | BRL | | Raia Drogasil, SA | | | 3,062,380 | | |
| | | | 19,704,935 | | |
| | | Energy (6.2%) | |
| | 78,580 | SAR | | Arabian Drilling Company# | | | 3,676,423 | | |
| | 185,940 | EUR | | Galp Energia SGPS, SA | | | 2,799,282 | | |
| | 435,320 | INR | | Oil & Natural Gas Corp., Ltd. | | | 973,019 | | |
| | 1,050,800 | THB | | PTT Exploration & Production, PCL | | | 4,799,157 | | |
| | 140,290 | INR | | Reliance Industries, Ltd. | | | 3,859,518 | | |
| | 288,530 | | | TechnipFMC, PLC~ | | | 6,209,166 | | |
| | | | 22,316,565 | | |
| | | Financials (11.5%) | |
| | 431,800 | HKD | | AIA Group, Ltd. | | | 3,749,666 | | |
| | 1,064,000 | BRL | | B3, SA-Brasil Bolsa Balcao | | | 2,342,520 | | |
| | 476,950 | BRL | | Banco BTG Pactual, SA | | | 2,800,163 | | |
| | 4,962,000 | IDR | | Bank Central Asia, Tbk PT | | | 2,733,668 | | |
| | 18,631,480 | IDR | | Bank Mandiri Persero, Tbk PT | | | 6,656,134 | | |
| | 1,621,643 | CNY | | CITIC Securities Company, Ltd. - Class A | | | 4,813,598 | | |
| | 203,880 | INR | | HDFC Bank, Ltd. | | | 3,614,079 | | |
| | 209,125 | | | ICICI Bank, Ltd. (ADR) | | | 4,640,484 | | |
| | 558,970 | | | Itau Unibanco Holding, SA (ADR) | | | 2,968,131 | | |
| | 96,560 | KRW | | Meritz Financial Group, Inc. | | | 3,593,733 | | |
| | 713,000 | HKD | | Ping An Insurance Group Company of
China, Ltd. - Class H | | | 3,616,675 | | |
| | | | 41,528,851 | | |
See accompanying Notes to Schedule of Investments
CALAMOS OPEN-END FAMILY OF FUNDS ANNUAL REPORT
142
Evolving World Growth Fund Schedule of Investments October 31, 2023
NUMBER OF
SHARES | | | | VALUE | |
| | | Health Care (3.9%) | |
| | 54,300 | INR | | Apollo Hospitals Enterprise, Ltd. | | $ | 3,158,553 | | |
| | 28,420 | DKK | | Novo Nordisk, A/S - Class B | | | 2,741,854 | | |
| | 229,400 | HKD | | WuXi AppTec Company, Ltd. - Class H* | | | 2,756,594 | | |
| | 850,500 | HKD | | Wuxi Biologics Cayman, Inc.*# | | | 5,288,186 | | |
| | | | 13,945,187 | | |
| | | Industrials (6.4%) | |
| | 245,000 | INR | | Hindustan Aeronautics, Ltd. | | | 5,367,498 | | |
| | 146,593 | INR | | Larsen & Toubro, Ltd. | | | 5,148,082 | | |
| | 932,480 | BRL | | Rumo, SA | | | 4,126,271 | | |
| | 67,900 | INR | | Siemens, Ltd. | | | 2,724,893 | | |
| | 315,780 | INR | | Titagarh Rail System, Ltd. | | | 2,888,535 | | |
| | 1,440,000 | CNY | | Weichai Power Company, Ltd. - Class A | | | 2,736,690 | | |
| | | 22,991,969 | | |
| | | Information Technology (17.4%) | |
| | 321,800 | TWD | | Accton Technology Corp. | | | 4,986,053 | | |
| | 101,600 | JPY | | Advantest Corp.^ | | | 2,617,076 | | |
| | 115,110 | TWD | | Alchip Technologies, Ltd. | | | 9,440,905 | | |
| | 14,495 | SAR | | Elm Company | | | 2,710,153 | | |
| | 16,550 | | | Fabrinet# | | | 2,565,250 | | |
| | 513,930 | INR | | KPIT Technologies, Ltd. | | | 7,564,545 | | |
| | 151,000 | TWD | | MediaTek, Inc. | | | 3,941,002 | | |
| | 109,600 | HKD | | Sunny Optical Technology Group
Company, Ltd. | | | 918,221 | | |
| | 1,619,649 | TWD | | Taiwan Semiconductor Manufacturing
Company, Ltd.~ | | | 26,452,927 | | |
| | 527,800 | HKD | | Xiaomi Corp. - Class B*# | | | 946,358 | | |
| | 73,700 | CNY | | Zhongji Innolight Company, Ltd. - Class A | | | 887,850 | | |
| | | | 63,030,340 | | |
| | | Materials (1.4%) | |
| | 3,247,500 | IDR | | Pantai Indah Kapuk Dua Tbk# | | | 893,395 | | |
| | 2,606,000 | HKD | | Zijin Mining Group Company,
Ltd. - Class H | | | 4,031,249 | | |
| | | | 4,924,644 | | |
| | | Real Estate (4.7%) | |
| | 3,002,290 | MXN | | Corp. Inmobiliaria Vesta SAB de CV^ | | | 9,415,357 | | |
| | 590,270 | INR | | DLF, Ltd. | | | 3,991,624 | | |
| | 400,670 | INR | | Macrotech Developers, Ltd.* | | | 3,786,130 | | |
| | | | 17,193,111 | | |
| | | TOTAL COMMON STOCKS
(Cost $273,837,627) | | | 289,274,616 | | |
PREFERRED STOCK (0.8%) | | | |
| | | Industrials (0.8%) | |
| | 1,379,870 | BRL | | Randon, SA Implementos e
Participacoes‡
(Cost $3,475,906) | | | 2,985,944 | | |
NUMBER OF
CONTRACTS/
NOTIONAL
AMOUNT | | | | VALUE | |
PURCHASED OPTIONS (1.4%)# | | | | | |
| | | | | Communication Services (0.0%) | | | |
| | | | | Baidu, Inc. | | | | | |
| | 1,182 | | | | | | | | | | |
| | 12,411,000 | | | Call, 11/17/23, Strike $150.00 | | $ | 4,137 | | |
| | 918 | | | | | | | | | | |
| | 9,639,000 | | | Call, 01/19/24, Strike $150.00 | | | 40,392 | | |
| | | | 44,529 | | |
| | | | | Consumer Discretionary (0.5%) | | | |
| | | | | Alibaba Group Holding, Ltd. | | | | | |
| | 2,890 | | | | | | | | | | |
| | 23,854,060 | | | Call, 11/17/23, Strike $100.00 | | | 30,345 | | |
| | 1,398 | | | | | | | | | | |
| | 11,539,092 | | | Call, 01/19/24, Strike $100.00 | | | 170,556 | | |
| | 1,350 | | | New Oriental Education &
Technology Group, Inc. | | | | | |
| | 8,841,150 | | | Call, 01/19/24, Strike $65.00 | | | 877,500 | | |
| | 1,555 | | | PDD Holdings, Inc. | | | | | |
| | 15,770,810 | | | Call, 01/19/24, Strike $120.00 | | | 622,000 | | |
| | | | 1,700,401 | | |
| | | | | Information Technology (0.2%) | | | |
| | 193 | | | NVIDIA Corp. | | | | | |
| | 7,870,540 | | | Call, 01/19/24, Strike $425.00 | | | 607,950 | | |
| | | | | Other (0.7%) | | | |
| | 10,200 | | | iShares MSCI Emerging Markets | | | | | |
| | 37,434,000 | | | Put, 11/17/23, Strike $37.00 | | | 714,000 | | |
| | 8,906 | | | iShares MSCI India ETF | | | | | |
| | 38,509,544 | | | Put, 12/15/23, Strike $44.00 | | | 979,660 | | |
| | 4,710 | | | KE Holdings, Inc. | | | | | |
| | 6,928,410 | | | Call, 01/19/24, Strike $19.85 | | | 120,105 | | |
| | 4,639 | | | Petroleo Brasileiro, SA | | | | | |
| | 6,958,500 | | | Call, 01/19/24, Strike $14.00 | | | 607,709 | | |
| | 4,480 | | | Trip.com Group, Ltd. | | | | | |
| | 15,232,000 | | | Call, 01/19/24, Strike $44.00 | | | 112,000 | | |
| | 4,900 | | | Vale, SA | | | | | |
| | 6,717,900 | | | Call, 11/17/23, Strike $14.00 | | | 132,300 | | |
| | | | 2,665,774 | | |
| | | | | TOTAL PURCHASED OPTIONS
(Cost $10,924,242) | | | 5,018,654 | | |
See accompanying Notes to Schedule of Investments
www.calamos.com
143
Evolving World Growth Fund Schedule of Investments October 31, 2023
NUMBER OF
SHARES/
PRINCIPAL
AMOUNT | | | | VALUE | |
INVESTMENT OF CASH COLLATERAL FOR SECURITIES
LOANED (2.9%) | |
| | 10,539,663 | | | State Street Navigator Securities
Lending Government Money
Market Portfolio, 5.358%†***
(Cost $10,539,663) | | $ | 10,539,663 | | |
| | | TOTAL INVESTMENTS (103.5%)
(Cost $363,980,107) | | | 374,205,026 | | |
PAYABLE UPON RETURN OF SECURITIES ON LOAN (-2.9%) | | | (10,539,663 | ) | |
LIABILITIES, LESS OTHER ASSETS (-0.6%) | | | (2,283,179 | ) | |
NET ASSETS (100.0%) | | $ | 361,382,184 | | |
FORWARD FOREIGN CURRENCY CONTRACTS
COUNTERPARTY | | LONG
CONTRACTS | | SETTLEMENT
DATE | | LOCAL
CURRENCY | | CURRENT
VALUE | | UNREALIZED
GAIN/LOSS | |
State Street Bank and
Trust | | South African Rand | | 12/29/23 | | | 250,000,000 | | | $ | 13,347,206 | | | $ | 287,570 | | |
State Street Bank and
Trust | | Brazilian Real | | 12/29/23 | | | 44,390,000 | | | | 8,748,278 | | | | (78,878 | ) | |
| | | $ | 208,692 | | |
NOTES TO SCHEDULE OF INVESTMENTS
* Securities issued and sold pursuant to a Rule 144A transaction are exempted from the registration requirement of the Securities Act of 1933, as amended. These securities may only be sold to qualified institutional buyers ("QIBs"), such as the Fund. Any resale of these securities must generally be effected through a sale that is registered under the Act or otherwise exempted from such registration requirements.
# Non-income producing security.
^ Security, or portion of security, is on loan.
~ Security, or portion of security, is segregated as collateral for written options. The aggregate value of such securities is $11,789,739.
‡ Variable rate security. The rate shown is the rate in effect at October 31, 2023.
† Represents investment of cash collateral received from securities on loan as of October 31, 2023.
*** The rate disclosed is the 7 day net yield as of October 31, 2023.
FOREIGN CURRENCY ABBREVIATIONS
BRL Brazilian Real
CNY Chinese Yuan Renminbi
DKK Danish Krone
EUR European Monetary Unit
HKD Hong Kong Dollar
IDR Indonesian Rupiah
INR Indian Rupee
JPY Japanese Yen
KRW South Korean Won
MXN Mexican Peso
PHP Philippine Peso
SAR Saudi Riyal
THB Thai Baht
TWD New Taiwan Dollar
Note: Value for securities denominated in foreign currencies is shown in U.S. dollars. The principal amount for such securities is shown in the respective foreign currency.
CURRENCY EXPOSURE
OCTOBER 31, 2023
| | | VALUE | | % OF TOTAL
INVESTMENTS | |
US Dollar | | $ | 92,667,786 | | | | 24.8 | % | |
Indian Rupee | | | 78,640,210 | | | | 21.0 | % | |
Hong Kong Dollar | | | 57,515,337 | | | | 15.4 | % | |
New Taiwan Dollar | | | 44,820,887 | | | | 12.0 | % | |
Mexican Peso | | | 16,604,029 | | | | 4.4 | % | |
European Monetary Unit | | | 15,724,568 | | | | 4.2 | % | |
Brazilian Real | | | 15,317,278 | | | | 4.1 | % | |
Chinese Yuan Renminbi | | | 14,348,147 | | | | 3.8 | % | |
Indonesian Rupiah | | | 13,173,712 | | | | 3.5 | % | |
South Korean Won | | | 6,646,836 | | | | 1.8 | % | |
Saudi Riyal | | | 6,386,576 | | | | 1.7 | % | |
Thai Baht | | | 4,799,157 | | | | 1.3 | % | |
Danish Krone | | | 2,741,854 | | | | 0.7 | % | |
Japanese Yen | | | 2,617,076 | | | | 0.7 | % | |
Philippine Peso | | | 2,201,573 | | | | 0.6 | % | |
Total Investments | | $ | 374,205,026 | | | | 100.0 | % | |
Currency exposure may vary over time.
See accompanying Notes to Schedule of Investments
CALAMOS OPEN-END FAMILY OF FUNDS ANNUAL REPORT
144
Global Equity Fund Schedule of Investments October 31, 2023
NUMBER OF
SHARES | | | | VALUE | |
COMMON STOCKS (94.9%) | | | |
| | | Communication Services (4.8%) | |
| | 17,700 | | | Alphabet, Inc. - Class A# | | $ | 2,196,216 | | |
| | 3,610 | | | Meta Platforms, Inc. - Class A# | | | 1,087,585 | | |
| | 26,100 | HKD | | Tencent Holdings, Ltd. | | | 965,928 | | |
| | | | 4,249,729 | | |
| | | Consumer Discretionary (9.8%) | |
| | 23,140 | | | Amazon.com, Inc.#~ | | | 3,079,703 | | |
| | 565 | | | Chipotle Mexican Grill, Inc.# | | | 1,097,343 | | |
| | 3,605 | EUR | | Ferrari, NV | | | 1,091,247 | | |
| | 880 | EUR | | LVMH Moet Hennessy Louis Vuitton, SE | | | 630,019 | | |
| | 27,400 | | | MakeMyTrip, Ltd.# | | | 1,061,202 | | |
| | 870 | | | MercadoLibre, Inc.# | | | 1,079,444 | | |
| | 14,100 | | | Modine Manufacturing Company# | | | 556,950 | | |
| | | | 8,595,908 | | |
| | | Consumer Staples (3.2%) | |
| | 365,200 | CHF | | Aryzta, AG# | | | 669,342 | | |
| | 3,810 | | | Constellation Brands, Inc. - Class A | | | 892,111 | | |
| | 2,180 | | | Costco Wholesale Corp. | | | 1,204,319 | | |
| | | | 2,765,772 | | |
| | | Energy (7.0%) | |
| | 142,400 | GBP | | BP, PLC | | | 869,496 | | |
| | 34,320 | CAD | | Canadian Natural Resources, Ltd.^ | | | 2,179,354 | | |
| | 11,860 | | | Chevron Corp. | | | 1,728,358 | | |
| | 62,400 | | | TechnipFMC, PLC | | | 1,342,848 | | |
| | | | 6,120,056 | | |
| | | Financials (8.6%) | |
| | 2,795 | | | Aon, PLC - Class A | | | 864,773 | | |
| | 10,100 | | | Apollo Global Management, Inc. | | | 782,144 | | |
| | 1,172,000 | IDR | | Bank Mandiri Persero, Tbk PT | | | 418,699 | | |
| | 4,050 | | | Chubb, Ltd. | | | 869,211 | | |
| | 52,990 | INR | | HDFC Bank, Ltd. | | | 939,327 | | |
| | 28,900 | | | ICICI Bank, Ltd. (ADR) | | | 641,291 | | |
| | 2,760 | | | JPMorgan Chase & Company | | | 383,806 | | |
| | 10,800 | | | Morgan Stanley | | | 764,856 | | |
| | 13,400 | JPY | | Sumitomo Mitsui Financial Group, Inc. | | | 645,987 | | |
| | 3,620 | | | Visa, Inc. - Class A^ | | | 851,062 | | |
| | 9,100 | | | Wells Fargo & Company | | | 361,907 | | |
| | | | 7,523,063 | | |
| | | Health Care (12.0%) | |
| | 14,170 | GBP | | AstraZeneca, PLC | | | 1,774,135 | | |
| | 6,415 | | | Eli Lilly & Company | | | 3,553,461 | | |
| | 39,570 | | | Novo Nordisk, A/S (ADR) | | | 3,821,275 | | |
| | 2,444 | | | UnitedHealth Group, Inc. | | | 1,308,909 | | |
| | | | 10,457,780 | | |
NUMBER OF
SHARES | | | | VALUE | |
| | | Industrials (17.5%) | |
| | 13,410 | CAD | | Canadian Pacific Kansas City, Ltd. | | $ | 952,117 | | |
| | 4,230 | | | EMCOR Group, Inc. | | | 874,129 | | |
| | 50,000 | INR | | Hindustan Aeronautics, Ltd. | | | 1,095,408 | | |
| | 20,300 | JPY | | Hitachi, Ltd. | | | 1,286,747 | | |
| | 25,200 | JPY | | Komatsu, Ltd. | | | 579,005 | | |
| | 28,800 | JPY | | Kyudenko Corp. | | | 860,284 | | |
| | 153,100 | GBP | | Melrose Industries, PLC | | | 871,716 | | |
| | 95,600 | SEK | | Munters Group, AB* | | | 1,167,153 | | |
| | 12,690 | | | Quanta Services, Inc. | | | 2,120,753 | | |
| | 691,300 | GBP | | Rolls-Royce Holdings, PLC# | | | 1,819,656 | | |
| | 4,310 | EUR | | Safran, SA | | | 673,306 | | |
| | 5,440 | EUR | | Schneider Electric, SE | | | 836,984 | | |
| | 25,520 | | | Vertiv Holdings Company | | | 1,002,170 | | |
| | 6,820 | | | Waste Management, Inc. | | | 1,120,731 | | |
| | | | 15,260,159 | | |
| | | Information Technology (28.7%) | |
| | 14,900 | TWD | | Alchip Technologies, Ltd. | | | 1,222,044 | | |
| | 16,100 | | | Apple, Inc. | | | 2,749,397 | | |
| | 3,048 | EUR | | ASML Holding, NV | | | 1,832,215 | | |
| | 2,900 | | | Cadence Design Systems, Inc.# | | | 695,565 | | |
| | 5,090 | | | Fabrinet# | | | 788,950 | | |
| | 4,500 | JPY | | Keyence Corp. | | | 1,742,033 | | |
| | 14,875 | | | Micron Technology, Inc. | | | 994,691 | | |
| | 13,910 | | | Microsoft Corp.~ | | | 4,703,110 | | |
| | 11,220 | | | NVIDIA Corp.††† | | | 4,575,516 | | |
| | 15,260 | | | Oracle Corp. | | | 1,577,884 | | |
| | 6,550 | EUR | | SAP, SE | | | 878,567 | | |
| | 12,060 | CAD | | Shopify, Inc. - Class A#^ | | | 569,540 | | |
| | 6,075 | | | Snowflake, Inc. - Class A# | | | 881,665 | | |
| | 95,000 | TWD | | Taiwan Semiconductor Manufacturing
Company, Ltd. | | | 1,551,588 | | |
| | 3,400 | | | Taiwan Semiconductor Manufacturing
Company, Ltd. (ADR) | | | 293,454 | | |
| | | | 25,056,219 | | |
| | | Materials (2.3%) | |
| | 19,500 | | | Freeport-McMoRan, Inc. | | | 658,710 | | |
| | 3,465 | | | Linde, PLC | | | 1,324,184 | | |
| | | | 1,982,894 | | |
| | | Real Estate (1.0%) | |
| | 285,700 | MXN | | Corp. Inmobiliaria Vesta SAB de CV^ | | | 895,972 | | |
| | | TOTAL COMMON STOCKS
(Cost $59,565,049) | | | 82,907,552 | | |
See accompanying Notes to Schedule of Investments
www.calamos.com
145
Global Equity Fund Schedule of Investments October 31, 2023
NUMBER OF
CONTRACTS/
NOTIONAL
AMOUNT | | | | VALUE | |
PURCHASED OPTION (0.2%)# | | | |
| | | Industrials (0.2%) | |
| | 130 | | | Quanta Services, Inc. | | | | | |
| | 2,172,560 | | | Put, 11/17/23, Strike $175.00
(Cost $145,863) | | $ | 139,100 | | |
NUMBER OF
SHARES/
PRINCIPAL
AMOUNT | | | | VALUE | |
INVESTMENT OF CASH COLLATERAL FOR SECURITIES
LOANED (4.6%) | | | |
| | 4,058,291 | | | State Street Navigator Securities
Lending Government Money Market
Portfolio, 5.358%†***
(Cost $4,058,291) | | 4,058,291 | |
| | | TOTAL INVESTMENTS (99.7%)
(Cost $63,769,203) | | | 87,104,943 | | |
PAYABLE UPON RETURN OF SECURITIES ON LOAN (-4.6%) | | | (4,058,291 | ) | |
OTHER ASSETS, LESS LIABILITIES (4.9%) | | | 4,300,601 | | |
NET ASSETS (100.0%) | | $ | 87,347,253 | | |
NOTES TO SCHEDULE OF INVESTMENTS
# Non-income producing security.
~ Security, or portion of security, is segregated as collateral (or collateral for potential future transactions) for written options. The aggregate value of such securities is $930,468.
^ Security, or portion of security, is on loan.
* Securities issued and sold pursuant to a Rule 144A transaction are exempted from the registration requirement of the Securities Act of 1933, as amended. These securities may only be sold to qualified institutional buyers ("QIBs"), such as the Fund. Any resale of these securities must generally be effected through a sale that is registered under the Act or otherwise exempted from such registration requirements.
†† Security or a portion of the security purchased on a delayed delivery or when-issued basis.
† Represents investment of cash collateral received from securities on loan as of October 31, 2023.
*** The rate disclosed is the 7 day net yield as of October 31, 2023.
FOREIGN CURRENCY ABBREVIATIONS
CAD Canadian Dollar
CHF Swiss Franc
EUR European Monetary Unit
GBP British Pound Sterling
HKD Hong Kong Dollar
IDR Indonesian Rupiah
INR Indian Rupee
JPY Japanese Yen
MXN Mexican Peso
SEK Swedish Krona
TWD New Taiwan Dollar
ABBREVIATION
ADR American Depositary Receipt
Note: Value for securities denominated in foreign currencies is shown in U.S. dollars. The date on options represents the expiration date of the option contract. The option contract may be exercised at any date on or before the date shown.
CURRENCY EXPOSURE
OCTOBER 31, 2023
| | | VALUE | | % OF TOTAL
INVESTMENTS | |
US Dollar | | $ | 58,087,074 | | | | 66.7 | % | |
European Monetary Unit | | | 5,942,338 | | | | 6.8 | % | |
British Pound Sterling | | | 5,335,003 | | | | 6.1 | % | |
Japanese Yen | | | 5,114,056 | | | | 5.9 | % | |
Canadian Dollar | | | 3,701,011 | | | | 4.3 | % | |
New Taiwan Dollar | | | 2,773,632 | | | | 3.2 | % | |
Indian Rupee | | | 2,034,735 | | | | 2.3 | % | |
Swedish Krona | | | 1,167,153 | | | | 1.3 | % | |
Hong Kong Dollar | | | 965,928 | | | | 1.1 | % | |
Mexican Peso | | | 895,972 | | | | 1.0 | % | |
Swiss Franc | | | 669,342 | | | | 0.8 | % | |
Indonesian Rupiah | | | 418,699 | | | | 0.5 | % | |
Total Investments | | $ | 87,104,943 | | | | 100.0 | % | |
Currency exposure may vary over time.
See accompanying Notes to Schedule of Investments
CALAMOS OPEN-END FAMILY OF FUNDS ANNUAL REPORT
146
Global Opportunities Fund Schedule of Investments October 31, 2023
PRINCIPAL
AMOUNT | | | | VALUE | |
CONVERTIBLE BONDS (32.2%) | | | |
| | | Communication Services (0.8%) | |
| | 1,576,000 | | | Liberty Media Corp.-Liberty Formula One
2.250%, 08/15/27 | | $ | 1,570,846 | | |
| | | Consumer Discretionary (3.7%) | |
| | 3,570,000 | | | MakeMyTrip, Ltd.
0.000%, 02/15/28 | | | 4,066,159 | | |
| | 3,100,000 | | | Wynn Macau, Ltd.*
4.500%, 03/07/29 | | | 3,162,372 | | |
| | | | 7,228,531 | | |
| | | Consumer Staples (2.9%) | |
| | 1,500,000 | EUR | | Fomento Economico Mexicano
SAB de CV
2.625%, 02/24/26 | | | 1,554,344 | | |
| | 4,255,000 | | | Post Holdings, Inc.
2.500%, 08/15/27 | | | 4,061,695 | | |
| | | | 5,616,039 | | |
| | | Energy (2.2%) | |
| | 1,800,000 | EUR | | Eni S.p.A
2.950%, 09/14/30 | | | 1,947,015 | | |
| | 2,200,000 | EUR | | Saipem S.p.A
2.875%, 09/11/29 | | | 2,385,597 | | |
| | | | 4,332,612 | | |
| | | Financials (2.2%) | |
| | 1,900,000 | EUR | | Citigroup Global Markets Funding
Luxembourg SCA
0.000%, 03/15/28 | | | 2,073,557 | | |
| | 2,200,000 | | | Morgan Stanley Finance, LLC
1.000%, 11/23/27 | | | 2,230,360 | | |
| | | | 4,303,917 | | |
| | | Health Care (1.1%) | |
| | 1,095,000 | | | Dexcom, Inc.
0.250%, 11/15/25 | | | 1,039,450 | | |
| | 1,129,000 | | | Shockwave Medical, Inc.*
1.000%, 08/15/28 | | | 1,094,690 | | |
| | | | 2,134,140 | | |
| | | Industrials (7.0%) | |
| | 220,000,000 | JPY | | ANA Holdings, Inc.
0.000%, 12/10/31 | | | 1,605,408 | | |
| | 1,488,000 | | | Parsons Corp.
0.250%, 08/15/25 | | | 1,952,018 | | |
| | 1,700,000 | EUR | | Prysmian S.p.A
0.000%, 02/02/26 | | | 1,848,417 | | |
| | 2,600,000 | EUR | | Rheinmetall AG
1.875%, 02/07/28 | | | 2,930,787 | | |
| | 1,610,000 | EUR | | Schneider Electric, SE
0.000%, 06/15/26 | | | 3,048,266 | | |
| | 1,500,000 | EUR | | SPIE, SA
2.000%, 01/17/28 | | | 1,534,267 | | |
PRINCIPAL
AMOUNT | | | | VALUE | |
| | 961,000 | | | Tetra Tech, Inc.*
2.250%, 08/15/28 | | $ | 930,911 | | |
| | | | 13,850,074 | | |
| | | Information Technology (8.4%) | |
| | 2,240,000 | | | Akamai Technologies, Inc.*
1.125%, 02/15/29 | | | 2,205,302 | | |
| | 1,763,000 | | | Camtek, Ltd.*
0.000%, 12/01/26 | | | 1,902,665 | | |
| | 2,622,000 | | | Datadog, Inc.
0.125%, 06/15/25 | | | 2,887,451 | | |
| | 1,000,000 | | | Gigabyte Technology Company, Ltd.
0.010%, 07/27/28 | | | 957,500 | | |
| | 18,000,000 | HKD | | Kingsoft Corp, Ltd.
0.625%, 04/29/25 | | | 2,380,732 | | |
| | 1,500,000 | | | Progress Software Corp.
1.000%, 04/15/26 | | | 1,525,455 | | |
| | 1,082,000 | | | Rapid7, Inc.*
1.250%, 03/15/29 | | | 1,046,749 | | |
| | 3,000,000 | | | SK Hynix, Inc.
1.750%, 04/11/30 | | | 3,629,880 | | |
| | | | 16,535,734 | | |
| | | Materials (1.6%) | |
| | 1,000,000 | | | Glencore Funding, LLC
0.000%, 03/27/25 | | | 1,048,910 | | |
| | 2,200,000 | | | LG Chem, Ltd.
1.250%, 07/18/28 | | | 2,067,802 | | |
| | | | 3,116,712 | | |
| | | Other (0.8%) | |
| | 2,370,000 | EUR | | Edenred
0.000%, 09/06/24 | | | 1,506,449 | | |
| | | Real Estate (1.5%) | |
| | 2,700,000 | EUR | | ANLLIAN Capital, Ltd.
0.000%, 02/05/25 | | | 3,061,366 | | |
| | | TOTAL CONVERTIBLE BONDS
(Cost $65,409,046) | | | 63,256,420 | | |
CORPORATE BOND (1.0%) | | | |
| | | Energy (1.0%) | |
| | 1,940,000 | | | Noble Finance II, LLC*
8.000%, 04/15/30
(Cost $1,964,026) | | | 1,948,555 | | |
NUMBER OF
SHARES | | | | VALUE | |
CONVERTIBLE PREFERRED STOCK (1.6%) | | | |
| | | Financials (1.6%) | |
| | 63,900 | | | Apollo Global Management, Inc.
6.750%, 07/31/26
(Cost $3,304,429) | | | 3,074,229 | | |
See accompanying Notes to Schedule of Investments
www.calamos.com
147
Global Opportunities Fund Schedule of Investments October 31, 2023
NUMBER OF
SHARES | | | | VALUE | |
COMMON STOCKS (57.1%) | | | |
| | | Communication Services (3.6%) | |
| | 33,014 | | | Alphabet, Inc. - Class A# | | $ | 4,096,377 | | |
| | 3,600 | | | Meta Platforms, Inc. - Class A# | | | 1,084,572 | | |
| | 49,900 | HKD | | Tencent Holdings, Ltd. | | | 1,846,736 | | |
| | | | 7,027,685 | | |
| | | Consumer Discretionary (1.5%) | |
| | 22,700 | | | Amazon.com, Inc.# | | | 3,021,143 | | |
| | | Consumer Staples (2.8%) | |
| | 25,250 | | | Coca-Cola Company~ | | | 1,426,372 | | |
| | 8,300 | | | Constellation Brands, Inc. - Class A | | | 1,943,445 | | |
| | 3,990 | | | Costco Wholesale Corp. | | | 2,204,236 | | |
| | | | 5,574,053 | | |
| | | Energy (5.3%) | |
| | 360,000 | GBP | | BP, PLC | | | 2,198,165 | | |
| | 51,900 | CAD | | Canadian Natural Resources, Ltd.^ | | | 3,295,701 | | |
| | 15,852 | | | Chevron Corp. | | | 2,310,112 | | |
| | 80,000 | GBP | | Shell, PLC | | | 2,578,146 | | |
| | | | 10,382,124 | | |
| | | Financials (6.5%) | |
| | 7,245 | | | Aon, PLC - Class A | | | 2,241,603 | | |
| | 3,276,000 | IDR | | Bank Mandiri Persero, Tbk PT | | | 1,170,358 | | |
| | 107,250 | EUR | | Bank of Ireland Group, PLC | | | 961,144 | | |
| | 109,300 | INR | | HDFC Bank, Ltd. | | | 1,937,507 | | |
| | 7,650 | | | JPMorgan Chase & Company~ | | | 1,063,809 | | |
| | 25,300 | | | Morgan Stanley | | | 1,791,746 | | |
| | 41,000 | | | UBS Group, AG#^ | | | 961,860 | | |
| | 6,460 | | | Visa, Inc. - Class A^ | | | 1,518,746 | | |
| | 25,400 | | | Wells Fargo & Company | | | 1,010,158 | | |
| | | | 12,656,931 | | |
| | | Health Care (10.0%) | |
| | 18,700 | GBP | | AstraZeneca, PLC | | | 2,341,307 | | |
| | 11,500 | | | Eli Lilly & Company | | | 6,370,195 | | |
| | 18,250 | EUR | | Gerresheimer, AG | | | 1,702,236 | | |
| | 71,550 | | | Novo Nordisk, A/S (ADR) | | | 6,909,584 | | |
| | 4,370 | | | UnitedHealth Group, Inc. | | | 2,340,397 | | |
| | | | 19,663,719 | | |
| | | Industrials (7.5%) | |
| | 20,300 | CAD | | Canadian Pacific Kansas City, Ltd. | | | 1,441,311 | | |
| | 26,200 | JPY | | Hitachi, Ltd. | | | 1,660,728 | | |
| | 63,600 | JPY | | Komatsu, Ltd. | | | 1,461,298 | | |
| | 263,000 | GBP | | Melrose Industries, PLC | | | 1,497,462 | | |
| | 8,690 | | | Quanta Services, Inc. | | | 1,452,273 | | |
| | 1,320,000 | GBP | | Rolls-Royce Holdings, PLC# | | | 3,474,535 | | |
NUMBER OF
SHARES | | | | VALUE | |
| | 50,500 | | | Vertiv Holdings Company | | $ | 1,983,135 | | |
| | 10,200 | | | Waste Management, Inc. | | | 1,676,166 | | |
| | | | 14,646,908 | | |
| | | Information Technology (18.7%) | |
| | 21,500 | TWD | | Alchip Technologies, Ltd. | | | 1,763,352 | | |
| | 32,440 | | | Apple, Inc. | | | 5,539,779 | | |
| | 5,180 | EUR | | ASML Holding, NV | | | 3,113,804 | | |
| | 5,300 | JPY | | Keyence Corp. | | | 2,051,728 | | |
| | 24,810 | | | Microsoft Corp. | | | 8,388,509 | | |
| | 21,830 | | | NVIDIA Corp.††† | | | 8,902,274 | | |
| | 28,050 | | | Oracle Corp. | | | 2,900,370 | | |
| | 252,000 | TWD | | Taiwan Semiconductor
Manufacturing Company, Ltd. | | | 4,115,791 | | |
| | | | 36,775,607 | | |
| | | Materials (1.2%) | |
| | 36,700 | | | Freeport-McMoRan, Inc. | | | 1,239,726 | | |
| | 2,800 | | | Linde, PLC | | | 1,070,048 | | |
| | | | 2,309,774 | | |
| | | TOTAL COMMON STOCKS
(Cost $72,880,316) | | | 112,057,944 | | |
PRINCIPAL
AMOUNT | | | | VALUE | |
U.S. GOVERNMENT AND AGENCY SECURITIES (4.2%) | | | |
| | | | | United States Treasury Note | | | | | |
| | 2,140,000 | | | 4.125%, 08/31/30^ | | | 2,041,527 | | |
| | 2,140,000 | | | 4.000%, 06/30/28 | | | 2,066,020 | | |
| | 2,120,000 | | | 4.625%, 09/15/26 | | | 2,104,431 | | |
| | 2,120,000 | | | 4.500%, 07/15/26 | | | 2,096,812 | | |
| | | TOTAL U.S. GOVERNMENT AND
AGENCY SECURITIES
(Cost $8,416,031) | | | 8,308,790 | | |
NUMBER OF
CONTRACTS/
NOTIONAL
AMOUNT | | | | VALUE | |
PURCHASED OPTIONS (0.5%)# | | | |
| | | Consumer Discretionary (0.1%) | |
| | 110 | | | Toyota Motor Corp. | | | | | |
| | 1,926,980 | | | Call, 04/19/24, Strike $185.00 | | | 106,150 | | |
| | | Energy (0.1%) | |
| | 820 | | | Noble Corp., PLC | | | | | |
| | 3,828,580 | | | Call, 03/15/24, Strike $55.00 | | | 135,300 | | |
| | | Other (0.3%) | |
| | 320 | | | Baidu, Inc. | | | | | |
| | 3,360,000 | | | Call, 01/19/24, Strike $150.00 | | | 14,080 | | |
| | 965 | | | ICICI Bank, Ltd. | | | | | |
| | 2,141,335 | | | Call, 01/19/24, Strike $24.00 | | | 26,538 | | |
See accompanying Notes to Schedule of Investments
CALAMOS OPEN-END FAMILY OF FUNDS ANNUAL REPORT
148
Global Opportunities Fund Schedule of Investments October 31, 2023
NUMBER OF
CONTRACTS/
NOTIONAL
AMOUNT | | | | VALUE | |
| | 555 | | | Invesco QQQ Trust | | | | | |
| | 19,476,060 | | | Put, 12/29/23, Strike $355.00 | | $ | 719,002 | | |
| | | | 759,620 | | |
| | | TOTAL PURCHASED OPTIONS
(Cost $1,500,775) | | | 1,001,070 | | |
NUMBER OF
SHARES/
PRINCIPAL
AMOUNT | | | | VALUE | |
INVESTMENT OF CASH COLLATERAL FOR SECURITIES
LOANED (2.2%) | | | |
| | 4,264,427 | | | State Street Navigator Securities
Lending Government Money
Market Portfolio, 5.358%†***
(Cost $4,264,427) | | | 4,264,427 | | |
| | | TOTAL INVESTMENTS (98.8%)
(Cost $157,739,050) | | | 193,911,435 | | |
PAYABLE UPON RETURN OF SECURITIES ON LOAN (-2.2%) | | | (4,264,427 | ) | |
OTHER ASSETS, LESS LIABILITIES (3.4%) | | | 6,688,544 | | |
NET ASSETS (100.0%) | | $ | 196,335,552 | | |
NOTES TO SCHEDULE OF INVESTMENTS
* Securities issued and sold pursuant to a Rule 144A transaction are exempted from the registration requirement of the Securities Act of 1933, as amended. These securities may only be sold to qualified institutional buyers ("QIBs"), such as the Fund. Any resale of these securities must generally be effected through a sale that is registered under the Act or otherwise exempted from such registration requirements.
# Non-income producing security.
~ Security, or portion of security, is segregated as collateral (or collateral for potential future transactions) for written options. The aggregate value of such securities is $1,763,198.
^ Security, or portion of security, is on loan.
†† Security or a portion of the security purchased on a delayed delivery or when-issued basis.
† Represents investment of cash collateral received from securities on loan as of October 31, 2023.
*** The rate disclosed is the 7 day net yield as of October 31, 2023.
FOREIGN CURRENCY ABBREVIATIONS
CAD Canadian Dollar
EUR European Monetary Unit
GBP British Pound Sterling
HKD Hong Kong Dollar
IDR Indonesian Rupiah
INR Indian Rupee
JPY Japanese Yen
TWD New Taiwan Dollar
Note: Value for securities denominated in foreign currencies is shown in U.S. dollars. The principal amount for such securities is shown in the respective foreign currency. The date on options represents the expiration date of the option contract. The option contract may be exercised at any date on or before the date shown.
CURRENCY EXPOSURE
OCTOBER 31, 2023
| | | VALUE | | % OF TOTAL
INVESTMENTS | |
US Dollar | | $ | 129,423,921 | | | | 66.8 | % | |
European Monetary Unit | | | 27,667,249 | | | | 14.3 | % | |
British Pound Sterling | | | 12,089,615 | | | | 6.2 | % | |
Japanese Yen | | | 6,779,162 | | | | 3.5 | % | |
New Taiwan Dollar | | | 5,879,143 | | | | 3.0 | % | |
Canadian Dollar | | | 4,737,012 | | | | 2.4 | % | |
Hong Kong Dollar | | | 4,227,468 | | | | 2.2 | % | |
Indian Rupee | | | 1,937,507 | | | | 1.0 | % | |
Indonesian Rupiah | | | 1,170,358 | | | | 0.6 | % | |
Total Investments | | $ | 193,911,435 | | | | 100.0 | % | |
Currency exposure may vary over time.
See accompanying Notes to Schedule of Investments
www.calamos.com
149
International Small Cap Growth Fund Schedule of Investments October 31, 2023
NUMBER OF
SHARES | | | | VALUE | |
COMMON STOCKS (95.2%) | | | |
| | | Communication Services (0.7%) | |
| | 257 | EUR | | Scout24, SE* | | $ | 15,811 | | |
| | | Consumer Discretionary (14.2%) | |
| | 835 | INR | | Amber Enterprises India, Ltd.# | | | 29,378 | | |
| | 185,000 | PHP | | Bloomberry Resorts Corp.# | | | 29,703 | | |
| | 680 | INR | | Dixon Technologies India, Ltd. | | | 41,737 | | |
| | 15,300 | INR | | Kalyan Jewellers India, Ltd. | | | 53,166 | | |
| | 1,175 | | | MakeMyTrip, Ltd.# | | | 45,508 | | |
| | 610,000 | IDR | | Map Aktif Adiperkasa PT | | | 28,609 | | |
| | 9,300 | HKD | | Samsonite International, SA*# | | | 28,803 | | |
| | 1,400 | JPY | | Toyota Boshoku Corp. | | | 24,347 | | |
| | 1,935 | INR | | TVS Motor Company, Ltd. | | | 37,004 | | |
| | 18,900 | HKD | | Wynn Macau, Ltd.# | | | 16,738 | | |
| | | | 334,993 | | |
| | | Consumer Staples (4.6%) | |
| | 16,100 | CHF | | Aryzta, AG# | | | 29,508 | | |
| | 1,000 | JPY | | Kobe Bussan Company, Ltd. | | | 24,748 | | |
| | 1,300 | JPY | | Rohto Pharmaceutical Company, Ltd. | | | 30,331 | | |
| | 1,100 | JPY | | Yamazaki Baking Company, Ltd. | | | 23,259 | | |
| | | | 107,846 | | |
| | | Energy (6.4%) | |
| | 3,595 | CAD | | ARC Resources, Ltd. | | | 57,836 | | |
| | 21,370 | EUR | | Saipem S.p.A# | | | 32,564 | | |
| | 2,770 | | | TechnipFMC, PLC | | | 59,611 | | |
| | | | 150,011 | | |
| | | Financials (5.3%) | |
| | 2,920 | EUR | | Bank of Ireland Group, PLC | | | 26,168 | | |
| | 8,600 | JPY | | Concordia Financial Group, Ltd. | | | 39,959 | | |
| | 1,800 | JPY | | Japan Exchange Group, Inc. | | | 35,595 | | |
| | 7,095 | AUD | | Steadfast Group, Ltd. | | | 24,398 | | |
| | | | 126,120 | | |
| | | Health Care (6.4%) | |
| | 1,425 | GBP | | Ergomed, PLC# | | | 23,211 | | |
| | 1,072 | EUR | | Gerresheimer, AG | | | 99,989 | | |
| | 103 | CHF | | Ypsomed Holding, AG | | | 28,387 | | |
| | | | 151,587 | | |
| | | Industrials (31.8%) | |
| | 7,230 | GBP | | Ashtead Technology Holdings, PLC | | | 42,261 | | |
| | 1,200 | JPY | | BayCurrent Consulting, Inc. | | | 30,128 | | |
| | 855 | EUR | | DO & CO, AG | | | 99,876 | | |
| | 700 | JPY | | Ebara Corp. | | | 30,998 | | |
NUMBER OF
SHARES | | | | VALUE | |
| | 1,060 | INR | | Hindustan Aeronautics, Ltd. | | $ | 23,223 | | |
| | 5,700 | JPY | | INFRONEER Holdings, Inc. | | | 60,128 | | |
| | 700 | JPY | | Japan Airport Terminal Company, Ltd. | | | 30,785 | | |
| | 2,000 | JPY | | Japan Elevator Service Holdings Company, Ltd. | | | 26,504 | | |
| | 1,100 | JPY | | Keisei Electric Railway Company, Ltd. | | | 41,437 | | |
| | 800 | JPY | | Kyudenko Corp. | | | 23,897 | | |
| | 2,390 | EUR | | Leonardo S.p.A | | | 36,119 | | |
| | 11,600 | GBP | | Melrose Industries, PLC | | | 66,048 | | |
| | 7,517 | SEK | | Munters Group, AB* | | | 91,773 | | |
| | 2,200 | JPY | | Sojitz Corp. | | | 45,684 | | |
| | 1,120 | CAD | | Stantec, Inc. | | | 68,529 | | |
| | 3,740 | INR | | Titagarh Rail System, Ltd. | | | 34,211 | | |
| | | 751,601 | | |
| | | Information Technology (17.8%) | |
| | 3,160 | TWD | | Accton Technology Corp. | | | 48,962 | | |
| | 850 | TWD | | Alchip Technologies, Ltd. | | | 69,714 | | |
| | 507 | EUR | | BE Semiconductor Industries, NV | | | 52,373 | | |
| | 168 | | | Fabrinet# | | | 26,040 | | |
| | 980 | KRW | | HPSP Company, Ltd. | | | 22,732 | | |
| | 530 | JPY | | Ibiden Company, Ltd. | | | 22,597 | | |
| | 4,150 | INR | | KPIT Technologies, Ltd. | | | 61,084 | | |
| | 2,980 | GBP | | Sage Group, PLC | | | 35,205 | | |
| | 600 | JPY | | SCREEN Holdings Company, Ltd. | | | 27,895 | | |
| | 300 | JPY | | SHIFT, Inc.# | | | 54,432 | | |
| | | | 421,034 | | |
| | | Materials (2.2%) | |
| | 930 | CAD | | ERO Copper Corp.# | | | 12,621 | | |
| | 1,385 | EUR | | SOL S.p.A | | | 39,858 | | |
| | | | 52,479 | | |
| | | Real Estate (5.8%) | |
| | 22,800 | MXN | | Corp. Inmobiliaria Vesta SAB de CV | | | 71,502 | | |
| | 3,180 | INR | | Macrotech Developers, Ltd.* | | | 30,049 | | |
| | 7,500 | JPY | | Mirarth Holdings, Inc. | | | 21,863 | | |
| | 175 | EUR | | VGP, NV | | | 14,246 | | |
| | | | 137,660 | | |
| | | TOTAL COMMON STOCKS
(Cost $2,140,980) | | | 2,249,142 | | |
PREFERRED STOCK (1.2%) | | | |
| | | Industrials (1.2%) | |
| | 12,490 | BRL | | Randon, SA Implementos e
Participacoes
(Cost $32,527) | | | 27,028 | | |
See accompanying Notes to Schedule of Investments
CALAMOS OPEN-END FAMILY OF FUNDS ANNUAL REPORT
150
International Small Cap Growth Fund Schedule of Investments October 31, 2023
NUMBER OF
CONTRACTS/
NOTIONAL
AMOUNT | | | | VALUE | |
PURCHASED OPTION (0.3%)# | |
| | | Other (0.3%) | |
| | 31 | | | iShares MSCI India Small-Cap ETF | | | | | |
| | 191,952 | | | Put, 02/16/24, Strike $62.00
(Cost $6,690) | | $ | 6,975 | | |
| | | TOTAL INVESTMENTS (96.7%)
(Cost $2,180,197) | | | 2,283,145 | | |
OTHER ASSETS, LESS LIABILITIES (3.3%) | | | 78,877 | | |
NET ASSETS (100.0%) | | $ | 2,362,022 | | |
NOTES TO SCHEDULE OF INVESTMENTS
* Securities issued and sold pursuant to a Rule 144A transaction are exempted from the registration requirement of the Securities Act of 1933, as amended. These securities may only be sold to qualified institutional buyers ("QIBs"), such as the Fund. Any resale of these securities must generally be effected through a sale that is registered under the Act or otherwise exempted from such registration requirements.
# Non-income producing security.
FOREIGN CURRENCY ABBREVIATIONS
AUD Australian Dollar
BRL Brazilian Real
CAD Canadian Dollar
CHF Swiss Franc
EUR European Monetary Unit
GBP British Pound Sterling
HKD Hong Kong Dollar
IDR Indonesian Rupiah
INR Indian Rupee
JPY Japanese Yen
KRW South Korean Won
MXN Mexican Peso
PHP Philippine Peso
SEK Swedish Krona
TWD New Taiwan Dollar
Note: Value for securities denominated in foreign currencies is shown in U.S. dollars. The date on options represents the expiration date of the option contract. The option contract may be exercised at any date on or before the date shown.
CURRENCY EXPOSURE
OCTOBER 31, 2023
| | | VALUE | | % OF TOTAL
INVESTMENTS | |
Japanese Yen | | $ | 594,587 | | | | 26.0 | % | |
European Monetary Unit | | | 417,004 | | | | 18.3 | % | |
Indian Rupee | | | 309,852 | | | | 13.6 | % | |
British Pound Sterling | | | 166,726 | | | | 7.3 | % | |
Canadian Dollar | | | 138,986 | | | | 6.1 | % | |
US Dollar | | | 138,134 | | | | 6.0 | % | |
New Taiwan Dollar | | | 118,676 | | | | 5.2 | % | |
Swedish Krona | | | 91,773 | | | | 4.0 | % | |
Mexican Peso | | | 71,502 | | | | 3.1 | % | |
Swiss Franc | | | 57,895 | | | | 2.5 | % | |
Hong Kong Dollar | | | 45,541 | | | | 2.0 | % | |
Philippine Peso | | | 29,703 | | | | 1.3 | % | |
Indonesian Rupiah | | | 28,609 | | | | 1.3 | % | |
Brazilian Real | | | 27,027 | | | | 1.2 | % | |
Australian Dollar | | | 24,398 | | | | 1.1 | % | |
South Korean Won | | | 22,732 | | | | 1.0 | % | |
Total Investments | | $ | 2,283,145 | | | | 100.0 | % | |
Currency exposure may vary over time.
See accompanying Notes to Schedule of Investments
www.calamos.com
151
Total Return Bond Fund Schedule of Investments October 31, 2023
PRINCIPAL
AMOUNT | | | | VALUE | |
CORPORATE BONDS (41.5%) | | | |
| | | Airlines (1.3%) | |
| | 99,368 | | | Air Canada Pass Through Trust
Series 2015-2, Class AA*
3.750%, 06/15/29 | | $ | 89,869 | | |
| | 95,604 | | | Alaska Airlines Pass Through Trust
Series 2020-1, Class A*
4.800%, 02/15/29 | | | 89,612 | | |
| | 48,468 | | | British Airways Pass Through Trust
Series 2013-1, Class A*
4.625%, 12/20/25 | | | 47,929 | | |
| | 96,562 | | | British Airways Pass Through Trust
Series 2019-1, Class A*
3.350%, 12/15/30 | | | 85,461 | | |
| | 126,224 | | | JetBlue Pass Through Trust
Series 2019-1, Class AA
2.750%, 11/15/33 | | | 105,133 | | |
| | | | 418,004 | | |
| | | Communication Services (2.1%) | |
| | 200,000 | | | Ashtead Capital, Inc.*
4.375%, 08/15/27 | | | 185,284 | | |
| | 100,000 | | | Charter Communications Operating, LLC /
Charter Communications Operating Capital
2.800%, 04/01/31 | | | 76,775 | | |
| | 150,000 | | | Comcast Corp.
3.900%, 03/01/38 | | | 116,444 | | |
| | 75,000 | | | Paramount Global
3.450%, 10/04/26 | | | 68,000 | | |
| | 100,000 | | | United States Cellular Corp.
6.700%, 12/15/33 | | | 95,235 | | |
| | 150,000 | | | Verizon Communications, Inc.
4.016%, 12/03/29 | | | 134,028 | | |
| | | | 675,766 | | |
| | | Consumer Discretionary (3.0%) | |
| | 150,000 | | | Cargill, Inc.*
3.125%, 05/25/51 | | | 91,047 | | |
| | 200,000 | | | Ford Motor Credit Company, LLC
4.000%, 11/13/30 | | | 164,916 | | |
| | 100,000 | | | GLP Capital, LP / GLP Financing II, Inc.
3.250%, 01/15/32 | | | 75,775 | | |
| | 100,000 | | | goeasy, Ltd.*
4.375%, 05/01/26 | | | 90,645 | | |
| | 125,000 | | | Kohl's Corp.
5.550%, 07/17/45 | | | 72,270 | | |
| | 100,000 | | | M/I Homes, Inc.
3.950%, 02/15/30 | | | 80,019 | | |
| | 100,000 | | | Mattel, Inc.
6.200%, 10/01/40 | | | 85,268 | | |
| | 100,000 | | | Newell Brands, Inc.
5.200%, 04/01/26 | | | 94,457 | | |
PRINCIPAL
AMOUNT | | | | VALUE | |
| | 100,000 | | | NIKE, Inc.
2.850%, 03/27/30 | | $ | 85,578 | | |
| | 100,000 | | | Tractor Supply Company
5.250%, 05/15/33 | | | 91,648 | | |
| | | | 931,623 | | |
| | | Consumer Staples (2.6%) | |
| | 125,000 | | | Anheuser-Busch InBev Worldwide, Inc.
3.500%, 06/01/30 | | | 109,906 | | |
| | 125,000 | | | Archer-Daniels-Midland Company
3.250%, 03/27/30 | | | 108,435 | | |
| | 125,000 | | | Costco Wholesale Corp.
1.600%, 04/20/30 | | | 98,972 | | |
| | 100,000 | | | Edgewell Personal Care Company*
4.125%, 04/01/29 | | | 84,093 | | |
| | 125,000 | | | Hershey Company
1.700%, 06/01/30 | | | 98,106 | | |
| | 200,000 | | | JBS USA LUX, SA / JBS USA
Food Company / JBS USA Finance, Inc.
5.500%, 01/15/30 | | | 182,986 | | |
| | 100,000 | | | Kimberly-Clark Corp.
3.100%, 03/26/30 | | | 86,301 | | |
| | 50,000 | | | Pilgrim's Pride Corp.
4.250%, 04/15/31 | | | 41,312 | | |
| | | | 810,111 | | |
| | | Energy (1.1%) | |
| | 175,000 | | | Energy Transfer, LP‡
8.656%, 11/01/66
3 mo. USD LIBOR + 3.02% | | | 143,080 | | |
| | 100,000 | | | EQM Midstream Partners, LP*
7.500%, 06/01/27 | | | 99,416 | | |
| | 100,000 | | | EQT Corp.*
3.125%, 05/15/26 | | | 92,622 | | |
| | | | 335,118 | | |
| | | Financials (12.3%) | |
| | 115,000 | | | Ally Financial, Inc.‡
4.700%, 11/01/35
5 year CMT + 3.87% | | | 75,144 | | |
| | 100,000 | | | Aviation Capital Group, LLC*
3.500%, 11/01/27 | | | 87,894 | | |
| | 100,000 | | | Avolon Holdings Funding, Ltd.*
5.500%, 01/15/26 | | | 96,386 | | |
| | 125,000 | | | AXIS Specialty Finance, PLC
4.000%, 12/06/27 | | | 114,840 | | |
| | 100,000 | | | Bank of America Corp.‡
2.087%, 06/14/29
SOFR + 1.06% | | | 82,563 | | |
| | 150,000 | | | Bank of Montreal‡
3.088%, 01/10/37
5 year CMT + 1.40% | | | 108,716 | | |
| | 75,000 | | | 4.800%, 11/01/35
5 year CMT + 2.98% | | | 67,112 | | |
See accompanying Notes to Schedule of Investments
CALAMOS OPEN-END FAMILY OF FUNDS ANNUAL REPORT
152
Total Return Bond Fund Schedule of Investments October 31, 2023
PRINCIPAL
AMOUNT | | | | VALUE | |
| | 100,000 | | | Bank of New York Mellon Corp.‡
5.834%, 10/25/33
SOFR + 2.07% | | $ | 95,858 | | |
| | 150,000 | | | Berkshire Hathaway Finance Corp.
4.250%, 01/15/49 | | | 116,270 | | |
| | 125,000 | | | BP Capital Markets, PLC‡
4.875%, 11/01/35
5 year CMT + 4.40% | | | 108,846 | | |
| | 175,000 | | | Brookfield Finance, Inc.
2.724%, 04/15/31 | | | 135,765 | | |
| | 150,000 | | | Capital One Financial Corp.‡
2.359%, 07/29/32
SOFR + 1.34% | | | 99,383 | | |
| | 100,000 | | | Charles Schwab Corp.‡
4.000%, 11/01/35
5 year CMT + 3.17% | | | 79,543 | | |
| | 100,000 | | | Chubb INA Holdings, Inc.&
4.150%, 03/13/43 | | | 77,445 | | |
| | 150,000 | | | Citigroup, Inc.‡
3.875%, 11/01/35
5 year CMT + 3.42% | | | 125,940 | | |
| | 100,000 | | | Essential Properties, LP
2.950%, 07/15/31 | | | 71,589 | | |
| | 100,000 | | | Essex Portfolio, LP
1.700%, 03/01/28 | | | 83,088 | | |
| | 100,000 | | | Global Net Lease, Inc. / Global Net Lease
Operating Partnership, LP*
3.750%, 12/15/27 | | | 75,952 | | |
| | 125,000 | | | Globe Life, Inc.
4.550%, 09/15/28 | | | 117,337 | | |
| | 150,000 | | | Goldman Sachs Group, Inc.‡
3.800%, 05/10/26
5 year CMT + 2.97% | | | 117,166 | | |
| | 250,000 | | | ILFC E-Capital Trust II*‡
7.459%, 12/21/65
3 mo. USD LIBOR + 1.80% | | | 188,042 | | |
| | 125,000 | | | JPMorgan Chase & Company‡^
3.650%, 11/01/35
5 year CMT + 2.85% | | | 108,608 | | |
| | 200,000 | | | LSEGA Financing, PLC*
2.000%, 04/06/28 | | | 168,650 | | |
| | 125,000 | | | Markel Corp.
3.500%, 11/01/27 | | | 114,249 | | |
| | 100,000 | | | MetLife, Inc.
6.400%, 12/15/66 | | | 93,949 | | |
| | 100,000 | | | Necessity Retail REIT, Inc. /
American Finance Operating Partner, LP*
4.500%, 09/30/28 | | | 74,965 | | |
| | 118,000 | | | PartnerRe Finance B, LLC‡^
4.500%, 10/01/50
5 year CMT + 3.82% | | | 97,182 | | |
| | 100,000 | | | Primerica, Inc.
2.800%, 11/19/31 | | | 77,162 | | |
| | 100,000 | | | Prologis, LP
2.875%, 11/15/29 | | | 84,374 | | |
PRINCIPAL
AMOUNT | | | | VALUE | |
| | 100,000 | | | Radian Group, Inc.
4.500%, 10/01/24 | | $ | 97,554 | | |
| | 125,000 | | | RenaissanceRe Finance, Inc.
3.450%, 07/01/27 | | | 113,563 | | |
| | 100,000 | | | SLM Corp.
3.125%, 11/02/26 | | | 87,560 | | |
| | 100,000 | | | Toronto-Dominion Bank
4.456%, 06/08/32 | | | 87,212 | | |
| | 125,000 | | | Travelers Companies, Inc.
2.550%, 04/27/50 | | | 68,041 | | |
| | 200,000 | | | USAA Capital Corp.*
2.125%, 05/01/30 | | | 158,038 | | |
| | 125,000 | | | Ventas Realty, LP
4.000%, 03/01/28 | | | 113,875 | | |
| | 100,000 | | | VICI Properties, LP /
VICI Note Company, Inc.*
3.500%, 02/15/25 | | | 95,763 | | |
| | 125,000 | | | Wells Fargo & Company&
4.400%, 06/14/46 | | | 87,515 | | |
| | | | 3,853,139 | | |
| | | Health Care (3.0%) | |
| | 100,000 | | | Charles River Laboratories International, Inc.*
3.750%, 03/15/29 | | | 84,824 | | |
| | 150,000 | | | CVS Health Corp.
4.780%, 03/25/38 | | | 124,063 | | |
| | 100,000 | | | DaVita, Inc.*
4.625%, 06/01/30 | | | 78,461 | | |
| | 100,000 | | | Elanco Animal Health, Inc.^
6.650%, 08/28/28 | | | 95,816 | | |
| | 100,000 | | | Illumina, Inc.
5.750%, 12/13/27 | | | 97,721 | | |
| | 150,000 | | | Johnson & Johnson
3.400%, 01/15/38 | | | 116,702 | | |
| | 100,000 | | | Kaiser Foundation Hospitals
2.810%, 06/01/41 | | | 64,315 | | |
| | 100,000 | | | Royalty Pharma, PLC
2.200%, 09/02/30 | | | 76,369 | | |
| | 100,000 | | | UnitedHealth Group, Inc.
5.250%, 02/15/28 | | | 99,364 | | |
| | 100,000 | | | Zoetis, Inc.
5.600%, 11/16/32 | | | 97,077 | | |
| | | | 934,712 | | |
| | | Industrials (6.4%) | |
| | 125,000 | | | Air Lease Corp.‡
4.650%, 11/01/35
5 year CMT + 4.08% | | | 106,769 | | |
| | 100,000 | | | Albertsons Companies, Inc. /
Safeway, Inc. / New Albertsons,
LP / Albertsons, LLC*
4.625%, 01/15/27 | | | 94,123 | | |
| | 100,000 | | | Allegiant Travel Company*
7.250%, 08/15/27 | | | 91,078 | | |
See accompanying Notes to Schedule of Investments
www.calamos.com
153
Total Return Bond Fund Schedule of Investments October 31, 2023
PRINCIPAL
AMOUNT | | | | VALUE | |
| | 40,000 | | | Ball Corp.
6.875%, 03/15/28 | | $ | 39,974 | | |
| | 125,000 | | | Beacon Roofing Supply, Inc.*
4.500%, 11/15/26 | | | 116,752 | | |
| | 100,000 | | | Burlington Northern Santa Fe, LLC
4.950%, 09/15/41 | | | 86,134 | | |
| | 100,000 | | | Cascades, Inc. / Cascades USA, Inc.*^
5.125%, 01/15/26 | | | 95,594 | | |
| | 100,000 | | | Cummins, Inc.
4.875%, 10/01/43 | | | 85,658 | | |
| | 130,000 | | | Delta Air Lines Pass Through Trust
Series 2019-1, Class AA
3.204%, 10/25/25 | | | 127,717 | | |
| | 100,000 | | | EnerSys*
4.375%, 12/15/27 | | | 89,825 | | |
| | 100,000 | | | Graphic Packaging International, LLC*
1.512%, 04/15/26 | | | 88,761 | | |
| | 80,000 | | | GXO Logistics, Inc.
1.650%, 07/15/26 | | | 70,498 | | |
| | 100,000 | | | Hawaiian Brand Intellectual
Property, Ltd. / HawaiianMiles Loyalty, Ltd.*
5.750%, 01/20/26 | | | 73,980 | | |
| | 100,000 | | | Honeywell International, Inc.
1.950%, 06/01/30 | | | 79,546 | | |
| | 100,000 | | | Illinois Tool Works, Inc.
4.875%, 09/15/41 | | | 88,019 | | |
| | 125,000 | | | Infor, Inc.*
1.750%, 07/15/25 | | | 115,263 | | |
| | 125,000 | | | Roper Technologies, Inc.
1.400%, 09/15/27 | | | 105,876 | | |
| | 250,000 | | | SMBC Aviation Capital Finance DAC*
1.900%, 10/15/26 | | | 220,477 | | |
| | 125,000 | | | TransDigm, Inc.*
6.250%, 03/15/26 | | | 122,327 | | |
| | 107,482 | | | United Airlines Pass Through Trust
Series 2018-1, Class B
4.600%, 09/01/27 | | | 99,722 | | |
| | | | 1,998,093 | | |
| | | Information Technology (3.9%) | |
| | 150,000 | | | Apple, Inc.
4.375%, 05/13/45 | | | 123,192 | | |
| | 100,000 | | | Broadridge Financial Solutions, Inc.
3.400%, 06/27/26 | | | 93,557 | | |
| | 125,000 | | | CGI, Inc.
1.450%, 09/14/26 | | | 110,199 | | |
| | 125,000 | | | Fortinet, Inc.^
2.200%, 03/15/31 | | | 95,395 | | |
| | 100,000 | | | Intuit, Inc.
5.200%, 09/15/33 | | | 95,174 | | |
| | 157,000 | | | Microsoft Corp.
4.100%, 02/06/37 | | | 136,533 | | |
| | 125,000 | | | NVIDIA Corp.
3.500%, 04/01/40 | | | 93,831 | | |
PRINCIPAL
AMOUNT | | | | VALUE | |
| | 100,000 | | | Open Text Corp.*
6.900%, 12/01/27 | | $ | 99,808 | | |
| | 100,000 | | | Take-Two Interactive Software, Inc.
4.950%, 03/28/28 | | | 96,128 | | |
| | 100,000 | | | TTM Technologies, Inc.*
4.000%, 03/01/29 | | | 82,272 | | |
| | 100,000 | | | Twilio, Inc.
3.625%, 03/15/29 | | | 83,457 | | |
| | 150,000 | | | VMware, Inc.
1.800%, 08/15/28 | | | 123,848 | | |
| | | | 1,233,394 | | |
| | | Materials (0.9%) | |
| | 100,000 | | | ArcelorMittal, SA
6.550%, 11/29/27 | | | 100,483 | | |
| | 100,000 | | | Clearwater Paper Corp.*
5.375%, 02/01/25 | | | 98,000 | | |
| | 100,000 | | | Georgia-Pacific, LLC*
3.600%, 03/01/25 | | | 97,149 | | |
| | | | 295,632 | | |
| | | Other (0.4%) | |
| | 125,000 | | | Intact Financial Corp.*
5.459%, 09/22/32 | | | 115,839 | | |
| | | Real Estate (2.0%) | |
| | 100,000 | | | Brixmor Operating Partnership, LP
4.125%, 06/15/26 | | | 94,130 | | |
| | 150,000 | | | EPR Properties
4.950%, 04/15/28 | | | 130,800 | | |
| | 125,000 | | | Forestar Group, Inc.*
3.850%, 05/15/26 | | | 112,180 | | |
| | 100,000 | | | Healthpeak OP LLC
3.250%, 07/15/26 | | | 93,559 | | |
| | 100,000 | | | Public Storage
2.300%, 05/01/31 | | | 77,849 | | |
| | 125,000 | | | Tanger Properties, LP
3.875%, 07/15/27 | | | 110,241 | | |
| | | | 618,759 | | |
| | | Utilities (2.5%) | |
| | 150,000 | | | Berkshire Hathaway Energy Company
3.800%, 07/15/48 | | | 99,335 | | |
| | 100,000 | | | Consolidated Edison Company of
New York, Inc.
3.350%, 04/01/30 | | | 86,250 | | |
| | 150,000 | | | Duke Energy Carolinas, LLC
3.700%, 12/01/47 | | | 100,973 | | |
| | 100,000 | | | Entergy Texas, Inc.
1.500%, 09/01/26 | | | 87,387 | | |
| | 100,000 | | | Monongahela Power Company*
3.550%, 05/15/27 | | | 92,114 | | |
| | 150,000 | | | Northern States Power Company
3.750%, 12/01/47 | | | 95,454 | | |
See accompanying Notes to Schedule of Investments
CALAMOS OPEN-END FAMILY OF FUNDS ANNUAL REPORT
154
Total Return Bond Fund Schedule of Investments October 31, 2023
PRINCIPAL
AMOUNT | | | | VALUE | |
| | 150,000 | | | Public Service Electric and Gas Company
3.600%, 12/01/47 | | $ | 101,920 | | |
| | 125,000 | | | Southern Company‡
3.750%, 09/15/51
5 year CMT + 2.92% | | | 106,427 | | |
| | | | 769,860 | | |
| | | | | TOTAL CORPORATE BONDS
(Cost $15,200,759) | | | 12,990,050 | | |
BANK LOANS (5.1%)¡ | | | |
| | | Airlines (0.6%) | |
| | 166,500 | | | American Airlines, Inc.‡
10.427%, 04/20/28
3 mo. SOFR + 4.75% | | | 169,102 | | |
| | | Communication Services (2.1%) | |
| | 223,858 | | | APi Group DE, Inc.
7.825%, 01/03/29
1 mo. SOFR + 2.50% | | | 224,473 | | |
| | 290,554 | | | Go Daddy Operating Company, LLC‡
7.824%, 11/09/29
1 mo. SOFR + 2.50% | | | 291,148 | | |
| | 147,609 | | | Nexstar Broadcasting, Inc.‡
7.939%, 09/18/26
1 mo. SOFR + 2.50% | | | 147,742 | | |
| | | | 663,363 | | |
| | | Consumer Discretionary (1.1%) | |
| | 59,111 | | | American Axle and Manufacturing, Inc.‡
9.007%, 12/13/29
3 mo. SOFR + 3.50% | | | 58,988 | | |
| | 39,389 | | | American Axle and Manufacturing, Inc.‡
8.941%, 12/13/29
1 mo. SOFR + 3.50% | | | 39,307 | | |
| | 243,750 | | | Murphy USA, Inc.‡
7.179%, 01/31/28
1 mo. SOFR + 1.75% | | | 244,741 | | |
| | | | 343,036 | | |
| | | Financials (0.4%) | |
| | 132,109 | | | Jazz Financing Lux Sarl‡
8.939%, 05/05/28
1 mo. SOFR + 3.50% | | | 132,218 | | |
| | | Health Care (0.5%) | |
| | 127,057 | | | Icon Luxembourg Sarl‡
7.902%, 07/03/28
3 mo. SOFR + 2.25% | | | 127,277 | | |
| | 31,656 | | | PRA Health Sciences, Inc.
7.902%, 07/03/28
3 mo. SOFR + 2.25% | | | 31,711 | | |
| | | | 158,988 | | |
PRINCIPAL
AMOUNT | | | | VALUE | |
| | | Industrials (0.3%) | |
| | 99,250 | | | Summit Materials, LLC‡
8.571%, 12/14/27
3 mo. SOFR + 3.00% | | $ | 99,793 | | |
| | | | 99,793 | | |
| | | Materials (0.1%) | |
| | 41,409 | | | Axalta Coating Systems U.S. Holdings, Inc.‡
7.890%, 12/20/29
3 mo. SOFR + 2.50% | | | 41,515 | | |
| | | | | TOTAL BANK LOANS
(Cost $1,603,258) | | | 1,608,015 | | |
U.S. GOVERNMENT AND AGENCY SECURITIES (43.4%) | | | |
| | | Other (43.4%) | |
| | 82,384 | | | Federal Home Loan Mortgage Corp. Pool
2.500%, 02/01/35 | | | 72,404 | | |
| | 140,356 | | | 4.000%, 05/01/49 | | | 123,463 | | |
| | 118,828 | | | Federal National Mortgage Association
2.500%, 09/01/31 | | | 109,559 | | |
| | 94,964 | | | 3.000%, 02/01/33 | | | 87,624 | | |
| | 51,303 | | | 3.000%, 01/01/35 | | | 46,518 | | |
| | 258,117 | | | 3.000%, 07/01/46 | | | 212,598 | | |
| | 166,045 | | | 3.000%, 03/01/47 | | | 136,763 | | |
| | 46,068 | | | 4.000%, 03/01/47 | | | 40,678 | | |
| | 144,775 | | | 3.500%, 08/01/47 | | | 123,317 | | |
| | 81,958 | | | 4.500%, 04/01/48 | | | 74,687 | | |
| | 106,063 | | | 4.000%, 06/01/48 | | | 93,450 | | |
| | 72,049 | | | 3.500%, 02/01/49 | | | 61,087 | | |
| | 64,030 | | | 3.000%, 07/01/49 | | | 51,984 | | |
| | 123,777 | | | 3.500%, 11/01/49 | | | 104,781 | | |
| | 596,216 | | | 2.500%, 04/01/50 | | | 462,623 | | |
| | 517,341 | | | 3.000%, 04/01/50 | | | 419,379 | | |
| | 423,909 | | | 3.500%, 04/01/50 | | | 355,741 | | |
| | 801,730 | | | 2.500%, 07/01/51 | | | 618,120 | | |
| | 587,817 | | | 2.000%, 01/01/52 | | | 432,776 | | |
| | 588,953 | | | 4.500%, 06/01/52 | | | 526,392 | | |
| | 526,129 | | | 4.000%, 11/01/52 | | | 455,033 | | |
| | 472,218 | | | 4.500%, 11/01/52 | | | 422,057 | | |
| | 465,095 | | | 5.500%, 12/01/52 | | | 442,402 | | |
| | 775,977 | | | 5.500%, 08/01/53 | | | 736,572 | | |
| | 841,623 | | | 6.000%, 09/01/53 | | | 819,360 | | |
| | 142,034 | | | Government National Mortgage
Association II Pool
3.500%, 10/20/47 | | | 122,730 | | |
| | 107,721 | | | 3.000%, 10/20/47 | | | 90,333 | | |
| | 500,000 | | | United States Treasury Bond
3.500%, 02/15/39 | | | 413,945 | | |
| | 400,000 | | | 1.125%, 05/15/40 | | | 218,063 | | |
| | 200,000 | | | 4.000%, 11/15/42 | | | 169,547 | | |
| | 460,000 | | | 3.875%, 02/15/43 | | | 382,519 | | |
| | 325,000 | | | 3.875%, 05/15/43 | | | 269,902 | | |
| | 500,000 | | | 3.000%, 05/15/47 | | | 346,875 | | |
| | 300,000 | | | 3.000%, 02/15/49 | | | 206,391 | | |
| | 500,000 | | | 2.250%, 08/15/49 | | | 291,914 | | |
| | 125,000 | | | 2.375%, 11/15/49 | | | 75,098 | | |
| | 500,000 | | | 2.000%, 02/15/50 | | | 273,750 | | |
| | 200,000 | | | 2.875%, 05/15/52 | | | 133,484 | | |
See accompanying Notes to Schedule of Investments
www.calamos.com
155
Total Return Bond Fund Schedule of Investments October 31, 2023
PRINCIPAL
AMOUNT | | | | VALUE | |
| | 846,280 | | | United States Treasury Inflation
Indexed Note
0.500%, 01/15/28 | | $ | 776,748 | | |
| | 675,000 | | | United States Treasury Note
3.875%, 03/31/25 | | | 662,383 | | |
| | 500,000 | | | 4.500%, 07/15/26 | | | 494,531 | | |
| | 200,000 | | | 3.875%, 12/31/27 | | | 192,656 | | |
| | 175,000 | | | 3.750%, 06/30/30 | | | 163,420 | | |
| | 300,000 | | | 3.500%, 02/15/33 | | | 268,617 | | |
| | 500,000 | | | 3.375%, 05/15/33^ | | | 442,227 | | |
| | 350,000 | | | 3.000%, 08/15/52 | | | 240,160 | | |
| | 425,000 | | | 3.625%, 02/15/53 | | | 331,234 | | |
| | | | | TOTAL U.S. GOVERNMENT AND
AGENCY SECURITIES
(Cost $16,292,759) | | | 13,595,895 | | |
RESIDENTIAL MORTGAGE BACKED SECURITIES (1.7%) | | | |
| | | Other (1.7%) | |
| | 100,000 | | | BX Trust Series 2019-OC11, Class A*
3.202%, 12/09/41 | | | 82,687 | | |
| | 500,000 | | | Freddie Mac Multifamily Structured Pass
Through Certificates K157, Class A2‡
3.990%, 05/25/33 | | | 454,133 | | |
| | | | | TOTAL RESIDENTIAL MORTGAGE
BACKED SECURITIES
(Cost $683,786) | | | 536,820 | | |
ASSET BACKED SECURITIES (6.3%) | | | |
| | | Communication Services (0.3%) | |
| | 100,000 | | | T-Mobile U.S. Trust Series 2022-1A, Class A*
4.910%, 05/22/28 | | | 98,613 | | |
| | | Financials (3.3%) | |
| | 104,711 | | | Commonbond Student Loan Trust
Series 2021-A-GS, Class A*
1.200%, 03/25/52 | | | 85,035 | | |
| | 85,529 | | | ELFI Graduate Loan Program, LLC
Series 2022-A, Class A*
4.510%, 08/26/47 | | | 80,857 | | |
| | 51,681 | | | Enterprise Fleet Financing, LLC
Series 2022-4, Class A2*
5.760%, 10/22/29 | | | 51,412 | | |
| | 150,000 | | | Hertz Vehicle Financing III, LP
Series 2021-2A, Class A*
1.680%, 12/27/27 | | | 131,226 | | |
| | 150,000 | | | Oscar US Funding XII, LLC
Series 2021-1A, Class A4*
1.000%, 04/10/28 | | | 141,056 | | |
| | 110,000 | | | Pawneee Equipment Receivables, LLC
Series 2022-1, Class A3*
5.170%, 02/15/28 | | | 108,671 | | |
| | 237,000 | | | Progress Residential Trust
Series 2021-SFR5, Class B*
1.658%, 07/17/38 | | | 207,681 | | |
PRINCIPAL
AMOUNT | | | | VALUE | |
| | 71,595 | | | SoFi Professional Loan Program, LLC
Series 2017-F, Class A2FX*
2.840%, 01/25/41 | | $ | 68,889 | | |
| | 150,000 | | | Toyota Auto Loan Extended Note Trust
Series 2019-1A, Class A*
2.560%, 11/25/31 | | | 147,071 | | |
| | | | 1,021,898 | | |
| | | Other (2.7%) | |
| | 150,000 | | | Aligned Data Centers Issuer, LLC
Series 2021-1A, Class A2*
1.937%, 08/15/46 | | | 130,901 | | |
| | 78,889 | | | Amur Equipment Finance
Receivables XI, LLC
Series 2022-2A, Class A2*
5.300%, 06/21/28 | | | 78,023 | | |
| | 98,500 | | | CLI Funding VI, LLC
Series 2020-3A, Class A*
2.070%, 10/18/45 | | | 85,255 | | |
| | 100,000 | | | Daimler Trucks Retail Trust
Series 2022-1, Class A3
5.230%, 02/17/26 | | | 99,069 | | |
| | 93,974 | | | MVW Owner Trust
Series 2019-1A, Class A*
2.890%, 11/20/36 | | | 90,141 | | |
| | 57,898 | | | SCF Equipment Leasing, LLC
Series 2021-1A, Class A3*
0.830%, 08/21/28 | | | 56,915 | | |
| | 99,667 | | | SVC ABS, LLC
Series 2023-1A, - Class A*
5.150%, 02/20/53 | | | 92,544 | | |
| | 225,000 | | | Tesla Auto Lease Trust
Series 2021-B, Class B*
0.910%, 09/22/25 | | | 216,861 | | |
| | | | 849,709 | | |
| | | | | TOTAL ASSET BACKED SECURITIES
(Cost $2,111,596) | | | 1,970,220 | | |
NUMBER OF
SHARES/
PRINCIPAL
AMOUNT | | | | VALUE | |
INVESTMENT OF CASH COLLATERAL FOR SECURITIES
LOANED (2.3%) | | | |
| | 719,238 | | | State Street Navigator Securities
Lending Government Money
Market Portfolio, 5.358%†***
(Cost $719,238) | | | 719,238 | | |
| | | | | TOTAL INVESTMENTS (100.3%)
(Cost $36,611,396) | | | 31,420,238 | | |
PAYABLE UPON RETURN OF SECURITIES ON LOAN (-2.3%) | | | (719,238 | ) | |
OTHER ASSETS, LESS LIABILITIES (2.0%) | | | 622,551 | | |
NET ASSETS (100.0%) | | $ | 31,323,551 | | |
See accompanying Notes to Schedule of Investments
CALAMOS OPEN-END FAMILY OF FUNDS ANNUAL REPORT
156
Total Return Bond Fund Schedule of Investments October 31, 2023
NOTES TO SCHEDULE OF INVESTMENTS
* Securities issued and sold pursuant to a Rule 144A transaction are exempted from the registration requirement of the Securities Act of 1933, as amended. These securities may only be sold to qualified institutional buyers ("QIBs"), such as the Fund. Any resale of these securities must generally be effected through a sale that is registered under the Act or otherwise exempted from such registration requirements.
‡ Variable rate security. The rate shown is the rate in effect at October 31, 2023.
& Illiquid security.
^ Security, or portion of security, is on loan.
¡ Bank loans generally are subject to mandatory and/or optional prepayment. As a result, the actual remaining maturity of bank loans may be substantially less than the stated maturities shown.
† Represents investment of cash collateral received from securities on loan as of October 31, 2023.
*** The rate disclosed is the 7 day net yield as of October 31, 2023.
FUTURES CONTRACTS
NUMBER OF
CONTRACTS | | DESCRIPTION | | EXPIRATION
DATE | | NOTIONAL
VALUE | | MARKET VALUE/
UNREALIZED
APPRECIATION
(DEPRECIATION) | |
Sales | | | |
| | 2,000,000 | | | U.S. Treasury Note 5-Year | | Dec 2023 | | $ | 2,089,531 | | | $ | (36,689 | ) | |
See accompanying Notes to Schedule of Investments
www.calamos.com
157
High Income Opportunities Fund Schedule of Investments October 31, 2023
PRINCIPAL
AMOUNT | | | | VALUE | |
ASSET BACKED SECURITY (0.3%) | | | |
| | | Other (0.3%) | |
| | 100,000 | | | SVC ABS, LLC Series 2023-1A, Class C*
6.700%, 02/20/53
(Cost $92,003) | | | $88,590 | | |
CORPORATE BONDS (82.1%) | | | |
| | | Airlines (1.5%) | |
| | 17,334 | | | Air Canada Pass Through Trust
Series 2015-2, Class B*
5.000%, 06/15/25 | | | 17,248 | | |
| | 87,956 | | | Alaska Airlines Pass Through Trust
Series 2020-1, Class A*
4.800%, 02/15/29 | | | 82,443 | | |
| | 39,347 | | | Alaska Airlines Pass Through Trust
Series 2020-1, Class B*
8.000%, 02/15/27 | | | 39,274 | | |
| | 109,200 | | | American Airlines Pass Through Trust
Series 2021-1, Class B
3.950%, 01/11/32 | | | 93,136 | | |
| | 54,167 | | | American Airlines, Inc. / AAdvantage
Loyalty IP, Ltd.*
5.500%, 04/20/26 | | | 52,693 | | |
| | 96,389 | | | British Airways Pass Through Trust
Series 2021-1, Class B*
3.900%, 03/15/33 | | | 83,752 | | |
| | 95,351 | | | JetBlue Pass Through Trust
Series 2020-1, Class B
7.750%, 05/15/30 | | | 94,805 | | |
| | 65,000 | | | Spirit Loyalty Cayman, Ltd. /
Spirit IP Cayman, Ltd.*
8.000%, 09/20/25 | | | 48,268 | | |
| | | | 511,619 | | |
| | | Communication Services (9.5%) | |
| | 200,000 | | | Altice France, SA*
5.500%, 10/15/29 | | | 138,506 | | |
| | 105,000 | | | APi Group DE, Inc.*
4.750%, 10/15/29 | | | 90,544 | | |
| | 139,000 | | | Arrow Bidco, LLC*
9.500%, 03/15/24 | | | 140,860 | | |
| | 200,000 | | | Ashtead Capital, Inc.*
2.450%, 08/12/31 | | | 147,536 | | |
| | 119,000 | | | Audacy Capital Corp.*
6.750%, 03/31/29 | | | 1,934 | | |
| | 44,000 | | | 6.500%, 05/01/27 | | | 660 | | |
| | 87,000 | | | Cincinnati Bell Telephone Company, LLC
6.300%, 12/01/28 | | | 70,403 | | |
| | 90,000 | | | Clear Channel Outdoor Holdings, Inc.*
9.000%, 09/15/28 | | | 87,763 | | |
| | 135,000 | | | Consolidated Communications, Inc.*^
6.500%, 10/01/28 | | | 107,145 | | |
| | 250,000 | | | CSC Holdings, LLC*
5.375%, 02/01/28 | | | 199,345 | | |
PRINCIPAL
AMOUNT | | | | VALUE | |
| | 220,000 | | | 4.500%, 11/15/31 | | $ | 145,539 | | |
| | 215,000 | | | 5.750%, 01/15/30 | | | 113,337 | | |
| | 75,000 | | | Diamond Sports Group, LLC /
Diamond Sports Finance Company*@
6.625%, 08/15/27& | | | 951 | | |
| | 55,000 | | | 5.375%, 08/15/26 | | | 674 | | |
| | 215,000 | | | Directv Financing, LLC /
Directv Financing Co-Obligor, Inc.*
5.875%, 08/15/27 | | | 188,426 | | |
| | 101,000 | | | Frontier California, Inc.
6.750%, 05/15/27 | | | 93,255 | | |
| | 60,000 | | | Frontier Communications Holdings, LLC*
5.000%, 05/01/28 | | | 52,073 | | |
| | 24,000 | | | 8.750%, 05/15/30 | | | 22,894 | | |
| | 101,000 | | | Frontier Florida, LLC@
6.860%, 02/01/28 | | | 92,977 | | |
| | 140,000 | | | Frontier North, Inc.@
6.730%, 02/15/28 | | | 129,874 | | |
| | 90,000 | | | Go Daddy Operating Company, LLC /
GD Finance Company, Inc.*
3.500%, 03/01/29 | | | 76,067 | | |
| | 25,000 | | | 5.250%, 12/01/27 | | | 23,639 | | |
| | 35,000 | | | iHeartCommunications, Inc.
8.375%, 05/01/27 | | | 21,482 | | |
| | 35,000 | | | 5.250%, 08/15/27*^ | | | 25,691 | | |
| | 70,000 | | | Intelsat Jackson Holdings, SA@&
9.750%, 07/15/25* | | | — | | |
| | 50,000 | | | 5.500%, 08/01/23 | | | — | | |
| | 76,068 | | | Ligado Networks, LLC*
15.500%, 11/01/23
15.50% PIK rate | | | 19,174 | | |
| | 65,000 | | | Lumen Technologies, Inc.
7.600%, 09/15/39 | | | 17,689 | | |
| | 45,000 | | | 4.000%, 02/15/27*^ | | | 30,768 | | |
| | 23,000 | | | 7.650%, 03/15/42 | | | 6,195 | | |
| | 48,000 | | | Match Group Holdings II, LLC*
3.625%, 10/01/31 | | | 37,164 | | |
| | 75,000 | | | Nexstar Media, Inc.*
5.625%, 07/15/27 | | | 67,536 | | |
| | 135,000 | | | Paramount Global
4.900%, 08/15/44 | | | 85,042 | | |
| | 31,000 | | | Qwest Corp.
7.250%, 09/15/25 | | | 29,769 | | |
| | 46,000 | | | Scripps Escrow II, Inc.*
3.875%, 01/15/29 | | | 34,941 | | |
| | 23,000 | | | 5.375%, 01/15/31^ | | | 14,292 | | |
| | 85,000 | | | Scripps Escrow, Inc.*^
5.875%, 07/15/27 | | | 63,628 | | |
| | 115,000 | | | Sirius XM Radio, Inc.*
5.500%, 07/01/29 | | | 101,998 | | |
| | 95,000 | | | 4.000%, 07/15/28 | | | 80,828 | | |
| | 50,000 | | | 3.125%, 09/01/26 | | | 44,925 | | |
| | 24,000 | | | 3.875%, 09/01/31 | | | 18,078 | | |
| | 77,000 | | | Spanish Broadcasting System, Inc.*
9.750%, 03/01/26 | | | 47,986 | | |
See accompanying Notes to Schedule of Investments
CALAMOS OPEN-END FAMILY OF FUNDS ANNUAL REPORT
158
High Income Opportunities Fund Schedule of Investments October 31, 2023
PRINCIPAL
AMOUNT | | | | VALUE | |
| | 85,000 | | | Sprint, LLC
7.125%, 06/15/24 | | $ | 85,484 | | |
| | 100,000 | | | Stagwell Global, LLC*
5.625%, 08/15/29 | | | 82,736 | | |
| | 80,000 | | | Telecom Italia Capital, SA
6.000%, 09/30/34 | | | 65,894 | | |
| | 98,000 | | | Telesat Canada / Telesat, LLC*
4.875%, 06/01/27 | | | 58,678 | | |
| | 35,000 | | | Time Warner Cable, LLC
7.300%, 07/01/38 | | | 32,783 | | |
| | 105,000 | | | United States Cellular Corp.^
6.700%, 12/15/33 | | | 99,997 | | |
| | 35,000 | | | Univision Communications, Inc.*
8.000%, 08/15/28 | | | 33,170 | | |
| | 45,000 | | | Viasat, Inc.*
5.625%, 04/15/27 | | | 39,372 | | |
| | | | 3,169,702 | | |
| | | Consumer Discretionary (17.6%) | |
| | 100,000 | | | Abercrombie & Fitch Management
Company*
8.750%, 07/15/25 | | | 101,668 | | |
| | 90,000 | | | Adams Homes, Inc.*
9.250%, 10/15/28 | | | 88,344 | | |
| | 120,000 | | | Adient Global Holdings Company*
8.250%, 04/15/31 | | | 117,427 | | |
| | 36,000 | | | American Axle & Manufacturing, Inc.
6.875%, 07/01/28 | | | 32,085 | | |
| | 84,000 | | | Ashton Woods USA, LLC / Ashton
Woods Finance Company*
4.625%, 08/01/29 | | | 68,271 | | |
| | 72,000 | | | 6.625%, 01/15/28 | | | 66,081 | | |
| | 118,000 | | | At Home Group, Inc.*
4.875%, 07/15/28 | | | 41,005 | | |
| | 123,000 | | | Bath & Body Works, Inc.
6.694%, 01/15/27 | | | 119,203 | | |
| | 115,000 | | | 6.875%, 11/01/35 | | | 101,647 | | |
| | 61,000 | | | Caesars Entertainment, Inc.*^
4.625%, 10/15/29 | | | 50,221 | | |
| | 46,000 | | | 8.125%, 07/01/27 | | | 45,602 | | |
| | 100,000 | | | Carnival Corp.*
6.000%, 05/01/29 | | | 84,576 | | |
| | 46,000 | | | 7.625%, 03/01/26 | | | 44,754 | | |
| | 45,000 | | | 4.000%, 08/01/28 | | | 39,205 | | |
| | 6,000 | | | 7.000%, 08/15/29 | | | 5,894 | | |
| | 100,000 | | | Carriage Services, Inc.*^
4.250%, 05/15/29 | | | 81,893 | | |
| | 17,000 | | | Carvana Company*
14.000%, 06/01/31 | | | 12,794 | | |
| | 14,000 | | | 13.000%, 06/01/30 | | | 10,506 | | |
| | 9,000 | | | 12.000%, 12/01/28 | | | 6,740 | | |
| | 190,000 | | | CCO Holdings, LLC / CCO Holdings
Capital Corp.*
4.250%, 02/01/31 | | | 148,037 | | |
| | 185,000 | | | 5.125%, 05/01/27 | | | 170,459 | | |
| | 110,000 | | | 6.375%, 09/01/29 | | | 101,134 | | |
| | 100,000 | | | 4.750%, 03/01/30 | | | 82,608 | | |
PRINCIPAL
AMOUNT | | | | VALUE | |
| | 55,000 | | | 5.000%, 02/01/28 | | $ | 49,275 | | |
| | 50,000 | | | 4.500%, 08/15/30 | | | 40,186 | | |
| | 48,000 | | | 4.750%, 02/01/32 | | | 37,521 | | |
| | 48,000 | | | CDI Escrow Issuer, Inc.*
5.750%, 04/01/30 | | | 43,015 | | |
| | 75,000 | | | Cedar Fair, LP^
5.250%, 07/15/29 | | | 64,867 | | |
| | 50,000 | | | Churchill Downs, Inc.*
6.750%, 05/01/31 | | | 46,748 | | |
| | 80,000 | | | Dana, Inc.
4.250%, 09/01/30 | | | 63,657 | | |
| | 68,000 | | | 4.500%, 02/15/32 | | | 53,297 | | |
| | 100,000 | | | DISH DBS Corp.
5.250%, 12/01/26* | | | 80,897 | | |
| | 77,000 | | | 7.750%, 07/01/26 | | | 51,669 | | |
| | 60,000 | | | 7.375%, 07/01/28 | | | 33,828 | | |
| | 45,000 | | | 5.125%, 06/01/29 | | | 23,223 | | |
| | 88,000 | | | DISH Network Corp.*
11.750%, 11/15/27 | | | 87,239 | | |
| | 200,000 | | | Empire Resorts, Inc.*
7.750%, 11/01/26 | | | 163,786 | | |
| | 95,000 | | | Everi Holdings, Inc.*
5.000%, 07/15/29 | | | 79,910 | | |
| | 200,000 | | | Ford Motor Credit Company, LLC
5.113%, 05/03/29 | | | 181,644 | | |
| | 200,000 | | | 4.000%, 11/13/30 | | | 164,916 | | |
| | 200,000 | | | 2.900%, 02/16/28 | | | 170,314 | | |
| | 36,000 | | | Gap, Inc.*
3.875%, 10/01/31 | | | 25,971 | | |
| | 45,000 | | | General Motors Company
5.200%, 04/01/45 | | | 33,356 | | |
| | 150,000 | | | goeasy, Ltd.*
5.375%, 12/01/24^ | | | 147,431 | | |
| | 80,000 | | | 4.375%, 05/01/26 | | | 72,516 | | |
| | 50,000 | | | Goodyear Tire & Rubber Company^
5.250%, 07/15/31 | | | 40,781 | | |
| | 41,000 | | | Group 1 Automotive, Inc.*
4.000%, 08/15/28 | | | 35,437 | | |
| | 95,000 | | | Guitar Center, Inc.*^
8.500%, 01/15/26 | | | 80,291 | | |
| | 25,975 | | | JetBlue Pass Through Trust
Series 2019-2, Class B
8.000%, 11/15/27 | | | 26,149 | | |
| | 77,000 | | | Kohl's Corp.
5.550%, 07/17/45 | | | 44,518 | | |
| | 100,000 | | | LCM Investments Holdings II, LLC*^
8.250%, 08/01/31 | | | 95,843 | | |
| | 95,000 | | | Liberty Interactive, LLC
8.250%, 02/01/30 | | | 25,028 | | |
| | 90,000 | | | Life Time, Inc.*
8.000%, 04/15/26 | | | 87,958 | | |
| | 50,000 | | | 5.750%, 01/15/26 | | | 48,493 | | |
| | 45,000 | | | Light & Wonder International, Inc.*
7.500%, 09/01/31 | | | 44,015 | | |
| | 35,000 | | | Lindblad Expeditions Holdings, Inc.*
9.000%, 05/15/28 | | | 34,311 | | |
See accompanying Notes to Schedule of Investments
www.calamos.com
159
High Income Opportunities Fund Schedule of Investments October 31, 2023
PRINCIPAL
AMOUNT | | | | VALUE | |
| | 62,000 | | | Lindblad Expeditions, LLC*
6.750%, 02/15/27 | | $ | 56,375 | | |
| | 65,000 | | | M/I Homes, Inc.
3.950%, 02/15/30 | | | 52,012 | | |
| | 159,000 | | | Macy's Retail Holdings, LLC
6.700%, 07/15/34* | | | 122,600 | | |
| | 50,000 | | | 4.300%, 02/15/43 | | | 27,437 | | |
| | 100,000 | | | Midwest Gaming Borrower, LLC /
Midwest Gaming Finance Corp.*
4.875%, 05/01/29 | | | 83,477 | | |
| | 55,000 | | | Newell Brands, Inc.
5.200%, 04/01/26 | | | 51,951 | | |
| | 50,000 | | | Nordstrom, Inc.
5.000%, 01/15/44 | | | 30,110 | | |
| | 48,000 | | | 4.250%, 08/01/31 | | | 35,190 | | |
| | 100,000 | | | PENN Entertainment, Inc.*^
4.125%, 07/01/29 | | | 77,766 | | |
| | 250,000 | | | PetSmart, Inc. / PetSmart Finance Corp.*
4.750%, 02/15/28 | | | 221,407 | | |
| | 120,000 | | | Premier Entertainment Sub, LLC /
Premier Entertainment Finance Corp.*^
5.625%, 09/01/29 | | | 84,455 | | |
| | 224,000 | | | Rite Aid Corp.*@
8.000%, 11/15/26 | | | 155,767 | | |
| | 50,000 | | | Royal Caribbean Cruises, Ltd.*
7.250%, 01/15/30 | | | 49,464 | | |
| | 120,000 | | | Simmons Foods, Inc. / Simmons
Prepared Foods, Inc. / Simmons Pet Food,
Inc. / Simmons Feed*
4.625%, 03/01/29 | | | 97,582 | | |
| | 180,000 | | | Six Flags Entertainment Corp.*^
7.250%, 05/15/31 | | | 165,818 | | |
| | 108,000 | | | Sonic Automotive, Inc.*^
4.625%, 11/15/29 | | | 90,063 | | |
| | 70,000 | | | Speedway Motorsports, LLC / Speedway
Funding II, Inc.*
4.875%, 11/01/27 | | | 62,687 | | |
| | 160,000 | | | Station Casinos, LLC*
4.500%, 02/15/28 | | | 138,338 | | |
| | 59,000 | | | Taylor Morrison Communities, Inc.*
5.750%, 01/15/28 | | | 53,744 | | |
| | 25,000 | | | Viking Cruises, Ltd.*
9.125%, 07/15/31 | | | 24,595 | | |
| | 100,000 | | | Vista Outdoor, Inc.*
4.500%, 03/15/29 | | | 93,160 | | |
| | 45,000 | | | Windsor Holdings III, LLC*
8.500%, 06/15/30 | | | 44,177 | | |
| | 175,000 | | | ZF North America Capital, Inc.*
7.125%, 04/14/30 | | | 170,327 | | |
| | | | 5,886,746 | | |
| | | Consumer Staples (3.6%) | |
| | 117,000 | | | 1375209 B.C., Ltd.*^
9.000%, 01/30/28 | | | 113,750 | | |
| | 90,000 | | | B&G Foods, Inc.*
8.000%, 09/15/28 | | | 87,862 | | |
PRINCIPAL
AMOUNT | | | | VALUE | |
| | 107,000 | | | Central Garden & Pet Company*
4.125%, 04/30/31 | | $ | 85,520 | | |
| | 110,000 | | | Edgewell Personal Care Company*
4.125%, 04/01/29 | | | 92,502 | | |
| | 115,000 | | | Energizer Holdings, Inc.*^
4.375%, 03/31/29 | | | 94,684 | | |
| | 24,000 | | | 6.500%, 12/31/27 | | | 22,549 | | |
| | 115,000 | | | JBS USA LUX, SA / JBS USA Food
Company / JBS USA Finance, Inc.
5.500%, 01/15/30 | | | 105,217 | | |
| | 60,000 | | | 5.125%, 02/01/28 | | | 56,351 | | |
| | 35,000 | | | 5.750%, 04/01/33 | | | 30,816 | | |
| | 63,000 | | | New Albertsons, LP
7.750%, 06/15/26 | | | 63,701 | | |
| | 96,000 | | | Performance Food Group, Inc.*
4.250%, 08/01/29 | | | 81,461 | | |
| | 75,000 | | | Pilgrim's Pride Corp.
4.250%, 04/15/31 | | | 61,967 | | |
| | 39,000 | | | Post Holdings, Inc.*
5.750%, 03/01/27 | | | 37,237 | | |
| | 90,000 | | | Prestige Brands, Inc.*
3.750%, 04/01/31 | | | 71,746 | | |
| | 75,000 | | | United Natural Foods, Inc.*^
6.750%, 10/15/28 | | | 58,693 | | |
| | 130,000 | | | Vector Group, Ltd.*
5.750%, 02/01/29 | | | 110,387 | | |
| | 45,000 | | | Williams Scotsman, Inc.*
7.375%, 10/01/31 | | | 44,434 | | |
| | | | 1,218,877 | | |
| | | Energy (11.1%) | |
| | 90,000 | | | Antero Resources Corp.*
5.375%, 03/01/30 | | | 82,264 | | |
| | 90,000 | | | Apache Corp.
5.100%, 09/01/40 | | | 70,072 | | |
| | 75,000 | | | Buckeye Partners, LP
3.950%, 12/01/26 | | | 68,452 | | |
| | 50,000 | | | 5.850%, 11/15/43 | | | 35,413 | | |
| | 135,000 | | | Callon Petroleum Company*^
7.500%, 06/15/30 | | | 130,866 | | |
| | 45,000 | | | Cheniere Energy, Inc.
4.625%, 10/15/28 | | | 41,139 | | |
| | 72,000 | | | Chesapeake Energy Corp.*
6.750%, 04/15/29 | | | 70,649 | | |
| | 124,000 | | | Civitas Resources, Inc.*
8.750%, 07/01/31 | | | 125,303 | | |
| | 75,000 | | | Continental Resources, Inc.*
2.875%, 04/01/32 | | | 55,559 | | |
| | 45,000 | | | 5.750%, 01/15/31 | | | 41,774 | | |
| | 76,000 | | | DT Midstream, Inc.*
4.125%, 06/15/29 | | | 65,448 | | |
| | 85,000 | | | Earthstone Energy Holdings, LLC*
8.000%, 04/15/27 | | | 86,290 | | |
| | 35,000 | | | 9.875%, 07/15/31 | | | 37,769 | | |
See accompanying Notes to Schedule of Investments
CALAMOS OPEN-END FAMILY OF FUNDS ANNUAL REPORT
160
High Income Opportunities Fund Schedule of Investments October 31, 2023
PRINCIPAL
AMOUNT | | | | VALUE | |
| | 55,000 | | | Enbridge, Inc.‡
7.375%, 01/15/83
5 year CMT + 3.71% | | $ | 51,181 | | |
| | 140,000 | | | Energy Transfer, LP‡
8.656%, 11/01/66
3 mo. USD LIBOR + 3.28% | | | 114,464 | | |
| | 70,000 | | | 6.500%, 11/01/35
5 year CMT + 5.69% | | | 63,613 | | |
| | 120,000 | | | EnLink Midstream Partners, LP
9.780%, 11/01/35‡
3 mo. USD LIBOR + 4.11% | | | 107,161 | | |
| | 90,000 | | | 4.850%, 07/15/26 | | | 85,098 | | |
| | 61,000 | | | Enlink Midstream, LLC*
6.500%, 09/01/30 | | | 58,648 | | |
| | 145,000 | | | EQM Midstream Partners, LP*
7.500%, 06/01/27 | | | 144,153 | | |
| | 70,000 | | | Genesis Energy, LP / Genesis Energy
Finance Corp.
8.875%, 04/15/30 | | | 68,063 | | |
| | 32,000 | | | 6.250%, 05/15/26 | | | 30,549 | | |
| | 95,000 | | | Gulfport Energy Corp.
8.000%, 05/17/26* | | | 95,040 | | |
| | 90,000 | | | 6.375%, 05/15/25@& | | | — | | |
| | 27,505 | | | 8.000%, 05/17/26^ | | | 27,517 | | |
| | 125,000 | | | Hilcorp Energy I, LP / Hilcorp
Finance Company*
6.000%, 04/15/30 | | | 111,146 | | |
| | 72,000 | | | Howard Midstream Energy Partners, LLC*
6.750%, 01/15/27 | | | 68,473 | | |
| | 89,000 | | | Magnolia Oil & Gas Operating, LLC /
Magnolia Oil & Gas Finance Corp.*
6.000%, 08/01/26 | | | 85,153 | | |
| | 50,000 | | | Moss Creek Resources Holdings, Inc.*
7.500%, 01/15/26 | | | 47,863 | | |
| | 45,000 | | | 10.500%, 05/15/27 | | | 44,538 | | |
| | 70,000 | | | Nabors Industries, Inc.*
7.375%, 05/15/27 | | | 65,551 | | |
| | 70,000 | | | Nabors Industries, Ltd.*
7.500%, 01/15/28 | | | 61,855 | | |
| | 86,000 | | | New Fortress Energy, Inc.*
6.750%, 09/15/25 | | | 80,035 | | |
| | 45,000 | | | 6.500%, 09/30/26 | | | 40,342 | | |
| | 43,000 | | | Oceaneering International, Inc.*
6.000%, 02/01/28 | | | 39,432 | | |
| | 95,000 | | | Parkland Corp.*
5.875%, 07/15/27 | | | 91,357 | | |
| | 53,000 | | | Patterson-UTI Energy, Inc.
5.150%, 11/15/29 | | | 47,348 | | |
| | 26,000 | | | Permian Resources Operating LLC*
7.000%, 01/15/32 | | | 25,441 | | |
| | 100,000 | | | Plains All American Pipeline, LP‡
9.736%, 11/01/35
3 mo. USD LIBOR + 4.11% | | | 94,394 | | |
| | 135,000 | | | Rockcliff Energy II, LLC*
5.500%, 10/15/29 | | | 122,534 | | |
| | 49,000 | | | Southwestern Energy Company
4.750%, 02/01/32 | | | 42,187 | | |
PRINCIPAL
AMOUNT | | | | VALUE | |
| | 45,000 | | | 5.375%, 02/01/29 | | $ | 41,689 | | |
| | 24,000 | | | Sunoco, LP / Sunoco Finance Corp.
4.500%, 04/30/30 | | | 20,650 | | |
| | 140,600 | | | Transocean, Inc.*
8.750%, 02/15/30 | | | 140,486 | | |
| | 60,000 | | | Venture Global Calcasieu Pass, LLC*
6.250%, 01/15/30 | | | 56,641 | | |
| | 25,000 | | | 4.125%, 08/15/31 | | | 20,210 | | |
| | 25,000 | | | 3.875%, 08/15/29 | | | 20,941 | | |
| | 120,000 | | | Venture Global LNG, Inc.*
8.375%, 06/01/31 | | | 114,600 | | |
| | 75,000 | | | 8.125%, 06/01/28 | | | 72,872 | | |
| | 45,000 | | | 9.875%, 02/01/32 | | | 45,669 | | |
| | 25,000 | | | 9.500%, 02/01/29 | | | 25,376 | | |
| | 85,000 | | | Vital Energy, Inc.
9.500%, 01/15/25 | | | 85,461 | | |
| | 55,000 | | | 7.750%, 07/31/29*^ | | | 49,709 | | |
| | 11,000 | | | 9.750%, 10/15/30 | | | 10,788 | | |
| | 90,000 | | | VOC Escrow, Ltd.*
5.000%, 02/15/28 | | | 81,186 | | |
| | 118,000 | | | Weatherford International, Ltd.*
8.625%, 04/30/30 | | | 119,418 | | |
| | | | 3,729,830 | | |
| | | Financials (13.0%) | |
| | 115,000 | | | Acrisure, LLC / Acrisure Finance, Inc.*
7.000%, 11/15/25 | | | 111,725 | | |
| | 120,000 | | | Aethon United BR, LP / Aethon
United Finance Corp.*
8.250%, 02/15/26 | | | 119,329 | | |
| | 121,000 | | | AG Issuer, LLC*
6.250%, 03/01/28 | | | 112,128 | | |
| | 145,000 | | | Alliant Holdings Intermediate, LLC /
Alliant Holdings Co-Issuer*
6.750%, 10/15/27 | | | 132,455 | | |
| | 146,000 | | | Ally Financial, Inc.
4.700%, 11/01/35
7 year CMT + 3.48%‡ | | | 92,326 | | |
| | 40,000 | | | 8.000%, 11/01/31 | | | 39,115 | | |
| | 150,000 | | | AmWINS Group, Inc.*
4.875%, 06/30/29 | | | 128,766 | | |
| | 98,000 | | | Aviation Capital Group, LLC*
3.500%, 11/01/27 | | | 86,136 | | |
| | 40,000 | | | Avolon Holdings Funding, Ltd.*
5.500%, 01/15/26 | | | 38,554 | | |
| | 170,000 | | | BroadStreet Partners, Inc.*
5.875%, 04/15/29 | | | 148,339 | | |
| | 85,000 | | | Brookfield Property REIT, Inc. /
BPR Cumulus, LLC /
BPR Nimbus, LLC / GGSI Sellco, LLC*
4.500%, 04/01/27 | | | 70,934 | | |
| | 56,000 | | | 5.750%, 05/15/26 | | | 51,360 | | |
| | 200,000 | | | Burford Capital Global Financial, LLC*
6.875%, 04/15/30 | | | 181,068 | | |
| | 120,000 | | | Credit Acceptance Corp.
6.625%, 03/15/26^ | | | 114,379 | | |
| | 89,000 | | | 5.125%, 12/31/24* | | | 86,171 | | |
See accompanying Notes to Schedule of Investments
www.calamos.com
161
High Income Opportunities Fund Schedule of Investments October 31, 2023
PRINCIPAL
AMOUNT | | | | VALUE | |
| | 90,000 | | | Cushman & Wakefield U.S. Borrower LLC*^
8.875%, 09/01/31 | | $ | 85,509 | | |
| | 123,000 | | | Enact Holdings, Inc.*
6.500%, 08/15/25 | | | 121,144 | | |
| | 138,000 | | | Global Net Lease, Inc. / Global Net
Lease Operating Partnership, LP*
3.750%, 12/15/27 | | | 104,814 | | |
| | 68,000 | | | Icahn Enterprises, LP / Icahn
Enterprises Finance Corp.^
4.375%, 02/01/29 | | | 52,764 | | |
| | 195,000 | | | Iron Mountain, Inc.*
5.250%, 03/15/28 | | | 178,663 | | |
| | 22,000 | | | 7.000%, 02/15/29 | | | 21,368 | | |
| | 260,000 | | | Jefferies Finance, LLC /
JFIN Co-Issuer Corp.*
5.000%, 08/15/28 | | | 208,559 | | |
| | 182,000 | | | Ladder Capital Finance Holdings, LLLP /
Ladder Capital Finance Corp.*
5.250%, 10/01/25 | | | 173,519 | | |
| | 48,000 | | | 4.750%, 06/15/29 | | | 38,745 | | |
| | 95,000 | | | LD Holdings Group, LLC*
6.125%, 04/01/28 | | | 53,233 | | |
| | 110,000 | | | Level 3 Financing, Inc.*
4.250%, 07/01/28 | | | 62,292 | | |
| | 74,000 | | | 3.400%, 03/01/27^ | | | 68,857 | | |
| | 45,000 | | | 4.625%, 09/15/27 | | | 30,371 | | |
| | 65,000 | | | LPL Holdings, Inc.*
4.000%, 03/15/29 | | | 55,924 | | |
| | 90,000 | | | Macquarie Airfinance Holdings, Ltd.*
8.125%, 03/30/29 | | | 88,768 | | |
| | 138,000 | | | MetLife, Inc.
6.400%, 12/15/66 | | | 129,650 | | |
| | 110,000 | | | Nationstar Mortgage Holdings, Inc.*
5.500%, 08/15/28 | | | 97,475 | | |
| | 95,000 | | | Navient Corp.
5.000%, 03/15/27 | | | 83,788 | | |
| | 50,000 | | | 4.875%, 03/15/28 | | | 41,484 | | |
| | 110,000 | | | Necessity Retail REIT, Inc. / American
Finance Operating Partner, LP*
4.500%, 09/30/28 | | | 82,461 | | |
| | 65,000 | | | OneMain Finance Corp.
3.875%, 09/15/28 | | | 51,767 | | |
| | 60,000 | | | 9.000%, 01/15/29^ | | | 58,666 | | |
| | 45,000 | | | 7.125%, 03/15/26^ | | | 43,798 | | |
| | 45,000 | | | Park Intermediate Holdings, LLC /
PK Domestic Property, LLC /
PK Finance Co-Issuer*^
5.875%, 10/01/28 | | | 40,637 | | |
| | 150,000 | | | PHH Mortgage Corp.*
7.875%, 03/15/26 | | | 130,081 | | |
| | 100,000 | | | RHP Hotel Properties, LP /
RHP Finance Corp.*
4.500%, 02/15/29 | | | 85,245 | | |
| | 45,000 | | | Rocket Mortgage, LLC / Rocket
Mortgage Co-Issuer, Inc.*
3.875%, 03/01/31 | | | 34,830 | | |
PRINCIPAL
AMOUNT | | | | VALUE | |
| | 45,000 | | | 3.625%, 03/01/29^ | | $ | 36,630 | | |
| | 20,000 | | | 2.875%, 10/15/26 | | | 17,467 | | |
| | 90,000 | | | StoneX Group, Inc.*
8.625%, 06/15/25 | | | 90,539 | | |
| | 100,000 | | | United Wholesale Mortgage, LLC*
5.500%, 04/15/29 | | | 83,774 | | |
| | 50,000 | | | 5.750%, 06/15/27 | | | 45,627 | | |
| | 50,000 | | | Uniti Group, LP / Uniti Group Finance,
Inc. / CSL Capital, LLC*
10.500%, 02/15/28 | | | 48,211 | | |
| | 50,000 | | | 6.500%, 02/15/29^ | | | 32,514 | | |
| | 200,000 | | | VZ Secured Financing, BV*
5.000%, 01/15/32 | | | 152,414 | | |
| | 98,000 | | | XHR, LP*
6.375%, 08/15/25 | | | 95,643 | | |
| | | | 4,340,016 | | |
| | | Health Care (5.2%) | |
| | 210,000 | | | Bausch Health Companies, Inc.*
11.000%, 09/30/28^ | | | 128,554 | | |
| | 39,000 | | | 14.000%, 10/15/30 | | | 21,485 | | |
| | 36,000 | | | 6.125%, 02/01/27^ | | | 20,113 | | |
| | 170,000 | | | CHS/Community Health Systems, Inc.*
6.125%, 04/01/30 | | | 66,082 | | |
| | 100,000 | | | 8.000%, 03/15/26 | | | 91,560 | | |
| | 49,000 | | | 6.875%, 04/15/29 | | | 20,228 | | |
| | 12,000 | | | 5.250%, 05/15/30 | | | 8,532 | | |
| | 175,000 | | | DaVita, Inc.*
4.625%, 06/01/30 | | | 137,307 | | |
| | 100,000 | | | 3.750%, 02/15/31 | | | 71,994 | | |
| | 72,000 | | | Embecta Corp.*
5.000%, 02/15/30 | | | 57,231 | | |
| | 24,000 | | | 6.750%, 02/15/30 | | | 19,907 | | |
| | 45,000 | | | Encompass Health Corp.
4.750%, 02/01/30 | | | 39,064 | | |
| | 45,000 | | | 4.500%, 02/01/28^ | | | 40,609 | | |
| | 110,000 | | | HCA, Inc.
7.500%, 11/06/33 | | | 112,919 | | |
| | 210,000 | | | Jazz Securities DAC*
4.375%, 01/15/29 | | | 182,664 | | |
| | 19,970 | | | Mallinckrodt International Finance, SA /
Mallinckrodt CB, LLC*@
10.000%, 06/15/29 | | | 1,419 | | |
| | 110,000 | | | Medline Borrower, LP*
5.250%, 10/01/29^ | | | 93,749 | | |
| | 110,000 | | | 3.875%, 04/01/29 | | | 92,922 | | |
| | 200,000 | | | Organon & Company / Organon
Foreign Debt Co-Issuer, BV*
5.125%, 04/30/31 | | | 156,656 | | |
| | 107,000 | | | Team Health Holdings, Inc.*
6.375%, 02/01/25 | | | 85,917 | | |
| | 200,000 | | | Tenet Healthcare Corp.
6.250%, 02/01/27 | | | 192,424 | | |
| | 120,000 | | | 6.875%, 11/15/31 | | | 110,857 | | |
| | | | 1,752,193 | | |
See accompanying Notes to Schedule of Investments
CALAMOS OPEN-END FAMILY OF FUNDS ANNUAL REPORT
162
High Income Opportunities Fund Schedule of Investments October 31, 2023
PRINCIPAL
AMOUNT | | | | VALUE | |
| | | Industrials (12.2%) | |
| | 100,000 | | | ACCO Brands Corp.*^
4.250%, 03/15/29 | | $ | 83,057 | | |
| | 150,000 | | | AerCap Holdings, NV^‡
5.875%, 10/10/79
5 year CMT + 4.54% | | | 141,093 | | |
| | 95,000 | | | Air Lease Corp.‡
4.125%, 11/01/35
5 year CMT + 3.15% | | | 68,346 | | |
| | 155,000 | | | Albertsons Companies, Inc. /
Safeway, Inc. / New Albertsons, LP /
Albertsons, LLC*
4.625%, 01/15/27 | | | 145,891 | | |
| | 75,000 | | | 5.875%, 02/15/28 | | | 71,954 | | |
| | 68,000 | | | 3.500%, 03/15/29 | | | 58,031 | | |
| | 100,000 | | | Allegiant Travel Company*
7.250%, 08/15/27 | | | 91,078 | | |
| | 20,000 | | | American Airlines Group, Inc.*
3.750%, 03/01/25 | | | 18,727 | | |
| | 49,000 | | | Arcosa, Inc.*
4.375%, 04/15/29 | | | 42,905 | | |
| | 225,000 | | | ARD Finance, SA*
6.500%, 06/30/27
7.250% PIK rate | | | 131,382 | | |
| | 68,000 | | | Beacon Roofing Supply, Inc.*
4.125%, 05/15/29 | | | 57,156 | | |
| | 45,000 | | | Bombardier, Inc.*
7.875%, 04/15/27 | | | 43,358 | | |
| | 87,000 | | | BWX Technologies, Inc.*
4.125%, 04/15/29 | | | 75,265 | | |
| | 95,000 | | | Cascades, Inc. / Cascades USA, Inc.*
5.375%, 01/15/28 | | | 86,334 | | |
| | 23,000 | | | Delta Air Lines, Inc. / SkyMiles IP, Ltd.*
4.750%, 10/20/28 | | | 21,618 | | |
| | 125,000 | | | Deluxe Corp.*
8.000%, 06/01/29 | | | 99,071 | | |
| | 72,000 | | | Eco Material Technologies, Inc.*
7.875%, 01/31/27 | | | 68,508 | | |
| | 50,000 | | | Emerald Debt Merger Sub, LLC*
6.625%, 12/15/30 | | | 47,633 | | |
| | 45,000 | | | EnerSys*
4.375%, 12/15/27 | | | 40,421 | | |
| | 57,000 | | | Graham Packaging Company, Inc.*
7.125%, 08/15/28 | | | 44,316 | | |
| | 60,000 | | | Graphic Packaging International, LLC*
4.750%, 07/15/27^ | | | 56,069 | | |
| | 44,000 | | | 3.500%, 03/01/29 | | | 36,959 | | |
| | 107,000 | | | Great Lakes Dredge & Dock Corp.*^
5.250%, 06/01/29 | | | 87,662 | | |
| | 180,000 | | | H&E Equipment Services, Inc.*
3.875%, 12/15/28 | | | 152,856 | | |
| | 130,000 | | | Hawaiian Brand Intellectual Property, Ltd. /
HawaiianMiles Loyalty, Ltd.*
5.750%, 01/20/26 | | | 96,174 | | |
PRINCIPAL
AMOUNT | | | | VALUE | |
| | 115,000 | | | Herc Holdings, Inc.*
5.500%, 07/15/27 | | $ | 108,331 | | |
| | 115,000 | | | IEA Energy Services, LLC*
6.625%, 08/15/29 | | | 109,859 | | |
| | 61,000 | | | JELD-WEN, Inc.*
4.625%, 12/15/25 | | | 57,947 | | |
| | 45,000 | | | 4.875%, 12/15/27 | | | 38,425 | | |
| | 145,000 | | | Ken Garff Automotive, LLC*
4.875%, 09/15/28 | | | 123,562 | | |
| | 100,000 | | | Knife River Holding Company*
7.750%, 05/01/31 | | | 99,783 | | |
| | 46,000 | | | MasTec, Inc.*^
4.500%, 08/15/28 | | | 40,447 | | |
| | 60,000 | | | Moog, Inc.*
4.250%, 12/15/27 | | | 54,482 | | |
| | 120,000 | | | Newfold Digital Holdings Group, Inc.*^
6.000%, 02/15/29 | | | 79,336 | | |
| | 95,000 | | | Novelis Corp.*
4.750%, 01/30/30 | | | 80,992 | | |
| | 35,000 | | | OI European Group, BV*
4.750%, 02/15/30 | | | 29,802 | | |
| | 100,000 | | | Pactiv Evergreen Group Issuer, Inc. /
Pactiv Evergreen Group Issuer, LLC*^
4.000%, 10/15/27 | | | 88,042 | | |
| | 135,000 | | | Patrick Industries, Inc.*^
4.750%, 05/01/29 | | | 110,985 | | |
| | 45,000 | | | QVC, Inc.
5.450%, 08/15/34 | | | 19,166 | | |
| | 78,000 | | | Sealed Air Corp.*
6.125%, 02/01/28 | | | 74,281 | | |
| | 24,000 | | | 5.000%, 04/15/29 | | | 21,418 | | |
| | 86,000 | | | Sensata Technologies, Inc.*
3.750%, 02/15/31 | | | 68,960 | | |
| | 71,000 | | | Sinclair Television Group, Inc.*
4.125%, 12/01/30 | | | 44,689 | | |
| | 45,000 | | | 5.500%, 03/01/30 | | | 24,476 | | |
| | 90,000 | | | Standard Industries, Inc.*
5.000%, 02/15/27 | | | 83,364 | | |
| | 76,000 | | | Stericycle, Inc.*^
3.875%, 01/15/29 | | | 64,939 | | |
| | 69,000 | | | STL Holding Company, LLC*
7.500%, 02/15/26 | | | 64,804 | | |
| | 115,000 | | | TransDigm, Inc.
6.250%, 03/15/26* | | | 112,541 | | |
| | 95,000 | | | 6.875%, 12/15/30* | | | 91,940 | | |
| | 70,000 | | | 6.750%, 08/15/28* | | | 68,127 | | |
| | 67,000 | | | 7.500%, 03/15/27 | | | 67,009 | | |
| | 96,000 | | | Tronox, Inc.*
4.625%, 03/15/29 | | | 75,466 | | |
| | 36,679 | | | United Airlines Pass Through Trust
Series 2019-2, Class B
3.500%, 11/01/29 | | | 32,508 | | |
| | 96,000 | | | Vertiv Group Corp.*
4.125%, 11/15/28 | | | 84,014 | | |
See accompanying Notes to Schedule of Investments
www.calamos.com
163
High Income Opportunities Fund Schedule of Investments October 31, 2023
PRINCIPAL
AMOUNT | | | | VALUE | |
| | 90,000 | | | Wabash National Corp.*
4.500%, 10/15/28 | | $ | 74,631 | | |
| | 75,000 | | | Waste Pro USA, Inc.*
5.500%, 02/15/26 | | | 69,191 | | |
| | 56,000 | | | Williams Scotsman International, Inc.*
4.625%, 08/15/28 | | | 49,823 | | |
| | | | 4,079,204 | | |
| | | Information Technology (3.7%) | |
| | 48,000 | | | Booz Allen Hamilton, Inc.*
4.000%, 07/01/29 | | | 42,396 | | |
| | 56,000 | | | Coherent Corp.*^
5.000%, 12/15/29 | | | 47,613 | | |
| | 100,000 | | | CommScope Technologies, LLC*
6.000%, 06/15/25 | | | 60,406 | | |
| | 90,000 | | | CommScope, Inc.*^
4.750%, 09/01/29 | | | 61,482 | | |
| | 48,000 | | | Dun & Bradstreet Corp.*^
5.000%, 12/15/29 | | | 41,359 | | |
| | 48,000 | | | Fair Isaac Corp.*
4.000%, 06/15/28 | | | 42,823 | | |
| | 100,000 | | | KBR, Inc.*
4.750%, 09/30/28 | | | 88,185 | | |
| | 100,000 | | | MPH Acquisition Holdings, LLC*
5.750%, 11/01/28^ | | | 74,675 | | |
| | 50,000 | | | 5.500%, 09/01/28 | | | 41,819 | | |
| | 45,000 | | | NCL Corp., Ltd.*
8.125%, 01/15/29 | | | 44,025 | | |
| | 44,000 | | | NCR Voyix Corp.*
5.125%, 04/15/29 | | | 37,887 | | |
| | 68,000 | | | ON Semiconductor Corp.*
3.875%, 09/01/28 | | | 58,445 | | |
| | 72,000 | | | Open Text Corp.*
3.875%, 02/15/28 | | | 62,717 | | |
| | 45,000 | | | 6.900%, 12/01/27 | | | 44,914 | | |
| | 36,000 | | | 3.875%, 12/01/29 | | | 29,555 | | |
| | 36,000 | | | Open Text Holdings, Inc.*^
4.125%, 12/01/31 | | | 28,382 | | |
| | 104,000 | | | Playtika Holding Corp.*
4.250%, 03/15/29 | | | 83,963 | | |
| | 120,000 | | | TTM Technologies, Inc.*
4.000%, 03/01/29 | | | 98,726 | | |
| | 65,000 | | | Twilio, Inc.^
3.625%, 03/15/29 | | | 54,247 | | |
| | 23,000 | | | 3.875%, 03/15/31 | | | 18,410 | | |
| | 100,000 | | | Viavi Solutions, Inc.*
3.750%, 10/01/29 | | | 79,615 | | |
| | 100,000 | | | ZoomInfo Technologies, LLC /
ZoomInfo Finance Corp.*
3.875%, 02/01/29 | | | 82,683 | | |
| | | | 1,224,327 | | |
PRINCIPAL
AMOUNT | | | | VALUE | |
| | | Materials (3.0%) | |
| | 52,000 | | | ArcelorMittal, SA^
7.000%, 10/15/39 | | $ | 49,458 | | |
| | 47,000 | | | ATI, Inc.^
5.875%, 12/01/27 | | | 43,775 | | |
| | 25,000 | | | Carpenter Technology Corp.
7.625%, 03/15/30 | | | 24,837 | | |
| | 70,000 | | | Chemours Company*^
4.625%, 11/15/29 | | | 54,172 | | |
| | 145,000 | | | Clearwater Paper Corp.*
4.750%, 08/15/28 | | | 128,138 | | |
| | 75,000 | | | Cleveland-Cliffs, Inc.*
6.750%, 04/15/30 | | | 69,683 | | |
| | 48,000 | | | Commercial Metals Company
4.125%, 01/15/30 | | | 40,625 | | |
| | 24,000 | | | 4.375%, 03/15/32 | | | 19,395 | | |
| | 45,000 | | | HB Fuller Company
4.250%, 10/15/28 | | | 39,057 | | |
| | 85,000 | | | JW Aluminum Continuous Cast Company*
10.250%, 06/01/26 | | | 84,790 | | |
| | 100,000 | | | Kaiser Aluminum Corp.*
4.625%, 03/01/28 | | | 83,587 | | |
| | 11,000 | | | 4.500%, 06/01/31^ | | | 8,137 | | |
| | 24,000 | | | LSF11 A5 HoldCo, LLC*
6.625%, 10/15/29 | | | 19,692 | | |
| | 117,000 | | | Mercer International, Inc.
5.125%, 02/01/29^ | | | 91,895 | | |
| | 47,000 | | | 12.875%, 10/01/28* | | | 47,529 | | |
| | 65,000 | | | Owens-Brockway Glass Container, Inc.*^
7.250%, 05/15/31 | | | 59,565 | | |
| | 45,000 | | | 6.625%, 05/13/27 | | | 42,879 | | |
| | 100,000 | | | Silgan Holdings, Inc.
4.125%, 02/01/28 | | | 89,195 | | |
| | 44,000 | | | Trinseo Materials Operating SCA /
Trinseo Materials Finance, Inc.*
5.125%, 04/01/29 | | | 18,852 | | |
| | | | 1,015,261 | | |
| | | Other (0.3%) | |
| | 45,000 | | | Gen Digital, Inc.*
7.125%, 09/30/30^ | | | 43,867 | | |
| | 45,000 | | | 6.750%, 09/30/27 | | | 43,880 | | |
| | | | 87,747 | | |
| | | Real Estate (0.8%) | |
| | 71,000 | | | EPR Properties
3.750%, 08/15/29 | | | 56,112 | | |
| | 67,000 | | | Forestar Group, Inc.*
5.000%, 03/01/28 | | | 59,098 | | |
| | 48,000 | | | 3.850%, 05/15/26 | | | 43,077 | | |
| | 95,000 | | | MIWD Holdco II, LLC / MIWD Finance Corp.*^
5.500%, 02/01/30 | | | 75,465 | | |
| | 45,000 | | | Service Properties Trust
5.250%, 02/15/26 | | | 40,396 | | |
| | | | 274,148 | | |
See accompanying Notes to Schedule of Investments
CALAMOS OPEN-END FAMILY OF FUNDS ANNUAL REPORT
164
High Income Opportunities Fund Schedule of Investments October 31, 2023
PRINCIPAL
AMOUNT | | | | VALUE | |
| | | Special Purpose Acquisition Companies (0.3%) | |
| | 95,000 | | | Fertitta Entertainment, LLC / Fertitta
Entertainment Finance Company, Inc.*
6.750%, 01/15/30 | | $ | 75,592 | | |
| | 46,000 | | | 4.625%, 01/15/29 | | | 38,837 | | |
| | | | 114,429 | | |
| | | Utilities (0.3%) | |
| | 34,000 | | | PPL Capital Funding, Inc.‡
8.317%, 03/30/67
3 mo. USD LIBOR + 2.67% | | | 30,806 | | |
| | 45,000 | | | Vistra Corp.*‡
7.000%, 11/01/67
5 year CMT + 5.74% | | | 41,166 | | |
| | 25,000 | | | 8.000%, 11/01/67
5 year CMT + 6.93% | | | 23,784 | | |
| | | | 95,756 | | |
| | | | | TOTAL CORPORATE BONDS
(Cost $31,981,171) | | | 27,499,855 | | |
CONVERTIBLE BONDS (0.8%) | | | |
| | | Communication Services (0.1%) | |
| | 67,000 | | | Cable One, Inc.
0.000%, 03/15/26 | | | 54,852 | | |
| | | Consumer Discretionary (0.6%) | |
| | 135,000 | | | DISH Network Corp.
0.000%, 12/15/25 | | | 82,828 | | |
| | 118,000 | | | 2.375%, 03/15/24 | | | 113,069 | | |
| | | | 195,897 | | |
| | | Other (0.1%) | |
| | 50,000 | | | Multiplan Corp.*
6.000%, 10/15/27 | | | 33,251 | | |
| | | | | TOTAL CONVERTIBLE BONDS
(Cost $305,217) | | | 284,000 | | |
BANK LOANS (13.1%)¡ | | | |
| | | Airlines (0.5%) | |
| | 85,500 | | | American Airlines, Inc.‡
10.427%, 04/20/28
3 mo. SOFR + 4.75% | | | 86,836 | | |
| | 75,000 | | | Mileage Plus Holdings, LLC‡
10.798%, 06/21/27
3 mo. SOFR + 5.25% | | | 77,416 | | |
| | | | 164,252 | | |
| | | Communication Services (0.4%) | |
| | 12,183 | | | Clear Channel Outdoor Holdings, Inc.‡
5.388%, 08/21/26
3 mo. SOFR + 3.50% | | | 11,731 | | |
| | 33,139 | | | DIRECTV Financing, LLC‡
10.325%, 08/02/27
1 mo. SOFR + 5.00% | | | 32,304 | | |
PRINCIPAL
AMOUNT | | | | VALUE | |
| | 146,000 | | | Entercom Media Corp.‡
8.145%, 11/18/24
3 mo. SOFR + 2.50% | | $ | 64,217 | | |
| | 50,000 | | | Telesat Canada‡
8.434%, 12/07/26
1 mo. SOFR + 2.75% | | | 34,463 | | |
| | | | 142,715 | | |
| | | Consumer Discretionary (2.2%) | |
| | 59,111 | | | American Axle and Manufacturing, Inc.‡
9.007%, 12/13/29
3 mo. SOFR + 3.50% | | | 58,988 | | |
| | 39,389 | | | American Axle and Manufacturing, Inc.‡
8.941%, 12/13/29
1 mo. SOFR + 3.50% | | | 39,307 | | |
| | 99,500 | | | Caesars Entertainment Corp.‡
8.674%, 02/06/30
1 mo. SOFR + 3.25% | | | 99,265 | | |
| | 99,750 | | | Carnival Corp.‡
8.336%, 08/08/27
1 mo. SOFR + 3.00% | | | 98,129 | | |
| | 99,500 | | | Hanesbrands, Inc.‡
9.074%, 03/08/30
1 mo. SOFR + 3.75% | | | 98,381 | | |
| | 52,191 | | | Life Time Fitness, Inc.‡
10.130%, 01/15/26
3 mo. SOFR + 4.75% | | | 52,302 | | |
| | 105,141 | | | Petco Health and Wellness Company, Inc.‡
8.902%, 03/03/28
3 mo. SOFR + 3.25% | | | 102,980 | | |
| | 87,730 | | | PetSmart, Inc.‡
9.174%, 02/11/28
1 mo. SOFR + 3.75% | | | 86,807 | | |
| | 62,206 | | | TKC Holdings, Inc.‡
10.939%, 05/15/28
1 mo. SOFR + 5.50% | | | 59,718 | | |
| | 25,000 | | | Windsor Holdings III, LLC‡
9.815%, 08/01/30
1 mo. SOFR + 4.50% | | | 24,958 | | |
| | | | 720,835 | | |
| | | Consumer Staples (0.4%) | |
| | 90,000 | | | Star Parent, Inc.‡
9.386%, 09/27/30 | | | 86,040 | | |
| | 50,000 | | | United Natural Foods, Inc.‡
8.689%, 10/22/25
1 mo. SOFR + 3.25% | | | 49,931 | | |
| | | | 135,971 | | |
| | | Energy (0.6%) | |
| | 100,000 | | | New Fortress Energy, Inc.‡!
0.000%, 10/23/30 | | | 92,500 | | |
| | 119,525 | | | Par Petroleum, LLC‡
9.773%, 02/28/30
3 mo. SOFR + 4.25% | | | 119,376 | | |
| | | | 211,876 | | |
See accompanying Notes to Schedule of Investments
www.calamos.com
165
High Income Opportunities Fund Schedule of Investments October 31, 2023
PRINCIPAL
AMOUNT | | | | VALUE | |
| | | Financials (2.1%) | |
| | 20,000 | | | Advisor Group, Inc.‡
9.824%, 08/17/28
1 mo. SOFR + 4.50% | | $ | 19,934 | | |
| | 99,499 | | | Alliant Holdings Intermediate, LLC‡
8.835%, 11/05/27
1 mo. SOFR + 3.50% | | | 99,276 | | |
| | 54,414 | | | Amynta Agency Borrower, Inc.‡
10.325%, 02/28/28
1 mo. SOFR + 5.00% | | | 54,452 | | |
| | 19,890 | | | Amynta Agency Borrower, Inc.‡
10.424%, 02/28/28
1 mo. SOFR + 5.00% | | | 19,904 | | |
| | 98,995 | | | AssuredPartners, Inc.‡
8.824%, 02/12/27
1 mo. SOFR + 3.50% | | | 98,253 | | |
| | 59,850 | | | Avolon TLB Borrower 1 LLC‡
7.839%, 06/22/28
1 mo. SOFR + 2.50% | | | 59,933 | | |
| | 79,886 | | | Castlelake Aviation, Ltd.!
0.000%, 10/22/26 | | | 79,836 | | |
| | 54,588 | | | Castlelake Aviation, Ltd.‡
8.421%, 10/22/27
3 mo. SOFR + 2.75% | | | 54,524 | | |
| | 99,250 | | | Hub International, Ltd.‡
9.365%, 11/10/29
3 mo. SOFR + 4.00% | | | 99,236 | | |
| | 128,700 | | | VFH Parent, LLC‡
8.427%, 01/13/29
1 mo. SOFR + 3.00% | | | 128,070 | | |
| | | | 713,418 | | |
| | | Health Care (1.9%) | |
| | 165,806 | | | Amneal Pharmaceuticals, LLC‡
8.939%, 05/04/25
1 mo. SOFR + 3.50% | | | 162,814 | | |
| | 53,364 | | | Icon Luxembourg Sarl‡
7.902%, 07/03/28
3 mo. SOFR + 2.25% | | | 53,456 | | |
| | 129,379 | | | Mallinckrodt International Finance, SA‡
12.703%, 09/30/27
1 mo. SOFR + 7.25% | | | 98,580 | | |
| | 108,235 | | | Padagis, LLC‡
10.434%, 07/06/28
3 mo. SOFR + 4.75% | | | 96,420 | | |
| | 13,296 | | | PRA Health Sciences, Inc.
7.902%, 07/03/28
3 mo. SOFR + 2.25% | | | 13,319 | | |
| | 279,687 | | | Team Health Holdings, Inc.‡
10.577%, 03/02/27
1 mo. SOFR + 5.25% | | | 202,151 | | |
| | 798 | | | Team Health Holdings, Inc.‡
10.574%, 03/02/27
1 mo. SOFR + 5.25% | | | 576 | | |
| | | | 627,316 | | |
PRINCIPAL
AMOUNT | | | | VALUE | |
| | | Industrials (1.4%) | |
| | 48,875 | | | ACProducts, Inc.‡
9.902%, 05/17/28
3 mo. SOFR + 4.25% | | $ | 39,005 | | |
| | 59,250 | | | Air Canada‡
9.128%, 08/11/28
3 mo. SOFR + 3.50% | | | 59,265 | | |
| | 99,250 | | | ChampionX Corp.‡
8.177%, 06/07/29
1 mo. SOFR + 2.75% | | | 99,699 | | |
| | 57,723 | | | Emrld Borrower, LP‡
8.380%, 05/31/30
3 mo. SOFR + 3.00% | | | 57,669 | | |
| | 98,750 | | | Scientific Games International, Inc.‡
8.435%, 04/14/29
1 mo. SOFR + 3.00% | | | 98,781 | | |
| | 97,003 | | | United Airlines, Inc.‡
9.189%, 04/21/28
1 mo. SOFR + 3.75% | | | 96,942 | | |
| | | | 451,361 | | |
| | | Information Technology (1.3%) | |
| | 93,011 | | | Banff Merger Sub, Inc.‡
9.189%, 10/02/25
1 mo. SOFR + 3.75% | | | 93,030 | | |
| | 81,084 | | | Camelot Finance SA‡
8.439%, 10/30/26
1 mo. SOFR + 3.00% | | | 81,076 | | |
| | 65,000 | | | Central Parent, Inc.!
0.000%, 07/06/29 | | | 64,716 | | |
| | 24,813 | | | Central Parent, Inc.‡
9.406%, 07/06/29
3 mo. SOFR + 4.00% | | | 24,704 | | |
| | 89,179 | | | Dun & Bradstreet Corp.‡
8.176%, 02/06/26
1 mo. SOFR + 2.75% | | | 89,179 | | |
| | 91,415 | | | II-VI, Inc.‡
8.189%, 07/02/29
1 mo. SOFR + 2.75% | | | 91,372 | | |
| | | | 444,077 | | |
| | | Materials (1.6%) | |
| | 65,000 | | | Chemours Company‡
8.824%, 08/18/28
1 mo. SOFR + 2.50% | | | 63,375 | | |
| | 99,750 | | | Ineos US Finance, LLC‡
8.825%, 02/18/30
3 mo. SOFR + 3.50% | | | 97,802 | | |
| | 116,892 | | | Innophos, Inc.‡
8.689%, 02/05/27
1 mo. SOFR + 3.25% | | | 115,868 | | |
| | 124,688 | | | LSF11 A5 Holdco, LLC‡
9.674%, 10/15/28
1 mo. SOFR + 4.25% | | | 122,545 | | |
| | 49,746 | | | Trinseo Materials Operating SCA‡
7.939%, 05/03/28
1 mo. SOFR + 2.50% | | | 39,731 | | |
See accompanying Notes to Schedule of Investments
CALAMOS OPEN-END FAMILY OF FUNDS ANNUAL REPORT
166
High Income Opportunities Fund Schedule of Investments October 31, 2023
PRINCIPAL
AMOUNT | | | | VALUE | |
| | 99,242 | | | W.R. Grace & Co.-Conn.‡
9.402%, 09/22/28
3 mo. SOFR + 3.75% | | $ | 97,630 | | |
| | | | 536,951 | | |
| | | Special Purpose Acquisition Companies (0.7%) | |
| | 44,438 | | | Clydesdale Acquisition Holdings, Inc.‡
9.599%, 04/13/29
1 mo. SOFR + 4.18% | | | 43,095 | | |
| | 24,625 | | | Fertitta Entertainment, LLC‡
9.324%, 01/27/29
1 mo. SOFR + 4.00% | | | 24,119 | | |
| | 99,000 | | | Oscar AcquisitionCo, LLC‡
9.990%, 04/29/29
3 mo. SOFR + 4.50% | | | 96,597 | | |
| | 99,000 | | | Patagonia Holdco, LLC‡
11.117%, 08/01/29
3 mo. SOFR + 5.75% | | | 85,883 | | |
| | | | 249,694 | | |
| | | | | TOTAL BANK LOANS
(Cost $4,600,410) | | | 4,398,466 | | |
NUMBER OF
SHARES | | | | VALUE | |
COMMON STOCKS (1.1%) | | | |
| | | Communication Services (0.0%)# | |
| | 2,040 | | | Altice USA, Inc. - Class A | | | 5,896 | | |
| | 1,273 | | | Cumulus Media, Inc. - Class A | | | 5,741 | | |
| | | | 11,637 | | |
| | | Energy (1.0%) | |
| | 1,068 | | | Chaparral Energy, Inc. - Class A&# | | | 47,526 | | |
| | 291 | | | Chesapeake Energy Corp.^ | | | 25,049 | | |
| | 6,600 | | | Energy Transfer, LP | | | 86,790 | | |
| | 3,970 | | | Enterprise Products Partners, LP | | | 103,379 | | |
| | 660 | | | EP Energy Corp.&# | | | 1,733 | | |
| | 857 | | | ONEOK, Inc. | | | 55,876 | | |
| | | | 320,353 | | |
| | | Special Purpose Acquisition Company (0.1%) | |
| | 1,134 | | | Intelsat Emergence, SA&# | | | 26,932 | | |
| | | | | TOTAL COMMON STOCKS
(Cost $569,635) | | | 358,922 | | |
WARRANTS (0.0%)# | | | |
| | | Energy (0.0%) | |
| | 4,950 | | | Mcdermott International, Ltd.&
06/30/27, Strike $15.98 | | | 1 | | |
| | 4,455 | | | Mcdermott International, Ltd.
06/30/27, Strike $12.33 | | | — | | |
| | | | | TOTAL WARRANTS
(Cost $1,909) | | | 1 | | |
NUMBER OF
SHARES | | | | VALUE | |
CONVERTIBLE PREFERRED STOCK (0.1%) | | | |
| | | Energy (0.1%) | |
| | 2 | | | Gulfport Energy Corp.#
10.000%,
(Cost $—) | | | $17,750 | | |
PREFERRED STOCKS (0.7%) | | | |
| | | Communication Services (0.1%) | |
| | 1,110 | | | United States Cellular Corp.
5.500%, 06/01/70 | | | 16,228 | | |
| | 1,060 | | | United States Cellular Corp.
5.500%, 03/01/70 | | | 15,752 | | |
| | | | 31,980 | | |
| | | Consumer Discretionary (0.2%) | |
| | 590 | | | Guitar Center, Inc.&# | | | 62,245 | | |
| | | Energy (0.4%) | |
| | 2,625 | | | NuStar Energy, LP‡
11.315%,
3 mo. USD LIBOR + 5.64% | | | 65,887 | | |
| | 682 | | | NuStar Energy, LP‡‡
12.438%,
3 mo. USD LIBOR + 6.77% | | | 17,371 | | |
| | 2,930 | | | NuStar Logistics, LP‡
12.390%, 01/15/43
3 mo. USD LIBOR + 7.00% | | | 76,121 | | |
| | | | 159,379 | | |
| | | | | TOTAL PREFERRED STOCKS
(Cost $263,089) | | | 253,604 | | |
NUMBER OF
SHARES/
PRINCIPAL
AMOUNT | | | | VALUE | |
INVESTMENT OF CASH COLLATERAL FOR SECURITIES
LOANED (11.8%) | | | |
| | 3,958,408 | | | State Street Navigator Securities
Lending Government Money
Market Portfolio, 5.358%†***
(Cost $3,958,408) | | | 3,958,408 | | |
| | | TOTAL INVESTMENTS (110.0%)
(Cost $41,771,842) | | | 36,859,596 | | |
PAYABLE UPON RETURN OF SECURITIES ON LOAN (-11.8%) | | | (3,958,408 | ) | |
OTHER ASSETS, LESS LIABILITIES (1.8%) | | | 575,830 | | |
NET ASSETS (100.0%) | | $ | 33,477,018 | | |
See accompanying Notes to Schedule of Investments
www.calamos.com
167
High Income Opportunities Fund Schedule of Investments October 31, 2023
NOTES TO SCHEDULE OF INVESTMENTS
* Securities issued and sold pursuant to a Rule 144A transaction are exempted from the registration requirement of the Securities Act of 1933, as amended. These securities may only be sold to qualified institutional buyers ("QIBs"), such as the Fund. Any resale of these securities must generally be effected through a sale that is registered under the Act or otherwise exempted from such registration requirements.
^ Security, or portion of security, is on loan.
@ In default status and considered non-income producing.
& Illiquid security.
‡ Variable rate security. The rate shown is the rate in effect at October 31, 2023.
¡ Bank loans generally are subject to mandatory and/or optional prepayment. As a result, the actual remaining maturity of bank loans may be substantially less than the stated maturities shown.
! This position represents an unsettled loan commitment at period end. Certain details associated with this purchase are not known prior to the settlement date, including coupon rate, which will be adjusted on settlement date.
# Non-income producing security.
‡‡ Perpetual maturity.
† Represents investment of cash collateral received from securities on loan as of October 31, 2023.
*** The rate disclosed is the 7 day net yield as of October 31, 2023.
See accompanying Notes to Schedule of Investments
CALAMOS OPEN-END FAMILY OF FUNDS ANNUAL REPORT
168
Short-Term Bond Fund Schedule of Investments October 31, 2023
PRINCIPAL
AMOUNT | | | | VALUE | |
CORPORATE BONDS (57.2%) | | | |
| | | Airlines (1.0%) | |
| | 238,159 | | | Air Canada Pass Through Trust
Series 2015-2, Class B*
5.000%, 06/15/25 | | $ | 236,980 | | |
| | 956,044 | | | Alaska Airlines Pass Through Trust
Series 2020-1, Class A*
4.800%, 02/15/29 | | | 896,119 | | |
| | 196,735 | | | Alaska Airlines Pass Through Trust
Series 2020-1, Class B*
8.000%, 02/15/27 | | | 196,371 | | |
| | 593,737 | | | British Airways Pass Through Trust
Series 2013-1, Class A*
4.625%, 12/20/25 | | | 587,123 | | |
| | 406,848 | | | British Airways Pass Through Trust
Series 2019-1, Class A*
3.350%, 12/15/30 | | | 360,077 | | |
| | 850,026 | | | JetBlue Pass Through Trust
Series 2020-1, Class B
7.750%, 05/15/30 | | | 845,156 | | |
| | 500,000 | | | Spirit Loyalty Cayman, Ltd. / Spirit IP
Cayman, Ltd.*
8.000%, 09/20/25 | | | 369,345 | | |
| | | | 3,491,171 | | |
| | | Communication Services (2.6%) | |
| | 1,000,000 | | | Ashtead Capital, Inc.*
4.375%, 08/15/27 | | | 926,420 | | |
| | 1,000,000 | | | AT&T, Inc.
1.700%, 03/25/26 | | | 907,960 | | |
| | 1,000,000 | | | Bell Canada
0.750%, 03/17/24 | | | 980,710 | | |
| | 750,000 | | | Cogent Communications Group, Inc.*
3.500%, 05/01/26 | | | 685,065 | | |
| | 1,000,000 | | | Comcast Corp.
5.250%, 11/07/25 | | | 995,320 | | |
| | 822,000 | | | Netflix, Inc.*
3.625%, 06/15/25 | | | 793,296 | | |
| | 500,000 | | | NTT Finance Corp.*^
0.583%, 03/01/24 | | | 491,280 | | |
| | 500,000 | | | Paramount Global
3.450%, 10/04/26 | | | 453,335 | | |
| | 400,000 | | | Qwest Corp.^
7.250%, 09/15/25 | | | 384,120 | | |
| | 1,000,000 | | | Rogers Communications, Inc.
3.625%, 12/15/25 | | | 950,190 | | |
| | 500,000 | | | Sirius XM Radio, Inc.*
3.125%, 09/01/26 | | | 449,245 | | |
| | 1,000,000 | | | Verizon Communications, Inc.
0.850%, 11/20/25 | | | 905,880 | | |
| | 500,000 | | | Warnermedia Holdings, Inc.
3.788%, 03/15/25 | | | 484,125 | | |
| | | | 9,406,946 | | |
PRINCIPAL
AMOUNT | | | | VALUE | |
| | | Consumer Discretionary (5.4%) | |
| | 1,157,000 | | | Abercrombie & Fitch Management
Company*
8.750%, 07/15/25 | | $ | 1,176,299 | | |
| | 1,000,000 | | | Aptiv, PLC
2.396%, 02/18/25 | | | 954,170 | | |
| | 500,000 | | | AutoZone, Inc.
5.050%, 07/15/26 | | | 491,870 | | |
| | 500,000 | | | 4.500%, 02/01/28 | | | 472,995 | | |
| | 500,000 | | | BMW US Capital, LLC*
3.900%, 04/09/25 | | | 488,265 | | |
| | 1,066,000 | | | BorgWarner, Inc.*
5.000%, 10/01/25 | | | 1,043,763 | | |
| | 750,000 | | | Brunswick Corp.
0.850%, 08/18/24 | | | 718,095 | | |
| | 500,000 | | | Caesars Entertainment, Inc.*
6.250%, 07/01/25 | | | 492,515 | | |
| | 1,000,000 | | | CCO Holdings, LLC / CCO Holdings
Capital Corp.*
5.125%, 05/01/27 | | | 921,400 | | |
| | 375,000 | | | Dana Financing Luxembourg Sarl*
5.750%, 04/15/25 | | | 365,696 | | |
| | 1,000,000 | | | Ford Motor Credit Company, LLC
6.950%, 03/06/26 | | | 1,003,850 | | |
| | 500,000 | | | 2.300%, 02/10/25 | | | 472,565 | | |
| | 1,000,000 | | | General Motors Financial Company, Inc.
1.200%, 10/15/24 | | | 953,540 | | |
| | 200,000 | | | 5.400%, 04/06/26 | | | 195,770 | | |
| | 750,000 | | | goeasy, Ltd.*
5.375%, 12/01/24^ | | | 737,152 | | |
| | 200,000 | | | 4.375%, 05/01/26 | | | 181,290 | | |
| | 500,000 | | | Goodyear Tire & Rubber Company
9.500%, 05/31/25 | | | 506,770 | | |
| | 1,251,000 | | | Hasbro, Inc.
3.000%, 11/19/24 | | | 1,211,819 | | |
| | 500,000 | | | International Game Technology, PLC*
4.125%, 04/15/26 | | | 471,685 | | |
| | 369,648 | | | JetBlue Pass Through Trust
Series 2019-2, Class B
8.000%, 11/15/27 | | | 372,124 | | |
| | 500,000 | | | Kia Corp.*
2.375%, 02/14/25 | | | 477,685 | | |
| | 500,000 | | | Kohl's Corp.
4.250%, 07/17/25 | | | 469,300 | | |
| | 750,000 | | | L Brands, Inc.*^
9.375%, 07/01/25 | | | 773,520 | | |
| | 250,000 | | | Lennar Corp.
4.500%, 04/30/24 | | | 248,093 | | |
| | 1,000,000 | | | Lowe's Companies, Inc.^
4.400%, 09/08/25 | | | 978,130 | | |
| | 750,000 | | | Mattel, Inc.*^
3.375%, 04/01/26 | | | 695,115 | | |
| | 500,000 | | | 5.875%, 12/15/27 | | | 479,770 | | |
See accompanying Notes to Schedule of Investments
www.calamos.com
169
Short-Term Bond Fund Schedule of Investments October 31, 2023
PRINCIPAL
AMOUNT | | | | VALUE | |
| | 500,000 | | | Newell Brands, Inc.
5.200%, 04/01/26 | | $ | 472,285 | | |
| | 500,000 | | | Nordstrom, Inc.^
2.300%, 04/08/24 | | | 492,165 | | |
| | 1,000,000 | | | VF Corp.
2.400%, 04/23/25 | | | 941,810 | | |
| | | | 19,259,506 | | |
| | | Consumer Staples (1.6%) | |
| | 500,000 | | | Darling Ingredients, Inc.*
5.250%, 04/15/27 | | | 476,450 | | |
| | 1,000,000 | | | Dollar General Corp.
4.250%, 09/20/24 | | | 983,700 | | |
| | 1,000,000 | | | General Mills, Inc.^
5.241%, 11/18/25 | | | 989,730 | | |
| | 750,000 | | | Keurig Dr Pepper, Inc.
0.750%, 03/15/24 | | | 735,510 | | |
| | 300,000 | | | McCormick & Company, Inc.
0.900%, 02/15/26 | | | 268,419 | | |
| | 500,000 | | | Mondelez International, Inc.
2.125%, 03/17/24 | | | 493,050 | | |
| | 1,000,000 | | | United Rentals North America, Inc.
3.875%, 11/15/27 | | | 920,650 | | |
| | 1,000,000 | | | Walgreens Boots Alliance, Inc.
0.950%, 11/17/23 | | | 997,890 | | |
| | | | 5,865,399 | | |
| | | Energy (1.8%) | |
| | 500,000 | | | Enbridge, Inc.
2.500%, 02/14/25 | | | 478,350 | | |
| | 375,000 | | | 2.150%, 02/16/24 | | | 370,781 | | |
| | 1,000,000 | | | Enterprise Products Operating, LLC
5.050%, 01/10/26 | | | 988,490 | | |
| | 500,000 | | | EQM Midstream Partners, LP*
7.500%, 06/01/27 | | | 497,080 | | |
| | 500,000 | | | EQT Corp.
3.125%, 05/15/26*^ | | | 463,110 | | |
| | 277,000 | | | 6.125%, 02/01/25 | | | 276,288 | | |
| | 1,000,000 | | | Eversource Energy
4.200%, 06/27/24 | | | 987,960 | | |
| | 1,000,000 | | | ONEOK, Inc.
5.550%, 11/01/26 | | | 988,580 | | |
| | 500,000 | | | Parkland Corp.*^
5.875%, 07/15/27 | | | 480,825 | | |
| | 1,000,000 | | | Williams Companies, Inc.
5.400%, 03/02/26 | | | 988,640 | | |
| | | | 6,520,104 | | |
| | | Financials (20.6%) | |
| | 500,000 | | | AerCap Ireland Capital DAC /
AerCap Global Aviation Trust
2.875%, 08/14/24 | | | 486,065 | | |
| | 500,000 | | | 1.750%, 10/29/24 | | | 477,465 | | |
| | 1,000,000 | | | African Development Bank
3.375%, 07/07/25 | | | 969,950 | | |
PRINCIPAL
AMOUNT | | | | VALUE | |
| | 500,000 | | | American Express Company
5.389%, 07/28/27‡
SOFR + 0.97% | | $ | 489,915 | | |
| | 500,000 | | | 2.250%, 03/04/25 | | | 475,805 | | |
| | 2,000,000 | | | Asian Development Bank
0.375%, 06/11/24 | | | 1,938,360 | | |
| | 1,000,000 | | | Asian Infrastructure Investment Bank
4.000%, 01/18/28 | | | 957,120 | | |
| | 750,000 | | | Aviation Capital Group, LLC*
1.950%, 09/20/26 | | | 652,492 | | |
| | 500,000 | | | Avolon Holdings Funding, Ltd.*
3.950%, 07/01/24 | | | 490,320 | | |
| | 250,000 | | | 5.500%, 01/15/26 | | | 240,965 | | |
| | 500,000 | | | Bank of America Corp.‡
2.456%, 10/22/25
3 mo. SOFR + 1.13% | | | 480,640 | | |
| | 500,000 | | | 1.530%, 12/06/25
SOFR + 0.65% | | | 472,430 | | |
| | 250,000 | | | 1.658%, 03/11/27
SOFR + 0.91% | | | 223,685 | | |
| | 250,000 | | | 0.981%, 09/25/25
SOFR + 0.91% | | | 237,948 | | |
| | 1,000,000 | | | Bank of Montreal
5.203%, 02/01/28 | | | 964,350 | | |
| | 1,000,000 | | | Bank of Nova Scotia
1.450%, 01/10/25 | | | 947,930 | | |
| | 1,000,000 | | | Bank of NY Mellon Corp.‡
4.414%, 07/24/26
SOFR + 1.35% | | | 971,380 | | |
| | 500,000 | | | Barclays, PLC‡
5.304%, 08/09/26
1 year CMT + 2.30% | | | 488,055 | | |
| | 500,000 | | | 1.007%, 12/10/24
1 year CMT + 0.80% | | | 496,850 | | |
| | 500,000 | | | Blackstone Private Credit Fund
2.350%, 11/22/24 | | | 475,715 | | |
| | 267,000 | | | Brookfield Finance, Inc.
4.000%, 04/01/24 | | | 264,944 | | |
| | 1,000,000 | | | Camden Property Trust
5.850%, 11/03/26 | | | 1,001,210 | | |
| | 500,000 | | | Capital One Financial Corp.‡
4.985%, 07/24/26
SOFR + 2.16% | | | 482,260 | | |
| | 500,000 | | | 2.636%, 03/03/26
SOFR + 1.29% | | | 469,030 | | |
| | 250,000 | | | Charles Schwab Corp.^
0.900%, 03/11/26 | | | 220,535 | | |
| | 1,000,000 | | | Citigroup, Inc.‡
0.981%, 05/01/25
SOFR + 0.67% | | | 970,540 | | |
| | 500,000 | | | 2.014%, 01/25/26
SOFR + 0.69% | | | 472,160 | | |
| | 500,000 | | | Citizens Bank NA‡
6.064%, 10/24/25
SOFR + 1.45% | | | 479,180 | | |
| | 500,000 | | | 4.119%, 05/23/25
SOFR + 1.40% | | | 482,095 | | |
See accompanying Notes to Schedule of Investments
CALAMOS OPEN-END FAMILY OF FUNDS ANNUAL REPORT
170
Short-Term Bond Fund Schedule of Investments October 31, 2023
PRINCIPAL
AMOUNT | | | | VALUE | |
| | 1,000,000 | | | CNO Global Funding*
1.650%, 01/06/25 | | $ | 940,440 | | |
| | 1,000,000 | | | Cooperatieve Rabobank UA
1.375%, 01/10/25 | | | 949,370 | | |
| | 250,000 | | | 3.875%, 08/22/24 | | | 245,870 | | |
| | 1,000,000 | | | Council Of Europe Development Bank
3.750%, 05/25/26 | | | 968,230 | | |
| | 475,000 | | | Credit Acceptance Corp.*
5.125%, 12/31/24 | | | 459,900 | | |
| | 500,000 | | | Credit Suisse AG/New York NY
3.700%, 02/21/25 | | | 481,685 | | |
| | 250,000 | | | 0.495%, 02/02/24 | | | 246,438 | | |
| | 1,500,000 | | | Danske Bank, A/S*^‡
0.976%, 09/10/25
1 year CMT + 0.55% | | | 1,428,465 | | |
| | 1,250,000 | | | Discover Bank
2.450%, 09/12/24 | | | 1,203,962 | | |
| | 1,000,000 | | | DNB Bank, ASA*‡
0.856%, 09/30/25
1 year CMT + 0.33% | | | 951,390 | | |
| | 957,000 | | | Enact Holdings, Inc.*
6.500%, 08/15/25 | | | 942,559 | | |
| | 1,250,000 | | | European Bank for Reconstruction &
Development
0.500%, 11/25/25 | | | 1,137,937 | | |
| | 1,000,000 | | | 0.500%, 05/19/25 | | | 928,280 | | |
| | 1,000,000 | | | European Investment Bank
0.375%, 07/24/24 | | | 963,910 | | |
| | 500,000 | | | Fifth Third Bancorp
4.300%, 01/16/24^ | | | 497,385 | | |
| | 500,000 | | | 1.707%, 11/01/27‡
SOFR + 0.69% | | | 426,800 | | |
| | 750,000 | | | Goldman Sachs Group, Inc.
0.855%, 02/12/26‡
SOFR + 0.61% | | | 695,835 | | |
| | 500,000 | | | 1.757%, 01/24/25‡
SOFR + 0.73% | | | 493,875 | | |
| | 500,000 | | | 1.217%, 12/06/23 | | | 497,785 | | |
| | 450,000 | | | HSBC Holdings, PLC‡
2.999%, 03/10/26
SOFR + 1.43% | | | 429,210 | | |
| | 1,000,000 | | | Huntington National Bank‡
5.699%, 11/18/25
SOFR + 1.22% | | | 971,720 | | |
| | 1,000,000 | | | Inter-American Development Bank^
1.750%, 03/14/25 | | | 952,450 | | |
| | 1,000,000 | | | Inter-American Investment Corp.
2.625%, 04/22/25 | | | 959,830 | | |
| | 1,000,000 | | | International Bank for Reconstruction &
Development
1.625%, 01/15/25 | | | 955,980 | | |
| | 500,000 | | | International Finance Corp.
3.625%, 09/15/25 | | | 486,285 | | |
| | 500,000 | | | JPMorgan Chase & Company‡
2.595%, 02/24/26
SOFR + 0.92% | | | 476,670 | | |
PRINCIPAL
AMOUNT | | | | VALUE | |
| | 500,000 | | | 0.824%, 06/01/25
3 mo. SOFR + 0.54% | | $ | 483,165 | | |
| | 250,000 | | | 1.578%, 04/22/27
SOFR + 0.89% | | | 223,005 | | |
| | 250,000 | | | 0.768%, 08/09/25
SOFR + 0.49% | | | 238,858 | | |
| | 500,000 | | | KeyBank NA^
4.150%, 08/08/25 | | | 465,795 | | |
| | 1,000,000 | | | KfW
1.250%, 01/31/25 | | | 950,100 | | |
| | 1,000,000 | | | Kreditanstalt fuer Wiederaufbau
3.375%, 08/23/24 | | | 982,610 | | |
| | 300,000 | | | 1.000%, 10/01/26 | | | 268,152 | | |
| | 1,000,000 | | | Ladder Capital Finance Holdings, LLLP /
Ladder Capital Finance Corp.*
5.250%, 10/01/25 | | | 953,400 | | |
| | 500,000 | | | Lloyds Banking Group, PLC‡
3.511%, 03/18/26
1 year CMT + 1.60% | | | 479,550 | | |
| | 750,000 | | | LSEGA Financing, PLC*
0.650%, 04/06/24 | | | 733,320 | | |
| | 500,000 | | | Macquarie Group, Ltd.*‡
1.201%, 10/14/25
SOFR + 0.69% | | | 475,580 | | |
| | 250,000 | | | Manufacturers & Traders Trust Company
4.650%, 01/27/26 | | | 236,125 | | |
| | 1,000,000 | | | Metropolitan Life Global Funding I*
2.800%, 03/21/25 | | | 961,790 | | |
| | 500,000 | | | 5.000%, 01/06/26^ | | | 492,605 | | |
| | 500,000 | | | Mitsubishi UFJ Financial Group, Inc.‡
5.063%, 09/12/25
1 year CMT + 1.55% | | | 494,525 | | |
| | 500,000 | | | 4.788%, 07/18/25
1 year CMT + 1.70% | | | 494,350 | | |
| | 520,000 | | | Mondelez International Holdings
Netherlands, BV*
0.750%, 09/24/24 | | | 496,616 | | |
| | 750,000 | | | Morgan Stanley‡
0.790%, 05/30/25
SOFR + 0.53% | | | 723,472 | | |
| | 750,000 | | | Nasdaq, Inc.
5.350%, 06/28/28^ | | | 730,620 | | |
| | 42,000 | | | 5.650%, 06/28/25 | | | 41,864 | | |
| | 500,000 | | | National Bank of Canada‡
3.750%, 06/09/25
SOFR + 1.01% | | | 491,275 | | |
| | 1,000,000 | | | National Securities Clearing Corp.*
5.150%, 05/30/25 | | | 992,750 | | |
| | 500,000 | | | NatWest Markets, PLC*^
1.600%, 09/29/26 | | | 438,665 | | |
| | 500,000 | | | Nordea Bank Abp*
4.750%, 09/22/25 | | | 489,885 | | |
| | 500,000 | | | 1.500%, 09/30/26 | | | 438,860 | | |
| | 1,000,000 | | | Nordic Investment Bank
2.625%, 04/04/25 | | | 962,260 | | |
| | 1,000,000 | | | 0.375%, 09/11/25^ | | | 915,660 | | |
See accompanying Notes to Schedule of Investments
www.calamos.com
171
Short-Term Bond Fund Schedule of Investments October 31, 2023
PRINCIPAL
AMOUNT | | | | VALUE | |
| | 1,000,000 | | | Oesterreichische Kontrollbank, AG
3.625%, 09/09/27 | | $ | 955,440 | | |
| | 1,000,000 | | | 1.500%, 02/12/25 | | | 951,210 | | |
| | 500,000 | | | OneMain Finance Corp.
3.500%, 01/15/27 | | | 424,170 | | |
| | 250,000 | | | 6.125%, 03/15/24 | | | 249,768 | | |
| | 1,000,000 | | | PayPal Holdings, Inc.
2.650%, 10/01/26 | | | 921,270 | | |
| | 750,000 | | | PNC Financial Services Group, Inc.
5.671%, 10/28/25‡
SOFR + 1.09% | | | 742,507 | | |
| | 250,000 | | | 2.200%, 11/01/24 | | | 240,478 | | |
| | 935,000 | | | Pricoa Global Funding I*
4.200%, 08/28/25 | | | 910,363 | | |
| | 500,000 | | | 1.200%, 09/01/26 | | | 440,380 | | |
| | 1,000,000 | | | Prologis, LP
4.875%, 06/15/28 | | | 962,210 | | |
| | 1,000,000 | | | Radian Group, Inc.
4.500%, 10/01/24 | | | 975,540 | | |
| | 500,000 | | | Rocket Mortgage, LLC / Rocket
Mortgage Co-Issuer, Inc.*
2.875%, 10/15/26 | | | 436,680 | | |
| | 750,000 | | | Royal Bank Of Canada
6.000%, 11/01/27 | | | 750,202 | | |
| | 250,000 | | | Royal Bank of Canada
0.875%, 01/20/26 | | | 224,105 | | |
| | 500,000 | | | SBA Tower Trust*
1.631%, 05/15/51 | | | 433,340 | | |
| | 250,000 | | | 1.840%, 04/15/27 | | | 214,339 | | |
| | 200,000 | | | 1.884%, 07/15/50 | | | 181,436 | | |
| | 190,000 | | | 2.836%, 01/15/50 | | | 181,492 | | |
| | 500,000 | | | Skandinaviska Enskilda Banken, AB*
0.650%, 09/09/24^ | | | 478,130 | | |
| | 300,000 | | | 1.200%, 09/09/26 | | | 262,785 | | |
| | 500,000 | | | SLM Corp.
3.125%, 11/02/26 | | | 437,800 | | |
| | 500,000 | | | Starwood Property Trust, Inc.*
5.500%, 11/01/23 | | | 500,000 | | |
| | 500,000 | | | 3.750%, 12/31/24 | | | 473,385 | | |
| | 500,000 | | | State Street Corp.‡
5.751%, 11/04/26
SOFR + 1.35% | | | 497,185 | | |
| | 500,000 | | | 2.354%, 11/01/25
SOFR + 0.94% | | | 480,295 | | |
| | 500,000 | | | StoneX Group, Inc.*
8.625%, 06/15/25 | | | 502,995 | | |
| | 1,000,000 | | | Svenska Handelsbanken, AB*
3.650%, 06/10/25 | | | 965,480 | | |
| | 500,000 | | | Synovus Bank
5.625%, 02/15/28 | | | 443,695 | | |
| | 500,000 | | | Toronto-Dominion Bank
3.766%, 06/06/25 | | | 483,390 | | |
| | 250,000 | | | 1.200%, 06/03/26 | | | 221,575 | | |
| | 250,000 | | | 0.750%, 09/11/25^ | | | 227,870 | | |
| | 250,000 | | | 0.750%, 01/06/26 | | | 223,603 | | |
PRINCIPAL
AMOUNT | | | | VALUE | |
| | 1,000,000 | | | Toyota Motor Credit Corp.
4.625%, 01/12/28 | | $ | 968,550 | | |
| | 1,000,000 | | | Truist Financial Corp.‡
5.900%, 10/28/26
SOFR + 1.63% | | | 980,930 | | |
| | 500,000 | | | UBS AG/London*
0.450%, 02/09/24 | | | 492,520 | | |
| | 1,000,000 | | | Ventas Realty, LP
3.500%, 02/01/25 | | | 964,030 | | |
| | 750,000 | | | VICI Properties, LP /
VICI Note Company, Inc.*^
3.500%, 02/15/25 | | | 718,222 | | |
| | | | 73,643,882 | | |
| | | Health Care (4.4%) | |
| | 500,000 | | | Amgen, Inc.
5.250%, 03/02/25 | | | 496,195 | | |
| | 1,000,000 | | | Baxter International, Inc.
1.322%, 11/29/24 | | | 950,960 | | |
| | 500,000 | | | 0.868%, 12/01/23 | | | 497,855 | | |
| | 1,000,000 | | | Blue Cross and Blue Shield of Minnesota*
3.790%, 05/01/25 | | | 952,270 | | |
| | 250,000 | | | Cigna Corp.
0.613%, 03/15/24 | | | 245,213 | | |
| | 1,000,000 | | | CVS Health Corp.
5.000%, 02/20/26 | | | 981,020 | | |
| | 750,000 | | | Elevance Health, Inc.
2.375%, 01/15/25 | | | 719,820 | | |
| | 1,000,000 | | | Gilead Sciences, Inc.
3.500%, 02/01/25 | | | 971,940 | | |
| | 250,000 | | | Haleon UK Capital PLC
3.125%, 03/24/25 | | | 240,375 | | |
| | 1,000,000 | | | Haleon US Capital LLC
3.024%, 03/24/24 | | | 987,240 | | |
| | 1,000,000 | | | Health Care Service Corp. A Mutual
Legal Reserve Company*
1.500%, 06/01/25 | | | 929,720 | | |
| | 1,000,000 | | | Illumina, Inc.
5.800%, 12/12/25 | | | 990,440 | | |
| | 1,000,000 | | | IQVIA, Inc.*
5.700%, 05/15/28 | | | 959,990 | | |
| | 500,000 | | | Laboratory Corp. of America Holdings
3.600%, 02/01/25 | | | 485,660 | | |
| | 500,000 | | | 2.300%, 12/01/24 | | | 480,410 | | |
| | 1,000,000 | | | McKesson Corp.
0.900%, 12/03/25^ | | | 907,010 | | |
| | 500,000 | | | 5.250%, 02/15/26 | | | 494,790 | | |
| | 500,000 | | | PerkinElmer, Inc.
0.850%, 09/15/24 | | | 477,175 | | |
| | 750,000 | | | Quest Diagnostics, Inc.
3.500%, 03/30/25 | | | 723,442 | | |
| | 750,000 | | | Teva Pharmaceutical Finance
Netherlands III, BV
3.150%, 10/01/26 | | | 660,210 | | |
See accompanying Notes to Schedule of Investments
CALAMOS OPEN-END FAMILY OF FUNDS ANNUAL REPORT
172
Short-Term Bond Fund Schedule of Investments October 31, 2023
PRINCIPAL
AMOUNT | | | | VALUE | |
| | 750,000 | | | Thermo Fisher Scientific, Inc.
1.215%, 10/18/24 | | $ | 716,790 | | |
| | 500,000 | | | UnitedHealth Group, Inc.
5.250%, 02/15/28 | | | 496,820 | | |
| | 500,000 | | | 5.150%, 10/15/25^ | | | 498,300 | | |
| | | | 15,863,645 | | |
| | | Industrials (6.3%) | |
| | 500,000 | | | Air Lease Corp.
0.800%, 08/18/24 | | | 478,130 | | |
| | 500,000 | | | Allegiant Travel Company*
7.250%, 08/15/27 | | | 455,390 | | |
| | 410,000 | | | Ball Corp.
6.875%, 03/15/28 | | | 409,734 | | |
| | 250,000 | | | 4.000%, 11/15/23 | | | 249,740 | | |
| | 750,000 | | | Beacon Roofing Supply, Inc.*^
4.500%, 11/15/26 | | | 700,515 | | |
| | 1,000,000 | | | Berry Global, Inc.*
4.875%, 07/15/26 | | | 955,300 | | |
| | 1,000,000 | | | Canadian Pacific Railway Company
1.350%, 12/02/24 | | | 952,150 | | |
| | 1,000,000 | | | Cascades, Inc. / Cascades USA, Inc.*
5.125%, 01/15/26 | | | 955,940 | | |
| | 666,666 | | | Delta Air Lines, Inc. / SkyMiles IP, Ltd.*
4.500%, 10/20/25 | | | 648,526 | | |
| | 500,000 | | | GATX Corp.
4.350%, 02/15/24 | | | 497,535 | | |
| | 500,000 | | | Graphic Packaging International, LLC*
1.512%, 04/15/26 | | | 443,805 | | |
| | 500,000 | | | 0.821%, 04/15/24 | | | 488,050 | | |
| | 500,000 | | | GXO Logistics, Inc.
1.650%, 07/15/26 | | | 440,610 | | |
| | 500,000 | | | Harley-Davidson Financial Services, Inc.*^
6.500%, 03/10/28 | | | 489,035 | | |
| | 750,000 | | | Hawaiian Brand Intellectual
Property, Ltd. / HawaiianMiles
Loyalty, Ltd.*
5.750%, 01/20/26 | | | 554,850 | | |
| | 1,000,000 | | | Ingersoll Rand, Inc.
5.400%, 08/14/28 | | | 974,700 | | |
| | 1,000,000 | | | Leidos, Inc.
3.625%, 05/15/25 | | | 961,250 | | |
| | 1,000,000 | | | Lennox International, Inc.
5.500%, 09/15/28 | | | 976,170 | | |
| | 1,000,000 | | | Mohawk Industries, Inc.^
5.850%, 09/18/28 | | | 983,770 | | |
| | 1,000,000 | | | Nordson Corp
5.600%, 09/15/28 | | | 981,740 | | |
| | 500,000 | | | Owens Corning
4.200%, 12/01/24 | | | 492,360 | | |
| | 1,000,000 | | | Parker-Hannifin Corp.
2.700%, 06/14/24 | | | 980,340 | | |
| | 1,000,000 | | | Penske Truck Leasing Company, LP /
PTL Finance Corp.*
4.200%, 04/01/27 | | | 929,300 | | |
PRINCIPAL
AMOUNT | | | | VALUE | |
| | 500,000 | | | Roper Technologies, Inc.^
1.000%, 09/15/25 | | $ | 458,100 | | |
| | 1,000,000 | | | Ryder System, Inc.^
5.650%, 03/01/28 | | | 978,500 | | |
| | 389,000 | | | Sealed Air Corp.*
6.125%, 02/01/28 | | | 370,452 | | |
| | 500,000 | | | SMBC Aviation Capital Finance DAC*
1.900%, 10/15/26 | | | 440,955 | | |
| | 49,000 | | | TransDigm, Inc.*
6.250%, 03/15/26 | | | 47,952 | | |
| | 1,000,000 | | | Tyco Electronics Group SA
4.500%, 02/13/26 | | | 976,640 | | |
| | 1,000,000 | | | Verisk Analytics, Inc.
4.000%, 06/15/25 | | | 968,950 | | |
| | 1,000,000 | | | Waste Management, Inc.
3.500%, 05/15/24 | | | 987,330 | | |
| | 750,000 | | | WESCO Distribution, Inc.*
7.125%, 06/15/25 | | | 751,500 | | |
| | 723,000 | | | Williams Scotsman, Inc.*
6.125%, 06/15/25 | | | 712,654 | | |
| | | | 22,691,973 | | |
| | | Information Technology (5.2%) | |
| | 1,000,000 | | | Autodesk, Inc.
4.375%, 06/15/25 | | | 977,830 | | |
| | 1,000,000 | | | Booz Allen Hamilton, Inc.*
3.875%, 09/01/28 | | | 893,670 | | |
| | 715,000 | | | Broadridge Financial Solutions, Inc.
3.400%, 06/27/26 | | | 668,933 | | |
| | 500,000 | | | CDW, LLC / CDW Finance Corp.
5.500%, 12/01/24 | | | 495,410 | | |
| | 300,000 | | | 4.125%, 05/01/25 | | | 289,812 | | |
| | 500,000 | | | CGI, Inc.
1.450%, 09/14/26 | | | 440,795 | | |
| | 500,000 | | | Fidelity National Information
Services, Inc.
4.500%, 07/15/25 | | | 488,645 | | |
| | 500,000 | | | 0.600%, 03/01/24 | | | 491,050 | | |
| | 750,000 | | | Hewlett Packard Enterprise Company
1.450%, 04/01/24 | | | 736,080 | | |
| | 250,000 | | | 5.900%, 10/01/24 | | | 249,692 | | |
| | 500,000 | | | HP, Inc.
1.450%, 06/17/26 | | | 447,285 | | |
| | 1,000,000 | | | Intel Corp.
2.875%, 05/11/24 | | | 985,840 | | |
| | 1,000,000 | | | International Business Machines Corp.
4.500%, 02/06/26 | | | 975,930 | | |
| | 500,000 | | | 1.000%, 03/15/26 | | | 446,140 | | |
| | 1,000,000 | | | Intuit, Inc.
5.250%, 09/15/26 | | | 997,050 | | |
| | 500,000 | | | KLA Corp.
4.650%, 11/01/24 | | | 494,410 | | |
| | 1,000,000 | | | Mercedes-Benz Finance North America, LLC*
5.375%, 11/26/25 | | | 994,800 | | |
See accompanying Notes to Schedule of Investments
www.calamos.com
173
Short-Term Bond Fund Schedule of Investments October 31, 2023
PRINCIPAL
AMOUNT | | | | VALUE | |
| | 1,000,000 | | | Microsoft Corp.
3.125%, 11/03/25 | | $ | 960,420 | | |
| | 1,000,000 | | | NetApp, Inc.
1.875%, 06/22/25 | | | 935,830 | | |
| | 1,000,000 | | | NVIDIA Corp.^
0.584%, 06/14/24 | | | 969,810 | | |
| | 500,000 | | | Open Text Corp.*
6.900%, 12/01/27 | | | 499,040 | | |
| | 1,000,000 | | | Oracle Corp.
2.650%, 07/15/26 | | | 920,470 | | |
| | 750,000 | | | PTC, Inc.*
3.625%, 02/15/25 | | | 725,055 | | |
| | 500,000 | | | Take-Two Interactive Software, Inc.
5.000%, 03/28/26 | | | 489,645 | | |
| | 500,000 | | | 3.550%, 04/14/25 | | | 483,245 | | |
| | 500,000 | | | Texas Instruments, Inc.
4.600%, 02/15/28 | | | 486,065 | | |
| | 250,000 | | | 1.125%, 09/15/26 | | | 223,850 | | |
| | 750,000 | | | VMware, Inc.
1.000%, 08/15/24 | | | 720,945 | | |
| | | | 18,487,747 | | |
| | | Materials (1.6%) | |
| | 250,000 | | | Avery Dennison Corp.
0.850%, 08/15/24 | | | 240,053 | | |
| | 350,000 | | | Clearwater Paper Corp.*
5.375%, 02/01/25 | | | 343,000 | | |
| | 1,000,000 | | | Genuine Parts Company
1.750%, 02/01/25 | | | 945,340 | | |
| | 1,000,000 | | | Linde, Inc.
4.700%, 12/05/25 | | | 989,030 | | |
| | 1,500,000 | | | OCI, NV*
4.625%, 10/15/25 | | | 1,428,675 | | |
| | 500,000 | | | Sherwin-Williams Company
4.050%, 08/08/24^ | | | 492,605 | | |
| | 200,000 | | | 4.250%, 08/08/25 | | | 194,378 | | |
| | 1,000,000 | | | Sonoco Products Company
1.800%, 02/01/25 | | | 949,440 | | |
| | | | 5,582,521 | | |
| | | Other (0.4%) | |
| | 1,000,000 | | | Federation des Caisses Desjardins
du Quebec*
4.400%, 08/23/25 | | | 968,310 | | |
| | 500,000 | | | Gen Digital, Inc.*
6.750%, 09/30/27 | | | 487,560 | | |
| | | | 1,455,870 | | |
| | | Real Estate (3.3%) | |
| | 1,000,000 | | | American Tower Corp.
1.600%, 04/15/26 | | | 895,820 | | |
| | 250,000 | | | 0.600%, 01/15/24 | | | 247,190 | | |
| | 1,000,000 | | | Boston Properties, LP
6.750%, 12/01/27 | | | 984,030 | | |
| | 1,000,000 | | | Brixmor Operating Partnership, LP
4.125%, 06/15/26 | | | 941,300 | | |
PRINCIPAL
AMOUNT | | | | VALUE | |
| | 1,000,000 | | | Crown Castle, Inc.
4.450%, 02/15/26 | | $ | 963,460 | | |
| | 500,000 | | | EPR Properties
4.500%, 04/01/25 | | | 483,660 | | |
| | 500,000 | | | Equinix, Inc.
1.000%, 09/15/25 | | | 455,590 | | |
| | 250,000 | | | 1.250%, 07/15/25^ | | | 230,725 | | |
| | 500,000 | | | Federal Realty Investment Trust^
1.250%, 02/15/26 | | | 449,455 | | |
| | 750,000 | | | Forestar Group, Inc.*
3.850%, 05/15/26 | | | 673,080 | | |
| | 1,000,000 | | | Healthpeak OP LLC
3.400%, 02/01/25 | | | 966,610 | | |
| | 1,000,000 | | | Public Storage
5.125%, 01/15/29 | | | 974,720 | | |
| | 1,000,000 | | | Realty Income Corp.
5.050%, 01/13/26 | | | 981,930 | | |
| | 500,000 | | | 4.625%, 11/01/25 | | | 487,470 | | |
| | 500,000 | | | Simon Property Group, LP
1.375%, 01/15/27^ | | | 433,670 | | |
| | 250,000 | | | 2.000%, 09/13/24 | | | 241,608 | | |
| | 500,000 | | | Welltower OP, LLC
3.625%, 03/15/24 | | | 495,210 | | |
| | 250,000 | | | Welltower, Inc.
4.000%, 06/01/25 | | | 241,802 | | |
| | 500,000 | | | Weyerhaeuser Company
4.750%, 05/15/26 | | | 487,035 | | |
| | | | 11,634,365 | | |
| | | Special Purpose Acquisition Companies (0.5%) | |
| | 1,000,000 | | | New York Life Global Funding*
3.600%, 08/05/25 | | | 967,560 | | |
| | 1,000,000 | | | Novartis Capital Corp.
3.400%, 05/06/24 | | | 988,280 | | |
| | | | 1,955,840 | | |
| | | Utilities (2.5%) | |
| | 250,000 | | | AES Corp.
1.375%, 01/15/26 | | | 222,315 | | |
| | 500,000 | | | Alexander Funding Trust*
1.841%, 11/15/23 | | | 499,180 | | |
| | 1,000,000 | | | CMS Energy Corp.
3.600%, 11/15/25 | | | 951,900 | | |
| | 250,000 | | | Consolidated Edison, Inc.
0.650%, 12/01/23 | | | 249,043 | | |
| | 300,000 | | | DPL, Inc.
4.125%, 07/01/25 | | | 285,138 | | |
| | 750,000 | | | Enel Finance International, NV*
2.650%, 09/10/24 | | | 728,280 | | |
| | 300,000 | | | Entergy Corp.
0.900%, 09/15/25 | | | 273,219 | | |
| | 500,000 | | | Entergy Texas, Inc.
1.500%, 09/01/26 | | | 436,935 | | |
| | 1,000,000 | | | National Rural Utilities Cooperative
Finance Corp.
5.450%, 10/30/25 | | | 999,020 | | |
See accompanying Notes to Schedule of Investments
CALAMOS OPEN-END FAMILY OF FUNDS ANNUAL REPORT
174
Short-Term Bond Fund Schedule of Investments October 31, 2023
PRINCIPAL
AMOUNT | | | | VALUE | |
| | 25,000 | | | PPL Capital Funding, Inc.‡
8.317%, 03/30/67
3 mo. USD LIBOR + 2.67% | | $ | 22,651 | | |
| | 1,000,000 | | | Public Service Enterprise Group, Inc.^
0.841%, 11/08/23 | | | 999,140 | | |
| | 200,000 | | | Sempra
3.300%, 04/01/25 | | | 192,400 | | |
| | 1,000,000 | | | Southern California Gas Company
3.150%, 09/15/24 | | | 976,650 | | |
| | 1,000,000 | | | Veralto Corp.*
5.500%, 09/18/26 | | | 989,940 | | |
| | 500,000 | | | WEC Energy Group, Inc.
5.000%, 09/27/25 | | | 493,015 | | |
| | 500,000 | | | 0.800%, 03/15/24 | | | 490,840 | | |
| | | | 8,809,666 | | |
| | | | | TOTAL CORPORATE BONDS
(Cost $212,701,311) | | | 204,668,635 | | |
U.S. GOVERNMENT AND AGENCY SECURITIES (6.6%) | | | |
| | 1,000,000 | | | Federal Home Loan Mortgage Corp.
4.000%, 11/25/24 | | | 985,270 | | |
| | 12,250,000 | | | United States Treasury Note
3.500%, 04/30/28 | | | 11,592,041 | | |
| | 4,000,000 | | | 3.625%, 03/31/28 | | | 3,807,656 | | |
| | 2,500,000 | | | 4.000%, 06/30/28 | | | 2,413,574 | | |
| | 1,800,000 | | | 1.125%, 10/31/26 | | | 1,613,461 | | |
| | 1,750,000 | | | 4.125%, 07/31/28^ | | | 1,697,774 | | |
| | 1,600,000 | | | 4.000%, 02/29/28 | | | 1,547,625 | | |
| | | | | TOTAL U.S. GOVERNMENT AND
AGENCY SECURITIES
(Cost $24,798,593) | | | 23,657,401 | | |
SOVEREIGN BONDS (1.8%) | | | |
| | 1,000,000 | | | Development Bank of Japan, Inc.*
5.125%, 09/01/26 | | | 994,640 | | |
| | 1,000,000 | | | Export Development Canada
3.375%, 08/26/25 | | | 968,480 | | |
| | 500,000 | | | 3.875%, 02/14/28 | | | 478,240 | | |
| | 1,000,000 | | | Japan Bank for International
Cooperation
4.250%, 04/27/26 | | | 973,620 | | |
| | 500,000 | | | Kommunalbanken AS*
0.500%, 01/13/26 | | | 451,100 | | |
| | 200,000 | | | 4.500%, 09/01/28 | | | 195,276 | | |
| | 1,000,000 | | | Kommuninvest I Sverige AB*
4.250%, 12/10/25 | | | 980,890 | | |
| | 1,000,000 | | | Svensk ExportKredit AB
4.125%, 06/14/28 | | | 959,840 | | |
| | 500,000 | | | 3.625%, 09/03/24^ | | | 491,440 | | |
| | | | | TOTAL SOVEREIGN BONDS
(Cost $6,684,783) | | | 6,493,526 | | |
PRINCIPAL
AMOUNT | | | | VALUE | |
BANK LOANS (7.8%)¡ | | | |
| | | Airlines (0.4%) | |
| | 423,000 | | | American Airlines, Inc.‡
10.427%, 04/20/28
3 mo. SOFR + 4.75% | | $ | 429,609 | | |
| | 966,316 | | | Mileage Plus Holdings, LLC‡
10.798%, 06/21/27
3 mo. LIBOR + 5.25% | | | 997,441 | | |
| | | | 1,427,050 | | |
| | | Communication Services (1.5%) | |
| | 895,430 | | | APi Group DE, Inc.
7.825%, 01/03/29
1 mo. SOFR + 3.25% | | | 897,893 | | |
| | 629,156 | | | DIRECTV Financing, LLC‡
10.325%, 08/02/27
1 mo. SOFR + 5.00% | | | 613,317 | | |
| | 1,167,285 | | | Go Daddy Operating Company, LLC‡
7.824%, 11/09/29
1 mo. SOFR + 2.50% | | | 1,169,672 | | |
| | 1,000,000 | | | Match Group, Inc.‡
7.298%, 02/13/27
3 mo. SOFR + 1.75% | | | 997,080 | | |
| | 590,437 | | | Nexstar Broadcasting, Inc.‡
7.939%, 09/18/26
1 mo. SOFR + 2.50% | | | 590,968 | | |
| | 1,000,000 | | | Virgin Media Bristol, LLC‡
7.949%, 01/31/28
1 mo. SOFR + 2.50% | | | 973,130 | | |
| | | | 5,242,060 | | |
| | | Consumer Discretionary (1.3%) | |
| | 644,670 | | | Adient US LLC‡
8.689%, 04/10/28
1 mo. SOFR + 3.25% | | | 645,273 | | |
| | 591,111 | | | American Axle and Manufacturing, Inc.‡
9.006%, 12/13/29
3 mo. LIBOR + 3.50% | | | 589,882 | | |
| | 393,070 | | | American Axle and Manufacturing, Inc.‡
8.941%, 12/13/29
1 mo. SOFR + 3.50% | | | 393,070 | | |
| | 497,500 | | | Hanesbrands, Inc.‡
9.074%, 03/08/30
1 mo. SOFR + 3.75% | | | 491,903 | | |
| | 600,000 | | | Life Time Fitness, Inc.‡!
0.000%, 01/15/26 | | | 601,275 | | |
| | 976,225 | | | Murphy USA, Inc.‡
7.179%, 01/31/28
1 mo. SOFR + 1.75% | | | 980,193 | | |
| | 489,975 | | | PetSmart, Inc.‡
9.174%, 02/11/28
1 mo. SOFR + 3.75% | | | 484,820 | | |
| | 600,000 | | | SkyMiles IP, Ltd.‡
9.166%, 10/20/27
3 mo. SOFR + 3.75% | | | 615,471 | | |
| | | | 4,801,887 | | |
See accompanying Notes to Schedule of Investments
www.calamos.com
175
Short-Term Bond Fund Schedule of Investments October 31, 2023
PRINCIPAL
AMOUNT | | | | VALUE | |
| | | Financials (0.9%) | |
| | 992,500 | | | Castlelake Aviation, Ltd.‡
8.421%, 10/22/27
3 mo. SOFR + 2.75% | | $ | 991,349 | | |
| | 165,000 | | | Delos Aircraft Leasing DAC‡
7.402%, 10/31/27
3 mo. SOFR + 2.00% | | | 165,181 | | |
| | 140,000 | | | Delos Aircraft Leasing DAC!
0.000%, 10/31/27 | | | 140,153 | | |
| | 994,737 | | | Iron Mountain, Inc.‡
7.191%, 01/02/26
1 mo. LIBOR + 1.75% | | | 993,802 | | |
| | 881,829 | | | Jazz Financing Lux Sarl‡
8.939%, 05/05/28
1 mo. SOFR + 3.50% | | | 882,561 | | |
| | | | 3,173,046 | | |
| | | Health Care (1.2%) | |
| | 191,565 | | | Avantor Funding, Inc.‡
7.674%, 11/08/27
1 mo. SOFR + 2.25% | | | 191,725 | | |
| | 970,059 | | | DaVita, Inc.‡
7.189%, 08/12/26
1 mo. SOFR + 1.75% | | | 960,121 | | |
| | 991,738 | | | Elanco Animal Health, Inc.‡
7.165%, 08/01/27
1 mo. SOFR + 1.75% | | | 970,356 | | |
| | 254,114 | | | Icon Luxembourg Sarl‡
7.902%, 07/03/28
3 mo. SOFR + 2.25% | | | 254,555 | | |
| | 878,997 | | | Organon & Company‡
8.451%, 06/02/28
1 mo. SOFR + 3.00% | | | 878,338 | | |
| | 987,500 | | | Perrigo Investments, LLC‡
7.674%, 04/20/29
1 mo. SOFR + 2.25% | | | 984,538 | | |
| | 63,313 | | | PRA Health Sciences, Inc.
7.902%, 07/03/28
3 mo. SOFR + 2.25% | | | 63,422 | | |
| | | | 4,303,055 | | |
| | | Industrials (1.3%) | |
| | 493,750 | | | Air Canada‡
9.128%, 08/11/28
3 mo. LIBOR + 3.50% | | | 493,873 | | |
| | 992,500 | | | ChampionX Corp.‡
8.177%, 06/07/29
1 mo. SOFR + 3.25% | | | 996,996 | | |
| | 995,000 | | | H.B. Fuller Company‡
7.574%, 02/15/30
1 mo. SOFR + 2.50% | | | 998,836 | | |
| | 982,412 | | | Jeld-Wen, Inc.‡
7.689%, 07/28/28
1 mo. SOFR + 2.25% | | | 983,026 | | |
| | 992,500 | | | Summit Materials, LLC‡
8.571%, 12/14/27
3 mo. SOFR + 3.00% | | | 997,929 | | |
| | | | 4,470,660 | | |
PRINCIPAL
AMOUNT | | | | VALUE | |
| | | Information Technology (0.8%) | |
| | 1,142,690 | | | II-VI, Inc.‡
8.189%, 07/02/29
1 mo. SOFR + 2.75% | | $ | 1,142,153 | | |
| | 874,619 | | | TTM Technologies, Inc.‡
8.065%, 05/30/30
1 mo. SOFR + 2.75% | | | 875,165 | | |
| | 992,500 | | | ZoomInfo LLC‡
8.174%, 02/28/30
1 mo. SOFR + 2.75% | | | 997,462 | | |
| | | | 3,014,780 | | |
| | | Materials (0.4%) | |
| | 418,688 | | | Axalta Coating Systems U.S. Holdings, Inc.‡
7.890%, 12/20/29
3 mo. SOFR + 2.50% | | | 419,762 | | |
| | 997,055 | | | Chemours Company‡
8.824%, 08/18/28
1 mo. SOFR + 2.50% | | | 972,129 | | |
| | | | 1,391,891 | | |
| | | | | TOTAL BANK LOANS
(Cost $27,793,114) | | | 27,824,429 | | |
ASSET BACKED SECURITIES (19.4%) | | | |
| | | Communication Services (0.5%) | |
| | 1,000,000 | | | T-Mobile U.S. Trust
Series 2022-1A, Class A*
4.910%, 05/22/28 | | | 986,124 | | |
| | 1,000,000 | | | Verizon Master Trust
Series 2021-2, Class B
1.280%, 04/20/28 | | | 950,430 | | |
| | | | 1,936,554 | | |
| | | Consumer Discretionary (0.7%) | |
| | 1,500,000 | | | Avis Budget Rental Car Funding AESOP, LLC
Series 2019-2A, Class A*
3.350%, 09/22/25 | | | 1,469,556 | | |
| | 902,056 | | | BMW Vehicle Lease Trust
Series 2022-1, Class A3
1.100%, 03/25/25 | | | 893,222 | | |
| | | | 2,362,778 | | |
| | | Financials (8.9%) | |
| | 2,000,000 | | | American Express Credit
Account Master Trust
Series 2021-1, Class A
0.900%, 11/15/26 | | | 1,900,248 | | |
| | 2,000,000 | | | Capital One Multi-Asset Execution Trust
Series 2021-A3, Class A3
1.040%, 11/15/26 | | | 1,902,548 | | |
| | 1,000,000 | | | Capital One Prime Auto Receivables Trust
Series 2022-1, Class A3
3.170%, 04/15/27 | | | 964,143 | | |
| | 322,529 | | | Commonbond Student Loan Trust
Series 2017-B-GS, Class A1*
2.680%, 09/25/42 | | | 283,106 | | |
See accompanying Notes to Schedule of Investments
CALAMOS OPEN-END FAMILY OF FUNDS ANNUAL REPORT
176
Short-Term Bond Fund Schedule of Investments October 31, 2023
PRINCIPAL
AMOUNT | | | | VALUE | |
| | 121,094 | | | Commonbond Student Loan Trust
Series 2018-C-GS, Class A1*
3.870%, 02/25/46 | | $ | 109,930 | | |
| | 405,218 | | | Commonbond Student Loan Trust
Series 2019-A-GS, Class A1*
2.540%, 01/25/47 | | | 351,685 | | |
| | 209,422 | | | Commonbond Student Loan Trust
Series 2021-A-GS, Class A*
1.200%, 03/25/52 | | | 170,070 | | |
| | 653,739 | | | Commonbond Student Loan Trust
Series 2021-B-GS, Class A*
1.170%, 09/25/51 | | | 528,040 | | |
| | 308,277 | | | Credit Acceptance Auto Loan Trust
Series 2021-2A, Class A*
0.960%, 02/15/30 | | | 305,188 | | |
| | 500,000 | | | Credit Acceptance Auto Loan Trust
Series 2021-4, Class A*
1.260%, 10/15/30 | | | 486,113 | | |
| | 1,500,000 | | | Dell Equipment Finance Trust
Series 2022-2, Class B*
4.400%, 07/22/27 | | | 1,460,169 | | |
| | 1,500,000 | | | Discover Card Execution Note Trust
Series 2022-A2, Class A
3.320%, 05/15/27 | | | 1,446,003 | | |
| | 823,887 | | | ELFI Graduate Loan Program, LLC
Series 2021-A, Class A*
1.530%, 12/26/46 | | | 685,994 | | |
| | 1,047,728 | | | ELFI Graduate Loan Program, LLC
Series 2022-A, Class A*
4.510%, 08/26/47 | | | 990,491 | | |
| | 127,344 | | | Enterprise Fleet Financing, LLC
Series 2020-2, Class A2*
0.610%, 07/20/26 | | | 126,307 | | |
| | 483,919 | | | Enterprise Fleet Financing, LLC
Series 2022-4, Class A2*
5.760%, 10/22/29 | | | 481,406 | | |
| | 2,000,000 | | | Ford Credit Auto Owner Trust
Series 2019-1, Class A*
3.520%, 07/15/30 | | | 1,989,811 | | |
| | 1,500,000 | | | Hertz Vehicle Financing LLC
Series 2021-1A, Class A*
1.210%, 12/26/25 | | | 1,429,507 | | |
| | 1,000,000 | | | Kubota Credit Owner Trust
Series 2023-2A, Class A3*
5.280%, 01/18/28 | | | 985,901 | | |
| | 1,130,497 | | | MMAF Equipment Finance LLC
Series 2017-B, Class A5*
2.720%, 06/15/40 | | | 1,100,212 | | |
| | 2,000,000 | | | MMAF Equipment Finance LLC
Series 2023-A, Class A3*
5.540%, 12/13/29 | | | 1,977,076 | | |
| | 1,369,086 | | | Navient Private Education Refi Loan Trust
Series 2020-BA, Class A2*
2.120%, 01/15/69 | | | 1,239,856 | | |
PRINCIPAL
AMOUNT | | | | VALUE | |
| | 271,000 | | | NextGear Floorplan Master Owner Trust
Series 2021-1A, Class A*
0.850%, 07/15/26 | | $ | 260,511 | | |
| | 780,000 | | | OneMain Direct Auto Receivables Trust
Series 2021-1A, Class A*
0.870%, 07/14/28 | | | 740,649 | | |
| | 777,000 | | | OneMain Direct Auto Receivables Trust
Series 2021-1A, Class B*
1.260%, 07/14/28 | | | 689,038 | | |
| | 1,080,000 | | | Oscar US Funding XII, LLC
Series 2021-1A, Class A4*
1.000%, 04/10/28 | | | 1,015,605 | | |
| | 167,412 | | | Pawneee Equipment Receivables, LLC
Series 2021-1, Class A2*
1.100%, 07/15/27 | | | 162,591 | | |
| | 2,020,000 | | | Pawneee Equipment Receivables, LLC
Series 2022-1, Class A3*
5.170%, 02/15/28 | | | 1,995,598 | | |
| | 400,000 | | | PenFed Auto Receivables Owner Trust
Series 2022-A, Class A3*
3.960%, 04/15/26 | | | 394,651 | | |
| | 300,000 | | | PenFed Auto Receivables Owner Trust
Series 2022-A, Class A4*
4.180%, 12/15/28 | | | 291,622 | | |
| | 1,234,422 | | | Progress Residential Trust
Series 2019-SFR4, Class A*
2.687%, 10/17/36 | | | 1,193,965 | | |
| | 792,000 | | | Progress Residential Trust
Series 2021-SFR5, Class B*
1.658%, 07/17/38 | | | 694,022 | | |
| | 1,160,086 | | | SoFi Professional Loan Program Trust
Series 2020-C, Class AFX*
1.950%, 02/15/46 | | | 1,039,678 | | |
| | 748,847 | | | SoFi Professional Loan Program, LLC
Series 2017-F, Class A2FX*
3.600%, 02/25/48 | | | 720,671 | | |
| | 1,615,000 | | | Toyota Auto Loan Extended Note Trust
Series 2019-1A, Class A*
2.560%, 11/25/31 | | | 1,583,467 | | |
| | | | 31,695,872 | | |
| | | Health Care (0.3%) | |
| | 1,000,000 | | | DT Auto Owner Trust
Series 2022-2A, Class B*
4.220%, 01/15/27 | | | 984,460 | | |
| | | Industrials (0.2%) | |
| | 1,000,000 | | | John Deere Owner Trust
Series 2021-B, Class A4
0.740%, 05/15/28 | | | 927,163 | | |
| | | Information Technology (0.5%) | |
| | 1,916,667 | | | Vantage Data Centers Issuer, LLC
Series 2019-1A, Class A2*
3.188%, 07/15/44 | | | 1,866,458 | | |
See accompanying Notes to Schedule of Investments
www.calamos.com
177
Short-Term Bond Fund Schedule of Investments October 31, 2023
PRINCIPAL
AMOUNT | | | | VALUE | |
| | | Other (7.8%) | |
| | 2,000,000 | | | Aligned Data Centers Issuer, LLC
Series 2021-1A, Class A2*
1.937%, 08/15/46 | | $ | 1,745,348 | | |
| | 500,000 | | | American Express Credit Account
Master Trust
Series 2023-2, Class A
4.800%, 05/15/30 | | | 484,112 | | |
| | 473,335 | | | Amur Equipment Finance Receivables XI, LLC
Series 2022-2A, Class A2*
5.300%, 06/21/28 | | | 468,138 | | |
| | 420,821 | | | Atalaya Equipment Leasing Trust
Series 2021-1A, Class A2*
1.230%, 05/15/26 | | | 415,385 | | |
| | 1,000,000 | | | BA Credit Card Trust
Series 2022-A1, Class A1
3.530%, 11/15/27 | | | 965,789 | | |
| | 330,000 | | | CCG Receivables Trust
Series 2021-2, Class B*
1.270%, 03/14/29 | | | 305,711 | | |
| | 1,000,000 | | | CCG Receivables Trust
Series 2023-1, Class B*
5.990%, 09/16/30 | | | 991,226 | | |
| | 1,000,000 | | | CCG Receivables Trust
Series 2023-1, Class C*
6.280%, 09/16/30 | | | 992,012 | | |
| | 1,313,333 | | | CLI Funding VI, LLC
Series 2020-3A, Class A*
2.070%, 10/18/45 | | | 1,136,734 | | |
| | 25,391 | | | CNH Equipment Trust
Series 2020-A, Class A3
1.160%, 06/16/25 | | | 25,312 | | |
| | 1,609,000 | | | CNH Equipment Trust
Series 2020-A, Class B
2.300%, 10/15/27 | | | 1,585,482 | | |
| | 1,000,000 | | | Daimler Trucks Retail Trust
Series 2022-1, Class A3
5.230%, 02/17/26 | | | 990,686 | | |
| | 2,000,000 | | | DLLAD, LLC
Series 2023-1A, Class A3*
4.790%, 01/20/28 | | | 1,952,918 | | |
| | 1,462,500 | | | Domino's Pizza Master Issuer, LLC
Series 2021-1A, Class A21*
2.662%, 04/25/51 | | | 1,216,443 | | |
| | 1,250,000 | | | HPEFS Equipment Trust
Series 2022-1A, Class B*
1.790%, 05/21/29 | | | 1,205,441 | | |
| | 250,000 | | | HPEFS Equipment Trust
Series 2022-2A, Class B*
4.200%, 09/20/29 | | | 243,061 | | |
| | 1,000,000 | | | Kubota Credit Owner Trust
Series 2023-1A, Class A3*
5.020%, 06/15/27 | | | 982,576 | | |
| | 187,947 | | | MVW Owner Trust
Series 2019-1A, Class A*
2.890%, 11/20/36 | | | 180,282 | | |
PRINCIPAL
AMOUNT | | | | VALUE | |
| | 1,500,000 | | | NextGear Floorplan Master Owner Trust
Series 2023-1A, Class A2*
5.740%, 03/15/28 | | $ | 1,488,497 | | |
| | 1,000,000 | | | OCCU Auto Receivables Trust
Series 2023-1A, Class A2*
6.230%, 04/15/27 | | | 998,643 | | |
| | 317,695 | | | SCF Equipment Leasing, LLC
Series 2021-1A, Class A3*
0.830%, 08/21/28 | | | 312,305 | | |
| | 1,629,000 | | | SCF Equipment Leasing, LLC
Series 2022-1A, Class A3*
2.920%, 07/20/29 | | | 1,570,823 | | |
| | 482,856 | | | SoFi Consumer Loan Program Trust
Series 2023-1S, Class A*
5.810%, 05/15/31 | | | 481,819 | | |
| | 996,667 | | | SVC ABS, LLC
Series 2023-1A, - Class A*
5.150%, 02/20/53 | | | 925,438 | | |
| | 467,204 | | | Tesla Auto Lease Trust
Series 2021-A, Class B*
1.020%, 03/20/25 | | | 465,930 | | |
| | 775,000 | | | Tesla Auto Lease Trust
Series 2021-B, Class B*
0.910%, 09/22/25 | | | 746,966 | | |
| | 1,000,000 | | | USAA Auto Owner Trust
Series 2022-A, Class A3*
4.860%, 11/16/26 | | | 989,027 | | |
| | 1,000,000 | | | Veridian Auto Receivables Trust
Series 2023-1A, Class A3*
5.560%, 03/15/28 | | | 984,427 | | |
| | 1,000,000 | | | Verizon Master Trust
Series 2023-1, Class A
4.490%, 01/22/29 | | | 974,932 | | |
| | 2,000,000 | | | World Omni Auto Receivables Trust
Series 2022-B, Class A3
3.250%, 07/15/27 | | | 1,940,097 | | |
| | | | 27,765,560 | | |
| | | Utilities (0.5%) | |
| | 1,934,252 | | | Harley-Davidson Motorcycle Trust
Series 2022-A, Class A3
3.060%, 02/15/27 | | | 1,892,953 | | |
| | | | | TOTAL ASSET BACKED SECURITIES
(Cost $72,101,504) | | | 69,431,798 | | |
MUNICIPAL OBLIGATIONS (4.6%) | | | |
| | | Airlines (0.1%) | |
| | 250,000 | | | Dallas Fort Worth International Airport
1.041%, 11/01/23 | | | 250,000 | | |
| | | Consumer Discretionary (0.1%) | |
| | 300,000 | | | Washington State Housing
Finance Commission
5.345%, 12/01/27 | | | 296,392 | | |
See accompanying Notes to Schedule of Investments
CALAMOS OPEN-END FAMILY OF FUNDS ANNUAL REPORT
178
Short-Term Bond Fund Schedule of Investments October 31, 2023
PRINCIPAL
AMOUNT | | | | VALUE | |
| | 200,000 | | | Washington State Housing
Finance Commission
5.285%, 06/01/27 | | $ | 198,002 | | |
| | | | 494,394 | | |
| | | Other (4.2%) | |
| | 400,000 | | | Alaska Housing Finance Corp.
0.846%, 12/01/23 | | | 398,480 | | |
| | 250,000 | | | Armada Area Schools
0.950%, 05/01/25 | | | 233,610 | | |
| | 155,000 | | | City of Auburn CA
0.961%, 06/01/25 | | | 143,697 | | |
| | 250,000 | | | City of Carbondale IL
2.163%, 12/01/23 | | | 249,139 | | |
| | 280,000 | | | City of Mishawaka IN
4.680%, 02/15/26 | | | 271,903 | | |
| | 205,000 | | | City of Mishawaka IN
4.700%, 08/15/26 | | | 198,175 | | |
| | 1,000,000 | | | City of Montclair CA
0.926%, 06/01/24 | | | 970,831 | | |
| | 120,000 | | | City of Omaha NE
0.983%, 04/15/26 | | | 107,895 | | |
| | 500,000 | | | City of Wheaton IL
0.786%, 12/01/24 | | | 474,464 | | |
| | 300,000 | | | Colorado Housing and Finance Authority
1.650%, 11/01/25 | | | 278,561 | | |
| | 150,000 | | | Colorado Housing and Finance Authority
0.858%, 11/01/24 | | | 144,833 | | |
| | 895,000 | | | Connecticut Housing Finance Authority
0.974%, 11/15/25 | | | 822,892 | | |
| | 250,000 | | | Corona-Norco Unified School District
1.000%, 09/01/25 | | | 230,104 | | |
| | 250,000 | | | County of Bergen NJ
2.000%, 11/01/23 | | | 250,000 | | |
| | 155,000 | | | County of Santa Cruz AZ Pledged Revenue
1.250%, 07/01/24 | | | 150,363 | | |
| | 250,000 | | | Cypress-Fairbanks Independent
School District
5.000%, 02/15/25 | | | 247,947 | | |
| | 135,000 | | | East Montgomery County
Improvement District
1.550%, 08/15/26 | | | 121,011 | | |
| | 175,000 | | | Encinitas Public Financing Authority
1.020%, 10/01/25 | | | 160,716 | | |
| | 175,000 | | | Encinitas Public Financing Authority
0.790%, 10/01/24 | | | 167,271 | | |
| | 400,000 | | | Fairfield Facilities Corp.
2.000%, 09/01/24 | | | 386,626 | | |
| | 450,000 | | | Florida Housing Finance Corp.
5.077%, 07/01/26 | | | 444,799 | | |
| | 220,000 | | | Florida Housing Finance Corp.
5.086%, 01/01/27 | | | 216,749 | | |
| | 200,000 | | | Florida Housing Finance Corp.
5.136%, 07/01/27 | | | 196,376 | | |
PRINCIPAL
AMOUNT | | | | VALUE | |
| | 250,000 | | | Galveston Independent School District
5.000%, 02/01/25 | | $ | 247,977 | | |
| | 200,000 | | | Indiana Bond Bank
0.650%, 02/01/24 | | | 197,382 | | |
| | 250,000 | | | Indiana Housing & Community
Development Authority
5.065%, 01/01/27 | | | 246,328 | | |
| | 175,000 | | | Indiana Housing & Community
Development Authority
5.095%, 07/01/26 | | | 173,069 | | |
| | 160,000 | | | Indiana Housing & Community
Development Authority
5.095%, 01/01/26 | | | 158,724 | | |
| | 505,000 | | | Iowa Finance Authority
5.502%, 07/01/28 | | | 495,375 | | |
| | 350,000 | | | Iowa Finance Authority
5.412%, 07/01/27 | | | 344,716 | | |
| | 500,000 | | | Lake Central Multi-District School
Building Corp.
0.853%, 01/15/24 | | | 495,184 | | |
| | 125,000 | | | Lakeside Fire Protection District
1.620%, 08/01/24 | | | 120,933 | | |
| | 700,000 | | | Metropolitan Washington Airports
Authority Dulles Toll Road Revenue
1.737%, 10/01/25 | | | 652,176 | | |
| | 300,000 | | | Minnesota Housing Finance Agency
5.113%, 01/01/26 | | | 297,641 | | |
| | 215,000 | | | Minnetonka Independent School
District No 276
2.000%, 01/01/24 | | | 213,744 | | |
| | 450,000 | | | Nevada Housing Division
5.268%, 04/01/27 | | | 444,532 | | |
| | 435,000 | | | Nevada Housing Division
5.338%, 10/01/27 | | | 428,622 | | |
| | 250,000 | | | Nevada Housing Division
5.251%, 10/01/26 | | | 247,691 | | |
| | 390,000 | | | New York City Transitional Finance
Authority Future Tax Secured Revenue
3.430%, 08/01/26 | | | 370,344 | | |
| | 390,000 | | | New York City Transitional Finance
Authority Future Tax Secured Revenue
1.250%, 05/01/26 | | | 352,296 | | |
| | 255,000 | | | New York State Dormitory Authority
2.438%, 02/15/26 | | | 238,037 | | |
| | 150,000 | | | Pharr San Juan Alamo Independent
School District TX
5.000%, 02/01/25 | | | 148,993 | | |
| | 400,000 | | | Regional Transportation Authority
3.000%, 06/01/25 | | | 384,174 | | |
| | 265,000 | | | Sallisaw Municipal Authority
1.420%, 09/01/24 | | | 255,541 | | |
| | 155,000 | | | State of Hawaii
1.033%, 08/01/25 | | | 143,402 | | |
See accompanying Notes to Schedule of Investments
www.calamos.com
179
Short-Term Bond Fund Schedule of Investments October 31, 2023
PRINCIPAL
AMOUNT | | | | VALUE | |
| | 250,000 | | | Thornapple Kellogg School District
0.930%, 05/01/25 | | $ | 233,811 | | |
| | 525,000 | | | Town of Stratford CT
0.956%, 08/01/24 | | | 506,865 | | |
| | 145,000 | | | Victor Valley Community College District
2.878%, 08/01/26 | | | 134,325 | | |
| | 170,000 | | | Westminster Public Schools
0.906%, 12/01/26 | | | 149,170 | | |
| | 125,000 | | | Wichita Falls 4B Sales Tax Corp.
1.049%, 09/01/25 | | | 114,991 | | |
| | 340,000 | | | Williamston Community Schools
School District
1.050%, 05/01/25 | | | 318,562 | | |
| | | | 14,981,047 | | |
| | | Utilities (0.2%) | |
| | 505,000 | | | Augusta GA Water & Sewer Revenue
4.300%, 10/01/26 | | | 488,226 | | |
| | 135,000 | | | City of Fountain Company Electric
Water & Wastewater Utility
Enterprise Revenue
0.930%, 12/01/23 | | | 134,446 | | |
| | | | 622,672 | | |
| | | | | TOTAL MUNICIPAL OBLIGATIONS
(Cost $16,814,629) | | | 16,348,113 | | |
RESIDENTIAL MORTGAGE BACKED SECURITIES (1.0%) | | | |
| | 953,447 | | | BANK Series 2019-BN16, Class A2
3.933%, 02/15/52 | | | 948,431 | | |
| | 32,437 | | | CSAIL Commercial Mortgage Trust
Series 2017-CX9, Class A2
3.054%, 09/15/50 | | | 31,610 | | |
| | 1,000,000 | | | GS Mortgage Securities Corp. II
Series 2023-SHIP, Class A*‡
4.322%, 09/10/38 | | | 946,772 | | |
| | 1,472,984 | | | GS Mortgage-Backed Securities Corp.
Trust Series 2021-PJ4, Class A8*‡
2.500%, 09/25/51 | | | 1,215,421 | | |
| | 573,322 | | | GS Mortgage-Backed Securities Trust
Series 2021-PJ11, Class A8*‡
2.500%, 04/25/52 | | | 470,578 | | |
| | 29,180 | | | Wells Fargo Commercial Mortgage Trust
Series 2015-LC20, Class A2
2.678%, 04/15/50 | | | 29,180 | | |
| | | | | TOTAL RESIDENTIAL MORTGAGE
BACKED SECURITIES
(Cost $4,001,543) | | | 3,641,992 | | |
NUMBER OF
SHARES/
PRINCIPAL
AMOUNT | | | | VALUE | |
INVESTMENT OF CASH COLLATERAL FOR SECURITIES
LOANED (2.0%) | |
| | 7,108,153 | | | State Street Navigator Securities
Lending Government Money
Market Portfolio, 5.358%†***
(Cost $7,108,153) | | $ | 7,108,153 | | |
| | | TOTAL INVESTMENTS (100.4%)
(Cost $372,003,630) | | | 359,174,047 | | |
PAYABLE UPON RETURN OF SECURITIES ON LOAN (-2.0%) | | | (7,108,153 | ) | |
OTHER ASSETS, LESS LIABILITIES (1.6%) | | | 5,566,547 | | |
NET ASSETS (100.0%) | | $ | 357,632,441 | | |
NOTES TO SCHEDULE OF INVESTMENTS
* Securities issued and sold pursuant to a Rule 144A transaction are exempted from the registration requirement of the Securities Act of 1933, as amended. These securities may only be sold to qualified institutional buyers ("QIBs"), such as the Fund. Any resale of these securities must generally be effected through a sale that is registered under the Act or otherwise exempted from such registration requirements.
^ Security, or portion of security, is on loan.
‡ Variable rate security. The rate shown is the rate in effect at October 31, 2023.
¡ Bank loans generally are subject to mandatory and/or optional prepayment. As a result, the actual remaining maturity of bank loans may be substantially less than the stated maturities shown.
! This position represents an unsettled loan commitment at period end. Certain details associated with this purchase are not known prior to the settlement date, including coupon rate, which will be adjusted on settlement date.
† Represents investment of cash collateral received from securities on loan as of October 31, 2023.
*** The rate disclosed is the 7 day net yield as of October 31, 2023.
FUTURES CONTRACTS
NUMBER OF
CONTRACTS | | DESCRIPTION | | EXPIRATION
DATE | | NOTIONAL
VALUE | | MARKET VALUE/
UNREALIZED
APPRECIATION
(DEPRECIATION) | |
Sales | | | |
| | 30,000,000 | | | U.S. Treasury Note 5-Year | | Dec 2023 | | $ | 31,342,969 | | | $ | (547,615 | ) | |
See accompanying Notes to Schedule of Investments
CALAMOS OPEN-END FAMILY OF FUNDS ANNUAL REPORT
180
Statements of Assets and Liabilities October 31, 2023
| | | MARKET NEUTRAL
INCOME FUND | | HEDGED EQUITY
FUND | | PHINEUS
LONG/SHORT
FUND | | MERGER
ARBITRAGE
FUND | | CONVERTIBLE
FUND | |
ASSETS | |
Investments in securities, at cost | | $ | 11,822,568,769 | | | $ | 471,835,211 | | | $ | 883,579,357 | | | $ | 1,969,517 | | | $ | 880,757,974 | | |
Investments in affiliated funds, at cost | | | 350,000,000 | | | | — | | | | — | | | | — | | | | — | | |
Investment in securities, at value* | | $ | 13,082,331,393 | | | $ | 577,785,571 | | | $ | 887,325,133 | | | $ | 1,899,839 | | | $ | 844,932,230 | | |
Investments in affiliated funds, at value | | | 326,238,322 | | | | — | | | | — | | | | — | | | | — | | |
Cash with custodian | | | 601,363,777 | | | | 4,090,109 | | | | 58,181,975 | | | | 151,471 | | | | 24,516,882 | | |
Foreign currency (cost $40,188,118) | | | 40,188,118 | | | | — | | | | — | | | | — | | | | — | | |
Cash collateral held | | | 1,151,839 | | | | — | | | | — | | | | — | | | | — | | |
Collateral for ASCOTs(1) | | | 11,160,000 | | | | — | | | | — | | | | — | | | | — | | |
Foreign collateral for short positions | | | 66,556,512 | | | | — | | | | — | | | | — | | | | — | | |
Collateral for short positions | | | 711,909,489 | | | | — | | | | — | | | | — | | | | — | | |
Restricted cash for short positions | | | 1,354,829,240 | | | | — | | | | 674,078,733 | | | | 293,832 | | | | 139 | | |
Restricted foreign currency for short positions (cost $112,374,843) | | | 103,085,500 | | | | — | | | | — | | | | — | | | | — | | |
Unrealized appreciation on total return swaps | | | 291,468 | | | | — | | | | — | | | | — | | | | — | | |
Unrealized appreciation on forward foreign currency contracts | | | 334,662 | | | | — | | | | — | | | | — | | | | 87,142 | | |
Receivables: | |
Accrued interest and dividends | | | 23,916,465 | | | | 404,301 | | | | 561,791 | | | | 6,021 | | | | 2,229,401 | | |
Investments sold | | | 141,435,561 | | | | — | | | | 73,057,273 | | | | 17,241 | | | | 1,967,024 | | |
Fund shares sold | | | 21,051,263 | | | | 3,309,585 | | | | 1,033,226 | | | | 26,847 | | | | 637,812 | | |
Due from investment advisor | | | — | | | | — | | | | — | | | | 20,019 | | | | — | | |
Prepaid expenses | | | 205,732 | | | | 28,589 | | | | 41,392 | | | | — | | | | 39,224 | | |
Deferred offering costs | | | — | | | | — | | | | — | | | | 118,379 | | | | — | | |
Other assets | | | 620,099 | | | | — | | | | 1,334,044 | | | | — | | | | 142,512 | | |
Total assets | | | 16,486,669,440 | | | | 585,618,155 | | | | 1,695,613,567 | | | | 2,533,649 | | | | 874,552,366 | | |
LIABILITIES | |
Due to custodian bank | | | 5,457,496 | | | | — | | | | — | | | | — | | | | — | | |
Due to custodian bank for restricted cash | | | 300,000 | | | | — | | | | — | | | | — | | | | — | | |
Collateral for securities loaned | | | 130,372,948 | | | | 6,187,314 | | | | 11,890,737 | | | | — | | | | 36,784,235 | | |
Cash collateral received | | | 880,000 | | | | — | | | | — | | | | — | | | | — | | |
Foreign currency overdraft (cost $40,699,706, $276) | | | 40,641,061 | | | | — | | | | 276 | | | | — | | | | — | | |
Securities sold short, at value (proceeds $2,260,175,982, $702,501,619, and
$293,832) | | | 2,183,690,072 | | | | — | | | | 669,325,818 | | | | 280,379 | | | | — | | |
Options written, at value (premium $219,352,018, $20,949,358, and $12,343,738) | | | 100,716,170 | | | | 15,076,475 | | | | 11,101,535 | | | | — | | | | — | | |
Unrealized depreciation on total return swaps | | | 62,608 | | | | — | | | | — | | | | — | | | | — | | |
Unrealized depreciation on forward foreign currency contracts | | | 405,382 | | | | — | | | | — | | | | — | | | | 16,390 | | |
Payables: | |
Investments purchased | | | 62,394,096 | | | | 2,142,508 | | | | 65,114,218 | | | | 57,631 | | | | — | | |
Fund shares redeemed | | | 15,690,622 | | | | 847,018 | | | | 1,056,544 | | | | — | | | | 1,648,831 | | |
Affiliates: | |
Investment Advisory fees | | | 7,717,702 | | | | 356,499 | | | | 987,143 | | | | 1,472 | | | | 536,655 | | |
Distribution fees | | | 27,723 | | | | 811 | | | | 2,648 | | | | 6 | | | | 5,088 | | |
Deferred revenue | | | — | | | | — | | | | — | | | | 55,076 | | | | — | | |
Deferred compensation to trustees | | | 140,563 | | | | — | | | | — | | | | — | | | | 142,512 | | |
Trustees' fees and officer compensation | | | 70,795 | | | | 4,228 | | | | 6,428 | | | | 1,088 | | | | 7,093 | | |
Other accounts payable and accrued liabilities | | | 3,615,480 | | | | 122,729 | | | | 231,941 | | | | 79,353 | | | | 216,266 | | |
Total liabilities | | | 2,552,182,718 | | | | 24,737,582 | | | | 759,717,288 | | | | 475,005 | | | | 39,357,070 | | |
NET ASSETS | | $ | 13,934,486,722 | | | $ | 560,880,573 | | | $ | 935,896,279 | | | $ | 2,058,644 | | | $ | 835,195,296 | | |
COMPOSITION OF NET ASSETS | |
Paid in capital | | $ | 12,884,140,409 | | | $ | 499,559,367 | | | $ | 927,477,300 | | | $ | 2,110,468 | | | $ | 873,605,733 | | |
Accumulated distributable earnings (loss) | | | 1,050,346,313 | | | | 61,321,206 | | | | 8,418,979 | | | | (51,824 | ) | | | (38,410,437 | ) | |
NET ASSETS | | $ | 13,934,486,722 | | | $ | 560,880,573 | | | $ | 935,896,279 | | | $ | 2,058,644 | | | $ | 835,195,296 | | |
CLASS A SHARES† | |
Net assets applicable to shares outstanding | | $ | 1,009,975,953 | | | $ | 24,754,304 | | | $ | 65,214,046 | | | $ | 97,312 | | | $ | 243,515,714 | | |
Shares outstanding | | | 68,629,199 | | | | 1,762,191 | | | | 4,367,489 | | | | 10,000 | | | | 13,397,939 | | |
Net asset value and redemption price per share | | $ | 14.72 | | | $ | 14.05 | | | $ | 14.93 | | | $ | 9.73 | | | $ | 18.18 | | |
Maximum offering price per share (Net asset value, plus 4.75% of offering price) | | $ | 15.14 | # | | $ | 14.75 | | | $ | 15.67 | | | $ | 10.22 | | | $ | 18.60 | # | |
See accompanying Notes to Financial Statements
www.calamos.com
181
Statements of Assets and Liabilities October 31, 2023
| | | MARKET NEUTRAL
INCOME FUND | | HEDGED EQUITY
FUND | | PHINEUS
LONG/SHORT
FUND | | MERGER
ARBITRAGE
FUND | | CONVERTIBLE
FUND | |
CLASS C SHARES†** | |
Net assets applicable to shares outstanding | | $ | 254,477,940 | | | $ | 8,702,997 | | | $ | 32,461,019 | | | $ | 97,248 | | | $ | 31,772,827 | | |
Shares outstanding | | | 17,205,578 | | | | 636,743 | | | | 2,300,106 | | | | 10,000 | | | | 1,803,723 | | |
Net asset value and redemption price per share | | $ | 14.79 | | | $ | 13.67 | | | $ | 14.11 | | | $ | 9.72 | | | $ | 17.62 | | |
CLASS I SHARES† | |
Net assets applicable to shares outstanding | | $ | 12,620,873,996 | | | $ | 527,423,272 | | | $ | 838,221,214 | | | $ | 1,864,084 | | | $ | 559,906,755 | | |
Shares outstanding | | | 868,213,249 | | | | 37,488,343 | | | | 55,241,841 | | | | 191,530 | | | | 36,016,625 | | |
Net asset value and redemption price per share | | $ | 14.54 | | | $ | 14.07 | | | $ | 15.17 | | | $ | 9.73 | | | $ | 15.55 | | |
CLASS R6 SHARES† | |
Net assets applicable to shares outstanding | | $ | 49,158,833 | | | $ | — | | | $ | — | | | $ | — | | | $ | — | | |
Shares Outstanding | | | 3,380,087 | | | | — | | | | — | | | | — | | | | — | | |
Net asset value and redemption price per share | | $ | 14.54 | | | $ | — | | | $ | — | | | $ | — | | | $ | — | | |
| * Includes securities on loan | | $ | 222,812,564 | | | $ | 13,880,038 | | | $ | 30,569,738 | | | $ | — | | | $ | 42,509,643 | | |
† No par value; unlimited number of shares authorized.
# For Market Neutral Income Fund maximum offering price per share is Net asset value plus 2.75% of offering price. For Convertible Fund maximum offering price per share is Net asset value plus 2.25% of offering price.
** Redemption price may be reduced by contingent deferred sales charge.
(1) Asset Swapped Convertible Option Transaction.
See accompanying Notes to Financial Statements
CALAMOS OPEN-END FAMILY OF FUNDS ANNUAL REPORT
182
Statements of Assets and Liabilities October 31, 2023
| | | GLOBAL
CONVERTIBLE
FUND | | TIMPANI
SMALL CAP
GROWTH FUND | | TIMPANI SMID
GROWTH FUND | | GROWTH FUND | | GROWTH AND
INCOME FUND | |
ASSETS | |
Investments in securities, at cost | | $ | 140,076,364 | | | $ | 211,567,972 | | | $ | 14,458,444 | | | $ | 756,850,392 | | | $ | 1,327,843,153 | | |
Investment in securities, at value* | | $ | 125,179,187 | | | $ | 236,826,343 | | | $ | 16,129,465 | | | $ | 1,160,259,739 | | | $ | 2,161,576,045 | | |
Cash with custodian | | | 659,461 | | | | 3,287,900 | | | | 209,495 | | | | 30,054,468 | | | | 155,710,647 | | |
Variation margin on open futures contracts | | | — | | | | — | | | | — | | | | 289,596 | | | | — | | |
Receivables: | |
Accrued interest and dividends | | | 357,097 | | | | 17,142 | | | | 520 | | | | 379,855 | | | | 2,346,906 | | |
Investments sold | | | — | | | | 1,831,324 | | | | 74,290 | | | | 25,522,114 | | | | 8,927,932 | | |
Fund shares sold | | | 100 | | | | 225,330 | | | | — | | | | 86,724 | | | | 1,360,664 | | |
Due from investment advisor | | | 3,418 | | | | 20,340 | | | | 12,824 | | | | — | | | | — | | |
Prepaid expenses | | | 12,625 | | | | 33,401 | | | | 26,501 | | | | 33,597 | | | | 55,712 | | |
Other assets | | | — | | | | — | | | | — | | | | 687,173 | | | | 298,273 | | |
Total assets | | | 126,211,888 | | | | 242,241,780 | | | | 16,453,095 | | | | 1,217,313,266 | | | | 2,330,276,179 | | |
LIABILITIES | |
Collateral for securities loaned | | | 5,551,209 | | | | — | | | | — | | | | 1,717,018 | | | | 52,088,275 | | |
Foreign currency overdraft (cost $54) | | | — | | | | — | | | | — | | | | — | | | | 54 | | |
Options written, at value (premium $139,955, and $69,698) | | | 58,220 | | | | — | | | | — | | | | 72,720 | | | | — | | |
Payables: | |
Investments purchased | | | — | | | | 3,542,939 | | | | 262,950 | | | | 14,904,047 | | | | 4,554,681 | | |
Fund shares redeemed | | | 80,596 | | | | 142,815 | | | | — | | | | 961,704 | | | | 2,425,140 | | |
Affiliates: | |
Investment Advisory fees | | | 90,025 | | | | 195,684 | | | | 13,556 | | | | 959,558 | | | | 1,337,807 | | |
Distribution fees | | | 260 | | | | 446 | | | | 5 | | | | 13,039 | | | | 20,399 | | |
Deferred compensation to trustees | | | — | | | | — | | | | — | | | | 690,766 | | | | 298,273 | | |
Trustees' fees and officer compensation | | | 2,723 | | | | 2,950 | | | | 1,979 | | | | 9,826 | | | | 15,956 | | |
Other accounts payable and accrued liabilities | | | 40,425 | | | | 96,221 | | | | 18,916 | | | | 302,335 | | | | 424,891 | | |
Total liabilities | | | 5,823,458 | | | | 3,981,055 | | | | 297,406 | | | | 19,631,013 | | | | 61,165,476 | | |
NET ASSETS | | $ | 120,388,430 | | | $ | 238,260,725 | | | $ | 16,155,689 | | | $ | 1,197,682,253 | | | $ | 2,269,110,703 | | |
COMPOSITION OF NET ASSETS | |
Paid in capital | | $ | 148,613,837 | | | $ | 357,005,570 | | | $ | 18,166,555 | | | $ | 756,410,819 | | | $ | 1,382,041,415 | | |
Accumulated distributable earnings (loss) | | | (28,225,407 | ) | | | (118,744,845 | ) | | | (2,010,866 | ) | | | 441,271,434 | | | | 887,069,288 | | |
NET ASSETS | | $ | 120,388,430 | | | $ | 238,260,725 | | | $ | 16,155,689 | | | $ | 1,197,682,253 | | | $ | 2,269,110,703 | | |
CLASS A SHARES† | |
Net assets applicable to shares outstanding | | $ | 8,454,572 | | | $ | 18,282,630 | | | $ | 340,766 | | | $ | 925,437,001 | | | $ | 1,182,666,638 | | |
Shares outstanding | | | 844,354 | | | | 823,623 | | | | 37,486 | | | | 28,500,813 | | | | 30,004,870 | | |
Net asset value and redemption price per share | | $ | 10.01 | | | $ | 22.20 | | | $ | 9.09 | | | $ | 32.47 | | | $ | 39.42 | | |
Maximum offering price per share (Net asset value, plus 4.75% of offering price) | | $ | 10.24 | # | | $ | 23.31 | | | $ | 9.54 | | | $ | 34.09 | | | $ | 41.39 | | |
CLASS C SHARES†** | |
Net assets applicable to shares outstanding | | $ | 2,615,276 | | | $ | 3,647,737 | | | $ | — | | | $ | 9,492,780 | | | $ | 79,895,472 | | |
Shares outstanding | | | 272,391 | | | | 162,276 | | | | — | | | | 754,098 | | | | 2,018,858 | | |
Net asset value and redemption price per share | | $ | 9.60 | | | $ | 22.48 | | | $ | — | | | $ | 12.59 | | | $ | 39.57 | | |
CLASS I SHARES† | |
Net assets applicable to shares outstanding | | $ | 109,318,582 | | | $ | 191,831,387 | | | $ | 15,495,191 | | | $ | 262,752,472 | | | $ | 978,583,205 | | |
Shares outstanding | | | 10,883,183 | | | | 8,336,389 | | | | 1,683,952 | | | | 5,306,561 | | | | 26,113,014 | | |
Net asset value and redemption price per share | | $ | 10.04 | | | $ | 23.01 | | | $ | 9.20 | | | $ | 49.51 | | | $ | 37.47 | | |
CLASS R6 SHARES† | |
Net assets applicable to shares outstanding | | $ | — | | | $ | 24,498,971 | | | $ | 319,732 | | | $ | — | | | $ | 27,965,388 | | |
Shares Outstanding | | | — | | | | 1,060,134 | | | | 34,732 | | | | — | | | | 745,867 | | |
Net asset value and redemption price per share | | $ | — | | | $ | 23.11 | | | $ | 9.21 | | | $ | — | | | $ | 37.49 | | |
| * Includes securities on loan | | $ | 5,875,614 | | | $ | — | | | $ | — | | | $ | 50,029,184 | | | $ | 92,834,593 | | |
† No par value; unlimited number of shares authorized.
# For Global Convertible Fund maximum offering price per share is Net asset value plus 2.25% of offering price.
** Redemption price may be reduced by contingent deferred sales charge.
See accompanying Notes to Financial Statements
www.calamos.com
183
Statements of Assets and Liabilities October 31, 2023
| | | DIVIDEND
GROWTH FUND | | SELECT FUND | | INTERNATIONAL
GROWTH FUND | | EVOLVING
WORLD GROWTH
FUND | | GLOBAL EQUITY
FUND | |
ASSETS | |
Investments in securities, at cost | | $ | 9,360,765 | | | $ | 30,780,978 | | | $ | 172,930,665 | | | $ | 363,980,107 | | | $ | 63,769,203 | | |
Investment in securities, at value* | | $ | 15,107,063 | | | $ | 41,923,294 | | | $ | 190,753,122 | | | $ | 374,205,026 | | | $ | 87,104,943 | | |
Cash with custodian | | | 167,810 | | | | 1,412,482 | | | | 10,238,774 | | | | 3,763,888 | | | | 4,581,740 | | |
Foreign currency (cost $19 and $16) | | | — | | | | — | | | | 19 | | | | — | | | | 16 | | |
Unrealized appreciation on forward foreign currency contracts | | | — | | | | — | | | | — | | | | 287,570 | | | | — | | |
Receivables: | |
Accrued interest and dividends | | | 9,178 | | | | 13,436 | | | | 442,610 | | | | 159,144 | | | | 92,170 | | |
Investments sold | | | 38,939 | | | | 835,644 | | | | — | | | | 3,241,323 | | | | 1,543,199 | | |
Fund shares sold | | | 18,042 | | | | 133 | | | | 62,301 | | | | 652,866 | | | | 59,356 | | |
Due from investment advisor | | | 13,083 | | | | 21,086 | | | | 57,297 | | | | 163,289 | | | | 1,539 | | |
Prepaid expenses | | | 24,844 | | | | 12,200 | | | | 26,369 | | | | 39,245 | | | | 21,715 | | |
Other assets | | | — | | | | 74,055 | | | | 46,612 | | | | 13,735 | | | | 23,909 | | |
Total assets | | | 15,378,959 | | | | 44,292,330 | | | | 201,627,104 | | | | 382,526,086 | | | | 93,428,587 | | |
LIABILITIES | |
Collateral for securities loaned | | | 66,806 | | | | — | | | | 5,053,942 | | | | 10,539,663 | | | | 4,058,291 | | |
Unrealized depreciation on forward foreign currency contracts | | | — | | | | — | | | | 40,898 | | | | 78,878 | | | | — | | |
Payables: | |
Investments purchased | | | 39,405 | | | | 839,660 | | | | 6,276,917 | | | | 5,791,242 | | | | 1,814,862 | | |
Fund shares redeemed | | | 7,042 | | | | — | | | | 148,781 | | | | 2,164,994 | | | | 21,911 | | |
Affiliates: | |
Investment Advisory fees | | | 13,785 | | | | 37,311 | | | | 145,122 | | | | 350,036 | | | | 63,003 | | |
Distribution fees | | | 197 | | | | 162 | | | | 638 | | | | 723 | | | | 310 | | |
Deferred compensation to trustees | | | — | | | | 74,055 | | | | 46,612 | | | | 13,735 | | | | 23,909 | | |
Trustees' fees and officer compensation | | | 2,021 | | | | 2,209 | | | | 3,142 | | | | 3,344 | | | | 3,204 | | |
Other accounts payable and accrued liabilities | | | 18,020 | | | | 22,799 | | | | 329,739 | | | | 2,201,287 | | | | 95,844 | | |
Total liabilities | | | 147,276 | | | | 976,196 | | | | 12,045,791 | | | | 21,143,902 | | | | 6,081,334 | | |
NET ASSETS | | $ | 15,231,683 | | | $ | 43,316,134 | | | $ | 189,581,313 | | | $ | 361,382,184 | | | $ | 87,347,253 | | |
COMPOSITION OF NET ASSETS | |
Paid in capital | | $ | 8,825,394 | | | $ | 30,399,621 | | | $ | 191,331,999 | | | $ | 468,244,799 | | | $ | 64,684,123 | | |
Accumulated distributable earnings (loss) | | | 6,406,289 | | | | 12,916,513 | | | | (1,750,686 | ) | | | (106,862,615 | ) | | | 22,663,130 | | |
NET ASSETS | | $ | 15,231,683 | | | $ | 43,316,134 | | | $ | 189,581,313 | | | $ | 361,382,184 | | | $ | 87,347,253 | | |
CLASS A SHARES† | |
Net assets applicable to shares outstanding | | $ | 5,250,340 | | | $ | 11,533,347 | | | $ | 41,631,309 | | | $ | 36,830,451 | | | $ | 20,461,987 | | |
Shares outstanding | | | 361,740 | | | | 687,815 | | | | 2,562,078 | | | | 2,476,603 | | | | 1,693,551 | | |
Net asset value and redemption price per share | | $ | 14.51 | | | $ | 16.77 | | | $ | 16.25 | | | $ | 14.87 | | | $ | 12.08 | | |
Maximum offering price per share (Net asset value, plus 4.75% of offering price) | | $ | 15.23 | | | $ | 17.61 | | | $ | 17.06 | | | $ | 15.61 | | | $ | 12.68 | | |
CLASS C SHARES†** | |
Net assets applicable to shares outstanding | | $ | 2,341,928 | | | $ | 119,685 | | | $ | 1,339,204 | | | $ | 3,930,205 | | | $ | 611,324 | | |
Shares outstanding | | | 170,455 | | | | 8,632 | | | | 99,608 | | | | 287,491 | | | | 63,385 | | |
Net asset value and redemption price per share | | $ | 13.74 | | | $ | 13.86 | | | $ | 13.44 | | | $ | 13.67 | | | $ | 9.64 | | |
CLASS I SHARES† | |
Net assets applicable to shares outstanding | | $ | 7,639,415 | | | $ | 31,663,102 | | | $ | 141,782,244 | | | $ | 320,621,528 | | | $ | 66,180,773 | | |
Shares outstanding | | | 524,311 | | | | 1,814,068 | | | | 8,338,438 | | | | 21,330,727 | | | | 5,191,947 | | |
Net asset value and redemption price per share | | $ | 14.57 | | | $ | 17.45 | | | $ | 17.00 | | | $ | 15.03 | | | $ | 12.75 | | |
CLASS R6 SHARES† | |
Net assets applicable to shares outstanding | | $ | — | | | $ | — | | | $ | 4,828,556 | | | $ | — | | | $ | 93,169 | | |
Shares Outstanding | | | — | | | | — | | | | 280,585 | | | | — | | | | 7,303 | | |
Net asset value and redemption price per share | | $ | — | | | $ | — | | | $ | 17.21 | | | $ | — | | | $ | 12.76 | | |
| * Includes securities on loan | | $ | 324,889 | | | $ | 1,095,331 | | | $ | 9,753,260 | | | $ | 13,121,053 | | | $ | 4,785,626 | | |
† No par value; unlimited number of shares authorized.
** Redemption price may be reduced by contingent deferred sales charge.
See accompanying Notes to Financial Statements
CALAMOS OPEN-END FAMILY OF FUNDS ANNUAL REPORT
184
Statements of Assets and Liabilities October 31, 2023
| | | GLOBAL
OPPORTUNITIES
FUND | | INTERNATIONAL
SMALL CAP
GROWTH FUND | | TOTAL RETURN
BOND FUND | | HIGH INCOME
OPPORTUNITIES
FUND | | SHORT-TERM
BOND FUND | |
ASSETS | |
Investments in securities, at cost | | $ | 157,739,050 | | | $ | 2,180,197 | | | $ | 36,611,396 | | | $ | 41,771,842 | | | $ | 372,003,630 | | |
Investment in securities, at value* | | $ | 193,911,435 | | | $ | 2,283,145 | | | $ | 31,420,238 | | | $ | 36,859,596 | | | $ | 359,174,047 | | |
Cash with custodian | | | 5,219,143 | | | | 86,886 | | | | 387,352 | | | | 382,075 | | | | 4,172,306 | | |
Foreign currency (cost $144,805 and $121) | | | 144,648 | | | | 121 | | | | — | | | | — | | | | — | | |
Variation margin on open futures contracts | | | — | | | | — | | | | 41,312 | | | | — | | | | 1,163,403 | | |
Receivables: | |
Accrued interest and dividends | | | 433,575 | | | | 4,593 | | | | 259,884 | | | | 514,008 | | | | 2,403,591 | | |
Investments sold | | | 2,195,128 | | | | 19,323 | | | | — | | | | 19,669 | | | | 1,349,084 | | |
Fund shares sold | | | 204,380 | | | | — | | | | 3,014 | | | | — | | | | — | | �� |
Due from investment advisor | | | 70,158 | | | | 10,458 | | | | 11,901 | | | | 15,327 | | | | 1,314 | | |
Prepaid expenses | | | 24,916 | | | | 22,930 | | | | 22,447 | | | | 22,380 | | | | 25,436 | | |
Other assets | | | 112,175 | | | | — | | | | 26,903 | | | | 81,608 | | | | — | | |
Total assets | | | 202,315,558 | | | | 2,427,456 | | | | 32,173,051 | | | | 37,894,663 | | | | 368,289,181 | | |
LIABILITIES | |
Collateral for securities loaned | | | 4,264,427 | | | | — | | | | 719,238 | | | | 3,958,408 | | | | 7,108,153 | | |
Variation margin on open futures contracts | | | — | | | | — | | | | — | | | | — | | | | 546,886 | | |
Payables: | |
Investments purchased | | | 792,617 | | | | 43,284 | | | | — | | | | 237,085 | | | | 1,742,220 | | |
Fund shares redeemed | | | 519,947 | | | | — | | | | 49,372 | | | | 81,238 | | | | 31,079 | | |
Dividends payable | | | — | | | | — | | | | 14,261 | | | | 6,351 | | | | 1,087,289 | | |
Affiliates: | |
Investment Advisory fees | | | 170,287 | | | | 1,920 | | | | 11,993 | | | | 17,232 | | | | 91,027 | | |
Distribution fees | | | 1,516 | | | | 1 | | | | 179 | | | | 371 | | | | 48 | | |
Deferred compensation to trustees | | | 112,175 | | | | — | | | | 26,903 | | | | 81,608 | | | | — | | |
Trustees' fees and officer compensation | | | 2,968 | | | | 1,006 | | | | 2,266 | | | | 2,173 | | | | 3,531 | | |
Other accounts payable and accrued liabilities | | | 116,069 | | | | 19,223 | | | | 25,288 | | | | 33,179 | | | | 46,507 | | |
Total liabilities | | | 5,980,006 | | | | 65,434 | | | | 849,500 | | | | 4,417,645 | | | | 10,656,740 | | |
NET ASSETS | | $ | 196,335,552 | | | $ | 2,362,022 | | | $ | 31,323,551 | | | $ | 33,477,018 | | | $ | 357,632,441 | | |
COMPOSITION OF NET ASSETS | |
Paid in capital | | $ | 175,631,410 | | | $ | 2,899,043 | | | $ | 38,371,320 | | | $ | 50,372,888 | | | $ | 383,126,602 | | |
Accumulated distributable earnings (loss) | | | 20,704,142 | | | | (537,021 | ) | | | (7,047,769 | ) | | | (16,895,870 | ) | | | (25,494,161 | ) | |
NET ASSETS | | $ | 196,335,552 | | | $ | 2,362,022 | | | $ | 31,323,551 | | | $ | 33,477,018 | | | $ | 357,632,441 | | |
CLASS A SHARES† | |
Net assets applicable to shares outstanding | | $ | 81,820,721 | | | $ | 20,367 | | | $ | 11,764,186 | | | $ | 25,252,497 | | | $ | 3,523,253 | | |
Shares outstanding | | | 8,545,763 | | | | 2,701 | | | | 1,403,260 | | | | 3,499,790 | | | | 378,719 | | |
Net asset value and redemption price per share | | $ | 9.57 | | | $ | 7.54 | | | $ | 8.38 | | | $ | 7.22 | | | $ | 9.30 | | |
Maximum offering price per share (Net asset value, plus 4.75% of offering price) | | $ | 10.05 | | | $ | 7.92 | | | $ | 8.57 | # | | $ | 7.39 | # | | $ | 9.51 | # | |
CLASS C SHARES†** | |
Net assets applicable to shares outstanding | | $ | 7,316,928 | | | $ | 7,493 | | | $ | 323,208 | | | $ | 438,204 | | | $ | — | | |
Shares outstanding | | | 909,224 | | | | 1,005 | | | | 38,567 | | | | 56,629 | | | | — | | |
Net asset value and redemption price per share | | $ | 8.05 | | | $ | 7.46 | | | $ | 8.38 | | | $ | 7.74 | | | $ | — | | |
CLASS I SHARES† | |
Net assets applicable to shares outstanding | | $ | 107,197,903 | | | $ | 2,326,544 | | | $ | 19,236,157 | | | $ | 7,786,317 | | | $ | 354,109,188 | | |
Shares outstanding | | | 10,740,134 | | | | 307,580 | | | | 2,293,882 | | | | 1,078,825 | | | | 38,097,975 | | |
Net asset value and redemption price per share | | $ | 9.98 | | | $ | 7.56 | | | $ | 8.39 | | | $ | 7.22 | | | $ | 9.29 | | |
CLASS R6 SHARES† | |
Net assets applicable to shares outstanding | | $ | — | | | $ | 7,618 | | | $ | — | | | $ | — | | | $ | — | | |
Shares Outstanding | | | — | | | | 1,007 | | | | — | | | | — | | | | — | | |
Net asset value and redemption price per share | | $ | — | | | $ | 7.56 | | | $ | — | | | $ | — | | | $ | — | | |
| * Includes securities on loan | | $ | 6,201,125 | | | $ | — | | | $ | 799,984 | | | $ | 4,116,275 | | | $ | 13,258,558 | | |
† No par value; unlimited number of shares authorized.
** Redemption price may be reduced by contingent deferred sales charge.
# For Total Return Bond Fund, High Income Opportunities Fund, and Short-Term Bond Fund, maximum offering price per share is Net asset value plus 2.25% of offering price.
See accompanying Notes to Financial Statements
www.calamos.com
185
Statements of Operations Year Ended October 31, 2023
| | | MARKET NEUTRAL
INCOME FUND | | HEDGED EQUITY
FUND | | PHINEUS
LONG/SHORT
FUND | | MERGER
ARBITRAGE
FUND(a) | | CONVERTIBLE
FUND | |
INVESTMENT INCOME | |
Interest | | $ | 71,406,020 | | | $ | 35,009 | | | $ | 2,974,736 | | | $ | 633 | | | $ | 8,248,223 | | |
(Amortization)/accretion of investment securities | | | (144,931,175 | ) | | | — | | | | — | | | | 579 | | | | (8,105,211 | ) | |
Net interest | | | (73,525,155 | ) | | | 35,009 | | | | 2,974,736 | | | | 1,212 | | | | 143,012 | | |
Dividends | | | 135,845,692 | | | | 9,663,697 | | | | 12,677,329 | | | | 2,231 | | | | 5,266,328 | | |
Dividends from affiliated funds | | | 12,341,657 | | | | — | | | | — | | | | — | | | | — | | |
Dividend taxes withheld | | | (46,748 | ) | | | (3,614 | ) | | | (52,978 | ) | | | — | | | | — | | |
Securities lending income, net of rebates received or paid to borrowers | | | 569,189 | | | | 18,312 | | | | 18,156 | | | | — | | | | 1,158,781 | | |
Other income | | | 110,283,095 | | | | — | | | | 17,711,081 | | | | — | | | | — | | |
Total investment income | | | 185,467,730 | | | | 9,713,404 | | | | 33,328,324 | | | | 3,443 | | | | 6,568,121 | | |
EXPENSES | |
Investment advisory fees | | | 96,435,157 | | | | 4,195,408 | | | | 11,334,604 | | | | 1,472 | | | | 6,890,150 | | |
Distribution fees | |
Class A | | | 2,776,602 | | | | 71,775 | | | | 161,385 | | | | 22 | | | | 681,441 | | |
Class C | | | 2,804,949 | | | | 83,540 | | | | 341,487 | | | | 87 | | | | 385,597 | | |
Dividend or interest expense on short positions | | | 25,624,620 | | | | — | | | | 6,814,631 | | | | — | | | | — | | |
Transfer agent fees | | | 12,762,719 | | | | 621,739 | | | | 911,256 | | | | 192 | | | | 959,827 | | |
Fund administration fees | | | 924,595 | | | | 35,091 | | | | 58,432 | | | | 128 | | | | 60,142 | | |
Accounting fees | | | 807,871 | | | | 45,822 | | | | 59,789 | | | | 1,415 | | | | 59,853 | | |
Printing and mailing fees | | | 662,719 | | | | 40,100 | | | | 62,145 | | | | 544 | | | | 59,674 | | |
Trustees' fees and officer compensation | | | 613,166 | | | | 37,360 | | | | 51,248 | | | | 1,088 | | | | 52,154 | | |
Legal fees | | | 609,108 | | | | 33,577 | | | | 47,096 | | | | 1,184 | | | | 53,406 | | |
Audit fees | | | 395,063 | | | | 24,835 | | | | 36,026 | | | | 6,466 | | | | 34,889 | | |
Registration fees | | | 292,700 | | | | 83,221 | | | | 81,848 | | | | — | | | | 74,493 | | |
Custodian fees | | | 288,950 | | | | 21,358 | | | | 119,537 | | | | 544 | | | | 11,517 | | |
Organization expense | | | — | | | | — | | | | — | | | | 2,210 | | | | — | | |
Offering costs | | | — | | | | — | | | | — | | | | 11,392 | | | | — | | |
Other | | | 1,079,940 | | | | 25,261 | | | | 75,766 | | | | 224 | | | | 82,113 | | |
Total expenses | | | 146,078,159 | | | | 5,319,087 | | | | 20,155,250 | | | | 26,968 | | | | 9,405,256 | | |
Less expense reductions | | | (985,807 | ) | | | — | | | | — | | | | (25,019 | ) | | | — | | |
Net expenses | | | 145,092,352 | | | | 5,319,087 | | | | 20,155,250 | | | | 1,949 | | | | 9,405,256 | | |
NET INVESTMENT INCOME (LOSS) | | | 40,375,378 | | | | 4,394,317 | | | | 13,173,074 | | | | 1,494 | | | | (2,837,135 | ) | |
REALIZED AND UNREALIZED GAIN (LOSS) | |
Net realized gain (loss) from: | |
Investments, excluding purchased options | | | 774,823,940 | | | | 35,561,950 | | | | 30,438,468 | | | | 2,508 | | | | 22,740,131 | | |
Purchased options | | | (411,779,309 | ) | | | (29,159,091 | ) | | | (77,780,931 | ) | | | — | | | | 1,239,823 | | |
Foreign currency transactions | | | 5,553,439 | | | | — | | | | (37,722 | ) | | | 400 | | | | (80,338 | ) | |
Forward foreign currency contracts | | | (8,784,267 | ) | | | — | | | | — | | | | — | | | | 380,938 | | |
Written options | | | 257,137,442 | | | | 8,128,628 | | | | 81,068,649 | | | | — | | | | — | | |
Short positions | | | 78,946,490 | | | | — | | | | (44,966,288 | ) | | | — | | | | — | | |
Total return swaps | | | (3,421,202 | ) | | | — | | | | — | | | | — | | | | — | | |
Change in net unrealized appreciation/(depreciation) on: | |
Investments, excluding purchased options | | | 349,384,778 | | | | 13,981,320 | | | | 8,167,425 | | | | (69,678 | ) | | | (26,913,414 | ) | |
Affiliated funds | | | 351,172 | | | | — | | | | — | | | | — | | | | — | | |
Purchased options | | | 145,343,446 | | | | 12,002,587 | | | | (1,282,532 | ) | | | — | | | | (419,880 | ) | |
Foreign currency translations | | | 13,053,635 | | | | — | | | | 7,129 | | | | (1 | ) | | | — | | |
Forward foreign currency contracts | | | 1,329,556 | | | | — | | | | — | | | | — | | | | 97,472 | | |
Written options | | | 19,160,962 | | | | (378,105 | ) | | | (4,196,917 | ) | | | — | | | | — | | |
Short positions | | | (107,845,202 | ) | | | — | | | | 11,603,299 | | | | 13,453 | | | | — | | |
Total return swaps | | | 228,860 | | | | — | | | | — | | | | — | | | | — | | |
NET GAIN (LOSS) | | | 1,113,483,740 | | | | 40,137,289 | | | | 3,020,580 | | | | (53,318 | ) | | | (2,955,268 | ) | |
NET INCREASE (DECREASE) IN NET ASSETS RESULTING
FROM OPERATIONS | | $ | 1,153,859,118 | | | $ | 44,531,606 | | | $ | 16,193,654 | | | $ | (51,824 | ) | | $ | (5,792,403 | ) | |
(a) Calamos Merger Arbitrage Fund commenced operations on September 29, 2023.
See accompanying Notes to Financial Statements
CALAMOS OPEN-END FAMILY OF FUNDS ANNUAL REPORT
186
Statements of Operations Year Ended October 31, 2023
| | | GLOBAL
CONVERTIBLE
FUND | | TIMPANI
SMALL CAP
GROWTH FUND | | TIMPANI SMID
GROWTH FUND | | GROWTH FUND | | GROWTH AND
INCOME FUND | |
INVESTMENT INCOME | |
Interest | | $ | 1,158,825 | | | $ | 129,347 | | | $ | 7,514 | | | $ | 2,012,040 | | | $ | 12,213,227 | | |
(Amortization)/accretion of investment securities | | | (1,960,153 | ) | | | — | | | | — | | | | — | | | | (9,010,334 | ) | |
Net interest | | | (801,328 | ) | | | 129,347 | | | | 7,514 | | | | 2,012,040 | | | | 3,202,893 | | |
Dividends | | | 523,301 | | | | 685,967 | | | | 44,271 | | | | 8,699,997 | | | | 31,434,918 | | |
Foreign taxes withheld | | | (4,136 | ) | | | — | | | | (24 | ) | | | (42,918 | ) | | | (13,593 | ) | |
Securities lending income, net of rebates received or paid to borrowers | | | 99,855 | | | | — | | | | — | | | | 96,830 | | | | 1,002,931 | | |
Other income | | | — | | | | — | | | | — | | | | 54,656 | | | | — | | |
Total investment income | | | (182,308 | ) | | | 815,314 | | | | 51,761 | | | | 10,820,605 | | | | 35,627,149 | | |
EXPENSES | |
Investment advisory fees | | | 1,084,984 | | | | 2,723,817 | | | | 166,130 | | | | 11,166,371 | | | | 15,797,951 | | |
Distribution fees | |
Class A | | | 22,544 | | | | 53,621 | | | | 788 | | | | 2,343,524 | | | | 3,048,790 | | |
Class C | | | 31,657 | | | | 43,087 | | | | — | | | | 106,182 | | | | 833,024 | | |
Transfer agent fees | | | 138,271 | | | | 376,647 | | | | 14,563 | | | | 1,261,534 | | | | 1,989,994 | | |
Fund administration fees | | | 7,995 | | | | 19,399 | | | | 1,115 | | | | 75,849 | | | | 145,382 | | |
Accounting fees | | | 22,339 | | | | 32,814 | | | | 13,199 | | | | 74,492 | | | | 127,580 | | |
Printing and mailing fees | | | 10,944 | | | | 24,409 | | | | 3,655 | | | | 49,469 | | | | 105,794 | | |
Trustees' fees and officer compensation | | | 19,265 | | | | 26,708 | | | | 15,036 | | | | 61,133 | | | | 105,510 | | |
Legal fees | | | 19,256 | | | | 24,524 | | | | 13,707 | | | | 56,726 | | | | 104,947 | | |
Audit fees | | | 13,208 | | | | 17,613 | | | | 10,257 | | | | 42,814 | | | | 72,677 | | |
Registration fees | | | 50,979 | | | | 78,942 | | | | 45,476 | | | | 59,783 | | | | 86,101 | | |
Custodian fees | | | 2,647 | | | | — | | | | 7,950 | | | | 35,086 | | | | 32,749 | | |
Other | | | 17,051 | | | | 30,484 | | | | 10,960 | | | | 104,040 | | | | 175,293 | | |
Total expenses | | | 1,441,140 | | | | 3,452,065 | | | | 302,836 | | | | 15,437,003 | | | | 22,625,792 | | |
Less expense reductions | | | (3,418 | ) | | | (205,982 | ) | | | (109,798 | ) | | | — | | | | — | | |
Net expenses | | | 1,437,722 | | | | 3,246,083 | | | | 193,038 | | | | 15,437,003 | | | | 22,625,792 | | |
NET INVESTMENT INCOME (LOSS) | | | (1,620,030 | ) | | | (2,430,769 | ) | | | (141,277 | ) | | | (4,616,398 | ) | | | 13,001,357 | | |
REALIZED AND UNREALIZED GAIN (LOSS) | |
Net realized gain (loss) from: | |
Investments, excluding purchased options | | | (6,175,683 | ) | | | (15,959,746 | ) | | | (1,063,992 | ) | | | 61,381,733 | | | | 96,568,682 | | |
Purchased options | | | 401,811 | | | | — | | | | — | | | | (6,326,898 | ) | | | 1,138,460 | | |
Foreign currency transactions | | | (20,140 | ) | | | — | | | | — | | | | — | | | | 23,381 | | |
Forward foreign currency contracts | | | — | | | | — | | | | — | | | | — | | | | 47,407 | | |
Written options | | | — | | | | — | | | | — | | | | 2,185,419 | | | | (1,080,920 | ) | |
Futures contracts | | | — | | | | — | | | | — | | | | 849,189 | | | | — | | |
Change in net unrealized appreciation/(depreciation) on: | |
Investments, excluding purchased options | | | 12,656,216 | | | | (28,976,215 | ) | | | (604,298 | ) | | | 114,045,269 | | | | 45,847,911 | | |
Purchased options | | | 588,290 | | | | — | | | | — | | | | (230 | ) | | | (910,208 | ) | |
Foreign currency translations | | | 1,182 | | | | — | | | | — | | | | 1,694 | | | | (137 | ) | |
Written options | | | 81,735 | | | | — | | | | — | | | | (3,022 | ) | | | — | | |
Futures contracts | | | — | | | | — | | | | — | | | | (118,877 | ) | | | — | | |
NET GAIN (LOSS) | | | 7,533,411 | | | | (44,935,961 | ) | | | (1,668,290 | ) | | | 172,014,277 | | | | 141,634,576 | | |
NET INCREASE (DECREASE) IN NET ASSETS RESULTING
FROM OPERATIONS | | $ | 5,913,381 | | | $ | (47,366,730 | ) | | $ | (1,809,567 | ) | | $ | 167,397,879 | | | $ | 154,635,933 | | |
See accompanying Notes to Financial Statements
www.calamos.com
187
Statements of Operations Year Ended October 31, 2023
| | | DIVIDEND
GROWTH FUND | | SELECT FUND | | INTERNATIONAL
GROWTH FUND | | EVOLVING
WORLD GROWTH
FUND | | GLOBAL EQUITY
FUND | |
INVESTMENT INCOME | |
Interest | | $ | 9,316 | | | $ | 65,120 | | | $ | 101,751 | | | $ | 712,091 | | | $ | 100,155 | | |
(Amortization)/accretion of investment securities | | | — | | | | — | | | | — | | | | (1,369,417 | ) | | | — | | |
Net interest | | | 9,316 | | | | 65,120 | | | | 101,751 | | | | (657,326 | ) | | | 100,155 | | |
Dividends | | | 266,514 | | | | 505,244 | | | | 3,261,925 | | | | 7,531,444 | | | | 1,128,212 | | |
Dividend taxes withheld | | | (56 | ) | | | — | | | | (362,263 | ) | | | (929,982 | ) | | | (81,608 | ) | |
Securities lending income, net of rebates received or paid to borrowers | | | 709 | | | | 597 | | | | 25,013 | | | | 18,071 | | | | 4,598 | | |
Total investment income | | | 276,483 | | | | 570,961 | | | | 3,026,426 | | | | 5,962,207 | | | | 1,151,357 | | |
EXPENSES | |
Investment advisory fees | | | 167,768 | | | | 435,234 | | | | 2,111,272 | | | | 4,721,499 | | | | 804,022 | | |
Performance fees | | | — | | | | — | | | | (66,928 | ) | | | — | | | | (52,637 | ) | |
Distribution fees | |
Class A | | | 13,628 | | | | 29,711 | | | | 119,674 | | | | 101,507 | | | | 54,468 | | |
Class C | | | 23,980 | | | | 1,336 | | | | 18,294 | | | | 56,043 | | | | 6,942 | | |
Transfer agent fees | | | 21,130 | | | | 30,563 | | | | 259,447 | | | | 569,498 | | | | 58,529 | | |
Fund administration fees | | | 1,036 | | | | 2,747 | | | | 13,394 | | | | 27,755 | | | | 4,893 | | |
Accounting fees | | | 16,125 | | | | 15,960 | | | | 27,784 | | | | 35,631 | | | | 21,271 | | |
Printing and mailing fees | | | 7,051 | | | | 10,335 | | | | 19,941 | | | | 44,984 | | | | 9,869 | | |
Trustees' fees and officer compensation | | | 15,020 | | | | 16,058 | | | | 22,540 | | | | 31,409 | | | | 17,263 | | |
Legal fees | | | 13,896 | | | | 14,830 | | | | 22,836 | | | | 31,067 | | | | 16,910 | | |
Audit fees | | | 10,224 | | | | 10,988 | | | | 15,110 | | | | 21,227 | | | | 12,021 | | |
Registration fees | | | 43,803 | | | | 44,440 | | | | 57,329 | | | | 63,169 | | | | 56,170 | | |
Custodian fees | | | 2,937 | | | | 1,260 | | | | 70,904 | | | | 333,361 | | | | 13,281 | | |
Other | | | 9,967 | | | | 12,194 | | | | 55,232 | | | | 54,868 | | | | 50,618 | | |
Total expenses | | | 346,565 | | | | 625,656 | | | | 2,746,829 | | | | 6,092,018 | | | | 1,073,620 | | |
Less expense reductions | | | (124,694 | ) | | | (202,897 | ) | | | (682,887 | ) | | | (1,467,736 | ) | | | (87,632 | ) | |
Net expenses | | | 221,871 | | | | 422,759 | | | | 2,063,942 | | | | 4,624,282 | | | | 985,988 | | |
NET INVESTMENT INCOME (LOSS) | | | 54,612 | | | | 148,202 | | | | 962,484 | | | | 1,337,925 | | | | 165,369 | | |
REALIZED AND UNREALIZED GAIN (LOSS) | |
Net realized gain (loss) from: | |
Investments, excluding purchased options | | | 928,739 | | | | 1,968,869 | | | | (5,671,190 | )(b) | | | (31,861,723 | )(b) | | | (38,082 | ) | |
Purchased options | | | (2,070 | ) | | | — | | | | 534,209 | | | | 5,760,360 | | | | (225,504 | ) | |
Foreign currency transactions | | | — | | | | — | | | | (14,435 | ) | | | (778,500 | ) | | | (28,114 | ) | |
Forward foreign currency contracts | | | — | | | | — | | | | (374,998 | ) | | | (722,236 | ) | | | — | | |
Written options | | | — | | | | — | | | | — | | | | 56,726 | | | | 49,709 | | |
Change in net unrealized appreciation/(depreciation) on: | |
Investments | | | 279,558 | | | | 1,474,054 | | | | 16,160,359 | (c) | | | 39,785,760 | (c) | | | 6,693,029 | (c) | |
Purchased options | | | — | | | | — | | | | (526,728 | ) | | | (3,772,436 | ) | | | (267,541 | ) | |
Foreign currency translations | | | — | | | | — | | | | 6,740 | | | | 13,139 | | | | 3,131 | | |
Forward foreign currency contracts | | | — | | | | — | | | | (40,898 | ) | | | 208,692 | | | | — | | |
NET GAIN (LOSS) | | | 1,206,227 | | | | 3,442,923 | | | | 10,073,059 | | | | 8,689,782 | | | | 6,186,628 | | |
NET INCREASE (DECREASE) IN NET ASSETS RESULTING
FROM OPERATIONS | | $ | 1,260,839 | | | $ | 3,591,125 | | | $ | 11,035,543 | | | $ | 10,027,707 | | | $ | 6,351,997 | | |
(b) Net of foreign capital gains tax of $71,883 and $1,264,804, respectively.
(c) Net of change of $(132,304), (203,299), and (641), respectively in deferred capital gains tax.
See accompanying Notes to Financial Statements
CALAMOS OPEN-END FAMILY OF FUNDS ANNUAL REPORT
188
Statements of Operations Year Ended October 31, 2023
| | | GLOBAL
OPPORTUNITIES
FUND | | INTERNATIONAL
SMALL CAP
GROWTH FUND | | TOTAL RETURN
BOND FUND | | HIGH INCOME
OPPORTUNITIES
FUND | | SHORT-TERM
BOND FUND | |
INVESTMENT INCOME | |
Interest | | $ | 850,317 | | | $ | 2,850 | | | $ | 1,426,048 | | | $ | 2,358,056 | | | $ | 13,582,660 | | |
(Amortization)/accretion of investment securities | | | (1,070,410 | ) | | | — | | | | (307 | ) | | | 81,544 | | | | (508,773 | ) | |
Net interest | | | (220,093 | ) | | | 2,850 | | | | 1,425,741 | | | | 2,439,600 | | | | 13,073,887 | | |
Dividends | | | 2,669,841 | | | | 31,502 | | | | — | | | | 50,369 | | | | — | | |
Dividend taxes withheld | | | (504 | ) | | | (4,498 | ) | | | — | | | | — | | | | (3,708 | ) | |
Securities lending income, net of rebates received or paid to borrowers | | | 71,505 | | | | — | | | | 3,022 | | | | 19,380 | | | | 50,198 | | |
Total investment income | | | 2,520,749 | | | | 29,854 | | | | 1,428,763 | | | | 2,509,349 | | | | 13,120,377 | | |
EXPENSES | |
Investment advisory fees | | | 2,161,339 | | | | 22,312 | | | | 150,899 | | | | 211,524 | | | | 1,105,907 | | |
Distribution fees | |
Class A | | | 223,645 | | | | 63 | | | | 34,100 | | | | 66,019 | | | | 8,688 | | |
Class C | | | 80,116 | | | | 137 | | | | 4,245 | | | | 5,141 | | | | — | | |
Transfer agent fees | | | 244,276 | | | | 8,030 | | | | 37,567 | | | | 40,192 | | | | 59,190 | | |
Fund administration fees | | | 13,758 | | | | 150 | | | | 2,122 | | | | 2,209 | | | | 23,219 | | |
Accounting fees | | | 25,410 | | | | 110 | | | | 21,888 | | | | 33,971 | | | | 48,126 | | |
Printing and mailing fees | | | 28,605 | | | | 7,158 | | | | 9,195 | | | | 9,647 | | | | 7,265 | | |
Trustees' fees and officer compensation | | | 23,006 | | | | 14,521 | | | | 15,623 | | | | 15,752 | | | | 29,327 | | |
Legal fees | | | 36,472 | | | | 14,089 | | | | 14,606 | | | | 14,597 | | | | 28,428 | | |
Audit fees | | | 15,535 | | | | 13,230 | | | | 10,690 | | | | 10,703 | | | | 19,815 | | |
Registration fees | | | 55,270 | | | | 39,494 | | | | 45,606 | | | | 43,618 | | | | 35,779 | | |
Custodian fees | | | 24,688 | | | | 8,673 | | | | 2,555 | | | | 2,270 | | | | 8,085 | | |
Interest expense on uncommitted credit facility | | | — | | | | — | | | | 1,609 | | | | — | | | | — | | |
Offering costs | | | — | | | | 57,217 | | | | — | | | | — | | | | — | | |
Other | | | 60,344 | | | | 21,797 | | | | 20,210 | | | | 33,041 | | | | 55,494 | | |
Total expenses | | | 2,992,464 | | | | 206,981 | | | | 370,915 | | | | 488,684 | | | | 1,429,323 | | |
Less expense reductions | | | (597,703 | ) | | | (180,947 | ) | | | (113,216 | ) | | | (153,238 | ) | | | (1,314 | ) | |
Net expenses | | | 2,394,761 | | | | 26,034 | | | | 257,699 | | | | 335,446 | | | | 1,428,009 | | |
NET INVESTMENT INCOME (LOSS) | | | 125,988 | | | | 3,820 | | | | 1,171,064 | | | | 2,173,903 | | | | 11,692,368 | | |
REALIZED AND UNREALIZED GAIN (LOSS) | |
Net realized gain (loss) from: | |
Investments, excluding purchased options | | | (118,934 | )(b) | | | (340,660 | ) | | | (1,132,332 | ) | | | (857,251 | ) | | | (3,044,424 | ) | |
Purchased options | | | (4,420,479 | ) | | | (9,779 | ) | | | — | | | | — | | | | — | | |
Foreign currency transactions | | | 11,100 | | | | (2,343 | ) | | | — | | | | — | | | | — | | |
Forward foreign currency contracts | | | 1 | | | | 264 | | | | — | | | | — | | | | — | | |
Written options | | | 130,275 | | | | — | | | | — | | | | — | | | | — | | |
Futures contracts | | | — | | | | — | | | | (10,578 | ) | | | — | | | | (871,016 | ) | |
Change in net unrealized appreciation/(depreciation) on: | |
Investments, excluding purchased options | | | 15,189,135 | (c) | | | 298,640 | | | | 243,925 | | | | 500,890 | | | | 7,120,459 | | |
Purchased options | | | 720,360 | | | | 285 | | | | — | | | | — | | | | — | | |
Foreign currency translations | | | 4,066 | | | | (54 | ) | | | — | | | | — | | | | — | | |
Futures contracts | | | — | | | | — | | | | (39,454 | ) | | | — | | | | (362,910 | ) | |
NET GAIN (LOSS) | | | 11,515,524 | | | | (53,647 | ) | | | (938,439 | ) | | | (356,361 | ) | | | 2,842,109 | | |
NET INCREASE (DECREASE) IN NET ASSETS RESULTING
FROM OPERATIONS | | $ | 11,641,512 | | | $ | (49,827 | ) | | $ | 232,625 | | | $ | 1,817,542 | | | $ | 14,534,477 | | |
(b) Net of foreign capital gains tax of $48,348.
(c) Net of change of $43,272 in deferred capital gains tax.
See accompanying Notes to Financial Statements
www.calamos.com
189
Statements of Changes in Net Assets
| | | MARKET NEUTRAL INCOME FUND | | HEDGED EQUITY FUND | | PHINEUS LONG/SHORT FUND | |
| | | YEAR ENDED
OCTOBER 31,
2023 | | YEAR ENDED
OCTOBER 31,
2022 | | YEAR ENDED
OCTOBER 31,
2023 | | YEAR ENDED
OCTOBER 31,
2022 | | YEAR ENDED
OCTOBER 31,
2023 | | YEAR ENDED
OCTOBER 31,
2022 | |
OPERATIONS | |
Net investment income (loss) | | $ | 40,375,378 | | | $ | (162,644,551 | ) | | $ | 4,394,317 | | | $ | 4,066,574 | | | $ | 13,173,074 | | | $ | (1,295,838 | ) | |
Net realized gain (loss) | | | 692,476,533 | | | | 489,248,309 | | | | 14,531,487 | | | | 14,281,105 | | | | (11,277,824 | ) | | | (12,461,561 | ) | |
Change in unrealized appreciation/(depreciation) | | | 421,007,207 | | | | (1,306,006,674 | ) | | | 25,605,802 | | | | (88,426,189 | ) | | | 14,298,404 | | | | (30,733,535 | ) | |
Net increase (decrease) in net assets resulting
from operations | | | 1,153,859,118 | | | | (979,402,916 | ) | | | 44,531,606 | | | | (70,078,510 | ) | | | 16,193,654 | | | | (44,490,934 | ) | |
DISTRIBUTIONS TO SHAREHOLDERS | |
Class A | | | (15,497,256 | ) | | | (2,530,481 | ) | | | (195,091 | ) | | | (109,918 | ) | | | — | | | | — | | |
Class C | | | (2,020,518 | ) | | | — | | | | (22,845 | ) | | | — | | | | — | | | | — | | |
Class I | | | (222,576,278 | ) | | | (64,002,758 | ) | | | (4,621,754 | ) | | | (2,334,728 | ) | | | (229,407 | ) | | | — | | |
Class R6 | | | (814,421 | ) | | | (617,073 | ) | | | — | | | | — | | | | — | | | | — | | |
Total distributions | | | (240,908,473 | ) | | | (67,150,312 | ) | | | (4,839,690 | ) | | | (2,444,646 | ) | | | (229,407 | ) | | | — | | |
CAPITAL SHARE TRANSACTIONS | | | (3,042,937,950 | ) | | | 664,127,462 | | | | (67,675,834 | ) | | | 105,216,503 | | | | 135,307,620 | | | | 270,199,042 | | |
TOTAL INCREASE (DECREASE) IN NET ASSETS | | | (2,129,987,305 | ) | | | (382,425,766 | ) | | | (27,983,918 | ) | | | 32,693,347 | | | | 151,271,867 | | | | 225,708,108 | | |
NET ASSETS | |
Beginning of year | | $ | 16,064,474,027 | | | $ | 16,446,899,793 | | | $ | 588,864,491 | | | $ | 556,171,144 | | | $ | 784,624,412 | | | $ | 558,916,304 | | |
End of year | | $ | 13,934,486,722 | | | $ | 16,064,474,027 | | | $ | 560,880,573 | | | $ | 588,864,491 | | | $ | 935,896,279 | | | $ | 784,624,412 | | |
See accompanying Notes to Financial Statements
CALAMOS OPEN-END FAMILY OF FUNDS ANNUAL REPORT
190
Statements of Changes in Net Assets
| | | MERGER
ARBITRAGE FUND | | CONVERTIBLE FUND | | GLOBAL CONVERTIBLE FUND | |
| | | YEAR ENDED
OCTOBER 31,
2023(a) | | YEAR ENDED
OCTOBER 31,
2023 | | YEAR ENDED
OCTOBER 31,
2022 | | YEAR ENDED
OCTOBER 31,
2023 | | YEAR ENDED
OCTOBER 31,
2022 | |
OPERATIONS | |
Net investment income (loss) | | $ | 1,494 | | | $ | (2,837,135 | ) | | $ | (14,493,334 | ) | | $ | (1,620,030 | ) | | $ | (1,848,482 | ) | |
Net realized gain (loss) | | | 2,908 | | | | 24,280,554 | | | | 18,435,173 | | | | (5,794,012 | ) | | | (2,249,072 | ) | |
Change in unrealized appreciation/(depreciation) | | | (56,226 | ) | | | (27,235,822 | ) | | | (333,562,858 | ) | | | 13,327,423 | | | | (57,878,046 | ) | |
Net increase (decrease) in net assets resulting
from operations | | | (51,824 | ) | | | (5,792,403 | ) | | | (329,621,019 | ) | | | 5,913,381 | | | | (61,975,600 | ) | |
DISTRIBUTIONS TO SHAREHOLDERS | |
Class A | | | — | | | | (2,369,927 | ) | | | (49,468,941 | ) | | | (25,216 | ) | | | (2,202,209 | ) | |
Class C | | | — | | | | (135,629 | ) | | | (8,312,063 | ) | | | — | | | | (688,433 | ) | |
Class I | | | — | | | | (8,355,601 | ) | | | (154,675,818 | ) | | | (474,967 | ) | | | (30,244,502 | ) | |
Class R6 | | | — | | | | — | | | | — | | | | — | | | | — | | |
Total distributions | | | — | | | | (10,861,157 | ) | | | (212,456,822 | ) | | | (500,183 | ) | | | (33,135,144 | ) | |
CAPITAL SHARE TRANSACTIONS | | | 2,110,468 | | | | (164,628,325 | ) | | | (96,875,594 | ) | | | (16,914,443 | ) | | | (57,001,247 | ) | |
TOTAL INCREASE (DECREASE) IN NET ASSETS | | | 2,058,644 | | | | (181,281,885 | ) | | | (638,953,435 | ) | | | (11,501,245 | ) | | | (152,111,991 | ) | |
NET ASSETS | |
Beginning of year | | $ | — | | | $ | 1,016,477,181 | | | $ | 1,655,430,616 | | | $ | 131,889,675 | | | $ | 284,001,666 | | |
End of year | | $ | 2,058,644 | | | $ | 835,195,296 | | | $ | 1,016,477,181 | | | $ | 120,388,430 | | | $ | 131,889,675 | | |
(a) Calamos Merger Arbitrage Fund commenced operations on September 29, 2023.
See accompanying Notes to Financial Statements
www.calamos.com
191
Statements of Changes in Net Assets
| | | TIMPANI SMALL CAP
GROWTH FUND | | TIMPANI SMID GROWTH FUND | | GROWTH FUND | |
| | | YEAR ENDED
OCTOBER 31,
2023 | | YEAR ENDED
OCTOBER 31,
2022 | | YEAR ENDED
OCTOBER 31,
2023 | | YEAR ENDED
OCTOBER 31,
2022 | | YEAR ENDED
OCTOBER 31,
2023 | | YEAR ENDED
OCTOBER 31,
2022 | |
OPERATIONS | |
Net investment income (loss) | | $ | (2,430,769 | ) | | $ | (2,105,207 | ) | | $ | (141,277 | ) | | $ | (92,327 | ) | | $ | (4,616,398 | ) | | $ | (8,582,382 | ) | |
Net realized gain (loss) | | | (15,959,746 | ) | | | (123,002,610 | ) | | | (1,063,992 | ) | | | (2,469,497 | ) | | | 58,089,443 | | | | (2,394,192 | ) | |
Change in unrealized appreciation/(depreciation) | | | (28,976,215 | ) | | | (81,291,878 | ) | | | (604,298 | ) | | | (7,270,735 | ) | | | 113,924,834 | | | | (530,033,970 | ) | |
Net increase (decrease) in net assets resulting
from operations | | | (47,366,730 | ) | | | (206,399,695 | ) | | | (1,809,567 | ) | | | (9,832,559 | ) | | | 167,397,879 | | | | (541,010,544 | ) | |
DISTRIBUTIONS TO SHAREHOLDERS | |
Class A | | | — | | | | — | | | | — | | | | (17,064 | ) | | | — | | | | (152,810,088 | ) | |
Class C | | | — | | | | — | | | | — | | | | — | | | | — | | | | (5,873,124 | ) | |
Class I | | | — | | | | — | | | | — | | | | (2,419,370 | ) | | | — | | | | (29,081,247 | ) | |
Class R6 | | | — | | | | — | | | | — | | | | (46,994 | ) | | | — | | | | — | | |
Total distributions | | | — | | | | — | | | | — | | | | (2,483,428 | ) | | | — | | | | (187,764,459 | ) | |
CAPITAL SHARE TRANSACTIONS | | | (56,927,569 | ) | | | 94,246,952 | | | | 806,907 | | | | 3,020,993 | | | | (128,729,370 | ) | | | 29,684,003 | | |
TOTAL INCREASE (DECREASE) IN NET ASSETS | | | (104,294,299 | ) | | | (112,152,743 | ) | | | (1,002,660 | ) | | | (9,294,994 | ) | | | 38,668,509 | | | | (699,091,000 | ) | |
NET ASSETS | |
Beginning of year | | $ | 342,555,024 | | | $ | 454,707,767 | | | $ | 17,158,349 | | | $ | 26,453,343 | | | $ | 1,159,013,744 | | | $ | 1,858,104,744 | | |
End of year | | $ | 238,260,725 | | | $ | 342,555,024 | | | $ | 16,155,689 | | | $ | 17,158,349 | | | $ | 1,197,682,253 | | | $ | 1,159,013,744 | | |
See accompanying Notes to Financial Statements
CALAMOS OPEN-END FAMILY OF FUNDS ANNUAL REPORT
192
Statements of Changes in Net Assets
| | | GROWTH AND INCOME FUND | | DIVIDEND GROWTH FUND | | SELECT FUND | |
| | | YEAR ENDED
OCTOBER 31,
2023 | | YEAR ENDED
OCTOBER 31,
2022 | | YEAR ENDED
OCTOBER 31,
2023 | | YEAR ENDED
OCTOBER 31,
2022 | | YEAR ENDED
OCTOBER 31,
2023 | | YEAR ENDED
OCTOBER 31,
2022 | |
OPERATIONS | |
Net investment income (loss) | | $ | 13,001,357 | | | $ | 6,844,613 | | | $ | 54,612 | | | $ | 52,685 | | | $ | 148,202 | | | $ | 80,479 | | |
Net realized gain (loss) | | | 96,697,010 | | | | 69,929,006 | | | | 926,669 | | | | 50,850 | | | | 1,968,869 | | | | 1,399,226 | | |
Change in unrealized appreciation/(depreciation) | | | 44,937,566 | | | | (518,391,799 | ) | | | 279,558 | | | | (2,930,056 | ) | | | 1,474,054 | | | | (9,783,898 | ) | |
Net increase (decrease) in net assets resulting
from operations | | | 154,635,933 | | | | (441,618,180 | ) | | | 1,260,839 | | | | (2,826,521 | ) | | | 3,591,125 | | | | (8,304,193 | ) | |
DISTRIBUTIONS TO SHAREHOLDERS | |
Class A | | | (45,490,533 | ) | | | (82,367,258 | ) | | | (20,668 | ) | | | (425,805 | ) | | | (301,604 | ) | | | (1,043,899 | ) | |
Class C | | | (2,715,457 | ) | | | (4,863,487 | ) | | | (4,734 | ) | | | (157,226 | ) | | | (4,429 | ) | | | (63,375 | ) | |
Class I | | | (40,538,603 | ) | | | (72,241,118 | ) | | | (41,829 | ) | | | (876,353 | ) | | | (747,170 | ) | | | (2,763,310 | ) | |
Class R6 | | | (774,460 | ) | | | (409,283 | ) | | | — | | | | — | | | | — | | | | — | | |
Total distributions | | | (89,519,053 | ) | | | (159,881,146 | ) | | | (67,231 | ) | | | (1,459,384 | ) | | | (1,053,203 | ) | | | (3,870,584 | ) | |
CAPITAL SHARE TRANSACTIONS | | | (74,053,714 | ) | | | 31,501,713 | | | | (3,540,025 | ) | | | 4,334,104 | | | | (1,679,203 | ) | | | 949,359 | | |
TOTAL INCREASE (DECREASE) IN NET ASSETS | | | (8,936,834 | ) | | | (569,997,613 | ) | | | (2,346,417 | ) | | | 48,199 | | | | 858,719 | | | | (11,225,418 | ) | |
NET ASSETS | |
Beginning of year | | $ | 2,278,047,537 | | | $ | 2,848,045,150 | | | $ | 17,578,100 | | | $ | 17,529,901 | | | $ | 42,457,415 | | | $ | 53,682,833 | | |
End of year | | $ | 2,269,110,703 | | | $ | 2,278,047,537 | | | $ | 15,231,683 | | | $ | 17,578,100 | | | $ | 43,316,134 | | | $ | 42,457,415 | | |
See accompanying Notes to Financial Statements
www.calamos.com
193
Statements of Changes in Net Assets
| | | INTERNATIONAL GROWTH FUND | | EVOLVING WORLD
GROWTH FUND | | GLOBAL EQUITY FUND | |
| | | YEAR ENDED
OCTOBER 31,
2023 | | YEAR ENDED
OCTOBER 31,
2022 | | YEAR ENDED
OCTOBER 31,
2023 | | YEAR ENDED
OCTOBER 31,
2022 | | YEAR ENDED
OCTOBER 31,
2023 | | YEAR ENDED
OCTOBER 31,
2022 | |
OPERATIONS | |
Net investment income (loss) | | $ | 962,484 | | | $ | 2,730,007 | | | $ | 1,337,925 | | | $ | 3,848,325 | | | $ | 165,369 | | | $ | 286,802 | | |
Net realized gain (loss) | | | (5,526,414 | ) | | | (15,184,813 | ) | | | (27,545,373 | ) | | | (71,936,171 | ) | | | (241,991 | ) | | | 4,821,165 | | |
Change in unrealized appreciation/(depreciation) | | | 15,599,473 | | | | (91,504,187 | ) | | | 36,235,155 | | | | (119,340,645 | ) | | | 6,428,619 | | | | (38,283,955 | ) | |
Net increase (decrease) in net assets resulting
from operations | | | 11,035,543 | | | | (103,958,993 | ) | | | 10,027,707 | | | | (187,428,491 | ) | | | 6,351,997 | | | | (33,175,988 | ) | |
DISTRIBUTIONS TO SHAREHOLDERS | |
Class A | | | — | | | | (11,177,695 | ) | | | (273,392 | ) | | | (175,029 | ) | | | (892,677 | ) | | | (3,462,651 | ) | |
Class C | | | — | | | | (630,114 | ) | | | — | | | | — | | | | (36,318 | ) | | | (185,192 | ) | |
Class I | | | — | | | | (30,545,299 | ) | | | (3,280,771 | ) | | | (3,000,642 | ) | | | (2,193,473 | ) | | | (9,750,158 | ) | |
Class R6 | | | — | | | | (235,038 | ) | | | — | | | | — | | | | (477 | ) | | | (17,305 | ) | |
Total distributions | | | — | | | | (42,588,146 | ) | | | (3,554,163 | ) | | | (3,175,671 | ) | | | (3,122,945 | ) | | | (13,415,306 | ) | |
CAPITAL SHARE TRANSACTIONS | | | 4,712,379 | | | | 18,279,801 | | | | (3,991,771 | ) | | | (30,492,519 | ) | | | 10,701,040 | | | | (17,417,765 | ) | |
TOTAL INCREASE (DECREASE) IN NET ASSETS | | | 15,747,922 | | | | (128,267,338 | ) | | | 2,481,773 | | | | (221,096,681 | ) | | | 13,930,092 | | | | (64,009,059 | ) | |
NET ASSETS | |
Beginning of year | | $ | 173,833,391 | | | $ | 302,100,729 | | | $ | 358,900,411 | | | $ | 579,997,092 | | | $ | 73,417,161 | | | $ | 137,426,220 | | |
End of year | | $ | 189,581,313 | | | $ | 173,833,391 | | | $ | 361,382,184 | | | $ | 358,900,411 | | | $ | 87,347,253 | | | $ | 73,417,161 | | |
See accompanying Notes to Financial Statements
CALAMOS OPEN-END FAMILY OF FUNDS ANNUAL REPORT
194
Statements of Changes in Net Assets
| | | GLOBAL OPPORTUNITIES FUND | | INTERNATIONAL
SMALL CAP GROWTH FUND | | TOTAL RETURN BOND FUND | |
| | | YEAR ENDED
OCTOBER 31,
2023 | | YEAR ENDED
OCTOBER 31,
2022 | | YEAR ENDED
OCTOBER 31,
2023 | | YEAR ENDED
OCTOBER 31,
2022(b) | | YEAR ENDED
OCTOBER 31,
2023 | | YEAR ENDED
OCTOBER 31,
2022 | |
OPERATIONS | |
Net investment income (loss) | | $ | 125,988 | | | $ | (569,879 | ) | | $ | 3,820 | | | $ | 12,557 | | | $ | 1,171,064 | | | $ | 1,081,645 | | |
Net realized gain (loss) | | | (4,398,037 | ) | | | (9,894,317 | ) | | | (352,518 | ) | | | (295,600 | ) | | | (1,142,910 | ) | | | (367,555 | ) | |
Change in unrealized appreciation/(depreciation) | | | 15,913,561 | | | | (58,964,837 | ) | | | 298,871 | | | | (196,004 | ) | | | 204,471 | | | | (7,169,177 | ) | |
Net increase (decrease) in net assets resulting
from operations | | | 11,641,512 | | | | (69,429,033 | ) | | | (49,827 | ) | | | (479,047 | ) | | | 232,625 | | | | (6,455,087 | ) | |
DISTRIBUTIONS TO SHAREHOLDERS | |
Class A | | | (328,166 | ) | | | (6,304,125 | ) | | | (77 | ) | | | — | | | | (492,871 | ) | | | (715,465 | ) | |
Class C | | | (6,784 | ) | | | (644,077 | ) | | | (182 | ) | | | — | | | | (12,234 | ) | | | (23,532 | ) | |
Class I | | | (565,211 | ) | | | (8,160,730 | ) | | | (14,635 | ) | | | — | | | | (755,052 | ) | | | (1,122,873 | ) | |
Class R6 | | | — | | | | — | | | | (56 | ) | | | — | | | | — | | | | — | | |
Total distributions | | | (900,161 | ) | | | (15,108,932 | ) | | | (14,950 | ) | | | — | | | | (1,260,157 | ) | | | (1,861,870 | ) | |
CAPITAL SHARE TRANSACTIONS | | | (26,126,629 | ) | | | 14,369,955 | | | | 658,512 | | | | 2,247,334 | | | | (1,481,529 | ) | | | (25,023,659 | ) | |
TOTAL INCREASE (DECREASE) IN NET ASSETS | | | (15,385,278 | ) | | | (70,168,010 | ) | | | 593,735 | | | | 1,768,287 | | | | (2,509,061 | ) | | | (33,340,616 | ) | |
NET ASSETS | |
Beginning of year | | $ | 211,720,830 | | | $ | 281,888,840 | | | $ | 1,768,287 | | | $ | — | | | $ | 33,832,612 | | | $ | 67,173,228 | | |
End of year | | $ | 196,335,552 | | | $ | 211,720,830 | | | $ | 2,362,022 | | | $ | 1,768,287 | | | $ | 31,323,551 | | | $ | 33,832,612 | | |
(b) International Small Cap Growth Fund commenced operations on March 31, 2022.
See accompanying Notes to Financial Statements
www.calamos.com
195
Statements of Changes in Net Assets
| | | HIGH INCOME
OPPORTUNITIES FUND | | SHORT-TERM BOND FUND | |
| | | YEAR ENDED
OCTOBER 31,
2023 | | YEAR ENDED
OCTOBER 31,
2022 | | YEAR ENDED
OCTOBER 31,
2023 | | YEAR ENDED
OCTOBER 31,
2022 | |
OPERATIONS | |
Net investment income (loss) | | $ | 2,173,903 | | | $ | 1,939,629 | | | $ | 11,692,368 | | | $ | 5,920,207 | | |
Net realized gain (loss) | | | (857,251 | ) | | | (193,556 | ) | | | (3,915,440 | ) | | | (3,585,753 | ) | |
Change in unrealized appreciation/(depreciation) | | | 500,890 | | | | (6,307,176 | ) | | | 6,757,549 | | | | (20,840,467 | ) | |
Net increase (decrease) in net assets resulting
from operations | | | 1,817,542 | | | | (4,561,103 | ) | | | 14,534,477 | | | | (18,506,013 | ) | |
DISTRIBUTIONS TO SHAREHOLDERS | |
Class A | | | (1,629,693 | ) | | | (1,423,098 | ) | | | (124,683 | ) | | | (38,158 | ) | |
Class C | | | (25,964 | ) | | | (22,262 | ) | | | — | | | | — | | |
Class I | | | (529,918 | ) | | | (524,930 | ) | | | (13,801,746 | ) | | | (6,266,171 | ) | |
Class R6 | | | — | | | | — | | | | — | | | | — | | |
Total distributions | | | (2,185,575 | ) | | | (1,970,290 | ) | | | (13,926,429 | ) | | | (6,304,329 | ) | |
CAPITAL SHARE TRANSACTIONS | | | (2,550,728 | ) | | | (1,566,132 | ) | | | (2,011,700 | ) | | | 74,786,794 | | |
TOTAL INCREASE (DECREASE) IN NET ASSETS | | | (2,918,761 | ) | | | (8,097,525 | ) | | | (1,403,652 | ) | | | 49,976,452 | | |
NET ASSETS | |
Beginning of year | | $ | 36,395,779 | | | $ | 44,493,304 | | | $ | 359,036,093 | | | $ | 309,059,641 | | |
End of year | | $ | 33,477,018 | | | $ | 36,395,779 | | | $ | 357,632,441 | | | $ | 359,036,093 | | |
See accompanying Notes to Financial Statements
CALAMOS OPEN-END FAMILY OF FUNDS ANNUAL REPORT
196
Notes to Financial Statements
Note 1 – Organization and Significant Accounting Policies
Organization. CALAMOS INVESTMENT TRUST, a Massachusetts business trust organized December 21, 1987 (the "Trust"), consists of twenty series, Market Neutral Income Fund, Hedged Equity Fund, Phineus Long/Short Fund, Merger Arbitrage Fund (commenced operations on September 29, 2023), Convertible Fund, Global Convertible Fund, Timpani Small Cap Growth Fund, Timpani SMID Growth Fund, Growth Fund, Growth and Income Fund, Dividend Growth Fund, Select Fund , International Growth Fund, Evolving World Growth Fund, Global Equity Fund, Global Opportunities Fund, International Small Cap Growth Fund, Total Return Bond Fund, High Income Opportunities Fund, and Short-Term Bond Fund (each a "Fund" and collectively the "Funds"). The Trust is registered under the Investment Company Act of 1940 as amended (the "1940 Act") as an open-end management investment company. Each Fund is considered an investment company under U.S. GAAP and follows the accounting and reporting guidance applicable to investment companies. The Trust currently offers Class A, Class C (except Timpani SMID Growth Fund and Short-Term Bond Fund), and Class I shares of each of the Funds. Class R6 shares are offered in Market Neutral Income Fund, Timpani Small Cap Growth Fund, Timpani SMID Growth Fund, Growth and Income Fund, International Growth Fund, Global Equity Fund, and International Small Cap Growth Fund only.
Significant Accounting Policies. The financial statements have been prepared in conformity with accounting principles generally accepted in the United States of America (U.S. GAAP), and the Funds are each considered an investment company under U.S. GAAP and follow the accounting and reporting guidance applicable to investment companies. The Funds adhere to the accounting and reporting requirements set forth in Accounting Standards Codification (ASC) Topic 946: Financial Services—Investment Companies. Under U.S. GAAP, management is required to make certain estimates and assumptions at the date of the financial statements and actual results may differ from those estimates. Subsequent events, if any, through the date that the financial statements were issued, have been evaluated in the preparation of the financial statements. The following summarizes the significant accounting policies of the Funds:
Effective January 24, 2023, the SEC adopted rule and form amendments to require mutual funds and ETFs to transmit streamlined annual and semiannual reports to shareholders that highlight key information to shareholders. Other information, including financial statements, will no longer appear in shareholder reports but will be available online, delivered free of charge upon request, and filed with the SEC on a semiannual basis on Form N-CSR. The rule and form amendments have a compliance date of July 24, 2024. At this time, management is evaluating the impact of these rule and form amendment changes on the content of the current shareholder reports and the new annual and semiannual streamlined shareholder reports.
Fund Valuation. The Trust's Board of Trustees ("Board" or "Trustees"), including a majority of the Trustees who are not "interested persons" of the Trust, have designated Calamos Advisors LLC ("Calamos Advisors", or the "Advisor") to perform fair valuation determinations related to all Fund investments under the oversight of the Board. As "valuation designee" Calamos Advisors has adopted procedures to guide the determination of the net asset value ("NAV") on any day on which the Funds' NAVs are determined. The valuation of the Funds' investments is in accordance with these procedures.
Fund securities that are traded on U.S. securities exchanges, except option securities, are valued at the official closing price, which is the last current reported sales price on its principal exchange at the time each Fund determines its NAV. Securities traded in the over-the-counter market and quoted on The NASDAQ Stock Market are valued at the NASDAQ Official Closing Price, as determined by NASDAQ, or lacking a NASDAQ Official Closing Price, the last current reported sale price on NASDAQ at the time a Fund determines its NAV. When a last sale or closing price is not available, equity securities, other than option securities, that are traded on a U.S. securities exchange and other equity securities traded in the over-the-counter market are valued at the mean between the most recent bid and asked quotations on its principal exchange in accordance with guidelines adopted by the Board. Each option security traded on a U.S. securities exchange is valued at the mid-point of the consolidated bid/ask quote for the option security, also in accordance with guidelines adopted by the Board. Each over-the-counter option that is not traded through the Options Clearing Corporation is valued either by an independent pricing agent approved by the Board or based on a quotation provided by the counterparty to such option under the ultimate supervision of the Board.
Fixed income securities, bank loans, certain convertible preferred securities, and non-exchange traded derivatives are normally valued by independent pricing services or by dealers or brokers who make markets in such securities. Valuations of such fixed income securities, bank loans, certain convertible preferred securities, and non-exchange traded derivatives consider yield or price of equivalent securities of comparable quality, coupon rate, maturity, type of issue, trading characteristics and other market data and do not rely exclusively upon exchange or over-the-counter prices.
Trading on European and Far Eastern exchanges and over-the-counter markets is typically completed at various times before the close of business on each day on which the New York Stock Exchange ("NYSE") is open. Each security trading on these
www.calamos.com
197
Notes to Financial Statements
exchanges or in over-the-counter markets may be valued utilizing a systematic fair valuation model provided by an independent pricing service approved by the Board. The valuation of each security that meets certain criteria in relation to the valuation model is systematically adjusted to reflect the impact of movement in the U.S. market after the foreign markets close. Securities that do not meet the criteria, or that are principally traded in other foreign markets, are valued as of the last reported sale price at the time the respective Fund determines its NAV, or when reliable market prices or quotations are not readily available, at the mean between the most recent bid and asked quotations as of the close of the appropriate exchange or other designated time. Trading of foreign securities may not take place on every NYSE business day. In addition, trading may take place in various foreign markets on Saturdays or on other days when the NYSE is not open and on which the respective Fund's NAV is not calculated.
If the Advisor's pricing committee determines that the valuation of a security in accordance with the methods described above is not reflective of a fair value for such security, the security is valued at a fair value by the pricing committee.
Each Fund also may use fair value pricing, pursuant to guidelines adopted by Calamos Advisors, if trading in the security is halted or if the value of a security it holds is materially affected by events occurring before the Fund's pricing time but after the close of the primary market or exchange on which the security is listed. Those procedures may utilize valuations furnished by pricing services approved by the Calamos Advisors, which may be based on market transactions for comparable securities and various relationships between securities that are generally recognized by institutional traders, a computerized matrix system, or appraisals derived from information concerning the securities or similar securities received from recognized dealers in those securities.
When fair value pricing of securities is employed, the prices of securities used by a Fund to calculate its NAV may differ from market quotations or official closing prices. There can be no assurance that a Fund could purchase or sell a portfolio security at the price used to calculate a Fund's NAV.
Investment Transactions. Investment transactions are recorded on a trade date basis as of October 31, 2023. Net realized gains and losses from investment transactions are reported on an identified cost basis. Interest income is recognized using the accrual method and includes accretion of original issue and market discount and amortization of premium. Dividend income is recognized on the ex-dividend date, except that certain dividends from foreign securities are recorded as soon as the information becomes available after the ex-dividend date.
Foreign Currency Translation. Values of investments and other assets and liabilities denominated in foreign currencies are translated into U.S. dollars using a rate quoted by a major bank or dealer in the particular currency market, as reported by a recognized quotation dissemination service.
The Funds do not isolate that portion of the results of operations resulting from changes in foreign exchange rates on investments from the fluctuations arising from changes in market prices of securities held. Such fluctuations are included with the net realized and unrealized gain or loss from investments.
Reported net realized foreign currency gains or losses arise from disposition of foreign currency, the difference in the foreign exchange rates between the trade and settlement dates on securities transactions, and the difference between the amounts of dividends, interest and foreign withholding taxes recorded on the ex-date or accrual date and the U.S. dollar equivalent of the amounts actually received or paid. Net unrealized foreign exchange gains and losses arise from changes (due to the changes in the exchange rate) in the value of foreign currency and other assets and liabilities denominated in foreign currencies held at period end.
Allocation of Expenses Among Funds and Classes. Expenses directly attributable to a Fund are charged to that Fund; certain other common expenses of the Trust, Calamos Advisors Trust, Calamos Convertible Opportunities and Income Fund, Calamos Convertible and High Income Fund, Calamos Strategic Total Return Fund, Calamos Global Total Return Fund, Calamos Global Dynamic Income Fund, Calamos Dynamic Convertible and Income Fund, Calamos Long/Short Equity and Dynamic Income Trust, Calamos Antetokounmpo Sustainable Equities Trust, and Calamos ETF Trust are allocated proportionately among each Fund to which the expenses relate in relation to the net assets of each Fund or on another reasonable basis. Expenses directly attributable to a particular class of a Fund in the Trust are charged directly to such class. In calculating the net asset value per share of each class, investment income, realized and unrealized gains and losses and expenses other than class specific expenses are allocated daily to each class of shares based upon the proportion of net assets of each class at the beginning of each day plus current day fund share activity.
CALAMOS OPEN-END FAMILY OF FUNDS ANNUAL REPORT
198
Notes to Financial Statements
Income Taxes. No provision has been made for U.S. income taxes because the Trust's policy is to continue to qualify as a regulated investment company under the Internal Revenue Code of 1986, as amended, and distribute to shareholders substantially all of the Funds' taxable income and net realized gains.
Dividends and distributions paid to shareholders are recorded on the ex-dividend date. The amount of dividends and distributions from net investment income and net realized capital gains is determined in accordance with federal income tax regulations, which may differ from U.S. generally accepted accounting principles. To the extent these "book/tax" differences are permanent in nature, such amounts are reclassified within the capital accounts based on their federal tax-basis treatment. These differences are primarily due to differing treatments for foreign currency transactions, contingent payment debt instruments and methods of amortizing and accreting for fixed income securities. The financial statements are not adjusted for temporary differences.
The Funds recognized no liability for uncertain tax positions. A reconciliation is not provided as the beginning and ending amounts of unrecognized benefits are zero, with no interim additions, reductions or settlements. Tax years 2020 – 2022 remain subject to examination by the U.S. and the State of Illinois tax jurisdictions for those Funds that have been in existence during that time, and for all years since inception for those Funds created subsequent to October 31, 2020.
Indemnifications. Under the Trust's organizational documents, the Trust is obligated to indemnify its officers and trustees against certain liabilities incurred by them by reason of having been an officer or trustee of the Trust. In addition, in the normal course of business, the Trust may enter into contracts that provide general indemnifications to other parties. Each Fund's maximum exposure under these arrangements is unknown as this would involve future claims that may be made against the Fund that have not yet occurred. Currently, the Funds' management expects the risk of material loss in connection to a potential claim to be remote.
Note 2 – Investment Adviser and Transactions With Affiliates Or Certain Other Parties
Pursuant to an investment advisory agreement with Calamos Advisors, each Fund pays a monthly investment advisory fee based on the average daily net assets of the Fund, as shown below:
AVERAGE DAILY NET ASSETS | | GROWTH FUND
ANNUAL RATE | | EVOLVING WORLD
GROWTH FUND
ANNUAL RATE | | TOTAL RETURN
BOND FUND
ANNUAL RATE | | SELECT FUND,
DIVIDEND GROWTH FUND,
INTERNATIONAL GROWTH FUND*,
GLOBAL EQUITY FUND*,
GLOBAL OPPORTUNITIES FUND
ANNUAL RATE | |
First $500 million | | | 1.00 | % | | | 1.10 | % | | | 0.45 | % | | | 1.00 | % | |
Next $500 million | | | 0.90 | % | | | 1.05 | % | | | 0.43 | % | | | 0.95 | % | |
Next $5 billion | | | 0.80 | % | | | 1.00 | % | | | 0.41 | % | | | 0.90 | % | |
Over $6 billion | | | 0.70 | % | | | 0.90 | % | | | 0.35 | % | | | 0.80 | % | |
* International Growth Fund and Global Equity Fund are subject to a possible adjustment based on performance as described below.
AVERAGE DAILY NET ASSETS | | GLOBAL
CONVERTIBLE
FUND
ANNUAL RATE | | TIMPANI
SMALL CAP
GROWTH
FUND
ANNUAL RATE | | TIMPANI
SMID
GROWTH
FUND
ANNUAL RATE | | SHORT-TERM
BOND FUND
ANNUAL RATE | | GROWTH AND
INCOME FUND,
CONVERTIBLE FUND,
MARKET NEUTRAL
INCOME FUND,
HEDGED EQUITY
FUND
ANNUAL RATE | | HIGH INCOME
OPPORTUNITIES
FUND
ANNUAL RATE | | PHINEUS
LONG/SHORT
FUND
ANNUAL RATE | |
First $500 million | | | 0.85 | % | | | 0.90 | % | | | 0.95 | % | | | 0.30 | % | | | 0.75 | % | | | 0.60 | % | | | 1.25 | % | |
Next $500 million | | | 0.80 | % | | | 0.80 | % | | | 0.85 | % | | | 0.27 | % | | | 0.70 | % | | | 0.55 | % | | | 1.20 | % | |
Over $1 billion | | | 0.75 | % | | | 0.75 | % | | | 0.80 | % | | | 0.25 | % | | | 0.65 | % | | | 0.50 | % | | | 1.15 | % | |
www.calamos.com
199
Notes to Financial Statements
AVERAGE DAILY NET ASSETS | | MERGER
ARBITRAGE FUND
ANNUAL RATE | | INTERNATIONAL
SMALL CAP
GROWTH FUND
ANNUAL RATE | |
First $500 million | | | 1.00 | % | | | 0.95 | % | |
Next $500 million | | | 0.95 | % | | | 0.90 | % | |
Over $1 billion | | | 0.90 | % | | | 0.85 | % | |
The average investment advisory fee rate as of the period ended October 31, 2023 was as follows:
FUND | | PERCENTAGE | |
Market Neutral Income Fund | | | 0.66 | % | |
Hedged Equity Fund | | | 0.74 | | |
Phineus Long/Short Fund | | | 1.23 | | |
Merger Arbitrage Fund | | | 1.00 | | |
Convertible Fund | | | 0.73 | | |
Global Convertible Fund | | | 0.85 | | |
Timpani Small Cap Growth Fund | | | 0.90 | | |
Timpani SMID Growth Fund | | | 0.95 | | |
Growth Fund | | | 0.92 | | |
Growth and Income Fund | | | 0.68 | | |
Dividend Growth Fund | | | 1.00 | | |
Select Fund | | | 1.00 | | |
International Growth Fund | | | 1.00 | | |
Evolving World Growth Fund | | | 1.10 | | |
Global Equity Fund | | | 1.00 | | |
Global Opportunities Fund | | | 1.00 | | |
International Small Cap Growth Fund | | | 0.95 | | |
Total Return Bond Fund | | | 0.45 | | |
High Income Opportunities Fund | | | 0.60 | | |
Short-Term Bond Fund | | | 0.30 | | |
Each of the International Growth and Global Equity Funds pays a fee based on average daily net assets of the Fund that is accrued daily and paid on a monthly basis, subject to possible adjustment based on the Fund's investment performance (since March 2006 for International Growth Fund and since February 2008 for Global Equity Fund). The performance adjustment increases or decreases the management fee, on a monthly basis, by 1/12 of 0.03% of a Fund's average daily net assets over the performance period for each full 1% increment amount by which a Fund outperforms or underperforms the benchmark index ("Index"), on an annualized basis, over the performance measurement period. The benchmark indexes are the MSCI EAFE Growth Index and the MSCI World Index for the International Growth Fund and Global Equity Fund, respectively.
The base fee is shown in the table above. The performance adjustment rate is calculated by comparing over the performance measurement period the Fund's Class A share performance to that of the respective Index. The performance measurement period commenced at the beginning of each Fund's first full month of operation (April 2005 and March 2007 for the International Growth Fund and Global Equity Fund, respectively). The first performance adjustment was applied to the advisory fee at the end of the twelfth month. Each month subsequent to the twelfth month, a new month is added to the performance measurement period until the performance measurement period includes 36 months. Thereafter, the performance measurement period consists of the most recent month plus the previous 35 months.
The performance comparison is made at the end of each month. The maximum annualized performance adjustment rate is +/- 0.30% of the Fund's average daily net assets over the performance measurement period. The performance adjustment rate is divided by twelve and multiplied by the Fund's average daily net assets over the performance measurement period, and the resulting dollar amount is then added to or subtracted from the base fee. Calamos Advisors may receive a positive
CALAMOS OPEN-END FAMILY OF FUNDS ANNUAL REPORT
200
Notes to Financial Statements
performance adjustment even if the Fund has a negative return over a performance measurement period if it otherwise outperforms the Index during that period.
Each Fund may invest in shares of the Timpani Small Cap Growth Fund ("SCG"), Timpani SMID Growth Fund ("SMID") or Short Term Bond Fund ("STBF"). Calamos Advisors has contractually agreed to waive a portion of its advisory fee charged to the Fund equal to the advisory fee paid by SCG, SMID or STBF, respectively, attributable to the Fund's investment in SCG, SMID or STBF, respectively, based on daily net assets. For the period ended October 31, 2023, the total advisory fees waived pursuant to such agreement were $985,807 for the Market Neutral Income Fund and are included in the Statements of Operations under the caption "Expense reductions".
As of October 31, 2023, the Market Neutral Income Fund had holdings of $326.2 million in STBF. During the year from November 1, 2022 through October 31, 2023, the Market Neutral Income Fund had no subscriptions or redemptions and earned $12.3 million in dividends.
The Funds reimburses Calamos Advisors for a portion of compensation paid to the Trust's Chief Compliance Officer. This compensation is reported as part of the "Trustees' fees and officer compensation" expense on the Statements of Operations.
Calamos Advisors has contractually agreed to limit the annual ordinary operating expenses of each Fund as a percentage of the average daily net assets through March 1, 2025 (except as noted) as follows:
FUND | | CLASS A
SHARES | | CLASS C
SHARES | | CLASS I
SHARES | | CLASS R6
SHARES | |
Calamos Market Neutral Income Fund | | | 1.75 | % | | | 2.50 | % | | | 1.50 | % | | | 1.50% less
the annual
sub-transfer
agency
ratio* | | |
Calamos Hedged Equity Fund | | | 1.25 | % | | | 2.00 | % | | | 1.00 | % | | | — | | |
Calamos Phineus Long/Short Fund | | | 2.00 | % | | | 2.75 | % | | | 1.75 | % | | | — | | |
Calamos Merger Arbitrage Fund(1) | | | 1.50 | % | | | 2.25 | % | | | 1.25 | % | | | — | | |
Calamos Convertible Fund | | | 1.75 | % | | | 2.50 | % | | | 1.50 | % | | | — | | |
Calamos Global Convertible Fund | | | 1.35 | % | | | 2.10 | % | | | 1.10 | % | | | — | | |
Calamos Timpani Small Cap Growth Fund | | | 1.30 | % | | | 2.05 | % | | | 1.05 | % | | | 1.05% less
the annual
sub-transfer
agency
ratio* | | |
Calamos Timpani SMID Growth Fund | | | 1.35 | % | | | — | | | | 1.10 | % | | | 1.10% less
the annual
sub-transfer
agency
ratio* | | |
Calamos Growth Fund | | | 1.75 | % | | | 2.50 | % | | | 1.50 | % | | | — | | |
Calamos Growth and Income Fund | | | 1.75 | % | | | 2.50 | % | | | 1.50 | % | | | 1.50% less
the annual
sub-transfer
agency
ratio* | | |
Calamos Dividend Growth Fund | | | 1.35 | % | | | 2.10 | % | | | 1.10 | % | | | — | | |
Calamos Select Fund | | | 1.15 | % | | | 1.90 | % | | | 0.90 | % | | | — | | |
www.calamos.com
201
Notes to Financial Statements
FUND | | CLASS A
SHARES | | CLASS C
SHARES | | CLASS I
SHARES | | CLASS R6
SHARES | |
Calamos International Growth Fund(2) | | | 1.20 | % | | | 1.95 | % | | | 0.95 | % | | 0.95% less
the annual
sub-transfer
agency
ratio* | |
Calamos Evolving World Growth Fund | | | 1.30 | % | | | 2.05 | % | | | 1.05 | % | | — | |
Calamos Global Equity Fund | | | 1.40 | % | | | 2.15 | % | | | 1.15 | % | | 1.15% less
the annual
sub-transfer
agency
ratio* | |
Calamos Global Opportunities Fund | | | 1.22 | % | | | 1.97 | % | | | 0.97 | % | | — | |
Calamos International Small Cap Growth Fund(3) | | | 1.35 | % | | | 2.10 | % | | | 1.10 | % | | 1.10% less
the annual
sub-transfer
agency
ratio* | |
Calamos Total Return Bond Fund | | | 0.90 | % | | | 1.65 | % | | | 0.65 | % | | — | |
Calamos High Income Opportunities Fund | | | 1.00 | % | | | 1.75 | % | | | 0.75 | % | | — | |
Calamos Short-Term Bond Fund | | | 0.65 | % | | | — | | | | 0.40 | % | | — | |
* The annual sub-transfer agency ratio is equal to the aggregate sub-transfer agency expenses common to the other share classes of the Fund divided by the aggregated average annual net assets of the Fund's other share classes.
(1) The Contractual limitation is through October 31, 2026 for the Calamos Merger Arbitrage Fund.
(2) For the Period November 1, 2022 through February 28, 2023, Class A Shares 1.10%, Class C Shares 1.85%, Class I Shares 0.85%, Class R6 Shares 0.85% less the annual sub-transfer agency ratio. For the Period March 1, 2023 through March 31, 2025, Class A Shares 1.20%, Class C Shares 1.95%, Class I Shares 0.95%, Class R6 Shares 0.95% less the annual sub-transfer agency ratio.
(3) The Contractual limitation is through March 31, 2025 for the Calamos International Small Cap Growth Fund.
For the year ended October 31, 2023, Calamos Advisors waived or absorbed the following expenses:
FUND | | AMOUNT | |
Market Neutral Income Fund | | $ | 985,807 | | |
Merger Arbitrage Fund | | | 25,019 | | |
Global Convertible Fund | | | 3,418 | | |
Timpani Small Cap Growth Fund | | | 205,982 | | |
Timpani SMID Growth Fund | | | 109,798 | | |
Dividend Growth Fund | | | 124,694 | | |
Select Fund | | | 202,897 | | |
International Growth Fund | | | 682,887 | | |
Evolving World Growth Fund | | | 1,467,736 | | |
Global Equity Fund | | | 87,632 | | |
Global Opportunities Fund | | | 597,703 | | |
International Small Cap Growth Fund | | | 180,947 | | |
Total Return Bond Fund | | | 113,216 | | |
High Income Opportunities Fund | | | 153,238 | | |
Short-Term Bond Fund | | | 1,314 | | |
These amounts are included in the Statements of Operations under the caption "Expense reductions".
CALAMOS OPEN-END FAMILY OF FUNDS ANNUAL REPORT
202
Notes to Financial Statements
As Distributor, Calamos Financial Services LLC ("CFS") assumed all expenses of personnel, office space, office facilities and equipment incidental to such service. Each Fund has adopted a Distribution Plan pursuant to Rule 12b-1 under the 1940 Act whereby the Fund pays to CFS a distribution and/or service fee at the annual rate of 0.25% of the average daily net assets of the Fund's Class A shares; a service fee at the annual rate of 0.25% and a distribution fee at the rate of 0.75% of the average daily net assets of the Fund's Class C shares. No such fees are paid on each Fund's Class I or Class R6 shares.
CFS also receives a sales commission and/or an underwriting fee on certain sales of each Fund's Class A shares. During the period ended October 31, 2023, CFS received commissions and underwriting fees as follows:
FUND | | AMOUNT | |
Market Neutral Income Fund | | $ | 16,859 | | |
Hedged Equity Fund | | | 4,124 | | |
Phineus Long/Short Fund | | | 28,486 | | |
Convertible Fund | | | 8,213 | | |
Global Convertible Fund | | | 13 | | |
Timpani Small Cap Growth Fund | | | 10,051 | | |
Growth Fund | | | 31,494 | | |
Growth and Income Fund | | | 98,168 | | |
Dividend Growth Fund | | | 1,274 | | |
Select Fund | | | 968 | | |
International Growth Fund | | | 1,082 | | |
Evolving World Growth Fund | | | 4,241 | | |
Global Equity Fund | | | 590 | | |
Global Opportunities Fund | | | 6,347 | | |
International Small Cap Growth Fund | | | 3 | | |
Total Return Bond Fund | | | 47 | | |
High Income Opportunities Fund | | | 754 | | |
Short-Term Bond Fund | | | 33 | | |
A trustee and certain officers of the Trust are also officers and directors of CFS and Calamos Advisors. Such trustee and officers serve without direct compensation from the Trust. The Trust's Statement of Additional Information contains additional information about the Trust's Trustees and Officers and is available without charge, upon request, at www.calamos.com or by calling 800.582.6959.
As of October 31, 2023, certain affiliates of Calamos Advisors hold material investments in the Funds as follows:
FUND | | PERCENTAGE | |
Merger Arbitrage Fund | | | 47 | % | |
Timpani SMID Growth Fund | | | 66 | | |
Select Fund | | | 35 | | |
Global Equity Fund | | | 27 | | |
International Small Cap Growth Fund | | | 65 | | |
High Income Opportunities Fund | | | 34 | | |
As of October 31, 2023, the Market Neutral Income Fund held 91.3% of the outstanding shares of Short Term Bond Fund.
The Trust has adopted a deferred compensation plan (the "Plan"). Under the Plan, a trustee who is not an "interested person" (as defined in the 1940 Act) and has elected to participate in the Plan (a "participating trustee") may defer receipt of all or a portion of his compensation from the Trust. The deferred compensation payable to the participating trustee is credited to the trustee's deferral account as of the business day such compensation would have been paid to the participating trustee. The value of amounts deferred for a participating trustee is determined by reference to the change in value of Class I shares of one or more funds of the Trust designated by the participant. The value of the account increases with contributions to the account or with increases in the value of the measuring shares, and the value of the account decreases with withdrawals from the account or with declines in the value of the measuring shares.
www.calamos.com
203
Notes to Financial Statements
At October 31, 2023, the Funds had deferred compensation balances, which are included in "Other assets" on the Statements of Assets and Liabilities, as follows:
FUND | | AMOUNT | |
Market Neutral Income Fund | | $ | 140,563 | | |
Convertible Fund | | | 142,512 | | |
Growth Fund | | | 690,766 | | |
Growth and Income Fund | | | 298,273 | | |
Select Fund | | | 74,055 | | |
International Growth Fund | | | 46,612 | | |
Evolving World Growth Fund | | | 13,735 | | |
Global Equity Fund | | | 23,909 | | |
Global Opportunities Fund | | | 112,175 | | |
Total Return Bond Fund | | | 26,903 | | |
High Income Opportunities Fund | | | 81,608 | | |
Each Fund's obligation to make payments under the Plan is a general obligation of the Fund and is included in "Payable for deferred compensation to trustees" on the Statements of Assets and Liabilities at October 31, 2023.
Interfund Lending Program and Joint Credit Agreement
The SEC has granted an exemptive order to the Funds permitting the Funds to participate in an interfund lending facility whereby participating Funds may directly lend to and borrow money from each other (an "Interfund Loan") for temporary purposes (e.g., to satisfy redemption requests or when a sale of securities "fails," resulting in an unanticipated cash shortfall) (the "InterFund Program"). The InterFund Program is subject to a number of conditions, which are discussed in detail in the Funds' statement of additional information. Any loan made through the InterFund Program is expected to be more beneficial to a borrowing Fund (i.e., at a lower interest rate) than borrowing from a bank and more beneficial to a lending Fund (i.e., at a higher rate of return) than an alternative short-term investment. The duration of an InterFund Loan will be limited to the time required to receive payment for securities sold, but in no event more than seven days. In addition, each InterFund Loan may be called on one business day's notice by a lending Fund and may be repaid on any day by a borrowing Fund. No Interfund Loans were made during the period.
On April 30, 2021, the Trust, on behalf of the Funds, entered into a $50,000,000 Demand Discretionary Credit Agreement with State Street Bank and Trust Company (the "Credit Agreement"). Effective May 10, 2022, International Small Cap Fund was added to the Credit Agreement. On November 30, 2022, the Credit Agreement was increased to $100,000,000. Each Fund may borrow under the Credit Agreement to meet shareholder redemptions and for other lawful temporary purposes. Borrowing results in interest expense and other fees and expenses, which may increase a Fund's net expenses and reduce a Fund's return. In addition, borrowing by a Fund may create leverage by increasing a Fund's investment exposure. This will result in changes in a Fund's net asset value, either positive or negative, being greater than it would have been if the Fund had not borrowed. Administration, legal, and arrangement fees, if applicable, under the Credit Agreement are allocated among Funds based upon factors deemed relevant by the Adviser and the Board of each Fund, while fees on any amounts drawn by a Fund under the Credit Agreement are borne by that Fund. At October 31, 2023, there were no borrowings under the Credit Agreement. Please see the supplement to the Prospectus and Statement of Additional Information for more information about the Credit Agreement.
Note 3 – Investments
The cost of purchases and proceeds from sales of long-term investments, excluding investments sold short, for the year ended October 31, 2023 are shown in the table below. Furthermore, the cost of purchases to cover short sales and the proceeds of short sales were $2,154,765,576 and $1,940,039,260 for Market Neutral income Fund, and $1,975,993,798 and $2,256,043,885 for Phineus Long/Short Fund, respectively.
| | | COST OF PURCHASES | | PROCEEDS FROM SALES | |
FUND | | U.S. GOV'T
SECURITIES | | OTHER | | U.S. GOV'T
SECURITIES | | OTHER | |
Market Neutral Income Fund | | $ | — | | | $ | 3,451,837,024 | | | $ | — | | | $ | 6,828,926,520 | | |
Hedged Equity Fund | | | — | | | | 107,713,559 | | | | — | | | | 186,815,490 | | |
CALAMOS OPEN-END FAMILY OF FUNDS ANNUAL REPORT
204
Notes to Financial Statements
| | | COST OF PURCHASES | | PROCEEDS FROM SALES | |
FUND | | U.S. GOV'T
SECURITIES | | OTHER | | U.S. GOV'T
SECURITIES | | OTHER | |
Phineus Long/Short Fund | | $ | — | | | $ | 1,300,919,994 | | | $ | — | | | $ | 1,246,070,174 | | |
Merger Arbitrage Fund | | | — | | | | 2,133,348 | | | | — | | | | 166,918 | | |
Convertible Fund | | | — | | | | 360,045,677 | | | | — | | | | 531,919,077 | | |
Global Convertible Fund | | | — | | | | 33,616,130 | | | | — | | | | 51,488,105 | | |
Timpani Small Cap Growth Fund | | | — | | | | 647,464,960 | | | | — | | | | 708,216,384 | | |
Timpani SMID Growth Fund | | | — | | | | 41,002,280 | | | | — | | | | 40,281,865 | | |
Growth Fund | | | — | | | | 674,644,690 | | | | — | | | | 811,777,357 | | |
Growth and Income Fund | | | — | | | | 427,912,268 | | | | — | | | | 602,580,385 | | |
Dividend Growth Fund | | | — | | | | 4,627,796 | | | | — | | | | 7,878,764 | | |
Select Fund | | | — | | | | 23,115,825 | | | | — | | | | 25,143,297 | | |
International Growth Fund | | | — | | | | 270,738,673 | | | | — | | | | 270,008,978 | | |
Evolving World Growth Fund | | | — | | | | 566,924,236 | | | | — | | | | 574,673,933 | | |
Global Equity Fund | | | — | | | | 74,326,586 | | | | — | | | | 70,610,596 | | |
Global Opportunities Fund | | | 8,413,638 | | | | 160,762,893 | | | | 7,013,318 | | | | 192,600,787 | | |
International Small Cap Growth Fund | | | — | | | | 3,530,087 | | | | — | | | | 2,826,414 | | |
Total Return Bond Fund | | | 11,008,069 | | | | 2,610,691 | | | | 8,119,363 | | | | 6,894,399 | | |
High Income Opportunities Fund | | | — | | | | 8,482,789 | | | | — | | | | 11,170,048 | | |
Short-Term Bond Fund | | | 25,190,176 | | | | 123,278,242 | | | | 20,299,449 | | | | 131,867,490 | | |
The following information is presented on a federal income tax basis as of October 31, 2023. Differences between the cost basis under U.S. generally accepted accounting principles and federal income tax purposes are primarily due to temporary differences.
The cost basis of investments for federal income tax purposes at October 31, 2023 was as follows:
| FUND | | COST BASIS OF
INVESTMENTS | | GROSS UNREALIZED
APPRECIATION | | GROSS UNREALIZED
DEPRECIATION | �� | NET UNREALIZED
APPRECIATION
(DEPRECIATION) | |
Market Neutral Income Fund | | $ | 10,499,413,634 | | | $ | 2,044,149,684 | | | $ | (1,428,718,077 | ) | | $ | 615,431,607 | | |
Hedged Equity Fund | | | 462,812,181 | | | | 124,418,197 | | | | (24,521,282 | ) | | | 99,896,915 | | |
Phineus Long/Short Fund | | | 189,033,021 | | | | 78,373,086 | | | | (60,508,327 | ) | | | 17,864,759 | | |
Merger Arbitrage Fund | | | 1,675,714 | | | | 15,893 | | | | (72,147 | ) | | | (56,254 | ) | |
Convertible Fund | | | 897,330,624 | | | | 52,129,046 | | | | (104,527,440 | ) | | | (52,398,394 | ) | |
Global Convertible Fund | | | 143,514,863 | | | | 8,005,172 | | | | (26,399,068 | ) | | | (18,393,896 | ) | |
Timpani Small Cap Growth Fund | | | 214,049,423 | | | | 31,671,678 | | | | (8,894,758 | ) | | | 22,776,920 | | |
Timpani SMID Growth Fund | | | 14,556,200 | | | | 2,161,833 | | | | (588,568 | ) | | | 1,573,265 | | |
Growth Fund | | | 757,587,951 | | | | 412,971,860 | | | | (10,518,707 | ) | | | 402,453,153 | | |
Growth and Income Fund | | | 1,356,740,324 | | | | 871,453,677 | | | | (66,617,956 | ) | | | 804,835,721 | | |
Dividend Growth Fund | | | 9,396,016 | | | | 5,981,695 | | | | (270,648 | ) | | | 5,711,047 | | |
Select Fund | | | 30,804,140 | | | | 11,760,160 | | | | (641,006 | ) | | | 11,119,154 | | |
International Growth Fund | | | 172,932,224 | | | | 25,947,071 | | | | (8,126,173 | ) | | | 17,820,898 | | |
Evolving World Growth Fund | | | 365,585,358 | | | | 38,803,238 | | | | (29,974,878 | ) | | | 8,828,360 | | |
Global Equity Fund | | | 63,785,253 | | | | 24,512,575 | | | | (1,192,885 | ) | | | 23,319,690 | | |
Global Opportunities Fund | | | 158,276,354 | | | | 41,595,686 | | | | (5,960,605 | ) | | | 35,635,081 | | |
International Small Cap Growth Fund | | | 2,180,173 | | | | 237,602 | | | | (134,630 | ) | | | 102,972 | | |
Total Return Bond Fund | | | 36,827,751 | | | | 20,907 | | | | (5,465,109 | ) | | | (5,444,202 | ) | |
High Income Opportunities Fund | | | 41,855,555 | | | | 154,618 | | | | (5,150,577 | ) | | | (4,995,959 | ) | |
Short-Term Bond Fund | | | 375,980,766 | | | | 173,351 | | | | (17,527,685 | ) | | | (17,354,334 | ) | |
www.calamos.com
205
Notes to Financial Statements
Note 4 – Income Taxes
For the fiscal year ended October 31, 2023, the Fund recorded the following permanent reclassifications to reflect tax character. The results of operations and net assets were not affected by these reclassifications.
| FUND | | PAID-IN
CAPITAL | | UNDISTRIBUTED/
(OVERDISTRIBUTED)
NET INVESTMENT
INCOME | | ACCUMULATED
NET REALIZED
GAIN/(LOSS) ON
INVESTMENTS | |
Market Neutral Income Fund | | $ | 27,648,744 | | | $ | 234,059,093 | | | $ | (261,707,837 | ) | |
Hedged Equity Fund | | | 0 | | | | (441,044 | ) | | | 441,044 | | |
Phineus Long/Short Fund | | | 3,403,572 | | | | (2,745,778 | ) | | | (657,794 | ) | |
Merger Arbitrage Fund | | | 0 | | | | 0 | | | | 0 | | |
Convertible Fund | | | 2,344,170 | | | | 13,401,647 | | | | (15,745,817 | ) | |
Global Convertible Fund | | | (221,174 | ) | | | 229,230 | | | | (8,056 | ) | |
Timpani Small Cap Growth Fund | | | (1,634,023 | ) | | | 1,634,951 | | | | (928 | ) | |
Timpani SMID Growth Fund | | | (98,188 | ) | | | 97,276 | | | | 912 | | |
Growth Fund | | | 218,974 | | | | 4,372,647 | | | | (4,591,621 | ) | |
Growth and Income Fund | | | 4,805,152 | | | | 9,995,655 | | | | (14,800,807 | ) | |
Dividend Growth Fund | | | 264,622 | | | | 0 | | | | (264,622 | ) | |
Select Fund | | | 153,683 | | | | (153,512 | ) | | | (171 | ) | |
International Growth Fund | | | 0 | | | | (451,675 | ) | | | 451,675 | | |
Evolving World Growth Fund | | | (85,991 | ) | | | 493,893 | | | | (407,902 | ) | |
Global Equity Fund | | | 66,947 | | | | (96,408 | ) | | | 29,461 | | |
Global Opportunities Fund | | | (57,901 | ) | | | 1,394,419 | | | | (1,336,518 | ) | |
International Small Cap Growth Fund | | | (6,803 | ) | | | 4,724 | | | | 2,079 | | |
Total Return Bond Fund | | | 0 | | | | 53,275 | | | | (53,275 | ) | |
High Income Opportunities Fund | | | (47 | ) | | | 19,252 | | | | (19,205 | ) | |
Short-Term Bond Fund | | | 0 | | | | 1,380,711 | | | | (1,380,711 | ) | |
Distributions were characterized for federal income tax purposes as follows:
| | | YEAR ENDED
OCTOBER 31, 2023 | | YEAR ENDED
OCTOBER 31, 2022 | |
FUND | | ORDINARY
INCOME | | LONG-TERM
CAPITAL GAIN | | RETURN OF
CAPITAL | | ORDINARY
INCOME | | LONG-TERM
CAPITAL GAIN | | RETURN OF
CAPITAL | |
Market Neutral Income Fund | | $ | 240,908,473 | | | $ | — | | | $ | — | | | $ | 67,150,312 | | | $ | — | | | $ | — | | |
Hedged Equity Fund | | | 4,839,690 | | | | — | | | | — | | | | 2,444,646 | | | | — | | | | — | | |
Phineus Long/Short Fund | | | 229,407 | | | | — | | | | — | | | | — | | | | — | | | | — | | |
Merger Arbitrage Fund | | | — | | | | — | | | | — | | | | — | | | | — | | | | — | | |
Convertible Fund | | | 10,861,157 | | | | — | | | | — | | | | 54,892,564 | | | | 157,564,258 | | | | — | | |
Global Convertible Fund | | | 500,183 | | | | — | | | | — | | | | 17,366,007 | | | | 15,769,528 | | | | 391 | | |
Timpani Small Cap Growth Fund | | | — | | | | — | | | | — | | | | — | | | | — | | | | — | | |
Timpani SMID Growth Fund | | | — | | | | — | | | | — | | | | 334,328 | | | | 2,149,114 | | | | 14 | | |
Growth Fund | | | — | | | | — | | | | — | | | | 56,615,558 | | | | 131,149,309 | | | | 408 | | |
Growth and Income Fund | | | 27,666,243 | | | | 61,852,810 | | | | — | | | | 55,045,973 | | | | 104,835,173 | | | | — | | |
Dividend Growth Fund | | | 67,231 | | | | — | | | | — | | | | 58,287 | | | | 1,401,097 | | | | — | | |
Select Fund | | | — | | | | 1,053,203 | | | | — | | | | 1,439,973 | | | | 2,430,611 | | | | — | | |
International Growth Fund | | | — | | | | — | | | | — | | | | 13,108,287 | | | | 29,479,859 | | | | — | | |
Evolving World Growth Fund | | | 3,554,163 | | | | — | | | | — | | | | 3,175,671 | | | | — | | | | — | | |
Global Equity Fund | | | 89,812 | | | | 3,033,133 | | | | — | | | | 1,770,057 | | | | 11,645,249 | | | | — | | |
CALAMOS OPEN-END FAMILY OF FUNDS ANNUAL REPORT
206
Notes to Financial Statements
| | | YEAR ENDED
OCTOBER 31, 2023 | | YEAR ENDED
OCTOBER 31, 2022 | |
FUND | | ORDINARY
INCOME | | LONG-TERM
CAPITAL GAIN | | RETURN OF
CAPITAL | | ORDINARY
INCOME | | LONG-TERM
CAPITAL GAIN | | RETURN OF
CAPITAL | |
Global Opportunities Fund | | $ | 900,161 | | | $ | — | | | $ | — | | | $ | 5,452,181 | | | $ | 9,656,929 | | | $ | 178 | | |
International Small Cap Growth Fund | | | 14,950 | | | | — | | | | — | | | | — | | | | — | | | | — | | |
Total Return Bond Fund | | | 1,260,157 | | | | — | | | | — | | | | 1,140,747 | | | | 721,123 | | | | — | | |
High Income Opportunities Fund | | | 2,185,575 | | | | — | | | | — | | | | 1,970,290 | | | | — | | | | — | | |
Short-Term Bond Fund | | | 13,926,429 | | | | — | | | | — | | | | 6,304,329 | | | | — | | | | — | | |
As of October 31, 2023, the components of accumulated earnings/(loss) on a tax basis were as follows:
| | MARKET NEUTRAL
INCOME FUND | | HEDGED EQUITY
FUND | | PHINEUS
LONG/SHORT
FUND | | MERGER
ARBITRAGE
FUND | | CONVERTIBLE
FUND | |
Undistributed ordinary income | | $ | 349,112,893 | | | $ | 1,112,069 | | | $ | 15,023,292 | | | $ | 4,430 | | | $ | 3,640,053 | | |
Undistributed capital gains | | | 264,903,893 | | | | — | | | | — | | | | — | | | | 10,737,524 | | |
Total undistributed earnings | | | 614,016,786 | | | | 1,112,069 | | | | 15,023,292 | | | | 4,430 | | | | 14,377,577 | | |
Accumulated capital and other losses | | | — | | | | (39,502,002 | ) | | | — | | | | — | | | | — | | |
Net unrealized gains/(losses) | | | 615,213,414 | | | | 99,896,915 | | | | 17,862,092 | | | | (56,254 | ) | | | (52,327,642 | ) | |
Total accumulated earnings/(losses) | | | 1,229,230,200 | | | | 61,506,982 | | | | 32,885,384 | | | | (51,824 | ) | | | (37,950,065 | ) | |
Other | | | (178,883,887 | ) | | | (185,776 | ) | | | (24,466,405 | ) | | | — | | | | (460,372 | ) | |
Paid-in-capital | | | 12,884,140,409 | | | | 499,559,367 | | | | 927,477,300 | | | | 2,110,468 | | | | 873,605,733 | | |
Net assets applicable to common shareholders | | $ | 13,934,486,722 | | | $ | 560,880,573 | | | $ | 935,896,279 | | | $ | 2,058,644 | | | $ | 835,195,296 | | |
| | GLOBAL
CONVERTIBLE
FUND | | TIMPANI SMALL
CAP GROWTH
FUND | | TIMPANI SMID
GROWTH FUND | | GROWTH FUND | | GROWTH AND
INCOME FUND | |
Undistributed ordinary income | | $ | — | | | $ | — | | | $ | — | | | $ | — | | | $ | 3,293,976 | | |
Undistributed capital gains | | | — | | | | — | | | | — | | | | 54,359,263 | | | | 88,007,206 | | |
Total undistributed earnings | | | — | | | | — | | | | — | | | | 54,359,263 | | | | 91,301,182 | | |
Accumulated capital and other losses | | | (9,825,642 | ) | | | (141,521,765 | ) | | | (3,584,131 | ) | | | — | | | | — | | |
Net unrealized gains/(losses) | | | (18,399,765 | ) | | | 22,776,920 | | | | 1,573,265 | | | | 402,450,107 | | | | 804,835,594 | | |
Total accumulated earnings/(losses) | | | (28,225,407 | ) | | | (118,744,845 | ) | | | (2,010,866 | ) | | | 456,809,370 | | | | 896,136,776 | | |
Other | | | — | | | | — | | | | — | | | | (15,537,936 | ) | | | (9,067,488 | ) | |
Paid-in-capital | | | 148,613,837 | | | | 357,005,570 | | | | 18,166,555 | | | | 756,410,819 | | | | 1,382,041,415 | | |
Net assets applicable to common shareholders | | $ | 120,388,430 | | | $ | 238,260,725 | | | $ | 16,155,689 | | | $ | 1,197,682,253 | | | $ | 2,269,110,703 | | |
| | DIVIDEND
GROWTH FUND | | SELECT FUND | | INTERNATIONAL
GROWTH FUND | | EVOLVING WORLD
GROWTH FUND | | GLOBAL EQUITY
FUND | |
Undistributed ordinary income | | $ | 19,617 | | | $ | 7,503 | | | $ | 513,134 | | | $ | 1,902,247 | | | $ | 71,181 | | |
Undistributed capital gains | | | 676,191 | | | | 1,903,912 | | | | — | | | | — | | | | — | | |
Total undistributed earnings | | | 695,808 | | | | 1,911,415 | | | | 513,134 | | | | 1,902,247 | | | | 71,181 | | |
Accumulated capital and other losses | | | — | | | | — | | | | (19,729,439 | ) | | | (115,456,741 | ) | | | (87,223 | ) | |
Net unrealized gains/(losses) | | | 5,711,047 | | | | 11,119,154 | | | | 17,537,433 | | | | 6,869,607 | | | | 23,270,998 | | |
Total accumulated earnings/(losses) | | | 6,406,855 | | | | 13,030,569 | | | | (1,678,872 | ) | | | (106,684,887 | ) | | | 23,254,956 | | |
Other | | | (566 | ) | | | (114,056 | ) | | | (71,814 | ) | | | (177,728 | ) | | | (591,826 | ) | |
Paid-in-capital | | | 8,825,394 | | | | 30,399,621 | | | | 191,331,999 | | | | 468,244,799 | | | | 64,684,123 | | |
Net assets applicable to common shareholders | | $ | 15,231,683 | | | $ | 43,316,134 | | | $ | 189,581,313 | | | $ | 361,382,184 | | | $ | 87,347,253 | | |
www.calamos.com
207
Notes to Financial Statements
| | GLOBAL
OPPORTUNITIES
FUND | | INTERNATIONAL
SMALL CAP
GROWTH FUND | | TOTAL RETURN
BOND FUND | | HIGH INCOME
OPPORTUNITIES
FUND | | SHORT-TERM
BOND FUND | |
Undistributed ordinary income | | $ | 621,259 | | | $ | — | | | $ | 59,635 | | | $ | 60,882 | | | $ | 1,756,198 | | |
Undistributed capital gains | | | — | | | | — | | | | — | | | | — | | | | — | | |
Total undistributed earnings | | | 621,259 | | | | — | | | | 59,635 | | | | 60,882 | | | | 1,756,198 | | |
Accumulated capital and other losses | | | (14,549,671 | ) | | | (639,912 | ) | | | (1,555,259 | ) | | | (11,844,971 | ) | | | (9,896,025 | ) | |
Net unrealized gains/(losses) | | | 35,601,311 | | | | 102,891 | | | | (5,444,202 | ) | | | (4,995,959 | ) | | | (17,354,334 | ) | |
Total accumulated earnings/(losses) | | | 21,672,899 | | | | (537,021 | ) | | | (6,939,826 | ) | | | (16,780,048 | ) | | | (25,494,161 | ) | |
Other | | | (968,757 | ) | | | — | | | | (107,943 | ) | | | (115,822 | ) | | | — | | |
Paid-in-capital | | | 175,631,410 | | | | 2,899,043 | | | | 38,371,320 | | | | 50,372,888 | | | | 383,126,602 | | |
Net assets applicable to common shareholders | | $ | 196,335,552 | | | $ | 2,362,022 | | | $ | 31,323,551 | | | $ | 33,477,018 | | | $ | 357,632,441 | | |
The following Funds had capital loss carryforwards for the year ended October 31, 2023, with no expiration date, available to offset future realized capital gains:
FUND | | SHORT-TERM | | LONG-TERM | |
Hedged Equity Fund | | $ | 10,122,784 | | | $ | 29,379,218 | | |
Global Convertible Fund | | | 3,387,652 | | | | 4,547,197 | | |
Timpani Small Cap Growth Fund | | | 141,521,765 | | | | — | | |
Timpani SMID Growth Fund | | | 3,584,131 | | | | — | | |
International Growth Fund | | | 19,729,439 | | | | — | | |
Evolving World Growth Fund | | | 115,456,741 | | | | — | | |
Global Equity Fund | | | 87,223 | | | | — | | |
Global Opportunities Fund | | | 14,549,671 | | | | — | | |
International Small Cap Growth Fund | | | 595,152 | | | | 42,723 | | |
Total Return Bond Fund | | | 565,607 | | | | 989,652 | | |
High Income Opportunities Fund | | | 1,278,659 | | | | 10,566,312 | | |
Short-Term Bond Fund | | | 3,908,289 | | | | 5,987,736 | | |
The capital loss carryforwards utilized in the year ended October 31, 2023 in Market Neutral Income Fund, Hedged Equity Fund, Phineus Long/Short Fund and Growth Fund are $129,720,451, $25,244,090, $12,960,751, and $744,551, respectively.
Note 5 – Short Sales
Securities sold short represent obligations to deliver the securities at a future date. A Fund may sell a security it does not own in anticipation of a decline in the value of that security before the delivery date. When the Fund sells a security short, it must borrow the security sold short and deliver it to the broker-dealer through which it made the short sale. Dividends paid on securities sold short are disclosed as an expense on the Statements of Operations. A gain, limited to the price at which a Fund sold the security short, or a loss, unlimited in size, will be realized upon the termination of a short sale.
To secure its obligation to deliver to the broker-dealer the securities sold short, a Fund must segregate an amount of cash or liquid securities with its custodian equal to any excess of the current market value of the securities sold short over any cash or liquid securities deposited as collateral with the broker in connection with the short sale (not including the proceeds of the short sale). As a result of that requirement, a Fund will not gain any leverage merely by selling short, except to the extent that it earns interest or other income or gains on the segregated cash or liquid securities while also being subject to the possibility of gain or loss from the securities sold short. Other income includes income from interest on short sales of $110,283,095 and $17,711,081 on the Market Neutral Income Fund and Phineus Long/Short Fund, respectively, during the year ended October 31, 2023.
Note 6 – Derivative Instruments
Foreign Currency Risk. Each Fund may engage in portfolio hedging with respect to changes in currency exchange rates by entering into forward foreign currency contracts to purchase or sell currencies. A forward foreign currency contract is a commitment to purchase or sell a foreign currency at a future date at a negotiated forward rate. Risks associated with such
CALAMOS OPEN-END FAMILY OF FUNDS ANNUAL REPORT
208
Notes to Financial Statements
contracts include, among other things, movement in the value of the foreign currency relative to the U.S. dollar and the ability of the counterparty to perform.
To mitigate the counterparty risk, the Fund may enter into an International Swaps and Derivatives Association, Inc. Master Agreement ("ISDA Master Agreement") or similar agreement with its derivative contract counterparties. An ISDA Master Agreement is a bilateral agreement between a Fund and a counterparty that governs over-the-counter derivatives and foreign exchange contracts and typically contains, among other things, collateral posting terms and netting provisions in the event of a default and/or termination event. Under an ISDA Master Agreement, a Fund may, under certain circumstances, offset with the counterparty certain derivative financial instrument's payables and/or receivables with collateral held and/or posted and create one single net payment. The provisions of the ISDA Master Agreement typically permit a single net payment in the event of default (close-out netting) including the bankruptcy or insolvency of the counterparty. Generally, collateral is exchanged between a Fund and the counterparty and the amount of collateral due from a Fund or to a counterparty has to exceed a minimum transfer amount threshold before a transfer has to be made. To the extent amounts due to the Fund from its counterparties are not fully collateralized, contractually or otherwise, the Fund bears the risk of loss from counterparty nonperformance. When a Fund is required to post collateral under the terms of a derivatives transaction and master netting agreement, a Fund's custodian holds the collateral in a segregated account, subject to the terms of a tri-party agreement among a Fund, the custodian and the counterparty. The master netting agreement and tri-party agreement provide, in relevant part, that the counterparty may have rights to the amounts in the segregated account in the event that a Fund defaults in its obligation with respect to the derivative instrument that is subject to the collateral requirement. When a counterparty is required to post collateral under the terms of a derivatives transaction and master netting agreement, the counterparty delivers such amount to a Fund's custodian. The master netting agreement provides, in relevant part, that the Fund may have rights to such collateral in the event that the counterparty defaults in its obligation with respect to the derivative instrument that is subject to the collateral requirement. Generally before a default, neither a Fund nor the counterparty may resell, rehypothecate, or repledge any collateral that it receives.
For financial reporting purposes, the Funds do not offset derivative assets and derivative liabilities that are subject to netting arrangements in the Statements of Assets and Liabilities. A Fund's net counterparty exposure is reflected in the counterparty table below. The net unrealized gain, if any, represents the credit risk to the respective Fund on a forward foreign currency contract. The contracts are valued daily at forward foreign exchange rates. The Funds realize a gain or loss when a position is closed or upon settlement of the contracts.
As of October 31, 2023, the Funds had outstanding forward foreign currency contracts listed on the Schedules of Investments.
Equity Risk. Each Fund may engage in option transactions and in doing so achieves similar objectives to what it would achieve through the sale or purchase of individual securities. A call option, upon payment of a premium, gives the purchaser of the option the right to buy, and the seller of the option the obligation to sell, the underlying security, index or other instrument at the exercise price. A put option gives the purchaser of the option, upon payment of a premium, the right to sell, and the seller the obligation to buy, the underlying security, index, or other instrument at the exercise price.
To seek to offset some of the risk of a potential decline in value of certain long positions, each Fund may also purchase put options on individual securities, broad-based securities indexes or certain exchange-traded funds ("ETFs"). Each Fund may also seek to generate income from option premiums by writing (selling) options on a portion of the equity securities (including securities that are convertible into equity securities) in a Fund's portfolio, on broad-based securities indexes, or certain ETFs.
When a Fund purchases an option, it pays a premium and an amount equal to that premium is recorded as an asset. When a Fund writes an option, it receives a premium and an amount equal to that premium is recorded as a liability. The asset or liability is adjusted daily to reflect the current market value of the option. If an option expires unexercised, a Fund realizes a gain or loss to the extent of the premium received or paid. If an option is exercised, the premium received or paid is recorded as an adjustment to the proceeds from the sale or the cost basis of the purchase. The difference between the premium and the amount received or paid on a closing purchase or sale transaction is also treated as a realized gain or loss. The cost of securities acquired through the exercise of call options is increased by premiums paid. The proceeds from securities sold through the exercise of put options are decreased by the premiums paid. Gain or loss on written options and purchased options is presented separately on the Statements of Operations as net realized gain or loss on written options and net realized gain or loss on purchased options, respectively.
www.calamos.com
209
Notes to Financial Statements
Options written by each Fund do not typically give rise to counterparty credit risk since options written obligate each Fund and not the counterparty to perform. Exchange traded purchased options have minimal counterparty credit risk to each Fund since the exchange's clearinghouse, as counterparty to such instruments, guarantees against a possible default. As of October 31, 2023, the Funds had outstanding purchased options and/or written options as listed on the Schedule of Investments.
As of October 31, 2023, the Funds had outstanding derivative contracts which are reflected on the Statements of Assets and Liabilities as follows:
| | | ASSET
DERIVATIVES | | LIABILITY
DERIVATIVES | |
| | | MARKET NEUTRAL INCOME FUND | |
Gross amounts at fair value: | |
Forward foreign currency contracts(1) | | $ | 334,662 | | | $ | 405,382 | | |
Purchased Options(2) | | | 177,662,240 | | | | — | | |
Total Return Swaps(5) | | | 291,468 | | | | 62,608 | | |
Written Options(3) | | | — | | | | 100,716,170 | | |
| | | $ | 178,288,370 | | | $ | 101,184,160 | | |
| | | HEDGED EQUITY FUND | |
Gross amounts at fair value: | |
Purchased Options(2) | | $ | 25,351,150 | | | $ | — | | |
Written Options(3) | | | — | | | | 15,076,475 | | |
| | | $ | 25,351,150 | | | $ | 15,076,475 | | |
| | | PHINEUS LONG/SHORT FUND | |
Gross amounts at fair value: | |
Purchased Options(2) | | $ | 10,118,055 | | | $ | — | | |
Written Options(3) | | | — | | | | 11,101,535 | | |
| | | $ | 10,118,055 | | | $ | 11,101,535 | | |
| | | CONVERTIBLE FUND | |
Gross amounts at fair value: | |
Forward foreign currency contracts(1) | | $ | 87,142 | | | $ | 16,390 | | |
Purchased Options(2) | | | 1,285,050 | | | | — | | |
| | | $ | 1,372,192 | | | $ | 16,390 | | |
| | | GLOBAL CONVERTIBLE FUND | |
Gross amounts at fair value: | |
Purchased Options(2) | | $ | 1,193,090 | | | $ | — | | |
Written Options(3) | | | — | | | | 58,220 | | |
| | | $ | 1,193,090 | | | $ | 58,220 | | |
| | | GROWTH FUND | |
Gross amounts at fair value: | |
Purchased Options(2) | | $ | 102,420 | | | $ | — | | |
Written Options(3) | | | — | | | | 72,720 | | |
| | | $ | 102,420 | | | $ | 72,720 | | |
CALAMOS OPEN-END FAMILY OF FUNDS ANNUAL REPORT
210
Notes to Financial Statements
| | | ASSET
DERIVATIVES | | LIABILITY
DERIVATIVES | |
| | | GROWTH AND INCOME FUND | |
Gross amounts at fair value: | |
Purchased Options(2) | | $ | 1,932,700 | | | $ | — | | |
| | | $ | 1,932,700 | | | $ | — | | |
| | | INTERNATIONAL GROWTH FUND | |
Gross amounts at fair value: | |
Forward foreign currency contracts(1) | | $ | — | | | $ | 40,898 | | |
Purchased Options(2) | | | 422,315 | | | | — | | |
| | | $ | 422,315 | | | $ | 40,898 | | |
| | | EVOLVING WORLD GROWTH FUND | |
Gross amounts at fair value: | |
Forward foreign currency contracts(1) | | $ | 287,570 | | | $ | 78,878 | | |
Purchased Options(2) | | | 5,018,654 | | | | — | | |
| | | $ | 5,306,224 | | | $ | 78,878 | | |
| | | GLOBAL EQUITY FUND | |
Gross amounts at fair value: | |
Purchased Options(2) | | $ | 139,100 | | | $ | — | | |
| | | $ | 139,100 | | | $ | — | | |
| | | GLOBAL OPPORTUNITIES FUND | |
Gross amounts at fair value: | |
Purchased Options(2) | | $ | 1,001,070 | | | $ | — | | |
| | | $ | 1,001,070 | | | $ | — | | |
| | | INTERNATIONAL SMALL CAP
GROWTH FUND | |
Gross amounts at fair value: | |
Purchased Options(2) | | $ | 6,975 | | | $ | — | | |
| | | $ | 6,975 | | | $ | — | | |
| | | TOTAL RETURN BOND FUND | |
Gross amounts at fair value: | |
Futures contracts(5) | | $ | — | | | $ | 36,689 | | |
| | | $ | — | | | $ | 36,689 | | |
| | | SHORT-TERM BOND FUND | |
Gross amounts at fair value: | |
Futures contracts(5) | | $ | — | | | $ | 547,615 | | |
| | | $ | — | | | $ | 547,615 | | |
www.calamos.com
211
Notes to Financial Statements
| | | GROSS AMOUNTS NOT OFFSET
IN THE STATEMENT OF ASSETS AND LIABILITIES | |
MARKET NEUTRAL INCOME FUND | | GROSS AMOUNTS PRESENTED IN THE
STATEMENT OF ASSETS AND LIABILITIES | | COLLATERAL | | NET AMOUNT
RECEIVABLE IN
THE EVENT | | NET AMOUNT
PAYABLE IN
THE EVENT | |
Counterparty | | | | ASSETS | | LIABILITIES | | PLEDGED | | OF DEFAULT | | OF DEFAULT | |
Bank of New York | | ISDA | | $ | 1,247 | | | $ | — | | | $ | — | | | $ | 1,247 | | | $ | — | | |
State Street Bank and Trust | | ISDA | | | 333,415 | | | | 405,382 | | | | — | | | | — | | | | 71,967 | | |
JPMorgan Chase Bank N.A. | | ISDA | | | 291,468 | | | | 62,608 | | | | — | | | | 228,860 | | | | — | | |
| | | | | $ | 626,130 | | | $ | 467,990 | | | $ | — | | | $ | 230,107 | | | $ | 71,967 | | |
CONVERTIBLE FUND | | GROSS AMOUNTS PRESENTED IN THE
STATEMENT OF ASSETS AND LIABILITIES | | COLLATERAL | | NET AMOUNT
RECEIVABLE IN
THE EVENT | | NET AMOUNT
PAYABLE IN
THE EVENT | |
Counterparty | | | | ASSETS | | LIABILITIES | | PLEDGED | | OF DEFAULT | | OF DEFAULT | |
Bank of New York | | ISDA | | $ | 3,114 | | | $ | 199 | | | $ | — | | | $ | 2,915 | | | $ | — | | |
State Street Bank and Trust | | ISDA | | | 84,028 | | | | 16,191 | | | | — | | | | 67,837 | | | | — | | |
| | | | | $ | 87,142 | | | $ | 16,390 | | | $ | — | | | $ | 70,752 | | | $ | — | | |
INTERNATIONAL GROWTH FUND | | GROSS AMOUNTS PRESENTED IN THE
STATEMENT OF ASSETS AND LIABILITIES | | COLLATERAL | | NET AMOUNT
RECEIVABLE IN
THE EVENT | | NET AMOUNT
PAYABLE IN
THE EVENT | |
Counterparty | | | | ASSETS | | LIABILITIES | | PLEDGED | | OF DEFAULT | | OF DEFAULT | |
State Street Bank and Trust | | ISDA | | $ | — | | | $ | 40,898 | | | $ | — | | | $ | — | | | $ | 40,898 | | |
| | | | | $ | — | | | $ | 40,898 | | | $ | — | | | $ | — | | | $ | 40,898 | | |
EVOLVING WORLD GROWTH FUND | | GROSS AMOUNTS PRESENTED IN THE
STATEMENT OF ASSETS AND LIABILITIES | | COLLATERAL | | NET AMOUNT
RECEIVABLE IN
THE EVENT | | NET AMOUNT
PAYABLE IN
THE EVENT | |
Counterparty | | | | ASSETS | | LIABILITIES | | PLEDGED | | OF DEFAULT | | OF DEFAULT | |
State Street Bank and Trust | | ISDA | | $ | 287,570 | | | $ | 78,878 | | | $ | — | | | $ | 208,692 | | | $ | — | | |
| | | | | $ | 287,570 | | | $ | 78,878 | | | $ | — | | | $ | 208,692 | | | $ | — | | |
For the year ended October 31, 2023, the volume of derivative activity for the Fund is reflected below:*
FUND | | FORWARD
FOREIGN CURRENCY
CONTRACTS(1) | | PURCHASED
OPTIONS(2) | | FUTURES
CONTRACTS(5) | | WRITTEN
OPTIONS(3) | | SWAPS(4) | |
Market Neutral Income Fund | | | 469,187,046 | | | | 238,719 | | | | — | | | | 198,615 | | | | 80,083,612 | | |
Hedged Equity Fund | | | — | | | | 16,180 | | | | — | | | | 10,180 | | | | — | | |
Phineus Long/Short Fund | | | — | | | | 1,116,511 | | | | — | | | | 1,102,703 | | | | — | | |
Convertible Fund | | | 34,999,355 | | | | 2,777 | | | | — | | | | — | | | | — | | |
Global Convertible Fund | | | — | | | | 1,515 | | | | — | | | | 82 | | | | — | | |
Growth Fund | | | — | | | | 58,100 | | | | 143 | | | | 58,595 | | | | — | | |
Growth and Income Fund | | | 2,416,128 | | | | 148,122 | | | | — | | | | 13,060 | | | | — | | |
Dividend Growth Fund | | | — | | | | 17 | | | | — | | | | — | | | | — | | |
International Growth Fund | | | 59,662,878 | | | | 21,346 | | | | — | | | | — | | | | — | | |
Evolving World Growth Fund | | | 44,718,683 | | | | 207,755 | | | | — | | | | 10,200 | | | | — | | |
Global Equity Fund | | | — | | | | 1,291 | | | | — | | | | 160 | | | | — | | |
Global Opportunities Fund | | | — | | | | 13,085 | | | | — | | | | 630 | | | | — | | |
International Small Cap Growth Fund | | | — | | | | 67 | | | | — | | | | — | | | | — | | |
Total Return Bond Fund | | | — | | | | — | | | | 72 | | | | — | | | | — | | |
Short-Term Bond Fund | | | — | | | | — | | | | 1,126 | | | | — | | | | — | | |
* Activity during the period is measured by opened number of contracts for options purchased or written, opened foreign currency contracts (measured in notional), opened number of contracts for futures contracts, and opened total return swaps (measured in notional).
CALAMOS OPEN-END FAMILY OF FUNDS ANNUAL REPORT
212
Notes to Financial Statements
(1) Generally, the Statement of Assets and Liabilities location for Forward contracts is Unrealized appreciation on forward foreign currency contracts for asset derivatives and Unrealized depreciation on forward foreign currency contracts for liability derivatives.
(2) Generally, the Statement of Assets and Liabilities location for Purchased Options is "Investments in securities, at value".
(3) Generally, the Statement of Assets and Liabilities location for Written Options is "Options written, at value".
(4) Generally, the Statement of Assets and Liabilities location for Swap contracts is Unrealized appreciation on total return swaps for asset derivatives and Unrealized depreciation on total return swaps for liability derivatives.
(5) Generally, the Statement of Assets and Liabilities location for Futures contracts is Variation margin on open futures contracts for asset derivatives and Variation margin on open futures contracts for liability derivatives.
Note 7 – Securities Lending
The Funds may loan one or more of their securities to broker-dealers and banks through the Securities Loan Agreements. In Securities Loan Agreements, the "collateral" are the loaned securities themselves. Additionally, the set-off and netting provisions of a Securities Loan Agreement may not extend to the obligations of the counterparty's affiliates or across varying types of transactions. Any such loan must be secured by collateral in cash or cash equivalents maintained on a current basis in an amount at least equal to the value of the securities loaned by the Funds. The Funds continue to receive the equivalent of the interest or dividends paid by the issuer on the securities loaned and also receive an additional return that may be in the form of a fixed fee or a percentage of the collateral. The additional return is disclosed on a net basis as Securities lending income in the Statement of Operations. Upon receipt of cash or cash equivalent collateral, the Funds' securities lending agent invests any cash collateral into short term investments following investment guidelines approved by Calamos Advisors. The Funds record the investment of collateral as an asset and the value of the collateral as a liability on the Statements of Assets and Liabilities. If the value of the invested collateral declines below the value of the collateral deposited by the borrower, the Funds will record unrealized depreciation equal to the decline in value of the invested collateral. The Funds will pay reasonable fees to persons unaffiliated with the Funds for services in arranging these loans. The Funds have the right to call a loan and obtain the securities loaned at any time. The Funds do not have the right to vote the securities during the existence of the loan but could call the loan in an attempt to permit voting of the securities in certain circumstances. Upon return of the securities loaned, the cash or cash equivalent collateral will be returned to the borrower. In the event of bankruptcy or other default of the borrower, the Funds could experience both delays in liquidating the loan collateral or recovering the loaned securities and losses, including (a) possible decline in the value of the collateral or in the value of the securities loaned during the period while the Funds seek to enforce its rights thereto, (b) possible subnormal levels of income and lack of access to income during this period, and (c) the expenses of enforcing their rights. In an effort to reduce these risks, the Funds' security lending agent monitors and reports to Calamos Advisors on the creditworthiness of the firms to which a Fund lends securities.
The following table indicates the total amount of securities loaned by asset class, reconciled to the gross liability payable upon return of the securities loaned by the Funds as of October 31, 2023.
| | | AMOUNT OF
COLLATERAL
HELD IN
SHORT TERM
INVESTMENTS
AND
RESTRICTED | | AMOUNT OF
NON-CASH | | TOTAL | | VALUE OF SECURITIES ON
LOAN TO BROKER-DEALERS AND
BANKS BY ASSET CLASS ON LOAN | | EXCESS
AMOUNT
DUE TO/(FROM) | |
FUND | | CASH | | COLLATERAL | | COLLATERAL | | EQUITY | | FIXED INCOME | | TOTAL | | COUNTERPARTY | |
Market Neutral Income Fund | | $ | 130,372,948 | | | $ | 95,999,066 | | | $ | 226,372,014 | | | $ | 112,373,751 | | | $ | 110,438,813 | | | $ | 222,812,564 | | | $ | 3,559,450 | | |
Hedged Equity Fund | | | 6,187,314 | | | | 7,875,537 | | | | 14,062,851 | | | | 13,880,038 | | | | — | | | | 13,880,038 | | | | 182,813 | | |
Phineus Long/Short Fund | | | 11,890,737 | | | | 19,252,889 | | | | 31,143,626 | | | | 30,569,738 | | | | — | | | | 30,569,738 | | | | 573,888 | | |
Convertible Fund | | | 36,784,235 | | | | 6,842,780 | | | | 43,627,015 | | | | 3,513,744 | | | | 38,995,899 | | | | 42,509,643 | | | | 1,117,372 | | |
Global Convertible Fund | | | 5,551,209 | | | | 426,730 | | | | 5,977,939 | | | | 576,652 | | | | 5,298,962 | | | | 5,875,614 | | | | 102,325 | | |
Growth Fund | | | 1,717,018 | | | | 48,857,995 | | | | 50,575,013 | | | | 50,029,184 | | | | — | | | | 50,029,184 | | | | 545,829 | | |
Growth and Income Fund | | | 52,088,275 | | | | 42,213,006 | | | | 94,301,281 | | | | 51,539,888 | | | | 41,294,705 | | | | 92,834,593 | | | | 1,466,688 | | |
Dividend Growth Fund | | | 66,806 | | | | 261,525 | | | | 328,331 | | | | 324,889 | | | | — | | | | 324,889 | | | | 3,442 | | |
Select Fund | | | — | | | | 1,107,677 | | | | 1,107,677 | | | | 1,095,331 | | | | — | | | | 1,095,331 | | | | 12,346 | | |
International Growth Fund | | | 5,053,942 | | | | 5,117,682 | | | | 10,171,624 | | | | 9,753,260 | | | | — | | | | 9,753,260 | | | | 418,364 | | |
Evolving World Growth Fund | | | 10,539,663 | | | | 3,218,431 | | | | 13,758,094 | | | | 13,121,053 | | | | — | | | | 13,121,053 | | | | 637,041 | | |
Global Equity Fund | | | 4,058,291 | | | | 900,450 | | | | 4,958,741 | | | | 4,785,626 | | | | — | | | | 4,785,626 | | | | 173,115 | | |
www.calamos.com
213
Notes to Financial Statements
| | | AMOUNT OF
COLLATERAL
HELD IN
SHORT TERM
INVESTMENTS
AND
RESTRICTED | | AMOUNT OF
NON-CASH | | TOTAL | | VALUE OF SECURITIES ON
LOAN TO BROKER-DEALERS AND
BANKS BY ASSET CLASS ON LOAN | | EXCESS
AMOUNT
DUE TO/(FROM) | |
FUND | | CASH | | COLLATERAL | | COLLATERAL | | EQUITY | | FIXED INCOME | | TOTAL | | COUNTERPARTY | |
Global Opportunities Fund | | $ | 4,264,427 | | | $ | 2,119,078 | | | $ | 6,383,505 | | | $ | 3,720,292 | | | $ | 2,480,833 | | | $ | 6,201,125 | | | $ | 182,380 | | |
Total Return Bond Fund | | | 719,238 | | | | 98,000 | | | | 817,238 | | | | — | | | | 799,984 | | | | 799,984 | | | | 17,254 | | |
High Income Opportunities Fund | | | 3,958,408 | | | | 226,828 | | | | 4,185,236 | | | | 25,049 | | | | 4,091,225 | | | | 4,116,274 | | | | 68,962 | | |
Short-Term Bond Fund | | | 7,108,153 | | | | 6,441,565 | | | | 13,549,718 | | | | — | | | | 13,258,558 | | | | 13,258,558 | | | | 291,160 | | |
Note 8 – Fair Value Measurements
Various inputs are used to determine the value of the Funds' investments. These inputs are categorized into three broad levels as follows:
• Level 1 – Prices are determined using inputs from unadjusted quoted prices from active markets (including securities actively traded on a securities exchange) for identical assets.
• Level 2 – Prices are determined using significant observable market inputs other than unadjusted quoted prices, including quoted prices of similar securities, fair value adjustments to quoted foreign securities, interest rates, credit risk, prepayment speeds, and other relevant data.
• Level 3 – Prices reflect unobservable market inputs (including the Funds' own judgments about assumptions market participants would use in determining fair value) when observable inputs are unavailable.
Debt securities are valued based upon evaluated prices received from an independent pricing service or from a dealer or broker who makes markets in such securities. Pricing services utilize various observable market data and as such, debt securities are generally categorized as Level 2. The levels are not necessarily an indication of the risk or liquidity of the Fund's investments.
The following is a summary of the inputs used in valuing the Funds' holdings at fair value:
| | | MARKET NEUTRAL INCOME FUND | |
| | | LEVEL 1 | | LEVEL 2 | | LEVEL 3 | | TOTAL | |
Assets: | |
Convertible Bonds | | $ | — | | | $ | 5,241,477,841 | | | $ | — | | | $ | 5,241,477,841 | | |
Corporate Bonds | | | — | | | | 231,165,071 | | | | — | | | | 231,165,071 | | |
Convertible Preferred Stocks | | | 65,916,992 | | | | — | | | | — | | | | 65,916,992 | | |
Common Stocks | | | 7,181,840,874 | | | | 7,093,787 | | | | 41,310,000 | | | | 7,230,244,661 | | |
Investments in Affiliated Funds | | | 326,238,322 | | | | — | | | | — | | | | 326,238,322 | | |
Warrants | | | 3,194,495 | | | | 2,090,658 | | | | — | | | | 5,285,153 | | |
Rights | | | 16,000 | | | | 190,487 | | | | — | | | | 206,487 | | |
Purchased Options | | | 152,024,590 | | | | 25,637,650 | | | | — | | | | 177,662,240 | | |
Investment of Cash Collateral For Securities Loaned | | | — | | | | 130,372,948 | | | | — | | | | 130,372,948 | | |
Forward Foreign Currency Contracts | | | — | | | | 334,662 | | | | — | | | | 334,662 | | |
Total Return Swaps | | | — | | | | 291,468 | | | | — | | | | 291,468 | | |
Total | | $ | 7,729,231,273 | | | $ | 5,638,654,572 | | | $ | 41,310,000 | | | $ | 13,409,195,845 | | |
CALAMOS OPEN-END FAMILY OF FUNDS ANNUAL REPORT
214
Notes to Financial Statements
| | | MARKET NEUTRAL INCOME FUND | |
| | | LEVEL 1 | | LEVEL 2 | | LEVEL 3 | | TOTAL | |
Liabilities: | |
Common Stocks Sold Short | | $ | 2,183,690,072 | | | $ | — | | | $ | — | | | $ | 2,183,690,072 | | |
Written Options | | | 100,678,170 | | | | 38,000 | | | | — | | | | 100,716,170 | | |
Forward Foreign Currency Contracts | | | — | | | | 405,382 | | | | — | | | | 405,382 | | |
Total Return Swaps | | | — | | | | 62,608 | | | | — | | | | 62,608 | | |
Total | | $ | 2,284,368,242 | | | $ | 505,990 | | | $ | — | | | $ | 2,284,874,232 | | |
| | | HEDGED EQUITY FUND | |
| | | LEVEL 1 | | LEVEL 2 | | LEVEL 3 | | TOTAL | |
Assets: | |
Common Stocks | | $ | 529,854,006 | | | $ | — | | | $ | — | | | $ | 529,854,006 | | |
Exchange-Traded Funds | | | 10,393,107 | | | | — | | | | — | | | | 10,393,107 | | |
Convertible Bonds | | | — | | | | 5,999,994 | | | | — | | | | 5,999,994 | | |
Purchased Options | | | 25,351,150 | | | | — | | | | — | | | | 25,351,150 | | |
Investment of Cash Collateral For Securities Loaned | | | — | | | | 6,187,314 | | | | — | | | | 6,187,314 | | |
Total | | $ | 565,598,263 | | | $ | 12,187,308 | | | $ | — | | | $ | 577,785,571 | | |
Liabilities: | |
Written Options | | $ | 15,076,475 | | | $ | — | | | $ | — | | | $ | 15,076,475 | | |
Total | | $ | 15,076,475 | | | $ | — | | | $ | — | | | $ | 15,076,475 | | |
| | | PHINEUS LONG/SHORT FUND | |
| | | LEVEL 1 | | LEVEL 2 | | LEVEL 3 | | TOTAL | |
Assets: | |
Common Stocks | | $ | 822,690,541 | | | $ | — | | | $ | — | | | $ | 822,690,541 | | |
Exchange-Traded Funds | | | 42,625,800 | | | | — | | | | — | | | | 42,625,800 | | |
Purchased Options | | | 10,118,055 | | | | — | | | | — | | | | 10,118,055 | | |
Investment of Cash Collateral For Securities Loaned | | | — | | | | 11,890,737 | | | | — | | | | 11,890,737 | | |
Total | | $ | 875,434,396 | | | $ | 11,890,737 | | | $ | — | | | $ | 887,325,133 | | |
Liabilities: | |
Common Stocks Sold Short | | $ | 101,502,066 | | | $ | — | | | $ | — | | | $ | 101,502,066 | | |
Exchange-Traded Funds Sold Short | | | 567,823,752 | | | | — | | | | — | | | | 567,823,752 | | |
Written Options | | | 11,101,535 | | | | — | | | | — | | | | 11,101,535 | | |
Total | | $ | 680,427,353 | | | $ | — | | | $ | — | | | $ | 680,427,353 | | |
| | | MERGER ARBITRAGE FUND | |
| | | LEVEL 1 | | LEVEL 2 | | LEVEL 3 | | TOTAL | |
Assets: | |
Convertible Bonds | | $ | — | | | $ | 533,729 | | | $ | — | | | $ | 533,729 | | |
Corporate Bonds | | | — | | | | 78,663 | | | | — | | | | 78,663 | | |
Common Stocks | | | 1,130,579 | | | | 2,338 | | | | 154,530 | | | | 1,287,447 | | |
Total | | $ | 1,130,579 | | | $ | 614,730 | | | $ | 154,530 | | | $ | 1,899,839 | | |
Liabilities: | |
Common Stocks Sold Short | | $ | 280,379 | | | $ | — | | | $ | — | | | $ | 280,379 | | |
Total | | $ | 280,379 | | | $ | — | | | $ | — | | | $ | 280,379 | | |
www.calamos.com
215
Notes to Financial Statements
| | | CONVERTIBLE FUND | |
| | | LEVEL 1 | | LEVEL 2 | | LEVEL 3 | | TOTAL | |
Assets: | |
Convertible Bonds | | $ | — | | | $ | 769,345,807 | | | $ | — | | | $ | 769,345,807 | | |
Convertible Preferred Stocks | | | 28,298,358 | | | | — | | | | — | | | | 28,298,358 | | |
U.S. Government and Agency Securities | | | — | | | | 9,218,780 | | | | — | | | | 9,218,780 | | |
Purchased Options | | | 1,285,050 | | | | — | | | | — | | | | 1,285,050 | | |
Investment of Cash Collateral For Securities Loaned | | | — | | | | 36,784,235 | | | | — | | | | 36,784,235 | | |
Forward Foreign Currency Contracts | | | — | | | | 87,142 | | | | — | | | | 87,142 | | |
Total | | $ | 29,583,408 | | | $ | 815,435,964 | | | $ | — | | | $ | 845,019,372 | | |
Liabilities: | |
Forward Foreign Currency Contracts | | $ | — | | | $ | 16,390 | | | $ | — | | | $ | 16,390 | | |
Total | | $ | — | | | $ | 16,390 | | | $ | — | | | $ | 16,390 | | |
| | | GLOBAL CONVERTIBLE FUND | |
| | | LEVEL 1 | | LEVEL 2 | | LEVEL 3 | | TOTAL | |
Assets: | |
Convertible Bonds | | $ | — | | | $ | 111,835,446 | | | $ | — | | | $ | 111,835,446 | | |
Convertible Preferred Stocks | | | 5,596,658 | | | | — | | | | — | | | | 5,596,658 | | |
U.S. Government and Agency Securities | | | — | | | | 1,002,784 | | | | — | | | | 1,002,784 | | |
Purchased Options | | | 1,193,090 | | | | — | | | | — | | | | 1,193,090 | | |
Investment of Cash Collateral For Securities Loaned | | | — | | | | 5,551,209 | | | | — | | | | 5,551,209 | | |
Total | | $ | 6,789,748 | | | $ | 118,389,439 | | | $ | — | | | $ | 125,179,187 | | |
Liabilities: | |
Written Options | | $ | 58,220 | | | $ | — | | | $ | — | | | $ | 58,220 | | |
Total | | $ | 58,220 | | | $ | — | | | $ | — | | | $ | 58,220 | | |
| | | TIMPANI SMALL CAP GROWTH FUND | |
| | | LEVEL 1 | | LEVEL 2 | | LEVEL 3 | | TOTAL | |
Assets: | |
Common Stocks | | $ | 236,826,343 | | | $ | — | | | $ | — | | | $ | 236,826,343 | | |
Total | | $ | 236,826,343 | | | $ | — | | | $ | — | | | $ | 236,826,343 | | |
| | | TIMPANI SMID GROWTH FUND | |
| | | LEVEL 1 | | LEVEL 2 | | LEVEL 3 | | TOTAL | |
Assets: | |
Common Stocks | | $ | 16,129,465 | | | $ | — | | | $ | — | | | $ | 16,129,465 | | |
Total | | $ | 16,129,465 | | | $ | — | | | $ | — | | | $ | 16,129,465 | | |
| | | GROWTH FUND | |
| | | LEVEL 1 | | LEVEL 2 | | LEVEL 3 | | TOTAL | |
Assets: | |
Common Stocks | | $ | 1,158,440,301 | | | $ | — | | | $ | — | | | $ | 1,158,440,301 | | |
Purchased Options | | | 102,420 | | | | — | | | | — | | | | 102,420 | | |
Investment of Cash Collateral For Securities Loaned | | | — | | | | 1,717,018 | | | | — | | | | 1,717,018 | | |
Total | | $ | 1,158,542,721 | | | $ | 1,717,018 | | | $ | — | | | $ | 1,160,259,739 | | |
CALAMOS OPEN-END FAMILY OF FUNDS ANNUAL REPORT
216
Notes to Financial Statements
| | | GROWTH FUND | |
| | | LEVEL 1 | | LEVEL 2 | | LEVEL 3 | | TOTAL | |
Liabilities: | |
Futures Contracts | | $ | 145,915 | | | $ | — | | | $ | — | | | $ | 145,915 | | |
Written Options | | | 72,720 | | | | — | | | | — | | | | 72,720 | | |
Total | | $ | 218,635 | | | $ | — | | | $ | — | | | $ | 218,635 | | |
| | | GROWTH AND INCOME FUND | |
| | | LEVEL 1 | | LEVEL 2 | | LEVEL 3 | | TOTAL | |
Assets: | |
Convertible Bonds | | $ | — | | | $ | 369,325,558 | | | $ | — | | | $ | 369,325,558 | | |
Convertible Preferred Stocks | | | 22,495,231 | | | | 6,910,945 | | | | — | | | | 29,406,176 | | |
Common Stocks | | | 1,659,906,801 | | | | — | | | | — | | | | 1,659,906,801 | | |
U.S. Government and Agency Securities | | | — | | | | 48,916,535 | | | | — | | | | 48,916,535 | | |
Purchased Options | | | 1,932,700 | | | | — | | | | — | | | | 1,932,700 | | |
Investment of Cash Collateral For Securities Loaned | | | — | | | | 52,088,275 | | | | — | | | | 52,088,275 | | |
Total | | $ | 1,684,334,732 | | | $ | 477,241,313 | | | $ | — | | | $ | 2,161,576,045 | | |
| | | DIVIDEND GROWTH FUND | |
| | | LEVEL 1 | | LEVEL 2 | | LEVEL 3 | | TOTAL | |
Assets: | |
Common Stocks | | $ | 14,932,596 | | | $ | — | | | $ | — | | | $ | 14,932,596 | | |
Exchange-Traded Funds | | | 107,661 | | | | — | | | | — | | | | 107,661 | | |
Investment of Cash Collateral For Securities Loaned | | | — | | | | 66,806 | | | | — | | | | 66,806 | | |
Total | | $ | 15,040,257 | | | $ | 66,806 | | | $ | — | | | $ | 15,107,063 | | |
| | | SELECT FUND | |
| | | LEVEL 1 | | LEVEL 2 | | LEVEL 3 | | TOTAL | |
Assets: | |
Common Stocks | | $ | 41,923,294 | | | $ | — | | | $ | — | | | $ | 41,923,294 | | |
Total | | $ | 41,923,294 | | | $ | — | | | $ | — | | | $ | 41,923,294 | | |
| | | INTERNATIONAL GROWTH FUND | |
| | | LEVEL 1 | | LEVEL 2 | | LEVEL 3 | | TOTAL | |
Assets: | |
Common Stocks | | $ | 44,092,058 | | | $ | 141,184,807 | | | $ | — | | | $ | 185,276,865 | | |
Purchased Options | | | 422,315 | | | | — | | | | — | | | | 422,315 | | |
Investment of Cash Collateral For Securities Loaned | | | — | | | | 5,053,942 | | | | — | | | | 5,053,942 | | |
Total | | $ | 44,514,373 | | | $ | 146,238,749 | | | $ | — | | | $ | 190,753,122 | | |
Liabilities: | |
Forward Foreign Currency Contracts | | $ | — | | | $ | 40,898 | | | $ | — | | | $ | 40,898 | | |
Total | | $ | — | | | $ | 40,898 | | | $ | — | | | $ | 40,898 | | |
www.calamos.com
217
Notes to Financial Statements
| | | EVOLVING WORLD GROWTH FUND | |
| | | LEVEL 1 | | LEVEL 2 | | LEVEL 3 | | TOTAL | |
Assets: | |
Convertible Bonds | | $ | — | | | $ | 66,386,149 | | | $ | — | | | $ | 66,386,149 | | |
Common Stocks | | | 60,935,969 | | | | 228,338,647 | | | | — | | | | 289,274,616 | | |
Preferred Stock | | | 2,985,944 | | | | — | | | | — | | | | 2,985,944 | | |
Purchased Options | | | 5,018,654 | | | | — | | | | — | | | | 5,018,654 | | |
Investment of Cash Collateral For Securities Loaned | | | — | | | | 10,539,663 | | | | — | | | | 10,539,663 | | |
Forward Foreign Currency Contracts | | | — | | | | 287,570 | | | | — | | | | 287,570 | | |
Total | | $ | 68,940,567 | | | $ | 305,552,029 | | | $ | — | | | $ | 374,492,596 | | |
Liabilities: | |
Forward Foreign Currency Contracts | | $ | — | | | $ | 78,878 | | | $ | — | | | $ | 78,878 | | |
Total | | $ | — | | | $ | 78,878 | | | $ | — | | | $ | 78,878 | | |
| | | GLOBAL EQUITY FUND | |
| | | LEVEL 1 | | LEVEL 2 | | LEVEL 3 | | TOTAL | |
Assets: | |
Common Stocks | | $ | 58,486,666 | | | $ | 24,420,886 | | | $ | — | | | $ | 82,907,552 | | |
Purchased Options | | | 139,100 | | | | — | | | | — | | | | 139,100 | | |
Investment of Cash Collateral For Securities Loaned | | | — | | | | 4,058,291 | | | | — | | | | 4,058,291 | | |
Total | | $ | 58,625,766 | | | $ | 28,479,177 | | | $ | — | | | $ | 87,104,943 | | |
| | | GLOBAL OPPORTUNITIES FUND | |
| | | LEVEL 1 | | LEVEL 2 | | LEVEL 3 | | TOTAL | |
Assets: | |
Convertible Bonds | | $ | — | | | $ | 63,256,420 | | | $ | — | | | $ | 63,256,420 | | |
Corporate Bonds | | | — | | | | 1,948,555 | | | | — | | | | 1,948,555 | | |
Convertible Preferred Stocks | | | 3,074,229 | | | | — | | | | — | | | | 3,074,229 | | |
Common Stocks | | | 78,183,647 | | | | 33,874,297 | | | | — | | | | 112,057,944 | | |
U.S. Government and Agency Securities | | | — | | | | 8,308,790 | | | | — | | | | 8,308,790 | | |
Purchased Options | | | 1,001,070 | | | | — | | | | — | | | | 1,001,070 | | |
Investment of Cash Collateral For Securities Loaned | | | — | | | | 4,264,427 | | | | — | | | | 4,264,427 | | |
Total | | $ | 82,258,946 | | | $ | 111,652,489 | | | $ | — | | | $ | 193,911,435 | | |
| | | INTERNATIONAL SMALL CAP GROWTH FUND | |
| | | LEVEL 1 | | LEVEL 2 | | LEVEL 3 | | TOTAL | |
Assets: | |
Common Stocks | | $ | 523,093 | | | $ | 1,726,049 | | | $ | — | | | $ | 2,249,142 | | |
Preferred Stock | | | 27,028 | | | | — | | | | — | | | | 27,028 | | |
Purchased Options | | | 6,975 | | | | — | | | | — | | | | 6,975 | | |
Total | | $ | 557,096 | | | $ | 1,726,049 | | | $ | — | | | $ | 2,283,145 | | |
CALAMOS OPEN-END FAMILY OF FUNDS ANNUAL REPORT
218
Notes to Financial Statements
| | | TOTAL RETURN BOND FUND | |
| | | LEVEL 1 | | LEVEL 2 | | LEVEL 3 | | TOTAL | |
Assets: | |
Corporate Bonds | | $ | — | | | $ | 12,990,050 | | | $ | — | | | $ | 12,990,050 | | |
Bank Loans | | | — | | | | 1,608,015 | | | | — | | | | 1,608,015 | | |
U.S. Government and Agency Securities | | | — | | | | 13,595,895 | | | | — | | | | 13,595,895 | | |
Residential Mortgage Backed Securities | | | — | | | | 536,820 | | | | — | | | | 536,820 | | |
Asset Backed Securities | | | — | | | | 1,970,220 | | | | — | | | | 1,970,220 | | |
Investment of Cash Collateral For Securities Loaned | | | — | | | | 719,238 | | | | — | | | | 719,238 | | |
Total | | $ | — | | | $ | 31,420,238 | | | $ | — | | | $ | 31,420,238 | | |
Liabilities: | |
Futures Contracts | | $ | 36,689 | | | $ | — | | | $ | — | | | $ | 36,689 | | |
Total | | $ | 36,689 | | | $ | — | | | $ | — | | | $ | 36,689 | | |
| | | HIGH INCOME OPPORTUNITIES FUND | |
| | | LEVEL 1 | | LEVEL 2 | | LEVEL 3 | | TOTAL | |
Assets: | |
Asset Backed Securities | | $ | — | | | $ | 88,590 | | | $ | — | | | $ | 88,590 | | |
Corporate Bonds | | | — | | | | 27,499,855 | | | | — | | | | 27,499,855 | | |
Convertible Bonds | | | — | | | | 284,000 | | | | — | | | | 284,000 | | |
Bank Loans | | | — | | | | 4,398,466 | | | | — | | | | 4,398,466 | | |
Common Stocks | | | 282,731 | | | | 76,191 | | | | — | | | | 358,922 | | |
Warrants | | | — | | | | 1 | | | | — | | | | 1 | | |
Convertible Preferred Stocks | | | — | | | | 17,750 | | | | — | | | | 17,750 | | |
Preferred Stocks | | | 175,131 | | | | 78,473 | | | | — | | | | 253,604 | | |
Investment of Cash Collateral For Securities Loaned | | | — | | | | 3,958,408 | | | | — | | | | 3,958,408 | | |
Total | | $ | 457,862 | | | $ | 36,401,734 | | | $ | — | | | $ | 36,859,596 | | |
| | | SHORT-TERM BOND FUND | |
| | | LEVEL 1 | | LEVEL 2 | | LEVEL 3 | | TOTAL | |
Assets: | |
Corporate Bonds | | $ | — | | | $ | 204,668,635 | | | $ | — | | | $ | 204,668,635 | | |
U.S. Government and Agency Securities | | | — | | | | 23,657,401 | | | | — | | | | 23,657,401 | | |
Sovereign Bonds | | | — | | | | 6,493,526 | | | | — | | | | 6,493,526 | | |
Bank Loans | | | — | | | | 27,824,429 | | | | — | | | | 27,824,429 | | |
Asset Backed Securities | | | — | | | | 69,431,798 | | | | — | | | | 69,431,798 | | |
Municipal Obligations | | | — | | | | 16,348,113 | | | | — | | | | 16,348,113 | | |
Residential Mortgage Backed Securities | | | — | | | | 3,641,992 | | | | — | | | | 3,641,992 | | |
Investment of Cash Collateral For Securities Loaned | | | — | | | | 7,108,153 | | | | — | | | | 7,108,153 | | |
Total | | $ | — | | | $ | 359,174,047 | | | $ | — | | | $ | 359,174,047 | | |
Liabilities: | |
Futures Contracts | | $ | 547,615 | | | $ | — | | | $ | — | | | $ | 547,615 | | |
Total | | $ | 547,615 | | | $ | — | | | $ | — | | | $ | 547,615 | | |
www.calamos.com
219
Notes to Financial Statements
The following is a reconciliation of the fair valuations using significant unobservable inputs (Level 3) for the Market Neutral Income Fund's assets and liabilities during the year ended October 31, 2023:
Investments
in
Securities | | Balance
as of
October 31,
2022 | | Accrued
Discounts/
(Premiums) | | Realized
Gain
(Loss) | | Change in
Unrealized
Appreciation
(Depreciation) | | Purchases | | Sales
Proceeds | | Transfers
into
Level 3 | | Transfers
out of
Level 3 | | Balance
as of
October 31,
2023 | | Net change in
Unrealized
Appreciation
(Depreciation) from
investments still held
as of October 31, 2023 | |
Common
Stocks | | $ | — | | | $ | — | | | $ | — | | | $ | — | | | $ | — | | | $ | — | | | $ | 41,310,000 | | | $ | — | | | $ | 41,310,000 | | | $ | — | | |
Total | | $ | — | | | $ | — | | | $ | — | | | $ | — | | | $ | — | | | $ | — | | | $ | 41,310,000 | | | $ | — | | | $ | 41,310,000 | | | $ | — | | |
The following is a reconciliation of the fair valuations using significant unobservable inputs (Level 3) for the Merger Arbitrage Fund's assets and liabilities during the year ended October 31, 2023:
Investments
in
Securities | | Balance
as of
October 31,
2022 | | Accrued
Discounts/
(Premiums) | | Realized
Gain
(Loss) | | Change in
Unrealized
Appreciation
(Depreciation) | | Purchases | | Sales
Proceeds | | Transfers
into
Level 3 | | Transfers
out of
Level 3 | | Balance
as of
October 31,
2023 | | Net change in
Unrealized
Appreciation
(Depreciation) from
investments still held
as of October 31, 2023 | |
Common
Stocks | | $ | — | | | $ | — | | | $ | — | | | $ | — | | | $ | — | | | $ | — | | | $ | 154,530 | | | $ | — | | | $ | 154,530 | | | $ | — | | |
Total | | $ | — | | | $ | — | | | $ | — | | | $ | — | | | $ | — | | | $ | — | | | $ | 154,530 | | | $ | — | | | $ | 154,530 | | | $ | — | | |
As of October 31, 2023, Level 3 investments were valued by the Company using unadjusted pricing quotes obtained from dealers.
CALAMOS OPEN-END FAMILY OF FUNDS ANNUAL REPORT
220
Notes to Financial Statements
Note 9 – Capital Share Transactions
The following table summarizes the activity in capital shares of the Funds for the Year ended October 31, 2023:
| | | MARKET NEUTRAL
INCOME FUND | | HEDGED EQUITY FUND | | PHINEUS LONG/SHORT FUND | |
Class A | | Shares | | Dollars | | Shares | | Dollars | | Shares | | Dollars | |
Shares sold | | | 12,170,301 | | | $ | 174,881,045 | | | | 314,123 | �� | | $ | 4,355,061 | | | | 1,406,590 | | | $ | 21,423,583 | | |
Shares issued as reinvestment of distributions | | | 867,511 | | | | 12,393,537 | | | | 13,915 | | | | 186,843 | | | | — | | | | — | | |
Less shares redeemed | | | (34,288,966 | ) | | | (491,435,483 | ) | | | (1,151,110 | ) | | | (15,663,173 | ) | | | (860,503 | ) | | | (13,143,169 | ) | |
Net increase (decrease) | | | (21,251,154 | ) | | $ | (304,160,901 | ) | | | (823,072 | ) | | $ | (11,121,269 | ) | | | 546,087 | | | $ | 8,280,414 | | |
Class C | | Shares | | Dollars | | Shares | | Dollars | | Shares | | Dollars | |
Shares sold | | | 1,141,139 | | | $ | 16,548,973 | | | | 153,444 | | | $ | 2,068,519 | | | | 410,144 | | | $ | 5,943,464 | | |
Shares issued as reinvestment of distributions | | | 112,172 | | | | 1,605,256 | | | | 1,760 | | | | 22,724 | | | | — | | | | — | | |
Less shares redeemed | | | (6,048,533 | ) | | | (87,408,980 | ) | | | (135,503 | ) | | | (1,826,078 | ) | | | (364,773 | ) | | | (5,312,518 | ) | |
Net increase (decrease) | | | (4,795,222 | ) | | $ | (69,254,751 | ) | | | 19,701 | | | $ | 265,165 | | | | 45,371 | | | $ | 630,946 | | |
Class I | | Shares | | Dollars | | Shares | | Dollars | | Shares | | Dollars | |
Shares sold | | | 187,447,512 | | | $ | 2,661,213,488 | | | | 12,788,661 | | | $ | 176,576,502 | | | | 25,949,835 | | | $ | 402,905,403 | | |
Shares issued as reinvestment of distributions | | | 13,110,726 | | | | 185,267,214 | | | | 340,304 | | | | 4,617,784 | | | | 15,148 | | | | 228,127 | | |
Less shares redeemed | | | (390,304,518 | ) | | | (5,518,414,072 | ) | | | (17,426,092 | ) | | | (238,014,016 | ) | | | (17,828,557 | ) | | | (276,737,270 | ) | |
Net increase (decrease) | | | (189,746,280 | ) | | $ | (2,671,933,370 | ) | | | (4,297,127 | ) | | $ | (56,819,730 | ) | | | 8,136,426 | | | $ | 126,396,260 | | |
Class R6 | | Shares | | Dollars | | Shares | | Dollars | | Shares | | Dollars | |
Shares sold | | | 483,417 | | | $ | 6,918,049 | | | | — | | | $ | — | | | | — | | | $ | — | | |
Shares issued as reinvestment of distributions | | | 34,210 | | | | 484,970 | | | | — | | | | — | | | | — | | | | — | | |
Less shares redeemed | | | (349,530 | ) | | | (4,991,947 | ) | | | — | | | | — | | | | — | | | | — | | |
Net increase (decrease) | | | 168,097 | | | $ | 2,411,072 | | | | — | | | $ | — | | | | — | | | $ | — | | |
www.calamos.com
221
Notes to Financial Statements
| | | MERGER ARBITRAGE
FUND(a) | | CONVERTIBLE FUND | | GLOBAL CONVERTIBLE FUND | |
Class A | | Shares | | Dollars | | Shares | | Dollars | | Shares | | Dollars | |
Shares sold | | | 10,000 | | | $ | 100,000 | | | | 1,504,705 | | | $ | 28,823,555 | | | | 124,764 | | | $ | 1,288,444 | | |
Shares issued as reinvestment of distributions | | | — | | | | — | | | | 114,111 | | | | 2,150,596 | | | | 2,291 | | | | 24,156 | | |
Less shares redeemed | | | — | | | | — | | | | (4,068,962 | ) | | | (77,321,899 | ) | | | (398,849 | ) | | | (3,990,708 | ) | |
Net increase (decrease) | | | 10,000 | | | $ | 100,000 | | | | (2,450,146 | ) | | $ | (46,347,748 | ) | | | (271,794 | ) | | $ | (2,678,108 | ) | |
Class C | | Shares | | Dollars | | Shares | | Dollars | | Shares | | Dollars | |
Shares sold | | | 10,000 | | | $ | 100,000 | | | | 302,944 | | | $ | 5,602,479 | | | | 17,911 | | | $ | 175,953 | | |
Shares issued as reinvestment of distributions | | | — | | | | — | | | | 7,504 | | | | 135,456 | | | | — | | | | — | | |
Less shares redeemed | | | — | | | | — | | | | (824,838 | ) | | | (15,151,925 | ) | | | (116,401 | ) | | | (1,146,474 | ) | |
Net increase (decrease) | | | 10,000 | | | $ | 100,000 | | | | (514,390 | ) | | $ | (9,413,990 | ) | | | (98,490 | ) | | $ | (970,521 | ) | |
Class I | | Shares | | Dollars | | Shares | | Dollars | | Shares | | Dollars | |
Shares sold | | | 191,530 | | | $ | 1,910,468 | | | | 13,481,446 | | | $ | 219,294,017 | | | | 4,281,532 | | | $ | 43,701,747 | | |
Shares issued as reinvestment of distributions | | | — | | | | — | | | | 499,000 | | | | 8,054,555 | | | | 44,862 | | | | 474,411 | | |
Less shares redeemed | | | — | | | | — | | | | (20,730,117 | ) | | | (336,215,159 | ) | | | (5,705,217 | ) | | | (57,441,972 | ) | |
Net increase (decrease) | | | 191,530 | | | $ | 1,910,468 | | | | (6,749,671 | ) | | $ | (108,866,587 | ) | | | (1,378,823 | ) | | $ | (13,265,814 | ) | |
Class R6 | | Shares | | Dollars | | Shares | | Dollars | | Shares | | Dollars | |
Shares sold | | | — | | | $ | — | | | | — | | | $ | — | | | | — | | | $ | — | | |
Shares issued as reinvestment of distributions | | | — | | | | — | | | | — | | | | — | | | | — | | | | — | | |
Less shares redeemed | | | — | | | | — | | | | — | | | | — | | | | — | | | | — | | |
Net increase (decrease) | | | — | | | $ | — | | | | — | | | $ | — | | | | — | | | $ | — | | |
(a) Calamos Merger Arbitrage Fund commenced operations on September 29, 2023.
CALAMOS OPEN-END FAMILY OF FUNDS ANNUAL REPORT
222
Notes to Financial Statements
| | | TIMPANI SMALL CAP
GROWTH FUND | | TIMPANI SMID
GROWTH FUND | | GROWTH FUND | |
Class A | | Shares | | Dollars | | Shares | | Dollars | | Shares | | Dollars | |
Shares sold | | | 213,781 | | | $ | 5,334,892 | | | | 9,599 | | | $ | 91,993 | | | | 448,404 | | | $ | 13,637,659 | | |
Shares issued as reinvestment of distributions | | | — | | | | — | | | | — | | | | — | | | | — | | | | — | | |
Less shares redeemed | | | (292,028 | ) | | | (7,283,307 | ) | | | (2,244 | ) | | | (22,479 | ) | | | (3,825,623 | ) | | | (118,160,284 | ) | |
Net increase (decrease) | | | (78,247 | ) | | $ | (1,948,415 | ) | | | 7,355 | | | $ | 69,514 | | | | (3,377,219 | ) | | $ | (104,522,625 | ) | |
Class C | | Shares | | Dollars | | Shares | | Dollars | | Shares | | Dollars | |
Shares sold | | | 32,966 | | | $ | 836,452 | | | | — | | | $ | — | | | | 46,362 | | | $ | 573,172 | | |
Shares issued as reinvestment of distributions | | | — | | | | — | | | | — | | | | — | | | | — | | | | — | | |
Less shares redeemed | | | (35,311 | ) | | | (899,810 | ) | | | — | | | | — | | | | (405,713 | ) | | | (4,801,705 | ) | |
Net increase (decrease) | | | (2,345 | ) | | $ | (63,358 | ) | | | — | | | $ | — | | | | (359,351 | ) | | $ | (4,228,533 | ) | |
Class I | | Shares | | Dollars | | Shares | | Dollars | | Shares | | Dollars | |
Shares sold | | | 2,812,358 | | | $ | 72,418,856 | | | | 168,329 | | | $ | 1,662,934 | | | | 230,544 | | | $ | 10,893,185 | | |
Shares issued as reinvestment of distributions | | | — | | | | — | | | | — | | | | — | | | | — | | | | — | | |
Less shares redeemed | | | (5,200,522 | ) | | | (133,471,595 | ) | | | (96,521 | ) | | | (925,541 | ) | | | (664,396 | ) | | | (30,871,397 | ) | |
Net increase (decrease) | | | (2,388,164 | ) | | $ | (61,052,739 | ) | | | 71,808 | | | $ | 737,393 | | | | (433,852 | ) | | $ | (19,978,212 | ) | |
Class R6 | | Shares | | Dollars | | Shares | | Dollars | | Shares | | Dollars | |
Shares sold | | | 290,165 | | | $ | 7,218,285 | | | | — | | | $ | — | | | | — | | | $ | — | | |
Shares issued as reinvestment of distributions | | | — | | | | — | | | | — | | | | — | | | | — | | | | — | | |
Less shares redeemed | | | (41,692 | ) | | | (1,081,342 | ) | | | — | | | | — | | | | — | | | | — | | |
Net increase (decrease) | | | 248,473 | | | $ | 6,136,943 | | | | — | | | $ | — | | | | — | �� | | $ | — | | |
www.calamos.com
223
Notes to Financial Statements
| | | GROWTH AND INCOME FUND | | DIVIDEND GROWTH FUND | | SELECT FUND | |
Class A | | Shares | | Dollars | | Shares | | Dollars | | Shares | | Dollars | |
Shares sold | | | 1,395,701 | | | $ | 55,123,038 | | | | 66,886 | | | $ | 934,201 | | | | 21,923 | | | $ | 357,049 | | |
Shares issued as reinvestment of distributions | | | 1,105,036 | | | | 41,224,918 | | | | 1,525 | | | | 20,483 | | | | 18,659 | | | | 285,851 | | |
Less shares redeemed | | | (3,785,998 | ) | | | (149,024,604 | ) | | | (92,888 | ) | | | (1,322,079 | ) | | | (86,039 | ) | | | (1,415,180 | ) | |
Net increase (decrease) | | | (1,285,261 | ) | | $ | (52,676,648 | ) | | | (24,477 | ) | | $ | (367,395 | ) | | | (45,457 | ) | | $ | (772,280 | ) | |
Class C | | Shares | | Dollars | | Shares | | Dollars | | Shares | | Dollars | |
Shares sold | | | 333,444 | | | $ | 13,342,934 | | | | 26,870 | | | $ | 371,068 | | | | 1,006 | | | $ | 14,390 | | |
Shares issued as reinvestment of distributions | | | 72,707 | | | | 2,706,158 | | | | 364 | | | | 4,659 | | | | 347 | | | | 4,429 | | |
Less shares redeemed | | | (567,882 | ) | | | (22,558,728 | ) | | | (29,170 | ) | | | (409,286 | ) | | | (5,508 | ) | | | (75,176 | ) | |
Net increase (decrease) | | | (161,731 | ) | | $ | (6,509,636 | ) | | | (1,936 | ) | | $ | (33,559 | ) | | | (4,155 | ) | | $ | (56,357 | ) | |
Class I | | Shares | | Dollars | | Shares | | Dollars | | Shares | | Dollars | |
Shares sold | | | 3,530,219 | | | $ | 132,943,429 | | | | 179,291 | | | $ | 2,720,520 | | | | 91,036 | | | $ | 1,481,648 | | |
Shares issued as reinvestment of distributions | | | 1,131,090 | | | | 40,224,840 | | | | 3,110 | | | | 41,829 | | | | 46,957 | | | | 747,078 | | |
Less shares redeemed | | | (5,335,877 | ) | | | (198,352,324 | ) | | | (416,596 | ) | | | (5,901,420 | ) | | | (187,861 | ) | | | (3,079,292 | ) | |
Net increase (decrease) | | | (674,568 | ) | | $ | (25,184,055 | ) | | | (234,195 | ) | | $ | (3,139,071 | ) | | | (49,868 | ) | | $ | (850,566 | ) | |
Class R6 | | Shares | | Dollars | | Shares | | Dollars | | Shares | | Dollars | |
Shares sold | | | 338,993 | | | $ | 12,207,180 | | | | — | | | $ | — | | | | — | | | $ | — | | |
Shares issued as reinvestment of distributions | | | 21,604 | | | | 774,460 | | | | — | | | | — | | | | — | | | | — | | |
Less shares redeemed | | | (71,796 | ) | | | (2,665,015 | ) | | | — | | | | — | | | | — | | | | — | | |
Net increase (decrease) | | | 288,801 | | | $ | 10,316,625 | | | | — | | | $ | — | | | | — | | | $ | — | | |
CALAMOS OPEN-END FAMILY OF FUNDS ANNUAL REPORT
224
Notes to Financial Statements
| | | INTERNATIONAL
GROWTH FUND | | EVOLVING WORLD
GROWTH FUND | | GLOBAL EQUITY FUND | |
Class A | | Shares | | Dollars | | Shares | | Dollars | | Shares | | Dollars | |
Shares sold | | | 256,761 | | | $ | 4,451,721 | | | | 565,595 | | | $ | 9,160,185 | | | | 85,674 | | | $ | 1,051,791 | | |
Shares issued as reinvestment of distributions | | | — | | | | — | | | | 16,179 | | | | 255,623 | | | | 70,675 | | | | 795,802 | | |
Less shares redeemed | | | (740,569 | ) | | | (12,753,986 | ) | | | (647,793 | ) | | | (10,312,912 | ) | | | (301,037 | ) | | | (3,670,818 | ) | |
Net increase (decrease) | | | (483,808 | ) | | $ | (8,302,265 | ) | | | (66,019 | ) | | $ | (897,104 | ) | | | (144,688 | ) | | $ | (1,823,225 | ) | |
Class C | | Shares | | Dollars | | Shares | | Dollars | | Shares | | Dollars | |
Shares sold | | | 8,311 | | | $ | 119,516 | | | | 25,567 | | | $ | 380,930 | | | | 7,374 | | | $ | 71,977 | | |
Shares issued as reinvestment of distributions | | | — | | | | — | | | | — | | | | — | | | | 4,013 | | | | 36,318 | | |
Less shares redeemed | | | (63,336 | ) | | | (912,752 | ) | | | (199,158 | ) | | | (2,937,159 | ) | | | (25,671 | ) | | | (249,212 | ) | |
Net increase (decrease) | | | (55,025 | ) | | $ | (793,236 | ) | | | (173,591 | ) | | $ | (2,556,229 | ) | | | (14,284 | ) | | $ | (140,917 | ) | |
Class I | | Shares | | Dollars | | Shares | | Dollars | | Shares | | Dollars | |
Shares sold | | | 3,281,140 | | | $ | 57,478,839 | | | | 11,322,989 | | | $ | 185,490,477 | | | | 1,150,279 | | | $ | 15,507,044 | | |
Shares issued as reinvestment of distributions | | | — | | | | — | | | | 205,070 | | | | 3,266,770 | | | | 184,546 | | | | 2,188,709 | | |
Less shares redeemed | | | (2,426,078 | ) | | | (43,942,761 | ) | | | (11,733,016 | ) | | | (189,295,685 | ) | | | (402,657 | ) | | | (5,110,431 | ) | |
Net increase (decrease) | | | 855,062 | | | $ | 13,536,078 | | | | (204,957 | ) | | $ | (538,438 | ) | | | 932,168 | | | $ | 12,585,322 | | |
Class R6 | | Shares | | Dollars | | Shares | | Dollars | | Shares | | Dollars | |
Shares sold | | | 64,500 | | | $ | 1,169,046 | | | | — | | | $ | — | | | | 6,358 | | | $ | 79,421 | | |
Shares issued as reinvestment of distributions | | | — | | | | — | | | | — | | | | — | | | | 40 | | | | 477 | | |
Less shares redeemed | | | (49,940 | ) | | | (897,244 | ) | | | — | | | | — | | | | (3 | ) | | | (38 | ) | |
Net increase (decrease) | | | 14,560 | | | $ | 271,802 | | | | — | | | $ | — | | | | 6,395 | | | $ | 79,860 | | |
www.calamos.com
225
Notes to Financial Statements
| | | GLOBAL
OPPORTUNITIES FUND | | INTERNATIONAL
SMALL CAP
GROWTH FUND | | TOTAL RETURN
BOND FUND | |
Class A | | Shares | | Dollars | | Shares | | Dollars | | Shares | | Dollars | |
Shares sold | | | 841,115 | | | $ | 8,263,851 | | | | 4,126 | | | $ | 33,328 | | | | 88,728 | | | $ | 798,909 | | |
Shares issued as reinvestment of distributions | | | 29,808 | | | | 304,335 | | | | 10 | | | | 77 | | | | 49,508 | | | | 438,950 | | |
Less shares redeemed | | | (1,764,946 | ) | | | (17,425,978 | ) | | | (3,113 | ) | | | (24,904 | ) | | | (425,660 | ) | | | (3,801,898 | ) | |
Net increase (decrease) | | | (894,023 | ) | | $ | (8,857,792 | ) | | | 1,023 | | | $ | 8,501 | | | | (287,424 | ) | | $ | (2,564,039 | ) | |
Class C | | Shares | | Dollars | | Shares | | Dollars | | Shares | | Dollars | |
Shares sold | | | 194,062 | | | $ | 1,612,104 | | | | 3,690 | | | $ | 28,189 | | | | 1,794 | | | $ | 16,045 | | |
Shares issued as reinvestment of distributions | | | 781 | | | | 6,767 | | | | 23 | | | | 182 | | | | 1,348 | | | | 11,954 | | |
Less shares redeemed | | | (259,535 | ) | | | (2,157,512 | ) | | | (3,708 | ) | | | (29,884 | ) | | | (27,855 | ) | | | (245,982 | ) | |
Net increase (decrease) | | | (64,692 | ) | | $ | (538,641 | ) | | | 5 | | | $ | (1,513 | ) | | | (24,713 | ) | | $ | (217,983 | ) | |
Class I | | Shares | | Dollars | | Shares | | Dollars | | Shares | | Dollars | |
Shares sold | | | 2,795,086 | | | $ | 28,665,714 | | | | 78,640 | | | $ | 636,833 | | | | 867,270 | | | $ | 7,722,963 | | |
Shares issued as reinvestment of distributions | | | 52,626 | | | | 560,275 | | | | 1,839 | | | | 14,635 | | | | 83,382 | | | | 738,883 | | |
Less shares redeemed | | | (4,470,328 | ) | | | (45,956,185 | ) | | | — | | | | — | | | | (803,160 | ) | | | (7,161,353 | ) | |
Net increase (decrease) | | | (1,622,616 | ) | | $ | (16,730,196 | ) | | | 80,479 | | | $ | 651,468 | | | | 147,492 | | | $ | 1,300,493 | | |
Class R6 | | Shares | | Dollars | | Shares | | Dollars | | Shares | | Dollars | |
Shares sold | | | — | | | $ | — | | | | — | | | $ | — | | | | — | | | $ | — | | |
Shares issued as reinvestment of distributions | | | — | | | | — | | | | 7 | | | | 56 | | | | — | | | | — | | |
Less shares redeemed | | | — | | | | — | | | | — | | | | — | | | | — | | | | — | | |
Net increase (decrease) | | | — | | | $ | — | | | | 7 | | | $ | 56 | | | | — | | | $ | — | | |
CALAMOS OPEN-END FAMILY OF FUNDS ANNUAL REPORT
226
Notes to Financial Statements
| | | HIGH INCOME
OPPORTUNITIES FUND | | SHORT-TERM BOND FUND | |
Class A | | Shares | | Dollars | | Shares | | Dollars | |
Shares sold | | | 125,036 | | | $ | 930,176 | | | | 286,429 | | | $ | 2,682,456 | | |
Shares issued as reinvestment of distributions | | | 209,678 | | | | 1,549,071 | | | | 13,227 | | | | 123,782 | | |
Less shares redeemed | | | (504,389 | ) | | | (3,731,630 | ) | | | (150,216 | ) | | | (1,408,916 | ) | |
Net increase (decrease) | | | (169,675 | ) | | $ | (1,252,383 | ) | | | 149,440 | | | $ | 1,397,322 | | |
Class C | | Shares | | Dollars | | Shares | | Dollars | |
Shares sold | | | 18,288 | | | $ | 144,615 | | | | — | | | $ | — | | |
Shares issued as reinvestment of distributions | | | 3,282 | | | | 25,955 | | | | — | | | | — | | |
Less shares redeemed | | | (25,382 | ) | | | (201,323 | ) | | | — | | | | — | | |
Net increase (decrease) | | | (3,812 | ) | | $ | (30,753 | ) | | | — | | | $ | — | | |
Class I | | Shares | | Dollars | | Shares | | Dollars | |
Shares sold | | | 272,227 | | | $ | 2,016,027 | | | | 1,665,162 | | | $ | 15,595,621 | | |
Shares issued as reinvestment of distributions | | | 69,814 | | | | 515,875 | | | | 144,315 | | | | 1,349,695 | | |
Less shares redeemed | | | (516,836 | ) | | | (3,799,494 | ) | | | (2,181,708 | ) | | | (20,354,338 | ) | |
Net increase (decrease) | | | (174,795 | ) | | $ | (1,267,592 | ) | | | (372,231 | ) | | $ | (3,409,022 | ) | |
Class R6 | | Shares | | Dollars | | Shares | | Dollars | |
Shares sold | | | — | | | $ | — | | | | — | | | $ | — | | |
Shares issued as reinvestment of distributions | | | — | | | | — | | | | — | | | | — | | |
Less shares redeemed | | | — | | | | — | | | | — | | | | — | | |
Net increase (decrease) | | | — | | | $ | — | | | | — | | | $ | — | | |
www.calamos.com
227
Notes to Financial Statements
The following table summarizes the activity in capital shares of the Funds for the Year ended October 31, 2022:
| | MARKET NEUTRAL
INCOME FUND | | HEDGED EQUITY FUND | | PHINEUS LONG/SHORT FUND | |
Class A | | Shares | | Dollars | | Shares | | Dollars | | Shares | | Dollars | |
Shares sold | | | 33,416,629 | | | $ | 480,597,207 | | | | 1,729,518 | | | $ | 24,861,744 | | | | 1,367,804 | | | $ | 20,814,938 | | |
Shares issued as reinvestment of distributions | | | 142,979 | | | | 2,012,211 | | | | 7,536 | | | | 105,853 | | | | — | | | | — | | |
Less shares redeemed | | | (34,938,628 | ) | | | (494,152,004 | ) | | | (1,492,083 | ) | | | (20,606,634 | ) | | | (908,010 | ) | | | (13,646,441 | ) | |
Net increase (decrease) | | | (1,379,020 | ) | | $ | (11,542,586 | ) | | | 244,971 | | | $ | 4,360,963 | | | | 459,794 | | | $ | 7,168,497 | | |
Class C | | Shares | | Dollars | | Shares | | Dollars | | Shares | | Dollars | |
Shares sold | | | 5,359,254 | | | $ | 77,840,039 | | | | 216,029 | | | $ | 2,952,619 | | | | 450,627 | | | $ | 6,512,659 | | |
Shares issued as reinvestment of distributions | | | — | | | | — | | | | — | | | | — | | | | — | | | | — | | |
Less shares redeemed | | | (5,149,618 | ) | | | (73,465,291 | ) | | | (82,788 | ) | | | (1,125,448 | ) | | | (217,039 | ) | | | (3,146,259 | ) | |
Net increase (decrease) | | | 209,636 | | | $ | 4,374,748 | | | | 133,241 | | | $ | 1,827,171 | | | | 233,588 | | | $ | 3,366,400 | | |
Class I | | Shares | | Dollars | | Shares | | Dollars | | Shares | | Dollars | |
Shares sold | | | 449,267,900 | | | $ | 6,380,594,057 | | | | 20,185,735 | | | $ | 282,931,966 | | | | 27,530,365 | | | $ | 424,306,901 | | |
Shares issued as reinvestment of distributions | | | 3,823,767 | | | | 53,144,384 | | | | 167,105 | | | | 2,329,953 | | | | — | | | | — | | |
Less shares redeemed | | | (418,040,213 | ) | | | (5,807,275,155 | ) | | | (13,697,320 | ) | | | (186,233,550 | ) | | | (10,925,487 | ) | | | (164,642,756 | ) | |
Net increase (decrease) | | | 35,051,454 | | | $ | 626,463,286 | | | | 6,655,520 | | | $ | 99,028,369 | | | | 16,604,878 | | | $ | 259,664,145 | | |
Class R6 | | Shares | | Dollars | | Shares | | Dollars | | Shares | | Dollars | |
Shares sold | | | 12,848,988 | | | $ | 183,489,735 | | | | — | | | $ | — | | | | — | | | $ | — | | |
Shares issued as reinvestment of distributions | | | 39,768 | | | | 546,242 | | | | — | | | | — | | | | — | | | | — | | |
Less shares redeemed | | | (10,288,626 | ) | | | (139,203,963 | ) | | | — | | | | — | | | | — | | | | — | | |
Net increase (decrease) | | | 2,600,130 | | | $ | 44,832,014 | | | | — | | | $ | — | | | | — | | | $ | — | | |
CALAMOS OPEN-END FAMILY OF FUNDS ANNUAL REPORT
228
Notes to Financial Statements
| | CONVERTIBLE FUND | | GLOBAL CONVERTIBLE FUND | | TIMPANI SMALL CAP
GROWTH FUND | |
Class A | | Shares | | Dollars | | Shares | | Dollars | | Shares | | Dollars | |
Shares sold | | | 1,958,928 | | | $ | 42,089,291 | | | | 107,978 | | | $ | 1,306,291 | | | | 476,181 | | | $ | 14,861,366 | | |
Shares issued as reinvestment of distributions | | | 1,982,992 | | | | 45,106,908 | | | | 171,157 | | | | 2,094,959 | | | | — | | | | — | | |
Less shares redeemed | | | (3,596,705 | ) | | | (75,287,073 | ) | | | (365,752 | ) | | | (3,944,262 | ) | | | (407,923 | ) | | | (12,421,882 | ) | |
Net increase (decrease) | | | 345,215 | | | $ | 11,909,126 | | | | (86,617 | ) | | $ | (543,012 | ) | | | 68,258 | | | $ | 2,439,484 | | |
Class C | | Shares | | Dollars | | Shares | | Dollars | | Shares | | Dollars | |
Shares sold | | | 297,979 | | | $ | 6,194,650 | | | | 59,674 | | | $ | 710,530 | | | | 133,685 | | | $ | 4,567,938 | | |
Shares issued as reinvestment of distributions | | | 372,254 | | | | 8,282,648 | | | | 57,982 | | | | 688,248 | | | | — | | | | — | | |
Less shares redeemed | | | (1,043,405 | ) | | | (21,404,792 | ) | | | (123,280 | ) | | | (1,363,701 | ) | | | (41,821 | ) | | | (1,205,095 | ) | |
Net increase (decrease) | | | (373,172 | ) | | $ | (6,927,494 | ) | | | (5,624 | ) | | $ | 35,077 | | | | 91,864 | | | $ | 3,362,843 | | |
Class I | | Shares | | Dollars | | Shares | | Dollars | | Shares | | Dollars | |
Shares sold | | | 18,061,409 | | | $ | 323,015,317 | | | | 5,707,273 | | | $ | 64,103,440 | | | | 8,060,814 | | | $ | 268,408,302 | | |
Shares issued as reinvestment of distributions | | | 7,781,222 | | | | 151,456,381 | | | | 2,463,533 | | | | 30,153,639 | | | | — | | | | — | | |
Less shares redeemed | | | (31,825,456 | ) | | | (576,328,924 | ) | | | (13,434,789 | ) | | | (150,750,391 | ) | | | (6,206,325 | ) | | | (186,523,352 | ) | |
Net increase (decrease) | | | (5,982,825 | ) | | $ | (101,857,226 | ) | | | (5,263,983 | ) | | $ | (56,493,312 | ) | | | 1,854,489 | | | $ | 81,884,950 | | |
Class R6 | | Shares | | Dollars | | Shares | | Dollars | | Shares | | Dollars | |
Shares sold | | | — | | | $ | — | | | | — | | | $ | — | | | | 457,378 | | | $ | 15,496,235 | | |
Shares issued as reinvestment of distributions | | | — | | | | — | | | | — | | | | — | | | | — | | | | — | | |
Less shares redeemed | | | — | | | | — | | | | — | | | | — | | | | (311,499 | ) | | | (8,936,560 | ) | |
Net increase (decrease) | | | — | | | $ | — | | | | — | | | $ | — | | | | 145,879 | | | $ | 6,559,675 | | |
www.calamos.com
229
Notes to Financial Statements
| | TIMPANI SMID
GROWTH FUND | | GROWTH FUND | | GROWTH AND INCOME FUND | |
Class A | | Shares | | Dollars | | Shares | | Dollars | | Shares | | Dollars | |
Shares sold | | | 35,268 | | | $ | 377,269 | | | | 805,432 | | | $ | 29,007,364 | | | | 1,577,898 | | | $ | 67,773,292 | | |
Shares issued as reinvestment of distributions | | | 1,258 | | | | 17,064 | | | | 3,649,882 | | | | 141,615,426 | | | | 1,671,502 | | | | 74,377,578 | | |
Less shares redeemed | | | (15,295 | ) | | | (153,848 | ) | | | (3,891,971 | ) | | | (134,061,085 | ) | | | (3,742,633 | ) | | | (157,611,231 | ) | |
Net increase (decrease) | | | 21,231 | | | $ | 240,485 | | | | 563,343 | | | $ | 36,561,705 | | | | (493,233 | ) | | $ | (15,460,361 | ) | |
Class C | | Shares | | Dollars | | Shares | | Dollars | | Shares | | Dollars | |
Shares sold | | | — | | | $ | — | | | | 59,922 | | | $ | 882,302 | | | | 549,078 | | | $ | 23,529,048 | | |
Shares issued as reinvestment of distributions | | | — | | | | — | | | | 383,579 | | | | 5,849,577 | | | | 107,166 | | | | 4,851,411 | | |
Less shares redeemed | | | — | | | | — | | | | (554,289 | ) | | | (7,618,188 | ) | | | (507,554 | ) | | | (21,618,671 | ) | |
Net increase (decrease) | | | — | | | $ | — | | | | (110,788 | ) | | $ | (886,309 | ) | | | 148,690 | | | $ | 6,761,788 | | |
Class I | | Shares | | Dollars | | Shares | | Dollars | | Shares | | Dollars | |
Shares sold | | | 196,721 | | | $ | 2,271,211 | | | | 245,554 | | | $ | 12,804,961 | | | | 4,514,729 | | | $ | 183,580,235 | | |
Shares issued as reinvestment of distributions | | | 177,113 | | | | 2,419,370 | | | | 483,617 | | | | 28,480,183 | | | | 1,699,167 | | | | 71,724,554 | | |
Less shares redeemed | | | (172,744 | ) | | | (2,005,300 | ) | | | (897,150 | ) | | | (47,276,537 | ) | | | (5,762,414 | ) | | | (228,175,183 | ) | |
Net increase (decrease) | | | 201,090 | | | $ | 2,685,281 | | | | (167,979 | ) | | $ | (5,991,393 | ) | | | 451,482 | | | $ | 27,129,606 | | |
Class R6 | | Shares | | Dollars | | Shares | | Dollars | | Shares | | Dollars | |
Shares sold | | | 4,006 | | | $ | 48,233 | | | | — | | | $ | — | | | | 384,521 | | | $ | 15,255,602 | | |
Shares issued as reinvestment of distributions | | | 3,440 | | | | 46,994 | | | | — | | | | — | | | | 9,937 | | | | 409,283 | | |
Less shares redeemed | | | — | | | | — | | | | — | | | | — | | | | (67,028 | ) | | | (2,594,205 | ) | |
Net increase (decrease) | | | 7,446 | | | $ | 95,227 | | | | — | | | $ | — | | | | 327,430 | | | $ | 13,070,680 | | |
CALAMOS OPEN-END FAMILY OF FUNDS ANNUAL REPORT
230
Notes to Financial Statements
| | DIVIDEND GROWTH FUND | | SELECT FUND | | INTERNATIONAL GROWTH FUND | |
Class A | | Shares | | Dollars | | Shares | | Dollars | | Shares | | Dollars | |
Shares sold | | | 101,442 | | | $ | 1,544,378 | | | | 58,525 | | | $ | 1,017,078 | | | | 598,449 | | | $ | 11,738,319 | | |
Shares issued as reinvestment of distributions | | | 26,908 | | | | 420,845 | | | | 53,515 | | | | 983,612 | | | | 449,071 | | | | 10,122,059 | | |
Less shares redeemed | | | (42,193 | ) | | | (642,307 | ) | | | (72,812 | ) | | | (1,267,711 | ) | | | (759,164 | ) | | | (15,202,096 | ) | |
Net increase (decrease) | | | 86,157 | | | $ | 1,322,916 | | | | 39,228 | | | $ | 732,979 | | | | 288,356 | | | $ | 6,658,282 | | |
Class C | | Shares | | Dollars | | Shares | | Dollars | | Shares | | Dollars | |
Shares sold | | | 81,257 | | | $ | 1,126,742 | | | | 979 | | | $ | 12,900 | | | | 12,124 | | | $ | 219,252 | | |
Shares issued as reinvestment of distributions | | | 10,240 | | | | 153,491 | | | | 4,089 | | | | 63,375 | | | | 33,222 | | | | 628,226 | | |
Less shares redeemed | | | (41,410 | ) | | | (598,268 | ) | | | (42,908 | ) | | | (639,915 | ) | | | (49,244 | ) | | | (858,782 | ) | |
Net increase (decrease) | | | 50,087 | | | $ | 681,965 | | | | (37,840 | ) | | $ | (563,640 | ) | | | (3,898 | ) | | $ | (11,304 | ) | |
Class I | | Shares | | Dollars | | Shares | | Dollars | | Shares | | Dollars | |
Shares sold | | | 276,953 | | | $ | 4,136,647 | | | | 166,871 | | | $ | 2,938,755 | | | | 1,470,202 | | | $ | 30,576,518 | | |
Shares issued as reinvestment of distributions | | | 56,033 | | | | 876,353 | | | | 145,162 | | | | 2,762,434 | | | | 1,294,238 | | | | 30,388,703 | | |
Less shares redeemed | | | (179,350 | ) | | | (2,683,777 | ) | | | (272,265 | ) | | | (4,921,169 | ) | | | (2,524,778 | ) | | | (53,119,293 | ) | |
Net increase (decrease) | | | 153,636 | | | $ | 2,329,223 | | | | 39,768 | | | $ | 780,020 | | | | 239,662 | | | $ | 7,845,928 | | |
Class R6 | | Shares | | Dollars | | Shares | | Dollars | | Shares | | Dollars | |
Shares sold | | | — | | | $ | — | | | | — | | | $ | — | | | | 260,145 | | | $ | 4,892,431 | | |
Shares issued as reinvestment of distributions | | | — | | | | — | | | | — | | | | — | | | | 9,913 | | | | 235,038 | | |
Less shares redeemed | | | — | | | | — | | | | — | | | | — | | | | (67,655 | ) | | | (1,340,574 | ) | |
Net increase (decrease) | | | — | | | $ | — | | | | — | | | $ | — | | | | 202,403 | | | $ | 3,786,895 | | |
www.calamos.com
231
Notes to Financial Statements
| | EVOLVING WORLD
GROWTH FUND | | GLOBAL EQUITY FUND | | GLOBAL OPPORTUNITIES FUND | |
Class A | | Shares | | Dollars | | Shares | | Dollars | | Shares | | Dollars | |
Shares sold | | | 792,429 | | | $ | 14,519,997 | | | | 163,327 | | | $ | 2,279,703 | | | | 1,088,375 | | | $ | 12,903,771 | | |
Shares issued as reinvestment of distributions | | | 8,171 | | | | 165,063 | | | | 201,704 | | | | 3,080,018 | | | | 503,552 | | | | 5,816,024 | | |
Less shares redeemed | | | (717,551 | ) | | | (13,643,363 | ) | | | (293,951 | ) | | | (4,102,636 | ) | | | (1,529,480 | ) | | | (17,020,570 | ) | |
Net increase (decrease) | | | 83,049 | | | $ | 1,041,697 | | | | 71,080 | | | $ | 1,257,085 | | | | 62,447 | | | $ | 1,699,225 | | |
Class C | | Shares | | Dollars | | Shares | | Dollars | | Shares | | Dollars | |
Shares sold | | | 54,708 | | | $ | 946,233 | | | | 14,131 | | | $ | 158,930 | | | | 340,975 | | | $ | 3,131,965 | | |
Shares issued as reinvestment of distributions | | | — | | | | — | | | | 14,803 | | | | 184,890 | | | | 65,588 | | | | 644,077 | | |
Less shares redeemed | | | (374,763 | ) | | | (6,679,062 | ) | | | (47,824 | ) | | | (512,505 | ) | | | (350,910 | ) | | | (3,074,317 | ) | |
Net increase (decrease) | | | (320,055 | ) | | $ | (5,732,829 | ) | | | (18,890 | ) | | $ | (168,685 | ) | | | 55,653 | | | $ | 701,725 | | |
Class I | | Shares | | Dollars | | Shares | | Dollars | | Shares | | Dollars | |
Shares sold | | | 12,249,000 | | | $ | 224,001,306 | | | | 178,242 | | | $ | 2,734,794 | | | | 6,178,298 | | | $ | 71,792,097 | | |
Shares issued as reinvestment of distributions | | | 146,559 | | | | 2,986,867 | | | | 607,155 | | | | 9,732,703 | | | | 673,478 | | | | 8,081,729 | | |
Less shares redeemed | | | (13,482,472 | ) | | | (252,789,560 | ) | | | (1,903,888 | ) | | | (30,858,817 | ) | | | (6,062,855 | ) | | | (67,904,821 | ) | |
Net increase (decrease) | | | (1,086,913 | ) | | $ | (25,801,387 | ) | | | (1,118,491 | ) | | $ | (18,391,320 | ) | | | 788,921 | | | $ | 11,969,005 | | |
Class R6 | | Shares | | Dollars | | Shares | | Dollars | | Shares | | Dollars | |
Shares sold | | | — | | | $ | — | | | | — | | | $ | — | | | | — | | | $ | — | | |
Shares issued as reinvestment of distributions | | | — | | | | — | | | | 1,079 | | | | 17,305 | | | | — | | | | — | | |
Less shares redeemed | | | — | | | | — | | | | (8,911 | ) | | | (132,150 | ) | | | — | | | | — | | |
Net increase (decrease) | | | — | | | $ | — | | | | (7,832 | ) | | $ | (114,845 | ) | | | — | | | $ | — | | |
CALAMOS OPEN-END FAMILY OF FUNDS ANNUAL REPORT
232
Notes to Financial Statements
| | INTERNATIONAL SMALL CAP
GROWTH FUND(a) | | TOTAL RETURN BOND FUND | | HIGH INCOME
OPPORTUNITIES FUND | |
Class A | | Shares | | Dollars | | Shares | | Dollars | | Shares | | Dollars | |
Shares sold | | | 1,678 | | | $ | 15,000 | | | | 123,447 | | | $ | 1,211,083 | | | | 252,917 | | | $ | 2,033,928 | | |
Shares issued as reinvestment of distributions | | | — | | | | — | | | | 64,636 | | | | 637,786 | | | | 171,917 | | | | 1,343,273 | | |
Less shares redeemed | | | — | | | | — | | | | (607,540 | ) | | | (5,953,120 | ) | | | (783,609 | ) | | | (6,366,587 | ) | |
Net increase (decrease) | | | 1,678 | | | $ | 15,000 | | | | (419,457 | ) | | $ | (4,104,251 | ) | | | (358,775 | ) | | $ | (2,989,386 | ) | |
Class C | | Shares | | Dollars | | Shares | | Dollars | | Shares | | Dollars | |
Shares sold | | | 1,000 | | | $ | 10,000 | | | | 18,746 | | | $ | 190,543 | | | | 8,316 | | | $ | 73,900 | | |
Shares issued as reinvestment of distributions | | | — | | | | — | | | | 2,365 | | | | 23,491 | | | | 2,666 | | | | 22,262 | | |
Less shares redeemed | | | — | | | | — | | | | (33,217 | ) | | | (315,063 | ) | | | (24,601 | ) | | | (203,280 | ) | |
Net increase (decrease) | | | 1,000 | | | $ | 10,000 | | | | (12,106 | ) | | $ | (101,029 | ) | | | (13,619 | ) | | $ | (107,118 | ) | |
Class I | | Shares | | Dollars | | Shares | | Dollars | | Shares | | Dollars | |
Shares sold | | | 227,101 | | | $ | 2,212,334 | | | | 506,117 | | | $ | 4,770,630 | | | | 729,592 | | | $ | 5,834,515 | | |
Shares issued as reinvestment of distributions | | | — | | | | — | | | | 111,309 | | | | 1,111,405 | | | | 65,707 | | | | 512,816 | | |
Less shares redeemed | | | — | | | | — | | | | (2,614,273 | ) | | | (26,700,414 | ) | | | (621,832 | ) | | | (4,816,959 | ) | |
Net increase (decrease) | | | 227,101 | | | $ | 2,212,334 | | | | (1,996,847 | ) | | $ | (20,818,379 | ) | | | 173,467 | | | $ | 1,530,372 | | |
Class R6 | | Shares | | Dollars | | Shares | | Dollars | | Shares | | Dollars | |
Shares sold | | | 1,000 | | | $ | 10,000 | | | | — | | | $ | — | | | | — | | | $ | — | | |
Shares issued as reinvestment of distributions | | | — | | | | — | | | | — | | | | — | | | | — | | | | — | | |
Less shares redeemed | | | — | | | | — | | | | — | | | | — | | | | — | | | | — | | |
Net increase (decrease) | | | 1,000 | | | $ | 10,000 | | | | — | | | $ | — | | | | — | | | $ | — | | |
(a) International Small Cap Growth Fund commenced operations on March 31, 2022.
www.calamos.com
233
Notes to Financial Statements
| | SHORT-TERM BOND FUND | |
Class A | | Shares | | Dollars | |
Shares sold | | | 522,033 | | | $ | 4,960,770 | | |
Shares issued as reinvestment of distributions | | | 3,445 | | | | 32,935 | | |
Less shares redeemed | | | (564,631 | ) | | | (5,358,149 | ) | |
Net increase (decrease) | | | (39,153 | ) | | $ | (364,444 | ) | |
Class C | | Shares | | Dollars | |
Shares sold | | | — | | | $ | — | | |
Shares issued as reinvestment of distributions | | | — | | | | — | | |
Less shares redeemed | | | — | | | | — | | |
Net increase (decrease) | | | — | | | $ | — | | |
Class I | | Shares | | Dollars | |
Shares sold | | | 9,802,212 | | | $ | 96,319,676 | | |
Shares issued as reinvestment of distributions | | | 69,370 | | | | 661,301 | | |
Less shares redeemed | | | (2,333,029 | ) | | | (21,829,739 | ) | |
Net increase (decrease) | | | 7,538,553 | | | $ | 75,151,238 | | |
Class R6 | | Shares | | Dollars | |
Shares sold | | | — | | | $ | — | | |
Shares issued as reinvestment of distributions | | | — | | | | — | | |
Less shares redeemed | | | — | | | | — | | |
Net increase (decrease) | | | — | | | $ | — | | |
CALAMOS OPEN-END FAMILY OF FUNDS ANNUAL REPORT
234
Calamos Market Neutral Income Fund Financial Highlights
Selected data for a share outstanding throughout each year were as follows:
| | | CLASS A | |
| | | Year Ended October 31, | |
| | | 2023 | | 2022 | | 2021 | | 2020 | | 2019 | |
Net asset value, beginning of year | | $ | 13.84 | | | $ | 14.63 | | | $ | 13.77 | | | $ | 13.47 | | | $ | 13.52 | | |
Income from investment operations: | |
Net investment income (loss)(a) | | | 0.01 | | | | (0.04 | ) | | | (0.45 | ) | | | 0.19 | | | | 0.27 | | |
Net realized and unrealized gain (loss) | | | 1.07 | | | | (0.72 | ) | | | 1.37 | | | | 0.24 | | | | 0.28 | | |
Total from investment operations | | | 1.08 | | | | (0.76 | ) | | | 0.92 | | | | 0.43 | | | | 0.55 | | |
Distributions: | |
Dividends from net investment income | | | (0.20 | ) | | | (0.03 | ) | | | (0.06 | ) | | | (0.13 | ) | | | (0.19 | ) | |
Dividends from net realized gains | | | — | | | | — | | | | — | | | | — | | | | (0.41 | ) | |
Total distributions** | | | (0.20 | ) | | | (0.03 | ) | | | (0.06 | ) | | | (0.13 | ) | | | (0.60 | ) | |
Net asset value, end of year | | $ | 14.72 | | | $ | 13.84 | | | $ | 14.63 | | | $ | 13.77 | | | $ | 13.47 | | |
Ratios and supplemental data: | |
Total return(b) | | | 7.76 | % | | | (5.22 | %) | | | 6.67 | % | | | 3.27 | % | | | 4.32 | % | |
Net assets, end of year (000) | | $ | 1,009,976 | | | $ | 1,244,117 | | | $ | 1,334,984 | | | $ | 817,405 | | | $ | 744,356 | | |
Ratio of net expenses to average net assets | | | 1.20 | %(c) | | | 1.16 | %(d) | | | 1.14 | %(e) | | | 1.20 | %(f) | | | 1.24 | %(g) | |
Ratio of gross expenses to average net assets prior to expense reductions | | | 1.21 | % | | | 1.17 | % | | | 1.14 | % | | | 1.21 | % | | | 1.24 | % | |
Ratio of net investment income (loss) to average net assets | | | 0.06 | % | | | (1.12 | %) | | | (3.15 | %) | | | 1.43 | % | | | 2.04 | % | |
| | | Year Ended October 31, | |
| | | 2023 | | 2022 | | 2021 | | 2020 | | 2019 | |
Portfolio turnover rate | | | 28 | % | | | 41 | % | | | 49 | % | | | 77 | % | | | 74 | % | |
** Distribution for annual periods determined in accordance with federal income tax regulations.
(a) Net investment income (loss) allocated based on average shares method.
(b) Total return measures net investment income (loss) and capital gain or loss from portfolio investments assuming reinvestment of dividends and capital gains distributions. Total return is not annualized for periods that are less than a full year, does not reflect the effect of sales charge for Class A shares nor the contingent deferred sales charge for Class C shares and does not reflect the deduction of taxes that a shareholder would pay on fund distributions or the redemption of fund shares.
(c) Ratio of net expenses, excluding dividend expense on short positions, to average net assets was 1.03% for the year ended October 31, 2023.
(d) Ratio of net expenses, excluding dividend expense on short positions, to average net assets was 1.01% for the year ended October 31, 2022.
(e) Ratio of net expenses, excluding dividend expense on short positions, to average net assets was 1.03% for the year ended October 31, 2021.
(f) Ratio of net expenses, excluding dividend expense on short positions, to average net assets was 1.05% for the year ended October 31, 2020.
(g) Ratio of net expenses, excluding dividend expense on short positions, to average net assets was 1.06% for the year ended October 31, 2019.
www.calamos.com
235
Calamos Market Neutral Income Fund Financial Highlights
Selected data for a share outstanding throughout each year were as follows:
| | | CLASS C | |
| | | Year Ended October 31, | |
| | | 2023 | | 2022 | | 2021 | | 2020 | | 2019 | |
Net asset value, beginning of year | | $ | 13.92 | | | $ | 14.80 | | | $ | 13.98 | | | $ | 13.70 | | | $ | 13.73 | | |
Income from investment operations: | |
Net investment income (loss)(a) | | | (0.10 | ) | | | (0.27 | ) | | | (0.57 | ) | | | 0.10 | | | | 0.18 | | |
Net realized and unrealized gain (loss) | | | 1.07 | | | | (0.61 | ) | | | 1.39 | | | | 0.24 | | | | 0.28 | | |
Total from investment operations | | | 0.97 | | | | (0.88 | ) | | | 0.82 | | | | 0.34 | | | | 0.46 | | |
Distributions: | |
Dividends from net investment income | | | (0.10 | ) | | | — | | | | (0.00 | )* | | | (0.06 | ) | | | (0.08 | ) | |
Dividends from net realized gains | | | — | | | | — | | | | — | | | | — | | | | (0.41 | ) | |
Total distributions** | | | (0.10 | ) | | | — | | | | (0.00 | )* | | | (0.06 | ) | | | (0.49 | ) | |
Net asset value, end of year | | $ | 14.79 | | | $ | 13.92 | | | $ | 14.80 | | | $ | 13.98 | | | $ | 13.70 | | |
Ratios and supplemental data: | |
Total return(b) | | | 6.93 | % | | | (5.95 | %) | | | 5.88 | % | | | 2.46 | % | | | 3.56 | % | |
Net assets, end of year (000) | | $ | 254,478 | | | $ | 306,312 | | | $ | 322,432 | | | $ | 252,490 | | | $ | 261,352 | | |
Ratio of net expenses to average net assets | | | 1.95 | %(c) | | | 1.91 | %(d) | | | 1.89 | %(e) | | | 1.95 | %(f) | | | 1.98 | %(g) | |
Ratio of gross expenses to average net assets prior to expense reductions | | | 1.96 | % | | | 1.92 | % | | | 1.89 | % | | | 1.96 | % | | | 1.99 | % | |
Ratio of net investment income (loss) to average net assets | | | (0.69 | %) | | | (1.87 | %) | | | (3.92 | %) | | | 0.70 | % | | | 1.31 | % | |
* Amounts are less than $0.005.
** Distribution for annual periods determined in accordance with federal income tax regulations.
(a) Net investment income (loss) allocated based on average shares method.
(b) Total return measures net investment income (loss) and capital gain or loss from portfolio investments assuming reinvestment of dividends and capital gains distributions. Total return is not annualized for periods that are less than a full year, does not reflect the effect of sales charge for Class A shares nor the contingent deferred sales charge for Class C shares and does not reflect the deduction of taxes that a shareholder would pay on fund distributions or the redemption of fund shares.
(c) Ratio of net expenses, excluding dividend expense on short positions, to average net assets was 1.77% for the year ended October 31, 2023.
(d) Ratio of net expenses, excluding dividend expense on short positions, to average net assets was 1.76% for the year ended October 31, 2022.
(e) Ratio of net expenses, excluding dividend expense on short positions, to average net assets was 1.78% for the year ended October 31, 2021.
(f) Ratio of net expenses, excluding dividend expense on short positions, to average net assets was 1.80% for the year ended October 31, 2020.
(g) Ratio of net expenses, excluding dividend expense on short positions, to average net assets was 1.80% for the year ended October 31, 2019.
CALAMOS OPEN-END FAMILY OF FUNDS ANNUAL REPORT
236
Calamos Market Neutral Income Fund Financial Highlights
Selected data for a share outstanding throughout each year were as follows:
| | | CLASS I | |
| | | Year Ended October 31, | |
| | | 2023 | | 2022 | | 2021 | | 2020 | | 2019 | |
Net asset value, beginning of year | | $ | 13.68 | | | $ | 14.45 | | | $ | 13.60 | | | $ | 13.30 | | | $ | 13.36 | | |
Income from investment operations: | |
Net investment income (loss)(a) | | | 0.04 | | | | (0.12 | ) | | | (0.41 | ) | | | 0.22 | | | | 0.30 | | |
Net realized and unrealized gain (loss) | | | 1.06 | | | | (0.59 | ) | | | 1.35 | | | | 0.24 | | | | 0.28 | | |
Total from investment operations | | | 1.10 | | | | (0.71 | ) | | | 0.94 | | | | 0.46 | | | | 0.58 | | |
Distributions: | |
Dividends from net investment income | | | (0.24 | ) | | | (0.06 | ) | | | (0.09 | ) | | | (0.16 | ) | | | (0.23 | ) | |
Dividends from net realized gains | | | — | | | | — | | | | — | | | | — | | | | (0.41 | ) | |
Total distributions** | | | (0.24 | ) | | | (0.06 | ) | | | (0.09 | ) | | | (0.16 | ) | | | (0.64 | ) | |
Net asset value, end of year | | $ | 14.54 | | | $ | 13.68 | | | $ | 14.45 | | | $ | 13.60 | | | $ | 13.30 | | |
Ratios and supplemental data: | |
Total return(b) | | | 8.07 | % | | | (5.01 | %) | | | 6.92 | % | | | 3.51 | % | | | 4.62 | % | |
Net assets, end of year (000) | | $ | 12,620,874 | | | $ | 14,470,090 | | | $ | 14,780,637 | | | $ | 9,207,961 | | | $ | 7,709,445 | | |
Ratio of net expenses to average net assets | | | 0.95 | %(c) | | | 0.91 | %(d) | | | 0.89 | %(e) | | | 0.95 | %(f) | | | 0.99 | %(g) | |
Ratio of gross expenses to average net assets prior to expense reductions | | | 0.95 | % | | | 0.92 | % | | | 0.89 | % | | | 0.96 | % | | | 0.99 | % | |
Ratio of net investment income (loss) to average net assets | | | 0.31 | % | | | (0.87 | %) | | | (2.90 | %) | | | 1.66 | % | | | 2.28 | % | |
** Distribution for annual periods determined in accordance with federal income tax regulations.
(a) Net investment income (loss) allocated based on average shares method.
(b) Total return measures net investment income (loss) and capital gain or loss from portfolio investments assuming reinvestment of dividends and capital gains distributions. Total return is not annualized for periods that are less than a full year, does not reflect the effect of sales charge for Class A shares nor the contingent deferred sales charge for Class C shares and does not reflect the deduction of taxes that a shareholder would pay on fund distributions or the redemption of fund shares.
(c) Ratio of net expenses, excluding dividend expense on short positions, to average net assets was 0.77% for the year ended October 31, 2023.
(d) Ratio of net expenses, excluding dividend expense on short positions, to average net assets was 0.76% for the year ended October 31, 2022.
(e) Ratio of net expenses, excluding dividend expense on short positions, to average net assets was 0.78% for the year ended October 31, 2021.
(f) Ratio of net expenses, excluding dividend expense on short positions, to average net assets was 0.80% for the year ended October 31, 2020.
(g) Ratio of net expenses, excluding dividend expense on short positions, to average net assets was 0.81% for the year ended October 31, 2019.
www.calamos.com
237
Calamos Market Neutral Income Fund Financial Highlights
Selected data for a share outstanding throughout each period were as follows:
| | | CLASS R6 | |
| | | Year Ended October 31, | | June 23, 2020•
through
October 31, | |
| | | 2023 | | 2022 | | 2021 | | 2020 | |
Net asset value, beginning of period | | $ | 13.68 | | | $ | 14.46 | | | $ | 13.61 | | | $ | 13.35 | | |
Income from investment operations: | |
Net investment income (loss)(a) | | | 0.06 | | | | (0.11 | ) | | | (0.38 | ) | | | 0.05 | | |
Net realized and unrealized gain (loss) | | | 1.05 | | | | (0.60 | ) | | | 1.33 | | | | 0.21 | | |
Total from investment operations | | | 1.11 | | | | (0.71 | ) | | | 0.95 | | | | 0.26 | | |
Distributions: | |
Dividends from net investment income | | | (0.25 | ) | | | (0.07 | ) | | | (0.10 | ) | | | — | | |
Dividends from net realized gains | | | — | | | | — | | | | — | | | | — | | |
Total distributions** | | | (0.25 | ) | | | (0.07 | ) | | | (0.10 | ) | | | — | | |
Net asset value, end of period | | $ | 14.54 | | | $ | 13.68 | | | $ | 14.46 | | | $ | 13.61 | | |
Ratios and supplemental data: | |
Total return(b) | | | 8.08 | % | | | (4.94 | %) | | | 6.99 | % | | | 1.95 | % | |
Net assets, end of year (000) | | $ | 49,159 | | | $ | 43,956 | | | $ | 8,846 | | | $ | 10 | | |
Ratio of net expenses to average net assets | | | 0.86 | %(c) | | | 0.86 | %(d) | | | 0.82 | %(e) | | | 0.77 | %(f)(g) | |
Ratio of gross expenses to average net assets prior to expense reductions | | | 0.87 | % | | | 0.87 | % | | | 0.83 | % | | | 0.77 | %(g) | |
Ratio of net investment income (loss) to average net assets | | | 0.40 | % | | | (0.82 | %) | | | (2.64 | %) | | | 1.06 | %(g) | |
• Commencement of operations.
** Distribution for annual periods determined in accordance with federal income tax regulations.
(a) Net investment income (loss) allocated based on average shares method.
(b) Total return measures net investment income (loss) and capital gain or loss from portfolio investments assuming reinvestment of dividends and capital gains distributions. Total return is not annualized for periods that are less than a full year, does not reflect the effect of sales charge for Class A shares nor the contingent deferred sales charge for Class C shares and does not reflect the deduction of taxes that a shareholder would pay on fund distributions or the redemption of fund shares.
(c) Ratio of net expenses, excluding dividend expense on short positions, to average net assets was 0.69% for the year ended October 31, 2023.
(d) Ratio of net expenses, excluding dividend expense on short positions, to average net assets was 0.69% for the year ended October 31, 2022.
(e) Ratio of net expenses, excluding dividend expense on short positions, to average net assets was 0.70% for the year ended October 31, 2021.
(f) Ratio of net expenses, excluding dividend expense on short positions, to average net assets was 0.66% for the year ended October 31, 2020.
(g) Annualized.
CALAMOS OPEN-END FAMILY OF FUNDS ANNUAL REPORT
238
Calamos Hedged Equity Fund Financial Highlights
Selected data for a share outstanding throughout each year were as follows:
| | | CLASS A | |
| | | Year Ended October 31, | |
| | | 2023 | | 2022 | | 2021 | | 2020 | | 2019 | |
Net asset value, beginning of year | | $ | 13.08 | | | $ | 14.66 | | | $ | 12.35 | | | $ | 11.88 | | | $ | 11.44 | | |
Income from investment operations: | |
Net investment income (loss)(a) | | | 0.08 | | | | 0.06 | | | | 0.06 | | | | 0.10 | | | | 0.10 | | |
Net realized and unrealized gain (loss) | | | 0.98 | | | | (1.60 | ) | | | 2.32 | | | | 0.47 | | | | 0.64 | | |
Total from investment operations | | | 1.06 | | | | (1.54 | ) | | | 2.38 | | | | 0.57 | | | | 0.74 | | |
Distributions: | |
Dividends from net investment income | | | (0.09 | ) | | | (0.04 | ) | | | (0.07 | ) | | | (0.10 | ) | | | (0.05 | ) | |
Dividends from net realized gains | | | — | | | | — | | | | — | | | | — | | | | (0.25 | ) | |
Total distributions** | | | (0.09 | ) | | | (0.04 | ) | | | (0.07 | ) | | | (0.10 | ) | | | (0.30 | ) | |
Net asset value, end of year | | $ | 14.05 | | | $ | 13.08 | | | $ | 14.66 | | | $ | 12.35 | | | $ | 11.88 | | |
Ratios and supplemental data: | |
Total return(b) | | | 8.10 | % | | | (10.51 | %) | | | 19.20 | % | | | 4.92 | % | | | 6.65 | % | |
Net assets, end of year (000) | | $ | 24,754 | | | $ | 33,814 | | | $ | 34,309 | | | $ | 15,782 | | | $ | 10,412 | | |
Ratio of net expenses to average net assets | | | 1.17 | % | | | 1.16 | % | | | 1.17 | % | | | 1.15 | % | | | 1.21 | % | |
Ratio of gross expenses to average net assets prior to expense reductions | | | 1.17 | % | | | 1.16 | % | | | 1.17 | % | | | 1.20 | % | | | 1.21 | % | |
Ratio of net investment income (loss) to average net assets | | | 0.58 | % | | | 0.42 | % | | | 0.44 | % | | | 0.84 | % | | | 0.86 | % | |
| | | Year Ended October 31, | |
| | | 2023 | | 2022 | | 2021 | | 2020 | | 2019 | |
Portfolio turnover rate | | | 19 | % | | | 32 | % | | | 39 | % | | | 57 | % | | | 82 | % | |
** Distribution for annual periods determined in accordance with federal income tax regulations.
(a) Net investment income (loss) allocated based on average shares method.
(b) Total return measures net investment income (loss) and capital gain or loss from portfolio investments assuming reinvestment of dividends and capital gains distributions. Total return is not annualized for periods that are less than a full year, does not reflect the effect of sales charge for Class A shares nor the contingent deferred sales charge for Class C shares and does not reflect the deduction of taxes that a shareholder would pay on fund distributions or the redemption of fund shares.
www.calamos.com
239
Calamos Hedged Equity Fund Financial Highlights
Selected data for a share outstanding throughout each year were as follows:
| | | CLASS C | |
| | | Year Ended October 31, | |
| | | 2023 | | 2022 | | 2021 | | 2020 | | 2019 | |
Net asset value, beginning of year | | $ | 12.78 | | | $ | 14.39 | | | $ | 12.18 | | | $ | 11.72 | | | $ | 11.35 | | |
Income from investment operations: | |
Net investment income (loss)(a) | | | (0.03 | ) | | | (0.04 | ) | | | (0.04 | ) | | | 0.01 | | | | 0.01 | | |
Net realized and unrealized gain (loss) | | | 0.96 | | | | (1.57 | ) | | | 2.28 | | | | 0.48 | | | | 0.63 | | |
Total from investment operations | | | 0.93 | | | | (1.61 | ) | | | 2.24 | | | | 0.49 | | | | 0.64 | | |
Distributions: | |
Dividends from net investment income | | | (0.04 | ) | | | — | | | | (0.03 | ) | | | (0.03 | ) | | | (0.02 | ) | |
Dividends from net realized gains | | | — | | | | — | | | | — | | | | — | | | | (0.25 | ) | |
Total distributions** | | | (0.04 | ) | | | — | | | | (0.03 | ) | | | (0.03 | ) | | | (0.27 | ) | |
Net asset value, end of year | | $ | 13.67 | | | $ | 12.78 | | | $ | 14.39 | | | $ | 12.18 | | | $ | 11.72 | | |
Ratios and supplemental data: | |
Total return(b) | | | 7.28 | % | | | (11.19 | %) | | | 18.43 | % | | | 4.19 | % | | | 5.88 | % | |
Net assets, end of year (000) | | $ | 8,703 | | | $ | 7,884 | | | $ | 6,960 | | | $ | 3,429 | | | $ | 2,151 | | |
Ratio of net expenses to average net assets | | | 1.92 | % | | | 1.91 | % | | | 1.92 | % | | | 1.90 | % | | | 1.96 | % | |
Ratio of gross expenses to average net assets prior to expense reductions | | | 1.92 | % | | | 1.91 | % | | | 1.92 | % | | | 1.95 | % | | | 1.96 | % | |
Ratio of net investment income (loss) to average net assets | | | (0.20 | %) | | | (0.31 | %) | | | (0.30 | %) | | | 0.08 | % | | | 0.11 | % | |
** Distribution for annual periods determined in accordance with federal income tax regulations.
(a) Net investment income (loss) allocated based on average shares method.
(b) Total return measures net investment income (loss) and capital gain or loss from portfolio investments assuming reinvestment of dividends and capital gains distributions. Total return is not annualized for periods that are less than a full year, does not reflect the effect of sales charge for Class A shares nor the contingent deferred sales charge for Class C shares and does not reflect the deduction of taxes that a shareholder would pay on fund distributions or the redemption of fund shares.
CALAMOS OPEN-END FAMILY OF FUNDS ANNUAL REPORT
240
Calamos Hedged Equity Fund Financial Highlights
Selected data for a share outstanding throughout each year were as follows:
| | | CLASS I | |
| | | Year Ended October 31, | |
| | | 2023 | | 2022 | | 2021 | | 2020 | | 2019 | |
Net asset value, beginning of year | | $ | 13.09 | | | $ | 14.66 | | | $ | 12.34 | | | $ | 11.87 | | | $ | 11.45 | | |
Income from investment operations: | |
Net investment income (loss)(a) | | | 0.11 | | | | 0.10 | | | | 0.10 | | | | 0.13 | | | | 0.13 | | |
Net realized and unrealized gain (loss) | | | 0.99 | | | | (1.61 | ) | | | 2.31 | | | | 0.47 | | | | 0.64 | | |
Total from investment operations | | | 1.10 | | | | (1.51 | ) | | | 2.41 | | | | 0.60 | | | | 0.77 | | |
Distributions: | |
Dividends from net investment income | | | (0.12 | ) | | | (0.06 | ) | | | (0.09 | ) | | | (0.13 | ) | | | (0.10 | ) | |
Dividends from net realized gains | | | — | | | | — | | | | — | | | | — | | | | (0.25 | ) | |
Total distributions** | | | (0.12 | ) | | | (0.06 | ) | | | (0.09 | ) | | | (0.13 | ) | | | (0.35 | ) | |
Net asset value, end of year | | $ | 14.07 | | | $ | 13.09 | | | $ | 14.66 | | | $ | 12.34 | | | $ | 11.87 | | |
Ratios and supplemental data: | |
Total return(b) | | | 8.41 | % | | | (10.33 | %) | | | 19.60 | % | | | 5.09 | % | | | 7.01 | % | |
Net assets, end of year (000) | | $ | 527,423 | | | $ | 547,166 | | | $ | 514,903 | | | $ | 342,851 | | | $ | 224,234 | | |
Ratio of net expenses to average net assets | | | 0.92 | % | | | 0.91 | % | | | 0.92 | % | | | 0.90 | % | | | 0.96 | % | |
Ratio of gross expenses to average net assets prior to expense reductions | | | 0.92 | % | | | 0.91 | % | | | 0.92 | % | | | 0.95 | % | | | 0.96 | % | |
Ratio of net investment income (loss) to average net assets | | | 0.81 | % | | | 0.69 | % | | | 0.73 | % | | | 1.09 | % | | | 1.12 | % | |
** Distribution for annual periods determined in accordance with federal income tax regulations.
(a) Net investment income (loss) allocated based on average shares method.
(b) Total return measures net investment income (loss) and capital gain or loss from portfolio investments assuming reinvestment of dividends and capital gains distributions. Total return is not annualized for periods that are less than a full year, does not reflect the effect of sales charge for Class A shares nor the contingent deferred sales charge for Class C shares and does not reflect the deduction of taxes that a shareholder would pay on fund distributions or the redemption of fund shares.
www.calamos.com
241
Calamos Phineus Long/Short Fund Financial Highlights
Selected data for a share outstanding throughout each year were as follows:
| | | CLASS A | |
| | | Year Ended October 31, | |
| | | 2023 | | 2022 | | 2021 | | 2020 | | 2019 | |
Net asset value, beginning of year | | $ | 14.60 | | | $ | 15.46 | | | $ | 11.18 | | | $ | 11.63 | | | $ | 12.15 | | |
Income from investment operations: | |
Net investment income (loss)(a) | | | 0.19 | | | | (0.06 | ) | | | (0.13 | ) | | | (0.08 | ) | | | 0.04 | | |
Net realized and unrealized gain (loss) | | | 0.14 | | | | (0.80 | ) | | | 4.41 | | | | (0.36 | ) | | | (0.12 | ) | |
Total from investment operations | | | 0.33 | | | | (0.86 | ) | | | 4.28 | | | | (0.44 | ) | | | (0.08 | ) | |
Distributions: | |
Dividends from net investment income | | | — | | | | — | | | | — | | | | (0.01 | ) | | | — | | |
Dividends from net realized gains | | | — | | | | — | | | | — | | | | — | | | | (0.44 | ) | |
Return of capital | | | — | | | | — | | | | — | | | | (0.00 | )* | | | — | | |
Total distributions** | | | — | | | | — | | | | — | | | | (0.01 | ) | | | (0.44 | ) | |
Net asset value, end of year | | $ | 14.93 | | | $ | 14.60 | | | $ | 15.46 | | | $ | 11.18 | | | $ | 11.63 | | |
Ratios and supplemental data: | |
Total return(b) | | | 2.12 | % | | | (5.44 | %) | | | 38.19 | % | | | (3.77 | %) | | | (0.45 | %) | |
Net assets, end of year (000) | | $ | 65,214 | | | $ | 55,800 | | | $ | 51,971 | | | $ | 40,748 | | | $ | 76,689 | | |
Ratio of net expenses to average net assets | | | 2.38 | %(c) | | | 2.38 | %(d) | | | 2.34 | %(e) | | | 2.91 | %(f) | | | 2.95 | %(g) | |
Ratio of gross expenses to average net assets prior to expense reductions | | | 2.38 | % | | | 2.38 | % | | | 2.34 | % | | | 2.92 | % | | | 2.96 | % | |
Ratio of net investment income (loss) to average net assets | | | 1.21 | % | | | (0.43 | %) | | | (0.88 | %) | | | (0.68 | %) | | | 0.33 | % | |
| | | Year Ended October 31, | |
| | | 2023 | | 2022 | | 2021 | | 2020 | | 2019 | |
Portfolio turnover rate | | | 194 | % | | | 214 | % | | | 211 | % | | | 206 | % | | | 135 | % | |
* Amounts are less than $0.005.
** Distribution for annual periods determined in accordance with federal income tax regulations.
(a) Net investment income (loss) allocated based on average shares method.
(b) Total return measures net investment income (loss) and capital gain or loss from portfolio investments assuming reinvestment of dividends and capital gains distributions. Total return is not annualized for periods that are less than a full year, does not reflect the effect of sales charge for Class A shares nor the contingent deferred sales charge for Class C shares and does not reflect the deduction of taxes that a shareholder would pay on fund distributions or the redemption of fund shares.
(c) Ratio of net expenses, excluding dividend expense on short positions, to average net assets was 1.64% for the year ended October 31, 2023.
(d) Ratio of net expenses, excluding dividend expense on short positions, to average net assets was 1.64% for the year ended October 31, 2022.
(e) Ratio of net expenses, excluding dividend expense on short positions, to average net assets was 1.67% for the year ended October 31, 2021.
(f) Ratio of net expenses, excluding dividend expense on short positions, to average net assets was 1.71% for the year ended October 31, 2020.
(g) Ratio of net expenses, excluding dividend expense on short positions, to average net assets was 1.64% for the year ended October 31, 2019.
CALAMOS OPEN-END FAMILY OF FUNDS ANNUAL REPORT
242
Calamos Phineus Long/Short Fund Financial Highlights
Selected data for a share outstanding throughout each year were as follows:
| | | CLASS C | |
| | | Year Ended October 31, | |
| | | 2023 | | 2022 | | 2021 | | 2020 | | 2019 | |
Net asset value, beginning of year | | $ | 13.90 | | | $ | 14.83 | | | $ | 10.80 | | | $ | 11.32 | | | $ | 11.92 | | |
Income from investment operations: | |
Net investment income (loss)(a) | | | 0.07 | | | | (0.17 | ) | | | (0.24 | ) | | | (0.16 | ) | | | (0.05 | ) | |
Net realized and unrealized gain (loss) | | | 0.14 | | | | (0.76 | ) | | | 4.27 | | | | (0.36 | ) | | | (0.11 | ) | |
Total from investment operations | | | 0.21 | | | | (0.93 | ) | | | 4.03 | | | | (0.52 | ) | | | (0.16 | ) | |
Distributions: | |
Dividends from net investment income | | | — | | | | — | | | | — | | | | — | | | | — | | |
Dividends from net realized gains | | | — | | | | — | | | | — | | | | — | | | | (0.44 | ) | |
Return of capital | | | — | | | | — | | | | — | | | | (0.00 | )* | | | — | | |
Total distributions** | | | — | | | | — | | | | — | | | | (0.00 | )* | | | (0.44 | ) | |
Net asset value, end of year | | $ | 14.11 | | | $ | 13.90 | | | $ | 14.83 | | | $ | 10.80 | | | $ | 11.32 | | |
Ratios and supplemental data: | |
Total return(b) | | | 1.37 | % | | | (6.20 | %) | | | 37.31 | % | | | (4.59 | %) | | | (1.15 | %) | |
Net assets, end of year (000) | | $ | 32,461 | | | $ | 31,352 | | | $ | 29,980 | | | $ | 22,528 | | | $ | 38,072 | | |
Ratio of net expenses to average net assets | | | 3.13 | %(c) | | | 3.12 | %(d) | | | 3.09 | %(e) | | | 3.65 | %(f) | | | 3.69 | %(g) | |
Ratio of gross expenses to average net assets prior to expense reductions | | | 3.13 | % | | | 3.12 | % | | | 3.09 | % | | | 3.65 | % | | | 3.70 | % | |
Ratio of net investment income (loss) to average net assets | | | 0.46 | % | | | (1.19 | %) | | | (1.63 | %) | | | (1.43 | %) | | | (0.42 | %) | |
* Amounts are less than $0.005.
** Distribution for annual periods determined in accordance with federal income tax regulations.
(a) Net investment income (loss) allocated based on average shares method.
(b) Total return measures net investment income (loss) and capital gain or loss from portfolio investments assuming reinvestment of dividends and capital gains distributions. Total return is not annualized for periods that are less than a full year, does not reflect the effect of sales charge for Class A shares nor the contingent deferred sales charge for Class C shares and does not reflect the deduction of taxes that a shareholder would pay on fund distributions or the redemption of fund shares.
(c) Ratio of net expenses, excluding dividend expense on short positions, to average net assets was 2.39% for the year ended October 31, 2023.
(d) Ratio of net expenses, excluding dividend expense on short positions, to average net assets was 2.39% for the year ended October 31, 2022.
(e) Ratio of net expenses, excluding dividend expense on short positions, to average net assets was 2.42% for the year ended October 31, 2021.
(f) Ratio of net expenses, excluding dividend expense on short positions, to average net assets was 2.46% for the year ended October 31, 2020.
(g) Ratio of net expenses, excluding dividend expense on short positions, to average net assets was 2.39% for the year ended October 31, 2019.
www.calamos.com
243
Calamos Phineus Long/Short Fund Financial Highlights
Selected data for a share outstanding throughout each year were as follows:
| | | CLASS I | |
| | | Year Ended October 31, | |
| | | 2023 | | 2022 | | 2021 | | 2020 | | 2019 | |
Net asset value, beginning of year | | $ | 14.81 | | | $ | 15.64 | | | $ | 11.28 | | | $ | 11.75 | | | $ | 12.23 | | |
Income from investment operations: | |
Net investment income (loss)(a) | | | 0.23 | | | | (0.02 | ) | | | (0.10 | ) | | | (0.05 | ) | | | 0.07 | | |
Net realized and unrealized gain (loss) | | | 0.13 | | | | (0.81 | ) | | | 4.46 | | | | (0.37 | ) | | | (0.11 | ) | |
Total from investment operations | | | 0.36 | | | | (0.83 | ) | | | 4.36 | | | | (0.42 | ) | | | (0.04 | ) | |
Distributions: | |
Dividends from net investment income | | | (0.00 | )* | | | — | | | | — | | | | (0.02 | ) | | | — | | |
Dividends from net realized gains | | | — | | | | — | | | | — | | | | — | | | | (0.44 | ) | |
Return of capital | | | — | | | | — | | | | — | | | | (0.03 | ) | | | — | | |
Total distributions** | | | (0.00 | )* | | | — | | | | — | | | | (0.05 | ) | | | (0.44 | ) | |
Net asset value, end of year | | $ | 15.17 | | | $ | 14.81 | | | $ | 15.64 | | | $ | 11.28 | | | $ | 11.75 | | |
Ratios and supplemental data: | |
Total return(b) | | | 2.40 | % | | | (5.25 | %) | | | 38.69 | % | | | (3.67 | %) | | | (0.16 | %) | |
Net assets, end of year (000) | | $ | 838,221 | | | $ | 697,472 | | | $ | 476,965 | | | $ | 344,843 | | | $ | 678,157 | | |
Ratio of net expenses to average net assets | | | 2.13 | %(c) | | | 2.14 | %(d) | | | 2.09 | %(e) | | | 2.64 | %(f) | | | 2.68 | %(g) | |
Ratio of gross expenses to average net assets prior to expense reductions | | | 2.13 | % | | | 2.14 | % | | | 2.09 | % | | | 2.65 | % | | | 2.69 | % | |
Ratio of net investment income (loss) to average net assets | | | 1.48 | % | | | (0.12 | )% | | | (0.63 | %) | | | (0.42 | %) | | | 0.57 | % | |
* Amounts are less than $0.005.
** Distribution for annual periods determined in accordance with federal income tax regulations.
(a) Net investment income (loss) allocated based on average shares method.
(b) Total return measures net investment income (loss) and capital gain or loss from portfolio investments assuming reinvestment of dividends and capital gains distributions. Total return is not annualized for periods that are less than a full year, does not reflect the effect of sales charge for Class A shares nor the contingent deferred sales charge for Class C shares and does not reflect the deduction of taxes that a shareholder would pay on fund distributions or the redemption of fund shares.
(c) Ratio of net expenses, excluding dividend expense on short positions, to average net assets was 1.39% for the year ended October 31, 2023.
(d) Ratio of net expenses, excluding dividend expense on short positions, to average net assets was 1.38% for the year ended October 31, 2022.
(e) Ratio of net expenses, excluding dividend expense on short positions, to average net assets was 1.42% for the year ended October 31, 2021.
(f) Ratio of net expenses, excluding dividend expense on short positions, to average net assets was 1.46% for the year ended October 31, 2020.
(g) Ratio of net expenses, excluding dividend expense on short positions, to average net assets was 1.39% for the year ended October 31, 2019.
CALAMOS OPEN-END FAMILY OF FUNDS ANNUAL REPORT
244
Calamos Merger Arbitrage Fund Financial Highlights
Selected data for a share outstanding throughout each year were as follows:
| | | CLASS A | |
| | | September 29, 2023•
through
October 31,
2023 | |
Net asset value, beginning of year | | $ | 10.00 | | |
Income from investment operations: | |
Net investment income (loss)(a) | | | 0.00 | | |
Net realized and unrealized gain (loss) | | | (0.27 | ) | |
Total from investment operations | | | (0.27 | ) | |
Distributions: | |
Dividends from net investment income | | | — | | |
Dividends from net realized gains | | | — | | |
Total distributions** | | | — | | |
Net asset value, end of year | | $ | 9.73 | | |
Ratios and supplemental data: | |
Total return(b) | | | (2.70 | %) | |
Net assets, end of year (000) | | $ | 97 | | |
Ratio of net expenses to average net assets | | | 1.50 | %(c) | |
Ratio of gross expenses to average net assets prior to expense reductions | | | 6.06 | %(c) | |
Ratio of net investment income (loss) to average net assets | | | 0.52 | %(c) | |
| | | September 29, 2023•
through
October 31,
2023 | |
Portfolio turnover rate | | | 13 | %(d) | |
• Commencement of operations.
** Distribution for annual periods determined in accordance with federal income tax regulations.
(a) Net investment income (loss) allocated based on average shares method.
(b) Total return measures net investment income (loss) and capital gain or loss from portfolio investments assuming reinvestment of dividends and capital gains distributions. Total return is not annualized for periods that are less than a full year, does not reflect the effect of sales charge for Class A shares nor the contingent deferred sales charge for Class C shares and does not reflect the deduction of taxes that a shareholder would pay on fund distributions or the redemption of fund shares.
(c) Annualized.
(d) Not annualized.
www.calamos.com
245
Calamos Merger Arbitrage Fund Financial Highlights
Selected data for a share outstanding throughout each year were as follows:
| | | CLASS C | |
| | | September 29, 2023•
through
October 31,
2023 | |
Net asset value, beginning of year | | $ | 10.00 | | |
Income from investment operations: | |
Net investment income (loss)(a) | | | 0.00 | | |
Net realized and unrealized gain (loss) | | | (0.28 | ) | |
Total from investment operations | | | (0.28 | ) | |
Distributions: | |
Dividends from net investment income | | | — | | |
Dividends from net realized gains | | | — | | |
Total distributions** | | | — | | |
Net asset value, end of year | | $ | 9.72 | | |
Ratios and supplemental data: | |
Total return(b) | | | (2.80 | %) | |
Net assets, end of year (000) | | $ | 97 | | |
Ratio of net expenses to average net assets | | | 2.25 | %(c) | |
Ratio of gross expenses to average net assets prior to expense reductions | | | 6.81 | %(c) | |
Ratio of net investment income (loss) to average net assets | | | (0.23 | %)(c) | |
• Commencement of operations.
** Distribution for annual periods determined in accordance with federal income tax regulations.
(a) Net investment income (loss) allocated based on average shares method.
(b) Total return measures net investment income (loss) and capital gain or loss from portfolio investments assuming reinvestment of dividends and capital gains distributions. Total return is not annualized for periods that are less than a full year, does not reflect the effect of sales charge for Class A shares nor the contingent deferred sales charge for Class C shares and does not reflect the deduction of taxes that a shareholder would pay on fund distributions or the redemption of fund shares.
(c) Annualized.
CALAMOS OPEN-END FAMILY OF FUNDS ANNUAL REPORT
246
Calamos Merger Arbitrage Fund Financial Highlights
Selected data for a share outstanding throughout each year were as follows:
| | | CLASS I | |
| | | September 29, 2023•
through
October 31,
2023 | |
Net asset value, beginning of year | | $ | 10.00 | | |
Income from investment operations: | |
Net investment income (loss)(a) | | | 0.01 | | |
Net realized and unrealized gain (loss) | | | (0.28 | ) | |
Total from investment operations | | | (0.27 | ) | |
Distributions: | |
Dividends from net investment income | | | — | | |
Dividends from net realized gains | | | — | | |
Total distributions** | | | — | | |
Net asset value, end of year | | $ | 9.73 | | |
Ratios and supplemental data: | |
Total return(b) | | | (2.70 | %) | |
Net assets, end of year (000) | | $ | 1,864 | | |
Ratio of net expenses to average net assets | | | 1.25 | %(c) | |
Ratio of gross expenses to average net assets prior to expense reductions | | | 5.81 | %(c) | |
Ratio of net investment income (loss) to average net assets | | | 1.13 | %(c) | |
• Commencement of operations.
** Distribution for annual periods determined in accordance with federal income tax regulations.
(a) Net investment income (loss) allocated based on average shares method.
(b) Total return measures net investment income (loss) and capital gain or loss from portfolio investments assuming reinvestment of dividends and capital gains distributions. Total return is not annualized for periods that are less than a full year, does not reflect the effect of sales charge for Class A shares nor the contingent deferred sales charge for Class C shares and does not reflect the deduction of taxes that a shareholder would pay on fund distributions or the redemption of fund shares.
(c) Annualized.
www.calamos.com
247
Calamos Convertible Fund Financial Highlights
Selected data for a share outstanding throughout each year were as follows:
| | | CLASS A | |
| | | Year Ended October 31, | |
| | | 2023 | | 2022 | | 2021 | | 2020 | | 2019 | |
Net asset value, beginning of year | | $ | 18.57 | | | $ | 27.25 | | | $ | 22.78 | | | $ | 17.45 | | | $ | 18.11 | | |
Income from investment operations: | |
Net investment income (loss)(a) | | | (0.08 | ) | | | (0.27 | ) | | | (0.61 | ) | | | 0.47 | | | | 0.51 | | |
Net realized and unrealized gain (loss) | | | (0.15 | ) | | | (5.20 | ) | | | 6.68 | | | | 4.99 | | | | 1.00 | | |
Total from investment operations | | | (0.23 | ) | | | (5.47 | ) | | | 6.07 | | | | 5.46 | | | | 1.51 | | |
Distributions: | |
Dividends from net investment income | | | (0.16 | ) | | | (0.02 | ) | | | (0.06 | ) | | | (0.13 | ) | | | (0.35 | ) | |
Dividends from net realized gains | | | — | | | | (3.19 | ) | | | (1.54 | ) | | | — | | | | (1.82 | ) | |
Total distributions** | | | (0.16 | ) | | | (3.21 | ) | | | (1.60 | ) | | | (0.13 | ) | | | (2.17 | ) | |
Net asset value, end of year | | $ | 18.18 | | | $ | 18.57 | | | $ | 27.25 | | | $ | 22.78 | | | $ | 17.45 | | |
Ratios and supplemental data: | |
Total return(b) | | | (1.26 | %) | | | (22.29 | %) | | | 27.09 | % | | | 31.58 | % | | | 10.02 | % | |
Net assets, end of year (000) | | $ | 243,516 | | | $ | 294,233 | | | $ | 422,476 | | | $ | 333,481 | | | $ | 245,948 | | |
Ratio of net expenses to average net assets | | | 1.13 | % | | | 1.10 | % | | | 1.08 | % | | | 1.13 | % | | | 1.16 | % | |
Ratio of gross expenses to average net assets prior to expense reductions | | | 1.13 | % | | | 1.10 | % | | | 1.08 | % | | | 1.13 | % | | | 1.16 | % | |
Ratio of net investment income (loss) to average net assets | | | (0.44 | %) | | | (1.30 | %) | | | (2.35 | %) | | | 2.37 | % | | | 2.98 | % | |
| | | Year Ended October 31, | |
| | | 2023 | | 2022 | | 2021 | | 2020 | | 2019 | |
Portfolio turnover rate | | | 40 | % | | | 39 | % | | | 41 | % | | | 71 | % | | | 37 | % | |
** Distribution for annual periods determined in accordance with federal income tax regulations.
(a) Net investment income (loss) allocated based on average shares method.
(b) Total return measures net investment income (loss) and capital gain or loss from portfolio investments assuming reinvestment of dividends and capital gains distributions. Total return is not annualized for periods that are less than a full year, does not reflect the effect of sales charge for Class A shares nor the contingent deferred sales charge for Class C shares and does not reflect the deduction of taxes that a shareholder would pay on fund distributions or the redemption of fund shares.
CALAMOS OPEN-END FAMILY OF FUNDS ANNUAL REPORT
248
Calamos Convertible Fund Financial Highlights
Selected data for a share outstanding throughout each year were as follows:
| | | CLASS C | |
| | | Year Ended October 31, | |
| | | 2023 | | 2022 | | 2021 | | 2020 | | 2019 | |
Net asset value, beginning of year | | $ | 18.03 | | | $ | 26.73 | | | $ | 22.48 | | | $ | 17.27 | | | $ | 17.92 | | |
Income from investment operations: | |
Net investment income (loss)(a) | | | (0.22 | ) | | | (0.42 | ) | | | (0.80 | ) | | | 0.32 | | | | 0.39 | | |
Net realized and unrealized gain (loss) | | | (0.13 | ) | | | (5.09 | ) | | | 6.59 | | | | 4.93 | | | | 0.99 | | |
Total from investment operations | | | (0.35 | ) | | | (5.51 | ) | | | 5.79 | | | | 5.25 | | | | 1.38 | | |
Distributions: | |
Dividends from net investment income | | | (0.06 | ) | | | — | | | | — | | | | (0.04 | ) | | | (0.21 | ) | |
Dividends from net realized gains | | | — | | | | (3.19 | ) | | | (1.54 | ) | | | — | | | | (1.82 | ) | |
Total distributions** | | | (0.06 | ) | | | (3.19 | ) | | | (1.54 | ) | | | (0.04 | ) | | | (2.03 | ) | |
Net asset value, end of year | | $ | 17.62 | | | $ | 18.03 | | | $ | 26.73 | | | $ | 22.48 | | | $ | 17.27 | | |
Ratios and supplemental data: | |
Total return(b) | | | (2.01 | %) | | | (22.88 | %) | | | 26.16 | % | | | 30.53 | % | | | 9.21 | % | |
Net assets, end of year (000) | | $ | 31,773 | | | $ | 41,804 | | | $ | 71,925 | | | $ | 56,935 | | | $ | 56,070 | | |
Ratio of net expenses to average net assets | | | 1.88 | % | | | 1.85 | % | | | 1.83 | % | | | 1.88 | % | | | 1.91 | % | |
Ratio of gross expenses to average net assets prior to expense reductions | | | 1.88 | % | | | 1.85 | % | | | 1.83 | % | | | 1.88 | % | | | 1.91 | % | |
Ratio of net investment income (loss) to average net assets | | | (1.19 | %) | | | (2.04 | %) | | | (3.10 | %) | | | 1.65 | % | | | 2.34 | % | |
** Distribution for annual periods determined in accordance with federal income tax regulations.
(a) Net investment income (loss) allocated based on average shares method.
(b) Total return measures net investment income (loss) and capital gain or loss from portfolio investments assuming reinvestment of dividends and capital gains distributions. Total return is not annualized for periods that are less than a full year, does not reflect the effect of sales charge for Class A shares nor the contingent deferred sales charge for Class C shares and does not reflect the deduction of taxes that a shareholder would pay on fund distributions or the redemption of fund shares.
www.calamos.com
249
Calamos Convertible Fund Financial Highlights
Selected data for a share outstanding throughout each year were as follows:
| | | CLASS I | |
| | | Year Ended October 31, | |
| | | 2023 | | 2022 | | 2021 | | 2020 | | 2019 | |
Net asset value, beginning of year | | $ | 15.91 | | | $ | 23.82 | | | $ | 20.05 | | | $ | 15.38 | | | $ | 16.23 | | |
Income from investment operations: | |
Net investment income (loss)(a) | | | (0.03 | ) | | | (0.19 | ) | | | (0.48 | ) | | | 0.46 | | | | 0.49 | | |
Net realized and unrealized gain (loss) | | | (0.12 | ) | | | (4.49 | ) | | | 5.86 | | | | 4.39 | | | | 0.88 | | |
Total from investment operations | | | (0.15 | ) | | | (4.68 | ) | | | 5.38 | | | | 4.85 | | | | 1.37 | | |
Distributions: | |
Dividends from net investment income | | | (0.21 | ) | | | (0.04 | ) | | | (0.07 | ) | | | (0.18 | ) | | | (0.40 | ) | |
Dividends from net realized gains | | | — | | | | (3.19 | ) | | | (1.54 | ) | | | — | | | | (1.82 | ) | |
Total distributions** | | | (0.21 | ) | | | (3.23 | ) | | | (1.61 | ) | | | (0.18 | ) | | | (2.22 | ) | |
Net asset value, end of year | | $ | 15.55 | | | $ | 15.91 | | | $ | 23.82 | | | $ | 20.05 | | | $ | 15.38 | | |
Ratios and supplemental data: | |
Total return(b) | | | (1.04 | %) | | | (22.09 | %) | | | 27.40 | % | | | 31.91 | % | | | 10.31 | % | |
Net assets, end of year (000) | | $ | 559,907 | | | $ | 680,441 | | | $ | 1,161,030 | | | $ | 773,460 | | | $ | 442,907 | | |
Ratio of net expenses to average net assets | | | 0.88 | % | | | 0.85 | % | | | 0.83 | % | | | 0.88 | % | | | 0.91 | % | |
Ratio of gross expenses to average net assets prior to expense reductions | | | 0.88 | % | | | 0.85 | % | | | 0.83 | % | | | 0.88 | % | | | 0.91 | % | |
Ratio of net investment income (loss) to average net assets | | | (0.19 | %) | | | (1.04 | %) | | | (2.09 | %) | | | 2.60 | % | | | 3.21 | % | |
** Distribution for annual periods determined in accordance with federal income tax regulations.
(a) Net investment income (loss) allocated based on average shares method.
(b) Total return measures net investment income (loss) and capital gain or loss from portfolio investments assuming reinvestment of dividends and capital gains distributions. Total return is not annualized for periods that are less than a full year, does not reflect the effect of sales charge for Class A shares nor the contingent deferred sales charge for Class C shares and does not reflect the deduction of taxes that a shareholder would pay on fund distributions or the redemption of fund shares.
CALAMOS OPEN-END FAMILY OF FUNDS ANNUAL REPORT
250
Calamos Global Convertible Fund Financial Highlights
Selected data for a share outstanding throughout each year were as follows:
| | | CLASS A | |
| | | Year Ended October 31, | |
| | | 2023 | | 2022 | | 2021 | | 2020 | | 2019 | |
Net asset value, beginning of year | | $ | 9.59 | | | $ | 14.85 | | | $ | 13.48 | | | $ | 11.08 | | | $ | 10.81 | | |
Income from investment operations: | |
Net investment income (loss)(a) | | | (0.15 | ) | | | (0.01 | ) | | | (0.44 | ) | | | 0.24 | | | | 0.10 | | |
Net realized and unrealized gain (loss) | | | 0.60 | | | | (3.45 | ) | | | 2.95 | | | | 2.37 | | | | 0.70 | | |
Total from investment operations | | | 0.45 | | | | (3.46 | ) | | | 2.51 | | | | 2.61 | | | | 0.80 | | |
Distributions: | |
Dividends from net investment income | | | (0.03 | ) | | | (0.01 | ) | | | (0.01 | ) | | | (0.06 | ) | | | (0.22 | ) | |
Dividends from net realized gains | | | — | | | | (1.79 | ) | | | (1.13 | ) | | | (0.15 | ) | | | (0.31 | ) | |
Total distributions** | | | (0.03 | ) | | | (1.80 | ) | | | (1.14 | ) | | | (0.21 | ) | | | (0.53 | ) | |
Net asset value, end of year | | $ | 10.01 | | | $ | 9.59 | | | $ | 14.85 | | | $ | 13.48 | | | $ | 11.08 | | |
Ratios and supplemental data: | |
Total return(b) | | | 4.78 | % | | | (26.01 | %) | | | 18.86 | % | | | 23.93 | % | | | 7.90 | % | |
Net assets, end of year (000) | | $ | 8,455 | | | $ | 10,698 | | | $ | 17,865 | | | $ | 11,231 | | | $ | 8,998 | | |
Ratio of net expenses to average net assets | | | 1.34 | % | | | 1.28 | % | | | 1.25 | % | | | 1.33 | % | | | 1.32 | % | |
Ratio of gross expenses to average net assets prior to expense reductions | | | 1.34 | % | | | 1.28 | % | | | 1.25 | % | | | 1.34 | % | | | 1.32 | % | |
Ratio of net investment income (loss) to average net assets | | | (1.48 | %) | | | (0.11 | %) | | | (2.96 | %) | | | 1.96 | % | | | 0.91 | % | |
| | | Year Ended October 31, | |
| | | 2023 | | 2022 | | 2021 | | 2020 | | 2019 | |
Portfolio turnover rate | | | 27 | % | | | 31 | % | | | 35 | % | | | 48 | % | | | 45 | % | |
** Distribution for annual periods determined in accordance with federal income tax regulations.
(a) Net investment income (loss) allocated based on average shares method.
(b) Total return measures net investment income (loss) and capital gain or loss from portfolio investments assuming reinvestment of dividends and capital gains distributions. Total return is not annualized for periods that are less than a full year, does not reflect the effect of sales charge for Class A shares nor the contingent deferred sales charge for Class C shares and does not reflect the deduction of taxes that a shareholder would pay on fund distributions or the redemption of fund shares.
www.calamos.com
251
Calamos Global Convertible Fund Financial Highlights
Selected data for a share outstanding throughout each year were as follows:
| | | CLASS C | |
| | | Year Ended October 31, | |
| | | 2023 | | 2022 | | 2021 | | 2020 | | 2019 | |
Net asset value, beginning of year | | $ | 9.23 | | | $ | 14.47 | | | $ | 13.25 | | | $ | 10.93 | | | $ | 10.69 | | |
Income from investment operations: | |
Net investment income (loss)(a) | | | (0.22 | ) | | | (0.09 | ) | | | (0.54 | ) | | | 0.14 | | | | 0.02 | | |
Net realized and unrealized gain (loss) | | | 0.59 | | | | (3.36 | ) | | | 2.89 | | | | 2.35 | | | | 0.69 | | |
Total from investment operations | | | 0.37 | | | | (3.45 | ) | | | 2.35 | | | | 2.49 | | | | 0.71 | | |
Distributions: | |
Dividends from net investment income | | | — | | | | — | | | | — | | | | (0.02 | ) | | | (0.16 | ) | |
Dividends from net realized gains | | | — | | | | (1.79 | ) | | | (1.13 | ) | | | (0.15 | ) | | | (0.31 | ) | |
Total distributions** | | | — | | | | (1.79 | ) | | | (1.13 | ) | | | (0.17 | ) | | | (0.47 | ) | |
Net asset value, end of year | | $ | 9.60 | | | $ | 9.23 | | | $ | 14.47 | | | $ | 13.25 | | | $ | 10.93 | | |
Ratios and supplemental data: | |
Total return(b) | | | 4.01 | % | | | (26.58 | %) | | | 17.95 | % | | | 23.09 | % | | | 7.01 | % | |
Net assets, end of year (000) | | $ | 2,615 | | | $ | 3,425 | | | $ | 5,448 | | | $ | 4,824 | | | $ | 3,409 | | |
Ratio of net expenses to average net assets | | | 2.09 | % | | | 2.03 | % | | | 2.00 | % | | | 2.08 | % | | | 2.07 | % | |
Ratio of gross expenses to average net assets prior to expense reductions | | | 2.09 | % | | | 2.03 | % | | | 2.00 | % | | | 2.09 | % | | | 2.07 | % | |
Ratio of net investment income (loss) to average net assets | | | (2.23 | %) | | | (0.85 | %) | | | (3.72 | %) | | | 1.21 | % | | | 0.16 | % | |
** Distribution for annual periods determined in accordance with federal income tax regulations.
(a) Net investment income (loss) allocated based on average shares method.
(b) Total return measures net investment income (loss) and capital gain or loss from portfolio investments assuming reinvestment of dividends and capital gains distributions. Total return is not annualized for periods that are less than a full year, does not reflect the effect of sales charge for Class A shares nor the contingent deferred sales charge for Class C shares and does not reflect the deduction of taxes that a shareholder would pay on fund distributions or the redemption of fund shares.
CALAMOS OPEN-END FAMILY OF FUNDS ANNUAL REPORT
252
Calamos Global Convertible Fund Financial Highlights
Selected data for a share outstanding throughout each year were as follows:
| | | CLASS I | |
| | | Year Ended October 31, | |
| | | 2023 | | 2022 | | 2021 | | 2020 | | 2019 | |
Net asset value, beginning of year | | $ | 9.60 | | | $ | 14.87 | | | $ | 13.50 | | | $ | 11.08 | | | $ | 10.82 | | |
Income from investment operations: | |
Net investment income (loss)(a) | | | (0.13 | ) | | | 0.01 | | | | (0.40 | ) | | | 0.26 | | | | 0.12 | | |
Net realized and unrealized gain (loss) | | | 0.61 | | | | (3.46 | ) | | | 2.94 | | | | 2.39 | | | | 0.70 | | |
Total from investment operations | | | 0.48 | | | | (3.45 | ) | | | 2.54 | | | | 2.65 | | | | 0.82 | | |
Distributions: | |
Dividends from net investment income | | | (0.04 | ) | | | (0.03 | ) | | | (0.04 | ) | | | (0.08 | ) | | | (0.25 | ) | |
Dividends from net realized gains | | | — | | | | (1.79 | ) | | | (1.13 | ) | | | (0.15 | ) | | | (0.31 | ) | |
Total distributions** | | | (0.04 | ) | | | (1.82 | ) | | | (1.17 | ) | | | (0.23 | ) | | | (0.56 | ) | |
Net asset value, end of year | | $ | 10.04 | | | $ | 9.60 | | | $ | 14.87 | | | $ | 13.50 | | | $ | 11.08 | | |
Ratios and supplemental data: | |
Total return(b) | | | 5.00 | % | | | (25.82 | %) | | | 19.09 | % | | | 24.36 | % | | | 8.09 | % | |
Net assets, end of year (000) | | $ | 109,319 | | | $ | 117,766 | | | $ | 260,688 | | | $ | 192,475 | | | $ | 120,526 | | |
Ratio of net expenses to average net assets | | | 1.09 | % | | | 1.03 | % | | | 1.00 | % | | | 1.08 | % | | | 1.07 | % | |
Ratio of gross expenses to average net assets prior to expense reductions | | | 1.09 | % | | | 1.03 | % | | | 1.00 | % | | | 1.09 | % | | | 1.07 | % | |
Ratio of net investment income (loss) to average net assets | | | (1.23 | %) | | | 0.13 | % | | | (2.71 | %) | | | 2.19 | % | | | 1.16 | % | |
** Distribution for annual periods determined in accordance with federal income tax regulations.
(a) Net investment income (loss) allocated based on average shares method.
(b) Total return measures net investment income (loss) and capital gain or loss from portfolio investments assuming reinvestment of dividends and capital gains distributions. Total return is not annualized for periods that are less than a full year, does not reflect the effect of sales charge for Class A shares nor the contingent deferred sales charge for Class C shares and does not reflect the deduction of taxes that a shareholder would pay on fund distributions or the redemption of fund shares.
www.calamos.com
253
Calamos Timpani Small Cap Growth Fund Financial Highlights
Selected data for a share outstanding throughout each year were as follows:
| | | CLASS A* | |
| | | Year Ended October 31, | | May 31, 2019
through
October 31, | | July 1, 2018
through
May 31, | | Year Ended
June 30, | |
| | | 2023 | | 2022 | | 2021 | | 2020 | | 2019 | | 2019† | | 2018 | |
Net asset value, beginning of year | | $ | 26.35 | | | $ | 42.31 | | | $ | 29.18 | | | $ | 22.31 | | | $ | 22.51 | | | $ | 25.02 | | | $ | 18.54 | | |
Income from investment operations: | |
Net investment income (loss)(a) | | | (0.26 | ) | | | (0.24 | ) | | | (0.45 | ) | | | (0.28 | ) | | | (0.11 | ) | | | (0.29 | ) | | | (0.28 | ) | |
Net realized and unrealized gain (loss) | | | (3.89 | ) | | | (15.72 | ) | | | 14.95 | | | | 8.29 | | | | (0.09 | ) | | | (0.80 | ) | | | 6.76 | | |
Total from investment operations | | | (4.15 | ) | | | (15.96 | ) | | | 14.50 | | | | 8.01 | | | | (0.20 | ) | | | (1.09 | ) | | | 6.48 | | |
Distributions: | |
Dividends from net investment income | | | — | | | | — | | | | — | | | | — | | | | — | | | | — | | | | — | | |
Dividends from net realized gains | | | — | | | | — | | | | (1.37 | ) | | | (1.14 | ) | | | — | | | | (1.42 | ) | | | — | | |
Return of capital | | | — | | | | — | | | | (0.00 | )** | | | — | | | | — | | | | — | | | | — | | |
Total distributions*** | | | — | | | | — | | | | (1.37 | ) | | | (1.14 | ) | | | — | | | | (1.42 | ) | | | — | | |
Net asset value, end of year | | $ | 22.20 | | | $ | 26.35 | | | $ | 42.31 | | | $ | 29.18 | | | $ | 22.31 | | | $ | 22.51 | | | $ | 25.02 | | |
Ratios and supplemental data: | |
Total return(b) | | | (15.75 | %) | | | (37.71 | %) | | | 50.42 | % | | | 37.60 | % | | | (0.89 | %) | | | (3.52 | %) | | | 34.95 | % | |
Net assets, end of year (000) | | $ | 18,283 | | | $ | 23,762 | | | $ | 35,274 | | | $ | 9,313 | | | $ | 6,857 | | | $ | 5,551 | | | $ | 5,890 | | |
Ratio of net expenses to average net assets | | | 1.30 | % | | | 1.30 | % | | | 1.30 | % | | | 1.30 | % | | | 1.30 | %(c) | | | 1.50 | %(c) | | | 1.50 | % | |
Ratio of gross expenses to average net assets
prior to expense reductions | | | 1.37 | % | | | 1.37 | % | | | 1.37 | % | | | 1.40 | % | | | 1.35 | %(c) | | | 1.71 | %(c) | | | 1.74 | % | |
Ratio of net investment income (loss) to
average net assets | | | (1.03 | %) | | | (0.78 | %) | | | (1.15 | %) | | | (1.16 | %) | | | (1.18 | %)(c) | | | (1.31 | %)(c) | | | (1.33 | %) | |
| | | Year Ended October 31, | | May 31, 2019
through
October 31, | | July 1, 2018
through
May 31, | | Year Ended
June 30, | |
| | | 2023 | | 2022 | | 2021 | | 2020 | | 2019 | | 2019† | | 2018 | |
Portfolio turnover rate | | | 215 | % | | | 197 | % | | | 165 | % | | | 181 | % | | | 142 | % | | | 112 | % | | | 126 | % | |
* Prior to May 31, 2019, Class A shares were Class Y shares of the predecessor fund.
† Pursuant to the Reorganization of the Predecessor Fund into the Fund, Class Y shareholders of the Predecessor Fund received Class A shares of the Fund, and Service Class and Institutional Class shareholders of the Predecessor Fund each received Class I shares of the Fund. As a result of the Reorganization, the Fund adopted the performance and financial history of the Predecessor Fund. Accordingly, the data shown for periods prior to May 31, 2019 is the data of the Predecessor Fund.
** Amounts are less than $0.005.
*** Distribution for annual periods determined in accordance with federal income tax regulations.
(a) Net investment income (loss) allocated based on average shares method.
(b) Total return measures net investment income (loss) and capital gain or loss from portfolio investments assuming reinvestment of dividends and capital gains distributions. Total return is not annualized for periods that are less than a full year, does not reflect the effect of sales charge for Class A shares and does not reflect the deduction of taxes that a shareholder would pay on fund distributions or the redemption of fund shares.
(c) Annualized.
CALAMOS OPEN-END FAMILY OF FUNDS ANNUAL REPORT
254
Calamos Timpani Small Cap Growth Fund Financial Highlights
Selected data for a share outstanding throughout each year were as follows:
| | | CLASS C | |
| | | Year Ended October 31, | | June 25, 2021•
through
October 31, | |
| | | 2023 | | 2022 | | 2021 | |
Net asset value, beginning of year | | $ | 26.88 | | | $ | 43.50 | | | $ | 41.91 | | |
Income from investment operations: | |
Net investment income (loss)(a) | | | (0.45 | ) | | | (0.45 | ) | | | (0.82 | ) | |
Net realized and unrealized gain (loss) | | | (3.95 | ) | | | (16.17 | ) | | | 2.41 | | |
Total from investment operations | | | (4.40 | ) | | | (16.62 | ) | | | 1.59 | | |
Distributions: | |
Dividends from net investment income | | | — | | | | — | | | | — | | |
Dividends from net realized gains | | | — | | | | — | | | | — | | |
Total distributions** | | | — | | | | — | | | | — | | |
Net asset value, end of year | | $ | 22.48 | | | $ | 26.88 | | | $ | 43.50 | | |
Ratios and supplemental data:(b) | |
Total return | | | (16.37 | %) | | | (38.18 | %) | | | 3.75 | % | |
Net assets, end of year (000) | | $ | 3,648 | | | $ | 4,425 | | | $ | 3,165 | | |
Ratio of net expenses to average net assets | | | 2.05 | % | | | 2.05 | % | | | 2.05 | %(c) | |
Ratio of gross expenses to average net assets prior to expense reductions | | | 2.12 | % | | | 2.12 | % | | | 2.06 | %(c) | |
Ratio of net investment income (loss) to average net assets | | | (1.79 | %) | | | (1.50 | %) | | | (2.00 | %)(c) | |
• Commencement of operations.
** Distribution for annual periods determined in accordance with federal income tax regulations.
(a) Net investment income (loss) allocated based on average shares method.
(b) Total return measures net investment income (loss) and capital gain or loss from portfolio investments assuming reinvestment of dividends and capital gains distributions. Total return is not annualized for periods that are less than a full year, does not reflect the effect of sales charge for Class A shares nor the contingent deferred sales charge for Class C shares and does not reflect the deduction of taxes that a shareholder would pay on fund distributions or the redemption of fund shares.
(c) Annualized.
www.calamos.com
255
Calamos Timpani Small Cap Growth Fund Financial Highlights
Selected data for a share outstanding throughout each year were as follows:
| | | CLASS I* | |
| | | Year Ended October 31, | | May 31, 2019
through
October 31, | | July 1, 2018
through
May 31, | | Year Ended
June 30, | |
| | | 2023 | | 2022 | | 2021 | | 2020 | | 2019 | | 2019† | | 2018 | |
Net asset value, beginning of year | | $ | 27.24 | | | $ | 43.65 | | | $ | 29.99 | | | $ | 22.85 | | | $ | 23.02 | | | $ | 25.47 | | | $ | 18.80 | | |
Income from investment operations: | |
Net investment income (loss)(a) | | | (0.20 | ) | | | (0.16 | ) | | | (0.36 | ) | | | (0.23 | ) | | | (0.09 | ) | | | (0.20 | ) | | | (0.20 | ) | |
Net realized and unrealized gain (loss) | | | (4.03 | ) | | | (16.25 | ) | | | 15.39 | | | | 8.51 | | | | (0.08 | ) | | | (0.83 | ) | | | 6.87 | | |
Total from investment operations | | | (4.23 | ) | | | (16.41 | ) | | | 15.03 | | | | 8.28 | | | | (0.17 | ) | | | (1.03 | ) | | | 6.67 | | |
Distributions: | |
Dividends from net investment income | | | — | | | | — | | | | — | | | | — | | | | — | | | | — | | | | — | | |
Dividends from net realized gains | | | — | | | | — | | | | (1.37 | ) | | | (1.14 | ) | | | — | | | | (1.42 | ) | | | — | | |
Return of capital | | | — | | | | — | | | | (0.00 | )** | | | — | | | | — | | | | — | | | | — | | |
Total distributions*** | | | — | | | | — | | | | (1.37 | ) | | | (1.14 | ) | | | — | | | | (1.42 | ) | | | — | | |
Net asset value, end of year | | $ | 23.01 | | | $ | 27.24 | | | $ | 43.65 | | | $ | 29.99 | | | $ | 22.85 | | | $ | 23.02 | | | $ | 25.47 | | |
Ratios and supplemental data: | |
Total return(b) | | | (15.53 | %) | | | (37.57 | %) | | | 50.80 | % | | | 37.90 | % | | | (0.74 | %) | | | (3.21 | %) | | | 35.48 | % | |
Net assets, end of year (000) | | $ | 191,831 | | | $ | 292,187 | | | $ | 387,149 | | | $ | 124,867 | | | $ | 72,539 | | | $ | 68,510 | | | $ | 69,095 | | |
Ratio of net expenses to average net assets | | | 1.05 | % | | | 1.05 | % | | | 1.05 | % | | | 1.05 | % | | | 1.05 | %(c) | | | 1.10 | %(c) | | | 1.10 | % | |
Ratio of gross expenses to average net assets
prior to expense reductions | | | 1.12 | % | | | 1.12 | % | | | 1.11 | % | | | 1.16 | % | | | 1.11 | %(c) | | | 1.34 | %(c) | | | 1.36 | % | |
Ratio of net investment income (loss) to
average net assets | | | (0.78 | %) | | | (0.52 | %) | | | (0.90 | %) | | | (0.92 | %) | | | (0.93 | %)(c) | | | (0.92 | %)(c) | | | (0.92 | %) | |
* Prior to May 31, 2019, Class I shares were Institutional Class shares or Service Class shares of the predecessor fund. Results shown are exclusive of the Service Class shares.
† Pursuant to the Reorganization of the Predecessor Fund into the Fund, Class Y shareholders of the Predecessor Fund received Class A shares of the Fund, and Service Class and Institutional Class shareholders of the Predecessor Fund each received Class I shares of the Fund. As a result of the Reorganization, the Fund adopted the performance and financial history of the Predecessor Fund. Accordingly, the data shown for periods prior to May 31, 2019 is the data of the Predecessor Fund.
** Amounts are less than $0.005.
*** Distribution for annual periods determined in accordance with federal income tax regulations.
(a) Net investment income (loss) allocated based on average shares method.
(b) Total return measures net investment income (loss) and capital gain or loss from portfolio investments assuming reinvestment of dividends and capital gains distributions. Total return is not annualized for periods that are less than a full year, does not reflect the effect of sales charge for Class A shares and does not reflect the deduction of taxes that a shareholder would pay on fund distributions or the redemption of fund shares.
(c) Annualized.
CALAMOS OPEN-END FAMILY OF FUNDS ANNUAL REPORT
256
Calamos Timpani Small Cap Growth Fund Financial Highlights
Selected data for a share outstanding throughout each year were as follows:
| | | CLASS R6 | |
| | | Year Ended October 31, | | May 31, 2019•
through
October 31, | |
| | | 2023 | | 2022 | | 2021 | | 2020 | | 2019 | |
Net asset value, beginning of year | | $ | 27.33 | | | $ | 43.74 | | | $ | 30.02 | | | $ | 22.86 | | | $ | 23.02 | | |
Income from investment operations: | |
Net investment income (loss)(a) | | | (0.17 | ) | | | (0.11 | ) | | | (0.32 | ) | | | (0.21 | ) | | | (0.08 | ) | |
Net realized and unrealized gain (loss) | | | (4.05 | ) | | | (16.30 | ) | | | 15.41 | | | | 8.51 | | | | (0.08 | ) | |
Total from investment operations | | | (4.22 | ) | | | (16.41 | ) | | | 15.09 | | | | 8.30 | | | | (0.16 | ) | |
Distributions: | |
Dividends from net investment income | | | — | | | | — | | | | — | | | | — | | | | — | | |
Dividends from net realized gains | | | — | | | | — | | | | (1.37 | ) | | | (1.14 | ) | | | — | | |
Total distributions** | | | — | | | | — | | | | (1.37 | ) | | | (1.14 | ) | | | — | | |
Net asset value, end of year | | $ | 23.11 | | | $ | 27.33 | | | $ | 43.74 | | | $ | 30.02 | | | $ | 22.86 | | |
Ratios and supplemental data: | |
Total return(b) | | | (15.41 | %) | | | (37.51 | %) | | | 50.96 | % | | | 37.98 | % | | | (0.70 | %) | |
Net assets, end of year (000) | | $ | 24,499 | | | $ | 22,181 | | | $ | 29,120 | | | $ | 1,562 | | | $ | 1,063 | | |
Ratio of net expenses to average net assets | | | 0.92 | % | | | 0.93 | % | | | 0.96 | % | | | 0.98 | % | | | 1.00 | %(c) | |
Ratio of gross expenses to average net assets prior to expense reductions | | | 0.99 | % | | | 1.00 | % | | | 1.02 | % | | | 1.09 | % | | | 0.96 | %(c) | |
Ratio of net investment income (loss) to average net assets | | | (0.67 | %) | | | (0.37 | %) | | | (0.80 | %) | | | (0.84 | %) | | | (0.84 | %)(c) | |
• Commencement of operations.
** Distribution for annual periods determined in accordance with federal income tax regulations.
(a) Net investment income (loss) allocated based on average shares method.
(b) Total return measures net investment income (loss) and capital gain or loss from portfolio investments assuming reinvestment of dividends and capital gains distributions. Total return is not annualized for periods that are less than a full year.
(c) Annualized.
www.calamos.com
257
Calamos Timpani SMID Growth Financial Highlights
Selected data for a share outstanding throughout each year were as follows:
| | | CLASS A | |
| | | Year Ended October 31, | | August 1, 2019•
through
October 31, | |
| | | 2023 | | 2022 | | 2021 | | 2020 | | 2019 | |
Net asset value, beginning of year | | $ | 10.14 | | | $ | 18.17 | | | $ | 12.34 | | | $ | 9.01 | | | $ | 10.00 | | |
Income from investment operations: | |
Net investment income (loss)(a) | | | (0.10 | ) | | | (0.08 | ) | | | (0.20 | ) | | | (0.13 | ) | | | (0.03 | ) | |
Net realized and unrealized gain (loss) | | | (0.95 | ) | | | (6.23 | ) | | | 6.03 | | | | 3.46 | | | | (0.96 | ) | |
Total from investment operations | | | (1.05 | ) | | | (6.31 | ) | | | 5.83 | | | | 3.33 | | | | (0.99 | ) | |
Distributions: | |
Dividends from net investment income | | | — | | | | — | | | | — | | | | — | | | | — | | |
Dividends from net realized gains | | | — | | | | (1.72 | ) | | | — | | | | — | | | | — | | |
Total distributions** | | | — | | | | (1.72 | ) | | | — | | | | — | | | | — | | |
Net asset value, end of year | | $ | 9.09 | | | $ | 10.14 | | | $ | 18.17 | | | $ | 12.34 | | | $ | 9.01 | | |
Ratios and supplemental data: | |
Total return(b) | | | (10.36 | %) | | | (37.07 | %) | | | 47.04 | % | | | 36.96 | % | | | (9.90 | %) | |
Net assets, end of year (000) | | $ | 341 | | | $ | 305 | | | $ | 162 | | | $ | 182 | | | $ | 9 | | |
Ratio of net expenses to average net assets | | | 1.35 | % | | | 1.35 | % | | | 1.35 | % | | | 1.35 | % | | | 1.37 | %(c) | |
Ratio of gross expenses to average net assets prior to expense reductions | | | 1.98 | % | | | 1.93 | % | | | 1.79 | % | | | 2.45 | % | | | 3.42 | %(c) | |
Ratio of net investment income (loss) to average net assets | | | (1.06 | %) | | | (0.68 | %) | | | (1.22 | %) | | | (1.21 | %) | | | (1.11 | %)(c) | |
| | | Year Ended October 31, | | August 1, 2019•
through
October 31, | |
| | | 2023 | | 2022 | | 2021 | | 2020 | | 2019 | |
Portfolio turnover rate | | | 231 | % | | | 205 | % | | | 188 | % | | | 201 | % | | | 55 | % | |
• Commencement of operations.
** Distribution for annual periods determined in accordance with federal income tax regulations.
(a) Net investment income (loss) allocated based on average shares method.
(b) Total return measures net investment income (loss) and capital gain or loss from portfolio investments assuming reinvestment of dividends and capital gains distributions. Total return is not annualized for periods that are less than a full year, does not reflect the effect of sales charge for Class A shares.
(c) Annualized.
CALAMOS OPEN-END FAMILY OF FUNDS ANNUAL REPORT
258
Calamos Timpani SMID Growth Financial Highlights
Selected data for a share outstanding throughout each year were as follows:
| | | CLASS I | |
| | | Year Ended October 31, | | August 1, 2019•
through
October 31, | |
| | | 2023 | | 2022 | | 2021 | | 2020 | | 2019 | |
Net asset value, beginning of year | | $ | 10.23 | | | $ | 18.28 | | | $ | 12.38 | | | $ | 9.02 | | | $ | 10.00 | | |
Income from investment operations: | |
Net investment income (loss)(a) | | | (0.08 | ) | | | (0.06 | ) | | | (0.16 | ) | | | (0.10 | ) | | | (0.02 | ) | |
Net realized and unrealized gain (loss) | | | (0.95 | ) | | | (6.27 | ) | | | 6.06 | | | | 3.46 | | | | (0.96 | ) | |
Total from investment operations | | | (1.03 | ) | | | (6.33 | ) | | | 5.90 | | | | 3.36 | | | | (0.98 | ) | |
Distributions: | |
Dividends from net investment income | | | — | | | | — | | | | — | | | | — | | | | — | | |
Dividends from net realized gains | | | — | | | | (1.72 | ) | | | — | | | | — | | | | — | | |
Total distributions** | | | — | | | | (1.72 | ) | | | — | | | | — | | | | — | | |
Net asset value, end of year | | $ | 9.20 | | | $ | 10.23 | | | $ | 18.28 | | | $ | 12.38 | | | $ | 9.02 | | |
Ratios and supplemental data: | |
Total return(b) | | | (10.07 | %) | | | (36.95 | %) | | | 47.46 | % | | | 37.25 | % | | | (9.80 | %) | |
Net assets, end of year (000) | | $ | 15,495 | | | $ | 16,497 | | | $ | 25,793 | | | $ | 16,877 | | | $ | 9,348 | | |
Ratio of net expenses to average net assets | | | 1.10 | % | | | 1.10 | % | | | 1.10 | % | | | 1.10 | % | | | 1.10 | %(c) | |
Ratio of gross expenses to average net assets prior to expense reductions | | | 1.73 | % | | | 1.65 | % | | | 1.55 | % | | | 2.25 | % | | | 3.17 | %(c) | |
Ratio of net investment income (loss) to average net assets | | | (0.80 | %) | | | (0.48 | %) | | | (0.98 | %) | | | (0.94 | %) | | | (0.85 | %)(c) | |
• Commencement of operations.
** Distribution for annual periods determined in accordance with federal income tax regulations.
(a) Net investment income (loss) allocated based on average shares method.
(b) Total return measures net investment income (loss) and capital gain or loss from portfolio investments assuming reinvestment of dividends and capital gains distributions. Total return is not annualized for periods that are less than a full year.
(c) Annualized.
www.calamos.com
259
Calamos Timpani SMID Growth Financial Highlights
Selected data for a share outstanding throughout each year were as follows:
| | | CLASS R6 | |
| | | Year Ended October 31, | | August 1, 2019•
through
October 31, | |
| | | 2023 | | 2022 | | 2021 | | 2020 | | 2019 | |
Net asset value, beginning of year | | $ | 10.23 | | | $ | 18.28 | | | $ | 12.38 | | | $ | 9.02 | | | $ | 10.00 | | |
Income from investment operations: | |
Net investment income (loss)(a) | | | (0.08 | ) | | | (0.05 | ) | | | (0.18 | ) | | | (0.09 | ) | | | (0.02 | ) | |
Net realized and unrealized gain (loss) | | | (0.94 | ) | | | (6.28 | ) | | | 6.08 | | | | 3.45 | | | | (0.96 | ) | |
Total from investment operations | | | (1.02 | ) | | | (6.33 | ) | | | 5.90 | | | | 3.36 | | | | (0.98 | ) | |
Distributions: | |
Dividends from net investment income | | | — | | | | — | | | | — | | | | — | | | | — | | |
Dividends from net realized gains | | | — | | | | (1.72 | ) | | | — | | | | — | | | | — | | |
Total distributions** | | | — | | | | (1.72 | ) | | | — | | | | — | | | | — | | |
Net asset value, end of year | | $ | 9.21 | | | $ | 10.23 | | | $ | 18.28 | | | $ | 12.38 | | | $ | 9.02 | | |
Ratios and supplemental data: | |
Total return(b) | | | (9.97 | %) | | | (36.95 | %) | | | 47.46 | % | | | 37.25 | % | | | (9.80 | %) | |
Net assets, end of year (000) | | $ | 320 | | | $ | 355 | | | $ | 499 | | | $ | 12 | | | $ | 9 | | |
Ratio of net expenses to average net assets | | | 1.07 | % | | | 1.07 | % | | | 1.08 | % | | | 1.06 | % | | | 1.07 | %(c) | |
Ratio of gross expenses to average net assets prior to expense reductions | | | 1.70 | % | | | 1.63 | % | | | 1.48 | % | | | 2.25 | % | | | 3.16 | %(c) | |
Ratio of net investment income (loss) to average net assets | | | (0.77 | %) | | | (0.43 | %) | | | (1.04 | %) | | | (0.90 | %) | | | (0.81 | %)(c) | |
• Commencement of operations.
** Distribution for annual periods determined in accordance with federal income tax regulations.
(a) Net investment income (loss) allocated based on average shares method.
(b) Total return measures net investment income (loss) and capital gain or loss from portfolio investments assuming reinvestment of dividends and capital gains distributions. Total return is not annualized for periods that are less than a full year.
(c) Annualized.
CALAMOS OPEN-END FAMILY OF FUNDS ANNUAL REPORT
260
Calamos Growth Fund Financial Highlights
Selected data for a share outstanding throughout each year were as follows:
| | | CLASS A | |
| | | Year Ended October 31, | |
| | | 2023 | | 2022 | | 2021 | | 2020 | | 2019 | |
Net asset value, beginning of year | | $ | 28.24 | | | $ | 45.88 | | | $ | 34.96 | | | $ | 32.23 | | | $ | 33.14 | | |
Income from investment operations: | |
Net investment income (loss)(a) | | | (0.13 | ) | | | (0.22 | ) | | | (0.33 | ) | | | (0.14 | ) | | | (0.04 | ) | |
Net realized and unrealized gain (loss) | | | 4.36 | | | | (12.47 | ) | | | 15.44 | | | | 5.90 | | | | 3.53 | | |
Total from investment operations | | | 4.23 | | | | (12.69 | ) | | | 15.11 | | | | 5.76 | | | | 3.49 | | |
Distributions: | |
Dividends from net investment income | | | — | | | | — | | | | — | | | | — | | | | — | | |
Dividends from net realized gains | | | — | | | | (4.95 | ) | | | (4.19 | ) | | | (3.03 | ) | | | (4.40 | ) | |
Total distributions** | | | — | | | | (4.95 | ) | | | (4.19 | ) | | | (3.03 | ) | | | (4.40 | ) | |
Net asset value, end of year | | $ | 32.47 | | | $ | 28.24 | | | $ | 45.88 | | | $ | 34.96 | | | $ | 32.23 | | |
Ratios and supplemental data: | |
Total return(b) | | | 14.98 | % | | | (30.58 | %) | | | 46.00 | % | | | 19.11 | % | | | 13.97 | % | |
Net assets, end of year (000) | | $ | 925,437 | | | $ | 900,167 | | | $ | 1,436,709 | | | $ | 1,093,909 | | | $ | 1,066,939 | | |
Ratio of net expenses to average net assets | | | 1.32 | % | | | 1.30 | % | | | 1.28 | % | | | 1.34 | % | | | 1.34 | % | |
Ratio of gross expenses to average net assets prior to expense reductions | | | 1.32 | % | | | 1.30 | % | | | 1.28 | % | | | 1.34 | % | | | 1.34 | % | |
Ratio of net investment income (loss) to average net assets | | | (0.43 | %) | | | (0.64 | %) | | | (0.80 | %) | | | (0.45 | %) | | | (0.12 | %) | |
| | | Year Ended October 31, | |
| | | 2023 | | 2022 | | 2021 | | 2020 | | 2019 | |
Portfolio turnover rate | | | 57 | % | | | 42 | % | | | 45 | % | | | 115 | % | | | 69 | % | |
** Distribution for annual periods determined in accordance with federal income tax regulations.
(a) Net investment income (loss) allocated based on average shares method.
(b) Total return measures net investment income (loss) and capital gain or loss from portfolio investments assuming reinvestment of dividends and capital gains distributions. Total return is not annualized for periods that are less than a full year, does not reflect the effect of sales charge for Class A shares nor the contingent deferred sales charge for Class C shares and does not reflect the deduction of taxes that a shareholder would pay on fund distributions or the redemption of fund shares.
www.calamos.com
261
Calamos Growth Fund Financial Highlights
Selected data for a share outstanding throughout each year were as follows:
| | | CLASS C | |
| | | Year Ended October 31, | |
| | | 2023 | | 2022 | | 2021 | | 2020 | | 2019 | |
Net asset value, beginning of year | | $ | 11.03 | | | $ | 21.21 | | | $ | 18.18 | | | $ | 18.26 | | | $ | 21.00 | | |
Income from investment operations: | |
Net investment income (loss)(a) | | | (0.14 | ) | | | (0.19 | ) | | | (0.29 | ) | | | (0.20 | ) | | | (0.13 | ) | |
Net realized and unrealized gain (loss) | | | 1.70 | | | | (5.04 | ) | | | 7.51 | | | | 3.15 | | | | 1.79 | | |
Total from investment operations | | | 1.56 | | | | (5.23 | ) | | | 7.22 | | | | 2.95 | | | | 1.66 | | |
Distributions: | |
Dividends from net investment income | | | — | | | | — | | | | — | | | | — | | | | — | | |
Dividends from net realized gains | | | — | | | | (4.95 | ) | | | (4.19 | ) | | | (3.03 | ) | | | (4.40 | ) | |
Total distributions** | | | — | | | | (4.95 | ) | | | (4.19 | ) | | | (3.03 | ) | | | (4.40 | ) | |
Net asset value, end of year | | $ | 12.59 | | | $ | 11.03 | | | $ | 21.21 | | | $ | 18.18 | | | $ | 18.26 | | |
Ratios and supplemental data: | |
Total return(b) | | | 14.14 | % | | | (31.12 | %) | | | 44.94 | % | | | 18.23 | % | | | 13.18 | % | |
Net assets, end of year (000) | | $ | 9,493 | | | $ | 12,281 | | | $ | 25,965 | | | $ | 35,843 | | | $ | 50,442 | | |
Ratio of net expenses to average net assets | | | 2.08 | % | | | 2.05 | % | | | 2.04 | % | | | 2.09 | % | | | 2.11 | % | |
Ratio of gross expenses to average net assets prior to expense reductions | | | 2.08 | % | | | 2.05 | % | | | 2.04 | % | | | 2.10 | % | | | 2.12 | % | |
Ratio of net investment income (loss) to average net assets | | | (1.16 | %) | | | (1.39 | %) | | | (1.53 | %) | | | (1.17 | %) | | | (0.73 | %) | |
** Distribution for annual periods determined in accordance with federal income tax regulations.
(a) Net investment income (loss) allocated based on average shares method.
(b) Total return measures net investment income (loss) and capital gain or loss from portfolio investments assuming reinvestment of dividends and capital gains distributions. Total return is not annualized for periods that are less than a full year, does not reflect the effect of sales charge for Class A shares nor the contingent deferred sales charge for Class C shares and does not reflect the deduction of taxes that a shareholder would pay on fund distributions or the redemption of fund shares.
CALAMOS OPEN-END FAMILY OF FUNDS ANNUAL REPORT
262
Calamos Growth Fund Financial Highlights
Selected data for a share outstanding throughout each year were as follows:
| | | CLASS I | |
| | | Year Ended October 31, | |
| | | 2023 | | 2022 | | 2021 | | 2020 | | 2019 | |
Net asset value, beginning of year | | $ | 42.95 | | | $ | 66.93 | | | $ | 49.25 | | | $ | 44.13 | | | $ | 43.48 | | |
Income from investment operations: | |
Net investment income (loss)(a) | | | (0.09 | ) | | | (0.20 | ) | | | (0.33 | ) | | | (0.09 | ) | | | 0.06 | | |
Net realized and unrealized gain (loss) | | | 6.65 | | | | (18.83 | ) | | | 22.20 | | | | 8.24 | | | | 4.99 | | |
Total from investment operations | | | 6.56 | | | | (19.03 | ) | | | 21.87 | | | | 8.15 | | | | 5.05 | | |
Distributions: | |
Dividends from net investment income | | | — | | | | — | | | | — | | | | — | | | | — | | |
Dividends from net realized gains | | | — | | | | (4.95 | ) | | | (4.19 | ) | | | (3.03 | ) | | | (4.40 | ) | |
Total distributions** | | | — | | | | (4.95 | ) | | | (4.19 | ) | | | (3.03 | ) | | | (4.40 | ) | |
Net asset value, end of year | | $ | 49.51 | | | $ | 42.95 | | | $ | 66.93 | | | $ | 49.25 | | | $ | 44.13 | | |
Ratios and supplemental data: | |
Total return(b) | | | 15.27 | % | | | (30.43 | %) | | | 46.40 | % | | | 19.39 | % | | | 14.24 | % | |
Net assets, end of year (000) | | $ | 262,752 | | | $ | 246,566 | | | $ | 395,431 | | | $ | 291,027 | | | $ | 280,294 | | |
Ratio of net expenses to average net assets | | | 1.07 | % | | | 1.05 | % | | | 1.03 | % | | | 1.09 | % | | | 1.09 | % | |
Ratio of gross expenses to average net assets prior to expense reductions | | | 1.07 | % | | | 1.05 | % | | | 1.03 | % | | | 1.09 | % | | | 1.09 | % | |
Ratio of net investment income (loss) to average net assets | | | (0.18 | %) | | | (0.39 | %) | | | (0.56 | %) | | | (0.20 | %) | | | 0.15 | % | |
** Distribution for annual periods determined in accordance with federal income tax regulations.
(a) Net investment income (loss) allocated based on average shares method.
(b) Total return measures net investment income (loss) and capital gain or loss from portfolio investments assuming reinvestment of dividends and capital gains distributions. Total return is not annualized for periods that are less than a full year, does not reflect the effect of sales charge for Class A shares nor the contingent deferred sales charge for Class C shares and does not reflect the deduction of taxes that a shareholder would pay on fund distributions or the redemption of fund shares.
www.calamos.com
263
Calamos Growth and Income Fund Financial Highlights
Selected data for a share outstanding throughout each year were as follows:
| | | CLASS A | |
| | | Year Ended October 31, | |
| | | 2023 | | 2022 | | 2021 | | 2020 | | 2019 | |
Net asset value, beginning of year | | $ | 38.33 | | | $ | 48.18 | | | $ | 36.26 | | | $ | 33.43 | | | $ | 32.53 | | |
Income from investment operations: | |
Net investment income (loss)(a) | | | 0.19 | | | | 0.08 | | | | 0.07 | | | | 0.30 | | | | 0.32 | | |
Net realized and unrealized gain (loss) | | | 2.38 | | | | (7.32 | ) | | | 13.01 | | | | 3.74 | | | | 2.99 | | |
Total from investment operations | | | 2.57 | | | | (7.24 | ) | | | 13.08 | | | | 4.04 | | | | 3.31 | | |
Distributions: | |
Dividends from net investment income | | | (0.44 | ) | | | (0.24 | ) | | | (0.27 | ) | | | (0.41 | ) | | | (0.50 | ) | |
Dividends from net realized gains | | | (1.04 | ) | | | (2.37 | ) | | | (0.89 | ) | | | (0.80 | ) | | | (1.91 | ) | |
Total distributions** | | | (1.48 | ) | | | (2.61 | ) | | | (1.16 | ) | | | (1.21 | ) | | | (2.41 | ) | |
Net asset value, end of year | | $ | 39.42 | | | $ | 38.33 | | | $ | 48.18 | | | $ | 36.26 | | | $ | 33.43 | | |
Ratios and supplemental data: | |
Total return(b) | | | 6.86 | % | | | (15.77 | %) | | | 36.68 | % | | | 12.43 | % | | | 11.51 | % | |
Net assets, end of year (000) | | $ | 1,182,667 | | | $ | 1,199,491 | | | $ | 1,531,445 | | | $ | 1,163,876 | | | $ | 1,129,201 | | |
Ratio of net expenses to average net assets | | | 1.06 | % | | | 1.05 | % | | | 1.06 | % | | | 1.08 | % | | | 1.09 | % | |
Ratio of gross expenses to average net assets prior to expense reductions | | | 1.06 | % | | | 1.05 | % | | | 1.06 | % | | | 1.08 | % | | | 1.09 | % | |
Ratio of net investment income (loss) to average net assets | | | 0.48 | % | | | 0.19 | % | | | 0.15 | % | | | 0.86 | % | | | 1.01 | % | |
| | | Year Ended October 31, | |
| | | 2023 | | 2022 | | 2021 | | 2020 | | 2019 | |
Portfolio turnover rate | | | 20 | % | | | 24 | % | | | 18 | % | | | 35 | % | | | 19 | % | |
** Distribution for annual periods determined in accordance with federal income tax regulations.
(a) Net investment income (loss) allocated based on average shares method.
(b) Total return measures net investment income (loss) and capital gain or loss from portfolio investments assuming reinvestment of dividends and capital gains distributions. Total return is not annualized for periods that are less than a full year, does not reflect the effect of sales charge for Class A shares nor the contingent deferred sales charge for Class C shares and does not reflect the deduction of taxes that a shareholder would pay on fund distributions or the redemption of fund shares.
CALAMOS OPEN-END FAMILY OF FUNDS ANNUAL REPORT
264
Calamos Growth and Income Fund Financial Highlights
Selected data for a share outstanding throughout each year were as follows:
| | | CLASS C | |
| | | Year Ended October 31, | |
| | | 2023 | | 2022 | | 2021 | | 2020 | | 2019 | |
Net asset value, beginning of year | | $ | 38.57 | | | $ | 48.55 | | | $ | 36.57 | | | $ | 33.68 | | | $ | 32.69 | | |
Income from investment operations: | |
Net investment income (loss)(a) | | | (0.11 | ) | | | (0.24 | ) | | | (0.25 | ) | | | 0.04 | | | | 0.12 | | |
Net realized and unrealized gain (loss) | | | 2.38 | | | | (7.37 | ) | | | 13.12 | | | | 3.79 | | | | 2.98 | | |
Total from investment operations | | | 2.27 | | | | (7.61 | ) | | | 12.87 | | | | 3.83 | | | | 3.10 | | |
Distributions: | |
Dividends from net investment income | | | (0.23 | ) | | | — | | | | — | | | | (0.14 | ) | | | (0.20 | ) | |
Dividends from net realized gains | | | (1.04 | ) | | | (2.37 | ) | | | (0.89 | ) | | | (0.80 | ) | | | (1.91 | ) | |
Total distributions** | | | (1.27 | ) | | | (2.37 | ) | | | (0.89 | ) | | | (0.94 | ) | | | (2.11 | ) | |
Net asset value, end of year | | $ | 39.57 | | | $ | 38.57 | | | $ | 48.55 | | | $ | 36.57 | | | $ | 33.68 | | |
Ratios and supplemental data: | |
Total return(b) | | | 6.08 | % | | | (16.41 | %) | | | 35.66 | % | | | 11.62 | % | | | 10.68 | % | |
Net assets, end of year (000) | | $ | 79,895 | | | $ | 84,104 | | | $ | 98,647 | | | $ | 101,490 | | | $ | 136,333 | | |
Ratio of net expenses to average net assets | | | 1.81 | % | | | 1.80 | % | | | 1.81 | % | | | 1.84 | % | | | 1.85 | % | |
Ratio of gross expenses to average net assets prior to expense reductions | | | 1.81 | % | | | 1.80 | % | | | 1.81 | % | | | 1.84 | % | | | 1.85 | % | |
Ratio of net investment income (loss) to average net assets | | | (0.27 | %) | | | (0.56 | %) | | | (0.57 | %) | | | 0.13 | % | | | 0.37 | % | |
** Distribution for annual periods determined in accordance with federal income tax regulations.
(a) Net investment income (loss) allocated based on average shares method.
(b) Total return measures net investment income (loss) and capital gain or loss from portfolio investments assuming reinvestment of dividends and capital gains distributions. Total return is not annualized for periods that are less than a full year, does not reflect the effect of sales charge for Class A shares nor the contingent deferred sales charge for Class C shares and does not reflect the deduction of taxes that a shareholder would pay on fund distributions or the redemption of fund shares.
www.calamos.com
265
Calamos Growth and Income Fund Financial Highlights
Selected data for a share outstanding throughout each year were as follows:
| | | CLASS I | |
| | | Year Ended October 31, | |
| | | 2023 | | 2022 | | 2021 | | 2020 | | 2019 | |
Net asset value, beginning of year | | $ | 36.50 | | | $ | 46.02 | | | $ | 34.68 | | | $ | 32.03 | | | $ | 31.28 | | |
Income from investment operations: | |
Net investment income (loss)(a) | | | 0.27 | | | | 0.17 | | | | 0.17 | | | | 0.36 | | | | 0.39 | | |
Net realized and unrealized gain (loss) | | | 2.25 | | | | (6.97 | ) | | | 12.44 | | | | 3.58 | | | | 2.85 | | |
Total from investment operations | | | 2.52 | | | | (6.80 | ) | | | 12.61 | | | | 3.94 | | | | 3.24 | | |
Distributions: | |
Dividends from net investment income | | | (0.51 | ) | | | (0.35 | ) | | | (0.38 | ) | | | (0.49 | ) | | | (0.58 | ) | |
Dividends from net realized gains | | | (1.04 | ) | | | (2.37 | ) | | | (0.89 | ) | | | (0.80 | ) | | | (1.91 | ) | |
Total distributions** | | | (1.55 | ) | | | (2.72 | ) | | | (1.27 | ) | | | (1.29 | ) | | | (2.49 | ) | |
Net asset value, end of year | | $ | 37.47 | | | $ | 36.50 | | | $ | 46.02 | | | $ | 34.68 | | | $ | 32.03 | | |
Ratios and supplemental data: | |
Total return(b) | | | 7.12 | % | | | (15.55 | %) | | | 37.02 | % | | | 12.72 | % | | | 11.81 | % | |
Net assets, end of year (000) | | $ | 978,583 | | | $ | 977,765 | | | $ | 1,211,985 | | | $ | 818,641 | | | $ | 735,329 | | |
Ratio of net expenses to average net assets | | | 0.81 | % | | | 0.80 | % | | | 0.81 | % | | | 0.83 | % | | | 0.85 | % | |
Ratio of gross expenses to average net assets prior to expense reductions | | | 0.81 | % | �� | | 0.80 | % | | | 0.81 | % | | | 0.83 | % | | | 0.85 | % | |
Ratio of net investment income (loss) to average net assets | | | 0.73 | % | | | 0.44 | % | | | 0.40 | % | | | 1.11 | % | | | 1.27 | % | |
** Distribution for annual periods determined in accordance with federal income tax regulations.
(a) Net investment income (loss) allocated based on average shares method.
(b) Total return measures net investment income (loss) and capital gain or loss from portfolio investments assuming reinvestment of dividends and capital gains distributions. Total return is not annualized for periods that are less than a full year, does not reflect the effect of sales charge for Class A shares nor the contingent deferred sales charge for Class C shares and does not reflect the deduction of taxes that a shareholder would pay on fund distributions or the redemption of fund shares.
CALAMOS OPEN-END FAMILY OF FUNDS ANNUAL REPORT
266
Calamos Growth and Income Fund Financial Highlights
Selected data for a share outstanding throughout each period were as follows:
| | | CLASS R6 | |
| | | Year Ended October 31, | | June 23, 2020•
through
October 31, | |
| | | 2023 | | 2022 | | 2021 | | 2020 | |
Net asset value, beginning of period | | $ | 36.51 | | | $ | 46.04 | | | $ | 34.69 | | | $ | 33.24 | | |
Income from investment operations: | |
Net investment income (loss)(a) | | | 0.30 | | | | 0.21 | | | | 0.16 | | | | 0.12 | | |
Net realized and unrealized gain (loss) | | | 2.26 | | | | (6.99 | ) | | | 12.49 | | | | 1.42 | | |
Total from investment operations | | | 2.56 | | | | (6.78 | ) | | | 12.65 | | | | 1.54 | | |
Distributions: | |
Dividends from net investment income | | | (0.54 | ) | | | (0.38 | ) | | | (0.41 | ) | | | (0.09 | ) | |
Dividends from net realized gains | | | (1.04 | ) | | | (2.37 | ) | | | (0.89 | ) | | | — | | |
Total distributions** | | | (1.58 | ) | | | (2.75 | ) | | | (1.30 | ) | | | (0.09 | ) | |
Net asset value, end of period | | $ | 37.49 | | | $ | 36.51 | | | $ | 46.04 | | | $ | 34.69 | | |
Ratios and supplemental data: | |
Total return(b) | | | 7.21 | % | | | (15.50 | %) | | | 37.14 | % | | | 4.63 | % | |
Net assets, end of year (000) | | $ | 27,965 | | | $ | 16,688 | | | $ | 5,968 | | | $ | 15 | | |
Ratio of net expenses to average net assets | | | 0.71 | % | | | 0.73 | % | | | 0.73 | % | | | 0.71 | %(c) | |
Ratio of gross expenses to average net assets prior to expense reductions | | | 0.71 | % | | | 0.73 | % | | | 0.73 | % | | | 0.71 | %(c) | |
Ratio of net investment income (loss) to average net assets | | | 0.78 | % | | | 0.55 | % | | | 0.38 | % | | | 0.99 | %(c) | |
• Commencement of operations.
** Distribution for annual periods determined in accordance with federal income tax regulations.
(a) Net investment income (loss) allocated based on average shares method.
(b) Total return measures net investment income (loss) and capital gain or loss from portfolio investments assuming reinvestment of dividends and capital gains distributions. Total return is not annualized for periods that are less than a full year, does not reflect the effect of sales charge for Class A shares nor the contingent deferred sales charge for Class C shares and does not reflect the deduction of taxes that a shareholder would pay on fund distributions or the redemption of fund shares.
(c) Annualized.
www.calamos.com
267
Calamos Dividend Growth Fund Financial Highlights
Selected data for a share outstanding throughout each year were as follows:
| | | CLASS A | |
| | | Year Ended October 31, | |
| | | 2023 | | 2022 | | 2021 | | 2020 | | 2019 | |
Net asset value, beginning of year | | $ | 13.41 | | | $ | 17.13 | | | $ | 13.04 | | | $ | 13.37 | | | $ | 12.34 | | |
Income from investment operations: | |
Net investment income (loss)(a) | | | 0.04 | | | | 0.03 | | | | 0.00 | * | | | 0.05 | | | | 0.07 | | |
Net realized and unrealized gain (loss) | | | 1.11 | | | | (2.41 | ) | | | 5.24 | | | | 1.13 | | | | 1.50 | | |
Total from investment operations | | | 1.15 | | | | (2.38 | ) | | | 5.24 | | | | 1.18 | | | | 1.57 | | |
Distributions: | |
Dividends from net investment income | | | (0.05 | ) | | | — | | | | (0.02 | ) | | | (0.06 | ) | | | (0.08 | ) | |
Dividends from net realized gains | | | — | | | | (1.34 | ) | | | (1.13 | ) | | | (1.45 | ) | | | (0.46 | ) | |
Total distributions** | | | (0.05 | ) | | | (1.34 | ) | | | (1.15 | ) | | | (1.51 | ) | | | (0.54 | ) | |
Net asset value, end of year | | $ | 14.51 | | | $ | 13.41 | | | $ | 17.13 | | | $ | 13.04 | | | $ | 13.37 | | |
Ratios and supplemental data: | |
Total return(b) | | | 8.61 | % | | | (15.01 | %) | | | 42.42 | % | | | 9.20 | % | | | 13.63 | % | |
Net assets, end of year (000) | | $ | 5,250 | | | $ | 5,181 | | | $ | 5,139 | | | $ | 3,534 | | | $ | 3,638 | | |
Ratio of net expenses to average net assets | | | 1.35 | % | | | 1.35 | % | | | 1.35 | % | | | 1.35 | % | | | 1.35 | % | |
Ratio of gross expenses to average net assets prior to expense reductions | | | 2.09 | % | | | 2.03 | % | | | 2.04 | % | | | 2.15 | % | | | 1.94 | % | |
Ratio of net investment income (loss) to average net assets | | | 0.29 | % | | | 0.23 | % | | | 0.02 | % | | | 0.40 | % | | | 0.60 | % | |
| | | Year Ended October 31, | |
| | | 2023 | | 2022 | | 2021 | | 2020 | | 2019 | |
Portfolio turnover rate | | | 28 | % | | | 25 | % | | | 20 | % | | | 22 | % | | | 15 | % | |
* Amounts are less than $0.005.
** Distribution for annual periods determined in accordance with federal income tax regulations.
(a) Net investment income (loss) allocated based on average shares method.
(b) Total return measures net investment income (loss) and capital gain or loss from portfolio investments assuming reinvestment of dividends and capital gains distributions. Total return is not annualized for periods that are less than a full year, does not reflect the effect of sales charge for Class A shares nor the contingent deferred sales charge for Class C shares and does not reflect the deduction of taxes that a shareholder would pay on fund distributions or the redemption of fund shares.
CALAMOS OPEN-END FAMILY OF FUNDS ANNUAL REPORT
268
Calamos Dividend Growth Fund Financial Highlights
Selected data for a share outstanding throughout each year were as follows:
| | | CLASS C | |
| | | Year Ended October 31, | |
| | | 2023 | | 2022 | | 2021 | | 2020 | | 2019 | |
Net asset value, beginning of year | | $ | 12.77 | | | $ | 16.49 | | | $ | 12.67 | | | $ | 13.07 | | | $ | 12.09 | | |
Income from investment operations: | |
Net investment income (loss)(a) | | | (0.06 | )(b) | | | (0.07 | ) | | | (0.11 | ) | | | (0.04 | ) | | | (0.01 | ) | |
Net realized and unrealized gain (loss) | | | 1.06 | | | | (2.31 | ) | | | 5.07 | | | | 1.09 | | | | 1.45 | | |
Total from investment operations | | | 1.00 | | | | (2.38 | ) | | | 4.96 | | | | 1.05 | | | | 1.44 | | |
Distributions: | |
Dividends from net investment income | | | (0.03 | ) | | | — | | | | (0.01 | ) | | | — | | | | — | | |
Dividends from net realized gains | | | — | | | | (1.34 | ) | | | (1.13 | ) | | | (1.45 | ) | | | (0.46 | ) | |
Total distributions** | | | (0.03 | ) | | | (1.34 | ) | | | (1.14 | ) | | | (1.45 | ) | | | (0.46 | ) | |
Net asset value, end of year | | $ | 13.74 | | | $ | 12.77 | | | $ | 16.49 | | | $ | 12.67 | | | $ | 13.07 | | |
Ratios and supplemental data: | |
Total return(c) | | | 7.82 | % | | | (15.63 | %) | | | 41.37 | % | | | 8.35 | % | | | 12.74 | % | |
Net assets, end of year (000) | | $ | 2,342 | | | $ | 2,202 | | | $ | 2,017 | | | $ | 685 | | | $ | 659 | | |
Ratio of net expenses to average net assets | | | 2.10 | % | | | 2.10 | % | | | 2.10 | % | | | 2.11 | % | | | 2.10 | % | |
Ratio of gross expenses to average net assets prior to expense reductions | | | 2.85 | % | | | 2.78 | % | | | 2.78 | % | | | 2.91 | % | | | 2.65 | % | |
Ratio of net investment income (loss) to average net assets | | | (0.46 | %) | | | (0.51 | %) | | | (0.74 | %) | | | (0.36 | %) | | | (0.06 | %) | |
** Distribution for annual periods determined in accordance with federal income tax regulations.
(a) Net investment income (loss) allocated based on average shares method.
(b) The amount shown for a share outstanding throughout the period may not correlate with the Statement of Operations for the period due to class specific expenses.
(c) Total return measures net investment income (loss) and capital gain or loss from portfolio investments assuming reinvestment of dividends and capital gains distributions. Total return is not annualized for periods that are less than a full year, does not reflect the effect of sales charge for Class A shares nor the contingent deferred sales charge for Class C shares and does not reflect the deduction of taxes that a shareholder would pay on fund distributions or the redemption of fund shares.
www.calamos.com
269
Calamos Dividend Growth Fund Financial Highlights
Selected data for a share outstanding throughout each year were as follows:
| | | CLASS I | |
| | | Year Ended October 31, | |
| | | 2023 | | 2022 | | 2021 | | 2020 | | 2019 | |
Net asset value, beginning of year | | $ | 13.44 | | | $ | 17.15 | | | $ | 13.03 | | | $ | 13.36 | | | $ | 12.33 | | |
Income from investment operations: | |
Net investment income (loss)(a) | | | 0.08 | | | | 0.07 | | | | 0.04 | | | | 0.08 | | | | 0.11 | | |
Net realized and unrealized gain (loss) | | | 1.11 | | | | (2.41 | ) | | | 5.23 | | | | 1.12 | | | | 1.49 | | |
Total from investment operations | | | 1.19 | | | | (2.34 | ) | | | 5.27 | | | | 1.20 | | | | 1.60 | | |
Distributions: | |
Dividends from net investment income | | | (0.06 | ) | | | (0.03 | ) | | | (0.02 | ) | | | (0.08 | ) | | | (0.11 | ) | |
Dividends from net realized gains | | | — | | | | (1.34 | ) | | | (1.13 | ) | | | (1.45 | ) | | | (0.46 | ) | |
Total distributions** | | | (0.06 | ) | | | (1.37 | ) | | | (1.15 | ) | | | (1.53 | ) | | | (0.57 | ) | |
Net asset value, end of year | | $ | 14.57 | | | $ | 13.44 | | | $ | 17.15 | | | $ | 13.03 | | | $ | 13.36 | | |
Ratios and supplemental data: | |
Total return(b) | | | 8.88 | % | | | (14.76 | %) | | | 42.73 | % | | | 9.46 | % | | | 13.93 | % | |
Net assets, end of year (000) | | $ | 7,639 | | | $ | 10,195 | | | $ | 10,373 | | | $ | 8,974 | | | $ | 12,986 | | |
Ratio of net expenses to average net assets | | | 1.10 | % | | | 1.10 | % | | | 1.10 | % | | | 1.10 | % | | | 1.10 | % | |
Ratio of gross expenses to average net assets prior to expense reductions | | | 1.84 | % | | | 1.78 | % | | | 1.80 | % | | | 1.88 | % | | | 1.67 | % | |
Ratio of net investment income (loss) to average net assets | | | 0.56 | % | | | 0.48 | % | | | 0.28 | % | | | 0.67 | % | | | 0.92 | % | |
** Distribution for annual periods determined in accordance with federal income tax regulations.
(a) Net investment income (loss) allocated based on average shares method.
(b) Total return measures net investment income (loss) and capital gain or loss from portfolio investments assuming reinvestment of dividends and capital gains distributions. Total return is not annualized for periods that are less than a full year, does not reflect the effect of sales charge for Class A shares nor the contingent deferred sales charge for Class C shares and does not reflect the deduction of taxes that a shareholder would pay on fund distributions or the redemption of fund shares.
CALAMOS OPEN-END FAMILY OF FUNDS ANNUAL REPORT
270
Calamos Select Fund Financial Highlights
Selected data for a share outstanding throughout each year were as follows:
| | | CLASS A | |
| | | Year Ended October 31, | |
| | | 2023 | | 2022 | | 2021 | | 2020 | | 2019 | |
Net asset value, beginning of year | | $ | 15.86 | | | $ | 20.48 | | | $ | 14.93 | | | $ | 14.21 | | | $ | 15.37 | | |
Income from investment operations: | |
Net investment income (loss)(a) | | | 0.03 | | | | 0.00 | | | | (0.03 | ) | | | 0.07 | | | | 0.15 | | |
Net realized and unrealized gain (loss) | | | 1.29 | | | | (3.12 | ) | | | 6.39 | | | | 0.74 | | | | 0.95 | | |
Total from investment operations | | | 1.32 | | | | (3.12 | ) | | | 6.36 | | | | 0.81 | | | | 1.10 | | |
Distributions: | |
Dividends from net investment income | | | — | | | | — | | | | — | | | | (0.09 | ) | | | (0.06 | ) | |
Dividends from net realized gains | | | (0.41 | ) | | | (1.50 | ) | | | (0.81 | ) | | | — | | | | (2.20 | ) | |
Total distributions** | | | (0.41 | ) | | | (1.50 | ) | | | (0.81 | ) | | | (0.09 | ) | | | (2.26 | ) | |
Net asset value, end of year | | $ | 16.77 | | | $ | 15.86 | | | $ | 20.48 | | | $ | 14.93 | | | $ | 14.21 | | |
Ratios and supplemental data: | |
Total return(b) | | | 8.60 | % | | | (16.22 | %) | | | 43.93 | % | | | 5.71 | % | | | 10.14 | % | |
Net assets, end of year (000) | | $ | 11,533 | | | $ | 11,628 | | | $ | 14,211 | | | $ | 10,595 | | | $ | 11,363 | | |
Ratio of net expenses to average net assets | | | 1.15 | % | | | 1.15 | % | | | 1.15 | % | | | 1.15 | % | | | 1.15 | % | |
Ratio of gross expenses to average net assets prior to expense reductions | | | 1.62 | % | | | 1.57 | % | | | 1.57 | % | | | 1.64 | % | | | 1.62 | % | |
Ratio of net investment income (loss) to average net assets | | | 0.16 | % | | | 0.00 | % | | | (0.19 | %) | | | 0.49 | % | | | 1.06 | % | |
| | | Year Ended October 31, | |
| | | 2023 | | 2022 | | 2021 | | 2020 | | 2019 | |
Portfolio turnover rate | | | 55 | % | | | 34 | % | | | 25 | % | | | 136 | % | | | 78 | % | |
** Distribution for annual periods determined in accordance with federal income tax regulations.
(a) Net investment income (loss) allocated based on average shares method.
(b) Total return measures net investment income (loss) and capital gain or loss from portfolio investments assuming reinvestment of dividends and capital gains distributions. Total return is not annualized for periods that are less than a full year, does not reflect the effect of sales charge for Class A shares nor the contingent deferred sales charge for Class C shares and does not reflect the deduction of taxes that a shareholder would pay on fund distributions or the redemption of fund shares.
www.calamos.com
271
Calamos Select Fund Financial Highlights
Selected data for a share outstanding throughout each year were as follows:
| | | CLASS C | |
| | | Year Ended October 31, | |
| | | 2023 | | 2022 | | 2021 | | 2020 | | 2019 | |
Net asset value, beginning of year | | $ | 13.28 | | | $ | 17.52 | | | $ | 12.97 | | | $ | 12.36 | | | $ | 13.77 | | |
Income from investment operations: | |
Net investment income (loss)(a) | | | (0.08 | ) | | | (0.12 | ) | | | (0.14 | ) | | | (0.01 | ) | | | 0.02 | | |
Net realized and unrealized gain (loss) | | | 1.07 | | | | (2.62 | ) | | | 5.50 | | | | 0.62 | | | | 0.83 | | |
Total from investment operations | | | 0.99 | | | | (2.74 | ) | | | 5.36 | | | | 0.61 | | | | 0.85 | | |
Distributions: | |
Dividends from net investment income | | | — | | | | — | | | | — | | | | — | | | | (0.06 | ) | |
Dividends from net realized gains | | | (0.41 | ) | | | (1.50 | ) | | | (0.81 | ) | | | — | | | | (2.20 | ) | |
Total distributions** | | | (0.41 | ) | | | (1.50 | ) | | | (0.81 | ) | | | — | | | | (2.26 | ) | |
Net asset value, end of year | | $ | 13.86 | | | $ | 13.28 | | | $ | 17.52 | | | $ | 12.97 | | | $ | 12.36 | | |
Ratios and supplemental data: | |
Total return(b) | | | 7.76 | % | | | (16.85 | %) | | | 42.92 | % | | | 4.85 | % | | | 9.33 | % | |
Net assets, end of year (000) | | $ | 120 | | | $ | 170 | | | $ | 887 | | | $ | 1,056 | | | $ | 5,274 | | |
Ratio of net expenses to average net assets | | | 1.90 | % | | | 1.91 | % | | | 1.90 | % | | | 1.90 | % | | | 1.90 | % | |
Ratio of gross expenses to average net assets prior to expense reductions | | | 2.36 | % | | | 2.33 | % | | | 2.33 | % | | | 2.40 | % | | | 2.35 | % | |
Ratio of net investment income (loss) to average net assets | | | (0.57 | %) | | | (0.77 | %) | | | (0.92 | %) | | | (0.11 | %) | | | 0.15 | % | |
** Distribution for annual periods determined in accordance with federal income tax regulations.
(a) Net investment income (loss) allocated based on average shares method.
(b) Total return measures net investment income (loss) and capital gain or loss from portfolio investments assuming reinvestment of dividends and capital gains distributions. Total return is not annualized for periods that are less than a full year, does not reflect the effect of sales charge for Class A shares nor the contingent deferred sales charge for Class C shares and does not reflect the deduction of taxes that a shareholder would pay on fund distributions or the redemption of fund shares.
CALAMOS OPEN-END FAMILY OF FUNDS ANNUAL REPORT
272
Calamos Select Fund Financial Highlights
Selected data for a share outstanding throughout each year were as follows:
| | | CLASS I | |
| | | Year Ended October 31, | |
| | | 2023 | | 2022 | | 2021 | | 2020 | | 2019 | |
Net asset value, beginning of year | | $ | 16.45 | | | $ | 21.15 | | | $ | 15.36 | | | $ | 14.62 | | | $ | 15.80 | | |
Income from investment operations: | |
Net investment income (loss)(a) | | | 0.07 | | | | 0.05 | | | | 0.01 | | | | 0.10 | | | | 0.16 | | |
Net realized and unrealized gain (loss) | | | 1.34 | | | | (3.23 | ) | | | 6.59 | | | | 0.76 | | | | 1.01 | | |
Total from investment operations | | | 1.41 | | | | (3.18 | ) | | | 6.60 | | | | 0.86 | | | | 1.17 | | |
Distributions: | |
Dividends from net investment income | | | — | | | | (0.02 | ) | | | — | | | | (0.12 | ) | | | (0.15 | ) | |
Dividends from net realized gains | | | (0.41 | ) | | | (1.50 | ) | | | (0.81 | ) | | | — | | | | (2.20 | ) | |
Total distributions** | | | (0.41 | ) | | | (1.52 | ) | | | (0.81 | ) | | | (0.12 | ) | | | (2.35 | ) | |
Net asset value, end of year | | $ | 17.45 | | | $ | 16.45 | | | $ | 21.15 | | | $ | 15.36 | | | $ | 14.62 | | |
Ratios and supplemental data: | |
Total return(b) | | | 8.84 | % | | | (16.00 | %) | | | 44.28 | % | | | 5.92 | % | | | 10.43 | % | |
Net assets, end of year (000) | | $ | 31,663 | | | $ | 30,660 | | | $ | 38,585 | | | $ | 36,075 | | | $ | 28,389 | | |
Ratio of net expenses to average net assets | | | 0.90 | % | | | 0.90 | % | | | 0.90 | % | | | 0.90 | % | | | 0.90 | % | |
Ratio of gross expenses to average net assets prior to expense reductions | | | 1.37 | % | | | 1.32 | % | | | 1.32 | % | | | 1.39 | % | | | 1.36 | % | |
Ratio of net investment income (loss) to average net assets | | | 0.41 | % | | | 0.25 | % | | | 0.07 | % | | | 0.69 | % | | | 1.13 | % | |
** Distribution for annual periods determined in accordance with federal income tax regulations.
(a) Net investment income (loss) allocated based on average shares method.
(b) Total return measures net investment income (loss) and capital gain or loss from portfolio investments assuming reinvestment of dividends and capital gains distributions. Total return is not annualized for periods that are less than a full year, does not reflect the effect of sales charge for Class A shares nor the contingent deferred sales charge for Class C shares and does not reflect the deduction of taxes that a shareholder would pay on fund distributions or the redemption of fund shares.
www.calamos.com
273
Calamos International Growth Fund Financial Highlights
Selected data for a share outstanding throughout each year were as follows:
| | | CLASS A | |
| | | Year Ended October 31, | |
| | | 2023 | | 2022 | | 2021 | | 2020 | | 2019 | |
Net asset value, beginning of year | | $ | 15.43 | | | $ | 28.83 | | | $ | 22.96 | | | $ | 17.97 | | | $ | 18.10 | | |
Income from investment operations: | |
Net investment income (loss)(a) | | | 0.05 | | | | 0.21 | | | | 0.05 | | | | (0.04 | ) | | | 0.09 | | |
Net realized and unrealized gain (loss) | | | 0.77 | | | | (9.48 | ) | | | 7.29 | | | | 5.03 | | | | 1.80 | | |
Total from investment operations | | | 0.82 | | | | (9.27 | ) | | | 7.34 | | | | 4.99 | | | | 1.89 | | |
Distributions: | |
Dividends from net investment income | | | — | | | | (0.00 | )* | | | — | | | | — | | | | — | | |
Dividends from net realized gains | | | — | | | | (4.13 | ) | | | (1.47 | ) | | | — | | | | (2.02 | ) | |
Total distributions** | | | — | | | | (4.13 | ) | | | (1.47 | ) | | | — | | | | (2.02 | ) | |
Net asset value, end of year | | $ | 16.25 | | | $ | 15.43 | | | $ | 28.83 | | | $ | 22.96 | | | $ | 17.97 | | |
Ratios and supplemental data: | |
Total return(b) | | | 5.31 | % | | | (36.67 | %) | | | 32.76 | % | | | 27.82 | % | | | 13.07 | % | |
Net assets, end of year (000) | | $ | 41,631 | | | $ | 46,993 | | | $ | 79,503 | | | $ | 60,527 | | | $ | 53,950 | | |
Ratio of net expenses to average net assets | | | 1.16 | % | | | 1.10 | % | | | 1.10 | % | | | 1.10 | % | | | 1.10 | % | |
Ratio of gross expenses to average net assets prior to expense reductions | | | 1.49 | % | | | 1.64 | % | | | 1.56 | % | | | 1.52 | % | | | 1.48 | % | |
Ratio of net investment income (loss) to average net assets | | | 0.27 | % | | | 1.04 | % | | | 0.19 | % | | | (0.20 | %) | | | 0.51 | % | |
| | | Year Ended October 31, | |
| | | 2023 | | 2022 | | 2021 | | 2020 | | 2019 | |
Portfolio turnover rate | | | 131 | % | | | 129 | % | | | 99 | % | | | 85 | % | | | 81 | % | |
* Amounts are less than $0.005.
** Distribution for annual periods determined in accordance with federal income tax regulations.
(a) Net investment income (loss) allocated based on average shares method.
(b) Total return measures net investment income (loss) and capital gain or loss from portfolio investments assuming reinvestment of dividends and capital gains distributions. Total return is not annualized for periods that are less than a full year, does not reflect the effect of sales charge for Class A shares nor the contingent deferred sales charge for Class C shares and does not reflect the deduction of taxes that a shareholder would pay on fund distributions or the redemption of fund shares.
CALAMOS OPEN-END FAMILY OF FUNDS ANNUAL REPORT
274
Calamos International Growth Fund Financial Highlights
Selected data for a share outstanding throughout each year were as follows:
| | | CLASS C | |
| | | Year Ended October 31, | |
| | | 2023 | | 2022 | | 2021 | | 2020 | | 2019 | |
Net asset value, beginning of year | | $ | 12.86 | | | $ | 24.94 | | | $ | 20.17 | | | $ | 15.91 | | | $ | 16.38 | | |
Income from investment operations: | |
Net investment income (loss)(a) | | | (0.07 | ) | | | 0.05 | | | | (0.16 | ) | | | (0.16 | ) | | | (0.05 | ) | |
Net realized and unrealized gain (loss) | | | 0.65 | | | | (8.00 | ) | | | 6.40 | | | | 4.42 | | | | 1.60 | | |
Total from investment operations | | | 0.58 | | | | (7.95 | ) | | | 6.24 | | | | 4.26 | | | | 1.55 | | |
Distributions: | |
Dividends from net investment income | | | — | | | | — | | | | — | | | | — | | | | — | | |
Dividends from net realized gains | | | — | | | | (4.13 | ) | | | (1.47 | ) | | | — | | | | (2.02 | ) | |
Total distributions** | | | — | | | | (4.13 | ) | | | (1.47 | ) | | | — | | | | (2.02 | ) | |
Net asset value, end of year | | $ | 13.44 | | | $ | 12.86 | | | $ | 24.94 | | | $ | 20.17 | | | $ | 15.91 | | |
Ratios and supplemental data: | |
Total return(b) | | | 4.51 | % | | | (37.18 | %) | | | 31.79 | % | | | 26.84 | % | | | 12.21 | % | |
Net assets, end of year (000) | | $ | 1,339 | | | $ | 1,989 | | | $ | 3,953 | | | $ | 6,344 | | | $ | 9,022 | | |
Ratio of net expenses to average net assets | | | 1.91 | % | | | 1.85 | % | | | 1.85 | % | | | 1.85 | % | | | 1.85 | % | |
Ratio of gross expenses to average net assets prior to expense reductions | | | 2.24 | % | | | 2.39 | % | | | 2.31 | % | | | 2.27 | % | | | 2.26 | % | |
Ratio of net investment income (loss) to average net assets | | | (0.48 | %) | | | 0.27 | % | | | (0.69 | %) | | | (0.95 | %) | | | (0.35 | %) | |
** Distribution for annual periods determined in accordance with federal income tax regulations.
(a) Net investment income (loss) allocated based on average shares method.
(b) Total return measures net investment income (loss) and capital gain or loss from portfolio investments assuming reinvestment of dividends and capital gains distributions. Total return is not annualized for periods that are less than a full year, does not reflect the effect of sales charge for Class A shares nor the contingent deferred sales charge for Class C shares and does not reflect the deduction of taxes that a shareholder would pay on fund distributions or the redemption of fund shares.
www.calamos.com
275
Calamos International Growth Fund Financial Highlights
Selected data for a share outstanding throughout each year were as follows:
| | | CLASS I | |
| | | Year Ended October 31, | |
| | | 2023 | | 2022 | | 2021 | | 2020 | | 2019 | |
Net asset value, beginning of year | | $ | 16.10 | | | $ | 29.92 | | | $ | 23.73 | | | $ | 18.53 | | | $ | 18.55 | | |
Income from investment operations: | |
Net investment income (loss)(a) | | | 0.09 | | | | 0.27 | | | | 0.12 | | | | 0.01 | | | | 0.13 | | |
Net realized and unrealized gain (loss) | | | 0.81 | | | | (9.88 | ) | | | 7.54 | | | | 5.19 | | | | 1.87 | | |
Total from investment operations | | | 0.90 | | | | (9.61 | ) | | | 7.66 | | | | 5.20 | | | | 2.00 | | |
Distributions: | |
Dividends from net investment income | | | — | | | | (0.08 | ) | | | (0.00 | )* | | | — | | | | — | | |
Dividends from net realized gains | | | — | | | | (4.13 | ) | | | (1.47 | ) | | | — | | | | (2.02 | ) | |
Total distributions** | | | — | | | | (4.21 | ) | | | (1.47 | ) | | | — | | | | (2.02 | ) | |
Net asset value, end of year | | $ | 17.00 | | | $ | 16.10 | | | $ | 29.92 | | | $ | 23.73 | | | $ | 18.53 | | |
Ratios and supplemental data: | |
Total return(b) | | | 5.59 | % | | | (36.54 | %) | | | 33.13 | % | | | 28.06 | % | | | 13.32 | % | |
Net assets, end of year (000) | | $ | 141,782 | | | $ | 120,520 | | | $ | 216,723 | | | $ | 156,321 | | | $ | 134,562 | | |
Ratio of net expenses to average net assets | | | 0.91 | % | | | 0.85 | % | | | 0.85 | % | | | 0.85 | % | | | 0.85 | % | |
Ratio of gross expenses to average net assets prior to expense reductions | | | 1.24 | % | | | 1.39 | % | | | 1.31 | % | | | 1.28 | % | | | 1.23 | % | |
Ratio of net investment income (loss) to average net assets | | | 0.52 | % | | | 1.28 | % | | | 0.43 | % | | | 0.05 | % | | | 0.75 | % | |
* Amounts are less than $0.005.
** Distribution for annual periods determined in accordance with federal income tax regulations.
(a) Net investment income (loss) allocated based on average shares method.
(b) Total return measures net investment income (loss) and capital gain or loss from portfolio investments assuming reinvestment of dividends and capital gains distributions. Total return is not annualized for periods that are less than a full year, does not reflect the effect of sales charge for Class A shares nor the contingent deferred sales charge for Class C shares and does not reflect the deduction of taxes that a shareholder would pay on fund distributions or the redemption of fund shares.
CALAMOS OPEN-END FAMILY OF FUNDS ANNUAL REPORT
276
Calamos International Growth Fund Financial Highlights
Selected data for a share outstanding throughout each year were as follows:
| | | CLASS R6 | |
| | | Year Ended October 31, | |
| | | 2023 | | 2022 | | 2021 | | 2020 | | 2019 | |
Net asset value, beginning of year | | $ | 16.28 | | | $ | 30.20 | | | $ | 23.93 | | | $ | 18.67 | | | $ | 18.66 | | |
Income from investment operations: | |
Net investment income (loss)(a) | | | 0.11 | | | | 0.31 | | | | 0.15 | | | | 0.05 | | | | 0.20 | | |
Net realized and unrealized gain (loss) | | | 0.82 | | | | (10.00 | ) | | | 7.61 | | | | 5.21 | | | | 1.83 | | |
Total from investment operations | | | 0.93 | | | | (9.69 | ) | | | 7.76 | | | | 5.26 | | | | 2.03 | | |
Distributions: | |
Dividends from net investment income | | | — | | | | (0.10 | ) | | | (0.02 | ) | | | — | | | | — | | |
Dividends from net realized gains | | | — | | | | (4.13 | ) | | | (1.47 | ) | | | — | | | | (2.02 | ) | |
Total distributions** | | | — | | | | (4.23 | ) | | | (1.49 | ) | | | — | | | | (2.02 | ) | |
Net asset value, end of year | | $ | 17.21 | | | $ | 16.28 | | | $ | 30.20 | | | $ | 23.93 | | | $ | 18.67 | | |
Ratios and supplemental data: | |
Total return(b) | | | 5.71 | % | | | (36.47 | %) | | | 33.24 | % | | | 28.23 | % | | | 13.41 | % | |
Net assets, end of year (000) | | $ | 4,829 | | | $ | 4,332 | | | $ | 1,921 | | | $ | 1,012 | | | $ | 7,463 | | |
Ratio of net expenses to average net assets | | | 0.81 | % | | | 0.75 | % | | | 0.77 | % | | | 0.76 | % | | | 0.77 | % | |
Ratio of gross expenses to average net assets prior to expense reductions | | | 1.13 | % | | | 1.28 | % | | | 1.22 | % | | | 1.17 | % | | | 1.15 | % | |
Ratio of net investment income (loss) to average net assets | | | 0.61 | % | | | 1.59 | % | | | 0.51 | % | | | 0.24 | % | | | 1.13 | % | |
** Distribution for annual periods determined in accordance with federal income tax regulations.
(a) Net investment income (loss) allocated based on average shares method.
(b) Total return measures net investment income (loss) and capital gain or loss from portfolio investments assuming reinvestment of dividends and capital gains distributions. Total return is not annualized for periods that are less than a full year, does not reflect the effect of sales charge for Class A shares nor the contingent deferred sales charge for Class C shares and does not reflect the deduction of taxes that a shareholder would pay on fund distributions or the redemption of fund shares.
www.calamos.com
277
Calamos Evolving World Growth Fund Financial Highlights
Selected data for a share outstanding throughout each year were as follows:
| | | CLASS A | |
| | | Year Ended October 31, | |
| | | 2023 | | 2022 | | 2021 | | 2020 | | 2019 | |
Net asset value, beginning of year | | $ | 14.51 | | | $ | 22.25 | | | $ | 19.60 | | | $ | 14.12 | | | $ | 12.54 | | |
Income from investment operations: | |
Net investment income (loss)(a) | | | 0.01 | | | | 0.12 | | | | (0.05 | ) | | | (0.07 | ) | | | 0.09 | | |
Net realized and unrealized gain (loss) | | | 0.46 | | | | (7.79 | ) | | | 3.15 | | | | 5.66 | | | | 1.49 | | |
Total from investment operations | | | 0.47 | | | | (7.67 | ) | | | 3.10 | | | | 5.59 | | | | 1.58 | | |
Distributions: | |
Dividends from net investment income | | | (0.11 | ) | | | (0.07 | ) | | | — | | | | (0.11 | ) | | | — | | |
Dividends from net realized gains | | | — | | | | — | | | | (0.45 | ) | | | — | | | | — | | |
Total distributions** | | | (0.11 | ) | | | (0.07 | ) | | | (0.45 | ) | | | (0.11 | ) | | | — | | |
Net asset value, end of year | | $ | 14.87 | | | $ | 14.51 | | | $ | 22.25 | | | $ | 19.60 | | | $ | 14.12 | | |
Ratios and supplemental data: | |
Total return(b) | | | 3.19 | % | | | (34.55 | %) | | | 15.87 | % | | | 39.81 | % | | | 12.60 | % | |
Net assets, end of year (000) | | $ | 36,830 | | | $ | 36,890 | | | $ | 54,731 | | | $ | 31,015 | | | $ | 28,168 | | |
Ratio of net expenses to average net assets | | | 1.29 | % | | | 1.30 | % | | | 1.30 | % | | | 1.56 | % | | | 1.64 | % | |
Ratio of gross expenses to average net assets prior to expense reductions | | | 1.63 | % | | | 1.63 | % | | | 1.60 | % | | | 1.64 | % | | | 1.64 | % | |
Ratio of net investment income (loss) to average net assets | | | 0.09 | % | | | 0.67 | % | | | (0.21 | %) | | | (0.47 | %) | | | 0.63 | % | |
| | | Year Ended October 31, | |
| | | 2023 | | 2022 | | 2021 | | 2020 | | 2019 | |
Portfolio turnover rate | | | 137 | % | | | 132 | % | | | 140 | % | | | 125 | % | | | 78 | % | |
** Distribution for annual periods determined in accordance with federal income tax regulations.
(a) Net investment income (loss) allocated based on average shares method.
(b) Total return measures net investment income (loss) and capital gain or loss from portfolio investments assuming reinvestment of dividends and capital gains distributions. Total return is not annualized for periods that are less than a full year, does not reflect the effect of sales charge for Class A shares nor the contingent deferred sales charge for Class C shares and does not reflect the deduction of taxes that a shareholder would pay on fund distributions or the redemption of fund shares.
CALAMOS OPEN-END FAMILY OF FUNDS ANNUAL REPORT
278
Calamos Evolving World Growth Fund Financial Highlights
Selected data for a share outstanding throughout each year were as follows:
| | | CLASS C | |
| | | Year Ended October 31, | |
| | | 2023 | | 2022 | | 2021 | | 2020 | | 2019 | |
Net asset value, beginning of year | | $ | 13.34 | | | $ | 20.55 | | | $ | 18.26 | | | $ | 13.16 | | | $ | 11.78 | | |
Income from investment operations: | |
Net investment income (loss)(a) | | | (0.09 | ) | | | (0.03 | ) | | | (0.22 | ) | | | (0.18 | ) | | | (0.01 | ) | |
Net realized and unrealized gain (loss) | | | 0.42 | | | | (7.18 | ) | | | 2.96 | | | | 5.28 | | | | 1.39 | | |
Total from investment operations | | | 0.33 | | | | (7.21 | ) | | | 2.74 | | | | 5.10 | | | | 1.38 | | |
Distributions: | |
Dividends from net investment income | | | — | | | | — | | | | — | | | | — | | | | — | | |
Dividends from net realized gains | | | — | | | | — | | | | (0.45 | ) | | | — | | | | — | | |
Total distributions** | | | — | | | | — | | | | (0.45 | ) | | | — | | | | — | | |
Net asset value, end of year | | $ | 13.67 | | | $ | 13.34 | | | $ | 20.55 | | | $ | 18.26 | | | $ | 13.16 | | |
Ratios and supplemental data: | |
Total return(b) | | | 2.40 | % | | | (35.04 | %) | | | 15.05 | % | | | 38.75 | % | | | 11.71 | % | |
Net assets, end of year (000) | | $ | 3,930 | | | $ | 6,153 | | | $ | 16,050 | | | $ | 13,183 | | | $ | 13,478 | | |
Ratio of net expenses to average net assets | | | 2.04 | % | | | 2.05 | % | | | 2.05 | % | | | 2.32 | % | | | 2.39 | % | |
Ratio of gross expenses to average net assets prior to expense reductions | | | 2.38 | % | | | 2.39 | % | | | 2.34 | % | | | 2.39 | % | | | 2.39 | % | |
Ratio of net investment income (loss) to average net assets | | | (0.63 | %) | | | (0.16 | %) | | | (1.04 | %) | | | (1.23 | %) | | | (0.11 | %) | |
** Distribution for annual periods determined in accordance with federal income tax regulations.
(a) Net investment income (loss) allocated based on average shares method.
(b) Total return measures net investment income (loss) and capital gain or loss from portfolio investments assuming reinvestment of dividends and capital gains distributions. Total return is not annualized for periods that are less than a full year, does not reflect the effect of sales charge for Class A shares nor the contingent deferred sales charge for Class C shares and does not reflect the deduction of taxes that a shareholder would pay on fund distributions or the redemption of fund shares.
www.calamos.com
279
Calamos Evolving World Growth Fund Financial Highlights
Selected data for a share outstanding throughout each year were as follows:
| | | CLASS I | |
| | | Year Ended October 31, | |
| | | 2023 | | 2022 | | 2021 | | 2020 | | 2019 | |
Net asset value, beginning of year | | $ | 14.67 | | | $ | 22.51 | | | $ | 19.78 | | | $ | 14.26 | | | $ | 12.63 | | |
Income from investment operations: | |
Net investment income (loss)(a) | | | 0.06 | | | | 0.17 | | | | 0.01 | | | | (0.03 | ) | | | 0.12 | | |
Net realized and unrealized gain (loss) | | | 0.45 | | | | (7.87 | ) | | | 3.18 | | | | 5.71 | | | | 1.51 | | |
Total from investment operations | | | 0.51 | | | | (7.70 | ) | | | 3.19 | | | | 5.68 | | | | 1.63 | | |
Distributions: | |
Dividends from net investment income | | | (0.15 | ) | | | (0.14 | ) | | | (0.01 | ) | | | (0.16 | ) | | | — | | |
Dividends from net realized gains | | | — | | | | — | | | | (0.45 | ) | | | — | | | | — | | |
Total distributions** | | | (0.15 | ) | | | (0.14 | ) | | | (0.46 | ) | | | (0.16 | ) | | | — | | |
Net asset value, end of year | | $ | 15.03 | | | $ | 14.67 | | | $ | 22.51 | | | $ | 19.78 | | | $ | 14.26 | | |
Ratios and supplemental data: | |
Total return(b) | | | 3.44 | % | | | (34.39 | %) | | | 16.17 | % | | | 40.16 | % | | | 12.91 | % | |
Net assets, end of year (000) | | $ | 320,622 | | | $ | 315,858 | | | $ | 509,216 | | | $ | 193,243 | | | $ | 120,318 | | |
Ratio of net expenses to average net assets | | | 1.04 | % | | | 1.05 | % | | | 1.05 | % | | | 1.30 | % | | | 1.39 | % | |
Ratio of gross expenses to average net assets prior to expense reductions | | | 1.38 | % | | | 1.38 | % | | | 1.35 | % | | | 1.39 | % | | | 1.39 | % | |
Ratio of net investment income (loss) to average net assets | | | 0.35 | % | | | 0.90 | % | | | 0.04 | % | | | (0.22 | %) | | | 0.91 | % | |
** Distribution for annual periods determined in accordance with federal income tax regulations.
(a) Net investment income (loss) allocated based on average shares method.
(b) Total return measures net investment income (loss) and capital gain or loss from portfolio investments assuming reinvestment of dividends and capital gains distributions. Total return is not annualized for periods that are less than a full year, does not reflect the effect of sales charge for Class A shares nor the contingent deferred sales charge for Class C shares and does not reflect the deduction of taxes that a shareholder would pay on fund distributions or the redemption of fund shares.
CALAMOS OPEN-END FAMILY OF FUNDS ANNUAL REPORT
280
Calamos Global Equity Fund Financial Highlights
Selected data for a share outstanding throughout each year were as follows:
| | | CLASS A | |
| | | Year Ended October 31, | |
| | | 2023 | | 2022 | | 2021 | | 2020 | | 2019 | |
Net asset value, beginning of year | | $ | 11.50 | | | $ | 18.40 | | | $ | 14.05 | | | $ | 11.64 | | | $ | 13.61 | | |
Income from investment operations: | |
Net investment income (loss)(a) | | | 0.01 | | | | 0.02 | | | | (0.08 | ) | | | (0.07 | ) | | | (0.01 | ) | |
Net realized and unrealized gain (loss) | | | 1.07 | | | | (4.94 | ) | | | 5.49 | | | | 3.37 | | | | 0.79 | | |
Total from investment operations | | | 1.08 | | | | (4.92 | ) | | | 5.41 | | | | 3.30 | | | | 0.78 | | |
Distributions: | |
Dividends from net investment income | | | — | | | | — | | | | — | | | | — | | | | — | | |
Dividends from net realized gains | | | (0.50 | ) | | | (1.98 | ) | | | (1.06 | ) | | | (0.89 | ) | | | (2.75 | ) | |
Total distributions** | | | (0.50 | ) | | | (1.98 | ) | | | (1.06 | ) | | | (0.89 | ) | | | (2.75 | ) | |
Net asset value, end of year | | $ | 12.08 | | | $ | 11.50 | | | $ | 18.40 | | | $ | 14.05 | | | $ | 11.64 | | |
Ratios and supplemental data: | |
Total return(b) | | | 9.68 | % | | | (29.36 | %) | | | 39.89 | % | | | 30.07 | % | | | 10.28 | % | |
Net assets, end of year (000) | | $ | 20,462 | | | $ | 21,143 | | | $ | 32,511 | | | $ | 21,814 | | | $ | 20,236 | | |
Ratio of net expenses to average net assets | | | 1.41 | % | | | 1.40 | % | | | 1.40 | % | | | 1.40 | % | | | 1.40 | % | |
Ratio of gross expenses to average net assets prior to expense reductions | | | 1.52 | % | | | 1.61 | % | | | 1.58 | % | | | 1.65 | % | | | 1.51 | % | |
Ratio of net investment income (loss) to average net assets | | | 0.04 | % | | | 0.17 | % | | | (0.48 | %) | | | (0.59 | %) | | | (0.08 | %) | |
| | | Year Ended October 31, | |
| | | 2023 | | 2022 | | 2021 | | 2020 | | 2019 | |
Portfolio turnover rate | | | 90 | % | | | 77 | % | | | 72 | % | | | 71 | % | | | 72 | % | |
** Distribution for annual periods determined in accordance with federal income tax regulations.
(a) Net investment income (loss) allocated based on average shares method.
(b) Total return measures net investment income (loss) and capital gain or loss from portfolio investments assuming reinvestment of dividends and capital gains distributions. Total return is not annualized for periods that are less than a full year, does not reflect the effect of sales charge for Class A shares nor the contingent deferred sales charge for Class C shares and does not reflect the deduction of taxes that a shareholder would pay on fund distributions or the redemption of fund shares.
www.calamos.com
281
Calamos Global Equity Fund Financial Highlights
Selected data for a share outstanding throughout each year were as follows:
| | | CLASS C | |
| | | Year Ended October 31, | |
| | | 2023 | | 2022 | | 2021 | | 2020 | | 2019 | |
Net asset value, beginning of year | | $ | 9.35 | | | $ | 15.45 | | | $ | 12.03 | | | $ | 10.15 | | | $ | 12.34 | | |
Income from investment operations: | |
Net investment income (loss)(a) | | | (0.07 | ) | | | (0.07 | ) | | | (0.18 | ) | | | (0.14 | ) | | | (0.09 | ) | |
Net realized and unrealized gain (loss) | | | 0.86 | | | | (4.05 | ) | | | 4.66 | | | | 2.91 | | | | 0.65 | | |
Total from investment operations | | | 0.79 | | | | (4.12 | ) | | | 4.48 | | | | 2.77 | | | | 0.56 | | |
Distributions: | |
Dividends from net investment income | | | — | | | | — | | | | — | | | | — | | | | — | | |
Dividends from net realized gains | | | (0.50 | ) | | | (1.98 | ) | | | (1.06 | ) | | | (0.89 | ) | | | (2.75 | ) | |
Total distributions** | | | (0.50 | ) | | | (1.98 | ) | | | (1.06 | ) | | | (0.89 | ) | | | (2.75 | ) | |
Net asset value, end of year | | $ | 9.64 | | | $ | 9.35 | | | $ | 15.45 | | | $ | 12.03 | | | $ | 10.15 | | |
Ratios and supplemental data: | |
Total return(b) | | | 8.99 | % | | | (29.96 | %) | | | 38.88 | % | | | 29.19 | % | | | 9.36 | % | |
Net assets, end of year (000) | | $ | 611 | | | $ | 726 | | | $ | 1,492 | | | $ | 4,635 | | | $ | 8,011 | | |
Ratio of net expenses to average net assets | | | 2.16 | % | | | 2.15 | % | | | 2.15 | % | | | 2.15 | % | | | 2.15 | % | |
Ratio of gross expenses to average net assets prior to expense reductions | | | 2.28 | % | | | 2.37 | % | | | 2.33 | % | | | 2.40 | % | | | 2.26 | % | |
Ratio of net investment income (loss) to average net assets | | | (0.71 | %) | | | (0.59 | %) | | | (1.32 | %) | | | (1.31 | %) | | | (0.86 | %) | |
** Distribution for annual periods determined in accordance with federal income tax regulations.
(a) Net investment income (loss) allocated based on average shares method.
(b) Total return measures net investment income (loss) and capital gain or loss from portfolio investments assuming reinvestment of dividends and capital gains distributions. Total return is not annualized for periods that are less than a full year, does not reflect the effect of sales charge for Class A shares nor the contingent deferred sales charge for Class C shares and does not reflect the deduction of taxes that a shareholder would pay on fund distributions or the redemption of fund shares.
CALAMOS OPEN-END FAMILY OF FUNDS ANNUAL REPORT
282
Calamos Global Equity Fund Financial Highlights
Selected data for a share outstanding throughout each year were as follows:
| | | CLASS I | |
| | | Year Ended October 31, | |
| | | 2023 | | 2022 | | 2021 | | 2020 | | 2019 | |
Net asset value, beginning of year | | $ | 12.10 | | | $ | 19.20 | | | $ | 14.59 | | | $ | 12.02 | | | $ | 13.93 | | |
Income from investment operations: | |
Net investment income (loss)(a) | | | 0.04 | | | | 0.05 | | | | (0.04 | ) | | | (0.04 | ) | | | 0.02 | | |
Net realized and unrealized gain (loss) | | | 1.13 | | | | (5.17 | ) | | | 5.71 | | | | 3.50 | | | | 0.82 | | |
Total from investment operations | | | 1.17 | | | | (5.12 | ) | | | 5.67 | | | | 3.46 | | | | 0.84 | | |
Distributions: | |
Dividends from net investment income | | | (0.02 | ) | | | — | | | | — | | | | — | | | | — | | |
Dividends from net realized gains | | | (0.50 | ) | | | (1.98 | ) | | | (1.06 | ) | | | (0.89 | ) | | | (2.75 | ) | |
Total distributions** | | | (0.52 | ) | | | (1.98 | ) | | | (1.06 | ) | | | (0.89 | ) | | | (2.75 | ) | |
Net asset value, end of year | | $ | 12.75 | | | $ | 12.10 | | | $ | 19.20 | | | $ | 14.59 | | | $ | 12.02 | | |
Ratios and supplemental data: | |
Total return(b) | | | 9.98 | % | | | (29.20 | %) | | | 40.29 | % | | | 30.46 | % | | | 10.52 | % | |
Net assets, end of year (000) | | $ | 66,181 | | | $ | 51,538 | | | $ | 103,256 | | | $ | 65,062 | | | $ | 52,619 | | |
Ratio of net expenses to average net assets | | | 1.15 | % | | | 1.15 | % | | | 1.15 | % | | | 1.15 | % | | | 1.15 | % | |
Ratio of gross expenses to average net assets prior to expense reductions | | | 1.25 | % | | | 1.36 | % | | | 1.33 | % | | | 1.40 | % | | | 1.26 | % | |
Ratio of net investment income (loss) to average net assets | | | 0.28 | % | | | 0.37 | % | | | (0.23 | %) | | | (0.34 | %) | | | 0.14 | % | |
** Distribution for annual periods determined in accordance with federal income tax regulations.
(a) Net investment income (loss) allocated based on average shares method.
(b) Total return measures net investment income (loss) and capital gain or loss from portfolio investments assuming reinvestment of dividends and capital gains distributions. Total return is not annualized for periods that are less than a full year, does not reflect the effect of sales charge for Class A shares nor the contingent deferred sales charge for Class C shares and does not reflect the deduction of taxes that a shareholder would pay on fund distributions or the redemption of fund shares.
www.calamos.com
283
Calamos Global Equity Fund Financial Highlights
Selected data for a share outstanding throughout each period were as follows:
| | | CLASS R6 | |
| | | Year Ended October 31, | | June 23, 2020•
through
October 31, | |
| | | 2023 | | 2022 | | 2021 | | 2020 | |
Net asset value, beginning of period | | $ | 12.11 | | | $ | 19.21 | | | $ | 14.59 | | | $ | 13.19 | | |
Income from investment operations: | |
Net investment income (loss)(a) | | | 0.05 | | | | (0.02 | ) | | | (0.03 | ) | | | (0.02 | ) | |
Net realized and unrealized gain (loss) | | | 1.13 | | | | (5.10 | ) | | | 5.71 | | | | 1.42 | | |
Total from investment operations | | | 1.18 | | | | (5.12 | ) | | | 5.68 | | | | 1.40 | | |
Distributions: | |
Dividends from net investment income | | | (0.03 | ) | | | — | | | | — | | | | — | | |
Dividends from net realized gains | | | (0.50 | ) | | | (1.98 | ) | | | (1.06 | ) | | | — | | |
Total distributions** | | | (0.53 | ) | | | (1.98 | ) | | | (1.06 | ) | | | — | | |
Net asset value, end of period | | $ | 12.76 | | | $ | 12.11 | | | $ | 19.21 | | | $ | 14.59 | | |
Ratios and supplemental data: | |
Total return(b) | | | 10.04 | % | | | (29.18 | %) | | | 40.36 | % | | | 10.61 | % | |
Net assets, end of year (000) | | $ | 93 | | | $ | 11 | | | $ | 168 | | | $ | 120 | | |
Ratio of net expenses to average net assets | | | 1.06 | % | | | 1.12 | % | | | 1.09 | % | | | 1.09 | %(c) | |
Ratio of gross expenses to average net assets prior to expense reductions | | | 1.14 | % | | | 1.35 | % | | | 1.27 | % | | | 1.36 | %(c) | |
Ratio of net investment income (loss) to average net assets | | | 0.35 | % | | | (0.12 | %) | | | (0.18 | %) | | | (0.45 | %)(c) | |
• Commencement of operations.
** Distribution for annual periods determined in accordance with federal income tax regulations.
(a) Net investment income (loss) allocated based on average shares method.
(b) Total return measures net investment income (loss) and capital gain or loss from portfolio investments assuming reinvestment of dividends and capital gains distributions. Total return is not annualized for periods that are less than a full year, does not reflect the effect of sales charge for Class A shares nor the contingent deferred sales charge for Class C shares and does not reflect the deduction of taxes that a shareholder would pay on fund distributions or the redemption of fund shares.
(c) Annualized.
CALAMOS OPEN-END FAMILY OF FUNDS ANNUAL REPORT
284
Calamos Global Opportunities Fund Financial Highlights
Selected data for a share outstanding throughout each year were as follows:
| | | CLASS A | |
| | | Year Ended October 31, | |
| | | 2023 | | 2022 | | 2021 | | 2020 | | 2019 | |
Net asset value, beginning of year | | $ | 9.15 | | | $ | 12.72 | | | $ | 10.02 | | | $ | 8.51 | | | $ | 8.99 | | |
Income from investment operations: | |
Net investment income (loss)(a) | | | 0.00 | | | | (0.03 | ) | | | (0.04 | ) | | | 0.07 | | | | 0.10 | | |
Net realized and unrealized gain (loss) | | | 0.46 | | | | (2.88 | ) | | | 3.42 | | | | 1.55 | | | | 0.37 | | |
Total from investment operations | | | 0.46 | | | | (2.91 | ) | | | 3.38 | | | | 1.62 | | | | 0.47 | | |
Distributions: | |
Dividends from net investment income | | | (0.04 | ) | | | — | | | | (0.05 | ) | | | (0.02 | ) | | | (0.07 | ) | |
Dividends from net realized gains | | | — | | | | (0.66 | ) | | | (0.63 | ) | | | (0.09 | ) | | | (0.88 | ) | |
Total distributions** | | | (0.04 | ) | | | (0.66 | ) | | | (0.68 | ) | | | (0.11 | ) | | | (0.95 | ) | |
Net asset value, end of year | | $ | 9.57 | | | $ | 9.15 | | | $ | 12.72 | | | $ | 10.02 | | | $ | 8.51 | | |
Ratios and supplemental data: | |
Total return(b) | | | 4.97 | % | | | (23.93 | %) | | | 34.84 | % | | | 19.09 | % | | | 6.67 | % | |
Net assets, end of year (000) | | $ | 81,821 | | | $ | 86,403 | | | $ | 119,261 | | | $ | 88,618 | | | $ | 83,069 | | |
Ratio of net expenses to average net assets | | | 1.22 | % | | | 1.22 | % | | | 1.31 | % | | | 1.53 | % | | | 1.49 | % | |
Ratio of gross expenses to average net assets prior to expense reductions | | | 1.49 | % | | | 1.46 | % | | | 1.45 | % | | | 1.53 | % | | | 1.49 | % | |
Ratio of net investment income (loss) to average net assets | | | (0.05 | %) | | | (0.28 | %) | | | (0.33 | %) | | | 0.78 | % | | | 1.20 | % | |
| | | Year Ended October 31, | |
| | | 2023 | | 2022 | | 2021 | | 2020 | | 2019 | |
Portfolio turnover rate | | | 81 | % | | | 92 | % | | | 82 | % | | | 119 | % | | | 69 | % | |
** Distribution for annual periods determined in accordance with federal income tax regulations.
(a) Net investment income (loss) allocated based on average shares method.
(b) Total return measures net investment income (loss) and capital gain or loss from portfolio investments assuming reinvestment of dividends and capital gains distributions. Total return is not annualized for periods that are less than a full year, does not reflect the effect of sales charge for Class A shares nor the contingent deferred sales charge for Class C shares and does not reflect the deduction of taxes that a shareholder would pay on fund distributions or the redemption of fund shares.
www.calamos.com
285
Calamos Global Opportunities Fund Financial Highlights
Selected data for a share outstanding throughout each year were as follows:
| | | CLASS C | |
| | | Year Ended October 31, | |
| | | 2023 | | 2022 | | 2021 | | 2020 | | 2019 | |
Net asset value, beginning of year | | $ | 7.73 | | | $ | 10.92 | | | $ | 8.71 | | | $ | 7.45 | | | $ | 7.98 | | |
Income from investment operations: | |
Net investment income (loss)(a) | | | (0.07 | ) | | | (0.09 | ) | | | (0.11 | ) | | | 0.00 | | | | 0.04 | | |
Net realized and unrealized gain (loss) | | | 0.40 | | | | (2.44 | ) | | | 2.95 | | | | 1.35 | | | | 0.31 | | |
Total from investment operations | | | 0.33 | | | | (2.53 | ) | | | 2.84 | | | | 1.35 | | | | 0.35 | | |
Distributions: | |
Dividends from net investment income | | | (0.01 | ) | | | — | | | | — | | | | — | | | | — | | |
Dividends from net realized gains | | | — | | | | (0.66 | ) | | | (0.63 | ) | | | (0.09 | ) | | | (0.88 | ) | |
Total distributions** | | | (0.01 | ) | | | (0.66 | ) | | | (0.63 | ) | | | (0.09 | ) | | | (0.88 | ) | |
Net asset value, end of year | | $ | 8.05 | | | $ | 7.73 | | | $ | 10.92 | | | $ | 8.71 | | | $ | 7.45 | | |
Ratios and supplemental data: | |
Total return(b) | | | 4.22 | % | | | (24.43 | %) | | | 33.77 | % | | | 18.22 | % | | | 5.87 | % | |
Net assets, end of year (000) | | $ | 7,317 | | | $ | 7,528 | | | $ | 10,032 | | | $ | 8,946 | | | $ | 14,742 | | |
Ratio of net expenses to average net assets | | | 1.97 | % | | | 1.97 | % | | | 2.07 | % | | | 2.28 | % | | | 2.28 | % | |
Ratio of gross expenses to average net assets prior to expense reductions | | | 2.24 | % | | | 2.21 | % | | | 2.20 | % | | | 2.28 | % | | | 2.28 | % | |
Ratio of net investment income (loss) to average net assets | | | (0.80 | %) | | | (1.03 | %) | | | (1.09 | %) | | | 0.01 | % | | | 0.50 | % | |
** Distribution for annual periods determined in accordance with federal income tax regulations.
(a) Net investment income (loss) allocated based on average shares method.
(b) Total return measures net investment income (loss) and capital gain or loss from portfolio investments assuming reinvestment of dividends and capital gains distributions. Total return is not annualized for periods that are less than a full year, does not reflect the effect of sales charge for Class A shares nor the contingent deferred sales charge for Class C shares and does not reflect the deduction of taxes that a shareholder would pay on fund distributions or the redemption of fund shares.
CALAMOS OPEN-END FAMILY OF FUNDS ANNUAL REPORT
286
Calamos Global Opportunities Fund Financial Highlights
Selected data for a share outstanding throughout each year were as follows:
| | | CLASS I | |
| | | Year Ended October 31, | |
| | | 2023 | | 2022 | | 2021 | | 2020 | | 2019 | |
Net asset value, beginning of year | | $ | 9.53 | | | $ | 13.18 | | | $ | 10.36 | | | $ | 8.79 | | | $ | 9.25 | | |
Income from investment operations: | |
Net investment income (loss)(a) | | | 0.02 | | | | (0.02 | ) | | | (0.01 | ) | | | 0.09 | | | | 0.13 | | |
Net realized and unrealized gain (loss) | | | 0.48 | | | | (2.96 | ) | | | 3.54 | | | | 1.60 | | | | 0.38 | | |
Total from investment operations | | | 0.50 | | | | (2.98 | ) | | | 3.53 | | | | 1.69 | | | | 0.51 | | |
Distributions: | |
Dividends from net investment income | | | (0.05 | ) | | | (0.01 | ) | | | (0.08 | ) | | | (0.03 | ) | | | (0.09 | ) | |
Dividends from net realized gains | | | — | | | | (0.66 | ) | | | (0.63 | ) | | | (0.09 | ) | | | (0.88 | ) | |
Total distributions** | | | (0.05 | ) | | | (0.67 | ) | | | (0.71 | ) | | | (0.12 | ) | | | (0.97 | ) | |
Net asset value, end of year | | $ | 9.98 | | | $ | 9.53 | | | $ | 13.18 | | | $ | 10.36 | | | $ | 8.79 | | |
Ratios and supplemental data: | |
Total return(b) | | | 5.21 | % | | | (23.66 | %) | | | 35.16 | % | | | 19.33 | % | | | 6.95 | % | |
Net assets, end of year (000) | | $ | 107,198 | | | $ | 117,790 | | | $ | 152,596 | | | $ | 65,909 | | | $ | 53,594 | | |
Ratio of net expenses to average net assets | | | 0.97 | % | | | 0.97 | % | | | 1.04 | % | | | 1.28 | % | | | 1.25 | % | |
Ratio of gross expenses to average net assets prior to expense reductions | | | 1.24 | % | | | 1.21 | % | | | 1.20 | % | | | 1.28 | % | | | 1.25 | % | |
Ratio of net investment income (loss) to average net assets | | | 0.20 | % | | | (0.14 | %) | | | (0.09 | %) | | | 1.01 | % | | | 1.47 | % | |
** Distribution for annual periods determined in accordance with federal income tax regulations.
(a) Net investment income (loss) allocated based on average shares method.
(b) Total return measures net investment income (loss) and capital gain or loss from portfolio investments assuming reinvestment of dividends and capital gains distributions. Total return is not annualized for periods that are less than a full year, does not reflect the effect of sales charge for Class A shares nor the contingent deferred sales charge for Class C shares and does not reflect the deduction of taxes that a shareholder would pay on fund distributions or the redemption of fund shares.
www.calamos.com
287
Calamos International Small Cap Growth Fund Financial Highlights
Selected data for a share outstanding throughout each year were as follows:
| | | CLASS A | |
| | | Year Ended
October 31,
2023 | | March 31, 2022•
through
October 31,
2022 | |
Net asset value, beginning of year | | $ | 7.65 | | | $ | 10.00 | | |
Income from investment operations: | |
Net investment income (loss)(a) | | | 0.00 | * | | | 0.05 | | |
Net realized and unrealized gain (loss) | | | (0.06 | ) | | | (2.40 | ) | |
Total from investment operations | | | (0.06 | ) | | | (2.35 | ) | |
Distributions: | |
Dividends from net investment income | | | (0.05 | ) | | | — | | |
Dividends from net realized gains | | | — | | | | — | | |
Total distributions** | | | (0.05 | ) | | | — | | |
Net asset value, end of year | | $ | 7.54 | | | $ | 7.65 | | |
Ratios and supplemental data: | |
Total return(b) | | | (0.87 | %) | | | (23.50 | %) | |
Net assets, end of year (000) | | $ | 20 | | | $ | 13 | | |
Ratio of net expenses to average net assets | | | 1.35 | % | | | 2.66 | %(c) | |
Ratio of gross expenses to average net assets prior to expense reductions | | | 9.06 | % | | | 11.03 | %(c) | |
Ratio of net investment income (loss) to average net assets | | | (0.04 | %) | | | (9.66 | %)(c) | |
| | | Year Ended
October 31,
2023 | | March 31, 2022•
through
October 31,
2022 | |
Portfolio turnover rate | | | 126 | % | | | 64 | %(d) | |
• Commencement of operations.
* Amounts are less than $0.005.
** Distribution for annual periods determined in accordance with federal income tax regulations.
(a) Net investment income (loss) allocated based on average shares method.
(b) Total return measures net investment income (loss) and capital gain or loss from portfolio investments assuming reinvestment of dividends and capital gains distributions. Total return is not annualized for periods that are less than a full year, does not reflect the effect of sales charge for Class A shares nor the contingent deferred sales charge for Class C shares and does not reflect the deduction of taxes that a shareholder would pay on fund distributions or the redemption of fund shares.
(c) Annualized.
(d) Not annualized.
CALAMOS OPEN-END FAMILY OF FUNDS ANNUAL REPORT
288
Calamos International Small Cap Growth Fund Financial Highlights
Selected data for a share outstanding throughout each year were as follows:
| | | CLASS C | |
| | | Year Ended
October 31,
2023 | | March 31, 2022•
through
October 31,
2022 | |
Net asset value, beginning of year | | $ | 7.62 | | | $ | 10.00 | | |
Income from investment operations: | |
Net investment income (loss)(a) | | | (0.07 | ) | | | 0.01 | | |
Net realized and unrealized gain (loss) | | | (0.05 | ) | | | (2.39 | ) | |
Total from investment operations | | | (0.12 | ) | | | (2.38 | ) | |
Distributions: | |
Dividends from net investment income | | | (0.04 | ) | | | — | | |
Dividends from net realized gains | | | — | | | | — | | |
Total distributions** | | | (0.04 | ) | | | — | | |
Net asset value, end of year | | $ | 7.46 | | | $ | 7.62 | | |
Ratios and supplemental data: | |
Total return(b) | | | (1.62 | %) | | | (23.80 | %) | |
Net assets, end of year (000) | | $ | 7 | | | $ | 8 | | |
Ratio of net expenses to average net assets | | | 2.09 | % | | | 2.67 | %(c) | |
Ratio of gross expenses to average net assets prior to expense reductions | | | 9.79 | % | | | 11.03 | %(c) | |
Ratio of net investment income (loss) to average net assets | | | (0.92 | %) | | | (9.66 | %)(c) | |
• Commencement of operations.
** Distribution for annual periods determined in accordance with federal income tax regulations.
(a) Net investment income (loss) allocated based on average shares method.
(b) Total return measures net investment income (loss) and capital gain or loss from portfolio investments assuming reinvestment of dividends and capital gains distributions. Total return is not annualized for periods that are less than a full year, does not reflect the effect of sales charge for Class A shares nor the contingent deferred sales charge for Class C shares and does not reflect the deduction of taxes that a shareholder would pay on fund distributions or the redemption of fund shares.
(c) Annualized.
www.calamos.com
289
Calamos International Small Cap Growth Fund Financial Highlights
Selected data for a share outstanding throughout each year were as follows:
| | | CLASS I | |
| | | Year Ended
October 31,
2023 | | March 31, 2022•
through
October 31,
2022 | |
Net asset value, beginning of year | | $ | 7.66 | | | $ | 10.00 | | |
Income from investment operations: | |
Net investment income (loss)(a) | | | 0.01 | | | | 0.06 | | |
Net realized and unrealized gain (loss) | | | (0.05 | ) | | | (2.40 | ) | |
Total from investment operations | | | (0.04 | ) | | | (2.34 | ) | |
Distributions: | |
Dividends from net investment income | | | (0.06 | ) | | | — | | |
Dividends from net realized gains | | | — | | | | — | | |
Total distributions** | | | (0.06 | ) | | | — | | |
Net asset value, end of year | | $ | 7.56 | | | $ | 7.66 | | |
Ratios and supplemental data: | |
Total return(b) | | | (0.48 | %) | | | (23.40 | %) | |
Net assets, end of year (000) | | $ | 2,327 | | | $ | 1,740 | | |
Ratio of net expenses to average net assets | | | 1.10 | % | | | 2.67 | %(c) | |
Ratio of gross expenses to average net assets prior to expense reductions | | | 8.80 | % | | | 11.03 | %(c) | |
Ratio of net investment income (loss) to average net assets | | | 0.17 | % | | | (9.66 | %)(c) | |
• Commencement of operations.
** Distribution for annual periods determined in accordance with federal income tax regulations.
(a) Net investment income (loss) calculated based on average shares method.
(b) Total return measures net investment income (loss) and capital gain or loss from portfolio investments assuming reinvestment of dividends and capital gains distributions. Total return is not annualized for periods that are less than a full year, does not reflect the effect of sales charge for Class A shares nor the contingent deferred sales charge for Class C shares and does not reflect the deduction of taxes that a shareholder would pay on fund distributions or the redemption of fund shares.
(c) Annualized.
CALAMOS OPEN-END FAMILY OF FUNDS ANNUAL REPORT
290
Calamos International Small Cap Growth Fund Financial Highlights
Selected data for a share outstanding throughout each year were as follows:
| | | CLASS R6 | |
| | | Year Ended
October 31,
2023 | | March 31, 2022•
through
October 31,
2022 | |
Net asset value, beginning of year | | $ | 7.66 | | | $ | 10.00 | | |
Income from investment operations: | |
Net investment income (loss)(a) | | | 0.01 | | | | 0.06 | | |
Net realized and unrealized gain (loss) | | | (0.05 | ) | | | (2.40 | ) | |
Total from investment operations | | | (0.04 | ) | | | (2.34 | ) | |
Distributions: | |
Dividends from net investment income | | | (0.06 | ) | | | — | | |
Dividends from net realized gains | | | — | | | | — | | |
Total distributions** | | | (0.06 | ) | | | — | | |
Net asset value, end of year | | $ | 7.56 | | | $ | 7.66 | | |
Ratios and supplemental data: | |
Total return(b) | | | (0.48 | %) | | | (23.40 | %) | |
Net assets, end of year (000) | | $ | 8 | | | $ | 8 | | |
Ratio of net expenses to average net assets | | | 1.07 | % | | | 2.67 | %(c) | |
Ratio of gross expenses to average net assets prior to expense reductions | | | 8.78 | % | | | 11.03 | %(c) | |
Ratio of net investment income (loss) to average net assets | | | 0.19 | % | | | (9.66 | %)(c) | |
• Commencement of operations.
** Distribution for annual periods determined in accordance with federal income tax regulations.
(a) Net investment income (loss) allocated based on average shares method.
(b) Total return measures net investment income (loss) and capital gain or loss from portfolio investments assuming reinvestment of dividends and capital gains distributions. Total return is not annualized for periods that are less than a full year, does not reflect the effect of sales charge for Class A shares nor the contingent deferred sales charge for Class C shares and does not reflect the deduction of taxes that a shareholder would pay on fund distributions or the redemption of fund shares.
(c) Annualized.
www.calamos.com
291
Calamos Total Return Bond Fund Financial Highlights
Selected data for a share outstanding throughout each year were as follows:
| | | CLASS A | |
| | | Year Ended October 31, | |
| | | 2023 | | 2022 | | 2021 | | 2020 | | 2019 | |
Net asset value, beginning of year | | $ | 8.67 | | | $ | 10.61 | | | $ | 10.85 | | | $ | 10.53 | | | $ | 9.81 | | |
Income from investment operations: | |
Net investment income (loss)(a) | | | 0.30 | | | | 0.24 | | | | 0.19 | | | | 0.21 | | | | 0.27 | | |
Net realized and unrealized gain (loss) | | | (0.27 | ) | | | (1.81 | ) | | | (0.19 | ) | | | 0.33 | | | | 0.72 | | |
Total from investment operations | | | 0.03 | | | | (1.57 | ) | | | — | | | | 0.54 | | | | 0.99 | | |
Distributions: | |
Dividends from net investment income | | | (0.32 | ) | | | (0.24 | ) | | | (0.23 | ) | | | (0.22 | ) | | | (0.27 | ) | |
Dividends from net realized gains | | | — | | | | (0.13 | ) | | | (0.01 | ) | | | — | | | | — | | |
Total distributions** | | | (0.32 | ) | | | (0.37 | ) | | | (0.24 | ) | | | (0.22 | ) | | | (0.27 | ) | |
Net asset value, end of year | | $ | 8.38 | | | $ | 8.67 | | | $ | 10.61 | | | $ | 10.85 | | | $ | 10.53 | | |
Ratios and supplemental data: | |
Total return(b) | | | 0.18 | % | | | (15.13 | %) | | | 0.01 | % | | | 5.18 | % | | | 10.24 | % | |
Net assets, end of year (000) | | $ | 11,764 | | | $ | 14,662 | | | $ | 22,394 | | | $ | 24,376 | | | $ | 22,565 | | |
Ratio of net expenses to average net assets | | | 0.90 | % | | | 0.90 | % | | | 0.90 | % | | | 0.90 | % | | | 0.90 | % | |
Ratio of gross expenses to average net assets prior to expense reductions | | | 1.24 | % | | | 1.15 | % | | | 1.01 | % | | | 1.03 | % | | | 1.09 | % | |
Ratio of net investment income (loss) to average net assets | | | 3.36 | % | | | 2.48 | % | | | 1.77 | % | | | 2.00 | % | | | 2.67 | % | |
| | | Year Ended October 31, | |
| | | 2023 | | 2022 | | 2021 | | 2020 | | 2019 | |
Portfolio turnover rate | | | 41 | % | | | 28 | % | | | 51 | % | | | 61 | % | | | 64 | % | |
** Distribution for annual periods determined in accordance with federal income tax regulations.
(a) Net investment income (loss) allocated based on average shares method.
(b) Total return measures net investment income (loss) and capital gain or loss from portfolio investments assuming reinvestment of dividends and capital gains distributions. Total return is not annualized for periods that are less than a full year, does not reflect the effect of sales charge for Class A shares nor the contingent deferred sales charge for Class C shares and does not reflect the deduction of taxes that a shareholder would pay on fund distributions or the redemption of fund shares.
CALAMOS OPEN-END FAMILY OF FUNDS ANNUAL REPORT
292
Calamos Total Return Bond Fund Financial Highlights
Selected data for a share outstanding throughout each year were as follows:
| | | CLASS C | |
| | | Year Ended October 31, | |
| | | 2023 | | 2022 | | 2021 | | 2020 | | 2019 | |
Net asset value, beginning of year | | $ | 8.67 | | | $ | 10.61 | | | $ | 10.85 | | | $ | 10.53 | | | $ | 9.81 | | |
Income from investment operations: | |
Net investment income (loss)(a) | | | 0.23 | | | | 0.17 | | | | 0.11 | | | | 0.14 | | | | 0.20 | | |
Net realized and unrealized gain (loss) | | | (0.27 | ) | | | (1.81 | ) | | | (0.19 | ) | | | 0.32 | | | | 0.72 | | |
Total from investment operations | | | (0.04 | ) | | | (1.64 | ) | | | (0.08 | ) | | | 0.46 | | | | 0.92 | | |
Distributions: | |
Dividends from net investment income | | | (0.25 | ) | | | (0.17 | ) | | | (0.15 | ) | | | (0.14 | ) | | | (0.20 | ) | |
Dividends from net realized gains | | | — | | | | (0.13 | ) | | | (0.01 | ) | | | — | | | | — | | |
Total distributions** | | | (0.25 | ) | | | (0.30 | ) | | | (0.16 | ) | | | (0.14 | ) | | | (0.20 | ) | |
Net asset value, end of year | | $ | 8.38 | | | $ | 8.67 | | | $ | 10.61 | | | $ | 10.85 | | | $ | 10.53 | | |
Ratios and supplemental data: | |
Total return(b) | | | (0.57 | %) | | | (15.76 | %) | | | (0.74 | %) | | | 4.40 | % | | | 9.42 | % | |
Net assets, end of year (000) | | $ | 323 | | | $ | 549 | | | $ | 800 | | | $ | 1,777 | | | $ | 2,929 | | |
Ratio of net expenses to average net assets | | | 1.65 | % | | | 1.65 | % | | | 1.65 | % | | | 1.65 | % | | | 1.65 | % | |
Ratio of gross expenses to average net assets prior to expense reductions | | | 1.99 | % | | | 1.90 | % | | | 1.76 | % | | | 1.77 | % | | | 1.84 | % | |
Ratio of net investment income (loss) to average net assets | | | 2.60 | % | | | 1.72 | % | | | 1.02 | % | | | 1.28 | % | | | 1.98 | % | |
** Distribution for annual periods determined in accordance with federal income tax regulations.
(a) Net investment income (loss) allocated based on average shares method.
(b) Total return measures net investment income (loss) and capital gain or loss from portfolio investments assuming reinvestment of dividends and capital gains distributions. Total return is not annualized for periods that are less than a full year, does not reflect the effect of sales charge for Class A shares nor the contingent deferred sales charge for Class C shares and does not reflect the deduction of taxes that a shareholder would pay on fund distributions or the redemption of fund shares.
www.calamos.com
293
Calamos Total Return Bond Fund Financial Highlights
Selected data for a share outstanding throughout each year were as follows:
| | | CLASS I | |
| | | Year Ended October 31, | |
| | | 2023 | | 2022 | | 2021 | | 2020 | | 2019 | |
Net asset value, beginning of year | | $ | 8.68 | | | $ | 10.61 | | | $ | 10.85 | | | $ | 10.54 | | | $ | 9.81 | | |
Income from investment operations: | |
Net investment income (loss)(a) | | | 0.32 | | | | 0.26 | | | | 0.22 | | | | 0.24 | | | | 0.30 | | |
Net realized and unrealized gain (loss) | | | (0.27 | ) | | | (1.79 | ) | | | (0.20 | ) | | | 0.32 | | | | 0.73 | | |
Total from investment operations | | | 0.05 | | | | (1.53 | ) | | | 0.02 | | | | 0.56 | | | | 1.03 | | |
Distributions: | |
Dividends from net investment income | | | (0.34 | ) | | | (0.27 | ) | | | (0.25 | ) | | | (0.25 | ) | | | (0.30 | ) | |
Dividends from net realized gains | | | — | | | | (0.13 | ) | | | (0.01 | ) | | | — | | | | — | | |
Total distributions** | | | (0.34 | ) | | | (0.40 | ) | | | (0.26 | ) | | | (0.25 | ) | | | (0.30 | ) | |
Net asset value, end of year | | $ | 8.39 | | | $ | 8.68 | | | $ | 10.61 | | | $ | 10.85 | | | $ | 10.54 | | |
Ratios and supplemental data: | |
Total return(b) | | | 0.55 | % | | | (14.92 | %) | | | 0.17 | % | | | 5.34 | % | | | 10.62 | % | |
Net assets, end of year (000) | | $ | 19,236 | | | $ | 18,622 | | | $ | 43,979 | | | $ | 60,602 | | | $ | 35,570 | | |
Ratio of net expenses to average net assets | | | 0.65 | % | | | 0.65 | % | | | 0.65 | % | | | 0.65 | % | | | 0.65 | % | |
Ratio of gross expenses to average net assets prior to expense reductions | | | 0.99 | % | | | 0.88 | % | | | 0.76 | % | | | 0.77 | % | | | 0.84 | % | |
Ratio of net investment income (loss) to average net assets | | | 3.61 | % | | | 2.65 | % | | | 2.02 | % | | | 2.21 | % | | | 2.92 | % | |
** Distribution for annual periods determined in accordance with federal income tax regulations.
(a) Net investment income (loss) allocated based on average shares method.
(b) Total return measures net investment income (loss) and capital gain or loss from portfolio investments assuming reinvestment of dividends and capital gains distributions. Total return is not annualized for periods that are less than a full year, does not reflect the effect of sales charge for Class A shares nor the contingent deferred sales charge for Class C shares and does not reflect the deduction of taxes that a shareholder would pay on fund distributions or the redemption of fund shares.
CALAMOS OPEN-END FAMILY OF FUNDS ANNUAL REPORT
294
Calamos High Income Opportunities Fund Financial Highlights
Selected data for a share outstanding throughout each year were as follows:
| | | CLASS A | |
| | | Year Ended October 31, | |
| | | 2023 | | 2022 | | 2021 | | 2020 | | 2019 | |
Net asset value, beginning of year | | $ | 7.30 | | | $ | 8.58 | | | $ | 7.96 | | | $ | 8.34 | | | $ | 8.37 | | |
Income from investment operations: | |
Net investment income (loss)(a) | | | 0.45 | | | | 0.37 | | | | 0.35 | | | | 0.43 | | | | 0.48 | | |
Net realized and unrealized gain (loss) | | | (0.07 | ) | | | (1.27 | ) | | | 0.66 | | | | (0.35 | ) | | | (0.01 | ) | |
Total from investment operations | | | 0.38 | | | | (0.90 | ) | | | 1.01 | | | | 0.08 | | | | 0.47 | | |
Distributions: | |
Dividends from net investment income | | | (0.46 | ) | | | (0.38 | ) | | | (0.27 | ) | | | (0.46 | ) | | | (0.50 | ) | |
Dividends from net realized gains | | | — | | | | — | | | | — | | | | — | | | | — | | |
Return of capital | | | — | | | | — | | | | (0.12 | ) | | | — | | | | — | | |
Total distributions** | | | (0.46 | ) | | | (0.38 | ) | | | (0.39 | ) | | | (0.46 | ) | | | (0.50 | ) | |
Net asset value, end of year | | $ | 7.22 | | | $ | 7.30 | | | $ | 8.58 | | | $ | 7.96 | | | $ | 8.34 | | |
Ratios and supplemental data: | |
Total return(b) | | | 5.22 | % | | | (10.67 | %) | | | 12.88 | % | | | 1.13 | % | | | 5.85 | % | |
Net assets, end of year (000) | | $ | 25,252 | | | $ | 26,775 | | | $ | 34,550 | | | $ | 30,580 | | | $ | 35,124 | | |
Ratio of net expenses to average net assets | | | 1.00 | % | | | 1.00 | % | | | 1.00 | % | | | 1.00 | % | | | 1.00 | % | |
Ratio of gross expenses to average net assets prior to expense reductions | | | 1.43 | % | | | 1.40 | % | | | 1.33 | % | | | 1.37 | % | | | 1.23 | % | |
Ratio of net investment income (loss) to average net assets | | | 6.12 | % | | | 4.71 | % | | | 4.10 | % | | | 5.34 | % | | | 5.71 | % | |
| | | Year Ended October 31, | |
| | | 2023 | | 2022 | | 2021 | | 2020 | | 2019 | |
Portfolio turnover rate | | | 25 | % | | | 30 | % | | | 49 | % | | | 52 | % | | | 46 | % | |
** Distribution for annual periods determined in accordance with federal income tax regulations.
(a) Net investment income (loss) allocated based on average shares method.
(b) Total return measures net investment income (loss) and capital gain or loss from portfolio investments assuming reinvestment of dividends and capital gains distributions. Total return is not annualized for periods that are less than a full year, does not reflect the effect of sales charge for Class A shares nor the contingent deferred sales charge for Class C shares and does not reflect the deduction of taxes that a shareholder would pay on fund distributions or the redemption of fund shares.
www.calamos.com
295
Calamos High Income Opportunities Fund Financial Highlights
Selected data for a share outstanding throughout each year were as follows:
| | | CLASS C | |
| | | Year Ended October 31, | |
| | | 2023 | | 2022 | | 2021 | | 2020 | | 2019 | |
Net asset value, beginning of year | | $ | 7.80 | | | $ | 9.14 | | | $ | 8.45 | | | $ | 8.82 | | | $ | 8.82 | | |
Income from investment operations: | |
Net investment income (loss)(a) | | | 0.43 | | | | 0.33 | | | | 0.31 | | | | 0.40 | | | | 0.45 | | |
Net realized and unrealized gain (loss) | | | (0.09 | ) | | | (1.35 | ) | | | 0.71 | | | | (0.38 | ) | | | (0.02 | ) | |
Total from investment operations | | | 0.34 | | | | (1.02 | ) | | | 1.02 | | | | 0.02 | | | | 0.43 | | |
Distributions: | |
Dividends from net investment income | | | (0.40 | ) | | | (0.32 | ) | | | (0.21 | ) | | | (0.39 | ) | | | (0.43 | ) | |
Dividends from net realized gains | | | — | | | | — | | | | — | | | | — | | | | — | | |
Return of capital | | | — | | | | — | | | | (0.12 | ) | | | — | | | | — | | |
Total distributions** | | | (0.40 | ) | | | (0.32 | ) | | | (0.33 | ) | | | (0.39 | ) | | | (0.43 | ) | |
Net asset value, end of year | | $ | 7.74 | | | $ | 7.80 | | | $ | 9.14 | | | $ | 8.45 | | | $ | 8.82 | | |
Ratios and supplemental data: | |
Total return(b) | | | 4.35 | % | | | (11.35 | %) | | | 12.11 | % | | | 0.38 | % | | | 5.04 | % | |
Net assets, end of year (000) | | $ | 438 | | | $ | 471 | | | $ | 677 | | | $ | 981 | | | $ | 1,887 | | |
Ratio of net expenses to average net assets | | | 1.75 | % | | | 1.75 | % | | | 1.75 | % | | | 1.75 | % | | | 1.75 | % | |
Ratio of gross expenses to average net assets prior to expense reductions | | | 2.18 | % | | | 2.15 | % | | | 2.08 | % | | | 2.11 | % | | | 2.08 | % | |
Ratio of net investment income (loss) to average net assets | | | 5.37 | % | | | 3.95 | % | | | 3.38 | % | | | 4.67 | % | | | 5.16 | % | |
** Distribution for annual periods determined in accordance with federal income tax regulations.
(a) Net investment income (loss) allocated based on average shares method.
(b) Total return measures net investment income (loss) and capital gain or loss from portfolio investments assuming reinvestment of dividends and capital gains distributions. Total return is not annualized for periods that are less than a full year, does not reflect the effect of sales charge for Class A shares nor the contingent deferred sales charge for Class C shares and does not reflect the deduction of taxes that a shareholder would pay on fund distributions or the redemption of fund shares.
CALAMOS OPEN-END FAMILY OF FUNDS ANNUAL REPORT
296
Calamos High Income Opportunities Fund Financial Highlights
Selected data for a share outstanding throughout each year were as follows:
| | | CLASS I | |
| | | Year Ended October 31, | |
| | | 2023 | | 2022 | | 2021 | | 2020 | | 2019 | |
Net asset value, beginning of year | | $ | 7.30 | | | $ | 8.58 | | | $ | 7.96 | | | $ | 8.34 | | | $ | 8.37 | | |
Income from investment operations: | |
Net investment income (loss)(a) | | | 0.47 | | | | 0.39 | | | | 0.37 | | | | 0.44 | | | | 0.50 | | |
Net realized and unrealized gain (loss) | | | (0.07 | ) | | | (1.27 | ) | | | 0.67 | | | | (0.34 | ) | | | (0.01 | ) | |
Total from investment operations | | | 0.40 | | | | (0.88 | ) | | | 1.04 | | | | 0.10 | | | | 0.49 | | |
Distributions: | |
Dividends from net investment income | | | (0.48 | ) | | | (0.40 | ) | | | (0.30 | ) | | | (0.48 | ) | | | (0.52 | ) | |
Dividends from net realized gains | | | — | | | | — | | | | — | | | | — | | | | — | | |
Return of capital | | | — | | | | — | | | | (0.12 | ) | | | — | | | | — | | |
Total distributions** | | | (0.48 | ) | | | (0.40 | ) | | | (0.42 | ) | | | (0.48 | ) | | | (0.52 | ) | |
Net asset value, end of year | | $ | 7.22 | | | $ | 7.30 | | | $ | 8.58 | | | $ | 7.96 | | | $ | 8.34 | | |
Ratios and supplemental data: | |
Total return(b) | | | 5.48 | % | | | (10.45 | %) | | | 13.16 | % | | | 1.38 | % | | | 6.11 | % | |
Net assets, end of year (000) | | $ | 7,786 | | | $ | 9,150 | | | $ | 9,267 | | | $ | 6,716 | | | $ | 7,003 | | |
Ratio of net expenses to average net assets | | | 0.75 | % | | | 0.75 | % | | | 0.75 | % | | | 0.75 | % | | | 0.75 | % | |
Ratio of gross expenses to average net assets prior to expense reductions | | | 1.18 | % | | | 1.15 | % | | | 1.08 | % | | | 1.12 | % | | | 0.99 | % | |
Ratio of net investment income (loss) to average net assets | | | 6.36 | % | | | 4.98 | % | | | 4.34 | % | | | 5.56 | % | | | 5.97 | % | |
** Distribution for annual periods determined in accordance with federal income tax regulations.
(a) Net investment income (loss) allocated based on average shares method.
(b) Total return measures net investment income (loss) and capital gain or loss from portfolio investments assuming reinvestment of dividends and capital gains distributions. Total return is not annualized for periods that are less than a full year, does not reflect the effect of sales charge for Class A shares nor the contingent deferred sales charge for Class C shares and does not reflect the deduction of taxes that a shareholder would pay on fund distributions or the redemption of fund shares.
www.calamos.com
297
Calamos Short-Term Bond Fund Financial Highlights
Selected data for a share outstanding throughout each year were as follows:
| | | CLASS A | |
| | | Year Ended October 31, | |
| | | 2023 | | 2022 | | 2021 | | 2020 | | 2019 | |
Net asset value, beginning of year | | $ | 9.28 | | | $ | 9.91 | | | $ | 10.23 | | | $ | 10.20 | | | $ | 9.98 | | |
Income from investment operations: | |
Net investment income (loss)(a) | | | 0.28 | | | | 0.13 | | | | 0.15 | | | | 0.21 | | | | 0.25 | | |
Net realized and unrealized gain (loss) | | | 0.07 | | | | (0.62 | ) | | | (0.07 | ) | | | 0.12 | | | | 0.23 | | |
Total from investment operations | | | 0.35 | | | | (0.49 | ) | | | 0.08 | | | | 0.33 | | | | 0.48 | | |
Distributions: | |
Dividends from net investment income | | | (0.33 | ) | | | (0.14 | ) | | | (0.31 | ) | | | (0.25 | ) | | | (0.26 | ) | |
Dividends from net realized gains | | | — | | | | — | | | | (0.09 | ) | | | (0.05 | ) | | | (0.00 | )* | |
Total distributions** | | | (0.33 | ) | | | (0.14 | ) | | | (0.40 | ) | | | (0.30 | ) | | | (0.26 | ) | |
Net asset value, end of year | | $ | 9.30 | | | $ | 9.28 | | | $ | 9.91 | | | $ | 10.23 | | | $ | 10.20 | | |
Ratios and supplemental data: | |
Total return(b) | | | 3.79 | % | | | (4.99 | %) | | | 0.85 | % | | | 3.24 | % | | | 4.84 | % | |
Net assets, end of year (000) | | $ | 3,523 | | | $ | 2,128 | | | $ | 2,661 | | | $ | 3,225 | | | $ | 601 | | |
Ratio of net expenses to average net assets | | | 0.63 | % | | | 0.63 | % | | | 0.65 | % | | | 0.65 | % | | | 0.65 | % | |
Ratio of gross expenses to average net assets prior to expense reductions | | | 0.63 | % | | | 0.63 | % | | | 0.65 | % | | | 0.68 | % | | | 0.74 | % | |
Ratio of net investment income (loss) to average net assets | | | 2.94 | % | | | 1.36 | % | | | 1.51 | % | | | 2.12 | % | | | 2.47 | % | |
| | | Year Ended October 31, | |
| | | 2023 | | 2022 | | 2021 | | 2020 | | 2019 | |
Portfolio turnover rate | | | 41 | % | | | 48 | % | | | 44 | % | | | 41 | % | | | 132 | % | |
* Amounts are less than $0.005.
** Distribution for annual periods determined in accordance with federal income tax regulations.
(a) Net investment income (loss) allocated based on average shares method.
(b) Total return measures net investment income (loss) and capital gain or loss from portfolio investments assuming reinvestment of dividends and capital gains distributions. Total return is not annualized for periods that are less than a full year, does not reflect the effect of sales charge for Class A shares nor the contingent deferred sales charge for Class C shares and does not reflect the deduction of taxes that a shareholder would pay on fund distributions or the redemption of fund shares.
CALAMOS OPEN-END FAMILY OF FUNDS ANNUAL REPORT
298
Calamos Short-Term Bond Fund Financial Highlights
Selected data for a share outstanding throughout each year were as follows:
| | | CLASS I | |
| | | Year Ended October 31, | |
| | | 2023 | | 2022 | | 2021 | | 2020 | | 2019 | |
Net asset value, beginning of year | | $ | 9.28 | | | $ | 9.91 | | | $ | 10.23 | | | $ | 10.20 | | | $ | 9.98 | | |
Income from investment operations: | |
Net investment income (loss)(a) | | | 0.30 | | | | 0.15 | | | | 0.17 | | | | 0.25 | | | | 0.28 | | |
Net realized and unrealized gain (loss) | | | 0.06 | | | | (0.62 | ) | | | (0.06 | ) | | | 0.10 | | | | 0.22 | | |
Total from investment operations | | | 0.36 | | | | (0.47 | ) | | | 0.11 | | | | 0.35 | | | | 0.50 | | |
Distributions: | |
Dividends from net investment income | | | (0.35 | ) | | | (0.16 | ) | | | (0.34 | ) | | | (0.27 | ) | | | (0.28 | ) | |
Dividends from net realized gains | | | — | | | | — | | | | (0.09 | ) | | | (0.05 | ) | | | (0.00 | )* | |
Total distributions** | | | (0.35 | ) | | | (0.16 | ) | | | (0.43 | ) | | | (0.32 | ) | | | (0.28 | ) | |
Net asset value, end of year | | $ | 9.29 | | | $ | 9.28 | | | $ | 9.91 | | | $ | 10.23 | | | $ | 10.20 | | |
Ratios and supplemental data: | |
Total return(b) | | | 3.93 | % | | | (4.77 | %) | | | 1.11 | % | | | 3.49 | % | | | 5.09 | % | |
Net assets, end of year (000) | | $ | 354,109 | | | $ | 356,908 | | | $ | 306,398 | | | $ | 176,439 | | | $ | 217,552 | | |
Ratio of net expenses to average net assets | | | 0.39 | % | | | 0.38 | % | | | 0.40 | % | | | 0.40 | % | | | 0.40 | % | |
Ratio of gross expenses to average net assets prior to expense reductions | | | 0.39 | % | | | 0.38 | % | | | 0.40 | % | | | 0.42 | % | | | 0.47 | % | |
Ratio of net investment income (loss) to average net assets | | | 3.17 | % | | | 1.58 | % | | | 1.73 | % | | | 2.44 | % | | | 2.73 | % | |
* Amounts are less than $0.005.
** Distribution for annual periods determined in accordance with federal income tax regulations.
(a) Net investment income (loss) allocated based on average shares method.
(b) Total return measures net investment income (loss) and capital gain or loss from portfolio investments assuming reinvestment of dividends and capital gains distributions. Total return is not annualized for periods that are less than a full year, does not reflect the effect of sales charge for Class A shares nor the contingent deferred sales charge for Class C shares and does not reflect the deduction of taxes that a shareholder would pay on fund distributions or the redemption of fund shares.
www.calamos.com
299
Report of Independent Registered Public Accounting Firm
To the shareholders and the Board of Trustees of Calamos Investment Trust
Opinion on the Financial Statements and Financial Highlights
We have audited the accompanying statements of assets and liabilities of Calamos Investment Trust comprising the Calamos Market Neutral Income Fund, Calamos Hedged Equity Fund, Calamos Phineus Long/Short Fund, Calamos Merger Arbitrage Fund, Calamos Convertible Fund, Calamos Global Convertible Fund, Calamos Timpani Small Cap Growth Fund, Calamos Timpani SMID Growth Fund, Calamos Growth Fund, Calamos Growth and Income Fund, Calamos Dividend Growth Fund, Calamos Select Fund, Calamos International Growth Fund, Calamos Evolving World Growth Fund, Calamos Global Equity Fund, Calamos Global Opportunities Fund, Calamos International Small Cap Growth Fund, Calamos Total Return Bond Fund, Calamos High Income Opportunities Fund, and Calamos Short-Term Bond Fund (the "Funds"), including the schedules of investments, as of October 31, 2023; the related statements of operations, changes in net assets, and the financial highlights for the periods indicated in the table below; and the related notes. In our opinion, the financial statements and financial highlights present fairly, in all material respects, the financial position of each of the funds listed above constituting Calamos Investment Trust as of October 31, 2023, and the results of their operations, the changes in their net assets, and the financial highlights for each of the periods listed in the table below in conformity with accounting principles generally accepted in the United States of America.
Individual Fund Comprising the
Calamos Investment Trust | | Statement of
Operations | | Statements of
Changes in
Net Assets | | Financial Highlights | |
Calamos Market Neutral Income Fund, Calamos Hedged Equity Fund, Calamos Phineus Long/Short Fund, Calamos Convertible Fund, Calamos Global Convertible Fund, Calamos Growth Fund, Calamos Growth and Income Fund, Calamos Dividend Growth Fund, Calamos Select Fund, Calamos International Growth Fund, Calamos Evolving World Growth Fund, Calamos Global Equity Fund, Calamos Global Opportunities Fund, Calamos Total Return Bond Fund, Calamos High Income Opportunities Fund, and Calamos Short-Term Bond Fund | | For the year ended October 31, 2023 | | For the years ended October 31, 2023 and 2022 | | For the five years ended October 31, 2023, 2022, 2021, 2020, and 2019 respectively | |
Calamos Timpani Small Cap Growth Fund (formerly, Frontier Timpani Small Cap Growth Fund for the period July 1, 2018 through May 31, 2019) | | For the year ended October 31, 2023 | | For the years ended October 31, 2023 and 2022 | | For the years ended October 31, 2023, 2022, 2021, 2020, and the period from May 31, 2019 (commencement of operations) through October 31, 2019 and July 1, 2018 through May 31, 2019 | |
Calamos Timpani SMID Growth Fund | | For the year ended October 31, 2023 | | For the years ended October 31, 2023 and 2022 | | For the years ended October 31, 2023, 2022, 2021, 2020, and the period from July 31, 2019 (commencement of operations) through October 31, 2019 | |
Calamos International Small Cap Growth Fund | | For the year ended October 31, 2023 | | For the year ended October 31, 2023 and the period from March 31, 2022 (commencement of operations) through October 31, 2022 | | For the year ended October 31, 2023 and the period from March 31, 2022 (commencement of operations) through October 31, 2022 | |
Calamos Merger Arbitrage Fund | | For the period from September 29, 2023 (commencement of operations) to October 31, 2023 | |
Basis for Opinion
These financial statements and financial highlights are the responsibility of the Funds' management. Our responsibility is to express an opinion on the Funds' financial statements and financial highlights based on our audits. We are a public accounting firm registered with the Public Company Accounting Oversight Board (United States) (PCAOB) and are required to be independent with respect to the Funds in accordance with the U.S. federal securities laws and the applicable rules and regulations of the Securities and Exchange Commission and the PCAOB.
CALAMOS OPEN-END FAMILY OF FUNDS ANNUAL REPORT
300
Report of Independent Registered Public Accounting Firm
We conducted our audits in accordance with the standards of the PCAOB. Those standards require that we plan and perform the audit to obtain reasonable assurance about whether the financial statements and financial highlights are free of material misstatement, whether due to error or fraud. The Funds are not required to have, nor were we engaged to perform, an audit of their internal control over financial reporting. As part of our audits we are required to obtain an understanding of internal control over financial reporting but not for the purpose of expressing an opinion on the effectiveness of the Funds' internal control over financial reporting. Accordingly, we express no such opinion.
Our audits included performing procedures to assess the risks of material misstatement of the financial statements and financial highlights, whether due to error or fraud, and performing procedures that respond to those risks. Such procedures included examining, on a test basis, evidence regarding the amounts and disclosures in the financial statements and financial highlights. Our audits also included evaluating the accounting principles used and significant estimates made by management, as well as evaluating the overall presentation of the financial statements and financial highlights. Our procedures included confirmation of securities owned as of October 31, 2023, by correspondence with the custodian and brokers; when replies were not received from brokers, we performed other auditing procedures. We believe that our audits provide a reasonable basis for our opinion.

Chicago, Illinois
December 20, 2023
We have served as the auditor of one or more Calamos Advisors LLC investment companies since 2003.
www.calamos.com
301
Trustee Approval of Management Agreement (Unaudited)
The Board of Trustees ("Board" or the "Trustees") of Calamos Investment Trust (the "Trust" and each series of the Trust, a "Fund" and, collectively, the "Funds") oversees the management of each of the Funds, and, as required by law, determines annually whether to continue the Trust's management agreement with Calamos Advisors LLC ("Adviser") pursuant to which the Adviser serves as the investment manager and administrator for each of the Funds. The "Independent Trustees," who comprise more than 80% of the Board, have never been affiliated with the Adviser.
In connection with their most recent consideration regarding the continuation of the management agreement,* the Trustees received and reviewed a substantial amount of information provided by the Adviser in response to detailed requests of the Independent Trustees and their independent legal counsel. In the course of their consideration of the agreement, the Independent Trustees were advised by their counsel, and in addition to meeting with management of the Adviser, they met separately in executive session with their counsel.
At a meeting held on June 21, 2023, based on their evaluation of the information referred to above and other information provided in this and previous meetings, the Trustees determined that the overall arrangements between the Trust and the Adviser on behalf of the Funds were fair in light of the nature, quality and extent of the services provided by the Adviser and its affiliates, the fees charged for those services and other matters that the Trustees considered relevant in the exercise of their business judgment. At that meeting, the Trustees, including all of the Independent Trustees, approved the continuation of the management agreement with respect to all of the Funds through July 31, 2024, subject to possible earlier termination as provided in the agreement.
In connection with its consideration of the management agreement, the Board considered, among other things: (i) the nature, quality and extent of the Adviser's services, (ii) the investment performance of each Fund as well as performance information for comparable funds and other, comparable clients of the Adviser, (iii) the fees and other expenses paid by each Fund as well as expense information for comparable funds and for other, comparable clients of the Adviser, (iv) the profitability of the Adviser and its affiliates from their relationship with each Fund, (v) whether economies of scale may be realized as each Fund grows and whether potential economies may be shared, in some measure, with Fund investors and (vi) other benefits to the Adviser from its relationship with the Funds. In the Board's deliberations, no single factor was responsible for the Board's decision to approve continuation of the management agreement, and each Trustee may have afforded different weight to the various factors.
Nature, Quality and Extent of Services. The Board's consideration of the nature, quality and extent of the Adviser's services to the Funds took into account the knowledge gained from the Board's meetings with the Adviser throughout the years. In addition, the Board considered: the Adviser's long-term history of managing the Funds; the consistency of investment approach; the background and experience of the Adviser's investment personnel responsible for managing the Funds; and the Adviser's performance as administrator of the Funds, including, among other things, in the areas of brokerage selection, trade execution, compliance and shareholder communications. The Board also reviewed the Adviser's resources and key personnel involved in providing investment management services to the Funds. The Board noted the personal investments that the Adviser's key investment personnel have made in the Funds, which further aligns the interests of the Adviser and its personnel with those of the Funds' shareholders. In addition, the Board considered compliance reports about the Adviser from the Funds' Chief Compliance Officer.
The Board also considered the information provided by the Adviser regarding the Funds' performance and the steps the Adviser is taking to improve performance. In particular, the Board noted the additional personnel added to the Adviser's investment team, which includes portfolio managers, research analysts, research associates and risk management personnel. The Board also noted the Adviser's significant investment into its infrastructure and investment processes.
Investment Performance of the Funds. The Board considered each Fund's investment performance over various time periods, including how the Fund performed compared to the average performance of a group of comparable funds (the Fund's "Category") selected by an independent third-party service provider. In certain instances noted below, the Category represents a custom group of comparable funds, also selected by the independent third-party service provider. The performance periods considered by the Board ended on March 31, 2023, except where otherwise noted. Where available, the Board considered one-, three-, five- and ten-year performance. To the extent the Board considered data for periods other than those ending on March 31, 2023 or considered comparative data in addition to that of the Category, such as comparative data for an
* Please see separate disclosure relating to the Trustee Approval of Management Agreement for Merger Arbitrage Fund.
CALAMOS OPEN-END FAMILY OF FUNDS ANNUAL REPORT
302
Trustee Approval of Management Agreement (Unaudited)
alternate group of comparable funds (a "category"), the data was still produced by an independent third-party service provider.
Further detail considered by the Board regarding the investment performance of each Fund is set forth below:
Calamos Growth Fund. The Board considered that the Fund outperformed its custom Category average for the year-to-date and three-year periods, though it underperformed for the remaining periods. The Board also considered that the Fund outperformed both of its benchmarks for the year-to-date period. The Board further noted that, because of changes to the portfolio management team in 2020, only the recent performance data was attributable to the existing team.
Calamos Select Fund. The Board considered that the Fund outperformed its custom Category average for the year-to-date and three-year periods, though it underperformed for the remaining periods. The Board further noted that, because of changes to the portfolio management team in 2020, only the recent performance data was attributable to the existing team.
Calamos Dividend Growth Fund. The Board considered that the Fund outperformed its custom Category average for the year-to-date and three- and five-year periods, though it underperformed for the one-year period.
Calamos International Growth Fund. The Board considered that the Fund outperformed its Category average for the year-to-date and three-year periods, though it underperformed in the remaining periods.
Calamos International Small Cap Growth Fund. The Board considered that, while the Fund underperformed its Category average for the one-year and year-to-date periods, the Fund had only commenced operations in March 2022 and that it would be prudent to allow the portfolio management team time to further develop its performance record with the Fund.
Calamos Evolving World Growth Fund. The Board considered that the Fund outperformed its Category average for the year-to-date and three-, five- and ten-year periods, though it underperformed for the one-year period.
Calamos Global Equity Fund. The Board considered that the Fund outperformed its Category average for the three-, five- and ten-year periods, though it underperformed for the year-to-date and one-year periods.
Calamos Growth and Income Fund. The Board considered that the Fund outperformed its custom Category average for the year-to-date and three-, five- and ten-year periods, though it underperformed for the one-year period.
Calamos Global Opportunities Fund. The Board considered that the Fund outperformed its custom Category average for the year-to-date and three-, five- and ten-year periods, though it underperformed for the one-year period.
Calamos Convertible Fund. The Board considered that the Fund outperformed its Category average for the year-to-date and three- and five-year periods and underperformed for the one- and ten-year periods.
Calamos Global Convertible Fund. The Board considered that the Fund outperformed its Category average for the year-to-date period, though it underperformed for the remaining periods. The Board noted the Adviser's representation that the Fund is the only U.S.-based convertible fund with a global mandate in its Category, and therefore considered the Adviser's assertion that the Global Convertible UCITS fund managed by the Adviser and its performance universe are a better comparative source than the Category. As a result, the Board considered the Fund's similarity to the UCITS fund managed by the Adviser, noting that the UCITS fund outperformed peers for the three- and five-year periods and only underperformed peers for the more recent one-year period. The Board also considered that the Fund outperformed its benchmark for the year-to-date period.
Calamos Total Return Bond Fund. The Board considered that the Fund outperformed its Category average for the one- and ten-year periods, though it underperformed for the remaining periods. The Board also considered that as of March 31, 2023, the Fund outperformed its benchmark for the one- and three-year periods and ranked in the first quartile of its Category for the one-year period.
Calamos High Income Opportunities Fund. The Board considered that the Fund outperformed its Category average for the three- and five-year periods, though it underperformed for the remaining periods.
Calamos Market Neutral Income Fund. The Board considered that the Fund outperformed its custom Category average for the year-to-date and five- and ten-year periods, though it underperformed for the remaining periods. The Board also considered that the Fund outperformed both of its benchmarks for the three-, five- and ten-year and since inception periods.
www.calamos.com
303
Trustee Approval of Management Agreement (Unaudited)
Calamos Hedged Equity Fund. The Board considered that the Fund outperformed its Category average for the three- and five-year periods, though it underperformed for the remaining periods.
Calamos Phineus Long/Short Fund. The Board considered that the Fund outperformed its Category average for the year-to-date and three-, five- and ten-year periods and only underperformed for the one-year period.
Calamos Short-Term Bond Fund. The Board considered that the Fund outperformed its Category average for the one- and three-year periods.
Calamos Timpani Small Cap Growth Fund. The Board considered that the Fund outperformed its Category average for the ten-year period and underperformed for the remaining periods.
Calamos Timpani SMID Growth Fund. The Board considered that the Fund outperformed its custom Category average for the year-to-date period and underperformed its custom Category average for the remaining periods. The Board also considered that the Fund ranked in the second quartile of its Custom category for the year-to-date period and that, because it was launched in 2019, it did not yet have a longer performance track record.
Costs of Services Provided and Profits Realized by the Adviser. Using information provided by an independent third-party service provider, the Board evaluated each Fund's actual management fee rate compared to the median management fee rate for other mutual funds similar in size, character and investment strategy (the Fund's "Expense Group"), and the Fund's total expense ratio compared to the median total expense ratio of the Fund's Expense Group.
The Board also reviewed the Adviser's management fee rates for its institutional separate accounts, other advisory accounts and sub-advisory accounts with comparable investment strategies. The Board took into account that although, generally, the rates of fees paid by institutional clients or for sub-advisory services were lower than the rates of fees paid by the Funds, the differences reflected the Adviser's greater level of responsibilities and significantly broader scope of services regarding the Funds, the more extensive regulatory obligations and risks associated with managing the Funds, and other financial considerations with respect to creation and sponsorship of the Funds. The Board considered factors that led to more expenses for registered funds including but not limited to: (i) capital expenditures to establish a Fund, (ii) length of time to reach critical mass, and the related expenses, (iii) higher servicing costs of intermediaries and shareholders, (iv) higher redemption rates of assets under management, (v) entrepreneurial risk assumed by the Adviser and (vi) greater exposure to "make whole" errors.
The Board also considered the Adviser's costs in serving as the Funds' investment adviser and manager, including but not limited to costs associated with technology, infrastructure and compliance necessary to manage the Funds. The Board reviewed the Adviser's methodology for allocating costs among the Adviser's lines of business. The Board also considered information regarding the structure of the Adviser's compensation program for portfolio managers, analysts and certain other employees, and the relationship of such compensation to the attraction and retention of quality personnel. Finally, the Board reviewed information on the profitability of the Adviser in serving as each Fund's investment manager and of the Adviser and its affiliates in all of their relationships with each Fund, as well as an explanation of the methodology utilized in allocating various expenses among the Funds and the Adviser's other business units. Data was provided to the Board with respect to profitability, both on a pre- and post-marketing cost basis. The Board reviewed the financial statements of the Adviser's parent company and discussed its corporate structure.
Further detail considered by the Board regarding the management fee rate and total expense ratio of each Fund is set forth below:
Calamos Growth Fund. The Board considered that the Fund's management fee rate and total expense ratio are higher than the respective medians of the Fund's Expense Group.
Calamos Select Fund. The Board considered that the Fund's management fee rate and total expense ratio are higher than the respective medians of the Fund's Expense Group. The Board also considered that the Adviser had contractually agreed to limit Fund expenses through March 1, 2024 and was currently subsidizing the Fund under this arrangement.
Calamos Dividend Growth Fund. The Board considered that the Fund's management fee rate is lower than its Expense Group median, though the Fund's total expense ratio is higher than its Expense Group median. The Board reviewed the Fund's expenses in light of its performance record and level of assets. The Board also considered that the Adviser had contractually agreed to limit Fund expenses through March 1, 2024 and was currently subsidizing the Fund under this arrangement.
CALAMOS OPEN-END FAMILY OF FUNDS ANNUAL REPORT
304
Trustee Approval of Management Agreement (Unaudited)
Calamos International Growth Fund. The Board considered that the Fund's management fee rate and total expense ratio are lower than the respective medians of the Fund's Expense Group. The Board also noted that the Fund's management fee is subject to a performance adjustment, which serves to lower the management fee during periods of underperformance.
Calamos International Small Cap Growth Fund. The Board considered that the Fund's management fee rate is lower than the Fund's Expense Group median, though the Fund's total expense ratio is higher than its Expense Group median. The Board also considered that the Adviser had contractually agreed to limit Fund expenses through March 31, 2025 and was currently subsidizing the Fund under this arrangement.
Calamos Evolving World Growth Fund. The Board considered that the Fund's management fee rate and total expense ratio are lower than the respective medians of the Fund's Expense Group.
Calamos Global Equity Fund. The Board considered that, while the Fund's management fee rate and total expense ratio are higher than the respective medians of the Fund's Expense Group, the Fund's management fee is subject to a performance adjustment, which serves to lower the management fee during periods of underperformance. The Board also considered that the Adviser had contractually agreed to limit Fund expenses through March 1, 2024 and was currently subsidizing the Fund under this arrangement.
Calamos Growth and Income Fund. The Board considered that the Fund's management fee rate and total expense ratio are higher than the respective medians of the Fund's Expense Group. The Board reviewed the Fund's expenses in light of its performance record.
Calamos Global Opportunities Fund. The Board considered that the Fund's management fee rate and total expense ratio are higher than the respective medians of the Fund's Expense Group. The Board reviewed the Fund's expenses in light of its performance record. The Board also considered that the Adviser had contractually agreed to limit Fund expenses through March 1, 2024 and was currently subsidizing the Fund under this arrangement.
Calamos Convertible Fund. The Board considered that the Fund's management fee rate is equal to the Fund's Expense Group median, though the Fund's total expense ratio is higher than its Expense Group median. The Board noted that the Fund's total expense ratio was only three basis points above the respective Expense Group median. The Board also reviewed the Fund's expenses in light of its more recent performance record.
Calamos Global Convertible Fund. The Board considered that the Fund's management fee rate and total expense ratio are higher than the respective medians of the Fund's Expense Group. The Board also considered, however, that the Fund offers a unique mandate and the Adviser's assertion that, as a result, there are no appropriate peer funds against which to meaningfully compare the Fund's fees.
Calamos Total Return Bond Fund. The Board considered that the Fund's management fee rate is lower than its Expense Group median, though its total expense ratio is higher than its Expense Group median. The Board also considered that the Adviser had contractually agreed to limit Fund expenses through March 1, 2024 and was currently subsidizing the Fund under this arrangement. The Board also reviewed the Fund's expenses in light of its performance record.
Calamos High Income Opportunities Fund. The Board considered that the Fund's management fee rate is lower than the median of the Fund's Expense Group, and the Fund's total expense ratio is equal to the median of the Fund's Expense Group. The Board also considered that the Adviser had contractually agreed to limit Fund expenses through March 1, 2024 and was currently subsidizing the Fund under this arrangement.
Calamos Market Neutral Income Fund. The Board considered that the Fund's management fee rate and total expense ratio are lower than the respective medians of the Fund's Expense Group.
Calamos Hedged Equity Fund. The Board considered that the Fund's management fee rate and total expense ratio are lower than the respective medians of the Fund's Expense Group.
Calamos Phineus Long/Short Fund. The Board considered that the Fund's management fee rate and total expense ratio are lower than the respective medians of the Fund's Expense Group.
Calamos Short-Term Bond Fund. The Board considered that the Fund's management fee rate and total expense ratio are lower than the respective medians of the Fund's Expense Group.
www.calamos.com
305
Trustee Approval of Management Agreement (Unaudited)
Calamos Timpani Small Cap Growth Fund. The Board considered that the Fund's management fee rate and total expense ratio are higher than the respective medians of the Fund's Expense Group. The Board also considered that the Adviser had contractually agreed to limit Fund expenses through March 1, 2024 and was currently subsidizing the Fund under this arrangement.
Calamos Timpani SMID Growth Fund. The Board considered that the Fund's management fee rate is lower than the median of the Fund's Expense Group, and the total expense ratio is higher than the median of the Fund's Expense Group. The Board considered the Fund's expenses in light of its level of assets. The Board also considered that the Adviser had contractually agreed to limit Fund expenses through March 1, 2024 and was currently subsidizing the Fund under this arrangement.
Economies of Scale. The Board considered whether each Fund's management fee shares with shareholders potential economies of scale that may be achieved by the Adviser. The Board recognized that breakpoints in the fee schedule for each Fund could result in the sharing of economies of scale as Fund assets increase. The Board also considered the Adviser's agreement to reimburse each Fund for a portion of its expenses if the Fund's expense ratio otherwise would exceed a certain level. The Board also considered the benefits accruing to shareholders from the Adviser's investments into its infrastructure and investment processes. The Board concluded that the breakpoints in the fee schedule for each Fund allow shareholders to benefit from potential economies of scale that may be achieved by the Adviser.
Other Benefits Derived from the Relationship with the Funds. The Board also considered other benefits that accrue to the Adviser and its affiliates from their relationship with the Funds. The Board concluded that while the Adviser may potentially benefit from its relationship with the Funds in ways other than the fees payable by the Funds, the Funds also may benefit from their relationship with the Adviser in ways other than the services to be provided by the Adviser and its affiliates pursuant to their agreement with the Funds and the fees payable by the Funds.
The Board also considered the Adviser's use of a portion of the commissions paid by the Funds on their portfolio brokerage transactions to obtain research products and services benefiting the Funds and/or other clients of the Adviser and concluded, based on reports from the Funds' Chief Compliance Officer, that the Adviser's use of "soft" commission dollars to obtain research products and services was consistent with regulatory requirements.
After full consideration of the above factors as well as other factors that were instructive in their consideration, the Trustees, including all of the Independent Trustees, concluded that the continuation of the management agreement for each Fund with the Adviser was in the best interest of each respective Fund and its shareholders.
CALAMOS OPEN-END FAMILY OF FUNDS ANNUAL REPORT
306
Trustee Approval of Management Agreement for Merger Arbitrage Fund (Unaudited)
Calamos Merger Arbitrage Fund. The Board of Trustees ("Board" or the "Trustees") of Calamos Investment Trust ("Trust"), on behalf of its new series, Calamos Merger Arbitrage Fund (the "New Fund"), oversees the management of the New Fund, and, as required by law, determines whether to approve or (annually thereafter) continue the New Fund's management agreement with Calamos Advisors LLC ("Adviser") pursuant to which the Adviser serves as the investment manager and provides certain administrative services for the New Fund. The "Independent Trustees," who comprise more than 80% of the Board, have never been affiliated with the Adviser.
In connection with their consideration regarding the initial approval of the management agreement for the New Fund, the Trustees received and reviewed a substantial amount of information provided by the Adviser in response to detailed requests from the Independent Trustees and their independent legal counsel. The Board, including the Independent Trustees, considered the data provided by the Adviser and concluded that sufficient information had been provided to allow them to evaluate the terms of the management agreement and the New Fund's investment advisory fee. In the course of their consideration of the agreement, the Independent Trustees were advised by their counsel and, in addition to meeting with management of the Adviser, they met separately in executive session with their counsel.
At a meeting held on September 26, 2023, based on their evaluation of the information referred to above and other information provided in this and previous meetings, the Trustees determined that the overall arrangements between the New Fund and the Adviser were fair in light of the nature, quality and extent of the services to be provided by the Adviser and its affiliates, the proposed fees to be charged for those services, and other matters that the Trustees considered relevant in the exercise of their business judgment. At that meeting, the Trustees, including all of the Independent Trustees, approved the management agreement with respect to the New Fund through September 1, 2025, subject to possible earlier termination as provided in the management agreement.
In connection with its consideration of the management agreement with respect to the New Fund, the Board considered, among other things: (i) the nature, quality and extent of the Adviser's services to be provided, (ii) the fees and other expenses to be paid by the New Fund as well as expense information for comparable funds, (iii) the expected profitability of the Adviser and its affiliates from their relationship with the New Fund, (iv) whether economies of scale may be realized as the New Fund grows and whether potential economies may be shared, in some measure, with the New Fund's investors; and (v) other benefits to the Adviser from its relationship with the New Fund. In the Board's deliberations, no single factor was responsible for the Board's decision to approve the management agreement, and each Trustee may have afforded different weight to the various factors.
Nature, Quality and Extent of Services. The Board's consideration of the nature, quality and extent of the Adviser's services to be provided to the New Fund took into account the knowledge that may be gained from the Board's meetings with the Adviser throughout the years. In addition, the Board considered: the Adviser's long-term history of managing the other Funds in the Calamos fund complex; the consistency of the Adviser's investment approach; and the Adviser's provision of administrative services for the other Funds in the Calamos fund complex, including, among other things, in the areas of brokerage selection, trade execution, compliance and shareholder communications. The Board also reviewed the Adviser's resources and key personnel expected to be involved in providing investment management services to the New Fund. The Board also considered compliance reports about the Adviser from the Trust's Chief Compliance Officer. The Board concluded that the nature, quality and extent of the services to be provided by the Adviser to the New Fund were appropriate and consistent with the management agreement and that the New Fund was likely to benefit from services to be provided under the management agreement with the Adviser.
Investment Performance of the New Fund. Because the New Fund has not yet commenced operations, the Board did not consider the investment performance of the New Fund. The Board did consider, however, the results of another account managed by the Adviser with a similar strategy to the one the New Fund is expected to pursue.
Costs of Services Provided and Profits Realized by the Adviser. Using information provided by an independent third-party service provider, the Board evaluated the New Fund's proposed management fee rate compared to the median management fee rate for other mutual funds similar in size, character and investment strategy (the "Expense Group") and estimated total expense ratio compared to the median total expense ratio of the Expense Group. The Board considered that the Fund's estimated total net expense ratio and proposed management fee rate are both lower than the respective medians of the Expense Group. The Board also took into account the Adviser's agreement to cap expenses of the Fund. The Board noted that under the contractual expense cap, the total annual expenses for the Fund's Class A shares, Class C shares and Class I shares are capped at 1.50%, 2.25% and 1.25% of average net assets, respectively, through October 31, 2026. Lastly, the
www.calamos.com
307
Trustee Approval of Management Agreement for Merger Arbitrage Fund (Unaudited)
Board considered the Adviser's confidence in the Fund's investment team to deliver favorable performance and scale given its track record with another account that it manages in a strategy similar to that of the New Fund.
Economies of Scale. The Board considered whether the New Fund's proposed management fee shares with shareholders potential economies of scale that may be achieved by the Adviser. The Board recognized that breakpoints in the proposed fee schedule for the New Fund could result in the sharing of economies of scale as the New Fund's assets increase. The Board also considered the Adviser's agreement to reimburse the New Fund for a portion of its expenses if the New Fund's expense ratio otherwise would exceed a certain level. The Board concluded that the breakpoints in the proposed fee schedule for the New Fund allow shareholders to benefit from potential economies of scale that may be achieved by the Adviser.
Profitability. The Board considered information on the anticipated profitability of the Adviser in serving as the New Fund's investment manager and of the Adviser and its affiliates in their relationships with the New Fund, as well as an explanation of the methodology utilized in allocating various expenses among the Funds in the Calamos fund complex and the Adviser's other business units.
Other Benefits Derived from the Relationship with the New Fund. The Board considered other benefits that could accrue to the Adviser and its affiliates from their relationship with the New Fund. The Board concluded that while the Adviser may potentially benefit from its relationship with the New Fund in ways other than the proposed fees payable by the New Fund, the New Fund also may benefit from its relationship with the Adviser in ways other than the services to be provided by the Adviser and its affiliates pursuant to its agreement with the New Fund and the proposed fees payable by the New Fund.
The Board also considered the Adviser's proposed use of a portion of the commissions to be paid by the New Fund on its portfolio brokerage transactions to obtain research products and services benefiting the New Fund and/or other clients of the Adviser and concluded, based on reports from the New Fund's Chief Compliance Officer, that the Adviser's use of "soft" commission dollars to obtain research products and services is consistent with regulatory requirements.
In light of all the information presented, and after full consideration of the above factors as well as other factors that were instructive in their consideration, the Trustees, including all of the Independent Trustees, concluded that the proposed amendment to the Trust's management agreement with the Adviser to add the New Fund was, and its approval would be, in the best interest of the New Fund and its shareholders.
CALAMOS OPEN-END FAMILY OF FUNDS ANNUAL REPORT
308
Trustees and Officers (Unaudited)
The management of the Trust, including general supervision of the duties performed for the Trust under the investment management agreement between the Trust and Calamos Advisors, is the responsibility of its board of trustees. Each trustee elected will hold office for the lifetime of the Trust or until such trustee's earlier resignation, death or removal; however, each trustee who is not an interested person of the Trust shall retire as a trustee at the end of the calendar year in which the trustee attains the age of 75 years. The Trust's Statement of Additional Information contains additional information about the Trust's Trustees and Officers and is available without charge, upon request, at www.calamos.com or by calling 800.582.6959.
The following table sets forth each trustee's name, year of birth, position(s) with the Trust, number of portfolios in the Calamos Fund Complex overseen, principal occupation(s) during the past five years and other directorships held, and date first elected or appointed. Each Trustee oversees each Fund of the Trust.
NAME AND
YEAR OF BIRTH | | POSITION(S) AND
LENGTH OF TIME
WITH THE TRUST | | PORTFOLIOS IN
FUND COMPLEX^
OVERSEEN | | PRINCIPAL OCCUPATION(S)
DURING THE PAST 5 YEARS
AND OTHER DIRECTORSHIPS | | EXPERIENCE, QUALIFICATIONS,
ATTRIBUTES, SKILLS FOR
BOARD MEMBERSHIP | |
Trustees who are interested persons of the Trust: | |
John P. Calamos, Sr. (1940)* | | Chairman, Trustee and President (since 1988) | | | 31 | | | Founder, Chairman and Global Chief Investment Officer, Calamos Asset Management, Inc. ("CAM"), Calamos Investments LLC ("CILLC"), Calamos Advisors LLC and its predecessor ("Calamos Advisors") and Calamos Wealth Management LLC ("CWM"); Director, CAM; Global Chief Investment Officer, Calamos Antetokounmpo Asset Management LLC ("CGAM"); and previously Chief Executive Officer, Calamos Financial Services LLC and its predecessor ("CFS"), CAM, CILLC, Calamos Advisors, and CWM | | Served for multiple years as a trustee of the Funds; more than 25 years of experience in the financial services industry; experience serving on boards of other entities, including other investment companies; and earned a Masters of Business Administration degree | |
Trustees who are not interested persons of the Trust: | |
John E. Neal (1950) | | Trustee (since 2001); Lead Independent Trustee (since July 2019) | | | 32 | ^^ | | Retired; private investor; Director, Equity Residential Trust (publicly-owned REIT); Director, Creation Investments (private international microfinance company); Director, Centrust Bank (Northbrook, Illinois community bank); formerly, Director, Neuro-ID (private company providing prescriptive analytics for the risk industry) (until 2021); formerly, Partner, Linden LLC (health care private equity) (until 2018) | | Served for multiple years as a trustee of the Funds; more than 25 years of experience in the financial services industry; experience serving on boards of other entities, including other investment companies; and earned a Masters of Business Administration degree | |
William R. Rybak (1951) | | Trustee (since 2002) | | | 31 | | | Private investor; Chairman (since 2016) and Director (since 2010), Christian Brothers Investment Services Inc.; Trustee, JNL Series Trust and JNL Investors Series Trust (since 2007), JNL Variable Fund LLC (2007-2020), Jackson Variable Series Trust (2018-2020) and JNL Strategic Income Fund LLC (2007-2018), (open-end mutual funds)**; Trustee, Lewis University (since 2012); formerly Director, Private Bancorp (2003-2017); Executive Vice President and Chief Financial Officer, Van Kampen Investments, Inc. and subsidiaries (investment manager) (until 2000) | | Served for multiple years as a trustee of the Funds; more than 25 years of experience in the financial services industry; experience serving on boards of other entities, including other investment companies; and earned a Masters of Business Administration degree | |
www.calamos.com
309
Trustees and Officers (Unaudited)
NAME AND
YEAR OF BIRTH | | POSITION(S) AND
LENGTH OF TIME
WITH THE TRUST | | PORTFOLIOS IN
FUND COMPLEX^
OVERSEEN | | PRINCIPAL OCCUPATION(S)
DURING THE PAST 5 YEARS
AND OTHER DIRECTORSHIPS | | EXPERIENCE, QUALIFICATIONS,
ATTRIBUTES, SKILLS FOR
BOARD MEMBERSHIP | |
Virginia G. Breen (1964) | | Trustee (since 2015) | | | 31 | | | Private Investor; Trustee, UBS NY Fund Cluster (open-end funds) (since 2023)***; Director, Paylocity Holding Corporation (since 2018); Trustee, Neuberger Berman Private Equity Registered Funds (registered private equity funds) (since 2015)****; Director, UBS A&Q Fund Complex (closed-end funds) (since 2008)*****; Trustee, Jones Lang LaSalle Income Property Trust, Inc. (REIT) (2004-2023); Director, Tech and Energy Transition Corporation (blank check company) (2021-2023) | | Served for multiple years as a trustee of the Funds; more than 25 years of experience in the financial services industry; experience serving on boards of other entities, including other investment companies; and earned a Masters of Business Administration degree | |
Lloyd A. Wennlund (1957) | | Trustee (since 2018) | | | 31 | | | Trustee and Chairman, Datum One Series Trust (since 2020); Expert Affiliate, Bates Group, LLC (financial services consulting and expert testimony firm) (since 2018); Executive Vice President, The Northern Trust Company (1989-2017); President and Business Unit Head of Northern Funds and Northern Institutional Funds (1994-2017); Director, Northern Trust Investments (1998-2017); Governor (2004-2017) and Executive Committee member (2011-2017), Investment Company Institute Board of Governors; Member, Securities Industry Financial Markets Association (SIFMA) Advisory Council, Private Client Services Committee and Private Client Steering Group (2006-2017); Board Member, Chicago Advisory Board of the Salvation Army (2011-2019) | | More than 25 years of experience in the financial services industry; experience serving on boards of other entities, including other investment companies | |
Karen L. Stuckey (1953) | | Trustee (since December 2019) | | | 31 | | | Member of Desert Mountain Community Foundation Advisory Board (non-profit organization) (2015-2021); Partner (1990-2012) of PricewaterhouseCoopers LLP (professional services firm) (held various positions from 1975-1990); Member of Executive, Nominating, and Audit Committees and Chair of Finance Committee (1992-2006); Emeritus Trustee (since 2007) of Lehigh University; member, Women's Investment Management Forum (professional organization) (since inception); formerly, Trustee, Denver Board of OppenheimerFunds (open-end mutual funds) (2012-2019) | | More than 25 years of experience in the financial services industry; experience serving on boards of other entities, including other investment companies | |
CALAMOS OPEN-END FAMILY OF FUNDS ANNUAL REPORT
310
Trustees and Officers (Unaudited)
NAME AND
YEAR OF BIRTH | | POSITION(S) AND
LENGTH OF TIME
WITH THE TRUST | | PORTFOLIOS IN
FUND COMPLEX^
OVERSEEN | | PRINCIPAL OCCUPATION(S)
DURING THE PAST 5 YEARS
AND OTHER DIRECTORSHIPS | | EXPERIENCE, QUALIFICATIONS,
ATTRIBUTES, SKILLS FOR
BOARD MEMBERSHIP | |
Christopher M. Toub (1959) | | Trustee (since December 2019) | | | 31 | | | Private investor; formerly Director of Equities, AllianceBernstein LP (until 2012) | | More than 25 years of experience in the financial services industry; and earned a Masters of Business Administration degree | |
^ The Fund Complex consists of Calamos Investment Trust, Calamos Advisors Trust, Calamos Convertible Opportunities and Income Fund, Calamos Convertible and High Income Fund, Calamos Strategic Total Return Fund, Calamos Global Total Return Fund, Calamos Global Dynamic Income Fund, Calamos Dynamic Convertible and Income Fund, Calamos Long/Short Equity & Dynamic Income Trust, Calamos ETF Trust, Calamos Antetokounmpo Sustainable Equities Trust, and Calamos Aksia Alternative Credit and Income Fund.
^^ Mr. Neal is the only Trustee of the Trust who oversees Calamos Aksia Alternative Credit and Income Fund.
* Mr. Calamos, Sr. is an "interested person" of the Trust as defined in the 1940 Act because he is an officer of the Trust and an affiliate of Calamos Advisors and CFS.
** Overseeing 131 portfolios in fund complex.
*** Overseeing thirty-eight portfolios in fund complex.
**** Overseeing twenty-one portfolios in fund complex.
***** Overseeing three portfolios in fund complex.
The address of each trustee is 2020 Calamos Court, Naperville, Illinois 60563.
www.calamos.com
311
Trustees and Officers (Unaudited)
Officers. The preceding table gives information about John P. Calamos, Sr., who is Chairman, Trustee and President of the Trust. The following table sets forth each other officer's name, year of birth, position with the Trust and date first appointed to that position, and principal occupation(s) during the past five years. Each officer serves until his or her successor is chosen and qualified or until his or her resignation or removal by the board of trustees.
NAME AND YEAR OF BIRTH | | POSITION(S) WITH TRUST | | PRINCIPAL OCCUPATION(S) | |
Robert Behan (1964) | | Vice President (since 2013) | | Executive Vice President, Chief Distribution Officer (since 2021), CAM, CILLC, Calamos Advisors, and CFS; Vice President (since 2022), CGAM; prior thereto President, CAM, CILLC, Calamos Advisors, and CFS (2015-2021); Head of Global Distribution (2013-February 2021); Executive Vice President (2013-2015); Senior Vice President (2009-2013), Head of US Intermediary Distribution (2010-2013) | |
Thomas E. Herman (1961) | | Vice President (since 2016) and Chief Financial Officer (2016-2017 and since 2019) | | Executive Vice President (since 2021) and Chief Financial Officer, CAM, CILLC, Calamos Advisors, and CWM (since 2016); Chief Financial Officer (since 2022), CGAM; prior thereto, Chief Financial Officer and Treasurer, Harris Associates (2010-2016) | |
Erik D. Ojala (1975) | | Vice President and Secretary (since 2023) | | Senior Vice President, General Counsel and Secretary, CAM, CILLC, Calamos Advisors, CWM (since 2023); Chief Legal Officer, CGAM (since 2023); General Counsel and Secretary, CFS (since 2023); prior thereto, Executive Vice President and General Counsel (2017-2023), Secretary (2010-2023) and Chief Compliance Officer (2022-2023), Harbor Capital Advisors, Inc.; Director and Secretary (2019-2023) and Chief Compliance Officer (2022-2023), Harbor Trust Company, Inc.; Director, Executive Vice President (2017-2023) and Chief Compliance Officer (2017-2021, 2022-2023), Harbor Funds Distributors, Inc.; Director (2017-2023), Assistant Secretary (2014-2023) and Chief Compliance Officer (2022-2023), Harbor Services Group, Inc.; and Chief Compliance Officer, Harbor ETF Trust (2021-2023); Chief Compliance Officer of Harbor Funds (2017-2023) | |
John S. Koudounis (1966) | | Vice President (since 2016) | | President (since February 2021) and Chief Executive Officer, CAM, CILLC, Calamos Advisors, CWM, and CFS (since 2016); Director, CAM (since 2016); Chairman and Chief Executive Officer (since 2022), CGAM; prior thereto President and Chief Executive Officer (2010-2016), Mizuho Securities USA Inc. | |
Mark J. Mickey (1951) | | Chief Compliance Officer (since 2005) | | Chief Compliance Officer, Calamos Funds (since 2005) | |
Stephen Atkins (1965) | | Treasurer (since 2020) | | Senior Vice President, Head of Fund Administration (since 2020), Calamos Advisors; prior thereto Consultant, Fund Accounting and Administration, Vx Capital Partners (2019-2020); Chief Financial Officer and Treasurer of SEC Registered Funds, and Senior Vice President, Head of European Special Purpose Vehicles Accounting and Administration, Avenue Capital Group (2010-2018) | |
Daniel Dufresne (1974) | | Vice President (since 2021) | | Executive Vice President and Chief Operating Officer, CAM, CILLC, Calamos Advisors, and CWM (since 2021); President (since 2022), CGAM; prior thereto Citadel (1999-2020); Partner (2008-2020); Managing Director, Global Treasurer (2008-2020); Global Head of Operations (2011-2020); Global Head of Counterparty Strategy (2018-2020); Senior Advisor to the COO (2020); CEO, Citadel Clearing LLC (2015-2020) | |
The address of each officer is 2020 Calamos Court, Naperville, Illinois 60563.
CALAMOS OPEN-END FAMILY OF FUNDS ANNUAL REPORT
312
Tax Information (Unaudited)
We are providing this information as required by the Internal Revenue Code (Code). The amounts shown may differ from those elsewhere in this report due to differences between tax and financial reporting requirements. In February 2024, shareholders will receive Form 1099-DIV which will include their share of qualified dividends and capital gains distributed during the calendar year 2023. Shareholders are advised to check with their tax advisors for information on the treatment of these amounts on their individual income tax returns.
Under Section 852(b)(3)(C) of the Code, the Funds hereby designate the following amounts as capital gain dividends for the fiscal period ended October 31, 2023:
MARKET NEUTRAL
INCOME FUND | | HEDGED EQUITY
FUND | | PHINEUS LONG/SHORT
FUND | | MERGER ARBITRAGE
FUND | |
| $ | 0 | | | $ | 0 | | | $ | 0 | | | $ | 0 | | |
CONVERTIBLE
FUND | | GLOBAL
CONVERTIBLE FUND | | TIMPANI
SMALL CAP
GROWTH FUND | | TIMPANI SMID
GROWTH FUND | |
| $ | 0 | | | $ | 0 | | | $ | 0 | | | $ | 0 | | |
GROWTH
FUND | | GROWTH AND
INCOME FUND | | DIVIDEND
GROWTH FUND | | SELECT FUND | |
| $ | 0 | | | $ | 61,852,810 | | | $ | 0 | | | $ | 1,053,203 | | |
INTERNATIONAL
GROWTH FUND | | EVOLVING WORLD
GROWTH FUND | | GLOBAL EQUITY
FUND | | GLOBAL
OPPORTUNITIES FUND | |
| $ | 0 | | | $ | 0 | | | $ | 3,033,133 | | | $ | 0 | | |
INTERNATIONAL
SMALL CAP
GROWTH FUND | | TOTAL RETURN
BOND FUND | | HIGH INCOME
OPPORTUNITIES FUND | | SHORT-TERM
BOND FUND | |
| $ | 0 | | | $ | 0 | | | $ | 0 | | | $ | 0 | | |
Under Section 854(b)(2) of the Code, the Funds hereby designate the following amounts, or the maximum amount allowable under the Code, as qualified dividends for the fiscal period ended October 31, 2023:
MARKET NEUTRAL
INCOME FUND | | HEDGED EQUITY
FUND | | PHINEUS LONG/SHORT
FUND | | MERGER ARBITRAGE
FUND | |
| $ | 134,545,905 | | | $ | 4,363,382 | | | $ | 11,450,456 | | | $ | 2,212 | | |
CONVERTIBLE
FUND | | GLOBAL
CONVERTIBLE FUND | | TIMPANI
SMALL CAP
GROWTH FUND | | TIMPANI SMID
GROWTH FUND | |
| $ | 4,888,184 | | | $ | 500,183 | | | $ | 545,651 | | | $ | 36,375 | | |
GROWTH
FUND | | GROWTH AND
INCOME FUND | | DIVIDEND
GROWTH FUND | | SELECT FUND | |
| $ | 8,429,669 | | | $ | 22,871,153 | | | $ | 54,612 | | | $ | 0 | | |
INTERNATIONAL
GROWTH FUND | | EVOLVING WORLD
GROWTH FUND | | GLOBAL EQUITY
FUND | | GLOBAL
OPPORTUNITIES FUND | |
| $ | 862,076 | | | $ | 2,806,314 | | | $ | 138,214 | | | $ | 1,521,420 | | |
INTERNATIONAL
SMALL CAP
GROWTH FUND | | TOTAL RETURN
BOND FUND | | HIGH INCOME
OPPORTUNITIES FUND | | SHORT-TERM
BOND FUND | |
| $ | 8,318 | | | $ | 0 | | | $ | 26,625 | | | $ | 0 | | |
www.calamos.com
313
Tax Information (Unaudited)
Under Section 854(b)(2) of the Code, the Funds hereby designate the following percentage amounts of the ordinary income dividends as income qualifying for the dividends received deduction for the period ended October 31, 2023:
MARKET NEUTRAL
INCOME FUND | | HEDGED EQUITY
FUND | | PHINEUS LONG/SHORT
FUND | | MERGER ARBITRAGE
FUND | |
| | 31.5 | % | | | 100.0 | % | | | 100.0 | % | | | 0.0 | % | |
CONVERTIBLE
FUND | | GLOBAL
CONVERTIBLE FUND | | TIMPANI
SMALL CAP
GROWTH FUND | | TIMPANI SMID
GROWTH FUND | |
| | 58.9 | % | | | 100.0 | % | | | 0.0 | % | | | 0.0 | % | |
GROWTH
FUND | | GROWTH AND
INCOME FUND | | DIVIDEND
GROWTH FUND | | SELECT FUND | |
| | 0.0 | % | | | 100.0 | % | | | 100.0 | % | | | 100.0 | % | |
INTERNATIONAL
GROWTH FUND | | EVOLVING WORLD
GROWTH FUND | | GLOBAL EQUITY
FUND | | GLOBAL
OPPORTUNITIES FUND | |
| | 0.0 | % | | | 2.2 | % | | | 100.0 | % | | | 66.3 | % | |
INTERNATIONAL
SMALL CAP
GROWTH FUND | | TOTAL RETURN
BOND FUND | | HIGH INCOME
OPPORTUNITIES FUND | | SHORT-TERM
BOND FUND | |
| | 0.0 | % | | | 0.0 | % | | | 1.2 | % | | | 0.0 | % | |
At October 31, 2023, more than 50% of each of International Growth Fund and Evolving World Growth Fund total assets were invested in securities of foreign issuers. In most instances, foreign taxes were withheld from income paid to each fund on these investments. International Growth Fund and Evolving World Growth Fund elect to treat foreign taxes paid as allowed under Section 853 of the Code. This election will allow shareholders of record as of the 2023 distribution date to treat the proportionate share of foreign taxes paid by International Growth Fund and Evolving World Growth Fund as having been paid directly by them. The shareholder shall consider these amounts as foreign taxes paid in the tax year in which they receive the distribution.
CALAMOS OPEN-END FAMILY OF FUNDS ANNUAL REPORT
314
This page intentionally left blank.
MANAGING YOUR CALAMOS FUNDS INVESTMENTS
Calamos Investments offers several convenient means to monitor, manage and feel confident about your Calamos investment choice.
24-HOUR AUTOMATED SHAREHOLDER ASSISTANCE: 800.823.7386
Through a single toll-free number, Calamos 24-Hour Shareholder Assistance is fast and easy. Get fund prices and account balances, review recent transactions, order statements, literature and more.
PERSONAL ASSISTANCE: 800.582.6959
Dial this toll-free number to speak with a knowledgeable Client Services Representative who can help answer questions or address issues concerning your Calamos Fund.
ONLINE ACCOUNT MANAGEMENT:
www.calamos.com
Manage your personal account of Calamos Funds online at www.calamos.com. On your account access page, you can view account history and download data.
YOUR FINANCIAL ADVISOR
We encourage you to talk to your financial advisor to determine how the Calamos Funds can benefit your investment portfolio based on your financial goals, risk tolerance, time horizon and income needs.
This report, including the audited financial statements contained herein, is submitted for general information for the shareholders of the Funds. The report is not authorized for distribution to prospective investors in the Funds unless accompanied by a currently effective prospectus of the Funds. The views expressed in this report reflect those of Calamos Advisors LLC only through October 31, 2023.
A description of the Calamos Proxy Voting Policies and Procedures and the Funds' proxy voting record for the 12-month period ended June 30 are available free of charge upon request by calling 800.582.6959, by visiting the Calamos Web site at www.calamos.com, or by writing Calamos at: Calamos Investments, Attn: Client Services, 2020 Calamos Court, Naperville, IL 60563. The Funds' proxy voting record is also available free of charge by visiting the SEC Web site at www.sec.gov.
The Funds file a complete list of their portfolio holdings with the SEC for the first and third quarters each fiscal year as an exhibit to its reports on Form N-PORT. The Forms N-PORT are available free of charge, upon request, by calling or writing Calamos Investments at the phone number or address provided above or by visiting the SEC Web site at www.sec.gov.
FOR 24-HOUR AUTOMATED SHAREHOLDER ASSISTANCE: 800.823.7386
TO OBTAIN INFORMATION ABOUT YOUR INVESTMENTS: 800.582.6959
VISIT OUR WEB SITE: www.calamos.com
INVESTMENT ADVISER:
Calamos Advisors LLC
2020 Calamos Court
Naperville, IL 60563-2787
CUSTODIAN AND FUND ACCOUNTING AGENT:
State Street Bank and Trust Company
Boston, MA
TRANSFER AGENT:
U.S. Bank Global Fund Services
615 E. Michigan St., 3rd Floor
Milwaukee, WI 53202
INDEPENDENT REGISTERED PUBLIC ACCOUNTING FIRM:
Deloitte & Touche LLP
Chicago, IL
LEGAL COUNSEL:
Ropes & Gray LLP
Chicago, IL

Visit our Web site for timely fund performance, detailed fund profiles, fund news and insightful market commentary.

2020 Calamos Court
Naperville, IL 60563-2787
800.582.6959
www.calamos.com
© 2023 Calamos Investments LLC. All Rights Reserved. Calamos® and Calamos Investments® are registered trademarks of Calamos Investments LLC.
CITANR 1631 2023
Item 1(b). Registrant has included in its Rule 30e-3(c) notice only the disclosures specified by Rule 30e-3(c)(1) and (2). Therefore, Registrant has not included a copy of the notice herewith.
ITEM 2. CODE OF ETHICS.
(a) As of the end of the period covered by this report, the registrant has adopted a code of ethics (the “Code of Ethics”) that applies to its principal executive officer, principal financial officer, principal accounting officer or controller, or person performing similar functions.
(b) No response required.
(c) The registrant has not amended its Code of Ethics as it relates to any element of the code of ethics definition enumerated in paragraph (b) of this Item 2 during the period covered by this report.
(d) The registrant has not granted a waiver or an implicit waiver from its Code of Ethics during the period covered by this report.
(e) Not applicable.
(f) (1) The registrant’s Code of Ethics is attached as an Exhibit hereto.
ITEM 3. AUDIT COMMITTEE FINANCIAL EXPERT.
The registrant’s Board of Trustees has determined that it has five audit committee financial experts serving on its audit committee, each of whom is an independent Trustee for purpose of this N-CSR item: John E. Neal, William R. Rybak, Virginia G. Breen, Karen L. Stuckey and Christopher M. Toub. Under applicable securities laws, a person who is determined to be an audit committee financial expert will not be deemed an “expert” for any purpose, including without limitation for the purposes of Section 11 of the Securities Act of 1933, as a result of being designated or identified as an audit committee financial expert pursuant to this Item. The designation or identification of a person as an audit committee financial expert does not impose on such person any duties, obligations, or liabilities that are greater than the duties, obligations and liabilities imposed on such person as a member of audit committee and board of directors in the absence of such designation or identification. The designation or identification of a person as an audit committee financial expert pursuant to this Item does not affect the duties, obligations, or liabilities of any other member of the audit committee or board of trustees.
ITEM 4. PRINCIPAL ACCOUNTANT FEES AND SERVICES.
| Fiscal Years Ended | | 10/31/2022 | | | 10/31/2023 | |
| Audit Fees(a) | | $ | 555,303 | | | $ | 538,593 | |
| Audit-Related Fees(b) | | $ | 170,568 | | | $ | 166,914 | |
| Tax Fees(c) | | $ | 785,460 | | | $ | 893,901 | |
| All Other Fees(d) | | $ | - | | | $ | - | |
| Total | | $ | 1,511,331 | | | $ | 1,599,408 | |
(a) Audit fees are the aggregate fees billed in each of the last two fiscal years for professional services rendered by the principal accountant to the registrant for the audit of the registrant’s annual financial statements or services that are normally provided by the accountant in connection with statutory and regulatory filings or engagements for those fiscal years.
(b) Audit-related fees are the aggregate fees billed in each of the last two fiscal years for assurance and related services rendered by the principal accountant to the registrant that are reasonably related to the performance of the audit of the registrant’s financial statements and are not reported under paragraph (a) of this Item 4.
(c) Tax fees are the aggregate fees billed in each of the last two fiscal years for professional services rendered by the principal accountant to the registrant for tax compliance, tax advice and tax planning.
(d) All other fees are the aggregate fees billed in each of the last two fiscal years for products and services provided by the principal accountant to the registrant, other than the services reported in paragraph (a)-(c) of this Item 4.
(e) (1) Registrant’s audit committee meets with the principal accountants and management to review and pre-approve all audit services to be provided by the principal accountants.
The audit committee shall pre-approve all non-audit services to be provided by the principal accountants to the registrant, including the fees and other compensation to be paid to the principal accountants; provided that the pre-approval of non-audit services is waived if (i) the services were not recognized by management at the time of the engagement as non-audit services,(ii) the aggregate fees for all non-audit services provided to the registrant are less than 5% of the total fees paid by the registrant to its principal accountants during the fiscal year in which the non-audit services are provided, and (iii) such services are promptly brought to the attention of the audit committee by management and the audit committee approves them prior to the completion of the audit.
The audit committee shall pre-approve all non-audit services to be provided by the principal accountants to the investment adviser or any entity controlling, controlled by or under common control with the adviser that provides ongoing services to the registrant if the engagement relates directly to the operations or financial reporting of the registrant, including the fees and other compensation to be paid to the principal accountants; provided that pre-approval of non-audit services to the adviser or an affiliate of the adviser is not required if (i) the services were not recognized by management at the time of the engagement as non-audit services, (ii) the aggregate fees for all non-audit services provided to the adviser and all entities controlling, controlled by or under common control with the adviser are less than 5% of the total fees for non-audit services requiring pre-approval under paragraph (e)(1)of this Item 4 paid by the registrant, the adviser or its affiliates to the registrant’s principal accountants during the fiscal year in which the non-audit services are provided, and (iii) such services are promptly brought to the attention of the audit committee by management and the audit committee approves them prior to the completion of the audit.
(e)(2) No percentage of the principal accountant’s fees or services described in each of paragraphs (b)—(d) of this Item were approved pursuant to the waiver provision paragraph (c)(7)(i)(C) of Rule 2-01 of Regulation S-X.
(f) No disclosures are required by this Item 4(f).
(g) The following table presents the aggregate non-audit fees billed in each of the last two fiscal years for services rendered by the principal accountant to the registrant and the aggregate non-audit fees billed in each of the last two fiscal years for services rendered by the principal accountant to the investment adviser or any entity controlling, controlled by or under common control of the adviser.
| Fiscal Years Ended | | 10/31/2022 | | | 10/31/2023 | |
| Registrant | | $ | 785,460 | | | $ | 893,901 | |
| Investment Adviser | | $ | - | | | $ | 120 | |
(h) No disclosures are required by this Item 4(h).
(i) Not applicable.
(j) Not applicable.
ITEM 5. AUDIT COMMITTEE OF LISTED REGISTRANTS.
Not applicable.
ITEM 6. SCHEDULE OF INVESTMENTS
(a) Included in the Report to Shareholders in Item 1.
(b) Not applicable.
ITEM 7. DISCLOSURE OF PROXY VOTING POLICIES AND PROCEDURES FOR CLOSED-END MANAGEMENT INVESTMENT COMPANIES.
Not applicable.
ITEM 8. PORTFOLIO MANAGERS OF CLOSED-END MANAGEMENT INVESTMENT COMPANIES.
Not applicable.
ITEM 9. PURCHASES OF EQUITY SECURITIES BY CLOSED-END MANAGEMENT INVESTMENT COMPANY AND AFFILIATED PURCHASERS.
Not applicable.
ITEM 10. SUBMISSION OF MATTERS TO A VOTE OF SECURITY HOLDERS.
No material changes.
ITEM 11. CONTROLS AND PROCEDURES.
a) The registrant’s principal executive officer and principal financial officer have evaluated the registrant’s disclosure controls and procedures within 90 days of this filing and have concluded that the registrant’s disclosure controls and procedures were effective, as of that date, in ensuring that information required to be disclosed by the registrant in this Form N-CSR was recorded, processed, summarized, and timely reported.
b) There were no changes in the registrant’s internal controls over financial reporting (as defined in Rule 30a-3(d) under the Investment Company Act of 1940) that occurred during the period covered by this report that has materially affected, or is reasonably likely to materially affect, the registrant’s internal control over financial reporting.
ITEM 12. DISCLOSURE OF SECURITIES LENDING ACTIVITIES FOR CLOSED-END MANAGEMENT INVESTMENT COMPANIES.
Not applicable.
ITEM 13. EXHIBITS.
(a)(1) Code of Ethics
(a)(2)(i) Certification of Principal Executive Officer.
(a)(2)(ii) Certification of Principal Financial Officer.
SIGNATURES
Pursuant to the requirements of the Securities Exchange Act of 1934 and the Investment Company Act of 1940, the registrant has duly caused this report to be signed on its behalf by the undersigned, thereunto duly authorized.
Calamos Investment Trust
| By: | /s/ John P. Calamos, Sr. | |
| Name: | John P. Calamos, Sr. | |
| Title: | Principal Executive Officer | |
| Date: | December 28, 2023 | |
| By: | /s/ Thomas E. Herman | |
| Name: | Thomas E. Herman | |
| Title: | Principal Financial Officer | |
| Date: | December 28, 2023 | |
Pursuant to the requirements of the Securities Exchange Act of 1934 and the Investment Company Act of 1940, this report has been signed by the following persons on behalf of the registrant and in the capacities and on the dates indicated.
| By: | /s/ John P. Calamos, Sr. | |
| Name: | John P. Calamos, Sr. | |
| Title: | Principal Executive Officer | |
| Date: | December 28, 2023 | |
| By: | /s/ Thomas E. Herman | |
| Name: | Thomas E. Herman | |
| Title: | Principal Financial Officer | |
| Date: | December 28, 2023 | |