UNITED STATES
SECURITIES AND EXCHANGE COMMISSION
Washington, D.C. 20549
FORM N-CSR
CERTIFIED SHAREHOLDER REPORT OF REGISTERED
MANAGEMENT INVESTMENT COMPANIES
INVESTMENT COMPANY ACT FILE NUMBER: 811-05443
Calamos Investment Trust
(EXACT NAME OF REGISTRANT AS SPECIFIED IN CHARTER)
2020 Calamos Court, Naperville
Illinois 60563-2787
(ADDRESS OF PRINCIPAL EXECUTIVE OFFICES)
John P Calamos, Sr., President,
Calamos Advisors LLC
2020 Calamos Court,
Naperville, Illinois
60563-2787
(NAME AND ADDRESS OF AGENT FOR SERVICE)
REGISTRANT’S TELEPHONE NUMBER, INCLUDING AREA CODE: (630) 245-7200
DATE OF FISCAL YEAR END: October 31, 2012
DATE OF REPORTING PERIOD: November 1, 2011 through April 30, 2012
Item 1. Report to Shareholders

Experience and Foresight
About Calamos Investments
For more than 30 years, we have helped investors like you manage and build wealth to meet long-term objectives. Because investors have different time horizons, risk tolerances and goals, we offer funds to suit a variety of asset allocation needs. Our 13 mutual funds include equity, enhanced fixed income and alternative funds. We offer U.S. funds, as well as global and international choices.
We are dedicated to helping our clients build and protect wealth. We understand when you entrust us with your assets, you also entrust us with your achievements, goals and aspirations. We believe we best honor this trust by making investment decisions guided by integrity, by discipline and by our conscientious research.
We believe that an active, risk-conscious approach is essential for wealth creation. In the 1970s, we pioneered the use of convertible securities as a means to control risk in volatile markets. We followed with strategies that combine convertibles and stocks, with the aim of participating in equity market upside with potentially less volatility than an all-stock portfolio. In the 1990s, we introduced our first stock fund, which invests in growth companies both large and small. Across our funds, our investment process seeks to manage risk at multiple levels and draws upon our experience investing through many market cycles. In a rapidly changing environment, we believe that this active management is essential.
We are global in our perspective. We believe that globalization offers tremendous opportunities for countries and companies all over the world. In our U.S., global and international portfolios, we are seeking to capitalize on the potential growth of the global economy.
We believe there are opportunities in all markets. Our history traces back to the 1970s, a period of significant volatility and economic concerns. We have invested through multiple market cycles, each with its own challenges. Out of this experience comes our belief that the flipside of volatility is opportunity.
Letter to Shareholders

JOHN P. CALAMOS, SR.
CEO and Co-CIO
Dear Fellow Shareholder:
Welcome to your semiannual report for the six-month period ended April 30, 2012. In this report, you will find commentary from the Calamos Investment Management Team, as well as a listing of portfolio holdings, financial statements and highlights, and detailed information about the performance and positioning of the Calamos Funds.
Market Review
Entering the semiannual period, our view was that the U.S. economy was not headed for a double dip recession. During the period, improving economic data supported our constructive view. However, even as market sentiment improved and risk appetites increased, the global markets remained volatile. Sovereign debt pressures in the eurozone and the potential for slowing growth in emerging markets were of particular concern.
Overall, for the six-month period, global equity markets experienced significant gains. In the U.S., stocks rallied to a double-digit performance, with the S&P 500 Index1 returning an impressive 12.77% for the period. While the global equity markets didn’t quite match that pace, the MSCI World Index2, a measure of developed market equity performance, still managed to post a healthy 7.87% gain. Meanwhile, the emerging markets returned to positive territory with a gain of 4.02% in the MSCI Emerging Markets Index3.
Convertible securities also enjoyed the six-month rally, as the BofA Merrill Lynch All U.S. Convertible Ex-Mandatory Index4 returned 7.11%. In a demonstration of the strengthening economy, high yield issuance reached record levels in the first quarter of 2012, while performance for the six-month period was also robust, with a 6.77% return in the Credit Suisse High Yield Index5. The broad U.S. bond market, as measured by the Barclays Capital U.S. Aggregate Bond Index6, posted a 2.44% gain.
Opportunities in the Global Economy
While the strong performance over the semiannual period has been a welcome development, we know from experience that volatility can work both ways, and we therefore continue to actively monitor the global economy and the companies we have chosen for the funds. We expect slow but positive growth in the U.S. and in the global economy as a whole. We are prepared for ups and downs along the way and anticipate continued volatility in the global financial markets.
Letter to Shareholders
We believe the period’s strong showing serves as a timely reminder of the resilience of global growth equities as a long-term investment opportunity. Our valuation models show that growth continues to be priced at a large discount all around the world. Overall, our view is that equities represent the most compelling investment on an asset class basis. However, as in the past, trying to time when the equity markets will respond positively for a pronounced period is extremely difficult.
We have identified a number of important secular themes that we believe will drive global growth for years to come. The growth of a middle class in many emerging market regions is an exciting trend, and globally focused businesses are in the best position to capitalize on this increasingly prosperous new customer base. In addition, information technology firms—which comprise a substantial portion of the holdings in many of the Calamos funds—represent an excellent opportunity to take advantage of the growing needs of both global consumers and productivity-seeking businesses around the world.
We also see a considerable cyclical opportunity coming from global reflation activities as global stimulus efforts and increasing liquidity measures taken by the world’s central banks persist. Despite some pullback in the period, we continue to hold a favorable outlook for opportunities in areas such as energy and materials based on strong global demand for resources, especially within developing economies.
We believe that these prominent secular themes and cyclical factors will provide growth opportunities for companies all throughout the world, particularly those with geographically diversified revenues, strong global brands and healthy balance sheets. We believe that global companies may be less vulnerable to economic weakness in a particular country or region, and we are favoring companies domiciled in developed countries that are capitalizing on many of the growth trends currently available in emerging markets.
We also continue to think broadly in terms of how we invest to capitalize on these themes and companies. As noted earlier, we believe that growth equities remain among the most compelling investing opportunities, but we have also found attractive possibilities in the mid-grade corporate debt of these types of firms for investors seeking income-oriented total return. In addition, despite the low interest rate environment and resultant low new issuance for convertible securities, our decades of experience in this area have helped to uncover a number of worthwhile opportunities here as well.
Thinking Long-Term and Thinking Globally
Experience has shown us that volatility and uncertainty have always been, and will continue to be, big factors in investing. Yet it is that same experience that has taught us that while we may not be able to control market volatility or anticipate every potential event in the global economy, we can still find investing success over the long term with a disciplined approach that fully takes into account both risks and rewards. We believe that
| | | | |
| 2 | | CALAMOS FAMILY OF FUNDS SEMIANNUAL REPORT | | |
Letter to Shareholders
volatility and uncertainty do not constitute an argument to stay out of the markets, but rather a reason to rely on the same comprehensive approach to investing that has served us remarkably well over the past several decades.
While we may not be able to precisely time the arrival of the next true bull market, we believe that there are compelling choices for long-term investors. Our active, team-oriented investment process continues to seek out and analyze global opportunities that we believe will deliver long-term results to shareholders over full market cycles. Despite the challenges that exist, we are optimistic about the investing prospects we see in the coming months and years, and we believe that the wide array of Calamos Funds will provide the means to capitalize on those opportunities.
As always, we appreciate the trust you have placed in us to manage your assets and help you achieve your financial goals. We encourage you to visit us at calamos.com or contact us at 800.582.6959 with any questions or concerns about our funds that are not addressed in this report.
Sincerely,

John P. Calamos, Sr.
CEO and Co-CIO,
Calamos Advisors LLC
Before investing, carefully consider a fund’s investment objectives, risks, charges and expenses. Please see the prospectus containing this and other information or call 800.582.6959. Please read the prospectus carefully.
Performance data represents past performance, which is no guarantee of future results. Current performance may be lower or higher than the performance quoted.
| 1 | The S&P 500 Index is an unmanaged index generally considered representative of the U.S. stock market. Source: Lipper, Inc. |
| 2 | The MSCI World Index (U.S. Dollars) is a market-capitalization weighted index composed of companies representative of the market structure of developed market countries in North America, Europe and the Asia/Pacific region. Source: Lipper, Inc. |
| 3 | The MSCI Emerging Markets Index is a free float-adjusted market capitalization index considered broadly representative of emerging market equity performance. The index represents companies within the constituent emerging markets that are available to investors worldwide. |
4 The BofA Merrill Lynch All U.S. Convertibles Ex-Mandatory Index represents the U.S. convertible securities market excluding mandatory convertibles.
| 5 | The Credit Suisse High Yield Index is an unmanaged index of approximately 1,600 issues with an average maturity range of seven to ten years with a minimum capitalization of $75 million. The Index is considered generally representative of the U.S. market for high-yield bonds. |
| 6 | The Barclays Capital U.S. Aggregate Bond Index is considered generally representative of the investment-grade bond market. Source: Lipper, Inc. |
Unmanaged index returns assume reinvestment of any and all distributions and, unlike fund returns, do not reflect fees, expenses or sales charges. Investors cannot invest directly in an index.
Investments in overseas markets pose special risks, including currency fluctuation and political risks. These risks are generally intensified for investments in emerging markets. Countries, regions, and sectors mentioned are presented to illustrate countries, regions, and sectors in which a fund may invest. Fund holdings are subject to change daily. The Funds are actively managed.
The information contained herein is based on internal research derived from various sources and does not purport to be statements of all material facts relating to the securities mentioned. The information contained herein, while not guaranteed as to the accuracy or completeness, has been obtained from sources we believe to be reliable. There are certain risks involved with investing in convertible securities in addition to market risk, such as call risk, dividend risk, liquidity risk and default risk, that should be carefully considered prior to investing. This information is being provided for informational purposes only and should not be considered investment advice or an offer to buy or sell any security in the portfolio.
This report is intended for informational purposes only and should not be considered investment advice.
Calamos Growth Fund
| | |
| FUND NASDAQ SYMBOLS |
A Shares | | CVGRX |
B Shares | | CVGBX |
C Shares | | CVGCX |
I Shares | | CGRIX |
R Shares | | CGRRX |
| | | |
|
| FUND CUSIP NUMBERS |
A Shares | | 128119302 |
B Shares | | 128119740 |
C Shares | | 128119856 |
I Shares | | 128119807 |
R Shares | | 128119435 |
| | | |
FUND OBJECTIVE
Long-term capital growth
INVESTMENT STRATEGY
| | > | | Blends rigorous economic and broad themes analysis with intensive company and security research seeking to identify businesses with higher growth relative to peers | |
| | > | | Determines the quality and sustainability of a company’s growth by assessing its fundamentals and management among other factors | |
| | > | | Uses proprietary valuation models to ascertain a stock’s return potential | |
| | > | | Adheres to strict risk-management guidelines to determine portfolio construction | |
INVESTOR PROFILE
This Fund may be suitable for investors who seek:
| | > | | A portfolio that pursues the highest potential growth opportunities regardless of company size or industry | |
| | > | | A relatively aggressive yet diversified way to participate in the stock market’s long-term growth potential | |
CALAMOS GROWTH FUND
INVESTMENT TEAM DISCUSSION
The Calamos Investment Management Team discusses the Fund’s performance, strategy and positioning during the six-month period ended April 30, 2012.
Q. What is the Fund’s investment strategy?
A. Calamos Growth Fund invests in U.S. companies that we believe have the best prospects for sustainable and high relative growth. The Fund offers an attractive way to participate in long-term growth trends by focusing on companies with global strategies, global brands and geographically diversified revenues. We believe that there are many exciting growth trends within the global economy and we have sought companies with good earnings prospects, high returns on invested capital, sustainable free cash flow, and low debt-to-capital ratios. We believe that many stocks of U.S. multinational companies are presently trading at extremely attractive prices, based on a variety of measures.
Q. How has the Fund performed?
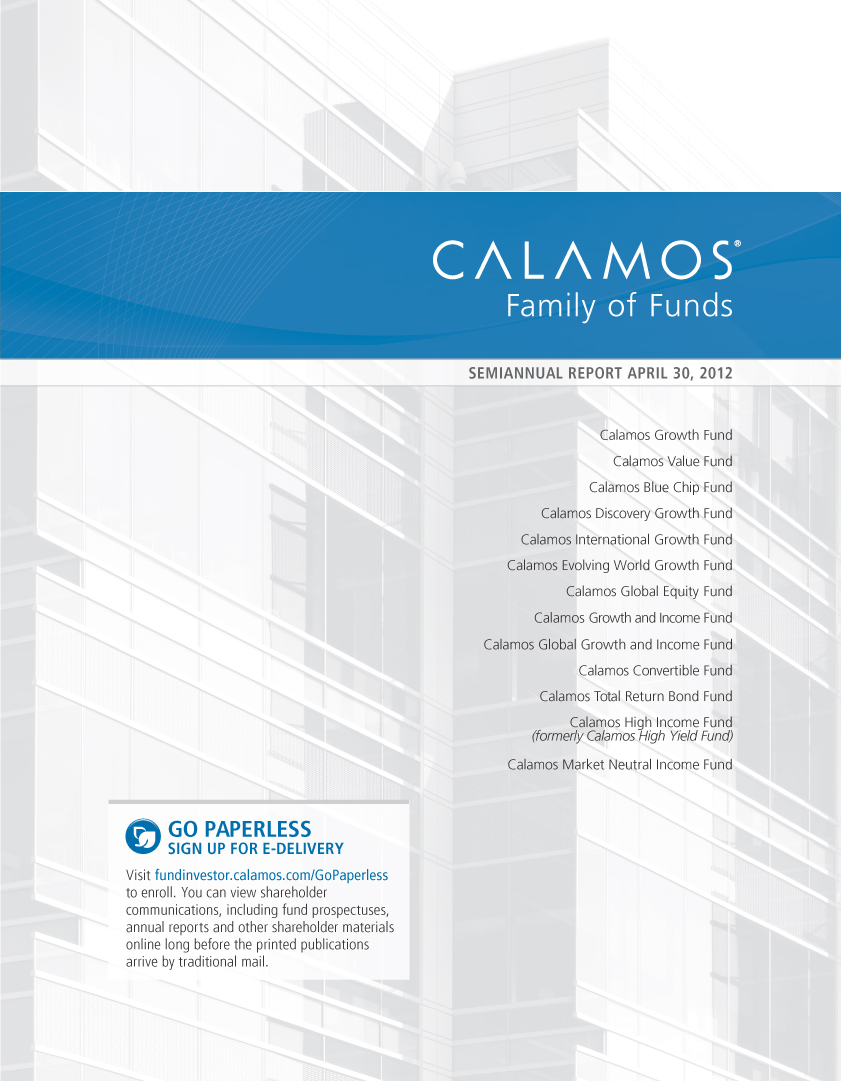
A. Because we believe equity funds are best utilized within asset allocations as long-term investments, we encourage investors to evaluate performance over multiple market cycles. Since its inception on September 4, 1990, the Fund has returned 13.61% on an annualized basis (Class A shares at net asset value). For this period, the broad equity market, as measured by the S&P 500 Index, returned 9.26%, while the Russell Midcap® Growth Index and the Russell 3000® Growth Index, returned 10.41% and 8.60%, respectively. The Russell 3000® Growth Index provides a point of comparison for the broad U.S. growth equity market, including companies of all capitalizations, while the Russell Midcap® Growth Index is a measure of mid-cap growth stocks, one segment of the Fund’s potential universe of investments.
For the semiannual period ended April 30, 2012, the Growth Fund returned 9.24% versus the Russell 3000® Growth Index return of 13.86%. For this same period, the Russell Midcap® Growth Index rose 12.26% and the S&P 500 Index returned 12.77%.
Q. What factors influenced performance over the semiannual period?
A. Relative performance for the Fund trailed the benchmark Russell 3000® Growth Index during the six-month period. Much of that underperformance occurred during the first two months of the period, as fundamentals were often overlooked and global macro issues and short-term considerations drove market results. The market environment at this time was defined by general risk aversion, with “risk-off” sectors (defensive, non-cyclicals) performing the best. Our preference for higher growing and more cyclical investments, while still attractively valued, was not rewarded early in the period and hindered Fund performance. We believe that valuations of U.S. growth equities remain compelling and offer particularly attractive risk/reward characteristics.
In terms of sector performance, the Fund’s holdings within the materials sector trailed the stronger Russell 3000® Growth Index returns. Most notably, holdings related to gold mining and production contributed to lag, as firms incurred rising input and extraction costs during the period. We continue to believe the sector will be supported
| | | | |
| 4 | | CALAMOS FAMILY OF FUNDS SEMIANNUAL REPORT | | |
Calamos Growth Fund
by increased demand for resources from emerging market regions, as well as by reflation efforts and accommodative global central bank policies. We are focused on long-term opportunities within the diversified metals and mining, fertilizers and agricultural chemicals and gold industries.
Security selection within the energy sector detracted from returns during the period. Select holdings in the equipment and services and exploration and production industries were weak, as reservations about the global macro environment resulted in uncertain earnings forecasts. In addition, companies that derive a part of their business from natural gas were under pressure, as prices for the commodity fell and costs escalated. We continue to look favorably on the long-term opportunities in the energy sector, particularly given the ongoing global stimulus and liquidity from the world’s central banks. We believe holdings within the sector should continue to benefit from reflation efforts, as well as from long-term secular themes, such as strong global demand for energy resources, especially within developing economies. Our research focus remains on the oil and gas equipment and services, drilling and exploration and production industries.
While the Fund’s underweight position to the industrials sector contributed favorably to relative performance in the period, security selection within the sector trailed the stronger index returns. In particular, holdings in the electrical equipment and freight and logistics industries lagged. We believe there are attractive long-term opportunities in the sector, most notably those associated with the global infrastructure build-out. We are focused on those companies in industries such as industrial machinery, construction and equipment that we believe offer compelling growth potential at reasonable valuations. We are particularly interested in those companies that are positioned to benefit from the growth in emerging market regions.
The information technology sector posted one of the strongest performances within the benchmark Russell 3000® Growth Index for the period. In the Fund, an overweight allocation enhanced returns while security selection was strong, yet trailed that of the index. We maintain conviction in the sector due to the higher cash flows, lower debt levels and cleaner balance sheets we see in many companies. In addition, we expect these companies to thrive in the future as they develop solutions to improve and enhance productivity and business performance. The sector continues to profit from many of the long-term secular growth themes we have identified, including strong business and consumer demand for products and services that provide access to information and entertainment. Many companies are also benefiting from frequent innovations that bring together many different technologies, strengthening connectivity for individuals and businesses.
The Fund’s strong security selection within the health care sector was a positive contributor to performance in the period. Specifically, holdings within the health care equipment and supplies and pharmaceuticals industries outperformed. Our focus remains on corporate performance, cash flows and fundamentals. Because health care spending is not as dependent on robust economic growth, we view the Fund’s health care holdings as providing defensive characteristics. We are especially attracted to those companies furthest removed from increased government regulation, such as those in the health care equipment industry.
An underweight allocation and strong security selection within the consumer staples sector also contributed favorably to Fund performance in the period. Although the
| | | | |
| SECTOR WEIGHTINGS | |
Information Technology | | | 41.3 | % |
Consumer Discretionary | | | 14.1 | |
Health Care | | | 9.9 | |
Energy | | | 9.3 | |
Materials | | | 7.8 | |
Industrials | | | 7.7 | |
Consumer Staples | | | 3.3 | |
Financials | | | 2.7 | |
Telecommunication Services | | | 0.6 | |
| | | | | |
Sector weightings are subject to change daily and are calculated as a percentage of net assets. The table excludes cash or cash equivalents, any government/sovereign bonds or broad based index hedging securities the Fund may hold.
Calamos Growth Fund
Fund’s absolute allocation to the sector is low, the companies that we did invest in performed particularly well in the period, especially those in the beverages and food products industries. In regard to the underweight position, names within the consumer staples sector tend to be more defensive and exhibit lower growth characteristics. Within the sector, we strive to invest in companies with growing niche brands and those with strong global operations.
ANNUALIZED RETURN: SINCE INCEPTION (9/4/90) THROUGH 4/30/12
Performance data quoted represents past performance, which is no guarantee of future results. Current performance may be lower or higher than the performance quoted.
The principal value and investment return of an investment will fluctuate so that your shares, when redeemed, may be worth more or less than their original cost. You can obtain performance data current to the most recent month end by visiting www.calamos.com. Average annual total return measures net investment income and capital gain or loss from portfolio investments as an annualized average. All performance shown assumes reinvestment of dividends and capital gains distributions. Performance is for the Fund’s Class A shares at net asset value and does not include the Fund’s maximum front-end sales charge of 4.75%—had it been included, the Fund’s return would have been lower. The Fund also offers Class B, Class C, Class I and Class R shares, the performance of which may vary. Performance shown reflects an expense reimbursement that improved results. Source: State Street Corporation and Lipper, Inc.
Q. What changes were made over the course of the reporting period?
A. We maintain our emphasis on firms with globally diversified revenues and strong brands that are poised to benefit from global growth opportunities. After the strong and rapid market advance of the past several months, we believe a continued focus on risk management and valuation sensitivity is most appropriate. As such, during the period we aimed to reduce price-risk in select names and take some cyclicality out of the Fund, especially from those sectors related to reflation, such as industrials and energy. While these sectors were reduced, we continue to believe that the reflation theme can provide good long-term opportunities, given strong signals from the Federal Reserve and other global central banks that they would remain accommodative and provide a backstop for the markets, if necessary.
The Fund’s largest allocations in absolute terms include the information technology, consumer discretionary and health care sectors. The Fund’s largest overweight allocation is to the information technology sector, while the Fund’s allocation to consumer staples remains notably underweight.
Among the sector positioning changes during the period, allocations to the technology and health care sectors increased, while positioning in the industrials and energy sectors decreased, as stated above.
| | | | |
| 6 | | CALAMOS FAMILY OF FUNDS SEMIANNUAL REPORT | | |
Calamos Growth Fund
Q. What is the outlook for U.S. growth stocks and the Fund?
We remain optimistic about the prospects of U.S. growth stocks and we have positioned the Fund accordingly. Our active approach is uncovering opportunities supported by long-term secular trends such as globalization, the growth and maturation of the emerging middle class, as well as productivity enhancement capabilities in a globally competitive environment. We believe large multinational companies with globally diversified revenues and access to capital are poised to capitalize on both secular and cyclical trends. Overall, growth equities remain especially attractive to us, as investors continue to discount the growth of future cash flows, while growth premiums remain historically low.
Calamos Growth Fund
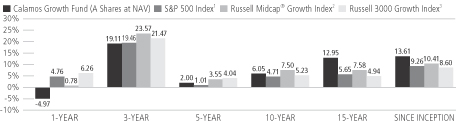
GROWTH OF $10,000: FOR 10-YEAR PERIOD ENDED 4/30/12
AVERAGE ANNUAL TOTAL RETURN† AS OF 4/30/12
| | | | | | | | | | | | | | | | |
| | | 6
MONTHS | | | 1
YEAR | | | 5
YEARS | | | 10 YEARS
OR ^SINCE
INCEPTION | |
| Class A Shares – Inception 9/4/90 | | | | | | | | | | | | | | | | |
Without Sales Charge | | | 9.24 | % | | | -4.97 | % | | | 2.00 | % | | | 6.05 | % |
With Sales Charge | | | 4.05 | | | | -9.49 | | | | 1.02 | | | | 5.53 | |
| |
| Class B Shares – Inception 9/11/00 | | | | | | | | | | | | | | | | |
Without Sales Charge | | | 8.85 | | | | -5.68 | | | | 1.24 | | | | 5.41 | |
With Sales Charge | | | 3.85 | | | | -10.18 | | | | 0.90 | | | | 5.41 | |
| |
| Class C Shares – Inception 9/3/96 | | | | | | | | | | | | | | | | |
Without Sales Charge | | | 8.85 | | | | -5.68 | | | | 1.24 | | | | 5.26 | |
With Sales Charge | | | 7.85 | | | | -6.58 | | | | 1.24 | | | | 5.26 | |
| |
| Class I Shares – Inception 9/18/97 | | | 9.39 | | | | -4.73 | | | | 2.26 | | | | 6.32 | |
| |
| Class R Shares – Inception 3/1/07 | | | 9.12 | | | | -5.21 | | | | 1.75 | | | | 2.97 | ^ |
| |
Performance data quoted represents past performance, which is no guarantee of future results. Current performance may be lower or higher than the performance quoted. The principal value and investment return of an investment will fluctuate so that your shares, when redeemed, may be worth more or less than their original cost.
Performance of the Growth Fund includes the effects of an overpayment of dividends and/or capital gains distributions to shareholders of certain share Classes of the Fund (and a corresponding capital contribution by Calamos Asset Management, Inc., the predecessor to Calamos Advisors LLC), which increased certain return figures.
| † | Average annual total return measures net investment income and capital gain or loss from portfolio investments as an annualized average assuming reinvestment of dividends and capital gains distributions. Performance shown reflects the effects of an expense reimbursement that improved results and was in effect until March 31, 2000. Load-adjusted returns are adjusted for the maximum front-end sales load of 4.75% for Class A shares and returns for Class B and C have been adjusted for the contingent deferred sales charge (CDSC). |
NOTES:
The graphs do not reflect the income taxes that you would pay on fund distributions or the redemption of fund shares. Fund performance includes reinvestment of dividends and adjustment for the maximum sales charge for Class A shares. The performance of other classes will vary from the performance of the class shown based on the difference in sales charges and fees paid by shareholders investing in different share classes.
| 1 | The S&P 500 Index is an unmanaged index generally considered representative of the U.S. stock market. Index data shown for the Since Inception Growth of $10,000 graph is from 8/31/90, since comparative index data is only available for full monthly periods. Source: Lipper, Inc. |
| 2 | The Russell Midcap® Growth Index measures the performance of mid-sized companies with growth characteristics. Index data shown for the Annualized Return Since Inception graph is from 8/31/90, since comparative index data is only available for full monthly periods. Source: Lipper, Inc. |
| 3 | The Russell 3000® Growth Index measures the performance of companies with higher price-to-book ratios and higher forecasted growth values. Index data shown for the Annualized Return Since Inception graph is from 8/31/90, since comparative index data is only available for full monthly periods. Source: Lipper, Inc. |
Index returns assume reinvestment of dividends and do not reflect deduction of fees and expenses. It is not possible to invest directly in an index.
| | | | |
| 8 | | CALAMOS FAMILY OF FUNDS SEMIANNUAL REPORT | | |
Calamos Value Fund
CALAMOS VALUE FUND
INVESTMENT TEAM DISCUSSION
The Calamos Investment Management Team discusses the Fund’s performance, strategy and positioning during the six-month period ended April 30, 2012.
Q. What is the Fund’s investment strategy?
A. Calamos Value Fund invests in U.S. companies where we believe the stock price has been temporarily depressed due to one-time events or market sentiment that we expect to change. The Fund provides a value-oriented complement to a growth-oriented portfolio. Our goal is to purchase stocks at discounts to our estimates of intrinsic business value. We analyze cash flows and return on invested capital to determine intrinsic business value.
This Fund’s investment strategy differs from some other value funds in that we will not invest in a company solely because it is “cheap.” Before we buy a stock, we need to see a potential catalyst, or believe that some other factor will arise that will lead to the company receiving more favorable recognition in the market. We want to see companies with compelling strategies for improving their cash flows, balance sheet health and overall market position.
Q. How has the Fund performed?
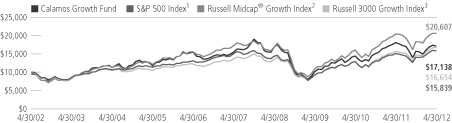
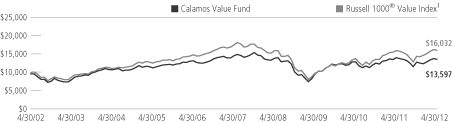
A. Because we believe equity funds are best utilized within asset allocations as long-term investments, we encourage investors to evaluate performance over longer time periods. Since its inception on January 2, 2002, the Fund has returned 3.44% on an annualized basis (Class A shares at net asset value) versus 4.69% for the Russell 1000® Value Index. For the semiannual period ended April 30, 2012, the Fund returned 6.67% versus 11.62% for the Russell 1000® Value Index.
Q. What factors influenced performance over the semiannual period?
A. The Fund’s underweight position and security selection within the financial sector hampered performance in the period. Index returns were boosted by companies within the commercial banks and consumer finance industries, which came after weaker performance in these industries during the final months of last year. We remain cautious and underweight relative to the index and have generally avoided large parts of the sector due to increased regulations globally and significant business risks remaining in many financial institutions. However, we have found favorable opportunities within globally diversified asset managers and selected insurers that we believe have lower underlying credit risk.
While our underweight position to the energy sector added to Fund returns, lagging selection detracted from performance during the period. Select holdings in the equipment and services and exploration and production industries were particularly weak, as reservations about the global macro environment resulted in uncertain earnings forecasts. In addition, companies that derive a part of their business from natural gas were under pressure as prices for the commodity fell and costs escalated. We continue to look favorably on the long-term opportunities in the energy sector, particularly given the ongoing global stimulus and liquidity from the world’s central
| | |
| FUND NASDAQ SYMBOLS |
A Shares | | CVAAX |
B Shares | | CVABX |
C Shares | | CVACX |
I Shares | | CVAIX |
R Shares | | CVARX |
| | | |
|
| FUND CUSIP NUMBERS |
A Shares | | 128119666 |
B Shares | | 128119658 |
C Shares | | 128119641 |
I Shares | | 128119633 |
R Shares | | 128119419 |
| | | |
FUND OBJECTIVE
Long-term capital growth
INVESTMENT STRATEGY
| | > | | Invests in companies that are deemed to be trading well below their intrinsic values but possess identifiable potential catalysts that can spur them to normal levels | |
| | > | | Companies under consideration must possess risk-mitigating characteristics, such as sound financials and branded products within their industry | |
| | > | | Employs qualitative (bottom-up) research to help determine how an issuer’s stock is valued relative to calculations of intrinsic worth | |
| | > | | Utilizes top-down portfolio construction to pursue macro-level economic themes and support diversification among industries and sectors | |
INVESTOR PROFILE
This Fund may be suitable for investors who seek:
| | > | | A vehicle for building assets to meet medium-range to long-range financial goals | |
| | > | | A value-oriented complement to a growth-oriented portfolio | |
Calamos Value Fund
| | | | |
| SECTOR WEIGHTINGS | |
Information Technology | | | 34.2 | % |
Health Care | | | 15.8 | |
Consumer Staples | | | 14.4 | |
Consumer Discretionary | | | 12.7 | |
Financials | | | 9.5 | |
Energy | | | 6.3 | |
Industrials | | | 4.1 | |
Materials | | | 2.2 | |
Sector weightings are subject to change daily and are calculated as a percentage of net assets. The table excludes cash or cash equivalents, any government/sovereign bonds or broad based index hedging securities the Fund may hold.
banks. We believe the Fund’s holdings within the sector should continue to benefit from reflation efforts, as well as from long-term secular themes such as strong global demand for energy resources, especially within emerging economies. Our research focus remains on the oil and gas equipment and services, drilling and exploration and production industries.
The Fund’s overweight allocation to the consumer discretionary sector was additive to performance, as this sector was the top performing area within the index during the reporting period. Security selection within the sector was positive, yet lagged the stronger returns of the index and detracted from relative performance. We continue to have conviction in our holdings and believe they are well-positioned to benefit from global secular trends. Broadly within the sector, we are attracted to global businesses with strong brands and diversified revenues, as well as those servicing a growing and maturing consumer base within the emerging markets.
A lack of exposure (0% allocation) to the utilities sector added value to the Fund, as its more defensive nature held back returns in a strong market rally and made this one of the worst performing areas within the index during the reporting period. Utilities remain a highly regulated area where we do not typically find many attractive risk/reward opportunities.
Q. What changes were made to the Fund’s portfolio over the course of the reporting period?
A. We maintain our emphasis on firms with globally diversified revenues and strong brands that are poised to benefit from long-term secular trends. After a strong and rapid market advance over several months, we believed a continued focus on risk management and valuation sensitivity was most appropriate. As such, during the reporting period we aimed to reduce price-risk in select names and to take some cyclicality out of the Fund, especially from those sectors related to reflation, such as industrials and energy. While these sectors were reduced, we continue to believe that the reflation theme can provide good long-term opportunities, given strong signals from the Federal Reserve and other global central banks that they would remain accommodative and provide a backstop for the markets, if necessary.
The Fund’s largest allocations in absolute terms include the information technology, health care and consumer staples sectors. Relative to the Russell 1000® Value Index, the Fund’s largest overweight allocation is to the information technology sector, while allocation to the financial sector remains notably underweight.
Among the sector positioning changes during the reporting period were increased allocations to the information technology and health care sectors, while positioning in the industrials and energy sectors decreased, as noted above.
Q. What is your outlook for the Fund?
We remain optimistic about the prospects of globalization and we have positioned the Fund accordingly. Our active approach is uncovering opportunities supported by long-term secular trends, such as the evolution and maturation of the emerging middle class, as well as productivity enhancement capabilities in a globally competitive environment. We believe large multinational companies with diversified revenue bases and access to capital are poised to take advantage of both secular and cyclical trends. Overall, equities remain especially attractive to us, as we continue to find many companies trading at significant discounts to their underlying fundamentals and future cash flows.
| | | | |
| 10 | | CALAMOS FAMILY OF FUNDS SEMIANNUAL REPORT | | |
Calamos Value Fund
ANNUALIZED RETURN: SINCE INCEPTION (1/2/02) THROUGH 4/30/12
Performance data quoted represents past performance, which is no guarantee of future results. Current performance may be lower or higher than the performance quoted.
The principal value and investment return of an investment will fluctuate so that your shares, when redeemed, may be worth more or less than their original cost. You can obtain performance data current to the most recent month end by visiting www.calamos.com. Average annual total return measures net investment income and capital gain or loss from portfolio investments as an annualized average. All performance shown assumes reinvestment of dividends and capital gains distributions. Performance is for the Fund’s Class A shares at net asset value and does not include the Fund’s maximum front-end sales charge of 4.75%—had it been included, the Fund’s return would have been lower. The Fund also offers Class B, Class C, Class I and Class R shares, the performance of which may vary. Performance shown reflects an expense reimbursement that improved results. Source: State Street Corporation and Lipper, Inc.
Calamos Value Fund
GROWTH OF $10,000: FOR 10-YEAR PERIOD ENDED 4/30/12
AVERAGE ANNUAL TOTAL RETURN† AS OF 4/30/12
| | | | | | | | | | | | | | | | |
| | | 6
MONTHS | | | 1
YEAR | | | 5
YEARS | | | 10 YEARS
OR ^SINCE
INCEPTION | |
| Class A Shares – Inception 1/2/02 | | | | | | | | | | | | | | | | |
Without Sales Charge | | | 6.67 | % | | | -2.76 | % | | | -1.32 | % | | | 3.63 | % |
With Sales Charge | | | 1.61 | | | | -7.41 | | | | -2.28 | | | | 3.12 | |
| |
| Class B Shares – Inception 1/2/02 | | | | | | | | | | | | | | | | |
Without Sales Charge | | | 6.29 | | | | -3.46 | | | | -2.05 | | | | 3.02 | |
With Sales Charge | | | 1.29 | | | | -8.29 | | | | -2.41 | | | | 3.02 | |
| |
| Class C Shares – Inception 1/2/02 | | | | | | | | | | | | | | | | |
Without Sales Charge | | | 6.30 | | | | -3.47 | | | | -2.06 | | | | 2.85 | |
With Sales Charge | | | 5.30 | | | | -4.43 | | | | -2.06 | | | | 2.85 | |
| |
| Class I Shares – Inception 3/1/02 | | | 6.81 | | | | -2.47 | | | | -1.07 | | | | 3.89 | |
| |
| Class R Shares – Inception 3/1/07 | | | 6.54 | | | | -3.02 | | | | -1.57 | | | | -0.59 | ^ |
| |
Performance data quoted represents past performance, which is no guarantee of future results. Current performance may be lower or higher than the performance quoted. The principal value and investment return of an investment will fluctuate so that your shares, when redeemed, may be worth more or less than their original cost.
| † | Average annual total return measures net investment income and capital gain or loss from portfolio investments as an annualized average assuming reinvestment of dividends and capital gains distributions. Performance shown reflects the effects of an expense reimbursement that improved results and was in effect until March 31, 2004. Load-adjusted returns are adjusted for the maximum front-end sales load of 4.75% for Class A shares and returns for Class B and C shares have been adjusted for the contingent deferred sales charge (CDSC). |
NOTES:
The graph does not reflect the income taxes that you would pay on fund distributions or the redemption of fund shares. Fund performance includes reinvestment of dividends and adjustment for the maximum sales charge for Class A shares. The performance of other classes will vary from the performance of the class shown based on the difference in sales charges and fees paid by shareholders investing in different share classes.
| 1 | The Russell 1000® Value Index measures the performance of those companies in the Russell 1000® Index with lower price-to-book ratios and lower forecasted growth values. Index data shown is from 12/31/01, since comparative index data is only available for full monthly periods. Source: Lipper, Inc. |
Index returns assume reinvestment of dividends and do not reflect deduction of fees and expenses. It is not possible to invest directly in an index.
| | | | |
| 12 | | CALAMOS FAMILY OF FUNDS SEMIANNUAL REPORT | | |
Calamos Blue Chip Fund
CALAMOS BLUE CHIP FUND
INVESTMENT TEAM DISCUSSION
The Calamos Investment Management Team discusses the Fund’s performance, strategy and positioning during the six-month period ended April 30, 2012.
Q. What is the Fund’s investment strategy?
A. Calamos Blue Chip Fund invests in large-cap equities that we believe have the best prospects for growth. The Fund offers an attractive way to participate in long-term growth trends in the large cap space by focusing on well-known businesses with established operations and good prospects for sustainable growth. We believe these “blue chip” companies may offer a higher degree of stability compared to smaller, less-tested companies. While the Fund invests primarily in U.S.-domiciled businesses, we favor companies with global presence and geographically diversified revenues that we believe are positioned to capitalize on global economic growth and global secular trends.
Q. How has the Fund performed?
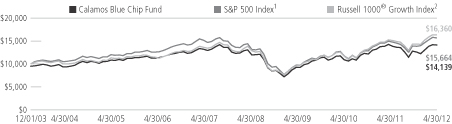
A. Because we believe equity funds are best utilized within asset allocations as long-term investments, we encourage investors to evaluate performance over longer time periods. Since its inception on December 1, 2003, the Fund has returned 4.81% on an annualized basis (Class A shares at net asset value) versus a 5.34% return for the S&P 500 Index and the Russell 1000® Growth Index return of 5.87%. For the most recent six-month reporting period ended April 30, 2012, Calamos Blue Chip Fund returned 10.67%, versus 12.77% for the S&P 500 Index and 14.13% for the Russell 1000® Growth Index.
Q. What factors influenced performance over the semiannual period?
A. An overweight position and lagging selection within the energy sector detracted from returns during the period. Select holdings in the equipment and services and exploration and production industries were particularly weak, as reservations about the global macro environment resulted in uncertain earnings forecasts. In addition, companies deriving a part of their business from natural gas were under pressure, as prices for the commodity fell and costs escalated. We continue to look favorably on the long-term opportunities in the energy sector, particularly given the ongoing global stimulus and liquidity from the world’s central banks. We believe our holdings within the sector should continue to benefit from reflation efforts, as well as from long-term secular themes such as strong global demand for energy resources, especially within emerging economies. Our research focus remains on the oil and gas equipment and services, drilling and exploration & production industries.
The Fund’s holdings within the materials sector trailed the stronger Russell 1000® Growth Index returns, holding back relative performance in the period. Most notably, holdings related to gold mining and production contributed to the lag, as these firms incurred rising input and extraction costs during the period. Many of these gold-related holdings are now priced with very low growth assumptions, making valuations attractive. We continue to believe the sector will be supported by increased demand for resources from emerging market regions, as well as by reflation efforts and
| | |
| FUND NASDAQ SYMBOLS |
A Shares | | CBCAX |
B Shares | | CBCBX |
C Shares | | CBXCX |
I Shares | | CBCIX |
R Shares | | CBCRX |
| | | |
|
| FUND CUSIP NUMBERS |
A Shares | | 128119625 |
B Shares | | 128119617 |
C Shares | | 128119591 |
I Shares | | 128119583 |
R Shares | | 128119427 |
| | | |
FUND OBJECTIVE
Long-term capital growth
INVESTMENT STRATEGY
| | > | | Invest in larger, established companies with balance sheet strength that can also help mitigate downside risk | |
| | > | | We look for businesses with diversified product lines that can increase productivity to maintain growth | |
| | > | | Apply proprietary models to determine return potential of companies | |
| | > | | Each security is further vetted within the context of the portfolio | |
| | > | | We seek to identify long-term secular themes that can drive growth for decades. Investment candidates emerge from the intersection of our top-down (overlay of macroeconomic themes) and bottom-up analysis | |
INVESTOR PROFILE
This Fund may be suitable for investors who seek:
| | > | | A vehicle for building assets to meet medium- to long-range financial goals | |
| | > | | A larger-cap growth offering of diversified companies providing broad market participation | |
Calamos Blue Chip Fund
| | | | |
| SECTOR WEIGHTINGS | |
Information Technology | | | 41.2 | % |
Consumer Discretionary | | | 13.7 | |
Health Care | | | 12.1 | |
Energy | | | 10.6 | |
Industrials | | | 6.8 | |
Consumer Staples | | | 5.4 | |
Materials | | | 5.0 | |
Financials | | | 2.3 | |
Telecommunication Services | | | 1.3 | |
| | | | | |
Sector weightings are subject to change daily and are calculated as a percentage of net assets. The table excludes cash or cash equivalents, any government/sovereign bonds or broad based index hedging securities the Fund may hold.
accommodative global central bank policies. We are focused on long-term opportunities within the diversified metals & mining, fertilizers and agricultural chemicals and gold industries.
Security selection within the consumer discretionary sector was additive to performance in the reporting period. The Fund’s top holdings within the sector are in the Internet retail industry, and after declining in the beginning of the period these companies bounced back and have performed particularly well. We continue to have conviction in these names and believe they are well-positioned to benefit from global secular trends. Broadly within the sector, we are attracted to global businesses with strong brands and diversified revenues, as well as those servicing a growing and maturing consumer base within the emerging markets.
Strong security selection within the health care sector was a positive contributor to performance in the period. Specifically, Fund holdings within the health care equipment and supplies and pharmaceuticals industries outperformed. Our focus remains on corporate performance, cash flows and fundamentals. Because health care spending is not as dependant on robust economic growth, we view the Fund’s health care holdings as providing defensive characteristics. We are especially attracted to those companies furthest removed from increased government regulation, such as those in the health care equipment industry.
Q. What changes were made to the Fund’s portfolio over the course of the reporting period?
A. We maintain our emphasis on firms with globally diversified revenues and strong brands that are poised to benefit from global growth opportunities. After a strong and rapid market advance over several months, we believed a continued focus on risk management and valuation sensitivity was most appropriate. As such, during the reporting period we aimed at reducing price-risk in select names and taking some cyclicality out of the fund, especially from those sectors related to reflation, such as industrials and energy. While these sectors were reduced, we continue to believe that the reflation theme can provide good long-term opportunities. The Federal Reserve and other global central banks have shown strong signals that they would remain accommodative and provide a backstop for the markets if necessary.
The Fund’s largest allocations in absolute terms include the information technology, consumer discretionary and health care sectors. Relative to the Russell 1000® Growth Index, the Fund’s largest overweight allocation is to the information technology sector, while allocations to consumer staples and industrials remain notably underweight.
Among the positioning changes during the reporting period, allocations to the consumer discretionary and consumer staples sectors increased, while positioning in the industrials and energy sectors decreased, as stated above.
| | | | |
| 14 | | CALAMOS FAMILY OF FUNDS SEMIANNUAL REPORT | | |
Calamos Blue Chip Fund
Q. What is your outlook for large cap growth equities and the Fund?
We remain optimistic about the prospects of large cap growth equities and we have positioned the Fund accordingly. Our active approach is uncovering opportunities supported by long-term secular trends such as globalization, the growth and maturation of the emerging middle class, as well as productivity enhancement capabilities in a globally competitive environment. We believe large multinational companies with globally diversified revenues and access to capital are poised to capitalize on both secular and cyclical trends. Overall, large cap growth equities remain especially attractive to us, as investors continue to discount the growth of future cash flows, while growth premiums remain historically low.
Calamos Blue Chip Fund
GROWTH OF $10,000: SINCE INCEPTION (12/1/03) THROUGH 4/30/12
AVERAGE ANNUAL TOTAL RETURN† AS OF 4/30/12
| | | | | | | | | | | | | | | | |
| | | 6
MONTHS | | | 1
YEAR | | | 5
YEARS | | | SINCE
INCEPTION | |
| Class A Shares – Inception 12/1/03 | | | | | | | | | | | | | | | | |
Without Sales Charge | | | 10.67 | % | | | -1.08 | % | | | 1.79 | % | | | 4.81 | % |
With Sales Charge | | | 5.39 | | | | -5.78 | | | | 0.81 | | | | 4.20 | |
| |
| Class B Shares – Inception 12/1/03 | | | | | | | | | | | | | | | | |
Without Sales Charge | | | 10.27 | | | | -1.89 | | | | 1.03 | | | | 4.06 | |
With Sales Charge | | | 5.27 | | | | -6.79 | | | | 0.65 | | | | 4.06 | |
| |
| Class C Shares – Inception 12/1/03 | | | | | | | | | | | | | | | | |
Without Sales Charge | | | 10.26 | | | | -1.81 | | | | 1.03 | | | | 4.03 | |
With Sales Charge | | | 9.26 | | | | -2.79 | | | | 1.03 | | | | 4.03 | |
| |
| Class I Shares – Inception 12/1/03 | | | 10.75 | | | | -0.86 | | | | 2.05 | | | | 5.08 | |
| |
| Class R Shares – Inception 3/1/07 | | | 10.50 | | | | -1.38 | | | | 1.54 | | | | 2.51 | |
| |
Performance data quoted represents past performance, which is no guarantee of future results. Current performance may be lower or higher than the performance quoted. The principal value and investment return of an investment will fluctuate so that your shares, when redeemed, may be worth more or less than their original cost.
| † | Average annual total return measures net investment income and capital gain or loss from portfolio investments as an annualized average assuming reinvestment of dividends and capital gains distributions. Performance shown reflects the effects of an expense reimbursement that improved results and was in effect until March 31, 2004. Load-adjusted returns are adjusted for the maximum front-end sales load of 4.75% for Class A shares and returns for Class B and C shares have been adjusted for the contingent deferred sales charge (CDSC). |
NOTES:
The graph does not reflect the income taxes that you would pay on fund distributions or the redemption of fund shares. Fund performance includes reinvestment of dividends and adjustment for the maximum sales charge for Class A shares. The performance of other classes will vary from the performance of the class shown based on the difference in sales charges and fees paid by shareholders investing in different share classes.
| 1 | The S&P 500 Index is an unmanaged index generally considered representative of the U.S. stock market. Index data shown for the Since Inception Growth of $10,000 graph is from 11/30/03, since comparative index data is only available for full monthly periods. Source: Lipper, Inc. |
| 2 | The Russell 1000® Growth Index measures the performance of the large-cap growth segment of the U.S. equity universe. It includes those Russell 1000 companies with higher price to-book ratios and higher forecasted growth values. Index data shown for the Since Inception Growth of $10,000 graph is from 11/30/03, since comparative index data is only available for full monthly periods. Source: Lipper, Inc. |
Index returns assume reinvestment of dividends and do not reflect deduction of fees and expenses. It is not possible to invest directly in an index.
| | | | |
| 16 | | CALAMOS FAMILY OF FUNDS SEMIANNUAL REPORT | | |
Calamos Discovery Growth Fund
CALAMOS DISCOVERY GROWTH FUND
INVESTMENT TEAM DISCUSSION
The Calamos Investment Management Team discusses the Fund’s performance, strategy and positioning during the six-month period ended April 30, 2012.
Q. What is the Fund’s investment strategy?
A. Calamos Discovery Growth Fund invests in small cap and mid cap (“SMID”) equities that we believe have the best prospects for growth. The Fund offers a relatively aggressive yet diversified way to get exposure to the SMID space and participate in the long-term growth potential of the U.S. stock market. While Discovery Growth is one of our newer funds, it is managed by the same investment team and draws upon the same research process that we use for all of our other funds. Our investment process is designed to identify companies with higher growth profiles and greater returns on invested capital relative to peers. We favor companies with geographically diversified revenues that are participating in long-term global growth trends.
We expect to concentrate on small cap companies that, if successful, will grow into mid caps. We have the flexibility to continue holding these successful mid cap companies. We believe that a mid cap company that has successfully grown from a small cap has demonstrated the potential of its business model and its ability to deliver sustained earnings growth.
Q. How has the Fund performed?
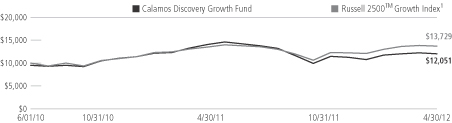
A. For the semiannual period ended April 30, 2012, the Discovery Growth Fund returned 4.98% (Class A shares at net asset value), versus 11.72% for the Russell 2500™ Growth Index. Since its inception on June 1, 2010, the Fund gained 13.08%, versus the 19.65% return for the index.
Q. What factors influenced performance over the semiannual period?
A. The Fund’s security selection within the energy sector was the largest detractor from performance during the semiannual period. Select holdings in the equipment & services and exploration & production industries lagged the index. In particular, those holdings with a larger portion of their business related to natural gas production suffered due to lower prices and higher costs. Despite the weakness in the period, we have a favorable long-term view of the opportunities in the energy sector, particularly as global stimulus and liquidity from the world’s central banks persist. We believe the portfolio’s holdings within the sector will benefit from long-term secular themes, such as strong global demand for energy resources, especially within developing economies.
The Fund’s relative security selection in the consumer discretionary sector also detracted from returns during the period. Holdings within the Internet retail industry underperformed, in particular. We favor an opportunistic approach in this sector and continue seeking companies with high growth potential, often including those with an in-demand category niche and a scalable business model.
The Fund’s security selection within the industrials sector trailed the stronger index returns and thus hampered results. In particular, holdings in the machinery industry lagged as concerns about a slowing pace of global growth negatively impacted
| | |
| FUND NASDAQ SYMBOLS |
A Shares | | CADGX |
B Shares | | CBDGX |
C Shares | | CCDGX |
I Shares | | CIDGX |
R Shares | | CRDGX |
| | | |
|
| FUND CUSIP NUMBERS |
A Shares | | 128120102 |
B Shares | | 128120201 |
C Shares | | 128120300 |
I Shares | | 128120409 |
R Shares | | 128120508 |
| | | |
FUND OBJECTIVE
Long-term capital growth
INVESTMENT STRATEGY
| | > | | Focus on small cap and mid cap companies | |
| | > | | Blends rigorous economic and broad themes analysis with intensive company and security research seeking to identify businesses with higher growth relative to peers | |
| | > | | Seeks to determine the quality and sustainability of a company’s growth by assessing its fundamentals and management among other factors | |
| | > | | Uses proprietary valuation models to ascertain a stock’s return potential | |
| | > | | Adheres to strict risk-management guidelines in constructing the portfolio and assessing a security’s fit within the portfolio | |
INVESTOR PROFILE
This Fund may be suitable for investors who seek:
| | > | | Exposure to small cap and mid cap companies | |
| | > | | A relatively aggressive yet diversified way to participate in the U.S. stock market’s long-term growth potential | |
Calamos Discovery Growth Fund
| | | | |
| SECTOR WEIGHTINGS | |
Information Technology | | | 37.3 | % |
Industrials | | | 15.8 | |
Health Care | | | 14.5 | |
Consumer Discretionary | | | 9.5 | |
Materials | | | 7.9 | |
Energy | | | 4.8 | |
Financials | | | 4.0 | |
Consumer Staples | | | 1.7 | |
Sector weightings are subject to change daily and are calculated as a percentage of net assets. The table excludes cash or cash equivalents, any government/sovereign bonds or broad based index hedging securities the Fund may hold.
holdings. We believe there are attractive long-term opportunities in the sector, most notably those associated with the global infrastructure build-out. We are focused on those companies in industries such as industrial machinery, construction and equipment that we believe offer compelling global growth potential. We are particularly interested in those companies positioned to benefit from the growth in emerging economies.
Relative security selection in the information technology sector contributed the most to performance during the semiannual period. We maintain high conviction in information technology due to the higher growth potential and secular demand trends that make the sector appealing relative to the broad market. The Fund’s holdings in technology are positioned to benefit from many long-term themes we have identified, including the demand for the latest connectivity devices, the need for information and entertainment, and the increased emphasis on productivity enhancement in a low-growth economy.
Strong security selection within the health care sector was also a positive contributor to performance in the period. Specifically, the Fund’s holdings within the health care equipment and health care technology industries outperformed due to strong growth fundamentals. We are especially attracted to those companies with strong volume growth trends, as well as those relatively less affected by increased government regulation, such as companies in health care technology and biotechnology.
Q. How is the Fund positioned?
A. The Fund’s largest allocations, in absolute terms, are in the information technology and health care sectors. Details discussing our positioning in these sectors are discussed above.
Relative to the Russell 2500™ Growth Index, the Fund’s largest underweight allocations are to the financial and consumer discretionary sectors. We continue to hold a low weight in financials due to our belief that sector growth dynamics are changing for the worse. Government regulations, both existing and proposed, make it difficult for firms in this sector to reestablish the level of growth and cash flow margins that were attainable in the past. Within consumer discretionary, we continue to be opportunistic and seek companies delivering high relative growth, but also with business models able to withstand a challenging economic landscape.
Q. What is your outlook for small and mid cap equities and the Fund?
A. The Fund’s holdings of small to mid cap growth companies continue to deliver strong fundamentals. These companies are generating strong earnings growth with high returns on invested capital while using less debt relative to holdings in the index. With respect to valuations, small to mid cap growth equities remain compelling as investors continue to place very little investment premium on growth companies relative to value. Historically, when investor sentiment shifts and companies are once again rewarded for higher long-term growth potential, the expansion in earnings multiples can be significant.
| | | | |
| 18 | | CALAMOS FAMILY OF FUNDS SEMIANNUAL REPORT | | |
Calamos Discovery Growth Fund
As we consider the macroeconomic environment going forward, we remain optimistic about positive, but slow, economic growth domestically and globally. We believe a robust pickup in economic growth is hindered by long-term fiscal challenges and the necessary deleveraging process still underway. Still, the forces of globalization, world demographic changes and business and consumer trends all continue to offer very attractive investment opportunities for small to mid cap growth investors. We believe the Fund is well-positioned to provide access to these secular trends and we expect the portfolio to benefit from our experienced, consistent and selective investment approach.
Calamos Discovery Growth Fund
GROWTH OF $10,000: SINCE INCEPTION (6/1/10) THROUGH 4/30/12
AVERAGE ANNUAL TOTAL RETURN† AS OF 4/30/12
| | | | | | | | | | | | |
| | | 6
MONTHS | | | 1
YEAR | | | SINCE
INCEPTION | |
| Class A Shares – Inception 6/1/10 | | | | | | | | | | | | |
Without Sales Charge | | | 4.98 | % | | | -17.60 | % | | | 13.08 | % |
With Sales Charge | | | 0.00 | | | | -21.49 | | | | 10.23 | |
| |
| Class B Shares – Inception 6/1/10 | | | | | | | | | | | | |
Without Sales Charge | | | 4.61 | | | | -18.16 | | | | 12.26 | |
With Sales Charge | | | -0.39 | | | | -22.26 | | | | 10.37 | |
| |
| Class C Shares – Inception 6/1/10 | | | | | | | | | | | | |
Without Sales Charge | | | 4.61 | | | | -18.16 | | | | 12.26 | |
With Sales Charge | | | 3.61 | | | | -18.98 | | | | 12.26 | |
| |
| Class I Shares – Inception 6/1/10 | | | 5.14 | | | | -17.38 | | | | 13.37 | |
| |
| Class R Shares – Inception 6/1/10 | | | 4.91 | | | | -17.75 | | | | 12.82 | |
| |
Performance data quoted represents past performance, which is no guarantee of future results. Current performance may be lower or higher than the performance quoted. The principal value and investment return of an investment will fluctuate so that your shares, when redeemed, may be worth more or less than their original cost.
| † | Average annual total return measures net investment income and capital gain or loss from portfolio investments as an annualized average assuming reinvestment of dividends and capital gains distributions. Load-adjusted returns are adjusted for the maximum front-end sales load of 4.75% for Class A shares and returns for Class B and C shares have been adjusted for the contingent deferred sales charge (CDSC). |
NOTES:
The graphs do not reflect the income taxes you would pay on fund distributions or the redemption of fund shares. Fund performance includes reinvestment of dividends and adjustment for the maximum sales charge for Class A shares. The performance of other classes will vary from the performance of the class shown based on the difference in sales charges and fees paid by shareholders investing in different share classes.
| 1 | The Russell 2500™ Growth Index measures the performance of the small- to mid-cap growth segment of the U.S. equity universe. It includes those Russell 2500 companies with higher price-to-book ratios and higher forecasted growth values. Source: Lipper, Inc. |
Index returns assume reinvestments of dividends and do not reflect deduction of fees and expenses. It is not possible to invest directly in an index.
| | | | |
| 20 | | CALAMOS FAMILY OF FUNDS SEMIANNUAL REPORT | | |
Calamos International Growth Fund
CALAMOS INTERNATIONAL GROWTH FUND
INVESTMENT TEAM DISCUSSION
The Calamos Investment Management Team discusses the Fund’s performance, strategy and positioning during the six-month period ended April 30, 2012.
Q. What is the Fund’s investment strategy?
A. Calamos International Growth Fund invests in an equity portfolio representing non-U.S. companies of all sizes and industries that offer high relative and sustainable growth potential. This is a non-U.S. strategy for diversification and access to international growth companies, with an active growth focus. Our investment criteria favor companies that we believe offer the best prospects for growth. These companies are typically characterized by high earnings growth, healthy balance sheets and high return on invested capital. In the current environment, we are emphasizing companies with global presence and geographically diversified revenue streams. We believe that such companies offer more attractive prospects than those more dependent on a single economy.
We have the flexibility to invest across sectors in companies domiciled in developed and developing markets. We favor companies based in markets that are moving toward a greater level of economic freedom, which we believe is a catalyst for wealth creation.
Q. How has the Fund performed?
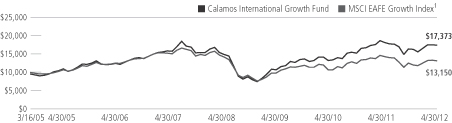
A. Because we believe equity funds are best utilized within asset allocations as long-term investments, we encourage investors to evaluate performance over longer time periods. Since its inception on March 16, 2005, the Fund has returned 8.80% on an annualized basis (Class A shares at net asset value), versus the MSCI EAFE Growth Index, which returned 3.92% for the same period. For the six-month period ended April 30, 2012, the Fund gained 6.19% versus a 5.00% return for the MSCI EAFE Growth Index.
Q. What factors influenced performance over the semiannual period?
A. In the information technology sector selection was notably positive, particularly within the semiconductors and semiconductors equipment industries. We maintain conviction in this sector due to the higher cash flows, lower debt levels and cleaner balance sheets we see in many IT companies. We also expect these companies to benefit from many of the long-term secular themes we have identified, including an increased demand for gadgets and electronics as well as productivity enhancement.
An overweight position and strong security selection within the health care sector also contributed to relative returns during the period, as names within the pharmaceuticals and health care equipment and supplies industries strongly outperformed those within the index. Our focus within this sector remains on companies that have displayed strong corporate performance, healthy cash flows, strong fundamentals and those that are more insulated from the impacts of health care reform.
Selection within the materials sector hampered relative performance during the time period, as names within the metals and mining industry—most notably the portfolio’s
| | |
| FUND NASDAQ SYMBOLS |
A Shares | | CIGRX |
B Shares | | CIGBX |
C Shares | | CIGCX |
I Shares | | CIGIX |
R Shares | | CIGFX |
| | | |
| |
| FUND CUSIP NUMBERS | | |
A Shares | | 128119575 |
B Shares | | 128119567 |
C Shares | | 128119559 |
I Shares | | 128119542 |
R Shares | | 128119393 |
| | | |
FUND OBJECTIVE
Long-term capital growth
INVESTMENT STRATEGY
| | > | | Applies bottom-up research and top-down analysis to target securities of non-U.S. companies that display acceleration in revenue growth, earnings growth and return on capital | |
| | > | | Conducts extensive balance sheet and income statement analysis to determine the intrinsic value of companies under consideration | |
| | > | | Emphasizes countries espousing free-market principles | |
| | > | | Seeks to outperform the MSCI EAFE Growth Index1 over the long term with less volatility | |
INVESTOR PROFILE
This Fund may be suitable for investors who seek:
| | > | | To diversify beyond the domestic market by investing in overseas growth stocks, potentially increasing long-term capital growth | |
| | > | | An equity portfolio representing companies of all sizes and industries that offer high relative and sustainable growth potential | |
Calamos International Growth Fund
| | | | |
| SECTOR WEIGHTINGS | |
Information Technology | | | 32.5 | % |
Materials | | | 13.6 | |
Health Care | | | 13.3 | |
Energy | | | 10.3 | |
Consumer Staples | | | 9.5 | |
Consumer Discretionary | | | 6.2 | |
Telecommunication Services | | | 3.4 | |
Industrials | | | 3.3 | |
Financials | | | 0.9 | |
| | | | | |
Sector weightings are subject to change daily and are calculated as a percentage of net assets. The table excludes cash or cash equivalents, any government/sovereign bonds or broad based index hedging securities the Fund may hold.
allocation to gold—lagged the index. We continue to believe this sector will be supported by increased demand for resources from emerging market regions, as well as reflation efforts and accommodative global central bank policies.
From a geographic standpoint, the Fund’s holdings within Israel, Denmark and the United Kingdom contributed to relative returns. Additionally, the portfolio’s holdings within emerging market areas, most notably within Brazil and South Korea, also aided performance. The Fund’s holdings within Canada detracted value during the period.
Q. How is the Fund positioned?
The Fund is currently positioned with large allocations to the information technology, materials and health care sectors. Details regarding positioning within these sectors have been discussed above. The Fund’s largest underweight allocations are to the financial and industrials sectors. We have generally held a low weight within financials and remain cautious due to increased regulations as well as the ongoing European debt crisis. Within industrials, we are attracted to those companies in areas such as industrial machinery, construction and equipment that offer solid growth potential and which stand to benefit from the global infrastructure build-out. We are particularly interested in those companies that are positioned to benefit from continued growth within emerging market economies.
From a geographic standpoint, the portfolio is currently underweight to Japan relative to the index based on our assessment of macroeconomic factors and valuations. Additionally, the Fund’s allocation to emerging markets was slightly increased during the time period, as we are favoring these areas due to their higher growth potential and rapidly growing middle class.
During the time period, the Fund’s allocation to health care increased, while its investments within the industrials sector were reduced. Within health care, our focus remains on companies that have displayed strong corporate performance, healthy cash flows and strong fundamentals. While we continue to favor the industrials sector from a thematic standpoint and believe the global infrastructure build-out lends itself to this area, we believe that valuations have richened and have therefore chosen to reduce the portfolio’s holdings within this sector.
Q. What is your outlook for international equities and the Fund?
We expect continued growth in the global economy as a whole, and believe that a number of themes (including increasing wealth and middle class consumption within emerging market countries) will provide growth opportunities for companies all throughout the world. However, we also believe that despite these trends, global markets remain volatile and an overall challenging investment environment.
Although we expect continued volatility and uneven economic global growth, we believe that international growth equities remain an attractive area for long-term investment. We have positioned this Fund to emphasize companies with geographically diversified revenues, strong global brands and healthy balance sheets. We believe that multinational companies may be less vulnerable to economic weakness in a particular country or region, and are therefore favoring companies domiciled in developed countries that are capitalizing on many of the growth trends currently available in emerging markets.
| | | | |
| 22 | | CALAMOS FAMILY OF FUNDS SEMIANNUAL REPORT | | |
Calamos International Growth Fund
GROWTH OF $10,000: SINCE INCEPTION (3/16/05) THROUGH 4/30/12
AVERAGE ANNUAL TOTAL RETURN† AS OF 4/30/12
| | | | | | | | | | | | | | | | |
| | | 6
MONTHS | | | 1
YEAR | | | 5
YEARS | | | SINCE
INCEPTION | |
| Class A Shares – Inception 3/16/05 | | | | | | | | | | | | | | | | |
Without Sales Charge | | | 6.19 | % | | | -6.53 | % | | | 3.07 | % | | | 8.80 | % |
With Sales Charge | | | 1.17 | | | | -10.95 | | | | 2.08 | | | | 8.06 | |
| |
| Class B Shares – Inception 3/16/05 | | | | | | | | | | | | | | | | |
Without Sales Charge | | | 5.81 | | | | -7.22 | | | | 2.31 | | | | 7.99 | |
With Sales Charge | | | 0.81 | | | | -11.86 | | | | 1.94 | | | | 7.99 | |
| |
| Class C Shares – Inception 3/16/05 | | | | | | | | | | | | | | | | |
Without Sales Charge | | | 5.81 | | | | -7.17 | | | | 2.31 | | | | 7.99 | |
With Sales Charge | | | 4.81 | | | | -8.10 | | | | 2.31 | | | | 7.99 | |
| |
| Class I Shares – Inception 3/16/05 | | | 6.38 | | | | -6.26 | | | | 3.34 | | | | 9.08 | |
| |
| Class R Shares – Inception 3/1/07 | | | 6.13 | | | | -6.69 | | | | 2.83 | | | | 4.50 | |
| |
Performance data quoted represents past performance, which is no guarantee of future results. Current performance may be lower or higher than the performance quoted. The principal value and investment return of an investment will fluctuate so that your shares, when redeemed, may be worth more or less than their original cost.
| † | Average annual total return measures net investment income and capital gain or loss from portfolio investments as an annualized average assuming reinvestment of dividends and capital gains distributions. Performance shown reflects the effects of an expense reimbursement that improved results and was in effect until March 31, 2005. Load-adjusted returns are adjusted for the maximum front-end sales load of 4.75% for Class A shares and returns for Class B and C shares have been adjusted for the contingent deferred sales charge (CDSC). |
NOTES:
The graph does not reflect the income taxes that you would pay on fund distributions or the redemption of fund shares. Fund performance includes reinvestment of dividends and adjustment for the maximum sales charge for Class A shares. The performance of other classes will vary from the performance of the class shown based on the difference in sales charges and fees paid by shareholders investing in different share classes.
| 1 | The MSCI EAFE Growth Index measures developed market growth equity performance (excluding the U.S. and Canada). Source: MSCI Barra. |
Index returns assume reinvestment of dividends and do not reflect deduction of fees and expenses. It is not possible to invest directly in an index.
Calamos Evolving World Growth Fund
| | |
| FUND NASDAQ SYMBOLS |
A Shares | | CNWGX |
B Shares | | CNWZX |
C Shares | | CNWDX |
I Shares | | CNWIX |
R Shares | | CNWRX |
| | | |
|
| FUND CUSIP NUMBERS |
A Shares | | 128119161 |
B Shares | | 128119153 |
C Shares | | 128119146 |
I Shares | | 128119138 |
R Shares | | 128119120 |
| | | |
FUND OBJECTIVE
Long-term capital growth
INVESTMENT STRATEGY
| | > | | Invests in the securities of companies based in developing countries and also developed-world companies with ties to emerging economies | |
| | > | | Manages the Fund according to our stringent growth discipline, targeting companies that we believe offer the best opportunities for capital appreciation over the long term | |
| | > | | Can flexibly deploy assets across sectors, countries, market caps and security types in an effort to manage risk and maximize return | |
INVESTOR PROFILE
This Fund may be suitable for investors who seek:
| | > | | Enhanced diversification potential | |
| | > | | A portfolio of companies that we believe offer high relative and sustainable growth potential | |
| | > | | A risk-conscious means to participate in the long-term growth potential of developing markets | |
| | > | | An asset-allocation solution that could potentially reduce volatility and increase total return in an investment portfolio | |
CALAMOS EVOLVING WORLD GROWTH FUND
INVESTMENT TEAM DISCUSSION
The Calamos Investment Management Team discusses the Fund’s performance, strategy and positioning during the six-month period ended April 30, 2012.
Q. What is the Fund’s investment strategy?
A. Calamos Evolving World Growth Fund invests in both equities and convertible securities in companies all around the world that have exposure to emerging economies. The Fund is an emerging markets growth equity strategy that we believe may provide a compelling core allocation for long-term investors.
In a global economy, companies all over the world, including those in the U.S. and other developed markets, may be able to benefit from the growing prosperity and progress in emerging markets. In this Fund, our investment team can invest not only in companies based in emerging markets, but also in companies based in developed markets that derive a significant portion (generally, 20% or more) of firm revenues from or have a significant percentage of invested assets in emerging markets. Our emphasis is on what a company is doing and the clients it serves, not where it is located. We believe that this flexibility to invest in developed and developing markets potentially mitigates the risks of investing solely in companies domiciled in emerging markets.
Generally, the companies in which we invest are characterized by high earnings growth, healthy balance sheets and high return on invested capital.
Q. How has the Fund performed?
A. Since its inception on August 15, 2008, the Fund returned 7.88% on an annualized basis (Class A shares at net asset value) versus the 4.08% return of the MSCI Emerging Markets Index. For the six-month period ended April 30, 2012, the Fund returned 4.33% and the index returned 4.02%.
Q. What factors influenced performance over the semiannual period?
An overweight position and strong selection within the consumer staples sector enhanced performance during the six-month period. The Fund’s larger allocation to the beverages and food and staples retailing industries contributed to relative performance. Within this sector, we have favored companies with strong global operations and those with significant exposure to emerging market areas.
Strong selection within the energy sector—most notably within the oil and gas exploration and production industry—also contributed to performance during the period. We believe this area of the market will continue to benefit from ongoing global reflation efforts, as well as from long-term secular themes such as global demand for energy resources.
Security selection within materials hampered relative performance. The Fund’s allocation to the gold industry detracted value as these firms incurred the rising cost of extraction during the time period. We believe this sector will benefit from an increased demand for resources generated by emerging market regions, as well as global reflation efforts and accommodative global central bank policies. An underweight position and security selection within the telecommunication services sector also weighed on performance during the six-month period.
| | | | |
| 24 | | CALAMOS FAMILY OF FUNDS SEMIANNUAL REPORT | | |
Calamos Evolving World Growth Fund
Q. How is the Fund positioned?
A. The Fund is positioned to provide a risk-managed approach to emerging market investing. We are focusing on globally diversified companies that present compelling growth opportunities. Within the Fund, we have exposure to companies domiciled in developed countries that generate a significant amount of revenue (generally, 20% or more) from emerging market regions. This allows us to tap into emerging market growth by investing in more global companies that possess geographically diversified revenue streams and potentially lower risk profiles.
The Fund currently is positioned with large allocations to the information technology, consumer staples and energy sectors. Details regarding positioning within consumer staples and energy have been discussed above. We continue to favor the information technology sector due to its high growth potential, along with the cleaner balance sheets and attractive valuations we see in many IT companies. The sector also continues to benefit from many of the long-term secular themes we have identified. We expect these companies to benefit in the future from increased demand for gadgets and electronics as well as productivity enhancement. In addition, many technology companies have revenue exposure to emerging market regions, tapping into their growing middle class consumption.
During the time period, the Fund’s allocation to health care increased, while its investments within the industrials sector were reduced. Within health care, our focus remains on companies that have displayed strong corporate performance, healthy cash flows and solid fundamentals. While we continue to favor the industrials sector from a thematic standpoint and believe the global infrastructure build-out lends itself to this area, we believe that valuations have richened and have therefore chosen to reduce the portfolio’s holdings within this sector.
Q. What is your outlook for emerging markets and the Fund?
A. We believe that emerging markets present significant long-term opportunities and will be a primary source of global economic growth going forward. The ongoing economic success within emerging market countries has led to a rapid increase of their middle classes and, as a result, an increase in their demand for goods and services. We also believe that as a result of increasing wealth and success within emerging markets, there will be a greater demand for infrastructure within these areas. These continuing trends within developing regions can benefit companies in a wide range of sectors.
However, despite these trends and the potential for growth, emerging markets remain volatile and an overall challenging investment environment. As such, we have positioned this Fund as a risk-managed approach to emerging market investing that allows investors the opportunity to gain exposure to emerging market investments while simultaneously attempting to manage risk and protect investments in the event of sudden declines. Our goal is for the strategy to participate when emerging market returns increase and provide downside protection when they falter.
As discussed above, this portfolio focuses on where a company does business and not just on where the company is domiciled. Therefore, the Fund has the ability to invest in both developed and emerging market countries. The Fund also has the flexibility to invest in convertible securities, which offer the potential for participation in equity market upside with potential downside protection. We believe these factors, as well as our extensive experience, will help us to position the Fund to best capitalize on the growth potential of emerging market areas.
| | | | |
| SECTOR WEIGHTINGS | |
Information Technology | | | 24.9 | % |
Consumer Staples | | | 18.0 | |
Energy | | | 13.5 | |
Materials | | | 10.8 | |
Health Care | | | 6.5 | |
Telecommunication Services | | | 6.4 | |
Consumer Discretionary | | | 5.8 | |
Industrials | | | 3.6 | |
Financials | | | 1.9 | |
| | | | | |
Sector weightings are subject to change daily and are calculated as a percentage of net assets. The table excludes cash or cash equivalents, any government/sovereign bonds or broad based index hedging securities the Fund may hold.
Calamos Evolving World Growth Fund
GROWTH OF $10,000: SINCE INCEPTION (8/15/08) THROUGH 4/30/12
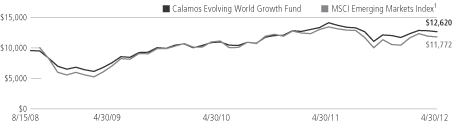
AVERAGE ANNUAL TOTAL RETURN† AS OF 4/30/12
| | | | | | | | | | | | |
| | | 6
MONTHS | | | 1
YEAR | | | SINCE
INCEPTION | |
| Class A Shares – Inception 8/15/08 | | | | | | | | | | | | |
Without Sales Charge | | | 4.33 | % | | | -10.46 | % | | | 7.88 | % |
With Sales Charge | | | -0.61 | | | | -14.69 | | | | 6.47 | |
| |
| Class B Shares – Inception 8/15/08 | | | | | | | | | | | | |
Without Sales Charge | | | 3.90 | | | | -11.17 | | | | 7.07 | |
With Sales Charge | | | -1.10 | | | | -15.61 | | | | 6.40 | |
| |
| Class C Shares – Inception 8/15/08 | | | | | | | | | | | | |
Without Sales Charge | | | 3.98 | | | | -11.11 | | | | 7.10 | |
With Sales Charge | | | 2.98 | | | | -12.00 | | | | 7.10 | |
| |
| Class I Shares – Inception 8/15/08 | | | 4.46 | | | | -10.21 | | | | 8.17 | |
| |
| Class R Shares – Inception 8/15/08 | | | 4.26 | | | | -10.67 | | | | 7.62 | |
| |
Performance data quoted represents past performance, which is no guarantee of future results. Current performance may be lower or higher than the performance quoted. The principal value and investment return of an investment will fluctuate so that your shares, when redeemed, may be worth more or less than their original cost.
| † | Average annual total return measures net investment income and capital gain or loss from portfolio investments as an annualized average assuming reinvestment of dividends and capital gains distributions. Load-adjusted returns are adjusted for the maximum front-end sales load of 4.75% for Class A shares and returns for Class B and C shares have been adjusted for the contingent deferred sales charge (CDSC). |
NOTES:
The graph does not reflect the income taxes that you would pay on fund distributions or the redemption of fund shares. Fund performance includes reinvestment of dividends and adjustment for the maximum sales charge for Class A shares. The performance of other classes will vary from the performance of the class shown based on the difference in sales charges and fees paid by shareholders investing in different share classes.
| 1 | The MSCI Emerging Markets Index is a free float-adjusted market capitalization index considered broadly representative of emerging market equity performance. The index represents companies within the constituent emerging markets that are available to investors worldwide. Index data shown for the Since Inception Growth of $10,000 graph is from 8/31/08, since comparative index data is only available for full monthly periods. Source: Lipper, Inc. |
Index returns assume reinvestment of dividends and do not reflect deduction of fees and expenses. It is not possible to invest directly in an index.
| | | | |
| 26 | | CALAMOS FAMILY OF FUNDS SEMIANNUAL REPORT | | |
Calamos Global Equity Fund
CALAMOS GLOBAL EQUITY FUND
INVESTMENT TEAM DISCUSSION
The Calamos Investment Management Team discusses the Fund’s performance, strategy and positioning during the six-month period ended April 30, 2012.
Q. What is the Fund’s investment strategy?
A. Calamos Global Equity Fund invests primarily in a globally diversified portfolio of equity securities in companies that we believe offer the best opportunities for growth. The Fund provides a global growth strategy for a core global portfolio allocation. We employ an active management approach that blends global investment themes and our proprietary fundamental research. The companies we seek are usually characterized by high earnings growth, healthy balance sheets and high return on invested capital. In the current environment, we are favoring companies with global presence that are participating in the long-term growth trends we see around the world. The Fund may invest in securities of issuers in the emerging markets.
Q. How has the Fund performed?
A. We encourage investors to consider long-term performance, particularly for investments such as equity funds. Since its inception on March 1, 2007, the Fund returned 6.38% on an annualized basis (Class A shares at net asset value) versus 0.14% for the MSCI World Index. For the six-month period ended April 30, 2012, Calamos Global Equity Fund returned 7.58% versus a 7.87% return for the MSCI World Index.
Q. What factors influenced performance over the semiannual period?
A. The Fund’s overweight to and strong selection within the information technology sector added to returns during the six-month period. Selection was notably positive within the semiconductors and semiconductors equipment and computers and peripherals industries. We maintain conviction in this sector due to the higher cash flows, lower debt levels and cleaner balance sheets we see in many IT companies. We also expect these companies to benefit from many of the long-term secular themes we have identified, including an increased demand for connectivity, gadgets and electronics as well as productivity enhancement.
Security selection within the health care sector also contributed to relative returns during the period, as names within the pharmaceuticals and health care equipment and supplies industries strongly outperformed those within the index. Our focus within this sector remains on companies more insulated from the impacts of health care reform, and those that have displayed strong corporate performance, healthy cash flows and strong fundamentals.
Selection within materials hampered relative performance during the time period, as names within the metals and mining industry, most notably the allocation to gold, lagged the index. We continue to believe this sector will be supported by increased demand for resources from emerging market regions, as well as reflation efforts and accommodative global central bank policies.
| | |
| FUND NASDAQ SYMBOLS |
A Shares | | CAGEX |
B Shares | | CBGEX |
C Shares | | CCGEX |
I Shares | | CIGEX |
R Shares | | CRGEX |
| | | |
|
| FUND CUSIP NUMBERS |
A Shares | | 128119484 |
B Shares | | 128119476 |
C Shares | | 128119468 |
I Shares | | 128119450 |
R Shares | | 128119443 |
| | | |
FUND OBJECTIVE
Long-term capital growth
INVESTMENT STRATEGY
| | > | | Invests primarily in equity securities of companies around the world | |
| | > | | Focuses on a company’s earnings growth potential, financial strength and stability | |
| | > | | Considers the value of a stock relative to the issuer’s worth and looks for near-term catalysts that could trigger an increase in the stock’s price | |
| | > | | Assesses the issuer’s financial soundness, earnings and cash flow forecast, and quality of management | |
| | > | | Applies macro-level themes and top-down diversification by industry and company type in an effort to lower risk | |
INVESTOR PROFILE
This Fund may be suitable for investors who seek:
| | > | | A diversified means to participate in the long-term growth potential of the global equity markets | |
Calamos Global Equity Fund
| | | | |
| SECTOR WEIGHTINGS | | | |
Information Technology | | | 37.5 | % |
Health Care | | | 15.3 | |
Materials | | | 11.1 | |
Energy | | | 10.1 | |
Consumer Discretionary | | | 7.0 | |
Consumer Staples | | | 6.7 | |
Industrials | | | 3.0 | |
Financials | | | 2.2 | |
Telecommunication Services | | | 1.9 | |
| | | | | |
Sector weightings are subject to change daily and are calculated as a percentage of net assets. The table excludes cash or cash equivalents, any government/sovereign bonds or broad based index hedging securities the Fund may hold.
From a geographic standpoint, the Fund’s holdings within Denmark, Israel and France contributed to relative returns and outperformed the index during the period. Additionally, holdings within emerging market areas, most notably within Brazil and South Korea, also aided performance. The portfolio’s holdings within Canada detracted value during the period.
Q. How is the Fund positioned?
A. The Fund is positioned with large allocations to the information technology, health care and materials sectors. Details regarding our positioning within these sectors have been discussed above. The Fund’s largest underweight allocations are to the financials and industrials sectors. We have generally held a low weight within financials and remain cautious due to increased regulations, as well as the ongoing European debt crisis. Within industrials, we are attracted to those companies in industries such as industrial machinery, construction and equipment that offer solid growth potential and which stand to benefit from the global infrastructure build-out. We are particularly interested in those companies that are positioned to benefit from continued growth within emerging market economies.
From a geographic standpoint, the portfolio is currently underweight to Japan relative to the index. Japan remains a challenging investment environment where we are closely monitoring valuations. Additionally, the Fund’s allocation to emerging markets was slightly increased during the time period. Emerging market economies are an area we are favoring due to their higher growth potential and rapidly growing middle class.
During the time period, the Fund’s allocation to health care increased, while its investments within the industrials sector were reduced. Within health care, our focus remains on companies that have displayed strong corporate performance, healthy cash flows and strong fundamentals. While we continue to favor the industrials sector from a thematic standpoint and believe the global infrastructure build-out lends itself to this area, we believe that valuations have richened and have therefore chosen to reduce the portfolio’s holdings within this sector.
Q. What is your outlook for global equities and the Fund?
A. We expect continued growth in the global economy as a whole and believe that a number of prominent themes (including increasing wealth and middle class consumption within emerging market countries) will provide growth opportunities for companies all throughout the world. Despite these trends, however, global markets overall remain a somewhat volatile and challenging investment environment.
Nevertheless, we believe that global growth equities remain an attractive area for long-term investment. We have positioned this Fund to emphasize companies with geographically diversified revenues, strong global brands and healthy balance sheets. We believe that multinational companies may be less vulnerable to economic weakness in a particular country or region. In particular, we are favoring companies domiciled in developed countries that are capitalizing on many of the growth trends currently available in emerging markets.
| | | | |
| 28 | | CALAMOS FAMILY OF FUNDS SEMIANNUAL REPORT | | |
Calamos Global Equity Fund
GROWTH OF $10,000: SINCE INCEPTION (3/1/07) THROUGH 4/30/12
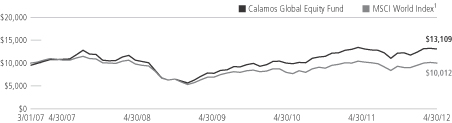
AVERAGE ANNUAL TOTAL RETURN† AS OF 4/30/12
| | | | | | | | | | | | | | | | |
| | | 6
MONTHS | | | 1
YEAR | | | 5
YEARS | | | SINCE
INCEPTION | |
| Class A Shares – Inception 3/1/07 | | | | | | | | | | | | | | | | |
Without Sales Charge | | | 7.58 | % | | | -2.32 | % | | | 4.81 | % | | | 6.38 | % |
With Sales Charge | | | 2.43 | | | | -6.98 | | | | 3.80 | | | | 5.38 | |
| |
| Class B Shares – Inception 3/1/07 | | | | | | | | | | | | | | | | |
Without Sales Charge | | | 7.19 | | | | -3.06 | | | | 4.04 | | | | 5.57 | |
With Sales Charge | | | 2.19 | | | | -7.91 | | | | 3.69 | | | | 5.42 | |
| |
| Class C Shares – Inception 3/1/07 | | | | | | | | | | | | | | | | |
Without Sales Charge | | | 7.12 | | | | -3.14 | | | | 4.03 | | | | 5.57 | |
With Sales Charge | | | 6.12 | | | | -4.11 | | | | 4.03 | | | | 5.57 | |
| |
| Class I Shares – Inception 3/1/07 | | | 7.61 | | | | -2.08 | | | | 5.10 | | | | 6.65 | |
| |
| Class R Shares – Inception 3/1/07 | | | 7.32 | | | | -2.64 | | | | 4.55 | | | | 6.10 | |
| |
Performance data quoted represents past performance, which is no guarantee of future results. Current performance may be lower or higher than the performance quoted. The principal value and investment return of an investment will fluctuate so that your shares, when redeemed, may be worth more or less than their original cost.
| † | Average annual total return measures net investment income and capital gain or loss from portfolio investments as an annualized average assuming reinvestment of dividends and capital gains distributions. Load-adjusted returns are adjusted for the maximum front-end sales load of 4.75% for Class A shares and returns for Class B and C shares have been adjusted for the contingent deferred sales charge (CDSC). |
NOTES:
The graph does not reflect the income taxes that you would pay on fund distributions or the redemption of fund shares. Fund performance includes reinvestment of dividends and adjustment for the maximum sales charge for Class A shares. The performance of other classes will vary from the performance of the class shown based on the difference in sales charges and fees paid by shareholders investing in different share classes.
| 1 | The MSCI World Index (U.S. Dollars) is a market-capitalization weighted index composed of companies representative of the market structure of developed market countries in North America, Europe and the Asia/Pacific region. Since inception data for the index is shown from 2/28/07 since data is only available for full monthly periods. Source: Lipper, Inc. |
Index returns assume reinvestment of dividends and do not reflect deduction of fees and expenses. It is not possible to invest directly in an index.
Calamos Growth and Income Fund
| | |
| FUND NASDAQ SYMBOLS |
A Shares | | CVTRX |
B Shares | | CVTYX |
C Shares | | CVTCX |
I Shares | | CGIIX |
R Shares | | CGNRX |
| | | |
|
| FUND CUSIP NUMBERS |
A Shares | | 128119104 |
B Shares | | 128119765 |
C Shares | | 128119831 |
I Shares | | 128119872 |
R Shares | | 128119336 |
| | | |
FUND OBJECTIVE
High long-term total return through growth and current income
INVESTMENT STRATEGY
| | > | | Seeks to maintain an appropriate balance between risk and reward over the course of the market cycle by strategically investing across a combination of stocks, convertible securities and bonds | |
| | > | | Seeks significant equity participation while aiming for greater downside protection than a pure-stock portfolio | |
| | > | | Diversifies across a variety of industries, market sectors, market capitalizations and credit-quality tiers | |
INVESTOR PROFILE
This Fund may be suitable for investors who seek:
| | > | | A total return oriented investment that offers the upside potential of equities with potentially lower volatility than stock-only investments | |
CALAMOS GROWTH AND INCOME FUND
INVESTMENT TEAM DISCUSSION
The Calamos Investment Management Team discusses the Fund’s performance, strategy and positioning during the six-month period ended April 30, 2012.
Q. What is the Fund’s investment strategy?
A. Calamos Growth and Income Fund invests in a combination of stocks, convertible securities and bonds of U.S. companies. The Fund offers a total return-oriented investment that seeks to maintain a balance of risk and reward through full market cycles. As we focus on managing volatility, we endeavor to participate in a greater portion of equity market upside than downside. We invest in equities, convertible securities and bonds issued primarily by U.S.-based companies. We currently emphasize companies with global presence and geographically diversified revenues that we believe are positioned to capitalize on global economic growth and global secular trends.
Q. How has the Fund performed?
A. Because we believe equity funds are best utilized within asset allocations as long-term investments, we encourage investors to evaluate performance over longer time periods. Since its inception on September 22, 1988, the Fund returned 11.63% on an annualized basis (Class A shares at net asset value). This return surpasses that of the broader equity market, as measured by the S&P 500 Index, which gained 9.62% for the period. The Fund also outperformed the convertible securities market, as measured by the BofA Merrill Lynch All U.S. Convertibles Ex-Mandatory Index, which returned 9.07%.
For the six-month period ended April 30, 2012, the Fund earned 3.68%, versus returns of 12.77% for the S&P 500 Index and 7.11% for the BofA Merrill Lynch All U.S. Convertibles Ex-Mandatory Index.
Q. Please discuss the Fund’s low-volatility* characteristics.
A. We believe the Fund’s historical low-volatility characteristics are a by-product of our investment style and focus on participating in equity market upside with less volatility than the market as a whole. Beta is one popular statistic for measuring volatility. Beta considers a fund’s historic volatility versus the market, which is assigned a beta of 1.0. A fund with half the volatility of the market would have a beta of 0.5, while a fund with at beta of 2.0 would have been twice as volatile as the market.
Since its inception, the Fund has had a beta of 0.72 versus the S&P 500 Index. The Fund has therefore outperformed the broader equity market, as measured by the S&P 500 Index, with less volatility than the equity markets. Please note that past performance does not indicate future results and that beta is one of many measures of risk.
| * | The Fund’s historical performance has exhibited lower volatility, as measured by beta and standard deviation, over the life of the Fund. The Fund’s investment objective does not seek to reduce volatility, and as a result, the Fund may experience volatility in some market conditions. (Source for beta and standard deviation data is Morningstar, Inc.) |
| | | | |
| 30 | | CALAMOS FAMILY OF FUNDS SEMIANNUAL REPORT | | |
Calamos Growth and Income Fund
Q. What factors influenced performance over the semiannual period?
A. Pursuant to our goal of accessing equity market returns with lower volatility over a full market cycle, the Fund is managed in a risk-aware manner. During the semiannual period, the Fund participated in equity upside and provided periods of downside resilience, but underperformed the benchmark over the complete period. Most notably, the Fund’s holdings of equity-sensitive securities, such as convertibles, lagged the rapid pace and magnitude of gains in the S&P 500 Index.
In terms of sector performance, the Fund’s relative selection within the materials sector detracted the most from performance in the semiannual period. Most notably, our investments related to the gold mining and production industry underperformed, as these companies faced significantly rising production costs which offset the benefit of high precious metals prices. We continue to forecast benefits from strong demand in emerging markets and sustained global reflation efforts, which should support commodity prices. We are particularly focused on long-term opportunities within the gold mining and production and fertilizers and agricultural industries.
Though the Fund’s overweight allocation to the information technology sector contributed value during the period, relative security selection lagged the S&P 500 Index, a combination that resulted in a negative overall impact on relative performance. Specifically, holdings within the systems software industry underperformed the index. We continue to hold conviction in this industry group, and the technology sector overall, due to its high cash flows, strong balance sheets and attractive valuations. The sector also benefits from many long-term themes we have identified, including the demand for the latest connectivity devices, the need for information and entertainment, as well as productivity enhancement in a low-growth economy.
The Fund’s relative security selection within the energy sector also hampered performance. Holdings within the oil and gas exploration and production industry, in particular, negatively impacted performance, with companies generating a significant portion of their production in natural gas underperforming as prices continued to drop and production costs increased. Despite the weakness in the period, we have a favorable long-term view of the opportunities in the energy sector, particularly as global stimulus and liquidity from the world’s central banks persists. We believe the portfolio’s holdings within the sector will benefit from long-term secular themes, such as strong global demand for energy resources, especially within developing economies.
The Fund’s underweight to the more defensive utilities sector also contributed to relative performance during the period as it was the weakest performing sector within the S&P 500. We believe other sectors present more attractive growth opportunities and a better combination of risk and reward.
Q. How is the Fund positioned?
A. We continue to favor businesses with globally diversified revenues and compelling growth opportunities. After a strong and rapid market advance during the first several months of the period, we believe an enhanced focus on risk management and valuation sensitivity is appropriate. As such, during the period we increased valuation sensitivity and lessened the cyclical exposure in the Fund, particularly in sectors such as industrials and materials. We continue to believe reflation exposure will provide good long-term opportunities, given signals from the Federal Reserve and other global
| | | | |
| SECTOR WEIGHTINGS | | | |
Information Technology | | | 36.3 | % |
Health Care | | | 13.0 | |
Energy | | | 10.6 | |
Consumer Discretionary | | | 6.8 | |
Materials | | | 6.6 | |
Financials | | | 5.6 | |
Industrials | | | 5.5 | |
Consumer Staples | | | 3.0 | |
Sector weightings are subject to change daily and are calculated as a percentage of net assets. The table excludes cash or cash equivalents, any government/sovereign bonds or broad based index hedging securities the Fund may hold.
Calamos Growth and Income Fund
ANNUALIZED RETURN: SINCE INCEPTION (9/22/88) THROUGH 4/30/12
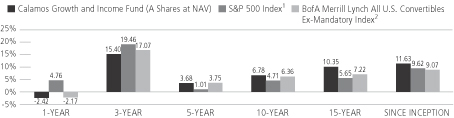
Performance data quoted represents past performance, which is no guarantee of future results. Current performance may be lower or higher than the performance quoted.
The principal value and investment return of an investment will fluctuate so that your shares, when redeemed, may be worth more or less than their original cost. You can obtain performance data current to the most recent month end by visiting www.calamos.com. Average annual total return measures net investment income and capital gain or loss from portfolio investments as an annualized average. All performance shown assumes reinvestment of dividends and capital gains distributions. Performance is for the fund’s Class A shares at net asset value and does not include the Fund’s maximum front-end sales charge of 4.75%—had it been included, the Fund’s return would have been lower. The Fund also offers Class B, Class C, Class I and R shares, the performance of which may vary. Performance shown reflects an expense reimbursement that improved results. Source: State Street Corporation and Lipper, Inc.
central banks that they would remain accommodative and provide a backstop for the markets, if necessary.
With respect to sector positioning, the portfolio is currently positioned with large absolute allocations to the information technology and health care sectors. Details regarding our positioning in technology have been discussed above. Within health care, we favor more innovative companies with identifiable secular demand trends and those relatively less affected by government regulation.
Among the positioning changes over the semiannual period was a small increase in the overall holdings of equity-sensitive securities, such as synthetic convertible bonds. We added to these positions with the goal of increasing overall portfolio credit quality and income in addition to creating access to certain companies without a convertible bond issue outstanding.
Generally, convertible securities have been attractively valued in the market over the period with a small discount to theoretical value. In addition, in an environment of intermittent volatility, we favored convertibles’ ability to capture a significant degree of underlying equity upside while also providing a measure of downside resilience. With respect to credit quality, we favor a relatively higher quality portfolio with low exposure to single-B rated issues (approximately 3% as of 4/30/12) and no holdings rated CCC or below as of the period-end.
Q. Why are you limiting investments in the Fund?
A. As part of the investment process, we continually assess the opportunities in the convertible market. While our investment view of the convertible market is constructive, we determined that some of the trends we were seeing in the market could result in a lower than normal level of issuance of convertibles from companies in our investable universe. Therefore, effective as of the close of business on January 20, 2012, the Fund began limiting new investments to investors who own shares, with certain exceptions.
| | | | |
| 32 | | CALAMOS FAMILY OF FUNDS SEMIANNUAL REPORT | | |
Calamos Growth and Income Fund
We still are encouraged by those opportunities that we see in the convertible market and believe that convertible securities continue to have attractive risk-reward characteristics. The move to limit purchases is intended to be a proactive step to help preserve those opportunities for existing shareholders.
Q. What is your outlook for growth equities and the Fund?
A. The persistent global macroeconomic concerns and periods of intermittent volatility in recent months have particularly focused our attention on the fundamental and risk/reward attributes of the equity and equity-sensitive securities in the Fund. Generally speaking, we believe investors are not paying adequately for future corporate growth potential, and this continues to create opportunities for equity exposure. Perhaps a reflection of widespread investor skepticism about future growth prospects, our active and risk-aware approach is uncovering equities and equity-sensitive securities with attractive fundamentals, reasonable valuations and an appropriate blend of upside capture and downside resilience.
We are favoring large multinational companies with well-diversified revenues, solid balance sheets and global growth opportunities with respect to both secular and cyclical trends. We are focused on opportunities supported by long-term secular trends such as the dynamics of the global emerging middle class, as well as productivity enhancement solutions in an era of low global growth. Specifically, we are favoring equity and equity-sensitive investments in sectors such as technology, health care and energy, where we continue to invest in leading businesses at reasonable valuations. Conversely, we are generally avoiding specific companies most exposed to government expenditures and onerous regulations.
Calamos Growth and Income Fund
GROWTH OF $10,000: FOR 10-YEAR PERIOD ENDED 4/30/12
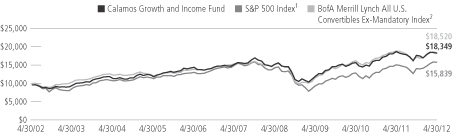
AVERAGE ANNUAL TOTAL RETURN† AS OF 4/30/12
| | | | | | | | | | | | | | | | |
| | | 6
MONTHS | | | 1
YEAR | | | 5
YEARS | | | 10 YEARS
OR ^SINCE
INCEPTION | |
| Class A Shares – Inception 9/22/88 | | | | | | | | | | | | | | | | |
Without Sales Charge | | | 3.68 | % | | | -2.42 | % | | | 3.68 | % | | | 6.78 | % |
With Sales Charge | | | -1.24 | | | | -7.05 | | | | 2.68 | | | | 6.26 | |
| |
| Class B Shares – Inception 9/11/00 | | | | | | | | | | | | | | | | |
Without Sales Charge | | | 3.33 | | | | -3.12 | | | | 2.90 | | | | 6.14 | |
With Sales Charge | | | -1.67 | | | | -7.93 | | | | 2.54 | | | | 6.14 | |
| |
| Class C Shares – Inception 8/5/96 | | | | | | | | | | | | | | | | |
Without Sales Charge | | | 3.31 | | | | -3.12 | | | | 2.90 | | | | 5.98 | |
With Sales Charge | | | 2.31 | | | | -4.08 | | | | 2.90 | | | | 5.98 | |
| |
| Class I Shares – Inception 9/18/97 | | | 3.83 | | | | -2.16 | | | | 3.94 | | | | 7.04 | |
| |
| Class R Shares – Inception 3/1/07 | | | 3.56 | | | | -2.66 | | | | 3.42 | | | | 4.07 | ^ |
| |
Performance data quoted represents past performance, which is no guarantee of future results. Current performance may be lower or higher than the performance quoted. The principal value and investment return of an investment will fluctuate so that your shares, when redeemed, may be worth more or less than their original cost.
Performance of the Growth and Income Fund includes the effects of an overpayment of dividends and/or capital gains distributions to shareholders of certain share Classes of the Fund (and a corresponding capital contribution by Calamos Asset Management, Inc., the predecessor to Calamos Advisors LLC), which increased certain return figures.
| † | Average annual total return measures net investment income and capital gain or loss from portfolio investments as an annualized average assuming reinvestment of dividends and capital gains distributions. Load-adjusted returns are adjusted for the maximum front-end sales load of 4.75% for Class A shares and returns for Class B and C shares have been adjusted for the contingent deferred sales charge (CDSC). |
NOTES:
The graphs do not reflect the income taxes that you would pay on fund distributions or the redemption of fund shares. Fund performance includes reinvestment of dividends and adjustment for the maximum sales charge for Class A shares. The performance of other classes will vary from the performance of the class shown based on the difference in sales charges and fees paid by shareholders investing in different share classes.
| 1 | The S&P 500 Index is an unmanaged index generally considered representative of the U.S. stock market. Source: Lipper, Inc. |
| 2 | The BofA Merrill Lynch All U.S. Convertibles Ex-Mandatory Index represents the U.S. convertibles securities market excluding mandatory convertibles. Index data shown for the Annualized Return Since Inception graph is from 9/30/88, since comparative index data is only available for full monthly periods. Source: Lipper, Inc. |
Index returns assume reinvestment of dividends and do not reflect deduction of fees and expenses. It is not possible to invest directly in an index.
| | | | |
| 34 | | CALAMOS FAMILY OF FUNDS SEMIANNUAL REPORT | | |
Calamos Global Growth and Income Fund
CALAMOS GLOBAL GROWTH AND INCOME FUND
INVESTMENT TEAM DISCUSSION
The Calamos Investment Management Team discusses the Fund’s performance, strategy and positioning during the six-month period ended April 30, 2012.
Q. What is the Fund’s investment strategy?
A. Calamos Global Growth and Income Fund invests in a combination of stocks, convertible securities and bonds of both U.S. and non-U.S. companies. The Fund offers a total return-oriented investment that seeks to maintain a balance of risk and reward through full market cycles. As we focus on managing volatility, we endeavor to participate in a greater portion of equity market upside than downside. We currently emphasize companies with global presence and geographically diversified revenues that we believe are positioned to capitalize on global economic growth and global secular trends.
Q. How has the Fund performed?
A. Because we believe equity funds are best utilized within asset allocations as long-term investments, we encourage investors to evaluate performance over longer time periods. Since its inception on September 9, 1996, the Fund has returned 8.71% on an annualized basis (Class A shares at net asset value) and outperformed the MSCI World Index, which gained 5.71% for the same period. For the six-month reporting period ended April 30, 2012, the Fund earned 2.58%, versus 7.87% for the MSCI World Index.
Q. Please discuss the Fund’s low-volatility* characteristics.
A. We believe the Fund’s historical low-volatility characteristics are a by-product of our investment style and focus on participating in equity market upside with less volatility than the market as a whole. Beta is one popular statistic for measuring volatility. Beta considers a fund’s historic volatility versus the market, which is assigned a beta of 1.0. A fund with half the volatility of the market would have a beta of 0.5, while a fund with at beta of 2.0 would have been twice as volatile as the market.
Since its inception, the Fund has had a beta of 0.71 versus the MSCI World Index. The Fund has therefore outperformed the global equity market, as measured by the MSCI World Index, with less volatility than the equity markets. Please note that past performance does not indicate future results and that beta is one of many measures of risk.
Q. What factors influenced performance over the semiannual period?
A. Pursuant to our goal of accessing equity market returns with lower volatility over a full market cycle, the Fund is managed in a risk-aware manner. During the semiannual
| * | The Fund’s historical performance has exhibited lower volatility, as measured by beta and standard deviation, over the life of the Fund. The Fund’s investment objective does not seek to reduce volatility, and as a result, the Fund may experience volatility in some market conditions. (Source for beta and standard deviation data is Morningstar, Inc.) |
| | |
| FUND NASDAQ SYMBOLS |
A Shares | | CVLOX |
B Shares | | CVLDX |
C Shares | | CVLCX |
I Shares | | CGCIX |
R Shares | | CVLRX |
| | | |
|
| FUND CUSIP NUMBERS |
A Shares | | 128119500 |
B Shares | | 128119732 |
C Shares | | 128119708 |
I Shares | | 128119609 |
R Shares | | 128119385 |
| | | |
FUND OBJECTIVE
High long-term total return through capital appreciation and current income
INVESTMENT STRATEGY
| | > | | Offers a defensive approach to equity exposure applying dynamic asset allocation on a global scale | |
| | > | | Attempts to maintain a consistent balance between risk and reward over the course of different global market cycles by strategically investing across a combination of stocks, convertible securities and bonds | |
| | > | | Emphasizes countries espousing free-market principles | |
INVESTOR PROFILE
This Fund may be suitable for investors who seek:
| | > | | A risk-managed approach to pursuing growth opportunities around the world | |
| | > | | A portfolio of securities representing various-sized companies from multiple countries | |
| | > | | A strategy designed to enhance return by providing broad global diversification with less volatility than typical stock-only investments | |
Calamos Global Growth and Income Fund
| | | | |
| SECTOR WEIGHTINGS | |
Information Technology | | | 23.8 | % |
Health Care | | | 14.8 | |
Consumer Staples | | | 11.4 | |
Energy | | | 10.1 | |
Materials | | | 9.5 | |
Consumer Discretionary | | | 7.3 | |
Financials | | | 6.0 | |
Industrials | | | 2.4 | |
Telecommunication Services | | | 2.2 | |
| | | | | |
Sector weightings are subject to change daily and are calculated as a percentage of net assets. The table excludes cash or cash equivalents, any government/sovereign bonds or broad based index hedging securities the Fund may hold.
period, the Fund participated in equity upside and provided periods of downside resilience, but underperformed the benchmark MSCI World Index over the complete period. Most notably, the Fund’s holdings of equity-sensitive securities, such as convertibles, lagged the rapid pace and significant magnitude of gains in the index.
In terms of sector performance, the Fund’s security selection and overweight position to the materials sector hampered relative performance during the six-month period. The portfolio’s allocation to the gold industry in particular detracted value, as these firms incurred the rising cost of extraction during the period. We believe this sector will benefit from an increased demand for resources generated by emerging market regions, as well as global reflation efforts and accommodative global central bank policies.
Weak selection within energy also detracted value during the period, as selection within the oil and gas equipment and services industry was weak relative to the MSCI World Index. We believe this area of the market will continue to benefit from ongoing global reflation efforts as well as from long-term secular themes, such as strong global demand for energy resources.
Strong selection within health care contributed to relative returns during the period, as names within the pharmaceuticals industry strongly outperformed those within the index. Our focus within this sector remains on companies more insulated from the impacts of health care reform, and those that have displayed strong corporate performance, healthy cash flows and strong fundamentals.
From a geographic standpoint, the Fund’s holdings within Denmark and France contributed to relative returns and outperformed the index during the period, while underweight positions to Spain and Japan also aided performance. The portfolio’s holdings within the U.S. and Canada detracted value during the period.
Q. How is the Fund positioned?
A. The Fund is currently positioned with large allocations to the information technology and health care sectors. Details regarding our positioning within health care have been discussed above. With respect to information technology, we maintain conviction in this sector due to the higher cash flows, lower debt levels and cleaner balance sheets we see in many IT companies. We also expect these companies to benefit from many of the long-term secular themes we have identified, including an increased demand for gadgets and electronics as well as productivity enhancement.
| | | | |
| 36 | | CALAMOS FAMILY OF FUNDS SEMIANNUAL REPORT | | |
Calamos Global Growth and Income Fund
ANNUALIZED RETURN: SINCE INCEPTION (9/9/96) THROUGH 4/30/12
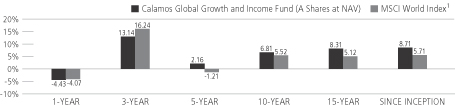
Performance data quoted represents past performance, which is no guarantee of future results. Current performance may be lower or higher than the performance quoted.
The principal value and investment return of an investment will fluctuate so that your shares, when redeemed, may be worth more or less than their original cost. You can obtain performance data current to the most recent month end by visiting www.calamos.com. Average annual total return measures net investment income and capital gain or loss from portfolio investments as an annualized average. All performance shown assumes reinvestment of dividends and capital gains distributions. Performance is for the Fund’s Class A shares at net asset value and does not include the Fund’s maximum front-end sales charge of 4.75%—had it been included, the Fund’s return would have been lower. The Fund also offers Class B, Class C, Class I and Class R shares, the performance of which may vary. Performance shown reflects an expense reimbursement that improved results. Source: State Street Corporation and Lipper, Inc.
The Fund’s largest underweight allocations are to the financials and industrials sectors. We have generally held a low weight within financials and remain cautious due to increased regulations, as well as the ongoing European debt crisis. Within industrials, we are attracted to those companies in industries such as industrial machinery, construction and equipment that offer solid growth potential and which stand to benefit from the global infrastructure build-out. We are particularly interested in those companies that are positioned to benefit from continued growth within emerging market economies. From a geographic standpoint, the portfolio is currently underweight to Japan relative to the index. Japan remains a challening investment environment where we are closely monitoring valuations.
During the time period, the Fund’s allocation to health care increased, while its investments within the energy sector were slightly reduced. Within health care, our focus remains on companies that have displayed strong corporate performance, healthy cash flows and strong fundamentals. Within energy, as discussed above, we continue to have a favorable view and believe in the long-term opportunities available in the sector; however, we wanted to reduce some of the cyclicality within the portfolio. We continue to believe that the reflation theme will provide some long-term opportunities, given strong signals from the Federal Reserve and other global central banks that they would remain accommodative and provide a backstop for the markets, if necessary.
Q. Why are you limiting investments in the Fund?
A. As part of the investment process, we continually assess the opportunities in the convertible market. While our investment view of the convertible market is constructive, we determined that some of the trends we were seeing in the market could result in a lower than normal level of issuance of convertibles from companies in our investable universe. Therefore, effective as of the close of business on January 20, 2012, the Fund began limiting new investments to investors who own shares, with certain exceptions.
We still are encouraged by those opportunities that we see in the convertible market and believe that convertible securities continue to have attractive risk-reward characteristics. The move to limit purchases is intended to be a proactive step to help preserve those opportunities for existing shareholders.
Calamos Global Growth and Income Fund
Q. What is your outlook for global growth equities and the Fund?
A. We expect continued growth in the global economy as a whole, and believe that a number of themes (including increasing wealth and middle class consumption within emerging market countries) will provide growth opportunities for companies all throughout the world. Despite these trends, however, global markets overall remain a somewhat volatile and challenging investment environment.
Nevertheless, we believe that global growth equities remain an attractive area for long-term investment. We have positioned this Fund to emphasize companies with geographically diversified revenues, strong global brands and healthy balance sheets. We believe that multinational companies may be less vulnerable to economic weakness in a particular country or region. In particular, we are favoring companies domiciled in developed countries that are capitalizing on many of the growth trends currently available in emerging markets.
| | | | |
| 38 | | CALAMOS FAMILY OF FUNDS SEMIANNUAL REPORT | | |
Calamos Global Growth and Income Fund
GROWTH OF $10,000: FOR 10-YEAR PERIOD ENDED 4/30/12
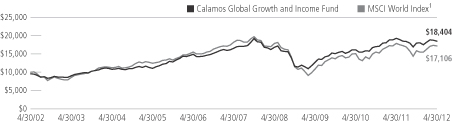
AVERAGE ANNUAL TOTAL RETURN† AS OF 4/30/12
| | | | | | | | | | | | | | | | |
| | | 6
MONTHS | | | 1
YEAR | | | 5
YEARS | | | 10 YEARS
OR ^SINCE
INCEPTION | |
| Class A Shares – Inception 9/9/96 | | | | | | | | | | | | | | | | |
Without Sales Charge | | | 2.58 | % | | | -4.43 | % | | | 2.16 | % | | | 6.81 | % |
With Sales Charge | | | -2.32 | | | | -8.99 | | | | 1.18 | | | | 6.29 | |
| |
| Class B Shares – Inception 9/11/00 | | | | | | | | | | | | | | | | |
Without Sales Charge | | | 2.22 | | | | -5.12 | | | | 1.40 | | | | 6.16 | |
With Sales Charge | | | -2.78 | | | | -9.82 | | | | 1.03 | | | | 6.16 | |
| |
| Class C Shares – Inception 9/24/96 | | | | | | | | | | | | | | | | |
Without Sales Charge | | | 2.32 | | | | -5.07 | | | | 1.41 | | | | 6.00 | |
With Sales Charge | | | 1.32 | | | | -6.01 | | | | 1.41 | | | | 6.00 | |
| |
| Class I Shares – Inception 9/18/97 | | | 2.81 | | | | -4.10 | | | | 2.42 | | | | 7.09 | |
| |
| Class R Shares – Inception 3/1/07 | | | 2.47 | | | | -4.59 | | | | 1.93 | | | | 2.74 | ^ |
| |
Performance data quoted represents past performance, which is no guarantee of future results. Current performance may be lower or higher than the performance quoted. The principal value and investment return of an investment will fluctuate so that your shares, when redeemed, may be worth more or less than their original cost.
Performance of the Global Growth and Income Fund includes the effects of an overpayment of dividends and/or capital gains distributions to shareholders of certain share Classes of the Fund (and a corresponding capital contribution by Calamos Asset Management, Inc., the predecessor to Calamos Advisors LLC), which increased certain return figures.
| † | Average annual total return measures net investment income and capital gain or loss from portfolio investments as an annualized average assuming reinvestment of dividends and capital gains distributions. Performance shown reflects the effects of an expense reimbursement that improved results and was in effect until March 31, 2003. Load-adjusted returns are adjusted for the maximum front-end sales load of 4.75% for Class A shares and returns for Class B and C shares have been adjusted for the contingent deferred sales charge (CDSC). |
NOTES:
The graphs do not reflect the income taxes that you would pay on fund distributions or the redemption of fund shares. Fund performance includes reinvestment of dividends and adjustment for the maximum sales charge for Class A shares. The performance of other classes will vary from the performance of the class shown based on the difference in sales charges and fees paid by shareholders investing in different share classes.
| 1 | The MSCI World Index (U.S. Dollars) is a market-capitalization weighted index composed of companies representative of the market structure of developed market countries in North America, Europe and the Asia/Pacific region. Since inception data for the index is shown from 8/31/96 since data is only available for full monthly periods. Source: Lipper, Inc. |
Index returns assume reinvestment of dividends and do not reflect deduction of fees and expenses. It is not possible to invest directly in an index.
Calamos Convertible Fund
| | |
| FUND NASDAQ SYMBOLS |
A Shares | | CCVIX |
B Shares | | CALBX |
C Shares | | CCVCX |
I Shares | | CICVX |
R Shares | | CCVRX |
| | | |
|
| FUND CUSIP NUMBERS |
A Shares | | 128119401 |
B Shares | | 128119773 |
C Shares | | 128119823 |
I Shares | | 128119864 |
R Shares | | 128119369 |
| | | |
FUND OBJECTIVE
Current income with a secondary objective of growth
INVESTMENT STRATEGY
| | > | | Invests in convertible securities issued by both U.S. and foreign companies | |
| | > | | Emphasizes diversification across market sectors and credit quality, favoring companies with higher-quality balance sheets | |
| | > | | Utilizes a highly disciplined strategy that seeks to enhance investment returns while managing risk | |
INVESTOR PROFILE
This Fund may be suitable for investors who seek:
| | > | | Current income as well as capital growth potential | |
| | > | | An investment that provides the growth potential of equities along with the income and limited downside potential typical of fixed-income securities | |
CALAMOS CONVERTIBLE FUND
INVESTMENT TEAM DISCUSSION
The Calamos Investment Management Team discusses the Fund’s performance, strategy and positioning during the six-month period ended April 30, 2012.
Q. What is the Fund’s investment strategy?
A. Calamos Convertible Fund invests in convertible securities primarily issued by U.S. companies, though 5% to 15% may be invested in non-U.S. securities. The Fund, which may also invest in equities, offers participation in the equity markets with income generation and potentially less downside volatility than an all-equity portfolio. We pay close attention to risk and reward characteristics, including valuations, equity sensitivity, credit quality, and balance sheets as we position the portfolio to reflect our view of secular and cyclical opportunities.
Q. What is a convertible security?
A. A convertible security is a bond or preferred stock that can be exchanged, or converted, into a specific number of shares of common stock of the issuer’s company. Convertible securities combine characteristics of stocks and fixed-income securities. Like stocks, convertibles typically offer potential upside participation in rising equity markets. Like bonds, convertible securities may provide income and potential downside protection in declining markets.
Q. How has the Fund performed?
A. Because we believe convertible funds are best utilized within asset allocations as long-term investments, we encourage investors to evaluate performance over longer time periods. Since its inception on June 21, 1985, the Fund has returned 9.38% on an annualized basis (Class A shares at net asset value) compared with a gain of 8.34% for the Value Line Convertible Index and 10.25% for the S&P 500 Index. For the six-month period ended April 30, 2012, the Fund returned 0.62%. For this same period, the BofA Merrill Lynch All U.S. Convertibles Ex-Mandatory Index (V0A0) returned 7.11%, the Value Line Convertible Index gained 7.95%, and the S&P 500 Index returned 12.77%.
We compare the Fund’s performance to multiple benchmarks to provide a more complete assessment of its performance. Because convertibles have equity characteristics, they can be thought of as equity-linked securities. Therefore, we compare the Fund’s performance to the S&P 500 Index. We also measure the Fund’s performance against the Value Line Convertible Index, which has a history that dates to the inception of Calamos Convertible Fund. We utilize the newer BofA Merrill Lynch All U.S. Convertibles Ex-Mandatory Index for research and analysis.
Q. Please discuss the Fund’s low-volatility* characteristics.
A. We believe the Fund’s historical low-volatility characteristics are a by-product of our investment style and focus on participating in equity market upside with less volatility
| * | The Fund’s historical performance has exhibited lower volatility, as measured by beta and standard deviation, over the life of the Fund. The Fund’s investment objective does not seek to reduce volatility, and as a result, the Fund may experience volatility in some market conditions. (Source for beta and standard deviation data is Morningstar, Inc.) |
| | | | |
| 40 | | CALAMOS FAMILY OF FUNDS SEMIANNUAL REPORT | | |
Calamos Convertible Fund
than the market as a whole. Beta is one popular statistic for measuring volatility. Beta considers a fund’s historic volatility versus the market, which is assigned a beta of 1.0. A fund with half the volatility of the market would have a beta of 0.5, while a fund with at beta of 2.0 would have been twice as volatile as the market.
Since its inception, the Fund has had a beta of 0.62 versus the S&P 500 Index. The Fund has therefore captured a significant portion of the equity market upside, as measured by the S&P 500 Index, with less volatility than the equity markets. Please note that past performance does not indicate future results and that beta is one of many measures of risk.
Q. What factors influenced performance over the semiannual period?
A. The Fund’s performance lagged, as our continued focus on higher quality issues and attention to risk management kept us away from the most equity-sensitive convertibles and those in the lower credit tiers that performed best over the six-month reporting period.
The Fund’s overweight position and security selection within the materials sector detracted the most from performance versus the BofA Merrill Lynch All U.S. Convertibles Ex-Mandatory Index during the six-month period. The materials sector was the weakest performing sector in the index, and the Fund’s gold metals and mining names underperformed as these companies faced significantly rising production costs in the face of rising oil and gas prices. We continue to expect that commodity prices will find support from strong demand in emerging markets and sustained global reflation efforts. We are particularly focused on long-term opportunities within the gold mining and production and fertilizers and agricultural industries.
An underweight position and security selection within the health care sector also hampered performance during the period. Security selections in the biotechnology, pharmaceuticals and health care equipment industries lagged behind those in the index, where the most speculative grade and extremely equity-sensitive convertibles performed best. We maintain a constructive view of the sector given changing global demographics and improved access to health care in the emerging markets we believe will drive long-term growth within the sector.
The Fund’s overweight position and security selection in energy also detracted from performance during the period. In particular, our positioning within the oil and gas exploration and production industry lagged. Despite the weakness in the period, we have a favorable long-term view of the opportunities in the energy sector, particularly as global stimulus and liquidity from the world’s central banks persists. We believe the portfolio’s holdings within the sector will benefit from long-term secular themes, such as strong global demand for energy resources, especially within developing economies.
The Fund’s underweight to utilities contributed to relative performance during the period. We believe other sectors present more attractive growth opportunities and a better combination of risk and reward.
Q. How is the Fund positioned?
A. We remain enthusiastic about the valuations we continue to see in growth equities and believe convertible securities to be an attractive means of accessing the well-priced growth opportunities in those companies. We also maintain our view that asset
Calamos Convertible Fund
| | | | |
| SECTOR WEIGHTINGS | |
Information Technology | | | 32.8 | % |
Health Care | | | 14.8 | |
Energy | | | 11.4 | |
Industrials | | | 5.5 | |
Consumer Discretionary | | | 5.3 | |
Materials | | | 4.6 | |
Financials | | | 4.3 | |
Consumer Staples | | | 4.1 | |
Telecommunication Services | | | 0.7 | |
| | | | | |
Sector weightings are subject to change daily and are calculated as a percentage of net assets. The table excludes cash or cash equivalents, any government/sovereign bonds or broad based index hedging securities the Fund may hold.
reflation activities (low interest rates and asset purchases) by the world’s central banks will persist. As such, we maintain our focus on the cyclical sectors that should benefit from these activities while at the same time keeping attuned to valuations.
Information Technology remains the Fund’s largest portfolio weight given long-term secular trends, which include a strong demand from consumers for mobility technologies and software that leads to productivity enhancement. The Fund continues to be underweight to the financial sector given the increased costs of regulation and government intervention in the sector, along with a lack of transparency concerning bad mortgage loans and foreclosures.
From a credit perspective, the Fund has been significantly underweight to the most speculative credit tiers (those rated B- and CCC), as their weak credit attributes do not typically provide the downside protection we desire. Our attention in the convertible market focuses on those issues that offer an attractive combination of risk-reward, valuation and balance sheet health.
Q. What is your outlook for convertible securities and the Fund?
A. The low interest rate environment continues to present a challenge to the convertible market. Historically, issuers brought convertibles to market as a means of reducing their cost of capital by offering the conversion feature in exchange for a lower coupon on the convertible bonds. In the current environment, however, issuers are finding the low interest rates attractive without having to offer the equity enhancement. As such, new convertible issuance remains near historic lows, which was a primary factor in our implementation of a hard close on most new investments in the Fund.
While we expect the low interest rate and low new issuance trend to continue for the foreseeable future, the existing convertible market continues to provide opportunities. Given our decades of experience in this area, we believe are well positioned to find those opportunities, even in a challenging environment for new issuance.
ANNUALIZED RETURN: SINCE INCEPTION (6/21/85) THROUGH 4/30/12
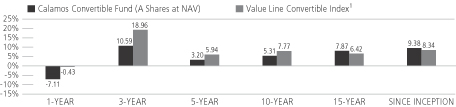
Performance data quoted represents past performance, which is no guarantee of future results. Current performance may be lower or higher than the performance quoted.
The principal value and investment return of an investment will fluctuate so that your shares, when redeemed, may be worth more or less than their original cost. You can obtain performance data current to the most recent month end by visiting www.calamos.com. Average annual total return measures net investment income and capital gain or loss from portfolio investments as an annualized average. All performance shown assumes reinvestment of dividends and capital gains distributions. Performance is for the Fund’s Class A shares at net asset value and does not include the Fund’s maximum front-end sales charge of 4.75%—had it been included, the Fund’s return would have been lower. The Fund also offers Class B, Class C, Class I and Class R shares, the performance of which may vary. Performance shown reflects an expense reimbursement that improved results. Source: State Street Corporation, Lipper, Inc., and Mellon Analytical Solutions, LLC.
| | | | |
| 42 | | CALAMOS FAMILY OF FUNDS SEMIANNUAL REPORT | | |
Calamos Convertible Fund
The Fund’s focus continues to be on the portion of the convertible market that we believe offers the most attractive risk/reward characteristics. At the end of the reporting period, nearly 40% of the U.S. convertible market was trading with these characteristics. We are still encouraged by the opportunities that we see in the convertible market and we believe that the Fund is well positioned given the expected volatility in the future.
Calamos Convertible Fund
GROWTH OF $10,000: FOR 10-YEAR PERIOD ENDED 4/30/12
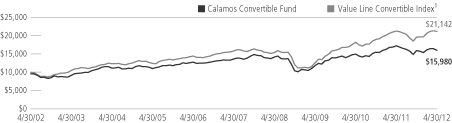
AVERAGE ANNUAL TOTAL RETURN† AS OF 4/30/12
| | | | | | | | | | | | | | | | |
| | | 6
MONTHS | | | 1
YEAR | | | 5
YEARS | | | 10 YEARS
OR ^SINCE
INCEPTION | |
| Class A Shares – Inception 6/21/85 | | | | | | | | | | | | | | | | |
Without Sales Charge | | | 0.62 | % | | | -7.11 | % | | | 3.20 | % | | | 5.31 | % |
With Sales Charge | | | -4.15 | | | | -11.53 | | | | 2.21 | | | | 4.80 | |
| |
| Class B Shares – Inception 9/11/00 | | | | | | | | | | | | | | | | |
Without Sales Charge | | | 0.22 | | | | -7.80 | | | | 2.43 | | | | 4.68 | |
With Sales Charge | | | -4.46 | | | | -12.09 | | | | 2.09 | | | | 4.68 | |
| |
| Class C Shares – Inception 7/5/96 | | | | | | | | | | | | | | | | |
Without Sales Charge | | | 0.21 | | | | -7.80 | | | | 2.43 | | | | 4.52 | |
With Sales Charge | | | -0.71 | | | | -8.64 | | | | 2.43 | | | | 4.52 | |
| |
| Class I Shares – Inception 6/25/97 | | | 0.72 | | | | -6.89 | | | | 3.46 | | | | 5.57 | |
| |
| Class R Shares – Inception 3/1/07 | | | 0.51 | | | | -7.34 | | | | 2.98 | | | | 3.48 | ^ |
| |
Performance data quoted represents past performance, which is no guarantee of future results. Current performance may be lower or higher than the performance quoted. The principal value and investment return of an investment will fluctuate so that your shares, when redeemed, may be worth more or less than their original cost.
Performance of the Convertible Fund includes the effects of an overpayment of dividends and/or capital gains distributions to shareholders of certain share Classes of the Fund (and a corresponding capital contribution by Calamos Asset Management, Inc., the predecessor to Calamos Advisors LLC), which increased certain return figures.
| † | Average annual total return measures net investment income and capital gain or loss from portfolio investments as an annualized average assuming reinvestment of dividends and capital gains distributions. Load-adjusted returns are adjusted for the maximum front-end sales load of 4.75% for Class A shares and returns for Class B and C shares have been adjusted for the contingent deferred sales charge (CDSC). |
NOTES:
The graphs do not reflect the income of taxes that you would pay on fund distributions or the redemption of fund shares. Fund performance includes reinvestment of dividends and adjustment for the maximum sales charge for Class A shares. The performance of other classes will vary from the performance of the class shown based on the difference in sales charges and fees paid by shareholders investing in different share classes.
| 1 | The Value Line Convertible Index is an equally-weighted index of the larger convertibles, representing 90% of the U.S. convertible securities market. Index data shown for the Annualized Returns Since Inception graph is from 6/30/85, since comparative index data is only available for full monthly periods. Source: Mellon Analytical Solutions, LLC. |
Index returns assume reinvestment of dividends and do not reflect deduction of fees and expenses. It is not possible to invest directly in an index.
| | | | |
| 44 | | CALAMOS FAMILY OF FUNDS SEMIANNUAL REPORT | | |
Calamos Total Return Bond Fund
CALAMOS TOTAL RETURN BOND FUND
INVESTMENT TEAM DISCUSSION
The Calamos Investment Management Team discusses the Fund’s performance, strategy and positioning during the six-month period ended April 30, 2012.
Q. What is the Fund’s investment strategy?
A. Calamos Total Return Bond Fund invests in the major sectors of the U.S. investment-grade bond market, including U.S. Treasurys, agency issues, mortgage-backed securities and corporate debt. The Fund emphasizes yield and capital preservation, and can provide income generation with a conservative total return approach, along with portfolio diversification when combined with other asset classes. To increase return potential and enhance risk management, we also can invest opportunistically in other sectors of the fixed income market, such as high yield corporate bonds, international bonds and currencies.
Q. How has the Fund performed?
A. Since its inception on June 27, 2007, the Total Return Bond Fund has returned an average annualized 6.49% (Class A shares at net asset value) versus a 6.86% return in the Barclays Capital U.S. Aggregate Bond Index. For the six-month period ended April 30, 2012, the Fund returned 1.61%, versus a return of 2.44% for the index.
Q. What factors influenced performance over the semiannual period?
A. The Fund benefited from an overweight to corporate securities during the semiannual period, but security selection within the corporate space detracted from returns. Specifically, the financial sector outperformed and we have been, and remain, underweight to the sector as we continue to hold a cautious outlook on many banks and securities firms. The Fund’s overweight to high quality sovereign debt was also a contributor to relative returns.
An underweight to the Treasury sector and a preference for short durations therein was also a drag on returns. We continue to believe that inflation is more likely than not to put upward pressure on interest rates in the future. To the extent we are involved in Treasury and government-related securities, we are keeping the maturities fairly short so as to reduce sensitivity to rising rates and to allow us the opportunity to reposition should more attractive yield opportunities present themselves in the near future.
Q. How is the Fund positioned?
A. As always, the Fund positioning takes both opportunity and risk into consideration. The heaviest portfolio weight and largest relative overweight is in corporate securities. We also have a relative overweight to sovereign debt securities, where we own very high quality bonds. We continue to find little value in U.S. Treasurys and therefore remain underweight. We are also positioned with an underweight to both mortgages and agencies.
Within the corporate space, the Fund’s heaviest weighting is in the information technology sector, followed by industrials and energy. We continue to find attractively priced securities in these sectors that we see as well supported by fundamental
| | |
| FUND NASDAQ SYMBOLS |
A Shares | | CTRAX |
B Shares | | CTXBX |
C Shares | | CTRCX |
I Shares | | CTRIX |
R Shares | | CTRRX |
| | | |
|
| FUND CUSIP NUMBERS |
A Shares | | 128119310 |
B Shares | | 128119294 |
C Shares | | 128119286 |
I Shares | | 128119278 |
R Shares | | 128119260 |
| | | |
FUND OBJECTIVE
Total return, consistent with preservation of capital and prudent investment management
INVESTMENT STRATEGY
| | > | | Invests across the broad sectors of the U.S. investment-grade bond market, including Treasurys and agencies, mortgage-backed securities, corporate debt, and asset-backed securities | |
| | > | | Opportunistic sector allocations provide greater flexibility in managing risk and reward | |
| | > | | Complementary allocations may include high-yield securities, international bonds and currencies, among others | |
| | > | | Credit and interest rate exposure may be further tailored via derivative-based strategies | |
INVESTOR PROFILE
This Fund may be suitable for investors who seek:
| | > | | Broad exposure to the major sectors of the U.S. bond market | |
| | > | | A conservative total return approach, with an emphasis on yield and capital preservation | |
| | > | | Portfolio diversification when combined with other asset classes | |
Calamos Total Return Bond Fund
| | | | |
| ASSET ALLOCATION | | | |
Corporate Bonds | | | 57.7 | % |
Sovereign Bonds | | | 19.6 | |
U.S. Government and Agency Securities | | | 14.2 | |
Cash and Receivables/Payables | | | 4.4 | |
Residential Mortgage-Backed Securities | | | 3.6 | |
Convertible Bonds | | | 0.5 | |
Sector weightings are subject to change daily and are calculated as a percentage of net assets. The table excludes cash or cash equivalents, any government/sovereign bonds or broad-based index hedging securities the Fund may hold.
strength and forward-looking macroeconomic factors. The portfolio is underweight to financials, utilities and telecommunications, primarily as a function of finding better relative opportunities in the other sectors.
Q. What is your outlook for fixed income and the Fund?
A. We continue to find certain segments of the fixed income market to be very attractive. Particularly, the mid-grade credit space—encompassing the higher quality portion of the high yield market and the lower quality portion of investment grade—offers yield, the opportunity for capital gains and risk reduction as it pertains to rising interest rates. The Fund is positioned accordingly.
We see a likelihood of higher inflation in future quarters and years, which will have the likely effect of putting upward pressure on interest rates to the particular detriment of U.S. Treasurys and government-related bonds. At the same time, while the lowest quality corporate debt offers high levels of yield, we view many of these companies as less compelling investments, given our economic outlook. We continue to see a favorable environment for issuance of debt, which thus far has allowed many companies to restructure their debt maturities in more favorable ways and at lower rates of interest. We believe there is still a meaningful opportunity for investors to shift the bulk of their fixed income assets away from Treasurys and government-related securities and into mid-grade credits as a core holding.
| | | | |
| 46 | | CALAMOS FAMILY OF FUNDS SEMIANNUAL REPORT | | |
Calamos Total Return Bond Fund
GROWTH OF $10,000: SINCE INCEPTION (6/27/07) THROUGH 4/30/12
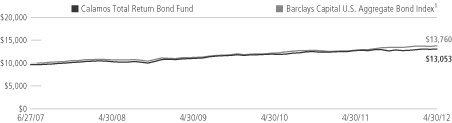
AVERAGE ANNUAL TOTAL RETURN† AS OF 4/30/12
| | | | | | | | | | | | |
| | | 6
MONTHS | | | 1
YEAR | | | SINCE
INCEPTION | |
| Class A Shares – Inception 6/27/07 | | | | | | | | | | | | |
Without Sales Charge | | | 1.61 | % | | | 2.39 | % | | | 6.49 | % |
With Sales Charge | | | -2.16 | | | | -1.49 | | | | 5.65 | |
| |
| Class B Shares – Inception 6/27/07 | | | | | | | | | | | | |
Without Sales Charge | | | 1.24 | | | | 1.63 | | | | 5.70 | |
With Sales Charge | | | -2.24 | | | | -1.84 | | | | 5.50 | |
| |
| Class C Shares – Inception 6/27/07 | | | | | | | | | | | | |
Without Sales Charge | | | 1.33 | | | | 1.63 | | | | 5.70 | |
With Sales Charge | | | 0.33 | | | | 0.64 | | | | 5.70 | |
| |
| Class I Shares – Inception 6/27/07 | | | 1.83 | | | | 2.65 | | | | 6.77 | |
| |
| Class R Shares – Inception 6/27/07 | | | 1.58 | | | | 2.23 | | | | 6.25 | |
| |
Performance data quoted represents past performance, which is no guarantee of future results. Current performance may be lower or higher than the performance quoted. The principal value and investment return of an investment will fluctuate so that your shares, when redeemed, may be worth more or less than their original cost.
| † | Average annual total return measures net investment income and capital gain or loss from portfolio investments as an annualized average assuming reinvestment of dividends and capital gains distributions. Load-adjusted returns are adjusted for the maximum front-end sales load of 3.75% for Class A shares and returns for Class B and C shares have been adjusted for the contingent deferred sales charge (CDSC). |
NOTES:
The graph does not reflect the income taxes that you would pay on fund distributions or the redemption of fund shares. Fund performance includes reinvestment of dividends and adjustment for the maximum sales charge for Class A shares. The performance of other classes will vary from the performance of the class shown based on the difference in sales charges and fees paid by shareholders investing in different share classes.
| 1 | The Barclays Capital U.S. Aggregate Bond Index is considered generally representative of the investment-grade bond market. Index data shown for the Since Inception Growth of $10,000 graph is from 6/30/07, since comparative index data is only available for full monthly periods. Source: Lipper, Inc. |
Index returns assume reinvestment of dividends and do not reflect deduction of fees and expenses. It is not possible to invest directly in an index.
Calamos High Income Fund
| | |
| FUND NASDAQ SYMBOLS |
A Shares | | CHYDX |
B Shares | | CAHBX |
C Shares | | CCHYX |
I Shares | | CIHYX |
R Shares | | CHYRX |
| | | |
|
| FUND CUSIP NUMBERS |
A Shares | | 128119815 |
B Shares | | 128119724 |
C Shares | | 128119799 |
I Shares | | 128119781 |
R Shares | | 128119377 |
| | | |
FUND OBJECTIVE
Highest level of current income obtainable with reasonable risk, with a secondary objective of capital gain where consistent with the Fund’s primary objective
INVESTMENT STRATEGY
| | > | | Conducts proprietary, in-depth credit analysis of individual issuers, taking a combination of quantitative and qualitative factors into consideration | |
| | > | | Seeks companies with respectable balance sheets that offer a good yield, sustainable growth and reliable long-term debt servicing | |
| | > | | Attempts to identify companies that have the potential for capital appreciation through credit upgrades, mergers and acquisitions, and special situations | |
| | > | | Dynamically blends straight high-yield bonds, higher-yielding convertible and synthetic high-yield securities to construct a diversified portfolio with a consistent risk/reward profile | |
INVESTOR PROFILE
This Fund may be suitable for investors who seek:
| | > | | A broader opportunity set of bonds and convertible securities designed to generate the highest-yield potential and capital gain | |
| | > | | Risk management that employs stringent credit analysis | |
CALAMOS HIGH INCOME FUND
INVESTMENT TEAM DISCUSSION
The Calamos Investment Management Team discusses the Fund’s performance, strategy and positioning during the six-month period ended April 30, 2012.
Q. What is the Fund’s investment strategy?
A. Calamos High Income Fund invests in a diversified portfolio of high-yield bonds of U.S. and non-U.S. companies that have the potential for income and capital appreciation. The Fund seeks to provide higher income compared with investment grade securities and government bonds and invests in the higher quality portion of the high yield market. We emphasize companies that offer relatively better balance sheets, reliable cash flows and debt servicing, and the potential for credit upgrades. We also have the flexibility to include investment-grade bonds in the Fund, which we believe provides us with additional advantages in tailoring the risk and reward characteristics of the Fund.
Q. How has the Fund performed?
A. Because we believe high yield funds are best utilized within asset allocations as long-term investments, we encourage investors to evaluate performance over longer time periods. Since its inception on August 2, 1999, Calamos High Income Fund has returned 6.82% on an annualized basis (Class A shares at net asset value), versus a 7.61% gain in the Credit Suisse High Yield Index. For the six-month period ended April 30, 2012, the Fund earned 4.87% versus 6.77% for the Credit Suisse High Yield Index.
Q. What factors influenced performance over the semiannual period?
A. The Fund’s security selection within the energy sector contributed to returns, although an overweight to the sector offset a portion of that outperformance. Specifically, security selection within oil and gas refining and marketing firms was especially strong during the period. In our view, these companies and our other holdings in the sector will continue to benefit from operating in a supply-constrained environment and the global effort to inflate asset prices.
An overweight to the information technology sector contributed to returns during the period. We continue to view the sector as a beneficiary of multiple long-term trends, including the force of global competition which leads businesses everywhere to seek ongoing cost reduction and productivity enhancement.
The Fund’s security selection in the utilities sector also contributed to returns, with holdings in the gas utilities industry benefitting from falling input costs as natural gas prices have trended lower.
Security selection in the materials sector was the most significant drag on relative performance during the period, though the Fund’s holdings did post a positive absolute return. The Fund’s positions in the metals and mining industry, particularly those related to gold, underperformed in the face of higher production costs. We remain invested in the industry however, as we continue to see longer-term opportunities and attractive valuations.
| | | | |
| 48 | | CALAMOS FAMILY OF FUNDS SEMIANNUAL REPORT | | |
Calamos High Income Fund
Q. How is the Fund positioned?
A. As always, the Fund’s positioning takes both opportunity and risk into consideration. The largest portfolio weight and largest relative overweight for the period is in the energy sector. We continue to find attractively priced securities in this sector that we see as well supported by fundamental strength and forward-looking macroeconomic factors, with holdings in the exploration and production, equipment and services, and refining and marketing industries. The consumer discretionary sector represents the Fund’s next largest portfolio weight, although the Fund is underweight relative to the Credit Suisse High Yield Index. The underweight is primarily a function of finding better relative opportunities in other sectors, such as energy, information technology and industrials. The Fund’s other large underweight is to the financial sector, which we have been generally less inclined to own as the burden of regulation has grown heavier.
From a credit standpoint, the average credit quality of the portfolio is higher than that of the index. This is typical for the Fund, as our credit process almost always keeps us out of the most speculative high yield securities. There are times when the lowest credit tier shows the strongest performance, and the trailing six-month period was one of those times. We do not believe this performance pattern is likely to persist, however. To the contrary, we view the risk that investors must bear to earn the higher yield as unjustified given what we see as a sluggish and uneven pace of economic growth in the future.
Q. What is your outlook for corporate credit and the Fund?
A. We find certain segments of the fixed income market to be very attractive. The mid-grade credit space in particular, encompassing the higher quality portion of the high yield market and the lower quality portion of investment grade, offers yield, the potential opportunity for capital gain and risk reduction as it pertains to rising interest rates. The Fund is positioned accordingly. We see a likelihood of higher inflation in future quarters and years, which will have the likely effect of putting upward pressure on interest rates to the particular detriment of U.S. Treasurys and government-related bonds. At the same time, while the lowest quality corporate debt offers high levels of yield, we view many of those companies as less compelling investments given our economic outlook.
We see a continued favorable environment for issuance of debt. Already, this has allowed many companies to restructure their debt maturities in more favorable ways and at lower rates of interest. We believe there is still a meaningful opportunity for investors to shift the bulk of their fixed income assets away from Treasurys and government-related securities and into mid-grade credits as a core holding.
| | | | |
| SECTOR WEIGHTINGS | | | |
Energy | | | 22.7 | % |
Consumer Discretionary | | | 16.6 | |
Industrials | | | 13.1 | |
Information Technology | | | 13.0 | |
Health Care | | | 9.8 | |
Materials | | | 6.7 | |
Consumer Staples | | | 5.2 | |
Financials | | | 5.0 | |
Utilities | | | 3.5 | |
| | | | | |
Sector weightings are subject to change daily and are calculated as a percentage of net assets. The table excludes cash or cash equivalents, any government/sovereign bonds or broad based index hedging securities the Fund may hold.
Calamos High Income Fund
ANNUALIZED RETURN: SINCE INCEPTION (8/2/99) THROUGH 4/30/12
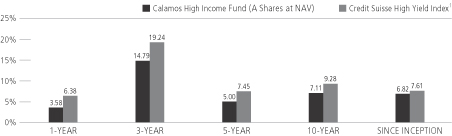
Performance data quoted represents past performance, which is no guarantee of future results. Current performance may be lower or higher than the performance quoted.
The principal value and investment return of an investment will fluctuate so that your shares, when redeemed, may be worth more or less than their original cost. You can obtain performance data current to the most recent month end by visiting www.calamos.com. Average annual total return measures net investment income and capital gain or loss from portfolio investments as an annualized average. All performance shown assumes reinvestment of dividends and capital gains distributions. Performance is for the Fund’s Class A shares at net asset value and does not include the Fund’s maximum front-end sales charge of 4.75%—had it been included, the Fund’s return would have been lower. The Fund also offers Class B, Class C, Class I and Class R shares, the performance of which may vary. Performance shown reflects an expense reimbursement that improved results. Source: State Street Corporation and Mellon Analytical Solutions, LLC.
| | | | |
| 50 | | CALAMOS FAMILY OF FUNDS SEMIANNUAL REPORT | | |
Calamos High Income Fund
GROWTH OF $10,000: FOR 10-YEAR PERIOD ENDED 4/30/12
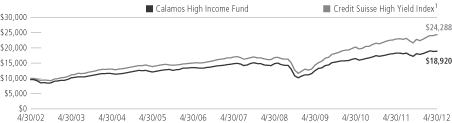
AVERAGE ANNUAL TOTAL RETURN† AS OF 4/30/12
| | | | | | | | | | | | | | | | |
| | | 6
MONTHS | | | 1
YEAR | | | 5
YEARS | | | 10 YEARS
OR ^SINCE
INCEPTION | |
| Class A Shares – Inception 8/2/99 | | | | | | | | | | | | | | | | |
Without Sales Charge | | | 4.87 | % | | | 3.58 | % | | | 5.00 | % | | | 7.11 | % |
With Sales Charge | | | -0.08 | | | | -1.38 | | | | 3.98 | | | | 6.58 | |
| |
| Class B Shares – Inception 12/21/00 | | | | | | | | | | | | | | | | |
Without Sales Charge | | | 4.48 | | | | 2.75 | | | | 4.20 | | | | 6.46 | |
With Sales Charge | | | -0.52 | | | | -2.07 | | | | 3.90 | | | | 6.46 | |
| |
| Class C Shares – Inception 12/21/00 | | | | | | | | | | | | | | | | |
Without Sales Charge | | | 4.54 | | | | 2.80 | | | | 4.21 | | | | 6.31 | |
With Sales Charge | | | 3.54 | | | | 1.83 | | | | 4.21 | | | | 6.31 | |
| |
| Class I Shares – Inception 3/1/02 | | | 4.99 | | | | 3.83 | | | | 5.26 | | | | 7.38 | |
| |
| Class R Shares – Inception 3/1/07 | | | 4.76 | | | | 3.23 | | | | 4.74 | | | | 5.13 | ^ |
| |
Performance data quoted represents past performance, which is no guarantee of future results. Current performance may be lower or higher than the performance quoted. The principal value and investment return of an investment will fluctuate so that your shares, when redeemed, may be worth more or less than their original cost.
Performance of the High Income Fund includes the effects of an overpayment of dividends and/or capital gains distributions to shareholders of certain share Classes of the Fund (and a corresponding capital contribution by Calamos Asset Management, Inc., the predecessor to Calamos Advisors LLC), which increased certain return figures.
| † | Average annual total return measures net investment income and capital gain or loss from portfolio investments as an annualized average assuming reinvestment of dividends and capital gains distributions. Performance shown reflects the effects of an expense reimbursement that improved results and was in effect until March 31, 2003. Load-adjusted returns are adjusted for the maximum front-end sales load of 4.75% for Class A shares and returns for Class B and C shares have been adjusted for the contingent deferred sales charge (CDSC). |
NOTES:
The graph does not reflect the income taxes that you would pay on fund distributions or the redemption of fund shares. Fund performance includes reinvestment of dividends and adjustment for the maximum sales charge for Class A shares. The performance of other classes will vary from the performance of the class shown based on the difference in sales charges and fees paid by shareholders investing in different share classes.
| 1 | The Credit Suisse High Yield Index is an unmanaged index of high-yield debt securities. Index data shown is from 7/31/99, since comparative index data is only available for full monthly periods. Source: Mellon Analytical Solutions, LLC |
Index returns assume reinvestment of dividends and do not reflect deduction of fees and expenses. It is not possible to invest directly in an index.
Calamos Market Neutral Income Fund
| | |
| FUND NASDAQ SYMBOLS |
A Shares | | CVSIX |
B Shares | | CAMNX |
C Shares | | CVSCX |
I Shares | | CMNIX |
R Shares | | CVSRX |
| | | |
|
| FUND CUSIP NUMBERS |
A Shares | | 128119203 |
B Shares | | 128119757 |
C Shares | | 128119849 |
I Shares | | 128119880 |
R Shares | | 128119351 |
| | | |
FUND OBJECTIVE
High current income consistent with stability of principal
INVESTMENT STRATEGY
| | > | | Dynamically combines complementary income-producing strategies such as convertible arbitrage and covered call writing, varying the emphasis of each based on market conditions | |
| | > | | The convertible arbitrage strategy invests in convertible securities and sells short underlying stocks to generate income and hedge against equity market risk | |
| | > | | Through covered call writing, income is generated by writing (selling) options on the portfolio’s equities and market indexes | |
INVESTOR PROFILE
This Fund may be suitable for investors who seek:
| | > | | The potential for an attractive income stream with relative stability of principal | |
| | > | | A strategy designed to provide added diversification and reduced volatility | |
CALAMOS MARKET NEUTRAL INCOME FUND
INVESTMENT TEAM DISCUSSION
The Calamos Investment Management Team discusses the Fund’s performance, strategy and positioning during the six-month period ended April 30, 2012.
Q. What is the Fund’s investment strategy?
A. Calamos Market Neutral Income Fund primarily utilizes two complementary income producing strategies, covered call writing and convertible arbitrage. The Fund seeks to deliver positive returns, regardless of whether the equity market is rising or falling.
In the convertible arbitrage strategy, we invest in convertible securities and short sell the convertibles’ underlying equities to generate income and hedge against risk. Through covered call writing, we seek to enhance Fund returns by selling (“writing”) options on the Fund’s equities and market indexes. We believe that both strategies are advantageous through full market cycles, but we vary the allocation to each strategy based on our assessment of the market environment. The aim of this dynamic allocation approach is to provide attractive returns with a lower risk profile over full market cycles.
Q. How has the Fund performed?
A. Because we believe alternative funds are best utilized within asset allocations as long-term investments, we encourage investors to evaluate performance over longer time periods. Since its inception on September 4, 1990, the Fund has returned 7.07% on an annualized basis (Class A shares at net asset value). For the same period, the Barclays Capital U.S. Government/Credit Bond Index has earned 7.13%, while the Citigroup 30-Day U.S. Treasury Bill Index has earned 3.15%.
For the six-month period ended April 30, 2012, the Fund earned 4.54% versus a 2.50% gain for the Barclays Capital U.S. Government/Credit Bond Index and a 0.01% return for the Citigroup 30-Day U.S. Treasury Bill Index.
Q. How did the strategies on the whole contribute to performance?
A. The covered call and convertible arbitrage strategies both contributed positively to Fund performance during the reporting period. The rising equity market and falling volatility observed during the period was especially favorable to the covered call strategy, which outperformed convertible arbitrage.
Q. How did the covered call strategy contribute?
A. The covered call strategy benefited from strong equity returns over the six-month period, as reflected by the 12.77% return of the S&P 500. The strong equity market supported the return of the Fund’s equity basket that is managed to closely match the performance in the S&P 500. While calls were written approximately 5% out of the money and capped much of the upside performance of the equity basket, the strategy also benefited from premiums collected on the written calls. Additionally, volatility was very high at the beginning of the reporting period with the VIX Index at 29.96 to start
| | | | |
| 52 | | CALAMOS FAMILY OF FUNDS SEMIANNUAL REPORT | | |
Calamos Market Neutral Income Fund
the period before finishing April at 17.15. As such, the Fund benefited early in the reporting period as it sold calls with higher premiums that were generated by higher volatility.
We have seen disparity between put and call premiums, with puts being much more expensive than calls. In response, we had implemented a Treasury hedge strategy that was negatively correlated with the equity markets to serve as a “synthetic put” position that also provided a positive yield carry. The spread between the 2- and 10-year Treasurys narrowed by 9 basis points during the reporting period, which was slightly beneficial to returns.
Q. How did convertible arbitrage contribute to returns?
A. The convertible arbitrage strategy performed well and also benefited from the rising equity market during the period. The convertible market was up 6.52% for the period, as measured by the BofA Merrill Lynch U.S. Convertible Securities Index. Credit spreads also tightened during the period and helped support the bond portion of the convertibles. Two factors that provided a headwind to performance were declining volatility and the low interest rate environment. Declining volatility impacted the embedded option in the convertible, while the near-zero Fed Funds rate meant that there was no interest earned on the cash proceeds received from stocks that were sold short.
Q. Did the allocations to convertible arbitrage and covered call writing change over the period?
A. At the beginning of the reporting period covered call writing reflected 53.8% of the portfolio, while convertible arbitrage reflected 46.2%; at the end of the period, the weighting was 45.9% to the covered calls and 54.1% to convertible arbitrage. While the allocations do show a slight increase to the covered call writing strategy during the period, this was mostly attributed to the outperformance of covered call writing versus convertible arbitrage over the six months.
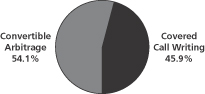
Calamos Market Neutral Income Fund
ANNUALIZED RETURN: SINCE INCEPTION (9/4/90) THROUGH 4/30/12
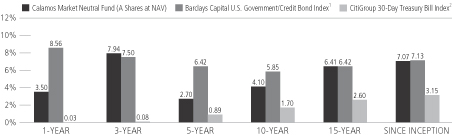
Performance data quoted represents past performance, which is no guarantee of future results. Current performance may be lower or higher than the performance quoted.
The principal value and investment return of an investment will fluctuate so that your shares, when redeemed, may be worth more or less than their original cost. You can obtain performance data current to the most recent month end by visiting www.calamos.com. Average annual total return measures net investment income and capital gain or loss from portfolio investments as an annualized average. All performance shown assumes reinvestment of dividends and capital gains distributions. Performance is for the Fund’s Class A shares at net asset value and does not include the Fund’s maximum front-end sales charge of 4.75%—had it been included, the Fund’s return would have been lower. The Fund also offers Class B, Class C, Class I and Class R shares, the performance of which may vary. Performance shown reflects an expense reimbursement that improved results. Source: State Street Corporation, Lipper, Inc., and Mellon Analytical Solutions, LLC.
Q. What conditions have contributed to the Fund being “soft closed?”
A. The low interest rate environment continues to hamper new convertible issuance. From an issuers’ perspective, a primary reason for including a conversion option in a bond is to receive lower cost financing in exchange. In this environment, issuers have been able to find very attractive financing rates without having to include a conversion option. As such, issuance is near historic lows and has not been sufficient to replace retiring convertible debt. The U.S. convertible market is still roughly $200 billion in size and we do believe that there are ample opportunities for our current shareholders. Should the historically low interest rate environment persist as the Federal Reserve has indicated, however, we believe it prudent to preserve opportunities for our current shareholders.
Q. What is your outlook for the Fund?
A. We expect to see volatile markets in the future as investors sort through many uncertainties that are expected to drive performance. The low interest rate environment may continue to provide some headwind to convertible arbitrage, but we still see arbitrage opportunities available in the market. Spikes in volatility also offer opportunities for call writing to capture higher call premiums. As the Fund derives benefits from volatility, we expect the current environment to be supportive going forward.
| | | | |
| 54 | | CALAMOS FAMILY OF FUNDS SEMIANNUAL REPORT | | |
Calamos Market Neutral Income Fund
GROWTH OF $10,000: FOR 10-YEAR PERIOD ENDED 4/30/12
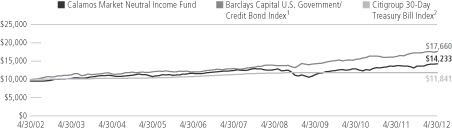
AVERAGE ANNUAL TOTAL RETURN† AS OF 4/30/12
| | | | | | | | | | | | | | | | |
| | | 6
MONTHS | | | 1
YEAR | | | 5
YEARS | | | 10 YEARS
OR ^SINCE
INCEPTION | |
| Class A Shares – Inception 9/4/90 | | | | | | | | | | | | | | | | |
Without Sales Charge | | | 4.54 | % | | | 3.50 | % | | | 2.70 | % | | | 4.10 | % |
With Sales Charge | | | -0.39 | | | | -1.38 | | | | 1.70 | | | | 3.59 | |
| |
| Class B Shares – Inception 9/11/00 | | | | | | | | | | | | | | | | |
Without Sales Charge | | | 4.06 | | | | 2.64 | | | | 1.91 | | | | 3.48 | |
With Sales Charge | | | -0.94 | | | | -2.36 | | | | 1.55 | | | | 3.48 | |
| |
| Class C Shares – Inception 2/16/00 | | | | | | | | | | | | | | | | |
Without Sales Charge | | | 4.16 | | | | 2.71 | | | | 1.92 | | | | 3.32 | |
With Sales Charge | | | 3.16 | | | | 1.71 | | | | 1.92 | | | | 3.32 | |
| |
| Class I Shares – Inception 5/10/00 | | | 4.63 | | | | 3.72 | | | | 2.95 | | | | 4.38 | |
| |
| Class R Shares – Inception 3/1/07 | | | 4.36 | | | | 3.19 | | | | 2.42 | | | | 2.67 | ^ |
| |
Performance data quoted represents past performance, which is no guarantee of future results. Current performance may be lower or higher than the performance quoted. The principal value and investment return of an investment will fluctuate so that your shares, when redeemed, may be worth more or less than their original cost.
Performance of the Market Neutral Income Fund includes the effects of an overpayment of dividends and/or capital gains distributions to shareholders of certain share Classes for the Fund (and a corresponding capital contribution by Calamos Asset Management, Inc., the predecessor to Calamos Advisors LLC), which increased certain return figures.
| † | Average annual total return measures net investment income and capital gain or loss from portfolio investments as an annualized average assuming reinvestment of dividends and capital gains distributions. Performance shown reflects the effects of an expense reimbursement that improved results and was in effect until March 31, 2000. Load-adjusted returns are adjusted for the maximum front-end sales load of 4.75% for Class A shares and returns for Class B and C shares have been adjusted for the contingent deferred sales charge (CDSC). |
NOTES:
The graphs do not reflect the income taxes that you would pay on fund distributions or the redemption of fund shares. Fund performance includes reinvestment of dividends and adjustment for the maximum sales charge for Class A shares. The performance of other classes will vary from the performance of the class shown based on the difference in sales charges and fees paid by shareholders investing in different share classes.
| 1 | The Barclays Capital U.S. Government/Credit Bond Index is comprised of long-term government and investment grade corporate debt securities and is generally considered representative of the performance of the broad U.S. bond market. Index data shown for the Annualized Returns Since Inception graph is from 8/31/90, since comparative index data is only available for full monthly periods. Source: Lipper, Inc. |
| 2 | The Citigroup 30-Day Treasury Bill Index is an unmanaged index generally considered representative of the performance of short-term money instruments. U.S. Treasury Bills are backed by the full faith and credit of the U.S. government and offer a guarantee as to the repayment of principal and interest at maturity. Index data shown for the Annualized Returns Since Inception graph is from 8/31/90, since comparative index data is only available for full monthly periods. Source: Mellon Analytical Solutions, LLC |
Index returns assume reinvestment of dividends and do not reflect deduction of fees and expenses. It is not possible to invest directly in an index.
Expense Overview
EXPENSE OVERVIEW
As a shareholder of a mutual fund, you incur two types of costs. You incur:
1) Transaction costs, including sales charges, or loads, on purchase payment and redemption fees.
2) Ongoing costs, including management fees, distribution and/or service (12b-1) fees and other fund expenses.
The examples in this report are based on an investment of $1,000 made at the beginning of the period and held for the entire period from November 1, 2011 to April 30, 2012. It is intended to help you understand the ongoing costs associated with investing in each mutual fund and to compare these costs with the ongoing costs of investing in other mutual funds.
There are two parts of each Fund’s chart:
Actual
In this part of the chart, you’ll see the actual expenses you would have paid on a $1,000 investment made at the beginning of the period and held for the entire period in each fund from November 1, 2011 to April 30, 2012, the period covered by this report. This chart also shows the actual returns, after expenses, you would have earned during that time. This chart can help you estimate your own expenses. For example, if you invested $8,600 in Class A shares of the fund, simply divide $8,600 by $1,000, then multiply that result by the figure in the Actual Expenses per $1,000 row. In this example, you would multiply 8.6 times the figure.
Hypothetical
In this part of the chart, you’ll see the hypothetical expenses you would have paid on a $1,000 investment from November 1, 2011 to April 30, 2012, and the hypothetical returns, after expenses, you would have earned during that time. The Securities and Exchange Commission (SEC) has established the guidelines for this chart, including the assumed 5% annual rate of return before expenses, which is what you’ll see in the chart. Note that this chart will not help you determine your own expenses, but will help you compare expenses of the fund you own to the expenses of another fund since the information for that fund should be calculated using the same assumptions.
Please note that the expenses shown in the chart are meant to highlight your ongoing costs only and do not include any transactional costs, such as sales charges (loads), redemption fees or exchange fees. Therefore, the second line of the chart is useful in comparing ongoing costs only and will not help you determine the relative total costs of owning different funds. In addition, if these transaction costs were included, your costs would have been higher.
| | | | |
| 56 | | CALAMOS FAMILY OF FUNDS SEMIANNUAL REPORT | | |
Expense Overview
| | | | | | | | | | | | | | | | | | | | |
| The actual and hypothetical examples shown assume a $1,000 investment at the beginning of the period, November 1, 2011 and held through April 30, 2012. | |
| | | CLASS A
SHARES | | | CLASS B
SHARES | | | CLASS C
SHARES | | | CLASS I
SHARES | | | CLASS R
SHARES | |
| CALAMOS GROWTH FUND | |
Actual Expenses per $1,000* | | $ | 6.66 | | | $ | 10.54 | | | $ | 10.54 | | | $ | 5.36 | | | $ | 7.90 | |
Actual – Ending Balance | | $ | 1,092.40 | | | $ | 1,088.50 | | | $ | 1,088.50 | | | $ | 1,093.90 | | | $ | 1,091.20 | |
| | | | |
Hypothetical Expenses per $1,000* | | $ | 6.42 | | | $ | 10.17 | | | $ | 10.17 | | | $ | 5.17 | | | $ | 7.62 | |
Hypothetical – Ending Value | | $ | 1,018.50 | | | $ | 1,014.77 | | | $ | 1,014.77 | | | $ | 1,019.74 | | | $ | 1,017.30 | |
| | | | |
Annualized Expense Ratio | | | 1.28% | | | | 2.03% | | | | 2.03% | | | | 1.03% | | | | 1.52% | |
| CALAMOS VALUE FUND | |
Actual Expenses per $1,000* | | $ | 5.91 | | | $ | 9.75 | | | $ | 9.75 | | | $ | 4.63 | | | $ | 7.19 | |
Actual – Ending Balance | | $ | 1,066.70 | | | $ | 1,062.90 | | | $ | 1,063.00 | | | $ | 1,068.10 | | | $ | 1,065.40 | |
| | | | |
Hypothetical Expenses per $1,000* | | $ | 5.77 | | | $ | 9.52 | | | $ | 9.52 | | | $ | 4.52 | | | $ | 7.02 | |
Hypothetical – Ending Value | | $ | 1,019.14 | | | $ | 1,015.41 | | | $ | 1,015.41 | | | $ | 1,020.39 | | | $ | 1,017.90 | |
| | | | |
Annualized Expense Ratio(1) | | | 1.15% | | | | 1.90% | | | | 1.90% | | | | 0.90% | | | | 1.40% | |
| CALAMOS BLUE CHIP FUND | |
Actual Expenses per $1,000* | | $ | 6.02 | | | $ | 9.93 | | | $ | 9.93 | | | $ | 4.72 | | | $ | 7.33 | |
Actual – Ending Balance | | $ | 1,106.70 | | | $ | 1,102.70 | | | $ | 1,102.60 | | | $ | 1,107.50 | | | $ | 1,105.00 | |
| | | | |
Hypothetical Expenses per $1,000* | | $ | 5.77 | | | $ | 9.52 | | | $ | 9.52 | | | $ | 4.52 | | | $ | 7.02 | |
Hypothetical – Ending Value | | $ | 1,019.14 | | | $ | 1,015.41 | | | $ | 1,015.41 | | | $ | 1,020.39 | | | $ | 1,017.90 | |
| | | | |
Annualized Expense Ratio(1) | | | 1.15% | | | | 1.90% | | | | 1.90% | | | | 0.90% | | | | 1.40% | |
CALAMOS DISCOVERY GROWTH FUND | |
Actual Expenses per $1,000* | | $ | 7.64 | | | $ | 11.45 | | | $ | 11.45 | | | $ | 6.38 | | | $ | 8.92 | |
Actual – Ending Balance | | $ | 1,049.80 | | | $ | 1,046.10 | | | $ | 1,046.10 | | | $ | 1,051.40 | | | $ | 1,049.10 | |
| | | | |
Hypothetical Expenses per $1,000* | | $ | 7.52 | | | $ | 11.26 | | | $ | 11.26 | | | $ | 6.27 | | | $ | 8.77 | |
Hypothetical – Ending Value | | $ | 1,017.40 | | | $ | 1,013.67 | | | $ | 1,013.67 | | | $ | 1,018.65 | | | $ | 1,016.16 | |
| | | | |
Annualized Expense Ratio(1) | | | 1.50% | | | | 2.25% | | | | 2.25% | | | | 1.25% | | | | 1.75% | |
| CALAMOS INTERNATIONAL GROWTH FUND | |
Actual Expenses per $1,000* | | $ | 7.18 | | | $ | 11.00 | | | $ | 11.00 | | | $ | 5.90 | | | $ | 8.46 | |
Actual – Ending Balance | | $ | 1,061.90 | | | $ | 1,058.10 | | | $ | 1,058.10 | | | $ | 1,063.80 | | | $ | 1,061.30 | |
| | | | |
Hypothetical Expenses per $1,000* | | $ | 7.02 | | | $ | 10.77 | | | $ | 10.77 | | | $ | 5.77 | | | $ | 8.27 | |
Hypothetical – Ending Value | | $ | 1,017.90 | | | $ | 1,014.17 | | | $ | 1,014.17 | | | $ | 1,019.14 | | | $ | 1,016.66 | |
| | | | |
Annualized Expense Ratio(1) | | | 1.40% | | | | 2.15% | | | | 2.15% | | | | 1.15% | | | | 1.65% | |
| CALAMOS EVOLVING WORLD GROWTH FUND | |
Actual Expenses per $1,000* | | $ | 7.93 | | | $ | 11.71 | | | $ | 11.77 | | | $ | 6.71 | | | $ | 9.19 | |
Actual – Ending Balance | | $ | 1,043.30 | | | $ | 1,039.00 | | | $ | 1,039.80 | | | $ | 1,044.60 | | | $ | 1,042.60 | |
| | | | |
Hypothetical Expenses per $1,000* | | $ | 7.82 | | | $ | 11.56 | | | $ | 11.61 | | | $ | 6.62 | | | $ | 9.07 | |
Hypothetical – Ending Value | | $ | 1,017.11 | | | $ | 1,013.38 | | | $ | 1,013.33 | | | $ | 1,018.30 | | | $ | 1,015.86 | |
| | | | |
Annualized Expense Ratio | | | 1.56% | | | | 2.31% | | | | 2.32% | | | | 1.32% | | | | 1.81% | |
| * | Expenses for all Fund Classes A, B, C, I and R, are equal to the Fund's annualized expense ratio, multiplied by the average account value over the period, multiplied by 182/366. |
| (1) | Annualized Expense Ratios for Calamos Value Fund, Calamos Blue Chip Fund, Calamos Discovery Growth Fund and Calamos International Growth Fund are adjusted to reflect fee waiver. |
Expense Overview
The actual and hypothetical examples shown assume a $1,000 investment at the beginning of the period, November 1, 2011 and held through April 30, 2012.
| | | | | | | | | | | | | | | | | | | | |
| | | CLASS A
SHARES | | | CLASS B
SHARES | | | CLASS C
SHARES | | | CLASS I
SHARES | | | CLASS R
SHARES | |
| CALAMOS GLOBAL EQUITY FUND | |
Actual Expenses per $1,000* | | $ | 7.23 | | | $ | 11.08 | | | $ | 11.07 | | | $ | 5.94 | | | $ | 8.51 | |
Actual – Ending Balance | | $ | 1,075.80 | | | $ | 1,071.90 | | | $ | 1,071.20 | | | $ | 1,076.10 | | | $ | 1,073.20 | |
| | | | |
Hypothetical Expenses per $1,000* | | $ | 7.02 | | | $ | 10.77 | | | $ | 10.77 | | | $ | 5.77 | | | $ | 8.27 | |
Hypothetical – Ending Value | | $ | 1,017.90 | | | $ | 1,014.17 | | | $ | 1,014.17 | | | $ | 1,019.14 | | | $ | 1,016.66 | |
| | | | |
Annualized Expense Ratio(1) | | | 1.40% | | | | 2.15% | | | | 2.15% | | | | 1.15% | | | | 1.65% | |
| CALAMOS GROWTH AND INCOME FUND | |
Actual Expenses per $1,000* | | $ | 5.47 | | | $ | 9.25 | | | $ | 9.25 | | | $ | 4.21 | | | $ | 6.73 | |
Actual – Ending Balance | | $ | 1,036.80 | | | $ | 1,033.30 | | | $ | 1,033.10 | | | $ | 1,038.30 | | | $ | 1,035.60 | |
| | | | |
Hypothetical Expenses per $1,000* | | $ | 5.42 | | | $ | 9.17 | | | $ | 9.17 | | | $ | 4.17 | | | $ | 6.67 | |
Hypothetical – Ending Value | | $ | 1,019.49 | | | $ | 1,015.76 | | | $ | 1,015.76 | | | $ | 1,020.74 | | | $ | 1,018.25 | |
| | | | |
Annualized Expense Ratio | | | 1.08% | | | | 1.83% | | | | 1.83% | | | | 0.83% | | | | 1.33% | |
| CALAMOS GLOBAL GROWTH AND INCOME FUND | |
Actual Expenses per $1,000* | | $ | 6.65 | | | $ | 10.41 | | | $ | 10.41 | | | $ | 5.40 | | | $ | 7.90 | |
Actual – Ending Balance | | $ | 1,025.80 | | | $ | 1,022.20 | | | $ | 1,023.20 | | | $ | 1,028.10 | | | $ | 1,024.70 | |
| | | | |
Hypothetical Expenses per $1,000* | | $ | 6.62 | | | $ | 10.37 | | | $ | 10.37 | | | $ | 5.37 | | | $ | 7.87 | |
Hypothetical – Ending Value | | $ | 1,018.30 | | | $ | 1,014.57 | | | $ | 1,014.57 | | | $ | 1,019.54 | | | $ | 1,017.06 | |
| | | | |
Annualized Expense Ratio | | | 1.32% | | | | 2.07% | | | | 2.07% | | | | 1.07% | | | | 1.57% | |
| CALAMOS CONVERTIBLE FUND | |
Actual Expenses per $1,000* | | $ | 5.54 | | | $ | 9.26 | | | $ | 9.26 | | | $ | 4.29 | | | $ | 6.78 | |
Actual – Ending Balance | | $ | 1,006.20 | | | $ | 1,002.20 | | | $ | 1,002.10 | | | $ | 1,007.20 | | | $ | 1,005.10 | |
| | | | |
Hypothetical Expenses per $1,000* | | $ | 5.57 | | | $ | 9.32 | | | $ | 9.32 | | | $ | 4.32 | | | $ | 6.82 | |
Hypothetical – Ending Value | | $ | 1,019.34 | | | $ | 1,015.61 | | | $ | 1,015.61 | | | $ | 1,020.59 | | | $ | 1,018.10 | |
| | | | |
Annualized Expense Ratio | | | 1.11% | | | | 1.86% | | | | 1.86% | | | | 0.86% | | | | 1.36% | |
| CALAMOS TOTAL RETURN BOND FUND | |
Actual Expenses per $1,000* | | $ | 4.51 | | | $ | 8.26 | | | $ | 8.26 | | | $ | 3.26 | | | $ | 5.76 | |
Actual – Ending Balance | | $ | 1,016.10 | | | $ | 1,012.40 | | | $ | 1,013.30 | | | $ | 1,018.30 | | | $ | 1,015.80 | |
| | | | |
Hypothetical Expenses per $1,000* | | $ | 4.52 | | | $ | 8.27 | | | $ | 8.27 | | | $ | 3.27 | | | $ | 5.77 | |
Hypothetical – Ending Value | | $ | 1,020.39 | | | $ | 1,016.66 | | | $ | 1,016.66 | | | $ | 1,021.63 | | | $ | 1,019.14 | |
| | | | |
Annualized Expense Ratio(1) | | | 0.90% | | | | 1.65% | | | | 1.65% | | | | 0.65% | | | | 1.15% | |
| CALAMOS HIGH INCOME FUND | |
Actual Expenses per $1,000* | | $ | 6.16 | | | $ | 9.96 | | | $ | 9.97 | | | $ | 4.84 | | | $ | 7.43 | |
Actual – Ending Balance | | $ | 1,048.70 | | | $ | 1,044.80 | | | $ | 1,045.40 | | | $ | 1,049.90 | | | $ | 1,047.60 | |
| | | | |
Hypothetical Expenses per $1,000* | | $ | 6.07 | | | $ | 9.82 | | | $ | 9.82 | | | $ | 4.77 | | | $ | 7.32 | |
Hypothetical – Ending Value | | $ | 1,018.85 | | | $ | 1,015.12 | | | $ | 1,015.12 | | | $ | 1,020.14 | | | $ | 1,017.60 | |
| | | | |
Annualized Expense Ratio | | | 1.21% | | | | 1.96% | | | | 1.96% | | | | 0.95% | | | | 1.46% | |
| CALAMOS MARKET NEUTRAL INCOME FUND | |
Actual Expenses per $1,000* | | $ | 6.00 | | | $ | 9.79 | | | $ | 9.80 | | | $ | 4.73 | | | $ | 7.27 | |
Actual – Ending Balance | | $ | 1,045.40 | | | $ | 1,040.60 | | | $ | 1,041.60 | | | $ | 1,046.30 | | | $ | 1,043.60 | |
| | | | |
Hypothetical Expenses per $1,000* | | $ | 5.92 | | | $ | 9.67 | | | $ | 9.67 | | | $ | 4.67 | | | $ | 7.17 | |
Hypothetical – Ending Value | | $ | 1,019.00 | | | $ | 1,015.27 | | | $ | 1,015.27 | | | $ | 1,020.24 | | | $ | 1,017.75 | |
| | | | |
Annualized Expense Ratio(2) | | | 1.18% | | | | 1.93% | | | | 1.93% | | | | 0.93% | | | | 1.43% | |
| * | Expenses for all Fund Classes A, B, C, I and R, are equal to the Fund's annualized expense ratio, multiplied by the average account value over the period, multiplied by 182/366. |
| (1) | Annualized Expense Ratios for Calamos Global Equity Fund and Calamos Total Return Bond Fund are adjusted to reflect fee waiver. |
| (2) | Includes 0.04% related to dividend and interest expense on short positions. |
| | | | |
| 58 | | CALAMOS FAMILY OF FUNDS SEMIANNUAL REPORT | | |
Growth Fund Schedule of Investments April 30, 2012 (Unaudited)
| | | | | | | | | | |
NUMBER OF
SHARES | | | | | | | VALUE | |
| | | | | | | | | | |
| | | | | | | | | | |
| | COMMON STOCKS (96.3%) | |
| | | | | | Consumer Discretionary (14.1%) | |
| | 1,432,500 | | | | | Amazon.com, Inc.#~ | | $ | 332,196,750 | |
| | 1,320,942 | | | | | Apollo Group, Inc. - Class A# | | | 46,523,577 | |
| | 560,000 | | | | | Bed Bath & Beyond, Inc.# | | | 39,418,400 | |
| | 610,000 | | | | | Coach, Inc.~ | | | 44,627,600 | |
| | 1,247,879 | | | | | Francesca’s Holdings Corp.# | | | 39,121,007 | |
| | 1,300,000 | | | | | Gap, Inc. | | | 37,050,000 | |
| | 870,894 | | | | | Harman International Industries, Inc. | | | 43,178,925 | |
| | 1,040,000 | | | | | O’Reilly Automotive, Inc.# | | | 109,678,400 | |
| | 368,700 | | | | | Priceline.com, Inc.# | | | 280,514,334 | |
| | 895,000 | | | | | Starbucks Corp. | | | 51,355,100 | |
| | 600,000 | | | | | Tempur-Pedic International, Inc.# | | | 35,304,000 | |
| | 555,000 | | | | | Tiffany & Company | | | 37,995,300 | |
| | | | | | | | | | |
| | | | | | | | | 1,096,963,393 | |
| | | | | | | | | | |
| | | | | | Consumer Staples (3.3%) | |
| | 2,700,000 | | | | | Companhia de Bebidas das Americas~ | | | 113,346,000 | |
| | 1,019,000 | | | | | Mead Johnson Nutrition Company | | | 87,185,640 | |
| | 813,400 | | | | | Monster Beverage Corp.# | | | 52,838,464 | |
| | | | | | | | | | |
| | | | | | | | | 253,370,104 | |
| | | | | | | | | | |
| | | | | | Energy (9.3%) | |
| | 300,000 | | | | | Apache Corp. | | | 28,782,000 | |
| | 398,000 | | | | | CNOOC, Ltd. | | | 84,236,700 | |
| | 425,000 | | | | | Concho Resources, Inc.# | | | 45,551,500 | |
| | 750,000 | | | | | EQT Corp. | | | 37,365,000 | |
| | 1,050,000 | | | | | FMC Technologies, Inc.# | | | 49,350,000 | |
| | 1,240,000 | | | | | Helmerich & Payne, Inc. | | | 63,723,600 | |
| | 2,090,000 | | | | | National Oilwell Varco, Inc. | | | 158,338,400 | |
| | 750,000 | | | | | Occidental Petroleum Corp. | | | 68,415,000 | |
| | 750,000 | | | | | Oceaneering International, Inc. | | | 38,722,500 | |
| | 500,000 | | | | | Rosetta Resources, Inc.# | | | 25,135,000 | |
| | 1,610,000 | | | | | Schlumberger, Ltd. | | | 119,365,400 | |
| | | | | | | | | | |
| | | | | | | | | 718,985,100 | |
| | | | | | | | | | |
| | | | | | Financials (2.7%) | |
| | 760,000 | | | | | American Express Company | | | 45,759,600 | |
| | 2,573,620 | | | | | Discover Financial Services | | | 87,245,718 | |
| | 600,000 | | | | | IntercontinentalExchange, Inc.# | | | 79,824,000 | |
| | | | | | | | | | |
| | | | | | | | | 212,829,318 | |
| | | | | | | | | | |
| | | | | | Health Care (9.9%) | |
| | 1,285,000 | | | | | Celgene Corp.#~ | | | 93,702,200 | |
| | 168,666 | | | | | Cerner Corp.# | | | 13,677,126 | |
| | 975,000 | | | | | Cubist Pharmaceuticals, Inc.# | | | 41,223,000 | |
| | 1,342,307 | | | | | Illumina, Inc.# | | | 59,772,931 | |
| | 430,000 | | | | | Intuitive Surgical, Inc.# | | | 248,626,000 | |
| | 610,000 | | | | | Johnson & Johnson | | | 39,704,900 | |
| | | | | | | | | | |
NUMBER OF
SHARES | | | | | | | VALUE | |
| | | | | | | | | | |
| | 850,000 | | | | | Life Technologies Corp.# | | $ | 39,406,000 | |
| | 575,000 | | | | | Novo Nordisk, A/S | | | 84,536,500 | |
| | 336,048 | | | DKK | | Novo Nordisk, A/S - Class B | | | 49,541,207 | |
| | 274,387 | | | | | Perrigo Company | | | 28,783,196 | |
| | 950,000 | | | | | Questcor Pharmaceuticals, Inc.# | | | 42,655,000 | |
| | 1,600,000 | | | | | Seattle Genetics, Inc.# | | | 31,632,000 | |
| | | | | | | | | | |
| | | | | | | | | 773,260,060 | |
| | | | | | | | | | |
| | | | | | Industrials (7.7%) | |
| | 4,000,000 | | | CHF | | ABB, Ltd.# | | | 72,891,533 | |
| | 680,000 | | | | | Acacia Research Corp.# | | | 27,880,000 | |
| | 1,725,000 | | | | | AGCO Corp.# | | | 80,333,250 | |
| | 1,244,000 | | | | | Dover Corp. | | | 77,949,040 | |
| | 1,538,000 | | | | | Eaton Corp. | | | 74,100,840 | |
| | 65,000 | | | | | Expeditors International of Washington, Inc. | | | 2,600,000 | |
| | 932,300 | | | | | Fluor Corp. | | | 53,840,325 | |
| | 950,000 | | | | | J.B. Hunt Transport Services, Inc. | | | 52,563,500 | |
| | 890,000 | | | | | Parker-Hannifin Corp. | | | 78,044,100 | |
| | 375,000 | | | | | WW Grainger, Inc. | | | 77,932,500 | |
| | | | | | | | | | |
| | | | | | | | | 598,135,088 | |
| | | | | | | | | | |
| | | | | | Information Technology (40.9%) | |
| | 1,409,000 | | | | | Accenture, PLC - Class A~ | | | 91,514,550 | |
| | 2,200,000 | | | | | Akamai Technologies, Inc.# | | | 71,720,000 | |
| | 617,750 | | | | | Apple, Inc.#~ | | | 360,914,260 | |
| | 1,270,000 | | | | | Ariba, Inc.#~ | | | 48,514,000 | |
| | 970,000 | | | | | ASML Holding, NV | | | 49,460,300 | |
| | 1,100,000 | | | | | Avago Technologies, Ltd. | | | 37,928,000 | |
| | 1,887,082 | | | | | Check Point Software Technologies, Ltd.# | | | 109,696,077 | |
| | 1,061,000 | | | | | Cognizant Technology Solutions Corp. - Class A# | | | 77,792,520 | |
| | 1,170,000 | | | | | CommVault Systems, Inc.# | | | 60,921,900 | |
| | 975,000 | | | | | eBay, Inc.# | | | 40,023,750 | |
| | 2,750,000 | | | | | EMC Corp.#~ | | | 77,577,500 | |
| | 340,000 | | | | | F5 Networks, Inc.# | | | 45,536,200 | |
| | 3,055,000 | | | | | Fortinet, Inc.# | | | 79,796,600 | |
| | 507,250 | | | | | Google, Inc.# | | | 307,002,917 | |
| | 2,200,000 | | | JPY | | Gree, Inc. | | | 59,502,620 | |
| | 815,000 | | | | | Informatica Corp.# | | | 37,506,300 | |
| | 700,000 | | | | | Intuit, Inc. | | | 40,579,000 | |
| | 1,100,000 | | | | | KLA-Tencor Corp. | | | 57,365,000 | |
| | 265,000 | | | | | MasterCard, Inc. - Class A | | | 119,851,550 | |
| | 1,550,000 | | | | | Nuance Communications, Inc.# | | | 37,882,000 | |
| | 8,400,000 | | | | | Oracle Corp. | | | 246,876,000 | |
| | 364,100 | | | | | Parametric Technology Corp.# | | | 7,857,278 | |
| | 4,420,000 | | | | | QUALCOMM, Inc. | | | 282,172,800 | |
| | 2,060,000 | | | | | Rackspace Hosting, Inc.# | | | 119,665,400 | |
| | | | | | |
| See accompanying Notes to Schedule of Investments | | www.calamos.com | | | 59 | |
Growth Fund Schedule of Investments April 30, 2012 (Unaudited)
| | | | | | | | | | |
NUMBER OF
SHARES | | | | | | | VALUE | |
| | | | | | | | | | |
| | 1,685,000 | | | | | Red Hat, Inc.# | | $ | 100,442,850 | |
| | 2,150,000 | | | | | Riverbed Technology, Inc.# | | | 42,419,500 | |
| | 645,000 | | | | | Salesforce.com, Inc.# | | | 100,445,850 | |
| | 685,000 | | | | | SAP, AG | | | 45,408,650 | |
| | 2,050,000 | | | | | Skyworks Solutions, Inc.# | | | 55,637,000 | |
| | 975,000 | | | | | Solarwinds, Inc.# | | | 45,737,250 | |
| | 775,000 | | | | | Teradata Corp.# | | | 54,079,500 | |
| | 2,700,000 | | | | | TIBCO Software, Inc.# | | | 88,830,000 | |
| | 975,000 | | | | | VeriFone Systems, Inc.# | | | 46,449,000 | |
| | 1,240,000 | | | | | VMware, Inc. - Class A# | | | 138,532,800 | |
| | | | | | | | | | |
| | | | | | | | | 3,185,638,922 | |
| | | | | | | | | | |
| | | | | | Materials (7.8%) | |
| | 500,000 | | | | | Agrium, Inc. | | | 43,950,000 | |
| | 1,575,000 | | | GBP | | Anglo American, PLC | | | 60,865,505 | |
| | 3,575,000 | | | | | Barrick Gold Corp.~ | | | 144,537,250 | |
| | 1,300,000 | | | | | Cliffs Natural Resources, Inc. | | | 80,938,000 | |
| | 740,000 | | | | | Goldcorp, Inc. | | | 28,312,400 | |
| | 1,025,000 | | | | | Molycorp, Inc.# | | | 27,736,500 | |
| | 1,310,000 | | | | | Mosaic Company | | | 69,194,200 | |
| | 780,000 | | | | | Rio Tinto, PLC | | | 43,734,600 | |
| | 525,000 | | | | | Royal Gold, Inc. | | | 32,529,000 | |
| | 5,100,000 | | | | | Yamana Gold, Inc. | | | 74,970,000 | |
| | | | | | | | | | |
| | | | | | | | | 606,767,455 | |
| | | | | | | | | | |
| | | | | | Telecommunication Services (0.6%) | |
| | 1,513,080 | | | | | Tim Participacoes, SA | | | 45,286,484 | |
| | | | | | | | | | |
| | | | | | TOTAL COMMON STOCKS
(Cost $5,718,823,925) | | | 7,491,235,924 | |
| | | | | | | | | | |
| | | | | | | | | | |
NUMBER OF
CONTRACTS | | | | | | | VALUE | |
| | PURCHASED OPTIONS (0.4%)# | |
| | | | | | Consumer Discretionary (0.0%) | |
| | 12,900 | | | | | Amazon.com, Inc. Put, 07/21/12, Strike $140.00 | | | 561,150 | |
| | 3,500 | | | | | Priceline.com, Inc. Put, 07/21/12, Strike $505.00 | | | 936,250 | |
| | | | | | | | | | |
| | | | | | | | | 1,497,400 | |
| | | | | | | | | | |
| | | | | | Information Technology (0.4%) | |
| | 6,400 | | | | | Apple, Inc. Put, 01/19/13, Strike $535.00 | | | 28,768,000 | |
| | | | | | | | | | |
| | | | | | TOTAL PURCHASED OPTIONS
(Cost $36,565,294) | | | 30,265,400 | |
| | | | | | | | | | |
| | | | | | | | | | |
NUMBER OF
SHARES | | | | | | | VALUE | |
| | | | | | | | | | |
| | SHORT TERM INVESTMENT (4.7%) | |
| | 366,920,872 | | | | | Fidelity Prime Money Market Fund - Institutional Class (Cost $366,920,872) | | $ | 366,920,872 | |
| | | | | | | | | | |
| TOTAL INVESTMENTS (101.4%)
(Cost $6,122,310,091) | | | 7,888,422,196 | |
| | | | | | | | | | |
| |
| | LIABILITIES, LESS OTHER ASSETS (-1.4%) | | | (105,853,185 | ) |
| | | | | | | | | | |
| |
| | NET ASSETS (100.0%) | | $ | 7,782,569,011 | |
| | | | | | | | | | |
| | | | | | | | | | |
NUMBER OF
CONTRACTS | | | | | | | VALUE | |
| | WRITTEN OPTION (-0.2%)# | |
| | | | | | Consumer Discretionary (-0.2%) | |
| | 3,694 | | | | | Amazon.com, Inc. Call, 07/21/12, Strike $190.00 (Premium $5,242,394) | | | (16,429,065 | ) |
| | | | | | | | | | |
FORWARD FOREIGN CURRENCY CONTRACTS
| | | | | | | | | | | | | | | | |
COUNTER
PARTY | | SHORT CONTRACTS | | SETTLEMENT DATE | | LOCAL CURRENCY | | | CURRENT
VALUE | | | UNREALIZED
GAIN/LOSS | |
| Northern Trust Company | | Brazilian Real | | 07/19/12 | | | 188,413,000 | | | $ | 97,416,369 | | | $ | 3,968,155 | |
| Northern Trust Company | | British Pound Sterling | | 07/19/12 | | | 59,445,000 | | | | 96,428,155 | | | | (2,168,299 | ) |
| Citibank N.A. | | Danish Krone | | 07/19/12 | | | 689,998,000 | | | | 122,845,604 | | | | (1,403,430 | ) |
| UBS AG | | European Monetary Unit | | 07/19/12 | | | 32,890,000 | | | | 43,554,773 | | | | (523,273 | ) |
| Citibank N.A. | | Hong Kong Dollar | | 07/19/12 | | | 488,879,000 | | | | 63,029,486 | | | | (6,184 | ) |
| Barclays Bank PLC | | Japanese Yen | | 07/19/12 | | | 4,288,877,000 | | | | 53,758,349 | | | | (744,849 | ) |
| Barclays Bank PLC | | Swiss Franc | | 07/19/12 | | | 71,304,000 | | | | 78,635,743 | | | | (1,066,473 | ) |
| | | | | | | | | | | | | | | | |
| | | | | | | | | | | | | | $ | (1,944,353 | ) |
| | | | | | | | | | | | | | | | |
NOTES TO SCHEDULE OF INVESTMENTS
| # | Non-income producing security. |
| ~ | Security, or portion of security, is segregated as collateral (or potential collateral for future transactions) for written options. The aggregate value of such securities is $128,747,658. |
FOREIGN CURRENCY ABBREVIATIONS
| | |
| CHF | | Swiss Franc |
| DKK | | Danish Krone |
| GBP | | British Pound Sterling |
| JPY | | Japanese Yen |
Note: Value for securities denominated in foreign currencies is shown in U.S. dollars. The date on options represents the expiration date of the option contract. The option contract may be exercised at any date on or before the date shown.
| | | | |
| 60 | | CALAMOS FAMILY OF FUNDS SEMIANNUAL REPORT | | See accompanying Notes to Financial Statements |
Value Fund Schedule of Investments April 30, 2012 (Unaudited)
| | | | | | | | | | |
NUMBER OF
SHARES | | | | | | | VALUE | |
| | | | | | | | | | |
| | | | | | | | | | |
| | COMMON STOCKS (99.2%) | |
| | | | | | Consumer Discretionary (12.7%) | |
| | 33,670 | | | | | Best Buy Company, Inc. | | $ | 743,097 | |
| | 40,000 | | | | | Carnival Corp. | | | 1,299,600 | |
| | 6,000 | | | | | Nike, Inc. - Class B | | | 671,220 | |
| | 42,000 | | | JPY | | Nikon Corp. | | | 1,244,809 | |
| | 35,700 | | | | | TJX Companies, Inc. | | | 1,489,047 | |
| | | | | | | | | | |
| | | | | | | | | 5,447,773 | |
| | | | | | | | | | |
| | | | | | Consumer Staples (14.4%) | |
| | 26,500 | | | | | Coca-Cola Company~ | | | 2,022,480 | |
| | 18,100 | | | EUR | | Danone, SA | | | 1,274,224 | |
| | 40,500 | | | GBP | | Diageo, PLC | | | 1,021,542 | |
| | 13,100 | | | CHF | | Nestlé, SA | | �� | 802,890 | |
| | 17,850 | | | | | Wal-Mart Stores, Inc. | | | 1,051,543 | |
| | | | | | | | | | |
| | | | | | | | | 6,172,679 | |
| | | | | | | | | | |
| | | | | | Energy (6.3%) | |
| | 16,500 | | | | | Baker Hughes, Inc. | | | 727,815 | |
| | 44,000 | | | | | Chesapeake Energy Corp. | | | 811,360 | |
| | 6,000 | | | | | ConocoPhillips | | | 429,780 | |
| | 10,300 | | | | | Devon Energy Corp. | | | 719,455 | |
| | | | | | | | | | |
| | | | | | | | | 2,688,410 | |
| | | | | | | | | | |
| | | | | | Financials (9.5%) | |
| | 8,800 | | | | | Franklin Resources, Inc. | | | 1,104,488 | |
| | 20,000 | | | | | Legg Mason, Inc. | | | 521,400 | |
| | 48,000 | | | | | Leucadia National Corp. | | | 1,193,280 | |
| | 11,300 | | | | | Prudential Financial, Inc. | | | 684,102 | |
| | 9,000 | | | | | Travelers Companies, Inc. | | | 578,880 | |
| | | | | | | | | | |
| | | | | | | | | 4,082,150 | |
| | | | | | | | | | |
| | | | | | Health Care (15.8%) | |
| | 10,500 | | | | | Amgen, Inc. | | | 746,655 | |
| | 8,900 | | | | | Biogen Idec, Inc.# | | | 1,192,689 | |
| | 27,500 | | | | | Johnson & Johnson | | | 1,789,975 | |
| | 16,200 | | | | | Merck & Company, Inc. | | | 635,688 | |
| | 13,750 | | | CHF | | Novartis, AG | | | 759,223 | |
| | 46,500 | | | | | Pfizer, Inc. | | | 1,066,245 | |
| | 13,300 | | | | | Teva Pharmaceutical Industries, Ltd. | | | 608,342 | |
| | | | | | | | | | |
| | | | | | | | | 6,798,817 | |
| | | | | | | | | | |
| | | | | | Industrials (4.1%) | |
| | 11,000 | | | | | Dover Corp. | | | 689,260 | |
| | 4,700 | | | | | Eaton Corp. | | | 226,446 | |
| | 5,700 | | | | | FedEx Corp.~ | | | 502,968 | |
| | 3,800 | | | EUR | | Siemens, AG | | | 352,718 | |
| | | | | | | | | | |
| | | | | | | | | 1,771,392 | |
| | | | | | | | | | |
| | | | | | Information Technology (34.2%) | |
| | 12,000 | | | | | Automatic Data Processing, Inc. | | | 667,440 | |
| | 24,000 | | | | | CA, Inc. | | | 634,080 | |
| | | | | | | | | | |
NUMBER OF
SHARES | | | | | | | VALUE | |
| | | | | | | | | | |
| | 15,500 | | | | | Canon, Inc. | | $ | 703,080 | |
| | 64,600 | | | | | Cisco Systems, Inc. | | | 1,301,690 | |
| | 35,000 | | | | | Corning, Inc. | | | 502,250 | |
| | 96,250 | | | | | Dell, Inc.~# | | | 1,575,613 | |
| | 44,400 | | | | | eBay, Inc.# | | | 1,822,620 | |
| | 66,350 | | | | | Microsoft Corp. | | | 2,124,527 | |
| | 60,000 | | | | | Oracle Corp. | | | 1,763,400 | |
| | 24,800 | | | | | QUALCOMM, Inc. | | | 1,583,232 | |
| | 16,000 | | | | | SAP, AG | | | 1,060,640 | |
| | 60,000 | | | | | Yahoo!, Inc.# | | | 932,400 | |
| | | | | | | | | | |
| | | | | | | | | 14,670,972 | |
| | | | | | | | | | |
| | | | | | Materials (2.2%) | |
| | 11,000 | | | | | Agrium, Inc. | | | 966,900 | |
| | | | | | | | | | |
| | | | | | TOTAL COMMON STOCKS (Cost $36,310,629) | | | 42,599,093 | |
| | | | | | | | | | |
| | | | | | | | | | |
| | SHORT TERM INVESTMENT (1.0%) | |
| | 416,677 | | | | | Fidelity Prime Money Market Fund - Institutional Class
(Cost $416,677) | | | 416,677 | |
| | | | | | | | | | |
| TOTAL INVESTMENTS (100.2%)
(Cost $36,727,306) | | | 43,015,770 | |
| | | | | | | | | | |
| |
| | LIABILITIES, LESS OTHER ASSETS (-0.2%) | | | (96,270 | ) |
| | | | | | | | | | |
| |
| | NET ASSETS (100.0%) | | $ | 42,919,500 | |
| | | | | | | | | | |
FORWARD FOREIGN CURRENCY CONTRACTS
| | | | | | | | | | | | | | | | |
COUNTER
PARTY | | SHORT
CONTRACTS | | SETTLEMENT
DATE | | LOCAL
CURRENCY | | | CURRENT
VALUE | | | UNREALIZED
GAIN/LOSS | |
| Northern Trust Company | | British Pound Sterling | | 07/19/12 | | | 581,000 | | | $ | 942,464 | | | $ | (21,192 | ) |
| UBS AG | | European Monetary Unit | | 07/19/12 | | | 1,783,000 | | | | 2,361,148 | | | | (28,367 | ) |
| Barclays Bank PLC | | Japanese Yen | | 07/19/12 | | | 152,748,000 | | | | 1,914,599 | | | | (26,528 | ) |
| Barclays Bank PLC | | Swiss Franc | | 07/19/12 | | | 1,340,000 | | | | 1,477,784 | | | | (20,042 | ) |
| | | | | | | | | | | | | | | | |
| | | | | | | | | | | | | | $ | (96,129 | ) |
| | | | | | | | | | | | | | | | |
NOTES TO SCHEDULE OF INVESTMENTS
| ~ | Security, or portion of security, is segregated as collateral (or potential collateral for future transactions) for written options. The aggregate value of such securities is $742,116. |
| # | Non-income producing security. |
FOREIGN CURRENCY ABBREVIATIONS
| | |
| CHF | | Swiss Franc |
| EUR | | European Monetary Unit |
| GBP | | British Pound Sterling |
| JPY | | Japanese Yen |
Note: Value for securities denominated in foreign currencies is shown in U.S. dollars.
| | | | | | |
| See accompanying Notes to Financial Statements | | www.calamos.com | | | 61 | |
Blue Chip Fund Schedule of Investments April 30, 2012 (Unaudited)
| | | | | | | | | | |
NUMBER OF
SHARES | | | | | | | VALUE | |
| | | | | | | | | | |
| | | | | | | | | | |
| | COMMON STOCKS (98.0%) | |
| | | | | | Consumer Discretionary (13.7%) | |
| | 10,075 | | | | | Amazon.com, Inc.# | | $ | 2,336,393 | |
| | 4,900 | | | | | Bed Bath & Beyond, Inc.# | | | 344,911 | |
| | 8,650 | | | | | Coach, Inc. | | | 632,834 | |
| | 15,300 | | | | | Nike, Inc. - Class B | | | 1,711,611 | |
| | 2,750 | | | | | Priceline.com, Inc.#~ | | | 2,092,255 | |
| | 10,500 | | | | | Starbucks Corp. | | | 602,490 | |
| | 20,000 | | | | | TJX Companies, Inc. | | | 834,200 | |
| | 10,200 | | | | | Yum! Brands, Inc. | | | 741,846 | |
| | | | | | | | | | |
| | | | | | | | | 9,296,540 | |
| | | | | | | | | | |
| | | | | | Consumer Staples (5.4%) | |
| | 29,350 | | | | | Coca-Cola Company~ | | | 2,239,992 | |
| | 5,150 | | | | | Herbalife, Ltd. | | | 362,148 | |
| | 12,575 | | | | | Mead Johnson Nutrition Company | | | 1,075,917 | |
| | | | | | | | | | |
| | | | | | | | | 3,678,057 | |
| | | | | | | | | | |
| | | | | | Energy (10.6%) | |
| | 9,700 | | | | | Chevron Corp. | | | 1,033,632 | |
| | 18,150 | | | | | Exxon Mobil Corp. | | | 1,567,071 | |
| | 15,400 | | | | | Helmerich & Payne, Inc. | | | 791,406 | |
| | 14,550 | | | | | National Oilwell Varco, Inc. | | | 1,102,308 | |
| | 10,500 | | | | | Occidental Petroleum Corp. | | | 957,810 | |
| | 23,150 | | | | | Schlumberger, Ltd. | | | 1,716,341 | |
| | | | | | | | | | |
| | | | | | | | | 7,168,568 | |
| | | | | | | | | | |
| | | | | | Financials (2.3%) | |
| | 12,100 | | | | | American Express Company | | | 728,541 | |
| | 6,500 | | | | | Franklin Resources, Inc. | | | 815,815 | |
| | | | | | | | | | |
| | | | | | | | | 1,544,356 | |
| | | | | | | | | | |
| | | | | | Health Care (12.1%) | |
| | 4,800 | | | | | Amgen, Inc. | | | 341,328 | |
| | 18,700 | | | | | Celgene Corp.# | | | 1,363,604 | |
| | 3,400 | | | | | Intuitive Surgical, Inc.# | | | 1,965,880 | |
| | 21,700 | | | | | Johnson & Johnson | | | 1,412,453 | |
| | 21,000 | | | | | Novo Nordisk, A/S | | | 3,087,420 | |
| | | | | | | | | | |
| | | | | | | | | 8,170,685 | |
| | | | | | | | | | |
| | | | | | Industrials (6.8%) | |
| | 11,500 | | | | | 3M Company | | | 1,027,640 | |
| | 32,250 | | | | | ABB, Ltd.# | | | 608,558 | |
| | 8,000 | | | | | Danaher Corp. | | | 433,760 | |
| | 17,175 | | | | | Dover Corp. | | | 1,076,185 | |
| | 22,525 | | | | | Eaton Corp. | | | 1,085,254 | |
| | 11,700 | | | JPY | | Komatsu, Ltd. | | | 336,726 | |
| | | | | | | | | | |
| | | | | | | | | 4,568,123 | |
| | | | | | | | | | |
| | | | | | Information Technology (40.8%) | |
| | 33,100 | | | | | Accenture, PLC - Class A | | | 2,149,845 | |
| | 5,060 | | | | | Apple, Inc.#~ | | | 2,956,254 | |
| | | | | | | | | | |
NUMBER OF
SHARES | | | | | | | VALUE | |
| | | | | | | | | | |
| | 18,500 | | | | | Autodesk, Inc.# | | $ | 728,345 | |
| | 12,328 | | | | | Check Point Software Technologies, Ltd.# | | | 716,627 | |
| | 58,350 | | | | | Cisco Systems, Inc. | | | 1,175,753 | |
| | 58,000 | | | | | eBay, Inc.# | | | 2,380,900 | |
| | 65,275 | | | | | EMC Corp.# | | | 1,841,408 | |
| | 4,280 | | | | | Google, Inc.# | | | 2,590,384 | |
| | 3,500 | | | | | International Business Machines Corp. | | | 724,780 | |
| | 6,500 | | | | | Intuit, Inc. | | | 376,805 | |
| | 3,975 | | | | | MasterCard, Inc. - Class A | | | 1,797,773 | |
| | 77,000 | | | | | Oracle Corp. | | | 2,263,030 | |
| | 40,800 | | | | | QUALCOMM, Inc. | | | 2,604,672 | |
| | 8,425 | | | | | Salesforce.com, Inc.# | | | 1,312,025 | |
| | 620 | | | KRW | | Samsung Electronics Company, Ltd. | | | 758,856 | |
| | 15,800 | | | | | SAP, AG | | | 1,047,382 | |
| | 238,000 | | | TWD | | Taiwan Semiconductor Manufacturing Company, Ltd. | | | 703,442 | |
| | 5,500 | | | | | Teradata Corp.# | | | 383,790 | |
| | 9,500 | | | | | VMware, Inc. - Class A# | | | 1,061,340 | |
| | | | | | | | | | |
| | | | | | | | | 27,573,411 | |
| | | | | | | | | | |
| | | | | | Materials (5.0%) | |
| | 26,950 | | | | | Barrick Gold Corp. | | | 1,089,588 | |
| | 4,950 | | | | | Cliffs Natural Resources, Inc. | | | 308,187 | |
| | 18,750 | | | | | Goldcorp, Inc. | | | 717,375 | |
| | 11,150 | | | | | Newmont Mining Corp. | | | 531,298 | |
| | 12,600 | | | | | Rio Tinto, PLC | | | 706,482 | |
| | | | | | | | | | |
| | | | | | | | | 3,352,930 | |
| | | | | | | | | | |
| | | | | | Telecommunication Services (1.3%) | |
| | 29,129 | | | | | Tim Participacoes, SA | | | 871,831 | |
| | | | | | | | | | |
| | | | | | TOTAL COMMON STOCKS (Cost $50,875,261) | | | 66,224,501 | |
| | | | | | | | | | |
| | | | | | | | | | |
NUMBER OF
CONTRACTS | | | | | | | VALUE | |
| | PURCHASED OPTIONS (0.4%)# | |
| | | | | | Consumer Discretionary (0.0%) | | | | |
| | 100 | | | | | Amazon.com, Inc. Put, 07/21/12, Strike $140.00 | | | 4,350 | |
| | 28 | | | | | Priceline.com, Inc. Put, 07/21/12, Strike $505.00 | | | 7,490 | |
| | | | | | | | | | |
| | | | | | | | | 11,840 | |
| | | | | | | | | | |
| | | | | | Information Technology (0.4%) | | | | |
| | 55 | | | | | Apple, Inc. Put, 01/19/13, Strike $535.00 | | | 247,225 | |
| | | | | | | | | | |
| | | | | | TOTAL PURCHASED OPTIONS (Cost $307,819) | | | 259,065 | |
| | | | | | | | | | |
| | | | |
| 62 | | CALAMOS FAMILY OF FUNDS SEMIANNUAL REPORT | | See accompanying Notes to Schedule of Investments |
Blue Chip Fund Schedule of Investments April 30, 2012 (Unaudited)
| | | | | | | | | | |
NUMBER OF
SHARES | | | | | | | VALUE | |
| | | | | | | | | | |
| | SHORT TERM INVESTMENT (4.0%) | |
| | 2,703,903 | | | | | Fidelity Prime Money Market Fund - Institutional Class (Cost $2,703,903) | | $ | 2,703,903 | |
| | | | | | | | | | |
| TOTAL INVESTMENTS (102.4%)
(Cost $53,886,983) | | | 69,187,469 | |
| | | | | | | | | | |
| |
| | LIABILITIES, LESS OTHER ASSETS (-2.4%) | | | (1,591,752 | ) |
| | | | | | | | | | |
| |
| | NET ASSETS (100.0%) | | $ | 67,595,717 | |
| | | | | | | | | | |
| | | | | | | | | | |
NUMBER OF
CONTRACTS | | | | | | | VALUE | |
| | WRITTEN OPTION (-0.2%)# | |
| | | | | | Consumer Discretionary (-0.2%) | | | | |
| | 28 | | | | | Amazon.com, Inc.
Call, 07/21/12, Strike $190.00
(Premium $39,733) | | | (124,530 | ) |
| | | | | | | | | | |
FORWARD FOREIGN CURRENCY CONTRACTS
| | | | | | | | | | | | | | | | |
COUNTER
PARTY | | SHORT
CONTRACTS | | SETTLEMENT
DATE | | LOCAL
CURRENCY | | | CURRENT
VALUE | | | UNREALIZED
GAIN/LOSS | |
| Northern Trust Company | | Brazilian Real | | 07/19/12 | | | 1,180,000 | | | $ | 610,103 | | | $ | 24,852 | |
| Northern Trust Company | | British Pound Sterling | | 07/19/12 | | | 412,000 | | | | 668,322 | | | | (15,028 | ) |
| Citibank N.A. | | Danish Krone | | 07/19/12 | | | 15,919,000 | | | | 2,834,181 | | | | (32,379 | ) |
| UBS AG | | European Monetary Unit | | 07/19/12 | | | 757,000 | | | | 1,002,462 | | | | (12,044 | ) |
| Barclays Bank PLC | | Japanese Yen | | 07/19/12 | | | 26,798,000 | | | | 335,896 | | | | (960 | ) |
| Citibank N.A. | | New Taiwanese Dollar | | 07/19/12 | | | 12,938,000 | | | | 443,176 | | | | (3,123 | ) |
| Northern Trust Company | | South Korean Won | | 07/19/12 | | | 566,145,000 | | | | 498,384 | | | | (1,765 | ) |
| Barclays Bank PLC | | Swiss Franc | | 07/19/12 | | | 575,000 | | | | 634,124 | | | | (8,600 | ) |
| | | | | | | | | | | | | | | | |
| | | | | | | | | | | | | | $ | (49,047 | ) |
| | | | | | | | | | | | | | | | |
NOTES TO SCHEDULE OF INVESTMENTS
| # | Non-income producing security. |
| ~ | Security, or portion of security, is segregated as collateral (or potential collateral for future transactions) for written options. The aggregate value of such securities is $3,458,035. |
FOREIGN CURRENCY ABBREVIATIONS
| | |
| JPY | | Japanese Yen |
| KRW | | South Korean Won |
| TWD | | New Taiwanese Dollar |
Note: Value for securities denominated in foreign currencies is shown in U.S. dollars. The date on options represents the expiration date of the option contract. The option contract may be exercised at any date on or before the date shown.
| | | | | | |
| See accompanying Notes to Financial Statements | | www.calamos.com | | | 63 | |
Discovery Growth Fund Schedule of Investments April 30, 2012 (Unaudited)
| | | | | | | | | | |
NUMBER OF
SHARES | | | | | | | VALUE | |
| | | | | | | | | | |
| | | | | | | | | | |
| | COMMON STOCKS (95.5%) | |
| | | | | | Consumer Discretionary (9.5%) | |
| | 36,000 | | | | | Brunswick Corporation | | $ | 946,440 | |
| | 24,957 | | | | | Francesca’s Holdings Corp.# | | | 782,402 | |
| | 10,600 | | | | | ITT Educational Services, Inc.# | | | 699,812 | |
| | 21,200 | | | | | Vera Bradley, Inc.# | | | 550,776 | |
| | 19,500 | | | | | Wolverine World Wide, Inc. | | | 818,025 | |
| | | | | | | | | | |
| | | | | | | | | 3,797,455 | |
| | | | | | | | | | |
| | | | | | Consumer Staples (1.7%) | |
| | 13,800 | | | | | Fresh Market, Inc.# | | | 706,146 | |
| | | | | | | | | | |
| | | | | | Energy (4.8%) | |
| | 16,800 | | | | | Atwood Oceanics, Inc.# | | | 744,744 | |
| | 21,300 | | | | | Gulfport Energy Corp.# | | | 558,273 | |
| | 14,700 | | | | | Unit Corp.# | | | 621,075 | |
| | | | | | | | | | |
| | | | | | | | | 1,924,092 | |
| | | | | | | | | | |
| | | | | | Financials (4.0%) | |
| | 17,200 | | | | | First Cash Financial Services, Inc.# | | | 704,512 | |
| | 26,000 | | | | | MarketAxess Holdings, Inc. | | | 892,060 | |
| | | | | | | | | | |
| | | | | | | | | 1,596,572 | |
| | | | | | | | | | |
| | | | | | Health Care (14.5%) | |
| | 72,000 | | | | | Achillion Pharmaceuticals, Inc.# | | | 478,800 | |
| | 17,765 | | | | | Cyberonics, Inc.# | | | 680,399 | |
| | 47,000 | | | | | HealthStream, Inc.# | | | 1,077,240 | |
| | 59,000 | | | | | ImmunoGen, Inc.# | | | 752,250 | |
| | 19,300 | | | | | Jazz Pharmaceuticals, PLC# | | | 984,879 | |
| | 29,800 | | | | | MAKO Surgical Corp.# | | | 1,231,038 | |
| | 100,000 | | | | | SciClone Pharmaceuticals, Inc.# | | | 599,000 | |
| | | | | | | | | | |
| | | | | | | | | 5,803,606 | |
| | | | | | | | | | |
| | | | | | Industrials (15.8%) | |
| | 27,500 | | | | | 3D Systems Corp.# | | | 810,975 | |
| | 10,800 | | | | | Advisory Board Company# | | | 984,528 | |
| | 23,000 | | | | | Donaldson Company, Inc. | | | 797,180 | |
| | 29,200 | | | | | II-VI, Inc.# | | | 595,972 | |
| | 11,800 | | | | | Raven Industries, Inc. | | | 710,478 | |
| | 16,000 | | | | | Robbins & Myers, Inc. | | | 779,360 | |
| | 10,300 | | | | | Westinghouse Air Brake Technologies Corp. | | | 801,134 | |
| | 27,100 | | | | | Westport Innovations, Inc.# | | | 848,230 | |
| | | | | | | | | | |
| | | | | | | | | 6,327,857 | |
| | | | | | | | | | |
| | | | | | Information Technology (37.3%) | |
| | 23,000 | | | | | Ariba, Inc.#~ | | | 878,600 | |
| | 40,300 | | | | | Aruba Networks, Inc.# | | | 851,136 | |
| | 36,400 | | | | | Aspen Technology, Inc.# | | | 719,992 | |
| | 19,800 | | | | | Cognex Corp. | | | 796,950 | |
| | 14,500 | | | | | Coherent, Inc.# | | | 762,700 | |
| | 14,700 | | | | | FARO Technologies, Inc.# | | | 822,906 | |
| | | | | | | | | | |
NUMBER OF
SHARES | | | | | | | VALUE | |
| | | | | | | | | | |
| | 31,000 | | | | | Jive Software, Inc.# | | $ | 738,110 | |
| | 28,000 | | | | | Kenexa Corp.# | | | 914,760 | |
| | 9,800 | | | | | LinkedIn Corp.# | | | 1,062,810 | |
| | 18,800 | | | | | Liquidity Services, Inc.# | | | 1,002,604 | |
| | 17,300 | | | | | LogMeIn, Inc.# | | | 622,973 | |
| | 16,500 | | | | | Manhattan Associates, Inc.# | | | 827,475 | |
| | 20,000 | | | | | NetSuite, Inc.# | | | 887,600 | |
| | 10,000 | | | | | OpenTable, Inc.# | | | 447,300 | |
| | 17,900 | | | | | Sourcefire, Inc.# | | | 912,721 | |
| | 31,000 | | | | | TIBCO Software, Inc.# | | | 1,019,900 | |
| | 11,500 | | | | | Ultimate Software Group, Inc.# | | | 887,340 | |
| | 38,400 | | | | | ValueClick, Inc.# | | | 813,312 | |
| | | | | | | | | | |
| | | | | | | | | 14,969,189 | |
| | | | | | | | | | |
| | | | | | Materials (7.9%) | |
| | 68,000 | | | CAD | | Alacer Gold Corp.# | | | 550,691 | |
| | 24,400 | | | | | Allied Nevada Gold Corp.# | | | 714,676 | |
| | 130,300 | | | | | Graphic Packaging Holding Company# | | | 697,105 | |
| | 19,600 | | | | | Kronos Worldwide, Inc. | | | 465,304 | |
| | 58,500 | | | | | Steel Dynamics, Inc. | | | 747,045 | |
| | | | | | | | | | |
| | | | | | | | | 3,174,821 | |
| | | | | | | | | | |
| | | | | | TOTAL COMMON STOCKS (Cost $35,185,656) | | | 38,299,738 | |
| | | | | | | | | | |
| | | | | | | | | | |
| | SHORT TERM INVESTMENT (1.3%) | |
| | 536,071 | | | | | Fidelity Prime Money Market Fund - Institutional Class
(Cost $536,071) | | | 536,071 | |
| | | | | | | | | | |
| TOTAL INVESTMENTS (96.8%)
(Cost $35,721,727) | | | 38,835,809 | |
| | | | | | | | | | |
| |
| | OTHER ASSETS, LESS LIABILITIES (3.2%) | | | 1,289,550 | |
| | | | | | | | | | |
| |
| | NET ASSETS (100.0%) | | $ | 40,125,359 | |
| | | | | | | | | | |
NOTES TO SCHEDULE OF INVESTMENTS
| # | Non-income producing security. |
| ~ | Security, or portion of security, is segregated as collateral (or potential collateral for future transactions) for written options. The aggregate value of such securities is $767,820. |
FOREIGN CURRENCY ABBREVIATIONS
Note: Value for securities denominated in foreign currencies is shown in U.S. dollars.
| | | | |
| 64 | | CALAMOS FAMILY OF FUNDS SEMIANNUAL REPORT | | See accompanying Notes to Financial Statements |
International Growth Fund Schedule of Investments April 30, 2012 (Unaudited)
| | | | | | | | | | |
NUMBER OF
SHARES | | | | | | | VALUE | |
| | | | | | | | | | |
| | | | | | | | | | |
| | COMMON STOCKS (93.0%) | |
| | | | | | Consumer Discretionary (6.2%) | |
| | 74,000 | | | JPY | | Benesse Holdings, Inc. | | $ | 3,674,217 | |
| | 7,500,000 | | | HKD | | Hengdeli Holdings, Ltd. | | | 2,988,458 | |
| | 33,500 | | | KRW | | Hyundai Motor Company | | | 7,908,354 | |
| | 72,766 | | | CHF | | Swatch Group, AG | | | 5,816,802 | |
| | 42,413 | | | CHF | | Swatch Group, AG | | | 19,595,147 | |
| | 2,390,200 | | | HKD | | Wynn Macau, Ltd. | | | 7,640,145 | |
| | | | | | | | | | |
| | | | | | | | | 47,623,123 | |
| | | | | | | | | | |
| | | | | | Consumer Staples (9.5%) | |
| | 169,000 | | | EUR | | Anheuser-Busch InBev, NV | | | 12,180,757 | |
| | 587,000 | | | BRL | | Companhia de Bebidas das Americas | | | 24,725,352 | |
| | 235,000 | | | EUR | | Danone, SA | | | 16,543,787 | |
| | 140,000 | | | EUR | | Heineken, NV | | | 7,662,667 | |
| | 352,000 | | | BRL | | Natura Cosméticos, SA | | | 8,079,112 | |
| | 710,000 | | | HKD | | Tsingtao Brewery Company, Ltd. - Class H | | | 4,290,512 | |
| | | | | | | | | | |
| | | | | | | | | 73,482,187 | |
| | | | | | | | | | |
| | | | | | Energy (10.3%) | |
| | 369,870 | | | CAD | | Calfrac Well Services, Ltd. | | | 10,146,760 | |
| | 530,000 | | | CAD | | Ensign Energy Services, Inc. | | | 7,661,487 | |
| | 125,000 | | | CAD | | Pacific Rubiales Energy Corp. | | | 3,586,071 | |
| | 300,000 | | | GBP | | Petrofac, Ltd. | | | 8,471,793 | |
| | 150,000 | | | | | Schlumberger, Ltd. | | | 11,121,000 | |
| | 256,000 | | | NOK | | StatoilHydro, ASA | | | 6,869,091 | |
| | 509,920 | | | NOK | | Subsea 7, SA# | | | 13,206,395 | |
| | 116,000 | | | EUR | | Technip, SA | | | 13,173,004 | |
| | 175,000 | | | NOK | | TGS Nopec Geophysical Company, ASA | | | 5,080,707 | |
| | | | | | | | | | |
| | | | | | | | | 79,316,308 | |
| | | | | | | | | | |
| | | | | | Financials (0.9%) | |
| | 1,500,000 | | | GBP | | Aberdeen Asset Management, PLC | | | 6,903,723 | |
| | | | | | | | | | |
| | | | | | Health Care (13.3%) | |
| | 6,032,032 | | | SGD | | Biosensors International Group, Ltd.# | | | 6,489,808 | |
| | 85,000 | | | EUR | | Carl Zeiss Meditec, AG | | | 2,366,428 | |
| | 58,000 | | | DKK | | Coloplast, A/S - Class B | | | 10,737,842 | |
| | 240,000 | | | | | Covidien, PLC | | | 13,255,200 | |
| | 165,000 | | | AUD | | CSL, Ltd. | | | 6,283,288 | |
| | 4,180,000 | | | MXN | | Genomma Lab Internacional,
SAB de CV# | | | 7,348,562 | |
| | 242,064 | | | DKK | | Novo Nordisk, A/S - Class B | | | 35,685,803 | |
| | 80,200 | | | JPY | | Sawai Pharmaceutical Company, Ltd. | | | 8,451,673 | |
| | 307,000 | | | GBP | | Shire, PLC | | | 10,005,940 | |
| | 9,000 | | | EUR | | Virbac, SA | | | 1,513,720 | |
| | | | | | | | | | |
| | | | | | | | | 102,138,264 | |
| | | | | | | | | | |
| | | | | | Industrials (3.3%) | |
| | 448,000 | | | CHF | | ABB, Ltd.# | | | 8,163,852 | |
| | | | | | | | | | |
NUMBER OF
SHARES | | | | | | | VALUE | |
| | | | | | | | | | |
| | 1,300,000 | | | AUD | | Boart Longyear, Ltd. | | $ | 5,602,309 | |
| | 20,000 | | | KRW | | Samsung Engineering Company, Ltd. | | | 3,786,500 | |
| | 86,500 | | | EUR | | Siemens, AG | | | 8,028,966 | |
| | | | | | | | | | |
| | | | | | | | | 25,581,627 | |
| | | | | | | | | | |
| | | | | | Information Technology (32.5%) | |
| | 404,000 | | | | | Accenture, PLC - Class A~ | | | 26,239,800 | |
| | 111,606 | | | | | Allot Communications, Ltd.# | | | 2,738,811 | |
| | 167,000 | | | EUR | | ASML Holding, NV | | | 8,497,468 | |
| | 220,000 | | | GBP | | Aveva Group, PLC | | | 5,957,019 | |
| | 500,000 | | | TWD | | Catcher Technology Company, Ltd. | | | 3,174,609 | |
| | 436,000 | | | | | Check Point Software Technologies, Ltd.#~ | | | 25,344,680 | |
| | 120,000 | | | BRL | | Cielo, SA | | | 3,600,976 | |
| | 78,000 | | | EUR | | Dassault Systemes, SA | | | 7,569,085 | |
| | 350,000 | | | EUR | | Dialog Semiconductor, PLC# | | | 7,711,897 | |
| | 280,000 | | | JPY | | GREE, Inc. | | | 7,573,061 | |
| | 650,000 | | | INR | | HCL Technologies Ltd. | | | 6,307,010 | |
| | 2,700,000 | | | TWD | | Hon Hai Precision Industry Company, Ltd. | | | 8,489,276 | |
| | 85,000 | | | EUR | | Ingenico, SA | | | 4,471,048 | |
| | 361,000 | | | | | Mellanox Technologies, Ltd.# | | | 21,150,990 | |
| | 142,000 | | | | | Nice-Systems, Ltd.# | | | 5,455,640 | |
| | 163,000 | | | CAD | | Open Text Corp.# | | | 9,137,966 | |
| | 600,000 | | | NOK | | Opera Software, ASA | | | 3,877,269 | |
| | 2,700,000 | | | TWD | | Pegatron Corp. | | | 3,883,961 | |
| | 210,000 | | | | | RADWARE, Ltd.# | | | 8,080,800 | |
| | 6,600 | | | KRW | | Samsung Electronics Company, Ltd. | | | 8,078,145 | |
| | 506,500 | | | EUR | | SAP, AG | | | 33,587,817 | |
| | 8,515,000 | | | TWD | | Taiwan Semiconductor Manufacturing Company, Ltd. | | | 25,167,245 | |
| | 415,000 | | | INR | | Tata Consultancy Services, Ltd. | | | 9,787,483 | |
| | 200,000 | | | BRL | | Totvs, SA | | | 3,897,909 | |
| | | | | | | | | | |
| | | | | | | | | 249,779,965 | |
| | | | | | | | | | |
| | | | | | Materials (13.6%) | |
| | 186,000 | | | GBP | | Anglo American, PLC | | | 7,187,926 | |
| | 125,000 | | | ZAR | | AngloGold Ashanti, Ltd. | | | 4,286,106 | |
| | 347,000 | | | CAD | | Barrick Gold Corp. | | | 14,036,666 | |
| | 305,000 | | | CAD | | Goldcorp, Inc. | | | 11,680,063 | |
| | 496,000 | | | AUD | | Newcrest Mining, Ltd. | | | 13,516,038 | |
| | 65,000 | | | CAD | | Potash Corp. of Saskatchewan, Inc. | | | 2,763,578 | |
| | 132,000 | | | GBP | | Rio Tinto, PLC | | | 7,399,231 | |
| | 33,600 | | | CHF | | Syngenta, AG | | | 11,782,736 | |
| | 185,000 | | | CAD | | Teck Resources, Ltd. - Class B | | | 6,902,971 | |
| | 957,000 | | | CAD | | Yamana Gold, Inc. | | | 14,037,485 | |
| | 228,000 | | | NOK | | Yara International, ASA | | | 11,176,582 | |
| | | | | | | | | | |
| | | | | | | | | 104,769,382 | |
| | | | | | | | | | |
| | | | | | |
| See accompanying Notes to Schedule of Investments | | www.calamos.com | | | 65 | |
International Growth Fund Schedule of Investments April 30, 2012 (Unaudited)
| | | | | | | | | | |
NUMBER OF
SHARES | | | | | | | VALUE | |
| | | | | | | | | | |
| | | | | | | | | | |
| | | | | | Telecommunication Services (3.4%) | |
| | 118,000 | | | SEK | | Millicom International Cellular, SA# | | $ | 12,489,209 | |
| | 2,254,306 | | | BRL | | Tim Participacoes, SA | | | 13,411,238 | |
| | | | | | | | | | |
| | | | | | | | | 25,900,447 | |
| | | | | | | | | | |
| | | | | | TOTAL COMMON STOCKS
(Cost $655,880,777) | | | 715,495,026 | |
| | | | | | | | | | |
| | | | | | | | | | |
| | RIGHTS (0.0%)# | |
| | | | | | Consumer Staples (0.0%) | |
| | 1,429 | | | BRL | | Companhia de Bebidas das Americas, Rights
(Cost $0) | | | 12,347 | |
| | | | | | | | | | |
| | | | | | | | | | |
| | SHORT TERM INVESTMENT (6.8%) | |
| | 52,287,458 | | | | | Fidelity Prime Money Market Fund - Institutional Class (Cost $52,287,458) | | | 52,287,458 | |
| | | | | | | | | | |
| TOTAL INVESTMENTS (99.8%)
(Cost $708,168,235) | | | 767,794,831 | |
| | | | | | | | | | |
| |
| | OTHER ASSETS, LESS LIABILITIES (0.2%) | | | 1,654,125 | |
| | | | | | | | | | |
| |
| | NET ASSETS (100.0%) | | $ | 769,448,956 | |
| | | | | | | | | | |
NOTES TO SCHEDULE OF INVESTMENTS
| ~ | Security, or portion of security, is segregated as collateral (or potential collateral for future transactions) for written options. The aggregate value of such securities is $1,192,969. |
| # | Non-income producing security. |
FOREIGN CURRENCY ABBREVIATIONS
| | |
| AUD | | Australian Dollar |
| BRL | | Brazilian Real |
| CAD | | Canadian Dollar |
| CHF | | Swiss Franc |
| DKK | | Danish Krone |
| EUR | | European Monetary Unit |
| GBP | | British Pound Sterling |
| HKD | | Hong Kong Dollar |
| INR | | Indian Rupee |
| JPY | | Japanese Yen |
| KRW | | South Korean Won |
| MXN | | Mexican Peso |
| NOK | | Norwegian Krone |
| SEK | | Swedish Krona |
| SGD | | Singapore Dollar |
| TWD | | New Taiwanese Dollar |
| ZAR | | South African Rand |
Note: Value for securities denominated in foreign currencies is shown in U.S. dollars.
CURRENCY EXPOSURE
APRIL 30, 2012
| | | | | | | | |
| | | VALUE | | | % OF TOTAL
INVESTMENTS | |
| US Dollar | | $ | 165,674,379 | | | | 21.6% | |
| European Monetary Unit | | | 123,306,644 | | | | 16.1% | |
| Canadian Dollar | | | 79,953,047 | | | | 10.4% | |
| Brazilian Real | | | 53,726,934 | | | | 7.0% | |
| Danish Krone | | | 46,423,645 | | | | 6.0% | |
| British Pound Sterling | | | 45,925,632 | | | | 6.0% | |
| Swiss Franc | | | 45,358,537 | | | | 5.9% | |
| New Taiwanese Dollar | | | 40,715,091 | | | | 5.3% | |
| Norwegian Krone | | | 40,210,044 | | | | 5.2% | |
| Australian Dollar | | | 25,401,635 | | | | 3.3% | |
| South Korean Won | | | 19,772,999 | | | | 2.6% | |
| Japanese Yen | | | 19,698,951 | | | | 2.6% | |
| Indian Rupee | | | 16,094,493 | | | | 2.1% | |
| Hong Kong Dollar | | | 14,919,115 | | | | 1.9% | |
| Swedish Krona | | | 12,489,209 | | | | 1.6% | |
| Mexican Peso | | | 7,348,562 | | | | 1.0% | |
| Singapore Dollar | | | 6,489,808 | | | | 0.8% | |
| South African Rand | | | 4,286,106 | | | | 0.6% | |
| Total Investments | | $ | 767,794,831 | | | | 100.0% | |
| | |
Currency exposure may vary over time.
| | | | |
| 66 | | CALAMOS FAMILY OF FUNDS SEMIANNUAL REPORT | | See accompanying Notes to Financial Statements |
Evolving World Growth Fund Schedule of Investments April 30, 2012 (Unaudited)
| | | | | | | | | | |
PRINCIPAL
AMOUNT | | | | | | | VALUE | |
| | | | | | | | | | |
| | CONVERTIBLE BONDS (19.3%) | |
| | | | | | Consumer Discretionary (1.0%) | |
| | 27,000,000 | | | HKD | | Hengdeli Holdings, Ltd.
2.500%, 10/20/15 | | $ | 3,538,563 | |
| | | | | | | | | | |
| | | | | | Consumer Staples (0.3%) | |
| | 7,000,000 | | | ZAR | | Shoprite Investments Pty, Ltd.
6.500%, 04/03/17 | | | 978,476 | |
| | | | | | | | | | |
| | | | | | Energy (5.2%) | |
| | 41,800,000 | | | HKD | | China Petroleum & Chemical Corp.
0.000%, 04/24/14 | | | 6,303,416 | |
| | 5,700,000 | | | | | Subsea 7, SA
2.250%, 10/11/13 | | | 6,985,129 | |
| | | | | | Technip, SA | | | | |
| | 2,000,000 | | | EUR | | 0.250%, 01/01/17 | | | 2,799,626 | |
| | 1,140,000 | | | EUR | | 0.500%, 01/01/16 | | | 1,484,949 | |
| | | | | | | | | | |
| | | | | | | | | 17,573,120 | |
| | | | | | | | | | |
| | | | | | Financials (1.9%) | |
| | 7,500,000 | | | SGD | | Temasek Financial, Ltd.
(Standard Chartered, PLC)§
0.000%, 10/24/14 | | | 6,352,727 | |
| | | | | | | | | | |
| | | | | | Industrials (0.8%) | |
| | 2,750,000 | | | | | Siemens AG
1.050%, 08/16/17 | | | 2,701,875 | |
| | | | | | | | | | |
| | | | | | Information Technology (5.0%) | |
| | 157,500,000 | | | TWD | | Catcher Technology Company, Ltd.
0.000%, 04/27/16 | | | 6,039,338 | |
| | 1,985,000 | | | | | Intel Corp.
3.250%, 08/01/39 | | | 2,786,444 | |
| | 3,800,000 | | | | | Pegatron Corp.
0.000%, 02/06/17 | | | 4,359,749 | |
| | 3,500,000 | | | | | United Microelectronics Corp.
0.000%, 05/24/16 | | | 3,504,375 | |
| | | | | | | | | | |
| | | | | | | | | 16,689,906 | |
| | | | | | | | | | |
| | | | | | Materials (3.6%) | |
| | 5,900,000 | | | | | AngloGold Ashanti, Ltd.
3.500%, 05/22/14 | | | 6,313,000 | |
| | 1,680,000 | | | | | Goldcorp, Inc.
2.000%, 08/01/14 | | | 1,938,300 | |
| | | | | | Newmont Mining Corp. | | | | |
| | 1,580,000 | | | | | 1.625%, 07/15/17 | | | 2,016,475 | |
| | 1,475,000 | | | | | 1.250%, 07/15/14 | | | 1,812,406 | |
| | | | | | | | | | |
| | | | | | | | | 12,080,181 | |
| | | | | | | | | | |
| | | | | | Telecommunication Services (1.5%) | |
| | 4,600,000 | | | | | Billion Express Investments, Ltd. 0.750%, 10/18/15 | | | 4,947,502 | |
| | | | | | | | | | |
| | | | | | TOTAL CONVERTIBLE BONDS
(Cost $64,918,849) | | | 64,862,350 | |
| | | | | | | | | | |
| | | | | | | | | | |
NUMBER OF
SHARES | | | | | | | VALUE | |
| | | | | | | | | | |
| | COMMON STOCKS (72.1%) | |
| | | | | | Consumer Discretionary (4.8%) | |
| | 1,600,000 | | | INR | | DISH TV India, Ltd.# | | $ | 1,807,408 | |
| | 6,800,000 | | | HKD | | Hengdeli Holdings, Ltd. | | | 2,709,535 | |
| | 23,700 | | | KRW | | Hyundai Motor Company | | | 5,594,866 | |
| | 4,344 | | | CHF | | Swatch Group, AG | | | 2,006,963 | |
| | 3,437 | | | CHF | | Swatch Group, AG | | | 274,748 | |
| | 1,124,800 | | | HKD | | Wynn Macau, Ltd. | | | 3,595,363 | |
| | | | | | | | | | |
| | | | | | | | | 15,988,883 | |
| | | | | | | | | | |
| | | | | | Consumer Staples (17.7%) | |
| | 147,750 | | | HKD | | Biostime International Holdings, Ltd. | | | 423,818 | |
| | 69,000 | | | | | Coca-Cola Company~ | | | 5,266,080 | |
| | 90,000 | | | INR | | Colgate-Palmolive India, Ltd. | | | 1,890,203 | |
| | 364,500 | | | BRL | | Companhia de Bebidas das Americas | | | 15,353,306 | |
| | 91,000 | | | EUR | | Danone, SA | | | 6,406,318 | |
| | 85,000 | | | GBP | | Diageo, PLC | | | 2,143,978 | |
| | 514,000 | | | INR | | Hindustan Unilever, Ltd. | | | 4,067,712 | |
| | 1,270,000 | | | INR | | ITC, Ltd. | | | 5,909,956 | |
| | 36,500 | | | | | Mead Johnson Nutrition Company | | | 3,122,940 | |
| | 231,500 | | | BRL | | Natura Cosméticos, SA | | | 5,313,393 | |
| | 21,200 | | | INR | | Nestlé India, Ltd. | | | 1,880,558 | |
| | 40,000 | | | CHF | | Nestlé, SA | | | 2,451,571 | |
| | 876,000 | | | HKD | | Tsingtao Brewery Company, Ltd. - Class H | | | 5,293,645 | |
| | | | | | | | | | |
| | | | | | | | | 59,523,478 | |
| | | | | | | | | | |
| | | | | | Energy (8.3%) | |
| | 3,100,000 | | | HKD | | CNOOC, Ltd. | | | 6,550,761 | |
| | 80,000 | | | | | National Oilwell Varco, Inc. | | | 6,060,800 | |
| | 32,000 | | | | | Occidental Petroleum Corp. | | | 2,919,040 | |
| | 110,000 | | | CAD | | Pacific Rubiales Energy Corp. | | | 3,155,742 | |
| | 102,000 | | | GBP | | Petrofac, Ltd. | | | 2,880,410 | |
| | 35,000 | | | ZAR | | Sasol, Ltd. | | | 1,664,059 | |
| | 65,000 | | | | | Schlumberger, Ltd. | | | 4,819,100 | |
| | | | | | | | | | |
| | | | | | | | | 28,049,912 | |
| | | | | | | | | | |
| | | | | | Health Care (6.5%) | |
| | 2,100,000 | | | SGD | | Biosensors International Group, Ltd.# | | | 2,259,371 | |
| | 11,000 | | | DKK | | Coloplast, A/S - Class B | | | 2,036,487 | |
| | 3,055,000 | | | MXN | | Genomma Lab Internacional, SAB de CV# | | | 5,370,779 | |
| | 81,800 | | | DKK | | Novo Nordisk, A/S - Class B | | | 12,059,202 | |
| | | | | | | | | | |
| | | | | | | | | 21,725,839 | |
| | | | | | | | | | |
| | | | | | Industrials (2.8%) | |
| | 145,000 | | | CHF | | ABB, Ltd.# | | | 2,642,318 | |
| | 130,000 | | | HKD | | Hutchison Whampoa, Ltd. | | | 1,245,406 | |
| | 18,600 | | | KRW | | Samsung Engineering Company, Ltd. | | | 3,521,445 | |
| | 23,300 | | | EUR | | Siemens, AG | | | 2,162,716 | |
| | | | | | | | | | |
| | | | | | | | | 9,571,885 | |
| | | | | | | | | | |
| | | | | | |
| See accompanying Notes to Schedule of Investments | | www.calamos.com | | | 67 | |
Evolving World Growth Fund Schedule of Investments April 30, 2012 (Unaudited)
| | | | | | | | | | |
NUMBER OF
SHARES | | | | | | | VALUE | |
| | | | | | | | | | |
| | | | | | | | | | |
| | | | | | Information Technology (19.9%) | |
| | 1,150,000 | | | HKD | | AAC Technologies Holdings, Inc. | | $ | 3,376,911 | |
| | 5,700 | | | | | Apple, Inc.# | | | 3,330,168 | |
| | 41,000 | | | | | Check Point Software Technologies, Ltd.#~ | | | 2,383,330 | |
| | 102,000 | | | BRL | | Cielo, SA | | | 3,060,829 | |
| | 465,000 | | | INR | | HCL Technologies Ltd. | | | 4,511,938 | |
| | 1,700,000 | | | TWD | | Hon Hai Precision Industry Company, Ltd. | | | 5,345,100 | |
| | 3,500 | | | KRW | | NHN Corp. | | | 791,228 | |
| | 133,500 | | | | | QUALCOMM, Inc. | | | 8,522,640 | |
| | 7,900 | | | KRW | | Samsung Electronics Company, Ltd. | | | 9,669,295 | |
| | 1,190,000 | | | CLP | | Sonda, SA | | | 3,544,733 | |
| | 4,835,649 | | | TWD | | Taiwan Semiconductor Manufacturing Company, Ltd. | | | 14,292,421 | |
| | 216,000 | | | INR | | Tata Consultancy Services, Ltd. | | | 5,094,208 | |
| | 160,000 | | | BRL | | Totvs, SA | | | 3,118,327 | |
| | | | | | | | | | |
| | | | | | | | | 67,041,128 | |
| | | | | | | | | | |
| | | | | | Materials (7.2%) | |
| | 15,500 | | | GBP | | Anglo American, PLC | | | 598,994 | |
| | 152,300 | | | CAD | | Barrick Gold Corp. | | | 6,160,761 | |
| | 106,000 | | | CAD | | Goldcorp, Inc. | | | 4,059,300 | |
| | 26,000 | | | | | Newmont Mining Corp. | | | 1,238,900 | |
| | 57,200 | | | GBP | | Rio Tinto, PLC | | | 3,206,334 | |
| | 415,500 | | | CAD | | Yamana Gold, Inc. | | | 6,094,645 | |
| | 62,000 | | | NOK | | Yara International, ASA | | | 3,039,246 | |
| | | | | | | | | | |
| | | | | | | | | 24,398,180 | |
| | | | | | | | | | |
| | | | | | Telecommunication Services (4.9%) | |
| | 330,000 | | | HKD | | China Mobile, Ltd. | | | 3,650,963 | |
| | 40,000 | | | SEK | | Millicom International Cellular, SA | | | 4,233,630 | |
| | 1,424,871 | | | BRL | | Tim Participacoes, SA | | | 8,476,792 | |
| | | | | | | | | | |
| | | | | | | | | 16,361,385 | |
| | | | | | | | | | |
| | | | | | TOTAL COMMON STOCKS (Cost $224,418,909) | | | 242,660,690 | |
| | | | | | | | | | |
| | | | | | | | | | |
| | RIGHTS (0.0%)# | |
| | | | | | Consumer Staples (0.0%) | |
| | 887 | | | BRL | | Companhia de Bebidas das Americas, Rights (Cost $0) | | | 7,664 | |
| | | | | | | | | | |
| | SHORT TERM INVESTMENT (9.0%) | |
| | 30,385,577 | | | | | Fidelity Prime Money Market Fund - Institutional Class (Cost $30,385,577) | | | 30,385,577 | |
| | | | | | | | | | |
| TOTAL INVESTMENTS (100.4%)
(Cost $319,723,335) | | | 337,916,281 | |
| | | | | | | | | | |
| |
| | LIABILITIES, LESS OTHER ASSETS (-0.4%) | | | (1,386,170 | ) |
| | | | | | | | | | |
| |
| | NET ASSETS (100.0%) | | $ | 336,530,111 | |
| | | | | | | | | | |
NOTES TO SCHEDULE OF INVESTMENTS
| § | Securities exchangeable or convertible into securities of one or more entities that are different than the issuer. Each entity is identified in the parenthetical. |
| # | Non-income producing security. |
| ~ | Security, or portion of security, is segregated as collateral (or potential collateral for future transactions) for written options. The aggregate value of such securities is $832,205. |
FOREIGN CURRENCY ABBREVIATIONS
| | |
| BRL | | Brazilian Real |
| CAD | | Canadian Dollar |
| CHF | | Swiss Franc |
| CLP | | Chilean Peso |
| DKK | | Danish Krone |
| EUR | | European Monetary Unit |
| GBP | | British Pound Sterling |
| HKD | | Hong Kong Dollar |
| INR | | Indian Rupee |
| KRW | | South Korean Won |
| MXN | | Mexican Peso |
| NOK | | Norwegian Krone |
| SEK | | Swedish Krona |
| SGD | | Singapore Dollar |
| TWD | | New Taiwanese Dollar |
| ZAR | | South African Rand |
Note: Value for securities denominated in foreign currencies is shown in U.S. dollars. The principal amount for such securities is shown in the respective foreign currency.
| | | | |
| 68 | | CALAMOS FAMILY OF FUNDS SEMIANNUAL REPORT | | See accompanying Notes to Financial Statements |
Evolving World Growth Fund Schedule of Investments April 30, 2012 (Unaudited)
CURRENCY EXPOSURE
APRIL 30, 2012
| | | | | | | | |
| | | VALUE | | | % OF TOTAL
INVESTMENTS | |
| US Dollar | | $ | 105,413,830 | | | | 31.2% | |
| Hong Kong Dollar | | | 36,688,381 | | | | 10.9% | |
| Brazilian Real | | | 35,330,311 | | | | 10.5% | |
| New Taiwanese Dollar | | | 25,676,859 | | | | 7.6% | |
| Indian Rupee | | | 25,161,983 | | | | 7.4% | |
| South Korean Won | | | 19,576,834 | | | | 5.8% | |
| Canadian Dollar | | | 19,470,448 | | | | 5.8% | |
| Danish Krone | | | 14,095,689 | | | | 4.2% | |
| European Monetary Unit | | | 12,853,609 | | | | 3.8% | |
| British Pound Sterling | | | 8,829,716 | | | | 2.6% | |
| Singapore Dollar | | | 8,612,098 | | | | 2.5% | |
| Swiss Franc | | | 7,375,600 | | | | 2.2% | |
| Mexican Peso | | | 5,370,779 | | | | 1.6% | |
| Swedish Krona | | | 4,233,630 | | | | 1.2% | |
| Chilean Peso | | | 3,544,733 | | | | 1.0% | |
| Norwegian Krone | | | 3,039,246 | | | | 0.9% | |
| South African Rand | | | 2,642,535 | | | | 0.8% | |
| Total Investments | | $ | 337,916,281 | | | | 100.0% | |
| | |
Currency exposure may vary over time.
| | | | | | |
| See accompanying Notes to Financial Statements | | www.calamos.com | | | 69 | |
Global Equity Fund Schedule of Investments April 30, 2012 (Unaudited)
| | | | | | | | | | |
NUMBER OF
SHARES | | | | | | | VALUE | |
| | | | | | | | | | |
| | COMMON STOCKS (94.5%) | |
| | | | | | Consumer Discretionary (7.0%) | |
| | 26,100 | | | | | Amazon.com, Inc.# | | $ | 6,052,590 | |
| | 25,000 | | | | | DIRECTV - Class A# | | | 1,231,750 | |
| | 9,500 | | | KRW | | Hyundai Motor Company | | | 2,242,668 | |
| | 1,400 | | | | | Priceline.com, Inc.# | | | 1,065,148 | |
| | 16,055 | | | CHF | | Swatch Group, AG | | | 1,283,412 | |
| | 10,162 | | | CHF | | Swatch Group, AG | | | 4,694,926 | |
| | 429,800 | | | HKD | | Wynn Macau, Ltd. | | | 1,373,832 | |
| | | | | | | | | | |
| | | | | | | | | 17,944,326 | |
| | | | | | | | | | |
| | | | | | Consumer Staples (6.7%) | |
| | 37,500 | | | EUR | | Anheuser-Busch InBev, NV | | | 2,702,830 | |
| | 44,000 | | | | | Coca-Cola Company | | | 3,358,080 | |
| | 166,000 | | | BRL | | Companhia de Bebidas das Americas | | | 6,992,178 | |
| | 35,000 | | | EUR | | Heineken, NV | | | 1,915,667 | |
| | 26,500 | | | | | Mead Johnson Nutrition Company | | | 2,267,340 | |
| | | | | | | | | | |
| | | | | | | | | 17,236,095 | |
| | | | | | | | | | |
| | | | | | Energy (10.1%) | |
| | 15,500 | | | | | Apache Corp. | | | 1,487,070 | |
| | 74,800 | | | CAD | | Calfrac Well Services, Ltd. | | | 2,052,012 | |
| | 138,000 | | | CAD | | Ensign Energy Services, Inc. | | | 1,994,878 | |
| | 69,600 | | | | | Helmerich & Payne, Inc. | | | 3,576,744 | |
| | 47,100 | | | | | National Oilwell Varco, Inc. | | | 3,568,296 | |
| | 28,600 | | | | | Occidental Petroleum Corp. | | | 2,608,892 | |
| | 80,000 | | | GBP | | Petrofac, Ltd. | | | 2,259,145 | |
| | 26,800 | | | | | Schlumberger, Ltd. | | | 1,986,952 | |
| | 95,076 | | | NOK | | Subsea 7, SA# | | | 2,462,369 | |
| | 35,150 | | | EUR | | Technip, SA | | | 3,991,647 | |
| | | | | | | | | | |
| | | | | | | | | 25,988,005 | |
| | | | | | | | | | |
| | | | | | Financials (2.2%) | |
| | 24,500 | | | | | American Express Company | | | 1,475,145 | |
| | 22,000 | | | | | Franklin Resources, Inc. | | | 2,761,220 | |
| | 22,900 | | | | | T. Rowe Price Group, Inc. | | | 1,445,334 | |
| | | | | | | | | | |
| | | | | | | | | 5,681,699 | |
| | | | | | | | | | |
| | | | | | Health Care (15.3%) | |
| | 600,000 | | | SGD | | Biosensors International Group, Ltd.# | | | 645,535 | |
| | 52,500 | | | | | Celgene Corp.# | | | 3,828,300 | |
| | 13,800 | | | DKK | | Coloplast, A/S - Class B | | | 2,554,866 | |
| | 68,500 | | | | | Covidien, PLC | | | 3,783,255 | |
| | 35,000 | | | AUD | | CSL, Ltd. | | | 1,332,819 | |
| | 66,000 | | | | | Cubist Pharmaceuticals, Inc.# | | | 2,790,480 | |
| | 1,007,000 | | | MXN | | Genomma Lab Internacional, SAB de CV# | | | 1,770,335 | |
| | 13,550 | | | | | Intuitive Surgical, Inc.# | | | 7,834,610 | |
| | | | | | | | | | |
NUMBER OF
SHARES | | | | | | | VALUE | |
| | | | | | | | | | |
| | 83,300 | | | DKK | | Novo Nordisk, A/S - Class B | | $ | 12,280,336 | |
| | 72,500 | | | GBP | | Shire, PLC | | | 2,362,966 | |
| | | | | | | | | | |
| | | | | | | | | 39,183,502 | |
| | | | | | | | | | |
| | | | | | Industrials (3.0%) | |
| | 124,500 | | | CHF | | ABB, Ltd.# | | | 2,268,749 | |
| | 300,000 | | | AUD | | Boart Longyear, Ltd. | | | 1,292,840 | |
| | 18,000 | | | | | Eaton Corp. | | | 867,240 | |
| | 5,500 | | | KRW | | Samsung Engineering Company, Ltd. | | | 1,041,288 | |
| | 24,700 | | | EUR | | Siemens, AG | | | 2,292,664 | |
| | | | | | | | | | |
| | | | | | | | | 7,762,781 | |
| | | | | | | | | | |
| | | | | | Information Technology (37.2%) | |
| | 88,200 | | | | | Accenture, PLC - Class A | | | 5,728,590 | |
| | 24,553 | | | | | Allot Communications, Ltd.# | | | 602,531 | |
| | 18,890 | | | | | Apple, Inc.#~ | | | 11,036,294 | |
| | 43,000 | | | EUR | | ASML Holding, NV | | | 2,187,971 | |
| | 61,000 | | | GBP | | Aveva Group, PLC | | | 1,651,719 | |
| | 84,126 | | | | | Check Point Software Technologies, Ltd.#~ | | | 4,890,244 | |
| | 55,000 | | | EUR | | Dialog Semiconductor, PLC# | | | 1,211,870 | |
| | 70,000 | | | | | eBay, Inc.# | | | 2,873,500 | |
| | 75,000 | | | | | EMC Corp.# | | | 2,115,750 | |
| | 19,450 | | | | | F5 Networks, Inc.# | | | 2,604,938 | |
| | 11,475 | | | | | Google, Inc.#~ | | | 6,945,014 | |
| | 46,000 | | | JPY | | Gree, Inc. | | | 1,244,146 | |
| | 6,800 | | | | | MasterCard, Inc. - Class A | | | 3,075,436 | |
| | 67,000 | | | | | Mellanox Technologies, Ltd.# | | | 3,925,530 | |
| | 29,000 | | | CAD | | Open Text Corp.# | | | 1,625,773 | |
| | 93,500 | | | | | Oracle Corp. | | | 2,747,965 | |
| | 130,200 | | | | | QUALCOMM, Inc. | | | 8,311,968 | |
| | 32,700 | | | | | Salesforce.com, Inc.# | | | 5,092,371 | |
| | 1,800 | | | KRW | | Samsung Electronics Company, Ltd. | | | 2,203,130 | |
| | 143,800 | | | EUR | | SAP, AG | | | 9,535,890 | |
| | 33,000 | | | | | Solarwinds, Inc.# | | | 1,548,030 | |
| | 1,900,000 | | | TWD | | Taiwan Semiconductor Manufacturing Company, Ltd. | | | 5,615,709 | |
| | 20,000 | | | | | Teradata Corp.# | | | 1,395,600 | |
| | 41,000 | | | | | TIBCO Software, Inc.# | | | 1,348,900 | |
| | 52,200 | | | | | VMware, Inc. - Class A# | | | 5,831,784 | |
| | | | | | | | | | |
| | | | | | | | | 95,350,653 | |
| | | | | | | | | | |
| | | | | | Materials (11.1%) | |
| | 33,000 | | | GBP | | Anglo American, PLC | | | 1,275,277 | |
| | 97,650 | | | | | Barrick Gold Corp. | | | 3,947,990 | |
| | 110,500 | | | CAD | | Goldcorp, Inc. | | | 4,231,629 | |
| | 165,100 | | | AUD | | Newcrest Mining, Ltd. | | | 4,498,988 | |
| | 73,000 | | | | | Newmont Mining Corp. | | | 3,478,450 | |
| | 21,500 | | | GBP | | Rio Tinto, PLC | | | 1,205,178 | |
| | | | |
| 70 | | CALAMOS FAMILY OF FUNDS SEMIANNUAL REPORT | | See accompanying Notes to Schedule of Investments |
Global Equity Fund Schedule of Investments April 30, 2012 (Unaudited)
| | | | | | | | | | |
NUMBER OF
SHARES | | | | | | | VALUE | |
| | | | | | | | | | |
| | 7,200 | | | CHF | | Syngenta, AG | | $ | 2,524,872 | |
| | 309,100 | | | CAD | | Yamana Gold, Inc. | | | 4,533,946 | |
| | 58,100 | | | NOK | | Yara International, ASA | | | 2,848,068 | |
| | | | | | | | | | |
| | | | | | | | | 28,544,398 | |
| | | | | | | | | | |
| | | | | | Telecommunication Services (1.9%) | |
| | 19,200 | | | SEK | | Millicom International
Cellular, SA# | | | 2,032,142 | |
| | 484,353 | | | BRL | | Tim Participacoes, SA | | | 2,881,496 | |
| | | | | | | | | | |
| | | | | | | | | 4,913,638 | |
| | | | | | | | | | |
| | | | | | TOTAL COMMON STOCKS
(Cost $222,755,277) | | | 242,605,097 | |
| | | | | | | | | | |
| | RIGHTS (0.0%)# | |
| | | | | | Consumer Staples (0.0%) | |
| | 404 | | | BRL | | Companhia de Bebidas das Americas, Rights
(Cost $0) | | | 3,491 | |
| | | | | | | | | | |
| | | | | | | | | | |
NUMBER OF
CONTRACTS | | | | | | | VALUE | |
| | PURCHASED OPTIONS (0.3%)# | |
| | | | | | Consumer Discretionary (0.0%) | |
| | | | | | Amazon.com, Inc. | | | | |
| | 160 | | | | | Put, 07/21/12, Strike $140.00 | | | 6,960 | |
| | 100 | | | | | Put, 07/21/12, Strike $150.00 | | | 6,100 | |
| | 13 | | | | | Priceline.com, Inc. Put, 07/21/12, Strike $505.00 | | | 3,477 | |
| | | | | | | | | | |
| | | | | | | | | 16,537 | |
| | | | | | | | | | |
| | | | | | Information Technology (0.3%) | |
| | 185 | | | | | Apple, Inc. Put, 01/19/13, Strike $535.00 | | | 831,575 | |
| | | | | | | | | | |
| | | | | | TOTAL PURCHASED OPTIONS
(Cost $897,517) | | | 848,112 | |
| | | | | | | | | | |
| | | | | | | | | | |
NUMBER OF
SHARES | | | | | | | VALUE | |
| | SHORT TERM INVESTMENT (7.1%) | |
| | 18,207,767 | | | | | Fidelity Prime Money Market Fund - Institutional Class (Cost $18,207,767) | | | 18,207,767 | |
| | | | | | | | | | |
| TOTAL INVESTMENTS (101.9%)
(Cost $241,860,561) | | | 261,664,467 | |
| | | | | | | | | | |
| |
| | LIABILITIES, LESS OTHER ASSETS (-1.9%) | | | (4,927,269 | ) |
| | | | | | | | | | |
| |
| | NET ASSETS (100.0%) | | $ | 256,737,198 | |
| | | | | | | | | | |
| | | | | | | | | | |
NUMBER OF
CONTRACTS | | | | | | | VALUE | |
| | | | | | | | | | |
| | | | | | | | | | |
| | WRITTEN OPTION (-0.1%)# | |
| | | | | | Consumer Discretionary (-0.1%) | | | | |
| | 46 | | | | | Amazon.com, Inc. Call, 07/21/12, Strike $190.00 (Premium $65,277) | | $ | (204,585 | ) |
| | | | | | | | | | |
FORWARD FOREIGN CURRENCY CONTRACTS
| | | | | | | | | | | | | | | | |
COUNTER
PARTY | | SHORT CONTRACTS | | SETTLEMENT DATE | | LOCAL
CURRENCY | | | CURRENT
VALUE | | | UNREALIZED
GAIN/LOSS | |
| UBS AG | | Australian Dollar | | 07/19/12 | | | 6,908,000 | | | $ | 7,140,317 | | | $ | (46,913 | ) |
| Northern Trust Company | | Brazilian Real | | 07/19/12 | | | 10,309,000 | | | | 5,330,128 | | | | 217,117 | |
| UBS AG | | Brazilian Real | | 07/19/12 | | | 2,907,000 | | | | 1,503,025 | | | | 17,396 | |
| Northern Trust Company | | British Pound Sterling | | 07/19/12 | | | 5,386,000 | | | | 8,736,850 | | | | (196,458 | ) |
| Northern Trust Company | | Canadian Dollar | | 07/19/12 | | | 10,227,000 | | | | 10,334,425 | | | | (110,185 | ) |
| Citibank N.A. | | Danish Krone | | 07/19/12 | | | 76,768,000 | | | | 13,667,592 | | | | (156,143 | ) |
| UBS AG | | European Monetary Unit | | 07/19/12 | | | 16,751,000 | | | | 22,182,609 | | | | (266,505 | ) |
| Citibank N.A. | | Hong Kong Dollar | | 07/19/12 | | | 6,063,000 | | | | 781,682 | | | | (77 | ) |
| Barclays Bank PLC | | Japanese Yen | | 07/19/12 | | | 95,051,000 | | | | 1,191,404 | | | | (6,479 | ) |
| Citibank N.A. | | Mexican Peso | | 07/19/12 | | | 48,762,000 | | | | 3,717,192 | | | | (44,031 | ) |
| Citibank N.A. | | New Taiwanese Dollar | | 07/19/12 | | | 79,273,000 | | | | 2,715,403 | | | | (19,134 | ) |
| UBS AG | | Norwegian Krone | | 07/19/12 | | | 19,955,000 | | | | 3,476,352 | | | | (42,842 | ) |
| Citibank N.A. | | Singapore Dollar | | 07/19/12 | | | 612,000 | | | | 494,657 | | | | (3,668 | ) |
| Northern Trust Company | | South Korean Won | | 07/19/12 | | | 3,469,716,000 | | | | 3,054,429 | | | | (16,124 | ) |
| UBS AG | | Swedish Krona | | 07/19/12 | | | 9,817,000 | | | | 1,456,161 | | | | (14,285 | ) |
| Barclays Bank PLC | | Swiss Franc | | 07/19/12 | | | 9,141,000 | | | | 10,080,912 | | | | (136,719 | ) |
| | | | | | | | | | | | | | | | |
| | | | | | | | | | | | | | $ | (825,050 | ) |
| | | | | | | | | | | | | | | | |
| | | | | |
COUNTER
PARTY | | LONG CONTRACTS | | SETTLEMENT DATE | | LOCAL
CURRENCY | | | CURRENT
VALUE | | | UNREALIZED
GAIN/LOSS | |
| Citibank N.A. | | British Pound Sterling | | 07/19/12 | | | 320,000 | | | $ | 519,085 | | | $ | 2,789 | |
| Northern Trust Company | | Mexican Peso | | 07/19/12 | | | 27,266,000 | | | | 2,078,523 | | | | 22,993 | |
| | | | | | | | | | | | | | | | |
| | | | | | | | | | | | | | $ | 25,782 | |
| | | | | | | | | | | | | | | | |
NOTES TO SCHEDULE OF INVESTMENTS
| # | Non-income producing security. |
| ~ | Security, or portion of security, is segregated as collateral (or potential collateral for future transactions) for written options. The aggregate value of such securities is $2,781,861. |
| | | | | | |
| See accompanying Notes to Financial Statements | | www.calamos.com | | | 71 | |
Global Equity Fund Schedule of Investments April 30, 2012 (Unaudited)
FOREIGN CURRENCY ABBREVIATIONS
| | |
| AUD | | Australian Dollar |
| BRL | | Brazilian Real |
| CAD | | Canadian Dollar |
| CHF | | Swiss Franc |
| DKK | | Danish Krone |
| EUR | | European Monetary Unit |
| GBP | | British Pound Sterling |
| HKD | | Hong Kong Dollar |
| JPY | | Japanese Yen |
| KRW | | South Korean Won |
| MXN | | Mexican Peso |
| NOK | | Norwegian Krone |
| SEK | | Swedish Krona |
| SGD | | Singapore Dollar |
| TWD | | New Taiwanese Dollar |
Note: Value for securities denominated in foreign currencies is shown in U.S. dollars. The date on options represents the expiration date of the option contract. The option contract may be exercised at any date on or before the date shown.
CURRENCY EXPOSURE
APRIL 30, 2012
| | | | | | | | |
| | | VALUE | | | % OF TOTAL
INVESTMENTS | |
| US Dollar | | $ | 148,545,210 | | | | 56.8% | |
| European Monetary Unit | | | 23,838,539 | | | | 9.1% | |
| Danish Krone | | | 14,835,202 | | | | 5.7% | |
| Canadian Dollar | | | 14,438,238 | | | | 5.5% | |
| Swiss Franc | | | 10,771,959 | | | | 4.1% | |
| Brazilian Real | | | 9,877,165 | | | | 3.8% | |
| British Pound Sterling | | | 8,754,285 | | | | 3.4% | |
| Australian Dollar | | | 7,124,647 | | | | 2.7% | |
| New Taiwanese Dollar | | | 5,615,709 | | | | 2.1% | |
| South Korean Won | | | 5,487,086 | | | | 2.1% | |
| Norwegian Krone | | | 5,310,437 | | | | 2.0% | |
| Swedish Krona | | | 2,032,142 | | | | 0.8% | |
| Mexican Peso | | | 1,770,335 | | | | 0.7% | |
| Hong Kong Dollar | | | 1,373,832 | | | | 0.5% | |
| Japanese Yen | | | 1,244,146 | | | | 0.5% | |
| Singapore Dollar | | | 645,535 | | | | 0.2% | |
| Total Investments | | $ | 261,664,467 | | | | 100.0% | |
| | |
Currency exposure may vary over time.
| | | | |
| 72 | | CALAMOS FAMILY OF FUNDS SEMIANNUAL REPORT | | See accompanying Notes to Financial Statements |
Growth and Income Fund Schedule of Investments April 30, 2012 (Unaudited)
| | | | | | | | | | |
PRINCIPAL
AMOUNT | | | | | | | VALUE | |
| | | | | | | | | | |
| | CONVERTIBLE BONDS (32.2%) | |
| | | | | | Consumer Discretionary (3.0%) | |
| | 23,113,000 | | | | | International Game Technology 3.250%, 05/01/14 | | $ | 25,568,756 | |
| | 27,000,000 | | | | | Liberty Media Corp.
(Viacom, CBS Corp. -
Class B)§ 3.250%, 03/15/31 | | | 23,726,250 | |
| | 31,980,000 | | | | | Omnicom Group, Inc. 0.000%, 07/01/38 | | | 35,297,925 | |
| | 47,500,000 | | | | | Priceline.com, Inc.* 1.000%, 03/15/18 | | | 52,784,375 | |
| | | | | | | | | | |
| | | | | | | | | 137,377,306 | |
| | | | | | | | | | |
| | | | | | Energy (1.7%) | |
| | 21,650,000 | | | | | Chesapeake Energy Corp. 2.500%, 05/15/37 | | | 18,889,625 | |
| | 23,500,000 | | | | | Helix Energy Solutions Group, Inc. 3.250%, 03/15/32 | | | 26,936,875 | |
| | | | | | Technip, SA | | | | |
| | 19,005,900 | | | EUR | | 0.250%, 01/01/17 | | | 26,604,708 | |
| | 4,298,700 | | | EUR | | 0.500%, 01/01/16 | | | 5,599,428 | |
| | | | | | | | | | |
| | | | | | | | | 78,030,636 | |
| | | | | | | | | | |
| | | | | | Financials (1.0%) | |
| | 16,747,000 | | | | | Leucadia National Corp. 3.750%, 04/15/14 | | | 20,347,605 | |
| | 27,500,000 | | | SGD | | Temasek Financial, Ltd. (Standard Chartered, PLC)§ 0.000%, 10/24/14 | | | 23,293,333 | |
| | | | | | | | | | |
| | | | | | | | | 43,640,938 | |
| | | | | | | | | | |
| | | | | | Health Care (7.1%) | |
| | 56,634,000 | | | | | Amgen, Inc. 0.375%, 02/01/13 | | | 58,474,605 | |
| | | | | | Gilead Sciences, Inc. | | | | |
| | 60,000,000 | | | | | 1.625%, 05/01/16 | | | 79,650,000 | |
| | 15,750,000 | | | | | 1.000%, 05/01/14 | | | 20,002,500 | |
| | 20,000,000 | | | | | Hologic, Inc.‡ 2.000%, 12/15/37 | | | 21,650,000 | |
| | 41,500,000 | | | | | Medtronic, Inc. 1.625%, 04/15/13 | | | 41,966,875 | |
| | 23,500,000 | | | | | Salix Pharmaceuticals, Ltd.* 1.500%, 03/15/19 | | | 23,999,375 | |
| | 40,000,000 | | | | | Shire, PLC 2.750%, 05/09/14 | | | 47,236,917 | |
| | 32,000,000 | | | | | Teva Pharmaceutical Industries, Ltd. 0.250%, 02/01/26 | | | 34,880,000 | |
| | | | | | | | | | |
| | | | | | | | | 327,860,272 | |
| | | | | | | | | | |
| | | | | | Industrials (1.4%) | |
| | 33,000,000 | | | | | AGCO Corp.~ 1.250%, 12/15/36 | | | 41,951,250 | |
| | 25,000,000 | | | | | Siemens AG 1.050%, 08/16/17 | | | 24,562,500 | |
| | | | | | | | | | |
| | | | | | | | | 66,513,750 | |
| | | | | | | | | | |
| | | | | | | | | | |
PRINCIPAL
AMOUNT | | | | | | | VALUE | |
| | | | | | | | | | |
| | | | | | | | | | |
| | | | | | Information Technology (15.1%) | |
| | 45,000,000 | | | | | Electronic Arts, Inc.* 0.750%, 07/15/16 | | $ | 41,625,000 | |
| | 98,780,000 | | | | | EMC Corp. 1.750%, 12/01/13 | | | 176,075,350 | |
| | 52,000,000 | | | | | Intel Corp. 3.250%, 08/01/39 | | | 72,995,000 | |
| | | | | | Lam Research Corp.* | | | | |
| | 31,000,000 | | | | | 0.500%, 05/15/16 | | | 30,883,750 | |
| | 26,933,000 | | | | | 1.250%, 05/15/18 | | | 27,067,665 | |
| | 22,000,000 | | | | | Linear Technology Corp. 3.000%, 05/01/27 | | | 23,210,000 | |
| | 45,000,000 | | | | | Microsoft Corp.* 0.000%, 06/15/13 | | | 49,275,000 | |
| | 60,000,000 | | | | | Nuance Communications, Inc.* 2.750%, 11/01/31 | | | 67,500,000 | |
| | 9,306,000 | | | | | ON Semiconductor Corp. 2.625%, 12/15/26 | | | 10,527,413 | |
| | 17,800,000 | | | | | Rovi Corp. 2.625%, 02/15/40 | | | 18,245,000 | |
| | 31,500,000 | | | | | SanDisk Corp. 1.500%, 08/15/17 | | | 32,799,375 | |
| | 37,000,000 | | | | | Symantec Corp. 1.000%, 06/15/13 | | | 39,543,750 | |
| | 29,000,000 | | | | | Take-Two Interactive Software, Inc.* 1.750%, 12/01/16 | | | 29,398,750 | |
| | 45,180,000 | | | | | TIBCO Software, Inc.* 2.250%, 05/01/32 | | | 46,083,600 | |
| | 30,500,000 | | | | | VeriFone Systems, Inc. 1.375%, 06/15/12 | | | 33,740,625 | |
| | | | | | | | | | |
| | | | | | | | | 698,970,278 | |
| | | | | | | | | | |
| | | | | | Materials (2.9%) | |
| | 50,200,000 | | | | | Goldcorp, Inc. 2.000%, 08/01/14 | | | 57,918,250 | |
| | | | | | Newmont Mining Corp. | | | | |
| | 33,689,000 | | | | | 1.250%, 07/15/14 | | | 41,395,359 | |
| | 28,500,000 | | | | | 1.625%, 07/15/17 | | | 36,373,125 | |
| | | | | | | | | | |
| | | | | | | | | 135,686,734 | |
| | | | | | | | | | |
| | | | | | TOTAL CONVERTIBLE BONDS (Cost $1,371,326,247) | | | 1,488,079,914 | |
| | | | | | | | | | |
| | | | | | | | | | |
| | SYNTHETIC CONVERTIBLE SECURITIES (15.0%) | |
| | Corporate Bonds (4.9%) | |
| | | | | | Consumer Discretionary (2.1%) | |
| | 23,500,000 | | | | | Expedia, Inc. 5.950%, 08/15/20 | | | 24,607,414 | |
| | 23,500,000 | | | | | Gap, Inc. 5.950%, 04/12/21 | | | 24,338,809 | |
| | 11,000,000 | | | | | Hanesbrands, Inc. 6.375%, 12/15/20 | | | 11,412,500 | |
| | 12,500,000 | | | | | J.C. Penney Company, Inc. 7.650%, 08/15/16 | | | 13,750,000 | |
| | | | | | |
| See accompanying Notes to Schedule of Investments | | www.calamos.com | | | 73 | |
Growth and Income Fund Schedule of Investments April 30, 2012 (Unaudited)
| | | | | | | | | | |
PRINCIPAL
AMOUNT | | | | | | | VALUE | |
| | | | | | | | | | |
| | 23,000,000 | | | | | Limited Brands, Inc. 5.625%, 02/15/22 | | $ | 23,258,750 | |
| | | | | | | | | | |
| | | | | | | | | 97,367,473 | |
| | | | | | | | | | |
| | | | | | Energy (1.3%) | |
| | 25,000,000 | | | | | Continental Resources, Inc.* 5.000%, 09/15/22 | | | 25,406,250 | |
| | 11,000,000 | | | | | Noble Energy, Inc. 4.150%, 12/15/21 | | | 11,530,937 | |
| | 20,555,000 | | | | | Oil States International, Inc. 6.500%, 06/01/19 | | | 21,839,687 | |
| | | | | | | | | | |
| | | | | | | | | 58,776,874 | |
| | | | | | | | | | |
| | | | | | | | | | |
| | | | | | Financials (0.2%) | |
| | 12,000,000 | | | | | Neuberger Berman Group LLC* 5.875%, 03/15/22 | | | 12,270,000 | |
| | | | | | | | | | |
| | | | | | Health Care (0.5%) | |
| | 10,750,000 | | | | | Endo Pharmaceuticals Holdings, Inc. 7.000%, 07/15/19 | | | 11,529,375 | |
| | 11,000,000 | | | | | Mylan, Inc.* 6.000%, 11/15/18 | | | 11,605,000 | |
| | | | | | | | | | |
| | | | | | | | | 23,134,375 | |
| | | | | | | | | | |
| | | | | | Industrials (0.2%) | |
| | 7,694,000 | | | | | Actuant Corp.* 5.625%, 06/15/22 | | | 7,934,438 | |
| | | | | | | | | | |
| | | | | | Information Technology (0.5%) | | | | |
| | 10,625,000 | | | | | Anixter, Inc. 5.625%, 05/01/19 | | | 10,917,187 | |
| | 10,750,000 | | | | | Seagate Technology 6.875%, 05/01/20 | | | 11,583,125 | |
| | | | | | | | | | |
| | | | | | | | | 22,500,312 | |
| | | | | | | | | | |
| | | | | | Materials (0.1%) | |
| | 4,780,000 | | | | | Ball Corp. 5.000%, 03/15/22 | | | 4,869,625 | |
| | | | | | | | | | |
| | | | | | TOTAL CORPORATE BONDS | | | 226,853,097 | |
| | | | | | | | | | |
| | Sovereign Bonds (9.9%) | |
| | 9,700,000 | | | BRL | | Federative Republic of Brazil 10.000%, 01/01/14 | | | 53,436,891 | |
| | | | | | Government of Canada | | | | |
| | 75,000,000 | | | CAD | | 2.000%, 12/01/14 | | | 77,017,260 | |
| | 13,000,000 | | | CAD | | 2.000%, 06/01/16 | | | 13,382,953 | |
| | | | | | Government of New Zealand | | | | |
| | 25,500,000 | | | NZD | | 6.000%, 04/15/15 | | | 22,790,557 | |
| | 25,000,000 | | | NZD | | 6.500%, 04/15/13 | | | 21,211,672 | |
| | | | | | Government of Singapore | | | | |
| | 55,000,000 | | | SGD | | 1.375%, 10/01/14 | | | 45,699,911 | |
| | 48,043,000 | | | SGD | | 2.375%, 04/01/17 | | | 42,320,118 | |
| | 7,249,000 | | | SGD | | 1.125%, 04/01/16 | | | 6,038,326 | |
| | | | | | Kingdom of Norway | | | | |
| | 240,000,000 | | | NOK | | 4.250%, 05/19/17 | | | 47,310,985 | |
| | 100,000,000 | | | NOK | | 5.000%, 05/15/15 | | | 19,276,772 | |
| | 97,000,000 | | | NOK | | 6.500%, 05/15/13 | | | 17,805,240 | |
| | | | | | | | | | |
PRINCIPAL
AMOUNT | | | | | | | VALUE | |
| | | | | | | | | | |
| | 560,000,000 | | | SEK | | Kingdom of Sweden 3.000%, 07/12/16 | | $ | 88,917,965 | |
| | | | | | | | | | |
| | | | | | TOTAL SOVEREIGN BONDS | | | 455,208,650 | |
| | | | | | | | | | |
| | | | | | | | | | |
NUMBER OF
CONTRACTS | | | | | | | VALUE | |
| | | | | | | | | | |
| | Purchased Options (0.2%)# | |
| | | | | | Energy (0.0%) | | | | |
| | 6,750 | | | | | Chesapeake Energy Corp. Call, 01/19/13, Strike $30.00 | | | 300,375 | |
| | | | | | | | | | |
| | | | | | Information Technology (0.2%) | | | | |
| | 665 | | | | | Apple, Inc. Call, 01/19/13, Strike $500.00 | | | 7,635,863 | |
| | | | | | | | | | |
| | | | | | TOTAL PURCHASED OPTIONS | | | 7,936,238 | |
| | | | | | | | | | |
| | | | | | TOTAL SYNTHETIC CONVERTIBLE SECURITIES (Cost $658,069,971) | | | 689,997,985 | |
| | | | | | | | | | |
| | | | | | | | | | |
NUMBER OF
SHARES | | | | | | | VALUE | |
| | CONVERTIBLE PREFERRED STOCKS (4.8%) | |
| | | | | | Energy (3.2%) | | | | |
| | 1,552,000 | | | | | Apache Corp.~ 6.000% | | | 82,442,240 | |
| | 76,100 | | | | | Chesapeake Energy Corp.* 5.750% | | | 65,926,500 | |
| | | | | | | | | | |
| | | | | | | | | 148,368,740 | |
| | | | | | | | | | |
| | | | | | Financials (1.6%) | | | | |
| | 690,000 | | | | | Affiliated Managers Group, Inc. 5.150% | | | 29,799,375 | |
| | 41,000 | | | | | Wells Fargo & Company 7.500% | | | 45,921,230 | |
| | | | | | | | | | |
| | | | | | | | | 75,720,605 | |
| | | | | | | | | | |
| | | | | | TOTAL CONVERTIBLE PREFERRED STOCKS (Cost $230,959,180) | | | 224,089,345 | |
| | | | | | | | | | |
| | | | | | | | | | |
| | COMMON STOCKS (45.2%) | |
| | | | | | Consumer Discretionary (1.7%) | |
| | 350,000 | | | | | Amazon.com, Inc.#~ | | | 81,165,000 | |
| | | | | | | | | | |
| | | | | | Consumer Staples (3.0%) | |
| | 1,050,000 | | | | | Coca-Cola Company~ | | | 80,136,000 | |
| | 690,000 | | | | | Mead Johnson Nutrition Company | | | 59,036,400 | |
| | | | | | | | | | |
| | | | | | | | | 139,172,400 | |
| | | | | | | | | | |
| | | | | | Energy (4.4%) | |
| | 1,100,000 | | | | | Helmerich & Payne, Inc. | | | 56,529,000 | |
| | 425,000 | | | | | National Oilwell Varco, Inc. | | | 32,198,000 | |
| | 480,000 | | | | | Occidental Petroleum Corp. | | | 43,785,600 | |
| | | | |
| 74 | | CALAMOS FAMILY OF FUNDS SEMIANNUAL REPORT | | See accompanying Notes to Schedule of Investments |
Growth and Income Fund Schedule of Investments April 30, 2012 (Unaudited)
| | | | | | | | | | |
NUMBER OF
SHARES | | | | | | | VALUE | |
| | | | | | | | | | |
| | 950,000 | | | | | Schlumberger, Ltd. | | $ | 70,433,000 | |
| | | | | | | | | | |
| | | | | | | | | 202,945,600 | |
| | | | | | | | | | |
| | | | | | Financials (2.8%) | |
| | 375,000 | | | | | Franklin Resources, Inc. | | | 47,066,250 | |
| | 1,275,000 | | | | | T. Rowe Price Group, Inc. | | | 80,471,625 | |
| | | | | | | | | | |
| | | | | | | | | 127,537,875 | |
| | | | | | | | | | |
| | | | | | Health Care (5.4%) | |
| | 475,000 | | | | | Biogen Idec, Inc.# | | | 63,654,750 | |
| | 925,000 | | | | | Johnson & Johnson | | | 60,208,250 | |
| | 1,850,000 | | | | | Merck & Company, Inc. | | | 72,594,000 | |
| | 360,000 | | | DKK | | Novo Nordisk, A/S - Class B | | | 53,072,282 | |
| | | | | | | | | | |
| | | | | | | | | 249,529,282 | |
| | | | | | | | | | |
| | | | | | Industrials (3.9%) | |
| | 2,400,000 | | | CHF | | ABB, Ltd.# | | | 43,734,920 | |
| | 765,000 | | | | | Dover Corp. | | | 47,934,900 | |
| | 1,800,000 | | | | | Eaton Corp. | | | 86,724,000 | |
| | | | | | | | | | |
| | | | | | | | | 178,393,820 | |
| | | | | | | | | | |
| | | | | | Information Technology (20.4%) | |
| | 1,100,000 | | | | | Accenture, PLC - Class A | | | 71,445,000 | |
| | 101,741 | | | | | Check Point Software
Technologies, Ltd.# | | | 5,914,204 | |
| | 3,000,000 | | | | | Cisco Systems, Inc.~ | | | 60,450,000 | |
| | 2,750,000 | | | | | Dell, Inc. #~ | | | 45,017,500 | |
| | 3,120,000 | | | | | eBay, Inc.#~ | | | 128,076,000 | |
| | 1,575,000 | | | | | Intel Corp. | | | 44,730,000 | |
| | 130,000 | | | | | MasterCard, Inc. - Class A | | | 58,795,100 | |
| | 2,880,325 | | | | | Microsoft Corp. | | | 92,228,007 | |
| | 4,500,000 | | | | | Oracle Corp. | | | 132,255,000 | |
| | 1,910,000 | | | | | QUALCOMM, Inc. | | | 121,934,400 | |
| | 830,000 | | | | | SAP, AG | | | 55,020,700 | |
| | 1,100,000 | | | | | Teradata Corp.# | | | 76,758,000 | |
| | 3,150,000 | | | | | Yahoo!, Inc.#~ | | | 48,951,000 | |
| | | | | | | | | | |
| | | | | | | | | 941,574,911 | |
| | | | | | | | | | |
| | | | | | Materials (3.6%) | | | | |
| | 1,750,000 | | | | | Barrick Gold Corp. | | | 70,752,500 | |
| | 510,000 | | | | | Cliffs Natural Resources, Inc. | | | 31,752,600 | |
| | 450,000 | | | | | Mosaic Company | | | 23,769,000 | |
| | 2,750,000 | | | | | Yamana Gold, Inc. | | | 40,425,000 | |
| | | | | | | | | | |
| | | | | | | | | 166,699,100 | |
| | | | | | | | | | |
| | | | | | TOTAL COMMON STOCKS
(Cost $1,674,113,550) | | | 2,087,017,988 | |
| | | | | | | | | | |
| | | | | | | | | | |
| | | | | | | | | | |
NUMBER OF
CONTRACTS | | | | | | | VALUE | |
| | | | | | | | | | |
| | PURCHASED OPTIONS (0.1%)# | |
| | | | | | Consumer Discretionary (0.0%) | | | | |
| | 3,500 | | | | | Amazon.com, Inc. Put, 07/21/12, Strike $140.00 | | $ | 152,250 | |
| | | | | | | | | | |
| | | | | | Information Technology (0.1%) | | | | |
| | 61,000 | | | | | EMC Corp. Put, 10/20/12, Strike $25.00 | | | 5,032,500 | |
| | | | | | | | | | |
| | | | | | TOTAL PURCHASED OPTIONS
(Cost $10,015,947) | | | 5,184,750 | |
| | | | | | | | | | |
| | | | | | | | | | |
NUMBER OF
SHARES | | | | | | | VALUE | |
| | SHORT TERM INVESTMENT (2.0%) | |
| | 91,119,248 | | | | | Fidelity Prime Money Market Fund - Institutional Class
(Cost $91,119,248) | | | 91,119,248 | |
| | | | | | | | | | |
| TOTAL INVESTMENTS (99.3%)
(Cost $4,035,604,143) | | | 4,585,489,230 | |
| | | | | | | | | | |
| |
| | OTHER ASSETS, LESS LIABILITIES (0.7%) | | | 30,466,970 | |
| | | | | | | | | | |
| |
| | NET ASSETS (100.0%) | | $ | 4,615,956,200 | |
| | | | | | | | | | |
| | | | | | | | | | |
NUMBER OF
CONTRACTS | | | | | | | VALUE | |
| | WRITTEN OPTIONS (-0.3%)# | |
| | | | | | Consumer Discretionary (-0.1%) | | | | |
| | 1,002 | | | | | Amazon.com, Inc. Call, 07/21/12, Strike $190.00 | | | (4,456,395 | ) |
| | | | | | | | | | |
| | | | | | Information Technology (-0.2%) | | | | |
| | 25,000 | | | | | EMC Corp. Call, 01/18/14, Strike $30.00 | | | (7,937,500 | ) |
| | | | | | | | | | |
| | | | | | TOTAL WRITTEN OPTIONS
(Premium $8,760,030) | | | (12,393,895 | ) |
| | | | | | | | | | |
FORWARD FOREIGN CURRENCY CONTRACTS
| | | | | | | | | | | | | | | | |
COUNTER
PARTY | | SHORT CONTRACTS | | SETTLEMENT DATE | | LOCAL CURRENCY | | | CURRENT
VALUE | | | UNREALIZED
GAIN/LOSS | |
| Northern Trust Company | | British Pound Sterling | | 07/19/12 | | | 32,972,000 | | | $ | 53,485,224 | | | $ | (1,202,677 | ) |
| Citibank N.A. | | Danish Krone | | 07/19/12 | | | 272,242,000 | | | | 48,469,319 | | | | (553,730 | ) |
| UBS AG | | European Monetary Unit | | 07/19/12 | | | 74,914,000 | | | | 99,205,298 | | | | (1,191,866 | ) |
| Barclays Bank PLC | | Swiss Franc | | 07/19/12 | | | 42,782,000 | | | | 47,181,005 | | | | (639,878 | ) |
| | | | | | | | | | | | | | | | |
| | | | | | | | | | | | | | $ | (3,588,151 | ) |
| | | | | | | | | | | | | | | | |
| | | | | | |
| See accompanying Notes to Schedule of Investments | | www.calamos.com | | | 75 | |
Growth and Income Fund Schedule of Investments April 30, 2012 (Unaudited)
NOTES TO SCHEDULE OF INVESTMENTS
| § | Securities exchangeable or convertible into securities of one or more entities that are different than the issuer. Each entity is identified in the parenthetical. |
| * | Securities issued and sold pursuant to a Rule 144A transaction are excepted from the registration requirement of the Securities Act of 1933, as amended. These securities may only be sold to qualified institutional buyers (“QIBs”), such as the fund. Any resale of these securities must generally be effected through a sale that is registered under the Act or otherwise exempted from such registration requirements. At April 30, 2012, the value of 144A securities that could not be exchanged to the registered form is $458,419,015 or 9.9% of net assets. |
| ‡ | Variable rate or step bond security. The rate shown is the rate in effect at April 30, 2012. |
| ~ | Security, or portion of security, is segregated as collateral (or potential collateral for future transactions) for written options. The aggregate value of such securities is $53,634,127. |
| # | Non-income producing security. |
FOREIGN CURRENCY ABBREVIATIONS
| | |
| BRL | | Brazilian Real |
| CAD | | Canadian Dollar |
| CHF | | Swiss Franc |
| DKK | | Danish Krone |
| EUR | | European Monetary Unit |
| NOK | | Norwegian Krone |
| NZD | | New Zealand Dollar |
| SEK | | Swedish Krona |
| SGD | | Singapore Dollar |
Note: Value for securities denominated in foreign currencies is shown in U.S. dollars. The principal amount for such securities is shown in the respective foreign currency. The date on options represents the expiration date of the option contract. The option contract may be exercised at any date on or before the date shown.
| | | | |
| 76 | | CALAMOS FAMILY OF FUNDS SEMIANNUAL REPORT | | See accompanying Notes to Financial Statements |
Global Growth and Income Fund Schedule of Investments April 30, 2012 (Unaudited)
| | | | | | | | | | |
PRINCIPAL
AMOUNT | | | | | | | VALUE | |
| | | | | | | | | | |
| | | | | | | | | | |
| | CONVERTIBLE BONDS (35.9%) | |
| | | | | | Consumer Discretionary (3.2%) | |
| | 70,000,000 | | | HKD | | Hengdeli Holdings, Ltd. 2.500%, 10/20/15 | | $ | 9,174,052 | |
| | 10,000,000 | | | | | Liberty Media Corp.
(Viacom, CBS Corp. - Class B)§ 3.250%, 03/15/31 | | | 8,787,500 | |
| | 15,100,000 | | | | | Omnicom Group, Inc. 0.000%, 07/01/38 | | | 16,666,625 | |
| | 18,000,000 | | | | | Priceline.com, Inc.* 1.000%, 03/15/18 | | | 20,002,500 | |
| | | | | | | | | | |
| | | | | | | | | 54,630,677 | |
| | | | | | | | | | |
| | | | | | Consumer Staples (3.4%) | |
| | 1,260,000,000 | | | JPY | | Asahi Group Holdings, Ltd. 0.000%, 05/26/28 | | | 16,642,975 | |
| | | | | | Unicharm Corp. | | | | |
| | 2,060,000,000 | | | JPY | | 0.000%, 09/24/15 | | | 31,065,618 | |
| | 640,000,000 | | | JPY | | 0.000%, 09/24/13 | | | 9,455,831 | |
| | | | | | | | | | |
| | | | | | | | | 57,164,424 | |
| | | | | | | | | | |
| | | | | | Energy (5.1%) | |
| | 39,500,000 | | | | | Subsea 7, SA 2.250%, 10/11/13 | | | 48,405,715 | |
| | | | | | Technip, SA | | | | |
| | 21,350,000 | | | EUR | | 0.500%, 01/01/16 | | | 27,810,221 | |
| | 7,041,200 | | | EUR | | 0.250%, 01/01/17 | | | 9,856,364 | |
| | | | | | | | | | |
| | | | | | | | | 86,072,300 | |
| | | | | | | | | | |
| | | | | | Financials (3.2%) | |
| | 13,400,000 | | | | | Affiliated Managers Group, Inc. 3.950%, 08/15/38 | | | 14,823,750 | |
| | 3,730,000 | | | | | Leucadia National Corp. 3.750%, 04/15/14 | | | 4,531,950 | |
| | 41,500,000 | | | SGD | | Temasek Financial, Ltd.
(Standard Chartered, PLC)§ 0.000%, 10/24/14 | | | 35,151,758 | |
| | | | | | | | | | |
| | | | | | | | | 54,507,458 | |
| | | | | | | | | | |
| | | | | | Health Care (6.4%) | |
| | 23,850,000 | | | | | Gilead Sciences, Inc. 1.625%, 05/01/16 | | | 31,660,875 | |
| | 1,270,000,000 | | | JPY | | Sawai Pharmaceutical Company, Ltd. 0.000%, 09/17/15 | | | 17,046,281 | |
| | 36,300,000 | | | | | Shire, PLC 2.750%, 05/09/14 | | | 42,867,502 | |
| | 7,725,000 | | | | | Teva Pharmaceutical Industries, Ltd. 0.250%, 02/01/26 | | | 8,420,250 | |
| | 5,800,000 | | | EUR | | UCB, SA 4.500%, 10/22/15 | | | 8,965,472 | |
| | | | | | | | | | |
| | | | | | | | | 108,960,380 | |
| | | | | | | | | | |
| | | | | | Industrials (1.0%) | |
| | 17,750,000 | | | | | Siemens AG 1.050%, 08/16/17 | | | 17,439,375 | |
| | | | | | | | | | |
| | | | | | | | | | |
PRINCIPAL
AMOUNT | | | | | | | VALUE | |
| | | | | | | | | | |
| | | | | | | | | | |
| | | | | | Information Technology (7.6%) | |
| | 4,000,000 | | | | | Dialog Semiconductor, PLC 1.000%, 04/12/17 | | $ | 4,263,730 | |
| | 14,300,000 | | | | | EMC Corp. 1.750%, 12/01/13 | | | 25,489,750 | |
| | 8,800,000 | | | | | Hon Hai Precision Industry Company, Ltd. 0.000%, 10/12/13 | | | 8,838,501 | |
| | 20,400,000 | | | | | Intel Corp. 3.250%, 08/01/39 | | | 28,636,500 | |
| | 8,100,000 | | | | | Linear Technology Corp. 3.000%, 05/01/27 | | | 8,545,500 | |
| | 15,600,000 | | | | | Microsoft Corp.* 0.000%, 06/15/13 | | | 17,082,000 | |
| | 16,300,000 | | | | | Nuance Communications, Inc.* 2.750%, 11/01/31 | | | 18,337,500 | |
| | 17,000,000 | | | | | TIBCO Software, Inc.* 2.250%, 05/01/32 | | | 17,340,000 | |
| | | | | | | | | | |
| | | | | | | | | 128,533,481 | |
| | | | | | | | | | |
| | | | | | Materials (4.9%) | |
| | 14,000,000 | | | | | AngloGold Ashanti, Ltd. 3.500%, 05/22/14 | | | 14,980,000 | |
| | 32,000,000 | | | | | Goldcorp, Inc. 2.000%, 08/01/14 | | | 36,920,000 | |
| | | | | | Newmont Mining Corp. | | | | |
| | 16,600,000 | | | | | 1.625%, 07/15/17 | | | 21,185,750 | |
| | 8,300,000 | | | | | 1.250%, 07/15/14 | | | 10,198,625 | |
| | | | | | | | | | |
| | | | | | | | | 83,284,375 | |
| | | | | | | | | | |
| | | | | | Telecommunication Services (1.1%) | |
| | 16,500,000 | | | | | Billion Express Investments, Ltd. 0.750%, 10/18/15 | | | 17,746,475 | |
| | | | | | | | | | |
| | | | | | TOTAL CONVERTIBLE BONDS (Cost $582,976,121) | | | 608,338,945 | |
| | | | | | | | | | |
| | | | | | | | | | |
| | SYNTHETIC CONVERTIBLE SECURITIES (14.2%) | |
| | Corporate Bonds (3.3%) | |
| | | | | | Consumer Discretionary (1.0%) | |
| | 25,000,000 | | | CNY | | BSH Bosch und Siemens Hausgerate, GmbH 2.375%, 09/29/14 | | | 3,915,252 | |
| | 4,400,000 | | | | | Expedia, Inc. 5.950%, 08/15/20 | | | 4,607,346 | |
| | 4,500,000 | | | | | Gap, Inc. 5.950%, 04/12/21 | | | 4,660,623 | |
| | 4,400,000 | | | | | Limited Brands, Inc. 5.625%, 02/15/22 | | | 4,449,500 | |
| | | | | | | | | | |
| | | | | | | | | 17,632,721 | |
| | | | | | | | | | |
| | | | | | Consumer Staples (0.2%) | |
| | 27,000,000 | | | CNY | | Tesco, PLC 1.750%, 09/01/14 | | | 4,228,079 | |
| | | | | | | | | | |
| | | | | | Energy (0.5%) | |
| | 4,500,000 | | | | | Continental Resources, Inc.* 5.000%, 09/15/22 | | | 4,573,125 | |
| | | | | | |
| See accompanying Notes to Schedule of Investments | | www.calamos.com | | | 77 | |
Global Growth and Income Fund Schedule of Investments April 30, 2012 (Unaudited)
| | | | | | | | | | |
PRINCIPAL
AMOUNT | | | | | | | VALUE | |
| | | | | | | | | | |
| | 4,100,000 | | | | | Oil States International, Inc. 6.500%, 06/01/19 | | $ | 4,356,250 | |
| | | | | | | | | | |
| | | | | | | | | 8,929,375 | |
| | | | | | | | | | |
| | | Financials (1.0%) | | | | |
| | | | | | Caterpillar, Inc. | | | | |
| | 100,000,000 | | | CNY | | 1.350%, 07/12/13 | | | 15,598,618 | |
| | 5,500,000 | | | CNY | | 2.000%, 12/01/12 | | | 869,544 | |
| | | | | | | | | | |
| | | | | | | | | 16,468,162 | |
| | | | | | | | | | |
| | | Health Care (0.3%) | | | | |
| | 4,150,000 | | | | | Mylan, Inc.* 6.000%, 11/15/18 | | | 4,378,250 | |
| | | | | | | | | | |
| | | | | | Telecommunication Services (0.3%) | |
| | 28,000,000 | | | CNY | | America Movil, SAB de CV 3.500%, 02/08/15 | | | 4,490,006 | |
| | | | | | | | | | |
| | | | | | TOTAL CORPORATE BONDS | | | 56,126,593 | |
| | | | | | | | | | |
| | Sovereign Bonds (10.6%) | |
| | | | | | Federative Republic of Brazil | | | | |
| | 2,640,000 | | | BRL | | 10.000%, 01/01/14 | | | 14,543,649 | |
| | 800,000 | | | BRL | | 10.000%, 01/01/13 | | | 4,374,741 | |
| | | | | | Government of Canada | | | | |
| | 27,000,000 | | | CAD | | 2.000%, 12/01/14 | | | 27,726,213 | |
| | 14,100,000 | | | CAD | | 2.000%, 06/01/16 | | | 14,515,356 | |
| | | | | | Government of New Zealand | | | | |
| | 10,000,000 | | | NZD | | 6.000%, 04/15/15 | | | 8,937,473 | |
| | 7,800,000 | | | NZD | | 6.500%, 04/15/13 | | | 6,618,042 | |
| | | | | | Government of Singapore | | | | |
| | 19,800,000 | | | SGD | | 1.375%, 10/01/14 | | | 16,451,968 | |
| | 17,628,000 | | | SGD | | 2.375%, 04/01/17 | | | 15,528,153 | |
| | 4,404,000 | | | SGD | | 1.125%, 04/01/16 | | | 3,668,477 | |
| | | | | | Kingdom of Norway | | | | |
| | 112,500,000 | | | NOK | | 4.250%, 05/19/17 | | | 22,177,024 | |
| | 32,000,000 | | | NOK | | 5.000%, 05/15/15 | | | 6,168,567 | |
| | 30,000,000 | | | NOK | | 6.500%, 05/15/13 | | | 5,506,775 | |
| | 213,000,000 | | | SEK | | Kingdom of Sweden 3.000%, 07/12/16 | | | 33,820,583 | |
| | | | | | | | | | |
| | | | | | TOTAL SOVEREIGN BONDS | | | 180,037,021 | |
| | | | | | | | | | |
NUMBER OF
CONTRACTS | | | | | | | VALUE | |
| | | | | | | | | | |
| | Purchased Options (0.3%)# | |
| | | | | | Information Technology (0.3%) | |
| | 295 | | | | | Apple, Inc. Call, 01/19/13, Strike $500.00 | | | 3,387,338 | |
| | 610 | | | | | VMware, Inc. Class A Call, 01/18/14, Strike $110.00 | | | 1,531,100 | |
| | | | | | | | | | |
| | | | | | TOTAL PURCHASED OPTIONS | | | 4,918,438 | |
| | | | | | | | | | |
| | | | | | TOTAL SYNTHETIC
CONVERTIBLE SECURITIES
(Cost $226,574,347) | | | 241,082,052 | |
| | | | | | | | | | |
| | | | | | | | | | |
| | | | | | | | | | |
NUMBER OF
SHARES | | | | | | | VALUE | |
| | | | | | | | | | |
| | CONVERTIBLE PREFERRED STOCKS (1.4%) | |
| | | | | | Energy (1.4%) | |
| | 149,000 | | | | | Apache Corp.~
6.000% | | $ | 7,914,880 | |
| | 17,400 | | | | | Chesapeake Energy Corp.*
5.750% | | | 15,089,000 | |
| | | | | | | | | | |
| | | | | | TOTAL CONVERTIBLE
PREFERRED STOCKS
(Cost $30,414,504) | | | 23,003,880 | |
| | | | | | | | | | |
| | | | | | | | | | |
| | COMMON STOCKS (46.6%) | |
| | | | | | Consumer Discretionary (3.1%) | |
| | 195,025 | | | CHF | | Swatch Group, AG | | | 15,589,997 | |
| | 81,753 | | | CHF | | Swatch Group, AG | | | 37,770,543 | |
| | | | | | | | | | |
| | | | | | | | | 53,360,540 | |
| | | | | | | | | | |
| | | | | | Consumer Staples (7.8%) | |
| | 400,000 | | | JPY | | Asahi Group Holdings, Ltd. | | | 9,006,895 | |
| | 535,000 | | | | | Coca-Cola Company~ | | | 40,831,200 | |
| | 473,500 | | | EUR | | Danone, SA | | | 33,333,971 | |
| | 810,000 | | | GBP | | Diageo, PLC | | | 20,430,850 | |
| | 170,000 | | | EUR | | Heineken, NV | | | 9,304,666 | |
| | 310,000 | | | CHF | | Nestlé, SA | | | 18,999,676 | |
| | | | | | | | | | |
| | | | | | | | | 131,907,258 | |
| | | | | | | | | | |
| | | | | | Energy (3.1%) | |
| | 414,500 | | | | | Helmerich & Payne, Inc. | | | 21,301,155 | |
| | 110,000 | | | | | National Oilwell Varco, Inc. | | | 8,333,600 | |
| | 324,000 | | | | | Schlumberger, Ltd. | | | 24,021,360 | |
| | | | | | | | | | |
| | | | | | | | | 53,656,115 | |
| | | | | | | | | | |
| | | | | | Financials (1.8%) | |
| | 163,000 | | | | | Franklin Resources, Inc. | | | 20,458,130 | |
| | 162,000 | | | | | T. Rowe Price Group, Inc. | | | 10,224,630 | |
| | | | | | | | | | |
| | | | | | | | | 30,682,760 | |
| | | | | | | | | | |
| | | | | | Health Care (8.1%) | |
| | 329,000 | | | | | Covidien, PLC | | | 18,170,670 | |
| | 252,000 | | | | | Johnson & Johnson | | | 16,402,680 | |
| | 285,000 | | | CHF | | Novartis, AG | | | 15,736,632 | |
| | 564,000 | | | DKK | | Novo Nordisk, A/S - Class B | | | 83,146,576 | |
| | 42,300 | | | JPY | | Sawai Pharmaceutical Company, Ltd. | | | 4,457,678 | |
| | | | | | | | | | |
| | | | | | | | | 137,914,236 | |
| | | | | | | | | | |
| | | | | | Industrials (1.4%) | |
| | 835,000 | | | CHF | | ABB, Ltd.# | | | 15,216,108 | |
| | 90,000 | | | EUR | | Siemens, AG | | | 8,353,837 | |
| | | | | | | | | | |
| | | | | | | | | 23,569,945 | |
| | | | | | | | | | |
| | | | | | Information Technology (15.9%) | |
| | 222,000 | | | EUR | | ASML Holding, NV | | | 11,296,035 | |
| | 411,760 | | | | | Check Point Software Technologies, Ltd.# | | | 23,935,609 | |
| | | | |
| 78 | | CALAMOS FAMILY OF FUNDS SEMIANNUAL REPORT | | See accompanying Notes to Schedule of Investments |
Global Growth and Income Fund Schedule of Investments April 30, 2012 (Unaudited)
| | | | | | | | | | |
NUMBER OF
SHARES | | | | | | | VALUE | |
| | | | | | | | | | |
| | 1,105,000 | | | | | Cisco Systems, Inc. | | $ | 22,265,750 | |
| | 1,030,000 | | | | | Dell, Inc.~# | | | 16,861,100 | |
| | 187,000 | | | EUR | | Dialog Semiconductor, PLC# | | | 4,120,356 | |
| | 428,000 | | | | | eBay, Inc.# | | | 17,569,400 | |
| | 4,100,000 | | | TWD | | Hon Hai Precision Industry Company, Ltd. | | | 12,891,123 | |
| | 530,000 | | | | | Microsoft Corp. | | | 16,970,600 | |
| | 622,500 | | | | | QUALCOMM, Inc. | | | 39,740,400 | |
| | 982,000 | | | EUR | | SAP, AG | | | 65,119,914 | |
| | 6,400,000 | | | TWD | | Taiwan Semiconductor Manufacturing Company, Ltd. | | | 18,916,074 | |
| | 1,250,000 | | | | | Yahoo!, Inc.# | | | 19,425,000 | |
| | | | | | | | | | |
| | | | | | | | | 269,111,361 | |
| | | | | | | | | | |
| | | | | | Materials (4.6%) | |
| | 803,500 | | | CAD | | Barrick Gold Corp. | | | 32,502,769 | |
| | 1,169,400 | | | AUD | | Newcrest Mining, Ltd. | | | 31,866,240 | |
| | 244,000 | | | GBP | | Rio Tinto, PLC | | | 13,677,367 | |
| | | | | | | | | | |
| | | | | | | | | 78,046,376 | |
| | | | | | | | | | |
| | | | | | Telecommunication Services (0.8%) | |
| | 125,000 | | | SEK | | Millicom International Cellular, SA | | | 13,230,095 | |
| | | | | | | | | | |
| | | | | | TOTAL COMMON STOCKS (Cost $715,844,509) | | | 791,478,686 | |
| | | | | | | | | | |
| | | | | | | | | | |
| | SHORT TERM INVESTMENT (2.0%) | |
| | 33,629,814 | | | | | Fidelity Prime Money Market Fund - Institutional Class
(Cost $33,629,814) | | | 33,629,814 | |
| | | | | | | | | | |
| TOTAL INVESTMENTS (100.1%)
(Cost $1,589,439,295) | | | 1,697,533,377 | |
| | | | | | | | | | |
| |
| | LIABILITIES, LESS OTHER ASSETS (-0.1%) | | | (1,051,632 | ) |
| | | | | | | | | | |
| |
| | NET ASSETS (100.0%) | | $ | 1,696,481,745 | |
| | | | | | | | | | |
FORWARD FOREIGN CURRENCY CONTRACTS
| | | | | | | | | | | | | | | | |
COUNTER
PARTY | | SHORT CONTRACTS | | SETTLEMENT DATE | | LOCAL CURRENCY | | | CURRENT
VALUE | | | UNREALIZED
GAIN/LOSS | |
| UBS AG | | Australian Dollar | | 07/19/12 | | | 32,143,000 | | | $ | 33,223,974 | | | $ | (218,288 | ) |
| Northern Trust Company | | British Pound Sterling | | 07/19/12 | | | 54,958,000 | | | | 89,149,610 | | | | (2,004,633 | ) |
| Northern Trust Company | | Canadian Dollar | | 07/19/12 | | | 21,461,000 | | | | 21,686,427 | | | | (231,220 | ) |
| Citibank N.A. | | Danish Krone | | 07/19/12 | | | 427,243,000 | | | | 76,065,328 | | | | (868,996 | ) |
| UBS AG | | European Monetary Unit | | 07/19/12 | | | 125,259,000 | | | | 165,874,956 | | | | (1,992,844 | ) |
| Citibank N.A. | | Hong Kong Dollar | | 07/19/12 | | | 147,055,000 | | | | 18,959,295 | | | | (1,860 | ) |
| Barclays Bank PLC | | Japanese Yen | | 07/19/12 | | | 6,606,359,000 | | | | 82,806,514 | | | | (1,147,326 | ) |
| Citibank N.A. | | New Taiwanese Dollar | | 07/19/12 | | | 821,732,000 | | | | 28,147,462 | | | | (198,344 | ) |
| UBS AG | | Norwegian Krone | | 07/19/12 | | | 173,834,000 | | | | 30,283,546 | | | | (373,209 | ) |
| | | | | | | | | | | | | | | | |
COUNTER
PARTY | | SHORT CONTRACTS | | SETTLEMENT DATE | | LOCAL CURRENCY | | | CURRENT
VALUE | | | UNREALIZED
GAIN/LOSS | |
| UBS AG | | Swedish Krona | | 07/19/12 | | | 63,911,000 | | | $ | 9,479,953 | | | $ | (92,998 | ) |
| Barclays Bank PLC | | Swiss Franc | | 07/19/12 | | | 90,558,000 | | | | 99,869,511 | | | | (1,354,450 | ) |
| | | | | | | | | | | | | | | | |
| | | | | | | | | | | | | | $ | (8,484,168 | ) |
| | | | | | | | | | | | | | | | |
| | | | | |
COUNTER
PARTY | | LONG CONTRACTS | | SETTLEMENT DATE | | LOCAL CURRENCY | | | CURRENT
VALUE | | | UNREALIZED
GAIN/LOSS | |
| Citibank N.A. | | Australian Dollar | | 07/19/12 | | | 2,537,000 | | | $ | 2,622,320 | | | $ | 23,052 | |
| Northern Trust Company | | Hong Kong Dollar | | 07/19/12 | | | 20,671,000 | | | | 2,665,041 | | | | 222 | |
| | | | | | | | | | | | | | | | |
| | | | | | | | | | | | | | $ | 23,274 | |
| | | | | | | | | | | | | | | | |
NOTES TO SCHEDULE OF INVESTMENTS
| § | Securities exchangeable or convertible into securities of one or more entities that are different than the issuer. Each entity is identified in the parenthetical. |
| * | Securities issued and sold pursuant to a Rule 144A transaction are excepted from the registration requirement of the Securities Act of 1933, as amended. These securities may only be sold to qualified institutional buyers (“QIBs”), such as the fund. Any resale of these securities must generally be effected through a sale that is registered under the Act or otherwise exempted from such registration requirements. At April 30, 2012, the value of 144A securities that could not be exchanged to the registered form is $92,229,250 or 5.4% of net assets. |
| ~ | Security, or portion of security, is segregated as collateral (or potential collateral for future transactions) for written options. The aggregate value of such securities is $6,389,871. |
| # | Non-income producing security. |
FOREIGN CURRENCY ABBREVIATIONS
| | |
| AUD | | Australian Dollar |
| BRL | | Brazilian Real |
| CAD | | Canadian Dollar |
| CHF | | Swiss Franc |
| CNY | | Chinese Yuan Renminbi |
| DKK | | Danish Krone |
| EUR | | European Monetary Unit |
| GBP | | British Pound Sterling |
| HKD | | Hong Kong Dollar |
| JPY | | Japanese Yen |
| NOK | | Norwegian Krone |
| NZD | | New Zealand Dollar |
| SEK | | Swedish Krona |
| SGD | | Singapore Dollar |
| TWD | | New Taiwanese Dollar |
Note: Value for securities denominated in foreign currencies is shown in U.S. dollars. The principal amount for such securities is shown in the respective foreign currency. The date on options represents the expiration date of the option contract. The option contract may be exercised at any date on or before the date shown.
| | | | | | |
| See accompanying Notes to Financial Statements | | www.calamos.com | | | 79 | |
Global Growth and Income Fund Schedule of Investments April 30, 2012 (Unaudited)
CURRENCY EXPOSURE
APRIL 30, 2012
| | | | | | | | |
| | | VALUE | | | % OF TOTAL
INVESTMENTS | �� |
| US Dollar | | $ | 848,258,883 | | | | 50.0% | |
| European Monetary Unit | | | 178,160,836 | | | | 10.5% | |
| Swiss Franc | | | 103,312,956 | | | | 6.1% | |
| Japanese Yen | | | 87,675,278 | | | | 5.1% | |
| Danish Krone | | | 83,146,576 | | | | 4.9% | |
| Canadian Dollar | | | 74,744,338 | | | | 4.4% | |
| Singapore Dollar | | | 70,800,356 | | | | 4.2% | |
| Swedish Krona | | | 47,050,678 | | | | 2.8% | |
| British Pound Sterling | | | 34,108,217 | | | | 2.0% | |
| Norwegian Krone | | | 33,852,366 | | | | 2.0% | |
| Australian Dollar | | | 31,866,240 | | | | 1.9% | |
| New Taiwanese Dollar | | | 31,807,197 | | | | 1.9% | |
| Chinese Yuan Renminbi | | | 29,101,499 | | | | 1.7% | |
| Brazilian Real | | | 18,918,390 | | | | 1.1% | |
| New Zealand Dollar | | | 15,555,515 | | | | 0.9% | |
| Hong Kong Dollar | | | 9,174,052 | | | | 0.5% | |
| Total Investments | | $ | 1,697,533,377 | | | | 100.0% | |
| | |
Currency exposure may vary over time.
| | | | |
| 80 | | CALAMOS FAMILY OF FUNDS SEMIANNUAL REPORT | | See accompanying Notes to Financial Statements |
Convertible Fund Schedule of Investments April 30, 2012 (Unaudited)
| | | | | | | | | | |
PRINCIPAL
AMOUNT | | | | | | | VALUE | |
| | | | | | | | | | |
| | | | | | | | | | |
| | CONVERTIBLE BONDS (61.9%) | |
| | | | | | Consumer Discretionary (4.1%) | |
| | | | | | Omnicom Group, Inc. | | | | |
| | 19,400,000 | | | | | 0.000%, 07/01/38 | | $ | 21,412,750 | |
| | 12,000,000 | | | | | 0.000%, 07/31/32 | | | 12,300,000 | |
| | 46,500,000 | | | | | Priceline.com, Inc.*
1.000%, 03/15/18 | | | 51,673,125 | |
| | | | | | | | | | |
| | | | | | | | | 85,385,875 | |
| | | | | | | | | | |
| | | | | | Consumer Staples (4.1%) | |
| | 15,000,000 | | | | | Smithfield Foods, Inc.
4.000%, 06/30/13 | | | 16,631,250 | |
| | 28,000,000 | | | | | Tyson Foods, Inc. - Series A
3.250%, 10/15/13 | | | 33,740,000 | |
| | | | | | Unicharm Corp. | | | | |
| | 1,200,000,000 | | | JPY | | 0.000%, 09/24/13 | | | 17,729,684 | |
| | 1,150,000,000 | | | JPY | | 0.000%, 09/24/15 | | | 17,342,456 | |
| | | | | | | | | | |
| | | | | | | | | 85,443,390 | |
| | | | | | | | | | |
| | | | | | Energy (4.8%) | |
| | 48,750,000 | | | | | Chesapeake Energy Corp.
2.750%, 11/15/35 | | | 45,459,375 | |
| | 13,400,000 | | | | | Hornbeck Offshore Services, Inc.‡
1.625%, 11/15/26 | | | 14,405,000 | |
| | 18,000,000 | | | | | Subsea 7, SA
2.250%, 10/11/13 | | | 22,058,301 | |
| | | | | | Technip, SA | | | | |
| | 10,391,900 | | | EUR | | 0.250%, 01/01/17 | | | 14,546,718 | |
| | 3,684,600 | | | EUR | | 0.500%, 01/01/16 | | | 4,799,510 | |
| | | | | | | | | | |
| | | | | | | | | 101,268,904 | |
| | | | | | | | | | |
| | | | | | Financials (1.7%) | |
| | 3,168,000 | | | | | Affiliated Managers Group, Inc.
3.950%, 08/15/38 | | | 3,504,600 | |
| | 14,250,000 | | | | | Leucadia National Corp.
3.750%, 04/15/14 | | | 17,313,750 | |
| | 16,000,000 | | | SGD | | Temasek Financial, Ltd. (Standard Chartered, PLC)§
0.000%, 10/24/14 | | | 13,552,485 | |
| | | | | | | | | | |
| | | | | | | | | 34,370,835 | |
| | | | | | | | | | |
| | | | | | Health Care (14.8%) | |
| | 66,650,000 | | | | | Amgen, Inc.
0.375%, 02/01/13 | | | 68,816,125 | |
| | 22,500,000 | | | | | Endo Pharmaceuticals Holdings, Inc.
1.750%, 04/15/15 | | | 29,756,250 | |
| | 62,000,000 | | | | | Gilead Sciences, Inc.
1.625%, 05/01/16 | | | 82,305,000 | |
| | | | | | Hologic, Inc.‡ | | | | |
| | 37,500,000 | | | | | 2.000%, 12/15/37 | | | 40,593,750 | |
| | 23,500,000 | | | | | 2.000%, 03/01/42 | | | 22,325,000 | |
| | 9,351,000 | | | | | LifePoint Hospitals, Inc.
3.500%, 05/15/14 | | | 9,760,106 | |
| | 22,725,000 | | | | | Teleflex, Inc.
3.875%, 08/01/17 | | | 27,014,344 | |
| | | | | | | | | | |
PRINCIPAL
AMOUNT | | | | | | | VALUE | |
| | | | | | | | | | |
| | 27,350,000 | | | | | Teva Pharmaceutical Industries, Ltd.
0.250%, 02/01/26 | | $ | 29,811,500 | |
| | | | | | | | | | |
| | | | | | | | | 310,382,075 | |
| | | | | | | | | | |
| | | | | | Industrials (3.2%) | |
| | 21,000,000 | | | | | Navistar International Corp.
3.000%, 10/15/14 | | | 21,761,250 | |
| | 22,000,000 | | | | | Siemens AG
1.050%, 08/16/17 | | | 21,615,000 | |
| | 22,000,000 | | | | | Trinity Industries, Inc.
3.875%, 06/01/36 | | | 23,265,000 | |
| | | | | | | | | | |
| | | | | | | | | 66,641,250 | |
| | | | | | | | | | |
| | | | | | Information Technology (23.9%) | |
| | 15,150,000 | | | | | Anixter International, Inc.~
1.000%, 02/15/13 | | | 18,236,812 | |
| | 51,000,000 | | | | | EMC Corp.
1.750%, 12/01/13 | | | 90,907,500 | |
| | 68,500,000 | | | | | Intel Corp.
3.250%, 08/01/39 | | | 96,156,875 | |
| | 23,000,000 | | | | | Lam Research Corp.*
0.500%, 05/15/16 | | | 22,913,750 | |
| | 19,814,000 | | | | | 1.250%, 05/15/18 | | | 19,913,070 | |
| | 43,000,000 | | | | | Linear Technology Corp.
3.000%, 05/01/27 | | | 45,365,000 | |
| | 26,429,000 | | | | | Microsoft Corp.*
0.000%, 06/15/13 | | | 28,939,755 | |
| | 26,300,000 | | | | | Nuance Communications, Inc.*
2.750%, 11/01/31 | | | 29,587,500 | |
| | 13,069,000 | | | | | ON Semiconductor Corp.
2.625%, 12/15/26 | | | 14,457,839 | |
| | 58,300,000 | | | | | SanDisk Corp.
1.500%, 08/15/17 | | | 60,704,875 | |
| | 48,697,000 | | | | | Symantec Corp.
1.000%, 06/15/13 | | | 52,044,919 | |
| | 21,000,000 | | | | | TIBCO Software, Inc.*
2.250%, 05/01/32 | | | 21,420,000 | |
| | | | | | | | | | |
| | | | | | | | | 500,647,895 | |
| | | | | | | | | | |
| | | | | | Materials (4.6%) | |
| | 18,000,000 | | | | | AngloGold Ashanti, Ltd.
3.500%, 05/22/14 | | | 19,260,000 | |
| | 16,977,000 | | | | | Goldcorp, Inc.
2.000%, 08/01/14 | | | 19,587,214 | |
| | | | | | Newmont Mining Corp. | | | | |
| | 24,750,000 | | | | | 1.250%, 07/15/14 | | | 30,411,562 | |
| | 9,100,000 | | | | | 1.625%, 07/15/17 | | | 11,613,875 | |
| | 13,728,000 | | | | | Steel Dynamics, Inc.
5.125%, 06/15/14 | | | 14,894,880 | |
| | | | | | | | | | |
| | | | | | | | | 95,767,531 | |
| | | | | | | | | | |
| | | | | | Telecommunication Services (0.7%) | |
| | 12,000,000 | | | | | tw telecom, Inc.
2.375%, 04/01/26 | | | 14,745,000 | |
| | | | | | | | | | |
| | | | | | TOTAL CONVERTIBLE BONDS
(Cost $1,223,347,829) | | | 1,294,652,755 | |
| | | | | | | | | | |
| | | | | | |
| See accompanying Notes to Schedule of Investments | | www.calamos.com | | | 81 | |
Convertible Fund Schedule of Investments April 30, 2012 (Unaudited)
| | | | | | | | | | |
PRINCIPAL
AMOUNT | | | | | | | VALUE | |
| | | | | | | | | | |
| | | | | | | | | | |
| | SYNTHETIC CONVERTIBLE SECURITIES (13.5%) | |
| | Corporate Bonds (0.9%) | |
| | | | | | Energy (0.5%) | |
| | 9,100,000 | | | | | Oil States International, Inc.
6.500%, 06/01/19 | | $ | 9,668,750 | |
| | | | | | | | | | |
| | | | | | Information Technology (0.4%) | |
| | 8,915,000 | | | | | Anixter, Inc.
5.625%, 05/01/19 | | | 9,160,163 | |
| | | | | | | | | | |
| | | | | | TOTAL CORPORATE BONDS | | | 18,828,913 | |
| | | | | | | | | | |
| | Sovereign Bonds (11.1%) | |
| | 48,150,000 | | | CAD | | Government of Canada
2.000%, 12/01/14 | | | 49,445,081 | |
| | | | | | Government of New Zealand | | | | |
| | 22,000,000 | | | NZD | | 6.000%, 04/15/15 | | | 19,662,441 | |
| | 19,000,000 | | | NZD | | 6.500%, 04/15/13 | | | 16,120,871 | |
| | | | | | Government of Singapore | | | | |
| | 42,000,000 | | | SGD | | 1.375%, 10/01/14 | | | 34,898,114 | |
| | 19,000,000 | | | SGD | | 2.375%, 04/01/17 | | | 16,736,720 | |
| | | | | | Kingdom of Norway | | | | |
| | 130,000,000 | | | NOK | | 4.250%, 05/19/17 | | | 25,626,783 | |
| | 120,000,000 | | | NOK | | 6.500%, 05/15/13 | | | 22,027,102 | |
| | 300,000,000 | | | SEK | | Kingdom of Sweden
3.000%, 07/12/16 | | | 47,634,624 | |
| | | | | | | | | | |
| | | | | | TOTAL SOVEREIGN BONDS | | | 232,151,736 | |
| | | | | | | | | | |
NUMBER OF
CONTRACTS | | | | | | | VALUE | |
| | | | | | | | | | |
| | Purchased Options (1.5%)# | |
| | | | | | Information Technology (1.5%) | |
| | 5,000 | | | | | Accenture, PLC Call, 01/18/14, Strike $65.00 | | | 3,825,000 | |
| | 335 | | | | | Apple, Inc. Call, 01/19/13, Strike $500.00 | | | 3,846,638 | |
| | 5,200 | | | EUR | | ASML Holding, NV Call, 06/21/13, Strike $36.00 | | | 4,154,036 | |
| | 3,000 | | | | | Celgene Corp. Call, 01/18/14, Strike $75.00 | | | 3,165,000 | |
| | 5,850 | | | | | Check Point Software
Technologies, Ltd. Call, 01/19/13, Strike $55.00 | | | 4,153,500 | |
| | 4,250 | | | | | ebay, Inc. Call, 01/18/14, Strike $40.00 | | | 3,410,625 | |
| | 500 | | | | | MasterCard, Inc. Call, 01/18/14, Strike $420.00 | | | 4,841,250 | |
| | 6,300 | | | EUR | | SAP, AG Call, 06/21/13, Strike $48.00 | | | 4,699,202 | |
| | | | | | | | | | |
| | | | | | TOTAL PURCHASED OPTIONS | | | 32,095,251 | |
| | | | | | | | | | |
| | | | | | TOTAL SYNTHETIC
CONVERTIBLE SECURITIES
(Cost $260,045,114) | | | 283,075,900 | |
| | | | | | | | | | |
| | | | | | | | | | |
| | | | | | | | | | |
NUMBER OF
SHARES | | | | | | | VALUE | |
| | | | | | | | | | |
| | | | | | | | | | |
| | CONVERTIBLE PREFERRED STOCKS (5.2%) | |
| | | | | | Energy (3.8%) | |
| | 1,225,000 | | | | | Apache Corp.~ 6.000% | | $ | 65,072,000 | |
| | 16,000 | | | | | Chesapeake Energy Corp.* 5.750% | | | 13,840,000 | |
| | | | | | | | | | |
| | | | | | | | | 78,912,000 | |
| | | | | | | | | | |
| | | | | | Financials (1.4%) | |
| | | | | | Affiliated Managers Group, Inc. | | | | |
| | 425,000 | | | | | 5.150% | | | 18,354,687 | |
| | 216,808 | | | | | 5.100% | | | 10,840,400 | |
| | | | | | | | | | |
| | | | | | | | | 29,195,087 | |
| | | | | | | | | | |
| | | | | | TOTAL CONVERTIBLE
PREFERRED STOCKS (Cost $106,429,165) | | | 108,107,087 | |
| | | | | | | | | | |
| | | | | | | | | | |
| | COMMON STOCKS (14.0%) | |
| | | | | | Consumer Discretionary (1.2%) | |
| | 93,345 | | | CHF | | Swatch Group, AG | | | 7,461,855 | |
| | 37,264 | | | CHF | | Swatch Group, AG | | | 17,216,267 | |
| | | | | | | | | | |
| | | | | | | | | 24,678,122 | |
| | | | | | | | | | |
| | | | | | Energy (2.3%) | |
| | 500,000 | | | | | Helmerich & Payne, Inc. | | | 25,695,000 | |
| | 280,000 | | | | | National Oilwell Varco, Inc. | | | 21,212,800 | |
| | | | | | | | | | |
| | | | | | | | | 46,907,800 | |
| | | | | | | | | | |
| | | | | | Financials (1.2%) | |
| | 200,000 | | | | | Franklin Resources, Inc. | | | 25,102,000 | |
| | | | | | | | | | |
| | | | | | Industrials (2.3%) | |
| | 400,000 | | | | | Dover Corp. | | | 25,064,000 | |
| | 485,000 | | | | | Eaton Corp. | | | 23,367,300 | |
| | | | | | | | | | |
| | | | | | | | | 48,431,300 | |
| | | | | | | | | | |
| | | | | | Information Technology (7.0%) | |
| | 875,000 | | | | | CA, Inc. | | | 23,117,500 | |
| | 1,250,000 | | | | | Microsoft Corp. | | | 40,025,000 | |
| | 850,000 | | | | | QUALCOMM, Inc. | | | 54,264,000 | |
| | 450,000 | | | | | SAP, AG | | | 29,830,500 | |
| | | | | | | | | | |
| | | | | | | | | 147,237,000 | |
| | | | | | | | | | |
| | | | | | TOTAL COMMON STOCKS (Cost $238,692,587) | | | 292,356,222 | |
| | | | | | | | | | |
| | | | | | | | | | |
| | SHORT TERM INVESTMENT (3.9%) | |
| | 81,134,007 | | | | | Fidelity Prime Money Market Fund - Institutional Class
(Cost $81,134,007) | | | 81,134,007 | |
| | | | | | | | | | |
| TOTAL INVESTMENTS (98.5%)
(Cost $1,909,648,702) | | | 2,059,325,971 | |
| | | | | | | | | | |
| |
| | OTHER ASSETS, LESS LIABILITIES (1.5%) | | | 31,907,031 | |
| | | | | | | | | | |
| |
| | NET ASSETS (100.0%) | | $ | 2,091,233,002 | |
| | | | | | | | | | |
| | | | |
| 82 | | CALAMOS FAMILY OF FUNDS SEMIANNUAL REPORT | | See accompanying Notes to Schedule of Investments |
Convertible Fund Schedule of Investments April 30, 2012 (Unaudited)
FORWARD FOREIGN CURRENCY CONTRACTS
| | | | | | | | | | | | | | | | |
COUNTER
PARTY | | SHORT
CONTRACTS | | SETTLEMENT
DATE | | LOCAL
CURRENCY | | | CURRENT
VALUE | | | UNREALIZED
GAIN/LOSS | |
| Northern Trust Company | | British Pound Sterling | | 07/19/12 | | | 21,066,000 | | | $ | 34,172,016 | | | $ | (768,397 | ) |
| UBS AG | | European Monetary Unit | | 07/19/12 | | | 43,455,000 | | | | 57,545,535 | | | | (691,360 | ) |
| Citibank N.A. | | Hong Kong Dollar | | 07/19/12 | | | 59,096,000 | | | | 7,619,044 | | | | (748 | ) |
| Barclays Bank PLC | | Japanese Yen | | 07/19/12 | | | 2,537,783,000 | | | | 31,809,498 | | | | (440,736 | ) |
| UBS AG | | Norwegian Krone | | 07/19/12 | | | 79,215,000 | | | | 13,800,011 | | | | (170,069 | ) |
| Barclays Bank PLC | | Swiss Franc | | 07/19/12 | | | 22,218,000 | | | | 24,502,538 | | | | (332,308 | ) |
| | | | | | | | | | | | | | | | |
| | | | | | | | | | | | | | $ | (2,403,618 | ) |
| | | | | | | | | | | | | | | | |
| | | | | |
COUNTER
PARTY | | LONG
CONTRACTS | | SETTLEMENT
DATE | | LOCAL
CURRENCY | | | CURRENT
VALUE | | | UNREALIZED
GAIN/LOSS | |
| Citibank N.A. | | British Pound Sterling | | 07/19/12 | | | 9,945,000 | | | $ | 16,132,189 | | | $ | 86,678 | |
| Northern Trust Company | | Hong Kong Dollar | | 07/19/12 | | | 42,181,000 | | | | 5,438,251 | | | | 453 | |
| Citibank N.A. | | Swiss Franc | | 07/19/12 | | | 1,606,000 | | | | 1,771,135 | | | | 4,896 | |
| | | | | | | | | | | | | | | | |
| | | | | | | | | | | | | | $ | 92,027 | |
| | | | | | | | | | | | | | | | |
NOTES TO SCHEDULE OF INVESTMENTS
| * | Securities issued and sold pursuant to a Rule 144A transaction are excepted from the registration requirement of the Securities Act of 1933, as amended. These securities may only be sold to qualified institutional buyers (“QIBs”), such as the fund. Any resale of these securities must generally be effected through a sale that is registered under the Act or otherwise exempted from such registration requirements. At April 30, 2012, the value of 144A securities that could not be exchanged to the registered form is $188,287,200 or 9.0% of net assets. |
| ‡ | Variable rate or step bond security. The rate shown is the rate in effect at April 30, 2012. |
| § | Securities exchangeable or convertible into securities of one or more entities that are different than the issuer. Each entity is identified in the parenthetical. |
| ~ | Security, or portion of security, is segregated as collateral (or potential collateral for future transactions) for written options. The aggregate value of such securities is $2,014,685. |
| # | Non-income producing security. |
FOREIGN CURRENCY ABBREVIATIONS
| | |
| CAD | | Canadian Dollar |
| CHF | | Swiss Franc |
| EUR | | European Monetary Unit |
| JPY | | Japanese Yen |
| NOK | | Norwegian Krone |
| NZD | | New Zealand Dollar |
| SEK | | Swedish Krona |
| SGD | | Singapore Dollar |
Note: Value for securities denominated in foreign currencies is shown in U.S. dollars. The principal amount for such securities is shown in the respective foreign currency. The date on options represents the expiration date of the option contract. The option contract may be exercised at any date on or before the date shown.
| | | | | | |
| See accompanying Notes to Financial Statements | | www.calamos.com | | | 83 | |
Total Return Bond Fund Schedule of Investments April 30, 2012 (Unaudited)
| | | | | | | | | | |
PRINCIPAL
AMOUNT | | | | | | | VALUE | |
| | | | | | | | | | |
| | | | | | | | | | |
| | CORPORATE BONDS (57.7%) | |
| | | | | | Consumer Discretionary (5.0%) | |
| | 4,000,000 | | | CNY | | BSH Bosch und Siemens
Hausgerate, GmbH 2.375%, 09/29/14 | | $ | 626,440 | |
| | 1,000,000 | | | | | DIRECTV Financing Company, Inc. 4.750%, 10/01/14 | | | 1,083,935 | |
| | 1,000,000 | | | | | DIRECTV Holdings, LLC 3.550%, 03/15/15 | | | 1,058,658 | |
| | 1,500,000 | | | | | Hasbro, Inc. 6.125%, 05/15/14 | | | 1,635,027 | |
| | 500,000 | | | | | Interpublic Group of Companies, Inc. 4.000%, 03/15/22 | | | 500,780 | |
| | 250,000 | | | | | J.C. Penney Company, Inc. 9.000%, 08/01/12 | | | 255,000 | |
| | 2,000,000 | | | | | Lowe’s Companies, Inc. 1.625%, 04/15/17 | | | 2,003,646 | |
| | 1,010,000 | | | | | Macy’s Retail Holdings, Inc. 3.875%, 01/15/22 | | | 1,041,884 | |
| | 2,000,000 | | | | | Mattel, Inc. 2.500%, 11/01/16 | | | 2,064,036 | |
| | 500,000 | | | | | Time Warner, Inc. 3.150%, 07/15/15 | | | 529,655 | |
| | 1,000,000 | | | | | Walt Disney Company 0.875%, 12/01/14 | | | 1,004,897 | |
| | | | | | | | | | |
| | | | | | | | | 11,803,958 | |
| | | | | | | | | | |
| | | | | | Consumer Staples (3.3%) | |
| | 1,000,000 | | | | | Altria Group, Inc. 9.250%, 08/06/19 | | | 1,366,427 | |
| | 1,000,000 | | | | | Anheuser-Busch InBev, NV 3.000%, 10/15/12 | | | 1,011,326 | |
| | 1,000,000 | | | | | Archer-Daniels-Midland Company‡ 0.670%, 08/13/12 | | | 1,001,176 | |
| | 2,000,000 | | | | | Coca-Cola Company 3.625%, 03/15/14 | | | 2,116,472 | |
| | 1,000,000 | | | | | Kellogg Company 4.450%, 05/30/16 | | | 1,116,768 | |
| | 1,000,000 | | | | | Philip Morris International, Inc. 6.875%, 03/17/14 | | | 1,118,101 | |
| | | | | | | | | | |
| | | | | | | | | 7,730,270 | |
| | | | | | | | | | |
| | | | | | Energy (6.0%) | |
| | 1,000,000 | | | | | Chesapeake Energy Corp. 6.500%, 08/15/17 | | | 1,002,500 | |
| | 1,000,000 | | | | | ConocoPhillips 5.750%, 02/01/19 | | | 1,234,046 | |
| | 1,000,000 | | | | | Continental Resources, Inc.* 5.000%, 09/15/22 | | | 1,016,250 | |
| | 814,000 | | | | | Frontier Oil Corp. 6.875%, 11/15/18 | | | 854,700 | |
| | 1,000,000 | | | | | Hess Corp. 8.125%, 02/15/19 | | | 1,301,649 | |
| | | | | | | | | | |
PRINCIPAL
AMOUNT | | | | | | | VALUE | |
| | | | | | | | | | |
| | 1,000,000 | | | | | Noble Holding International, Ltd. 3.450%, 08/01/15 | | $ | 1,058,475 | |
| | 2,000,000 | | | | | Occidental Petroleum Corp. 1.750%, 02/15/17 | | | 2,031,704 | |
| | 1,000,000 | | | | | Rowan Companies, Inc. 7.875%, 08/01/19 | | | 1,205,204 | |
| | 2,000,000 | | | | | Schlumberger Investment, SA* 1.950%, 09/14/16 | | | 2,044,174 | |
| | 1,000,000 | | | | | SESI, LLC 6.375%, 05/01/19 | | | 1,045,000 | |
| | 600,000 | | | | | SM Energy Company 6.500%, 11/15/21 | | | 636,000 | |
| | 500,000 | | | | | Tennessee Gas Pipeline Company 8.000%, 02/01/16 | | | 585,347 | |
| | | | | | | | | | |
| | | | | | | | | 14,015,049 | |
| | | | | | | | | | |
| | | | | | Financials (8.1%) | |
| | 1,000,000 | | | | | AON Corp. 5.000%, 09/30/20 | | | 1,113,036 | |
| | 1,500,000 | | | | | Berkshire Hathaway Finance Corp. 5.000%, 08/15/13 | | | 1,584,912 | |
| | 1,000,000 | | | | | BlackRock, Inc. 3.500%, 12/10/14 | | | 1,069,754 | |
| | | | | | Caterpillar, Inc. | | | | |
| | 13,000,000 | | | CNY | | 2.000%, 12/01/12 | | | 2,055,287 | |
| | 13,000,000 | | | CNY | | 1.350%, 07/12/13 | | | 2,027,820 | |
| | 250,000 | | | | | CME Group Index Services, LLC* 4.400%, 03/15/18 | | | 273,392 | |
| | 1,000,000 | | | | | CME Group, Inc. 5.750%, 02/15/14 | | | 1,088,638 | |
| | 1,000,000 | | | | | Franklin Resources, Inc. 3.125%, 05/20/15 | | | 1,054,563 | |
| | | | | | John Deere Capital Corp. | | | | |
| | 1,000,000 | | | | | 3.150%, 10/15/21 | | | 1,040,697 | |
| | 1,000,000 | | | | | 1.250%, 12/02/14 | | | 1,013,602 | |
| | 1,500,000 | | | | | JPMorgan Chase & Company‡ 1.266%, 01/24/14 | | | 1,508,295 | |
| | 1,000,000 | | | | | PACCAR Financial Corp. 1.600%, 03/15/17 | | | 1,002,046 | |
| | 1,000,000 | | | | | Prudential Financial, Inc. 4.750%, 09/17/15 | | | 1,087,416 | |
| | 1,000,000 | | | | | US Bancorp 4.200%, 05/15/14 | | | 1,068,709 | |
| | 2,000,000 | | | | | Xstrata Canada Financial Corp.* 3.600%, 01/15/17 | | | 2,080,084 | |
| | | | | | | | | | |
| | | | | | | | | 19,068,251 | |
| | | | | | | | | | |
| | | | | | Health Care (4.2%) | |
| | 1,500,000 | | | | | Biogen Idec, Inc. 6.000%, 03/01/13 | | | 1,562,197 | |
| | 1,000,000 | | | | | Gilead Sciences, Inc. 2.400%, 12/01/14 | | | 1,035,874 | |
| | 500,000 | | | | | Mylan, Inc.* 7.625%, 07/15/17 | | | 556,250 | |
| | | | |
| 84 | | CALAMOS FAMILY OF FUNDS SEMIANNUAL REPORT | | See accompanying Notes to Schedule of Investments |
Total Return Bond Fund Schedule of Investments April 30, 2012 (Unaudited)
| | | | | | | | | | |
PRINCIPAL
AMOUNT | | | | | | | VALUE | |
| | | | | | | | | | |
| | 1,000,000 | | | | | Quest Diagnostics, Inc.‡ 1.324%, 03/24/14 | | $ | 1,008,590 | |
| | 2,000,000 | | | | | St. Jude Medical, Inc. 3.750%, 07/15/14 | | | 2,123,104 | |
| | 1,500,000 | | | | | Teva Pharmaceutical Industries, Ltd. 3.000%, 06/15/15 | | | 1,579,413 | |
| | | | | | Thermo Fisher Scientific, Inc. | | | | |
| | 1,500,000 | | | | | 2.250%, 08/15/16 | | | 1,566,450 | |
| | 500,000 | | | | | 2.050%, 02/21/14 | | | 513,077 | |
| | | | | | | | | | |
| | | | | | | | | 9,944,955 | |
| | | | | | | | | | |
| | | | | | Industrials (9.0%) | |
| | 1,000,000 | | | | | AGCO Corp.* 5.875%, 12/01/21 | | | 1,069,435 | |
| | 3,000,000 | | | | | Danaher Corp. 1.300%, 06/23/14 | | | 3,050,541 | |
| | 1,500,000 | | | | | Eaton Corp. 5.750%, 07/15/12 | | | 1,515,903 | |
| | 1,500,000 | | | | | Emerson Electric Company 4.125%, 04/15/15 | | | 1,642,674 | |
| | 2,000,000 | | | | | Express Scripts Holding Co.* 2.650%, 02/15/17 | | | 2,038,234 | |
| | 2,000,000 | | | | | Fluor Corp. 3.375%, 09/15/21 | | | 2,054,208 | |
| | 1,500,000 | | | | | Goodrich Corp. 6.125%, 03/01/19 | | | 1,812,082 | |
| | | | | | Joy Global, Inc. | | | | |
| | 1,500,000 | | | | | 6.000%, 11/15/16 | | | 1,710,825 | |
| | 1,500,000 | | | | | 5.125%, 10/15/21 | | | 1,657,783 | |
| | 1,000,000 | | | | | Northrop Grumman Corp. 3.700%, 08/01/14 | | | 1,057,999 | |
| | 1,495,000 | | | | | Parker-Hannifin Corp. 5.500%, 05/15/18 | | | 1,792,305 | |
| | 1,500,000 | | | | | United Parcel Service, Inc. 3.875%, 04/01/14 | | | 1,593,587 | |
| | | | | | | | | | |
| | | | | | | | | 20,995,576 | |
| | | | | | | | | | |
| | | | | | Information Technology (16.4%) | | | | |
| | 1,000,000 | | | | | Adobe Systems, Inc. 3.250%, 02/01/15 | | | 1,055,643 | |
| | | | | | Agilent Technologies, Inc. | | | | |
| | 1,500,000 | | | | | 5.500%, 09/14/15 | | | 1,690,653 | |
| | 500,000 | | | | | 6.500%, 11/01/17 | | | 609,655 | |
| | 500,000 | | | | | 2.500%, 07/15/13 | | | 508,096 | |
| | | | | | Amphenol Corp. | | | | |
| | 2,000,000 | | | | | 4.750%, 11/15/14 | | | 2,169,464 | |
| | 2,000,000 | | | | | 4.000%, 02/01/22 | | | 2,052,472 | |
| | 1,500,000 | | | | | Analog Devices, Inc. 3.000%, 04/15/16 | | | 1,592,739 | |
| | 1,000,000 | | | | | Anixter International, Inc. 5.950%, 03/01/15 | | | 1,047,500 | |
| | 890,000 | | | | | Anixter, Inc. 5.625%, 05/01/19 | | | 914,475 | |
| | 2,000,000 | | | | | BMC Software, Inc. 4.250%, 02/15/22 | | | 2,041,672 | |
| | | | | | | | | | |
PRINCIPAL
AMOUNT | | | | | | | VALUE | |
| | | | | | | | | | |
| | | | | | Brocade Communications
Systems, Inc. | | | | |
| | 500,000 | | | | | 6.625%, 01/15/18 | | $ | 527,500 | |
| | 100,000 | | | | | 6.875%, 01/15/20 | | | 109,750 | |
| | 1,000,000 | | | | | CA, Inc. 5.375%, 12/01/19 | | | 1,116,776 | |
| | 1,000,000 | | | | | Cisco Systems, Inc.‡ 0.724%, 03/14/14 | | | 1,005,754 | |
| | 3,000,000 | | | | | eBay, Inc. 3.250%, 10/15/20 | | | 3,116,196 | |
| | 2,000,000 | | | | | Google, Inc. 1.250%, 05/19/14 | | | 2,033,058 | |
| | 2,000,000 | | | | | Intel Corp. 1.950%, 10/01/16 | | | 2,071,594 | |
| | | | | | International Business Machines Corp. | | | | |
| | 1,050,000 | | | | | 2.100%, 05/06/13 | | | 1,067,808 | |
| | 1,000,000 | | | | | 2.000%, 01/05/16 | | | 1,035,375 | |
| | 1,000,000 | | | | | Jabil Circuit, Inc. 7.750%, 07/15/16 | | | 1,141,250 | |
| | 1,500,000 | | | | | Juniper Networks, Inc. 3.100%, 03/15/16 | | | 1,563,583 | |
| | | | | | Lexmark International, Inc. | | | | |
| | 1,500,000 | | | | | 6.650%, 06/01/18 | | | 1,722,465 | |
| | 500,000 | | | | | 5.900%, 06/01/13 | | | 520,478 | |
| | 1,500,000 | | | | | National Semiconductor Corp. 3.950%, 04/15/15 | | | 1,635,042 | |
| | 1,500,000 | | | | | Oracle Corp. 3.750%, 07/08/14 | | | 1,604,331 | |
| | 3,000,000 | | | | | Symantec Corp. 2.750%, 09/15/15 | | | 3,123,342 | |
| | | | | | Xerox Corp. | | | | |
| | 1,000,000 | | | | | 4.250%, 02/15/15 | | | 1,066,395 | |
| | 250,000 | | | | | 1.318%, 05/16/14‡ | | | 248,878 | |
| | | | | | | | | | |
| | | | | | | | | 38,391,944 | |
| | | | | | | | | | |
| | | | | | Materials (5.2%) | |
| | | | | | Anglo American, PLC* | | | | |
| | 1,000,000 | | | | | 9.375%, 04/08/14 | | | 1,145,404 | |
| | 1,000,000 | | | | | 4.450%, 09/27/20 | | | 1,053,178 | |
| | 190,000 | | | | | Ball Corp. 5.000%, 03/15/22 | | | 193,563 | |
| | | | | | Barrick Gold Corp. | | | | |
| | 1,000,000 | | | | | 6.950%, 04/01/19 | | | 1,231,521 | |
| | 1,000,000 | | | | | 1.750%, 05/30/14 | | | 1,014,596 | |
| | 2,000,000 | | | | | Ecolab, Inc. 2.375%, 12/08/14 | | | 2,071,524 | |
| | 1,500,000 | | | | | Newmont Mining Corp. 5.125%, 10/01/19 | | | 1,694,410 | |
| | 1,500,000 | | | | | Potash Corp. of Saskatchewan, Inc. 3.250%, 12/01/17 | | | 1,613,598 | |
| | 2,000,000 | | | | | Rio Tinto Finance USA, Ltd. 1.875%, 11/02/15 | | | 2,047,276 | |
| | | | | | | | | | |
| | | | | | | | | 12,065,070 | |
| | | | | | | | | | |
| | | | | | |
| See accompanying Notes to Schedule of Investments | | www.calamos.com | | | 85 | |
Total Return Bond Fund Schedule of Investments April 30, 2012 (Unaudited)
| | | | | | | | | | |
PRINCIPAL
AMOUNT | | | | | | | VALUE | |
| | | | | | | | | | |
| | | | | | | | | | |
| | | | | | | | | | |
| | | | | | Telecommunication Services (0.5%) | |
| | 1,000,000 | | | | | American Tower Corp. 5.900%, 11/01/21 | | $ | 1,126,139 | |
| | | | | | | | | | |
| | | | | | TOTAL CORPORATE BONDS (Cost $128,016,282) | | | 135,141,212 | |
| | | | | | | | | | |
| | | | | | | | | | |
| | CONVERTIBLE BONDS (0.5%) | |
| | | | | | Information Technology (0.5%) | |
| | 1,000,000 | | | | | Nuance Communications, Inc.* 2.750%, 11/01/31 (Cost $1,077,692) | | | 1,125,000 | |
| | | | | | | | | | |
| | SOVEREIGN BONDS (19.6%) | |
| | 255,000 | | | BRL | | Federative Republic of Brazil 10.000%, 01/01/14 | | | 1,404,784 | |
| | 8,150,000 | | | CAD | | Government of Canada 3.000%, 06/01/14 | | | 8,528,191 | |
| | 11,350,000 | | | NZD | | Government of New Zealand 6.000%, 04/15/15 | | | 10,144,032 | |
| | 10,000,000 | | | SGD | | Government of Singapore 2.375%, 04/01/17 | | | 8,808,800 | |
| | 45,000,000 | | | NOK | | Kingdom of Norway 4.250%, 05/19/17 | | | 8,870,810 | |
| | 50,800,000 | | | SEK | | Kingdom of Sweden 3.000%, 07/12/16 | | | 8,066,130 | |
| | | | | | | | | | |
| | | | | | TOTAL SOVEREIGN BONDS (Cost $40,950,315) | | | 45,822,747 | |
| | | | | | | | | | |
| | | | | | | | | | |
| | U.S. GOVERNMENT AND AGENCY SECURITIES (14.2%) | |
| | | | | | United States Treasury Note | | | | |
| | 9,000,000 | | | | | 0.250%, 11/30/13 | | | 9,001,764 | |
| | 8,000,000 | | | | | 0.250%, 01/15/15 | | | 7,978,752 | |
| | 7,000,000 | | | | | 1.875%, 06/15/12 | | | 7,016,408 | |
| | 3,500,000 | | | | | 1.375%, 02/15/13 | | | 3,533,222 | |
| | 3,000,000 | | | | | 2.625%, 07/31/14 | | | 3,156,093 | |
| | 2,500,000 | | | | | 0.250%, 12/15/14 | | | 2,494,140 | |
| | | | | | | | | | |
| | | | | | TOTAL U.S. GOVERNMENT AND AGENCY SECURITIES (Cost $33,035,624) | | | 33,180,379 | |
| | | | | | | | | | |
| | | | | | | | | | |
| | RESIDENTIAL MORTGAGE BACKED SECURITIES (3.6%) | |
| | | | | | Federal National Mortgage Association | | | | |
| | 2,870,542 | | | | | 6.000%, 06/01/37 | | | 3,205,700 | |
| | 1,323,299 | | | | | 5.500%, 06/01/37 | | | 1,448,237 | |
| | 1,305,112 | | | | | 5.622%, 11/01/37‡ | | | 1,411,034 | |
| | 727,219 | | | | | 6.000%, 05/01/37 | | | 812,127 | |
| | 709,807 | | | | | 6.500%, 03/01/38 | | | 802,235 | |
| | 406,120 | | | | | 6.500%, 06/01/36 | | | 460,621 | |
| | 216,607 | | | | | 4.612%, 05/01/38‡ | | | 232,592 | |
| | | | | | | | | | |
| | | | | | TOTAL RESIDENTIAL MORTGAGE BACKED SECURITIES (Cost $7,665,704) | | | 8,372,546 | |
| | | | | | | | | | |
| | | | | | | | | | |
| | | | | | | | | | |
NUMBER OF
SHARES | | | | | | | VALUE | |
| | | | | | | | | | |
| | | | | | | | | | |
| | SHORT TERM INVESTMENT (4.3%) | |
| | 10,098,950 | | | | | Fidelity Prime Money Market Fund - Institutional Class
(Cost $10,098,950) | | $ | 10,098,950 | |
| | | | | | | | | | |
| TOTAL INVESTMENTS (99.9%)
(Cost $220,844,567) | | | 233,740,834 | |
| | | | | | | | | | |
| |
| | OTHER ASSETS, LESS LIABILITIES (0.1%) | | | 206,520 | |
| | | | | | | | | | |
| |
| | NET ASSETS (100.0%) | | $ | 233,947,354 | |
| | | | | | | | | | |
NOTES TO SCHEDULE OF INVESTMENTS
| ‡ | Variable rate or step bond security. The rate shown is the rate in effect at April 30, 2012. |
| * | Securities issued and sold pursuant to a Rule 144A transaction are excepted from the registration requirement of the Securities Act of 1933, as amended. These securities may only be sold to qualified institutional buyers (“QIBs”), such as the fund. Any resale of these securities must generally be effected through a sale that is registered under the Act or otherwise exempted from such registration requirements. At April 30, 2012, the value of 144A securities that could not be exchanged to the registered form is $8,277,482 or 3.5% of net assets. |
FOREIGN CURRENCY ABBREVIATIONS
| | |
| BRL | | Brazilian Real |
| CAD | | Canadian Dollar |
| CNY | | Chinese Yuan Renminbi |
| NOK | | Norwegian Krone |
| NZD | | New Zealand Dollar |
| SEK | | Swedish Krona |
| SGD | | Singapore Dollar |
Note: Value for securities denominated in foreign currencies is shown in U.S. dollars. The principal amount for such securities is shown in the respective foreign currency.
| | | | |
| 86 | | CALAMOS FAMILY OF FUNDS SEMIANNUAL REPORT | | See accompanying Notes to Financial Statements |
High Income Fund Schedule of Investments April 30, 2012 (Unaudited)
| | | | | | | | | | |
PRINCIPAL
AMOUNT | | | | | | | VALUE | |
| | | | | | | | | | |
| | CORPORATE BONDS (89.8%) | |
| | | | | | Consumer Discretionary (16.6%) | |
| | 3,000,000 | | | | | American Axle & Manufacturing, Inc.
7.875%, 03/01/17 | | $ | 3,112,500 | |
| | 3,691,000 | | | | | Dana Holding Corp.
6.750%, 02/15/21 | | | 3,990,894 | |
| | 3,000,000 | | | | | Gap, Inc.
5.950%, 04/12/21 | | | 3,107,082 | |
| | 4,800,000 | | | | | Goodyear Tire & Rubber Company~
8.250%, 08/15/20 | | | 5,100,000 | |
| | | | | | Icahn Enterprises, LP | | | | |
| | 2,100,000 | | | | | 7.750%, 01/15/16 | | | 2,220,750 | |
| | 468,000 | | | | | 8.000%, 01/15/18 | | | 502,515 | |
| | 2,847,000 | | | | | J.C. Penney Company, Inc.
6.375%, 10/15/36 | | | 2,455,537 | |
| | | | | | Jaguar Land Rover, PLC* | | | | |
| | 3,000,000 | | | | | 7.750%, 05/15/18 | | | 3,142,500 | |
| | 2,700,000 | | | | | 8.125%, 05/15/21 | | | 2,835,000 | |
| | 3,900,000 | | | | | Lear Corp.
8.125%, 03/15/20 | | | 4,368,000 | |
| | 3,300,000 | | | | | Liberty Media Corp.
8.250%, 02/01/30 | | | 3,374,250 | |
| | 3,000,000 | | | | | Limited Brands, Inc.
6.950%, 03/01/33 | | | 2,925,000 | |
| | | | | | Meritage Homes Corp. | | | | |
| | 2,175,000 | | | | | 7.000%, 04/01/22* | | | 2,213,063 | |
| | 1,000,000 | | | | | 7.150%, 04/15/20 | | | 1,037,500 | |
| | | | | | Royal Caribbean Cruises, Ltd. | | | | |
| | 2,750,000 | | | | | 7.500%, 10/15/27 | | | 2,787,812 | |
| | 1,000,000 | | | | | 7.250%, 03/15/18~ | | | 1,072,500 | |
| | 3,720,000 | | | | | Wynn Las Vegas, LLC
7.750%, 08/15/20 | | | 4,129,200 | |
| | | | | | | | | | |
| | | | | | | | | 48,374,103 | |
| | | | | | | | | | |
| | | | | | Consumer Staples (5.2%) | |
| | 2,445,000 | | | | | Darling International, Inc.
8.500%, 12/15/18 | | | 2,753,681 | |
| | 2,500,000 | | | | | Dean Foods Company
9.750%, 12/15/18 | | | 2,801,563 | |
| | 1,450,000 | | | | | Elizabeth Arden, Inc.
7.375%, 03/15/21 | | | 1,598,625 | |
| | 2,482,000 | | | | | JBS USA, LLC*
7.250%, 06/01/21 | | | 2,382,720 | |
| | 5,537,000 | | | | | Post Holdings, Inc.*
7.375%, 02/15/22 | | | 5,772,322 | |
| | | | | | | | | | |
| | | | | | | | | 15,308,911 | |
| | | | | | | | | | |
| | | | | | Energy (20.9%) | |
| | 8,500,000 | | | NOK | | Aker Solutions, ASA
8.700%, 06/26/14 | | | 1,614,549 | |
| | 829,000 | | | | | Atwood Oceanics, Inc.
6.500%, 02/01/20 | | | 876,668 | |
| | 2,047,000 | | | | | Basic Energy Services, Inc.
7.750%, 02/15/19 | | | 2,098,175 | |
| | | | | | | | | | |
PRINCIPAL
AMOUNT | | | | | | | VALUE | |
| | | | | | | | | | |
| | 8,650,000 | | | | | Calfrac Holdings, LP*
7.500%, 12/01/20 | | $ | 8,520,250 | |
| | 3,750,000 | | | | | Calumet Specialty Products, LP
9.375%, 05/01/19 | | | 3,928,125 | |
| | 4,000,000 | | | | | Carrizo Oil & Gas, Inc.
8.625%, 10/15/18 | | | 4,260,000 | |
| | 2,303,000 | | | | | Frontier Oil Corp.
6.875%, 11/15/18 | | | 2,418,150 | |
| | 2,875,000 | | | | | GulfMark Offshore, Inc.*
6.375%, 03/15/22 | | | 2,939,687 | |
| | 2,469,000 | | | | | Helix Energy Solutions Group, Inc.*
9.500%, 01/15/16 | | | 2,595,536 | |
| | | | | | Linn Energy, LLC | | | | |
| | 4,000,000 | | | | | 8.625%, 04/15/20 | | | 4,390,000 | |
| | 1,000,000 | | | | | 6.250%, 11/01/19* | | | 986,250 | |
| | 600,000 | | | | | Oasis Petroleum, Inc.
6.500%, 11/01/21 | | | 615,000 | |
| | 2,800,000 | | | | | Parker Drilling Company*
9.125%, 04/01/18 | | | 2,982,000 | |
| | 4,000,000 | | | | | Pioneer Drilling Company*
9.875%, 03/15/18 | | | 4,240,000 | |
| | 2,850,000 | | | | | Samson Investment Company*
9.750%, 02/15/20 | | | 2,978,250 | |
| | | | | | SESI, LLC | | | | |
| | 3,000,000 | | | | | 6.375%, 05/01/19 | | | 3,135,000 | |
| | 2,000,000 | | | | | 7.125%, 12/15/21* | | | 2,175,000 | |
| | 1,500,000 | | | | | SM Energy Company
6.500%, 11/15/21 | | | 1,590,000 | |
| | 2,660,000 | | | | | Swift Energy Company
8.875%, 01/15/20 | | | 2,912,700 | |
| | 150,000 | | | | | Unit Corp.
6.625%, 05/15/21 | | | 153,000 | |
| | 5,400,000 | | | | | W&T Offshore, Inc.
8.500%, 06/15/19 | | | 5,724,000 | |
| | | | | | | | | | |
| | | | | | | | | 61,132,340 | |
| | | | | | | | | | |
| | | | | | Financials (4.6%) | |
| | 2,134,000 | | | | | AON Corp.
8.205%, 01/01/27 | | | 2,503,882 | |
| | 1,390,000 | | | | | Chesapeake Oilfield Finance, Inc.*
6.625%, 11/15/19 | | | 1,313,550 | |
| | 3,000,000 | | | | | Neuberger Berman Group LLC*
5.875%, 03/15/22 | | | 3,067,500 | |
| | 2,800,000 | | | | | Nuveen Investments, Inc.
10.500%, 11/15/15 | | | 2,905,000 | |
| | 3,335,000 | | | | | Omega Healthcare Investors, Inc.
6.750%, 10/15/22 | | | 3,518,425 | |
| | | | | | | | | | |
| | | | | | | | | 13,308,357 | |
| | | | | | | | | | |
| | | | | | Health Care (9.8%) | |
| | 96,000 | | | | | AMERIGROUP Corp.
7.500%, 11/15/19 | | | 105,120 | |
| | 1,654,000 | | | | | DaVita, Inc.
6.625%, 11/01/20 | | | 1,738,768 | |
| | | | | | |
| See accompanying Notes to Schedule of Investments | | www.calamos.com | | | 87 | |
High Income Fund Schedule of Investments April 30, 2012 (Unaudited)
| | | | | | | | | | |
PRINCIPAL
AMOUNT | | | | | | | VALUE | |
| | | | | | | | | | |
| | 5,750,000 | | | | | Grifols, SA
8.250%, 02/01/18 | | $ | 6,188,437 | |
| | 1,300,000 | | | | | Health Management Associates, Inc.*
7.375%, 01/15/20 | | | 1,360,125 | |
| | 2,000,000 | | | | | LifePoint Hospitals, Inc.
6.625%, 10/01/20 | | | 2,115,000 | |
| | | | | | Mylan, Inc.* | | | | |
| | 700,000 | | | | | 7.875%, 07/15/20 | | | 787,500 | |
| | 690,000 | | | | | 7.625%, 07/15/17 | | | 767,625 | |
| | 1,076,000 | | | | | PSS World Medical, Inc.*
6.375%, 03/01/22 | | | 1,108,280 | |
| | 4,383,000 | | | | | Teleflex, Inc.
6.875%, 06/01/19 | | | 4,711,725 | |
| | 6,500,000 | | | | | Valeant Pharmaceuticals
International, Inc.*
7.250%, 07/15/22 | | | 6,516,250 | |
| | 3,000,000 | | | | | Warner Chilcott Company, LLC
7.750%, 09/15/18 | | | 3,292,500 | |
| | | | | | | | | | |
| | | | | | | | | 28,691,330 | |
| | | | | | | | | | |
| | | | | | Industrials (12.0%) | |
| | 2,184,000 | | | | | Abengoa, SA*
8.875%, 11/01/17 | | | 2,096,640 | |
| | | | | | Belden, Inc. | | | | |
| | 2,175,000 | | | | | 7.000%, 03/15/17 | | | 2,245,688 | |
| | 625,000 | | | | | 9.250%, 06/15/19 | | | 678,125 | |
| | 3,885,000 | | | | | Boart Longyear Management Pty., Ltd.*
7.000%, 04/01/21 | | | 4,088,962 | |
| | 5,600,000 | | | | | Deluxe Corp.
7.000%, 03/15/19 | | | 5,838,000 | |
| | 2,070,000 | | | | | Dycom Investments, Inc.
7.125%, 01/15/21 | | | 2,142,450 | |
| | 1,490,000 | | | | | Monaco SpinCo, Inc.*†
6.750%, 04/30/20 | | | 1,549,600 | |
| | 2,950,000 | | | | | Rexel, SA*
6.125%, 12/15/19 | | | 3,005,313 | |
| | 3,000,000 | | | | | Sensata Technologies Holding, B.V.*
6.500%, 05/15/19 | | | 3,142,500 | |
| | 4,260,000 | | | | | Titan International, Inc.
7.875%, 10/01/17 | | | 4,536,900 | |
| | 2,400,000 | | | | | TransDigm Group, Inc.
7.750%, 12/15/18 | | | 2,628,000 | |
| | 3,000,000 | | | | | UR Financing Escrow Corp.*
7.625%, 04/15/22 | | | 3,180,000 | |
| | | | | | | | | | |
| | | | | | | | | 35,132,178 | |
| | | | | | | | | | |
| | | | | | Information Technology (13.0%) | |
| | 800,000 | | | | | Anixter International, Inc.
5.950%, 03/01/15 | | | 838,000 | |
| | 3,450,000 | | | | | Audatex North America, Inc.*
6.750%, 06/15/18 | | | 3,631,125 | |
| | | | | | Equinix, Inc. | | | | |
| | 3,000,000 | | | | | 7.000%, 07/15/21 | | | 3,285,000 | |
| | 1,020,000 | | | | | 8.125%, 03/01/18 | | | 1,132,200 | |
| | | | | | | | | | |
PRINCIPAL
AMOUNT | | | | | | | VALUE | |
| | | | | | | | | | |
| | 3,000,000 | | | | | Hughes Satellite Systems Corp.
7.625%, 06/15/21 | | $ | 3,266,250 | |
| | 2,800,000 | | | | | iGATE Corp.
9.000%, 05/01/16 | | | 3,052,000 | |
| | 4,280,000 | | | | | Jabil Circuit, Inc.
8.250%, 03/15/18 | | | 5,007,600 | |
| | 5,405,000 | | | | | Sanmina-SCI Corp.*
7.000%, 05/15/19 | | | 5,553,637 | |
| | 5,800,000 | | | | | Seagate Technology 6.875%, 05/01/20 | | | 6,249,500 | |
| | 2,725,000 | | | | | ViaSat, Inc.
8.875%, 09/15/16 | | | 2,963,438 | |
| | 2,900,000 | | | | | Viasystems, Inc.*
7.875%, 05/01/19 | | | 2,950,750 | |
| | | | | | | | | | |
| | | | | | | | | 37,929,500 | |
| | | | | | | | | | |
| | | | | | Materials (5.1%) | |
| | 415,000 | | | | | Allegheny Ludlum Corp.
6.950%, 12/15/25 | | | 490,128 | |
| | 1,300,000 | | | | | Clearwater Paper Corp.
7.125%, 11/01/18 | | | 1,391,000 | |
| | 5,750,000 | | | | | FMG Resources*
8.250%, 11/01/19 | | | 6,253,125 | |
| | 3,700,000 | | | | | Greif, Inc.
7.750%, 08/01/19 | | | 4,199,500 | |
| | 1,090,000 | | | | | Sealed Air Corp.*
8.125%, 09/15/19 | | | 1,223,525 | |
| | 500,000 | | | | | Steel Dynamics, Inc.
7.625%, 03/15/20 | | | 552,500 | |
| | 645,000 | | | | | Union Carbide Corp.
7.875%, 04/01/23 | | | 789,066 | |
| | | | | | | | | | |
| | | | | | | | | 14,898,844 | |
| | | | | | | | | | |
| | | | | | Utilities (2.6%) | |
| | | | | | AES Corp. | | | | |
| | 3,000,000 | | | | | 7.750%, 10/15/15 | | | 3,390,000 | |
| | 1,400,000 | | | | | 7.375%, 07/01/21* | | | 1,564,500 | |
| | 2,600,000 | | | | | AmeriGas Finance Corp.
7.000%, 05/20/22 | | | 2,658,500 | |
| | | | | | | | | | |
| | | | | | | | | 7,613,000 | |
| | | | | | | | | | |
| | | | | | TOTAL CORPORATE BONDS
(Cost $251,424,956) | | | 262,388,563 | |
| | | | | | | | | | |
| | | | | | | | | | |
| | CONVERTIBLE BONDS (2.7%) | |
| | | | | | Industrials (1.1%) | |
| | 2,900,000 | | | | | Titan Machinery, Inc.*
3.750%, 05/01/19 | | | 3,139,250 | |
| | | | | | | | | | |
| | | | | | Materials (1.6%) | |
| | 4,400,000 | | | | | AngloGold Ashanti, Ltd.
3.500%, 05/22/14 | | | 4,708,000 | |
| | | | | | | | | | |
| | | | | | TOTAL CONVERTIBLE BONDS
(Cost $8,068,345) | | | 7,847,250 | |
| | | | | | | | | | |
| | | | |
| 88 | | CALAMOS FAMILY OF FUNDS SEMIANNUAL REPORT | | See accompanying Notes to Schedule of Investments |
High Income Fund Schedule of Investments April 30, 2012 (Unaudited)
| | | | | | | | | | |
PRINCIPAL
AMOUNT | | | | | | | VALUE | |
| | | | | | | | | | |
| | | | | | | | | | |
| | SOVEREIGN BONDS (1.4%) | |
| | | | | | Federative Republic of Brazil | | | | |
| | 645,600 | | | BRL | | 10.000%, 01/01/14 | | $ | 3,556,583 | |
| | 130,000 | | | BRL | | 10.000%, 01/01/13 | | | 710,895 | |
| | | | | | | | | | |
| | | | | | TOTAL SOVEREIGN BONDS
(Cost $4,272,405) | | | 4,267,478 | |
| | | | | | | | | | |
| | | | | | | | | | |
NUMBER OF
SHARES | | | | | | | VALUE | |
| | CONVERTIBLE PREFERRED STOCKS (3.1%) | |
| | | | | | Energy (1.8%) | |
| | 65,000 | | | | | Apache Corp.
6.000% | | | 3,452,800 | |
| | 2,250 | | | | | Chesapeake Energy Corp.*
5.750% | | | 1,946,250 | |
| | | | | | | | | | |
| | | | | | | | | 5,399,050 | |
| | | | | | | | | | |
| | | | | | Financials (0.4%) | |
| | 20,690 | | | | | Affiliated Managers Group, Inc.
5.100% | | | 1,034,500 | |
| | | | | | | | | | |
| | | | | | Utilities (0.9%) | |
| | 50,000 | | | | | NextEra Energy, Inc.
7.000% | | | 2,697,500 | |
| | | | | | | | | | |
| | | | | | TOTAL CONVERTIBLE
PREFERRED STOCKS
(Cost $10,382,614) | | | 9,131,050 | |
| | | | | | | | | | |
| | SHORT TERM INVESTMENT (2.1%) | |
| | 6,062,506 | | | | | Fidelity Prime Money Market Fund - Institutional Class
(Cost $6,062,506) | | | 6,062,506 | |
| | | | | | | | | | |
| TOTAL INVESTMENTS (99.1%)
(Cost $280,210,826) | | | 289,696,847 | |
| | | | | | | | | | |
| |
| | OTHER ASSETS, LESS LIABILITIES (0.9%) | | | 2,503,659 | |
| | | | | | | | | | |
| |
| | NET ASSETS (100.0%) | | $ | 292,200,506 | |
| | | | | | | | | | |
NOTES TO SCHEDULE OF INVESTMENTS
| ~ | Security, or portion of security, is segregated as collateral (or potential collateral for future transactions) for written options. The aggregate value of such securities is $1,083,125. |
| * | Securities issued and sold pursuant to a Rule 144A transaction are excepted from the registration requirement of the Securities Act of 1933, as amended. These securities may only be sold to qualified institutional buyers (“QIBs”), such as the fund. Any resale of these securities must generally be effected through a sale that is registered under the Act or otherwise exempted from such registration requirements. At April 30, 2012, the value of 144A securities that could not be exchanged to the registered form is $65,050,422 or 22.3% of net assets. |
| † | Security or a portion of the security purchased on a delayed delivery or when-issued basis. |
FOREIGN CURRENCY ABBREVIATIONS
| | |
| BRL | | Brazilian Real |
| NOK | | Norwegian Krone |
Note: Value for securities denominated in foreign currencies is shown in U.S. dollars. The principal amount for such securities is shown in the respective foreign currency.
| | | | | | |
| See accompanying Notes to Financial Statements | | www.calamos.com | | | 89 | |
Market Neutral Income Fund Schedule of Investments April 30, 2012 (Unaudited)
| | | | | | | | | | |
PRINCIPAL
AMOUNT | | | | | | | VALUE | |
| | | | | | | | | | |
| | CONVERTIBLE BONDS (27.3%) | |
| | | | | | Consumer Discretionary (3.4%) | |
| | 2,600,000 | | | | | Coinstar, Inc. 4.000%, 09/01/14 | | $ | 4,381,000 | |
| | 5,600,000 | | | | | D.R. Horton, Inc.~ 2.000%, 05/15/14 | | | 7,637,000 | |
| | 12,500,000 | | | | | Gaylord Entertainment Company* 3.750%, 10/01/14 | | | 16,296,875 | |
| | 4,500,000 | | | | | MGM Resorts International~ 4.250%, 04/15/15 | | | 4,775,625 | |
| | 7,000,000 | | | | | Sirius XM Radio, Inc.* 7.000%, 12/01/14 | | | 10,211,250 | |
| | 5,000,000 | | | | | Sonic Automotive, Inc. 5.000%, 10/01/29 | | | 7,306,250 | |
| | 7,000,000 | | | | | Sotheby’s 3.125%, 06/15/13 | | | 8,916,250 | |
| | 14,800,000 | | | | | Virgin Media, Inc. 6.500%, 11/15/16 | | | 22,459,000 | |
| | | | | | | | | | |
| | | | | | | | | 81,983,250 | |
| | | | | | | | | | |
| | | | | | Consumer Staples (1.4%) | |
| | 19,800,000 | | | | | Smithfield Foods, Inc.~ 4.000%, 06/30/13 | | | 21,953,250 | |
| | 9,500,000 | | | | | Tyson Foods, Inc. - Series A~ 3.250%, 10/15/13 | | | 11,447,500 | |
| | | | | | | | | | |
| | | | | | | | | 33,400,750 | |
| | | | | | | | | | |
| | | | | | Energy (1.0%) | |
| | 7,500,000 | | | | | Newpark Resources, Inc. 4.000%, 10/01/17 | | | 7,425,000 | |
| | 10,000,000 | | | | | Petroleum Development Corp.* 3.250%, 05/15/16 | | | 10,700,000 | |
| | 6,000,000 | | | | | Stone Energy Corp.* 1.750%, 03/01/17 | | | 5,805,000 | |
| | | | | | | | | | |
| | | | | | | | | 23,930,000 | |
| | | | | | | | | | |
| | | | | | Financials (1.0%) | |
| | 7,000,000 | | | | | Affiliated Managers Group, Inc. 3.950%, 08/15/38 | | | 7,743,750 | |
| | 3,000,000 | | | | | Amtrust Financial Services, Inc.* 5.500%, 12/15/21 | | | 3,337,500 | |
| | 13,800,000 | | | | | Knight Capital Group, Inc. 3.500%, 03/15/15 | | | 13,472,250 | |
| | | | | | | | | | |
| | | | | | | | | 24,553,500 | |
| | | | | | | | | | |
| | | | | | Health Care (3.8%) | |
| | 25,100,000 | | | | | AMERIGROUP Corp.~ 2.000%, 05/15/12 | | | 36,583,250 | |
| | 12,000,000 | | | | | LifePoint Hospitals, Inc. 3.500%, 05/15/14 | | | 12,525,000 | |
| | 4,500,000 | | | | | Medivation, Inc. 2.625%, 04/01/17 | | | 5,051,250 | |
| | 2,000,000 | | | | | Molina Healthcare, Inc. 3.750%, 10/01/14 | | | 2,260,000 | |
| | | | | | | | | | |
PRINCIPAL
AMOUNT | | | | | | | VALUE | |
| | | | | | | | | | |
| | 10,000,000 | | | | | Onyx Pharmaceuticals, Inc. 4.000%, 08/15/16 | | $ | 13,825,000 | |
| | 11,500,000 | | | | | PSS World Medical, Inc.* 3.125%, 08/01/14 | | | 14,547,500 | |
| | 7,000,000 | | | | | Volcano Corp. 2.875%, 09/01/15 | | | 8,312,500 | |
| | | | | | | | | | |
| | | | | | | | | 93,104,500 | |
| | | | | | | | | | |
| | | | | | Industrials (2.3%) | |
| | 2,400,000 | | | | | Altra Holdings, Inc.* 2.750%, 03/01/31 | | | 2,361,000 | |
| | 4,000,000 | | | | | Chart Industries, Inc. 2.000%, 08/01/18 | | | 5,280,000 | |
| | 10,000,000 | | | | | EnerSys‡ 3.375%, 06/01/38 | | | 11,637,500 | |
| | 7,000,000 | | | | | General Cable Corp. 0.875%, 11/15/13 | | | 6,860,000 | |
| | 2,000,000 | | | | | Greenbrier Companies, Inc.* 3.500%, 04/01/18 | | | 1,822,500 | |
| | 16,000,000 | | | | | Navistar International Corp. 3.000%, 10/15/14 | | | 16,580,000 | |
| | 6,500,000 | | | | | Terex Corp. 4.000%, 06/01/15 | | | 10,318,750 | |
| | | | | | | | | | |
| | | | | | | | | 54,859,750 | |
| | | | | | | | | | |
| | | | | | Information Technology (9.6%) | |
| | 17,800,000 | | | | | Alliance Data Systems Corp.~ 1.750%, 08/01/13 | | | 29,459,000 | |
| | 6,000,000 | | | | | Arris Group, Inc.~ 2.000%, 11/15/26 | | | 6,285,000 | |
| | 5,500,000 | | | | | BroadSoft, Inc.* 1.500%, 07/01/18 | | | 6,572,500 | |
| | 20,000,000 | | | | | CACI International, Inc.~ 2.125%, 05/01/14 | | | 24,500,000 | |
| | 10,900,000 | | | | | Ciena Corp.* 3.750%, 10/15/18 | | | 11,717,500 | |
| | 5,625,000 | | | | | Comtech Telecommunications Corp. 3.000%, 05/01/29 | | | 6,236,719 | |
| | 18,605,000 | | | | | Concur Technologies, Inc.* 2.500%, 04/15/15 | | | 23,535,325 | |
| | 5,000,000 | | | | | DealerTrack Holdings, Inc.* 1.500%, 03/15/17 | | | 5,325,000 | |
| | 9,300,000 | | | | | Equinix, Inc. 3.000%, 10/15/14 | | | 14,717,250 | |
| | 8,150,000 | | | | | FEI Company~ 2.875%, 06/01/13 | | | 14,242,125 | |
| | 2,000,000 | | | | | JDS Uniphase Corp. 1.000%, 05/15/26 | | | 1,995,000 | |
| | 5,000,000 | | | | | Mentor Graphics Corp. 4.000%, 04/01/31 | | | 5,350,000 | |
| | 4,332,000 | | | | | Micron Technology, Inc. 1.875%, 06/01/27 | | | 3,958,365 | |
| | 20,000,000 | | | | | Microsoft Corp.~* 0.000%, 06/15/13 | | | 21,900,000 | |
| | | | |
| 90 | | CALAMOS FAMILY OF FUNDS SEMIANNUAL REPORT | | See accompanying Notes to Schedule of Investments |
Market Neutral Income Fund Schedule of Investments April 30, 2012 (Unaudited)
| | | | | | | | | | |
PRINCIPAL
AMOUNT | | | | | | | VALUE | |
| | | | | | | | | | |
| | 20,000,000 | | | | | NetApp, Inc.
1.750%, 06/01/13 | | $ | 25,975,000 | |
| | 5,200,000 | | | | | Photronics, Inc.*
3.250%, 04/01/16 | | | 5,161,000 | |
| | 10,500,000 | | | | | Rovi Corp.
2.625%, 02/15/40 | | | 10,762,500 | |
| | 7,700,000 | | | | | SanDisk Corp.
1.500%, 08/15/17 | | | 8,017,625 | |
| | 7,300,000 | | | | | TTM Technologies, Inc.
3.250%, 05/15/15 | | | 7,683,250 | |
| | | | | | | | | | |
| | | | | | | | | 233,393,159 | |
| | | | | | | | | | |
| | | | | | Materials (3.3%) | |
| | 5,000,000 | | | | | Allegheny Technologies, Inc.
4.250%, 06/01/14 | | | 6,331,250 | |
| | 7,000,000 | | | | | Goldcorp, Inc.
2.000%, 08/01/14 | | | 8,076,250 | |
| | 2,950,000 | | | | | Horsehead Holding Corp.*
3.800%, 07/01/17 | | | 3,093,813 | |
| | 21,242,000 | | | | | Kinross Gold Corp.
1.750%, 03/15/28 | | | 21,056,132 | |
| | 6,125,000 | | | | | RTI International Metals, Inc.
3.000%, 12/01/15 | | | 6,461,875 | |
| | 10,700,000 | | | | | Steel Dynamics, Inc.
5.125%, 06/15/14 | | | 11,609,500 | |
| | 19,000,000 | | | | | United States Steel Corp.
4.000%, 05/15/14 | | | 22,040,000 | |
| | | | | | | | | | |
| | | | | | | | | 78,668,820 | |
| | | | | | | | | | |
| | | | | | Telecommunication Services (1.5%) | |
| | 4,000,000 | | | | | NII Holdings, Inc.
3.125%, 06/15/12 | | | 4,020,000 | |
| | 14,500,000 | | | | | SBA Communications Corp.
1.875%, 05/01/13 | | | 19,103,750 | |
| | 11,300,000 | | | | | tw telecom, Inc.
2.375%, 04/01/26 | | | 13,884,875 | |
| | | | | | | | | | |
| | | | | | | | | 37,008,625 | |
| | | | | | | | | | |
| | | | | | TOTAL CONVERTIBLE BONDS (Cost $607,173,937) | | | 660,902,354 | |
| | | | | | | | | | |
| | | | | | | | | | |
| | U.S. GOVERNMENT AND AGENCY SECURITIES (8.2%) | |
| | | | | | United States Treasury Note | | | | |
| | 110,000,000 | | | | | 2.125%, 08/15/21~ | | | 112,835,910 | |
| | 60,000,000 | | | | | 2.000%, 11/15/21 | | | 60,665,640 | |
| | 25,000,000 | | | | | 2.000%, 02/15/22 | | | 25,191,400 | |
| | | | | | | | | | |
| | | | | | TOTAL U.S. GOVERNMENT AND AGENCY SECURITIES (Cost $194,663,722) | | | 198,692,950 | |
| | | | | | | | | | |
| | | | | | | | | | |
| | SYNTHETIC CONVERTIBLE SECURITIES 15.1% | |
| | Corporate Bonds (5.1%) | |
| | | | | | Consumer Discretionary (1.2%) | |
| | | | | | American Axle & Manufacturing, Inc. | | | | |
| | 5,000,000 | | | | | 7.875%, 03/01/17 | | | 5,187,500 | |
| | 2,175,000 | | | | | 5.250%, 02/11/14 | | | 2,262,000 | |
| | | | | | | | | | |
PRINCIPAL
AMOUNT | | | | | | | VALUE | |
| | | | | | | | | | |
| | 2,190,000 | | | | | D.R. Horton, Inc.
6.875%, 05/01/13 | | $ | 2,294,025 | |
| | 500,000 | | | | | Express, LLC
8.750%, 03/01/18 | | | 556,250 | |
| | 2,988,000 | | | | | Hanesbrands, Inc.‡
4.146%, 12/15/14 | | | 2,999,235 | |
| | 6,000,000 | | | | | Jarden Corp.
8.000%, 05/01/16 | | | 6,596,250 | |
| | 7,550,000 | | | | | Royal Caribbean Cruises, Ltd.
7.000%, 06/15/13 | | | 7,927,500 | |
| | | | | | | | | | |
| | | | | | | | | 27,822,760 | |
| | | | | | | | | | |
| | | | | | Consumer Staples (0.3%) | |
| | 4,000,000 | | | | | Constellation Brands, Inc.
7.250%, 09/01/16 | | | 4,540,000 | |
| | 2,000,000 | | | | | Smithfield Foods, Inc.
7.750%, 05/15/13 | | | 2,130,000 | |
| | | | | | | | | | |
| | | | | | | | | 6,670,000 | |
| | | | | | | | | | |
| | | | | | Energy (0.7%) | |
| | 2,000,000 | | | | | Basic Energy Services, Inc.
7.125%, 04/15/16 | | | 2,040,000 | |
| | 3,870,000 | | | | | Bristow Group, Inc.
7.500%, 09/15/17 | | | 4,063,500 | |
| | 2,554,000 | | | | | Frontier Oil Corp.
8.500%, 09/15/16 | | | 2,726,395 | |
| | 2,330,000 | | | | | HollyFrontier Corp.
9.875%, 06/15/17 | | | 2,621,250 | |
| | 6,105,000 | | | | | SESI, LLC~
6.875%, 06/01/14 | | | 6,150,787 | |
| | | | | | | | | | |
| | | | | | | | | 17,601,932 | |
| | | | | | | | | | |
| | | | | | Financials (0.3%) | |
| | | | | | Leucadia National Corp. | | | | |
| | 5,000,000 | | | | | 8.125%, 09/15/15 | | | 5,593,750 | |
| | 1,475,000 | | | | | 7.000%, 08/15/13 | | | 1,548,750 | |
| | | | | | | | | | |
| | | | | | | | | 7,142,500 | |
| | | | | | | | | | |
| | | | | | Health Care (0.3%) | |
| | 640,000 | | | | | Bio-Rad Laboratories, Inc.
8.000%, 09/15/16 | | | 710,400 | |
| | 4,000,000 | | | | | Mylan, Inc.*
7.625%, 07/15/17 | | | 4,450,000 | |
| | 3,000,000 | | | | | Valeant Pharmaceuticals International, Inc.*
6.500%, 07/15/16 | | | 3,123,750 | |
| | | | | | | | | | |
| | | | | | | | | 8,284,150 | |
| | | | | | | | | | |
| | | | | | Industrials (1.4%) | |
| | 3,000,000 | | | | | Alliant Techsystems, Inc.
6.750%, 04/01/16 | | | 3,086,250 | |
| | 6,360,000 | | | | | Belden, Inc.
7.000%, 03/15/17 | | | 6,566,700 | |
| | | | | | Deluxe Corp. | | | | |
| | 4,000,000 | | | | | 7.375%, 06/01/15 | | | 4,090,000 | |
| | 2,000,000 | | | | | 5.125%, 10/01/14 | | | 2,047,500 | |
| | | | | | |
| See accompanying Notes to Schedule of Investments | | www.calamos.com | | | 91 | |
Market Neutral Income Fund Schedule of Investments April 30, 2012 (Unaudited)
| | | | | | | | | | |
PRINCIPAL
AMOUNT | | | | | | | VALUE | |
| | | | | | | | | | |
| | 3,000,000 | | | | | FTI Consulting, Inc.
7.750%, 10/01/16 | | $ | 3,135,000 | |
| | 7,075,000 | | | | | H&E Equipment Services, Inc.
8.375%, 07/15/16 | | | 7,340,312 | |
| | 4,000,000 | | | | | Titan International, Inc.
7.875%, 10/01/17 | | | 4,260,000 | |
| | 3,710,000 | | | | | WESCO Distribution, Inc.
7.500%, 10/15/17 | | | 3,816,663 | |
| | | | | | | | | | |
| | | | | | | | | 34,342,425 | |
| | | | | | | | | | |
| | | | | | Information Technology (0.7%) | |
| | 10,000,000 | | | | | Anixter International, Inc.~
5.950%, 03/01/15 | | | 10,475,000 | |
| | 5,000,000 | | | | | Jabil Circuit, Inc.
7.750%, 07/15/16 | | | 5,706,250 | |
| | 250,000 | | | | | ViaSat, Inc.
8.875%, 09/15/16 | | | 271,875 | |
| | | | | | | | | | |
| | | | | | | | | 16,453,125 | |
| | | | | | | | | | |
| | | | | | Materials (0.2%) | |
| | 5,000,000 | | | | | Ball Corp.
7.125%, 09/01/16 | | | 5,500,000 | |
| | | | | | | | | | |
| | | | | | TOTAL CORPORATE BONDS | | | 123,816,892 | |
| | | | | | | | | | |
| | Sovereign Bonds (9.8%) | |
| | 1,800,000 | | | BRL | | Federative Republic of Brazil
10.000%, 01/01/13 | | | 9,843,167 | |
| | | | | | Government of Canada | | | | |
| | 20,000,000 | | | CAD | | 2.000%, 06/01/16 | | | 20,589,158 | |
| | 10,000,000 | | | CAD | | 1.500%, 06/01/12 | | | 10,126,841 | |
| | 5,000,000 | | | CAD | | 2.000%, 03/01/14 | | | 5,121,476 | |
| | 5,000,000 | | | CAD | | 1.750%, 03/01/13 | | | 5,082,097 | |
| | 5,000,000 | | | CAD | | 1.500%, 11/01/13 | | | 5,074,708 | |
| | | | | | Government of New Zealand | | | | |
| | 32,000,000 | | | NZD | | 6.500%, 04/15/13 | | | 27,150,940 | |
| | 16,000,000 | | | NZD | | 6.000%, 04/15/15 | | | 14,299,957 | |
| | | | | | Government of Singapore | | | | |
| | 21,000,000 | | | SGD | | 1.625%, 04/01/13 | | | 17,185,874 | |
| | 19,493,000 | | | SGD | | 1.125%, 04/01/16 | | | 16,237,425 | |
| | 12,000,000 | | | SGD | | 1.375%, 10/01/14 | | | 9,970,890 | |
| | 6,434,000 | | | SGD | | 2.375%, 04/01/17 | | | 5,667,582 | |
| | | | | | Kingdom of Norway | | | | |
| | 127,000,000 | | | NOK | | 4.250%, 05/19/17 | | | 25,035,396 | |
| | 110,000,000 | | | NOK | | 5.000%, 05/15/15 | | | 21,204,449 | |
| | 287,500,000 | | | SEK | | Kingdom of Sweden 3.000%, 07/12/16 | | | 45,649,848 | |
| | | | | | | | | | |
| | | | | | TOTAL SOVEREIGN BONDS | | | 238,239,808 | |
| | | | | | | | | | |
| | | | | | | | | | |
NUMBER OF
CONTRACTS | | | | | | | VALUE | |
| | Purchased Options (0.2%)# | |
| | | | | | Energy (0.2%) | |
| | | | | | El Paso Corp. | | | | |
| | 2,000 | | | | | Call, 01/19/13, Strike $20.00 | | | 1,950,000 | |
| | | | | | | | | | |
NUMBER OF
CONTRACTS | | | | | | | VALUE | |
| | | | | | | | | | |
| | 2,000 | | | | | Call, 01/19/13, Strike $17.50 | | $ | 2,435,000 | |
| | | | | | | | | | |
| | | | | | TOTAL PURCHASED OPTIONS | | | 4,385,000 | |
| | | | | | | | | | |
| | | | | | TOTAL SYNTHETIC CONVERTIBLE SECURITIES (Cost $346,318,656) | | | 366,441,700 | |
| | | | | | | | | | |
| | | | | | | | | | |
NUMBER OF
SHARES | | | | | | | VALUE | |
| | COMMON STOCKS (46.0%) | |
| | | | | | Consumer Discretionary (3.3%) | |
| | 51,000 | | | | | Amazon.com, Inc.~# | | | 11,826,900 | |
| | 85,000 | | | | | CBS Corp. - Class B | | | 2,834,750 | |
| | 69,000 | | | | | Coach, Inc. | | | 5,048,040 | |
| | 270,500 | | | | | Comcast Corp. - Class A | | | 8,204,265 | |
| | 70,000 | | | | | DIRECTV - Class A# | | | 3,448,900 | |
| | 78,000 | | | | | Home Depot, Inc. | | | 4,039,620 | |
| | 83,500 | | | | | International Game Technology | | | 1,300,930 | |
| | 57,500 | | | | | Macy’s, Inc. | | | 2,358,650 | |
| | 90,000 | | | | | McDonald’s Corp. | | | 8,770,500 | |
| | 2,500 | | | | | Priceline.com, Inc.# | | | 1,902,050 | |
| | 67,500 | | | | | Starbucks Corp. | | | 3,873,150 | |
| | 85,000 | | | | | Target Corp. | | | 4,924,900 | |
| | 30,000 | | | | | Time Warner Cable, Inc. | | | 2,413,500 | |
| | 85,000 | | | | | Time Warner, Inc. | | | 3,184,100 | |
| | 66,000 | | | | | TJX Companies, Inc. | | | 2,752,860 | |
| | 213,300 | | | | | Walt Disney Company | | | 9,195,363 | |
| | 40,000 | | | | | Yum! Brands, Inc. | | | 2,909,200 | |
| | | | | | | | | | |
| | | | | | | | | 78,987,678 | |
| | | | | | | | | | |
| | | | | | Consumer Staples (5.0%) | |
| | 192,000 | | | | | Altria Group, Inc. | | | 6,184,320 | |
| | 100,000 | | | | | Archer-Daniels-Midland Company | | | 3,083,000 | |
| | 360,000 | | | | | Coca-Cola Company~ | | | 27,475,200 | |
| | 55,000 | | | | | Colgate-Palmolive Company | | | 5,441,700 | |
| | 80,000 | | | | | Costco Wholesale Corp. | | | 7,053,600 | |
| | 130,000 | | | | | CVS Caremark Corp. | | | 5,800,600 | |
| | 75,000 | | | | | Kimberly-Clark Corp. | | | 5,885,250 | |
| | 100,000 | | | | | Kraft Foods, Inc. - Class A | | | 3,987,000 | |
| | 21,000 | | | | | Mead Johnson Nutrition Company | | | 1,796,760 | |
| | 160,800 | | | | | PepsiCo, Inc. | | | 10,612,800 | |
| | 147,500 | | | | | Philip Morris International, Inc. | | | 13,202,725 | |
| | 262,800 | | | | | Procter & Gamble Company | | | 16,724,592 | |
| | 246,500 | | | | | Wal-Mart Stores, Inc.~ | | | 14,521,315 | |
| | | | | | | | | | |
| | | | | | | | | 121,768,862 | |
| | | | | | | | | | |
| | | | | | Energy (5.4%) | |
| | 23,700 | | | | | Anadarko Petroleum Corp. | | | 1,735,077 | |
| | 67,500 | | | | | Apache Corp. | | | 6,475,950 | |
| | 40,000 | | | | | Baker Hughes, Inc. | | | 1,764,400 | |
| | 195,000 | | | | | Chesapeake Energy Corp. | | | 3,595,800 | |
| | | | |
| 92 | | CALAMOS FAMILY OF FUNDS SEMIANNUAL REPORT | | See accompanying Notes to Schedule of Investments |
Market Neutral Income Fund Schedule of Investments April 30, 2012 (Unaudited)
| | | | | | | | | | |
NUMBER OF
SHARES | | | | | | | VALUE | |
| | | | | | | | | | |
| | 197,500 | | | | | Chevron Corp. | | $ | 21,045,600 | |
| | 131,500 | | | | | ConocoPhillips | | | 9,419,345 | |
| | 38,000 | | | | | Devon Energy Corp. | | | 2,654,300 | |
| | 37,500 | | | | | EOG Resources, Inc. | | | 4,117,875 | |
| | 420,820 | | | | | Exxon Mobil Corp. | | | 36,333,599 | |
| | 89,000 | | | | | Halliburton Company | | | 3,045,580 | |
| | 25,000 | | | | | Helmerich & Payne, Inc. | | | 1,284,750 | |
| | 105,000 | | | | | Marathon Oil Corp. | | | 3,080,700 | |
| | 52,500 | | | | | Marathon Petroleum Corp. | | | 2,184,525 | |
| | 55,000 | | | | | Nabors Industries, Ltd.# | | | 915,750 | |
| | 50,000 | | | | | National Oilwell Varco, Inc. | | | 3,788,000 | |
| | 115,000 | | | | | Occidental Petroleum Corp. | | | 10,490,300 | |
| | 247,000 | | | | | Schlumberger, Ltd. | | | 18,312,580 | |
| | | | | | | | | | |
| | | | | | | | | 130,244,131 | |
| | | | | | | | | | |
| | | | | | Financials (4.9%) | |
| | 47,000 | | | | | Aflac, Inc. | | | 2,116,880 | |
| | 135,000 | | | | | American Express Company~ | | | 8,128,350 | |
| | 200,000 | | | | | Bank of New York Mellon Corp. | | | 4,730,000 | |
| | 85,000 | | | | | BB&T Corp. | | | 2,723,400 | |
| | 200,000 | | | | | Berkshire Hathaway, Inc. -
Class B~# | | | 16,090,000 | |
| | 11,000 | | | | | BlackRock, Inc. | | | 2,107,380 | |
| | 35,100 | | | | | Franklin Resources, Inc. | | | 4,405,401 | |
| | 48,000 | | | | | Goldman Sachs Group, Inc. | | | 5,527,200 | |
| | 517,700 | | | | | JPMorgan Chase & Company | | | 22,250,746 | |
| | 84,140 | | | | | MetLife, Inc. | | | 3,031,564 | |
| | 29,000 | | | | | Prudential Financial, Inc. | | | 1,755,660 | |
| | 61,000 | | | | | State Street Corp. | | | 2,819,420 | |
| | 83,000 | | | | | T. Rowe Price Group, Inc. | | | 5,238,545 | |
| | 91,000 | | | | | Travelers Companies, Inc. | | | 5,853,120 | |
| | 342,500 | | | | | US Bancorp | | | 11,018,225 | |
| | 625,000 | | | | | Wells Fargo & Company | | | 20,893,750 | |
| | | | | | | | | | |
| | | | | | | | | 118,689,641 | |
| | | | | | | | | | |
| | | | | | Health Care (5.7%) | |
| | 210,800 | | | | | Abbott Laboratories | | | 13,082,248 | |
| | 65,000 | | | | | Agilent Technologies, Inc. | | | 2,741,700 | |
| | 36,000 | | | | | Allergan, Inc. | | | 3,456,000 | |
| | 54,000 | | | | | AmerisourceBergen Corp. | | | 2,009,340 | |
| | 109,000 | | | | | Amgen, Inc. | | | 7,750,990 | |
| | 60,000 | | | | | Baxter International, Inc. | | | 3,324,600 | |
| | 200,200 | | | | | Bristol-Myers Squibb Company | | | 6,680,674 | |
| | 85,000 | | | | | Celgene Corp.# | | | 6,198,200 | |
| | 10,000 | | | | | Intuitive Surgical, Inc.# | | | 5,782,000 | |
| | 538,750 | | | | | Johnson & Johnson | | | 35,067,237 | |
| | 90,000 | | | | | Medtronic, Inc. | | | 3,438,000 | |
| | 344,200 | | | | | Merck & Company, Inc. | | | 13,506,408 | |
| | 1,083,600 | | | | | Pfizer, Inc. | | | 24,846,948 | |
| | | | | | | | | | |
NUMBER OF
SHARES | | | | | | | VALUE | |
| | | | | | | | | | |
| | 85,000 | | | | | Stryker Corp. | | $ | 4,638,450 | |
| | 45,000 | | | | | Thermo Fisher Scientific, Inc. | | | 2,504,250 | |
| | 65,000 | | | | | UnitedHealth Group, Inc. | | | 3,649,750 | |
| | | | | | | | | | |
| | | | | | | | | 138,676,795 | |
| | | | | | | | | | |
| | | | | | Industrials (4.0%) | |
| | 136,000 | | | | | 3M Company | | | 12,152,960 | |
| | 81,000 | | | | | Caterpillar, Inc. | | | 8,324,370 | |
| | 85,000 | | | | | CSX Corp. | | | 1,896,350 | |
| | 20,000 | | | | | Cummins, Inc. | | | 2,316,600 | |
| | 40,000 | | | | | Danaher Corp. | | | 2,168,800 | |
| | 50,000 | | | | | Eaton Corp. | | | 2,409,000 | |
| | 60,000 | | | | | Emerson Electric Company | | | 3,152,400 | |
| | 29,000 | | | | | FedEx Corp. | | | 2,558,960 | |
| | 33,000 | | | | | Fluor Corp. | | | 1,905,750 | |
| | 1,227,500 | | | | | General Electric Company | | | 24,034,450 | |
| | 72,500 | | | | | Honeywell International, Inc. | | | 4,397,850 | |
| | 30,000 | | | | | Norfolk Southern Corp. | | | 2,187,900 | |
| | 15,000 | | | | | Precision Castparts Corp. | | | 2,645,550 | |
| | 25,000 | | | | | Union Pacific Corp. | | | 2,811,000 | |
| | 82,500 | | | | | United Parcel Service, Inc. | | | 6,446,550 | |
| | 200,000 | | | | | United Technologies Corp. | | | 16,328,000 | |
| | | | | |
| | | | | | | | | 95,736,490 | |
| | | | | | | | | | |
| | | | | | Information Technology (10.0%) | |
| | 50,000 | | | | | Accenture, PLC - Class A | | | 3,247,500 | |
| | 88,650 | | | | | Apple, Inc.# | | | 51,792,876 | |
| | 19,934 | | | | | Autodesk, Inc.# | | | 784,802 | |
| | 42,000 | | | | | Automatic Data Processing, Inc. | | | 2,336,040 | |
| | 725,000 | | | | | Cisco Systems, Inc. | | | 14,608,750 | |
| | 18,500 | | | | | Citrix Systems, Inc.# | | | 1,583,785 | |
| | 57,000 | | | | | Cognizant Technology Solutions Corp. - Class A# | | | 4,179,240 | |
| | 210,000 | | | | | Dell, Inc.# | | | 3,437,700 | |
| | 120,000 | | | | | eBay, Inc.# | | | 4,926,000 | |
| | 340,000 | | | | | EMC Corp.# | | | 9,591,400 | |
| | 32,400 | | | | | Google, Inc.# | | | 19,609,452 | |
| | 456,500 | | | | | Intel Corp. | | | 12,964,600 | |
| | 114,200 | | | | | International Business Machines Corp. | | | 23,648,536 | |
| | 95,000 | | | | | Jabil Circuit, Inc. | | | 2,227,750 | |
| | 6,000 | | | | | MasterCard, Inc. - Class A | | | 2,713,620 | |
| | 703,400 | | | | | Microsoft Corp. | | | 22,522,868 | |
| | 110,000 | | | | | NVIDIA Corp.# | | | 1,430,000 | |
| | 1,029,500 | | | | | Oracle Corp. | | | 30,257,005 | |
| | 306,100 | | | | | QUALCOMM, Inc. | | | 19,541,424 | |
| | 25,000 | | | | | Salesforce.com, Inc.# | | | 3,893,250 | |
| | 90,000 | | | | | Symantec Corp.# | | | 1,486,800 | |
| | 30,000 | | | | | Teradata Corp.# | | | 2,093,400 | |
| | | | | | |
| See accompanying Notes to Schedule of Investments | | www.calamos.com | | | 93 | |
Market Neutral Income Fund Schedule of Investments April 30, 2012 (Unaudited)
| | | | | | | | | | |
NUMBER OF
SHARES | | | | | | | VALUE | |
| | | | | | | | | | |
| | 120,000 | | | | | Texas Instruments, Inc. | | $ | 3,832,800 | |
| | | | | | | | | | |
| | | | | | | | | 242,709,598 | |
| | | | | | | | | | |
| | | | | | Materials (5.6%) | |
| | 26,000 | | | | | Cliffs Natural Resources, Inc. | | | 1,618,760 | |
| | 130,000 | | | | | Dow Chemical Company | | | 4,404,400 | |
| | 123,000 | | | | | E.I. du Pont de Nemours and Company | | | 6,575,580 | |
| | 98,000 | | | | | Freeport-McMoRan Copper & Gold, Inc. | | | 3,753,400 | |
| | 75,000 | | | | | Kroger Co. | | | 1,745,250 | |
| | 52,000 | | | | | Monsanto Company | | | 3,961,360 | |
| | 90,000 | | | | | Mosaic Company | | | 4,753,800 | |
| | 59,000 | | | | | Newmont Mining Corp. | | | 2,811,350 | |
| | 45,000 | | | | | PPG Industries, Inc. | | | 4,735,800 | |
| | 628,000 | | | | | SPDR Gold Trust# | | | 101,660,640 | |
| | | | | | | | | | |
| | | | | | | | | 136,020,340 | |
| | | | | | | | | | |
| | | | | | Telecommunication Services (1.4%) | |
| | 600,100 | | | | | AT&T, Inc. | | | 19,749,291 | |
| | 335,000 | | | | | Verizon Communications, Inc. | | | 13,527,300 | |
| | | | | | | | | | |
| | | | | | | | | 33,276,591 | |
| | | | | | | | | | |
| | | | | | Utilities (0.7%) | |
| | 65,000 | | | | | American Electric Power Co., Inc. | | | 2,524,600 | |
| | 62,000 | | | | | Dominion Resources, Inc. | | | 3,235,780 | |
| | 169,600 | | | | | Duke Energy Corp. | | | 3,634,528 | |
| | 75,000 | | | | | Edison International | | | 3,300,750 | |
| | 100,000 | | | | | Southern Company | | | 4,594,000 | |
| | | | | | | | | | |
| | | | | | | | | 17,289,658 | |
| | | | | | | | | | |
| | | | | | TOTAL COMMON STOCKS
(Cost $1,089,919,675) | | | 1,113,399,784 | |
| | | | | | | | | | |
| | | | | | | | | | |
NUMBER OF
CONTRACTS | | | | | | | VALUE | |
| | PURCHASED OPTIONS (0.1%)# | |
| | | | | | Materials (0.0%) | |
| | 6,280 | | | | | SPDR Gold Trust
Put, 06/29/12, Strike $125.00 | | | 62,800 | |
| | 5,675 | | | | | Call, 06/29/12, Strike $175.00 | | | 462,512 | |
| | | | | | | | | | |
| | | | | | | | | 525,312 | |
| | | | | | | | | | |
| | | | | | Other (0.1%) | |
| | | | | | S & P 500 Index | | | | |
| | 1,000 | | | | | Put, 05/19/12, Strike $1,325.00 | | | 340,000 | |
| | 1,000 | | | | | Put, 05/19/12, Strike $1,300.00 | | | 200,000 | |
| | 600 | | | | | Put, 06/16/12, Strike $1,325.00 | | | 720,000 | |
| | | | | | | | | | |
| | | | | | | | | 1,260,000 | |
| | | | | | | | | | |
| | | | | | TOTAL PURCHASED OPTIONS
(Cost $5,868,490) | | | 1,785,312 | |
| | | | | | | | | | |
| | | | | | | | | | |
NUMBER OF
SHARES | | | | | | | VALUE | |
| | | | | | | | | | |
| | SHORT TERM INVESTMENT (2.5%) | |
| | 59,848,423 | | | | | Fidelity Prime Money Market Fund - Institutional Class
(Cost $59,848,423) | | $ | 59,848,423 | |
| | | | | | | | | | |
| TOTAL INVESTMENTS (99.2%)
(Cost $2,303,792,903) | | | 2,401,070,523 | |
| | | | | | | | | | |
| |
| | OTHER ASSETS, LESS LIABILITIES (0.8%) | | | 19,543,238 | |
| | | | | | | | | | |
| |
| | NET ASSETS (100.0%) | | $ | 2,420,613,761 | |
| | | | | | | | | | |
| | | | | | | | | | |
PRINCIPAL
AMOUNT | | | | | | | VALUE | |
| U.S. GOVERNMENT AND AGENCY SECURITIES
SOLD SHORT (-9.3%)# |
|
| | | | | | United States Treasury Note | | | | |
| | (50,000,000 | ) | | | | 0.250%, 11/30/13 | | | (50,009,800 | ) |
| | (175,000,000 | ) | | | | 0.250%, 02/28/14 | | | (175,020,475 | ) |
| | | | | | | | | | |
| | | | | | TOTAL U.S. GOVERNMENT
AND AGENCY SECURITIES SOLD SHORT
(Proceeds $224,722,872) | | | (225,030,275 | ) |
| | | | | | | | | | |
| | | | | | | | | | |
NUMBER OF
SHARES | | | | | | | VALUE | |
| | COMMON STOCKS SOLD SHORT (-12.6%)# | |
| | | | | | Consumer Discretionary (-1.9%) | |
| | (53,100 | ) | | | | Coinstar, Inc. | | | (3,334,149 | ) |
| | (207,700 | ) | | | | D.R. Horton, Inc. | | | (3,395,895 | ) |
| | (322,700 | ) | | | | Gaylord Entertainment Company | | | (10,158,596 | ) |
| | (124,600 | ) | | | | MGM Resorts International | | | (1,672,132 | ) |
| | (2,812,000 | ) | | | | Sirius XM Radio, Inc. | | | (6,355,120 | ) |
| | (264,800 | ) | | | | Sonic Automotive, Inc. | | | (4,453,936 | ) |
| | (125,000 | ) | | | | Sotheby’s | | | (4,915,000 | ) |
| | (515,500 | ) | | | | Virgin Media, Inc. | | | (12,660,680 | ) |
| | | | | | | | | | |
| | | | | | | | | (46,945,508 | ) |
| | | | | | | | | | |
| | | | | | Consumer Staples (-0.8%) | |
| | (590,900 | ) | | | | Smithfield Foods, Inc. | | | (12,385,264 | ) |
| | (408,300 | ) | | | | Tyson Foods, Inc. - Class A | | | (7,451,475 | ) |
| | | | | | | | | | |
| | | | | | | | | (19,836,739 | ) |
| | | | | | | | | | |
| | | | | | Energy (-0.4%) | |
| | (370,873 | ) | | | | Newpark Resources, Inc. | | | (2,358,752 | ) |
| | (130,000 | ) | | | | Petroleum Development Corp. | | | (4,470,700 | ) |
| | (63,500 | ) | | | | Stone Energy Corp. | | | (1,781,175 | ) |
| | | | | | | | | | |
| | | | | | | | | (8,610,627 | ) |
| | | | | | | | | | |
| | | | | | Financials (-0.3%) | |
| | (22,340 | ) | | | | Affiliated Managers Group, Inc. | | | (2,538,271 | ) |
| | (50,000 | ) | | | | Amtrust Financial Services, Inc. | | | (1,362,000 | ) |
| | (269,900 | ) | | | | Knight Capital Group, Inc. | | | (3,546,486 | ) |
| | | | | | | | | | |
| | | | | | | | | (7,446,757 | ) |
| | | | | | | | | | |
| | | | |
| 94 | | CALAMOS FAMILY OF FUNDS SEMIANNUAL REPORT | | See accompanying Notes to Schedule of Investments |
Market Neutral Income Fund Schedule of Investments April 30, 2012 (Unaudited)
| | | | | | | | | | |
NUMBER OF
SHARES | | | | | | | VALUE | |
| | | | | | | | | | |
| | | | | | | | | | |
| | | | | | Health Care (-1.8%) | |
| | (276,900 | ) | | | | AMERIGROUP Corp. | | $ | (17,101,344 | ) |
| | (80,150 | ) | | | | LifePoint Hospitals, Inc. | | | (3,127,453 | ) |
| | (28,600 | ) | | | | Medivation, Inc. | | | (2,313,168 | ) |
| | (28,500 | ) | | | | Molina Healthcare, Inc. | | | (731,025 | ) |
| | (125,250 | ) | | | | Onyx Pharmaceuticals, Inc. | | | (5,700,127 | ) |
| | (389,850 | ) | | | | PSS World Medical, Inc. | | | (9,329,111 | ) |
| | (156,300 | ) | | | | Volcano Corp. | | | (4,243,545 | ) |
| | | | | | | | | | |
| | | | | | | | | (42,545,773 | ) |
| | | | | | | | | | |
| | | | | | Industrials (-0.9%) | |
| | (40,825 | ) | | | | Altra Holdings, Inc. | | | (746,281 | ) |
| | (43,000 | ) | | | | Chart Industries, Inc. | | | (3,286,490 | ) |
| | (109,500 | ) | | | | EnerSys | | | (3,827,025 | ) |
| | (21,750 | ) | | | | General Cable Corp. | | | (640,320 | ) |
| | (24,000 | ) | | | | Greenbrier Companies, Inc. | | | (414,000 | ) |
| | (169,300 | ) | | | | Navistar International Corp. | | | (5,747,735 | ) |
| | (304,900 | ) | | | | Terex Corp. | | | (6,902,936 | ) |
| | | | | | | | | | |
| | | | | | | | | (21,564,787 | ) |
| | | | | | | | | | |
| | | | | | Information Technology (-4.6%) | |
| | (203,900 | ) | | | | Alliance Data Systems Corp. | | | (26,199,111 | ) |
| | (76,000 | ) | | | | Arris Group, Inc. | | | (982,680 | ) |
| | (101,000 | ) | | | | BroadSoft, Inc. | | | (4,323,810 | ) |
| | (182,500 | ) | | | | CACI International, Inc. - Class A | | | (11,156,225 | ) |
| | (335,400 | ) | | | | Ciena Corp. | | | (4,970,628 | ) |
| | (76,800 | ) | | | | Comtech Telecommunications Corp. | | | (2,374,656 | ) |
| | (234,000 | ) | | | | Concur Technologies, Inc. | | | (13,235,040 | ) |
| | (70,000 | ) | | | | DealerTrack Holdings, Inc. | | | (2,088,100 | ) |
| | (45,000 | ) | | | | Equinix, Inc. | | | (7,389,000 | ) |
| | (250,680 | ) | | | | FEI Company | | | (12,576,616 | ) |
| | (134,500 | ) | | | | Mentor Graphics Corp. | | | (1,943,525 | ) |
| | (218,976 | ) | | | | Micron Technology, Inc. | | | (1,443,052 | ) |
| | (342,500 | ) | | | | NetApp, Inc. | | | (13,299,275 | ) |
| | (324,480 | ) | | | | Photronics, Inc. | | | (2,008,531 | ) |
| | (54,900 | ) | | | | Rovi Corp. | | | (1,570,140 | ) |
| | (85,300 | ) | | | | SanDisk Corp. | | | (3,156,953 | ) |
| | (274,900 | ) | | | | TTM Technologies, Inc. | | | (2,839,717 | ) |
| | | | | | | | | | |
| | | | | | | | | (111,557,059 | ) |
| | | | | | | | | | |
| | | | | | Materials (-1.0%) | |
| | (71,500 | ) | | | | Allegheny Technologies, Inc. | | | (3,070,210 | ) |
| | (50,900 | ) | | | | Goldcorp, Inc. | | | (1,947,434 | ) |
| | (136,000 | ) | | | | Horsehead Holding Corp. | | | (1,527,280 | ) |
| | (93,600 | ) | | | | RTI International Metals, Inc. | | | (2,297,880 | ) |
| | (285,300 | ) | | | | Steel Dynamics, Inc. | | | (3,643,281 | ) |
| | (414,500 | ) | | | | United States Steel Corp. | | | (11,742,785 | ) |
| | | | | | | | | | |
| | | | | | | | | (24,228,870 | ) |
| | | | | | | | | | |
| | | | | | | | | | |
NUMBER OF
SHARES | | | | | | | VALUE | |
| | | | | | | | | | |
| | | | | | | | | | |
| | | | | | Telecommunication Services (-0.9%) | |
| | (228,500 | ) | | | | SBA Communications Corp. | | $ | (12,279,590 | ) |
| | (417,600 | ) | | | | tw telecom, Inc. | | | (9,095,328 | ) |
| | | | | | | | | | |
| | | | | | | | | (21,374,918 | ) |
| | | | | | | | | | |
| | | | | | TOTAL COMMON STOCKS SOLD SHORT
(Proceeds $265,037,331) | | | (304,111,038 | ) |
| | | | | | | | | | |
| | | | | | | | | | |
NUMBER OF
CONTRACTS | | | | | | | VALUE | |
| | WRITTEN OPTIONS (-0.8%)# | |
| | | | | | Consumer Discretionary (0.0%) | |
| | 850 | | | | | D.R. Horton, Inc.
Call, 01/19/13, Strike $12.50 | | | (382,500 | ) |
| | | | | | | | | | |
| | | | | | Health Care (0.0%) | |
| | 500 | | | | | Onyx Pharmaceuticals, Inc.
Call, 08/18/12, Strike $50.00 | | | (175,000 | ) |
| | | | | | | | | | |
| | | | | | Industrials (0.0%) | |
| | 90 | | | | | Chart Industries, Inc.
Call, 09/22/12, Strike $80.00 | | | (63,000 | ) |
| | 300 | | | | | EnerSys Call, 06/16/12, Strike $30.00 | | | (162,000 | ) |
| | | | | | | | | | |
| | | | | | | | | (225,000 | ) |
| | | | | | | | | | |
| | | | | | Information Technology (-0.1%) | |
| | 950 | | | | | Jabil Circuit, Inc. Call, 06/16/12, Strike $25.00 | | | (42,750 | ) |
| | 5,800 | | | | | Microsoft Corp. Call, 01/19/13, Strike $32.50 | | | (1,087,500 | ) |
| | 550 | | | | | Nvidia Corp Call, 06/16/12, Strike $17.00 | | | (3,575 | ) |
| | 125 | | | | | Salesforce.com, Inc. Call, 05/19/12, Strike $140.00 | | | (229,688 | ) |
| | | | | | | | | | |
| | | | | | | | | (1,363,513 | ) |
| | | | | | | | | | |
| | | | | | Materials (-0.1%) | |
| | | | | | SPDR Gold Trust | | | | |
| | 4,830 | | | | | Call, 06/29/12, Strike $161.00 | | | (2,137,275 | ) |
| | 1,450 | | | | | Call, 06/29/12, Strike $158.00 | | | (899,000 | ) |
| | | | | | | | | | |
| | | | | | | | | (3,036,275 | ) |
| | | | | | | | | | |
| | | | | | Other (-0.6%) | |
| | | | | | S & P 500 Index | | | | |
| | 1,750 | | | | | Call, 05/19/12, Strike $1,400.00 | | | (2,677,500 | ) |
| | 1,500 | | | | | Call, 09/22/12, Strike $1,450.00 | | | (4,117,500 | ) |
| | 1,300 | | | | | Call, 06/16/12, Strike $1,425.00 | | | (1,885,000 | ) |
| | 1,100 | | | | | Call, 07/21/12, Strike $1,450.00 | | | (1,584,000 | ) |
| | 700 | | | | | Call, 06/16/12, Strike $1,390.00 | | | (2,257,500 | ) |
| | 500 | | | | | Call, 07/21/12, Strike $1,425.00 | | | (1,212,500 | ) |
| | | | | | | | | | |
| | | | | | | | | (13,734,000 | ) |
| | | | | | | | | | |
| | | | | | TOTAL WRITTEN OPTIONS
(Premium $18,547,703) | | | (18,916,288 | ) |
| | | | | | | | | | |
| | | | | | |
| See accompanying Notes to Schedule of Investments | | www.calamos.com | | | 95 | |
Market Neutral Income Fund Schedule of Investments April 30, 2012 (Unaudited)
NOTES TO SCHEDULE OF INVESTMENTS
| ~ | Security, or portion of security, is segregated as collateral (or potential collateral for future transactions) for written options and securities sold short. The aggregate value of such securities is $209,758,956. |
| * | Securities issued and sold pursuant to a Rule 144A transaction are excepted from the registration requirement of the Securities Act of 1933, as amended. These securities may only be sold to qualified institutional buyers (“QIBs”), such as the fund. Any resale of these securities must generally be effected through a sale that is registered under the Act or otherwise exempted from such registration requirements. At April 30, 2012, the value of 144A securities that could not be exchanged to the registered form is $149,960,513 or 6.2% of net assets. |
| ‡ | Variable rate or step bond security. The rate shown is the rate in effect at April 30, 2012. |
| # | Non-income producing security. |
FOREIGN CURRENCY ABBREVIATIONS
| | |
| BRL | | Brazilian Real |
| CAD | | Canadian Dollar |
| NOK | | Norwegian Krone |
| NZD | | New Zealand Dollar |
| SEK | | Swedish Krona |
| SGD | | Singapore Dollar |
Note: Value for securities denominated in foreign currencies is shown in U.S. dollars. The principal amount for such securities is shown in the respective foreign currency. The date on options represents the expiration date of the option contract. The option contract may be exercised at any date on or before the date shown.
| | | | |
| 96 | | CALAMOS FAMILY OF FUNDS SEMIANNUAL REPORT | | See accompanying Notes to Financial Statements |
Statements of Assets and Liabilities April 30, 2012 (Unaudited)
| | | | | | | | | | | | | | | | | | | | |
| | | GROWTH FUND | | | VALUE
FUND | | | BLUE CHIP
FUND | | | DISCOVERY
GROWTH FUND | | | INTERNATIONAL
GROWTH FUND | |
ASSETS | | | | | | | | | | | | | | | | | | | | |
Investments in securities, at cost | | $ | 6,122,310,091 | | | $ | 36,727,306 | | | $ | 53,886,983 | | | $ | 35,721,727 | | | $ | 708,168,235 | |
| |
Investments in securities, at value | | $ | 7,888,422,196 | | | $ | 43,015,770 | | | $ | 69,187,469 | | | $ | 38,835,809 | | | $ | 767,794,831 | |
Cash with custodian (interest bearing) | | | — | | | | — | | | | — | | | | — | | | | — | |
Restricted cash for short positions (interest bearing) | | | — | | | | — | | | | — | | | | — | | | | — | |
Due from investment advisor | | | — | | | | 25,094 | | | | 29,614 | | | | 22,718 | | | | 180,217 | |
Foreign currency (cost $983,708) | | | — | | | | — | | | | — | | | | — | | | | 983,708 | |
Unrealized appreciation on forward foreign currency contracts | | | 1,799,856 | | | | — | | | | 8,059 | | | | — | | | | — | |
Receivables: | | | | | | | | | | | | | | | | | | | | |
Accrued interest and dividends | | | 7,091,054 | | | | 53,582 | | | | 82,261 | | | | 3,140 | | | | 2,068,226 | |
Investments sold | | | 195,199,848 | | �� | | — | | | | 222,603 | | | | 2,058,556 | | | | — | |
Fund shares sold | | | 8,144,397 | | | | 5,964 | | | | 75,960 | | | | 66,423 | | | | 4,927,885 | |
Prepaid expenses | | | 269,507 | | | | 45,696 | | | | 43,341 | | | | 30,873 | | | | 97,918 | |
Other assets | | | 761,502 | | | | 71,919 | | | | 64,968 | | | | 6,722 | | | | 64,312 | |
| |
Total assets | | | 8,101,688,360 | | | | 43,218,025 | | | | 69,714,275 | | | | 41,024,241 | | | | 776,117,097 | |
| |
LIABILITIES | | | | | | | | | | | | | | | | | | | | |
Securities sold short, at value (proceeds $-) | | | — | | | | — | | | | — | | | | — | | | | — | |
Options written, at value (premium $5,242,394; $39,733) | | | 16,429,065 | | | | — | | | | 124,530 | | | | — | | | | — | |
Unrealized depreciation on forward foreign currency contracts | | | 3,744,209 | | | | 96,129 | | | | 57,106 | | | | — | | | | — | |
Payables: | | | | | | | | | | | | | | | | | | | | |
Investments purchased | | | 278,117,196 | | | | — | | | | 1,604,836 | | | | 811,011 | | | | 4,904,445 | |
Fund shares redeemed | | | 12,068,181 | | | | 70,760 | | | | 186,835 | | | | 32,082 | | | | 905,762 | |
Dividends payable | | | — | | | | — | | | | — | | | | — | | | | — | |
Affiliates: | | | | | | | | | | | | | | | | | | | | |
Investment advisory fees | | | 5,243,970 | | | | 35,035 | | | | 56,392 | | | | 32,817 | | | | 688,792 | |
Distribution fees | | | 76,676 | | | | 326 | | | | 554 | | | | 314 | | | | 4,540 | |
Deferred compensation to trustees | | | 761,502 | | | | 71,919 | | | | 64,968 | | | | 6,722 | | | | 64,312 | |
Financial accounting fees | | | 73,344 | | | | 399 | | | | 642 | | | | 374 | | | | 6,981 | |
Trustees’ fees and officer compensation | | | 14,701 | | | | 520 | | | | 503 | | | | 491 | | | | 537 | |
Other accounts payable and accrued liabilities | | | 2,590,505 | | | | 23,437 | | | | 22,192 | | | | 15,071 | | | | 92,772 | |
| |
Total liabilities | | | 319,119,349 | | | | 298,525 | | | | 2,118,558 | | | | 898,882 | | | | 6,668,141 | |
| |
NET ASSETS | | $ | 7,782,569,011 | | | $ | 42,919,500 | | | $ | 67,595,717 | | | $ | 40,125,359 | | | $ | 769,448,956 | |
| |
COMPOSITION OF NET ASSETS | | | | | | | | | | | | | | | | | | | | |
Paid in capital | | $ | 5,653,976,548 | | | $ | 42,302,045 | | | $ | 65,061,511 | | | $ | 36,738,141 | | | $ | 747,002,420 | |
Undistributed net investment income (loss) | | | (15,960,711 | ) | | | 105,304 | | | | (70,658 | ) | | | (296,624 | ) | | | 553,652 | |
Accumulated net realized gain (loss) on investments, foreign currency transactions, written options and short positions | | | 391,572,616 | | | | (5,680,370 | ) | | | (12,562,172 | ) | | | 569,760 | | | | (37,721,520 | ) |
Unrealized appreciation (depreciation) of investments, foreign currency translations, written options and short positions | | | 1,752,980,558 | | | | 6,192,521 | | | | 15,167,036 | | | | 3,114,082 | | | | 59,614,404 | |
| |
NET ASSETS | | $ | 7,782,569,011 | | | $ | 42,919,500 | | | $ | 67,595,717 | | | $ | 40,125,359 | | | $ | 769,448,956 | |
| |
CLASS A SHARES† | | | | | | | | | | | | | | | | | | | | |
Net assets applicable to shares outstanding | | $ | 4,009,843,660 | | | $ | 25,014,896 | | | $ | 27,206,693 | | | $ | 26,349,542 | | | $ | 352,863,528 | |
Shares outstanding | | | 75,219,844 | | | | 2,084,371 | | | | 1,987,788 | | | | 2,085,034 | | | | 20,357,392 | |
Net asset value and redemption price per share | | $ | 53.31 | | | $ | 12.00 | | | $ | 13.69 | | | $ | 12.64 | | | $ | 17.33 | |
| |
Maximum offering price per share (Net asset value, plus 4.75% of offering price) | | $ | 55.97 | | | $ | 12.60 | | | $ | 14.37 | | | $ | 13.27 | | | $ | 18.19 | |
| |
CLASS B SHARES†** | | | | | | | | | | | | | | | | | | | | |
Net assets applicable to shares outstanding | | $ | 262,174,880 | | | $ | 1,718,372 | | | $ | 2,428,417 | | | $ | 1,514,300 | | | $ | 11,527,200 | |
Shares outstanding | | | 4,999,892 | | | | 154,140 | | | | 186,921 | | | | 121,327 | | | | 695,236 | |
Net asset value and redemption price per share | | $ | 52.44 | | | $ | 11.15 | | | $ | 12.99 | | | $ | 12.48 | | | $ | 16.58 | |
| |
CLASS C SHARES†** | | | | | | | | | | | | | | | | | | | | |
Net assets applicable to shares outstanding | | $ | 1,512,678,715 | | | $ | 3,874,853 | | | $ | 10,817,097 | | | $ | 2,656,629 | | | $ | 62,565,535 | |
Shares outstanding | | | 31,657,812 | | | | 347,800 | | | | 832,210 | | | | 212,802 | | | | 3,778,430 | |
Net asset value and redemption price per share | | $ | 47.78 | | | $ | 11.14 | | | $ | 13.00 | | | $ | 12.48 | | | $ | 16.56 | |
| |
CLASS I SHARES† | | | | | | | | | | | | | | | | | | | | |
Net assets applicable to shares outstanding | | $ | 1,980,134,738 | | | $ | 12,214,355 | | | $ | 27,029,385 | | | $ | 8,347,396 | | | $ | 335,191,270 | |
Shares outstanding | | | 33,859,900 | | | | 997,959 | | | | 1,958,345 | | | | 657,631 | | | | 19,133,463 | |
Net asset value and redemption price per share | | $ | 58.48 | | | $ | 12.24 | | | $ | 13.80 | | | $ | 12.69 | | | $ | 17.52 | |
| |
CLASS R SHARES† | | | | | | | | | | | | | | | | | | | | |
Net assets applicable to shares outstanding | | $ | 17,737,018 | | | $ | 97,024 | | | $ | 114,125 | | | $ | 1,257,492 | | | $ | 7,301,423 | |
Shares outstanding | | | 337,382 | | | | 8,158 | | | | 8,410 | | | | 99,835 | | | | 425,857 | |
Net asset value and redemption price per share | | $ | 52.57 | | | $ | 11.89 | | | $ | 13.57 | | | $ | 12.60 | | | $ | 17.15 | |
| |
| † | No par value; unlimited number of shares authorized. |
| ** | Redemption price may be reduced by contingent deferred sales charge. |
| | | | | | |
| See accompanying Notes to Financial Statements | | www.calamos.com | | | 97 | |
Statements of Assets and Liabilities April 30, 2012 (Unaudited)
| | | | | | | | | | | | | | | | | | | | |
| | | EVOLVING WORLD
GROWTH FUND | | | GLOBAL EQUITY
FUND | | | GROWTH AND
INCOME FUND | | | GLOBAL GROWTH
AND INCOME
FUND | | | CONVERTIBLE
FUND | |
ASSETS | | | | | | | | | | | | | | | | | | | | |
Investments in securities, at cost | | $ | 319,723,335 | | | $ | 241,860,561 | | | $ | 4,035,604,143 | | | $ | 1,589,439,295 | | | $ | 1,909,648,702 | |
| |
Investments in securities, at value | | $ | 337,916,281 | | | $ | 261,664,467 | | | $ | 4,585,489,230 | | | $ | 1,697,533,377 | | | $ | 2,059,325,971 | |
Cash with custodian (interest bearing) | | | — | | | | — | | | | — | | | | — | | | | — | |
Restricted cash for short positions (interest bearing) | | | — | | | | — | | | | — | | | | — | | | | — | |
Due from investment advisor | | | — | | | | 35,350 | | | | — | | | | — | | | | — | |
Foreign currency (cost $704,227; $232) | | | 704,227 | | | | — | | | | — | | | | 232 | | | | — | |
Unrealized appreciation on forward foreign currency contracts | | | — | | | | 20,185 | | | | — | | | | 23,052 | | | | 90,826 | |
Receivables: | | | | | | | | | | | | | | | | | | | | |
Accrued interest and dividends | | | 550,270 | | | | 483,300 | | | | 21,938,661 | | | | 7,458,865 | | | | 11,698,344 | |
Investments sold | | | 426,548 | | | | 2,334,653 | | | | 67,746,540 | | | | 42,637,992 | | | | 39,571,996 | |
Fund shares sold | | | 6,322,608 | | | | 2,343,655 | | | | 5,038,313 | | | | 1,258,242 | | | | 157,352 | |
Prepaid expenses | | | 60,485 | | | | 52,777 | | | | 197,484 | | | | 99,008 | | | | 108,416 | |
Other assets | | | 25,632 | | | | 36,580 | | | | 357,664 | | | | 127,917 | | | | 178,672 | |
| |
Total assets | | | 346,006,051 | | | | 266,970,967 | | | | 4,680,767,892 | | | | 1,749,138,685 | | | | 2,111,131,577 | |
| |
LIABILITIES | | | | | | | | | | | | | | | | | | | | |
Securities sold short, at value (proceeds $-) | | | — | | | | — | | | | — | | | | — | | | | — | |
Options written, at value (premium $65,277; $8,760,030) | | | — | | | | 204,585 | | | | 12,393,895 | | | | — | | | | — | |
Unrealized depreciation on forward foreign currency contracts | | | — | | | | 819,453 | | | | 3,588,151 | | | | 8,483,946 | | | | 2,402,417 | |
Payables: | | | | | | | | | | | | | | | | | | | | |
Investments purchased | | | 8,685,946 | | | | 8,701,214 | | | | 36,420,840 | | | | 34,917,269 | | | | 8,649,646 | |
Fund shares redeemed | | | 360,431 | | | | 223,957 | | | | 8,367,823 | | | | 7,489,817 | | | | 6,649,241 | |
Dividends payable | | | — | | | | — | | | | — | | | | — | | | | — | |
Affiliates: | | | | | | | | | | | | | | | | | | | | |
Investment advisory fees | | | 296,177 | | | | 218,392 | | | | 2,522,104 | | | | 1,323,548 | | | | 1,201,436 | |
Distribution fees | | | 1,561 | | | | 1,183 | | | | 55,737 | | | | 10,443 | | | | 20,581 | |
Deferred compensation to trustees | | | 25,632 | | | | 36,580 | | | | 357,664 | | | | 127,917 | | | | 178,672 | |
Financial accounting fees | | | 3,067 | | | | 2,341 | | | | 43,118 | | | | 15,973 | | | | 19,975 | |
Trustees’ fees and officer compensation | | | 399 | | | | 216 | | | | 6,451 | | | | 2,592 | | | | 8,016 | |
Other accounts payable and accrued liabilities | | | 102,727 | | | | 25,848 | | | | 1,055,909 | | | | 285,435 | | | | 768,591 | |
| |
Total liabilities | | | 9,475,940 | | | | 10,233,769 | | | | 64,811,692 | | | | 52,656,940 | | | | 19,898,575 | |
| |
NET ASSETS | | $ | 336,530,111 | | | $ | 256,737,198 | | | $ | 4,615,956,200 | | | $ | 1,696,481,745 | | | $ | 2,091,233,002 | |
| |
COMPOSITION OF NET ASSETS | | | | | | | | | | | | | | | | | | | | |
Paid in capital | | $ | 314,879,550 | | | $ | 240,104,280 | | | $ | 3,903,834,934 | | | $ | 1,541,499,300 | | | $ | 1,815,475,432 | |
Undistributed net investment income (loss) | | | 123,499 | | | | 352,196 | | | | (27,002,644 | ) | | | (19,786,520 | ) | | | (21,969,594 | ) |
Accumulated net realized gain (loss) on investments, foreign currency transactions, written options and short positions | | | 3,416,782 | | | | (2,579,923 | ) | | | 196,505,402 | | | | 75,160,997 | | | | 150,404,644 | |
Unrealized appreciation (depreciation) of investments, foreign currency translations, written options and short positions | | | 18,110,280 | * | | | 18,860,645 | | | | 542,618,508 | | | | 99,607,968 | | | | 147,322,520 | |
| |
NET ASSETS | | $ | 336,530,111 | | | $ | 256,737,198 | | | $ | 4,615,956,200 | | | $ | 1,696,481,745 | | | $ | 2,091,233,002 | |
| |
CLASS A SHARES† | | | | | | | | | | | | | | | | | | | | |
Net assets applicable to shares outstanding | | $ | 143,015,429 | | | $ | 89,971,808 | | | $ | 2,138,229,968 | | | $ | 354,404,306 | | | $ | 942,262,156 | |
Shares outstanding | | | 10,990,460 | | | | 6,891,098 | | | | 65,031,491 | | | | 32,561,138 | | | | 53,088,323 | |
Net asset value and redemption price per share | | $ | 13.01 | | | $ | 13.06 | | | $ | 32.88 | | | $ | 10.88 | | | $ | 17.75 | |
| |
Maximum offering price per share (Net asset value, plus 4.75% of offering price) | | $ | 13.66 | | | $ | 13.71 | | | $ | 34.52 | | | $ | 11.42 | | | $ | 18.64 | |
| |
CLASS B SHARES†** | | | | | | | | | | | | | | | | | | | | |
Net assets applicable to shares outstanding | | $ | 1,783,754 | | | $ | 2,636,587 | | | $ | 129,897,379 | | | $ | 22,729,525 | | | $ | 17,418,693 | |
Shares outstanding | | | 139,309 | | | | 208,154 | | | | 3,470,818 | | | | 2,067,800 | | | | 813,556 | |
Net asset value and redemption price per share | | $ | 12.80 | | | $ | 12.67 | | | $ | 37.43 | | | $ | 10.99 | | | $ | 21.41 | |
| |
CLASS C SHARES†** | | | | | | | | | | | | | | | | | | | | |
Net assets applicable to shares outstanding | | $ | 18,724,092 | | | $ | 17,217,540 | | | $ | 1,360,188,525 | | | $ | 268,870,386 | | | $ | 493,680,678 | |
Shares outstanding | | | 1,463,109 | | | | 1,361,787 | | | | 41,222,958 | | | | 26,165,476 | | | | 27,971,167 | |
Net asset value and redemption price per share | | $ | 12.80 | | | $ | 12.64 | | | $ | 33.00 | | | $ | 10.28 | | | $ | 17.65 | |
| |
CLASS I SHARES† | | | | | | | | | | | | | | | | | | | | |
Net assets applicable to shares outstanding | | $ | 171,516,425 | | | $ | 144,921,191 | | | $ | 967,716,358 | | | $ | 1,048,422,638 | | | $ | 633,874,536 | |
Shares outstanding | | | 13,106,578 | | | | 11,018,585 | | | | 30,102,026 | | | | 94,819,325 | | | | 38,312,345 | |
Net asset value and redemption price per share | | $ | 13.09 | | | $ | 13.15 | | | $ | 32.15 | | | $ | 11.06 | | | $ | 16.54 | |
| |
CLASS R SHARES† | | | | | | | | | | | | | | | | | | | | |
Net assets applicable to shares outstanding | | $ | 1,490,411 | | | $ | 1,990,072 | | | $ | 19,923,970 | | | $ | 2,054,890 | | | $ | 3,996,939 | |
Shares outstanding | | | 114,803 | | | | 154,243 | | | | 609,218 | | | | 190,235 | | | | 225,959 | |
Net asset value and redemption price per share | | $ | 12.98 | | | $ | 12.90 | | | $ | 32.70 | | | $ | 10.80 | | | $ | 17.69 | |
| |
| † | No par value; unlimited number of shares authorized. |
| ** | Redemption price may be reduced by contingent deferred sales charge. |
| * | Net of deferred foreign capital gains tax of $73,149. |
| | | | |
| 98 | | CALAMOS FAMILY OF FUNDS SEMIANNUAL REPORT | | See accompanying Notes to Financial Statements |
Statements of Assets and Liabilities April 30, 2012 (Unaudited)
| | | | | | | | | | | | |
| | | TOTAL RETURN
BOND FUND | | | HIGH INCOME
FUND | | | MARKET NEUTRAL
INCOME FUND | |
ASSETS | | | | | | | | | | | | |
Investments in securities, at cost | | $ | 220,844,567 | | | $ | 280,210,826 | | | $ | 2,303,792,903 | |
| |
Investments in securities, at value | | $ | 233,740,834 | | | $ | 289,696,847 | | | $ | 2,401,070,523 | |
Cash with custodian (interest bearing) | | | — | | | | — | | | | 4,587,938 | |
Restricted cash for short positions (interest bearing) | | | — | | | | — | | | | 542,054,891 | |
Due from investment advisor | | | 29,472 | | | | — | | | | — | |
Foreign currency (cost $-) | | | — | | | | — | | | | — | |
Unrealized appreciation on forward foreign currency contracts | | | — | | | | — | | | | — | |
Receivables: | | | | | | | | | | | | |
Accrued interest and dividends | | | 2,016,481 | | | | 5,275,500 | | | | 12,314,430 | |
Investments sold | | | 1,232,066 | | | | 129,607 | | | | 20,840,823 | |
Fund shares sold | | | 740,244 | | | | 1,165,100 | | | | 9,267,572 | |
Prepaid expenses | | | 46,739 | | | | 55,673 | | | | 166,334 | |
Other assets | | | 41,181 | | | | 81,814 | | | | 160,214 | |
| |
Total assets | | | 237,847,017 | | | | 296,404,541 | | | | 2,990,462,725 | |
| |
LIABILITIES | | | | | | | | | | | | |
Securities sold short, at value (proceeds $489,760,203) | | | — | | | | — | | | | 529,141,313 | |
Options written, at value (premium $18,547,703) | | | — | | | | — | | | | 18,916,288 | |
Unrealized depreciation on forward foreign currency contracts | | | — | | | | — | | | | — | |
Payables: | | | | | | | | | | | | |
Investments purchased | | | 3,438,154 | | | | 2,998,260 | | | | 15,750,319 | |
Fund shares redeemed | | | 214,349 | | | | 704,991 | | | | 3,541,587 | |
Dividends payable | | | 54,515 | | | | 136,892 | | | | — | |
Affiliates: | | | | | | | | | | | | |
Investment advisory fees | | | 104,519 | | | | 179,870 | | | | 1,369,158 | |
Distribution fees | | | 2,530 | | | | 2,801 | | | | 16,216 | |
Deferred compensation to trustees | | | 41,181 | | | | 81,814 | | | | 160,214 | |
Financial accounting fees | | | 2,164 | | | | 2,732 | | | | 22,915 | |
Trustees’ fees and officer compensation | | | 708 | | | | 831 | | | | 4,517 | |
Other accounts payable and accrued liabilities | | | 41,543 | | | | 95,844 | | | | 926,437 | |
| |
Total liabilities | | | 3,899,663 | | | | 4,204,035 | | | | 569,848,964 | |
| |
NET ASSETS | | $ | 233,947,354 | | | $ | 292,200,506 | | | $ | 2,420,613,761 | |
| |
COMPOSITION OF NET ASSETS | | | | | | | | | | | | |
Paid in capital | | $ | 221,903,443 | | | $ | 281,312,798 | | | $ | 2,439,187,334 | |
Undistributed net investment income (loss) | | | (228,499 | ) | | | (466,747 | ) | | | 5,584,626 | |
Accumulated net realized gain (loss) on investments, foreign currency transactions, written options and short positions | | | (620,595 | ) | | | 1,869,315 | | | | (81,661,979 | ) |
Unrealized appreciation (depreciation) of investments, foreign currency translations, written options and short positions | | | 12,893,005 | | | | 9,485,140 | | | | 57,503,780 | |
| |
NET ASSETS | | $ | 233,947,354 | | | $ | 292,200,506 | | | $ | 2,420,613,761 | |
| |
CLASS A SHARES† | | | | | | | | | | | | |
Net assets applicable to shares outstanding | | $ | 131,690,643 | | | $ | 213,015,635 | | | $ | 1,146,526,729 | |
Shares outstanding | | | 11,891,970 | | | | 21,875,361 | | | | 91,149,209 | |
Net asset value and redemption price per share | | $ | 11.07 | | | $ | 9.74 | | | $ | 12.58 | |
| |
Maximum offering price per share (Net asset value, plus 4.75% of offering price) | | $ | 11.50 | # | | $ | 10.23 | | | $ | 13.21 | |
| |
CLASS B SHARES†** | | | | | | | | | | | | |
Net assets applicable to shares outstanding | | $ | 11,199,381 | | | $ | 7,206,068 | | | $ | 15,850,007 | |
Shares outstanding | | | 1,011,422 | | | | 708,736 | | | | 1,196,781 | |
Net asset value and redemption price per share | | $ | 11.07 | | | $ | 10.17 | | | $ | 13.24 | |
| |
CLASS C SHARES†** | | | | | | | | | | | | |
Net assets applicable to shares outstanding | | $ | 47,947,135 | | | $ | 41,954,534 | | | $ | 288,375,210 | |
Shares outstanding | | | 4,331,344 | | | | 4,160,074 | | | | 22,583,151 | |
Net asset value and redemption price per share | | $ | 11.07 | | | $ | 10.09 | | | $ | 12.77 | |
| |
CLASS I SHARES† | | | | | | | | | | | | |
Net assets applicable to shares outstanding | | $ | 41,395,743 | | | $ | 29,686,861 | | | $ | 965,336,202 | |
Shares outstanding | | | 3,739,500 | | | | 3,048,704 | | | | 77,490,578 | |
Net asset value and redemption price per share | | $ | 11.07 | | | $ | 9.74 | | | $ | 12.46 | |
| |
CLASS R SHARES† | | | | | | | | | | | | |
Net assets applicable to shares outstanding | | $ | 1,714,452 | | | $ | 337,408 | | | $ | 4,525,613 | |
Shares outstanding | | | 154,799 | | | | 34,684 | | | | 360,852 | |
Net asset value and redemption price per share | | $ | 11.08 | | | $ | 9.73 | | | $ | 12.54 | |
| |
| † | No par value; unlimited number of shares authorized. |
| ** | Redemption price may be reduced by contingent deferred sales charge. |
| # | For Total Return Bond Fund, maximum offering price per share is Net asset value plus 3.75% of offering price. |
| | | | | | |
| See accompanying Notes to Financial Statements | | www.calamos.com | | | 99 | |
Statements of Operations Six Months Ended April 30, 2012 (Unaudited)
| | | | | | | | | | | | | | | | | | | | |
| | | GROWTH
FUND | | | VALUE
FUND | | | BLUE CHIP
FUND | | | DISCOVERY
GROWTH FUND | | | INTERNATIONAL
GROWTH FUND | |
INVESTMENT INCOME | | | | | | | | | | | | | | | | | | | | |
Interest | | $ | 827,094 | | | $ | — | | | $ | 267 | | | $ | 93 | | | $ | 3,955 | |
Dividends | | | 34,016,963 | | | | 439,763 | | | | 370,228 | | | | 68,057 | | | | 5,340,826 | |
Dividend taxes withheld | | | (758,560 | ) | | | (14,196 | ) | | | (10,634 | ) | | | — | | | | (432,987 | ) |
| |
Total investment income | | | 34,085,497 | | | | 425,567 | | | | 359,861 | | | | 68,150 | | | | 4,911,794 | |
| |
| | | | | |
EXPENSES | | | | | | | | | | | | | | | | | | | | |
Investment advisory fees | | | 30,791,349 | | | | 205,965 | | | | 313,675 | | | | 192,076 | | | | 3,068,772 | |
Performance fees | | | — | | | | — | | | | — | | | | — | | | | 498,416 | |
Distribution fees | | | | | | | | | | | | | | | | | | | | |
Class A | | | 5,087,193 | | | | 29,816 | | | | 30,883 | | | | 31,661 | | | | 360,256 | |
Class B | | | 1,444,500 | | | | 9,719 | | | | 12,688 | | | | 7,348 | | | | 60,805 | |
Class C | | | 7,396,261 | | | | 19,154 | | | | 51,678 | | | | 12,811 | | | | 278,436 | |
Class R | | | 36,651 | | | | 230 | | | | 264 | | | | 3,008 | | | | 11,646 | |
Transfer agent fees | | | 6,052,786 | | | | 26,685 | | | | 26,966 | | | | 16,157 | | | | 344,000 | |
Printing and mailing fees | | | 608,069 | | | | 8,722 | | | | 9,214 | | | | 16,360 | | | | 58,230 | |
Financial accounting fees | | | 430,665 | | | | 2,350 | | | | 3,578 | | | | 2,190 | | | | 35,351 | |
Accounting fees | | | 186,909 | | | | 8,179 | | | | 8,561 | | | | 7,901 | | | | 23,636 | |
Trustees’ fees and officer compensation | | | 136,049 | | | | 7,940 | | | | 8,226 | | | | 7,854 | | | | 16,117 | |
Registration fees | | | 97,809 | | | | 26,737 | | | | 28,967 | | | | 28,045 | | | | 47,275 | |
Custodian fees | | | 91,106 | | | | 4,502 | | | | 6,114 | | | | 4,295 | | | | 77,911 | |
Audit fees | | | 85,671 | | | | 6,020 | | | | 6,244 | | | | 5,980 | | | | 12,197 | |
Legal fees | | | 71,720 | | | | 4,239 | | | | 4,401 | | | | 4,151 | | | | 7,360 | |
Dividend and interest expense on short positions | | | — | | | | — | | | | — | | | | — | | | | — | |
Other | | | 164,281 | | | | 4,554 | | | | 3,695 | | | | 2,914 | | | | 17,526 | |
| |
Total expenses | | | 52,681,019 | | | | 364,812 | | | | 515,154 | | | | 342,751 | | | | 4,917,934 | |
Less expense reductions | | | — | | | | (120,528 | ) | | | (137,296 | ) | | | (47,806 | ) | | | (642,450 | ) |
| |
Net expenses | | | 52,681,019 | | | | 244,284 | | | | 377,858 | | | | 294,945 | | | | 4,275,484 | |
| |
NET INVESTMENT INCOME (LOSS) | | | (18,595,522 | ) | | | 181,283 | | | | (17,997 | ) | | | (226,795 | ) | | | 636,310 | |
| |
| | | | | |
REALIZED AND UNREALIZED GAIN (LOSS) | | | | | | | | | | | | | | | | | | | | |
Net realized gain (loss) from: | | | | | | | | | | | | | | | | | | | | |
Investments, excluding purchased options | | | 417,644,906 | | | | 6,184 | | | | 206,285 | | | | 2,553,941 | | | | 22,824,688 | |
Purchased options | | | (10,619,024 | ) | | | — | | | | (80,301 | ) | | | — | | | | — | |
Foreign currency transactions | | | 10,950,977 | | | | 244,080 | | | | 274,400 | | | | (9,077 | ) | | | (244,392 | ) |
Written options | | | (26,404,079 | ) | | | — | | | | (206,401 | ) | | | — | | | | — | |
Short positions | | | — | | | | — | | | | — | | | | — | | | | — | |
Change in net unrealized appreciation/(depreciation) on: | | | | | | | | | | | | | | | | | | | | |
Investments, excluding purchased options | | | 305,860,957 | | | | 2,359,676 | | | | 6,442,164 | | | | (269,311 | ) | | | 16,803,809 | |
Purchased options | | | (6,299,894 | ) | | | — | | | | (48,754 | ) | | | — | | | | — | |
Foreign currency translations | | | 1,256,946 | | | | (110,916 | ) | | | (47,566 | ) | | | — | | | | (27,098 | ) |
Written options | | | (11,186,671 | ) | | | — | | | | (84,797 | ) | | | — | | | | — | |
Short positions | | | — | | | | — | | | | — | | | | — | | | | — | |
| |
NET GAIN (LOSS) | | | 681,204,118 | | | | 2,499,024 | | | | 6,455,030 | | | | 2,275,553 | | | | 39,357,007 | |
| |
NET INCREASE (DECREASE) IN NET ASSETS RESULTING FROM OPERATIONS | | $ | 662,608,596 | | | $ | 2,680,307 | | | $ | 6,437,033 | | | $ | 2,048,758 | | | $ | 39,993,317 | |
| |
| | | | |
| 100 | | CALAMOS FAMILY OF FUNDS SEMIANNUAL REPORT | | See accompanying Notes to Financial Statements |
Statements of Operations Six Months Ended April 30, 2012 (Unaudited)
| | | | | | | | | | | | | | | | | | | | |
| | | EVOLVING WORLD
GROWTH FUND | | | GLOBAL EQUITY
FUND | | | GROWTH AND
INCOME FUND | | | GLOBAL GROWTH
AND INCOME
FUND | | | CONVERTIBLE
FUND | |
INVESTMENT INCOME | | | | | | | | | | | | | | | | | | | | |
Interest | | $ | 502,856 | | | $ | 747 | | | $ | 36,430,848 | | | $ | 12,289,121 | | | $ | 30,789,959 | |
Dividends | | | 1,926,463 | | | | 1,332,504 | | | | 24,736,059 | | | | 8,726,468 | | | | 6,595,706 | |
Dividend taxes withheld | | | (118,255 | ) | | | (90,797 | ) | | | (217,033 | ) | | | (601,309 | ) | | | — | |
| |
Total investment income | | | 2,311,064 | | | | 1,242,454 | | | | 60,949,874 | | | | 20,414,280 | | | | 37,385,665 | |
| |
| | | | | |
EXPENSES | | | | | | | | | | | | | | | | | | | | |
Investment advisory fees | | | 1,461,848 | | | | 913,099 | | | | 15,002,314 | | | | 7,979,361 | | | | 8,004,748 | |
Performance fees | | | — | | | | 84,235 | | | | — | | | | — | | | | — | |
Distribution fees | | | | | | | | | | | | | | | | | | | | |
Class A | | | 151,720 | | | | 81,060 | | | | 2,587,740 | | | | 457,425 | | | | 1,408,986 | |
Class B | | | 8,759 | | | | 12,865 | | | | 763,878 | | | | 132,762 | | | | 95,920 | |
Class C | | | 65,243 | | | | 62,382 | | | | 6,733,875 | | | | 1,374,068 | | | | 2,691,114 | |
Class R | | | 3,401 | | | | 4,792 | | | | 44,330 | | | | 4,321 | | | | 10,183 | |
Transfer agent fees | | | 103,402 | | | | 64,598 | | | | 2,557,205 | | | | 590,600 | | | | 1,485,341 | |
Printing and mailing fees | | | 18,856 | | | | 15,112 | | | | 294,514 | | | | 58,901 | | | | 148,989 | |
Financial accounting fees | | | 15,156 | | | | 10,412 | | | | 256,732 | | | | 96,407 | | | | 133,943 | |
Accounting fees | | | 15,354 | | | | 12,414 | | | | 120,053 | | | | 52,006 | | | | 67,696 | |
Trustees’ fees and officer compensation | | | 10,898 | | | | 9,522 | | | | 81,096 | | | | 34,902 | | | | 52,049 | |
Registration fees | | | 38,516 | | | | 30,397 | | | | 88,360 | | | | 51,883 | | | | 59,833 | |
Custodian fees | | | 56,941 | | | | 20,048 | | | | 108,648 | | | | 78,601 | | | | 51,485 | |
Audit fees | | | 8,631 | | | | 7,387 | | | | 54,622 | | | | 23,713 | | | | 30,616 | |
Legal fees | | | 5,226 | | | | 4,645 | | | | 36,435 | | | | 16,636 | | | | 29,413 | |
Dividend and interest expense on short positions | | | — | | | | — | | | | — | | | | — | | | | — | |
Other | | | 12,172 | | | | 10,824 | | | | 90,225 | | | | 41,792 | | | | 66,810 | |
| |
Total expenses | | | 1,976,123 | | | | 1,343,792 | | | | 28,820,027 | | | | 10,993,378 | | | | 14,337,126 | |
Less expense reductions | | | — | | | | (132,591 | ) | | | — | | | | — | | | | — | |
| |
Net expenses | | | 1,976,123 | | | | 1,211,201 | | | | 28,820,027 | | | | 10,993,378 | | | | 14,337,126 | |
| |
NET INVESTMENT INCOME (LOSS) | | | 334,941 | | | | 31,253 | | | | 32,129,847 | | | | 9,420,902 | | | | 23,048,539 | |
| |
| | | | | |
REALIZED AND UNREALIZED GAIN (LOSS) | | | | | | | | | | | | | | | | | | | | |
Net realized gain (loss) from: | | | | | | | | | | | | | | | | | | | | |
Investments, excluding purchased options | | | 3,259,442 | | | | 2,107,122 | | | | 165,847,947 | | | | 56,422,001 | | | | 121,787,069 | |
Purchased options | | | — | | | | (10,215 | ) | | | 19,364,288 | | | | 2,523,058 | | | | (6,339,320 | ) |
Foreign currency transactions | | | (239,018 | ) | | | 1,328,075 | | | | 4,172,160 | | | | 17,098,587 | | | | 2,241,441 | |
Written options | | | — | | | | (488,949 | ) | | | 6,151,403 | | | | — | | | | — | |
Short positions | | | — | | | | — | | | | — | | | | — | | | | — | |
Change in net unrealized appreciation/(depreciation) on: | | | | | | | | | | | | | | | | | | | | |
Investments | | | 7,956,136 | * | | | 12,099,015 | | | | (47,896,984 | ) | | | (34,811,207 | ) | | | (127,740,555 | ) |
Purchased options | | | — | | | | (49,405 | ) | | | (10,023,584 | ) | | | 1,484,527 | | | | 1,433,074 | |
Foreign currency translations | | | (17,811 | ) | | | (464,937 | ) | | | (356,500 | ) | | | (6,405,081 | ) | | | (1,633,459 | ) |
Written options | | | — | | | | (139,308 | ) | | | (7,213,039 | ) | | | — | | | | — | |
Short positions | | | — | | | | — | | | | — | | | | — | | | | — | |
| |
NET GAIN (LOSS) | | | 10,958,749 | | | | 14,381,398 | | | | 130,045,691 | | | | 36,311,885 | | | | (10,251,750 | ) |
| |
NET INCREASE (DECREASE) IN NET ASSETS RESULTING FROM OPERATIONS | | $ | 11,293,690 | | | $ | 14,412,651 | | | $ | 162,175,538 | | | $ | 45,732,787 | | | $ | 12,796,789 | |
| |
| * | Net of change of $(69,807) in deferred capital gains tax. |
| | | | | | |
| See accompanying Notes to Financial Statements | | www.calamos.com | | | 101 | |
Statements of Operations Six Months Ended April 30, 2012 (Unaudited)
| | | | | | | | | | | | |
| | | TOTAL RETURN
BOND FUND | | | HIGH INCOME
FUND | | | MARKET NEUTRAL
INCOME FUND | |
INVESTMENT INCOME | | | | | | | | | | | | |
Interest | | $ | 3,354,485 | | | $ | 8,789,392 | | | $ | 22,814,366 | |
Dividends | | | 8,045 | | | | 360,659 | | | | 11,422,151 | |
Dividend taxes withheld | | | — | | | | — | | | | — | |
| |
Total investment income | | | 3,362,530 | | | | 9,150,051 | | | | 34,236,517 | |
| |
| | | |
EXPENSES | | | | | | | | | | | | |
Investment advisory fees | | | 629,674 | | | | 1,022,171 | | | | 8,125,497 | |
Performance fees | | | — | | | | — | | | | — | |
Distribution fees | | | | | | | | | | | | |
Class A | | | 155,538 | | | | 247,478 | | | | 1,514,531 | |
Class B | | | 63,006 | | | | 40,872 | | | | 83,594 | |
Class C | | | 244,512 | | | | 201,998 | | | | 1,452,280 | |
Class R | | | 4,226 | | | | 760 | | | | 9,709 | |
Transfer agent fees | | | 78,818 | | | | 150,616 | | | | 1,738,399 | |
Printing and mailing fees | | | 16,542 | | | | 18,466 | | | | 231,583 | |
Financial accounting fees | | | 13,060 | | | | 15,547 | | | | 136,052 | |
Accounting fees | | | 21,112 | | | | 20,532 | | | | 87,102 | |
Trustees’ fees and officer compensation | | | 10,970 | | | | 11,656 | | | | 47,120 | |
Registration fees | | | 35,587 | | | | 30,292 | | | | 97,224 | |
Custodian fees | | | 8,648 | | | | 9,266 | | | | 48,694 | |
Audit fees | | | 8,018 | | | | 8,726 | | | | 31,358 | |
Legal fees | | | 5,559 | | | | 6,801 | | | | 22,859 | |
Dividend and interest expense on short positions | | | — | | | | — | | | | 477,863 | |
Other | | | 6,622 | | | | 8,129 | | | | 69,297 | |
| |
Total expenses | | | 1,301,892 | | | | 1,793,310 | | | | 14,173,162 | |
Less expense reductions | | | (90,451 | ) | | | — | | | | — | |
| |
Net expenses | | | 1,211,441 | | | | 1,793,310 | | | | 14,173,162 | |
| |
NET INVESTMENT INCOME (LOSS) | | | 2,151,089 | | | | 7,356,741 | | | | 20,063,355 | |
| |
| | | |
REALIZED AND UNREALIZED GAIN (LOSS) | | | | | | | | | | | | |
Net realized gain (loss) from: | | | | | | | | | | | | |
Investments, excluding purchased options | | | 248,961 | | | | 1,859,165 | | | | 41,679,358 | |
Purchased options | | | — | | | | — | | | | (35,732,809 | ) |
Foreign currency transactions | | | 19,291 | | | | 36,433 | | | | 128,556 | |
Written options | | | — | | | | — | | | | (11,006,579 | ) |
Short positions | | | — | | | | — | | | | (11,446,584 | ) |
Change in net unrealized appreciation/(depreciation) on: | | | | | | | | | | | | |
Investments | | | 1,372,533 | | | | 3,530,434 | | | | 99,661,045 | |
Purchased options | | | — | | | | — | | | | 13,193,790 | |
Foreign currency translations | | | (1,412 | ) | | | (492 | ) | | | (7,957 | ) |
Written options | | | — | | | | — | | | | 11,212,879 | |
Short positions | | | — | | | | — | | | | (22,508,156 | ) |
| |
NET GAIN (LOSS) | | | 1,639,373 | | | | 5,425,540 | | | | 85,173,543 | |
| |
NET INCREASE (DECREASE) IN NET ASSETS RESULTING FROM OPERATIONS | | $ | 3,790,462 | | | $ | 12,782,281 | | | $ | 105,236,898 | |
| |
| | | | |
| 102 | | CALAMOS FAMILY OF FUNDS SEMIANNUAL REPORT | | See accompanying Notes to Financial Statements |
Statements of Changes in Net Assets
| | | | | | | | | | | | | | | | | | | | | | | | |
| | | GROWTH FUND | | | VALUE FUND | | | BLUE CHIP FUND | |
| | | (UNAUDITED) SIX MONTHS ENDED APRIL 30, 2012 | | | YEAR ENDED
OCTOBER 31,
2011 | | | (UNAUDITED)
SIX MONTHS
ENDED
APRIL 30, 2012 | | | YEAR ENDED
OCTOBER 31,
2011 | | | (UNAUDITED)
SIX MONTHS
ENDED
APRIL 30,
2012 | | | YEAR ENDED
OCTOBER 31,
2011 | |
OPERATIONS | | | | | | | | | | | | | | | | | | | | | | | | |
Net investment income (loss) | | $ | (18,595,522 | ) | | $ | (65,349,605 | ) | | $ | 181,283 | | | $ | 26,436 | | | $ | (17,997 | ) | | $ | (224,982 | ) |
Net realized gain (loss) | | | 391,572,780 | | | | 222,317,790 | | | | 250,264 | | | | 2,251,488 | | | | 193,983 | | | | 3,943,064 | |
Change in unrealized appreciation/(depreciation) | | | 289,631,338 | | | | 176,380,543 | | | | 2,248,760 | | | | (478,748 | ) | | | 6,261,047 | | | | (1,338,504 | ) |
| |
Net increase (decrease) in net assets resulting from operations | | | 662,608,596 | | | | 333,348,728 | | | | 2,680,307 | | | | 1,799,176 | | | | 6,437,033 | | | | 2,379,578 | |
| |
| | | | | | |
DISTRIBUTIONS TO SHAREHOLDERS | | | | | | | | | | | | | | | | | | | | | | | | |
Net investment income | | | | | | | | | | | | | | | | | | | | | | | | |
Class A | | | — | | | | — | | | | — | | | | — | | | | — | | | | — | |
Class B | | | — | | | | — | | | | — | | | | — | | | | — | | | | — | |
Class C | | | — | | | | — | | | | — | | | | — | | | | — | | | | — | |
Class I | | | — | | | | — | | | | — | | | | — | | | | — | | | | — | |
Class R | | | — | | | | — | | | | — | | | | — | | | | — | | | | — | |
Net realized gains | | | | | | | | | | | | | | | | | | | | | | | | |
Class A | | | (171,056,925 | ) | | | — | | | | — | | | | — | | | | — | | | | — | |
Class B | | | (13,005,728 | ) | | | — | | | | — | | | | — | | | | — | | | | — | |
Class C | | | (68,697,929 | ) | | | — | | | | — | | | | — | | | | — | | | | — | |
Class I | | | (63,002,615 | ) | | | — | | | | — | | | | — | | | | — | | | | — | |
Class R | | | (557,225 | ) | | | — | | | | — | | | | — | | | | — | | | | — | |
| |
Total distributions | | | (316,320,422 | ) | | | — | | | | — | | | | — | | | | — | | | | — | |
| | | | | | |
CAPITAL SHARE TRANSACTIONS | | | (290,721,249 | ) | | | (900,316,614 | ) | | | (1,324,522 | ) | | | (19,038,248 | ) | | | 761,166 | | | | (4,840,062 | ) |
| |
TOTAL INCREASE (DECREASE) IN NET ASSETS | | | 55,566,925 | | | | (566,967,886 | ) | | | 1,355,785 | | | | (17,239,072 | ) | | | 7,198,199 | | | | (2,460,484 | ) |
| |
| | | | | | |
NET ASSETS | | | | | | | | | | | | | | | | | | | | | | | | |
Beginning of period | | $ | 7,727,002,086 | | | $ | 8,293,969,972 | | | $ | 41,563,715 | | | $ | 58,802,787 | | | $ | 60,397,518 | | | $ | 62,858,002 | |
| |
End of period | | | 7,782,569,011 | | | | 7,727,002,086 | | | | 42,919,500 | | | | 41,563,715 | | | | 67,595,717 | | | | 60,397,518 | |
| |
Undistributed net investment income (loss) | | $ | (15,960,711 | ) | | $ | 2,634,811 | | | $ | 105,304 | | | $ | (75,979 | ) | | $ | (70,658 | ) | | $ | (52,661 | ) |
| | | | | | |
| See accompanying Notes to Financial Statements | | www.calamos.com | | | 103 | |
Statements of Changes in Net Assets
| | | | | | | | | | | | | | | | | | | | | | | | |
| | | DISCOVERY GROWTH FUND | | | INTERNATIONAL GROWTH
FUND | | | EVOLVING WORLD
GROWTH FUND | |
| | | (UNAUDITED)
SIX MONTHS
ENDED
APRIL 30,
2012 | | | YEAR ENDED
OCTOBER 31,
2011 | | | (UNAUDITED)
SIX MONTHS
ENDED
APRIL 30,
2012 | | | YEAR ENDED
OCTOBER 31,
2011 | | | (UNAUDITED)
SIX MONTHS
ENDED
APRIL 30,
2012 | | | YEAR ENDED
OCTOBER 31,
2011 | |
OPERATIONS | | | | | | | | | | | | | | | | | | | | | | | | |
Net investment income (loss) | | $ | (226,795 | ) | | $ | (364,497 | ) | | $ | 636,310 | | | $ | (982,131 | ) | | $ | 334,941 | | | $ | 254,563 | |
Net realized gain (loss) | | | 2,544,864 | | | | (1,799,462 | ) | | | 22,580,296 | | | | 24,328,585 | | | | 3,020,424 | | | | 2,173,782 | |
Change in unrealized appreciation/(depreciation) | | | (269,311 | ) | | | 733,494 | | | | 16,776,711 | | | | (15,716,383 | ) | | | 7,938,325 | | | | (7,599,126 | ) |
| |
Net increase (decrease) in net assets resulting from operations | | | 2,048,758 | | | | (1,430,465 | ) | | | 39,993,317 | | | | 7,630,071 | | | | 11,293,690 | | | | (5,170,781 | ) |
| |
| | | | | | |
DISTRIBUTIONS TO SHAREHOLDERS | | | | | | | | | | | | | | | | | | | | | | | | |
Net investment income | | | | | | | | | | | | | | | | | | | | | | | | |
Class A | | | — | | | | (17,972 | ) | | | — | | | | — | | | | — | | | | (162,959 | ) |
Class B | | | — | | | | — | | | | — | | | | — | | | | — | | | | — | |
Class C | | | — | | | | — | | | | — | | | | — | | | | — | | | | (3 | ) |
Class I | | | — | | | | (6,039 | ) | | | — | | | | — | | | | (75,083 | ) | | | (240,077 | ) |
Class R | | | — | | | | — | | | | — | | | | — | | | | — | | | | — | |
Net realized gains | | | | | | | | | | | | | | | | | | | | | | | | |
Class A | | | — | | | | — | | | | — | | | | — | | | | — | | | | — | |
Class B | | | — | | | | — | | | | — | | | | — | | | | — | | | | — | |
Class C | | | — | | | | — | | | | — | | | | — | | | | — | | | | — | |
Class I | | | — | | | | — | | | | — | | | | — | | | | — | | | | — | |
Class R | | | — | | | | — | | | | — | | | | — | | | | — | | | | — | |
| |
Total distributions | | | — | | | | (24,011 | ) | | | — | | | | — | | | | (75,083 | ) | | | (403,039 | ) |
| | | | | | |
CAPITAL SHARE TRANSACTIONS | | | 1,699,919 | | | | 16,865,867 | | | | 193,872,684 | | | | 229,257,961 | | | | 119,738,314 | | | | 106,833,895 | |
| |
TOTAL INCREASE (DECREASE) IN NET ASSETS | | | 3,748,677 | | | | 15,411,391 | | | | 233,866,001 | | | | 236,888,032 | | | | 130,956,921 | | | | 101,260,075 | |
| |
| | | | | | |
NET ASSETS | | | | | | | | | | | | | | | | | | | | | | | | |
Beginning of period | | $ | 36,376,682 | | | $ | 20,965,291 | | | $ | 535,582,955 | | | $ | 298,694,923 | | | $ | 205,573,190 | | | $ | 104,313,115 | |
| |
End of period | | | 40,125,359 | | | | 36,376,682 | | | | 769,448,956 | | | | 535,582,955 | | | | 336,530,111 | | | | 205,573,190 | |
| |
Undistributed net investment income (loss) | | $ | (296,624 | ) | | $ | (69,829 | ) | | $ | 553,652 | | | $ | (82,658 | ) | | $ | 123,499 | | | $ | (136,359 | ) |
| | | | |
| 104 | | CALAMOS FAMILY OF FUNDS SEMIANNUAL REPORT | | See accompanying Notes to Financial Statements |
Statements of Changes in Net Assets
| | | | | | | | | | | | | | | | | | | | | | | | |
| | | GLOBAL EQUITY FUND | | | GROWTH AND INCOME FUND | | | GLOBAL GROWTH AND
INCOME FUND | |
| | | (UNAUDITED)
SIX MONTHS
ENDED
APRIL 30,
2012 | | | YEAR ENDED
OCTOBER 31,
2011 | | | (UNAUDITED)
SIX MONTHS
ENDED
APRIL 30,
2012 | | | YEAR ENDED
OCTOBER 31,
2011 | | | (UNAUDITED)
SIX MONTHS
ENDED
APRIL 30,
2012 | | | YEAR ENDED
OCTOBER 31,
2011 | |
OPERATIONS | | | | | | | | | | | | | | | | | | | | | | | | |
Net investment income (loss) | | $ | 31,253 | | | $ | (522,850 | ) | | $ | 32,129,847 | | | $ | 60,221,479 | | | $ | 9,420,902 | | | $ | 16,284,884 | |
Net realized gain (loss) | | | 2,936,033 | | | | 4,413,804 | | | | 195,535,798 | | | | 248,182,074 | | | | 76,043,646 | | | | 102,075,393 | |
Change in unrealized appreciation/(depreciation) | | | 11,445,365 | | | | (2,329,495 | ) | | | (65,490,107 | ) | | | (3,482,786 | ) | | | (39,731,761 | ) | | | (34,843,830 | ) |
| |
Net increase (decrease) in net assets resulting from operations | | | 14,412,651 | | | | 1,561,459 | | | | 162,175,538 | | | | 304,920,767 | | | | 45,732,787 | | | | 83,516,447 | |
| |
| | | | | | |
DISTRIBUTIONS TO SHAREHOLDERS | | | | | | | | | | | | | | | | | | | | | | | | |
Net investment income | | | | | | | | | | | | | | | | | | | | | | | | |
Class A | | | — | | | | — | | | | (26,171,975 | ) | | | (25,957,322 | ) | | | (5,589,729 | ) | | | — | |
Class B | | | — | | | | — | | | | (1,029,667 | ) | | | (1,619,274 | ) | | | (226,302 | ) | | | — | |
Class C | | | — | | | | — | | | | (11,953,838 | ) | | | (10,595,096 | ) | | | (2,819,979 | ) | | | — | |
Class I | | | — | | | | — | | | | (13,131,994 | ) | | | (12,473,313 | ) | | | (19,377,149 | ) | | | — | |
Class R | | | — | | | | — | | | | (208,781 | ) | | | (154,174 | ) | | | (23,213 | ) | | | — | |
Net realized gains | | | | | | | | | | | | | | | | | | | | | | | | |
Class A | | | — | | | | — | | | | — | | | | — | | | | — | | | | — | |
Class B | | | — | | | | — | | | | — | | | | — | | | | — | | | | — | |
Class C | | | — | | | | — | | | | — | | | | — | | | | — | | | | — | |
Class I | | | — | | | | — | | | | — | | | | — | | | | — | | | | — | |
Class R | | | — | | | | — | | | | — | | | | — | | | | — | | | | — | |
| |
Total distributions | | | — | | | | — | | | | (52,496,255 | ) | | | (50,799,179 | ) | | | (28,036,372 | ) | | | — | |
| | | | | | |
CAPITAL SHARE TRANSACTIONS | | | 112,564,899 | | | | 75,692,471 | | | | 87,214,947 | | | | 170,193,154 | | | | 11,540,381 | | | | 180,939,135 | |
| |
TOTAL INCREASE (DECREASE) IN NET ASSETS | | | 126,977,550 | | | | 77,253,930 | | | | 196,894,230 | | | | 424,314,742 | | | | 29,236,796 | | | | 264,455,582 | |
| |
| | | | | | |
NET ASSETS | | | | | | | | | | | | | | | | | | | | | | | | |
Beginning of period | | $ | 129,759,648 | | | $ | 52,505,718 | | | $ | 4,419,061,970 | | | $ | 3,994,747,228 | | | $ | 1,667,244,949 | | | $ | 1,402,789,367 | |
| |
End of period | | | 256,737,198 | | | | 129,759,648 | | | | 4,615,956,200 | | | | 4,419,061,970 | | | | 1,696,481,745 | | | | 1,667,244,949 | |
| |
Undistributed net investment income (loss) | | $ | 352,196 | | | $ | 320,943 | | | $ | (27,002,644 | ) | | $ | (6,636,236 | ) | | $ | (19,786,520 | ) | | $ | (1,171,050 | ) |
| | | | | | |
| See accompanying Notes to Financial Statements | | www.calamos.com | | | 105 | |
Statements of Changes in Net Assets
| | | | | | | | | | | | | | | | | | | | | | | | |
| | | CONVERTIBLE FUND | | | TOTAL RETURN BOND FUND | | | HIGH INCOME FUND | |
| | | (UNAUDITED)
SIX MONTHS
ENDED
APRIL 30, 2012 | | | YEAR ENDED
OCTOBER 31,
2011 | | | (UNAUDITED)
SIX MONTHS
ENDED
APRIL 30,
2012 | | | YEAR ENDED
OCTOBER 31,
2011 | | | (UNAUDITED)
SIX MONTHS
ENDED
APRIL 30,
2012 | | | YEAR ENDED
OCTOBER 31,
2011 | |
OPERATIONS | | | | | | | | | | | | | | | | | | | | | | | | |
Net investment income (loss) | | $ | 23,048,539 | | | $ | 63,114,151 | | | $ | 2,151,089 | | | $ | 4,718,422 | | | $ | 7,356,741 | | | $ | 16,094,252 | |
Net realized gain (loss) | | | 117,689,190 | | | | 237,820,727 | | | | 268,252 | | | | 3,118,207 | | | | 1,895,598 | | | | 9,423,856 | |
Change in unrealized appreciation/(depreciation) | | | (127,940,940 | ) | | | (198,086,013 | ) | | | 1,371,121 | | | | (3,258,667 | ) | | | 3,529,942 | | | | (16,708,082 | ) |
| |
Net increase (decrease) in net assets resulting from operations | | | 12,796,789 | | | | 102,848,865 | | | | 3,790,462 | | | | 4,577,962 | | | | 12,782,281 | | | | 8,810,026 | |
| |
| | | | | | |
DISTRIBUTIONS TO SHAREHOLDERS | | | | | | | | | | | | | | | | | | | | | | | | |
Net investment income | | | | | | | | | | | | | | | | | | | | | | | | |
Class A | | | (6,903,299 | ) | | | (20,535,534 | ) | | | (2,289,137 | ) | | | (2,766,649 | ) | | | (5,621,188 | ) | | | (11,829,284 | ) |
Class B | | | (170 | ) | | | (147,375 | ) | | | (198,725 | ) | | | (310,482 | ) | | | (187,857 | ) | | | (710,814 | ) |
Class C | | | (305,060 | ) | | | (4,920,598 | ) | | | (745,844 | ) | | | (803,600 | ) | | | (963,288 | ) | | | (2,409,652 | ) |
Class I | | | (5,731,806 | ) | | | (14,980,646 | ) | | | (829,700 | ) | | | (1,197,027 | ) | | | (780,307 | ) | | | (2,094,172 | ) |
Class R | | | (18,404 | ) | | | (41,109 | ) | | | (29,347 | ) | | | (33,900 | ) | | | (8,382 | ) | | | (16,309 | ) |
Net realized gains | | | | | | | | | | | | | | | | | | | | | | | | |
Class A | | | (92,347,671 | ) | | | (54,633,170 | ) | | | (417,256 | ) | | | (924,221 | ) | | | (2,568,614 | ) | | | — | |
Class B | | | (1,293,102 | ) | | | (1,239,349 | ) | | | (47,389 | ) | | | (170,079 | ) | | | (111,731 | ) | | | — | |
Class C | | | (43,373,641 | ) | | | (21,557,539 | ) | | | (174,376 | ) | | | (396,193 | ) | | | (520,378 | ) | | | — | |
Class I | | | (56,490,063 | ) | | | (30,982,002 | ) | | | (144,946 | ) | | | (391,713 | ) | | | (312,122 | ) | | | — | |
Class R | | | (317,644 | ) | | | (105,836 | ) | | | (5,793 | ) | | | (11,594 | ) | | | (3,959 | ) | | | — | |
| |
Total distributions | | | (206,780,860 | ) | | | (149,143,158 | ) | | | (4,882,513 | ) | | | (7,005,458 | ) | | | (11,077,826 | ) | | | (17,060,231 | ) |
| | | | | | |
CAPITAL SHARE TRANSACTIONS | | | (353,777,692 | ) | | | (704,942,659 | ) | | | 13,867,722 | | | | (11,531,073 | ) | | | 36,755,619 | | | | (59,999,470 | ) |
| |
TOTAL INCREASE (DECREASE) IN NET ASSETS | | | (547,761,763 | ) | | | (751,236,952 | ) | | | 12,775,671 | | | | (13,958,569 | ) | | | 38,460,074 | | | | (68,249,675 | ) |
| |
| | | | | | |
NET ASSETS | | | | | | | | | | | | | | | | | | | | | | | | |
Beginning of period | | $ | 2,638,994,765 | | | $ | 3,390,231,717 | | | $ | 221,171,683 | | | $ | 235,130,252 | | | $ | 253,740,432 | | | $ | 321,990,107 | |
| |
End of period | | | 2,091,233,002 | | | | 2,638,994,765 | | | | 233,947,354 | | | | 221,171,683 | | | | 292,200,506 | | | | 253,740,432 | |
| |
Undistributed net investment income (loss) | | $ | (21,969,594 | ) | | $ | (32,059,394 | ) | | $ | (228,499 | ) | | $ | 1,713,165 | | | $ | (466,747 | ) | | $ | (262,466 | ) |
| | | | |
| 106 | | CALAMOS FAMILY OF FUNDS SEMIANNUAL REPORT | | See accompanying Notes to Financial Statements |
Statements of Changes in Net Assets
| | | | | | | | |
| | | MARKET NEUTRAL
INCOME FUND | |
| | | (UNAUDITED)
SIX MONTHS
ENDED
APRIL 30, 2012 | | | YEAR ENDED
OCTOBER 31,
2011 | |
OPERATIONS | | | | | | | | |
Net investment income (loss) | | $ | 20,063,355 | | | $ | 40,558,813 | |
Net realized gain (loss) | | | (16,378,058 | ) | | | 39,779,544 | |
Change in unrealized appreciation/(depreciation) | | | 101,551,601 | | | | (7,255,563 | ) |
| |
Net increase (decrease) in net assets resulting from operations | | | 105,236,898 | | | | 73,082,794 | |
| |
| | |
DISTRIBUTIONS TO SHAREHOLDERS | | | | | | | | |
Net investment income | | | | | | | | |
Class A | | | (7,693,915 | ) | | | (21,334,226 | ) |
Class B | | | (36,258 | ) | | | (165,280 | ) |
Class C | | | (709,915 | ) | | | (2,811,375 | ) |
Class I | | | (6,479,325 | ) | | | (12,657,072 | ) |
Class R | | | (19,607 | ) | | | (41,268 | ) |
Net realized gains | | | | | | | | |
Class A | | | — | | | | — | |
Class B | | | — | | | | — | |
Class C | | | — | | | | — | |
Class I | | | — | | | | — | |
Class R | | | — | | | | — | |
| |
Total distributions | | | (14,939,020 | ) | | | (37,009,221 | ) |
| | |
CAPITAL SHARE TRANSACTIONS | | | (11,538,153 | ) | | | 199,946,278 | |
| |
TOTAL INCREASE (DECREASE) IN NET ASSETS | | | 78,759,725 | | | | 236,019,851 | |
| |
| | |
NET ASSETS | | | | | | | | |
Beginning of period | | $ | 2,341,854,036 | | | $ | 2,105,834,185 | |
| |
End of period | | | 2,420,613,761 | | | | 2,341,854,036 | |
| |
Undistributed net investment income (loss) | | $ | 5,584,626 | | | $ | 460,291 | |
| | | | | | |
| See accompanying Notes to Financial Statements | | www.calamos.com | | | 107 | |
Notes to Financial Statements
Note 1 – Organization and Significant Accounting Policies
Organization. CALAMOS INVESTMENT TRUST, a Massachusetts business trust organized December 21, 1987 (the “Trust”), consists of thirteen series, Growth Fund, Value Fund, Blue Chip Fund, Discovery Growth Fund, International Growth Fund, Evolving World Growth Fund, Global Equity Fund, Growth and Income Fund, Global Growth and Income Fund, Convertible Fund, Total Return Bond Fund, High Income Fund (formerly High Yield Fund), and Market Neutral Income Fund (each a “Fund” and collectively the “Funds”). The Trust is registered under the Investment Company Act of 1940, as amended, (the “1940 Act”) as an open-end management investment company. The Trust currently offers Class A, Class C, Class I and Class R shares of each of the Funds. Class B shares continue to be outstanding, but are no longer an offered class of shares.
Fund Valuation. The valuation of the Funds’ investments is in accordance with policies and procedures adopted by and under the ultimate supervision of the board of trustees.
Fund securities that are traded on U.S. securities exchanges, except option securities, are valued at the last current reported sales price at the time each Fund determines its net asset value (“NAV”). Securities traded in the over-the-counter market and quoted on The NASDAQ Stock Market are valued at the NASDAQ Official Closing Price, as determined by NASDAQ, or lacking a NASDAQ Official Closing Price, the last current reported sale price on NASDAQ at the time a Fund determines its NAV.
When a last sale or closing price is not available, equity securities, other than option securities, that are traded on a U.S. securities exchange and other equity securities traded in the over-the-counter market are valued at the mean between the most recent bid and asked quotations in accordance with guidelines adopted by the board of trustees. Each option security traded on a U.S. securities exchange is valued at the mid-point of the consolidated bid/ask quote for the option security, also in accordance with guidelines adopted by the board of trustees. Each over-the-counter option that is not traded through the Options Clearing Corporation is valued based on a quotation provided by the counterparty to such option under the ultimate supervision of the board of trustees.
Fixed income securities, certain convertible preferred securities and non-exchange traded derivatives are normally valued by independent pricing services or by dealers or brokers who make markets in such securities. Valuations of such fixed income securities, certain convertible preferred securities and non-exchange traded derivatives consider yield or price of equivalent securities of comparable quality, coupon rate, maturity, type of issue, trading characteristics and other market data and do not rely exclusively upon exchange or over-the-counter prices.
Trading on European and Far Eastern exchanges and over-the-counter markets is typically completed at various times before the close of business on each day on which the New York Stock Exchange (“NYSE”) is open. Each security trading on these exchanges or over-the-counter markets may be valued utilizing a systematic fair valuation model provided by an independent pricing service approved by the board of trustees. The valuation of each security that meets certain criteria in relation to the valuation model is systematically adjusted to reflect the impact of movement in the U.S. market after the foreign markets close. Securities that do not meet the criteria, or that are principally traded in other foreign markets, are valued as of the last reported sale price at the time the respective Fund determines its NAV, or when reliable market prices or quotations are not readily available, at the mean between the most recent bid and asked quotations as of the close of the appropriate exchange or other designated time. Trading of foreign securities may not take place on every NYSE business day. In addition, trading may take place in various foreign markets on Saturdays or on other days when the NYSE is not open and on which the respective Fund’s NAV is not calculated.
If the pricing committee determines that the valuation of a security in accordance with the methods described above is not reflective of a fair value for such security, the security is valued at a fair value by the pricing committee, under the ultimate supervision of the board of trustees, following the guidelines and/or procedures adopted by the board of trustees.
Each Fund also may use fair value pricing, pursuant to guidelines adopted by the board of trustees and under the ultimate supervision of the board of trustees, if trading in the security is halted or if the value of a security it holds is materially affected by events occurring before the Fund’s pricing time but after the close of the primary market or exchange on which the security is listed. Those procedures may utilize valuations furnished by pricing services approved by the board of trustees, which may be based on market transactions for comparable securities and various relationships between securities that are generally recognized by institutional traders, a computerized matrix system, or appraisals derived from information concerning the securities or similar securities received from recognized dealers in those securities.
| | | | |
| 108 | | CALAMOS FAMILY OF FUNDS SEMIANNUAL REPORT | | |
Notes to Financial Statements
When fair value pricing of securities is employed, the prices of securities used by the Fund to calculate its NAV may differ from market quotations or official closing prices. In light of the judgment involved in fair valuations, there can be no assurance that a fair value assigned to a particular security is accurate.
Investment Transactions. Investment transactions are recorded on a trade date basis. Net realized gains and losses from investment transactions are reported on an identified cost basis. Interest income is recognized using the accrual method and includes accretion of original issue and market discount and amortization of premium. Dividend income is recognized on the ex-dividend date, except that certain dividends from foreign securities are recorded as soon as the information becomes available after the ex-dividend date.
Foreign Currency Translation. Values of investments and other assets and liabilities denominated in foreign currencies are translated into U.S. dollars using a rate quoted by a major bank or dealer in the particular currency market, as reported by a recognized quotation dissemination service.
The Funds do not isolate that portion of the results of operations resulting from changes in foreign exchange rates on investments from the fluctuations arising from changes in market prices of securities held. Such fluctuations are included with the net realized and unrealized gain or loss from investments.
Reported net realized foreign currency gains or losses arise from disposition of foreign currency, the difference in the foreign exchange rates between the trade and settlement dates on securities transactions, and the difference between the amounts of dividends, interest and foreign withholding taxes recorded on the ex-date or accrual date and the U.S. dollar equivalent of the amounts actually received or paid. Net unrealized foreign exchange gains and losses arise from changes (due to the changes in the exchange rate) in the value of foreign currency and other assets and liabilities denominated in foreign currencies held at period end.
Allocation of Expenses Among Funds and Classes. Expenses directly attributable to a Fund are charged to that Fund; certain other common expenses of the Trust, Calamos Advisors Trust, Calamos Convertible Opportunities and Income Fund, Calamos Convertible and High Income Fund, Calamos Strategic Total Return Fund, Calamos Global Total Return Fund and Calamos Global Dynamic Income Fund are allocated proportionately among each fund to which the expenses relate in relation to the net assets of each fund or on another reasonable basis. Expenses directly attributable to a particular class of a fund in the Trust are charged directly to such class. In calculating the net asset value per share of each class, investment income, realized and unrealized gains and losses and expenses other than class specific expenses are allocated daily to each class of shares based upon the proportion of net assets of each class at the beginning of each day plus current day fund share activity.
Use of Estimates. The preparation of financial statements in conformity with U.S. generally accepted accounting principles requires management to make estimates and assumptions that affect the amounts reported in the financial statements and accompanying notes. Actual results may differ from those estimates.
Income Taxes. No provision has been made for U.S. income taxes because the Trust’s policy is to continue to qualify as a regulated investment company under the Internal Revenue Code of 1986, as amended, and distribute to shareholders substantially all of the Funds’ taxable income and net realized gains.
Dividends and distributions paid to shareholders are recorded on the ex-dividend date. The amount of dividends and distributions from net investment income and net realized capital gains is determined in accordance with federal income tax regulations, which may differ from U.S. generally accepted accounting principles. To the extent these “book/tax” differences are permanent in nature, such amounts are reclassified within the capital accounts based on their federal tax-basis treatment. These differences are primarily due to differing treatments for foreign currency transactions, contingent payment debt instruments and methods of amortizing and accreting for fixed income securities. The financial statements are not adjusted for temporary differences.
The Funds recognized no liability for uncertain tax positions. A reconciliation is not provided as the beginning and ending amounts of unrecognized benefits are zero, with no interim additions, reductions or settlements. Tax years 2007 – 2010 remain subject to examination by the U.S. and the State of Illinois tax jurisdictions.
Indemnifications. Under the Trust’s organizational documents, the Trust is obligated to indemnify its officers and trustees against certain liabilities incurred by them by reason of having been an officer or trustee of the Trust. In addition, in the normal course of business, the Trust may enter into contracts that provide general indemnifications to other parties. Each Fund’s maximum exposure
Notes to Financial Statements
under these arrangements is unknown as this would involve future claims that may be made against the Fund that have not yet occurred. Currently, the Funds’ management expects the risk of material loss in connection to a potential claim to be remote.
Note 2 – Investment Adviser and Transactions With Affiliates Or Certain Other Parties
Pursuant to an investment advisory agreement with Calamos Advisors LLC (“Calamos Advisors”), each Fund pays a monthly investment advisory fee based on the average daily net assets of the Fund, as shown below:
| | | | | | | | | | | | | | | | |
| AVERAGE DAILY NET ASSETS | | GROWTH FUND ANNUAL RATE | | | EVOLVING WORLD GROWTH FUND ANNUAL RATE | | | TOTAL RETURN BOND FUND ANNUAL RATE | | | VALUE FUND, BLUE CHIP FUND,
DISCOVERY GROWTH FUND,
INTERNATIONAL GROWTH FUND*,
GLOBAL EQUITY FUND*,
GLOBAL GROWTH AND
INCOME FUND ANNUAL RATE | |
| First $500 million | | | 1.00% | | | | 1.10% | | | | 0.55% | | | | 1.00% | |
| | | | |
| Next $500 million | | | 0.90% | | | | 1.05% | | | | 0.53% | | | | 0.95% | |
| | | | |
| Next $5 billion | | | 0.80% | | | | 1.00% | | | | 0.51% | | | | 0.90% | |
| | | | |
| Next $5 billion | | | 0.78% | | | | 0.98% | | | | 0.49% | | | | 0.88% | |
| | | | |
| Next $5 billion | | | 0.76% | | | | 0.96% | | | | 0.48% | | | | 0.86% | |
| | | | |
| Next $5 billion | | | 0.74% | | | | 0.94% | | | | 0.47% | | | | 0.84% | |
| | | | |
| Next $5 billion | | | 0.72% | | | | 0.92% | | | | 0.46% | | | | 0.82% | |
| | | | |
| Over $26 billion | | | 0.70% | | | | 0.90% | | | | 0.45% | | | | 0.80% | |
| | | | |
| * | International Growth Fund and Global Equity Fund are subject to a possible adjustment based on performance as described below. |
| | | | |
| AVERAGE DAILY NET ASSETS | | GROWTH AND INCOME FUND, CONVERTIBLE FUND, HIGH INCOME FUND, AND MARKET NEUTRAL INCOME FUND ANNUAL RATE | |
| First $500 million | | | 0.75% | |
| | | | |
| Next $500 million | | | 0.70% | |
| | | | |
| Over $1 billion | | | 0.65% | |
| | | | |
Each of the International Growth Fund and Global Equity Fund pays a fee based on average daily net assets of the Fund that is accrued daily and paid on a monthly basis, subject to possible adjustment based on the Fund’s investment performance (since March 2006 for International Growth Fund and since February 2008 for Global Equity Fund). The performance adjustment increases or decreases the management fee, on a monthly basis, by 1/12 of 0.03% of a Fund’s average daily net assets over the performance period for each full 1% increment amount by which a Fund outperforms or underperforms the benchmark index (“Index”), on an annualized basis, over the performance measurement period. The benchmark indexes are the MSCI EAFE Growth Index and the MSCI World Index for the International Growth Fund and Global Equity Fund, respectively.
The base fee is shown in the table above. The performance adjustment rate is calculated by comparing over the performance measurement period the Fund’s Class A share performance to that of the respective Index. The performance measurement period commenced at the beginning of each Fund’s first full month of operation (April 2005 and March 2007 for the International Growth Fund and Global Equity Fund, respectively). The first performance adjustment was applied to the advisory fee at the end of the twelfth month. Each month subsequent to the twelfth month, a new month is added to the performance measurement period until the performance measurement period includes 36 months. Thereafter, the performance measurement period consists of the most recent month plus the previous 35 months.
The performance comparison is made at the end of each month. The maximum annualized performance adjustment rate is +/-0.30% of the Fund’s average daily net assets over the performance measurement period. The performance adjustment rate is divided by twelve and multiplied by the Fund’s average daily net assets over the performance measurement period, and the resulting dollar amount is then added to or subtracted from the base fee. Calamos Advisors may receive a positive performance adjustment even if the Fund has a negative return over a performance measurement period if it otherwise outperforms the Index during that period.
| | | | |
| 110 | | CALAMOS FAMILY OF FUNDS SEMIANNUAL REPORT | | |
Notes to Financial Statements
Pursuant to a financial accounting services agreement, during the period the Funds paid Calamos Advisors a fee for financial accounting services payable monthly at the annual rate of 0.0175% on the first $1 billion of combined assets, 0.0150% on the next $1 billion of combined assets and 0.0110% on combined assets above $2 billion (for purposes of this calculation “combined assets” means the sum of the total average daily net assets of Calamos Investment Trust, Calamos Advisors Trust, and the total average weekly managed assets of Calamos Convertible and High Income Fund, Calamos Strategic Total Return Fund, Calamos Convertible Opportunities and Income Fund, Calamos Global Total Return Fund and Calamos Global Dynamic Income Fund). Financial accounting services include, but are not limited to, the following: managing expenses and expense payment processing; monitoring the calculation of expense accrual amounts; calculating, tracking and reporting tax adjustments on all assets; and monitoring trustee deferred compensation plan accruals and valuations. The Funds pay their pro rata share of the financial accounting services fee payable to Calamos Advisors based on their relative portion of combined assets used in calculating the fee.
The Trust reimburses Calamos Advisors for a portion of compensation paid to the Trust’s Chief Compliance Officer. This compensation is reported as part of “Trustees’ fees and officer compensation” expense on the Statements of Operations.
Calamos Advisors has contractually agreed to limit the annual ordinary operating expenses of each Fund as a percentage of the average daily net assets as follows:
| | | | | | | | | | | | | | | | | | | | |
| FUND | | CLASS A
SHARES | | | CLASS B
SHARES | | | CLASS C
SHARES | | | CLASS I
SHARES | | | CLASS R
SHARES | |
| Growth Fund | | | 1.75% | | | | 2.50% | | | | 2.50% | | | | 1.50% | | | | 2.00% | |
| Value Fund | | | 1.15% | | | | 1.90% | | | | 1.90% | | | | 0.90% | | | | 1.40% | |
| Blue Chip Fund | | | 1.15% | | | | 1.90% | | | | 1.90% | | | | 0.90% | | | | 1.40% | |
| Discovery Growth Fund | | | 1.50% | | | | 2.25% | | | | 2.25% | | | | 1.25% | | | | 1.75% | |
| International Growth Fund | | | 1.40% | | | | 2.15% | | | | 2.15% | | | | 1.15% | | | | 1.65% | |
| Evolving World Growth Fund | | | 1.75% | | | | 2.50% | | | | 2.50% | | | | 1.50% | | | | 2.00% | |
| Global Equity Fund | | | 1.40% | | | | 2.15% | | | | 2.15% | | | | 1.15% | | | | 1.65% | |
| Growth and Income Fund | | | 1.75% | | | | 2.50% | | | | 2.50% | | | | 1.50% | | | | 2.00% | |
| Global Growth and Income Fund | | | 1.75% | | | | 2.50% | | | | 2.50% | | | | 1.50% | | | | 2.00% | |
| Convertible Fund | | | 1.75% | | | | 2.50% | | | | 2.50% | | | | 1.50% | | | | 2.00% | |
| Total Return Bond Fund | | | 0.90% | | | | 1.65% | | | | 1.65% | | | | 0.65% | | | | 1.15% | |
| High Income Fund | | | 1.75% | | | | 2.50% | | | | 2.50% | | | | 1.50% | | | | 2.00% | |
| Market Neutral Income Fund | | | 1.75% | | | | 2.50% | | | | 2.50% | | | | 1.50% | | | | 2.00% | |
These agreements are binding on Calamos Advisors through June 30, 2013.
For the period ended April 30, 2012, Calamos Advisors waived or absorbed the following expenses:
| | | | |
| FUND | | AMOUNT | |
| Value Fund | | $ | 120,528 | |
| Blue Chip Fund | | | 137,296 | |
| Discovery Growth Fund | | | 47,806 | |
| International Growth Fund | | | 642,450 | |
| Global Equity Fund | | | 132,591 | |
| Total Return Bond Fund | | | 90,451 | |
These amounts are included in the Statements of Operations under the caption “Expense reductions”.
As Distributor, Calamos Financial Services LLC (“CFS”) assumed all expenses of personnel, office space, office facilities and equipment incidental to such service. Each Fund has adopted a Distribution Plan pursuant to Rule 12b-1 under the 1940 Act whereby the Fund pays to CFS a distribution and/or service fee at the annual rate of 0.25% of the average daily net assets of the Fund’s Class A shares; a service fee at the annual rate of 0.25% and a distribution fee at the rate of 0.75% of the average daily net assets of the Fund’s Class B and Class C shares; and a service fee at the annual rate of 0.25% and a distribution fee of 0.25% of the average daily net assets of the Fund’s Class R shares. No such fees are paid on each Fund’s Class I shares.
Notes to Financial Statements
CFS also receives a sales commission and/or an underwriting fee on certain sales of each Fund’s Class A shares. During the period ended April 30, 2012, CFS received commissions and underwriting fees as follows:
| | | | |
| FUND | | AMOUNT | |
| Growth Fund | | $ | 151,793 | |
| Value Fund | | | 1,193 | |
| Blue Chip Fund | | | 2,383 | |
| Discovery Growth Fund | | | 10,012 | |
| International Growth Fund | | | 37,211 | |
| Evolving World Growth Fund | | | 19,344 | |
| Global Equity Fund | | | 41,213 | |
| Growth and Income Fund | | | 214,083 | |
| Global Growth and Income Fund | | | 19,208 | |
| Convertible Fund | | | 812 | |
| Total Return Bond Fund | | | 8,015 | |
| High Income Fund | | | 18,395 | |
| Market Neutral Income Fund | | | 16,046 | |
Pursuant to an agreement with US Bancorp Fund Services, LLC, the Funds’ transfer agent (“US Bancorp”), CFS provides certain shareholder administrative services to US Bancorp. CFS receives from US Bancorp an annual aggregate fee of $175,000, paid in monthly installments, for providing these services which relate to Calamos Investment Trust and Calamos Advisors Trust. Also, US Bancorp pays license fees to unaffiliated third parties for CFS’ utilization of certain transfer agent and phone systems in providing the shareholder administrative services. The fees paid to CFS and the payment of license fees to third parties are borne by US Bancorp. The Funds have not assumed or incurred any additional expenses in connection with CFS providing these services to US Bancorp, and the transfer agency fees payable by the Funds to US Bancorp have not increased as a result thereof.
A trustee and certain officers of the Trust are also officers and directors of CFS and Calamos Advisors. Such trustee and officers serve without direct compensation from the Trust. The Funds’ Statement of Additional Information contains additional information about the Funds’ trustees and is available upon request without charge by calling our toll free number 800.582.6959.
Certain affiliates of Calamos Advisors hold material investments in the Funds. As of April 30, 2012, they held 48% of the outstanding shares of Discovery Growth Fund.
The Trust has adopted a deferred compensation plan (the “Plan”). Under the Plan, a trustee who is not an “interested person” (as defined in the 1940 Act) and has elected to participate in the Plan (a “participating trustee”) may defer receipt of all or a portion of his compensation from the Trust. The deferred compensation payable to the participating trustee is credited to the trustee’s deferral account as of the business day such compensation would have been paid to the participating trustee. The value of amounts deferred for a participating trustee is determined by reference to the change in value of Class I shares of one or more funds of the Trust designated by the participant. The value of the account increases with contributions to the account or with increases in the value of the measuring shares, and the value of the account decreases with withdrawals from the account or with declines in the value of the measuring shares.
| | | | |
| 112 | | CALAMOS FAMILY OF FUNDS SEMIANNUAL REPORT | | |
Notes to Financial Statements
At April 30, 2012, the Fund’s had deferred compensation balances, which are included in “Other assets” on the Statements of Assets and Liabilities, as follows:
| | | | |
| FUND | | AMOUNT | |
| Growth Fund | | $ | 761,502 | |
| Value Fund | | | 71,919 | |
| Blue Chip Fund | | | 64,968 | |
| Discovery Growth Fund | | | 6,722 | |
| International Growth Fund | | | 64,312 | |
| Evolving World Growth Fund | | | 25,632 | |
| Global Equity Fund | | | 36,580 | |
| Growth and Income Fund | | | 357,664 | |
| Global Growth and Income Fund | | | 127,917 | |
| Convertible Fund | | | 178,672 | |
| Total Return Bond Fund | | | 41,181 | |
| High Income Fund | | | 81,814 | |
| Market Neutral Income Fund | | | 160,214 | |
Each Fund’s obligation to make payments under the Plan is a general obligation of the Fund and is included in “Payable for deferred compensation to trustees” on the Statements of Assets and Liabilities at April 30, 2012.
Note 3 – Investments
The cost of purchases and proceeds from sale of long-term investments for the period ended April 30, 2012 were as follows:
| | | | | | | | | | | | | | | | |
| | | COST OF PURCHASES | | | PROCEEDS FROM SALES | |
| FUND | | U.S. GOV’T
SECURITIES | | | OTHER | | | U.S. GOV’T
SECURITIES | | | OTHER | |
| Growth Fund | | $ | — | | | $ | 1,774,168,598 | | | $ | — | | | $ | 2,684,992,055 | |
| Value Fund | | | — | | | | 2,446,683 | | | | — | | | | 3,512,895 | |
| Blue Chip Fund | | | — | | | | 15,386,756 | | | | — | | | | 15,919,694 | |
| Discovery Growth Fund | | | — | | | | 23,578,153 | | | | — | | | | 22,931,805 | |
| International Growth Fund | | | — | | | | 375,497,066 | | | | — | | | | 197,788,054 | |
| Evolving World Growth Fund | | | — | | | | 198,561,365 | | | | — | | | | 80,836,699 | |
| Global Equity Fund | | | — | | | | 159,192,082 | | | | — | | | | 51,255,902 | |
| Growth and Income Fund | | | — | | | | 1,199,520,398 | | | | — | | | | 1,138,289,708 | |
| Global Growth and Income Fund | | | — | | | | 557,359,904 | | | | — | | | | 555,196,731 | |
| Convertible Fund | | | — | | | | 556,202,650 | | | | — | | | | 1,161,621,829 | |
| Total Return Bond Fund | | | 23,018,237 | | | | 25,705,746 | | | | 19,823,657 | | | | 20,801,837 | |
| High Income Fund | | | — | | | | 110,208,546 | | | | — | | | | 70,442,588 | |
| Market Neutral Income Fund | | | 335,622,271 | | | | 880,234,242 | | | | 342,340,625 | | | | 1,052,547,005 | |
The following information is presented on a federal income tax basis as of April 30, 2012. Differences between the cost basis under U.S. generally accepted accounting principles and federal income tax purposes are primarily due to temporary differences.
Notes to Financial Statements
The cost basis of investments for federal income tax purposes at April 30, 2012 was as follows:
| | | | | | | | | | | | | | | | |
| Fund | | COST BASIS OF
INVESTMENTS | | | GROSS UNREALIZED
APPRECIATION | | | GROSS UNREALIZED
DEPRECIATION | | | NET UNREALIZED
APPRECIATION
(DEPRECIATION) | |
| Growth Fund | | $ | 6,121,704,833 | | | $ | 1,909,054,318 | | | $ | (142,336,955 | ) | | $ | 1,766,717,363 | |
| Value Fund | | | 36,727,306 | | | | 8,314,244 | | | | (2,025,780 | ) | | | 6,288,464 | |
| Blue Chip Fund | | | 53,886,983 | | | | 16,160,131 | | | | (859,645 | ) | | | 15,300,486 | |
| Discovery Growth Fund | | | 35,721,727 | | | | 4,864,695 | | | | (1,750,613 | ) | | | 3,114,082 | |
| International Growth Fund | | | 708,168,235 | | | | 85,459,741 | | | | (25,833,145 | ) | | | 59,626,596 | |
| Evolving World Growth Fund | | | 319,405,338 | | | | 28,199,488 | | | | (9,688,545 | ) | | | 18,510,943 | |
| Global Equity Fund | | | 241,903,879 | | | | 28,798,241 | | | | (9,037,653 | ) | | | 19,760,588 | |
| Growth and Income Fund | | | 4,029,121,099 | | | | 672,292,081 | | | | (115,923,950 | ) | | | 556,368,131 | |
| Global Growth and Income Fund | | | 1,587,664,373 | | | | 154,064,466 | | | | (44,195,462 | ) | | | 109,869,004 | |
| Convertible Fund | | | 1,907,238,187 | | | | 189,690,439 | | | | (37,602,655 | ) | | | 152,087,784 | |
| Total Return Bond Fund | | | 222,136,399 | | | | 11,656,792 | | | | (52,357 | ) | | | 11,604,435 | |
| High Income Fund | | | 280,477,344 | | | | 11,848,716 | | | | (2,629,213 | ) | | | 9,219,503 | |
| Market Neutral Income Fund | | | 2,291,173,971 | | | | 165,367,089 | | | | (55,470,537 | ) | | | 109,896,552 | |
Note 4 – Income Taxes
The tax character of distributions for the period ended April 30, 2012 will be determined at the end of each Fund’s current fiscal year. Distributions during the fiscal period ended October 31, 2011 were characterized for federal income tax purposes as follows:
| | | | | | | | |
| | | YEAR ENDED
OCTOBER 31, 2011 | |
| FUND | | ORDINARY INCOME | | | LONG-TERM CAPITAL GAIN | |
| Growth Fund | | $ | — | | | $ | — | |
| Value Fund | | | — | | | | — | |
| Blue Chip Fund | | | — | | | | — | |
| Discovery Growth Fund | | | 24,011 | | | | — | |
| International Growth Fund | | | 374,669 | | | | — | |
| Evolving World Growth Fund | | | 559,421 | | | | 241,388 | |
| Global Equity Fund | | | — | | | | — | |
| Growth and Income Fund | | | 50,799,179 | | | | — | |
| Global Growth and Income Fund | | | — | | | | — | |
| Convertible Fund | | | 88,153,788 | | | | 130,552,557 | |
| Total Return Bond Fund | | | 6,253,408 | | | | 1,364,565 | |
| High Income Fund | | | 18,466,898 | | | | — | |
| Market Neutral Income Fund | | | 37,009,221 | | | | — | |
| | | | |
| 114 | | CALAMOS FAMILY OF FUNDS SEMIANNUAL REPORT | | |
Notes to Financial Statements
As of October 31, 2011, the components of accumulated earnings/(loss) on a tax basis were as follows:
| | | | | | | | | | | | | | | | | | | | |
| | | GROWTH FUND | | | VALUE FUND | | | BLUE CHIP FUND | | | DISCOVERY GROWTH FUND | | | INTERNATIONAL GROWTH FUND | |
| Undistributed ordinary income | | $ | — | | | $ | — | | | $ | — | | | $ | — | | | $ | — | |
| Undistributed capital gains | | | 316,320,258 | | | | — | | | | — | �� | | | — | | | | — | |
| | | | |
| Total undistributed earnings | | | 316,320,258 | | | | — | | | | — | | | | — | | | | — | |
| Accumulated capital and other losses | | | — | | | | (5,930,634 | ) | | | (12,756,155 | ) | | | (1,975,104 | ) | | | (60,073,901 | ) |
| Net unrealized gain/(losses) | | | 1,463,349,220 | | | | 3,943,761 | | | | 8,905,989 | | | | 3,383,393 | | | | 42,609,778 | |
| | | | |
| Total accumulated earnings/(losses) | | | 1,779,669,478 | | | | (1,986,873 | ) | | | (3,850,166 | ) | | | 1,408,289 | | | | (17,464,123 | ) |
| Other | | | 2,634,811 | | | | (75,979 | ) | | | (52,661 | ) | | | (69,829 | ) | | | (82,658 | ) |
| Paid-in capital | | | 5,944,697,797 | | | | 43,626,567 | | | | 64,300,345 | | | | 35,038,222 | | | | 553,129,736 | |
| | | | |
| | $ | 7,727,002,086 | | | $ | 41,563,715 | | | $ | 60,397,518 | | | $ | 36,376,682 | | | $ | 535,582,955 | |
| | | | |
| | | | | |
| | | EVOLVING WORLD GROWTH FUND | | | GLOBAL EQUITY FUND | | | GROWTH AND INCOME FUND | | | GLOBAL GROWTH AND INCOME FUND | | | CONVERTIBLE FUND | |
| Undistributed ordinary income | | $ | — | | | $ | — | | | $ | 16,864,239 | | | $ | 8,034,909 | | | $ | — | |
| Undistributed capital gains | | | — | | | | — | | | | — | | | | — | | | | 193,821,216 | |
| | | | |
| Total undistributed earnings | | | — | | | | — | | | | 16,864,239 | | | | 8,034,909 | | | | 193,821,216 | |
| Accumulated capital and other losses | | | — | | | | (5,318,585 | ) | | | (31,989,842 | ) | | | (10,344,026 | ) | | | — | |
| Net unrealized gain/(losses) | | | 10,514,710 | | | | 7,217,909 | | | | 614,862,276 | | | | 143,319,522 | | | | 281,429,910 | |
| | | | |
| Total accumulated earnings/(losses) | | | 10,514,710 | | | | 1,899,324 | | | | 599,736,673 | | | | 141,010,405 | | | | 475,251,126 | |
| Other | | | (82,756 | ) | | | 320,943 | | | | 2,705,310 | | | | (3,724,375 | ) | | | (5,509,485 | ) |
| Paid-in capital | | | 195,141,236 | | | | 127,539,381 | | | | 3,816,619,987 | | | | 1,529,958,919 | | | | 2,169,253,124 | |
| | | | |
| | $ | 205,573,190 | | | $ | 129,759,648 | | | $ | 4,419,061,970 | | | $ | 1,667,244,949 | | | $ | 2,638,994,765 | |
| | | | |
| | | | | |
| | | | | | | | | TOTAL RETURN BOND FUND | | | HIGH INCOME FUND | | | MARKET NEUTRAL INCOME FUND | |
| Undistributed ordinary income | | | | | | | | | | $ | 1,901,924 | | | $ | 71,490 | | | $ | 3,208,156 | |
| Undistributed capital gains | | | | | | | | | | | 789,612 | | | | 3,516,566 | | | | — | |
| | | | | | | | | | | | |
| Total undistributed earnings | | | | | | | | | | | 2,691,536 | | | | 3,588,056 | | | | 3,208,156 | |
| Accumulated capital and other losses | | | | | | | | | | | — | | | | — | | | | (87,024,189 | ) |
| Net unrealized gain/(losses) | | | | | | | | | | | 10,512,492 | | | | 5,818,774 | | | | (13,865,519 | ) |
| | | | | | | | | | | | |
| Total accumulated earnings/(losses) | | | | | | | | | | | 13,204,028 | | | | 9,406,830 | | | | (97,681,552 | ) |
| Other | | | | | | | | | | | (68,066 | ) | | | (223,577 | ) | | | (11,189,899 | ) |
| Paid-in capital | | | | | | | | | | | 208,035,721 | | | | 244,557,179 | | | | 2,450,725,487 | |
| | | | | | | | | | | | |
| | | | | | | | | | $ | 221,171,683 | | | $ | 253,740,432 | | | $ | 2,341,854,036 | |
| | | | | | | | | | | | |
As of October 31, 2011, the Funds had capital loss carryforwards which, if not used, will expire as follows:
| | | | | | | | | | | | |
| FUND | | 2017 | | | 2018 | | | 2019 | |
| Value Fund | | $ | (81,431 | ) | | $ | (5,849,203 | ) | | $ | — | |
| Blue Chip Fund | | | (11,540,860 | ) | | | (1,215,295 | ) | | | — | |
| Discovery Growth Fund | | | — | | | | (11,120 | ) | | | (1,963,984 | ) |
| International Growth Fund | | | (60,073,901 | ) | | | — | | | | — | |
| Global Equity Fund | | | (3,358,510 | ) | | | (1,960,075 | ) | | | — | |
| Growth and Income Fund | | | — | | | | (31,989,842 | ) | | | — | |
| Global Growth and Income Fund | | | — | | | | (10,344,026 | ) | | | — | |
| Market Neutral Income Fund | | | (54,932,896 | ) | | | (32,091,293 | ) | | | — | |
Notes to Financial Statements
Note 5 – Short Sales
Securities sold short represent obligations to deliver the securities at a future date. A Fund may sell a security it does not own in anticipation of a decline in the value of that security. When a Fund sells a security short, it must borrow the security sold short and deliver it to the broker-dealer through which it made the short sale. Dividends paid on securities sold short are disclosed as an expense on the Statements of Operations. A gain, limited to the price at which the Fund sold the security short, or a loss, unlimited in size, will be realized upon the termination of a short sale.
To secure its obligation to deliver to the broker-dealer the securities sold short, a Fund must segregate an amount of cash or liquid securities with its custodian equal to any excess of the current market value of the securities sold short over any cash or liquid securities deposited as collateral with the broker in connection with the short sale (not including the proceeds of the short sale). As a result of that requirement, a Fund will not gain any leverage merely by selling short, except to the extent that it earns interest or other income or gains on the segregated cash or liquid securities while also being subject to the possibility of gain or loss from the securities sold short.
Note 6 – Derivative Instruments
Foreign Currency Risk. The Funds may engage in portfolio hedging with respect to changes in currency exchange rates by entering into forward foreign currency contracts to purchase or sell currencies. A forward foreign currency contract is a commitment to purchase or sell a foreign currency at a future date at a negotiated forward rate. Risks associated with such contracts include, among other things, movement in the value of the foreign currency relative to the U.S. dollar and the ability of the counterparty to perform. The net unrealized gain, if any, represents the credit risk to the respective Fund on a forward foreign currency contract. The contracts are valued daily at forward foreign exchange rates. The Funds realize a gain or loss when a position is closed or upon settlement of the contracts.
As of April 30, 2012, the Funds had outstanding forward foreign currency contracts as listed on the Schedules of Investments.
Equity Risk. Each Fund may engage in option transactions and in doing so achieves similar objectives to what it would achieve through the sale or purchase of individual securities. A call option, upon payment of a premium, gives the purchaser of the option the right to buy, and the seller of the option the obligation to sell, the underlying security, index or other instrument at the exercise price. A put option gives the purchaser of the option, upon payment of a premium, the right to sell, and the seller the obligation to buy, the underlying security, index, or other instrument at the exercise price.
To seek to offset some of the risk of a potential decline in value of certain long positions, each Fund may also purchase put options on individual securities, broad-based securities indexes or certain exchange traded funds (“ETFs”). Each Fund may also seek to generate income from option premiums by writing (selling) options on a portion of the equity securities (including securities that are convertible into equity securities) in the Fund’s portfolio, on broad-based securities indexes, or certain ETFs.
When the Fund purchases an option, it pays a premium and an amount equal to that premium is recorded as an asset. When the Fund writes an option, it receives a premium and an amount equal to that premium is recorded as a liability. The asset or liability is adjusted daily to reflect the current market value of the option. If an option expires unexercised, the Fund realizes a gain or loss to the extent of the premium received or paid. If an option is exercised, the premium received or paid is recorded as an adjustment to the proceeds from the sale or the cost basis of the purchase. The difference between the premium and the amount received or paid on a closing purchase or sale transaction is also treated as a realized gain or loss. The cost of securities acquired through the exercise of call options is increased by premiums paid. The proceeds from securities sold through the exercise of put options are decreased by the premiums paid. Gain or loss on written options and purchased options is presented separately as net realized gain or loss on written options and net realized gain or loss on purchased options, respectively.
| | | | |
| 116 | | CALAMOS FAMILY OF FUNDS SEMIANNUAL REPORT | | |
Notes to Financial Statements
As of April 30, 2012, the Funds had outstanding purchased options and/or written options as listed on the Schedules of Investments. For the period ended April 30, 2012, the Funds had the following transactions in options written:
| | | | | | | | | | | | | | | | |
| | | GROWTH FUND | | | BLUE CHIP FUND | |
| | | NUMBER OF
CONTRACTS | | | PREMIUMS
RECEIVED | | | NUMBER OF
CONTRACTS | | | PREMIUMS
RECEIVED | |
| | | | | | | | | | | | | | | | |
| Options outstanding at October 31, 2011 | | | — | | | $ | — | | | | — | | | $ | — | |
| Options written | | | 12,900 | | | | 18,095,281 | | | | 100 | | | | 140,261 | |
| Options closed | | | (9,206 | ) | | | (12,852,887 | ) | | | (72 | ) | | | (100,528 | ) |
| Options exercised | | | — | | | | — | | | | — | | | | — | |
| Options expired | | | — | | | | — | | | | — | | | | — | |
| | | | |
| Options outstanding at April 30, 2012 | | | 3,694 | | | $ | 5,242,394 | | | | 28 | | | $ | 39,733 | |
| | |
| | | GLOBAL EQUITY FUND | | | GROWTH AND INCOME FUND | |
| | | NUMBER OF
CONTRACTS | | | PREMIUMS
RECEIVED | | | NUMBER OF
CONTRACTS | | | PREMIUMS
RECEIVED | |
| Options outstanding at October 31, 2011 | | | — | | | $ | — | | | | 59,500 | | | $ | 12,790,925 | |
| Options written | | | 260 | | | | 339,710 | | | | 33,650 | | | | 15,616,901 | |
| Options closed | | | (214 | ) | | | (274,433 | ) | | | (67,148 | ) | | | (19,647,796 | ) |
| Options exercised | | | — | | | | — | | | | — | | | | — | |
| Options expired | | | — | | | | — | | | | — | | | | — | |
| | | | |
| Options outstanding at April 30, 2012 | | | 46 | | | $ | 65,277 | | | | 26,002 | | | $ | 8,760,030 | |
| | | |
| | | | | | | | | MARKET NEUTRAL INCOME FUND | |
| | | | | | | | | NUMBER OF
CONTRACTS | | | PREMIUMS
RECEIVED | |
| Options outstanding at October 31, 2011 | | | | | | | | | | | 22,380 | | | $ | 26,271,461 | |
| Options written | | | | | | | | | | | 36,860 | | | | 48,996,897 | |
| Options closed | | | | | | | | | | | (35,120 | ) | | | (56,565,873 | ) |
| Options exercised | | | | | | | | | | | (25 | ) | | | (30,648 | ) |
| Options expired | | | | | | | | | | | (1,800 | ) | | | (124,134 | ) |
| | | | | | | | | | | | |
| Options outstanding at April 30, 2012 | | | | | | | | | | | 22,295 | | | $ | 18,547,703 | |
Notes to Financial Statements
Below are the types of derivatives in the Funds by gross value as of April 30, 2012:
| | | | | | | | | | | | | | |
| | | | | ASSETS | | | | | LIABILITIES | | | |
| FUND | | DERIVATIVE TYPE | | STATEMENT OF ASSETS & LIABILITIES LOCATION | | VALUE | | | STATEMENT OF ASSETS & LIABILITIES LOCATION | | VALUE | |
| Growth Fund | | Options purchased | | Investments in securities | | $ | 30,265,400 | | | — | | $ | — | |
| | Options written | | — | | | — | | | Options written | | | 16,429,065 | |
| | Forward Foreign Currency
contracts | | Unrealized appreciation on forward foreign currency contracts | | | 3,968,155 | | | Unrealized depreciation on forward foreign currency contracts | | | 5,912,508 | |
| Value Fund | | Forward Foreign Currency contracts | | Unrealized appreciation on forward foreign currency contracts | | | — | | | Unrealized depreciation on forward foreign currency contracts | | | 96,129 | |
| Blue Chip Fund | | Options purchased | | Investments in securities | | | 259,065 | | | — | | | — | |
| | Options written | | — | | | — | | | Options written | | | 124,530 | |
| | Forward Foreign Currency contracts | | Unrealized appreciation on forward foreign currency contracts | | | 40,667 | | | Unrealized depreciation on forward foreign currency contracts | | | 89,714 | |
| Global Equity Fund | | Options purchased | | Investments in securities | | | 848,112 | | | — | | | — | |
| | Options written | | — | | | — | | | Options written | | | 204,585 | |
| | Forward Foreign Currency contracts | | Unrealized appreciation on forward foreign currency contracts | | | 303,232 | | | Unrealized depreciation on forward foreign currency contracts | | | 1,102,500 | |
| Growth and Income Fund | | Options purchased | | Investments in securities | | | 13,120,988 | | | — | | | — | |
| | Options written | | — | | | — | | | Options written | | | 12,393,895 | |
| | Forward Foreign Currency contracts | | Unrealized appreciation on forward foreign currency contracts | | | — | | | Unrealized depreciation on forward foreign currency contracts | | | 3,588,151 | |
| Global Growth and Income Fund | | Options purchased | | Investments in securities | | | 4,918,438 | | | — | | | — | |
| | Forward Foreign Currency contracts | | Unrealized appreciation on forward foreign currency contracts | | | 23,274 | | | Unrealized depreciation on forward foreign currency contracts | | | 8,484,168 | |
| Convertible Fund | | Options purchased | | Investments in securities | | | 32,095,251 | | | — | | | — | |
| | Forward Foreign Currency contracts | | Unrealized appreciation on forward foreign currency contracts | | | 92,027 | | | Unrealized depreciation on forward foreign currency contracts | | | 2,403,618 | |
| Market Neutral Income Fund | | Options purchased | | Investments in securities | | | 6,170,312 | | | — | | | — | |
| | Options written | | — | | | — | | | Options written | | | 18,916,288 | |
| | | | |
| 118 | | CALAMOS FAMILY OF FUNDS SEMIANNUAL REPORT | | |
Notes to Financial Statements
Volume of Derivative Activity for the Six Months Ended April 30, 2012*
| | | | | | | | |
| FUND | | DERIVATIVE TYPE | | | VOLUME | |
| Growth Fund | | | Equity: Purchased Options | | | | 27,650 | |
| | | Written Options | | | | 12,900 | |
| | | Forward Foreign Currency Contracts | | | | 1,306,330,179 | |
| Value Fund | | | Forward Foreign Currency Contracts | | | | 14,196,068 | |
| Blue Chip Fund | | | Equity: Purchased Options | | | | 215 | |
| | | Written Options | | | | 100 | |
| | | Forward Foreign Currency Contracts | | | | 17,844,291 | |
| Global Equity Fund | | | Equity: Purchased Options | | | | 508 | |
| | | Written Options | | | | 260 | |
| | | Forward Foreign Currency Contracts | | | | 174,392,745 | |
| Growth and Income Fund | | | Equity: Purchased Options | | | | 65,825 | |
| | | Written Options | | | | 33,650 | |
| | | Forward Foreign Currency Contracts | | | | 537,158,580 | |
| Global Growth and Income Fund | | | Equity: Purchased Options | | | | 1,115 | |
| | | Forward Foreign Currency Contracts | | | | 1,417,031,452 | |
| Convertible Fund | | | Equity: Purchased Options | | | | 25,520 | |
| | | Forward Foreign Currency Contracts | | | | 383,198,081 | |
| Market Neutral Income Fund | | | Equity: Purchased Options | | | | 37,310 | |
| | | Written Options | | | | 36,860 | |
| * | Activity during the period is measured by opened number of contracts for options purchased or written and opened foreign currency contracts with foreign currency exposure measured in U.S. dollar notional. |
Note 7 – Synthetic Convertible Securities
A Fund may establish a “synthetic” convertible instrument by combining separate securities that possess the economic characteristics similar to a convertible security, i.e., fixed-income securities (“fixed-income component”), which may be a convertible or non-convertible security and the right to acquire equity securities (“convertible component”). The fixed-income component is achieved by investing in fixed income securities such as bonds, preferred stocks, and money market instruments. The convertible component is achieved by investing in warrants or purchased options to buy common stock at a certain exercise price, or options on a stock index. In establishing a synthetic instrument, the Fund may pool a basket of fixed-income securities and a basket of warrants or purchased options that produce the economic characteristics similar to a convertible security. Within each basket of fixed-income securities and warrants or options, different companies may issue the fixed-income and convertible components, which may be purchased separately and at different times.
A Fund may also purchase synthetic securities created by other parties, typically investment banks, including convertible structured notes. Convertible structured notes are fixed-income debentures linked to equity. Convertible structured notes have the attributes of a convertible security; however, the investment bank that issued the convertible note assumes the credit risk associated with the investment, rather than the issuer of the underlying common stock into which the note is convertible. Purchasing synthetic convertible securities may offer more flexibility than purchasing a convertible security.
Note 8 – When-Issued and Delayed Delivery Securities
A Fund may purchase securities on a when-issued or delayed-delivery basis. Although the payment and interest terms of these securities are established at the time the Fund enters into the commitment, the securities may be delivered and paid for a month or more after the date of purchase, when their value may have changed. A Fund makes such commitments only with the intention of actually acquiring the securities, but may sell the securities before the settlement date if Calamos Advisors deems it advisable for investment reasons. A Fund may utilize spot and forward foreign currency exchange transactions to reduce the risk inherent in fluctuations in the exchange rate between one currency and another when securities are purchased or sold on a when-issued or delayed-delivery basis.
Notes to Financial Statements
At the time when the Fund enters into a binding obligation to purchase securities on a when-issued basis, liquid assets (cash, U.S. Government securities or other “high-grade” debt obligations) of the Fund having a value at least as great as the purchase price of the securities to be purchased will be segregated on the books of the Fund and held by the custodian throughout the period of the obligation. The use of this investment strategy may increase net asset value fluctuation.
Note 9 – Fair Value Measurements
Various inputs are used to determine the value of the Funds’ investments. These inputs are categorized into three broad levels as follows:
| | • | | Level 1 – Prices are determined using inputs from unadjusted quoted prices from active markets (including securities actively traded on a securities exchange) for identical assets. |
| | • | | Level 2 – Prices are determined using significant observable market inputs other than unadjusted quoted prices, including quoted prices of similar securities, fair value adjustments to quoted foreign securities, interest rates, credit risk, prepayment speeds, and other relevant data. |
| | • | | Level 3 – Prices reflect unobservable market inputs (including the Funds’ own judgments about assumptions market participants would use in determining fair value) when observable inputs are unavailable. |
Debt securities are valued based upon evaluated prices received from an independent pricing service or from a dealer or broker who makes markets in such securities. Pricing services utilize various observable market data and as such, debt securities are generally categorized as Level 2. The levels are not necessarily an indication of the risk or liquidity of the Funds’ investments. Transfers between the levels for investment securities or other financial instruments are measured at the end of the reporting period.
The following is a summary of the inputs used in valuing the Funds’ holdings at fair value:
| | | | | | | | | | | | | | | | |
| | | GROWTH FUND | |
| | | LEVEL 1 | | | LEVEL 2 | | | LEVEL 3 | | | TOTAL | |
| | | | | | | | | | | | | | | | |
| Assets: | | | | | | | | | | | | | | | | |
Common Stocks | | $ | 7,321,326,592 | | | $ | 169,909,332 | | | $ | — | | | $ | 7,491,235,924 | |
Purchased Options | | | 30,265,400 | | | | | | | | | | | | 30,265,400 | |
Short Term Investment | | | 366,920,872 | | | | | | | | | | | | 366,920,872 | |
Forward Foreign Currency Contracts | | | | | | | 3,968,155 | | | | | | | | 3,968,155 | |
| | | | |
Total | | $ | 7,718,512,864 | | | $ | 173,877,487 | | | $ | — | | | $ | 7,892,390,351 | |
| | | | |
| Liabilities: | | | | | | | | | | | | | | | | |
Written Option | | $ | 16,429,065 | | | $ | — | | | $ | — | | | $ | 16,429,065 | |
Forward Foreign Currency Contracts | | | | | | | 5,912,508 | | | | | | | | 5,912,508 | |
| | | | |
Total | | $ | 16,429,065 | | | $ | 5,912,508 | | | $ | — | | | $ | 22,341,573 | |
| | | | |
| | | | |
| INVESTMENTS, AT VALUE: | | TRANSFERS INTO
LEVEL 1* | | | TRANSFERS OUT OF
LEVEL 1 | | | TRANSFERS INTO
LEVEL 2 | | | TRANSFERS OUT OF
LEVEL 2* | |
Common Stocks | | $ | 72,891,533 | | | $ | — | | | $ | — | | | $ | 72,891,533 | |
| | | | |
Total | | $ | 72,891,533 | | | $ | — | | | $ | — | | | $ | 72,891,533 | |
| | | | |
|
* Transfers to Level 1 from Level 2 were due to the absence of an applied factor utilizing a systematic fair valuation model on securities that trade on European and Far Eastern exchanges. | |
| | | | |
| 120 | | CALAMOS FAMILY OF FUNDS SEMIANNUAL REPORT | | |
Notes to Financial Statements
| | | | | | | | | | | | | | | | |
| | | VALUE FUND | |
| | | LEVEL 1 | | | LEVEL 2 | | | LEVEL 3 | | | TOTAL | |
| Assets: | | | | | | | | | | | | | | | | |
Common Stocks | | $ | 37,143,687 | | | $ | 5,455,406 | | | $ | — | | | $ | 42,599,093 | |
Short Term Investment | | | 416,677 | | | | | | | | | | | | 416,677 | |
| | | | |
Total | | $ | 37,560,364 | | | $ | 5,455,406 | | | $ | — | | | $ | 43,015,770 | |
| | | | |
| Liabilities: | | | | | | | | | | | | | | | | |
Forward Foreign Currency Contracts | | $ | — | | | $ | 96,129 | | | $ | — | | | $ | 96,129 | |
| | | | |
Total | | $ | — | | | $ | 96,129 | | | $ | — | | | $ | 96,129 | |
| | | | |
| |
| | | BLUE CHIP FUND | |
| | | LEVEL 1 | | | LEVEL 2 | | | LEVEL 3 | | | TOTAL | |
| Assets: | | | | | | | | | | | | | | | | |
Common Stocks | | $ | 64,425,477 | | | $ | 1,799,024 | | | $ | — | | | $ | 66,224,501 | |
Purchased Options | | | 259,065 | | | | | | | | | | | | 259,065 | |
Short Term Investment | | | 2,703,903 | | | | | | | | | | | | 2,703,903 | |
Forward Foreign Currency Contracts | | | | | | | 40,667 | | | | | | | | 40,667 | |
| | | | |
Total | | $ | 67,388,445 | | | $ | 1,839,691 | | | $ | — | | | $ | 69,228,136 | |
| | | | |
| Liabilities: | | | | | | | | | | | | | | | | |
Written Option | | $ | 124,530 | | | $ | — | | | $ | — | | | $ | 124,530 | |
Forward Foreign Currency Contracts | | | | | | | 89,714 | | | | | | | | 89,714 | |
| | | | |
Total | | $ | 124,530 | | | $ | 89,714 | | | $ | — | | | $ | 214,244 | |
| | | | |
| |
| | | DISCOVERY GROWTH FUND | |
| | | LEVEL 1 | | | LEVEL 2 | | | LEVEL 3 | | | TOTAL | |
| | | | | | | | | | | | | | | | |
| Assets: | | | | | | | | | | | | | | | | |
Common Stocks | | $ | 38,299,738 | | | $ | — | | | $ | — | | | $ | 38,299,738 | |
Short Term Investment | | | 536,071 | | | | | | | | | | | | 536,071 | |
| | | | |
Total | | $ | 38,835,809 | | | $ | — | | | $ | — | | | $ | 38,835,809 | |
| | | | |
| |
| | | INTERNATIONAL GROWTH FUND | |
| | | LEVEL 1 | | | LEVEL 2 | | | LEVEL 3 | | | TOTAL | |
| Assets: | | | | | | | | | | | | | | | | |
Common Stocks | | $ | 262,566,969 | | | $ | 452,928,057 | | | $ | — | | | $ | 715,495,026 | |
Rights | | | | | | | 12,347 | | | | | | | | 12,347 | |
Short Term Investment | | | 52,287,458 | | | | | | | | | | | | 52,287,458 | |
| | | | |
Total | | $ | 314,854,427 | | | $ | 452,940,404 | | | $ | — | | | $ | 767,794,831 | |
| | | | |
| | | | |
| INVESTMENTS, AT VALUE: | | TRANSFERS INTO
LEVEL 1* | | | TRANSFERS OUT OF
LEVEL 1 | | | TRANSFERS INTO
LEVEL 2 | | | TRANSFERS OUT OF
LEVEL 2* | |
Common Stocks | | $ | 8,163,852 | | | $ | — | | | $ | — | | | $ | 8,163,852 | |
| | | | |
Total | | $ | 8,163,852 | | | $ | — | | | $ | — | | | $ | 8,163,852 | |
| | | | |
|
* Transfers to Level 1 from Level 2 were due to the absence of an applied factor utilizing a systematic fair valuation model on securities that trade on European and Far Eastern exchanges. | |
Notes to Financial Statements
| | | | | | | | | | | | | | | | |
| | | EVOLVING WORLD GROWTH FUND | |
| | | LEVEL 1 | | | LEVEL 2 | | | LEVEL 3 | | | TOTAL | |
| Assets: | | | | | | | | | | | | | | | | |
Convertible Bonds | | $ | — | | | $ | 64,862,350 | | | $ | — | | | $ | 64,862,350 | |
Common Stocks | | | 104,013,923 | | | | 138,646,767 | | | | | | | | 242,660,690 | |
Rights | | | | | | | 7,664 | | | | | | | | 7,664 | |
Short Term Investment | | | 30,385,577 | | | | | | | | | | | | 30,385,577 | |
| | | | |
Total | | $ | 134,399,500 | | | $ | 203,516,781 | | | $ | — | | | $ | 337,916,281 | |
| | | | |
| | | | |
| INVESTMENTS, AT VALUE: | | TRANSFERS INTO
LEVEL 1* | | | TRANSFERS OUT
OF LEVEL 1 | | | TRANSFERS INTO
LEVEL 2 | | | TRANSFERS OUT OF
LEVEL 2* | |
Common Stocks | | $ | 2,642,318 | | | $ | — | | | $ | — | | | $ | 2,642,318 | |
| | | | |
Total | | $ | 2,642,318 | | | $ | — | | | $ | — | | | $ | 2,642,318 | |
| | | | |
|
* Transfers to Level 1 from Level 2 were due to the absence of an applied factor utilizing a systematic fair valuation model on securities that trade on European and Far Eastern exchanges. | |
| |
| | | GLOBAL EQUITY FUND | |
| | | LEVEL 1 | | | LEVEL 2 | | | LEVEL 3 | | | TOTAL | |
| | | | | | | | | | | | | | | | |
| Assets: | | | | | | | | | | | | | | | | |
Common Stocks | | $ | 157,840,327 | | | $ | 84,764,770 | | | $ | — | | | $ | 242,605,097 | |
Rights | | | | | | | 3,491 | | | | | | | | 3,491 | |
Purchased Options | | | 848,112 | | | | | | | | | | | | 848,112 | |
Short Term Investment | | | 18,207,767 | | | | | | | | | | | | 18,207,767 | |
Forward Foreign Currency Contracts | | | | | | | 303,232 | | | | | | | | 303,232 | |
| | | | |
Total | | $ | 176,896,206 | | | $ | 85,071,493 | | | $ | — | | | $ | 261,967,699 | |
| | | | |
| Liabilities: | | | | | | | | | | | | | | | | |
Written Option | | $ | 204,585 | | | $ | — | | | $ | — | | | $ | 204,585 | |
Forward Foreign Currency Contracts | | | | | | | 1,102,500 | | | | | | | | 1,102,500 | |
| | | | |
Total | | $ | 204,585 | | | $ | 1,102,500 | | | $ | — | | | $ | 1,307,085 | |
| | | | |
| | | | |
| INVESTMENTS, AT VALUE: | | TRANSFERS INTO
LEVEL 1* | | | TRANSFERS OUT
OF LEVEL 1 | | | TRANSFERS INTO
LEVEL 2 | | | TRANSFERS OUT OF
LEVEL 2* | |
Common Stocks | | $ | 2,268,749 | | | $ | — | | | $ | — | | | $ | 2,268,749 | |
| | | | |
Total | | $ | 2,268,749 | | | $ | — | | | $ | — | | | $ | 2,268,749 | |
| | | | |
|
* Transfers to Level 1 from Level 2 were due to the absence of an applied factor utilizing a systematic fair valuation model on securities that trade on European and Far Eastern exchanges. | |
| | | | |
| 122 | | CALAMOS FAMILY OF FUNDS SEMIANNUAL REPORT | | |
Notes to Financial Statements
| | | | | | | | | | | | | | | | |
| | | GROWTH AND INCOME FUND | |
| | | | | | | | | | | | | | | | |
| | | LEVEL 1 | | | LEVEL 2 | | | LEVEL 3 | | | TOTAL | |
| Assets: | | | | | | | | | | | | | | | | |
Convertible Bonds | | $ | — | | | $ | 1,488,079,914 | | | $ | — | | | $ | 1,488,079,914 | |
Synthetic Convertible Securities (Corporate Bonds) | | | | | | | 226,853,097 | | | | | | | | 226,853,097 | |
Synthetic Convertible Securities (Sovereign Bonds) | | | | | | | 455,208,650 | | | | | | | | 455,208,650 | |
Synthetic Convertible Securities (Purchased Options) | | | 7,936,238 | | | | | | | | | | | | 7,936,238 | |
Convertible Preferred Stocks | | | 128,363,470 | | | | 95,725,875 | | | | | | | | 224,089,345 | |
Common Stocks | | | 2,033,945,706 | | | | 53,072,282 | | | | | | | | 2,087,017,988 | |
Purchased Options | | | 5,184,750 | | | | | | | | | | | | 5,184,750 | |
Short Term Investment | | | 91,119,248 | | | | | | | | | | | | 91,119,248 | |
| | | | |
Total | | $ | 2,266,549,412 | | | $ | 2,318,939,818 | | | $ | — | | | $ | 4,585,489,230 | |
| | | | |
| Liabilities: | | | | | | | | | | | | | | | | |
Written Options | | $ | 12,393,895 | | | $ | — | | | $ | — | | | $ | 12,393,895 | |
Forward Foreign Currency Contracts | | | | | | | 3,588,151 | | | | | | | | 3,588,151 | |
| | | | |
Total | | $ | 12,393,895 | | | $ | 3,588,151 | | | $ | — | | | $ | 15,982,046 | |
| | | | |
| | | | |
| INVESTMENTS, AT VALUE: | | TRANSFERS
INTO LEVEL 1* | | | TRANSFERS OUT OF
LEVEL 1 | | | TRANSFERS INTO
LEVEL 2 | | | TRANSFERS OUT OF
LEVEL 2* | |
Common Stocks | | $ | 43,734,920 | | | $ | — | | | $ | — | | | $ | 43,734,920 | |
| | | | |
Total | | $ | 43,734,920 | | | $ | — | | | $ | — | | | $ | 43,734,920 | |
| | | | |
|
* Transfers to Level 1 from Level 2 were due to the absence of an applied factor utilizing a systematic fair valuation model on securities that trade on European and Far Eastern exchanges. | |
| |
| | | GLOBAL GROWTH AND INCOME FUND | |
| | | LEVEL 1 | | | LEVEL 2 | | | LEVEL 3 | | | TOTAL | |
| | | | | | | | | | | | | | | | |
| Assets: | | | | | | | | | | | | | | | | |
Convertible Bonds | | $ | — | | | $ | 608,338,945 | | | $ | — | | | $ | 608,338,945 | |
Synthetic Convertible Securities (Corporate Bonds) | | | | | | | 56,126,593 | | | | | | | | 56,126,593 | |
Synthetic Convertible Securities (Sovereign Bonds) | | | | | | | 180,037,021 | | | | | | | | 180,037,021 | |
Synthetic Convertible Securities (Purchased Options) | | | 4,918,438 | | | | | | | | | | | | 4,918,438 | |
Convertible Preferred Stocks | | | 7,914,880 | | | | 15,089,000 | | | | | | | | 23,003,880 | |
Common Stocks | | | 364,230,161 | | | | 427,248,525 | | | | | | | | 791,478,686 | |
Short Term Investment | | | 33,629,814 | | | | | | | | | | | | 33,629,814 | |
Forward Foreign Currency Contracts | | | | | | | 23,274 | | | | | | | | 23,274 | |
| | | | |
Total | | $ | 410,693,293 | | | $ | 1,286,863,358 | | | $ | — | | | $ | 1,697,556,651 | |
| | | | |
| Liabilities: | | | | | | | | | | | | | | | | |
Forward Foreign Currency Contracts | | $ | — | | | $ | 8,484,168 | | | $ | — | | | $ | 8,484,168 | |
| | | | |
Total | | $ | — | | | $ | 8,484,168 | | | $ | — | | | $ | 8,484,168 | |
| | | | |
| | | | |
| INVESTMENTS, AT VALUE: | | TRANSFERS
INTO LEVEL 1* | | | TRANSFERS OUT OF
LEVEL 1 | | | TRANSFERS INTO
LEVEL 2 | | | TRANSFERS OUT OF
LEVEL 2* | |
Common Stocks | | $ | 15,216,108 | | | $ | — | | | $ | — | | | $ | 15,216,108 | |
| | | | |
Total | | $ | 15,216,108 | | | $ | — | | | $ | — | | | $ | 15,216,108 | |
| | | | |
|
* Transfers to Level 1 from Level 2 were due to the absence of an applied factor utilizing a systematic fair valuation model on securities that trade on European and Far Eastern exchanges. | |
Notes to Financial Statements
| | | | | | | | | | | | | | | | |
| | | CONVERTIBLE FUND | |
| | | | | | | | | | | | | | | | |
| | | LEVEL 1 | | | LEVEL 2 | | | LEVEL 3 | | | TOTAL | |
| Assets: | | | | | | | | | | | | | | | | |
Convertible Bonds | | $ | — | | | $ | 1,294,652,755 | | | $ | — | | | $ | 1,294,652,755 | |
Synthetic Convertible Securities (Corporate Bonds) | | | | | | | 18,828,913 | | | | | | | | 18,828,913 | |
Synthetic Convertible Securities (Sovereign Bonds) | | | | | | | 232,151,736 | | | | | | | | 232,151,736 | |
Synthetic Convertible Securities (Purchased Options) | | | 32,095,251 | | | | | | | | | | | | 32,095,251 | |
Convertible Preferred Stocks | | | 65,072,000 | | | | 43,035,087 | | | | | | | | 108,107,087 | |
Common Stocks | | | 267,678,100 | | | | 24,678,122 | | | | | | | | 292,356,222 | |
Short Term Investment | | | 81,134,007 | | | | | | | | | | | | 81,134,007 | |
Forward Foreign Currency Contracts | | | | | | | 92,027 | | | | | | | | 92,027 | |
| | | | |
Total | | $ | 445,979,358 | | | $ | 1,613,438,640 | | | $ | — | | | $ | 2,059,417,998 | |
| | | | |
| Liabilities: | | | | | | | | | | | | | | | | |
Forward Foreign Currency Contracts | | $ | — | | | $ | 2,403,628 | | | $ | — | | | $ | 2,403,628 | |
| | | | |
Total | | $ | — | | | $ | 2,403,628 | | | $ | — | | | $ | 2,403,628 | |
| | | | |
| |
| | | TOTAL RETURN BOND FUND | |
| | | LEVEL 1 | | | LEVEL 2 | | | LEVEL 3 | | | TOTAL | |
| Assets: | | | | | | | | | | | | | | | | |
Corporate Bonds | | $ | — | | | $ | 135,141,212 | | | $ | — | | | $ | 135,141,212 | |
Convertible Bonds | | | | | | | 1,125,000 | | | | | | | | 1,125,000 | |
Sovereign Bonds | | | | | | | 45,822,747 | | | | | | | | 45,822,747 | |
U.S. Government and Agency Securities | | | | | | | 33,180,379 | | | | | | | | 33,180,379 | |
Residential Mortgage Backed Securities | | | | | | | 8,372,546 | | | | | | | | 8,372,546 | |
Short Term Investment | | | 10,098,950 | | | | | | | | | | | | 10,098,950 | |
| | | | |
| Total | | $ | 10,098,950 | | | $ | 223,641,884 | | | $ | — | | | $ | 233,740,834 | |
| | | | |
| |
| | | HIGH INCOME FUND | |
| | | LEVEL 1 | | | LEVEL 2 | | | LEVEL 3 | | | TOTAL | |
| | | | | | | | | | | | | | | | |
| Assets: | | | | | | | | | | | | | | | | |
Corporate Bonds | | $ | — | | | $ | 262,388,563 | | | $ | — | | | $ | 262,388,563 | |
Convertible Bonds | | | | | | | 7,847,250 | | | | | | | | 7,847,250 | |
Sovereign Bonds | | | | | | | 4,267,478 | | | | | | | | 4,267,478 | |
Convertible Preferred Stocks | | | 3,452,800 | | | | 5,678,250 | | | | | | | | 9,131,050 | |
Short Term Investment | | | 6,062,506 | | | | | | | | | | | | 6,062,506 | |
| | | | |
Total | | $ | 9,515,306 | | | $ | 280,181,541 | | | $ | — | | | $ | 289,696,847 | |
| | | | |
| | | | |
| 124 | | CALAMOS FAMILY OF FUNDS SEMIANNUAL REPORT | | |
Notes to Financial Statements
| | | | | | | | | | | | | | | | |
| | | MARKET NEUTRAL INCOME FUND | |
| | | | | | | | | | | | | | | | |
| | | LEVEL 1 | | | LEVEL 2 | | | LEVEL 3 | | | TOTAL | |
| Assets: | | | | | | | | | | | | | | | | |
Convertible Bonds | | $ | — | | | $ | 660,902,354 | | | $ | — | | | $ | 660,902,354 | |
U.S. Government and Agency Securities | | | | | | | 198,692,950 | | | | | | | | 198,692,950 | |
Synthetic Convertible Securities (Corporate Bonds) | | | | | | | 123,816,892 | | | | | | | | 123,816,892 | |
Synthetic Convertible Securities (Sovereign Bonds) | | | | | | | 238,239,808 | | | | | | | | 238,239,808 | |
Synthetic Convertible Securities (Purchased Options) | | | 4,385,000 | | | | | | | | | | | | 4,385,000 | |
Common Stocks | | | 1,113,399,784 | | | | | | | | | | | | 1,113,399,784 | |
Purchased Options | | | 1,785,312 | | | | | | | | | | | | 1,785,312 | |
Short Term Investment | | | 59,848,423 | | | | | | | | | | | | 59,848,423 | |
| | | | |
Total | | $ | 1,179,418,519 | | | $ | 1,221,652,004 | | | $ | — | | | $ | 2,401,070,523 | |
| | | | |
| Liabilities: | | | | | | | | | | | | | | | | |
U.S. Government and Agency Securities Sold Short | | $ | — | | | $ | 225,030,275 | | | $ | — | | | $ | 225,030,275 | |
Common Stocks Sold Short | | | 304,111,038 | | | | | | | | | | | | 304,111,038 | |
Written Options | | | 18,916,288 | | | | | | | | | | | | 18,916,288 | |
| | | | |
Total | | $ | 323,027,326 | | | $ | 225,030,275 | | | $ | — | | | $ | 548,057,601 | |
| | | | |
Notes to Financial Statements
Note 10 – Capital Share Transactions
The following table summarizes the activity in capital shares of the Funds:
| | | | | | | | | | | | | | | | | | | | | | | | | | | | | | | | |
| For the Period Ended April 30, 2012 | |
| | | GROWTH FUND | | | VALUE FUND | | | BLUE CHIP FUND | | | DISCOVERY GROWTH
FUND | |
| Class A | | Shares | | | Dollars | | | Shares | | | Dollars | | | Shares | | | Dollars | | | Shares | | | Dollars | |
| Shares sold | | | 6,318,510 | | | $ | 324,761,050 | | | | 113,298 | | | $ | 1,315,691 | | | | 1,185,047 | | | $ | 15,872,157 | | | | 951,483 | | | $ | 11,811,593 | |
| Shares issued as reinvestment of distributions | | | 3,461,089 | | | | 160,594,515 | | | | — | | | | — | | | | — | | | | — | | | | — | | | | — | |
| Less shares redeemed | | | (17,467,854 | ) | | | (888,968,673 | ) | | | (159,289 | ) | | | (1,803,671 | ) | | | (1,032,556 | ) | | | (13,895,492 | ) | | | (814,909 | ) | | | (10,357,367 | ) |
| | | | |
| Net increase (decrease) | | | (7,688,255 | ) | | $ | (403,613,108 | ) | | | (45,991 | ) | | $ | (487,980 | ) | | | 152,491 | | | $ | 1,976,665 | | | | 136,574 | | | $ | 1,454,226 | |
| | | | |
| | | | | | | | |
| Class B | | Shares | | | Dollars | | | Shares | | | Dollars | | | Shares | | | Dollars | | | Shares | | | Dollars | |
| Shares sold* | | | 34,857 | | | $ | 1,653,358 | | | | 4,325 | | | $ | 44,426 | | | | 19,940 | | | $ | 249,243 | | | | 5,064 | | | $ | 61,495 | |
| Shares issued as reinvestment of distributions | | | 252,072 | | | | 11,534,817 | | | | — | | | | — | | | | — | | | | — | | | | — | | | | — | |
| Less shares redeemed | | | (1,944,442 | ) | | | (98,374,799 | ) | | | (70,269 | ) | | | (750,758 | ) | | | (78,508 | ) | | | (949,549 | ) | | | (5,382 | ) | | | (65,482 | ) |
| | | | |
| Net increase (decrease) | | | (1,657,513 | ) | | $ | (85,186,624 | ) | | | (65,944 | ) | | $ | (706,332 | ) | | | (58,568 | ) | | $ | (700,306 | ) | | | (318 | ) | | $ | (3,987 | ) |
| | | | |
| | | | | | | | |
| Class C | | Shares | | | Dollars | | | Shares | | | Dollars | | | Shares | | | Dollars | | | Shares | | | Dollars | |
| Shares sold | | | 1,109,084 | | | $ | 49,727,294 | | | | 29,767 | | | $ | 314,435 | | | | 76,152 | | | $ | 904,884 | | | | 117,154 | | | $ | 1,403,433 | |
| Shares issued as reinvestment of distributions | | | 1,249,989 | | | | 52,124,549 | | | | — | | | | — | | | | — | | | | — | | | | — | | | | — | |
| Less shares redeemed | | | (3,563,880 | ) | | | (162,695,071 | ) | | | (61,118 | ) | | | (649,239 | ) | | | (105,074 | ) | | | (1,282,108 | ) | | | (115,927 | ) | | | (1,364,802 | ) |
| | | | |
| Net increase (decrease) | | | (1,204,807 | ) | | $ | (60,843,228 | ) | | | (31,351 | ) | | $ | (334,804 | ) | | | (28,922 | ) | | $ | (377,224 | ) | | | 1,227 | | | $ | 38,631 | |
| | | | |
| | | | | | | | |
| Class I | | Shares | | | Dollars | | | Shares | | | Dollars | | | Shares | | | Dollars | | | Shares | | | Dollars | |
| Shares sold | | | 7,130,977 | | | $ | 398,188,342 | | | | 29,815 | | | $ | 343,089 | | | | 29,362 | | | $ | 384,240 | | | | 34,756 | | | $ | 433,962 | |
| Shares issued as reinvestment of distributions | | | 1,131,951 | | | | 57,571,037 | | | | — | | | | — | | | | — | | | | — | | | | — | | | | — | |
| Less shares redeemed | | | (3,622,498 | ) | | | (200,868,871 | ) | | | (11,700 | ) | | | (138,495 | ) | | | (41,523 | ) | | | (522,445 | ) | | | (18,204 | ) | | | (222,913 | ) |
| | | | |
| Net increase (decrease) | | | 4,640,430 | | | $ | 254,890,508 | | | | 18,115 | | | $ | 204,594 | | | | (12,161 | ) | | $ | (138,205 | ) | | | 16,552 | | | $ | 211,049 | |
| | | | |
| | | | | | | | |
| Class R | | Shares | | | Dollars | | | Shares | | | Dollars | | | Shares | | | Dollars | | | Shares | | | Dollars | |
| Shares sold | | | 122,597 | | | $ | 6,286,826 | | | | — | | | $ | — | | | | 19 | | | $ | 236 | | | | 99,835 | | | $ | 1,220,500 | |
| Shares issued as reinvestment of distributions | | | 11,656 | | | | 533,852 | | | | — | | | | — | | | | — | | | | — | | | | — | | | | — | |
| Less shares redeemed | | | (55,177 | ) | | | (2,789,475 | ) | | | — | | | | — | | | | — | | | | — | | | | (100,000 | ) | | | (1,220,500 | ) |
| | | | |
| Net increase (decrease) | | | 79,076 | | | $ | 4,031,203 | | | | — | | | $ | — | | | | 19 | | | $ | 236 | | | | (165 | ) | | $ | — | |
| | | | |
| * | Class B shares continue to be outstanding but are no longer an offered class of shares. |
| | | | |
| 126 | | CALAMOS FAMILY OF FUNDS SEMIANNUAL REPORT | | |
Notes to Financial Statements
| | | | | | | | | | | | | | | | | | | | | | | | | | | | | | | | |
| | | INTERNATIONAL
GROWTH FUND | | | EVOLVING WORLD
GROWTH FUND | | | GLOBAL EQUITY FUND | | | GROWTH AND
INCOME FUND | |
| Class A | | Shares | | | Dollars | | | Shares | | | Dollars | | | Shares | | | Dollars | | | Shares | | | Dollars | |
| Shares sold | | | 8,481,683 | | | $ | 141,080,507 | | | | 4,907,618 | | | $ | 62,818,317 | | | | 6,573,788 | | | $ | 84,427,978 | | | | 8,380,571 | | | $ | 270,420,454 | |
| Shares issued as reinvestment of distributions | | | — | | | | — | | | | — | | | | — | | | | — | | | | — | | | | 745,042 | | | | 23,703,896 | |
| Less shares redeemed | | | (2,754,645 | ) | | | (45,804,422 | ) | | | (2,284,220 | ) | | | (29,351,636 | ) | | | (3,926,254 | ) | | | (50,549,651 | ) | | | (6,903,736 | ) | | | (223,027,508 | ) |
| | | | |
| Net increase (decrease) | | | 5,727,038 | | | $ | 95,276,085 | | | | 2,623,398 | | | $ | 33,466,681 | | | | 2,647,534 | | | $ | 33,878,327 | | | | 2,221,877 | | | $ | 71,096,842 | |
| | | | |
| | | | | | | | |
| Class B | | Shares | | | Dollars | | | Shares | | | Dollars | | | Shares | | | Dollars | | | Shares | | | Dollars | |
| Shares sold* | | | 7,800 | | | $ | 125,744 | | | | 4,196 | | | $ | 52,542 | | | | 20,422 | | | $ | 245,795 | | | | 42,129 | | | $ | 1,527,563 | |
| Shares issued as reinvestment of distributions | | | — | | | | — | | | | — | | | | — | | | | — | | | | — | | | | 23,537 | | | | 847,526 | |
| Less shares redeemed | | | (174,131 | ) | | | (2,779,481 | ) | | | (12,225 | ) | | | (152,738 | ) | | | (32,428 | ) | | | (391,600 | ) | | | (1,666,625 | ) | | | (61,690,448 | ) |
| | | | |
| Net increase (decrease) | | | (166,331 | ) | | $ | (2,653,737 | ) | | | (8,029 | ) | | $ | (100,196 | ) | | | (12,006 | ) | | $ | (145,805 | ) | | | (1,600,959 | ) | | $ | (59,315,359 | ) |
| | | | |
| | | | | | | | |
| Class C | | Shares | | | Dollars | | | Shares | | | Dollars | | | Shares | | | Dollars | | | Shares | | | Dollars | |
| Shares sold | | | 795,112 | | | $ | 12,694,014 | | | | 919,381 | | | $ | 11,556,663 | | | | 677,255 | | | $ | 8,319,051 | | | | 2,398,034 | | | $ | 76,614,847 | |
| Shares issued as reinvestment of distributions | | | — | | | | — | | | | — | | | | — | | | | — | | | | — | | | | 283,716 | | | | 9,049,894 | |
| Less shares redeemed | | | (426,211 | ) | | | (6,718,856 | ) | | | (180,202 | ) | | | (2,213,230 | ) | | | (193,168 | ) | | | (2,306,342 | ) | | | (3,187,965 | ) | | | (103,394,613 | ) |
| | | | |
| Net increase (decrease) | | | 368,901 | | | $ | 5,975,158 | | | | 739,179 | | | $ | 9,343,433 | | | | 484,087 | | | $ | 6,012,709 | | | | (506,215 | ) | | $ | (17,729,872 | ) |
| | | | |
| | | | | | | | |
| Class I | | Shares | | | Dollars | | | Shares | | | Dollars | | | Shares | | | Dollars | | | Shares | | | Dollars | |
| Shares sold | | | 9,054,605 | | | $ | 154,053,897 | | | | 6,951,247 | | | $ | 89,083,770 | | | | 6,681,659 | | | $ | 83,879,677 | | | | 6,622,181 | | | $ | 209,464,160 | |
| Shares issued as reinvestment of distributions | | | — | | | | — | | | | 5,596 | | | | 67,606 | | | | — | | | | — | | | | 349,377 | | | | 10,878,537 | |
| Less shares redeemed | | | (3,658,766 | ) | | | (62,149,177 | ) | | | (965,493 | ) | | | (12,284,866 | ) | | | (866,404 | ) | | | (11,207,374 | ) | | | (4,141,768 | ) | | | (131,116,241 | ) |
| | | | |
| Net increase (decrease) | | | 5,395,839 | | | $ | 91,904,720 | | | | 5,991,350 | | | $ | 76,866,510 | | | | 5,815,255 | | | $ | 72,672,303 | | | | 2,829,790 | | | $ | 89,226,456 | |
| | | | |
| | | | | | | | |
| Class R | | Shares | | | Dollars | | | Shares | | | Dollars | | | Shares | | | Dollars | | | Shares | | | Dollars | |
| Shares sold | | | 251,130 | | | $ | 4,208,692 | | | | 113,523 | | | $ | 1,419,296 | | | | 155,536 | | | $ | 1,904,524 | | | | 199,528 | | | $ | 6,367,452 | |
| Shares issued as reinvestment of distributions | | | — | | | | — | | | | — | | | | — | | | | — | | | | — | | | | 5,626 | | | | 178,503 | |
| Less shares redeemed | | | (52,124 | ) | | | (838,234 | ) | | | (101,039 | ) | | | (1,257,410 | ) | | | (143,486 | ) | | | (1,757,159 | ) | | | (80,598 | ) | | | (2,609,075 | ) |
| | | | |
| Net increase (decrease) | | | 199,006 | | | $ | 3,370,458 | | | | 12,484 | | | $ | 161,886 | | | | 12,050 | | | $ | 147,365 | | | | 124,556 | | | $ | 3,936,880 | |
| | | | |
| * | Class B shares continue to be outstanding but are no longer an offered class of shares. |
Notes to Financial Statements
| | | | | | | | | | | | | | | | | | | | | | | | | | | | | | | | |
| | | GLOBAL GROWTH AND
INCOME FUND | | | CONVERTIBLE FUND | | | TOTAL RETURN
BOND FUND | | | HIGH INCOME FUND | |
| Class A | | Shares | | | Dollars | | | Shares | | | Dollars | | | Shares | | | Dollars | | | Shares | | | Dollars | |
| Shares sold | | | 3,197,792 | | | $ | 34,614,079 | | | | 744,122 | | | $ | 13,145,393 | | | | 3,119,057 | | | $ | 34,374,742 | | | | 5,789,717 | | | $ | 56,067,631 | |
| Shares issued as reinvestment of distributions | | | 471,521 | | | | 5,129,185 | | | | 4,929,123 | | | | 84,465,153 | | | | 233,621 | | | | 2,562,234 | | | | 811,288 | | | | 7,864,936 | |
| Less shares redeemed | | | (5,804,375 | ) | | | (63,091,114 | ) | | | (18,428,394 | ) | | | (333,372,357 | ) | | | (1,794,444 | ) | | | (19,834,410 | ) | | | (3,579,929 | ) | | | (34,639,573 | ) |
| | | | |
| Net increase (decrease) | | | (2,135,062 | ) | | $ | (23,347,850 | ) | | | (12,755,149 | ) | | $ | (235,761,811 | ) | | | 1,558,234 | | | $ | 17,102,566 | | | | 3,021,076 | | | $ | 29,292,994 | |
| | | | |
| | | | | | | | |
| Class B | | Shares | | | Dollars | | | Shares | | | Dollars | | | Shares | | | Dollars | | | Shares | | | Dollars | |
| Shares sold* | | | 26,090 | | | $ | 282,305 | | | | 15,939 | | | $ | 329,547 | | | | 91,281 | | | $ | 1,007,728 | | | | 26,720 | | | $ | 269,630 | |
| Shares issued as reinvestment of distributions | | | 16,919 | | | | 188,817 | | | | 40,979 | | | | 845,807 | | | | 16,104 | | | | 176,329 | | | | 23,376 | | | | 236,289 | |
| Less shares redeemed | | | (811,711 | ) | | | (8,954,854 | ) | | | (183,460 | ) | | | (4,036,016 | ) | | | (370,430 | ) | | | (4,087,670 | ) | | | (309,212 | ) | | | (3,128,727 | ) |
| | | | |
| Net increase (decrease) | | | (768,702 | ) | | $ | (8,483,732 | ) | | | (126,542 | ) | | $ | (2,860,662 | ) | | | (263,045 | ) | | $ | (2,903,613 | ) | | | (259,116 | ) | | $ | (2,622,808 | ) |
| | | | |
| | | | | | | | |
| Class C | | Shares | | | Dollars | | | Shares | | | Dollars | | | Shares | | | Dollars | | | Shares | | | Dollars | |
| Shares sold | | | 1,228,917 | | | $ | 12,435,251 | | | | 674,078 | | | $ | 11,508,711 | | | | 736,590 | | | $ | 8,119,645 | | | | 531,558 | | | $ | 5,340,521 | |
| Shares issued as reinvestment of distributions | | | 199,053 | | | | 2,076,124 | | | | 1,756,624 | | | | 29,909,980 | | | | 56,794 | | | | 621,590 | | | | 105,082 | | | | 1,054,119 | |
| Less shares redeemed | | | (3,120,906 | ) | | | (31,930,629 | ) | | | (4,984,972 | ) | | | (89,802,841 | ) | | | (828,404 | ) | | | (9,142,769 | ) | | | (447,493 | ) | | | (4,495,131 | ) |
| | | | |
| Net increase (decrease) | | | (1,692,936 | ) | | $ | (17,419,254 | ) | | | (2,554,270 | ) | | $ | (48,384,150 | ) | | | (35,020 | ) | | $ | (401,534 | ) | | | 189,147 | | | $ | 1,899,509 | |
| | | | |
| | | | | | | | |
| Class I | | Shares | | | Dollars | | | Shares | | | Dollars | | | Shares | | | Dollars | | | Shares | | | Dollars | |
| Shares sold | | | 11,979,918 | | | $ | 131,411,075 | | | | 6,382,825 | | | $ | 106,925,618 | | | | 121,289 | | | $ | 1,334,243 | | | | 1,173,414 | | | $ | 11,399,914 | |
| Shares issued as reinvestment of distributions | | | 1,653,280 | | | | 18,159,927 | | | | 3,025,994 | | | | 48,363,771 | | | | 86,655 | | | | 950,073 | | | | 95,424 | | | | 925,211 | |
| Less shares redeemed | | | (8,082,645 | ) | | | (89,253,110 | ) | | | (13,044,929 | ) | | | (222,233,411 | ) | | | (208,476 | ) | | | (2,299,552 | ) | | | (433,350 | ) | | | (4,202,322 | ) |
| | | | |
| Net increase (decrease) | | | 5,550,553 | | | $ | 60,317,892 | | | | (3,636,110 | ) | | $ | (66,944,022 | ) | | | (532 | ) | | $ | (15,236 | ) | | | 835,488 | | | $ | 8,122,803 | |
| | | | |
| | | | | | | | |
| Class R | | Shares | | | Dollars | | | Shares | | | Dollars | | | Shares | | | Dollars | | | Shares | | | Dollars | |
| Shares sold | | | 50,999 | | | $ | 556,918 | | | | 23,265 | | | $ | 418,192 | | | | 13,189 | | | $ | 146,105 | | | | 6,547 | | | $ | 63,386 | |
| Shares issued as reinvestment of distributions | | | 1,947 | | | | 21,222 | | | | 17,079 | | | | 291,600 | | | | 3,156 | | | | 34,598 | | | | 544 | | | | 5,262 | |
| Less shares redeemed | | | (9,643 | ) | | | (104,815 | ) | | | (29,522 | ) | | | (536,839 | ) | | | (8,605 | ) | | | (95,164 | ) | | | (572 | ) | | | (5,527 | ) |
| | | | |
| Net increase (decrease) | | | 43,303 | | | $ | 473,325 | | | | 10,822 | | | $ | 172,953 | | | | 7,740 | | | $ | 85,539 | | | | 6,519 | | | $ | 63,121 | |
| | | | |
| * | Class B shares continue to be outstanding but are no longer an offered class of shares. |
| | | | |
| 128 | | CALAMOS FAMILY OF FUNDS SEMIANNUAL REPORT | | |
Notes to Financial Statements
| | | | | | | | |
| | | MARKET NEUTRAL
INCOME FUND | |
| Class A | | Shares | | | Dollars | |
| Shares sold | | | 15,120,408 | | | $ | 186,046,304 | |
| Shares issued as reinvestment of distributions | | | 611,101 | | | | 7,455,769 | |
| Less shares redeemed | | | (30,464,980 | ) | | | (374,982,674 | ) |
| | | | |
| Net increase (decrease) | | | (14,733,471 | ) | | $ | (181,480,601 | ) |
| | | | |
| | |
| Class B | | Shares | | | Dollars | |
| Shares sold* | | | 8,963 | | | $ | 116,613 | |
| Shares issued as reinvestment of distributions | | | 2,001 | | | | 25,458 | |
| Less shares redeemed | | | (237,937 | ) | | | (3,082,382 | ) |
| | | | |
| Net increase (decrease) | | | (226,973 | ) | | $ | (2,940,311 | ) |
| | | | |
| | |
| Class C | | Shares | | | Dollars | |
| Shares sold | | | 533,835 | | | $ | 6,691,300 | |
| Shares issued as reinvestment of distributions | | | 43,982 | | | | 540,208 | |
| Less shares redeemed | | | (2,376,326 | ) | | | (29,623,599 | ) |
| | | | |
| Net increase (decrease) | | | (1,798,509 | ) | | $ | (22,392,091 | ) |
| | | | |
| | |
| Class I | | Shares | | | Dollars | |
| Shares sold | | | 27,833,985 | | | $ | 339,489,446 | |
| Shares issued as reinvestment of distributions | | | 402,612 | | | | 4,876,418 | |
| Less shares redeemed | | | (12,299,112 | ) | | | (150,350,565 | ) |
| | | | |
| Net increase (decrease) | | | 15,937,485 | | | $ | 194,015,299 | |
| | | | |
| | |
| Class R | | Shares | | | Dollars | |
| Shares sold | | | 149,877 | | | $ | 1,840,635 | |
| Shares issued as reinvestment of distributions | | | 1,167 | | | | 14,218 | |
| Less shares redeemed | | | (47,970 | ) | | | (595,302 | ) |
| | | | |
| Net increase (decrease) | | | 103,074 | | | $ | 1,259,551 | |
| | | | |
| * | Class B shares continue to be outstanding but are no longer an offered class of shares. |
Notes to Financial Statements
The following table summarizes the activity in capital shares of the Funds:
| | | | | | | | | | | | | | | | | | | | | | | | | | | | | | | | |
| For the Fiscal Year Ended October 31, 2011 | | | | | | | | | | |
| | | GROWTH FUND | | | VALUE FUND | | | BLUE CHIP FUND | | | DISCOVERY GROWTH
FUND | |
| Class A | | Shares | | | Dollars | | | Shares | | | Dollars | | | Shares | | | Dollars | | | Shares | | | Dollars | |
| Shares sold | | | 18,644,155 | | | $ | 998,946,026 | | | | 140,907 | | | $ | 1,603,273 | | | | 878,672 | | | $ | 11,254,473 | | | | 1,655,363 | | | $ | 22,202,512 | |
| Shares issued as reinvestment of distributions | | | — | | | | — | | | | — | | | | — | | | | — | | | | — | | | | 1,416 | | | | 17,960 | |
| Less shares redeemed | | | (31,732,735 | ) | | | (1,687,461,706 | ) | | | (874,375 | ) | | | (10,216,967 | ) | | | (1,099,058 | ) | | | (14,030,088 | ) | | | (959,049 | ) | | | (12,499,298 | ) |
| | | | |
| Net increase (decrease) | | | (13,088,580 | ) | | $ | (688,515,680 | ) | | | (733,468 | ) | | $ | (8,613,694 | ) | | | (220,386 | ) | | $ | (2,775,615 | ) | | | 697,730 | | | $ | 9,721,174 | |
| | | | |
| | | | | | | | |
| Class B | | Shares | | | Dollars | | | Shares | | | Dollars | | | Shares | | | Dollars | | | Shares | | | Dollars | |
| Shares sold* | | | 62,628 | | | $ | 3,310,996 | | | | 9,071 | | | $ | 98,403 | | | | 19,509 | | | $ | 238,564 | | | | 29,459 | | | $ | 401,260 | |
| Shares issued as reinvestment of distributions | | | — | | | | — | | | | — | | | | — | | | | — | | | | — | | | | — | | | | — | |
| Less shares redeemed | | | (3,798,520 | ) | | | (201,132,338 | ) | | | (166,097 | ) | | | (1,765,835 | ) | | | (138,381 | ) | | | (1,691,428 | ) | | | (7,814 | ) | | | (99,263 | ) |
| | | | |
| Net increase (decrease) | | | (3,735,892 | ) | | $ | (197,821,342 | ) | | | (157,026 | ) | | $ | (1,667,432 | ) | | | (118,872 | ) | | $ | (1,452,864 | ) | | | 21,645 | | | $ | 301,997 | |
| | | | |
| | | | | | | | |
| Class C | | Shares | | | Dollars | | | Shares | | | Dollars | | | Shares | | | Dollars | | | Shares | | | Dollars | |
| Shares sold | | | 2,139,676 | | | $ | 105,010,774 | | | | 27,551 | | | $ | 294,895 | | | | 119,980 | | | $ | 1,452,352 | | | | 96,147 | | | $ | 1,263,926 | |
| Shares issued as reinvestment of distributions | | | — | | | | — | | | | — | | | | — | | | | — | | | | — | | | | — | | | | — | |
| Less shares redeemed | | | (7,637,141 | ) | | | (370,178,487 | ) | | | (220,246 | ) | | | (2,381,009 | ) | | | (186,817 | ) | | | (2,256,309 | ) | | | (17,713 | ) | | | (225,189 | ) |
| | | | |
| Net increase (decrease) | | | (5,497,465 | ) | | $ | (265,167,713 | ) | | | (192,695 | ) | | $ | (2,086,114 | ) | | | (66,837 | ) | | $ | (803,957 | ) | | | 78,434 | | | $ | 1,038,737 | |
| | | | |
| | | | | | | | |
| Class I | | Shares | | | Dollars | | | Shares | | | Dollars | | | Shares | | | Dollars | | | Shares | | | Dollars | |
| Shares sold | | | 9,641,591 | | | $ | 556,573,593 | | | | 52,897 | | | $ | 617,133 | | | | 97,274 | | | $ | 1,236,549 | | | | 698,776 | | | $ | 9,481,749 | |
| Shares issued as reinvestment of distributions | | | — | | | | — | | | | — | | | | — | | | | — | | | | — | | | | 473 | | | | 6,005 | |
| Less shares redeemed | | | (5,372,590 | ) | | | (309,270,842 | ) | | | (621,724 | ) | | | (7,288,141 | ) | | | (83,115 | ) | | | (1,044,346 | ) | | | (276,215 | ) | | | (3,683,795 | ) |
| | | | |
| Net increase (decrease) | | | 4,269,001 | | | $ | 247,302,751 | | | | (568,827 | ) | | $ | (6,671,008 | ) | | | 14,159 | | | $ | 192,203 | | | | 423,034 | | | $ | 5,803,959 | |
| | | | |
| | | | | | | | |
| Class R | | Shares | | | Dollars | | | Shares | | | Dollars | | | Shares | | | Dollars | | | Shares | | | Dollars | |
| Shares sold | | | 150,566 | | | $ | 8,017,686 | | | | — | | | $ | — | | | | 41 | | | $ | 485 | | | | — | | | $ | — | |
| Shares issued as reinvestment of distributions | | | — | | | | — | | | | — | | | | — | | | | — | | | | — | | | | — | | | | — | |
| Less shares redeemed | | | (78,463 | ) | | | (4,132,316 | ) | | | — | | | | — | | | | (27 | ) | | | (314 | ) | | | — | | | | — | |
| | | | |
| Net increase (decrease) | | | 72,103 | | | $ | 3,885,370 | | | | — | | | $ | — | | | | 14 | | | $ | 171 | | | | — | | | $ | — | |
| | | | |
| * | Class B shares continue to be outstanding but are no longer an offered class of shares. |
| | | | |
| 130 | | CALAMOS FAMILY OF FUNDS SEMIANNUAL REPORT | | |
Notes to Financial Statements
| | | | | | | | | | | | | | | | | | | | | | | | | | | | | | | | |
| | | INTERNATIONAL
GROWTH FUND | | | EVOLVING WORLD GROWTH FUND | | | GLOBAL EQUITY FUND | | | GROWTH AND
INCOME FUND | |
| Class A | | Shares | | | Dollars | | | Shares | | | Dollars | | | Shares | | | Dollars | | | Shares | | | Dollars | |
| Shares sold | | | 9,892,494 | | | $ | 166,842,873 | | | | 7,903,337 | | | $ | 101,678,888 | | | | 5,198,374 | | | $ | 64,610,914 | | | | 21,287,332 | | | $ | 682,851,158 | |
| Shares issued as reinvestment of distributions | | | — | | | | — | | | | 12,433 | | | | 160,644 | | | | — | | | | — | | | | 753,248 | | | | 23,181,141 | |
| Less shares redeemed | | | (4,104,510 | ) | | | (68,328,532 | ) | | | (3,164,678 | ) | | | (40,401,648 | ) | | | (3,633,534 | ) | | | (44,586,614 | ) | | | (15,840,019 | ) | | | (503,405,743 | ) |
| | | | |
| Net increase (decrease) | | | 5,787,984 | | | $ | 98,514,341 | | | | 4,751,092 | | | $ | 61,437,884 | | | | 1,564,840 | | | $ | 20,024,300 | | | | 6,200,561 | | | $ | 202,626,556 | |
| | | | |
| | | | | | | | |
| Class B | | Shares | | | Dollars | | | Shares | | | Dollars | | | Shares | | | Dollars | | | Shares | | | Dollars | |
| Shares sold* | | | 46,738 | | | $ | 752,123 | | | | 14,030 | | | $ | 179,076 | | | | 41,783 | | | $ | 505,632 | | | | 115,696 | | | $ | 4,190,833 | |
| Shares issued as reinvestment of distributions | | | — | | | | — | | | | — | | | | — | | | | — | | | | — | | | | 36,771 | | | | 1,291,592 | |
| Less shares redeemed | | | (295,362 | ) | | | (4,768,692 | ) | | | (14,350 | ) | | | (187,576 | ) | | | (52,243 | ) | | | (628,093 | ) | | | (3,943,401 | ) | | | (143,451,510 | ) |
| | | | |
| Net increase (decrease) | | | (248,624 | ) | | $ | (4,016,569 | ) | | | (320 | ) | | $ | (8,500 | ) | | | (10,460 | ) | | $ | (122,461 | ) | | | (3,790,934 | ) | | $ | (137,969,085 | ) |
| | | | |
| | | | | | | | |
| Class C | | Shares | | | Dollars | | | Shares | | | Dollars | | | Shares | | | Dollars | | | Shares | | | Dollars | |
| Shares sold | | | 1,008,370 | | | $ | 16,344,023 | | | | 524,359 | | | $ | 6,800,890 | | | | 437,587 | | | $ | 5,296,282 | | | | 5,841,148 | | | $ | 188,007,942 | |
| Shares issued as reinvestment of distributions | | | — | | | | — | | | | — | ** | | | 3 | | | | — | | | | — | | | | 253,431 | | | | 7,841,179 | |
| Less shares redeemed | | | (825,535 | ) | | | (13,299,071 | ) | | | (82,437 | ) | | | (1,060,141 | ) | | | (150,499 | ) | | | (1,758,021 | ) | | | (6,984,380 | ) | | | (223,219,866 | ) |
| | | | |
| Net increase (decrease) | | | 182,835 | | | $ | 3,044,952 | | | | 441,922 | | | $ | 5,740,752 | | | | 287,088 | | | $ | 3,538,261 | | | | (889,801 | ) | | $ | (27,370,745 | ) |
| | | | |
| | | | | | | | |
| Class I | | Shares | | | Dollars | | | Shares | | | Dollars | | | Shares | | | Dollars | | | Shares | | | Dollars | |
| Shares sold | | | 11,608,419 | | | $ | 196,374,015 | | | | 9,125,841 | | | $ | 122,077,563 | | | | 4,665,735 | | | $ | 58,299,980 | | | | 14,554,192 | | | $ | 455,935,129 | |
| Shares issued as reinvestment of distributions | | | — | | | | — | | | | 18,136 | | | | 235,045 | | | | — | | | | — | | | | 329,400 | | | | 9,904,933 | |
| Less shares redeemed | | | (4,037,948 | ) | | | (67,040,950 | ) | | | (6,271,063 | ) | | | (82,665,264 | ) | | | (522,607 | ) | | | (6,462,566 | ) | | | (10,797,036 | ) | | | (337,528,288 | ) |
| | | | |
| Net increase (decrease) | | | 7,570,471 | | | $ | 129,333,065 | | | | 2,872,914 | | | $ | 39,647,344 | | | | 4,143,128 | | | $ | 51,837,414 | | | | 4,086,556 | | | $ | 128,311,774 | |
| | | | |
| | | | | | | | |
| Class R | | Shares | | | Dollars | | | Shares | | | Dollars | | | Shares | | | Dollars | | | Shares | | | Dollars | |
| Shares sold | | | 200,476 | | | $ | 3,180,522 | | | | 1,924 | | | $ | 24,313 | | | | 38,560 | | | $ | 485,325 | | | | 359,294 | | | $ | 11,534,518 | |
| Shares issued as reinvestment of distributions | | | — | | | | — | | | | — | | | | — | | | | — | | | | — | | | | 3,724 | | | | 113,853 | |
| Less shares redeemed | | | (49,398 | ) | | | (798,350 | ) | | | (644 | ) | | | (7,898 | ) | | | (5,697 | ) | | | (70,368 | ) | | | (221,019 | ) | | | (7,053,717 | ) |
| | | | |
| Net increase (decrease) | | | 151,078 | | | $ | 2,382,172 | | | | 1,280 | | | $ | 16,415 | | | | 32,863 | | | $ | 414,957 | | | | 141,999 | | | $ | 4,594,654 | |
| | | | |
| * | Class B shares continue to be outstanding but are no longer an offered class of shares. |
| ** | Amount is less than 1 share. |
Notes to Financial Statements
| | | | | | | | | | | | | | | | | | | | | | | | | | | | | | | | |
| | | GLOBAL GROWTH AND INCOME FUND | | | CONVERTIBLE FUND | | | TOTAL RETURN BOND FUND | | | HIGH INCOME FUND | |
| Class A | | Shares | | | Dollars | | | Shares | | | Dollars | | | Shares | | | Dollars | | | Shares | | | Dollars | |
| Shares sold | | | 13,669,755 | | | $ | 147,978,344 | | | | 12,825,865 | | | $ | 254,836,038 | | | | 4,587,031 | | | $ | 51,087,821 | | | | 8,350,150 | | | $ | 81,901,944 | |
| Shares issued as reinvestment of distributions | | | — | | | | — | | | | 3,355,055 | | | | 65,257,533 | | | | 317,545 | | | | 3,493,022 | | | | 1,130,945 | | | | 11,154,362 | |
| Less shares redeemed | | | (10,310,071 | ) | | | (111,590,193 | ) | | | (39,224,271 | ) | | | (773,242,771 | ) | | | (4,806,176 | ) | | | (53,349,837 | ) | | | (11,850,125 | ) | | | (116,501,048 | ) |
| | | | |
| Net increase (decrease) | | | 3,359,684 | | | $ | 36,388,151 | | | | (23,043,351 | ) | | $ | (453,149,200 | ) | | | 98,400 | | | $ | 1,231,006 | | | | (2,369,030 | ) | | $ | (23,444,742 | ) |
| | | | |
| | | | | | | | |
| Class B | | Shares | | | Dollars | | | Shares | | | Dollars | | | Shares | | | Dollars | | | Shares | | | Dollars | |
| Shares sold* | | | 128,783 | | | $ | 1,415,644 | | | | 22,839 | | | $ | 532,013 | | | | 329,560 | | | $ | 3,666,077 | | | | 108,332 | | | $ | 1,117,673 | |
| Shares issued as reinvestment of distributions | | | — | | | | — | | | | 42,214 | | | | 975,630 | | | | 30,890 | | | | 338,548 | | | | 49,197 | | | | 505,228 | |
| Less shares redeemed | | | (1,491,580 | ) | | | (16,301,624 | ) | | | (1,550,596 | ) | | | (36,928,052 | ) | | | (992,157 | ) | | | (10,958,545 | ) | | | (867,046 | ) | | | (8,938,554 | ) |
| | | | |
| Net increase (decrease) | | | (1,362,797 | ) | | $ | (14,885,980 | ) | | | (1,485,543 | ) | | $ | (35,420,409 | ) | | | (631,707 | ) | | $ | (6,953,920 | ) | | | (709,517 | ) | | $ | (7,315,653 | ) |
| | | | |
| | | | | | | | |
| Class C | | Shares | | | Dollars | | | Shares | | | Dollars | | | Shares | | | Dollars | | | Shares | | | Dollars | |
| Shares sold | | | 5,945,225 | | | $ | 61,163,406 | | | | 1,137,764 | | | $ | 22,326,523 | | | | 1,837,182 | | | $ | 20,476,423 | | | | 628,707 | | | $ | 6,400,888 | |
| Shares issued as reinvestment of distributions | | | — | | | | — | | | | 897,862 | | | | 17,382,615 | | | | 71,543 | | | | 784,343 | | | | 152,350 | | | | 1,551,087 | |
| Less shares redeemed | | | (6,689,654 | ) | | | (68,451,953 | ) | | | (7,704,360 | ) | | | (150,790,428 | ) | | | (2,067,503 | ) | | | (22,830,672 | ) | | | (1,487,597 | ) | | | (15,196,399 | ) |
| | | | |
| Net increase (decrease) | | | (744,429 | ) | | $ | (7,288,547 | ) | | | (5,668,734 | ) | | $ | (111,081,290 | ) | | | (158,778 | ) | | $ | (1,569,906 | ) | | | (706,540 | ) | | $ | (7,244,424 | ) |
| | | | |
| | | | | | | | |
| Class I | | Shares | | | Dollars | | | Shares | | | Dollars | | | Shares | | | Dollars | | | Shares | | | Dollars | |
| Shares sold | | | 30,071,139 | | | $ | 329,200,802 | | | | 26,312,319 | | | $ | 490,915,951 | | | | 175,234 | | | $ | 1,955,719 | | | | 832,741 | | | $ | 8,217,710 | |
| Shares issued as reinvestment of distributions | | | — | | | | — | | | | 1,630,911 | | | | 29,785,868 | | | | 142,281 | | | | 1,564,429 | | | | 190,434 | | | | 1,882,953 | |
| Less shares redeemed | | | (14,780,096 | ) | | | (162,663,087 | ) | | | (33,878,336 | ) | | | (627,322,643 | ) | | | (731,102 | ) | | | (8,017,064 | ) | | | (3,280,248 | ) | | | (32,127,192 | ) |
| | | | |
| Net increase (decrease) | | | 15,291,043 | | | $ | 166,537,715 | | | | (5,935,106 | ) | | $ | (106,620,824 | ) | | | (413,587 | ) | | $ | (4,496,916 | ) | | | (2,257,073 | ) | | $ | (22,026,529 | ) |
| | | | |
| | | | | | | | |
| Class R | | Shares | | | Dollars | | | Shares | | | Dollars | | | Shares | | | Dollars | | | Shares | | | Dollars | |
| Shares sold | | | 90,745 | | | $ | 971,053 | | | | 105,919 | | | $ | 2,081,654 | | | | 20,576 | | | $ | 227,667 | | | | 5,594 | | | $ | 55,006 | |
| Shares issued as reinvestment of distributions | | | — | | | | — | | | | 6,590 | | | | 127,822 | | | | 4,090 | | | | 45,005 | | | | 780 | | | | 7,663 | |
| Less shares redeemed | | | (72,762 | ) | | | (783,257 | ) | | | (44,606 | ) | | | (880,412 | ) | | | (1,281 | ) | | | (14,009 | ) | | | (3,089 | ) | | | (30,791 | ) |
| | | | |
| Net increase (decrease) | | | 17,983 | | | $ | 187,796 | | | | 67,903 | | | $ | 1,329,064 | | | | 23,385 | | | $ | 258,663 | | | | 3,285 | | | $ | 31,878 | |
| | | | |
| * | Class B shares continue to be outstanding but are no longer an offered class of shares. |
| | | | |
| 132 | | CALAMOS FAMILY OF FUNDS SEMIANNUAL REPORT | | |
Notes to Financial Statements
| | | | | | | | |
| | | MARKET NEUTRAL INCOME FUND | |
| Class A | | Shares | | | Dollars | |
| Shares sold | | | 52,377,397 | | | $ | 631,584,348 | |
| Shares issued as reinvestment of distributions | | | 1,724,623 | | | | 20,509,729 | |
| Less shares redeemed | | | (49,274,289 | ) | | | (593,526,394 | ) |
| | | | |
| Net increase (decrease) | | | 4,827,731 | | | $ | 58,567,683 | |
| | | | |
| | |
| Class B | | Shares | | | Dollars | |
| Shares sold* | | | 35,030 | | | $ | 442,806 | |
| Shares issued as reinvestment of distributions | | | 9,194 | | | | 115,138 | |
| Less shares redeemed | | | (646,149 | ) | | | (8,207,226 | ) |
| | | | |
| Net increase (decrease) | | | (601,925 | ) | | $ | (7,649,282 | ) |
| | | | |
| | |
| Class C | | Shares | | | Dollars | |
| Shares sold | | | 2,380,180 | | | $ | 29,037,039 | |
| Shares issued as reinvestment of distributions | | | 171,412 | | | | 2,070,890 | |
| Less shares redeemed | | | (7,390,392 | ) | | | (90,422,341 | ) |
| | | | |
| Net increase (decrease) | | | (4,838,800 | ) | | $ | (59,314,412 | ) |
| | | | |
| | |
| Class I | | Shares | | | Dollars | |
| Shares sold | | | 42,896,384 | | | $ | 511,981,871 | |
| Shares issued as reinvestment of distributions | | | 757,010 | | | | 8,906,726 | |
| Less shares redeemed | | | (26,280,690 | ) | | | (313,263,165 | ) |
| | | | |
| Net increase (decrease) | | | 17,372,704 | | | $ | 207,625,432 | |
| | | | |
| | |
| Class R | | Shares | | | Dollars | |
| Shares sold | | | 135,727 | | | $ | 1,633,219 | |
| Shares issued as reinvestment of distributions | | | 2,577 | | | | 30,565 | |
| Less shares redeemed | | | (78,408 | ) | | | (946,927 | ) |
| | | | |
| Net increase (decrease) | | | 59,896 | | | $ | 716,857 | |
| | | | |
| * | Class B shares continue to be outstanding but are no longer an offered class of shares. |
Calamos Growth Fund Financial Highlights
Selected data for a share outstanding throughout each period were as follows:
| | | | | | | | | | | | | | | | | | | | | | | | |
| | | CLASS A | |
| | | (Unaudited) Six Months
Ended
April 30, | | | Year Ended October 31, | |
| | | 2012 | | | 2011 | | | 2010 | | | 2009 | | | 2008 | | | 2007 | |
Net asset value, beginning of period | | | $51.06 | | | | $49.18 | | | | $40.60 | | | | $32.20 | | | | $70.29 | | | | $55.12 | |
| |
Income from investment operations: | | | | | | | | | | | | | | | | | | | | | | | | |
Net investment income (loss)(a) | | | (0.10 | ) | | | (0.32 | ) | | | (0.16 | ) | | | (0.14 | ) | | | (0.24 | ) | | | (0.35 | ) |
| |
Net realized and unrealized gain (loss) | | | 4.50 | | | | 2.20 | | | | 8.74 | | | | 8.54 | | | | (30.29 | ) | | | 17.49 | |
| |
Total from investment operations | | | 4.40 | | | | 1.88 | | | | 8.58 | | | | 8.40 | | | | (30.53 | ) | | | 17.14 | |
| |
Distributions: | | | | | | | | | | | | | | | | | | | | | | | | |
Dividends from net investment income | | | — | | | | — | | | | — | | | | — | | | | — | | | | — | |
| |
Dividends from net realized gains | | | (2.15 | ) | | | — | | | | — | | | | — | | | | (7.56 | ) | | | (1.97 | ) |
| |
Total distributions | | | (2.15 | ) | | | — | | | | — | | | | — | | | | (7.56 | ) | | | (1.97 | ) |
| |
Net asset value, end of period | | | $53.31 | | | | $51.06 | | | | $49.18 | | | | $40.60 | | | | $32.20 | | | | $70.29 | |
| |
Ratios and supplemental data: | | | | | | | | | | | | | | | | | | | | | | | | |
Total return(b) | | | 9.24% | | | | 3.82% | | | | 21.13% | | | | 26.09% | | | | (48.11% | ) | | | 32.15% | |
| |
Net assets, end of period (000) | | | $4,009,844 | | | | $4,232,942 | | | | $4,721,389 | | | | $5,017,458 | | | | $5,052,016 | | | | $12,068,660 | |
| |
Ratio of net expenses to average net assets | | | 1.28% | (c) | | | 1.26% | | | | 1.27% | | | | 1.32% | | | | 1.21% | | | | 1.20% | |
| |
Ratio of gross expenses to average net assets prior to expense reductions | | | 1.28% | (c) | | | 1.26% | | | | 1.27% | | | | 1.33% | | | | 1.22% | | | | 1.21% | |
| |
Ratio of net investment income (loss) to average net assets | | | (0.38% | )(c) | | | (0.60% | ) | | | (0.37% | ) | | | (0.44% | ) | | | (0.46% | ) | | | (0.61% | ) |
| |
| | |
| | | (Unaudited) Six Months
Ended
April 30, | | | Year Ended October 31, | |
| | | 2012 | | | 2011 | | | 2010 | | | 2009 | | | 2008 | | | 2007 | |
Portfolio turnover rate | | | 23.8% | | | | 84.7% | | | | 52.7% | | | | 52.3% | | | | 73.9% | | | | 75.8% | |
| |
| (a) | Net investment income allocated based on average shares method. |
| (b) | Total return measures net investment income and capital gain or loss from portfolio investments assuming reinvestment of dividends and capital gains distributions. Total return is not annualized for periods that are less than a full year, does not reflect the effect of sales charge for Class A shares nor the contingent deferred sales charge for Class B and C shares and does not reflect the deduction of taxes that a shareholder would pay on fund distributions or the redemption of fund shares. |
| | | | |
| 134 | | CALAMOS FAMILY OF FUNDS SEMIANNUAL REPORT | | |
Calamos Growth Fund Financial Highlights
| | | | | | | | | | | | | | | | | | | | | | | | |
| | | CLASS B | |
| | | (Unaudited) Six Months
Ended
April 30, | | | Year Ended October 31, | |
| | | 2012 | | | 2011 | | | 2010 | | | 2009 | | | 2008 | | | 2007 | |
Net asset value, beginning of period | | | $50.44 | | | | $48.96 | | | | $40.72 | | | | $32.53 | | | | $71.41 | | | | $56.37 | |
| |
Income from investment operations: | | | | | | | | | | | | | | | | | | | | | | | | |
Net investment income (loss)(a) | | | (0.28 | ) | | | (0.71 | ) | | | (0.50 | ) | | | (0.39 | ) | | | (0.63 | ) | | | (0.80 | ) |
| |
Net realized and unrealized gain (loss) | | | 4.43 | | | | 2.19 | | | | 8.74 | | | | 8.58 | | | | (30.69 | ) | | | 17.81 | |
| |
Total from investment operations | | | 4.15 | | | | 1.48 | | | | 8.24 | | | | 8.19 | | | | (31.32 | ) | | | 17.01 | |
| |
Distributions: | | | | | | | | | | | | | | | | | | | | | | | | |
Dividends from net investment income | | | — | | | | — | | | | — | | | | — | | | | — | | | | — | |
| |
Dividends from net realized gains | | | (2.15 | ) | | | — | | | | — | | | | — | | | | (7.56 | ) | | | (1.97 | ) |
| |
Total distributions | | | (2.15 | ) | | | — | | | | — | | | | — | | | | (7.56 | ) | | | (1.97 | ) |
| |
Net asset value, end of period | | | $52.44 | | | | $50.44 | | | | $48.96 | | | | $40.72 | | | | $32.53 | | | | $71.41 | |
| |
Ratios and supplemental data: | | | | | | | | | | | | | | | | | | | | | | | | |
Total return(b) | | | 8.85% | | | | 3.02% | | | | 20.24% | | | | 25.18% | | | | (48.50% | ) | | | 31.18% | |
| |
Net assets, end of period (000) | | | $262,175 | | | | $335,792 | | | | $508,828 | | | | $593,604 | | | | $609,200 | | | | $1,396,806 | |
| |
Ratio of net expenses to average net assets | | | 2.03% | (c) | | | 2.01% | | | | 2.02% | | | | 2.07% | | | | 1.96% | | | | 1.95% | |
| |
Ratio of gross expenses to average net assets prior to expense reductions | | | 2.03% | (c) | | | 2.01% | | | | 2.02% | | | | 2.08% | | | | 1.97% | | | | 1.96% | |
| |
Ratio of net investment income (loss) to average net assets | | | (1.13% | )(c) | | | (1.34% | ) | | | (1.12% | ) | | | (1.19% | ) | | | (1.21% | ) | | | (1.36% | ) |
| |
| | | | | | | | | | | | | | | | | | | | | | | | |
| | | CLASS C | |
| | | (Unaudited) Six Months
Ended
April 30, | | | Year Ended October 31, | |
| | | 2012 | | | 2011 | | | 2010 | | | 2009 | | | 2008 | | | 2007 | |
Net asset value, beginning of period | | | $46.16 | | | | $44.80 | | | | $37.26 | | | | $29.77 | | | | $66.05 | | | | $52.29 | |
| |
Income from investment operations: | | | | | | | | | | | | | | | | | | | | | | | | |
Net investment income (loss)(a) | | | (0.26 | ) | | | (0.66 | ) | | | (0.45 | ) | | | (0.36 | ) | | | (0.58 | ) | | | (0.74 | ) |
| |
Net realized and unrealized gain (loss) | | | 4.03 | | | | 2.02 | | | | 7.99 | | | | 7.85 | | | | (28.14 | ) | | | 16.47 | |
| |
Total from investment operations | | | 3.77 | | | | 1.36 | | | | 7.54 | | | | 7.49 | | | | (28.72 | ) | | | 15.73 | |
| |
Distributions: | | | | | | | | | | | | | | | | | | | | | | | | |
Dividends from net investment income | | | — | | | | — | | | | — | | | | — | | | | — | | | | — | |
| |
Dividends from net realized gains | | | (2.15 | ) | | | — | | | | — | | | | — | | | | (7.56 | ) | | | (1.97 | ) |
| |
Total distributions | | | (2.15 | ) | | | — | | | | — | | | | — | | | | (7.56 | ) | | | (1.97 | ) |
| |
Net asset value, end of period | | | $47.78 | | | | $46.16 | | | | $44.80 | | | | $37.26 | | | | $29.77 | | | | $66.05 | |
| |
Ratios and supplemental data: | | | | | | | | | | | | | | | | | | | | | | | | |
Total return(b) | | | 8.85% | | | | 3.04% | | | | 20.24% | | | | 25.16% | | | | (48.50% | ) | | | 31.16% | |
| |
Net assets, end of period (000) | | | $1,512,679 | | | | $1,517,047 | | | | $1,718,714 | | | | $1,720,775 | | | | $1,732,305 | | | | $3,801,620 | |
| |
Ratio of net expenses to average net assets | | | 2.03% | (c) | | | 2.01% | | | | 2.02% | | | | 2.07% | | | | 1.96% | | | | 1.95% | |
| |
Ratio of gross expenses to average net assets prior to expense reductions | | | 2.03% | (c) | | | 2.01% | | | | 2.02% | | | | 2.08% | | | | 1.97% | | | | 1.96% | |
| |
Ratio of net investment income (loss) to average net assets | | | (1.12% | )(c) | | | (1.35% | ) | | | (1.12% | ) | | | (1.19% | ) | | | (1.21% | ) | | | (1.36% | ) |
| |
| (a) | Net investment income allocated based on average shares method. |
| (b) | Total return measures net investment income and capital gain or loss from portfolio investments assuming reinvestment of dividends and capital gains distributions. Total return is not annualized for periods that are less than a full year, does not reflect the effect of sales charge for Class A shares nor the contingent deferred sales charge for Class B and C shares and does not reflect the deduction of taxes that a shareholder would pay on fund distributions or the redemption of fund shares. |
Calamos Growth Fund Financial Highlights
| | | | | | | | | | | | | | | | | | | | | | | | |
| | | CLASS I | |
| | | (Unaudited) Six Months Ended April 30, | | | Year Ended October 31, | |
| | | 2012 | | | 2011 | | | 2010 | | | 2009 | | | 2008 | | | 2007 | |
Net asset value, beginning of period | | | $55.72 | | | | $53.54 | | | | $44.09 | | | | $34.88 | | | | $75.28 | | | | $58.75 | |
| |
Income from investment operations: | | | | | | | | | | | | | | | | | | | | | | | | |
Net investment income (loss)(a) | | | (0.03 | ) | | | (0.21 | ) | | | (0.05 | ) | | | (0.07 | ) | | | (0.11 | ) | | | (0.23 | ) |
| |
Net realized and unrealized gain (loss) | | | 4.94 | | | | 2.39 | | | | 9.50 | | | | 9.28 | | | | (32.73 | ) | | | 18.73 | |
| |
Total from investment operations | | | 4.91 | | | | 2.18 | | | | 9.45 | | | | 9.21 | | | | (32.84 | ) | | | 18.50 | |
| |
Distributions: | | | | | | | | | | | | | | | | | | | | | | | | |
Dividends from net investment income | | | — | | | | — | | | | — | | | | — | | | | — | | | | — | |
| |
Dividends from net realized gains | | | (2.15 | ) | | | — | | | | — | | | | — | | | | (7.56 | ) | | | (1.97 | ) |
| |
Total distributions | | | (2.15 | ) | | | — | | | | — | | | | — | | | | (7.56 | ) | | | (1.97 | ) |
| |
Net asset value, end of period | | | $58.48 | | | | $55.72 | | | | $53.54 | | | | $44.09 | | | | $34.88 | | | | $75.28 | |
| |
Ratios and supplemental data: | | | | | | | | | | | | | | | | | | | | | | | | |
Total return(b) | | | 9.39% | | | | 4.07% | | | | 21.43% | | | | 26.40% | | | | (47.97% | ) | | | 32.49% | |
| |
Net assets, end of period (000) | | | $1,980,135 | | | | $1,628,191 | | | | $1,335,967 | | | | $652,733 | | | | $468,906 | | | | $226,225 | |
| |
Ratio of net expenses to average net assets | | | 1.03% | (c) | | | 1.01% | | | | 1.02% | | | | 1.07% | | | | 0.96% | | | | 0.95% | |
| |
Ratio of gross expenses to average net assets prior to expense reductions | | | 1.03% | (c) | | | 1.01% | | | | 1.02% | | | | 1.07% | | | | 0.97% | | | | 0.96% | |
| |
Ratio of net investment income (loss) to average net assets | | | (0.11% | )(c) | | | (0.37% | ) | | | (0.11% | ) | | | (0.20% | ) | | | (0.21% | ) | | | (0.36% | ) |
| |
| | | | | | | | | | | | | | | | | | | | | | | | |
| | | CLASS R | |
| | | (Unaudited) Six Months
Ended
April 30, | | | Year Ended October 31, | | | March 1, 2007*
through
October 31, | |
| | | 2012 | | | 2011 | | | 2010 | | | 2009 | | | 2008 | | | 2007 | |
Net asset value, beginning of period | | | $50.44 | | | | $48.71 | | | | $40.31 | | | | $32.05 | | | | $70.16 | | | | $53.60 | |
| |
Income from investment operations: | | | | | | | | | | | | | | | | | | | | | | | | |
Net investment income (loss)(a) | | | (0.15 | ) | | | (0.46 | ) | | | (0.27 | ) | | | (0.25 | ) | | | (0.35 | ) | | | (0.36 | ) |
| |
Net realized and unrealized gain (loss) | | | 4.43 | | | | 2.19 | | | | 8.67 | | | | 8.51 | | | | (30.20 | ) | | | 16.92 | |
| |
Total from investment operations | | | 4.28 | | | | 1.73 | | | | 8.40 | | | | 8.26 | | | | (30.55 | ) | | | 16.56 | |
| |
Distributions: | | | | | | | | | | | | | | | | | | | | | | | | |
Dividends from net investment income | | | — | | | | — | | | | — | | | | — | | | | — | | | | — | |
| |
Dividends from net realized gains | | | (2.15 | ) | | | — | | | | — | | | | — | | | | (7.56 | ) | | | — | |
| |
Total distributions | | | (2.15 | ) | | | — | | | | — | | | | — | | | | (7.56 | ) | | | — | |
| |
Net asset value, end of period | | | $52.57 | | | | $50.44 | | | | $48.71 | | | | $40.31 | | | | $32.05 | | | | $70.16 | |
| |
Ratios and supplemental data: | | | | | | | | | | | | | | | | | | | | | | | | |
Total return(b) | | | 9.12% | | | | 3.55% | | | | 20.84% | | | | 25.77% | | | | (48.24% | ) | | | 30.90% | |
| |
Net assets, end of period (000) | | | $17,737 | | | | $13,030 | | | | $9,071 | | | | $3,872 | | | | $780 | | | | $404 | |
| |
Ratio of net expenses to average net assets | | | 1.52% | (c) | | | 1.51% | | | | 1.52% | | | | 1.56% | | | | 1.46% | | | | 1.45% | (c) |
| |
Ratio of gross expenses to average net assets prior to expense reductions | | | 1.52% | (c) | | | 1.51% | | | | 1.52% | | | | 1.56% | | | | 1.47% | | | | 1.46% | (c) |
| |
Ratio of net investment income (loss) to average net assets | | | (0.60% | )(c) | | | (0.88% | ) | | | (0.62% | ) | | | (0.73% | ) | | | (0.71% | ) | | | (0.86% | )(c) |
| |
| * | Commencement of operations. |
| (a) | Net investment income allocated based on average shares method. |
| (b) | Total return measures net investment income and capital gain or loss from portfolio investments assuming reinvestment of dividends and capital gains distributions. Total return is not annualized for periods that are less than a full year, does not reflect the effect of sales charge for Class A shares nor the contingent deferred sales charge for Class B and C shares and does not reflect the deduction of taxes that a shareholder would pay on fund distributions or the redemption of fund shares. |
| | | | |
| 136 | | CALAMOS FAMILY OF FUNDS SEMIANNUAL REPORT | | |
Calamos Value Fund Financial Highlights
Selected data for a share outstanding throughout each period were as follows:
| | | | | | | | | | | | | | | | | | | | | | | | |
| | | CLASS A | |
| | | (Unaudited)
Six Months
Ended
April 30, | | | Year Ended October 31, | |
| | | 2012 | | | 2011 | | | 2010 | | | 2009 | | | 2008 | | | 2007 | |
Net asset value, beginning of period | | | $11.25 | | | | $11.02 | | | | $10.57 | | | | $8.90 | | | | $14.68 | | | | $13.63 | |
| |
Income from investment operations: | | | | | | | | | | | | | | | | | | | | | | | | |
Net investment income (loss)(a) | | | 0.05 | | | | 0.01 | | | | (0.00 | )** | | | 0.04 | | | | 0.03 | | | | 0.01 | |
| |
Net realized and unrealized gain (loss) | | | 0.70 | | | | 0.22 | | | | 0.48 | | | | 1.64 | | | | (4.83 | ) | | | 1.73 | |
| |
Total from investment operations | | | 0.75 | | | | 0.23 | | | | 0.48 | | | | 1.68 | | | | (4.80 | ) | | | 1.74 | |
| |
Distributions: | | | | | | | | | | | | | | | | | | | | | | | | |
Dividends from net investment income | | | — | | | | — | | | | (0.03 | ) | | | (0.01 | ) | | | (0.08 | ) | | | — | |
| |
Dividends from net realized gains | | | — | | | | — | | | | — | | | | — | | | | (0.90 | ) | | | (0.69 | ) |
| |
Total distributions | | | — | | | | — | | | | (0.03 | ) | | | (0.01 | ) | | | (0.98 | ) | | | (0.69 | ) |
| |
Net asset value, end of period | | | $12.00 | | | | $11.25 | | | | $11.02 | | | | $10.57 | | | | $8.90 | | | | $14.68 | |
| |
Ratios and supplemental data: | | | | | | | | | | | | | | | | | | | | | | | | |
Total return(b) | | | 6.67% | | | | 2.09% | | | | 4.52% | | | | 18.85% | | | | (34.79% | ) | | | 13.33% | |
| |
Net assets, end of period (000) | | | $25,015 | | | | $23,964 | | | | $31,556 | | | | $32,877 | | | | $45,372 | | | | $76,676 | |
| |
Ratio of net expenses to average net assets | | | 1.15% | (c) | | | 1.52% | | | | 1.60% | | | | 1.59% | | | | 1.48% | | | | 1.46% | |
| |
Ratio of gross expenses to average net assets prior to expense reductions | | | 1.74% | (c) | | | 1.67% | | | | 1.60% | | | | 1.59% | | | | 1.49% | | | | 1.46% | |
| |
Ratio of net investment income (loss) to average net assets | | | 0.91% | (c) | | | 0.11% | | | | 0.03% | | | | 0.50% | | | | 0.24% | | | | 0.05% | |
| |
| | |
| | | (Unaudited)
Six Months
Ended
April 30, | | | Year Ended October 31, | |
| | | 2012 | | | 2011 | | | 2010 | | | 2009 | | | 2008 | | | 2007 | |
Portfolio turnover rate | | | 6.0% | | | | 27.4% | | | | 37.7% | | | | 58.7% | | | | 61.0% | | | | 29.6% | |
| |
| ** | Amount is less than $0.005. |
| (a) | Net investment income allocated based on average shares method. |
| (b) | Total return measures net investment income and capital gain or loss from portfolio investments assuming reinvestment of dividends and capital gains distributions. Total return is not annualized for periods that are less than a full year, does not reflect the effect of sales charge for Class A shares nor the contingent deferred sales charge for Class B and C shares and does not reflect the deduction of taxes that a shareholder would pay on fund distributions or the redemption of fund shares. |
Calamos Value Fund Financial Highlights
| | | | | | | | | | | | | | | | | | | | | | | | |
| | | CLASS B | |
| | | (Unaudited)
Six Months
Ended
April 30, | | | Year Ended October 31, | |
| | | 2012 | | | 2011 | | | 2010 | | | 2009 | | | 2008 | | | 2007 | |
Net asset value, beginning of period | | | $10.49 | | | | $10.35 | | | | $9.98 | | | | $8.46 | | | | $14.01 | | | | $13.13 | |
| |
Income from investment operations: | | | | | | | | | | | | | | | | | | | | | | | | |
Net investment income (loss)(a) | | | 0.01 | | | | (0.07 | ) | | | (0.07 | ) | | | (0.02 | ) | | | (0.06 | ) | | | (0.09 | ) |
| |
Net realized and unrealized gain (loss) | | | 0.65 | | | | 0.21 | | | | 0.44 | | | | 1.54 | | | | (4.59 | ) | | | 1.66 | |
| |
Total from investment operations | | | 0.66 | | | | 0.14 | | | | 0.37 | | | | 1.52 | | | | (4.65 | ) | | | 1.57 | |
| |
Distributions: | | | | | | | | | | | | | | | | | | | | | | | | |
Dividends from net investment income | | | — | | | | — | | | | — | | | | — | | | | — | | | | — | |
| |
Dividends from net realized gains | | | — | | | | — | | | | — | | | | — | | | | (0.90 | ) | | | (0.69 | ) |
| |
Total distributions | | | — | | | | — | | | | — | | | | — | | | | (0.90 | ) | | | (0.69 | ) |
| |
Net asset value, end of period | | | $11.15 | | | | $10.49 | | | | $10.35 | | | | $9.98 | | | | $8.46 | | | | $14.01 | |
| |
Ratios and supplemental data: | | | | | | | | | | | | | | | | | | | | | | | | |
Total return(b) | | | 6.29% | | | | 1.35% | | | | 3.71% | | | | 17.97% | | | | (35.24% | ) | | | 12.50% | |
| |
Net assets, end of period (000) | | | $1,718 | | | | $2,308 | | | | $3,903 | | | | $5,145 | | | | $5,377 | | | | $10,867 | |
| |
Ratio of net expenses to average net assets | | | 1.90% | (c) | | | 2.29% | | | | 2.34% | | | | 2.34% | | | | 2.23% | | | | 2.21% | |
| |
Ratio of gross expenses to average net assets prior to expense reductions | | | 2.48% | (c) | | | 2.42% | | | | 2.34% | | | | 2.34% | | | | 2.24% | | | | 2.21% | |
| |
Ratio of net investment income (loss) to average net assets | | | 0.20% | (c) | | | (0.63% | ) | | | (0.70% | ) | | | (0.29% | ) | | | (0.51% | ) | | | (0.70% | ) |
| |
| | | | | | | | | | | | | | | | | | | | | | | | |
| | | CLASS C | |
| | | (Unaudited)
Six Months
Ended
April 30, | | | Year Ended October 31, | |
| | | 2012 | | | 2011 | | | 2010 | | | 2009 | | | 2008 | | | 2007 | |
Net asset value, beginning of period | | | $10.48 | | | | $10.34 | | | | $9.97 | | | | $8.45 | | | | $14.00 | | | | $13.12 | |
| |
Income from investment operations: | | | | | | | | | | | | | | | | | | | | | | | | |
Net investment income (loss)(a) | | | 0.01 | | | | (0.07 | ) | | | (0.07 | ) | | | (0.02 | ) | | | (0.06 | ) | | | (0.09 | ) |
| |
Net realized and unrealized gain (loss) | | | 0.65 | | | | 0.21 | | | | 0.44 | | | | 1.54 | | | | (4.59 | ) | | | 1.66 | |
| |
Total from investment operations | | | 0.66 | | | | 0.14 | | | | 0.37 | | | | 1.52 | | | | (4.65 | ) | | | 1.57 | |
| |
Distributions: | | | | | | | | | | | | | | | | | | | | | | | | |
Dividends from net investment income | | | — | | | | — | | | | — | | | | — | | | | — | | | | — | |
| |
Dividends from net realized gains | | | — | | | | — | | | | — | | | | — | | | | (0.90 | ) | | | (0.69 | ) |
| |
Total distributions | | | — | | | | — | | | | — | | | | — | | | | (0.90 | ) | | | (0.69 | ) |
| |
Net asset value, end of period | | | $11.14 | | | | $10.48 | | | | $10.34 | | | | $9.97 | | | | $8.45 | | | | $14.00 | |
| |
Ratios and supplemental data: | | | | | | | | | | | | | | | | | | | | | | | | |
Total return(b) | | | 6.30% | | | | 1.35% | | | | 3.71% | | | | 17.99% | | | | (35.27% | ) | | | 12.51% | |
| |
Net assets, end of period (000) | | | $3,875 | | | | $3,974 | | | | $5,915 | | | | $6,946 | | | | $7,295 | | | | $14,364 | |
| |
Ratio of net expenses to average net assets | | | 1.90% | (c) | | | 2.28% | | | | 2.35% | | | | 2.34% | | | | 2.23% | | | | 2.21% | |
| |
Ratio of gross expenses to average net assets prior to expense reductions | | | 2.49% | (c) | | | 2.42% | | | | 2.35% | | | | 2.34% | | | | 2.24% | | | | 2.21% | |
| |
Ratio of net investment income (loss) to average net assets | | | 0.17% | (c) | | | (0.63% | ) | | | (0.71% | ) | | | (0.29% | ) | | | (0.51% | ) | | | (0.70% | ) |
| |
| (a) | Net investment income allocated based on average shares method. |
| (b) | Total return measures net investment income and capital gain or loss from portfolio investments assuming reinvestment of dividends and capital gains distributions. Total return is not annualized for periods that are less than a full year, does not reflect the effect of sales charge for Class A shares nor the contingent deferred sales charge for Class B and C shares and does not reflect the deduction of taxes that a shareholder would pay on fund distributions or the redemption of fund shares. |
| | | | |
| 138 | | CALAMOS FAMILY OF FUNDS SEMIANNUAL REPORT | | |
Calamos Value Fund Financial Highlights
| | | | | | | | | | | | | | | | | | | | | | | | |
| | | CLASS I | |
| | | (Unaudited)
Six Months
Ended
April 30, | | | Year Ended October 31, | |
| | | 2012 | | | 2011 | | | 2010 | | | 2009 | | | 2008 | | | 2007 | |
Net asset value, beginning of period | | | $11.46 | | | | $11.20 | | | | $10.74 | | | | $9.05 | | | | $14.92 | | | | $13.81 | |
| |
Income from investment operations: | | | | | | | | | | | | | | | | | | | | | | | | |
Net investment income (loss)(a) | | | 0.07 | | | | 0.04 | | | | 0.03 | | | | 0.06 | | | | 0.06 | | | | 0.04 | |
| |
Net realized and unrealized gain (loss) | | | 0.71 | | | | 0.22 | | | | 0.48 | | | | 1.67 | | | | (4.91 | ) | | | 1.76 | |
| |
Total from investment operations | | | 0.78 | | | | 0.26 | | | | 0.51 | | | | 1.73 | | | | (4.85 | ) | | | 1.80 | |
| |
Distributions: | | | | | | | | | | | | | | | | | | | | | | | | |
Dividends from net investment income | | | — | | | | — | | | | (0.05 | ) | | | (0.04 | ) | | | (0.12 | ) | | | — | |
| |
Dividends from net realized gains | | | — | | | | — | | | | — | | | | — | | | | (0.90 | ) | | | (0.69 | ) |
| |
Total distributions | | | — | | | | — | | | | (0.05 | ) | | | (0.04 | ) | | | (1.02 | ) | | | (0.69 | ) |
| |
Net asset value, end of period | | | $12.24 | | | | $11.46 | | | | $11.20 | | | | $10.74 | | | | $9.05 | | | | $14.92 | |
| |
Ratios and supplemental data: | | | | | | | | | | | | | | | | | | | | | | | | |
Total return(b) | | | 6.81% | | | | 2.32% | | | | 4.79% | | | | 19.23% | | | | (34.64% | ) | | | 13.60% | |
| |
Net assets, end of period (000) | | | $12,214 | | | | $11,227 | | | | $17,340 | | | | $18,396 | | | | $17,711 | | | | $29,628 | |
| |
Ratio of net expenses to average net assets | | | 0.90% | (c) | | | 1.27% | | | | 1.35% | | | | 1.34% | | | | 1.23% | | | | 1.21% | |
| |
Ratio of gross expenses to average net assets prior to expense reductions | | | 1.49% | (c) | | | 1.42% | | | | 1.35% | | | | 1.34% | | | | 1.24% | | | | 1.21% | |
| |
Ratio of net investment income (loss) to average net assets | | | 1.16% | (c) | | | 0.37% | | | | 0.28% | | | | 0.69% | | | | 0.49% | | | | 0.30% | |
| |
| | | | | | | | | | | | | | | | | | | | | | | | |
| | | CLASS R | |
| | | (Unaudited)
Six Months
Ended
April 30, | | | Year Ended October 31, | | | March 1, 2007*
through
October 31, | |
| | | 2012 | | | 2011 | | | 2010 | | | 2009 | | | 2008 | | | 2007 | |
Net asset value, beginning of period | | | $11.16 | | | | $10.96 | | | | $10.52 | | | | $8.87 | | | | $14.66 | | | | $13.18 | |
| |
Income from investment operations: | | | | | | | | | | | | | | | | | | | | | | | | |
Net investment income (loss)(a) | | | 0.04 | | | | (0.01 | ) | | | (0.02 | ) | | | 0.02 | | | | (0.00 | )** | | | (0.02 | ) |
| |
Net realized and unrealized gain (loss) | | | 0.69 | | | | 0.21 | | | | 0.46 | | | | 1.63 | | | | (4.82 | ) | | | 1.50 | |
| |
Total from investment operations | | | 0.73 | | | | 0.20 | | | | 0.44 | | | | 1.65 | | | | (4.82 | ) | | | 1.48 | |
| |
Distributions: | | | | | | | | | | | | | | | | | | | | | | | | |
Dividends from net investment income | | | — | | | | — | | | | (0.00 | )** | | | — | | | | (0.07 | ) | | | — | |
| |
Dividends from net realized gains | | | — | | | | — | | | | — | | | | — | | | | (0.90 | ) | | | — | |
| |
Total distributions | | | — | | | | — | | | | — | | | | — | | | | (0.97 | ) | | | — | |
| |
Net asset value, end of period | | | $11.89 | | | | $11.16 | | | | $10.96 | | | | $10.52 | | | | $8.87 | | | | $14.66 | |
| |
Ratios and supplemental data: | | | | | | | | | | | | | | | | | | | | | | | | |
Total return(b) | | | 6.54% | | | | 1.82% | | | | 4.21% | | | | 18.60% | | | | (34.96% | ) | | | 11.23% | |
| |
Net assets, end of period (000) | | | $97 | | | | $91 | | | | $89 | | | | $86 | | | | $72 | | | | $111 | |
| |
Ratio of net expenses to average net assets | | | 1.40% | (c) | | | 1.76% | | | | 1.85% | | | | 1.83% | | | | 1.73% | | | | 1.71% | (c) |
| |
Ratio of gross expenses to average net assets prior to expense reductions | | | 1.98% | (c) | | | 1.93% | | | | 1.85% | | | | 1.84% | | | | 1.74% | | | | 1.71% | (c) |
| |
Ratio of net investment income (loss) to average net assets | | | 0.67% | (c) | | | (0.10% | ) | | | (0.23% | ) | | | 0.18% | | | | (0.01% | ) | | | (0.20% | )(c) |
| |
| * | Commencement of operations. |
| ** | Amount is less than $0.005. |
| (a) | Net investment income allocated based on average shares method. |
| (b) | Total return measures net investment income and capital gain or loss from portfolio investments assuming reinvestment of dividends and capital gains distributions. Total return is not annualized for periods that are less than a full year, does not reflect the effect of sales charge for Class A shares nor the contingent deferred sales charge for Class B and C shares and does not reflect the deduction of taxes that a shareholder would pay on fund distributions or the redemption of fund shares. |
Calamos Blue Chip Fund Financial Highlights
Selected data for a share outstanding throughout each period were as follows:
| | | | | | | | | | | | | | | | | | | | | | | | |
| | | CLASS A | |
| | | (Unaudited) Six Months
Ended
April 30, | | | Year Ended October 31, | |
| | | 2012 | | | 2011 | | | 2010 | | | 2009 | | | 2008 | | | 2007 | |
Net asset value, beginning of period | | | $12.37 | | | | $11.93 | | | | $10.51 | | | | $8.91 | | | | $14.82 | | | | $12.75 | |
| |
Income from investment operations: | | | | | | | | | | | | | | | | | | | | | | | | |
Net investment income (loss)(a) | | | 0.00 | ** | | | (0.03 | ) | | | (0.02 | ) | | | 0.06 | | | | 0.06 | | | | 0.04 | |
| |
Net realized and unrealized gain (loss) | | | 1.32 | | | | 0.47 | | | | 1.46 | | | | 1.58 | | | | (5.05 | ) | | | 2.11 | |
| |
Total from investment operations | | | 1.32 | | | | 0.44 | | | | 1.44 | | | | 1.64 | | | | (4.99 | ) | | | 2.15 | |
| |
Distributions: | | | | | | | | | | | | | | | | | | | | | | | | |
Dividends from net investment income | | | — | | | | — | | | | (0.02 | ) | | | (0.04 | ) | | | (0.03 | ) | | | (0.04 | ) |
| |
Dividends from net realized gains | | | — | | | | — | | | | — | | | | — | | | | (0.89 | ) | | | (0.04 | ) |
| |
Total distributions | | | — | | | | — | | | | (0.02 | ) | | | (0.04 | ) | | | (0.92 | ) | | | (0.08 | ) |
| |
Net asset value, end of period | | | $13.69 | | | | $12.37 | | | | $11.93 | | | | $10.51 | | | | $8.91 | | | | $14.82 | |
| |
Ratios and supplemental data: | | | | | | | | | | | | | | | | | | | | | | | | |
Total return(b) | | | 10.67% | | | | 3.69% | | | | 13.72% | | | | 18.50% | | | | (35.66% | ) | | | 16.93% | |
| |
Net assets, end of period (000) | | | $27,207 | | | | $22,702 | | | | $24,518 | | | | $32,143 | | | | $67,229 | | | | $107,955 | |
| |
Ratio of net expenses to average net assets | | | 1.15% | (c) | | | 1.44% | | | | 1.56% | | | | 1.54% | | | | 1.45% | | | | 1.44% | |
| |
Ratio of gross expenses to average net assets prior to expense reductions | | | 1.59% | (c) | | | 1.57% | | | | 1.56% | | | | 1.55% | | | | 1.46% | | | | 1.45% | |
| |
Ratio of net investment income (loss) to average net assets | | | 0.01% | (c) | | | (0.28% | ) | | | (0.18% | ) | | | 0.72% | | | | 0.49% | | | | 0.33% | |
| |
| | |
| | | (Unaudited) Six Months
Ended
April 30, | | | Year Ended October 31, | |
| | | 2012 | | | 2011 | | | 2010 | | | 2009 | | | 2008 | | | 2007 | |
Portfolio turnover rate | | | 25.0% | | | | 73.5% | | | | 49.4% | | | | 79.0% | | | | 39.8% | | | | 45.9% | |
| |
| ** | Amount is less than $0.005. |
| (a) | Net investment income allocated based on average shares method. |
| (b) | Total return measures net investment income and capital gain or loss from portfolio investments assuming reinvestment of dividends and capital gains distributions. Total return is not annualized for periods that are less than a full year, does not reflect the effect of sales charge for Class A shares nor the contingent deferred sales charge for Class B and C shares and does not reflect the deduction of taxes that a shareholder would pay on fund distributions or the redemption of fund shares. |
| | | | |
| 140 | | CALAMOS FAMILY OF FUNDS SEMIANNUAL REPORT | | |
Calamos Blue Chip Fund Financial Highlights
| | | | | | | | | | | | | | | | | | | | | | | | |
| | | CLASS B | |
| | | (Unaudited)
Six Months
Ended
April 30, | | | Year Ended October 31, | |
| | | 2012 | | | 2011 | | | 2010 | | | 2009 | | | 2008 | | | 2007 | |
Net asset value, beginning of period | | | $11.78 | | | | $11.45 | | | | $10.14 | | | | $8.63 | | | | $14.44 | | | | $12.49 | |
| |
Income from investment operations: | | | | | | | | | | | | | | | | | | | | | | | | |
Net investment income (loss)(a) | | | (0.05 | ) | | | (0.13 | ) | | | (0.10 | ) | | | (0.02 | ) | | | (0.03 | ) | | | (0.06 | ) |
| |
Net realized and unrealized gain (loss) | | | 1.26 | | | | 0.46 | | | | 1.41 | | | | 1.53 | | | | (4.89 | ) | | | 2.05 | |
| |
Total from investment operations | | | 1.21 | | | | 0.33 | | | | 1.31 | | | | 1.51 | | | | (4.92 | ) | | | 1.99 | |
| |
Distributions: | | | | | | | | | | | | | | | | | | | | | | | | |
Dividends from net investment income | | | — | | | | — | | | | — | | | | — | | | | — | | | | — | |
| |
Dividends from net realized gains | | | — | | | | — | | | | — | | | | — | | | | (0.89 | ) | | | (0.04 | ) |
| |
Total distributions | | | — | | | | — | | | | — | | | | — | | | | (0.89 | ) | | | (0.04 | ) |
| |
Net asset value, end of period | | | $12.99 | | | | $11.78 | | | | $11.45 | | | | $10.14 | | | | $8.63 | | | | $14.44 | |
| |
Ratios and supplemental data: | | | | | | | | | | | | | | | | | | | | | | | | |
Total return(b) | | | 10.27% | | | | 2.88% | | | | 12.92% | | | | 17.50% | | | | (36.08% | ) | | | 15.96% | |
| |
Net assets, end of period (000) | | | $2,428 | | | | $2,893 | | | | $4,171 | | | | $5,087 | | | | $4,833 | | | | $8,694 | |
| |
Ratio of net expenses to average net assets | | | 1.90% | (c) | | | 2.20% | | | | 2.31% | | | | 2.29% | | | | 2.20% | | | | 2.19% | |
| |
Ratio of gross expenses to average net assets prior to expense reductions | | | 2.34% | (c) | | | 2.32% | | | | 2.31% | | | | 2.29% | | | | 2.21% | | | | 2.20% | |
| |
Ratio of net investment income (loss) to average net assets | | | (0.76% | )(c) | | | (1.03% | ) | | | (0.92% | ) | | | (0.25% | ) | | | (0.26% | ) | | | (0.42% | ) |
| |
| | | | | | | | | | | | | | | | | | | | | | | | |
| | | CLASS C | |
| | | (Unaudited)
Six Months
Ended
April 30, | | | Year Ended October 31, | |
| | | 2012 | | | 2011 | | | 2010 | | | 2009 | | | 2008 | | | 2007 | |
Net asset value, beginning of period | | | $11.79 | | | | $11.45 | | | | $10.15 | | | | $8.63 | | | | $14.45 | | | | $12.49 | |
| |
Income from investment operations: | | | | | | | | | | | | | | | | | | | | | | | | |
Net investment income (loss)(a) | | | (0.05 | ) | | | (0.12 | ) | | | (0.10 | ) | | | (0.02 | ) | | | (0.03 | ) | | | (0.06 | ) |
| |
Net realized and unrealized gain (loss) | | | 1.26 | | | | 0.46 | | | | 1.40 | | | | 1.54 | | | | (4.90 | ) | | | 2.06 | |
| |
Total from investment operations | | | 1.21 | | | | 0.34 | | | | 1.30 | | | | 1.52 | | | | (4.93 | ) | | | 2.00 | |
| |
Distributions: | | | | | | | | | | | | | | | | | | | | | | | | |
Dividends from net investment income | | | — | | | | — | | | | — | | | | — | | | | — | | | | — | |
| |
Dividends from net realized gains | | | — | | | | — | | | | — | | | | — | | | | (0.89 | ) | | | (0.04 | ) |
| |
Total distributions | | | — | | | | — | | | | — | | | | — | | | | (0.89 | ) | | | (0.04 | ) |
| |
Net asset value, end of period | | | $13.00 | | | | $11.79 | | | | $11.45 | | | | $10.15 | | | | $8.63 | | | | $14.45 | |
| |
Ratios and supplemental data: | | | | | | | | | | | | | | | | | | | | | | | | |
Total return(b) | | | 10.26% | | | | 2.97% | | | | 12.81% | | | | 17.61% | | | | (36.13% | ) | | | 16.04% | |
| |
Net assets, end of period (000) | | | $10,817 | | | | $10,153 | | | | $10,628 | | | | $10,359 | | | | $8,489 | | | | $14,389 | |
| |
Ratio of net expenses to average net assets | | | 1.90% | (c) | | | 2.19% | | | | 2.31% | | | | 2.29% | | | | 2.20% | | | | 2.19% | |
| |
Ratio of gross expenses to average net assets prior to expense reductions | | | 2.34% | (c) | | | 2.32% | | | | 2.31% | | | | 2.29% | | | | 2.21% | | | | 2.20% | |
| |
Ratio of net investment income (loss) to average net assets | | | (0.76% | )(c) | | | (1.03% | ) | | | (0.92% | ) | | | (0.25% | ) | | | (0.26% | ) | | | (0.42% | ) |
| |
| (a) | Net investment income allocated based on average shares method. |
| (b) | Total return measures net investment income and capital gain or loss from portfolio investments assuming reinvestment of dividends and capital gains distributions. Total return is not annualized for periods that are less than a full year, does not reflect the effect of sales charge for Class A shares nor the contingent deferred sales charge for Class B and C shares and does not reflect the deduction of taxes that a shareholder would pay on fund distributions or the redemption of fund shares. |
Calamos Blue Chip Fund Financial Highlights
| | | | | | | | | | | | | | | | | | | | | | | | |
| | | CLASS I | |
| | | (Unaudited)
Six Months
Ended
April 30, | | | Year Ended October 31, | |
| | | 2012 | | | 2011 | | | 2010 | | | 2009 | | | 2008 | | | 2007 | |
Net asset value, beginning of period | | | $12.46 | | | | $11.98 | | | | $10.56 | | | | $8.97 | | | | $14.90 | | | | $12.84 | |
| |
Income from investment operations: | | | | | | | | | | | | | | | | | | | | | | | | |
Net investment income (loss)(a) | | | 0.02 | | | | (0.00 | )** | | | 0.01 | | | | 0.07 | | | | 0.09 | | | | 0.08 | |
| |
Net realized and unrealized gain (loss) | | | 1.32 | | | | 0.48 | | | | 1.46 | | | | 1.59 | | | | (5.06 | ) | | | 2.11 | |
| |
Total from investment operations | | | 1.34 | | | | 0.48 | | | | 1.47 | | | | 1.66 | | | | (4.97 | ) | | | 2.19 | |
| |
Distributions: | | | | | | | | | | | | | | | | | | | | | | | | |
Dividends from net investment income | | | — | | | | — | | | | (0.05 | ) | | | (0.07 | ) | | | (0.07 | ) | | | (0.09 | ) |
| |
Dividends from net realized gains | | | — | | | | — | | | | — | | | | — | | | | (0.89 | ) | | | (0.04 | ) |
| |
Total distributions | | | — | | | | — | | | | (0.05 | ) | | | (0.07 | ) | | | (0.96 | ) | | | (0.13 | ) |
| |
Net asset value, end of period | | | $13.80 | | | | $12.46 | | | | $11.98 | | | | $10.56 | | | | $8.97 | | | | $14.90 | |
| |
Ratios and supplemental data: | | | | | | | | | | | | | | | | | | | | | | | | |
Total return(b) | | | 10.75% | | | | 4.01% | | | | 13.97% | | | | 18.74% | | | | (35.44% | ) | | | 17.15% | |
| |
Net assets, end of period (000) | | | $27,029 | | | | $24,547 | | | | $23,441 | | | | $21,604 | | | | $22,337 | | | | $34,783 | |
| |
Ratio of net expenses to average net assets | | | 0.90% | (c) | | | 1.18% | | | | 1.31% | | | | 1.29% | | | | 1.20% | | | | 1.19% | |
| |
Ratio of gross expenses to average net assets prior to expense reductions | | | 1.34% | (c) | | | 1.32% | | | | 1.31% | | | | 1.29% | | | | 1.21% | | | | 1.20% | |
| |
Ratio of net investment income (loss) to average net assets | | | 0.24% | (c) | | | (0.02% | ) | | | 0.08% | | | | 0.76% | | | | 0.74% | | | | 0.58% | |
| |
| | | | | | | | | | | | | | | | | | | | | | | | |
| | | CLASS R | |
| | | (Unaudited)
Six Months
Ended
April 30, | | | Year Ended October 31, | | | March 1, 2007*
through
October 31, | |
| | | 2012 | | | 2011 | | | 2010 | | | 2009 | | | 2008 | | | 2007 | |
Net asset value, beginning of period | | | $12.28 | | | | $11.87 | | | | $10.47 | | | | $8.88 | | | | $14.79 | | | | $12.80 | |
| |
Income from investment operations: | | | | | | | | | | | | | | | | | | | | | | | | |
Net investment income (loss)(a) | | | (0.02 | ) | | | (0.07 | ) | | | (0.05 | ) | | | 0.02 | | | | 0.03 | | | | 0.01 | |
| |
Net realized and unrealized gain (loss) | | | 1.31 | | | | 0.48 | | | | 1.45 | | | | 1.60 | | | | (5.04 | ) | | | 1.98 | |
| |
Total from investment operations | | | 1.29 | | | | 0.41 | | | | 1.40 | | | | 1.62 | | | | (5.01 | ) | | | 1.99 | |
| |
Distributions: | | | | | | | | | | | | | | | | | | | | | | | | |
Dividends from net investment income | | | — | | | | — | | | | — | | | | (0.03 | ) | | | (0.01 | ) | | | — | |
| |
Dividends from net realized gains | | | — | | | | — | | | | — | | | | — | | | | (0.89 | ) | | | — | |
| |
Total distributions | | | — | | | | — | | | | — | | | | (0.03 | ) | | | (0.90 | ) | | | — | |
| |
Net asset value, end of period | | | $13.57 | | | | $12.28 | | | | $11.87 | | | | $10.47 | | | | $8.88 | | | | $14.79 | |
| |
Ratios and supplemental data: | | | | | | | | | | | | | | | | | | | | | | | | |
Total return(b) | | | 10.50% | | | | 3.45% | | | | 13.37% | | | | 18.28% | | | | (35.82% | ) | | | 15.55% | |
| |
Net assets, end of period (000) | | | $114 | | | | $103 | | | | $99 | | | | $88 | | | | $106 | | | | $116 | |
| |
Ratio of net expenses to average net assets | | | 1.40% | (c) | | | 1.68% | | | | 1.81% | | | | 1.79% | | | | 1.70% | | | | 1.69% | (c) |
| |
Ratio of gross expenses to average net assets prior to expense reductions | | | 1.84% | (c) | | | 1.82% | | | | 1.81% | | | | 1.80% | | | | 1.71% | | | | 1.70% | (c) |
| |
Ratio of net investment income (loss) to average net assets | | | (0.26% | )(c) | | | (0.52% | ) | | | (0.43% | ) | | | 0.28% | | | | 0.24% | | | | 0.08% | (c) |
| |
| * | Commencement of operations. |
| ** | Amount is less than $0.005. |
| (a) | Net investment income allocated based on average shares method. |
| (b) | Total return measures net investment income and capital gain or loss from portfolio investments assuming reinvestment of dividends and capital gains distributions. Total return is not annualized for periods that are less than a full year, does not reflect the effect of sales charge for Class A shares nor the contingent deferred sales charge for Class B and C shares and does not reflect the deduction of taxes that a shareholder would pay on fund distributions or the redemption of fund shares. |
| | | | |
| 142 | | CALAMOS FAMILY OF FUNDS SEMIANNUAL REPORT | | |
Calamos Discovery Growth Fund Financial Highlights
Selected data for a share outstanding throughout each period were as follows:
| | | | | | | | | | | | |
| | | CLASS A | |
| | | (Unaudited)
Six Months
Ended
April 30, | | | Year Ended
October 31, | | | June 1, 2010*
through
October 31, | |
| | | 2012 | | | 2011 | | | 2010 | |
Net asset value, beginning of period | | | $12.04 | | | | $11.64 | | | | $10.00 | |
| |
Income from investment operations: | | | | | | | | | | | | |
Net investment income (loss)(a) | | | (0.07 | ) | | | (0.14 | ) | | | (0.04 | ) |
| |
Net realized and unrealized gain (loss) | | | 0.67 | | | | 0.55 | | | | 1.68 | |
| |
Total from investment operations | | | 0.60 | | | | 0.41 | | | | 1.64 | |
| |
Distributions: | | | | | | | | | | | | |
Dividends from net investment income | | | — | | | | (0.01 | ) | | | — | |
| |
Dividends from net realized gains | | | — | | | | — | | | | — | |
| |
Total distributions | | | — | | | | (0.01 | ) | | | — | |
| |
Net asset value, end of period | | | $12.64 | | | | $12.04 | | | | $11.64 | |
| |
Ratios and supplemental data: | | | | | | | | | | | | |
Total return(b) | | | 4.98% | | | | 3.55% | | | | 16.40% | |
| |
Net assets, end of period (000) | | | $26,350 | | | | $23,463 | | | | $14,557 | |
| |
Ratio of net expenses to average net assets | | | 1.50% | (c) | | | 1.50% | | | | 1.50% | (c) |
| |
Ratio of gross expenses to average net assets prior to expense reductions | | | 1.75% | (c) | | | 1.84% | | | | 2.63% | (c) |
| |
Ratio of net investment income (loss) to average net assets | | | (1.15% | )(c) | | | (1.08% | ) | | | (0.99% | )(c) |
| |
| | | |
| | | (Unaudited) Six Months
Ended April 30, | | | Year Ended
October 31, | | | June 1, 2010*
through
October 31, | |
| | | 2012 | | | 2011 | | | 2010 | |
Portfolio turnover rate | | | 61.6% | | | | 97.1% | | | | 26.2% | |
| |
| * | Commencement of operations. |
| (a) | Net investment income allocated based on average shares method. |
| (b) | Total return measures net investment income and capital gain or loss from portfolio investments assuming reinvestment of dividends and capital gains distributions. Total return is not annualized for periods that are less than a full year, does not reflect the effect of sales charge for Class A shares nor the contingent deferred sales charge for Class B and C shares and does not reflect the deduction of taxes that a shareholder would pay on fund distributions or the redemption of fund shares. |
Calamos Discovery Growth Fund Financial Highlights
| | | | | | | | | | | | |
| | | CLASS B | |
| | | (Unaudited)
Six Months
Ended
April 30, | | | Year Ended
October 31, | | | June 1, 2010*
through
October 31, | |
| | | 2012 | | | 2011 | | | 2010 | |
Net asset value, beginning of period | | | $11.93 | | | | $11.60 | | | | $10.00 | |
| |
Income from investment operations: | | | | | | | | | | | | |
Net investment income (loss)(a) | | | (0.11 | ) | | | (0.24 | ) | | | (0.08 | ) |
| |
Net realized and unrealized gain (loss) | | | 0.66 | | | | 0.57 | | | | 1.68 | |
| |
Total from investment operations | | | 0.55 | | | | 0.33 | | | | 1.60 | |
| |
Distributions: | | | | | | | | | | | | |
Dividends from net investment income | | | — | | | | — | | | | — | |
| |
Dividends from net realized gains | | | — | | | | — | | | | — | |
| |
Total distributions | | | — | | | | — | | | | — | |
| |
Net asset value, end of period | | | $12.48 | | | | $11.93 | | | | $11.60 | |
| |
Ratios and supplemental data: | | | | | | | | | | | | |
Total return(b) | | | 4.61% | | | | 2.84% | | | | 16.00% | |
| |
Net assets, end of period (000) | | | $1,514 | | | | $1,451 | | | | $1,160 | |
| |
Ratio of net expenses to average net assets | | | 2.25% | (c) | | | 2.25% | | | | 2.25% | (c) |
| |
Ratio of gross expenses to average net assets prior to expense reductions | | | 2.50% | (c) | | | 2.61% | | | | 3.41% | (c) |
| |
Ratio of net investment income (loss) to average net assets | | | (1.89% | )(c) | | | (1.81% | ) | | | (1.74% | )(c) |
| |
| | | | | | | | | | | | |
| | | CLASS C | |
| | | (Unaudited)
Six Months
Ended
April 30, | | | Year Ended
October 31, | | | June 1, 2010*
through
October 31, | |
| | | 2012 | | | 2011 | | | 2010 | |
Net asset value, beginning of period | | | $11.93 | | | | $11.60 | | | | $10.00 | |
| |
Income from investment operations: | | | | | | | | | | | | |
Net investment income (loss)(a) | | | (0.11 | ) | | | (0.24 | ) | | | (0.08 | ) |
| |
Net realized and unrealized gain (loss) | | | 0.66 | | | | 0.57 | | | | 1.68 | |
| |
Total from investment operations | | | 0.55 | | | | 0.33 | | | | 1.60 | |
| |
Distributions: | | | | | | | | | | | | |
Dividends from net investment income | | | — | | | | — | | | | — | |
| |
Dividends from net realized gains | | | — | | | | — | | | | — | |
| |
Total distributions | | | — | | | | — | | | | — | |
| |
Net asset value, end of period | | | $12.48 | | | | $11.93 | | | | $11.60 | |
| |
Ratios and supplemental data: | | | | | | | | | | | | |
Total return(b) | | | 4.61% | | | | 2.84% | | | | 16.00% | |
| |
Net assets, end of period (000) | | | $2,657 | | | | $2,524 | | | | $1,545 | |
| |
Ratio of net expenses to average net assets | | | 2.25% | (c) | | | 2.25% | | | | 2.25% | (c) |
| |
Ratio of gross expenses to average net assets prior to expense reductions | | | 2.50% | (c) | | | 2.59% | | | | 3.38% | (c) |
| |
Ratio of net investment income (loss) to average net assets | | | (1.89% | )(c) | | | (1.82% | ) | | | (1.76% | )(c) |
| |
| * | Commencement of operations. |
| (a) | Net investment income allocated based on average shares method. |
| (b) | Total return measures net investment income and capital gain or loss from portfolio investments assuming reinvestment of dividends and capital gains distributions. Total return is not annualized for periods that are less than a full year, does not reflect the effect of sales charge for Class A shares nor the contingent deferred sales charge for Class B and C shares and does not reflect the deduction of taxes that a shareholder would pay on fund distributions or the redemption of fund shares. |
| | | | |
| 144 | | CALAMOS FAMILY OF FUNDS SEMIANNUAL REPORT | | |
Calamos Discovery Growth Fund Financial Highlights
| | | | | | | | | | | | |
| | | CLASS I | |
| | | (Unaudited) Six Months
Ended
April 30, | | | Year Ended
October 31, | | | June 1, 2010*
through
October 31, | |
| | | 2012 | | | 2011 | | | 2010 | |
Net asset value, beginning of period | | | $12.07 | | | | $11.65 | | | | $10.00 | |
| |
Income from investment operations: | | | | | | | | | | | | |
Net investment income (loss)(a) | | | (0.05 | ) | | | (0.12 | ) | | | (0.03 | ) |
| |
Net realized and unrealized gain (loss) | | | 0.67 | | | | 0.57 | | | | 1.68 | |
| |
Total from investment operations | | | 0.62 | | | | 0.45 | | | | 1.65 | |
| |
Distributions: | | | | | | | | | | | | |
Dividends from net investment income | | | — | | | | (0.03 | ) | | | — | |
| |
Dividends from net realized gains | | | — | | | | — | | | | — | |
| |
Total distributions | | | — | | | | (0.03 | ) | | | — | |
| |
Net asset value, end of period | | | $12.69 | | | | $12.07 | | | | $11.65 | |
| |
Ratios and supplemental data: | | | | | | | | | | | | |
Total return(b) | | | 5.14% | | | | 3.82% | | | | 16.50% | |
| |
Net assets, end of period (000) | | | $8,347 | | | | $7,738 | | | | $2,540 | |
| |
Ratio of net expenses to average net assets | | | 1.25% | (c) | | | 1.25% | | | | 1.25% | (c) |
| |
Ratio of gross expenses to average net assets prior to expense reductions | | | 1.50% | (c) | | | 1.54% | | | | 2.40% | (c) |
| |
Ratio of net investment income (loss) to average net assets | | | (0.89% | )(c) | | | (0.89% | ) | | | (0.74% | )(c) |
| |
| | | | | | | | | | | | |
| | | CLASS R | |
| | | (Unaudited) Six Months
Ended
April 30, | | | Year Ended
October 31, | | | June 1, 2010*
through
October 31, | |
| | | 2012 | | | 2011 | | | 2010 | |
Net asset value, beginning of period | | | $12.01 | | | | $11.63 | | | | $10.00 | |
| |
Income from investment operations: | | | | | | | | | | | | |
Net investment income (loss)(a) | | | (0.08 | ) | | | (0.17 | ) | | | (0.05 | ) |
| |
Net realized and unrealized gain (loss) | | | 0.67 | | | | 0.55 | | | | 1.68 | |
| |
Total from investment operations | | | 0.59 | | | | 0.38 | | | | 1.63 | |
| |
Distributions: | | | | | | | | | | | | |
Dividends from net investment income | | | — | | | | — | | | | — | |
| |
Dividends from net realized gains | | | — | | | | — | | | | — | |
| |
Total distributions | | | — | | | | — | | | | — | |
| |
Net asset value, end of period | | | $12.60 | | | | $12.01 | | | | $11.63 | |
| |
Ratios and supplemental data: | | | | | | | | | | | | |
Total return(b) | | | 4.91% | | | | 3.27% | | | | 16.30% | |
| |
Net assets, end of period (000) | | | $1,257 | | | | $1,201 | | | | $1,163 | |
| |
Ratio of net expenses to average net assets | | | 1.75% | (c) | | | 1.75% | | | | 1.75% | (c) |
| |
Ratio of gross expenses to average net assets prior to expense reductions | | | 2.00% | (c) | | | 2.13% | | | | 2.91% | (c) |
| |
Ratio of net investment income (loss) to average net assets | | | (1.39% | )(c) | | | (1.29% | ) | | | (1.24% | )(c) |
| |
| * | Commencement of operations. |
| (a) | Net investment income allocated based on average shares method. |
| (b) | Total return measures net investment income and capital gain or loss from portfolio investments assuming reinvestment of dividends and capital gains distributions. Total return is not annualized for periods that are less than a full year, does not reflect the effect of sales charge for Class A shares nor the contingent deferred sales charge for Class B and C shares and does not reflect the deduction of taxes that a shareholder would pay on fund distributions or the redemption of fund shares. |
Calamos International Growth Fund Financial Highlights
Selected data for a share outstanding throughout each period were as follows:
| | | | | | | | | | | | | | | | | | | | | | | | |
| | | CLASS A | |
| | | (Unaudited)
Six Months
Ended
April 30, | | | Year Ended October 31, | |
| | | 2012 | | | 2011 | | | 2010 | | | 2009 | | | 2008 | | | 2007 | |
Net asset value, beginning of period | | | $16.32 | | | | $15.46 | | | | $12.64 | | | | $8.90 | | | | $19.16 | | | | $13.34 | |
| |
Income from investment operations: | | | | | | | | | | | | | | | | | | | | | | | | |
Net investment income (loss) | | | 0.02 | (a) | | | (0.04 | )(a) | | | (0.04 | )(a) | | | 0.03 | (a) | | | 0.04 | (a) | | | 0.06 | |
| |
Net realized and unrealized gain (loss) | | | 0.99 | | | | 0.90 | | | | 2.86 | | | | 3.71 | | | | (9.61 | ) | | | 5.85 | |
| |
Total from investment operations | | | 1.01 | | | | 0.86 | | | | 2.82 | | | | 3.74 | | | | (9.57 | ) | | | 5.91 | |
| |
Distributions: | | | | | | | | | | | | | | | | | | | | | | | | |
Dividends from net investment income | | | — | | | | — | | | | — | | | | — | | | | (0.08 | ) | | | (0.05 | ) |
| |
Dividends from net realized gains | | | — | | | | — | | | | — | | | | — | | | | (0.61 | ) | | | (0.04 | ) |
| |
Total distributions | | | — | | | | — | | | | — | | | | — | | | | (0.69 | ) | | | (0.09 | ) |
| |
Net asset value, end of period | | | $17.33 | | | | $16.32 | | | | $15.46 | | | | $12.64 | | | | $8.90 | | | | $19.16 | |
| |
Ratios and supplemental data: | | | | | | | | | | | | | | | | | | | | | | | | |
Total return(b) | | | 6.19% | | | | 5.56% | | | | 22.31% | | | | 42.02% | | | | (51.67% | ) | | | 44.59% | |
| |
Net assets, end of period (000) | | | $352,864 | | | | $238,764 | | | | $136,723 | | | | $112,647 | | | | $130,686 | | | | $270,864 | |
| |
Ratio of net expenses to average net assets | | | 1.40% | (c) | | | 1.49% | | | | 1.67% | | | | 1.62% | | | | 1.48% | | | | 1.49% | |
| |
Ratio of gross expenses to average net assets prior to expense reductions | | | 1.61% | (c) | | | 1.58% | | | | 1.67% | | | | 1.62% | | | | 1.48% | | | | 1.49% | |
| |
Ratio of net investment income (loss) to average net assets | | | 0.19% | (c) | | | (0.21% | ) | | | (0.26% | ) | | | 0.35% | | | | 0.25% | | | | 0.40% | |
| |
| | |
| | | (Unaudited)
Six Months
Ended
April 30, | | | Year Ended October 31, | |
| | | 2012 | | | 2011 | | | 2010 | | | 2009 | | | 2008 | | | 2007 | |
Portfolio turnover rate | | | 33.1% | | | | 59.6% | | | | 63.1% | | | | 86.9% | | | | 87.7% | | | | 80.1% | |
| |
| (a) | Net investment income allocated based on average shares method. |
| (b) | Total return measures net investment income and capital gain or loss from portfolio investments assuming reinvestment of dividends and capital gains distributions. Total return is not annualized for periods that are less than a full year, does not reflect the effect of sales charge for Class A shares nor the contingent deferred sales charge for Class B and C shares and does not reflect the deduction of taxes that a shareholder would pay on fund distributions or the redemption of fund shares. |
| | | | |
| 146 | | CALAMOS FAMILY OF FUNDS SEMIANNUAL REPORT | | |
Calamos International Growth Fund Financial Highlights
| | | | | | | | | | | | | | | | | | | | | | | | |
| | | CLASS B | |
| | | (Unaudited)
Six Months
Ended
April 30, | | | Year Ended October 31, | |
| | | 2012 | | | 2011 | | | 2010 | | | 2009 | | | 2008 | | | 2007 | |
Net asset value, beginning of period | | | $15.67 | | | | $14.96 | | | | $12.32 | | | | $8.74 | | | | $18.88 | | | | $13.20 | |
| |
Income from investment operations: | | | | | | | | | | | | | | | | | | | | | | | | |
Net investment income (loss) | | | (0.05 | )(a) | | | (0.16 | )(a) | | | (0.14 | )(a) | | | (0.03 | )(a) | | | (0.07 | )(a) | | | (0.04 | ) |
| |
Net realized and unrealized gain (loss) | | | 0.96 | | | | 0.87 | | | | 2.78 | | | | 3.61 | | | | (9.46 | ) | | | 5.76 | |
| |
Total from investment operations | | | 0.91 | | | | 0.71 | | | | 2.64 | | | | 3.58 | | | | (9.53 | ) | | | 5.72 | |
| |
Distributions: | | | | | | | | | | | | | | | | | | | | | | | | |
Dividends from net investment income | | | — | | | | — | | | | — | | | | — | | | | — | | | | — | |
| |
Dividends from net realized gains | | | — | | | | — | | | | — | | | | — | | | | (0.61 | ) | | | (0.04 | ) |
| |
Total distributions | | | — | | | | — | | | | — | | | | — | | | | (0.61 | ) | | | (0.04 | ) |
| |
Net asset value, end of period | | | $16.58 | | | | $15.67 | | | | $14.96 | | | | $12.32 | | | | $8.74 | | | | $18.88 | |
| |
Ratios and supplemental data: | | | | | | | | | | | | | | | | | | | | | | | | |
Total return(b) | | | 5.81% | | | | 4.75% | | | | 21.43% | | | | 40.96% | | | | (52.02% | ) | | | 43.49% | |
| |
Net assets, end of period (000) | | | $11,527 | | | | $13,500 | | | | $16,606 | | | | $17,019 | | | | $15,978 | | | | $40,659 | |
| |
Ratio of net expenses to average net assets | | | 2.15% | (c) | | | 2.25% | | | | 2.42% | | | | 2.37% | | | | 2.23% | | | | 2.24% | |
| |
Ratio of gross expenses to average net assets prior to expense reductions | | | 2.35% | (c) | | | 2.32% | | | | 2.42% | | | | 2.38% | | | | 2.23% | | | | 2.24% | |
| |
Ratio of net investment income (loss) to average net assets | | | (0.67% | )(c) | | | (1.01% | ) | | | (1.02% | ) | | | (0.34% | ) | | | (0.50% | ) | | | (0.35% | ) |
| |
| | | | | | | | | | | | | | | | | | | | | | | | |
| | | CLASS C | |
| | | (Unaudited)
Six Months
Ended
April 30, | | | Year Ended October 31, | |
| | | 2012 | | | 2011 | | | 2010 | | | 2009 | | | 2008 | | | 2007 | |
Net asset value, beginning of period | | | $15.65 | | | | $14.94 | | | | $12.30 | | | | $8.72 | | | | $18.85 | | | | $13.18 | |
| |
Income from investment operations: | | | | | | | | | | | | | | | | | | | | | | | | |
Net investment income (loss) | | | (0.05 | )(a) | | | (0.16 | )(a) | | | (0.14 | )(a) | | | (0.03 | )(a) | | | (0.07 | )(a) | | | (0.04 | ) |
| |
Net realized and unrealized gain (loss) | | | 0.96 | | | | 0.87 | | | | 2.78 | | | | 3.61 | | | | (9.45 | ) | | | 5.75 | |
| |
Total from investment operations | | | 0.91 | | | | 0.71 | | | | 2.64 | | | | 3.58 | | | | (9.52 | ) | | | 5.71 | |
| |
Distributions: | | | | | | | | | | | | | | | | | | | | | | | | |
Dividends from net investment income | | | — | | | | — | | | | — | | | | — | | | | — | | | | — | |
| |
Dividends from net realized gains | | | — | | | | — | | | | — | | | | — | | | | (0.61 | ) | | | (0.04 | ) |
| |
Total distributions | | | — | | | | — | | | | — | | | | — | | | | (0.61 | ) | | | (0.04 | ) |
| |
Net asset value, end of period | | | $16.56 | | | | $15.65 | | | | $14.94 | | | | $12.30 | | | | $8.72 | | | | $18.85 | |
| |
Ratios and supplemental data: | | | | | | | | | | | | | | | | | | | | | | | | |
Total return(b) | | | 5.81% | | | | 4.75% | | | | 21.46% | | | | 41.06% | | | | (52.05% | ) | | | 43.48% | |
| |
Net assets, end of period (000) | | | $62,566 | | | | $53,355 | | | | $48,200 | | | | $43,138 | | | | $43,401 | | | | $96,202 | |
| |
Ratio of net expenses to average net assets | | | 2.15% | (c) | | | 2.25% | | | | 2.42% | | | | 2.37% | | | | 2.23% | | | | 2.24% | |
| |
Ratio of gross expenses to average net assets prior to expense reductions | | | 2.36% | (c) | | | 2.32% | | | | 2.42% | | | | 2.37% | | | | 2.23% | | | | 2.24% | |
| |
Ratio of net investment income (loss) to average net assets | | | (0.60% | )(c) | | | (0.98% | ) | | | (1.01% | ) | | | (0.36% | ) | | | (0.50% | ) | | | (0.35% | ) |
| |
| (a) | Net investment income allocated based on average shares method. |
| (b) | Total return measures net investment income and capital gain or loss from portfolio investments assuming reinvestment of dividends and capital gains distributions. Total return is not annualized for periods that are less than a full year, does not reflect the effect of sales charge for Class A shares nor the contingent deferred sales charge for Class B and C shares and does not reflect the deduction of taxes that a shareholder would pay on fund distributions or the redemption of fund shares. |
Calamos International Growth Fund Financial Highlights
| | | | | | | | | | | | | | | | | | | | | | | | |
| | | CLASS I | |
| | | (Unaudited)
Six Months
Ended
April 30, | | | Year Ended October 31, | |
| | | 2012 | | | 2011 | | | 2010 | | | 2009 | | | 2008 | | | 2007 | |
Net asset value, beginning of period | | | $16.47 | | | | $15.57 | | | | $12.72 | | | | $8.93 | | | | $19.22 | | | | $13.37 | |
| |
Income from investment operations: | | | | | | | | | | | | | | | | | | | | | | | | |
Net investment income (loss) | | | 0.04 | (a) | | | 0.01 | (a) | | | 0.01 | (a) | | | 0.05 | (a) | | | 0.08 | (a) | | | 0.07 | |
| |
Net realized and unrealized gain (loss) | | | 1.01 | | | | 0.89 | | | | 2.87 | | | | 3.74 | | | | (9.65 | ) | | | 5.90 | |
| |
Total from investment operations | | | 1.05 | | | | 0.90 | | | | 2.88 | | | | 3.79 | | | | (9.57 | ) | | | 5.97 | |
| |
Distributions: | | | | | | | | | | | | | | | | | | | | | | | | |
Dividends from net investment income | | | — | | | | — | | | | (0.03 | ) | | | — | | | | (0.11 | ) | | | (0.08 | ) |
| |
Dividends from net realized gains | | | — | | | | — | | | | — | | | | — | | | | (0.61 | ) | | | (0.04 | ) |
| |
Total distributions | | | — | | | | — | | | | (0.03 | ) | | | — | | | | (0.72 | ) | | | (0.12 | ) |
| |
Net asset value, end of period | | | $17.52 | | | | $16.47 | | | | $15.57 | | | | $12.72 | | | | $8.93 | | | | $19.22 | |
| |
Ratios and supplemental data: | | | | | | | | | | | | | | | | | | | | | | | | |
Total return(b) | | | 6.38% | | | | 5.78% | | | | 22.66% | | | | 42.44% | | | | (51.56% | ) | | | 45.01% | |
| |
Net assets, end of period (000) | | | $335,191 | | | | $226,298 | | | | $96,003 | | | | $42,392 | | | | $78,423 | | | | $157,986 | |
| |
Ratio of net expenses to average net assets | | | 1.15% | (c) | | | 1.23% | | | | 1.42% | | | | 1.35% | | | | 1.23% | | | | 1.24% | |
| |
Ratio of gross expenses to average net assets prior to expense reductions | | | 1.36% | (c) | | �� | 1.33% | | | | 1.42% | | | | 1.36% | | | | 1.23% | | | | 1.24% | |
| |
Ratio of net investment income (loss) to average net assets | | | 0.44% | (c) | | | 0.07% | | | | 0.06% | | | | 0.51% | | | | 0.50% | | | | 0.65% | |
| |
| | | | | | | | | | | | | | | | | | | | | | | | |
| | | CLASS R | |
| | | (Unaudited)
Six Months
Ended
April 30, | | | Year Ended October 31, | | | March 1, 2007*
through
October 31, | |
| | | 2012 | | | 2011 | | | 2010 | | | 2009 | | | 2008 | | | 2007 | |
Net asset value, beginning of period | | | $16.16 | | | | $15.35 | | | | $12.58 | | | | $8.88 | | | | $19.13 | | | | $14.19 | |
| |
Income from investment operations: | | | | | | | | | | | | | | | | | | | | | | | | |
Net investment income (loss) | | | 0.00 | (a)** | | | (0.08 | )(a) | | | (0.07 | )(a) | | | 0.00 | (a)** | | | 0.00 | (a)** | | | 0.02 | |
| |
Net realized and unrealized gain (loss) | | | 0.99 | | | | 0.89 | | | | 2.84 | | | | 3.70 | | | | (9.59 | ) | | | 4.92 | |
| |
Total from investment operations | | | 0.99 | | | | 0.81 | | | | 2.77 | | | | 3.70 | | | | (9.59 | ) | | | 4.94 | |
| |
Distributions: | | | | | | | | | | | | | | | | | | | | | | | | |
Dividends from net investment income | | | — | | | | — | | | | — | | | | — | | | | (0.05 | ) | | | — | |
| |
Dividends from net realized gains | | | — | | | | — | | | | — | | | | — | | | | (0.61 | ) | | | — | |
| |
Total distributions | | | — | | | | — | | | | — | | | | — | | | | (0.66 | ) | | | — | |
| |
Net asset value, end of period | | | $17.15 | | | | $16.16 | | | | $15.35 | | | | $12.58 | | | | $8.88 | | | | $19.13 | |
| |
Ratios and supplemental data: | | | | | | | | | | | | | | | | | | | | | | | | |
Total return(b) | | | 6.13% | | | | 5.28% | | | | 22.02% | | | | 41.67% | | | | (51.78% | ) | | | 34.81% | |
| |
Net assets, end of period (000) | | | $7,301 | | | | $3,667 | | | | $1,163 | | | | $598 | | | | $83 | | | | $135 | |
| |
Ratio of net expenses to average net assets | | | 1.65% | (c) | | | 1.73% | | | | 1.92% | | | | 1.89% | | | | 1.73% | | | | 1.74% | (c) |
| |
Ratio of gross expenses to average net assets prior to expense reductions | | | 1.86% | (c) | | | 1.84% | | | | 1.92% | | | | 1.89% | | | | 1.73% | | | | 1.74% | (c) |
| |
Ratio of net investment income (loss) to average net assets | | | 0.03% | (c) | | | (0.46% | ) | | | (0.49% | ) | | | 0.02% | | | | 0.00% | | | | 0.15% | (c) |
| |
| * | Commencement of operations. |
| ** | Amount is less than $0.005. |
| (a) | Net investment income allocated based on average shares method. |
| (b) | Total return measures net investment income and capital gain or loss from portfolio investments assuming reinvestment of dividends and capital gains distributions. Total return is not annualized for periods that are less than a full year, does not reflect the effect of sales charge for Class A shares nor the contingent deferred sales charge for Class B and C shares and does not reflect the deduction of taxes that a shareholder would pay on fund distributions or the redemption of fund shares. |
| | | | |
| 148 | | CALAMOS FAMILY OF FUNDS SEMIANNUAL REPORT | | |
Calamos Evolving World Growth Fund Financial Highlights
Selected data for a share outstanding throughout each period were as follows:
| | | | | | | | | | | | | | | | | | | | |
| | | CLASS A | |
| | | (Unaudited)
Six Months
Ended
April 30, | | | Year Ended October 31, | | | August 15, 2008*
through
October 31, | |
| | | 2012 | | | 2011 | | | 2010 | | | 2009 | | | 2008 | |
Net asset value, beginning of period | | | $12.47 | | | | $12.42 | | | | $10.30 | | | | $7.33 | | | | $10.00 | |
| |
Income from investment operations: | | | | | | | | | | | | | | | | | | | | |
Net investment income (loss)(a) | | | 0.01 | | | | 0.01 | | | | 0.08 | | | | 0.12 | | | | 0.01 | |
| |
Net realized and unrealized gain (loss) | | | 0.53 | | | | 0.08 | | | | 2.11 | | | | 2.91 | | | | (2.68 | ) |
| |
Total from investment operations | | | 0.54 | | | | 0.09 | | | | 2.19 | | | | 3.03 | | | | (2.67 | ) |
| |
Distributions: | | | | | | | | | | | | | | | | | | | | |
Dividends from net investment income | | | — | | | | (0.04 | ) | | | (0.07 | ) | | | (0.06 | ) | | | — | |
| |
Dividends from net realized gains | | | — | | | | — | | | | — | | | | — | | | | — | |
| |
Total distributions | | | — | | | | (0.04 | ) | | | (0.07 | ) | | | (0.06 | ) | | | — | |
| |
Net asset value, end of period | | | $13.01 | | | | $12.47 | | | | $12.42 | | | | $10.30 | | | | $7.33 | |
| |
Ratios and supplemental data: | | | | | | | | | | | | | | | | | | | | |
Total return(b) | | | 4.33% | | | | 0.68% | | | | 21.40% | | | | 41.76% | | | | (26.70% | ) |
| |
Net assets, end of period (000) | | | $143,015 | | | | $104,365 | | | | $44,895 | | | | $15,276 | | | | $1,194 | |
| |
Ratio of net expenses to average net assets | | | 1.56% | (c) | | | 1.58% | | | | 1.67% | | | | 1.75% | | | | 1.68% | (c) |
| |
Ratio of gross expenses to average net assets prior to expense reductions | | | 1.56% | (c) | | | 1.58% | | | | 1.67% | | | | 1.97% | | | | 3.01% | (c) |
| |
Ratio of net investment income (loss) to average net assets | | | 0.17% | (c) | | | 0.08% | | | | 0.67% | | | | 1.31% | | | | 0.71% | (c) |
| |
| | | |
| | | (Unaudited)
Six Months
Ended
April 30, | | | Year Ended October 31, | | | August 15, 2008*
through
October 31, | |
| | | 2012 | | | 2011 | | | 2010 | | | 2009 | | | 2008 | |
Portfolio turnover rate | | | 32.5% | | | | 67.4% | | | | 48.3% | | | | 73.5% | | | | 1.2% | |
| |
| * | Commencement of operations. |
| (a) | Net investment income allocated based on average shares method. |
| (b) | Total return measures net investment income and capital gain or loss from portfolio investments assuming reinvestment of dividends and capital gains distributions. Total return is not annualized for periods that are less than a full year, does not reflect the effect of sales charge for Class A shares nor the contingent deferred sales charge for Class B and C shares and does not reflect the deduction of taxes that a shareholder would pay on fund distributions or the redemption of fund shares. |
Calamos Evolving World Growth Fund Financial Highlights
| | | | | | | | | | | | | | | | | | | | |
| | | CLASS B | |
| | | (Unaudited)
Six Months
Ended
April 30, | | | Year Ended October 31, | | | August 15, 2008*
through
October 31, | |
| | | 2012 | | | 2011 | | | 2010 | | | 2009 | | | 2008 | |
Net asset value, beginning of period | | | $12.32 | | | | $12.32 | | | | $10.24 | | | | $7.32 | | | | $10.00 | |
| |
Income from investment operations: | | | | | | | | | | | | | | | | | | | | |
Net investment income (loss)(a) | | | (0.04 | ) | | | (0.09 | ) | | | (0.01 | ) | | | 0.07 | | | | (0.00 | )** |
| |
Net realized and unrealized gain (loss) | | | 0.52 | | | | 0.09 | | | | 2.10 | | | | 2.89 | | | | (2.68 | ) |
| |
Total from investment operations | | | 0.48 | | | | — | | | | 2.09 | | | | 2.96 | | | | (2.68 | ) |
| |
Distributions: | | | | | | | | | | | | | | | | | | | | |
Dividends from net investment income | | | — | | | | — | | | | (0.01 | ) | | | (0.04 | ) | | | — | |
| |
Total distributions | | | — | | | | — | | | | (0.01 | ) | | | (0.04 | ) | | | — | |
| |
Net asset value, end of period | | | $12.80 | | | | $12.32 | | | | $12.32 | | | | $10.24 | | | | $7.32 | |
| |
Ratios and supplemental data: | | | | | | | | | | | | | | | | | | | | |
Total return(b) | | | 3.90% | | | | 0.00% | | | | 20.42% | | | | 40.71% | | | | (26.80% | ) |
| |
Net assets, end of period (000) | | | $1,784 | | | | $1,815 | | | | $1,819 | | | | $1,349 | | | | $732 | |
| |
Ratio of net expenses to average net assets | | | 2.31% | (c) | | | 2.33% | | | | 2.43% | | | | 2.49% | | | | 2.43% | (c) |
| |
Ratio of gross expenses to average net assets prior to expense reductions | | | 2.31% | (c) | | | 2.33% | | | | 2.43% | | | | 2.95% | | | | 3.76% | (c) |
| |
Ratio of net investment income (loss) to average net assets | | | (0.62% | )(c) | | | (0.71% | ) | | | (0.11% | ) | | | 0.83% | | | | (0.04% | )(c) |
| |
| | | | | | | | | | | | | | | | | | | | |
| | | CLASS C | |
| | | (Unaudited)
Six Months
Ended
April 30, | | | Year Ended October 31, | | | August 15, 2008*
through
October 31, | |
| | | 2012 | | | 2011 | | | 2010 | | | 2009 | | | 2008 | |
Net asset value, beginning of period | | | $12.31 | | | | $12.31 | | | | $10.24 | | | | $7.32 | | | | $10.00 | |
| |
Income from investment operations: | | | | | | | | | | | | | | | | | | | | |
Net investment income (loss)(a) | | | (0.03 | ) | | | (0.09 | ) | | | (0.01 | ) | | | 0.07 | | | | (0.00 | )** |
| |
Net realized and unrealized gain (loss) | | | 0.52 | | | | 0.09 | | | | 2.10 | | | | 2.89 | | | | (2.68 | ) |
| |
Total from investment operations | | | 0.49 | | | | — | | | | 2.09 | | | | 2.96 | | | | (2.68 | ) |
| |
Distributions: | | | | | | | | | | | | | | | | | | | | |
Dividends from net investment income | | | — | | | | (0.00 | )** | | | (0.02 | ) | | | (0.04 | ) | | | — | |
| |
Dividends from net realized gains | | | — | | | | — | | | | — | | | | — | | | | — | |
| |
Total distributions | | | — | | | | — | | | | (0.02 | ) | | | (0.04 | ) | | | — | |
| |
Net asset value, end of period | | | $12.80 | | | | $12.31 | | | | $12.31 | | | | $10.24 | | | | $7.32 | |
| |
Ratios and supplemental data: | | | | | | | | | | | | | | | | | | | | |
Total return(b) | | | 3.98% | | | | 0.00% | | | | 20.43% | | | | 40.71% | | | | (26.80% | ) |
| |
Net assets, end of period (000) | | | $18,724 | | | | $8,913 | | | | $3,472 | | | | $1,431 | | | | $734 | |
| |
Ratio of net expenses to average net assets | | | 2.32% | (c) | | | 2.33% | | | | 2.43% | | | | 2.49% | | | | 2.43% | (c) |
| |
Ratio of gross expenses to average net assets prior to expense reductions | | | 2.32% | (c) | | | 2.33% | | | | 2.43% | | | | 2.95% | | | | 3.76% | (c) |
| |
Ratio of net investment income (loss) to average net assets | | | (0.56% | )(c) | | | (0.66% | ) | | | (0.07% | ) | | | 0.82% | | | | (0.04% | )(c) |
| |
| * | Commencement of operations. |
| ** | Amount is less than $0.005. |
| (a) | Net investment income allocated based on average shares method. |
| (b) | Total return measures net investment income and capital gain or loss from portfolio investments assuming reinvestment of dividends and capital gains distributions. Total return is not annualized for periods that are less than a full year, does not reflect the effect of sales charge for Class A shares nor the contingent deferred sales charge for Class B and C shares and does not reflect the deduction of taxes that a shareholder would pay on fund distributions or the redemption of fund shares. |
| | | | |
| 150 | | CALAMOS FAMILY OF FUNDS SEMIANNUAL REPORT | | |
Calamos Evolving World Growth Fund Financial Highlights
| | | | | | | | | | | | | | | | | | | | |
| | | CLASS I | |
| | | (Unaudited)
Six Months
Ended
April 30, | | | Year Ended October 31, | | | August 15, 2008*
through
October 31, | |
| | | 2012 | | | 2011 | | | 2010 | | | 2009 | | | 2008 | |
Net asset value, beginning of period | | | $12.54 | | | | $12.46 | | | | $10.32 | | | | $7.33 | | | | $10.00 | |
| |
Income from investment operations: | | | | | | | | | | | | | | | | | | | | |
Net investment income (loss)(a) | | | 0.03 | | | | 0.04 | | | | 0.10 | | | | 0.15 | | | | 0.02 | |
| |
Net realized and unrealized gain (loss) | | | 0.53 | | | | 0.09 | | | | 2.12 | | | | 2.91 | | | | (2.69 | ) |
| |
Total from investment operations | | | 0.56 | | | | 0.13 | | | | 2.22 | | | | 3.06 | | | | (2.67 | ) |
| |
Distributions: | | | | | | | | | | | | | | | | | | | | |
Dividends from net investment income | | | (0.01 | ) | | | (0.05 | ) | | | (0.08 | ) | | | (0.07 | ) | | | — | |
| |
Dividends from net realized gains | | | — | | | | — | | | | — | | | | — | | | | — | |
| |
Total distributions | | | (0.01 | ) | | | (0.05 | ) | | | (0.08 | ) | | | (0.07 | ) | | | — | |
| |
Net asset value, end of period | | | $13.09 | | | | $12.54 | | | | $12.46 | | | | $10.32 | | | | $7.33 | |
| |
Ratios and supplemental data: | | | | | | | | | | | | | | | | | | | | |
Total return(b) | | | 4.46% | | | | 1.05% | | | | 21.68% | | | | 42.14% | | | | (26.70% | ) |
| |
Net assets, end of period (000) | | | $171,516 | | | | $89,205 | | | | $52,875 | | | | $24,132 | | | | $15,404 | |
| |
Ratio of net expenses to average net assets | | | 1.32% | (c) | | | 1.33% | | | | 1.43% | | | | 1.49% | | | | 1.43% | (c) |
| |
Ratio of gross expenses to average net assets prior to expense reductions | | | 1.32% | (c) | | | 1.33% | | | | 1.43% | | | | 1.97% | | | | 2.76% | (c) |
| |
Ratio of net investment income (loss) to average net assets | | | 0.43% | (c) | | | 0.33% | | | | 0.92% | | | | 1.86% | | | | 0.96% | (c) |
| |
| | | | | | | | | | | | | | | | | | | | |
| | | CLASS R | |
| | | (Unaudited)
Six Months
Ended
April 30, | | | Year Ended October 31, | | | August 15, 2008*
through
October 31, | |
| | | 2012 | | | 2011 | | | 2010 | | | 2009 | | | 2008 | |
Net asset value, beginning of period | | | $12.45 | | | | $12.39 | | | | $10.28 | | | | $7.33 | | | | $10.00 | |
| |
Income from investment operations: | | | | | | | | | | | | | | | | | | | | |
Net investment income (loss)(a) | | | (0.01 | ) | | | (0.03 | ) | | | 0.04 | | | | 0.11 | | | | 0.01 | |
| |
Net realized and unrealized gain (loss) | | | 0.54 | | | | 0.09 | | | | 2.11 | | | | 2.89 | | | | (2.68 | ) |
| |
Total from investment operations | | | 0.53 | | | | 0.06 | | | | 2.15 | | | | 3.00 | | | | (2.67 | ) |
| |
Distributions: | | | | | | | | | | | | | | | | | | | | |
Dividends from net investment income | | | — | | | | — | | | | (0.04 | ) | | | (0.05 | ) | | | — | |
| |
Dividends from net realized gains | | | — | | | | — | | | | — | | | | — | | | | — | |
| |
Total distributions | | | — | | | | — | | | | (0.04 | ) | | | (0.05 | ) | | | — | |
| |
Net asset value, end of period | | | $12.98 | | | | $12.45 | | | | $12.39 | | | | $10.28 | | | | $7.33 | |
| |
Ratios and supplemental data: | | | | | | | | | | | | | | | | | | | | |
Total return(b) | | | 4.26% | | | | 0.48% | | | | 20.99% | | | | 41.32% | | | | (26.70% | ) |
| |
Net assets, end of period (000) | | | $1,490 | | | | $1,274 | | | | $1,252 | | | | $1,040 | | | | $732 | |
| |
Ratio of net expenses to average net assets | | | 1.81% | (c) | | | 1.83% | | | | 1.93% | | | | 1.99% | | | | 1.93% | (c) |
| |
Ratio of gross expenses to average net assets prior to expense reductions | | | 1.81% | (c) | | | 1.83% | | | | 1.93% | | | | 2.49% | | | | 3.26% | (c) |
| |
Ratio of net investment income (loss) to average net assets | | | (0.12% | )(c) | | | (0.21% | ) | | | 0.38% | | | | 1.37% | | | | 0.46% | (c) |
| |
| * | Commencement of operations. |
| (a) | Net investment income allocated based on average shares method. |
| (b) | Total return measures net investment income and capital gain or loss from portfolio investments assuming reinvestment of dividends and capital gains distributions. Total return is not annualized for periods that are less than a full year, does not reflect the effect of sales charge for Class A shares nor the contingent deferred sales charge for Class B and C shares and does not reflect the deduction of taxes that a shareholder would pay on fund distributions or the redemption of fund shares. |
Calamos Global Equity Fund Financial Highlights
Selected data for a share outstanding throughout each period were as follows:
| | | | | | | | | | | | | | | | | | | | | | | | |
| | | CLASS A | |
| | | (Unaudited)
Six Months
Ended
April 30, | | | Year Ended October 31, | | | March 1, 2007*
through
October 31, | |
| | | 2012 | | | 2011 | | | 2010 | | | 2009 | | | 2008 | | | 2007 | |
Net asset value, beginning of period | | | $12.14 | | | | $11.28 | | | | $9.12 | | | | $7.16 | | | | $13.44 | | | | $10.00 | |
| |
Income from investment operations: | | | | | | | | | | | | | | | | | | | | | | | | |
Net investment income (loss)(a) | | | (0.00 | )** | | | (0.07 | ) | | | (0.07 | ) | | | (0.03 | ) | | | (0.06 | ) | | | (0.02 | ) |
| |
Net realized and unrealized gain (loss) | | | 0.92 | | | | 0.93 | | | | 2.23 | | | | 2.33 | | | | (6.22 | ) | | | 3.46 | |
| |
Total from investment operations | | | 0.92 | | | | 0.86 | | | | 2.16 | | | | 2.30 | | | | (6.28 | ) | | | 3.44 | |
| |
Distributions: | | | | | | | | | | | | | | | | | | | | | | | | |
Dividends from net investment income | | | — | | | | — | | | | — | | | | (0.33 | ) | | | — | | | | — | |
| |
Dividends from net realized gains | | | — | | | | — | | | | — | | | | — | | | | — | | | | — | |
| |
Return of capital | | | — | | | | — | | | | — | | | | (0.01 | ) | | | — | | | | — | |
| |
Total distributions | | | — | | | | — | | | | — | | | | (0.34 | ) | | | — | | | | — | |
| |
Net asset value, end of period | | | $13.06 | | | | $12.14 | | | | $11.28 | | | | $9.12 | | | | $7.16 | | | | $13.44 | |
| |
Ratios and supplemental data: | | | | | | | | | | | | | | | | | | | | | | | | |
Total return(b) | | | 7.58% | | | | 7.62% | | | | 23.68% | | | | 34.24% | | | | (46.73% | ) | | | 34.40% | |
| |
Net assets, end of period (000) | | | $89,972 | | | | $51,525 | | | | $30,212 | | | | $21,162 | | | | $23,904 | | | | $42,097 | |
| |
Ratio of net expenses to average net assets | | | 1.40% | (c) | | | 1.57% | | | | 1.88% | | | | 1.95% | | | | 1.82% | | | | 1.75% | (c) |
| |
Ratio of gross expenses to average net assets prior to expense reductions | | | 1.55% | (c) | | | 1.66% | | | | 1.88% | | | | 2.05% | | | | 1.82% | | | | 1.92% | (c) |
| |
Ratio of net investment income (loss) to average net assets | | | (0.06% | )(c) | | | (0.60% | ) | | | (0.71% | ) | | | (0.45% | ) | | | (0.52% | ) | | | (0.30% | )(c) |
| |
| | | |
| | | (Unaudited)
Six Months
Ended
April 30, | | | Year Ended October 31, | | | March 1, 2007*
through
October 31, | |
| | | 2012 | | | 2011 | | | 2010 | | | 2009 | | | 2008 | | | 2007 | |
Portfolio turnover rate | | | 29.2% | | | | 58.8% | | | | 65.1% | | | | 101.6% | | | | 83.7% | | | | 45.8% | |
| |
| * | Commencement of operations. |
| ** | Amount is less than $0.005. |
| (a) | Net investment income allocated based on average shares method. |
| (b) | Total return measures net investment income and capital gain or loss from portfolio investments assuming reinvestment of dividends and capital gains distributions. Total return is not annualized for periods that are less than a full year, does not reflect the effect of sales charge for Class A shares nor the contingent deferred sales charge for Class B and C shares and does not reflect the deduction of taxes that a shareholder would pay on fund distributions or the redemption of fund shares. |
| | | | |
| 152 | | CALAMOS FAMILY OF FUNDS SEMIANNUAL REPORT | | |
Calamos Global Equity Fund Financial Highlights
| | | | | | | | | | | | | | | | | | | | | | | | |
| | | CLASS B | |
| | | (Unaudited)
Six Months
Ended
April 30, | | | Year Ended October 31, | | | March 1, 2007*
through
October 31, | |
| | | 2012 | | | 2011 | | | 2010 | | | 2009 | | | 2008 | | | 2007 | |
Net asset value, beginning of period | | | $11.82 | | | | $11.06 | | | | $9.02 | | | | $7.06 | | | | $13.36 | | | | $10.00 | |
| |
Income from investment operations: | | | | | | | | | | | | | | | | | | | | | | | | |
Net investment income (loss)(a) | | | (0.05 | ) | | | (0.16 | ) | | | (0.15 | ) | | | (0.09 | ) | | | (0.14 | ) | | | (0.08 | ) |
| |
Net realized and unrealized gain (loss) | | | 0.90 | | | | 0.92 | | | | 2.19 | | | | 2.33 | | | | (6.16 | ) | | | 3.44 | |
| |
Total from investment operations | | | 0.85 | | | | 0.76 | | | | 2.04 | | | | 2.24 | | | | (6.30 | ) | | | 3.36 | |
| |
Distributions: | | | | | | | | | | | | | | | | | | | | | | | | |
Dividends from net investment income | | | — | | | | — | | | | — | | | | (0.27 | ) | | | — | | | | — | |
| |
Dividends from net realized gains | | | — | | | | — | | | | — | | | | — | | | | — | | | | — | |
| |
Return of capital | | | — | | | | — | | | | — | | | | (0.01 | ) | | | — | | | | — | |
| |
Total distributions | | | — | | | | — | | | | — | | | | (0.28 | ) | | | — | | | | — | |
| |
Net asset value, end of period | | | $12.67 | | | | $11.82 | | | | $11.06 | | | | $9.02 | | | | $7.06 | | | | $13.36 | |
| |
Ratios and supplemental data: | | | | | | | | | | | | | | | | | | | | | | | | |
Total return(b) | | | 7.19% | | | | 6.87% | | | | 22.62% | | | | 33.48% | | | | (47.16% | ) | | | 33.60% | |
| |
Net assets, end of period (000) | | | $2,637 | | | | $2,603 | | | | $2,552 | | | | $2,125 | | | | $1,531 | | | | $2,529 | |
| |
Ratio of net expenses to average net assets | | | 2.15% | (c) | | | 2.35% | | | | 2.63% | | | | 2.71% | | | | 2.57% | | | | 2.50% | (c) |
| |
Ratio of gross expenses to average net assets prior to expense reductions | | | 2.31% | (c) | | | 2.42% | | | | 2.63% | | | | 2.81% | | | | 2.57% | | | | 2.67% | (c) |
| |
Ratio of net investment income (loss) to average net assets | | | (0.90% | )(c) | | | (1.37% | ) | | | (1.46% | ) | | | (1.18% | ) | | | (1.27% | ) | | | (1.05% | )(c) |
| |
| | | | | | | | | | | | | | | | | | | | | | | | |
| | | CLASS C | |
| | | (Unaudited)
Six Months
Ended
April 30, | | | Year Ended October 31, | | | March 1, 2007*
through
October 31, | |
| | | 2012 | | | 2011 | | | 2010 | | | 2009 | | | 2008 | | | 2007 | |
Net asset value, beginning of period | | | $11.80 | | | | $11.04 | | | | $9.00 | | | | $7.07 | | | | $13.37 | | | | $10.00 | |
| |
Income from investment operations: | | | | | | | | | | | | | | | | | | | | | | | | |
Net investment income (loss)(a) | | | (0.05 | ) | | | (0.16 | ) | | | (0.15 | ) | | | (0.09 | ) | | | (0.14 | ) | | | (0.08 | ) |
| |
Net realized and unrealized gain (loss) | | | 0.89 | | | | 0.92 | | | | 2.19 | | | | 2.32 | | | | (6.16 | ) | | | 3.45 | |
| |
Total from investment operations | | | 0.84 | | | | 0.76 | | | | 2.04 | | | | 2.23 | | | | (6.30 | ) | | | 3.37 | |
| |
Distributions: | | | | | | | | | | | | | | | | | | | | | | | | |
Dividends from net investment income | | | — | | | | — | | | | — | | | | (0.29 | ) | | | — | | | | — | |
| |
Dividends from net realized gains | | | — | | | | — | | | | — | | | | — | | | | — | | | | — | |
| |
Return of capital | | | — | | | | — | | | | — | | | | (0.01 | ) | | | — | | | | — | |
| |
Total distributions | | | — | | | | — | | | | — | | | | (0.30 | ) | | | — | | | | — | |
| |
Net asset value, end of period | | | $12.64 | | | | $11.80 | | | | $11.04 | | | | $9.00 | | | | $7.07 | | | | $13.37 | |
| |
Ratios and supplemental data: | | | | | | | | | | | | | | | | | | | | | | | | |
Total return(b) | | | 7.12% | | | | 6.88% | | | | 22.67% | | | | 33.29% | | | | (47.12% | ) | | | 33.70% | |
| |
Net assets, end of period (000) | | | $17,218 | | | | $10,359 | | | | $6,523 | | | | $4,490 | | | | $4,339 | | | | $3,261 | |
| |
Ratio of net expenses to average net assets | | | 2.15% | (c) | | | 2.32% | | | | 2.63% | | | | 2.70% | | | | 2.57% | | | | 2.50% | (c) |
| |
Ratio of gross expenses to average net assets prior to expense reductions | | | 2.30% | (c) | | | 2.41% | | | | 2.63% | | | | 2.81% | | | | 2.57% | | | | 2.67% | (c) |
| |
Ratio of net investment income (loss) to average net assets | | | (0.81% | )(c) | | | (1.33% | ) | | | (1.46% | ) | | | (1.22% | ) | | | (1.27% | ) | | | (1.05% | )(c) |
| |
| * | Commencement of operations. |
| (a) | Net investment income allocated based on average shares method. |
| (b) | Total return measures net investment income and capital gain or loss from portfolio investments assuming reinvestment of dividends and capital gains distributions. Total return is not annualized for periods that are less than a full year, does not reflect the effect of sales charge for Class A shares nor the contingent deferred sales charge for Class B and C shares and does not reflect the deduction of taxes that a shareholder would pay on fund distributions or the redemption of fund shares. |
Calamos Global Equity Fund Financial Highlights
| | | | | | | | | | | | | | | | | | | | | | | | |
| | | CLASS I | |
| | | (Unaudited)
Six Months
Ended
April 30, | | | Year Ended October 31, | | | March 1, 2007*
through
October 31, | |
| | | 2012 | | | 2011 | | | 2010 | | | 2009 | | | 2008 | | | 2007 | |
Net asset value, beginning of period | | | $12.22 | | | | $11.31 | | | | $9.13 | | | | $7.19 | | | | $13.46 | | | | $10.00 | |
| |
Income from investment operations: | | | | | | | | | | | | | | | | | | | | | | | | |
Net investment income (loss)(a) | | | 0.01 | | | | (0.04 | ) | | | (0.04 | ) | | | (0.01 | ) | | | (0.03 | ) | | | (0.00 | )** |
| |
Net realized and unrealized gain (loss) | | | 0.92 | | | | 0.95 | | | | 2.22 | | | | 2.34 | | | | (6.24 | ) | | | 3.46 | |
| |
Total from investment operations | | | 0.93 | | | | 0.91 | | | | 2.18 | | | | 2.33 | | | | (6.27 | ) | | | 3.46 | |
| |
Distributions: | | | | | | | | | | | | | | | | | | | | | | | | |
Dividends from net investment income | | | — | | | | — | | | | — | | | | (0.38 | ) | | | — | | | | — | |
| |
Dividends from net realized gains | | | — | | | | — | | | | — | | | | — | | | | — | | | | — | |
| |
Return of capital | | | — | | | | — | | | | — | | | | (0.01 | ) | | | — | | | | — | |
| |
Total distributions | | | — | | | | — | | | | — | | | | (0.39 | ) | | | — | | | | — | |
| |
Net asset value, end of period | | | $13.15 | | | | $12.22 | | | | $11.31 | | | | $9.13 | | | | $7.19 | | | | $13.46 | |
| |
Ratios and supplemental data: | | | | | | | | | | | | | | | | | | | | | | | | |
Total return(b) | | | 7.61% | | | | 8.05% | | | | 23.88% | | | | 34.70% | | | | (46.58% | ) | | | 34.60% | |
| |
Net assets, end of period (000) | | | $144,921 | | | | $63,563 | | | | $11,996 | | | | $4,724 | | | | $3,436 | | | | $5,714 | |
| |
Ratio of net expenses to average net assets | | | 1.15% | (c) | | | 1.27% | | | | 1.63% | | | | 1.70% | | | | 1.57% | | | | 1.50% | (c) |
| |
Ratio of gross expenses to average net assets prior to expense reductions | | | 1.29% | (c) | | | 1.39% | | | | 1.63% | | | | 1.81% | | | | 1.57% | | | | 1.67% | (c) |
| |
Ratio of net investment income (loss) to average net assets | | | 0.23% | (c) | | | (0.29% | ) | | | (0.39% | ) | | | (0.18% | ) | | | (0.27% | ) | | | (0.05% | )(c) |
| |
| | | | | | | | | | | | | | | | | | | | | | | | |
| | | CLASS R | |
| | | (Unaudited)
Six Months
Ended
April 30, | | | Year Ended October 31, | | | March 1, 2007*
through
October 31, | |
| | | 2012 | | | 2011 | | | 2010 | | | 2009 | | | 2008 | | | 2007 | |
Net asset value, beginning of period | | | $12.02 | | | | $11.19 | | | | $9.07 | | | | $7.13 | | | | $13.41 | | | | $10.00 | |
| |
Income from investment operations: | | | | | | | | | | | | | | | | | | | | | | | | |
Net investment income (loss)(a) | | | (0.02 | ) | | | (0.10 | ) | | | (0.10 | ) | | | (0.05 | ) | | | (0.08 | ) | | | (0.04 | ) |
| |
Net realized and unrealized gain (loss) | | | 0.90 | | | | 0.93 | | | | 2.22 | | | | 2.32 | | | | (6.20 | ) | | | 3.45 | |
| |
Total from investment operations | | | 0.88 | | | | 0.83 | | | | 2.12 | | | | 2.27 | | | | (6.28 | ) | | | 3.41 | |
| |
Distributions: | | | | | | | | | | | | | | | | | | | | | | | | |
Dividends from net investment income | | | — | | | | — | | | | — | | | | (0.32 | ) | | | — | | | | — | |
| |
Dividends from net realized gains | | | — | | | | — | | | | — | | | | — | | | | — | | | | — | |
| |
Return of capital | | | — | | | | — | | | | — | | | | (0.01 | ) | | | — | | | | — | |
| |
Total distributions | | | — | | | | — | | | | — | | | | (0.33 | ) | | | — | | | | — | |
| |
Net asset value, end of period | | | $12.90 | | | | $12.02 | | | | $11.19 | | | | $9.07 | | | | $7.13 | | | | $13.41 | |
| |
Ratios and supplemental data: | | | | | | | | | | | | | | | | | | | | | | | | |
Total return(b) | | | 7.32% | | | | 7.42% | | | | 23.37% | | | | 33.92% | | | | (46.83% | ) | | | 34.10% | |
| |
Net assets, end of period (000) | | | $1,990 | | | | $1,709 | | | | $1,223 | | | | $962 | | | | $713 | | | | $1,341 | |
| |
Ratio of net expenses to average net assets | | | 1.65% | (c) | | | 1.83% | | | | 2.13% | | | | 2.20% | | | | 2.07% | | | | 2.00% | (c) |
| |
Ratio of gross expenses to average net assets prior to expense reductions | | | 1.80% | (c) | | | 1.91% | | | | 2.13% | | | | 2.31% | | | | 2.07% | | | | 2.17% | (c) |
| |
Ratio of net investment income (loss) to average net assets | | | (0.39% | )(c) | | | (0.85% | ) | | | (0.96% | ) | | | (0.68% | ) | | | (0.77% | ) | | | (0.55% | )(c) |
| |
| * | Commencement of operations. |
| ** | Amount is less than $0.005. |
| (a) | Net investment income allocated based on average shares method. |
| (b) | Total return measures net investment income and capital gain or loss from portfolio investments assuming reinvestment of dividends and capital gains distributions. Total return is not annualized for periods that are less than a full year, does not reflect the effect of sales charge for Class A shares nor the contingent deferred sales charge for Class B and C shares and does not reflect the deduction of taxes that a shareholder would pay on fund distributions or the redemption of fund shares. |
| | | | |
| 154 | | CALAMOS FAMILY OF FUNDS SEMIANNUAL REPORT | | |
Calamos Growth and Income Fund Financial Highlights
Selected data for a share outstanding throughout each period were as follows:
| | | | | | | | | | | | | | | | | | | | | | | | |
| | | CLASS A | |
| | | (Unaudited) Six Months Ended April 30, | | | Year Ended October 31, | |
| | | 2012 | | | 2011 | | | 2010 | | | 2009 | | | 2008 | | | 2007 | |
Net asset value, beginning of period | | | $32.12 | | | | $30.15 | | | | $27.49 | | | | $21.13 | | | | $35.83 | | | | $32.71 | |
| |
Income from investment operations: | | | | | | | | | | | | | | | | | | | | | | | | |
Net investment income (loss) | | | 0.26 | (a) | | | 0.51 | (a) | | | 0.64 | (a) | | | 0.62 | (a) | | | 0.37 | (a) | | | 0.32 | |
| |
Net realized and unrealized gain (loss) | | | 0.91 | | | | 1.89 | | | | 2.70 | | | | 6.17 | | | | (12.09 | ) | | | 5.04 | |
| |
Total from investment operations | | | 1.17 | | | | 2.40 | | | | 3.34 | | | | 6.79 | | | | (11.72 | ) | | | 5.36 | |
| |
Distributions: | | | | | | | | | | | | | | | | | | | | | | | | |
Dividends from net investment income | | | (0.41 | ) | | | (0.43 | ) | | | (0.68 | ) | | | (0.43 | ) | | | (0.52 | ) | | | (0.50 | ) |
| |
Dividends from net realized gains | | | — | | | | — | | | | — | | | | — | | | | (2.46 | ) | | | (1.74 | ) |
| |
Total distributions | | | (0.41 | ) | | | (0.43 | ) | | | (0.68 | ) | | | (0.43 | ) | | | (2.98 | ) | | | (2.24 | ) |
| |
Net asset value, end of period | | | $32.88 | | | | $32.12 | | | | $30.15 | | | | $27.49 | | | | $21.13 | | | | $35.83 | |
| |
Ratios and supplemental data: | | | | | | | | | | | | | | | | | | | | | | | | |
Total return(b) | | | 3.68% | | | | 8.04% | | | | 12.31% | | | | 32.49% | | | | (35.31% | ) | | | 17.38% | |
| |
Net assets, end of period (000) | | | $2,138,230 | | | | $2,017,175 | | | | $1,706,548 | | | | $1,748,479 | | | | $1,749,433 | | | | $3,441,626 | |
| |
Ratio of net expenses to average net assets | | | 1.08% | (c) | | | 1.08% | | | | 1.09% | | | | 1.12% | | | | 1.06% | | | | 1.06% | |
| |
Ratio of gross expenses to average net assets prior to expense reductions | | | 1.08% | (c) | | | 1.08% | | | | 1.09% | | | | 1.12% | | | | 1.07% | | | | 1.06% | |
| |
Ratio of net investment income (loss) to average net assets | | | 1.63% | (c) | | | 1.60% | | | | 2.26% | | | | 2.69% | | | | 1.26% | | | | 1.16% | |
| |
| | |
| | | (Unaudited) Six Months
Ended
April 30, | | | Year Ended October 31, | |
| | | 2012 | | | 2011 | | | 2010 | | | 2009 | | | 2008 | | | 2007 | |
Portfolio turnover rate | | | 26.2% | | | | 55.1% | | | | 54.6% | | | | 66.2% | | | | 83.4% | | | | 66.0% | |
| |
| (a) | Net investment income allocated based on average shares method. |
| (b) | Total return measures net investment income and capital gain or loss from portfolio investments assuming reinvestment of dividends and capital gains distributions. Total return is not annualized for periods that are less than a full year, does not reflect the effect of sales charge for Class A shares nor the contingent deferred sales charge for Class B and C shares and does not reflect the deduction of taxes that a shareholder would pay on fund distributions or the redemption of fund shares. |
Calamos Growth and Income Fund Financial Highlights
| | | | | | | | | | | | | | | | | | | | | | | | |
| | | CLASS B | |
| | | (Unaudited) Six Months Ended April 30, | | | Year Ended October 31, | |
| | | 2012 | | | 2011 | | | 2010 | | | 2009 | | | 2008 | | | 2007 | |
Net asset value, beginning of period | | | $36.47 | | | | $34.22 | | | | $31.10 | | | | $23.85 | | | | $40.09 | | | | $36.32 | |
| |
Income from investment operations: | | | | | | | | | | | | | | | | | | | | | | | | |
Net investment income (loss) | | | 0.16 | (a) | | | 0.32 | (a) | | | 0.49 | (a) | | | 0.50 | (a) | | | 0.17 | (a) | | | 0.12 | |
| |
Net realized and unrealized gain (loss) | | | 1.05 | | | | 2.14 | | | | 3.05 | | | | 6.97 | | | | (13.63 | ) | | | 5.60 | |
| |
Total from investment operations | | | 1.21 | | | | 2.46 | | | | 3.54 | | | | 7.47 | | | | (13.46 | ) | | | 5.72 | |
| |
Distributions: | | | | | | | | | | | | | | | | | | | | | | | | |
Dividends from net investment income | | | (0.25 | ) | | | (0.21 | ) | | | (0.42 | ) | | | (0.22 | ) | | | (0.32 | ) | | | (0.21 | ) |
| |
Dividends from net realized gains | | | — | | | | — | | | | — | | | | — | | | | (2.46 | ) | | | (1.74 | ) |
| |
Total distributions | | | (0.25 | ) | | | (0.21 | ) | | | (0.42 | ) | | | (0.22 | ) | | | (2.78 | ) | | | (1.95 | ) |
| |
Net asset value, end of period | | | $37.43 | | | | $36.47 | | | | $34.22 | | | | $31.10 | | | | $23.85 | | | | $40.09 | |
| |
Ratios and supplemental data: | | | | | | | | | | | | | | | | | | | | | | | | |
Total return(b) | | | 3.33% | | | | 7.21% | | | | 11.46% | | | | 31.48% | | | | (35.80% | ) | | | 16.53% | |
| |
Net assets, end of period (000) | | | $129,897 | | | | $184,989 | | | | $303,273 | | | | $376,111 | | | | $385,128 | | | | $739,884 | |
| |
Ratio of net expenses to average net assets | | | 1.83% | (c) | | | 1.82% | | | | 1.84% | | | | 1.87% | | | | 1.81% | | | | 1.81% | |
| |
Ratio of gross expenses to average net assets prior to expense reductions | | | 1.83% | (c) | | | 1.82% | | | | 1.84% | | | | 1.88% | | | | 1.82% | | | | 1.81% | |
| |
Ratio of net investment income (loss) to average net assets | | | 0.88% | (c) | | | 0.88% | | | | 1.51% | | | | 1.95% | | | | 0.51% | | | | 0.41% | |
| |
| | | | | | | | | | | | | | | | | | | | | | | | |
| | | CLASS C | |
| | | (Unaudited) Six Months Ended April 30, | | | Year Ended October 31, | |
| | | 2012 | | | 2011 | | | 2010 | | | 2009 | | | 2008 | | | 2007 | |
Net asset value, beginning of period | | | $32.23 | | | | $30.30 | | | | $27.62 | | | | $21.23 | | | | $36.05 | | | | $32.89 | |
| |
Income from investment operations: | | | | | | | | | | | | | | | | | | | | | | | | |
Net investment income (loss) | | | 0.14 | (a) | | | 0.27 | (a) | | | 0.43 | (a) | | | 0.45 | (a) | | | 0.15 | (a) | | | 0.10 | |
| |
Net realized and unrealized gain (loss) | | | 0.92 | | | | 1.91 | | | | 2.72 | | | | 6.19 | | | | (12.16 | ) | | | 5.05 | |
| |
Total from investment operations | | | 1.06 | | | | 2.18 | | | | 3.15 | | | | 6.64 | | | | (12.01 | ) | | | 5.15 | |
| |
Distributions: | | | | | | | | | | | | | | | | | | | | | | | | |
Dividends from net investment income | | | (0.29 | ) | | | (0.25 | ) | | | (0.47 | ) | | | (0.25 | ) | | | (0.35 | ) | | | (0.25 | ) |
| |
Dividends from net realized gains | | | — | | | | — | | | | — | | | | — | | | | (2.46 | ) | | | (1.74 | ) |
| |
Total distributions | | | (0.29 | ) | | | (0.25 | ) | | | (0.47 | ) | | | (0.25 | ) | | | (2.81 | ) | | | (1.99 | ) |
| |
Net asset value, end of period | | | $33.00 | | | | $32.23 | | | | $30.30 | | | | $27.62 | | | | $21.23 | | | | $36.05 | |
| |
Ratios and supplemental data: | | | | | | | | | | | | | | | | | | | | | | | | |
Total return(b) | | | 3.31% | | | | 7.23% | | | | 11.50% | | | | 31.49% | | | | (35.82% | ) | | | 16.53% | |
| |
Net assets, end of period (000) | | | $1,360,189 | | | | $1,344,781 | | | | $1,291,168 | | | | $1,263,459 | | | | $1,212,715 | | | | $2,244,752 | |
| |
Ratio of net expenses to average net assets | | | 1.83% | (c) | | | 1.83% | | | | 1.84% | | | | 1.87% | | | | 1.81% | | | | 1.81% | |
| |
Ratio of gross expenses to average net assets prior to expense reductions | | | 1.83% | (c) | | | 1.83% | | | | 1.84% | | | | 1.87% | | | | 1.82% | | | | 1.81% | |
| |
Ratio of net investment income (loss) to average net assets | | | 0.88% | (c) | | | 0.86% | | | | 1.51% | | | | 1.94% | | | | 0.51% | | | | 0.41% | |
| |
| (a) | Net investment income allocated based on average shares method. |
| (b) | Total return measures net investment income and capital gain or loss from portfolio investments assuming reinvestment of dividends and capital gains distributions. Total return is not annualized for periods that are less than a full year, does not reflect the effect of sales charge for Class A shares nor the contingent deferred sales charge for Class B and C shares and does not reflect the deduction of taxes that a shareholder would pay on fund distributions or the redemption of fund shares. |
| | | | |
| 156 | | CALAMOS FAMILY OF FUNDS SEMIANNUAL REPORT | | |
Calamos Growth and Income Fund Financial Highlights
| | | | | | | | | | | | | | | | | | | | | | | | |
| | | CLASS I | |
| | | (Unaudited) Six Months Ended April 30, | | | Year Ended October 31, | |
| | | 2012 | | | 2011 | | | 2010 | | | 2009 | | | 2008 | | | 2007 | |
Net asset value, beginning of period | | | $31.41 | | | | $29.48 | | | | $26.89 | | | | $20.69 | | | | $35.13 | | | | $32.11 | |
| |
Income from investment operations: | | | | | | | | | | | | | | | | | | | | | | | | |
Net investment income (loss) | | | 0.30 | (a) | | | 0.58 | (a) | | | 0.70 | (a) | | | 0.68 | (a) | | | 0.42 | (a) | | | 0.46 | |
| |
Net realized and unrealized gain (loss) | | | 0.89 | | | | 1.84 | | | | 2.64 | | | | 6.01 | | | | (11.82 | ) | | | 4.88 | |
| |
Total from investment operations | | | 1.19 | | | | 2.42 | | | | 3.34 | | | | 6.69 | | | | (11.40 | ) | | | 5.34 | |
| |
Distributions: | | | | | | | | | | | | | | | | | | | | | | | | |
Dividends from net investment income | | | (0.45 | ) | | | (0.49 | ) | | | (0.75 | ) | | | (0.49 | ) | | | (0.58 | ) | | | (0.58 | ) |
| |
Dividends from net realized gains | | | — | | | | — | | | | — | | | | — | | | | (2.46 | ) | | | (1.74 | ) |
| |
Total distributions | | | (0.45 | ) | | | (0.49 | ) | | | (0.75 | ) | | | (0.49 | ) | | | (3.04 | ) | | | (2.32 | ) |
| |
Net asset value, end of period | | | $32.15 | | | | $31.41 | | | | $29.48 | | | | $26.89 | | | | $20.69 | | | | $35.13 | |
| |
Ratios and supplemental data: | | | | | | | | | | | | | | | | | | | | | | | | |
Total return(b) | | | 3.83% | | | | 8.31% | | | | 12.61% | | | | 32.75% | | | | (35.14% | ) | | | 17.70% | |
| |
Net assets, end of period (000) | | | $967,716 | | | | $856,632 | | | | $683,473 | | | | $352,451 | | | | $140,308 | | | | $173,650 | |
| |
Ratio of net expenses to average net assets | | | 0.83% | (c) | | | 0.83% | | | | 0.84% | | | | 0.87% | | | | 0.81% | | | | 0.81% | |
| |
Ratio of gross expenses to average net assets prior to expense reductions | | | 0.83% | (c) | | | 0.83% | | | | 0.84% | | | | 0.87% | | | | 0.82% | | | | 0.81% | |
| |
Ratio of net investment income (loss) to average net assets | | | 1.88% | (c) | | | 1.85% | | | | 2.51% | | | | 2.92% | | | | 1.51% | | | | 1.41% | |
| |
| | | | | | | | | | | | | | | | | | | | | | | | |
| | | CLASS R | |
| | | (Unaudited) Six Months Ended April 30, | | | Year Ended October 31, | | | March 1, 2007*
through October 31, | |
| | | 2012 | | | 2011 | | | 2010 | | | 2009 | | | 2008 | | | 2007 | |
Net asset value, beginning of period | | | $31.95 | | | | $30.02 | | | | $27.39 | | | | $21.08 | | | | $35.80 | | | | $31.32 | |
| |
Income from investment operations: | | | | | | | | | | | | | | | | | | | | | | | | |
Net investment income (loss) | | | 0.22 | (a) | | | 0.43 | (a) | | | 0.57 | (a) | | | 0.56 | (a) | | | 0.28 | (a) | | | 0.20 | |
| |
Net realized and unrealized gain (loss) | | | 0.90 | | | | 1.88 | | | | 2.69 | | | | 6.14 | | | | (12.05 | ) | | | 4.57 | |
| |
Total from investment operations | | | 1.12 | | | | 2.31 | | | | 3.26 | | | | 6.70 | | | | (11.77 | ) | | | 4.77 | |
| |
Distributions: | | | | | | | | | | | | | | | | | | | | | | | | |
Dividends from net investment income | | | (0.37 | ) | | | (0.38 | ) | | | (0.63 | ) | | | (0.39 | ) | | | (0.49 | ) | | | (0.29 | ) |
| |
Dividends from net realized gains | | | — | | | | — | | | | — | | | | — | | | | (2.46 | ) | | | — | |
| |
Total distributions | | | (0.37 | ) | | | (0.38 | ) | | | (0.63 | ) | | | (0.39 | ) | | | (2.95 | ) | | | (0.29 | ) |
| |
Net asset value, end of period | | | $32.70 | | | | $31.95 | | | | $30.02 | | | | $27.39 | | | | $21.08 | | | | $35.80 | |
| |
Ratios and supplemental data: | | | | | | | | | | | | | | | | | | | | | | | | |
Total return(b) | | | 3.56% | | | | 7.75% | | | | 12.05% | | | | 32.11% | | | | (35.49% | ) | | | 15.32% | |
| |
Net assets, end of period (000) | | | $19,924 | | | | $15,486 | | | | $10,285 | | | | $2,636 | | | | $690 | | | | $115 | |
| |
Ratio of net expenses to average net assets | | | 1.33% | (c) | | | 1.33% | | | | 1.34% | | | | 1.36% | | | | 1.31% | | | | 1.31% | (c) |
| |
Ratio of gross expenses to average net assets prior to expense reductions | | | 1.33% | (c) | | | 1.33% | | | | 1.34% | | | | 1.37% | | | | 1.32% | | | | 1.31% | (c) |
| |
Ratio of net investment income (loss) to average net assets | | | 1.36% | (c) | | | 1.34% | | | | 2.00% | | | | 2.35% | | | | 1.01% | | | | 0.91% | (c) |
| |
| * | Commencement of operations. |
| (a) | Net investment income allocated based on average shares method. |
| (b) | Total return measures net investment income and capital gain or loss from portfolio investments assuming reinvestment of dividends and capital gains distributions. Total return is not annualized for periods that are less than a full year, does not reflect the effect of sales charge for Class A shares nor the contingent deferred sales charge for Class B and C shares and does not reflect the deduction of taxes that a shareholder would pay on fund distributions or the redemption of fund shares. |
Calamos Global Growth and Income Fund Financial Highlights
Selected data for a share outstanding throughout each period were as follows:
| | | | | | | | | | | | | | | | | | | | | | | | |
| | | CLASS A | |
| | | (Unaudited)
Six Months
Ended
April 30, | | | Year Ended October 31, | | | | |
| | | 2012 | | | 2011 | | | 2010 | | | 2009 | | | 2008 | | | 2007 | |
Net asset value, beginning of period | | | $10.77 | | | | $10.16 | | | | $9.20 | | | | $7.35 | | | | $12.83 | | | | $10.50 | |
| |
Income from investment operations: | | | | | | | | | | | | | | | | | | | | | | | | |
Net investment income (loss)(a) | | | 0.05 | | | | 0.11 | | | | 0.17 | | | | 0.21 | | | | 0.12 | | | | 0.07 | |
| |
Net realized and unrealized gain (loss) | | | 0.23 | | | | 0.50 | | | | 0.98 | | | | 1.87 | | | | (4.88 | ) | | | 2.60 | |
| |
Total from investment operations | | | 0.28 | | | | 0.61 | | | | 1.15 | | | | 2.08 | | | | (4.76 | ) | | | 2.67 | |
| |
Distributions: | | | | | | | | | | | | | | | | | | | | | | | | |
Dividends from net investment income | | | (0.17 | ) | | | — | | | | (0.04 | ) | | | (0.23 | ) | | | — | | | | — | |
| |
Dividends from net realized gains
| | | — | | | | — | | | | — | | | | — | | | | (0.72 | ) | | | (0.34 | ) |
| |
Return of capital | | | — | | | | — | | | | (0.15 | ) | | | — | | | | — | | | | — | |
| |
Total distributions | | | (0.17 | ) | | | — | | | | (0.19 | ) | | | (0.23 | ) | | | (0.72 | ) | | | (0.34 | ) |
| |
Net asset value, end of period | | | $10.88 | | | | $10.77 | | | | $10.16 | | | | $9.20 | | | | $7.35 | | | | $12.83 | |
| |
Ratios and supplemental data: | | | | | | | | | | | | | | | | | | | | | | | | |
Total return(b) | | | 2.58% | | | | 6.00% | | | | 12.64% | | | | 29.16% | | | | (39.08% | ) | | | 26.17% | |
| |
Net assets, end of period (000) | | | $354,404 | | | | $373,595 | | | | $318,493 | | | | $273,281 | | | | $300,563 | | | | $625,429 | |
| |
Ratio of net expenses to average net assets | | | 1.32% | (c) | | | 1.32% | | | | 1.36% | | | | 1.44% | | | | 1.36% | | | | 1.38% | |
| |
Ratio of gross expenses to average net assets prior to expense reductions | | | 1.32% | (c) | | | 1.32% | | | | 1.36% | | | | 1.44% | | | | 1.36% | | | | 1.38% | |
| |
Ratio of net investment income (loss) to average net assets | | | 1.08% | (c) | | | 1.01% | | | | 1.74% | | | | 2.66% | | | | 1.12% | | | | 0.61% | |
| |
| | | |
| | | (Unaudited)
Six Months
Ended
April 30, | | | Year Ended October 31, | | | | |
| | | 2012 | | | 2011 | | | 2010 | | | 2009 | | | 2008 | | | 2007 | |
Portfolio turnover rate | | | 33.6% | | | | 73.1% | | | | 62.2% | | | | 97.3% | | | | 117.7% | | | | 83.3% | |
| |
| (a) | Net investment income allocated based on average shares method. |
| (b) | Total return measures net investment income and capital gain or loss from portfolio investments assuming reinvestment of dividends and capital gains distributions. Total return is not annualized for periods that are less than a full year, does not reflect the effect of sales charge for Class A shares nor the contingent deferred sales charge for Class B and C shares and does not reflect the deduction of taxes that a shareholder would pay on fund distributions or the redemption of fund shares. |
| | | | |
| 158 | | CALAMOS FAMILY OF FUNDS SEMIANNUAL REPORT | | |
Calamos Global Growth and Income Fund Financial Highlights
| | | | | | | | | | | | | | | | | | | | | | | | |
| | | CLASS B | |
| | | (Unaudited)
Six Months
Ended
April 30, | | | Year Ended October 31, | | | | |
| | | 2012 | | | 2011 | | | 2010 | | | 2009 | | | 2008 | | | 2007 | |
Net asset value, beginning of period | | | $10.85 | | | | $10.32 | | | | $9.37 | | | | $7.52 | | | | $13.21 | | | | $10.88 | |
| |
Income from investment operations: | | | | | | | | | | | | | | | | | | | | | | | | |
Net investment income (loss)(a) | | | 0.02 | | | | 0.03 | | | | 0.10 | | | | 0.15 | | | | 0.04 | | | | (0.02 | ) |
| |
Net realized and unrealized gain (loss) | | | 0.22 | | | | 0.50 | | | | 1.00 | | | | 1.91 | | | | (5.01 | ) | | | 2.69 | |
| |
Total from investment operations | | | 0.24 | | | | 0.53 | | | | 1.10 | | | | 2.06 | | | | (4.97 | ) | | | 2.67 | |
| |
Distributions: | | | | | | | | | | | | | | | | | | | | | | | | |
Dividends from net investment income | | | (0.10 | ) | | | — | | | | (0.03 | ) | | | (0.21 | ) | | | — | | | | — | |
| |
Dividends from net realized gains | | | — | | | | — | | | | — | | | | — | | | | (0.72 | ) | | | (0.34 | ) |
| |
Return of capital | | | — | | | | — | | | | (0.12 | ) | | | — | | | | — | | | | — | |
| |
Total distributions | | | (0.10 | ) | | | — | | | | (0.15 | ) | | | (0.21 | ) | | | (0.72 | ) | | | (0.34 | ) |
| |
Net asset value, end of period | | | $10.99 | | | | $10.85 | | | | $10.32 | | | | $9.37 | | | | $7.52 | | | | $13.21 | |
| |
Ratios and supplemental data: | | | | | | | | | | | | | | | | | | | | | | | | |
Total return(b) | | | 2.22% | | | | 5.14% | | | | 11.86% | | | | 28.21% | | | | (39.57% | ) | | | 25.23% | |
| |
Net assets, end of period (000) | | | $22,730 | | | | $30,770 | | | | $43,323 | | | | $50,466 | | | | $52,729 | | | | $99,134 | |
| |
Ratio of net expenses to average net assets | | | 2.07% | (c) | | | 2.07% | | | | 2.12% | | | | 2.19% | | | | 2.11% | | | | 2.13% | |
| |
Ratio of gross expenses to average net assets prior to expense reductions | | | 2.07% | (c) | | | 2.07% | | | | 2.12% | | | | 2.19% | | | | 2.11% | | | | 2.13% | |
| |
Ratio of net investment income (loss) to average net assets | | | 0.30% | (c) | | | 0.26% | | | | 0.99% | | | | 1.93% | | | | 0.37% | | | | (0.14% | ) |
| |
| | | | | | | | | | | | | | | | | | | | | | | | |
| | | CLASS C | |
| | | (Unaudited)
Six Months
Ended
April 30, | | | Year Ended October 31, | | | | |
| | | 2012 | | | 2011 | | | 2010 | | | 2009 | | | 2008 | | | 2007 | |
Net asset value, beginning of period | | | $10.15 | | | | $9.65 | | | | $8.78 | | | | $7.06 | | | | $12.45 | | | | $10.27 | |
| |
Income from investment operations: | | | | | | | | | | | | | | | | | | | | | | | | |
Net investment income (loss)(a) | | | 0.02 | | | | 0.03 | | | | 0.09 | | | | 0.14 | | | | 0.04 | | | | (0.02 | ) |
| |
Net realized and unrealized gain (loss) | | | 0.22 | | | | 0.47 | | | | 0.94 | | | | 1.79 | | | | (4.71 | ) | | | 2.54 | |
| |
Total from investment operations | | | 0.24 | | | | 0.50 | | | | 1.03 | | | | 1.93 | | | | (4.67 | ) | | | 2.52 | |
| |
Distributions: | | | | | | | | | | | | | | | | | | | | | | | | |
Dividends from net investment income | | | (0.11 | ) | | | — | | | | (0.03 | ) | | | (0.21 | ) | | | — | | | | — | |
| |
Dividends from net realized gains | | | — | | | | — | | | | — | | | | — | | | | (0.72 | ) | | | (0.34 | ) |
| |
Return of capital | | | — | | | | — | | | | (0.13 | ) | | | — | | | | — | | | | — | |
| |
Total distributions | | | (0.11 | ) | | | — | | | | (0.16 | ) | | | (0.21 | ) | | | (0.72 | ) | | | (0.34 | ) |
| |
Net asset value, end of period | | | $10.28 | | | | $10.15 | | | | $9.65 | | | | $8.78 | | | | $7.06 | | | | $12.45 | |
| |
Ratios and supplemental data: | | | | | | | | | | | | | | | | | | | | | | | | |
Total return(b) | | | 2.32% | | | | 5.18% | | | | 11.81% | | | | 28.23% | | | | (39.58% | ) | | | 25.27% | |
| |
Net assets, end of period (000) | | | $268,870 | | | | $282,801 | | | | $276,141 | | | | $235,776 | | | | $236,088 | | | | $429,028 | |
| |
Ratio of net expenses to average net assets | | | 2.07% | (c) | | | 2.07% | | | | 2.11% | | | | 2.19% | | | | 2.11% | | | | 2.13% | |
| |
Ratio of gross expenses to average net assets prior to expense reductions | | | 2.07% | (c) | | | 2.07% | | | | 2.11% | | | | 2.19% | | | | 2.11% | | | | 2.13% | |
| |
Ratio of net investment income (loss) to average net assets | | | 0.34% | (c) | | | 0.26% | | | | 0.99% | | | | 1.91% | | | | 0.37% | | | | (0.14% | ) |
| |
| (a) | Net investment income allocated based on average shares method. |
| (b) | Total return measures net investment income and capital gain or loss from portfolio investments assuming reinvestment of dividends and capital gains distributions. Total return is not annualized for periods that are less than a full year, does not reflect the effect of sales charge for Class A shares nor the contingent deferred sales charge for Class B and C shares and does not reflect the deduction of taxes that a shareholder would pay on fund distributions or the redemption of fund shares. |
Calamos Global Growth and Income Fund Financial Highlights
| | | | | | | | | | | | | | | | | | | | | | | | |
| | | CLASS I | |
| | | (Unaudited)
Six Months
Ended
April 30, | | | Year Ended October 31, | | | | |
| | | 2012 | | | 2011 | | | 2010 | | | 2009 | | | 2008 | | | 2007 | |
Net asset value, beginning of period | | | $10.96 | | | | $10.32 | | | | $9.33 | | | | $7.43 | | | | $12.94 | | | | $10.57 | |
| |
Income from investment operations: | | | | | | | | | | | | | | | | | | | | | | | | |
Net investment income (loss)(a) | | | 0.07 | | | | 0.14 | | | | 0.19 | | | | 0.23 | | | | 0.14 | | | | 0.10 | |
| |
Net realized and unrealized gain (loss) | | | 0.24 | | | | 0.50 | | | | 1.00 | | | | 1.90 | | | | (4.93 | ) | | | 2.61 | |
| |
Total from investment operations | | | 0.31 | | | | 0.64 | | | | 1.19 | | | | 2.13 | | | | (4.79 | ) | | | 2.71 | |
| |
Distributions: | | | | | | | | | | | | | | | | | | | | | | | | |
Dividends from net investment income | | | (0.21 | ) | | | — | | | | (0.04 | ) | | | (0.23 | ) | | | — | | | | — | |
| |
Dividends from net realized gains | | | — | | | | — | | | | — | | | | — | | | | (0.72 | ) | | | (0.34 | ) |
| |
Return of capital | | | — | | | | — | | | | (0.16 | ) | | | — | | | | — | | | | — | |
| |
Total distributions | | | (0.21 | ) | | | — | | | | (0.20 | ) | | | (0.23 | ) | | | (0.72 | ) | | | (0.34 | ) |
| |
Net asset value, end of period | | | $11.06 | | | | $10.96 | | | | $10.32 | | | | $9.33 | | | | $7.43 | | | | $12.94 | |
| |
Ratios and supplemental data: | | | | | | | | | | | | | | | | | | | | | | | | |
Total return(b) | | | 2.81% | | | | 6.20% | | | | 12.92% | | | | 29.62% | | | | (38.97% | ) | | | 26.38% | |
| |
Net assets, end of period (000) | | | $1,048,423 | | | | $978,511 | | | | $763,531 | | | | $227,445 | | | | $145,751 | | | | $225,092 | |
| |
Ratio of net expenses to average net assets | | | 1.07% | (c) | | | 1.07% | | | | 1.11% | | | | 1.18% | | | | 1.11% | | | | 1.13% | |
| |
Ratio of gross expenses to average net assets prior to expense reductions | | | 1.07% | (c) | | | 1.07% | | | | 1.11% | | | | 1.18% | | | | 1.11% | | | | 1.13% | |
| |
Ratio of net investment income (loss) to average net assets | | | 1.36% | (c) | | | 1.25% | | | | 1.97% | | | | 2.82% | | | | 1.37% | | | | 0.86% | |
| |
| | | | | | | | | | | | | | | | | | | | | | | | |
| | | CLASS R | |
| | | (Unaudited)
Six Months
Ended
April 30, | | | Year Ended October 31, | | | March 1, 2007*
through
October 31, | |
| | | 2012 | | | 2011 | | | 2010 | | | 2009 | | | 2008 | | | 2007 | |
Net asset value, beginning of period | | | $10.67 | | | | $10.09 | | | | $9.16 | | | | $7.32 | | | | $12.81 | | | | $10.63 | |
| |
Income from investment operations: | | | | | | | | | | | | | | | | | | | | | | | | |
Net investment income (loss)(a) | | | 0.05 | | | | 0.08 | | | | 0.14 | | | | 0.19 | | | | 0.09 | | | | 0.03 | |
| |
Net realized and unrealized gain (loss) | | | 0.21 | | | | 0.50 | | | | 0.97 | | | | 1.87 | | | | (4.86 | ) | | | 2.15 | |
| |
Total from investment operations | | | 0.26 | | | | 0.58 | | | | 1.11 | | | | 2.06 | | | | (4.77 | ) | | | 2.18 | |
| |
Distributions: | | | | | | | | | | | | | | | | | | | | | | | | |
Dividends from net investment income | | | (0.13 | ) | | | — | | | | (0.04 | ) | | | (0.22 | ) | | | — | | | | — | |
| |
Dividends from net realized gains | | | — | | | | — | | | | — | | | | — | | | | (0.72 | ) | | | — | |
| |
Return of capital | | | — | | | | — | | | | (0.14 | ) | | | — | | | | — | | | | — | |
| |
Total distributions | | | (0.13 | ) | | | — | | | | (0.18 | ) | | | (0.22 | ) | | | (0.72 | ) | | | — | |
| |
Net asset value, end of period | | | $10.80 | | | | $10.67 | | | | $10.09 | | | | $9.16 | | | | $7.32 | | | | $12.81 | |
| |
Ratios and supplemental data: | | | | | | | | | | | | | | | | | | | | | | | | |
Total return(b) | | | 2.47% | | | | 5.75% | | | | 12.26% | | | | 29.06% | | | | (39.23% | ) | | | 20.51% | |
| |
Net assets, end of period (000) | | | $2,055 | | | | $1,567 | | | | $1,302 | | | | $377 | | | | $209 | | | | $121 | |
| |
Ratio of net expenses to average net assets | | | 1.57% | (c) | | | 1.57% | | | | 1.61% | | | | 1.69% | | | | 1.61% | | | | 1.63% | (c) |
| |
Ratio of gross expenses to average net assets prior to expense reductions | | | 1.57% | (c) | | | 1.57% | | | | 1.61% | | | | 1.69% | | | | 1.61% | | | | 1.63% | (c) |
| |
Ratio of net investment income (loss) to average net assets | | | 0.89% | (c) | | | 0.77% | | | | 1.43% | | | | 2.41% | | | | 0.87% | | | | 0.36% | (c) |
| |
| * | Commencement of operations. |
| (a) | Net investment income allocated based on average shares method. |
| (b) | Total return measures net investment income and capital gain or loss from portfolio investments assuming reinvestment of dividends and capital gains distributions. Total return is not annualized for periods that are less than a full year, does not reflect the effect of sales charge for Class A shares nor the contingent deferred sales charge for Class B and C shares and does not reflect the deduction of taxes that a shareholder would pay on fund distributions or the redemption of fund shares. |
| | | | |
| 160 | | CALAMOS FAMILY OF FUNDS SEMIANNUAL REPORT | | |
Calamos Convertible Fund Financial Highlights
Selected data for a share outstanding throughout each period were as follows:
| | | | | | | | | | | | | | | | | | | | | | | | |
| | | CLASS A | |
| | | (Unaudited) Six Months Ended April 30, | | | Year Ended October 31, | |
| | | 2012 | | | 2011 | | | 2010 | | | 2009 | | | 2008 | | | 2007 | |
Net asset value, beginning of period | | | $19.28 | | | | $19.60 | | | | $18.31 | | | | $14.13 | | | | $20.77 | | | | $19.98 | |
| |
Income from investment operations: | | | | | | | | | | | | | | | | | | | | | | | | |
Net investment income (loss)(a) | | | 0.19 | | | | 0.40 | | | | 0.53 | | | | 0.56 | | | | 0.42 | | | | 0.41 | |
| |
Net realized and unrealized gain (loss) | | | (0.13 | ) | | | 0.14 | | | | 1.45 | | | | 4.15 | | | | (6.52 | ) | | | 2.33 | |
| |
Total from investment operations | | | 0.06 | | | | 0.54 | | | | 1.98 | | | | 4.71 | | | | (6.10 | ) | | | 2.74 | |
| |
Distributions: | | | | | | | | | | | | | | | | | | | | | | | | |
Dividends from net investment income | | | (0.11 | ) | | | (0.25 | ) | | | (0.69 | ) | | | (0.50 | ) | | | (0.48 | ) | | | (0.86 | ) |
| |
Dividends from net realized gains | | | (1.48 | ) | | | (0.61 | ) | | | — | | | | (0.03 | ) | | | (0.06 | ) | | | (1.09 | ) |
| |
Total distributions | | | (1.59 | ) | | | (0.86 | ) | | | (0.69 | ) | | | (0.53 | ) | | | (0.54 | ) | | | (1.95 | ) |
| |
Net asset value, end of period | | | $17.75 | | | | $19.28 | | | | $19.60 | | | | $18.31 | | | | $14.13 | | | | $20.77 | |
| |
Ratios and supplemental data: | | | | | | | | | | | | | | | | | | | | | | | | |
Total return(b) | | | 0.62% | | | | 2.73% | | | | 11.06% | | | | 34.00% | | | | (30.12% | ) | | | 14.80% | |
| |
Net assets, end of period (000) | | | $942,262 | | | | $1,269,501 | | | | $1,741,954 | | | | $1,822,596 | | | | $222,243 | | | | $297,122 | |
| |
Ratio of net expenses to average net assets | | | 1.11% | (c) | | | 1.07% | | | | 1.08% | | | | 1.10% | | | | 1.14% | | | | 1.13% | |
| |
Ratio of gross expenses to average net assets prior to expense reductions | | | 1.11% | (c) | | | 1.07% | | | | 1.08% | | | | 1.11% | | | | 1.15% | | | | 1.13% | |
| |
Ratio of net investment income (loss) to average net assets | | | 2.07% | (c) | | | 2.03% | | | | 2.82% | | | | 3.37% | | | | 2.22% | | | | 2.11% | |
| |
| | |
| | | (Unaudited) Six Months Ended April 30, | | | Year Ended October 31, | |
| | | 2012 | | | 2011 | | | 2010 | | | 2009 | | | 2008 | | | 2007 | |
Portfolio turnover rate | | | 24.4% | | | | 65.7% | | | | 77.4% | | | | 45.7% | | | | 90.9% | | | | 92.7% | |
| |
| (a) | Net investment income allocated based on average shares method. |
| (b) | Total return measures net investment income and capital gain or loss from portfolio investments assuming reinvestment of dividends and capital gains distributions. Total return is not annualized for periods that are less than a full year, does not reflect the effect of sales charge for Class A shares nor the contingent deferred sales charge for Class B and C shares and does not reflect the deduction of taxes that a shareholder would pay on fund distributions or the redemption of fund shares. |
Calamos Convertible Fund Financial Highlights
| | | | | | | | | | | | | | | | | | | | | | | | |
| | | CLASS B | |
| | | (Unaudited) Six Months Ended April 30, | | | Year Ended October 31, | |
| | | 2012 | | | 2011 | | | 2010 | | | 2009 | | | 2008 | | | 2007 | |
Net asset value, beginning of period | | | $22.89 | | | | $23.14 | | | | $21.48 | | | | $16.48 | | | | $24.27 | | | | $23.02 | |
| |
Income from investment operations: | | | | | | | | | | | | | | | | | | | | | | | | |
Net investment income (loss)(a) | | | 0.14 | | | | 0.32 | | | | 0.47 | | | | 0.52 | | | | 0.32 | | | | 0.31 | |
| |
Net realized and unrealized gain (loss) | | | (0.14 | ) | | | 0.15 | | | | 1.69 | | | | 4.86 | | | | (7.62 | ) | | | 2.71 | |
| |
Total from investment operations | | | — | | | | 0.47 | | | | 2.16 | | | | 5.38 | | | | (7.30 | ) | | | 3.02 | |
| |
Distributions: | | | | | | | | | | | | | | | | | | | | | | | | |
Dividends from net investment income | | | (0.00 | )** | | | (0.11 | ) | | | (0.50 | ) | | | (0.35 | ) | | | (0.43 | ) | | | (0.68 | ) |
| |
Dividends from net realized gains | | | (1.48 | ) | | | (0.61 | ) | | | — | | | | (0.03 | ) | | | (0.06 | ) | | | (1.09 | ) |
| |
Total distributions | | | (1.48 | ) | | | (0.72 | ) | | | (0.50 | ) | | | (0.38 | ) | | | (0.49 | ) | | | (1.77 | ) |
| |
Net asset value, end of period | | | $21.41 | | | | $22.89 | | | | $23.14 | | | | $21.48 | | | | $16.48 | | | | $24.27 | |
| |
Ratios and supplemental data: | | | | | | | | | | | | | | | | | | | | | | | | |
Total return(b) | | | 0.22% | | | | 2.01% | | | | 10.20% | | | | 33.04% | | | | (30.66% | ) | | | 13.91% | |
| |
Net assets, end of period (000) | | | $17,419 | | | | $21,517 | | | | $56,141 | | | | $88,956 | | | | $67,313 | | | | $129,258 | |
| |
Ratio of net expenses to average net assets | | | 1.86% | (c) | | | 1.82% | | | | 1.83% | | | | 1.85% | | | | 1.89% | | | | 1.88% | |
| |
Ratio of gross expenses to average net assets prior to expense reductions | | | 1.86% | (c) | | | 1.82% | | | | 1.83% | | | | 1.86% | | | | 1.90% | | | | 1.88% | |
| |
Ratio of net investment income (loss) to average net assets | | | 1.32% | (c) | | | 1.36% | | | | 2.12% | | | | 2.78% | | | | 1.47% | | | | 1.36% | |
| |
| | | | | | | | | | | | | | | | | | | | | | | | |
| | | CLASS C | |
| | | (Unaudited) Six Months Ended April 30, | | | Year Ended October 31, | |
| | | 2012 | | | 2011 | | | 2010 | | | 2009 | | | 2008 | | | 2007 | |
Net asset value, beginning of period | | | $19.15 | | | | $19.51 | | | | $18.24 | | | | $14.09 | | | | $20.82 | | | | $20.02 | |
| |
Income from investment operations: | | | | | | | | | | | | | | | | | | | | | | | | |
Net investment income (loss)(a) | | | 0.12 | | | | 0.25 | | �� | | 0.38 | | | | 0.43 | | | | 0.28 | | | | 0.27 | |
| |
Net realized and unrealized gain (loss) | | | (0.13 | ) | | | 0.14 | | | | 1.45 | | | | 4.14 | | | | (6.51 | ) | | | 2.33 | |
| |
Total from investment operations | | | (0.01 | ) | | | 0.39 | | | | 1.83 | | | | 4.57 | | | | (6.23 | ) | | | 2.60 | |
| |
Distributions: | | | | | | | | | | | | | | | | | | | | | | | | |
Dividends from net investment income | | | (0.01 | ) | | | (0.14 | ) | | | (0.56 | ) | | | (0.39 | ) | | | (0.44 | ) | | | (0.71 | ) |
| |
Dividends from net realized gains | | | (1.48 | ) | | | (0.61 | ) | | | — | | | | (0.03 | ) | | | (0.06 | ) | | | (1.09 | ) |
| |
Total distributions | | | (1.49 | ) | | | (0.75 | ) | | | (0.56 | ) | | | (0.42 | ) | | | (0.50 | ) | | | (1.80 | ) |
| |
Net asset value, end of period | | | $17.65 | | | | $19.15 | | | | $19.51 | | | | $18.24 | | | | $14.09 | | | | $20.82 | |
| |
Ratios and supplemental data: | | | | | | | | | | | | | | | | | | | | | | | | |
Total return(b) | | | 0.21% | | | | 1.99% | | | | 10.20% | | | | 33.01% | | | | (30.62% | ) | | | 13.93% | |
| |
Net assets, end of period (000) | | | $493,681 | | | | $584,428 | | | | $706,108 | | | | $579,959 | | | | $164,363 | | | | $268,809 | |
| |
Ratio of net expenses to average net assets | | | 1.86% | (c) | | | 1.82% | | | | 1.83% | | | | 1.85% | | | | 1.89% | | | | 1.88% | |
| |
Ratio of gross expenses to average net assets prior to expense reductions | | | 1.86% | (c) | | | 1.82% | | | | 1.83% | | | | 1.86% | | | | 1.90% | | | | 1.88% | |
| |
Ratio of net investment income (loss) to average net assets | | | 1.31% | (c) | | | 1.26% | | | | 2.03% | | | | 2.66% | | | | 1.47% | | | | 1.36% | |
| |
| ** | Amount is less than $0.005. |
| (a) | Net investment income allocated based on average shares method. |
| (b) | Total return measures net investment income and capital gain or loss from portfolio investments assuming reinvestment of dividends and capital gains distributions. Total return is not annualized for periods that are less than a full year, does not reflect the effect of sales charge for Class A shares nor the contingent deferred sales charge for Class B and C shares and does not reflect the deduction of taxes that a shareholder would pay on fund distributions or the redemption of fund shares. |
| | | | |
| 162 | | CALAMOS FAMILY OF FUNDS SEMIANNUAL REPORT | | |
Calamos Convertible Fund Financial Highlights
| | | | | | | | | | | | | | | | | | | | | | | | |
| | | CLASS I | |
| | | (Unaudited) Six Months Ended April 30, | | | Year Ended October 31, | |
| | | 2012 | | | 2011 | | | 2010 | | | 2009 | | | 2008 | | | 2007 | |
Net asset value, beginning of period | | | $18.10 | | | | $18.44 | | | | $17.27 | | | | $13.35 | | | | $19.62 | | | | $18.98 | |
| |
Income from investment operations: | | | | | | | | | | | | | | | | | | | | | | | | |
Net investment income (loss)(a) | | | 0.20 | | | | 0.42 | | | | 0.53 | | | | 0.56 | | | | 0.43 | | | | 0.44 | |
| |
Net realized and unrealized gain (loss) | | | (0.13 | ) | | | 0.14 | | | | 1.38 | | | | 3.92 | | | | (6.15 | ) | | | 2.20 | |
| |
Total from investment operations | | | 0.07 | | | | 0.56 | | | | 1.91 | | | | 4.48 | | | | (5.72 | ) | | | 2.64 | |
| |
Distributions: | | | | | | | | | | | | | | | | | | | | | | | | |
Dividends from net investment income | | | (0.15 | ) | | | (0.29 | ) | | | (0.74 | ) | | | (0.53 | ) | | | (0.49 | ) | | | (0.91 | ) |
| |
Dividends from net realized gains | | | (1.48 | ) | | | (0.61 | ) | | | — | | | | (0.03 | ) | | | (0.06 | ) | | | (1.09 | ) |
| |
Total distributions | | | (1.63 | ) | | | (0.90 | ) | | | (0.74 | ) | | | (0.56 | ) | | | (0.55 | ) | | | (2.00 | ) |
| |
Net asset value, end of period | | | $16.54 | | | | $18.10 | | | | $18.44 | | | | $17.27 | | | | $13.35 | | | | $19.62 | |
| |
Ratios and supplemental data: | | | | | | | | | | | | | | | | | | | | | | | | |
Total return(b) | | | 0.72% | | | | 3.00% | | | | 11.32% | | | | 34.30% | | | | (29.95% | ) | | | 15.11% | |
| |
Net assets, end of period (000) | | | $633,875 | | | | $759,415 | | | | $883,151 | | | | $424,287 | | | | $15,152 | | | | $17,781 | |
| |
Ratio of net expenses to average net assets | | | 0.86% | (c) | | | 0.82% | | | | 0.82% | | | | 0.85% | | | | 0.89% | | | | 0.88% | |
| |
Ratio of gross expenses to average net assets prior to expense reductions | | | 0.86% | (c) | | | 0.82% | | | | 0.82% | | | | 0.85% | | | | 0.90% | | | | 0.88% | |
| |
Ratio of net investment income (loss) to average net assets | | | 2.33% | (c) | | | 2.26% | | | | 2.97% | | | | 3.56% | | | | 2.47% | | | | 2.36% | |
| |
| | | | | | | | | | | | | | | | | | | | | | | | |
| | | CLASS R | |
| | | (Unaudited) Six Months Ended April 30, | | | Year Ended October 31, | | | March 1, 2007* through October 31, | |
| | | 2012 | | | 2011 | | | 2010 | | | 2009 | | | 2008 | | | 2007 | |
Net asset value, beginning of period | | | $19.21 | | | | $19.55 | | | | $18.28 | | | | $14.11 | | | | $20.75 | | | | $19.04 | |
| |
Income from investment operations: | | | | | | | | | | | | | | | | | | | | | | | | |
Net investment income (loss)(a) | | | 0.16 | | | | 0.34 | | | | 0.45 | | | | 0.51 | | | | 0.37 | | | | 0.24 | |
| |
Net realized and unrealized gain (loss) | | | (0.12 | ) | | | 0.14 | | | | 1.48 | | | | 4.15 | | | | (6.49 | ) | | | 2.03 | |
| |
Total from investment operations | | | 0.04 | | | | 0.48 | | | | 1.93 | | | | 4.66 | | | | (6.12 | ) | | | 2.27 | |
| |
Distributions: | | | | | | | | | | | | | | | | | | | | | | | | |
Dividends from net investment income | | | (0.08 | ) | | | (0.21 | ) | | | (0.66 | ) | | | (0.46 | ) | | | (0.46 | ) | | | (0.56 | ) |
| |
Dividends from net realized gains | | | (1.48 | ) | | | (0.61 | ) | | | — | | | | (0.03 | ) | | | (0.06 | ) | | | — | |
| |
Total distributions | | | (1.56 | ) | | | (0.82 | ) | | | (0.66 | ) | | | (0.49 | ) | | | (0.52 | ) | | | (0.56 | ) |
| |
Net asset value, end of period | | | $17.69 | | | | $19.21 | | | | $19.55 | | | | $18.28 | | | | $14.11 | | | | $20.75 | |
| |
Ratios and supplemental data: | | | | | | | | | | | | | | | | | | | | | | | | |
Total return(b) | | | 0.51% | | | | 2.46% | | | | 10.78% | | | | 33.68% | | | | (30.19% | ) | | | 12.08% | |
| |
Net assets, end of period (000) | | | $3,997 | | | | $4,134 | | | | $2,878 | | | | $705 | | | | $78 | | | | $112 | |
| |
Ratio of net expenses to average net assets | | | 1.36% | (c) | | | 1.32% | | | | 1.32% | | | | 1.35% | | | | 1.39% | | | | 1.38% | (c) |
| |
Ratio of gross expenses to average net assets prior to expense reductions | | | 1.36% | (c) | | | 1.32% | | | | 1.32% | | | | 1.36% | | | | 1.40% | | | | 1.38% | (c) |
| |
Ratio of net investment income (loss) to average net assets | | | 1.80% | (c) | | | 1.72% | | | | 2.39% | | | | 3.06% | | | | 1.97% | | | | 1.86% | (c) |
| |
| * | Commencement of operations. |
| (a) | Net investment income allocated based on average shares method. |
| (b) | Total return measures net investment income and capital gain or loss from portfolio investments assuming reinvestment of dividends and capital gains distributions. Total return is not annualized for periods that are less than a full year, does not reflect the effect of sales charge for Class A shares nor the contingent deferred sales charge for Class B and C shares and does not reflect the deduction of taxes that a shareholder would pay on fund distributions or the redemption of fund shares. |
Calamos Total Return Bond Fund Financial Highlights
Selected data for a share outstanding throughout each period were as follows:
| | | | | | | | | | | | | | | | | | | | | | | | |
| | | CLASS A | |
| | | (Unaudited)
Six Months
Ended
April 30, | | | Year Ended October 31, | | | June 27, 2007*
through
October 31, | |
| | | 2012 | | | 2011 | | | 2010 | | | 2009 | | | 2008 | | | 2007 | |
Net asset value, beginning of period | | | $11.14 | | | | $11.23 | | | | $11.06 | | | | $9.82 | | | | $10.25 | | | | $10.00 | |
| |
Income from investment operations: | | | | | | | | | | | | | | | | | | | | | | | | |
Net investment income (loss) | | | 0.11 | (a) | | | 0.26 | (a) | | | 0.31 | (a) | | | 0.35 | (a) | | | 0.33 | (a) | | | 0.15 | |
| |
Net realized and unrealized gain (loss) | | | 0.07 | | | | 0.02 | | | | 0.45 | | | | 1.30 | | | | (0.35 | ) | | | 0.25 | |
| |
Total from investment operations | | | 0.18 | | | | 0.28 | | | | 0.76 | | | | 1.65 | | | | (0.02 | ) | | | 0.40 | |
| |
Distributions: | | | | | | | | | | | | | | | | | | | | | | | | |
Dividends from net investment income | | | (0.21 | ) | | | (0.28 | ) | | | (0.59 | ) | | | (0.41 | ) | | | (0.41 | ) | | | (0.15 | ) |
| |
Dividends from net realized gains | | | (0.04 | ) | | | (0.09 | ) | | | — | | | | — | | | | — | | | | — | |
| |
Total distributions | | | (0.25 | ) | | | (0.37 | ) | | | (0.59 | ) | | | (0.41 | ) | | | (0.41 | ) | | | (0.15 | ) |
| |
Net asset value, end of period | | | $11.07 | | | | $11.14 | | | | $11.23 | | | | $11.06 | | | | $9.82 | | | | $10.25 | |
| |
Ratios and supplemental data: | | | | | | | | | | | | | | | | | | | | | | | | |
Total return(b) | | | 1.61% | | | | 2.64% | | | | 7.12% | | | | 17.10% | | | | (0.33% | ) | | | 4.00% | |
| |
Net assets, end of period (000) | | | $131,691 | | | | $115,090 | | | | $114,922 | | | | $94,831 | | | | $55,858 | | | | $39,590 | |
| |
Ratio of net expenses to average net assets | | | 0.90% | (c) | | | 0.90% | | | | 0.90% | | | | 0.88% | | | | 0.83% | | | | 0.90% | (c) |
| |
Ratio of gross expenses to average net assets prior to expense reductions | | | 0.98% | (c) | | | 0.97% | | | | 0.98% | | | | 1.00% | | | | 1.13% | | | | 1.66% | (c) |
| |
Ratio of net investment income (loss) to average net assets | | | 2.03% | (c) | | | 2.37% | | | | 2.83% | | | | 3.30% | | | | 3.24% | | | | 4.11% | (c) |
| |
| | | |
| | | (Unaudited)
Six Months
Ended
April 30, | | | Year Ended October 31, | | | June 27, 2007*
through
October 31, | |
| | | 2012 | | | 2011 | | | 2010 | | | 2009 | | | 2008 | | | 2007 | |
Portfolio turnover rate | | | 18.3% | | | | 41.5% | | | | 55.7% | | | | 287.2% | | | | 678.6% | | | | 235.8% | |
| |
| * | Commencement of operations. |
| (a) | Net investment income allocated based on average shares method. |
| (b) | Total return measures net investment income and capital gain or loss from portfolio investments assuming reinvestment of dividends and capital gains distributions. Total return is not annualized for periods that are less than a full year, does not reflect the effect of sales charge for Class A shares nor the contingent deferred sales charge for Class B and C shares and does not reflect the deduction of taxes that a shareholder would pay on fund distributions or the redemption of fund shares. |
| | | | |
| 164 | | CALAMOS FAMILY OF FUNDS SEMIANNUAL REPORT | | |
Calamos Total Return Bond Fund Financial Highlights
| | | | | | | | | | | | | | | | | | | | | | | | |
| | | CLASS B | |
| | | (Unaudited)
Six Months
Ended
April 30, | | | Year Ended October 31, | | | June 27, 2007*
through
October 31, | |
| | | 2012 | | | 2011 | | | 2010 | | | 2009 | | | 2008 | | | 2007 | |
Net asset value, beginning of period | | | $11.14 | | | | $11.23 | | | | $11.06 | | | | $9.82 | | | | $10.25 | | | | $10.00 | |
| |
Income from investment operations: | | | | | | | | | | | | | | | | | | | | | | | | |
Net investment income (loss) | | | 0.07 | (a) | | | 0.19 | (a) | | | 0.23 | (a) | | | 0.27 | (a) | | | 0.26 | (a) | | | 0.12 | |
| |
Net realized and unrealized gain (loss) | | | 0.07 | | | | 0.01 | | | | 0.44 | | | | 1.31 | | | | (0.36 | ) | | | 0.25 | |
| |
Total from investment operations | | | 0.14 | | | | 0.20 | | | | 0.67 | | | | 1.58 | | | | (0.10 | ) | | | 0.37 | |
| |
Distributions: | | | | | | | | | | | | | | | | | | | | | | | | |
Dividends from net investment income | | | (0.17 | ) | | | (0.20 | ) | | | (0.50 | ) | | | (0.34 | ) | | | (0.33 | ) | | | (0.12 | ) |
| |
Dividends from net realized gains | | | (0.04 | ) | | | (0.09 | ) | | | — | | | | — | | | | — | | | | — | |
| |
Total distributions | | | (0.21 | ) | | | (0.29 | ) | | | (0.50 | ) | | | (0.34 | ) | | | (0.33 | ) | | | (0.12 | ) |
| |
Net asset value, end of period | | | $11.07 | | | | $11.14 | | | | $11.23 | | | | $11.06 | | | | $9.82 | | | | $10.25 | |
| |
Ratios and supplemental data: | | | | | | | | | | | | | | | | | | | | | | | | |
Total return(b) | | | 1.24% | | | | 1.88% | | | | 6.33% | | | | 16.23% | | | | (1.07% | ) | | | 3.74% | |
| |
Net assets, end of period (000) | | | $11,199 | | | | $14,193 | | | | $21,402 | | | | $22,103 | | | | $12,539 | | | | $1,983 | |
| |
Ratio of net expenses to average net assets | | | 1.65% | (c) | | | 1.65% | | | | 1.65% | | | | 1.63% | | | | 1.58% | | | | 1.65% | (c) |
| |
Ratio of gross expenses to average net assets prior to expense reductions | | | 1.73% | (c) | | | 1.72% | | | | 1.73% | | | | 1.75% | | | | 1.88% | | | | 2.41% | (c) |
| |
Ratio of net investment income (loss) to average net assets | | | 1.30% | (c) | | | 1.67% | | | | 2.10% | | | | 2.56% | | | | 2.49% | | | | 3.36% | (c) |
| |
| | | | | | | | | | | | | | | | | | | | | | | | |
| | | CLASS C | |
| | | (Unaudited)
Six Months
Ended
April 30, | | | Year Ended October 31, | | | June 27, 2007*
through
October 31, | |
| | | 2012 | | | 2011 | | | 2010 | | | 2009 | | | 2008 | | | 2007 | |
Net asset value, beginning of period | | | $11.13 | | | | $11.22 | | | | $11.06 | | | | $9.82 | | | | $10.25 | | | | $10.00 | |
| |
Income from investment operations: | | | | | | | | | | | | | | | | | | | | | | | | |
Net investment income (loss) | | | 0.07 | (a) | | | 0.18 | (a) | | | 0.23 | (a) | | | 0.27 | (a) | | | 0.25 | (a) | | | 0.12 | |
| |
Net realized and unrealized gain (loss) | | | 0.08 | | | | 0.02 | | | | 0.43 | | | | 1.31 | | | | (0.35 | ) | | | 0.25 | |
| |
Total from investment operations | | | 0.15 | | | | 0.20 | | | | 0.66 | | | | 1.58 | | | | (0.10 | ) | | | 0.37 | |
| |
Distributions: | | | | | | | | | | | | | | | | | | | | | | | | |
Dividends from net investment income | | | (0.17 | ) | | | (0.20 | ) | | | (0.50 | ) | | | (0.34 | ) | | | (0.33 | ) | | | (0.12 | ) |
| |
Dividends from net realized gains | | | (0.04 | ) | | | (0.09 | ) | | | — | | | | — | | | | — | | | | — | |
| |
Total distributions | | | (0.21 | ) | | | (0.29 | ) | | | (0.50 | ) | | | (0.34 | ) | | | (0.33 | ) | | | (0.12 | ) |
| |
Net asset value, end of period | | | $11.07 | | | | $11.13 | | | | $11.22 | | | | $11.06 | | | | $9.82 | | | | $10.25 | |
| |
Ratios and supplemental data: | | | | | | | | | | | | | | | | | | | | | | | | |
Total return(b) | | | 1.33% | | | | 1.88% | | | | 6.24% | | | | 16.23% | | | | (1.07% | ) | | | 3.74% | |
| |
Net assets, end of period (000) | | | $47,947 | | | | $48,612 | | | | $50,793 | | | | $39,605 | | | | $19,018 | | | | $1,527 | |
| |
Ratio of net expenses to average net assets | | | 1.65% | (c) | | | 1.65% | | | | 1.65% | | | | 1.63% | | | | 1.58% | | | | 1.65% | (c) |
| |
Ratio of gross expenses to average net assets prior to expense reductions | | | 1.73% | (c) | | | 1.72% | | | | 1.73% | | | | 1.75% | | | | 1.88% | | | | 2.41% | (c) |
| |
Ratio of net investment income (loss) to average net assets | | | 1.29% | (c) | | | 1.63% | | | | 2.09% | | | | 2.54% | | | | 2.49% | | | | 3.36% | (c) |
| |
| * | Commencement of operations. |
| (a) | Net investment income allocated based on average shares method. |
| (b) | Total return measures net investment income and capital gain or loss from portfolio investments assuming reinvestment of dividends and capital gains distributions. Total return is not annualized for periods that are less than a full year, does not reflect the effect of sales charge for Class A shares nor the contingent deferred sales charge for Class B and C shares and does not reflect the deduction of taxes that a shareholder would pay on fund distributions or the redemption of fund shares. |
Calamos Total Return Bond Fund Financial Highlights
| | | | | | | | | | | | | | | | | | | | | | | | |
| | | CLASS I | |
| | | (Unaudited)
Six Months
Ended
April 30, | | | Year Ended October 31, | | | June 27, 2007*
through
October 31, | |
| | | 2012 | | | 2011 | | | 2010 | | | 2009 | | | 2008 | | | 2007 | |
Net asset value, beginning of period | | | $11.13 | | | | $11.22 | | | | $11.06 | | | | $9.82 | | | | $10.24 | | | | $10.00 | |
| |
Income from investment operations: | | | | | | | | | | | | | | | | | | | | | | | | |
Net investment income (loss) | | | 0.13 | (a) | | | 0.29 | (a) | | | 0.34 | (a) | | | 0.38 | (a) | | | 0.36 | (a) | | | 0.16 | |
| |
Net realized and unrealized gain (loss) | | | 0.07 | | | | 0.02 | | | | 0.43 | | | | 1.30 | | | | (0.35 | ) | | | 0.24 | |
| |
Total from investment operations | | | 0.20 | | | | 0.31 | | | | 0.77 | | | | 1.68 | | | | 0.01 | | | | 0.40 | |
| |
Distributions: | | | | | | | | | | | | | | | | | | | | | | | | |
Dividends from net investment income | | | (0.22 | ) | | | (0.31 | ) | | | (0.61 | ) | | | (0.44 | ) | | | (0.43 | ) | | | (0.16 | ) |
| |
Dividends from net realized gains | | | (0.04 | ) | | | (0.09 | ) | | | — | | | | — | | | | — | | | | — | |
| |
Total distributions | | | (0.26 | ) | | | (0.40 | ) | | | (0.61 | ) | | | (0.44 | ) | | | (0.43 | ) | | | (0.16 | ) |
| |
Net asset value, end of period | | | $11.07 | | | | $11.13 | | | | $11.22 | | | | $11.06 | | | | $9.82 | | | | $10.24 | |
| |
Ratios and supplemental data: | | | | | | | | | | | | | | | | | | | | | | | | |
Total return(b) | | | 1.83% | | | | 2.90% | | | | 7.30% | | | | 17.39% | | | | 0.02% | | | | 4.06% | |
| |
Net assets, end of period (000) | | | $41,396 | | | | $41,639 | | | | $46,625 | | | | $41,689 | | | | $34,049 | | | | $33,698 | |
| |
Ratio of net expenses to average net assets | | | 0.65% | (c) | | | 0.65% | | | | 0.65% | | | | 0.63% | | | | 0.58% | | | | 0.65% | (c) |
| |
Ratio of gross expenses to average net assets prior to expense reductions | | | 0.73% | (c) | | | 0.72% | | | | 0.73% | | | | 0.75% | | | | 0.88% | | | | 1.41% | (c) |
| |
Ratio of net investment income (loss) to average net assets | | | 2.29% | (c) | | | 2.64% | | | | 3.07% | | | | 3.59% | | | | 3.49% | | | | 4.36% | (c) |
| |
| | | | | | | | | | | | | | | | | | | | | | | | |
| | | CLASS R | |
| | | (Unaudited)
Six Months
Ended
April 30, | | | Year Ended October 31, | | | June 27, 2007*
through
October 31, | |
| | | 2012 | | | 2011 | | | 2010 | | | 2009 | | | 2008 | | | 2007 | |
Net asset value, beginning of period | | | $11.14 | | | | $11.23 | | | | $11.06 | | | | $9.82 | | | | $10.25 | | | | $10.00 | |
| |
Income from investment operations: | | | | | | | | | | | | | | | | | | | | | | | | |
Net investment income (loss) | | | 0.10 | (a) | | | 0.23 | (a) | | | 0.28 | (a) | | | 0.33 | (a) | | | 0.31 | (a) | | | 0.14 | |
| |
Net realized and unrealized gain (loss) | | | 0.07 | | | | 0.02 | | | | 0.45 | | | | 1.30 | | | | (0.36 | ) | | | 0.25 | |
| |
Total from investment operations | | | 0.17 | | | | 0.25 | | | | 0.73 | | | | 1.63 | | | | (0.05 | ) | | | 0.39 | |
| |
Distributions: | | | | | | | | | | | | | | | | | | | | | | | | |
Dividends from net investment income | | | (0.19 | ) | | | (0.25 | ) | | | (0.56 | ) | | | (0.39 | ) | | | (0.38 | ) | | | (0.14 | ) |
| |
Dividends from net realized gains | | | (0.04 | ) | | | (0.09 | ) | | | — | | | | — | | | | — | | | | — | |
| |
Total distributions | | | (0.23 | ) | | | (0.34 | ) | | | (0.56 | ) | | | (0.39 | ) | | | (0.38 | ) | | | (0.14 | ) |
| |
Net asset value, end of period | | | $11.08 | | | | $11.14 | | | | $11.23 | | | | $11.06 | | | | $9.82 | | | | $10.25 | |
| |
Ratios and supplemental data: | | | | | | | | | | | | | | | | | | | | | | | | |
Total return(b) | | | 1.58% | | | | 2.39% | | | | 6.86% | | | | 16.81% | | | | (0.58% | ) | | | 3.91% | |
| |
Net assets, end of period (000) | | | $1,714 | | | | $1,638 | | | | $1,389 | | | | $1,283 | | | | $1,033 | | | | $1,039 | |
| |
Ratio of net expenses to average net assets | | | 1.15% | (c) | | | 1.15% | | | | 1.15% | | | | 1.13% | | | | 1.08% | | | | 1.15% | (c) |
| |
Ratio of gross expenses to average net assets prior to expense reductions | | | 1.23% | (c) | | | 1.22% | | | | 1.23% | | | | 1.25% | | | | 1.38% | | | | 1.91% | (c) |
| |
Ratio of net investment income (loss) to average net assets | | | 1.79% | (c) | | | 2.10% | | | | 2.59% | | | | 3.09% | | | | 2.99% | | | | 3.86% | (c) |
| |
| * | Commencement of operations. |
| (a) | Net investment income allocated based on average shares method. |
| (b) | Total return measures net investment income and capital gain or loss from portfolio investments assuming reinvestment of dividends and capital gains distributions. Total return is not annualized for periods that are less than a full year, does not reflect the effect of sales charge for Class A shares nor the contingent deferred sales charge for Class B and C shares and does not reflect the deduction of taxes that a shareholder would pay on fund distributions or the redemption of fund shares. |
| | | | |
| 166 | | CALAMOS FAMILY OF FUNDS SEMIANNUAL REPORT | | |
Calamos High Income Fund Financial Highlights
Selected data for a share outstanding throughout each period were as follows:
| | | | | | | | | | | | | | | | | | | | | | | | |
| | | CLASS A | |
| | | (Unaudited)
Six Months
Ended
April 30, | | | Year Ended October 31, | |
| | | 2012 | | | 2011 | | | 2010 | | | 2009 | | | 2008 | | | 2007 | |
Net asset value, beginning of period | | | $9.68 | | | | $9.97 | | | | $9.52 | | | | $7.11 | | | | $10.96 | | | | $10.71 | |
| |
Income from investment operations: | | | | | | | | | | | | | | | | | | | | | | | | |
Net investment income (loss) | | | 0.27 | (a) | | | 0.59 | (a) | | | 0.63 | (a) | | | 0.61 | (a) | | | 0.55 | (a) | | | 0.61 | |
| |
Net realized and unrealized gain (loss) | | | 0.19 | | | | (0.24 | ) | | | 0.58 | | | | 2.29 | | | | (3.44 | ) | | | 0.34 | |
| |
Total from investment operations | | | 0.46 | | | | 0.35 | | | | 1.21 | | | | 2.90 | | | | (2.89 | ) | | | 0.95 | |
| |
Distributions: | | | | | | | | | | | | | | | | | | | | | | | | |
Dividends from net investment income | | | (0.27 | ) | | | (0.64 | ) | | | (0.76 | ) | | | (0.49 | ) | | | (0.73 | ) | | | (0.64 | ) |
| |
Dividends from net realized gains | | | (0.13 | ) | | | — | | | | — | | | | — | | | | (0.23 | ) | | | (0.06 | ) |
| |
Total distributions | | | (0.40 | ) | | | (0.64 | ) | | | (0.76 | ) | | | (0.49 | ) | | | (0.96 | ) | | | (0.70 | ) |
| |
Net asset value, end of period | | | $9.74 | | | | $9.68 | | | | $9.97 | | | | $9.52 | | | | $7.11 | | | | $10.96 | |
| |
Ratios and supplemental data: | | | | | | | | | | | | | | | | | | | | | | | | |
Total return(b) | | | 4.87% | | | | 3.62% | | | | 13.26% | | | | 42.27% | | | | (28.60% | ) | | | 9.16% | |
| |
Net assets, end of period (000) | | | $213,016 | | | | $182,515 | | | | $211,632 | | | | $207,057 | | | | $90,995 | | | | $186,816 | |
| |
Ratio of net expenses to average net assets | | | 1.21% | (c) | | | 1.22% | | | | 1.21% | | | | 1.22% | | | | 1.21% | | | | 1.19% | |
| |
Ratio of gross expenses to average net assets prior to expense reductions | | | 1.21% | (c) | | | 1.22% | | | | 1.21% | | | | 1.22% | | | | 1.21% | | | | 1.20% | |
| |
Ratio of net investment income (loss) to average net assets | | | 5.51% | (c) | | | 6.01% | | | | 6.56% | | | | 7.48% | | | | 5.69% | | | | 5.39% | |
| |
| | |
| | | (Unaudited)
Six Months
Ended
April 30, | | | Year Ended October 31, | |
| | | 2012 | | | 2011 | | | 2010 | | | 2009 | | | 2008 | | | 2007 | |
Portfolio turnover rate | | | 27.2% | | | | 72.6% | | | | 57.6% | | | | 55.0% | | | | 47.5% | | | | 74.1% | |
| |
| (a) | Net investment income allocated based on average shares method. |
| (b) | Total return measures net investment income and capital gain or loss from portfolio investments assuming reinvestment of dividends and capital gains distributions. Total return is not annualized for periods that are less than a full year, does not reflect the effect of sales charge for Class A shares nor the contingent deferred sales charge for Class B and C shares and does not reflect the deduction of taxes that a shareholder would pay on fund distributions or the redemption of fund shares. |
Calamos High Income Fund Financial Highlights
| | | | | | | | | | | | | | | | | | | | | | | | |
| | | CLASS B | |
| | | (Unaudited)
Six Months
Ended
April 30, | | | Year Ended October 31, | |
| | | 2012 | | | 2011 | | | 2010 | | | 2009 | | | 2008 | | | 2007 | |
Net asset value, beginning of period | | | $10.09 | | | | $10.37 | | | | $9.86 | | | | $7.35 | | | | $11.28 | | | | $11.00 | |
| |
Income from investment operations: | | | | | | | | | | | | | | | | | | | | | | | | |
Net investment income (loss) | | | 0.24 | (a) | | | 0.54 | (a) | | | 0.58 | (a) | | | 0.57 | (a) | | | 0.50 | (a) | | | 0.50 | |
| |
Net realized and unrealized gain (loss) | | | 0.21 | | | | (0.26 | ) | | | 0.60 | | | | 2.36 | | | | (3.55 | ) | | | 0.39 | |
| |
Total from investment operations | | | 0.45 | | | | 0.28 | | | | 1.18 | | | | 2.93 | | | | (3.05 | ) | | | 0.89 | |
| |
Distributions: | | | | | | | | | | | | | | | | | | | | | | | | |
Dividends from net investment income | | | (0.24 | ) | | | (0.56 | ) | | | (0.67 | ) | | | (0.42 | ) | | | (0.65 | ) | | | (0.55 | ) |
| |
Dividends from net realized gains | | | (0.13 | ) | | | — | | | | — | | | | — | | | | (0.23 | ) | | | (0.06 | ) |
| |
Total distributions | | | (0.37 | ) | | | (0.56 | ) | | | (0.67 | ) | | | (0.42 | ) | | | (0.88 | ) | | | (0.61 | ) |
| |
Net asset value, end of period | | | $10.17 | | | | $10.09 | | | | $10.37 | | | | $9.86 | | | | $7.35 | | | | $11.28 | |
| |
Ratios and supplemental data: | | | | | | | | | | | | | | | | | | | | | | | | |
Total return(b) | | | 4.48% | | | | 2.79% | | | | 12.45% | | | | 41.16% | | | | (29.06% | ) | | | 8.32% | |
| |
Net assets, end of period (000) | | | $7,206 | | | | $9,766 | | | | $17,387 | | | | $19,897 | | | | $14,956 | | | | $27,806 | |
| |
Ratio of net expenses to average net assets | | | 1.96% | (c) | | | 1.96% | | | | 1.96% | | | | 1.98% | | | | 1.96% | | | | 1.94% | |
| |
Ratio of gross expenses to average net assets prior to expense reductions | | | 1.96% | (c) | | | 1.96% | | | | 1.96% | | | | 1.98% | | | | 1.96% | | | | 1.95% | |
| |
Ratio of net investment income (loss) to average net assets | | | 4.77% | (c) | | | 5.28% | | | | 5.82% | | | | 6.83% | | | | 4.94% | | | | 4.64% | |
| |
| | | | | | | | | | | | | | | | | | | | | | | | |
| | | CLASS C | |
| | | (Unaudited)
Six Months
Ended
April 30, | | | Year Ended October 31, | |
| | | 2012 | | | 2011 | | | 2010 | | | 2009 | | | 2008 | | | 2007 | |
Net asset value, beginning of period | | | $10.01 | | | | $10.29 | | | | $9.80 | | | | $7.31 | | | | $11.22 | | | | $10.95 | |
| |
Income from investment operations: | | | | | | | | | | | | | | | | | | | | | | | | |
Net investment income (loss) | | | 0.24 | (a) | | | 0.54 | (a) | | | 0.58 | (a) | | | 0.56 | (a) | | | 0.49 | (a) | | | 0.48 | |
| |
Net realized and unrealized gain (loss) | | | 0.21 | | | | (0.25 | ) | | | 0.58 | | | | 2.36 | | | | (3.52 | ) | | | 0.40 | |
| |
Total from investment operations | | | 0.45 | | | | 0.29 | | | | 1.16 | | | | 2.92 | | | | (3.03 | ) | | | 0.88 | |
| |
Distributions: | | | | | | | | | | | | | | | | | | | | | | | | |
Dividends from net investment income | | | (0.24 | ) | | | (0.57 | ) | | | (0.67 | ) | | | (0.43 | ) | | | (0.65 | ) | | | (0.55 | ) |
| |
Dividends from net realized gains | | | (0.13 | ) | | | — | | | | — | | | | — | | | | (0.23 | ) | | | (0.06 | ) |
| |
Total distributions | | | (0.37 | ) | | | (0.57 | ) | | | (0.67 | ) | | | (0.43 | ) | | | (0.88 | ) | | | (0.61 | ) |
| |
Net asset value, end of period | | | $10.09 | | | | $10.01 | | | | $10.29 | | | | $9.80 | | | | $7.31 | | | | $11.22 | |
| |
Ratios and supplemental data: | | | | | | | | | | | | | | | | | | | | | | | | |
Total return(b) | | | 4.54% | | | | 2.83% | | | | 12.34% | | | | 41.16% | | | | (29.03% | ) | | | 8.27% | |
| |
Net assets, end of period (000) | | | $41,955 | | | | $39,764 | | | | $48,149 | | | | $45,673 | | | | $28,261 | | | | $48,377 | |
| |
Ratio of net expenses to average net assets | | | 1.96% | (c) | | | 1.97% | | | | 1.96% | | | | 1.98% | | | | 1.96% | | | | 1.94% | |
| |
Ratio of gross expenses to average net assets prior to expense reductions | | | 1.96% | (c) | | | 1.97% | | | | 1.96% | | | | 1.98% | | | | 1.96% | | | | 1.95% | |
| |
Ratio of net investment income (loss) to average net assets | | | 4.76% | (c) | | | 5.26% | | | | 5.81% | | | | 6.80% | | | | 4.94% | | | | 4.64% | |
| |
| (a) | Net investment income allocated based on average shares method. |
| (b) | Total return measures net investment income and capital gain or loss from portfolio investments assuming reinvestment of dividends and capital gains distributions. Total return is not annualized for periods that are less than a full year, does not reflect the effect of sales charge for Class A shares nor the contingent deferred sales charge for Class B and C shares and does not reflect the deduction of taxes that a shareholder would pay on fund distributions or the redemption of fund shares. |
| | | | |
| 168 | | CALAMOS FAMILY OF FUNDS SEMIANNUAL REPORT | | |
Calamos High Income Fund Financial Highlights
| | | | | | | | | | | | | | | | | | | | | | | | |
| | | CLASS I | |
| | | (Unaudited)
Six Months
Ended
April 30, | | | Year Ended October 31, | |
| | | 2012 | | | 2011 | | | 2010 | | | 2009 | | | 2008 | | | 2007 | |
Net asset value, beginning of period | | | $9.68 | | | | $9.97 | | | | $9.52 | | | | $7.12 | | | | $10.96 | | | | $10.71 | |
| |
Income from investment operations: | | | | | | | | | | | | | | | | | | | | | | | | |
Net investment income (loss) | | | 0.28 | (a) | | | 0.62 | (a) | | | 0.65 | (a) | | | 0.63 | (a) | | | 0.57 | (a) | | | 0.60 | |
| |
Net realized and unrealized gain (loss) | | | 0.19 | | | | (0.24 | ) | | | 0.58 | | | | 2.28 | | | | (3.42 | ) | | | 0.38 | |
| |
Total from investment operations | | | 0.47 | | | | 0.38 | | | | 1.23 | | | | 2.91 | | | | (2.85 | ) | | | 0.98 | |
| |
Distributions: | | | | | | | | | | | | | | | | | | | | | | | | |
Dividends from net investment income | | | (0.28 | ) | | | (0.67 | ) | | | (0.78 | ) | | | (0.51 | ) | | | (0.76 | ) | | | (0.67 | ) |
| |
Dividends from net realized gains | | | (0.13 | ) | | | — | | | | — | | | | — | | | | (0.23 | ) | | | (0.06 | ) |
| |
Total distributions | | | (0.41 | ) | | | (0.67 | ) | | | (0.78 | ) | | | (0.51 | ) | | | (0.99 | ) | | | (0.73 | ) |
| |
Net asset value, end of period | | | $9.74 | | | | $9.68 | | | | $9.97 | | | | $9.52 | | | | $7.12 | | | | $10.96 | |
| |
Ratios and supplemental data: | | | | | | | | | | | | | | | | | | | | | | | | |
Total return(b) | | | 4.99% | | | | 3.88% | | | | 13.58% | | | | 42.41% | | | | (28.31% | ) | | | 9.43% | |
| |
Net assets, end of period (000) | | | $29,687 | | | | $21,424 | | | | $44,574 | | | | $19,286 | | | | $8,010 | | | | $9,109 | |
| |
Ratio of net expenses to average net assets | | | 0.95% | (c) | | | 0.96% | | | | 0.96% | | | | 0.97% | | | | 0.96% | | | | 0.94% | |
| |
Ratio of gross expenses to average net assets prior to expense reductions | | | 0.95% | (c) | | | 0.96% | | | | 0.96% | | | | 0.97% | | | | 0.96% | | | | 0.95% | |
| |
Ratio of net investment income (loss) to average net assets | | | 5.75% | (c) | | | 6.29% | | | | 6.76% | | | | 7.61% | | | | 5.94% | | | | 5.64% | |
| |
| | | | | | | | | | | | | | | | | | | | | | | | |
| | | CLASS R | |
| | | (Unaudited)
Six Months
Ended
April 30, | | | Year Ended October 31, | | | March 1, 2007*
through
October 31, | |
| | | 2012 | | | 2011 | | | 2010 | | | 2009 | | | 2008 | | | 2007 | |
Net asset value, beginning of period | | | $9.67 | | | | $9.96 | | | | $9.52 | | | | $7.11 | | | | $10.95 | | | | $10.84 | |
| |
Income from investment operations: | | | | | | | | | | | | | | | | | | | | | | | | |
Net investment income (loss) | | | 0.25 | (a) | | | 0.57 | (a) | | | 0.60 | (a) | | | 0.59 | (a) | | | 0.53 | (a) | | | 0.37 | |
| |
Net realized and unrealized gain (loss) | | | 0.20 | | | | (0.24 | ) | | | 0.57 | | | | 2.29 | | | | (3.43 | ) | | | 0.13 | |
| |
Total from investment operations | | | 0.45 | | | | 0.33 | | | | 1.17 | | | | 2.88 | | | | (2.90 | ) | | | 0.50 | |
| |
Distributions: | | | | | | | | | | | | | | | | | | | | | | | | |
Dividends from net investment income | | | (0.26 | ) | | | (0.62 | ) | | | (0.73 | ) | | | (0.47 | ) | | | (0.71 | ) | | | (0.39 | ) |
| |
Dividends from net realized gains | | | (0.13 | ) | | | — | | | | — | | | | — | | | | (0.23 | ) | | | — | |
| |
Total distributions | | | (0.39 | ) | | | (0.62 | ) | | | (0.73 | ) | | | (0.47 | ) | | | (0.94 | ) | | | (0.39 | ) |
| |
Net asset value, end of period | | | $9.73 | | | | $9.67 | | | | $9.96 | | | | $9.52 | | | | $7.11 | | | | $10.95 | |
| |
Ratios and supplemental data: | | | | | | | | | | | | | | | | | | | | | | | | |
Total return(b) | | | 4.76% | | | | 3.37% | | | | 12.88% | | | | 41.93% | | | | (28.71% | ) | | | 4.69% | |
| |
Net assets, end of period (000) | | | $337 | | | | $272 | | | | $248 | | | | $122 | | | | $75 | | | | $105 | |
| |
Ratio of net expenses to average net assets | | | 1.46% | (c) | | | 1.47% | | | | 1.46% | | | | 1.48% | | | | 1.46% | | | | 1.44% | (c) |
| |
Ratio of gross expenses to average net assets prior to expense reductions | | | 1.46% | (c) | | | 1.47% | | | | 1.46% | | | | 1.48% | | | | 1.46% | | | | 1.45% | (c) |
| |
Ratio of net investment income (loss) to average net assets | | | 5.26% | (c) | | | 5.74% | | | | 6.28% | | | | 7.31% | | | | 5.44% | | | | 5.14% | (c) |
| |
| * | Commencement of operations. |
| (a) | Net investment income allocated based on average shares method. |
| (b) | Total return measures net investment income and capital gain or loss from portfolio investments assuming reinvestment of dividends and capital gains distributions. Total return is not annualized for periods that are less than a full year, does not reflect the effect of sales charge for Class A shares nor the contingent deferred sales charge for Class B and C shares and does not reflect the deduction of taxes that a shareholder would pay on fund distributions or the redemption of fund shares. |
Calamos Market Neutral Income Fund Financial Highlights
Selected data for a share outstanding throughout each period were as follows:
| | | | | | | | | | | | | | | | | | | | | | | | |
| | | CLASS A | |
| | | (Unaudited)
Six Months
Ended
April 30, | | | Year Ended October 31, | |
| | | 2012 | | | 2011 | | | 2010 | | | 2009 | | | 2008 | | | 2007 | |
Net asset value, beginning of period | | | $12.11 | | | | $11.91 | | | | $11.35 | | | | $10.97 | | | | $13.31 | | | | $12.77 | |
| |
Income from investment operations: | | | | | | | | | | | | | | | | | | | | | | | | |
Net investment income (loss)(a) | | | 0.10 | | | | 0.22 | | | | 0.23 | | | | 0.30 | | | | 0.30 | | | | 0.47 | |
| |
Net realized and unrealized gain (loss) | | | 0.45 | | | | 0.18 | | | | 0.46 | | | | 0.89 | | | | (2.13 | ) | | | 0.51 | |
| |
Total from investment operations | | | 0.55 | | | | 0.40 | | | | 0.69 | | | | 1.19 | | | | (1.83 | ) | | | 0.98 | |
| |
Distributions: | | | | | | | | | | | | | | | | | | | | | | | | |
Dividends from net investment income | | | (0.08 | ) | | | (0.20 | ) | | | (0.13 | ) | | | (0.52 | ) | | | (0.51 | ) | | | (0.44 | ) |
| |
Dividends from net realized gains | | | — | | | | — | | | | — | | | | (0.29 | ) | | | — | | | | — | |
| |
Total distributions | | | (0.08 | ) | | | (0.20 | ) | | | (0.13 | ) | | | (0.81 | ) | | | (0.51 | ) | | | (0.44 | ) |
| |
Net asset value, end of period | | | $12.58 | | | | $12.11 | | | | $11.91 | | | | $11.35 | | | | $10.97 | | | | $13.31 | |
| |
Ratios and supplemental data: | | | | | | | | | | | | | | | | | | | | | | | | |
Total return(b) | | | 4.54% | | | | 3.40% | | | | 6.11% | | | | 11.77% | | | | (14.22% | ) | | | 7.81% | |
| |
Net assets, end of period (000) | | | $1,146,527 | | | | $1,282,438 | | | | $1,203,750 | | | | $938,686 | | | | $815,845 | | | | $1,012,912 | |
| |
Ratio of net expenses to average net assets | | | 1.18% | (c) | | | 1.21% | | | | 1.19% | | | | 1.19% | | | | 1.12% | | | | 1.18% | |
| |
Ratio of gross expenses to average net assets prior to expense reductions | | | 1.18% | (c) | | | 1.21% | | | | 1.19% | | | | 1.20% | | | | 1.13% | | | | 1.19% | |
| |
Ratio of net investment income (loss) to average net assets | | | 1.70% | (c) | | | 1.80% | | | | 2.00% | | | | 2.80% | | | | 2.40% | | | | 3.63% | |
| |
Ratio of net expenses, excluding dividend and interest expense on short positions, to average net assets | | | 1.14% | (c) | | | 1.14% | | | | 1.14% | | | | 1.15% | | | | 1.08% | | | | 1.10% | |
| |
| | |
| | | (Unaudited)
Six Months
Ended
April 30, | | | Year Ended October 31, | |
| | | 2012 | | | 2011 | | | 2010 | | | 2009 | | | 2008 | | | 2007 | |
Portfolio turnover rate | | | 44.4% | | | | 98.5% | | | | 87.8% | | | | 79.8% | | | | 112.0% | | | | 104.7% | |
| |
| (a) | Net investment income allocated based on average shares method. |
| (b) | Total return measures net investment income and capital gain or loss from portfolio investments assuming reinvestment of dividends and capital gains distributions. Total return is not annualized for periods that are less than a full year, does not reflect the effect of sales charge for Class A shares nor the contingent deferred sales charge for Class B and C shares and does not reflect the deduction of taxes that a shareholder would pay on fund distributions or the redemption of fund shares. |
| | | | |
| 170 | | CALAMOS FAMILY OF FUNDS SEMIANNUAL REPORT | | |
Calamos Market Neutral Income Fund Financial Highlights
| | | | | | | | | | | | | | | | | | | | | | | | |
| | | CLASS B | |
| | | (Unaudited)
Six Months
Ended
April 30, | | | Year Ended October 31, | |
| | | 2012 | | | 2011 | | | 2010 | | | 2009 | | | 2008 | | | 2007 | |
Net asset value, beginning of period | | | $12.75 | | | | $12.51 | | | | $11.92 | | | | $11.48 | | | | $13.90 | | | | $13.31 | |
| |
Income from investment operations: | | | | | | | | | | | | | | | | | | | | | | | | |
Net investment income (loss)(a) | | | 0.06 | | | | 0.14 | | | | 0.15 | | | | 0.24 | | | | 0.22 | | | | 0.39 | |
| |
Net realized and unrealized gain (loss) | | | 0.46 | | | | 0.20 | | | | 0.48 | | | | 0.92 | | | | (2.23 | ) | | | 0.53 | |
| |
Total from investment operations | | | 0.52 | | | | 0.34 | | | | 0.63 | | | | 1.16 | | | | (2.01 | ) | | | 0.92 | |
| |
Distributions: | | | | | | | | | | | | | | | | | | | | | | | | |
Dividends from net investment income | | | (0.03 | ) | | | (0.10 | ) | | | (0.04 | ) | | | (0.43 | ) | | | (0.41 | ) | | | (0.33 | ) |
| |
Dividends from net realized gains | | | — | | | | — | | | | — | | | | (0.29 | ) | | | — | | | | — | |
| |
Total distributions | | | (0.03 | ) | | | (0.10 | ) | | | (0.04 | ) | | | (0.72 | ) | | | (0.41 | ) | | | (0.33 | ) |
| |
Net asset value, end of period | | | $13.24 | | | | $12.75 | | | | $12.51 | | | | $11.92 | | | | $11.48 | | | | $13.90 | |
| |
Ratios and supplemental data: | | | | | | | | | | | | | | | | | | | | | | | | |
Total return(b) | | | 4.06% | | | | 2.70% | | | | 5.31% | | | | 10.87% | | | | (14.84% | ) | | | 7.04% | |
| |
Net assets, end of period (000) | | | $15,850 | | | | $18,147 | | | | $25,349 | | | | $34,370 | | | | $43,852 | | | | $52,502 | |
| |
Ratio of net expenses to average net assets | | | 1.93% | (c) | | | 1.97% | | | | 1.94% | | | | 1.95% | | | | 1.87% | | | | 1.93% | |
| |
Ratio of gross expenses to average net assets prior to expense reductions | | | 1.93% | (c) | | | 1.97% | | | | 1.94% | | | | 1.95% | | | | 1.88% | | | | 1.94% | |
| |
Ratio of net investment income (loss) to average net assets | | | 0.96% | (c) | | | 1.07% | | | | 1.27% | | | | 2.13% | | | | 1.65% | | | | 2.88% | |
| |
Ratio of net expenses, excluding dividend and interest expense on short positions, to average net assets | | | 1.89% | (c) | | | 1.89% | | | | 1.88% | | | | 1.91% | | | | 1.83% | | | | 1.85% | |
| |
| | | | | | | | | | | | | | | | | | | | | | | | |
| | | CLASS C | |
| | | (Unaudited)
Six Months
Ended
April 30, | | | Year Ended October 31, | |
| | | 2012 | | | 2011 | | | 2010 | | | 2009 | | | 2008 | | | 2007 | |
Net asset value, beginning of period | | | $12.29 | | | | $12.08 | | | | $11.52 | | | | $11.12 | | | | $13.48 | | | | $12.93 | |
| |
Income from investment operations: | | | | | | | | | | | | | | | | | | | | | | | | |
Net investment income (loss)(a) | | | 0.06 | | | | 0.13 | | | | 0.15 | | | | 0.23 | | | | 0.21 | | | | 0.38 | |
| |
Net realized and unrealized gain (loss) | | | 0.45 | | | | 0.18 | | | | 0.46 | | | | 0.90 | | | | (2.16 | ) | | | 0.51 | |
| |
Total from investment operations | | | 0.51 | | | | 0.31 | | | | 0.61 | | | | 1.13 | | | | (1.95 | ) | | | 0.89 | |
| |
Distributions: | | | | | | | | | | | | | | | | | | | | | | | | |
Dividends from net investment income | | | (0.03 | ) | | | (0.10 | ) | | | (0.05 | ) | | | (0.44 | ) | | | (0.41 | ) | | | (0.34 | ) |
| |
Dividends from net realized gains | | | — | | | | — | | | | — | | | | (0.29 | ) | | | — | | | | — | |
| |
Total distributions | | | (0.03 | ) | | | (0.10 | ) | | | (0.05 | ) | | | (0.73 | ) | | | (0.41 | ) | | | (0.34 | ) |
| |
Net asset value, end of period | | | $12.77 | | | | $12.29 | | | | $12.08 | | | | $11.52 | | | | $11.12 | | | | $13.48 | |
| |
Ratios and supplemental data: | | | | | | | | | | | | | | | | | | | | | | | | |
Total return(b) | | | 4.16% | | | | 2.61% | | | | 5.31% | | | | 10.91% | | | | (14.84% | ) | | | 7.01% | |
| |
Net assets, end of period (000) | | | $288,375 | | | | $299,733 | | | | $353,019 | | | | $330,360 | | | | $363,213 | | | | $457,924 | |
| |
Ratio of net expenses to average net assets | | | 1.93% | (c) | | | 1.97% | | | | 1.94% | | | | 1.95% | | | | 1.87% | | | | 1.93% | |
| |
Ratio of gross expenses to average net assets prior to expense reductions | | | 1.93% | (c) | | | 1.97% | | | | 1.94% | | | | 1.95% | | | | 1.88% | | | | 1.94% | |
| |
Ratio of net investment income (loss) to average net assets | | | 0.95% | (c) | | | 1.06% | | | | 1.26% | | | | 2.10% | | | | 1.65% | | | | 2.88% | |
| |
Ratio of net expenses, excluding dividend and interest expense on short positions, to average net assets | | | 1.89% | (c) | | | 1.89% | | | | 1.88% | | | | 1.91% | | | | 1.83% | | | | 1.85% | |
| |
| (a) | Net investment income allocated based on average shares method. |
| (b) | Total return measures net investment income and capital gain or loss from portfolio investments assuming reinvestment of dividends and capital gains distributions. Total return is not annualized for periods that are less than a full year, does not reflect the effect of sales charge for Class A shares nor the contingent deferred sales charge for Class B and C shares and does not reflect the deduction of taxes that a shareholder would pay on fund distributions or the redemption of fund shares. |
Calamos Market Neutral Income Fund Financial Highlights
| | | | | | | | | | | | | | | | | | | | | | | | |
| | | CLASS I | |
| | | (Unaudited)
Six Months
Ended
April 30, | | | Year Ended October 31, | |
| | | 2012 | | | 2011 | | | 2010 | | | 2009 | | | 2008 | | | 2007 | |
Net asset value, beginning of period | | | $12.00 | | | | $11.80 | | | | $11.25 | | | | $10.88 | | | | $13.21 | | | | $12.67 | |
| |
Income from investment operations: | | | | | | | | | | | | | | | | | | | | | | | | |
Net investment income (loss)(a) | | | 0.12 | | | | 0.24 | | | | 0.25 | | | | 0.32 | | | | 0.32 | | | | 0.50 | |
| |
Net realized and unrealized gain (loss) | | | 0.43 | | | | 0.19 | | | | 0.46 | | | | 0.89 | | | | (2.11 | ) | | | 0.51 | |
| |
Total from investment operations | | | 0.55 | | | | 0.43 | | | | 0.71 | | | | 1.21 | | | | (1.79 | ) | | | 1.01 | |
| |
Distributions: | | | | | | | | | | | | | | | | | | | | | | | | |
Dividends from net investment income | | | (0.09 | ) | | | (0.23 | ) | | | (0.16 | ) | | | (0.55 | ) | | | (0.54 | ) | | | (0.47 | ) |
| |
Dividends from net realized gains | | | — | | | | — | | | | — | | | | (0.29 | ) | | | — | | | | — | |
| |
Total distributions | | | (0.09 | ) | | | (0.23 | ) | | | (0.16 | ) | | | (0.84 | ) | | | (0.54 | ) | | | (0.47 | ) |
| |
Net asset value, end of period | | | $12.46 | | | | $12.00 | | | | $11.80 | | | | $11.25 | | | | $10.88 | | | | $13.21 | |
| |
Ratios and supplemental data: | | | | | | | | | | | | | | | | | | | | | | | | |
Total return(b) | | | 4.63% | | | | 3.70% | | | | 6.33% | | | | 12.07% | | | | (14.03% | ) | | | 8.12% | |
| |
Net assets, end of period (000) | | | $965,336 | | | | $738,421 | | | | $521,364 | | | | $183,133 | | | | $102,745 | | | | $24,954 | |
| |
Ratio of net expenses to average net assets | | | 0.93% | (c) | | | 0.96% | | | | 0.96% | | | | 0.94% | | | | 0.87% | | | | 0.93% | |
| |
Ratio of gross expenses to average net assets prior to expense reductions | | | 0.93% | (c) | | | 0.96% | | | | 0.96% | | | | 0.95% | | | | 0.88% | | | | 0.94% | |
| |
Ratio of net investment income (loss) to average net assets | | | 1.92% | (c) | | | 2.04% | | | | 2.22% | | | | 2.99% | | | | 2.65% | | | | 3.88% | |
| |
Ratio of net expenses, excluding dividend and interest expense on short positions, to average net assets | | | 0.89% | (c) | | | 0.89% | | | | 0.89% | | | | 0.90% | | | | 0.83% | | | | 0.85% | |
| |
| | | | | | | | | | | | | | | | | | | | | | | | |
| | | CLASS R | |
| | | (Unaudited)
Six Months
Ended
April 30, | | | Year Ended October 31, | | | March 1, 2007*
through
October 31, | |
| | | 2012 | | | 2011 | | | 2010 | | | 2009 | | | 2008 | | | 2007 | |
Net asset value, beginning of period | | | $12.08 | | | | $11.88 | | | | $11.33 | | | | $10.96 | | | | $13.31 | | | | $12.84 | |
| |
Income from investment operations: | | | | | | | | | | | | | | | | | | | | | | | | |
Net investment income (loss)(a) | | | 0.09 | | | | 0.19 | | | | 0.20 | | | | 0.25 | | | | 0.27 | | | | 0.30 | |
| |
Net realized and unrealized gain (loss) | | | 0.44 | | | | 0.18 | | | | 0.46 | | | | 0.91 | | | | (2.14 | ) | | | 0.40 | |
| |
Total from investment operations | | | 0.53 | | | | 0.37 | | | | 0.66 | | | | 1.16 | | | | (1.87 | ) | | | 0.70 | |
| |
Distributions: | | | | | | | | | | | | | | | | | | | | | | | | |
Dividends from net investment income | | | (0.07 | ) | | | (0.17 | ) | | | (0.11 | ) | | | (0.50 | ) | | | (0.48 | ) | | | (0.23 | ) |
| |
Dividends from net realized gains | | | — | | | | — | | | | — | | | | (0.29 | ) | | | — | | | | — | |
| |
Total distributions | | | (0.07 | ) | | | (0.17 | ) | | | (0.11 | ) | | | (0.79 | ) | | | (0.48 | ) | | | (0.23 | ) |
| |
Net asset value, end of period | | | $12.54 | | | | $12.08 | | | | $11.88 | | | | $11.33 | | | | $10.96 | | | | $13.31 | |
| |
Ratios and supplemental data: | | | | | | | | | | | | | | | | | | | | | | | | |
Total return(b) | | | 4.36% | | | | 3.18% | | | | 5.84% | | | | 11.46% | | | | (14.48% | ) | | | 5.47% | |
| |
Net assets, end of period (000) | | | $4,526 | | | | $3,114 | | | | $2,351 | | | | $1,034 | | | | $162 | | | | $105 | |
| |
Ratio of net expenses to average net assets | | | 1.43% | (c) | | | 1.46% | | | | 1.46% | | | | 1.44% | | | | 1.37% | | | | 1.43% | (c) |
| |
Ratio of gross expenses to average net assets prior to expense reductions | | | 1.43% | (c) | | | 1.46% | | | | 1.46% | | | | 1.44% | | | | 1.38% | | | | 1.44% | (c) |
| |
Ratio of net investment income (loss) to average net assets | | | 1.41% | (c) | | | 1.55% | | | | 1.72% | | | | 2.36% | | | | 2.15% | | | | 3.38% | (c) |
| |
Ratio of net expenses, excluding dividend and interest expense on short positions, to average net assets | | | 1.39% | (c) | | | 1.39% | | | | 1.39% | | | | 1.40% | | | | 1.33% | | | | 1.35% | (c) |
| |
| * | Commencement of operations. |
| (a) | Net investment income allocated based on average shares method. |
| (b) | Total return measures net investment income and capital gain or loss from portfolio investments assuming reinvestment of dividends and capital gains distributions. Total return is not annualized for periods that are less than a full year, does not reflect the effect of sales charge for Class A shares nor the contingent deferred sales charge for Class B and C shares and does not reflect the deduction of taxes that a shareholder would pay on fund distributions or the redemption of fund shares. |
| | | | |
| 172 | | CALAMOS FAMILY OF FUNDS SEMIANNUAL REPORT | | |
Report of Independent Registered Public Accounting Firm
To the Shareholders and Board of Trustees of Calamos Investment Trust
We have reviewed the accompanying statements of assets and liabilities, including the schedules of investments, of Calamos Investment Trust (the “Trust”), including Calamos Growth Fund, Calamos Value Fund, Calamos Blue Chip Fund, Calamos Discovery Growth Fund, Calamos International Growth Fund, Calamos Evolving World Growth Fund, Calamos Global Equity Fund, Calamos Growth and Income Fund, Calamos Global Growth and Income Fund, Calamos Convertible Fund, Calamos Total Return Bond Fund, Calamos High Income Fund (formerly Calamos High Yield Fund), and Calamos Market Neutral Income Fund (the “Funds”), as of April 30, 2012, and the related statements of operations and changes in net assets and the financial highlights for the semi-annual period then ended. These interim financial statements and financial highlights are the responsibility of the Trust’s management.
We conducted our reviews in accordance with standards of the Public Company Accounting Oversight Board (United States). A review of interim financial information consists principally of applying analytical procedures and making inquiries of persons responsible for financial and accounting matters. It is substantially less in scope than an audit conducted in accordance with standards of the Public Company Accounting Oversight Board (United States), the objective of which is the expression of an opinion regarding the financial statements and financial highlights taken as a whole. Accordingly, we do not express such an opinion.
Based on our reviews, we are not aware of any material modifications that should be made to such interim financial statements and financial highlights for them to be in conformity with accounting principles generally accepted in the United States of America.
We have previously audited, in accordance with the standards of the Public Company Accounting Oversight Board (United States), the statements of changes in net assets of the Funds for the year ended October 31, 2011 and the financial highlights for each of the periods presented; and in our report dated December 16, 2011, we expressed an unqualified opinion on such statements of changes in net assets and financial highlights.
Chicago, Illinois
June 21, 2012
This page intentionally left blank.
This page intentionally left blank.
This page intentionally left blank.
MANAGING YOUR CALAMOS FUNDS INVESTMENTS
Calamos Investments offers several convenient means to monitor, manage and feel confident about your Calamos investment choice.
24-HOUR AUTOMATED SHAREHOLDER ASSISTANCE: 800.823.7386
Through a single toll-free number, Calamos 24-Hour Shareholder Assistance is fast and easy. Get fund prices and account balances, review recent transactions, order statements, literature and more.
PERSONAL ASSISTANCE: 800.582.6959
Dial this toll-free number to speak with a knowledgeable Client Services Representative who can help answer questions or address issues concerning your Calamos Fund.
ONLINE ACCOUNT MANAGEMENT: www.calamos.com
Manage your personal account of Calamos Funds online at www.calamos.com. On your account access page, you can view account history and download data.
YOUR FINANCIAL ADVISOR
We encourage you to talk to your financial advisor to determine how the Calamos Funds can benefit your investment portfolio based on your financial goals, risk tolerance, time horizon and income needs.
| | |

| | STAY CONNECTED www.calamos.com |
|
Visit our website for timely fund performance, detailed fund profiles, fund news and insightful market commentary. |
This report, including the audited financial statements contained herein, is submitted for general information for the shareholders of the Funds. The report is not authorized for distribution to prospective investors in the Funds unless accompanied by a currently effective prospectus of the Funds and, after July 31, 2012, updated performance data for the most recently completed fiscal quarter. The views expressed in this report reflect those of Calamos Advisors LLC only through April 30, 2012. The managers’ views are subject to change at any time based on market and other conditions.
A description of the Calamos Proxy Voting Policies and Procedures and the Funds’ proxy voting record for the 12 month period ended June 30, 2011 are available free of charge upon request by calling 800.582.6959, by visiting the Calamos website at www.calamos.com, or by writing Calamos at: Calamos Investments, Attn: Client Services, 2020 Calamos Court, Naperville, IL 60563. The Funds’ proxy voting record is also available free of charge by visiting the SEC website at http://www.sec.gov.
The Funds file a complete list of their portfolio holdings with the SEC for the first and third quarters each fiscal year on Form N-Q. The Forms N-Q are available free of charge, upon request, by calling or writing Calamos Investments at the phone number or address provided above or by visiting the SEC website at http://www.sec.gov. You may also review or, for a fee, copy the forms at the SEC’s Public Reference Room in Washington, D.C. Information on the operation of the Public Reference Room may be obtained by calling 800.732.0330.
FOR 24 HOUR AUTOMATED SHAREHOLDER ASSISTANCE: 800.823.7386
TO OBTAIN INFORMATION ABOUT YOUR INVESTMENTS: 800.582.6959
VISIT OUR WEBSITE: www.calamos.com
INVESTMENT ADVISER:
Calamos Advisors LLC
2020 Calamos Court
Naperville, IL 60563-2787
TRANSFER AGENT:
U.S. Bancorp Fund Services, LLC
615 E. Michigan St., 3rd Floor
Milwaukee, WI 53202
INDEPENDENT REGISTERED PUBLIC ACCOUNTING FIRM:
Deloitte & Touche LLP
Chicago, IL
LEGAL COUNSEL:
K&L Gates LLP
Chicago, IL

2020 Calamos Court
Naperville, IL 60563-2787
800.582.6959
www.calamos.com
© 2012 Calamos Holdings LLC. All Rights Reserved.
Calamos® and Calamos Investments® are registered
trademarks of Calamos Holdings LLC.
MFSAN 1631 2012
ITEM 2. CODE OF ETHICS.
Not applicable.
ITEM 3. AUDIT COMMITTEE FINANCIAL EXPERT.
Not applicable.
ITEM 4. PRINCIPAL ACCOUNTANT FEES AND SERVICES.
Not applicable.
ITEM 5. AUDIT COMMITTEE OF LISTED REGISTRANTS.
Not applicable.
ITEM 6. SCHEDULE OF INVESTMENTS
Included in the Report to Shareholders in Item 1.
ITEM 7. DISCLOSURE OF PROXY VOTING POLICIES AND PROCEDURES FOR CLOSED-END MANAGEMENT INVESTMENT COMPANIES.
Not applicable.
ITEM 8. PORTFOLIO MANAGERS OF CLOSED-END MANAGEMENT INVESTMENT COMPANIES.
Not applicable.
ITEM 9. PURCHASES OF EQUITY SECURITIES BY CLOSED-END MANAGEMENT INVESTMENT COMPANY AND AFFILIATED PURCHASERS.
Not applicable.
ITEM 10. SUBMISSION OF MATTERS TO A VOTE OF SECURITY HOLDERS.
No material changes.
ITEM 11. CONTROLS AND PROCEDURES.
a) The registrant’s principal executive officer and principal financial officer have evaluated the registrant’s disclosure controls and procedures within 90 days of this filing and have concluded that the registrant’s disclosure controls and procedures were effective, as of that date, in ensuring that information required to be disclosed by the registrant in this Form N-CSR was recorded, processed, summarized, and reported timely.
b) There were no changes in the registrant’s internal controls over financial reporting (as defined in Rule 30a-3(d) under the Investment Company Act of 1940) that occurred during the second fiscal quarter of the period covered by this report that has materially affected, or is reasonably likely to materially affect, the registrant’s internal control over financial reporting.
ITEM 12. EXHIBITS.
(a)(1) Code of Ethics—Not applicable.
(a)(2)(i) Certification of Principal Executive Officer.
(a)(2)(ii) Certification of Principal Financial Officer.
SIGNATURES
Pursuant to the requirements of the Securities Exchange Act of 1934 and the Investment Company Act of 1940, the registrant has duly caused this report to be signed on its behalf by the undersigned, thereunto duly authorized.
| | |
| Calamos Investment Trust |
| |
By: | | /s/ John P. Calamos, Sr. |
Name: | | John P. Calamos, Sr. |
Title: | | Principal Executive Officer |
Date: | | June 22, 2012 |
| | |
By: | | /s/ Nimish S. Bhatt |
Name: | | Nimish S. Bhatt |
Title: | | Principal Financial Officer |
Date: | | June 22, 2012 |
Pursuant to the requirements of the Securities Exchange Act of 1934 and the Investment Company Act of 1940, this report has been signed by the following persons on behalf of the registrant and in the capacities and on the dates indicated.
| | |
By: | | /s/ John P. Calamos, Sr. |
Name: | | John P. Calamos, Sr. |
Title: | | Principal Executive Officer |
Date: | | June 22, 2012 |
| | |
By: | | /s/ Nimish S. Bhatt |
Name: | | Nimish S. Bhatt |
Title: | | Principal Financial Officer |
Date: | | June 22, 2012 |