UNITED STATES
SECURITIES AND EXCHANGE COMMISSION
Washington, D.C. 20549
FORM N-CSR
CERTIFIED SHAREHOLDER REPORT OF REGISTERED
MANAGEMENT INVESTMENT COMPANIES
INVESTMENT COMPANY ACT FILE NUMBER: 811-05443
Calamos Investment Trust
(EXACT NAME OF REGISTRANT AS SPECIFIED IN CHARTER)
2020 Calamos Court, Naperville
Illinois 60563-2787
(ADDRESS OF PRINCIPAL EXECUTIVE OFFICES)
John P Calamos, Sr., President,
Calamos Advisors LLC
2020 Calamos Court,
Naperville, Illinois
60563-2787
(NAME AND ADDRESS OF AGENT FOR SERVICE)
REGISTRANT’S TELEPHONE NUMBER, INCLUDING AREA CODE: (630) 245-7200
DATE OF FISCAL YEAR END: October 31, 2013
DATE OF REPORTING PERIOD: November 1, 2012 through April 30, 2013
Item 1. Report to Shareholders


Experience and Foresight
About Calamos Investments
For nearly 35 years, we have helped investors like you manage and build wealth to meet long-term objectives. Because investors have different time horizons, risk tolerances and goals, we offer funds to suit a variety of asset allocation needs. Our 13 mutual funds include equity, enhanced fixed income and alternative funds. We offer U.S. funds, as well as global and international choices.
We are dedicated to helping our clients build and protect wealth. We understand when you entrust us with your assets, you also entrust us with your achievements, goals and aspirations. We believe we best honor this trust by making investment decisions guided by integrity, by discipline and by our conscientious research.
We believe an active, risk-conscious approach is essential for wealth creation. In the 1970s, we pioneered the use of convertible securities as a means to control risk in volatile markets. We followed with strategies that combine convertibles and stocks, with the aim of participating in equity market upside with potentially less volatility than an all-stock portfolio. In the 1990s, we introduced our first stock fund, which invests in growth companies both large and small. Across our funds, our investment process seeks to manage risk at multiple levels and draws upon our experience investing through many market cycles. In a rapidly changing environment, we believe that this active management is essential.
We are global in our perspective. We believe globalization offers tremendous opportunities for countries and companies all over the world. In our U.S., global and international portfolios, we are seeking to capitalize on the potential growth of the global economy.
We believe there are opportunities in all markets. Our history traces back to the 1970s, a period of significant volatility and economic concerns. We have invested through multiple market cycles, each with its own challenges. Out of this experience comes our belief that the flipside of volatility is opportunity.
Letter to Shareholders

JOHN P. CALAMOS, SR.
CEO and Global Co-CIO
Dear Fellow Shareholder:
Welcome to your semiannual report for the six-month period ended April 30, 2013. In this report, you will find commentary from the Calamos Investment Management Team, as well as a listing of portfolio holdings, financial statements and highlights, and detailed information about the performance and positioning of the Calamos Funds.
Market Review
Today’s market conditions remind me of the often tumultuous 1970s, when macro events fueled uncertainty and volatility. This time around, however, massive accommodative monetary policy from the Federal Reserve and central banks around the world has supported the global equity markets and their overall recoveries. However, these aggressive easing policies have also driven government bond yields in developed markets to historic lows. As a result, the search for income continued to be a primary concern for many investors, contributing to distortions in the equity markets as well.
The U.S. stuck to its slow-growth trajectory, adding to its growing string of consecutive quarters of economic expansion. A recovering housing market and rising equity markets contributed to a “wealth effect” that carried through to retail and auto sales. Although sequestration cast a shadow at the end of the year that carried into 2013, the country managed to avoid the fiscal cliff, and the passage of a new continuing resolution has prevented a Washington shutdown.
Elsewhere, we continued to see underwhelming euro zone GDP and ongoing tensions between the haves and have-nots. Italy’s ill-fated election, as well as Cyprus’ woes and the EU’s missteps in addressing them, underscored the tensions in the EU and the complexities of the bailout-austerity cycle. There was better news coming out of Japan, however, as the Bank of Japan took steps during the period to reverse deflation, resulting in better factory output, consumer confidence and business sentiment for that key global economy.
Conditions were best in the U.S., as economic recovery continued at a slow and steady pace. U.S. stocks rallied to a double-digit performance, with the S&P 500 Index1 returning an impressive 14.42% for the period. Global markets also participated in the upswing, as the MSCI World Index2, a measure of developed market equity performance, posted a robust 13.78% gain. Meanwhile, emerging markets lagged their developed-market counterparts for the period amid concerns of slowing growth and less accommodative monetary policy in several key economies, but the MSCI Emerging Markets Index3 still managed a gain of 5.40%.
Letter to Shareholders
Many of the Calamos Funds utilize convertible securities, and this area of the market also enjoyed the six-month rally, as the BofA Merrill Lynch All U.S. Convertible Ex-Mandatory Index4 returned 12.69%, prompted by lower-quality higher yielding securities. High yield issuance continued to maintain a steady pace, while performance for the six-month period was also healthy, with a 7.21% return in the Credit Suisse High Yield Index5. The lower yielding U.S. bond market was more muted, however, as the Barclays Capital U.S. Aggregate Bond Index6 posted a gain of just 0.90%.
Global Outlook: Cautious Optimism
Our global outlook remains cautiously optimistic, and we believe, now more than ever, that active management and diversification are crucial to long-term investing success.
We expect the global economic recovery to continue at a measured pace, led by the U.S. and the emerging markets. Our greatest concerns relate to euro zone GDP and a potential slowdown in earnings growth, globally. We believe that valuations and long-term secular trends (including those related to the EM consumer) support our positioning. Recent housing and consumer data in the U.S. has been encouraging, and although some of China’s first quarter economic data (GDP and industrial production) has fallen short of estimates, numbers remain high in absolute terms and relative to developed markets.
On the back of central bank intervention and investors’ quest for income, valuations for areas such as staples have become stretched to a point that we believe merits caution. Meanwhile, we believe that the valuations of growth equities are attractive by many measures. For example, U.S. growth equities are highly compelling on the basis of free cash flow yields versus 10-year Treasury yields, as well as on a P/E basis versus value stocks. Many growth-rich but dividend-poor technology stocks are especially undervalued. After strong performance in the first half of 2012, we’ve seen the sector give some back, but the fundamentals still look attractive from both top-down and bottom-up perspectives.
We are also encouraged by trends in the U.S. and global convertible markets. Economic growth has supported increased issuance globally, and we continue to find attractively valued convertibles that offer the characteristics we seek—that is, a balance between equity participation and potential downside resilience.
A Global, Long-Term Perspective
Despite our broadly constructive outlook for equities and the global economy, we expect continued choppiness in the markets, and would not be surprised to see the equity market correct off recent highs, with overpriced sectors potentially coming under particular pressure. We believe this can create new buying opportunities, and we are carefully assessing opportunities across industries.
In this environment, we believe that maintaining long-term focus, global perspective and a commitment to diversified asset allocation are vital to investing success. We recognize that our role is to understand and adapt to the markets we are in, and we believe that our experience, proprietary research and active approach position us
| | | | |
| 2 | | CALAMOS FAMILY OF FUNDS SEMIANNUAL REPORT | | |
Letter to Shareholders
well in this regard. We continue to enhance our team and our approach, adding new resources, including a dedicated value investing team, additional specialized team members and more risk management capabilities.
As always, we appreciate the trust you have placed in us to manage your assets and help you achieve your financial goals. We encourage you to visit us at www.calamos.com or contact us at 800.582.6959 with any questions or concerns about our funds that are not addressed in this report.
Sincerely,

John P. Calamos, Sr.
CEO and Global Co-CIO,
Calamos Advisors LLC
Before investing, carefully consider a fund’s investment objectives, risks, charges and expenses. Please see the prospectus containing this and other information or call 800.582.6959. Please read the prospectus carefully. Performance data represents past performance, which is no guarantee of future results. Current performance may be lower or higher than the performance quoted.
| 1 | The S&P 500 Index is an unmanaged index generally considered representative of the U.S. stock market. Source: Lipper, Inc. |
| 2 | The MSCI World Index (U.S. Dollars) is a market-capitalization weighted index composed of companies representative of the market structure of developed market countries in North America, Europe and the Asia/Pacific region. Source: Lipper, Inc. |
| 3 | The MSCI Emerging Markets Index is a free float-adjusted market capitalization index considered broadly representative of emerging market equity performance. The index represents companies within the constituent emerging markets that are available to investors worldwide. |
| 4 | The BofA Merrill Lynch All U.S. Convertibles Ex-Mandatory Index represents the U.S. convertible securities market excluding mandatory convertibles. |
| 5 | The Credit Suisse High Yield Index is an unmanaged index of approximately 1,600 issues with an average maturity range of seven to ten years with a minimum capitalization of $75 million. The Index is considered generally representative of the U.S. market for high yield bonds. |
| 6 | The Barclays U.S. Aggregate Bond Index is considered generally representative of the investment-grade bond market. Source: Lipper, Inc. |
Unmanaged index returns assume reinvestment of any and all distributions and, unlike fund returns, do not reflect fees, expenses or sales charges. Investors cannot invest directly in an index.
Investments in overseas markets pose special risks, including currency fluctuation and political risks. These risks are generally intensified for investments in emerging markets. Countries, regions, and sectors mentioned are presented to illustrate countries, regions, and sectors in which a fund may invest. Fund holdings are subject to change daily. The Funds are actively managed.
The information contained herein is based on internal research derived from various sources and does not purport to be statements of all material facts relating to the securities mentioned. The information contained herein, while not guaranteed as to the accuracy or completeness, has been obtained from sources we believe to be reliable. There are certain risks involved with investing in convertible securities in addition to market risk, such as call risk, dividend risk, liquidity risk and default risk, that should be carefully considered prior to investing. This information is being provided for informational purposes only and should not be considered investment advice or an offer to buy or sell any security in the portfolio.
This report is intended for informational purposes only and should not be considered investment advice.
Calamos Growth Fund
| | |
| FUND NASDAQ SYMBOLS |
A Shares | | CVGRX |
B Shares | | CVGBX |
C Shares | | CVGCX |
I Shares | | CGRIX |
R Shares | | CGRRX |
| | | |
|
| FUND CUSIP NUMBERS |
A Shares | | 128119302 |
B Shares | | 128119740 |
C Shares | | 128119856 |
I Shares | | 128119807 |
R Shares | | 128119435 |
| | | |
FUND OBJECTIVE
Long-term capital growth
INVESTMENT STRATEGY
| | > | | Blends rigorous economic and broad themes analysis with intensive company and security research seeking to identify businesses with higher growth relative to peers | |
| | > | | Determines the quality and sustainability of a company’s growth by assessing its fundamentals and management among other factors | |
| | > | | Uses proprietary valuation models to ascertain a stock’s return potential | |
| | > | | Adheres to strict risk-management guidelines to determine portfolio construction | |
INVESTOR PROFILE
This Fund may be suitable for investors who seek:
| | > | | A portfolio that pursues the highest potential growth opportunities regardless of company size or industry | |
| | > | | A relatively aggressive yet diversified way to participate in the stock market’s long-term growth potential | |
CALAMOS GROWTH FUND
INVESTMENT TEAM DISCUSSION
The Calamos Investment Management Team, led by Global Co-Chief Investment Officers John P. Calamos, Sr. and Gary D. Black, discusses the Fund’s performance, strategy and positioning during the six-month period ended April 30, 2013.
Q. What is the Fund’s investment strategy?
A. Calamos Growth Fund invests in U.S. companies that we believe have the best prospects for sustainable and high relative growth. The Fund offers an attractive way to participate in long-term growth trends by focusing on companies with strong, enduring strategies, disciplined and forward-thinking management and solid long-term execution. We believe that there are many exciting growth trends within the global economy, and we have sought companies with good earnings prospects, high returns on invested capital, sustainable free cash flow, and low debt-to-capital ratios.
Q. How has the Fund performed?
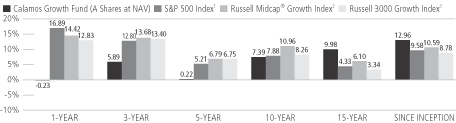
A. Because we believe equity funds are best utilized within asset allocations as long-term investments, we encourage investors to evaluate performance over multiple market cycles. Since its inception on September 4, 1990, the Fund has returned 12.96% on an annualized basis (Class A shares at net asset value). For this period, the broad equity market, as measured by the S&P 500 Index, returned 9.58%, while the Russell Midcap® Growth Index and the Russell 3000® Growth Index, returned 10.59% and 8.78%, respectively. The Russell 3000® Growth Index provides a point of comparison for the broad U.S. growth equity market, including companies of all capitalizations, while the Russell Midcap® Growth Index is a measure of mid-cap growth stocks, one segment of the Fund’s potential universe of investments.
For the six-month period ended April 30, 2013, Calamos Growth Fund returned 6.59% versus the S&P 500 Index gain of 14.42%. For this same period, the Russell Midcap® Growth Index rose 17.75% and the Russell 3000® Growth Index gained 13.93%.
Q. What factors influenced performance over the period?
A. The Fund trailed the Russell 3000® Growth Index as higher yielding and more defensive investments outperformed. Our focus on companies with cleaner balance sheets and globally diversified revenues was not rewarded in the period, as investors favored more leveraged growth and U.S.-focused businesses. In this environment, we continue to emphasize multinationals, which have greater flexibility to participate in global secular growth trends and to go where capital is treated best. The period also saw those companies with the highest current dividend yields yet slowest long-term projected growth outperform.
Sector performance within the market also illustrated that investors were focused on yield as opposed to growth over the six-month period. Signs of a rotation from defensive sectors to more cyclical growth areas (such as information technology, energy and industrials) appeared in the final weeks of the period, and corresponding performance within the Fund improved in kind.
In terms of specific sector performance, stock selection decisions within the consumer discretionary sector detracted from Fund returns. In particular, positioning within the Internet retail and specialty retail industries held back returns. Shares of some select
| | | | |
| 4 | | CALAMOS FAMILY OF FUNDS SEMIANNUAL REPORT | | |
Calamos Growth Fund
retailers delivered sales forecasts that fell short of expectations during the period, but we remain committed over the long term to companies with well-known brands, global business strategies and those with the ability to reach a geographically diversified customer base.
Stock selection within the materials sector also weighed on performance. On an industry level, an overweight allocation to and selection within the metals and mining industry (primarily gold miners) detracted from returns. We had maintained an overweight to the sector because we believe increased demand for resources from emerging market regions and accommodative global central bank policies can provide a tailwind to select industries.
The Fund’s selection within the energy sector detracted from performance. Specifically, holdings within the oil-and-gas equipment and services industry underperformed those of the benchmark. Our focus within the sector remains on the oil-and-gas exploration-and-production and equipment-and-services industries. These particular industries possess relatively stronger growth fundamentals that are less tied to the price of underlying commodities. As in materials, we believe that slow but continued global economic growth (including rebounding economic data in emerging markets), and global accommodative monetary policy can support opportunities within the energy sector. Investor preference for onshore energy production hindered the returns of the offshore companies, yet many of these maintain strong growth characteristics and attractive valuations.
While the Fund’s average overweight positioning within the health care sector helped performance, security selection within the sector hindered. Holdings within the pharmaceuticals and health care equipment industries underperformed, as investors favored the more defensive, slower-growth, higher yielding big pharmaceutical companies. Within health care, we seek investments with strong corporate fundamentals, attractive near-term catalysts, leading market share positions, the opportunity to participate in the growth of the emerging markets, as well as those that are furthest removed from government regulations.
The information technology sector was one of the worst performing areas over the period, and the Fund’s overweight allocation detracted from performance. However, security selection within the sector contributed favorably on a relative basis. We continue to focus on companies with solid balance sheets, globally diversified revenue bases and productivity enhancement capabilities. As long-term investors, we maintain conviction in technology because we believe many companies in the sector stand to benefit from long-term secular growth themes, including persistent innovation, enhanced mobility and global connectivity.
Q. What changes were made over the course of the reporting period?
A. We recognize that our role as a Fund manager is to understand and adapt to the markets we are in, and we remain committed to improving performance. In many ways, the Fund was positioned too defensively throughout much of 2012, with an emphasis on higher-quality balance sheets and the use of metals and mining companies and oil businesses as a cautious view on government currency operations. In 2013, the Fund reflected changes away from that stance, yet the market’s preference for low-growth businesses and high dividend yields proved to be out of favor with a higher-growth bias.
| | | | |
| SECTOR WEIGHTINGS | |
Information Technology | | | 36.1 | % |
Consumer Discretionary | | | 19.0 | |
Industrials | | | 13.6 | |
Health Care | | | 12.6 | |
Energy | | | 6.6 | |
Consumer Staples | | | 5.6 | |
Financials | | | 4.8 | |
Materials | | | 0.9 | |
| | | | | |
Sector weightings are subject to change daily and are calculated as a percentage of net assets. The table excludes cash or cash equivalents, any government/sovereign bonds or broad based index hedging securities the Fund may hold.
Calamos Growth Fund
We continue to focus on secular themes related to mobility and connectivity within technology, and on strong global brands within the consumer sectors. We are also attracted to companies tied to the global infrastructure build-out, as well as those that are considered productivity enhancers. Growth prospects remain compelling for multinational firms whose businesses are closely tied to emerging market consumer spending and the evolution of high-tech manufacturing.
On a sector basis, we have found the most opportunity within the information technology, consumer discretionary and industrials sectors. Relative to the Russell 3000® Growth Index, the Fund’s largest overweight allocation is to information technology, while it remains underweight relative to the consumer staples sector.
Among positioning changes during the period, we reduced the Fund’s allocation to information technology, primarily through the sale of companies where we believed that fundamentals and near-term growth catalysts had deteriorated. We remain committed to the vast growth opportunities within the sector overall, however, and therefore maintain an overweight allocation. We also pared the allocation to the materials sector during the period. We eliminated Fund holdings within the gold metals and mining industry due to higher costs, poor earnings and our desire to add names with improving near-term growth opportunities.
Based on the strength we see in infrastructure build-out and high-tech manufacturing trends, we increased the Fund’s allocation to the industrials sector, adding companies broadly across industries, including construction and engineering, railroads and airlines. Many companies in the sector are compelling from both valuation and fundamental perspectives. Our focus is on companies capitalizing on global manufacturing, especially in areas such as the machinery and construction and engineering industries, where the project pipeline is attractive. We also increased the portfolio’s allocation to the consumer discretionary sector, adding positions within the home improvement and apparel retail industries.
Q. What is the outlook for U.S. growth stocks and the Fund?
A. We continue to have a constructive view of U.S. growth stocks, particularly larger multinational firms, and we remain committed to improving Fund performance.
In our view, equity valuations continue to be attractive relative to cash flows, forward earnings expectations and the fixed income market, and growth equity premiums are even more appealing. In other words, the markets are still are not paying a premium for growth stocks. Investors continue to favor yield over growth, but we believe that stock prices have become too high for many of the companies paying high dividends.
In this environment, we maintain a preference for higher growth investments in the Fund. Despite near-term concerns and heightened choppiness in the global markets, we believe that our focus on U.S. multinational businesses remains appropriate for long-term investors. We favor businesses that we believe are capable of succeeding within a slower growth environment.
| | | | |
| 6 | | CALAMOS FAMILY OF FUNDS SEMIANNUAL REPORT | | |
Calamos Growth Fund
ANNUALIZED RETURN: SINCE INCEPTION (9/4/90) THROUGH 4/30/13
Performance data quoted represents past performance, which is no guarantee of future results. Current performance may be lower or higher than the performance quoted.
The principal value and investment return of an investment will fluctuate so that your shares, when redeemed, may be worth more or less than their original cost. You can obtain performance data current to the most recent month end by visiting www.calamos.com. Average annual total return measures net investment income and capital gain or loss from portfolio investments as an annualized average. All performance shown assumes reinvestment of dividends and capital gains distributions. Performance is for the Fund’s Class A shares at net asset value and does not include the Fund’s maximum front-end sales charge of 4.75%—had it been included, the Fund’s return would have been lower. The Fund also offers Class B, Class C, Class I and Class R shares, the performance of which may vary. Performance shown reflects an expense reimbursement that improved results. Source: State Street Corporation and Lipper, Inc.
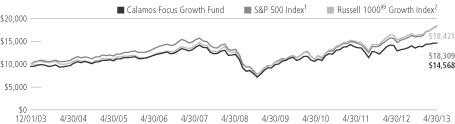
Calamos Growth Fund
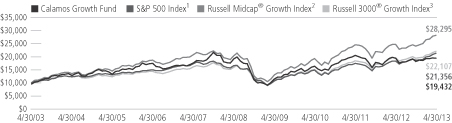
GROWTH OF $10,000: FOR 10-YEAR PERIOD ENDED 4/30/13
AVERAGE ANNUAL TOTAL RETURN† AS OF 4/30/13
| | | | | | | | | | | | | | | | | | | | |
| | | 6
MONTHS | | 1
YEAR | | 5
YEARS | | 10 YEARS
OR ^SINCE
INCEPTION |
Class A Shares – Inception 9/4/90 | | | | | | | | | | | | | | | | | | | | |
Without Sales Charge | | | | 6.59 | % | | | | -0.23 | % | | | | 0.22 | % | | | | 7.39 | % |
With Sales Charge | | | | 1.53 | | | | | -4.97 | | | | | -0.75 | | | | | 6.87 | |
Class B Shares – Inception 9/11/00 | | | | | | | | | | | | | | | | | | | | |
Without Sales Charge | | | | 6.19 | | | | | -0.98 | | | | | -0.53 | | | | | 6.75 | |
With Sales Charge | | | | 1.28 | | | | | -5.56 | | | | | -0.88 | | | | | 6.75 | |
Class C Shares – Inception 9/3/96 | | | | | | | | | | | | | | | | | | | | |
Without Sales Charge | | | | 6.19 | | | | | -0.97 | | | | | -0.53 | | | | | 6.59 | |
With Sales Charge | | | | 5.22 | | | | | -1.87 | | | | | -0.53 | | | | | 6.59 | |
Class I Shares – Inception 9/18/97 | | | | 6.72 | | | | | 0.02 | | | | | 0.47 | | | | | 7.66 | |
Class R Shares – Inception 3/1/07 | | | | 6.46 | | | | | -0.46 | | | | | -0.03 | | | | | 2.41 | ^ |
Performance data quoted represents past performance, which is no guarantee of future results. Current performance may be lower or higher than the performance quoted. The principal value and investment return of an investment will fluctuate so that your shares, when redeemed, may be worth more or less than their original cost.
| † | Average annual total return measures net investment income and capital gain or loss from portfolio investments as an annualized average assuming reinvestment of dividends and capital gains distributions. Performance shown reflects the effects of an expense reimbursement that improved results and was in effect until March 31, 2000. Load-adjusted returns are adjusted for the maximum front-end sales load of 4.75% for Class A shares and returns for Class B and C have been adjusted for the contingent deferred sales charge (CDSC). |
NOTES:
The graphs do not reflect the income taxes that you would pay on fund distributions or the redemption of fund shares. Fund performance includes reinvestment of dividends and adjustment for the maximum sales charge for Class A shares. The performance of other classes will vary from the performance of the class shown based on the difference in sales charges and fees paid by shareholders investing in different share classes.
| 1 | The S&P 500 Index is an unmanaged index generally considered representative of the U.S. stock market. Index data shown for the Annualized Return Since Inception graph is from 8/31/90, since comparative index data is only available for full monthly periods. Source: Lipper, Inc. |
| 2 | The Russell Midcap® Growth Index measures the performance of mid-sized companies with growth characteristics. Index data shown for the Annualized Return Since Inception graph is from 8/31/90, since comparative index data is only available for full monthly periods. Source: Lipper, Inc. |
| 3 | The Russell 3000® Growth Index measures the performance of companies with higher price-to-book ratios and higher forecasted growth values. Index data shown for the Annualized Return Since Inception graph is from 8/31/90, since comparative index data is only available for full monthly periods. Source: Lipper, Inc. |
Index returns assume reinvestment of dividends and do not reflect deduction of fees and expenses. It is not possible to invest directly in an index.
| | | | |
| 8 | | CALAMOS FAMILY OF FUNDS SEMIANNUAL REPORT | | |
Calamos Value Fund
CALAMOS VALUE FUND
INVESTMENT TEAM DISCUSSION
The Calamos Investment Management Team, led by Global Co-Chief Investment Officers John P. Calamos, Sr. and Gary D. Black, discusses the Fund’s performance, strategy and positioning during the six-month period ended April 30, 2013.
Q. What is the Fund’s investment strategy?
A. We believe that superior returns can be earned over time by investing in good businesses at value prices, actively managing positions to source incremental returns and limit losses and holding stocks only until they are appropriately valued. The Fund seeks to invest in the stocks of companies that are not broken, just a bit battered, and to own them while their stock prices reflect a view more dire than ours. A unifying theme at Calamos is that growth in cash flows drives growth in stock prices. Growth can come in two forms—secular long-term growth and short-term cyclical growth. Strong long-term secular growth companies are generally too expensive for this Fund’s discipline, so the team focuses on misunderstood and mispriced slower-growing companies with the expectation that the stock market’s negative sentiment for them will abate relatively soon. Often this means we are only temporary owners of a business, as we aim to own it only for as long as it is undervalued. A strong business will usually not remain misunderstood and undervalued by the stock market forever, but over time can recover and become fully valued.
Q. How has the Fund performed?
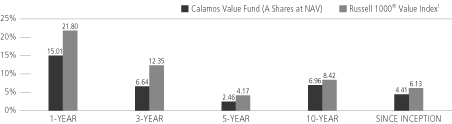
A. Because we believe equity funds are best utilized within asset allocations as long-term investments, we encourage investors to evaluate performance over longer time periods. Since its inception on January 2, 2002, the Fund has returned 4.41% on an annualized basis (Class A shares at net asset value) versus 6.10% for the Russell 1000® Value Index. For the six-month period ended April 30, 2013, the Fund returned 13.59% versus 16.31% for the Russell 1000® Value Index.
This semiannual period represents the first full six-month term during which the Calamos Value Fund was completely managed by the new Value Team, which brought its extensive value-specific experience to Calamos in July of 2012.
Q. What factors influenced performance over the period?
A. The Fund’s focus on companies with strong free cash flows and resilient business models produced stable returns in the six-month period, but fell short of the Russell 1000® Value Index performance. The Fund’s overweight in the industrials sector, based on an expected pickup in manufacturing activity, supported performance, as economic data showed improvement and Fund names benefited from exposure to the crude-by-rail theme.
The Fund’s preference for consumer names with strong brands that drive sustainable cash flows and operating margins proved beneficial, as the consumer proved a bit more resilient than some expected. While we have seen a steady rally in U.S. equities thus far in 2013, the early year preference for high-beta cyclical names gave way to a focus on defensive high yielding names (that is, dividend-paying stocks) in the latter part of the period. Since we take an agnostic view of dividends as a use of cash, the Fund lagged the move upward as it was underweighted in high yielding groups like consumer staples and utilities.
| | |
| FUND NASDAQ SYMBOLS |
A Shares | | CVAAX |
B Shares | | CVABX |
C Shares | | CVACX |
I Shares | | CVAIX |
R Shares | | CVARX |
| | | |
|
| FUND CUSIP NUMBERS |
A Shares | | 128119666 |
B Shares | | 128119658 |
C Shares | | 128119641 |
I Shares | | 128119633 |
R Shares | | 128119419 |
| | | |
FUND OBJECTIVE
Long-term capital growth
INVESTMENT STRATEGY
| | > | | Seeks to buy good businesses trading at value prices, including those demonstrating sustainable return on invested capital, price/cash flow, and a potential catalyst for change in 3-9 months | |
| | > | | Focuses on finding strong businesses with the potential to drive superior returns | |
| | > | | Looks to deliver absolute returns and manage downside risk and capital loss by using active portfolio management to source incremental returns and protect capital | |
INVESTOR PROFILE
This Fund may be suitable for investors who seek:
| | > | | A vehicle for building assets to meet medium-range to long-range financial goals | |
| | > | | A value-oriented complement to a growth-oriented portfolio | |
Calamos Value Fund
| | | | |
| SECTOR WEIGHTINGS | |
Financials | | | 26.7 | % |
Energy | | | 16.1 | |
Consumer Discretionary | | | 15.9 | |
Industrials | | | 14.2 | |
Health Care | | | 8.8 | |
Consumer Staples | | | 5.6 | |
Materials | | | 5.0 | |
Information Technology | | | 3.3 | |
Other | | | 0.2 | |
| | | | | |
Sector weightings are subject to change daily and are calculated as a percentage of net assets. The table excludes cash or cash equivalents, any government/sovereign bonds or broad based index hedging securities the Fund may hold.
Q. What changes were made to the Fund’s portfolio over the course of the reporting period?
A. Our focus continues to be on investments in companies with strong sustainable cash flows driven by some combination of management expertise, proprietary technology, niche market focus, barriers to competitive entry and/or powerful brand names that are trading at a discount to intrinsic value. What we are looking for in a company does not change—market prices do. As is our active nature, we scaled out of names that approached our price targets and re-invested the cash in new opportunities.
We made additions to the energy, health care and consumer discretionary sectors. The increase in energy was the largest change, as we added to the Fund’s exposure in large cap integrated oil names, moving from an underweight to a slight overweight at the end of the reporting period, as we continue to see the shale gas revolution as a long-term trend. In health care, the Fund’s increase was a result of adding a large pharmaceutical company, with no major sells during the period. Our preference on the health care front is to continue to avoid HMOs, while preferring drug and medical device names for their more stable margin and cash flow profiles. In consumer discretionary, we continued to add exposure to media content providers, who we feel have strong pricing power in this environment and are benefiting from increasing numbers of access providers adding new revenue streams to the traditional cable distribution model. The consumer discretionary sector continues to be the largest overweight in the Fund.
We decreased the Fund’s exposure in industrials, financials and information technology during the period. In industrials, we have shifted the focus of investments away from the extended valuations in railroads and toward construction and agricultural names, which looked a bit battered after the March reporting period. We slightly reduced the Fund’s exposure in the financials sector, though it continues to be its largest sector from an absolute standpoint. We made changes in the market cap of the Fund’s bank exposure during the period, favoring large cap global banks and alternative asset managers as a nice play on continuing improvements in the investment environment. There were minimal changes made in consumer staples, materials, telecommunication services and utilities during the reporting period, all of which remained underweight versus the benchmark.
Q. What is your outlook for the value equities and the Fund?
A. Throughout the stock market, companies with cash are in demand, as investors seek not only nice dividends today but also the opportunity to grow that dividend in the future. A focus on current yield has morphed into a focus on growth in payouts, at least for now. We believe that in the near term the market will continue to favor large companies with excess cash on their balance sheets and lots of free cash flow that they can put toward dividends and buybacks.
We believe that our active approach to value is well suited to the current market environment. Specifically, we believe that our focus on misunderstood and mispriced slower-growing companies has unearthed a number of compelling opportunities for the Fund.
| | | | |
| 10 | | CALAMOS FAMILY OF FUNDS SEMIANNUAL REPORT | | |
Calamos Value Fund
ANNUALIZED RETURN: SINCE INCEPTION (1/2/02) THROUGH 4/30/13
Performance data quoted represents past performance, which is no guarantee of future results. Current performance may be lower or higher than the performance quoted.
The principal value and investment return of an investment will fluctuate so that your shares, when redeemed, may be worth more or less than their original cost. You can obtain performance data current to the most recent month end by visiting www.calamos.com. Average annual total return measures net investment income and capital gain or loss from portfolio investments as an annualized average. All performance shown assumes reinvestment of dividends and capital gains distributions. Performance is for the Fund’s Class A shares at net asset value and does not include the Fund’s maximum front-end sales charge of 4.75%—had it been included, the Fund’s return would have been lower. The Fund also offers Class B, Class C, Class I and Class R shares, the performance of which may vary. Performance shown reflects an expense reimbursement that improved results. Source: State Street Corporation and Lipper, Inc.
Calamos Value Fund
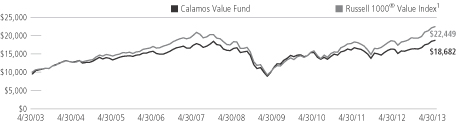
GROWTH OF $10,000: FOR 10-YEAR PERIOD ENDED 4/30/13
AVERAGE ANNUAL TOTAL RETURN† AS OF 4/30/13
| | | | | | | | | | | | | | | | | | | | |
| | | 6
MONTHS | | 1
YEAR | | 5
YEARS | | 10 YEARS
OR ^SINCE
INCEPTION |
Class A Shares – Inception 1/2/02 | | | | | | | | | | | | | | | | | | | | |
Without Sales Charge | | | | 13.59 | % | | | | 15.01 | % | | | | 2.46 | % | | | | 6.96 | % |
With Sales Charge | | | | 8.16 | | | | | 9.53 | | | | | 1.47 | | | | | 6.45 | |
Class B Shares – Inception 1/2/02 | | | | | | | | | | | | | | | | | | | | |
Without Sales Charge | | | | 13.18 | | | | | 14.09 | | | | | 1.69 | | | | | 6.33 | |
With Sales Charge | | | | 8.18 | | | | | 9.09 | | | | | 1.31 | | | | | 6.33 | |
Class C Shares – Inception 1/2/02 | | | | | | | | | | | | | | | | | | | | |
Without Sales Charge | | | | 13.27 | | | | | 14.19 | | | | | 1.70 | | | | | 6.16 | |
With Sales Charge | | | | 12.27 | | | | | 13.19 | | | | | 1.70 | | | | | 6.16 | |
Class I Shares – Inception 3/1/02 | | | | 13.71 | | | | | 15.29 | | | | | 2.72 | | | | | 7.24 | |
Class R Shares – Inception 3/1/07 | | | | 13.48 | | | | | 14.72 | | | | | 2.20 | | | | | 1.75 | ^ |
Performance data quoted represents past performance, which is no guarantee of future results. Current performance may be lower or higher than the performance quoted. The principal value and investment return of an investment will fluctuate so that your shares, when redeemed, may be worth more or less than their original cost.
| † | Average annual total return measures net investment income and capital gain or loss from portfolio investments as an annualized average assuming reinvestment of dividends and capital gains distributions. Performance shown reflects the effects of an expense reimbursement that improved results and was in effect until March 31, 2004. Load-adjusted returns are adjusted for the maximum front-end sales load of 4.75% for Class A shares and returns for Class B and C shares have been adjusted for the contingent deferred sales charge (CDSC). |
NOTES:
The graph does not reflect the income taxes that you would pay on fund distributions or the redemption of fund shares. Fund performance includes reinvestment of dividends and adjustment for the maximum sales charge for Class A shares. The performance of other classes will vary from the performance of the class shown based on the difference in sales charges and fees paid by shareholders investing in different share classes.
| 1 | The Russell 1000® Value Index measures the performance of those companies in the Russell 1000® Index with lower price-to-book ratios and lower forecasted growth values. Index data shown for the Annualized Return Since Inception graph is from 12/31/01, since comparative index data is only available for full monthly periods. Source: Lipper, Inc. |
Index returns assume reinvestment of dividends and do not reflect deduction of fees and expenses. It is not possible to invest directly in an index.
| | | | |
| 12 | | CALAMOS FAMILY OF FUNDS SEMIANNUAL REPORT | | |
Calamos Focus Growth Fund
CALAMOS FOCUS GROWTH FUND
INVESTMENT TEAM DISCUSSION
The Calamos Investment Management Team, led by Global Co-Chief Investment Officers John P. Calamos, Sr. and Gary D. Black, discusses the Fund’s performance, strategy and positioning during the six-month period ended April 30, 2013.
Q. What is the Fund’s investment strategy?
A. Calamos Blue Chip Fund changed its name to Calamos Focus Growth Fund effective March 1, 2013, reflecting its more focused approach to investing primarily in U.S.-based, large cap companies that we believe have the best prospects for sustainable for growth. We believe these “blue chip” companies may offer a higher degree of stability compared to smaller, less-tested companies, and that our more focused approach to this area may provide an opportunity for investors to diversify their equity allocation with a more concentrated strategy. While the Fund invests primarily in U.S.-domiciled businesses, we continue to favor companies with a global presence and geographically diversified revenues that we believe are positioned to capitalize on global economic growth and global secular trends.
Q. How has the Fund performed?
A. Because we believe equity funds are best utilized within asset allocations as long-term investments, we encourage investors to evaluate performance over longer time periods. Since its inception on December 1, 2003, the Fund has returned 4.62% on an annualized basis (Class A shares at net asset value) versus a 6.51% return for the S&P 500 Index and a 6.57% return for the Russell 1000® Growth Index. For the six-month period ended April 30, 2013, the Calamos Focus Growth Fund returned 7.67% versus 14.42% for the S&P 500 Index and 13.71% for the Russell 1000® Growth Index.
Q. What factors influenced performance over the period?
A. Higher yielding and more defensive investments outperformed in the market. Our focus on companies with cleaner balance sheets and globally diversified revenues was not rewarded, as investors favored more leveraged growth and U.S.-focused businesses. In this environment, we continue to emphasize multinationals, which have greater flexibility to participate in global secular growth trends and to go where capital is treated best. The period also saw those companies with higher dividend yields and slower long-term projected growth outperform.
Sector performance within the market also illustrated that investors were focused on yield as opposed to growth over the six-month period. While market sentiment was defensive on a sector level, investors were less concerned about balance sheet strength in an overall environment boasting easier access to capital. Signs of a rotation from defensive sectors to more cyclical growth areas (such as information technology, energy and industrials) appeared in the final weeks of the period, and corresponding performance within the Fund improved in kind.
The Fund’s security selection within the energy sector detracted from performance in the period. Specifically, holdings within the oil-and-gas equipment and services industry underperformed those of the benchmark. Our focus within the sector remains on the oil-and-gas equipment-and-services and exploration-and-production industries. These
| | |
| FUND NASDAQ SYMBOLS |
A Shares | | CBCAX |
B Shares | | CBCBX |
C Shares | | CBXCX |
I Shares | | CBCIX |
R Shares | | CBCRX |
| | | |
|
| FUND CUSIP NUMBERS |
A Shares | | 128119625 |
B Shares | | 128119617 |
C Shares | | 128119591 |
I Shares | | 128119583 |
R Shares | | 128119427 |
| | | |
FUND OBJECTIVE
Long-term capital growth
INVESTMENT STRATEGY
| | > | | A growth-oriented large cap portfolio with 38 holdings | |
| | > | | Seeks to capitalize on higher-growth businesses with attractive fundamentals | |
| | > | | Active management blending investment themes and fundamental research | |
INVESTOR PROFILE
This Fund may be suitable for investors who seek:
| | > | | A vehicle for building assets to meet medium- to long-range financial goals | |
| | > | | A larger-cap growth offering of diversified companies providing broad market participation | |
Calamos Focus Growth Fund
| | | | |
| SECTOR WEIGHTINGS | |
Information Technology | | | 40.6 | % |
Consumer Discretionary | | | 16.3 | |
Health Care | | | 12.4 | |
Industrials | | | 11.5 | |
Consumer Staples | | | 7.1 | |
Energy | | | 6.3 | |
Financials | | | 4.9 | |
| | | | | |
Sector weightings are subject to change daily and are calculated as a percentage of net assets. The table excludes cash or cash equivalents, any government/sovereign bonds or broad based index hedging securities the Fund may hold.
particular industries possess relatively stronger growth fundamentals that are less tied to the price of underlying commodities. We believe that slow but continued global economic growth (including rebounding economic data in emerging markets), and global accommodative monetary policy can support opportunities within the energy sector.
Positioning within the materials sector also hampered performance. On an industry level, an overweight allocation to and selection within the metals and mining industry (primarily gold miners) detracted from returns, and we have since eliminated the Fund’s metals and mining holdings. We continue to believe some areas of the sector will be supported by increased demand for resources from emerging market regions, as well as by reflation efforts and accommodative global central bank policies.
An underweight allocation and security selection within the consumer discretionary sector detracted from performance. In particular, positioning within the Internet retail, media and specialty retail industries held back returns. Shares of some select retailers delivered sales forecasts that fell short of expectations during the period.
While the Fund’s average overweight positioning within the health care sector helped performance, security selection hindered relative returns. While positive, the Fund’s returns within the sector failed to match those within the Russell 1000® Growth Index. Specifically, holdings within the pharmaceuticals and health care equipment industries underperformed, as investors favored the more defensive, slower-growth, higher yielding big pharmaceutical companies.
Q. What changes were made to the Fund’s portfolio over the course of the reporting period?
A. We continue to focus on secular themes related to mobility and connectivity within information technology, and on strong global brands within the consumer sectors. We are also attracted to companies tied to the global infrastructure build-out, as well as those that are considered productivity enhancers. Growth prospects remain compelling for multinational firms whose businesses are closely tied to emerging market consumer spending and the evolution of high-tech manufacturing.
On a sector basis, we have found the most opportunity within the information technology, consumer discretionary and health care sectors. Relative to the Russell 1000® Growth Index, the Fund’s largest overweight allocation is to information technology, while it remains underweight relative to the consumer staples sector.
Among the positioning changes during the period, we increased the Fund’s allocation to the industrials sector based on the strength we see in infrastructure build-out and high-tech manufacturing trends. Many companies in the sector are compelling from both valuation and fundamental perspectives. Our focus is on companies capitalizing on global manufacturing trends related to areas such as the construction and electrical component and equipment industries, where the project pipeline is attractive. We also increased the portfolio’s allocation to the consumer discretionary sector, adding to positions where near-term growth catalysts are strong and revenues are globally diversified.
We eliminated the Fund’s allocation to the materials sector, ending the period with a 0% weighting. We sold holdings within the gold metals and mining industry due to higher costs, poor earnings and our goal of adding companies with improving near-term growth opportunities. We will look to opportunistically add names to the sector, should they demonstrate improving fundamentals, sustainable growth and attractive valuations.
| | | | |
| 14 | | CALAMOS FAMILY OF FUNDS SEMIANNUAL REPORT | | |
Calamos Focus Growth Fund
Q. What is your outlook for large cap growth equities and the Fund?
A. We continue to have a constructive view of large cap U.S. growth stocks, particularly multinational firms, and we remain committed to improving Fund performance. We believe a focused approach, guided by our proprietary research, will serve the Fund well.
In our view, equity valuations continue to be attractive relative to cash flows, forward earnings projections and the fixed income market, and growth equity premiums are even more appealing. In other words, the markets are still are not paying a premium for growth stocks. Investors continue to favor yield over growth, but we believe that stock prices have become too high for many of the companies paying high dividends.
In this environment, we maintain a preference for larger cap, higher-growth investments in the Fund. Despite near-term concerns and heightened choppiness in the global markets, we believe that our focus on U.S. multinational businesses remains appropriate for long-term investors. We favor businesses that we believe are capable of succeeding within a slower-growth environment, and we believe the Fund’s more focused approach will help us to concentrate our efforts on our highest conviction names.
Calamos Focus Growth Fund
GROWTH OF $10,000: SINCE INCEPTION (12/1/03) THROUGH 4/30/13
AVERAGE ANNUAL TOTAL RETURN† AS OF 4/30/13
| | | | | | | | | | | | | | | | | | | | |
| | | 6
MONTHS | | 1
YEAR | | 5
YEARS | | SINCE
INCEPTION |
Class A Shares – Inception 12/1/03 | | | | | | | | | | | | | | | | | | | | |
Without Sales Charge | | | | 7.67 | % | | | | 3.03 | % | | | | 2.51 | % | | | | 4.62 | % |
With Sales Charge | | | | 2.58 | | | | | -1.84 | | | | | 1.51 | | | | | 4.08 | |
Class B Shares – Inception 12/1/03 | | | | | | | | | | | | | | | | | | | | |
Without Sales Charge | | | | 7.26 | | | | | 2.31 | | | | | 1.74 | | | | | 3.95 | |
With Sales Charge | | | | 2.26 | | | | | -2.69 | | | | | 1.37 | | | | | 3.95 | |
Class C Shares – Inception 12/1/03 | | | | | | | | | | | | | | | | | | | | |
Without Sales Charge | | | | 7.26 | | | | | 2.23 | | | | | 1.74 | | | | | 3.84 | |
With Sales Charge | | | | 6.26 | | | | | 1.23 | | | | | 1.74 | | | | | 3.84 | |
Class I Shares – Inception 12/1/03 | | | | 7.78 | | | | | 3.33 | | | | | 2.77 | | | | | 4.89 | |
Class R Shares – Inception 3/1/07 | | | | 7.52 | | | | | 2.77 | | | | | 2.25 | | | | | 2.55 | |
Performance data quoted represents past performance, which is no guarantee of future results. Current performance may be lower or higher than the performance quoted. The principal value and investment return of an investment will fluctuate so that your shares, when redeemed, may be worth more or less than their original cost.
| † | Average annual total return measures net investment income and capital gain or loss from portfolio investments as an annualized average assuming reinvestment of dividends and capital gains distributions. Performance shown reflects the effects of an expense reimbursement that improved results and was in effect until March 31, 2004. Load-adjusted returns are adjusted for the maximum front-end sales load of 4.75% for Class A shares and returns for Class B and C shares have been adjusted for the contingent deferred sales charge (CDSC). |
NOTES:
The graph does not reflect the income taxes that you would pay on fund distributions or the redemption of fund shares. Fund performance includes reinvestment of dividends and adjustment for the maximum sales charge for Class A shares. The performance of other classes will vary from the performance of the class shown based on the difference in sales charges and fees paid by shareholders investing in different share classes.
| 1 | The S&P 500 Index is an unmanaged index generally considered representative of the U.S. stock market. Index data shown for the Since Inception Growth of $10,000 graph is from 11/30/03, since comparative index data is only available for full monthly periods. Source: Lipper, Inc. |
| 2 | The Russell 1000® Growth Index measures the performance of the large-cap growth segment of the U.S. equity universe. It includes those Russell 1000 companies with higher price to-book ratios and higher forecasted growth values. Index data shown for the Since Inception Growth of $10,000 graph is from 11/30/03, since comparative index data is only available for full monthly periods. Source: Lipper, Inc. |
Index returns assume reinvestment of dividends and do not reflect deduction of fees and expenses. It is not possible to invest directly in an index.
| | | | |
| 16 | | CALAMOS FAMILY OF FUNDS SEMIANNUAL REPORT | | |
Calamos Discovery Growth Fund
CALAMOS DISCOVERY GROWTH FUND
INVESTMENT TEAM DISCUSSION
The Calamos Investment Management Team, led by Global Co-Chief Investment Officers John P. Calamos, Sr. and Gary D. Black, discusses the Fund’s performance, strategy and positioning during the six-month period ended April 30, 2013.
Q. What is the Fund’s investment strategy?
A. Calamos Discovery Growth Fund invests in small cap and mid cap (“SMID”) equities that we believe have the best prospects for growth. The Fund offers a relatively aggressive yet diversified way to get exposure to the SMID space and participate in the long-term growth potential of the U.S. stock market. While Discovery Growth is one of our newer funds, it is managed by the same investment team and draws upon the same research process that we use for all of our other funds. Our investment process is designed to identify companies with higher growth profiles and greater returns on invested capital relative to peers. We favor companies with geographically diversified revenues that are participating in long-term global growth trends.
We expect to concentrate on small cap companies that, if successful, will grow into mid caps. We have the flexibility to continue holding these successful mid cap companies. We believe that a mid cap company that has successfully grown from a small cap has demonstrated the potential of its business model and its ability to deliver sustained earnings growth.
Q. How has the Fund performed?
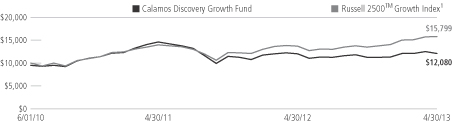
A. For the six-month period ended April 30, 2013, the Calamos Discovery Growth Fund returned 7.19% (Class A shares at net asset value) versus 16.79% for the Russell 2500™ Growth Index. Since its inception on June 1, 2010, the Fund gained 8.50% versus an 18.06% return for the index.
Q. What factors influenced performance over the period?
A. Our focus on companies with cleaner balance sheets and globally diversified revenues was not rewarded, as investors favored more leveraged growth, and were less concerned about balance sheet strength in an overall low cost of capital environment. We continue to emphasize those companies with greater flexibility to participate in secular growth trends and the ability to go where capital is treated best.
We see many of the most compelling growth opportunities in companies in the information technology sector, where we find innovative products and strong balance sheets, as well as participation in secular themes, such as productivity enhancement and constant communication and connectivity. We continue to believe many companies in the technology sector stand to benefit from long-term secular growth themes, including persistent innovation, enhanced mobility and global connectivity. In addition, as investors lengthen their view from extremely short-term time horizons, we believe these businesses trading at attractive valuations will be rewarded. However, IT was one of the worst performing areas within the Russell 2500™ Growth Index over the period, and the Fund’s average overweight allocation detracted from performance. Stock selection decisions within the sector also hampered returns, specifically positioning within the semiconductors and software industries.
| | |
| FUND NASDAQ SYMBOLS |
A Shares | | CADGX |
B Shares | | CBDGX |
C Shares | | CCDGX |
I Shares | | CIDGX |
R Shares | | CRDGX |
| | | |
|
| FUND CUSIP NUMBERS |
A Shares | | 128120102 |
B Shares | | 128120201 |
C Shares | | 128120300 |
I Shares | | 128120409 |
R Shares | | 128120508 |
| | | |
FUND OBJECTIVE
Long-term capital growth
INVESTMENT STRATEGY
| | > | | Focus on small cap and mid cap companies | |
| | > | | Blends rigorous economic and broad themes analysis with intensive company and security research seeking to identify businesses with higher growth relative to peers | |
| | > | | Seeks to determine the quality and sustainability of a company’s growth by assessing its fundamentals and management among other factors | |
| | > | | Uses proprietary valuation models to ascertain a stock’s return potential | |
| | > | | Adheres to strict risk-management guidelines in constructing the portfolio and assessing a security’s fit within the portfolio | |
INVESTOR PROFILE
This Fund may be suitable for investors who seek:
| | > | | Exposure to small cap and mid cap companies | |
| | > | | A relatively aggressive yet diversified way to participate in the U.S. stock market’s long-term growth potential | |
Calamos Discovery Growth Fund
| | | | |
| SECTOR WEIGHTINGS | |
Information Technology | | | 19.8 | % |
Health Care | | | 17.7 | |
Consumer Discretionary | | | 16.1 | |
Industrials | | | 15.5 | |
Financials | | | 10.2 | |
Energy | | | 8.7 | |
Materials | | | 5.2 | |
Consumer Staples | | | 3.9 | |
Sector weightings are subject to change daily and are calculated as a percentage of net assets. The table excludes cash or cash equivalents, any government/sovereign bonds or broad based index hedging securities the Fund may hold.
The Fund’s security selection within the health care sector hindered returns, specifically companies within the biotechnology and health care technology industries.
The Fund’s security selection within the industrials sector also detracted from relative returns, specifically as positioning within the machinery and trading companies and distributors industries underperformed. Our focus is on companies capitalizing on global manufacturing, especially in areas such as the machinery, aerospace and defense and commercial services industries, where project pipelines are attractive.
Stock selection within the financials sector trailed index returns and detracted from performance in the period. The Fund’s positioning within the capital markets and real estate management and development industries underperformed.
Q. How is the Fund positioned?
A. The Fund’s largest allocations in absolute terms include the information technology, consumer discretionary and industrials sectors. Relative to the Russell 2500™ Growth Index, the portfolio’s largest overweight allocation is to the energy sector, while the Fund is underweight relative to the consumer discretionary sector. Within consumer discretionary, we seek to invest in companies delivering higher relative growth and those that exhibit fundamentals that are able to stand up to a volatile and challenging economic environment.
Among positioning changes during the period, we reduced the Fund’s allocation to information technology, mainly by selling companies where we believed that fundamentals and near-term growth catalysts had deteriorated. However, we remain committed to the vast growth opportunities within the sector overall for the reasons outlined above. We added to the Fund’s allocation within the health care sector during the period, where positions were added within the biotechnology and health care services industries. Within health care, we seek investments that offer strong corporate fundamentals, attractive near-term catalysts and leading market share positions. We are also attracted to innovative companies pursuing growth opportunities within the emerging markets, as well as those that are furthest removed from government regulation. In addition, we increased the Fund’s allocation to the financials and energy sectors during the period. In regard to financials, we believe the relative appeal of the sector has improved. Loan growth, better prospects in the housing market and healthier consumer balance sheets support our more positive view.
Q. What is your outlook for small and mid cap equities and the Fund?
A. In our view, small and mid cap equities continue to be attractive and growth equity premiums are even more appealing. With respect to valuations, small to mid cap growth equities remain compelling, as investors continue to place very little investment premium on growth companies relative to value. We remain constructive, and believe these companies remain well positioned as the economic recovery continues. Investors continue to favor yield over growth, but we believe that stock prices have become too high for many of the companies paying high dividends.
In this environment, we maintain a preference for higher-growth investments in the Fund, and those that we believe are capable of succeeding within a slower-growth landscape. Despite near-term concerns and heightened choppiness in the global markets, we believe that our focus on companies generating strong earnings growth and high returns on invested capital remains appropriate for long-term investors.
| | | | |
| 18 | | CALAMOS FAMILY OF FUNDS SEMIANNUAL REPORT | | |
Calamos Discovery Growth Fund
GROWTH OF $10,000: SINCE INCEPTION (6/1/10) THROUGH 4/30/13
AVERAGE ANNUAL TOTAL RETURN† AS OF 4/30/13
| | | | | | | | | | | | | | | |
| | | 6
MONTHS | | 1
YEAR | | SINCE
INCEPTION |
Class A Shares – Inception 6/1/2010 | | | | | | | | | | | | | | | |
Without Sales Charge | | | | 7.19 | % | | | | 0.24 | % | | | | 8.50 | % |
With Sales Charge | | | | 2.10 | | | | | -4.52 | | | | | 6.70 | |
Class B Shares – Inception 6/1/2010 | | | | | | | | | | | | | | | |
Without Sales Charge | | | | 6.79 | | | | | -0.48 | | | | | 7.72 | |
With Sales Charge | | | | 1.79 | | | | | -5.46 | | | | | 6.82 | |
Class C Shares – Inception 6/1/2010 | | | | | | | | | | | | | | | |
Without Sales Charge | | | | 6.70 | | | | | -0.48 | | | | | 7.72 | |
With Sales Charge | | | | 5.70 | | | | | -1.48 | | | | | 7.72 | |
Class I Shares – Inception 6/1/2010 | | | | 7.32 | | | | | 0.55 | | | | | 8.80 | |
Class R Shares – Inception 6/1/2010 | | | | 7.05 | | | | | 0.00 | | | | | 8.25 | |
Performance data quoted represents past performance, which is no guarantee of future results. Current performance may be lower or higher than the performance quoted. The principal value and investment return of an investment will fluctuate so that your shares, when redeemed, may be worth more or less than their original cost.
| † | Average annual total return measures net investment income and capital gain or loss from portfolio investments as an annualized average assuming reinvestment of dividends and capital gains distributions. Load-adjusted returns are adjusted for the maximum front-end sales load of 4.75% for Class A shares and returns for Class B and C shares have been adjusted for the contingent deferred sales charge (CDSC). |
NOTES:
The graphs do not reflect the income taxes you would pay on fund distributions or the redemption of fund shares. Fund performance includes reinvestment of dividends and adjustment for the maximum sales charge for Class A shares. The performance of other classes will vary from the performance of the class shown based on the difference in sales charges and fees paid by shareholders investing in different share classes.
| 1 | The Russell 2500™ Growth Index measures the performance of the small- to mid-cap growth segment of the U.S. equity universe. It includes those Russell 2500 companies with higher price-to-book ratios and higher forecasted growth values. Source: Lipper, Inc. |
Index returns assume reinvestments of dividends and do not reflect deduction of fees and expenses. It is not possible to invest directly in an index.
Calamos International Growth Fund
| | |
| FUND NASDAQ SYMBOLS |
A Shares | | CIGRX |
B Shares | | CIGBX |
C Shares | | CIGCX |
I Shares | | CIGIX |
R Shares | | CIGFX |
| | | |
| |
| FUND CUSIP NUMBERS | | |
A Shares | | 128119575 |
B Shares | | 128119567 |
C Shares | | 128119559 |
I Shares | | 128119542 |
R Shares | | 128119393 |
| | | |
FUND OBJECTIVE
Long-term capital growth
INVESTMENT STRATEGY
| | > | | Applies bottom-up research and top-down analysis to target securities of non-U.S. companies that display acceleration in revenue growth, earnings growth and return on capital | |
| | > | | Conducts extensive balance sheet and income statement analysis to determine the intrinsic value of companies under consideration | |
| | > | | Emphasizes countries espousing free-market principles | |
INVESTOR PROFILE
This Fund may be suitable for investors who seek:
| | > | | To diversify beyond the domestic market by investing in overseas growth stocks, potentially increasing long-term capital growth | |
| | > | | An equity portfolio representing companies of all sizes and industries that offer high relative and sustainable growth potential | |
CALAMOS INTERNATIONAL GROWTH FUND
INVESTMENT TEAM DISCUSSION
The Calamos Investment Management Team, led by Global Co-Chief Investment Officers John P. Calamos, Sr. and Gary D. Black, discusses the Fund’s performance, strategy and positioning during the six-month period ended April 30, 2013.
Q. What is the Fund’s investment strategy?
A. Calamos International Growth Fund invests in an equity portfolio of non-U.S. companies of all sizes and industries that offer high relative and sustainable growth potential. This is a strategy for diversification and access to international growth companies, with an active growth focus. Our investment criteria favor companies that we believe offer the best prospects for growth. These companies are typically characterized by high earnings growth, healthy balance sheets and high return on invested capital. In the current environment, we are emphasizing companies with global presence and geographically diversified revenue streams. We believe that such companies offer more attractive prospects than those more dependent on a single economy.
We have the flexibility to invest across sectors, in companies domiciled in developed and developing markets. We favor companies based in markets that are moving toward a greater level of economic freedom, which we believe is a catalyst for wealth creation.
Q. How has the Fund performed?
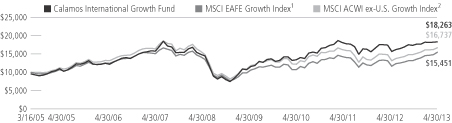
A. Because we believe equity funds are best utilized within asset allocations as long-term investments, we encourage investors to evaluate performance over longer time periods. Since its inception on March 16, 2005, the Fund has returned 8.34% on an annualized basis (Class A shares at net asset value) versus a 5.50% return in the MSCI EAFE Growth Index and a 6.17% return in the MSCI ACWI ex-U.S. Growth Index over the same period. For the six-month period ended April 30, 2013, the Fund gained 5.49% versus a 17.44% return for the MSCI EAFE Growth Index and a 13.43% return in the MSCI ACWI ex-U.S. Growth Index.
Q. What factors influenced performance over the period?
A. There was a significant bias to more defensive areas within the non-U.S. equity market that illustrated investors were more focused on yield than growth within their equity allocations. However, we maintained a preference for higher-quality companies with clean balance sheets and globally diversified revenues.
We believe that the valuations of some dividend-oriented stocks have become stretched as investors have sought income in a global low-rate environment. However, our focus on risk management has precluded our ownership of a number of these companies during the period.
We continue to see many of the most compelling growth opportunities in companies in the information technology sector, where we find innovative products and strong balance sheets. Within IT, we are favoring businesses that exhibit higher cash flows, cleaner balance sheets and lower debt levels, and we believe technology firms will benefit from many of the long-term secular growth themes we have identified. However, the Fund’s stock selection decisions within the sector held back returns, as holdings within the electronic equipment and semiconductors industries lagged.
| | | | |
| 20 | | CALAMOS FAMILY OF FUNDS SEMIANNUAL REPORT | | |
Calamos International Growth Fund
Security selection within the materials sector also hindered returns, particularly the Fund’s allocation to the gold mining industry, which was challenged by higher costs of extraction and production during the period, as well as the rising prices of mining infrastructure.
The Fund’s underweight position to financials hampered performance, as this was the best performing sector within the MSCI ACWI ex-U.S. Growth Index during the time period.
From a geographic standpoint, the Fund’s holdings within Canada and an underweight position to Japan detracted from performance during the six-month period. Japan has recently taken unprecedented steps to stimulate its economy, including doubling the money in circulation in the next two years and implementing an inflation target of 2%. While we have already seen some of the positive effects of these measures, we believe that much of this has already been priced into the market and we are therefore not jumping headfirst into this area. While resulting from bottom-up analysis rather than a top-down preference for individual countries, stock selection within Switzerland, China and Ireland aided performance.
Q. How is the Fund positioned?
A. The Fund is positioned to focus on higher secular growth businesses, such as those within the information technology and health care sectors. We continue to favor companies with global operations, as well as those able to tap into the growth occurring within emerging market economies.
The Fund’s largest allocations in absolute terms include the information technology, health care, consumer staples and energy sectors. Relative to the MSCI ACWI ex-U.S. Growth Index, the Fund’s largest overweight allocation is to the information technology sector, and it is underweight to the consumer staples and financials sectors.
Among the positioning changes that were made during the time period, we reduced the Fund’s allocation to materials, eliminating positions in gold miners. In light of our more constructive view on the global markets, we opportunistically reduced our exposure to gold, which was originally used to guard against the potential for a systemic market shock and a weakening of the dollar.
We increased the Fund’s exposure to the financials sector. While we remain conscious of the risks associated within this area, we have been adding to our allocation as a reflection of our now cautiously optimistic global equity outlook.
The Fund’s allocation to emerging markets was increased. While emerging markets have retreated more recently, we still believe there is significant growth potential within these economies. The Fund’s holdings within emerging market regions are typically larger, more established companies that display geographically diverse revenue streams. The Fund is underweight to Japan, as explained in the previous section.
Q. What is your outlook for international equities and the Fund?
A. We see many exciting opportunities among international equities and for the Fund. While we realize there may be shorter-term periods of volatility and near-term concerns, improving global GDP growth and continued accommodative monetary policy should continue to fuel equity markets. Multinational businesses are exhibiting strong profit growth. In our view, equity valuations continue to be attractive relative to cash flows and fixed income, and growth equity premiums are even more appealing.
| | | | |
| SECTOR WEIGHTINGS | | | |
Information Technology | | | 32.9 | % |
Health Care | | | 17.3 | |
Consumer Staples | | | 11.0 | |
Energy | | | 9.5 | |
Consumer Discretionary | | | 9.1 | |
Financials | | | 7.2 | |
Industrials | | | 5.1 | |
Materials | | | 2.9 | |
Telecommunication Services | | | 0.6 | |
| | | | | |
Sector weightings are subject to change daily and are calculated as a percentage of net assets. The table excludes cash or cash equivalents, any government/sovereign bonds or broad based index hedging securities the Fund may hold.
Calamos International Growth Fund
We continue to focus on secular themes related to mobility and connectivity within technology, and strong global brands within the consumer sectors. We are also attracted to companies tied to the global infrastructure build-out, as well as those able to deliver productivity enhancements. We strive to invest in global multinational companies with diversified revenue bases, and those positioned to benefit from the growing middle class in emerging economies. We expect policy uncertainty and market fluctuations will continue, but generally improving economic data, attractive valuations and robust secular trends support our active and risk-aware approach to accessing long-term opportunities.
| | | | |
| 22 | | CALAMOS FAMILY OF FUNDS SEMIANNUAL REPORT | | |
Calamos International Growth Fund
GROWTH OF $10,000: SINCE INCEPTION (3/16/05) THROUGH 4/30/13
AVERAGE ANNUAL TOTAL RETURN† AS OF 4/30/13
| | | | | | | | | | | | | | | | | | | | |
| | | 6
MONTHS | | 1
YEAR | | 5
YEARS | | SINCE
INCEPTION |
Class A Shares – Inception 3/16/05 | | | | | | | | | | | | | | | | | | | | |
Without Sales Charge | | | | 5.49 | % | | | | 5.13 | % | | | | 2.25 | % | | | | 8.34 | % |
With Sales Charge | | | | 0.49 | | | | | 0.15 | | | | | 1.26 | | | | | 7.69 | |
| Class B Shares – Inception 3/16/05 | | | | | | | | | | | | | | | | | | | | |
Without Sales Charge | | | | 5.17 | | | | | 4.34 | | | | | 1.49 | | | | | 7.55 | |
With Sales Charge | | | | 0.17 | | | | | -0.66 | | | | | 1.11 | | | | | 7.55 | |
Class C Shares – Inception 3/16/05 | | | | | | | | | | | | | | | | | | | | |
Without Sales Charge | | | | 5.17 | | | | | 4.35 | | | | | 1.50 | | | | | 7.53 | |
With Sales Charge | | | | 4.17 | | | | | 3.35 | | | | | 1.50 | | | | | 7.53 | |
Class I Shares – Inception 3/16/05 | | | | 5.70 | | | | | 5.40 | | | | | 2.52 | | | | | 8.62 | |
Class R Shares – Inception 3/1/07 | | | | 5.37 | | | | | 4.82 | | | | | 2.00 | | | | | 4.55 | |
Performance data quoted represents past performance, which is no guarantee of future results. Current performance may be lower or higher than the performance quoted. The principal value and investment return of an investment will fluctuate so that your shares, when redeemed, may be worth more or less than their original cost.
| † | Average annual total return measures net investment income and capital gain or loss from portfolio investments as an annualized average assuming reinvestment of dividends and capital gains distributions. Performance shown reflects the effects of an expense reimbursement that improved results and was in effect until March 31, 2005. Load-adjusted returns are adjusted for the maximum front-end sales load of 4.75% for Class A shares and returns for Class B and C shares have been adjusted for the contingent deferred sales charge (CDSC). |
NOTES:
The graph does not reflect the income taxes that you would pay on fund distributions or the redemption of fund shares. Fund performance includes reinvestment of dividends and adjustment for the maximum sales charge for Class A shares. The performance of other classes will vary from the performance of the class shown based on the difference in sales charges and fees paid by shareholders investing in different share classes.
| 1 | The MSCI EAFE Growth Index measures developed market growth equity performance (excluding the U.S. and Canada). Source: MSCI Barra. |
| 2 | The MSCI ACWI ex-U.S. Growth Index measures equity market performance of companies outside of the United States with higher growth values in developed and emerging markets. |
Index returns assume reinvestment of dividends and do not reflect deduction of fees and expenses. It is not possible to invest directly in an index.
Calamos Evolving World Growth Fund
| | |
| FUND NASDAQ SYMBOLS |
A Shares | | CNWGX |
B Shares | | CNWZX |
C Shares | | CNWDX |
I Shares | | CNWIX |
R Shares | | CNWRX |
| | | |
|
| FUND CUSIP NUMBERS |
A Shares | | 128119161 |
B Shares | | 128119153 |
C Shares | | 128119146 |
I Shares | | 128119138 |
R Shares | | 128119120 |
| | | |
FUND OBJECTIVE
Long-term capital growth
INVESTMENT STRATEGY
| | > | | Invests in the securities of companies based in developing countries and also developed-world companies with ties to emerging economies | |
| | > | | Manages the Fund according to our stringent growth discipline, targeting companies that we believe offer the best opportunities for capital appreciation over the long term | |
| | > | | Can flexibly deploy assets across sectors, countries, market caps and security types in an effort to manage risk and maximize return | |
INVESTOR PROFILE
This Fund may be suitable for investors who seek:
| | > | | Enhanced diversification potential | |
| | > | | A portfolio of companies that we believe offer high relative and sustainable growth potential | |
| | > | | A risk-conscious means to participate in the long-term growth potential of developing markets | |
| | > | | An asset-allocation solution that could potentially reduce volatility and increase total return in an investment portfolio | |
CALAMOS EVOLVING WORLD GROWTH FUND
INVESTMENT TEAM DISCUSSION
The Calamos Investment Management Team, led by Global Co-Chief Investment Officers John P. Calamos, Sr. and Gary D. Black, discusses the Fund’s performance, strategy and positioning during the six-month period ended April 30, 2013.
Q. What is the Fund’s investment strategy?
A. Calamos Evolving World Growth Fund invests in both equities and convertible securities in companies all around the world that have exposure to emerging economies. The Fund is an emerging markets growth equity strategy that we believe may provide a compelling core allocation for long-term investors.
In a global economy, companies all over the world, including those in the U.S. and other developed markets, may be able to benefit from the growing prosperity and progress in emerging markets. In this Fund, our investment team can invest not only in companies based in emerging markets, but also in companies based in developed markets that have a significant percentage of invested assets in emerging markets or derive a significant portion of firm revenues from them. Our emphasis is on what a company is doing and the clients it serves, not where it is located. We believe that this flexibility to invest in developed and developing markets potentially mitigates the risks of investing solely in companies domiciled in emerging markets.
Generally, the companies in which we invest are characterized by high earnings growth, healthy balance sheets and high return on invested capital.
Q. How has the Fund performed?
A. Since its inception on August 15, 2008, the Fund returned 6.61% on an annualized basis (Class A shares at net asset value) versus the 4.14% return of the MSCI Emerging Markets Index. For the six-month period ended April 30, 2013, the Fund returned 3.43% and the MSCI Emerging Markets Index returned 5.40%.
Q. What factors influenced performance over the period?
A. Emerging markets delivered moderate gains overall for the period but fell short of the stronger returns of global developed market indexes. In particular, emerging markets trailed during the first four months of 2013, as a result of decelerating economic growth, selectively tighter monetary policy versus developed markets and periods of capital outflows. The Fund also delivered a moderate gain but trailed the MSCI Emerging Markets Index return, due primarily to our relatively cautious positioning in several market segments and our preference for companies with stronger balance sheets and greater capital efficiency. With respect to market segments, the Fund’s relatively defensive positioning resulted in less exposure to financials, coupled with higher exposure to gold mining and production, which was employed to guard against the potential for a systemic market shock and a weakening of the dollar.
We continue to favor the health care sector due to the emergence of the emerging market middle class and the need for services and technology in these growing markets around the world. The Fund’s overweight allocation and security selection in the sector contributed most to performance. We remain especially attracted to select companies within the pharmaceutical and health care equipment industries due to their leading innovation and long-term growth potential in emerging economies.
| | | | |
| 24 | | CALAMOS FAMILY OF FUNDS SEMIANNUAL REPORT | | |
Calamos Evolving World Growth Fund
We continue to see many of the most compelling growth opportunities in companies in the information technology sector, where we find innovative products and strong balance sheets, and the Fund’s overweight allocation to the sector also enhanced performance. Specifically, larger exposure and stock selection in the semiconductor industry added value. We expect global and emerging market businesses in the sector to benefit from secular growth themes, including productivity enhancement, enhanced mobility and connectivity, and demand for information and entertainment.
The Fund’s underweight allocation and security selection within financials held back performance. Specifically, the Fund’s lower exposure and trailing selection in the diversified bank industry underperformed the MSCI Emerging Markets Index. We have been cautious and underweight in financials due to our concerns regarding complex global regulations and persistent capital risks. Although macro concerns remain, we believe the relative merits of the sector have improved and we are actively seeking opportunities. Rising loan growth, attractive valuations and increased incomes in emerging markets support a relatively more positive view and larger weight.
Gold mining companies were challenged in the period by higher costs of extraction and production, as well as by the rising prices of mining infrastructure, and a higher relative allocation to this industry hurt the Fund’s performance in the materials sector. While valuations and fundamentals of select companies within the gold industry remain attractive, we have reduced the Fund’s exposure to gold positions, which, as previously noted, were used primarily to guard against the potential for a systemic market shock and a weakening of the dollar.
Q. How is the Fund positioned?
A. We believe that the growth of emerging markets is a global growth opportunity, and as such we own a combination of emerging market-domiciled companies and multinational companies with global operations capable of accessing growth within emerging market economies. Given our view of improving global economic fundamentals and attractive emerging market equity valuations, we have continued to position the Fund to reflect a more cautiously optimistic market outlook and therefore have decreased defensive exposure in areas such as materials. We have maintained significant investments in higher secular growth businesses, such as those in the information technology, health care and consumer sectors. While we are cautiously optimistic overall, we also anticipate periods of volatility within global and emerging markets, and therefore maintain a strong focus on risk management.
As noted, we decreased the Fund’s weight in the materials sector, and more specifically, its exposure to the gold mining and production industry. We increased the Fund’s investment in the financials sector. While we remain conscious of the risks associated with this area, we have been adding to the Fund’s allocation as a reflection of our now cautiously optimistic global equity outlook. We favor select opportunities in higher-quality diversified banks and asset management firms accessing growth trends in the emerging economies.
Q. What is your outlook for emerging markets and the Fund?
A. We believe emerging markets will be a significant driver of future global economic growth and present an array of long-term investment opportunities. Moreover, we believe our approach is well suited to pursue emerging market opportunities while
| | | | |
| SECTOR WEIGHTINGS | |
Information Technology | | | 32.1 | % |
Consumer Staples | | | 15.5 | |
Health Care | | | 11.5 | |
Energy | | | 8.9 | |
Financials | | | 8.6 | |
Industrials | | | 7.2 | |
Consumer Discretionary | | | 5.7 | |
Materials | | | 3.6 | |
Telecommunication Services | | | 3.3 | |
| | | | | |
Sector weightings are subject to change daily and are calculated as a percentage of net assets. The table excludes cash or cash equivalents, any government/sovereign bonds or broad based index hedging securities the Fund may hold.
Calamos Evolving World Growth Fund
addressing the risk and volatility considerations that this area often entails. The increased prosperity within emerging market countries has led to a rapid growth of the middle class and, as a result, an increase in their demand for discretionary goods and services. We also believe this economic development and its related effects will boost demand for infrastructure projects within many emerging economies. These robust secular trends represent future growth opportunities for companies in a wide range of sectors.
Despite these trends and explosive growth within emerging economies, these markets remain volatile and thus can be challenging for investors. As such, we have positioned this Fund as a risk-managed approach to emerging market investing. We strive to provide investors the opportunity to gain exposure to growth in emerging economies while managing risk and providing a measure of downside protection in the event of broad market declines. As discussed above, this portfolio emphasizes where a company generates revenue more heavily than where the company is domiciled, and therefore has the ability to invest in both developed and emerging market countries. The Fund also maintains the flexibility to selectively invest in convertible securities, offering the potential to participate in equity market upside with potential downside protection. We believe these factors, as well as our extensive experience in global investing, will help us to position the Fund to capitalize on leading economic growth, attractive valuations and secular demand trends in the emerging economies.
| | | | |
| 26 | | CALAMOS FAMILY OF FUNDS SEMIANNUAL REPORT | | |
Calamos Evolving World Growth Fund
GROWTH OF $10,000: SINCE INCEPTION (8/15/08) THROUGH 4/30/13
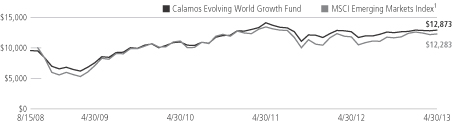
AVERAGE ANNUAL TOTAL RETURN† AS OF 4/30/13
| | | | | | | | | | | | | | | |
| | | 6
MONTHS | | 1
YEAR | | SINCE
INCEPTION |
Class A Shares – Inception 8/15/08 | | | | | | | | | | | | | | | |
Without Sales Charge | | | | 3.43 | % | | | | 2.00 | % | | | | 6.61 | % |
With Sales Charge | | | | -1.48 | | | | | -2.86 | | | | | 5.51 | |
Class B Shares – Inception 8/15/08 | | | | | | | | | | | | | | | |
Without Sales Charge | | | | 3.02 | | | | | 1.25 | | | | | 5.81 | |
With Sales Charge | | | | -1.98 | | | | | -3.75 | | | | | 5.46 | |
Class C Shares – Inception 8/15/08 | | | | | | | | | | | | | | | |
Without Sales Charge | | | | 3.02 | | | | | 1.17 | | | | | 5.81 | |
With Sales Charge | | | | 2.02 | | | | | 0.17 | | | | | 5.81 | |
Class I Shares – Inception 8/15/08 | | | | 3.57 | | | | | 2.23 | | | | | 6.88 | |
Class R Shares – Inception 8/15/08 | | | | 3.29 | | | | | 1.69 | | | | | 6.33 | |
Performance data quoted represents past performance, which is no guarantee of future results. Current performance may be lower or higher than the performance quoted. The principal value and investment return of an investment will fluctuate so that your shares, when redeemed, may be worth more or less than their original cost.
| † | Average annual total return measures net investment income and capital gain or loss from portfolio investments as an annualized average assuming reinvestment of dividends and capital gains distributions. Load-adjusted returns are adjusted for the maximum front-end sales load of 4.75% for Class A shares and returns for Class B and C shares have been adjusted for the contingent deferred sales charge (CDSC). |
NOTES:
The graph does not reflect the income taxes that you would pay on fund distributions or the redemption of fund shares. Fund performance includes reinvestment of dividends and adjustment for the maximum sales charge for Class A shares. The performance of other classes will vary from the performance of the class shown based on the difference in sales charges and fees paid by shareholders investing in different share classes.
| 1 | The MSCI Emerging Markets Index is a free float-adjusted market capitalization index considered broadly representative of emerging market equity performance. The index represents companies within the constituent emerging markets that are available to investors worldwide. Index data shown for the Since Inception Growth of $10,000 graph is from 8/31/08, since comparative index data is only available for full monthly periods. Source: Lipper, Inc. |
Index returns assume reinvestment of dividends and do not reflect deduction of fees and expenses. It is not possible to invest directly in an index.
Calamos Global Equity Fund
| | |
| FUND NASDAQ SYMBOLS |
A Shares | | CAGEX |
B Shares | | CBGEX |
C Shares | | CCGEX |
I Shares | | CIGEX |
R Shares | | CRGEX |
| | | |
|
| FUND CUSIP NUMBERS |
A Shares | | 128119484 |
B Shares | | 128119476 |
C Shares | | 128119468 |
I Shares | | 128119450 |
R Shares | | 128119443 |
| | | |
FUND OBJECTIVE
Long-term capital growth
INVESTMENT STRATEGY
| | > | | Invests primarily in equity securities of companies around the world | |
| | > | | Focuses on a company’s earnings growth potential, financial strength and stability | |
| | > | | Considers the value of a stock relative to the issuer’s worth and looks for near-term catalysts that could trigger an increase in the stock’s price | |
| | > | | Assesses the issuer’s financial soundness, earnings and cash flow forecast, and quality of management | |
| | > | | Applies macro-level themes and top-down diversification by industry and company type in an effort to lower risk | |
INVESTOR PROFILE
This Fund may be suitable for investors who seek:
| | > | | A diversified means to participate in the long-term growth potential of the global equity markets | |
CALAMOS GLOBAL EQUITY FUND
INVESTMENT TEAM DISCUSSION
The Calamos Investment Management Team, led by Global Co-Chief Investment Officers John P. Calamos, Sr. and Gary D. Black, discusses the Fund’s performance, strategy and positioning during the six-month period ended April 30, 2013.
Q. What is the Fund’s investment strategy?
A. Calamos Global Equity Fund invests primarily in a globally diversified portfolio of equity securities in companies that we believe offer the best opportunities for growth. The Fund provides a growth strategy for a core global portfolio allocation. We employ an active management approach that reflects our identification of secular, long-term investment themes and our proprietary fundamental research. The companies we seek are usually characterized by high earnings growth, healthy balance sheets and high return on invested capital. In the current environment, we are favoring companies with global presence. The Fund may invest in securities of issuers in the emerging markets.
Q. How has the Fund performed?
A. We encourage investors to consider long-term performance, particularly for investments such as equity funds. Since its inception on March 1, 2007, the Fund returned 5.93% on an annualized basis (Class A shares at net asset value) versus 2.76% for the MSCI World Index and 3.97% for the MSCI ACWI Growth Index. For the six-month period ended April 30, 2013, Calamos Global Equity Fund returned 4.10% versus a 15.02% return for the MSCI World Index and 13.14% for the MSCI ACWI Growth Index.
Q. What factors influenced performance over the period?
A. We believe that global equity valuations, long-term secular growth trends and a cautiously optimistic outlook support a higher-growth positioning. While we are cautiously optimistic that global growth will continue, we also foresee ongoing volatility within the global markets and therefore maintain a strong focus on risk management, including a disciplined valuation approach. There was a significant bias to more defensive areas within the global market that illustrated investors were more focused on yield than growth within their equity allocations. As such, the portfolio’s focus on higher-quality companies with clean balance sheets and globally diversified revenues was not beneficial during the time period.
Aside from our bias toward higher-growth businesses, the Fund’s security selection within the materials sector detracted value, particularly our allocation to the gold industry. Gold mining companies were challenged during the period by higher costs of extraction and production, as well as the rising prices of mining infrastructure. The portfolio’s allocation to gold was originally used to guard against the potential for a systemic market shock and a weakening of the dollar. However, during the time period we opportunistically reduced our exposure to the gold positions as a reflection of our now more productive view of the global equity market.
As investors favored yield over growth, the Fund’s overweight allocation to the information technology sector also held back performance, as technology was one of the weakest performing sectors within the MSCI ACWI Growth Index. Within IT, we are
| | | | |
| 28 | | CALAMOS FAMILY OF FUNDS SEMIANNUAL REPORT | | |
Calamos Global Equity Fund
favoring businesses that exhibit higher cash flows, cleaner balance sheets and lower debt levels. We believe that technology firms will benefit from many of the long-term secular growth themes we have identified, such as persistent innovation, enhanced mobility and global connectivity.
The Fund’s selection within the health care sector hampered relative returns, as our holdings within the health care equipment and supplies and pharmaceuticals industries lagged. Within this sector, we seek investments that offer strong corporate fundamentals, attractive near-term catalysts and leading market share positions. We are also attracted to innovative companies pursuing growth opportunities within the emerging markets, as well as those furthest removed from government regulations.
From a geographic standpoint, the Fund’s holdings within the United States and Canada and an underweight position to Japan detracted from performance. Japan has recently taken unprecedented steps to stimulate its economy, including doubling the amount of money in circulation over the next two years and implementing an inflation target of 2%. While we have already seen some of the positive effects of these policies in market prices, we believe much of this has already been priced into the market, and therefore are not jumping headfirst into this area until we see some structural change that would fundamentally improve the business landscape. Selection within the United Kingdom and Ireland contributed to relative returns.
Q. How is the Fund positioned?
A. The Fund is positioned to focus on higher secular growth businesses, such as those found within the information technology and health care sectors. We are continuing to favor companies with global operations that are able to tap into the growth occurring within emerging market economies.
The Fund’s largest allocations in absolute terms include the information technology, health care, consumer discretionary and financials sectors. Relative to the MSCI ACWI Growth Index, the Fund’s largest overweight allocation is to the information technology sector, and it is underweight to the consumer staples sector.
Among the positioning changes that were made during the time period, we reduced the Fund’s allocation to the materials sector. In light of our more constructive view on the global markets, we opportunistically reduced our exposure to gold, which was originally used as a global hedge against financial crises and further dollar debasement.
We increased the Fund’s exposure to the financials sector. While we remain conscious of the risks associated within this area, we have been adding to our allocation as a reflection of our now cautiously optimistic global equity outlook. Within this sector we are focusing on asset managers.
During the period, the Fund’s allocation to emerging markets was increased. While emerging markets have retreated more recently, we still believe there is significant growth potential within this area. The Fund’s holdings within emerging market regions are typically larger, more established companies that display geographically diverse revenue streams. The Fund is underweight to Japan and roughly equal weight to the United States relative to the MSCI ACWI Growth Index.
| | | | |
| SECTOR WEIGHTINGS | | | |
Information Technology | | | 40.6 | % |
Health Care | | | 16.6 | |
Consumer Discretionary | | | 11.7 | |
Financials | | | 8.8 | |
Energy | | | 8.6 | |
Consumer Staples | | | 7.5 | |
Industrials | | | 2.7 | |
Materials | | | 0.9 | |
Telecommunication Services | | | 0.6 | |
Sector weightings are subject to change daily and are calculated as a percentage of net assets. The table excludes cash or cash equivalents, any government/sovereign bonds or broad based index hedging securities the Fund may hold.
Calamos Global Equity Fund
Q. What is your outlook for global equities and the Fund?
A. As we look out over the next several quarters, we maintain a cautiously optimistic outlook for global equities. There may be shorter-term periods of volatility and near-term concerns, but improving global GDP growth and continued accommodative monetary policy should continue to fuel equity markets. Multinational businesses are exhibiting strong profit growth. In addition, many of the dislocations resulting from the 2008 credit crisis have been reduced in the U.S., and we have seen loan growth, falling housing inventories and a reduction in delinquent loans. In our view, equity valuations continue to be attractive relative to cash flows and fixed income, and growth equity premiums are even more appealing. Investors continue to favor yield over growth, but we believe that may begin to change as the Federal Reserve reduces its balance sheet in the future and longer-term rates rise. Despite slowing GDP growth in some of the emerging economies, we continue to believe that emerging markets will continue to expand and will be key to the overall growth of the global economy.
We expect uncertainty and market fluctuations will continue, but generally improving economic data, attractive valuations and robust secular trends support our active and risk-aware approach to accessing long-term opportunities.
| | | | |
| 30 | | CALAMOS FAMILY OF FUNDS SEMIANNUAL REPORT | | |
Calamos Global Equity Fund
GROWTH OF $10,000: SINCE INCEPTION (3/1/07) THROUGH 4/30/13
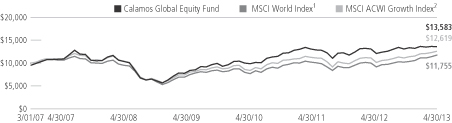
AVERAGE ANNUAL TOTAL RETURN† AS OF 4/30/13
| | | | | | | | | | | | | | | | | | | | |
| | | 6
MONTHS | | 1
YEAR | | 5
YEARS | | SINCE
INCEPTION |
Class A Shares – Inception 3/1/07 | | | | | | | | | | | | | | | | | | | | |
Without Sales Charge | | | | 4.10 | % | | | | 3.62 | % | | | | 3.67 | % | | | | 5.93 | % |
With Sales Charge | | | | -0.86 | | | | | -1.29 | | | | | 2.67 | | | | | 5.09 | |
Class B Shares – Inception 3/1/07 | | | | | | | | | | | | | | | | | | | | |
Without Sales Charge | | | | 3.74 | | | | | 2.84 | | | | | 2.90 | | | | | 5.13 | |
With Sales Charge | | | | -1.26 | | | | | -2.16 | | | | | 2.54 | | | | | 5.13 | |
Class C Shares – Inception 3/1/07 | | | | | | | | | | | | | | | | | | | | |
Without Sales Charge | | | | 3.67 | | | | | 2.85 | | | | | 2.90 | | | | | 5.13 | |
With Sales Charge | | | | 2.67 | | | | | 1.85 | | | | | 2.90 | | | | | 5.13 | |
Class I Shares – Inception 3/1/07 | | | | 4.24 | | | | | 3.93 | | | | | 3.94 | | | | | 6.21 | |
Class R Shares – Inception 3/1/07 | | | | 3.99 | | | | | 3.43 | | | | | 3.42 | | | | | 5.66 | |
Performance data quoted represents past performance, which is no guarantee of future results. Current performance may be lower or higher than the performance quoted. The principal value and investment return of an investment will fluctuate so that your shares, when redeemed, may be worth more or less than their original cost.
| † | Average annual total return measures net investment income and capital gain or loss from portfolio investments as an annualized average assuming reinvestment of dividends and capital gains distributions. Load-adjusted returns are adjusted for the maximum front-end sales load of 4.75% for Class A shares and returns for Class B and C shares have been adjusted for the contingent deferred sales charge (CDSC). |
NOTES:
The graph does not reflect the income taxes that you would pay on fund distributions or the redemption of fund shares. Fund performance includes reinvestment of dividends and adjustment for the maximum sales charge for Class A shares. The performance of other classes will vary from the performance of the class shown based on the difference in sales charges and fees paid by shareholders investing in different share classes.
| 1 | The MSCI World Index (U.S. Dollars) is a market-capitalization weighted index composed of companies representative of the market structure of developed market countries in North America, Europe and the Asia/Pacific region. Since inception data for the index is shown from 2/28/07 since data is only available for full monthly periods. Source: Lipper, Inc. |
| 2 | The MSCI ACWI Growth Index is designed to measure the equity performance of companies with higher growth values in developed and emerging markets. |
Index returns assume reinvestment of dividends and do not reflect deduction of fees and expenses. It is not possible to invest directly in an index.
Calamos Growth and Income Fund
| | |
| FUND NASDAQ SYMBOLS |
A Shares | | CVTRX |
B Shares | | CVTYX |
C Shares | | CVTCX |
I Shares | | CGIIX |
R Shares | | CGNRX |
| | | |
|
| FUND CUSIP NUMBERS |
A Shares | | 128119104 |
B Shares | | 128119765 |
C Shares | | 128119831 |
I Shares | | 128119872 |
R Shares | | 128119336 |
| | | |
FUND OBJECTIVE
High long-term total return through growth and current income
INVESTMENT STRATEGY
| | > | | Seeks to maintain an appropriate balance between risk and reward over the course of the market cycle by strategically investing across a combination of stocks, convertible securities and bonds | |
| | > | | Seeks significant equity participation while aiming for greater downside protection than a pure-stock portfolio | |
| | > | | Diversifies across a variety of industries, market sectors, market capitalizations and credit-quality tiers | |
INVESTOR PROFILE
This Fund may be suitable for investors who seek:
| | > | | A total return-oriented investment that offers the upside potential of equities with potentially lower volatility than stock-only investments | |
CALAMOS GROWTH AND INCOME FUND
INVESTMENT TEAM DISCUSSION
The Calamos Investment Management Team, led by Global Co-Chief Investment Officers John P. Calamos, Sr. and Gary D. Black, discusses the Fund’s performance, strategy and positioning during the six-month period ended April 30, 2013.
Q. What is the Fund’s investment strategy?
A. Calamos Growth and Income Fund invests in a combination of stocks, convertible securities and bonds of U.S. companies. The Fund offers a total return-oriented investment that seeks to keep a consistent balance of risk and reward through full market cycles. As we focus on managing volatility, we endeavor to participate in a greater portion of equity market upside than downside. We currently emphasize companies with global presence and geographically diversified revenues that we believe are positioned to capitalize on global economic growth and global secular trends.
Q. How has the Fund performed?
A. Because we believe equity funds are best utilized within asset allocations as long-term investments, we encourage investors to evaluate performance over longer time periods. Since its inception on September 22, 1988, the Fund returned 11.33% on an annualized basis (Class A shares at net asset value). This return surpasses that of the broader equity market, as measured by the S&P 500 Index, which gained 9.90% for the period. The Fund also outperformed the convertible securities market, as measured by the BofA Merrill Lynch All U.S. Convertibles ex-Mandatory Index, which returned 9.31%.
For the six-month period ended April 30, 2013, the Fund earned 4.36%, versus returns of 14.42% for the S&P 500 Index and 12.69% for the BofA Merrill Lynch All U.S. Convertibles ex-Mandatory Index.
Q. Please discuss the Fund’s low-volatility* characteristics.
A. We believe the Fund’s historical low-volatility characteristics are a by-product of our investment style and focus on participating in equity market upside with less volatility than the market as a whole. Beta is one popular statistic for measuring volatility. Beta considers a fund’s historic volatility versus the market, which is assigned a beta of 1.0. A fund with half the volatility of the market would have a beta of 0.5, while a fund with a beta of 2.0 would have been twice as volatile as the market.
Since its inception, the Fund has had a beta of 0.72 versus the S&P 500 Index. The Fund has therefore outperformed the broader equity market, as measured by the S&P 500 Index, with less volatility than the equity markets. Please note that past performance does not indicate future results and that beta is one of many measures of risk.
Q. What factors influenced performance over the period?
A. During the period, the Fund’s emphasis on higher-quality companies with stronger balance sheets, greater capital efficiency and relatively higher growth profiles was not
| * | The Fund’s historical performance has exhibited lower volatility, as measured by beta and standard deviation, over the life of the Fund. The Fund’s investment objective does not seek to reduce volatility, and as a result, the Fund may experience volatility in some market conditions. (Source for beta and standard deviation data is Morningstar, Inc.) |
| | | | |
| 32 | | CALAMOS FAMILY OF FUNDS SEMIANNUAL REPORT | | |
Calamos Growth and Income Fund
rewarded. The significant differences in sector performance during the period reflected investor preference for dividend yield rather than growth within their equity exposure.
While market sentiment generally favored more defensive sectors, investors did not necessarily reward balance sheet strength and growth attributes for individual companies. Signs of a rotation from defensive sectors to more cyclical growth areas (including information technology, energy and industrials) appeared in the final weeks of the period, and corresponding performance within the Fund improved as well.
The Fund’s overweight allocation and security selection in information technology hindered performance. Specifically, positions in the computer storage and systems software industries underperformed the S&P 500 Index. Technology sector returns lagged despite its higher overall growth rates and attractive historic valuation relative to the broad market. The growth thesis informing our overweight to information technology remains intact, as consumers and businesses alike demand innovations that enhance mobility, productivity and connectivity.
The Fund’s average overweight allocation and selection in materials also hampered returns. Specifically, holdings in the gold mining and production industry underperformed the broad market and made the largest negative impact on Fund performance. Gold mining companies were challenged during the period by higher costs of extraction and production, as well as by the rising prices of mining infrastructure. While valuations and fundamentals of select companies within the industry remain attractive, we reduced the Fund’s exposure to gold mining positions, which were used primarily as a global hedge against financial crises and currency debasement.
Security selection and an underweight position within the consumer discretionary sector also detracted from Fund performance. In particular, holdings within the Internet retail industry lagged peers. Although U.S. consumer trends are somewhat mixed, overall retail spending continues to increase. We strive to build positions in companies with well-established brands and global business strategies. Current holdings within the sector extend across a number of industries, some of which include Internet retail, apparel, home improvement, media and leisure.
| | | | |
| SECTOR WEIGHTINGS | |
Information Technology | | | 28.6 | % |
Financials | | | 13.9 | |
Energy | | | 12.7 | |
Health Care | | | 11.9 | |
Industrials | | | 10.3 | |
Consumer Discretionary | | | 10.2 | |
Consumer Staples | | | 6.6 | |
Materials | | | 3.0 | |
Utilities | | | 0.6 | |
| | | | | |
Sector weightings are subject to change daily and are calculated as a percentage of net assets. The table excludes cash or cash equivalents, any government/sovereign bonds or broad based index hedging securities the Fund may hold.
Calamos Growth and Income Fund
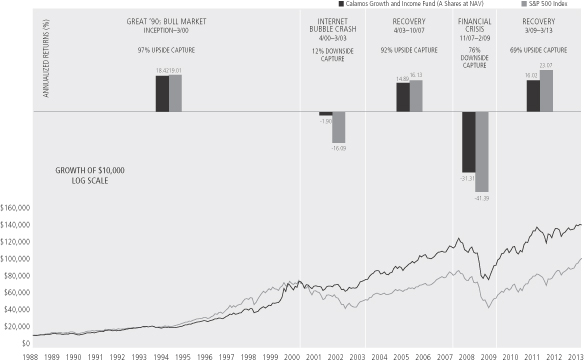
Performance data quoted represents past performance, which is no guarantee of future results. Current performance may be lower or higher than the performance quoted. The principal value and return of an investment will fluctuate so that your shares, when redeemed, may be worth more or less than their original cost. Performance reflected at NAV does not include the Fund’s maximum front-end sales load of 4.75% had it been included, the Fund’s return would have been lower. For the most recent fund performance information visit www.calamos.com.
There is no assurance that the fund will achieve or maintain its investment objective. Results are before taxes on fund distributions and assume reinvestment of dividends and capital gains. Index data shown is from 11/1/88, since comparative index data is available only for full monthly periods.
Logarithmic scales can be useful when looking at performance data over a long period of time. Common percent changes are represented by an equal spacing between the numbers in the scale. For example, the distance between $1 and $2 is equal to the distance between $2 and $4 because both scenarios represent a 100% increase in price.
Upside capture ratio measures a manager’s performance in up markets relative to the named index itself. It is calculated by taking the security’s upside capture return and dividing it by the benchmark’s upside capture return. Downside capture ratio measures manager’s performance in down markets as defined by the named index. A down-market is defined as those periods (months or quarters) in which named index return is less than 0. In essence, it tells you what percentage of the downmarket was captures by the manager. For example, if the ratio is 110%, the manager has captured 110% of the down-market and therefore underperformed the market on the downside. Source: State Street Corporation and Lipper, Inc.
Q. Please describe the Fund’s participation in up and down markets since its inception.
A. There are a variety of ways to express up- and down-market capture, whether it’s calculated daily, monthly, quarterly, etc., or as we look at the markets—in longer-term up- and down-market trends. In the chart above, you can see how the Calamos Growth and Income Fund performed through a few distinct market periods.
The first phase shows the Fund’s participation from its September 22, 1988 inception through March 31, 2000, when the equity market peaked prior to the end of the Internet bubble and the subsequent market crash. The Fund participated well during this up-market phase, gaining 18.42%, while the S&P 500 Index gained 19.01%.
The next phase was a sharp market decline from March 31, 2000 through March 31, 2003, as stocks sold off strongly on the heels of the tech bubble burst and the events of September 11, 2001. The Fund’s more conservative positioning and lower sensitivity to the equity market served investors well during this period, limiting the loss to only 1.90%, compared to a 16.09% decline in the S&P 500 Index.
| | | | |
| 34 | | CALAMOS FAMILY OF FUNDS SEMIANNUAL REPORT | | |
Calamos Growth and Income Fund
After March 31, 2003, the equity market once again began a strong upward move, with the S&P 500 Index climbing 16.13% through the market peak of October 31, 2007. During this period, the Fund participated strongly, gaining 14.89% and capturing 92% of the equity market’s rise.
In October 2007, markets peaked as a financial crisis gripped the U.S. and global economy. This induced a selloff, which saw the equity market fall 41.39% through March 1, 2009. The Fund was not immune to the liquidity crisis, falling 31.31%, but experiencing only 76% of the equity market’s downside.
In the ensuing and ongoing recovery since March of 2009, the Fund has captured 69% of the equity market’s upside.
Q. How is the Fund positioned?
A. Given our view of improving economic fundamentals and attractive equity valuations, we have continued to position the Fund to reflect a more cautiously optimistic market outlook and have decreased reflation-sensitive exposure in areas such as materials. We have maintained significant investments in higher secular growth businesses, such as those in information technology, health care and the consumer areas. We continue to favor companies with diversified global operations, strong cash flow generation and catalysts for growth and innovation. While our market outlook is cautiously optimistic overall, we also anticipate periods of volatility within markets and therefore maintain a strong focus on risk management.
Among positioning changes during the period, we decreased the Fund’s weight in the materials sector. More specifically, we significantly reduced the exposure to the gold mining and production industry, which, as noted, had served as a global hedge against systemic risk and currency debasement. We increased the Fund’s exposure to the financials sector during the period, adding weight as a reflection of improved bottom-up company fundamentals and an improved outlook for financial companies against the backdrop of a recovering economy. We have recently favored opportunities in the asset management industry and select, higher-quality diversified banks.
We also increased the Fund’s holdings in the industrials sector, adding investments across industries including aerospace, industrial machinery and construction. Many companies in the sector are compelling from both valuation and fundamental perspectives, particularly those with global scale and those serving diverse business segments that stand to benefit from the economic recovery.
Q. What is your outlook for the Fund?
A. We believe the Fund is well positioned, given our expectations of economic recovery and the potential for market volatility, and that valuations for equities and equity-sensitive securities remain attractive. A recovering housing sector and rising equity markets have contributed to higher confidence levels and increased auto sales in the U.S., underscoring the resiliency of the consumer. Despite a solid rise in household spending during the first quarter, the slow pace of overall growth may be attributable to the payroll tax increase and federal spending sequester.
Outside the U.S., we remain concerned about anemic euro zone GDP and tensions between the haves and have-nots, as the bailout-austerity cycle continues to be complex. Within the emerging markets, average growth rates remain well above those in developed economies, but certain tighter monetary policies could pose headwinds for growth.
We are encouraged by trends in the U.S. convertible markets. Economic growth has supported increased issuance, and we view this growing issuance as a positive for the Fund. We continue to find attractively valued convertibles that offer the characteristics we seek; that is, a balance between equity participation and potential downside resilience.
We expect policy uncertainty and market fluctuations to continue, but modest economic growth, attractive valuations and robust secular themes support our active and risk-aware approach to investing in equity and equity-sensitive markets.
Calamos Growth and Income Fund
ANNUALIZED RETURN: SINCE INCEPTION (9/22/88) THROUGH 4/30/13
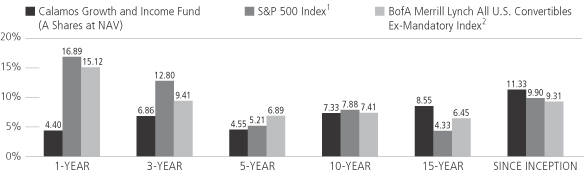
Performance data quoted represents past performance, which is no guarantee of future results. Current performance may be lower or higher than the performance quoted.
The principal value and investment return of an investment will fluctuate so that your shares, when redeemed, may be worth more or less than their original cost. You can obtain performance data current to the most recent month end by visiting www.calamos.com. Average annual total return measures net investment income and capital gain or loss from portfolio investments as an annualized average. All performance shown assumes reinvestment of dividends and capital gains distributions. Performance is for the fund’s Class A shares at net asset value and does not include the Fund’s maximum front-end sales charge of 4.75%—had it been included, the Fund’s return would have been lower. The Fund also offers Class B, Class C, Class I and R shares, the performance of which may vary. Performance shown reflects an expense reimbursement that improved results. Source: State Street Corporation and Lipper, Inc.
| | | | |
| 36 | | CALAMOS FAMILY OF FUNDS SEMIANNUAL REPORT | | |
Calamos Growth and Income Fund
GROWTH OF $10,000: FOR 10-YEAR PERIOD ENDED 4/30/13
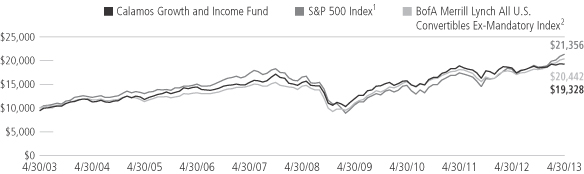
AVERAGE ANNUAL TOTAL RETURN† AS OF 4/30/13
| | | | | | | | | | | | | | | | | | | | |
| | | 6
MONTHS | | 1
YEAR | | 5
YEARS | | 10 YEARS
OR ^SINCE
INCEPTION |
Class A Shares – Inception 9/22/88 | | | | | | | | | | | | | | | | | | | | |
Without Sales Charge | | | | 4.36 | % | | | | 4.40 | % | | | | 4.55 | % | | | | 7.33 | % |
With Sales Charge | | | | -0.61 | | | | | -0.56 | | | | | 3.53 | | | | | 6.81 | |
Class B Shares – Inception 9/11/00 | | | | | | | | | | | | | | | | | | | | |
Without Sales Charge | | | | 4.35 | | | | | 4.13 | | | | | 3.87 | | | | | 6.69 | |
With Sales Charge | | | | -0.65 | | | | | -0.87 | | | | | 3.53 | | | | | 6.69 | |
Class C Shares – Inception 8/5/96 | | | | | | | | | | | | | | | | | | | | |
Without Sales Charge | | | | 3.95 | | | | | 3.60 | | | | | 3.77 | | | | | 6.53 | |
With Sales Charge | | | | 2.95 | | | | | 2.60 | | | | | 3.77 | | | | | 6.53 | |
Class I Shares – Inception 9/18/97 | | | | 4.46 | | | | | 4.64 | | | | | 4.81 | | | | | 7.61 | |
Class R Shares – Inception 3/1/07 | | | | 4.22 | | | | | 4.15 | | | | | 4.29 | | | | | 4.08 | ^ |
Performance data quoted represents past performance, which is no guarantee of future results. Current performance may be lower or higher than the performance quoted. The principal value and investment return of an investment will fluctuate so that your shares, when redeemed, may be worth more or less than their original cost.
| † | Average annual total return measures net investment income and capital gain or loss from portfolio investments as an annualized average assuming reinvestment of dividends and capital gains distributions. Load-adjusted returns are adjusted for the maximum front-end sales load of 4.75% for Class A shares and returns for Class B and C shares have been adjusted for the contingent deferred sales charge (CDSC). |
NOTES:
The graphs do not reflect the income taxes that you would pay on fund distributions or the redemption of fund shares. Fund performance includes reinvestment of dividends and adjustment for the maximum sales charge for Class A shares. The performance of other classes will vary from the performance of the class shown based on the difference in sales charges and fees paid by shareholders investing in different share classes.
| 1 | The S&P 500 Index is an unmanaged index generally considered representative of the U.S. stock market. Source: Lipper, Inc. |
| 2 | The BofA Merrill Lynch All U.S. Convertibles Ex-Mandatory Index represents the U.S. convertibles securities market excluding mandatory convertibles. Index data shown for the Annualized Return Since Inception graph is from 9/30/88, since comparative index data is only available for full monthly periods. Source: Lipper, Inc. |
Index returns assume reinvestment of dividends and do not reflect deduction of fees and expenses. It is not possible to invest directly in an index.
Calamos Global Growth and Income Fund
| | |
| FUND NASDAQ SYMBOLS |
A Shares | | CVLOX |
B Shares | | CVLDX |
C Shares | | CVLCX |
I Shares | | CGCIX |
R Shares | | CVLRX |
| | | |
|
| FUND CUSIP NUMBERS |
A Shares | | 128119500 |
B Shares | | 128119732 |
C Shares | | 128119708 |
I Shares | | 128119609 |
R Shares | | 128119385 |
| | | |
FUND OBJECTIVE
High long-term total return through capital appreciation and current income
INVESTMENT STRATEGY
| | > | | Offers a defensive approach to equity exposure applying dynamic asset allocation on a global scale | |
| | > | | Attempts to maintain a consistent balance between risk and reward over the course of different global market cycles by strategically investing across a combination of stocks, convertible securities and bonds | |
| | > | | Emphasizes countries espousing free-market principles | |
INVESTOR PROFILE
This Fund may be suitable for investors who seek:
| | > | | A risk-managed approach to pursuing growth opportunities around the world | |
| | > | | A portfolio of securities representing various-sized companies from multiple countries | |
| | > | | A strategy designed to enhance return by providing broad global diversification with less volatility than typical stock-only investments | |
CALAMOS GLOBAL GROWTH AND INCOME FUND
INVESTMENT TEAM DISCUSSION
The Calamos Investment Management Team, led by Global Co-Chief Investment Officers John P. Calamos, Sr. and Gary D. Black, discusses the Fund’s performance, strategy and positioning during the six-month period ended April 30, 2013.
Q. What is the Fund’s investment strategy?
A. Calamos Global Growth and Income Fund invests in a combination of stocks, convertible securities and bonds of both U.S. and non-U.S. companies. The Fund offers a total return-oriented investment that seeks to keep a consistent balance of risk and reward through full market cycles. As we focus on managing volatility, we endeavor to participate in a greater portion of equity market upside than downside. We currently emphasize multinational companies with global presence and geographically diversified revenues that we believe are positioned to capitalize on global economic growth and global secular trends.
Q. How has the Fund performed?
A. Because we believe equity funds are best utilized within asset allocations as long-term investments, we encourage investors to evaluate performance over longer time periods. Since its inception on September 9, 1996, the Fund has returned 8.56% on an annualized basis (Class A shares at net asset value) and outperformed the MSCI ACWI Index, which gained 6.46% for the same period. For the six-month period ended April 30, 2013, the Fund earned 5.82%, versus 13.78% for the MSCI ACWI Index.
Q. Please discuss the Fund’s low-volatility* characteristics.
A. We believe the Fund’s historical low-volatility characteristics are a by-product of our investment style and focus on participating in equity market upside with less volatility than the market as a whole. Beta is one popular statistic for measuring volatility. Beta considers a fund’s historic volatility versus the market, which is assigned a beta of 1.0. A fund with half the volatility of the market would have a beta of 0.5, while a fund with a beta of 2.0 would have been twice as volatile as the market.
Since its inception, the Fund has had a beta of 0.69 versus the MSCI ACWI Index. The Fund has therefore outperformed the global equity market, as measured by the MSCI ACWI Index, with less volatility than the equity markets. Please note that past performance does not indicate future results and that beta is one of many measures of risk.
Q. What factors influenced performance over the period?
A. Global equities and convertibles delivered strong gains during the period, amid generally strengthening economic data within the United States and Japan, and despite economic uncertainty within the euro zone. The Fund’s emphasis on higher-quality companies with stronger balance sheets, greater capital efficiency and relatively higher
| * | The Fund’s historical performance has exhibited lower volatility, as measured by beta and standard deviation, over the life of the Fund. The Fund’s investment objective does not seek to reduce volatility, and as a result, the Fund may experience volatility in some market conditions. (Source for beta and standard deviation data is Morningstar, Inc.) |
| | | | |
| 38 | | CALAMOS FAMILY OF FUNDS SEMIANNUAL REPORT | | |
Calamos Global Growth and Income Fund
growth profiles was not rewarded. The significant differences in global sector performance during the period reflected investor preference for dividend yield without much regard to quality rather than growth within their equity allocations. We believe global equity valuations, long-term secular trends, and our cautiously optimistic macro outlook support the Fund’s positioning.
We had been concerned about the potential for downward volatility in the markets amid EU turmoil and the uncertainty of the sequester in the U.S. Reflecting a more cautious stance, the Fund was overweight to materials, and the gold mining and production industry in particular. These issues underperformed the broad market during the period and made the largest negative impact on Fund performance. Gold mining companies were challenged in the period by higher costs of extraction and production, as well as the rising prices of mining infrastructure. While valuations and fundamentals of select companies within the industry remain attractive, we reduced the Fund exposure to gold mining positions, which had been used primarily to guard against the potential for a systemic market shock and a weakening of the dollar.
The Fund’s underweight allocation and security selection within financials also hampered returns, specifically within the diversified bank industry. Historically, we have been underweight in financials, but we believe the relative merits of the sector have improved. Rising loan growth, attractive valuations and improved prospects for global real estate support a relatively more positive view and larger weight.
We continue to believe that technology firms will benefit from many of the long-term secular growth themes we have identified, such as persistent innovation, enhanced mobility and global connectivity. However, the Fund’s overweight allocation and security selection in information technology negatively impacted performance during the period. Specifically, positions in the application software industry underperformed the MSCI ACWI Index. Technology returns lagged, despite the sector’s higher overall growth rates, cleaner balance sheets and attractive historic valuation relative to the broad market. The growth thesis informing the Fund’s overweight to information technology remains intact, for the reasons noted above.
An overweight allocation to the health care sector supported performance the most in the period. Fund holdings delivered strong gains but lagged those in the MSCI ACWI Index, offsetting the benefit of the Fund’s overweight exposure.
| | | | |
| SECTOR WEIGHTINGS | |
Information Technology | | | 24.0 | % |
Health Care | | | 16.6 | |
Financials | | | 11.4 | |
Energy | | | 10.1 | |
Consumer Discretionary | | | 9.4 | |
Industrials | | | 8.0 | |
Consumer Staples | | | 7.4 | |
Materials | | | 3.3 | |
Telecommunication Services | | | 2.7 | |
Utilities | | | 1.1 | |
Sector weightings are subject to change daily and are calculated as a percentage of net assets. The table excludes cash or cash equivalents, any government/sovereign bonds or broad based index hedging securities the Fund may hold.
Calamos Global Growth and Income Fund
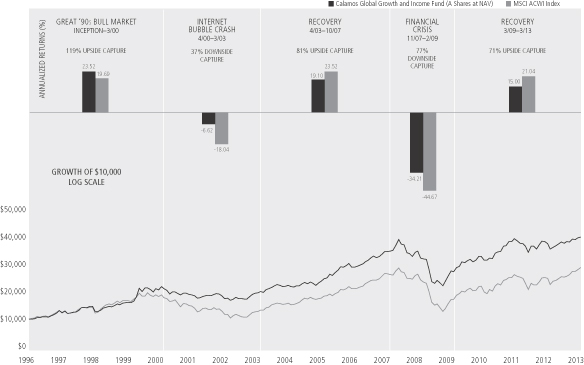
Performance data quoted represents past performance, which is no guarantee of future results. Current performance may be lower or higher than the performance quoted. The principal value and return of an investment will fluctuate so that your shares, when redeemed, may be worth more or less than their original cost. Performance reflected at NAV does not include the Fund’s maximum front-end sales load of 4.75% had it been included, the Fund’s return would have been lower. For the most recent fund performance information visit www.calamos.com.
There is no assurance that the fund will achieve or maintain its investment objective. Results are before taxes on fund distributions and assume reinvestment of dividends and capital gains. Index data shown is from 11/1/88, since comparative index data is available only for full monthly periods.
Logarithmic scales can be useful when looking at performance data over a long period of time. Common percent changes are represented by an equal spacing between the numbers in the scale. For example, the distance between $1 and $2 is equal to the distance between $2 and $4 because both scenarios represent a 100% increase in price.
Upside capture ratio measures a manager’s performance in up markets relative to the named index itself. It is calculated by taking the security’s upside capture return and dividing it by the benchmark’s upside capture return. Downside capture ratio measures manager’s performance in down markets as defined by the named index. A down-market is defined as those periods (months or quarters) in which named index return is less than 0. In essence, it tells you what percentage of the downmarket was captures by the manager. For example, if the ratio is 110%, the manager has captured 110% of the down-market and therefore underperformed the market on the downside. Source: State Street Corporation and Lipper, Inc.
Q. Please describe the Fund’s participation in up and down markets since its inception.
A. There are a variety of ways to express up- and down-market capture, whether it’s calculated daily, monthly, quarterly, etc., or as we look at the markets—in longer-term up- and down-market trends. In the chart above, you can see how the Calamos Global Growth and Income Fund performed through a few distinct market periods.
The first phase shows the Fund’s participation from its September 9, 1996 inception through March 31, 2000, when the equity market peaked prior to the end of the Internet bubble and the subsequent market crash. The Fund participated well during this up-market phase, gaining 23.52%, while the MSCI ACWI Index gained 19.69%.
The next phase was a sharp market decline from March 31, 2000 through March 31, 2003, as stocks sold off strongly on the heels of the tech bubble burst and the events of September 11, 2001. The Fund’s more conservative positioning and lower sensitivity to the equity market served investors well during this period, limiting the loss to only 6.62%, compared to an 18.04% decline in the MSCI ACWI Index.
| | | | |
| 40 | | CALAMOS FAMILY OF FUNDS SEMIANNUAL REPORT | | |
Calamos Global Growth and Income Fund
After March 31, 2003, the global equity market once again began a strong upward move, with the MSCI ACWI Index climbing 23.52% through the market peak of October 31, 2007. During this period, the Fund participated strongly, gaining 19.10% and capturing 81% of the global equity market’s rise.
In October 2007, markets peaked as a financial crisis gripped the U.S. and global economy. This induced a selloff, which saw the global equity market fall 44.67% through March 1, 2009. The Fund was not immune to the liquidity crisis, falling 34.21%, but experiencing only 77% of the market’s downside.
In the ensuing and ongoing recovery since March of 2009, the Fund has captured 71% of the global equity market’s upside.
Q. How is the Fund positioned?
A. Given our view of improving global economic fundamentals and attractive global equity valuations, we have continued to position the portfolio to reflect a more cautiously optimistic market outlook and decreased exposure in areas such as materials. We have maintained significant investments in higher secular growth businesses, such as those in the information technology, health care and consumer sectors. We continue to favor companies with diversified global operations, particularly those able to access the growth occurring within emerging market economies. While we are cautiously optimistic overall, we also anticipate periods of volatility within the global markets and therefore maintain a strong focus on risk management.
With respect to specific changes in Fund positioning, we decreased our holdings in the materials sector during the period. More specifically, we reduced exposure to the gold mining and production industry, which, as noted, served as a global hedge against financial crises and currency debasement. We increased the Fund’s exposure to the financials sector during the period. While we remain conscious of the risks associated with this area, we have been adding to our allocation as a reflection of improved sector fundamentals and our constructive global equity outlook. We favor select opportunities in higher-quality diversified banks and asset management firms accessing global growth trends in both developed and emerging economies.
Q. What is your outlook for global growth equities and the Fund?
A. Our global outlook remains cautiously optimistic and we expect the economic recovery to continue at an uneven pace over the next several quarters. We believe global equity valuations and growth prospects remain attractive going forward, as the global economy shows signs of slow but positive growth. A recovering housing sector and rising equity markets have led to increased auto sales and higher confidence levels in the U.S., underscoring the resiliency of the consumer. Despite a solid rise in household spending during the first months of the year, however, the overall sluggish pace of growth may be attributable to the payroll tax hike and federal spending sequester. Investors appear to be debating whether the most recent economic data is signaling a temporary slowdown or a more protracted weakness. We have also seen evidence of equities being used as bond substitutes, with equity dividend yields outpacing those found in corporate bonds in some cases.
Outside the U.S., we are closely monitoring euro zone GDP and tensions between the haves and have-nots, as the bailout-austerity cycle continues to be complex. Within the emerging markets, growth targets remain well above those in developed economies, but tighter monetary policies in some countries could create near-term headwinds for growth. Based on the trend of the last three years, investors are concerned that we may once again face a sell-off at some point during the second quarter. While we are aware of this inclination, we believe timing when to enter and exit global markets is extremely difficult.
We are encouraged by trends in the U.S. and global convertible markets. Economic growth has supported increased issuance in the U.S. and globally, and we view this growing issuance as a positive for the Fund. We continue to find attractively valued convertibles that offer the characteristics we seek; that is, a balance between equity participation and potential downside resilience.
Calamos Global Growth and Income Fund
We expect policy uncertainty and market fluctuations to continue, but modest global economic growth, attractive valuations and robust secular themes support our active and risk-aware approach to investing in equity and equity-sensitive markets.
ANNUALIZED RETURN: SINCE INCEPTION (9/9/96) THROUGH 4/30/13
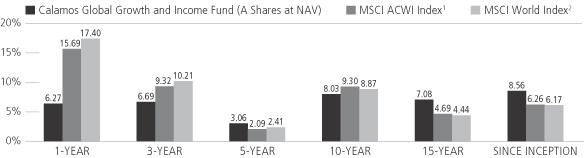
Performance data quoted represents past performance, which is no guarantee of future results. Current performance may be lower or higher than the performance quoted.
The principal value and investment return of an investment will fluctuate so that your shares, when redeemed, may be worth more or less than their original cost. You can obtain performance data current to the most recent month end by visiting www.calamos.com. Average annual total return measures net investment income and capital gain or loss from portfolio investments as an annualized average. All performance shown assumes reinvestment of dividends and capital gains distributions. Performance is for the Fund’s Class A shares at net asset value and does not include the Fund’s maximum front-end sales charge of 4.75%—had it been included, the Fund’s return would have been lower. The Fund also offers Class B, Class C, Class I and Class R shares, the performance of which may vary. Performance shown reflects an expense reimbursement that improved results. Source: State Street Corporation and Lipper, Inc.
| | | | |
| 42 | | CALAMOS FAMILY OF FUNDS SEMIANNUAL REPORT | | |
Calamos Global Growth and Income Fund
GROWTH OF $10,000: FOR 10-YEAR PERIOD ENDED 4/30/13

AVERAGE ANNUAL TOTAL RETURN† AS OF 4/30/13
| | | | | | | | | | | | | | | | | | | | |
| | | 6
MONTHS | | 1
YEAR | | 5
YEARS | | 10 YEARS
OR ^SINCE
INCEPTION |
Class A Shares – Inception 9/9/96 | | | | | | | | | | | | | | | | | | | | |
Without Sales Charge | | | | 5.82 | % | | | | 6.27 | % | | | | 3.06 | % | | | | 8.03 | % |
With Sales Charge | | | | 0.81 | | | | | 1.25 | | | | | 2.06 | | | | | 7.50 | |
Class B Shares – Inception 9/11/00 | | | | | | | | | | | | | | | | | | | | |
Without Sales Charge | | | | 5.35 | | | | | 5.38 | | | | | 2.27 | | | | | 7.37 | |
With Sales Charge | | | | 0.35 | | | | | 0.38 | | | | | 1.90 | | | | | 7.37 | |
Class C Shares – Inception 9/24/96 | | | | | | | | | | | | | | | | | | | | |
Without Sales Charge | | | | 5.41 | | | | | 5.38 | | | | | 2.27 | | | | | 7.21 | |
With Sales Charge | | | | 4.41 | | | | | 4.38 | | | | | 2.27 | | | | | 7.21 | |
Class I Shares – Inception 9/18/97 | | | | 5.93 | | | | | 6.45 | | | | | 3.31 | | | | | 8.28 | |
Class R Shares – Inception 3/1/07 | | | | 5.64 | | | | | 5.95 | | | | | 2.81 | | | | | 3.25 | ^ |
Performance data quoted represents past performance, which is no guarantee of future results. Current performance may be lower or higher than the performance quoted. The principal value and investment return of an investment will fluctuate so that your shares, when redeemed, may be worth more or less than their original cost.
| † | Average annual total return measures net investment income and capital gain or loss from portfolio investments as an annualized average assuming reinvestment of dividends and capital gains distributions. Performance shown reflects the effects of an expense reimbursement that improved results and was in effect until March 31, 2003. Load-adjusted returns are adjusted for the maximum front-end sales load of 4.75% for Class A shares and returns for Class B and C shares have been adjusted for the contingent deferred sales charge (CDSC). |
NOTES:
The graphs do not reflect the income taxes that you would pay on fund distributions or the redemption of fund shares. Fund performance includes reinvestment of dividends and adjustment for the maximum sales charge for Class A shares. The performance of other classes will vary from the performance of the class shown based on the difference in sales charges and fees paid by shareholders investing in different share classes.
| 1 | The MSCI ACWI Index is a free float-adjusted market capitalization weighted index that is designed to measure the equity market performance of developed and emerging markets. |
| 2 | The MSCI World Index (U.S. Dollars) is a market-capitalization weighted index composed of companies representative of the market structure of developed market countries in North America, Europe and the Asia/Pacific region. Since inception data for the index is shown from 9/30/96 since data is only available for full monthly periods. Source: Lipper, Inc. |
Index returns assume reinvestment of dividends and do not reflect deduction of fees and expenses. It is not possible to invest directly in an index.
Calamos Convertible Fund
| | |
| FUND NASDAQ SYMBOLS |
A Shares | | CCVIX |
B Shares | | CALBX |
C Shares | | CCVCX |
I Shares | | CICVX |
R Shares | | CCVRX |
| | | |
|
| FUND CUSIP NUMBERS |
A Shares | | 128119401 |
B Shares | | 128119773 |
C Shares | | 128119823 |
I Shares | | 128119864 |
R Shares | | 128119369 |
| | | |
FUND OBJECTIVE
Current income with a secondary objective of growth
INVESTMENT STRATEGY
| | > | | Invests in convertible securities issued by both U.S. and foreign companies | |
| | > | | Emphasizes diversification across market sectors and credit quality, favoring companies with higher-quality balance sheets | |
| | > | | Utilizes a highly disciplined strategy that seeks to enhance investment returns while managing risk | |
INVESTOR PROFILE
This Fund may be suitable for investors who seek:
| | > | | Current income as well as capital growth potential | |
| | > | | An investment that provides the growth potential of equities along with the income and limited downside potential typical of fixed income securities | |
CALAMOS CONVERTIBLE FUND
INVESTMENT TEAM DISCUSSION
The Calamos Investment Management Team, led by Global Co-Chief Investment Officers John P. Calamos, Sr. and Gary D. Black, discusses the Fund’s performance, strategy and positioning during the six-month period ended April 30, 2013.
Q. What is the Fund’s investment strategy?
A. Calamos Convertible Fund invests in convertible securities primarily issued by U.S. companies, though 5% to 15% may be invested in non-U.S. securities. The Fund, which may also invest in equities, offers participation in the equity markets with income generation and potentially less downside volatility than an all-equity portfolio. We pay close attention to risk and reward characteristics, including valuations, equity sensitivity, credit quality, and balance sheets as we position the portfolio to reflect our view of secular and cyclical opportunities.
Q. What is a convertible security?
A convertible security is a bond or preferred stock that can be exchanged, or converted, into a specific number of shares of common stock of the issuer’s company. Convertible securities combine characteristics of stocks and fixed-income securities. Like stocks, convertibles typically offer potential upside participation in rising equity markets. Like bonds, convertible securities may provide income and potential downside protection in declining markets.
Q. How has the Fund performed?
A. Because we believe convertible funds are best utilized within asset allocations as long-term investments, we encourage investors to evaluate performance over longer time periods. Since its inception on June 21, 1985, the Fund has returned 9.39% on an annualized basis (Class A shares at net asset value) compared with a gain of 8.62% for the Value Line Convertible Index and 10.48% for the S&P 500 Index. For the six-month period ended April 30, 2013, the Fund returned 9.77%. For this same period, the BofA Merrill Lynch All U.S. Convertible ex-Mandatory Index (VXA0) returned 12.69%, the Value Line Convertible Index gained 11.03%, and the S&P 500 Index returned 14.42%.
We compare the Fund’s performance to multiple benchmarks to provide a more complete assessment of its performance. Because convertibles have equity characteristics, they can be thought of as equity-linked securities. Therefore, we compare the Fund’s performance to the S&P 500 Index. We also measure the Fund’s performance against the Value Line Convertible Index, which has a history that dates to the inception of Calamos Convertible Fund. We utilize the newer BofA Merrill Lynch All U.S. Convertibles ex-Mandatory Index for research and analysis.
Q. Please discuss the Fund’s low-volatility* characteristics.
A. We believe the Fund’s historical low-volatility characteristics are a by-product of our investment style and focus on participating in equity market upside with less volatility
| * | The Fund’s historical performance has exhibited lower volatility, as measured by beta and standard deviation, over the life of the Fund. The Fund’s investment objective does not seek to reduce volatility, and as a result, the Fund may experience volatility in some market conditions. (Source for beta and standard deviation data is Morningstar, Inc.) |
| | | | |
| 44 | | CALAMOS FAMILY OF FUNDS SEMIANNUAL REPORT | | |
Calamos Convertible Fund
than the market as a whole. Beta is one popular statistic for measuring volatility. Beta considers a fund’s historic volatility versus the market, which is assigned a beta of 1.0. A fund with half the volatility of the market would have a beta of 0.5, while a fund with a beta of 2.0 would have been twice as volatile as the market.
Since its inception, the Fund has had a beta of 0.62 versus the S&P 500 Index. The Fund has therefore captured a significant portion of the equity market’s gain, as measured by the S&P 500 Index, with less volatility than the equity markets. Please note that past performance does not indicate future results and that beta is one of many measures of risk.
Q. What factors influenced performance over the period?
A. The reporting period began amid many uncertainties, including the U.S. elections and the fiscal cliff negotiations. As these uncertainties were resolved, investors embraced a stronger risk appetite that saw the equity, convertible and high yield credit markets all perform strongly. The low interest rate environment motivated investors to seek higher yielding securities in both the equity and credit markets. As such, high yield credit spreads narrowed during the period as investors moved into lower-quality securities. Additionally, investors favored the more defensive economic sectors in the equity market, as the stocks in these areas offered higher dividends. In this environment, we were pleased with the Fund’s return, which participated in over two-thirds of the equity market upside.
At the same time, we acknowledge that the Fund did have a lower return than the convertible index, which had a higher concentration in convertibles at either extreme of the risk/reward spectrum, with significantly high equity or credit sensitivity (and typically the highest yields). Within the sectors, our selections favored convertibles with more balanced attributes, as opposed to the heavily equity-sensitive and credit-sensitive names. We believe that one of the most compelling features of convertible securities is that many (but not all) offer an attractive balance of upside participation and potential downside resilience. We have found that such hybrid characteristics have been particularly useful in providing an asymmetrical risk/return profile over full market cycles. Yet during the period, it was the most equity-sensitive issues that led within the BofA Merrill Lynch All U.S. Convertible ex-Mandatory Index (VXA0).
From an economic sector perspective, security selection within the information technology sector detracted from returns, as holdings within the communications equipment, semiconductors and applications software industries lagged.
An underweight position and issue selection within the industrials sector also hampered performance. Here, the Fund’s lack of exposure to transportation-related names held back results. Many of the convertibles in this area were very equity-sensitive and of low credit quality and, as such, did not meet our risk management criteria.
The Fund’s underweight position and issue selection in consumer staples supported returns, particularly its exposure in the super centers industry.
An underweight position and security selection within the consumer discretionary sector supported returns during the period. Our holdings in the apparel industry performed strongly, while our relatively lighter weight to the homebuilding industry also enhanced results.
| | | | |
| SECTOR WEIGHTINGS | |
Information Technology | | | 22.0 | % |
Financials | | | 19.6 | |
Consumer Discretionary | | | 15.6 | |
Health Care | | | 15.2 | |
Industrials | | | 11.3 | |
Energy | | | 8.6 | |
Materials | | | 1.6 | |
Utilities | | | 1.0 | |
Telecommunication Services | | | 0.7 | |
Consumer Staples | | | 0.1 | |
Sector weightings are subject to change daily and are calculated as a percentage of net assets. The table excludes cash or cash equivalents, any government/sovereign bonds or broad based index hedging securities the Fund may hold.
Calamos Convertible Fund
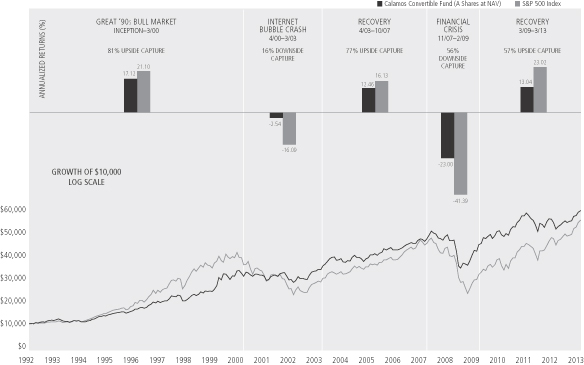
Performance data quoted represents past performance, which is no guarantee of future results. Current performance may be lower or higher than the performance quoted. The principal value and return of an investment will fluctuate so that your shares, when redeemed, may be worth more or less than their original cost. Performance reflected at NAV does not include the Fund’s maximum front-end sales load of 4.75% had it been included, the Fund’s return would have been lower. For the most recent fund performance information visit www.calamos.com.
There is no assurance that the fund will achieve or maintain its investment objective. Results are before taxes on fund distributions and assume reinvestment of dividends and capital gains. Index data shown is from 11/1/88, since comparative index data is available only for full monthly periods.
Logarithmic scales can be useful when looking at performance data over a long period of time. Common percent changes are represented by an equal spacing between the numbers in the scale. For example, the distance between $1 and $2 is equal to the distance between $2 and $4 because both scenarios represent a 100% increase in price.
Upside capture ratio measures a manager’s performance in up markets relative to the named index itself. It is calculated by taking the security’s upside capture return and dividing it by the benchmark’s upside capture return. Downside capture ratio measures manager’s performance in down markets as defined by the named index. A down-market is defined as those periods (months or quarters) in which named index return is less than 0. In essence, it tells you what percentage of the downmarket was captures by the manager. For example, if the ratio is 110%, the manager has captured 110% of the down-market and therefore underperformed the market on the downside. Source: State Street Corporation and Lipper, Inc.
Q. Please describe the Fund’s participation in up and down markets since inception.
A. There are a variety of ways to express up- and down-market capture, whether it’s calculated daily, monthly, quarterly, etc., or as we look at the markets—in longer-term up- and down-market trends. In the chart above, you can see how the Calamos Convertible Fund performed compared to the U.S. equity market through a few distinct market periods since its inception.
The first phase shows the Fund’s participation from its inception in July of 1985 through March 31, 2000, when the equity market peaked prior to the end of the Internet bubble and the subsequent market crash. The Fund participated well during this up-market phase, gaining 13.56%, while the S&P 500 Index gained 18.18%.
The next phase was a sharp market decline from March 31, 2000 through March 31, 2003, as stocks sold off strongly on the heels of the tech bubble burst and the events of September 11, 2001. The Fund’s more conservative positioning and lower sensitivity to the equity market served investors well during this period, limiting the loss to only 2.54%, compared to a 16.09% decline in the S&P 500 Index.
After March 31, 2003, the equity market once again began a strong upward move, with the S&P 500 Index climbing 16.13% through the market peak of October 31, 2007. During this period, the Fund participated strongly, gaining 12.46% and capturing 77% of the equity market’s rise.
| | | | |
| 46 | | CALAMOS FAMILY OF FUNDS SEMIANNUAL REPORT | | |
Calamos Convertible Fund
In October 2007, markets peaked as a financial crisis gripped the U.S. and global economy. This induced a selloff, which saw the equity market fall 41.39% through March 1, 2009. The Fund was not immune to the liquidity crisis, falling 23.00%, but experiencing only 56% of the equity market’s downside.
Q. How is the Fund positioned?
A. We have continued to emphasize convertible securities that offer asymmetric risk-return characteristics versus the underlying stocks, and have been encouraged that this segment of the market has benefited from the strong performance of the convertibles’ underlying equities. We continue to see attractive opportunities in growth equities and, as a significant number of convertibles have been issued by growth issuers, we feel that convertibles provide an attractive means of accessing this well-priced growth.
From an economic sector perspective, the Fund’s heaviest weightings are in the information technology and financials sectors, while its lowest weights are in the more defensive telecommunication services and consumer staples categories. Our more constructive economic outlook afforded the opportunity to increase the Fund’s exposure to the financials sector during the period, as we believe the sector will continue to benefit from improvements in the economy. Asset managers have benefited from strong market performance, while banks have benefited from an improving housing market and a decline in foreclosures. We also trimmed the Fund’s exposure to technology during the period.
In regard to credit quality, while we have recently increased the Fund’s exposure to the lower-quality credit tiers, it still holds a relative underweight to the B and CCC tiers relative the BofA Merrill Lynch All U.S. Convertible Index, as we maintain concerns about the lack of downside protection in these credit tiers.
Q. What is your outlook for convertible securities and the Fund?
A. We believe the case for convertibles and this Fund remain solid. We are encouraged by trends in the U.S. and global convertible markets. Economic growth has supported increased issuance in the U.S. and globally, and we view this growing global issuance as a positive for the Fund. We continue to find attractively valued convertibles that offer the characteristics we seek; that is, a balance between equity participation and potential downside resilience.
Despite a broadly constructive outlook for equities, convertible securities and the global economy, we expect persistent choppiness in the markets and would not be surprised to see the equity market correct off recent highs. We believe that such an environment can underscore the potential benefits of strategic allocations to convertibles.
ANNUALIZED RETURN: SINCE INCEPTION (6/21/85) THROUGH 4/30/13
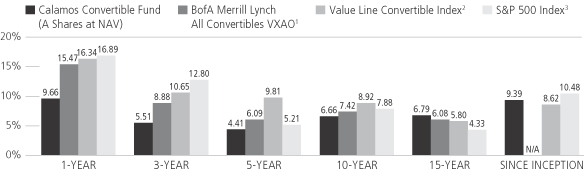
Performance data quoted represents past performance, which is no guarantee of future results. Current performance may be lower or higher than the performance quoted.
The principal value and investment return of an investment will fluctuate so that your shares, when redeemed, may be worth more or less than their original cost. You can obtain performance data current to the most recent month end by visiting www.calamos.com. Average annual total return measures net investment income and capital gain or loss from portfolio investments as an annualized average. All performance shown assumes reinvestment of dividends and capital gains distributions. Performance is for the Fund’s Class A shares at net asset value and does not include the Fund’s maximum front-end sales charge of 4.75%—had it been included, the Fund’s return would have been lower. The Fund also offers Class B, Class C, Class I and Class R shares, the performance of which may vary. Performance shown reflects an expense reimbursement that improved results. Source: State Street Corporation, Lipper, Inc., and Mellon Analytical Solutions, LLC.
Calamos Convertible Fund
GROWTH OF $10,000: FOR 10-YEAR PERIOD ENDED 4/30/13
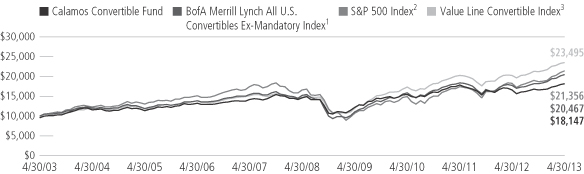
AVERAGE ANNUAL TOTAL RETURN† AS OF 4/30/13
| | | | | | | | | | | | | | | | | | | | |
| | | 6
MONTHS | | 1
YEAR | | 5
YEARS | | 10 YEARS
OR ^SINCE
INCEPTION |
Class A Shares – Inception 6/21/85 | | | | | | | | | | | | | | | | | | | | |
Without Sales Charge | | | | 9.77 | % | | | | 9.66 | % | | | | 4.41 | % | | | | 6.66 | % |
With Sales Charge | | | | 4.57 | | | | | 4.42 | | | | | 3.39 | | | | | 6.14 | |
Class B Shares – Inception 9/11/00 | | | | | | | | | | | | | | | | | | | | |
Without Sales Charge | | | | 9.39 | | | | | 8.88 | | | | | 3.63 | | | | | 6.03 | |
With Sales Charge | | | | 4.39 | | | | | 3.88 | | | | | 3.30 | | | | | 6.03 | |
Class C Shares – Inception 7/5/96 | | | | | | | | | | | | | | | | | | | | |
Without Sales Charge | | | | 9.33 | | | | | 8.84 | | | | | 3.62 | | | | | 5.87 | |
With Sales Charge | | | | 8.33 | | | | | 7.84 | | | | | 3.62 | | | | | 5.87 | |
Class I Shares – Inception 6/25/97 | | | | 9.88 | | | | | 9.97 | | | | | 4.68 | | | | | 6.93 | |
Class R Shares – Inception 3/1/07 | | | | 9.61 | | | | | 9.37 | | | | | 4.14 | | | | | 4.41 | ^ |
Performance data quoted represents past performance, which is no guarantee of future results. Current performance may be lower or higher than the performance quoted. The principal value and investment return of an investment will fluctuate so that your shares, when redeemed, may be worth more or less than their original cost.
| † | Average annual total return measures net investment income and capital gain or loss from portfolio investments as an annualized average assuming reinvestment of dividends and capital gains distributions. Load-adjusted returns are adjusted for the maximum front-end sales load of 4.75% for Class A shares and returns for Class B and C shares have been adjusted for the contingent deferred sales charge (CDSC). |
NOTES:
The graphs do not reflect the income of taxes that you would pay on fund distributions or the redemption of fund shares. Fund performance includes reinvestment of dividends and adjustment for the maximum sales charge for Class A shares. The performance of other classes will vary from the performance of the class shown based on the difference in sales charges and fees paid by shareholders investing in different share classes.
| 1 | The BofA Merrill Lynch All U.S. Convertibles Ex-Mandatory Index is comprised of approximately 700 issues of only convertible bonds and preferreds of all qualities. |
| 2 | The S&P 500 Index is an unmanaged index generally considered representative of the U.S. stock market. |
| 3 | The Value Line Convertible Index is an equally-weighted index of the larger convertibles, representing 90% of the U.S. convertible securities market. Index data shown for the Annualized Returns Since Inception graph is from 6/30/85, since comparative index data is only available for full monthly periods. Source: Mellon Analytical Solutions, LLC. |
Index returns assume reinvestment of dividends and do not reflect deduction of fees and expenses. It is not possible to invest directly in an index.
| | | | |
| 48 | | CALAMOS FAMILY OF FUNDS SEMIANNUAL REPORT | | |
Calamos Total Return Bond Fund
CALAMOS TOTAL RETURN BOND FUND
INVESTMENT TEAM DISCUSSION
The Calamos Investment Management Team, led by Global Co-Chief Investment Officers John P. Calamos, Sr. and Gary D. Black, discusses the Fund’s performance, strategy and positioning during the six-month period ended April 30, 2013.
Q. What is the Fund’s investment strategy?
A. Calamos Total Return Bond Fund invests in the major sectors of the U.S. investment-grade bond market, including U.S. Treasurys, agency issues, mortgage-backed securities and corporate debt. The Fund emphasizes yield and capital preservation, and can provide income generation with a conservative total return approach, along with portfolio diversification when combined with other asset classes. To increase return potential and enhance risk management, we also can invest opportunistically in other sectors of the fixed-income market, such as high yield corporate bonds, international bonds and currencies.
Q. How has the Fund performed?
A. Since its inception on June 27, 2007, Calamos Total Return Bond Fund has returned an average annualized 5.83% (Class A shares at net asset value) versus a 6.30% return in the Barclays U.S. Aggregate Bond Index. For the six-month period ended April 30, 2013, the Fund returned 0.94% versus a return of 0.90% for the index.
Q. What factors influenced performance over the period?
A. During the reporting period, corporate bonds outperformed Treasury and agency bonds. As such, the Fund benefited from its heavy weighting to corporate bonds relative to the Barclays U.S. Aggregate Bond Index. Additionally, while the yield curve remained relatively flat during the period, the curve did experience a slight twist over the six months, as short-term yields declined from already low levels while longer-term yields notched higher.
We actively manage the Fund’s sensitivity to interest rates, particularly in regard to duration, which is a measure of a bond’s interest rate sensitivity, with higher durations indicating greater vulnerability to a change in rates. The Fund’s relatively lower duration—especially as it related to its positioning in Treasury securities—served the portfolio well during the period, as prices on lower-duration securities increased while yields fell. Sovereign bonds also posted stronger relative returns, benefiting the Fund’s positioning in this area as well. The portfolio’s slight allocation to convertible bonds detracted marginally from returns, as the underlying stocks of these convertibles underperformed during the period.
Q. How is the Fund positioned?
A. While recent economic data has alleviated concerns about a near-term rise in inflation, we still see risks—especially in longer-dated bonds—given recent Federal Reserve meeting minutes, which brought into question how much longer the Fed might be engaged in activities geared towards keeping longer-term rates low. As such, we have maintained a shorter average duration than the Barclays U.S. Aggregate Bond Index for the Fund, believing that longer-duration instruments are not adequately
| | |
| FUND NASDAQ SYMBOLS |
A Shares | | CTRAX |
B Shares | | CTXBX |
C Shares | | CTRCX |
I Shares | | CTRIX |
R Shares | | CTRRX |
| | | |
|
| FUND CUSIP NUMBERS |
A Shares | | 128119310 |
B Shares | | 128119294 |
C Shares | | 128119286 |
I Shares | | 128119278 |
R Shares | | 128119260 |
| | | |
FUND OBJECTIVE
Total return, consistent with preservation of capital and prudent investment management
INVESTMENT STRATEGY
| | > | | Invests across the broad sectors of the U.S. investment-grade bond market, including Treasurys and agencies, mortgage-backed securities, corporate debt, and asset-backed securities | |
| | > | | Opportunistic sector allocations provide greater flexibility in managing risk and reward | |
| | > | | Complementary allocations may include high yield securities, international bonds and currencies, among others | |
| | > | | Credit and interest rate exposure may be further tailored via derivative- based strategies | |
INVESTOR PROFILE
This Fund may be suitable for investors who seek:
| | > | | Broad exposure to the major sectors of the U.S. bond market | |
| | > | | A conservative total return approach, with an emphasis on yield and capital preservation | |
| | > | | Portfolio diversification when combined with other asset classes | |
Calamos Total Return Bond Fund
| | | | |
| ASSET ALLOCATION | |
Corporate Bonds | | | 79.7 | % |
U.S. Government and Agency Securities | | | 8.5 | |
Sovereign Bonds | | | 6.7 | |
Residential Mortgage Backed Securities | | | 2.6 | |
Cash and Receivables/
Payables | | | 2.0 | |
Convertible Bonds | | | 0.5 | |
Asset allocation is subject to change daily and is calculated as a percentage of net assets.
compensating investors for the increased risk should longer-term rates eventually rise. We do not see yields further out on the curve justifying the additional risk of the eventual rise in longer-term interest rates.
In this low interest-rate environment, we have also seen improvement in corporate balance sheets as issuers have wisely sought to refinance debt at very attractive rates. As such, we believe corporate credit is the most attractive segment of the bond market at present and remain significantly overweight this segment relative to the Barclays U.S. Aggregate Bond Index. Yields are relatively high, and we continue to find quality businesses that we see improving their balance sheet strength over time.
In the corporate bond area, the Fund has placed its heaviest emphasis in names within the industrials, information technology and health care sectors. The Fund’s lightest weights are in telecommunication services, utilities and consumer staples. As discussed, the Fund’s positioning in Treasurys and government-related securities has favored shorter maturities so as to reduce their sensitivity to rising rates, and to allow us the opportunity to reposition should more attractive yield opportunities present themselves in the near future.
Q. What is your outlook for fixed income and the Fund?
A. We maintain an optimistic economic outlook over the next several quarters. While we realize there may be shorter-term periods of volatility and near-term concerns, improving global GDP growth and continued accommodative monetary policy should continue. As mentioned in our positioning, we are seeing the best opportunities in fixed income as currently coming from the corporate sector. Here, we have witnessed multinational businesses exhibiting strong profit growth, as nearly three-quarters of the market recently beat earnings expectations.
In addition, many of the dislocations resulting from the 2008 credit crisis have been reduced, including a pick-up in loan growth, falling housing inventories and a reduction in delinquent loans. The Fed’s continued focus on the unemployment rate combined with the recent challenging jobs report suggests that the low interest rate environment is likely to persist. We have favored corporate bonds from issuers demonstrating strong or improving corporate balance sheets, growing cash flows and yields that still offer a real return to investors.
| | | | |
| 50 | | CALAMOS FAMILY OF FUNDS SEMIANNUAL REPORT | | |
Calamos Total Return Bond Fund
GROWTH OF $10,000: SINCE INCEPTION (6/27/07) THROUGH 4/30/13
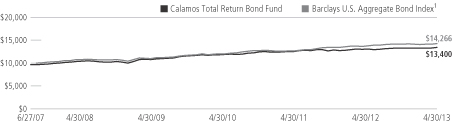
AVERAGE ANNUAL TOTAL RETURN† AS OF 4/30/13
| | | | | | | | | | | | | | | | | | | | |
| | | 6
MONTHS | | 1
YEAR | | 5
YEARS | | SINCE
INCEPTION |
Class A Shares – Inception 6/27/07 | | | | | | | | | | | | | | | | | | | | |
Without Sales Charge | | | | 0.94 | % | | | | 2.66 | % | | | | 5.18 | % | | | | 5.83 | % |
With Sales Charge | | | | -2.81 | | | | | -1.17 | | | | | 4.37 | | | | | 5.14 | |
Class B Shares – Inception 6/27/07 | | | | | | | | | | | | | | | | | | | | |
Without Sales Charge | | | | 0.57 | | | | | 1.90 | | | | | 4.40 | | | | | 5.04 | |
With Sales Charge | | | | -2.90 | | | | | -1.59 | | | | | 4.19 | | | | | 4.98 | |
Class C Shares – Inception 6/27/07 | | | | | | | | | | | | | | | | | | | | |
Without Sales Charge | | | | 0.47 | | | | | 1.81 | | | | | 4.39 | | | | | 5.03 | |
With Sales Charge | | | | -0.52 | | | | | 0.82 | | | | | 4.39 | | | | | 5.03 | |
Class I Shares – Inception 6/27/07 | | | | 0.97 | | | | | 2.83 | | | | | 5.43 | | | | | 6.09 | |
Class R Shares – Inception 6/27/07 | | | | 0.81 | | | | | 2.32 | | | | | 4.92 | | | | | 5.56 | |
Performance data quoted represents past performance, which is no guarantee of future results. Current performance may be lower or higher than the performance quoted. The principal value and investment return of an investment will fluctuate so that your shares, when redeemed, may be worth more or less than their original cost.
| † | Average annual total return measures net investment income and capital gain or loss from portfolio investments as an annualized average assuming reinvestment of dividends and capital gains distributions. Load-adjusted returns are adjusted for the maximum front-end sales load of 3.75% for Class A shares and returns for Class B and C shares have been adjusted for the contingent deferred sales charge (CDSC). |
NOTES:
The graph does not reflect the income taxes that you would pay on fund distributions or the redemption of fund shares. Fund performance includes reinvestment of dividends and adjustment for the maximum sales charge for Class A shares. The performance of other classes will vary from the performance of the class shown based on the difference in sales charges and fees paid by shareholders investing in different share classes.
| 1 | The Barclays U.S. Aggregate Bond Index is considered generally representative of the investment-grade bond market. Index data shown for the Since Inception Growth of $10,000 graph is from 6/30/07, since comparative index data is only available for full monthly periods. Source: Lipper, Inc. |
Index returns assume reinvestment of dividends and do not reflect deduction of fees and expenses. It is not possible to invest directly in an index.
Calamos High Income Fund
| | |
| FUND NASDAQ SYMBOLS |
A Shares | | CHYDX |
B Shares | | CAHBX |
C Shares | | CCHYX |
I Shares | | CIHYX |
R Shares | | CHYRX |
| | | |
|
| FUND CUSIP NUMBERS |
A Shares | | 128119815 |
B Shares | | 128119724 |
C Shares | | 128119799 |
I Shares | | 128119781 |
R Shares | | 128119377 |
| | | |
FUND OBJECTIVE
Highest level of current income obtainable with reasonable risk, with a secondary objective of capital gain where consistent with the Fund’s primary objective
INVESTMENT STRATEGY
| | > | | Conducts proprietary, in-depth credit analysis of individual issuers, taking a combination of quantitative and qualitative factors into consideration | |
| | > | | Seeks companies with respectable balance sheets that offer a good yield, sustainable growth and reliable long-term debt servicing | |
| | > | | Attempts to identify companies that have the potential for capital appreciation through credit upgrades, mergers and acquisitions, and special situations | |
| | > | | Dynamically blends straight high yield bonds, higher-yielding convertible and synthetic high yield securities to construct a diversified portfolio with a consistent risk/reward profile | |
INVESTOR PROFILE
This Fund may be suitable for investors who seek:
| | > | | A broader opportunity set of bonds and convertible securities designed to generate the highest yield potential and capital gain | |
| | > | | Risk management that employs stringent credit analysis | |
CALAMOS HIGH INCOME FUND
INVESTMENT TEAM DISCUSSION
The Calamos Investment Management Team, led by Global Co-Chief Investment Officers John P. Calamos, Sr. and Gary D. Black, discusses the Fund’s performance, strategy and positioning during the six-month period ended April 30, 2013.
Q. What is the Fund’s investment strategy?
A. Calamos High Income Fund invests in diversified portfolio of high yield bonds of U.S. and non-U.S. companies that have the potential for income and capital appreciation. The Fund offers higher income, compared with investment grade securities and government bonds, and invests in the higher-quality portion of the high yield market. We emphasize companies that offer relatively better balance sheets, reliable cash flows and debt servicing, and the potential for credit upgrades. We also have the flexibility to include investment-grade bonds in the Fund, which we believe provides us with additional advantages in tailoring the risk and reward characteristics of the Fund.
Q. How has the Fund performed?
A. Because we believe high yield funds are best utilized within asset allocations as long-term investments, we encourage investors to evaluate performance over longer time periods. Since its inception on August 2, 1999, Calamos High Income Fund has returned 7.13% on an annualized basis (Class A shares at net asset value), versus an 8.01% gain in the Credit Suisse High Yield Index. For the six-month period ended April 30, 2013, the Fund earned 6.60% versus 7.21% for the Credit Suisse High Yield Index.
Q. What factors influenced performance over the period?
A. During the reporting period, high yield bonds performed strongly as high yield credit spreads tightened by 108 basis points, as measured by J.P. Morgan. As credit spreads narrowed, yields on high yield bonds fell to historic lows. Credit quality was also a significant factor as the lower credit tiers outperformed. Within the Credit Suisse High Yield Index, CCC-rated securities and B-rated securities were up 10.5% and 7.8%, respectively, while the BB and BBB areas were up 5.7% and 4.2%. The Fund’s return was supported by strong security selection rather than a reliance on the lowest credit quality issues which rallied the most as noted above.
From an economic sector perspective, the best performing sectors within the Credit Suisse High Yield Index included information technology (+9.4%) and consumer staples (+7.9%), while sectors lagging the index return included utilities (+6.2%) and telecommunication services (+6.3%).
The Fund’s security selection within the financials sector supported performance, particularly our holdings within the asset management industry.
Fund returns were also enhanced by the performance of selections in the telecommunication services sector, where holdings within the wireless telecommunications industry outperformed.
Selections in the materials sector hindered returns, as the Fund’s relatively higher allocation to holdings in the gold mining industry held back performance. Selections in the energy sector also hampered performance, as Fund holdings in the oil-and-gas equipment and services industry lagged.
| | | | |
| 52 | | CALAMOS FAMILY OF FUNDS SEMIANNUAL REPORT | | |
Calamos High Income Fund
Q. How is the Fund positioned?
A. We continue to emphasize mid-grade corporate credits in the Fund, as we believe that they offer compelling yields and capital appreciation potential at levels of risk we consider appropriate. In the current environment, we have also been selective in regard to the most speculative issues, reflecting our concerns that these credits may not presently provide adequate compensation for their incremental yield pick-ups. As such, the Fund has maintained a higher average credit quality relative to the Credit Suisse High Yield Index. During the six-month period, we favored credits with reliable debt servicing for the Fund.
Q. What is your outlook for high yield securities and the Fund?
A. As we look forward, our global economic outlook is one of cautious optimism. We believe the U.S. is positioned to continue on its slow and steady recovery. Sustained improvements in the housing sector and rising equity markets have contributed to consumer confidence, the impacts of which are rippling though to other areas of the economy. Job growth has continued to move in the right direction, although the pace has been discouraging and uneven. Many high yield issuers look well positioned for the future, having taken advantage of low rates to refinance and push out debt obligations and bring down borrowing costs. Overall, we see a supportive environment for a number of well-run issuers of higher income securities.
We also believe that mid-grade corporate credits also look far more compelling than longer-dated government bonds. Although we cannot predict when rates will move upward (particularly as unemployment numbers are still notably above the Federal Reserve’s hurdle), history has shown that rate increases can happen very quickly. Thus, we believe moderate duration positioning remains essential.
Given current spread levels, we expect the performance of high income strategies to reflect bottom-up fundamental considerations, rather than a further narrowing of spreads. We believe this is an environment suited to our approach, and we remain committed to our course of adding value through rigorous credit research.
| | | | |
| SECTOR WEIGHTINGS | |
Consumer Discretionary | | | 20.1 | % |
Industrials | | | 17.4 | |
Energy | | | 16.2 | |
Information Technology | | | 11.8 | |
Materials | | | 7.7 | |
Health Care | | | 7.6 | |
Financials | | | 6.7 | |
Consumer Staples | | | 4.3 | |
Utilities | | | 2.6 | |
Telecommunication Services | | | 2.3 | |
Sector weightings are subject to change daily and are calculated as a percentage of net assets. The table excludes cash or cash equivalents, any government/sovereign bonds or broad based index hedging securities the Fund may hold.
Calamos High Income Fund
ANNUALIZED RETURN: SINCE INCEPTION (8/2/99) THROUGH 4/30/13
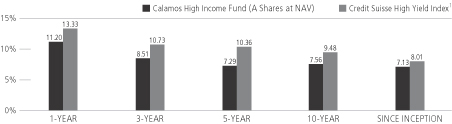
Performance data quoted represents past performance, which is no guarantee of future results. Current performance may be lower or higher than the performance quoted.
The principal value and investment return of an investment will fluctuate so that your shares, when redeemed, may be worth more or less than their original cost. You can obtain performance data current to the most recent month end by visiting www.calamos.com. Average annual total return measures net investment income and capital gain or loss from portfolio investments as an annualized average. All performance shown assumes reinvestment of dividends and capital gains distributions. Performance is for the Fund’s Class A shares at net asset value and does not include the Fund’s maximum front-end sales charge of 4.75%—had it been included, the Fund’s return would have been lower. The Fund also offers Class B, Class C, Class I and Class R shares, the performance of which may vary. Performance shown reflects an expense reimbursement that improved results. Source: State Street Corporation and Mellon Analytical Solutions, LLC.
| | | | |
| 54 | | CALAMOS FAMILY OF FUNDS SEMIANNUAL REPORT | | |
Calamos High Income Fund
GROWTH OF $10,000: FOR 10-YEAR PERIOD ENDED 4/30/13
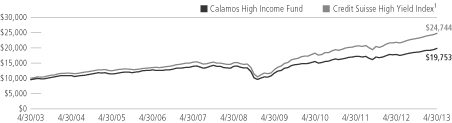
AVERAGE ANNUAL TOTAL RETURN† AS OF 4/30/13
| | | | | | | | | | | | | | | | |
| | | 6
MONTHS | | | 1
YEAR | | | 5
YEARS | | | 10 YEARS
OR ^SINCE
INCEPTION | |
Class A Shares – Inception 8/2/99 | | | | | | | | | | | | | | | | |
Without Sales Charge | | | 6.60 | % | | | 11.20 | % | | | 7.29 | % | | | 7.56 | % |
With Sales Charge | | | 1.58 | | | | 5.87 | | | | 6.26 | | | | 7.04 | |
Class B Shares – Inception 12/21/00 | | | | | | | | | | | | | | | | |
Without Sales Charge | | | 6.24 | | | | 10.37 | | | | 6.49 | | | | 6.94 | |
With Sales Charge | | | 1.24 | | | | 5.37 | | | | 6.18 | | | | 6.94 | |
Class C Shares – Inception 12/21/00 | | | | | | | | | | | | | | | | |
Without Sales Charge | | | 6.20 | | | | 10.38 | | | | 6.50 | | | | 6.76 | |
With Sales Charge | | | 5.20 | | | | 9.38 | | | | 6.50 | | | | 6.76 | |
Class I Shares – Inception 3/1/02 | | | 6.75 | | | | 11.47 | | | | 7.56 | | | | 7.83 | |
Class R Shares – Inception 3/1/07 | | | 6.45 | | | | 10.94 | | | | 7.04 | | | | 6.05^ | |
Performance data quoted represents past performance, which is no guarantee of future results. Current performance may be lower or higher than the performance quoted. The principal value and investment return of an investment will fluctuate so that your shares, when redeemed, may be worth more or less than their original cost.
| † | Average annual total return measures net investment income and capital gain or loss from portfolio investments as an annualized average assuming reinvestment of dividends and capital gains distributions. Performance shown reflects the effects of an expense reimbursement that improved results and was in effect until March 31, 2003. Load-adjusted returns are adjusted for the maximum front-end sales load of 4.75% for Class A shares and returns for Class B and C shares have been adjusted for the contingent deferred sales charge (CDSC). |
NOTES:
The graph does not reflect the income taxes that you would pay on fund distributions or the redemption of fund shares. Fund performance includes reinvestment of dividends and adjustment for the maximum sales charge for Class A shares. The performance of other classes will vary from the performance of the class shown based on the difference in sales charges and fees paid by shareholders investing in different share classes.
| 1 | The Credit Suisse High Yield Index is an unmanaged index of high yield debt securities. Index data shown is from 7/31/99, since comparative index data is only available for full monthly periods. Source: Mellon Analytical Solutions, LLC |
Index returns assume reinvestment of dividends and do not reflect deduction of fees and expenses. It is not possible to invest directly in an index.
Calamos Market Neutral Income Fund
| | |
| FUND NASDAQ SYMBOLS |
A Shares | | CVSIX |
B Shares | | CAMNX |
C Shares | | CVSCX |
I Shares | | CMNIX |
R Shares | | CVSRX |
| | | |
|
| FUND CUSIP NUMBERS |
A Shares | | 128119203 |
B Shares | | 128119757 |
C Shares | | 128119849 |
I Shares | | 128119880 |
R Shares | | 128119351 |
| | | |
FUND OBJECTIVE
High current income consistent with stability of principal
INVESTMENT STRATEGY
| | > | | Dynamically combines complementary income-producing strategies such as convertible arbitrage and covered call writing, varying the emphasis of each based on market conditions | |
| | > | | The convertible arbitrage strategy invests in convertible securities and sells short underlying stocks to generate income and hedge against equity market risk | |
| | > | | Through covered call writing, income is generated by writing (selling) options on the portfolio’s equities and market indexes | |
INVESTOR PROFILE
This Fund may be suitable for investors who seek:
| | > | | The potential for an attractive income stream with relative stability of principal | |
| | > | | A strategy designed to provide added diversification and reduced volatility | |
CALAMOS MARKET NEUTRAL INCOME FUND
INVESTMENT TEAM DISCUSSION
The Calamos Investment Management Team, led by Global Co-Chief Investment Officers John P. Calamos, Sr. and Gary D. Black, discusses the Fund’s performance, strategy and positioning during the six-month period ended April 30, 2013.
Q. What is the Fund’s investment strategy?
A. Calamos Market Neutral Income Fund primarily utilizes two complementary income producing strategies, covered call writing and convertible arbitrage. The Fund seeks to deliver steady and positive returns, regardless of whether the equity market is rising or falling.
In the convertible arbitrage strategy, we invest in convertible securities and short sell the convertibles’ underlying equities to generate income and hedge against risk. Through covered call writing, we seek to enhance Fund returns by selling (“writing”) options on the Fund’s equities and market indexes. We believe that both strategies are advantageous through full market cycles, but we vary the allocation to each strategy based on our assessment of the market environment. The aim of this dynamic allocation approach is to provide attractive returns with a lower risk profile over full market cycles.
Q. How has the Fund performed?
A. Because we believe alternative funds are best utilized within asset allocations as long-term investments, we encourage investors to evaluate performance over longer time periods. Since its inception on September 4, 1990, the Fund has returned 6.93% on an annualized basis (Class A shares at net asset value). For the same period, the Barclays U.S. Government/Credit Bond Index has earned 7.01%, while the Citigroup 30-Day U.S. Treasury Bill Index has earned 3.01%.
For the six-month period ended April 30, 2013, the Fund earned 2.40% versus a 1.08% gain for the Barclays U.S. Government/Credit Bond Index and a 0.03% return for the Citigroup 30-Day U.S. Treasury Bill Index.
Q. How did the strategies on the whole contribute to performance?
A. The covered call and convertible arbitrage strategies both contributed positively to Fund performance during the reporting period. The rising equity market and falling volatility during the period was especially favorable to the covered call strategy, which outperformed convertible arbitrage.
Q. How did the covered call strategy contribute?
A. The covered call strategy benefited from strong equity returns over the six-month period, as reflected by the 14.42% gain in the S&P 500 Index. The strong equity market supported the return of the Fund’s equity basket, which is managed to closely track the S&P 500 Index’s performance. While calls were written approximately 3% to 5% out of the money and capped much of the upside performance of the equity basket, the strategy also benefited from the premiums collected on the written calls.
| | | | |
| 56 | | CALAMOS FAMILY OF FUNDS SEMIANNUAL REPORT | | |
Calamos Market Neutral Income Fund
Q. How did convertible arbitrage contribute to returns?
A. The convertible arbitrage strategy performed well and also benefited from the rising equity market during the period. The convertible market, as measured by the BofA Merrill Lynch U.S. Convertible Securities Index, was up 12.69% for the period. Credit spreads tightened during the period and helped support the bond portion of the convertibles. Two factors that provided a headwind to performance were declining volatility and the low interest rate environment. Declining volatility impacted the embedded option in the convertible, while the near-zero Fed Funds rate meant that there was no interest earned on the cash proceeds received from stocks sold short.
Q. Did the allocations to convertible arbitrage and covered call writing change over the period?
A. At the beginning of the six-month period, covered call writing reflected 44.8% of the portfolio, while convertible arbitrage reflected 55.2%. As of the end of the reporting period on April 30, 2013, the weighting was 47.1% for covered calls and 52.9% for convertible arbitrage. The slight increase in the allocation to covered calls was reflective of the strong equity market performance during the period, which, as noted above, benefited the covered call portion of the portfolio to a greater extent than it did convertible arbitrage.
Q. What is your outlook for the Fund?
A. We believe the Fund continues to provide investors with the opportunity for diversification, alternative asset allocation and potential yield in a low interest rate environment. While we are encouraged by recent positive economic trends in the U.S. and global markets, we continue to expect persistent choppiness in the markets. As the Fund derives benefits from volatility, we expect the current environment to be supportive for performance. Convertible arbitrage should benefit from continued “volatility in volatility,” as this type of environment provides several hedge rebalancing opportunities that will be supportive to the Fund. Spikes in volatility may also provide opportunities for the call writing strategy to capture higher call premiums.
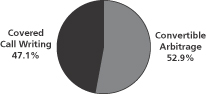
Calamos Market Neutral Income Fund
ANNUALIZED RETURN: SINCE INCEPTION (9/4/90) THROUGH 4/30/13
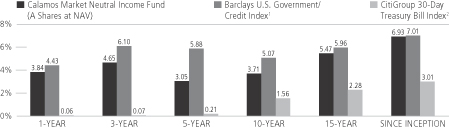
Performance data quoted represents past performance, which is no guarantee of future results. Current performance may be lower or higher than the performance quoted.
The principal value and investment return of an investment will fluctuate so that your shares, when redeemed, may be worth more or less than their original cost. You can obtain performance data current to the most recent month end by visiting www.calamos.com. Average annual total return measures net investment income and capital gain or loss from portfolio investments as an annualized average. All performance shown assumes reinvestment of dividends and capital gains distributions. Performance is for the Fund’s Class A shares at net asset value and does not include the Fund’s maximum front-end sales charge of 4.75%—had it been included, the Fund’s return would have been lower. The Fund also offers Class B, Class C, Class I and Class R shares, the performance of which may vary. Performance shown reflects an expense reimbursement that improved results. Source: State Street Corporation, Lipper, Inc., and Mellon Analytical Solutions, LLC.
| | | | |
| 58 | | CALAMOS FAMILY OF FUNDS SEMIANNUAL REPORT | | |
Calamos Market Neutral Income Fund
GROWTH OF $10,000: FOR 10-YEAR PERIOD ENDED 4/30/13
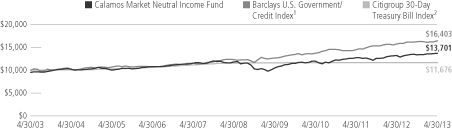
AVERAGE ANNUAL TOTAL RETURN† AS OF 4/30/13
| | | | | | | | | | | | | | | | | | | | |
| | | 6
MONTHS | | 1
YEAR | | 5
YEARS | | 10 YEARS
OR ^SINCE
INCEPTION |
Class A Shares – Inception 9/4/90 | | | | | | | | | | | | | | | | | | | | |
Without Sales Charge | | | | 2.40 | % | | | | 3.84 | % | | | | 3.05 | % | | | | 3.71 | % |
With Sales Charge | | | | -2.45 | | | | | -1.12 | | | | | 2.05 | | | | | 3.20 | |
Class B Shares – Inception 9/11/00 | | | | | | | | | | | | | | | | | | | | |
Without Sales Charge | | | | 2.00 | | | | | 3.10 | | | | | 2.28 | | | | | 3.09 | |
With Sales Charge | | | | -3.00 | | | | | -1.90 | | | | | 1.91 | | | | | 3.09 | |
Class C Shares – Inception 2/16/00 | | | | | | | | | | | | | | | | | | | | |
Without Sales Charge | | | | 1.97 | | | | | 3.07 | | | | | 2.28 | | | | | 2.93 | |
With Sales Charge | | | | 0.97 | | | | | 2.07 | | | | | 2.28 | | | | | 2.93 | |
Class I Shares – Inception 5/10/00 | | | | 2.47 | | | | | 4.05 | | | | | 3.31 | | | | | 3.97 | |
Class R Shares – Inception 3/1/07 | | | | 2.20 | | | | | 3.52 | | | | | 2.78 | | | | | 2.81 | ^ |
Performance data quoted represents past performance, which is no guarantee of future results. Current performance may be lower or higher than the performance quoted. The principal value and investment return of an investment will fluctuate so that your shares, when redeemed, may be worth more or less than their original cost.
| † | Average annual total return measures net investment income and capital gain or loss from portfolio investments as an annualized average assuming reinvestment of dividends and capital gains distributions. Performance shown reflects the effects of an expense reimbursement that improved results and was in effect until March 31, 2000. Load-adjusted returns are adjusted for the maximum front-end sales load of 4.75% for Class A shares and returns for Class B and C shares have been adjusted for the contingent deferred sales charge (CDSC). |
NOTES:
The graphs do not reflect the income taxes that you would pay on fund distributions or the redemption of fund shares. Fund performance includes reinvestment of dividends and adjustment for the maximum sales charge for Class A shares. The performance of other classes will vary from the performance of the class shown based on the difference in sales charges and fees paid by shareholders investing in different share classes.
| 1 | The Barclays U.S. Government/Credit Index is comprised of long-term government and investment-grade corporate debt securities and is generally considered representative of the performance of the broad U.S. bond market. Index data shown for the Annualized Returns Since Inception graph is from 8/31/90, since comparative index data is only available for full monthly periods. Source: Lipper, Inc. |
| 2 | The Citigroup 30-Day Treasury Bill Index is an unmanaged index generally considered representative of the performance of short-term money instruments. U.S. Treasury Bills are backed by the full faith and credit of the U.S. government and offer a guarantee as to the repayment of principal and interest at maturity. Index data shown for the Annualized Returns Since Inception graph is from 8/31/90, since comparative index data is only available for full monthly periods. Source: Mellon Analytical Solutions, LLC |
Index returns assume reinvestment of dividends and do not reflect deduction of fees and expenses. It is not possible to invest directly in an index.
Expense Overview
EXPENSE OVERVIEW
As a shareholder of a mutual fund, you incur two types of costs. You incur:
1) Transaction costs, including sales charges, or loads, on purchase payment and redemption fees.
2) Ongoing costs, including management fees, distribution and/or service (12b-1) fees and other fund expenses.
The examples in this report are based on an investment of $1,000 made at the beginning of the period and held for the entire period from November 1, 2012 to April 30, 2013. It is intended to help you understand the ongoing costs associated with investing in each mutual fund and to compare these costs with the ongoing costs of investing in other mutual funds.
There are two parts of each Fund’s chart:
Actual
In this part of the chart, you’ll see the actual expenses you would have paid on a $1,000 investment made at the beginning of the period and held for the entire period in each fund from November 1, 2012 to April 30, 2013, the period covered by this report. This chart also shows the actual returns, after expenses, you would have earned during that time. This chart can help you estimate your own expenses. For example, if you invested $8,600 in Class A shares of the fund, simply divide $8,600 by $1,000, then multiply that result by the figure in the Actual Expenses per $1,000 row. In this example, you would multiply 8.6 times the figure.
Hypothetical
In this part of the chart, you’ll see the hypothetical expenses you would have paid on a $1,000 investment from November 1, 2012 to April 30, 2013, and the hypothetical returns, after expenses, you would have earned during that time. The Securities and Exchange Commission (SEC) has established the guidelines for this chart, including the assumed 5% annual rate of return before expenses, which is what you’ll see in the chart. Note that this chart will not help you determine your own expenses, but will help you compare expenses of the fund you own to the expenses of another fund since the information for that fund should be calculated using the same assumptions.
Please note that the expenses shown in the chart are meant to highlight your ongoing costs only and do not include any transactional costs, such as sales charges (loads), redemption fees or exchange fees. Therefore, the second line of the chart is useful in comparing ongoing costs only and will not help you determine the relative total costs of owning different funds. In addition, if these transaction costs were included, your costs would have been higher.
| | | | |
| 60 | | CALAMOS FAMILY OF FUNDS SEMIANNUAL REPORT | | |
Expense Example
The actual and hypothetical examples shown assume a $1,000 investment at the beginning of the period, November 1, 2012 and held through April 30, 2013.
| | | | | | | | | | | | | | | | | | | | |
| | | CLASS A
SHARES | | | CLASS B
SHARES | | | CLASS C
SHARES | | | CLASS I
SHARES | | | CLASS R
SHARES | |
| CALAMOS GROWTH FUND | | | | | | | | | | | | | |
Actual Expenses per $1,000* | | $ | 6.66 | | | $ | 10.48 | | | $ | 10.43 | | | $ | 5.38 | | | $ | 7.88 | |
Actual – Ending Balance | | $ | 1,065.90 | | | $ | 1,061.90 | | | $ | 1,061.90 | | | $ | 1,067.20 | | | $ | 1,064.60 | |
| | | | |
Hypothetical Expenses per $1,000* | | $ | 6.51 | | | $ | 10.24 | | | $ | 10.19 | | | $ | 5.26 | | | $ | 7.70 | |
Hypothetical – Ending Value | | $ | 1,018.35 | | | $ | 1,014.63 | | | $ | 1,014.68 | | | $ | 1,019.59 | | | $ | 1,017.16 | |
| | | | |
Annualized expense ratio | | | 1.30% | | | | 2.05% | | | | 2.04% | | | | 1.05% | | | | 1.54% | |
| CALAMOS VALUE FUND | | | | | | | | | | | | | |
Actual Expenses per $1,000* | | $ | 6.09 | | | $ | 10.04 | | | $ | 10.05 | | | $ | 4.77 | | | $ | 7.41 | |
Actual – Ending Balance | | $ | 1,135.90 | | | $ | 1,131.80 | | | $ | 1,132.70 | | | $ | 1,137.10 | | | $ | 1,134.80 | |
| | | | |
Hypothetical Expenses per $1,000* | | $ | 5.76 | | | $ | 9.49 | | | $ | 9.49 | | | $ | 4.51 | | | $ | 7.00 | |
Hypothetical – Ending Value | | $ | 1,019.09 | | | $ | 1,015.37 | | | $ | 1,015.37 | | | $ | 1,020.33 | | | $ | 1,017.85 | |
| | | | |
Annualized expense ratio(1) | | | 1.15% | | | | 1.90% | | | | 1.90% | | | | 0.90% | | | | 1.40% | |
| CALAMOS FOCUS GROWTH FUND | | | | | | | | | | | | | |
Actual Expenses per $1,000* | | $ | 5.92 | | | $ | 9.76 | | | $ | 9.76 | | | $ | 4.64 | | | $ | 7.20 | |
Actual – Ending Balance | | $ | 1,076.70 | | | $ | 1,072.60 | | | $ | 1,072.60 | | | $ | 1,077.80 | | | $ | 1,075.20 | |
| | | | |
Hypothetical Expenses per $1,000* | | $ | 5.76 | | | $ | 9.49 | | | $ | 9.49 | | | $ | 4.51 | | | $ | 7.00 | |
Hypothetical – Ending Value | | $ | 1,019.09 | | | $ | 1,015.37 | | | $ | 1,015.37 | | | $ | 1,020.33 | | | $ | 1,017.85 | |
| | | | |
Annualized expense ratio(1) | | | 1.15% | | | | 1.90% | | | | 1.90% | | | | 0.90% | | | | 1.40% | |
| CALAMOS DISCOVERY GROWTH FUND | | | | | | | | | | | | | |
Actual Expenses per $1,000* | | $ | 7.71 | | | $ | 11.54 | | | $ | 11.53 | | | $ | 6.43 | | | $ | 8.98 | |
Actual – Ending Balance | | $ | 1,071.90 | | | $ | 1,067.90 | | | $ | 1,067.00 | | | $ | 1,073.20 | | | $ | 1,070.50 | |
| | | | |
Hypothetical Expenses per $1,000* | | $ | 7.50 | | | $ | 11.23 | | | $ | 11.23 | | | $ | 6.26 | | | $ | 8.75 | |
Hypothetical – Ending Value | | $ | 1,017.36 | | | $ | 1,013.64 | | | $ | 1,013.64 | | | $ | 1,018.60 | | | $ | 1,016.12 | |
| | | | |
Annualized expense ratio(1) | | | 1.50% | | | | 2.25% | | | | 2.25% | | | | 1.25% | | | | 1.75% | |
| CALAMOS INTERNATIONAL GROWTH FUND | | | | | | | | | | | | | |
Actual Expenses per $1,000* | | $ | 7.13 | | | $ | 10.94 | | | $ | 10.94 | | | $ | 5.87 | | | $ | 8.40 | |
Actual – Ending Balance | | $ | 1,054.90 | | | $ | 1,051.70 | | | $ | 1,051.70 | | | $ | 1,057.00 | | | $ | 1,053.70 | |
| | | | |
Hypothetical Expenses per $1,000* | | $ | 7.00 | | | $ | 10.74 | | | $ | 10.74 | | | $ | 5.76 | | | $ | 8.25 | |
Hypothetical – Ending Value | | $ | 1,017.85 | | | $ | 1,014.13 | | | $ | 1,014.13 | | | $ | 1,019.09 | | | $ | 1,016.61 | |
| | | | |
Annualized expense ratio(1) | | | 1.40% | | | | 2.15% | | | | 2.15% | | | | 1.15% | | | | 1.65% | |
| CALAMOS EVOLVING WORLD GROWTH FUND | | | | | | | | | | | | | |
Actual Expenses per $1,000* | | $ | 8.02 | | | $ | 11.78 | | | $ | 11.78 | | | $ | 6.76 | | | $ | 9.27 | |
Actual – Ending Balance | | $ | 1,034.30 | | | $ | 1,030.20 | | | $ | 1,030.20 | | | $ | 1,035.70 | | | $ | 1,032.90 | |
| | | | |
Hypothetical Expenses per $1,000* | | $ | 7.95 | | | $ | 11.68 | | | $ | 11.68 | | | $ | 6.71 | | | $ | 9.20 | |
Hypothetical – Ending Value | | $ | 1,016.91 | | | $ | 1,013.19 | | | $ | 1,013.19 | | | $ | 1,018.15 | | | $ | 1,015.67 | |
| | | | |
Annualized expense ratio | | | 1.59% | | | | 2.34% | | | | 2.34% | | | | 1.34% | | | | 1.84% | |
| CALAMOS GLOBAL EQUITY FUND | | | | | | | | | | | | | |
Actual Expenses per $1,000* | | $ | 7.08 | | | $ | 10.86 | | | $ | 10.86 | | | $ | 5.82 | | | $ | 8.35 | |
Actual – Ending Balance | | $ | 1,041.00 | | | $ | 1,037.40 | | | $ | 1,036.70 | | | $ | 1,042.40 | | | $ | 1,039.90 | |
| | | | |
Hypothetical Expenses per $1,000* | | $ | 7.00 | | | $ | 10.74 | | | $ | 10.74 | | | $ | 5.76 | | | $ | 8.25 | |
Hypothetical – Ending Value | | $ | 1,017.85 | | | $ | 1,014.13 | | | $ | 1,014.13 | | | $ | 1,019.09 | | | $ | 1,016.61 | |
| | | | |
Annualized expense ratio(1) | | | 1.40% | | | | 2.15% | | | | 2.15% | | | | 1.15% | | | | 1.65% | |
| *Expense | for all Fund Classes A, B, C, I and R, are equal to Fund’s annualized expense ratio, multiplied by the average value over the period, multiplied by 181/365. |
| (1) | Annualized Expense Ratios for Calamos Value Fund, Calamos Focus Growth Fund, Calamos Discovery Growth Fund, Calamos International Growth Fund and Calamos Global Equity Fund are adjusted to reflect fee waiver. |
Expense Example
The actual and hypothetical examples shown assume a $1,000 investment at the beginning of the period, November 1, 2012 and held through April 30, 2013.
| | | | | | | | | | | | | | | | | | | | |
| CALAMOS GROWTH AND INCOME FUND | | | | | | | | | | | | | |
Actual Expenses per $1,000* | | $ | 5.57 | | | $ | 5.42 | | | $ | 9.36 | | | $ | 4.31 | | | $ | 6.84 | |
Actual – Ending Balance | | $ | 1,043.60 | | | $ | 1,043.50 | | | $ | 1,039.50 | | | $ | 1,044.60 | | | $ | 1,042.20 | |
| | | | |
Hypothetical Expenses per $1,000* | | $ | 5.51 | | | $ | 5.36 | | | $ | 9.25 | | | $ | 4.26 | | | $ | 6.76 | |
Hypothetical – Ending Value | | $ | 1,019.34 | | | $ | 1,019.49 | | | $ | 1,015.62 | | | $ | 1,020.58 | | | $ | 1,018.10 | |
| | | | |
Annualized expense ratio | | | 1.10% | | | | 1.07% | | | | 1.85% | | | | 0.85% | | | | 1.35% | |
| CALAMOS GLOBAL GROWTH AND INCOME FUND | | | | | | | | | | | | | |
Actual Expenses per $1,000* | | $ | 7.20 | | | $ | 11.00 | | | $ | 11.00 | | | $ | 5.82 | | | $ | 8.46 | |
Actual – Ending Balance | | $ | 1,058.20 | | | $ | 1,053.50 | | | $ | 1,054.10 | | | $ | 1,059.30 | | | $ | 1,056.40 | |
| | | | |
Hypothetical Expenses per $1,000* | | $ | 7.05 | | | $ | 10.79 | | | $ | 10.79 | | | $ | 5.71 | | | $ | 8.30 | |
Hypothetical – Ending Value | | $ | 1,017.80 | | | $ | 1,014.08 | | | $ | 1,014.08 | | | $ | 1,019.14 | | | $ | 1,016.56 | |
| | | | |
Annualized expense ratio | | | 1.41% | | | | 2.16% | | | | 2.16% | | | | 1.14% | | | | 1.66% | |
| CALAMOS CONVERTIBLE FUND | | | | | | | | | | | | | |
Actual Expenses per $1,000* | | $ | 5.88 | | | $ | 9.76 | | | $ | 9.76 | | | $ | 4.58 | | | $ | 7.17 | |
Actual – Ending Balance | | $ | 1,097.70 | | | $ | 1,093.90 | | | $ | 1,093.30 | | | $ | 1,098.80 | | | $ | 1,096.10 | |
| | | | |
Hypothetical Expenses per $1,000* | | $ | 5.66 | | | $ | 9.39 | | | $ | 9.39 | | | $ | 4.41 | | | $ | 6.90 | |
Hypothetical – Ending Value | | $ | 1,019.19 | | | $ | 1,015.47 | | | $ | 1,015.47 | | | $ | 1,020.43 | | | $ | 1,017.95 | |
| | | | |
Annualized expense ratio | | | 1.13% | | | | 1.88% | | | | 1.88% | | | | 0.88% | | | | 1.38% | |
| CALAMOS TOTAL RETURN BOND FUND | | | | | | | | | | | | | |
Actual Expenses per $1,000* | | $ | 4.48 | | | $ | 8.21 | | | $ | 8.20 | | | $ | 3.24 | | | $ | 5.73 | |
Actual – Ending Balance | | $ | 1,009.40 | | | $ | 1,005.70 | | | $ | 1,004.70 | | | $ | 1,009.70 | | | $ | 1,008.10 | |
| | | | |
Hypothetical Expenses per $1,000* | | $ | 4.51 | | | $ | 8.25 | | | $ | 8.25 | | | $ | 3.26 | | | $ | 5.76 | |
Hypothetical – Ending Value | | $ | 1,020.33 | | | $ | 1,016.61 | | | $ | 1,016.61 | | | $ | 1,021.57 | | | $ | 1,019.09 | |
| | | | |
Annualized expense ratio(1) | | | 0.90% | | | | 1.65% | | | | 1.65% | | | | 0.65% | | | | 1.15% | |
| CALAMOS HIGH INCOME FUND | | | | | | | | | | | | | |
Actual Expenses per $1,000* | | $ | 5.99 | | | $ | 9.82 | | | $ | 9.82 | | | $ | 4.72 | | | $ | 7.27 | |
Actual – Ending Balance | | $ | 1,066.00 | | | $ | 1,062.40 | | | $ | 1,062.00 | | | $ | 1,067.50 | | | $ | 1,064.50 | |
| | | | |
Hypothetical Expenses per $1,000* | | $ | 5.86 | | | $ | 9.59 | | | $ | 9.59 | | | $ | 4.61 | | | $ | 7.10 | |
Hypothetical – Ending Value | | $ | 1,018.99 | | | $ | 1,015.27 | | | $ | 1,015.27 | | | $ | 1,020.23 | | | $ | 1,017.75 | |
| | | | |
Annualized expense ratio | | | 1.17% | | | | 1.92% | | | | 1.92% | | | | 0.92% | | | | 1.42% | |
| CALAMOS MARKET NEUTRAL INCOME FUND | | | | | | | | | | | | | |
Actual Expenses per $1,000* | | $ | 6.67 | | | $ | 10.47 | | | $ | 10.42 | | | $ | 5.37 | | | $ | 8.02 | |
Actual – Ending Balance | | $ | 1,024.00 | | | $ | 1,020.00 | | | $ | 1,019.70 | | | $ | 1,024.70 | | | $ | 1,022.00 | |
| | | | |
Hypothetical Expenses per $1,000* | | $ | 6.66 | | | $ | 10.44 | | | $ | 10.39 | | | $ | 5.36 | | | $ | 8.00 | |
Hypothetical – Ending Value | | $ | 1,018.20 | | | $ | 1,014.43 | | | $ | 1,014.48 | | | $ | 1,019.49 | | | $ | 1,016.86 | |
| | | | |
Annualized expense ratio(2) | | | 1.33% | | | | 2.09% | | | | 2.08% | | | | 1.07% | | | | 1.60% | |
| * | Expense for all Fund Classes A, B, C, I and R, are equal to Fund’s annualized expense ratio, multiplied by the average value over the period, multiplied by 181/365. |
| (1) | Annualized Expense Ratios for Calamos Total Return Bond Fund are adjusted to reflect fee waiver. |
| (2) | Includes 0.21% related to dividend expense for short positions. |
| | | | |
| 62 | | CALAMOS FAMILY OF FUNDS SEMIANNUAL REPORT | | |
Growth Fund Schedule of Investments April 30, 2013 (Unaudited)
| | | | | | | | | | |
NUMBER OF
SHARES | | | | | | | VALUE | |
| | COMMON STOCKS (99.2%) | |
| | | | | | Consumer Discretionary (19.0%) | |
| | 696,750 | | | | | Amazon.com, Inc.#~ | | $ | 176,842,117 | |
| | 31,300 | | | | | AutoZone, Inc.# | | | 12,804,517 | |
| | 192,271 | | | CHF | | Compagnie Financière Richemont, SA | | | 15,560,242 | |
| | 740,000 | | | | | Expedia, Inc.~ | | | 41,321,600 | |
| | 850,000 | | | | | Gap, Inc. | | | 32,291,500 | |
| | 692,000 | | | | | Home Depot, Inc. | | | 50,758,200 | |
| | 1,110,000 | | | | | Las Vegas Sands Corp. | | | 62,437,500 | |
| | 425,000 | | | | | Lululemon Athletica, Inc.# | | | 32,355,250 | |
| | 1,690,000 | | | | | Michael Kors Holdings, Ltd.# | | | 96,228,600 | |
| | 105,000 | | | | | Mohawk Industries, Inc.# | | | 11,642,400 | |
| | 488,000 | | | | | Nike, Inc. - Class B | | | 31,036,800 | |
| | 29,400 | | | | | NVR, Inc.# | | | 30,282,000 | |
| | 326,841 | | | | | Polaris Industries, Inc. | | | 28,170,426 | |
| | 163,200 | | | | | Priceline.com, Inc.# | | | 113,585,568 | |
| | 247,000 | | | | | Scripps Networks Interactive, Inc. - Class A | | | 16,445,260 | |
| | 2,055,000 | | | | | Starbucks Corp. | | | 125,026,200 | |
| | 100,000 | | | | | Whirlpool Corp. | | | 11,428,000 | |
| | 609,559 | | | | | Williams-Sonoma, Inc. | | | 32,721,127 | |
| | | | | | | | | | |
| | | | | | | | | 920,937,307 | |
| | | | | | | | | | |
| | | | | | Consumer Staples (5.6%) | |
| | 770,000 | | | | | Coca-Cola Company | | | 32,594,100 | |
| | 2,700,000 | | | | | Companhia de Bebidas das Americas | | | 113,454,000 | |
| | 263,000 | | | | | Costco Wholesale Corp. | | | 28,517,090 | |
| | 415,000 | | | | | Hain Celestial Group, Inc.# | | | 27,078,750 | |
| | 174,000 | | | | | Mead Johnson Nutrition Company | | | 14,109,660 | |
| | 316,198 | | | | | Philip Morris International, Inc. | | | 30,225,367 | |
| | 435,000 | | | GBP | | SABMiller, PLC | | | 23,471,405 | |
| | | | | | | | | | |
| | | | | | | | | 269,450,372 | |
| | | | | | | | | | |
| | | | | | Energy (6.6%) | |
| | 865,000 | | | | | Cameron International Corp.# | | | 53,240,750 | |
| | 565,000 | | | | | Continental Resources, Inc.# | | | 45,154,800 | |
| | 568,000 | | | | | EOG Resources, Inc. | | | 68,818,880 | |
| | 817,500 | | | | | National Oilwell Varco, Inc. | | | 53,317,350 | |
| | 1,355,000 | | | | | Schlumberger, Ltd. | | | 100,852,650 | |
| | | | | | | | | | |
| | | | | | | | | 321,384,430 | |
| | | | | | | | | | |
| | | | | | Financials (4.8%) | |
| | 365,466 | | | | | American Express Company | | | 25,001,529 | |
| | 1,600,000 | | | | | Blackstone Group, LP | | | 32,880,000 | |
| | 357,000 | | | | | Discover Financial Services | | | 15,615,180 | |
| | 600,000 | | | | | IntercontinentalExchange, Inc.# | | | 97,758,000 | |
| | 375,000 | | | | | Lazard, Ltd. | | | 12,712,500 | |
| | 565,000 | | | | | Raymond James Financial, Inc. | | | 23,402,300 | |
| | 385,000 | | | | | T. Rowe Price Group, Inc. | | | 27,912,500 | |
| | | | | | | | | | |
| | | | | | | | | 235,282,009 | |
| | | | | | | | | | |
| | | | | | | | | | |
NUMBER OF
SHARES | | | | | | | VALUE | |
| | | | | | | | | | |
| | | | | | Health Care (12.6%) | |
| | 118,500 | | | | | Biogen Idec, Inc.# | | $ | 25,943,205 | |
| | 390,932 | | | | | Celgene Corp.# | | | 46,157,341 | |
| | 1,069,000 | | | | | Cerner Corp.# | | | 103,447,130 | |
| | 160,000 | | | | | Covance, Inc.# | | | 11,929,600 | |
| | 2,725,000 | | | | | Gilead Sciences, Inc.# | | | 137,994,000 | |
| | 49,500 | | | | | Intuitive Surgical, Inc.# | | | 24,368,355 | |
| | 632,000 | | | | | Jazz Pharmaceuticals, PLC# | | | 36,877,200 | |
| | 1,150,000 | | | | | Mylan, Inc.# | | | 33,476,500 | |
| | 500,000 | | | | | Novo Nordisk, A/S | | | 88,315,000 | |
| | 179,048 | | | DKK | | Novo Nordisk, A/S - Class B | | | 31,516,894 | |
| | 460,000 | | | | | Pacira Pharmaceuticals, Inc.# | | | 13,280,200 | |
| | 257,000 | | | | | Regeneron Pharmaceuticals, Inc.# | | | 55,290,980 | |
| | | | | | | | | | |
| | | | | | | | | 608,596,405 | |
| | | | | | | | | | |
| | | | | | Industrials (13.6%) | |
| | 2,850,000 | | | CHF | | ABB, Ltd.# | | | 64,629,176 | |
| | 1,043,000 | | | | | AGCO Corp. | | | 55,539,750 | |
| | 150,000 | | | | | Allegiant Travel Company | | | 13,485,000 | |
| | 440,000 | | | | | Caterpillar, Inc.~ | | | 37,254,800 | |
| | 695,000 | | | | | Chicago Bridge & Iron Company, NV | | | 37,384,050 | |
| | 1,054,000 | | | | | Dover Corp. | | | 72,704,920 | |
| | 1,249,000 | | | | | Eaton Corp. | | | 76,701,090 | |
| | 108,000 | | | | | Flowserve Corp. | | | 17,076,960 | |
| | 667,300 | �� | | | | Fluor Corp. | | | 38,022,754 | |
| | 510,000 | | | | | Jacobs Engineering Group, Inc.# | | | 25,744,800 | |
| | 235,000 | | | | | Kansas City Southern | | | 25,631,450 | |
| | 340,000 | | | | | Kirby Corp.# | | | 25,462,600 | |
| | 675,000 | | | | | Manitowoc Company, Inc. | | | 12,663,000 | |
| | 217,000 | | | | | MSC Industrial Direct Company, Inc. - Class A | | | 17,099,600 | |
| | 380,000 | | | | | Rockwell Automation, Inc. | | | 32,216,400 | |
| | 233,000 | | | | | Roper Industries, Inc. | | | 27,878,450 | |
| | 262,000 | | | | | Union Pacific Corp. | | | 38,765,520 | |
| | 460,000 | | | | | United Technologies Corp. | | | 41,993,400 | |
| | | | | | | | | | |
| | | | | | | | | 660,253,720 | |
| | | | | | | | | | |
| | | | | | Information Technology (36.1%) | |
| | 1,468,000 | | | | | Accenture, PLC - Class A~ | | | 119,553,920 | |
| | 535,850 | | | | | Apple, Inc.~ | | | 237,247,587 | |
| | 1,676,202 | | | | | Aruba Networks, Inc.# | | | 37,697,783 | |
| | 1,436,000 | | | | | Cognizant Technology Solutions Corp. - Class A# | | | 93,052,800 | |
| | 585,000 | | | | | CommVault Systems, Inc.# | | | 43,020,900 | |
| | 1,529,000 | | | | | eBay, Inc.#~ | | | 80,104,310 | |
| | 3,350,000 | | | | | Facebook, Inc.# | | | 92,996,000 | |
| | 315,000 | | | | | FleetCor Technologies, Inc.# | | | 24,223,500 | |
| | 242,050 | | | | | Google, Inc.# | | | 199,587,168 | |
| | 310,000 | | | | | LinkedIn Corp. - Class A# | | | 59,547,900 | |
| | 260,000 | | | | | Manhattan Associates, Inc.# | | | 18,254,600 | |
| | | | | | |
| See accompanying Notes to Schedule of Investments | | www.calamos.com | | | 63 | |
Growth Fund Schedule of Investments April 30, 2013 (Unaudited)
| | | | | | | | | | |
NUMBER OF
SHARES | | | | | | | VALUE | |
| | 273,000 | | | | | MasterCard, Inc. - Class A | | $ | 150,949,890 | |
| | 160,000 | | | | | MAXIMUS, Inc. | | | 12,750,400 | |
| | 814,000 | | | | | Oracle Corp. | | | 26,682,920 | |
| | 255,000 | | | | | Palo Alto Networks, Inc.# | | | 13,795,500 | |
| | 2,212,000 | | | | | QUALCOMM, Inc. | | | 136,303,440 | |
| | 2,355,000 | | | | | Salesforce.com, Inc.#~ | | | 96,814,050 | |
| | 43,100 | | | KRW | | Samsung Electronics Company, Ltd. | | | 59,608,181 | |
| | 775,000 | | | | | SanDisk Corp.# | | | 40,641,000 | |
| | 1,580,750 | | | | | SAP, AG | | | 126,222,888 | |
| | 740,000 | | | | | Solarwinds, Inc.# | | | 37,629,000 | |
| | 2,160,000 | | | | | Taiwan Semiconductor Manufacturing Company, Ltd. | | | 41,212,800 | |
| | | | | | | | | | |
| | | | | | | | | 1,747,896,537 | |
| | | | | | | | | | |
| | | | | | Materials (0.9%) | |
| | 242,000 | | | | | Eastman Chemical Company | | | 16,129,300 | |
| | 295,000 | | | | | Rock Tenn Company - Class A | | | 29,541,300 | |
| | | | | | | | | | |
| | | | | | | | | 45,670,600 | |
| | | | | | | | | | |
| | | | | | TOTAL COMMON STOCKS
(Cost $3,715,053,578) | | | 4,809,471,380 | |
| | | | | | | | | | |
| | | | | | | | | | |
| | SHORT TERM INVESTMENT (0.2%) | �� |
| | 7,239,144 | | | | | Fidelity Prime Money Market Fund - Institutional Class
(Cost $7,239,144) | | | 7,239,144 | |
| | | | | | | | | | |
| TOTAL INVESTMENTS (99.4%)
(Cost $3,722,292,722) | | | 4,816,710,524 | |
| | | | | | | | | | |
| |
| | OTHER ASSETS, LESS LIABILITIES (0.6%) | | | 29,519,969 | |
| | | | | | | | | | |
| |
| | NET ASSETS (100.0%) | | $ | 4,846,230,493 | |
| | | | | | | | | | |
FORWARD FOREIGN CURRENCY CONTRACTS
| | | | | | | | | | | | | | | | |
COUNTER
PARTY | | SHORT CONTRACTS | | SETTLEMENT DATE | | LOCAL CURRENCY | | | CURRENT VALUE | | | UNREALIZED
GAIN/LOSS | |
| JPMorgan Chase Bank | | Brazilian Real | | 07/18/13 | | | 214,616,000 | | | $ | 106,180,317 | | | $ | 918,840 | |
| Citibank N.A. | | British Pound Sterling | | 07/18/13 | | | 14,071,000 | | | | 21,847,140 | | | | (308,435 | ) |
| Goldman Sachs Capital Markets LP | | Danish Krone | | 07/18/13 | | | 687,055,000 | | | | 121,465,343 | | | | (745,185 | ) |
| Northern Trust Company | | European Monetary Unit | | 07/18/13 | | | 112,137,000 | | | | 147,754,107 | | | | (956,681 | ) |
| Citibank N.A. | | New Taiwanese Dollar | | 07/18/13 | | | 730,878,000 | | | | 24,790,079 | | | | (296,848 | ) |
| JPMorgan Chase Bank | | New Taiwanese Dollar | | 07/18/13 | | | 396,051,000 | | | | 13,433,344 | | | | (39,668 | ) |
| Northern Trust Company | | South Korean Won | | 07/18/13 | | | 61,020,892,000 | | | | 55,252,983 | | | | (960,069 | ) |
| JPMorgan Chase Bank | | Swiss Franc | | 07/18/13 | | | 4,611,000 | | | | 4,963,047 | | | | (90,359 | ) |
| UBS AG | | Swiss Franc | | 07/18/13 | | | 70,290,000 | | | | 75,656,598 | | | | (40,258 | ) |
| | | | | | | | | | | | | | | | |
| | | | | | | | | | | | | | $ | (2,518,663 | ) |
| | | | | | | | | | | | | | | | |
| | | | | | | | | | | | | | | | |
| COUNTERPARTY | | LONG CONTRACTS | | SETTLEMENT DATE | | LOCAL CURRENCY | | | CURRENT
VALUE | | | UNREALIZED
GAIN/LOSS | |
| Northern Trust Company | | Brazilian Real | | 07/18/13 | | | 11,640,000 | | | $ | 5,758,839 | | | $ | 23,153 | |
| Citibank N.A. | | Danish Krone | | 07/18/13 | | | 78,580,000 | | | | 13,892,260 | | | | 111,757 | |
| UBS AG | | European Monetary Unit | | 07/18/13 | | | 22,359,000 | | | | 29,460,696 | | | | 249,959 | |
| Northern Trust Company | | Swiss Franc | | 07/18/13 | | | 3,839,000 | | | | 4,132,105 | | | | 12,675 | |
| | | | | | | | | | | | | | | | |
| | | | | | | | | | | | | | $ | 397,544 | |
| | | | | | | | | | | | | | | | |
NOTES TO SCHEDULE OF INVESTMENTS
| # | Non-income producing security. |
| ~ | Security, or portion of security, is segregated as collateral (or potential collateral for future transactions) for written options. The aggregate value of such securities is $534,690. |
FOREIGN CURRENCY ABBREVIATIONS
| | |
| CHF | | Swiss Franc |
| DKK | | Danish Krone |
| GBP | | British Pound Sterling |
| KRW | | South Korean Won |
Note: Value for securities denominated in foreign currencies is shown in U.S. dollars.
| | | | |
| 64 | | CALAMOS FAMILY OF FUNDS SEMIANNUAL REPORT | | See accompanying Notes to Financial Statements |
Value Fund Schedule of Investments April 30, 2013 (Unaudited)
| | | | | | | | | | |
NUMBER OF
SHARES | | | | | | | VALUE | |
| | COMMON STOCKS (95.5%) | |
| | | | | | Consumer Discretionary (15.9%) | | | | |
| | 50,000 | | | | | Allison Transmission Holdings, Inc. | | $ | 1,140,500 | |
| | 3,050 | | | | | Amazon.com, Inc.# | | | 774,121 | |
| | 32,820 | | | | | Omnicom Group, Inc. | | | 1,961,651 | |
| | 29,800 | | | | | Scripps Networks Interactive, Inc. - Class A | | | 1,984,084 | |
| | 42,315 | | | | | Time Warner, Inc. | | | 2,529,591 | |
| | 31,275 | | | | | Walt Disney Company | | | 1,965,321 | |
| | 16,000 | | | | | Wynn Resorts, Ltd. | | | 2,196,800 | |
| | | | | | | | | | |
| | | | | | | | | 12,552,068 | |
| | | | | | | | | | |
| | | | | | Consumer Staples (5.6%) | | | | |
| | 40,500 | | | GBP | | Diageo, PLC | | | 1,236,773 | |
| | 5,900 | | | | | Diageo, PLC | | | 720,980 | |
| | 35,943 | | | | | Nu Skin Enterprises, Inc. - Class A | | | 1,823,388 | |
| | 35,017 | | | | | WhiteWave Foods Company# | | | 592,137 | |
| | | | | | | | | | |
| | | | | | | | | 4,373,278 | |
| | | | | | | | | | |
| | | | | | Energy (16.1%) | | | | |
| | 17,200 | | | | | Anadarko Petroleum Corp. | | | 1,457,872 | |
| | 50,000 | | | | | Baker Hughes, Inc. | | | 2,269,500 | |
| | 18,600 | | | | | Chevron Corp. | | | 2,269,386 | |
| | 36,400 | | | | | Exxon Mobil Corp. | | | 3,239,236 | |
| | 15,555 | | | | | National Oilwell Varco, Inc. | | | 1,014,497 | |
| | 33,330 | | | | | Noble Corp. | | | 1,249,875 | |
| | 32,095 | | | | | Seadrill, Ltd. | | | 1,235,337 | |
| | | | | | | | | | |
| | | | | | | | | 12,735,703 | |
| | | | | | | | | | |
| | | | | | Financials (26.7%) | | | | |
| | 54,850 | | | | | American International Group, Inc.# | | | 2,271,887 | |
| | 15,606 | | | | | Berkshire Hathaway, Inc. - Class B# | | | 1,659,230 | |
| | 60,000 | | | | | Citigroup, Inc. | | | 2,799,600 | |
| | 36,200 | | | | | Discover Financial Services | | | 1,583,388 | |
| | 44,530 | | | | | JPMorgan Chase & Company~ | | | 2,182,415 | |
| | 51,000 | | | | | MetLife, Inc. | | | 1,988,490 | |
| | 128,100 | | | | | Morgan Stanley | | | 2,837,415 | |
| | 82,750 | | | | | Och-Ziff Capital Management Group, LLC - Class A | | | 849,015 | |
| | 62,000 | | | | | The Carlyle Group, LP | | | 2,013,760 | |
| | 31,100 | | | | | Validus Holdings, Ltd. | | | 1,200,771 | |
| | 44,590 | | | | | Wells Fargo & Company | | | 1,693,528 | |
| | | | | | | | | | |
| | | | | | | | | 21,079,499 | |
| | | | | | | | | | |
| | | | | | Health Care (8.8%) | | | | |
| | 22,465 | | | | | Covidien, PLC | | | 1,434,165 | |
| | 14,568 | | | | | McKesson Corp. | | | 1,541,586 | |
| | 25,000 | | | | | Merck & Company, Inc.~ | | | 1,175,000 | |
| | 72,734 | | | | | Teva Pharmaceutical Industries, Ltd. | | | 2,784,985 | |
| | | | | | | | | | |
| | | | | | | | | 6,935,736 | |
| | | | | | | | | | |
| | | | | | | | | | |
NUMBER OF
SHARES | | | | | | | VALUE | |
| | | | | | | | | | |
| | | | | | Industrials (14.2%) | | | | |
| | 18,400 | | | | | Caterpillar, Inc. | | $ | 1,557,928 | |
| | 8,200 | | | | | FedEx Corp. | | | 770,882 | |
| | 98,580 | | | | | General Electric Company | | | 2,197,348 | |
| | 44,440 | | | | | Raytheon Company~ | | | 2,727,727 | |
| | 41,970 | | | | | URS Corp.~ | | | 1,843,323 | |
| | 76,565 | | | | | Xylem, Inc. | | | 2,124,679 | |
| | | | | | | | | | |
| | | | | | | | | 11,221,887 | |
| | | | | | | | | | |
| | | | | | Information Technology (3.3%) | | | | |
| | 109,000 | | | | | Intel Corp. | | | 2,610,550 | |
| | | | | | | | | | |
| | | | | | Materials (4.9%) | | | | |
| | 15,700 | | | | | Agrium, Inc. | | | 1,439,219 | |
| | 78,500 | | | | | Freeport-McMoRan Copper & Gold, Inc. | | | 2,388,755 | |
| | | | | | | | | | |
| | | | | | | | | 3,827,974 | |
| | | | | | | | | | |
| | | | | | TOTAL COMMON STOCKS
(Cost $70,597,209) | | | 75,336,695 | |
| | | | | | | | | | |
| | | | | | | | | | |
NUMBER OF
CONTRACTS | | | | | | | VALUE | |
| | PURCHASED OPTIONS (0.3%)# | |
| | | | | | Information Technology (0.0%) | | | | |
| | 525 | | | | | Cisco Systems, Inc.
Call, 05/18/13, Strike $21.00 | | | 29,400 | |
| | | | | | | | | | |
| | | | | | Materials (0.1%) | | | | |
| | 1,100 | | | | | Freeport-McMoRan Copper & Gold, Inc.
Call, 05/18/13, Strike $31.00 | | | 61,600 | |
| | | | | | | | | | |
| | | | | | Other (0.2%) | | | | |
| | | | | | SPDR S&P 500 ETF Trust | | | | |
| | 1,250 | | | | | Put, 05/18/13, Strike $156.00 | | | 75,000 | |
| | 1,250 | | | | | Put, 05/18/13, Strike $155.00 | | | 58,750 | |
| | | | | | | | | | |
| | | | | | | | | 133,750 | |
| | | | | | | | | | |
| | | | | | TOTAL PURCHASED OPTIONS
(Cost $314,102) | | | 224,750 | |
| | | | | | | | | | |
| | | | | | | | | | |
NUMBER OF
SHARES | | | | | | | VALUE | |
| | SHORT TERM INVESTMENT (4.4%) | |
| | 3,458,028 | | | | | Fidelity Prime Money Market Fund - Institutional Class
(Cost $3,458,028) | | | 3,458,028 | |
| | | | | | | | | | |
| TOTAL INVESTMENTS (100.2%)
(Cost $74,369,339) | | | 79,019,473 | |
| | | | | | | | | | |
| |
| | LIABILITIES, LESS OTHER ASSETS (-0.2%) | | | (123,866 | ) |
| | | | | | | | | | |
| |
| | NET ASSETS (100.0%) | | $ | 78,895,607 | |
| | | | | | | | | | |
| | | | | | |
| See accompanying Notes to Schedule of Investments | | www.calamos.com | | | 65 | |
Value Fund Schedule of Investments April 30, 2013 (Unaudited)
| | | | | | | | | | |
NUMBER OF
CONTRACTS | | | | | | | VALUE | |
| | WRITTEN OPTIONS (-0.3%)# | |
| | | | | | Consumer Staples (-0.1%) | | | | |
| | 215 | | | | | Whole Foods Market, Inc.
Put, 05/18/13, Strike $88.00 | | $ | (62,780 | ) |
| | | | | | | | | | |
| | | | | | Financials (0.0%) | | | | |
| | 700 | | | | | Morgan Stanley
Put, 05/18/13, Strike $21.00 | | | (11,550 | ) |
| | | | | | | | | | |
| | | | | | Health Care (0.0%) | | | | |
| | 200 | | | | | Johnson & Johnson
Put, 05/18/13, Strike $85.00 | | | (17,500 | ) |
| | | | | | | | | | |
| | | | | | Information Technology (-0.2%) | | | | |
| | 525 | | | | | Cisco Systems, Inc.
Put, 05/18/13, Strike $20.00 | | | (13,650 | ) |
| | 3,000 | | | | | Zynga, Inc. - Class A
Put, 05/18/13, Strike $3.50 | | | (111,000 | ) |
| | | | | | | | | | |
| | | | | | | | | (124,650 | ) |
| | | | | | | | | | |
| | | | | | Telecommunication Services (0.0%) | | | | |
| | 575 | | | | | Vodafone Group,
PLC Put, 05/18/13, Strike $30.00 | | | (25,875 | ) |
| | | | | | | | | | |
| | | | | | TOTAL WRITTEN OPTIONS
(Premium $359,488) | | | (242,355 | ) |
| | | | | | | | | | |
NOTES TO SCHEDULE OF INVESTMENTS
| # | Non-income producing security. |
| ~ | Security, or portion of security, is segregated as collateral (or potential collateral for future transactions) for written options. The aggregate value of such securities is $3,230,636. |
FOREIGN CURRENCY ABBREVIATIONS
| | |
| GBP | | British Pound Sterling |
Note: Value for securities denominated in foreign currencies is shown in U.S. dollars. The date on options represents the expiration date of the option contract. The option contract may be exercised at any date on or before the date shown.
| | | | |
| 66 | | CALAMOS FAMILY OF FUNDS SEMIANNUAL REPORT | | See accompanying Notes to Financial Statements |
Focus Growth Fund Schedule of Investments April 30, 2013 (Unaudited)
| | | | | | | | | | |
NUMBER OF
SHARES | | | | | | | VALUE | |
| | COMMON STOCKS (99.1%) | |
| | | | | | Consumer Discretionary (16.3%) | | | | |
| | 10,640 | | | | | Amazon.com, Inc.# | | $ | 2,700,538 | |
| | 19,625 | | | | | Michael Kors Holdings, Ltd.# | | | 1,117,448 | |
| | 24,150 | | | | | Nike, Inc. - Class B | | | 1,535,940 | |
| | 2,570 | | | | | Priceline.com, Inc.# | | | 1,788,694 | |
| | 38,170 | | | | | Starbucks Corp.~ | | | 2,322,263 | |
| | | | | | | | | | |
| | | | | | | | | 9,464,883 | |
| | | | | | | | | | |
| | | | | | Consumer Staples (7.1%) | | | | |
| | 30,200 | | | | | Coca-Cola Company~ | | | 1,278,366 | |
| | 39,000 | | | | | Companhia de Bebidas das Americas | | | 1,638,780 | |
| | 6,025 | | | | | Costco Wholesale Corp. | | | 653,291 | |
| | 6,000 | | | | | Philip Morris International, Inc. | | | 573,540 | |
| | | | | | | | | | |
| | | | | | | | | 4,143,977 | |
| | | | | | | | | | |
| | | | | | Energy (6.3%) | | | | |
| | 9,400 | | | | | Cameron International Corp.# | | | 578,570 | |
| | 4,700 | | | | | EOG Resources, Inc. | | | 569,452 | |
| | 12,850 | | | | | National Oilwell Varco, Inc. | | | 838,077 | |
| | 22,250 | | | | | Schlumberger, Ltd. | | | 1,656,067 | |
| | | | | | | | | | |
| | | | | | | | | 3,642,166 | |
| | | | | | | | | | |
| | | | | | Financials (4.9%) | | | | |
| | 47,500 | | | | | Blackstone Group, LP | | | 976,125 | |
| | 6,500 | | | | | Franklin Resources, Inc. | | | 1,005,290 | |
| | 12,300 | | | | | T. Rowe Price Group, Inc. | | | 891,750 | |
| | | | | | | | | | |
| | | | | | | | | 2,873,165 | |
| | | | | | | | | | |
| | | | | | Health Care (12.4%) | | | | |
| | 8,775 | | | | | Celgene Corp.# | | | 1,036,064 | |
| | 13,350 | | | | | Cerner Corp.# | | | 1,291,880 | |
| | 38,000 | | | | | Gilead Sciences, Inc.# | | | 1,924,320 | |
| | 16,770 | | | | | Novo Nordisk, A/S | | | 2,962,085 | |
| | | | | | | | | | |
| | | | | | | | | 7,214,349 | |
| | | | | | | | | | |
| | | | | | Industrials (11.5%) | | | | |
| | 23,160 | | | | | AGCO Corp. | | | 1,233,270 | |
| | 13,000 | | | | | Caterpillar, Inc.~ | | | 1,100,710 | |
| | 19,025 | | | | | Eaton Corp., PLC | | | 1,168,325 | |
| | 6,910 | | | | | MSC Industrial Direct Company, Inc. - Class A | | | 544,508 | |
| | 13,200 | | | | | Rockwell Automation, Inc. | | | 1,119,096 | |
| | 16,250 | | | | | United Technologies Corp. | | | 1,483,463 | |
| | | | | | | | | | |
| | | | | | | | | 6,649,372 | |
| | | | | | | | | | |
| | | | | | Information Technology (40.6%) | | | | |
| | 6,900 | | | | | Apple, Inc.~ | | | 3,054,975 | |
| | 35,350 | | | | | Aruba Networks, Inc.# | | | 795,021 | |
| | 21,075 | | | | | Cognizant Technology Solutions Corp. - Class A# | | | 1,365,660 | |
| | 40,600 | | | | | eBay, Inc.# | | | 2,127,034 | |
| | 63,850 | | | | | Facebook, Inc.# | | | 1,772,476 | |
| | | | | | | | | | |
NUMBER OF
SHARES | | | | | | | VALUE | |
| | 3,680 | | | | | Google, Inc.# | | $ | 3,034,417 | |
| | 5,420 | | | | | MasterCard, Inc. - Class A | | | 2,996,881 | |
| | 31,350 | | | | | QUALCOMM, Inc. | | | 1,931,787 | |
| | 39,160 | | | | | Salesforce.com, Inc.# | | | 1,609,868 | |
| | 1,030 | | | KRW | | Samsung Electronics Company, Ltd. | | | 1,424,511 | |
| | 29,900 | | | | | SAP, AG | | | 2,387,515 | |
| | 293,500 | | | TWD | | Taiwan Semiconductor Manufacturing Company, Ltd. | | | 1,089,305 | |
| | | | | | | | | | |
| | | | | | | | | 23,589,450 | |
| | | | | | | | | | |
| | | | | | TOTAL COMMON STOCKS
(Cost $46,320,400) | | | 57,577,362 | |
| | | | | | | | | | |
| | SHORT TERM INVESTMENT (0.5%) | |
| | 289,213 | | | | | Fidelity Prime Money Market Fund - Institutional Class
(Cost $289,213) | | | 289,213 | |
| | | | | | | | | | |
| TOTAL INVESTMENTS (99.6%)
(Cost $46,609,613) | | | 57,866,575 | |
| | | | | | | | | | |
| |
| | OTHER ASSETS, LESS LIABILITIES (0.4%) | | | 209,022 | |
| | | | | | | | | | |
| |
| | NET ASSETS (100.0%) | | $ | 58,075,597 | |
| | | | | | | | | | |
FORWARD FOREIGN CURRENCY CONTRACTS
| | | | | | | | | | | | | | | | |
COUNTER
PARTY | | SHORT CONTRACTS | | SETTLEMENT DATE | | LOCAL CURRENCY | | | CURRENT
VALUE | | | UNREALIZED
GAIN/LOSS | |
| JPMorgan Chase Bank | | Brazilian Real | | 07/18/13 | | | 3,061,000 | | | $ | 1,514,416 | | | $ | 13,105 | |
| Goldman Sachs Capital Markets LP | | Danish Krone | | 07/18/13 | | | 15,256,000 | | | | 2,697,128 | | | | (16,547 | ) |
| Northern Trust Company | | European Monetary Unit | | 07/18/13 | | | 1,695,000 | | | | 2,233,368 | | | | (14,461 | ) |
| Citibank N.A. | | New Taiwanese Dollar | | 07/18/13 | | | 27,438,000 | | | | 930,648 | | | | (11,144 | ) |
| JPMorgan Chase Bank | | New Taiwanese Dollar | | 07/18/13 | | | 2,270,000 | | | | 76,994 | | | | (227 | ) |
| Northern Trust Company | | South Korean Won | | 07/18/13 | | | 1,509,514,000 | | | | 1,366,829 | | | | (23,750 | ) |
| | | | | | | | | | | | | | | | |
| | | | | | | | | | | | | | $ | (53,024 | ) |
| | | | | | | | | | | | | | | | |
NOTES TO SCHEDULE OF INVESTMENTS
| # | Non-income producing security. |
| ~ | Security, or portion of security, is segregated as collateral (or potential collateral for future transactions) for written options. The aggregate value of such securities is $550,482. |
FOREIGN CURRENCY ABBREVIATIONS
| | |
| KRW | | South Korean Won |
| TWD | | New Taiwanese Dollar |
Note: Value for securities denominated in foreign currencies is shown in U.S. dollars.
| | | | | | |
| See accompanying Notes to Financial Statements | | www.calamos.com | | | 67 | |
Discovery Growth Fund Schedule of Investments April 30, 2013 (Unaudited)
| | | | | | | | | | |
NUMBER OF
SHARES | | | | | | | VALUE | |
| | COMMON STOCKS (97.1%) | |
| | | | | | Consumer Discretionary (16.1%) | | | | |
| | 4,200 | | | | | Buffalo Wild Wings, Inc.# | | $ | 378,000 | |
| | 4,900 | | | | | Deckers Outdoor Corp.# | | | 270,088 | |
| | 10,400 | | | | | Dollar Tree, Inc.# | | | 494,624 | |
| | 17,300 | | | | | Home Inns & Hotels Management, Inc.# | | | 431,116 | |
| | 18,400 | | | | | Lennar Corp. - Class A | | | 758,448 | |
| | 28,400 | | | | | LKQ Corp.# | | | 683,872 | |
| | 8,400 | | | | | Meritage Homes Corp.# | | | 409,836 | |
| | 4,400 | | | | | Monro Muffler Brake, Inc. | | | 181,984 | |
| | 1,600 | | | | | Netflix, Inc.# | | | 345,712 | |
| | 3,100 | | | | | PVH Corp. | | | 357,771 | |
| | 7,300 | | | | | Six Flags Entertainment Corp. | | | 531,951 | |
| | 4,000 | | | | | Ulta Salon Cosmetics & Fragrance, Inc.# | | | 350,600 | |
| | 29,600 | | | | | Winnebago Industries, Inc.# | | | 542,272 | |
| | | | | | | | | | |
| | | | | | | | | 5,736,274 | |
| | | | | | | | | | |
| | | | | | Consumer Staples (3.9%) | | | | |
| | 25,000 | | | | | Boulder Brands, Inc.# | | | 225,250 | |
| | 8,900 | | | | | Fresh Market, Inc.# | | | 364,277 | |
| | 12,400 | | | | | Hain Celestial Group, Inc.# | | | 809,100 | |
| | | | | | | | | | |
| | | | | | | | | 1,398,627 | |
| | | | | | | | | | |
| | | | | | Energy (8.7%) | | | | |
| | 33,200 | | | | | Basic Energy Services, Inc.# | | | 455,836 | |
| | 8,200 | | | | | CARBO Ceramics, Inc. | | | 579,330 | |
| | 5,500 | | | | | Dril-Quip, Inc.# | | | 460,405 | |
| | 16,000 | | | | | Gulfport Energy Corp.# | | | 835,040 | |
| | 60,272 | | | | | Key Energy Services, Inc.# | | | 358,016 | |
| | 5,800 | | | | | Oceaneering International, Inc. | | | 406,986 | |
| | | | | | | | | | |
| | | | | | | | | 3,095,613 | |
| | | | | | | | | | |
| | | | | | Financials (10.2%) | | | | |
| | 4,600 | | | | | Credit Acceptance Corp.# | | | 461,518 | |
| | 3,500 | | | | | First Cash Financial Services, Inc.# | | | 180,145 | |
| | 18,100 | | | | | Homeowners Choice, Inc. | | | 480,374 | |
| | 5,500 | | | | | Jones Lang LaSalle, Inc.~ | | | 544,610 | |
| | 15,600 | | | | | Lazard, Ltd. | | | 528,840 | |
| | 13,600 | | | | | Main Street Capital Corp. | | | 408,816 | |
| | 5,600 | | | | | Potlatch Corp. | | | 265,160 | |
| | 9,500 | | | | | Stifel Financial Corp.# | | | 306,090 | |
| | 14,300 | | | | | The Carlyle Group, LP | | | 464,464 | |
| | | | | | | | | | |
| | | | | | | | | 3,640,017 | |
| | | | | | | | | | |
| | | | | | Health Care (17.7%) | | | | |
| | 24,500 | | | | | Acadia Healthcare Company, Inc.# | | | 772,975 | |
| | 21,900 | | | | | Air Methods Corp. | | | 801,321 | |
| | 7,900 | | | | | BioMarin Pharmaceutical, Inc.# | | | 518,240 | |
| | 16,200 | | | | | Cepheid, Inc.# | | | 617,706 | |
| | 14,800 | | | | | Cyberonics, Inc.# | | | 642,616 | |
| | | | | | | | | | |
NUMBER OF
SHARES | | | | | | | VALUE | |
| | 17,200 | | | | | ICON, PLC# | | $ | 552,464 | |
| | 17,400 | | | | | Incyte Corp.# | | | 385,410 | |
| | 4,800 | | | | | Jazz Pharmaceuticals, PLC# | | | 280,080 | |
| | 6,800 | | | | | MEDNAX, Inc.# | | | 603,364 | |
| | 5,500 | | | | | Onyx Pharmaceuticals, Inc.# | | | 521,400 | |
| | 16,200 | | | | | Team Health Holdings, Inc.# | | | 603,936 | |
| | | | | | | | | | |
| | | | | | | | | 6,299,512 | |
| | | | | | | | | | |
| | | | | | Industrials (15.5%) | | | | |
| | 15,000 | | | | | ADT Corp.# | | | 654,600 | |
| | 7,700 | | | | | B/E Aerospace, Inc.# | | | 483,098 | |
| | 4,000 | | | | | Copa Holdings, SA | | | 502,320 | |
| | 13,000 | | | | | Fortune Brands Home & Security, Inc.# | | | 473,070 | |
| | 42,600 | | | | | H&E Equipment Services, Inc. | | | 867,336 | |
| | 12,500 | | | | | KEYW Holding Corp.# | | | 169,875 | |
| | 23,800 | | | | | On Assignment, Inc.# | | | 577,626 | |
| | 29,100 | | | | | Quanta Services, Inc.# | | | 799,668 | |
| | 14,400 | | | | | Terex Corp.# | | | 411,840 | |
| | 23,400 | | | | | USG Corp.# | | | 608,166 | |
| | | | | | | | | | |
| | | | | | | | | 5,547,599 | |
| | | | | | | | | | |
| | | | | | Information Technology (19.8%) | | | | |
| | 29,300 | | | | | Ciena Corp.# | | | 438,328 | |
| | 26,000 | | | | | Cirrus Logic, Inc.# | | | 502,060 | |
| | 21,800 | | | | | Ellie Mae, Inc.# | | | 567,236 | |
| | 2,325 | | | | | Equinix, Inc.# | | | 497,782 | |
| | 49,000 | | | | | Fairchild Semiconductor International, Inc.# | | | 632,100 | |
| | 28,600 | | | | | Finisar Corp.# | | | 367,224 | |
| | 39,750 | | | | | Fortinet, Inc.# | | | 713,910 | |
| | 18,600 | | | | | InterXion Holding, NV# | | | 465,558 | |
| | 5,250 | | | | | MAXIMUS, Inc. | | | 418,373 | |
| | 112,400 | | | | | MEMC Electronic Materials, Inc.# | | | 606,960 | |
| | 12,200 | | | | | NetEase, Inc. | | | 687,958 | |
| | 80,100 | | | | | ON Semiconductor Corp.# | | | 629,586 | |
| | 28,550 | | | | | TIBCO Software, Inc.# | | | 554,155 | |
| | | | | | | | | | |
| | | | | | | | | 7,081,230 | |
| | | | | | | | | | |
| | | | | | Materials (5.2%) | | | | |
| | 7,000 | | | | | Eagle Materials, Inc. | | | 474,250 | |
| | 34,400 | | | | | Horsehead Holding Corp.# | | | 368,080 | |
| | 5,500 | | | | | Rockwood Holdings, Inc. | | | 356,895 | |
| | 53,500 | | | | | Stillwater Mining Company# | | | 665,540 | |
| | | | | | | | | | |
| | | | | | | | | 1,864,765 | |
| | | | | | | | | | |
| | | | | | TOTAL COMMON STOCKS
(Cost $34,474,902) | | | 34,663,637 | |
| | | | | | | | | | |
| | | | |
| 68 | | CALAMOS FAMILY OF FUNDS SEMIANNUAL REPORT | | See accompanying Notes to Schedule of Investments |
Discovery Growth Fund Schedule of Investments April 30, 2013 (Unaudited)
| | | | | | | | | | |
NUMBER OF
SHARES | | | | | | | VALUE | |
| | SHORT TERM INVESTMENT (5.6%) | |
| | 2,019,642 | | | | | Fidelity Prime Money Market Fund - Institutional Class
(Cost $2,019,642) | | $ | 2,019,642 | |
| | | | | | | | | | |
| TOTAL INVESTMENTS (102.7%)
(Cost $36,494,544) | | | 36,683,279 | |
| | | | | | | | | | |
| |
| | LIABILITIES, LESS OTHER ASSETS (-2.7%) | | | (967,854 | ) |
| | | | | | | | | | |
| |
| | NET ASSETS (100.0%) | | $ | 35,715,425 | |
| | | | | | | | | | |
NOTES TO SCHEDULE OF INVESTMENTS
| # | Non-income producing security. |
| ~ | Security, or portion of security, is segregated as collateral (or potential collateral for future transactions) for written options. The aggregate value of such securities is $99,020. |
| | | | | | |
| See accompanying Notes to Financial Statements | | www.calamos.com | | | 69 | |
International Growth Fund Schedule of Investments April 30, 2013 (Unaudited)
| | | | | | | | | | |
NUMBER OF
SHARES | | | | | | | VALUE | |
| | COMMON STOCKS (95.6%) | |
| | | | | | Consumer Discretionary (9.1%) | |
| | 56,000 | | | EUR | | Adidas, AG | | $ | 5,855,765 | |
| | 70,000 | | | GBP | | ASOS, PLC# | | | 3,483,322 | |
| | 195,000 | | | CHF | | Compagnie Financière Richemont, SA | | | 15,781,096 | |
| | 2,300,000 | | | HKD | | MGM China Holdings, Ltd. | | | 5,429,350 | |
| | 100,000 | | | | | Michael Kors Holdings, Ltd.#~ | | | 5,694,000 | |
| | 113,700 | | | | | Signet Jewelers, Ltd. | | | 7,814,601 | |
| | 73,500 | | | CHF | | Swatch Group, AG | | | 42,168,459 | |
| | 2,600,000 | | | HKD | | Wynn Macau, Ltd.# | | | 7,907,799 | |
| | | | | | | | | | |
| | | | | | | | | 94,134,392 | |
| | | | | | | | | | |
| | | | | | Consumer Staples (11.0%) | |
| | 131,000 | | | EUR | | Anheuser-Busch InBev, NV | | | 12,585,249 | |
| | 890,100 | | | BRL | | Companhia de Bebidas das Americas | | | 36,836,326 | |
| | 77,000 | | | EUR | | Danone, SA | | | 5,872,650 | |
| | 350,000 | | | GBP | | Diageo, PLC | | | 10,688,157 | |
| | 168,000 | | | CHF | | Nestlé, SA | | | 11,980,501 | |
| | 250,000 | | | GBP | | SABMiller, PLC | | | 13,489,313 | |
| | 1,360,000 | | | HKD | | Tsingtao Brewery Company, Ltd. - Class H | | | 9,122,371 | |
| | 8,500,000 | | | HKD | | Want Want China Holdings, Ltd. | | | 13,503,155 | |
| | | | | | | | | | |
| | | | | | | | | 114,077,722 | |
| | | | | | | | | | |
| | | | | | Energy (9.5%) | |
| | 2,400,000 | | | HKD | | CNOOC, Ltd. | | | 4,495,368 | |
| | 286,000 | | | CAD | | Ensign Energy Services, Inc. | | | 4,814,690 | |
| | 931,000 | | | NOK | | Petroleum Geo-Services, ASA | | | 13,678,641 | |
| | 272,000 | | | | | Schlumberger, Ltd.~ | | | 20,244,960 | |
| | 356,000 | | | NOK | | StatoilHydro, ASA | | | 8,715,369 | |
| | 819,920 | | | NOK | | Subsea 7, SA | | | 17,700,667 | |
| | 118,000 | | | EUR | | Technip, SA | | | 12,656,722 | |
| | 465,000 | | | NOK | | TGS Nopec Geophysical Company, ASA | | | 16,720,076 | |
| | | | | | | | | | |
| | | | | | | | | 99,026,493 | |
| | | | | | | | | | |
| | | | | | Financials (7.2%) | |
| | 2,100,000 | | | GBP | | Aberdeen Asset Management, PLC | | | 14,658,647 | |
| | 16,000 | | | CAD | | Fairfax Financial Holdings, Ltd. | | | 6,418,582 | |
| | 675,000 | | | MXN | | Grupo Financiero Banorte SAB de CV | | | 5,086,557 | |
| | 157,958 | | | GBP | | Schroders, PLC | | | 5,736,862 | |
| | 925,000 | | | SGD | | Singapore Exchange, Ltd. | | | 5,632,621 | |
| | 480,000 | | | GBP | | Standard Chartered, PLC | | | 12,080,358 | |
| | 380,000 | | | SEK | | Svenska Handelsbanken, AB - A Shares | | | 17,323,502 | |
| | 876,000 | | | HKD | | Wharf Holdings, Ltd. | | | 7,824,520 | |
| | | | | | | | | | |
| | | | | | | | | 74,761,649 | |
| | | | | | | | | | |
| | | | | | Health Care (17.3%) | |
| | 404,000 | | | | | Covidien, PLC | | | 25,791,360 | |
| | 208,000 | | | AUD | | CSL, Ltd. | | | 13,593,411 | |
| | | | | | | | | | |
NUMBER OF
SHARES | | | | | | | VALUE | |
| | 8,872,000 | | | MXN | | Genomma Lab Internacional, SAB de CV# | | $ | 19,158,136 | |
| | 203,000 | | | | �� | Jazz Pharmaceuticals, PLC# | | | 11,845,050 | |
| | 2,625 | | | JPY | | M3, Inc. | | | 5,937,267 | |
| | 204,000 | | | CHF | | Novartis, AG | | | 15,101,628 | |
| | 273,064 | | | DKK | | Novo Nordisk, A/S - Class B | | | 48,066,044 | |
| | 662,000 | | | | | QIAGEN, NV#~ | | | 13,160,560 | |
| | 101,200 | | | JPY | | Sawai Pharmaceutical Company, Ltd. | | | 13,072,598 | |
| | 765,000 | | | INR | | Sun Pharmaceutical Industries, Ltd. | | | 13,512,947 | |
| | | | | | | | | | |
| | | | | | | | | 179,239,001 | |
| | | | | | | | | | |
| | | | | | Industrials (5.1%) | |
| | 721,000 | | | CHF | | ABB, Ltd.# | | | 16,350,048 | |
| | 104,000 | | | | | Eaton Corp., PLC | | | 6,386,640 | |
| | 335,000 | | | GBP | | Experian, PLC | | | 5,894,233 | |
| | 366,000 | | | EUR | | Koninklijke Philips Electronics, NV | | | 10,130,170 | |
| | 37,000 | | | EUR | | Krones, AG | | | 2,577,189 | |
| | 112,500 | | | EUR | | Siemens, AG | | | 11,754,792 | |
| | | | | | | | | | |
| | | | | | | | | 53,093,072 | |
| | | | | | | | | | |
| | | | | | Information Technology (32.9%) | |
| | 1,250,000 | | | HKD | | AAC Technologies Holdings, Inc. | | | 6,118,587 | |
| | 629,500 | | | | | Accenture, PLC - Class A | | | 51,266,480 | |
| | 220,000 | | | GBP | | Aveva Group, PLC | | | 7,594,096 | |
| | 174,000 | | | | | Check Point Software Technologies, Ltd.#~ | | | 8,111,880 | |
| | 63,000 | | | CAD | | Constellation Software, Inc. | | | 8,598,442 | |
| | 44,000 | | | EUR | | Dassault Systemes, SA | | | 5,371,405 | |
| | 795,122 | | | INR | | HCL Technologies Ltd. | | | 10,637,219 | |
| | 6,200,200 | | | TWD | | Hon Hai Precision Industry Company, Ltd. | | | 16,026,141 | |
| | 176,000 | | | | | Infosys, Ltd. | | | 7,346,240 | |
| | 130,000 | | | JPY | | Kakaku.com, Inc. | | | 3,360,753 | |
| | 110,000 | | | TWD | | Largan Precision Company, Ltd. | | | 3,010,569 | |
| | 147,000 | | | KRW | | LG Display Company, Ltd.# | | | 4,022,432 | |
| | 1,640,000 | | | SEK | | LM Ericsson Telephone Company | | | 20,395,653 | |
| | 815,000 | | | TWD | | MediaTek, Inc. | | | 9,945,903 | |
| | 8,700,000 | | | TWD | | Pegatron Corp.# | | | 14,263,191 | |
| | 20,500 | | | KRW | | Samsung Electronics Company, Ltd. | | | 28,351,919 | |
| | 635,500 | | | EUR | | SAP, AG | | | 50,663,316 | |
| | 295,000 | | | KRW | | SK Hynix, Inc.# | | | 8,034,721 | |
| | 13,162,000 | | | TWD | | Taiwan Semiconductor Manufacturing Company, Ltd. | | | 48,849,861 | |
| | 502,000 | | | INR | | Tata Consultancy Services, Ltd. | | | 12,848,820 | |
| | 191,000 | | | | | TE Connectivity, Ltd. | | | 8,318,050 | |
| | 247,000 | | | BRL | | Totvs, SA | | | 4,666,550 | |
| | 175,000 | | | TWD | | TPK Holding Company, Ltd. | | | 3,560,364 | |
| | | | | | | | | | |
| | | | | | | | | 341,362,592 | |
| | | | | | | | | | |
| | | | |
| 70 | | CALAMOS FAMILY OF FUNDS SEMIANNUAL REPORT | | See accompanying Notes to Schedule of Investments |
International Growth Fund Schedule of Investments April 30, 2013 (Unaudited)
| | | | | | | | | | |
NUMBER OF
SHARES | | | | | | | VALUE | |
| | | | | | | | | | |
| | | | | | Materials (2.9%) | |
| | 51,600 | | | CHF | | Syngenta, AG | | $ | 22,060,001 | |
| | 168,600 | | | NOK | | Yara International, ASA | | | 7,919,808 | |
| | | | | | | | | | |
| | | | | | | | | 29,979,809 | |
| | | | | | | | | | |
| | | | | | Telecommunication Services (0.6%) | |
| | 34,000 | | | KRW | | SK Telecom Company, Ltd. | | | 5,984,846 | |
| | | | | | | | | | |
| | | | | | TOTAL COMMON STOCKS
(Cost $851,849,680) | | | 991,659,576 | |
| | | | | | | | | | |
| | | | | | | | | | |
| | SHORT TERM INVESTMENT (3.7%) | |
| | 38,507,942 | | | | | Fidelity Prime Money Market Fund - Institutional Class
(Cost $38,507,942) | | | 38,507,942 | |
| | | | | | | | | | |
| TOTAL INVESTMENTS (99.3%)
(Cost $890,357,622) | | | 1,030,167,518 | |
| | | | | | | | | | |
| |
| | OTHER ASSETS, LESS LIABILITIES (0.7%) | | | 7,032,506 | |
| | | | | | | | | | |
| |
| | NET ASSETS (100.0%) | | $ | 1,037,200,024 | |
| | | | | | | | | | |
NOTES TO SCHEDULE OF INVESTMENTS
| # | Non-income producing security. |
| ~ | Security, or portion of security, is segregated as collateral (or potential collateral for future transactions) for written options. The aggregate value of such securities is $548,235. |
FOREIGN CURRENCY ABBREVIATIONS
| | |
| AUD | | Australian Dollar |
| BRL | | Brazilian Real |
| CAD | | Canadian Dollar |
| CHF | | Swiss Franc |
| DKK | | Danish Krone |
| EUR | | European Monetary Unit |
| GBP | | British Pound Sterling |
| HKD | | Hong Kong Dollar |
| INR | | Indian Rupee |
| JPY | | Japanese Yen |
| KRW | | South Korean Won |
| MXN | | Mexican Peso |
| NOK | | Norwegian Krone |
| SEK | | Swedish Krona |
| SGD | | Singapore Dollar |
| TWD | | New Taiwanese Dollar |
Note: Value for securities denominated in foreign currencies is shown in U.S. dollars.
CURRENCY EXPOSURE
APRIL 30, 2013
| | | | | | | | |
| | | VALUE | | | % OF TOTAL
INVESTMENTS | |
| US Dollar | | $ | 204,487,763 | | | | 19.8% | |
| Swiss Franc | | | 123,441,733 | | | | 12.0% | |
| European Monetary Unit | | | 117,467,258 | | | | 11.4% | |
| New Taiwanese Dollar | | | 95,656,029 | | | | 9.3% | |
| British Pound Sterling | | | 73,624,988 | | | | 7.1% | |
| Norwegian Krone | | | 64,734,561 | | | | 6.3% | |
| Hong Kong Dollar | | | 54,401,150 | | | | 5.3% | |
| Danish Krone | | | 48,066,044 | | | | 4.7% | |
| South Korean Won | | | 46,393,918 | | | | 4.5% | |
| Brazilian Real | | | 41,502,876 | | | | 4.0% | |
| Swedish Krona | | | 37,719,155 | | | | 3.7% | |
| Indian Rupee | | | 36,998,986 | | | | 3.6% | |
| Mexican Peso | | | 24,244,693 | | | | 2.4% | |
| Japanese Yen | | | 22,370,618 | | | | 2.2% | |
| Canadian Dollar | | | 19,831,714 | | | | 1.9% | |
| Australian Dollar | | | 13,593,411 | | | | 1.3% | |
| Singapore Dollar | | | 5,632,621 | | | | 0.5% | |
| Total Investments | | $ | 1,030,167,518 | | | | 100.0% | |
Currency exposure may vary over time.
| | | | | | |
| See accompanying Notes to Financial Statements | | www.calamos.com | | | 71 | |
Evolving World Growth Fund Schedule of Investments April 30, 2013 (Unaudited)
| | | | | | | | | | |
PRINCIPAL
AMOUNT | | | | | | | VALUE | |
| | CONVERTIBLE BONDS (20.1%) | |
| | | | | | Energy (3.7%) | |
| | 3,857,900 | | | EUR | | CGGVeritas
1.750%, 01/01/16 | | $ | 1,453,230 | |
| | 21,800,000 | | | HKD | | China Petroleum & Chemical Corp.
0.000%, 04/24/14 | | | 3,360,310 | |
| | | | | | Subsea 7, SA | | | | |
| | 5,700,000 | | | | | 2.250%, 10/11/13 | | | 6,085,799 | |
| | 800,000 | | | | | 1.000%, 10/05/17 | | | 806,736 | |
| | | | | | Technip, SA | | | | |
| | 2,000,000 | | | EUR | | 0.250%, 01/01/17 | | | 2,854,640 | |
| | 1,140,000 | | | EUR | | 0.500%, 01/01/16 | | | 1,476,555 | |
| | | | | | | | | | |
| | | | | | | | | 16,037,270 | |
| | | | | | | | | | |
| | | | | | Financials (3.9%) | |
| | 3,000,000 | | | | | Cathay Financial Holding Company, Ltd.
0.000%, 08/14/14 | | | 3,479,153 | |
| | 10,250,000 | | | SGD | | Temasek Financial, Ltd.
(Standard Chartered, PLC)§
0.000%, 10/24/14 | | | 8,828,054 | |
| | 34,000,000 | | | HKD | | Wharf Holdings, Ltd.
2.300%, 06/07/14 | | | 4,515,512 | |
| | | | | | | | | | |
| | | | | | | | | 16,822,719 | |
| | | | | | | | | | |
| | | | | | Health Care (0.9%) | |
| | 19,380,000 | | | SEK | | Elekta, AB
2.750%, 04/25/17 | | | 3,785,822 | |
| | | | | | | | | | |
| | | | | | Industrials (3.8%) | |
| | 4,600,000 | | | EUR | | Deutsche Post, AG
0.600%, 12/06/19 | | | 6,815,691 | |
| | 3,200,000 | | | | | Larsen & Toubro, Ltd.
3.500%, 10/22/14 | | | 3,312,999 | |
| | 6,250,000 | | | | | Siemens, AG
1.050%, 08/16/17 | | | 6,528,407 | |
| | | | | | | | | | |
| | | | | | | | | 16,657,097 | |
| | | | | | | | | | |
| | | | | | Information Technology (2.9%) | |
| | 7,000,000 | | | | | Pegatron Corp.
0.000%, 02/06/17 | | | 8,646,462 | |
| | 3,600,000 | | | | | SK Hynix, Inc.
2.650%, 05/14/15 | | | 4,086,180 | |
| | | | | | | | | | |
| | | | | | | | | 12,732,642 | |
| | | | | | | | | | |
| | | | | | Materials (2.5%) | |
| | 2,000,000 | | | | | Cemex SAB de CV
4.875%, 03/15/15 | | | 2,395,860 | |
| | 4,000,000 | | | | | Glencore Finance Europe, SA
5.000%, 12/31/14 | | | 4,580,280 | |
| | 3,475,000 | | | | | Newmont Mining Corp.
1.250%, 07/15/14 | | | 3,654,536 | |
| | | | | | | | | | |
| | | | | | | | | 10,630,676 | |
| | | | | | | | | | |
| | | | | | Telecommunication Services (2.4%) | |
| | 6,300,000 | | | | | Billion Express Investments, Ltd.
0.750%, 10/18/15 | | | 6,510,987 | |
| | | | | | | | | | |
PRINCIPAL
AMOUNT | | | | | | | VALUE | |
| | 3,100,000 | | | | | SK Telecom Company, Ltd.
1.750%, 04/07/14 | | $ | 4,004,451 | |
| | | | | | | | | | |
| | | | | | | | | 10,515,438 | |
| | | | | | | | | | |
| | | | | | TOTAL CONVERTIBLE BONDS
(Cost $87,061,137) | | | 87,181,664 | |
| | | | | | | | | | |
NUMBER OF
SHARES | | | | | | | VALUE | |
| | COMMON STOCKS (76.3%) | |
| | | | | | Consumer Discretionary (5.7%) | |
| | 55,000 | | | BRL | | Abril Educação, SA | | | 1,182,057 | |
| | 30,000 | | | CHF | | Compagnie Financière Richemont, SA | | | 2,427,861 | |
| | 2,466,000 | | | INR | | DISH TV India, Ltd.# | | | 3,101,090 | |
| | 55,000 | | | BRL | | Estacio Participacoes, SA | | | 1,311,258 | |
| | 896,000 | | | HKD | | MGM China Holdings, Ltd. | | | 2,115,086 | |
| | 67,000 | | | ZAR | | Naspers, Ltd. | | | 4,489,846 | |
| | 11,400 | | | CHF | | Swatch Group, AG | | | 6,540,414 | |
| | 1,150,000 | | | HKD | | Wynn Macau, Ltd.# | | | 3,497,680 | |
| | | | | | | | | | |
| | | | | | | | | 24,665,292 | |
| | | | | | | | | | |
| | | | | | Consumer Staples (15.5%) | |
| | 174,655 | | | HKD | | Biostime International Holdings, Ltd. | | | 1,007,793 | |
| | 138,000 | | | | | Coca-Cola Company~ | | | 5,841,540 | |
| | 475,900 | | | BRL | | Companhia de Bebidas das Americas | | | 19,694,874 | |
| | 141,000 | | | GBP | | Diageo, PLC | | | 4,305,801 | |
| | 1,580,000 | | | INR | | ITC, Ltd. | | | 9,654,548 | |
| | 21,200 | | | INR | | Nestlé India, Ltd. | | | 1,961,707 | |
| | 55,000 | | | CHF | | Nestlé, SA | | | 3,922,188 | |
| | 82,000 | | | GBP | | SABMiller, PLC | | | 4,424,495 | |
| | 1,136,000 | | | HKD | | Tsingtao Brewery Company, Ltd. - Class H | | | 7,619,863 | |
| | 5,660,000 | | | HKD | | Want Want China Holdings, Ltd. | | | 8,991,512 | |
| | | | | | | | | | |
| | | | | | | | | 67,424,321 | |
| | | | | | | | | | |
| | | | | | Energy (5.2%) | |
| | 486,263 | | | HKD | | Anton Oilfield Services Group/Hong Kong | | | 389,236 | |
| | 3,100,000 | | | HKD | | CNOOC, Ltd. | | | 5,806,517 | |
| | 43,000 | | | | | Occidental Petroleum Corp. | | | 3,838,180 | |
| | 196,000 | | | NOK | | Petroleum Geo-Services, ASA | | | 2,879,714 | |
| | 35,000 | | | ZAR | | Sasol, Ltd. | | | 1,516,078 | |
| | 112,000 | | | | | Schlumberger, Ltd. | | | 8,336,160 | |
| | | | | | | | | | |
| | | | | | | | | 22,765,885 | |
| | | | | | | | | | |
| | | | | | Financials (4.7%) | |
| | 575,000 | | | ZAR | | Coronation Fund Managers, Ltd. | | | 3,442,742 | |
| | 600,000 | | | MXN | | Grupo Financiero Banorte SAB de CV | | | 4,521,384 | |
| | 175,000 | | | GBP | | Standard Chartered, PLC | | | 4,404,297 | |
| | 5,400,000 | | | HKD | | Value Partners Group, Ltd. | | | 3,315,142 | |
| | 505,000 | | | HKD | | Wharf Holdings, Ltd. | | | 4,510,711 | |
| | | | | | | | | | |
| | | | | | | | | 20,194,276 | |
| | | | | | | | | | |
| | | | |
| 72 | | CALAMOS FAMILY OF FUNDS SEMIANNUAL REPORT | | See accompanying Notes to Schedule of Investments |
Evolving World Growth Fund Schedule of Investments April 30, 2013 (Unaudited)
| | | | | | | | | | |
NUMBER OF
SHARES | | | | | | | VALUE | |
| | | | | | | | | | |
| | | | | | Health Care (10.6%) | |
| | 4,803,000 | | | MXN | | Genomma Lab Internacional, SAB de CV# | | $ | 10,371,565 | |
| | 322,941 | | | INR | | Glenmark Pharmaceuticals, Ltd. | | | 2,922,220 | |
| | 107,000 | | | | | Mindray Medical International, Ltd. | | | 4,225,430 | |
| | 97,200 | | | DKK | | Novo Nordisk, A/S - Class B | | | 17,109,614 | |
| | 226,000 | | | BRL | | Qualicorp, SA# | | | 2,202,674 | |
| | 3,400,000 | | | HKD | | Sino Biopharmaceutical, Ltd. | | | 2,346,087 | |
| | 390,000 | | | INR | | Sun Pharmaceutical Industries, Ltd. | | | 6,888,953 | |
| | | | | | | | | | |
| | | | | | | | | 46,066,543 | |
| | | | | | | | | | |
| | | | | | Industrials (3.4%) | |
| | 290,000 | | | CHF | | ABB, Ltd.# | | | 6,576,302 | |
| | 334,000 | | | HKD | | Hutchison Whampoa, Ltd. | | | 3,633,661 | |
| | 111,000 | | | EUR | | Koninklijke Philips Electronics, NV | | | 3,072,265 | |
| | 60,000 | | | INR | | Larsen & Toubro, Ltd. | | | 1,686,959 | |
| | | | | | | | | | |
| | | | | | | | | 14,969,187 | |
| | | | | | | | | | |
| | | | | | Information Technology (29.2%) | |
| | 1,091,000 | | | HKD | | AAC Technologies Holdings, Inc. | | | 5,340,302 | |
| | 21,100 | | | | | Apple, Inc.~ | | | 9,342,025 | |
| | 2,100,000 | | | TWD | | Chipbond Technology Corp. | | | 5,353,466 | |
| | 458,280 | | | INR | | HCL Technologies Ltd. | | | 6,130,914 | |
| | 2,775,000 | | | TWD | | Hon Hai Precision Industry Company, Ltd. | | | 7,172,759 | |
| | 76,000 | | | TWD | | Largan Precision Company, Ltd. | | | 2,080,030 | |
| | 77,000 | | | KRW | | LG Display Company, Ltd.# | | | 2,106,988 | |
| | 591,000 | | | TWD | | MediaTek, Inc. | | | 7,212,305 | |
| | 800,000 | | | TWD | | Novatek Microelectronics Corp. | | | 3,911,274 | |
| | 166,500 | | | | | QUALCOMM, Inc. | | | 10,259,730 | |
| | 13,850 | | | KRW | | Samsung Electronics Company, Ltd. | | | 19,154,833 | |
| | 42,000 | | | | | SINA Corp.# | | | 2,365,440 | |
| | 171,000 | | | KRW | | SK Hynix, Inc.# | | | 4,657,415 | |
| | 1,515,000 | | | CLP | | Sonda, SA | | | 5,243,550 | |
| | 5,326,649 | | | TWD | | Taiwan Semiconductor Manufacturing Company, Ltd. | | | 19,769,493 | |
| | 294,000 | | | INR | | Tata Consultancy Services, Ltd. | | | 7,525,006 | |
| | 133,000 | | | HKD | | Tencent Holdings, Ltd. | | | 4,588,269 | |
| | 125,000 | | | BRL | | Totvs, SA | | | 2,361,614 | |
| | 122,000 | | | TWD | | TPK Holding Company, Ltd. | | | 2,482,083 | |
| | | | | | | | | | |
| | | | | | | | | 127,057,496 | |
| | | | | | | | | | |
| | | | | | Materials (1.1%) | |
| | 675,000 | | | MXN | | Grupo Mexico SAB de CV | | | 2,423,202 | |
| | 46,000 | | | NOK | | Yara International, ASA | | | 2,160,802 | |
| | | | | | | | | | |
| | | | | | | | | 4,584,004 | |
| | | | | | | | | | |
| | | | | | Telecommunication Services (0.9%) | |
| | 22,700 | | | KRW | | SK Telecom Company, Ltd. | | | 3,995,765 | |
| | | | | | | | | | |
| | | | | | TOTAL COMMON STOCKS
(Cost $295,260,982) | | | 331,722,769 | |
| | | | | | | | | | |
| | | | | | | | | | |
NUMBER OF
SHARES | | | | | | | VALUE | |
| | SHORT TERM INVESTMENT (4.6%) | |
| | 19,897,898 | | | | | Fidelity Prime Money Market Fund - Institutional Class
(Cost $19,897,898) | | $ | 19,897,898 | |
| | | | | | | | | | |
| TOTAL INVESTMENTS (101.0%)
(Cost $402,220,017) | | | 438,802,331 | |
| | | | | | | | | | |
| |
| | LIABILITIES, LESS OTHER ASSETS (-1.0%) | | | (4,141,609 | ) |
| | | | | | | | | | |
| |
| | NET ASSETS (100.0%) | | $ | 434,660,722 | |
| | | | | | | | | | |
NOTES TO SCHEDULE OF INVESTMENTS
| § | Securities exchangeable or convertible into securities of one or more entities that are different than the issuer. Each entity is identified in the parenthetical. |
| # | Non-income producing security. |
| ~ | Security, or portion of security, is segregated as collateral (or potential collateral for future transactions) for written options. The aggregate value of such securities is $571,353. |
FOREIGN CURRENCY ABBREVIATIONS
| | |
| BRL | | Brazilian Real |
| CHF | | Swiss Franc |
| CLP | | Chilean Peso |
| DKK | | Danish Krone |
| EUR | | European Monetary Unit |
| GBP | | British Pound Sterling |
| HKD | | Hong Kong Dollar |
| INR | | Indian Rupee |
| KRW | | South Korean Won |
| MXN | | Mexican Peso |
| NOK | | Norwegian Krone |
| SEK | | Swedish Krona |
| SGD | | Singapore Dollar |
| TWD | | New Taiwanese Dollar |
| ZAR | | South African Rand |
Note: Value for securities denominated in foreign currencies is shown in U.S. dollars. The principal amount for such securities is shown in the respective foreign currency.
| | | | | | |
| See accompanying Notes to Financial Statements | | www.calamos.com | | | 73 | |
Evolving World Growth Fund Schedule of Investments April 30, 2013 (Unaudited)
CURRENCY EXPOSURE
APRIL 30, 2013
| | | | | | | | |
| | | VALUE | | | % OF TOTAL
INVESTMENTS | |
| US Dollar | | $ | 118,198,253 | | | | 26.9% | |
| Hong Kong Dollar | | | 61,037,681 | | | | 13.9% | |
| New Taiwanese Dollar | | | 47,981,410 | | | | 10.9% | |
| Indian Rupee | | | 39,871,397 | | | | 9.1% | |
| South Korean Won | | | 29,915,001 | | | | 6.8% | |
| Brazilian Real | | | 26,752,477 | | | | 6.1% | |
| Swiss Franc | | | 19,466,765 | | | | 4.4% | |
| Mexican Peso | | | 17,316,151 | | | | 3.9% | |
| Danish Krone | | | 17,109,614 | | | | 3.9% | |
| European Monetary Unit | | | 15,672,381 | | | | 3.6% | |
| British Pound Sterling | | | 13,134,593 | | | | 3.0% | |
| South African Rand | | | 9,448,666 | | | | 2.2% | |
| Singapore Dollar | | | 8,828,054 | | | | 2.0% | |
| Chilean Peso | | | 5,243,550 | | | | 1.2% | |
| Norwegian Krone | | | 5,040,516 | | | | 1.2% | |
| Swedish Krona | | | 3,785,822 | | | | 0.9% | |
| Total Investments | | $ | 438,802,331 | | | | 100.0% | |
Currency exposure may vary over time.
| | | | |
| 74 | | CALAMOS FAMILY OF FUNDS SEMIANNUAL REPORT | | See accompanying Notes to Financial Statements |
Global Equity Fund Schedule of Investments April 30, 2013 (Unaudited)
| | | | | | | | | | |
NUMBER OF
SHARES | | | | | | | VALUE | |
| | COMMON STOCKS (98.0%) | |
| | | | | | Consumer Discretionary (11.7%) | |
| | 36,600 | | | | | Amazon.com, Inc.# | | $ | 9,289,446 | |
| | 23,000 | | | | | CBS Corp. - Class B | | | 1,052,940 | |
| | 65,000 | | | CHF | | Compagnie Financière Richemont, SA | | | 5,260,365 | |
| | 856,000 | | | HKD | | MGM China Holdings, Ltd. | | | 2,020,663 | |
| | 61,000 | | | | | Michael Kors Holdings, Ltd.# | | | 3,473,340 | |
| | 34,000 | | | | | News Corp. - Class B~ | | | 1,058,080 | |
| | 33,200 | | | | | Signet Jewelers, Ltd. | | | 2,281,836 | |
| | 78,000 | | | | | Starbucks Corp. | | | 4,745,520 | |
| | 20,850 | | | CHF | | Swatch Group, AG | | | 11,962,073 | |
| | 18,000 | | | | | Time Warner, Inc. | | | 1,076,040 | |
| | 75,000 | | | | | TJX Companies, Inc. | | | 3,657,750 | |
| | 705,000 | | | HKD | | Wynn Macau, Ltd.# | | | 2,144,230 | |
| | | | | | | | | | |
| | | | | | | | | 48,022,283 | |
| | | | | | | | | | |
| | | | | | Consumer Staples (7.5%) | |
| | 51,500 | | | EUR | | Anheuser-Busch InBev, NV | | | 4,947,636 | |
| | 130,000 | | | | | Coca-Cola Company | | | 5,502,900 | |
| | 340,000 | | | BRL | | Companhia de Bebidas das Americas | | | 14,070,724 | |
| | 11,000 | | | | | Costco Wholesale Corp. | | | 1,192,730 | |
| | 98,000 | | | GBP | | SABMiller, PLC | | | 5,287,811 | |
| | | | | | | | | | |
| | | | | | | | | 31,001,801 | |
| | | | | | | | | | |
| | | | | | Energy (8.6%) | |
| | 34,000 | | | | | Cameron International Corp.# | | | 2,092,700 | |
| | 53,500 | | | | | EOG Resources, Inc. | | | 6,482,060 | |
| | 51,000 | | | | | Occidental Petroleum Corp. | | | 4,552,260 | |
| | 283,600 | | | NOK | | Petroleum Geo-Services, ASA | | | 4,166,770 | |
| | 107,800 | | | | | Schlumberger, Ltd. | | | 8,023,554 | |
| | 111,076 | | | NOK | | Subsea 7, SA | | | 2,397,940 | |
| | 29,150 | | | EUR | | Technip, SA | | | 3,126,639 | |
| | 124,000 | | | NOK | | TGS Nopec Geophysical Company, ASA | | | 4,458,687 | |
| | | | | | | | | | |
| | | | | | | | | 35,300,610 | |
| | | | | | | | | | |
| | | | | | Financials (8.8%) | |
| | 120,000 | | | | | Blackstone Group, LP | | | 2,466,000 | |
| | 6,000 | | | CAD | | Fairfax Financial Holdings, Ltd. | | | 2,406,968 | |
| | 40,600 | | | | | Franklin Resources, Inc. | | | 6,279,196 | |
| | 265,000 | | | MXN | | Grupo Financiero Banorte SAB de CV | | | 1,996,944 | |
| | 62,832 | | | GBP | | Schroders, PLC | | | 2,281,990 | |
| | 341,000 | | | SGD | | Singapore Exchange, Ltd. | | | 2,076,458 | |
| | 119,000 | | | GBP | | Standard Chartered, PLC | | | 2,994,922 | |
| | 98,000 | | | SEK | | Svenska Handelsbanken, AB - A Shares | | | 4,467,640 | |
| | 94,900 | | | | | T. Rowe Price Group, Inc. | | | 6,880,250 | |
| | 52,000 | | | | | Waddell & Reed Financial, Inc. | | | 2,229,240 | |
| | 234,000 | | | HKD | | Wharf Holdings, Ltd. | | | 2,090,112 | |
| | | | | | | | | | |
| | | | | | | | | 36,169,720 | |
| | | | | | | | | | |
| | | | | | | | | | |
NUMBER OF
SHARES | | | | | | | VALUE | |
| | | | | | | | | | |
| | | | | | Health Care (16.6%) | |
| | 93,800 | | | | | Amgen, Inc. | | $ | 9,774,898 | |
| | 116,200 | | | | | Covidien, PLC | | | 7,418,208 | |
| | 45,000 | | | AUD | | CSL, Ltd. | | | 2,940,882 | |
| | 2,412,000 | | | MXN | | Genomma Lab Internacional, SAB de CV# | | | 5,208,456 | |
| �� | 114,000 | | | | | Gilead Sciences, Inc.# | | | 5,772,960 | |
| | 11,150 | | | | | Intuitive Surgical, Inc.# | | | 5,489,034 | |
| | 55,000 | | | | | Jazz Pharmaceuticals, PLC# | | | 3,209,250 | |
| | 62,000 | | | | | Johnson & Johnson | | | 5,284,260 | |
| | 108,900 | | | DKK | | Novo Nordisk, A/S - Class B | | | 19,169,104 | |
| | 60,000 | | | | | Varian Medical Systems, Inc.# | | | 3,908,400 | |
| | | | | | | | | | |
| | | | | | | | | 68,175,452 | |
| | | | | | | | | | |
| | | | | | Industrials (2.7%) | |
| | 241,500 | | | CHF | | ABB, Ltd.# | | | 5,476,472 | |
| | 42,000 | | | | | Eaton Corp., PLC | | | 2,579,220 | |
| | 111,000 | | | EUR | | Koninklijke Philips Electronics, NV | | | 3,072,265 | |
| | | | | | | | | | |
| | | | | | | | | 11,127,957 | |
| | | | | | | | | | |
| | | | | | Information Technology (40.6%) | |
| | 236,300 | | | | | Accenture, PLC - Class A | | | 19,244,272 | |
| | 45,575 | | | | | Apple, Inc.~ | | | 20,178,331 | |
| | 86,000 | | | GBP | | Aveva Group, PLC | | | 2,968,601 | |
| | 58,000 | | | | | Cognizant Technology Solutions Corp. - Class A# | | | 3,758,400 | |
| | 195,000 | | | | | eBay, Inc.# | | | 10,216,050 | |
| | 101,000 | | | | | Facebook, Inc.# | | | 2,803,760 | |
| | 24,625 | | | | | Google, Inc.#~ | | | 20,305,036 | |
| | 1,150,000 | | | TWD | | Hon Hai Precision Industry Company, Ltd. | | | 2,972,495 | |
| | 8,300 | | | | | LinkedIn Corp. - Class A# | | | 1,594,347 | |
| | 415,000 | | | SEK | | LM Ericsson Telephone Company | | | 5,161,095 | |
| | 10,100 | | | | | MasterCard, Inc. - Class A | | | 5,584,593 | |
| | 205,000 | | | TWD | | MediaTek, Inc. | | | 2,501,730 | |
| | 226,200 | | | | | QUALCOMM, Inc. | | | 13,938,444 | |
| | 182,000 | | | | | Salesforce.com, Inc.# | | | 7,482,020 | |
| | 5,500 | | | KRW | | Samsung Electronics Company, Ltd. | | | 7,606,613 | |
| | 44,000 | | | | | SanDisk Corp.# | | | 2,307,360 | |
| | 251,700 | | | EUR | | SAP, AG | | | 20,066,021 | |
| | 78,000 | | | KRW | | SK Hynix, Inc.# | | | 2,124,435 | |
| | 3,815,000 | | | TWD | | Taiwan Semiconductor Manufacturing Company, Ltd. | | | 14,159,111 | |
| | 49,000 | | | | | TE Connectivity, Ltd. | | | 2,133,950 | |
| | | | | | | | | | |
| | | | | | | | | 167,106,664 | |
| | | | | | | | | | |
| | | | | | Materials (0.9%) | |
| | 9,100 | | | CHF | | Syngenta, AG | | | 3,890,427 | |
| | | | | | | | | | |
| | | | | | Telecommunication Services (0.6%) | |
| | 14,000 | | | KRW | | SK Telecom Company, Ltd. | | | 2,464,348 | |
| | | | | | | | | | |
| | | | | | TOTAL COMMON STOCKS
(Cost $351,921,460) | | | 403,259,262 | |
| | | | | | | | | | |
| | | | | | |
| See accompanying Notes to Schedule of Investments | | www.calamos.com | | | 75 | |
Global Equity Fund Schedule of Investments April 30, 2013 (Unaudited)
| | | | | | | | | | |
NUMBER OF
SHARES | | | | | | | VALUE | |
| | SHORT TERM INVESTMENT (2.5%) | |
| | 10,212,885 | | | | | Fidelity Prime Money Market Fund - Institutional Class
(Cost $10,212,885) | | $ | 10,212,885 | |
| | | | | | | | | | |
| TOTAL INVESTMENTS (100.5%)
(Cost $362,134,345) | | | 413,472,147 | |
| | | | | | | | | | |
| |
| | LIABILITIES, LESS OTHER ASSETS (-0.5%) | | | (1,911,529 | ) |
| | | | | | | | | | |
| |
| | NET ASSETS (100.0%) | | $ | 411,560,618 | |
| | | | | | | | | | |
NOTES TO SCHEDULE OF INVESTMENTS
| # | Non-income producing security. |
| ~ | Security, or portion of security, is segregated as collateral (or potential collateral for future transactions) for written options. The aggregate value of such securities is $569,041. |
FOREIGN CURRENCY ABBREVIATIONS
| | |
| AUD | | Australian Dollar |
| BRL | | Brazilian Real |
| CAD | | Canadian Dollar |
| CHF | | Swiss Franc |
| DKK | | Danish Krone |
| EUR | | European Monetary Unit |
| GBP | | British Pound Sterling |
| HKD | | Hong Kong Dollar |
| KRW | | South Korean Won |
| MXN | | Mexican Peso |
| NOK | | Norwegian Krone |
| SEK | | Swedish Krona |
| SGD | | Singapore Dollar |
| TWD | | New Taiwanese Dollar |
Note: Value for securities denominated in foreign currencies is shown in U.S. dollars.
CURRENCY EXPOSURE
APRIL 30, 2013
| | | | | | | | |
| | | VALUE | | | % OF TOTAL
INVESTMENTS | |
| US Dollar | | $ | 235,531,520 | | | | 57.0% | |
| European Monetary Unit | | | 31,212,561 | | | | 7.6% | |
| Swiss Franc | | | 26,589,337 | | | | 6.4% | |
| New Taiwanese Dollar | | | 19,633,336 | | | | 4.7% | |
| Danish Krone | | | 19,169,104 | | | | 4.6% | |
| Brazilian Real | | | 14,070,724 | | | | 3.4% | |
| British Pound Sterling | | | 13,533,324 | | | | 3.3% | |
| South Korean Won | | | 12,195,396 | | | | 3.0% | |
| Norwegian Krone | | | 11,023,397 | | | | 2.7% | |
| Swedish Krona | | | 9,628,735 | | | | 2.3% | |
| Mexican Peso | | | 7,205,400 | | | | 1.7% | |
| Hong Kong Dollar | | | 6,255,005 | | | | 1.5% | |
| Australian Dollar | | | 2,940,882 | | | | 0.7% | |
| Canadian Dollar | | | 2,406,968 | | | | 0.6% | |
| Singapore Dollar | | | 2,076,458 | | | | 0.5% | |
| Total Investments | | $ | 413,472,147 | | | | 100.0% | |
Currency exposure may vary over time.
| | | | |
| 76 | | CALAMOS FAMILY OF FUNDS SEMIANNUAL REPORT | | See accompanying Notes to Financial Statements |
Growth and Income Fund Schedule of Investments April 30, 2013 (Unaudited)
| | | | | | | | | | |
PRINCIPAL
AMOUNT | | | | | | | VALUE | |
| | CONVERTIBLE BONDS (34.9%) | |
| | | | | | Consumer Discretionary (4.6%) | |
| | 19,970,000 | | | | | Iconix Brand Group, Inc.*
1.500%, 03/15/18 | | $ | 22,790,463 | |
| | 10,780,000 | | | | | Jarden Corp.*
1.875%, 09/15/18 | | | 12,653,295 | |
| | 38,195,000 | | | | | Liberty Interactive, LLC (Time Warner Cable, Inc., Time Warner, Inc.)*§
0.750%, 03/30/43 | | | 39,619,864 | |
| | 31,980,000 | | | | | Omnicom Group, Inc.
0.000%, 07/01/38 | | | 38,187,158 | |
| | 47,500,000 | | | | | Priceline.com, Inc.
1.000%, 03/15/18 | | | 53,988,738 | |
| | | | | | | | | | |
| | | | | | | | | 167,239,518 | |
| | | | | | | | | | |
| | | | | | Energy (4.5%) | |
| | | | | | CGGVeritas | | | | |
| | 65,403,700 | | | EUR | | 1.750%, 01/01/16 | | | 24,636,885 | |
| | 17,073,400 | | | EUR | | 1.250%, 01/01/19 | | | 6,992,815 | |
| | 23,500,000 | | | | | Helix Energy Solutions Group, Inc.
3.250%, 03/15/32 | | | 29,557,008 | |
| | 22,250,000 | | | | | Hornbeck Offshore Services, Inc.*
1.500%, 09/01/19 | | | 25,875,193 | |
| | 44,000,000 | | | | | Subsea 7, SA
1.000%, 10/05/17 | | | 44,370,462 | |
| | | | | | Technip, SA | | | | |
| | 19,005,900 | | | EUR | | 0.250%, 01/01/17 | | | 27,127,502 | |
| | 4,298,700 | | | EUR | | 0.500%, 01/01/16 | | | 5,567,779 | |
| | | | | | | | | | |
| | | | | | | | | 164,127,644 | |
| | | | | | | | | | |
| | | | | | Financials (3.4%) | |
| | 12,417,000 | | | | | Amtrust Financial Services, Inc.
5.500%, 12/15/21 | | | 16,808,024 | |
| | 20,550,000 | | | | | Ares Capital Corp.
5.750%, 02/01/16 | | | 22,618,871 | |
| | 11,650,000 | | | EUR | | Industrivarden, AB
2.500%, 02/27/15 | | | 19,595,994 | |
| | 16,747,000 | | | | | Leucadia National Corp.
3.750%, 04/15/14 | | | 24,366,885 | |
| | 27,500,000 | | | SGD | | Temasek Financial, Ltd. (Standard Chartered, PLC)§
0.000%, 10/24/14 | | | 23,685,023 | |
| | 17,800,000 | | | | | Walter Investment Management Corp.
4.500%, 11/01/19 | | | 18,864,796 | |
| | | | | | | | | | |
| | | | | | | | | 125,939,593 | |
| | | | | | | | | | |
| | | | | | Health Care (6.1%) | |
| | 15,500,000 | | | | | Gilead Sciences, Inc.
1.625%, 05/01/16 | | | 34,840,280 | |
| | 33,500,000 | | | | | Hologic, Inc.‡
2.000%, 12/15/37 | | | 38,269,730 | |
| | 8,100,000 | | | | | Insulet Corp.
3.750%, 06/15/16 | | | 9,475,542 | |
| | 23,500,000 | | | | | Medicines Company*
1.375%, 06/01/17 | | | 31,997,130 | |
| | | | | | | | | | |
PRINCIPAL
AMOUNT | | | | | | | VALUE | |
| | 20,000,000 | | | | | Molina Healthcare, Inc.*
1.125%, 01/15/20 | | $ | 21,164,100 | |
| | 3,725,000 | | | | | Pacira Pharmaceuticals, Inc.*
3.250%, 02/01/19 | | | 5,139,960 | |
| | 23,500,000 | | | | | Salix Pharmaceuticals, Ltd.
1.500%, 03/15/19 | | | 25,570,232 | |
| | 20,000,000 | | | | | Volcano Corp.
1.750%, 12/01/17 | | | 19,322,200 | |
| | 31,500,000 | | | | | WellPoint, Inc.*
2.750%, 10/15/42 | | | 37,820,160 | |
| | | | | | | | | | |
| | | | | | | | | 223,599,334 | |
| | | | | | | | | | |
| | | | | | Industrials (3.4%) | |
| | 33,000,000 | | | | | AGCO Corp.
1.250%, 12/15/36 | | | 43,670,715 | |
| | 13,700,000 | | | EUR | | Deutsche Post, AG
0.600%, 12/06/19 | | | 20,298,904 | |
| | 58,000,000 | | | | | Siemens, AG
1.050%, 08/16/17 | | | 60,583,621 | |
| | | | | | | | | | |
| | | | | | | | | 124,553,240 | |
| | | | | | | | | | |
| | | | | | Information Technology (9.9%) | |
| | 43,615,000 | | | | | EMC Corp.
1.750%, 12/01/13 | | | 61,371,975 | |
| | 7,700,000 | | | | | Ixia
3.000%, 12/15/15 | | | 8,995,140 | |
| | | | | | Lam Research Corp. | | | | |
| | 31,000,000 | | | | | 0.500%, 05/15/16 | | | 33,310,740 | |
| | 26,933,000 | | | | | 1.250%, 05/15/18 | | | 30,809,332 | |
| | 37,430,000 | | | | | Linear Technology Corp.
3.000%, 05/01/27 | | | 39,823,274 | |
| | 33,000,000 | | | | | Nuance Communications, Inc.
2.750%, 08/15/27 | | | 39,938,745 | |
| | 40,662,000 | | | | | Salesforce.com, Inc.*
0.250%, 04/01/18 | | | 40,912,478 | |
| | 58,000,000 | | | | | SanDisk Corp.
1.500%, 08/15/17 | | | 73,155,690 | |
| | 20,500,000 | | | | | Symantec Corp.
1.000%, 06/15/13 | | | 25,920,200 | |
| | 10,000,000 | | | | | Take-Two Interactive Software, Inc.
1.750%, 12/01/16 | | | 11,202,700 | |
| | | | | | | | | | |
| | | | | | | | | 365,440,274 | |
| | | | | | | | | | |
| | | | | | Materials (3.0%) | |
| | 15,000,000 | | | | | Glencore Finance Europe, SA
5.000%, 12/31/14 | | | 17,176,050 | |
| | 53,000,000 | | | | | Newmont Mining Corp.
1.250%, 07/15/14 | | | 55,738,245 | |
| | 16,880,000 | | | | | RTI International Metals, Inc.
1.625%, 10/15/19 | | | 17,221,904 | |
| | 17,500,000 | | | | | Steel Dynamics, Inc.
5.125%, 06/15/14 | | | 19,418,963 | |
| | | | | | | | | | |
| | | | | | | | | 109,555,162 | |
| | | | | | | | | | |
| | | | | | TOTAL CONVERTIBLE BONDS
(Cost $1,203,629,216) | | | 1,280,454,765 | |
| | | | | | | | | | |
| | | | | | |
| See accompanying Notes to Schedule of Investments | | www.calamos.com | | | 77 | |
Growth and Income Fund Schedule of Investments April 30, 2013 (Unaudited)
| | | | | | | | | | |
PRINCIPAL
AMOUNT | | | | | | | VALUE | |
| | SYNTHETIC CONVERTIBLE SECURITIES (5.6%) | |
| | Corporate Bonds (4.8%) | |
| | | | | | Consumer Discretionary (2.4%) | |
| | | | | | DISH Network Corp. | | | | |
| | 12,500,000 | | | | | 5.875%, 07/15/22 | | $ | 12,757,813 | |
| | 10,030,000 | | | | | 5.125%, 05/01/20* | | | 9,954,775 | |
| | 23,500,000 | | | | | Expedia, Inc.
5.950%, 08/15/20 | | | 26,385,447 | |
| | 11,000,000 | | | | | Hanesbrands, Inc.
6.375%, 12/15/20 | | | 12,175,625 | |
| | 23,000,000 | | | | | L Brands, Inc.
5.625%, 02/15/22 | | | 24,753,750 | |
| | 3,040,000 | | | | | PVH Corp.
4.500%, 12/15/22 | | | 3,140,700 | |
| | | | | | | | | | |
| | | | | | | | | 89,168,110 | |
| | | | | | | | | | |
| | | | | | Energy (0.8%) | |
| | | | | | Oil States International, Inc. | | | | |
| | 18,369,000 | | | | | 6.500%, 06/01/19 | | | 19,827,040 | |
| | 9,140,000 | | | | | 5.125%, 01/15/23* | | | 9,402,775 | |
| | | | | | | | | | |
| | | | | | | | | 29,229,815 | |
| | | | | | | | | | |
| | | | | | Financials (0.3%) | |
| | 12,000,000 | | | | | Neuberger Berman Group LLC*
5.875%, 03/15/22 | | | 12,915,000 | |
| | | | | | | | | | |
| | | | | | Health Care (0.3%) | |
| | 10,750,000 | | | | | Endo Health Solutions, Inc.
7.000%, 07/15/19 | | | 11,811,563 | |
| | | | | | | | | | |
| | | | | | Industrials (0.3%) | |
| | 9,941,000 | | | | | Actuant Corp.
5.625%, 06/15/22 | | | 10,400,771 | |
| | | | | | | | | | |
| | | | | | Information Technology (0.7%) | |
| | 11,925,000 | | | | | Anixter, Inc.
5.625%, 05/01/19 | | | 12,811,922 | |
| | 11,415,000 | | | | | Brocade Communications Systems, Inc.*
4.625%, 01/15/23 | | | 11,272,312 | |
| | | | | | | | | | |
| | | | | | | | | 24,084,234 | |
| | | | | | | | | | |
| | | | | | TOTAL CORPORATE BONDS | | | 177,609,493 | |
| | | | | | | | | | |
NUMBER OF
CONTRACTS | | | | | | | VALUE | |
| | | | | | | | | | |
| | Purchased Options (0.8%)# | |
| | | | | | Consumer Discretionary (0.3%) | |
| | 6,500 | | | | | Gap, Inc.
Call, 01/17/15, Strike $35.00 | | | 4,517,500 | |
| | 7,200 | | | | | Las Vegas Sands Corp.
Call, 01/17/15, Strike $55.00 | | | 6,768,000 | |
| | | | | | | | | | |
| | | | | | | | | 11,285,500 | |
| | | | | | | | | | |
| | | | | | Energy (0.2%) | |
| | 10,200 | | | | | Chesapeake Energy Corp.
Call, 01/17/15, Strike $20.00 | | | 3,442,500 | |
| | | | | | | | | | |
NUMBER OF
CONTRACTS | | | | | | | VALUE | |
| | | | | | Continental Resources, Inc. | | | | |
| | 1,980 | | | | | Call, 01/17/15, Strike $95.00 | | $ | 1,683,000 | |
| | 1,980 | | | | | Call, 01/17/15, Strike $90.00 | | | 2,049,300 | |
| | | | | | | | | | |
| | | | | | | | | 7,174,800 | |
| | | | | | | | | | |
| | | | | | Information Technology (0.3%) | |
| | 565 | | | | | Google, Inc.
Call, 01/17/15, Strike $750.00 | | | 7,893,050 | |
| | 6,300 | | | | | Salesforce.com, Inc.
Call, 01/18/14, Strike $42.50 | | | 2,646,000 | |
| | | | | | | | | | |
| | | | | | | | | 10,539,050 | |
| | | | | | | | | | |
| | | | | | TOTAL PURCHASED OPTIONS | | | 28,999,350 | |
| | | | | | | | | | |
| | | | | | TOTAL SYNTHETIC CONVERTIBLE SECURITIES
(Cost $201,400,553) | | | 206,608,843 | |
| | | | | | | | | | |
NUMBER OF
SHARES | | | | | | | VALUE | |
| | CONVERTIBLE PREFERRED STOCKS (9.7%) | |
| | | | | | Energy (2.2%) | |
| | 81,000 | | | | | Chesapeake Energy Corp.*
5.750% | | | 81,838,125 | |
| | | | | | | | | | |
| | | | | | Financials (3.7%) | |
| | 690,000 | | | | | Affiliated Managers Group, Inc.
5.150% | | | 37,216,875 | |
| | 155,000 | | | | | Fifth Third Bancorp
8.500% | | | 22,899,700 | |
| | 420,000 | | | | | MetLife, Inc.
5.000% | | | 21,063,000 | |
| | 41,000 | | | | | Wells Fargo & Company
7.500% | | | 54,109,750 | |
| | | | | | | | | | |
| | | | | | | | | 135,289,325 | |
| | | | | | | | | | |
| | | | | | Industrials (3.2%) | |
| | 125,626 | | | | | Genesee & Wyoming, Inc.
5.000% | | | 15,200,746 | |
| | 1,700,000 | | | | | United Technologies Corp.
7.500% | | | 100,538,000 | |
| | | | | | | | | | |
| | | | | | | | | 115,738,746 | |
| | | | | | | | | | |
| | | | | | Utilities (0.6%) | |
| | 380,000 | | | | | NextEra Energy, Inc.
5.889% | | | 21,941,200 | |
| | | | | | | | | | |
| | | | | | TOTAL CONVERTIBLE
PREFERRED STOCKS
(Cost $310,828,371) | | | 354,807,396 | |
| | | | | | | | | | |
| | | | | | | | | | |
| | COMMON STOCKS (47.6%) | |
| | | | | | Consumer Discretionary (2.9%) | |
| | 310,000 | | | | | Amazon.com, Inc.# | | | 78,681,100 | |
| | 380,000 | | | | | Home Depot, Inc. | | | 27,873,000 | |
| | | | | | | | | | |
| | | | | | | | | 106,554,100 | |
| | | | | | | | | | |
| | | | |
| 78 | | CALAMOS FAMILY OF FUNDS SEMIANNUAL REPORT | | See accompanying Notes to Schedule of Investments |
Growth and Income Fund Schedule of Investments April 30, 2013 (Unaudited)
| | | | | | | | | | |
NUMBER
OF SHARES | | | | | | | VALUE | |
| | | | | | | | | | |
| | | | | | Consumer Staples (6.6%) | |
| | 2,850,000 | | | | | Coca-Cola Company | | $ | 120,640,500 | |
| | 890,000 | | | | | Companhia de Bebidas das Americas | | | 37,397,800 | |
| | 335,000 | | | | | Costco Wholesale Corp. | | | 36,324,050 | |
| | 285,000 | | | | | Philip Morris International, Inc. | | | 27,243,150 | |
| | 415,000 | | | | | Walgreen Company | | | 20,546,650 | |
| | | | | | | | | | |
| | | | | | | | | 242,152,150 | |
| | | | | | | | | | |
| | | | | | Energy (5.0%) | |
| | 310,000 | | | | | EOG Resources, Inc. | | | 37,559,600 | |
| | 425,000 | | | | | National Oilwell Varco, Inc. | | | 27,718,500 | |
| | 480,000 | | | | | Occidental Petroleum Corp. | | | 42,844,800 | |
| | 990,000 | | | | | Schlumberger, Ltd. | | | 73,685,700 | |
| | | | | | | | | | |
| | | | | | | | | 181,808,600 | |
| | | | | | | | | | |
| | | | | | Financials (6.5%) | |
| | 375,000 | | | | | Franklin Resources, Inc. | | | 57,997,500 | |
| | 130,000 | | | | | Goldman Sachs Group, Inc. | | | 18,989,100 | |
| | 1,000,000 | | | | | JPMorgan Chase & Company | | | 49,010,000 | |
| | 1,130,000 | | | | | T. Rowe Price Group, Inc. | | | 81,925,000 | |
| | 850,000 | | | | | Wells Fargo & Company | | | 32,283,000 | |
| | | | | | | | | | |
| | | | | | | | | 240,204,600 | |
| | | | | | | | | | |
| | | | | | Health Care (5.5%) | |
| | 160,000 | | | | | Celgene Corp.# | | | 18,891,200 | |
| | 925,000 | | | | | Johnson & Johnson | | | 78,837,750 | |
| | 840,000 | | | | | Merck & Company, Inc. | | | 39,480,000 | |
| | 360,000 | | | DKK | | Novo Nordisk, A/S - Class B | | | 63,368,939 | |
| | | | | | | | | | |
| | | | | | | | | 200,577,889 | |
| | | | | | | | | | |
| | | | | | Industrials (3.4%) | |
| | 385,000 | | | | | Caterpillar, Inc. | | | 32,597,950 | |
| | 765,000 | | | | | Dover Corp. | | | 52,769,700 | |
| | 650,000 | | | | | Eaton Corp., PLC | | | 39,916,500 | |
| | | | | | | | | | |
| | | | | | | | | 125,284,150 | |
| | | | | | | | | | |
| | | | | | Information Technology (17.7%) | |
| | 1,100,000 | | | | | Accenture, PLC - Class A | | | 89,584,000 | |
| | 275,000 | | | | | Apple, Inc. | | | 121,756,250 | |
| | 1,800,000 | | | | | Cisco Systems, Inc. | | | 37,656,000 | |
| | 320,000 | | | | | Cognizant Technology Solutions Corp. - Class A# | | | 20,736,000 | |
| | 1,500,000 | | | | | eBay, Inc.# | | | 78,585,000 | |
| | 75,000 | | | | | MasterCard, Inc. - Class A | | | 41,469,750 | |
| | 2,800,000 | | | | | Oracle Corp. | | | 91,784,000 | |
| | 1,330,000 | | | | | QUALCOMM, Inc. | | | 81,954,600 | |
| | 35,000 | | | KRW | | Samsung Electronics Company, Ltd. | | | 48,405,715 | |
| | 500,000 | | | | | SAP, AG | | | 39,925,000 | |
| | | | | | | | | | |
| | | | | | | | | 651,856,315 | |
| | | | | | | | | | |
| | | | | | TOTAL COMMON STOCKS
(Cost $1,365,800,529) | | | 1,748,437,804 | |
| | | | | | | | | | |
| | | | | | | | | | |
NUMBER
OF SHARES | | | | | | | VALUE | |
| | SHORT TERM INVESTMENT (0.3%) | |
| | 12,591,454 | | | | | Fidelity Prime Money Market
Fund - Institutional Class
(Cost $12,591,454) | | $ | 12,591,454 | |
| | | | | | | | | | |
| TOTAL INVESTMENTS (98.1%)
(Cost $3,094,250,123) | | | 3,602,900,262 | |
| | | | | | | | | | |
| |
| | OTHER ASSETS, LESS LIABILITIES (1.9%) | | | 70,546,280 | |
| | | | | | | | | | |
| |
| | NET ASSETS (100.0%) | | $ | 3,673,446,542 | |
| | | | | | | | | | |
FORWARD FOREIGN CURRENCY CONTRACTS
| | | | | | | | | | | | | | | | |
COUNTER
PARTY | | SHORT CONTRACTS | | SETTLEMENT DATE | | LOCAL CURRENCY | | | CURRENT
VALUE | | | UNREALIZED
GAIN/LOSS | |
| JPMorgan Chase Bank | | Brazilian Real | | 07/18/13 | | | 70,744,000 | | | $ | 35,000,281 | | | $ | 302,878 | |
| Citibank N.A. | | British Pound Sterling | | 07/18/13 | | | 10,093,000 | | | | 15,670,754 | | | | (221,238 | ) |
| Goldman Sachs Capital Markets LP | | Danish Krone | | 07/18/13 | | | 327,800,000 | | | | 57,952,187 | | | | (355,534 | ) |
| Northern Trust Company | | European Monetary Unit | | 07/18/13 | | | 131,563,000 | | | | 173,350,219 | | | | (1,122,412 | ) |
| Goldman Sachs Capital Markets LP | | Norwegian Krone | | 07/18/13 | | | 168,024,000 | | | | 29,055,044 | | | | 186,548 | |
| Northern Trust Company | | South Korean Won | | 07/18/13 | | | 49,552,928,000 | | | | 44,869,011 | | | | (779,638 | ) |
| Bank of America N.A. | | Swedish Krona | | 07/18/13 | | | 14,894,000 | | | | 2,294,253 | | | | (43,775 | ) |
| Northern Trust Company | | Swedish Krona | | 07/18/13 | | | 106,280,000 | | | | 16,371,239 | | | | 259,125 | |
| | | | | | | | | | | | | | | | |
| | | | | | | | | | | | | | $ | (1,774,046 | ) |
| | | | | | | | | | | | | | | | |
| | | | | |
COUNTER
PARTY | | LONG CONTRACTS | | SETTLEMENT DATE | | LOCAL CURRENCY | | | CURRENT
VALUE | | | UNREALIZED
GAIN/LOSS | |
| Northern Trust Company | | Brazilian Real | | 07/18/13 | | | 3,837,000 | | | $ | 1,898,339 | | | $ | 7,632 | |
| UBS AG | | European Monetary Unit | | 07/18/13 | | | 13,419,000 | | | | 17,681,161 | | | | 150,016 | |
| UBS AG | | Norwegian Krone | | 07/18/13 | | | 23,809,000 | | | | 4,117,100 | | | | 38,680 | |
| Barclays Bank PLC | | Swedish Krona | | 07/18/13 | | | 14,942,000 | | | | 2,301,647 | | | | 18,472 | |
| | | | | | | | | | | | | | | | |
| | | | | | | | | | | | | | $ | 214,800 | |
| | | | | | | | | | | | | | | | |
NOTES TO SCHEDULE OF INVESTMENTS
| * | Securities issued and sold pursuant to a Rule 144A transaction are excepted from the registration requirement of the Securities Act of 1933, as amended. These securities may only be sold to qualified institutional buyers (“QIBs”), such as the fund. Any resale of these securities must generally be effected through a sale that is registered under the Act or otherwise exempted from such registration requirements. |
| § | Securities exchangeable or convertible into securities of one or more entities that are different than the issuer. Each entity is identified in the parenthetical. |
| | | | | | |
| See accompanying Notes to Financial Statements | | www.calamos.com | | | 79 | |
Growth and Income Fund Schedule of Investments April 30, 2013 (Unaudited)
| ‡ | Variable rate or step bond security. The rate shown is the rate in effect at April 30, 2013. |
| # | Non-income producing security. |
| | |
| FOREIGN CURRENCY ABBREVIATIONS |
| DKK | | Danish Krone |
| EUR | | European Monetary Unit |
| KRW | | South Korean Won |
| SGD | | Singapore Dollar |
Note: Value for securities denominated in foreign currencies is shown in U.S. dollars. The principal amount for such securities is shown in the respective foreign currency. The date on options represents the expiration date of the option contract. The option contract may be exercised at any date on or before the date shown.
| | | | |
| 80 | | CALAMOS FAMILY OF FUNDS SEMIANNUAL REPORT | | See accompanying Notes to Financial Statements |
Global Growth and Income Fund Schedule of Investments April 30, 2013 (Unaudited)
| | | | | | | | | | |
PRINCIPAL
AMOUNT | | | | | | | VALUE | |
| | CONVERTIBLE BONDS (35.3%) | |
| | | | | | Consumer Discretionary (2.9%) | |
| | 1,950,000 | | | | | Liberty Interactive, LLC (Time Warner Cable, Inc., Time Warner, Inc.)*§
0.750%, 03/30/43 | | $ | 2,022,745 | |
| | 7,300,000 | | | | | Omnicom Group, Inc.
0.000%, 07/01/38 | | | 8,716,894 | |
| | 9,500,000 | | | | | Priceline.com, Inc.
1.000%, 03/15/18 | | | 10,797,747 | |
| | | | | | | | | | |
| | | | | | | | | 21,537,386 | |
| | | | | | | | | | |
| | | | | | Consumer Staples (1.8%) | |
| | 710,000,000 | | | JPY | | Asahi Group Holdings, Ltd.
0.000%, 05/26/28 | | | 9,069,129 | |
| | 240,000,000 | | | JPY | | Unicharm Corp.
0.000%, 09/24/15 | | | 3,996,630 | |
| | | | | | | | | | |
| | | | | | | | | 13,065,759 | |
| | | | | | | | | | |
| | | | | | Energy (3.4%) | |
| | 12,600,000 | | | | | Subsea 7, SA
1.000%, 10/05/17 | | | 12,706,087 | |
| | | | | | Technip, SA | | | | |
| | 5,641,200 | | | EUR | | 0.250%, 01/01/17 | | | 8,051,798 | |
| | 3,221,100 | | | EUR | | 0.500%, 01/01/16 | | | 4,172,045 | |
| | | | | | | | | | |
| | | | | | | | | 24,929,930 | |
| | | | | | | | | | |
| | | | | | Financials (6.7%) | |
| | 7,900,000 | | | | | Affiliated Managers Group, Inc.
3.950%, 08/15/38 | | | 9,913,631 | |
| | | | | | Industrivarden, AB | | | | |
| | 6,900,000 | | | EUR | | 1.875%, 02/27/17 | | | 10,022,140 | |
| | 2,400,000 | | | EUR | | 2.500%, 02/27/15 | | | 4,036,943 | |
| | 3,730,000 | | | | | Leucadia National Corp.
3.750%, 04/15/14 | | | 5,427,150 | |
| | 23,000,000 | | | SGD | | Temasek Financial, Ltd. (Standard Chartered, PLC)§
0.000%, 10/24/14 | | | 19,809,292 | |
| | | | | | | | | | |
| | | | | | | | | 49,209,156 | |
| | | | | | | | | | |
| | | | | | Health Care (5.1%) | |
| | 60,000,000 | | | SEK | | Elekta, AB
2.750%, 04/25/17 | | | 11,720,811 | |
| | 7,900,000 | | | | | QIAGEN, NV
3.250%, 05/16/26 | | | 9,679,870 | |
| | 550,000,000 | | | JPY | | Sawai Pharmaceutical Company, Ltd. 0.000%, 09/17/15 | | | 7,677,056 | |
| | 3,300,000 | | | EUR | | UCB, SA 4.500%, 10/22/15 | | | 5,417,491 | |
| | 2,950,000 | | | | | WellPoint, Inc.*
2.750%, 10/15/42 | | | 3,541,888 | |
| | | | | | | | | | |
| | | | | | | | | 38,037,116 | |
| | | | | | | | | | |
| | | | | | Industrials (4.5%) | |
| | 13,300,000 | | | EUR | | Deutsche Post, AG
0.600%, 12/06/19 | | | 19,706,236 | |
| | | | | | | | | | |
PRINCIPAL
AMOUNT | | | | | | | VALUE | |
| | 12,750,000 | | | | | Siemens, AG
1.050%, 08/16/17 | | $ | 13,317,951 | |
| | | | | | | | | | |
| | | | | | | | | 33,024,187 | |
| | | | | | | | | | |
| | | | | | Information Technology (5.5%) | |
| | 6,300,000 | | | | | Hon Hai Precision Industry
Company, Ltd.
0.000%, 10/12/13 | | | 6,297,426 | |
| | 1,077,000 | | | | | Nuance Communications, Inc.
2.750%, 11/01/31 | | | 1,125,072 | |
| | 7,000,000 | | | | | Pegatron Corp.
0.000%, 02/06/17 | | | 8,646,462 | |
| | 6,650,000 | | | | | SanDisk Corp.
1.500%, 08/15/17 | | | 8,387,678 | |
| | 4,900,000 | | | | | SK Hynix, Inc.
2.650%, 05/14/15 | | | 5,561,745 | |
| | 3,400,000 | | | | | Symantec Corp.
1.000%, 06/15/13 | | | 4,298,960 | |
| | 5,000,000 | | | | | TPK Holding Company, Ltd.
0.000%, 10/01/17 | | | 6,573,018 | |
| | | | | | | | | | |
| | | | | | | | | 40,890,361 | |
| | | | | | | | | | |
| | | | | | Materials (3.3%) | |
| | 13,300,000 | | | | | Goldcorp, Inc.
2.000%, 08/01/14 | | | 13,732,183 | |
| | 10,500,000 | | | | | Newmont Mining Corp.
1.250%, 07/15/14 | | | 11,042,483 | |
| | | | | | | | | | |
| | | | | | | | | 24,774,666 | |
| | | | | | | | | | |
| | | | | | Telecommunication Services (2.1%) | |
| | 690,000,000 | | | JPY | | KDDI Corp.
0.000%, 12/14/15 | | | 11,576,437 | |
| | 3,175,000 | | | | | SK Telecom Company, Ltd.
1.750%, 04/07/14 | | | 4,101,333 | |
| | | | | | | | | | |
| | | | | | | | | 15,677,770 | |
| | | | | | | | | | |
| | | | | | TOTAL CONVERTIBLE BONDS
(Cost $251,227,042) | | | 261,146,331 | |
| | | | | | | | | | |
| | | | | | | | | | |
| | SYNTHETIC CONVERTIBLE SECURITIES (11.1%) | |
| | Corporate Bonds (4.2%) | | | | |
| | | | | | Consumer Discretionary (1.9%) | |
| | 25,000,000 | | | CNY | | BSH Bosch und Siemens Hausgerate, GmbH
2.375%, 09/29/14 | | | 4,062,997 | |
| | 4,400,000 | | | | | Expedia, Inc.
5.950%, 08/15/20 | | | 4,940,254 | |
| | 4,400,000 | | | | | L Brands, Inc.
5.625%, 02/15/22 | | | 4,735,500 | |
| | | | | | | | | | |
| | | | | | | | | 13,738,751 | |
| | | | | | | | | | |
| | | | | | Consumer Staples (0.6%) | |
| | 27,000,000 | | | CNY | | Tesco, PLC
1.750%, 09/01/14 | | | 4,342,861 | |
| | | | | | | | | | |
| | | | | | |
| See accompanying Notes to Schedule of Investments | | www.calamos.com | | | 81 | |
Global Growth and Income Fund Schedule of Investments April 30, 2013 (Unaudited)
| | | | | | | | | | |
PRINCIPAL
AMOUNT | | | | | | | VALUE | |
| | | | | | | | | | |
| | | | | | Industrials (1.1%) | |
| | 50,000,000 | | | CNY | | Caterpillar, Inc.
1.350%, 07/12/13 | | $ | 8,093,512 | |
| | | | | | | | | | |
| | | | | | Telecommunication Services (0.6%) | |
| | 28,000,000 | | | CNY | | América Móvil, SAB de CV
3.500%, 02/08/15 | | | 4,610,735 | |
| | | | | | | | | | |
| | | | | | TOTAL CORPORATE BONDS | | | 30,785,859 | |
| | | | | | | | | | |
| | Sovereign Bonds (5.7%) | |
| | | | | | Government of Canada | | | | |
| | 7,600,000 | | | CAD | | 2.000%, 12/01/14 | | | 7,666,574 | |
| | 3,100,000 | | | CAD | | 2.000%, 06/01/16 | | | 3,165,126 | |
| | | | | | Government of Singapore | | | | |
| | 7,800,000 | | | SGD | | 1.375%, 10/01/14 | | | 6,439,861 | |
| | 4,404,000 | | | SGD | | 1.125%, 04/01/16 | | | 3,671,943 | |
| | 54,000,000 | | | NOK | | Kingdom of Norway
4.250%, 05/19/17 | | | 10,464,753 | |
| | 65,000,000 | | | SEK | | Kingdom of Sweden
3.000%, 07/12/16 | | | 10,688,912 | |
| | | | | | | | | | |
| | | | | | TOTAL SOVEREIGN BONDS | | | 42,097,169 | |
| | | | | | | | | | |
NUMBER OF
CONTRACTS | | | | | | | VALUE | |
| | | | | | | | | | |
| | Purchased Options (1.2%)# | | | | |
| | | | | | Consumer Discretionary (0.5%) | | | | |
| | 1,125 | | | EUR | | Adidas, AG
Call, 12/19/14, Strike 68.00 | | | 2,148,275 | |
| | 1,970 | | | | | Las Vegas Sands Corp.
Call, 01/17/15, Strike $55.00 | | | 1,851,800 | |
| | | | | | | | | | |
| | | | | | | | | 4,000,075 | |
| | | | | | | | | | |
| | | | | | Health Care (0.2%) | | | | |
| | 2,320 | | | | | Gilead Sciences, Inc.
Call, 01/17/15, Strike $52.50 | | | 1,838,600 | |
| | | | | | | | | | |
| | | | | | Information Technology (0.5%) | | | | |
| | 160 | | | | | Google, Inc.
Call, 01/17/15, Strike $750.00 | | | 2,235,200 | |
| | 1,440 | | | | | Salesforce.com, Inc.
Call, 01/17/15, Strike $42.50 | | | 1,090,800 | |
| | | | | | | | | | |
| | | | | | | | | 3,326,000 | |
| | | | | | | | | | |
| | | | | | TOTAL PURCHASED OPTIONS | | | 9,164,675 | |
| | | | | | | | | | |
| | | | | | TOTAL SYNTHETIC CONVERTIBLE SECURITIES
(Cost $77,173,492) | | | 82,047,703 | |
| | | | | | | | | | |
NUMBER OF
SHARES | | | | | | | VALUE | |
| | CONVERTIBLE PREFERRED STOCKS (4.4%) | | | | |
| | | | | | Energy (2.5%) | | | | |
| | 18,188 | | | | | Chesapeake Energy Corp.*
5.750% | | | 18,294,854 | |
| | | | | | | | | | |
| | | | | | Financials (0.8%) | | | | |
| | 40,000 | | | | | Fifth Third Bancorp
8.500% | | | 5,909,600 | |
| | | | | | | | | | |
| | | | | | | | | | |
NUMBER OF
SHARES | | | | | | | VALUE | |
| | | | | | | | | | |
| | | | | | Utilities (1.1%) | | | | |
| | 143,000 | | | | | NextEra Energy, Inc.
5.599% | | $ | 8,197,475 | |
| | | | | | | | | | |
| | | | | | TOTAL CONVERTIBLE
PREFERRED STOCKS
(Cost $29,494,684) | | | 32,401,929 | |
| | | | | | | | | | |
| | | | | | | | | | |
| | COMMON STOCKS (48.9%) | |
| | | | | | Consumer Discretionary (4.1%) | | | | |
| | 53,300 | | | CHF | | Swatch Group, AG | | | 30,579,304 | |
| | | | | | | | | | |
| | | | | | Consumer Staples (5.0%) | | | | |
| | 500,000 | | | | | Coca-Cola Company | | | 21,165,000 | |
| | 249,500 | | | GBP | | Diageo, PLC | | | 7,619,129 | |
| | 147,500 | | | GBP | | SABMiller, PLC | | | 7,958,695 | |
| | | | | | | | | | |
| | | | | | | | | 36,742,824 | |
| | | | | | | | | | |
| | | | | | Energy (4.2%) | | | | |
| | 39,500 | | | | | EOG Resources, Inc. | | | 4,785,820 | |
| | 130,000 | | | | | Murphy Oil Corp. | | | 8,071,700 | |
| | 254,932 | | | NOK | | Petroleum Geo-Services, ASA | | | 3,745,567 | |
| | 190,000 | | | | | Schlumberger, Ltd. | | | 14,141,700 | |
| | | | | | | | | | |
| | | | | | | | | 30,744,787 | |
| | | | | | | | | | |
| | | | | | Financials (3.9%) | | | | |
| | 79,000 | | | | | Franklin Resources, Inc. | | | 12,218,140 | |
| | 106,000 | | | | | JPMorgan Chase & Company | | | 5,195,060 | |
| | 159,500 | | | | | T. Rowe Price Group, Inc. | | | 11,563,750 | |
| | | | | | | | | | |
| | | | | | | | | 28,976,950 | |
| | | | | | | | | | |
| | | | | | Health Care (11.3%) | | | | |
| | 111,950 | | | | | Amgen, Inc. | | | 11,666,309 | |
| | 174,000 | | | | | Covidien, PLC | | | 11,108,160 | |
| | 163,000 | | | | | Johnson & Johnson | | | 13,892,490 | |
| | 160,000 | | | CHF | | Novartis, AG | | | 11,844,414 | |
| | 201,150 | | | DKK | | Novo Nordisk, A/S - Class B | | | 35,407,395 | |
| | | | | | | | | | |
| | | | | | | | | 83,918,768 | |
| | | | | | | | | | |
| | | | | | Industrials (2.4%) | | | | |
| | 430,000 | | | CHF | | ABB, Ltd.# | | | 9,751,069 | |
| | 50,000 | | | | | Eaton Corp., PLC | | | 3,070,500 | |
| | 172,000 | | | EUR | | Koninklijke Philips Electronics, NV | | | 4,760,626 | |
| | | | | | | | | | |
| | | | | | | | | 17,582,195 | |
| | | | | | | | | | |
| | | | | | Information Technology (18.0%) | | | | |
| | 178,000 | | | | | Accenture, PLC - Class A | | | 14,496,320 | |
| | 20,500 | | | | | Apple, Inc. | | | 9,076,375 | |
| | 510,000 | | | | | Cisco Systems, Inc. | | | 10,669,200 | |
| | 295,000 | | | | | eBay, Inc.# | | | 15,455,050 | |
| | 2,810,000 | | | TWD | | Hon Hai Precision Industry Company, Ltd. | | | 7,263,226 | |
| | 401,560 | | | SEK | | LM Ericsson Telephone Company | | | 4,993,950 | |
| | 275,500 | | | | | QUALCOMM, Inc. | | | 16,976,310 | |
| | 2,900 | | | KRW | | Samsung Electronics Company, Ltd. | | | 4,010,759 | |
| | | | |
| 82 | | CALAMOS FAMILY OF FUNDS SEMIANNUAL REPORT | | See accompanying Notes to Schedule of Investments |
Global Growth and Income Fund Schedule of Investments April 30, 2013 (Unaudited)
| | | | | | | | | | |
NUMBER OF
SHARES | | | | | | | VALUE | |
| | 440,500 | | | EUR | | SAP, AG | | $ | 35,117,531 | |
| | 4,100,000 | | | TWD | | Taiwan Semiconductor Manufacturing Company, Ltd. | | | 15,216,869 | |
| | | | | | | | | | |
| | | | | | | | | 133,275,590 | |
| | | | | | | | | | |
| | | | | | TOTAL COMMON STOCKS
(Cost $289,319,436) | | | 361,820,418 | |
| | | | | | | | | | |
| | | | | | | | | | |
| | SHORT TERM INVESTMENT (0.0%) | | | | |
| | 603 | | | | | Fidelity Prime Money Market Fund - Institutional Class
(Cost $603) | | | 603 | |
| | | | | | | | | | |
| TOTAL INVESTMENTS (99.7%)
(Cost $647,215,257) | | | 737,416,984 | |
| | | | | | | | | | |
| |
| | OTHER ASSETS, LESS LIABILITIES (0.3%) | | | 2,238,781 | |
| | | | | | | | | | |
| |
| | NET ASSETS (100.0%) | | $ | 739,655,765 | |
| | | | | | | | | | |
NOTES TO SCHEDULE OF INVESTMENTS
| * | Securities issued and sold pursuant to a Rule 144A transaction are excepted from the registration requirement of the Securities Act of 1933, as amended. These securities may only be sold to qualified institutional buyers (“QIBs”), such as the fund. Any resale of these securities must generally be effected through a sale that is registered under the Act or otherwise exempted from such registration requirements. |
| § | Securities exchangeable or convertible into securities of one or more entities that are different than the issuer. Each entity is identified in the parenthetical. |
| # | Non-income producing security. |
FOREIGN CURRENCY ABBREVIATIONS
| | |
| CAD | | Canadian Dollar |
| CHF | | Swiss Franc |
| CNY | | Chinese Yuan Renminbi |
| DKK | | Danish Krone |
| EUR | | European Monetary Unit |
| GBP | | British Pound Sterling |
| JPY | | Japanese Yen |
| KRW | | South Korean Won |
| NOK | | Norwegian Krone |
| SEK | | Swedish Krona |
| SGD | | Singapore Dollar |
| TWD | | New Taiwanese Dollar |
Note: Value for securities denominated in foreign currencies is shown in U.S. dollars. The principal amount for such securities is shown in the respective foreign currency. The date on options represents the expiration date of the option contract. The option contract may be exercised at any date on or before the date shown.
CURRENCY EXPOSURE
APRIL 30, 2013
| | | | | | | | |
| | | VALUE | | | % OF TOTAL
INVESTMENTS | |
| US Dollar | | $ | 378,536,893 | | | | 51.3% | |
| European Monetary Unit | | | 93,433,085 | | | | 12.7% | |
| Swiss Franc | | | 52,174,787 | | | | 7.1% | |
| Danish Krone | | | 35,407,395 | | | | 4.8% | |
| Japanese Yen | | | 32,319,252 | | | | 4.4% | |
| Singapore Dollar | | | 29,921,096 | | | | 4.1% | |
| Swedish Krona | | | 27,403,673 | | | | 3.7% | |
| New Taiwanese Dollar | | | 22,480,095 | | | | 3.0% | |
| Chinese Yuan Renminbi | | | 21,110,105 | | | | 2.9% | |
| British Pound Sterling | | | 15,577,824 | | | | 2.1% | |
| Norwegian Krone | | | 14,210,320 | | | | 1.9% | |
| Canadian Dollar | | | 10,831,700 | | | | 1.5% | |
| South Korean Won | | | 4,010,759 | | | | 0.5% | |
| Total Investments | | $ | 737,416,984 | | | | 100.0% | |
Currency exposure may vary over time.
| | | | | | |
| See accompanying Notes to Financial Statements | | www.calamos.com | | | 83 | |
Convertible Fund Schedule of Investments April 30, 2013 (Unaudited)
| | | | | | | | | | |
PRINCIPAL
AMOUNT | | | | | | | VALUE | |
| | CONVERTIBLE BONDS (59.7%) | |
| | | | | | Consumer Discretionary (10.0%) | |
| | 12,400,000 | | | | | Iconix Brand Group, Inc.*
1.500%, 03/15/18 | | $ | 14,151,314 | |
| | 8,384,000 | | | | | Jarden Corp.*
1.875%, 09/15/18 | | | 9,840,930 | |
| | 6,500,000 | | | | | KB Home
1.375%, 02/01/19 | | | 7,534,930 | |
| | 12,000,000 | | | | | Liberty Interactive, LLC (Time Warner Cable, Inc., Time Warner, Inc.)*§
0.750%, 03/30/43 | | | 12,447,660 | |
| | 12,000,000 | | | | | MGM Resorts International
4.250%, 04/15/15 | | | 13,322,040 | |
| | 19,400,000 | | | | | Omnicom Group, Inc.
0.000%, 07/01/38 | | | 23,165,443 | |
| | 20,500,000 | | | | | Priceline.com, Inc.
1.000%, 03/15/18 | | | 23,300,402 | |
| | 12,500,000 | | | | | Standard Pacific Corp.
1.250%, 08/01/32 | | | 16,636,438 | |
| | | | | | | | | | |
| | | | | | | | | 120,399,157 | |
| | | | | | | | | | |
| | | | | | Consumer Staples (0.1%) | |
| | 90,000,000 | | | JPY | | Unicharm Corp.
0.000%, 09/24/15 | | | 1,498,736 | |
| | | | | | | | | | |
| | | | | | Energy (6.0%) | |
| | 10,500,000 | | | | | Exterran Holdings, Inc.
4.250%, 06/15/14 | | | 13,165,058 | |
| | 13,400,000 | | | | | Hornbeck Offshore Services, Inc.‡ 1.625%, 11/15/26 | | | 14,324,600 | |
| | 5,200,000 | | | | | Newpark Resources, Inc.
4.000%, 10/01/17 | | | 6,515,340 | |
| | 7,250,000 | | | | | SEACOR Holdings, Inc.*
2.500%, 12/15/27 | | | 7,962,566 | |
| | 16,000,000 | | | | | Subsea 7, SA
1.000%, 10/05/17 | | | 16,134,714 | |
| | 10,391,900 | | | EUR | | Technip, SA
0.250%, 01/01/17 | | | 14,832,567 | |
| | | | | | | | | | |
| | | | | | | | | 72,934,845 | |
| | | | | | | | | | |
| | | | | | Financials (7.9%) | |
| | 3,168,000 | | | | | Affiliated Managers Group, Inc.
3.950%, 08/15/38 | | | 3,975,492 | |
| | 16,000,000 | | | | | Ares Capital Corp.*
4.750%, 01/15/18 | | | 16,881,360 | |
| | 10,150,000 | | | | | Fidelity National Financial, Inc.
4.250%, 08/15/18 | | | 14,327,080 | |
| | 3,975,000 | | | | | IAS Operating Partnership, LP*
5.000%, 03/15/18 | | | 4,023,912 | |
| | | | | | Industrivarden, AB | | | | |
| | 6,500,000 | | | EUR | | 1.875%, 02/27/17 | | | 9,441,147 | |
| | 1,850,000 | | | EUR | | 2.500%, 02/27/15 | | | 3,111,810 | |
| | 8,450,000 | | | | | Leucadia National Corp.
3.750%, 04/15/14 | | | 12,294,750 | |
| | | | | | | | | | |
PRINCIPAL
AMOUNT | | | | | | | VALUE | |
| | 10,700,000 | | | | | Starwood Property Trust, Inc.
4.550%, 03/01/18 | | $ | 11,869,242 | |
| | 16,000,000 | | | SGD | | Temasek Financial, Ltd. (Standard Chartered, PLC)§
0.000%, 10/24/14 | | | 13,780,377 | |
| | | | | | | | | | |
| | 5,700,000 | | | | | Walter Investment Management Corp.
4.500%, 11/01/19 | | | 6,040,974 | |
| | | | | | | | | | |
| | | | | | | | | 95,746,144 | |
| | | | | | | | | | |
| | | | | | Health Care (12.7%) | |
| | 8,915,000 | | | | | Chemed Corp.
1.875%, 05/15/14 | | | 9,894,134 | |
| | 17,800,000 | | | | | Gilead Sciences, Inc.
1.625%, 05/01/16 | | | 40,010,128 | |
| | 11,000,000 | | | | | Hologic, Inc.‡
2.000%, 12/15/37 | | | 12,566,180 | |
| | 10,000,000 | | | | | Medicines Company*
1.375%, 06/01/17 | | | 13,615,800 | |
| | 12,500,000 | | | | | Molina Healthcare, Inc.*
1.125%, 01/15/20 | | | 13,227,562 | |
| | 4,000,000 | | | | | OPKO Health, Inc.*
3.000%, 02/01/33 | | | 3,844,960 | |
| | 4,500,000 | | | | | Pacira Pharmaceuticals, Inc.*
3.250%, 02/01/19 | | | 6,209,348 | |
| | 12,500,000 | | | | | Salix Pharmaceuticals, Ltd.
1.500%, 03/15/19 | | | 13,601,187 | |
| | 4,000,000 | | | | | Theravance, Inc.
2.125%, 01/15/23 | | | 5,632,020 | |
| | 20,818,000 | | | | | WellPoint, Inc.*
2.750%, 10/15/42 | | | 24,994,924 | |
| | 9,000,000 | | | | | Wright Medical Group, Inc.*
2.000%, 08/15/17 | | | 10,333,845 | |
| | | | | | | | | | |
| | | | | | | | | 153,930,088 | |
| | | | | | | | | | |
| | | | | | Industrials (5.3%) | |
| | 1,610,000 | | | | | Alliant Techsystems, Inc.
3.000%, 08/15/24 | | | 1,784,806 | |
| | 4,400,000 | | | EUR | | Deutsche Post, AG
0.600%, 12/06/19 | | | 6,519,356 | |
| | 11,000,000 | | | | | General Cable Corp.‡
4.500%, 11/15/29 | | | 13,402,400 | |
| | 11,500,000 | | | | | Siemens, AG
1.050%, 08/16/17 | | | 12,012,270 | |
| | 25,620,000 | | | | | Trinity Industries, Inc.
3.875%, 06/01/36 | | | 30,628,710 | |
| | | | | | | | | | |
| | | | | | | | | 64,347,542 | |
| | | | | | | | | | |
| | | | | | Information Technology (15.4%) | |
| | 18,000,000 | | | | | Arris Group, Inc.
2.000%, 11/15/26 | | | 19,835,640 | |
| | 9,607,000 | | | | | EMC Corp.
1.750%, 12/01/13 | | | 13,518,298 | |
| | 12,500,000 | | | | | Intel Corp.
2.950%, 12/15/35 | | | 13,947,062 | |
| | | | |
| 84 | | CALAMOS FAMILY OF FUNDS SEMIANNUAL REPORT | | See accompanying Notes to Schedule of Investments |
Convertible Fund Schedule of Investments April 30, 2013 (Unaudited)
| | | | | | | | | | |
PRINCIPAL
AMOUNT | | | | | | | VALUE | |
| | 9,250,000 | | | | | Ixia
3.000%, 12/15/15 | | $ | 10,805,850 | |
| | 11,500,000 | | | | | Linear Technology Corp.
3.000%, 05/01/27 | | | 12,235,310 | |
| | | | | | Nuance Communications, Inc. | |
| | 11,300,000 | | | | | 2.750%, 11/01/31 | | | 11,804,376 | |
| | 5,000,000 | | | | | 2.750%, 08/15/27 | | | 6,051,325 | |
| | 12,400,000 | | | | | Salesforce.com, Inc.*
0.250%, 04/01/18 | | | 12,476,384 | |
| | 33,000,000 | | | | | SanDisk Corp.
1.500%, 08/15/17 | | | 41,623,065 | |
| | 11,000,000 | | | | | SK Hynix, Inc.
2.650%, 05/14/15 | | | 12,485,550 | |
| | 19,097,000 | | | | | Symantec Corp.
1.000%, 06/15/13 | | | 24,146,247 | |
| | 6,600,000 | | | | | Take-Two Interactive Software, Inc.
1.750%, 12/01/16 | | | 7,393,782 | |
| | | | | | | | | | |
| | | | | | | | | 186,322,889 | |
| | | | | | | | | | |
| | | | | | Materials (1.6%) | |
| | 5,000,000 | | | | | Glencore Finance Europe, SA
5.000%, 12/31/14 | | | 5,725,350 | |
| | 5,400,000 | | | | | RTI International Metals, Inc.
3.000%, 12/01/15 | | | 6,045,300 | |
| | 6,500,000 | | | | | Steel Dynamics, Inc.
5.125%, 06/15/14 | | | 7,212,757 | |
| | | | | | | | | | |
| | | | | | | | | 18,983,407 | |
| | | | | | | | | | |
| | | | | | Telecommunication Services (0.7%) | |
| | 470,000,000 | | | JPY | | KDDI Corp.
0.000%, 12/14/15 | | | 7,885,399 | |
| | | | | | | | | | |
| | | | | | TOTAL CONVERTIBLE BONDS
(Cost $659,182,658) | | | 722,048,207 | |
| | | | | | | | | | |
| | | | | | | | | | |
| | SYNTHETIC CONVERTIBLE SECURITIES (5.0%) | |
| | Corporate Bonds (3.7%) | |
| | | | | | Consumer Discretionary (0.6%) | |
| | | | | | DISH Network Corp. | | | | |
| | 3,170,000 | | | | | 5.125%, 05/01/20* | | | 3,146,225 | |
| | 2,830,000 | | | | | 5.875%, 07/15/22 | | | 2,888,369 | |
| | 1,450,000 | | | | | PVH Corp.
4.500%, 12/15/22 | | | 1,498,031 | |
| | | | | | | | | | |
| | | | | | | | | 7,532,625 | |
| | | | | | | | | | |
| | | | | | Energy (0.3%) | |
| | 3,070,000 | | | | | Oil States International, Inc.*
5.125%, 01/15/23 | | | 3,158,263 | |
| | | | | | | | | | |
| | | | | | Industrials (1.4%) | |
| | 6,100,000 | | | | | AGCO Corp.
5.875%, 12/01/21 | | | 6,713,812 | |
| | 3,500,000 | | | | | Clean Harbors, Inc.*
5.125%, 06/01/21 | | | 3,670,625 | |
| | | | | | | | | | |
PRINCIPAL
AMOUNT | | | | | | | VALUE | |
| | 6,000,000 | | | | | Deluxe Corp.*
6.000%, 11/15/20 | | $ | 6,266,250 | |
| | | | | | | | | | |
| | | | | | | | | 16,650,687 | |
| | | | | | | | | | |
| | | | | | Information Technology (1.4%) | |
| | 10,000,000 | | | | | Anixter, Inc.
5.625%, 05/01/19 | | | 10,743,750 | |
| | 6,600,000 | | | | | Brocade Communications Systems, Inc.*
4.625%, 01/15/23 | | | 6,517,500 | |
| | | | | | | | | | |
| | | | | | | | | 17,261,250 | |
| | | | | | | | | | |
| | | | | | TOTAL CORPORATE BONDS | | | 44,602,825 | |
| | | | | | | | | | |
NUMBER OF
CONTRACTS | | | | | | | VALUE | |
| | | | | | | | | | |
| | Purchased Options (1.3%)# | |
| | | | | | Consumer Discretionary (0.3%) | |
| | 3,400 | | | | | Starbucks Corp.
Call, 01/18/14, Strike $52.50 | | | 3,400,000 | |
| | | | | | | | | | |
| | | | | | Energy (0.1%) | |
| | 1,300 | | | | | EOG Resources, Inc.
Call, 01/18/14, Strike $115.00 | | | 1,989,000 | |
| | | | | | | | | | |
| | | | | | Health Care (0.2%) | |
| | 430 | | | | | Regeneron Pharmaceuticals, Inc.
Call, 01/18/14, Strike $160.00 | | | 2,726,200 | |
| | | | | | | | | | |
| | | | | | Information Technology (0.7%) | |
| | 2,200 | | | | | Accenture, PLC
Call, 01/18/14, Strike $65.00 | | | 3,839,000 | |
| | 1,420 | | | | | Cognizant Technology Solutions Corp.
Call, 01/17/15, Strike $80.00 | | | 852,000 | |
| | 1,600 | | | | | Salesforce.com, Inc.
Call, 01/18/14, Strike $42.50 | | | 672,000 | |
| | 3,500 | | | EUR | | SAP, AG
Call, 12/20/13, Strike 56.00 | | | 2,959,188 | |
| | | | | | | | | | |
| | | | | | | | | 8,322,188 | |
| | | | | | | | | | |
| | | | | | TOTAL PURCHASED OPTIONS | | | 16,437,388 | |
| | | | | | | | | | |
| | | | | | TOTAL SYNTHETIC CONVERTIBLE SECURITIES
(Cost $56,161,782) | | | 61,040,213 | |
| | | | | | | | | | |
| | | | | | | | | | |
NUMBER OF
SHARES | | | | | | | VALUE | |
| | | | | | | | | | |
| | CONVERTIBLE PREFERRED STOCKS (17.0%) | |
| | | | | | Consumer Discretionary (2.3%) | |
| | 590,000 | | | | | General Motors Company
4.750% | | | 27,423,200 | |
| | | | | | | | | | |
| | | | | | Energy (2.2%) | |
| | 25,800 | | | | | Chesapeake Energy Corp.*
5.750% | | | 26,077,575 | |
| | | | | | | | | | |
| | | | | | |
| See accompanying Notes to Schedule of Investments | | www.calamos.com | | | 85 | |
Convertible Fund Schedule of Investments April 30, 2013 (Unaudited)
| | | | | | | | | | |
NUMBER OF
SHARES | | | | | | | VALUE | |
| | | | | | | | | | |
| | | | | | Financials (7.8%) | |
| | | | | | Affiliated Managers Group, Inc. | | | | |
| | 425,000 | | | | | 5.150% | | $ | 22,923,437 | |
| | 232,551 | | | | | 5.100% | | | 15,014,074 | |
| | 110,000 | | | | | Fifth Third Bancorp
8.500% | | | 16,251,400 | |
| | 280,000 | | | | | MetLife, Inc.
5.000% | | | 14,042,000 | |
| | 20,000 | | | | | Wells Fargo & Company
7.500% | | | 26,395,000 | |
| | | | | | | | | | |
| | | | | | | | | 94,625,911 | |
| | | | | | | | | | |
| | | | | | Industrials (3.7%) | |
| | 32,589 | | | | | Genesee & Wyoming, Inc.
5.000% | | | 3,943,269 | |
| | 100,000 | | | | | Stanley Black & Decker, Inc.
4.750% | | | 12,390,000 | |
| | 480,000 | | | | | United Technologies Corp.
7.500% | | | 28,387,200 | |
| | | | | | | | | | |
| | | | | | | | | 44,720,469 | |
| | | | | | | | | | |
| | | | | | Utilities (1.0%) | |
| | 220,000 | | | | | NextEra Energy, Inc.
5.599% | | | 12,611,500 | |
| | | | | | | | | | |
| | | | | | TOTAL CONVERTIBLE PREFERRED STOCKS
(Cost $181,980,709) | | | 205,458,655 | |
| | | | | | | | | | |
| | | | | | | | | | |
| | COMMON STOCKS (14.0%) | | | | |
| | | | | | Consumer Discretionary (2.4%) | | | | |
| | 23,000 | | | | | Priceline.com, Inc.# | | | 16,007,770 | |
| | 22,450 | | | CHF | | Swatch Group, AG | | | 12,880,026 | |
| | | | | | | | | | |
| | | | | | | | | 28,887,796 | |
| | | | | | | | | | |
| | | | | | Financials (3.9%) | | | | |
| | 100,000 | | | | | Franklin Resources, Inc. | | | 15,466,000 | |
| | 375,000 | | | | | JPMorgan Chase & Company | | | 18,378,750 | |
| | 190,000 | | | | | T. Rowe Price Group, Inc. | | | 13,775,000 | |
| | | | | | | | | | |
| | | | | | | | | 47,619,750 | |
| | | | | | | | | | |
| | | | | | Health Care (2.3%) | | | | |
| | 485,000 | | | | | Mylan, Inc.# | | | 14,118,350 | |
| | 75,000 | | | | | Novo Nordisk, A/S | | | 13,247,250 | |
| | | | | | | | | | |
| | | | | | | | | 27,365,600 | |
| | | | | | | | | | |
| | | | | | Industrials (0.9%) | | | | |
| | 170,000 | | | | | Eaton Corp., PLC | | | 10,439,700 | |
| | | | | | | | | | |
| | | | | | Information Technology (4.5%) | | | | |
| | 385,000 | | | | | Oracle Corp. | | | 12,620,300 | |
| | 200,000 | | | | | QUALCOMM, Inc. | | | 12,324,000 | |
| | 12,000 | | | KRW | | Samsung Electronics Company, Ltd. | | | 16,596,245 | |
| | 170,000 | | | | | SAP, AG | | | 13,574,500 | |
| | | | | | | | | | |
| | | | | | | | | 55,115,045 | |
| | | | | | | | | | |
| | | | | | TOTAL COMMON STOCKS
(Cost $139,019,604) | | | 169,427,891 | |
| | | | | | | | | | |
| | | | | | | | | | |
NUMBER OF
SHARES | | | | | | | VALUE | |
| | SHORT TERM INVESTMENT (1.7%) | | | | |
| | 20,365,042 | | | | | Fidelity Prime Money Market Fund - Institutional Class
(Cost $20,365,042) | | $ | 20,365,042 | |
| | | | | | | | | | |
| TOTAL INVESTMENTS (97.4%)
(Cost $1,056,709,795) | | | 1,178,340,008 | |
| | | | | | | | | | |
| |
| | OTHER ASSETS, LESS LIABILITIES (2.6%) | | | 31,854,348 | |
| | | | | | | | | | |
| |
| | NET ASSETS (100.0%) | | $ | 1,210,194,356 | |
| | | | | | | | | | |
| | | | | | | | | | |
FORWARD FOREIGN CURRENCY CONTRACTS
| | | | | | | | | | | | | | | | |
COUNTER
PARTY | | SHORT CONTRACTS | | SETTLEMENT DATE | | LOCAL CURRENCY | | | CURRENT
VALUE | | | UNREALIZED
GAIN/LOSS | |
| Citibank N.A. | | British Pound Sterling | | 07/18/13 | | | 5,995,000 | | | $ | 9,308,052 | | | $ | (131,410 | ) |
| Goldman Sachs Capital Markets LP | | Danish Krone | | 07/18/13 | | | 68,231,000 | | | | 12,062,647 | | | | (74,004 | ) |
| Northern Trust Company | | European Monetary Unit | | 07/18/13 | | | 40,968,000 | | | | 53,980,312 | | | | (349,513 | ) |
| Citibank N.A. | | Japanese Yen | | 07/18/13 | | | 139,975,000 | | | | 1,436,464 | | | | (28,905 | ) |
| Northern Trust Company | | Japanese Yen | | 07/18/13 | | | 2,010,303,000 | | | | 20,630,318 | | | | (147,996 | ) |
| Goldman Sachs Capital Markets LP | | Norwegian Krone | | 07/18/13 | | | 63,382,000 | | | | 10,960,141 | | | | 70,370 | |
| Northern Trust Company | | South Korean Won | | 07/18/13 | | | 27,311,079,000 | | | | 24,729,540 | | | | (429,697 | ) |
| Northern Trust Company | | Swedish Krona | | 07/18/13 | | | 56,374,000 | | | | 8,683,781 | | | | 137,447 | |
| UBS AG | | Swiss Franc | | 07/18/13 | | | 11,388,000 | | | | 12,257,467 | | | | (6,522 | ) |
| | | | | | | | | | | | | | | | |
| | | | | | | | | | | | | | $ | (960,230 | ) |
| | | | | | | | | | | | | | | | |
| | | | | |
| COUNTERPARTY | | LONG CONTRACTS | | SETTLEMENT DATE | | LOCAL CURRENCY | | | CURRENT
VALUE | | | UNREALIZED
GAIN/LOSS | |
| Citibank N.A. | | European Monetary Unit | | 07/18/13 | | | 5,156,000 | | | $ | 6,793,656 | | | $ | 82,462 | |
| UBS AG | | European Monetary Unit | | 07/18/13 | | | 4,874,000 | | | | 6,422,087 | | | | 54,488 | |
| UBS AG | | Norwegian Krone | | 07/18/13 | | | 10,940,000 | | | | 1,891,767 | | | | 17,773 | |
| | | | | | | | | | | | | | | | |
| | | | | | | | | | | | | | $ | 154,723 | |
| | | | | | | | | | | | | | | | |
NOTES TO SCHEDULE OF INVESTMENTS
| * | Securities issued and sold pursuant to a Rule 144A transaction are excepted from the registration requirement of the Securities Act of 1933, as amended. These securities may only be sold to qualified institutional buyers (“QIBs”), such as the fund. Any resale of these securities must generally be effected through a sale that is registered under the Act or otherwise exempted from such registration requirements. |
| § | Securities exchangeable or convertible into securities of one or more entities that are different than the issuer. Each entity is identified in the parenthetical. |
| ‡ | Variable rate or step bond security. The rate shown is the rate in effect at April 30, 2013. |
| # | Non-income producing security. |
| | | | |
| 86 | | CALAMOS FAMILY OF FUNDS SEMIANNUAL REPORT | | See accompanying Notes to Financial Statements |
Convertible Fund Schedule of Investments April 30, 2013 (Unaudited)
FOREIGN CURRENCY ABBREVIATIONS
| | |
| CHF | | Swiss Franc |
| EUR | | European Monetary Unit |
| JPY | | Japanese Yen |
| KRW | | South Korean Won |
| SGD | | Singapore Dollar |
Note: Value for securities denominated in foreign currencies is shown in U.S. dollars. The principal amount for such securities is shown in the respective foreign currency. The date on options represents the expiration date of the option contract. The option contract may be exercised at any date on or before the date shown.
| | | | | | |
| See accompanying Notes to Financial Statements | | www.calamos.com | | | 87 | |
Total Return Bond Fund Schedule of Investments April 30, 2013 (Unaudited)
| | | | | | | | | | |
PRINCIPAL
AMOUNT | | | | | | | VALUE | |
| | CORPORATE BONDS (79.7%) | |
| | | | | | Consumer Discretionary (13.2%) | |
| | 2,000,000 | | | | | Amazon.com, Inc.
1.200%, 11/29/17 | | $ | 2,000,420 | |
| | 1,000,000 | | | | | American Axle & Manufacturing, Inc.*
9.250%, 01/15/17 | | | 1,096,875 | |
| | 4,000,000 | | | CNY | | BSH Bosch und Siemens Hausgerate, GmbH 2.375%, 09/29/14 | | | 650,079 | |
| | 1,000,000 | | | | | Carnival Corp.
1.875%, 12/15/17 | | | 1,006,060 | |
| | 1,000,000 | | | | | DIRECTV Financing Company, Inc.
4.750%, 10/01/14 | | | 1,055,925 | |
| | 1,000,000 | | | | | DIRECTV Holdings, LLC
3.550%, 03/15/15 | | | 1,048,045 | |
| | 2,000,000 | | | | | DISH Network Corp.
4.625%, 07/15/17 | | | 2,037,500 | |
| | 2,000,000 | | | | | Harley-Davidson Financial Services, Inc.*
1.150%, 09/15/15 | | | 2,005,260 | |
| | 1,500,000 | | | | | Hasbro, Inc.
6.125%, 05/15/14 | | | 1,583,535 | |
| | | | | | Interpublic Group of Companies, Inc. | | | | |
| | 1,000,000 | | | | | 2.250%, 11/15/17 | | | 1,008,415 | |
| | 500,000 | | | | | 4.000%, 03/15/22 | | | 512,723 | |
| | 1,500,000 | | | | | Kohl’s Corp.
3.250%, 02/01/23 | | | 1,492,320 | |
| | 2,000,000 | | | | | Lennar Corp.*
4.125%, 12/01/18 | | | 2,040,000 | |
| | 2,000,000 | | | | | Macy’s Retail Holdings, Inc.
3.875%, 01/15/22 | | | 2,155,650 | |
| | | | | | Mattel, Inc. | | | | |
| | 2,000,000 | | | | | 2.500%, 11/01/16 | | | 2,093,390 | |
| | 500,000 | | | | | 1.700%, 03/15/18 | | | 506,453 | |
| | 380,000 | | | | | NCL Corp., Ltd. - Class C*
5.000%, 02/15/18 | | | 397,575 | |
| | 1,000,000 | | | | | PVH Corp.
4.500%, 12/15/22 | | | 1,033,125 | |
| | 500,000 | | | | | Time Warner, Inc.
3.150%, 07/15/15 | | | 526,347 | |
| | 2,000,000 | | | | | Turlock Corp.*
1.500%, 11/02/17 | | | 2,015,170 | |
| | 1,000,000 | | | | | Walt Disney Company
0.875%, 12/01/14 | | | 1,008,880 | |
| | 600,000 | | | | | Wynn Las Vegas, LLC
7.875%, 11/01/17 | | | 641,625 | |
| | | | | | | | | | |
| | | | | | | | | 27,915,372 | |
| | | | | | | | | | |
| | | | | | Consumer Staples (4.1%) | |
| | 338,000 | | | | | Altria Group, Inc.
9.250%, 08/06/19 | | | 473,212 | |
| | 1,000,000 | | | | | Anheuser-Busch InBev, NV
0.800%, 07/15/15 | | | 1,004,350 | |
| | 1,000,000 | | | | | ConAgra Foods, Inc.
1.350%, 09/10/15 | | | 1,012,785 | |
| | | | | | | | | | |
PRINCIPAL
AMOUNT | | | | | | | VALUE | |
| | 2,000,000 | | | | | Diageo, PLC
1.500%, 05/11/17 | | $ | 2,039,920 | |
| | 1,000,000 | | | | | Kellogg Company
4.450%, 05/30/16 | | | 1,103,375 | |
| | | | | | | | | | |
| | 1,000,000 | | | | | Philip Morris International, Inc.
6.875%, 03/17/14 | | | 1,057,345 | |
| | | | | | Reynolds American, Inc. | | | | |
| | 1,000,000 | | | | | 3.250%, 11/01/22 | | | 1,012,590 | |
| | 1,000,000 | | | | | 1.050%, 10/30/15 | | | 1,002,610 | |
| | | | | | | | | | |
| | | | | | | | | 8,706,187 | |
| | | | | | | | | | |
| | | | | | Energy (7.0%) | |
| | | | | | Chesapeake Energy Corp. | | | | |
| | 2,000,000 | | | | | 3.250%, 03/15/16 | | | 2,028,750 | |
| | 1,000,000 | | | | | 6.500%, 08/15/17 | | | 1,116,875 | |
| | 2,000,000 | | | | | FMC Technologies, Inc.
2.000%, 10/01/17 | | | 2,037,150 | |
| | 814,000 | | | | | Frontier Oil Corp.
6.875%, 11/15/18 | | | 884,716 | |
| | 1,000,000 | | | | | Hess Corp.
8.125%, 02/15/19 | | | 1,305,455 | |
| | 1,000,000 | | | | | Noble Holding International, Ltd.
3.450%, 08/01/15 | | | 1,046,280 | |
| | 1,000,000 | | | | | Rowan Companies, Inc.
7.875%, 08/01/19 | | | 1,260,660 | |
| | 2,000,000 | | | | | Schlumberger Investment, SA*
1.950%, 09/14/16 | | | 2,068,640 | |
| | 1,000,000 | | | | | SESI, LLC
6.375%, 05/01/19 | | | 1,088,125 | |
| | 500,000 | | | | | Tennessee Gas Pipeline Company
8.000%, 02/01/16 | | | 592,555 | |
| | 1,200,000 | | | | | Tesoro Corp.
4.250%, 10/01/17 | | | 1,266,000 | |
| | | | | | | | | | |
| | | | | | | | | 14,695,206 | |
| | | | | | | | | | |
| | | | | | Financials (6.8%) | |
| | 1,000,000 | | | | | AON Corp.
5.000%, 09/30/20 | | | 1,174,090 | |
| | 1,500,000 | | | | | Berkshire Hathaway Finance Corp.
5.000%, 08/15/13 | | | 1,520,025 | |
| | 1,000,000 | | | | | BlackRock, Inc.
3.500%, 12/10/14 | | | 1,048,635 | |
| | 500,000 | | | | | CC Holdings GS V, LLC*
2.381%, 12/15/17 | | | 507,813 | |
| | 250,000 | | | | | CME Group Index Services, LLC*
4.400%, 03/15/18 | | | 283,395 | |
| | 1,000,000 | | | | | CME Group, Inc.
5.750%, 02/15/14 | | | 1,040,210 | |
| | 1,000,000 | | | | | Franklin Resources, Inc.
3.125%, 05/20/15 | | | 1,049,975 | |
| | 1,000,000 | | | | | Goldman Sachs Group, Inc.
1.600%, 11/23/15 | | | 1,014,305 | |
| | | | | | JPMorgan Chase & Company | | | | |
| | 1,500,000 | | | | | 1.075%, 01/24/14‡ | | | 1,507,920 | |
| | 1,000,000 | | | | | 2.000%, 08/15/17 | | | 1,027,395 | |
| | | | |
| 88 | | CALAMOS FAMILY OF FUNDS SEMIANNUAL REPORT | | See accompanying Notes to Schedule of Investments |
Total Return Bond Fund Schedule of Investments April 30, 2013 (Unaudited)
| | | | | | | | | | |
PRINCIPAL
AMOUNT | | | | | | | VALUE | |
| | 1,000,000 | | | | | PACCAR Financial Corp.
1.600%, 03/15/17 | | $ | 1,022,680 | |
| | 1,000,000 | | | | | Prudential Financial, Inc.
4.750%, 09/17/15 | | | 1,089,240 | |
| | 2,000,000 | | | | | Xstrata Canada Financial Corp.*
3.600%, 01/15/17 | | | 2,117,360 | |
| | | | | | | | | | |
| | | | | | | | | 14,403,043 | |
| | | | | | | | | | |
| | | | | | Health Care (12.1%) | |
| | | | | | AbbVie, Inc.* | | | | |
| | 2,000,000 | | | | | 1.750%, 11/06/17 | | | 2,033,870 | |
| | 200,000 | | | | | 1.200%, 11/06/15 | | | 201,769 | |
| | | | | | Agilent Technologies, Inc. | | | | |
| | 1,500,000 | | | | | 5.500%, 09/14/15 | | | 1,655,250 | |
| | 500,000 | | | | | 6.500%, 11/01/17 | | | 601,720 | |
| | 500,000 | | | | | 2.500%, 07/15/13 | | | 501,765 | |
| | 2,000,000 | | | | | Celgene Corp.
1.900%, 08/15/17 | | | 2,049,860 | |
| | 1,000,000 | | | | | DaVita HealthCare Partners, Inc.
6.375%, 11/01/18 | | | 1,071,250 | |
| | 2,000,000 | | | | | Express Scripts Holding Company
2.650%, 02/15/17 | | | 2,106,000 | |
| | 1,000,000 | | | | | Gilead Sciences, Inc.
2.400%, 12/01/14 | | | 1,027,625 | |
| | 2,000,000 | | | | | Laboratory Corp. of America Holdings
2.200%, 08/23/17 | | | 2,039,440 | |
| | | | | | Mylan, Inc.* | | | | |
| | 1,000,000 | | | | | 6.000%, 11/15/18 | | | 1,096,930 | |
| | 500,000 | | | | | 7.625%, 07/15/17 | | | 557,242 | |
| | 1,000,000 | | | | | Quest Diagnostics, Inc.‡
1.134%, 03/24/14 | | | 1,005,060 | |
| | 1,500,000 | | | | | Teva Pharmaceutical Industries, Ltd.
3.000%, 06/15/15 | | | 1,571,137 | |
| | | | | | Thermo Fisher Scientific, Inc. | | | | |
| | 1,500,000 | | | | | 2.250%, 08/15/16 | | | 1,545,292 | |
| | 1,000,000 | | | | | 1.850%, 01/15/18 | | | 1,000,980 | |
| | 500,000 | | | | | 2.050%, 02/21/14 | | | 505,243 | |
| | 2,000,000 | | | | | UnitedHealth Group, Inc.
1.400%, 10/15/17 | | | 2,026,630 | |
| | 2,000,000 | | | | | Watson Pharmaceuticals, Inc.
1.875%, 10/01/17 | | | 2,001,740 | |
| | | | | | Zoetis, Inc.* | | | | |
| | 500,000 | | | | | 1.875%, 02/01/18 | | | 510,798 | |
| | 500,000 | | | | | 1.150%, 02/01/16 | | | 503,790 | |
| | | | | | | | | | |
| | | | | | | | | 25,613,391 | |
| | | | | | | | | | |
| | | | | | Industrials (13.8%) | |
| | 2,000,000 | | | | | ADT Corp.
2.250%, 07/15/17 | | | 2,031,600 | |
| | 1,000,000 | | | | | AGCO Corp.
5.875%, 12/01/21 | | | 1,100,625 | |
| | 500,000 | | | | | Bombardier, Inc.*
4.250%, 01/15/16 | | | 524,375 | |
| | 1,000,000 | | | | | Case New Holland, Inc.
7.750%, 09/01/13 | | | 1,020,625 | |
| | | | | | | | | | |
PRINCIPAL
AMOUNT | | | | | | | VALUE | |
| | 13,000,000 | | | CNY | | Caterpillar, Inc.
1.350%, 07/12/13 | | $ | 2,104,313 | |
| | 3,000,000 | | | | | Danaher Corp.
1.300%, 06/23/14 | | | 3,031,500 | |
| | 1,500,000 | | | | | Emerson Electric Company
4.125%, 04/15/15 | | | 1,600,568 | |
| | 2,000,000 | | | | | General Electric Company
0.850%, 10/09/15 | | | 2,012,290 | |
| | 1,500,000 | | | | | Goodrich Corp.
6.125%, 03/01/19 | | | 1,876,800 | |
| | | | | | Joy Global, Inc. | | | | |
| | 1,500,000 | | | | | 6.000%, 11/15/16 | | | 1,724,085 | |
| | 1,500,000 | | | | | 5.125%, 10/15/21 | | | 1,702,702 | |
| | 1,500,000 | | | | | Nielsen Finance, LLC*
4.500%, 10/01/20 | | | 1,533,750 | |
| | 1,000,000 | | | | | Northrop Grumman Corp.
3.700%, 08/01/14 | | | 1,037,390 | |
| | 1,495,000 | | | | | Parker-Hannifin Corp.
5.500%, 05/15/18 | | | 1,787,743 | |
| | 200,000 | | | | | Precision Castparts Corp.
0.700%, 12/20/15 | | | 200,856 | |
| | 1,000,000 | | | | | Roper Industries, Inc.
1.850%, 11/15/17 | | | 1,016,480 | |
| | 1,000,000 | | | | | Triumph Group, Inc.
8.625%, 07/15/18 | | | 1,115,000 | |
| | 1,500,000 | | | | | United Parcel Service, Inc.
3.875%, 04/01/14 | | | 1,548,533 | |
| | 2,000,000 | | | | | Verisk Analytics, Inc.
4.125%, 09/12/22 | | | 2,106,840 | |
| | | | | | | | | | |
| | | | | | | | | 29,076,075 | |
| | | | | | | | | | |
| | | | | | Information Technology (15.1%) | |
| | 1,000,000 | | | | | Adobe Systems, Inc.
3.250%, 02/01/15 | | | 1,041,905 | |
| | | | | | Amphenol Corp. | | | | |
| | 2,000,000 | | | | | 4.750%, 11/15/14 | | | 2,115,030 | |
| | 2,000,000 | | | | | 4.000%, 02/01/22 | | | 2,140,210 | |
| | 1,500,000 | | | | | Analog Devices, Inc.
3.000%, 04/15/16 | | | 1,590,697 | |
| | 1,000,000 | | | | | Anixter International, Inc.
5.950%, 03/01/15 | | | 1,069,375 | |
| | 1,000,000 | | | | | Anixter, Inc.
5.625%, 05/01/19 | | | 1,074,375 | |
| | 500,000 | | | | | Apple, Inc.
1.000%, 05/03/18 | | | 498,155 | |
| | 2,000,000 | | | | | Autodesk, Inc.
1.950%, 12/15/17 | | | 2,004,140 | |
| | 2,000,000 | | | | | BMC Software, Inc.
4.250%, 02/15/22 | | | 2,030,320 | |
| | 100,000 | | | | | Brocade Communications Systems, Inc.
6.875%, 01/15/20 | | | 110,283 | |
| | 1,000,000 | | | | | CA, Inc.
5.375%, 12/01/19 | | | 1,135,120 | |
| | | | | | |
| See accompanying Notes to Schedule of Investments | | www.calamos.com | | | 89 | |
Total Return Bond Fund Schedule of Investments April 30, 2013 (Unaudited)
| | | | | | | | | | |
PRINCIPAL
AMOUNT | | | | | | | VALUE | |
| | | | | | eBay, Inc. | | | | |
| | 3,000,000 | | | | | 3.250%, 10/15/20 | | $ | 3,256,320 | |
| | 2,000,000 | | | | | 1.350%, 07/15/17 | | | 2,032,840 | |
| | 1,500,000 | | | | | Fiserv, Inc.
3.500%, 10/01/22 | | | 1,532,685 | |
| | 1,000,000 | | | | | International Business Machines Corp.
2.000%, 01/05/16 | | | 1,037,590 | |
| | 1,500,000 | | | | | Juniper Networks, Inc.
3.100%, 03/15/16 | | | 1,576,665 | |
| | 1,500,000 | | | | | National Semiconductor Corp.
3.950%, 04/15/15 | | | 1,598,160 | |
| | 1,500,000 | | | | | Nuance Communications, Inc.*
5.375%, 08/15/20 | | | 1,544,063 | |
| | 3,000,000 | | | | | Symantec Corp.
2.750%, 09/15/15 | | | 3,108,660 | |
| | | | | | Xerox Corp. | | | | |
| | 1,000,000 | | | | | 4.250%, 02/15/15 | | | 1,054,620 | |
| | 250,000 | | | | | 1.110%, 05/16/14‡ | | | 250,506 | |
| | | | | | | | | | |
| | | | | | | | | 31,801,719 | |
| | | | | | | | | | |
| | | | | | Materials (6.5%) | |
| | 2,000,000 | | | | | Agrium, Inc.
3.150%, 10/01/22 | | | 2,006,230 | |
| | 1,000,000 | | | | | Anglo American, PLC*
9.375%, 04/08/14 | | | 1,077,205 | |
| | 1,000,000 | | | | | Ashland, Inc.*
3.000%, 03/15/16 | | | 1,022,500 | |
| | | | | | Barrick Gold Corp. | | | | |
| | 1,000,000 | | | | | 6.950%, 04/01/19 | | | 1,218,295 | |
| | 1,000,000 | | | | | 1.750%, 05/30/14 | | | 1,009,335 | |
| | | | | | | | | | |
| | 2,000,000 | | | | | Ecolab, Inc.
2.375%, 12/08/14 | | | 2,052,860 | |
| | 1,500,000 | | | | | Newmont Mining Corp.
5.125%, 10/01/19 | | | 1,704,045 | |
| | 1,500,000 | | | | | Potash Corp. of Saskatchewan, Inc. 3.250%, 12/01/17 | | | 1,630,170 | |
| | 2,000,000 | | | | | Rio Tinto Finance USA, Ltd.
1.875%, 11/02/15 | | | 2,052,930 | |
| | | | | | | | | | |
| | | | | | | | | 13,773,570 | |
| | | | | | | | | | |
| | | | | | Telecommunication Services (0.6%) | |
| | 1,000,000 | | | | | American Tower Corp.
5.900%, 11/01/21 | | | 1,199,385 | |
| | | | | | | | | | |
| | | | | | Utilities (0.5%) | |
| | 500,000 | | | | | Mckesson Corp.
0.950%, 12/04/15 | | | 502,683 | |
| | 500,000 | | | | | NextEra Energy, Inc.
1.200%, 06/01/15 | | | 504,375 | |
| | | | | | | | | | |
| | | | | | | | | 1,007,058 | |
| | | | | | | | | | |
| | | | | | TOTAL CORPORATE BONDS
(Cost $161,184,162) | | | 168,191,006 | |
| | | | | | | | | | |
| | | | | | | | | | |
PRINCIPAL
AMOUNT | | | | | | | VALUE | |
| | CONVERTIBLE BONDS (0.5%) | |
| | | | | | Industrials (0.5%) | |
| | 1,000,000 | | | | | Siemens, AG
1.050%, 08/16/17
(Cost $1,050,447) | | $ | 1,044,545 | |
| | | | | | | | | | |
| | | | | | | | | | |
| | SOVEREIGN BONDS (6.7%) | |
| | 1,000,000 | | | CAD | | Government of Canada
3.000%, 06/01/14 | | | 1,014,006 | |
| | 4,800,000 | | | NZD | | Government of New Zealand
6.000%, 04/15/15 | | | 4,390,020 | |
| | 45,000,000 | | | NOK | | Kingdom of Norway
4.250%, 05/19/17 | | | 8,720,628 | |
| | | | | | | | | | |
| | | | | | TOTAL SOVEREIGN BONDS
(Cost $12,864,344) | | | 14,124,654 | |
| | | | | | | | | | |
| | | | | | | | | | |
| | U.S. GOVERNMENT AND AGENCY SECURITIES (8.5%) | |
| | | | | | United States Treasury Note | |
| | 8,000,000 | | | | | 0.250%, 01/15/15 | | | 8,007,187 | |
| | 4,400,000 | | | | | 0.250%, 11/30/13 | | | 4,404,211 | |
| | 3,000,000 | | | | | 2.625%, 07/31/14 | | | 3,092,344 | |
| | 2,500,000 | | | | | 0.250%, 12/15/14 | | | 2,502,246 | |
| | | | | | | | | | |
| | | | | | TOTAL U.S. GOVERNMENT AND AGENCY SECURITIES
(Cost $17,897,852) | | | 18,005,988 | |
| | | | | | | | | | |
| | RESIDENTIAL MORTGAGE BACKED SECURITIES (2.6%) | |
| | | | | | Federal National Mortgage Association | | | | |
| | 2,075,072 | | | | | 6.000%, 06/01/37 | | | 2,309,115 | |
| | 978,258 | | | | | 2.830%, 11/01/37‡ | | | 1,046,931 | |
| | 676,770 | | | | | 5.500%, 06/01/37 | | | 736,317 | |
| | 481,733 | | | | | 6.000%, 05/01/37 | | | 536,067 | |
| | 350,761 | | | | | 6.500%, 03/01/38 | | | 390,065 | |
| | 205,253 | | | | | 6.500%, 06/01/36 | | | 229,257 | |
| | 136,203 | | | | | 4.596%, 05/01/38‡ | | | 143,513 | |
| | | | | | | | | | |
| | | | | | TOTAL RESIDENTIAL MORTGAGE BACKED SECURITIES
(Cost $4,971,377) | | | 5,391,265 | |
| | | | | | | | | | |
NUMBER OF
SHARES | | | | | | | VALUE | |
| | SHORT TERM INVESTMENT (0.0%) | |
| | 305 | | | | | Fidelity Prime Money Market Fund - Institutional Class
(Cost $305) | | | 305 | |
| | | | | | | | | | |
| TOTAL INVESTMENTS (98.0%)
(Cost $197,968,487) | | | 206,757,763 | |
| | | | | | | | | | |
| |
| | OTHER ASSETS, LESS LIABILITIES (2.0%) | | | 4,275,769 | |
| | | | | | | | | | |
| |
| | NET ASSETS (100.0%) | | $ | 211,033,532 | |
| | | | | | | | | | |
| | | | |
| 90 | | CALAMOS FAMILY OF FUNDS SEMIANNUAL REPORT | | See accompanying Notes to Schedule of Investments |
Total Return Bond Fund Schedule of Investments April 30, 2013 (Unaudited)
NOTES TO SCHEDULE OF INVESTMENTS
| * | Securities issued and sold pursuant to a Rule 144A transaction are excepted from the registration requirement of the Securities Act of 1933, as amended. These securities may only be sold to qualified institutional buyers (“QIBs”), such as the fund. Any resale of these securities must generally be effected through a sale that is registered under the Act or otherwise exempted from such registration requirements. |
| ‡ | Variable rate or step bond security. The rate shown is the rate in effect at April 30, 2013. |
FOREIGN CURRENCY ABBREVIATIONS
| | |
| CAD | | Canadian Dollar |
| CNY | | Chinese Yuan Renminbi |
| NOK | | Norwegian Krone |
| NZD | | New Zealand Dollar |
Note: Value for securities denominated in foreign currencies is shown in U.S. dollars. The principal amount for such securities is shown in the respective foreign currency.
| | | | | | |
| See accompanying Notes to Financial Statements | | www.calamos.com | | | 91 | |
High Income Fund Schedule of Investments April 30, 2013 (Unaudited)
| | | | | | | | | | |
PRINCIPAL
AMOUNT | | | | | | | VALUE | |
| | CORPORATE BONDS (92.5%) | |
| | | | | | Consumer Discretionary (20.1%) | |
| | | | | | American Axle & Manufacturing, Inc. | | | | |
| | 2,560,000 | | | | | 6.625%, 10/15/22 | | $ | 2,742,400 | |
| | 440,000 | | | | | 6.250%, 03/15/21 | | | 465,575 | |
| | 700,000 | | | | | Brookfield Residential Properties, Inc.*
6.500%, 12/15/20 | | | 756,875 | |
| | 3,730,000 | | | | | Brunswick Corp.
7.125%, 08/01/27 | | | 3,956,131 | |
| | 550,000 | | | | | Cogeco Cable, Inc.*
4.875%, 05/01/20 | | | 561,688 | |
| | 1,500,000 | | | | | Coinstar, Inc.*
6.000%, 03/15/19 | | | 1,557,188 | |
| | 3,691,000 | | | | | Dana Holding Corp.
6.750%, 02/15/21 | | | 4,064,714 | |
| | 1,318,000 | | | | | Dillard’s, Inc.
7.130%, 08/01/18 | | | 1,503,344 | |
| | | | | | DISH Network Corp. | | | | |
| | 2,130,000 | | | | | 5.875%, 07/15/22 | | | 2,173,931 | |
| | 1,580,000 | | | | | 5.125%, 05/01/20* | | | 1,568,150 | |
| | 1,700,000 | | | | | Dufry Finance, SCA*
5.500%, 10/15/20 | | | 1,792,437 | |
| | 4,800,000 | | | | | Goodyear Tire & Rubber Company~
8.250%, 08/15/20 | | | 5,385,000 | |
| | 2,700,000 | | | | | Jaguar Land Rover Automotive, PLC*
8.125%, 05/15/21 | | | 3,081,375 | |
| | 750,000 | | | | | 5.625%, 02/01/23 | | | 787,500 | |
| | 5,000,000 | | | | | L Brands, Inc.
6.950%, 03/01/33 | | | 5,296,875 | |
| | 480,000 | | | | | Lear Corp.*
4.750%, 01/15/23 | | | 483,600 | |
| | 3,300,000 | | | | | Liberty Interactive, LLC
8.250%, 02/01/30 | | | 3,675,375 | |
| | 1,400,000 | | | | | 8.500%, 07/15/29 | | | 1,565,375 | |
| | 200,000 | | | | | Lynx I Corp.*
5.375%, 04/15/21 | | | 215,125 | |
| | 200,000 | | | | | Lynx II Corp.*
6.375%, 04/15/23 | | | 217,375 | |
| | | | | | Meritage Homes Corp. | | | | |
| | 2,175,000 | | | | | 7.000%, 04/01/22 | | | 2,461,828 | |
| | 1,000,000 | | | | | 7.150%, 04/15/20 | | | 1,133,125 | |
| | 1,070,000 | | | | | NCL Corp., Ltd. - Class C*
5.000%, 02/15/18 | | | 1,119,488 | |
| | 1,600,000 | | | | | Netflix, Inc.*
5.375%, 02/01/21 | | | 1,650,000 | |
| | 1,360,000 | | | | | Royal Caribbean Cruises, Ltd.
7.500%, 10/15/27 | | | 1,551,250 | |
| | 1,000,000 | | | | | 7.250%, 03/15/18~ | | | 1,156,250 | |
| | 4,628,000 | | | | | Ryland Group, Inc.
6.625%, 05/01/20 | | | 5,137,080 | |
| | 1,500,000 | | | | | Six Flags Entertainment Corp.*
5.250%, 01/15/21 | | | 1,537,500 | |
| | 621,000 | | | | | Taylor Morrison Communities, Inc.* 5.250%, 04/15/21 | | | 639,242 | |
| | | | | | | | | | |
PRINCIPAL
AMOUNT | | | | | | | VALUE | |
| | 1,600,000 | | | | | Viking Cruises, Ltd.*
8.500%, 10/15/22 | | $ | 1,794,000 | |
| | 161,000 | | | | | Wolverine World Wide, Inc.*
6.125%, 10/15/20 | | | 175,389 | |
| | | | | | | | | | |
| | | | | | | | | 60,205,185 | |
| | | | | | | | | | |
| | | | | | Consumer Staples (4.3%) | |
| | 1,800,000 | | | | | Fidelity & Guaranty Life Holdings, Inc.* 6.375%, 04/01/21 | | | 1,865,250 | |
| | 2,482,000 | | | | | JBS USA, LLC*
7.250%, 06/01/21 | | | 2,629,369 | |
| | 2,890,000 | | | | | Land O’Lakes, Inc.*
6.000%, 11/15/22 | | | 3,106,750 | |
| | 2,837,000 | | | | | Post Holdings, Inc.
7.375%, 02/15/22 | | | 3,154,389 | |
| | 830,000 | | | | | Sun Products Corp.*
7.750%, 03/15/21 | | | 861,644 | |
| | 995,000 | | | | | Wells Enterprises, Inc.*
6.750%, 02/01/20 | | | 1,083,306 | |
| | | | | | | | | | |
| | | | | | | | | 12,700,708 | |
| | | | | | | | | | |
| | | | | | Energy (16.2%) | |
| | 17,000,000 | | | NOK | | Aker Solutions, ASA‡
6.080%, 10/09/19 | | | 3,007,023 | |
| | 9,500,000 | | | NOK | | 6.120%, 06/06/17 | | | 1,700,988 | |
| | 2,750,000 | | | | | Bristow Group, Inc.
6.250%, 10/15/22 | | | 2,999,219 | |
| | 2,310,000 | | | | | Calfrac Holdings, LP*
7.500%, 12/01/20 | | | 2,369,194 | |
| | 3,305,000 | | | | | Calumet Specialty Products Partners, LP 9.375%, 05/01/19 | | | 3,701,600 | |
| | 1,500,000 | | | | | 9.625%, 08/01/20* | | | 1,716,562 | |
| | | | | | Carrizo Oil & Gas, Inc. | | | | |
| | 2,600,000 | | | | | 8.625%, 10/15/18 | | | 2,876,250 | |
| | 1,460,000 | | | | | 7.500%, 09/15/20 | | | 1,575,887 | |
| | 600,000 | | | | | Chesapeake Energy Corp.
5.375%, 06/15/21 | | | 628,500 | |
| | 1,390,000 | | | | | Chesapeake Oilfield Finance, Inc.*
7.125%, 11/15/19 | | | 1,431,700 | |
| | 1,655,000 | | | | | Drill Rigs Holdings, Inc.*
6.500%, 10/01/17 | | | 1,674,653 | |
| | 496,000 | | | | | EPL Oil & Gas, Inc.
8.250%, 02/15/18 | | | 536,610 | |
| | 2,875,000 | | | | | Gulfmark Offshore, Inc.
6.375%, 03/15/22 | | | 3,009,766 | |
| | 820,000 | | | | | Gulfport Energy Corp.*
7.750%, 11/01/20 | | | 879,963 | |
| | 2,215,000 | | | | | Oasis Petroleum, Inc.
6.500%, 11/01/21 | | | 2,446,191 | |
| | 2,000,000 | | | | | 6.875%, 01/15/23 | | | 2,217,500 | |
| | 1,300,000 | | | | | Oil States International, Inc.*
5.125%, 01/15/23 | | | 1,337,375 | |
| | 1,400,000 | | | | | Parker Drilling Company
9.125%, 04/01/18 | | | 1,534,750 | |
| | | | |
| 92 | | CALAMOS FAMILY OF FUNDS SEMIANNUAL REPORT | | See accompanying Notes to Schedule of Investments |
High Income Fund Schedule of Investments April 30, 2013 (Unaudited)
| | | | | | | | | | |
PRINCIPAL
AMOUNT | | | | | | | VALUE | |
| | 2,013,000 | | | | | Petroleum Geo-Services, ASA*
7.375%, 12/15/18 | | $ | 2,259,592 | |
| | 3,000,000 | | | | | Pioneer Energy Services Corp.
9.875%, 03/15/18 | | | 3,288,750 | |
| | 2,850,000 | | | | | Samson Investment Company*
9.750%, 02/15/20 | | | 3,026,344 | |
| | 2,900,000 | | | | | W&T Offshore, Inc.
8.500%, 06/15/19 | | | 3,182,750 | |
| | 1,060,000 | | | | | Western Refining, Inc.*
6.250%, 04/01/21 | | | 1,099,088 | |
| | | | | | | | | | |
| | | | | | | | | 48,500,255 | |
| | | | | | | | | | |
| | | | | | Financials (4.3%) | |
| | 2,134,000 | | | | | AON Corp.
8.205%, 01/01/27 | | | 2,801,088 | |
| | 1,000,000 | | | | | Jefferies Finance, LLC*
7.375%, 04/01/20 | | | 1,034,375 | |
| | 895,000 | | | | | Nationstar Mortgage, LLC/Nationstar Capital Corp.*
6.500%, 07/01/21 | | | 939,750 | |
| | 3,000,000 | | | | | Neuberger Berman Group LLC*
5.875%, 03/15/22 | | | 3,228,750 | |
| | | | | | Nuveen Investments, Inc.* | | | | |
| | 2,990,000 | | | | | 9.500%, 10/15/20 | | | 3,189,956 | |
| | 1,460,000 | | | | | 9.125%, 10/15/17 | | | 1,546,688 | |
| | | | | | | | | | |
| | | | | | | | | 12,740,607 | |
| | | | | | | | | | |
| | | | | | Health Care (7.6%) | |
| | 3,200,000 | | | | | Community Health Systems, Inc.
7.125%, 07/15/20 | | | 3,602,000 | |
| | | | | | HCA Holdings, Inc. | | | | |
| | 3,300,000 | | | | | 7.750%, 05/15/21 | | | 3,735,187 | |
| | 725,000 | | | | | 6.250%, 02/15/21 | | | 796,594 | |
| | 1,300,000 | | | | | Health Management Associates, Inc.
7.375%, 01/15/20 | | | 1,445,437 | |
| | 2,155,000 | | | | | Hologic, Inc.
6.250%, 08/01/20 | | | 2,330,094 | |
| | 2,383,000 | | | | | Teleflex, Inc.
6.875%, 06/01/19 | | | 2,609,385 | |
| | 1,590,000 | | | | | Tenet Healthcare Corp.
6.750%, 02/01/20 | | | 1,730,119 | |
| | 2,700,000 | | | | | Valeant Pharmaceuticals International, Inc.*
7.250%, 07/15/22 | | | 3,074,625 | |
| | 3,000,000 | | | | | Warner Chilcott Company, LLC
7.750%, 09/15/18 | | | 3,266,250 | |
| | | | | | | | | | |
| | | | | | | | | 22,589,691 | |
| | | | | | | | | | |
| | | | | | Industrials (16.9%) | |
| | 2,500,000 | | | | | Belden, Inc.*
5.500%, 09/01/22 | | | 2,585,937 | |
| | 1,570,000 | | | | | Bombardier, Inc.*
6.125%, 01/15/23 | | | 1,710,319 | |
| | 3,000,000 | | | | | Clean Harbors, Inc.*
5.125%, 06/01/21 | | | 3,146,250 | |
| | | | | | | | | | |
PRINCIPAL
AMOUNT | | | | | | | VALUE | |
| | 2,700,000 | | | | | Deluxe Corp.
7.000%, 03/15/19 | | $ | 2,973,375 | |
| | 1,530,000 | | | | | Digitalglobe, Inc.*
5.250%, 02/01/21 | | | 1,552,950 | |
| | 2,100,000 | | | | | Dycom Investments, Inc.
7.125%, 01/15/21 | | | 2,295,562 | |
| | 2,825,000 | | | | | Edgen Murray Corp.*
8.750%, 11/01/20 | | | 3,013,922 | |
| | 2,071,000 | | | | | General Cable Corp.*
5.750%, 10/01/22 | | | 2,143,485 | |
| | 790,000 | | | | | GrafTech International, Ltd.*
6.375%, 11/15/20 | | | 830,981 | |
| | 3,000,000 | | | | | H&E Equipment Services, Inc.
7.000%, 09/01/22 | | | 3,337,500 | |
| | 2,900,000 | | | | | Iron Mountain, Inc.
5.750%, 08/15/24 | | | 2,990,625 | |
| | 3,170,000 | | | | | Manitowoc Company, Inc.
5.875%, 10/15/22 | | | 3,350,294 | |
| | 1,655,000 | | | | | Mead Products, LLC/ACCO Brands Corp.*
6.750%, 04/30/20 | | | 1,761,541 | |
| | 740,000 | | | | | Navistar International Corp.
8.250%, 11/01/21 | | | 771,450 | |
| | | | | | Nortek, Inc. | | | | |
| | 395,000 | | | | | 8.500%, 04/15/21* | | | 439,438 | |
| | 341,000 | | | | | 8.500%, 04/15/21 | | | 381,494 | |
| | 2,150,000 | | | | | Rexel, SA*
6.125%, 12/15/19 | | | 2,311,250 | |
| | 3,000,000 | | | | | Sensata Technologies, B.V.*
6.500%, 05/15/19 | | | 3,271,875 | |
| | 1,835,000 | | | | | Terex Corp.
6.000%, 05/15/21 | | | 1,972,625 | |
| | 4,260,000 | | | | | Titan International, Inc.
7.875%, 10/01/17 | | | 4,608,787 | |
| | 450,000 | | | | | Triumph Group, Inc.*
4.875%, 04/01/21 | | | 468,281 | |
| | | | | | United Rentals North America, Inc. | | | | |
| | 3,000,000 | | | | | 7.625%, 04/15/22 | | | 3,429,375 | |
| | 1,200,000 | | | | | 6.125%, 06/15/23 | | | 1,296,750 | |
| | | | | | | | | | |
| | | | | | | | | 50,644,066 | |
| | | | | | | | | | |
| | | | | | Information Technology (11.8%) | |
| | | | | | Amkor Technology, Inc. | | | | |
| | 2,500,000 | | | | | 6.625%, 06/01/21 | | | 2,593,750 | |
| | 1,460,000 | | | | | 6.375%, 10/01/22 | | | 1,501,975 | |
| | | | | | Equinix, Inc. | | | | |
| | 550,000 | | | | | 5.375%, 04/01/23 | | | 577,156 | |
| | 330,000 | | | | | 4.875%, 04/01/20 | | | 347,119 | |
| | 3,000,000 | | | | | Hughes Satellite Systems Corp.
7.625%, 06/15/21 | | | 3,442,500 | |
| | 2,700,000 | | | | | iGATE Corp.
9.000%, 05/01/16 | | | 2,951,438 | |
| | 2,895,000 | | | | | Lender Processing Services, Inc.
5.750%, 04/15/23 | | | 3,097,650 | |
| | 3,000,000 | | | | | Nuance Communications, Inc.*
5.375%, 08/15/20 | | | 3,088,125 | |
| | | | | | |
| See accompanying Notes to Schedule of Investments | | www.calamos.com | | | 93 | |
High Income Fund Schedule of Investments April 30, 2013 (Unaudited)
| | | | | | | | | | |
PRINCIPAL
AMOUNT | | | | | | | VALUE | |
| | | | | | NXP BV* | | | | |
| | 800,000 | | | | | 5.750%, 02/15/21 | | $ | 854,000 | |
| | 800,000 | | | | | 5.750%, 03/15/23 | | | 840,500 | |
| | 5,405,000 | | | | | Sanmina Corp.*
7.000%, 05/15/19 | | | 5,746,191 | |
| | 4,100,000 | | | | | Seagate Technology, PLC
6.875%, 05/01/20 | | | 4,486,937 | |
| | 1,550,000 | | | | | SunGard Data Systems, Inc.*
6.625%, 11/01/19 | | | 1,642,031 | |
| | 2,900,000 | | | | | Viasystems, Inc.*
7.875%, 05/01/19 | | | 3,115,688 | |
| | 933,000 | | | | | WEX, Inc.*
4.750%, 02/01/23 | | | 934,749 | |
| | | | | | | | | | |
| | | | | | | | | 35,219,809 | |
| | | | | | | | | | |
| | | | | | Materials (7.7%) | |
| | 800,000 | | | | | Ardagh Packaging Finance, PLC*
7.000%, 11/15/20 | | | 839,500 | |
| | 1,255,000 | | | | | Crown Cork & Seal Company, Inc.
7.375%, 12/15/26 | | | 1,424,425 | |
| | 2,175,000 | | | | | FMG Resources*
8.250%, 11/01/19 | | | 2,393,859 | |
| | 3,700,000 | | | | | Greif, Inc.
7.750%, 08/01/19 | | | 4,347,500 | |
| | 1,630,000 | | | | | IAMGOLD Corp.*
6.750%, 10/01/20 | | | 1,549,519 | |
| | 2,800,000 | | | | | Inmet Mining Corp.*
8.750%, 06/01/20 | | | 3,015,250 | |
| | 610,000 | | | | | 7.500%, 06/01/21 | | | 638,213 | |
| | 3,000,000 | | | | | New Gold, Inc.*
6.250%, 11/15/22 | | | 3,097,500 | |
| | | | | | Sealed Air Corp.* | | | | |
| | 550,000 | | | | | 6.500%, 12/01/20 | | | 614,281 | |
| | 300,000 | | | | | 5.250%, 04/01/23 | | | 308,063 | |
| | | | | | Steel Dynamics, Inc.* | | | | |
| | 941,000 | | | | | 6.125%, 08/15/19 | | | 1,034,512 | |
| | 430,000 | | | | | 6.375%, 08/15/22 | | | 472,731 | |
| | 300,000 | | | | | 5.250%, 04/15/23 | | | 310,125 | |
| | 2,200,000 | | | | | Trinseo Op/ Trinseo Finance, Inc.*
8.750%, 02/01/19 | | | 2,211,000 | |
| | 754,000 | | | | | United States Steel Corp.
6.875%, 04/01/21 | | | 782,746 | |
| | | | | | | | | | |
| | | | | | | | | 23,039,224 | |
| | | | | | | | | | |
| | | | | | Telecommunication Services (2.1%) | | | | |
| | 745,000 | | | | | Frontier Communications Corp.
7.625%, 04/15/24 | | | 779,456 | |
| | | | | | Intelsat, SA* | | | | |
| | 1,450,000 | | | | | 7.750%, 06/01/21 | | | 1,533,375 | |
| | 100,000 | | | | | 8.125%, 06/01/23 | | | 106,625 | |
| | | | | | MetroPCS Wireless, Inc.* | | | | |
| | 3,120,000 | | | | | 6.625%, 04/01/23 | | | 3,352,050 | |
| | 450,000 | | | | | 6.250%, 04/01/21 | | | 482,625 | |
| | | | | | | | | | |
| | | | | | | | | 6,254,131 | |
| | | | | | | | | | |
| | | | | | | | | | |
PRINCIPAL
AMOUNT | | | | | | | VALUE | |
| | | | | | | | | | |
| | | | | | Utilities (1.5%) | | | | |
| | 1,400,000 | | | | | AES Corp.
7.375%, 07/01/21 | | $ | 1,661,625 | |
| | 2,600,000 | | | | | AmeriGas Finance Corp.
7.000%, 05/20/22 | | | 2,912,000 | |
| | | | | | | | | | |
| | | | | | | | | 4,573,625 | |
| | | | | | | | | | |
| | | | | | TOTAL CORPORATE BONDS
(Cost $258,944,722) | | | 276,467,301 | |
| | | | | | | | | | |
| | | | | | | | | | |
| | CONVERTIBLE BOND (0.8%) | | | | |
| | | | | | Financials (0.8%) | | | | |
| | 2,134,000 | | | | | Ares Capital Corp.
5.750%, 02/01/16 (Cost $2,255,237) | | | 2,348,841 | |
| | | | | | | | | | |
| | | | | | | | | | |
NUMBER OF
SHARES | | | | | | | VALUE | |
| | CONVERTIBLE PREFERRED STOCKS (3.4%) | | | | |
| | | | | | Financials (1.6%) | | | | |
| | 60,000 | | | | | Affiliated Managers Group, Inc.
5.100% | | | 3,873,750 | |
| | 6,723 | | | | | Fifth Third Bancorp
8.500% | | | 993,256 | |
| | | | | | | | | | |
| | | | | | | | | 4,867,006 | |
| | | | | | | | | | |
| | | | | | Industrials (0.5%) | | | | |
| | 25,000 | | | | | United Technologies Corp.
7.500% | | | 1,478,500 | |
| | | | | | | | | | |
| | | | | | Telecommunication Services (0.2%) | | | | |
| | 9,201 | | | | | Intelsat, SA
5.750% | | | 506,055 | |
| | | | | | | | | | |
| | | | | | Utilities (1.1%) | | | | |
| | 60,000 | | | | | NextEra Energy, Inc.
5.599% | | | 3,439,500 | |
| | | | | | | | | | |
| | | | | | TOTAL CONVERTIBLE PREFERRED STOCKS
(Cost $8,779,948) | | | 10,291,061 | |
| | | | | | | | | | |
| | SHORT TERM INVESTMENT (2.5%) | | | | |
| | 7,419,250 | | | | | Fidelity Prime Money Market Fund - Institutional Class
(Cost $7,419,250) | | | 7,419,250 | |
| | | | | | | | | | |
| TOTAL INVESTMENTS (99.2%)
(Cost $277,399,157) | | | 296,526,453 | |
| | | | | | | | | | |
| |
| | OTHER ASSETS, LESS LIABILITIES (0.8%) | | | 2,411,525 | |
| | | | | | | | | | |
| |
| | NET ASSETS (100.0%) | | $ | 298,937,978 | |
| | | | | | | | | | |
| | | | |
| 94 | | CALAMOS FAMILY OF FUNDS SEMIANNUAL REPORT | | See accompanying Notes to Schedule of Investments |
High Income Fund Schedule of Investments April 30, 2013 (Unaudited)
NOTES TO SCHEDULE OF INVESTMENTS
| * | Securities issued and sold pursuant to a Rule 144A transaction are excepted from the registration requirement of the Securities Act of 1933, as amended. These securities may only be sold to qualified institutional buyers (“QIBs”), such as the fund. Any resale of these securities must generally be effected through a sale that is registered under the Act or otherwise exempted from such registration requirements. |
| ~ | Security, or portion of security, is segregated as collateral (or potential collateral for future transactions) for written options. The aggregate value of such securities is $567,813. |
| ‡ | Variable rate or step bond security. The rate shown is the rate in effect at April 30, 2013. |
FOREIGN CURRENCY ABBREVIATIONS
Note: Value for securities denominated in foreign currencies is shown in U.S. dollars. The principal amount for such securities is shown in the respective foreign currency.
| | | | | | |
| See accompanying Notes to Financial Statements | | www.calamos.com | | | 95 | |
Market Neutral Income Fund Schedule of Investments April 30, 2013 (Unaudited)
| | | | | | | | | | |
PRINCIPAL
AMOUNT | | | | | | | VALUE | |
| | CONVERTIBLE BONDS (28.0%) | |
| | | | | | Consumer Discretionary (4.2%) | |
| | 10,100,000 | | | | | Coinstar, Inc.~ 4.000%, 09/01/14 | | $ | 13,250,745 | |
| | 4,000,000 | | | | | Iconix Brand Group, Inc.*
1.500%, 03/15/18 | | | 4,564,940 | |
| | 10,000,000 | | | | | Jarden Corp.*
1.875%, 09/15/18 | | | 11,737,750 | |
| | 4,000,000 | | | | | M/I Homes, Inc.
3.000%, 03/01/18 | | | 4,256,140 | |
| | 6,000,000 | | | | | Meritage Homes Corp.
1.875%, 09/15/32 | | | 7,056,900 | |
| | 6,500,000 | | | | | MGM Resorts International~
4.250%, 04/15/15 | | | 7,216,105 | |
| | 9,000,000 | | | | | Sirius XM Radio, Inc.*
7.000%, 12/01/14 | | | 16,739,235 | |
| | 7,000,000 | | | | | Sotheby’s~
3.125%, 06/15/13 | | | 7,527,730 | |
| | 2,000,000 | | | | | Standard Pacific Corp.
1.250%, 08/01/32 | | | 2,661,830 | |
| | 14,800,000 | | | | | Virgin Media, Inc.
6.500%, 11/15/16 | | | 38,532,392 | |
| | | | | | | | | | |
| | | | | | | | | 113,543,767 | |
| | | | | | | | | | |
| | | | | | Consumer Staples (0.5%) | |
| | 9,500,000 | | | | | Tyson Foods, Inc. - Series A~
3.250%, 10/15/13 | | | 14,027,510 | |
| | | | | | | | | | |
| | | | | | Energy (2.2%) | |
| | 5,000,000 | | | | | Carrizo Oil & Gas, Inc.~
4.375%, 06/01/28 | | | 5,020,125 | |
| | 9,000,000 | | | | | Exterran Holdings, Inc.
4.250%, 06/15/14 | | | 11,284,335 | |
| | 6,000,000 | | | | | Hornbeck Offshore Services, Inc.‡
1.625%, 11/15/26 | | | 6,414,000 | |
| | 7,500,000 | | | | | Newpark Resources, Inc.~
4.000%, 10/01/17 | | | 9,397,125 | |
| | 11,500,000 | | | | | Petroleum Development Corp.*
3.250%, 05/15/16 | | | 14,479,362 | |
| | 7,500,000 | | | | | SEACOR Holdings, Inc.~*
2.500%, 12/15/27 | | | 8,237,138 | |
| | 6,000,000 | | | | | Stone Energy Corp.~*
1.750%, 03/01/17 | | | 5,529,450 | |
| | | | | | | | | | |
| | | | | | | | | 60,361,535 | |
| | | | | | | | | | |
| | | | | | Financials (1.9%) | |
| | 5,000,000 | | | | | Amtrust Financial Services, Inc.
5.500%, 12/15/21 | | | 6,768,150 | |
| | 5,000,000 | | | | | Encore Capital Group, Inc.*
3.000%, 11/27/17 | | | 5,585,025 | |
| | 4,000,000 | | | | | Forestar Group, Inc.
3.750%, 03/01/20 | | | 4,673,000 | |
| | 8,500,000 | | | | | Gaylord Entertainment Company*
3.750%, 10/01/14 | | | 17,042,330 | |
| | | | | | | | | | |
PRINCIPAL
AMOUNT | | | | | | | VALUE | |
| | 4,500,000 | | | | | PHH Corp. 4.000%, 09/01/14 | | $ | 4,938,143 | |
| | 7,000,000 | | | | | Starwood Property Trust, Inc.
4.550%, 03/01/18 | | | 7,764,925 | |
| | 5,000,000 | | | | | Walter Investment Management Corp.
4.500%, 11/01/19 | | | 5,299,100 | |
| | | | | | | | | | |
| | | | | | | | | 52,070,673 | |
| | | | | | | | | | |
| | | | | | Health Care (2.7%) | |
| | 10,000,000 | | | | | Endo Health Solutions, Inc.
1.750%, 04/15/15 | | | 13,501,600 | |
| | 14,000,000 | | | | | LifePoint Hospitals, Inc.~
3.500%, 05/15/14 | | | 15,209,950 | |
| | 2,000,000 | | | | | Medivation, Inc.
2.625%, 04/01/17 | | | 2,622,070 | |
| | | | | | Molina Healthcare, Inc. | | | | |
| | 9,000,000 | | | | | 3.750%, 10/01/14 | | | 11,007,540 | |
| | 5,000,000 | | | | | 1.125%, 01/15/20* | | | 5,291,025 | |
| | 6,000,000 | | | | | Salix Pharmaceuticals, Ltd.
2.750%, 05/15/15 | | | 7,934,640 | |
| | 12,500,000 | | | | | Volcano Corp.
1.750%, 12/01/17 | | | 12,076,375 | |
| | 5,000,000 | | | | | Wright Medical Group, Inc.*
2.000%, 08/15/17 | | | 5,741,025 | |
| | | | | | | | | | |
| | | | | | | | | 73,384,225 | |
| | | | | | | | | | |
| | | | | | Industrials (1.6%) | |
| | 1,200,000 | | | | | Altra Holdings, Inc.
2.750%, 03/01/31 | | | 1,422,036 | |
| | 4,000,000 | | | | | Chart Industries, Inc.
2.000%, 08/01/18 | | | 5,674,240 | |
| | 13,000,000 | | | | | EnerSys‡
3.375%, 06/01/38 | | | 16,580,785 | |
| | 19,993,000 | | | | | General Cable Corp.
0.875%, 11/15/13 | | | 19,948,915 | |
| | | | | | | | | | |
| | | | | | | | | 43,625,976 | |
| | | | | | | | | | |
| | | | | | Information Technology (10.9%) | |
| | 8,000,000 | | | | | Arris Group, Inc.~
2.000%, 11/15/26 | | | 8,815,840 | |
| | 10,000,000 | | | | | Blucora, Inc.*
4.250%, 04/01/19 | | | 10,265,550 | |
| | 7,750,000 | | | | | Bottomline Technologies, Inc.~
1.500%, 12/01/17 | | | 8,713,209 | |
| | 5,500,000 | | | | | Broadsoft, Inc.
1.500%, 07/01/18 | | | 5,603,950 | |
| | 20,000,000 | | | | | CACI International, Inc.~
2.125%, 05/01/14 | | | 22,931,400 | |
| | 15,900,000 | | | | | Ciena Corp.~*
3.750%, 10/15/18 | | | 17,661,322 | |
| | 5,625,000 | | | | | Comtech Telecommunications Corp.~
3.000%, 05/01/29 | | | 5,772,797 | |
| | 16,605,000 | | | | | Concur Technologies, Inc.~*
2.500%, 04/15/15 | | | 24,523,094 | |
| | | | |
| 96 | | CALAMOS FAMILY OF FUNDS SEMIANNUAL REPORT | | See accompanying Notes to Schedule of Investments |
Market Neutral Income Fund Schedule of Investments April 30, 2013 (Unaudited)
| | | | | | | | | | |
PRINCIPAL
AMOUNT | | | | | | | VALUE | |
| | 5,000,000 | | | | | Dealertrack Technologies, Inc.
1.500%, 03/15/17 | | $ | 5,284,000 | |
| | 7,300,000 | | | | | Equinix, Inc.
3.000%, 10/15/14 | | | 14,429,691 | |
| | 8,150,000 | | | | | FEI Company~ 2.875%, 06/01/13 | | | 17,752,004 | |
| | 35,000,000 | | | | | JDS Uniphase Corp.
1.000%, 05/15/26 | | | 34,956,950 | |
| | 10,000,000 | | | | | Lam Research Corp.~ 0.500%, 05/15/16 | | | 10,745,400 | |
| | 7,000,000 | | | | | Mentor Graphics Corp.
4.000%, 04/01/31 | | | 8,292,935 | |
| | | | | | Micron Technology, Inc. | | | | |
| | 8,332,000 | | | | | 1.875%, 06/01/27 | | | 8,732,311 | |
| | 4,000,000 | | | | | 1.625%, 02/15/33* | | | 4,545,440 | |
| | 14,000,000 | | | | | NetApp, Inc.
1.750%, 06/01/13 | | | 15,385,230 | |
| | | | | | Nuance Communications, Inc. | | | | |
| | 5,000,000 | | | | | 2.750%, 08/15/27 | | | 6,051,325 | |
| | 2,500,000 | | | | | 2.750%, 11/01/31 | | | 2,611,588 | |
| | 5,200,000 | | | | | Photronics, Inc.
3.250%, 04/01/16 | | | 5,753,878 | |
| | 5,500,000 | | | | | Rovi Corp.
2.625%, 02/15/40 | | | 5,642,092 | |
| | | | | | SanDisk Corp. | | | | |
| | 25,000,000 | | | | | 1.000%, 05/15/13 | | | 24,999,250 | |
| | 5,200,000 | | | | | 1.500%, 08/15/17~ | | | 6,558,786 | |
| | 4,500,000 | | | | | SYNNEX Corp.
4.000%, 05/15/18 | | | 5,263,290 | |
| | 1,500,000 | | | | | Take-Two Interactive Software, Inc.
1.750%, 12/01/16 | | | 1,680,405 | |
| | 4,300,000 | | | | | TTM Technologies, Inc.~
3.250%, 05/15/15 | | | 4,300,753 | |
| | 5,000,000 | | | | | Xilinx, Inc.
2.625%, 06/15/17 | | | 7,147,500 | |
| | | | | | | | | | |
| | | | | | | | | 294,419,990 | |
| | | | | | | | | | |
| | | | | | Materials (2.5%) | |
| | 7,500,000 | | | | | Allegheny Technologies, Inc.
4.250%, 06/01/14 | | | 7,892,737 | |
| | 20,000,000 | | | | | Goldcorp, Inc.
2.000%, 08/01/14 | | | 20,649,900 | |
| | 2,950,000 | | | | | Horsehead Holding Corp.
3.800%, 07/01/17 | | | 2,959,219 | |
| | 7,000,000 | | | | | Royal Gold, Inc.
2.875%, 06/15/19 | | | 6,865,565 | |
| | 4,600,000 | | | | | RTI International Metals, Inc.
1.625%, 10/15/19 | | | 4,693,173 | |
| | 5,000,000 | | | | | Silver Standard Resources, Inc.*
2.875%, 02/01/33 | | | 3,870,675 | |
| | 10,700,000 | | | | | Steel Dynamics, Inc.
5.125%, 06/15/14 | | | 11,873,308 | |
| | 7,500,000 | | | | | United States Steel Corp.
2.750%, 04/01/19 | | | 7,596,563 | |
| | | | | | | | | | |
| | | | | | | | | 66,401,140 | |
| | | | | | | | | | |
| | | | | | | | | | |
PRINCIPAL
AMOUNT | | | | | | | VALUE | |
| | | | | | | | | | |
| | | | | | Telecommunication Services (1.5%) | |
| | 14,500,000 | | | | | SBA Communications Corp.
1.875%, 05/01/13 | | $ | 25,578,290 | |
| | 11,300,000 | | | | | tw telecom, Inc.
2.375%, 04/01/26 | | | 16,348,558 | |
| | | | | | | | | | |
| | | | | | | | | 41,926,848 | |
| | | | | | | | | | |
| | | | | | TOTAL CONVERTIBLE BONDS
(Cost $686,628,726) | | | 759,761,664 | |
| | | | | | | | | | |
| | | | | | | | | | |
| | SYNTHETIC CONVERTIBLE SECURITIES (22.8%) | |
| | Corporate Bonds (18.7%) | |
| | | | | | Consumer Discretionary (4.3%) | |
| | 6,500,000 | | | | | Amazon.com, Inc.
0.650%, 11/27/15 | | | 6,505,102 | |
| | 1,000,000 | | | | | America Honda Finance Corp.*
1.000%, 08/11/15 | | | 1,007,835 | |
| | 5,000,000 | | | | | American Axle & Manufacturing, Inc.*
9.250%, 01/15/17 | | | 5,484,375 | |
| | 2,190,000 | | | | | D.R. Horton, Inc.
6.875%, 05/01/13 | | | 2,190,000 | |
| | | | | | Daimler Finance North America, LLC* | | | | |
| | 5,000,000 | | | | | 1.300%, 07/31/15 | | | 5,037,450 | |
| | 5,000,000 | | | | | 1.250%, 01/11/16 | | | 5,028,725 | |
| | 5,000,000 | | | | | DIRECTV Holdings, LLC
3.500%, 03/01/16 | | | 5,340,775 | |
| | | | | | DISH Network Corp. | | | | |
| | 10,000,000 | | | | | 4.250%, 04/01/18* | | | 9,868,750 | |
| | 5,000,000 | | | | | 6.625%, 10/01/14 | | | 5,325,000 | |
| | 2,200,000 | | | | | Express, LLC
8.750%, 03/01/18 | | | 2,387,000 | |
| | 5,000,000 | | | | | Harley-Davidson Financial Services, Inc.*
1.150%, 09/15/15 | | | 5,013,150 | |
| | 4,000,000 | | | | | Hyundai Capital America*
1.625%, 10/02/15 | | | 4,022,820 | |
| | 8,500,000 | | | | | Interpublic Group of Companies, Inc.
10.000%, 07/15/17 | | | 9,068,437 | |
| | 8,480,000 | | | | | Liberty Interactive, LLC
5.700%, 05/15/13 | | | 8,495,900 | |
| | 5,000,000 | | | | | Meritage Homes Corp.*
4.500%, 03/01/18 | | | 5,043,750 | |
| | 2,770,000 | | | | | NCL Corp., Ltd. - Class C*
5.000%, 02/15/18 | | | 2,898,113 | |
| | | | | | Royal Caribbean Cruises, Ltd. | | | | |
| | 11,200,000 | | | | | 7.000%, 06/15/13 | | | 11,270,000 | |
| | 2,906,000 | | | | | 6.875%, 12/01/13 | | | 2,996,813 | |
| | 2,500,000 | | | | | Time Warner, Inc.
3.150%, 07/15/15 | | | 2,631,738 | |
| | 8,750,000 | | | | | Viacom, Inc.
1.250%, 02/27/15 | | | 8,825,906 | |
| | 3,000,000 | | | | | Volkswagen International Finance, NV*
1.150%, 11/20/15 | | | 3,023,070 | |
| | | | | | |
| See accompanying Notes to Schedule of Investments | | www.calamos.com | | | 97 | |
Market Neutral Income Fund Schedule of Investments April 30, 2013 (Unaudited)
| | | | | | | | | | |
PRINCIPAL
AMOUNT | | | | | | | VALUE | |
| | 4,100,000 | | | | | Wynn Las Vegas, LLC
7.875%, 11/01/17 | | $ | 4,384,437 | |
| | | | | | | | | | |
| | | | | | | | | 115,849,146 | |
| | | | | | | | | | |
| | | | | | Consumer Staples (1.9%) | |
| | 5,000,000 | | | | | Anheuser-Busch InBev, NV
0.800%, 07/15/15 | | | 5,021,750 | |
| | 2,000,000 | | | | | Campbell Soup‡
0.574%, 08/01/14 | | | 2,003,670 | |
| | | | | | ConAgra Foods, Inc. | | | | |
| | 5,000,000 | | | | | 1.350%, 09/10/15 | | | 5,063,925 | |
| | 4,500,000 | | | | | 1.300%, 01/25/16 | | | 4,547,565 | |
| | 4,000,000 | | | | | Constellation Brands, Inc.
7.250%, 09/01/16 | | | 4,632,500 | |
| | 3,000,000 | | | | | Costco Wholesale Corp.
0.650%, 12/07/15 | | | 3,016,695 | |
| | 500,000 | | | | | General Mills, Inc.
0.875%, 01/29/16 | | | 502,828 | |
| | 6,561,000 | | | | | Kellogg Company
1.125%, 05/15/15 | | | 6,626,216 | |
| | 3,000,000 | | | | | Kraft Foods Group, Inc.
1.625%, 06/04/15 | | | 3,052,950 | |
| | 5,000,000 | | | | | PepsiCo, Inc.
0.700%, 08/13/15 | | | 5,023,975 | |
| | 7,800,000 | | | | | Reynolds American, Inc.
1.050%, 10/30/15 | | | 7,820,358 | |
| | 3,000,000 | | | | | Walgreen Company
1.000%, 03/13/15 | | | 3,023,310 | |
| | | | | | | | | | |
| | | | | | | | | 50,335,742 | |
| | | | | | | | | | |
| | | | | | Energy (2.1%) | |
| | 10,445,000 | | | | | Cameron International Corp.
1.600%, 04/30/15 | | | 10,537,856 | |
| | 5,000,000 | | | | | Chesapeake Energy Corp.
3.250%, 03/15/16 | | | 5,071,875 | |
| | 8,000,000 | | | | | Frontier Oil Corp.
6.875%, 11/15/18 | | | 8,695,000 | |
| | 5,560,000 | | | | | Helix Energy Solutions Group, Inc.*
9.500%, 01/15/16 | | | 5,708,397 | |
| | 3,920,000 | | | | | HollyFrontier Corp.
9.875%, 06/15/17 | | | 4,150,300 | |
| | 8,000,000 | | | | | Marathon Oil Corp.
0.900%, 11/01/15 | | | 8,019,160 | |
| | 3,053,000 | | | | | SESI, LLC
6.875%, 06/01/14 | | | 3,058,724 | |
| | 12,000,000 | | | | | Whiting Petroleum Corp.
7.000%, 02/01/14 | | | 12,487,500 | |
| | | | | | | | | | |
| | | | | | | | | 57,728,812 | |
| | | | | | | | | | |
| | | | | | Financials (3.0%) | |
| | 5,000,000 | | | | | Abn Amro Bank, NV*
1.375%, 01/22/16 | | | 5,033,000 | |
| | 8,000,000 | | | | | Bank of America Corp.
1.250%, 01/11/16 | | | 8,004,920 | |
| | | | | | | | | | |
PRINCIPAL
AMOUNT | | | | | | | VALUE | |
| | 500,000 | | | | | Berkshire Hathaway, Inc.
0.800%, 02/11/16 | | $ | 503,338 | |
| | 5,585,000 | | | | | BlackRock, Inc.
1.375%, 06/01/15 | | | 5,686,144 | |
| | 3,000,000 | | | | | Charles Schwab Corp.
0.850%, 12/04/15 | | | 3,017,625 | |
| | 7,000,000 | | | | | Goldman Sachs Group, Inc.
1.600%, 11/23/15 | | | 7,100,135 | |
| | | | | | JPMorgan Chase & Company | | | | |
| | 15,000,000 | | | | | 0.800%, 04/23/15 | | | 14,989,875 | |
| | 5,000,000 | | | | | 1.100%, 10/15/15 | | | 5,019,050 | |
| | | | | | Leucadia National Corp. | | | | |
| | 14,406,000 | | | | | 7.000%, 08/15/13 | | | 14,649,101 | |
| | 5,000,000 | | | | | 8.125%, 09/15/15 | | | 5,715,625 | |
| | 6,000,000 | | | | | Morgan Stanley
1.750%, 02/25/16 | | | 6,047,490 | |
| | 5,000,000 | | | | | Wells Fargo & Company
1.500%, 07/01/15 | | | 5,088,175 | |
| | | | | | | | | | |
| | | | | | | | | 80,854,478 | |
| | | | | | | | | | |
| | | | | | Health Care (2.0%) | |
| | 10,000,000 | | | | | AbbVie, Inc.*
1.200%, 11/06/15 | | | 10,088,450 | |
| | 14,193,000 | | | | | Amgen, Inc.
1.875%, 11/15/14 | | | 14,470,544 | |
| | 640,000 | | | | | Bio-Rad Laboratories, Inc.
8.000%, 09/15/16 | | | 681,200 | |
| | 2,130,000 | | | | | Community Health Systems, Inc.
5.125%, 08/15/18 | | | 2,279,100 | |
| | 5,000,000 | | | | | DaVita HealthCare Partners, Inc.
6.375%, 11/01/18 | | | 5,356,250 | |
| | 4,400,000 | | | | | Gilead Sciences, Inc.
2.400%, 12/01/14 | | | 4,521,550 | |
| | 4,000,000 | | | | | Mylan, Inc.*
7.625%, 07/15/17 | | | 4,457,940 | |
| | 3,050,000 | | | | | Thermo Fisher Scientific, Inc.
3.200%, 05/01/15 | | | 3,173,418 | |
| | 3,000,000 | | | | | Valeant Pharmaceuticals International, Inc.*
6.500%, 07/15/16 | | | 3,129,375 | |
| | 5,000,000 | | | | | WellPoint, Inc.
1.250%, 09/10/15 | | | 5,043,475 | |
| | | | | | | | | | |
| | | | | | | | | 53,201,302 | |
| | | | | | | | | | |
| | | | | | Industrials (2.9%) | |
| | 11,087,000 | | | | | Case New Holland, Inc.
7.750%, 09/01/13 | | | 11,315,670 | |
| | | | | | Caterpillar, Inc. | | | | |
| | 5,000,000 | | | | | 0.950%, 06/26/15 | | | 5,051,075 | |
| | 4,625,000 | | | | | 0.700%, 02/26/16 | | | 4,632,909 | |
| | 4,000,000 | | | | | CNH Capital, LLC
3.875%, 11/01/15 | | | 4,142,500 | |
| | 3,510,000 | | | | | Deluxe Corp.
5.125%, 10/01/14 | | | 3,656,981 | |
| | | | |
| 98 | | CALAMOS FAMILY OF FUNDS SEMIANNUAL REPORT | | See accompanying Notes to Schedule of Investments |
Market Neutral Income Fund Schedule of Investments April 30, 2013 (Unaudited)
| | | | | | | | | | |
PRINCIPAL
AMOUNT | | | | | | | VALUE | |
| | | | | | General Electric Capital Corp. | | | | |
| | 10,000,000 | | | | | 1.625%, 07/02/15 | | $ | 10,188,100 | |
| | 5,000,000 | | | | | 1.000%, 12/11/15 | | | 5,040,025 | |
| | 1,400,000 | | | | | General Electric Company
0.850%, 10/09/15 | | | 1,408,603 | |
| | 5,000,000 | | | | | John Deere Capital Corp.
0.950%, 06/29/15 | | | 5,048,025 | |
| | 1,000,000 | | | | | PACCAR Financial Corp.
0.800%, 02/08/16 | | | 1,003,825 | |
| | | | | | Titan International, Inc. | | | | |
| | 4,440,000 | | | | | 7.875%, 10/01/17 | | | 4,803,525 | |
| | 1,460,000 | | | | | 7.875%, 10/01/17* | | | 1,604,175 | |
| | 11,960,000 | | | | | Triumph Group, Inc.
8.000%, 11/15/17 | | | 12,842,050 | |
| | 8,000,000 | | | | | Turlock Corp.*
0.950%, 11/02/15 | | | 8,034,520 | |
| | | | | | | | | | |
| | | | | | | | | 78,771,983 | |
| | | | | | | | | | |
| | | | | | Information Technology (1.3%) | |
| | 10,000,000 | | | | | Anixter International, Inc.
5.950%, 03/01/15 | | | 10,693,750 | |
| | 5,000,000 | | | | | Fidelity National Information Services, Inc.
7.625%, 07/15/17 | | | 5,352,675 | |
| | 5,000,000 | | | | | International Business Machines Corp.
0.550%, 02/06/15 | | | 5,017,425 | |
| | 5,000,000 | | | | | Jabil Circuit, Inc.
7.750%, 07/15/16 | | | 5,806,250 | |
| | | | | | Seagate Technology, PLC | | | | |
| | 2,766,000 | | | | | 10.000%, 05/01/14* | | | 2,904,300 | |
| | 2,500,000 | | | | | 7.750%, 12/15/18 | | | 2,768,750 | |
| | 3,000,000 | | | | | Texas Instruments, Inc.
0.450%, 08/03/15 | | | 2,998,770 | |
| | | | | | | | | | |
| | | | | | | | | 35,541,920 | |
| | | | | | | | | | |
| | | | | | Materials (0.6%) | |
| | 3,000,000 | | | | | Ashland, Inc.*
3.000%, 03/15/16 | | | 3,067,500 | |
| | 5,100,000 | | | | | Ball Corp.
7.125%, 09/01/16 | | | 5,390,062 | |
| | 7,625,000 | | | | | Ecolab, Inc.
1.000%, 08/09/15 | | | 7,662,172 | |
| | | | | | | | | | |
| | | | | | | | | 16,119,734 | |
| | | | | | | | | | |
| | | | | | Telecommunication Services (0.4%) | |
| | | | | | AT&T, Inc. | | | | |
| | 6,155,000 | | | | | 0.800%, 12/01/15 | | | 6,154,477 | |
| | 5,000,000 | | | | | 0.900%, 02/12/16 | | | 5,010,350 | |
| | | | | | | | | | |
| | | | | | | | | 11,164,827 | |
| | | | | | | | | | |
| | | | | | Utilities (0.2%) | | | | |
| | 3,000,000 | | | | | Calpine Corp.*
7.250%, 10/15/17 | | | 3,181,875 | |
| | 2,500,000 | | | | | NextEra Energy, Inc.
1.200%, 06/01/15 | | | 2,521,875 | |
| | | | | | | | | | |
| | | | | | | | | 5,703,750 | |
| | | | | | | | | | |
| | | | | | TOTAL CORPORATE BONDS | | | 505,271,694 | |
| | | | | | | | | | |
| | | | | | | | | | |
PRINCIPAL
AMOUNT | | | | | | | VALUE | |
| | Sovereign Bonds (4.0%) | | | | |
| | | | | | Government of Canada | | | | |
| | 20,000,000 | | | CAD | | 2.000%, 06/01/16 | | $ | 20,420,170 | |
| | 5,000,000 | | | CAD | | 2.000%, 03/01/14 | | | 5,004,045 | |
| | 5,000,000 | | | CAD | | 1.500%, 11/01/13 | | | 4,975,259 | |
| | | | | | Government of Singapore | | | | |
| | 19,493,000 | | | SGD | | 1.125%, 04/01/16 | | | 16,252,766 | |
| | 12,000,000 | | | SGD | | 1.375%, 10/01/14 | | | 9,907,477 | |
| | 110,000,000 | | | NOK | | Kingdom of Norway
5.000%, 05/15/15 | | | 20,533,174 | |
| | 187,500,000 | | | SEK | | Kingdom of Sweden
3.000%, 07/12/16 | | | 30,833,401 | |
| | | | | | | | | | |
| | | | | | TOTAL SOVEREIGN BONDS | | | 107,926,292 | |
| | | | | | | | | | |
| | | | | | | | | | |
NUMBER OF
CONTRACTS | | | | | | | VALUE | |
| | | | | | | | | | |
| | Purchased Options (0.1%)# | | | | |
| | | | | | Consumer Discretionary (0.1%) | | | | |
| | 1,600 | | | | | Under Armour, Inc. Call, 01/18/14, Strike $50.00 | | | 1,680,000 | |
| | | | | | | | | | |
| | | | | | Information Technology (0.0%) | | | | |
| | 2,650 | | | | | Infosys, Ltd. Call, 01/18/14, Strike $52.50 | | | 337,875 | |
| | 1,600 | | | | | KLA-Tencor Corp. Call, 01/18/14, Strike $55.00 | | | 672,000 | |
| | | | | | | | | | |
| | | | | | | | | 1,009,875 | |
| | | | | | | | | | |
| | | | | | TOTAL PURCHASED OPTIONS | | | 2,689,875 | |
| | | | | | | | | | |
| | | | | | TOTAL SYNTHETIC
CONVERTIBLE SECURITIES
(Cost $607,228,155) | | | 615,887,861 | |
| | | | | | | | | | |
| | | | | | | | | | |
NUMBER OF
SHARES | | | | | | | VALUE | |
| | COMMON STOCKS (43.2%) | | | | |
| | | | | | Consumer Discretionary (4.5%) | | | | |
| | 42,000 | | | | | Amazon.com, Inc.~# | | | 10,660,020 | |
| | 38,500 | | | | | Bed Bath & Beyond, Inc.# | | | 2,648,800 | |
| | 55,000 | | | | | CBS Corp. - Class B | | | 2,517,900 | |
| | 94,000 | | | | | Coach, Inc. | | | 5,532,840 | |
| | 270,500 | | | | | Comcast Corp. - Class A | | | 11,171,650 | |
| | 26,500 | | | | | D.R. Horton, Inc. | | | 691,120 | |
| | 50,000 | | | | | DIRECTV - Class A# | | | 2,828,000 | |
| | 25,000 | | | | | Discovery Communications, Inc.# | | | 1,970,500 | |
| | 26,000 | | | | | Dollar General Corp.# | | | 1,354,340 | |
| | 1,676 | | | CHF | | Dufry, AG# | | | 223,282 | |
| | 450,000 | | | | | Ford Motor Company | | | 6,169,500 | |
| | 78,000 | | | | | Home Depot, Inc. | | | 5,721,300 | |
| | 44,110 | | | | | Ignite Restaurant Group, Inc.# | | | 769,278 | |
| | 38,500 | | | | | International Game Technology | | | 652,575 | |
| | 75,000 | | | | | Johnson Controls, Inc. | | | 2,625,750 | |
| | | | | | |
| See accompanying Notes to Schedule of Investments | | www.calamos.com | | | 99 | |
Market Neutral Income Fund Schedule of Investments April 30, 2013 (Unaudited)
| | | | | | | | | | |
NUMBER OF
SHARES | | | | | | | VALUE | |
| | 55,000 | | | | | Kohl’s Corp. | | $ | 2,588,300 | |
| | 15,000 | | | | | Lennar Corp. - Class A | | | 618,300 | |
| | 50,000 | | | | | Lowe’s Companies, Inc. | | | 1,921,000 | |
| | 57,500 | | | | | Macy’s, Inc. | | | 2,564,500 | |
| | 90,000 | | | | | McDonald’s Corp. | | | 9,192,600 | |
| | 18,906 | | | | | Michael Kors Holdings, Ltd.# | | | 1,076,508 | |
| | 60,000 | | | | | Nike, Inc. - Class B | | | 3,816,000 | |
| | 25,000 | | | HKD | | Prada S.p.A | | | 225,741 | |
| | 7,000 | | | | | Priceline.com, Inc.# | | | 4,871,930 | |
| | 32,000 | | | | | PulteGroup, Inc.# | | | 671,680 | |
| | 25,000 | | | | | Ross Stores, Inc. | | | 1,651,750 | |
| | 65,000 | | | | | Starbucks Corp. | | | 3,954,600 | |
| | 60,000 | | | | | Target Corp. | | | 4,233,600 | |
| | 30,000 | | | | | Time Warner Cable, Inc. | | | 2,816,700 | |
| | 85,000 | | | | | Time Warner, Inc. | | | 5,081,300 | |
| | 66,000 | | | | | TJX Companies, Inc. | | | 3,218,820 | |
| | 6,237 | | | | | Ulta Salon Cosmetics & Fragrance, Inc.# | | | 546,673 | |
| | 36,500 | | | | | Viacom, Inc. - Class B | | | 2,335,635 | |
| | 213,300 | | | | | Walt Disney Company | | | 13,403,772 | |
| | 40,000 | | | | | Yum! Brands, Inc. | | | 2,724,800 | |
| | | | | | | | | | |
| | | | | | | | | 123,051,064 | |
| | | | | | | | | | |
| | | | | | Consumer Staples (5.1%) | | | | |
| | 257,000 | | | | | Altria Group, Inc. | | | 9,383,070 | |
| | 110,000 | | | | | Archer-Daniels-Midland Company | | | 3,733,400 | |
| | 575,000 | | | | | Coca-Cola Company~ | | | 24,339,750 | |
| | 55,000 | | | | | Colgate-Palmolive Company | | | 6,567,550 | |
| | 37,000 | | | | | Costco Wholesale Corp. | | | 4,011,910 | |
| | 145,000 | | | | | CVS Caremark Corp. | | | 8,436,100 | |
| | 7,655 | | | GBP | | Diageo, PLC | | | 233,765 | |
| | 3,678 | | | | | Estee Lauder Companies Inc. | | | 255,069 | |
| | 50,000 | | | | | Kimberly-Clark Corp. | | | 5,159,500 | |
| | 53,333 | | | | | Kraft Foods Group, Inc. | | | 2,746,116 | |
| | 40,931 | | | | | Lorillard, Inc. | | | 1,755,531 | |
| | 32,000 | | | | | Mead Johnson Nutrition Company | | | 2,594,880 | |
| | 150,000 | | | | | Mondelez International, Inc. | | | 4,717,500 | |
| | 160,800 | | | | | PepsiCo, Inc. | | | 13,261,176 | |
| | 200,122 | | | | | Philip Morris International, Inc. | | | 19,129,662 | |
| | 190,000 | | | | | Procter & Gamble Company | | | 14,586,300 | |
| | 221,500 | | | | | Wal-Mart Stores, Inc. | | | 17,214,980 | |
| | | | | | | | | | |
| | | | | | | | | 138,126,259 | |
| | | | | | | | | | |
| | | | | | Energy (4.9%) | | | | |
| | 43,700 | | | | | Anadarko Petroleum Corp. | | | 3,704,012 | |
| | 32,500 | | | | | Apache Corp. | | | 2,401,100 | |
| | 75,000 | | | | | Baker Hughes, Inc. | | | 3,404,250 | |
| | 3,833 | | | | | Cameron International Corp.# | | | 235,921 | |
| | 75,000 | | | | | Chesapeake Energy Corp. | | | 1,465,500 | |
| | | | | | | | | | |
NUMBER OF
SHARES | | | | | | | VALUE | |
| | 197,500 | | | | | Chevron Corp. | | $ | 24,096,975 | |
| | 100,000 | | | | | ConocoPhillips | | | 6,045,000 | |
| | 58,000 | | | | | Devon Energy Corp. | | | 3,193,480 | |
| | 37,500 | | | | | EOG Resources, Inc. | | | 4,543,500 | |
| | 375,820 | | | | | Exxon Mobil Corp. | | | 33,444,222 | |
| | 89,000 | | | | | Halliburton Company | | | 3,806,530 | |
| | 17,000 | | | | | Helmerich & Payne, Inc. | | | 996,540 | |
| | 105,000 | | | | | Marathon Oil Corp. | | | 3,430,350 | |
| | 52,500 | | | | | Marathon Petroleum Corp. | | | 4,113,900 | |
| | 20,000 | | | | | Murphy Oil Corp. | | | 1,241,800 | |
| | 55,000 | | | | | Nabors Industries, Ltd. | | | 813,450 | |
| | 35,000 | | | | | National Oilwell Varco, Inc. | | | 2,282,700 | |
| | 100,000 | | | | | Occidental Petroleum Corp. | | | 8,926,000 | |
| | 65,750 | | | | | Phillips 66 | | | 4,007,462 | |
| | 186,000 | | | | | Schlumberger, Ltd. | | | 13,843,980 | |
| | 55,000 | | | | | Spectra Energy Corp. | | | 1,734,150 | |
| | 14,815 | | | | | Transocean, Ltd.# | | | 762,528 | |
| | 65,000 | | | | | Valero Energy Corp. | | | 2,620,800 | |
| | 28,070 | | | | | WPX Energy, Inc.# | | | 438,734 | |
| | | | | | | | | | |
| | | | | | | | | 131,552,884 | |
| | | | | | | | | | |
| | | | | | Financials (7.4%) | |
| | 37,000 | | | | | Aflac, Inc. | | | 2,014,280 | |
| | 95,000 | | | | | Allstate Corp. | | | 4,679,700 | |
| | 135,000 | | | | | American Express Company~ | | | 9,235,350 | |
| | 28,500 | | | | | American Tower Corp. | | | 2,393,715 | |
| | 950,000 | | | | | Bank of America Corp. | | | 11,694,500 | |
| | 200,000 | | | | | Bank of New York Mellon Corp. | | | 5,644,000 | |
| | 85,000 | | | | | BB&T Corp. | | | 2,615,450 | |
| | 200,000 | | | | | Berkshire Hathaway, Inc. - Class B~# | | | 21,264,000 | |
| | 23,500 | | | | | BlackRock, Inc. | | | 6,262,750 | |
| | 25,526 | | | | | Blackstone Group, LP | | | 524,559 | |
| | 82,733 | | | | | Capital One Financial Corp. | | | 4,780,313 | |
| | 20,000 | | | | | Chubb Corp. | | | 1,761,400 | |
| | 255,000 | | | | | Citigroup, Inc. | | | 11,898,300 | |
| | 51,000 | | | | | Discover Financial Services | | | 2,230,740 | |
| | 110,000 | | | | | Fifth Third Bancorp | | | 1,873,300 | |
| | 28,121 | | | | | Franklin Resources, Inc. | | | 4,349,194 | |
| | 73,000 | | | | | Goldman Sachs Group, Inc. | | | 10,663,110 | |
| | 45,000 | | | | | Hartford Financial Services Group, Inc. | | | 1,264,050 | |
| | 523,197 | | | | | JPMorgan Chase & Company | | | 25,641,885 | |
| | 38,000 | | | | | Lincoln National Corp. | | | 1,292,380 | |
| | 126,140 | | | | | MetLife, Inc. | | | 4,918,199 | |
| | 126,701 | | | | | Morgan Stanley | | | 2,806,427 | |
| | 47,800 | | | | | Principal Financial Group, Inc. | | | 1,725,580 | |
| | 44,000 | | | | | Prudential Financial, Inc. | | | 2,658,480 | |
| | 29,000 | | | | | Simon Property Group, Inc. | | | 5,164,030 | |
| | 23,857 | | | | | SLM Corp. | | | 492,647 | |
| | | | |
| 100 | | CALAMOS FAMILY OF FUNDS SEMIANNUAL REPORT | | See accompanying Notes to Schedule of Investments |
Market Neutral Income Fund Schedule of Investments April 30, 2013 (Unaudited)
| | | | | | | | | | |
NUMBER OF
SHARES | | | | | | | VALUE | |
| | 58,500 | | | | | State Street Corp. | | $ | 3,420,495 | |
| | 43,000 | | | | | T. Rowe Price Group, Inc. | | | 3,117,500 | |
| | 61,000 | | | | | Travelers Companies, Inc. | | | 5,210,010 | |
| | 342,500 | | | | | US Bancorp | | | 11,398,400 | |
| | 30,000 | | | | | Vornado Realty Trust | | | 2,626,800 | |
| | 625,000 | | | | | Wells Fargo & Company | | | 23,737,500 | |
| | | | | | | | | | |
| | | | | | | | | 199,359,044 | |
| | | | | | | | | | |
| | | | | | Health Care (5.7%) | |
| | 210,800 | | | | | Abbott Laboratories | | | 7,782,736 | |
| | 210,800 | | | | | AbbVie, Inc. | | | 9,707,340 | |
| | 26,500 | | | | | Aetna, Inc. | | | 1,522,160 | |
| | 35,000 | | | | | Agilent Technologies, Inc. | | | 1,450,400 | |
| | 17,903 | | | | | Alere, Inc.# | | | 459,749 | |
| | 24,845 | | | | | Alkermes, PLC# | | | 760,505 | |
| | 36,000 | | | | | Allergan, Inc. | | | 4,087,800 | |
| | 79,000 | | | | | Amgen, Inc. | | | 8,232,590 | |
| | 60,000 | | | | | Baxter International, Inc. | | | 4,192,200 | |
| | 3,235 | | | | | Biogen Idec, Inc.# | | | 708,239 | |
| | 140,200 | | | | | Bristol-Myers Squibb Company | | | 5,568,744 | |
| | 40,000 | | | | | Celgene Corp.# | | | 4,722,800 | |
| | 35,500 | | | | | Cigna Corp. | | | 2,349,035 | |
| | 75,497 | | | | | Covidien, PLC | | | 4,819,728 | |
| | 10,000 | | | | | DaVita HealthCare Partners, Inc.# | | | 1,186,500 | |
| | 14,587 | | | | | Endologix, Inc.# | | | 219,097 | |
| | 70,000 | | | | | Express Scripts Holding Company# | | | 4,155,900 | |
| | 125,000 | | | | | Gilead Sciences, Inc.# | | | 6,330,000 | |
| | 30,957 | | | | | Insulet Corp.# | | | 781,355 | |
| | 4,000 | | | | | Intuitive Surgical, Inc.# | | | 1,969,160 | |
| | 315,750 | | | | | Johnson & Johnson | | | 26,911,373 | |
| | 8,000 | | | | | Laboratory Corp. of America Holdings# | | | 746,880 | |
| | 90,000 | | | | | Medtronic, Inc. | | | 4,201,200 | |
| | 369,539 | | | | | Merck & Company, Inc. | | | 17,368,333 | |
| | 758,600 | | | | | Pfizer, Inc. | | | 22,052,502 | |
| | 15,000 | | | | | Quest Diagnostics, Inc. | | | 844,950 | |
| | 42,500 | | | | | St. Jude Medical, Inc. | | | 1,751,850 | |
| | 25,000 | | | | | Stryker Corp. | | | 1,639,500 | |
| | 45,000 | | | | | Thermo Fisher Scientific, Inc. | | | 3,630,600 | |
| | 6,196 | | | | | Thoratec Corp.# | | | 224,295 | |
| | 85,000 | | | | | UnitedHealth Group, Inc. | | | 5,094,050 | |
| | | | | | | | | | |
| | | | | | | | | 155,471,571 | |
| | | | | | | | | | |
| | | | | | Industrials (3.9%) | |
| | 51,000 | | | | | 3M Company | | | 5,340,210 | |
| | 35,000 | | | | | Boeing Company | | | 3,199,350 | |
| | 111,000 | | | | | Caterpillar, Inc. | | | 9,398,370 | |
| | 135,000 | | | | | CSX Corp. | | | 3,319,650 | |
| | 32,500 | | | | | Cummins, Inc. | | | 3,457,675 | |
| | | | | | | | | | |
NUMBER OF
SHARES | | | | | | | VALUE | |
| | 60,000 | | | | | Danaher Corp. | | $ | 3,656,400 | |
| | 17,000 | | | | | Deere & Company | | | 1,518,100 | |
| | 48,000 | | | | | Eaton Corp., PLC | | | 2,947,680 | |
| | 60,000 | | | | | Emerson Electric Company | | | 3,330,600 | |
| | 31,500 | | | | | Expeditors International of Washington, Inc. | | | 1,131,795 | |
| | 35,000 | | | | | FedEx Corp. | | | 3,290,350 | |
| | 33,000 | | | | | Fluor Corp. | | | 1,880,340 | |
| | 1,227,500 | | | | | General Electric Company | | | 27,360,975 | |
| | 72,500 | | | | | Honeywell International, Inc. | | | 5,331,650 | |
| | 11,125 | | | | | Jacobs Engineering Group, Inc.# | | | 561,590 | |
| | 17,500 | | | | | Joy Global, Inc. | | | 989,100 | |
| | 46,000 | | | | | Norfolk Southern Corp. | | | 3,561,320 | |
| | 12,500 | | | | | Precision Castparts Corp. | | | 2,391,125 | |
| | 24,336 | | | | | Terex Corp.# | | | 696,010 | |
| | 40,000 | | | | | Union Pacific Corp. | | | 5,918,400 | |
| | 82,500 | | | | | United Parcel Service, Inc. | | | 7,081,800 | |
| | 100,000 | | | | | United Technologies Corp. | | | 9,129,000 | |
| | | | | | | | | | |
| | | | | | | | | 105,491,490 | |
| | | | | | | | | | |
| | | | | | Information Technology (7.8%) | |
| | 75,000 | | | | | Accenture, PLC - Class A | | | 6,108,000 | |
| | 75,000 | | | | | Apple, Inc. | | | 33,206,250 | |
| | 42,000 | | | | | Automatic Data Processing, Inc. | | | 2,828,280 | |
| | 90,000 | | | | | Broadcom Corp. - Class A | | | 3,240,000 | |
| | 725,000 | | | | | Cisco Systems, Inc. | | | 15,167,000 | |
| | 18,500 | | | | | Citrix Systems, Inc.# | | | 1,150,145 | |
| | 33,038 | | | | | Cognizant Technology Solutions
Corp. - Class A# | | | 2,140,862 | |
| | 125,000 | | | | | Dell, Inc. | | | 1,675,000 | |
| | 95,000 | | | | | eBay, Inc.# | | | 4,977,050 | |
| | 370,000 | | | | | EMC Corp.# | | | 8,299,100 | |
| | 23,750 | | | | | Google, Inc.# | | | 19,583,538 | |
| | 856,500 | | | | | Intel Corp. | | | 20,513,175 | |
| | 114,200 | | | | | International Business Machines Corp. | | | 23,130,068 | |
| | 13,500 | | | | | MasterCard, Inc. - Class A | | | 7,464,555 | |
| | 20,000 | | | | | Microchip Technology, Inc. | | | 728,400 | |
| | 600,000 | | | | | Microsoft Corp. | | | 19,860,000 | |
| | 110,000 | | | | | NVIDIA Corp. | | | 1,514,700 | |
| | 2,104 | | | | | OpenTable, Inc.# | | | 116,541 | |
| | 304,500 | | | | | Oracle Corp. | | | 9,981,510 | |
| | 231,100 | | | | | QUALCOMM, Inc. | | | 14,240,382 | |
| | 46,000 | | | | | Salesforce.com, Inc.# | | | 1,891,060 | |
| | 159 | | | KRW | | Samsung Electronics Company, Ltd. | | | 219,900 | |
| | 18,054 | | | | | SINA Corp.# | | | 1,016,801 | |
| | 9,200 | | | HKD | | Tencent Holdings, Ltd. | | | 317,384 | |
| | 120,000 | | | | | Texas Instruments, Inc. | | | 4,345,200 | |
| | 25,000 | | | | | VeriSign, Inc.# | | | 1,151,750 | |
| | | | | | |
| See accompanying Notes to Schedule of Investments | | www.calamos.com | | | 101 | |
Market Neutral Income Fund Schedule of Investments April 30, 2013 (Unaudited)
| | | | | | | | | | |
NUMBER OF
SHARES | | | | | | | VALUE | |
| | 45,000 | | | | | Visa, Inc. | | $ | 7,580,700 | |
| | 9,373 | | | | | Yelp, Inc.# | | | 243,979 | |
| | | | | | | | | | |
| | | | | | | | | 212,691,330 | |
| | | | | | | | | | |
| | | | | | Materials (1.2%) | |
| | 9,000 | | | | | CF Industries Holdings, Inc. | | | 1,678,590 | |
| | 26,000 | | | | | Cliffs Natural Resources, Inc. | | | 554,840 | |
| | 130,000 | | | | | Dow Chemical Company | | | 4,408,300 | |
| | 123,000 | | | | | E.I. du Pont de Nemours and Company | | | 6,704,730 | |
| | 163,000 | | | | | Freeport-McMoRan Copper & Gold, Inc. | | | 4,960,090 | |
| | 52,000 | | | | | Monsanto Company | | | 5,554,640 | |
| | 45,000 | | | | | Mosaic Company | | | 2,771,550 | |
| | 84,000 | | | | | Newmont Mining Corp. | | | 2,721,600 | |
| | 16,000 | | | | | PPG Industries, Inc. | | | 2,354,240 | |
| | | | | | | | | | |
| | | | | | | | | 31,708,580 | |
| | | | | | | | | | |
| | | | | | Telecommunication Services (1.5%) | |
| | 630,100 | | | | | AT&T, Inc. | | | 23,603,546 | |
| | 94,000 | | | | | CenturyLink, Inc. | | | 3,531,580 | |
| | 255,000 | | | | | Verizon Communications, Inc. | | | 13,747,050 | |
| | | | | | | | | | |
| | | | | | | | | 40,882,176 | |
| | | | | | | | | | |
| | | | | | Utilities (1.2%) | |
| | 43,000 | | | | | American Electric Power Company, Inc. | | | 2,211,490 | |
| | 30,000 | | | | | Consolidated Edison, Inc. | | | 1,909,500 | |
| | 55,000 | | | | | Dominion Resources, Inc. | | | 3,392,400 | |
| | 65,000 | | | | | Duke Energy Corp. | | | 4,888,000 | |
| | 24,000 | | | | | Entergy Corp. | | | 1,709,520 | |
| | 70,000 | | | | | Exelon Corp. | | | 2,625,700 | |
| | 35,000 | | | | | FirstEnergy Corp. | | | 1,631,000 | |
| | 40,000 | | | | | NextEra Energy, Inc. | | | 3,281,200 | |
| | 40,000 | | | | | PG&E Corp. | | | 1,937,600 | |
| | 50,000 | | | | | PPL Corp. | | | 1,669,000 | |
| | 60,000 | | | | | Public Service Enterprise Group, Inc. | | | 2,196,600 | |
| | 75,000 | | | | | Southern Company | | | 3,617,250 | |
| | 30,000 | | | | | Wisconsin Energy Corp. | | | 1,348,200 | |
| | 45,000 | | | | | Xcel Energy, Inc. | | | 1,430,550 | |
| | | | | | | | | | |
| | | | | | | | | 33,848,010 | |
| | | | | | | | | | |
| | | | | | TOTAL COMMON STOCKS
(Cost $1,058,741,826) | | | 1,172,182,408 | |
| | | | | | | | | | |
| | | | | | | | | | |
NUMBER OF
CONTRACTS | | | | | | | VALUE | |
| | PURCHASED OPTIONS (0.2%)# | |
| | | | | | Other (0.2%) | |
| | | | | | S & P 500 Index | | | | |
| | 1,000 | | | | | Put, 07/20/13, Strike $1,530.00 | | | 1,915,000 | |
| | 850 | | | | | Put, 06/28/13, Strike $1,550.00 | | | 1,572,500 | |
| | 500 | | | | | Put, 06/22/13, Strike $1,560.00 | | | 922,500 | |
| | | | | | | | | | |
NUMBER OF
CONTRACTS | | | | | | | VALUE | |
| | 500 | | | | | Put, 07/20/13, Strike $1,540.00 | | $ | 1,092,500 | |
| | | | | | | | | | |
| | | | | | TOTAL PURCHASED OPTIONS
(Cost $7,833,887) | | | 5,502,500 | |
| | | | | | | | | | |
NUMBER OF
SHARES | | | | | | | VALUE | |
| | SHORT TERM INVESTMENT (7.8%) | | | | |
| | 211,360,604 | | | | | Fidelity Prime Money Market Fund - Institutional Class
(Cost $211,360,604) | | | 211,360,604 | |
| | | | | | | | | | |
| TOTAL INVESTMENTS (102.0%)
(Cost $2,571,793,198) | | | 2,764,695,037 | |
| | | | | | | | | | |
| |
| | LIABILITIES, LESS OTHER ASSETS (-2.0%) | | | (53,640,735 | ) |
| | | | | | | | | | |
| |
| | NET ASSETS (100.0%) | | $ | 2,711,054,302 | |
| | | | | | | | | | |
| | COMMON STOCKS SOLD SHORT (-13.0%)# | |
| | | | | | Consumer Discretionary (-2.9%) | |
| | (9,340 | ) | | | | BJ’s Restaurants, Inc. | | | (320,362 | ) |
| | (100,000 | ) | | | | Coinstar, Inc. | | | (5,281,000 | ) |
| | (12,796 | ) | | | | Gap, Inc. | | | (486,120 | ) |
| | (29,156 | ) | | | | Groupon, Inc. | | | (177,851 | ) |
| | (9,627 | ) | | | | Hasbro, Inc. | | | (456,031 | ) |
| | (17,422 | ) | | | | Hibbett Sports, Inc. | | | (955,597 | ) |
| | (84,300 | ) | | | | Iconix Brand Group, Inc. | | | (2,415,195 | ) |
| | (116,500 | ) | | | | Jarden Corp. | | | (5,243,665 | ) |
| | (49,500 | ) | | | | M/I Homes, Inc. | | | (1,217,700 | ) |
| | (45,000 | ) | | | | Meritage Homes Corp. | | | (2,195,550 | ) |
| | (124,600 | ) | | | | MGM Resorts International | | | (1,759,352 | ) |
| | (6,972 | ) | | | | Polaris Industries, Inc. | | | (600,917 | ) |
| | (4,000,000 | ) | | | | Sirius XM Radio, Inc. | | | (13,000,000 | ) |
| | (142,000 | ) | | | | Sotheby’s | | | (5,038,160 | ) |
| | (135,000 | ) | | | | Standard Pacific Corp. | | | (1,221,750 | ) |
| | (9,849 | ) | | | | Tiffany & Company | | | (725,674 | ) |
| | (120,000 | ) | | | | Under Armour, Inc. | | | (6,849,600 | ) |
| | (635,500 | ) | | | | Virgin Media, Inc. | | | (30,999,690 | ) |
| | | | | | | | | | |
| | | | | | | | | (78,944,214 | ) |
| | | | | | | | | | |
| | | | | | Consumer Staples (-0.5%) | |
| | (5,056 | ) | | | | Monster Beverage Corp. | | | (285,159 | ) |
| | (565,500 | ) | | | | Tyson Foods, Inc. - Class A | | | (13,928,265 | ) |
| | | | | | | | | | |
| | | | | | | | | (14,213,424 | ) |
| | | | | | | | | | |
| | | | | | Energy (-0.9%) | |
| | (232,000 | ) | | | | Exterran Holdings, Inc. | | | (6,129,440 | ) |
| | (14,018 | ) | | | | HollyFrontier Corp. | | | (693,190 | ) |
| | (48,000 | ) | | | | Hornbeck Offshore Services, Inc. | | | (2,156,160 | ) |
| | (438,873 | ) | | | | Newpark Resources, Inc. | | | (4,608,167 | ) |
| | (165,600 | ) | | | | PDC Energy, Inc. | | | (7,170,480 | ) |
| | (43,000 | ) | | | | SEACOR Holdings, Inc. | | | (3,100,730 | ) |
| | | | |
| 102 | | CALAMOS FAMILY OF FUNDS SEMIANNUAL REPORT | | See accompanying Notes to Schedule of Investments |
Market Neutral Income Fund Schedule of Investments April 30, 2013 (Unaudited)
| | | | | | | | | | |
NUMBER OF
SHARES | | | | | | | VALUE | |
| | (49,000 | ) | | | | Stone Energy Corp. | | $ | (966,770 | ) |
| | | | | | | | | | |
| | | | | | | | | (24,824,937 | ) |
| | | | | | | | | | |
| | | | | | Financials (-1.2%) | |
| | (114,650 | ) | | | | Amtrust Financial Services, Inc. | | | (3,629,819 | ) |
| | (117,959 | ) | | | | Encore Capital Group, Inc. | | | (3,360,652 | ) |
| | (112,000 | ) | | | | Forestar Group, Inc. | | | (2,412,480 | ) |
| | (38,104 | ) | | | | Janus Capital Group, Inc. | | | (339,887 | ) |
| | (58,500 | ) | | | | PHH Corp. | | | (1,233,180 | ) |
| | (369,406 | ) | | | | Ryman Hospitality Properties, Inc. | | | (16,423,791 | ) |
| | (100,000 | ) | | | | Starwood Property Trust, Inc. | | | (2,749,000 | ) |
| | (50,800 | ) | | | | Walter Investment Management Corp. | | | (1,704,848 | ) |
| | | | | | | | | | |
| | | | | | | | | (31,853,657 | ) |
| | | | | | | | | | |
| | | | | | Health Care (-1.2%) | |
| | (4,601 | ) | | | | C.R. Bard, Inc. | | | (457,155 | ) |
| | | | | | | | | | |
| | (22,928 | ) | | SEK | | Elekta, AB - Class B | | | (351,565 | ) |
| | (4,053 | ) | | | | Eli Lilly and Company | | | (224,455 | ) |
| | (160,000 | ) | | | | Endo Health Solutions, Inc. | | | (5,862,400 | ) |
| | (747 | ) | | | | HeartWare International, Inc. | | | (72,608 | ) |
| | (102,650 | ) | | | | LifePoint Hospitals, Inc. | | | (4,927,200 | ) |
| | (29,400 | ) | | | | Medivation, Inc. | | | (1,549,674 | ) |
| | (202,700 | ) | | | | Molina Healthcare, Inc. | | | (6,729,640 | ) |
| | (7,832 | ) | | | | Mylan, Inc. | | | (227,990 | ) |
| | (73,600 | ) | | | | Salix Pharmaceuticals, Ltd. | | | (3,848,544 | ) |
| | (8,989 | ) | | | | Techne Corp. | | | (576,555 | ) |
| | (15,546 | ) | | | | Vanguard Health Systems, Inc. | | | (227,438 | ) |
| | (162,500 | ) | | | | Volcano Corp. | | | (3,297,125 | ) |
| | (2,766 | ) | | DKK | | William Demant Holding, A/S | | | (221,474 | ) |
| | (139,000 | ) | | | | Wright Medical Group, Inc. | | | (3,258,160 | ) |
| | (6,212 | ) | | | | Zimmer Holdings, Inc. | | | (474,907 | ) |
| | | | | | | | | | |
| | | | | | | | | (32,306,890 | ) |
| | | | | | | | | | |
| | | | | | Industrials (-0.6%) | |
| | (26,425 | ) | | | | Altra Holdings, Inc. | | | (704,226 | ) |
| | (2,199 | ) | | | | American Railcar Industries, Inc. | | | (78,526 | ) |
| | (48,200 | ) | | | | Chart Industries, Inc. | | | (4,087,842 | ) |
| | (8,477 | ) | | | | Deluxe Corp. | | | (323,313 | ) |
| | (225,000 | ) | | | | EnerSys | | | (10,314,000 | ) |
| | (12,750 | ) | | | | General Cable Corp. | | | (439,620 | ) |
| | (2,211 | ) | | | | Trinity Industries, Inc. | | | (93,327 | ) |
| | | | | | | | | | |
| | | | | | | | | (16,040,854 | ) |
| | | | | | | | | | |
| | | | | | Information Technology (-4.7%) | |
| | (315,000 | ) | | | | Arris Group, Inc. | | | (5,200,650 | ) |
| | (200,000 | ) | | | | Blucora, Inc. | | | (2,954,000 | ) |
| | (142,200 | ) | | | | Bottomline Technologies, Inc. | | | (3,725,640 | ) |
| | (84,000 | ) | | | | BroadSoft, Inc. | | | (2,147,040 | ) |
| | (156,000 | ) | | | | CACI International, Inc. - Class A | | | (9,124,440 | ) |
| | (489,400 | ) | | | | Ciena Corp. | | | (7,321,424 | ) |
| | | | | | | | | | |
NUMBER OF
SHARES | | | | | | | VALUE | |
| | (40,300 | ) | | | | Comtech Telecommunications Corp. | | $ | (991,783 | ) |
| | (239,500 | ) | | | | Concur Technologies, Inc. | | | (17,509,845 | ) |
| | (77,000 | ) | | | | DealerTrack Holdings, Inc. | | | (2,144,450 | ) |
| | (76,000 | ) | | | | Equinix, Inc. | | | (16,271,600 | ) |
| | (5,993 | ) | | | | FactSet Research Systems, Inc. | | | (563,762 | ) |
| | (264,680 | ) | | | | FEI Company | | | (16,907,758 | ) |
| | (10,352 | ) | | | | Harris Corp. | | | (478,262 | ) |
| | (13,250 | ) | | | | Infosys, Ltd. | | | (553,055 | ) |
| | (56,000 | ) | | | | KLA-Tencor Corp. | | | (3,038,000 | ) |
| | (16,400 | ) | | | | Lam Research Corp. | | | (758,008 | ) |
| | (186,900 | ) | | | | Mentor Graphics Corp. | | | (3,412,794 | ) |
| | (488,976 | ) | | | | Micron Technology, Inc. | | | (4,606,154 | ) |
| | (307,700 | ) | | | | NetApp, Inc. | | | (10,735,653 | ) |
| | (44,918 | ) | | | | Nokia Corp. | | | (151,823 | ) |
| | (142,500 | ) | | | | Nuance Communications, Inc. | | | (2,713,200 | ) |
| | (224,480 | ) | | | | Photronics, Inc. | | | (1,771,147 | ) |
| | (77,600 | ) | | | | SanDisk Corp. | | | (4,069,344 | ) |
| | (97,500 | ) | | | | SYNNEX Corp. | | | (3,373,500 | ) |
| | (29,800 | ) | | | | Take-Two Interactive Software, Inc. | | | (454,748 | ) |
| | (68,800 | ) | | | | TTM Technologies, Inc. | | | (497,424 | ) |
| | (122,000 | ) | | | | Xilinx, Inc. | | | (4,625,020 | ) |
| | | | | | | | | | |
| | | | | | | | | (126,100,524 | ) |
| | | | | | | | | | |
| | | | | | Materials (-0.5%) | |
| | (35,000 | ) | | | | Allegheny Technologies, Inc. | | | (944,300 | ) |
| | (38,400 | ) | | | | Goldcorp, Inc. | | | (1,135,872 | ) |
| | (118,000 | ) | | | | Horsehead Holding Corp. | | | (1,262,600 | ) |
| | (19,750 | ) | | | | Royal Gold, Inc. | | | (1,097,705 | ) |
| | (66,000 | ) | | | | RTI International Metals, Inc. | | | (1,915,320 | ) |
| | (75,000 | ) | | | | Silver Standard Resources, Inc. | | | (535,500 | ) |
| | (319,800 | ) | | | | Steel Dynamics, Inc. | | | (4,809,792 | ) |
| | (163,500 | ) | | | | United States Steel Corp. | | | (2,910,300 | ) |
| | | | | | | | | | |
| | | | | | | | | (14,611,389 | ) |
| | | | | | | | | | |
| | | | | | Telecommunication Services (-0.5%) | |
| | (544,700 | ) | | | | tw telecom, Inc. | | | (14,750,476 | ) |
| | | | | | | | | | |
| | | | | | TOTAL COMMON STOCKS SOLD SHORT
(Proceeds $288,630,821) | | | (353,646,365 | ) |
| | | | | | | | | | |
| | | | | | | | | | |
PRINCIPAL
AMOUNT | | | | | | | VALUE | |
| | EXCHANGE-TRADED FUNDS SOLD SHORT (-0.3%)# | |
| | (13,153 | ) | | | | Consumer Discretionary Select Sector SPDR Fund | | | (718,285 | ) |
| | (22,318 | ) | | | | Consumer Staples Select Sector SPDR Fund | | | (913,699 | ) |
| | (15,856 | ) | | | | Health Care Select Sector SPDR Fund | | | (750,464 | ) |
| | | | | | |
| See accompanying Notes to Schedule of Investments | | www.calamos.com | | | 103 | |
Market Neutral Income Fund Schedule of Investments April 30, 2013 (Unaudited)
| | | | | | | | | | |
PRINCIPAL
AMOUNT | | | | | | | VALUE | |
| | (3,688 | ) | | | | iShares Dow Jones US Healthcare Providers Index Fund | | $ | (290,209 | ) |
| | (9,520 | ) | | | | iShares Dow Jones US Medical Devices Index Fund | | | (720,283 | ) |
| | (4,725 | ) | | | | iShares Nasdaq Biotechnology Index Fund | | | (813,928 | ) |
| | (7,700 | ) | | EUR | | iShares STOXX Europe 600 Automobiles & Parts Fund | | | (352,890 | ) |
| | (14,614 | ) | | | | Powershares Dynamic Pharmaceuticals Portfolio | | | (594,936 | ) |
| | (5,824 | ) | | | | Powershares QQQ | | | (411,932 | ) |
| | (31,200 | ) | | | | SPDR S&P Regional Banking ETF | | | (968,760 | ) |
| | (3,423 | ) | | | | SPDR S&P Retail ETF | | | (251,488 | ) |
| | | | | | | | | | |
| | | | | | TOTAL EXCHANGE-TRADED
FUNDS SOLD SHORT
(Proceeds $6,371,934) | | | (6,786,874 | ) |
| | | | | | | | | | |
NUMBER OF
CONTRACTS | | | | | | | VALUE | |
| | WRITTEN OPTIONS (-0.8%)# | |
| | | | | | Consumer Discretionary (0.0%) | |
| | 470 | | | | | Coach, Inc.
Call, 06/22/13, Strike $57.50 | | | (129,250 | ) |
| | 500 | | | | | Coinstar, Inc.
Call, 07/20/13, Strike $52.50 | | | (151,250 | ) |
| | 30 | | | | | Priceline.com, Inc.
Call, 07/20/13, Strike $750.00 | | | (48,600 | ) |
| | | | | | | | | | |
| | | | | | | | | (329,100 | ) |
| | | | | | | | | | |
| | | | | | Consumer Staples (0.0%) | |
| | 5,600 | | | | | Tyson Foods, Inc.
Put, 10/19/13, Strike $17.00 | | | (70,000 | ) |
| | | | | | | | | | |
| | | | | | Energy (0.0%) | |
| | 200 | | | | | Anadarko Petroleum Corp.
Put, 06/22/13, Strike $75.00 | | | (20,700 | ) |
| | 260 | | | | | Marathon Petroleum Corp.
Call, 05/18/13, Strike $90.00 | | | (2,600 | ) |
| | | | | | | | | | |
| | 150 | | | | | Phillips 66
Call, 05/18/13, Strike $65.00 | | | (8,625 | ) |
| | | | | | | | | | |
| | | | | | | | | (31,925 | ) |
| | | | | | | | | | |
| | | | | | Health Care (0.0%) | |
| | 845 | | | | | AbbVie, Inc.
Call, 06/22/13, Strike $47.50 | | | (76,050 | ) |
| | 175 | | | | | Amgen, Inc.
Call, 06/22/13, Strike $120.00 | | | (5,075 | ) |
| | 150 | | | | | Baxter International, Inc.
Call, 05/18/13, Strike $77.50 | | | (7,950 | ) |
| | | | | | | | | | |
| | | | | | | | | (89,075 | ) |
| | | | | | | | | | |
| | | | | | | | | | |
NUMBER OF
CONTRACTS | | | | | | | VALUE | |
| | | | | | | | | | |
| | | | | | Information Technology (0.0%) | |
| | 2 | | | | | Apple, Inc.
Put, 05/03/13, Strike $430.00 | | $ | (210 | ) |
| | 625 | | | | | Netapp, Inc.
Put, 06/22/13, Strike $32.00 | | | (67,813 | ) |
| | | | | | | | | | |
| | | | | | | | | (68,023 | ) |
| | | | | | | | | | |
| | | | | | Other (-0.8%) | |
| | | | | | S & P 500 Index | | | | |
| | 1,750 | | | | | Call, 07/20/13, Strike $1,600.00 | | | (5,643,750 | ) |
| | 1,450 | | | | | Call, 06/22/13, Strike $1,575.00 | | | (5,829,000 | ) |
| | 1,000 | | | | | Call, 05/18/13, Strike $1,550.00 | | | (4,770,000 | ) |
| | 750 | | | | | Call, 06/28/13, Strike $1,580.00 | | | (2,936,250 | ) |
| | 600 | | | | | Call, 06/22/13, Strike $1,590.00 | | | (1,845,000 | ) |
| | 500 | | | | | Call, 06/22/13, Strike $1,600.00 | | | (1,247,500 | ) |
| | | | | | | | | | |
| | | | | | | | | (22,271,500 | ) |
| | | | | | | | | | |
| | | | | | TOTAL WRITTEN OPTIONS
(Premium $13,486,712) | | | (22,859,623 | ) |
| | | | | | | | | | |
NOTES TO SCHEDULE OF INVESTMENTS
| ~ | Security, or portion of security, is segregated as collateral (or potential collateral for future transactions) for written options and securities sold short. The aggregate value of such securities is $176,494,080. |
| * | Securities issued and sold pursuant to a Rule 144A transaction are excepted from the registration requirement of the Securities Act of 1933, as amended. These securities may only be sold to qualified institutional buyers (“QIBs”), such as the fund. Any resale of these securities must generally be effected through a sale that is registered under the Act or otherwise exempted from such registration requirements. |
| ‡ | Variable rate or step bond security. The rate shown is the rate in effect at April 30, 2013. |
| # | Non-income producing security. |
FOREIGN CURRENCY ABBREVIATIONS
| | |
| CAD | | Canadian Dollar |
| CHF | | Swiss Franc |
| DKK | | Danish Krone |
| EUR | | European Monetary Unit |
| GBP | | British Pound Sterling |
| HKD | | Hong Kong Dollar |
| KRW | | South Korean Won |
| NOK | | Norwegian Krone |
| SEK | | Swedish Krona |
| SGD | | Singapore Dollar |
Note: Value for securities denominated in foreign currencies is shown in U.S. dollars. The principal amount for such securities is shown in the respective foreign currency. The date on options represents the expiration date of the option contract. The option contract may be exercised at any date on or before the date shown.
| | | | |
| 104 | | CALAMOS FAMILY OF FUNDS SEMIANNUAL REPORT | | See accompanying Notes to Financial Statements |
Statements of Assets and Liabilities April 30, 2013 (Unaudited)
| | | | | | | | | | | | | | | | | | | | |
| | | GROWTH FUND | | | VALUE
FUND | | | FOCUS GROWTH
FUND | | | DISCOVERY
GROWTH FUND | | | INTERNATIONAL
GROWTH FUND | |
ASSETS | | | | | | | | | | | | | | | | | | | | |
Investments in securities, at cost | | $ | 3,722,292,722 | | | $ | 74,369,339 | | | $ | 46,609,613 | | | $ | 36,494,544 | | | $ | 890,357,622 | |
Investments in securities, at value | | $ | 4,816,710,524 | | | $ | 79,019,473 | | | $ | 57,866,575 | | | $ | 36,683,279 | | | $ | 1,030,167,518 | |
Cash with custodian (interest bearing) | | | — | | | | — | | | | — | | | | — | | | | — | |
Restricted cash for short positions (interest bearing) | | | — | | | | — | | | | — | | | | — | | | | — | |
Due from investment advisor | | | — | | | | 33,093 | | | | 52,134 | | | | 11,816 | | | | 146,942 | |
Foreign currency (cost $4,849; $384,559) | | | — | | | | — | | | | 4,948 | | | | — | | | | 384,858 | |
Unrealized appreciation on forward foreign currency contracts | | | 1,280,556 | | | | — | | | | 13,105 | | | | — | | | | — | |
Receivables: | | | | | | | | | | | | | | | | | | | | |
Accrued interest and dividends | | | 5,106,708 | | | | 77,332 | | | | 35,221 | | | | 5,057 | | | | 2,501,404 | |
Investments sold | | | 47,703,823 | | | | 1,459,913 | | | | 778,787 | | | | 295,872 | | | | 14,999,989 | |
Fund shares sold | | | 1,796,019 | | | | 174,917 | | | | 12,428 | | | | 41,429 | | | | 6,186,029 | |
Prepaid expenses | | | 246,204 | | | | 41,310 | | | | 36,721 | | | | 20,875 | | | | 109,852 | |
Other assets | | | 789,933 | | | | 77,046 | | | | 70,038 | | | | 11,322 | | | | 72,541 | |
Total assets | | | 4,873,633,767 | | | | 80,883,084 | | | | 58,869,957 | | | | 37,069,650 | | | | 1,054,569,133 | |
LIABILITIES | | | | | | | | | | | | | | | | | | | | |
Due to custodian bank | | | — | | | | — | | | | — | | | | — | | | | — | |
Securities sold short, at value (proceeds $-) | | | — | | | | — | | | | — | | | | — | | | | — | |
Options written, at value (premium $359,488) | | | — | | | | 242,355 | | | | — | | | | — | | | | — | |
Unrealized depreciation on forward foreign currency contracts | | | 3,401,675 | | | | — | | | | 66,129 | | | | — | | | | — | |
Payables: | | | | | | | | | | | | | | | | | | | | |
Investments purchased | | | — | | | | 1,558,484 | | | | 574,997 | | | | 1,253,079 | | | | 10,925,894 | |
Fund shares redeemed | | | 16,669,335 | | | | 25,023 | | | | 11,773 | | | | 42,908 | | | | 5,059,845 | |
Dividends payable | | | — | | | | — | | | | — | | | | — | | | | — | |
Affiliates: | | | | | | | | | | | | | | | | | | | | |
Investment advisory fees | | | 3,375,731 | | | | 62,745 | | | | 47,757 | | | | 29,608 | | | | 834,939 | |
Distribution fees | | | 98,146 | | | | 1,068 | | | | 901 | | | | 549 | | | | 10,818 | |
Deferred compensation to trustees | | | 789,933 | | | | 77,046 | | | | 70,038 | | | | 11,322 | | | | 72,541 | |
Financial accounting fees | | | 46,622 | | | | 720 | | | | 547 | | | | 339 | | | | 9,671 | |
Trustees’ fees and officer compensation | | | 34,305 | | | | 2,051 | | | | 2,138 | | | | 2,021 | | | | 5,561 | |
Other accounts payable and accrued liabilities | | | 2,987,527 | | | | 17,985 | | | | 20,080 | | | | 14,399 | | | | 449,840 | |
Total liabilities | | | 27,403,274 | | | | 1,987,477 | | | | 794,360 | | | | 1,354,225 | | | | 17,369,109 | |
NET ASSETS | | $ | 4,846,230,493 | | | $ | 78,895,607 | | | $ | 58,075,597 | | | $ | 35,715,425 | | | $ | 1,037,200,024 | |
COMPOSITION OF NET ASSETS | | | | | | | | | | | | | | | | | | | | |
Paid in capital | | $ | 3,246,222,516 | | | $ | 69,815,285 | | | $ | 53,987,378 | | | $ | 32,022,615 | | | $ | 958,593,459 | |
Undistributed net investment income (loss) | | | (6,487,543 | ) | | | (36,859 | ) | | | (34,801 | ) | | | (136,250 | ) | | | 1,207,711 | |
Accumulated net realized gain (loss) on investments, foreign currency transactions, written options and short positions | | | 514,166,954 | | | | 4,350,222 | | | | (7,081,027 | ) | | | 3,640,325 | | | | (62,204,046 | ) |
Unrealized appreciation (depreciation) of investments, foreign currency translations, written options and short positions | | | 1,092,328,566 | | | | 4,766,959 | | | | 11,204,047 | | | | 188,735 | | | | 139,602,900 | * |
NET ASSETS | | $ | 4,846,230,493 | | | $ | 78,895,607 | | | $ | 58,075,597 | | | $ | 35,715,425 | | | $ | 1,037,200,024 | |
CLASS A SHARES† | | | | | | | | | | | | | | | | | | | | |
Net assets applicable to shares outstanding | | $ | 2,451,593,330 | | | $ | 57,939,403 | | | $ | 23,168,954 | | | $ | 22,385,639 | | | $ | 451,457,485 | |
Shares outstanding | | | 49,696,102 | | | | 4,260,584 | | | | 1,650,724 | | | | 1,766,196 | | | | 24,826,508 | |
Net asset value and redemption price per share | | $ | 49.33 | | | $ | 13.60 | | | $ | 14.04 | | | $ | 12.67 | | | $ | 18.18 | |
Maximum offering price per share (Net asset value, plus 4.75% of offering price) | | $ | 51.79 | | | $ | 14.28 | | | $ | 14.74 | | | $ | 13.30 | | | $ | 19.09 | |
CLASS B SHARES†** | | | | | | | | | | | | | | | | | | | | |
Net assets applicable to shares outstanding | | $ | 107,321,397 | | | $ | 1,014,763 | | | $ | 1,212,583 | | | $ | 1,452,253 | | | $ | 8,440,356 | |
Shares outstanding | | | 2,232,058 | | | | 79,886 | | | | 91,270 | | | | 116,889 | | | | 487,883 | |
Net asset value and redemption price per share | | $ | 48.08 | | | $ | 12.70 | | | $ | 13.29 | | | $ | 12.42 | | | $ | 17.30 | |
CLASS C SHARES†** | | | | | | | | | | | | | | | | | | | | |
Net assets applicable to shares outstanding | | $ | 1,080,017,444 | | | $ | 4,078,749 | | | $ | 9,558,491 | | | $ | 2,236,424 | | | $ | 69,694,942 | |
Shares outstanding | | | 24,843,945 | | | | 322,800 | | | | 719,134 | | | | 180,009 | | | | 4,033,880 | |
Net asset value and redemption price per share | | $ | 43.47 | | | $ | 12.64 | | | $ | 13.29 | | | $ | 12.42 | | | $ | 17.28 | |
CLASS I SHARES† | | | | | | | | | | | | | | | | | | | | |
Net assets applicable to shares outstanding | | $ | 1,194,204,305 | | | $ | 15,751,176 | | | $ | 23,943,789 | | | $ | 8,017,574 | | | $ | 489,602,513 | |
Shares outstanding | | | 21,858,005 | | | | 1,134,250 | | | | 1,692,576 | | | | 628,227 | | | | 26,628,603 | |
Net asset value and redemption price per share | | $ | 54.63 | | | $ | 13.89 | | | $ | 14.15 | | | $ | 12.76 | | | $ | 18.39 | |
CLASS R SHARES† | | | | | | | | | | | | | | | | | | | | |
Net assets applicable to shares outstanding | | $ | 13,094,017 | | | $ | 111,516 | | | $ | 191,780 | | | $ | 1,623,535 | | | $ | 18,004,728 | |
Shares outstanding | | | 270,152 | | | | 8,265 | | | | 13,806 | | | | 128,835 | | | | 1,002,373 | |
Net asset value and redemption price per share | | $ | 48.47 | | | $ | 13.49 | | | $ | 13.89 | | | $ | 12.60 | | | $ | 17.96 | |
| † | No par value; unlimited number of shares authorized. |
| ** | Redemption price may be reduced by contingent deferred sales charge. |
| * | Net of deferred foreign capital gains tax of $256,244. |
| | | | | | |
| See accompanying Notes to Financial Statements | | www.calamos.com | | | 105 | |
Statements of Assets and Liabilities April 30, 2013 (Unaudited)
| | | | | | | | | | | | | | | | | | | | |
| | | EVOLVING
WORLD GROWTH
FUND | | | GLOBAL EQUITY
FUND | | | GROWTH AND
INCOME FUND | | | GLOBAL GROWTH
AND INCOME
FUND | | | CONVERTIBLE
FUND | |
ASSETS | | | | | | | | | | | | | | | | | | | | |
Investments in securities, at cost | | $ | 402,220,017 | | | $ | 362,134,345 | | | $ | 3,094,250,123 | | | $ | 647,215,257 | | | $ | 1,056,709,795 | |
Investments in securities, at value | | $ | 438,802,331 | | | $ | 413,472,147 | | | $ | 3,602,900,262 | | | $ | 737,416,984 | | | $ | 1,178,340,008 | |
Cash with custodian (interest bearing) | | | 30,942 | | | | — | | | | — | | | | — | | | | — | |
Restricted cash for short positions (interest bearing) | | | — | | | | — | | | | — | | | | — | | | | — | |
Due from investment advisor | | | — | | | | 52,540 | | | | 87,894 | | | | — | | | | — | |
Foreign currency (cost $24,807; $60,435) | | | 24,984 | | | | 60,435 | | | | — | | | | — | | | | — | |
Unrealized appreciation on forward foreign currency contracts | | | — | | | | — | | | | 696,594 | | | | — | | | | 142,631 | |
Receivables: | | | | | | | | | | | | | | | | | | | | |
Accrued interest and dividends | | | 610,241 | | | | 754,158 | | | | 12,459,263 | | | | 3,062,969 | | | | 6,220,098 | |
Investments sold | | | 7,089,686 | | | | — | | | | 124,848,245 | | | | 4,004,230 | | | | 40,786,644 | |
Fund shares sold | | | 2,137,251 | | | | 940,641 | | | | 1,435,542 | | | | 229,427 | | | | 89,767 | |
Prepaid expenses | | | 46,826 | | | | 72,024 | | | | 165,327 | | | | 94,836 | | | | 89,708 | |
Other assets | | | 31,286 | | | | 42,303 | | | | 379,327 | | | | 139,054 | | | | 190,520 | |
Total assets | | | 448,773,547 | | | | 415,394,248 | | | | 3,742,972,454 | | | | 744,947,500 | | | | 1,225,859,376 | |
LIABILITIES | | | | | | | | | | | | | | | | | | | | |
Due to custodian bank | | | — | | | | — | | | | — | | | | 1,183,343 | | | | — | |
Securities sold short, at value (proceeds $-) | | | — | | | | — | | | | — | | | | — | | | | — | |
Options written, at value (premium $-) | | | — | | | | — | | | | — | | | | — | | | | — | |
Unrealized depreciation on forward foreign currency contracts | | | — | | | | — | | | | 2,255,840 | | | | — | | | | 948,138 | |
Payables: | | | | | | | | | | | | | | | | | | | | |
Investments purchased | | | 13,097,582 | | | | 2,529,211 | | | | 49,730,170 | | | | 1,508,484 | | | | 10,590,445 | |
Fund shares redeemed | | | 377,852 | | | | 872,139 | | | | 13,746,448 | | | | 1,517,105 | | | | 2,694,305 | |
Dividends payable | | | — | | | | — | | | | — | | | | — | | | | — | |
Affiliates: | | | | | | | | | | | | | | | | | | | | |
Investment advisory fees | | | 382,500 | | | | 335,718 | | | | 2,045,831 | | | | 608,516 | | | | 708,667 | |
Distribution fees | | | 3,525 | | | | 4,251 | | | | 89,398 | | | | 15,287 | | | | 25,917 | |
Deferred compensation to trustees | | | 31,286 | | | | 42,303 | | | | 379,327 | | | | 139,054 | | | | 190,520 | |
Financial accounting fees | | | 3,988 | | | | 3,849 | | | | 35,006 | | | | 7,097 | | | | 11,415 | |
Trustees’ fees and officer compensation | | | 3,238 | | | | 3,200 | | | | 21,993 | | | | 10,208 | | | | 10,202 | |
Other accounts payable and accrued liabilities | | | 212,854 | | | | 42,959 | | | | 1,221,899 | | | | 302,641 | | | | 485,411 | |
Total liabilities | | | 14,112,825 | | | | 3,833,630 | | | | 69,525,912 | | | | 5,291,735 | | | | 15,665,020 | |
NET ASSETS | | $ | 434,660,722 | | | $ | 411,560,618 | | | $ | 3,673,446,542 | | | $ | 739,655,765 | | | $ | 1,210,194,356 | |
COMPOSITION OF NET ASSETS | | | | | | | | | | | | | | | | | | | | |
Paid in capital | | $ | 405,249,760 | | | $ | 377,633,162 | | | $ | 2,982,340,410 | | | $ | 562,548,782 | | | $ | 1,010,381,897 | |
Undistributed net investment income (loss) | | | (128,321 | ) | | | 402,146 | | | | (5,248,287 | ) | | | (9,399,515 | ) | | | (6,251,275 | ) |
Accumulated net realized gain (loss) on investments, foreign currency transactions, written options and short positions | | | (6,923,983 | ) | | | (17,816,156 | ) | | | 189,256,071 | | | | 96,285,361 | | | | 85,236,202 | |
Unrealized appreciation (depreciation) of investments, foreign currency translations, written options and short positions | | | 36,463,266 | * | | | 51,341,466 | | | | 507,098,348 | | | | 90,221,137 | | | | 120,827,532 | |
NET ASSETS | | $ | 434,660,722 | | | $ | 411,560,618 | | | $ | 3,673,446,542 | | | $ | 739,655,765 | | | $ | 1,210,194,356 | |
CLASS A SHARES† | | | | | | | | | | | | | | | | | | | | |
Net assets applicable to shares outstanding | | $ | 143,998,937 | | | $ | 149,267,486 | | | $ | 1,707,436,723 | | | $ | 255,498,672 | | | $ | 505,698,784 | |
Shares outstanding | | | 10,850,617 | | | | 11,051,221 | | | | 51,917,074 | | | | 22,882,070 | | | | 28,518,997 | |
Net asset value and redemption price per share | | $ | 13.27 | | | $ | 13.51 | | | $ | 32.89 | | | $ | 11.17 | | | $ | 17.73 | |
Maximum offering price per share (Net asset value, plus 4.75% of offering price) | | $ | 13.93 | | | $ | 14.18 | | | $ | 34.53 | | | $ | 11.73 | | | $ | 18.61 | |
CLASS B SHARES†** | | | | | | | | | | | | | | | | | | | | |
Net assets applicable to shares outstanding | | $ | 1,701,364 | | | $ | 2,725,935 | | | $ | 65,103,163 | | | $ | 12,836,650 | | | $ | 12,228,533 | |
Shares outstanding | | | 131,295 | | | | 209,218 | | | | 1,726,757 | | | | 1,137,513 | | | | 565,189 | |
Net asset value and redemption price per share | | $ | 12.96 | | | $ | 13.03 | | | $ | 37.70 | | | $ | 11.28 | | | $ | 21.64 | |
CLASS C SHARES†** | | | | | | | | | | | | | | | | | | | | |
Net assets applicable to shares outstanding | | $ | 26,924,498 | | | $ | 34,480,904 | | | $ | 1,131,934,799 | | | $ | 202,809,793 | | | $ | 333,410,114 | |
Shares outstanding | | | 2,078,392 | | | | 2,651,532 | | | | 34,352,928 | | | | 19,282,433 | | | | 19,005,807 | |
Net asset value and redemption price per share | | $ | 12.95 | | | $ | 13.00 | | | $ | 32.95 | | | $ | 10.52 | | | $ | 17.54 | |
CLASS I SHARES† | | | | | | | | | | | | | | | | | | | | |
Net assets applicable to shares outstanding | | $ | 260,405,627 | | | $ | 216,958,794 | | | $ | 745,265,461 | | | $ | 266,012,544 | | | $ | 355,680,285 | |
Shares outstanding | | | 19,508,952 | | | | 15,931,754 | | | | 23,187,555 | | | | 23,446,231 | | | | 21,672,548 | |
Net asset value and redemption price per share | | $ | 13.35 | | | $ | 13.62 | | | $ | 32.14 | | | $ | 11.35 | | | $ | 16.41 | |
CLASS R SHARES† | | | | | | | | | | | | | | | | | | | | |
Net assets applicable to shares outstanding | | $ | 1,630,296 | | | $ | 8,127,499 | | | $ | 23,706,396 | | | $ | 2,498,106 | | | $ | 3,176,640 | |
Shares outstanding | | | 123,495 | | | | 609,925 | | | | 725,426 | | | | 225,502 | | | | 179,942 | |
Net asset value and redemption price per share | | $ | 13.20 | | | $ | 13.33 | | | $ | 32.68 | | | $ | 11.08 | | | $ | 17.65 | |
| † | No par value; unlimited number of shares authorized. |
| ** | Redemption price may be reduced by contingent deferred sales charge. |
| * | Net of deferred foreign capital gains tax of $144,822. |
| | | | |
| 106 | | CALAMOS FAMILY OF FUNDS SEMIANNUAL REPORT | | See accompanying Notes to Financial Statements |
Statements of Assets and Liabilities April 30, 2013 (Unaudited)
| | | | | | | | | | | | |
| | | TOTAL RETURN
BOND FUND | | | HIGH INCOME
FUND | | | MARKET NEUTRAL
INCOME FUND | |
ASSETS | | | | | | | | | | | | |
Investments in securities, at cost | | $ | 197,968,487 | | | $ | 277,399,157 | | | $ | 2,571,793,198 | |
Investments in securities, at value | | $ | 206,757,763 | | | $ | 296,526,453 | | | $ | 2,764,695,037 | |
Cash with custodian (interest bearing) | | | — | | | | — | | | | 18,968,131 | |
Restricted cash for short positions (interest bearing) | | | — | | | | — | | | | 314,903,927 | |
Due from investment advisor | | | 27,975 | | | | — | | | | — | |
Foreign currency (cost $52,111) | | | — | | | | — | | | | 52,713 | |
Unrealized appreciation on forward foreign currency contracts | | | — | | | | — | | | | — | |
Receivables: | | | | | | | | | | | | |
Accrued interest and dividends | | | 1,813,317 | | | | 4,814,885 | | | | 13,109,312 | |
Investments sold | | | 5,540,864 | | | | 235,325 | | | | 92,426,512 | |
Fund shares sold | | | 110,509 | | | | 107,534 | | | | 11,988,335 | |
Prepaid expenses | | | 30,057 | | | | 54,873 | | | | 129,177 | |
Other assets | | | 46,236 | | | | 87,972 | | | | 175,579 | |
Total assets | | | 214,326,721 | | | | 301,827,042 | | | | 3,216,448,723 | |
LIABILITIES | | | | | | | | | | | | |
Due to custodian bank | | | 19,003 | | | | — | | | | — | |
Securities sold short, at value (proceeds $295,002,755) | | | — | | | | — | | | | 360,433,239 | |
Options written, at value (premium $13,486,712) | | | — | | | | — | | | | 22,859,623 | |
Unrealized depreciation on forward foreign currency contracts | | | — | | | | — | | | | — | |
Payables: | | | | | | | | | | | | |
Investments purchased | | | 1,518,532 | | | | 240,585 | | | | 114,973,405 | |
Fund shares redeemed | | | 1,530,425 | | | | 2,186,956 | | | | 4,646,215 | |
Dividends payable | | | 24,351 | | | | 105,610 | | | | — | |
Affiliates: | | | | | | | | | | | | |
Investment advisory fees | | | 96,423 | | | | 184,018 | | | | 1,495,198 | |
Distribution fees | | | 4,048 | | | | 5,548 | | | | 31,684 | |
Deferred compensation to trustees | | | 46,236 | | | | 87,972 | | | | 175,579 | |
Financial accounting fees | | | 2,011 | | | | 2,813 | | | | 25,292 | |
Trustees’ fees and officer compensation | | | 2,989 | | | | 3,196 | | | | 12,671 | |
Other accounts payable and accrued liabilities | | | 49,171 | | | | 72,366 | | | | 741,515 | |
Total liabilities | | | 3,293,189 | | | | 2,889,064 | | | | 505,394,421 | |
NET ASSETS | | $ | 211,033,532 | | | $ | 298,937,978 | | | $ | 2,711,054,302 | |
COMPOSITION OF NET ASSETS | | | | | | | | | | | | |
Paid in capital | | $ | 199,689,941 | | | $ | 277,813,160 | | | $ | 2,668,824,597 | |
Undistributed net investment income (loss) | | | (558,755 | ) | | | (550,181 | ) | | | 2,233,630 | |
Accumulated net realized gain (loss) on investments, foreign currency transactions, written options and short positions | | | 3,092,891 | | | | 2,547,577 | | | | (78,117,883 | ) |
Unrealized appreciation (depreciation) of investments, foreign currency translations, written options and short positions | | | 8,809,455 | | | | 19,127,422 | | | | 118,113,958 | |
NET ASSETS | | $ | 211,033,532 | | | $ | 298,937,978 | | | $ | 2,711,054,302 | |
CLASS A SHARES† | | | | | | | | | | | | |
Net assets applicable to shares outstanding | | $ | 119,632,088 | | | $ | 221,908,762 | | | $ | 1,224,653,667 | |
Shares outstanding | | | 10,828,913 | | | | 21,945,543 | | | | 95,040,200 | |
Net asset value and redemption price per share | | $ | 11.05 | | | $ | 10.11 | | | $ | 12.89 | |
Maximum offering price per share (Net asset value, plus 4.75% of offering price) | | $ | 11.48 | # | | $ | 10.61 | | | $ | 13.53 | |
CLASS B SHARES†** | | | | | | | | | | | | |
Net assets applicable to shares outstanding | | $ | 6,681,819 | | | $ | 4,493,200 | | | $ | 10,629,136 | |
Shares outstanding | | | 604,872 | | | | 424,248 | | | | 782,382 | |
Net asset value and redemption price per share | | $ | 11.05 | | | $ | 10.59 | | | $ | 13.59 | |
CLASS C SHARES†** | | | | | | | | | | | | |
Net assets applicable to shares outstanding | | $ | 36,142,358 | | | $ | 40,860,275 | | | $ | 259,398,588 | |
Shares outstanding | | | 3,272,724 | | | | 3,892,100 | | | | 19,822,478 | |
Net asset value and redemption price per share | | $ | 11.04 | | | $ | 10.50 | | | $ | 13.09 | |
CLASS I SHARES† | | | | | | | | | | | | |
Net assets applicable to shares outstanding | | $ | 46,834,224 | | | $ | 31,317,912 | | | $ | 1,211,765,103 | |
Shares outstanding | | | 4,240,926 | | | | 3,097,164 | | | | 94,966,017 | |
Net asset value and redemption price per share | | $ | 11.04 | | | $ | 10.11 | | | $ | 12.76 | |
CLASS R SHARES† | | | | | | | | | | | | |
Net assets applicable to shares outstanding | | $ | 1,743,043 | | | $ | 357,829 | | | $ | 4,607,808 | |
Shares outstanding | | | 157,754 | | | | 35,426 | | | | 358,750 | |
Net asset value and redemption price per share | | $ | 11.05 | | | $ | 10.10 | | | $ | 12.84 | |
| † | No par value; unlimited number of shares authorized. |
| ** | Redemption price may be reduced by contingent deferred sales charge. |
| # | For Total Return Bond Fund, maximum offering price per share is Net asset value plus 3.75% of offering price. |
| | | | | | |
| See accompanying Notes to Financial Statements | | www.calamos.com | | | 107 | |
Statements of Operations Six Months Ended April 30, 2013 (Unaudited)
| | | | | | | | | | | | | | | | | | | | |
| | | GROWTH
FUND | | | VALUE
FUND | | | FOCUS GROWTH
FUND | | | DISCOVERY
GROWTH FUND | | | INTERNATIONAL
GROWTH FUND | |
INVESTMENT INCOME | | | | | | | | | | | | | | | | | | | | |
Interest | | $ | 3,486 | | | $ | 1,981 | | | $ | 2,633 | | | $ | — | | | $ | — | |
Dividends | | | 32,481,980 | | | | 715,245 | | | | 379,039 | | | | 202,447 | | | | 8,987,093 | |
Dividend taxes withheld | | | (513,502 | ) | | | (6,487 | ) | | | (7,327 | ) | | | — | | | | (760,330 | ) |
Total investment income | | | 31,971,964 | | | | 710,739 | | | | 374,345 | | | | 202,447 | | | | 8,226,763 | |
| | | | | |
EXPENSES | | | | | | | | | | | | | | | | | | | | |
Investment advisory fees | | | 23,125,369 | | | | 341,202 | | | | 294,169 | | | | 177,517 | | | | 4,925,364 | |
Performance fees | | | — | | | | — | | | | — | | | | — | | | | 165,364 | |
Distribution fees | | | | | | | | | | | | | | | | | | | | |
Class A | | | 3,567,969 | | | | 62,976 | | | | 28,274 | | | | 27,126 | | | | 586,325 | |
Class B | | | 679,896 | | | | 5,440 | | | | 7,051 | | | | 6,881 | | | | 44,462 | |
Class C | | | 5,874,035 | | | | 19,051 | | | | 47,707 | | | | 11,238 | | | | 338,352 | |
Class R | | | 37,353 | | | | 256 | | | | 452 | | | | 3,589 | | | | 39,290 | |
Transfer agent fees | | | 4,310,299 | | | | 25,078 | | | | 23,996 | | | | 13,227 | | | | 636,757 | |
Printing and mailing fees | | | 715,536 | | | | 10,858 | | | | 8,732 | | | | 7,521 | | | | 77,177 | |
Financial accounting fees | | | 320,679 | | | | 3,911 | | | | 3,371 | | | | 2,034 | | | | 58,012 | |
Accounting fees | | | 143,424 | | | | 9,990 | | | | 10,548 | | | | 10,690 | | | | 34,664 | |
Trustees’ fees and officer compensation | | | 122,340 | | | | 8,860 | | | | 8,829 | | | | 8,362 | | | | 27,118 | |
Custodian fees | | | 85,233 | | | | 4,007 | | | | 5,615 | | | | 3,558 | | | | 190,092 | |
Audit fees | | | 80,048 | | | | 6,765 | | | | 6,535 | | | | 6,265 | | | | 19,854 | |
Registration fees | | | 78,661 | | | | 28,716 | | | | 27,621 | | | | 28,462 | | | | 59,077 | |
Legal fees | | | 73,796 | | | | 8,250 | | | | 4,876 | | | | 4,641 | | | | 10,720 | |
Dividend or interest expense on short positions | | | — | | | | — | | | | — | | | | — | | | | — | |
Other | | | 192,815 | | | | 3,176 | | | | 32,320 | | | | 3,140 | | | | 22,470 | |
Total expenses | | | 39,407,453 | | | | 538,536 | | | | 510,096 | | | | 314,251 | | | | 7,235,098 | |
Less expense reductions | | | — | | | | (143,732 | ) | | | (160,853 | ) | | | (43,522 | ) | | | (405,403 | ) |
Net expenses | | | 39,407,453 | | | | 394,804 | | | | 349,243 | | | | 270,729 | | | | 6,829,695 | |
NET INVESTMENT INCOME (LOSS) | | | (7,435,489 | ) | | | 315,935 | | | | 25,102 | | | | (68,282 | ) | | | 1,397,068 | |
| | | | | |
REALIZED AND UNREALIZED GAIN (LOSS) | | | | | | | | | | | | | | | | | | | | |
Net realized gain (loss) from: | | | | | | | | | | | | | | | | | | | | |
Investments, excluding purchased options | | | 519,562,424 | | | | 5,682,443 | | | | 3,447,684 | | | | 4,478,982 | | | | (14,120,736 | ) |
Purchased options | | | (1,589,818 | ) | | | (323,214 | ) | | | — | | | | (726,966 | ) | | | — | |
Foreign currency transactions | | | (5,266,574 | ) | | | (148 | ) | | | 34,882 | | | | (374 | ) | | | (277,587 | ) |
Written options | | | 1,460,846 | | | | 382,973 | | | | — | | | | — | | | | — | |
Short positions | | | — | | | | — | | | | — | | | | — | | | | — | |
Change in net unrealized appreciation/(depreciation) on: | | | | | | | | | | | | | | | | | | | | |
Investments, excluding purchased options | | | (134,495,888 | ) | | | 3,266,275 | | | | 975,535 | | | | (1,610,289 | ) | | | 67,401,065 | * |
Purchased options | | | 1,488,943 | | | | (89,352 | ) | | | — | | | | 423,566 | | | | — | |
Foreign currency translations | | | (506,395 | ) | | | 259 | | | | (26,145 | ) | | | — | | | | 54,423 | |
Written options | | | (1,354,612 | ) | | | 117,133 | | | | — | | | | — | | | | — | |
Short positions | | | — | | | | — | | | | — | | | | — | | | | — | |
NET GAIN (LOSS) | | | 379,298,926 | | | | 9,036,369 | | | | 4,431,956 | | | | 2,564,919 | | | | 53,057,165 | |
NET INCREASE (DECREASE) IN NET ASSETS RESULTING FROM OPERATIONS | | $ | 371,863,437 | | | $ | 9,352,304 | | | $ | 4,457,058 | | | $ | 2,496,637 | | | $ | 54,454,233 | |
| * | Net of change of $205,767 in deferred capital gains tax. |
| | | | |
| 108 | | CALAMOS FAMILY OF FUNDS SEMIANNUAL REPORT | | See accompanying Notes to Financial Statements |
Statements of Operations Six Months Ended April 30, 2013 (Unaudited)
| | | | | | | | | | | | | | | | | | | | |
| | | EVOLVING
WORLD GROWTH
FUND | | | GLOBAL EQUITY
FUND | | | GROWTH AND
INCOME FUND | | | GLOBAL GROWTH
AND INCOME
FUND | | | CONVERTIBLE
FUND | |
INVESTMENT INCOME | | | | | | | | | | | | | | | | | | | | |
Interest | | $ | 683,255 | | | $ | — | | | $ | 31,406,664 | | | $ | 6,728,387 | | | $ | 14,495,150 | |
Dividends | | | 2,132,036 | | | | 3,085,577 | | | | 30,264,047 | | | | 6,601,221 | | | | 7,047,990 | |
Dividend taxes withheld | | | (127,690 | ) | | | (150,031 | ) | | | (247,683 | ) | | | (195,972 | ) | | | (33,775 | ) |
Total investment income | | | 2,687,601 | | | | 2,935,546 | | | | 61,423,028 | | | | 13,133,636 | | | | 21,509,365 | |
| | | | | |
EXPENSES | | | | | | | | | | | | | | | | | | | | |
Investment advisory fees | | | 1,990,725 | | | | 2,008,616 | | | | 13,202,093 | | | | 5,368,680 | | | | 4,624,737 | |
Performance fees | | | — | | | | 22,920 | | | | — | | | | — | | | | — | |
Distribution fees | | | | | | | | | | | | | | | | | | | | |
Class A | | | 168,653 | | | | 176,733 | | | | 2,293,285 | | | | 347,537 | | | | 690,944 | |
Class B | | | 8,203 | | | | 13,183 | | | | 87,335 | | | | 72,344 | | | | 64,718 | |
Class C | | | 120,136 | | | | 158,446 | | | | 5,966,175 | | | | 1,072,902 | | | | 1,755,961 | |
Class R | | | 3,959 | | | | 16,998 | | | | 58,050 | | | | 6,949 | | | | 8,039 | |
Transfer agent fees | | | 165,384 | | | | 165,210 | | | | 2,365,249 | | | | 478,932 | | | | 738,711 | |
Printing and mailing fees | | | 30,613 | | | | 30,819 | | | | 349,327 | | | | 74,233 | | | | 64,593 | |
Financial accounting fees | | | 20,741 | | | | 23,019 | | | | 226,198 | | | | 63,824 | | | | 74,976 | |
Accounting fees | | | 18,397 | | | | 19,280 | | | | 108,917 | | | | 38,464 | | | | 43,580 | |
Trustees’ fees and officer compensation | | | 14,452 | | | | 15,319 | | | | 86,331 | | | | 33,735 | | | | 33,472 | |
Custodian fees | | | 108,274 | | | | 41,922 | | | | 118,303 | | | | 103,964 | | | | 37,826 | |
Audit fees | | | 10,497 | | | | 11,261 | | | | 58,667 | | | | 20,903 | | | | 22,637 | |
Registration fees | | | 42,797 | | | | 37,363 | | | | 69,838 | | | | 46,912 | | | | 46,164 | |
Legal fees | | | 6,962 | | | | 6,389 | | | | 46,391 | | | | 20,039 | | | | 24,847 | |
Dividend or interest expense on short positions | | | — | | | | — | | | | — | | | | — | | | | — | |
Other | | | 16,938 | | | | 14,204 | | | | 82,557 | | | | 166,491 | | | | 48,385 | |
Total expenses | | | 2,726,731 | | | | 2,761,682 | | | | 25,118,716 | | | | 7,915,909 | | | | 8,279,590 | |
Less expense reductions | | | — | | | | (86,332 | ) | | | — | | | | — | | | | — | |
Net expenses | | | 2,726,731 | | | | 2,675,350 | | | | 25,118,716 | | | | 7,915,909 | | | | 8,279,590 | |
NET INVESTMENT INCOME (LOSS) | | | (39,130 | ) | | | 260,196 | | | | 36,304,312 | | | | 5,217,727 | | | | 13,229,775 | |
| | | | | |
REALIZED AND UNREALIZED GAIN (LOSS) | | | | | | | | | | | | | | | | | | | | |
Net realized gain (loss) from: | | | | | | | | | | | | | | | | | | | | |
Investments | | | (761,341 | ) | | | (7,070,257 | ) | | | 173,466,561 | | | | 81,474,940 | | | | 59,837,393 | |
Purchased options | | | — | | | | — | | | | (6,816,532 | ) | | | 2,234,353 | | | | 6,505,216 | |
Foreign currency transactions | | | (89,273 | ) | | | 750,799 | | | | (8,418,643 | ) | | | 6,067,348 | | | | 598,285 | |
Written options | | | — | | | | — | | | | 927,153 | | | | — | | | | 2,041,606 | |
Short positions | | | — | | | | — | | | | — | | | | — | | | | — | |
Change in net unrealized appreciation/(depreciation) on: | | | | | | | | | | | | | | | | | | | | |
Investments | | | 13,435,668 | * | | | 22,122,234 | | | | (18,824,203 | ) | | | (31,417,655 | ) | | | 40,709,301 | |
Purchased options | | | — | | | | — | | | | (5,298,882 | ) | | | 2,081,749 | | | | (586,620 | ) |
Foreign currency translations | | | 28,101 | | | | 203,037 | | | | (1,091,527 | ) | | | 52,840 | | | | (815,370 | ) |
Written options | | | — | | | | — | | | | (2,401,105 | ) | | | — | | | | (1,230,561 | ) |
Short positions | | | — | | | | — | | | | — | | | | — | | | | — | |
NET GAIN (LOSS) | | | 12,613,155 | | | | 16,005,813 | | | | 131,542,822 | | | | 60,493,575 | | | | 107,059,250 | |
NET INCREASE (DECREASE) IN NET ASSETS RESULTING FROM OPERATIONS | | $ | 12,574,025 | | | $ | 16,266,009 | | | $ | 167,847,134 | | | $ | 65,711,302 | | | $ | 120,289,025 | |
| * | Net of change of $(163,841) in deferred capital gains tax. |
| | | | | | |
| See accompanying Notes to Financial Statements | | www.calamos.com | | | 109 | |
Statements of Operations Six Months Ended April 30, 2013 (Unaudited)
| | | | | | | | | | | | |
| | | TOTAL RETURN
BOND FUND | | | HIGH INCOME
FUND | | | MARKET NEUTRAL
INCOME FUND | |
INVESTMENT INCOME | | | | | | | | | | | | |
Interest | | $ | 3,244,869 | | | $ | 9,266,655 | | | $ | 20,130,036 | |
Dividends | | | 2,106 | | | | 216,085 | | | | 13,717,495 | |
Dividend taxes withheld | | | — | | | | — | | | | — | |
Total investment income | | | 3,246,975 | | | | 9,482,740 | | | | 33,847,531 | |
| | | |
EXPENSES | | | | | | | | | | | | |
Investment advisory fees | | | 615,003 | | | | 1,111,787 | | | | 8,598,021 | |
Performance fees | | | — | | | | — | | | | — | |
Distribution fees | | | | | | | | | | | | |
Class A | | | 161,307 | | | | 272,487 | | | | 1,457,329 | |
Class B | | | 38,636 | | | | 26,049 | | | | 57,038 | |
Class C | | | 202,830 | | | | 208,582 | | | | 1,287,684 | |
Class R | | | 4,337 | | | | 894 | | | | 11,466 | |
Transfer agent fees | | | 86,836 | | | | 96,078 | | | | 1,663,740 | |
Printing and mailing fees | | | 17,184 | | | | 34,014 | | | | 188,886 | |
Financial accounting fees | | | 12,814 | | | | 16,987 | | | | 145,043 | |
Accounting fees | | | 20,283 | | | | 21,420 | | | | 98,539 | |
Trustees’ fees and officer compensation | | | 12,148 | | | | 13,442 | | | | 55,452 | |
Custodian fees | | | 7,923 | | | | 9,788 | | | | 48,572 | |
Audit fees | | | 8,799 | | | | 9,794 | | | | 39,345 | |
Registration fees | | | 33,086 | | | | 41,086 | | | | 80,180 | |
Legal fees | | | 6,456 | | | | 7,522 | | | | 27,844 | |
Dividend or interest expense on short positions | | | — | | | | — | | | | 2,629,609 | |
Other | | | 7,214 | | | | 7,106 | | | | 50,963 | |
Total expenses | | | 1,234,856 | | | | 1,877,036 | | | | 16,439,711 | |
Less expense reductions | | | (100,129 | ) | | | — | | | | — | |
Net expenses | | | 1,134,727 | | | | 1,877,036 | | | | 16,439,711 | |
NET INVESTMENT INCOME (LOSS) | | | 2,112,248 | | | | 7,605,704 | | | | 17,407,820 | |
| | | |
REALIZED AND UNREALIZED GAIN (LOSS) | | | | | | | | | | | | |
Net realized gain (loss) from: | | | | | | | | | | | | |
Investments | | | 4,242,942 | | | | 2,847,258 | | | | 34,299,492 | |
Purchased options | | | — | | | | — | | | | (25,652,138 | ) |
Foreign currency transactions | | | (31,422 | ) | | | (10,347 | ) | | | (27,035 | ) |
Written options | | | — | | | | — | | | | (10,000,975 | ) |
Short positions | | | — | | | | — | | | | (33,584,470 | ) |
Change in net unrealized appreciation/(depreciation) on: | | | | | | | | | | | | |
Investments | | | (4,482,296 | ) | | | 8,536,798 | | | | 118,971,531 | |
Purchased options | | | — | | | | — | | | | (4,706,490 | ) |
Foreign currency translations | | | 14,005 | | | | 41 | | | | (17,593 | ) |
Written options | | | — | | | | — | | | | (17,782,675 | ) |
Short positions | | | — | | | | — | | | | (20,400,588 | ) |
NET GAIN (LOSS) | | | (256,771 | ) | | | 11,373,750 | | | | 41,099,059 | |
NET INCREASE (DECREASE) IN NET ASSETS RESULTING FROM OPERATIONS | | $ | 1,855,477 | | | $ | 18,979,454 | | | $ | 58,506,879 | |
| | | | |
| 110 | | CALAMOS FAMILY OF FUNDS SEMIANNUAL REPORT | | See accompanying Notes to Financial Statements |
Statements of Changes in Net Assets
| | | | | | | | | | | | | | | | | | | | | | | | |
| | | GROWTH FUND | | | VALUE FUND | | | FOCUS GROWTH FUND | |
| | | (UNAUDITED)
SIX MONTHS
ENDED APRIL 30, 2013 | | | YEAR ENDED
OCTOBER 31,
2012 | | | (UNAUDITED)
SIX MONTHS
ENDED APRIL 30,
2013 | | | YEAR ENDED
OCTOBER 31,
2012 | | | (UNAUDITED)
SIX MONTHS
ENDED
APRIL 30,
2013 | | | YEAR ENDED
OCTOBER 31,
2012 | |
OPERATIONS | | | | | | | | | | | | | | | | | | | | | | | | |
Net investment income (loss) | | $ | (7,435,489 | ) | | $ | (40,065,292 | ) | | $ | 315,935 | | | $ | 346,869 | | | $ | 25,102 | | | $ | 7,339 | |
Net realized gain (loss) | | | 514,166,878 | | | | 449,914,876 | | | | 5,742,054 | | | | 4,862,459 | | | | 3,482,566 | | | | 2,479,718 | |
Change in unrealized appreciation/(depreciation) | | | (134,867,952 | ) | | | (236,152,702 | ) | | | 3,294,315 | | | | (2,471,117 | ) | | | 949,390 | | | | 1,348,668 | |
Net increase (decrease) in net assets resulting from operations | | | 371,863,437 | | | | 173,696,882 | | | | 9,352,304 | | | | 2,738,211 | | | | 4,457,058 | | | | 3,835,725 | |
| | | | | | |
DISTRIBUTIONS TO SHAREHOLDERS | | | | | | | | | | | | | | | | | | | | | | | | |
Net investment income | | | | | | | | | | | | | | | | | | | | | | | | |
Class A | | | — | | | | — | | | | (737,934 | ) | | | — | | | | (104,512 | ) | | | — | |
Class B | | | — | | | | — | | | | (1,950 | ) | | | — | | | | — | | | | — | |
Class C | | | — | | | | — | | | | (24,343 | ) | | | — | | | | — | | | | — | |
Class I | | | — | | | | — | | | | (182,009 | ) | | | — | | | | (196,514 | ) | | | — | |
Class R | | | — | | | | — | | | | (1,105 | ) | | | — | | | | (711 | ) | | | — | |
Net realized gains | | | | | | | | | | | | | | | | | | | | | | | | |
Class A | | | (219,525,801 | ) | | | (171,056,925 | ) | | | — | | | | — | | | | — | | | | — | |
Class B | | | (11,337,657 | ) | | | (13,005,728 | ) | | | — | | | | — | | | | — | | | | — | |
Class C | | | (100,066,425 | ) | | | (68,697,929 | ) | | | — | | | | — | | | | — | | | | — | |
Class I | | | (104,387,277 | ) | | | (63,002,615 | ) | | | — | | | | — | | | | — | | | | — | |
Class R | | | (1,135,750 | ) | | | (557,225 | ) | | | — | | | | — | | | | — | | | | — | |
Total distributions | | | (436,452,910 | ) | | | (316,320,422 | ) | | | (947,341 | ) | | | — | | | | (301,737 | ) | | | — | |
| | | | | | |
CAPITAL SHARE TRANSACTIONS | | | (1,480,853,272 | ) | | | (1,192,705,308 | ) | | | 16,782,791 | | | | 9,405,927 | | | | (4,453,491 | ) | | | (5,859,476 | ) |
TOTAL INCREASE (DECREASE) IN NET ASSETS | | | (1,545,442,745 | ) | | | (1,335,328,848 | ) | | | 25,187,754 | | | | 12,144,138 | | | | (298,170 | ) | | | (2,023,751 | ) |
| | | | | | |
NET ASSETS | | | | | | | | | | | | | | | | | | | | | | | | |
Beginning of period | | $ | 6,391,673,238 | | | $ | 7,727,002,086 | | | $ | 53,707,853 | | | $ | 41,563,715 | | | $ | 58,373,767 | | | $ | 60,397,518 | |
End of period | | | 4,846,230,493 | | | | 6,391,673,238 | | | | 78,895,607 | | | | 53,707,853 | | | | 58,075,597 | | | | 58,373,767 | |
Undistributed net investment income (loss) | | $ | (6,487,543 | ) | | $ | 947,946 | | | $ | (36,859 | ) | | $ | 594,547 | | | $ | (34,801 | ) | | $ | 241,834 | |
| | | | | | |
| See accompanying Notes to Financial Statements | | www.calamos.com | | | 111 | |
Statements of Changes in Net Assets
| | | | | | | | | | | | | | | | | | | | | | | | |
| | | DISCOVERY GROWTH FUND | | | INTERNATIONAL GROWTH
FUND | | | EVOLVING WORLD
GROWTH FUND | |
| | | (UNAUDITED)
SIX MONTHS
ENDED
APRIL 30,
2013 | | | YEAR ENDED
OCTOBER 31,
2012 | | | (UNAUDITED)
SIX MONTHS
ENDED
APRIL 30,
2013 | | | YEAR ENDED
OCTOBER 31,
2012 | | | (UNAUDITED)
SIX MONTHS
ENDED
APRIL 30,
2013 | | | YEAR ENDED
OCTOBER 31,
2012 | |
OPERATIONS | | | | | | | | | | | | | | | | | | | | | | | | |
Net investment income (loss) | | $ | (68,282 | ) | | $ | (421,773 | ) | | $ | 1,397,068 | | | $ | 2,843,664 | | | $ | (39,130 | ) | | $ | 1,218,386 | |
Net realized gain (loss) | | | 3,751,642 | | | | 1,851,947 | | | | (14,398,323 | ) | | | 12,337,579 | | | | (850,614 | ) | | | (7,148,490 | ) |
Change in unrealized appreciation/(depreciation) | | | (1,186,723 | ) | | | (2,007,935 | ) | | | 67,455,488 | | | | 29,309,719 | | | | 13,463,769 | | | | 12,827,542 | |
Net increase (decrease) in net assets resulting from operations | | | 2,496,637 | | | | (577,761 | ) | | | 54,454,233 | | | | 44,490,962 | | | | 12,574,025 | | | | 6,897,438 | |
| | | | | | |
DISTRIBUTIONS TO SHAREHOLDERS | | | | | | | | | | | | | | | | | | | | | | | | |
Net investment income | | | | | | | | | | | | | | | | | | | | | | | | |
Class A | | | — | | | | — | | | | (984,021 | ) | | | — | | | | — | | | | — | |
Class B | | | — | | | | — | | | | — | | | | — | | | | — | | | | — | |
Class C | | | — | | | | — | | | | — | | | | — | | | | — | | | | — | |
Class I | | | — | | | | — | | | | (1,796,204 | ) | | | — | | | | (417,372 | ) | | | (75,083 | ) |
Class R | | | — | | | | — | | | | (11,624 | ) | | | — | | | | — | | | | — | |
Net realized gains | | | | | | | | | | | | | | | | | | | | | | | | |
Class A | | | — | | | | — | | | | — | | | | — | | | | — | | | | — | |
Class B | | | — | | | | — | | | | — | | | | — | | | | — | | | | — | |
Class C | | | — | | | | — | | | | — | | | | — | | | | — | | | | — | |
Class I | | | — | | | | — | | | | — | | | | — | | | | — | | | | — | |
Class R | | | — | | | | — | | | | — | | | | — | | | | — | | | | — | |
Total distributions | | | — | | | | — | | | | (2,791,849 | ) | | | — | | | | (417,372 | ) | | | (75,083 | ) |
| | | | | | |
CAPITAL SHARE TRANSACTIONS | | | (1,559,321 | ) | | | (1,020,812 | ) | | | 23,380,087 | | | | 382,083,636 | | | | 83,536,414 | | | | 126,572,110 | |
TOTAL INCREASE (DECREASE) IN NET ASSETS | | | 937,316 | | | | (1,598,573 | ) | | | 75,042,471 | | | | 426,574,598 | | | | 95,693,067 | | | | 133,394,465 | |
| | | | | | |
NET ASSETS | | | | | | | | | | | | | | | | | | | | | | | | |
Beginning of period | | $ | 34,778,109 | | | $ | 36,376,682 | | | $ | 962,157,553 | | | $ | 535,582,955 | | | $ | 338,967,655 | | | $ | 205,573,190 | |
End of period | | | 35,715,425 | | | | 34,778,109 | | | | 1,037,200,024 | | | | 962,157,553 | | | | 434,660,722 | | | | 338,967,655 | |
Undistributed net investment income (loss) | | $ | (136,250 | ) | | $ | (67,968 | ) | | $ | 1,207,711 | | | $ | 2,602,492 | | | $ | (128,321 | ) | | $ | 328,181 | |
| | | | |
| 112 | | CALAMOS FAMILY OF FUNDS SEMIANNUAL REPORT | | See accompanying Notes to Financial Statements |
Statements of Changes in Net Assets
| | | | | | | | | | | | | | | | | | | | | | | | |
| | | GLOBAL EQUITY FUND | | | GROWTH AND INCOME FUND | | | GLOBAL GROWTH AND
INCOME FUND | |
| | | (UNAUDITED)
SIX MONTHS
ENDED
APRIL 30,
2013 | | | YEAR ENDED
OCTOBER 31,
2012 | | | (UNAUDITED)
SIX MONTHS
ENDED
APRIL 30,
2013 | | | YEAR ENDED
OCTOBER 31,
2012 | | | (UNAUDITED)
SIX MONTHS
ENDED
APRIL 30,
2013 | | | YEAR ENDED
OCTOBER 31,
2012 | |
OPERATIONS | | | | | | | | | | | | | | | | | | | | | | | | |
Net investment income (loss) | | $ | 260,196 | | | $ | (128,877 | ) | | $ | 36,304,312 | | | $ | 63,818,098 | | | $ | 5,217,727 | | | $ | 18,015,623 | |
Net realized gain (loss) | | | (6,319,458 | ) | | | (5,033,983 | ) | | | 159,158,539 | | | | 167,503,971 | | | | 89,776,641 | | | | 54,059,940 | |
Change in unrealized appreciation/(depreciation) | | | 22,325,271 | | | | 21,600,915 | | | | (27,615,717 | ) | | | (73,394,550 | ) | | | (29,283,066 | ) | | | (19,835,526 | ) |
Net increase (decrease) in net assets resulting from operations | | | 16,266,009 | | | | 16,438,055 | | | | 167,847,134 | | | | 157,927,519 | | | | 65,711,302 | | | | 52,240,037 | |
| | | | | | |
DISTRIBUTIONS TO SHAREHOLDERS | | | | | | | | | | | | | | | | | | | | | | | | |
Net investment income | | | | | | | | | | | | | | | | | | | | | | | | |
Class A | | | (244,642 | ) | | | — | | | | (15,773,387 | ) | | | (42,063,518 | ) | | | (2,349,628 | ) | | | (7,009,422 | ) |
Class B | | | — | | | | — | | | | (626,366 | ) | | | (1,291,507 | ) | | | (36,898 | ) | | | (267,238 | ) |
Class C | | | — | | | | — | | | | (7,810,027 | ) | | | (17,074,300 | ) | | | (731,303 | ) | | | (3,459,438 | ) |
Class I | | | (746,786 | ) | | | — | | | | (7,869,111 | ) | | | (21,721,909 | ) | | | (7,155,058 | ) | | | (24,269,976 | ) |
Class R | | | (5,447 | ) | | | — | | | | (175,342 | ) | | | (346,535 | ) | | | (16,661 | ) | | | (30,943 | ) |
Net realized gains | | | | | | | | | | | | | | | | | | | | | | | | |
Class A | | | — | | | | — | | | | (49,840,119 | ) | | | — | | | | (6,397,312 | ) | | | — | |
Class B | | | — | | | | — | | | | (1,916,346 | ) | | | — | | | | (332,463 | ) | | | — | |
Class C | | | — | | | | — | | | | (32,041,189 | ) | | | — | | | | (5,146,030 | ) | | | — | |
Class I | | | — | | | | — | | | | (23,069,234 | ) | | | — | | | | (17,597,797 | ) | | | — | |
Class R | | | — | | | | — | | | | (595,008 | ) | | | — | | | | (60,730 | ) | | | — | |
Total distributions | | | (996,875 | ) | | | — | | | | (139,716,129 | ) | | | (82,497,769 | ) | | | (39,823,880 | ) | | | (35,037,017 | ) |
| | | | | | |
CAPITAL SHARE TRANSACTIONS | | | 29,705,457 | | | | 220,388,324 | | | | (615,164,719 | ) | | | (234,011,464 | ) | | | (833,024,081 | ) | | | (137,655,545 | ) |
TOTAL INCREASE (DECREASE) IN NET ASSETS | | | 44,974,591 | | | | 236,826,379 | | | | (587,033,714 | ) | | | (158,581,714 | ) | | | (807,136,659 | ) | | | (120,452,525 | ) |
| | | | | | |
NET ASSETS | | | | | | | | | | | | | | | | | | | | | | | | |
Beginning of period | | $ | 366,586,027 | | | $ | 129,759,648 | | | $ | 4,260,480,256 | | | $ | 4,419,061,970 | | | $ | 1,546,792,424 | | | $ | 1,667,244,949 | |
End of period | | | 411,560,618 | | | | 366,586,027 | | | | 3,673,446,542 | | | | 4,260,480,256 | | | | 739,655,765 | | | | 1,546,792,424 | |
Undistributed net investment income (loss) | | $ | 402,146 | | | $ | 1,138,825 | | | $ | (5,248,287 | ) | | $ | (9,298,366 | ) | | $ | (9,399,515 | ) | | $ | (4,327,694 | ) |
| | | | | | |
| See accompanying Notes to Financial Statements | | www.calamos.com | | | 113 | |
Statements of Changes in Net Assets
| | | | | | | | | | | | | | | | | | | | | | | | |
| | | CONVERTIBLE FUND | | | TOTAL RETURN BOND FUND | | | HIGH INCOME FUND | |
| | | (UNAUDITED)
SIX MONTHS
ENDED
APRIL 30,
2013 | | | YEAR ENDED
OCTOBER 31,
2012 | | | (UNAUDITED)
SIX MONTHS
ENDED
APRIL 30,
2013 | | | YEAR ENDED
OCTOBER 31,
2012 | | | (UNAUDITED)
SIX MONTHS
ENDED
APRIL 30,
2013 | | | YEAR ENDED
OCTOBER 31,
2012 | |
OPERATIONS | | | | | | | | | | | | | | | | | | | | | | | | |
Net investment income (loss) | | $ | 13,229,775 | | | $ | 40,784,530 | | | $ | 2,112,248 | | | $ | 4,275,462 | | | $ | 7,605,704 | | | $ | 14,991,398 | |
Net realized gain (loss) | | | 68,982,500 | | | | 155,691,978 | | | | 4,211,520 | | | | 1,475,941 | | | | 2,836,911 | | | | 4,816,407 | |
Change in unrealized appreciation/(depreciation) | | | 38,076,750 | | | | (192,512,678 | ) | | | (4,468,291 | ) | | | 1,755,862 | | | | 8,536,839 | | | | 4,635,385 | |
Net increase (decrease) in net assets resulting from operations | | | 120,289,025 | | | | 3,963,830 | | | | 1,855,477 | | | | 7,507,265 | | | | 18,979,454 | | | | 24,443,190 | |
| | | | | | |
DISTRIBUTIONS TO SHAREHOLDERS | | | | | | | | | | | | | | | | | | | | | | | | |
Net investment income | | | | | | | | | | | | | | | | | | | | | | | | |
Class A | | | (758,875 | ) | | | (8,359,078 | ) | | | (1,847,223 | ) | | | (3,592,146 | ) | | | (6,928,305 | ) | | | (10,509,844 | ) |
Class B | | | — | | | | (170 | ) | | | (82,238 | ) | | | (257,383 | ) | | | (137,192 | ) | | | (312,056 | ) |
Class C | | | — | | | | (305,060 | ) | | | (433,367 | ) | | | (1,014,357 | ) | | | (1,093,650 | ) | | | (1,812,604 | ) |
Class I | | | (1,241,111 | ) | | | (7,272,171 | ) | | | (677,474 | ) | | | (1,291,953 | ) | | | (1,039,289 | ) | | | (1,583,127 | ) |
Class R | | | (229 | ) | | | (22,737 | ) | | | (22,106 | ) | | | (43,844 | ) | | | (10,818 | ) | | | (16,155 | ) |
Net realized gains | | | | | | | | | | | | | | | | | | | | | | | | |
Class A | | | (50,867,529 | ) | | | (92,347,672 | ) | | | (606,992 | ) | | | (417,256 | ) | | | (2,912,565 | ) | | | (2,568,614 | ) |
Class B | | | (961,028 | ) | | | (1,293,102 | ) | | | (36,406 | ) | | | (47,389 | ) | | | (74,184 | ) | | | (111,731 | ) |
Class C | | | (31,809,505 | ) | | | (43,373,641 | ) | | | (194,003 | ) | | | (174,376 | ) | | | (556,178 | ) | | | (520,378 | ) |
Class I | | | (38,165,099 | ) | | | (56,490,063 | ) | | | (192,508 | ) | | | (144,946 | ) | | | (424,052 | ) | | | (312,122 | ) |
Class R | | | (277,179 | ) | | | (317,644 | ) | | | (7,554 | ) | | | (5,793 | ) | | | (4,731 | ) | | | (3,959 | ) |
Total distributions | | | (124,080,555 | ) | | | (209,781,338 | ) | | | (4,099,871 | ) | | | (6,989,443 | ) | | | (13,180,964 | ) | | | (17,750,590 | ) |
| | | | | | |
CAPITAL SHARE TRANSACTIONS | | | (319,798,600 | ) | | | (899,392,771 | ) | | | (22,544,898 | ) | | | 14,133,319 | | | | (4,918,775 | ) | | | 37,625,231 | |
TOTAL INCREASE (DECREASE) IN NET ASSETS | | | (323,590,130 | ) | | | (1,105,210,279 | ) | | | (24,789,292 | ) | | | 14,651,141 | | | | 879,715 | | | | 44,317,831 | |
| | | | | | |
NET ASSETS | | | | | | | | | | | | | | | | | | | | | | | | |
Beginning of period | | $ | 1,533,784,486 | | | $ | 2,638,994,765 | | | $ | 235,822,824 | | | $ | 221,171,683 | | | $ | 298,058,263 | | | $ | 253,740,432 | |
End of period | | | 1,210,194,356 | | | | 1,533,784,486 | | | | 211,033,532 | | | | 235,822,824 | | | | 298,937,978 | | | | 298,058,263 | |
Undistributed net investment income (loss) | | $ | (6,251,275 | ) | | $ | (17,480,835 | ) | | $ | (558,755 | ) | | $ | 391,405 | | | $ | (550,181 | ) | | $ | 1,053,369 | |
| | | | |
| 114 | | CALAMOS FAMILY OF FUNDS SEMIANNUAL REPORT | | See accompanying Notes to Financial Statements |
Statements of Changes in Net Assets
| | | | | | | | |
| | | MARKET NEUTRAL
INCOME FUND | |
| | | (UNAUDITED)
SIX MONTHS
ENDED
APRIL 30,
2013 | | | YEAR ENDED
OCTOBER 31,
2012 | |
OPERATIONS | | | | | | | | |
Net investment income (loss) | | $ | 17,407,820 | | | $ | 39,999,426 | |
Net realized gain (loss) | | | (34,965,126 | ) | | | 15,386,918 | |
Change in unrealized appreciation/(depreciation) | | | 76,064,185 | | | | 86,097,594 | |
Net increase (decrease) in net assets resulting from operations | | | 58,506,879 | | | | 141,483,938 | |
| | |
DISTRIBUTIONS TO SHAREHOLDERS | | | | | | | | |
Net investment income | | | | | | | | |
Class A | | | (8,537,333 | ) | | | (14,727,966 | ) |
Class B | | | (31,615 | ) | | | (60,598 | ) |
Class C | | | (866,629 | ) | | | (1,290,576 | ) |
Class I | | | (9,483,144 | ) | | | (13,818,404 | ) |
Class R | | | (29,238 | ) | | | (44,158 | ) |
Net realized gains | | | | | | | | |
Class A | | | — | | | | — | |
Class B | | | — | | | | — | |
Class C | | | — | | | | — | |
Class I | | | — | | | | — | |
Class R | | | — | | | | — | |
Total distributions | | | (18,947,959 | ) | | | (29,941,702 | ) |
| | |
CAPITAL SHARE TRANSACTIONS | | | 189,827,650 | | | | 28,271,460 | |
TOTAL INCREASE (DECREASE) IN NET ASSETS | | | 229,386,570 | | | | 139,813,696 | |
| | |
NET ASSETS | | | | | | | | |
Beginning of period | | $ | 2,481,667,732 | | | $ | 2,341,854,036 | |
End of period | | | 2,711,054,302 | | | | 2,481,667,732 | |
Undistributed net investment income (loss) | | $ | 2,233,630 | | | $ | 3,773,769 | |
| | | | | | |
| See accompanying Notes to Financial Statements | | www.calamos.com | | | 115 | |
Notes to Financial Statements (Unaudited)
Note 1 – Organization and Significant Accounting Policies
Organization. CALAMOS INVESTMENT TRUST, a Massachusetts business trust organized December 21, 1987 (the “Trust”), consists of thirteen series, Growth Fund, Value Fund, Focus Growth Fund (formerly Blue Chip Fund), Discovery Growth Fund, International Growth Fund, Evolving World Growth Fund, Global Equity Fund, Growth and Income Fund, Global Growth and Income Fund, Convertible Fund, Total Return Bond Fund, High Income Fund and Market Neutral Income Fund (each a “Fund” and collectively the “Funds”). The Trust is registered under the Investment Company Act of 1940 as amended (the “1940 Act”) as an open-end management investment company. The Trust currently offers Class A, Class C, Class I and Class R shares of each of the Funds. Class B shares continue to be outstanding, but are no longer an offered class of shares.
Fund Valuation. The valuation of the Funds’ investments is in accordance with policies and procedures adopted by and under the ultimate supervision of the board of trustees.
Fund securities that are traded on U.S. securities exchanges, except option securities, are valued at the last current reported sales price at the time each Fund determines its net asset value (“NAV”). Securities traded in the over-the-counter market and quoted on The NASDAQ Stock Market are valued at the NASDAQ Official Closing Price, as determined by NASDAQ, or lacking a NASDAQ Official Closing Price, the last current reported sale price on NASDAQ at the time a Fund determines its NAV. When a last sale or closing price is not available, equity securities, other than option securities, that are traded on a U.S. securities exchange and other equity securities traded in the over-the-counter market are valued at the mean between the most recent bid and asked quotations in accordance with guidelines adopted by the board of trustees. Each option security traded on a U.S. securities exchange is valued at the mid-point of the consolidated bid/ask quote for the option security, also in accordance with guidelines adopted by the board of trustees. Each over-the-counter option that is not traded through the Options Clearing Corporation is valued based on a quotation provided by the counterparty to such option under the ultimate supervision of the board of trustees.
Fixed income securities, certain convertible preferred securities, and non-exchange traded derivatives are normally valued by independent pricing services or by dealers or brokers who make markets in such securities. Valuations of such fixed income securities, certain convertible preferred securities and non-exchange traded derivatives consider yield or price of equivalent securities of comparable quality, coupon rate, maturity, type of issue, trading characteristics and other market data and do not rely exclusively upon exchange or over-the-counter prices.
Trading on European and Far Eastern exchanges and over-the-counter markets is typically completed at various times before the close of business on each day on which the New York Stock Exchange (“NYSE”) is open. Each security trading on these exchanges or over-the-counter markets may be valued utilizing a systematic fair valuation model provided by an independent pricing service approved by the board of trustees. The valuation of each security that meets certain criteria in relation to the valuation model is systematically adjusted to reflect the impact of movement in the U.S. market after the foreign markets close. Securities that do not meet the criteria, or that are principally traded in other foreign markets, are valued as of the last reported sale price at the time the respective Fund determines its NAV, or when reliable market prices or quotations are not readily available, at the mean between the most recent bid and asked quotations as of the close of the appropriate exchange or other designated time. Trading of foreign securities may not take place on every NYSE business day. In addition, trading may take place in various foreign markets on Saturdays or on other days when the NYSE is not open and on which the respective Fund’s NAV is not calculated.
If the pricing committee determines that the valuation of a security in accordance with the methods described above is not reflective of a fair value for such security, the security is valued at a fair value by the pricing committee, under the ultimate supervision of the board of trustees, following the guidelines and/or procedures adopted by the board of trustees.
Each Fund also may use fair value pricing, pursuant to guidelines adopted by the board of trustees and under the ultimate supervision of the board of trustees, if trading in the security is halted or if the value of a security it holds is materially affected by events occurring before the Fund’s pricing time but after the close of the primary market or exchange on which the security is listed. Those procedures may utilize valuations furnished by pricing services approved by the board of trustees, which may be based on market transactions for comparable securities and various relationships between securities that are generally recognized by institutional traders, a computerized matrix system, or appraisals derived from information concerning the securities or similar securities received from recognized dealers in those securities.
| | | | |
| 116 | | CALAMOS��FAMILY OF FUNDS SEMIANNUAL REPORT | | |
Notes to Financial Statements (Unaudited)
When fair value pricing of securities is employed, the prices of securities used by the Fund to calculate its NAV may differ from market quotations or official closing prices. In light of the judgment involved in fair valuations, there can be no assurance that a fair value assigned to a particular security is accurate.
Investment Transactions. Investment transactions are recorded on a trade date basis as of April 30, 2013. Net realized gains and losses from investment transactions are reported on an identified cost basis. Interest income is recognized using the accrual method and includes accretion of original issue and market discount and amortization of premium. Dividend income is recognized on the ex-dividend date, except that certain dividends from foreign securities are recorded as soon as the information becomes available after the ex-dividend date.
Foreign Currency Translation. Values of investments and other assets and liabilities denominated in foreign currencies are translated into U.S. dollars using a rate quoted by a major bank or dealer in the particular currency market, as reported by a recognized quotation dissemination service.
The Funds do not isolate that portion of the results of operations resulting from changes in foreign exchange rates on investments from the fluctuations arising from changes in market prices of securities held. Such fluctuations are included with the net realized and unrealized gain or loss from investments.
Reported net realized foreign currency gains or losses arise from disposition of foreign currency, the difference in the foreign exchange rates between the trade and settlement dates on securities transactions, and the difference between the amounts of dividends, interest and foreign withholding taxes recorded on the ex-date or accrual date and the U.S. dollar equivalent of the amounts actually received or paid. Net unrealized foreign exchange gains and losses arise from changes (due to the changes in the exchange rate) in the value of foreign currency and other assets and liabilities denominated in foreign currencies held at period end.
Allocation of Expenses Among Funds and Classes. Expenses directly attributable to a Fund are charged to that Fund; certain other common expenses of the Trust, Calamos Advisors Trust, Calamos Convertible Opportunities and Income Fund, Calamos Convertible and High Income Fund, Calamos Strategic Total Return Fund, Calamos Global Total Return Fund and Calamos Global Dynamic Income Fund are allocated proportionately among each fund to which the expenses relate in relation to the net assets of each fund or on another reasonable basis. Expenses directly attributable to a particular class of a fund in the Trust are charged directly to such class. In calculating the net asset value per share of each class, investment income, realized and unrealized gains and losses and expenses other than class specific expenses are allocated daily to each class of shares based upon the proportion of net assets of each class at the beginning of each day plus current day fund share activity.
Use of Estimates. The preparation of financial statements in conformity with U.S. generally accepted accounting principles requires management to make estimates and assumptions that affect the amounts reported in the financial statements and accompanying notes. Actual results may differ from those estimates.
Income Taxes. No provision has been made for U.S. income taxes because the Trust’s policy is to continue to qualify as a regulated investment company under the Internal Revenue Code of 1986, as amended, and distribute to shareholders substantially all of the Funds’ taxable income and net realized gains.
Dividends and distributions paid to shareholders are recorded on the ex-dividend date. The amount of dividends and distributions from net investment income and net realized capital gains is determined in accordance with federal income tax regulations, which may differ from U.S. generally accepted accounting principles. To the extent these “book/tax” differences are permanent in nature, such amounts are reclassified within the capital accounts based on their federal tax-basis treatment. These differences are primarily due to differing treatments for foreign currency transactions, contingent payment debt instruments and methods of amortizing and accreting for fixed income securities. The financial statements are not adjusted for temporary differences.
The Funds recognized no liability for uncertain tax positions. A reconciliation is not provided as the beginning and ending amounts of unrecognized benefits are zero, with no interim additions, reductions or settlements. Tax years 2008 – 2012 remain subject to examination by the U.S. and the State of Illinois tax jurisdictions.
Indemnifications. Under the Trust’s organizational documents, the Trust is obligated to indemnify its officers and trustees against certain liabilities incurred by them by reason of having been an officer or trustee of the Trust. In addition, in the normal course of business, the Trust may enter into contracts that provide general indemnifications to other parties. Each Fund’s maximum exposure
Notes to Financial Statements (Unaudited)
under these arrangements is unknown as this would involve future claims that may be made against the Fund that have not yet occurred. Currently, the Funds’ management expects the risk of material loss in connection to a potential claim to be remote.
Note 2 – Investment Adviser and Transactions With Affiliates Or Certain Other Parties
Pursuant to an investment advisory agreement with Calamos Advisors LLC (“Calamos Advisors”), each Fund pays a monthly investment advisory fee based on the average daily net assets of the Fund, as shown below:
| | | | | | | | | | | | | | | | |
| AVERAGE DAILY NET ASSETS | | GROWTH FUND
ANNUAL RATE | | | EVOLVING WORLD
GROWTH FUND
ANNUAL RATE | | | TOTAL RETURN
BOND FUND
ANNUAL RATE | | | VALUE FUND, FOCUS GROWTH FUND,
INTERNATIONAL GROWTH FUND*,
GLOBAL EQUITY FUND*,
GLOBAL GROWTH AND INCOME FUND
ANNUAL RATE | |
| First $500 million | | | 1.00% | | | | 1.10% | | | | 0.55% | | | | 1.00% | |
| | | | |
| Next $500 million | | | 0.90% | | | | 1.05% | | | | 0.53% | | | | 0.95% | |
| | | | |
| Next $5 billion | | | 0.80% | | | | 1.00% | | | | 0.51% | | | | 0.90% | |
| | | | |
| Next $5 billion | | | 0.78% | | | | 0.98% | | | | 0.49% | | | | 0.88% | |
| | | | |
| Next $5 billion | | | 0.76% | | | | 0.96% | | | | 0.48% | | | | 0.86% | |
| | | | |
| Next $5 billion | | | 0.74% | | | | 0.94% | | | | 0.47% | | | | 0.84% | |
| | | | |
| Next $5 billion | | | 0.72% | | | | 0.92% | | | | 0.46% | | | | 0.82% | |
| | | | |
| Over $26 billion | | | 0.70% | | | | 0.90% | | | | 0.45% | | | | 0.80% | |
| | | | |
| * | International Growth Fund and Global Equity Fund are subject to a possible adjustment based on performance as described below. |
| | | | | | | | |
| AVERAGE DAILY NET ASSETS | | GROWTH AND INCOME FUND,
CONVERTIBLE FUND, HIGH INCOME FUND,
AND MARKET NEUTRAL INCOME FUND ANNUAL RATE | | | DISCOVERY GROWTH FUND ANNUAL RATE | |
| First $500 million | | | 0.75% | | | | 1.00% | |
| | | | |
| Next $500 million | | | 0.70% | | | | 0.90% | |
| | | | |
| Over $1 billion | | | 0.65% | | | | 0.80% | |
| | | | |
Each of the International Growth and Global Equity Funds pays a fee based on average daily net assets of the Fund that is accrued daily and paid on a monthly basis, subject to possible adjustment based on the Fund’s investment performance (since March 2006 for International Growth Fund and since February 2008 for Global Equity Fund). The performance adjustment increases or decreases the management fee, on a monthly basis, by 1/12 of 0.03% of a Fund’s average daily net assets over the performance period for each full 1% increment amount by which a Fund outperforms or underperforms the benchmark index (“Index”), on an annualized basis, over the performance measurement period. The benchmark indexes are the MSCI EAFE Growth Index and the MSCI World Index for the International Growth Fund and Global Equity Fund, respectively.
The base fee is shown in the table above. The performance adjustment rate is calculated by comparing over the performance measurement period the Fund’s Class A share performance to that of the respective Index. The performance measurement period commenced at the beginning of each Fund’s first full month of operation (April 2005 and March 2007 for the International Growth Fund and Global Equity Fund, respectively). The first performance adjustment was applied to the advisory fee at the end of the twelfth month. Each month subsequent to the twelfth month, a new month is added to the performance measurement period until the performance measurement period includes 36 months. Thereafter, the performance measurement period consists of the most recent month plus the previous 35 months.
The performance comparison is made at the end of each month. The maximum annualized performance adjustment rate is +/- 0.30% of the Fund’s average daily net assets over the performance measurement period. The performance adjustment rate is divided by twelve and multiplied by the Fund’s average daily net assets over the performance measurement period, and the resulting dollar amount is then added to or subtracted from the base fee. Calamos Advisors may receive a positive performance adjustment even if the Fund has a negative return over a performance measurement period if it otherwise outperforms the Index during that period.
| | | | |
| 118 | | CALAMOS FAMILY OF FUNDS SEMIANNUAL REPORT | | |
Notes to Financial Statements (Unaudited)
Pursuant to a financial accounting services agreement, during the year the Funds paid Calamos Advisors a fee for financial accounting services payable monthly at the annual rate of 0.0175% on the first $1 billion of combined assets, 0.0150% on the next $1 billion of combined assets and 0.0110% on combined assets above $2 billion (for purposes of this calculation “combined assets” means the sum of the total average daily net assets of Calamos Investment Trust, Calamos Advisors Trust and the total average weekly managed assets of Calamos Convertible and High Income Fund, Calamos Strategic Total Return Fund, Calamos Convertible Opportunities and Income Fund, Calamos Global Total Return Fund and Calamos Global Dynamic Income Fund). Financial accounting services include, but are not limited to, the following: managing expenses and expense payment processing; monitoring the calculation of expense accrual amounts; calculating, tracking and reporting tax adjustments on all assets; and monitoring trustee deferred compensation plan accruals and valuations. The Funds pay their pro rata share of the financial accounting services fee payable to Calamos Advisors based on their relative portion of combined assets used in calculating the fee.
The Trust reimburses Calamos Advisors for a portion of compensation paid to the Trust’s Chief Compliance Officer. This compensation is reported as part of “Trustees’ fees and officer compensation” expense on the Statements of Operations.
Calamos Advisors has contractually agreed to limit the annual ordinary operating expenses of each Fund as a percentage of the average daily net assets as follows:
| | | | | | | | | | | | | | | | | | | | |
| FUND | | CLASS A
SHARES | | | CLASS B
SHARES | | | CLASS C
SHARES | | | CLASS I
SHARES | | | CLASS R
SHARES | |
| Growth Fund | | | 1.75% | | | | 2.50% | | | | 2.50% | | | | 1.50% | | | | 2.00% | |
| Value Fund | | | 1.15% | | | | 1.90% | | | | 1.90% | | | | 0.90% | | | | 1.40% | |
| Focus Growth Fund | | | 1.15% | | | | 1.90% | | | | 1.90% | | | | 0.90% | | | | 1.40% | |
| Discovery Growth Fund | | | 1.50% | | | | 2.25% | | | | 2.25% | | | | 1.25% | | | | 1.75% | |
| International Growth Fund | | | 1.40% | | | | 2.15% | | | | 2.15% | | | | 1.15% | | | | 1.65% | |
| Evolving World Growth Fund | | | 1.75% | | | | 2.50% | | | | 2.50% | | | | 1.50% | | | | 2.00% | |
| Global Equity Fund | | | 1.40% | | | | 2.15% | | | | 2.15% | | | | 1.15% | | | | 1.65% | |
| Growth and Income Fund | | | 1.75% | | | | 2.50% | | | | 2.50% | | | | 1.50% | | | | 2.00% | |
| Global Growth and Income Fund | | | 1.75% | | | | 2.50% | | | | 2.50% | | | | 1.50% | | | | 2.00% | |
| Convertible Fund | | | 1.75% | | | | 2.50% | | | | 2.50% | | | | 1.50% | | | | 2.00% | |
| Total Return Bond Fund | | | 0.90% | | | | 1.65% | | | | 1.65% | | | | 0.65% | | | | 1.15% | |
| High Income Fund | | | 1.75% | | | | 2.50% | | | | 2.50% | | | | 1.50% | | | | 2.00% | |
| Market Neutral Income Fund | | | 1.75% | | | | 2.50% | | | | 2.50% | | | | 1.50% | | | | 2.00% | |
These agreements are binding on Calamos Advisors through June 30, 2013.
For the period ended April 30, 2013, the Funds waived or absorbed the following expenses:
| | | | |
| FUND | | AMOUNT | |
| Value Fund | | $ | 143,732 | |
| Focus Growth Fund | | | 160,853 | |
| Discovery Growth Fund | | | 43,522 | |
| International Growth Fund | | | 405,403 | |
| Global Equity Fund | | | 86,332 | |
| Total Return Bond Fund | | | 100,129 | |
These amounts are included in the Statements of Operations under the caption “Expense reductions”.
As Distributor, Calamos Financial Services LLC (“CFS”) assumed all expenses of personnel, office space, office facilities and equipment incidental to such service. Each Fund has adopted a Distribution Plan pursuant to Rule 12b-1 under the 1940 Act whereby the Fund pays to CFS a distribution and/or service fee at the annual rate of 0.25% of the average daily net assets of the Fund’s Class A shares; a service fee at the annual rate of 0.25% and a distribution fee at the rate of 0.75% of the average daily net assets of the Fund’s Class B and Class C shares; and a service fee at the annual rate of 0.25% and a distribution fee of 0.25% of the average daily net assets of the Fund’s Class R shares. No such fees are paid on each Fund’s Class I shares.
Notes to Financial Statements (Unaudited)
CFS also receives a sales commission and/or an underwriting fee on certain sales of each Fund’s Class A shares. During the period ended April 30, 2013, CFS received commissions and underwriting fees as follows:
| | | | |
| FUND | | AMOUNT | |
| Growth Fund | | $ | 66,120 | |
| Value Fund | | | 1,945 | |
| Focus Growth Fund | | | 1,231 | |
| Discovery Growth Fund | | | 3,263 | |
| International Growth Fund | | | 15,567 | |
| Evolving World Growth Fund | | | 24,652 | |
| Global Equity Fund | | | 21,225 | |
| Growth and Income Fund | | | 42,869 | |
| Global Growth and Income Fund | | | 6,846 | |
| Convertible Fund | | | 50 | |
| Total Return Bond Fund | | | 3,060 | |
| High Income Fund | | | 8,302 | |
| Market Neutral Income Fund | | | 33,522 | |
Pursuant to an agreement with US Bancorp Fund Services, LLC, the Funds’ transfer agent (“US Bancorp”), CFS provides certain shareholder administrative services to US Bancorp. CFS receives from US Bancorp an annual aggregate fee of $175,000, paid in monthly installments, for providing these services which relate to Calamos Investment Trust and Calamos Advisors Trust. Also, US Bancorp pays license fees to unaffiliated third parties for CFS’ utilization of certain transfer agent and phone systems in providing the shareholder administrative services. The fees paid to CFS and the payment of license fees to third parties are borne by US Bancorp. The Funds have not assumed or incurred any additional expenses in connection with CFS providing these services to US Bancorp, and the transfer agency fees payable by the Funds to US Bancorp have not increased as a result thereof.
A trustee and certain officers of the Trust are also officers and directors of CFS and Calamos Advisors. Such trustee and officers serve without direct compensation from the Trust. The Funds’ Statement of Additional Information contains additional information about the Funds’ trustees and is available upon request without charge by calling our toll free number 800.582.6959.
Certain affiliates of Calamos Advisors hold material investments in the Funds. As of April 30, 2013, they held 29% and 54% of the outstanding shares of Focus Growth Fund and Discovery Growth Fund, respectively.
The Trust has adopted a deferred compensation plan (the “Plan”). Under the Plan, a trustee who is not an “interested person” (as defined in the 1940 Act) and has elected to participate in the Plan (a “participating trustee”) may defer receipt of all or a portion of his compensation from the Trust. The deferred compensation payable to the participating trustee is credited to the trustee’s deferral account as of the business day such compensation would have been paid to the participating trustee. The value of amounts deferred for a participating trustee is determined by reference to the change in value of Class I shares of one or more funds of the Trust designated by the participant. The value of the account increases with contributions to the account or with increases in the value of the measuring shares, and the value of the account decreases with withdrawals from the account or with declines in the value of the measuring shares.
| | | | |
| 120 | | CALAMOS FAMILY OF FUNDS SEMIANNUAL REPORT | | |
Notes to Financial Statements (Unaudited)
At April 30, 2013, the Funds had deferred compensation balances, which are included in “Other assets” on the Statements of Assets and Liabilities, as follows:
| | | | |
| FUND | | AMOUNT | |
| Growth Fund | | $ | 789,933 | |
| Value Fund | | | 77,046 | |
| Focus Growth Fund | | | 70,038 | |
| Discovery Growth Fund | | | 11,322 | |
| International Growth Fund | | | 72,541 | |
| Evolving World Growth Fund | | | 31,286 | |
| Global Equity Fund | | | 42,303 | |
| Growth and Income Fund | | | 379,327 | |
| Global Growth and Income Fund | | | 139,054 | |
| Convertible Fund | | | 190,520 | |
| Total Return Bond Fund | | | 46,236 | |
| High Income Fund | | | 87,972 | |
| Market Neutral Income Fund | | | 175,579 | |
Each Fund’s obligation to make payments under the Plan is a general obligation of the Fund and is included in “Payable for deferred compensation to trustees” on the Statements of Assets and Liabilities at April 30, 2013.
Note 3 – Investments
The cost of purchases and proceeds from sale of long-term investments for the period ended April 30, 2013 were as follows:
| | | | | | | | | | | | | | | | |
| | | COST OF PURCHASES | | | PROCEEDS FROM SALES | |
| FUND | | U.S. GOV’T
SECURITIES | | | OTHER | | | U.S. GOV’T
SECURITIES | | | OTHER | |
| Growth Fund | | $ | — | | | $ | 1,669,570,601 | | | $ | — | | | $ | 3,579,168,593 | |
| Value Fund | | | — | | | | 105,990,219 | | | | — | | | | 90,242,278 | |
| Focus Growth Fund | | | — | | | | 27,161,964 | | | | — | | | | 31,198,408 | |
| Discovery Growth Fund | | | — | | | | 48,218,540 | | | | — | | | | 49,215,754 | |
| International Growth Fund | | | — | | | | 337,550,590 | | | | — | | | | 320,527,042 | |
| Evolving World Growth Fund | | | — | | | | 193,036,476 | | | | — | | | | 114,997,332 | |
| Global Equity Fund | | | — | | | | 154,630,860 | | | | — | | | | 117,683,952 | |
| Growth and Income Fund | | | — | | | | 1,258,489,714 | | | | — | | | | 1,971,633,200 | |
| Global Growth and Income Fund | | | — | | | | 208,662,208 | | | | — | | | | 1,023,208,437 | |
| Convertible Fund | | | — | | | | 527,060,709 | | | | — | | | | 981,948,938 | |
| Total Return Bond Fund | | | — | | | | 31,749,392 | | | | — | | | | 59,445,617 | |
| High Income Fund | | | — | | | | 80,756,765 | | | | — | | | | 87,722,010 | |
| Market Neutral Income Fund | | | — | | | | 913,622,957 | | | | — | | | | 927,800,890 | |
The following information is presented on a federal income tax basis as of April 30, 2013. Differences between the cost basis under U.S. generally accepted accounting principles and federal income tax purposes are primarily due to temporary differences.
Notes to Financial Statements (Unaudited)
The cost basis of investments for federal income tax purposes at April 30, 2013 was as follows:
| | | | | | | | | | | | | | | | |
| FUND | | COST BASIS OF
INVESTMENTS | | | GROSS UNREALIZED
APPRECIATION | | | GROSS UNREALIZED
DEPRECIATION | | | NET UNREALIZED
APPRECIATION
(DEPRECIATION) | |
| Growth Fund | | $ | 3,721,140,722 | | | $ | 1,128,346,883 | | | $ | (32,777,081 | ) | | $ | 1,095,569,802 | |
| Value Fund | | | 74,413,217 | | | | 5,658,819 | | | | (1,052,563 | ) | | | 4,606,256 | |
| Focus Growth Fund | | | 46,595,363 | | | | 12,258,621 | | | | (987,409 | ) | | | 11,271,212 | |
| Discovery Growth Fund | | | 36,494,531 | | | | 2,087,788 | | | | (1,899,040 | ) | | | 188,748 | |
| International Growth Fund | | | 890,464,498 | | | | 158,629,977 | | | | (18,926,957 | ) | | | 139,703,020 | |
| Evolving World Growth Fund | | | 401,627,216 | | | | 46,280,807 | | | | (9,105,692 | ) | | | 37,175,115 | |
| Global Equity Fund | | | 362,336,661 | | | | 58,630,440 | | | | (7,494,954 | ) | | | 51,135,486 | |
| Growth and Income Fund | | | 3,081,935,337 | | | | 586,381,608 | | | | (65,416,683 | ) | | | 520,964,925 | |
| Global Growth and Income Fund | | | 647,367,786 | | | | 97,263,753 | | | | (7,214,555 | ) | | | 90,049,198 | |
| Convertible Fund | | | 1,059,275,069 | | | | 131,665,015 | | | | (12,600,076 | ) | | | 119,064,939 | |
| Total Return Bond Fund | | | 198,858,458 | | | | 8,245,421 | | | | (346,116 | ) | | | 7,899,305 | |
| High Income Fund | | | 277,964,424 | | | | 18,739,168 | | | | (177,139 | ) | | | 18,562,029 | |
| Market Neutral Income Fund | | | 2,572,743,105 | | | | 247,673,671 | | | | (55,721,739 | ) | | | 191,951,932 | |
Note 4 – Income Taxes
The tax character of distributions for the period ended April 30, 2013 will be determined at the end of each Fund’s current fiscal year. Distributions during the fiscal period ended October 31, 2012 were characterized for federal income tax purposes as follows:
| | | | | | | | |
| | | YEAR ENDED
OCTOBER 31, 2012 | |
| FUND | | ORDINARY
INCOME | | | LONG-TERM
CAPITAL GAIN | |
| Growth Fund | | $ | — | | | $ | 316,320,422 | |
| Value Fund | | | — | | | | — | |
| Focus Growth Fund | | | — | | | | — | |
| Discovery Growth Fund | | | — | | | | — | |
| International Growth Fund | | | 1,523,973 | | | | — | |
| Evolving World Growth Fund | | | 496,169 | | | | — | |
| Global Equity Fund | | | — | | | | — | |
| Growth and Income Fund | | | 97,394,375 | | | | — | |
| Global Growth and Income Fund | | | 39,679,501 | | | | — | |
| Convertible Fund | | | 56,524,060 | | | | 213,577,422 | |
| Total Return Bond Fund | | | 5,946,236 | | | | 789,760 | |
| High Income Fund | | | 14,840,208 | | | | 3,613,655 | |
| Market Neutral Income Fund | | | 29,941,702 | | | | — | |
As of October 31, 2012, the components of accumulated earnings/(loss) on a tax basis were as follows:
| | | | | | | | | | | | | | | | | | | | |
| | | GROWTH
FUND | | | VALUE
FUND | | | FOCUS
GROWTH FUND | | | DISCOVERY
GROWTH FUND | | | INTERNATIONAL
GROWTH FUND | |
| Undistributed ordinary income | | $ | — | | | $ | 836,307 | | | $ | 274,716 | | | $ | — | | | $ | 2,791,467 | |
| Undistributed capital gains | | | 436,452,986 | | | | — | | | | — | | | | — | | | | — | |
| | | | |
| Total undistributed earnings | | | 436,452,986 | | | | 836,307 | | | | 274,716 | | | | — | | | | 2,791,467 | |
| Accumulated capital and other losses | | | — | | | | (1,359,857 | ) | | | (10,563,593 | ) | | | (111,317 | ) | | | (47,803,936 | ) |
| Net unrealized gain/(losses) | | | 1,227,417,429 | | | | 1,262,470 | | | | 10,254,657 | | | | 1,375,458 | | | | 72,040,536 | |
| | | | |
| Total accumulated earnings/(losses) | | | 1,663,870,415 | | | | 738,920 | | | | (34,220 | ) | | | 1,264,141 | | | | 27,028,067 | |
| Other | | | 727,035 | | | | (63,561 | ) | | | (32,882 | ) | | | (67,968 | ) | | | (83,886 | ) |
| Paid-in capital | | | 4,727,075,788 | | | | 53,032,494 | | | | 58,440,869 | | | | 33,581,936 | | | | 935,213,372 | |
| | | | |
| | $ | 6,391,673,238 | | | $ | 53,707,853 | | | $ | 58,373,767 | | | $ | 34,778,109 | | | $ | 962,157,553 | |
| | | | |
| | | | |
| 122 | | CALAMOS FAMILY OF FUNDS SEMIANNUAL REPORT | | |
Notes to Financial Statements (Unaudited)
| | | | | | | | | | | | | | | | | | | | |
| | | EVOLVING WORLD
GROWTH FUND | | | GLOBAL EQUITY
FUND | | | GROWTH AND
INCOME FUND | | | GLOBAL GROWTH
AND INCOME
FUND | | | CONVERTIBLE
FUND | |
| Undistributed ordinary income | | $ | 417,295 | | | $ | 996,824 | | | $ | 17,253,063 | | | $ | 9,388,895 | | | $ | — | |
| Undistributed capital gains | | | — | | | | — | | | | 107,460,840 | | | | 29,534,155 | | | | 122,075,792 | |
| | | | |
| Total undistributed earnings | | | 417,295 | | | | 996,824 | | | | 124,713,903 | | | | 38,923,050 | | | | 122,075,792 | |
| Accumulated capital and other losses | | | (6,680,965 | ) | | | (11,461,198 | ) | | | — | | | | — | | | | — | |
| Net unrealized gain/(losses) | | | 23,598,915 | | | | 28,961,102 | | | | 538,274,532 | | | | 117,939,085 | | | | 83,308,486 | |
| | | | |
| Total accumulated earnings/(losses) | | | 17,335,245 | | | | 18,496,728 | | | | 662,988,435 | | | | 156,862,135 | | | | 205,384,278 | |
| Other | | | (80,936 | ) | | | 161,594 | | | | (13,308 | ) | | | (5,642,574 | ) | | | (1,780,289 | ) |
| Paid-in capital | | | 321,713,346 | | | | 347,927,705 | | | | 3,597,505,129 | | | | 1,395,572,863 | | | | 1,330,180,497 | |
| | | | |
| | $ | 338,967,655 | | | $ | 366,586,027 | | | $ | 4,260,480,256 | | | $ | 1,546,792,424 | | | $ | 1,533,784,486 | |
| | | | |
| | | | | |
| | | | | | | | | TOTAL RETURN
BOND FUND | | | HIGH INCOME
FUND | | | MARKET NEUTRAL
INCOME FUND | |
| Undistributed ordinary income | | | | | | | | | | $ | 1,245,581 | | | $ | 1,354,043 | | | $ | 5,145,592 | |
| Undistributed capital gains | | | | | | | | | | | 620,757 | | | | 3,971,662 | | | | — | |
| | | | | | | | | | | | |
| Total undistributed earnings | | | | | | | | | | | 1,866,338 | | | | 5,325,705 | | | | 5,145,592 | |
| Accumulated capital and other losses | | | | | | | | | | | — | | | | — | | | | (39,055,896 | ) |
| Net unrealized gain/(losses) | | | | | | | | | | | 12,112,028 | | | | 10,074,013 | | | | 51,100,491 | |
| | | | | | | | | | | | |
| Total accumulated earnings/(losses) | | | | | | | | | | | 13,978,366 | | | | 15,399,718 | | | | 17,190,187 | |
| Other | | | | | | | | | | | (390,381 | ) | | | (73,390 | ) | | | (14,519,402 | ) |
| Paid-in capital | | | | | | | | | | | 222,234,839 | | | | 282,731,935 | | | | 2,478,996,947 | |
| | | | | | | | | | | | |
| | | | | | | | | | $ | 235,822,824 | | | $ | 298,058,263 | | | $ | 2,481,667,732 | |
| | | | | | | | | | | | |
The Regulated Investment Company Modernization Act of 2010 (the “Act”) modernized various tax rules for regulated investment companies, and was effective for taxable years beginning after the enactment date of December 22, 2010. One significant change is to the treatment of capital loss carryforwards. Now, any capital losses recognized will retain their character as either short-term or long-term capital losses, will be utilized before the pre-Act capital loss carryforwards, and will be carried forward indefinitely, until applied in offsetting future capital gains.
As of October 31, 2012, the Funds had pre-Act capital loss carryforwards which, if not used, will expire as follows:
| | | | | | | | | | | | |
| FUND | | 2017 | | | 2018 | | | 2019 | |
| Value Fund | | $ | — | | | $ | (1,359,857 | ) | | $ | — | |
| Focus Growth Fund | | | (9,348,298 | ) | | | (1,215,295 | ) | | | — | |
| Discovery Growth Fund | | | — | | | | — | | | | (111,317 | ) |
| International Growth Fund | | | (47,803,936 | ) | | | — | | | | — | |
| Global Equity Fund | | | (3,358,510 | ) | | | (1,960,075 | ) | | | — | |
| Market Neutral Income Fund | | | (6,964,603 | ) | | | (32,091,293 | ) | | | — | |
In addition, the Funds had post-Act capital losses as follows:
| | | | | | | | |
| FUND | | Short-Term | | | Long-Term | |
| Evolving World Growth Fund | | $ | (6,680,965 | ) | | $ | — | |
| Global Equity Fund | | | (6,142,613 | ) | | | — | |
Note 5 – Short Sales
Securities sold short represent obligations to deliver the securities at a future date. A Fund may sell a security it does not own in anticipation of a decline in the value of that security before the delivery date. When the Fund sells a security short, it must borrow the security sold short and deliver it to the broker-dealer through which it made the short sale. Dividends paid on securities sold short are disclosed as an expense on the Statements of Operations. A gain, limited to the price at which the Fund sold the security short, or a loss, unlimited in size, will be realized upon the termination of a short sale.
Notes to Financial Statements (Unaudited)
To secure its obligation to deliver to the broker-dealer the securities sold short, the Fund must segregate an amount of cash or liquid securities with its custodian equal to any excess of the current market value of the securities sold short over any cash or liquid securities deposited as collateral with the broker in connection with the short sale (not including the proceeds of the short sale). As a result of that requirement, the Fund will not gain any leverage merely by selling short, except to the extent that it earns interest or other income or gains on the segregated cash or liquid securities while also being subject to the possibility of gain or loss from the securities sold short.
Note 6 – Derivative Instruments
Foreign Currency Risk. Each Fund may engage in portfolio hedging with respect to changes in currency exchange rates by entering into forward foreign currency contracts to purchase or sell currencies. A forward foreign currency contract is a commitment to purchase or sell a foreign currency at a future date at a negotiated forward rate. Risks associated with such contracts include, among other things, movement in the value of the foreign currency relative to the U.S. dollar and the ability of the counterparty to perform. The net unrealized gain, if any, represents the credit risk to the respective Fund on a forward foreign currency contract. The contracts are valued daily at forward foreign exchange rates. The Funds realize a gain or loss when a position is closed or upon settlement of the contracts.
Equity Risk. Each Fund may engage in option transactions and in doing so achieves similar objectives to what it would achieve through the sale or purchase of individual securities. A call option, upon payment of a premium, gives the purchaser of the option the right to buy, and the seller of the option the obligation to sell, the underlying security, index or other instrument at the exercise price. A put option gives the purchaser of the option, upon payment of a premium, the right to sell, and the seller the obligation to buy, the underlying security, index, or other instrument at the exercise price.
To seek to offset some of the risk of a potential decline in value of certain long positions, each Fund may also purchase put options on individual securities, broad-based securities indexes or certain exchange traded funds (“ETFs”). Each Fund may also seek to generate income from option premiums by writing (selling) options on a portion of the equity securities (including securities that are convertible into equity securities) in the Fund’s portfolio, on broad-based securities indexes, or certain ETFs.
When the Fund purchases an option, it pays a premium and an amount equal to that premium is recorded as an asset. When the Fund writes an option, it receives a premium and an amount equal to that premium is recorded as a liability. The asset or liability is adjusted daily to reflect the current market value of the option. If an option expires unexercised, the Fund realizes a gain or loss to the extent of the premium received or paid. If an option is exercised, the premium received or paid is recorded as an adjustment to the proceeds from the sale or the cost basis of the purchase. The difference between the premium and the amount received or paid on a closing purchase or sale transaction is also treated as a realized gain or loss. The cost of securities acquired through the exercise of call options is increased by premiums paid. The proceeds from securities sold through the exercise of put options are decreased by the premiums paid. Gain or loss on written options and purchased options is presented separately as net realized gain or loss on written options and net realized gain or loss on purchased options, respectively.
As of April 30, 2013, the Funds had outstanding purchased options and/or written options as listed on the Schedules of Investments. For the period ended April 30, 2013, the Funds had the following transactions in options written:
| | | | | | | | | | | | | | | | |
| | | GROWTH FUND | | | VALUE FUND | |
| | | NUMBER OF
CONTRACTS | | | PREMIUMS
RECEIVED | | | NUMBER OF
CONTRACTS | | | PREMIUMS
RECEIVED | |
| Options outstanding at October 31, 2012 | | | 4,300 | | | $ | 1,773,862 | | | | — | | | $ | — | |
| Options written | | | — | | | | — | | | | 25,540 | | | | 2,142,366 | |
| Options closed | | | (4,300 | ) | | | (1,773,862 | ) | | | (15,455 | ) | | | (1,431,040 | ) |
| Options exercised | | | — | | | | — | | | | (2,045 | ) | | | (208,040 | ) |
| Options expired | | | — | | | | — | | | | (2,825 | ) | | | (143,798 | ) |
| | | | |
| Options outstanding at April 30, 2013 | | | — | | | $ | — | | | | 5,215 | | | $ | 359,488 | |
| | | | |
| 124 | | CALAMOS FAMILY OF FUNDS SEMIANNUAL REPORT | | |
Notes to Financial Statements (Unaudited)
| | | | | | | | | | | | | | | | |
| | | GROWTH AND INCOME FUND | | | CONVERTIBLE FUND | |
| | | NUMBER OF
CONTRACTS | | | PREMIUMS
RECEIVED | | | NUMBER OF
CONTRACTS | | | PREMIUMS
RECEIVED | |
| Options outstanding at October 31, 2012 | | | 14,020 | | | $ | 5,103,155 | | | | 16,120 | | | $ | 3,544,111 | |
| Options written | | | 20,350 | | | | 5,071,710 | | | | 12,000 | | | | 548,309 | |
| Options closed | | | (34,020 | ) | | | (9,555,335 | ) | | | (16,120 | ) | | | (3,544,111 | ) |
| Options exercised | | | (350 | ) | | | (619,530 | ) | | | — | | | | — | |
| Options expired | | | — | | | | — | | | | (12,000 | ) | | | (548,309 | ) |
| | | | |
| Options outstanding at April 30, 2013 | | | — | | | $ | — | | | | — | | | $ | — | |
| | | |
| | | | | | | | | MARKET NEUTRAL INCOME FUND | |
| | | | | | | | | NUMBER OF
CONTRACTS | | | PREMIUMS
RECEIVED | |
| Options outstanding at October 31, 2012 | | | | | | | | | | | 26,380 | | | $ | 27,086,654 | |
| Options written | | | | | | | | | | | 40,323 | | | | 41,288,635 | |
| Options closed | | | | | | | | | | | (47,175 | ) | | | (53,179,081 | ) |
| Options exercised | | | | | | | | | | | (3,501 | ) | | | (1,182,025 | ) |
| Options expired | | | | | | | | | | | (970 | ) | | | (527,471 | ) |
| | | | | | | | | | | | |
| Options outstanding at April 30, 2013 | | | | | | | | | | | 15,057 | | | $ | 13,486,712 | |
As of April 30, 2013, the Funds had outstanding derivative contracts which are reflected on the Statements of Assets and Liabilities as follows:
| | | | | | | | |
| | | ASSET DERIVATIVES | |
| | | FORWARD CONTRACTS1
FAIR VALUE | | | OPTION PURCHASED2
FAIR VALUE | |
| Growth Fund | | $ | 1,316,384 | | | $ | — | |
| Value Fund | | | — | | | | 224,750 | |
| Focus Growth Fund | | | 13,105 | | | | — | |
| Growth and Income Fund | | | 963,351 | | | | 28,999,350 | |
| Global Growth and Income Fund | | | — | | | | 9,164,675 | |
| Convertible Fund | | | 362,540 | | | | 16,437,388 | |
| Market Neutral Income Fund | | | — | | | | 8,192,375 | |
| |
| | | LIABILITY DERIVATIVES | |
| | | FORWARD CONTRACTS1
FAIR VALUE | | | OPTIONS WRITTEN3
FAIR VALUE | |
| Growth Fund | | $ | 3,437,503 | | | $ | — | |
| Value Fund | | | — | | | | 242,355 | |
| Focus Growth Fund | | | 66,129 | | | | — | |
| Growth and Income Fund | | | 2,522,597 | | | | — | |
| Convertible Fund | | | 1,168,047 | | | | — | |
| Market Neutral Income Fund | | | — | | | | 22,859,623 | |
| (1) | Generally, the statement of assets and liabilities location for Forward contracts is Unrealized appreciation on forward foreign currency contracts for asset derivatives and Unrealized depreciation on forward foreign currency contracts for liability derivatives. |
| (2) | Generally, the statement of assets and liabilities location for Options purchased is Investment in securities. |
| (3) | Generally, the statement of assets and liabilities location for Options written is Options written. |
Notes to Financial Statements (Unaudited)
For the period ended April 30, 2013, the volume of derivative activity for the Funds is reflected below*:
| | | | | | | | | | | | |
| | | DERIVATIVE TYPE | |
| | | FORWARD CONTRACTS
FAIR VALUE | | | OPTION PURCHASED
FAIR VALUE | | | OPTIONS WRITTEN
FAIR VALUE | |
| Growth Fund | | | 1,812,956,900 | | | | — | | | | — | |
| Value Fund | | | — | | | | 11,425 | | | | 25,540 | |
| Focus Growth Fund | | | 26,589,240 | | | | — | | | | — | |
| International Growth Fund | | | 3,176,076 | | | | — | | | | — | |
| Global Equity Fund | | | 154,012,734 | | | | — | | | | — | |
| Growth and Income Fund | | | 1,504,364,334 | | | | 36,300 | | | | 20,350 | |
| Global Growth and Income Fund | | | 625,056,769 | | | | 11,535 | | | | — | |
| Convertible Fund | | | 631,708,462 | | | | 30,660 | | | | 12,000 | |
| Market Neutral Income Fund | | | — | | | | 44,906 | | | | 40,323 | |
| * | Activity during the period is measured by opened number of contracts for options purchased or written and opened forward foreign currency contracts (measured in notional). |
Note 7 – Synthetic Convertible Securities
A Fund may establish a “synthetic” convertible instrument by combining separate securities that possess the economic characteristics similar to a convertible security, i.e., fixed-income securities (“fixed-income component”), which may be a convertible or non-convertible security and the right to acquire equity securities (“convertible component”). The fixed-income component is achieved by investing in fixed income securities such as bonds, preferred stocks, and money market instruments. The convertible component is achieved by investing in warrants or purchased options to buy common stock at a certain exercise price, or options on a stock index. In establishing a synthetic instrument, the Fund may pool a basket of fixed-income securities and a basket of warrants or purchased options that produce the economic characteristics similar to a convertible security. Within each basket of fixed-income securities and warrants or options, different companies may issue the fixed-income and convertible components, which may be purchased separately and at different times.
A Fund may also purchase synthetic securities created by other parties, typically investment banks, including convertible structured notes. Convertible structured notes are fixed-income debentures linked to equity. Convertible structured notes have the attributes of a convertible security; however, the investment bank that issued the convertible note assumes the credit risk associated with the investment, rather than the issuer of the underlying common stock into which the note is convertible. Purchasing synthetic convertible securities may offer more flexibility than purchasing a convertible security.
Note 8 – Fair Value Measurements
Various inputs are used to determine the value of the Funds’ investments. These inputs are categorized into three broad levels as follows:
| | • | | Level 1 – Prices are determined using inputs from unadjusted quoted prices from active markets (including securities actively traded on a securities exchange) for identical assets. |
| | • | | Level 2 – Prices are determined using significant observable market inputs other than unadjusted quoted prices, including quoted prices of similar securities, fair value adjustments to quoted foreign securities, interest rates, credit risk, prepayment speeds, and other relevant data. |
| | • | | Level 3 – Prices reflect unobservable market inputs (including the Funds’ own judgments about assumptions market participants would use in determining fair value) when observable inputs are unavailable. |
Debt securities are valued based upon evaluated prices received from an independent pricing service or from a dealer or broker who makes markets in such securities. Pricing services utilize various observable market data and as such, debt securities are generally categorized as Level 2. The levels are not necessarily an indication of the risk or liquidity of the Funds’ investments. Transfers between the levels for investment securities or other financial instruments are measured at the end of the reporting period.
| | | | |
| 126 | | CALAMOS FAMILY OF FUNDS SEMIANNUAL REPORT | | |
Notes to Financial Statements (Unaudited)
The following is a summary of the inputs used in valuing the Funds’ holdings at fair value:
| | | | | | | | | | | | | | | | |
| | | GROWTH FUND | |
| | | LEVEL 1 | | | LEVEL 2 | | | LEVEL 3 | | | TOTAL | |
| Assets: | | | | | | | | | | | | | | | | |
Common Stocks | | $ | 4,614,685,482 | | | $ | 194,785,898 | | | $ | — | | | $ | 4,809,471,380 | |
Short Term Investment | | | 7,239,144 | | | | | | | | | | | | 7,239,144 | |
Forward Foreign Currency Contracts | | | | | | | 1,316,384 | | | | | | | | 1,316,384 | |
| | | | |
Total | | $ | 4,621,924,626 | | | $ | 196,102,282 | | | $ | — | | | $ | 4,818,026,908 | |
| | | | |
| Liabilities: | | | | | | | | | | | | | | | | |
Forward Foreign Currency Contracts | | $ | — | | | $ | 3,437,503 | | | $ | — | | | $ | 3,437,503 | |
| | | | |
Total | | $ | — | | | $ | 3,437,503 | | | $ | — | | | $ | 3,437,503 | |
| | | | |
| |
| | | VALUE FUND | |
| | | LEVEL 1 | | | LEVEL 2 | | | LEVEL 3 | | | TOTAL | |
| Assets: | | | | | | | | | | | | | | | | |
Common Stocks | | $ | 74,099,922 | | | $ | 1,236,773 | | | $ | — | | | $ | 75,336,695 | |
Purchased Options | | | 224,750 | | | | | | | | | | | | 224,750 | |
Short Term Investment | | | 3,458,028 | | | | | | | | | | | | 3,458,028 | |
| | | | |
Total | | $ | 77,782,700 | | | $ | 1,236,773 | | | $ | — | | | $ | 79,019,473 | |
| | | | |
| Liabilities: | | | | | | | | | | | | | | | | |
Written Options | | $ | 242,355 | | | $ | — | | | $ | — | | | $ | 242,355 | |
| | | | |
Total | | $ | 242,355 | | | $ | — | | | $ | — | | | $ | 242,355 | |
| | | | |
| |
| | | FOCUS GROWTH FUND | |
| | | LEVEL 1 | | | LEVEL 2 | | | LEVEL 3 | | | TOTAL | |
| Assets: | | | | | | | | | | | | | | | | |
Common Stocks | | $ | 55,063,546 | | | $ | 2,513,816 | | | $ | — | | | $ | 57,577,362 | |
Short Term Investment | | | 289,213 | | | | | | | | | | | | 289,213 | |
Forward Foreign Currency Contracts | | | | | | | 13,105 | | | | | | | | 13,105 | |
| | | | |
Total | | $ | 55,352,759 | | | $ | 2,526,921 | | | $ | — | | | $ | 57,879,680 | |
| | | | |
| Liabilities: | | | | | | | | | | | | | | | | |
Forward Foreign Currency Contracts | | $ | — | | | $ | 66,129 | | | $ | — | | | $ | 66,129 | |
| | | | |
Total | | $ | — | | | $ | 66,129 | | | $ | — | | | $ | 66,129 | |
| | | | |
| |
| | | DISCOVERY GROWTH FUND | |
| | | LEVEL 1 | | | LEVEL 2 | | | LEVEL 3 | | | TOTAL | |
| Assets: | | | | | | | | | | | | | | | | |
Common Stocks | | $ | 34,663,637 | | | $ | — | | | $ | — | | | $ | 34,663,637 | |
Short Term Investment | | | 2,019,642 | | | | | | | | | | | | 2,019,642 | |
| | | | |
Total | | $ | 36,683,279 | | | $ | — | | | $ | — | | | $ | 36,683,279 | |
| | | | |
| |
| | | INTERNATIONAL GROWTH FUND | |
| | | LEVEL 1 | | | LEVEL 2 | | | LEVEL 3 | | | TOTAL | |
| Assets: | | | | | | | | | | | | | | | | |
Common Stocks | | $ | 251,559,104 | | | $ | 740,100,472 | | | $ | — | | | $ | 991,659,576 | |
Short Term Investment | | | 38,507,942 | | | | | | | | | | | | 38,507,942 | |
| | | | |
Total | | $ | 290,067,046 | | | $ | 740,100,472 | | | $ | — | | | $ | 1,030,167,518 | |
| | | | |
Notes to Financial Statements (Unaudited)
| | | | | | | | | | | | | | | | |
| | | EVOLVING WORLD GROWTH FUND | |
| | | LEVEL 1 | | | LEVEL 2 | | | LEVEL 3 | | | TOTAL | |
| Assets: | | | | | | | | | | | | | | | | |
Convertible Bonds | | $ | — | | | $ | 87,181,664 | | | $ | — | | | $ | 87,181,664 | |
Common Stocks | | | 93,520,685 | | | | 238,202,084 | | | | | | | | 331,722,769 | |
Short Term Investment | | | 19,897,898 | | | | | | | | | | | | 19,897,898 | |
| | | | |
Total | | $ | 113,418,583 | | | $ | 325,383,748 | | | $ | — | | | $ | 438,802,331 | |
| | | | |
| | | | |
| | | TRANSFERS IN
TO LEVEL 1 | | | TRANSFERS OUT
OF LEVEL 1* | | | TRANSFERS IN
TO LEVEL 2* | | | TRANSFERS OUT
OF LEVEL 2 | |
| Investments, at Value: | | | | | | | | | | | | | | | | |
Common Stocks | | $ | — | | | $ | 1,961,707 | | | $ | 1,961,707 | | | $ | — | |
| | | | |
Total | | $ | — | | | $ | 1,961,707 | | | $ | 1,961,707 | | | $ | — | |
| | | | |
| * | Transfers from Level 1 to Level 2 were due to the availability of an applied factor utilizing a systematic fair valuation model on securities that trade on European and Far Eastern exchanges. |
| | | | | | | | | | | | | | | | |
| |
| | | GLOBAL EQUITY FUND | |
| | | LEVEL 1 | | | LEVEL 2 | | | LEVEL 3 | | | TOTAL | |
| Assets: | | | | | | | | | | | | | | | | |
Common Stocks | | $ | 249,001,727 | | | $ | 154,257,535 | | | $ | — | | | $ | 403,259,262 | |
Short Term Investment | | | 10,212,885 | | | | | | | | | | | | 10,212,885 | |
| | | | |
Total | | $ | 259,214,612 | | | $ | 154,257,535 | | | $ | — | | | $ | 413,472,147 | |
| | | | |
| |
| | | GROWTH AND INCOME FUND | |
| | | LEVEL 1 | | | LEVEL 2 | | | LEVEL 3 | | | TOTAL | |
| Assets: | | | | | | | | | | | | | | | | |
Convertible Bonds | | $ | — | | | $ | 1,280,454,765 | | | $ | — | | | $ | 1,280,454,765 | |
Synthetic Convertible Securities (Corporate Bonds) | | | | | | | 177,609,493 | | | | | | | | 177,609,493 | |
Synthetic Convertible Securities (Purchased Options) | | | 28,999,350 | | | | | | | | | | | | 28,999,350 | |
Convertible Preferred Stocks | | | 235,752,396 | | | | 119,055,000 | | | | | | | | 354,807,396 | |
Common Stocks | | | 1,636,663,150 | | | | 111,774,654 | | | | | | | | 1,748,437,804 | |
Short Term Investment | | | 12,591,454 | | | | | | | | | | | | 12,591,454 | |
Forward Foreign Currency Contracts | | | | | | | 963,351 | | | | | | | | 963,351 | |
| | | | |
Total | | $ | 1,914,006,350 | | | $ | 1,689,857,263 | | | $ | — | | | $ | 3,603,863,613 | |
| | | | |
| Liabilities: | | | | | | | | | | | | | | | | |
Forward Foreign Currency Contracts | | $ | — | | | $ | 2,522,597 | | | $ | — | | | $ | 2,522,597 | |
| | | | |
Total | | $ | — | | | $ | 2,522,597 | | | $ | — | | | $ | 2,522,597 | |
| | | | |
| |
| | | GLOBAL GROWTH AND INCOME FUND | |
| | | LEVEL 1 | | | LEVEL 2 | | | LEVEL 3 | | | TOTAL | |
| Assets: | | | | | | | | | | | | | | | | |
Convertible Bonds | | $ | — | | | $ | 261,146,331 | | | $ | — | | | $ | 261,146,331 | |
Synthetic Convertible Securities (Corporate Bonds) | | | | | | | 30,785,859 | | | | | | | | 30,785,859 | |
Synthetic Convertible Securities (Sovereign Bonds) | | | | | | | 42,097,169 | | | | | | | | 42,097,169 | |
Synthetic Convertible Securities (Purchased Options) | | | 9,164,675 | | | | | | | | | | | | 9,164,675 | |
Convertible Preferred Stocks | | | 5,909,600 | | | | 26,492,329 | | | | | | | | 32,401,929 | |
Common Stocks | | | 183,551,884 | | | | 178,268,534 | | | | | | | | 361,820,418 | |
Short Term Investment | | | 603 | | | | | | | | | | | | 603 | |
| | | | |
Total | | $ | 198,626,762 | | | $ | 538,790,222 | | | $ | — | | | $ | 737,416,984 | |
| | | | |
| | | | |
| 128 | | CALAMOS FAMILY OF FUNDS SEMIANNUAL REPORT | | |
Notes to Financial Statements (Unaudited)
| | | | | | | | | | | | | | | | |
| | | CONVERTIBLE FUND | |
| | | LEVEL 1 | | | LEVEL 2 | | | LEVEL 3 | | | TOTAL | |
| Assets: | | | | | | | | | | | | | | | | |
Convertible Bonds | | $ | — | | | $ | 722,048,207 | | | $ | — | | | $ | 722,048,207 | |
Synthetic Convertible Securities (Corporate Bonds) | | | | | | | 44,602,825 | | | | | | | | 44,602,825 | |
Synthetic Convertible Securities (Purchased Options) | | | 16,437,388 | | | | | | | | | | | | 16,437,388 | |
Convertible Preferred Stocks | | | 128,832,069 | | | | 76,626,586 | | | | | | | | 205,458,655 | |
Common Stocks | | | 139,951,620 | | | | 29,476,271 | | | | | | | | 169,427,891 | |
Short Term Investment | | | 20,365,042 | | | | | | | | | | | | 20,365,042 | |
Forward Foreign Currency Contracts | | | | | | | 362,540 | | | | | | | | 362,540 | |
| | | | |
Total | | $ | 305,586,119 | | | $ | 873,116,429 | | | $ | — | | | $ | 1,178,702,548 | |
| | | | |
| Liabilities: | | | | | | | | | | | | | | | | |
Forward Foreign Currency Contracts | | $ | — | | | $ | 1,168,047 | | | $ | — | | | $ | 1,168,047 | |
| | | | |
Total | | $ | — | | | $ | 1,168,047 | | | $ | — | | | $ | 1,168,047 | |
| | | | |
| |
| | | TOTAL RETURN BOND FUND | |
| | | LEVEL 1 | | | LEVEL 2 | | | LEVEL 3 | | | TOTAL | |
| Assets: | | | | | | | | | | | | | | | | |
Corporate Bonds | | $ | — | | | $ | 168,191,006 | | | $ | — | | | $ | 168,191,006 | |
Convertible Bonds | | | | | | | 1,044,545 | | | | | | | | 1,044,545 | |
Sovereign Bonds | | | | | | | 14,124,654 | | | | | | | | 14,124,654 | |
U.S. Government and Agency Securities | | | | | | | 18,005,988 | | | | | | | | 18,005,988 | |
Residential Mortgage Backed Securities | | | | | | | 5,391,265 | | | | | | | | 5,391,265 | |
Short Term Investment | | | 305 | | | | | | | | | | | | 305 | |
| | | | |
Total | | $ | 305 | | | $ | 206,757,458 | | | $ | — | | | $ | 206,757,763 | |
| | | | |
| |
| | | HIGH INCOME FUND | |
| | | LEVEL 1 | | | LEVEL 2 | | | LEVEL 3 | | | TOTAL | |
| Assets: | | | | | | | | | | | | | | | | |
Corporate Bonds | | $ | — | | | $ | 276,467,301 | | | $ | — | | | $ | 276,467,301 | |
Convertible Bond | | | | | | | 2,348,841 | | | | | | | | 2,348,841 | |
Convertible Preferred Stocks | | | 2,977,811 | | | | 7,313,250 | | | | | | | | 10,291,061 | |
Short Term Investment | | | 7,419,250 | | | | | | | | | | | | 7,419,250 | |
| | | | |
Total | | $ | 10,397,061 | | | $ | 286,129,392 | | | $ | — | | | $ | 296,526,453 | |
| | | | |
Notes to Financial Statements (Unaudited)
| | | | | | | | | | | | | | | | |
| | | MARKET NEUTRAL INCOME FUND | |
| | | LEVEL 1 | | | LEVEL 2 | | | LEVEL 3 | | | TOTAL | |
| Assets: | | | | | | | | | | | | | | | | |
Convertible Bonds | | $ | — | | | $ | 759,761,664 | | | $ | — | | | $ | 759,761,664 | |
Synthetic Convertible Securities (Corporate Bonds) | | | | | | | 505,271,694 | | | | | | | | 505,271,694 | |
Synthetic Convertible Securities (Sovereign Bonds) | | | | | | | 107,926,292 | | | | | | | | 107,926,292 | |
Synthetic Convertible Securities (Purchased Options) | | | 2,689,875 | | | | | | | | | | | | 2,689,875 | |
Common Stocks | | | 1,170,962,336 | | | | 1,220,072 | | | | | | | | 1,172,182,408 | |
Purchased Options | | | 5,502,500 | | | | | | | | | | | | 5,502,500 | |
Short Term Investment | | | 211,360,604 | | | | | | | | | | | | 211,360,604 | |
| | | | |
Total | | $ | 1,390,515,315 | | | $ | 1,374,179,722 | | | $ | — | | | $ | 2,764,695,037 | |
| | | | |
| Liabilities: | | | | | | | | | | | | | | | | |
Common Stocks Sold Short | | $ | 353,073,326 | | | $ | 573,039 | | | $ | — | | | $ | 353,646,365 | |
Exchange-Traded Funds Sold Short | | | 6,433,984 | | | | 352,890 | | | | | | | | 6,786,874 | |
Written Options | | | 22,859,623 | | | | | | | | | | | | 22,859,623 | |
| | | | |
Total | | $ | 382,366,933 | | | $ | 925,929 | | | $ | — | | | $ | 383,292,862 | |
| | | | |
| | | | |
| 130 | | CALAMOS FAMILY OF FUNDS SEMIANNUAL REPORT | | |
Notes to Financial Statements (Unaudited)
Note 9 – Capital Share Transactions
The following table summarizes the activity in capital shares of the Funds:
| | | | | | | | | | | | | | | | | | | | | | | | | | | | | | | | |
| For the Period Ended April 30, 2013 | | | | | | | | | | | | | | | | | | | |
| | | GROWTH FUND | | | VALUE FUND | | | FOCUS GROWTH FUND | | | DISCOVERY GROWTH
FUND | |
| Class A | | Shares | | | Dollars | | | Shares | | | Dollars | | | Shares | | | Dollars | | | Shares | | | Dollars | |
| Shares sold | | | 3,623,845 | | | $ | 177,771,632 | | | | 1,723,467 | | | $ | 21,409,841 | | | | 579,774 | | | $ | 7,965,239 | | | | 144,309 | | | $ | 1,773,225 | |
| Shares issued as reinvestment of distributions | | | 4,375,618 | | | | 208,498,223 | �� | | | 59,323 | | | | 726,702 | | | | 7,383 | | | | 99,669 | | | | — | | | | — | |
| Less shares redeemed | | | (23,267,141 | ) | | | (1,145,769,225 | ) | | | (732,093 | ) | | | (9,479,202 | ) | | | (645,450 | ) | | | (8,942,353 | ) | | | (186,768 | ) | | | (2,295,071 | ) |
| | | | | | | | |
| Net increase (decrease) | | | (15,267,678 | ) | | $ | (759,499,370 | ) | | | 1,050,697 | | | $ | 12,657,341 | | | | (58,293 | ) | | $ | (877,445 | ) | | | (42,459 | ) | | $ | (521,846 | ) |
| | | | | | | | |
| | | | | | | | |
| Class B | | Shares | | | Dollars | | | Shares | | | Dollars | | | Shares | | | Dollars | | | Shares | | | Dollars | |
| Shares sold* | | | 20,035 | | | $ | 939,000 | | | | 9,977 | | | $ | 120,898 | | | | 7,491 | | | $ | 99,304 | | | | 7,095 | | | $ | 87,701 | |
| Shares issued as reinvestment of distributions | | | 220,222 | | | | 10,255,736 | | | | 166 | | | | 1,909 | | | | — | | | | — | | | | — | | | | — | |
| Less shares redeemed | | | (1,512,572 | ) | | | (72,891,827 | ) | | | (36,564 | ) | | | (435,348 | ) | | | (50,379 | ) | | | (653,139 | ) | | | (5,202 | ) | | | (61,348 | ) |
| | | | | | | | |
| Net increase (decrease) | | | (1,272,315 | ) | | $ | (61,697,091 | ) | | | (26,421 | ) | | $ | (312,541 | ) | | | (42,888 | ) | | $ | (553,835 | ) | | | 1,893 | | | $ | 26,353 | |
| | | | | | | | |
| | | | | | | | |
| Class C | | Shares | | | Dollars | | | Shares | | | Dollars | | | Shares | | | Dollars | | | Shares | | | Dollars | |
| Shares sold | | | 803,720 | | | $ | 34,375,105 | | | | 51,214 | | | $ | 605,092 | | | | 80,618 | | | $ | 1,034,692 | | | | 105,037 | | | $ | 1,266,329 | |
| Shares issued as reinvestment of distributions | | | 1,854,456 | | | | 78,072,616 | | | | 1,932 | | | | 22,046 | | | | — | | | | — | | | | — | | | | — | |
| Less shares redeemed | | | (6,363,979 | ) | | | (277,416,498 | ) | | | (64,356 | ) | | | (755,878 | ) | | | (110,810 | ) | | | (1,437,795 | ) | | | (120,455 | ) | | | (1,504,949 | ) |
| | | | | | | | |
| Net increase (decrease) | | | (3,705,803 | ) | | $ | (164,968,777 | ) | | | (11,210 | ) | | $ | (128,740 | ) | | | (30,192 | ) | | $ | (403,103 | ) | | | (15,418 | ) | | $ | (238,620 | ) |
| | | | | | | | |
| | | | | | | | |
| Class I | | Shares | | | Dollars | | | Shares | | | Dollars | | | Shares | | | Dollars | | | Shares | | | Dollars | |
| Shares sold | | | 2,100,032 | | | $ | 113,813,321 | | | | 455,572 | | | $ | 5,876,037 | | | | 26,497 | | | $ | 364,931 | | | | 73,170 | | | $ | 919,600 | |
| Shares issued as reinvestment of distributions | | | 1,766,350 | | | | 93,121,966 | | | | 14,490 | | | | 181,118 | | | | 14,398 | | | | 195,660 | | | | — | | | | — | |
| Less shares redeemed | | | (12,856,515 | ) | | | (699,022,283 | ) | | | (115,354 | ) | | | (1,491,739 | ) | | | (228,020 | ) | | | (3,187,552 | ) | | | (168,922 | ) | | | (2,104,449 | ) |
| | | | | | | | |
| Net increase (decrease) | | | (8,990,133 | ) | | $ | (492,086,996 | ) | | | 354,708 | | | $ | 4,565,416 | | | | (187,125 | ) | | $ | (2,626,961 | ) | | | (95,752 | ) | | $ | (1,184,849 | ) |
| | | | | | | | |
| | | | | | | | |
| Class R | | Shares | | | Dollars | | | Shares | | | Dollars | | | Shares | | | Dollars | | | Shares | | | Dollars | |
| Shares sold | | | 43,476 | | | $ | 2,101,894 | | | | 16 | | | $ | 210 | | | | 543 | | | $ | 7,402 | | | | 31,427 | | | $ | 390,000 | |
| Shares issued as reinvestment of distributions | | | 23,489 | | | | 1,100,673 | | | | 91 | | | | 1,105 | | | | 33 | | | | 451 | | | | — | | | | — | |
| Less shares redeemed | | | (119,893 | ) | | | (5,803,605 | ) | | | — | | | | — | | | | — | | | | — | | | | (2,427 | ) | | | (30,359 | ) |
| | | | | | | | |
| Net increase (decrease) | | | (52,928 | ) | | $ | (2,601,038 | ) | | | 107 | | | $ | 1,315 | | | | 576 | | | $ | 7,853 | | | | 29,000 | | | $ | 359,641 | |
| | | | | | | | |
| * | Class B shares continue to be outstanding but are no longer an offered class of shares. |
Notes to Financial Statements (Unaudited)
| | | | | | | | | | | | | | | | | | | | | | | | | | | | | | | | |
| | | INTERNATIONAL
GROWTH FUND | | | EVOLVING WORLD
GROWTH FUND | | | GLOBAL EQUITY FUND | | | GROWTH AND
INCOME FUND | |
| Class A | | Shares | | | Dollars | | | Shares | | | Dollars | | | Shares | | | Dollars | | | Shares | | | Dollars | |
| Shares sold | | | 7,782,919 | | | $ | 138,860,135 | | | | 2,901,741 | | | $ | 37,905,283 | | | | 5,887,895 | | | $ | 78,291,879 | | | | 2,697,629 | | | $ | 87,963,921 | |
| Shares issued as reinvestment of distributions | | | 52,310 | | | | 923,270 | | | | — | | | | — | | | | 17,456 | | | | 231,115 | | | | 1,880,736 | | | | 60,221,176 | |
| Less shares redeemed | | | (9,621,351 | ) | | | (172,604,080 | ) | | | (2,862,758 | ) | | | (37,355,718 | ) | | | (3,568,880 | ) | | | (47,826,120 | ) | | | (13,149,126 | ) | | | (429,251,031 | ) |
| | | | | | | | |
| Net increase (decrease) | | | (1,786,122 | ) | | $ | (32,820,675 | ) | | | 38,983 | | | $ | 549,565 | | | | 2,336,471 | | | $ | 30,696,874 | | | | (8,570,761 | ) | | $ | (281,065,934 | ) |
| | | | | | | | |
| | | | | | | | |
| Class B | | Shares | | | Dollars | | | Shares | | | Dollars | | | Shares | | | Dollars | | | Shares | | | Dollars | |
| Shares sold* | | | 28,423 | | | $ | 487,578 | | | | 15,936 | | | $ | 205,631 | | | | 48,707 | | | $ | 628,341 | | | | 16,712 | | | $ | 618,205 | |
| Shares issued as reinvestment of distributions | | | — | | | | — | | | | — | | | | — | | | | — | | | | — | | | | 56,819 | | | | 2,085,824 | |
| Less shares redeemed | | | (120,473 | ) | | | (2,038,784 | ) | | | (11,491 | ) | | | (147,669 | ) | | | (40,030 | ) | | | (517,972 | ) | | | (833,255 | ) | | | (31,144,082 | ) |
| | | | | | | | |
| Net increase (decrease) | | | (92,050 | ) | | $ | (1,551,206 | ) | | | 4,445 | | | $ | 57,962 | | | | 8,677 | | | $ | 110,369 | | | | (759,724 | ) | | $ | (28,440,053 | ) |
| | | | | | | | |
| | | | | | | | |
| Class C | | Shares | | | Dollars | | | Shares | | | Dollars | | | Shares | | | Dollars | | | Shares | | | Dollars | |
| Shares sold | | | 566,585 | | | $ | 9,606,489 | | | | 730,552 | | | $ | 9,315,180 | | | | 1,042,224 | | | $ | 13,393,684 | | | | 773,112 | | | $ | 25,190,075 | |
| Shares issued as reinvestment of distributions | | | — | | | | — | | | | — | | | | — | | | | — | | | | — | | | | 965,517 | | | | 31,060,689 | |
| Less shares redeemed | | | (526,084 | ) | | | (8,906,091 | ) | | | (364,636 | ) | | | (4,652,375 | ) | | | (444,451 | ) | | | (5,746,774 | ) | | | (5,714,024 | ) | | | (187,211,657 | ) |
| | | | | | | | |
| Net increase (decrease) | | | 40,501 | | | $ | 700,398 | | | | 365,916 | | | $ | 4,662,805 | | | | 597,773 | | | $ | 7,646,910 | | | | (3,975,395 | ) | | $ | (130,960,893 | ) |
| | | | | | | | |
| | | | | | | | |
| Class I | | Shares | | | Dollars | | | Shares | | | Dollars | | | Shares | | | Dollars | | | Shares | | | Dollars | |
| Shares sold | | | 8,716,813 | | | $ | 157,498,428 | | | | 10,202,399 | | | $ | 134,495,959 | | | | 3,815,758 | | | $ | 51,147,566 | | | | 3,032,255 | | | $ | 96,480,299 | |
| Shares issued as reinvestment of distributions | | | 89,627 | | | | 1,598,047 | | | | 27,826 | | | | 363,964 | | | | 47,653 | | | | 635,699 | | | | 845,738 | | | | 26,437,755 | |
| Less shares redeemed | | | (5,955,493 | ) | | | (107,258,796 | ) | | | (4,311,152 | ) | | | (56,604,131 | ) | | | (4,741,724 | ) | | | (63,751,167 | ) | | | (9,377,102 | ) | | | (298,884,587 | ) |
| | | | | | | | |
| Net increase (decrease) | | | 2,850,947 | | | $ | 51,837,679 | | | | 5,919,073 | | | $ | 78,255,792 | | | | (878,313 | ) | | $ | (11,967,902 | ) | | | (5,499,109 | ) | | $ | (175,966,533 | ) |
| | | | | | | | |
| | | | | | | | |
| Class R | | Shares | | | Dollars | | | Shares | | | Dollars | | | Shares | | | Dollars | | | Shares | | | Dollars | |
| Shares sold | | | 555,638 | | | $ | 9,798,817 | | | | 55,485 | | | $ | 707,890 | | | | 394,804 | | | $ | 5,225,309 | | | | 114,025 | | | $ | 3,700,051 | |
| Shares issued as reinvestment of distributions | | | 514 | | | | 8,961 | | | | — | | | | — | | | | 357 | | | | 4,668 | | | | 20,529 | | | | 653,652 | |
| Less shares redeemed | | | (258,266 | ) | | | (4,593,887 | ) | | | (53,655 | ) | | | (697,600 | ) | | | (151,119 | ) | | | (2,010,771 | ) | | | (94,950 | ) | | | (3,085,009 | ) |
| | | | | | | | |
| Net increase (decrease) | | | 297,886 | | | $ | 5,213,891 | | | | 1,830 | | | $ | 10,290 | | | | 244,042 | | | $ | 3,219,206 | | | | 39,604 | | | $ | 1,268,694 | |
| | | | | | | | |
| * | Class B shares continue to be outstanding but are no longer an offered class of shares. |
| | | | |
| 132 | | CALAMOS FAMILY OF FUNDS SEMIANNUAL REPORT | | |
Notes to Financial Statements (Unaudited)
| | | | | | | | | | | | | | | | | | | | | | | | | | | | | | | | |
| | | GLOBAL GROWTH
AND INCOME FUND | | | CONVERTIBLE FUND | | | TOTAL RETURN
BOND FUND | | | HIGH INCOME FUND | |
| Class A | | Shares | | | Dollars | | | Shares | | | Dollars | | | Shares | | | Dollars | | | Shares | | | Dollars | |
| Shares sold | | | 1,199,703 | | | $ | 13,122,763 | | | | 456,917 | | | $ | 7,697,869 | | | | 1,002,313 | | | $ | 11,096,968 | | | | 2,609,003 | | | $ | 25,920,278 | |
| Shares issued as reinvestment of distributions | | | 756,099 | | | | 8,155,997 | | | | 2,735,077 | | | | 45,128,774 | | | | 229,965 | | | | 2,541,509 | | | | 958,713 | | | | 9,518,071 | |
| Less shares redeemed | | | (7,097,470 | ) | | | (77,646,952 | ) | | | (11,394,680 | ) | | | (196,632,085 | ) | | | (2,750,978 | ) | | | (30,349,225 | ) | | | (3,320,233 | ) | | | (33,053,773 | ) |
| | | | | | | | |
| Net increase (decrease) | | | (5,141,668 | ) | | $ | (56,368,192 | ) | | | (8,202,686 | ) | | $ | (143,805,442 | ) | | | (1,518,700 | ) | | $ | (16,710,748 | ) | | | 247,483 | | | $ | 2,384,576 | |
| | | | | | | | |
| | | | | | | | |
| Class B | | Shares | | | Dollars | | | Shares | | | Dollars | | | Shares | | | Dollars | | | Shares | | | Dollars | |
| Shares sold* | | | 8,941 | | | $ | 98,309 | | | | 11,736 | | | $ | 237,222 | | | | 51,752 | | | $ | 573,479 | | | | 33,974 | | | $ | 352,083 | |
| Shares issued as reinvestment of distributions | | | 29,572 | | | | 322,632 | | | | 31,242 | | | | 630,774 | | | | 8,714 | | | | 96,308 | | | | 16,644 | | | | 172,717 | |
| Less shares redeemed | | | (418,923 | ) | | | (4,640,556 | ) | | | (146,682 | ) | | | (3,087,768 | ) | | | (272,559 | ) | | | (3,014,331 | ) | | | (202,684 | ) | | | (2,106,674 | ) |
| | | | | | | | |
| Net increase (decrease) | | | (380,410 | ) | | $ | (4,219,615 | ) | | | (103,704 | ) | | $ | (2,219,772 | ) | | | (212,093 | ) | | $ | (2,344,544 | ) | | | (152,066 | ) | | $ | (1,581,874 | ) |
| | | | | | | | |
| | | | | | | | |
| Class C | | Shares | | | Dollars | | | Shares | | | Dollars | | | Shares | | | Dollars | | | Shares | | | Dollars | |
| Shares sold | | | 460,758 | | | $ | 4,736,043 | | | | 482,283 | | | $ | 7,920,040 | | | | 377,632 | | | $ | 4,190,834 | | | | 271,437 | | | $ | 2,800,411 | |
| Shares issued as reinvestment of distributions | | | 439,157 | | | | 4,461,838 | | | | 1,411,403 | | | | 23,104,667 | | | | 42,938 | | | | 474,293 | | | | 120,194 | | | | 1,237,500 | |
| Less shares redeemed | | | (4,560,504 | ) | | | (47,049,102 | ) | | | (5,122,804 | ) | | | (87,809,747 | ) | | | (1,079,629 | ) | | | (11,913,481 | ) | | | (696,838 | ) | | | (7,195,683 | ) |
| | | | | | | | |
| Net increase (decrease) | | | (3,660,589 | ) | | $ | (37,851,221 | ) | | | (3,229,118 | ) | | $ | (56,785,040 | ) | | | (659,059 | ) | | $ | (7,248,354 | ) | | | (305,207 | ) | | $ | (3,157,772 | ) |
| | | | | | | | |
| | | | | | | | |
| Class I | | Shares | | | Dollars | | | Shares | | | Dollars | | | Shares | | | Dollars | | | Shares | | | Dollars | |
| Shares sold | | | 2,413,852 | | | $ | 26,818,940 | | | | 1,505,684 | | | $ | 23,863,816 | | | | 391,015 | | | $ | 4,303,344 | | | | 316,132 | | | $ | 3,147,406 | |
| Shares issued as reinvestment of distributions | | | 1,852,975 | | | | 20,297,892 | | | | 2,145,759 | | | | 32,744,280 | | | | 84,086 | | | | 928,766 | | | | 120,318 | | | | 1,194,695 | |
| Less shares redeemed | | | (70,053,794 | ) | | | (781,075,571 | ) | | | (10,784,459 | ) | | | (173,500,571 | ) | | | (133,778 | ) | | | (1,475,934 | ) | | | (691,540 | ) | | | (6,883,152 | ) |
| | | | | | | | |
| Net increase (decrease) | | | (65,786,967 | ) | | $ | (733,958,739 | ) | | | (7,133,016 | ) | | $ | (116,892,475 | ) | | | 341,323 | | | $ | 3,756,176 | | | | (255,090 | ) | | $ | (2,541,051 | ) |
| | | | | | | | |
| | | | | | | | |
| Class R | | Shares | | | Dollars | | | Shares | | | Dollars | | | Shares | | | Dollars | | | Shares | | | Dollars | |
| Shares sold | | | 21,384 | | | $ | 231,409 | | | | 18,836 | | | $ | 324,125 | | | | 7,102 | | | $ | 78,416 | | | | 4,369 | | | $ | 43,439 | |
| Shares issued as reinvestment of distributions | | | 5,021 | | | | 53,688 | | | | 15,266 | | | | 250,976 | | | | 2,882 | | | | 31,847 | | | | 692 | | | | 6,857 | |
| Less shares redeemed | | | (83,106 | ) | | | (911,411 | ) | | | (38,649 | ) | | | (670,972 | ) | | | (9,720 | ) | | | (107,691 | ) | | | (7,314 | ) | | | (72,950 | ) |
| | | | | | | | |
| Net increase (decrease) | | | (56,701 | ) | | $ | (626,314 | ) | | | (4,547 | ) | | $ | (95,871 | ) | | | 264 | | | $ | 2,572 | | | | (2,253 | ) | | $ | (22,654 | ) |
| | | | | | | | |
| * | Class B shares continue to be outstanding but are no longer an offered class of shares. |
Notes to Financial Statements (Unaudited)
| | | | | | | | |
| | | MARKET NEUTRAL
INCOME FUND | |
| Class A | | Shares | | | Dollars | |
| Shares sold | | | 17,811,383 | | | $ | 227,848,891 | |
| Shares issued as reinvestment of distributions | | | 650,321 | | | | 8,288,374 | |
| Less shares redeemed | | | (14,487,871 | ) | | | (184,870,096 | ) |
| | | | |
| Net increase (decrease) | | | 3,973,833 | | | $ | 51,267,169 | |
| | | | |
| | |
| Class B | | Shares | | | Dollars | |
| Shares sold* | | | 17,500 | | | $ | 234,975 | |
| Shares issued as reinvestment of distributions | | | 1,677 | | | | 22,519 | |
| Less shares redeemed | | | (205,156 | ) | | | (2,753,865 | ) |
| | | | |
| Net increase (decrease) | | | (185,979 | ) | | $ | (2,496,371 | ) |
| | | | |
| | |
| Class C | | Shares | | | Dollars | |
| Shares sold | | | 1,493,645 | | | $ | 19,443,394 | |
| Shares issued as reinvestment of distributions | | | 51,984 | | | | 672,812 | |
| Less shares redeemed | | | (2,504,120 | ) | | | (32,445,570 | ) |
| | | | |
| Net increase (decrease) | | | (958,491 | ) | | $ | (12,329,364 | ) |
| | | | |
| | |
| Class I | | Shares | | | Dollars | |
| Shares sold | | | 31,340,362 | | | $ | 397,196,326 | |
| Shares issued as reinvestment of distributions | | | 600,268 | | | | 7,573,931 | |
| Less shares redeemed | | | (19,821,197 | ) | | | (250,728,565 | ) |
| | | | |
| Net increase (decrease) | | | 12,119,433 | | | $ | 154,041,692 | |
| | | | |
| | |
| Class R | | Shares | | | Dollars | |
| Shares sold | | | 81,601 | | | $ | 1,040,509 | |
| Shares issued as reinvestment of distributions | | | 1,703 | | | | 21,621 | |
| Less shares redeemed | | | (135,746 | ) | | | (1,717,606 | ) |
| | | | |
| Net increase (decrease) | | | (52,442 | ) | | $ | (655,476 | ) |
| | | | |
| * | Class B shares continue to be outstanding but are no longer an offered class of shares. |
| | | | |
| 134 | | CALAMOS FAMILY OF FUNDS SEMIANNUAL REPORT | | |
Notes to Financial Statements (Unaudited)
The following table summarizes the activity in capital shares of the Funds:
| | | | | | | | | | | | | | | | | | | | | | | | | | | | | | | | |
| For the Fiscal Year Ended October 31, 2012 | | | | | | | | | | |
| | | GROWTH FUND | | | VALUE FUND | | | FOCUS GROWTH FUND | | | DISCOVERY GROWTH FUND | |
| Class A | | Shares | | | Dollars | | | Shares | | | Dollars | | | Shares | | | Dollars | | | Shares | | | Dollars | |
| Shares sold | | | 10,505,496 | | | $ | 536,106,065 | | | | 1,614,207 | | | $ | 19,571,310 | | | | 1,824,153 | | | $ | 24,189,889 | | | | 1,026,286 | | | $ | 12,703,946 | |
| Shares issued as reinvestment of distributions | | | 3,461,089 | | | | 160,594,515 | | | | — | | | | — | | | | — | | | | — | | | | — | | | | — | |
| Less shares redeemed | | | (31,910,904 | ) | | | (1,619,007,303 | ) | | | (534,682 | ) | | | (6,210,081 | ) | | | (1,950,433 | ) | | | (26,139,424 | ) | | | (1,166,091 | ) | | | (14,464,424 | ) |
| | | | |
| Net increase (decrease) | | | (17,944,319 | ) | | $ | (922,306,723 | ) | | | 1,079,525 | | | $ | 13,361,229 | | | | (126,280 | ) | | $ | (1,949,535 | ) | | | (139,805 | ) | | $ | (1,760,478 | ) |
| | | | |
| | | | | | | | |
| Class B | | Shares | | | Dollars | | | Shares | | | Dollars | | | Shares | | | Dollars | | | Shares | | | Dollars | |
| Shares sold* | | | 39,046 | | | $ | 1,860,390 | | | | 7,339 | | | $ | 77,704 | | | | 25,962 | | | $ | 322,461 | | | | 5,436 | | | $ | 65,795 | |
| Shares issued as reinvestment of distributions | | | 252,072 | | | | 11,534,817 | | | | — | | | | — | | | | — | | | | — | | | | — | | | | — | |
| Less shares redeemed | | | (3,444,150 | ) | | | (172,863,101 | ) | | | (121,116 | ) | | | (1,304,967 | ) | | | (137,293 | ) | | | (1,674,526 | ) | | | (12,085 | ) | | | (145,283 | ) |
| | | | |
| Net increase (decrease) | | | (3,153,032 | ) | | $ | (159,467,894 | ) | | | (113,777 | ) | | $ | (1,227,263 | ) | | | (111,331 | ) | | $ | (1,352,065 | ) | | | (6,649 | ) | | $ | (79,488 | ) |
| | | | |
| | | | | | | | |
| Class C | | Shares | | | Dollars | | | Shares | | | Dollars | | | Shares | | | Dollars | | | Shares | | | Dollars | |
| Shares sold | | | 1,609,590 | | | $ | 72,213,342 | | | | 45,158 | | | $ | 479,648 | | | | 102,668 | | | $ | 1,232,774 | | | | 124,386 | | | $ | 1,488,155 | |
| Shares issued as reinvestment of distributions | | | 1,249,989 | | | | 52,124,549 | | | | — | | | | — | | | | — | | | | — | | | | — | | | | — | |
| Less shares redeemed | | | (7,172,450 | ) | | | (326,005,316 | ) | | | (90,299 | ) | | | (971,280 | ) | | | (214,474 | ) | | | (2,632,941 | ) | | | (140,534 | ) | | | (1,653,651 | ) |
| | | | |
| Net increase (decrease) | | | (4,312,871 | ) | | $ | (201,667,425 | ) | | | (45,141 | ) | | $ | (491,632 | ) | | | (111,806 | ) | | $ | (1,400,167 | ) | | | (16,148 | ) | | $ | (165,496 | ) |
| | | | |
| | | | | | | | |
| Class I | | Shares | | | Dollars | | | Shares | | | Dollars | | | Shares | | | Dollars | | | Shares | | | Dollars | |
| Shares sold | | | 9,646,873 | | | $ | 536,691,413 | | | | 234,109 | | | $ | 2,873,701 | | | | 54,048 | | | $ | 706,266 | | | | 144,518 | | | $ | 1,723,197 | |
| Shares issued as reinvestment of distributions | | | 1,131,951 | | | | 57,571,037 | | | | — | | | | — | | | | — | | | | — | | | | — | | | | — | |
| Less shares redeemed | | | (9,150,156 | ) | | | (506,817,860 | ) | | | (434,411 | ) | | | (5,110,108 | ) | | | (144,853 | ) | | | (1,928,116 | ) | | | (61,618 | ) | | | (738,547 | ) |
| | | | |
| Net increase (decrease) | | | 1,628,668 | | | $ | 87,444,590 | | | | (200,302 | ) | | $ | (2,236,407 | ) | | | (90,805 | ) | | $ | (1,221,850 | ) | | | 82,900 | | | $ | 984,650 | |
| | | | |
| | | | | | | | |
| Class R | | Shares | | | Dollars | | | Shares | | | Dollars | | | Shares | | | Dollars | | | Shares | | | Dollars | |
| Shares sold | | | 180,292 | | | $ | 9,115,937 | | | | — | | | $ | — | | | | 4,845 | | | $ | 64,219 | | | | 99,835 | | | $ | 1,220,500 | |
| Shares issued as reinvestment of distributions | | | 11,656 | | | | 533,852 | | | | — | | | | — | | | | — | | | | — | | | | — | | | | — | |
| Less shares redeemed | | | (127,174 | ) | | | (6,357,645 | ) | | | — | | | | — | | | | (6 | ) | | | (78 | ) | | | (100,000 | ) | | | (1,220,500 | ) |
| | | | |
| Net increase (decrease) | | | 64,774 | | | $ | 3,292,144 | | | | — | | | $ | — | | | | 4,839 | | | $ | 64,141 | | | | (165 | ) | | $ | — | |
| | | | |
| * | Class B shares continue to be outstanding but are no longer an offered class of shares. |
Notes to Financial Statements (Unaudited)
| | | | | | | | | | | | | | | | | | | | | | | | | | | | | | | | |
| | | INTERNATIONAL GROWTH FUND | | | EVOLVING WORLD GROWTH FUND | | | GLOBAL EQUITY FUND | | | GROWTH AND INCOME FUND | |
| Class A | | Shares | | | Dollars | | | Shares | | | Dollars | | | Shares | | | Dollars | | | Shares | | | Dollars | |
| Shares sold | | | 19,839,314 | | | $ | 330,824,530 | | | | 7,620,647 | | | $ | 96,714,741 | | | | 10,430,802 | | | $ | 133,580,273 | | | | 11,969,866 | | | $ | 385,671,825 | |
| Shares issued as reinvestment of distributions | | | — | | | | — | | | | — | | | | — | | | | — | | | | — | | | | 1,194,455 | | | | 38,239,507 | |
| Less shares redeemed | | | (7,857,038 | ) | | | (130,638,683 | ) | | | (5,176,075 | ) | | | (65,500,409 | ) | | | (5,959,616 | ) | | | (77,031,653 | ) | | | (15,486,100 | ) | | | (500,117,210 | ) |
| | | | |
| Net increase (decrease) | | | 11,982,276 | | | $ | 200,185,847 | | | | 2,444,572 | | | $ | 31,214,332 | | | | 4,471,186 | | | $ | 56,548,620 | | | | (2,321,779 | ) | | $ | (76,205,878 | ) |
| | | | |
| | | | | | | | |
| Class B | | Shares | | | Dollars | | | Shares | | | Dollars | | | Shares | | | Dollars | | | Shares | | | Dollars | |
| Shares sold* | | | 10,240 | | | $ | 164,697 | | | | 4,589 | | | $ | 57,209 | | | | 32,925 | | | $ | 401,096 | | | | 48,217 | | | $ | 1,750,016 | |
| Shares issued as reinvestment of distributions | | | — | | | | — | | | | — | | | | — | | | | — | | | | — | | | | 29,365 | | | | 1,062,145 | |
| Less shares redeemed | | | (291,874 | ) | | | (4,647,688 | ) | | | (25,077 | ) | | | (306,796 | ) | | | (52,544 | ) | | | (638,753 | ) | | | (2,662,878 | ) | | | (98,273,664 | ) |
| | | | |
| Net increase (decrease) | | | (281,634 | ) | | $ | (4,482,991 | ) | | | (20,488 | ) | | $ | (249,587 | ) | | | (19,619 | ) | | $ | (237,657 | ) | | | (2,585,296 | ) | | $ | (95,461,503 | ) |
| | | | |
| | | | | | | | |
| Class C | | Shares | | | Dollars | | | Shares | | | Dollars | | | Shares | | | Dollars | | | Shares | | | Dollars | |
| Shares sold | | | 1,438,948 | | | $ | 22,952,276 | | | | 1,325,152 | | | $ | 16,534,845 | | | | 1,526,421 | | | $ | 18,726,273 | | | | 2,900,544 | | | $ | 92,829,831 | |
| Shares issued as reinvestment of distributions | | | — | | | | — | | | | — | | | | — | | | | — | | | | — | | | | 405,454 | | | | 13,007,195 | |
| Less shares redeemed | | | (855,098 | ) | | | (13,467,356 | ) | | | (336,606 | ) | | | (4,120,600 | ) | | | (350,362 | ) | | | (4,245,525 | ) | | | (6,706,848 | ) | | | (217,623,204 | ) |
| | | | |
| Net increase (decrease) | | | 583,850 | | | $ | 9,484,920 | | | | 988,546 | | | $ | 12,414,245 | | | | 1,176,059 | | | $ | 14,480,748 | | | | (3,400,850 | ) | | $ | (111,786,178 | ) |
| | | | |
| | | | | | | | |
| Class I | | Shares | | | Dollars | | | Shares | | | Dollars | | | Shares | | | Dollars | | | Shares | | | Dollars | |
| Shares sold | | | 17,663,962 | | | $ | 298,680,890 | | | | 9,650,910 | | | $ | 123,049,925 | | | | 14,224,507 | | | $ | 180,301,786 | | | | 10,305,880 | | | $ | 324,868,298 | |
| Shares issued as reinvestment of distributions | | | — | | | | — | | | | 5,596 | | | | 67,606 | | | | — | | | | — | | | | 577,286 | | | | 18,084,699 | |
| Less shares redeemed | | | (7,623,930 | ) | | | (129,698,251 | ) | | | (3,181,855 | ) | | | (40,171,605 | ) | | | (2,617,770 | ) | | | (33,574,169 | ) | | | (9,468,738 | ) | | | (299,903,926 | ) |
| | | | |
| Net increase (decrease) | | | 10,040,032 | | | $ | 168,982,639 | | | | 6,474,651 | | | $ | 82,945,926 | | | | 11,606,737 | | | $ | 146,727,617 | | | | 1,414,428 | | | $ | 43,049,071 | |
| | | | |
| | | | | | | | |
| Class R | | Shares | | | Dollars | | | Shares | | | Dollars | | | Shares | | | Dollars | | | Shares | | | Dollars | |
| Shares sold | | | 629,808 | | | $ | 10,394,017 | | | | 121,288 | | | $ | 1,515,936 | | | | 381,541 | | | $ | 4,808,402 | | | | 372,524 | | | $ | 11,924,841 | |
| Shares issued as reinvestment of distributions | | | — | | | | — | | | | — | | | | — | | | | — | | | | — | | | | 9,344 | | | | 298,328 | |
| Less shares redeemed | | | (152,172 | ) | | | (2,480,796 | ) | | | (101,942 | ) | | | (1,268,742 | ) | | | (157,851 | ) | | | (1,939,406 | ) | | | (180,708 | ) | | | (5,830,145 | ) |
| | | | |
| Net increase (decrease) | | | 477,636 | | | $ | 7,913,221 | | | | 19,346 | | | $ | 247,194 | | | | 223,690 | | | $ | 2,868,996 | | | | 201,160 | | | $ | 6,393,024 | |
| | | | |
| * | Class B shares continue to be outstanding but are no longer an offered class of shares. |
| | | | |
| 136 | | CALAMOS FAMILY OF FUNDS SEMIANNUAL REPORT | | |
Notes to Financial Statements (Unaudited)
| | | | | | | | | | | | | | | | | | | | | | | | | | | | | | | | |
| | | GLOBAL GROWTH AND INCOME FUND | | | CONVERTIBLE FUND | | | TOTAL RETURN BOND FUND | | | HIGH INCOME FUND | |
| Class A | | Shares | | | Dollars | | | Shares | | | Dollars | | | Shares | | | Dollars | | | Shares | | | Dollars | |
| Shares sold | | | 4,676,073 | | | $ | 50,328,371 | | | | 1,073,871 | | | $ | 18,893,724 | | | | 4,806,703 | | | $ | 53,045,894 | | | | 10,720,162 | | | $ | 104,172,343 | |
| Shares issued as reinvestment of distributions | | | 599,749 | | | | 6,448,673 | | | | 5,004,285 | | | | 85,735,396 | | | | 327,974 | | | | 3,606,008 | | | | 1,294,883 | | | | 12,565,688 | |
| Less shares redeemed | | | (11,948,284 | ) | | | (128,788,943 | ) | | | (35,199,945 | ) | | | (626,466,657 | ) | | | (3,120,800 | ) | | | (34,524,972 | ) | | | (9,171,270 | ) | | | (88,585,514 | ) |
| | | | |
| Net increase (decrease) | | | (6,672,462 | ) | | $ | (72,011,899 | ) | | | (29,121,789 | ) | | $ | (521,837,537 | ) | | | 2,013,877 | | | $ | 22,126,930 | | | | 2,843,775 | | | $ | 28,152,517 | |
| | | | |
| | | | | | | | |
| Class B | | Shares | | | Dollars | | | Shares | | | Dollars | | | Shares | | | Dollars | | | Shares | | | Dollars | |
| Shares sold* | | | 30,208 | | | $ | 326,329 | | | | 16,248 | | | $ | 336,236 | | | | 149,324 | | | $ | 1,650,230 | | | | 91,332 | | | $ | 933,602 | |
| Shares issued as reinvestment of distributions | | | 20,274 | | | | 223,707 | | | | 40,979 | | | | 845,807 | | | | 19,465 | | | | 213,491 | | | | 33,210 | | | | 336,058 | |
| Less shares redeemed | | | (1,369,061 | ) | | | (14,951,390 | ) | | | (328,432 | ) | | | (7,087,546 | ) | | | (626,291 | ) | | | (6,916,304 | ) | | | (516,080 | ) | | | (5,229,875 | ) |
| | | | |
| Net increase (decrease) | | | (1,318,579 | ) | | $ | (14,401,354 | ) | | | (271,205 | ) | | $ | (5,905,503 | ) | | | (457,502 | ) | | $ | (5,052,583 | ) | | | (391,538 | ) | | $ | (3,960,215 | ) |
| | | | |
| | | | | | | | |
| Class C | | Shares | | | Dollars | | | Shares | | | Dollars | | | Shares | | | Dollars | | | Shares | | | Dollars | |
| Shares sold | | | 1,483,744 | | | $ | 14,991,375 | | | | 684,833 | | | $ | 11,697,985 | | | | 1,160,218 | | | $ | 12,803,118 | | | | 913,283 | | | $ | 9,202,045 | |
| Shares issued as reinvestment of distributions | | | 248,159 | | | | 2,553,416 | | | | 1,756,623 | | | | 29,909,980 | | | | 71,364 | | | | 782,679 | | | | 166,088 | | | | 1,668,719 | |
| Less shares redeemed | | | (6,647,293 | ) | | | (67,471,674 | ) | | | (10,731,968 | ) | | | (189,705,588 | ) | | | (1,666,163 | ) | | | (18,395,787 | ) | | | (852,991 | ) | | | (8,611,697 | ) |
| | | | |
| Net increase (decrease) | | | (4,915,390 | ) | | $ | (49,926,883 | ) | | | (8,290,512 | ) | | $ | (148,097,623 | ) | | | (434,581 | ) | | $ | (4,809,990 | ) | | | 226,380 | | | $ | 2,259,067 | |
| | | | |
| | | | | | | | |
| Class I | | Shares | | | Dollars | | | Shares | | | Dollars | | | Shares | | | Dollars | | | Shares | | | Dollars | |
| Shares sold | | | 16,897,305 | | | $ | 184,516,172 | | | | 8,367,782 | | | $ | 139,103,591 | | | | 314,815 | | | $ | 3,473,712 | | | | 1,955,782 | | | $ | 19,059,577 | |
| Shares issued as reinvestment of distributions | | | 2,098,852 | | | | 22,816,153 | | | | 3,101,693 | | | | 49,556,014 | | | | 121,322 | | | | 1,333,425 | | | | 160,741 | | | | 1,560,084 | |
| Less shares redeemed | | | (19,031,731 | ) | | | (210,078,482 | ) | | | (24,612,366 | ) | | | (411,659,408 | ) | | | (276,566 | ) | | | (3,053,602 | ) | | | (977,485 | ) | | | (9,538,898 | ) |
| | | | |
| Net increase (decrease) | | | (35,574 | ) | | $ | (2,746,157 | ) | | | (13,142,891 | ) | | $ | (222,999,803 | ) | | | 159,571 | | | $ | 1,753,535 | | | | 1,139,038 | | | $ | 11,080,763 | |
| | | | |
| | | | | | | | |
| Class R | | Shares | | | Dollars | | | Shares | | | Dollars | | | Shares | | | Dollars | | | Shares | | | Dollars | |
| Shares sold | | | 243,891 | | | $ | 2,584,001 | | | | 36,133 | | | $ | 641,490 | | | | 15,774 | | | $ | 174,740 | | | | 12,558 | | | $ | 122,544 | |
| Shares issued as reinvestment of distributions | | | 2,639 | | | | 28,294 | | | | 17,316 | | | | 295,589 | | | | 4,254 | | | | 46,750 | | | | 890 | | | | 8,632 | |
| Less shares redeemed | | | (111,259 | ) | | | (1,181,547 | ) | | | (84,097 | ) | | | (1,489,384 | ) | | | (9,597 | ) | | | (106,063 | ) | | | (3,934 | ) | | | (38,077 | ) |
| | | | |
| Net increase (decrease) | | | 135,271 | | | $ | 1,430,748 | | | | (30,648 | ) | | $ | (552,305 | ) | | | 10,431 | | | $ | 115,427 | | | | 9,514 | | | $ | 93,099 | |
| | | | |
| * | Class B shares continue to be outstanding but are no longer an offered class of shares. |
Notes to Financial Statements (Unaudited)
| | | | | | | | |
| | | MARKET NEUTRAL INCOME FUND | |
| Class A | | Shares | | | Dollars | |
| Shares sold | | | 29,456,435 | | | $ | 366,459,302 | |
| Shares issued as reinvestment of distributions | | | 1,153,106 | | | | 14,280,789 | |
| Less shares redeemed | | | (45,425,854 | ) | | | (563,896,626 | ) |
| | | | |
| Net increase (decrease) | | | (14,816,313 | ) | | $ | (183,156,535 | ) |
| | | | |
| | |
| Class B | | Shares | | | Dollars | |
| Shares sold* | | | 12,949 | | | $ | 169,829 | |
| Shares issued as reinvestment of distributions | | | 3,301 | | | | 42,709 | |
| Less shares redeemed | | | (471,643 | ) | | | (6,194,208 | ) |
| | | | |
| Net increase (decrease) | | | (455,393 | ) | | $ | (5,981,670 | ) |
| | | | |
| | |
| Class C | | Shares | | | Dollars | |
| Shares sold | | | 918,605 | | | $ | 11,607,206 | |
| Shares issued as reinvestment of distributions | | | 78,835 | | | | 986,559 | |
| Less shares redeemed | | | (4,598,131 | ) | | | (58,049,887 | ) |
| | | | |
| Net increase (decrease) | | | (3,600,691 | ) | | $ | (45,456,122 | ) |
| | | | |
| | |
| Class I | | Shares | | | Dollars | |
| Shares sold | | | 45,989,733 | | | $ | 565,940,867 | |
| Shares issued as reinvestment of distributions | | | 863,801 | | | | 10,625,548 | |
| Less shares redeemed | | | (25,560,043 | ) | | | (315,592,232 | ) |
| | | | |
| Net increase (decrease) | | | 21,293,491 | | | $ | 260,974,183 | |
| | | | |
| | |
| Class R | | Shares | | | Dollars | |
| Shares sold | | | 254,780 | | | $ | 3,154,609 | |
| Shares issued as reinvestment of distributions | | | 2,643 | | | | 32,761 | |
| Less shares redeemed | | | (104,009 | ) | | | (1,295,766 | ) |
| | | | |
| Net increase (decrease) | | | 153,414 | | | $ | 1,891,604 | |
| | | | |
| * | Class B shares continue to be outstanding but are no longer an offered class of shares. |
| | | | |
| 138 | | CALAMOS FAMILY OF FUNDS SEMIANNUAL REPORT | | |
Calamos Growth Fund Financial Highlights
Selected data for a share outstanding throughout each period were as follows:
| | | | | | | | | | | | | | | | | | | | | | | | |
| | | CLASS A | |
| | | (Unaudited) Six Months
Ended
April 30, | | | Year Ended October 31, | |
| | | 2013 | | | 2012 | | | 2011 | | | 2010 | | | 2009 | | | 2008 | |
Net asset value, beginning of period | | | $49.90 | | | | $51.06 | | | | $49.18 | | | | $40.60 | | | | $32.20 | | | | $70.29 | |
Income from investment operations: | | | | | | | | | | | | | | | | | | | | | | | | |
Net investment income (loss)(a) | | | (0.04 | ) | | | (0.22 | ) | | | (0.32 | ) | | | (0.16 | ) | | | (0.14 | ) | | | (0.24 | ) |
Net realized and unrealized gain (loss) | | | 3.20 | | | | 1.21 | | | | 2.20 | | | | 8.74 | | | | 8.54 | | | | (30.29 | ) |
Total from investment operations | | | 3.16 | | | | 0.99 | | | | 1.88 | | | | 8.58 | | | | 8.40 | | | | (30.53 | ) |
Distributions: | | | | | | | | | | | | | | | | | | | | | | | | |
Dividends from net investment income | | | — | | | | — | | | | — | | | | — | | | | — | | | | — | |
Dividends from net realized gains | | | (3.73 | ) | | | (2.15 | ) | | | — | | | | — | | | | — | | | | (7.56 | ) |
Total distributions | | | (3.73 | ) | | | (2.15 | ) | | | — | | | | — | | | | — | | | | (7.56 | ) |
Net asset value, end of period | | | $49.33 | | | | $49.90 | | | | $51.06 | | | | $49.18 | | | | $40.60 | | | | $32.20 | |
Ratios and supplemental data: | | | | | | | | | | | | | | | | | | | | | | | | |
Total return(b) | | | 6.59% | | | | 2.26% | | | | 3.82% | | | | 21.13% | | | | 26.09% | | | | (48.11% | ) |
Net assets, end of period (000) | | | $2,451,593 | | | | $3,241,595 | | | | $4,232,942 | | | | $4,721,389 | | | | $5,017,458 | | | | $5,052,016 | |
Ratio of net expenses to average net assets | | | 1.30% | (c) | | | 1.29% | | | | 1.26% | | | | 1.27% | | | | 1.32% | | | | 1.21% | |
Ratio of gross expenses to average net assets prior to expense reductions | | | 1.30% | (c) | | | 1.29% | | | | 1.26% | | | | 1.27% | | | | 1.33% | | | | 1.22% | |
Ratio of net investment income (loss) to average net assets | | | (0.15% | )(c) | | | (0.44% | ) | | | (0.60% | ) | | | (0.37% | ) | | | (0.44% | ) | | | (0.46% | ) |
| | |
| | | (Unaudited)
Six Months
Ended
April 30, | | | Year Ended October 31, | |
| | | 2013 | | | 2012 | | | 2011 | | | 2010 | | | 2009 | | | 2008 | |
Portfolio turnover rate | | | 29.8% | | | | 57.0% | | | | 84.7% | | | | 52.7% | | | | 52.3% | | | | 73.9% | |
| (a) | Net investment income allocated based on average shares method. |
| (b) | Total return measures net investment income and capital gain or loss from portfolio investments assuming reinvestment of dividends and capital gains distributions. Total return is not annualized for periods that are less than a full year, does not reflect the effect of sales charge for Class A shares nor the contingent deferred sales charge for Class B and C shares and does not reflect the deduction of taxes that a shareholder would pay on fund distributions or the redemption of fund shares. |
Calamos Growth Fund Financial Highlights
| | | | | | | | | | | | | | | | | | | | | | | | |
| | | CLASS B | |
| | | (Unaudited) Six Months
Ended
April 30, | | | Year Ended October 31, | |
| | | 2013 | | | 2012 | | | 2011 | | | 2010 | | | 2009 | | | 2008 | |
Net asset value, beginning of period | | | $48.90 | | | | $50.44 | | | | $48.96 | | | | $40.72 | | | | $32.53 | | | | $71.41 | |
Income from investment operations: | | | | | | | | | | | | | | | | | | | | | | | | |
Net investment income (loss)(a) | | | (0.22 | ) | | | (0.59 | ) | | | (0.71 | ) | | | (0.50 | ) | | | (0.39 | ) | | | (0.63 | ) |
Net realized and unrealized gain (loss) | | | 3.13 | | | | 1.20 | | | | 2.19 | | | | 8.74 | | | | 8.58 | | | | (30.69 | ) |
Total from investment operations | | | 2.91 | | | | 0.61 | | | | 1.48 | | | | 8.24 | | | | 8.19 | | | | (31.32 | ) |
Distributions: | | | | | | | | | | | | | | | | | | | | | | | | |
Dividends from net investment income | | | — | | | | — | | | | — | | | | — | | | | — | | | | — | |
Dividends from net realized gains | | | (3.73 | ) | | | (2.15 | ) | | | — | | | | — | | | | — | | | | (7.56 | ) |
Total distributions | | | (3.73 | ) | | | (2.15 | ) | | | — | | | | — | | | | — | | | | (7.56 | ) |
Net asset value, end of period | | | $48.08 | | | | $48.90 | | | | $50.44 | | | | $48.96 | | | | $40.72 | | | | $32.53 | |
Ratios and supplemental data: | | | | | | | | | | | | | | | | | | | | | | | | |
Total return(b) | | | 6.19% | | | | 1.50% | | | | 3.02% | | | | 20.24% | | | | 25.18% | | | | (48.50% | ) |
Net assets, end of period (000) | | | $107,321 | | | | $171,357 | | | | $335,792 | | | | $508,828 | | | | $593,604 | | | | $609,200 | |
Ratio of net expenses to average net assets | | | 2.05% | (c) | | | 2.03% | | | | 2.01% | | | | 2.02% | | | | 2.07% | | | | 1.96% | |
Ratio of gross expenses to average net assets prior to expense reductions | | | 2.05% | (c) | | | 2.03% | | | | 2.01% | | | | 2.02% | | | | 2.08% | | | | 1.97% | |
Ratio of net investment income (loss) to average net assets | | | (0.92% | )(c) | | | (1.18% | ) | | | (1.34% | ) | | | (1.12% | ) | | | (1.19% | ) | | | (1.21% | ) |
| |
| | | CLASS C | |
| | | (Unaudited) Six Months
Ended
April 30, | | | Year Ended October 31, | |
| | | 2013 | | | 2012 | | | 2011 | | | 2010 | | | 2009 | | | 2008 | |
Net asset value, beginning of period | | | $44.56 | | | | $46.16 | | | | $44.80 | | | | $37.26 | | | | $29.77 | | | | $66.05 | |
Income from investment operations: | | | | | | | | | | | | | | | | | | | | | | | | |
Net investment income (loss)(a) | | | (0.20 | ) | | | (0.54 | ) | | | (0.66 | ) | | | (0.45 | ) | | | (0.36 | ) | | | (0.58 | ) |
Net realized and unrealized gain (loss) | | | 2.84 | | | | 1.09 | | | | 2.02 | | | | 7.99 | | | | 7.85 | | | | (28.14 | ) |
Total from investment operations | | | 2.64 | | | | 0.55 | | | | 1.36 | | | | 7.54 | | | | 7.49 | | | | (28.72 | ) |
Distributions: | | | | | | | | | | | | | | | | | | | | | | | | |
Dividends from net investment income | | | — | | | | — | | | | — | | | | — | | | | — | | | | — | |
Dividends from net realized gains | | | (3.73 | ) | | | (2.15 | ) | | | — | | | | — | | | | — | | | | (7.56 | ) |
Total distributions | | | (3.73 | ) | | | (2.15 | ) | | | — | | | | — | | | | — | | | | (7.56 | ) |
Net asset value, end of period | | | $43.47 | | | | $44.56 | | | | $46.16 | | | | $44.80 | | | | $37.26 | | | | $29.77 | |
Ratios and supplemental data: | | | | | | | | | | | | | | | | | | | | | | | | |
Total return(b) | | | 6.19% | | | | 1.51% | | | | 3.04% | | | | 20.24% | | | | 25.16% | | | | (48.50% | ) |
Net assets, end of period (000) | | | $1,080,017 | | | | $1,272,104 | | | | $1,517,047 | | | | $1,718,714 | | | | $1,720,775 | | | | $1,732,305 | |
Ratio of net expenses to average net assets | | | 2.04% | (c) | | | 2.04% | | | | 2.01% | | | | 2.02% | | | | 2.07% | | | | 1.96% | |
Ratio of gross expenses to average net assets prior to expense reductions | | | 2.04% | (c) | | | 2.04% | | | | 2.01% | | | | 2.02% | | | | 2.08% | | | | 1.97% | |
Ratio of net investment income (loss) to average net assets | | | (0.90% | )(c) | | | (1.19% | ) | | | (1.35% | ) | | | (1.12% | ) | | | (1.19% | ) | | | (1.21% | ) |
| (a) | Net investment income allocated based on average shares method. |
| (b) | Total return measures net investment income and capital gain or loss from portfolio investments assuming reinvestment of dividends and capital gains distributions. Total return is not annualized for periods that are less than a full year, does not reflect the effect of sales charge for Class A shares nor the contingent deferred sales charge for Class B and C shares and does not reflect the deduction of taxes that a shareholder would pay on fund distributions or the redemption of fund shares. |
| | | | |
| 140 | | CALAMOS FAMILY OF FUNDS SEMIANNUAL REPORT | | |
Calamos Growth Fund Financial Highlights
| | | | | | | | | | | | | | | | | | | | | | | | |
| | | CLASS I | |
| | | (Unaudited) Six Months
Ended
April 30, | | | Year Ended October 31, | |
| | | 2013 | | | 2012 | | | 2011 | | | 2010 | | | 2009 | | | 2008 | |
Net asset value, beginning of period | | | $54.81 | | | | $55.72 | | | | $53.54 | | | | $44.09 | | | | $34.88 | | | | $75.28 | |
Income from investment operations: | | | | | | | | | | | | | | | | | | | | | | | | |
Net investment income (loss)(a) | | | 0.03 | | | | (0.10 | ) | | | (0.21 | ) | | | (0.05 | ) | | | (0.07 | ) | | | (0.11 | ) |
Net realized and unrealized gain (loss) | | | 3.52 | | | | 1.34 | | | | 2.39 | | | | 9.50 | | | | 9.28 | | | | (32.73 | ) |
Total from investment operations | | | 3.55 | | | | 1.24 | | | | 2.18 | | | | 9.45 | | | | 9.21 | | | | (32.84 | ) |
Distributions: | | | | | | | | | | | | | | | | | | | | | | | | |
Dividends from net investment income | | | — | | | | — | | | | — | | | | — | | | | — | | | | — | |
Dividends from net realized gains | | | (3.73 | ) | | | (2.15 | ) | | | — | | | | — | | | | — | | | | (7.56 | ) |
Total distributions | | | (3.73 | ) | | | (2.15 | ) | | | — | | | | — | | | | — | | | | (7.56 | ) |
Net asset value, end of period | | | $54.63 | | | | $54.81 | | | | $55.72 | | | | $53.54 | | | | $44.09 | | | | $34.88 | |
Ratios and supplemental data: | | | | | | | | | | | | | | | | | | | | | | | | |
Total return(b) | | | 6.72% | | | | 2.53% | | | | 4.07% | | | | 21.43% | | | | 26.40% | | | | (47.97% | ) |
Net assets, end of period (000) | | | $1,194,204 | | | | $1,690,739 | | | | $1,628,191 | | | | $1,335,967 | | | | $652,733 | | | | $468,906 | |
Ratio of net expenses to average net assets | | | 1.05% | (c) | | | 1.04% | | | | 1.01% | | | | 1.02% | | | | 1.07% | | | | 0.96% | |
Ratio of gross expenses to average net assets prior to expense reductions | | | 1.05% | (c) | | | 1.04% | | | | 1.01% | | | | 1.02% | | | | 1.07% | | | | 0.97% | |
Ratio of net investment income (loss) to average net assets | | | 0.10% | (c) | | | (0.19% | ) | | | (0.37% | ) | | | (0.11% | ) | | | (0.20% | ) | | | (0.21% | ) |
| |
| | | CLASS R | |
| | | (Unaudited) Six Months
Ended
April 30, | | | Year Ended October 31, | |
| | | 2013 | | | 2012 | | | 2011 | | | 2010 | | | 2009 | | | 2008 | |
Net asset value, beginning of period | | | $49.15 | | | | $50.44 | | | | $48.71 | | | | $40.31 | | | | $32.05 | | | | $70.16 | |
Income from investment operations: | | | | | | | | | | | | | | | | | | | | | | | | |
Net investment income (loss)(a) | | | (0.10 | ) | | | (0.34 | ) | | | (0.46 | ) | | | (0.27 | ) | | | (0.25 | ) | | | (0.35 | ) |
Net realized and unrealized gain (loss) | | | 3.15 | | | | 1.20 | | | | 2.19 | | | | 8.67 | | | | 8.51 | | | | (30.20 | ) |
Total from investment operations | | | 3.05 | | | | 0.86 | | | | 1.73 | | | | 8.40 | | | | 8.26 | | | | (30.55 | ) |
Distributions: | | | | | | | | | | | | | | | | | | | | | | | | |
Dividends from net investment income | | | — | | | | — | | | | — | | | | — | | | | — | | | | — | |
Dividends from net realized gains | | | (3.73 | ) | | | (2.15 | ) | | | — | | | | — | | | | — | | | | (7.56 | ) |
Total distributions | | | (3.73 | ) | | | (2.15 | ) | | | — | | | | — | | | | — | | | | (7.56 | ) |
Net asset value, end of period | | | $48.47 | | | | $49.15 | | | | $50.44 | | | | $48.71 | | | | $40.31 | | | | $32.05 | |
Ratios and supplemental data: | | | | | | | | | | | | | | | | | | | | | | | | |
Total return(b) | | | 6.46% | | | | 2.02% | | | | 3.55% | | | | 20.84% | | | | 25.77% | | | | (48.24% | ) |
Net assets, end of period (000) | | | $13,094 | | | | $15,879 | | | | $13,030 | | | | $9,071 | | | | $3,872 | | | | $780 | |
Ratio of net expenses to average net assets | | | 1.54% | (c) | | | 1.54% | | | | 1.51% | | | | 1.52% | | | | 1.56% | | | | 1.46% | |
Ratio of gross expenses to average net assets prior to expense reductions | | | 1.54% | (c) | | | 1.54% | | | | 1.51% | | | | 1.52% | | | | 1.56% | | | | 1.47% | |
Ratio of net investment income (loss) to average net assets | | | (0.41% | )(c) | | | (0.68% | ) | | | (0.88% | ) | | | (0.62% | ) | | | (0.73% | ) | | | (0.71% | ) |
| (a) | Net investment income allocated based on average shares method. |
| (b) | Total return measures net investment income and capital gain or loss from portfolio investments assuming reinvestment of dividends and capital gains distributions. Total return is not annualized for periods that are less than a full year, does not reflect the effect of sales charge for Class A shares nor the contingent deferred sales charge for Class B and C shares and does not reflect the deduction of taxes that a shareholder would pay on fund distributions or the redemption of fund shares. |
Calamos Value Fund Financial Highlights
Selected data for a share outstanding throughout each period were as follows:
| | | | | | | | | | | | | | | | | | | | | | | | |
| | | CLASS A | |
| | | (Unaudited)
Six Months
Ended
April 30, | | | Year Ended October 31, | |
| | | 2013 | | | 2012 | | | 2011 | | | 2010 | | | 2009 | | | 2008 | |
Net asset value, beginning of period | | | $12.15 | | | | $11.25 | | | | $11.02 | | | | $10.57 | | | | $8.90 | �� | | | $14.68 | |
Income from investment operations: | | | | | | | | | | | | | | | | | | | | | | | | |
Net investment income (loss)(a) | | | 0.06 | | | | 0.10 | | | | 0.01 | | | | (0.00 | )** | | | 0.04 | | | | 0.03 | |
Net realized and unrealized gain (loss) | | | 1.57 | | | | 0.80 | | | | 0.22 | | | | 0.48 | | | | 1.64 | | | | (4.83 | ) |
Total from investment operations | | | 1.63 | | | | 0.90 | | | | 0.23 | | | | 0.48 | | | | 1.68 | | | | (4.80 | ) |
Distributions: | | | | | | | | | | | | | | | | | | | | | | | | |
Dividends from net investment income | | | (0.18 | ) | | | — | | | | — | | | | (0.03 | ) | | | (0.01 | ) | | | (0.08 | ) |
Dividends from net realized gains | | | — | | | | — | | | | — | | | | — | | | | — | | | | (0.90 | ) |
Total distributions | | | (0.18 | ) | | | — | | | | — | | | | (0.03 | ) | | | (0.01 | ) | | | (0.98 | ) |
Net asset value, end of period | | | $13.60 | | | | $12.15 | | | | $11.25 | | | | $11.02 | | | | $10.57 | | | | $8.90 | |
Ratios and supplemental data: | | | | | | | | | | | | | | | | | | | | | | | | |
Total return(b) | | | 13.59% | | | | 8.00% | | | | 2.09% | | | | 4.52% | | | | 18.85% | | | | (34.79% | ) |
Net assets, end of period (000) | | | $57,939 | | | | $38,992 | | | | $23,964 | | | | $31,556 | | | | $32,877 | | | | $45,372 | |
Ratio of net expenses to average net assets | | | 1.15% | (c) | | | 1.15% | | | | 1.52% | | | | 1.60% | | | | 1.59% | | | | 1.48% | |
Ratio of gross expenses to average net assets prior to expense reductions | | | 1.57% | (c) | | | 1.72% | | | | 1.67% | | | | 1.60% | | | | 1.59% | | | | 1.49% | |
Ratio of net investment income (loss) to average net assets | | | 0.93% | (c) | | | 0.84% | | | | 0.11% | | | | 0.03% | | | | 0.50% | | | | 0.24% | |
| | |
| | | (Unaudited)
Six Months
Ended
April 30, | | | Year Ended October 31, | |
| | | 2013 | | | 2012 | | | 2011 | | | 2010 | | | 2009 | | | 2008 | |
Portfolio turnover rate | | | 144.3% | | | | 204.9% | | | | 27.4% | | | | 37.7% | | | | 58.7% | | | | 61.0% | |
| ** | Amounts are less than $0.005. |
| (a) | Net investment income allocated based on average shares method. |
| (b) | Total return measures net investment income and capital gain or loss from portfolio investments assuming reinvestment of dividends and capital gains distributions. Total return is not annualized for periods that are less than a full year, does not reflect the effect of sales charge for Class A shares nor the contingent deferred sales charge for Class B and C shares and does not reflect the deduction of taxes that a shareholder would pay on fund distributions or the redemption of fund shares. |
| | | | |
| 142 | | CALAMOS FAMILY OF FUNDS SEMIANNUAL REPORT | | |
Calamos Value Fund Financial Highlights
| | | | | | | | | | | | | | | | | | | | | | | | |
| | | CLASS B | |
| | | (Unaudited)
Six Months
Ended
April 30, | | | Year Ended October 31, | |
| | | 2013 | | | 2012 | | | 2011 | | | 2010 | | | 2009 | | | 2008 | |
Net asset value, beginning of period | | | $11.24 | | | | $10.49 | | | | $10.35 | | | | $9.98 | | | | $8.46 | | | | $14.01 | |
Income from investment operations: | | | | | | | | | | | | | | | | | | | | | | | | |
Net investment income (loss)(a) | | | 0.02 | | | | 0.02 | | | | (0.07 | ) | | | (0.07 | ) | | | (0.02 | ) | | | (0.06 | ) |
Net realized and unrealized gain (loss) | | | 1.46 | | | | 0.73 | | | | 0.21 | | | | 0.44 | | | | 1.54 | | | | (4.59 | ) |
Total from investment operations | | | 1.48 | | | | 0.75 | | | | 0.14 | | | | 0.37 | | | | 1.52 | | | | (4.65 | ) |
Distributions: | | | | | | | | | | | | | | | | | | | | | | | | |
Dividends from net investment income | | | (0.02 | ) | | | — | | | | — | | | | — | | | | — | | | | — | |
Dividends from net realized gains | | | — | | | | — | | | | — | | | | — | | | | — | | | | (0.90 | ) |
Total distributions | | | (0.02 | ) | | | — | | | | — | | | | — | | | | — | | | | (0.90 | ) |
Net asset value, end of period | | | $12.70 | | | | $11.24 | | | | $10.49 | | | | $10.35 | | | | $9.98 | | | | $8.46 | |
Ratios and supplemental data: | | | | | | | | | | | | | | | | | | | | | | | | |
Total return(b) | | | 13.18% | | | | 7.15% | | | | 1.35% | | | | 3.71% | | | | 17.97% | | | | (35.24% | ) |
Net assets, end of period (000) | | | $1,015 | | | | $1,195 | | | | $2,308 | | | | $3,903 | | | | $5,145 | | | | $5,377 | |
Ratio of net expenses to average net assets | | | 1.90% | (c) | | | 1.90% | | | | 2.29% | | | | 2.34% | | | | 2.34% | | | | 2.23% | |
Ratio of gross expenses to average net assets prior to expense reductions | | | 2.32% | (c) | | | 2.47% | | | | 2.42% | | | | 2.34% | | | | 2.34% | | | | 2.24% | |
Ratio of net investment income (loss) to average net assets | | | 0.33% | (c) | | | 0.20% | | | | (0.63% | ) | | | (0.70% | ) | | | (0.29% | ) | | | (0.51% | ) |
| |
| | | CLASS C | |
| | | (Unaudited)
Six Months
Ended
April 30, | | | Year Ended October 31, | |
| | | 2013 | | | 2012 | | | 2011 | | | 2010 | | | 2009 | | | 2008 | |
Net asset value, beginning of period | | | $11.23 | | | | $10.48 | | | | $10.34 | | | | $9.97 | | | | $8.45 | | | | $14.00 | |
Income from investment operations: | | | | | | | | | | | | | | | | | | | | | | | | |
Net investment income (loss)(a) | | | 0.02 | | | | 0.02 | | | | (0.07 | ) | | | (0.07 | ) | | | (0.02 | ) | | | (0.06 | ) |
Net realized and unrealized gain (loss) | | | 1.46 | | | | 0.73 | | | | 0.21 | | | | 0.44 | | | | 1.54 | | | | (4.59 | ) |
Total from investment operations | | | 1.48 | | | | 0.75 | | | | 0.14 | | | | 0.37 | | | | 1.52 | | | | (4.65 | ) |
Distributions: | | | | | | | | | | | | | | | | | | | | | | | | |
Dividends from net investment income | | | (0.07 | ) | | | — | | | | — | | | | — | | | | — | | | | — | |
Dividends from net realized gains | | | — | | | | — | | | | — | | | | — | | | | — | | | | (0.90 | ) |
Total distributions | | | (0.07 | ) | | | — | | | | — | | | | — | | | | — | | | | (0.90 | ) |
Net asset value, end of period | | | $12.64 | | | | $11.23 | | | | $10.48 | | | | $10.34 | | | | $9.97 | | | | $8.45 | |
Ratios and supplemental data: | | | | | | | | | | | | | | | | | | | | | | | | |
Total return(b) | | | 13.27% | | | | 7.16% | | | | 1.35% | | | | 3.71% | | | | 17.99% | | | | (35.27% | ) |
Net assets, end of period (000) | | | $4,079 | | | | $3,753 | | | | $3,974 | | | | $5,915 | | | | $6,946 | | | | $7,295 | |
Ratio of net expenses to average net assets | | | 1.90% | (c) | | | 1.90% | | | | 2.28% | | | | 2.35% | | | | 2.34% | | | | 2.23% | |
Ratio of gross expenses to average net assets prior to expense reductions | | | 2.32% | (c) | | | 2.47% | | | | 2.42% | | | | 2.35% | | | | 2.34% | | | | 2.24% | |
Ratio of net investment income (loss) to average net assets | | | 0.27% | (c) | | | 0.16% | | | | (0.63% | ) | | | (0.71% | ) | | | (0.29% | ) | | | (0.51% | ) |
| (a) | Net investment income allocated based on average shares method. |
| (b) | Total return measures net investment income and capital gain or loss from portfolio investments assuming reinvestment of dividends and capital gains distributions. Total return is not annualized for periods that are less than a full year, does not reflect the effect of sales charge for Class A shares nor the contingent deferred sales charge for Class B and C shares and does not reflect the deduction of taxes that a shareholder would pay on fund distributions or the redemption of fund shares. |
Calamos Value Fund Financial Highlights
| | | | | | | | | | | | | | | | | | | | | | | | |
| | | CLASS I | |
| | | (Unaudited)
Six Months
Ended
April 30, | | | Year Ended October 31, | |
| | | 2013 | | | 2012 | | | 2011 | | | 2010 | | | 2009 | | | 2008 | |
Net asset value, beginning of period | | | $12.41 | | | | $11.46 | | | | $11.20 | | | | $10.74 | | | | $9.05 | | | | $14.92 | |
Income from investment operations: | | | | | | | | | | | | | | | | | | | | | | | | |
Net investment income (loss)(a) | | | 0.07 | | | | 0.14 | | | | 0.04 | | | | 0.03 | | | | 0.06 | | | | 0.06 | |
Net realized and unrealized gain (loss) | | | 1.61 | | | | 0.81 | | | | 0.22 | | | | 0.48 | | | | 1.67 | | | | (4.91 | ) |
Total from investment operations | | | 1.68 | | | | 0.95 | | | | 0.26 | | | | 0.51 | | | | 1.73 | | | | (4.85 | ) |
Distributions: | | | | | | | | | | | | | | | | | | | | | | | | |
Dividends from net investment income | | | (0.20 | ) | | | — | | | | — | | | | (0.05 | ) | | | (0.04 | ) | | | (0.12 | ) |
Dividends from net realized gains | | | — | | | | — | | | | — | | | | — | | | | — | | | | (0.90 | ) |
Total distributions | | | (0.20 | ) | | | — | | | | — | | | | (0.05 | ) | | | (0.04 | ) | | | (1.02 | ) |
Net asset value, end of period | | | $13.89 | | | | $12.41 | | | | $11.46 | | | | $11.20 | | | | $10.74 | | | | $9.05 | |
Ratios and supplemental data: | | | | | | | | | | | | | | | | | | | | | | | | |
Total return(b) | | | 13.71% | | | | 8.29% | | | | 2.32% | | | | 4.79% | | | | 19.23% | | | | (34.64% | ) |
Net assets, end of period (000) | | | $15,751 | | | | $9,671 | | | | $11,227 | | | | $17,340 | | | | $18,396 | | | | $17,711 | |
Ratio of net expenses to average net assets | | | 0.90% | (c) | | | 0.90% | | | | 1.27% | | | | 1.35% | | | | 1.34% | | | | 1.23% | |
Ratio of gross expenses to average net assets prior to expense reductions | | | 1.32% | (c) | | | 1.48% | | | | 1.42% | | | | 1.35% | | | | 1.34% | | | | 1.24% | |
Ratio of net investment income (loss) to average net assets | | | 1.16% | (c) | | | 1.15% | | | | 0.37% | | | | 0.28% | | | | 0.69% | | | | 0.49% | |
| |
| | | CLASS R | |
| | | (Unaudited)
Six Months
Ended
April 30, | | | Year Ended October 31, | |
| | | 2013 | | | 2012 | | | 2011 | | | 2010 | | | 2009 | | | 2008 | |
Net asset value, beginning of period | | | $12.02 | | | | $11.16 | | | | $10.96 | | | | $10.52 | | | | $8.87 | | | | $14.66 | |
Income from investment operations: | | | | | | | | | | | | | | | | | | | | | | | | |
Net investment income (loss)(a) | | | 0.05 | | | | 0.07 | | | | (0.01 | ) | | | (0.02 | ) | | | 0.02 | | | | (0.00 | )** |
Net realized and unrealized gain (loss) | | | 1.56 | | | | 0.79 | | | | 0.21 | | | | 0.46 | | | | 1.63 | | | | (4.82 | ) |
Total from investment operations | | | 1.61 | | | | 0.86 | | | | 0.20 | | | | 0.44 | | | | 1.65 | | | | (4.82 | ) |
Distributions: | | | | | | | | | | | | | | | | | | | | | | | | |
Dividends from net investment income | | | (0.14 | ) | | | — | | | | — | | | | (0.00 | )** | | | — | | | | (0.07 | ) |
Dividends from net realized gains | | | — | | | | — | | | | — | | | | — | | | | — | | | | (0.90 | ) |
Total distributions | | | (0.14 | ) | | | — | | | | — | | | | — | | | | — | | | | (0.97 | ) |
Net asset value, end of period | | | $13.49 | | | | $12.02 | | | | $11.16 | | | | $10.96 | | | | $10.52 | | | | $8.87 | |
Ratios and supplemental data: | | | | | | | | | | | | | | | | | | | | | | | | |
Total return(b) | | | 13.48% | | | | 7.71% | | | | 1.82% | | | | 4.21% | | | | 18.60% | | | | (34.96% | ) |
Net assets, end of period (000) | | | $112 | | | | $98 | | | | $91 | | | | $89 | | | | $86 | | | | $72 | |
Ratio of net expenses to average net assets | | | 1.40% | (c) | | | 1.40% | | | | 1.76% | | | | 1.85% | | | | 1.83% | | | | 1.73% | |
Ratio of gross expenses to average net assets prior to expense reductions | | | 1.82% | (c) | | | 1.97% | | | | 1.93% | | | | 1.85% | | | | 1.84% | | | | 1.74% | |
Ratio of net investment income (loss) to average net assets | | | 0.76% | (c) | | | 0.65% | | | | (0.10% | ) | | | (0.23% | ) | | | 0.18% | | | | (0.01% | ) |
| ** | Amounts are less than $0.005. |
| (a) | Net investment income allocated based on average shares method. |
| (b) | Total return measures net investment income and capital gain or loss from portfolio investments assuming reinvestment of dividends and capital gains distributions. Total return is not annualized for periods that are less than a full year, does not reflect the effect of sales charge for Class A shares nor the contingent deferred sales charge for Class B and C shares and does not reflect the deduction of taxes that a shareholder would pay on fund distributions or the redemption of fund shares. |
| | | | |
| 144 | | CALAMOS FAMILY OF FUNDS SEMIANNUAL REPORT | | |
Calamos Focus Growth Fund Financial Highlights
Selected data for a share outstanding throughout each period were as follows:
| | | | | | | | | | | | | | | | | | | | | | | | |
| | | CLASS A | |
| | | (Unaudited)
Six Months
Ended
April 30, | | | Year Ended October 31, | |
| | | 2013 | | | 2012 | | | 2011 | | | 2010 | | | 2009 | | | 2008 | |
Net asset value, beginning of period | | | $13.10 | | | | $12.37 | | | | $11.93 | | | | $10.51 | | | | $8.91 | | | | $14.82 | |
Income from investment operations: | | | | | | | | | | | | | | | | | | | | | | | | |
Net investment income (loss)(a) | | | 0.01 | | | | 0.01 | | | | (0.03 | ) | | | (0.02 | ) | | | 0.06 | | | | 0.06 | |
Net realized and unrealized gain (loss) | | | 0.99 | | | | 0.72 | | | | 0.47 | | | | 1.46 | | | | 1.58 | | | | (5.05 | ) |
Total from investment operations | | | 1.00 | | | | 0.73 | | | | 0.44 | | | | 1.44 | | | | 1.64 | | | | (4.99 | ) |
Distributions: | | | | | | | | | | | | | | | | | | | | | | | | |
Dividends from net investment income | | | (0.06 | ) | | | — | | | | — | | | | (0.02 | ) | | | (0.04 | ) | | | (0.03 | ) |
Dividends from net realized gains | | | — | | | | — | | | | — | | | | — | | | | — | | | | (0.89 | ) |
Total distributions | | | (0.06 | ) | | | — | | | | — | | | | (0.02 | ) | | | (0.04 | ) | | | (0.92 | ) |
Net asset value, end of period | | | $14.04 | | | | $13.10 | | | | $12.37 | | | | $11.93 | | | | $10.51 | | | | $8.91 | |
Ratios and supplemental data: | | | | | | | | | | | | | | | | | | | | | | | | |
Total return(b) | | | 7.67% | | | | 5.90% | | | | 3.69% | | | | 13.72% | | | | 18.50% | | | | (35.66% | ) |
Net assets, end of period (000) | | | $23,169 | | | | $22,389 | | | | $22,702 | | | | $24,518 | | | | $32,143 | | | | $67,229 | |
Ratio of net expenses to average net assets | | | 1.15% | (c) | | | 1.15% | | | | 1.44% | | | | 1.56% | | | | 1.54% | | | | 1.45% | |
Ratio of gross expenses to average net assets prior to expense reductions | | | 1.70% | (c) | | | 1.57% | | | | 1.57% | | | | 1.56% | | | | 1.55% | | | | 1.46% | |
Ratio of net investment income (loss) to average net assets | | | 0.12% | (c) | | | 0.06% | | | | (0.28% | ) | | | (0.18% | ) | | | 0.72% | | | | 0.49% | |
| | |
| | | (Unaudited)
Six Months
Ended
April 30, | | | Year Ended October 31, | |
| | | 2013 | | | 2012 | | | 2011 | | | 2010 | | | 2009 | | | 2008 | |
Portfolio turnover rate | | | 47.3% | | | | 47.9% | | | | 73.5% | | | | 49.4% | | | | 79.0% | | | | 39.8% | |
| (a) | Net investment income allocated based on average shares method. |
| (b) | Total return measures net investment income and capital gain or loss from portfolio investments assuming reinvestment of dividends and capital gains distributions. Total return is not annualized for periods that are less than a full year, does not reflect the effect of sales charge for Class A shares nor the contingent deferred sales charge for Class B and C shares and does not reflect the deduction of taxes that a shareholder would pay on fund distributions or the redemption of fund shares. |
Calamos Focus Growth Fund Financial Highlights
| | | | | | | | | | | | | | | | | | | | | | | | |
| | | CLASS B | |
| | | (Unaudited)
Six Months
Ended
April 30, | | | Year Ended October 31, | |
| | | 2013 | | | 2012 | | | 2011 | | | 2010 | | | 2009 | | | 2008 | |
Net asset value, beginning of period | | | $12.39 | | | | $11.78 | | | | $11.45 | | | | $10.14 | | | | $8.63 | | | | $14.44 | |
Income from investment operations: | | | | | | | | | | | | | | | | | | | | | | | | |
Net investment income (loss)(a) | | | (0.04 | ) | | | (0.08 | ) | | | (0.13 | ) | | | (0.10 | ) | | | (0.02 | ) | | | (0.03 | ) |
Net realized and unrealized gain (loss) | | | 0.94 | | | | 0.69 | | | | 0.46 | | | | 1.41 | | | | 1.53 | | | | (4.89 | ) |
Total from investment operations | | | 0.90 | | | | 0.61 | | | | 0.33 | | | | 1.31 | | | | 1.51 | | | | (4.92 | ) |
Distributions: | | | | | | | | | | | | | | | | | | | | | | | | |
Dividends from net investment income | | | — | | | | — | | | | — | | | | — | | | | — | | | | — | |
Dividends from net realized gains | | | — | | | | — | | | | — | | | | — | | | | — | | | | (0.89 | ) |
Total distributions | | | — | | | | — | | | | — | | | | — | | | | — | | | | (0.89 | ) |
Net asset value, end of period | | | $13.29 | | | | $12.39 | | | | $11.78 | | | | $11.45 | | | | $10.14 | | | | $8.63 | |
Ratios and supplemental data: | | | | | | | | | | | | | | | | | | | | | | | | |
Total return(b) | | | 7.26% | | | | 5.18% | | | | 2.88% | | | | 12.92% | | | | 17.50% | | | | (36.08% | ) |
Net assets, end of period (000) | | | $1,213 | | | | $1,662 | | | | $2,893 | | | | $4,171 | | | | $5,087 | | | | $4,833 | |
Ratio of net expenses to average net assets | | | 1.90% | (c) | | | 1.90% | | | | 2.20% | | | | 2.31% | | | | 2.29% | | | | 2.20% | |
Ratio of gross expenses to average net assets prior to expense reductions | | | 2.44% | (c) | | | 2.33% | | | | 2.32% | | | | 2.31% | | | | 2.29% | | | | 2.21% | |
Ratio of net investment income (loss) to average net assets | | | (0.61% | )(c) | | | (0.70% | ) | | | (1.03% | ) | | | (0.92% | ) | | | (0.25% | ) | | | (0.26% | ) |
| |
| | | CLASS C | |
| | | (Unaudited)
Six Months
Ended
April 30, | | | Year Ended October 31, | |
| | | 2013 | | | 2012 | | | 2011 | | | 2010 | | | 2009 | | | 2008 | |
Net asset value, beginning of period | | | $12.39 | | | | $11.79 | | | | $11.45 | | | | $10.15 | | | | $8.63 | | | | $14.45 | |
Income from investment operations: | | | | | | | | | | | | | | | | | | | | | | | | |
Net investment income (loss)(a) | | | (0.04 | ) | | | (0.09 | ) | | | (0.12 | ) | | | (0.10 | ) | | | (0.02 | ) | | | (0.03 | ) |
Net realized and unrealized gain (loss) | | | 0.94 | | | | 0.69 | | | | 0.46 | | | | 1.40 | | | | 1.54 | | | | (4.90 | ) |
Total from investment operations | | | 0.90 | | | | 0.60 | | | | 0.34 | | | | 1.30 | | | | 1.52 | | | | (4.93 | ) |
Distributions: | | | | | | | | | | | | | | | | | | | | | | | | |
Dividends from net investment income | | | — | | | | — | | | | — | | | | — | | | | — | | | | — | |
Dividends from net realized gains | | | — | | | | — | | | | — | | | | — | | | | — | | | | (0.89 | ) |
Total distributions | | | — | | | | — | | | | — | | | | — | | | | — | | | | (0.89 | ) |
Net asset value, end of period | | | $13.29 | | | | $12.39 | | | | $11.79 | | | | $11.45 | | | | $10.15 | | | | $8.63 | |
Ratios and supplemental data: | | | | | | | | | | | | | | | | | | | | | | | | |
Total return(b) | | | 7.26% | | | | 5.09% | | | | 2.97% | | | | 12.81% | | | | 17.61% | | | | (36.13% | ) |
Net assets, end of period (000) | | | $9,558 | | | | $9,287 | | | | $10,153 | | | | $10,628 | | | | $10,359 | | | | $8,489 | |
Ratio of net expenses to average net assets | | | 1.90% | (c) | | | 1.90% | | | | 2.19% | | | | 2.31% | | | | 2.29% | | | | 2.20% | |
Ratio of gross expenses to average net assets prior to expense reductions | | | 2.45% | (c) | | | 2.33% | | | | 2.32% | | | | 2.31% | | | | 2.29% | | | | 2.21% | |
Ratio of net investment income (loss) to average net assets | | | (0.64% | )(c) | | | (0.70% | ) | | | (1.03% | ) | | | (0.92% | ) | | | (0.25% | ) | | | (0.26% | ) |
| (a) | Net investment income allocated based on average shares method. |
| (b) | Total return measures net investment income and capital gain or loss from portfolio investments assuming reinvestment of dividends and capital gains distributions. Total return is not annualized for periods that are less than a full year, does not reflect the effect of sales charge for Class A shares nor the contingent deferred sales charge for Class B and C shares and does not reflect the deduction of taxes that a shareholder would pay on fund distributions or the redemption of fund shares. |
| | | | |
| 146 | | CALAMOS FAMILY OF FUNDS SEMIANNUAL REPORT | | |
Calamos Focus Growth Fund Financial Highlights
| | | | | | | | | | | | | | | | | | | | | | | | |
| | | CLASS I | |
| | | (Unaudited)
Six Months
Ended
April 30,
| | | Year Ended October 31, | |
| | | 2013 | | | 2012 | | | 2011 | | | 2010 | | | 2009 | | | 2008 | |
Net asset value, beginning of period | | | $13.23 | | | | $12.46 | | | | $11.98 | | | | $10.56 | | | | $8.97 | | | | $14.90 | |
Income from investment operations: | | | | | | | | | | | | | | | | | | | | | | | | |
Net investment income (loss)(a) | | | 0.03 | | | | 0.04 | | | | (0.00 | )** | | | 0.01 | | | | 0.07 | | | | 0.09 | |
Net realized and unrealized gain (loss) | | | 0.99 | | | | 0.73 | | | | 0.48 | | | | 1.46 | | | | 1.59 | | | | (5.06 | ) |
Total from investment operations | | | 1.02 | | | | 0.77 | | | | 0.48 | | | | 1.47 | | | | 1.66 | | | | (4.97 | ) |
Distributions: | | | | | | | | | | | | | | | | | | | | | | | | |
Dividends from net investment income | | | (0.10 | ) | | | — | | | | — | | | | (0.05 | ) | | | (0.07 | ) | | | (0.07 | ) |
Dividends from net realized gains | | | — | | | | — | | | | — | | | | — | | | | — | | | | (0.89 | ) |
Total distributions | | | (0.10 | ) | | | — | | | | — | | | | (0.05 | ) | | | (0.07 | ) | | | (0.96 | ) |
Net asset value, end of period | | | $14.15 | | | | $13.23 | | | | $12.46 | | | | $11.98 | | | | $10.56 | | | | $8.97 | |
Ratios and supplemental data: | | | | | | | | | | | | | | | | | | | | | | | | |
Total return(b) | | | 7.78% | | | | 6.18% | | | | 4.01% | | | | 13.97% | | | | 18.74% | | | | (35.44% | ) |
Net assets, end of period (000) | | | $23,944 | | | | $24,863 | | | | $24,547 | | | | $23,441 | | | | $21,604 | | | | $22,337 | |
Ratio of net expenses to average net assets | | | 0.90% | (c) | | | 0.90% | | | | 1.18% | | | | 1.31% | | | | 1.29% | | | | 1.20% | |
Ratio of gross expenses to average net assets prior to expense reductions | | | 1.45% | (c) | | | 1.32% | | | | 1.32% | | | | 1.31% | | | | 1.29% | | | | 1.21% | |
Ratio of net investment income (loss) to average net assets | | | 0.37% | (c) | | | 0.30% | | | | (0.02% | ) | | | 0.08% | | | | 0.76% | | | | 0.74% | |
| |
| | | CLASS R | |
| | | (Unaudited)
Six Months
Ended
April 30, | | | Year Ended October 31, | |
| | | 2013 | | | 2012 | | | 2011 | | | 2010 | | | 2009 | | | 2008 | |
Net asset value, beginning of period | | | $12.97 | | | | $12.28 | | | | $11.87 | | | | $10.47 | | | | $8.88 | | | | $14.79 | |
Income from investment operations: | | | | | | | | | | | | | | | | | | | | | | | | |
Net investment income (loss)(a) | | | (0.01 | ) | | | (0.03 | ) | | | (0.07 | ) | | | (0.05 | ) | | | 0.02 | | | | 0.03 | |
Net realized and unrealized gain (loss) | | | 0.98 | | | | 0.72 | | | | 0.48 | | | | 1.45 | | | | 1.60 | | | | (5.04 | ) |
Total from investment operations | | | 0.97 | | | | 0.69 | | | | 0.41 | | | | 1.40 | | | | 1.62 | | | | (5.01 | ) |
Distributions: | | | | | | | | | | | | | | | | | | | | | | | | |
Dividends from net investment income | | | (0.05 | ) | | | — | | | | — | | | | — | | | | (0.03 | ) | | | (0.01 | ) |
Dividends from net realized gains | | | — | | | | — | | | | — | | | | — | | | | — | | | | (0.89 | ) |
Total distributions | | | (0.05 | ) | | | — | | | | — | | | | — | | | | (0.03 | ) | | | (0.90 | ) |
Net asset value, end of period | | | $13.89 | | | | $12.97 | | | | $12.28 | | | | $11.87 | | | | $10.47 | | | | $8.88 | |
Ratios and supplemental data: | | | | | | | | | | | | | | | | | | | | | | | | |
Total return(b) | | | 7.52% | | | | 5.62% | | | | 3.45% | | | | 13.37% | | | | 18.28% | | | | (35.82% | ) |
Net assets, end of period (000) | | | $192 | | | | $172 | | | | $103 | | | | $99 | | | | $88 | | | | $106 | |
Ratio of net expenses to average net assets | | | 1.40% | (c) | | | 1.40% | | | | 1.68% | | | | 1.81% | | | | 1.79% | | | | 1.70% | |
Ratio of gross expenses to average net assets prior to expense reductions | | | 1.96% | (c) | | | 1.82% | | | | 1.82% | | | | 1.81% | | | | 1.80% | | | | 1.71% | |
Ratio of net investment income (loss) to average net assets | | | (0.14% | )(c) | | | (0.21% | ) | | | (0.52% | ) | | | (0.43% | ) | | | 0.28% | | | | 0.24% | |
| ** | Amount equated to less than $0.005 per common share. |
| (a) | Net investment income allocated based on average shares method. |
| (b) | Total return measures net investment income and capital gain or loss from portfolio investments assuming reinvestment of dividends and capital gains distributions. Total return is not annualized for periods that are less than a full year, does not reflect the effect of sales charge for Class A shares nor the contingent deferred sales charge for Class B and C shares and does not reflect the deduction of taxes that a shareholder would pay on fund distributions or the redemption of fund shares. |
Calamos Discovery Growth Fund Financial Highlights
Selected data for a share outstanding throughout each period were as follows:
| | | | | | | | | | | | | | | | |
| | | CLASS A | |
| | | (Unaudited) Six Months
Ended
April 30, | | | Year Ended October 31, | | | June 1, 2010*
through
October 31, | |
| | | 2013 | | | 2012 | | | 2011 | | | 2010 | |
Net asset value, beginning of period | | | $11.82 | | | | $12.04 | | | | $11.64 | | | | $10.00 | |
Income from investment operations: | | | | | | | | | | | | | | | | |
Net investment income (loss)(a) | | | (0.02 | ) | | | (0.13 | ) | | | (0.14 | ) | | | (0.04 | ) |
Net realized and unrealized gain (loss) | | | 0.87 | | | | (0.09 | ) | | | 0.55 | | | | 1.68 | |
Total from investment operations | | | 0.85 | | | | (0.22 | ) | | | 0.41 | | | | 1.64 | |
Distributions: | | | | | | | | | | | | | | | | |
Dividends from net investment income | | | — | | | | — | | | | (0.01 | ) | | | — | |
Dividends from net realized gains | | | — | | | | — | | | | — | | | | — | |
Total distributions | | | — | | | | — | | | | (0.01 | ) | | | — | |
Net asset value, end of period | | | $12.67 | | | | $11.82 | | | | $12.04 | | | | $11.64 | |
Ratios and supplemental data: | | | | | | | | | | | | | | | | |
Total return(b) | | | 7.19% | | | | (1.83% | ) | | | 3.55% | | | | 16.40% | |
Net assets, end of period (000) | | | $22,386 | | | | $21,384 | | | | $23,463 | | | | $14,557 | |
Ratio of net expenses to average net assets | | | 1.50% | (c) | | | 1.50% | | | | 1.50% | | | | 1.50% | (c) |
Ratio of gross expenses to average net assets prior to expense reductions | | | 1.75% | (c) | | | 1.74% | | | | 1.84% | | | | 2.63% | (c) |
Ratio of net investment income (loss) to average net assets | | | (0.36% | )(c) | | | (1.10% | ) | | | (1.08% | ) | | | (0.99% | )(c) |
| | | |
| | | (Unaudited)
Six Months
Ended
April 30, | | | Year Ended October 31, | | | June 1, 2010*
through
October 31, | |
| | | 2013 | | | 2012 | | | 2011 | | | 2010 | |
Portfolio turnover rate | | | 140.4% | | | | 139.8% | | | | 97.1% | | | | 26.2% | |
| * | Commencement of operations. |
| (a) | Net investment income allocated based on average shares method. |
| (b) | Total return measures net investment income and capital gain or loss from portfolio investments assuming reinvestment of dividends and capital gains distributions. Total return is not annualized for periods that are less than a full year, does not reflect the effect of sales charge for Class A shares nor the contingent deferred sales charge for Class B and C shares and does not reflect the deduction of taxes that a shareholder would pay on fund distributions or the redemption of fund shares. |
| | | | |
| 148 | | CALAMOS FAMILY OF FUNDS SEMIANNUAL REPORT | | |
Calamos Discovery Growth Fund Financial Highlights
| | | | | | | | | | | | | | | | |
| | | CLASS B | |
| | | (Unaudited)
Six Months
Ended
April 30, | | | Year Ended October 31, | | | June 1, 2010*
through
October 31, | |
| | | 2013 | | | 2012 | | | 2011 | | | 2010 | |
Net asset value, beginning of period | | | $11.63 | | | | $11.93 | | | | $11.60 | | | | $10.00 | |
Income from investment operations: | | | | | | | | | | | | | | | | |
Net investment income (loss)(a) | | | (0.07 | ) | | | (0.22 | ) | | | (0.24 | ) | | | (0.08 | ) |
Net realized and unrealized gain (loss) | | | 0.86 | | | | (0.08 | ) | | | 0.57 | | | | 1.68 | |
Total from investment operations | | | 0.79 | | | | (0.30 | ) | | | 0.33 | | | | 1.60 | |
Distributions: | | | | | | | | | | | | | | | | |
Dividends from net investment income | | | — | | | | — | | | | — | | | | — | |
Dividends from net realized gains | | | — | | | | — | | | | — | | | | — | |
Total distributions | | | — | | | | — | | | | — | | | | — | |
Net asset value, end of period | | | $12.42 | | | | $11.63 | | | | $11.93 | | | | $11.60 | |
Ratios and supplemental data: | | | | | | | | | | | | | | | | |
Total return(b) | | | 6.79% | | | | (2.51% | ) | | | 2.84% | | | | 16.00% | |
Net assets, end of period (000) | | | $1,452 | | | | $1,338 | | | | $1,451 | | | | $1,160 | |
Ratio of net expenses to average net assets | | | 2.25% | (c) | | | 2.25% | | | | 2.25% | | | | 2.25% | (c) |
Ratio of gross expenses to average net assets prior to expense reductions | | | 2.50% | (c) | | | 2.49% | | | | 2.61% | | | | 3.41% | (c) |
Ratio of net investment income (loss) to average net assets | | | (1.12% | )(c) | | | (1.84% | ) | | | (1.81% | ) | | | (1.74% | )(c) |
| |
| | | CLASS C | |
| | | (Unaudited)
Six Months
Ended
April 30, | | | Year Ended October 31, | | | June 1, 2010*
through
October 31, | |
| | | 2013 | | | 2012 | | | 2011 | | | 2010 | |
Net asset value, beginning of period | | | $11.64 | | | | $11.93 | | | | $11.60 | | | | $10.00 | |
Income from investment operations: | | | | | | | | | | | | | | | | |
Net investment income (loss)(a) | | | (0.07 | ) | | | (0.22 | ) | | | (0.24 | ) | | | (0.08 | ) |
Net realized and unrealized gain (loss) | | | 0.85 | | | | (0.07 | ) | | | 0.57 | | | | 1.68 | |
Total from investment operations | | | 0.78 | | | | (0.29 | ) | | | 0.33 | | | | 1.60 | |
Distributions: | | | | | | | | | | | | | | | | |
Dividends from net investment income | | | — | | | | — | | | | — | | | | — | |
Dividends from net realized gains | | | — | | | | — | | | | — | | | | — | |
Total distributions | | | — | | | | — | | | | — | | | | — | |
Net asset value, end of period | | | $12.42 | | | | $11.64 | | | | $11.93 | | | | $11.60 | |
Ratios and supplemental data: | | | | | | | | | | | | | | | | |
Total return(b) | | | 6.70% | | | | (2.43% | ) | | | 2.84% | | | | 16.00% | |
Net assets, end of period (000) | | | $2,236 | | | | $2,274 | | | | $2,524 | | | | $1,545 | |
Ratio of net expenses to average net assets | | | 2.25% | (c) | | | 2.25% | | | | 2.25% | | | | 2.25% | (c) |
Ratio of gross expenses to average net assets prior to expense reductions | | | 2.50% | (c) | | | 2.49% | | | | 2.59% | | | | 3.38% | (c) |
Ratio of net investment income (loss) to average net assets | | | (1.09% | )(c) | | | (1.84% | ) | | | (1.82% | ) | | | (1.76% | )(c) |
| * | Commencement of operations. |
| (a) | Net investment income allocated based on average shares method. |
| (b) | Total return measures net investment income and capital gain or loss from portfolio investments assuming reinvestment of dividends and capital gains distributions. Total return is not annualized for periods that are less than a full year, does not reflect the effect of sales charge for Class A shares nor the contingent deferred sales charge for Class B and C shares and does not reflect the deduction of taxes that a shareholder would pay on fund distributions or the redemption of fund shares. |
Calamos Discovery Growth Fund Financial Highlights
| | | | | | | | | | | | | | | | |
| | | CLASS I | |
| | | (Unaudited)
Six Months
Ended
April 30, | | | Year Ended October 31, | | | June 1, 2010*
through
October 31, | |
| | | 2013 | | | 2012 | | | 2011 | | | 2010 | |
Net asset value, beginning of period | | | $11.89 | | | | $12.07 | | | | $11.65 | | | | $10.00 | |
Income from investment operations: | | | | | | | | | | | | | | | | |
Net investment income (loss)(a) | | | (0.01 | ) | | | (0.10 | ) | | | (0.12 | ) | | | (0.03 | ) |
Net realized and unrealized gain (loss) | | | 0.88 | | | | (0.08 | ) | | | 0.57 | | | | 1.68 | |
Total from investment operations | | | 0.87 | | | | (0.18 | ) | | | 0.45 | | | | 1.65 | |
Distributions: | | | | | | | | | | | | | | | | |
Dividends from net investment income | | | — | | | | — | | | | (0.03 | ) | | | — | |
Dividends from net realized gains | | | — | | | | — | | | | — | | | | — | |
Total distributions | | | — | | | | — | | | | (0.03 | ) | | | — | |
Net asset value, end of period | | | $12.76 | | | | $11.89 | | | | $12.07 | | | | $11.65 | |
Ratios and supplemental data: | | | | | | | | | | | | | | | | |
Total return(b) | | | 7.32% | | | | (1.49% | ) | | | 3.82% | | | | 16.50% | |
Net assets, end of period (000) | | | $8,018 | | | | $8,608 | | | | $7,738 | | | | $2,540 | |
Ratio of net expenses to average net assets | | | 1.25% | (c) | | | 1.25% | | | | 1.25% | | | | 1.25% | (c) |
Ratio of gross expenses to average net assets prior to expense reductions | | | 1.49% | (c) | | | 1.49% | | | | 1.54% | | | | 2.40% | (c) |
Ratio of net investment income (loss) to average net assets | | | (0.11% | )(c) | | | (0.83% | ) | | | (0.89% | ) | | | (0.74% | )(c) |
| |
| | | CLASS R | |
| | | (Unaudited)
Six Months
Ended
April 30, | | | Year Ended October 31, | | | June 1, 2010*
through
October 31, | |
| | | 2013 | | | 2012 | | | 2011 | | | 2010 | |
Net asset value, beginning of period | | | $11.77 | | | | $12.01 | | | | $11.63 | | | | $10.00 | |
Income from investment operations: | | | | | | | | | | | | | | | | |
Net investment income (loss)(a) | | | (0.04 | ) | | | (0.16 | ) | | | (0.17 | ) | | | (0.05 | ) |
Net realized and unrealized gain (loss) | | | 0.87 | | | | (0.08 | ) | | | 0.55 | | | | 1.68 | |
Total from investment operations | | | 0.83 | | | | (0.24 | ) | | | 0.38 | | | | 1.63 | |
Distributions: | | | | | | | | | | | | | | | | |
Dividends from net investment income | | | — | | | | — | | | | — | | | | — | |
Dividends from net realized gains | | | — | | | | — | | | | — | | | | — | |
Total distributions | | | — | | | | — | | | | — | | | | — | |
Net asset value, end of period | | | $12.60 | | | | $11.77 | | | | $12.01 | | | | $11.63 | |
Ratios and supplemental data: | | | | | | | | | | | | | | | | |
Total return(b) | | | 7.05% | | | | (2.00% | ) | | | 3.27% | | | | 16.30% | |
Net assets, end of period (000) | | | $1,624 | | | | $1,175 | | | | $1,201 | | | | $1,163 | |
Ratio of net expenses to average net assets | | | 1.75% | (c) | | | 1.75% | | | | 1.75% | | | | 1.75% | (c) |
Ratio of gross expenses to average net assets prior to expense reductions | | | 2.00% | (c) | | | 1.99% | | | | 2.13% | | | | 2.91% | (c) |
Ratio of net investment income (loss) to average net assets | | | (0.63% | )(c) | | | (1.34% | ) | | | (1.29% | ) | | | (1.24% | )(c) |
| * | Commencement of operations. |
| (a) | Net investment income allocated based on average shares method. |
| (b) | Total return measures net investment income and capital gain or loss from portfolio investments assuming reinvestment of dividends and capital gains distributions. Total return is not annualized for periods that are less than a full year, does not reflect the effect of sales charge for Class A shares nor the contingent deferred sales charge for Class B and C shares and does not reflect the deduction of taxes that a shareholder would pay on fund distributions or the redemption of fund shares. |
| | | | |
| 150 | | CALAMOS FAMILY OF FUNDS SEMIANNUAL REPORT | | |
Calamos International Growth Fund Financial Highlights
Selected data for a share outstanding throughout each period were as follows:
| | | | | | | | | | | | | | | | | | | | | | | | |
| | | CLASS A | |
| | | (Unaudited)
Six Months
Ended
April 30, | | | Year Ended October 31, | |
| | | 2013 | | | 2012 | | | 2011 | | | 2010 | | | 2009 | | | 2008 | |
Net asset value, beginning of period | | | $17.27 | | | | $16.32 | | | | $15.46 | | | | $12.64 | | | | $8.90 | | | | $19.16 | |
Income from investment operations: | | | | | | | | | | | | | | | | | | | | | | | | |
Net investment income (loss)(a) | | | 0.02 | | | | 0.06 | | | | (0.04 | ) | | | (0.04 | ) | | | 0.03 | | | | 0.04 | |
Net realized and unrealized gain (loss) | | | 0.93 | | | | 0.89 | | | | 0.90 | | | | 2.86 | | | | 3.71 | | | | (9.61 | ) |
Total from investment operations | | | 0.95 | | | | 0.95 | | | | 0.86 | | | | 2.82 | | | | 3.74 | | | | (9.57 | ) |
Distributions: | | | | | | | | | | | | | | | | | | | | | | | | |
Dividends from net investment income | | | (0.04 | ) | | | — | | | | — | | | | — | | | | — | | | | (0.08 | ) |
Dividends from net realized gains | | | — | | | | — | | | | — | | | | — | | | | — | | | | (0.61 | ) |
Total distributions | | | (0.04 | ) | | | — | | | | — | | | | — | | | | — | | | | (0.69 | ) |
Net asset value, end of period | | | $18.18 | | | | $17.27 | | | | $16.32 | | | | $15.46 | | | | $12.64 | | | | $8.90 | |
Ratios and supplemental data: | | | | | | | | | | | | | | | | | | | | | | | | |
Total return(b) | | | 5.49% | | | | 5.82% | | | | 5.56% | | | | 22.31% | | | | 42.02% | | | | (51.67% | ) |
Net assets, end of period (000) | | | $451,457 | | | | $459,516 | | | | $238,764 | | | | $136,723 | | | | $112,647 | | | | $130,686 | |
Ratio of net expenses to average net assets | | | 1.40% | (c) | | | 1.40% | | | | 1.49% | | | | 1.67% | | | | 1.62% | | | | 1.48% | |
Ratio of gross expenses to average net assets prior to expense reductions | | | 1.48% | (c) | | | 1.59% | | | | 1.58% | | | | 1.67% | | | | 1.62% | | | | 1.48% | |
Ratio of net investment income (loss) to average net assets | | | 0.18% | (c) | | | 0.36% | | | | (0.21% | ) | | | (0.26% | ) | | | 0.35% | | | | 0.25% | |
| | |
| | | (Unaudited)
Six Months
Ended
April 30, | | | Year Ended October 31, | |
| | | 2013 | | | 2012 | | | 2011 | | | 2010 | | | 2009 | | | 2008 | |
Portfolio turnover rate | | | 32.8% | | | | 55.7% | | | | 59.6% | | | | 63.1% | | | | 86.9% | | | | 87.7% | |
| (a) | Net investment income (loss) allocated based on average shares method. |
| (b) | Total return measures net investment income (loss) and capital gain or loss from portfolio investments assuming reinvestment of dividends and capital gains distributions. Total return is not annualized for periods that are less than a full year, does not reflect the effect of sales charge for Class A shares nor the contingent deferred sales charge for Class B and C shares and does not reflect the deduction of taxes that a shareholder would pay on fund distributions or the redemption of fund shares. |
Calamos International Growth Fund Financial Highlights
| | | | | | | | | | | | | | | | | | | | | | | | |
| | | CLASS B | |
| | | (Unaudited)
Six Months
Ended
April 30, | | | Year Ended October 31, | |
| | | 2013 | | | 2012 | | | 2011 | | | 2010 | | | 2009 | | | 2008 | |
Net asset value, beginning of period | | | $16.45 | | | | $15.67 | | | | $14.96 | | | | $12.32 | | | | $8.74 | | | | $18.88 | |
Income from investment operations: | | | | | | | | | | | | | | | | | | | | | | | | |
Net investment income (loss)(a) | | | (0.05 | ) | | | (0.07 | ) | | | (0.16 | ) | | | (0.14 | ) | | | (0.03 | ) | | | (0.07 | ) |
Net realized and unrealized gain (loss) | | | 0.90 | | | | 0.85 | | | | 0.87 | | | | 2.78 | | | | 3.61 | | | | (9.46 | ) |
Total from investment operations | | | 0.85 | | | | 0.78 | | | | 0.71 | | | | 2.64 | | | | 3.58 | | | | (9.53 | ) |
Distributions: | | | | | | | | | | | | | | | | | | | | | | | | |
Dividends from net investment income | | | — | | | | — | | | | — | | | | — | | | | — | | | | — | |
Dividends from net realized gains | | | — | | | | — | | | | — | | | | — | | | | — | | | | (0.61 | ) |
Total distributions | | | — | | | | — | | | | — | | | | — | | | | — | | | | (0.61 | ) |
Net asset value, end of period | | | $17.30 | | | | $16.45 | | | | $15.67 | | | | $14.96 | | | | $12.32 | | | | $8.74 | |
Ratios and supplemental data: | | | | | | | | | | | | | | | | | | | | | | | | |
Total return(b) | | | 5.17% | | | | 4.98% | | | | 4.75% | | | | 21.43% | | | | 40.96% | | | | (52.02% | ) |
Net assets, end of period (000) | | | $8,440 | | | | $9,542 | | | | $13,500 | | | | $16,606 | | | | $17,019 | | | | $15,978 | |
Ratio of net expenses to average net assets | | | 2.15% | (c) | | | 2.15% | | | | 2.25% | | | | 2.42% | | | | 2.37% | | | | 2.23% | |
Ratio of gross expenses to average net assets prior to expense reductions | | | 2.23% | (c) | | | 2.34% | | | | 2.32% | | | | 2.42% | | | | 2.38% | | | | 2.23% | |
Ratio of net investment income (loss) to average net assets | | | (0.58% | )(c) | | | (0.45% | ) | | | (1.01% | ) | | | (1.02% | ) | | | (0.34% | ) | | | (0.50% | ) |
| |
| | | CLASS C | |
| | | (Unaudited)
Six Months
Ended
April 30, | | | Year Ended October 31, | |
| | | 2013 | | | 2012 | | | 2011 | | | 2010 | | | 2009 | | | 2008 | |
Net asset value, beginning of period | | | $16.43 | | | | $15.65 | | | | $14.94 | | | | $12.30 | | | | $8.72 | | | | $18.85 | |
Income from investment operations: | | | | | | | | | | | | | | | | | | | | | | | | |
Net investment income (loss)(a) | | | (0.04 | ) | | | (0.06 | ) | | | (0.16 | ) | | | (0.14 | ) | | | (0.03 | ) | | | (0.07 | ) |
Net realized and unrealized gain (loss) | | | 0.89 | | | | 0.84 | | | | 0.87 | | | | 2.78 | | | | 3.61 | | | | (9.45 | ) |
Total from investment operations | | | 0.85 | | | | 0.78 | | | | 0.71 | | | | 2.64 | | | | 3.58 | | | | (9.52 | ) |
Distributions: | | | | | | | | | | | | | | | | | | | | | | | | |
Dividends from net investment income | | | — | | | | — | | | | — | | | | — | | | | — | | | | — | |
Dividends from net realized gains | | | — | | | | — | | | | — | | | | — | | | | — | | | | (0.61 | ) |
Total distributions | | | — | | | | — | | | | — | | | | — | | | | — | | | | (0.61 | ) |
Net asset value, end of period | | | $17.28 | | | | $16.43 | | | | $15.65 | | | | $14.94 | | | | $12.30 | | | | $8.72 | |
Ratios and supplemental data: | | | | | | | | | | | | | | | | | | | | | | | | |
Total return(b) | | | 5.17% | | | | 4.98% | | | | 4.75% | | | | 21.46% | | | | 41.06% | | | | (52.05% | ) |
Net assets, end of period (000) | | | $69,695 | | | | $65,621 | | | | $53,355 | | | | $48,200 | | | | $43,138 | | | | $43,401 | |
Ratio of net expenses to average net assets | | | 2.15% | (c) | | | 2.15% | | | | 2.25% | | | | 2.42% | | | | 2.37% | | | | 2.23% | |
Ratio of gross expenses to average net assets prior to expense reductions | | | 2.23% | (c) | | | 2.34% | | | | 2.32% | | | | 2.42% | | | | 2.37% | | | | 2.23% | |
Ratio of net investment income (loss) to average net assets | | | (0.52% | )(c) | | | (0.41% | ) | | | (0.98% | ) | | | (1.01% | ) | | | (0.36% | ) | | | (0.50% | ) |
| (a) | Net investment income (loss) allocated based on average shares method. |
| (b) | Total return measures net investment income (loss) and capital gain or loss from portfolio investments assuming reinvestment of dividends and capital gains distributions. Total return is not annualized for periods that are less than a full year, does not reflect the effect of sales charge for Class A shares nor the contingent deferred sales charge for Class B and C shares and does not reflect the deduction of taxes that a shareholder would pay on fund distributions or the redemption of fund shares. |
| | | | |
| 152 | | CALAMOS FAMILY OF FUNDS SEMIANNUAL REPORT | | |
Calamos International Growth Fund Financial Highlights
| | | | | | | | | | | | | | | | | | | | | | | | |
| | | CLASS I | |
| | | (Unaudited)
Six Months
Ended
April 30, | | | Year Ended October 31, | |
| | | 2013 | | | 2012 | | | 2011 | | | 2010 | | | 2009 | | | 2008 | |
Net asset value, beginning of period | | | $17.47 | | | | $16.47 | | | | $15.57 | | | | $12.72 | | | | $8.93 | | | | $19.22 | |
Income from investment operations: | | | | | | | | | | | | | | | | | | | | | | | | |
Net investment income (loss)(a) | | | 0.05 | | | | 0.10 | | | | 0.01 | | | | 0.01 | | | | 0.05 | | | | 0.08 | |
Net realized and unrealized gain (loss) | | | 0.94 | | | | 0.90 | | | | 0.89 | | | | 2.87 | | | | 3.74 | | | | (9.65 | ) |
Total from investment operations | | | 0.99 | | | | 1.00 | | | | 0.90 | | | | 2.88 | | | | 3.79 | | | | (9.57 | ) |
Distributions: | | | | | | | | | | | | | | | | | | | | | | | | |
Dividends from net investment income | | | (0.07 | ) | | | — | | | | — | | | | (0.03 | ) | | | — | | | | (0.11 | ) |
Dividends from net realized gains | | | — | | | | — | | | | — | | | | — | | | | — | | | | (0.61 | ) |
Total distributions | | | (0.07 | ) | | | — | | | | — | | | | (0.03 | ) | | | — | | | | (0.72 | ) |
Net asset value, end of period | | | $18.39 | | | | $17.47 | | | | $16.47 | | | | $15.57 | | | | $12.72 | | | | $8.93 | |
Ratios and supplemental data: | | | | | | | | | | | | | | | | | | | | | | | | |
Total return(b) | | | 5.70% | | | | 6.07% | | | | 5.78% | | | | 22.66% | | | | 42.44% | | | | (51.56% | ) |
Net assets, end of period (000) | | | $489,603 | | | | $415,463 | | | | $226,298 | | | | $96,003 | | | | $42,392 | | | | $78,423 | |
Ratio of net expenses to average net assets | | | 1.15% | (c) | | | 1.15% | | | | 1.23% | | | | 1.42% | | | | 1.35% | | | | 1.23% | |
Ratio of gross expenses to average net assets prior to expense reductions | | | 1.23% | (c) | | | 1.34% | | | | 1.33% | | | | 1.42% | | | | 1.36% | | | | 1.23% | |
Ratio of net investment income (loss) to average net assets | | | 0.52% | (c) | | | 0.61% | | | | 0.07% | | | | 0.06% | | | | 0.51% | | | | 0.50% | |
| |
| | | CLASS R | |
| | | (Unaudited)
Six Months
Ended
April 30, | | | Year Ended October 31, | |
| | | 2013 | | | 2012 | | | 2011 | | | 2010 | | | 2009 | | | 2008 | |
Net asset value, beginning of period | | | $17.06 | | | | $16.16 | | | | $15.35 | | | | $12.58 | | | | $8.88 | | | | $19.13 | |
Income from investment operations: | | | | | | | | | | | | | | | | | | | | | | | | |
Net investment income (loss)(a) | | | 0.01 | | | | 0.02 | | | | (0.08 | ) | | | (0.07 | ) | | | 0.00 | ** | | | 0.00 | ** |
Net realized and unrealized gain (loss) | | | 0.91 | | | | 0.88 | | | | 0.89 | | | | 2.84 | | | | 3.70 | | | | (9.59 | ) |
Total from investment operations | | | 0.92 | | | | 0.90 | | | | 0.81 | | | | 2.77 | | | | 3.70 | | | | (9.59 | ) |
Distributions: | | | | | | | | | | | | | | | | | | | | | | | | |
Dividends from net investment income | | | (0.02 | ) | | | — | | | | — | | | | — | | | | — | | | | (0.05 | ) |
Dividends from net realized gains | | | — | | | | — | | | | — | | | | — | | | | — | | | | (0.61 | ) |
Total distributions | | | (0.02 | ) | | | — | | | | — | | | | — | | | | — | | | | (0.66 | ) |
Net asset value, end of period | | | $17.96 | | | | $17.06 | | | | $16.16 | | | | $15.35 | | | | $12.58 | | | | $8.88 | |
Ratios and supplemental data: | | | | | | | | | | | | | | | | | | | | | | | | |
Total return(b) | | | 5.37% | | | | 5.57% | | | | 5.28% | | | | 22.02% | | | | 41.67% | | | | (51.78% | ) |
Net assets, end of period (000) | | | $18,005 | | | | $12,016 | | | | $3,667 | | | | $1,163 | | | | $598 | | | | $83 | |
Ratio of net expenses to average net assets | | | 1.65% | (c) | | | 1.65% | | | | 1.73% | | | | 1.92% | | | | 1.89% | | | | 1.73% | |
Ratio of gross expenses to average net assets prior to expense reductions | | | 1.73% | (c) | | | 1.84% | | | | 1.84% | | | | 1.92% | | | | 1.89% | | | | 1.73% | |
Ratio of net investment income (loss) to average net assets | | | 0.10% | (c) | | | 0.11% | | | | (0.46% | ) | | | (0.49% | ) | | | 0.02% | | | | 0.00% | |
| ** | Amount is less than $0.005. |
| (a) | Net investment income (loss) allocated based on average shares method. |
| (b) | Total return measures net investment income (loss) and capital gain or loss from portfolio investments assuming reinvestment of dividends and capital gains distributions. Total return is not annualized for periods that are less than a full year, does not reflect the effect of sales charge for Class A shares nor the contingent deferred sales charge for Class B and C shares and does not reflect the deduction of taxes that a shareholder would pay on fund distributions or the redemption of fund shares. |
Calamos Evolving World Growth Fund Financial Highlights
Selected data for a share outstanding throughout each period were as follows:
| | | | | | | | | | | | | | | | | | | | | | | | |
| | | CLASS A | |
| | | (Unaudited)
Six Months
Ended
April 30, | | | Year Ended October 31, | | | August 15, 2008*
through
October 31, | |
| | | 2013 | | | 2012 | | | 2011 | | | 2010 | | | 2009 | | | 2008 | |
Net asset value, beginning of period | | | $12.83 | | | | $12.47 | | | | $12.42 | | | | $10.30 | | | | $7.33 | | | | $10.00 | |
Income from investment operations: | | | | | | | | | | | | | | | | | | | | | | | | |
Net investment income (loss)(a) | | | (0.01 | ) | | | 0.04 | | | | 0.01 | | | | 0.08 | | | | 0.12 | | | | 0.01 | |
Net realized and unrealized gain (loss) | | | 0.45 | | | | 0.32 | | | | 0.08 | | | | 2.11 | | | | 2.91 | | | | (2.68 | ) |
Total from investment operations | | | 0.44 | | | | 0.36 | | | | 0.09 | | | | 2.19 | | | | 3.03 | | | | (2.67 | ) |
Distributions: | | | | | | | | | | | | | | | | | | | | | | | | |
Dividends from net investment income | | | — | | | | — | | | | (0.04 | ) | | | (0.07 | ) | | | (0.06 | ) | | | — | |
Dividends from net realized gains | | | — | | | | — | | | | — | | | | — | | | | — | | | | — | |
Total distributions | | | — | | | | — | | | | (0.04 | ) | | | (0.07 | ) | | | (0.06 | ) | | | — | |
Net asset value, end of period | | | $13.27 | | | | $12.83 | | | | $12.47 | | | | $12.42 | | | | $10.30 | | | | $7.33 | |
Ratios and supplemental data: | | | | | | | | | | | | | | | | | | | | | | | | |
Total return(b) | | | 3.43% | | | | 2.89% | | | | 0.68% | | | | 21.40% | | | | 41.76% | | | | (26.70% | ) |
Net assets, end of period (000) | | | $143,999 | | | | $138,718 | | | | $104,365 | | | | $44,895 | | | | $15,276 | | | | $1,194 | |
Ratio of net expenses to average net assets | | | 1.59% | (c) | | | 1.60% | | | | 1.58% | | | | 1.67% | | | | 1.75% | | | | 1.68% | (c) |
Ratio of gross expenses to average net assets prior to expense reductions | | | 1.59% | (c) | | | 1.60% | | | | 1.58% | | | | 1.67% | | | | 1.97% | | | | 3.01% | (c) |
Ratio of net investment income (loss) to average net assets | | | (0.11% | )(c) | | | 0.32% | | | | 0.08% | | | | 0.67% | | | | 1.31% | | | | 0.71% | (c) |
| | | |
| | | (Unaudited)
Six Months
Ended
April 30, | | | Year Ended October 31, | | | August 15, 2008*
through
October 31, | |
| | | 2013 | | | 2012 | | | 2011 | | | 2010 | | | 2009 | | | 2008 | |
Portfolio turnover rate | | | 32.8% | | | | 50.1% | | | | 67.4% | | | | 48.3% | | | | 73.5% | | | | 1.2% | |
| * | Commencement of operations. |
| (a) | Net investment income (loss) allocated based on average shares method. |
| (b) | Total return measures net investment income (loss) and capital gain or loss from portfolio investments assuming reinvestment of dividends and capital gains distributions. Total return is not annualized for periods that are less than a full year, does not reflect the effect of sales charge for Class A shares nor the contingent deferred sales charge for Class B and C shares and does not reflect the deduction of taxes that a shareholder would pay on fund distributions or the redemption of fund shares. |
| | | | |
| 154 | | CALAMOS FAMILY OF FUNDS SEMIANNUAL REPORT | | |
Calamos Evolving World Growth Fund Financial Highlights
| | | | | | | | | | | | | | | | | | | | | | | | |
| | | CLASS B | |
| | | (Unaudited)
Six Months
Ended
April 30, | | | Year Ended October 31, | | | August 15, 2008*
through
October 31, | |
| | | 2013 | | | 2012 | | | 2011 | | | 2010 | | | 2009 | | | 2008 | |
Net asset value, beginning of period | | | $12.58 | | | | $12.32 | | | | $12.32 | | | | $10.24 | | | | $7.32 | | | | $10.00 | |
Income from investment operations: | | | | | | | | | | | | | | | | | | | | | | | | |
Net investment income (loss)(a) | | | (0.05 | ) | | | (0.06 | ) | | | (0.09 | ) | | | (0.01 | ) | | | 0.07 | | | | (0.00 | )** |
Net realized and unrealized gain (loss) | | | 0.43 | | | | 0.32 | | | | 0.09 | | | | 2.10 | | | | 2.89 | | | | (2.68 | ) |
Total from investment operations | | | 0.38 | | | | 0.26 | | | | — | | | | 2.09 | | | | 2.96 | | | | (2.68 | ) |
Distributions: | | | | | | | | | | | | | | | | | | | | | | | | |
Dividends from net investment income | | | — | | | | — | | | | — | | | | (0.01 | ) | | | (0.04 | ) | | | — | |
Dividends from net realized gains | | | — | | | | — | | | | — | | | | — | | | | — | | | | — | |
Total distributions | | | — | | | | — | | | | — | | | | (0.01 | ) | | | (0.04 | ) | | | — | |
Net asset value, end of period | | | $12.96 | | | | $12.58 | | | | $12.32 | | | | $12.32 | | | | $10.24 | | | | $7.32 | |
Ratios and supplemental data: | | | | | | | | | | | | | | | | | | | | | | | | |
Total return(b) | | | 3.02% | | | | 2.11% | | | | 0.00% | | | | 20.42% | | | | 40.71% | | | | (26.80% | ) |
Net assets, end of period (000) | | | $1,701 | | | | $1,595 | | | | $1,815 | | | | $1,819 | | | | $1,349 | | | | $732 | |
Ratio of net expenses to average net assets | | | 2.34% | (c) | | | 2.34% | | | | 2.33% | | | | 2.43% | | | | 2.49% | | | | 2.43% | (c) |
Ratio of gross expenses to average net assets prior to expense reductions | | | 2.34% | (c) | | | 2.34% | | | | 2.33% | | | | 2.43% | | | | 2.95% | | | | 3.76% | (c) |
Ratio of net investment income (loss) to average net assets | | | (0.85% | )(c) | | | (0.46% | ) | | | (0.71% | ) | | | (0.11% | ) | | | 0.83% | | | | (0.04% | )(c) |
| |
| | | CLASS C | |
| | | (Unaudited)
Six Months
Ended
April 30, | | | Year Ended October 31, | | | August 15, 2008*
through
October 31, | |
| | | 2013 | | | 2012 | | | 2011 | | | 2010 | | | 2009 | | | 2008 | |
Net asset value, beginning of period | | | $12.57 | | | | $12.31 | | | | $12.31 | | | | $10.24 | | | | $7.32 | | | | $10.00 | |
Income from investment operations: | | | | | | | | | | | | | | | | | | | | | | | | |
Net investment income (loss)(a) | | | (0.05 | ) | | | (0.05 | ) | | | (0.09 | ) | | | (0.01 | ) | | | 0.07 | | | | (0.00 | )** |
Net realized and unrealized gain (loss) | | | 0.43 | | | | 0.31 | | | | 0.09 | | | | 2.10 | | | | 2.89 | | | | (2.68 | ) |
Total from investment operations | | | 0.38 | | | | 0.26 | | | | — | | | | 2.09 | | | | 2.96 | | | | (2.68 | ) |
Distributions: | | | | | | | | | | | | | | | | | | | | | | | | |
Dividends from net investment income | | | — | | | | — | | | | (0.00 | )** | | | (0.02 | ) | | | (0.04 | ) | | | — | |
Dividends from net realized gains | | | — | | | | — | | | | — | | | | — | | | | — | | | | — | |
Total distributions | | | — | | | | — | | | | — | | | | (0.02 | ) | | | (0.04 | ) | | | — | |
Net asset value, end of period | | | $12.95 | | | | $12.57 | | | | $12.31 | | | | $12.31 | | | | $10.24 | | | | $7.32 | |
Ratios and supplemental data: | | | | | | | | | | | | | | | | | | | | | | | | |
Total return(b) | | | 3.02% | | | | 2.11% | | | | 0.00% | | | | 20.43% | | | | 40.71% | | | | (26.80% | ) |
Net assets, end of period (000) | | | $26,924 | | | | $21,527 | | | | $8,913 | | | | $3,472 | | | | $1,431 | | | | $734 | |
Ratio of net expenses to average net assets | | | 2.34% | (c) | | | 2.35% | | | | 2.33% | | | | 2.43% | | | | 2.49% | | | | 2.43% | (c) |
Ratio of gross expenses to average net assets prior to expense reductions | | | 2.34% | (c) | | | 2.35% | | | | 2.33% | | | | 2.43% | | | | 2.95% | | | | 3.76% | (c) |
Ratio of net investment income (loss) to average net assets | | | (0.85% | )(c) | | | (0.41% | ) | | | (0.66% | ) | | | (0.07% | ) | | | 0.82% | | | | (0.04% | )(c) |
| * | Commencement of operations. |
| ** | Amount equated to less than $0.005 per common share. |
| (a) | Net investment income (loss) allocated based on average shares method. |
| (b) | Total return measures net investment income (loss) and capital gain or loss from portfolio investments assuming reinvestment of dividends and capital gains distributions. Total return is not annualized for periods that are less than a full year, does not reflect the effect of sales charge for Class A shares nor the contingent deferred sales charge for Class B and C shares and does not reflect the deduction of taxes that a shareholder would pay on fund distributions or the redemption of fund shares. |
Calamos Evolving World Growth Fund Financial Highlights
| | | | | | | | | | | | | | | | | | | | | | | | |
| | | CLASS I | |
| | | (Unaudited)
Six Months
Ended
April 30, | | | Year Ended October 31, | | | August 15, 2008*
through
October 31, | |
| | | 2013 | | | 2012 | | | 2011 | | | 2010 | | | 2009 | | | 2008 | |
Net asset value, beginning of period | | | $12.92 | | | | $12.54 | | | | $12.46 | | | | $10.32 | | | | $7.33 | | | | $10.00 | |
Income from investment operations: | | | | | | | | | | | | | | | | | | | | | | | | |
Net investment income (loss)(a) | | | 0.01 | | | | 0.07 | | | | 0.04 | | | | 0.10 | | | | 0.15 | | | | 0.02 | |
Net realized and unrealized gain (loss) | | | 0.45 | | | | 0.32 | | | | 0.09 | | | | 2.12 | | | | 2.91 | | | | (2.69 | ) |
Total from investment operations | | | 0.46 | | | | 0.39 | | | | 0.13 | | | | 2.22 | | | | 3.06 | | | | (2.67 | ) |
Distributions: | | | | | | | | | | | | | | | | | | | | | | | | |
Dividends from net investment income | | | (0.03 | ) | | | (0.01 | ) | | | (0.05 | ) | | | (0.08 | ) | | | (0.07 | ) | | | — | |
Dividends from net realized gains | | | — | | | | — | | | | — | | | | — | | | | — | | | | — | |
Total distributions | | | (0.03 | ) | | | (0.01 | ) | | | (0.05 | ) | | | (0.08 | ) | | | (0.07 | ) | | | — | |
Net asset value, end of period | | | $13.35 | | | | $12.92 | | | | $12.54 | | | | $12.46 | | | | $10.32 | | | | $7.33 | |
Ratios and supplemental data: | | | | | | | | | | | | | | | | | | | | | | | | |
Total return(b) | | | 3.57% | | | | 3.11% | | | | 1.05% | | | | 21.68% | | | | 42.14% | | | | (26.70% | ) |
Net assets, end of period (000) | | | $260,406 | | | | $175,572 | | | | $89,205 | | | | $52,875 | | | | $24,132 | | | | $15,404 | |
Ratio of net expenses to average net assets | | | 1.34% | (c) | | | 1.35% | | | | 1.33% | | | | 1.43% | | | | 1.49% | | | | 1.43% | (c) |
Ratio of gross expenses to average net assets prior to expense reductions | | | 1.34% | (c) | | | 1.35% | | | | 1.33% | | | | 1.43% | | | | 1.97% | | | | 2.76% | (c) |
Ratio of net investment income (loss) to average net assets | | | 0.14% | (c) | | | 0.59% | | | | 0.33% | | | | 0.92% | | | | 1.86% | | | | 0.96% | (c) |
| |
| | | CLASS R | |
| | | (Unaudited)
Six Months
Ended
April 30, | | | Year Ended October 31, | | | August 15, 2008*
through
October 31, | |
| | | 2013 | | | 2012 | | | 2011 | | | 2010 | | | 2009 | | | 2008 | |
Net asset value, beginning of period | | | $12.78 | | | | $12.45 | | | | $12.39 | | | | $10.28 | | | | $7.33 | | | | $10.00 | |
Income from investment operations: | | | | | | | | | | | | | | | | | | | | | | | | |
Net investment income (loss)(a) | | | (0.02 | ) | | | 0.01 | | | | (0.03 | ) | | | 0.04 | | | | 0.11 | | | | 0.01 | |
Net realized and unrealized gain (loss) | | | 0.44 | | | | 0.32 | | | | 0.09 | | | | 2.11 | | | | 2.89 | | | | (2.68 | ) |
Total from investment operations | | | 0.42 | | | | 0.33 | | | | 0.06 | | | | 2.15 | | | | 3.00 | | | | (2.67 | ) |
Distributions: | | | | | | | | | | | | | | | | | | | | | | | | |
Dividends from net investment income | | | — | | | | — | | | | — | | | | (0.04 | ) | | | (0.05 | ) | | | — | |
Dividends from net realized gains | | | — | | | | — | | | | — | | | | — | | | | — | | | | — | |
Total distributions | | | — | | | | — | | | | — | | | | (0.04 | ) | | | (0.05 | ) | | | — | |
Net asset value, end of period | | | $13.20 | | | | $12.78 | | | | $12.45 | | | | $12.39 | | | | $10.28 | | | | $7.33 | |
Ratios and supplemental data: | | | | | | | | | | | | | | | | | | | | | | | | |
Total return(b) | | | 3.29% | | | | 2.65% | | | | 0.48% | | | | 20.99% | | | | 41.32% | | | | (26.70% | ) |
Net assets, end of period (000) | | | $1,630 | | | | $1,555 | | | | $1,274 | | | | $1,252 | | | | $1,040 | | | | $732 | |
Ratio of net expenses to average net assets | | | 1.84% | (c) | | | 1.84% | | | | 1.83% | | | | 1.93% | | | | 1.99% | | | | 1.93% | (c) |
Ratio of gross expenses to average net assets prior to expense reductions | | | 1.84% | (c) | | | 1.84% | | | | 1.83% | | | | 1.93% | | | | 2.49% | | | | 3.26% | (c) |
Ratio of net investment income (loss) to average net assets | | | (0.38% | )(c) | | | 0.05% | | | | (0.21% | ) | | | 0.38% | | | | 1.37% | | | | 0.46% | (c) |
| * | Commencement of operations. |
| (a) | Net investment income (loss) allocated based on average shares method. |
| (b) | Total return measures net investment income (loss) and capital gain or loss from portfolio investments assuming reinvestment of dividends and capital gains distributions. Total return is not annualized for periods that are less than a full year, does not reflect the effect of sales charge for Class A shares nor the contingent deferred sales charge for Class B and C shares and does not reflect the deduction of taxes that a shareholder would pay on fund distributions or the redemption of fund shares. |
| | | | |
| 156 | | CALAMOS FAMILY OF FUNDS SEMIANNUAL REPORT | | |
Calamos Global Equity Fund Financial Highlights
Selected data for a share outstanding throughout each period were as follows:
| | | | | | | | | | | | | | | | | | | | | | | | |
| | | CLASS A | |
| | | (Unaudited) Six Months
Ended
April 30, | | | Year Ended October 31, | |
| | | 2013 | | | 2012 | | | 2011 | | | 2010 | | | 2009 | | | 2008 | |
Net asset value, beginning of period | | | $13.00 | | | | $12.14 | | | | $11.28 | | | | $9.12 | | | | $7.16 | | | | $13.44 | |
Income from investment operations: | | | | | | | | | | | | | | | | | | | | | | | | |
Net investment income (loss)(a) | | | 0.00 | ** | | | (0.02 | ) | | | (0.07 | ) | | | (0.07 | ) | | | (0.03 | ) | | | (0.06 | ) |
Net realized and unrealized gain (loss) | | | 0.53 | | | | 0.88 | | | | 0.93 | | | | 2.23 | | | | 2.33 | | | | (6.22 | ) |
Total from investment operations | | | 0.53 | | | | 0.86 | | | | 0.86 | | | | 2.16 | | | | 2.30 | | | | (6.28 | ) |
Distributions: | | | | | | | | | | | | | | | | | | | | | | | | |
Dividends from net investment income | | | (0.02 | ) | | | — | | | | — | | | | — | | | | (0.33 | ) | | | — | |
Dividends from net realized gains | | | — | | | | — | | | | — | | | | — | | | | — | | | | — | |
Return of capital | | | — | | | | — | | | | — | | | | — | | | | (0.01 | ) | | | — | |
Total distributions | | | (0.02 | ) | | | — | | | | — | | | | — | | | | (0.34 | ) | | | — | |
Net asset value, end of period | | | $13.51 | | | | $13.00 | | | | $12.14 | | | | $11.28 | | | | $9.12 | | | | $7.16 | |
Ratios and supplemental data: | | | | | | | | | | | | | | | | | | | | | | | | |
Total return(b) | | | 4.10% | | | | 7.08% | | | | 7.62% | | | | 23.68% | | | | 34.24% | | | | (46.73% | ) |
Net assets, end of period (000) | | | $149,267 | | | | $113,260 | | | | $51,525 | | | | $30,212 | | | | $21,162 | | | | $23,904 | |
Ratio of net expenses to average net assets | | | 1.40% | (c) | | | 1.40% | | | | 1.57% | | | | 1.88% | | | | 1.95% | | | | 1.82% | |
Ratio of gross expenses to average net assets prior to expense reductions | | | 1.44% | (c) | | | 1.52% | | | | 1.66% | | | | 1.88% | | | | 2.05% | | | | 1.82% | |
Ratio of net investment income (loss) to average net assets | | | 0.07% | (c) | | | (0.14% | ) | | | (0.60% | ) | | | (0.71% | ) | | | (0.45% | ) | | | (0.52% | ) |
| | |
| | | (Unaudited) Six Months
Ended
April 30, | | | Year Ended October 31, | |
| | | 2013 | | | 2012 | | | 2011 | | | 2010 | | | 2009 | | | 2008 | |
Portfolio turnover rate | | | 30.1% | | | | 44.5% | | | | 58.8% | | | | 65.1% | | | | 101.6% | | | | 83.7% | |
| ** | Amounts are less than $0.005. |
| (a) | Net investment income allocated based on average shares method. |
| (b) | Total return measures net investment income and capital gain or loss from portfolio investments assuming reinvestment of dividends and capital gains distributions. Total return is not annualized for periods that are less than a full year, does not reflect the effect of sales charge for Class A shares nor the contingent deferred sales charge for Class B and C shares and does not reflect the deduction of taxes that a shareholder would pay on fund distributions or the redemption of fund shares. |
Calamos Global Equity Fund Financial Highlights
| | | | | | | | | | | | | | | | | | | | | | | | |
| | | CLASS B | |
| | | (Unaudited) Six Months
Ended
April 30, | | | Year Ended October 31, | |
| | | 2013 | | | 2012 | | | 2011 | | | 2010 | | | 2009 | | | 2008 | |
Net asset value, beginning of period | | | $12.56 | | | | $11.82 | | | | $11.06 | | | | $9.02 | | | | $7.06 | | | | $13.36 | |
Income from investment operations: | | | | | | | | | | | | | | | | | | | | | | | | |
Net investment income (loss)(a) | | | (0.04 | ) | | | (0.11 | ) | | | (0.16 | ) | | | (0.15 | ) | | | (0.09 | ) | | | (0.14 | ) |
Net realized and unrealized gain (loss) | | | 0.51 | | | | 0.85 | | | | 0.92 | | | | 2.19 | | | | 2.33 | | | | (6.16 | ) |
Total from investment operations | | | 0.47 | | | | 0.74 | | | | 0.76 | | | | 2.04 | | | | 2.24 | | | | (6.30 | ) |
Distributions: | | | | | | | | | | | | | | | | | | | | | | | | |
Dividends from net investment income | | | — | | | | — | | | | — | | | | — | | | | (0.27 | ) | | | — | |
Return of capital | | | — | | | | — | | | | — | | | | — | | | | (0.01 | ) | | | — | |
Total distributions | | | — | | | | — | | | | — | | | | — | | | | (0.28 | ) | | | — | |
Net asset value, end of period | | | $13.03 | | | | $12.56 | | | | $11.82 | | | | $11.06 | | | | $9.02 | | | | $7.06 | |
Ratios and supplemental data: | | | | | | | | | | | | | | | | | | | | | | | | |
Total return(b) | | | 3.74% | | | | 6.26% | | | | 6.87% | | | | 22.62% | | | | 33.48% | | | | (47.16% | ) |
Net assets, end of period (000) | | | $2,726 | | | | $2,519 | | | | $2,603 | | | | $2,552 | | | | $2,125 | | | | $1,531 | |
Ratio of net expenses to average net assets | | | 2.15% | (c) | | | 2.15% | | | | 2.35% | | | | 2.63% | | | | 2.71% | | | | 2.57% | |
Ratio of gross expenses to average net assets prior to expense reductions | | | 2.19% | (c) | | | 2.28% | | | | 2.42% | | | | 2.63% | | | | 2.81% | | | | 2.57% | |
Ratio of net investment income (loss) to average net assets | | | (0.69% | )(c) | | | (0.90% | ) | | | (1.37% | ) | | | (1.46% | ) | | | (1.18% | ) | | | (1.27% | ) |
| |
| | | CLASS C | |
| | | (Unaudited) Six Months
Ended
April 30, | | | Year Ended October 31, | |
| | | 2013 | | | 2012 | | | 2011 | | | 2010 | | | 2009 | | | 2008 | |
Net asset value, beginning of period | | | $12.54 | | | | $11.80 | | | | $11.04 | | | | $9.00 | | | | $7.07 | | | | $13.37 | |
Income from investment operations: | | | | | | | | | | | | | | | | | | | | | | | | |
Net investment income (loss)(a) | | | (0.04 | ) | | | (0.11 | )�� | | | (0.16 | ) | | | (0.15 | ) | | | (0.09 | ) | | | (0.14 | ) |
Net realized and unrealized gain (loss) | | | 0.50 | | | | 0.85 | | | | 0.92 | | | | 2.19 | | | | 2.32 | | | | (6.16 | ) |
Total from investment operations | | | 0.46 | | | | 0.74 | | | | 0.76 | | | | 2.04 | | | | 2.23 | | | | (6.30 | ) |
Distributions: | | | | | | | | | | | | | | | | | | | | | | | | |
Dividends from net investment income | | | — | | | | — | | | | — | | | | — | | | | (0.29 | ) | | | — | |
Dividends from net realized gains | | | — | | | | — | | | | — | | | | — | | | | — | | | | — | |
Return of capital | | | — | | | | — | | | | — | | | | — | | | | (0.01 | ) | | | — | |
Total distributions | | | — | | | | — | | | | — | | | | — | | | | (0.30 | ) | | | — | |
Net asset value, end of period | | | $13.00 | | | | $12.54 | | | | $11.80 | | | | $11.04 | | | | $9.00 | | | | $7.07 | |
Ratios and supplemental data: | | | | | | | | | | | | | | | | | | | | | | | | |
Total return(b) | | | 3.67% | | | | 6.27% | | | | 6.88% | | | | 22.67% | | | | 33.29% | | | | (47.12% | ) |
Net assets, end of period (000) | | | $34,481 | | | | $25,749 | | | | $10,359 | | | | $6,523 | | | | $4,490 | | | | $4,339 | |
Ratio of net expenses to average net assets | | | 2.15% | (c) | | | 2.15% | | | | 2.32% | | | | 2.63% | | | | 2.70% | | | | 2.57% | |
Ratio of gross expenses to average net assets prior to expense reductions | | | 2.19% | (c) | | | 2.27% | | | | 2.41% | | | | 2.63% | | | | 2.81% | | | | 2.57% | |
Ratio of net investment income (loss) to average net assets | | | (0.65% | )(c) | | | (0.89% | ) | | | (1.33% | ) | | | (1.46% | ) | | | (1.22% | ) | | | (1.27% | ) |
| (a) | Net investment income allocated based on average shares method. |
| (b) | Total return measures net investment income and capital gain or loss from portfolio investments assuming reinvestment of dividends and capital gains distributions. Total return is not annualized for periods that are less than a full year, does not reflect the effect of sales charge for Class A shares nor the contingent deferred sales charge for Class B and C shares and does not reflect the deduction of taxes that a shareholder would pay on fund distributions or the redemption of fund shares. |
| | | | |
| 158 | | CALAMOS FAMILY OF FUNDS SEMIANNUAL REPORT | | |
Calamos Global Equity Fund Financial Highlights
| | | | | | | | | | | | | | | | | | | | | | | | |
| | | CLASS I | |
| | | (Unaudited) Six Months
Ended
April 30, | | | Year Ended October 31, | |
| | | 2013 | | | 2012 | | | 2011 | | | 2010 | | | 2009 | | | 2008 | |
Net asset value, beginning of period | | | $13.11 | | | | $12.22 | | | | $11.31 | | | | $9.13 | | | | $7.19 | | | | $13.46 | |
Income from investment operations: | | | | | | | | | | | | | | | | | | | | | | | | |
Net investment income (loss)(a) | | | 0.02 | | | | 0.02 | | | | (0.04 | ) | | | (0.04 | ) | | | (0.01 | ) | | | (0.03 | ) |
Net realized and unrealized gain (loss) | | | 0.54 | | | | 0.87 | | | | 0.95 | | | | 2.22 | | | | 2.34 | | | | (6.24 | ) |
Total from investment operations | | | 0.56 | | | | 0.89 | | | | 0.91 | | | | 2.18 | | | | 2.33 | | | | (6.27 | ) |
Distributions: | | | | | | | | | | | | | | | | | | | | | | | | |
Dividends from net investment income | | | (0.05 | ) | | | — | | | | — | | | | — | | | | (0.38 | ) | | | — | |
Dividends from net realized gains | | | — | | | | — | | | | — | | | | — | | | | — | | | | — | |
Return of capital | | | — | | | | — | | | | — | | | | — | | | | (0.01 | ) | | | — | |
Total distributions | | | (0.05 | ) | | | — | | | | — | | | | — | | | | (0.39 | ) | | | — | |
Net asset value, end of period | | | $13.62 | | | | $13.11 | | | | $12.22 | | | | $11.31 | | | | $9.13 | | | | $7.19 | |
Ratios and supplemental data: | | | | | | | | | | | | | | | | | | | | | | | | |
Total return(b) | | | 4.24% | | | | 7.28% | | | | 8.05% | | | | 23.88% | | | | 34.70% | | | | (46.58% | ) |
Net assets, end of period (000) | | | $216,959 | | | | $220,364 | | | | $63,563 | | | | $11,996 | | | | $4,724 | | | | $3,436 | |
Ratio of net expenses to average net assets | | | 1.15% | (c) | | | 1.15% | | | | 1.27% | | | | 1.63% | | | | 1.70% | | | | 1.57% | |
Ratio of gross expenses to average net assets prior to expense reductions | | | 1.19% | (c) | | | 1.27% | | | | 1.39% | | | | 1.63% | | | | 1.81% | | | | 1.57% | |
Ratio of net investment income (loss) to average net assets | | | 0.30% | (c) | | | 0.13% | | | | (0.29% | ) | | | (0.39% | ) | | | (0.18% | ) | | | (0.27% | ) |
| |
| | | CLASS R | |
| | | (Unaudited) Six Months
Ended
April 30, | | | Year Ended October 31, | |
| | | 2013 | | | 2012 | | | 2011 | | | 2010 | | | 2009 | | | 2008 | |
Net asset value, beginning of period | | | $12.83 | | | | $12.02 | | | | $11.19 | | | | $9.07 | | | | $7.13 | | | | $13.41 | |
Income from investment operations: | | | | | | | | | | | | | | | | | | | | | | | | |
Net investment income (loss)(a) | | | (0.01 | ) | | | (0.06 | ) | | | (0.10 | ) | | | (0.10 | ) | | | (0.05 | ) | | | (0.08 | ) |
Net realized and unrealized gain (loss) | | | 0.52 | | | | 0.87 | | | | 0.93 | | | | 2.22 | | | | 2.32 | | | | (6.20 | ) |
Total from investment operations | | | 0.51 | | | | 0.81 | | | | 0.83 | | | | 2.12 | | | | 2.27 | | | | (6.28 | ) |
Distributions: | | | | | | | | | | | | | | | | | | | | | | | | |
Dividends from net investment income | | | (0.01 | ) | | | — | | | | — | | | | — | | | | (0.32 | ) | | | — | |
Dividends from net realized gains | | | — | | | | — | | | | — | | | | — | | | | — | | | | — | |
Return of capital | | | — | | | | — | | | | — | | | | — | | | | (0.01 | ) | | | — | |
Total distributions | | | (0.01 | ) | | | — | | | | — | | | | — | | | | (0.33 | ) | | | — | |
Net asset value, end of period | | | $13.33 | | | | $12.83 | | | | $12.02 | | | | $11.19 | | | | $9.07 | | | | $7.13 | |
Ratios and supplemental data: | | | | | | | | | | | | | | | | | | | | | | | | |
Total return(b) | | | 3.99% | | | | 6.74% | | | | 7.42% | | | | 23.37% | | | | 33.92% | | | | (46.83% | ) |
Net assets, end of period (000) | | | $8,127 | | | | $4,693 | | | | $1,709 | | | | $1,223 | | | | $962 | | | | $713 | |
Ratio of net expenses to average net assets | | | 1.65% | (c) | | | 1.65% | | | | 1.83% | | | | 2.13% | | | | 2.20% | | | | 2.07% | |
Ratio of gross expenses to average net assets prior to expense reductions | | | 1.70% | (c) | | | 1.78% | | | | 1.91% | | | | 2.13% | | | | 2.31% | | | | 2.07% | |
Ratio of net investment income (loss) to average net assets | | | (0.12% | )(c) | | | (0.45% | ) | | | (0.85% | ) | | | (0.96% | ) | | | (0.68% | ) | | | (0.77% | ) |
| (a) | Net investment income allocated based on average shares method. |
| (b) | Total return measures net investment income and capital gain or loss from portfolio investments assuming reinvestment of dividends and capital gains distributions. Total return is not annualized for periods that are less than a full year, does not reflect the effect of sales charge for Class A shares nor the contingent deferred sales charge for Class B and C shares and does not reflect the deduction of taxes that a shareholder would pay on fund distributions or the redemption of fund shares. |
Calamos Growth and Income Fund Financial Highlights
Selected data for a share outstanding throughout each period were as follows:
| | | | | | | | | | | | | | | | | | | | | | | | |
| | | CLASS A | |
| | | (Unaudited)
Six Months
Ended
April 30, | | | Year Ended October 31, | |
| | | 2013 | | | 2012 | | | 2011 | | | 2010 | | | 2009 | | | 2008 | |
Net asset value, beginning of period | | | $32.64 | | | | $32.12 | | | | $30.15 | | | | $27.49 | | | | $21.13 | | | | $35.83 | |
Income from investment operations: | | | | | | | | | | | | | | | | | | | | | | | | |
Net investment income (loss)(a) | | | 0.33 | | | | 0.52 | | | | 0.51 | | | | 0.64 | | | | 0.62 | | | | 0.37 | |
Net realized and unrealized gain (loss) | | | 1.06 | | | | 0.66 | | | | 1.89 | | | | 2.70 | | | | 6.17 | | | | (12.09 | ) |
Total from investment operations | | | 1.39 | | | | 1.18 | | | | 2.40 | | | | 3.34 | | | | 6.79 | | | | (11.72 | ) |
Distributions: | | | | | | | | | | | | | | | | | | | | | | | | |
Dividends from net investment income | | | (0.27 | ) | | | (0.66 | ) | | | (0.43 | ) | | | (0.68 | ) | | | (0.43 | ) | | | (0.52 | ) |
Dividends from net realized gains | | | (0.87 | ) | | | — | | | | — | | | | — | | | | — | | | | (2.46 | ) |
Total distributions | | | (1.14 | ) | | | (0.66 | ) | | | (0.43 | ) | | | (0.68 | ) | | | (0.43 | ) | | | (2.98 | ) |
Net asset value, end of period | | | $32.89 | | | | $32.64 | | | | $32.12 | | | | $30.15 | | | | $27.49 | | | | $21.13 | |
Ratios and supplemental data: | | | | | | | | | | | | | | | | | | | | | | | | |
Total return(b) | | | 4.36% | | | | 3.73% | | | | 8.04% | | | | 12.31% | | | | 32.49% | | | | (35.31% | ) |
Net assets, end of period (000) | | | $1,707,437 | | | | $1,974,535 | | | | $2,017,175 | | | | $1,706,548 | | | | $1,748,479 | | | | $1,749,433 | |
Ratio of net expenses to average net assets | | | 1.10% | (c) | | | 1.09% | | | | 1.08% | | | | 1.09% | | | | 1.12% | | | | 1.06% | |
Ratio of gross expenses to average net assets prior to expense reductions | | | 1.10% | (c) | | | 1.09% | | | | 1.08% | | | | 1.09% | | | | 1.12% | | | | 1.07% | |
Ratio of net investment income (loss) to average net assets | | | 2.02% | (c) | | | 1.62% | | | | 1.60% | | | | 2.26% | | | | 2.69% | | | | 1.26% | |
| | |
| | | (Unaudited)
Six Months
Ended
April 30, | | | Year Ended October 31, | |
| | | 2013 | | | 2012 | | | 2011 | | | 2010 | | | 2009 | | | 2008 | |
Portfolio turnover rate | | | 32.7% | | | | 42.8% | | | | 55.1% | | | | 54.6% | | | | 66.2% | | | | 83.4% | |
| (a) | Net investment income (loss) allocated based on average shares method. |
| (b) | Total return measures net investment income (loss) and capital gain or loss from portfolio investments assuming reinvestment of dividends and capital gains distributions. Total return is not annualized for periods that are less than a full year, does not reflect the effect of sales charge for Class A shares nor the contingent deferred sales charge for Class B and C shares and does not reflect the deduction of taxes that a shareholder would pay on fund distributions or the redemption of fund shares. |
| | | | |
| 160 | | CALAMOS FAMILY OF FUNDS SEMIANNUAL REPORT | | |
Calamos Growth and Income Fund Financial Highlights
| | | | | | | | | | | | | | | | | | | | | | | | |
| | | CLASS B | |
| | | (Unaudited)
Six Months
Ended
April 30, | | | Year Ended October 31, | |
| | | 2013 | | | 2012 | | | 2011 | | | 2010 | | | 2009 | | | 2008 | |
Net asset value, beginning of period | | | $37.26 | | | | $36.47 | | | | $34.22 | | | | $31.10 | | | | $23.85 | | | | $40.09 | |
Income from investment operations: | | | | | | | | | | | | | | | | | | | | | | | | |
Net investment income (loss)(a) | | | 0.38 | | | | 0.36 | | | | 0.32 | | | | 0.49 | | | | 0.50 | | | | 0.17 | |
Net realized and unrealized gain (loss) | | | 1.21 | | | | 0.77 | | | | 2.14 | | | | 3.05 | | | | 6.97 | | | | (13.63 | ) |
Total from investment operations | | | 1.59 | | | | 1.13 | | | | 2.46 | | | | 3.54 | | | | 7.47 | | | | (13.46 | ) |
Distributions: | | | | | | | | | | | | | | | | | | | | | | | | |
Dividends from net investment income | | | (0.28 | ) | | | (0.34 | ) | | | (0.21 | ) | | | (0.42 | ) | | | (0.22 | ) | | | (0.32 | ) |
Dividends from net realized gains | | | (0.87 | ) | | | — | | | | — | | | | — | | | | — | | | | (2.46 | ) |
Total distributions | | | (1.15 | ) | | | (0.34 | ) | | | (0.21 | ) | | | (0.42 | ) | | | (0.22 | ) | | | (2.78 | ) |
Net asset value, end of period | | | $37.70 | | | | $37.26 | | | | $36.47 | | | | $34.22 | | | | $31.10 | | | | $23.85 | |
Ratios and supplemental data: | | | | | | | | | | | | | | | | | | | | | | | | |
Total return(b) | | | 4.35% | | | | 3.12% | | | | 7.21% | | | | 11.46% | | | | 31.48% | | | | (35.80% | ) |
Net assets, end of period (000) | | | $65,103 | | | | $92,658 | | | | $184,989 | | | | $303,273 | | | | $376,111 | | | | $385,128 | |
Ratio of net expenses to average net assets | | | 1.07% | (c) | | | 1.73% | | | | 1.82% | | | | 1.84% | | | | 1.87% | | | | 1.81% | |
Ratio of gross expenses to average net assets prior to expense reductions | | | 1.07% | (c) | | | 1.73% | | | | 1.82% | | | | 1.84% | | | | 1.88% | | | | 1.82% | |
Ratio of net investment income (loss) to average net assets | | | 2.05% | (c) | | | 0.97% | | | | 0.88% | | | | 1.51% | | | | 1.95% | | | | 0.51% | |
| |
| | | CLASS C | |
| | | (Unaudited)
Six Months
Ended
April 30, | | | Year Ended October 31, | |
| | | 2013 | | | 2012 | | | 2011 | | | 2010 | | | 2009 | | | 2008 | |
Net asset value, beginning of period | | | $32.76 | | | | $32.23 | | | | $30.30 | | | | $27.62 | | | | $21.23 | | | | $36.05 | |
Income from investment operations: | | | | | | | | | | | | | | | | | | | | | | | | |
Net investment income (loss)(a) | | | 0.20 | | | | 0.28 | | | | 0.27 | | | | 0.43 | | | | 0.45 | | | | 0.15 | |
Net realized and unrealized gain (loss) | | | 1.07 | | | | 0.67 | | | | 1.91 | | | | 2.72 | | | | 6.19 | | | | (12.16 | ) |
Total from investment operations | | | 1.27 | | | | 0.95 | | | | 2.18 | | | | 3.15 | | | | 6.64 | | | | (12.01 | ) |
Distributions: | | | | | | | | | | | | | | | | | | | | | | | | |
Dividends from net investment income | | | (0.21 | ) | | | (0.42 | ) | | | (0.25 | ) | | | (0.47 | ) | | | (0.25 | ) | | | (0.35 | ) |
Dividends from net realized gains | | | (0.87 | ) | | | — | | | | — | | | | — | | | | — | | | | (2.46 | ) |
Total distributions | | | (1.08 | ) | | | (0.42 | ) | | | (0.25 | ) | | | (0.47 | ) | | | (0.25 | ) | | | (2.81 | ) |
Net asset value, end of period | | | $32.95 | | | | $32.76 | | | | $32.23 | | | | $30.30 | | | | $27.62 | | | | $21.23 | |
Ratios and supplemental data: | | | | | | | | | | | | | | | | | | | | | | | | |
Total return(b) | | | 3.95% | | | | 2.97% | | | | 7.23% | | | | 11.50% | | | | 31.49% | | | | (35.82% | ) |
Net assets, end of period (000) | | | $1,131,935 | | | | $1,255,629 | | | | $1,344,781 | | | | $1,291,168 | | | | $1,263,459 | | | | $1,212,715 | |
Ratio of net expenses to average net assets | | | 1.85% | (c) | | | 1.84% | | | | 1.83% | | | | 1.84% | | | | 1.87% | | | | 1.81% | |
Ratio of gross expenses to average net assets prior to expense reductions | | | 1.85% | (c) | | | 1.84% | | | | 1.83% | | | | 1.84% | | | | 1.87% | | | | 1.82% | |
Ratio of net investment income (loss) to average net assets | | | 1.26% | (c) | | | 0.87% | | | | 0.86% | | | | 1.51% | | | | 1.94% | | | | 0.51% | |
| (a) | Net investment income (loss) allocated based on average shares method. |
| (b) | Total return measures net investment income (loss) and capital gain or loss from portfolio investments assuming reinvestment of dividends and capital gains distributions. Total return is not annualized for periods that are less than a full year, does not reflect the effect of sales charge for Class A shares nor the contingent deferred sales charge for Class B and C shares and does not reflect the deduction of taxes that a shareholder would pay on fund distributions or the redemption of fund shares. |
Calamos Growth and Income Fund Financial Highlights
| | | | | | | | | | | | | | | | | | | | | | | | |
| | | CLASS I | |
| | | (Unaudited)
Six Months
Ended
April 30, | | | Year Ended October 31, | |
| | | 2013 | | | 2012 | | | 2011 | | | 2010 | | | 2009 | | | 2008 | |
Net asset value, beginning of period | | | $31.91 | | | | $31.41 | | | | $29.48 | | | | $26.89 | | | | $20.69 | | | | $35.13 | |
Income from investment operations: | | | | | | | | | | | | | | | | | | | | | | | | |
Net investment income (loss)(a) | | | 0.36 | | | | 0.59 | | | | 0.58 | | | | 0.70 | | | | 0.68 | | | | 0.42 | |
Net realized and unrealized gain (loss) | | | 1.04 | | | | 0.65 | | | | 1.84 | | | | 2.64 | | | | 6.01 | | | | (11.82 | ) |
Total from investment operations | | | 1.40 | | | | 1.24 | | | | 2.42 | | | | 3.34 | | | | 6.69 | | | | (11.40 | ) |
Distributions: | | | | | | | | | | | | | | | | | | | | | | | | |
Dividends from net investment income | | | (0.30 | ) | | | (0.74 | ) | | | (0.49 | ) | | | (0.75 | ) | | | (0.49 | ) | | | (0.58 | ) |
Dividends from net realized gains | | | (0.87 | ) | | | — | | | | — | | | | — | | | | — | | | | (2.46 | ) |
Total distributions | | | (1.17 | ) | | | (0.74 | ) | | | (0.49 | ) | | | (0.75 | ) | | | (0.49 | ) | | | (3.04 | ) |
Net asset value, end of period | | | $32.14 | | | | $31.91 | | | | $31.41 | | | | $29.48 | | | | $26.89 | | | | $20.69 | |
Ratios and supplemental data: | | | | | | | | | | | | | | | | | | | | | | | | |
Total return(b) | | | 4.46% | | | | 4.01% | | | | 8.31% | | | | 12.61% | | | | 32.75% | | | | (35.14% | ) |
Net assets, end of period (000) | | | $745,265 | | | | $915,394 | | | | $856,632 | | | | $683,473 | | | | $352,451 | | | | $140,308 | |
Ratio of net expenses to average net assets | | | 0.85% | (c) | | | 0.84% | | | | 0.83% | | | | 0.84% | | | | 0.87% | | | | 0.81% | |
Ratio of gross expenses to average net assets prior to expense reductions | | | 0.85% | (c) | | | 0.84% | | | | 0.83% | | | | 0.84% | | | | 0.87% | | | | 0.82% | |
Ratio of net investment income (loss) to average net assets | | | 2.27% | (c) | | | 1.87% | | | | 1.85% | | | | 2.51% | | | | 2.92% | | | | 1.51% | |
| |
| | | CLASS R | |
| | | (Unaudited)
Six Months
Ended
April 30, | | | Year Ended October 31, | |
| | | 2013 | | | 2012 | | | 2011 | | | 2010 | | | 2009 | | | 2008 | |
Net asset value, beginning of period | | | $32.46 | | | | $31.95 | | | | $30.02 | | | | $27.39 | | | | $21.08 | | | | $35.80 | |
Income from investment operations: | | | | | | | | | | | | | | | | | | | | | | | | |
Net investment income (loss)(a) | | | 0.28 | | | | 0.44 | | | | 0.43 | | | | 0.57 | | | | 0.56 | | | | 0.28 | |
Net realized and unrealized gain (loss) | | | 1.07 | | | | 0.66 | | | | 1.88 | | | | 2.69 | | | | 6.14 | | | | (12.05 | ) |
Total from investment operations | | | 1.35 | | | | 1.10 | | | | 2.31 | | | | 3.26 | | | | 6.70 | | | | (11.77 | ) |
Distributions: | | | | | | | | | | | | | | | | | | | | | | | | |
Dividends from net investment income | | | (0.26 | ) | | | (0.59 | ) | | | (0.38 | ) | | | (0.63 | ) | | | (0.39 | ) | | | (0.49 | ) |
Dividends from net realized gains | | | (0.87 | ) | | | — | | | | — | | | | — | | | | — | | | | (2.46 | ) |
Total distributions | | | (1.13 | ) | | | (0.59 | ) | | | (0.38 | ) | | | (0.63 | ) | | | (0.39 | ) | | | (2.95 | ) |
Net asset value, end of period | | | $32.68 | | | | $32.46 | | | | $31.95 | | | | $30.02 | | | | $27.39 | | | | $21.08 | |
Ratios and supplemental data: | | | | | | | | | | | | | | | | | | | | | | | | |
Total return(b) | | | 4.22% | | | | 3.49% | | | | 7.75% | | | | 12.05% | | | | 32.11% | | | | (35.49% | ) |
Net assets, end of period (000) | | | $23,706 | | | | $22,265 | | | | $15,486 | | | | $10,285 | | | | $2,636 | | | | $690 | |
Ratio of net expenses to average net assets | | | 1.35% | (c) | | | 1.34% | | | | 1.33% | | | | 1.34% | | | | 1.36% | | | | 1.31% | |
Ratio of gross expenses to average net assets prior to expense reductions | | | 1.35% | (c) | | | 1.34% | | | | 1.33% | | | | 1.34% | | | | 1.37% | | | | 1.32% | |
Ratio of net investment income (loss) to average net assets | | | 1.75% | (c) | | | 1.37% | | | | 1.34% | | | | 2.00% | | | | 2.35% | | | | 1.01% | |
| (a) | Net investment income (loss) allocated based on average shares method. |
| (b) | Total return measures net investment income (loss) and capital gain or loss from portfolio investments assuming reinvestment of dividends and capital gains distributions. Total return is not annualized for periods that are less than a full year, does not reflect the effect of sales charge for Class A shares nor the contingent deferred sales charge for Class B and C shares and does not reflect the deduction of taxes that a shareholder would pay on fund distributions or the redemption of fund shares. |
| | | | |
| 162 | | CALAMOS FAMILY OF FUNDS SEMIANNUAL REPORT | | |
Calamos Global Growth and Income Fund Financial Highlights
Selected data for a share outstanding throughout each period were as follows:
| | | | | | | | | | | | | | | | | | | | | | | | |
| | | CLASS A | |
| | | (Unaudited)
Six Months
Ended
April 30, | | | Year Ended October 31, | |
| | | 2013 | | | 2012 | | | 2011 | | | 2010 | | | 2009 | | | 2008 | |
Net asset value, beginning of period | | | $10.88 | | | | $10.77 | | | | $10.16 | | | | $9.20 | | | | $7.35 | | | | $12.83 | |
Income from investment operations: | | | | | | | | | | | | | | | | | | | | | | | | |
Net investment income (loss)(a) | | | 0.05 | | | | 0.11 | | | | 0.11 | | | | 0.17 | | | | 0.21 | | | | 0.12 | |
Net realized and unrealized gain (loss) | | | 0.57 | | | | 0.21 | | | | 0.50 | | | | 0.98 | | | | 1.87 | | | | (4.88 | ) |
Total from investment operations | | | 0.62 | | | | 0.32 | | | | 0.61 | | | | 1.15 | | | | 2.08 | | | | (4.76 | ) |
Distributions: | | | | | | | | | | | | | | | | | | | | | | | | |
Dividends from net investment income | | | (0.09 | ) | | | (0.21 | ) | | | — | | | | (0.04 | ) | | | (0.23 | ) | | | — | |
Dividends from net realized gains | | | (0.24 | ) | | | — | | | | — | | | | — | | | | — | | | | (0.72 | ) |
Return of capital | | | — | | | | — | | | | — | | | | (0.15 | ) | | | — | | | | — | |
Total distributions | | | (0.33 | ) | | | (0.21 | ) | | | — | | | | (0.19 | ) | | | (0.23 | ) | | | (0.72 | ) |
Net asset value, end of period | | | $11.17 | | | | $10.88 | | | | $10.77 | | | | $10.16 | | | | $9.20 | | | | $7.35 | |
Ratios and supplemental data: | | | | | | | | | | | | | | | | | | | | | | | | |
Total return(b) | | | 5.82% | | | | 3.03% | | | | 6.00% | | | | 12.64% | | | | 29.16% | | | | (39.08% | ) |
Net assets, end of period (000) | | | $255,499 | | | | $304,914 | | | | $373,595 | | | | $318,493 | | | | $273,281 | | | | $300,563 | |
Ratio of net expenses to average net assets | | | 1.41% | (c) | | | 1.32% | | | | 1.32% | | | | 1.36% | | | | 1.44% | | | | 1.36% | |
Ratio of gross expenses to average net assets prior to expense reductions | | | 1.41% | (c) | | | 1.32% | | | | 1.32% | | | | 1.36% | | | | 1.44% | | | | 1.36% | |
Ratio of net investment income (loss) to average net assets | | | 0.98% | (c) | | | 1.06% | | | | 1.01% | | | | 1.74% | | | | 2.66% | | | | 1.12% | |
| | |
| | | (Unaudited)
Six Months
Ended
April 30, | | | Year Ended October 31, | |
| | | 2013 | | | 2012 | | | 2011 | | | 2010 | | | 2009 | | | 2008 | |
Portfolio turnover rate | | | 19.1% | | | | 55.1% | | | | 73.1% | | | | 62.2% | | | | 97.3% | | | | 117.7% | |
| (a) | Net investment income (loss) allocated based on average shares method. |
| (b) | Total return measures net investment income (loss) and capital gain or loss from portfolio investments assuming reinvestment of dividends and capital gains distributions. Total return is not annualized for periods that are less than a full year, does not reflect the effect of sales charge for Class A shares nor the contingent deferred sales charge for Class B and C shares and does not reflect the deduction of taxes that a shareholder would pay on fund distributions or the redemption of fund shares. |
Calamos Global Growth and Income Fund Financial Highlights
| | | | | | | | | | | | | | | | | | | | | | | | |
| | | CLASS B | |
| | | (Unaudited)
Six Months
Ended
April 30, | | | Year Ended October 31, | |
| | | 2013 | | | 2012 | | | 2011 | | | 2010 | | | 2009 | | | 2008 | |
Net asset value, beginning of period | | | $10.97 | | | | $10.85 | | | | $10.32 | | | | $9.37 | | | | $7.52 | | | | $13.21 | |
Income from investment operations: | | | | | | | | | | | | | | | | | | | | | | | | |
Net investment income (loss)(a) | | | 0.01 | | | | 0.03 | | | | 0.03 | | | | 0.10 | | | | 0.15 | | | | 0.04 | |
Net realized and unrealized gain (loss) | | | 0.57 | | | | 0.21 | | | | 0.50 | | | | 1.00 | | | | 1.91 | | | | (5.01 | ) |
Total from investment operations | | | 0.58 | | | | 0.24 | | | | 0.53 | | | | 1.10 | | | | 2.06 | | | | (4.97 | ) |
Distributions: | | | | | | | | | | | | | | | | | | | | | | | | |
Dividends from net investment income | | | (0.03 | ) | | | (0.12 | ) | | | — | | | | (0.03 | ) | | | (0.21 | ) | | | — | |
Dividends from net realized gains | | | (0.24 | ) | | | — | | | | — | | | | — | | | | — | | | | (0.72 | ) |
Return of capital | | | — | | | | — | | | | — | | | | (0.12 | ) | | | — | | | | — | |
Total distributions | | | (0.27 | ) | | | (0.12 | ) | | | — | | | | (0.15 | ) | | | (0.21 | ) | | | (0.72 | ) |
Net asset value, end of period | | | $11.28 | | | | $10.97 | | | | $10.85 | | | | $10.32 | | | | $9.37 | | | | $7.52 | |
Ratios and supplemental data: | | | | | | | | | | | | | | | | | | | | | | | | |
Total return(b) | | | 5.35% | | | | 2.25% | | | | 5.14% | | | | 11.86% | | | | 28.21% | | | | (39.57% | ) |
Net assets, end of period (000) | | | $12,837 | | | | $16,654 | | | | $30,770 | | | | $43,323 | | | | $50,466 | | | | $52,729 | |
Ratio of net expenses to average net assets | | | 2.16% | (c) | | | 2.07% | | | | 2.07% | | | | 2.12% | | | | 2.19% | | | | 2.11% | |
Ratio of gross expenses to average net assets prior to expense reductions | | | 2.16% | (c) | | | 2.07% | | | | 2.07% | | | | 2.12% | | | | 2.19% | | | | 2.11% | |
Ratio of net investment income (loss) to average net assets | | | 0.23% | (c) | | | 0.30% | | | | 0.26% | | | | 0.99% | | | | 1.93% | | | | 0.37% | |
| |
| | | CLASS C | |
| | | (Unaudited)
Six Months
Ended
April 30, | | | Year Ended October 31, | |
| | | 2013 | | | 2012 | | | 2011 | | | 2010 | | | 2009 | | | 2008 | |
Net asset value, beginning of period | | | $10.25 | | | | $10.15 | | | | $9.65 | | | | $8.78 | | | | $7.06 | | | | $12.45 | |
Income from investment operations: | | | | | | | | | | | | | | | | | | | | | | | | |
Net investment income (loss)(a) | | | 0.01 | | | | 0.03 | | | | 0.03 | | | | 0.09 | | | | 0.14 | | | | 0.04 | |
Net realized and unrealized gain (loss) | | | 0.53 | | | | 0.20 | | | | 0.47 | | | | 0.94 | | | | 1.79 | | | | (4.71 | ) |
Total from investment operations | | | 0.54 | | | | 0.23 | | | | 0.50 | | | | 1.03 | | | | 1.93 | | | | (4.67 | ) |
Distributions: | | | | | | | | | | | | | | | | | | | | | | | | |
Dividends from net investment income | | | (0.03 | ) | | | (0.13 | ) | | | — | | | | (0.03 | ) | | | (0.21 | ) | | | — | |
Dividends from net realized gains | | | (0.24 | ) | | | — | | | | — | | | | — | | | | — | | | | (0.72 | ) |
Return of capital | | | — | | | | — | | | | — | | | | (0.13 | ) | | | — | | | | — | |
Total distributions | | | (0.27 | ) | | | (0.13 | ) | | | — | | | | (0.16 | ) | | | (0.21 | ) | | | (0.72 | ) |
Net asset value, end of period | | | $10.52 | | | | $10.25 | | | | $10.15 | | | | $9.65 | | | | $8.78 | | | | $7.06 | |
Ratios and supplemental data: | | | | | | | | | | | | | | | | | | | | | | | | |
Total return(b) | | | 5.41% | | | | 2.29% | | | | 5.18% | | | | 11.81% | | | | 28.23% | | | | (39.58% | ) |
Net assets, end of period (000) | | | $202,810 | | | | $235,194 | | | | $282,801 | | | | $276,141 | | | | $235,776 | | | | $236,088 | |
Ratio of net expenses to average net assets | | | 2.16% | (c) | | | 2.07% | | | | 2.07% | | | | 2.11% | | | | 2.19% | | | | 2.11% | |
Ratio of gross expenses to average net assets prior to expense reductions | | | 2.16% | (c) | | | 2.07% | | | | 2.07% | | | | 2.11% | | | | 2.19% | | | | 2.11% | |
Ratio of net investment income (loss) to average net assets | | | 0.23% | (c) | | | 0.31% | | | | 0.26% | | | | 0.99% | | | | 1.91% | | | | 0.37% | |
| (a) | Net investment income (loss) allocated based on average shares method. |
| (b) | Total return measures net investment income (loss) and capital gain or loss from portfolio investments assuming reinvestment of dividends and capital gains distributions. Total return is not annualized for periods that are less than a full year, does not reflect the effect of sales charge for Class A shares nor the contingent deferred sales charge for Class B and C shares and does not reflect the deduction of taxes that a shareholder would pay on fund distributions or the redemption of fund shares. |
| | | | |
| 164 | | CALAMOS FAMILY OF FUNDS SEMIANNUAL REPORT | | |
Calamos Global Growth and Income Fund Financial Highlights
| | | | | | | | | | | | | | | | | | | | | | | | |
| | | CLASS I | |
| | | (Unaudited)
Six Months
Ended
April 30, | | | Year Ended October 31, | |
| | | 2013 | | | 2012 | | | 2011 | | | 2010 | | | 2009 | | | 2008 | |
Net asset value, beginning of period | | | $11.06 | | | | $10.96 | | | | $10.32 | | | | $9.33 | | | | $7.43 | | | | $12.94 | |
Income from investment operations: | | | | | | | | | | | | | | | | | | | | | | | | |
Net investment income (loss)(a) | | | 0.07 | | | | 0.14 | | | | 0.14 | | | | 0.19 | | | | 0.23 | | | | 0.14 | |
Net realized and unrealized gain (loss) | | | 0.57 | | | | 0.22 | | | | 0.50 | | | | 1.00 | | | | 1.90 | | | | (4.93 | ) |
Total from investment operations | | | 0.64 | | | | 0.36 | | | | 0.64 | | | | 1.19 | | | | 2.13 | | | | (4.79 | ) |
Distributions: | | | | | | | | | | | | | | | | | | | | | | | | |
Dividends from net investment income | | | (0.11 | ) | | | (0.26 | ) | | | — | | | | (0.04 | ) | | | (0.23 | ) | | | — | |
Dividends from net realized gains | | | (0.24 | ) | | | — | | | | — | | | | — | | | | — | | | | (0.72 | ) |
Return of capital | | | — | | | | — | | | | — | | | | (0.16 | ) | | | — | | | | — | |
Total distributions | | | (0.35 | ) | | | (0.26 | ) | | | — | | | | (0.20 | ) | | | (0.23 | ) | | | (0.72 | ) |
Net asset value, end of period | | | $11.35 | | | | $11.06 | | | | $10.96 | | | | $10.32 | | | | $9.33 | | | | $7.43 | |
Ratios and supplemental data: | | | | | | | | | | | | | | | | | | | | | | | | |
Total return(b) | | | 5.93% | | | | 3.32% | | | | 6.20% | | | | 12.92% | | | | 29.62% | | | | (38.97% | ) |
Net assets, end of period (000) | | | $266,013 | | | | $986,986 | | | | $978,511 | | | | $763,531 | | | | $227,445 | | | | $145,751 | |
Ratio of net expenses to average net assets | | | 1.14% | (c) | | | 1.07% | | | | 1.07% | | | | 1.11% | | | | 1.18% | | | | 1.11% | |
Ratio of gross expenses to average net assets prior to expense reductions | | | 1.14% | (c) | | | 1.07% | | | | 1.07% | | | | 1.11% | | | | 1.18% | | | | 1.11% | |
Ratio of net investment income (loss) to average net assets | | | 1.19% | (c) | | | 1.31% | | | | 1.25% | | | | 1.97% | | | | 2.82% | | | | 1.37% | |
| |
| | | CLASS R | |
| | | (Unaudited)
Six Months
Ended
April 30, | | | Year Ended October 31, | |
| | | 2013 | | | 2012 | | | 2011 | | | 2010 | | | 2009 | | | 2008 | |
Net asset value, beginning of period | | | $10.79 | | | | $10.67 | | | | $10.09 | | | | $9.16 | | | | $7.32 | | | | $12.81 | |
Income from investment operations: | | | | | | | | | | | | | | | | | | | | | | | | |
Net investment income (loss)(a) | | | 0.04 | | | | 0.08 | | | | 0.08 | | | | 0.14 | | | | 0.19 | | | | 0.09 | |
Net realized and unrealized gain (loss) | | | 0.56 | | | | 0.21 | | | | 0.50 | | | | 0.97 | | | | 1.87 | | | | (4.86 | ) |
Total from investment operations | | | 0.60 | | | | 0.29 | | | | 0.58 | | | | 1.11 | | | | 2.06 | | | | (4.77 | ) |
Distributions: | | | | | | | | | | | | | | | | | | | | | | | | |
Dividends from net investment income | | | (0.07 | ) | | | (0.17 | ) | | | — | | | | (0.04 | ) | | | (0.22 | ) | | | — | |
Dividends from net realized gains | | | (0.24 | ) | | | — | | | | — | | | | — | | | | — | | | | (0.72 | ) |
Return of capital | | | — | | | | — | | | | — | | | | (0.14 | ) | | | — | | | | — | |
Total distributions | | | (0.31 | ) | | | (0.17 | ) | | | — | | | | (0.18 | ) | | | (0.22 | ) | | | (0.72 | ) |
Net asset value, end of period | | | $11.08 | | | | $10.79 | | | | $10.67 | | | | $10.09 | | | | $9.16 | | | | $7.32 | |
Ratios and supplemental data: | | | | | | | | | | | | | | | | | | | | | | | | |
Total return(b) | | | 5.64% | | | | 2.77% | | | | 5.75% | | | | 12.26% | | | | 29.06% | | | | (39.23% | ) |
Net assets, end of period (000) | | | $2,498 | | | | $3,045 | | | | $1,567 | | | | $1,302 | | | | $377 | | | | $209 | |
Ratio of net expenses to average net assets | | | 1.66% | (c) | | | 1.58% | | | | 1.57% | | | | 1.61% | | | | 1.69% | | | | 1.61% | |
Ratio of gross expenses to average net assets prior to expense reductions | | | 1.66% | (c) | | | 1.58% | | | | 1.57% | | | | 1.61% | | | | 1.69% | | | | 1.61% | |
Ratio of net investment income (loss) to average net assets | | | 0.73% | (c) | | | 0.75% | | | | 0.77% | | | | 1.43% | | | | 2.41% | | | | 0.87% | |
| (a) | Net investment income (loss) allocated based on average shares method. |
| (b) | Total return measures net investment income (loss) and capital gain or loss from portfolio investments assuming reinvestment of dividends and capital gains distributions. Total return is not annualized for periods that are less than a full year, does not reflect the effect of sales charge for Class A shares nor the contingent deferred sales charge for Class B and C shares and does not reflect the deduction of taxes that a shareholder would pay on fund distributions or the redemption of fund shares. |
Calamos Convertible Fund Financial Highlights
Selected data for a share outstanding throughout each period were as follows:
| | | | | | | | | | | | | | | | | | | | | | | | |
| | | CLASS A | |
| | | (Unaudited)
Six Months
Ended
April 30, | | | Year Ended October 31, | |
| | | 2013 | | | 2012 | | | 2011 | | | 2010 | | | 2009 | | | 2008 | |
Net asset value, beginning of period | | | $17.70 | | | | $19.28 | | | | $19.60 | | | | $18.31 | | | | $14.13 | | | | $20.77 | |
Income from investment operations: | | | | | | | | | | | | | | | | | | | | | | | | |
Net investment income (loss)(a) | | | 0.18 | | | | 0.37 | | | | 0.40 | | | | 0.53 | | | | 0.56 | | | | 0.42 | |
Net realized and unrealized gain (loss) | | | 1.43 | | | | (0.33 | ) | | | 0.14 | | | | 1.45 | | | | 4.15 | | | | (6.52 | ) |
Total from investment operations | | | 1.61 | | | | 0.04 | | | | 0.54 | | | | 1.98 | | | | 4.71 | | | | (6.10 | ) |
Distributions: | | | | | | | | | | | | | | | | | | | | | | | | |
Dividends from net investment income | | | (0.02 | ) | | | (0.14 | ) | | | (0.25 | ) | | | (0.69 | ) | | | (0.50 | ) | | | (0.48 | ) |
Dividends from net realized gains | | | (1.56 | ) | | | (1.48 | ) | | | (0.61 | ) | | | — | | | | (0.03 | ) | | | (0.06 | ) |
Total distributions | | | (1.58 | ) | | | (1.62 | ) | | | (0.86 | ) | | | (0.69 | ) | | | (0.53 | ) | | | (0.54 | ) |
Net asset value, end of period | | | $17.73 | | | | $17.70 | | | | $19.28 | | | | $19.60 | | | | $18.31 | | | | $14.13 | |
Ratios and supplemental data: | | | | | | | | | | | | | | | | | | | | | | | | |
Total return(b) | | | 9.77% | | | | 0.51% | | | | 2.73% | | | | 11.06% | | | | 34.00% | | | | (30.12% | ) |
Net assets, end of period (000) | | | $505,699 | | | | $650,100 | | | | $1,269,501 | | | | $1,741,954 | | | | $1,822,596 | | | | $222,243 | |
Ratio of net expenses to average net assets | | | 1.13% | (c) | | | 1.10% | | | | 1.07% | | | | 1.08% | | | | 1.10% | | | | 1.14% | |
Ratio of gross expenses to average net assets prior to expense reductions | | | 1.13% | (c) | | | 1.10% | | | | 1.07% | | | | 1.08% | | | | 1.11% | | | | 1.15% | |
Ratio of net investment income (loss) to average net assets | | | 2.16% | (c) | | | 2.07% | | | | 2.03% | | | | 2.82% | | | | 3.37% | | | | 2.22% | |
| | |
| | | (Unaudited)
Six Months
Ended
April 30, | | | Year Ended October 31, | |
| | | 2013 | | | 2012 | | | 2011 | | | 2010 | | | 2009 | | | 2008 | |
Portfolio turnover rate | | | 41.4% | | | | 56.6% | | | | 65.7% | | | | 77.4% | | | | 45.7% | | | | 90.9% | |
| (a) | Net investment income (loss) allocated based on average shares method. |
| (b) | Total return measures net investment income (loss) and capital gain or loss from portfolio investments assuming reinvestment of dividends and capital gains distributions. Total return is not annualized for periods that are less than a full year, does not reflect the effect of sales charge for Class A shares nor the contingent deferred sales charge for Class B and C shares and does not reflect the deduction of taxes that a shareholder would pay on fund distributions or the redemption of fund shares. |
| | | | |
| 166 | | CALAMOS FAMILY OF FUNDS SEMIANNUAL REPORT | | |
Calamos Convertible Fund Financial Highlights
| | | | | | | | | | | | | | | | | | | | | | | | |
| | | CLASS B | |
| | | (Unaudited)
Six Months
Ended
April 30, | | | Year Ended October 31, | |
| | | 2013 | | | 2012 | | | 2011 | | | 2010 | | | 2009 | | | 2008 | |
Net asset value, beginning of period | | | $21.31 | | | | $22.89 | | | | $23.14 | | | | $21.48 | | | | $16.48 | | | | $24.27 | |
Income from investment operations: | | | | | | | | | | | | | | | | | | | | | | | | |
Net investment income (loss)(a) | | | 0.15 | | | | 0.28 | | | | 0.32 | | | | 0.47 | | | | 0.52 | | | | 0.32 | |
Net realized and unrealized gain (loss) | | | 1.74 | | | | (0.38 | ) | | | 0.15 | | | | 1.69 | | | | 4.86 | | | | (7.62 | ) |
Total from investment operations | | | 1.89 | | | | (0.10 | ) | | | 0.47 | | | | 2.16 | | | | 5.38 | | | | (7.30 | ) |
Distributions: | | | | | | | | | | | | | | | | | | | | | | | | |
Dividends from net investment income | | | — | | | | (0.00 | )** | | | (0.11 | ) | | | (0.50 | ) | | | (0.35 | ) | | | (0.43 | ) |
Dividends from net realized gains | | | (1.56 | ) | | | (1.48 | ) | | | (0.61 | ) | | | — | | | | (0.03 | ) | | | (0.06 | ) |
Total distributions | | | (1.56 | ) | | | (1.48 | ) | | | (0.72 | ) | | | (0.50 | ) | | | (0.38 | ) | | | (0.49 | ) |
Net asset value, end of period | | | $21.64 | | | | $21.31 | | | | $22.89 | | | | $23.14 | | | | $21.48 | | | | $16.48 | |
Ratios and supplemental data: | | | | | | | | | | | | | | | | | | | | | | | | |
Total return(b) | | | 9.39% | | | | (0.25% | ) | | | 2.01% | | | | 10.20% | | | | 33.04% | | | | (30.66% | ) |
Net assets, end of period (000) | | | $12,229 | | | | $14,256 | | | | $21,517 | | | | $56,141 | | | | $88,956 | | | | $67,313 | |
Ratio of net expenses to average net assets | | | 1.88% | (c) | | | 1.85% | | | | 1.82% | | | | 1.83% | | | | 1.85% | | | | 1.89% | |
Ratio of gross expenses to average net assets prior to expense reductions | | | 1.88% | (c) | | | 1.85% | | | | 1.82% | | | | 1.83% | | | | 1.86% | | | | 1.90% | |
Ratio of net investment income (loss) to average net assets | | | 1.41% | (c) | | | 1.32% | | | | 1.36% | | | | 2.12% | | | | 2.78% | | | | 1.47% | |
| |
| | | CLASS C | |
| | | (Unaudited)
Six Months
Ended
April 30, | | | Year Ended October 31, | |
| | | 2013 | | | 2012 | | | 2011 | | | 2010 | | | 2009 | | | 2008 | |
Net asset value, beginning of period | | | $17.57 | | | | $19.15 | | | | $19.51 | | | | $18.24 | | | | $14.09 | | | | $20.82 | |
Income from investment operations: | | | | | | | | | | | | | | | | | | | | | | | | |
Net investment income (loss)(a) | | | 0.12 | | | | 0.23 | | | | 0.25 | | | | 0.38 | | | | 0.43 | | | | 0.28 | |
Net realized and unrealized gain (loss) | | | 1.41 | | | | (0.32 | ) | | | 0.14 | | | | 1.45 | | | | 4.14 | | | | (6.51 | ) |
Total from investment operations | | | 1.53 | | | | (0.09 | ) | | | 0.39 | | | | 1.83 | | | | 4.57 | | | | (6.23 | ) |
Distributions: | | | | | | | | | | | | | | | | | | | | | | | | |
Dividends from net investment income | | | — | | | | (0.01 | ) | | | (0.14 | ) | | | (0.56 | ) | | | (0.39 | ) | | | (0.44 | ) |
Dividends from net realized gains | | | (1.56 | ) | | | (1.48 | ) | | | (0.61 | ) | | | — | | | | (0.03 | ) | | | (0.06 | ) |
Total distributions | | | (1.56 | ) | | | (1.49 | ) | | | (0.75 | ) | | | (0.56 | ) | | | (0.42 | ) | | | (0.50 | ) |
Net asset value, end of period | | | $17.54 | | | | $17.57 | | | | $19.15 | | | | $19.51 | | | | $18.24 | | | | $14.09 | |
Ratios and supplemental data: | | | | | | | | | | | | | | | | | | | | | | | | |
Total return(b) | | | 9.33% | | | | (0.24% | ) | | | 1.99% | | | | 10.20% | | | | 33.01% | | | | (30.62% | ) |
Net assets, end of period (000) | | | $333,410 | | | | $390,649 | | | | $584,428 | | | | $706,108 | | | | $579,959 | | | | $164,363 | |
Ratio of net expenses to average net assets | | | 1.88% | (c) | | | 1.85% | | | | 1.82% | | | | 1.83% | | | | 1.85% | | | | 1.89% | |
Ratio of gross expenses to average net assets prior to expense reductions | | | 1.88% | (c) | | | 1.85% | | | | 1.82% | | | | 1.83% | | | | 1.86% | | | | 1.90% | |
Ratio of net investment income (loss) to average net assets | | | 1.41% | (c) | | | 1.32% | | | | 1.26% | | | | 2.03% | | | | 2.66% | | | | 1.47% | |
| ** | Amount equated to less than $0.005 per common share. |
| (a) | Net investment income (loss) allocated based on average shares method. |
| (b) | Total return measures net investment income (loss) and capital gain or loss from portfolio investments assuming reinvestment of dividends and capital gains distributions. Total return is not annualized for periods that are less than a full year, does not reflect the effect of sales charge for Class A shares nor the contingent deferred sales charge for Class B and C shares and does not reflect the deduction of taxes that a shareholder would pay on fund distributions or the redemption of fund shares. |
Calamos Convertible Fund Financial Highlights
| | | | | | | | | | | | | | | | | | | | | | | | |
| | | CLASS I | |
| | | (Unaudited)
Six Months
Ended
April 30, | | | Year Ended October 31, | |
| | | 2013 | | | 2012 | | | 2011 | | | 2010 | | | 2009 | | | 2008 | |
Net asset value, beginning of period | | | $16.51 | | | | $18.10 | | | | $18.44 | | | | $17.27 | | | | $13.35 | | | | $19.62 | |
Income from investment operations: | | | | | | | | | | | | | | | | | | | | | | | | |
Net investment income (loss)(a) | | | 0.19 | | | | 0.39 | | | | 0.42 | | | | 0.53 | | | | 0.56 | | | | 0.43 | |
Net realized and unrealized gain (loss) | | | 1.32 | | | | (0.30 | ) | | | 0.14 | | | | 1.38 | | | | 3.92 | | | | (6.15 | ) |
Total from investment operations | | | 1.51 | | | | 0.09 | | | | 0.56 | | | | 1.91 | | | | 4.48 | | | | (5.72 | ) |
Distributions: | | | | | | | | | | | | | | | | | | | | | | | | |
Dividends from net investment income | | | (0.05 | ) | | | (0.20 | ) | | | (0.29 | ) | | | (0.74 | ) | | | (0.53 | ) | | | (0.49 | ) |
Dividends from net realized gains | | | (1.56 | ) | | | (1.48 | ) | | | (0.61 | ) | | | — | | | | (0.03 | ) | | | (0.06 | ) |
Total distributions | | | (1.61 | ) | | | (1.68 | ) | | | (0.90 | ) | | | (0.74 | ) | | | (0.56 | ) | | | (0.55 | ) |
Net asset value, end of period | | | $16.41 | | | | $16.51 | | | | $18.10 | | | | $18.44 | | | | $17.27 | | | | $13.35 | |
Ratios and supplemental data: | | | | | | | | | | | | | | | | | | | | | | | | |
Total return(b) | | | 9.88% | | | | 0.81% | | | | 3.00% | | | | 11.32% | | | | 34.30% | | | | (29.95% | ) |
Net assets, end of period (000) | | | $355,680 | | | | $475,526 | | | | $759,415 | | | | $883,151 | | | | $424,287 | | | | $15,152 | |
Ratio of net expenses to average net assets | | | 0.88% | (c) | | | 0.85% | | | | 0.82% | | | | 0.82% | | | | 0.85% | | | | 0.89% | |
Ratio of gross expenses to average net assets prior to expense reductions | | | 0.88% | (c) | | | 0.85% | | | | 0.82% | | | | 0.82% | | | | 0.85% | | | | 0.90% | |
Ratio of net investment income (loss) to average net assets | | | 2.40% | (c) | | | 2.33% | | | | 2.26% | | | | 2.97% | | | | 3.56% | | | | 2.47% | |
| |
| | | CLASS R | |
| | | (Unaudited)
Six Months
Ended
April 30, | | | Year Ended October 31, | |
| | | 2013 | | | 2012 | | | 2011 | | | 2010 | | | 2009 | | | 2008 | |
Net asset value, beginning of period | | | $17.63 | | | | $19.21 | | | | $19.55 | | | | $18.28 | | | | $14.11 | | | | $20.75 | |
Income from investment operations: | | | | | | | | | | | | | | | | | | | | | | | | |
Net investment income (loss)(a) | | | 0.16 | | | | 0.32 | | | | 0.34 | | | | 0.45 | | | | 0.51 | | | | 0.37 | |
Net realized and unrealized gain (loss) | | | 1.42 | | | | (0.32 | ) | | | 0.14 | | | | 1.48 | | | | 4.15 | | | | (6.49 | ) |
Total from investment operations | | | 1.58 | | | | — | | | | 0.48 | | | | 1.93 | | | | 4.66 | | | | (6.12 | ) |
Distributions: | | | | | | | | | | | | | | | | | | | | | | | | |
Dividends from net investment income | | | (0.00 | )** | | | (0.10 | ) | | | (0.21 | ) | | | (0.66 | ) | | | (0.46 | ) | | | (0.46 | ) |
Dividends from net realized gains | | | (1.56 | ) | | | (1.48 | ) | | | (0.61 | ) | | | — | | | | (0.03 | ) | | | (0.06 | ) |
Total distributions | | | (1.56 | ) | | | (1.58 | ) | | | (0.82 | ) | | | (0.66 | ) | | | (0.49 | ) | | | (0.52 | ) |
Net asset value, end of period | | | $17.65 | | | | $17.63 | | | | $19.21 | | | | $19.55 | | | | $18.28 | | | | $14.11 | |
Ratios and supplemental data: | | | | | | | | | | | | | | | | | | | | | | | | |
Total return(b) | | | 9.61% | | | | 0.29% | | | | 2.46% | | | | 10.78% | | | | 33.68% | | | | (30.19% | ) |
Net assets, end of period (000) | | | $3,177 | | | | $3,253 | | | | $4,134 | | | | $2,878 | | | | $705 | | | | $78 | |
Ratio of net expenses to average net assets | | | 1.38% | (c) | | | 1.35% | | | | 1.32% | | | | 1.32% | | | | 1.35% | | | | 1.39% | |
Ratio of gross expenses to average net assets prior to expense reductions | | | 1.38% | (c) | | | 1.35% | | | | 1.32% | | | | 1.32% | | | | 1.36% | | | | 1.40% | |
Ratio of net investment income (loss) to average net assets | | | 1.92% | (c) | | | 1.82% | | | | 1.72% | | | | 2.39% | | | | 3.06% | | | | 1.97% | |
| ** | Amounts are less than $0.005. |
| (a) | Net investment income (loss) allocated based on average shares method. |
| (b) | Total return measures net investment income (loss) and capital gain or loss from portfolio investments assuming reinvestment of dividends and capital gains distributions. Total return is not annualized for periods that are less than a full year, does not reflect the effect of sales charge for Class A shares nor the contingent deferred sales charge for Class B and C shares and does not reflect the deduction of taxes that a shareholder would pay on fund distributions or the redemption of fund shares. |
| | | | |
| 168 | | CALAMOS FAMILY OF FUNDS SEMIANNUAL REPORT | | |
Calamos Total Return Bond Fund Financial Highlights
Selected data for a share outstanding throughout each period were as follows:
| | | | | | | | | | | | | | | | | | | | | | | | |
| | | CLASS A | |
| | | (Unaudited)
Six Months
Ended
April 30, | | | Year Ended October 31, | |
| | | 2013 | | | 2012 | | | 2011 | | | 2010 | | | 2009 | | | 2008 | |
Net asset value, beginning of period | | | $11.15 | | | | $11.14 | | | | $11.23 | | | | $11.06 | | | | $9.82 | | | | $10.25 | |
Income from investment operations: | | | | | | | | | | | | | | | | | | | | | | | | |
Net investment income (loss)(a) | | | 0.11 | | | | 0.22 | | | | 0.26 | | | | 0.31 | | | | 0.35 | | | | 0.33 | |
Net realized and unrealized gain (loss) | | | (0.01 | ) | | | 0.15 | | | | 0.02 | | | | 0.45 | | | | 1.30 | | | | (0.35 | ) |
Total from investment operations | | | 0.10 | | | | 0.37 | | | | 0.28 | | | | 0.76 | | | | 1.65 | | | | (0.02 | ) |
Distributions: | | | | | | | | | | | | | | | | | | | | | | | | |
Dividends from net investment income | | | (0.15 | ) | | | (0.32 | ) | | | (0.28 | ) | | | (0.59 | ) | | | (0.41 | ) | | | (0.41 | ) |
Dividends from net realized gains | | | (0.05 | ) | | | (0.04 | ) | | | (0.09 | ) | | | — | | | | — | | | | — | |
Total distributions | | | (0.20 | ) | | | (0.36 | ) | | | (0.37 | ) | | | (0.59 | ) | | | (0.41 | ) | | | (0.41 | ) |
Net asset value, end of period | | | $11.05 | | | | $11.15 | | | | $11.14 | | | | $11.23 | | | | $11.06 | | | | $9.82 | |
Ratios and supplemental data: | | | | | | | | | | | | | | | | | | | | | | | | |
Total return(b) | | | 0.94% | | | | 3.35% | | | | 2.64% | | | | 7.12% | | | | 17.10% | | | | (0.33% | ) |
Net assets, end of period (000) | | | $119,632 | | | | $137,672 | | | | $115,090 | | | | $114,922 | | | | $94,831 | | | | $55,858 | |
Ratio of net expenses to average net assets | | | 0.90% | (c) | | | 0.90% | | | | 0.90% | | | | 0.90% | | | | 0.88% | | | | 0.83% | |
Ratio of gross expenses to average net assets prior to expense reductions | | | 0.99% | (c) | | | 0.98% | | | | 0.97% | | | | 0.98% | | | | 1.00% | | | | 1.13% | |
Ratio of net investment income (loss) to average net assets | | | 2.00% | (c) | | | 1.98% | | | | 2.37% | | | | 2.83% | | | | 3.30% | | | | 3.24% | |
| | |
| | | (Unaudited)
Six Months
Ended
April 30, | | | Year Ended October 31, | |
| | | 2013 | | | 2012 | | | 2011 | | | 2010 | | | 2009 | | | 2008 | |
Portfolio turnover rate | | | 14.4% | | | | 34.4% | | | | 41.5% | | | | 55.7% | | | | 287.2% | | | | 678.6% | |
| (a) | Net investment income (loss) allocated based on average shares method. |
| (b) | Total return measures net investment income (loss) and capital gain or loss from portfolio investments assuming reinvestment of dividends and capital gains distributions. Total return is not annualized for periods that are less than a full year, does not reflect the effect of sales charge for Class A shares nor the contingent deferred sales charge for Class B and C shares and does not reflect the deduction of taxes that a shareholder would pay on fund distributions or the redemption of fund shares. |
Calamos Total Return Bond Fund Financial Highlights
| | | | | | | | | | | | | | | | | | | | | | | | |
| | | CLASS B | |
| | | (Unaudited)
Six Months
Ended
April 30, | | | Year Ended October 31, | |
| | | 2013 | | | 2012 | | | 2011 | | | 2010 | | | 2009 | | | 2008 | |
Net asset value, beginning of period | | | $11.15 | | | | $11.14 | | | | $11.23 | | | | $11.06 | | | | $9.82 | | | | $10.25 | |
Income from investment operations: | | | | | | | | | | | | | | | | | | | | | | | | |
Net investment income (loss)(a) | | | 0.07 | | | | 0.14 | | | | 0.19 | | | | 0.23 | | | | 0.27 | | | | 0.26 | |
Net realized and unrealized gain (loss) | | | (0.01 | ) | | | 0.14 | | | | 0.01 | | | | 0.44 | | | | 1.31 | | | | (0.36 | ) |
Total from investment operations | | | 0.06 | | | | 0.28 | | | | 0.20 | | | | 0.67 | | | | 1.58 | | | | (0.10 | ) |
Distributions: | | | | | | | | | | | | | | | | | | | | | | | | |
Dividends from net investment income | | | (0.11 | ) | | | (0.23 | ) | | | (0.20 | ) | | | (0.50 | ) | | | (0.34 | ) | | | (0.33 | ) |
Dividends from net realized gains | | | (0.05 | ) | | | (0.04 | ) | | | (0.09 | ) | | | — | | | | — | | | | — | |
Total distributions | | | (0.16 | ) | | | (0.27 | ) | | | (0.29 | ) | | | (0.50 | ) | | | (0.34 | ) | | | (0.33 | ) |
Net asset value, end of period | | | $11.05 | | | | $11.15 | | | | $11.14 | | | | $11.23 | | | | $11.06 | | | | $9.82 | |
Ratios and supplemental data: | | | | | | | | | | | | | | | | | | | | | | | | |
Total return(b) | | | 0.57% | | | | 2.59% | | | | 1.88% | | | | 6.33% | | | | 16.23% | | | | (1.07% | ) |
Net assets, end of period (000) | | | $6,682 | | | | $9,108 | | | | $14,193 | | | | $21,402 | | | | $22,103 | | | | $12,539 | |
Ratio of net expenses to average net assets | | | 1.65% | (c) | | | 1.65% | | | | 1.65% | | | | 1.65% | | | | 1.63% | | | | 1.58% | |
Ratio of gross expenses to average net assets prior to expense reductions | | | 1.74% | (c) | | | 1.73% | | | | 1.72% | | | | 1.73% | | | | 1.75% | | | | 1.88% | |
Ratio of net investment income (loss) to average net assets | | | 1.26% | (c) | | | 1.25% | | | | 1.67% | | | | 2.10% | | | | 2.56% | | | | 2.49% | |
| |
| | | CLASS C | |
| | | (Unaudited)
Six Months
Ended
April 30, | | | Year Ended October 31, | |
| | | 2013 | | | 2012 | | | 2011 | | | 2010 | | | 2009 | | | 2008 | |
Net asset value, beginning of period | | | $11.15 | | | | $11.13 | | | | $11.22 | | | | $11.06 | | | | $9.82 | | | | $10.25 | |
Income from investment operations: | | | | | | | | | | | | | | | | | | | | | | | | |
Net investment income (loss)(a) | | | 0.07 | | | | 0.14 | | | | 0.18 | | | | 0.23 | | | | 0.27 | | | | 0.25 | |
Net realized and unrealized gain (loss) | | | (0.02 | ) | | | 0.15 | | | | 0.02 | | | | 0.43 | | | | 1.31 | | | | (0.35 | ) |
Total from investment operations | | | 0.05 | | | | 0.29 | | | | 0.20 | | | | 0.66 | | | | 1.58 | | | | (0.10 | ) |
Distributions: | | | | | | | | | | | | | | | | | | | | | | | | |
Dividends from net investment income | | | (0.11 | ) | | | (0.23 | ) | | | (0.20 | ) | | | (0.50 | ) | | | (0.34 | ) | | | (0.33 | ) |
Dividends from net realized gains | | | (0.05 | ) | | | (0.04 | ) | | | (0.09 | ) | | | — | | | | — | | | | — | |
Total distributions | | | (0.16 | ) | | | (0.27 | ) | | | (0.29 | ) | | | (0.50 | ) | | | (0.34 | ) | | | (0.33 | ) |
Net asset value, end of period | | | $11.04 | | | | $11.15 | | | | $11.13 | | | | $11.22 | | | | $11.06 | | | | $9.82 | |
Ratios and supplemental data: | | | | | | | | | | | | | | | | | | | | | | | | |
Total return(b) | | | 0.47% | | | | 2.68% | | | | 1.88% | | | | 6.24% | | | | 16.23% | | | | (1.07% | ) |
Net assets, end of period (000) | | | $36,142 | | | | $43,823 | | | | $48,612 | | | | $50,793 | | | | $39,605 | | | | $19,018 | |
Ratio of net expenses to average net assets | | | 1.65% | (c) | | | 1.65% | | | | 1.65% | | | | 1.65% | | | | 1.63% | | | | 1.58% | |
Ratio of gross expenses to average net assets prior to expense reductions | | | 1.74% | (c) | | | 1.73% | | | | 1.72% | | | | 1.73% | | | | 1.75% | | | | 1.88% | |
Ratio of net investment income (loss) to average net assets | | | 1.26% | (c) | | | 1.25% | | | | 1.63% | | | | 2.09% | | | | 2.54% | | | | 2.49% | |
| (a) | Net investment income (loss) allocated based on average shares method. |
| (b) | Total return measures net investment income (loss) and capital gain or loss from portfolio investments assuming reinvestment of dividends and capital gains distributions. Total return is not annualized for periods that are less than a full year, does not reflect the effect of sales charge for Class A shares nor the contingent deferred sales charge for Class B and C shares and does not reflect the deduction of taxes that a shareholder would pay on fund distributions or the redemption of fund shares. |
| | | | |
| 170 | | CALAMOS FAMILY OF FUNDS SEMIANNUAL REPORT | | |
Calamos Total Return Bond Fund Financial Highlights
| | | | | | | | | | | | | | | | | | | | | | | | |
| | | CLASS I | |
| | | (Unaudited)
Six Months
Ended
April 30, | | | Year Ended October 31, | |
| | | 2013 | | | 2012 | | | 2011 | | | 2010 | | | 2009 | | | 2008 | |
Net asset value, beginning of period | | | $11.15 | | | | $11.13 | | | | $11.22 | | | | $11.06 | | | | $9.82 | | | | $10.24 | |
Income from investment operations: | | | | | | | | | | | | | | | | | | | | | | | | |
Net investment income (loss)(a) | | | 0.12 | | | | 0.25 | | | | 0.29 | | | | 0.34 | | | | 0.38 | | | | 0.36 | |
Net realized and unrealized gain (loss) | | | (0.01 | ) | | | 0.15 | | | | 0.02 | | | | 0.43 | | | | 1.30 | | | | (0.35 | ) |
Total from investment operations | | | 0.11 | | | | 0.40 | | | | 0.31 | | | | 0.77 | | | | 1.68 | | | | 0.01 | |
Distributions: | | | | | | | | | | | | | | | | | | | | | | | | |
Dividends from net investment income | | | (0.17 | ) | | | (0.34 | ) | | | (0.31 | ) | | | (0.61 | ) | | | (0.44 | ) | | | (0.43 | ) |
Dividends from net realized gains | | | (0.05 | ) | | | (0.04 | ) | | | (0.09 | ) | | | — | | | | — | | | | — | |
Total distributions | | | (0.22 | ) | | | (0.38 | ) | | | (0.40 | ) | | | (0.61 | ) | | | (0.44 | ) | | | (0.43 | ) |
Net asset value, end of period | | | $11.04 | | | | $11.15 | | | | $11.13 | | | | $11.22 | | | | $11.06 | | | | $9.82 | |
Ratios and supplemental data: | | | | | | | | | | | | | | | | | | | | | | | | |
Total return(b) | | | 0.97% | | | | 3.70% | | | | 2.90% | | | | 7.30% | | | | 17.39% | | | | 0.02% | |
Net assets, end of period (000) | | | $46,834 | | | | $43,464 | | | | $41,639 | | | | $46,625 | | | | $41,689 | | | | $34,049 | |
Ratio of net expenses to average net assets | | | 0.65% | (c) | | | 0.65% | | | | 0.65% | | | | 0.65% | | | | 0.63% | | | | 0.58% | |
Ratio of gross expenses to average net assets prior to expense reductions | | | 0.74% | (c) | | | 0.73% | | | | 0.72% | | | | 0.73% | | | | 0.75% | | | | 0.88% | |
Ratio of net investment income (loss) to average net assets | | | 2.25% | (c) | | | 2.24% | | | | 2.64% | | | | 3.07% | | | | 3.59% | | | | 3.49% | |
| |
| | | CLASS R | |
| | | (Unaudited)
Six Months
Ended
April 30, | | | Year Ended October 31, | |
| | | 2013 | | | 2012 | | | 2011 | | | 2010 | | | 2009 | | | 2008 | |
Net asset value, beginning of period | | | $11.15 | | | | $11.14 | | | | $11.23 | | | | $11.06 | | | | $9.82 | | | | $10.25 | |
Income from investment operations: | | | | | | | | | | | | | | | | | | | | | | | | |
Net investment income (loss)(a) | | | 0.10 | | | | 0.19 | | | | 0.23 | | | | 0.28 | | | | 0.33 | | | | 0.31 | |
Net realized and unrealized gain (loss) | | | (0.01 | ) | | | 0.15 | | | | 0.02 | | | | 0.45 | | | | 1.30 | | | | (0.36 | ) |
Total from investment operations | | | 0.09 | | | | 0.34 | | | | 0.25 | | | | 0.73 | | | | 1.63 | | | | (0.05 | ) |
Distributions: | | | | | | | | | | | | | | | | | | | | | | | | |
Dividends from net investment income | | | (0.14 | ) | | | (0.29 | ) | | | (0.25 | ) | | | (0.56 | ) | | | (0.39 | ) | | | (0.38 | ) |
Dividends from net realized gains | | | (0.05 | ) | | | (0.04 | ) | | | (0.09 | ) | | | — | | | | — | | | | — | |
Total distributions | | | (0.19 | ) | | | (0.33 | ) | | | (0.34 | ) | | | (0.56 | ) | | | (0.39 | ) | | | (0.38 | ) |
Net asset value, end of period | | | $11.05 | | | | $11.15 | | | | $11.14 | | | | $11.23 | | | | $11.06 | | | | $9.82 | |
Ratios and supplemental data: | | | | | | | | | | | | | | | | | | | | | | | | |
Total return(b) | | | 0.81% | | | | 3.09% | | | | 2.39% | | | | 6.86% | | | | 16.81% | | | | (0.58% | ) |
Net assets, end of period (000) | | | $1,743 | | | | $1,756 | | | | $1,638 | | | | $1,389 | | | | $1,283 | | | | $1,033 | |
Ratio of net expenses to average net assets | | | 1.15% | (c) | | | 1.15% | | | | 1.15% | | | | 1.15% | | | | 1.13% | | | | 1.08% | |
Ratio of gross expenses to average net assets prior to expense reductions | | | 1.24% | (c) | | | 1.23% | | | | 1.22% | | | | 1.23% | | | | 1.25% | | | | 1.38% | |
Ratio of net investment income (loss) to average net assets | | | 1.75% | (c) | | | 1.74% | | | | 2.10% | | | | 2.59% | | | | 3.09% | | | | 2.99% | |
| (a) | Net investment income (loss) allocated based on average shares method. |
| (b) | Total return measures net investment income (loss) and capital gain or loss from portfolio investments assuming reinvestment of dividends and capital gains distributions. Total return is not annualized for periods that are less than a full year, does not reflect the effect of sales charge for Class A shares nor the contingent deferred sales charge for Class B and C shares and does not reflect the deduction of taxes that a shareholder would pay on fund distributions or the redemption of fund shares. |
Calamos High Income Fund Financial Highlights
Selected data for a share outstanding throughout each period were as follows:
| | | | | | | | | | | | | | | | | | | | | | | | |
| | | CLASS A | |
| | | (Unaudited)
Six Months
Ended
April 30, | | | Year Ended October 31, | |
| | | 2013 | | | 2012 | | | 2011 | | | 2010 | | | 2009 | | | 2008 | |
Net asset value, beginning of period | | | $9.92 | | | | $9.68 | | | | $9.97 | | | | $9.52 | | | | $7.11 | | | | $10.96 | |
Income from investment operations: | | | | | | | | | | | | | | | | | | | | | | | | |
Net investment income (loss)(a) | | | 0.26 | | | | 0.53 | | | | 0.59 | | | | 0.63 | | | | 0.61 | | | | 0.55 | |
Net realized and unrealized gain (loss) | | | 0.37 | | | | 0.35 | | | | (0.24 | ) | | | 0.58 | | | | 2.29 | | | | (3.44 | ) |
Total from investment operations | | | 0.63 | | | | 0.88 | | | | 0.35 | | | | 1.21 | | | | 2.90 | | | | (2.89 | ) |
Distributions: | | | | | | | | | | | | | | | | | | | | | | | | |
Dividends from net investment income | | | (0.31 | ) | | | (0.51 | ) | | | (0.64 | ) | | | (0.76 | ) | | | (0.49 | ) | | | (0.73 | ) |
Dividends from net realized gains | | | (0.13 | ) | | | (0.13 | ) | | | — | | | | — | | | | — | | | | (0.23 | ) |
Total distributions | | | (0.44 | ) | | | (0.64 | ) | | | (0.64 | ) | | | (0.76 | ) | | | (0.49 | ) | | | (0.96 | ) |
Net asset value, end of period | | | $10.11 | | | | $9.92 | | | | $9.68 | | | | $9.97 | | | | $9.52 | | | | $7.11 | |
Ratios and supplemental data: | | | | | | | | | | | | | | | | | | | | | | | | |
Total return(b) | | | 6.60% | | | | 9.39% | | | | 3.62% | | | | 13.26% | | | | 42.27% | | | | (28.60% | ) |
Net assets, end of period (000) | | | $221,909 | | | | $215,299 | | | | $182,515 | | | | $211,632 | | | | $207,057 | | | | $90,995 | |
Ratio of net expenses to average net assets | | | 1.17% | (c) | | | 1.19% | | | | 1.22% | | | | 1.21% | | | | 1.22% | | | | 1.21% | |
Ratio of gross expenses to average net assets prior to expense reductions | | | 1.17% | (c) | | | 1.19% | | | | 1.22% | | | | 1.21% | | | | 1.22% | | | | 1.21% | |
Ratio of net investment income (loss) to average net assets | | | 5.22% | (c) | | | 5.46% | | | | 6.01% | | | | 6.56% | | | | 7.48% | | | | 5.69% | |
| | |
| | | (Unaudited)
Six Months
Ended
April 30, | | | Year Ended October 31, | |
| | | 2013 | | | 2012 | | | 2011 | | | 2010 | | | 2009 | | | 2008 | |
Portfolio turnover rate | | | 28.0% | | | | 73.9% | | | | 72.6% | | | | 57.6% | | | | 55.0% | | | | 47.5% | |
| (a) | Net investment income (loss) allocated based on average shares method. |
| (b) | Total return measures net investment income (loss) and capital gain or loss from portfolio investments assuming reinvestment of dividends and capital gains distributions. Total return is not annualized for periods that are less than a full year, does not reflect the effect of sales charge for Class A shares nor the contingent deferred sales charge for Class B and C shares and does not reflect the deduction of taxes that a shareholder would pay on fund distributions or the redemption of fund shares. |
| | | | |
| 172 | | CALAMOS FAMILY OF FUNDS SEMIANNUAL REPORT | | |
Calamos High Income Fund Financial Highlights
| | | | | | | | | | | | | | | | | | | | | | | | |
| | | CLASS B | |
| | | (Unaudited)
Six Months
Ended
April 30, | | | Year Ended October 31, | |
| | | 2013 | | | 2012 | | | 2011 | | | 2010 | | | 2009 | | | 2008 | |
Net asset value, beginning of period | | | $10.36 | | | | $10.09 | | | | $10.37 | | | | $9.86 | | | | $7.35 | | | | $11.28 | |
Income from investment operations: | | | | | | | | | | | | | | | | | | | | | | | | |
Net investment income (loss)(a) | | | 0.23 | | | | 0.48 | | | | 0.54 | | | | 0.58 | | | | 0.57 | | | | 0.50 | |
Net realized and unrealized gain (loss) | | | 0.40 | | | | 0.36 | | | | (0.26 | ) | | | 0.60 | | | | 2.36 | | | | (3.55 | ) |
Total from investment operations | | | 0.63 | | | | 0.84 | | | | 0.28 | | | | 1.18 | | | | 2.93 | | | | (3.05 | ) |
Distributions: | | | | | | | | | | | | | | | | | | | | | | | | |
Dividends from net investment income | | | (0.27 | ) | | | (0.44 | ) | | | (0.56 | ) | | | (0.67 | ) | | | (0.42 | ) | | | (0.65 | ) |
Dividends from net realized gains | | | (0.13 | ) | | | (0.13 | ) | | | — | | | | — | | | | — | | | | (0.23 | ) |
Total distributions | | | (0.40 | ) | | | (0.57 | ) | | | (0.56 | ) | | | (0.67 | ) | | | (0.42 | ) | | | (0.88 | ) |
Net asset value, end of period | | | $10.59 | | | | $10.36 | | | | $10.09 | | | | $10.37 | | | | $9.86 | | | | $7.35 | |
Ratios and supplemental data: | | | | | | | | | | | | | | | | | | | | | | | | |
Total return(b) | | | 6.24% | | | | 8.55% | | | | 2.79% | | | | 12.45% | | | | 41.16% | | | | (29.06% | ) |
Net assets, end of period (000) | | | $4,493 | | | | $5,973 | | | | $9,766 | | | | $17,387 | | | | $19,897 | | | | $14,956 | |
Ratio of net expenses to average net assets | | | 1.92% | (c) | | | 1.95% | | | | 1.96% | | | | 1.96% | | | | 1.98% | | | | 1.96% | |
Ratio of gross expenses to average net assets prior to expense reductions | | | 1.92% | (c) | | | 1.95% | | | | 1.96% | | | | 1.96% | | | | 1.98% | | | | 1.96% | |
Ratio of net investment income (loss) to average net assets | | | 4.49% | (c) | | | 4.73% | | | | 5.28% | | | | 5.82% | | | | 6.83% | | | | 4.94% | |
| |
| | | CLASS C | |
| | | (Unaudited)
Six Months
Ended
April 30, | | | Year Ended October 31, | |
| | | 2013 | | | 2012 | | | 2011 | | | 2010 | | | 2009 | | | 2008 | |
Net asset value, beginning of period | | | $10.28 | | | | $10.01 | | | | $10.29 | | | | $9.80 | | | | $7.31 | | | | $11.22 | |
Income from investment operations: | | | | | | | | | | | | | | | | | | | | | | | | |
Net investment income (loss)(a) | | | 0.23 | | | | 0.48 | | | | 0.54 | | | | 0.58 | | | | 0.56 | | | | 0.49 | |
Net realized and unrealized gain (loss) | | | 0.39 | | | | 0.36 | | | | (0.25 | ) | | | 0.58 | | | | 2.36 | | | | (3.52 | ) |
Total from investment operations | | | 0.62 | | | | 0.84 | | | | 0.29 | | | | 1.16 | | | | 2.92 | | | | (3.03 | ) |
Distributions: | | | | | | | | | | | | | | | | | | | | | | | | |
Dividends from net investment income | | | (0.27 | ) | | | (0.44 | ) | | | (0.57 | ) | | | (0.67 | ) | | | (0.43 | ) | | | (0.65 | ) |
Dividends from net realized gains | | | (0.13 | ) | | | (0.13 | ) | | | — | | | | — | | | | — | | | | (0.23 | ) |
Total distributions | | | (0.40 | ) | | | (0.57 | ) | | | (0.57 | ) | | | (0.67 | ) | | | (0.43 | ) | | | (0.88 | ) |
Net asset value, end of period | | | $10.50 | | | | $10.28 | | | | $10.01 | | | | $10.29 | | | | $9.80 | | | | $7.31 | |
Ratios and supplemental data: | | | | | | | | | | | | | | | | | | | | | | | | |
Total return(b) | | | 6.20% | | | | 8.65% | | | | 2.83% | | | | 12.34% | | | | 41.16% | | | | (29.03% | ) |
Net assets, end of period (000) | | | $40,860 | | | | $43,141 | | | | $39,764 | | | | $48,149 | | | | $45,673 | | | | $28,261 | |
Ratio of net expenses to average net assets | | | 1.92% | (c) | | | 1.94% | | | | 1.97% | | | | 1.96% | | | | 1.98% | | | | 1.96% | |
Ratio of gross expenses to average net assets prior to expense reductions | | | 1.92% | (c) | | | 1.94% | | | | 1.97% | | | | 1.96% | | | | 1.98% | | | | 1.96% | |
Ratio of net investment income (loss) to average net assets | | | 4.48% | (c) | | | 4.72% | | | | 5.26% | | | | 5.81% | | | | 6.80% | | | | 4.94% | |
| (a) | Net investment income (loss) allocated based on average shares method. |
| (b) | Total return measures net investment income (loss) and capital gain or loss from portfolio investments assuming reinvestment of dividends and capital gains distributions. Total return is not annualized for periods that are less than a full year, does not reflect the effect of sales charge for Class A shares nor the contingent deferred sales charge for Class B and C shares and does not reflect the deduction of taxes that a shareholder would pay on fund distributions or the redemption of fund shares. |
Calamos High Income Fund Financial Highlights
| | | | | | | | | | | | | | | | | | | | | | | | |
| | | CLASS I | |
| | | (Unaudited)
Six Months
Ended
April 30, | | | Year Ended October 31, | |
| | | 2013 | | | 2012 | | | 2011 | | | 2010 | | | 2009 | | | 2008 | |
Net asset value, beginning of period | | | $9.92 | | | | $9.68 | | | | $9.97 | | | | $9.52 | | | | $7.12 | | | | $10.96 | |
Income from investment operations: | | | | | | | | | | | | | | | | | | | | | | | | |
Net investment income (loss)(a) | | | 0.27 | | | | 0.56 | | | | 0.62 | | | | 0.65 | | | | 0.63 | | | | 0.57 | |
Net realized and unrealized gain (loss) | | | 0.38 | | | | 0.34 | | | | (0.24 | ) | | | 0.58 | | | | 2.28 | | | | (3.42 | ) |
Total from investment operations | | | 0.65 | | | | 0.90 | | | | 0.38 | | | | 1.23 | | | | 2.91 | | | | (2.85 | ) |
Distributions: | | | | | | | | | | | | | | | | | | | | | | | | |
Dividends from net investment income | | | (0.33 | ) | | | (0.53 | ) | | | (0.67 | ) | | | (0.78 | ) | | | (0.51 | ) | | | (0.76 | ) |
Dividends from net realized gains | | | (0.13 | ) | | | (0.13 | ) | | | — | | | | — | | | | — | | | | (0.23 | ) |
Total distributions | | | (0.46 | ) | | | (0.66 | ) | | | (0.67 | ) | | | (0.78 | ) | | | (0.51 | ) | | | (0.99 | ) |
Net asset value, end of period | | | $10.11 | | | | $9.92 | | | | $9.68 | | | | $9.97 | | | | $9.52 | | | | $7.12 | |
Ratios and supplemental data: | | | | | | | | | | | | | | | | | | | | | | | | |
Total return(b) | | | 6.75% | | | | 9.63% | | | | 3.88% | | | | 13.58% | | | | 42.41% | | | | (28.31% | ) |
Net assets, end of period (000) | | | $31,318 | | | | $33,271 | | | | $21,424 | | | | $44,574 | | | | $19,286 | | | | $8,010 | |
Ratio of net expenses to average net assets | | | 0.92% | (c) | | | 0.94% | | | | 0.96% | | | | 0.96% | | | | 0.97% | | | | 0.96% | |
Ratio of gross expenses to average net assets prior to expense reductions | | | 0.92% | (c) | | | 0.94% | | | | 0.96% | | | | 0.96% | | | | 0.97% | | | | 0.96% | |
Ratio of net investment income (loss) to average net assets | | | 5.47% | (c) | | | 5.71% | | | | 6.29% | | | | 6.76% | | | | 7.61% | | | | 5.94% | |
| |
| | | CLASS R | |
| | | (Unaudited)
Six Months
Ended
April 30, | | | Year Ended October 31, | |
| | | 2013 | | | 2012 | | | 2011 | | | 2010 | | | 2009 | | | 2008 | |
Net asset value, beginning of period | | | $9.91 | | | | $9.67 | | | | $9.96 | | | | $9.52 | | | | $7.11 | | | | $10.95 | |
Income from investment operations: | | | | | | | | | | | | | | | | | | | | | | | | |
Net investment income (loss)(a) | | | 0.25 | | | | 0.51 | | | | 0.57 | | | | 0.60 | | | | 0.59 | | | | 0.53 | |
Net realized and unrealized gain (loss) | | | 0.37 | | | | 0.34 | | | | (0.24 | ) | | | 0.57 | | | | 2.29 | | | | (3.43 | ) |
Total from investment operations | | | 0.62 | | | | 0.85 | | | | 0.33 | | | | 1.17 | | | | 2.88 | | | | (2.90 | ) |
Distributions: | | | | | | | | | | | | | | | | | | | | | | | | |
Dividends from net investment income | | | (0.30 | ) | | | (0.48 | ) | | | (0.62 | ) | | | (0.73 | ) | | | (0.47 | ) | | | (0.71 | ) |
Dividends from net realized gains | | | (0.13 | ) | | | (0.13 | ) | | | — | | | | — | | | | — | | | | (0.23 | ) |
Total distributions | | | (0.43 | ) | | | (0.61 | ) | | | (0.62 | ) | | | (0.73 | ) | | | (0.47 | ) | | | (0.94 | ) |
Net asset value, end of period | | | $10.10 | | | | $9.91 | | | | $9.67 | | | | $9.96 | | | | $9.52 | | | | $7.11 | |
Ratios and supplemental data: | | | | | | | | | | | | | | | | | | | | | | | | |
Total return(b) | | | 6.45% | | | | 9.17% | | | | 3.37% | | | | 12.88% | | | | 41.93% | | | | (28.71% | ) |
Net assets, end of period (000) | | | $358 | | | | $373 | | | | $272 | | | | $248 | | | | $122 | | | | $75 | |
Ratio of net expenses to average net assets | | | 1.42% | (c) | | | 1.44% | | | | 1.47% | | | | 1.46% | | | | 1.48% | | | | 1.46% | |
Ratio of gross expenses to average net assets prior to expense reductions | | | 1.42% | (c) | | | 1.44% | | | | 1.47% | | | | 1.46% | | | | 1.48% | | | | 1.46% | |
Ratio of net investment income (loss) to average net assets | | | 4.97% | (c) | | | 5.21% | | | | 5.74% | | | | 6.28% | | | | 7.31% | | | | 5.44% | |
| (a) | Net investment income (loss) allocated based on average shares method. |
| (b) | Total return measures net investment income (loss) and capital gain or loss from portfolio investments assuming reinvestment of dividends and capital gains distributions. Total return is not annualized for periods that are less than a full year, does not reflect the effect of sales charge for Class A shares nor the contingent deferred sales charge for Class B and C shares and does not reflect the deduction of taxes that a shareholder would pay on fund distributions or the redemption of fund shares. |
| | | | |
| 174 | | CALAMOS FAMILY OF FUNDS SEMIANNUAL REPORT | | |
Calamos Market Neutral Income Fund Financial Highlights
Selected data for a share outstanding throughout each period were as follows:
| | | | | | | | | | | | | | | | | | | | | | | | |
| | | CLASS A | |
| | | (Unaudited)
Six Months
Ended
April 30, | | | Year Ended October 31, | |
| | | 2013 | | | 2012 | | | 2011 | | | 2010 | | | 2009 | | | 2008 | |
Net asset value, beginning of period | | | $12.68 | | | | $12.11 | | | | $11.91 | | | | $11.35 | | | | $10.97 | | | | $13.31 | |
Income from investment operations: | | | | | | | | | | | | | | | | | | | | | | | | |
Net investment income (loss)(a) | | | 0.09 | | | | 0.21 | | | | 0.22 | | | | 0.23 | | | | 0.30 | | | | 0.30 | |
Net realized and unrealized gain (loss) | | | 0.21 | | | | 0.51 | | | | 0.18 | | | | 0.46 | | | | 0.89 | | | | (2.13 | ) |
Total from investment operations | | | 0.30 | | | | 0.72 | | | | 0.40 | | | | 0.69 | | | | 1.19 | | | | (1.83 | ) |
Distributions: | | | | | | | | | | | | | | | | | | | | | | | | |
Dividends from net investment income | | | (0.09 | ) | | | (0.15 | ) | | | (0.20 | ) | | | (0.13 | ) | | | (0.52 | ) | | | (0.51 | ) |
Dividends from net realized gains | | | — | | | | — | | | | — | | | | — | | | | (0.29 | ) | | | — | |
Total distributions | | | (0.09 | ) | | | (0.15 | ) | | | (0.20 | ) | | | (0.13 | ) | | | (0.81 | ) | | | (0.51 | ) |
Net asset value, end of period | | | $12.89 | | | | $12.68 | | | | $12.11 | | | | $11.91 | | | | $11.35 | | | | $10.97 | |
Ratios and supplemental data: | | | | | | | | | | | | | | | | | | | | | | | | |
Total return(b) | | | 2.40% | | | | 6.01% | | | | 3.40% | | | | 6.11% | | | | 11.77% | | | | (14.22% | ) |
Net assets, end of period (000) | | | $1,224,654 | | | | $1,155,161 | | | | $1,282,438 | | | | $1,203,750 | | | | $938,686 | | | | $815,845 | |
Ratio of net expenses to average net assets | | | 1.33% | (c) | | | 1.17% | | | | 1.21% | | | | 1.19% | | | | 1.19% | | | | 1.12% | |
Ratio of gross expenses to average net assets prior to expense reductions | | | 1.33% | (c) | | | 1.17% | | | | 1.21% | | | | 1.19% | | | | 1.20% | | | | 1.13% | |
Ratio of net investment income (loss) to average net assets | | | 1.35% | (c) | | | 1.65% | | | | 1.80% | | | | 2.00% | | | | 2.80% | | | | 2.40% | |
Ratio of net expenses, excluding dividend expense on short positions, to average net assets | | | 1.12% | (c) | | | 1.13% | | | | 1.14% | | | | 1.14% | | | | 1.15% | | | | 1.08% | |
| | |
| | | (Unaudited)
Six Months
Ended
April 30, | | | Year Ended October 31, | |
| | | 2013 | | | 2012 | | | 2011 | | | 2010 | | | 2009 | | | 2008 | |
Portfolio turnover rate | | | 34.2% | | | | 82.8% | | | | 98.5% | | | | 87.8% | | | | 79.8% | | | | 112.0% | |
| (a) | Net investment income allocated based on average shares method. |
| (b) | Total return measures net investment income and capital gain or loss from portfolio investments assuming reinvestment of dividends and capital gains distributions. Total return is not annualized for periods that are less than a full year, does not reflect the effect of sales charge for Class A shares nor the contingent deferred sales charge for Class B and C shares and does not reflect the deduction of taxes that a shareholder would pay on fund distributions or the redemption of fund shares. |
Calamos Market Neutral Income Fund Financial Highlights
| | | | | | | | | | | | | | | | | | | | | | | | |
| | | CLASS B | |
| | | (Unaudited)
Six Months
Ended
April 30, | | | Year Ended October 31, | |
| | | 2013 | | | 2012 | | | 2011 | | | 2010 | | | 2009 | | | 2008 | |
Net asset value, beginning of period | | | $13.36 | | | | $12.75 | | | | $12.51 | | | | $11.92 | | | | $11.48 | | | | $13.90 | |
Income from investment operations: | | | | | | | | | | | | | | | | | | | | | | | | |
Net investment income (loss)(a) | | | 0.04 | | | | 0.12 | | | | 0.14 | | | | 0.15 | | | | 0.24 | | | | 0.22 | |
Net realized and unrealized gain (loss) | | | 0.23 | | | | 0.54 | | | | 0.20 | | | | 0.48 | | | | 0.92 | | | | (2.23 | ) |
Total from investment operations | | | 0.27 | | | | 0.66 | | | | 0.34 | | | | 0.63 | | | | 1.16 | | | | (2.01 | ) |
Distributions: | | | | | | | | | | | | | | | | | | | | | | | | |
Dividends from net investment income | | | (0.04 | ) | | | (0.05 | ) | | | (0.10 | ) | | | (0.04 | ) | | | (0.43 | ) | | | (0.41 | ) |
Dividends from net realized gains | | | — | | | | — | | | | — | | | | — | | | | (0.29 | ) | | | — | |
Total distributions | | | (0.04 | ) | | | (0.05 | ) | | | (0.10 | ) | | | (0.04 | ) | | | (0.72 | ) | | | (0.41 | ) |
Net asset value, end of period | | | $13.59 | | | | $13.36 | | | | $12.75 | | | | $12.51 | | | | $11.92 | | | | $11.48 | |
Ratios and supplemental data: | | | | | | | | | | | | | | | | | | | | | | | | |
Total return(b) | | | 2.00% | | | | 5.18% | | | | 2.70% | | | | 5.31% | | | | 10.87% | | | | (14.84% | ) |
Net assets, end of period (000) | | | $10,629 | | | | $12,940 | | | | $18,147 | | | | $25,349 | | | | $34,370 | | | | $43,852 | |
Ratio of net expenses to average net assets | | | 2.09% | (c) | | | 1.92% | | | | 1.97% | | | | 1.94% | | | | 1.95% | | | | 1.87% | |
Ratio of gross expenses to average net assets prior to expense reductions | | | 2.09% | (c) | | | 1.92% | | | | 1.97% | | | | 1.94% | | | | 1.95% | | | | 1.88% | |
Ratio of net investment income (loss) to average net assets | | | 0.61% | (c) | | | 0.91% | | | | 1.07% | | | | 1.27% | | | | 2.13% | | | | 1.65% | |
Ratio of net expenses, excluding dividend expense on short positions, to average net assets | | | 1.87% | (c) | | | 1.89% | | | | 1.89% | | | | 1.88% | | | | 1.91% | | | | 1.83% | |
| |
| | | CLASS C | |
| | | (Unaudited)
Six Months
Ended
April 30, | | | Year Ended October 31, | |
| | | 2013 | | | 2012 | | | 2011 | | | 2010 | | | 2009 | | | 2008 | |
Net asset value, beginning of period | | | $12.88 | | | | $12.29 | | | | $12.08 | | | | $11.52 | | | | $11.12 | | | | $13.48 | |
Income from investment operations: | | | | | | | | | | | | | | | | | | | | | | | | |
Net investment income (loss)(a) | | | 0.04 | | | | 0.11 | | | | 0.13 | | | | 0.15 | | | | 0.23 | | | | 0.21 | |
Net realized and unrealized gain (loss) | | | 0.21 | | | | 0.54 | | | | 0.18 | | | | 0.46 | | | | 0.90 | | | | (2.16 | ) |
Total from investment operations | | | 0.25 | | | | 0.65 | | | | 0.31 | | | | 0.61 | | | | 1.13 | | | | (1.95 | ) |
Distributions: | | | | | | | | | | | | | | | | | | | | | | | | |
Dividends from net investment income | | | (0.04 | ) | | | (0.06 | ) | | | (0.10 | ) | | | (0.05 | ) | | | (0.44 | ) | | | (0.41 | ) |
Dividends from net realized gains | | | — | | | | — | | | | — | | | | — | | | | (0.29 | ) | | | — | |
Total distributions | | | (0.04 | ) | | | (0.06 | ) | | | (0.10 | ) | | | (0.05 | ) | | | (0.73 | ) | | | (0.41 | ) |
Net asset value, end of period | | | $13.09 | | | | $12.88 | | | | $12.29 | | | | $12.08 | | | | $11.52 | | | | $11.12 | |
Ratios and supplemental data: | | | | | | | | | | | | | | | | | | | | | | | | |
Total return(b) | | | 1.97% | | | | 5.28% | | | | 2.61% | | | | 5.31% | | | | 10.91% | | | | (14.84% | ) |
Net assets, end of period (000) | | | $259,399 | | | | $267,646 | | | | $299,733 | | | | $353,019 | | | | $330,360 | | | | $363,213 | |
Ratio of net expenses to average net assets | | | 2.08% | (c) | | | 1.92% | | | | 1.97% | | | | 1.94% | | | | 1.95% | | | | 1.87% | |
Ratio of gross expenses to average net assets prior to expense reductions | | | 2.08% | (c) | | | 1.92% | | | | 1.97% | | | | 1.94% | | | | 1.95% | | | | 1.88% | |
Ratio of net investment income (loss) to average net assets | | | 0.60% | (c) | | | 0.90% | | | | 1.06% | | | | 1.26% | | | | 2.10% | | | | 1.65% | |
Ratio of net expenses, excluding dividend expense on short positions, to average net assets | | | 1.87% | (c) | | | 1.88% | | | | 1.89% | | | | 1.88% | | | | 1.91% | | | | 1.83% | |
| (a) | Net investment income allocated based on average shares method. |
| (b) | Total return measures net investment income and capital gain or loss from portfolio investments assuming reinvestment of dividends and capital gains distributions. Total return is not annualized for periods that are less than a full year, does not reflect the effect of sales charge for Class A shares nor the contingent deferred sales charge for Class B and C shares and does not reflect the deduction of taxes that a shareholder would pay on fund distributions or the redemption of fund shares. |
| | | | |
| 176 | | CALAMOS FAMILY OF FUNDS SEMIANNUAL REPORT | | |
Calamos Market Neutral Income Fund Financial Highlights
| | | | | | | | | | | | | | | | | | | | | | | | |
| | | CLASS I | |
| | | (Unaudited)
Six Months
Ended
April 30, | | | Year Ended October 31, | |
| | | 2013 | | | 2012 | | | 2011 | | | 2010 | | | 2009 | | | 2008 | |
Net asset value, beginning of period | | | $12.56 | | | | $12.00 | | | | $11.80 | | | | $11.25 | | | | $10.88 | | | | $13.21 | |
Income from investment operations: | | | | | | | | | | | | | | | | | | | | | | | | |
Net investment income (loss)(a) | | | 0.10 | | | | 0.23 | | | | 0.24 | | | | 0.25 | | | | 0.32 | | | | 0.32 | |
Net realized and unrealized gain (loss) | | | 0.21 | | | | 0.51 | | | | 0.19 | | | | 0.46 | | | | 0.89 | | | | (2.11 | ) |
Total from investment operations | | | 0.31 | | | | 0.74 | | | | 0.43 | | | | 0.71 | | | | 1.21 | | | | (1.79 | ) |
Distributions: | | | | | | | | | | | | | | | | | | | | | | | | |
Dividends from net investment income | | | (0.11 | ) | | | (0.18 | ) | | | (0.23 | ) | | | (0.16 | ) | | | (0.55 | ) | | | (0.54 | ) |
Dividends from net realized gains | | | — | | | | — | | | | — | | | | — | | | | (0.29 | ) | | | — | |
Total distributions | | | (0.11 | ) | | | (0.18 | ) | | | (0.23 | ) | | | (0.16 | ) | | | (0.84 | ) | | | (0.54 | ) |
Net asset value, end of period | | | $12.76 | | | | $12.56 | | | | $12.00 | | | | $11.80 | | | | $11.25 | | | | $10.88 | |
Ratios and supplemental data: | | | | | | | | | | | | | | | | | | | | | | | | |
Total return(b) | | | 2.47% | | | | 6.25% | | | | 3.70% | | | | 6.33% | | | | 12.07% | | | | (14.03% | ) |
Net assets, end of period (000) | | | $1,211,765 | | | | $1,040,722 | | | | $738,421 | | | | $521,364 | | | | $183,133 | | | | $102,745 | |
Ratio of net expenses to average net assets | | | 1.07% | (c) | | | 0.92% | | | | 0.96% | | | | 0.96% | | | | 0.94% | | | | 0.87% | |
Ratio of gross expenses to average net assets prior to expense reductions | | | 1.07% | (c) | | | 0.92% | | | | 0.96% | | | | 0.96% | | | | 0.95% | | | | 0.88% | |
Ratio of net investment income (loss) to average net assets | | | 1.59% | (c) | | | 1.88% | | | | 2.04% | | | | 2.22% | | | | 2.99% | | | | 2.65% | |
Ratio of net expenses, excluding dividend expense on short positions, to average net assets | | | 0.87% | (c) | | | 0.88% | | | | 0.89% | | | | 0.89% | | | | 0.90% | | | | 0.83% | |
| |
| | | CLASS R | |
| | | (Unaudited)
Six Months
Ended
April 30, | | | Year Ended October 31, | |
| | | 2013 | | | 2012 | | | 2011 | | | 2010 | | | 2009 | | | 2008 | |
Net asset value, beginning of period | | | $12.64 | | | | $12.08 | | | | $11.88 | | | | $11.33 | | | | $10.96 | | | | $13.31 | |
Income from investment operations: | | | | | | | | | | | | | | | | | | | | | | | | |
Net investment income (loss)(a) | | | 0.07 | | | | 0.17 | | | | 0.19 | | | | 0.20 | | | | 0.25 | | | | 0.27 | |
Net realized and unrealized gain (loss) | | | 0.21 | | | | 0.52 | | | | 0.18 | | | | 0.46 | | | | 0.91 | | | | (2.14 | ) |
Total from investment operations | | | 0.28 | | | | 0.69 | | | | 0.37 | | | | 0.66 | | | | 1.16 | | | | (1.87 | ) |
Distributions: | | | | | | | | | | | | | | | | | | | | | | | | |
Dividends from net investment income | | | (0.08 | ) | | | (0.13 | ) | | | (0.17 | ) | | | (0.11 | ) | | | (0.50 | ) | | | (0.48 | ) |
Dividends from net realized gains | | | — | | | | — | | | | — | | | | — | | | | (0.29 | ) | | | — | |
Total distributions | | | (0.08 | ) | | | (0.13 | ) | | | (0.17 | ) | | | (0.11 | ) | | | (0.79 | ) | | | (0.48 | ) |
Net asset value, end of period | | | $12.84 | | | | $12.64 | | | | $12.08 | | | | $11.88 | | | | $11.33 | | | | $10.96 | |
Ratios and supplemental data: | | | | | | | | | | | | | | | | | | | | | | | | |
Total return(b) | | | 2.20% | | | | 5.72% | | | | 3.18% | | | | 5.84% | | | | 11.46% | | | | (14.48% | ) |
Net assets, end of period (000) | | | $4,608 | | | | $5,199 | | | | $3,114 | | | | $2,351 | | | | $1,034 | | | | $162 | |
Ratio of net expenses to average net assets | | | 1.60% | (c) | | | 1.42% | | | | 1.46% | | | | 1.46% | | | | 1.44% | | | | 1.37% | |
Ratio of gross expenses to average net assets prior to expense reductions | | | 1.60% | (c) | | | 1.42% | | | | 1.46% | | | | 1.46% | | | | 1.44% | | | | 1.38% | |
Ratio of net investment income (loss) to average net assets | | | 1.11% | (c) | | | 1.37% | | | | 1.55% | | | | 1.72% | | | | 2.36% | | | | 2.15% | |
Ratio of net expenses, excluding dividend expense on short positions, to average net assets | | | 1.37% | (c) | | | 1.38% | | | | 1.39% | | | | 1.39% | | | | 1.40% | | | | 1.33% | |
| (a) | Net investment income allocated based on average shares method. |
| (b) | Total return measures net investment income and capital gain or loss from portfolio investments assuming reinvestment of dividends and capital gains distributions. Total return is not annualized for periods that are less than a full year, does not reflect the effect of sales charge for Class A shares nor the contingent deferred sales charge for Class B and C shares and does not reflect the deduction of taxes that a shareholder would pay on fund distributions or the redemption of fund shares. |
Report of Independent Registered Public Accounting Firm
To the Shareholders and Board of Trustees of Calamos Investment Trust
We have reviewed the accompanying statements of assets and liabilities, including the schedules of investments, of Calamos Investment Trust (the “Trust”), including Calamos Growth Fund, Calamos Value Fund, Calamos Focus Growth Fund (formerly Calamos Blue Chip Fund), Calamos Discovery Growth Fund, Calamos International Growth Fund, Calamos Evolving World Growth Fund, Calamos Global Equity Fund, Calamos Growth and Income Fund, Calamos Global Growth and Income Fund, Calamos Convertible Fund, Calamos Total Return Bond Fund, Calamos High Income Fund, and Calamos Market Neutral Income Fund (the “Funds”), as of April 30, 2013, and the related statements of operations and changes in net assets and the financial highlights for the semi-annual period then ended. These interim financial statements and financial highlights are the responsibility of the Trust’s management.
We conducted our reviews in accordance with standards of the Public Company Accounting Oversight Board (United States). A review of interim financial information consists principally of applying analytical procedures and making inquiries of persons responsible for financial and accounting matters. It is substantially less in scope than an audit conducted in accordance with standards of the Public Company Accounting Oversight Board (United States), the objective of which is the expression of an opinion regarding the financial statements and financial highlights taken as a whole. Accordingly, we do not express such an opinion.
Based on our reviews, we are not aware of any material modifications that should be made to such interim financial statements and financial highlights for them to be in conformity with accounting principles generally accepted in the United States of America.
We have previously audited, in accordance with the standards of the Public Company Accounting Oversight Board (United States), the statements of changes in net assets of the Funds for the year ended October 31, 2012 and the financial highlights for each of the periods presented; and in our report dated December 14, 2012, we expressed an unqualified opinion on such statements of changes in net assets and financial highlights.

Chicago, Illinois
June 21, 2013
| | | | |
| 178 | | CALAMOS FAMILY OF FUNDS SEMIANNUAL REPORT | | |
Trustee Approval of the Management Agreement (Unaudited)
The Board of Trustees of Calamos Investment Trust oversees the management of each of the Funds, and, as required by law, determines annually whether to continue the Trust’s management agreement with Calamos Advisors (the “Adviser”) under which the Adviser serves as the investment manager and administrator for each of the Funds. The “Independent Trustees,” who comprise more than 80% of the Board, have never been affiliated with the Adviser.
In connection with their most recent consideration regarding the continuation of the management agreement, the Trustees received and reviewed a substantial amount of information provided by the Adviser in response to detailed requests of the Independent Trustees and their independent legal counsel. In the course of their consideration of the agreement, the Independent Trustees were advised by their counsel and, in addition to meeting with management of the Adviser, they met separately in executive session with their counsel.
At a meeting held on June 28, 2012, based on their evaluation of the information referred to above and other information, the Trustees determined that the overall arrangements between the Funds and the Adviser were fair and reasonable in light of the nature, extent and quality of the services provided by the Adviser and its affiliates, the fees charged for those services and other matters that the Trustees considered relevant in the exercise of their business judgment. At that meeting, the Trustees, including all of the Independent Trustees, approved the continuation of the management agreement with respect to all of the Funds through July 31, 2013, subject to possible earlier termination as provided in the agreement.
In connection with its consideration of the management agreement, the Board considered, among other things: (i) the nature, quality and extent of the Adviser’s services, (ii) the investment performance of each Fund as well as performance information for comparable funds and other comparable clients of the Adviser, (iii) the fees and other expenses paid by each Fund as well as expense information for comparable funds and for other, comparable clients of the Adviser, (iv) the profitability of the Adviser and its affiliates from their relationship with each Fund, (v) whether economies of scale may be realized as each Fund grows and whether potential economies may be shared, in some measure, with Fund investors and (vi) other benefits to the Adviser from its relationship with the Funds. In the Board’s deliberations, no single factor was responsible for the Board’s decision to approve continuation of the management agreements.
Nature, Extent and Quality of Services. The Board’s consideration of the nature, extent and quality of the Adviser’s services to the Funds took into account the knowledge gained from the Board’s meetings with the Adviser throughout the prior year. In addition, the Board considered: the Adviser’s long-term history of managing the Funds; the consistency of investment approach; the background and experience of the Adviser’s investment personnel responsible for managing the Funds; the Adviser’s performance as administrator of the Funds, including, among other things, in the areas of brokerage selection, trade execution, compliance and shareholder communications; and frequent favorable recognition of the Adviser and various Funds in the media and in industry publications. The Board also reviewed the Adviser’s resources and key personnel involved in providing investment management services to the Funds and the investment results produced by the Adviser’s in-house research. The Board noted the personal investments that the Adviser’s key investment personnel have made in the Funds, which further aligns the interests of the Adviser and its personnel with those of the Funds’ shareholders. In addition, the Board considered compliance reports about the Adviser from the Funds’ Chief Compliance Officer. The Board concluded that the nature, extent and quality of the services provided by the Adviser to each Fund were appropriate and consistent with the management agreements and that each Fund was likely to continue to benefit from services provided under its management agreement with the Adviser.
Investment Performance of the Funds. The Board considered each Fund’s investment performance over various time periods, including how the Fund performed compared to the median performance of a group of comparable funds (the Fund’s “Universe Median”) selected by Lipper, Inc., an independent data service provider (“Lipper”). The performance periods considered by the Board ended on March 31, 2012. Where available, the Board considered one-, three-, five- and ten-year performance.
Further detail considered by the Board regarding the investment performance of each Fund is set forth below:
Calamos Growth Fund. The Board considered that the Fund outperformed its Universe Median during the three- and ten-year periods, although it underperformed its Universe Median during the one- and five-year periods. The Board further noted that the Fund outperformed its benchmark for the quarter ended March 31, 2012.
Trustee Approval of the Management Agreement (Unaudited)
Calamos Growth and Income Fund. The Board considered that the Fund outperformed its Universe Median during the one-, three-, five- and ten-year periods and was near its Universe Median during the one-year period.
Calamos Value Fund. The Board considered that the Fund underperformed its Universe Median during the one-, three- and five-year periods. The Board also considered, however, the Adviser’s significant changes to the portfolio management team and proposed changes to the investment strategy.
Calamos Focus Growth Fund. The Board considered that the Fund underperformed its Universe Median during the one-, three- and five- year periods. The Board also considered, however, the Adviser’s assertion that much of the underperformance related to 2011. In connection with that assertion, the Board noted that during the 2011 contract review process the data considered by the Board reflected that the Fund had outperformed its Universe Median during the one-, three- and five- year periods ending March 31, 2011. The Board further noted that the Fund outperformed its benchmark for the quarter ended March 31, 2012.
Calamos Global Growth and Income Fund. The Board considered that the Fund outperformed its Universe Median during the one-, three-, five- and ten-year periods.
Calamos International Growth Fund. The Board considered that the Fund outperformed its Universe Median during the one-, three- and five-year periods.
Calamos Global Equity Fund. The Board considered that the Fund outperformed its Universe Median during the one-, three- and five-year periods.
Calamos Convertible Fund. The Board considered that the Fund outperformed its Universe Median during the five- year periods, although it underperformed its Universe Median during the one-, three- and ten-year periods. The Board noted that the Fund performed near the Universe Median for the one- and ten-year periods at the 52 percentile for the one-year period and the 53% for the ten-year period.
Calamos Market Neutral Income Fund. The Board considered that the Fund outperformed its Universe Median during the one-, three-, five- and ten-year periods.
Calamos High Income Fund. The Board considered that the Fund underperformed its Universe Median during the one-, three-, five- and ten-year periods. The Board also considered the Adviser’s assertion that the Fund has provided performance and access to the lower quality spectrum of the corporate bond market, without taking on the additional risks of overweighting the lowest tier of credit quality. In addition, the Board took into account the Adviser’s preference for the higher-quality credits within the high-yield issues, and its continued goal to invest in companies with relatively strong balance sheets, more diversified revenues and where possible, to participate in global trends.
Calamos Total Return Bond Fund. The Board considered that the Fund underperformed its Universe Median during the one- and three-year periods. The Board also noted, however, that the Fund outperformed its benchmark by 1.30% in the quarter ended March 31, 2012 and outperformed its benchmark in 2009. The Board further considered the Adviser’s assertion that underperformance in 2011 was primarily attributable to the Fund’s underweight in shorter duration securities and that the Fund is positioned to take advantage of a higher interest rate environment.
Calamos Evolving World Growth Fund. The Board considered that the Fund outperformed its Universe Median during the one-year period, although it slightly underperformed its Universe Median during the three-year period ranked in the 52 percentile.
Calamos Discovery Growth Fund. Noting that the Fund commenced operations in June 2010, the Board considered that the Fund outperformed its Universe Median during the one-year period.
For the reasons noted above, the Board concluded that continuation of the management agreement for each Fund was in the best interest of the Fund and its shareholders.
Costs of Services Provided and Profits Realized by the Adviser. Using information provided by Lipper, the Board evaluated each Fund’s actual management fee rate compared to the median management fee rate for other mutual funds similar in size, character and investment strategy (the Fund’s “Expense Group”), and the Fund’s total expense ratio compared to the median total expense ratio of the Fund’s Expense Group.
| | | | |
| 180 | | CALAMOS FAMILY OF FUNDS SEMIANNUAL REPORT | | |
Trustee Approval of the Management Agreement (Unaudited)
The Board also reviewed the Adviser’s management fee rates for its institutional separate accounts and for its sub-advised funds (for which the Adviser provides portfolio management services only). The Board took into account the Adviser’s assertion that although, generally, the rates of fees paid by institutional clients were lower than the rates of fees paid by the Funds, the differences reflected the Adviser’s greater level of responsibilities and significantly broader scope of services regarding the Funds, the more extensive regulatory obligations and risks associated with managing the Funds, and other financial considerations with respect to the Funds, including the capital expenditures required to establish a fund and the impact of higher redemption rates for open-end funds.
The Board also considered the Adviser’s costs in serving as the Funds’ investment adviser and manager, including costs associated with technology, infrastructure and compliance necessary to manage the Funds. The Board reviewed the Adviser’s methodology for allocating costs among the Adviser’s lines of business. The Board also considered information regarding the structure of the Adviser’s compensation program for portfolio managers, analysts and certain other employees and the relationship of such compensation to the attraction and retention of quality personnel. Finally, the Board reviewed information on the profitability of the Adviser in serving as each Fund’s investment manager and of the Adviser and its affiliates in all of their relationships with each Fund, as well as an explanation of the methodology utilized in allocating various expenses among the Funds and the Adviser’s other business units. Data was provided to the Board with respect to profitability, both on a pre- and post-marketing cost basis. The Board also reviewed the annual report of the Adviser’s parent company and discussed its corporate structure.
Further detail considered by the Board regarding the management fee rate and expense ratio of each Fund is set forth below:
Calamos Growth Fund. The Board considered that the Fund’s management fee rate is higher than the median of the Fund’s Expense Group. The Board also noted, however, that the Fund’s total expense ratio, which reflects the total fees paid by an investor, is lower than the median of the Fund’s Expense Group. In addition, the Board took into account the Adviser’s expense cap. The Board noted that under the expense cap, the Fund’s Class A total annual expenses would be capped at 1.75%.
Calamos Growth and Income Fund. The Board considered that the Fund’s management fee rate is at the median of the Fund’s Expense Group. The Board also noted, however, that the Fund’s total expense ratio, which reflects the total fees paid by an investor, is lower than the median of the Fund’s Expense Group. In addition, the Board took into account the Adviser’s proposed expense cap. The Board noted that under the expense cap, the Fund’s Class A total annual expenses would be capped at 1.75%.
Calamos Value Fund. The Board considered that the Fund’s management fee rate and total expense ratio are higher than the respective medians of the Fund’s Expense Group. In addition, the Board took into account the Adviser’s expense cap. The Board noted that under the expense cap, the Fund’s Class A total annual expenses would be capped at 1.15%.
Calamos Focus Growth Fund. The Board considered that the Fund’s management fee rate and total expense ratio are higher than the respective medians of the Fund’s Expense Group. The Board, in its consideration of expenses, also took into account the Adviser’s expense cap. The Board noted that under the expense cap, the Fund’s Class A total annual expenses would be capped at 1.15%.
Calamos Global Growth and Income Fund. The Board considered that the Fund’s management fee rate and total expense ratio are higher than the respective medians of the Fund’s Expense Group. The Board, in its consideration of expenses, also took into account its review of the Fund’s performance. In addition, the Board took into account the Adviser’s expense cap. The Board noted that under the expense cap, the Fund’s Class A total annual expenses would be capped at 1.75%.
Calamos International Growth Fund. The Board considered that the Fund’s management fee rate and total expense ratio are higher than the respective medians of the Fund’s Expense Group. The Board also considered, however, that the Fund’s contractual management fee rate, assuming all peer group funds included in the Fund’s Expense Group have a common asset level, is equal to the median of the Fund’s Expense Group. The Board, in its consideration of expenses, also took into account its review of the Fund’s performance. In addition, the Board took into account the Adviser’s expense cap. The Board noted that under the expense cap, the Fund’s Class A total annual expenses would be capped at 1.40%.
Calamos Global Equity Fund. The Board considered that the Fund’s management fee rate and total expense ratio are higher than the respective medians of the Fund’s Expense Group. The Board, in its consideration of expenses, also took into account its review of the Fund’s performance. In addition, the Board took into account the Adviser’s expense cap. The Board noted that under the expense cap, the Fund’s Class A total annual expenses would be capped at 1.40%.
Trustee Approval of the Management Agreement (Unaudited)
Calamos Convertible Fund. The Board considered that the Fund’s management fee rate and total expense ratio are higher than the respective medians of the Fund’s Expense Group. In addition, the Board took into account the Adviser’s expense cap. The Board noted that under the expense cap, the Fund’s Class A total annual expenses would be capped at 1.75%.
Calamos Market Neutral Income Fund. The Board considered that the Fund’s management fee rate and total expense ratio are lower than the respective medians of the Fund’s Expense Group. In addition, the Board took into account the Adviser’s expense cap. The Board noted that under the expense cap, the Fund’s Class A total annual expenses would be capped at 1.75%.
Calamos High Income Fund. The Board considered that the Fund’s management fee rate and total expense ratio are higher than the respective medians of the Fund’s Expense Group. In addition, the Board took into account the Adviser’s expense cap. The Board noted that under the expense cap, the Fund’s Class A total annual expenses would be capped at 1.75%.
Calamos Total Return Bond Fund. The Board considered that the Fund’s management fee rate is higher than the median of the Fund’s Expense Group. The Board also noted, however, that the Fund’s total expense ratio, which reflects the total fees paid by an investor, is near the median of the Fund’s Expense Group. In addition, the Board took into account the Adviser’s expense cap. The Board noted that under the expense cap, the Fund’s Class A total annual expenses would be capped at 0.90%.
Calamos Evolving World Growth Fund. The Board considered that the Fund’s management fee rate is at the median of the Fund’s Expense Group. The Board also noted that the Fund’s total expense ratio, which reflects the total fees paid by an investor, is lower than the median of the Fund’s Expense Group. In addition, the Board took into account the Adviser’s expense cap. The Board noted that under the expense cap, the Fund’s Class A total annual expenses would be capped at 1.75%.
Calamos Discovery Growth Fund. The Board considered that the Fund’s management fee rate is at the median of the Fund’s Expense Group and that the Fund’s total expense ratio, which reflects the total fees paid by an investor, is slightly higher than the median of the Fund’s Expense Group. In addition, the Board took into account the Adviser’s expense cap. The Board noted that under the expense cap, the Fund’s Class A total annual expenses would be capped at 1.50%.
After its review of all the matters addressed, including those outlined above, the Board concluded that the rate of management fee paid by each Fund to the Adviser, in light of the nature and quality of the services provided, was reasonable and in the best interest of Fund shareholders.
Economies of Scale and Fee Levels Reflecting Those Economies. The Board considered whether each Fund’s management fee shares with shareholders potential economies of scale that may be achieved by the Adviser. The Board recognized that breakpoints in the fee schedule for each Fund could result in the sharing of economies of scale as Fund assets increase. The Board also considered the Adviser’s agreement to reimburse each Fund for a portion of its expenses if the Fund expense ratio otherwise would exceed a certain level. The Board concluded that the breakpoints in the fee schedule for each Fund allow shareholders to benefit from potential economies of scale that may be achieved by the Adviser.
Other Benefits Derived from the Relationship with the Funds. The Board also considered other benefits that accrue to the Adviser and its affiliates from their relationship with the Funds. The Board concluded that, other than the services to be provided by the Adviser and its affiliates pursuant to their agreements with the Funds and the fees payable by the Funds therefore, the Funds and the Adviser may potentially benefit from their relationship with each other in other ways.
The Board also considered the Adviser’s use of a portion of the commissions paid by the Funds on their portfolio brokerage transactions to obtain research products and services benefiting the Funds and/or other clients of the Adviser and concluded, based on reports from the Funds’ Chief Compliance Officer, that the Adviser’s use of “soft” commission dollars to obtain research products and services was consistent with regulatory requirements.
After full consideration of the above factors as well as other factors that were instructive in their consideration, the Trustees, including all of the Independent Trustees, concluded that the continuation of the management agreement for each Fund with the Adviser was in the best interest of each respective Fund and its shareholders.
| | | | |
| 182 | | CALAMOS FAMILY OF FUNDS SEMIANNUAL REPORT | | |
MANAGING YOUR CALAMOS FUNDS INVESTMENTS
Calamos Investments offers several convenient means to monitor, manage and feel confident about your Calamos investment choice.
24-HOUR AUTOMATED SHAREHOLDER ASSISTANCE: 800.823.7386
Through a single toll-free number, Calamos 24-Hour Shareholder Assistance is fast and easy. Get fund prices and account balances, review recent transactions, order statements, literature and more.
PERSONAL ASSISTANCE: 800.582.6959
Dial this toll-free number to speak with a knowledgeable Client Services Representative who can help answer questions or address issues concerning your Calamos Fund.
ONLINE ACCOUNT MANAGEMENT: www.calamos.com
Manage your personal account of Calamos Funds online at www.calamos.com. On your account access page, you can view account history and download data.
YOUR FINANCIAL ADVISOR
We encourage you to talk to your financial advisor to determine how the Calamos Funds can benefit your investment portfolio based on your financial goals, risk tolerance, time horizon and income needs.
This report, including the audited financial statements contained herein, is submitted for general information for the shareholders of the Funds. The report is not authorized for distribution to prospective investors in the Funds unless accompanied by a currently effective prospectus of the Funds and, after July 31, 2013, updated performance data for the most recently completed fiscal quarter. The views expressed in this report reflect those of Calamos Advisors LLC only through April 30, 2013. The managers’ views are subject to change at any time based on market and other conditions.
A description of the Calamos Proxy Voting Policies and Procedures and the Funds’ proxy voting record for the 12-month period ended June 30, 2012 are available free of charge upon request by calling 800.582.6959, by visiting the Calamos Web site at www.calamos.com, or by writing Calamos at: Calamos Investments, Attn: Client Services, 2020 Calamos Court, Naperville, IL 60563. The Funds’ proxy voting record is also available free of charge by visiting the SEC Web site at www.sec.gov.
The Funds file a complete list of their portfolio holdings with the SEC for the first and third quarters each fiscal year on Form N-Q. The Forms N-Q are available free of charge, upon request, by calling or writing Calamos Investments at the phone number or address provided above or by visiting the SEC Web site at www.sec.gov. You may also review or, for a fee, copy the forms at the SEC’s Public Reference Room in Washington, D.C. Information on the operation of the Public Reference Room may be obtained by calling 800.732.0330.
FOR 24-HOUR AUTOMATED SHAREHOLDER ASSISTANCE: 800.823.7386
TO OBTAIN INFORMATION ABOUT YOUR INVESTMENTS: 800.582.6959
VISIT OUR WEB SITE: www.calamos.com
INVESTMENT ADVISER:
Calamos Advisors LLC
2020 Calamos Court
Naperville, IL 60563-2787
TRANSFER AGENT:
U.S. Bancorp Fund Services, LLC
615 E. Michigan St., 3rd Floor
Milwaukee, WI 53202
INDEPENDENT REGISTERED PUBLIC ACCOUNTING FIRM:
Deloitte & Touche LLP
Chicago, IL
LEGAL COUNSEL:
K&L Gates LLP
Chicago, IL
| | |

| | STAY CONNECTED www.calamos.com/connect |
|
Visit our Web site for timely fund performance, detailed fund profiles, fund news and insightful market commentary. |

2020 Calamos Court
Naperville, IL 60563-2787
800.582.6959
www.calamos.com
© 2013 Calamos Investments LLC. All Rights Reserved.
Calamos® and Calamos Investments® are registered
trademarks of Calamos Investments LLC.
MFSAN 1631 2013
ITEM 2. CODE OF ETHICS.
Not applicable.
ITEM 3. AUDIT COMMITTEE FINANCIAL EXPERT.
Not applicable.
ITEM 4. PRINCIPAL ACCOUNTANT FEES AND SERVICES.
Not applicable.
ITEM 5. AUDIT COMMITTEE OF LISTED REGISTRANTS.
Not applicable.
ITEM 6. SCHEDULE OF INVESTMENTS
Included in the Report to Shareholders in Item 1.
ITEM 7. DISCLOSURE OF PROXY VOTING POLICIES AND PROCEDURES FOR CLOSED-END MANAGEMENT INVESTMENT COMPANIES.
Not applicable.
ITEM 8. PORTFOLIO MANAGERS OF CLOSED-END MANAGEMENT INVESTMENT COMPANIES.
Not applicable.
ITEM 9. PURCHASES OF EQUITY SECURITIES BY CLOSED-END MANAGEMENT INVESTMENT COMPANY AND AFFILIATED PURCHASERS.
Not applicable.
ITEM 10. SUBMISSION OF MATTERS TO A VOTE OF SECURITY HOLDERS.
No material changes.
ITEM 11. CONTROLS AND PROCEDURES.
a) The registrant’s principal executive officer and principal financial officer have evaluated the registrant’s disclosure controls and procedures within 90 days of this filing and have concluded that the registrant’s disclosure controls and procedures were effective, as of that date, in ensuring that information required to be disclosed by the registrant in this Form N-CSR was recorded, processed, summarized, and reported timely.
b) There were no changes in the registrant’s internal controls over financial reporting (as defined in Rule 30a-3(d) under the Investment Company Act of 1940) that occurred during the second fiscal quarter of the period covered by this report that has materially affected, or is reasonably likely to materially affect, the registrant’s internal control over financial reporting.
ITEM 12. EXHIBITS.
(a)(1) Code of Ethics—Not applicable.
(a)(2)(i) Certification of Principal Executive Officer.
(a)(2)(ii) Certification of Principal Financial Officer.
SIGNATURES
Pursuant to the requirements of the Securities Exchange Act of 1934 and the Investment Company Act of 1940, the registrant has duly caused this report to be signed on its behalf by the undersigned, thereunto duly authorized.
| | |
| Calamos Investment Trust |
| |
By: | | /s/ John P. Calamos, Sr. |
Name: | | John P. Calamos, Sr. |
Title: | | Principal Executive Officer |
Date: | | June 21, 2013 |
| | |
By: | | /s/ Nimish S. Bhatt |
Name: | | Nimish S. Bhatt |
Title: | | Principal Financial Officer |
Date: | | June 21, 2013 |
Pursuant to the requirements of the Securities Exchange Act of 1934 and the Investment Company Act of 1940, this report has been signed by the following persons on behalf of the registrant and in the capacities and on the dates indicated.
| | |
By: | | /s/ John P. Calamos, Sr. |
Name: | | John P. Calamos, Sr. |
Title: | | Principal Executive Officer |
Date: | | June 21, 2013 |
| | |
By: | | /s/ Nimish S. Bhatt |
Name: | | Nimish S. Bhatt |
Title: | | Principal Financial Officer |
Date: | | June 21, 2013 |